1 Climate Resilience: Concepts, Theory and Methods of Measuring Adi Subiyanto 1 *, Rizaldi Boer 2 , Edvin Aldrian 3 , Perdinan 4 , Rilus Kinseng 5 1 Program of Applied Climatology, Graduate School of Bogor Agricultural University, Indonesia 2 Center for Climate Risk and Opportunity Management in Southeast Asia and Pacific, Bogor Agricultural University, Indonesia 3 Intergovernmental Panel on Climate Change, Working Group I Vice Chair, Indonesia 4 Department of Geophysics and Meteorology, Faculty of Mathematics and Natural Sciences, Bogor Agricultural University, Indonesia 5 Department of Communication Science and Community Development, Faculty of Human Ecology, Bogor Agricultural University, Indonesia *Corresponding Author: [email protected] Received: November 6, 2018; 1st Revised: January 14, 2019; Accepted: June 8, 2019 EnvironmentAsia 13(1) 2020 1-13 DOI 10.14456/ea.2020.1 ISSN 1906-1714; ONLINE ISSN: 2586-8861 Abstract Resilience is an intangible concept. One way to describe it is done by indicators that can represent the same unit (index). The purpose of the study is to develop a method of measuring the climate resilience index (RI) based on the concepts and theory of vulnerability, risk, and resilience. The design of study and methods are: 1) framework for analysis of the concepts of vulnerability, risk, and resilience; and 2) develop RI based on a risk management approach and set up resilience forming factors. The method of measuring RI includes the choice of indicators, weighting and scaling indicators, categories of resilience, and applying methods to measure RI at the provincial level in Indonesia. The results showed that RI=(ACI*TCI)/(EI*SI); where RI: climate resilience index, ACI: adaptive capacity index, TCI: transformative capacity index, EI: exposure index, and SI: sensitivity index. In the case of Indonesia, the average of RI is 0.70. The highest was Jakarta SCR (1.61) and the lowest was East Nusa Tenggara (0.29). In other words, East Nusa Tenggara has to be the first priority of development in the face of climate change threat. Keywords: Vulnerability; Risk; Resilience; Climate resilience index e international journal by the ai Society of Higher Education Institutes on Environment EnvironmentAsia 1. Introduction Research on resilience related to climate change threats is relatively new when compared to the vulnerability and risk. In fact, there is no consensus on how to measure resilience so it remains a challenge for researchers (Béné et al, 2013). The same extreme weather events can have an impact on different socioeconomic conditions, not only depending on location and time of incidence but also determined by community resources and agility associated with their experience and participation in dealing with the disturbance. The change in the research focus from vulnerability and risk to resilience is based more on the meaning of resilience that refers to a positive concept (reinforce), so it can be more integrated with sustainable development goals (Malone, 2009). The Intergovernmental Panel on Climate Change (IPCC) continues to develop its methodology in addressing the challenges of climate change. Significant changes are the change of the concept of vulnerability in the fourth assessment report or AR4 (IPCC, 2007) to risk assessment in the fifth assessment report or AR5 (IPCC, 2014).

Welcome message from author
This document is posted to help you gain knowledge. Please leave a comment to let me know what you think about it! Share it to your friends and learn new things together.
Transcript
1
Climate Resilience: Concepts, Theory and Methods of Measuring
Adi Subiyanto1*, Rizaldi Boer2, Edvin Aldrian3, Perdinan4, Rilus Kinseng5
1Program of Applied Climatology, Graduate School of Bogor Agricultural University, Indonesia2Center for Climate Risk and Opportunity Management in Southeast Asia and Pacific, Bogor
Agricultural University, Indonesia3Intergovernmental Panel on Climate Change, Working Group I Vice Chair, Indonesia
4Department of Geophysics and Meteorology, Faculty of Mathematics and Natural Sciences, Bogor Agricultural University, Indonesia
5Department of Communication Science and Community Development, Faculty of Human Ecology, Bogor Agricultural University, Indonesia
*Corresponding Author: [email protected]: November 6, 2018; 1st Revised: January 14, 2019; Accepted: June 8, 2019
EnvironmentAsia 13(1) 2020 1-13DOI 10.14456/ea.2020.1
ISSN 1906-1714; ONLINE ISSN: 2586-8861
AbstractResilience is an intangible concept. One way to describe it is done by indicators that can represent the same unit (index). The purpose of the study is to develop a method of measuring the climate resilience index (RI) based on the concepts and theory of vulnerability, risk, and resilience. The design of study and methods are: 1) framework for analysis of the concepts of vulnerability, risk, and resilience; and 2) develop RI based on a risk management approach and set up resilience forming factors. The method of measuring RI includes the choice of indicators, weighting and scaling indicators, categories of resilience, and applying methods to measure RI at the provincial level in Indonesia. The results showed that RI=(ACI*TCI)/(EI*SI); where RI: climate resilience index, ACI: adaptive capacity index, TCI: transformative capacity index, EI: exposure index, and SI: sensitivity index. In the case of Indonesia, the average of RI is 0.70. The highest was Jakarta SCR (1.61) and the lowest was East Nusa Tenggara (0.29). In other words, East Nusa Tenggara has to be the first priority of development in the face of climate change threat.
Keywords: Vulnerability; Risk; Resilience; Climate resilience index
1
N. Natarajan et al / EnvironmentAsia 12(3) (2019) xx-xx
EnvironmentAsia 12(3) (2019) xx-xxDOI xxxxxxxxxxxxx
ISSN 1906-1714; ONLINE ISSN: 2586-8861
People Perceptions on Implementation of Water Meters in Municipal Water Supply System: A Case Study from Pollachi Town, Tamil Nadu, India
Narayanan Natarajan*, Ramasamy Sakthi Manikandan, Gopal Harish Kumar, and Selvaraju Rajkumar
Department of Civil engineering, Mahalingam college of engineering and technology, Pollachi, Tamil Nadu, India
*Corresponding author: [email protected]: September 18, 2018; Revised: January 13, 2019; Accepted: June 11, 2019
AbstractUnderstanding the perception of people on the provision of water meters in houses can aid in the enhancement of water conservation strategies in a locality. In this study, the perception of the residents of the town of Pollachi, Tamil Nadu, India was assessed using a questionnaire survey. Queries were related to the quality of the water, duration and frequency of water supply, need for water pricing, usage of filters, preference for implementation of water meter, water treatment, etc. The survey was analyzed based on four major parameters, namely; age, gender, locality and literacy of the people. A total of 78 residents from various locations in and around Pollachi were considered for this survey. The study indicates that frequency of supply of water to the residents of the town is not uniform in all locations and the residents within the town received water supply for a longer duration compared to those living away from the town. The quality of water is perceived to be good by majority of the residents. There was a mixed response from the males and females regarding boiling of water and usage of filters. Perception of people over the provision of water meter in the house is mixed and most of the males perceived that a water meter should be provided compared to the females. Women had more conviction of the fact that the provision of a water meter would solve the water shortage problem in their town, in comparison with the men. Thus, provision of water meter will definitely aid in water conservation as people would have to pay as per their usage.
Keywords: Water meter; Perception; Municipal water supply; Water quality; Water demand
The international journal by the Thai Society of Higher Education Institutes on EnvironmentEnvironmentAsia
1. Introduction
Water scarcity is an issue that is threatening many developing countries today and India is no exception to that. India is the home for 1.34 billion people. With 16% of the global population, it has only 4% of the world’s water resources (Government of India, 1999). India has been taking significant steps to develop its water resources, but rapidly growing population,
industrial and infrastructural development, agriculture and unequal distribution of water has resulted in demand exceeding the supply (Cronin et al., 2014). According to National Institute of Hydrology (2010), the current water availability per capita is around 1,170 m3/person·year, indicating that India is just above the water stressed criteria of 1,000 m3/person (WRI, 2007), based on Government of India (1999). In addition, issues such as
1. IntroductionResearch on resilience related to
climate change threats is relatively new when compared to the vulnerability and risk. In fact, there is no consensus on how to measure resilience so it remains a challenge for researchers (Béné et al, 2013). The same extreme weather events can have an impact on different socioeconomic conditions, not only depending on location and time of incidence but also determined by community resources and agility associated with their experience and participation in dealing with the disturbance. The change in the research focus from vulnerability
and risk to resilience is based more on the meaning of resilience that refers to a positive concept (reinforce), so it can be more integrated with sustainable development goals (Malone, 2009).
The Intergovernmental Panel on Climate Change (IPCC) continues to develop its methodology in addressing the cha l l enges o f c l ima te change . Signif icant changes are the change of the concept of vulnerability in the fourth assessment report or AR4 (IPCC, 2007) to risk assessment in the fifth assessment report or AR5 (IPCC, 2014).
A. Subiyanto et al / EnvironmentAsia 13(1) (2020) 1-13
2
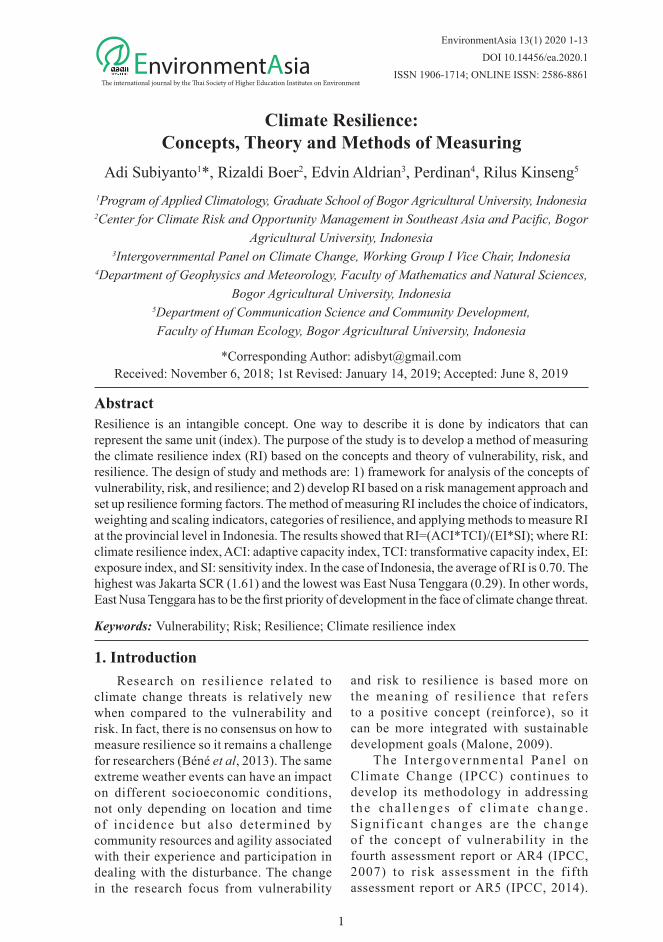
Figure 1. Thinking Framework
T h e c h a n g e o f c o n c e p t u a l b r i n g s consequences when it comes to measure the vu lnerab i l i ty and r i sk ind ices .In AR4, vulnerability factors include exposure , sens i t iv i ty, and adapt ive capacity; meanwhile AR5 has separated e x p o s u r e f r o m v u l n e r a b i l i t y. A R 5 emphasizes on the concept of risk in order to be more easily integrated with disaster studies.
Based on this fact, it is necessary to know about how the linkage (connectivity) between the concepts of vulnerability (in AR4) with the concept of risk (in AR5) is; and whether climate resilience measures can be developed based on the concept of vulnerability and risk. The objectives of the study are (1) to analyze vulnerability, risk or impact, and resilience by means of connectivity to changes concept in the AR4 to AR5 and compare to the resilience concept, and (2) to develop a method of measuring the climate resilience index based on the results of connectivity and comparability between concepts of vulnerability, risk, and resilience. The results of this analysis are expected to be used in measuring climate resilience index, both at national and sub-national scales (province).
2. Framework for analysis
Basically, this study was conducted to develop a method for measuring climate resilience index based on existing theories and concepts (Figure 1). The definition of theory is a set of concepts, assumptions, and generalizations that can be used to express and explain behavior in various organizations (Hoy and Miskel, 2010). Meanwhile, the concept is a number of characteristics associated with an object where the concept is created by classifying and grouping certain objects that have the same characteristics (Umar, 2004).
Theory can also be interpreted as a set of interrelated concepts and definitions that reflect a systematic view of phenomena and explain the relationship between variables (Siswoyo in Mardalis, 2003). The theory can limit the number of facts that are needed to be learned and can be used to predict further facts to be sought. The main concepts that being used in this study are the concept of vulnerability (AR4), the concept of risk/impact (AR5) and the concept of resilience. The concept of adaptive capacity is also used to clarify the discussion of the main concept. The reason, adaptation is often equated with the meaning of resilience. The result of the connectivity and the comparison between the concepts, is expected to be used to develop a method for measuring climate resilience index (RI).
A. Subiyanto et al / EnvironmentAsia 13(1) (2020) 1-13
3
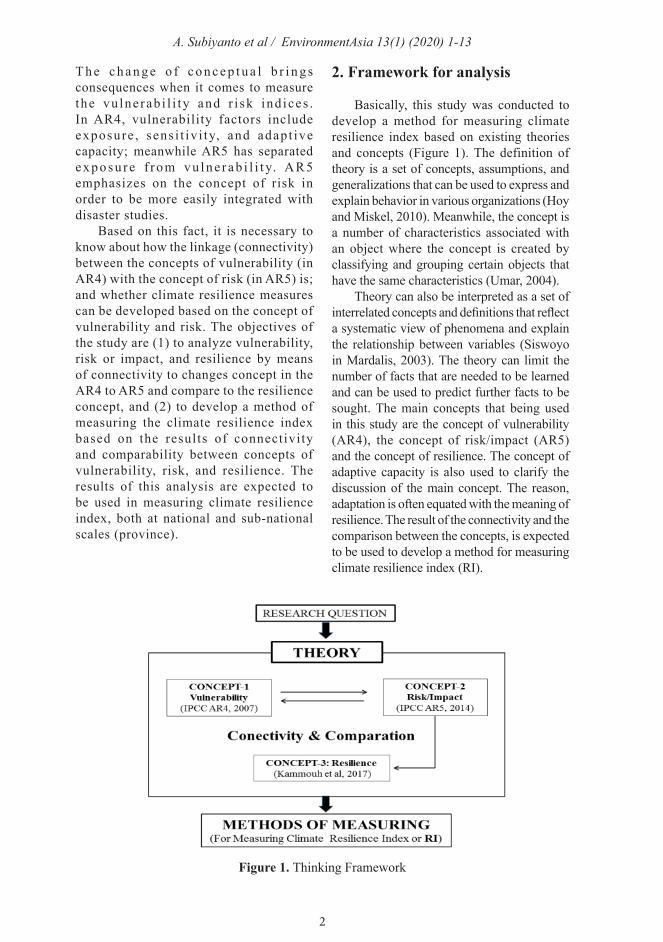
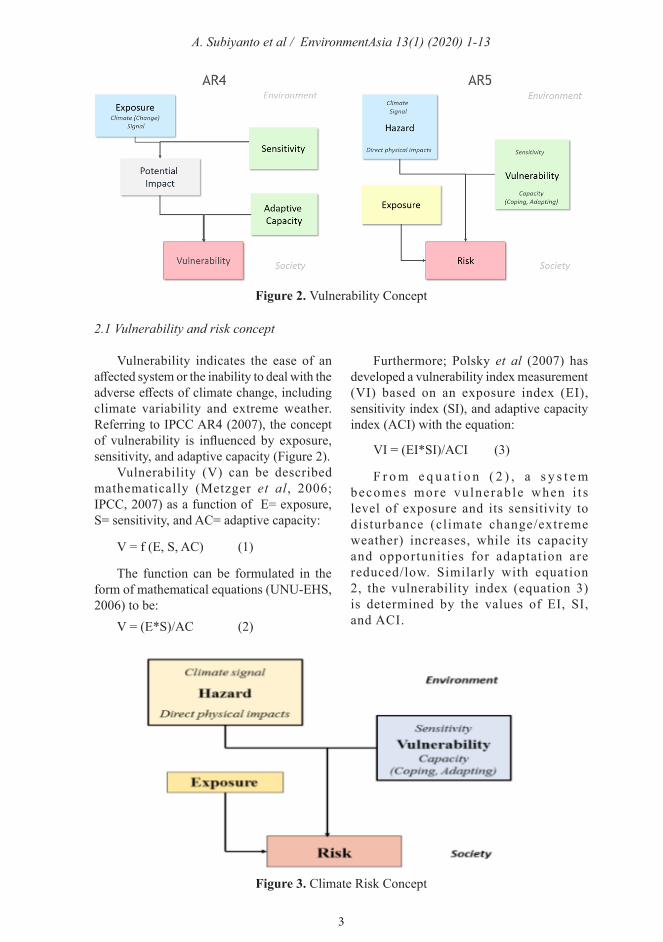
Figure 3. Climate Risk Concept
Figure 2. Vulnerability Concept
2.1 Vulnerability and risk concept
Vulnerability indicates the ease of an affected system or the inability to deal with the adverse effects of climate change, including climate variability and extreme weather. Referring to IPCC AR4 (2007), the concept of vulnerability is influenced by exposure, sensitivity, and adaptive capacity (Figure 2).
Vulnerability (V) can be described mathematically (Metzger et al, 2006; IPCC, 2007) as a function of E= exposure, S= sensitivity, and AC= adaptive capacity:
V = f (E, S, AC) (1)
The function can be formulated in the form of mathematical equations (UNU-EHS, 2006) to be:
V = (E*S)/AC (2)
Furthermore; Polsky et al (2007) has developed a vulnerability index measurement (VI) based on an exposure index (EI), sensitivity index (SI), and adaptive capacity index (ACI) with the equation:
VI = (EI*SI)/ACI (3)
F r o m e q u a t i o n ( 2 ) , a s y s t e m becomes more vu lnerab le when i t s level of exposure and its sensitivity to disturbance (climate change/extreme weather) increases, while its capacity and opportunities for adaptation are reduced/low. Similarly with equation 2, the vulnerability index (equation 3) is determined by the values of EI, SI, and ACI.
A. Subiyanto et al / EnvironmentAsia 13(1) (2020) 1-13
4
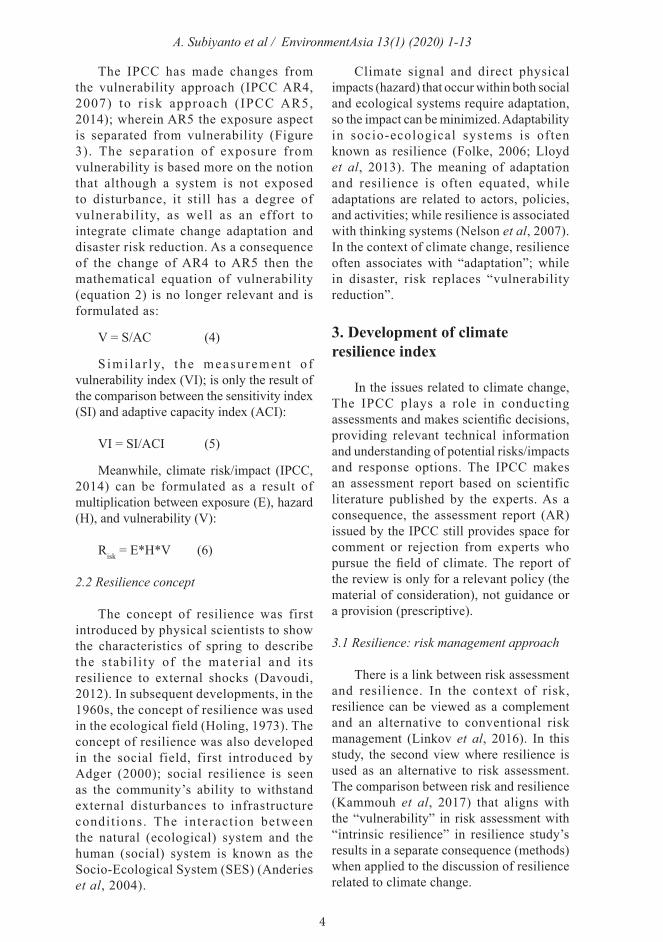
The IPCC has made changes from the vulnerability approach (IPCC AR4, 2007) to r isk approach (IPCC AR5, 2014); wherein AR5 the exposure aspect is separated from vulnerability (Figure 3). The separation of exposure from vulnerability is based more on the notion that although a system is not exposed to disturbance, it still has a degree of vulnerability, as well as an effort to integrate climate change adaptation and disaster risk reduction. As a consequence of the change of AR4 to AR5 then the mathematical equation of vulnerability (equation 2) is no longer relevant and is formulated as:
V = S/AC (4)
S imi l a r ly, t he measu remen t o f vulnerability index (VI); is only the result of the comparison between the sensitivity index (SI) and adaptive capacity index (ACI):
VI = SI/ACI (5)
Meanwhile, climate risk/impact (IPCC, 2014) can be formulated as a result of multiplication between exposure (E), hazard (H), and vulnerability (V):
Risk = E*H*V (6)
2.2 Resilience concept
The concept of resilience was first introduced by physical scientists to show the characteristics of spring to describe the stabil i ty of the material and i ts resilience to external shocks (Davoudi, 2012). In subsequent developments, in the 1960s, the concept of resilience was used in the ecological field (Holing, 1973). The concept of resilience was also developed in the social field, first introduced by Adger (2000); social resilience is seen as the community’s ability to withstand external disturbances to infrastructure condit ions. The interaction between the natural (ecological) system and the human (social) system is known as the Socio-Ecological System (SES) (Anderies et al, 2004).
Climate signal and direct physical impacts (hazard) that occur within both social and ecological systems require adaptation, so the impact can be minimized. Adaptability in socio-ecological systems is often known as resilience (Folke, 2006; Lloyd et al, 2013). The meaning of adaptation and resilience is often equated, while adaptations are related to actors, policies, and activities; while resilience is associated with thinking systems (Nelson et al, 2007). In the context of climate change, resilience often associates with “adaptation”; while in disaster, risk replaces “vulnerability reduction”.
3. Development of climate resilience index
In the issues related to climate change, The IPCC plays a role in conducting assessments and makes scientific decisions, providing relevant technical information and understanding of potential risks/impacts and response options. The IPCC makes an assessment report based on scientific literature published by the experts. As a consequence, the assessment report (AR) issued by the IPCC still provides space for comment or rejection from experts who pursue the field of climate. The report of the review is only for a relevant policy (the material of consideration), not guidance or a provision (prescriptive).
3.1 Resilience: risk management approach
There is a link between risk assessment and resilience. In the context of risk, resilience can be viewed as a complement and an alternative to conventional risk management (Linkov et al, 2016). In this study, the second view where resilience is used as an alternative to risk assessment. The comparison between risk and resilience (Kammouh et al, 2017) that aligns with the “vulnerability” in risk assessment with “intrinsic resilience” in resilience study’s results in a separate consequence (methods) when applied to the discussion of resilience related to climate change.
A. Subiyanto et al / EnvironmentAsia 13(1) (2020) 1-13
5
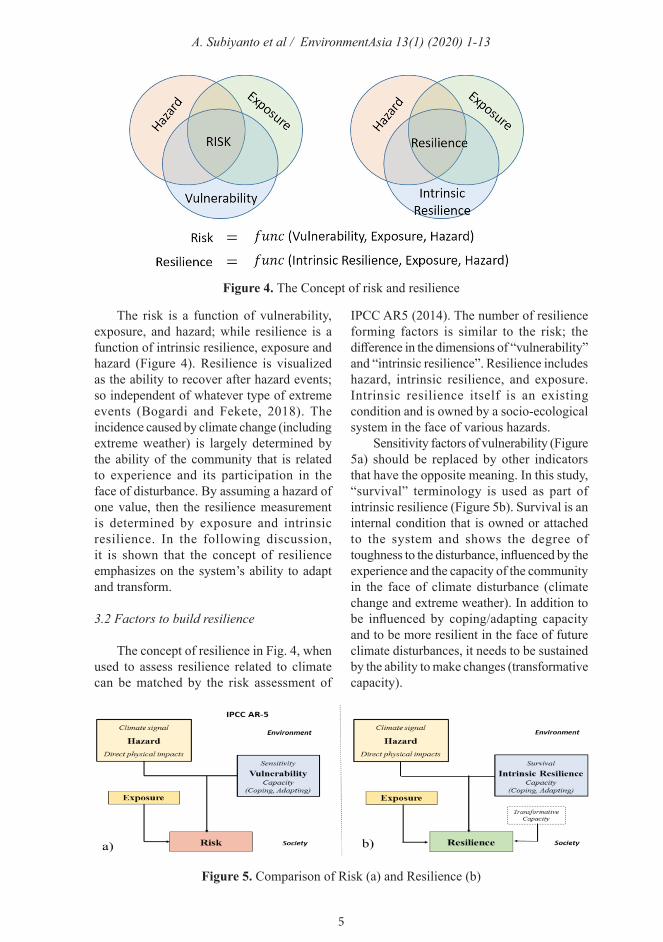
Figure 4. The Concept of risk and resilience
Figure 5. Comparison of Risk (a) and Resilience (b)
The risk is a function of vulnerability, exposure, and hazard; while resilience is a function of intrinsic resilience, exposure and hazard (Figure 4). Resilience is visualized as the ability to recover after hazard events; so independent of whatever type of extreme events (Bogardi and Fekete, 2018). The incidence caused by climate change (including extreme weather) is largely determined by the ability of the community that is related to experience and its participation in the face of disturbance. By assuming a hazard of one value, then the resilience measurement is determined by exposure and intrinsic resilience. In the following discussion, it is shown that the concept of resilience emphasizes on the system’s ability to adapt and transform.
3.2 Factors to build resilience
The concept of resilience in Fig. 4, when used to assess resilience related to climate can be matched by the risk assessment of
IPCC AR5 (2014). The number of resilience forming factors is similar to the risk; the difference in the dimensions of “vulnerability” and “intrinsic resilience”. Resilience includes hazard, intrinsic resilience, and exposure. Intrinsic resilience itself is an existing condition and is owned by a socio-ecological system in the face of various hazards.
Sensitivity factors of vulnerability (Figure 5a) should be replaced by other indicators that have the opposite meaning. In this study, “survival” terminology is used as part of intrinsic resilience (Figure 5b). Survival is an internal condition that is owned or attached to the system and shows the degree of toughness to the disturbance, influenced by the experience and the capacity of the community in the face of climate disturbance (climate change and extreme weather). In addition to be influenced by coping/adapting capacity and to be more resilient in the face of future climate disturbances, it needs to be sustained by the ability to make changes (transformative capacity).
A. Subiyanto et al / EnvironmentAsia 13(1) (2020) 1-13
6
Base on Fig. 5b, the measurement of the resilience index can be determined by the level of exposure and intrinsic resilience. The addi t ion of the t ransformat ive capacity factor is important when it wants to know the effectiveness and role of government (including community part icipation) in making changes to be t t e r cond i t ions . Governance and politics are the fundamental importance to unders tanding and analyzing the transformation (Patterson et al, 2017). The transformative capacity is at once an advantage of the concept of resilience compared to vulnerability and risk. It can be said that resilience is more assured in the face of various uncertainties in the future.
4. Methods for measuring climate resilience index
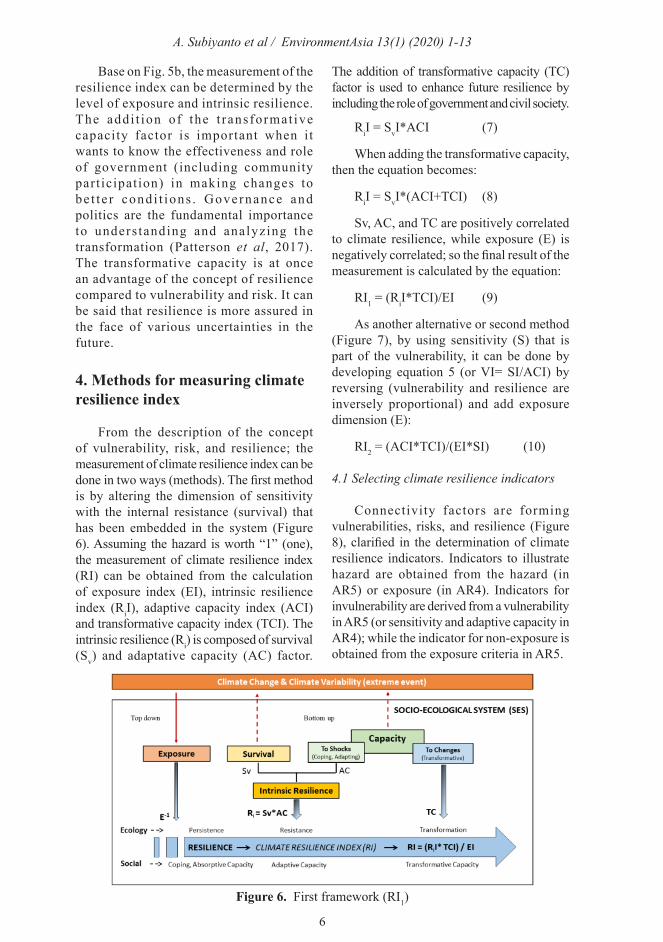
From the description of the concept of vulnerability, risk, and resilience; the measurement of climate resilience index can be done in two ways (methods). The first method is by altering the dimension of sensitivity with the internal resistance (survival) that has been embedded in the system (Figure 6). Assuming the hazard is worth “1” (one), the measurement of climate resilience index (RI) can be obtained from the calculation of exposure index (EI), intrinsic resilience index (RiI), adaptive capacity index (ACI) and transformative capacity index (TCI). The intrinsic resilience (Ri) is composed of survival (Sv) and adaptative capacity (AC) factor.
The addition of transformative capacity (TC) factor is used to enhance future resilience by including the role of government and civil society.
RiI = SvI*ACI (7)
When adding the transformative capacity, then the equation becomes:
RiI = SvI*(ACI+TCI) (8)
Sv, AC, and TC are positively correlated to climate resilience, while exposure (E) is negatively correlated; so the final result of the measurement is calculated by the equation:
RI1 = (RiI*TCI)/EI (9)
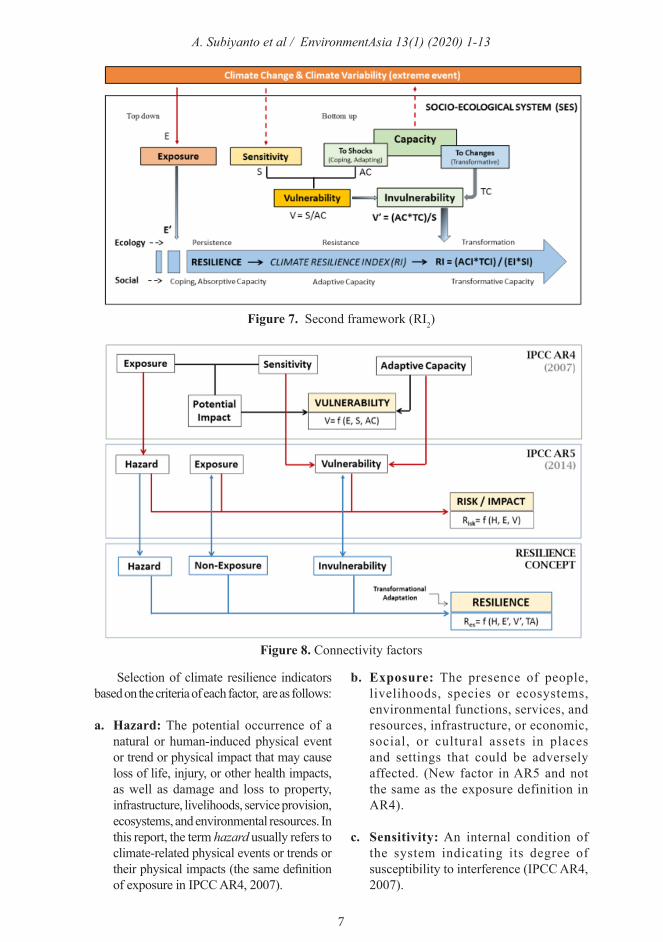
As another alternative or second method (Figure 7), by using sensitivity (S) that is part of the vulnerability, it can be done by developing equation 5 (or VI= SI/ACI) by reversing (vulnerability and resilience are inversely proportional) and add exposure dimension (E):
RI2 = (ACI*TCI)/(EI*SI) (10)
4.1 Selecting climate resilience indicators
Connectivity factors are forming vulnerabilities, risks, and resilience (Figure 8), clarified in the determination of climate resilience indicators. Indicators to illustrate hazard are obtained from the hazard (in AR5) or exposure (in AR4). Indicators for invulnerability are derived from a vulnerability in AR5 (or sensitivity and adaptive capacity in AR4); while the indicator for non-exposure is obtained from the exposure criteria in AR5.
Figure 6. First framework (RI1)
A. Subiyanto et al / EnvironmentAsia 13(1) (2020) 1-13
7
Figure 7. Second framework (RI2)
Figure 8. Connectivity factors
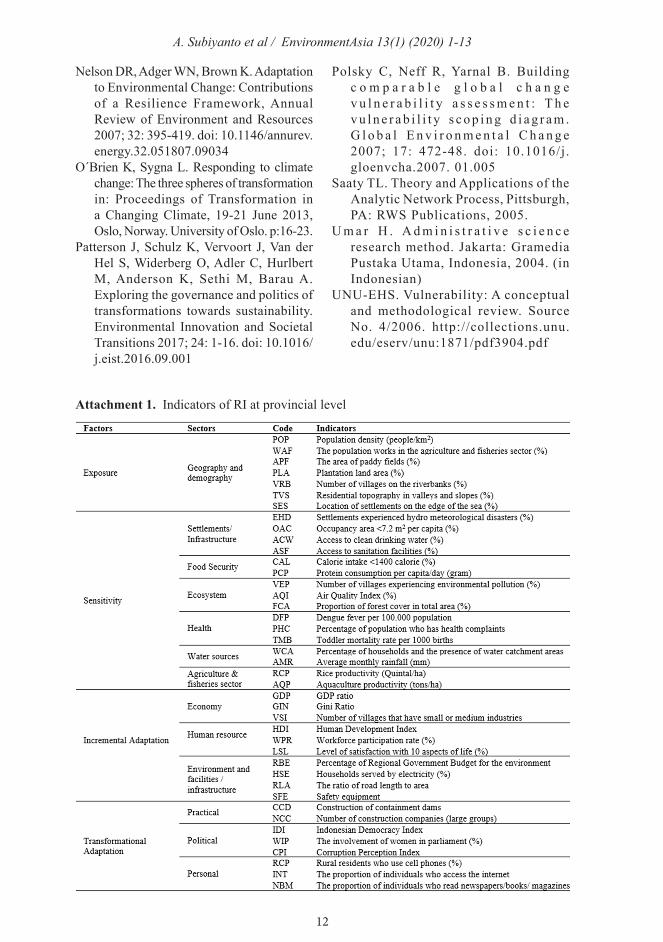
Selection of climate resilience indicators based on the criteria of each factor, are as follows:
a. Hazard: The potential occurrence of a natural or human-induced physical event or trend or physical impact that may cause loss of life, injury, or other health impacts, as well as damage and loss to property, infrastructure, livelihoods, service provision, ecosystems, and environmental resources. In this report, the term hazard usually refers to
climate-related physical events or trends or their physical impacts (the same definition of exposure in IPCC AR4, 2007).
b. Exposure: The presence of people, livelihoods, species or ecosystems, environmental functions, services, and resources, infrastructure, or economic, social, or cultural assets in places and settings that could be adversely affected. (New factor in AR5 and not the same as the exposure definition in AR4).
c. Sensitivity: An internal condition of the system indicating its degree of susceptibility to interference (IPCC AR4, 2007).
A. Subiyanto et al / EnvironmentAsia 13(1) (2020) 1-13
8
d. Adaptation: The process of adjustment to the actual or expected climate and its effects. In human systems, adaptation seeks to moderate or avoid harm or exploit beneficial opportunities. In some natural systems, human intervention may facilitate adjustment to expected climate and its effects (IPCC AR5, 2014).
Incremental adaptation: Adaptation actions where the central aim is to maintain the essence and integrity of a system or process at a given scale (IPCC AR5, 2014).
Transformational adaptation: Adaptation that changes the fundamental attributes of a system in response to climate and its effects (IPCC AR5, 2014).
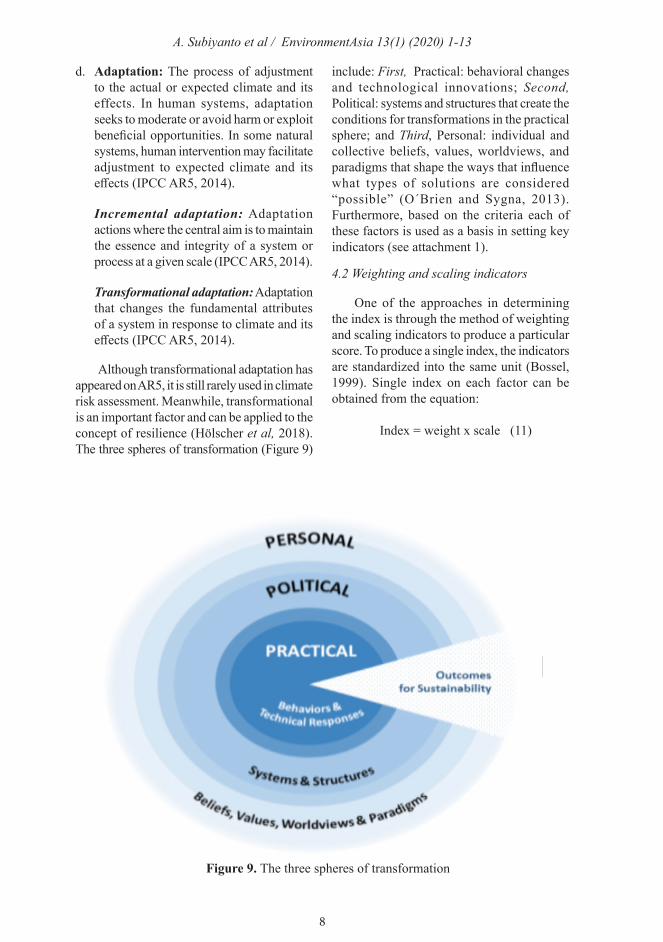
Although transformational adaptation has appeared on AR5, it is still rarely used in climate risk assessment. Meanwhile, transformational is an important factor and can be applied to the concept of resilience (Hölscher et al, 2018). The three spheres of transformation (Figure 9)
include: First, Practical: behavioral changes and technological innovations; Second, Political: systems and structures that create the conditions for transformations in the practical sphere; and Third, Personal: individual and collective beliefs, values, worldviews, and paradigms that shape the ways that influence what types of solutions are considered “possible” (O´Brien and Sygna, 2013). Furthermore, based on the criteria each of these factors is used as a basis in setting key indicators (see attachment 1).
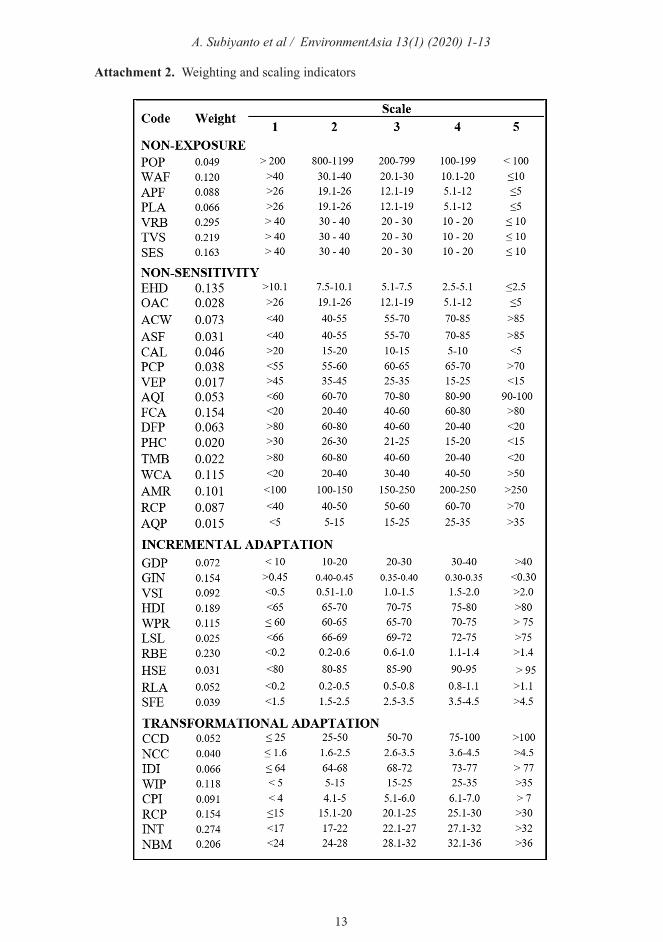
4.2 Weighting and scaling indicators
One of the approaches in determining the index is through the method of weighting and scaling indicators to produce a particular score. To produce a single index, the indicators are standardized into the same unit (Bossel, 1999). Single index on each factor can be obtained from the equation:
Index = weight x scale (11)
Figure 9. The three spheres of transformation
A. Subiyanto et al / EnvironmentAsia 13(1) (2020) 1-13
9
Weight determination was performed by the Analytical Hierarchy Process (AHP) (Saaty, 2005). The AHP analysis is used to derive the determinant and most influential factors that will later be scored to obtain a climate resilience index, which is a function of exposure, sensitivity, adaptive capacity and transformation capacity. The AHP analysis technique is performed on these four factors separately. The complete AHP stages are as follows:
1. Preparation of hierarchical model on each indicator (exposure, sensitivity, adaptive capacity, and transformative capacity).
2. Making the comparator field pairwise between variables (matrix in pairs).
3. Synthesis comparison to get priority (normalization test).
4. Consistency test is by using the value of consistency ratio (CR) if CR ≤ 0.1 then it is stated as consistent.
Referring to the scaling done by Doukakis (2005), 5 levels are used; namely: very low (scale 1), low (scale 2), medium (scale 3), high (scale 4), and very high (scale 5). In order to generate an index, each indicator of the resilience factor (exposure, sens i t iv i ty, adap t ive capac i ty, and transformative capacity) is scaled between 1 and 5 (see attachment 2).
4.3 Types of resilience
The formula that is recommended to be implemented is the second method [RI2=(ACI*TCI)/ (EI*SI)], on the premise that between vulnerability and resilience there are opposite meanings. RI is basically an inversion development (reversal of position) from the mathematical equation about vulnerability index (VI=(EI*SI)/ ACI). In accordance with the equation RI2 = (ACI*TCI)/(EI*SI), the lowest climate resilient indices up to the highest is:
The lowest climate resilience index (RI minimum) is obtained from ACI=1, TCI=1, EI=5, and SI=5 so that:
RImin = (ACIminxTCImin)/(EImaxxSImax) = (1x1)/(5x5) =1/25 = 0.04
The highest climate resilience index (RI maximum) is obtained from ACI= 5, TCI = 5, EI=1, and SI= 1 so that:
RImax= (ACImaxxTCImax)/(EIminxImin) = (5x5)/(1x1) = 25
Based on the interval of RI2, it is then divided into 5 levels (qualitative) so that it is relevant to the determination of the robustness scale which illustrates its correlation with the level of resilience. The advantage of using the same division like this, if each index compiler indicator is low or medium, then the calculation of the index will produce the same qualitative class (low or medium) so that there is consistency between the calculation of index value (quantitative assessment) and qualitative assessment. For this reason, based on qualitative and quantitative considerations, the value ranges of RI2 are set to 5 levels (Table 1), namely: very low, low, moderate, high, and very high.4.4 RI at provincial level in Indonesia
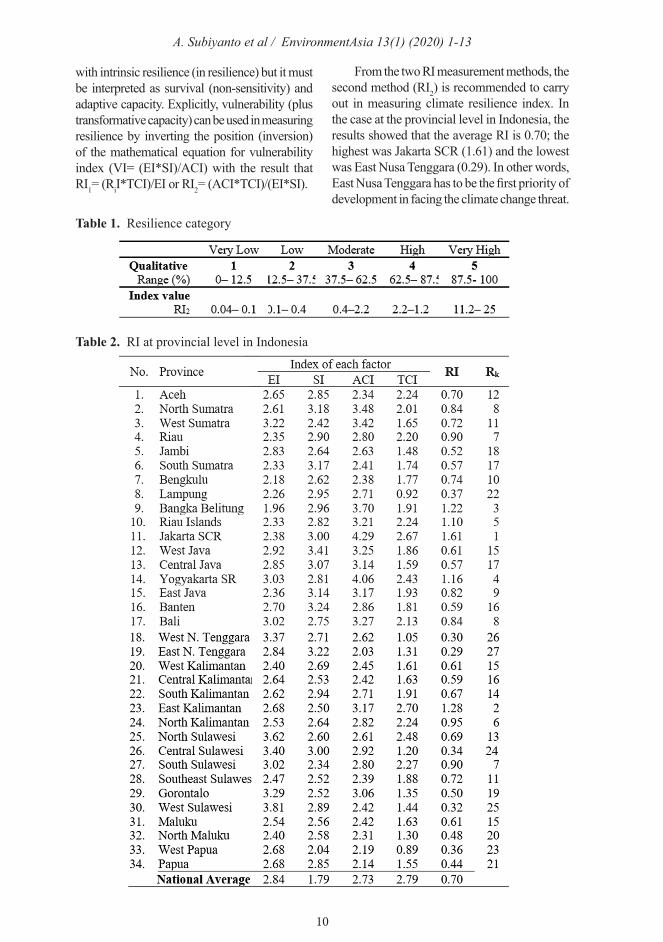
Table 2 is an example of the implementation
of RI measurements at the provincial level in Indonesia. Based on the table, RI averages 0.70 in the moderate category. There are 6 provinces that have RI with a lower category (0.1-0.4), namely: East Nusa Tenggara (0.29), West Nusa Tenggara (0.30), West Sulawesi (0.32), Central Sulawesi (0.34), West Papua (0.36), and Lampung (0.37).
5. Summary and Conclusions
As a consequence of the change of AR4 to AR5, the function of vulnerability only includes sensitivity and adaptive capacity [V=f (S, AC)]. Another consequence is that the measurement of vulnerability index (VI) is only the result of a comparison between the sensitivity index (SI) and adaptive capacity index (ACI) or VI=SI/ACI. There is a linkage between vulnerability, risk, and resilience so that the concept of vulnerability and risk can be used as an entry point in developing climate resilience.
Comparison of the concept of risk and resilience proposed by Kammouh et al, (2017) is more appropriate for disaster studies. Meanwhile, vulnerability (in risk) can be aligned
A. Subiyanto et al / EnvironmentAsia 13(1) (2020) 1-13
10
Table 1. Resilience category
with intrinsic resilience (in resilience) but it must be interpreted as survival (non-sensitivity) and adaptive capacity. Explicitly, vulnerability (plus transformative capacity) can be used in measuring resilience by inverting the position (inversion) of the mathematical equation for vulnerability index (VI= (EI*SI)/ACI) with the result that RI1= (RiI*TCI)/EI or RI2= (ACI*TCI)/(EI*SI).
From the two RI measurement methods, the second method (RI2) is recommended to carry out in measuring climate resilience index. In the case at the provincial level in Indonesia, the results showed that the average RI is 0.70; the highest was Jakarta SCR (1.61) and the lowest was East Nusa Tenggara (0.29). In other words, East Nusa Tenggara has to be the first priority of development in facing the climate change threat.
Table 2. RI at provincial level in Indonesia
A. Subiyanto et al / EnvironmentAsia 13(1) (2020) 1-13
11
Acknowledgements
The researcher would like to thank to the Indonesia Endowment Fund for Education (LPDP) as an institution that financed this research and also the Department of Geophysics and Meteorology, Bogor Agricultural University (IPB) that give much support to researchers.
References
Adger WN. Social and ecological resilience: Are they related? Progress in Human Geography 2000; 24 (3): 347-364.
doi: 10.1191/030913200701 540465Anderies JM, Jansen MA, Ostrom E. A framework to analyze the robustness
of social-ecological systems from an institutional perspective. Ecology and Society 2004; 9 (1): 18-27. doi: 10.5751/ES-00610-090118
Béné C. Towards a Quantifiable Measure of Resilience. IDS Working Paper 2013; 434: 27 pp. doi: 10.1111/j.2040-0209.2013.00434.x
Bogardi JJ, Fekete A. Disaster-Related Resilience as Ability and Process:
A Concept Guiding the analysis of Response Behavior Before, During and After Extreme Events. American Journal of Climate Change 2018; 7: 54-78.
doi: 10.4236/ajcc.2018.71006Bossel H. Indicators for Sustainable
Deve lopmen t : Theo ry, Me thod , Applications. Canada: International Institute for Sustainable Development (IISD), 1999.
Davoudi S. Resilience: a bridging concept or a dead end?. Planning Theory and Practice 2012; 13 (2): 299–333.
doi: 10.1080/14649357.2012.677124Doukakis E. Coastal vulnerability and risk
parameter. European Water 2005; 11/12: 3-7.Folke C. Resilience: The emergence of a
perspective for social-ecological systems analyses. Global Environmental Change 2006; 16 (3): 253-267. doi: 10.1016/j.gloenvcha. 2006.04.002
Holling CS. Resilience and Stability of Ecological Systems. Annual Review of Ecology and Systematics 1973; 4: 1-23. doi: 10.1146/annurev.es.04. 110173.000245
Hölscher K. Wittmayer JM, Loorbach D, Transition versus transformation: What’s the difference?. Environmental Innovation and Societal Transitions; 2018: 27: 1-3.
Hoy WK, Miskel CG. Educational administration: Theory, research, and practice, 9th edition. New York: McGraw-Hill, 2013.
IPCC. Climate Change: Impact, Adaptation and Vulnerability, Contribution of Working Group II to the Fourth Assessment Report of the IPCC, Cambridge, UK: Cambridge University Press, 2007.
IPCC. Annex II: Glossary [Mach, K.J., S. Planton and C. von Stechow (eds.)]. In: Climate Change 2014: Synthesis Report. Contribution of Working Groups I, II and III to the Fifth Assessment Report of the Intergovernmental Panel on Climate Change [Core Writing Team, R.K. Pachauri and L.A. Meyer (eds.)]. IPCC, Geneva, Switzerland, 2014; p. 117-130.
Kammouh O, Dervishaj G, Cimellaro GP. A new resilience rating system for Countries and State. Procedia Engineering 2017; 198: 985-998. doi: 10.1016/j.proeng.2017.07.144
Linkov I , Trump BD, Fox-Lent C. Resilience: Approaches to risk analysis and governance an introduction to the IRGC resource guide on resilience 2016. doi:10.5075/epfl-irgc-228206
Lloyd MG, Peel D, Duck RW. Toward a social-ecological resilience framework for coastal planning. Land Use Policy 2013; 30: 925-933. doi: 10.1016/j.landusepol.2012.06.012
Malone EL. Vulnerability and Resilience in the Face of Climate Change: Current Research and Needs for Population Information. Battelle Pacific Northwest Division (PNWD-4087), Richland, Washington, 2009. http://pai.org/wp-content/uploads/ 2009/08/Malone_resilience.pdf
Mardalis. Qualitative research methods (a proposal approach). Jakarta: Bumi Aksara Indonesia, 2003. (in Indonesian).
M e t z g e r M J , R o u n s e v e l l M D A , Acosta-Michlik L, Leemans L, Schröter L.
The vulnerability of ecosystem services to land use change. Agriculture, Ecosystems and Environment 2006; 114: 69-85.
doi: 10.1016/j.agee.2005.11.025
A. Subiyanto et al / EnvironmentAsia 13(1) (2020) 1-13
12
Nelson DR, Adger WN, Brown K. Adaptation to Environmental Change: Contributions of a Resilience Framework, Annual Review of Environment and Resources 2007; 32: 395-419. doi: 10.1146/annurev. energy.32.051807.09034
O´Brien K, Sygna L. Responding to climate change: The three spheres of transformation in: Proceedings of Transformation in
a Changing Climate, 19-21 June 2013, Oslo, Norway. University of Oslo. p:16-23.
Patterson J, Schulz K, Vervoort J, Van der Hel S, Widerberg O, Adler C, Hurlbert M, Anderson K, Sethi M, Barau A. Exploring the governance and politics of transformations towards sustainability. Environmental Innovation and Societal Transitions 2017; 24: 1-16. doi: 10.1016/ j.eist.2016.09.001
Polsky C, Neff R, Yarnal B. Building c o m p a r a b l e g l o b a l c h a n g e v u l n e r a b i l i t y a s s e s s m e n t : T h e v u l n e r a b i l i t y s c o p i n g d i a g r a m . G l o b a l E n v i r o n m e n t a l C h a n g e 2007; 17: 472-48. doi: 10.1016/j.gloenvcha.2007. 01.005
Saaty TL. Theory and Applications of the Analytic Network Process, Pittsburgh,
PA: RWS Publications, 2005.U m a r H . A d m i n i s t r a t i v e s c i e n c e
research method. Jakarta: Gramedia Pustaka Utama, Indonesia, 2004. (in Indonesian)
UNU-EHS. Vulnerability: A conceptual and methodological review. Source No. 4/2006. http://collections.unu.edu/eserv/unu:1871/pdf3904.pdf
Attachment 1. Indicators of RI at provincial level
Attachment 1. Indicators of RI at provincial level
A. Subiyanto et al / EnvironmentAsia 13(1) (2020) 1-13
13
Attachment 2. Weighting and scaling indicators
Related Documents