ENVIRONMENTALWAVEDATAFOR DETERMININGHULL STRUCTURAL LOADINGS i This document has been approved forpublicreleaseand sale;its distribution is unlimited. SHIPSTRUCTURE COMMITTEE 1977

Welcome message from author
This document is posted to help you gain knowledge. Please leave a comment to let me know what you think about it! Share it to your friends and learn new things together.
Transcript
ENVIRONMENTALWAVEDATAFOR
DETERMININGHULL STRUCTURAL LOADINGS
i
This document has been approvedfor publicreleaseand sale;its
distributionis unlimited.
SHIPSTRUCTURECOMMITTEE
1977

---
SHIP STRUCTURE COMMITTEEAN INTERAGENCY ADVISORY
COMMITTEE OEDICATED TO IMPROVING
THE STRUCTURE OF SHIPS
MEMBER AGENCIES ADDRESSCCIRRESPONOENCEUr!,c<ls,.,.,co”,,Cuord SMw,or,NO,,,sea s,,, em, Command
MI,,.,, Seol,f, Con,m,,ndsh,p S!,.,, ”,, co”’,.,,,..US.Cm,,Guard Heodquor,,,,
M.,,,,”!, Admin,s,,o,,on Wo, h,nqlo”. DC. 70590Ame,$com0.,,.. of Sh,p~,”g
,SR-223
l’lneShip Structure Committee recognizes thz,t .ir,formation concern i.n[;the
environmental conditions under which ships and mar<ne structures are
operated is of utr.ost importance for stnuckur.ai desi~n, and particularly
so for estimatin~~ their survival l.imitations . Recent progress in prijba–
bili.stic approaches to design permit: desi(<n.leads to be estimated with
reasonable accuracy where ocean TJaTTespect:.rair.the operating areas c].f
the ship (or marine structure ) are swfflcient ly known.
~~thO~~h there is a crest deal (jr data Ionvisually observed wave hej.ghtsand periods in the Nort’n Atlant, icar,d ir, ti,e Ncrth pacific OCean S , these
data are not in a form which the designer TELn IISe; they are not, in a COII_
sistent form which can be easily processed; t’hey cover only a. sma:l.1 PO+
tion of the geographical and sea state range. necessary for design purposes
and even some of these are of smnewha t questionable validity. Therefore,
it became necessary to undertake a stuciy directed toward developing a body
of complete and reliable ocean wave .loadin~ data.
This report describes the stu(iy and presents a rese>arch plan directe~
toward the development of wave loa,din,gdata i.n a fsr-n which can be IJS21
in rational hull structure design.

SSC-268
FINAL TECHNICAL REPORT
on
Project SR-223
“Wave Loading Data Plan”
ENv IRONMENTAL WAVE DATA FOR
DETERMINING HULL STRUCTURAL LOADINGS
by
D. Hoffman and D. A. Walden
with contributions by
V. J. Cardone, andW. J. Pierson, Jr.
WEBB INSTITUTE OF NAVAL ARCHITECTURE
under
Department of the NavyNaval Sea Systems Command
Contract No. NOO024-75-C-4209
This docment has beenapprovedfop public releaseandsale: its distribution is m limited.
U.S. Coast Guard HeadquartersWashington, O.C.
1977
ASSTRACT
A summary is given of the trade routes of U.S. ships, followed by suggestionsfor new projects and extension and improvement of current projects to meet theneed for additional data on sea conditions encountered by U.S. ships. It iS
concluded that the greatest benefit can be obtained by making a direct effortto obtain wave spectra for the ocean areas on important sea routes that are knownto experience severe sea conditions, probably by the use of moored buoys, andby further verification and im.proveurentof wave hindcast techniques for eventual
application tO obtaining wave spectra for design. At the same time, steps shouldbe initiated that may lead to the availability of wave data in the future, such asseeking oil company data.
It is felt that attention should also be given to the further analysis ofavailable data, and of new data produced by buoy deployment and hindcast procedures,including the measurement of directional spectra and their application to.dasign.Hindcast techniques should be extended to the southern hemisphere, and newtechniques for wave data collection -- disposable buoys and satellite systems --should continue to be developed.
A survey evaluation is given of observed and measured wave data coveringmajor U.S. routes, with appendices, tabulations and maps. The introductionof theoretical formulations leads to the discussion and evaluation of wave epectrslhindcasting techniques. The methods used to predict ship motions and loads areexplained followed by a section discussing the wave data format required forpredicting short and long-term loads and motions as well as numerical axampleashowing the effect on and sensitivityy of predictions to variation in wave dataformat.
Wed on the preceding discussion, presently available data suggested foruse in determining ship loads are given. The use of a combination of statisticsbased on observations on the frequency of occurrence of various wave heightsand a spectral family of measured spectra grouped by wave height is recommended.Finally, a survey of current and planned data collection projects is given.
ii

COWTSWTS
I. Introduction
BackgroundWave Data RequirementsTrade Routes of U.S. ShipsScope of Project
II. A Research Plan
GeneralHindcast TechniquesDevelopment and Use of Wave BuoysData from Fixed PlatformsMeasurement of Directional SpectraImprovement in Shipboard DataSatallite SystsmaPriorities
III. Observed Wave Data
Shipboard OperationsCollections of Observed DataUnusual Conditions
PI. Measured Wave Data
Sources of Wave MeasurementsReliability of Wave Msasuring TechniquesAnalysis of Records
v. Theoretical Spectral Formulations
Baaic FormulationsGenersl Form of Theoretical SpectraSpecific Theoretical FormulationsSpectral Shape Definition
VI. Wave Data from Hindcast Modelsby Vincent J. Cardone
IntroductionSignificant Wave Hindcast ModelsSpectral Wave Hindcast ModelsCurrent and Planned Wave Hindcast ActivitiesDevelopment of Operational Spectral Wave Forecast Models
ElsewhereDevelopment of Shallow Water Spectral Wave Hindcast Models
~
1
1I23
4
44556667
8
s11
14
22
222324”
I27
27272932
42
42 ~4346 ,55 ~55
iii

SsfE
VII.
VIII.
Ix.
Prediction of Loads
Ship Response PredictionTheory for Approximating the Distribution of a Function of
Random VariablesApplication of the TheoryDetails of Ship Response PredictionWave Data Format
Effect of Variation in Wave Data Format on Load Predictions
Comparative CalculationsProbability of Occurrence of Various Wave HeightsDirectional Information
Wave Data For Use
The Ideal DataPresent DataThe Future
References
Appendices
A
B
c
D
E
F
G
H
I
J
K
L
in Design
Base
Index of Punched Carda Carrying Wind and Wave DataAvailable from Various Sources
U.S. Naval Weather Service Command Summary of SynopticMeteorological Observation
Sample Tables of Wave Observations from Various Sources
A Description of Wave Measuring Systemsby W.J. Pierson, Jr.
A Tabulation with ,References of Available Measured Spectra
Catalog of Tucker Shipborne Wave Recorder Data
Sources of Unpublished Measured Data
A Comparison of the Draper and Spectral
Sample Measured Spectra
Ocean Wave Parametrization Techniquesby W.J. Pierson, Jr.
Methods of.Analyaia
A Comparison of Wave Buoy and Hindcast Wave Spectra
Proposed Buoy System for Wave Measurement off South Africaby Cdr. C.S. !U.ederman,USCG
iv
57
5758
606264
77
778286
90
909091
96
A-1
B-l
c-1
D-1
E-1
F-1
G1
H-1
I-1
J-1
K-1
L-1

LIST OF TABLES
II
III
Iv
v
VI
VII
VIII
Ix
x
XI
Correlation of Measured Maximum and Observed Wave Heights forIndividual Weather Ship Records
Correlation of Measured and Observed Wave Period
Special Hazards
Availabla Directional Spectra
Average Characteristics of Wave Spectra from both “Papa” and“India” -- Whole Sample
Average Characteristics of Wave Spectra from “India” -- Sam-ples of Eight Spectra
Wave Height Distributions used in Section 1 of Chapter VIII
North Atlantic Wave Height Distributions
Long-Term Vertical Bending Moment Predictions for VariousNorth Atlantic Wave Height Distributions
Wave Height Distributions -- World Routee
Long-Term Vertical Bending Moment Predictions for DifferentWorld-Wide Wave Height Distributions
12
20
26
66
66
S2
83
+34
85
85
v

LIST OF FIGuRSS
Zzsw?
1
2
3
4
5
6
7
8
9
10
11
12
13
14
15
16
17
18
19
20
21
22
23
l=.
Significant and Observed Wave Height Relationships
Areas of Coverage of Responsible WMO Members
Worldwide Wave Data (except
North Pacific Wave Data
North Atlantic Wave Data
Extreme North Atlantic Wave
North Pacific)
Data
Areas with Special Hazards and Locations of Measured Spectra
Change in Wave Dimensions for Opposing and Following Currents
spectral Skewness parmeter, y, vs. .$ignificant wave Height, H1/3
‘Theoreticaland Measured Relationship Between Frequency of MaximumSpectral Ordinates and Average Period
Relationship Between Different Period Definitions
Typical Fit Using JONSWAP Spectral Formulation
Comparison of JONSWAP and ISSC Spectra
Comparison of JONSWAP, “INDIA”, and Measured Spectra
Comparison of JONSWAP, “INDIA”, and Measured Spectra
Comparison of JONSWAP, “INDIA”, and Measured Spectra
Comparison of JONSWAP, “INDIA”, and Measured Spectra
Comparison of JONSWAP, “INDIA”, and Measured Spectra
Comparison of JONSWAP, “INDIA”, and Measured Spectra
Typical Fit Using Ochi’s Three-Parameter, Two-Stage Spectra
Comparison of Quadratic Regression Spectrum and Averages ofMeasured Spectra
JNWP Grid System of Northern Hemisphere
The Icosahedral-Gnomonic Pro.jection of the Earth Designed forGlobal Numerical Wave Prediction
vi
&
10
13
15
16
17
Ig
19
20
33
33
35
35
36
36
36
36
37
37
37
39
40
44
49

EL8Ks?
24
25
26
27
28
29
30
31
32
33
34
35
36
37
38
39
40
41
42
LIST OF FIGORSS (cent‘d)
!S3!?
A Comparison of Various Spectral Hindcast Model Predictions
Obsened and Hindcast Spectra at Station “J”
The Grid System of the Ff?WCOperational Mediterranean Sea WaveSpectral Model Grid
Calculation of rms Response
Scatter of Spectral Height Family - Group 1, 0-3 ft. Station “India”
Scatter of Spectral Height Family - Group 2, 3-6 ft. Station “India”
Scatter of Spectral Height Family - Group 3, 6-9 ft. Station “India”
Scatter of Spectral Height Family - Group 4, 9-12 ft. Station
“India”
Scatter of Spectral Height Family - Group 5, 12-16 ft. Station
“India”
Scatter of Spectral Height Family - Group 6, 16-21 ft. Station
“India”
Scatter of Spectral Height Family - Group 7, 21-27 ft. Station“India”
Scatter of Spectral Height Family - Group 8, 27-34 ft. Station“India”
Scatter of Spectral Height Family - Group 9, 34-42 ft. Station“India”
Scatter of Spectral Height Family - Group 10, >42 ft. Station“India”
Mean and Standard Deviationo-3 ft. Station “India”
Mean and Standard Deviation3-6 ft. Station “India”
Mean and Standard Deviation6-9 ft. Station “India”
-- Spectral Height Family Group 1,
-- Spectral Height Family Group 2,
-- Spectral Height Family Group 3,
Mean and Standard Deviation -- Spectral Height Family Group 4,9-12 ft. Station “India”
Mean and Standard Deviation -- Spectral Height Family Group 5,12-16 ft. Station “India”
vii
52
52
54
59
67
67
68
68
69
69
70
70
71
71
72

LIST OF FIGUBIS (cent,~d)
m43
44
45
46
47
48
49
50
51
52
53
54
55
56
57
i
Mean and Standard Deviation -- Spectral Height Family Group 6,16-21 ft. Statton “India”
Mean and Standard Deviation -- Spectral Height Family Group 7,21-27 ft. Station “India”
Mean and Standard Deviation -- Spectral Height Family Group 8,27-34 ft. Station “India”
Mesn and Standard Deviation -- Spectral Height Family Group 9,34-42 ft. Station “India”
Maan and Standard Deviation -- Spectral Height Family Group 10,>42 ft. Station “India”
Comparison of Spectral Shape Variation
Short-Tens Bending Moment Reaponaes for Light Load Wolverina State-- Mean IU4Sand Standard Deviation
Short-Term Bending Moment Responses for Full Load SL-7 Containership-- Mean 3MS and Standard Deviation
Short-Term Banding Msment Responsas for Universe Ireland, Mean SMS— —and Standard Deviations
Long-Tarm Vertical Bending Moment for Light Load Wolvarine Statefor Five Spectral Families
Long-Term Vertical Bending Moment for Full-Load SL-7 Containershipfor Five Spactral Familiea
Long-Tens Vertical Banding Moment for Full-Load Universe Irelandfor Five Spectral Families
— .
Contributions frmo the Various Wave Haight Groups and RelativeHeading Angles to the Total Probability of tha Acceleration at theForward Perpendicular of the Wolverina State exceeding 58.2 ft./aec2
Contributions from the Various Wave Height Groups and RelativeHeading Angles to the Total Probability of the Acceleration at theForward Perpendicular of the Wolverine State exceeding 29.4 ft./sec2
Contributions from the Varioua Wave Height Groups and RelativeHeading Angles to the Total Probability of the Vertical BendingMoment of the Wolver2ne State exceeding 9.6 x 10⁴ Ft-Tons
~
74
75
75
76
76
78
80
80
80
81
81
81
87
88
89
viii

-
LIST OF FIGURES (cent’d)
=
58 Location of NDBO Buoys in the Gulf of Maxico
59 NDBO Planned Buoy Locations Through Fiscal Year 1976
ix

SHIP STRUCTURE COMMITTEE
The SHIP STRUCTURE COMMITTEE is constituted to prosecute a researchprogram to improve the hul1 structures of ships by an extension of knowledgepertaining to design, materials and methods of fabrication.
RADM W. M. Benkert, USCG (Chairman)Chief, Office of Merchant Marine Safety
U.S. Coast Guard Headquarters
Mr. P. M. Palermo Mr. M. PitkinAsst. for Structures Asst. Administrator forNaval Ship Engineering Center Conrnercial DevelopmentNaval Ship Systems Command Maritime Administration
Mr. John L. Foley Mr. C. J. WhitestoneVice President Engineer OfficerAmerican Bureau of Shipping Military Seal ift Cormnand
SHIP STRUCTURE SUBCOMMITTEE
The SHIP STRUCTURE SUBCOMMITTEE acts for the Ship Structure Committeeon technical matters by providing technical coordination for the determinationof goals and objectives of the program, and by evaluating and interpreting theresults in terms of ship structural design, construction and operation.
NAVAL SEA SYSTEMS COMMAND NATIONAL ACADEMY OF SCIENCES
Mr. R. Johnson - MemberSHIP RESEARCH COMMITTEE
Mr. J. B. O’Brien - Contract AdministratorMr. C. Pohler - Member
Prof. J. E. Goldberg - Liaison
Mr. G. Sorkin - MemberMr. R. W. Rumke - Liaison
U.S. COAST GUARD
LCDR E. A. Chazal - SecretaryLCDR S. H. Davis - MemberCAPT C. B. Glass - MemberLCOR J. N. Naegle - Member
MARITIME AOMINISTRATION
Mr. F. Dashnaw - MemberMr. N. Hanmer - MemberMr. R. K. Kiss - MemberMr. F. Seibold - Member
MILITARY SEALIFT COMMAND
Mr. T. M. Chapman - MemberCDR J. L. Simmons - MemberMr. A. B. Stavovy - MemberMr. D. Stein - Member
AMERICAN BUREAU OF SHIPPING
SOCIETY OF NAVAL ARCHITECTS &MARINE ENGINEERS
Mr. A. B. Stavovy - Liaison
WELDING RESEARCH COUNCIL
Mr. K. H. Koopman - Liaison
INTERNATIONAL SHIP STRUCTURESCONGRESS
Prof. J. H. Evans - Liaison
U.S. COAST GUARD ACADEMY
CAPT W. C. Nolan - Liaison
STATE UNIV. OF N.Y. MARITIME COLLEGE
Dr. W. R. Porter - Liaison
AMERICAN IRON & STEEL INSTITUTE
Mr. R. H. Sterne - Liaison
~
Mr. S. G. Stfansen - ChairmanDr. H. Y. Jan - Member U.S. NAVAL ACADEMY
Mr. I. L. Stern - Member Dr. R. Bhattacharyya - Liaison
x

I. INTRODUCTION
Background
The dynamics of ships or other types of marine structures is determinedto a large extent by their responses to the environment in which they operate.Wind, waves, current and ice are the four environmental factors which individuallyand interactively contribute to the forces imposed on the system and hknce tothe resnlting responses. The definition of the excitation function is thereforeof critical importance and a prerequisite for a prediction of the behaviorof a ship in a realistic environment. Each of the above four categories isof e complex nature and involves several physicel phenomena. The waves,
however, are the major influence on the behavior of marine vehicles.
Ever since the probabilistic approach was developed by St. Denisand pierson (1953),*–the complex problem of ship behaviOr i-nwaves has beenconveniently separated into two components, i.e., the waves and the transferfunction. While the latter has received rather exteneive treatmant over thepact 20 years, the wave description has been left to the oceanographers studyingbasic prinicples such as generation of wavee, the energy balance in the waves,growth of waves with wind, etc. Understanding the mechanism of wave generationhas led oceanographers to formulate the shape of idealized wave spectra, par-ticularly the spectra of fully-developed storm seae, although the ehapes ofdeveloping and decaying spectra have also been studied. They have ak+O repOrtedspectra obtained from actual measuramente at varioue ocean locations, but havenot given much attention to the variations in shape that these epectra chow.Thus cross seas, as created by local wind sea superimposed on swell or severalswells, are not adequately represented by the ideal formulations; yet theeeconditions are very coumon.
Actual wave records and, particularly, wave spectra are available onlyfor limited ocean areas, and the present design practice in most casea ia to
aPPIY the abOve ideal mathematical formulations as defined by the observedsignificant wave height and period. This procedure requires tautious evaluation,as discussed in this report.
The state of the art of wave load prediction has thus reached a stagein which the continuous refinement and exact mathematical solution of transferfunctions cannot be satisfactorily applied to ship design without at least anequivalent refinement in the wave description. The time haa come when designershould actively seek the wave data needed, rather than to wait for the ocean-ographer to supply them. Hence, a major objective of this report is to makerecommendations regarding further research to obtain the needed wave information.
Wave Data Requirements
The definition of the type of wave data desired by the ship designer is
*See reference listed at the end of this report.

unfortunately often determined by the designer!s knowledge of available data.It is therefore important to define present needs as well as idealized require-ments assuming unlimfted wave data availabilityy. Only such an approach canlead to effective pursuance of future wave data collection and the correctapplication of such data in the statistical prediction of ship loadings inthe environment.
The method formulated by St. Denis and Pierson (1953) to obtain the responseof a ship or other systsm to waves utilizes the wave spectrum, which can beexpressed mathematically by analysis of a measured waverecord of 20 - 30minutes length or by estimate from the average characteristics of the seaway.wren the spectrum of the waves and the characteristic ship response to differentfrequencies (transfer function or response amplitude operator) the responsespectrum can be obtained, and hence the statistical properties of the shipresponse can be determined. For design purposee the response of the systemto all possible sea conditions ie of prime importance, and hence extensivewave data in spectral form are felt to be essential.
Ideally, these wave epectra should be directional, i.e., should define thewave components by direction as yell as by frequency, They should describeboth growing and decaying storm eeas, as well as fully-developed seas. Theyshould describe combinations of storm seas and swells that are typical ofwinter weather conditions in northern and southern latitudes, as well as slOw-moving circular storms of the tropics.
However, in view of the extreme cost and time associated with an extensivedata gathering plan, a more exact assessment is required today with regard tothe influence of variations in wave spectra on response. As mentioned previously,different wave data can affect the prediction of the design loada and hencethe structural design. Such influence can only be determined in terms of thefinal product, i.e., the loads predicted on the ship. It hae already beenshown (Hoffman, 1973, 1974, 1975) that such effects will vary from one size toanother and most likely will be a function of the type of responee in question,such as bending mometitor acceleration. Hence, further study is needed of thedegree of detail needed in wave spectral data.
In contrast to the ultimate need of the designer for optimum wave dataformatting, an important interim stage considers the best application ofpresently available data. Acquisition of reliable wava data is a lengthy processand an interim solution ia needed for the immediate years.
Thus, a survey and asseasmant of available ocean wave data and of itssuitability for design use is first required. Then a plan must be developedfor obtaining needed additional data in suitable format.
Trade Routes of U.S. Ships
An important question that arises in surveying available and needed oceanwave data is what ocean areas are of greatest interest. A study haa been madeto establish the most important world trade routes, with particular attention
-2-
to those served by U.S. ships. The routes of greatest volume of cargo andnumber of ships are those from the U.S. Eaat (and Gulf) coasts to Europe.There are three branches, one north of the British Isles to Scandinavia, oneto northern Europe via the English Channel and the third to the Mediterranean,but all are vitally affected by weather and sea conditions in the North AtlanticOcean.
Another important group of trade routes is between U.S. East and Gulfcoasts and the Caribbean and South America. These lend importance to seaconditions in the vicinity of Cape Hatteras and to the conditions prevailingduring hurricanes in the Gulf of Mexico and North Atlantic.
Also of importance are routes in the Pacific Ocean, which however arewidely scattered -- covering U.S. ports on West, East and Gulf coasts (PanamaCanal) and connecting with Japan, the Asian continent, Indonesia, Australia,New Zealand, etc. From the viewpoint of the effect of sea conditions on shipoperation, hcwever, the ocean area of greatest potential interest is the NorthPacific. Increased trade between West coast ports and Alaska has resulted ingrowing interest in sea conditions in the Gulf of Alaska.
Although relatively few U.S. flag ships transit the Indian Ocean, the easternpart of the area is of intereat during the monsoon season. The South Atlanticand South Pacific oceans, as a whole , are also of secondary interest.
Finally, consideration should be given to bulk petroleum movements toU.S. porta, which are carried on ships of which few are U.S. flag but manyof U.S. ownership. The predominant route is from the Persian Gulf and Capeof Good Hope to Caribbean and U.S. Gulf ports. Sea conditions in the vicinityof the Cape are of particular concern, as discussed in detail later in thisreport. The opening of the Suez Canal can be expected to divert some of thistraffic through the Mediterranean, but there can be no doubt that sea conditionsaround the Cape of Good Hope will continue to be of great importance.
Scope of Project
The scope of work for the project reported here was stated as followsin the contract schedule: “Conduct a survey and assessment of the type andscope of wave loading data presently available, and that which is needed, andestablish a research plan to acquire a sufficient quatitity of the needed wavedata in a form which can be used in hull structural design.”
This report describes the work done and presents the results of the studycarried out in accordance with the above. For convenience the proposed planfor further research on ocean wave data, developed in the course of the project,is presented in the following Chapter 11. A survey is then presented of varioustypes of ocean wave data, and their reliability (Chapters 111, IV, V, VI).Next the use of such wave data for the determination of hull loads is discussed,and the effect of variations in the wave data format is considered (ChaptersVII and VIII). Finally, recommendations are made regarding the best availabledata and current data collection projects are surveyed. (Chapter IX).
-3-
11. A RESF,ARCHPLAN
General
One of the principal objectives of this project was to develop a researchplan for the acquisition of required additional ocean wave data, and their trans-lation into a form useable by hull structural designers. On the basis of the
survey given in the following chapters, recommendations for short and long-rangeresearch are given here. In addition to the proposed research projects them-selves, however, consideration should be given to setting up a central managementor coordinating project to oversee the acquisition of data for use by navalarchitects. One object would be to keep all interested parties informed as towhat projects are being undertaken and who is sponsoring them.
Some of the projects listed below could produce immediately useful data ifundertaken promptly, while others would not be productive for some time. Adiscussion of recommended priorities is given at the end of the chapter.
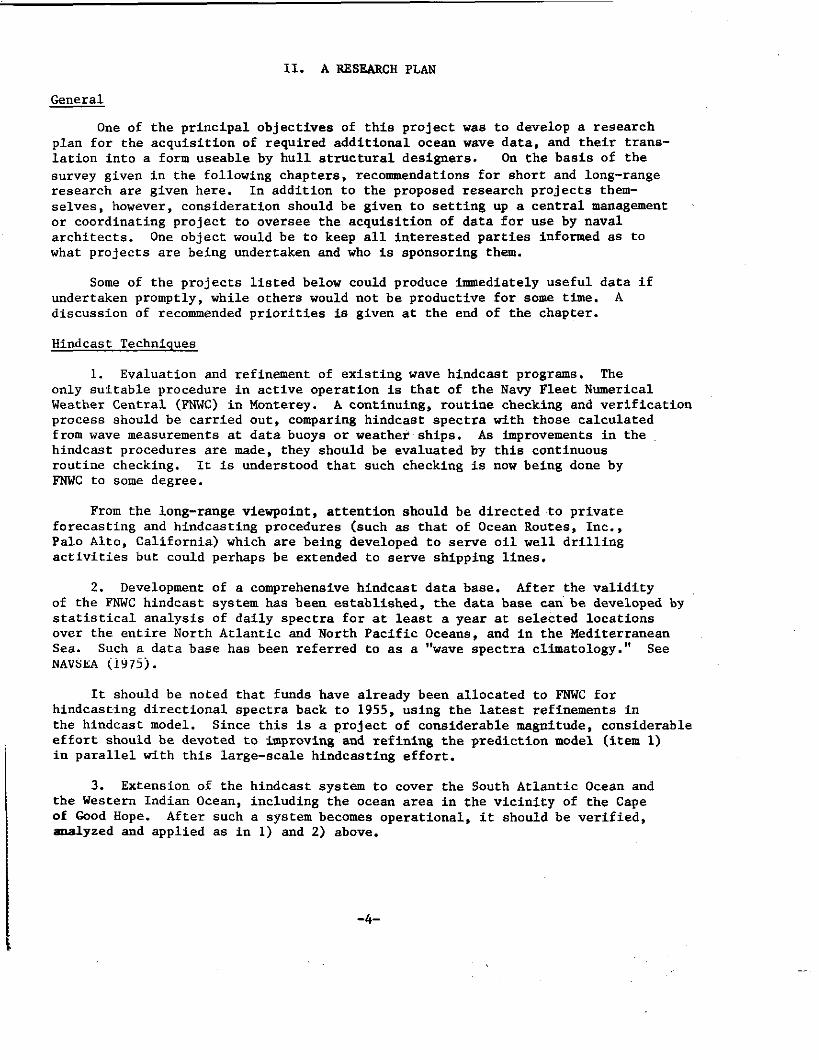
Hindcast Techniques
1. Evaluation and refinement of existing wave hindcast programs. Theonly suitable procedure in active operation is that of the Navy Fleet NumericalWeather Central (FNWC) in Monterey. A continuing, routine checking and verificationprocess should be carried out, comparing hindcast spectra with those calculatedfrom wave measurements at data buoys or weathei+ships. As improvements in thehindcast procedures are made, they should be evaluated by this continuousroutine checking. It is understood that such checking is now being done byFNWC to some degree.
From the long-range viewpoint, attention should be directed to privateforecasting and hindcasting procedures (such as that of Ocean Routes, Inc.,Palo Alto, California) which are being developed to serve oil well drillingactivities but could perhaps be extended to serve shipping lines.
2. Development of a comprehensive hindcast data baae. After the validityof the FNWC hindcast system has been established, the data base can be developed bystatistical analysis of daily spectra for at least a year at selected locationsover the entire North Atlantic and North Pacific Oceans, and in the MediterraneanSea. Such a data base has been referred to as a “wave spectra climatology.” SeeNAVSEA (1975).
It should be noted that funds have already been allocated to FNWC forhindcaseing directional spectra back to 1955, using the latest refinements inthe hindcast model. Since this is a project of considerable magnitude, considerableeffort should be devoted to improving and refining the prediction model (item 1)in parallel with this large-scale hindcasting effort.
3. Extension of the hindcast system to cover the South Atlantic Ocean andthe Western Indian Ocean, including the ocean area in the vicinity of the Capeof Good Hope. After such a systernbecomes operational, it should be verified,analyzed and applied as in 1) and 2) above.
-4-

This project may require direct support from shippi,ngand ship designinterests, since the Navy has not given it hi&h priority. Since a long time isrequired for this work, no ehort-term results can be expected.
Development and Use of Wave BUOYS
4. Deployment of buoys. A number of buoys ehould be set out, withtelemetered wave records regularly transmitted to shore and spectrally analyzed.See Steele (1974) for a description of the National Oceanic and AtmosphericAdministration (NOAA) Data Buoy Office (NDBO) syetem. The buoys would belocated on important steamship routes, particularly at locations where inadequatewave data are available. Resulting epectra would be used directly to increasethe bank of data for designers! use. See Appendix E.
Consideration should be given to incorporating slope, aa well as verticalacceleration measurements. Such slope measurements, while not eufficient todefine the directional spectra completely, can give some directional information.Cartwright (1961) discusses the limits of such slope measurements.
Tentative buoy locations:
(a)(b)(c)
(d)
North Atlantic (Grand Banks, Faraday Sea Mount)Near entrance to Engltsh ChannelNorth Pacific (South of Aleutians)Off South Africa.
Consideration should also be given to the possible future use of smallermoored byoys intermediate in size between the NOAA and the WAVERIDER (Dutch)buoye. However, the problsm of collecting and processing the data -- whichhas been solved by NOAA on an almost worldwide baais -- must be dealt with beforemaking practical use of such buoys. Hence, no immediately useful results canbe expected.
5. Analysis of buoy data. Statistical analysis of wave spectra should becarried out in a manner similar to that described in the eurvey portion ofthis report, i.e., stratified by wave height and analyzed to obtain mean valuesand stsndard deviations of spectral ordinates. Spectra should be ueed directlyas a basic for checking and evaluati~ the regular hindcast procedures discussedunder items 1 and 3.
It is recognized that although this approach may be the most practical anduseful for immediate problems in ship hull design, different types of analysisin order to improve the underlying theory of wave generation, propagation anddecay should also be carried out for long-range ueefulnese.
Data from Fixed Platforms
6. Oil company data. Companies engaged in off-shore drilling operationsin varioue parts of the world have been vigorously collecting proprietary wavedata in various formate. Efforts should be made to devise a procedure for makingdata for areas of interest to ship operation available generally. This should bemore readily accomplished when a government is involved in the data collection (asin the case of the Britieh Government in the areas around the British Isles).
-5-

Maasurament of Directional Suectra
7. Development of techniques. Further development of methods of obtainingaccurate directional apactra -- such aa stereo photographic techniquea — shouldba pursuad, ainca other methode (including wave buoys, item 4) are not cowletelyeatisfactory. Such accurate directional spectra would provide the ultimatebaaia for verifying hindcaat directional spectra.
A more long-range approach is the use of airborna synthetic apartureradare (sAR), which still requiree further theoretical developmetit. TMa approachcan potentially provide diradtional spectra with a very large number of dagreesof fraadom par frequancy band.
8. Application of directional spectra. Aa mora data in the fom ofdirectional apactra become available, both from measurement and hindcaating,raeearch ie needad on how to describa them in a generalized format for daaignuee. After grouping tha epectra by wave height, as hae been done with pointspectra, it ia neceeaary to describe the variability of wave energy wdthdirection aa well as with frequency.
Improvement In Shiuboard Data
9. Analysis of weather ahip data. All wava data currently being collectedby the various weather ships should be ragularly analyzed on a continuingbaeia, in a manner similar to the data from Statiom I, K and P, in parallel withwave buoy and FNNC hindcaating data collection and amalyeia.
10. Analysie of obeervational wave height infotmation. Data accumulatedfrom ships should be analyzed for several major routea acroaa the Atlanticend tha Pacific baaad on tha 6-hourly reports obtained by NOM, aa a means ofup-dating and improving availabla studias. At least 2 - 3 yaara of paat datashould ba included and the work should continue on a routine baeie (aa is nowbeing done for coaatal wave data).
Up-dating and extension of wave atlas publication should be encouraged, aafor example the extension of Hogben and Lumb (1967) to tha North Pacific.
11. Development of disposable buoy. Effort should be continued toward thadevelopment of a small buoy which can ba “ehot” off the eida of a ahip, capableof transmitting a signal for k hour when the ahlp ia moving at 20 - 30 knots. Itsaccuracy nead not be greater than that of axiating small buoys. Althoughsuch a device might have ita primary application to improving the quality ofoperational wave data, it would alao provide data of value In ship design.
Satellite Syetema
12. Centinued davelopmant of satellite wave maaeuremant. The anormouapotantial of aatallite wava measuring eystema dictatea tha continuation of affortaCO davelop a workable syatam for meaauring wave apactra from apacecraft, sincecurrant efforts are only partially aucceaaful. See Piereon (1976).
-6-

Priorities
The above plan covers a large number of areas for further work, withvarying time frames and coat factors. The following paragraphs attempt toaeaign priorities to the various areas of effort on the basis of obtaining themeet useful information at the least coet in the leaat time.
It ie believed that the first priority should be given to a direct effortto obtain wave epectra for the ocean areaa on important aea routee that areknown to experience severe aea conditions. The moat iimnediatalyavailablemethod ia the uae of moored buoys, aa outlined in item 4.
Of al.moatequal importance is balieved to the further verification andimprovement of wave hindcaet techniques, item 1, in order to prepare tha way foreventual application of tbia approach to obtaining wava spectra for design.
At the aama time, stepe should be initiated that may lead to the availabilityof wave data in the future, aa seeking oil company data, item 6.
Second priority should be given to furthar analyaia of available data,items 9 and 10, and of new data produced by buoy deployment and hindcaat procedures,items 2 and 5.
Attention should alao be given to the measurement of directional epectraaridtheir application to design, items 7 and 8.
~ priority should be given to the extension of hindcaat techniquesto tha southern hemisphere, item 3, and to the development of naw techniquesfor wave data collection, disposable buoya and satellite syatams, items 11 and 12.
Included in this catagory should alao be certain long-term aepecta of thevarioua reaaarch items, such aa:
- New hindcast procedure (item 1)- Development and uae of small wave buoya (item 4)- Development of airborne synthetic aperture radar (item 7).
-7-

III. OBSERVED WAVE DATA
Shipboard Operations
Centinuous information has been gathered on observed wave heights and direc.tions for approximately the last 100 years, and on wave periods for the last 25.This information comes from weather ships, voluntary observing ships and on a morelimited basis from research ships, light vessels, fishery protection vessels, etc.Since the largest number of the observations comes from voluntary observing shipssuch as merchant ships, there is extensive coverage of shipping routes.
Wave observation statistics are a collection of subjective judgments made bymany different observers. The accuracy of the observations of course varies greatlyfrom observer to observer. The reporting code used from 1949 to 1968 had disconti-nuities at 5 meters and 10 meters, e.g., 8 = 4m., 9 = 4.5111.,10 = 5.cm., and a simi-lar change at 10 m. This led to bias in favor of 4.5 m. and 9.5m. There is also apreference for whole meter wave heights in the higher ranges. The newer code re-duces these biases.
Three other factors also tend to bias observational data:
1. Fair weather bias occurs because ships in passage tend to avoid badweather, resulting in lower average winds.
2. Observers frequently fail to code wave observations if wave conditionsare calm; this reduces the percentage of reported fair weather condi-tions.
3. Observers tend to underestimate following seas and overestimate headseas because of the difference in ship behavior.
Since it is impossible to quantify these factors, there is no way to correct system-atically for the biases they induce.
Verploegh (1961) estimates the standard error based on comparison between shipsas follows:
Wave direction 10”-13”
Wave period 1.8 seconds
Wave height 0.3 m. at 1.5 m.. (1 ft. at 5 ft.)l.Om. at 6m. (3 ft. at 20 ft.)
In most cases, observations have been found to yield an adequate approximationin the range of practical interest, 5 to 30 feet (2 to 10 meters) , which representsover 95% of the expected frequency of occurrence. FOr values above 30 feet (10 me-ters) or below 5 feet (2 meters) the observers’ ability to estimate adequately isdoubtful, in the former case due to the conditions on board ship and in the lattercase due to cross seas, swell, etc.
-8-

In view of the large amount of observed data available and the uncertainty ofits reliability, it is not surprising that a number of comparisons have been madebetween visual and measured wave estimates. Fig. 1 from Hoffman (1974) shows signif-icant wave height versus observed wave height. It should be noted that all the ob-servations included in Hoffman’s data were made by trained observers on ocean weatherships. Hoffman’s data also include more cases of severe weather since weather shipsmust remain on station and are not free to avoid storms. It may be seen that below30 ft. observers tend to underestimate the wave heights. A reasonably good linearfit over the entire range is shown to be,
‘1/3= 7.0+ 0.775 H
v“
Table 1 from Hogben (1970) summarizes the results of several investigations ofcorrelations between observed and measured wave heights (maxima in individual re-cords). The measurements were rrmdewith Tucker wave recorders, with appropriatefrequency dependent corrections included. The observations were made by officersaboard merchant ships, rather than by professional weather ship observers. The ta-ble gives the coefficients A and B which gave the best linear fit to the data points,when plotted in a manner similar to Fig. 1, and the coefficient C which gave thebest fit for a line passing through the origin.
Also shown in Table 1 are the standard deviation, u, ofthe lines and the correlation coefficient, P. The latter is
Hm. H ii--. Fvv-
0=“Hm “ ‘Hv
the data points aboutdefined as follows:
where the lines over letters indicate averages.
It may be seen that the first three sets of data show very similar straight linefits. Where correlation coefficients are available, they show good agreement betweenobservations and measurement.
The material factors used to relate observations to measurements can only beexpected to yield good results when applied to data of the same nature as that fromwhich they were derived. This presents a difficulty in that whenever comparisons aremade between observed and measured values the observer on board a weather ship is atrained observer, whereas the largest number of observers are not. It is likely,however, that various types of observers will agree most closely in the range of 5 to30 feet (2 to 10 meters) , as previously noted.
The ability to estimate the significant wave height by means of observed waveheight is extremely important because of the large amount “of available observationaldata. It is apparent’that the several different realtionships in Table 1 show veryslight differences.
In the case of wave direction it is difficult to compare observation with meas-urement, since wave direction is not routinely measured. (The measurement of direc-tional spectra, being a special problem, is discussed later). Direction is, however,
-9-

JFFF$3-40
0
//
5 10 15
L* DATA 19(s9-1973 ,/”“ i. -/
./” / .---;
. . /,,----/- ~
/ //
25 30 35 40 fs
Figure 1. Significant and Observed Wave Height Relationships.
Table ICorrelation of Meaeured Maximum and Observed Wave Heights
for Individual Weather Ship Records
Reference A B(ft.) .J(ft.) c O(ft.) N P
Hc.gben& Lumb 1.41 6.72 4.59 1.89 5.41 905(1964)
Hogben L Lumb 1.41 6.46 4.17 1.70 4.43 317 0.86(1967)
Ifogben(1970) 0.83 6.26 3.25 1.42 5.03 527 0.73
A, B, and C are coefficientsfoundusinglinearregression.
Hm
Hm
where lfm
Hv
oND
-A HV+B (best straightline)
-CHV (best straight linethroughthe origin)
is measuredmaximum,exceptin Hogben(1970)whereit is derivedfrom
‘m - 1“6‘1/3’is observedwaveheight.
standarddeviation.numberof comparisons.correlationcoefficient.
-1o-

—
the easiest observation tg make visually. It is usually apparert when one is sight-ing along a crest line 90 to the direction of the waves. This shows up in the smal-ler percentage error in direction found in comparisons between ships. However, whenthe sea is reported as a combination of sea and swell the direction definition be-comes a problem.
In a similar way Table 2 shows the results of several comparisons between meas-ured and observed wave periods. As can be seen hy looking at the correlation factorsand standard deviations, the correlation between observed and measured periods ismuch less satisfactory than the correlation between observed and measured waveheights.
The poor correlation of period estimates may be at least partly due to the factthat period must be estimated by timing wave crests whereas heights can be directlyobserved. The combination of sea and swell, the periodic motion of the ship, and therandom nature of the waves contribute to the difficulty in observing period. Hence,all tabulations of period statistics must be viewed with extreme caution.
The National Climatic Center* can prepare Summaries of Synoptic MeteorologicalObservations (SSMO) based on a world-wide collec$ionaof observations from 1964 topresent. SSMOS can be prepared for individual 1 x 1 squares or for any desired ma-rine area so long as the boundaries are specified. The approximate number of re-corded observations within an area of interest can be furnished when desired. It canthen he decided if the area contains an adequate number of observations. Cost/time●stimates can be obtained from NCC.
The Naval Weather Service Command in 1969 began funding a centinuing program atthe National Climatic Center to publish complete SSMOS for selected ocean areas.Copies of these publications are available. Each volume contains a complete set oftables for two or more ocean areas. Information concerning the geographical bounda-ries of areas for which summaries have been prepared and/or published is given inAppendix B. They are at present limited to coastal areas and the Great Lakes.
Tables 18 and 19 in the SSMOS are the only ones including information on waves.(See example in Appendix C.) Other tables centain information on wind conditions,●tc. SSMOS include both monthly tabulations and annual summaries.
Collections of Observed Data
The World Meteorological Organization (W140)has designated specific areas tovarious national organizations who have collected the observed data on wave heisht,period and direction and coded them onto punched cards. Fig. 2 shows the areas ofresponsibility. Appendix A describes the extent and availability of these coded da-ta. This coded information, along with monthly climatological summaries which in-clude wind and wave information, is also available through the WMO. This type of in-formation has been available for many years and considerable use of it has been made.
Of greater immediate usefulness are published compilations of wave data. Thefollowing four figures show the results of several compilations of wave statistics.
● NCC, Federal Building, Asheville, North Carolina, 28801 (704) 254-0961.
-11-
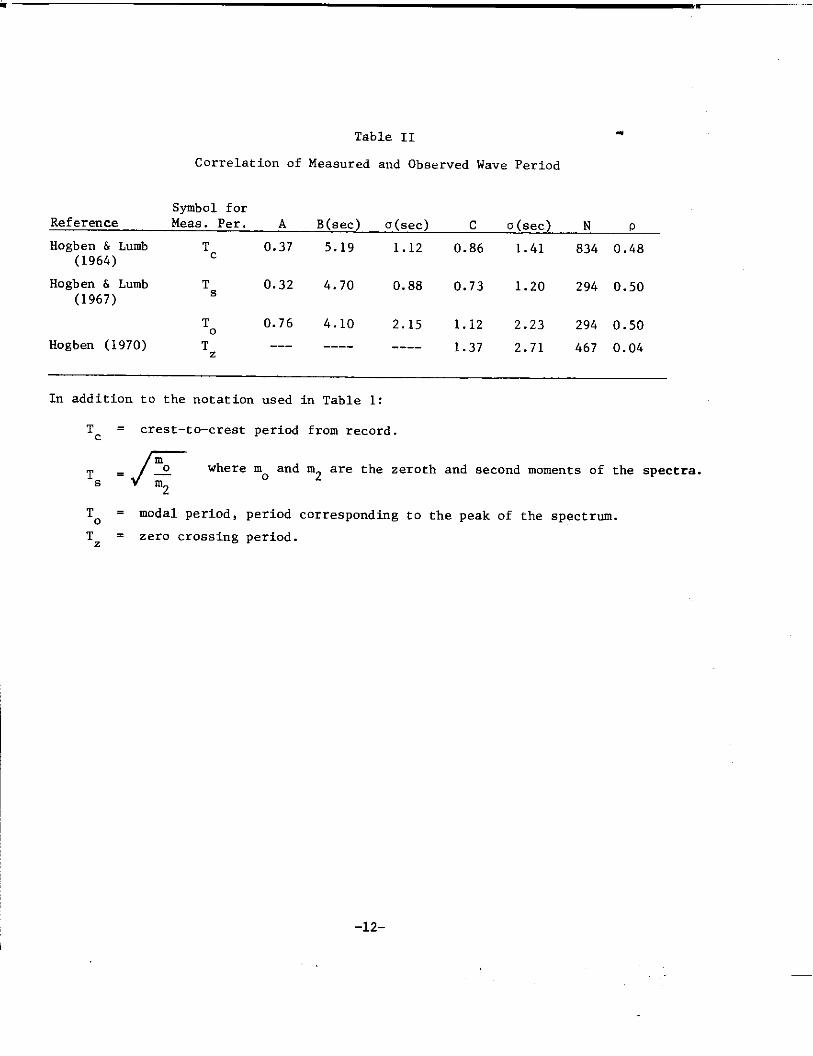
Ti?bleII
correlation of Measured and observed WaVe periOd
.
Symbol forReference Meas. Per. A B(sec) O(sec) c o(sec) N P
Hogben & Lumb Tc 0.37 5.19 1.12(1964)
0.86 1.41 834 0.48
Hogben & Lumb T~ 0.32 4.70 0.88 0.73 1.20(1967)
294 0.50
To 0.76 4.10 2.15 1.12 2.23 294 0.50
Hogben (1970) Tz --- ____ ---- 1.37 2.71 467 0.04
In addition to the notation used in Table 1:
T= = crest-to-crest period from record.
r
mT~=+
where no and m2are the zeroth and second moments of the spectra.
2
To = modal period, period corresponding to the peak of the spectrum.
Tz = zero crossing period.
-12-

-
““(-+/1“% c-w‘r.“x
b
.. .
v,$
. 0 J..., .
*. ..-”
. ,.* a
-.,.”._- ..,,.
pheim-Twmcl- 1,mmwn,”$m ,. ,”,”,”” !o”m, m* .-!.--=2!2
The addresses of the nine responsible WMO Members:
1. Germany, Federal Republic ofDirectorDeutscher WetterdienstSeewetteramtBernhard Nocht Strasse 762 Hamburg 4
2. Hong KongDirectorRoyal ObservatoryNathan Road, Kowloon
3. IndiaDirector GeneralObservatoriesLodi Road, New Delhi 3
5. NetherlandsDirector-in-ChiefKoninklijk NederlandsMeteorologisch InstituutUtrechtseweg 297, De Bilt
6. South AfricaDirectorWeather BureauPrivate Bag 97, Pretoria
7. uSADirectorNational Climatic CenterFederal BuildingAsheville, North Carolina 28801
4. Japan 8. UKDirector General Director-GeneralJapan Meteorological Agency Meteorological OfficeOte-machi Met O 12, London RoadChiyoda-ku, Tokyo Bracknell, Berkshire RG 12 2SZ
9. USSRInstitute of AeroclimatologyMolodezhnaya 3MOSCCNJ, B-296
Figure 2. Areas of Coverage of Responsible WMO Members.
-13-

—
Appendix C contains saq.le tables from a number of these sources. The firstlieted (Fig. 3), the work by Iiogbenand Lumb, la the most comprehensive. It
sourceinclude
coverage of moat major shipping routes. When using Hogben and Lumb statistica, thereport by Hogben (1974) which contains corrections to the directional classes, shoulbe consulted. One of the great deficiencies with the Hogban and Lumb data la thatthere is no coverage of Northern Pacific routee. Another shortcoming is that thearea blocks for which statistics are given (only 50 in all) are quits large.
It must be realized when using Hogben and Lumb data, or any other statisticsbased primarily on voluntary obaening ships, that the data are representative onlyof the condition encountered by the ships. This means that on the avarage the datarepresent leas severe conditions than thoee actually existing eince ships try toavoid regions of high wavee. A comparison between weather ship and transiant shiprecords by Quayle (1974) describes this bias.
The work by Yamanouchi and Ogawa (1970) (Fig. 4) covers the Northern Pacificregion not included in Hogben and Lumb (1967), In addition to the tables in thiswork which give the same information ae in Hogben and Lumb, there are roses and his-tograma which make it easy to see tha relations among conditione in differen~ areaeand at different times. It should be noted that the tablea in this publication in-clude all wavea higher than 7.7m (25.6 ft.) in one group. This lack of definitionin the probability of occurrence of the large waves makes these data inadequate foraccurately predicting long-term ship loads.
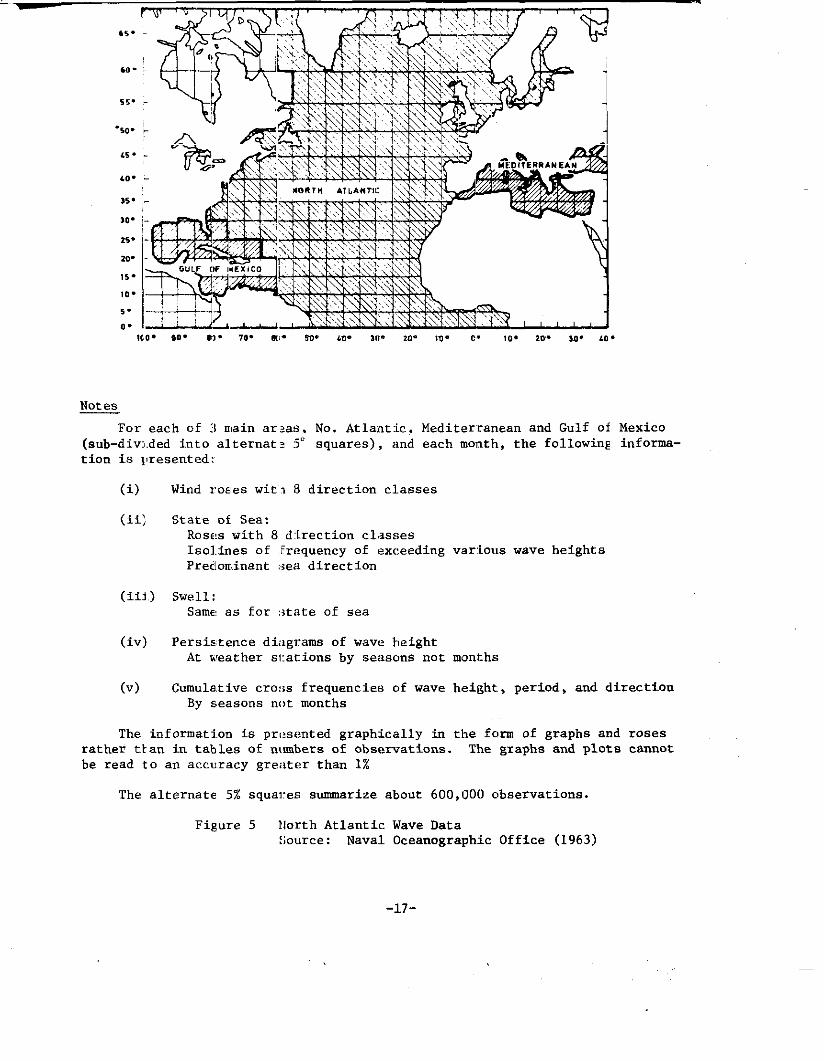
Fig. 5 indicatea that the u.S. Naval”Oceanographic publication (1963) which COYere the North Atlantic does not give aa much information ae Hogben and Lumb in thatnumbers of observations are not tabulated and thus percentage occurrences of largewave heighta cannot be obtained to an accuracy of greater than 1%. But it does giveinformation for much amdler areas (5° aquarea). Thie type of subdivision may beneeded for come purposes.
Fig. 6 ehowe that information on observations in the norther North Atlantic, aregion not covered in Hogben and Lumb, is availabla in Ewing and Hogben (1966).Appendix C contains sample tablea frcm all these various collections of wave obser-vations.
The 1964 ISSC Committee 1 report (ISSC 1964) includee statistical data for sh~route areas. The wave height bands used were ao broad, however, that the data araof limited usefulness.
Unusual Conditions
Bad weather areaa and seaaona are indicated by reference letters in the worldU18p,Fig. 7. Table 3 liets special hazards which are also indicated on tha map. Tttable also indicatea the cauae or tentative explanation of the hazard. In the caaetwhere currents are lieted they may be important not only in themselves but for theizeffect on waves. Fig, 8 indicatee the effect a current can have on waves.
This current effect la thought to be a factor off the Southeast Coast of South
!..h.
-14-

SO.
II.
I I ,,r,,,,,,,,,,,,,,,-, ,1BO . 0. 90 ● 140 ●
For each of 50 areas and each of four seasons (plus the whole year), the fol-lowing information is presented:
Tables for each of 12 direction classes (plus all directions combined) showingnwnbers of observations in cells corresponding to every combination of wave heightand period cc-denumber (i.e., height intervals in 1/2 meters and period intervals of2 seconds) for which observations have been reported.
About a million observations reported in the years 1953 to 1961 are covered.
Figure 3 Worldwide Wave Data (except North Pacific)Source: Hogben and Lumb (1967)
-15-

Notes
For each of 54 zones (as defined by the grid lines shown in the map above) andeach of 12 months (plus the whole year), the following information is presented:
(i)
(ii)
(iii)
(~v)
Wind velocity rose with 12 direction classesWave height rose with 12 direction classesWave period rose with 12 direction classes
Mean of wind speed, percentage of gale force (34 knots and above)Mean of wave heightMean of wave period
Histogram of wave heightHistogram of wave periodHistogram of wave speed
Tables of percentage frequency of ocurrence for wave height vs. waveperiod
About 1,500,000 observations reported
Figure 4 North Pacific Wave DataSource: Yamanouchi (1970)
in the years 1954-1963 are covered.
-16-
Ice. w. m]. 70. m:. 50. ‘w 3“. 20. m. c. ,“. 20. ,0. Lo.
Notes
For each of 3 main ar?as, No. Atlantic,(sub-divj.dedinto alternat~ .5”squares), andtion is lmese.nted:
Mediterranean and Gulf of Mexicoeach month, the following informa-
(i) Wind roses wit”~8 direction classes
(ii) State of Sea:Roses with 8 direction classesIsol.ines of frequency of exceeding var:ious wave heights
Predou..inant::eodirection
(iij.) Swell:Same as for :stateof sea
(iv) Persistence diagrams of wave heightAt weather si:ations by seasons not months
(v) Cumulative cross frequencies of wave height, period, and directf.onBy seasons not months
The information is presented graphically in the form of graphs and rosesrather ttan in tables of numbers of observations. The graphs and plots cannotbe read to an accuracy greuter than 1%
The alternate 5% squares summarize about 600,000 observations.
Figure 5 North Atlantic Wave DataSource: Naval Oceanographic Office (1963)
-17-

a
For each of 3 areas and 2 seasons, the following information is presented:
(i) Cumulative frequency curves of wave height and period and resettes ofBeaufort wind force with 8 direction classes.
(ii) Tables giving numbers of observations forWave height vs. wave periodWind direction vs. wind forceWave height vs. wind forceWave length vs. wave period
About 4,000 observations reported in the years 1953-1965 are covered.
Figure 6 Extreme North Atlantic Wave DataSource: Ewing and Hogben (1966)
-18-

-. , -. .,
-19-

3.5
3.0
UCIHo2,5
2,0
‘c/LoI,j
1,0
0.5
I I
Ho - WAVS HEIGHT IN STILLNATER
H. - WAVEHEIGHTIN CUkRSh”C
r .co - wAvsVELOclTYIN STILLWATER -
co = 3T (T - WAVS PER1OD)
U - VELOCITYOF CURRENT,POSITIVEFORFOLLOwINCAND NEGATIVE FOROPPCSING
Lo - WAVE LENGTHIN STILLWATER..7.Lc - WAVE LENGTHIN cCRREXT
k—.—-+--—.+$
HEIGNT
—. L
-0.2 -0.1
--+ ~ - -.,—
i...
-——
LENGTN
+
-.q-
0.1 ;.2
Figure 8 - Change inWave Dimensions forOppos~ng and FollowingCurrents (Wiegel, 1964)
opposingcurrent UI co f01lowingcurrent
TABLE III - SPECIm HAZARDSLocetio. NatureofHazard
A*
B
c
D
E
F
G
H
I
Sntr.n.eNantucketS.a.cd(PollackSip),NantucketShoals(Rips),tipof Cape Tidalctxren:s,shoalingCod (RacePoint), Bayof Fundy
GrandBanks
CaF.eHatteras
E.stemsideofNorthSea
WeStempartofE.Blishchannel(continentalshelf)
Bay of BiSCV
SoutheastCoastofSouthAfrica
PacificOceanNortheastofJapan
SeYWUX Narrows,Bc
HurricanesandTyphoonsfnvario.elo..tions
LabradorCurrent,shoaiLng
GulfStream
Shoaling
Sho.lins
Reflectionandrefraction
AgulhasCurrentandswellfromAntarcticOcean
K..oShi.Current
Tidalcurrents
Highwindsa“dw.”.?,
● lettersrefertoIocationsshowninFigure7.
-20-

Africa. Large waves can occur there when an area of low pressure moving to theeast-northeastward produces a strong southwesterly wind blowing against the flow ofthe Agulhas Current. This combination of conditions has produced waves of 7 to 8 m(23 to 26 ft.) with a period of about 10 seconds and length 60-90 m (200 to 700 ft.)roving to the northeast. There may also be wave trains emanating from severe Ant-arctic storm centers further south having periods greater than 14-15 sec. Theselong swells, or “Cape rollers” may in themselves be a hazard for large super tankers.But when these swells move in the same direction as the storm seas (Quayle, 1974 a)and the crests of the two wave trains coincide, a “freak wave” of 20 m (66 ft.) inheight may result. The lifetime of such a wave is short, and it will only extendover a limited distance.
-21-

Iv. MSASURSD WAVE DATA
Sources of Wave Measurements
The measured data are limited in qusntity and location compared with the vastsystsmatic accumulations of visual observations. The need for measured data haa,howevar, besn fully established and collection programs are sxpanding.
The number of wave measuring inatrumsnts that have been used in limited quantitis quite large. Altbough most have served a useful scientific purpose, few have beewidely used for long periods. The Tucker recordar (SBWR) ia the most successfulshipborne instrument, and has bean used on waather ahipa for generating large qusntities of measurad data for the North Atlantic, and lesser amounts for the North Pacific and elsewhere. It is somewhat restricted by the requirement that the ship be hovto. (A numbar of mssaur~ents hava been msda using tha Tucker recorder on ahipa atspaad, but the validity of these measurement is in doubt, as discusssd later). Thereliability of the Tucker recorder is critically dependsnt on the application of afrequency dependent calibration correction which depends on the size and characterstics of the vessel on which the recorder is mounted.
The British National Institution of Oceanography (NIO) bas used ocean weatherships (OWS) aquipped with Tucker wave recorders to record long saries wave records.The equipment is built into the ships. Other ships have also been equipped with NIOTucker recorders, including saveral American flsg merchsnt shipa. Howaver, the lat-ter rasults obtained are inadequate becsuae of the forward speed of tha ship, Webb(1974), Wheaton (1975). Appendix F describes the sxtent of the data accumulated Usir.these instrumsnta.
In locations where ftied towars are available, such as in the Gulf of Mexico, aresistance wire wave meter -- such as the Baylor gage -- is useful aa a simple yetaccurate maasuring instrument. The Vibratron, a low-noisa transducer used to meaaulpressure variations, has besn used to measure wava heights from the bottom, snd frorthe top of the Cobb Sea Mount off the West coaat of Canada. It has also been usedin coubination with an accelerometer on flosting drilling platforms.
Recsntly, the NOAA Data Buoy Office (NDBO) has used accalernmsters mounted In40-feet diameter buoys to mske mssaur-ta. The results thus far have besn good altheir progrsm is expanding. The Waverider buoy, a l-meter sphere with accelerometer’dasigned and msnufactursd in tha Netherlands, haa been used to measure lake andcoastal wave elevations. It has been used in open ocean locations in conjunctionwith specific ship test and measuring projects, but haa not been used routinely toobtain open ocean spectra. Buoys in the intermediate size range are being developetby oil companies for use in obtaining wava data for use in drilling platform designand operation; most of this information is proprietary.
Data from other wave measuring syatsme, such as wava towers snd pressure trsnsducers in shallow watar, the pitch/roll buoy, the clover leaf buOy, aarial phOtOgraphy, insging radars, airborne laser altimeters, over-the-horizon high-frequency radwaves, and a nanosecond airborne radar, have yet to ba ussd extenaivaly for navalarchitectural purposes.
-22-

The four instruments for msasuring wavee and providing data of importance tonaval architecturalin deep water or on the centinental shelf are the Tucker ShipborneHave Recorder, the NOAA Data Buoy Office Discus Buoy, the Baylor Gauga and the Wave-rider Buoy. See Appendix D for a full description of these instruments.
Reliability of Wave Measuring Techniques
Of the four important inatrumente mentioned in tha preceding section, all butthe Baylor Gauge, the instrumsnt used on oil platforms, meaaure an acceleration andconvert the data during processing to an elevation spectrum by means of either adouble integration in the time domain or its equivalent in frequsncy space. Thosethat measure acceleration attsmpt to correct for ship or buoy rasponse to the highfrequenciaa in one vay or another.
Each of the systems using an accelerometer measurea something slightly differ-ent. The ship with the SBWR does not fallow the o=bital motion of the shorter “aves.The Discus buoy of NDBO probably follows tha orbital motions of the larger waves.The Waverider buoy being small is almost equivalent to a freely floating particle ofwater on the free surface.
In addition, each of the aystam haa the equivalent of some kind of a band-paaefilter acting on what would have been a “pure” record of acceleration. This filteris a function of the dimensions and response of the platform and of the range of thaaccelerations eenaed by the recorder, The low-paas filter, deftied ae a function offrequency, say, F(w), operates on the true elevation spectrum S(w) to produce,
S*(W) = F(u) S(u)
The low-frequsncy range of the band-pass filter, say w - 0 through u - 2n/25,presents particular problems, at least with the SBWR and perhapa with the other two.Fortunately, the long waves with frequanciea this low (lengths greater than 3000 ft.)seldom need to be considered for practical purposes. However, certain aapacte ofnon-1inear wave theory auggeat they may prove to have theoretical importante.
For most wave frequencies of impo~tance to naval architecture, the filter F (u)can be found and the output spectrum S (u) can be used to Calculate s(IJ)as in
s(u) = S*(U) / F(u)
However, as F(w) approaches the high-f~equency cut-off, there will be a rangeof w where a subatantial smplification of S (u) is required, and when F(w) becomasnearly zero, the procedure yields poor results.
For these reasons, the SBWR yields useful spectra only over the frequency range,
2n125 ~ 0) < 2T15 Or 2nf4
or the wave length range,
100 ft. < L < 3oo0 ft.
-23-

An additional problem with the SBWR is that the final output is the sum of two measu-rements -- pressure and accelerction -- each of which ideally should have a differ-ent calibration factor.
The NDBO Discus Buoy must aleo have important filter effects for u > 2T/4. TheWaverider buoy seems to be a good standard for calibration and appears to have thewidest frequency range.
The Baylor wave gauge was used to maaeure hurricane waves in the Gulf of Mexico..It haa an unknown roll-off starting at w S 2?T/3, but still responds to high-fxequen-cy waves in a useful way. Additional study of the electronics in these gauges couldprovide further information on F(to).
Waves shorter than 100 ft. (U . 2./4) are seldom of importance to larger shipe,but they are important to small craft, surface effect-ships and hydrofoils, Theyalso contribute to problems in deck wetness and slamming. There is increasing evi-dence that strange things happen in the frequency range, 2n/4 < w < 2T (5 < L < 80ft.) and that this range is wind-speed dependent. Growth of the epectrum with windapeed in this range adds several feet to the significant wave height. New systemsand new techniques are required to measure these sDectral components and new baaicresearch programs to deveiop these spectral system~ need to b: funded.
Analysia of Records
Once a record of wave height has been obtained,it can be analyzed in severalways. The simplest is the Dra~er method of analyai~ in which the number of peaksand troughs, number of zero crossings, and higheet positive and negative maxima aredetermined from visual examination of the record. These valuee are then used to de-termine various parameters of the record. The other method is to compute the energyspectrum by taking the Fourier transform of the auto-correlation function or by meanaof a Fast Fourier analysia. The parameters are then determined by the relations be-tween the various moments of the epectrum. A detailed comparison of the resultsusing each of these methods with the same data is given in Appendix H.
This comparison is important because analysis of all the records from the Brit-ish NIO Tucker Recorders is being done solely by the Draper method. It can be con-
cl”ded ‘tit ‘he ‘1(~values derived by this method are quite good and these data
should be made ava able.
The original problem with the energy spectrum method of analysis waa the largeamount of computation required to produce the apectrum from.the record. This problamhas been solved with the advent of the large high-speed digital computer. The re-maining difficulty is that much of the data, as for example that from the Tucker waverecorder, is in the form of strip charte, which require a great deal of manual effortto read and to put into digital form. Thie problem is being eliminated in that moatrecording is now being done in a form that is directly compatible with computers.
The number of spectra available is limited but increasing. The map, Fig. 7shnvs the locations where spectra have been measured , as indicated by reference nem-
-24-

hers. A table giving details is givenvarious sources given in Appendix I.
,,
in Appendix E, with typical results from the
If specific information is required about the availability of measured data fora particular coastal location, Appendix G can be consulted. It is a table compiledby PIANC (Permanent International Association of Navigation Congresses) of organiza-tions which can provide detailed tifO~t ion concerning wave recording sites intheir countries.
As can be seen frctnthe study of large samples of spectra from a single locationthere is considerable variation in spectral shape. It is difficult to draw conclu-sions about “typical” or mean spectra for a location without having a large sample.
Such large samples of spectra are currently available for tbe following loca-tions: weather stations I, J and K in the eastern North Atlantic; station P in theeastern North Pacific; Cobb Sesmount; and tbe Great Lakes. NOAA Data Buoys in theGulf of Alaska, the Gulf of Mexico and off the eastern U.S. Coast have been provid-ing an increasing amount of data.
The number of directional spectra available is lir+ited to a mere bandful. Suchspectra, which specify the energy as a function of both direction and frequency, re-quire sophisticated measurements. The methods available to obtain directional in-formation include arrays of wave height measuring devices, slope measuring instru-ments, and stereo photography. Table 4 describes the directional spectra available.
-25-
-

Record Length
Sample Rate
Analysis Method
Smoothing
Corrections
Units (ordinate)
Units (abscissa)
Instrument
Time
Location
Number of Spectra
Table IV
Available Directional Spectra
Cote, L.J., et al(1960)
1300’ X 27oo’
~ = 3(3!
Correlation20 x 40 lags
2-dimensionalHamming
tilt of zero level
ftb
ft-l (wave number)
Stereo cameras
1954
40”N-65”w
1
Canham, H.J.S.,
et al (1962)
12 min.
.5 sec.
Correlation60 lags
factors ~ ~ ~4’ 2’ 4
noise correction
ftz . sec.
-1sec
NIOpitch-roll buoy
1959
North Atlantic
3
Longuet-Higgins,M.S., et al (1961)
same instrument andprocedure as Canham,H.J.S., et al (1962)
1953-1956
North Atlantic
5
-26-

.,
v. THEORETICAL SPECTfUiLFOSM02ATIONS
S8sic Formulations
The short-term description of the sea is the basic input required in order to$etermine the response of a vehicle in such a sea. The definition of short-te~is a period of time short enough to make it possible to describe the sea as astationary random process. The stationary property does not imply that the surfaceof the sea remains unchanged. On the contrary, at any given instant of time thesurface pattern is unique. However, the statistical properties of the short-termsea, defined by its spectrum, may be regarded as constant over such a period of:ime. The significant wave height and average period alone cannot characterize:he short-term sea; hence, the actual wave spectrum, describing how the componentsof the surface pattern are distributed over frequency, is required. When therandcamprocess is stationary the spectrum remains essentially unchanged.
NO records taken at different times having the same height and period would,sf course, not in general have the same spectrum. For the spectrum to remainthe same, all moments must also remain the same. The height and the period arefunctions of the zero and second moments of the spectrum. Characteristic periodsand other parameters are functions of higher order moments, all of which will changewith variations in spectral shape.
on the other hand, the first three or four moments do not exactly definethe shape. It can be seen from Figures 25, 34 and 48 that wave spectra arehighly irregular. While some of this irregularity in measured spectra is due tosampling variability, this does not account for it completely. This characteristicirregularity should be kept in mind whenever theoretical formulations are considered.
General Form of Theoretical Spectra
The lack of availability of measured spectra in a form suitable for applicationto response calculations has led to the use of mathematically formulated spectra.Although this approach has been extensively used, Pierson has tautioned that greatcare must be taken in choosing values of the parameters based on samples of spectra.(See Appendix J). The mathematical formulation commonly used is of the generalform shown below:
Sc (w) = AW ‘p ew (-Bw‘q) [1]
where S (u) is the variance spectrum ordinate (ft.2 . see) or (mz . .ec)w’ is the circular frequency = 2w/T (see-l)A,B,p ,q are the parameters of the spectrum
The various moments
m
m=c J
o
–-–—
of the spectrum are
s< (w) . Wc d~
defined as:
-27-

$
Introducing the Gamma function, for convenience,
.
r (x) -J
x-1Y
o
and letting
Y . ~ ~-q and
x= &
q
the equation for the moment of
Thus,
mc
‘-1
m0
‘1
‘2
order c becomes,
r (~)
. A r ($$, etc.qB~
[2]
[3]
[4]
[5]
[6]
Expressions using various combinations of the moments are often used indescribing spectra. For example,
significant wave height‘1/3
= 4X [7]
average mean period‘1 =
2n mofml [8]
energyaverageperiod‘-l
= 2n m-llrno [9]
-28-

average
average
zero crossing period
crest-to-crest period
skewness
broadness
flatness
271 (mO/m2)%‘2 =
[10]
‘4 =2n (ru211n4)% [11]
Y . ~31m2312 [12]
%
() ‘2E= l-— mm
[13]0.4
8=42 n Id
Specific Theoretical Formulations
By substituting tbe definition of the moments in terms of the spectralparameters, (14) and (15), intO the abOve definitions fOr Hi/3 and T1~ we find:
~ @
B-l/q‘1=2 ~ @
Solving for A and B,
A.=
B=
The form for the spectrum is now,
P-l [r(@)]p-2
SC(u) = f (y 2 ~-e ~xpp-1 ‘1/3
[r(~)l
[14]
HI:(J@’)q[-(&)ql -+ w-q [15]
1 1.(y)
-29-

To - 2a (~ B)‘/qP
TO find the frequency at which the peak of the spectrum occurs, we set thederivative with respect to u equal to zero:
Carrying out this differentiation, setting the result equal to zero, and callinsthe frequency at which the peak occurs, IJIo,we have:
I
.‘n
(; B)l/q\
ox
Letting p = 5 and q = 4 in [1S] yielde a formulation which is generallyreferred to ae the modified Pierson-Moskowitz spectrum,
I
SC(U) - 0.11 ($)4 1(,310-’ ()UT -4-p [-0.44 + ]
1
Thie ie the ISSC reco-ended spectral formulation, ISSC (1970). For this case,
T-l/T1 = 1.1114
T21Tl - 0.9208
c . indeterminate
y ‘1/3. 6.1438
6 liL,3 - indeterminatee
I
UoT-1
4.8692
-30-

---
It is possible to calculate c by truncatingIII* freauencies. It has been shown iiILoukakis
—
the spectral density function at(1970) that tha epectral broed---
ne~s fac~or for the above apectruniia given approximately by c = 0.59.
If p = 6 and q = 2 in [15], tha Ne~nn apectr~ ia Obtained:
2
()
UT ‘2
Sc(lo) = 9.39 (*)5-6
1%/3 u
exp [ -1.767 1 ]%
For this case,
T2/T1 =
E .
y ‘1/3.
% H1,3 -
UJoT1 =
0.9217
0.816
5.5279
14.8043
4.8223
TWO additional spectral formulationwere presented in Nlrakhin and Kbolodilin
Voznesenski-Netsvetayev spectrum,
()ti . 1.97 +-6
‘c u
basad on the above general formulation(1975) and are baaed on meaauramanta:
-4
()
exp [-0.53 + ]u
where
27=;= mean wave frequency
T1H1132.— .
‘< = ‘0 16zero moment
They define the spectrum peak as,
[1s (w) : - 2.10; %= 0.77
‘c @lax u
Krylov spectrum,
ti ()= 3.12 +-7
()
exp [ -0.79 * -4 ]
‘< u u
-31-

Spectral Shape Definition
It is evident from theformulation given bj [1] is
~2.21; ~ = 0.82
preceding presentation that, as long as the basicused for the spectral representation, the only way
one can control the ahape of the spectrum is by assigning different values to Ithe parameters, p and q.
In a recent study at Webb Institute, Walden and Hoffman (1975),an attemptwas made to determine revised values for p and q. Tbia was done by determiningthe flatness and skewness in terms of p and q from the theory and then choosing thecombination of p and q which provided the best fit to measured values. The measuredvalues were determined from the spectra available from Stations 1, K and P.
It was found that p and q are quite sensitive to the skewness and flatnesa.This means that if skewness and flatness could be determined accurately, p and qcould also be determined. Unfortunately, it also meana that if there is a smalluncertainty in skewness and flatness there is a large uncertainty in p and q.It wae found that the differences in measured skewness and flatness valuea whichresulted from different averaging procedures reeulted in pts from 6.2 - 5.7 andq’s from 5.9 - 3,9. Fig. 9 shows the skewness data from Station “Papa.” Theintercepts from this plot and from a similar plot of the flatness data provided thebasia for the choice of p and q.
It was also found that adjusting the values of p and q in the theoreticalformulation to provide better agreement between the measurement and theoreticalvalues of the broadness and flatness factors led to greater disagreement betweenthe values of other measured and theoretical parameters. In particular, the agreementwas worse for the frequently referred to relation between W. and T1.
It follows from the form of Eq. [1] that any combination of p and q predictsa relation of the form,
when c is a function of p and q. The c resulting from the revised p and qresulted in a worse fit to the measured data.
It can be seen from Fig. 10 that the actual relation is of the form
:Tl=cu
-32-

1
0
-2
“’\
_——.
1
0
Figure 9 -
II
I
— LIXE OF SLOPE --1, PASSING THROUGH--- DATA POINT AT MID RANGE —– --
INTERCEPT = 1, 64
-LEAST SQUARES FIT TO DATA
s,,”?, - -0.96s
[wERcEPT - 1.56
1 2 3 41“ HI,,
Spectral Skewness Parameter, y, vs..signLficant Wave Height, Hi/3(Walden and Hoffman, 1975)
f-i)..F?AWSEC
Theoretical and Measured RelationshipBetween Frequency of Maximum SpectralOrdinates and Average Period(Walden and Hoffman, 1975)
.i .2
Figure 10 -
,..
.-
1

where x is some power less than 1. This relation can never be accurately describedby a spectral formulation of the form in [1].
Ferdinand, et. al. (1975) have also conducted an investigation into determiningp and q. Their work was of a more limited scope and their measured values werebased on a much smaller sample. They found for their”limited sample that p = 4.9 and \q = 3.5 provides a better fit, based on measured and theoretical T-I/Te and TL/To Iratios. Fig. 11 shows the data on which they based their choice of p and q.
Some recent work with spectral formulations other than [1] has also beenattempted, Ewing (1974). The Joint North Sea Wave Project (.TONSWAP) was initiatedprimarily to study the form of the source function of the energy-balance equationfor the wave spectrum during conditions of wave growth. The formulation is forspectra corresponding to fetch-limited off-shore wind conditions and is a variancespectrum expressed as a function of frequency, f = l/T
I
whereUa forf~f
In~=
‘bfor f > fm I
Iand there are five parameters, fm, a, y, Oa and ub. As shown in Fig. 12, fm isthe frequency of the spectral peak, y is the ratio of the maximum spectral energy Ito the maximum of the corresponding Pierson-Moskowitz spectrum and o= and ab aremeasures of the left and right-sided widths of the spectrum.
It can be seen that if tbe last factor in [16],
P 1yexp -.f - fm)z .
202f2m
the latter reduces to the same form as
1
the basic fully-developed s~ectral formulations[15], with p = 5 and q = 4.
. .The additional factor or’scaling function yields a
wider variety of spectral shapes than the basic formulation and consequently it imakes it possible to obtain a better fit with measured spectra.
The JONSWAP spectrum has recently been presented in terms of the parametersHI/3 and Tl, Swing (1975); in its original form, it was based on wind speed andfetch. It is now possible to compare JONSWAP with corresponding Pierson-Moskowitzspectra”as”currently recommended by ISSC. Fig. 13 shows the ISSC and JONSWAPspectra for Hi/3 = 47.7 ft. and T~ = 11.5 seconds. It ~an be Seen that theJONSWAP spectrum is much more sharply peaked than the IsSC; there is thus lessenergy in the high and low-frequency regions above and below the peak. Figs. 14 - 19show some typical comparisons between measured, ISSC and JONSWAP spectra.
-34-

~
.
b..-
Iz.
.
m.
1
. , ,, ,., ,= IS
I
!s...“c
o
. . .
.a
3.
0 s . ~,. -
Figure 11. Relationship Between Different Period Definitions.(Ferdinand, et. al., 1975)
0.7 —
Ill11
H..
Figure 12. Typical Fit Using JONSWAF Spectral Formulation(Swing, 1974)
-35-

!,, ,,, ,$, <,,, ,,!, ,,. ,,, bbm ;,,,,,,,,,,, ,,,,, ,,,, ,’, ,,h. ,s,,,a-
Figure 13 - Comparison of JONSWAF and
ISSC Spectra
,0r I\
. 1 —1< (-,
IqI’?-ac
j !\, .:= ;1
so- ; ? msc A----
; \,% - ,,.,0 mm
‘,
I “-‘“-j,,.,,- I,,’, ‘., ‘..
,,,,/ ~.....,,-
:>/ --- ‘-......
-------......:--.:
00.2 0., .,. ,,: ,,,,
— -u . (*) ““ O.’ 0.9 ~.~
Figure 14 - Comparison of JONSWAI,
“INIIIA”,and Measured Spectra
Figure 15 - Comparison of JONSWAP, “INDIA”,..i and Measured Spectra
,.- ::. ./1
.
6s. ;~i1“1’ I
,. i1
,.. -——.. —.—
9<(u),o--d-sac —. _
,:l+..-
,0/r-.-’...\
% - ,..,,,Ql‘... 7, . ,.m ,,c 4
f
,0 ..—. — — —
:\ ~..~ ~,,,,
b.. /
y++
\ , -
0 .—0,, ,,, .,4 . . . ,:6
—— ——.+
rwm.r w,.)”.’ “.” “’ lo
Figure 16 - Comparison of JONSWAF, “INDIA”,and Measured Spectra
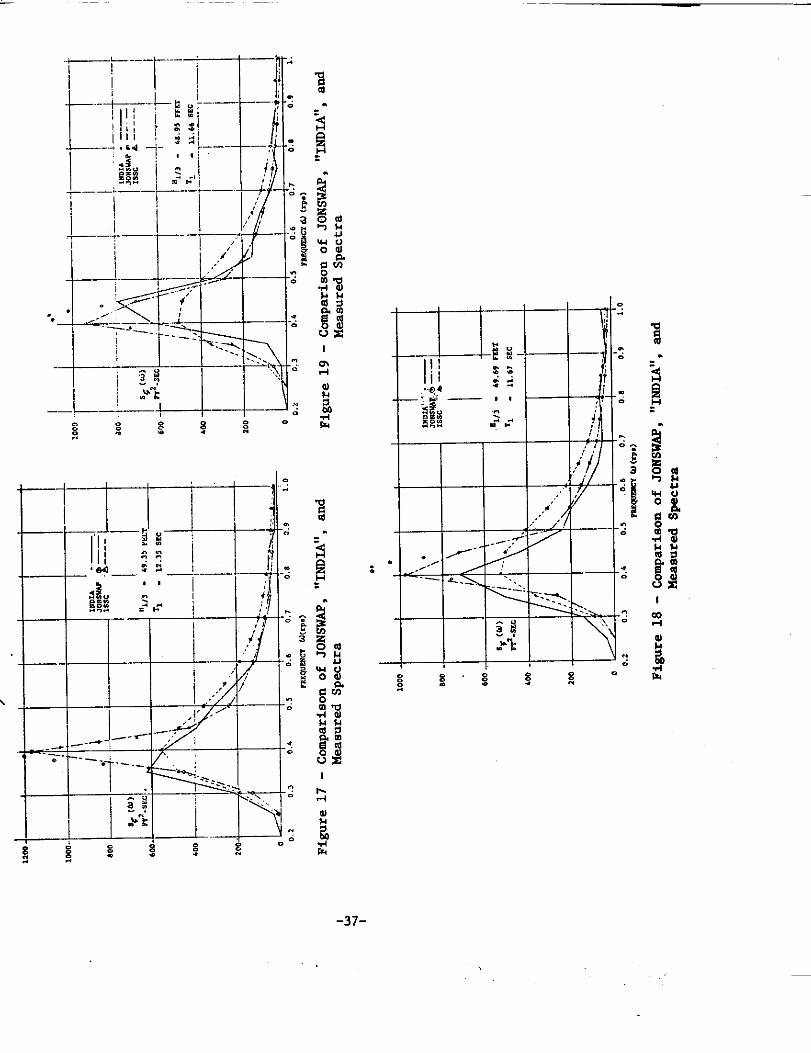
—
Imd
-37-
:

It is apparent thet cases can be found where the JONSWAP matches best, Figs. 16and 19, where the ISSC matches best, Figs, 14 and 17 and where neither isparticularly close, Figs. 15 and 18. The lines labeled JONSWAP in the figuresindicate the effective spectrum actually used in the program. The points representthe actual JONSWAP spectrum,
The JONSWAP form is of doubtful use for the open ocean becauee of the fetch-limlted and relatively shellow water nature of the measurements on which It iebased. W.J. Pierson (1975) raises serious questions about the procedures used indetermining the parameters in the JONSWAP spectrum, particularly the discardingof double-peaked spectra.
Ochi (1975) hae developed a three-parameter formulation of the f0110win8 form,
[17]
where W. is the frequency of the peak, H1/3 is the slgnificant waue height and Lie a shape parameter (which he eventually hopes to relate to an obeened quantitysuch as wind duration),
He obtains good fits to measured epectra, as shown in Fig. 20, by combiningtwo three-parameter spectra, one describing the low-frequency region with ~‘, Hi/3’,and Af and one describing the high.frequency region with ~’f, H1/3’!and k!!. Hefound ha could not adequately repreeent the measurad spectra with a eingle three-parameter spectrum.
He has developed a computer program which choosee ~’ , Hi/3’,,k‘, ~“, Hi/3”,and k“ by computing the spectra for various combinations of these parameter andthen picking the particular combination which provides the best fit in the laaatsquares senee to the measured spectra.
Gospodnetic and Miles (1974) studies the ehape of 307 spectra from Station!iIndiaflas a function of Hi/3 and T-1. They non-dimeneionalized SC(w) and uusing Hi/3 and T-l. They then grouped the 307 available epectra by HI/3 and T-1,using a second-order two-dimensional polynomial regreaaion in the parametersHi/3 and T-1 to fit the average epectra obtained by the grouping process. Thus,their aix-paremeter spectra have the form:
S(W, T, H)= ’00 + Alo (H - Ho) + Aol (T - To) + A20 (H - HO)2
+ All (H - Ho) (T - To) + A02 (T - TO)2
where T and H are substituted for T-l and Hi/3, respectively, and TO and HO areaverage values for the entire sample of spectra. The eix A-parameters wera plottedaa functions of u.
The difficulty ia that their analyais is baaad on only 295 measured spectra.Thus, some of their HIf3, T-1 groups have as few aa five spectra. This methodaccurately represents the average of the H1/3, T-I groupa but for 80 frequenciearequires 480 coefficients, which vary in no systematic way. So theirs la essentiallya 480-parameter spectrum. Fig. 21 illustrates their results.
-38-
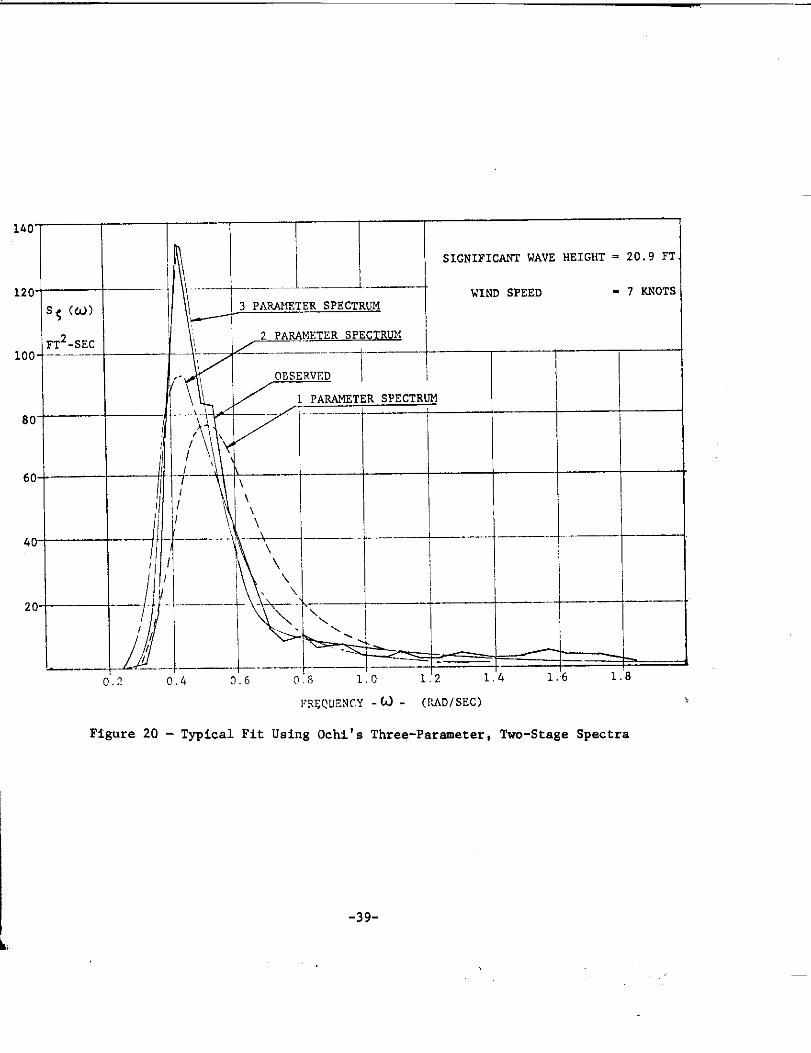
160
SIGNIFICANT WAVE HEIGHT = 20.9 FT.
120--l’s’rERSPECTRUM
WIND SPEED
5$ (u)
- 7 P.NOTS
FT2-SEC2 PARAMETER SPECTRUM
100--––—--
,.
[ 1 PARAMETER SPECTRUM
80
60
40
20-
0.2 0.4 0.6 0.s 1.0
FREQUENCY -~ - (PLD/SEC)
Figure 20 - Typical Fit Using Ochi’s Three-Parameter, Two-Stage Spectra
-39-
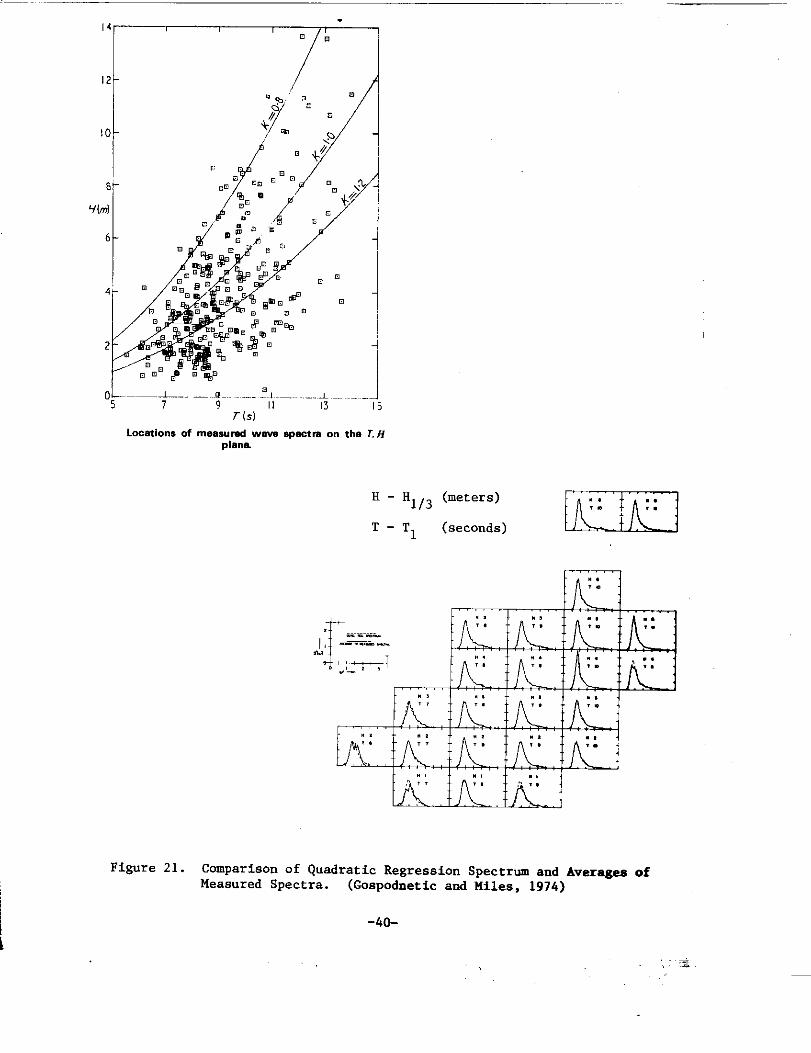
o&._.—*-._...;... .-.-+ ,....~.-.. .r (s)
LocationsofIneasuredwaw spectraO. the T, Hplane.
H - ‘1/3 ‘meters)
T-Tl (seconds) m
I..
Figure 21. Comparison of Quadratic Regression Spectrum and Averages ofMeasured Spectra. (Gospodnetic and Miles, 1974)
-40-

In all the above examples, Ewing (1974), Ochi (1975) and Gospodnetic and Mil(1974), the spectral formulation was obtained through curve-fitting of many wavespectral estimates obtained from wave records, and the additional parameterscontrolling the shape were not related to physical conditions. Hence, the abilit!to generalize is rather limited in all the above three cases. Another possibleway of generalizing such data is through the classification of spectra, asdiscussed in the following section.
In Appendix J, Pierson discusses the entire process of parametrization ofspectra. He concludes that often too little thought is given to what theparametrized spectra are supposed to represent. He suggests that the samplebe stratified to the greatest extent possible. These considerations will becomeincreasingly important as more measured or accurately hindcast spectra becomeavailable.
-41-
.
VI. WAVE DATA FROM HINDCAST MODELS
Introduction
As noted elsewhere in this report, the quantity of measured wave data remainsvery limited compared to visual estimates, despite the centinued development of newtechniques to measure waves and the rather intense activities being undertaken totest and implement the new techniques in the field. Measurement programs are ex-panding rapidly, most notably the NOAA data buoy program and the various specialmeasurement programs sponsored by the oil industry in the Gulf of Mexico, the Gulf
of Alaska and the North Sea. Nevertheless, these measurements are limited to thecentinental shelf zone. Spacecraft measurement systems may be able to provide wavemeasurements on a global scale within the next decade. The concept is being testedcurrently on GEOS-C and will again be used on SEASAT A in 1978. Until global-scalemeasurements become available, wave spectra calculated by means of hindcast proce-dures using wave generation and propagation models may be the only recourse for gen-eral climatological wave studies. This section therefore reviews the availablesources of hindcast data, outlines the models used to generate the data and de-scribes the sources of hindcast data that may become available soon on the basis ofcurrent and planned wave hindcast programs.
Hindcast wave data have been generated within the context of three basic activ-ities:
1.
2.
3.
Case studies associated with wave prediction model development. Thesedata are usually limited in area coverage and in time to match anavailable wave measurement data set and are available usually only inthe specific form analyzed and published for the purpose of model val-idation.
Climatological studies. In this activity a wave prediction model isused to compute a long history of wave data from which a wave clim-atologymay be developed.
Operational models. When a wave prediction model is used in an opera-tional hindcast/forecast cycle, t~o types of spectra are regularl~produced:
- Forecast spectra based on forecast wind fields, and- Hindcast spectra based on observed wind fields (which consti-
tute the initial conditions for the next forecast).
Prior to the introduction of digital computers to wave hindcast studies, thequantity of wave hindcast data was very limited and consisted mainly of significantwave height hindcast data calculated by means of wave models. These early modelswill be reviewed here briefly, but the emphasis wil1 be on spectral wave hindcastdata, as they are potentially the most useful data, and current and planned wavehindcast programs will employ the spectral approach to wave prediction.almost exclu-sively.
-42-
Significant Wave Hindcast Models
Most significant wave prediction methods are derived from the ori@nal work ofSverdrup-Munk (1947). The empirical relationships between the wind, its fetch andduration and the significant wave characteristics have been revised several tties(e.g., Bretschneider, 1952 and 1958, U.S. Army CERC, 1966). Prior to the mid 1960’sthe methods were applied manually to subjectively analyzed wind fields to produceoperational wave forecasts for marine forecast services. Hindcast data prior tothis period were limited to specific locations and storms. Walden (1957), for exam-ple, evaluated several methods by comparing their hindcasts of swell obsened offthe coast of Angola in January 1955. As another example, Bretschneider (1963)
applied the methOd tO the hindcast of significant wave conditions at Station J forthe December 1959 storm. The hindcast data generated in this typa of case study arenot very reliable because of the very subjective nature of the application of themethod, are not very sxtensive and are intrinsically not very useful since theyclosely overlap meaaured wave data.
.
Hindcast Data Produced by the FNWC SigrIificant Wave Forecast Model. The imple-mentalion of the aignificant wave method in an objective computerized w~ve forecastprogram was first accomplished at the U.S. Navy Fleet Numerical Weather Central (FNWC),areported by Hubert (1964). The method is an adaptation of the Sverdrup-Munk-Bretschneider system and was the operational wave forecast model of FNWC until De-cember 1974 when it was replaced by a spectral model, as described below. That FNWCmodel routinely produced a daily wave analysis that was achieved and today prnvidesthe largest existing hindcast data base of the significant wave variety. Specifi-cally, the hindcast wave data are available on the North Atlantic and North Pacificportions of the JNWP grid system (Fig. 22) in the form of combinedsea-swell heights (the square root of the sum of the squares of the seaand swell heights) and the average period and direction of the sea andswell. The data are available twice daily (OOCMT and 12GMT) between 1964and 1970 and 4 times daily from 1970 - 1974. To produce an enhanced wavehindcast data set, FNWC has extended the hindcasts back to 1946 on a once-a-daybasis. The data are stored on computer-compatible magnetic tape.
The FNWC significant wave hindcast data set is not homogeneous in that the pro-,, cedures for the specification of the meteorological input to the wave analysis fore-● cast program was centinually updated and refined. The most recent hindcast data are
probably the most reliable, as the input fields benefitted from a larger data base
.. of weather observations and were updated more frequently.’ The evolution of the me-thod is described more recently by Hubert and Mendenhall (1970) and Schwartz and Hu-bert (1973). Bunting (1970) has evaluated the hindcasts and forecasts of the FNWCmodel and compared the results to a spectral model ,,andto wave measurements made atArgus Island and at several North Atlantic Ocean Stations between March 1966 andMarch 1967.
Hindcast Data Produced by NOM Significant Wave Forecast Models. On October 1,1968, NOAA intreduced its first OperatiOnal autO~ted wave fOrecast mOdel. ‘emethod is a straightforward adaptation of the FNWC model described above. It con-
-43-

w.
A
0. tkitmdt.ttt-mxd
1!!!!!!!!!!!!● I !
>,, I , L-4&’, , ,
, ,, !,; I I II ,1 I ,,!. !; ! I I I ,: I!; II I 11’i I j, :, 1

-
times as the operational NOAA global wave forecast model. Forecasts are run twicedaily at the National Meteorological Center (NMC) and provide analysis and forecastson the portions of the NMC grid (JNWP) covering the North Atlantic and North PacificOceans. The technique is described in detail by Pore (1970).
The NOM model produces wind wave forecasts in terms of significant wave height,period and direction to 48 hours in 12-hour steps, as well as a wave specificationat initialization time (either 0000 or 1200 GMT). Swell information is not availa-ble as an analyzed (hindcast) quantity but as forecast out to 24, 36 and 48 hours.Since 1968, changes have been made in the way the surface wind fields that drive themodel are derived from the operational NMC hemisphere analysis and forecast modelsare described by Pore and Richardson (1969).
The NOAA wave forecast model has recently been extended to the Great Lakes,whereby significant wave information is specified every 12 hours from analysis time(again either 1200 or 0000 GMT) to +48 hours on a special grid of points extendingover all of the Great Lakes. A statistical procedure is used to provide the windson the relatively fine grid of points from the large-scale NMC analysis and fore-casts. The wind and wave specification procedures for the Great Lakes are describedin detail by Barrientos (1970).
As far as the author has been able to determine, there is no systematic effortwithin NOAA to archive the NOAA hindcast wave data generated within the context ofthe analysis (hindcast)/forecast cycle just described. However, inasmuch as mostanalysis/forecast products generated at NMC are intercepted and stored at the Na-tional Climatic Center at Asheville, North Carolina, it may be possible to retrievesome or all of the wave hindcast data generated by NOAA since the inception of themodels.
It is difficult to assess the accuracy of the NOAA wave hindcast data just de-scribed, since verification programs have heretofore been limited to the use of vis-ual wave estimates (e.g., Pore and Richardson, 1969).
Significant Wave Hindcast Data Produced in Climatological Studies. Significantwave hindcast models have been auulied in climatological studies for both extratrop-. .ical and tropical wind systems. Neu (1971), for example, used wind data for oneyear on the Canadian Atlantic Coast to calculate a wave climatology for the region.This approach is feasible for regions not affected significantly by swell, such asthe upper east coast, but may be quite unrepresentative for say the Gulf of Alaska.
The significant wave method has been applied to hurricanes on the basis of itsadaptation to moving fetches (Wilson, 1961). Patterson (1971) calibrated slch ahindcast model with wave measurements obtained near and in intense hurricanes in theGmlf of Mexico. The calibrated model has been used to develop a significant waveclimatology of hurricane-generated waves for the deep water portions of the Gulf ofMexico coast from Mississippi to Texas (Bea, 1974).
More general wave climatologies can be calculated from the time series of sig-nificant wave hindcasts produced by the FNWC and NOA4 significant wave hindcast pro-
-45-

gram. However, this has not been done, at least not in the public domain. It isprobably not worthwhile at this point to proceed with such an endeavor, as globalscale wave hindcast series are currentlY being calculated from more advanced andapparently mOre accurate spectral models, as will be described below.
Spectral Wave Hindcast Models
As early as 1953, the concepts of stochastic processes and spectra had alreadybeen incorporateed into a practical wave forecasting method. This technique, re-ferred to as the PNJ method (Pierson, Neumann and James, 1953 and 1955) was based onthe spectrum proposed by Neumann (1953) which in turn was derived with the use ofdata on wave heights and periods obtained by visual observing methods. This imagi-native derivation was in a sense verified when Pierson (1954) interpreted the ob-servable properties of waves in terms of the wave spectrum.
Among the innovative aspects of the PNJ method was the recognition of direc-tional properties nf .yaves-- fetch width as well as length were considered. The cOn-cept of moving fetch was introduced, and the “period increase””of swell was correct-ly explained in terms of spectral component group velocity dispersion effects.
One important waakness of all wave prediction schemes in existence in the early1950’s was the subjectivity of their application. Wave hindcasting and forecastingwas still an art -- only practitioners with considerable experience could produceconsistent results. With the development of numerical wsather prediction, however,it became evidsnt that large digital computers could be applied to the wave predic-tion problsm. Gelci and Chavy (1961) and Baer (1962) were among the first to use acomputer to make predictions of wave spectra.
Baer’s work repressnted an early attempt to build a cornprebensiveand complete-ly computerized wave prediction scheme. His model represented the North Atlanticocean with a grid of 519 points spaced 120 nautical miles apart. At each grid pointthe spectrum waa described by 120 numbers that represented ten frequencies and 12directions. Wind speed and direction were supplied to the grid and updated each 6hours, while the 120 numbers were systematIcally modified each two hours, to accountfor wave generation and propagation.
The ~J spectral cnmponent wave growth was coupled to the angular dispersionrelationship given by Project SWOP (Cote et al, 1960) and expressed in the form of alarge tab~e. At each tims step, growth was allowed only for components travelingwithin 90 of the wind direction, with the Neumann fully developed spectrum used tolimit growth. No other form of implicit or explicit attentuation was assumed.
Wave propagation waa approximated by the so-called jump technique -- that is,spectral components were simply translated to adjacent grid points after a suffi-cient number of time steps had clasped to account for the grid spacing. This tech-nique allowed the wave energy to retain the quaai-discontinuous characteristics im-parted by moving fetches, as occurs for sxample near meteorological frents. Baertested his model by hindcasting the severe wave conditions observed in the North At-lantic in December 1959.
-46-

The suitability of this model to further development was soon realized. By1964, a revised version had been used to hindcast the two-dimensional wave spectrumon the 519-point grid for the year 1959. This projdct, sponsored by the U.S. NavalOceanographic Office and carried out at New York University, has been summarized indetail by Bunting (1966). Briefly, the revisions included the introduction of ob-jective wind field analysis techniques (Thomasell and Welsh,’1963), the adoption ofthe Pierson-Moskowitz fully-developed spectrum as a limiting state and the additionof a dissipation mechanism based on gross Austausch turbulence to simulate theattsnuation of swell travening against wind-generated seas.
The end product of the project consisted of 30 reels of magnetic tape contain-ing 6-hourly wave apectra and wind data over a 15-month period at 519 grid points ofthe North Atlantic Ocean. The data were for the months of Decsmber 1955, November1956, Decsmber 1968, and January through Di?csmber1959.
For each of the grid”points throughout the period there are available 222pieces of six-hourly information consistfig of the following:
1) lgO numbers describing the directional wave spectrum for 15 frequencyranges and 12 directions.
2) 15 numbers summing the wave spectra for each of the frequency bands.
3) 12 numbers summing the wave spectra for each of the 12 directionranges.
4) 12 numbers giving the percentages of total energy in esch directionrange.
5) 2 numbers giving the wind apeed and direction.
6) 1 number giving the significant wave height equivalent to the spectralenergy.
The results have been used by Wachnik and Zarnick (1965) in the study of air-craft carrier motions. The centinusd availabilityy of this source dependa upon thecondition of the magnetic tape copies that are in the poeaession of the Naval Ocean-ographic Office.
The climatology described above will soon be replaced by a more extensive andaccurate file of spectra as a result of the operational status of a contemporaryspectral wave prediction at FNWC. The hindcast data presently available from thiseffort will be described after the nature of contemporary models in general is out-lined.
Modern Spectral Mcdel. The framework of contemporary spectral wave predictioncan be traced through the work of Gelci et al. (1956), Hasselmann (1960), Pierson etal. (1966) and Bamett (1968). These models are,based on the numerical integrationof the energy balance equation:
-47-

aat
E(f, @,x, t) = -Cg (f,e) . V E(f,e,t,x) - S
where E is the directional wave spectrum deftied as a function of frequency, f, di-rection, 9, position, x, and time t. C is the deep water Sroup velocity and S, thesource function, frepresents all physics processes that transfer energy to or fromthe spectrum. .Inprinciple, if S could be specified in terms of E and the windfield, the above equation could be numerically integrated, subject to appropriateeinitial and boundary conditions, to yield wave predictions with an accuracy limitedonly by errors in the wind field and in the numerical methods.
Propagation. The physical nature of wave propagation in deep water is well un-derstood as a result of the work of Barber and Ursell (1948), Groves and Melter(1961) and Snodgrass, et al. (1966). Each component in the two-dimensional spectrum ;travels along a great circle in its direction at the deep water group velocity ap-propriate to its frequency.
Baer (1962) demonstrated that propagation by a simple first order finite dif-ference analog was inadequate if the quasi-discontinuous nature of the spatial dis-tribution of wave energy is to be preserved. Such a scheme has been used by Gelci,er al. (1966) and Barnett (1968).
The jump technique, as developed by Baer (1962) partially overcame this diffi-culty but was at best only an approximation to propagation for most spectral compon-ents and it could lead to serious errors for large propagation distances. Pierson,Tick and Baer (1966) proposed a technique that combines the finite difference andjump techniques. Their propagation algorithm attempts to keep track of discontinui-ties in the energy field and employs jump techniques in such regions, while the fi-nite differences scheme is applied where the fields vary smoothly. Uzi and Isozaki(1972) I]avedeveloped a more complicated version of the jump technique whereby lat-eral spreading and longitudinal dispersion associated with discrete directionalspectral components are simulated. Ewing (1971) has proposed a model in which afourth-order differencing scheme is used to simulate propagation.
Most numerical models have used grid systems on conformal map projections be-cause of their minimal distortion, small-scale variation and conservation of angle.Grid paths on such projections are not, in general, great circles, though for dis-tances less than one q~arter ~f the ~arthIS circumference, errors are mot too large.For global scale predictions, Baer and Adamo (1966) proposed a grid ~tem based up-on the gnmmnic projection -- on which all straight lines are great circles. Amulti-pro.jection system was devised in which the earth was mapped onto 20 faces ofan icosahedron circumscribed about the earth. This “Icosshedra2~ c Projec-tio~.” is shown in Fig. 23. Within each triangular s“bprojection, ● ~ coordi-nate system defines a 1225 point grid of average spacing 95 nautical ties. A modi-fied jump technique has been used on the Northern Hemisphere portk Of this gridsystem and appears to give reasonable results.
-48-

Figure 23. The Icosahedral-Gnomonic Projection of the Earth Designed forGlobal Numerical Wave Prediction. (Baer and Adams, 1966.)
-49-

‘l’heSource Function. The dominantfrom a spectral component include direct transfers from the wind field, wave break-
processes that can transfer energy to or
ing and wave-wave non-linear interactions. The wind generation part of the sourcefunction, Sw, is usually expressed as
s = A(f, X, t) + B(f, X, t)w.
. E(f, X, t)
where A and B are also functions of the wind field. The quantity A has been givenphysical significance through the theory of Phillips (1957), which explains the ini-tial generation of gravity waves on an undisturbed sea surface through a resonantexcitation by incoherent aemoapheric turbulent pressure fluctuations beinted by the mean wind.
~ con”ec-To this author’s knowledge, the only reliable fiel measure-
ments of this pressure spectrum remain those of Priestly (1965) who obtained meas-urements over mowed grass for a variety of wind speed and stability conditions. Thelimited fetch wave growth studies of Snyder and Cox (1966), Barnett and Wilkerson(1967), Schule et al. (1971) and.Ross et al. (1971) have verified that the resonancemechanism is responsible for the early linear etage of wave growth. The wave pre-diction models of Barnett (1968), Inoue (1967) and Ewing (1971) and others all in-corporatee Priestly’s functional form of the three-dimensional pressure spectrum witha scaling factor fitted to growth rates determined in the field experiments.
The quantity B in (2) has been given dynamical significance through a series ofstudies beginning with the work of Miles (1957 and 1959). In those studies Mileswas the first to calculate the amplitude of the component of atmospheric pressure,induced by a prescribed free surface wave, in the air flow over the wave and inphase with wave slope. His analysis was quasi-laminar, atmospheric turbulence beingneglected except in the same that the wind profile over the waves was specified aslogarithmic. Phillips (1966) was successful in extending Miles’ model to includesome aspects of atmospheric turbulence and showed that these effects were importantin determining the energy transfer to spectral components possessing phase speedsabove anemometer height wind speeds.
The important result of the Miles-Phillips instability theories is that spec-tral energy increases exponentially with time or fetch until dissipative effects be-come important. For a neutrally stratified atmosphere, they show that the dimen-sionless growth rate B/f can be expressed solely as a function of dimensionlessfriction velocity, u~fc, where u* = ~ (T i. the surface shear stress and p isair density). The instability theories have been verified qualitively by directmeasurement of the wave-induced air velocity and pressure fields both in the labora-tory (Shamdin and Hsu, 1967) and in the field (Dobson, 1971), but the theoreticalgrowth rates appear to underestimate those observed by about a factor of 4.
The significance to wave prediction of non-linear wave-wave energy transfers asoriginally proposed by Phillips (1960) and developed by Hasselmann (1963) remains acontroversial subject, as does the related question of the existence of a fully-developed sea. Wave prediction models whose source function ignores non-linear en-ergy transfers invariably involve the concept of a fully-developed spectrum to limitspectral component growth at frequencies below the equilibrium range. The Pierson-Moskowitz spectrum has been widely used in this context.
The calculation of non-linear transfers involves evaluation of quadruple inte-
-50-

-..
grals over the directional spectrum. Even with the fastest computers available,such calculations are impractical in a wave prediction model. The wave-wave trans-fer rates have therefore been computed only for typical spectral shapes and appliedto a given spectrum parameterized in terms of total energy, mean frequency and meandirection. The wave prediction models of Barnett (1968) and Swing (1971) have in-cluded a wave-wave interaction component in their source function through such para.meterization.
Hindcast Data Generated Through Model Development. A very limited amount ofwave data has been generated in the process of model development for the variousspectral models described above. Ewing’s (1971) model, for example, was run only t<simulate two three-day periods in November 1966 and June 1967, for which wave meas-UreIOentS were available at Stations I and J in the North Atlantic 13c&Ln.
The limited applicability of most spectral models has made model intercompari-sons difficult except for ideal imposed wind conditions. Several hindcasts of thesevere storm in the North Atlantic in December 1959 have been compared by Hayes(1973). The comparison is significant because each hindcast was made by a numericalspectral model applied on the same sxact grid systsm (Baer, 1962) and driven withthe ssme wind fields. The differences between the hindcasts therefore reflect main-ly differences in the source function and propagation method. tii t~e hi~tOry ~fhindcast and observed significant wave height for this storm at ocean station J isshown in Fig. 24, with the hindcast and observed one-dimensional spectra at peakstorm conditions shown in Fig. 25. It is clear that the “second generation” spectralwave prediction models (Ino”e, 1967; Barnett, 196!3;Isozaki aridUji, 1973) signifi-cantly improved upon the original Baer (1962) results. The source function of Bar-nett’s model included a non-linear interaction parameterization but its hindcastsare not significantly better than those models that do not include non-linear trans-fers explicitly. Those models that include a dissipation mechanism for turbulentattenuation of spectral components propagating against locally wind generated seas(Inoue, 1967, and Isozaki and Uji, 1973) appear to simulate better the decay of seasafter peak storm conditions.
The observed spectrum at peak conditions (Fig. 25) appeare tO be narrOwer thanall hindcast spectra, and this discrepancy cannot be completely sxplained by sam-pling variability or the limited frequency resolution of the hindcast spectra. Fur-ther refinement of these hindcasts would appear to require two-dimensional measure-ments and a further reduction of the remaining differences between the grid windfields and the true wind distribution.
More recently, Feldhausen, et al. (1973) have also compared hindcasts for theEarnsetorm. Both spectral and significant wave methods were intercompared. For thebeat models, the correlation coefficient betwesn hindcast and measured significantwave height at station J averaged 0.85, but there was a systsmzitic tendency for allmethods to overspecify sea states between storm periods.
Operational Spectral Wave Prediction Models. The potential for the rapid accu--lation of a global scale wa’vehindcast data bank through the implementation of
-51-

14. . Isozoklr3Ujix Barnett0 Inoue
12- x A Baer--- Observed
10 -1’
8 -
6 -(
-x —x
4
2t/
o~0612160612180612 180612180612180
~16~17~ 18~19~20+
DECEMBER, 1959
Fig. 24 - A comparison of various spectral hindcast model predictions of thetime history of significant wave height at the position of theocean Station Vessel ‘J’ (52° 40’ N, 20°W) in the eastern NorthAtlantic, durfng the severe storm of December, 1959. (Hayes, 1973).
Fig. 25 -
400
300
‘:I-c m.
--.
-t
. ,,.1.,1a “1,
. *W”.,,. . . . . .. O.. r
..- .,,,,*
0 .04 C4 0, ,,0 .,2 ,,4 ,,s ,,,
PRCWE”G”,“,.’,
Observed and hindcast spectra at station ‘J’,(Hayes, 1973).
-52-
— —-’
spectral models in operational wave forecaat programs was realized in December 1974when the model described by Pierson, Tick and Baer (1966) became the operationalmodel of the FNWC. Two years earlier, a Mediterranean wave spectral model wasplaced into operational use at FNWC (Lazanoff, Stevenson, and Cardone, 1973). AS aresult, hindcast wave spectra are now produced routinely for the entire NorthernHemisphere and are archived at FNWC in the format to be described below.
Mediterranean Sea Wave Hindcast Data. Twice a day, the wave spectrum resolvedinto 15 frequencies and 12 directions is updated and forecast to 48 hours on a gridof points with average grid spacing of 40 nautical miles (Fig. 26) that representsthe Mediterranean. The forecasts have been verified against measured wave staff andlaser profilometer data with good results. Shallow water effects are not yet in themodel. FNWC is presently saving and archiving all grid point hindcast spectra,available 4 times per day, on magnetic tape along with the significant height field.This complete archiving system began in October 1975. Between April 1972 and Octo-ber 1975, the significant wave height field is available on microfilm and for mostof the period complete spectra are available for about 30 grid points distributedacrosa the grid, also on microfilm.
Northern Hemisphere Icosahedral Grid Hindcast Data. The Icosahedral hemispher-ic spectral wave prediction model has been operational at FNWC since December 1974.Forty-eight-hour forecasts and 12-hour hindcast updates of the spectral field aremade twice daily for the North Atlantic Ocean, the North Pacific Ocean and adjscentbasins, the Gulf of Mexico and northern half of the Indian Ocean. With regard toFig. 23, the model uses seven subprojections for the North Pacific, six for theNorth Atlantic and Gulf and one for the Indian Ocean. There are 325 grid points oneach subprojection with a spacing of 350 km at the point of tangency and 194 km atthe vertices. As in the Mediterranean model, at each grid point the spectrum is re-solved into 180 discrete variance elements representing 15 frequencies and 12 di-
rections of propagation.
Since October 1975, the wave hindcast spectra have been saved at all grid pointpoints and are available four times a day at six hour intervals (03GMT, 09GMT, 15GMT,21 GMT). Prior to October 1975, a small subset of grid points was available cover-ing portions of the Gulf of Alaska, the West Coast of the U.S. , the Gulf of Mexicoand portions of the North Atlantic.
Lazanoff and Stevenson (1975) have described the model itself as implemented atFNWC and have presented a preliminary evaluation of the hindcasts and forecasts asverified against measured wave data. They conclude that the method “produces farsuperior results than the previous FNWC operational singular wave model” for signif-icant heights.
More recently, comparisons of the hindcast data with wave spectra measured atlocations of NOAA data buoys (e.g., Appendix K) suggest that systematic errors maybe present in the FNWC model. These effects are probably caused by errors of a sys-temtiC IKXUre in the wind input to the FNWC model. Beginning in late 1975, speci-fication of the winds was changed (nit ala, personal coumnmication) to conform more
-53-

●SACLANT WAVE BUOY1&15 APRIL 1972
ASACLANT WAVE BUOY25.29 MAY 1972
_ NAvocEANo AIRPLANE TRACK,s. 1106Z-123OZ, 29 MAY 1972
. .
,.
I
( w “’=+-y.... .,, 0 ,! .< !,, ,., ,,, ,,,
Figure 26. The Grid System of the FwWC Operational Mediterranean Sea Wave Spectral Model Grid.(bzanof f, Stevenson and Cardone, 1973)

closely with the procedure described by Cardone (1969). Hindcasts made with the owind input have yet to be evaluated. Currently, a hindcast series is being generated on the Univac 1108 machine at the U.S. Naval Oceanographic Office. ‘l’hehind-casts will initially extend for a month period (mid December 1973 - mid January1974) and only for the North Atlantic portions of the grid system. The winds forthat hindcast were calculated precisely according to the procedure described by Ca]done. The hindcasts will be compare to special Tucker meter wave measurements madtat the ocean stations in the eastern North Atlantic during the SKYLAB experiment.This study should be completed within a few months and could provide insights as t(the role fo the wind input in the discrepancies observed in the FNWC operationaloutput.
Current and Planned Wave Hindcast Activities
The operation FNWC spectral model will provide an ever-expanding data base ofhindcast wave spectral data, since the total hindcast output continues to be ar-chived. This source will therefore rapidly increase and should supersede all exisling sources in quantity and probably in accuracy as well. To extend this data bastFNWC plans to hindcast a twenty-year period with the hemispheric spectral model.The effort will begin this year with a complete hindcast of the year 1975, and theewill be extended back in time year by year. The rapidity with which this effortwill proceed is not yet determinable as it depends on the exact nature of computerresources that will become available this year at FNWC.
Developmentt of Operational Spectral Wave Forecast Models Elsewhere
Several countries are engaged in the development of spectral models for evental operational application. The model described by Swing (1971) could now produceoperational spectral wave forecast and hindcasts for the eastern North Atlantic buhas not been implemented.
In Japan, the model developed by Isozaki and Uji (197L) has been programmed fa portion of the North Pacific Ocean. Recently, Isozaki and Uji (1974) performedtest hindcast with the model for a seven-day period in January 1972, using the ma-
r. rine boundary layer model of Cardone (1969) to provide the winds. The hindcasts W*i- compared to visual wave estimatee provided by ships. The comparisons were favorab
However, there is no indication that the model will be implemented operationally Ithe near future.
Australia is also engaged in the development of a spectral model for applica-tion to the southern oceans. The form this model will likely take was indicated ithe study of Dexter (1974) in which four spectral models were tested against simplidealized wind fields. The study suggest the form!an operational model will likeltake, but does not indicate when such a model will be implemented.
-55-

Development of Shallow Water Spectral Wave Hindcast Models
The emphasis in the development of new wave hindcast models appears to be onthe applicability to shallow seas. Cardone et al. (1975) have developed a modelthat can be applied to small time and space-scale meteorological phenomena each ashurricanes, with particular application to the continental shelf zone of the Gulf ofMexico. Iiindcasteof shallow water spectra associated with several hurricane com-pared quite favorably with spectra measured from specially instrumented oil rigs.The oil industry will probably use that model to calculate a climatology of hurri-cane-generated wave conditions in the Gulf of Mexico within the next year. In astudy supported by Shell Development Co. and NOM, the model ia being adapted to theeast coast of the U.S. (deep water), and may be applied to forecast hurricane gener-ated sea states quasi-operationally this summer, using NOAA’s computer in Miami.
Collins (1972) and Barnett (1969) have also developed spectral wave predictionmodels for shallow seas but the models have not been used extensively snough to pro-vide hindcast wave data.
A major re8earch effort ie currently underway in Great Britain to develop awave prediction model for application to the shallow and deep portione of the NorthSea. The model will employ a parametric approach (Hasselmann et al. 1976) for thewind eea, while ewell will be tracked separately. Bottom friction but not refrac-tion will be modelled.
The model will be used to hindcast a sample of 50 of the most eevere etornwthat occurred between 1965-1975. Wave records from oil rige and weather shipsavailable recently for the North Sea will be used to calibrate the model. Theeffort is schedulsd to be completed by the end of 1976.
-56-
VII . PREDICTION OF LOAOS
Ship Response Prediction
So far general wave characteristics and wave spectra -- theoretical, measuredand hindcast -- have been discussed. Considerateion must be given next to the use towhich the wave data are to be put -- namely, the determination of the responses ofships and ‘otherflo-stingstructures to the waves. This leads to the question of thecharacteristics and variability of the response spectra. In general, the main in-terest is in the area of the reaponme spectrum representing the root-mean-square ofthe process, whic~f ties the principal statiatical properties of the response. Bycontrast the _ of the wave spectra are of great importance, since they affectthe response spectrum area, yielding some scatter about the mean area. This state-ment will be clarified in the following paragraphs.
In general, on the basis of the superposition principle whose applicability toship motions was first demonstrated by St. Denis and Pierson (1953), the responsespectrum, SR, is obtained by multiplying a ,seaspectrum, SC, by the response ampli-tude operator @AO), Y, obtained from model tests in regular waves or by theoreti-cal calculation. Hence, for the point spectrum,
SR(W) = SC(U) Y(u)
It is apparent that the magnitude of the response spectrum ordinate at any fre-quency is directly,proportional to the sea spectral ordinate at that frequency. Forhighly tuned responses such as roll, with sharply peaked SAO’s, seemingly minorchanges in the shape of the sea spectrum can have large effects on the responsespectrum.
These changes in the sea spectral shape can be due to several causes. There iafirst the obvious variabilityy of sea conditions. Changes in ship speed or headingcan also affect the shape of the encounter spectrum, i.e., the waves which the shipactually sees and responds to, as discussed later.
It is often assumed that the ship response is a narrow-band process and there-fore that the short-term peak-to-mean responses are Rayleigh distributed, i.e.,
rr2
p(ro) = Q 2 ~- %s2rms .
when r. is peak-to-mean reeponse and ~*2 .I
SR(IJJ)du and
r: o
p(r > ro) = ~- *S2
Thus the probability of exceeding a certain response over a limited period of time,during which sea conditions are stationary, depends only on the rms response, i.e.,on the response spectrum area and not on its shape.
Nhen the variability of ocean wave spectra is considered, the problem of deter-mining the response is more complicated than when only one wave spectrum is consid-
-57-

r‘--ered,butapredictionforlongerperiodsoftime,suchasseveralhoursorthelifetimeoftheship,ispossible.Itwillbeassumedthatarepresentativerandomsampleofwavespectraisavailable,allfallingwithinarelativelysmallbandofsignificantwaveheights(hencespectralareas).Foraparticularshipspeed,head-ingandwavecomponentdirection;
fSR((A))du = f SC(U)Y(u)do
N=xSR((I,)n)AM = ~ SC(Un)y(~) Aun=1 n=1 nInthissummation,Y(%)hasspecificvaluesdependingon~ andrelativewavedi-rection.However,eachSC(Un)isarandomfunction,assumedtobenormallydistrib-uted,asillustratedinFig.27,forwhichthemeanandstandarddeviationareknownforeachvalueofUn.Hence,themeanandstandarddeviationofeachproductinthesumisalsoknown.
AssumingthatthefunctionsSG(Un)fordifferentvaluesofonareindependentoruncorrelated,thenthemeanandstandarddeviationofthermsvalues,[SR(Un)Au]%,canbedeterminedbystandardstatisticaltechniques,asshownbelow.
TheoryforApproximatingtheDistributionofaFunctionofRandomVariablesWewishtoapproximatethedistributionofafunctionofrandomvariablesof
theform
wheretheXNareNrandomvariableswithmeansp andstandarddeviations,a.n’ nIfgisrepresentedbyitsfirst-orderTaylorseriesexpansion,
N 3dx1J29ee*d$J= g(lj,v2,...,uN)+ ~ { y w1dJ2>....%)}{Xn-lln}n=1 n
Sogisnowapproximatedbyalinearcombinationoffunctions,forwhichthefollow-ingrelationsareeasilyderived.First,
%= N.j91J29***9MN)
AndiftheXn’sareindependent
a;=? {+ g(.ln=1 n 9“**slJN)}2 a2n
-58-
.

Y(atn)“1
II
II
= S$(q●Y(LJ)‘#)n) . n—
‘RL))n
(W.n)‘ti )n r
p(s@+!n)) F -U =
\asafinite
(AREA)%sum.
.. ..- -..-/ -- . .... -.——-___________ -=----- i.
Figure27 CalculationofrmsResponse
I
,

Application of the Theory
Now consider the function+
= = ~ s~(un) Y(wn) Au which defines the rms response, where~=1
the S<(U ) are N-random variables with mean and standard deviation pn and on. Themeanof~, isgiven by:
i
The standard deviaticn of ~ assuming the SC(wn) are independent, is givsn by:
.2R[
“$, +1
II
2Y(wn) Au o;
‘R
1‘4U2 ? Y2(Q AUIz U2
Rn= 1 n
i
In actual practice it was found in this study that the assumption of indepen-dence of spectral ordinates is not valid, and the correlation among them must betaken into account. This point is further discussed in a later section of thischapter on data format. Meanwhile, an alternate approach was to umke use of eightrepresentative spectra from each group and to compute the mean and standard devia-tion of rms response based on eight nns response spectra obtained using these wavespectra.
Either method can be extended to short-crested seas by considering the direc-tional components of the sea and the corresponding response amplitude operators.The final response spectrum can be obtained by integrating over wave direction.
2T
sR(&l) =f
SC(W,V) Y(w,$) dv
Q
The integral that determines the statistical properties of the response canthen be obtained,
In practice this result ie usually obtainedintegration. It applies to a specific ship
by numerical summation rather than byspeed and relative heading angle,
-60-

If it is assumed that for each ship heading the rms response, which is a result ofcontributions from all wave directions, as well as all frequencies, is normally dis-tributed, then the mean and standard deviation can be calculated in the manner justoutlined. (Of course, this assumption might not be true in the case of spectra fromtwo storms superimposed, or a sea spectrum made up of sea and swell coming from dif-ferent directions.)
Certain responses, acceleration at the forward perpendicular, for example, arestrongly dependent on frequency of encounter and thus ship heading relative to thewaves. Wave bending moment, which depends on effective wave length, is also depend-ent on heading angle. This means that for accurate predictions, reliable estimatesare required of the percentage of time spent at various headings of the ship rela-tive to the waves. This information can be obtained by combining information on theship’s course over its route with information on occurrence of various wave direc-tions from a statistical source. It has been found by experience that the incrementin relative heading must not be larger than 15°.
Hence, finally, the whole procedure described above must be carried out for eachship heading relative to the dominant wave direction. The final distribution of rmsresponse is a weighted sum (the contribution for each heading being weighted by theexpected percentage of time to be spent at that heading) of all the normal distribu-tions resulting from the calculation for each ship heading; it may not necessarilybe a normal distribution. The final result applies to one ship speed and one bandof significant wave heights.
It is recognized that any calculated wave spectra is an estimate whose confi-dence bounds depend on the length of the record and the spacing of data points. Inprinciple, therefore, it would be expected that the standard deviations of spectralordinates in a sample of wave spectra would include the effect of this sampling var-iability.
If the above calculation is made for a number of different wave height groups,the result can be nresented in the form of a Dlot of mean rms and standard deviation.of rms response vs. wave height. (See Chapte~ VIII).
One procedure, Band (1966), Hoffman and Lewis (1969), HOffman et al. (1972),for making long-term predictions of wave bending moment (or other ship responses)to integrate the Rayleigh distributions using the above assumption with regard tothe distribution of rum values (Rayleigh parameters) for each wave height group.Finally, these long-term distributions can be combined into a single distributionthe basis of the expected probability of each heading and wave height group.
It should be noted. however. that since the results of each individual wave
is
on
height group are combined to yie~d the long-term trend, a consistent approach mustbe adopted for each of these groups, i.e., number of spectra in the group used toobtain the rms response, the method of calculation or statistical combination of thedata, etc.
-61-

ml
I
DetailsofShi~ResDonsePredictionDetailswillbegiveninthissectionoftheprocedureforthelong-termpre-
dictionofwaveloads,assumingthatfamiliesofareavailable.
Itisassupedthatafamilyofwavespectra
wavespectraofdifferentseverity
hasbeendefined;foreachoftensignificantwaveheightgroups,eightspectrahavebeenchosenasrepresentative,sf,nwhereg=1....10,n=1....8.Thisfamilyisusedinmakinglong-termpredic-
tens.Theprocedureisgivenasfollows:1)Assumeaspreadingfunction,mostoftenthecosine-squaredfunction;
s~(w,$)= SC(LO)“ f(l))
I,I
wheref(l))= : COS2* for-~<~<~ andf(~)=O elsewhere——
J21T
f(~)d$= 10
where$istheanglebetweenaparticularwavecomponentandthedominantwavedi-rection.
2)Assumeprobabilities,P,ofvariousshipheadingsrelativetothedominantwaves,XpwhereY p(xi)=1,basedondetailsofship’srouteandoperation.Usuallyi=1sevenheadingsareusedinthecomputationwhich,becauseofthesymmetry,givere-sultsfor12headings.
3)Ob:~inprobabilityofoccurrenceofthe10significantwaveheightranges, p(g), 4
where~~1P(g)=1.Thisdistributiondependsonshiprouteandoperatingseasons.Thisinformationiscurrentlyobtainedfromsummariesoflargenumbersofvisualob-.servationsuchasHogbenandLumborNOAASummariesofSynopticMeteorologicalOb-servations.(SeeChapterIX).4)ObtainRAOSforresponseofinterestfrommodeltestsortheoreticalcalcula-~tions,Y(u9X4-$).. A
5)Computermsresponseforeachof80spectraforeachof7headings,X=,m 4’Y(U,)(~-l$) ‘g,nREsP(q,Sg,n)= (~)f(~)d~do
~$resultingin7x80=560responses.
. .
-62-

6) For each of the ten wave height groups, g, find mean andeach of seven headings, Xi.
llg(xi)= * f ~sp (xi, Sg,n)n= 1
O;(xi) = + ~ [ REsP2(xi, Sg,n) - !l:(xi) 1n=l
standard deviation at
7) Assume at each heading in each wave height group, the ITUSresponse, R13sP, isnormally distributed.
[m.9 - llg(xi)12
P(ms) =
Thus the probability
I 2 Og(xi)ze-J211Ug(Xi)z
of exceeding a particular value, rmso, is given by,
m
P(rms >
8) For each rma,
rmso) = J P(rms) d rum
rmso
the peak-to-mean responses, r, are Rayleigh distributed.
_—
P(r I nn.v)2r ~ 222
=x
where P(a I b) is read, “the probability of a for a given b.”The probability of r exceeding a particular value, r., is given by
r~‘1-- Zrlnsz
P(r > r. lrms)=e
Thus the total probability of exceeding r. for
p(r > r. I i,g)
a given heading in a given group,
is given by the product the probability of each rmstim~s the probabilityis,
P(r > I. I i,g)
which is the integral
of exceeding r. for that ma,
.
‘IP(r > r. \ nns) P(rms
o
value for that heading and groupsummed over rum values. That
I i,g) d ?IOS
of a Rayleigh distribution times a normal distribution.
-63-

9) The total probability of r exceeding r. is given by,
P(r > ro) = :~, ;i=1
where P (g) is the-probability of
p(g) P(xi) P(r >
occurrence of each
r. \ i,g)
wave height group and P(xi) isprobability of occurrence of each heading.
Wave Data Format
As has been explained in the previous sections, both the methods being used topredict ship loads and motion are based on the probability of occurrence of a numberof wave height groups, and the mean and standard deviation, due to variation inspectral shape, ship heading, etc. of rms ship response for each wave height group.The required wave data format differs for the two methods.
The first approach, discussed in a previous section, was based on the use of amean value and standard deviation of the wave spectral ordinate at each frequency
for each wave height group. These values are obtained from measured spectra by thefollowing procedure. First the spectra are sorted into wave height groups. Thenfor each group the values of the spectral ordinate are assumed to be normally dis-tributed at each frequency. The mean and unbiased estimation of standard deviationof spectral ordinates are then c~p”ted. It can be seen that by using this methodany number of apectra can be included in each group, each contributing to the meanand standard deviation of spectral ordinates at each frequency. The mean and stand-ard deviation of response spectral ordinates can then be conqmted.
It was previously explained that the assumption of independence of the spectralordinates was not valid. This means that the effect of the dependence must be in-cluded. Thus the correlation coefficients must be computed and their effect includ-ed in the method for predicting rms resp,JDsevariation. This is feasible, but it iscomplicated, and this approach has not yet been developed and applied.
The other method, multiplying a number of spectra from each group by the re-sponse operators, and then using the rms response values thus obtained to determinethe mean and standard deviation of rms response, was adopted here, as described inthe preceding section. The number of spectra in the highest groups was limited toeight by the number available. In the lower wave height groups, the number of spec-tra was limited to eight in order to maintain consistency of the short-term trendsand to limit computer time needed to make the response predictions. In groups wheremore than eight spectra were available, the eight were chosen “sing a Monte Carlotechnique designed to match as closely as possible four parameters, the H1 3, T1 and
c (the broadness factor, see Chapter V) 4, of the average spectrum of the wh Ie avail-able sample with the Hi/3, T1 and & of the average of eight selected spectra. Fur-thermore, the standard deviation of H1/~ of the whole available sample was matchedwfth the standard deviation of H1/s of the group of eight.
-64-

A typical example showing the characteristics of the total number of availablespectra and the selected eight is shown in Tables 5 and 6. The tables show ex-cellent agreement for Station “India.” Hence, the Monte Carlo selection procedureseems reasonable, and it was adopted instead of a purely random choice.
Such families of wave spectra have been developed at Webb Institute of NavalArchitecture from available wave records obtained at Stations “India”, Hoffman(1972), and “Kilo”, Hoffman (1975), in the North Atlantic and Station “Papa” in theNorth Pacific, Haffman (1974). The differences are not great among these families,but the one that is believed to have the best statistical basis because of themethod of selection and to be generally the most useful for ship design purposes isthe Station “India” family. Figs. 28 to 37 show the eight sp-ctra in each of theten wave height groups in this family. Also shown in Figs. 38 to 47 are the meansand standard deviations of spectral ordinates for each of the ten wave height groups.
(Text continues on Page 77)
-65-

Wave Ht.Band
=~
1 <32 3-63 6-94 9-125 12-166 16-217 21-278 27-349 34-42
10 >42
Q!2Q12345678910
Table V
Average Characteristics of Wave Spectrafrom both “Papa” and “India”
Whole Sample
No. ofRecs.
1431425587103654012
>454
Wave I-ft.Band
Width
<33-66-99-1212-1616-2121-2727-3434-42>42
PAPA
%3 ‘1ft. sec.
2.44 6.424.70 6.957.60 7.2410.64 7.6914.18 8.2418.43 8.7023.35 9.1130.82 10.1137.93 10.5343.59 10.88
.614
.629
.629
.662
.685
.701
.715
.753
.769
.775
w0.
.52
.52
.73
.63
.58
.52
.52
.47
.42
.42
No. ofRecs.
1239434340282558
~251
No. ofRecs.
8888888888
Table VI
Average Characteristicsof Wave Spectra
from “India”Samples of Eight Spectra
‘1f3ft.
2.404.907.3410.5113.9017.8223.3428.8937.0547.47
‘1sec.
7.067.488.358.348.938.788.859.9811.3411.64
‘1/3ft.
2.364.917.3610.6313.9717.9724.0830.2037.2247.69
INDIA
sec.
7.067.418.158.258.868.739.4-59,8711.2111.49
wE 0——
.571 .75
.591 .75
.628 .65
.640 .55
.674 .55
.675 .55
.704 .50
.722 .45
.760 .40
.782 .40
wco——
.568 .75
.590 .70
.626 .65
.638 .60
.677 .55
.673 .55
.708 .50
.737 .45
.764 .40
.784 .40
-66-
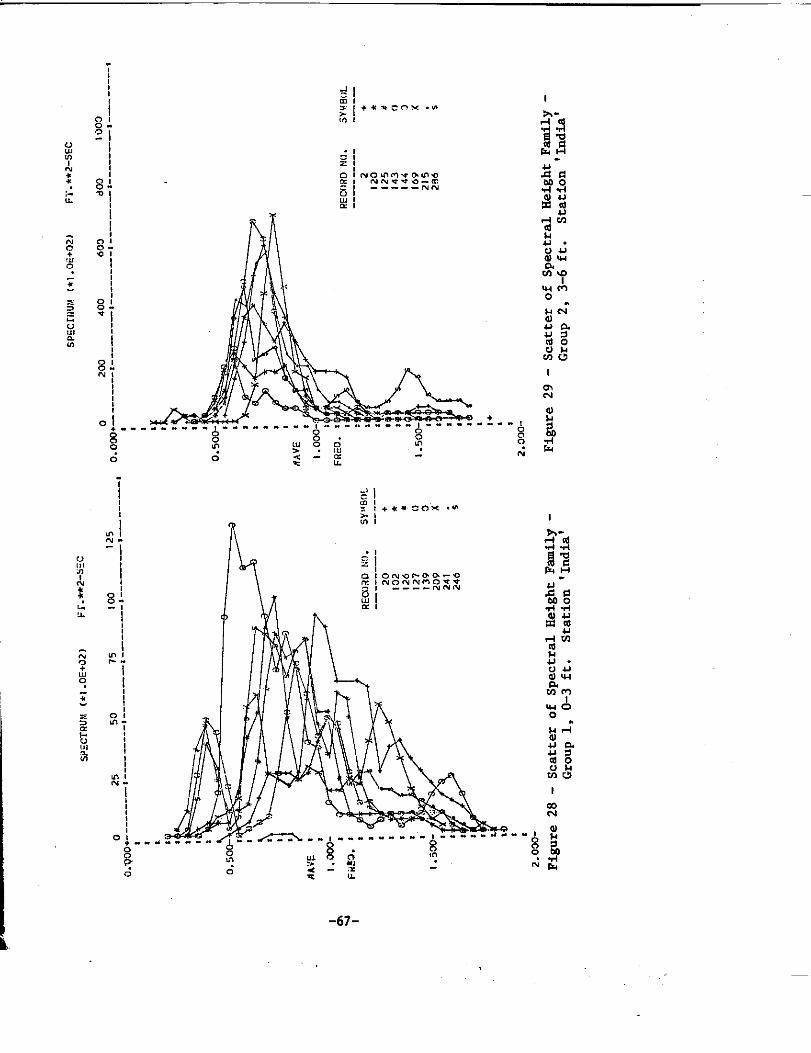
\+
J/t..”..”..
-67-
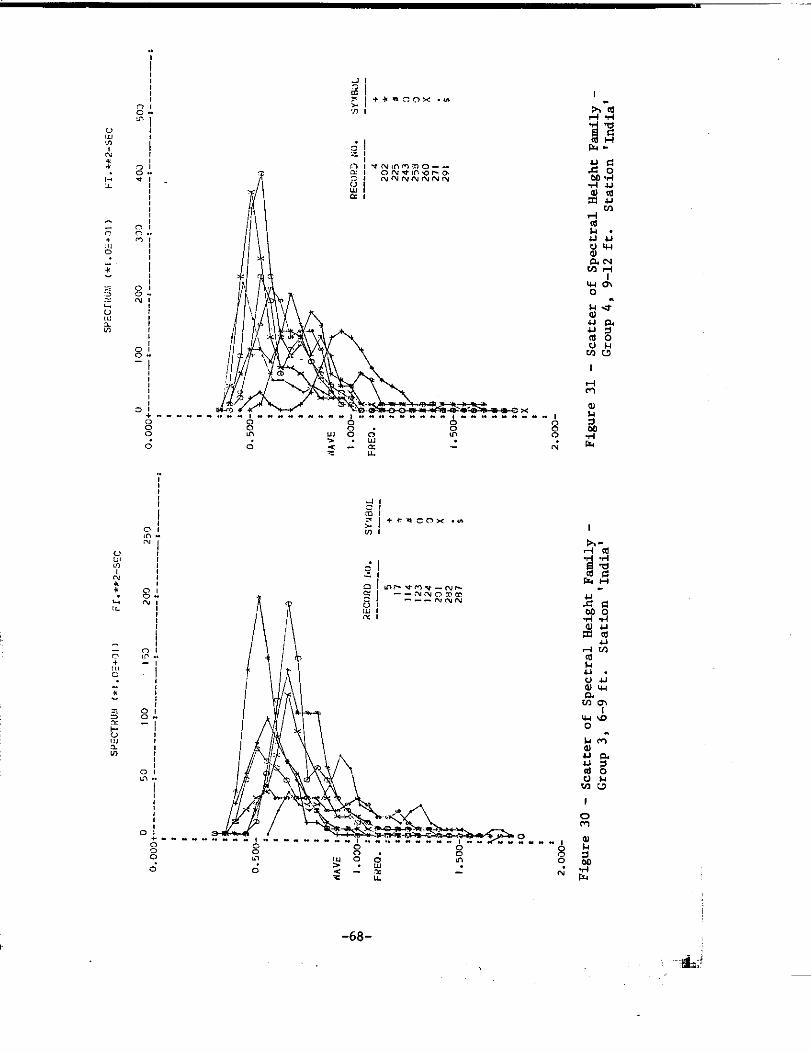
..”.

. . . . .
-69-
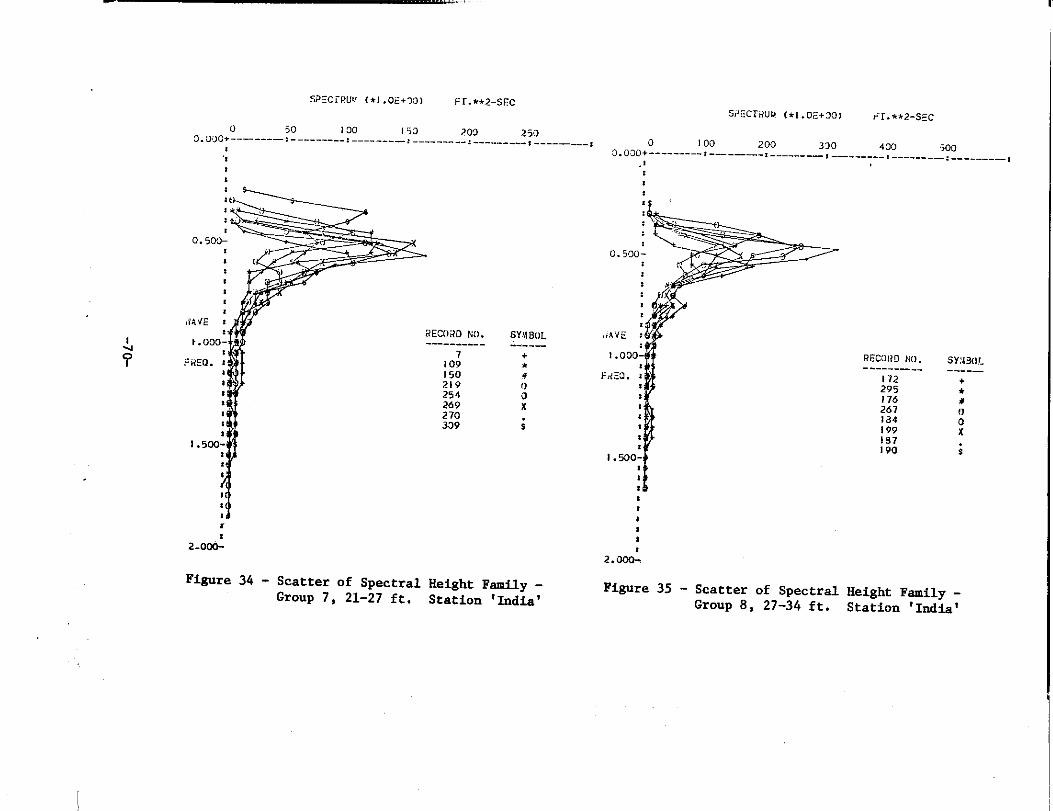
S?:crRuLl(*1.0 E+ X3) FT. **2-sFc
0 50 100 ,53 209 2503.u90+.---..-, -.._ -_-_-: . . .._ . . . . ------------------------------
Iir,
2-0c0-
Figure 34 -
.,
ZEC02D Ml._— -------
7
I 04150219254269270309
Scatter of SpectralGroup 7, 21-27 ft.
mu 8(X.—-. —
Height Family -
Station ‘India’
smxiw (, I .OZ+X) Fr. **2-sEc
0 100 200 330 400 500cl. 030+ --------- ,-.----..-, -....--— , _—------ , --_._ -_, _-.___ -_,.,
*
:**t
2.-
Figure 35 - Scatter of Spectral
Group 8, 27-34 ft,Height Family -Station ‘India’
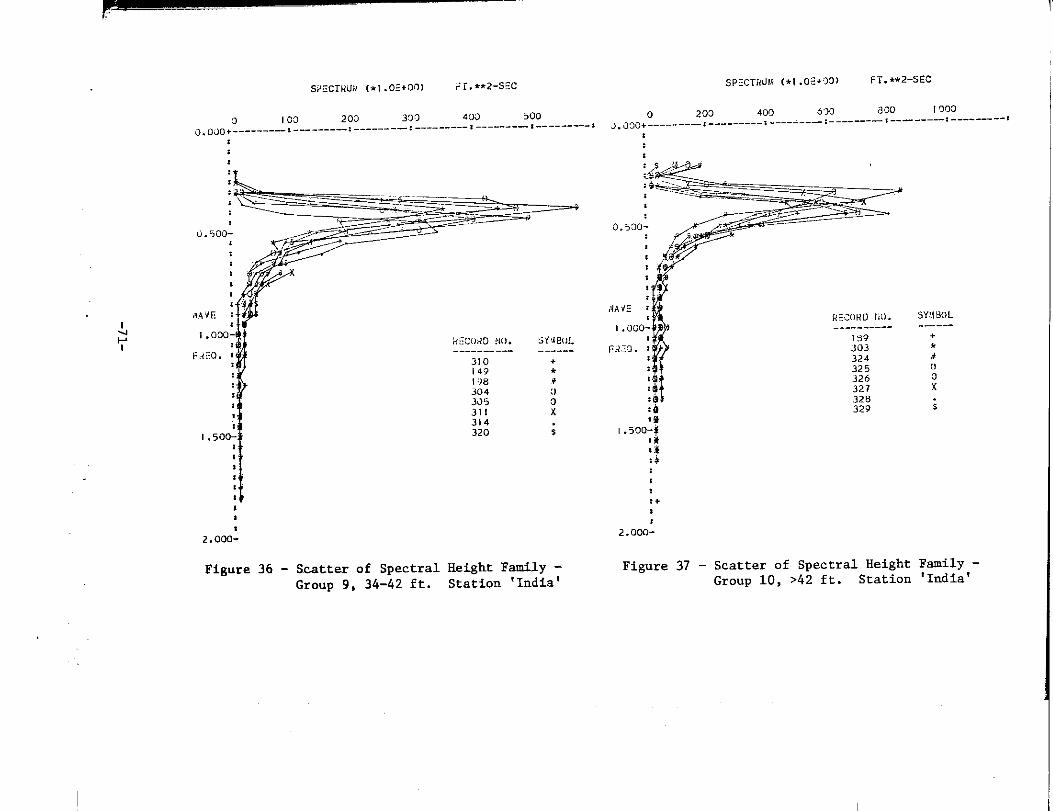
S2GCIHLJ;, (*! .Oz+ml ;r. *.2.s Ec w; CTlfdlJ (*1 .0:+30) FT. *2-sEC
0 10s 203 390 4 ml 300 0 203 409 630
o.uJo +-.---. -_,. ---. ---.: -------
aoo r ~03
_ , --------- ,--–—--—, ------—-, ~.a30+.______ —:-_ -_.. -..:--- -— .-— : --------- !--—--—— :----- —-- ,
:*

.
SPEC {RUM ( * I . oE+02 ) FT. *2-SEC
0 25 50 75 I 00 I 250.000+ -—----— , -------—, -—----—, .-----.— , _________ , -_._-. -_,
.We”
maw Iwh wulol. . . . . . . . . . . . . . . .AVMNR)@ *
Wxltw: ;
0.00200.01320.03650.11850.20210. IH340.19480.24880.36010.46470.49650.52290.479!L1.d7020..47820.42530.3s700.34080.25910.21650.20990.17710.17290.15240.12760.11530.10!360.09620.07920.05460.03580.02680.0)810. IX343
0.00530.01470. G3650. I 3(,30.20090. I 3’/50.28600.40[)10.35140.37300.34050.33200.26(310.28%70.26710.24310.25100.21830.!8970.18530.19090.15%Q. 15310.1293c1.09610.0144a.366i30.06850.07720.05670.02580.01690.01330.0092
Figure 38 - tin and 8tmdud Dwiation -- !lpoctralHeight Family @OUp 1, 0_3 ft.Station ‘Indtiq
swmrw (*I .0 E+02) FT. *2-sEc
o 20!3 400 600 8CU 10000. O’W+--------- t --- —---- L---------, -–.----— ,_________ , -—------ ,
,
8
MAVE $
I . OO(J-,,
8
*
0.000-’RECUHU IYPE
.-_—--__--AVERWE
UEAN-SID. DEV.MEAN+SLI. DEV.
SY!iBOL--——
+
:
0.01390.05020.106Ll0.17940.21260. 29v40.55431.21982.35532.92633.45903.85423.33682.4477I .6689] .23580.79290.64090.68610.60510.43460.3232:.:1:;
0:35860.42140.41590.33260.27!10.23330. IB580.12140.04200.0182
0.03670.0v680.16970.16070. ! 5930.09490.26630.72561.1563I .53062.04171.8821!.71431 .23/300.73700.60840.45480.43590.50640.4L1240.25350.10290. I 6680.18350.34820.49590.46820.32!30.25750.24940.22390.15430.02610.0402
Figure 39 Mean and Standard Deviation -- SpectralHeight Family Group 2, 3-6 ft.Station ‘Indiat

SPECTRUM (*1 .0S+01 ) Fr.-2-sEcSPECTUUM (*1. oE+o I) FT. *2-sEc
0 50 Ica 150 2W 250 0 100 200 300 4f2i3 500
0. 0,30+ .---—--, ----—-—, --.----—, ---—--—, -------— * -------—, 0. Ore+ -------- 1-------—: --—---—! -—— ——, --—----- , -—--—— s
,
**,
0.500-1<”>
FREO. ; ?{(
,
0. ooc-RECORD lYPE SYYBUL
------- —-- . . ----AVERAGE +
MEAi*S7D. DEV. *MEAN+ SfD. DEV. #
0.00000.05050.10570.21421.36184.374-15.98294.10382.90295.35673.90712.4-1522.7494I .79681 .98’/1I .65470.96520.92890.63380.65060. /3210.(4700. 7(970.47040.3459($ g:;
0:16310.15280.23850.21040.1 4/90.1!820.0487
*
0.500- “%
I . 50D
c u’
0. OuO-
0.59310.40800.23670.0889
REC1lRU TYPE--—-------
AVERAGEtik AN-S ID. UEV.KEAN+SID. UEV.
SYMBOL------
+**
0.00000.03000.10200.45814.12178.4679
1%.6011I 1 .7*36
7.12575.27385.32244.71794.53823.74243.44373.62313.40383.34302.54501 .6!)561.20900.93050.5&150.53210.46.?00.39020.44500.56750.58300.45940.45300. 34tJ00.16990.1754
Figure 40 - Mean and Standard Deviation -- Spectral Figure 41 - Mean and Standard Deviation -- SpectralHeight Family Group 3, 6-9 ft. Height Family Group 4, 9-12 ft.Station ‘India’ Station ‘India’

SPECTRUM (, I . OE+3,, FT. *.2-s Ec
0 200 400 6!)0 !3Ca 19000. 003+.—---—— t -.--..-----, --—---—, -------—, -____---, -_--___a
*,
*,
0.000-
Figure 42 -
0. oOLlo0.10480.32011.11005.9173
15.27]83u. 746841.102733.879721.954316.015013.049610.5698
7.97556.60315.52004.03513.24712.89542.88282.85322.25951.81451.7452I .9577I .8696I .3093I .05781.2244I .26771.04090.72520.38320.0686
0.02>00.!a150.2<360.96556.57i4
11.9=54!8.622313.28?9
5.33105.41.72.35393.95355.4a:53.53s02.54301.5914I .45361.1196! .0520I .05761.11.490.67220.64?30.5>?10.71210.81.30.57110.47?30.62710.77330.66??0.45.20.52570.1816
RECORD lYPE SYm!WL----------- -----
AVElfKE +MEAN-S II). DEV. *MEAwsro. DE v. s
Mean and Standard Deviation -- SpectralHeight Family Group 5, 12-16 ft.Station ‘India’
WECLWM (*I .oE+oo) FT. ●*2-SEC
0 25 50 75 100 1250, 003+ ------—-, -------—, -------—, ---—--—, -—.._ .---, ..-- __-.-,
*
i*
0.000-’RECORD TYPE SYMBOL
-- —------- ------
AvERAGE .MEAN- SII>.l J!:V. .ML AI{+:310.1>1.V. #
o. Oocu0.3941I .60059.@503
18.433126.088041.591346.435940.587239.114432.262125.944921.070516.1961]2.’2 456
9.35367.63356.14365.58055.66644.65404.20525.05414.36853.75583.52733.2682f.:;;:
!.62101.4164I .2035I .22320.4440
0.00000.76093.4193
21.128635.9.36429.197629.336335.441917.871817.484118.3564]2.469010.30d79.32677.64614.21254.29143.04852.2d443.13482.2369! .94202.52]4] .?5321.4814I .3529!.2T/ao.~:do0.7307I . !)560.91230.95171.55800.6486
Figure 43 - Mean and Standard Ilwtnt10:I -- SIMWIralHeight Family Group 6, 16-21 CL.Station ‘India’

p------.—. —..
SPECTRUM (,1. oE+w31 FT. ti2-sEc
0 50 100 150 2D0 2500. 000+--—--—— *-------— x--—---— , -————---, -—----..-, -___---_,
*
,*,
0.000-”REC(M?DTYPE SYSIBU1
----------- _____AVEUAGE +
ME,W-SID. UEV. +ME4WSTL7.DGv. *
0.14882.65508.3375
21.297534.692165.1179
106.1445101.3971
70.281556.166542.4!0729.413225. 11:7’)18.2/>)I.. 7X412.0440}0. 84229.3-4377.4D566.48047.22907.41)66.08475.94776.23’325.79784.72233.995a3.06411.8823I . 2’/50I.221O1.!3670.9452
0.39375.5199
17.698337.409832.594733.877032. 93-/643.197527.9345;:.:C/g
8:20066.64614.74452.44262.8J38L2.37123.00003.80[23.50793.079>3.47662.62472.63bs2.79842. t 703).9a152.18051.7945!.36811.270C0.86951.05300.9028
Figure 44 - Mean and Standard Deviation -- SnectralHeight Family Group 7, 21-27 ft.”Station ‘India’
SPECTRUM (*I .OE+OO) FT. *2-SEC
0 lm 2W 300 400 5000.000t----—---, ----—-—, ——---. -,-_____, _-_-_-, ___-__,
*
*
O.pl-**
,*
:
,
WAVE 1
1.00+’
FREo. ‘**8
*
1.500-’
:*
*
:
0.24993.36187.6591
37.8569111.1989179.2877157.1213116.8767Y2. 799354. I 33345.517539.426327.495720.517016.772913.672711.877010.497012.032611.98058.63828.1771
10.03299.59]28. 765]7.39165.86544.3!7873.60513.62272.48590.79060.53350.0390
0.66111.76285.602)
31.989657.797883.264561.139039.096519.76715.99017.7476
15.872011.27584.87525.07263.25394.55133.97535.44906.102 I4.24074.62467.64886.10054.83414.05L7Li3.46382.45841.5938I .82931.07150.81800.92020.1032
O.00*’
RECUllU lYPE SY!{B(lL---------- ------
AVEIL$GE +HEAti-sTD. DEv. .MEN+5~u. DEv. t
Figure 45 - Mean and Standard Deviation -- SpectralHeight Family Group 8, 27-34 ft.Station ‘India’
. _.. —..

#prmr ........ .....=...r.r.
,,.
SPECNNIM(*1.0E+30)FT.**2-SEC
o 100 200 330 400 5000.OF@------—-z---—--—8--—---—X---------8-------.-:-—----—s
1:1a;8:8
0.500-:188:8s
WAVE:I.OOO-:FREQ.:8aa
1.80546.171921.3473182.2296
223.7169i<5.06!3893.534968.525756.512441.544733.424226.255523.199719.112713.975314.376713.654410.67548.931110.72451::
1●500-‘aa18118110.OOO-: RECORDTYPESY’!N)L-----------------
AVEltA@ +MEAN-SII).DEV.*MEAN+S’1l).DEV.#
10:50387.91446.64986.00055.13634.75464.75824.19043.55232.92432.19570.7528
2.79974.468813.9120127.2340139.180786.581673.464539.515022.416215.612221.007610.30687.63029.78747.’/1754.77454.64925.02443.77793.37282.69573.95933.01611.46802.32232.59962.45172.69652.693-I2.0480I.98/352.27422.23711.2364
Figure46-MeanandStandardDeviation--SpectralHeightFamilyGroup9,34-42ft.Station‘India’
SPECII?UM(*i.OE+OO)FT.**2-SEC
o 2000.Ow+ 400 630 800 I000.------—:-----——-:_-—---_:-—----—$--------*-------:81:1t#r8
0.500-:Ia:ts8
NAVE:l.OOO-;FREQ.:s
1a188
I.500-21ait888810.000-* RECORDlYPESY!iB!)L---------------
AVERA(3E+MEAN-STL).DEV.*MEAN+SII).DEV.#
93.775426.5702Y4.4169387.6674587.9735513.1639295.1291175.2326116.803481.124456.329844.750044.145839.480534.151735.027733.507628.990225.140721.451219.824620.163318.823016.203014.404413.377812.563811.55159.54906.71784.80643.4070i.3548).3467
70.3020.7189.14228.5380.42I75.5566.354b.185625.2817.G3147.1647.02410.526.-127.7136.32812.8411.2913.8310.949.2949.4478.6387.0426.5216.4036.4836.8225.2372.4832.7722.1370.8693.563
Figure47-MeanandStandardDeviation--SpectraHeightFamilyGroup10,>42ft.Station‘India’
!i!km-z-- .’. “~-. --- .
I

SPEC”llNIM(*1.OE+OO)FT***2-SEC
o 100 200 330 4000●000+ 500------—-:---—-__*.-—--—:---------:---------:-—-----::8:88 1.89546.17198 21.34731$
0.500-: 223-7169a id5.06&388 93.5349a 68.5257: 56.5124I 41.54471 33.4242WAVE: 26.255523.1997I.OOO-s 19.112713.9753FRE(2.: 14.376713.65441 10.6754t
18a$
1.500-‘a1181I:11
0.OOO-:RECORDTYPESY’ff30L-----------------AVE}/A(uE+MEAN-S11).DEV.*MEAN+S’rD.DEV. #
8.9S1110.7.24510.50387.97446.64986.00055.13634.75464.75824.19043.55232.92432.19570.7523
2.799-14.468813.9120127.2340139.180786.581673.464539.515022.416215.612221.007610.30687.63029.78747.-/1754.77454.64925.02443.77793.37282.69573.95933.01611.46802.32232.59962.45172.69652.693-12.0480I.98852.27422.23711.2364
SPECIRUM(*1.OE+!)O)FT.*~2-sEc
o 2000.O(XJ+ 400 (j~o 800 1000-------—:---- *--—---_:-—----—#-—------:-—-----$818
4
8a#:8
0.500-;t:aa8:
WAVE:1.000-8FREQ.::s
sz::
1,500-1:ais:a8880.000-:
RECORDlYPESY!4B!)L--------------—AVERA(3E+MEAN-STD.DEV.*MEAN+SID.DEV.#
93.“775426.570294.4169387.6674587.9735513.1639295.1291175.2326116.803481.124456.329844.750044.145839.48(-)534.151735•027733.507628.990225.140721.451219.824620.1633t8.823016.203014.404413.377812.563811.55159.54906.71784.80643.4070i.35481.3467
70.3i)7620.710489.1442228.537500.4266I75.559466.35504.5.185625.286617.C3147.16407.024910.52176.723o7.71326.328912.843511.2967]3.8!34210.94449.29469.44748.63857.04276.52136.40326.48316.82205*23772.48302.77232.13710.86923.5630
Figure46-MeanandStandardDeviation--SpectralFigure47-MeanandStandardDeviation--SpectralHeightFamilyGroup9,34-42ft. HeightFamilyGroup10,>42ft.Station‘India’ Station‘India’

VIII.EFFECTOFVARIATIONINWAVEDATAFORMATONLOADPREDICTIONSComparativeCalculations
Fromthepointofviewofthenavalarchitect,theonlyvariationsinwavedatawhichareofconcernarethosewhichaffecthispredictionsofshipmotionsandloads.Itfollowsthatthosevariationsinwavedatawhichhavethegreatesteffectontheaccuracyofhispredictionsareofgreatestconcern.Thefollowingdiscussionwillindicatetheeffectofanumberofvariationsinwavedataformatonloadpredictions,usingasexamplesver-ticalbendingmomentforthe496-footgeneralcargocarrierWolverineState,the880-footSL-7high-speedcontainership,the1082-foottankerUniverseIreland,andthedesignfora1300-foot600,000-tonVLCC(basedontheoreticallyderivedRAOS).
Aspreviouslynoted,thedeterminationoftheadequacyofspecificwavedataforshipresponsecalculationsisafunctionnotonlyofthewavepara-metersbutalsoofthewavespectralshapecharacteristics.Hence,theavailabilityofwavedata,suchastheheightandperiodvaluesandtheirfrequencyofoccurrenceforcertainlocationsasafunctionoftheseasonordirectionofpropagation,isnotadequateforperformingthepredictionofshipresponsesandloadsinirregularseas.Adefinitionoftheseasurfaceintheformofspectramustbeavailable,alongwiththebasictransferfunc-tiongivenastheresponsetounitwaveheightasafunctionofwavefrequency.Ideally,aspreviouslydiscussed,measuredspectraforthespecificareaofinterestarepreferred.However,thelimitedavailabilityofsuchwavedatahasledtothesubstitutionofmathematicalformulationsfortheactualspectra.Theusualinputparametersrequiredtogenerateatheoreticalspectrumincludewaveheightandperiod,thoughotheradditionalparameterssuchasfetch,orthespectralpeakfrequency,havebeenshowntodefineamorerealisticspectralshape.(SeeChapterV).
Fig.48illustratessevenspectra,allhavingroughlythesameperiodandheightparameters~plottedinanon-dimensionalform.Alsoshownarethemeanlineandtheequivalenttwo-parameteridealspectrumcorrespondingtothemeanheightandperiodofthesevenrecords.Whenplottednon-dimensionallyinthisway,thetheoreticalspectrumisrepresentedbyasinglelineforallchoicesofH1/3andTl~thuseliminatingvariationsinthespectraresultingfromsmalldifferencesinH~/3andT1.Hence,thedifferencebe-tweeneachofthesevenspectralshapesandthesinglemeantheoreticalspectrumrepresentsactualvariationsinshape.
Thelargescatterofmeasuredspectraaboutthemeanovertheentirefrequencyrangeisofgreatsignificanceandwouldnaturallyleadtoscatterintheresponsespectraaswellasinthermsvalues.Eventhoughthemeanspectrumisnotappreciablydifferentfromthemeantheoreticalline,thisfactbearsnosignificanceastothesuitabilityofthetheoreticalspectrumtorepresentseaconditionsofthisseverity.
Oneapproachcommonlyusedtoobtainshortandlong-termresponsepre-dictionswhenmeasuredspectraarenotavailableistoobtainsomeindication
-77-. , —

,
I.010 i / / /!, 1.
f- —-. ....
- -.—..
\\\
\
-—.. ——-
—..--—-II
Fig.48-ComparisonofSpectralShapeVariation.
——-. —..— .——-—.
RecordNo. Hi/3 ‘1182 13.458.561224 14.018.84228 11.478.72265 13.588.98268 14.578.86273 14.908.73277 14.789.00Mean 13.878.82
~—” ‘———I T_ml
cs.624.700.628.658.662.638.687.660
TheoreticalSpectrum
\.\ r..-———.-———.—9 I1.0 1
Y--i---— ____
II
.--.. .-. -.--— .1 It~

ofscatterbymeansofthedistributionofthevariousperiodgroupswithintheboundsofeachwaveheightgroupsusingamathematicalformulationtodescribethevariousspectra,eachdefinedbyitsowncharacteristicperiod.Whilethismethodyieldssomemeasureofscatter,itfailstotakeintoaccountthevariationinspectralshapesdiscussedabove.Thiswouldnaturallyresultinalowerpredictedlong-termextremevalue,duetothesmallerstandarddeviationinRMSresponse.Furtherdoubtiscastonthismethodbytheextremeuncertaintyintheobservedperiodinformation.Ofthethreecommonlyobservedparameters,height,periodanddirection,periodisbyfarthemosttincertain.
Finally,wemayconsidertheapproachdescribedintheprecedingchapter--theuseofarandomsampleofwavespectraclassifiedbyareaorsignificantheight.Inthischaptertheuseofvariousformulationswillbecomparedtotheresultsobtainedbythismethod.Tosummarize,thefol-lowingformatsarecompared:
FormulationsITTCone-parameterspectrum,inwhichwaveheightis
theonlyparameter,ISSCtwo-parameterspectrum,inwhichbothsignificant
heightandaverageperiodareincluded.Families“H-Family”originalWebbrandomsample,Lewis(1967)Station“India”newWebbsamplesfromtheStation“Kilo”NorthAtlantic,Hoffman(1972,1975)Station“Papa”NewWebbsamplefromN.Pacific,Hoffmann(1974)
Theeffectonshort-termbendingmomentpredictionsofusinganumberofdatasourcesisshowninFigs.49through51.SeealsoHoffman(1975a)andHoffman(1975b).Thesefiguresshowthemeanandstandarddeviationofrmsbendingmo~entasafunctionofsignificantwaveheight.Thevariousspectralfamilieswerecreatedbyclassifyingmeasuredspectrafromthevarioussourcesbysignificantwaveheight(H143)andthenchoosinganumber(usuallyeight)torepresenteachwaveheightange,asoutlinedinthepre-viouschapter.Itmaybeseenfromthefigurestherearesignificantdif-ferencesinthecaseofthesmallWolverineState,lessdifferencesintheSL-7,andrelativelysmalldifferencesinthecaseofthelargetanker,UniverseIreland.
Inordertoevaluatetheeffectofthesedifferentsourcesofwavedataonlong-termpredictionsFigs.52through54comparethelong-termpredictionsbasedonthemeansandstandardsdeviationsdiscussedabove.Thewaveheightdistributions
.
usedinthesecalculationsaregiveninTable7.Itcanbe~een
-79-
- ---, ,... - . -.
—

_____—.
-. —-
!
I:...— ——
-- .–- -——-b——.——.-..--—————————— -L
1
!!

—
ll--mT3G—
25—
20—----
15—
“–--––r––‘–-———-—...——,}1ODELTESTRACS
.-—
-.—-
.——
.—
4\\‘<.,1s .... 3\$,
‘\$.__._]“\—.t11,
J,.-..-..-!.
.
.. —-.
——_
-----(.\k—
.
-------
/.
tj,:
-+‘\
—-
Lo-...Y’._ _SS?:31%GKXU,TIST-TOYSt~j---r.—.—.___s?~~
— “lndh””—- ‘.?apa’”—a- Issc.&.-~.lTTC— KFartily
I10 ~-MOcQ
.. ..-. -_
\iT>+,—--—\#—_
Fig.53-Long-TermVerticalBend-Fig.52-Long-TernVerticalBendingMomentforLightLoadWOLVERINESTATEforFiveSpectralFamilies.
ingMomentforFull-LoadSL-7ContainershipforFiveSpectralFamilies.
r - EEII$!)–---
*O--—
la-------
.. -——-
.--—-
k\—----\
.— “’PaOa’”!~..++-a-6-~- 1-Issc
lTTCH-Family
10.——-
-—.— .- LOG[~(X) Xi))
) 3 6 b-- —. —. —.Fig.54-Long-termVerticalBending
MomentforFull-Load-UNIVERSEIRELANDforFiveSpectralFamilie6.
-81-

thattherearesignificantdifferencesintheresults,becauseofthevariationsinbothmeanrmsresponseandstandarddeviation.Sincethecalculationbasedonactualwavespectralfamiliesisbelievedtobemoreaccuratethanuseofthetheoreticalformulations,itisconcludedthatinmostcasestheISSCformulaoverestimatesthetrendandthereforeisnotsatisfactoryforgeneraluse.Ontheotherhand,theITTCone-parameterformulationunder-estimatesthetrendandshouldbediscarded.
Asforthewavefamilyresults,the“India”familyisbelievedtobethemostcompleteandreliable,especiallyforawiderangeofshiptypesandsizes.Furthermore,resultsareinallcasesincloseagreementwithsimplerearlyH-familyresults.The“Papa”resultsdiffer,perhapsbecauseofaninadequatesampleofthehighestwaveheightgroups,aswellbecauseofpos-sibleoceanographicaldifference.
TableVIIWaveHeightDistributionsUsedin
Section1ofChapterVIIIISSC,ITTC,‘Papa’and‘India’Families
Range(ft)o-33-66-99-1212-1616-2121-2727-3434-42>42
8.7523.7530.7020.356.904.952.691.700.250005
H-FamilyRange(ft) g5-15 84.5415-25 13.3025-35 2.0135-45 0.14>45 0.01
Cum.91.2567.5036.8016.459.554.602.000.300.05
Cum.15.462.160.150.01
ProbabilityofOccurrenceofVariousWaveHeightsThepreviouspredictionsoflong-termresponsesutilizedanassumed
probabilityofoccurrenceofwaveheight,usuallyexpressedingroupscovering
-82-
.
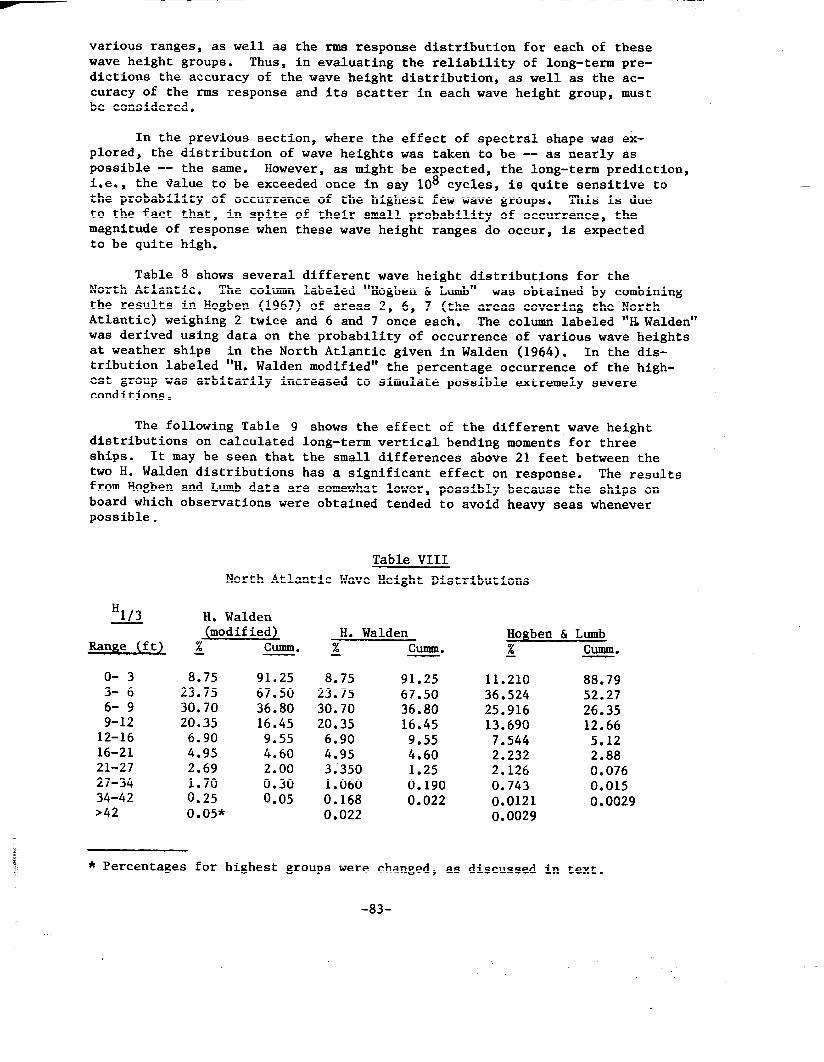
variousranges,aswellasthermsresponsedistributionforeachofthesewaveheightgroups.Thus,inevaluatingthereliabilityoflong-termpre-dictionstheaccuracyofthewaveheightdistribution,aswellastheac-curacyofthermsresponseanditsscatterineachwaveheightgroup,mustbeconsidered.
Intheprevioussection,wheretheeffectofspectralshapewasex-plored,thedistributionofwaveheightswastakentobe--asnearlyaspossible--thesame.However,asmightbeexpected,thelong-termprediction,i.e.,theValuetobeexceededonceinsay108cycles,isquitesensitivetotheprobabilityofoccurrenceofthehighestfewwavegroups.Thisisduetothefactthat,inspiteoftheirsmallprobabilityofoccurrence,themagnitudeofresponsewhenthesewaveheightrangesdooccur,isexpectedtobequitehigh.
Table8showsseveraldifferentwaveheightdistributionsfortheNorthAtlantic.Thecolumnlabeled“Hogben&Lumb”wasobtainedbycombiningtheresultsinHogben(1967)ofareas2,6,7(theareascoveringtheNorthAtlantic)weighing2twiceand6and7onceeach.Thecolumnlabeled“RWalden”wasderivedusingdataontheprobabilityofOccurrenceofvariouswaveheightsatweathershipsintheNorthAtlanticgiveninWalden(1964).Inthedis-tributionlabeled“H.Waldenmodified”thepercentageoccurrenceofthehigh-estgroupwasarbitrarilyincreasedtosimulatepossibleextremelysevereconditions.
ThefollowingTable9 showstheeffectofthedifferentwaveheightdistributionsoncalculatedlong-termverticalbendingmomentsforthreeships. Itmaybeseenthatthesmalldifferencesabove21feetbetweenthetwoH.Waldendistributionshasasignificanteffectonresponse.TheresultsfromHogbenandLumbdataaresomewhatlower~possiblybecausetheshipsonboardwhichobservationswereobtainedtendedtoavoidheavyseaswheneverpossible.
TableVIIINorthAtlanticWaveHeightDistributions
‘1/3Range(ft)o-33-66-99-1212-1616-2121-2727-3434-42>4z
H.Walden(modified)& cum.8.7523.7530.7020.356.904.952.691.700.250.05*
91.2567.5036.8016.459.554.602.000.300.05
H.Walden& Cumm.8.7523.7530.7020.356.904.953.3501.0600.1680.022
91.2567.5036.8016.459.554.601.250.1900.022
Hogben&Lumb~ Cumm.
11.21036.52425.91613.6907.5442.2322.126007430.01210.0029
88.7952.2726.3512.665.122.880.0760.0150.0029
*Percentagesforhighestgroupswerechanged,asdiscussedintext.
-83-
.
.

TableIX
Long-TermVerticalBendingMomentPredictionsforVariousNorthAtlanticWaveHeightDistributions*
Valuesexpectedtobeexceededonce
H.Walden(modified)
WolverineState496ft.,16-knot,lightload 1.882X10⁵
SL-7880.5ft.,15-knot,fullload 1.542X10⁵
UniverseIreland1082.7ft.,14-knot,fullload 4.043x10⁶
Anothersetifwaveheightdistributions,
in10”cycles,ft-tons
HogbenH.WaldenandLumb
1.846X1051.770x105
1.475x1051.3034x106
3.872X10⁶ 3.4210X10⁶
developedbyHoffmanfromHogbenandLumb(1967)dataforeightdifferentworldshippingroutes,issummarizedinTable10incumulativeform.ItmaybeseenthatNo.L“MostSevereNorthAtlantic,”isthesameas“H.Waldenmodified”inTable8.Calculatedlong-termbendingmomentsfora600,000-dwtVLCCdesignaregiveninTable11foralloftheaboveroutes.Itmaybeseenthatawidevariationinwaveheightdistributionsproducesconsiderablevariationinlong-termresponse.
Thusitcanbeseenthatforaccuratelong-termpredictionsreliablevaluesforprobabilityof80ccurrenceofthevariouswaveheightgroupsarenecessary.Ifthe10valueisrequired,thehighestthreewavegroupsseemtobeofgreatestimportance.
-84-

i-
ll“
RouteNo.1MeanHlt3(ft)
24810152025303550
Vertical
100.0091.2567.5036.8016.459*554.602.0000300.05
TableXWaveHeightDistributions-WorldRoutes
FrequencyofExceedanceofAverageSignificantWaveHeightH,,Q
2
100.OO86.3768.1735.4117.514.882.701.070.350002
3
100.0088.7971.1436.0117.184.552.560.970.310.01
4
100.0077.6235.1213.072.831.410.800.430.170002
5
100.0082.2656.6219.036.461.0700420.120.030.01
6
100.0082.7257.6019.966.821.130e480.150.040.01
1.MostsevereNorthAtlantic2.NorthAtlantic(NorthernEurope)3.NorthAtlantic(SouthernEurope)4.Europe--PersianGulfviaSo~thAfrica5.NorthPacific6.Europe--PersianGulfviaSuezCanal7.PersianGulf--USA8.Europe--USAWestCoast
TableXI
7
100.0074.5629.169.323.030.510.180.090.040.01
Long-termVerticalBendingMomentPredictionsforDifferentWorld-WideWaveHeightDistributions
600,000dwtVLCC,FU1lLoad8Valueexpectedtobeexceededoncein10cycles,
Speed30.06ft/sec.,17.8knotsRoute1 2 3 4 5
BendingMoment7.38067.05966.74696.70127.0074x10-6
-85-—
,.‘!s,.
\
66.7473
8
100.OO79.6454.3820.508.812.141.10O*4O0.130.O1
ft.-tons
76.7460
86.75f
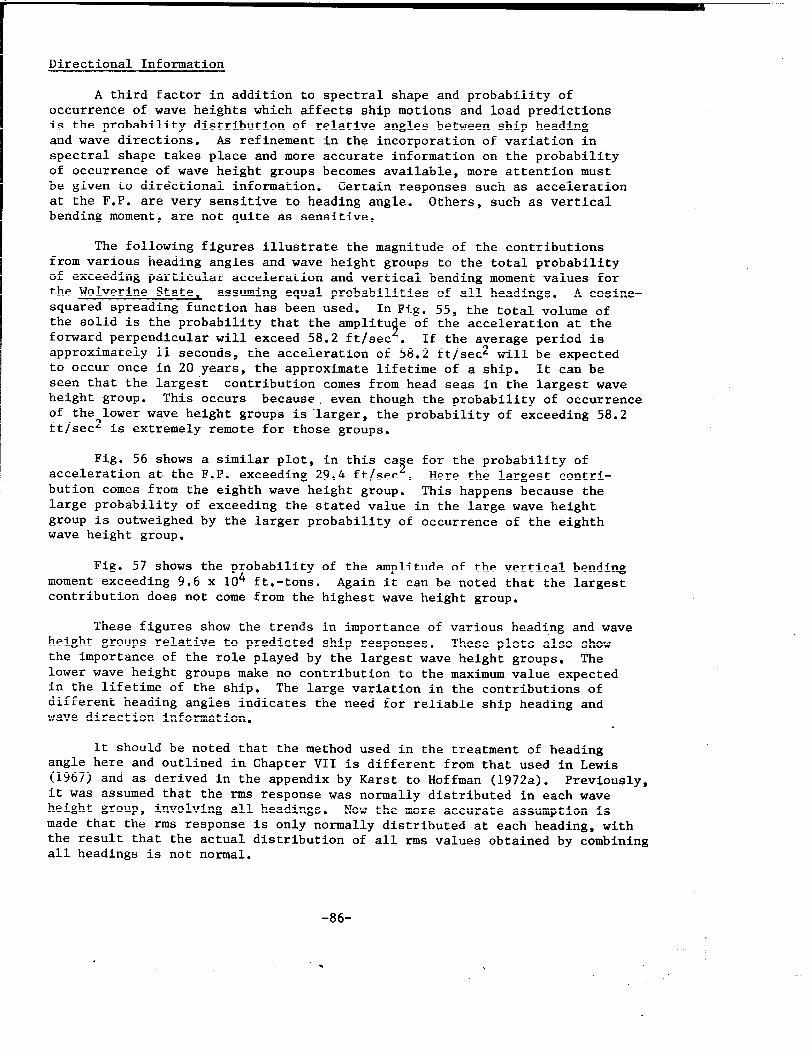
DirectionalInformationAthirdfactorinadditiontospectralshapeandprobabilityof
occurrenceofwaveheightswhichaffectsshipmotionsandloadpredictionsistheprobabilitydistributionofrelativeanglesbetweenshipheadingandwavedirections.Asrefinementintheincorporationofvariationinspectralshapetakesplaceandmoreaccurateinformationontheprobabilityofoccurrenceofwaveheightgroupsbecomesavailable,moreattentionmustbegiventodirectionalinformation.CertainresponsessuchasaccelerationattheF.P.areverysensitivetoheadingangle.Others,suchasverticalbendingmoment,arenotquiteassensitive.
ThefollowingfiguresillustratethemagnitudeofthecontributionsfromvariousheadinganglesandwaveheightgroupstothetotalprobabilityofexceedingparticularaccelerationandverticalbendingmomentvaluesfortheWolverineState,assumingequalprobabilitiesofallheadings.Acosine-squaredspreadingfunctionhasbeenused.InFi.g.55,thetotalvolumeofthesolidistheprobabilitythattheamplitueoftheaccelerationattheiforwardperpendicularwillexceed58.2ft/sec. Iftheaverageperiodisapproximately11seconds,theaccelerationof58.2ft/sec2willbeexpectedtooccuroncein20years,theapproximatelifetimeofaship.Itcanbeseenthatthelargestcontributioncomesfromheadseasinthelargestwaveheightgroup.Thisoccursbecause,eventhoughtheprobabilityofoccurrenceofthelowerwaveheightgroupsis‘larger,theprobabilityofexceeding58.2ft/sec2isextremelyremoteforthosegroups.
Fig.56showsasimilarplot,inthiscaefortheprobabilityof9accelerationattheF.P.exceeding29.4ft/sec. Herethelargestcontri-butioncomesfromtheeighthwaveheightgroup.Thishappensbecausethelargeprobabilityofexceedingthestatedvalueinthelargewaveheightgroupisoutweighedbythelargerprobabilityofoccurrenceoftheeighthwaveheightgroup.
Fig.57showstheprobabilityoftheamplitudeoftheverticalbendingmomentexceeding9.6x104ft.-tons.Againitcanbenotedthatthelargestcontributiondoesnotcomefromthehighestwaveheightgroup.
Thesefiguresshowthetrendsinimportanceofvariousheadingandwaveheightgroupsrelativetopredictedshipresponses.Theseplotsalsoshowtheimportanceoftheroleplayedbythelargestwaveheightgroups.Thelowerwaveheightgroupsmakenocontributiontothemaximumvalueexpectedinthelifetimeoftheship.Thelargevariationinthecontributionsofdifferentheadinganglesindicatestheneedforreliableshipheadingandwavedirectioninformation. .
ItshouldbenotedthatthemethodusedinthetreatmentofheadinganglehereandoutlinedinChapterVIIisdifferentfromthatusedinLewis(1967)andasderivedintheappendixbyKarsttoHoffman(1972a).Previously,itwasassumedthatthermsresponsewasnormallydistributedineachwaveheightgroup,involvingallheadings.Nowthemoreaccurateassumptionismadethatthermsresponseisonlynormallydistributedateachheading,withtheresultthattheactualdistributionofallrmsvaluesobtainedbycombiningallheadingsisnotnormal.
-86-
●

PROBABILITYOFACCELERATIONEXCEEDING
58.2FT/SEC2
10-
0.5x 10-80.4x 10-8
0.3x 10⁻⁸
0.2x 10⁻⁸
0.1x 10⁻⁸
9876
54 TOTALPROBABILITYOFACCELERATIONEXCEEDING3//2 58.2FT/SEC2=1.49~ 1o-8
10° / / ./090 180°FOLLOWING BEAM HEADSEAS SEAS SEAS
Figure55ContributionsfromtheVariousWaveHeightGroupsandRelativeHeadingAnglestotheTotalProbabilityoftheAccelerationattheForwardPerpendicularoftheWolverineStateexceeding58.2ft./sec2.
I
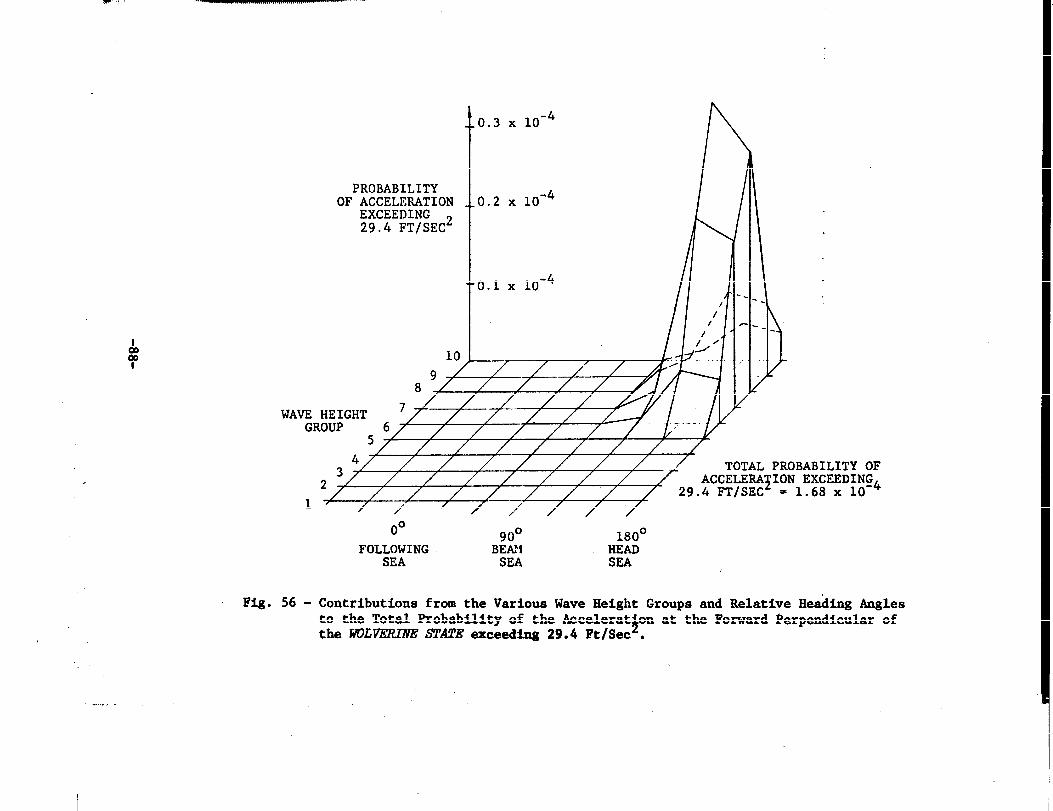
,.. ,,. . .,..,, .....
PROBABILITYOFACCELERATIONEXCEEDING29.4FT/SEC2
10
0.3x10⁻⁴
0.2x10⁻⁴
0.1x 10⁻⁴
/ / / /
II III\)---.---,..1
Fig.56-
WAVEHEIGHT7/GROUP6
5,’ /4/ ,/’Q ~/ TOTALPROBABILITYOF
/2“/ ACCELERA~IONEXCEEDIN~4, 29.4FT/SEC=1.68X10/ / / / /’/0° 90° 180°FOLLOWINGBEAM HEADSEA SEA SEA ,
ContributionsfromtheVariousWaveHeightGroupsandRelativeHeadingAnglestotheTotalProbabilityoftheAcceleratonattheForwardPerpendicularof$theWOLVZ!!SM2’11exceeding29.4Ft/Sec.
“..----

.
PROBABILITYOFBENDINGMOMENTEXCEEDING9.4x104FT-TONS
TOTALPROBABILITYOFBENDINGMOMENTEXCEEDING9.4X104FT-TONS=1.9x10’
WAVEHEIGHTGROUP
1
10
.
0.3x10⁻⁴t
0.2x10⁻⁴
0.1x10⁻⁴ I!-1-.}-10H/-,’/5 ...../4’‘;~’
//-.—
/ / J-’.’/ -
76
72 ‘“-”-’+-77-----’7’-”-7’ /“”-,690 ‘o180FOLLOWING BE&-i HEz4D
SEAS SEAS SEAS
----- _
.-.—.
\
Fig.57-ContributionsfromtheVariousWaveHeightGroupsandRelativeHeadingAnglestothe4TotalProbabilityoftheVerticalBendingMomentoftheJ40LVZ7R1A7ESTATEExceeding9.6x10Ft-Tons.
I

IX.WAVEDATAFORUSEINDESIGNTheIdealDataBase
Itisconcludedfromthediscussionintheprecedingchaptersthattheidealwavedatabasewouldbeaninfinitelylargesampleofdirectionalseaspectra,coveringallseasonsandalloceanareastraversedbyships.Sincesuchadatabaseisnotavailablenownorisitlikelytobeinasatisfactoryformintheforeseeablefuture,thequestionofhowtoanalyzeandclassifysuchamassofinformationforpracticalusehasnotyetbeenaddressed.Nodoubttheproblemcanbesolvedbystudyingstatisticallythevariabilityofwaveenergybydirectionaswellasbyfrequency~(Seeitem8inChapterII).
Thenearestfeasibleapproachtotheaboveidealdatabaseappearstobetheuseofwaveforecastingandhindcastingtechniques,asdescribedearlierinthisreport(ChapterVI).Thedistinctionbetweenforecastingandhindcastingissimplythattheformerinvolvespredictionsofwavesfromwindforecastswhilethelatterincludesdatafromactuallyobservedwinds.Whentheroutineoperationofsuchasystemhasbeenadequatelycheckedandverified,thenadatabaseforoneormoreyearscanbeconstructedforanynumberofpointsintheNorthAtlanticandNorthPacific.AlthoughthesystemofFNWC(basedinMonterey,California)appearsverypromisingforthispurpose,thecreationandverificationofsuchacomprehensiveclimatologyisstillsomedistanceinthefuture.Seriousthoughtsshould,however,begiventotheformatofthisclimatologicaldataandItsapplicationtodesignsoastofacilitateitsuseassoonasitbecomesavailable.
PresentDataMeanwhile,weareleftwithalargeamountofobservationalwavestatis-
ticsandalimitedquatityofpointspectracalculatedfromwavemeasurementsatspecificoceanlocations.Acommonlyusedmethodofapplyingthisinformationtowaveloadproblemsistoconstructwavespectrafromobservedwavedatabymeansofidealizedspectrumformulationsinwhichthevariablesarebasedontheobservedcharacteristics,suchaswaveheightandcharacteristicperiod.Thismethod,asshownhere(inChapterVIII)andinotherreferencedwork,isnotfelttobeentirelysatisfactorysinceitdoesnotgivesufficientweighttotheeffectsofspectrumvariabilityandseemstooverestimatethepredictedresponsesevenwheretheinputparameters,i.e.,thewaveheightandperiod,arebasedonactualmeasurement.
Theappmachrecommendedhere(asdescribedinChapterVIII)istomakeuseoffamiliesofspectraclassifiedbysignificantheightinconjunctionwithobserveddataonthedistributionofsignificantheights(i.e.,makingnouseofobsenedperiods).Thespectralshapevariationistakenaccountofbyeitheroftwomethods:
a)Useatleasteightspectraforeachwaveheightcategory.b)Usethemeanspectrumandstandarddeviationofordinates
foreachwaveheightcategory.
-90-

Astandardcosine-squaredspreadingfunctionwouldbeappliedtotakeaccountapproximatelyofshort-crestedness,andunlessinformationtothecontraryisavailableequalprobabilityofallheadingswouldbeassumed.
SpeedcanbeaccountedforbyselectingRAOSforthemaximumreasonablespeedtosuiteachwaveheightcategory.Nospecificallowanceneedbemadeforthepossibleeffectofmorethanonestorm--orseaandswell- com-bined,otherthanthe‘.aclusionofsuchconditionsinthestatisticalsampleofwavespectraused.
Theeffectofvariationinshipcargoloadingsonwavebendingmomentcaninmanycasesbeignored.Butwherelargevariationsindraftarepossible--asbetweenfullloadandballastconditionsofmammothtankers--completelyseparatecalculationsshouldbemadeforthesetwoconditionsofloading.SeeLewis,et.al.(1973).
AsindicatedinChapterIII,therecommendedsourcesofobservationaldatafordeterminingthewaveheightdistributionareasfollows:
HogbenandLumb(1967)fortheNorthandCentralAtlantic,IndianOcean,andSouthPacific.YsmanouchiandOgawa(1970)fortheNorthPacific.U.S.Navy,SummariesofSynopticMeteorologicalObservationsforregionswhichtheycover(seeAppendixB).
TherecommendedwavespectralfamiliesarethosederivedbyHoffman(1975)fromStation?$ndiatrecords,asgiveninChapterVIIIinthetwoforms:
a)Eight’representativespectraforeachgroup.b)Ameanspectrumandstandarddeviationsforeachgroup.
TheFutureThepreviouschaptershaveindicatedthecontinuingneedformore
datainorder,forexample,tostratifyspectrafurther,toimprovestatisticsofwaveheightoccurrenceandtoevaluatehindcastsandforecasts.Anumberofprojectsthatwillhelpfulfilltheseneeds,somestillintheplanningstageandsomealreadyoperationalonanexperimentalbasis,arediscussedbelow.
Satellites.TheGEOS-3satellitenowinoperationhasonboardaradaraltimeter.Thisinstrumentisbeingused,experimentallyatpresent,tomeasuresignificantwaveheights.Reliablemeasurementshavebeenmadeofsig-nificantwaveheightsoffrom2to10metersbyanalyzingthechangingshapeoftheradarreturnpulse.Theaccuracyofthemethodinmeasuringstormseasgeneratedbyhighwinds,wherethewavesarelong,isstillbeinginvestigated.
WhentheGEOS-3systembecomesfullyoperationalandstartscollectingdataroutinely,thepotentialvolumeofinformationisalmostoverwhelming.Datawillbeavailablefromallportionsoftheoceans,eventhosefarfromlandandtraveledonlyinfrequentlybyships.Theinformationwillbeavail-ablebothnightandday.Bytheverynatureofthisacquisitionandtransmis-sionthesedatawillbeindirectlycomputer-compatibleformandtheirmanagementshouldbestraightforward.
-91-

SEASAT-Aisscheduledforlaunchin1978.ThissatellitewillincludearadaraltimetersimilartothatonGEOS-3thatwillbeabletoprovidedataonsignificantwaveheight.Ithadbeenhopedthatthesyntheticapertureradartobeincludedonthissatellitewouldprovideasystemforimagingwaves,thusallowingtheestimationofwavespectra.Thereissomequestionnowastowhetheritwillbepossibletoobtainwaveimages,andhencespectralestimates,fromspacecraft.Thetaskdoesnotappeartobehopelessand-investigationsinthisareaarecontinuing.
AsystemtoprovideaccuratewindspeedmeasurementsistobeincludedonSEASAT-A.Thesewindspeedmeasurements,whichwillcoveralloceans,willbeusedasinputsfortheFNWCweatherforecastingandhindcastingmodel.SincethecurrentlimitingfactorintheFNWCwavepredictionsistheaccuracyofthewindfields,themoreaccuratewinddata--combinedwiththemoreac-curateadjustmentoftheempiricalfactorsinthemodelbasedonthesignificantwaveheightmeasurements--shouldgreatlyimprovetheaccuracyoftheFNWCpredictions.
DatafromPlatformsTheoilcompanies,inconnectionwiththeirinterestinexploringthe
possibilitiesofoilproductionofftheU.S.EastandWestCoastsandBritishIsles,willbecollectinglargeamountsofenvironmentaldataincludinginfor-mationonwaves.Unfortunately,ashasbeenthecasewithlargeamountsofdatacollectedb-ytheoilcompaniesintheNorthSea,GulfofMexicoandnearAlaska,mostofthisinformationwillbeconsideredproprietaryandwillnotbeimmediatelyavailable.IfthisinformationweremadeavailabletoFNWC,whosepredictionstheoilcompaniesuseroutinely,andtointerestedscientists,theaccuracyoftheirpredictionswouldundoubtedlyincrease.Furthermore,someoftheareascoveredarenearshippinglanesandwouldbeofconsiderablevalue,especiallybecauseoftheeffectofshoalingwaterandwavesteepness.
DataBuoysAsnotedinChapterIVtheNOAADataBuoyOffice(NDBO)hasdeployed
anumberof40-footdiscusbuoysforthecollectionofenvironmentaldata.Theinformationcollectedincludeswindspeedandtheverticalcomponentofbuoyaccelerationfromwhichspectraarecomputed.Figs.58and59showthecurrentandplannedlocationofthesebuoys.
NDBOhasovertheyearsdeployedseveraldifferentmeasurementsystemsforrecordingthewaves.Theseincludedaccelerometerdatasubjectedtodoubleintegration,anauto-covarianceanalysisand.awavespectrumanalysis.Plansforthefutureincludeawavedirectionalanalysis(tiummer/fall1976).Whilenotprovidingthewidescalecoverageofthesatellitesystems,theydoprovideyearroundinformationforspecificareas.TheirspectracanbeusedforcheckingandverifyingtheoutputoftheFNWChindcastmodelandotherlarge-scaledatacollectionsystems.Furthermore,ifadditionalfundingweremadeavailablebuoyscouldbedeployedinlocationswheread-ditionaldataareparticularlyneeded--asoffthecoastofSouthAfrica.(SeeAppendixL).

1
.
32
30
28
26
24
22.
20
18
96 94 92 90 88 86 84 82 801
78■
I tI 1. I 1
HurricaneEloise
fs~or-mTrack 32
GA., ATLANTIC-n- 01,’ANI 1 I 1 t i .—.—.—
/ 795kt/9G8mb~.,~D-109/23-00●
/18●85l(t/980mb&\. $’ EB-04(.&J_—75kf/!X?6mb12\ I
n ORo65kt/993mb
“L.- t-.—.—.u. I WV-4-A.1’ 30
r
\
I
9’6 9’49’2 8’J 80
Fig.58-LocationofNDBOBuoysinthe-IfofMexicofroml’DataReport:BuoyobservationsduringHurricaneELOISE[Sept.19tooct*11,1975]’1,EnvironmentalSciencesDiv.NDBONov.1975.
. . . \ —— .———--- .—..—--
I

o0mlI o
—.
.

ACKNOWLEDGMENTS
TheauthorswishtoacknowledgethehelpprovidedbytheNationalOceanographicandAtmosphericAdministration(NOAA)DataBuoyOffice(NDBO)inBaySt.Louis,MississippiandbyFleetNumericalWeatherCeniral(FNWC)inMonterey>california~inparticularMr.S.LazanoffofNAVOCEANO.
ThediscussionsandsupportgivenbyvariousmembersoftheresearchstaffatWebbInstituteofNavalArchitectureismuchappreciated,inparticularMr.T.E.Zielinskiwhoassistedwithcomputerprogramsandcalculations.
TheassistanceofProfessorW.J.Pierson,Jr.,andDr.VincentJ.CardoneoftheCUNYInstituteofMarineandAtmosphericSciencesisacknowledgedfortheirassistanceinprovidingbackgroundideasandinformation,aswellaspreparingmaterialforthereport:
Dr.Cardone:ChapterVIProfessorPierson:AppendicesDandJand
Cdr.C.S.Thiswork
partofChapter-IV.Niederman,USCG,oftheNOAADataBuoyOfficefurnishedAppendixL.wascarriedoutunderthesupervisionofEdwardV.Lewis,Director
ofResearch,WebbInstituteofNavalArchitecture.Hisvaluableopinioninallphasesoftheworkandhiseditingofthetextisgratefullyacknowledged.
Finally,theauthorsareindebtedtotheShipResearchCommitteeadvisorygroup,inparticulartotheChairman,Mr.Burkhart,fortheirconstructivecomments.
-95-
. I.- —

REFERENCESBaer,L.,1962:“AnExperimentinNumericalForecastingofDeepWaterOceanWaves,”ReportNo.LMSC-801296,LockheedCaliforniaCo.BaerL.andL.C.Adams,1966:“TheIcosahedralGnomonicProjectionandGridoftheWorldOceanforWaveStudies,”Report.No.LR20157,LockheedCaliforniaCo..Band,E.G.U.,1966:“AnalysisofShipDatatoPredictLong-TermTrendsofHullBendingMoments,”WebbReporttoA.B.S.,November1966.Barber,N.F.,andUrsell,1948:“TheGenerationandPropagationofOceanWavesandSwell,”Philos.Trans.R.Sot.A,Vol.240,p.527.Barnett,T.P.,1968:“OntheGeneration,DissipationandPredictionof IOceanWindWaves,”Jo.Geophys.Res.,Vol.73,pp.513-529. IBarnett,T.P.,1969:“WindWavesinShallowWater,”WestinghouseOceanResearchLaboratory,SanDiego,California.Barnett,T.P.andJ.C.Wilkerson,1967:“OntheGenerationofWindWavesasInferredfromAirborneMeasurementsofFetch-LimitedSpectra,”JournalofMarineResearch,Vol.25,pp.292-328.Barricutos,C.S.$1970:“AnObjectiveMethodforForecastingWindsOverLakeErieandLakeOntario,”ESSATechnicalMemorandumWBTMTDL34,U.S.DepartmentofCommerce,Washington,D.C.,p.20.Bea,R.G.,1974:“GulfofMexicoHurricaneWaveHeights,”OTCPaperNo.2110$OffshoreTechnologyConference,Houston,Texas.Bennet,C.M.,1968:“ADirectionalAnalysisofSeaWavesfromBottompressureMeasurements,“TransactionsMarineTech.Society.Bretschneider,C.L.,1952:“RevisedWaveForecastingRelationships,”Pro-ceedingsof2ndConferenceonCoastalEngineering,pp.1-5..Bretschneider,C.L.,1952:“RevisioninWaveForecasting,DeepandShallowWater,”Proceedingof6thConferenceonCoastalEngineerin~,pp.30-67.Bretschneider,C.L.,1963:“SignificantWaveHindcastsforStationJNorthAtlanticStonp,”TechnicalReport,NationalEngineeringScienceCo.,No.SN-77-1.Briscoe,M.G.,andGoudriaan,E.,1972:“ResearchUseoftheWaveridesBuoyinDeepWater,”UnderwaterJournal,Aug.,1972,pp.142-148.Brown,D.W.,Stringer,J.A.,andKelly,C.E.,1966:“OceanWaveMeasurementsUsingaWavePole,”Report66-1,PacificNavalLab.DefenceResearchBoard,Canada,August,1966.
-96-iI1!/, —
Bunting,D.C.,1966:“WaveHindcastProjectNorthAtlanticOcean,”TR-183,U.S.NavalOceanographicOffice,Washington,DC.Bunting,D.C.,1970:“EvaluatingForecastsofOcean-WaveSpectra,”Jo.Geophys.Res.,Vol.75,pp.4131-4143.Canham,H.J.S.,Cartwright,D.E.,Goodrich,G.J.,andHogben,N.,1962:“SeakeepingTrialsinOWSWeatherReporter,”RoyalInstituteofNavalArchitects.Cardone,V.J.,1-969:“SpecificationoftheWindDistributionintheMarineBoundaryLayerforWaveForecasting,”TR-69-1,GeophysicalScienceLaboratory,NewYorkUniversity.Cardone,V.J.,W.J.PiersonandE.G.Wand,1975:“HindcastingtheDirectionalSpectrumofHurricaneGeneratedWaves,”PaperNo.OTC2332,OffshoreTechnologyConference,Houston,Texas.Cartwright,D.E.,1961:“TheUseofDirectionalSpectrainStudyingtheOutputofaWaveRecorderonaMovingShip,”ConferenceonOceanWaveSpectra,Easton,MD.,NationalAcademyofsciences>Washington,DC.
Cartwright,D.E.andLonguet-Higgins,M.S.,1956:“TheStatisticalDistributionoftheMaximumofaRandomFunction,”Proc.RoyalSot.ofLondonSeriesA,Vol.237.
Caul,R.D.andBrown,N.L.,1967:“AComparisonofWaveMeasurementsformaFree-FloatingWaveMeterandtheMonsterBuoy,”Transactions2ndInter-nationalBuoyTechnicalSymposium/Expo.Chang,M.S.,1968:“MassTransportinSeepWaterLongCrestedRandomGravityWaves,”Jo.Geophys.Res.,Vol.24,pp.1515-1536.Collins,J.I.,1972:“PredictionofShallowWaterSpectra,”Jo.Geophys.Res.,Vol.77,pp.2693-2707.Cote,L.J.,J.O.Davis,R.J.McGough,E.Mehr,W.J.Pierson,F.J.Ropek,G.StephensonandR.C.Vetter,1960:“TheDirectionalSpectrumofaWindGeneratedSeaasDeterminedFromDataObtainedbytheStereoWaveObservationProject,”Meteor.Pap.Vol.2,p.88,NewYorkUniversityPress(NewYork).Crutcher,H.L.,1975:“ANoteonthePossibleMisuseoftheKolmogorov-SmirnovTest,”JournalofAppliedMeteorology,Vol.14,No.8,pp.1600-1603,December1975.Dexter,P.IL.,1974:“TestsofSomeProgrammedNumericalWaveForecastModels,”Jo.ofPhy.Oceanog.,Vol.4,No.4.Dobson,F.W.,1971:“MeasurementsofAtmosphericPressureonWindGeneratedSeaWaves,”Jo.FluidMech.,vol.48,pp.91-127.
Draper,L.,1966:“TheAnalysisandPresentationofWaveData—APleaforUniformity,”Proceedingsof10thConferenceofCoastalEngineering,Tokyo,Sept.,1966.
-97-
\

Draper, L., 1971: “Waves at North Carr Light Vessel, off Fife Ness,” NJOInt. Report A.50, Aug., 1971.
Draper, L., and Humphrey, J.D., 1973: “Aa Investigation into Large-Wave-HeightResponse of two Wave Recorders,” National Institute of Oceanography,Wormley, Godalming, Surrey, NIO Internal Report A-63.
Draper, L., and Fortnum, B.C.H., 1974: “Wave Racording Instruments for CivilEngineering Use,” Inetitute of Oceanographic Science, Wormley, July, 1974.
Draper, L., and Squire, E.M., 1967: “Waves at OWS India (59° N, 19° W)”, Trans.Roy. Inst. Nav. Arch., Vol. 109, pp. 85-93.
Draper, L. and Whitaker, M.A.B., 1965: ,,Waves at Ocean Weather Ship StatiOn
‘Juliet1,“ Drutschen Hyd. Zeitschrift Band 8.
Swing, J.A., 1969: “Some Measurements of the Directional Wave Spectrum,”Journal of Marine Research, vol. 27, No. 2, Nay 1969.
Ewing, J.A., 1971: WA N“merical WaVe prediction for the NOrth Atlantic
Ocean,” Deutsche Hydrogr. Zeit.,“Vol. 24, pp. 241-261.
Swing, J.A., 1974: “Some Reeults from the JONSWAP of Interest to Engineere,”International Symposium on the Dynamics of Marine Vehicles and Structures inWaves, London, April 1974.
Ewing, J.A., 1975: I,The“se of the JONSWAP SpeCtrum Given values Of ‘signi-
ficantWave Height and Period,” Contribution to the 1976 ISSC Committee I Report.
Ewing, J.A., and Hogben, N., 1966: “Soma Wave and Wind Data From Trawlere,”Marine Observer, No. 36, pp. 71-S0.
Ewing, J.A., and Hogben, N., 1971: ,twavespectra From wo Britieh Research
Trawlers,” National Physical Laboratory, Ship Division, Ship Report 150,National Institute of Oceanography, Wormley, Godalming, Surrey, England.
Feldhausen, P.H., Chakrabarti, S.K., and Wilson, B.W., 1974: “Comparison oft I for the NOrth Atlantic StO~ of DecetierVWave Hindcasts of Weather Station J
1959,” Deutsche Hydrog. Zeit., Vol. 26, No. 10.
Ferdinand, V., De Lembre, R., and Aertessen, G., 1975: “Spectree de Vaguesde 1‘Atlantique Nerd (Sea Spectra from the North Atlantic)”, AssociationTechnique Maritime et Aeronautique, Seasion 1975,
Gelci, R., Cazale, H., and Vassal, J., 1956: “Utilization des DiagranuueadePropagation a la Provision Energetique de la Houle,” Bull. Info?m, ComiteCentral d’Etude, Cotee, Vol. 9, pp. 416-425.
Gelci, R.H. and Chavy, P., 1961: “Technical Aspects of Numarical Forecastingof Swell,” Conference on Ocean Wave Spectra, Easton, Maryland.
-9s-

Gospodnetic, D., and Miles, M., 1974: I!someAspects of the Average Shape Of
Wave Spectra at Station ‘India’ (50° N, 19W)”, International Symposium on
the Dynamics of Marine Vehicles and Structures in Waves, London, April, 1974.
Groves, G.W., and J. Melter, 1961: “On the Propagation of Ocean Waves on aSphere,” Gaofis. Int. Mexico, Vol. 1, p. 77.
Hafer, R.A., 1970: “WaVe Measurements from the Drilling Rig SRDCO 135 F offthe Coast of British Columbia,” Report 70-3, Defense Research Board, Canada,July, 1970.
Rasselmann, K., 1960: llGrmdgleichungen der SeegangesvOraussage,” Schiffstechnik,
vol. 7, pp. 191-195.
Rasselmann, K., 1963: ,Ionthe NOn-linear Energy Transfer in a GravitY Wave
Spectrum F3: Evaluation of the Energy Flux and Swell-Sea Interaction for aNeumann Spectrum,” Jo. Fluid Mech., Vol. 15, p. 385
Hasselmann, K., D.B. Ross, P. Mullen and W. Sell, 1976: “A ParametricalWave Prediction Model,” To appear in Jo. of Physical Oceanoq.
Hayes, J., 1973: **A-vim of Ocean Wave Forecasting Techniques,” MastertsTheeis, New York University.
Hoffman, D., 1972: “Further Analyais of Ocean Wave Spectra at Station ‘India’,”Webb report eubmitted to SNAME, March 1972.
Hoffman, D., 1974: ,thalyei~ ~f Me~ured and calculated Datas” Proceedingsof International Symposium on the Dynamics of Marine Vehicles and Structuresin Waves, University College, London.
Hoffman, D., 1974a: “Analysis of Wave Spectra at Station ‘Papal,“ Webb reportsubmitted to Sea Use Foundation, December 1974.
Hoffman, D., 1975: “Analysis of Wave Spectra at Station ‘Kilo’,” Webb reportsubmitted to NSRDC under GRR program, October 1975.
Rc.ffman,D., 1975a: “Wave Data Application for Ship Response Predictions,”Final Webb Raport under GRR Program.
Hoffman, D., and Lewis, E.V., 1969: “Analysis and Interpretation of Full-Scale Data on Midship Bending Stresses of Dry Cargo Shipa,“ Report SSC-196.
Hoffman, D., and Marks, W., 1973: “Application of Wave Inputs to Seakeeping,”Seakeeping 1953-1973 T & R Symposium S-3, SNAME.
Hoffman, D. , Heiung,C., and Zielinski, T., 1975: “Wave Load Distributionson Large Shipai“ Paper presented at SNAME STAR Symposium, Washington, DC,Auguet 1975.
-99-

Hoffman, D. Williamson, J., and Lewis, E.V., 1972: “Correlation of Model andFull-Scale Results in Predicting Wave Bending Nnment Trends,” Report SSC-233.
Hoffman, D., and Zielinski, T., 1974: “Load Analysis of Atnmfc-Powered Vessels,“Hoffman Writ ime Consultants report prepared for G.G. Sharp under contractto Babcock h Wilcox, September 1974.
Hoffman, D., and Zielinski, T., 1975: “Effects of Spectral Shape on ShipResponse Predictions,” Webb report for ABS, September 1975.
Hogben il., 1970: “Measured and Visual Wave Data From Trawlers,“ MarineObserver, April 1970.
Hogben, N., 1974: “Ocean Wave Statistics -- ‘Five Mfnutea Slowt After SixYears,” National Physical Lab., Report Ship-180, England.
Hogben, N., and Lumb, F.L., 1964: “The Presentation of Wave Data fromVoluntary Observing Ships,” National Physical Lab, England, Shfp DivisionReport No. 49, 1964. (Appendix by Cartwright).
Hogben, N., and Lumb, F.L., 1967: “Ocean Wave Statistics,” Her Najeety’aStationary Office, London.
Hubert, W.E. , 1964: “Operational Forecasts of Sea and Swell,” First U.S.Navy Symposium on Military Oceanography, 17-19 June, 1964, Pp. 113-124.
Hubert, W.E. and B.R. Meudenhall, 1970: ,,The FNWC Singular Sea/Swell Model,”
FNWC Technical Note 59.
Inoue, T., 1967: “On the Growth of the Spectrum of a Wind Generated SeaAccording to a Modified Miles-Phillips Machanism and its Application to WaveForecasting,” TR-67-5, Geophysical Sciences Laboratory Report, New YorkUniversity, New York,
Inoue, T., 1967a: “Ocean Wave Spectra Estimated from Three Hour PressureRecords Obtained by FLIP,” New York University, Geophysical Science Lab. ,Rpt. No. 67-1, Feb. 1967.
Isozaki, I., and T. Uji, 1973: “Numerical Prediction of Ocean Wind Wavas,”Meteorological Research Institute, Tokyo.
Isozaki, 1,, and ‘1.Uji, 1974: UNwerical ~del Of Marine surface Winds
and its Application to the Prediction of Ocean Wind Waves,” Papers inMeteorology and Geophysics, Vol. 25, pp. 197-231.
Issc, 1970: 4th ISSC, Committee 1 (EnvironmentalCondftions) Report, Tokyo,
Larson, L.H. and Fenton, D., 1974: ,,Openocean Wava studies,” University ofWashington Data Report 1-73, February 1974.
Lazanoff, M. , 1964: ,,Wavepower ,qPecc=afrom Argus Island, September 19629”
Unpublished manuscript, MB No. o-46-64, Marine Sciance Department, U.S.Naval Oceanographic Office, Dec. 1964.
-1oo-

Lazanoff, S.M., N. Stevenson and V.J. Cardone, 1973: “A Mediterranean Sea UaveSpectral Model,” Technical Note 73-1, Fleet Numerical Weather Central,California.
Lazanoff, S., and N. Stevenson, 1975: ItAn~valuatio” Of a Hemispheric
Operational Wave Spectral Model,” Technical Note 75-3, Fleet NumericalCentral, Monterey, California.
Lewis, E.V., 1967: “Predicting Long-Term Distribution of Wave-InducedBending Moments on Ship Hulls,” SNAMJfSpring Meeting Proceedings.
Monterey,
Weather
Lewis, E.V., van Hooff, R., Hoffman, D. , Zubaly, R.B., and Maclean, W.M. ,1973: “Load Criteria for Ship Structural Design,” Report SSC-240.
Lockheed 1971: !!WaveSpectra E~ttiated from 355 North pacific Wave RecOrds
Collected at Station ‘Papa’ During 1969-71,“ Lockheed Shipbuilding and Co-nstructionCo. Report.
Lockheed 1973: “Wave Spectra Estimated from 305 North Pacific Wave RecordeCOllected at Station !Papa’ During 1972-73,“ Lockheed Shipbuilding andConstruction Co. Report.
Lockheed Shipbuilding and Construction Company,.,1974: “Instrumentalion andAnalysis of Data Collected on the S.S. Japan Mail and S.S. Phillipine Mail fromDecember 1971 to July 1973,” Report to Sea Use Foundation, Seattle, 1974.
Longuet-Higgins, M.S. 1952: “On the Statistical Distribution of the Heightsof Sea Wave8,” Journal of Marine Research, Vol. XI, No. 3.
Longuet-Higgine, M.S., Cartwright, D.E. and Smith, N.S., 1961: “Observations ofthe Directional Spectrum of Sea Waves Using the Motions of a Floating Buoy,”Conference on Ocean Wave Spectra, Easton, Maryland, National Academy of Sciences,Washington, DC, 1961.
Loukakis, T.A., 1970: “Experimental and Theoretical Determination of Wave Formand Ship Response Extremes,” MIT Report 69-7, May, 1970.
Mallory, J.K., 1975: “Abnormal Waves off the South African Coast -- a Danger toShipping,” The Naval Architect, July 1975.
Miles, J.W., 1957: UOn the Generation of Surface Waves by Shear Fl~s, ”
Journal of Fluid Mech., Vol. 3, pp.185-204.
Miles, J.W., 1959: “On the Generation of Surface Waves by Shear Flows, Part II,”Journal of Fluid Mech. Vol.,6, pp. 568-5S2.
Miles, M., 1972: “Wave Spectra Estimated from a Stratified Sample of 323 NorthAtlantic Wave Records,” Report LTR-SH-118A, Division of Mechanical Engineering,National Research Council, Canada, May, 1972.
Mirakhin and Rholodilin, 1975: “Probability Characteristics of Ship InclinationDue to Erupting Wave Impulse,” 14th ITTC, Ottawa, 1975.
-1o1-

Moskios, A., and Deleonibus, P., 1965: “Performance of a Shipboard Wave RaightSensor,” Informal Manuscript Report No. O-4-65, Marine Science Department,U.S. Naval Oceanographic Office, March, 1965.
Moskowitz, L., 1964: ,,E~timates of the power spectrums for FU1lY DevelOped
Seas for Wind Speed of 20 to 40 Knots,1!Journal of Geophysical Research, Vol.No. 24, pp. 5161-5179.
69,
I
Moskowitz, L., Pierson, W.J. and Mehr, E., 1962, lg63, lg65: “Wave SpectraEstimates from Wave Records Obtained by the OWS Weather Explorer and the OWSWeather Reporter (I, II and II), New York University, Department of Meteorologyand Oceanography, Geophysical Sciences Laboratory.
NAVSEA, 1975: “Seakeeping in the Ship Design Process,” Report of the SeakeepingWorkshop at U.S. liavalAcademy, June 1975, NAVSSA, NAVSEC and DTNSRDC Report,July, 1975.
Neumann, G., 1953: “On Ocean Wave Spectra and a New Method of ForecastingWind Generated Sea,” U.S. Beach Erosion Board, Technicel Memo. 43.
Neu, H.A., 1971: “Wave Climate of the Canadian Atlantic Coast and ContinentalShelf -- 1970,” Atlantic Oceanographic Laboratory Report, 1971-10.
Ochi, M., 1975: personal communication, July, 1975.
Patterson, M.M. , 1971: “Hindcasting Hurricane Waves in the Gdf of Mexico.”Paper No. 1345,
Phillips, O.M. ,of Fluid Mech.,
Phillips, O.M.,Amplitude, Part
Phillips, O.M. ,Press, England.
,Proceedings 1971 Of~ahore Technology Conference, Houston, Texaa.
1957: ,@onthe Gneration of Waves by Turbulent Wind,” Jou~~
Vol 2, pp. 417-445.
1960: “On the Dynamics of Unsteady Gravity Waves of FiniteI,” Journal of Fluid Mech. , Vol. 9, pp. 193-217.
1966: The Dynamite of the Upper Ocean, Cambridge University
,1unpublished manusmiPtsPickett, R.L. 1962: VA series of Wave Power Spectra,
IMB No. O-63-62, Marine Science Department, U.S. Naval Oceanographic Office, 1962,
Pierson, W.J., 1954: “The Interpretation of the Observable Properties of SeaWaves in Terms of the Energy Spectrum of the Gauesian Record,” Transactions,American Geophysical Union, Vol. 35, PP. 747-757.
Pierson, W.J. , 1975: Comments on “A Parametric Wave Prediction Model,” Personal
communication, Ott. 1975, revised, ilay,1976.
Pierson, W.J., 1976: “The Theory and Applications of Ocean Wave MeasuringSystems At and Below the Sea Surface, on the Land, from Aircraft, and fromSpacecraft,“ NASA Contractor Report CR-2646, New York University.
Pierson, W.J., Jr. and Marks W. , 1952: “The Power Spectrum Analysis of Ocean
Wave Records,” Transactions, Amer. Geophys. Union, Vol. 33, No. 6, December 1952.
-1o2-
i
II
I

-–
Pierson, W.J. and Moskowitz, L., 1964: “A Proposed Spectral Form for FullyDeveloped Wind Seas Based on the Similarity Theory of S.A. Kitaigorodskii,”Journal of Geophysical Research, Vol. 69, (24), pp. 5181-5190.
Pierson, W.J. , Neumann, G. and James, R.W., 1955: “Practical Methods forObserving and Forecasting Ocean Waves by Means of Wave Spectra and Statistics,“H.O. Pub. No,.603, U.S. Navy Hydrographic Office, Washington, D.C.
Pierson, W.J., Tick, L.J. and Baer, L., 1966: “Computer Based Procedures forPreparing Global Wave Forecasts and Wind Field Analyses Capable of Using WaveData Obtained by a Spacecraft,“ Proceedings of the Sixth Naval HydrodynamicsSymposium.
Ploeg, J., 1971: “Wave Climate Study -- Great Lakes and Gulf of St. Lawrence,”SNAME T & R Bulletin No. 2-17.
Pore, N.A., 1970: “Summary of Selected Reference Material on the Oceanographic
Phenomena of Tides, Storm Surges, Waves and Breakers,” ESSA Technical Memo.WBTM TDL 30, U.S. Dept. of Commerce, Washington, DOC.
Pore, N.A. and Richardson, W.S., 1969: “Second Interim Report on Sea and SwellForecasting,” ESSA Technical Memo. WBTM TDL 17.
Priestly, J.T., 1965: ,,Correlation studies of pressure Fluctuations On the
Ground Beneath a Turbulent Boundary Layer,” National Bureau of Standards,NBS Report 8942.
Quayle, 1974: ,lAclimatic Comparison of Ocean Weather Stations and Transient
Ship Records,“ Mariner’s Weather.Lo~, Sept. 1974.
Quayle, 1974a: “Cape Rollers -- Unusually High Swells off the South Africancoast,“ Mariner’s Weather ~, May 1974.
Ross, D.B., Cardone, V.J. and Conaway,, J.W., Jr., 1971: “Laser and MicrowaveObservations of Sea Surface Conditions for Fetch Limited to 17 to 25 m/s Winds,“IEEE Transactions on Geoscience Electronics, GE-8, 326-336.
Rudnick, P., 1969: “Wave Directions from a Large Spar Buoy,” Journal of MarineResearch, Vol. 27, No. 1.
— ——
St. Denis, M. and Pierson, W.J., 1953: “On the Motions of Ships in ConfusedSeas,” Transactions, SNAMI?..
Saetre, H.J., 1974: “On High Wave Conditions in the Northern North Sea,”Institute of Oceanographic Sciences, Surrey, England, Report No. 3.
Schule, J.J., Simpson, L.S. and DeLeonibus, P.S., 1971: “A Study of Fetch-Limited Wave Spectra with an Airborne Laser,” Journal of Geophysical Research,vol. 76, pp. 4160-4171.
—.
Schwartz, E. and Hubert, W.E., 1973: “The FNWC Singular Advective Wind Wave/Swell AnalysisNote No. 73-2,
and Forecast Model.” Fleet Numerical-Weather Central, TechnicalMonterey, California.
-lc13-
Shemdin, O.H., and Hsu, E.Y., 1967: WDirect Measurement Of Aerodynamic pressure
Above a Simple Progressive Gravity Wave,“ Journal of Fluid Mech., Vol. 30,pp. 403-417.
Snodgrass, F.E., Groves, G.E., Hasselmann, et. al., 1966: “Propagation of OceanSwell Across the Pacific,,,philo~. Trans. R. SOC. , A. VOI..259> P. 431.
—— .—
Snyder, R. and Cox, C.S., 1966: A Field Study of the Wind Generation of OceanWaves,” ~. Mar. Res,, Vol. 24, pp. 141-177.
Steele, K., 1975: “Buoys Now Provide Real Time Wave Spectra Data,” N.D.B.O. DataBuoy Technical Bulletin, Vol. 1, No. 6.
Steele, Michelena and Hall, 1974: l,NDBOWaVe Data -- Current and planned,“
Proceedings of the International Symposium on Ocean Wave Measurement and Analysis,Sept. 1974.
Thomasell, A. and Welsh, J.G., 1963: “Studies of the Specification of SurfaceWinds over the Ocean,” Traveler’s Research Center, Inc.
Tukey, J.W., 1949: “The Sampling Theory of Power Spectral Estimates,”Symposium at Woods Hole Oceanographic Institute, NAvEXOS-O-735, ONR.
U.S. Army Coastal Engineering Research Center (CERC), 1966: “Shore ProtectionPlanning and Design,” Technical Report No. 4, Third Edition.
U.S. Department of Commerce, 1972: NOAA Technical Procedures Bulletin No. 72,
Silver Springs, Maryland.
U.S. Naval Oceanographic Office, 1963: “Oceanographic Atlas of the North AtlanticOcean, Section IV, Sea and Swell,” U.S. Naval Oceanographic Office, PublicationNo. 700.
Verploegh, 1961: “On the Accuracy and the Interpretation of Wave Observationsfrom Selected Ships,“ WMO working papers.
Wachnick, Z.G. and Zarnick, E.E., 1965: !!shipMOtiOns Prediction in Realistic
short Crested Seas,“ Trans. SNAME, Vol. 73, PP. 100-134.
Walden, D.A. and Hoffman, D. , 1975: “An Investigation into the Effects of Varyingthe Shape Parameters in the Standard Spectral Formulation,” Webb Report.
Walden, H. 1957: “Methods of Swell Forecasting Demonstrated with an ExtraordinaryHigh Swell Off the Coast of Angola,” Proceedings of the Symposium on the Behavior ofShips in a Seaway, Netherlands Ship Model Basin, Wageningen.
Walden, H., 1964: “Die Eigenschaften der Meereswellenim Nordatlantischen Ozean,”Deutscher Wetterdienat Seewetteramt, Publication No. 41.
Webb, 1974: “Analysis of Data Obtained on Board tio American Mail Line Vessels,“Webb report prepared for Sea Use Foundation.
Wheaton and Boentgen, 1975: “Ship Response Instrumentation Aboard the ContainerahipS.S. Sea-Land McLean -- REisultsfrom the Second Operational Season in the No.Atlantic Service,” Teledyne Report to Ship Structure Committee, Project SR-211.
-1o4-
-–
Wiegel, R.L., 1964: Oceanographic Engineering, Prentice-Hall, Englewood Cliffs,N.J. p. 171.
Wilson, B.W., 1961: ,*Deepwater Wave Generation by Moving Wind SYstemss“
Jo. of Waterways and Harbors, Div. ASCE, WW2, pp. 113-141.
Yamanouchi, Y., 1969: “On the Encounter Wave Recorder for Free Running Modeland for Actual Ship,“ Proceedings of 12th International Towing Tank Conference,Rome, Italy.
Yamanouchi and Ogawa, 1970: “Statistical Diagrams on the Winds and Waves on theNorth Pacific Ocean,” Paper of the Ship Research Institute, Tokyo, Japan, March 1970.
-1o5-

AIPENDIX A
INDEX OF PUNCHED CARIM
CARRYING WIND AND WAVE DATA
AVAILASLE FROM VARIOUS SOURCES
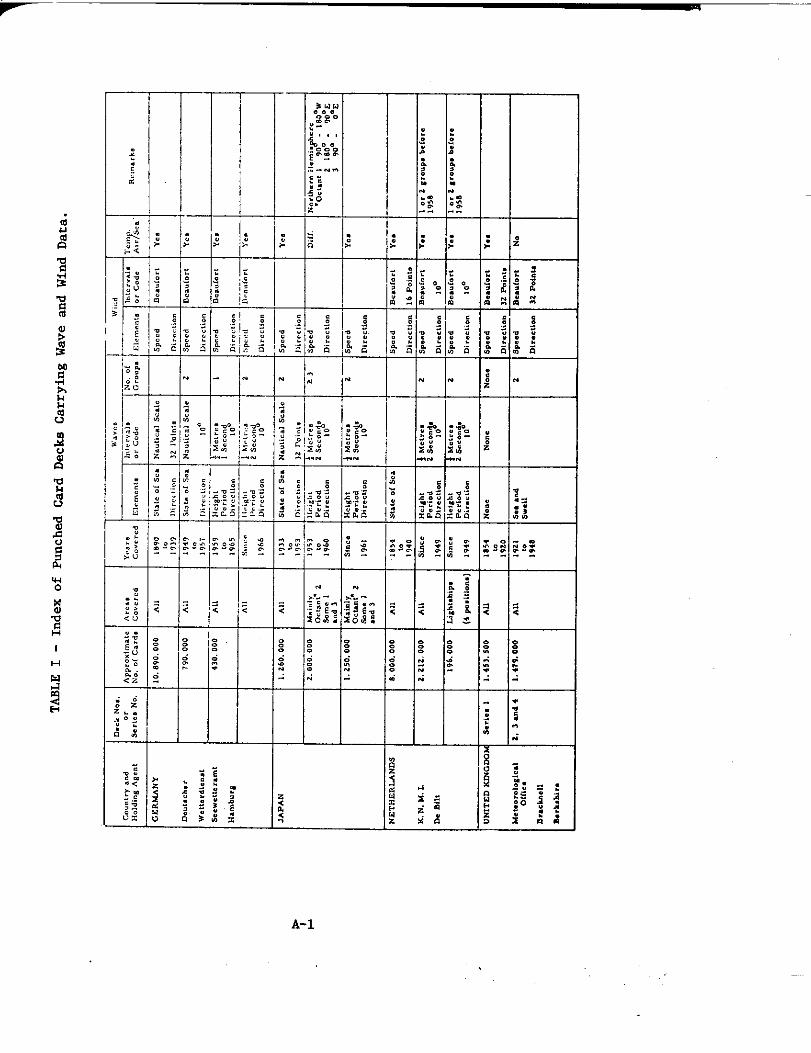
-—
J
I
A-1

. ——
C.untrY andNddi.g ,,,.”,
UNITED KINGDOM
M.tcc. r.l.,ic.!Ocfi<.
Brmknell
Be,k,hir.(Co.iw)
U.S.A.
Nac,ma,
W,.,!,., Records
C.ntre
,+sh.. ilk
N. Carolina
TABLE I (Cent’d.) - Index of Punched Card Decks Carrying Wave and Wind Data
Deck N...,
Series N<
?,9,13and 23
6, 10,14,8 and 24
8. 12,nd 22
——
D,., !16
ppr.xi,mat.o. ofCard,
3.973.000
279, 000
——.42.000
4.000
b.686.000
167.000
,...,0.. red
Ail
. . . .1%.,*. rhip..,,h,1,.,1.
..—i“l,t.l, ip.
All
.,..,. SC.
.“; . s,,.,,,...,,..,.
Ail
All
Y,.,.C... red
sin..1945
si.. e
19<7
——-
1949
181
1953
121
196:,.
,965
, ?,9,.
1963
.%,,,.
i963
HeightP. ridDirection
.——
H, i,h tP. .,0.4lx,, c,io.
—.—
H,igh,P. ridl). . . . ,iml
H,@.tP. rl.dDir. <,,..
wig,,II !.,,,.“,,..,,. ”
. . . . .,.,,,” .,.., cod.
. .4.,,..; ;eco”d,
10“
——. —+Met,..2 S...,d.
10“
j M.<r.,2 S,.”. (I.
10“
*
E2 Sped CO*S
Direction 10°
—
2 sped Knot.
Direc t!.” 10°
—
z Sp=.d K“. L.
IX,..,,..,d
~
N... N.,..
f-kspa=. ne..f.rtlx,..,,.. 30”
S,. ed Knot.
Directi.a” 10”
2 s,,... K“.,,
D,r.c,km 10°
r.,”p.Ii r/S.,
Ye.
Y.,
Ye.
N.
N.
Y..
— .—
R.m..k.
w.”,. ‘mm ,?50..,”.,,,, wind speedn.au[.r,..!1 w;,,.‘,( r.clb,,,? pd,,,sb.i. rc 1956
Shti. tical Summary
card. [ 1].
A,r/S,ate,”p, a,.,., . . . .f, e,1., 1... 1965.

APPENDIX B
U.S. NAVAL WSATHER SERVICE COMMAND
SUWMARYOF
SYNOPTIC METEOROLOGICAL OBSERVATIONS

3
b
5
VOLUKE AKEA
1 12
:
2 5678
9101112
13141516
17181920
CNINESE-PHILIPPINE COASTAL MASINE AREAS
NAM2 CENIT@L LOCATION
Gulf of Chihli 38.8”N 120.3”ETsingtao 36.3”N 122.2”EYellow Sea S.W, 33.6”N 121.8”EShanghai 30.5”N 122.8”E
Wenchow 27.3”N 122.3”ETaiwan E. 23.2”N 122.7”ETaiwan W. 23.4”N 119.4”ESWatow 22.2”N 116.S”E
Hong Kong 20.5”?4 112.8”ELuzon N.E. 18.8”N 123.3”ELuzon N.W. 18.5”N 117.9°EHainan S.E. 17.l”N 112.6”E
Luzon S.E. 13.5”N 123.8”EManila Bay 12.4*N 119.7”EWest York Ieland 12.5”N 114.O”EMindanao E. 9.O”N 127.O”E
Mindanao W. 7.5”N 122.O”EBalabac Strait 7.7”N IUJ.5”EBrunei N.W. 7.5”N 112.5”ESaigon 300 S.E. 6.8”N 108.6”E
NTIS NO.
AD 75S 372
AD 760 333
AD 762 423
AD 762 424
AB 762 425
B-1

JAPANESEAND KOREAN COASTALNAHINS AREAS
VOLUME
1
2
3
4
AHEA NAME
KushiroTomakomeiSendai
TokyoHachijo JimaNaSoya
NobeokeYaku ShimeAmami O Shime
OkinawaSakiahimaIalandeSouthernEa.etChineSea
Central Eaet ChinaSea
Northern Eaat ChinaSea
Nagaeaki
SaaeboInland SeaNateue
NiigataAkitaNekodate
Central Sea ofJapan
Southern Sea ofJapan
Wonean
KengnungPueanCheju Ieland
SouthernYellowSea
Inch’onKorea Bay
Benin IalandaVolcano IelandsMercue Ieland
CENTEAL LOCATION NTIS NO.
Au 757 107123
42.6”N.41.8”N39.5”N
145.88XL42.4”E142.7”E
35.5”N32.O”N33.8”N
140.9”E140.5”E137.4”E
An 754 773b56
32.3*N30. O”N2S .O“N
133.2*E130.O”E129.5*E
AD 753 46S789
26.O”N25.O”N27.7”N
101112
127.5”E124.5*E125.S”E
AD 753 216
13
14
30. O”N 126.O”E AD 743 48S
32.O”N 126.O”E
15 32.O”N 129.4”E
33.9”N34.2”N36.l”N
129.S”E133.2”E133.3*E
Ao 743 944
AD 742 797
AN 733-997
6
7
8
161718
38. O”N40 .O”Nb2.6”11
137.5”E138.O”E139.4”E
192021
22 39.9-N 133.7*E
23 38.O”N 133.5*E
24 40. O”N 129.8*E
.9
10
252627
38.1*N35.7*N34.l”N
129.8*E130.O*E127.4”E
AD 732 758
AO 730 95828 34.O”N 124.5*E
2930
36.5”N38.9”N
125.3”E123.6”E
27.5”N24.5”N24.O”N
142.5*E141.5”E153.5”E
AD 730 95811 313233
B-2

-
SOUTHWESTASIAN COASTAL WARINE AREAS
VOLUIU?,
1
2
3
4
5
6
ABEA
1
:b
567s
9101112
13141516
17181920
21222324
NAME
AkyabCalcuttaVishakhapatnamMamlipatam
MadrasN,E. CeylonS.E. CeylonW. Ceylon
Cape ComorinMangalorePanjimBombay
Gulf of CambayN,E. ArabIan SeaN.W. Arabian SeaS.E. Oman
KarachiSonmianiGwadarN. Gulf of Oman
S. Gulf of OmanS.E. Persian GulfN.E. Parsian GulfN.W. Persian Gulf
B-3
CENTRAL LOCATI02j
19.8”N 91.8”E19.S”N S8.5”E18.3”N 85.3”E15.7ell 82.3”E
11.9”N 81.4”E8.8*N 81.9”E5.8*N 81.2”E8.O”N 79.5”E
.7.9”N 77.4”E11.3”N 74.4”E14.4*N 72.7*E17.4”N 71.6”E
20.3”N 70.9”E20.5”N 67.O”E20.5”N 63.O”E20.3”N 59.8”E
22,9”N 68.3*E23.7”N 65.5”E23.6”N 62.5”E25.O”N 58.7”E
23.5*N 59.O”E25.3”N 53.7*E27.7”N 51.4”E27.5”N 50.O”E
NTIS NO.
AD 733 692
AD 736 449
m 735 441
AD 734 693
Al)733 693
AD 737 909
I

SAWAIIAN ANN SELECTEDNORTH PACIFIC ISUNO COASTAL MARINK AREAS
VOLDT.fS
1
2
3
4
5
AREA
1234
567
8910
111213
14151617
VOLDME AREA
1 1234
2 5
67
3 891011
4 121314
NAME
Hawaiian WindwardHawaiian LeewardBarking SandsFrench FrigateShoale
Johnston IelandMidway IslandWake Ieland
MajuroKwajaleinEniwetok
PonapeTrukPagan
SaipanGuamYapKoror
CENTRAL LOCATIOti NTIS NO.
20.9”N 156.O”W AD 723 79820.3”N 15S.2”W22.7”N 160.3”W23.6”N 166.5”w
17.4”N 169.3”W AD 725 13727.8”N 177.2”W19.2”N 166.4”E
6.8”N 171.4”E AD 725 13S8.8”N 167.7”E10.9”N 162.1°E
6.9”N 15S.6”E AD 726 7407.2”N 151.l”E17.5”N 145.2”E
14.8”N 145.4”E AD 727 90013.O”N 144.7”E9.6”N 139.1*E6.9”N 134.4”E
SOUTHEASTASIAN COASTALMARINE AREAS
NANs
Tonkin GulfDa NangNha TrangSaigon
Southeaet Gulf ofSiam
North Gulf of SiamSouthwest Gulf of
Siam
Kuala TrengganuEndauSouth Malacca StraitNorth Malacca Strait
Victoria PointRangoonPagoda Point
CENTKAL LOCATION
19.5”N 10S,O”E15.7”N 109.5”E12.5”N 11O.O”E9.3”N 107.3”E
9.3”N 103.7”E
12.O”N 101.O”E9.O”N 101.O”E
5.5”N 104.4”E2.6”N 104.9”E2.l”N 102.O”E6.O”N 99.O”E
10.O”N 96.8”E14.3”N 96.5”E15.7*N 93.3”E
NTIS NO.
AD 747 638
AD 749 936
AD 749 937
AD 750 159
B-4

1
3
4
5
6
AREA
123b56
7891011
121314151617
181920212223
24252627282930
313233343536
WESTESN EUROPEAN
NAMS
LisbonAveiroPort0La CoruneGijonBordeaux
NenceePlymouthEnglish ChannelDover StraitBristol Channel
Irish SeaCorkS.W. Irish CoastW. Irish CoastScottish SeaOuter Hebrides
Shetland Is. N~W.Orkney IelandaEdinburghGrimebyRhine DeltaBremerhaven
EebjergOogger BanksNorth SeaShetland1s. S.)3.StavangerBergenAleaund
01s0CopenhagenBornholm Is.Gulf of DanzigStockholmGulf of Rigs
COASTAL MARINE AREAS
CENTRAL LOCATION
38.O”N 10.7”W40.O”N 10.6”W42.O”N 10.5”W44 .O”N 9.7*W44.2-N 5.8”W44.8”N 2.a”w
46.8*N 3.6”w49.l”N 5.5”W49.7”N 2.8”W50.4”N .6”E51..1”N 6.O“W
53.7”N 4.8”W50.8”N 8.3”W52.2°K 11.5”W54.l”N 11.S”W56.1*N 7.4”W58.2”N 6.8”W
61.O”N 4.5*W59.O”N 3.4”W36.6”N 1.2”W53.9”N .9”E52.4-N 3.l”E54.2”N 7.O’E
55.9”N 6.5”E55.2”N 3.2”E56.9”N 2.2”E58.9”N .2*E57.8”N 5.7*E60.O”N 3.8”E62.2”N 4.3”E
58.1*N 9.8”E55.4”N U.2”E55.2”N 15.3”E56.I”N 19.2el?58.4”N 18.4”E58.5*N 21.2*E
NTIS NO.
All773 141
AD 773 59;
AD 775 177
AD 775 435
AD 776 396
AD 777 049
B-5

VOLUMS
7
8
WESTERN EUROPEAN COASTALMARINS AREAS (Continued)
ARsA
373839404142
43
44454647484950
NANE
Gulf of FinlandGulf of Bothnia S.Gulf of Bothnia N.MurmanskAndenesCentral NorwegianCoast
OSV Mike
Iceland S.E.RaykjavikIcelandN.W.Iceland N.IcelandN.E.AngmagsaalikCape Farewell S.E.
.
CENTRAL LOCATION NTIS NO.
60.O”N 25.5”E AD 777 13361.O”N 19.4”E63.9”N 21.8”E70.3”N 32.9”E70.2”N 17.4”E66.O”N 10.O”E
66.O”N 2.O”E
63.8”N 14.6”W AD 777 60164.O”N 24.l”w66.2”N 25.l”w66.,6”N 18.8”W66.3”N 13.4”W64.9”N 37.5”W58.O”N 38.5”W
B-6

-
VOLUME
1
2
3
5
6
7
8
9
AREA
1
;
4567
891011
1213lb15
16171819
22223
24252627
2829
3031
32333435
MEDITER2UNSAN MARINE ARBAS
NAME
RotaTangierMalaga
OranCartagenaBarcelonaMarseille
N. Kenorca24al10rcaAlgiersCorsica
SardiniaAnnab@RomeS. TyrrhenfanSea
s,W. SicilyTripoliN, Adriatic Sei,S. Adriatic Sea
W. Ionian SeaMaltaGulf of SidraE. Ienian Sea
N. Aegaan SeaS. Aegean SeaCreteBenghazi
ShodesCentral LevantineBasin
AlexandriaN. Cyprue
s. CyprusNile DeltaBeirutPort Said
CSNTSAL LOCATION
36.4”11 7.8”w35.O”N 7.7”W36.0”24 3.4*W
36.5°1i .3*W37.7”ti .5”E40.4”N 1.9”E42.6”N 5.O”E
40.8”t4 5.2*E38.9”N 4.6*E37,4”N 3.9”E42.7”N 8.4”E
39.O”N 9.l”E37.6”N 7.98P,.41.2”N 12.O”E39.l”N 13.4”E
36.8”N 12.2*E34.l”N 12.3”E43.9”N 14.7”E41.5”N lg,lOE
37.9*N 16.g”E35.3”N 16,7*E32.7°N lS.3”E37.6”N 20.4”E
39.9”N 24.8”E37.9”N 25.l”E35.8”N 24.9”E33.9”N 22.9”E
35.7”N 29.9”E34.O”N 27.5”E
32.2”N 27.8*I235.7”N 34.3*I3
33.9*N 31.9*E32.3*N 31.O”E34.2”N 34.9”E32.2”N 33.3”E
NTIS NO.
AO 713 992
m 714 288
m 713 779
IQ 713 780
An 713 648
~ 713 295
Al)713 084,
AD 713 085
AN 712 761
B-7

NORTH AMERICAN COASTALMARINE AR2AS (Revised)
VOLUME AREA
1 1234567
2
3
4
891011121314
15161718192021
NAus
Belle Iele StraitOSV BravoNS NewfoundlandCoaetSE NewfoundlandCoastPlacentia Bay SouthCabot StraitAnt$coeti Island
St. Lawrence RiverGulf of St. LawrencaCape Brenton Island SEHalifaxBoetonQuonset PointNew York
Atlantic CityNorfolkCape HatterasBermudaCharlestonJacksonvilleMiamf
GuantanamoRay lieetFort MyereApalachicolaPanaacolaNew.OrleaneGelveatonCorpus Christi
APPROXIMATECEWIBAL LOCATION
50.5”N 58.3”U51.5”N 51.0%49.2”N 52.7%147.O”N 51.5”W46,0”N 54.5*W46.8”N 58-.3”w49.6*N 62.5”W
49.4”U 66.9”w47.8”N 62.4”w44.9*N 58.9”W48.7”N 63.7”w43.4”N 68.3”W40;8”N 70.4”W40,4”N 72.7”W
39.O”N 72.5”V37.O”N 74.S”W34.7”N :74.Sew32.O”N “65.O”W32.9”N 77.4”W30.5”N 79.7”V27.O”N 79.2”W
19.O”N 75.O”W24.O”N 81.O”W25.8”N 83.2”w28.6”N S4.4”W28.7”N 87.5”w2S.28N 90.5”W28.4*N 93.5”W27.3”N 96.2”w
B-8

F
CARIBBRAN ~ uY ISL4ND COASTAL NARIN2 AREAS
2
3
VOLUFOt ABXA
1 123b
:
7891011
121314
:17
5
6
181920212223
242526272829
303132333435
APPROXIMATENAME CENTIbM LOCATION
British HondurasCiudad.delCarmenVeracrwzCape RojoYucatanIsle of Pinee
CepmanJamaicaWestJemaica SouthJemaica NorthJamaica Southeaet
Hiepaniola SouthWindward PaasageGrand BahameNaaaauSan SalvadorAckLina Ieland
HiepaniolaNorthSanto DomingoNone Paeaaga.Puerto Rico SouthPuerto Rico NorthViequea
Virgin IalendeLeeward IelandeWindward IslandsTrinidadBarcelonaCaracas
Gulf of VenezuelaRiohacheCartagenaColonGulf of PanamaGelapagoe Ialenda
17.5”N19.5*N19.5*N21.5”N22.5”N21.5”N
19.5”NlS.O”N17.O”N19.0°N17.O”N
17:O”N20.O”N26.5”N25.O”N24.O”N21.5”N
19.5”N17.5*N18.5”N17.5°N.19.5”N18.5”N
18.O”N16.5*N13.5”NU.O”N11.5*N11.5”N
12.5”N12.5”N11.5”N10.O”N8.O”N.5”s
87.5”W92.5”W95.O”W96.5”w89.5”W82.5”w
80.5°W79.O”W77.O”W77.O”W75.O”W
72.5”w74.O”w77.5”W77.O”W:75.O”W“73.5”W
69.O”W69.5”w6S.O”W66.5”w66.5”w65.6”w
64.O”W62.0°W60.5”w61.5*w64.5”W67.O”W
69.5”w72.5”W75.5”W80.O”W79.5”W90.5”W
B-9

INOON8SIANCOASTAL MARINS AREAS
VOLUMR AsF.A
1 1234567
891011121314
3 15161718192021
22232425262728
293031
234
353637383940
“NAns
SoutheaatSumatraChristmaa IslandSunda StraitNorthwestJava SeaBangka Island NorthwestNatuna IslandSarawak
Weat BorneoKarimata StraitSouthwestJava SeaSouth Central JavaSoutheaatJavaSoutheaatJava SaaNortheaat Java Sea
Bali SeaFloraa SeaNorthwest Floree SeaSouth Mekasaar StraitCentral Hekasaar StraitNorth Wakaeaar StraitSouthwaatCelebes Sea
Northwest Celebes SeaEaet Celebes SeaNortheaatMolucca SeaSoutheaatMolucca SeaNortheaatBanda SeaTimor NorthwestNorth TimorSea
Melville Ia2andWeat Arafura SeaEast Arafura SeaWeat Torrea StraitEaat Torrea StraitGulf of Papua Southeaat
SoutheeatNew GuineaNorthwest Solomon SeaMmiralty Ialanda EaatNew Ireland NortheaetNorth Solomon SeaSoutheastSolomon Sea
.APPROXIMATECENTRAL LOCATION
04.3”s10.5°s6.1”S4.0”s.8”s
3.5”N3.8*N
.7el’l2.7”s5.5”s8.4”s9,7°s6.3”s4.4”s
7.8”S7.8”S6.0”s4.2”s2.0”s.1”s
2.2”N
3.8*N3.O”N3.0°N1.0”s5.5”s7.8”s8.4”s
11.2”s9.3”s9.6”S10.5”s10.8”s10.3”s
10.7”s6.9”s1.8”s2.1”s5.5”s8.5”s
101.7”E105.5”E105.7”E107.5”E105.5”E108.O”E111.8”E
107.8”E109.2”E109.6”E11O.6”E115.2”E113.l”E113.9”E
116.5”E119.9”Ej17.5”E117.8aE117.8*E118.7aE120.3”E
120.2”E123.5”E127.O”E126.7”E131.o”l!124.5-E129.3”E
130.8”E133.3”E136,8”E140.5”E143.8”E146.8*E
151.5”EM8.7’E149.O”E152.6”E153.5”E154.5*E
B-10

~
EAST ~ICAN AND SELECTED ISLAND COASTAL MARINE AREAS
2
3
4
5
VOLUKS AnzA
1 123bs6
789101112
131415161718
z2122232425
26272829303132
APPROXIMATEN&m CENTS& LOCATION
Kuria Nuria IsWest Arabian SeaQamr BaySocotra ISGulf of Aden USGulf of Aden NW
Red Sea SouthRed Sea South CentralRed Sea CantralXed Sea North CentralRed Sea NorthGulf of Suez
Gulf of Men SWGulf of Men SESomali Coaet NESomali Coaat EaatSomali Co@et SESomali Coaat South
Kenya CoaatZanzibarTamzania Coaat SEPOrtO AmeliaLumboMozambiqueChannel NWMozambique Channel SW
LourencoMarqueaTulearNezambique Channal SENezambiqueChannel NEDiego GarciaGanNinicoy Ia
18.O*N16.O”N15.3*N13.3”N13.5*N12.6*N
14.6”N17.5°N20.5”N23.5”N26.4”N28.5”N
11.4”N12.4*N9.4”N6.5”N3.4”N.5”N
2.5”S5.5”s8.5”S11.5”s14.4”s17.5”s20.6”S
24.5”S25.0”s20.5”s13.2”s8.5”S.5*N
8.O”N
58.O”E57.O”E53.O”E54.4”E49.O”E45.7”!3
42.3”E40.5”E38.5”E37.O”E35.3”E-33.2*E
45.7”E51.5”E52.3*E:51.4”E“48.9*E45.8°E
42.8”E41.6”E41,8”E42.3”E42.2”E40.O”E37.2*E
37.4*E42.2”l!41.7”E46.3”E72.5”E73.o”l!7300”E
B-II
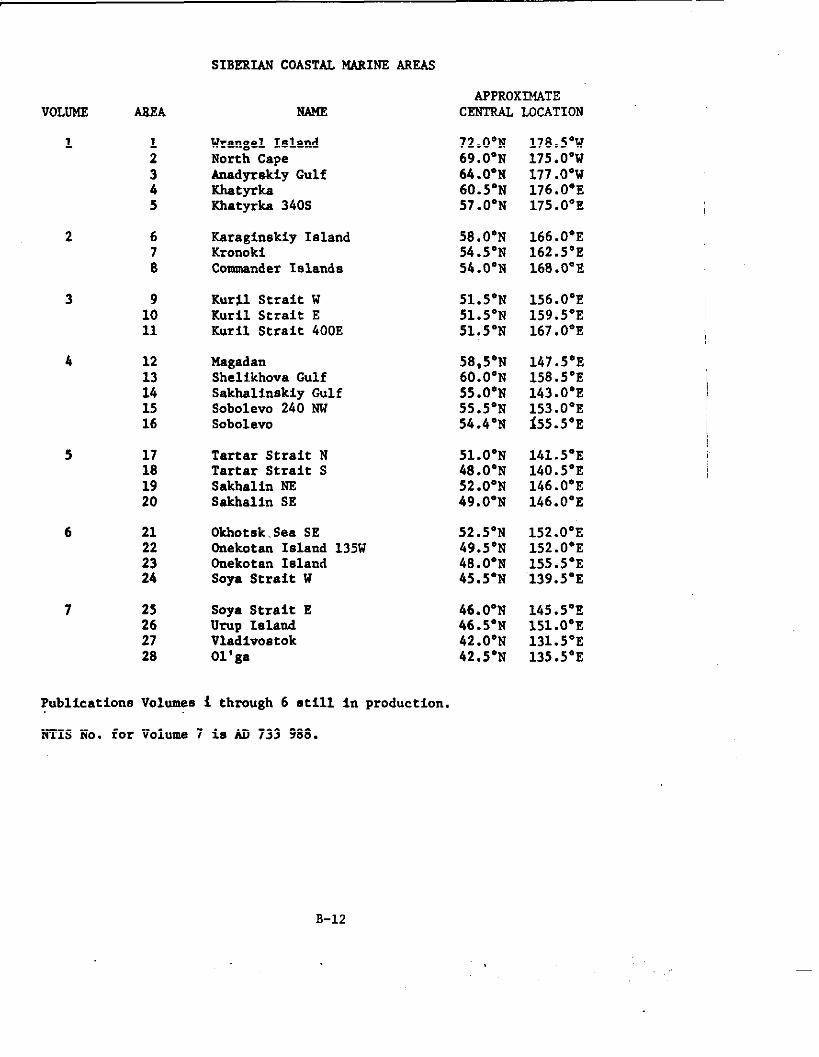
SIBERLANCOASTAL MARINE AREAS
VOLUME AXEA
1
5
6
7
Publications
NTIS No. for
12345
678
91011
1213141516
17181920
21
::24
25262728
NAME
Wrangel IelandNorth CapaAnadyrakiyGulfKhatyrkaKhatyrks 340S
=raginekiy IslandKronokiCoumander Islands
Kurll Strait WKuril Strait EKuril Strait 400E
MagadanShelikhoveGulfSakhalinekiyGulfSobolevo 24o NWSobolevo
Tartar Strait NTartar Strait SSakhalinNESakhalin SE
Okhotak.Sea SEOneketan Island 135WOnekotan IalanrlSoya Strait W
Soya Strait EUrup IslandVladivostok01’ga
Volumes i through 6 atill in production,
Volume 7 ia AD 733 988.
APPROXIMATECENTML LOCATION
72.O”N 178.5”W69.O”N 175.O”W64.O”N 177.Oew60.5”N 176.O”E57.O”N 175.O”E
58.O”N 166.O”E54.5”N 162.5”E54.O”N 168.O”E
51.5”N 156.O”E51.5”N 159.5”E51.5*N 167.O”E
58,5”N 147.5”E60.O”N 158.5”E55.O”N 143.O”E55.5”N 153.O”E54.4”N 155.5”E
51.O*N 141.5”E48.O”N 140.5”E52.O”N 146.O”E49.O”N 146.O”E
52.5”N 152.O”E49.5”N 152.O”E48.O”N 155.5”E45.5”N 139.5”E
46.O”N 145.5”?!46.5”N 151.O”E42.O”N 131.5”E42.5”N 135.5”E
B-12
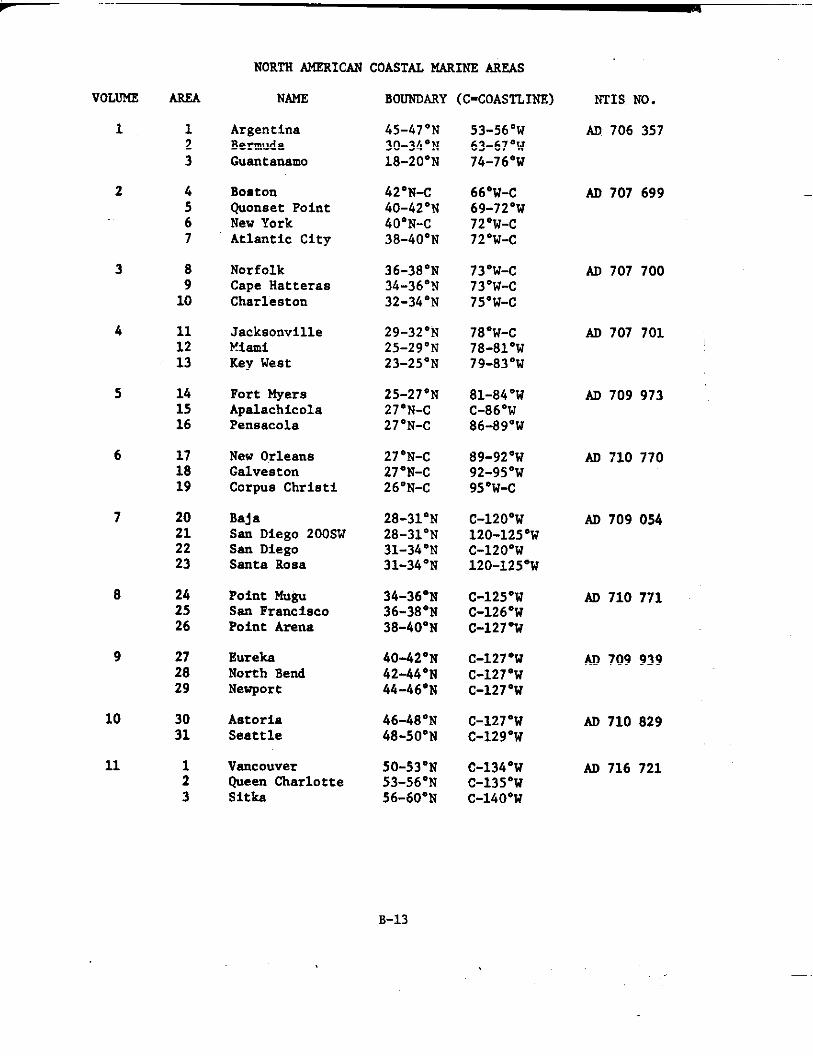
VOLUMI!
1
2
3
4
5
6
7
8
9
10
11
AR2A
123
4567
8910
111213
141516
171819
20212223
242526
272829
3031
:3
NORTH ~ICAN COASTAL MAHNS AMAS
NAM3
ArgentinaBermudaGuantanamo
BOBton@onset PointNew YorkAtlantic City
NorfolkCape HatterasCharleston
Jacksonville?’!iamiKay West
Fort MyersApalachicolaPensacola
New OrleansGa2vestonCorpus Christi
BajaSan Diego 200SWSan Diego,Santa Rosa
Point Mu@San FranciacoPoint Arena
EurekaNorth BendNevport
AstoriaSeattle
VancouverQueen CharlotteSitka
BouwomY (C-COASTLINR)
45-47”N30-34”N18-20”N
42”N-C40-42”N40”N-C38-40”N
36-38”N34-36”N32-34”N
29-32eti25-29”N23-25”N
25-27”N27”N-c27”N-c
27 “N-C27”N-C26”N-c
28-31*N28-31”N31-34”N31-34”N
34-36”N36-38”N38-40”N
40-42”N42-44”N44-46”N
46-48”N48-50”N
50-53”N53-56”N56-60”N
53-56”w63-67“W74-76*W
66”W-C69-72”w72”W-C72”w-C
73”W-C73”W-C75”W-C
78”w-c78-81”w79-83“W
81-84“Wc-86°w86-89”W
89-92”w92-95”w95”W-C
C-120”W120-125°WC-120”W120-125”W
C-l25”WC-l26”WC-127“W
C-127“WC-127*WC-127”W
C-127”WC-l29”W
C-134”WC-135”WC-140”W
NTIS.NO.
Au 706 357
AD 707 699
AD 707 700
AD 707 701
AD 709 973
AD 710 770
AD 709 054
AD 710 771
AD 709 939
AO 710 829
m 716 721
B-13

VOLIMS AREA
12 .456
13 78910
14 111213
15 1415161718
NORTH AMERICAN COASTAL MARINS ARSAS (Continued)
NAME mmmm (c-COASTLIm)
CordovaSewardKodiak
Unin!akDutch HarborA&kAttu
Bristol BaySt PaulSt Paul 180W
NunivakSt MatthewSt LawrenceCape LisburneBarrow
57”N-C57”N-C56”N-c
53”N-C51-55*N51-55*N51-55”N
55-59”N55-59”N55-59-N
59-62”N59-62”N62-66”N66-70”N70-74”N
140-146”WL46-151”W151-157°w
157-165”W165-172°W172-180”W172-180”E
C-165”W165-172”W172-180”W
C-171”W171-178”WC-172”WC-170”W154-170”W
NTIS NO.
AD 714 360
AD 717 949
Ao 719 345
.4D 718 346 I
B-14

Volume
1
1
1
2
2
2
2
3
3
4
4
4
4
Summary of Synoptic MeteorologicalObservations for Great Lakes Areas
Area
Ontario
Erie East
Erie West
Huron South
Huron Central
Huron Northwest
Georgian Bay
Michigan North
Michigan South
Superior East
Superior East Central
Superior West Central
Superior West
B-15

APPENDIX C
SAMPLE TABLES
OF WAVE OBSERVATIONS
FROM VARIOUS SOURCES

TABLE C-1
SAMPLE TASLES FROM “SUMMARY OF STNOPTIC METEOROLOGICAL OBSERVATIONS
FOR (VARIOUS AREAS),“ U.S. DEPT. OF COhMERCE, NOA4, ENVIRONMENTAL DATA SERVICE
DECEMBER
TAC.LE 18 (CnNT)
MINDSPEEDIKTSIVS SEAHEIGHT
PER1ODI [PRIMARY]lDVER-&LLl 1963-1969
AREA 0007 MAKE ISLANO19.3N 166. *E
TOT00s
IFTI
48+ PCTo-s
1.0
:;.0
::.0.0.0.0
::.0.0.0.0
::.0
2.3
ncr
<1
H5-618-91;;11
13-1617-1920-2223-2526-3233-4041+849-6061-707:;:6
TOT 00STOT PCT
4.10
2,09,58,83*9,3,3.0,0,0,0,0,0,0,0.0,0,0,C.0
24,8
11.21
,09.218.017,69.82.61.3.0.7.0.3,0.0.0,0,0.0,0.0
59,5
22.33 34.47
::1.02,63,63.91,3,7.0,0
;:.0
::,0.0
::
00,0.0,0,0.3.0,0,0.7.0.0.0
,0 .2,9.0 19,3.0 30,4.0 24,Z.0 Ij:;,0.0 Z.b.0 ,1.0,0 :;
:: :;.0 ,0
,0:: ,0.0 .0.0 ,0
:: ::
,0.0.0.0.0.0
30612,4 1.0 .0 100,0
PERCENT FREQUENCY OF h’AV2 HEIGHT tpT] VS WAVE PERIOO (.$EcfJNos)
PER1OOIS2CI
46*.78.910.111:1;2
INDETTOTAL~cr
<1 1-2
.9 8.9,0 1,2.3 ,2,0 .0
3-4 5-6 7 8-9 10.11 12 13-1617-1920-2z23-2526.32S!4.4041.4849.6061.707i.06 MEANHG7
k67
10101036
8,96,01.9,7.0
6.210.44.4.21.0,3.513523.1
3.410.67.5
:;.2
1;:2Z.1
.0
.51.21,0.7.2.0213,6
,0
:;
::.Z,08
1.6
1.73.43.1
:;.2
;;9.7
1::1.41.0
::
;:4.4
,0.9,9,5.3.0,015
2.6
.0
.0
.3
.2
.7.
.0
.0
.0
.0
.0
.0
::0.0
,0.0.0.3.0.0,0
.:
,000.0.0.0.0.00,0
.0
.0
.0
.0
.0
.0
.00.0
.0 .0
.0 .0
.0 .0
.0 ,0
.0 .0
.0 .0
.0 .00 0.0 .0
.0
::.0.0.0.0
.:
00 17s.0 201.0 121.0 33,0 24.0.0 2;0 583
,0 .0,0 .0 .0
1,4 .71s i; 106
2,6 10.4 lZ.1
.04,7 .0 100.0

TASLE C-2
SAMPLE TASLE FROM U.S. NAVAL OCEANOGF@J’HICOFFICE (1963)
c-2

-
‘kEEzlId:................................------------..” .
,.., ,“9,?” ,.”. ::
c-3

APPENDIX D
A DESCRIPTION OF WAVE MEASURING SYSTEMS
adapted from
“The Theory and Applications of Ocean Wave Measuring Systems at and
Below the Sea Surface, on the Land, from Aircraft and from Spacecraft”
by
Willard J. Pierson, Jr.
Prepared for the Goddard Space Flight Center, Greenbelt, Maryland
under contract NAS-5-ZO041
Report NASA CR-2646
June 1975
D-1

The Tucker Shipborne Wave Recorder
A routinely operated system for recording ocean waves is the Tucker ShipborneWave Recorder as described by Tucker (1956). This particular instrument has beenin virtually continuous use on the European weather ships since the time of the pub-lication of the above reference and many hundreds of records have been obtained invarious places in the eastern North Atlantic since that time. During SKYLAB for themonth of January 1974, the winds over the North Atlantic were extremely high and anarea of high winds where the winds exceeded 65 knots (3Z.5 meters per second), equalroughly to the area of the United States east of the Mississippi, occurred and last-ed for a number of days. European weather ships on station in the North Atlanticrecorded the waves during this period with this instrument for use in the interpre-tation of SKYLAB data.
The Tucker Shipborne Wave Recorder consists of two pressure-sensitive transduc-ers mounted with a water-tight seal on each side of the hull of a ship on the insideat a point below the water line. They are provided access to the ocean by means ofsmall holes drilled through the hull plates. The function of these two pressuretransducers is to provide the average value of the pressure caused by the height ofthe water on the outside of the ship above this point. The idea of these two trans-ducers to record that part of the wave motion is that these two signals are averagedbefore further processing. On the line connecting these two points, which are lo-cated near midships on the particular ship being used, is an accelerometer. The de-sign of this accelerometer is quite simple, and the signal recorded by the accelero-meter is double integrated continuously as a function of time to yield a functionthat represents the rise and fall of that point. The signal from the pressuretransducer is then added to this doubly integrated acceleration signal and the out-put is graphed as a function of time on a piece of chart paper. The ships on whichthese wave recorders are installed are typically quite small, being of the order of150 to 200 feet long (say, 50 to 65 meters long). When extremely high waves are be-ing recorded, the waves are typically four or five times longer than the ship and theship rides up and down on these waves and follows the wave profile quite closely.The correction added by the pressure transducer is thus a relatively small part ofthe total vertical excursion sensed by the ship. If the ship did not move up anddown on the waves, it would be flying part of the time and acting like a submarineduring the other part of the time. A sample record from this recorder is shown inFig. D-1. The date, time and other pertinent information is also shown on the fig-ure.
The wave record obtained by the Tucker Shipborne Wave Recorder needs to be correctedas a function of frequency. The double integration is not perfect so that somewaves are over amplified by the process for some frequencies and others are atten-uated. Also, the added correction for the pressure fluctuation due to the shorterperiod waves is a function of the depth of the pressure transducer on the side ofthe hull and of other dimensions of the ship. A calibration curve needs to be de-rived for each ship on which this recorder is installed. The procedures for deriv-ing this calibration curve were given by Cartwright (1961).
Wave records obtained by this instrument, as used on many different ships, havebeen spectrally analyzed and corrected according to the appropriate calibrationcurve by many different scientists. Pertinent references are Moskowitz, Pierson and
D-2

“,J-K$i&dolL— — 1 TT-
$’A’
D-3

Mehr (1962, 1963, 1965), Ewing and Hogben (1971), M. Miles (1972) and Hoffrmn(1974. a). Sample calibration curves for three different ships are tabulated as afunction of frequency in Table D-1 from Miles (1972). It can be noted that a spec-trum esthated from a record such as the one graphed in Fig. D-1 has to be multi-plied by values greater than one for low frequencies, values closer to one for cer-tain intermediate frequencies, and values considerably greater than one as the fre-quency increases towards the upper range of definition. For the high end of thefrequency band typically covered in a spectral analysis of such a record, the ampli-fication factors are very high, and any white noise digitization error in the rec-ords can lead to unrealistic valuea. Moat acientiats who analyze these records cal-culate the white noise level at the high end of the band, assuming it to be allwhite noise and well above some unknown Nyquist frequency. This white noise levelis then subracted from the entire record and the calibration curve given by theabove table is then applied. Fig. D-2 and D-3 shows some examples of spectra calcu-lated from the data obtained by the Tucker Shipborne Wave Recorder. The peak of thefirst spectrum is at a spectral value of about 50; that of the last one is at 0.07.
Table D-2 shows a sample from Miles (1972) of the data available from theserecords.height is
The parameters of records NW 181 to NW 210 are tabulated. The significantrelated to m. by
The values T(-1), T(1) and T(2) are different kinds of “average” period, hased onvarious moments of the spectrum. The K’s are related to slope parameters of thespectrum.
Table D-3 shows the values of the spectrum for the top record in Fig. D-2. Theraw spectrum is given by SO, the spectrum minus noise is given by S1, and the spec-trum after multiplication by the calibration curve is given by S3.
The data from this instrument have proved to be invaluable to naval architects.Over t!e years the records for the ten highest sequences observed in a twenty minuteinterval in the North Atlantic have been assembled and analyzed. The very highestwaves had a significant wave height of 55 feet from crest to trough. This impliesthat one wave in one hundred at that ttie was 1.5 times that significant wave height,or somewhere near 82 feet from the crest of the wave to the trough of the wave as itpassed the weather ship that was recording this train of waves. The probabilisticstructure of the wave motion for such extremely high waves has been quite well veri-fied by calculating the so-called significant nave height and the highest wave fn atwenty minute interval and comparing these values with the theoretical results ob-tained by Longuet-Higgins.
The advantages of the Tucker Shipborne Wave Recorder are considerable. It canbe mounted on any relatively small ship and waves can be recorded wherever that shipis stationed. The water can have any depth. Typically, the ship is hove to whilethe waves are being recorded but in principle it could be underway in head seas andrecord the waves as a function of their frequency of encounter. The calibrationproblem is somewhat more difficult under these circumstances, however, so that this
D-4
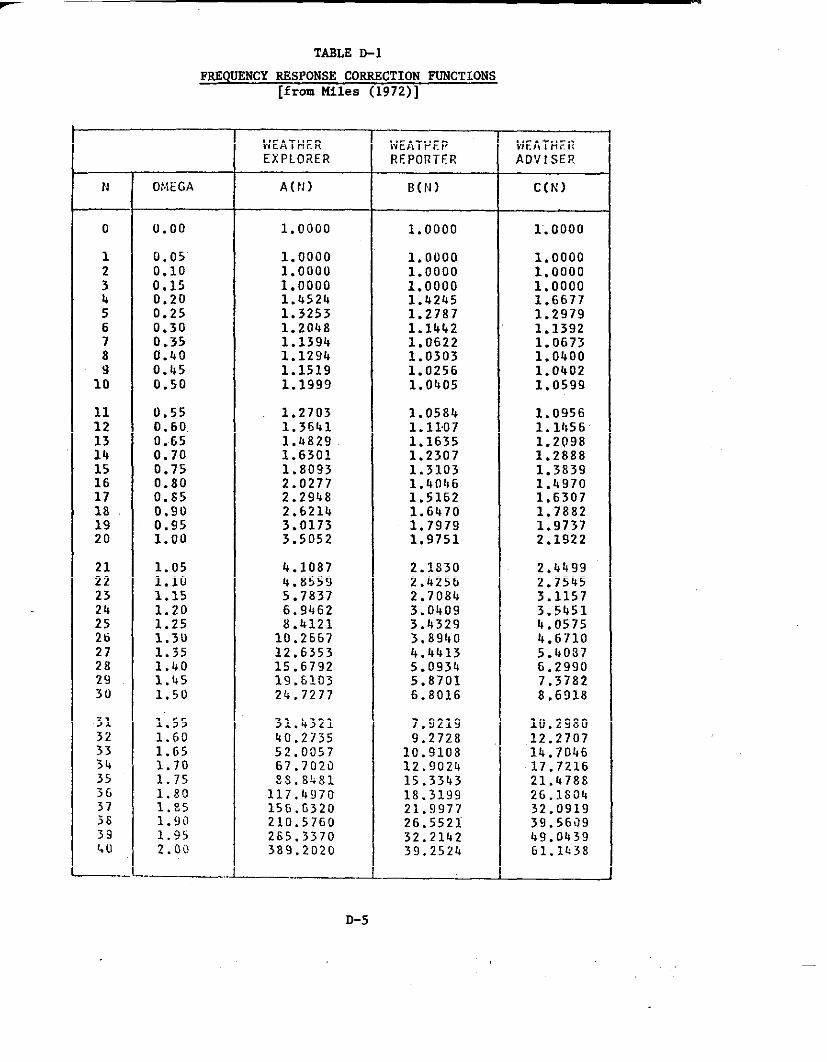
TASLE D-1
FSSQUSNCY RSSPONSE COBF.ECTIONFUNCTIONS[from Miles (1972)]
WEATHER NEATVEP WEhTHEl?EXPLORER REPORTER ADVISER
N 0:4EGA A(fl) B(H) C(N)
o 0.00 1.0000 1.0000 1’.0000
1 0.05’ 1.0000 1.00000.10
1.00001.0000
;1.0000 1.0000
0.15 1.0000 1.0000 1.00004 0.20 1.4524 1.42b5 1.66775 0.25 1.3253 1.2787 1.29796 0.30 1.204S 1.1442 1.13927 0.35 1.1394 1.0622 1.06738 0.40 1.1294 1.0303 1.0400Y 0.45 1.1519 1.0256 1.040210 0.50 1.1999 1.0405 1.0599
11 0.55 1.2703 1.05s412 0.60,
1.09561.3641 1.1107 1.1456
0..65 1.4829::
1.1635 1.20980.70 1.6301 1.2307 1.2888
15 0.75 1.80!33 1.37.03 1.383916 0.80 2.0277 1.4046 1.497017 0.s5 2.29U8 1.5162 1.630718 0.90 2.6214 1.6470 1.788219 0.95 3.0173 1.797920 1.00 3.5052
1.97371.9751 2.1922
1.05 4.1087:; 1.10
2.1S30 2.44994.8559 2.k256 2.7545
23 1.15 5.7837 2.708424 1.20
3.11576.9462 3.0409 3.5451
25 1.25 8.4121 3.4329 4.057526 1.3U 10.2667 3.8940 4.671027 1.35 12.6353 4.4413 5.40s728 1.40 15.679229 1,$5
5.0934 6.29’3019.6103 5.8701 7.3782
30 1,50 24.7277 6.s016 8,6918
31 1.55 31.4321 7.9219 lU.293032 1.60 40.213533
9.272S1.65
12.270752.0057
1
10.9108 14.7046;4 1.70 67.7020 12.9024 17.721635 1.75 SS.8b Sl 15.3343 21. b78S36 1.80 117.497031
18.31991.85
26.1S0415G.G320 21.9977 32.0919
3S l.g~ 210.5760 26.5521 3g.56~939 1.9s 265. 337o 32.2142 119.0439\ll 2.00 389.2o2o 39.2524 61. IL3S
— ——
D-5

TABLE D-2
SAMPLE DATA SDMMARY FOR SBWR FREQIJSNCYSPECTRA[Miles (1972)]
RECORD DATE 1!(1/3) CONFIDENCE INTERVAL T(-1) T(1) T(2) K(-1) K(1) K(2)Otl }1(1/3)
(H R- DY+O-YR) (i4ETERs) UPPER 95% LOWER 5% (SEC) (Silt) (SEC)
tiwl El 12-22 -12-G1 3.64S 4.033 3.300 11,03 9.8kI;w182
9.12 1,35 1.34 1,3512-27-12-61 4.102 4.491 3.748 9.33 8.56 8,11 1.08 1.03 1.13
ll\i183 12-28-12-61 5.331 5.756 4.938 8,67 7,70 7.23 0.88 0,86 0.88Nw184 12-22- 1-62 9.229 10,285 8.282 11.95 10.62Pl!ila5
9,74 0,92 0.91 0.9012-28- 1-62 L.551 4,976 4.162 10,58 9.41 8.75 1.16 1.14 1,15
IJW186 12-29- 1-62 6.968 7.765 6.252 10.08 9,06 8.45 0,89 0.89 0.90NW187 12-31- 1-62 10.04s 11.315 8,923 11.5b 10,03 9,08 0.85tlw138
0.82 0.8112- 9- 2-62 6.357 7.024 5.7s3 10,31 9,17 8.48 0.95 0.94 0.95
ll\l189 12-10- 2-62 13.657 15,170 12,294 12.11 10,13t;P!190
8.97 0.76 0.71 0.6812-11- 2-62 10.084 11,107 9,156 11,42 9.88 8.97 0.84 0.81 0,80
11W191 12-13- 2-b2 5.064 5.635 4,551 11.17 10.17I:W192
!7.50 1.16 1.17 1.19’12-15- 1-64 5.036 5.553 4.568 9.05 8.00 7,k2 0.94 0,92 0,93
l:ki193 12-20- 1-64 b. 739 5.173 4.342 9.29 8.35 7.83 1.00Fiwl!lh
0,99 1.0112-21- 1-64 6.668 7.446 5.972 12.62 11.12 10.11 1.14 1.12 1.10
NW19> 12-25- 1-64 3.592 3,975 3,24fj 11.33 10,29tiW196
9.67 1,3’3 I.til 1.4412-24- 1-64 2.427 2.679 2.19S 10.62 9,5s 8,92 1.59 1.59 1,61
t{w197 12-29- l-6k 8,047 8.990 7,203 10.53 9.40 8.68 0.87WW198 12-30- 1-64
0,86 0.8611,327 12.772 10.,046 i2,20. 10,82 9.88 0.85 0.83 0.83
lJvi199 12- 3- 2-64 8.197 9.047 7,k26 11.04 9,81 9.09 0.90 0.89 0.89:/w200 12- 4- 2-64 6.332 7.019 5,712 11.00 9.67 8.84 1.02 1.00 0.99
flw201 12- 5- 2-64 2.189 2.400 1.9!37 9,15 8,30 7.83 1.1,4 1,45:{W202 12-26- 7-G4
1.492.926 3.221 2.659 7.90 7,41 7.11 1.08 1.12 1.17
NW203 12-28- 7-6k 3.336 3.68k 3.022 9.73 8,94 8.46 1,24 1,27liW2U4
1..3012-29- 7-64 1.600 1.744 1,468 8.27 7.G3 7,30 1.53 1,56 1.63
:JW2U5 12-30- 7-b4 3,804 4.222 3.k27 8.79 8.23 7.91 1.05 1.09 1.14i:W206 12- 4- 8-G4 3.328 3.712 2.983 8.83 S,17 7,79 1,13 1.16 1.20NH207 12- 5- 8-64 3.602 4,016 3.230 9.67 8.96 8,50 1.19 .1.22 1.26:(W208 12- 8- 8-64 1.337 1,453 1.231 8,09 7,40 7,10 1,63 1.66 1.73tiw209 12-13- 8-Gk 0.G98 0,750 0,650 7.30 6,45 6.13 2.04 2.00 2,07NN210 12-15- S-64 1,208 .1.305 1,118 6,35 5.83 5.66 1,35 1,38 1.05

TMLE D-3 WAVE DISPLACEMENT 5pECTKUN [MILES (1972)]
1200 Feb. 10, 1962 Ship-Weather Reporter Record No.
Variance- 11.6438 M**2 Sig. Wave Hgt. - 13.6568 M
Noise Level- 0.2993 M**2/RFs CUT-OFF- 0.225 RFS
DOF- 26 Total DOF- 120
T(-l)-
K(-l)-
N
0123456789
10111213141516171819202122232425262728293031323334353637383940
12.1150 sec
0.7650
(%s)
0.000.050.100.150.200.250.300.350.400.450.500.550.600.650.700.750.800.850.900.951.001.051.101.151.201.251.301.351.401.451.501.551.601.651.701.751.801.851.901.952.00
T(l)- 10.1342 sec T(2)-
K(l)- 0.7108
0.00000.00000.00000.00000.00001.40032.6504
15.653341.845045.795630.055016.2779
9.24357.06544.27804.41762.62072.19311.95182.09002.47242.06851.50420.98570.86971.14811.01560.62770.61980.64560.61420.63590.53590.30570.27770.23350.27030.39210.32480.27930,3209
0.00000.00000.00000.00000.00001.10102.3511
15.354041.545745.496329.755715.9786
8.94416.76613.97874.11822.32141.89381.65251.79072.17311.76921.20480.68640.57040.84880.71620.42340.32890.33200.32810.30620.20400.05690.00000.00000.0000o.of+550.03090.00180.0008
D-7
8.9675
S2
NW189
sec
(M,,2/~s )
0.00000.00000.00000.00000.00001.40782.69o2
16.308742.806246.659230.961716.91139.93417.87234.89605.39623.26082.87142.72163.21954.29203.86212.92241.85911.73462.91392.78901.88031.67531.94872.23192.42541.89200.62090.00000.00000.00001.00090.82140.05730.0319

s(”) In’lrp,60.0
I NW 189L
40.0
Lm,=11.6m’%3=137m1200Z Feb.9, 1%2
20.0
0.4 0.8 I.2 1.6 w
5((U)m’/rp$1.2
\
NW 223
0.8 mO=0.35mz
‘,0’2.37m!2002March 12,,9,5
0.4-
J0.4 0.8 1.2 1.6u
Fig. D-2 – Sanmle Suectra Estimated
I
fro; Tuc~er Shipborne Wave
Recorder Data.
0.[2
O.oc
0.0.
s(w) all’,rps
hNw 288
~...0+ !8r”2
‘,,, ”082 m12002 Aw 9,1967
*0.4 0.8 [.2 1.6 w
r-
S (UJ) m’/rp,0.06
0.041200Zhtcy18,!’36C
0.02
0.4 0.8 I.2
Fig, D-3 - Sample SpectraShipborne Wave
from TuckerRecorder Data

is not done very often. This particular instrument has yielded a wealth of data onthe wave conditions jtistto the west of the British Isles over a period of almosttwenty years. Data on wave statistics can be found, for example, in a rePC,rtbYDraper and Squires (1967). The Tucker Shipborne Wave Recorder has also been in-stalled on a ship off the coast of South Africa for a number of years and is cur-rently in use on the weather ships from Canada that occupy weather station PAPA inthe North Pacific.
Data Buoys
The February 1975 issue of the “Data Buoy Technical Bulletin” (Volume 1 No. 6)published by the NOAA data buoy office, NSTL, Bay St. Louis, Mississippi, contains Idescription of a modification of the experimental buoys developed by NOAA so thatthey now provide real time wave spectral data. The article in this technical bulletin describes the system quite completely, and there is little point in paraphrasin~it. Therefore, the article is quoted in full below.
BUOYS NOW PROVIDE REAL TIME WAVE SPECTRAL DATA
“A new experimental wave measuring system was installed on two environmentaldata buoys in early December 1974. Both EB-01 (deployed in the Atlantic off NorfolkVirginia) and EB-03 (deployed in the Gulf of Alaska) are 12-meter diameter discusbuoys configured to produce, each 3 hours, raw data from which wave spectra are com-puted. These buoys are equipped with payloads that include an on-board programmablecomputer. The wave sensor hardware on board these two buoys consists of an acceler-ometer and a two-stage electronic double integrator sensor system that produces ana-logs of acceleration, velocity, and displacement for the vertical heave motion. Theon-board computer has been programmed to produce data from which heave displacementspectra are computed. A total of 51 data words associated with measurement of spec-tra is reported to the Miami Shore Collection Station (SCS) once every 3 hours.
‘rTheinstantaneous acceleration analog voltage is sampled each second by thebuoy multiplexer and analog-to-digital converter. Readings are taken for approxi-mately 15 minutes; the on-board digital computer processes these samples into 51autocovariances of acceleration, corresponding to lags of 0,1, 2 --- 50 seconds.These autocovariances are encoded and relayed to the SCS. They are then partiallydecoded and relayed to the Data Handling Center at the National Space TechnologyLaboratories. There, raw spectral densities are produced from the autocovariances,Harming smoothing is applied, noise corrections are made, and the spectrum is modi-fied to account for the ocean platform transfer function. Finally, the heave dis-placement spectrum is produced by assuming superposition and operating on each spec-tral density with U-4. These computations result in the graphic presentation ofspectral density for heave displacement at frequencies of 0.01, 0.02 --- 0.49, 0.50Hz.
“The performance of these systems has been determined by comparison of thespectra produced by the EB-03 system to spectra produced by a Waverider buoy de-ployed nearby. Shown below are results of this comparison test, during which EB-03was not anchored, but tethered to a ship standing by. Other tests have been per-formed and evaluations are continuing, but all preliminary analysis indicate that
D-9

—.
the spectral data are excellent.
“Both EB-01 and EB-03 have heen producing these spectra each 3 hours sinceearly December 1974. These buoys are being used to test the new measurement conceptfrom both the engineering and operational points of view, with the objective of in-stalling similar systems on future operational buoys.
-- NOBO Contact: K. Steele”
As can be seen from Fig. D-4, which accompanied this article, the spectra com-pare quite favorably. It is hoped that this experimental program will be extendedto include the other operational buoys presently on station in the North Pacific,the Gulf of Mexico, and off the east coast of the United States. If this were done,there would be a total of five experimental buoys, two in the Gulf of Alaska, twooff the east coast, and one in the Gulf of Mexico that will be able to obtain wavespectra every three hours routinely.
It is noted that these experimental buoys are quite a bit smaller than weatherships and that they probably track the rise and fall of the sea surface quite wellat the frequencies involved in the gravity wave spectrum. Thus only minor modifica-tions are required to relate the twice-integrated vertical accelerations recorded bythe sensor installed inside the buoy to the wave spectrum.
It might also be noted that there have been a number of variations of the basicTucker principle tested on various ships. A device with a laser on it that projectsover the bow of a ship can be used to measure the distance between the instrumentcontaining the laser and the surface of the water below. This distance plus thetwice integrated acceleration of the laser thsn yields a wave record. The problemwith this instrument is that the bow of the ship, especially when the ship is underway, may plunge below the surface of an oncoming wave and the entire instrument sys-tem may be damaged, or torn completely loose from its mounting, and lost at sea.However, for not too high waves such a system does provide better information on thehigh frequencies in the wave pattern.
Wave Poles and Wave Wires
Another system for recording the rise and fall of the sea surface as a functionof time at a fixed point is a wave pole, or a wave wire mounted in a fixed structure.Also pipes with spark plugs sticking out of the side at fairly close intervals havebeen used. The rising water shorts out these spark plugs as it rises and the signalthat is produced is a measure of the position of the last shorted out spark plug.These wave poles or wave wires work on a variety of prin~iples. Some sense thechange in capacitance induced by the rising and falling of water, others sense a changein resistance. However, the output is simply a graph of the rise and fall of thewater at the point involved. For all such systems, the frequency response of therecorder is usually a problem, and there tends to be some roll-off at some frequencythat in general is not too high. In considering the work of Stacy (1974) it appearsthat the very high-frequency part of the spectra of hurricane waves in the Gulf ofMexico may have undergone some attenuation due to this roll off. Such a recording
D-10

-
.m01Jh?4m,Hz
Figure D-4. Comparison of Displacement Spectra from EB-03 andWaverider at Latitude 4B0 54’ N, Longitude 126° 22’ W.
D-n

system has the disadvantage that it requires a fixed platform for installation.Consequently wave poles and wave wires can only be operated in shallow water. Waverecorders referred to as Baylor gages were installed on oil drilling platforms in theGulf of Mexico by a consortium of oil companies a number of years ago in order torecord the waves generated by hurricanes that passed near by. Later, the same oilcompanies supported a program to develop a numerical wave specification and numer-ical wave forecasting procedure for hurricanes in the Gulf of Mexico.
The Baylor gauge is described in a report by Draper and Fortnum (1974). Twomodels are available. One contains the electronics and transducer in a stainlesssteel bousing that can operate when submerged; the other is more conventional. Thewave staff consists of two tensioned steel wire ropes spaced about 9 inches apartand electrically connected to a transducer at the top of the staff. The sea wateracts as a short circuit between the two wire ropes and the transducer meaaures thea.c. impedance so that the length of the wire above the water surface is known.
The Waverider Buoy
The Waverider buoy is a sphere 0.7 meters in diameter. It is weighted to floatwith a preferred upward direction. An antenna sticks out the top, and the upperportion is transparent so that a flashing light can be seen inside the buoy. Thesensing system is an accelerometer that tends to stay vertical as the sphere pitchesand rolls on the waves. The sphere is tethered by an elastic line to a submergedbuoyant flost that produces tension on the anchoring line. It behaves essentiallylike a small fluid particle of sea water and follows the orbital velocity of thepassing wavea essentially in circles of varying radius with time. The vertical com-ponent of the acceleration of the buoy is recorded and double integrated. The out-put is therefore a representation of wave elevation versus ttie in Lagrangian coor-dinates. To first order, a spectrum from such a record is essentially the same asthe spectrum from waves passing a fixed point (see for example Cbang (1968)). Ofthe many commerciallyavailablewave recordingsystems,this one appears to havebeen very successful. A study by Briscoe and Goudriaan (1972)describesthe variousways that the data can by analyzedand shows numerous spectraobtainedfrom the datarecordedby this system.
Calibration of Wave Recorders
Draper and Humphery (1973) have compared the calibration of the shipborne waverecorder and the Waverider buoy. One of the problems in calibrating an instrumentthat sensesthe vertical acceleration of its motion ia that it is difficult to builda device that will accelerate and decelerate the recorder over distances much largerthan three meters. The shipborne wave recorder and the Waverider buoy have beencalibrated for simulated wavea of about three meters in height, but this did notdemonstrate the full capabilities of these recorders which are frequently used tomeasure much higher waves. In order to simulate waves of much greater height ar-rangements were made to use the “Big Wheel” Ferris wheel, or merry-go-round, atSouth Sea Fun Fair. This Ferris wheel has a diameter of 14 meters and could be ro-tated to give si.mulated wave periods from about 13.6 aeconda to 30 seconds. The ac-
D-12

-
celerometer part of the Tucker shipborne wave recorder and the Waverider buoy werefastened to a seat of the Ferris wheel and the Ferris wheel was rotated at variousspeeds, as rapidly as 13.6 seconds per rotation. The output of the recording systemshould be, after double integration, a sinusoid with height given by the diameter ofthe wheel after correction for known calibration effects.
The conclusions of this study were essentially that both instruments function aspredicted except that the shipborne wave recorder response was better for long peri-ods than had been theoretically calculated and that a slight correction to the pre-vious calibration for long period waves might be made under certain circumstances inanalyzing the data. The errors in the measurement of the waves as a function of tbefrequency spectrum are very small indeed compared to the problems of sampling varia-bility for the data. The two systems can be considered to have been thoroughly cal-ibrated by these techniques and by the studies that bad been carried out previously.
D-13

APPENDIX E
A Tabulation of Available Measured Spectra
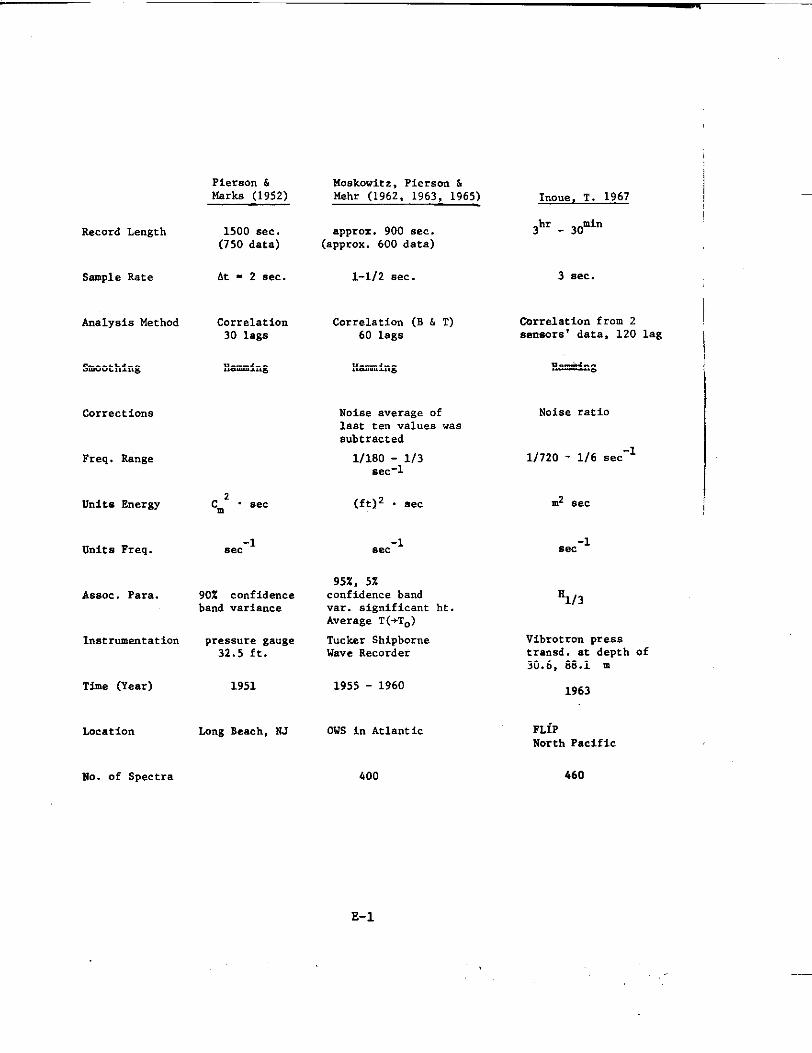
RecordLength
SampleRate
AnalysisMethod
Smoothing
Corrections
Freq.Ranse
UnitsEnergy
Units Freq.
Assoc. Para.
Instr.mentation
Tfme (Year)
Location
No. of Spectra
PierSo” 6Marks (1952)
1500 sec.(750 data)
At = 2 sec.
Correlation30 lags
Hamming
c2
. secm
-1sec
90% confidenceband variance
pressuregause32.5 ft.
1951
Long Beach, NJ
Moskowitz,Pierson&Mehr (1962,1963,1965)
approx.900 sec.(approx.600data)
1-1/2sec.
Correlation(B 6 T)60 lags
Hanming
Noiseaverageoflasttenvalueswassubtracted
1/1::=-11/3
(ft)z. se.
-1sec
95%,5%confidencebandvar.significantht.AverageT(+’20)
TuckerShipborneWave Recorder
1955 - 1960
OWS in Atla”tiC
400
Inoue,T. 1967
~hr- 3omin
3 sec.
Correlationfrom 2sensors’data, 120 lag
RamiMng
Noise ratio
11720 - 1/6 sec-1
~z *e=
-1sec
%3
Vibrotronpresstransd.at depth of30.6, SS.1 m
1963
FLiPNorth Pacific
.560
I
E-1

Record Length
Sample Sate
AnalysisNethod
Smoothing
Corrections
Freq. Range
Units Energy
Units Freq.
AtwOc. Para.
Instrumentation
T2me (Year)
bcaticm
2S0.of Spectra
.
Pickett (1962)Lazanoff (1964)
20 tin.
1 sec.
CorrelatIon60 lags
11120-112 sec-1
f tz sec.
-1sec
Total Energy
ResistanceWirestaff
1961, 1962
ksus Island
100
Brown,Stringer& Kelly (1966)
112 hour
Auto-correlation120 lags
ftz . Sec
-1sec
TotalEnergy
SparBuoy
1966
Pacific
E-2
Miles, N. (1972)
~otin, Ismi*
At - 0.613 sec
FFT
20 point averages10 point overlap
low passanti-aliasingfilteraveragelow freq.Cut offhigh freq. smoothingandwhite noise subtraction
O - 5.12 @Scoqut ed
o-2rps
mzlrps
radiansper sec (rps)
var.,sig. wave ht.T(-1), T(l), T(2)analosue+dig. + analog+ 10V pass filt.+digit.
Tucker ShipborneWave P.ecorder
14 years, 1954-1967
StationIndia,OWS WeatherExplorer,ReporterIII,Adviser
323
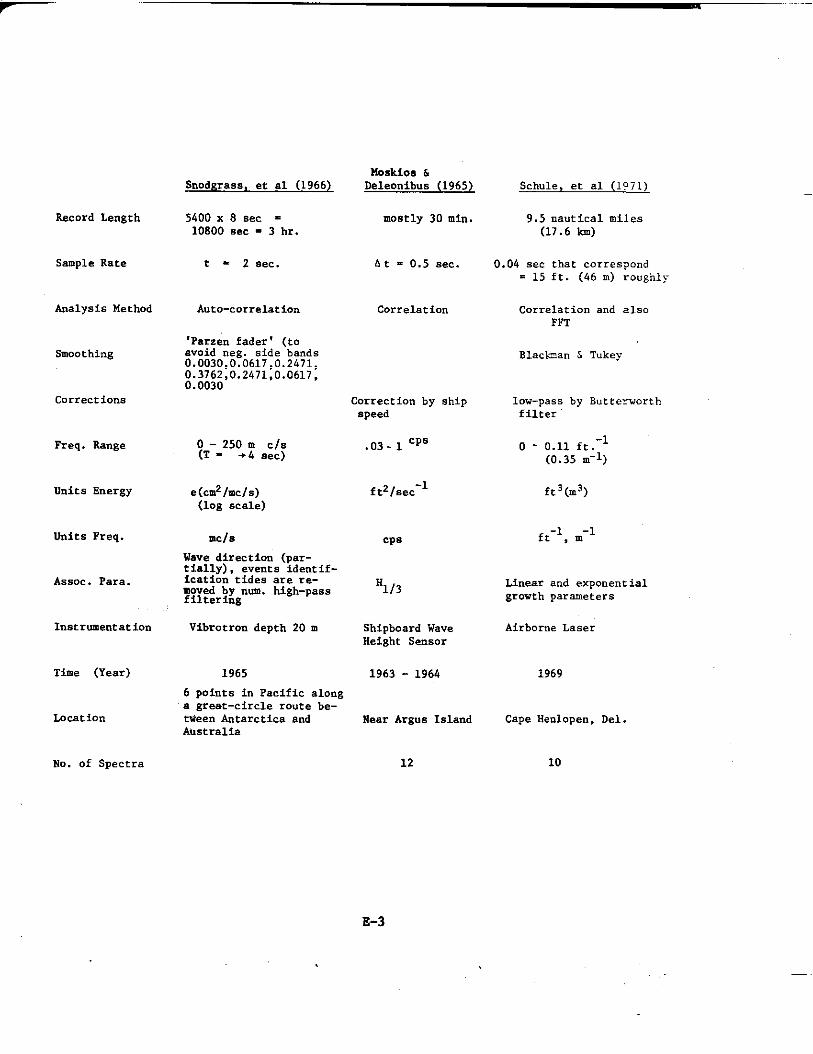
Snodgrass,et al (1966)Moskios&Deleonibus(1965)
mostly30 min.
Schule,et al (1?71)
RecordLength 5400x 8 sec =10800sec= 3 hr.
9.5 nautical miles(17.6 h)
SampleRate t = 2 eec. At = 0.5 sec. 0.04 sec that correspond= 15 ft. (46 m) ro”ghl:
AnalysisMethod Auto-correlation Correlation Correlationand 21s.FFT
“Parzenfader’(toSmoothing avoidneg.sidebands
0.0030,0.0617,0.2471,0.3762,0.2471,0.0617,0.0030
Corrections Correcticmby shipspeed
.03-1 ‘p’
low-passby Butterworth
filter
o - 0.11 ft.-l(0.35m-l)
Freq.Range ~T- 250 m CIS. +4 See)
ftzlsec-1UnitsEnergy e(cmzImcts)(log scale)
fts(ms)
-1 -1ft, mUnitsFreq. mcls
Wave direction(par-tially), eventsidentif-
Assoc.Para. icationtidesare re-movedby mm. high-passfilteri”g
Cps
%/3Linearand expo”encialgrowthparameters
Instrumentalion Vibrotrondepth20m ShipboardWaveHeightSensor
1963- 1964
AirborneLaser
Time (Year) 1965 1969
6 points in Pacific alonga great-circleroute be-
Location tveenAntarcticaandAtistr.alla
Cape Hen20pe”,Del.NearArgusIsland
No. of Spectra 12
E-3

Record Length
sample &te
AnalysisMethod
Sm..thing
Corrections
Freq. Range
Units Energy
Units Freq.
Assoc. Para.
Instrumentation
Time (Year)
Location
No. of Spectra
Barnett =dWilkerson(1967)
1200- 1700
0.05 sec. correspond
Correlation
Hamming
Airplanemotion wasfiltered, fIeq. “=Stransformed
.05 - .25 CPS
Bennett (1968~
1800 SeC(lBOOdata)
& = 1 Sec
Correlation60 lags
Pa#:wlag
o - 0.5 Hz(used O - 0.2)
m’ se.log- ower density
8IN lHz
Cps
growth of wind wave
Rz
DirectIonal
radar wave profiler& accelerometer(resOlu- Bottom Pressure
tion 1 ft. in verticalInstrument Array
100 ft. horizontal) (6 probes)
1965
Offshoreareas of theMiddle Atlantic States
1965
Gulf of Mexico offPanama City, Florida
Rudnick (1969)
1728 sec(864 data)
At = 2 sec
Correlation64 lags
Hamming
Cps
Directional
FLIP - Press sensorat 30 m, two hori-zontalace.
1963
near 39”20’N148”30’W
E-4

Record Length
Sample Rate
AnalysisMethod
Smoothing
Corrections
Freq. Range
Units Energy
Units Freq.
Assoc. Para.
Instlume”tatio”
Time (Year)
Location
No. of spectra
Caul a“d wing andBrown (1967) Hogben (1971)
15 mm 10 min.(900 data)
At = 1 SEC At =lsec
correlation Correlation
45 lag
Blacluaan& Tukey Hamming114,112,114
high and low freq.range were cut off noise
correction
O - 0.5 Hz(o - 0.35) O -0.25 Hz
~T2/& m2 se.
m Hz
B.F. No Hs Tz,Wind Dir.,WaveDir.
press. gauge in FFNM(free-floatin’gwavemate.) s accelerometer Tucker Shipbormfor Monster BUOY Wave Recorder
1966-1967 1963
Berm”daa“d off Marsden SquareSan Diego 285,286,287,217,
218,219,251,252,222
6 97
Yamano”chi (1969)
10 min.
lit = 0.5 sec.
Correlation60 lags
Q filter -0.06,0.24,0.64,0.24,-0.06
0-2 rps
m2 sec
circularfreq. rps
var%/3
ShipborneSncounterWave Recorder
1968
off Honshu
E-5

Longuet-Riggins,Cartwright&Smith (1963)
Record Length 12-17 min.(about2000 data)
Sample Rate At - 0.5 SeC
AnalysisMethod Correlation(57-66 lags)
Smoothing ILmming
114,112,114
Corrections subtractednoise energy
Freq. Range 0.4 - 4.0 rps
Units Energy F& XC
f3nitsFreq. circular freq.rps
A.ssoc.Para. directionalspectra
Instrumentation Roll-PitchBuoy
Time (Year) 1955-1956
Location )?.ngland
No. of Spectra
E-6
Ewing (1969}
25 min.
bt = 0.5 sec.
Correlation100 lass
0.8 - 0.24Cps
0.S - 0.24Cps
directionalspectra
CloverleafBUOY
1967
R.R. S. Discovery56”45’ N18”57‘ W
...L ..L.

Record Length
Sample Rate
Analysis
SmOotmng ICorrection
Freq. range
UnitsEnergy
UnitsFreq.
Assoc.Para.
Instrumentation
T2me
Location
# of Spectra
Notes
Rafer (1970) Lockheed (1974)
I hr. 8,10,20min.
At = .61035
COrrelation
.04-.2 Hz
ft2/ffz
w
Correlation
I limited
.053-2.0
mtlrps
ace. & press+ read Tucker
1967-69 1971-73
Coast of BC Pacific- betweenSeattle& Japan
425 176
Ship at speed
Larsen andFenton (1974)
30 min.
At = .8789
FFT
Imean and
trend removed
mzlrps+ ft
rps
Vibratron
1972-73
Cobb Saamount
614
Ploeg (1971)
20 min.
B&T
Ifanmingf
fttlrps
accelerometer
4,000
46 published
E-7
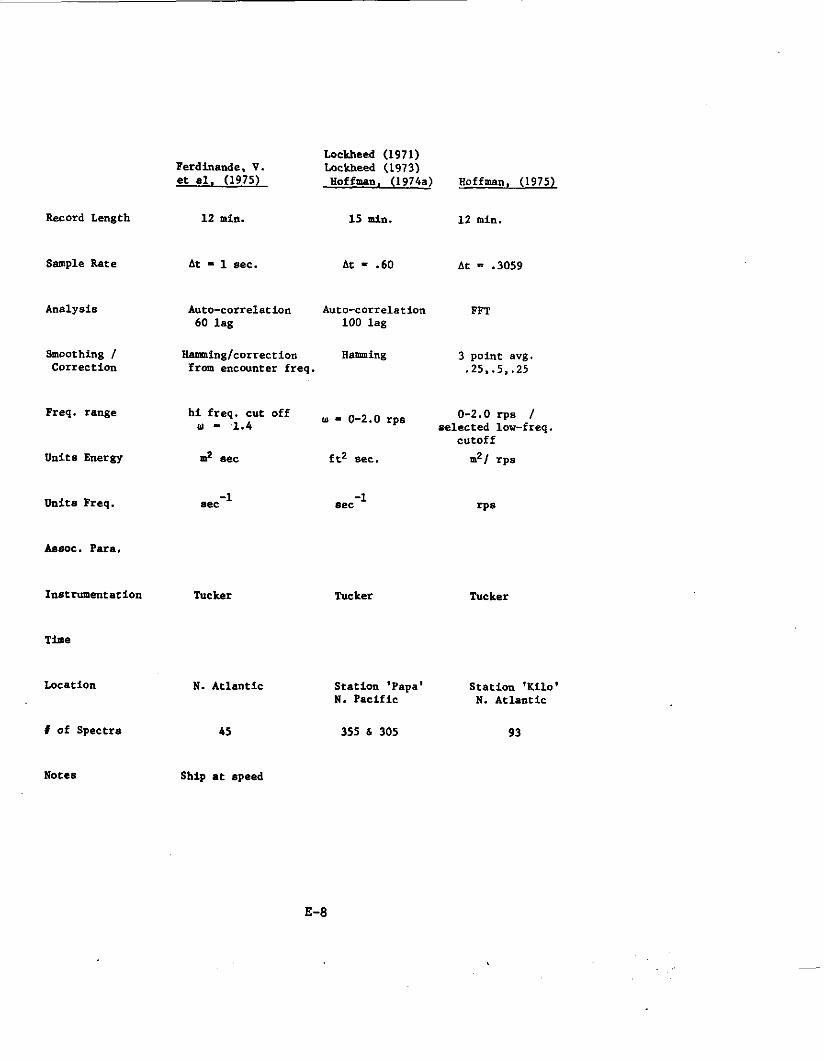
Record Length
Sample Kate
Analysis
SmoothinSfCorrection
Freq. range
Units Ener8y
Units Freq.
Asaoc. Para,
Instrumentation
Tfme
Location
t of Spectra
Notes
Lockheed (1971)Ferdinand, V. Lockheed (1973)et al, (1975) Hoffman, (1974a)
12 min. 15 mh.
lit- 1 sec. At = .60
Auto-correlation Auto-correlation60 las 100 lag
Saminslcorrection HammingTrmo encounterfreq.
hi freq. cut offu - 1..4
mz sec
-1sec
Tucker
N. Atlantic
45
Shipat speed
u = 0-2.0 rps
ftz see.
-1sec
Tucker
Hoffman, (1975)
12 min.
At = .3059
FFT
3 point avg.,25,.5,.25
0-2.0 rps Iselectedlow-freq.
cutoff
mz/ Tps
rps
Tucker
Station ‘Fapa’ Station ‘KilotN. Pacific N. Atlantic
355 6 305 93
E-8

-
Record Length
SampleRate
Analysis
Smoothing I
Correction
Freq. range
Units Energy
Units Freq.
Assoc.Para.
Instrumentation
Tfme
Saetre (1974)
13 min.
NOBO (see text)
At = 1 Sec
F~ auto-correlation51 lag
avg. over 6 harmonicsj Sa”ni”g / buoy
equilib.law tail at hi transferfunctionfreq. knowm
.02-.2 N2
M2iHz
Sk
Tucker
Winters69-70,71-72,72-73
LOcat ion North Sea
# of gpectra 41
Notes Storm epectra
.01-.50 Hz
mzIHz
Hz
Accel .
EBO 03 56”N,147.9”wEBO 13 36.5”N,73.5”WEBO 12 26”N, 94”W
System still underdevelopment
large no. of spectraavailable,potentialforlarge amounts of highquality spectra
E-9
~wc (see text)
every 12 hours
.04-.16HZ
f t2/Hz
Hz
Computer forecastusingPiersonlNTUspectralmodel
COntinuous
NorthernHemisphere
2275 grid points inN. Pacific
12 direction,15 fre-quency c-ponents ateach grid Pint
APPEWDIX F
Catalog of Tucker Shipborne Wave Recorder Data
From ISSC 1973 Committee 1 Report
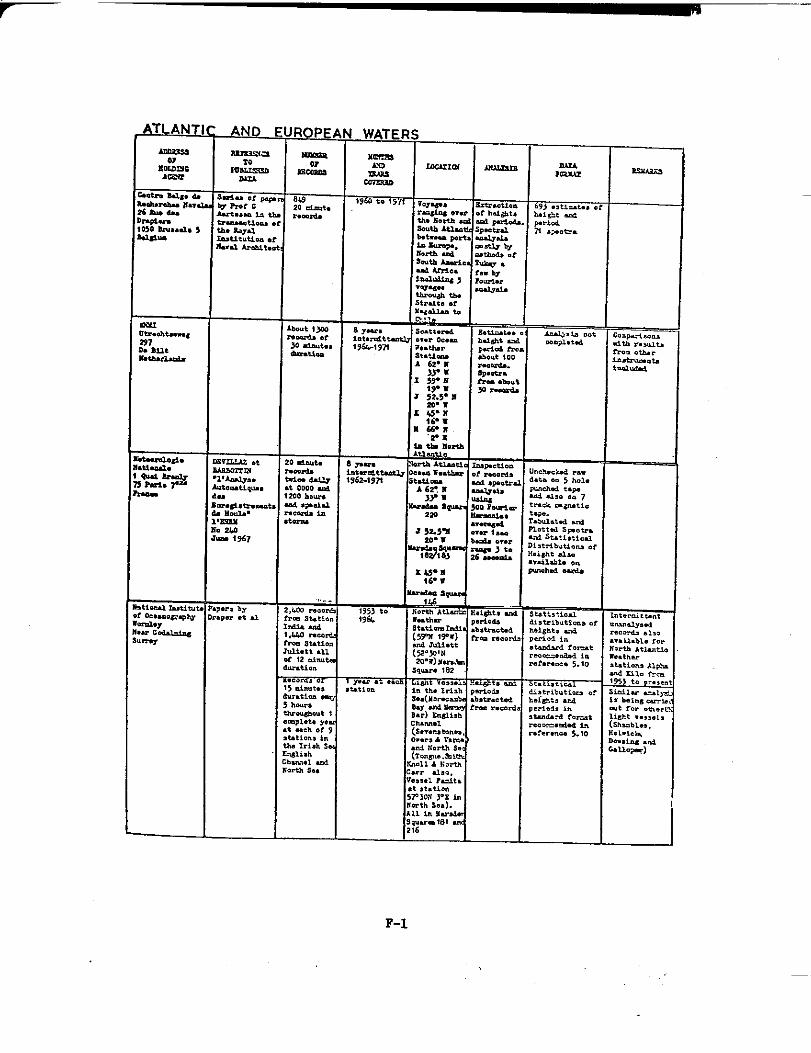
ATLANT AND EUR PE
T
-. -Id!. =J&
, t
F-1

ATLANTIC AND FUROPI
Nlms% mgwmaa
da F&m*!=S!.T DATA
I
-. .._-
-W&0
5,6 “-”l=,,5 tinu,..Iur.u..
Tt
r ,Z.,m Brui* Zstk.t.. .1a....ra 1,.lm a,r..,Qr p-la fro.. ... . 526 “cold..Smtt.r.d me CQ. t., ‘ml
rE.rdQn SWn-o *C P,.*.V.:B2W555:81 , frm 97
(huh~t)nb: ,n7.‘218. 219.Z5iti?sl
L
h.= ,.-”be ‘kUY& .P.dtiCOr$s 1..er.au.”.
I SW .,8, I
F-2

F-3

APPENDIX G
SOURCES OF UNPUBLISHED lf3ASUREDDATA
FROM
RSPORT OF THE INTERNATIONAL COMMISSION
FOR THs
STUDY OF WAVES
Excerpt from Bulletin No. 15 (vol. 11/1973)
of the
Permanent International Association of Navigation Congresses

AFRIQOT DU SUD — SOUTH AFRICA
1, HydraulicsResearchUnitS.A.CouncilforScientificandIndustrialResearchP.O.EIOX320Stcllenbosch(Cape)
2. oceanographyDepartmentUniversityofCapeTown%tvateBagRondebosch(Cape)
3. Oc-eanographicResearchUnitAngloAmericanCorporationOranjemund(SouthWestAfrica)
4, FkheriesDwdopment CorporaiionP.O.Box 539CapeTown (Cape)
5. OceanographyDivisionNationalPhysicalResearchLaboratoryP.O.Box 1COngeOa(Natsl)
1. SeewettcramtHamburgdesDcutschcnWetterdlenstes
2. DcutschcsHydrograpbischesInstitut2 Hamburg4 Bemhard-Nocht.Strasse78
3. BundesanstaltfurWasscrbauKarlsruhe
4. InstitutftiOcophysikdcrUniversititKiel
23KielNeue UniversAiX,HausB 2
5. TwhnischeUniversit%Hamburg
2Hamburg 36Jungiusstrasse9
6. Biologische.&MaltHelgoland
2192Helgoland
7. BundesforschungsanstaltfurFischerei2 Hamburg 50Palmaille9
G-1

8. — Strom— undHafenba.HamburgFocsch”ngsgruppeNe.werk
9. Forschungsstetten auf den InsdnNorderneyHe1801andSyo
10. Hydrautik — bzw. Wwserbauinstituten der Universkitene.aFranziusimtitut der T.U. HannoverWtchtweissinstitut dr.r T.U. Braunschweig3nstitut ffir theoretische Geophysik der UnivemiIX HamburgOzeanoqapbiwhe Forsch.ngsanstah KietImtitut ftir Mcereskunde KietBiotogiscbe Ansttdt HelgolaudBundesforschuossanstatt fii Fischemi
BUGIQUE — BELGIUM
L Monsieur ~Hydropaphe en ChefService Sp&iat de la C8teRue Christine 1138401 Ostendc
CANADA- CANADA
1. Cb.ief.EngineerDcsi8n Branch, Department of Pubtic WorksSir Charlm Tupper Buitding, Riverside Drive, Ottawa 8 (Ontario)
Z Tbef)iiorMadoe %ienca BranchEnvironment Canada6t 5 Booth Street, Ottawa (Ontario)KfA 0E6 Canada
3. The HeadHydrmdics bbontmyDivision of Mcchamical EngineeringNational Research CouncifMontreal Road, Ottawa (Ontario)KM 0R6 Canada
DANS- - DENMARS
L Vandbygningsinstituttet(OinishinstituteofApptiedHydraulics)Oster Voldgade 10Dk 1350 Copenhagen, K
G-2
.—
2. Vandbygning$direktoc?.ted(Dunish Board of hlaritimc Works)Kampnmnnsgade 1DK 1604 Copenhagen. V
mA39-~s D,.U@SIQUE - U.S.A.
L 3S. S. Army,‘Gsslal Engineering R&arch tinterKtngman BuildingFort Bdvoir, Virginia 2206QU.S. A.
SBPAGNS - gPA3N
L 3-abOIatoriode PucrlosRamo” IRIBARRENAlfonso XII, 3 — Madrid — 7
PINLANDE - S3NLAND
L Fhisb Meteorological InstituteVuorikafu 2400100 Helsinki 10
2. Finnish Oceanographical InstituteVuorimiebenkatu 100140 Helsinki t4
PltANCS - PSANCE
1. Service Techniquedm PharcsetBalks(1)1%routedcStains94- Bonne@sur-Mame
Z M4t40rologie Nationale Fran$aiw (2)1, Quai Bmnly75 — park P
3. C8ntrc Nationsf d’Exploitati.n des O&.m (CN=O)39, Avenue dWna75 — F& 169
4. Imdtut Francs,is du.P6trole (1.F.PJ1, Avenue de Bois-Prtau91 — Rucil.Malmaison
(1) Stations Onreldstm,mt a. law d. Ham (2 stations), i Rose.fl c1 k Port H.li.um + 3 tiuk dkmr4tremem a McJi-tmmte + okrvauons “iw+ll”.OtT-dwm -dins station%1. front of Lc H.vr. [2 swims), at R.%wU .nd .t Porl Hmligum + 3 dins b.op in {heMediwramm + visual .krv.ti.ns,
f2) k.. f~tcs ?wc emresistre.m,T.ck.er .UX points mtit.rologiqtm K et A (.. Jl + .taa’vati.m riwell~Two frlgatea wuh T=kr recmdmg mtr.mc.t$.1 rmteomlwcal poim K .“d A (or 11 + visual .krv.lmm
G-3

5. SOGREAH84186 Avenue L&on BlumCedex n. In38 — Grenoble-Gare
6. Laboratoire Central c?Hydrau!ique de France10, Rue E@ne Renault94 — .Maisons-AUOrt
7. Laboratoire National rYHydraulique
6. Quaiwati~78 — Chatou
8. Ceotre de Recherches et rYEmdes Ocianographiques2, Avenue wpp75 — Paris 7e
cw-D%B=TAGn . UNITSD 15.WDOM
1. British Oceanographic Data ServiceInstitute of Oceanographic SciencesWomdey Godalmkg (Surrey)GU85UB
z Mcteorologk.tl Office (Marine Division)Eastern RoadBrackmU (Berkskire)
ISLANDE - IRSI.AND
1. Meteorological Sernce44 Upper OCOnnell StreetDnbli” I
2. National Committee for Geodesy and GeophysicsStudy Gm”p of Oceanographic Obsemers(Chairman : Nick Bary of University college, Galway)
ISR&$L — ISRAEL
L TheIsraEl Ports AuthorityCoast study DivisionP.O.B. 15Ashdod
2 The Israeli Metewologicd ServiceClinutologiad Dtvision
P.O.B. 25Beit Dason
G-4
—

-
IIALIE - rrAI.Y
L
z
3.
4.
1.
z
3.
4.
1.
z
1.
2.
3.
Istituto Cmtrak di Statis!icaDireziouc Ciemerzde%vizi Tcmici
Rcparto SF
LWCO Roma
Skationsitrtophotogrammttriqucetdynamcnnttrique en service dcpuis 15 ..s :(Stereopbolowammetrical and dynamonutricd station operatin$ since 15 years):Ufdc40 del Genio Citile per 1. Opine MarittimeNaPoki
Mituto Talassografic.a ~ F. Ver~lli nvia Romolo Gessi 2Trieste (d6pendard du Mitist&e de ~Agricultwe — controlled by the h!inktry of AKriculluce)
istitwoIdrografcnddJaMarinaGeneva(d&pendantdelaMm”neMilitaire— .mmmlledbytheNe.vy)
JAPON - JAPAN
Chief of tbe Construction SectionHarbmr Bureau Ministry of Transport3.1-2, Krsumikaseki,Cbiyoda-KuTokyo
The Fisheries Asency (Ministry ofAsric.lrureandForestry)
The Ministry ofConstruction
Tbe Universities
MAROC — MOROCCO
Sem”* delaMtt60roIogkNationale7,rueduDmteurVeyreCasablanca
BibLiothtqueGiniraleduMinist?rcdesTravauPublicsRabat
NORV12GE- NORWAY
The Norwegian Meteorological fnstitutefWels Henrik Abelsvei 40Oslo
f3et Norske VerbsResearch D@artnmnt0510
Oept. of Port and tieao EngincerinSThe Tccbnical University of Norway70M Trondheim
G-5

PAYSBAS — NETHES3.AN09
1.
2.
3.
4.
5.
6.
7.
8.
9.
10.
11.
RijkswatmtaatDirectie Waterhuisho.diog m Waterheweging
Konin.q$kade 25%..Gravenhage
Rijkswaterstaat
Deltadknst
Van tiemadelaan 402‘s=Gravcubage
K.N.M.1. (lnstitut Royal Mttiorologique)De silt
W-aterloophndig LaboratoriumB.P. 177DeUt
Rijkswatm staatStudiedienst Vlksi.genprim Hendrikweg 3Wissingen
RijkswaterstaatDeltadiemtMoetdienst voor afsluitingmvcrkz.amnheden en metingen in de Z.euwse WaterenVan Veenla2.n 1Zierikzee
RiikswaterstaatDeltadimst
Meetdienst voor het BenedmririerengebiedKanastwex 2 (OZ)HeUev0e&i9”
RijkswatersiaatDirecde Waterhuisho.ding en WaterbewesingAfdelin$ HydrometieKoningsk?.de 25‘s-GravenhagO
Rijkswaterstaat●
Studie&enst UmuidenDe Wetstraat 3Umuiden
Rijkswaters@atStudiedienst HoomGrote Oost 26Hoom
RijkswaterstaatDirectie GroningenAfdelins StudiedienstFarmmerzijl 10Dell%jl
G-6

-
12. RljkswaterstaatZuidcrmmwrkenAf&ling WatcdoopkundeKanaalweg 3‘6-Gravenbmge
POLOGNE - POLAND
1. Insdtut Polonais #Hydmlogie et de M&?oroIogieSection MaritimeGdpiaut. Wazyntom 42
L Institut dcsConstructionsHydmtectmicpes de l,Acad&nie Polonaise dm ScimcssGdansk-Oliwe.u3. C!ystersow 11
3. InstitutMmitirmGdmmk Dlugi Targ 41/43
PORTUGAL - PORTUGAL
1. L.aboratorio Nwiond de Engeaharia CivilAwnida do BmsilL&boa .5
2. fmdtuto Hidrogra6w(Minis3erio de Marinha)RusdasTrinas49fisboa2
3. DireL@o dea %m”cos MaritimmRua &s Porlns de Santa Ant&a 167Maboa 2
4. Sern”so Meteorolosico NationalRua Saraiva de ~ath.a 2Lisbcla 3
Us&s,- u.ss.&
1. Strdc Oceanographic rnstituta6 Kropotkin$ki pcreulokMoscow
2. 0ccanolo2y Institute of tbe U.S.S.R Academy of ScicnwsL Zmnjaja ufitza, LublinoMoscow
G-7

Situationscptcmbre1972scptember 1972
,.
PAYS
COUNTSIPS
Akiw d“S.(ISouulAfrico
Allm.mm (R4P. F66.)Cornmny (Fed. ReP.)
DOCUMENTATION CONCEliNANTLES ENREG1STREMENT5DE LAMES
INFORMATION RELA’2XD TO WAVES RECORDS
Omnlsnm + dmsea
Organizations + Addrum
Hydraulics Rescamh Lh,it RA.Council ror Sci.ntikand r.d.wri.l ]kmwchP.0, Box 320S[cllonbosch (Cam)
Fishcri= Dm’dopmmtCorporationP,o. no, 539Can, Town (CaPe)
D,utsches HydrowaPhischesInstitut2 Hwnb,m 4 tlemhmd-Nochlslrassc 78
E.dmild. r,nrw.i,,lemcr,t
Recorditw Site
Uchwd BayA.wcl my.Id,nl,a thyM,% Point
;an, bmi.a,nbc,[, baaiJhvo P.i.1:.lkbmi;o. sbmih,lkbati
k & Syll
Comdonn&, gtq.,aphiques
Geogrnpbicd C..rdinaIcs
Lo”gk”de Latitude
Durte d’mrcgismmmt(c. m.is)
Recording Pwi.d(month)
elkk> 6 mois
oflcctiw6 month
101:
9
3s,433,6M,90,48,1sS,30
2s3030
::
;:
4:
:;
~39
6.
&oul&dt, Wb.t
awed $.<besi..ms
—
:0.
(1)
x
Dut
Ob]cctiw
—
:,C
[2)
—
xxxx
xxxx
:
x
—
N.
[3)
—
xx.xxxx
1xxxxxx
—
M,
:4)
—
x
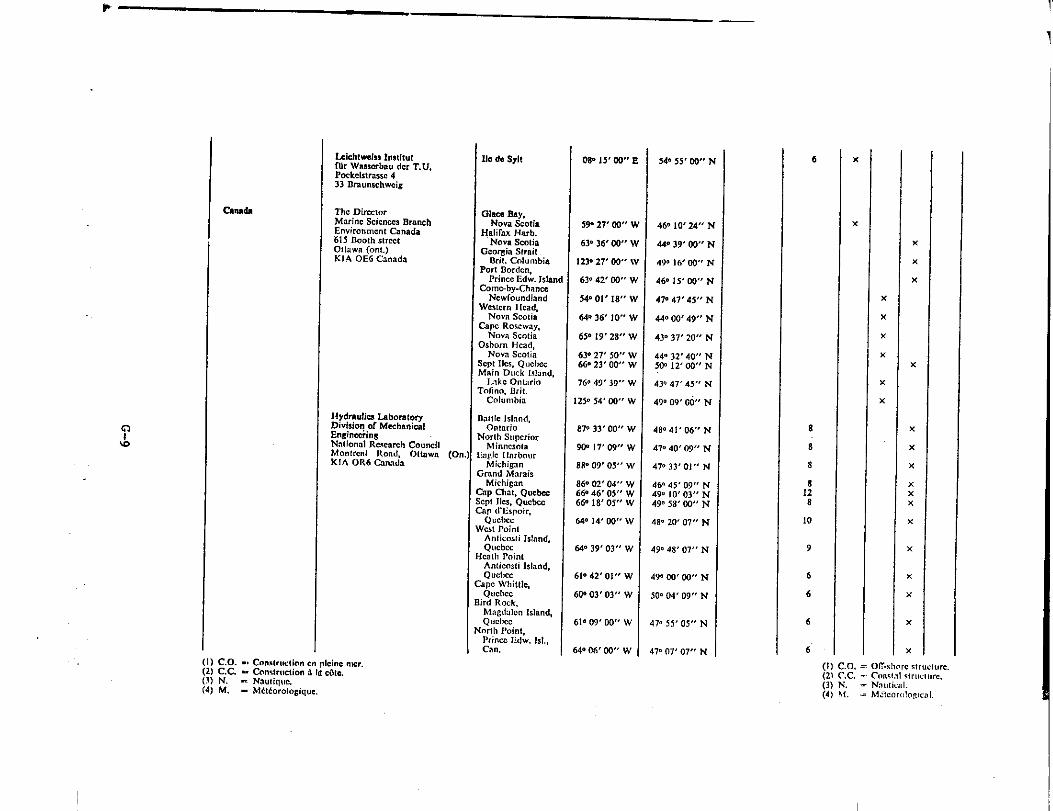
,.
1
Cured,
(1) Co. -, C“”,lr,lutl”n m ,1.4”. “*,.(1) CC. .- Conslroctio. A 18.Ote,(N N. = Noutk, ue,(4) M, - M&&mol.8iq.e.
Laichtwdss ImtltutllJr Wa$,crb, u de, T. U.Pcckelstra,sc 433 Drm.mhweig
The lli<ccto,MnriIIc Scimcm Br.mhEnvi,mmwnt Canada615 Booth streetOttawa (“”i.)K[A 0E6 Cmada
Hydraulics Laboratorybivkiq of Mcchmic,d;“E?.W,.8~al ikmal R.sw.rch Cc,uncj,Uo“t,.$!11<..<!,<maw. (0.<1A0R6 Chnm!a
[1. de Syl! 0W15< W’,
$927,00’, ,
53°36, W’, 1
13.27< w< 9
;3. 42, 03-1
!4. 01, Is- 1
W 36, 10<<!
;~. ,9. *~.? y
!3. 27, 50,,Y6.23,K)>,v
6,49,39,,V
5.543 w, v
7.33, 00- v
w 17, 09,,M
R-07’05<, N
5.02,04”M946’ 05- MP 1s’05,, w
[. 14, 02- \\
1.39’ 03,< w
.42, 01,, W
6@03,03,, W
61.09, c?@’W
W w L-al- w
w 55, w,
$6.10,24”:
M. 3P’ w i
W I(3,W 1
16.15, 00’, 1
17.47, 45-1
14.00,49”1
.3.37, 20” F
4-32,409, ?@ 12,00- F
3“ 47,45- !
9.09’ Gti F
SS4!, 06,, N
7.40<09<, N
7.33,01- w
5. 4S. 09,< N?. 10<03>, N)0 5S, 00,, N
1°20<07<< N
,.48, 0,,, N
10,2,2,m.. ~
,. 04, 09,, N
o 55< 05,, N
- 07, 077, N
6
8
8
s
1!8
10
9
6
6
6
6
x
x
x
x
.
K
K
,
x
x
x
x
<
<
<
(
(!1 co,= OILSIW. Slru.,,or,.(2) Cc, - r,,”,,,,! s,rw,,,,c,(3) N, - N.u!i.d.(4) M. = M,lcorc,lon,c.1.

PAYS
cam-rules
DmmmrhDmnmrk
b“.
Organism-+ .dms$es
Otgmizatiom + Addmsxs
V.ndbyminminmimttctDa.ish Hydraulics ImtitOmter Vold2ade 10DK 13S0 Cownhwcn K
ServiceTcchniqwd“ Phwcs et Bdises1<..1. de Stains 1291- D.nnc.il-s-Mmm
3nbomt. ire Nationalcrllydm”liqllcQuai Walicr 678- cl,,:.”
En&witde l’cnmEiwrmtIetIt
Rcco,dinE Site
East Point,Pri..o Edw. 1s1.,c.”.
cane North,cape B,e[on,Nova Scotia, 5.,
Fwsq..ile Point,IIrightm, On.
Hmslhulm tkub.(North 2CI)
Hirtdmls Hub,(North S.,)
Kmachi Ha,b.(Ambian S.,)
Slint.l.n,, is, S<”egrd
c4.xdorlnte3g$ogm.hiqlm
Geo2raphiml Coordinaks
Lormitude
61. S2, 02,< W
60s 16, M’, W
7P 44,03’, w
08. 3s, 31,, E
W57,1M”E
d6°S8,[2,>E17°41,36,<E
05.03,!2,,B
01. 4Y 10- w0!. 49, 55- wU- 40, S63-WIIP 36’ 07,, w0P40’2S,W
Latitude
46031, M’, N
S7. 07< 39,> N
5P 35, 34,7 N
24°47, 06,, N1S”S9<35,< N
4> 19’ IM’S N
.ITcctiw> 6 mois
effectiw6 month
8
12
104
24
3624
2.0
(1)
—
x
But
Objective
—
:.C
(2)
—
x
x
xx
x
xx
:xxx
xxx
xxxxx
—
N.
(3)
—
x
x
—
M.
[4)
—

-
xx Xx.x. XXx xxx xxx xx
x
G-n

x xxx x xx
G-12

Xxxx xxx xx XXxxxxxxxxx xxx
XXxxxxxxxxx xxx
x x x
Xxxx
}
-i
G-13

Xxxxxxxxxx xxx xxx.
XX,xxxxxx. xxxx x. ,x,x .. 7... x
xx xx x.., Xxx xxx xx xx
x.x
G14

U.5.A
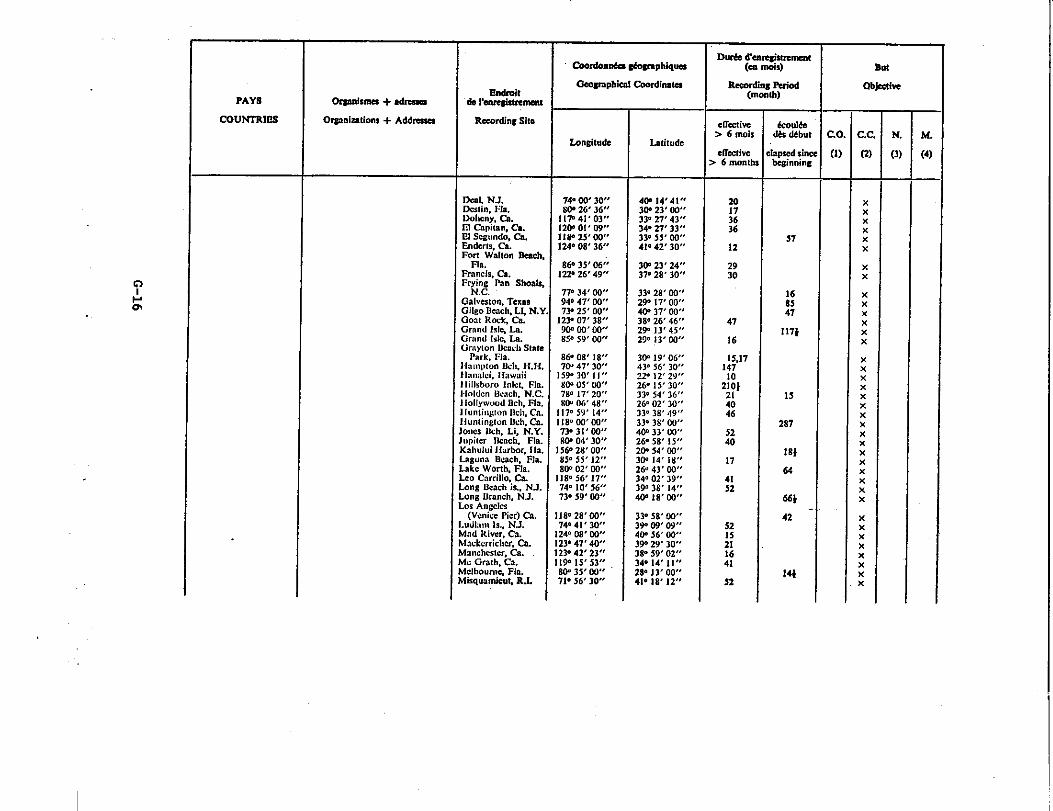
PAYS
CQ7J2473W2
OmrJslm$ + dmsaw
[email protected] + Addm.sim
Emdmitde l%lu@12mm
Recwlins Sit,
ht. NJ.ksti”, Ha.).hcny, cm1 C4mimn, C8.,1Scc,mdo, Ca.“de,,,, C,.Orl Walton SeactFl,,
r.l”cis,cl.O& Pm Shoal,
1,1,,s,.., T,XMIIlg. Beach,L2,N.batRd. G.ir”nd 1,1., La.rnnd MC, La.I,w,”” ]kuul, S,at2%k, 13a,. ,m,}!o” 3!4 H.H;x,mki. Ilawtiiilkboro lfilct, F),old.. 13c;,ch.N.C.1 Iy,vu”d 33ch,Fla,Ind!,l$o” 11.1,,c“u.tington I!+h, Ca,,., u&, Li, N.Y,pitcr Ikwb. Fla81!UIui Iiwbor, I 1,,wm Btach, F1a,kc Worth, l=!..m Cwril lo, Co,,,“* B,ach is.. NJ,ng 33rrmch,NJ.,, An@m(W.ic. Piw) Cz,JL,,,, I,., NJ.nd River, C..:Wk.,rricl,cr. Cn.wchc$lm, t..c Gm,h. C..,Ibour,% Flaisquamic.t, RJ,
7.m8itude
74. W 30,,NY 26’36~r!1?41,03,,12W0[,09,,11*2S’0%124.0S,36<>
8@ 35, Cd”12P 26,49.,
7P 34,00-94.47’02”73.25, 00-
123.07< 3S<<wco, oO-S5. 59, CW
M“ 08, ls-7LN47P30<,
159°30<11,,w“ 0s, Lo’,7s. 17, 20-W 06’ ‘4s,,
117.s,), 14,,I 18.w Lw73”31,80”SW 04,30-
156.28,00<,8S. 55, 12,,Sw 02, 02,,
11S.56<17,,74.10, 56-13.59, 0!2,,
!18.28 <03,,14-41, 30<S
124.08, 00)>123.47.40’5123. 42,23,,11915, 5s’48W 35, W,,71. M’ 30-
Latit.dc
@ 14,41,,3W 23,00°$33.27,439,24s27, 33‘,33.55, 00,,4P 42, 30><
312@23, 24,,37°2S,30,3
33.2s,w,29.17,!30<>w 37,M’,3S026’46°.2P 13,45,,29.83,w,,
3W 19,06,,43.56’30<,~,o,*?29..26”1s’30,,33.54,36,,26.02,30’,33.38’49,,33.38,cuss4@ 33,co’,16.58<!5,>2* 543WY!]@ 14’18,,26.43,09<<34.02,39,,39s38,14,,W 18,00<,
33.58,W3909,09,,W St!’00”3W 29’30<<38.$9,02”!4.14,11,,28.13,00,<41.18<12,,
.kctiw> 6 moi
.17cczivc6 Mm
57
::47
117*
1s
287
!8t
64
W
42
14
:(
[1
Clbjatiw
—
N,
(1
—
But
—
M,
(4]
—

———. .— --
17,1222
%211l;!
211Zg
3457
17
22
_ .—
108 I
102I179
96
30
2s
172
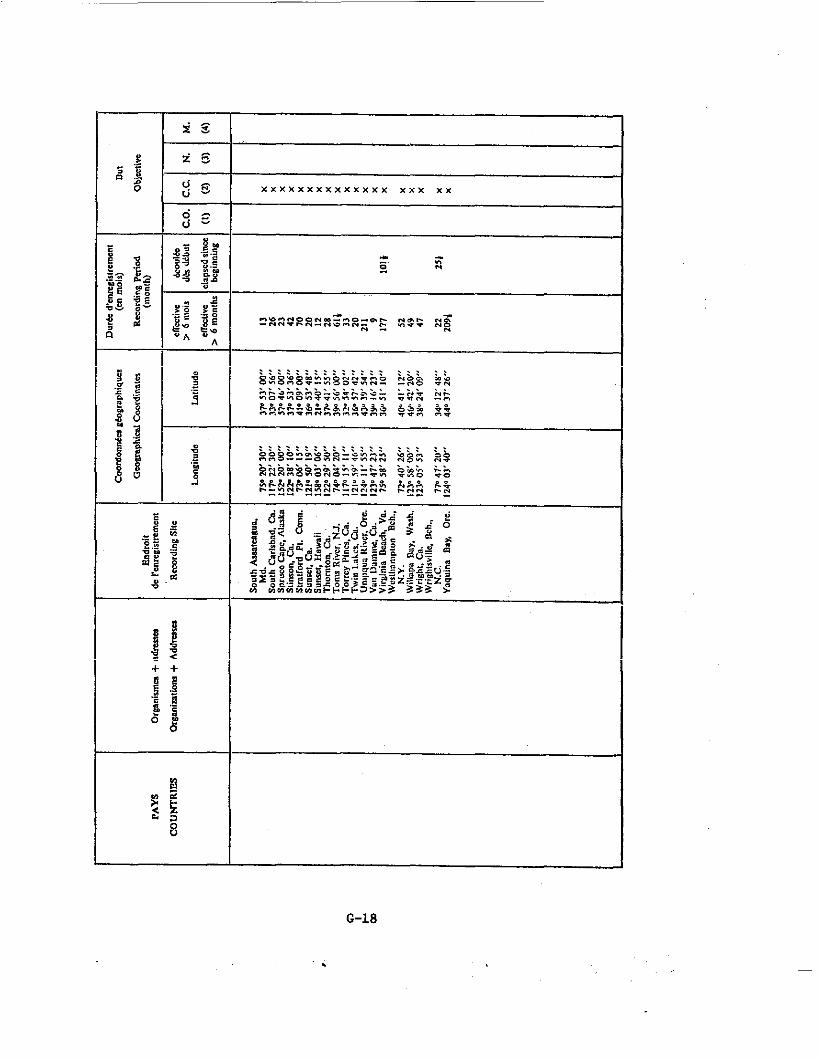
G-18
.
APPENDIX H
A COMPARISON OF THE DRAPER AND SPECTRAL METHODS OF ANALYSIS
This is a part of Hoffman (1974) , “Analysis of
Wave Records and Application to Design, ” Inter-
national Symposium on Ocean Wave Measurement andAnalysis, New Orleans, 1974, Vol. 11, pages 235-
253.

-4
The methods of data collection and analysis are closely linked to the specific
application fOr which the wave data are intended. While for response calculationof most types the spectrum is ideally suited, the maximum expected wave height is thecriterion for determining the height of a jack-up platform above the mean waterlevel. For long-term statistics the distributions of wave heights and periodsin various ocean zones are required which are often presented in histogram formatgiving the probability of exceedance and the frequency of occurrence of suchconditions. It is therefore desirable to establish the appropriate analysistechnique for each application and, furtherumre, to illustrate the relationshipbetween the results obtained by different analysis methods.
A large amount of wave measurement data is available to date oniy in ananalog form on paper strip charts. These represent data collected over the pasttwenty years, such as thousands of records at Weather Stations A, 1, J, K in
the eastern Atlantic, and other locations around the British Isles, recordedhy pen recorders. During the la.st few years the development of portable minirecording devices, along with the advent of the digital computer industry, haveled to more economical data storage such as tape cassettes as well as on-linedigitizing and processing of data using analog to digital converters in conjunc-tion with a digital computer. Wtiilewave records stored on magnetic tape areusually easy to reduce and analyze, the analysis or transfer of paper stripcharts to magnetic tape are usually time consuming and require variable amountsof manual work.
A substantial amount of the available wave records in deep water was col-lected using a Tucker wave meter mounted on small ships or trawlers and astandard analysis technique of the data was formulated through the”years and re-cently presented by Draper (1966). Each record, approximately 12 minutes long ischaracterized by stx parameters including the highest and second highest crestsand troughs about the mean line, and the number of zero upcrosiings as well asthe total number of crests. From the above parameters significant wave height(H ) is calculated, as well as the predicted maximum for a s~ecific steady1(3
sta e duration such as three hours . The zero crossing period Tz and the crestperiod ~c are also calculated as well as the spectral width paramster eT definedas
‘T= [1- (3211’2Most of the data analyzed as described above, which include but are not
limited to Draper (1965, ’67, ‘71), are-presented on an annual as well “asa seasonalbasis including the following:
1)
2)
3)
4)
Bar charts of the probability”of exceedance of Hi/s and ~=.
Histogram of zerc-crossing periods (Tz).
Histogram of spectral width parameter (ST).
Scatter diagrams illustrating the probability of occurrenceof wave con~itions within li~ted height and period bands suchas usually customary to describe visual wave statistics.
Two additional presentations suggested by Draper (1966)are diagramswhich illus-trate the persistenceof a range of wave heights of a given wave condition,oncea thresholdheight is achievedand the lifetimewave which is an estimateofthe most probablevalue of the height of tbe highestwave in the lifetimeof astructure.
H-1
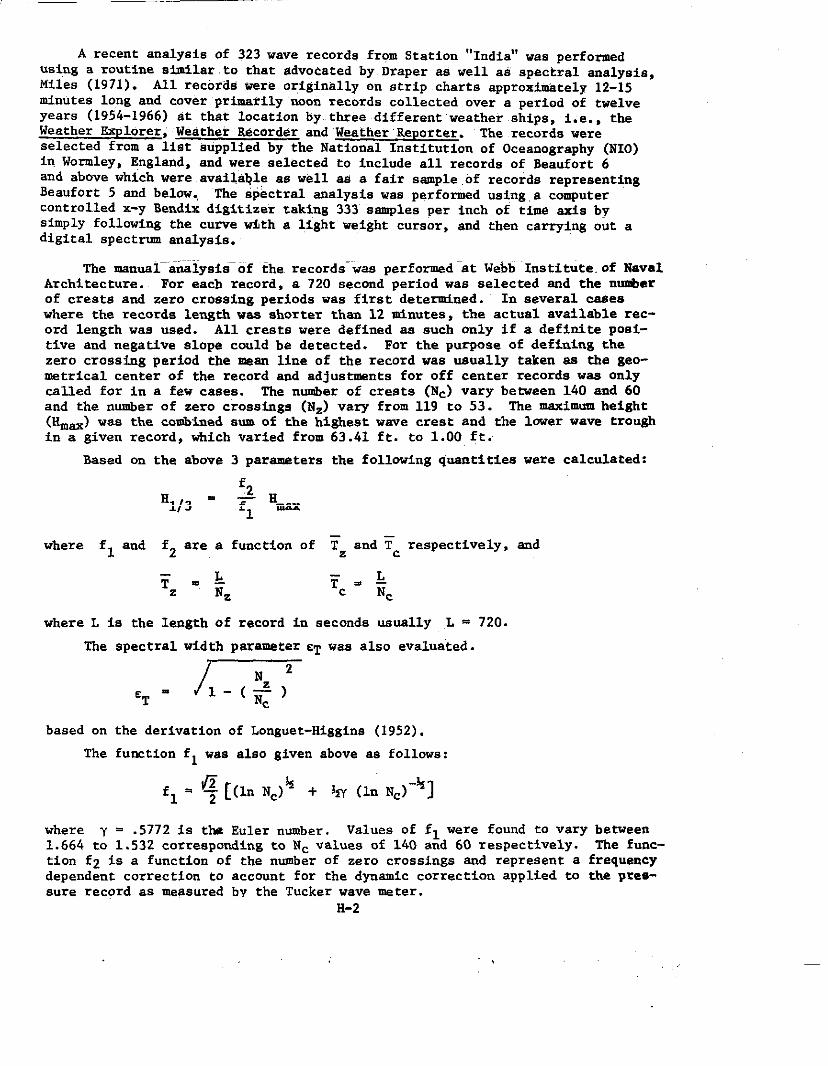
A recent analysisof 323 wave recordsfrom Station “India”was performedusing a routine similar~to that advocatedby.Draper as well as spectralanalyais,Miles (1971). All recordswere originallyon etrip charts approximately12-15minutes 10ng and cover“primarily“noonrecords collectedover a period of twelveyears (1954-1966)at that locationby three clifferent weather ships, i.e., theWeather Explorer;Weather R6cGrderand“WeatherRepdfter. The recordswereselectedfrom a list suppliedby the National Institutionof Oceanography(NIO)in Wormley,England,and were selectedto includeall recordsof Beaufort 6and abovewhich were availa$leas well as a fair sample of recoide representingBeaufort5 and below., The Spectralanalysiswas performedusing.a computercontrolledx-y Bendix digitizertak~ng 333 samples per inch of time axis bysimply followingthe curvewith a lightweight cursor,and then carrying out adigital spectrum analysis.
. . . .. .-The manual analysis of the.records-”i?asperformed “at Webb “Institute.of Naval
Architecture. For each record, a 720 second period was selected snd the nunberof crests and zero croseingperiods was first determined. In several oaseswhere the records lengthwas shorter than 12 minutee, the actual availablerec-ord length was used. All creets were defined aa such only if a definite posi-
tive and negative slope could be detected. For the purpose of defining thezero crossing period the mean line of the record was usually taken as the geo-metrical center of the record and adjustments for off center records waa onlycalled for in a faw cases. The number of crests (Nc) vary between 140 and 60and the number of zero croesings (Nz) vary from 119 to 53. The ~im~ height(~a) was the combined sum of the highest wave crest and the lower wave troughin a given record, which varied from 63.41 ft. to 1.00 ft.
Based CI-Ithe above 3 parameters the following quantities were calculated:
‘2%/3 “ q %x
where f~ and f2 are a function of ~z and ~c respectively, and
5= -. + Tc. kz Nc
where L ie tha Iength of record in seconds usually L = 720.
The spectral width parameter CT was also evaluated.
/N2
‘T -l-(f)
based on the derivation of Longuet-Higgine (1952).
The function f~ was also given above aa follows:
fl = $ [(in N=)% + 3fl (ln N=)-%]
where Y = .5772 is the Euler number. Values of fl were found to vary between
1.664 to 1.532 corresponding to Nc valuee of 140 and 60 respectively. The func-tion f2 is a function of the number of zero crossings and represent a frequencydependent correction to account for the dynamic correction applied to the pree-sure record as measured by the Tucker wave meter.
H-2

-
The frequency response correction f~ is given as a function of frequencyand can assume high values for the higher frequency range. Hence, each spectralestimate is multiplied by a different constant. ‘“Inthe above a-nalySisa meafi”-value.:representing the square root of the frequency response correction mustbe applied to the measured height and it is usual to select the constant cor-responding to the zero crossing frequency. For each of the three ships, a dif-ferent frequency response correction table was obtained and f2 values variedfrom 1.020 for zero crossing frequency of ..48radfsec to 1.872 at a zero cross-ing frequencyof 1.00 rad/sec.
The Hi/3 value obtained from spectral analysis were calculated from thesquare root of the area under the spectrum (rms) times four, i.e. ,
/j
.
%/3 = 4S(u) do = 4~
0
All spectra were represented at discrete frequencies between O -2.0 rad/sec atincrements of .05 radlsec.
The comparison between the HI/3 values obtained by the two msthods is il-lustrated graphically in Figures H-1 - 4. The overall agreement is rather good,though a slight tendency toward a lower estimate of Hi/3 from ~ is somewhatevident. For the 0-10 ft. wave height group, the approximation technique seemsto slightly overestimate the HI/3 by roughly 10%. Over the next range of 10-20ft. as well as 20-30 ft. there seems to be an increase in the scatter about themean line. However, the distribution about the mean lime is approximately equal,indicating an exc~l.lentagreemant between the two techniques with a standarddeviation of approximately *2.5 ft.
The data for HI/3 larger than 30 ft. are rather scarce; only 14 Of the 323records fall within this range. Most of the data fails below the idealizedmaan line, with only one point above it and two points lying on it. Hence, ingenera2 it can be stated that the predicted Hi/3 ia a reasonably good estimste.This, however, should be further investigated due to the fact that the relation-ship between H1/3 and HWX shown previously was made under the assuWtiOn Of anarrow band process. In reality, the value of ~ aa calculated from the ratioof Nz and Nc varies between 0.20-0.70, rather than the ass-d cue Of CT = 0.
The general relationship between Hm~ and Hi/3 WaS develOped by Car=ightand Longuet-Higgins (1956) using the distribution of maxiwa,
0max % ]%+% [1n(1_c2)% N]%[h (l-cz) N~=
P2 %(1 - %E2)%
2 - E2, i.e., the second moment about the origin
the number of crests
the process width parameter
Euler number
the Ze~Oth%
nuxnsntof the process, -=%
peak to mean, or mean to trough variation
H-3

m.,,.......“,.. .
.. ...
. .
,..,
++
--.-LL
Lc.
.“
.
. . .
. .
. .. .. . -
‘3“~” ~ . W“
3
K..“... ”.,
:. ..:. . ... .
. ....-
.’.“ -
. . .. .. :..
. . . . . . ..’: ... . . .. .
.. .. .
\
-.. .
. .. .
. . .. ..... .
.
mm” ~ . ~,T
11‘3
--lI
II”‘– y
m>
z
—
H-4

- —
8
L——.
----> .
+’,,
+ I
,.,c..
,’
,\
—.
+_——
\
‘%——
+
+
\
\
++
+
\
+
+
+
++
4
—
+&-
+
*
\+
\
+
+
-:
— :.,
I“
.;,,
m2
z
11 j

Substituting n and p;
Substituting for ~ the
fi [[h (k’)%N]% + b [In(1-s2)% N] ‘]generalized expression for c # O
*% . ~1/30 T
(1 - E212 i%
c4 ~ (1 ‘c2/2)% = fij[ in (1-.2)% N] % + ~ [In (1-.2)% N ] ‘%
1
/i H1,32EW= H-=
[[ in (1-.2)% N] % + %Y [In (1-s2)% N] ‘%
2(1-c2/2)~ 1
n= ‘1/3
f;max
+ln(l-E2) N + %[
%in (1 - 62) N]
-%
‘: =(2- E2)~
for c=O
‘$ [ (ln N)%‘1
=fl= + % (1IIN)-% I
where N is the number of zero crossings (Nz) which is equivalent to the number
of crests (Nc) .
Values for CT were calculated using the relationship between Nz and Nc andit was found that the range of f4 shift upward by approximately 8-10% hence,causing an equivalent decrease in the predicted Hi/3 value.
This, however, was offset by a correction of approximately the same orderto the HI/3 values calculated for the spectrum as a result of inclusion of zin the following relationship:
‘1/3 =4 (1 - S212)+ L&
Values of ET calculated from Nz and Nc were compared with those obtainedby the second and fourth moment of the process -es. It can be generally con-cluded that in spite of the fact that the difference in the order of 40-50%existed between the Hi/3 values obtained by the two methods the general agree-ment shown in Figures H-1 - 4 was maintained.
Comparison of the zero crossing period T= estimated for the record withthe calculated zero crossing period as obtained from the second moment of thespc[.t:rum,j.e.,
H-6

-
m
T2 .Zmg
are of a rather poor quality. In most cases, the predictedperiod was in theorder of 10-25 higher than the calculatedTZ and only 10-15 records out of 323were approximatelyequal or lower than the ~z calculated. In general, the ~zvaluee were in closer agreementwith T-1 or T1 respectivelyas illUStrated inFigure H-5.
The relatively large error in T and c is expectedbecause of the crude wayof maaeuring N= and Nc directly from the strip chart. It should be remembered,however, that even though the absolutevalue of T and E ray be in error the dis-tributionof the data is valid and is extremelyuseful for a quick relativelyinexpensiveanalysis of wavee in various ocean zones. It should also be notedthat the large difference in T and c between the two techniquesas compared tothe relativelygood agreemantof the HI ~ ratios can be logicallYexplained.
dWhile Hi/3 ia related to the zeroth mo nt of the process T is a functionofthe eecond mmment and c is a functionof the fourthmoment both of which aremore dependent on the tail of the spectrum. At this region, the Tucker wavemater reaulta require an increasinglylarger frequencyresponse correctionfunc-tion which ia often of a magnitude larger than the rest of the lowez frequencyrange. The tendencymay thereforebe to exaggeratethe spectral ordinate inthe tail of the spectrum in soma cases, which in turn “willcause a larger mo-ment with a correspondinggreater increasewith fourthmoment. It will alsoaffect the value of c~ as shown by the expressionbelow
~2 %c~ =,(1-*)
2
Aa a result of 2 decreasing the term under the radical sign gets larger andhence c increaee%
The comparisonbetween the predicted and calculatedzero crossing periodsand the epectralwidth paramater i.sillustratedin Figs. H-5, H-6, respect:ti~i::,,It is apparent that in the case of the period, the predictionmethOd is genera:..,higher than the calculated~. by 10-20%. The spectral width parameter ST as oiltained from the number of crests; is generally much lower than the calculatedvalue from the mnments of the record in the order of 20-30%.
A comparison of seven records all having a period T1 between 8.5-9.0 secOndaand Hi/3 between 11.50-15.00 ft. is given in Table H-1 shciwingthe characteristicparamatera as obtained by the two methode. It is evident from the table thatthe mean value of Hi/3 is extremely close by both rnethcdsand ~Z correspondsbetter to a period lying somewherebetween T-1 and TI, the energy average per-iod and the average wave period respectively. The mean deviation of q-is sobetarrtialand amounts to about 25%.
It is further illustrated that the values obtained from the analog rec,riiare conaistent and the deviation about the mean, though somewhat larger thanthat of the values obtained from spectral analysis are all the same, which isextremely useful in defining wave conditions at various locations.
It should be also noted that for several of the records the H~/3 was cal-
culated by averaging the 1/3 highest peak to trough heights over the length of
the record. The results obtained were within 3-5% of the calculated HI/3 from
H-7

“L ‘1T, -,2
* - ,.O,,,,.,,b
/
. . :
f=. 1.21) *2-7.,/ , —
... . :..: ... .
* / “.. ,. / ‘.,. :.. .~;, ,,:.G
, i .:. . “ T, - ,.4,, ,2. ,,
e. . . . . ..
,., j~lji?.:’./:yj~.,:..i.,,..::..%,,.,. ..,lx/ /
dII 8 4 Lb Ii ,> ,, ~
Fig. H-5 - Relationship between values’ of T2 and ~ calculatedm
from spectral analysis and the analog r~cord.
..-K:<
..I . . 1 I
. . . . . 1 ..
iI
. . . I . . . .“. .I . . . .. . .
..6- 4 -. -. /. . . .
. . .. . “..“ .
. .“ . .. . . . .. .
. . . . /:.
. .. . .“.,
I1“ A
j,---- 1 q /-1 “r),, 0!3 ..$
Fig. H-6 - Relationship between c~ and CTfrom spectral analysis and the
,,. @C-alculatedanalog record.
H-8

TARLE H-1
ComparativeResults of TWO wave AnalysisMethods
From SpectralAnalysis From Analog Record
RecordNo. ‘1/3 ‘-1 ‘1 ‘2 ‘s ‘1/3 ‘max
7=‘T
N=
182
224
228
265
268
273
277
Mean
13.45
14.01
11.47
13.58
14.57
14.90
14.78
13.87
9.33
10.60
9.61
9.80
9.81
9.76
9.94
9.83
8.56 8.11
8.84 8.02
8.72 8.24
8.98 8.44
8.86 8.31
8.73 8.20
9.00 8.29
8.82 8.24
.624 15.34
.700 14.44
.628 10.10
.658 13.87
.662 13.50
.638 16.20
.687 14.60
.660 14.00
22.07
21.48
14.83
19.80
18.75
22.50
20.79
20.03
8.89
9.35
9.35
9.35
9.11
9.00
9.86
9.27
.391 90
.586 95
.465 85
.586 95
.513 80
.553 80
.585 75
,.526 86 I
the spectral area. The only correction to the actual peak-to-trough heights wasa constant correction for frequency response, which was applied using the valuecorresponding to the frequency of the spectral peak.
The excellent agreement between the values of HI/s calculated by the dif-ferent techniques is of great importance and is indicative of the flexibilityof the Draper method of analysis. Although when comparing individual recordssome substantial deviation may occur occasionally, for statistical purposeswhere the mean is required, excellent agreement is shown in Table H-1 for HI/3.If T= is taken as the mean of T-1 and TI, a close approximation results. Itis felt, however, that the discrepancy in the periods by “thetwo methods is ofconcern.
The preceding comparison is of further significance since it covers boththe most comprehendive and the simplest possible approaches to data analysis.Several other methods fall in between these two techniques. For example, therms of the record can be determined directly from the record, and hence,the significant wave height. Similarly, by analyzing the peak-to-meandistribution of the record, the H1/3 can be directly obtained, as mentionedabove.
The degree of sophistication that should be applied to the data analysisshould be compatible with the method used to collect the data. If the latteris deficient, it may be useless to carry the analysis to a high degree ofaccuracy. In the above example, the source of the data in both cases wasidentical, i.e., paper strip charts recorded by a NIO Tucker wave meter.The limitation of the NIO recorder at high frequencies is known. It should,however, have a limited effect on the zero-crossing period which is a functionof the second moment only.
H-9

The broadness factor, E, is a function of the fourth moment which is moredependent on the high-frequency tail of”the spectrum; which msy be affectedin both techniques by the nature of ctierecord”obtained from the Tucker ineter.The discrepanciesare therefore”large And verj little”similarityexists betweenresults obtainedby the two methods.
‘l’hepurpose of the preceding evaluation was two-fold:
1. To evaluate the Draper technique by comparing with
spectral analysis and hence provide a criterionof accept-ance for the large amonnt of data already analyzedby thistechnique.
2. To determinethe extent one is justifiedin using it forgeneralanalyeisof strip chsrts.
The complete answer to these questionscan only be given in terms of theship responsesas predictedusing one eource of wave data or the other. If,however,one has to judge the reliabilityof such data baeed on the wavecharacteristicsonly it is apparentthat the method proposedin Draper (1966)only providesa partial answer, i.e., a good estimateof the significantwaveheight,but fails to supplementit with additionalrequiredinformationsuch asthe period or othsr parametersof interest.
E-lo
I
APPENDIX I
SAMPLE MllASUREDSPECTW

~1——....-.-——..—.—-
1 16-17 NOV. 1971Ma
1no
—.,
0900 h,,
1200 .
o
Sample from: Saetre, H.J., “On High Wave Conditions In the Northern NorthSea,” Institute of Oceanographic Sciences, Surrey England,Report No. 3, 1974.
This report ccmtxi.ns:a[)nu:dy::lsuf waves measurc,ldt,rl),::tIlreewinters byf.f/V- in the uortl)ernpart of the NcurthSe:,(77” “III’N, 1<’IX)’E). ‘fIw41spectra were selected from the S.LXmost severe sturms illordel t.1)study gruwthand decay of the spectra. It is concluded that storm spectra Lrom the North Sea(and North Atlantic) have the same form and that their shapes are similar to theJONSWAP spectrum, i.e., the spectrum has a much sharper peak than the Pierson-Moskowitz spectrum. In Seneral the wave spectrum 3 hours before the spectrumwith maximum total energy is sharper and has more energy in the peak frequencyband. For example, compare the spectra for 1500 and 1800 in the above sample.
Saetre fi.n,lsgood corre Iat.inn I,etweer)parameters dc rIved tti~jngthe moments
of the spectra and those clef iued IIV ‘T!!rkc!-’s method of visually in~pecting tl!e
wave record except in ttle CCIS,L uf specI r:,{ width parameter.
Based on all the records collected over the three winters, he draws the
following conclusions from the long term statistics: The Gumbel probabilitydistribution gives the best fit to the complete time series. The Gumbel prob-abilitydistribution gives higher extrapolated, predicted wave heights than theWeibull distribution applied to the same data set.
1-1.

q 0,*,U61N* S“,,9M
,,,, w. ,,. ,!1. C+,.w.in,, “mu,,, m,- “. m,,..,,.,a.,,.,!, .... ,!8, u“ m.. ,.”,, ●
,,,,, ,[.,,. ‘,.*,,,....,.,,w.?+,. ,,,,, ,“
w. ,, ,.,.,w.. ,,,,!.,,. ,,.,,,, ,,, ,(,,. *.,,,, ,,, ,,,,. ,.,,,, 9U
m.,). ,.,’,) .(,,. ,.,,,,
““ ,,:$,,“..,,”.s, W:;.”,,,4”,
Sample from:
#..,,. y:..,,,,8,,,,, ..,,,,,.,,,, ,,0.,,,.,,,, ..,00.0.,,4, ...).’,.,,,, ..,0,,,,,,,, 0.,,,,,.,,,, ,.,0,.,,,,,! ,.,.,,>.,1,. ,,’?0,,,,,,, ,,,,?,,.!.,, :,:::;,.,,,,,..,,, ,..,,,,..,., ,,,,?,,.,.,, ::::/:,,,,1.,..,,+ ..’?),,,,,,. .,,,,.,,,,,, ,,.,,!,.!,,, ...1.3,.,,,! 4.11..,,,,,, *.,6,,,.,,1, C.,,?.,.,,+, . ..’.,,,,,0, .,,,,,,.0,,, 0,,,,.,,0.. 0.!,50,,0!,, ,,, +,1,.,!,, ..,,’,,.,,,, ::;::,,,,,,,,,,,, ,.,,6,,,,0’. ,.,0,,,,,0,, ,,,0,,,.0!- ,,$,,,,.,,,, ,.,!?,*,w,, ..*.*,..,”,, ;.::,..,,,
Miles, M. ,
10..
t
NW 147
4.0 -
●W
...-
I... .,. ,., ,.$
“Wave Spectra Estimated from a Stratified Sampleof 323 North Atlantic Wave Records,’” Report LTR-SH-118A,Division of Mechanical Engineering, National Research Council,Canada, May 1972.
This report presents the 323 spectra and describesthe analysisprocedureused to compute thqrn.‘isshtmn in Table 1 In.this report (freqwencyresponsecorrectionfunctions),. the correctionfactor for than”OWS’Weather Explorerbecomaaextremelylarge”ti freqtiency“increases.“Fortfiisreason, recordsfrom thaWeather Explorershouldbe regardedas questionable.
These recordswere not selectedto repreeentfully developedconditiooa.Except for 16 records se~ted in order to facilitatea short study of spectralvariationwith time over limitedperiods,all recordswere taken at noon andwere chosen randomlyto representthe total range of conditionsencountered.
I-2

.
“+IL
DISPLACEMENT SPECTRUM10
J
“91 RMSA = 1.95FT
H~= 4x1.95 x (ClXC2)=11.70FT
LJ
~1~ ~’;~ SEE PAGES 22,238
7 —
I
6/ — ...—
5 I —. —.—.
I4
I
—— _-—–~– ‘—- “–
3
2 (4 —. .-—.. —. -—. ——.. ——.
I --- ,—
00 05 10 Is 20 2.5 30 35-40 45 50 55 60 65
FREOUENCY IN RPS
Sample from: Ploeg, J. , “Wave Climate Study -- Great Lakes and Gulf ofSt. Lawrence,” SNAMR T & R Bulletin No. 2-17.
The data tabulatedby Ploeg includesHI s and peak period IJJo.The spectraare availableonly in the form of plots. iTa ulationeof spectralordinateswerenever made. of the 4,000 spectra,there are only approximately10 spectrawith Hi/3 > 16 ft.
I-3

,..,,!,,
.“, ,
, ,,
.,,
.,,,.,.;r .,.1,:,,
E., ,,
,!.
,x,
“ h* x n., x xx
x ,,:x,x .?. ,,,x, x rxx”” x
I , “x.”” x, “ k,”,, .r ! ,,””, ,r r “,,,<, x,
, r“,, ., ,,r ,“, ,!, ,” ,,
11,1?! ( ,,, ,, ,,, ;,,~,:, II~ug u v:[l,raking wire pressuretransducer (vi’uraLrb,l;placed ULILiIL (.ULJ of LuLL Seamount in the North Pacific.The first volume of this report (Discussion of Data Analysis) provides a completedescription of the instrument used and the method of analysis.

Jfi PAN Q181L VOVA6E 13 sPECTRR 1
Sample from: Lockheed Shipbuilding and Construction Company, “Instrumentationand Analysis of Data Collected on the S.S. Japan Mail and theS.S. Philippine Mail from December 1971 to July 1973,” Reportto Sea Use Foundation, Seattle, 1974.
This report describes the data reduction techniques used on data gatheredwith Tucker meters installed on ships crossing the Pacific. The method describedis not unusual and the description tifit is straightforward. They fail, however,to mention several factors of crucial importance.
In almost all cases, the ship is traveling at a speed of approximately20 knots. This means that the frequency measured is actually the frequency ofencounter. If the direction in which the waves are traveling and the headingand speed of the ship are all known, the frequency,of encounter can be relatedto absolute frequency. This information can be extracted from the ships logswhich accompany this report.
If the waves are not predominantly from one direction but consist ratherOf a cOmbi~tion Of 10ca2 wind waves and swell, as is often the case, thenmeasurements from the ship at speed cannot be analyzed to give the true spectrum.
The dynamic effects of ship motion on the Tucker wave meters have not beendiscussed. The possible influence of such effects warrants careful consideration.
1-5

.!.-.!. 1- “,’!.. cm?. !,. “.,, ,,,,
,.,6 . ., ,,,, . . . ,. ,.,w. . ,, .6’-! . ,“cZ.,
,0!., 0, .,,, ,J5’W: :::“,-.-,.. :r,
“0,1, .,,,, . .m. %’<%,; : .,. s.!. W!,. -.2 FL. !!.,. -“0!,, ,0..., !., w,,, (c.,,.
.,,
Sample from: Moskowitz, L. , Pierson, W.J. , Jr. and Mehr, E., “WaveSpectra Esthated from Wave Records Obtained by the OWSWeather Explorer and the OWS Weather Reporter,” Parts1, 2 and 3, New York University, College of Engineering,Research Division, Department of Meteorology and Oceanography,November 1962, March 1963 and June 1965.
These data were collected to study the shape of fully developed spectra.Hence, the spectra included cannot be considered a random sample of typicalspectra encountered by ships.
I-6
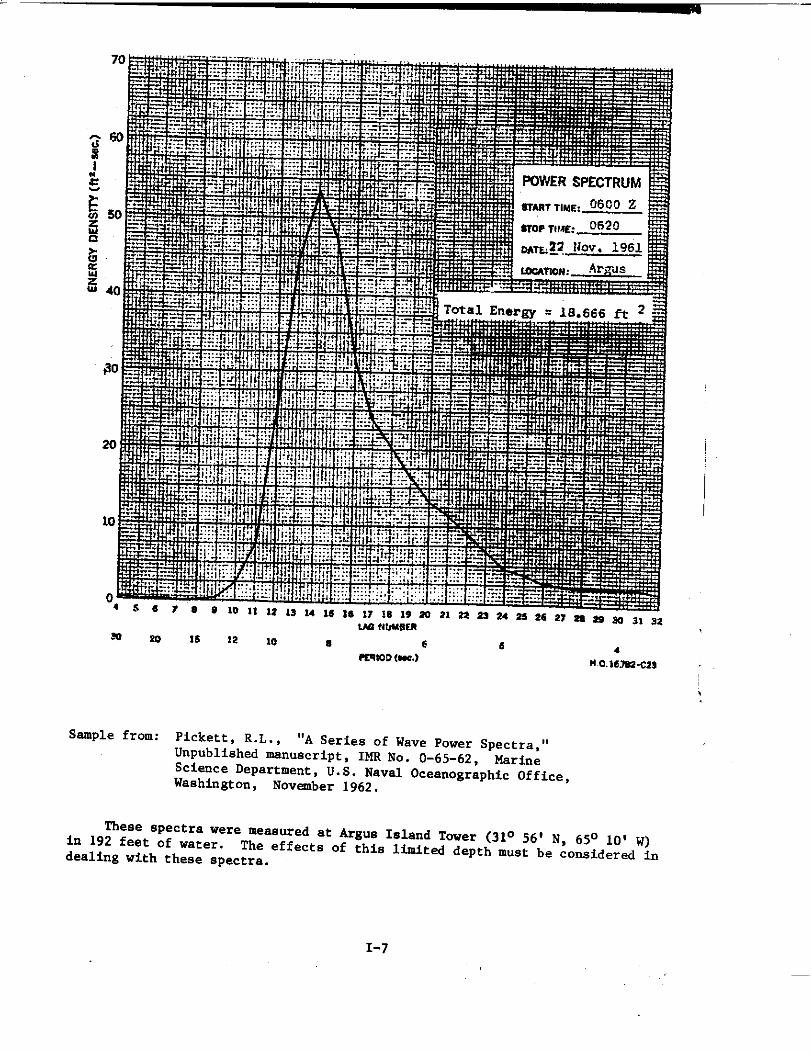
m 20
Sample from:
i
Is 12 ~fj 8 e 6~lOD (sac.)
4M.C.16Jw.cs3
Pickett, R.L., “A Series of Wave Power Spectra,‘qUnpublished manuscript, IMR No. o-65-62, M2rineScience Department, U.S. Naval Oceanographic office,Washington, November 1962.
These SpeCtra were measured at Argus Ieland Tower (31° 56! N, 65° 10! W)in 192 feet of water. The effects of this limited depth must be considered indealing with these spectra.
I-7

Fig. 1d)
Fig. lc)
Samples fram: Ferdinand, V., DeLambre, R. and Aertssen, G., “Spectres deVagues de l’Atlantique Nerd (Sea Spectra from the North At-lantic),” Association Technique W.xritime et Aeronautique,1975 Session.
The spectra included in this report were made using the Tucker ShipborneWave Recorder on French naval vessels in the North Atlantic. The measurementswere made while the vessels were at speed and correctedusing the equations: ,
,,~v
Ue=u J-&l; cos u,-.!J
SC(UI) = (1 -4 ; we Cos P)% s (@e)
where V is the ship speed,we is the encounterfrequency,and v is the anglebetwec.r[the directionin which the ship is travelingand that in which the wavesare traveling.
The dynxmic effects of the ship motion on the Tucker wave meter are notconsidered in the report.
Based on the spectra included the authors conclude p - 4.9 and q = 3.5provide a better mathematical approximation than the usual choice of p - 5 andq=4. Based on similar work done at Webb with a much larger group of spectra,we cannot support this conclusion. See text, chapter V.
I-8!
....’._. ..~’,, ,., .:
.

REMARKS ON OCKAN WAV1
ANIITHWIN All’]
’11 l!!,,
! I 1’ i 111:’’ 11:1:, .’1’1,1[1 ‘81’( 1(11111111::
[1 [1 \,.1 ,1 ,:({1 (,.(!, \ ,
I
I \ ,, (
—
Statisticsand Random Variables
In 1949,when J.W. Tukey wrote a paper entitled“The SamplingTheoryof Power SpectrumEstimates”, a new techniquebecame availableto study oceanwaves. The total varianceof the wave record could be reeolved into frequencybands in such a way that the contribution to the total variance from differentfrequency bands could be graphed or tabulated as a spectrum. A highly cor-related time history and a highly correlated covariance function were replacedby a sequence of essentially independent numbers in frequency epace thatformed the spectrum.
There are important parallels between spectral estimation and the estima-tion of the variance of a normal population. Given an independent sample ofeize n from a normal population, the mean and the variance can be estimatedfrom the sample. The estimated mean has a “student t“ distribution, andthe estimated variance has a Chi-Square distribution with n-1 degrees offreedom. A fiducial confidence interval on both the mean and the variencecan also be construtted. The essential point, however, is that theee estimateeof the parameters are both random variables and statistics.
In the spectral analysis of an ocean wave record, an estimate of a functioncalled a spectrum is found. Just as in the example from the normal distri-bution where p and Crzmust be distinguished from ~ and 82 (the “mean, u,
and the variance, U2, are unknown constants, and the second two are randomvariables that are estimates of p and U2), the spectrum of the populationfrom which the sample wave record was taken as defined by S(II))must bedistinguished from the estimate of the spectrum at a finite number of fre-quencies, as in
hj) uj = 21Tj t2pAt j=o top
The point of the paper by Tukey was to show that, with the method he used,every other estimate was independent and that theee estimatee had a Chi-Square distribution, whose degrees of freedom were known. The valuee ofL?(u,) are random variables. Fast Fourier Transforms (FPTe) make it possibleto estimate spectra such that all values of tbe spectrum are independent.
Since each point on a spectrum estimated by the technique of Tukey,either as originally propoeed or in terme of the more modern square filter
smoothed FFTs, is a random variable, the complete spectrum ie a random
function. Or stated in statistical terms, if S(u) is the true, but unknown,spectrum of the infinitely long stationary time aeriee, and if
J Wj-Auf2
then the variance in that band
; = ~ (jAw)Oj
is estimated by
Au
J-1
The experred value of !Ic,1 is given by
E (ioj) =M.03
and M has a Chi-Square distribution with an unknown scaling parameter,M ~th theadegrees of freedom given by Tukey in which M is unknown
ag~’ in which ?ioj 04is an estimate of it in exactly the same s nse as
is an estimate of 02 in a
ulation with a zero mean.
sample of size n from a univarjate normal pOp-
The spectral estimate:, S(jAw), j=O, 1...P, in theaolder methOd are
weakly correlated ~n that S(jAu) is not ind~pendent of S((j+l)Au), but in-dependent in that S(jAw) is independent of S(qAu) if q # j-1, j, j+l. Inboth cases, however, since each spectral estimate is a random variable,each and every one of the spectra that have been estimated from ocean waverecords over the course of the years i.sa random function. Plotting the90% fiducialconfidenceintervalson a number of spectral estimates with
tYpically 50 to 100 degrees of freedom, is a convincing way to learn howpoorly the true population parameters have been located.
In the sane sense that each spectral estimate is a random variable,it is also true that each spectral estimate is a “statistic” and that theentire sequence of frequency ordered spectral estimates is a sequence of“statistics”. It is true that these “statistics” are computed using ablend of Fourier series concepts plus probabilistic concepts. The spectralestimate is some linear combination of tbe observed data where the linearcombination involves trj.gonometric terms; it is nevertheless a statistic.
Target Populations
In statistical sampling theory, the first requirement is to definethe target population to be sampled. If one is interested in sellingclothes for 10 year old girls in New York City, it does little good tostudy the sizes of 5 year old boys in Manila. Only in the study by Moskowitz(1964)$ which led to the so-called Pierson-Moskowitz spectrum, was the targetpopulation defined and only in that study was it shown that the spectracould indeed have been samples from the target population. In each of fivedifferent wind speeds, the target population was the spectra of those recordsthat might be obtained for “infinite” fetch and duration, generated by awind blowing for a longinfinite ocean. It was“infinite” duration andthe wind needed to blow
time with a constant speed and direction over anpostulated that, for the wind speeds actually used,fetch were actually fairly finite as to the time
and the distance over which it blew. All other
* Note that the first word in the title of this paper is “Estimates”.
J-2

.
spectral parametrization procedures that have been proposed have ignoredthe two most essential aspects of statistical procedures, namely definingthe target population and proper consideration of sampling variability.
Since this study by Moskowitz is more than a decade old, much couldbe learned by repeating it, using better calibrated wavedata and FFTspectral estimates, a much larger sample, and tbe correct application ofthe Kolmogorov-Smirnov test (Crutcher, 1975). Of great importance wouldbe a careful study of the high-frequency tail of the spectrum. The equili-brium range probably does not exist.
A second important situation where a target population can probablyhe defined is that of the fetch-limited case. To simplify things, it wouldbe useful to use wave records where the upwind end of the fetch is land,where the wind is always from the same direction, and where the range ofadmissible wind speeds is severely restricted to one or two knots. The truepopulation spectra would then be functions only of wind speed, since thefetch would be fixed.
For the open ocean, far from land, in a region where a continuousprocession of transient cyclones and anticyclones moves by, the targetpopulation is difficult to define. An attempt to define a thi~d targetpopulation is, however, necessary.
Consider, for example, a point on the ocean surface, and a circlearound it with a radius of 10 nautical miles. NOW imagine a wave recordtaken for 20 minutes for every two-mile intersection on a square grid insidethis circle, all starting at the same time. There would be about 78 suchrecords. No two would be exact1y alike, and the correlation between nearbyrecords and spectra would be vanishingly small. If each spectrum wereestimated over exactly the same frequency bands for exactly the same algorithm,these 78 different spectra could be averaged. The average would still bea random function, but the confidence intervals would be about one-ninthas wide as those for one spectral estimate. The target population spectrumis then some spectrum,probably “ithin the 90% confidence intervals of thisaveraged estimate. The individual spectra from the 20-minute recordsshould fluctuate about this “averaged” spectrum in ways predictable fromsampling theory.
The target population is the limit in an infinite number of degrees offreedom of this kind of spectral estimate at each grid point of the model.If wave spectra could be estimated with 5000 or 4000 degrees of freedom,as
opposed to about 30 to 100, many of these problems could go away. A recentstudy by Pierson (1975) suggests that this may indeed be possible if waveimaging techniques can be f.rther developed.
Wave records taken for longer times at a point are usually not the answer.Increasing the record length from 20 minutes to 2,000 minutes (33 hours) leadsto problams of changing wind speed and direction over the longer recordingtime.
J-3
As an exception, in the trade wind areas of the world oceans, it mightbe a most interesting experiment to record wind speed, wind direction andwaves for several days continuously. Except for swell from some distantsource, that will usually be in different frequency bands, this long recordmay respond only to the minor (?) fluctuations in the strength of the trades.Its analysis could provide a very precise estimate of the spectrum of a targetpopulation with sampling variability greatly reduced.
Numerical Wave Prediction Models
Insofar as a numerical wave forecasting and wave specification (or hind-casting) method that attempts to describe the spectra of wind-generating gravitywaves and of swell is a valid method, it can only hope to predict, or specify,the expected value of the wave spectrum that will be observed at a particularpoint on the ocean surface (or in a particular area) for a particular time(+2o to 30 minutes) of observation. The actual spectrum computed from awave record at that point in space and time will not, and cannot be expectedto, agree with the predicted spectrum in exact detail because of the fundamen-tal nature of the waves. The random part of the problem cannot be predicted.The target population is the third example given above in the most generalcase and at various points in the model at various times,the target POPulatiOnbecomes either a fully developed sea or a fetchor duration-limited sea.
Stated another way, wave forecasting methods attempt to specify S(w) tobe varified against S(w). In this context, it should be emphasized that alltheories of wave generation and propagation are really working with S(u), andS(u,*), and are only indirectly concerned with the problem of verifying whatthey predict in terms of actual data. It may be, though, that some of themore recent aspects of wave generation theory have falsely attributed certaineffects of sampling variability incorrectly to some physical cause.
A numerical wave forcasting theory can be wrong in several differentways. One way is that the idealized spectrum, S(u), is really not an adequatedescription of the true population spectrum. A second is that the physicsof wave generation, wave propagation and wave dissipation is not correctlymodeled. A third would be that the winds that “generate” the waves are notgiven correctly. Even if perfectly correct in all three of the above ways,there would still be the problem of comparing the numerically predictedspectrum with the estimated spectrum, using valid sampling concepts.
Curve Fitting Procedures
The great danger in the present procedures for curve fitting spectralestimates lies in the lack of appreciation of the fact that they are indeedestimates with a substantial sampling variability. Insofar as these “estimates”are equated, without considering the consequences, to the true, but unknown,spectrum of the conceptual population for the seaway under considerateion, then
J-4

a mistake is being made. The consequences of this mistake are hard to define,
but they are nevertheless present.
Numerous fundamental points arise as to the best way to use estimated
wave spectra, as random functions, in problems of naval architecture. It is
here that various deterministic and probabilistic concepts are in sharp con-trast and even, at times, sharp conflict.
For example, in towing tank studies a long-crested approximation to a
random seaway can be generated. The response of this model to that seaway is
in principle a deterministic problem in hydrodynamics. The fact that the
spectrum of the seaway produced might depart substantially from the prototypewave conditions that attempts were being made to model is not critical. Forexample, a modeled spectrum that was twice too high in a given frequency bandwould produce an output in a linear theory that was twice too high in thespectrum of the mtion. The motion of the model predicted from the forcingfunction that was used would still be the correct one.
The real problems of Naval Architecture should be concerned with short-crested seas. Under these conditions, the coherency between the shipmotion and the forcing waves is not one. Most of the research in the timedomain in towing tanka does not carry over to real oceanic conditions. Modeltests are quite different from observing the waves at one point on the ocean,observing a ship!s motion in an area a few miles away and then trying to re-late the motion spectra to the wave spectra. (Someone might try this as athesis in naval architecture; nearly everyone will be interested in the result).
The lengthy debata over the ISSC spectrum and the validity of the freechoice of the two parameters A and B, as in,
s(u) - A exp (-B W-4) /u5
has never properly defined a target population, never checked on whether thespectral form lies within the appropriate limits of the variable estimates,and never looked at the sampling variability of A and B as multiple spectral
estimates from a target population. Were this done it would now become clear
that the model is inadequate.
Tha new spectral parametrization technique used in the JONSWAP programis even worse. The procedures fail to account for sampling variability effectsand stratify the spectra by using the “estimate” that was accidentallythe maximum. Its routine application is guaranteed to provide biased spectrafor design purposes in naval architecture. A paper has been written on thisparticular subject, Pierson (1975), but has not yet been published.
Attempts to parametrize ocean wave spectra in terms of analyticalfunctions and two or more constants, to be defined, are motivated by theidea that the new function is somehow better than the spectrum that was fitted.Even this is debatable. To use the resulting spectral form, it must beevaluated at a set of frequencies and multiplied by appropriate transfer
J-5

.—
functions so that the result will predict various ships’ motions. Are these
predicted motions any better in any way from those that would be predicted
using the original spectral estimates for each frequency band?
Other Parametrization Techniques
Various attemptshave been made to stratifyspectra accordingto windspeed only and accordingto non-dimensionalconcepts. The PiersOn-MOakOwitzspectrumused a non-dimen~io~alfrequency,~ = f U/g, where f is frequency,and U is wind velocity. S (f) had a ncin-dimensionalizedfonr”independentof F and t (fetchand duration). This may have been an accident,since morerecent results suggest that the equilibriumrange does not exist for highwinds. There are also reasons to doub~ that S(f, U, F, t) can be non-dfmsn-sionalizedto the form S(f U/g; g F/U ) for t large and F finite,andS(f U/g, f t/U) for F large and t finite.
For U alone fixed as a parameter, the family of all possible spectra
for a given U does not seem to have a properly defined target population even
for one single location on the ocean, as shoti by Moskowitz, for example.The ssmple space will have to be defined in terms of a distribution of diatr$-butions, and this is difficult to formalize. This is the concept of a strati-fied sample, somewhat analogous to tbe sampling techniques of politicalpollsters.
Another popular technique (as for example in the JONSWAF project) is theuse of a non-dimensional frequency given by f = f/f where f is the fre-quency of the spectral maximum for the estimated spec?rum. Asmshown in arecent paper (Pierson, 1975), this procedure is fraught with difficulty.
ConcludingRemarks
All in all, it seems that the need to think about the basic meaning ofspectral estimation, sampling variability, the terms “statistic’”and randomsample, and the concept of a target population should precede curve fittingtechniques applied to individual estimates of spectra. Sefore further debateabout present spectral parametrization techniques and before other new onesare attempted, the following questions need to be answered:
1. What are the target populations?2. What causes the parameters of the target populations
to vary as a function of the physics of the waves?3. Can sampled spectra be picked such that the parameters
of the target population are fixed, and then can theseparameters be in turn estimated from the spectra esti-mated for these conditions?
4. In what ways, if any, do parametrized spectra yieldmore useful results than using spectral estimates froma set of actual wave records?
J-6
.

So at the present state of wave data collection it is recognized thatthe target population cannot be defined as precisely as might be desired.This does not mean that this goal connot be accomplished in the future as abetter understanding is developed of r,heclimatology of waves. Essentially,samples from different populations have to be combined, and the overall pro-bability distribution for a new kind of climatological population needs tobe derived.
One segment of the target population is the fully-developed seas gene-rated by a wind that is constant in direction, without contamination fromother storms or swell. It would be grossly inaccurate to use this as theentire target population of seas expected to be encountered by ships, sinceaccount must be taken of waves caused by both growing and decaying seas, ofeffects of sudden wind shifts, of combined effects of different storms andof swell.
In this report it is assumed that without defining the target populationprecisely it is possible to make a useful stratified random sample of spectraat specific locations. It is recognized that the sample must be stratifiedover all seasons, so that seasonal variations can be included. It is recognized
that results apply only to the location where the samples are taken. However,
when results from several locations are compared (as, in this case, Stations1, K and P) limited judgments can be made regarding the variabilityy with
geographical location.
J-7

APPENDIX K
A COMPARISON OF WAVE BUOY AND
HINDCAST WAVE SPECTW
By
David A. Walden

Intreduction
Wave data for the month of March 1975 were obtained from the NOAA Data BuoyOffice for buoy EB-03 located at 56.0° N - 148.00 W in the Gulf of Alaska.
These data consistof spectral ordinates for frequencies from 0.01 to 0.50 Hz.in 0.01 Hz increments. The spectra are based on 16-minute samples taken everythree hours.
The predicted directional wave spectra produced by the Fleet NumericalWeather Central (FNWC) Spectral Ocean Wave Model (SOWN) were obtained from theNaval Oceanographic Office. These analyzed spectra are based on the bestavailable wind data, including measurements and the previous wind hindcast. Theycliffer from the spectral forecasts produced by FNWC, which are based on windforecasts. Both hindcasts and forecasts include the wave state of the previoushindcast. These spectra, again for March 1975, are the hindcasts for a com-putational grid point located at 56.2360 N - 147.537° W, 15 nautical miles ENEof EB-03. These spectra consist of 180 numbers, representing the spectralvariance in 15 frequency bands for 12 directions, which are computed every threehours with winds updated every aix hours. If at each frequency the variance issummed over the 12 directions, the one-dimensional frequency spectrum for a gridpoint can be derived.
Wave Heights and Periods
The first step in this study was to plot Hi/3 and T1 from both FNWC andEB-03, versus date. These plots are shown in Figs. K-1 and K-2. It can beseen from Fig. 2 that the T1 results from EB-03 are usually lower than the resultsfrom FNWC. This ia due to the fact that the plots are baaed on the assumptionthat the highest frequency for the FNWC spectrum is 1.03 rps, while the buoyspectra extend to 3.14 rps. It has since been learned that the FNWC high frequencyband extends from .164 Hz to .400 Hz (1.03 rps to 2.51 rps).
‘1/3is defined by
‘1/3 = 4@_, and
T, is defined by,
~‘1 = 2T ml
m
where m., ml are the moments defined by mn = J SC(U) (on dw
o
The effect of the high frequency tail of the EB-03 spectra is to make ml
larger and therefore TI smaller. Figs. K-3 and K-4 show HI/ 3 and T1 versus date
with HI s and T1 computed from EB-03 spectra which are cut off at 1.068 rpa.
1It can e seen that the agreement is greatly improved for wave period and slightly
improved for height.
K-1

Since most response sAO ts of medium-size ships have significant values
at frequencies above 1.03 rps, the FNUC spectra which, in its present form, lack
definition in this high frequency are not ideally suited for predicting the
motions and stresses of such ships. Thus the inclusion of only one”band from1.03 to 2.51 rps is a ‘s,ignificant ahnrtcomi,mg.As can he seen from the effect onT~, the laak of accuracyin describinghigh frequencycomponentssignificantlyaffectshighermoments of the spectra. Figs. K-5 and K-6 show the skewnessydefinedby y w rn3/m23/2for the FNWC cut “offat 1.03 rps spectra and the EB-03spectrawith and without the tail. The lines are least squaresfit to the datapoints. Also .qho~ is the ISSC relationbetween Y and H1,3
-1y = 6.1458 HIj3
The results for another shape parameter, flatness, defined by f?= m41m22, are shown
in Figure K-6. Similar results from Stations “I,“ “P” and “K” indicated a fairlyclose agreement with the ISSC line. Thus, the large scatter of the EB-03 datawith the tail included about the ISSC lines, compared with the scatter of theStation “P” data, raises some doubts about the buoy results, particularly the
high frequency tail which strongly affects m2 and m3.
Groups of Spectra
The next step was to create a group of spectrabased on Hi/3. The spectraselectedwere those for which H~/3 was between 2 and 3 meters for botb FNWC andEB-03 at the same times. Eight such spectra were found. The results are shown inFigs. K-7 and K-8. In spite of tbe selection of spectra where tbe wave heightartreedfairlv well. the ameements between the means is Door. This difference. .is important in predicting ship response?.
The next group was of 8 spectra from consecutive observation where HI/3 rangedfrom 1% meters to 3 meters. Again the maana, as seen in Figs. K-9 and K-10,show poor agreement. The last group was of 8 consecutive spectra including tbelargest H~/3 value (7.0 m). Figs. K-11 and K-12 show that the magnitudes of themaans do not agree. Fig, K-13 shows the non-dimensional means. It can be seenthat the means are in only fairagreement with each other and with tbe ISSCspectrum, but the shapes are similar.
Individual Spectra
A one-to-one comparison of the spectra near tbe peak of the HIf3 versus datecurve was made. These results are shown in Figs. K-14, K-15 and K-16, and innon-dimensional form in Figs. K-17, K-18 and K-19. The poor agreementin Figs.K-14 - K-16 and the somewhatimprovedagreementin the non-dimensionalFigs. K-17 -K-19 showe that there are large differencesin significantheight,HI/3, and meanperiod,TI, but that some similarityin spectrumshape exists.
‘1
At the suggestion of Profassor Pierson, the confidence intervals for theEB-03 spectra were investigated. The 90% confidence intervals based on the 36degrees of freedom at each ordinate are shown in Figs. K-14, K-15, K-16 and K-23.It can be seen that even if the actual spectra corresponded to tbe extremes ofthe confidence intervals, the agreement with the FNWC spectra is still poor.
K-2
Professor Pierson also suggested that the disagreement near 27 March mightbe due to an error in the arrival time in the FNWC model. For this reason,Fig. K-23 shows the FNWC spectrum for 12002 27 March and the EB-03 spectrum for12002 26 March. Significant disagreement is still apparent.
The non-dimensional results also show good agreement with the non-dimensionalISSC spectrum. This is expected since these cases approximate the pure fully-
developed, wind-generated sea on which the ISSC spectrum and the FNWC model arebased.
Fig. K-20 is a scatter diagram of FNWC H~/3 versus EB-03 (based on the
full spectra out to 3.14 rps). The lest squareslines through the origin hasslope 1.2, which indicatesthat the FNWC model is predictingan average totalenergy excess of about 20% over that measuredby the buoy for this period.
Wind Speed
In seeking an explanation for the differences between the FNWC and EB-03results, we examined the wind speed, which was given for both sets of data.The
andandall
allthe
This
1975
1results shown in Fig. K-21 indicate quite poor agreement in wind speed.
On the basis of a preliminary version of this report supplied to NOBO,>ther information, they have re-examined the wind data from EB-03 for MarchIave discovered that there were problems with the anemometers and thereforerinddata are unreliable.
It has also been learned that only after March 1975 has FNWC been correctingrindspeeds to 19.5 m. This includesobservationsused in determiningrind field and the values printed in the output with the spectral values.
Fig. K-22 shows that the wind directions agree for most cases within 30°.agreement caq be considered fairly good.
The following quotation from the Mariner’s Weather Lo~* indicates that March
was an exceptionally mild one in the Gulf of Alaska.
Thisunfortunateperiod whenthat are of
,,More Sto- tracked into the eastern Bering Sea, ad fewer
into the Gulf of Alaska, than normal. Higher-than-normal
pressure over extreme northern Canada diverted the storms
away from the Gulf of Alaska and further south along theU.S. west coast. ”
exulains the low sienif icant wave heights for this neriod. It iS. .that it was not possible to compare the FWC and EB-03 results for ahigher wave heights prevailed because it is these higher wavesmore significance in predicting chip responses.
*Mariner’a Weather Log, “Smooth Log, North Pacific Weather -- March and April 1975,”MWL, vol. 19, No. 5, September 1975.
K-3
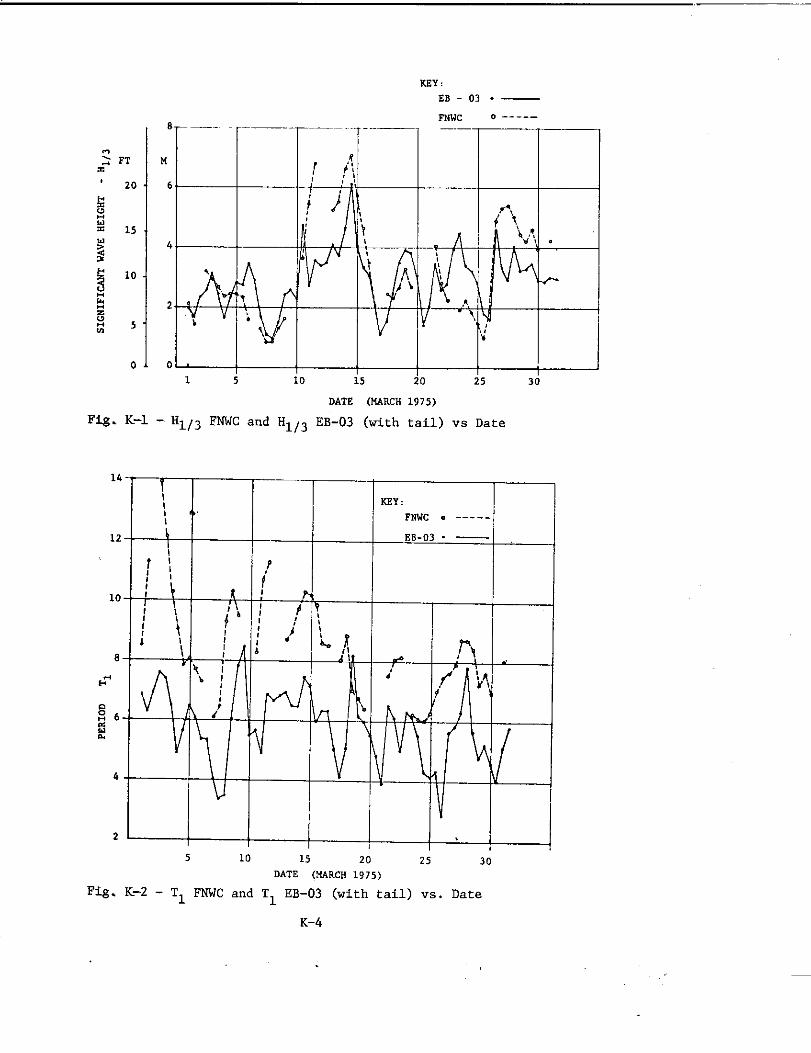
KEY:
EB-03. —
FNh7c . -----8---—-
M
6
4
.
2.
b
0
1 i5io 1
DATE (MAncH1975)
-II
Fig. K-1 - Hi/3 FNWC and H113 EB-03 (with tail) vs Date
2 L-
Cw :
FNWC . -----
EB-03 . —
5 10 15 20 25
DATE (XARCH 1975)30
Fig. K-2 - T1 F2iWCand T1 EB-03 (with tail) vs. Date
K-4

K2Y:
FT
25
‘1
M
8
6
4
2
011 1 1 I , , I
1 5 10 15 20 25 30
DATE (MARCH 1975)
‘ig” ‘-3 - ‘1/3FNWC and H1,3 EB-03 (without tail) vs Date
16
14
12
.-
810n:
E
a
6
I
DATE (MARCH 1975)
Fig. K-4 - ‘IIFWWC and ‘flEB-03 (without tail) vs Date
K-5

\
.
●
✎
,
5
-0.5
2.25
2.w —
86 T\++\
1.5- ~
FN 1-10 *..*
B 1-10 (..,.,,) +— ,
B 1.,0
1.00
1.$0t
-L0.2 ,
I
T1-
0.6 {
.
l“’-””-””---— + B s“..,
--’ B UN.
—a n!
.---,,,c _
\‘j:’””+● .”.
q
.,+.
\
.+:
.
●.,
.+..
. \
. .
:\\\
\.\.+
/+
I.. .
7‘\I‘\\II “
+1
Fig. K-5 -
Logarithm of Skew-ness vs. in H
1/3
Fig. K-6 - In @ (flat-ness) vs. in H
113

l’:(h-l“’”F+--
91mz I/.. .>M..KJ—,’ .
./‘1.00
,’—_ _m!r3, @ mm Bnllc -—/’
,’)’
... -,’
0.’2 0 !4 0 !6 0.’8 ,:0
id <,,,-1,
Fig. K-7 - Group of EB-03 spectrawith 2m . H1,3 . 3m
md
1.00
,,%(IJ)Ir’
,-/ Ef.,,o,a ,Rw BOW
. ..--1..... “n.!” ,.!”..,,.W<Z
1’
I
0.1 0,4 0.6 0.8 1.0
(4)(s,,-1,
F-. K-8 - Group of FNWC spectra with ~ < Hll ~ < 3m
K-7

o
W($td)
Fig. K-9 - Group of 8 consecutive spectra from EB-03
3.00—
2,00—.—
s~ (w
—
Qms%c
-L&.00
0,1
, +-. .,.
‘“,im 4-11\.p..o,.!.!!lctml
2.6 MAwU
1 0:5 0:6 .9.7 O:* oU (m->
Fig. K--1(I- Group of 8 consecutive spectra from FNwC
K-8

12,0
t
10.0-.
It
1,0
Bf(u>
I?ud-scc6,0
4.0Li
2.0
.,/
0.2
Fig. K-n -
~“\—..-—.
7 - ‘---
,/’ -’ -..
---- ---,,-
0,4 0.5
, 25-32
13-16 IUffifl
-—. .—..-— —
—- .—.
Group of 8 consecutive(bracketing peak Hi/3)
.. .
.
spectra from EB-03
Ii,“ ,,-3,
13-16MARC,P
12,0 -
1- !
-.
t==-
Fig. K-12 - Group of 8 consecutive spectra from FNWC(bracketing peak H1,3)
K-9

0,3— !
i-
L0.2
,#&-
0.1
—/j
I I
—0 0.2 0.4 0,6 0.8 ,,0 L.2 ,,, ,,* 1,,
!?%. K-13 - Non-dimensional means from EB-03 & FNNC spectra
bracbthg peak ‘1/3
I
PX17 —.
9m Cn”cidmlc. —-----
+(w)
)lzp%zc
0 0,s ,:0 1:5 2,0U (s.,-5
Fig. K-14 - EB-03 and FNWC spectra near peak H113
K-10
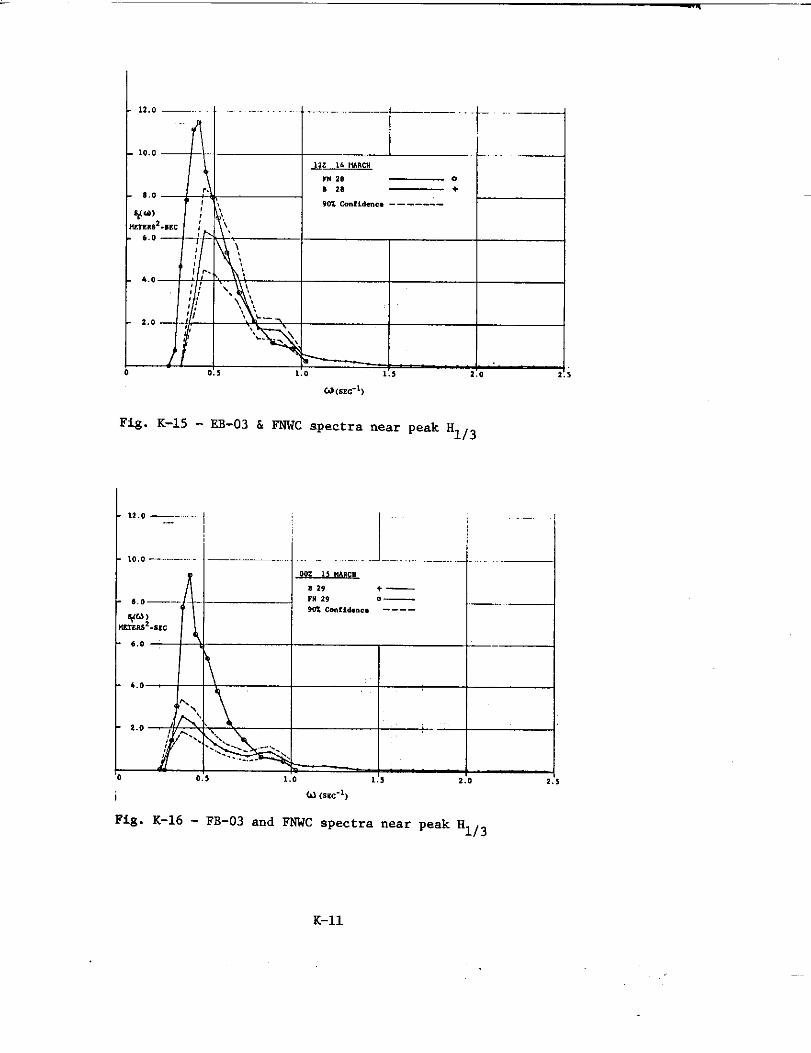
I
5
Fig. K-15 - EB-03 & FNWC spectra near peak H1,3
11.0 —-...,-
10.0—–—-.
I
.,. ,..00, ,, I!ARc”
B 29 +—
8,0—— FN 29 o—
902 Co.ridm.. ---—S@,
,Td.sm
6.0
6.0
,,..
0.> 1.0 1,5 2.0 2.s
I (d (w+,
Fig. K-16 - FB-03 and FNWC spectranear peak H1/3
K-n

—
I
k0.03 —-0.02
‘*%%
0.01
0 0.2 0
L
““”---T—
m lbmmcn
,2, .—l
I m,7. -
—
.
!_
i
—.
,.8
Fig. K-17 - Non-dimensional EB-03 & FNNC spectra near peak
%/3
0,03 _
0,02—
*
0,01— — —
-40.6
I ---1-–
lfz 14 mm”
,28 .—
$1.6 :
Fig. K-18 - Non-dimensional BB-03 & FNWC spectra near peak
%/3
K-12
o

L0,03
10,02—
S/u )
~,
O.OL—
0
—
—
—
___L.
WLJLw!4
B29 .—
rn29. —
I
Fig. K-19- Non-dimensional BB-03 & FNWC speCtra near peak Hi/3
8 ., :..
7
6 *
%3
m,.. . “
Smut/
. .
4
/.
,,.
,.
. . “. . . ,
2 “ , .
‘. “, ,.
1 / !$
Fig. K-20 - Scatter diagram
‘1/3 ‘Wc and Hi/3
— EB-03
i—..- ...—.6
K-13
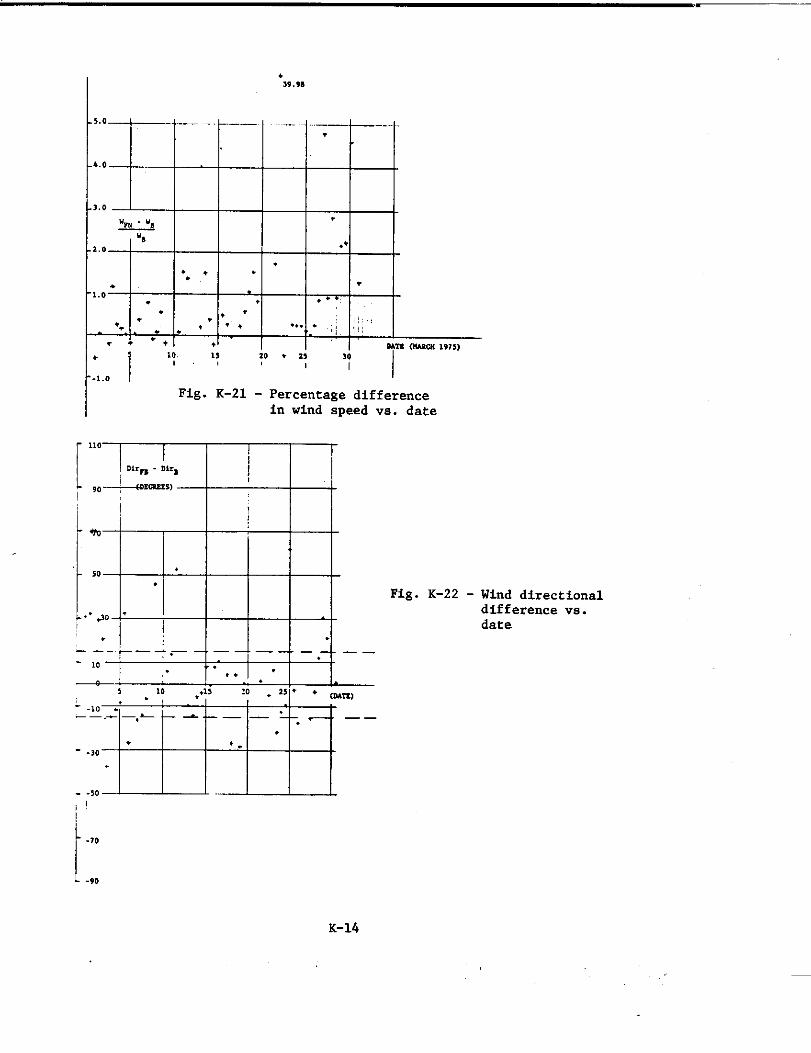
+19.98
ITT-WIWI -1111’11
I I 1+.+1 .1’ I I I
1’-1.0 1
Fig . K-21 - Percentage differencein wind speed vs. date
[
110
II
Dirm - D1rB
L ++mz,s,90 ; -
L* I
!
“1
50
.
1-.’40 “
I.
_ ;-r—-.—–.— _ ___ _“ __
,. ..+ .
.
5
‘*
10 ,+ls :0 . 25 . . <m=)
.,- -10 .“——..—, L- __ , ——
.
, +.- -30
- -50
Fig. K-22 - Wind directionaldifferencevs.date
K-14

,.”,
[(’ / nmc-h llm 152 +—
?I wncti I VW hfidsm. Iwnd. -----/15 — m e —_
S(al),..,s2 . s,,,,— .– —
I.
I..-—
I-!nvi - \--————,1 r%.,-/,}
\—.—
, ‘(---W-OS ..– .—-—Mw
s >0 mm.
I ““%-’--l0.2 0.. 0,6 0.8 1.0 ,.1 ,,, ,.’ ,., 2,0
u (arc-l)
Fig. K-23 - FNWC and EB-03 Spectra for 26-27 March
K-15

APPENDIX L
PROPOSED BUOY SYSTEM FOR
WAVE MEASUREMENT OFF SOUTH AFRICA
by
Cdr. C.S. Niederman, U.S.C.G.
NOAA Data Buoy Office

-
Introduction
This appendix reviews, in brief, a proposal submitted by the NOAA DataBuoy Office to the American Bureau of Shipping (ASS) during December 1975.It represents the state-of-the-art in proven wave measurement capability froma buoy reporting on a long-term basis in a severe ocean environment. A de-
scription of the buoy system, its data output, costs, and schedule, are pre-sented.
At the present time, June 1976, ABS is seeking additional monies fromshipping intcrests to assist them in funding such a buoy.
System Description
The system was designed to survive severe storms and strong currentsand to report wave conditions on a three-hour synoptic basis for a period ofat least a year. Thus it would be expected to report the severe seas offthe South African coast which have resulted in serious ship damage or loss.The system was to consist of a 40-foot (lZ-meter) diameter discus hull and abattery powered payload which transmitted in the SF range by relay to a u.S.shore communication etation. Unfortunately, the location IS bevond presentlyavailable USF satellite coverage, which is more reliable and less expensivethan tbe HF system. In addition to the wave measurement capability, windvector, air temperature and pressure measurements were proposed, since theirinclusion made little difference in cost and they would be parameters ofinterest in relation to the recorded waves.
The proposed wave measurement system consists of a hull-mounted accel-erometer and a wave spectrum analyzer which filters the acceleration datainto twelve discrete frequency bands, which can be selected during aesemblyto best describe the anticipated epectra. At the NOAA shore communicationstation (SCS) these inputs are converted to twelve-point displacement spectra.
The data at the SCS are then available on a real-time basic for use byforecasters and ship routers and on an archival basis for use by naval architects.The wave data available in the one-dimensional spectral form can be conver-ted easily, if desired, to wave heights and periods.
The systernproposed was selected from existing hardware wherever possibleto reduce production costs. The mooring costs were conservative since themnoring line length and diameter were chosen to withstand a maximum AgulhaeCurrent profile, which occurs in deep water off the continental ehelf. Costewould be less for mooring over the continental shelf, where water is ehallnwerand currents are less strong. The payload, including the sensors, the dataprocessing and control unit, and the communications set were mnstly on-handitems. The communications were to be set up from Miami to the buoy on a direct
L-1

command link and from the buoy via Ascension Island and Patrick Air ForceBase on the data link. A tape recorder was included on the buoy to providea record of data that might be lost in transmission. Logistic costs werebased on one repair trip during the year. Transportation costs to SouthAfrica were not included since it was felt that transportation might beavailable from a shipping beneficiary of the program. Redundancy of the pay-load was proposed as an option for added reliability, but the single-repairtrip cost was also retained. The costs were based on one year of operationwith a second year of operation proposed as an option for a redundant system.
Estimated costs, assuming the buoy to remain the property of the U.S.Government, are given in table K-1.
Table K-1WAVS hEASUREMSNT BUOY COSTS
FIRST YSAR SECOWD YEARSingle System Redundant System Redundant System
Payload & Spares ,
Including Wave
Spectral Analyzer
Power Supply
Integration & Test
Tape Recorder
Hull Refurbishment
Mooring* (11,000 ft. in
$ 33,000 $ 95,000** .$ 4,000
Aguihas Current)
Connnunications&Data Processing
Logistics (Deploy,Repair, Recover)
On-Load & Off-Loadon Transport —
2,000
7,000
5,000
20,000
60,000
23,000
25,000
20,000
4,000 4,000
13,000
5,000
20,000
60,000
23,000 5,000
25,000 11,ooo
20,000
TOTAL $195,000 $265,000 S20,000 Mditional
* Reduced to approximately $10,000 if moored on cent inental shelf ● t600-foot depth.
** This is more than twice as expensive as the single SyStem since *
first consists of parts on hand, while the second requires s- ~
procurement.
L-2

Conclusion
It is believed that the system described here would be a feasiblemethod for obtaining reliable, long-term wave data for an ocean area forwhich data are scarce. Furthermore, the spectra obtained would be consistentwith other data being collected in U. S. coastal waters.
The cost does not seem high in relation to the value and quality ofdata to be obtained and financial assistance may be obtained from the opera-tors of ships regularly engaged in service around the Cape of Good Hope.
L-3

IIuuIz,0% ,,, ,, 11 91 ,1 *1 C1:111OIC11 ,S, c;t
1111!1.1)111]11] )111 1111 1]11 II I I I \ IIPIllIll Ill:lllw!iwwH111!!!1/1111Ml !!1!N!Il!lll:iwlllll1111111l!l;!llllllllllll;,llll!!!1M IIINIIIIIIIIIlil!:UIllllullii!!:11Illl!illl(llll!!11111!1111!11IIlmll
Illllill”lll”llllllll,,,,,,,,!.,,,,,,,,,,,,,,,,,,,,,,,,,,,,,,,,,,,,,,,,,,,,,,,,,,,,,,,,,,,,,,Ill Ill 1/1 Ill Ill 1/1 Ill Ill Ill Ill 1/1 Ill Ill Ill 11.1Ill 1/1 Ill
s 8 7 s 6 4 1 1 1 ;“*. ,
] Sext “s-=%% 82 ?l!”a~vk’i ,.
*US. GOVERNMENT PRINTING OFFICE 1977- 240.897UV
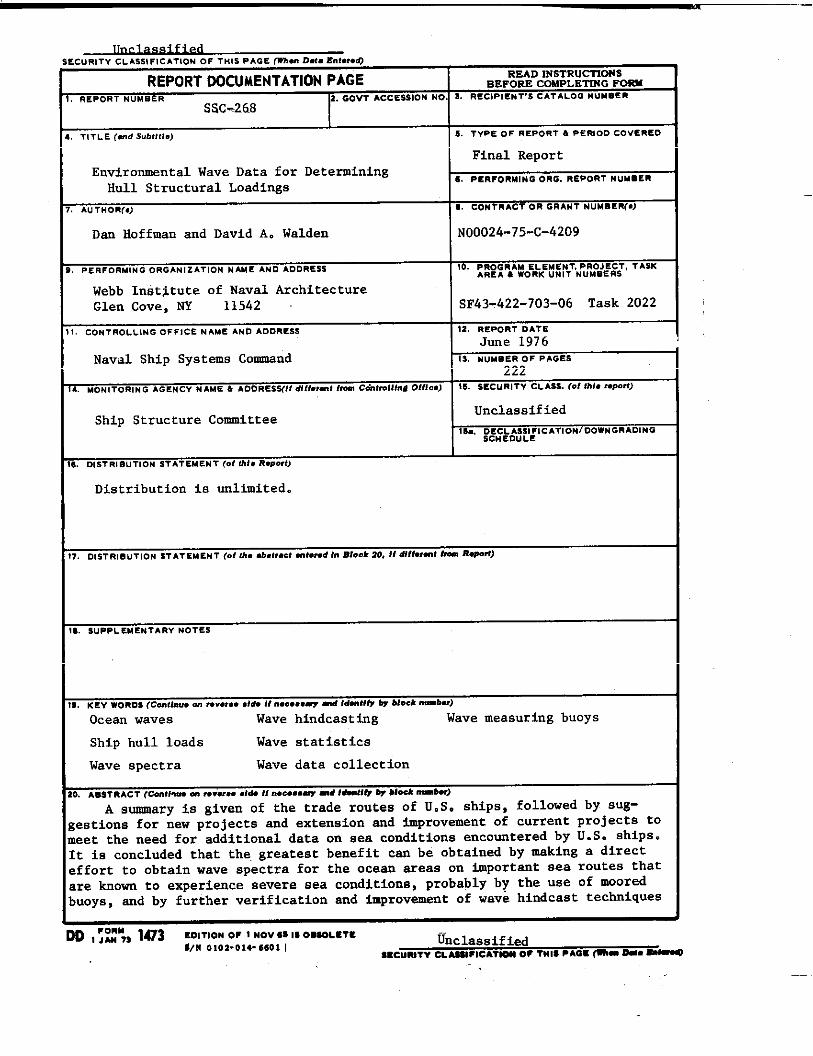
)RITY CLASSIFICATION OF THIS PAGE fW!en DM. .ht.r.d)
REPORT00CUAENTATIONPAGE READ INSTRUCTIONSBEFORE COMPLETING FORM
IEPoRT NUMBER 2. GOVT ACCESS1OM NO 3. RECIPIENT’S cATALOG NUUSSm
SSC-268I I
.!71. E (and S“btltl.) 5. TYPE OF REPoRT h PERIOD COVERCO
I Final ReportEnvironmental Wave Data for Determining
Hull Structural LoadingsS PI! RFORMINO ORG. REPoRT NUMmER
w THOR(*) m c0N7RAcT on GRANT NuMsEsf.J
Dan Hoffman and David A. Walden NoO024-75-C-4209
,ERFORMING ORGANIZATION NAME AND ADDRESS 10. PROGRAM ELEMENT. PROJECT, TASKARCA ● WORK UNIT NUMBERS
Webb Institute of Naval ArchitectureGlen Cove, NY 11542 SF43-422-703-06 Task 2022
CONTROLLING OFFICE NAME AND ADDRESS !2. REPORT DATE
June 1976Naval Ship Systems Command 13,NuMBER OF PAGES
222MON!T OR IN G AGENCY NAME 6 ADD RESS(II dlffw-t 1- Co%trolllnd O1flc.J w SECURITY CLASS. (of thh woro
Ship Structure Committee
IDISTRISUTlONSTATEMENT(d thl, Rw.xt)
Distribution is unlimited.
DISTRIBUTION STATEMENT f.f th. .b.t,.et 9mt_d I. B1.ok 20, u atl.rsnttramR**)
K EV WORDS (Conll”w M -Vu.- #ldc It “*o*,,w md Idm!lll? & blook “-b”)
Ocean waves Wave hindcasti.ng Wave measuring buoys
Ship hull loads Wave statistics
Wave spectra Wave data collection
AOSTRAC1 (C-11- -...0-. .Id.If “00...” -d lSmW& & Neck -S00
A summary is given of the trade routes of U.S. ships, followed by sug-etions for new projects and extension and improvement of current projects toet the need for additional data on sea conditions encountered by U.S. ships.is concluded that the greatest benefit can be obtained by making a direct
fort to obtain wave spectra for the ocean areas on important sea routes thate known to experience severe sea conditions, probably by the use of mooredoys, and by further verification and improvement of wave hindcast techniques
,yd$, 1473 EDITIONor 1NOvSs19ODCOLCTC
#/N 010’2-014-6601 I U-nclaasifiedSecunl?vCLNUFICATIOSorTHIS●Aac+ m. ~

,.,, !?,,, CLASSIFICATION OF TH,5 P. GE(Wh.o D.,a Ent.r.dJ
10. Abstract
Eor eventual application to obtaining wave spectra for design. At the same:ime,steps should be initiated that may lead to the availability of wave dataLn the future, as seeking oil company data.
It is felt that attention should also ge given to the further analysis of~vailable data, and of new data produced by buoy deployment and hindc?st?rocedures, including the measurement of directional spectra and theirsupplicationto design, Hindcast techniques should be extended to the southernhemisphere, and new techniques for wave data collection -- disposable buoysand satellite systems -- should continue to be developed.
A survey evaluation is given of observed and measured wave data coveringnajor U.S. routes, with appendices, tabulations and maps. The introductionof theoretical formulations leads to the discussion and evaluation of wavespectral hindcasting techniques. The methods used to predict ship motionsand loads are explained followed by a section discussing the wave data formatrequired for predicting short and long-term loads and motions as well asnumerical examples showing the effect on and sensitivity of predictions tovariation in wave data format.
Based on the preceding discussion, presently available data suggested foruse in determining ship loads are given. ‘l’heuse of a combination ofstatistics based on observations on the frequency of occurrence of variouswaveheights anda spectral family of measured spectra grouped by wave heightis recommended. Finally, a survey of current and planned data collectionprojects is given.
The opinions and conclusions presented in thie paper are those of theauthors and not necessarily those of the Ship Structure Committee nor of theDepartment of the Navy.
.sccumv CLASSI fICATION OF mm PA6E(WII.. hf. m.red)

. ,...,F. -- ‘
SHIP RESEARCH CW41TTEEMaritime Transportation I?esearch Board
National Academy of Sciences-National Research Council
interagencyThe Ship Research Com!rrittee has technical cognizance of theShip Structure Committee’s research program:
PROF. J. E. GO1.DBERG, Chairman, School of CioiZ Engrg., Georgia Inst. of Tech.DR. J. M, BARSOM, Szc!tion Sttperuisor, U.S. SteSZ CorporationMR. D. P. COURTSAL, vie< l%sidc~~t, D.~V~ CorpomtionMR. E. S. DILLON, Con.m3tant, Si2ver Sprin;, t.kwykmlDEAN D. C. DRUCKER, CoZ@e of I+@nwring, University of IZLinois
PROF. L. LAN DNEBER, rnst. of Rydrmlic Reswl>ch, The Univ8rsity of Iova
MR. O. H. OAKLEY, Coz.sultmt, LtJcm. Virg{~ziaMR. D. P. ROSE!,IAN, C)iie,f,vavczL .4rchitect, A2@omzutics, Inc.OEAN R. D. STOUT, G~cduabe School., Lzhigh U,live~sitgMR. R. U. RLOIKE, Ececutive Secretm’;l,Ship .Wseczrc~2Comittee
The Ship Design, P,esponse, and Load Criteria Advisory Groupprepared the project prospectus and evaluated the proposals for this project:
MR. D. P. ROSi24A 14,Cna irman, Cki.?f//avaZ A.rch>tect,F@mzzwtics, Inc.PROF. A. }l.-S ANG , Dept. o.t”Ci-2iZ E}2y.fl.eer,.n;,~nz~ersity of 11linoisPROF. S. tl. CRANDALL , Dept. of :~cch. EiiL7r9., Massachusetts Inst. of TechnologyDR. D. D KJViq, I%W?:J,W, St.ruct. Dyr,m!,ics d /!Lm<st.;c3, S.V. Research InstituteMR. W. J LA!iE, Sir:(ctwal Erqi?wer, .BethLehc! %eel CorporationDR. M. K. OCHI , ,?esearci~scientist, Naval S;lip:?osearch& DeveZOpment CenterPROF. W. l). PILKEY, Dept. of Mechanics, UniueYsity oaf VirginiaPROF. H. E. StlEETS, C%W, Dep.&. of C?cean .?ngginec?in~g, Uni.v.of Rhode IslandMR. H. S. TOWSEND, Cow Ltant, WesLport, (lmwctiwtPROF. G. A. WEMPNER, Schm2 of WgPJ. Science 3 Mecknic., Georgia In.t. of
Technology
The SR-223 Project ,!dvisot-y Committee provided the 1iaisontechnical guidance, and reviewed the project reports with the investigator:
Mr. M. D. Burkhart, Chairman, .HeaL,7 )~arine ~(:~c~~e ~c,foirs, o,~fieeof oeearwm@erof the NCZOZ,A lewndria, Va.
Prof. J. L. Bogdanoff , SCkml of Aeronautics & ,t.~tronautie:;,Amdue Uiiir)ersityProf. J. C. Samucls n~~t,J ...,.,o.fCi~~i7,~r!qineeri>l~& ,?no.Mechanics. Rmdard UiiiversituProf. M. Shinozuka, ‘ -Dept. of Plvi1 EngLeerin; “4 Erlg. :iechanics,’CoZwnbia University
SHIP ST?JLTL!RE CO!O1lTTEE PUBLICATIOi4”S
SSC-254,
SSC-255,
SSC-256,
SSC-257,
SSC-258 ,
SSC-259,
SSC-260,
SSC-261,
SSC-262 ,
SSC-263,
SSC-264 ,
SSC-265,
SSC-266,
SSC-?67>
These docxnenbs are distributed by the National TechnicalInforrnatiotiService, Springfield, Va. 22151. These dcw-
uments have been announced in ihe Cle~inghO~~e journal
U.S. Gouerrment Research & Development Reports (USGRDR),..
urxierthe ma% cated !41>.n~wn,bers.
A Guide for the Ncmti’e.ztwctiveTesting of )Jcxt–PdLt b]eldsin Commercialships – Part TZJOby R. A. Youshaw and E. L. Criscuolo. 1976.AD-A014548.
Purther Analysis of Slawing Data from the ,s.S. WGL,WRI?jESTATE byJ. W. Wheaton. 1976. AD-A021338.
DyncwnieCrack Propuga$ion and Arrest in Stru.ctunzZ Steels by G. T. HahnR. G. Hoagl.and, and A. R. Rosenfield. 1976. AD-A021339.
(SL-7 -5 ) - 3L-7 Instrmentzt ion Program Bczckg??wndcmd Research Plan bJW. J. Siekierka, R. A. Johnson, and CDR C. S. Loosmore, USCG. 1976.AD-A021337.
A Study to Obtai>[Criteria by R. L.AO-A025716.
Verification of Liquid NaturaZ Gas (LNG) Tank Loczd~n:
Bass, J. C. Hokanson, and P. A. COX. ]976.
(SL-7-6) - Verification of the Rigid Vinyl Modelin~gTechniyue: The SL-Structure by J. L. Rodd 1976. AD-A025717.
A Survey of Fastening Techniques for Shipbuilding by N. Yutani andT. L. Reynolds. 1976. AD-A031501.
Presenting DeZayed Cracks in .S’hipwelds - Part I by H. W. Mi shl er. 197fAD-A031515.
Preventing Delayed Cracks in Ship welds - Port II by H. W. Mi shl er.1976. AO-A031526.
(SL-7 -7 ) - Static StructtiraZCalibration of Ship Response Instrwnentati5ystem Aboard the Sea-Land McLean by R. R. Boentgen and J. W. Wheaton.1976. AD-A031527.
(SL-?-8) - Finst %ason Re.ul.tsfrom Ship Respon.e Instmunentation Abo~rtithe SL-7 Class Containership S.S. Sea–Land McLean in !iorthAtlanticYezwice by R. R. Boentgen, R. A. Fain and J. W. Wheaton. 1976. AD-A0397!
,1 study of Ship HulZ Crwk A~rester Systems by M. Kanninen , E. Mil 1s ,G. Hahn, C. Marschall , D. Broek, A. Coyle, K. Masubushi and K. Itoga.1976. AD-A040942.
I?evie?Jof Ship Strwe@TJaZ L)&z~Ls by R. Glasfeld , D. Jordan, /4. Kerr, Jr,and D. Zoner. lg77. AD-A0409L11.
Compress iw Strength of Ship HuZI?Girders - Part 1“1.?- Theorg and
Additional E.zperimentsby H. Becker and A. Colao. 1977.
Related Documents