BioMed Central Page 1 of 20 (page number not for citation purposes) BMC Biology Open Access Research article Environmentally-acquired bacteria influence microbial diversity and natural innate immune responses at gut surfaces Imke E Mulder †1 , Bettina Schmidt †1 , Christopher R Stokes 2 , Marie Lewis 2 , Mick Bailey 2 , Rustam I Aminov 1 , James I Prosser 3 , Bhupinder P Gill 4 , John R Pluske 5 , Claus-Dieter Mayer 6 , Corran C Musk 1 and Denise Kelly* 1 Address: 1 Gut Immunology Group, University of Aberdeen, Rowett Institute of Nutrition and Health, Greenburn Road, Aberdeen AB21 9SB, UK, 2 Veterinary Pathology, Infection & Immunity, Langford House, Langford, Bristol, BS40 5DU, UK, 3 Institute of Biological and Environmental Sciences, University of Aberdeen, St Machar Drive, Aberdeen AB24 3UU, UK, 4 Agricultural and Horticultural Development Board, Winterhill House, Snowdon Drive, Milton Keynes MK6 1AX, UK, 5 School of Veterinary and Biomedical Sciences, Murdoch University, Murdoch, WA 6150, Australia and 6 Biomathematics & Statistics Scotland, University of Aberdeen, Rowett Institute of Nutrition and Health, Greenburn Road, Aberdeen AB21 9SB, UK Email: Imke E Mulder - [email protected]; Bettina Schmidt - [email protected]; Christopher R Stokes - [email protected]; Marie Lewis - [email protected]; Mick Bailey - [email protected]; Rustam I Aminov - [email protected]; James I Prosser - [email protected]; Bhupinder P Gill - [email protected]; John R Pluske - [email protected]; Claus- Dieter Mayer - [email protected]; Corran C Musk - [email protected]; Denise Kelly* - [email protected] * Corresponding author †Equal contributors Abstract Background: Early microbial colonization of the gut reduces the incidence of infectious, inflammatory and autoimmune diseases. Recent population studies reveal that childhood hygiene is a significant risk factor for development of inflammatory bowel disease, thereby reinforcing the hygiene hypothesis and the potential importance of microbial colonization during early life. The extent to which early-life environment impacts on microbial diversity of the adult gut and subsequent immune processes has not been comprehensively investigated thus far. We addressed this important question using the pig as a model to evaluate the impact of early-life environment on microbe/host gut interactions during development. Results: Genetically-related piglets were housed in either indoor or outdoor environments or in experimental isolators. Analysis of over 3,000 16S rRNA sequences revealed major differences in mucosa-adherent microbial diversity in the ileum of adult pigs attributable to differences in early- life environment. Pigs housed in a natural outdoor environment showed a dominance of Firmicutes, in particular Lactobacillus, whereas animals housed in a hygienic indoor environment had reduced Lactobacillus and higher numbers of potentially pathogenic phylotypes. Our analysis revealed a strong negative correlation between the abundance of Firmicutes and pathogenic bacterial populations in the gut. These differences were exaggerated in animals housed in experimental isolators. Affymetrix microarray technology and Real-time Polymerase Chain Reaction revealed significant gut-specific gene responses also related to early-life environment. Significantly, indoor- housed pigs displayed increased expression of Type 1 interferon genes, Major Histocompatibility Complex class I and several chemokines. Gene Ontology and pathway analysis further confirmed these results. Published: 20 November 2009 BMC Biology 2009, 7:79 doi:10.1186/1741-7007-7-79 Received: 15 April 2009 Accepted: 20 November 2009 This article is available from: http://www.biomedcentral.com/1741-7007/7/79 © 2009 Mulder et al; licensee BioMed Central Ltd. This is an Open Access article distributed under the terms of the Creative Commons Attribution License (http://creativecommons.org/licenses/by/2.0 ), which permits unrestricted use, distribution, and reproduction in any medium, provided the original work is properly cited.

Welcome message from author
This document is posted to help you gain knowledge. Please leave a comment to let me know what you think about it! Share it to your friends and learn new things together.
Transcript
BioMed CentralBMC Biology
ss
Open AcceResearch articleEnvironmentally-acquired bacteria influence microbial diversity and natural innate immune responses at gut surfacesImke E Mulder†1, Bettina Schmidt†1, Christopher R Stokes2, Marie Lewis2, Mick Bailey2, Rustam I Aminov1, James I Prosser3, Bhupinder P Gill4, John R Pluske5, Claus-Dieter Mayer6, Corran C Musk1 and Denise Kelly*1Address: 1Gut Immunology Group, University of Aberdeen, Rowett Institute of Nutrition and Health, Greenburn Road, Aberdeen AB21 9SB, UK, 2Veterinary Pathology, Infection & Immunity, Langford House, Langford, Bristol, BS40 5DU, UK, 3Institute of Biological and Environmental Sciences, University of Aberdeen, St Machar Drive, Aberdeen AB24 3UU, UK, 4Agricultural and Horticultural Development Board, Winterhill House, Snowdon Drive, Milton Keynes MK6 1AX, UK, 5School of Veterinary and Biomedical Sciences, Murdoch University, Murdoch, WA 6150, Australia and 6Biomathematics & Statistics Scotland, University of Aberdeen, Rowett Institute of Nutrition and Health, Greenburn Road, Aberdeen AB21 9SB, UK
Email: Imke E Mulder - [email protected]; Bettina Schmidt - [email protected]; Christopher R Stokes - [email protected]; Marie Lewis - [email protected]; Mick Bailey - [email protected]; Rustam I Aminov - [email protected]; James I Prosser - [email protected]; Bhupinder P Gill - [email protected]; John R Pluske - [email protected]; Claus-Dieter Mayer - [email protected]; Corran C Musk - [email protected]; Denise Kelly* - [email protected]
* Corresponding author †Equal contributors
AbstractBackground: Early microbial colonization of the gut reduces the incidence of infectious,inflammatory and autoimmune diseases. Recent population studies reveal that childhood hygiene isa significant risk factor for development of inflammatory bowel disease, thereby reinforcing thehygiene hypothesis and the potential importance of microbial colonization during early life. Theextent to which early-life environment impacts on microbial diversity of the adult gut andsubsequent immune processes has not been comprehensively investigated thus far. We addressedthis important question using the pig as a model to evaluate the impact of early-life environmenton microbe/host gut interactions during development.
Results: Genetically-related piglets were housed in either indoor or outdoor environments or inexperimental isolators. Analysis of over 3,000 16S rRNA sequences revealed major differences inmucosa-adherent microbial diversity in the ileum of adult pigs attributable to differences in early-life environment. Pigs housed in a natural outdoor environment showed a dominance of Firmicutes,in particular Lactobacillus, whereas animals housed in a hygienic indoor environment had reducedLactobacillus and higher numbers of potentially pathogenic phylotypes. Our analysis revealed astrong negative correlation between the abundance of Firmicutes and pathogenic bacterialpopulations in the gut. These differences were exaggerated in animals housed in experimentalisolators. Affymetrix microarray technology and Real-time Polymerase Chain Reaction revealedsignificant gut-specific gene responses also related to early-life environment. Significantly, indoor-housed pigs displayed increased expression of Type 1 interferon genes, Major HistocompatibilityComplex class I and several chemokines. Gene Ontology and pathway analysis further confirmedthese results.
Published: 20 November 2009
BMC Biology 2009, 7:79 doi:10.1186/1741-7007-7-79
Received: 15 April 2009Accepted: 20 November 2009
This article is available from: http://www.biomedcentral.com/1741-7007/7/79
© 2009 Mulder et al; licensee BioMed Central Ltd. This is an Open Access article distributed under the terms of the Creative Commons Attribution License (http://creativecommons.org/licenses/by/2.0), which permits unrestricted use, distribution, and reproduction in any medium, provided the original work is properly cited.
Page 1 of 20(page number not for citation purposes)

BMC Biology 2009, 7:79 http://www.biomedcentral.com/1741-7007/7/79
Conclusion: Early-life environment significantly affects both microbial composition of the adult gutand mucosal innate immune function. We observed that a microbiota dominated by lactobacilli mayfunction to maintain mucosal immune homeostasis and limit pathogen colonization.
BackgroundThe gastrointestinal tract contains an immense number ofmicro-organisms, collectively known as the microbiota.The major functions of the microbiota include degradingdietary compounds, influencing nutrient partitioning andlipid metabolism, providing essential nutrients generatedas a result of microbial metabolism, protecting againstinvading pathogens and stimulating gut morphology [1-4]. The gut microbiota also plays an important role inmaintaining immune function. Recent work suggests thatthe commensal microbiota influences processes as com-plex as pathogen colonization, immune development andhomeostasis, T cell differentiation, inflammation, repairand angiogenesis [5-8].
The impact of the microbiota on host immunity isthought to be critically regulated in early life and inappro-priate exposure to bacteria during this developmental win-dow has been linked to the increased incidence ofinfectious, inflammatory and autoimmune diseases [9-11]. Clearly, the neonatal period is a critical time for gutcolonization, and can be affected by numerous factorsincluding gestational age, birth environment, mode ofdelivery, nutrition and antibiotic use [12,13].
The increase in immune-mediated disorders, particularlyin Westernized countries, has led to the so-called HygieneHypothesis, which postulates that the growing incidence ofimmune-mediated diseases is the consequence of reducedinfection and exposure to microbes during early child-hood [14]. In this context, the high-hygiene status of west-ern lifestyle, decreased infection rates and reducedbacterial load as a result of widespread use of vaccines andantibiotics are likely to be important contributory factors[15]. Animal models have provided some insight intoimmune-disease aetiology: animals susceptible toautoimmune disease have an increased incidence andseverity of disease when bred under germ-free conditionswhereas disease is prevented when the animals areexposed to bacteria [16]. This evidence supports thenotion that, in addition to naturally-acquired infections,colonization by the normal commensal microbiota is animportant factor limiting the incidences of immune-mediated diseases. Consistent with this is the growingawareness of the importance of the commensal microbi-ota in immune education in early life [8], which appearsto involve complex mechanisms of host-bacterial cross-talk [5,17-21].
In the current study we have investigated potential inter-actions between the rearing environment, gut microbiotaand immune function in the developing pig gut usingmolecular methods to evaluate both microbial diversityand host immune gene expression. Microbial diversity inthe gastrointestinal tract of these animals was character-ized by sequence analysis of 16S rRNA gene libraries. Spe-cific responses in transcriptome expression patterns of gutileal tissue were studied using Affymetrix GeneChip Por-cine Genome microarrays (Affymetrix, Santa Clara, CA).Biomarkers associated with immune function and alteredby rearing environment were identified and investigatedmore thoroughly by Real-time Polymerase Chain Reac-tion (PCR).
ResultsMucosal microbial diversity in the ileum of pigs from different environmentsWe investigated the influence of environmentally-acquired bacteria on the composition of the adultmucosa-adherent ileal microbiota in the pig. Animalswere housed in an indoor (IN) or an outdoor facility(OUT), as well as in individual isolator units receivingdaily doses of antibiotics (IR). Mucosa-adherent bacterialsamples from the ileum and fecal samples were collectedfrom all experimental animals at day 56. In addition tothis, fecal samples were taken from adult sows from boththe indoor (INS) and outdoor (OUTS) environments toconfirm 'environment' as the major factor contributing tothe experimental differences. Microbial composition ofthe ileum was examined by calculation of diversity indicesand analysis of the phylogenetic distribution of 16S rRNAgene sequences derived from clone libraries of each treat-ment. After quality control, a total of 3,089 validatedclones were analyzed.
Diversity MeasuresWe first investigated the effects of environment and high-hygiene status on a number of bacterial diversity indices.Estimates of diversity, richness and library coverage forthe 16S rRNA clone libraries from IN, OUT and IR areshown in Table 1. Species richness, estimated by Chao1,was highest in the IR and IN groups but lower in the OUTgroup. Good's coverage was 90.97 to 93.47% for all threetreatment groups, with the lowest coverage in IR libraries.Rarefaction analysis of clone libraries confirmed thesefindings and suggested that the IR and IN groups pos-sessed the most diverse mucosa-adherent bacterial com-
Page 2 of 20(page number not for citation purposes)
BMC Biology 2009, 7:79 http://www.biomedcentral.com/1741-7007/7/79
munity, whereas the OUT group showed lower microbialdiversity (Figure 1).
Collector's curves of the observed and estimated phylo-type richness are shown in Figure 2A-C. Each curve reflectsthe series of observed or estimated richness valuesobtained as more clones were added to the data set. Afteran initial steep rise, the curves level out, suggesting thatthe majority of phylotypes in the treatment groups wereadequately sampled. In the early stages of sampling andclone sequencing, both Chao1 and abundance-based cov-erage estimator (ACE) showed a sharp increase, togetherwith the observed phylotype number, in the IN group(Figure 2A). After the sampling of about 190 clones, thegap between the observed and estimated phylotype rich-ness was relatively constant, indicating repeated samplingof same phylotypes within samples. In the OUT group,the gap between the observed and estimated phylotyperichness was constant after the sampling point of 110clones (Figure 2B). The difference between the estimated
and observed phylotype richness was highest in the IRmucosal libraries. Novel phylotypes continued to be iden-tified up to the end of sampling (Figure 2C).
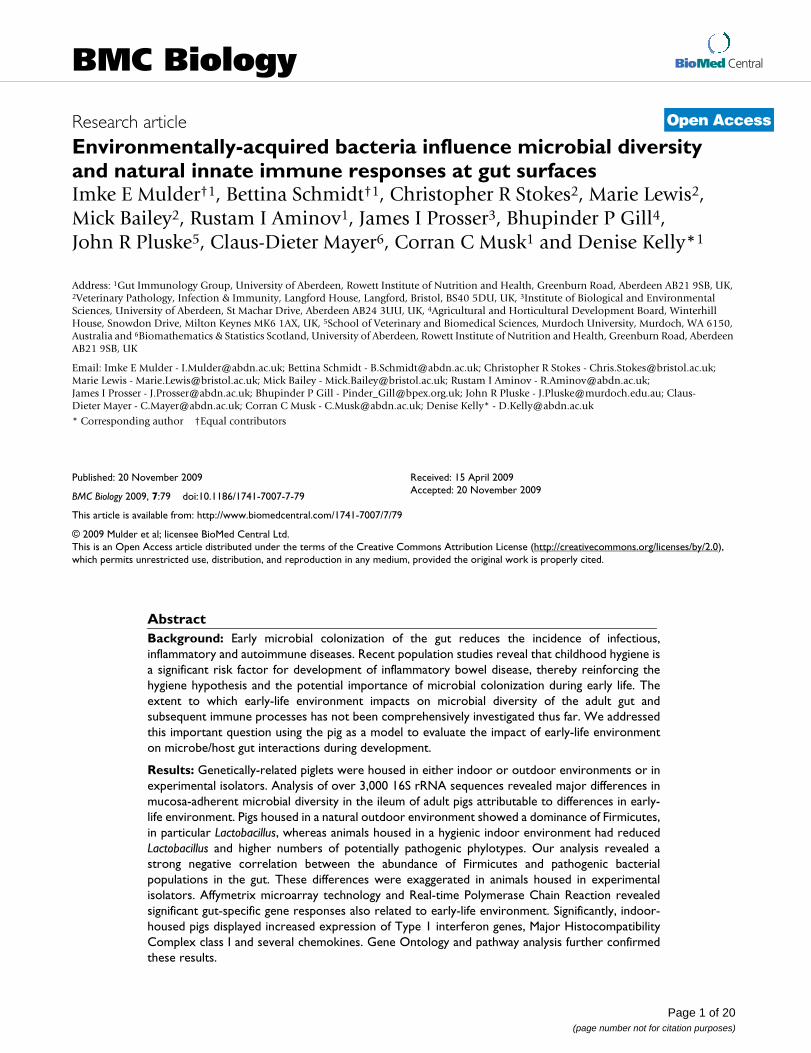
Phylogenetic affiliation of 16S rRNA gene sequencesPhylogenetic analysis was performed to establish taxo-nomic positioning of obtained sequences. All 16S rRNAgene sequences from the mucosa-adherent ileal and fecalsamples were subjected to the Ribosomal DatabaseProject (RDP) Classifier analysis (95% confidence thresh-old). Based on the classification results, the majority ofclones were assigned to four phyla: Firmicutes (69.7% ofall sequences), Proteobacteria (17.7%), Bacteroidetes(11.4%), and Actinobacteria (0.5%) (Figure 3 and Table2). The two major phyla, Firmicutes and Bacteroidetes,were significantly different between the libraries: the Fir-micutes showed a significant increase in the OUT groupcompared to the IR group, while the Bacteroidetes weresignificantly increased in both the INS and OUTS fecallibraries compared to the mucosa-adherent ileal libraries.
FirmicutesSeventy percent of all sequences were affiliated with theFirmicutes phylum. The outdoor environment favouredthe expansion of Firmicutes compared to the hygienicenvironment (Figure 3). At the lower taxa level this differ-ence was even more pronounced.
A large number of sequenced clones fell into the Bacilliclass. The most abundant order was Lactobacillales, whichwas dominated by Lactobacillaceae, but also containedStreptococcaceae, Leuconostocaceae, Enterococcaceae,Carnobacteriaceae and Aerococcaceae, although presentin lower abundance.
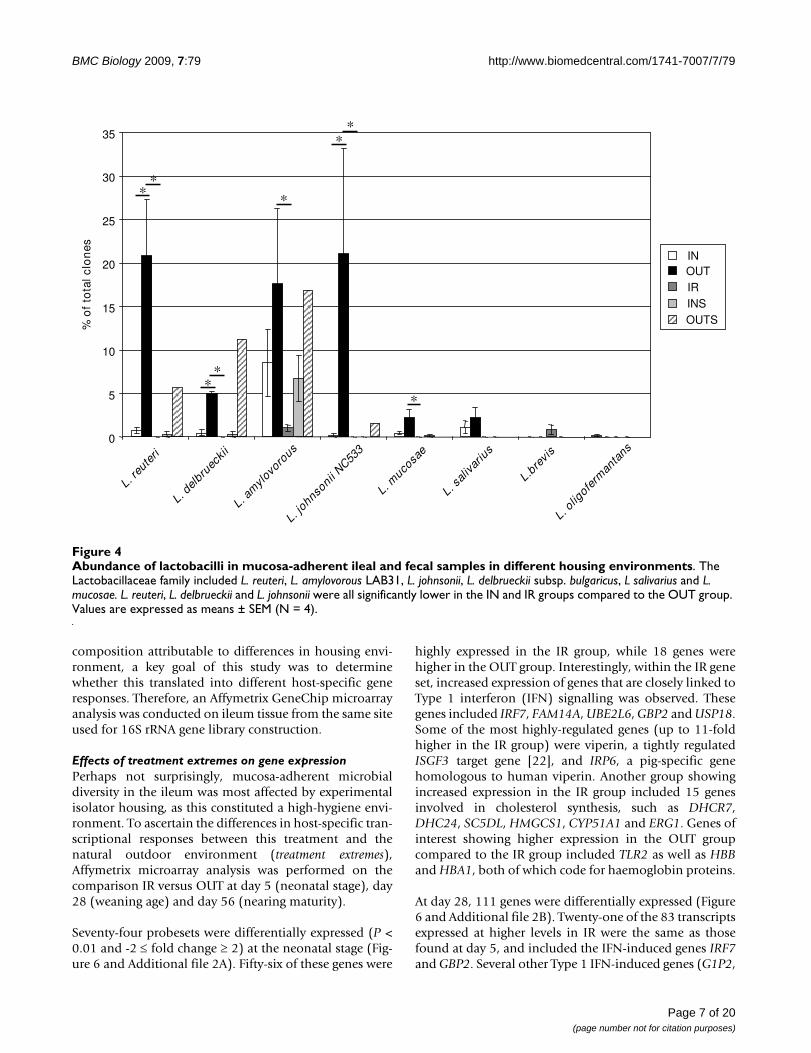
The Lactobacillaceae family in the OUT group (77.2% ofsequences) consisted of a small number of operationaltaxonomic units (OTUs), including Lactobacillus reuteri, L.amylovorous LAB31, L. johnsonii, L. delbrueckii subsp. bul-garicus, L. salivarius and L. mucosae (Figure 4). In contrast,the IN library contained only 12.8% Lactobacillaceae-affiliated clones, although phylotypes were similar tothose observed in the OUT group. L. reuteri, L. delbrueckiiand L. johnsonii were all significantly decreased comparedto the OUT group. The high-hygiene conditions associ-ated with IR exacerbated these differences. L. amylovorousLAB31 and L. brevis were present in very low abundance inthe IR libraries (3.58% of sequences) whereas L. reuteri, L.delbrueckii subsp. bulgaricus, L. johnsonii and L. mucosaewere not detected in this treatment group.
The observed differences in Lactobacillus levels betweenthe IR and OUT group were confirmed by enumeration ofbacteria in gut contents of both ileum and colon on deMan, Rogosa and Sharpe (MRS) agar. The OUT group had
Treatment-based rarefaction curves of 16S rRNA gene librariesFigure 1Treatment-based rarefaction curves of 16S rRNA gene libraries. The rarefaction curves from IN (pink), OUT (green) and IR (black) animals were generated by plotting the number of phylotypes (OTUs; defined at 99% sequence iden-tity) against the number of clones sequenced. The shape of the curves of observed phylotype richness indicates a trend of diminishing chance of finding new phylotypes as sampling continues.
0
50
100
150
200
1 48 95 142
189
236
283
330
377
424
471
518
565
612
659
706
753
800
847
894
941
988
Clones
OT
Us
OUTIR
IN
Table 1: Indices of diversity, richness and library coverage for 16S rRNA gene libraries.
Measurement IN OUT IR
No. of clones 995 734 780Chao1 estimator of species richness 259.02 254.89 302.53Shannon diversity index (H) 4.438 4.190 4.355Simpson diversity index (1-D) 0.980 0.975 0.979Simpson reciprocal index (1/D) 52.00 40.41 47.47
Good's estimator of coverage (%) 93.47 92.46 90.97
Calculations were made based on OTU definition at 99% sequence identity (N = 4).
Page 3 of 20(page number not for citation purposes)

BMC Biology 2009, 7:79 http://www.biomedcentral.com/1741-7007/7/79
Page 4 of 20(page number not for citation purposes)
Collector's curves of the observed and estimated phylotype richness of 16S rRNA gene librariesFigure 2Collector's curves of the observed and estimated phylotype richness of 16S rRNA gene libraries. Collector's curves of the observed (blue) and estimated (ACE (pink) and Chao1 (yellow)) phylotype richness calculated for IN (A), OUT (B) and IR (C) at 99% level. Each curve reflects observed or estimated richness values obtained as more clones are added to the data set. After an initial steep rise, the curves level out suggesting that a majority of clones in the treatment groups have been sampled. Differences between the estimates and observed phylotype richness were highest in the IR group. Novel phylo-types continued to be identified up to the end of sampling in this group.
C
B
A
0
50
100
150
200
250
300
350
1 37 73 109
145
181
217
253
289
325
361
397
433
469
505
541
577
613
649
685
721
OT
Us Observed
ACEChao1
Clones
OT
Us
ObservedACEChao1
0
50
100
150
200
250
300
350
1 50 99 148
197
246
295
344
393
442
491
540
589
638
687
736
785
834
883
932
981
Clones
OT
Us
Clones
0
50
100
150
200
250
300
350
1 39 77 115
153
191
229
267
305
343
381
419
457
495
533
571
609
647
685
723
761
ObservedACEChao1
BMC Biology 2009, 7:79 http://www.biomedcentral.com/1741-7007/7/79
three to four log10 colony forming units lactobacilli/gmore than the IR group, thus validating the 16S rRNAgene library results (Additional file 1).
Members of the Clostridia class were present in all treat-ment groups with 28.2% of all sequenced clones classifiedas Clostridia. Interestingly, pigs raised in the indoor envi-ronment showed the highest abundance of this class.
Clostridiaceae-affiliated clones were highly abundant inthe IN group and mainly identified as uncultured species.Clostridium beijerinckii NCIMB 8052 was significantly ele-vated in the IN libraries compared to the OUT and IRlibraries (Figure 5). The indoor environment alsofavoured the expansion of the bacterial cloneHH_aai33h06 (EU775688) on the ileal mucosa com-pared to the outdoor environment.
The Peptostreptoccocaceae family was another abundantmember of the Clostridia class, accounting for 19.1% ofthe sequenced clones in all treatment groups. The indoorenvironment favoured the expansion of Peptostreptocco-caceae. Seven predominant OTUs, represented by mainlyuncultured clones, were identified. Sequences of uncul-
tured clones BARB_aaa02d03 were significantly higher inthe IN and IR groups compared to the OUT group andwere not detected in the indoor fecal libraries (Figure 5).This possibly points to a preferential colonization of theileal mucosa in the indoor environment. Uncultured bac-terium clone BARB_aaa01f06 was significantly increasedin the ileal mucosal libraries of the IN group compared tothe OUT and IR groups, indicating a potential antibioticsensitivity of this bacterium.
BacteroidetesBacteroidetes were found in all libraries but in differentabundance. The most abundant group within this phylumwas represented by members of the Prevotellaceae family,followed by Porphyromonadaceae, Bacteroidaceae and,to a lesser extent, Sphingobacteriaceae and Flavobacte-riaceae.
All 16S rRNA gene libraries contained members of Prevo-tellaceae, yet they were most prevalent in the indoor envi-ronment, particularly in fecal libraries. High-hygieneconditions increased the numbers of Prevotellaceae onthe ileal mucosa.
Phylogenetic distribution of clones obtained from mucosa-adherent ileal and fecal samples in different housing environmentsFigure 3Phylogenetic distribution of clones obtained from mucosa-adherent ileal and fecal samples in different housing environments. The majority of clones were assigned to the phyla Firmicutes, Proteobacteria, Bacteroidetes, and Actinobac-teria. The Firmicutes phylum was significantly increased in the OUT group compared to the IR group (P < 0.05). The Bacter-oides phylum was significantly increased in both the INS and OUTS fecal libraries compared to the mucosa-adherent ileal libraries. Values are expressed as means ± SEM (N = 4).
INOUTIRINSOUTS
0
10
20
30
40
50
60
70
80
90
100
Actinobacteria Proteobacteria Bacteroidetes Firmicutes Other
Rel
ativ
e A
bu
nd
ance
(%
)
**
*
Page 5 of 20(page number not for citation purposes)

BMC Biology 2009, 7:79 http://www.biomedcentral.com/1741-7007/7/79
Porphyromonadaceae were mainly obtained from thefecal libraries of both farms. Most clones had only 97%similarity to previously isolated clones, specifically thePorphyromonadaceae bacterium sp DJF_B175(EU728718) and uncultured bacterial clones (EU472597,EU472617 and EU461958).
Bacteroidaceae were exclusively obtained from the indoorenvironment. Within the IN and IR groups, these includedBacteroides vulgatus (CP000139) and uncultured bacterialclones (EF403095, EF403812, EU779318 andDQ800210). In the IN fecal libraries two species wererelated to B. propionifaciens (AB264625.2) and unculturedbacterium clone p-240-o5 (AF371909).
ProteobacteriaEighteen percent of all clones were placed into the Proteo-bacteria phylum. γ-proteobacteria and ε-proteobacteriawere the most abundant groups, while members of the α-and β-proteobacteria were found only sporadically.
Twenty-eight γ-proteobacteria clones were obtained fromthe OUT mucosa-adherent libraries. These included E.coli, Actinobacillus minor and A. porcinus. Six OTUs belong-ing to Actinobacillus spp. were predominately present in
the IN group, including Actinobacillus minor, A. porcinusstrains H1498/H1215 and A. rossii strain JF1390. Thisclone has been isolated from the intestine and reproduc-tive tract of pigs and is considered an opportunistic path-ogen implicated in spontaneous abortion.
High-hygiene status increased the number of γ-proteobac-teria on the ileal mucosa. All 16S rRNA gene libraries fromthe IR group contained members of the γ-proteobacteriaclass and grouped mainly with Enterobacteriaceae,including sequences identified as E. coli spp. with patho-genic properties which may pose a health risk for theyoung pig as well as the human population.
Members of the ε-proteobacteria were the second mostabundant group within the Proteobacteria phylum andwere represented by two major bacterial families, Helico-bacteraceae and Campylobacteraceae. Most clones wereobtained from the IN group and included bacteria of rec-ognized pathogenic phenotype (13% of IN sequences).
Transcriptomic analysis of gene expression patterns in the ileum of pigs from different environmentsWhile the comprehensive profiling of the mucosa-adher-ent microbial community revealed large differences in
Table 2: Major phylogenetic distribution of 16S rRNA gene sequences and phylotypes from treatment groups.
Phylum Bacterial taxa IN OUT IR INS OUTS
% Bacteroidetes 3.72 1.08 20.97 26.44 13.70Prevotellaceae (%) 2.91 0.54 18.79 10.09 4.83Bacteroidaceae (%) 0.40 0 0.76 4.08 0Porphyromonadaceae (%) 0 0.40 0.63 3.84 8.87
% Proteobacteria 28.26 4.63 24.04 12.25 0α-proteobacteria (%) 0 0.13 0 0 0β-proteobacteria (%) 0.20 0 0.1 0.24 0γ-proteobacteria (%) 15.19 3.81 23.91 11.53 0Pasteurellaceae (%) 14.78 2.17 2.55 0 0Enterobacteriaceae (%) 0.4 1.36 20.7 0.24 0Pseudomonadaceae (%) 0 0 0 4.08 0Moraxellaceae (%) 0 0 0.63 6.25 0ε-proteobacteria (%) 12.97 0.4 0 0.48 0Helicobacteraceae (%) 10.46 0.4 0 0 0Campylobacteraceae (%) 2.61 0 0 0.48 0
% Firmicutes 66.29 94.0 54.21 73.55 83.06Erysipelotrichi (%) 0.90 0 0.12 0.72 0Bacilli (%) 18.81 81.8 3.70 19.95 49.18Order Bacillales (%) 0.2 0.2 0.12 5.28 0Order Lactobacillales (%) 18.6 81.6 3.58 14.42 49.18Clostridia (%) 46.68 12.12 47.69 51.92 33.87Lachnospiraceae (%) 3.52 0.95 8.95 3.84 8.87Veillonellaceae (%) 0 0.4 6.9 1.68 1.61Clostridiaceae (%) 13.17 2.72 1.27 19.95 8.06Peptostreptococcaceae (%) 24.44 7.49 28.9 15.38 2.41Ruminococcaceae (%) 0.90 0.54 6.26 6.97 7.25
Page 6 of 20(page number not for citation purposes)
BMC Biology 2009, 7:79 http://www.biomedcentral.com/1741-7007/7/79
composition attributable to differences in housing envi-ronment, a key goal of this study was to determinewhether this translated into different host-specific generesponses. Therefore, an Affymetrix GeneChip microarrayanalysis was conducted on ileum tissue from the same siteused for 16S rRNA gene library construction.
Effects of treatment extremes on gene expressionPerhaps not surprisingly, mucosa-adherent microbialdiversity in the ileum was most affected by experimentalisolator housing, as this constituted a high-hygiene envi-ronment. To ascertain the differences in host-specific tran-scriptional responses between this treatment and thenatural outdoor environment (treatment extremes),Affymetrix microarray analysis was performed on thecomparison IR versus OUT at day 5 (neonatal stage), day28 (weaning age) and day 56 (nearing maturity).
Seventy-four probesets were differentially expressed (P <0.01 and -2 ≤ fold change ≥ 2) at the neonatal stage (Fig-ure 6 and Additional file 2A). Fifty-six of these genes were
highly expressed in the IR group, while 18 genes werehigher in the OUT group. Interestingly, within the IR geneset, increased expression of genes that are closely linked toType 1 interferon (IFN) signalling was observed. Thesegenes included IRF7, FAM14A, UBE2L6, GBP2 and USP18.Some of the most highly-regulated genes (up to 11-foldhigher in the IR group) were viperin, a tightly regulatedISGF3 target gene [22], and IRP6, a pig-specific genehomologous to human viperin. Another group showingincreased expression in the IR group included 15 genesinvolved in cholesterol synthesis, such as DHCR7,DHC24, SC5DL, HMGCS1, CYP51A1 and ERG1. Genes ofinterest showing higher expression in the OUT groupcompared to the IR group included TLR2 as well as HBBand HBA1, both of which code for haemoglobin proteins.
At day 28, 111 genes were differentially expressed (Figure6 and Additional file 2B). Twenty-one of the 83 transcriptsexpressed at higher levels in IR were the same as thosefound at day 5, and included the IFN-induced genes IRF7and GBP2. Several other Type 1 IFN-induced genes (G1P2,
Abundance of lactobacilli in mucosa-adherent ileal and fecal samples in different housing environmentsFigure 4Abundance of lactobacilli in mucosa-adherent ileal and fecal samples in different housing environments. The Lactobacillaceae family included L. reuteri, L. amylovorous LAB31, L. johnsonii, L. delbrueckii subsp. bulgaricus, L salivarius and L. mucosae. L. reuteri, L. delbrueckii and L. johnsonii were all significantly lower in the IN and IR groups compared to the OUT group. Values are expressed as means ± SEM (N = 4).
*
0
5
10
15
20
25
30
35
L. reu
teri
L. del
bruec
kii
L. am
ylovo
rous
L. johnso
nii NC53
3
L. muco
sae
L. sal
ivar
ius
L.bre
vis
L. olig
oferm
anta
ns
% o
f to
tal c
lon
es
*
*
*
*
*
*
*
INOUTIRINSOUTS
Page 7 of 20(page number not for citation purposes)

BMC Biology 2009, 7:79 http://www.biomedcentral.com/1741-7007/7/79
IFIT2, IFIT3, MX2, ISG20 and IFITM3) were higher in IRanimals compared to OUT animals, indicating a consist-ent treatment effect on Type 1 IFN signalling pathways.Also in common with the day 5 gene expression set, ninecholesterol synthesis genes were increased in the IR group.Consistent with these findings, microbiota-driven effectson cholesterol metabolism and trafficking have been pre-viously documented [23]. Other transcripts expressedhigher in the IR group compared to the OUT groupincluded the chemokines CXCL12, CCL28, CCL2, CCL8and CXCL9, the chemokine receptor CCR5 and the chem-okine ligand CCL4L. PMP22 was increased in the OUTgroup. This gene is co-expressed with occludin and zonaoccludens 1 at tight junctions in epithelial cells [24].
Sixty-six genes were differentially expressed between IRand OUT at day 56 (Figure 6 and Additional file 2C).Some of the genes showing higher expression in the IRgroup included KAI1, CEBPB, LTB4DH, COL14A1 andCOL1A2. Changes in CEBPB (CCAAT/enhancer-bindingprotein beta) expression in IR animals may be function-ally important as this gene is involved in the regulation ofinflammatory responses [25]. Notably, a group of T-cell-related genes was increased in OUT animals, including
TCA_HUMAN, LY96, CD8A, TRGV9, LCP1, LCP2, CXCL9and TEC, all of which are involved in T cell signalling,expansion, activation and trafficking. Other highlyexpressed transcripts in the OUT group included EGR1,SELL (important for leukocyte-endothelial cell interac-tions), PIGR (poly-Ig receptor) and PIK3CG.
Consistently, PDK4 was higher in the OUT group com-pared to the IR group at all three time-points. PDK4 has animportant function in glucose metabolism, and its expres-sion is regulated by glucocorticoids, retinoic acid andinsulin; however, its potential relevance in host-microbeinteractions is currently unknown.
Biological pathway analysis revealed that a large numberof Immune response pathways were affected (Table 3 andFigure 7A). Other highly represented pathways includedG-protein and Congenital, hereditary and neonatal diseasesand abnormalities. Consistent with the analysis of individ-ual gene data, the pathway for Immune response-IFN alpha/beta signalling was increased at day 28 and day 56 in the IRgroup compared to the OUT group. Immune response-Anti-gen presentation by MHC class l was affected at all threetime-points and also higher in IR compared to OUT. Gene
Significantly affected bacterial clones in the mucosa-adherent ileum of animals in different housing environmentsFigure 5Significantly affected bacterial clones in the mucosa-adherent ileum of animals in different housing environ-ments. Clostridium beijerinckii NCIMB 8052, as well as uncultured bacterial clone BARB_aaa01f06, BARB_aaa02d03 and HH_aai33h06 were significantly decreased in the OUT library compared to the IN library. Uncultured bacterial clone BARB_aaa01f06 and Clostridium beijerinckii NCIMB 8052 were also significantly decreased in the IR group. Values are expressed as means ± SEM (N = 4).
0
2.5
5
7.5
10
Uncultured cloneBARB_aaa01f06
Uncultured cloneBARB_aaa02d03
Clostridium beijerinckii Uncultured cloneHH_aai33h06
% o
f to
tal c
lon
es
**
**
*
*
INOUTIR
Page 8 of 20(page number not for citation purposes)

BMC Biology 2009, 7:79 http://www.biomedcentral.com/1741-7007/7/79
Ontology (GO)-enrichment analysis (Table 4) furtherconfirmed these findings. While a number of GO catego-ries were consistently affected by treatment, includingImmune response (GO:0002376), the major biologicalprocess affected was Antigen processing and presentation(GO:0019882). Other affected GO-processes were Antigenprocessing and presentation of peptide antigen via MHC class I(GO:0002474), Antigen processing and presentation of pep-tide antigen (GO:0048002) and Antigen processing and pres-entation of peptide or polysaccharide antigen via MHC class II(GO:0002504).
Effects of housing environment on gene expressionDifferences in ileal mucosa-adherent microbial composi-tion between the IR group and the OUT group were asso-ciated with large host-specific transcriptional differencesin the ileum. We next set out to assess whether the micro-bial differences associated with the IN and OUT environ-ments had a similar impact on the gut transcriptome ofthe pig. While the number of differentially expressed
genes between IN and OUT housed animals was smallerthan between the treatment extremes (i.e. IR and OUT),similar trends could be discerned.
In the neonatal pig, the expression levels of 13 probesetswere differentially expressed between the IN and OUTanimals (Figure 6 and Additional file 2D). Nine geneswere higher in IN animals, and this included CXCL9,which is involved in T cell trafficking. Four genes showedhigher expression in OUT animals, including TFRC.
In weaning animals, 42 genes were differentiallyexpressed between the two rearing environments (Figure6 and Additional file 2E). Twelve transcripts were higherin IN animals, including TAFA2 (distantly related toCCL3), CCR1 and CXCR4. Of the 30 genes that werehigher in the OUT group, genes of interest includedPMP22, CNKSR1, TJP4 and LTBR (all increased betweentwo- and three-fold).
Differentially expressed genes in the ileum of animals housed in different environmentsFigure 6Differentially expressed genes in the ileum of animals housed in different environments. Differentially expressed genes at each time-point are shown for the two treatment comparisons (P < 0.01, -2 ≤ fold change ≥ 2, N = 6). Microbiota dif-ferences between the treatment groups were associated with large differences in gene expression in the ileum.
Gen
es Upregulated genes
Downregulated genes
-75
-50
-25
0
25
50
75
100
Day 5 Day 28 Day 56 Day 5 Day 28 Day 56
IR vs OUT IN vs OUT
Page 9 of 20(page number not for citation purposes)
BMC Biology 2009, 7:79 http://www.biomedcentral.com/1741-7007/7/79
The largest differences in gene expression were observed atday 56, when 71 genes were differentially expressedbetween the treatments (Figure 6 and Additional file 2F).Transcripts increased in IN animals (60 probesets in total)included three Type 1 IFN-inducible genes (IFRD1, OAS1and IFIT2). The antibacterial peptide genes LYZ (Lys-ozyme C precursor), PI3 (elafin precursor) and BPI (bac-tericidal permeability-increasing protein precursor) wereincreased 6.92-, 6.8- and 2.93-fold, respectively, in IN ani-mals compared to OUT animals and may contribute tothe observed differences in microbiota compositionbetween these groups. Furthermore, these peptides appearto maintain gut homeostasis as evidenced by their aber-rant expression in Crohn's Disease [26] and UlcerativeColitis [27]. CCL8 (a monocyte chemotactic protein) wasalso higher in the IN group. Some of the 11 genesincreased in OUT animals were PMP22 and SELL, inaccordance with the observations from the IR and OUTcomparison.
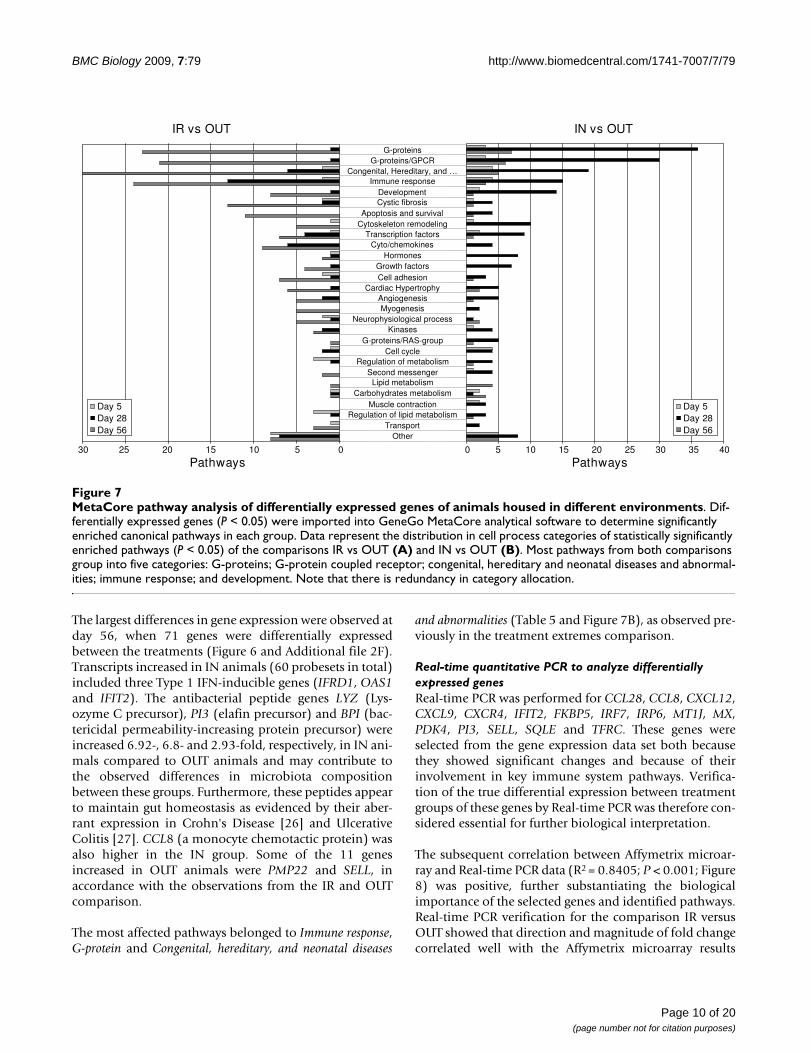
The most affected pathways belonged to Immune response,G-protein and Congenital, hereditary, and neonatal diseases
and abnormalities (Table 5 and Figure 7B), as observed pre-viously in the treatment extremes comparison.
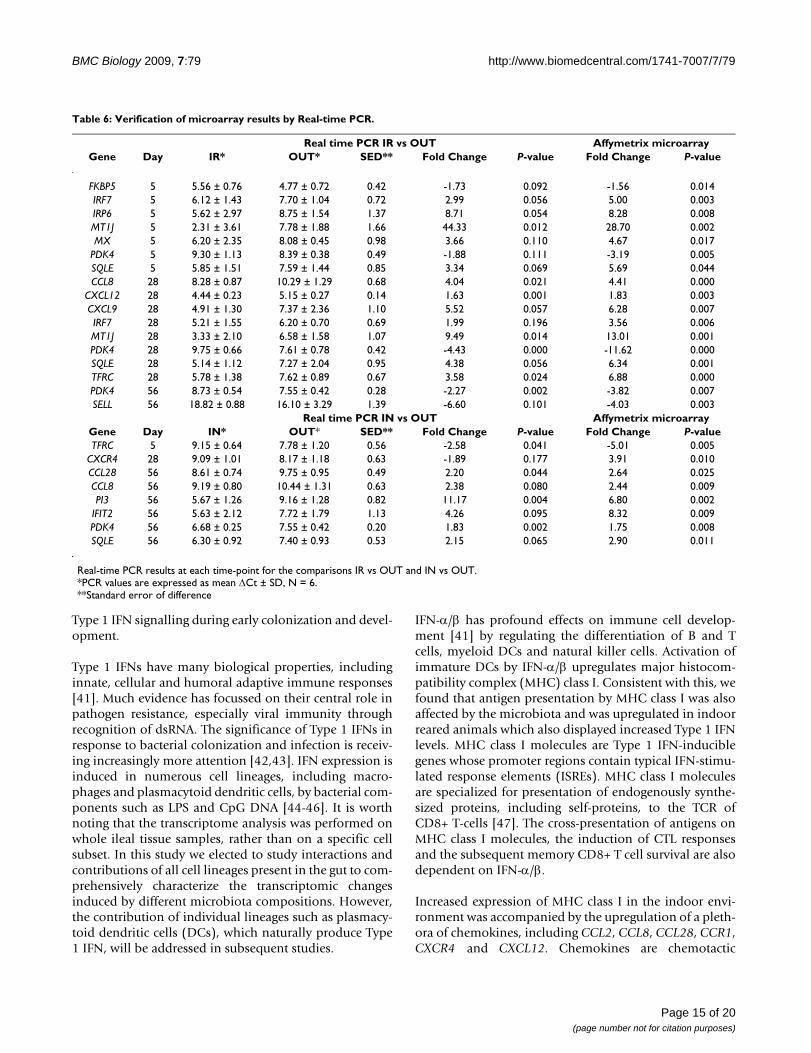
Real-time quantitative PCR to analyze differentially expressed genesReal-time PCR was performed for CCL28, CCL8, CXCL12,CXCL9, CXCR4, IFIT2, FKBP5, IRF7, IRP6, MT1J, MX,PDK4, PI3, SELL, SQLE and TFRC. These genes wereselected from the gene expression data set both becausethey showed significant changes and because of theirinvolvement in key immune system pathways. Verifica-tion of the true differential expression between treatmentgroups of these genes by Real-time PCR was therefore con-sidered essential for further biological interpretation.
The subsequent correlation between Affymetrix microar-ray and Real-time PCR data (R2 = 0.8405; P < 0.001; Figure8) was positive, further substantiating the biologicalimportance of the selected genes and identified pathways.Real-time PCR verification for the comparison IR versusOUT showed that direction and magnitude of fold changecorrelated well with the Affymetrix microarray results
MetaCore pathway analysis of differentially expressed genes of animals housed in different environmentsFigure 7MetaCore pathway analysis of differentially expressed genes of animals housed in different environments. Dif-ferentially expressed genes (P < 0.05) were imported into GeneGo MetaCore analytical software to determine significantly enriched canonical pathways in each group. Data represent the distribution in cell process categories of statistically significantly enriched pathways (P < 0.05) of the comparisons IR vs OUT (A) and IN vs OUT (B). Most pathways from both comparisons group into five categories: G-proteins; G-protein coupled receptor; congenital, hereditary and neonatal diseases and abnormal-ities; immune response; and development. Note that there is redundancy in category allocation.
30 25 20 15 10 5 0 0 5 10 15 20 25 30 35 40
IR vs OUT IN vs OUT
Pathways Pathways
OtherTransport
Regulation of lipid metabolismMuscle contraction
Carbohydrates metabolismLipid metabolism
Second messengerRegulation of metabolism
Cell cycleG-proteins/RAS-group
KinasesNeurophysiological process
MyogenesisAngiogenesis
Cardiac HypertrophyCell adhesionGrowth factors
HormonesCyto/chemokines
Transcription factorsCytoskeleton remodelingApoptosis and survival
Cystic fibrosisDevelopment
Immune responseCongenital, Hereditary, and …
G-proteins/GPCRG-proteins
Day 5Day 28Day 56
Day 5Day 28Day 56
Page 10 of 20(page number not for citation purposes)
BMC Biology 2009, 7:79 http://www.biomedcentral.com/1741-7007/7/79
(Table 6). In some cases the fold changes detected by Real-time PCR were lower than those observed by microarrayanalysis.
The differentially expressed genes from the IN versus OUTcomparison were examined by Real-time PCR and againcorrelated well with the Affymetrix microarray results(Table 6). Only CXCR4 expression in the IN groupshowed disagreement between the two platforms, as itwas increased using microarray analysis, and decreasedusing Real-time PCR.
DiscussionThe current study sought to investigate the effects of envi-ronmental hygiene on microbial colonization and com-position of the gut microbiota. Additionally,transcriptomic profiling was performed to assess the
impact of environmental hygiene on gene expression, inparticular those genes and pathways associated withimmune function. Both indoor and isolator (representingurban lifestyle and high-hygiene status, respectively), andoutdoor (representing rural lifestyle and low-hygiene sta-tus) conditions were compared using pigs as an experi-mental model.
Using extensive analysis of 16S rRNA gene libraries ourstudy categorically revealed that early-life environmenthas a major impact on microbial diversity and that thesedifferences are sustainable throughout adult life. Many ofthe bacterial phylotypes identified in our study are com-monly found in the human and animal gastrointestinaltract [28-30]. Our results also identified that only 3.3% ofthe clones had less than 97% sequence similarity to exist-ing database entries.
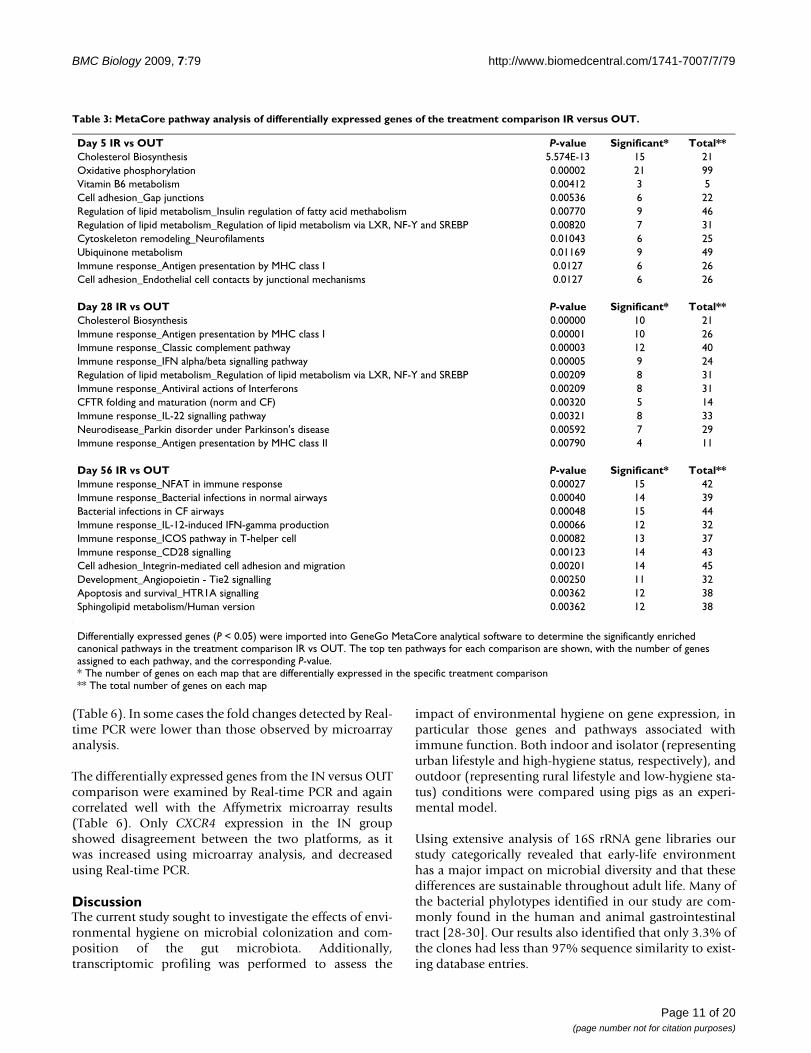
Table 3: MetaCore pathway analysis of differentially expressed genes of the treatment comparison IR versus OUT.
Day 5 IR vs OUT P-value Significant* Total**Cholesterol Biosynthesis 5.574E-13 15 21Oxidative phosphorylation 0.00002 21 99Vitamin B6 metabolism 0.00412 3 5Cell adhesion_Gap junctions 0.00536 6 22Regulation of lipid metabolism_Insulin regulation of fatty acid methabolism 0.00770 9 46Regulation of lipid metabolism_Regulation of lipid metabolism via LXR, NF-Y and SREBP 0.00820 7 31Cytoskeleton remodeling_Neurofilaments 0.01043 6 25Ubiquinone metabolism 0.01169 9 49Immune response_Antigen presentation by MHC class I 0.0127 6 26Cell adhesion_Endothelial cell contacts by junctional mechanisms 0.0127 6 26
Day 28 IR vs OUT P-value Significant* Total**Cholesterol Biosynthesis 0.00000 10 21Immune response_Antigen presentation by MHC class I 0.00001 10 26Immune response_Classic complement pathway 0.00003 12 40Immune response_IFN alpha/beta signalling pathway 0.00005 9 24Regulation of lipid metabolism_Regulation of lipid metabolism via LXR, NF-Y and SREBP 0.00209 8 31Immune response_Antiviral actions of Interferons 0.00209 8 31CFTR folding and maturation (norm and CF) 0.00320 5 14Immune response_IL-22 signalling pathway 0.00321 8 33Neurodisease_Parkin disorder under Parkinson's disease 0.00592 7 29Immune response_Antigen presentation by MHC class II 0.00790 4 11
Day 56 IR vs OUT P-value Significant* Total**Immune response_NFAT in immune response 0.00027 15 42Immune response_Bacterial infections in normal airways 0.00040 14 39Bacterial infections in CF airways 0.00048 15 44Immune response_IL-12-induced IFN-gamma production 0.00066 12 32Immune response_ICOS pathway in T-helper cell 0.00082 13 37Immune response_CD28 signalling 0.00123 14 43Cell adhesion_Integrin-mediated cell adhesion and migration 0.00201 14 45Development_Angiopoietin - Tie2 signalling 0.00250 11 32Apoptosis and survival_HTR1A signalling 0.00362 12 38Sphingolipid metabolism/Human version 0.00362 12 38
Differentially expressed genes (P < 0.05) were imported into GeneGo MetaCore analytical software to determine the significantly enriched canonical pathways in the treatment comparison IR vs OUT. The top ten pathways for each comparison are shown, with the number of genes assigned to each pathway, and the corresponding P-value.* The number of genes on each map that are differentially expressed in the specific treatment comparison** The total number of genes on each map
Page 11 of 20(page number not for citation purposes)

BM
C B
iolo
gy 2
009,
7:7
9ht
tp://
ww
w.b
iom
edce
ntra
l.com
/174
1-70
07/7
/79
Page
12
of 2
0(p
age
num
ber n
ot fo
r cita
tion
purp
oses
)
Table 4: GO analysis of differentially expressed genes of animals housed in different environments.
IR vs OUT IN vs OUTGO Category
GO Term Day 5 Day 28 Day 56 Day 5 Day 28 Day 56
Genes* P-value Genes* P-value Genes* P-value Genes* P-value Genes* P-value Genes* P-value
GO:0019882 Antigen processing and presentation
62 2.4E-33 28 8.0E-06 26 5.1E-05 25 6.0E-10 26 1.8E-07 26 8.8E-06
GO:0002376 Immune system process
65 3.5E-21 42 4.3E-07 33 0.001 27 1.6E-06 30 5.4E-05 35 2.7E-05
GO:0002474 Antigen processing and presentation of peptide antigen via MHC class I
15 1.6E-08 16 8.6E-10 15 7.8E-09 14 3.0E-11 15 1.5E-10 15 2.2E-09
GO:0048002 Antigen processing and presentation of peptide antigen
15 1.6E-08 16 8.6E-10 15 7.8E-09 14 3.0E-11 15 1.5E-10 15 2.2E-09
GO:0006955 Immune response
54 1.8E-16 31 4.7E-04 16 0.021 24 0.015
GO:0002504 Antigen processing and presentation of peptide or polysaccharide antigen via MHC class II
36 1.5E-17
GO:0050896 Response to stimulus
57 3.5E-07 41 0.018
GO:0006412 Translation 13 0.002GO:0006807 Nitrogen
compound metabolic process
9 0.007 8 0.021
GO:0030163 Protein catabolic process
5 0.008
Differentially expressed transcripts (P < 0.05) are shown assigned to the GO-category 'Biological Process'. The top ten GO-categories are shown. The number of transcripts for each function is shown, with the corresponding P-value.*Genes involved in the specific GO-category

BMC Biology 2009, 7:79 http://www.biomedcentral.com/1741-7007/7/79
A major finding of the current study was the significantincrease in the Firmicutes phylum in sow-reared pigshoused in outdoor environments compared to littermateshoused in isolators with daily antibiotic treatment.Within the Firmicutes phylum, the most compellingobservation was the abundance of lactobacilli in animalsreared in the outdoor environment. Lactobacilli are oftenassociated with the suckling pig and early stages of coloni-zation in the gastrointestinal tract. In this study, the highabundance of lactobacilli in the fecal samples obtainedfrom truly adult sows identified lactobacilli as normal col-onizers of the adult pig microbiota in the outdoor envi-ronment. Leser et al. [28] found similar high-abundancephylotypes associated with the ileum, including L. amylov-orous, L. johnsonii and L. reuteri, in pigs from different rear-ing environments. Our study further revealed that an
increase in hygiene status in pigs housed both indoor andin isolators with antibiotic administration was associatedwith a significant decrease in mucosa-adherent lactoba-cilli. Affected species included L. reuteri, L. delbrueckii, L.amylovorous, L. johnsonii and L. mucosae.
The reduced microbial diversity in outdoor animals com-pared to indoor and isolator housed groups was a some-what surprising outcome. These outdoor animals wereexposed to a huge variety of different bacterial species, aswell as fungi, Archaea and viruses, originating from bothmaternal and environmental sources. The soil especially ishugely abundant in micro-organisms, and estimates ofsoil diversity show the presence of at least 32 phyla, thedominant members of which are Proteobacteria, Bacter-oidetes and Firmicutes [31]. Soil ecosystems potentially
Table 5: MetaCore pathway analysis of differentially expressed genes of the treatment comparison IN versus OUT.
Day 5 IN vs OUT P-value Significant* Total**
Transcription_Ligand-Dependent Transcription of Retinoid-Target genes 0.00022 7 32G-protein signalling_G-Protein alpha-s signalling cascades 0.00473 5 28Transcription_CREM signalling in testis 0.00626 4 19Proteolysis_Putative ubiquitin pathway 0.01076 4 22Immune response_PGE2 signalling in immune response 0.01102 5 34Development_Lipoxin inhibitory action on PDGF, EGF and LTD4 signalling 0.01468 4 24Inhibitory action of Lipoxin A4 on PDGF, EGF and LTD4 signalling 0.01468 4 24Cell cycle_Initiation of mitosis 0.01694 4 25Cell cycle_Regulation of G1/S transition (part 1) 0.01748 5 38Muscle contraction_GPCRs in the regulation of smooth muscle tone 0.02082 6 54
Day 28 IN vs OUT P-value Significant* Total**Cytoskeleton remodeling_CDC42 in cellular processes 0.00013 7 22Oxidative stress_Role of ASK1 under oxidative stress 0.00013 7 22Immune response_Histamine H1 receptor signalling in immune response 0.00028 9 40Development_VEGF signalling and activation 0.00044 8 34Cytoskeleton remodeling_TGF, WNT and cytoskeletal remodeling 0.00079 15 107Cytoskeleton remodeling_Cytoskeleton remodeling 0.00079 14 96Immune response_IL-3 activation and signalling pathway 0.00108 7 30Immune response_Histamine signalling in dendritic cells 0.00118 8 39Development_TGF-beta receptor signalling 0.00135 9 49Signal transduction_Activation of PKC via G-Protein coupled receptor 0.00267 8 44
Day 56 IN vs OUT P-value Significant* Total**Peroxisomal branched chain fatty acid oxidation 0.00004 8 22Cholesterol Biosynthesis 0.00024 7 21Neurophysiological process_Dopamine D2 receptor transactivation of PDGFR in CNS 0.00068 6 18Propionate metabolism p.1 0.00196 5 15Development_Angiotensin signalling via beta-Arrestin 0.00281 6 23G-protein signalling_G-Protein alpha-12 signalling pathway 0.00448 7 33Delta508-CFTR traffic/ER-to-Golgi in CF 0.00783 4 13G-protein signalling_Rap2B regulation pathway 0.00783 3 7Development_Mu-type opioid receptor signalling via Beta-arrestin 0.00962 5 21Mitochondrial unsaturated fatty acid beta-oxidation 0.01709 4 16
Differentially expressed genes (P < 0.05) were imported into GeneGo MetaCore analytical software to determine the significantly enriched canonical pathways in the treatment comparison IN vs OUT. The top ten pathways for each comparison are shown, with the number of genes assigned to each pathway, and the corresponding P-value.* The number of genes on each map that are differentially expressed in the specific treatment comparison** The total number of genes on each map
Page 13 of 20(page number not for citation purposes)

BMC Biology 2009, 7:79 http://www.biomedcentral.com/1741-7007/7/79
provide an important source of microbes for gut coloniza-tion of outdoor animals. However, only a selective subsetof environmental bacteria colonize the intestine, since wenoted that the pig gut microbiota was comprised of arestricted number of phyla, dominated by Bacteroidetesand Firmicutes, consistent with published findings on thediversity of the adult human gut [29]. Current thinkinghas focussed on the benefits of a highly diverse gut micro-biota, as it has long been considered that this confersgreater plasticity of the bacterial community to respond toperturbations within the gut ecosystem [17]. Paradoxi-cally, we found that exposure to a large variety of environ-mental microbes in early life does not generate greaterdiversity in the adult gut but rather leads to a microbiotathat is dominated by a limited number of phyla com-posed of bacteria with proven health-promoting proper-ties.
Lactobacilli have long been known for their health-pro-moting effects and they directly limit the prevalence ofseveral intestinal pathogens including E. coli and salmo-nella [32-34]. In this study, L. reuteri was one of the mostabundant members of the mucosa-adherent microbiotaof the outdoor group. Reuterin, a broad-spectrum antimi-crobial substance, is produced by L. reuteri [35] and inhib-its most intestinal bacteria with the exception of
Lactobacillus strains [36]. Importantly, the greater abun-dance of L. reuteri in the outdoor animals may contributeto the enhanced presence of other Lactobacillus species aswell as the decreased microbial diversity observed in theseanimals. A further point meriting comment is the reducedpresence of potentially pathogenic phylotypes in outdoor-housed pigs. These phylotypes were clearly present inboth indoor and isolator housed animals, although ani-mals showed no overt signs of infection. The specificreduction in Firmicutes, in particular lactobacilli, in thesepigs may affect the normal mechanisms of colonizationresistance that control potentially pathogenic populationswithin the gut ecosystem.
Although there has been a major focus on health-promot-ing probiotic actions of lactobacilli following their intro-duction as oral supplements, significantly less attentionhas been paid to the effects of naturally-acquired, gut-col-onizing (autochthonous) lactobacilli. Given that immunemodulation is dependent on gut colonization, close prox-imity to the mucosa and host adaptation, naturally-acquired lactobacilli clearly deserve greater attention. Ofthose species studied, L. casei, L. johnsonii and L. plantarumare strong inducers of IL-12 and/or INF-γ, thereby favour-ing a Th1 cytokine profile [37,38]. Conversely, L. reuteriinhibits the induction of IL-12 and TNF-α and also atten-uates L. casei-induced IL-12 [38]. A fine balance betweenTh1-polarising lactobacilli strains and those which coun-terbalance such responses may be an important factor inmaintaining mucosal immune homeostasis and explainthe lack of overt Th1 or Th2 responses in outdoor-housedpigs in the current study.
While there was no evidence of Th1/Th2 pathways beingaffected, we found significant effects of environment onthe Type 1 interferon (IFN) signalling pathways. Isolator-reared pigs exhibited increased gene expression levels ofthe IFNα/β transcription/signalling factors IRF7 andUSP18. Type 1 IFN signalling induces the expression of alarge number of target genes, which in the current studyincluded MX2, G1P2, ISG20, FAM14A, IFIT2 and IFIT3.Three Type 1 IFN-inducible genes (IFRD1, OAS1 andIFIT2) were increased in indoor-housed animals com-pared to outdoor-housed animals, indicating that theIFNα/β pathway is directly affected by the housing envi-ronment. A number of recent studies further support ourdata describing the influence of the gut microbiota on theType 1 IFN pathway. For example, conventionalized pigsexhibited increased expression of IRF7, STAT1 and STAT2when compared with their germ-free counterparts [39].Conversely, bacterial colonization of germ-free mice ledto a decreased expression of the IFN-related genes IRF7,ISGF3G, IFIT1 and STAT1[40]. Our study further qualifiesthese findings by establishing that specific microbial com-position, rather than the microbiota as such, influences
Scatterplot of concurrence between Affymetrix microarray data and Real-time PCR dataFigure 8Scatterplot of concurrence between Affymetrix microarray data and Real-time PCR data. Correlation between mean fold change values of both comparisons obtained by Affymetrix microarray analysis and Real-time PCR analysis. The diagonal line represents the power trend-line (R2 = 0.8405).
R2= 0.8405
0.01
0.1
1
10
100
0.01 0.1 1 10 100Affymetrix Fold Change
Rea
l-ti
me
PC
R F
old
Ch
ang
e
IR vs OUTIN vs OUT
Page 14 of 20(page number not for citation purposes)
BMC Biology 2009, 7:79 http://www.biomedcentral.com/1741-7007/7/79
Type 1 IFN signalling during early colonization and devel-opment.
Type 1 IFNs have many biological properties, includinginnate, cellular and humoral adaptive immune responses[41]. Much evidence has focussed on their central role inpathogen resistance, especially viral immunity throughrecognition of dsRNA. The significance of Type 1 IFNs inresponse to bacterial colonization and infection is receiv-ing increasingly more attention [42,43]. IFN expression isinduced in numerous cell lineages, including macro-phages and plasmacytoid dendritic cells, by bacterial com-ponents such as LPS and CpG DNA [44-46]. It is worthnoting that the transcriptome analysis was performed onwhole ileal tissue samples, rather than on a specific cellsubset. In this study we elected to study interactions andcontributions of all cell lineages present in the gut to com-prehensively characterize the transcriptomic changesinduced by different microbiota compositions. However,the contribution of individual lineages such as plasmacy-toid dendritic cells (DCs), which naturally produce Type1 IFN, will be addressed in subsequent studies.
IFN-α/β has profound effects on immune cell develop-ment [41] by regulating the differentiation of B and Tcells, myeloid DCs and natural killer cells. Activation ofimmature DCs by IFN-α/β upregulates major histocom-patibility complex (MHC) class I. Consistent with this, wefound that antigen presentation by MHC class I was alsoaffected by the microbiota and was upregulated in indoorreared animals which also displayed increased Type 1 IFNlevels. MHC class I molecules are Type 1 IFN-induciblegenes whose promoter regions contain typical IFN-stimu-lated response elements (ISREs). MHC class I moleculesare specialized for presentation of endogenously synthe-sized proteins, including self-proteins, to the TCR ofCD8+ T-cells [47]. The cross-presentation of antigens onMHC class I molecules, the induction of CTL responsesand the subsequent memory CD8+ T cell survival are alsodependent on IFN-α/β.
Increased expression of MHC class I in the indoor envi-ronment was accompanied by the upregulation of a pleth-ora of chemokines, including CCL2, CCL8, CCL28, CCR1,CXCR4 and CXCL12. Chemokines are chemotactic
Table 6: Verification of microarray results by Real-time PCR.
Real time PCR IR vs OUT Affymetrix microarrayGene Day IR* OUT* SED** Fold Change P-value Fold Change P-value
FKBP5 5 5.56 ± 0.76 4.77 ± 0.72 0.42 -1.73 0.092 -1.56 0.014IRF7 5 6.12 ± 1.43 7.70 ± 1.04 0.72 2.99 0.056 5.00 0.003IRP6 5 5.62 ± 2.97 8.75 ± 1.54 1.37 8.71 0.054 8.28 0.008MT1J 5 2.31 ± 3.61 7.78 ± 1.88 1.66 44.33 0.012 28.70 0.002MX 5 6.20 ± 2.35 8.08 ± 0.45 0.98 3.66 0.110 4.67 0.017
PDK4 5 9.30 ± 1.13 8.39 ± 0.38 0.49 -1.88 0.111 -3.19 0.005SQLE 5 5.85 ± 1.51 7.59 ± 1.44 0.85 3.34 0.069 5.69 0.044CCL8 28 8.28 ± 0.87 10.29 ± 1.29 0.68 4.04 0.021 4.41 0.000
CXCL12 28 4.44 ± 0.23 5.15 ± 0.27 0.14 1.63 0.001 1.83 0.003CXCL9 28 4.91 ± 1.30 7.37 ± 2.36 1.10 5.52 0.057 6.28 0.007IRF7 28 5.21 ± 1.55 6.20 ± 0.70 0.69 1.99 0.196 3.56 0.006MT1J 28 3.33 ± 2.10 6.58 ± 1.58 1.07 9.49 0.014 13.01 0.001PDK4 28 9.75 ± 0.66 7.61 ± 0.78 0.42 -4.43 0.000 -11.62 0.000SQLE 28 5.14 ± 1.12 7.27 ± 2.04 0.95 4.38 0.056 6.34 0.001TFRC 28 5.78 ± 1.38 7.62 ± 0.89 0.67 3.58 0.024 6.88 0.000PDK4 56 8.73 ± 0.54 7.55 ± 0.42 0.28 -2.27 0.002 -3.82 0.007SELL 56 18.82 ± 0.88 16.10 ± 3.29 1.39 -6.60 0.101 -4.03 0.003
Real time PCR IN vs OUT Affymetrix microarrayGene Day IN* OUT* SED** Fold Change P-value Fold Change P-valueTFRC 5 9.15 ± 0.64 7.78 ± 1.20 0.56 -2.58 0.041 -5.01 0.005
CXCR4 28 9.09 ± 1.01 8.17 ± 1.18 0.63 -1.89 0.177 3.91 0.010CCL28 56 8.61 ± 0.74 9.75 ± 0.95 0.49 2.20 0.044 2.64 0.025CCL8 56 9.19 ± 0.80 10.44 ± 1.31 0.63 2.38 0.080 2.44 0.009PI3 56 5.67 ± 1.26 9.16 ± 1.28 0.82 11.17 0.004 6.80 0.002
IFIT2 56 5.63 ± 2.12 7.72 ± 1.79 1.13 4.26 0.095 8.32 0.009PDK4 56 6.68 ± 0.25 7.55 ± 0.42 0.20 1.83 0.002 1.75 0.008SQLE 56 6.30 ± 0.92 7.40 ± 0.93 0.53 2.15 0.065 2.90 0.011
Real-time PCR results at each time-point for the comparisons IR vs OUT and IN vs OUT.*PCR values are expressed as mean ΔCt ± SD, N = 6.**Standard error of difference
Page 15 of 20(page number not for citation purposes)

BMC Biology 2009, 7:79 http://www.biomedcentral.com/1741-7007/7/79
cytokines that function during immune responses torecruit effector cells to sites of inflammation and infec-tion. They are involved in the pathophysiology of manydiseases. Numerous chemokines have been implicated inthe pathology and perpetuation of tissue destructiveinflammatory processes in patients with IBD, includingCCL2 [48] and CCL8 [49]. Increased expression of thesechemokines in the indoor-housed animals indicates thepresence of an immune-activated gut microenvironment.This contrasts with the lack of innate and pro-inflamma-tory gene expression in the outdoor-housed animals,which may be indicative of a more immune-tolerant andhomeostatic mucosal immune system in these animals.Further studies are required to assess the impact of themicrobiota, immune gene transcription and immune celllineages on specific tolerance towards food and environ-mental antigens and long-term predisposition to infec-tion, food intolerance and allergy.
ConclusionEnvironmental exposure in early life has a significantimpact on microbiota composition of the adult gut andthe immune transcriptome during development. Rural,outdoor environments support the establishment of anatural microbiota dominated by lactobacilli and con-taining low numbers of potentially pathogenic bacteriaand this may be an important factor in maintainingmucosal immune homeostasis and limiting excessiveinflammatory responses in the gut. The significance of themicrobiome and transcriptome data presented herein inrelation to immune events such as oral tolerance and hostdefence against enteric pathogens is a major focus of ourfuture studies.
MethodsExperimental animals and tissue collectionTwelve Large White × Landrace sows (Sus scrofa) werehoused at either an indoor (intensive) or an outdoor(extensive) facility. The sows were artificially inseminatedby the same boar to minimize genetic variation among theoffspring. Three piglets from each outdoor-housed sow(OUT) and indoor-housed sow (IN) were left to sucklewith the mother until day 28, when all piglets wereweaned. Three piglets from each indoor-housed sow (18piglets in total) were transferred to individual isolatorunits at the School of Clinical Veterinary Science (Univer-sity of Bristol, UK) at 24 hours of age. These piglets weregiven a daily dose of antibiotic cocktail (Baytril (BayerHealthcare, Uxbridge, UK) and Amoxinsol 50 (Vétoqui-nol UK Ltd., Buckingham, UK)) for the duration of thestudy. Up until day 28, the isolator-housed piglets (IR)were fed commercial porcine milk replacer (PiggiMilk,Parnutt Foods Ltd., Sleaford, UK) dispensed by an auto-mated liquid feeding system. From day 29 onwards, all
piglets were fed creep feed (Multiwean, SCA Nutrition Ltd,Thirsk, UK) ad libitum. The experiment was run in threeconsecutive replicates, using four sows and 18 piglets inevery replicate.
Six randomly chosen piglets per treatment group were sac-rificed by injection of sodium pentobarbitone (Euthesate,Willows Francis Veterinary Ltd, Crawley, UK) at time-points on day 5, 28 and 56. The ileum, defined as theregion corresponding to 75% in length from the pyloricsphincter, was excised. Detailed molecular analysis wasperformed on this site as it represents a key regioninvolved in both immune-inductive and effector activi-ties, including bacterial antigen sampling. Two ileal tissuesamples were taken and either washed in ice-cold phos-phate buffered saline (PBS)/0.1% Tween 20 (Sigma-Aldrich, Gillingham, UK) for construction of mucosa-associated 16S rRNA gene libraries (10-cm piece) or proc-essed in ice-cold PBS and transferred to RNAlater (AppliedBiosystems, Warrington, UK) for Affymetrix microarrayand Real-time PCR studies (2-cm piece). All animal workwas performed according to the institutional and HomeOffice UK ethical guidelines.
Analysis of the mucosal microbiotaGut contents (N = 4 per treatment group) were removedfrom the ileum, and the tissue was washed with ice-coldPBS and incubated in ice-cold PBS/0.1% Tween 20 over-night. Detached bacteria were harvested by centrifugationat 10,000 × g for 10 min at 4°C. Total DNA from the pelletwas isolated using a DNA Spin Kit for Soil® (QBiogeneInc., Cambridge, UK) according to the manufacturer'sprotocol. PCR amplification of the 16S rRNA genes wascarried out with the universal primer set S-D-Bact-0008-a-S-20 (5'-AGAGTTTGATCMTGGCTCAG-3'; positions 8 to27 in the Escherichia coli 16S rRNA gene) and S-*-Univ-1492-a-A-19 (5'-ACGGCTACCTTGTTACGACTT-3'; posi-tions 1510 to 1492) [50]. Primer positions are repre-sented according to the OPD nomenclature [51]. PCRcycling conditions were one cycle at 94°C for 5 min, fol-lowed by 25 cycles at 94°C for 30 sec, 57°C for 30 sec,72°C for 2 min, with a final extension at 72°C for 10 min.PCR products were purified with the Wizard® SV Gel &PCR Clean-up System (Promega, Southampton, UK),cloned into the pCR-4 cloning vector and transformedinto E. coli TOP 10 chemically competent cells (TOPO TACloning Kit; Invitrogen, Paisley, UK) according to themanufacturer's instructions. Recombinant colonies werepicked and the inserts were sequenced in the RINHgenomics facility (University of Aberdeen, UK) using theprimer set S-*-Univ-0907-a-A-20 (5'CCGTCAATTCATTT-GAGTTT-3') and S-*-Univ-0519-a-A-18 (5'-GWATTAC-CGCGGCKGCTG-3') [50]. All clone libraries wereconstructed under identical conditions in order to mini-
Page 16 of 20(page number not for citation purposes)

BMC Biology 2009, 7:79 http://www.biomedcentral.com/1741-7007/7/79
mize sample-to-sample variation, thus the relative differ-ences in microbial composition between the samples trulyreflect animal treatment differences.
Enumeration of Lactobacillus speciesApproximately 70 mg gut contents from IR and OUT ani-mals at day 56 from both the ileum (IR: N = 3; OUT: N =2) and the colon (IR: N = 4; OUT: N = 3) were transferredto Hungate tubes containing 2 ml of MRS broth/0.2%Tween 80 (Oxoid, Basingstoke, UK) and dispersed by vor-texing. The gut content suspensions were diluted in aseries of seven sequential ten-fold dilutions. Twentymicrolitre aliquots of the dilutions were plated out onMRS agar plates and dried off. The plates were placed inan anaerobic gas jar and incubated at 37°C. Plates wereread and data recorded and calculated after 48 hours ofincubation.
Sequence alignment and phylogenetic analysisSequences were assembled using Lasergene 6 software(DNASTAR Inc.; Infogen Bioinformatics, Broxburn, UK)and tested for possible chimeras using Chimera Checkv2.7 (online analysis at RDP-II website, http://rdp8.cme.msu.edu/cgis/chimera.cgi?su=SSU and Bellero-phon [52]http://foo.maths.uq.edu.au/~huber/bellerophon.pl. Sequences with no close neighbours in RDP-IIwere additionally subjected to Basic Local AlignmentSearch Tool (BLAST) analysis http://www.ncbi.nlm.nih.gov/BLAST. Chimeric and poor qual-ity sequences were excluded from further phylogeneticanalysis.
The resulting 16S rRNA gene contigs were aligned usingMultiple Sequence Comparison by Log-Expectation(MUSCLE, http://www.ebi.ac.uk/Tools/muscle[53]) andthe alignments were inspected manually. The distancematrix (generated from the multiple sequence alignment)was calculated using the Dnadist application of the Phyl-ogeny Inference Package http://evolution.genetics.washington.edu/phylip.html and Jukes-Cantor distance of0.01. This stringent phylotype definition at 99% cut-offwas used in part because evidence suggests that bacteriawith nearly-identical 16S rRNA sequences may representvariable genotypes and different species [29].
Rarefaction and collector's curves of observed phylotypes,richness estimates and diversity indices were determinedwith the DOTUR program [54] using Jukes-Cantor cor-rected distance matrix. The bias-corrected Chao 1 richnessestimator was calculated after 1000 randomizations ofsampling without replacement. Collector's curves ofobserved and estimated (Chao 1 and the abundance-based coverage estimator, ACE) richness were con-structed. Diversity was estimated using the Shannon (H)and Simpson indices (D). The Simpson reciprocal index
was calculated as 1/D, and another version of the Simp-son diversity index as 1-D. The Good's coverage percent-age was calculated with the formula [1-(n/N)] × 100,where n is the number of phylotypes in a sample repre-sented by one clone (singletons) and N is the totalnumber of sequences in that sample [55].
Similarity search of the 16S rRNA gene sequences againstdatabase entries was performed using the BLAST programat the National Center for Biotechnology Information(NCBI) website http://www.ncbi.nlm.nih.gov/BLAST. Byusing a >99% sequence similarity criterion, the sequenceswere assigned to the respective bacterial phylotypes.
Phylotype comparisons were made among groups of sub-jects using the Mann-Whitney U test. Multiple compari-sons were carried out using the Kruskal-Wallis test, with P< 0.05 considered statistically significant.
Microarray hybridizations and data analysisIleal tissue (200 mg) (N = 6 per treatment group/time-point) was removed from RNAlater and lyzed in Trizol(Invitrogen). RNA was isolated using standard chloro-form/isopropanol steps. Total RNA was further extractedwith the RNeasy kit (Qiagen, Crawley, UK) according tothe manufacturer's instructions, including an RNase-freeDNase I (Qiagen) digestion step. RNA integrity was deter-mined using the Agilent 2100 Bioanalyzer (Agilent Tech-nologies, Wokingham, UK).
Eight microgram of total RNA was reverse transcribed tocDNA and then transcribed into biotin-labelled cRNAusing the One-Cycle Target Labeling Kit (Affymetrix, SantaClara, CA) according to the manufacturer's instructions.cRNA quality was determined by Agilent 2100 Bioana-lyzer. Hybridization to the GeneChip Porcine GenomeArray (Affymetrix) on a GeneChip Fluidics Station 450(Affymetrix) was performed at the Institute of Medical Sci-ences Microarray Core Facility (University of Aberdeen,UK). Chips were scanned with an Affymetrix GeneChipScanner 3000 (Affymetrix). Image quality analysis wasperformed using Gene Chip Operating Software (GCOS)(Affymetrix).
Further quality analysis, normalization by GeneChipRobust Multiarray Averaging (gcRMA), statistical analysisand heatmap generation was performed with the freelyavailable software packages R http://www.r-project.organd Bioconductor http://www.bioconductor.org[56]. Inparticular we used the moderated F-test provided by theBioconductor package limma to test for differential expres-sion [57].
Statistical analysis was performed separately for each ofthe three time-points (day 5, 28 and 56) on the two group
Page 17 of 20(page number not for citation purposes)

BMC Biology 2009, 7:79 http://www.biomedcentral.com/1741-7007/7/79
comparisons IR vs OUT and IN vs OUT. As detailed in thefirst Methods subsection, the animal experiments con-sisted of three replicates with two piglets in each of thethree experimental groups. This has created a three-groupdesign, with six biologically independent samples in eachgroup and replicate as an additional blocking factor.
To address the multiple testing issue the Storey method[58] was used to calculate q-values, as implemented in theBioconductor package qvalue. This method gives estimatesof the associated false discovery rate for a given cut-off.Although these q-values are shown in Additional file 2,the lists of differentially expressed genes were not basedonly on q-values or P-values, but tried to address the bal-ance between statistical significance and biological rele-vance. Thus, differences in gene expression betweentreatments were determined using a cut-off of P < 0.01and -2 ≤ fold change ≥ 2. This approach is very much inline with recommendations based on the MicorarrayQuality Control study (MAQC) [59], which recommendsthe use of fold change ranking plus a non-stringent P cut-off as a baseline practice in order to generate more repro-ducible differentially expressed gene lists.
Microarray data were submitted to the NCBI Gene Expres-sion Omnibus (accession number GSE15256; http://www.ncbi.nlm.nih.gov/geo).
Functional analysis of microarray dataGene Ontology (GO) based functional interpretation ofthe data was performed using the Database for Annota-tion, Visualization and Integrated Discovery (DAVID2006; http://david.abcc.ncifcrf.gov), an expanded versionof the original web-accessible programs described by Den-nis et al. [60]. Significantly different transcripts (P < 0.05)were allocated into the GO category Biological Process tounearth patterns of gene expression significantly enrichedfor specific GO terms.
All differentially expressed genes (P < 0.05) wereimported into MetaCore analytical software (GeneGo, StJoseph, MI) to generate pathway maps. MetaCore is a pro-prietary, manually curated database containing humanprotein-protein, protein-DNA and protein compoundinteractions, metabolic and signalling pathways, and theeffects of bioactive molecules. MetaCore software con-tains approximately 450 canonical signalling and meta-bolic pathways. Porcine Affymetrix probeset IDs wereconverted into human Affymetrix probeset IDs usingannotation supplied by Tsai et al. [61]. Integrated pathwayenrichment analysis was performed using the knowledge-based canonical pathways and endogenous metabolicpathways. Ranking of relevant integrated pathways wasbased on P-values calculated using hypergeometric distri-bution. P-values represented the probability of a given
number of genes from the input list to match a certainnumber of genes in the map by chance, considering thenumbers of genes in the experiment versus the number ofgenes in the map within the full set of all genes on maps.
Real-time PCR analysis of differentially expressed genesThe mRNA levels differentially expressed between thetreatment groups in microarray analyses were further val-idated using Real-time PCR. Two micrograms of total RNAisolated from the ileum (N = 6, isolated for microarrayanalysis) was reverse transcribed into cDNA using theHigh Capacity cDNA Reverse Transcription Kit (AppliedBiosystems) with random primers. Real-time PCR analysiswas performed using a 7500 Fast Real-Time PCR System(Applied Biosystems) with the Power SYBR Green PCRMaster Mix (Applied Biosystems) according to the manu-facturer's recommendations. Primers (Sigma-Aldrich;Additional file 3) were designed for the porcine sequenceof interest using Primer Express Software v3.0 (AppliedBiosystems). PCR cycling conditions were one cycle at95°C for 10 min, followed by 40 cycles at 95°C for 15 secand 60°C for 1 min, ending with a dissociation step. Allsamples were run in triplicate. EEF1A1 was selected as areference gene for normalization due to its low variationbetween samples in the microarray analysis.
Data were analyzed on a logarithmic scale with base 2 byStudent's t-test allowing for unequal variances with P <0.05 considered statistically significant. Standard errors ofdifferences were also calculated on this scale. Differenceswere back-transformed to calculate fold changes.
AbbreviationsACE: abundance-based coverage estimator; DCs: dendriticcells; GO: Gene Ontology; IFN: interferon; IN: indoor-housed piglets reared on the sow; INS: fecal samples fromadult sows from indoor environment; IR: isolator-housedpiglets receiving daily doses of antibiotics; MHC: majorhistocompatibility complex; MRS: De Man, Rogosa andSharpe; OTU: operational taxonomic unit; OUT: outdoor-housed piglets reared on the sow; OUTS: fecal samplesfrom adult sows from outdoor environment; PBS: phos-phate buffered saline; PCR: Polymerase Chain Reaction;RDP: Ribosomal Database Project.
Authors' contributionsDK, CRS, MB, JRP and BPG conceived and coordinatedthe study. IEM carried out the microarray experiment, bio-informatics analysis and RT-PCR work and drafted themanuscript along with BS and DK. BS carried out the 16SrRNA gene library preparation, constructed sequence con-tigs and performed phylogenetic identification. CRS, MLand MB conducted the animal trial. CDM helped with thestatistical design of the study and developed the analysisstrategy for the microarray and Real-time PCR data. CCM
Page 18 of 20(page number not for citation purposes)
BMC Biology 2009, 7:79 http://www.biomedcentral.com/1741-7007/7/79
carried out the phylogenetic analysis of clone libraries.RIA and JIP were involved in technical and scientific dis-cussion of the project. All authors read and approved thefinal manuscript.
Additional material
AcknowledgementsWe thank Dr Elaina Collie-Duguid and Diane Stewart at the Institute of Medical Sciences Microarray Core facility (University of Aberdeen) for Affymetrix microarray hybridization and chip processing. We also thank Dr George Grant at the RINH Gut Immunology Group (University of Aber-deen) for his work on the enumeration of Lactobacillus species and Pauline Young at the RINH Genomics Facility (University of Aberdeen) for sequencing of bacterial clones.
This work was supported by a joint grant from the Department for Envi-ronment, Food and Rural Affairs (DEFRA) and the Meat and Livestock Commission (MLC) to IEM and BS (LS3658/CSA 6738), and the Scottish Government Rural and Environment Research and Analysis Directorate (RERAD) to DK.
References1. Falk PG, Hooper LV, Midtvedt T, Gordon JI: Creating and main-
taining the gastrointestinal ecosystem: what we know andneed to know from gnotobiology. Microbiol Mol Biol Rev 1998,62:1157-70.
2. Salminen S, Bouley C, Boutron-Ruault MC, Cummings JH, Franck A,Gibson GR, Isolauri E, Moreau MC, Roberfroid M, Rowland I: Func-tional food science and gastrointestinal physiology and func-tion. British Journal of Nutrition 1998, 80:S147-S171.
3. Bäckhed F, Ding H, Wang T, Hooper LV, Koh GY, Nagy A, Semenk-ovich CF, Gordon JI: The gut microbiota as an environmentalfactor that regulates fat storage. Proc Natl Acad Sci USA 2004,101:15718-23.
4. Ley RE, Turnbaugh PJ, Klein S, Gordon JI: Microbial ecology:Human gut microbes associated with obesity. Nature 2006,444:1022-3.
5. Kelly D, Campbell JI, King TP, Grant G, Jansson EA, Coutts AGP, Pet-tersson S, Conway S: Commensal anaerobic gut bacteria atten-uate inflammation by regulating nuclear-cytoplasmicshuttling of PPAR-γ and RelA. Nat Immunol 2004, 5:104-12.
6. Rakoff-Nahoum S, Paglino J, Eslami-Varzaneh F, Edberg S, MedzhitovR: Recognition of commensal microflora by Toll-like recep-tors is required for intestinal homeostasis. Cell 2004,118:229-41.
7. Stappenbeck TS, Hooper LV, Gordon JI: Developmental regula-tion of intestinal angiogenesis by indigenous microbes viaPaneth cells. Proc Natl Acad Sci USA 2002, 99:15451-5.
8. Ivanov II, Frutos Rde L, Manel N, Yoshinaga K, Rifkin DB, Sartor RB,Finlay BB, Littman DR: Specific microbiota direct the differenti-ation of IL-17-producing T-helper cells in the mucosa of thesmall intestine. Cell Host & Microbe 2008, 4:337-49.
9. Elson CO: Animal models of experimental IBD: have theytaught enough or do we need more? Inflamm Bowel Dis 2006,12:S5.
10. Rakoff-Nahoum S, Hao L, Medzhitov R: Role of Toll-like receptorsin spontaneous commensal-dependent colitis. Immunity 2006,25:319-29.
11. Frank DN, Amand AL, Feldman RA, Boedeker EC, Harpaz N, PaceNR: Molecular-phylogenetic characterization of microbialcommunity imbalances in human inflammatory bowel dis-eases. Proc Natl Acad Sci USA 2007, 104:13780-5.
12. Long SS, Swenson RM: Development of anaerobic fecal flora inhealthy newborn infants. Journal of Pediatrics 1977, 91:298-301.
13. Penders J, Thijs C, Vink C, Stelma FF, Snijders B, Kummeling I, BrandtPA van den, Stobberingh EE: Factors influencing the compositionof the intestinal microbiota in early infancy. Pediatrics 2006,118:511-21.
14. Strachan DP: Hay fever, hygiene, and household size. BritishMedical Journal 1989, 299:1259-60.
15. Wills-Karp M, Santeliz J, Karp CL: The germless theory of allergicdisease: revisiting the hygiene hypothesis. Nat Rev Immunol2001, 1:69-75.
16. Bach JF: Six questions about the hygiene hypothesis. CellularImmunology 2005, 233:158-61.
17. Bäckhed F, Ley RE, Sonnenburg JL, Peterson DA, Gordon JI: Host-bacterial mutualism in the human intestine. Science 2005,307:1915-20.
18. Mazmanian SK, Liu CH, Tzianabos AO, Kasper DL: An immu-nomodulatory molecule of symbiotic bacteria directs matu-ration of the host immune system. Cell 2005, 122:107-18.
19. Sokol H, Pigneur B, Watterlot L, Lakhdari O, Bermudez-Humaran LG,Gratadoux JJ, Blugeon S, Bridonneau C, Furet JP, Corthier G, Gran-gette C, Vasquez N, Pochart P, Trugnan G, Thomas G, Blottiere HM,Dore J, Marteau P, Seksik P, Langella P: Faecalibacterium praus-nitzii is an anti-inflammatory commensal bacterium identi-fied by gut microbiota analysis of Crohn disease patients.Proc Natl Acad Sci USA 2008, 105:16731-6.
20. Vaishnava S, Behrendt CL, Ismail AS, Eckmann L, Hooper LV: Panethcells directly sense gut commensals and maintain homeosta-sis at the intestinal host-microbial interface. Proc Natl Acad SciUSA 2008, 105:20858-63.
21. Wen L, Ley RE, Volchkov PY, Stranges PB, Avanesyan L, StonebrakerAC, Hu C, Wong FS, Szot GL, Bluestone JA, Gordon JI, ChervonskyAV: Innate immunity and intestinal microbiota in the devel-opment of Type 1 diabetes. Nature 2008, 455:1109-13.
22. Severa M, Coccia EM, Fitzgerald KA: Toll-like receptor-depend-ent and -independent viperin gene expression and counter-regulation by PRDI-binding factor-1/BLIMP1. J Biol Chem 2006,281:26188-95.
23. Rawls JF, Samuel BS, Gordon JI: Gnotobiotic zebrafish revealevolutionarily conserved responses to the gut microbiota.Proc Natl Acad Sci USA 2004, 101:4596-601.
24. Notterpek L, Roux KJ, Amici SA, Yazdanpour A, Rahner C, FletcherBS: Peripheral myelin protein 22 is a constituent of intercel-lular junctions in epithelia. Proc Natl Acad Sci USA 2001,98:14404-9.
25. Cloutier A, Guindi C, Larivée P, Dubois CM, Amrani A, McDonald PP:Inflammatory cytokine production by human neutrophilsinvolves C/EBP transcription factors. J Immunol 2009,182:563-71.
26. Klein W, Tromm A, Folwaczny C, Hagedorn M, Duerig N, Epplen J,Schmiegel W, Griga T: A polymorphism of the bactericidal/per-
Additional file 1Enumeration of Lactobacillus species.Click here for file[http://www.biomedcentral.com/content/supplementary/1741-7007-7-79-S1.DOC]
Additional file 2Transcripts differentially expressed between treatments at all three time-points. Differentially expressed genes at each time point are shown for the comparison IR versus OUT, and IN versus OUT (P < 0.01, -2 fold change 2, N = 6).Click here for file[http://www.biomedcentral.com/content/supplementary/1741-7007-7-79-S2.DOC]
Additional file 3Real-time PCR primer sequences. Porcine gene-specific primers were designed for the sequence of interest using Primer Express Software v3.0 (Applied Biosystems).Click here for file[http://www.biomedcentral.com/content/supplementary/1741-7007-7-79-S3.DOC]
Page 19 of 20(page number not for citation purposes)
http://www.ncbi.nlm.nih.gov/entrez/query.fcgi?cmd=Retrieve&db=PubMed&dopt=Abstract&list_uids=9841668
http://www.ncbi.nlm.nih.gov/entrez/query.fcgi?cmd=Retrieve&db=PubMed&dopt=Abstract&list_uids=9841668
http://www.ncbi.nlm.nih.gov/entrez/query.fcgi?cmd=Retrieve&db=PubMed&dopt=Abstract&list_uids=9841668
http://www.ncbi.nlm.nih.gov/entrez/query.fcgi?cmd=Retrieve&db=PubMed&dopt=Abstract&list_uids=9849357
http://www.ncbi.nlm.nih.gov/entrez/query.fcgi?cmd=Retrieve&db=PubMed&dopt=Abstract&list_uids=9849357
http://www.ncbi.nlm.nih.gov/entrez/query.fcgi?cmd=Retrieve&db=PubMed&dopt=Abstract&list_uids=9849357
BMC Biology 2009, 7:79 http://www.biomedcentral.com/1741-7007/7/79
Publish with BioMed Central and every scientist can read your work free of charge
"BioMed Central will be the most significant development for disseminating the results of biomedical research in our lifetime."
Sir Paul Nurse, Cancer Research UK
Your research papers will be:
available free of charge to the entire biomedical community
peer reviewed and published immediately upon acceptance
cited in PubMed and archived on PubMed Central
yours — you keep the copyright
Submit your manuscript here:http://www.biomedcentral.com/info/publishing_adv.asp
BioMedcentral
meability increasing protein (BPI) gene is associated withCrohn's disease. Journal of Clinical Gastroenterology 2005, 39:282-3.
27. Schmid M, Fellermann K, Fritz P, Wiedow O, Stange EF, Wehkamp J:Attenuated induction of epithelial and leukocyte serine anti-proteases elafin and secretory leukocyte protease inhibitorin Crohn's disease. J Leukoc Biol 2007, 81:907-15.
28. Leser TD, Amenuvor JZ, Jensen TK, Lindecrona RH, Boye M, MollerK: Culture-independent analysis of gut bacteria: the pig gas-trointestinal tract microbiota revisited. Appl Environ Microbiol2002, 68:673-90.
29. Eckburg PB, Bik EM, Bernstein CN, Purdom E, Dethlefsen L, SargentM, Gill SR, Nelson KE, Relman DA: Diversity of the human intes-tinal microbial flora. Science 2005, 308:1635-8.
30. Ley RE, Hamady M, Lozupone C, Turnbaugh PJ, Ramey RR, Bircher JS,Schlegel ML, Tucker TA, Schrenzel MD, Knight R, Gordon JI: Evolu-tion of mammals and their gut microbes. Science 2008,320:1647-51.
31. Janssen PH: Identifying the dominant soil bacterial taxa inlibraries of 16S rRNA and 16S rRNA genes. Appl Environ Micro-biol 2006, 72:1719-1728.
32. Mack DR, Michail S, Wei S, McDougall L, Hollingsworth MA: Probi-otics inhibit enteropathogenic E. coli adherence in vitro byinducing intestinal mucin gene expression. Am J Physiol Gastroin-test Liver Physiol 1999, 276:G941-G950.
33. La Ragione RM, Narbad A, Gasson MJ, Woodward MJ: In vivo char-acterization of Lactobacillus johnsonii FI9785 for use as adefined competitive exclusion agent against bacterial patho-gens in poultry. Letters in Applied Microbiology 2004, 38:197-205.
34. Blomberg L, Henriksson A, Conway PL: Inhibition of adhesion ofEscherichia coli K88 to piglet ileal mucus by Lactobacillusspp. Appl Environ Microbiol 1993, 59:34-9.
35. Axelsson L, Chung TC, Dobrogosz WJ, Lindgren SE: Production ofa broad spectrum antimicrobial substance by Lactobacillusreuteri. Microb Ecol Health Dis 1989, 2:131-6.
36. Cleusix V, Lacroix C, Vollenweider S, Duboux M, Le Blay G: Inhibi-tory activity spectrum of reuterin produced by Lactobacillusreuteri against intestinal bacteria. BMC Microbiology 2007,7:101.
37. Haller D, Blum S, Bode C, Hammes WP, Schiffrin EJ: Activation ofhuman peripheral blood mononuclear cells by nonpatho-genic bacteria in vitro: evidence of NK cells as primary tar-gets. Infect Immun 2000, 68:752-9.
38. Christensen HR, Frokiar H, Pestka JJ: Lactobacilli differentiallymodulate expression of cytokines and maturation surfacemarkers in murine dendritic cells. J Immunol 2002, 168:171-8.
39. Chowdhury SR, King DE, Willing BP, Band MR, Beever JE, Lane AB,Loor JJ, Marini JC, Rund LA, Schook LB, Van Kessel AG, Gaskins HR:Transcriptome profiling of the small intestinal epithelium ingermfree versus conventional piglets. BMC Genomics 2007,8:215.
40. Munakata K, Yamamoto M, Anjiki N, Nishiyama M, Imamura S, IizukaS, Takashima K, Ishige A, Hioki K, Ohnishi Y, Watanabe K: Impor-tance of the interferon-alpha system in murine large intes-tine indicated by microarray analysis of commensal bacteria-induced immunological changes. BMC Genomics 2008, 9:192.
41. Theofilopoulos AN, Baccala R, Beutler B, Kono DH: Type I inter-ferons (alpha/beta) in immunity and autoimmunity. AnnualReview of Immunology 2005, 23:307-35.
42. Stetson DB, Medzhitov R: Recognition of cytosolic DNA acti-vates an IRF3-dependent innate immune response. Immunity2006, 24:93-103.
43. Charrel-Dennis M, Latz E, Halmen KA, Trieu-Cuot P, Fitzgerald KA,Kasper DL, Golenbock DT: TLR-independent Type I interferoninduction in response to an extracellular bacterial pathogenvia intracellular recognition of its DNA. Cell Host & Microbe2008, 4:543-54.
44. Sing A, Merlin T, Knopf HP, Nielsen PJ, Loppnow H, Galanos C, Freu-denberg MA: Bacterial induction of beta interferon in mice isa function of the lipopolysaccharide component. Infect Immun2000, 68:1600-7.
45. Krug A, Rothenfusser S, Hornung V, Jahrsdörfer B, Blackwell S, BallasZK, Endres S, Krieg AM, Hartmann G: Identification of CpG oli-gonucleotide sequences with high induction of IFN alpha/beta in plasmacytoid dendritic cells. European Journal of Immu-nology 2001, 31:2154-63.
46. Krieg AM: CpG motifs in bacterial DNA and their immuneeffects. Annual Review of Immunology 2002, 20:709-60.
47. Cresswell P: Antigen processing and presentation. Immunologi-cal Reviews 2005, 207:5-7.
48. McCormack G, Moriarty D, O'Donoghue DP, McCormick PA, Shea-han K, Baird AW: Tissue cytokine and chemokine expressionin inflammatory bowel disease. Inflamm Res 2001, 50:491-5.
49. Banks C, Bateman A, Payne R, Johnson P, Sheron N: Chemokineexpression in IBD. Mucosal chemokine expression is unselec-tively increased in both ulcerative colitis and Crohn's dis-ease. J Pathol 2003, 199:28-35.
50. Lane DJ: 16S/23S rRNA sequencing. In Nucleic Acid Techniques inBacterial Systematics Edited by: Stackebrandt E, Goodfellow M. NewYork: John Wiley and Sons; 1991:115-75.
51. Alm EW, Oerther DB, Larsen N, Stahl DA, Raskin L: The oligonu-cleotide probe database. Appl Environ Microbiol 1996,62:3557-3559.
52. Huber T, Faulkner G, Hugenholtz P: Bellerophon; a program todetect chimeric sequences in multiple sequence alignments.Bioinformatics 2004, 20:2317-2319.
53. Edgar RC: MUSCLE: multiple sequence alignment with highaccuracy and high throughput. Nucleic Acids Res 2004,32:1792-1797.
54. Schloss PD, Handelsman J: Introducing DOTUR, a computerprogram for defining operational taxonomic units and esti-mating species richness. Appl Environ Microbiol 2005,71:1501-1506.
55. Good IJ: The population frequencies of species and the esti-mation of population parameters. Biometrika 1953, 40:237-64.
56. Gentleman R, Carey V, Bates D, Bolstad B, Dettling M, Dudoit S, EllisB, Gautier L, Ge Y, Gentry J, Hornik K, Hothorn T, Huber W, IacusS, Irizarry R, Leisch F, Li C, Maechler M, Rossini AJ, Sawitzki G, SmithC, Smyth G, Tierney L, Yang JY, Zhang L: Bioconductor: open soft-ware development for computational biology and bioinfor-matics. Genome Biology 2004, 5:R80.
57. Smyth GK: Linear models and empirical Bayes methods forassessing differential expression in microarray experiments.Statistical Applications in Genetics and Molecular Biology 2004, 3:1-26.
58. Storey JD: A direct approach to false discovery rates. Journal ofthe Royal Statistical Society, Series B 2002, 64:479-98.
59. Shi L, Jones WD, Jensen RV, Harris SC, Perkins RG, Goodsaid FM,Guo L, Croner LJ, Boysen C, Fang H, Qian F, Amur S, Bao W, Barba-cioru CC, Bertholet V, Cao XM, Chu TM, Collins PJ, Fan XH, FruehFW, Fuscoe JC, Guo X, Han J, Herman D, Hong H, Kawasaki ES, LiQZ, Luo Y, Ma Y, Mei N, et al.: The balance of reproducibility,sensitivity, and specificity of lists of differentially expressedgenes in microarray studies. BMC Bioinformatics 2008, 9(Suppl9):S10.
60. Dennis G, Sherman B, Hosack D, Yang J, Gao W, Lane H, Lempicki R:DAVID: Database for annotation, visualization, and inte-grated discovery. Genome Biology 2003, 4:R60.
61. Tsai S, Cassady JP, Freking BA, Nonneman DJ, Rohrer GA, PiedrahitaJA: Annotation of the Affymetrix porcine genome microar-ray. Anim Genet 2006, 37:423-4.
Page 20 of 20(page number not for citation purposes)
http://www.ncbi.nlm.nih.gov/entrez/query.fcgi?cmd=Retrieve&db=PubMed&dopt=Abstract&list_uids=8439162
http://www.ncbi.nlm.nih.gov/entrez/query.fcgi?cmd=Retrieve&db=PubMed&dopt=Abstract&list_uids=8439162
http://www.ncbi.nlm.nih.gov/entrez/query.fcgi?cmd=Retrieve&db=PubMed&dopt=Abstract&list_uids=8439162
http://www.ncbi.nlm.nih.gov/entrez/query.fcgi?cmd=Retrieve&db=PubMed&dopt=Abstract&list_uids=8837410
Related Documents