Environmental Toxicology, Third Edition Sigmund F. Zakrzewski OXFORD UNIVERSITY PRESS

Welcome message from author
This document is posted to help you gain knowledge. Please leave a comment to let me know what you think about it! Share it to your friends and learn new things together.
Transcript
Environmental Toxicology,Third Edition
Sigmund F. Zakrzewski
OXFORD UNIVERSITY PRESS

ENVIRONMENTAL TOXICOLOGYTHIRD EDITION

This page intentionally left blank

ENVIRONMENTAL TOXICOLOGY
THIRD EDITION
Sigmund F. Zakrzewski
12002
3Oxford New York
Athens Auckland Bangkok Bogota Buenos Aires Cape Town
Chennai Dar es Salaam Delhi Florence Hong Kong Istanbul Karachi
Kolkata Kuala Lumpur Madrid Melbourne Mexico City Mumbai Nairobi
Paris Sao Paulo Shanghai Singapore Taipei Tokyo Toronto Warsaw
and associated companies in
Berlin Ibadan
Copyright # 2002 by Oxford University Press, Inc.
Published by Oxford University Press, Inc.
198 Madison Avenue, New York, New York 10016
Oxford is a registered trademark of Oxford University Press.
All rights reserved. No part of this publication may be reproduced,
stored in a retrieval system, or transmitted, in any form or by any means,
electronic, mechanical, photocopying, recording, or otherwise,
without the prior permission of Oxford University Press.
Library of Congress Cataloging-in-Publication Data
Zakrzewski, Sigmund F., 1919–
Environmental toxicology / Sigmund F. Zakrzewski.—3rd ed.
p. cm.
Rev. ed. of: Principles of environmental toxicology. 2nd ed. 1997.
Includes bibliographical references and index.
ISBN 0-19-514811-8
1. Environmental toxicology. I. Zakrzewski, Sigmund F., 1919–
Principles of environmental toxicology. II. Title.
RA1226 .Z35 2001
615.9002—dc21 2001034606
9 8 7 6 5 4 3 2 1
Printed in the United States of America
on acid-free paper
Preface to the Third Edition
This book, Environmental Toxicology, is essentially the third, updated and
improved version of the highly successful second edition of Principles of
Environmental Toxicology. Basically the same outlay of chapters and the
way of presentation were maintained; however, considerable changes and
improvement were incorporated into this edition. Most changes involved
updating of statistical information (when available), incorporation of new
or revised reports on environment and health, and updating information
on international meetings and conferences, such as Rio Plus Five in
Chapter 1, Kyoto Conference in Chapter 10, Cairo Plus Five in Chapter 14,
and POP Treaty in Chapter 15. A major change was the introduction of a new
chapter (Chapter 6) on endocrine disrupters.
The specific changes and additions were:
In Chapter 5, ‘‘Chemical Carcinogenesis and Mutagenesis,’’ a section was
added on oncogenes and tumor suppressors.
In Chapter 7, ‘‘Risk Assessment,’’ two sections were added; one on risk
assessment of endocrine disrupters and the other one on the principle of
precautionary action.
In Chapter 9, ‘‘Air Pollution,’’ the section on airborne particles was
extended to include most recent study on toxicity of particles. The section
on trends and present status of air quality was rewritten to incorporate new
statistical data and a most recent report by the American Lung Association
on ground level ozone in American cities and its health implications.
At the end of Chapter 10, ‘‘Pollution of the Atmosphere,’’ a section was
added on the effects of atmospheric changes on human health.

In Chapter 11, ‘‘Water and Land Pollution,’’ three new sections were
added: on genetically modified crops, on Pfiesteria pesticida in American
coastal waters and on zebra mussel in the Great Lakes.
In Chapter 14, ‘‘Population, Environment, and Women’s Issues,’’ the data
on world hunger and food availability were rewritten to conform with latest
available information.
For the first time in this series of books, certain information was obtained
from reliable sources, such as Environmental Protection Agency (EPA),
World Health Organization (WHO), American Lung Association (ALA),
and so on, on the Internet. In such cases the Internet address providing the
information is given in the references, together with the name of agency or
institution providing the information.
vi Preface to the Third Edition
Preface to the Second Edition
This edition of Principles of Environmental Toxicology is essentially pat-
terned on the first edition, but many changes have been introduced. While
the first edition was in circulation, several reviews of the book appeared in
different journals. Although the reviews were basically favorable, certain
shortcomings and omissions were pointed out. I am indebted to the
reviewers, and I took their comments into consideration while preparing
this edition. Thus, for instance, a section on indoor air pollution was
added in Chapter 8, and the scope of the book was widened beyond direct
concern with human toxicity. A section on wetlands and estuaries, including
a description of the plight of the Chesapeake Bay, was added in Chapter 10.
A new chapter, ‘‘Population, Environment, and Women’s Issues,’’ was
added. The original Chapter 6, on air pollution, was split into two chapters:
Chapter 8, on the problems of urban and industrial air pollution, and Chapter
9, on the despoilment of the earth’s atmosphere, meaning stratospheric
ozone depletion and global warming. This change allowed expansion of
the scope of both areas.
At the suggestion of the reviewer of this manuscript, the sequence of the
chapters was changed somewhat, and all but one of the appendices were
moved into the appropriate chapters. The chapter on occupational toxicol-
ogy (Chapter 10 in the first edition) was moved after Chapter 6 (‘‘Risk
Assessment’’).
Other changes involved updating the information contained in the first
edition. Two world events have taken place since the press time of the first
edition: the United Nations Conference on Environment and Development,
in Rio de Janeiro, and the United Nations Conference on Population and
Development, in Cairo. Brief descriptions of the proceedings and accom-
plishments of these conferences are included in Chapters 1 and 13, respec-
tively. Another major event was the publication by the Environmental
Protection Agency (in a preliminary report), as well as by independent scien-
tists, of new findings on the toxicity and environmental impact of chlori-
nated hydrocarbons. This newest information was also added. Because of the
discovery that polychlorinated biphenyls and dioxins affect the human
immune system at low doses—below the doses that produce a carcinogenic
effect—the basic functioning of the immune system was included in Chapter
7. Another change was the inclusion in Chapter 14 of a section that briefly
describes some important environmental acts and international treaties pro-
tecting marine life.
Despite these changes, this book is primarily a toxicology, and not an
ecology, text. Thus, certain important areas of interest to environmentalists
have been omitted. To remedy these shortcomings, a list of subjects for
student research and seminars has been included, as in the previous edition.
The book was originally prepared as a text for a one-semester introductory
three-credit course in environmental toxicology. However, with the expan-
sion of the scope of the topics in the second edition, it may be necessary to
upgrade the course to four or five credits to thoroughly cover the book’s
content.
Certain sections of this new edition were taken, with some modifications
and with permission, from my book People, Health, and Environment (1).
Reference
1. Zakrzewski, S. F. People, Health, and Environment; SFZ Publishing:Amherst, NY, 1994.
viii Preface to the Second Edition
Preface
Toxicology is traditionally defined as the study of the harmful effects of
drugs, chemicals, and chemical mixtures on living organisms. Within the
past two decades the environmental branch of toxicology has assumed a
wider meaning. The survival of individuals and the human race alike is
the ultimate goal of this area of study. However, the survival of humanity
depends on the survival of other species (plants and animals alike); on the
availability of clean water, air, and soil; and on the availability of energy.
Moreover, although preservation of our local and regional environment is
vital to our survival, global problems such as the increasing CO2 content in
the atmosphere and depletion of stratospheric ozone are also critical.
Use of poisons is as old as the human race. For centuries, primitive people
applied toxic plant extracts to poison their arrows for hunting and warfare.
In our civilization, poisons have been studied and used for political, finan-
cial, or marital advantages. Doull and Bruce covered this subject in more
detail in the introductory chapter of Cassarett and Doull’s Toxicology (1).
The credit for elevating toxicology to a true science goes to a Spanish
physician, Mattieu Joseph Benaventura Orfila (1787–1853), who first
described the correlation between the persistence of chemicals in the body
and their physiological effect. He also developed analytical testing methods
to detect the presence of toxins in the body and devised certain antidotal
therapies.
Contemporary toxicology has evolved into a study with three branches:
. Clinical toxicology is concerned with the effect of drugs onhuman patients.
. Forensic toxicology is concerned with the detection, for judicialpurposes, of the unlawful use of toxic agents.
. Environmental toxicology is concerned with the effects of toxins,whether purposely applied (such as pesticides) or derived fromindustrial processes, on health and the environment.
Environmental toxicology is a multidisciplinary science involving many
widely diverse areas of study such as
. chemistry, the characterization of toxins;
. pharmacology, the mode of entry and distribution of toxins inthe body;
. biochemistry, the metabolism and interaction of toxins with cellcomponents;
. physiology, the effect of toxins on body organs;
. biology, the effect of toxins on the environment;
. genetics, the effect toxins can have on the reproductive systemand on future generations by altering genetic codes;
. epidemiology, the effect on the population as a whole ofchronic exposure to small quantities of suspected agents;
. law, regulation of the use or release into the environment oftoxic substances; and
. economics, evaluation of the environmental cost vs. benefit ofeconomic development and the determination of trade-offsamong economy, health, and the environment.
About the Book
The following chapters were prepared as a text for a one-semester introduc-
tory course in environmental toxicology. This course is intended mainly for
students of chemistry or of other scientific disciplines who have some back-
ground in chemistry and for industrial chemists and chemical engineers who
wish to learn how chemicals interact with living organisms and how dete-
rioration of the environment affects our lives.
The first four chapters provide a background in basic toxicological prin-
ciples such as entry, mode of action, and metabolism of xenobiotics. (Xeno is
a Greek word for ‘‘alien’’ or ‘‘strange’’; thus, xenobiotics means a foreign,
biologically active substance.) Chapter 5 presents principles of chemical
carcinogenesis. The remainder of the text introduces the student to specific
environmental problems.
A one-semester course imposes certain limitations on the depth and
amount of coverage when such a great variety of subjects is involved.
Despite these limitations, this text will give students an overall view of envir-
onmental toxicology and of the environmental problems facing this planet.
Reference
1. Doull, J.; Bruce, M. C. In Cassarett and Doull’s Toxicology, 3rd ed.;Klaassen, C. D.; Amdur, M. O.; Doull, J., Eds.; MacMillan: New York,1986; Chapter 1, p 3.
x Preface
Acknowledgments
It gives me great pleasure to acknowledge with gratitude the help of my
professional colleague Dr. Debora L. Kramer and my daughter Nina (Dr.
Kristina M. Harff) in critically reviewing and greatly improving my manu-
script of the first edition of the Principles of Environmental Toxicology,
which set the foundation of the present book.
I am indebted to the reviewers of my manuscript of the second edition for
their constructive criticism and useful suggestions, which helped to improve
this book, and also to Jane M. Ehrke for her review and correction of the
section on the basic functioning of the immune system.

This page intentionally left blank
Contents
1. ENVIRONMENT: PAST AND PRESENT 3
Historical Perspective 3
Present State of the World 8
The United Nations Conference on Environment and
Development: The Earth Summit 12
Antienvironmental Movements in the United States 14
Rio Plus Five 15
The Impact of Global Trade on the Environment 16
2. REVIEW OF PHARMACOLOGIC CONCEPTS 19
Dose–Response Relationship 19
The Concept of Receptors 25
Mode of Entry of Toxins 26
Translocation of Xenobiotics 30
3. METABOLISM OF XENOBIOTICS 39
Phases of Metabolism 39
Phase 1—Biotransformations 40
Disposition of Epoxides 43

Phase 2—Conjugations 44
Glutathione 47
Induction and Inhibition of P-450 Isozymes 49
Activation of Precarcinogens 54
4. FACTORS THAT INFLUENCE TOXICITY 61
Selective Toxicity 61
Metabolic Pathways 62
Enzyme Activity 62
Xenobiotic-Metabolizing Systems 64
Toxicity Tests in Animals 65
Individual Variations in Response to Xenobiotics 69
5. CHEMICAL CARCINOGENESIS AND MUTAGENESIS 71
Environment and Cancer 71
Multistage Development of Cancer 73
Types of Carcinogens 75
Review of DNA and Chromosomal Structure 76
Mutagenesis 82
Interaction of Chemicals with DNA 85
Xenoestrogens and Breast Cancer 92
Carcinogenic Effect of Low-Frequency Electromagnetic Fields 94
DNA Repair Mechanism 94
Oncogenes and Tumor Supressor Genes 95
6. ENDOCRINE DISRUPTERS 98
Historical Perspectives 98
Hormonal Imbalance 99
Properties of Endocrine Disrupters 100
Environmental and Health Impact of Endocrine Disrupters 102
7. RISK ASSESSMENT 108
Hazard Assessment 108
xiv Contents
Dose–Response Assessment 114
Exposure Assessment 117
Risk Characterization 118
Critique of Risk Assessment 119
Risk Assessment of Endocrine Disrupters 120
Ecological Risk Assessment 121
The Principle of Precautionary Action 121
8. OCCUPATIONAL TOXICOLOGY 123
Threshold Limit Values and Biological Exposure Indices 123
Respiratory Toxicity 124
Irritation of Airways and Edema 125
Pulmonary Fibrosis 127
Pulmonary Neoplasia 129
Allergic Responses 129
Nephrotoxins 133
Liver Damage 138
Other Toxic Responses 142
9. AIR POLLUTION 145
Pollutant Cycles 145
Urban Pollutants: Their Sources and Biological Effects 145
Trends and Present Status of Air Quality 156
Pollution by Motor Vehicles 160
Pollution by Industrial Chemicals 162
Pollution by Incinerators 166
Tall Stacks and Their Role in Transport of Pollutants 168
Indoor Air Pollution 168
10. POLLUTION OF THE ATMOSPHERE 173
The Earth’s Atmosphere 173
Formation and Sustenance of Stratospheric Ozone 176
Contents xv
Depletion of Stratospheric Ozone 177
Emission of CO2 and Models of Climatic Changes 183
Current Developments 190
The Effects of Atmospheric Changes on Human Health 195
11. WATER AND LAND POLLUTION 199
Freshwater Reserves 199
Nitrogen Overload 200
Transport of Water Pollutants 201
Urban Pollutants 201
Lead Pollution 204
Soil Erosion 205
Nutrients and Pesticides 207
Alternative Agriculture 215
Genetically Modified Crops 215
Wetlands and Estuaries 217
Industrial Pollutants 220
Pollution of Groundwater 231
Airborne Water and Land Pollution 233
12. POLLUTION CONTROL 241
Clean-Coal Technology 241
Control of Mobile-Source Emission 245
Control of Nitrogen Oxides 249
Energy Conservation 250
Wastewater Treatment 252
Waste Disposal and Recycling 255
Hazardous Waste 263
13. RADIOACTIVE POLLUTION 267
Ionizing Radiation 267
Measurement of Radioactivity 269
xvi Contents
Sources of Radiation 270
Health and Biological Effects of Radiation 272
Nuclear Energy 275
14. POPULATION, ENVIRONMENT, AND WOMEN’S ISSUES 287
Present Trends in Population Growth 287
Effect of Overpopulation on the Environment 293
Overpopulation, Urban Sprawl, and Public Health 296
International Cooperation on Population Issues 298
15. REGULATORY POLICIES AND INTERNATIONAL
TREATIES 302
The National Environmental Policy Act 302
Environmental Regulatory Framework 303
EPA and Its Responsibilities 305
OSHA and Its Responsibilities 316
Miscellaneous Environmental Acts and Treaties 318
Appendix: Subjects for Student Seminars 321
Index 322
Contents xvii

This page intentionally left blank

ENVIRONMENTAL TOXICOLOGYTHIRD EDITION

This page intentionally left blank
1Environment
Past and Present
Historical Perspective
Concern for the environment is not an entirely new phenomenon. In isolated
instances, environmental and wildlife protection laws have been enacted in
the past. Similarly, astute early physicians and scientists occasionally recog-
nized occupationally related health problems within the general population.
Protective Legislation
As early as 500 BC, a law was passed in Athens requiring refuse disposal in a
designated location outside the city walls. Ancient Rome had laws prohibit-
ing disposal of trash into the river Tiber. In seventeenth century Sweden,
legislation was passed forbidding ‘‘slash and burn’’ land clearing; those who
broke the law were banished to the NewWorld. Although no laws protecting
workers from occupational hazards were enacted until much later, the first
observation that occupational exposure could create health hazards was
made in 1775 by a London physician, Percival Pott. He observed among
London chimney sweeps an unusually high rate of scrotal cancer that he
associated (and rightly so) with exposure to soot.
Colonial authorities in Newport, Rhode Island, recognizing a danger of
game depletion, established the first closed season on deer hunting as early
as 1639. Other communities became aware of the same problem; by the time
of the American Revolution, 12 colonies had legislated some kind of wildlife
protection. Following the example of Massachusetts, which established a
game agency in 1865, every state had game and fish protection laws before
3
the end of the nineteenth century (1). In 1885, to protect the population from
waterborne diseases such as cholera and typhoid fever, New York State
enacted the Water Supply Source Protection Rules and Regulations Program.
These instances of environmental concern were sporadic. It was not until
some time after World War II that concern for the environment and for the
effects of industrial development on human health became widespread.
The Industrial Revolution
The industrial development of the late eighteenth century, which continued
throughout the nineteenth and into the twentieth century, converted the
Western agricultural societies into industrialized societies. For the first
time in human history, pervasive hunger in the western world ceased to
be a problem. The living standard of the masses improved, and wealth
was somewhat better distributed. Throughout the nineteenth century, the
use of steam power and coal as fuel became widespread for manufacturing
and transportation. Smoke-spewing factory stacks became a symbol of pros-
perity. The successful technological development led people to believe that
their ability to use resources (which were considered to be inexhaustible)
and master nature was unlimited.
As early as 1899, T. C. Chamberlin observed that atmospheric carbon
dioxide was increasing because of coal combustion, and in 1903, S. A.
Arrhenius made the same observation. They suggested that excessive carbon
dioxide in the atmosphere may have an effect on the earth’s climate (2).
At the end of the nineteenth century, with the development of the internal
combustion engine, the automobile entered the scene. Early automobiles
were expensive and were considered a luxury and a plaything of the
wealthy. It was not until the Ford Model T was introduced in 1908 that
the automobile turned from a luxury into an everyday necessity; this blessing
of humanity later became a nightmare of many modern cities. With the
popularization of the automobile, the emphasis changed from coal to oil as
fuel. Although oil is cleaner-burning than coal, large-scale oil exploitation,
processing, and combustion began unnoticeably to take their toll on the
environment.
In 1922 a technological breakthrough occurred that left a toxic legacy of
lead: the introduction of leaded gasoline. This breakthrough was hailed as a
great achievement because it allowed an increase, in an inexpensive way, in
the compression of the engine, thus yielding more power without the neces-
sity of increasing the size and the weight of the engine.
In the early 1930s, another development took place that haunts us to this
day and probably will for another hundred years: the invention of chloro-
fluorocarbons (CFCs). These compounds, popularly known as freons, are
chemically stable, nonflammable, and nontoxic. They proved to be ideal
substances to replace toxic ammonia as refrigeration and air-conditioning
4 Environmental Toxicology

fluids. They also found many industrial applications. However, their use is
now ending because they keep destroying the earth’s protective ozone layer.
May these two examples of failed technology be a warning to those who have
an unshaken faith that technology alone can solve all our environmental
problems.
Good Life Through Chemistry
During and immediately after World War II, chemical industries began to
develop rapidly. ‘‘Good life through chemistry’’ was the slogan of those days.
Chemical fertilizers, insecticides, and herbicides came into widespread use.
These substances, together with the development of new high-yield grains
(specifically, rice and wheat), revolutionized world agriculture in the 1960s
in what came to be called the green revolution. Thus many developing
countries, especially in Asia, became self-sufficient in food production;
some even became food exporters.
Between 1950 and 1985, grain production more than doubled; after 1965,
nearly half of the increase was contributed by developing countries (3).
Between 1950 and 1973, the world economy expanded by an average of
5% per year, which resulted in rising income in all countries (4). This eco-
nomic expansion was paralleled by generally improved health throughout
the world. For instance, in India and China, the incidence of malaria, which
had plagued the population for generations, decreased between 1976 and
1983 as a result of the control of mosquitoes with pesticides.
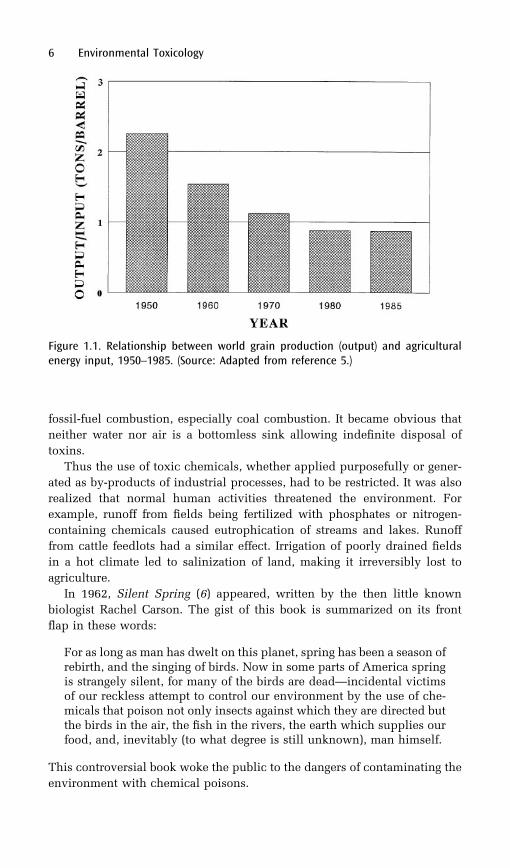
The progress was possible, at least in part, thanks to an enormous input of
energy; however, the yield of grain per unit of energy was constantly
decreasing, eventually reaching a constant value (Figure 1.1). This record
indicates that a future increase in the world grain supply may be achieved
only by increasing the acreage of land under cultivation or by genetic bioen-
gineering of new high-yield crops. The implications of this conclusion will
become obvious in the course of further discussion.
Warning Signs
Life appeared to be better for everyone. Then the negative aspects of this
progress, manifested by general deterioration of air and water quality, began
to surface. Three cases of widespread fatalities due to urban smog were
reported (Meuse Valley, Belgium, in 1930; Donora, Pennsylvania, in 1948;
and London, England, in 1952). In each of these cases, temperature inversion
(the settling of a layer of warm air on top of colder air) contributed to the air
pollution by keeping the pollutants near the ground. The number of fatalities
was 65, 20, and 4000 for Meuse Valley, Donora, and London, respectively.
These events brought worldwide attention to the danger from the emission of
toxic substances (sulfur dioxide, nitrogen oxides, etc.) as by-products of
Environment 5
fossil-fuel combustion, especially coal combustion. It became obvious that
neither water nor air is a bottomless sink allowing indefinite disposal of
toxins.
Thus the use of toxic chemicals, whether applied purposefully or gener-
ated as by-products of industrial processes, had to be restricted. It was also
realized that normal human activities threatened the environment. For
example, runoff from fields being fertilized with phosphates or nitrogen-
containing chemicals caused eutrophication of streams and lakes. Runoff
from cattle feedlots had a similar effect. Irrigation of poorly drained fields
in a hot climate led to salinization of land, making it irreversibly lost to
agriculture.
In 1962, Silent Spring (6) appeared, written by the then little known
biologist Rachel Carson. The gist of this book is summarized on its front
flap in these words:
For as long as man has dwelt on this planet, spring has been a season ofrebirth, and the singing of birds. Now in some parts of America springis strangely silent, for many of the birds are dead—incidental victimsof our reckless attempt to control our environment by the use of che-micals that poison not only insects against which they are directed butthe birds in the air, the fish in the rivers, the earth which supplies ourfood, and, inevitably (to what degree is still unknown), man himself.
This controversial book woke the public to the dangers of contaminating the
environment with chemical poisons.
6 Environmental Toxicology
Figure 1.1. Relationship between world grain production (output) and agriculturalenergy input, 1950–1985. (Source: Adapted from reference 5.)
Environment and the Economy
Environment is frequently sacrificed for the sake of the economy in our
society. This policy is shortsighted because destruction of the environment
undermines future economic resources. For example, the Midwestern agri-
cultural loss caused by ozone pollution is estimated to be about $5 billion
annually (7). Thus, the real tradeoff is not between economy and environ-
ment, but between economic prosperity now and in the future. A balance
between economic development and protection of resources has to be found.
W. U. Chandler’s treatise ‘‘Designing Sustainable Economics’’ presents a
detailed discussion of this subject (8).
The formation of the Club of Rome, an informal international gathering of
30 individuals from a variety of professions, such as scientists, educators,
economists, humanists, industrialists, and civil servants, in April 1968 in
Accadmia de Lincei in Rome, marked the beginning of the new era of a
holistic approach to environmental problems. The meeting was convened
at the urging of Aurelio Pecci, an industrial manager and economist.
Recognizing the complexity of interrelated problems afflicting modern socie-
ties, such as poverty, overpopulation, and environmental degradation, the
meeting discussed the present and future predicament of humanity. The
culmination of several deliberations of the club was a decision to initiate a
research project on the future of humanity. This research led to the publica-
tion in 1972 of a book titled The Limits to Growth (9). In essence, this book
was a computer modeling of the future of humanity, taking into considera-
tion population growth, industrial capital, food production, resource con-
sumption, and pollution. It concluded that ‘‘if present trends of population
and economic growth continue unchanged, . . . the most probable result will
be a sudden and uncontrollable decline in both population and industrial
capacity.’’ It also offered hope, suggesting that ‘‘it is possible to alter these
growth trends and to establish a condition of ecological and economic sta-
bility that is sustainable far into the future.’’
The environmental concern inspired by grassroots movements and by the
Club of Rome continued through the 1970s and permeated President Jimmy
Carter’s political establishment. In the late 1970s, the Carter administration
commissioned the preparation of an economic and scientific report that
would be a guideline for a future national environmental policy. This report,
published in 1980 under the title Global 2000 (10), warns that, unless cor-
rective measures are implemented soon, the world will be facing overpopu-
lation, energy and food shortages, and a general decline in the standard of
living.
The warnings of Global 2000 were not heeded because a different poli-
tico-economic philosophy surfaced during the 1980s. This change was
reflected in The Resourceful Earth: A Response to Global 2000 (11), a scien-
tific and economic report prepared in 1984 for the Reagan administration.
This report contends that long-term economic and population trends
Environment 7
‘‘strongly suggest a progressive improvement and enrichment of the earth’s
natural resource base, and of mankind’s lot on earth.’’ In general, this report
does not consider environmental deterioration a serious problem and does
not anticipate that unchecked population growth will eventually outstrip
agricultural production. Nor does it foresee that overuse of land and devel-
opment of industry may lead to ecological changes.
Although present world grain production keeps growing at a steady aver-
age rate of 26 million tons per year, the per capita production reached its
peak in 1985 and is slowly declining since then (12). An increase in food
production much above the present level would necessitate the cultivation
of more land and further deforestation or a dramatic break-through in genetic
engineering allowing production of crops of higher yield than presently
available. Opening of more land for agriculture on expense of forests
would lead to increased soil erosion, desertification, and, possibly, climatic
changes.
In May 1985, a British research team reported that the level of atmo-
spheric ozone over Antarctica had declined sharply. This discovery of an
ozone hole in the earth’s protective shield created concern in the scientific
community. The resultant increase in ultraviolet radiation reaching the
earth’s surface may increase the incidence of skin cancer, retard crop growth,
and affect the food chain of marine species.
Roger Revelle and Hans Suess (2) published a paper in 1957 calling atten-
tion to the fact that atmospheric carbon dioxide was increasing because of
fossil fuel combustion. The paper stated: ‘‘The increase is at present small
but may become significant during future decades if industrial combustion
continues to rise exponentially.’’ For three decades this warning was largely
ignored, until a disquieting paper appeared in a July 1986 issue of Nature
(13). The authors suggested that the forecasted climatic changes arising from
increasing carbon dioxide levels in the atmosphere were being realized. This
greenhouse effect and its consequences will be discussed in a later chapter.
For now, it suffices to say that adjustment to the new climatic conditions,
though gradual, will be costly.
Present State of the World
Environmental problems have assumed dimensions of a global magnitude.
What happens in a remote corner of the world concerns all of us, the best
example being the nuclear plant accident in Chernobyl (Chapter 13). The
burning of tropical forests in Brazil will affect not only the climate in Brazil,
but our climate as well. Overpopulation in developing countries may affect
our climate, economy, and political stability.
8 Environmental Toxicology
Population Growth
In State of the World 1987, Brown and Postel wrote, ‘‘Sometime in mid-1986,
world population reached 5 billion. Yet no celebrations were held in recog-
nition of this demographic milestone. Indeed, many who reflected on it were
left with a profound sense of unease about mounting pressure on the earth’s
forests, soil, and other natural systems’’ (3). Thirteen years later, in October
1999 another demographic milestone occurred—the earth’s population
swelled to 6 billion. Although no celebrations were held this time either,
this episode, in contrast to 1987, became highly publicized in the media. A
warning has been issued what this rapid population growth means for our
future.
Among other things, the increased population means an increased
demand for freshwater and energy. The absolute number of people is less
significant than the rate of population increase. In 1950 there were 2.5 billion
people; this number doubled in only 36 years. Population growth has slowed
in the last two decades from 2% to 1.33% annually, and it is expected to
slow even further in the next decade. However, at the present growth rate the
population would double again in the next 53 years. This translates to 12
billion people in the year 20521 Unfortunately, the fastest growth occurs in
the economically depressed developing countries, where the average annual
growth rate is 2.5% (doubling time, 27.6 years).
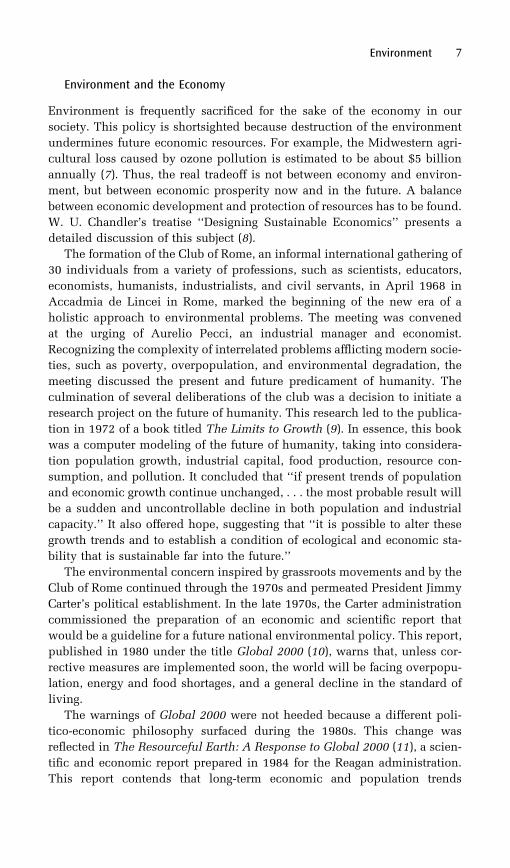
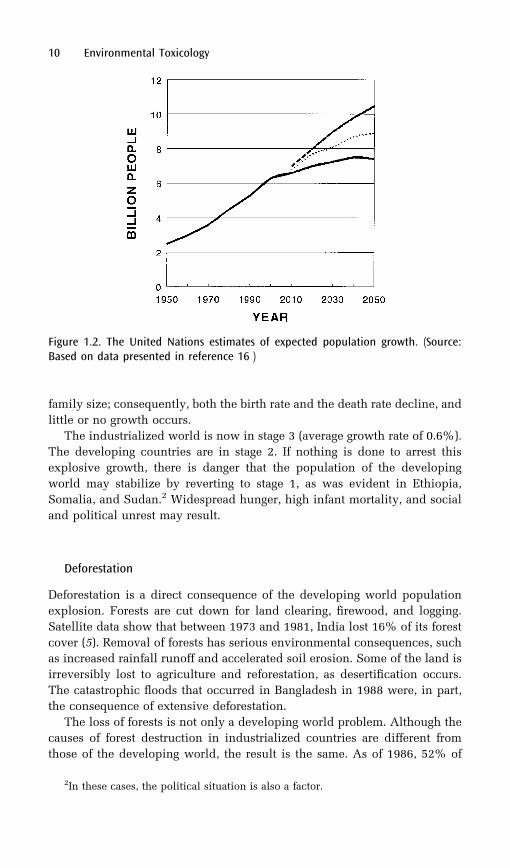
In 1981 the United Nations (U.N.) published estimates of expected popu-
lation growth. The low scenario estimated that the population will stabilize
in the year 2050, after reaching 8 billion people. In contrast, the high sce-
nario predicted stabilization around 2125 with 14.2 billion people (14). 1992
estimates set the number at 11.5 billion (15) and the most recent projections,
based on the assumption of continuous decrease in the rate of growth, in the
range of 7.3 to 10.7 billion with the mean of 8.9 billion by the year 2050
(Figure 1.2). The number of people the earth can support is difficult to
estimate because population growth affects the environment and the avail-
ability of resources, which in turn alter the earth’s carrying capacity.
Regardless of whether population-control policies are successful, even-
tually the world population will stabilize. How stabilization will be achieved
is another matter. The demographic-transition theory offered by demogra-
pher Frank Notestein (4) classifies all societies into one of three stages. Stage
1 characterizes primitive societies, in which both birth and death rates are
high; consequently, there is little population growth. In stage 2, thanks to
improved public health and hygiene, the death rate diminishes while the
birth rate remains unchanged; consequently, there is rapid population
growth. In stage 3, because of a high employment rate among women and
the desire to maintain a high standard of living, there is a tendency to limit
Environment 9
1The formula for calculating doubling time is: doubling time (years) ¼ (ln 2 � 100)/
percent annual growth. Because ln 2 ¼ 0:69, doubling time¼ 69/percent annual
growth.
family size; consequently, both the birth rate and the death rate decline, and
little or no growth occurs.
The industrialized world is now in stage 3 (average growth rate of 0.6%).
The developing countries are in stage 2. If nothing is done to arrest this
explosive growth, there is danger that the population of the developing
world may stabilize by reverting to stage 1, as was evident in Ethiopia,
Somalia, and Sudan.2 Widespread hunger, high infant mortality, and social
and political unrest may result.
Deforestation
Deforestation is a direct consequence of the developing world population
explosion. Forests are cut down for land clearing, firewood, and logging.
Satellite data show that between 1973 and 1981, India lost 16% of its forest
cover (5). Removal of forests has serious environmental consequences, such
as increased rainfall runoff and accelerated soil erosion. Some of the land is
irreversibly lost to agriculture and reforestation, as desertification occurs.
The catastrophic floods that occurred in Bangladesh in 1988 were, in part,
the consequence of extensive deforestation.
The loss of forests is not only a developing world problem. Although the
causes of forest destruction in industrialized countries are different from
those of the developing world, the result is the same. As of 1986, 52% of
10 Environmental Toxicology
Figure 1.2. The United Nations estimates of expected population growth. (Source:Based on data presented in reference 16 )
2In these cases, the political situation is also a factor.

the forests in West Germany were damaged, presumably by acid rain and air
pollution. More frightening is the rapidity with which this deterioration
occurred; in 1983 the reported damage was 34% (17). Forest damage is not
restricted to Germany. It has been reported in Scandinavia, the former
Czechoslovakia, and the eastern United States.
With the disappearance of forests, the global carbon dioxide balance
becomes disturbed. This shift may result in warming of the earth’s surface
and changes in precipitation patterns. Another consequence of deforestation
is a decline in biodiversity, as species disappear. During the 1986 National
Forum on Biodiversity in Washington, D.C., scientists warned of the possi-
bility of a mass extinction of species. This development may be compared
with the catastrophe that wiped out the dinosaurs and many other species
millions of years ago. Whereas then the extinction was due to natural causes,
this time it will be due to human handiwork.
Use of Resources
In industrialized countries, population pressure is not the greatest problem.
Rather, an insatiable demand for more manufactured goods and energy, as
well as the need for economic expansion to provide full employment, stres-
ses the environment. Because of these factors, even a modest increase in the
population of industrialized countries increases the demand for energy and
other resources to a much greater extent than it would in countries with a
low standard of living.
The population of North America, which represents about 5% of the
global population, consumes 35% of world resources. The United States
alone contributes 21% to the global atmospheric pollution with greenhouse
gases (18). The growth of urban centers (which is also a problem for the
developing countries) causes hydrological changes. Manufacturing, trans-
portation, and energy production cause air and water pollution, with all
their ecological consequences. High consumption of goods leads to the grow-
ing problem of household, manufacturing, and toxic waste disposal, which
presents a threat to groundwater. In cases of sea dumping, this threat is
extended to marine life.
Energy Sources
Last, but not least, there is the problem of energy. The supply of energy is
vital not only to transportation and to modern conveniences, but to food
production as well. The exact amount of world fossil fuel reserves is difficult
to estimate because some as yet untapped sources may be discovered.
According to Brown and Postel, by 1986 nearly half of the discovered oil
had already been consumed. As an estimate, the present proven energy
reserves, assuming 1986 production rates, are (19):
Environment 11
. oil, 40 years
. natural gas, 60 years
. coal, 390 years
Of course, how long these reserves actually last will depend on conservation
measures and the efficiency of energy use. In addition, both energy produc-
tion and use have an effect on the environment.
Nuclear energy produces neither carbon dioxide nor acid rain. Still, there
is serious concern about the possibility of radioactive contamination of the
environment resulting from the operation of nuclear reactors, storage of
spent fuel, and nuclear accidents.
The United Nations Conference on Environment andDevelopment: The Earth Summit
From June 3 to 14, 1992, representatives of 154 nations gathered under the
auspices of the United Nations, in Rio de Janeiro, to coin a blueprint for the
future sustainable development of the world. This blueprint was called
Agenda 21. The conference, referred to as Earth Summit, amassed not only
governmental representatives but also representatives of the global scientific
community, environmentalists, and many nongovernmental organizations
involved in U.N. activities.
The executive director of the U.N. Environment Programme, Mastafa K.
Tolba, outlined in his opening speech the problems facing the world: the
deterioration of environment, especially in developing countries, the loss of
species, climate change, the danger of rapidly growing population, and the
steadily increasing imbalance in income and wealth between the industria-
lized and developing countries. Other keynote speakers emphasized the
danger of environmental neglect. Gro Harlem Brundtland, Prime Minister
of Norway, expressed her concern this way: ‘‘We may temporarily immunize
ourselves emotionally to the images of starvation, drought, floods, and peo-
ple suffocating under the load of wastes we are piling on a nature so bounti-
ful, but there is a time bomb ticking. We cannot betray future generations.
They will judge us harshly if we fail at this crucial moment’’ (20). Similarly,
the U.N. Secretary-General, Boutros Boutros-Ghali, stated: ‘‘We are looking
at a time frame that extends far beyond the span of our individual lives . . .
We can waste the planet’s resources for a few decades more. . . . We must
realize that one day the storm will break on the heads of future generations.
For them it will be too late’’ (20). Despite this lofty rhetoric, the results of the
conference were mixed at best, and some parts of the conference were dis-
appointing. Before the Summit, the conference Secretary-General, Maurice
Strong, emphasized that the conference ‘‘will define the state of political will
to save our planet and to make it . . . a secure and hospitable home for
present and future generations’’ (21). Unfortunately, the results indicated
12 Environmental Toxicology
that perhaps the ‘‘political will’’ was not as strong as expected and narrow
national or regional self-interest still prevailed.
On the positive side was the recommendation that the 47th General
Assembly establish a high-level U.N. Commission on Sustainable
Development. The role of the Commission will be to oversee that the pro-
mises made at Rio de Janeiro are kept. Although the Commission lacks
enforcement power, it may exert its influence by shining the spotlight on
countries that renege on their promises. The other positive outcome was that
all 154 nations signed the convention on climate change, and 153, all but the
United States, signed the convention on biodiversity. (The biodiversity treaty
was eventually signed by President Clinton.) On the negative side, it has to
be noted that, because of the obstructive attitude of the United States, the
treaty on climate change was watered down, and no definite targets and
timetables for stabilizing carbon dioxide emissions were set. As it was finally
passed, the treaty set only nonbinding commitments for the industrialized
nations to limit their greenhouse-gas emissions. Because of the status of the
United States as the indisputable world power, the withdrawal of this nation
from signing the biodiversity convention also weakened this treaty.
Another drawback was the statement on forest protection, which was
watered down by the attitude of the developing countries. They felt that
the industrialized nations destroyed their own forests, and keep destroying
what is left from the original growth, yet they preach the need for forest
preservation to the developing, impoverished nations. Kamal Nath, Indian
Minister of the Environment, put it this way: ‘‘If our forests did not sustain
fuel needs, I shudder to think what our oil requirement would be . . . We do
not talk of the globalization of oil so we do not talk of globalization of
forests’’ (20).
Perhaps the greatest failure of the Earth Summit was that the issue of
population and its relation to poverty was not on the agenda at all.
At the conclusion of the conference, Agenda 21 was written to address all
the issues that had been discussed. Agenda 21 is a blueprint for international
cooperation for sustainable development. It is addressed to governments as
well as to civic organizations and to the population at large. The principal
aims of the Agenda are (20):
1. To ensure that world development proceeds in a sustainablemanner, that is, that future generations are taken intoconsideration in policy making. This goal should be attainedby a system of incentives and penalties to motivate economicbehavior.
2. To promote a coordinated international effort to eliminatepoverty throughout the world; to secure decent shelters, aclean water supply, hygienic facilities, energy, andtransportation for all people.
3. To minimize both industrial and municipal waste.
Environment 13
4. To promote efficient and sustainable use of resources, such asenergy, land, and water.
5. To promote sustainable use of the atmosphere, the oceans, andmarine organisms.
6. To promote better management of chemicals and chemicalwaste.
The big problem that arose at the conference was financial support for the
developing countries for implementation of the Agenda’s postulates.
Maurice Strong estimated the financial need for implementation at $125
billion annually (the current level of assistance from the industrialized
world is $55 billion). This amount could be raised if the industrialized
nations contributed, on the average, 0.7% of their gross national product.
So far only Norway, Sweden, Denmark, and Netherlands have complied
with this requirement. No deadline was set for other countries to achieve
this goal. The management of the funds was entrusted to the Global
Environmental Facility (which operates under the auspices of the World
Bank), regional banks, and certain U.N. agencies. Bilateral aid was not
excluded.
It remains to be seen whether the implementation of Agenda 21 will
succeed. In spite of its imperfections and failures, the Earth Summit will
go down in history as a valiant attempt to avert a global, ecological, and
economic disaster.
Antienvironmental Movements in the United States
In contrast to the spirit of the World Summit, an antienvironmental senti-
ment is brewing in certain circles in the United States. In the last few years,
several hundred antienvironmental organizations have sprouted across the
nation. They exist under misleading names such as ‘‘Citizens for the
Environment’’ or ‘‘Oregon Lands Coalition’’ (22). Masquerading as environ-
mental movements, their aim is to weaken the environmental regulatory
framework. These organizations are loosely connected and fall under the
general designation of ‘‘wise use’’ movement. Their common philosophy is
that the earth’s resources were meant to be exploited for human gains and
profit. This philosophy, however, fails to consider that the resources are not
inexhaustible and that they belong to the future as well to the present gen-
erations. The wise use movement strategy is a two-pronged attack: one prong
is directed toward organizing grassroots support in small Western towns,
and the other is engaged in lobbying in Washington, D.C. The immediate
aims of the movement are to allow the harvesting of old-growth forests,
eliminate or at least reduce the size of many national parks, repeal the
Endangered Species Act, and open the Arctic National Wildlife Refuge to
oil exploration. Despite its far-fetched and unrealistic objectives, the move-
ment is having some impact on national legislation. Its great success was the
14 Environmental Toxicology
inclusion (and the passage), in a transportation bill, of a provision that desig-
nated a part of the proceeds from the gasoline tax to be used for construction
of off-road vehicle trails through the wilderness.
Another group, called ‘‘People for the West,’’ was formed in 1989 as a
lobbying organization aimed specifically at preventing repeal by the
Congress of the 1872 Mining Law. This outdated law obliges the federal
government to sell federal land for $5 per acre to anyone who discovers
mineral deposits. Although the group is heavily funded by mining and oil
industries, it is now aiming to broaden its grassroots support and widen its
antienvironmental activities.
The deceit goes even further. Most recently a group that calls itself
Greening the Earth Society (http://www.greeningtheearthsociety.org) sprang
to life on the Internet. This group promotes the idea that the more CO2 is
emitted into the atmosphere the brighter will be our future. They claim that
high CO2 concentration will promote photosynthesis resulting in bigger
trees and better crops. Although there is some truth to this so-called carbon
fertilization, the idea of having greener earth due to an excess of CO2 in the
atmosphere is based on junk-science. The Greening the Earth Society is
nothing else but a front for irresponsible fossil fuel industries, which know-
ingly distort the truth to augment their profits.
Whether connected with the wise use movement or not, some well-
known syndicated columnists as well as politicians have also taken an
antienvironmental stand. The U.N. Conference on Environment and
Development in Rio de Janeiro was referred to in the press as a ‘‘scientific
fraud’’ (23), and environmentalism was called a ‘‘green tree with red
roots . . . a socialist dream . . . dressed up as compassion for the planet’’
(24).
Such attitudes are frightening, especially when they are so wide-
spread within the educated segment of the society. The message of
Agenda 21 still has a long way to go to be generally accepted. Let us
hope, however, that the young generation will be more receptive to the
message of the Agenda; after all, the young and those unborn are the
ones whose fate is at stake.
Rio Plus Five
Five years after the Earth Summit, from June 23 to 27, 1997, representatives
of states, signatories to the Rio Convention, gathered at a special session of
the U.N. General Assembly, to assess progress in the environmental status of
the earth. To a dismay of many, the world’s leaders agreed that in general not
much progress has been achieved in these five years. To the contrary, in
many respects the global environment has deteriorated. Only three indus-
trialized countries were true to their pledge to stabilize CO2 emissions at the
1990 level. Otherwise the emissions of this greenhouse gas have risen sub-
Environment 15
stantially. Air quality in most of the world’s urban areas has deteriorated,
fresh water supplies have dwindled, forest area has shrunk and species
extinction proceeded unabated. Moreover, the gap in wealth distribution
between rich and poor, between and within nations, grew worse aggravating
the problem of poverty in developing countries.
Developing countries felt betrayed because the industrialized world
default on its promises of financial assistance, without which the developing
nations were unable to protect their environment. Of all the industrialized
nations only Norway, Sweden, Denmark and the Netherlands lived up to
their promises to contribute 0.7% of their gross national product (GNP) to the
development assistance.
The problem of greenhouse gases emissions was hotly discussed and
charges and counter-charges were exchanged between nations. No agree-
ment in this area was reached and the debate was postponed to the forth-
coming meeting in Kyoto, Japan to be held in December 1997 (see Chapter
10)
On the positive side an agreement was reached on worldwide phaseout of
lead additives in gasoline. Also an intergovernmental forum was set up to
work out what could be done to protect world forests from cutting and
burning. Moreover an alliance was formed between World Bank and
World Wildlife Fund aiming to protect an overall 10% of world’s forests.
The World Bank promised internal changes to make sure that it funds only
environmentally sound projects. Worth mention were developments in
Costa Rica where the government set aside large tracts of land as conserva-
tion reserves. It also disclosed an ambitious plan to switch entirely to renew-
able energy sources by 2010.
It appeared that many governments, especially among those of the indus-
trialized nations lacked either a political will, or power to counteract the
selfishness of special interest groups (25).
The Impact of Global Trade on the Environment
In January 1995 governments of 135 countries and the European Union
created World Trade Organization (WTO). The general purpose of WTO is
to liberalize the international trade by
. Organizing international trade negotiations
. Overseeing rules of fair international trade
. Settling trade disputes between governments (26)
Although WTO may stimulate global economy, its extraordinary powers,
and mode of operation raise serious concerns among environmental and
labor movement. The matter of concern is that trade disputes between
nations about restrictions on certain imports are solved by a panel of three
judges behind closed door. This way, in the name of fair trade, WTO may
16 Environmental Toxicology
overrule national environment and health protecting laws and regulations.
There are no provisions for appeals from the rulings to any higher authori-
ties.
For instance, the United States imposed a ban on import of Venezuelan
gasoline because it did not comply with U.S. Environmental Protection
Agency (EPA) clean air standards that controlled amount of contaminants
in gasoline. Venezuela challenged the U.S. ban before the WTO panel and
won the case, thus forcing EPA to abandon its standards for foreign produ-
cers (26). Another case concerned protection of endangered species of tur-
tles. An estimated 150,000 of turtles die in shrimp nets each year. The
United States imposed a ban on import of shrimps from countries that do
not use turtles-excluding devices. India, Thailand, Malaysia and Pakistan
challenged U.S. rules and WTO panel decided in their favor (26).
Inversely, the United States challenged European Union ban on import of
hormone treated beef. WTO in a 1997 ruling sided with the United States
because the alleged health hazard of hormone treated beef lacked scientific
support (26). Concerning a trade in hazardous chemicals, or foods that may
represent health hazard, WTO subscribes to the concept of Risk
Assessment—as long there is no conclusive scientific evidence that a pro-
duct is harmful, it can not be banned from import. This contradicts the
internationally accepted precautionary principle (see Chapter 7) endorsed
at the 1992 Earth Summit (26).
Presently there is an increasing opposition building-up at the grass-root
level against WTO. This is not so much against the international trade but
rather against WTO’s mode of operation, its secrecy, arbitrary decision mak-
ing and insensitivity to environmental issues. The dissatisfaction with WTO
was best exemplified by demonstrations that took place in Seattle, in
December 1999.
References
1. Arrandale, T. In Earth’s Threatened Resources; Gimlin, H., Ed.;Congressional Quarterly: Washington, DC, 1986; pp 21–40.
2. Revelle, R.; Suess, H. E. Tellus 1957, IX, 18.3. World Resources Institute, International Institute for Environment and
Development in collaboration with U.N. Environment Programme.World Resources 1988–89, Food and Agriculture; Basic Books: NewYork, 1988; p 51.
4. Brown, L. R. In State of the World 1987; Brown, L. R., Ed.; WorldwatchInstitute: New York, London, 1987; p 20.
5. Brown, L. R.; Postel, S. In State of the World 1987; Brown, L. R., Ed.;Worldwatch Institute: New York, London, 1987; p 3.
6. Carson, R. Silent Spring; Houghton Mifflin: Boston, MA, 1962.7. MacKenzie, J. J.; El-Ashry, M. T. Ill Winds: Airborne Pollution’s Toll on
Trees and Crops; World Resources Institute: Washington, DC, 1988.
Environment 17
8. Chandler, W. U. In State of the World 1987; Brown, L. R., Ed.;Worldwatch Institute: New York, London, 1987; p 177.
9. Meadows, D. H.; Meadows, D. L.; Randers, J. The Limits to Growth;Universe Books: New York, 1972.
10. Global 2000, Report to the President; U.S. Government Printing Office:Washington, DC, 1980.
11. The Resourceful Earth: A Response to Global 2000; Simon, J. L.; Kahn,H., Eds.; Basil Blackwell: New York, 1984.
12. Brown L. In Vital Signs 1999, Part One Kay Indicators, Food Trends,p. 30. Worldwatch Insitute, W.W. Norton & Company, New York, 2000.
13. Johns, P. D.; Wigley, T. M. L.; Wright, P. B. Nature (London) 1986, 322,430.
14. Kuusi, P. This World of Man; Pergamon: Oxford, New York, 1985;Chapter 13, p 191.
15. World Resources Institute, International Institute for Environment andDevelopment in collaboration with U.N. Environment Programme.World Resources 1992–93, Population and Human Development;Oxford University: New York, 1992; pp 80 and 246.
16. United Nations Population Division, World Population Prospects: The1998 Revision forthcoming.hhttp://www.popin.org/pop1998/1.htmi
17. Thompson, R. In Earth’s Threatened Resources; Gimlin, H., Ed.;Congressional Quarterly: Washington, DC, 1986; p 1.
18. Zurer, P. Chem. Eng. News March 5, 1990, 13.19. World Resources Institute, International Institute for Environment and
Development in collaboration with U.N. Environment Programme.World Resources 1992–93, Energy; Oxford University: New York, 1992;p 143.
20. Hileman, B. Chem. Eng. News July 6, 1992, 7.21. Hileman, B. Chem. Eng. News June 15, 1992, 4.22. Ruben, B. Environmental Action; Environmental Action: Takoma Park,
MD, 1992; p 25.23. Thomas, C. Buffalo News June 6, 1992, B3.24. Will, G. Buffalo News June 9, 1992, p B3.25. Hileman, B. Chem. Eng. News July 14, 1997, 29.26. Hogue, C. Chem. Eng. News November 29, 1999, 24.
18 Environmental Toxicology
2Review of Pharmacologic Concepts
Dose–Response Relationship
Early scientific knowledge recognized two basic types of substances: bene-
ficial ones (such as foods and medicines), and harmful ones (those that cause
sickness or death). The latter were designated as poisons.
Modern science acknowledges that such a strict division is not justified.
As early as the sixteenth century, Paracelsus recognized that ‘‘the right dose
differentiates a poison and a remedy.’’ Many chemical substances or mix-
tures exert a whole spectrum of activities, ranging from beneficial to neutral
to lethal. Their effect depends not only on the quantity of the substance to
which an organism is exposed, but also on the species and size of the organ-
ism, its nutritional status, the method of exposure, and several related fac-
tors.
Alcohol is a good example. Taken in small quantities, alcohol may be
harmless and sometimes even medically recommended. However, an over-
dose causes intoxication and, in extreme cases, death. Similarly, vitamin A is
required for the normal functioning of most higher organisms, yet an over-
dose of it is highly toxic.
If the biological effect of a chemical is related to its dose, there must be a
measurable range between concentrations that produce no effect and those
that produce the maximum effect. The observation of an effect, whether
beneficial or harmful, is complicated by the fact that apparently homoge-
neous systems are, in fact, heterogeneous. Even an inbred species will exhi-
bit marked differences among individuals in response to chemicals. An
effect produced in one individual will not necessarily be repeated in another
19
one. Therefore, any meaningful estimation of the toxic potency of a com-
pound will involve statistical methods of evaluation.
Determination of Toxicity
To determine the toxicity of a compound for a biological system, an obser-
vable and well-defined end effect must be identified. Turbidity or acid pro-
duction, reflecting the growth or growth inhibition of a culture, may be used
as an end point in bacterial systems. In some cases, such as in the study of
mutagenesis, colony count may be used. Similarly, measures of viable cells,
cell protein, or colony count are useful end points in cell cultures. The most
readily observable end point with in vivo experiments is the death of an
animal, and this is frequently used as a first step in evaluating the toxicity
of a chemical. Inhibition of cell growth or death of animals are not the only
concerns of toxicology. Many other end points may be chosen, depending on
the goal of the experiment. Examples of such choices are inhibition of a
specific enzyme, sleeping time, occurrence of tumors, and time to the
onset of an effect.
Because the toxicity of a chemical is related to the size of the organism
exposed, dosemust be defined in terms of concentration rather than absolute
amount (1). (In medical literature and in pharmacokinetics, the total amount
administered is frequently referred to as the total dose.) Weight units (milli-
gram, microgram, nanogram, etc.) per milliliter of maintenance medium or
molar units (millimolar, micromolar, nanomolar)1 are used with in vitro
systems. In animal experiments doses are expressed in weight or molecular
units per kilogram of body weight or per square meter of body surface area.
As an example, a simple experiment is designed to determine the lethality
of a chemical in mice. The compound to be tested is administered to several
groups of animals, usually 5–10 animals per group, with each successive
group receiving a progressively larger dose. The number of dead animals
in each group is recorded. Then the percentage of dead animals at each
dose minus the percentage that died at the immediately lower dose is plotted
against the logarithm of the dose. This plot generates the Gaussian distribu-
tion curve, also known as the quantal dose–response curve, which is pre-
sented in Figure 2.1. The point at the top of the curve represents the mean of
the distribution, or the dose that kills 50% of the animals; it is designated as
LD50.2 The mean minus one standard deviation (SD) corresponds to LD16;
LD50 minus two SD corresponds to LD2.3. The mean plus one SD corresponds
to LD84; plus two SD corresponds to LD97.7.
20 Environmental Toxicology
1M always stands for moles per liter and is pronounced as molar. Thus, mM is
millimolar, mM micromolar, and nM nanomolar.2LD stands for lethal dose. Other terms are also used, depending on the type of
experiment. Thus IC stands for inhibitory concentration and ED for effective dose.

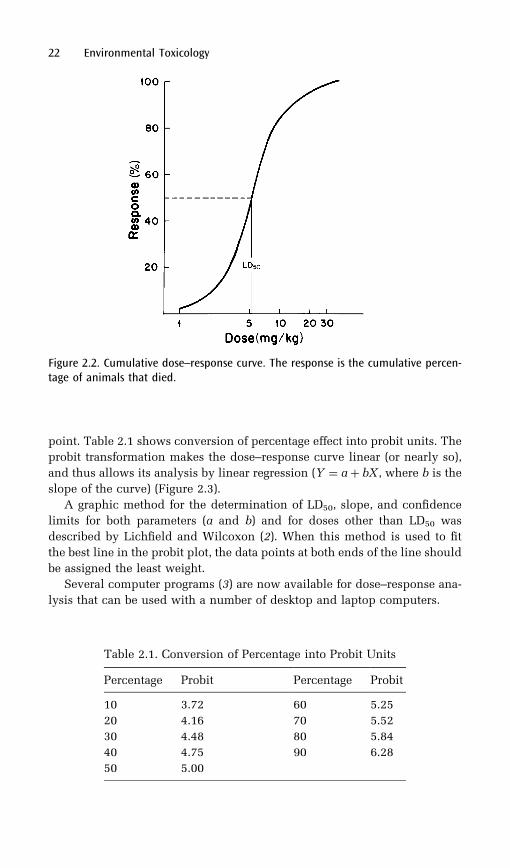
This type of plot is not very practical, so the cumulative percentage of
dead animals is usually plotted against the logarithm of the dose (Figure 2.2).
The use of a semilogarithmic plot originated with C. I. Bliss (1), who studied
the effect of insecticides on insects. He noticed that there were always some
dead insects at the minimum dose and always some survivors at the max-
imum dose. He also observed that doubling the dose always increased the
effect by a fixed interval. A mathematical model reflecting these conditions
suggested the use of a logarithmic, rather than a linear, dose scale. Because
the center portion of the curve is nearly linear, the effect in this segment is
proportional to the logarithm of the dose. The two ends of the curve asymp-
totically approach, but never reach, 0 and 100% effect. Thus, the threshold
dose (i.e., the dose below which there is no effect) cannot be determined
experimentally. Analysis of the curve in Figure 2.2 reveals that the confi-
dence limits of the data points are greatest in the central segment and lowest
at the flat segments of the curve.3 In these flat segments a small deviation of
the observed value from the expected value causes a large error in estimation
of the dose. Toxicologists must realize that only those data points that fall
along the straight portion of the curve are meaningful.
Probit Transformation
Bliss (1) introduced probit transformation (for probability), a different way of
plotting the dose–response curve. In this plot, effect is plotted in probit units,
LD50 being 5; each +SD adds a point to the scale, and each –SD subtracts a
Review of Pharmacologic Concepts 21
Figure 2.1. Quantal dose–response curve. The frequency represents the percentage ofanimals that died at each dose.
3Confidence limits are the two points, one on each side of the mean, between which
95%of the data points would fall if the experiment were repeated 100 times. The
distance between these points is referred to as the 95% confidence interval. It is
equal to the mean �1:96 (SD/ffiffiffi
np Þ2
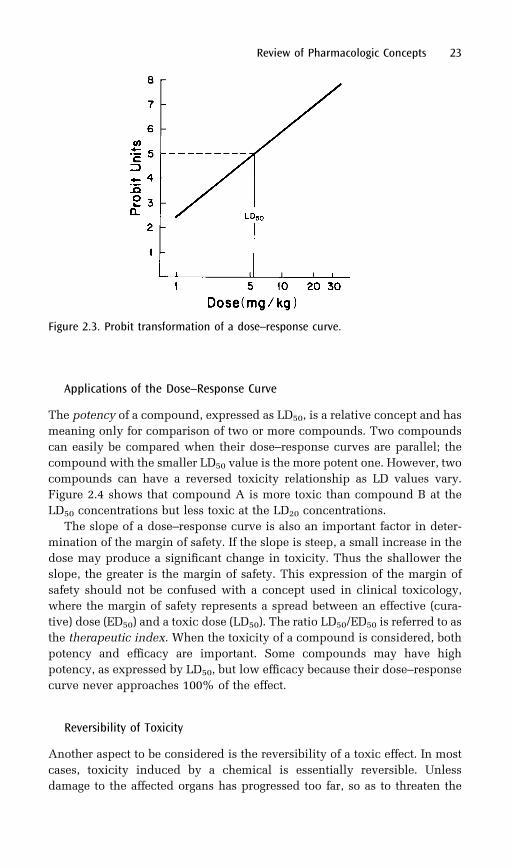
point. Table 2.1 shows conversion of percentage effect into probit units. The
probit transformation makes the dose–response curve linear (or nearly so),
and thus allows its analysis by linear regression (Y ¼ aþ bX , where b is the
slope of the curve) (Figure 2.3).
A graphic method for the determination of LD50, slope, and confidence
limits for both parameters (a and b) and for doses other than LD50 was
described by Lichfield and Wilcoxon (2). When this method is used to fit
the best line in the probit plot, the data points at both ends of the line should
be assigned the least weight.
Several computer programs (3) are now available for dose–response ana-
lysis that can be used with a number of desktop and laptop computers.
22 Environmental Toxicology
Figure 2.2. Cumulative dose–response curve. The response is the cumulative percen-tage of animals that died.
Table 2.1. Conversion of Percentage into Probit Units
Percentage Probit Percentage Probit
10 3.72 60 5.25
20 4.16 70 5.52
30 4.48 80 5.84
40 4.75 90 6.28
50 5.00
Applications of the Dose–Response Curve
The potency of a compound, expressed as LD50, is a relative concept and has
meaning only for comparison of two or more compounds. Two compounds
can easily be compared when their dose–response curves are parallel; the
compound with the smaller LD50 value is the more potent one. However, two
compounds can have a reversed toxicity relationship as LD values vary.
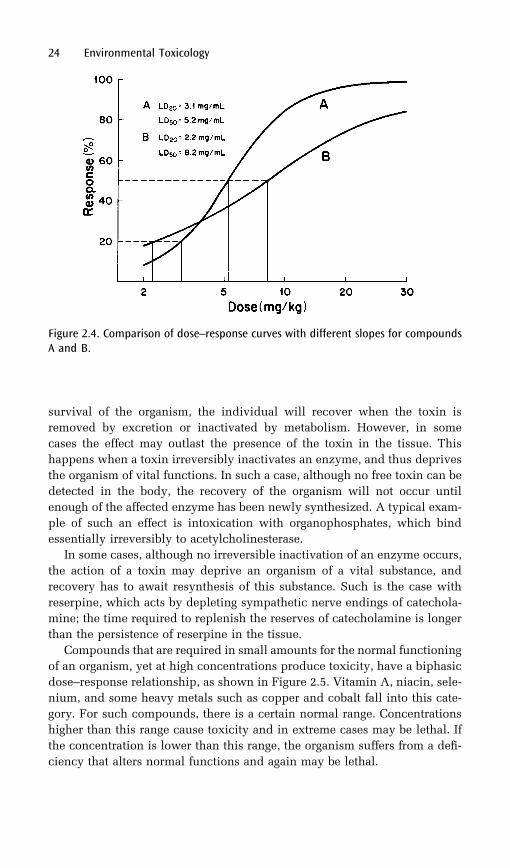
Figure 2.4 shows that compound A is more toxic than compound B at the
LD50 concentrations but less toxic at the LD20 concentrations.
The slope of a dose–response curve is also an important factor in deter-
mination of the margin of safety. If the slope is steep, a small increase in the
dose may produce a significant change in toxicity. Thus the shallower the
slope, the greater is the margin of safety. This expression of the margin of
safety should not be confused with a concept used in clinical toxicology,
where the margin of safety represents a spread between an effective (cura-
tive) dose (ED50) and a toxic dose (LD50). The ratio LD50/ED50 is referred to as
the therapeutic index. When the toxicity of a compound is considered, both
potency and efficacy are important. Some compounds may have high
potency, as expressed by LD50, but low efficacy because their dose–response
curve never approaches 100% of the effect.
Reversibility of Toxicity
Another aspect to be considered is the reversibility of a toxic effect. In most
cases, toxicity induced by a chemical is essentially reversible. Unless
damage to the affected organs has progressed too far, so as to threaten the
Review of Pharmacologic Concepts 23
Figure 2.3. Probit transformation of a dose–response curve.
survival of the organism, the individual will recover when the toxin is
removed by excretion or inactivated by metabolism. However, in some
cases the effect may outlast the presence of the toxin in the tissue. This
happens when a toxin irreversibly inactivates an enzyme, and thus deprives
the organism of vital functions. In such a case, although no free toxin can be
detected in the body, the recovery of the organism will not occur until
enough of the affected enzyme has been newly synthesized. A typical exam-
ple of such an effect is intoxication with organophosphates, which bind
essentially irreversibly to acetylcholinesterase.
In some cases, although no irreversible inactivation of an enzyme occurs,
the action of a toxin may deprive an organism of a vital substance, and
recovery has to await resynthesis of this substance. Such is the case with
reserpine, which acts by depleting sympathetic nerve endings of catechola-
mine; the time required to replenish the reserves of catecholamine is longer
than the persistence of reserpine in the tissue.
Compounds that are required in small amounts for the normal functioning
of an organism, yet at high concentrations produce toxicity, have a biphasic
dose–response relationship, as shown in Figure 2.5. Vitamin A, niacin, sele-
nium, and some heavy metals such as copper and cobalt fall into this cate-
gory. For such compounds, there is a certain normal range. Concentrations
higher than this range cause toxicity and in extreme cases may be lethal. If
the concentration is lower than this range, the organism suffers from a defi-
ciency that alters normal functions and again may be lethal.
24 Environmental Toxicology
Figure 2.4. Comparison of dose–response curves with different slopes for compoundsA and B.

The Concept of Receptors
Some chemicals, such as strong acids and bases, exert their toxic action in a
nonspecific way simply by denaturing protein and dissolving the tissue.
Such lesions are referred to as chemical burns. In most cases, however,
toxins act by interacting with specific components of the tissue, thus perturb-
ing normal metabolism. Early in the twentieth century, Paul Ehrlich (4)
proposed the concept of specific receptors. He postulated that a chemical,
in order to exert biological action, must reach a specific target area and fit
into a receptor site.
Many receptors have been identified; in all cases they are proteins. Some
of the proteins have enzymatic activity. For instance, dihydrofolate reduc-
tase is a receptor for antifolates (Chapter 4), and acetylcholinesterase is a
receptor for organophosphates. Some receptors serve as ‘‘transport vehicles’’
across the cellular membranes, such as the receptors for steroid hormones
(5). Specific receptors may be confined to certain tissues or may be distrib-
uted among all the cells of an organism.
Compounds in circulation are frequently bound, sometimes very tightly,
to plasma proteins. Although in many cases this binding is specific for a
given chemical, the proteins involved are not considered to be specific
receptors. Such interactions simply prevent the compound from reaching
target cells and do not result in biological action.
Review of Pharmacologic Concepts 25
Figure 2.5. Biphasic dose–response curve of compounds required for normal func-tioning of organisms.
Mode of Entry of Toxins
From the environmental point of view, the three principal routes of entry of
xenobiotics into the human body are percutaneous, respiratory, and oral.
(The term xenobiotics is a general designation of chemical compounds for-
eign to the organism. It is from the Greek xeno, meaning foreign.) In multi-
cellular animals, the extracellular space is filled with interstitial fluid. Thus,
regardless of how a compound enters the body (with the exception of intra-
venous administration), it enters interstitial fluid after penetrating the initial
cellular barrier (such as skin, intestinal mucosa, or the lining of the respira-
tory tract). From the interstitial fluid, the compound penetrates the capil-
laries and enters the bloodstream, which distributes it throughout the body.
Percutaneous Route
The skin forms a protective barrier that separates the rest of the body from
the environment. In the past it was thought that chemicals did not penetrate
the skin. In view of more recent research, this view no longer holds.
Although penetration of the skin by most substances is slow, this route of
entry plays an important role with regard to human and animal exposure to
toxic chemicals.
The skin consists of three layers: the outermost protective layer, the epi-
dermis; the middle layer, consisting of a highly vascularized connective
tissue called the dermis; and the innermost layer, consisting of a mixture
of adipose and connective tissue, called the hypodermis. In addition, the
skin contains epidermal appendages (hair follicles, sebaceous glands, and
sweat glands and ducts) that penetrate into the dermal layer.
Three possible routes of percutaneous absorption are diffusion through
the epidermis into the dermis, entry through sweat ducts, and entry along the
hair-follicle orifices. Although the latter routes present relatively easy access
to the vascularized dermal layer, it is believed that, because of its large sur-
face area, absorption through the epidermal cells is the major route of entry
of toxins.
The main obstacle to percutaneous penetration of water and xenobiotics
is the outermost membrane of the epidermis, called the stratum corneum.
This membrane is made up of several layers of dried, flattened keratinocytes.
There is no vascularization and no metabolic activity in the stratum cor-
neum. However, the lower basal layer of epidermis, although not vascular-
ized, has high metabolic activity and is capable of biotransformation of
xenobiotics (Chapter 3).
All entry of substances through the stratum corneum occurs by passive
diffusion across several cell layers. The locus of entry varies, depending on
the chemical properties of a xenobiotic. Polar substances are believed to
penetrate cell membranes through the protein filaments; nonpolar ones
26 Environmental Toxicology
enter through the lipid matrix (see the section on cellular uptake, later in this
chapter). Hydration of the stratum corneum increases its permeability for
polar substances. Electrolytes enter mainly in a nonionized form, and thus
the pH of the solution applied to the skin affects permeability. Many lipo-
philic substances, such as carbon tetrachloride and organophosphate insec-
ticides, readily penetrate the stratum corneum. Pretreatment of the skin with
solvents, such as dimethyl sulfoxide, methanol, ethanol, hexane, acetone,
and, in particular, a mixture of chloroform and methanol (6), increases per-
meability of the skin. This effect probably results from the removal of lipids
from the epidermis, which would alter its structure.
The permeability of skin is not uniform. It varies between species and
even within species, depending on the diffusivity and the thickness of the
stratum corneum (7). In general, gases penetrate skin more readily than
liquids and solutes. Solids do not penetrate as such. However, they may
be dissolved into the skin’s secretions and subsequently absorbed as solutes.
Percutaneous absorption is a time-dependent process, with passage
through the stratum corneum as the rate-limiting reaction. Therefore, dura-
tion of exposure to a xenobiotic is critical. It follows that the quick removal
of spills is of the utmost importance. The kinetics of percutaneous absorp-
tion resembles that of gastrointestinal absorption, except that the latter is
faster.
Respiratory Route
The respiratory system consists of three regions: nasopharyngeal, tracheo-
bronchial, and pulmonary. The nasopharyngeal canal is lined by ciliated
epithelium through which mucous glands are scattered. The role of this
region is to remove large inhaled particles and to increase the humidity
and temperature of inhaled air.
The tracheobronchial region consists of the trachea, bronchi, and bronch-
ioles. These are branched and successively narrower conduits between the
nasopharyngeal and pulmonary regions. They are lined with two types of
cells: ciliated epithelium and mucus-secreting goblet cells. The function of
these cells is to propel foreign particles from the deep parts of the lungs to
the oral cavity, where they can be either expelled with the sputum or swal-
lowed; this function is referred to as the mucociliary escalator. As the tra-
cheobronchial conduits branch, the airways become smaller but the total
surface area increases.
The pulmonary region consists of respiratory bronchioles (small tubes
about 1 mm long and 0.5 mm wide, seeded on one side with alveoli), alveo-
lar ducts (small tubes seeded on all sides with alveoli), and clusters of alveoli
(referred to as alveolar sacs).
Alveoli can be described as little bubbles about 150–350 mm in diameter
in which the exchange of gases between the environment and the blood takes
Review of Pharmacologic Concepts 27
place. The total alveolar surface area of the human lung is 35 m2 during
expiration and 100 m2 during deep inhalation. Three types of cells present
in the alveolar region deserve to be mentioned: squamous alveolar lining
cells (called Type I pneumocytes), surfactant-producing cells (called Type
II pneumocytes), and freely floating phagocytic macrophages. Type II pneu-
mocytes, in addition to producing surfactants (required to keep the alveoli
inflated), are involved in the repair of injuries. Blood capillaries are in inti-
mate contact with the alveolar lining cells, so that gases as well as solutes
can easily diffuse between them.
Inhaled xenobiotics can exert their harmful action either by damaging
respiratory tissue or by entering the circulation and causing systemic toxi-
city. Only the latter situation will be discussed in this chapter.
Readily water-soluble gases are removed, to a certain extent, in the naso-
pharyngeal and tracheobronchial region. Although this removal protects the
lower respiratory system, it does not prevent the entry of these gases into the
blood. Poorly water-soluble gases, although somewhat diluted by the humid-
ity of the nasopharyngeal region, reach the alveoli. The amount of a toxin
delivered to the lungs (in gaseous form, as liquid aerosols, or as particles)
depends on the concentration of the toxin in the air and on the minute
volume of respiration. The minute volume is a product of tidal volume
(i.e., normal respiratory volume, about 500 mL) and the number of breaths
per minute (about 15).
Gases diffuse readily through alveolar membranes according to Fick’s law
(8):
D ¼ cd � S=MW1=2 �A=d � ðPa � PbÞ ð2:1Þwhere D is the diffusion rate (g/cm2/per second); cd is the diffusion coeffi-
cient (cm2=s); S is solubility of the gas in blood; MW is molecular weight; A
and d are characteristics of the lung (surface area and thickness of the mem-
brane, respectively); and Pa and Pb are partial pressure of the gas in the
inspired air and in the blood, respectively. The first two expressions in
this equation represent the properties of the gas; the third one represents
the properties of the lungs.
Analysis of this equation indicates that as long as Pa is larger than Pb, D is
positive and there is uptake of gas by the blood. When Pa ¼ Pb, D ¼ 0; equi-
librium has been established between the gas in the alveoli and in the blood
so that no net gas exchange takes place. When Pb is larger than Pa (i.e., the
individual was removed from the toxic atmosphere), D becomes negative. In
this situation gas diffuses from the blood into the alveoli and is removed by
expiration.
Another important factor affecting diffusion rate is the solubility of the gas
in blood. When S is large, the diffusion rate is fast and the gas is removed
quickly from the alveoli. In this case, the limiting factor in delivery of gas to
the blood is the rate of supply of gas to the alveoli. Increasing minute volume
(either by deeper respiration or by faster respiration) increases gas delivery.
28 Environmental Toxicology
When S is small, the diffusion rate is slow; thus blood flow (i.e., cardiac
output) rather than minute volume becomes the rate-limiting factor in toxi-
city.
Toxins can also reach alveoli as liquid aerosols. If they are lipid-soluble,
they readily cross alveolar membranes by passive diffusion.
The toxicity of particulate matter depends on the size of the particles.
Particles larger than 5 mm are deposited in the nasopharyngeal region and
are either expelled by sneezing or propelled into the oral cavity, where they
are swallowed or expelled in the sputum. Particles 2–5 mm in size are depos-
ited in the tracheobronchial region. They are cleared by the mucociliary
escalator and eventually end up being expelled in the sputum or swallowed.
Particles 1 mm or smaller are deposited in alveoli. Then the free or pha-
gocytized particles may be carried to the tracheobronchial region, where
they are removed from the respiratory system by the mucociliary escalator.
Alternately, both free and phagocytized particles may pass through small
(0.8–1.0 nm) intercellular spaces between alveolar lining cells and enter
the lymphatic system. The latter, however, is a slow and inefficient process.
Particles resulting from combustion frequently carry adsorbed polycyclic
aromatic hydrocarbons (PAHs), some of which are carcinogens. These
adsorbed hydrocarbons may dissolve in alveolar fluid and enter the circula-
tion as solutes.
Oral Route
The absorption of compounds taken orally begins in the mouth and esopha-
gus. However, in most cases the retention time in this area is so short that no
significant absorption takes place.
In the stomach, compounds are mixed with food, acid, gastric enzymes,
and bacteria. All of these can alter the toxicity of the chemical, either by
influencing absorption or by modifying the compound. It has been demon-
strated that there are quantitative differences in toxicity, depending upon
whether compounds are administered with food or directly into the empty
stomach (9).
Most food absorption takes place in the small intestine. The gastrointest-
inal tract possesses specialized carrier systems for certain nutrients such as
carbohydrates, amino acids, calcium, and sodium. Some xenobiotics use
these routes of passage through the cells; others enter through passive diffu-
sion.
Lipid-soluble organic acids and bases are absorbed by passive diffusion
only in nonionized form. Equilibrium on both sides of the cell membrane is
established only between the nonionized forms, according to the
Henderson–Hasselbach equation4:
Review of Pharmacologic Concepts 29
4The pH values of body fluids are as follows: gastric juice, 1.0; contents of the small
intestine, 6.5; plasma and interstitial fluid, 7.4; urine, 6.8–7.8.
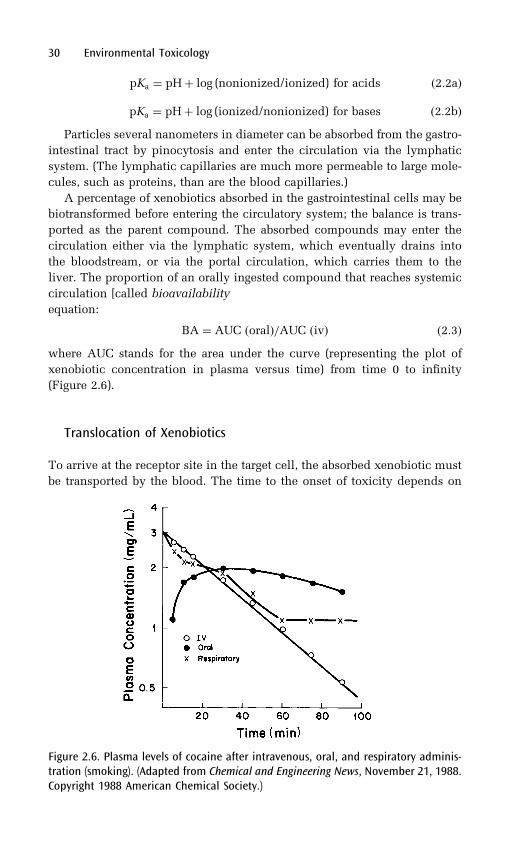
pKa ¼ pHþ log (nonionized/ionized) for acids ð2:2aÞ
pKa ¼ pHþ log (ionized/nonionized) for bases ð2:2bÞParticles several nanometers in diameter can be absorbed from the gastro-
intestinal tract by pinocytosis and enter the circulation via the lymphatic
system. (The lymphatic capillaries are much more permeable to large mole-
cules, such as proteins, than are the blood capillaries.)
A percentage of xenobiotics absorbed in the gastrointestinal cells may be
biotransformed before entering the circulatory system; the balance is trans-
ported as the parent compound. The absorbed compounds may enter the
circulation either via the lymphatic system, which eventually drains into
the bloodstream, or via the portal circulation, which carries them to the
liver. The proportion of an orally ingested compound that reaches systemic
circulation [called bioavailability (BA)] can be determined by the following
equation:
BA ¼ AUC ðoralÞ=AUC ðivÞ ð2:3Þwhere AUC stands for the area under the curve (representing the plot of
xenobiotic concentration in plasma versus time) from time 0 to infinity
(Figure 2.6).
Translocation of Xenobiotics
To arrive at the receptor site in the target cell, the absorbed xenobiotic must
be transported by the blood. The time to the onset of toxicity depends on
30 Environmental Toxicology
Figure 2.6. Plasma levels of cocaine after intravenous, oral, and respiratory adminis-tration (smoking). (Adapted from Chemical and Engineering News, November 21, 1988.Copyright 1988 American Chemical Society.)
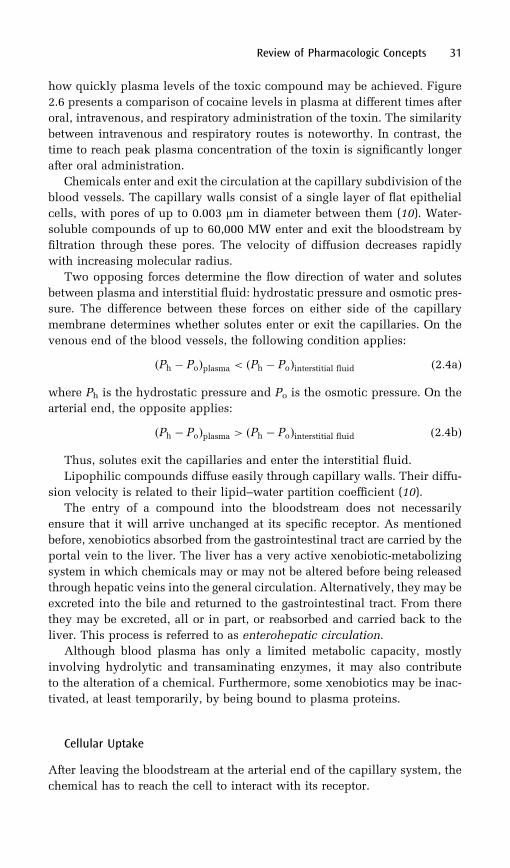
how quickly plasma levels of the toxic compound may be achieved. Figure
2.6 presents a comparison of cocaine levels in plasma at different times after
oral, intravenous, and respiratory administration of the toxin. The similarity
between intravenous and respiratory routes is noteworthy. In contrast, the
time to reach peak plasma concentration of the toxin is significantly longer
after oral administration.
Chemicals enter and exit the circulation at the capillary subdivision of the
blood vessels. The capillary walls consist of a single layer of flat epithelial
cells, with pores of up to 0.003 mm in diameter between them (10). Water-
soluble compounds of up to 60,000 MW enter and exit the bloodstream by
filtration through these pores. The velocity of diffusion decreases rapidly
with increasing molecular radius.
Two opposing forces determine the flow direction of water and solutes
between plasma and interstitial fluid: hydrostatic pressure and osmotic pres-
sure. The difference between these forces on either side of the capillary
membrane determines whether solutes enter or exit the capillaries. On the
venous end of the blood vessels, the following condition applies:
ðPh � PoÞplasma < ðPh � PoÞinterstitial fluid ð2:4aÞ
where Ph is the hydrostatic pressure and Po is the osmotic pressure. On the
arterial end, the opposite applies:
ðPh � PoÞplasma > ðPh � PoÞinterstitial fluid ð2:4bÞ
Thus, solutes exit the capillaries and enter the interstitial fluid.
Lipophilic compounds diffuse easily through capillary walls. Their diffu-
sion velocity is related to their lipid–water partition coefficient (10).
The entry of a compound into the bloodstream does not necessarily
ensure that it will arrive unchanged at its specific receptor. As mentioned
before, xenobiotics absorbed from the gastrointestinal tract are carried by the
portal vein to the liver. The liver has a very active xenobiotic-metabolizing
system in which chemicals may or may not be altered before being released
through hepatic veins into the general circulation. Alternatively, they may be
excreted into the bile and returned to the gastrointestinal tract. From there
they may be excreted, all or in part, or reabsorbed and carried back to the
liver. This process is referred to as enterohepatic circulation.
Although blood plasma has only a limited metabolic capacity, mostly
involving hydrolytic and transaminating enzymes, it may also contribute
to the alteration of a chemical. Furthermore, some xenobiotics may be inac-
tivated, at least temporarily, by being bound to plasma proteins.
Cellular Uptake
After leaving the bloodstream at the arterial end of the capillary system, the
chemical has to reach the cell to interact with its receptor.
Review of Pharmacologic Concepts 31
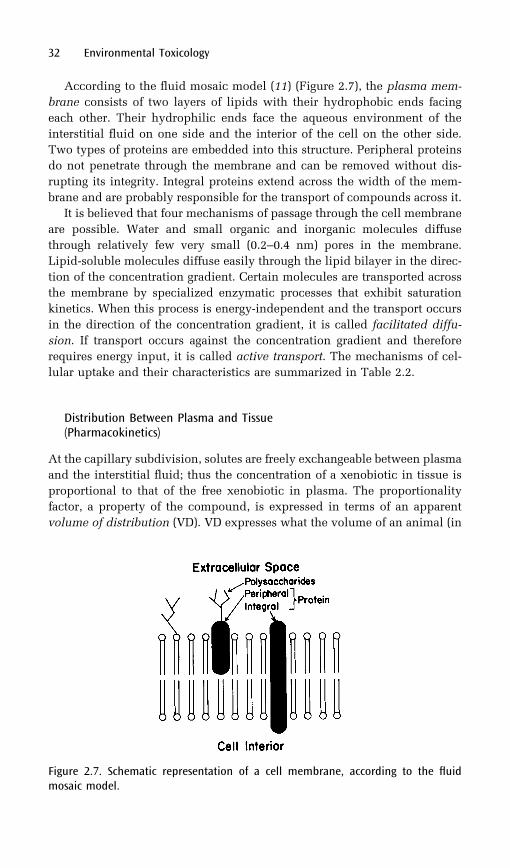
According to the fluid mosaic model (11) (Figure 2.7), the plasma mem-
brane consists of two layers of lipids with their hydrophobic ends facing
each other. Their hydrophilic ends face the aqueous environment of the
interstitial fluid on one side and the interior of the cell on the other side.
Two types of proteins are embedded into this structure. Peripheral proteins
do not penetrate through the membrane and can be removed without dis-
rupting its integrity. Integral proteins extend across the width of the mem-
brane and are probably responsible for the transport of compounds across it.
It is believed that four mechanisms of passage through the cell membrane
are possible. Water and small organic and inorganic molecules diffuse
through relatively few very small (0.2–0.4 nm) pores in the membrane.
Lipid-soluble molecules diffuse easily through the lipid bilayer in the direc-
tion of the concentration gradient. Certain molecules are transported across
the membrane by specialized enzymatic processes that exhibit saturation
kinetics. When this process is energy-independent and the transport occurs
in the direction of the concentration gradient, it is called facilitated diffu-
sion. If transport occurs against the concentration gradient and therefore
requires energy input, it is called active transport. The mechanisms of cel-
lular uptake and their characteristics are summarized in Table 2.2.
Distribution Between Plasma and Tissue(Pharmacokinetics)
At the capillary subdivision, solutes are freely exchangeable between plasma
and the interstitial fluid; thus the concentration of a xenobiotic in tissue is
proportional to that of the free xenobiotic in plasma. The proportionality
factor, a property of the compound, is expressed in terms of an apparent
volume of distribution (VD). VD expresses what the volume of an animal (in
32 Environmental Toxicology
Figure 2.7. Schematic representation of a cell membrane, according to the fluidmosaic model.
liters) should be if a compound were equally distributed between plasma
and tissue. In general, a large VD indicates easy uptake, whereas a small VD
indicates poor uptake of a compound by the tissue. However, the true picture
is complicated by the binding of a xenobiotic to plasma protein or its deposi-
tion in fat.
To determine VD, an animal is injected intravenously with the compound
in question. The concentration of the compound in plasma is determined at
frequent time intervals, and the logarithms of concentration are plotted ver-
sus time. The peak concentration occurs immediately after the injection.
Concentration decreases with time through two processes: uptake by tissue,
referred to as the � phase, and elimination from plasma, called the � phase.
Elimination may include one or more of the following: urinary excretion,
fecal excretion, excretion by exhalation, excretion with sweat, or metabo-
lism. When the rate of distribution is of the same order of magnitude as the
rate of elimination (but faster, as it usually is), a plot of the logarithm of
concentration versus time yields a biphasic curve (Figure 2.8A). This is
referred to as a two-compartment open model (12). The initial part of the
plot is a composite curve resulting from two first-order reactions,5 distribu-
tion and elimination, proceeding simultaneously. The tail end, appearing as
Review of Pharmacologic Concepts 33
Table 2.2. Mechanisms of Cellular Uptake and Their Characteristics
Mechanism Compound Kinetics Co vs. Ci Energy
Diffusion < 0.4 nm vi ¼ cdAðCo � CiÞ=d Co > Ci None
through pores
Diffusion
through
Lipophilic vi ¼ cdAðCo � CiÞ=d Co > Ci None
lipid layer
Facilitated Miscellaneous vi ¼ vmCs=ðKM þ CsÞ Co > Ci None
diffusion
Active Miscellaneous vi ¼ vmCs=ðKM þ CsÞ Co > Ci Required
transport
Co and Ci are concentration outside and inside the cell, respectively; vi is initial uptake velocity;
cd is diffusion coefficient; A and d are area and thickness of the membrane, respectively; vm is
maximum velocity; Cs is substrate concentration and KM is the Michaelis-Menten constant.
5The first-order reactions are characterized by a linear plot of the logarithm of
concentration vs. time. The derivation of this plot is as follows. According to thefirst-order kinetics, �dC=dt ¼ kC, where C is concentration, t is time, k is the rate
constant, and �dC=dt is the change of concentration over time. Rearrangement of the
equation gives �dC=C ¼ k dt, or d ln C ¼ �k dt. Integration yields the linear equation
ln C ¼ �ktþ constant, or log C ¼ ð�k=2:303Þtþ constant.
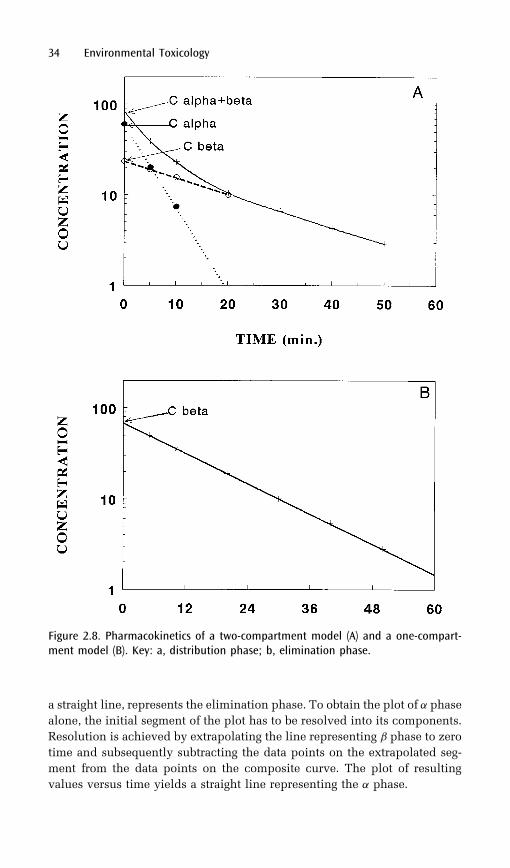
a straight line, represents the elimination phase. To obtain the plot of � phase
alone, the initial segment of the plot has to be resolved into its components.
Resolution is achieved by extrapolating the line representing � phase to zero
time and subsequently subtracting the data points on the extrapolated seg-
ment from the data points on the composite curve. The plot of resulting
values versus time yields a straight line representing the � phase.
34 Environmental Toxicology
Figure 2.8. Pharmacokinetics of a two-compartment model (A) and a one-compart-ment model (B). Key: a, distribution phase; b, elimination phase.
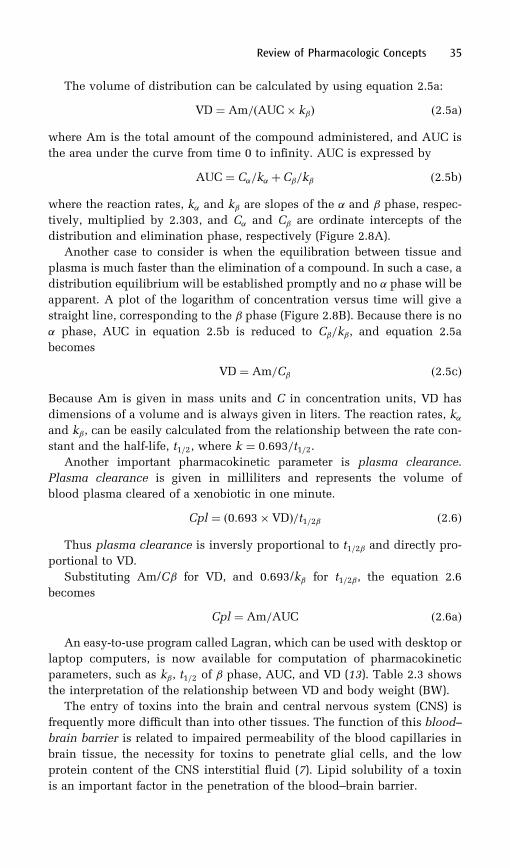
The volume of distribution can be calculated by using equation 2.5a:
VD ¼ Am=ðAUC� k�Þ ð2:5aÞ
where Am is the total amount of the compound administered, and AUC is
the area under the curve from time 0 to infinity. AUC is expressed by
AUC ¼ C�=k� þ C�=k� ð2:5bÞ
where the reaction rates, k� and k� are slopes of the � and � phase, respec-
tively, multiplied by 2.303, and C� and C� are ordinate intercepts of the
distribution and elimination phase, respectively (Figure 2.8A).
Another case to consider is when the equilibration between tissue and
plasma is much faster than the elimination of a compound. In such a case, a
distribution equilibrium will be established promptly and no � phase will be
apparent. A plot of the logarithm of concentration versus time will give a
straight line, corresponding to the � phase (Figure 2.8B). Because there is no
� phase, AUC in equation 2.5b is reduced to C�=k�, and equation 2.5a
becomes
VD ¼ Am=C� ð2:5cÞ
Because Am is given in mass units and C in concentration units, VD has
dimensions of a volume and is always given in liters. The reaction rates, k�and k�, can be easily calculated from the relationship between the rate con-
stant and the half-life, t1=2, where k ¼ 0:693=t1=2.
Another important pharmacokinetic parameter is plasma clearance.
Plasma clearance is given in milliliters and represents the volume of
blood plasma cleared of a xenobiotic in one minute.
Cpl ¼ ð0:693� VDÞ=t1=2� ð2:6Þ
Thus plasma clearance is inversly proportional to t1=2� and directly pro-
portional to VD.
Substituting Am/C� for VD, and 0.693/k� for t1=2�, the equation 2.6
becomes
Cpl ¼ Am=AUC ð2:6aÞ
An easy-to-use program called Lagran, which can be used with desktop or
laptop computers, is now available for computation of pharmacokinetic
parameters, such as k�, t1=2 of � phase, AUC, and VD (13). Table 2.3 shows
the interpretation of the relationship between VD and body weight (BW).
The entry of toxins into the brain and central nervous system (CNS) is
frequently more difficult than into other tissues. The function of this blood–
brain barrier is related to impaired permeability of the blood capillaries in
brain tissue, the necessity for toxins to penetrate glial cells, and the low
protein content of the CNS interstitial fluid (7). Lipid solubility of a toxin
is an important factor in the penetration of the blood–brain barrier.
Review of Pharmacologic Concepts 35

Storage of Chemicals in the Body
An important factor to be considered is the capability of certain chemicals or
their metabolites to be stored in the body. In general, a compound will
accumulate in the body after repeated intake if its elimination or biotrans-
formation is slower than the frequency of uptake. The best example of this
phenomenon is the accumulation and persistence of alcohol in the blood
after prolonged drinking. The human body metabolizes, on the average, one
drink (a 12-oz can of beer, a 5-oz glass of wine, or one shot of 86-proof liquor)
per hour. For a person weighing 140–160 pounds, the blood alcohol level
rises 20 mg% per drink per hour. Accumulation of alcohol in blood after
consuming one drink per hour or two drinks per hour, respectively, is shown
in Figure 2.9. When two drinks per hour are consumed, the uptake of alcohol
is much faster than its metabolism, so the alcohol levels build up rapidly. To
maintain legally safe levels of alcohol in the blood while driving (less than
50 mg%), it is recommended that one consume no more than one drink per
hour.
Some compounds are stored in the body in specific tissues. Such storage
effectively removes the material from circulation and thus decreases the
toxicity of the compound. Repeated doses of a toxic substance may be
taken up and subsequently stored without apparent toxicity until the storage
receptors become saturated; then toxicity suddenly occurs. In some cases,
the stored compound may be displaced from its storage receptor by another
compound that has an affinity for the same receptor. Examples of this phe-
nomenon are the displacement of antidiabetic sulfonylureas by sulfona-
mides and the ability of antimalarial drugs such as quinacrine (Atabrine)
and primaquine to displace each other (15) (Figure 2.10). A special danger
in such cases is that compounds may have escaped detoxifying metabolism
while stored in the body, and that their toxicity may be potent and prolonged
when they are released.
Lipophilic compounds [such as halogenated hydrocarbons, DDT (dichlor-
odiphenyl-trichloroethane), PCBs (polychlorinated biphenyls), etc.] may be
36 Environmental Toxicology
Table 2.3. Interpretation of the Relationship Between Volume of
Distribution and Body Weight
VD vs. BW Meaning Possible Interpretation
VD > BW Ct > Cp High lipophilicity or strong receptor
binding or deposition in fat
VD < BW Cp > Ct Hydrophilic compound with poor
transport or binding to plasma protein
VD is volume of distribution; BW is body weight; Cp and Ct are concentration in plasma and
tissue, respectively.

Figure 2.9. Accumulation of alcohol in humans after prolonged drinking. (1 drink = 1oz of 100-proof whiskey.) (Based on data in reference 14.)
Figure 2.10. Chemical structures of sulfonylurea vs. sulfonamide, and quinacrine vs.primaquine.
stored in fat without apparent harm to the exposed organism. However, these
toxins tend to accumulate in the food chain. Eventually the storage capacity
of an organism at the end of the food chain may be exceeded, and the toxin
may be released into circulation and into the milk. Another danger is that
during a period of starvation, as frequently happens to wild animals in
winter, fat deposits are mobilized for energy. Stored toxins are then released,
causing sickness or death.
In addition to possible lasting inactivation of xenobiotics due to storage in
various tissues, living organisms are partially protected by their reserve
functional capacity. Some organs (such as the lungs, liver, and kidney)
may withstand a certain amount of injury without any demonstrable symp-
toms. In such cases, the injury can be demonstrated only histologically.
References
1. Bliss, C. I. Ann. Appl. Biol. 1935, 22, 134.2. Lichfield, J. T., Jr.; Wilcoxon, F. J. Pharmacol. Exp. Ther. 1949, 96, 99.3. The following programs are applicable: WinNonlin (scientific
Consultung, Inc., 5625 Dillard Rd., Suite 215, Cary, NC 27511; SASprocedure PROBIT (SAS Institute, Inc., SAS Circle, Box 8000, Cary,NC 27512).
4. Ehrlich, P. Lancet 1913, 2, 445.5. Baxter, J. D.; Forsham, P. H. Am. J. Med. 1972, 53, 573.6. Loomis, T. A. Essentials of Toxicology; Lea & Febiger: Philadelphia, PA,
1978; Chapter 5, p 68.7. Klaassen, C. D. In Cassarett and Doull’s Toxicology; Klaassen, C. D.;
Amdur, M. O.; Doull, J., Eds.; MacMillan: New York, 1986; Chapter 3,p 33.
8. Review of Physiological Chemistry; Harper, H. A.; Rodwell, V. W.;Mayers, P. A., Eds.; Lange Medical: Los Altos, CA, 1979; Chapter 15, p218.
9. Worden, A. N.; Harper, K. H. Proc. Eur. Soc. Study Drug Toxicol. 1963, 2,15.
10. Goldstein, A.; Aronow, L.; Kalman, S. M. Principles of Drug Action; JohnWiley: New York, 1974; Chapter 2, p 129.
11. Review of Physiological Chemistry; Harper, H. A.; Rodwell, V. W.;Mayers, P. A., Eds.; Lange Medical: Los Altos, CA, 1979; Chapter 9, p112.
12. Greenblatt, D. J.; Koch-Weser, J. N. Engl. J. Med. October 2, 1975, 702.13. Gibaldi, M. In Biopharmaceutics and Clinical Pharmacokinetics; Lea &
Febiger: Philadelphia, PA, 1977; Chapter 1, p 1.14. Forney, R. B.; Hughes, F. W. Clin. Pharm. Ther. 1963, 4, 619.15. Loomis, T. A. Essentials of Toxicology; Lee & Febiger: Philadelphia, PA,
1978; Chapter 3, p 36.
38 Environmental Toxicology
3Metabolism of Xenobiotics
Phases of Metabolism
The action of most xenobiotics ends in either excretion or metabolic inacti-
vation. Some compounds, on the other hand, require metabolic activation
before they can exert any biological action. In most cases these biotransfor-
mations, activations as well as inactivations, are carried out by specialized
enzyme systems. The essential role of these enzymes is to facilitate elimina-
tion of xenobiotics. Water-soluble compounds usually do not need to be
metabolized, as they can be excreted in their original forms. Lipophilic
compounds can be disposed of through biliary excretion, or they may
undergo metabolism to become more polar and thus more water-soluble so
that they can be disposed of through the kidneys.
The metabolism of xenobiotics is usually carried out in two phases. Phase
1 involves oxidative reactions in most cases, whereas phase 2 involves con-
jugation (combination) with highly water-soluble moieties. Occasionally the
products of biotransformation are unstable and decompose to release highly
reactive compounds such as free radicals, strong electrophiles, or highly
stressed three-member rings (epoxides, azaridines, episulfides, and diazo-
methane; Figure 3.1) that have a tendency toward nucleophilic ring opening.
For order to be retained within the cells, the chemical reactions have to
occur through enzymatic processes in which the substrate is activated while
bound to the enzyme. Only after the desired reaction takes place is a stable
product released. Freely roaming reactive compounds are not welcome in a
living organism because they react randomly with macromolecules such as
DNA, RNA, and proteins. Alteration of DNA leads to faulty replication and
transcription. Alteration of RNA causes faulty messages that, in turn, lead to
39
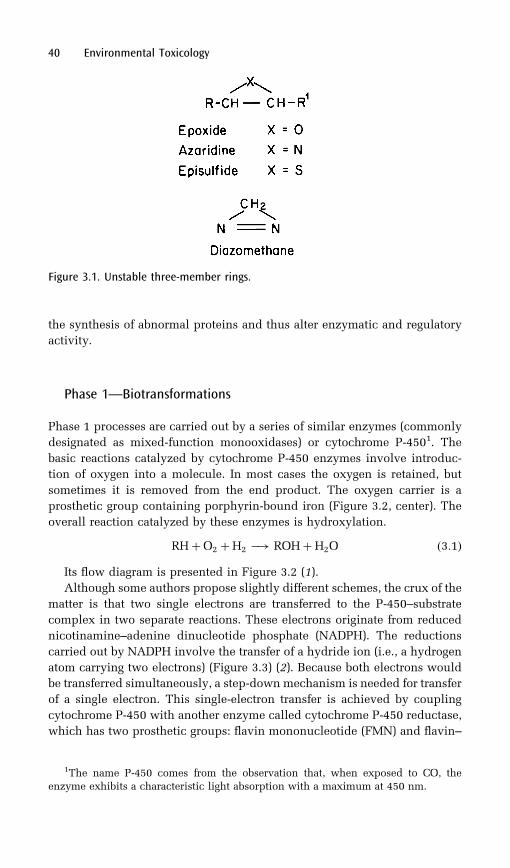
the synthesis of abnormal proteins and thus alter enzymatic and regulatory
activity.
Phase 1—Biotransformations
Phase 1 processes are carried out by a series of similar enzymes (commonly
designated as mixed-function monooxidases) or cytochrome P-4501. The
basic reactions catalyzed by cytochrome P-450 enzymes involve introduc-
tion of oxygen into a molecule. In most cases the oxygen is retained, but
sometimes it is removed from the end product. The oxygen carrier is a
prosthetic group containing porphyrin-bound iron (Figure 3.2, center). The
overall reaction catalyzed by these enzymes is hydroxylation.
RHþO2 þH2 �! ROHþH2O ð3:1Þ
Its flow diagram is presented in Figure 3.2 (1).
Although some authors propose slightly different schemes, the crux of the
matter is that two single electrons are transferred to the P-450–substrate
complex in two separate reactions. These electrons originate from reduced
nicotinamine–adenine dinucleotide phosphate (NADPH). The reductions
carried out by NADPH involve the transfer of a hydride ion (i.e., a hydrogen
atom carrying two electrons) (Figure 3.3) (2). Because both electrons would
be transferred simultaneously, a step-down mechanism is needed for transfer
of a single electron. This single-electron transfer is achieved by coupling
cytochrome P-450 with another enzyme called cytochrome P-450 reductase,
which has two prosthetic groups: flavin mononucleotide (FMN) and flavin–
40 Environmental Toxicology
Figure 3.1. Unstable three-member rings.
1The name P-450 comes from the observation that, when exposed to CO, the
enzyme exhibits a characteristic light absorption with a maximum at 450 nm.
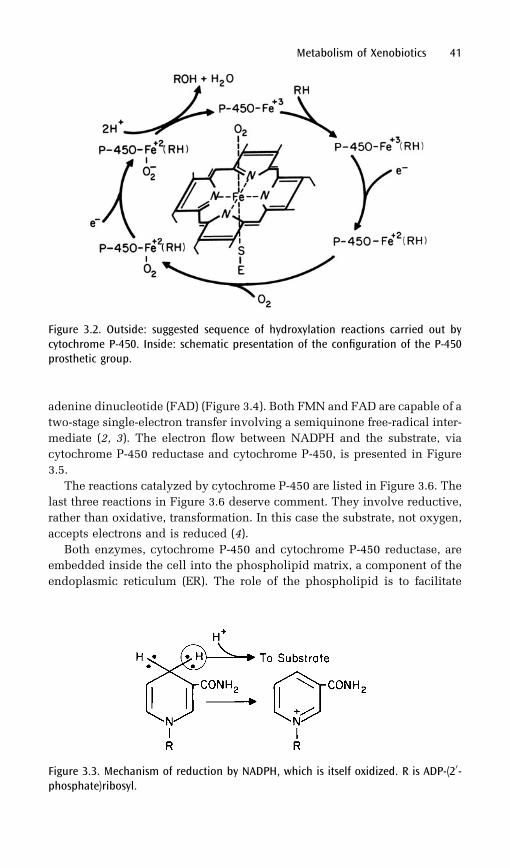
adenine dinucleotide (FAD) (Figure 3.4). Both FMN and FAD are capable of a
two-stage single-electron transfer involving a semiquinone free-radical inter-
mediate (2, 3). The electron flow between NADPH and the substrate, via
cytochrome P-450 reductase and cytochrome P-450, is presented in Figure
3.5.
The reactions catalyzed by cytochrome P-450 are listed in Figure 3.6. The
last three reactions in Figure 3.6 deserve comment. They involve reductive,
rather than oxidative, transformation. In this case the substrate, not oxygen,
accepts electrons and is reduced (4).
Both enzymes, cytochrome P-450 and cytochrome P-450 reductase, are
embedded inside the cell into the phospholipid matrix, a component of the
endoplasmic reticulum (ER). The role of the phospholipid is to facilitate
Metabolism of Xenobiotics 41
Figure 3.2. Outside: suggested sequence of hydroxylation reactions carried out bycytochrome P-450. Inside: schematic presentation of the configuration of the P-450prosthetic group.
Figure 3.3. Mechanism of reduction by NADPH, which is itself oxidized. R is ADP-(20-phosphate)ribosyl.
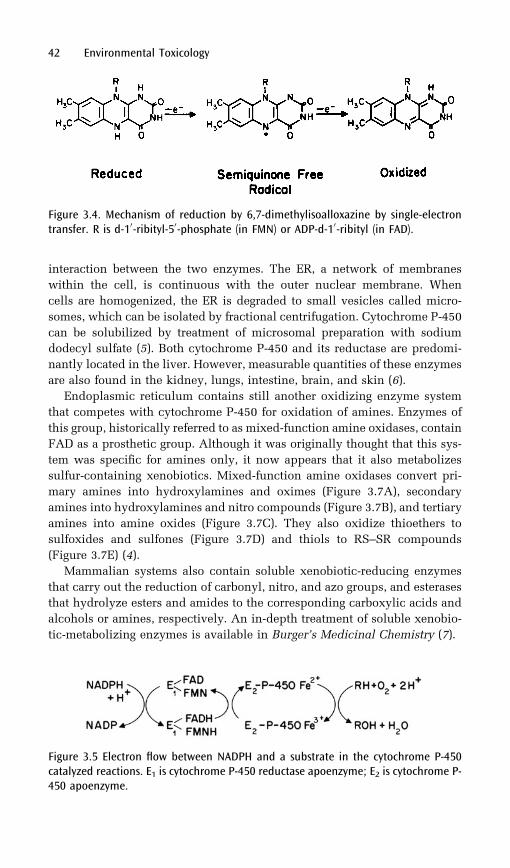
interaction between the two enzymes. The ER, a network of membranes
within the cell, is continuous with the outer nuclear membrane. When
cells are homogenized, the ER is degraded to small vesicles called micro-
somes, which can be isolated by fractional centrifugation. Cytochrome P-450
can be solubilized by treatment of microsomal preparation with sodium
dodecyl sulfate (5). Both cytochrome P-450 and its reductase are predomi-
nantly located in the liver. However, measurable quantities of these enzymes
are also found in the kidney, lungs, intestine, brain, and skin (6).
Endoplasmic reticulum contains still another oxidizing enzyme system
that competes with cytochrome P-450 for oxidation of amines. Enzymes of
this group, historically referred to as mixed-function amine oxidases, contain
FAD as a prosthetic group. Although it was originally thought that this sys-
tem was specific for amines only, it now appears that it also metabolizes
sulfur-containing xenobiotics. Mixed-function amine oxidases convert pri-
mary amines into hydroxylamines and oximes (Figure 3.7A), secondary
amines into hydroxylamines and nitro compounds (Figure 3.7B), and tertiary
amines into amine oxides (Figure 3.7C). They also oxidize thioethers to
sulfoxides and sulfones (Figure 3.7D) and thiols to RS–SR compounds
(Figure 3.7E) (4).
Mammalian systems also contain soluble xenobiotic-reducing enzymes
that carry out the reduction of carbonyl, nitro, and azo groups, and esterases
that hydrolyze esters and amides to the corresponding carboxylic acids and
alcohols or amines, respectively. An in-depth treatment of soluble xenobio-
tic-metabolizing enzymes is available in Burger’s Medicinal Chemistry (7).
42 Environmental Toxicology
Figure 3.4. Mechanism of reduction by 6,7-dimethylisoalloxazine by single-electrontransfer. R is d-10-ribityl-50-phosphate (in FMN) or ADP-d-10-ribityl (in FAD).
Figure 3.5 Electron flow between NADPH and a substrate in the cytochrome P-450catalyzed reactions. E1 is cytochrome P-450 reductase apoenzyme; E2 is cytochrome P-450 apoenzyme.
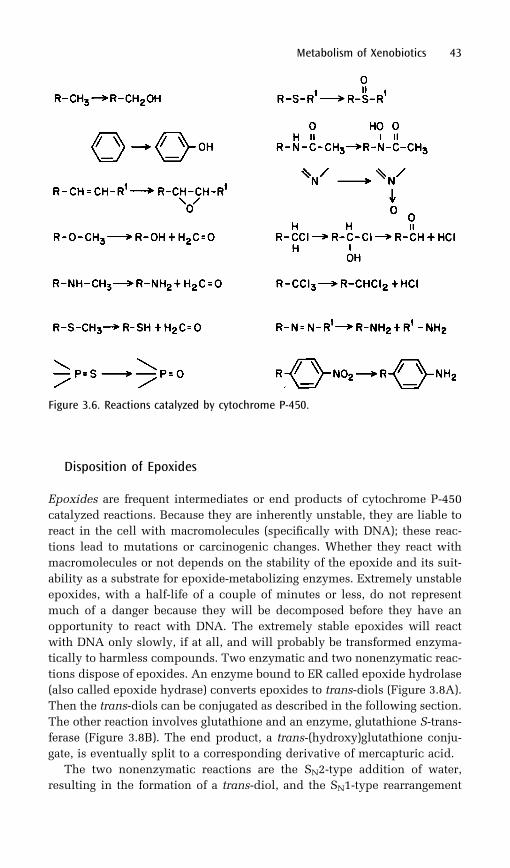
Disposition of Epoxides
Epoxides are frequent intermediates or end products of cytochrome P-450
catalyzed reactions. Because they are inherently unstable, they are liable to
react in the cell with macromolecules (specifically with DNA); these reac-
tions lead to mutations or carcinogenic changes. Whether they react with
macromolecules or not depends on the stability of the epoxide and its suit-
ability as a substrate for epoxide-metabolizing enzymes. Extremely unstable
epoxides, with a half-life of a couple of minutes or less, do not represent
much of a danger because they will be decomposed before they have an
opportunity to react with DNA. The extremely stable epoxides will react
with DNA only slowly, if at all, and will probably be transformed enzyma-
tically to harmless compounds. Two enzymatic and two nonenzymatic reac-
tions dispose of epoxides. An enzyme bound to ER called epoxide hydrolase
(also called epoxide hydrase) converts epoxides to trans-diols (Figure 3.8A).
Then the trans-diols can be conjugated as described in the following section.
The other reaction involves glutathione and an enzyme, glutathione S-trans-
ferase (Figure 3.8B). The end product, a trans-(hydroxy)glutathione conju-
gate, is eventually split to a corresponding derivative of mercapturic acid.
The two nonenzymatic reactions are the SN2-type addition of water,
resulting in the formation of a trans-diol, and the SN1-type rearrangement
Metabolism of Xenobiotics 43
Figure 3.6. Reactions catalyzed by cytochrome P-450.
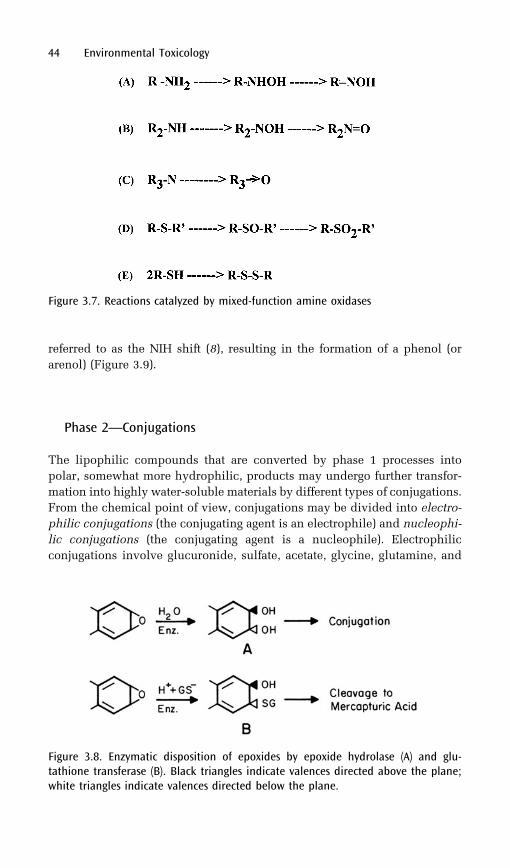
referred to as the NIH shift (8), resulting in the formation of a phenol (or
arenol) (Figure 3.9).
Phase 2—Conjugations
The lipophilic compounds that are converted by phase 1 processes into
polar, somewhat more hydrophilic, products may undergo further transfor-
mation into highly water-soluble materials by different types of conjugations.
From the chemical point of view, conjugations may be divided into electro-
philic conjugations (the conjugating agent is an electrophile) and nucleophi-
lic conjugations (the conjugating agent is a nucleophile). Electrophilic
conjugations involve glucuronide, sulfate, acetate, glycine, glutamine, and
44 Environmental Toxicology
Figure 3.7. Reactions catalyzed by mixed-function amine oxidases
Figure 3.8. Enzymatic disposition of epoxides by epoxide hydrolase (A) and glu-tathione transferase (B). Black triangles indicate valences directed above the plane;white triangles indicate valences directed below the plane.
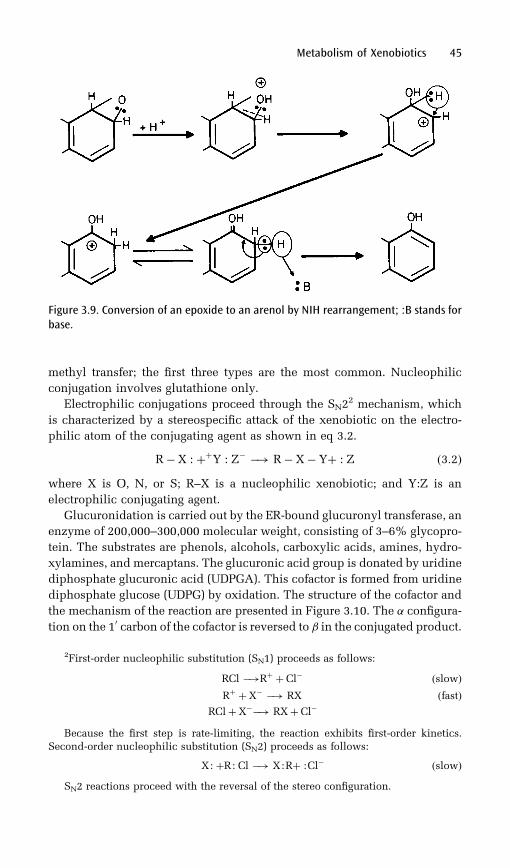
methyl transfer; the first three types are the most common. Nucleophilic
conjugation involves glutathione only.
Electrophilic conjugations proceed through the SN22 mechanism, which
is characterized by a stereospecific attack of the xenobiotic on the electro-
philic atom of the conjugating agent as shown in eq 3.2.
R� X : þþY : Z� �! R� X� Yþ : Z ð3:2Þwhere X is O, N, or S; R–X is a nucleophilic xenobiotic; and Y:Z is an
electrophilic conjugating agent.
Glucuronidation is carried out by the ER-bound glucuronyl transferase, an
enzyme of 200,000–300,000 molecular weight, consisting of 3–6% glycopro-
tein. The substrates are phenols, alcohols, carboxylic acids, amines, hydro-
xylamines, and mercaptans. The glucuronic acid group is donated by uridine
diphosphate glucuronic acid (UDPGA). This cofactor is formed from uridine
diphosphate glucose (UDPG) by oxidation. The structure of the cofactor and
the mechanism of the reaction are presented in Figure 3.10. The � configura-
tion on the 10 carbon of the cofactor is reversed to � in the conjugated product.
Metabolism of Xenobiotics 45
Figure 3.9. Conversion of an epoxide to an arenol by NIH rearrangement; :B stands forbase.
2First-order nucleophilic substitution (SN1) proceeds as follows:
RCl �!Rþ þ Cl� ðslowÞRþ þ X� �! RX ðfastÞ
RClþ X��! RXþ Cl�
Because the first step is rate-limiting, the reaction exhibits first-order kinetics.Second-order nucleophilic substitution (SN2) proceeds as follows:
X: þR: Cl �! X:Rþ :Cl� ðslowÞSN2 reactions proceed with the reversal of the stereo configuration.
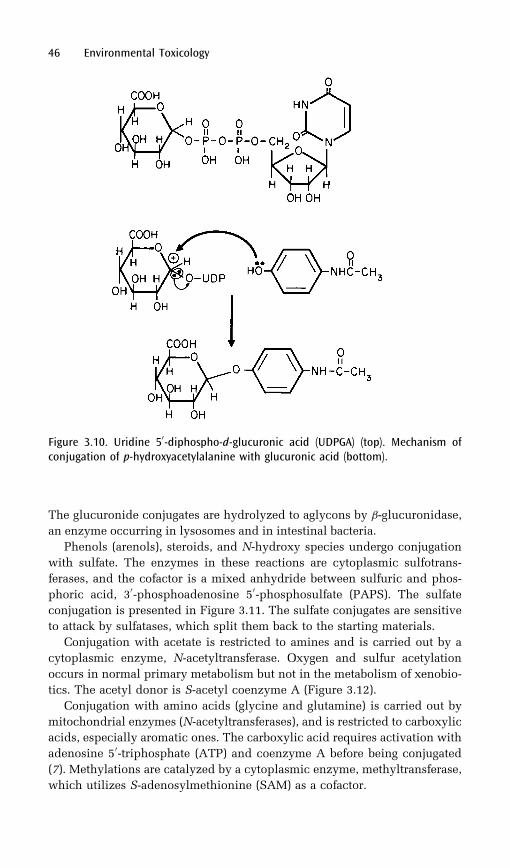
The glucuronide conjugates are hydrolyzed to aglycons by �-glucuronidase,
an enzyme occurring in lysosomes and in intestinal bacteria.
Phenols (arenols), steroids, and N-hydroxy species undergo conjugation
with sulfate. The enzymes in these reactions are cytoplasmic sulfotrans-
ferases, and the cofactor is a mixed anhydride between sulfuric and phos-
phoric acid, 30-phosphoadenosine 50-phosphosulfate (PAPS). The sulfate
conjugation is presented in Figure 3.11. The sulfate conjugates are sensitive
to attack by sulfatases, which split them back to the starting materials.
Conjugation with acetate is restricted to amines and is carried out by a
cytoplasmic enzyme, N-acetyltransferase. Oxygen and sulfur acetylation
occurs in normal primary metabolism but not in the metabolism of xenobio-
tics. The acetyl donor is S-acetyl coenzyme A (Figure 3.12).
Conjugation with amino acids (glycine and glutamine) is carried out by
mitochondrial enzymes (N-acetyltransferases), and is restricted to carboxylic
acids, especially aromatic ones. The carboxylic acid requires activation with
adenosine 50-triphosphate (ATP) and coenzyme A before being conjugated
(7). Methylations are catalyzed by a cytoplasmic enzyme, methyltransferase,
which utilizes S-adenosylmethionine (SAM) as a cofactor.
46 Environmental Toxicology
Figure 3.10. Uridine 50-diphospho-d-glucuronic acid (UDPGA) (top). Mechanism ofconjugation of p-hydroxyacetylalanine with glucuronic acid (bottom).
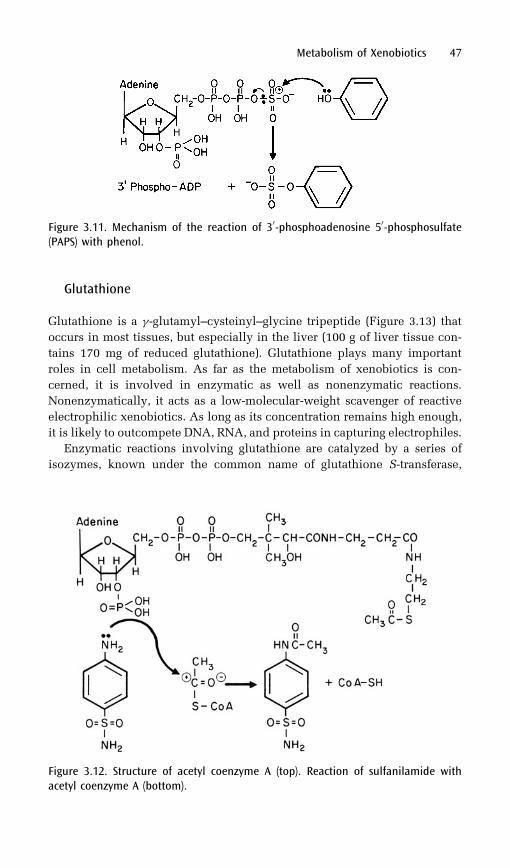
Glutathione
Glutathione is a �-glutamyl–cysteinyl–glycine tripeptide (Figure 3.13) that
occurs in most tissues, but especially in the liver (100 g of liver tissue con-
tains 170 mg of reduced glutathione). Glutathione plays many important
roles in cell metabolism. As far as the metabolism of xenobiotics is con-
cerned, it is involved in enzymatic as well as nonenzymatic reactions.
Nonenzymatically, it acts as a low-molecular-weight scavenger of reactive
electrophilic xenobiotics. As long as its concentration remains high enough,
it is likely to outcompete DNA, RNA, and proteins in capturing electrophiles.
Enzymatic reactions involving glutathione are catalyzed by a series of
isozymes, known under the common name of glutathione S-transferase,
Metabolism of Xenobiotics 47
Figure 3.11. Mechanism of the reaction of 30-phosphoadenosine 50-phosphosulfate(PAPS) with phenol.
Figure 3.12. Structure of acetyl coenzyme A (top). Reaction of sulfanilamide withacetyl coenzyme A (bottom).

with broad specificity for electrophilic substrates. (Isozymes are enzymes
with different chemical compositions but performing the same catalytic
functions.) At least five isozymes together comprise 10% of soluble liver
protein. Glutathione S-transferase catalyzes the reaction between glutathione
and aliphatic and aromatic epoxides, as well as aromatic and aliphatic
halides (Figure 3.14). The conjugated product is further hydrolyzed with
the removal of glutamyl and glycyl residues, followed by N-acetylation by
acetyltransferase. The end product is mercapturic acid, which is highly
water-soluble and easily excreted in urine.
Glutathione S-transferase also catalyzes reactions of organic nitrates with
glutathione. These reactions, however, do not proceed through the mercap-
turic acid pathway. They lead instead to reduction of the organic nitrate to
inorganic nitrite and oxidation of glutathione to its S–S dimer (Figure 3.15).
This reaction is responsible for the rapid inactivation of nitroglycerin, a
vasodilator used in the treatment of myocardial ischemia. The nitrites
48 Environmental Toxicology
Figure 3.13. Glutathione.
Figure 3.14. Mechanism of the reaction between aromatic (top) and aliphatic (middle)halides and glutathione. Structure of mercapturic acid (bottom).
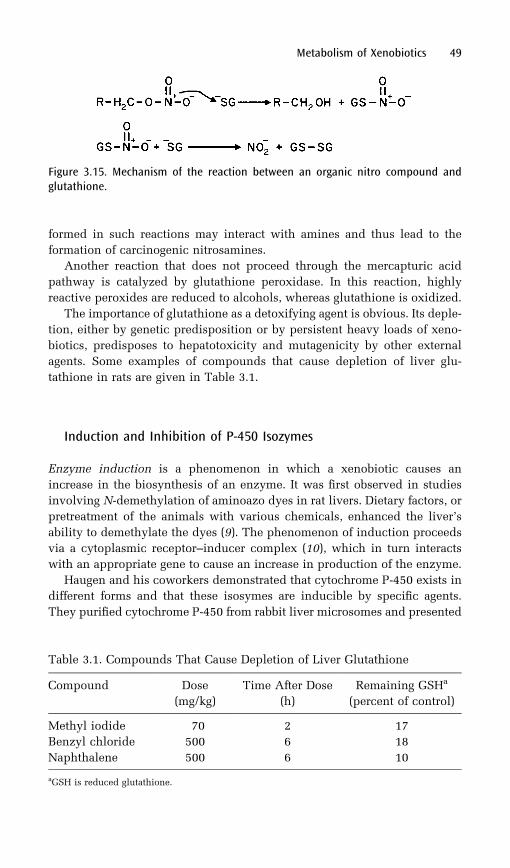
formed in such reactions may interact with amines and thus lead to the
formation of carcinogenic nitrosamines.
Another reaction that does not proceed through the mercapturic acid
pathway is catalyzed by glutathione peroxidase. In this reaction, highly
reactive peroxides are reduced to alcohols, whereas glutathione is oxidized.
The importance of glutathione as a detoxifying agent is obvious. Its deple-
tion, either by genetic predisposition or by persistent heavy loads of xeno-
biotics, predisposes to hepatotoxicity and mutagenicity by other external
agents. Some examples of compounds that cause depletion of liver glu-
tathione in rats are given in Table 3.1.
Induction and Inhibition of P-450 Isozymes
Enzyme induction is a phenomenon in which a xenobiotic causes an
increase in the biosynthesis of an enzyme. It was first observed in studies
involving N-demethylation of aminoazo dyes in rat livers. Dietary factors, or
pretreatment of the animals with various chemicals, enhanced the liver’s
ability to demethylate the dyes (9). The phenomenon of induction proceeds
via a cytoplasmic receptor–inducer complex (10), which in turn interacts
with an appropriate gene to cause an increase in production of the enzyme.
Haugen and his coworkers demonstrated that cytochrome P-450 exists in
different forms and that these isosymes are inducible by specific agents.
They purified cytochrome P-450 from rabbit liver microsomes and presented
Metabolism of Xenobiotics 49
Table 3.1. Compounds That Cause Depletion of Liver Glutathione
Compound Dose
(mg/kg)
Time After Dose
(h)
Remaining GSHa
(percent of control)
Methyl iodide 70 2 17
Benzyl chloride 500 6 18
Naphthalene 500 6 10
aGSH is reduced glutathione.
Figure 3.15. Mechanism of the reaction between an organic nitro compound andglutathione.
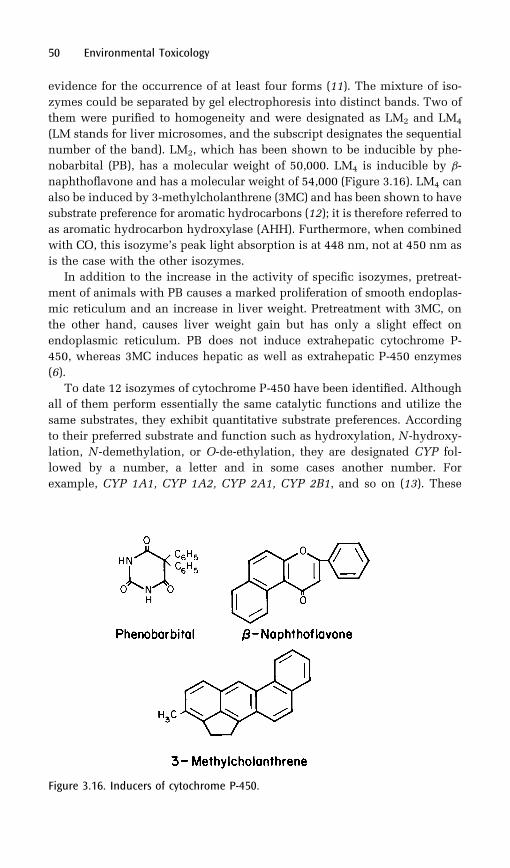
evidence for the occurrence of at least four forms (11). The mixture of iso-
zymes could be separated by gel electrophoresis into distinct bands. Two of
them were purified to homogeneity and were designated as LM2 and LM4
(LM stands for liver microsomes, and the subscript designates the sequential
number of the band). LM2, which has been shown to be inducible by phe-
nobarbital (PB), has a molecular weight of 50,000. LM4 is inducible by �-
naphthoflavone and has a molecular weight of 54,000 (Figure 3.16). LM4 can
also be induced by 3-methylcholanthrene (3MC) and has been shown to have
substrate preference for aromatic hydrocarbons (12); it is therefore referred to
as aromatic hydrocarbon hydroxylase (AHH). Furthermore, when combined
with CO, this isozyme’s peak light absorption is at 448 nm, not at 450 nm as
is the case with the other isozymes.
In addition to the increase in the activity of specific isozymes, pretreat-
ment of animals with PB causes a marked proliferation of smooth endoplas-
mic reticulum and an increase in liver weight. Pretreatment with 3MC, on
the other hand, causes liver weight gain but has only a slight effect on
endoplasmic reticulum. PB does not induce extrahepatic cytochrome P-
450, whereas 3MC induces hepatic as well as extrahepatic P-450 enzymes
(6).
To date 12 isozymes of cytochrome P-450 have been identified. Although
all of them perform essentially the same catalytic functions and utilize the
same substrates, they exhibit quantitative substrate preferences. According
to their preferred substrate and function such as hydroxylation, N -hydroxy-
lation, N -demethylation, or O-de-ethylation, they are designated CYP fol-
lowed by a number, a letter and in some cases another number. For
example, CYP 1A1, CYP 1A2, CYP 2A1, CYP 2B1, and so on (13). These
50 Environmental Toxicology
Figure 3.16. Inducers of cytochrome P-450.
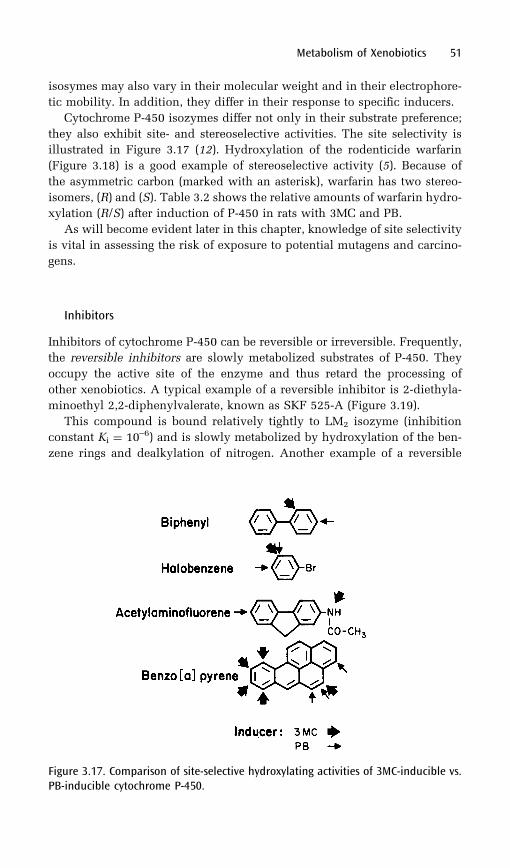
isosymes may also vary in their molecular weight and in their electrophore-
tic mobility. In addition, they differ in their response to specific inducers.
Cytochrome P-450 isozymes differ not only in their substrate preference;
they also exhibit site- and stereoselective activities. The site selectivity is
illustrated in Figure 3.17 (12). Hydroxylation of the rodenticide warfarin
(Figure 3.18) is a good example of stereoselective activity (5). Because of
the asymmetric carbon (marked with an asterisk), warfarin has two stereo-
isomers, (R) and (S). Table 3.2 shows the relative amounts of warfarin hydro-
xylation (R/S) after induction of P-450 in rats with 3MC and PB.
As will become evident later in this chapter, knowledge of site selectivity
is vital in assessing the risk of exposure to potential mutagens and carcino-
gens.
Inhibitors
Inhibitors of cytochrome P-450 can be reversible or irreversible. Frequently,
the reversible inhibitors are slowly metabolized substrates of P-450. They
occupy the active site of the enzyme and thus retard the processing of
other xenobiotics. A typical example of a reversible inhibitor is 2-diethyla-
minoethyl 2,2-diphenylvalerate, known as SKF 525-A (Figure 3.19).
This compound is bound relatively tightly to LM2 isozyme (inhibition
constant Ki ¼ 10–6) and is slowly metabolized by hydroxylation of the ben-
zene rings and dealkylation of nitrogen. Another example of a reversible
Metabolism of Xenobiotics 51
Figure 3.17. Comparison of site-selective hydroxylating activities of 3MC-inducible vs.PB-inducible cytochrome P-450.
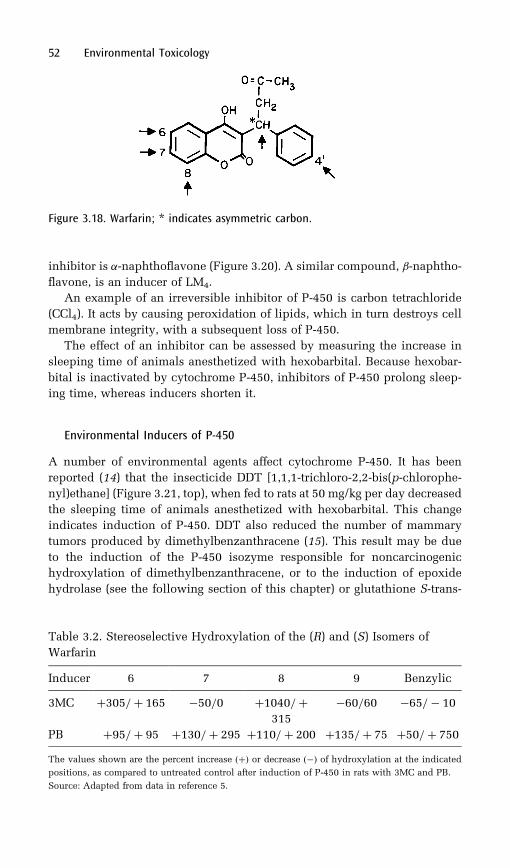
inhibitor is �-naphthoflavone (Figure 3.20). A similar compound, �-naphtho-
flavone, is an inducer of LM4.
An example of an irreversible inhibitor of P-450 is carbon tetrachloride
(CCl4). It acts by causing peroxidation of lipids, which in turn destroys cell
membrane integrity, with a subsequent loss of P-450.
The effect of an inhibitor can be assessed by measuring the increase in
sleeping time of animals anesthetized with hexobarbital. Because hexobar-
bital is inactivated by cytochrome P-450, inhibitors of P-450 prolong sleep-
ing time, whereas inducers shorten it.
Environmental Inducers of P-450
A number of environmental agents affect cytochrome P-450. It has been
reported (14) that the insecticide DDT [1,1,1-trichloro-2,2-bis(p-chlorophe-
nyl)ethane] (Figure 3.21, top), when fed to rats at 50 mg/kg per day decreased
the sleeping time of animals anesthetized with hexobarbital. This change
indicates induction of P-450. DDT also reduced the number of mammary
tumors produced by dimethylbenzanthracene (15). This result may be due
to the induction of the P-450 isozyme responsible for noncarcinogenic
hydroxylation of dimethylbenzanthracene, or to the induction of epoxide
hydrolase (see the following section of this chapter) or glutathione S-trans-
52 Environmental Toxicology
Figure 3.18. Warfarin; * indicates asymmetric carbon.
Table 3.2. Stereoselective Hydroxylation of the (R) and (S) Isomers of
Warfarin
Inducer 6 7 8 9 Benzylic
3MC þ305=þ 165 �50=0 þ1040=þ315
�60=60 �65=� 10
PB þ95=þ 95 þ130=þ 295 þ110=þ 200 þ135=þ 75 þ50=þ 750
The values shown are the percent increase ðþÞ or decrease ð�Þ of hydroxylation at the indicated
positions, as compared to untreated control after induction of P-450 in rats with 3MC and PB.
Source: Adapted from data in reference 5.
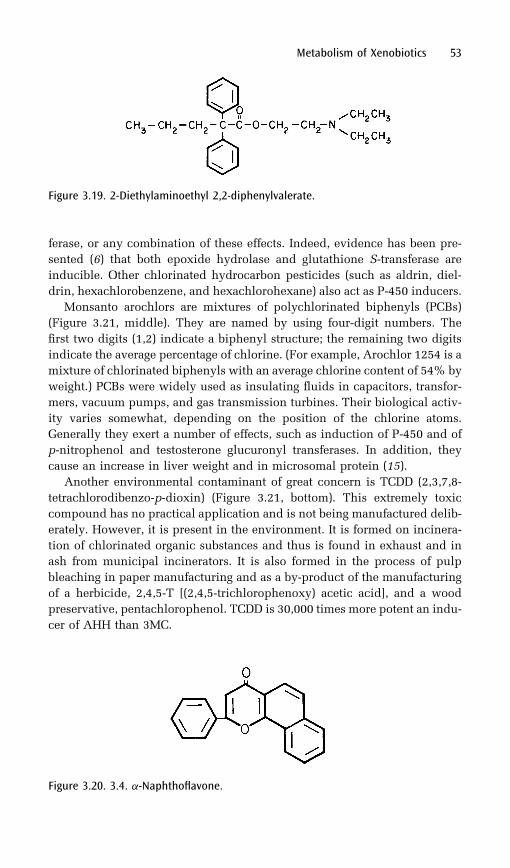
ferase, or any combination of these effects. Indeed, evidence has been pre-
sented (6) that both epoxide hydrolase and glutathione S-transferase are
inducible. Other chlorinated hydrocarbon pesticides (such as aldrin, diel-
drin, hexachlorobenzene, and hexachlorohexane) also act as P-450 inducers.
Monsanto arochlors are mixtures of polychlorinated biphenyls (PCBs)
(Figure 3.21, middle). They are named by using four-digit numbers. The
first two digits (1,2) indicate a biphenyl structure; the remaining two digits
indicate the average percentage of chlorine. (For example, Arochlor 1254 is a
mixture of chlorinated biphenyls with an average chlorine content of 54% by
weight.) PCBs were widely used as insulating fluids in capacitors, transfor-
mers, vacuum pumps, and gas transmission turbines. Their biological activ-
ity varies somewhat, depending on the position of the chlorine atoms.
Generally they exert a number of effects, such as induction of P-450 and of
p-nitrophenol and testosterone glucuronyl transferases. In addition, they
cause an increase in liver weight and in microsomal protein (15).
Another environmental contaminant of great concern is TCDD (2,3,7,8-
tetrachlorodibenzo-p-dioxin) (Figure 3.21, bottom). This extremely toxic
compound has no practical application and is not being manufactured delib-
erately. However, it is present in the environment. It is formed on incinera-
tion of chlorinated organic substances and thus is found in exhaust and in
ash from municipal incinerators. It is also formed in the process of pulp
bleaching in paper manufacturing and as a by-product of the manufacturing
of a herbicide, 2,4,5-T [(2,4,5-trichlorophenoxy) acetic acid], and a wood
preservative, pentachlorophenol. TCDD is 30,000 times more potent an indu-
cer of AHH than 3MC.
Metabolism of Xenobiotics 53
Figure 3.19. 2-Diethylaminoethyl 2,2-diphenylvalerate.
Figure 3.20. 3.4. �-Naphthoflavone.

The inducers discussed so far are specific for cytochrome P-450 isozymes,
although some of them may also have inducing activity for other xenobiotics’
metabolizing enzymes. Inducers specific for phase 2 metabolizing enzymes
occur in cruciferous vegetables (broccoli, cauliflower, mustard, cress, and
other cabbage-related plants). They specifically induce glutathione S-trans-
ferases and quinone reductase. One representative of this class has been
isolated from broccoli and identified as (–)-1-isothiocyanato-(4R)-(methylsul-
finyl)butane, which is known as sulforaphane (Figure 3.22) (16).
Because a diet rich in green and yellow vegetables lowers the risk of
cancer in humans (16), it is assumed that this protection against cancer is
due to the induction of phase 2 enzymes that detoxify the carcinogens. The
role of glutathione and of glutathione S-transferases as detoxifying agents has
been discussed. It will be shown in the following section that one pathway of
carcinogenic activation of benzo[a]pyrene involves the formation of qui-
nones. Thus, quinone reductase may prevent this pathway of activation.
Activation of Precarcinogens
As mentioned earlier, in some cases the metabolism of xenobiotics leads to
the formation of unstable intermediates that react with cellular macromole-
54 Environmental Toxicology
Figure 3.21. Structures of DTT, biphenyl, and tetrachlorodibenzo-p-dioxin.
Figure 3.22. Sulforaphane.

cules. This reaction leads to mutagenic or carcinogenic transformation. In
the following pages, activation of the most typical precarcinogens will be
discussed.
2-Naphthylamine, a compound used in dye manufacturing, has been
found to produce bladder cancer among workers employed in dye manufac-
turing. Injected 2-naphthylamine and other aromatic amines do not produce
tumors at the site of injection. Rather, they produce tumors in distant organs
such as the liver and urinary bladder. The tumor location indicates that these
chemicals are not carcinogens per se, but that metabolism of the chemical is
required to produce the carcinogenic insult (17). It was proposed (4) that 2-
naphthylamine becomes a carcinogen upon N-hydroxylation by cytochrome
P-450. When the hydroxylamine is stabilized by conjugation with glucuro-
nide, it becomes harmless. However, the conjugated compound can be
hydrolyzed back to the carcinogenic hydroxylamine, either by the action
of �-glucuronidase in the kidney or by acidic pH in the urine (Figure 3.23).
Aminofluorene was developed as an insecticide. However, because of its
carcinogenicity it was not released for commercial application. This com-
pound is acetylated, N-hydroxylated, and subsequently conjugated with sul-
fate, which is unstable and breaks down to a powerful electrophile (Figure
3.24) (7).
Dichloroethane is a waste product of vinyl chloride production and also a
laboratory solvent. Its analog, dibromoethane, is used as a gasoline additive
and as an insecticide. Both are carcinogens and mutagens. They may be
metabolized by conjugation with glutathione to produce haloethyl-S-glu-
tathione, a compound structurally similar to sulfur mustard, which was
used as a war gas during World War I (Yperite). Haloethyl-S-glutathione
acts by spontaneous formation of an unstable three-member ring that,
upon ring opening, reacts with cellular macromolecules (Figure 3.25) (18).
Metabolism of Xenobiotics 55
Figure 3.23. Carcinogenic activation of 2-naphthylamine.
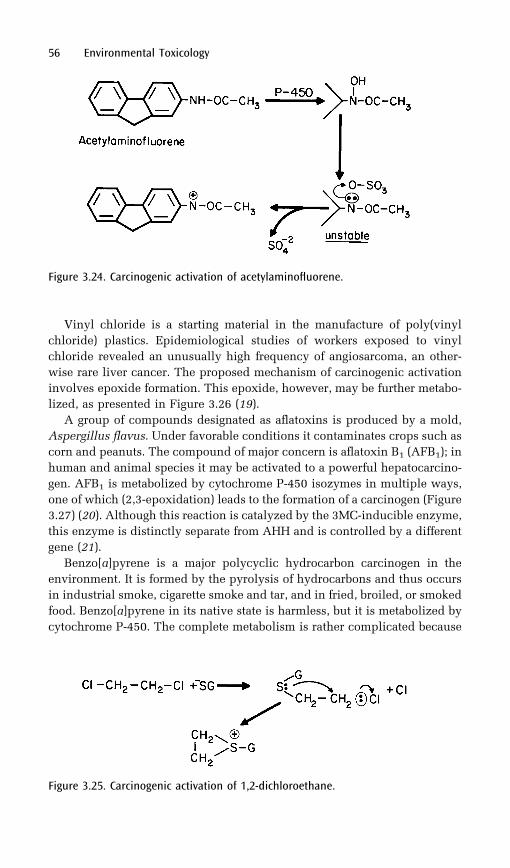
Vinyl chloride is a starting material in the manufacture of poly(vinyl
chloride) plastics. Epidemiological studies of workers exposed to vinyl
chloride revealed an unusually high frequency of angiosarcoma, an other-
wise rare liver cancer. The proposed mechanism of carcinogenic activation
involves epoxide formation. This epoxide, however, may be further metabo-
lized, as presented in Figure 3.26 (19).
A group of compounds designated as aflatoxins is produced by a mold,
Aspergillus flavus. Under favorable conditions it contaminates crops such as
corn and peanuts. The compound of major concern is aflatoxin B1 (AFB1); in
human and animal species it may be activated to a powerful hepatocarcino-
gen. AFB1 is metabolized by cytochrome P-450 isozymes in multiple ways,
one of which (2,3-epoxidation) leads to the formation of a carcinogen (Figure
3.27) (20). Although this reaction is catalyzed by the 3MC-inducible enzyme,
this enzyme is distinctly separate from AHH and is controlled by a different
gene (21).
Benzo[a]pyrene is a major polycyclic hydrocarbon carcinogen in the
environment. It is formed by the pyrolysis of hydrocarbons and thus occurs
in industrial smoke, cigarette smoke and tar, and in fried, broiled, or smoked
food. Benzo[a]pyrene in its native state is harmless, but it is metabolized by
cytochrome P-450. The complete metabolism is rather complicated because
56 Environmental Toxicology
Figure 3.24. Carcinogenic activation of acetylaminofluorene.
Figure 3.25. Carcinogenic activation of 1,2-dichloroethane.
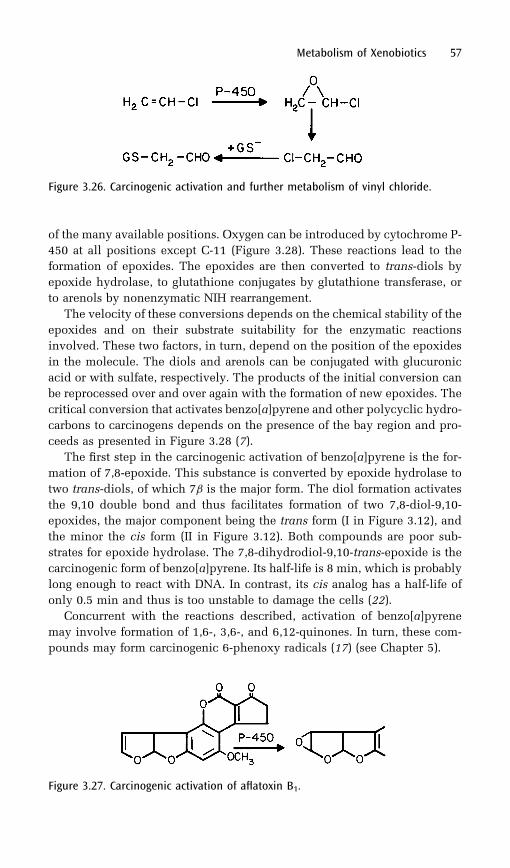
of the many available positions. Oxygen can be introduced by cytochrome P-
450 at all positions except C-11 (Figure 3.28). These reactions lead to the
formation of epoxides. The epoxides are then converted to trans-diols by
epoxide hydrolase, to glutathione conjugates by glutathione transferase, or
to arenols by nonenzymatic NIH rearrangement.
The velocity of these conversions depends on the chemical stability of the
epoxides and on their substrate suitability for the enzymatic reactions
involved. These two factors, in turn, depend on the position of the epoxides
in the molecule. The diols and arenols can be conjugated with glucuronic
acid or with sulfate, respectively. The products of the initial conversion can
be reprocessed over and over again with the formation of new epoxides. The
critical conversion that activates benzo[a]pyrene and other polycyclic hydro-
carbons to carcinogens depends on the presence of the bay region and pro-
ceeds as presented in Figure 3.28 (7).
The first step in the carcinogenic activation of benzo[a]pyrene is the for-
mation of 7,8-epoxide. This substance is converted by epoxide hydrolase to
two trans-diols, of which 7� is the major form. The diol formation activates
the 9,10 double bond and thus facilitates formation of two 7,8-diol-9,10-
epoxides, the major component being the trans form (I in Figure 3.12), and
the minor the cis form (II in Figure 3.12). Both compounds are poor sub-
strates for epoxide hydrolase. The 7,8-dihydrodiol-9,10-trans-epoxide is the
carcinogenic form of benzo[a]pyrene. Its half-life is 8 min, which is probably
long enough to react with DNA. In contrast, its cis analog has a half-life of
only 0.5 min and thus is too unstable to damage the cells (22).
Concurrent with the reactions described, activation of benzo[a]pyrene
may involve formation of 1,6-, 3,6-, and 6,12-quinones. In turn, these com-
pounds may form carcinogenic 6-phenoxy radicals (17) (see Chapter 5).
Metabolism of Xenobiotics 57
Figure 3.26. Carcinogenic activation and further metabolism of vinyl chloride.
Figure 3.27. Carcinogenic activation of aflatoxin B1.
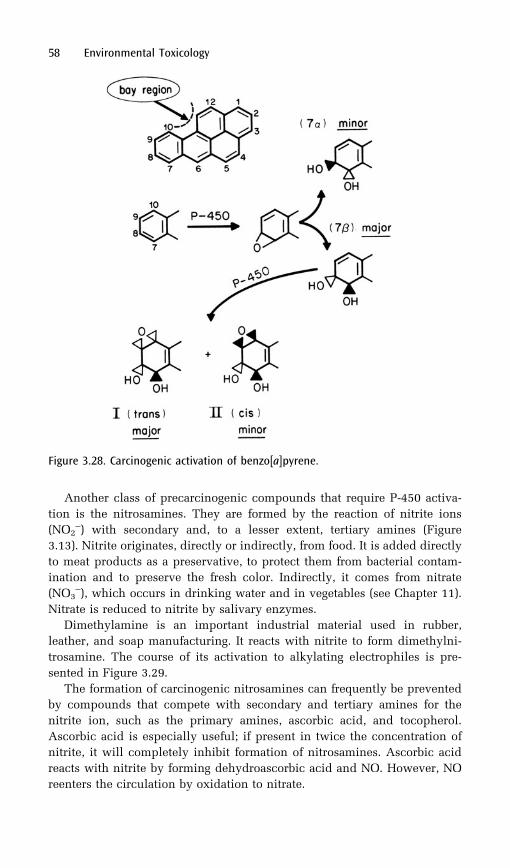
Another class of precarcinogenic compounds that require P-450 activa-
tion is the nitrosamines. They are formed by the reaction of nitrite ions
(NO2–) with secondary and, to a lesser extent, tertiary amines (Figure
3.13). Nitrite originates, directly or indirectly, from food. It is added directly
to meat products as a preservative, to protect them from bacterial contam-
ination and to preserve the fresh color. Indirectly, it comes from nitrate
(NO3–), which occurs in drinking water and in vegetables (see Chapter 11).
Nitrate is reduced to nitrite by salivary enzymes.
Dimethylamine is an important industrial material used in rubber,
leather, and soap manufacturing. It reacts with nitrite to form dimethylni-
trosamine. The course of its activation to alkylating electrophiles is pre-
sented in Figure 3.29.
The formation of carcinogenic nitrosamines can frequently be prevented
by compounds that compete with secondary and tertiary amines for the
nitrite ion, such as the primary amines, ascorbic acid, and tocopherol.
Ascorbic acid is especially useful; if present in twice the concentration of
nitrite, it will completely inhibit formation of nitrosamines. Ascorbic acid
reacts with nitrite by forming dehydroascorbic acid and NO. However, NO
reenters the circulation by oxidation to nitrate.
58 Environmental Toxicology
Figure 3.28. Carcinogenic activation of benzo[a]pyrene.
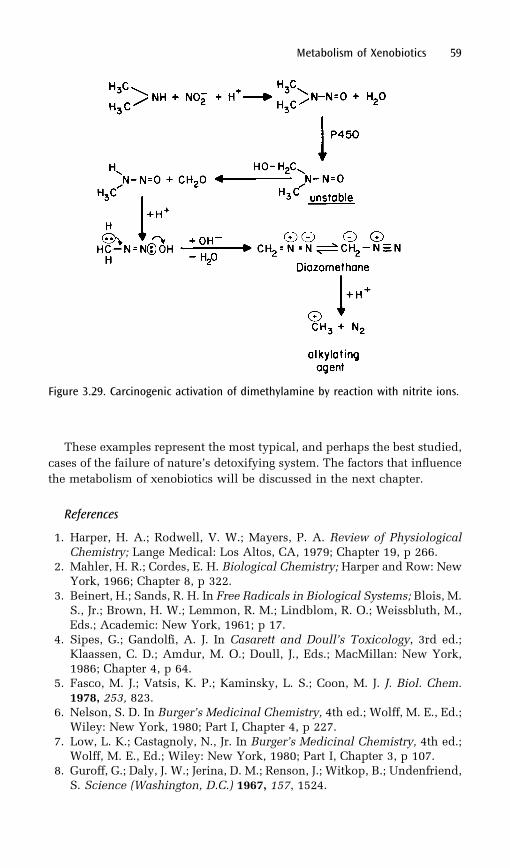
These examples represent the most typical, and perhaps the best studied,
cases of the failure of nature’s detoxifying system. The factors that influence
the metabolism of xenobiotics will be discussed in the next chapter.
References
1. Harper, H. A.; Rodwell, V. W.; Mayers, P. A. Review of PhysiologicalChemistry; Lange Medical: Los Altos, CA, 1979; Chapter 19, p 266.
2. Mahler, H. R.; Cordes, E. H. Biological Chemistry; Harper and Row: NewYork, 1966; Chapter 8, p 322.
3. Beinert, H.; Sands, R. H. In Free Radicals in Biological Systems; Blois, M.S., Jr.; Brown, H. W.; Lemmon, R. M.; Lindblom, R. O.; Weissbluth, M.,Eds.; Academic: New York, 1961; p 17.
4. Sipes, G.; Gandolfi, A. J. In Casarett and Doull’s Toxicology, 3rd ed.;Klaassen, C. D.; Amdur, M. O.; Doull, J., Eds.; MacMillan: New York,1986; Chapter 4, p 64.
5. Fasco, M. J.; Vatsis, K. P.; Kaminsky, L. S.; Coon, M. J. J. Biol. Chem.1978, 253, 823.
6. Nelson, S. D. In Burger’s Medicinal Chemistry, 4th ed.; Wolff, M. E., Ed.;Wiley: New York, 1980; Part I, Chapter 4, p 227.
7. Low, L. K.; Castagnoly, N., Jr. In Burger’s Medicinal Chemistry, 4th ed.;Wolff, M. E., Ed.; Wiley: New York, 1980; Part I, Chapter 3, p 107.
8. Guroff, G.; Daly, J. W.; Jerina, D. M.; Renson, J.; Witkop, B.; Undenfriend,S. Science (Washington, D.C.) 1967, 157, 1524.
Metabolism of Xenobiotics 59
Figure 3.29. Carcinogenic activation of dimethylamine by reaction with nitrite ions.
9. Brown, R. R.; Miller, J. A.; Miller, E. C. J. Biol. Chem. 1954, 209, 211.10. Poland, A.; Glover, E.; Kende, A. S. J. Biol. Chem. 1976, 251, 4936.11. Haugen, D. A.; van der Hoeven, T. A.; Coon, M. J. J. Biol. Chem. 1975,
250, 3567.12. Conney, A. H.; Lu, A. Y. H.; Levin, W.; West, S.; Smogyi, A.; Jacobson,
M.; Ryan, D.; Kunzman, R. Drug Metab. Dispos. 1973, 1, 1.13. Parkinson, A.; In Casarett and Doull’s Toxicology, 5th ed.; Klaassen, C.
D.; Ed.; McGraw-Hill Companies: New York, 1996; Chapter 6, p 113.14. Okey, A. B. Life Sci. 1972, 11, 833.15. Goldstein, J. A.; McKinney, J. D.; Lucier, G. W.; Hickman, P.; Bergman,
H.; Moore, J. A. Toxicol. Appl. Pharmacol. 1976, 36, 81.16. Yuesheng, Z.; Talalay, P.; Cheon-Gyu, Cho.; Posner, G. H. Proc. Natl.
Acad. Sci. U.S.A. 1992, 89, 2399.17. Selkirk, J. K. In Burger’s Medicinal Chemistry, 4th ed.; Wolff, M. E., Ed.;
Wiley: New York, 1980; Part I, Chapter 12, p 455.18. Williams, G. M.; Weisburger, J. H. In Casarett and Doull’s Toxicology,
3rd ed.; Klaassen, C. D.; Amdur, M. O.; Doull, J., Eds.; MacMillan: NewYork, 1986; Chapter 5, p 99.
19. Andrews, L. S.; Snyder, R. In Casarett and Doull’s Toxicology, 3rd ed.;Klaassen, C. D.; Amdur, M. O.; Doull, J., Eds.; MacMillan: New York,1986; Chapter 20, p 636.
20. Hayes, J. R.; Campbell, T. C. In Casarett and Doull’s Toxicology, 3rd ed.;Klaassen, C. D.; Amdur, M. O.; Doull, J., Eds.; MacMillan: New York,1986; Chapter 24, p 771.
21. Koser, P. L.; Faletto, M. B.; Maccubbin, A. E.; Gurtoo, H. J. Biol. Chem.1988, 263, 12584.
22. Walsh, C. Lecture notes on metabolic processing of drugs, toxins, andother xenobiotics, presented in MIT Course 20.610, 1979, ‘‘Principles ofToxicology.’’
60 Environmental Toxicology
4Factors That Influence Toxicity
Selective Toxicity
The more species are removed from each other in evolutionary development,
the greater is the likelihood of differences in response to toxic agents. One
obvious difference that affects toxicity is the size of the organisms. Much less
toxin is needed to kill a small insect than a considerably larger mammal
(everything else being equal). In addition, there is an inverse relationship
between the weight of an animal and its surface area; the smaller the animal,
the larger its surface area per gram of weight.
Thus, the weight ratio of a human being (70 kg) to a rat (200 g) is 350, but
the surface area ratio of a human being to a rat is only 55. Roughly, the
surface area of an animal (S) can be calculated as follows: S(m2) ¼ weight
(kg)2/3/10. This type of calculation is important when one is considering the
selective eradication of an uneconomical species, such as certain insects, by
spraying an area with insecticide. The goal is to control the insects without
harming wildlife, livestock, and human beings.
Other factors, such as the rate of percutaneous absorption, also have to be
considered. For instance, it has been shown that DDT (dichlorodiphenyltri-
chloroethane) is about equally toxic to insects and mammals when given by
injection, yet when applied externally it is considerably more toxic to
insects. This toxicity is due not only to the difference of the surface area:-
body weight ratio, but also to the fact that the chitinous exoskeleton of the
insect is more permeable to DDT than unprotected mammalian skin (1). Of
course, in real-life situations (i.e., outside the laboratory), most mammalian
skin is covered by fur, which gives the animals additional protection.
61
The foregoing discussion is not meant to imply that unrestricted spraying
with pesticides (especially chlorinated hydrocarbons, which are fat-soluble
and poorly biodegradable) is environmentally sound. Problems with their
use include lack of selectivity among insect species; leaching into water-
sheds and groundwater; and bioaccumulation in the food chain. These pro-
blems will be discussed in detail in Chapter 11.
Metabolic Pathways
Metabolic-pathway differences among species may provide another rationale
for achieving selective toxicity. A good example of this type of selectivity is
the chemotherapeutic use of sulfonamides. Human beings and, as far as we
know, most vertebrates require an exogenous supply of folic acid. Folic acid
is converted in the organism to tetrahydrofolic acid, an important cofactor
involved in the de novo biosynthesis of purine and pyrimidine nucleotides.
Certain gram-negative bacteria, on the other hand, are unable to assimilate
preformed folic acid. Instead, they have the capacity to synthesize a precur-
sor of tetrahydrofolic acid (namely, dihydropteroic acid) from 6-hydroxy-
methyl-7,8-dihydropteridine and p-aminobenzoic acid (Figure 4.1) (2).
Sulfonamides, because of their structural similarity to p-aminobenzoic
acid (see Figure 2.10 in Chapter 2), inhibit this reaction (3). Thus, these
bacteria are deprived of tetrahydrofolic acid cofactors. In turn, this depriva-
tion results in bacterial-growth inhibition. Humans are not affected because
they are not capable of carrying on this synthetic reaction.
Although sulfonamides have toxic side effects in humans, this toxicity is
not related to their biochemical mode of action. Instead, their low solubility
in urine makes them tend to precipitate in the kidney.
Enzyme Activity
In some cases metabolic pathways may be the same for several species, but
the enzymes that carry out certain reactions may differ. Hitchings and
Burchall (4) compared the inhibitory activity of two compounds toward
the enzyme dihydrofolate reductase (see Figure 4.1) obtained from different
species. The results of this experiment are summarized in Table 4.1.
The high sensitivity of the enzyme from the two bacterial strains to tri-
methoprim and its lack of sensitivity to pyrimethamine, as compared to the
relative insensitivity of the mammalian enzymes to both compounds, are
evident. Even so, pyrimethamine is not selective for bacteria; it was found
to be effective against plasmodia, the parasites that cause malaria.
Trimethoprim is used selectively against bacterial infections. The structures
of both compounds are presented in Figure 4.2.
62 Environmental Toxicology
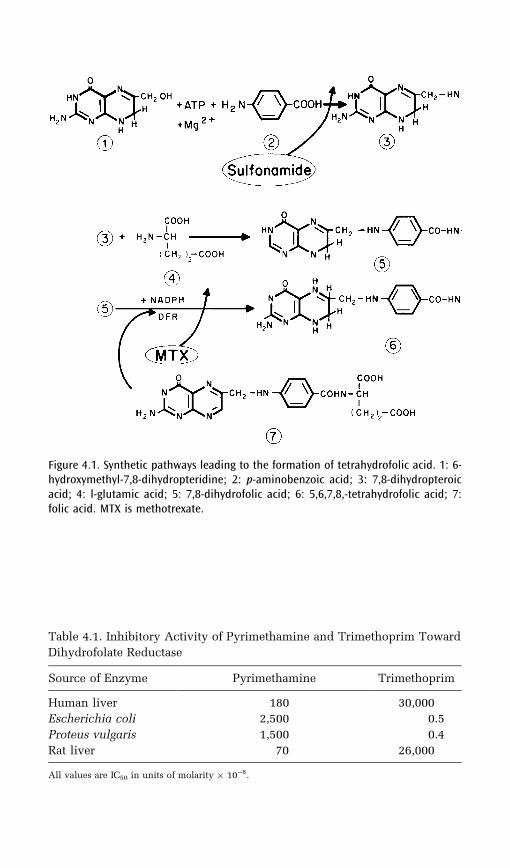
Figure 4.1. Synthetic pathways leading to the formation of tetrahydrofolic acid. 1: 6-hydroxymethyl-7,8-dihydropteridine; 2: p-aminobenzoic acid; 3: 7,8-dihydropteroicacid; 4: l-glutamic acid; 5: 7,8-dihydrofolic acid; 6: 5,6,7,8,-tetrahydrofolic acid; 7:folic acid. MTX is methotrexate.
Table 4.1. Inhibitory Activity of Pyrimethamine and Trimethoprim Toward
Dihydrofolate Reductase
Source of Enzyme Pyrimethamine Trimethoprim
Human liver 180 30,000
Escherichia coli 2,500 0.5
Proteus vulgaris 1,500 0.4
Rat liver 70 26,000
All values are IC50 in units of molarity � 10�8.
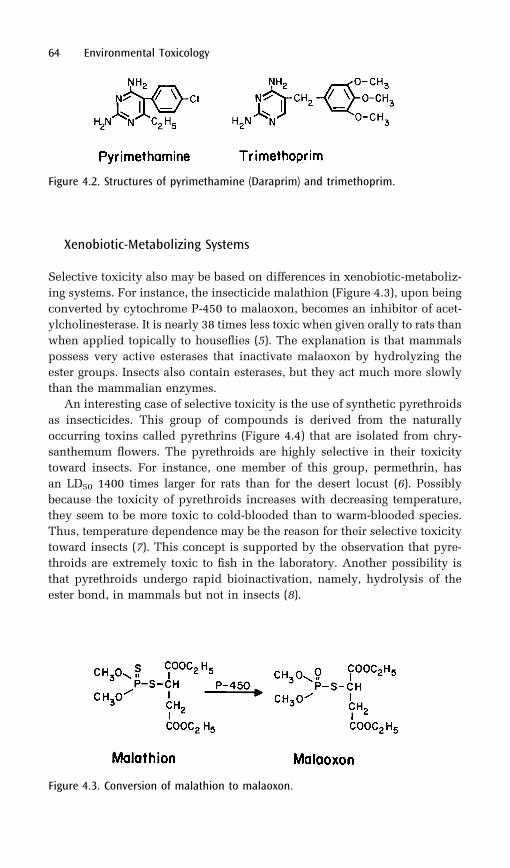
Xenobiotic-Metabolizing Systems
Selective toxicity also may be based on differences in xenobiotic-metaboliz-
ing systems. For instance, the insecticide malathion (Figure 4.3), upon being
converted by cytochrome P-450 to malaoxon, becomes an inhibitor of acet-
ylcholinesterase. It is nearly 38 times less toxic when given orally to rats than
when applied topically to houseflies (5). The explanation is that mammals
possess very active esterases that inactivate malaoxon by hydrolyzing the
ester groups. Insects also contain esterases, but they act much more slowly
than the mammalian enzymes.
An interesting case of selective toxicity is the use of synthetic pyrethroids
as insecticides. This group of compounds is derived from the naturally
occurring toxins called pyrethrins (Figure 4.4) that are isolated from chry-
santhemum flowers. The pyrethroids are highly selective in their toxicity
toward insects. For instance, one member of this group, permethrin, has
an LD50 1400 times larger for rats than for the desert locust (6). Possibly
because the toxicity of pyrethroids increases with decreasing temperature,
they seem to be more toxic to cold-blooded than to warm-blooded species.
Thus, temperature dependence may be the reason for their selective toxicity
toward insects (7). This concept is supported by the observation that pyre-
throids are extremely toxic to fish in the laboratory. Another possibility is
that pyrethroids undergo rapid bioinactivation, namely, hydrolysis of the
ester bond, in mammals but not in insects (8).
64 Environmental Toxicology
Figure 4.2. Structures of pyrimethamine (Daraprim) and trimethoprim.
Figure 4.3. Conversion of malathion to malaoxon.
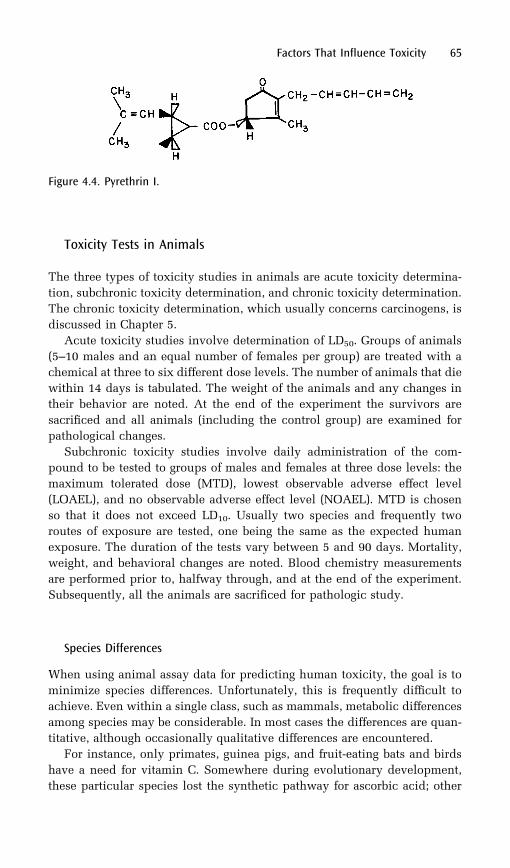
Toxicity Tests in Animals
The three types of toxicity studies in animals are acute toxicity determina-
tion, subchronic toxicity determination, and chronic toxicity determination.
The chronic toxicity determination, which usually concerns carcinogens, is
discussed in Chapter 5.
Acute toxicity studies involve determination of LD50. Groups of animals
(5–10 males and an equal number of females per group) are treated with a
chemical at three to six different dose levels. The number of animals that die
within 14 days is tabulated. The weight of the animals and any changes in
their behavior are noted. At the end of the experiment the survivors are
sacrificed and all animals (including the control group) are examined for
pathological changes.
Subchronic toxicity studies involve daily administration of the com-
pound to be tested to groups of males and females at three dose levels: the
maximum tolerated dose (MTD), lowest observable adverse effect level
(LOAEL), and no observable adverse effect level (NOAEL). MTD is chosen
so that it does not exceed LD10. Usually two species and frequently two
routes of exposure are tested, one being the same as the expected human
exposure. The duration of the tests vary between 5 and 90 days. Mortality,
weight, and behavioral changes are noted. Blood chemistry measurements
are performed prior to, halfway through, and at the end of the experiment.
Subsequently, all the animals are sacrificed for pathologic study.
Species Differences
When using animal assay data for predicting human toxicity, the goal is to
minimize species differences. Unfortunately, this is frequently difficult to
achieve. Even within a single class, such as mammals, metabolic differences
among species may be considerable. In most cases the differences are quan-
titative, although occasionally qualitative differences are encountered.
For instance, only primates, guinea pigs, and fruit-eating bats and birds
have a need for vitamin C. Somewhere during evolutionary development,
these particular species lost the synthetic pathway for ascorbic acid; other
Factors That Influence Toxicity 65
Figure 4.4. Pyrethrin I.
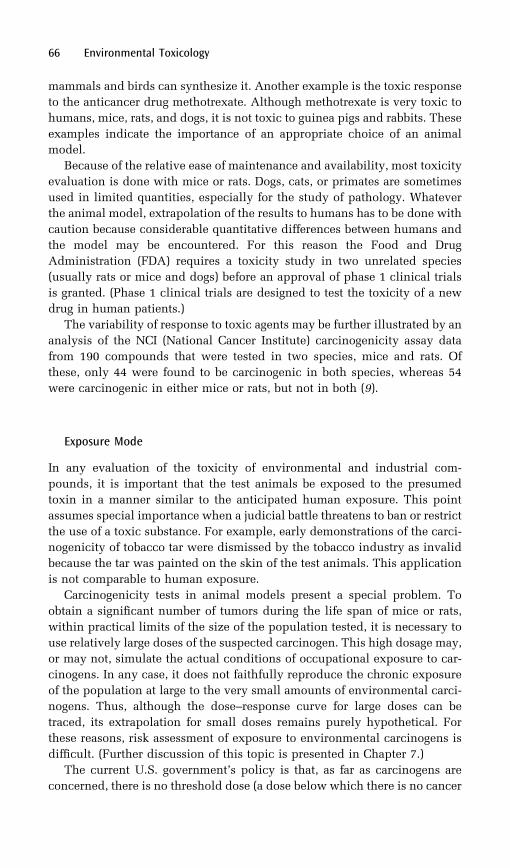
mammals and birds can synthesize it. Another example is the toxic response
to the anticancer drug methotrexate. Although methotrexate is very toxic to
humans, mice, rats, and dogs, it is not toxic to guinea pigs and rabbits. These
examples indicate the importance of an appropriate choice of an animal
model.
Because of the relative ease of maintenance and availability, most toxicity
evaluation is done with mice or rats. Dogs, cats, or primates are sometimes
used in limited quantities, especially for the study of pathology. Whatever
the animal model, extrapolation of the results to humans has to be done with
caution because considerable quantitative differences between humans and
the model may be encountered. For this reason the Food and Drug
Administration (FDA) requires a toxicity study in two unrelated species
(usually rats or mice and dogs) before an approval of phase 1 clinical trials
is granted. (Phase 1 clinical trials are designed to test the toxicity of a new
drug in human patients.)
The variability of response to toxic agents may be further illustrated by an
analysis of the NCI (National Cancer Institute) carcinogenicity assay data
from 190 compounds that were tested in two species, mice and rats. Of
these, only 44 were found to be carcinogenic in both species, whereas 54
were carcinogenic in either mice or rats, but not in both (9).
Exposure Mode
In any evaluation of the toxicity of environmental and industrial com-
pounds, it is important that the test animals be exposed to the presumed
toxin in a manner similar to the anticipated human exposure. This point
assumes special importance when a judicial battle threatens to ban or restrict
the use of a toxic substance. For example, early demonstrations of the carci-
nogenicity of tobacco tar were dismissed by the tobacco industry as invalid
because the tar was painted on the skin of the test animals. This application
is not comparable to human exposure.
Carcinogenicity tests in animal models present a special problem. To
obtain a significant number of tumors during the life span of mice or rats,
within practical limits of the size of the population tested, it is necessary to
use relatively large doses of the suspected carcinogen. This high dosage may,
or may not, simulate the actual conditions of occupational exposure to car-
cinogens. In any case, it does not faithfully reproduce the chronic exposure
of the population at large to the very small amounts of environmental carci-
nogens. Thus, although the dose–response curve for large doses can be
traced, its extrapolation for small doses remains purely hypothetical. For
these reasons, risk assessment of exposure to environmental carcinogens is
difficult. (Further discussion of this topic is presented in Chapter 7.)
The current U.S. government’s policy is that, as far as carcinogens are
concerned, there is no threshold dose (a dose below which there is no cancer
66 Environmental Toxicology
risk); any exposure, no matter how small the dose, is considered to be harm-
ful. In 1958 the U.S. Congress passed an amendment to the Food and
Cosmetic Act of 1938, known as the Delaney Clause, which states: ‘‘no addi-
tive shall be deemed to be safe if it is found to induce cancer when ingested
by man or animal, or if it is found, after tests which are appropriate for the
evaluation of safety of food additives, to induce cancer in man or animal . . .’’
In practical terms the Delaney amendment concerns mainly residues of can-
cer-causing pesticides in processed food. Since early 1993, both the federal
administration and the U.S. Congress began a push for replacement of the
Delaney amendment with risk assessment, that is, allowing residues of car-
cinogenic pesticides in processed food as long as they present negligible risk
only; negligible risk was defined as no more than one additional cancer per
one million people over a 70-year lifetime. The justification for the change of
policy was that modern analytical methods allow detection of much smaller
residues than was possible in 1958 when the Delaney Clause was formu-
lated. Thus, strict application of the Delaney Clause imposed unnecessary
hardship on the agricultural and food-processing industries, without provid-
ing much protection for the public. The revision of the Delaney Clause has
been controversial. The replacement of the Delaney Clause with risk assess-
ment has been supported by the Agricultural Chemical Manufacturers
Association and by the food-processing industry, but has been opposed by
many environmental organizations. In August 1996 the Food Quality
Protection Act was signed into the law. In this act the Delaney Clause was
replaced with a new standard of ‘‘reasonable certainty that no harm will
result from aggregate exposure to the pesticide chemical residue’’ (see
Chapter 15).
The risk assessment of carcinogens and the problems encountered with
pesticides are discussed in more detail in Chapters 7 and 11.
Individual Variations in Response to Xenobiotics
Variations among individuals within a species in response to xenobiotics
may be due to environmental causes, to the genetic makeup of an individual
or a group of individuals, and to the age of the individuals.
Environmental and Endocrine Factors
It has been demonstrated that the metabolism of a xenobiotic may be influ-
enced by diet (see reference 9 in Chapter 3). Another factor may be concur-
rent exposure to other xenobiotics, such as drugs or environmental toxins.
Induction and inhibition of xenobiotic-metabolizing enzymes were dis-
cussed in the preceding chapter. Metabolism of one chemical may be accel-
Factors That Influence Toxicity 67
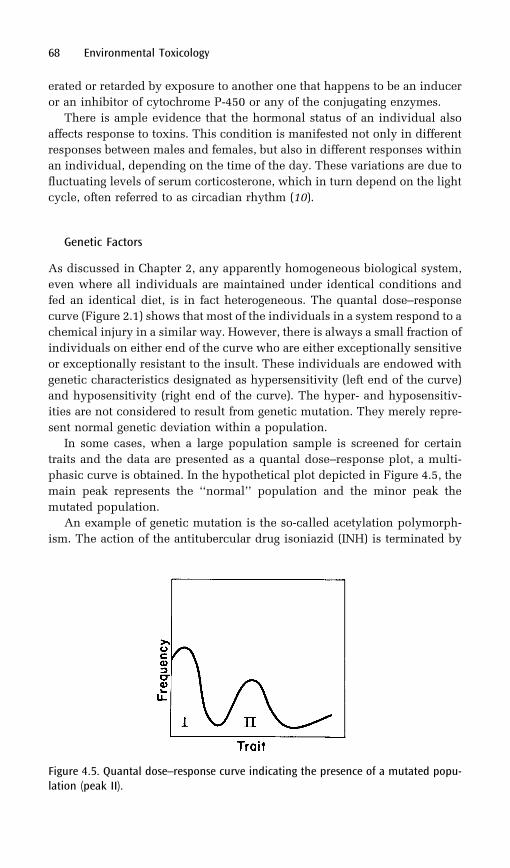
erated or retarded by exposure to another one that happens to be an inducer
or an inhibitor of cytochrome P-450 or any of the conjugating enzymes.
There is ample evidence that the hormonal status of an individual also
affects response to toxins. This condition is manifested not only in different
responses between males and females, but also in different responses within
an individual, depending on the time of the day. These variations are due to
fluctuating levels of serum corticosterone, which in turn depend on the light
cycle, often referred to as circadian rhythm (10).
Genetic Factors
As discussed in Chapter 2, any apparently homogeneous biological system,
even where all individuals are maintained under identical conditions and
fed an identical diet, is in fact heterogeneous. The quantal dose–response
curve (Figure 2.1) shows that most of the individuals in a system respond to a
chemical injury in a similar way. However, there is always a small fraction of
individuals on either end of the curve who are either exceptionally sensitive
or exceptionally resistant to the insult. These individuals are endowed with
genetic characteristics designated as hypersensitivity (left end of the curve)
and hyposensitivity (right end of the curve). The hyper- and hyposensitiv-
ities are not considered to result from genetic mutation. They merely repre-
sent normal genetic deviation within a population.
In some cases, when a large population sample is screened for certain
traits and the data are presented as a quantal dose–response plot, a multi-
phasic curve is obtained. In the hypothetical plot depicted in Figure 4.5, the
main peak represents the ‘‘normal’’ population and the minor peak the
mutated population.
An example of genetic mutation is the so-called acetylation polymorph-
ism. The action of the antitubercular drug isoniazid (INH) is terminated by
68 Environmental Toxicology
Figure 4.5. Quantal dose–response curve indicating the presence of a mutated popu-lation (peak II).
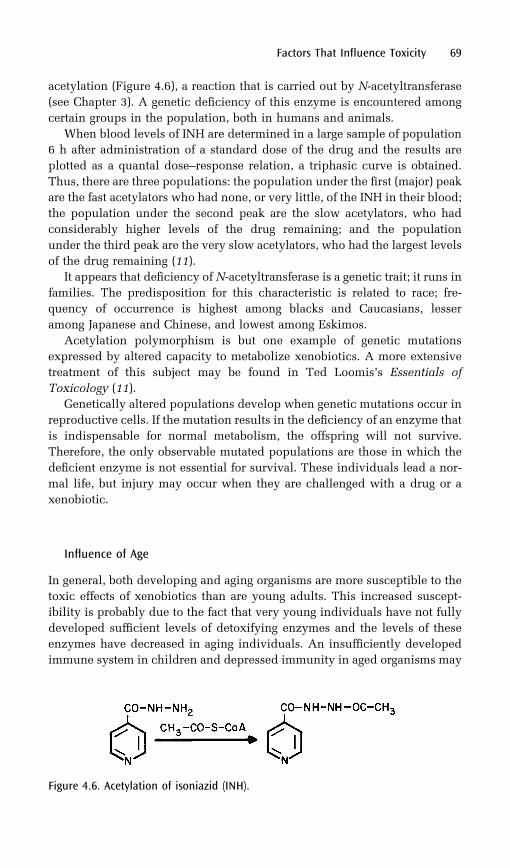
acetylation (Figure 4.6), a reaction that is carried out by N-acetyltransferase
(see Chapter 3). A genetic deficiency of this enzyme is encountered among
certain groups in the population, both in humans and animals.
When blood levels of INH are determined in a large sample of population
6 h after administration of a standard dose of the drug and the results are
plotted as a quantal dose–response relation, a triphasic curve is obtained.
Thus, there are three populations: the population under the first (major) peak
are the fast acetylators who had none, or very little, of the INH in their blood;
the population under the second peak are the slow acetylators, who had
considerably higher levels of the drug remaining; and the population
under the third peak are the very slow acetylators, who had the largest levels
of the drug remaining (11).
It appears that deficiency of N-acetyltransferase is a genetic trait; it runs in
families. The predisposition for this characteristic is related to race; fre-
quency of occurrence is highest among blacks and Caucasians, lesser
among Japanese and Chinese, and lowest among Eskimos.
Acetylation polymorphism is but one example of genetic mutations
expressed by altered capacity to metabolize xenobiotics. A more extensive
treatment of this subject may be found in Ted Loomis’s Essentials of
Toxicology (11).
Genetically altered populations develop when genetic mutations occur in
reproductive cells. If the mutation results in the deficiency of an enzyme that
is indispensable for normal metabolism, the offspring will not survive.
Therefore, the only observable mutated populations are those in which the
deficient enzyme is not essential for survival. These individuals lead a nor-
mal life, but injury may occur when they are challenged with a drug or a
xenobiotic.
Influence of Age
In general, both developing and aging organisms are more susceptible to the
toxic effects of xenobiotics than are young adults. This increased suscept-
ibility is probably due to the fact that very young individuals have not fully
developed sufficient levels of detoxifying enzymes and the levels of these
enzymes have decreased in aging individuals. An insufficiently developed
immune system in children and depressed immunity in aged organisms may
Factors That Influence Toxicity 69
Figure 4.6. Acetylation of isoniazid (INH).
also play a role (see also the section ‘‘Lead Pollution’’ in Chapter 11 and
‘‘Radiosensitivity’’ in Chapter 13.)
References
1. Klaassen, C. D. In Cassarett and Doull’s Toxicology, 3rd ed.; Klaassen, C.D.; Amdur, M. O.; Doull, J., Eds.; MacMillan: New York, 1986; Chapter 3,p 33.
2. Brown, G. M. In Chemistry and Biology of Pteridines; Iwai, K.; Akino, M.;Goto, M.; Iwashami, Y., Eds.; International Academic: Tokyo, Japan,1970.
3. Brown, G. M. J. Biol. Chem. 1962, 237, 536.4. Hitchings, G.; Burchall, J. Mol. Pharmacol. 1965, 1, 126.5. Metcalf, R. L. In Pest Control Strategies for the Future; Agricultural
Board Division of Biology and Agriculture, National Research Council,National Academy of Sciences: Washington, DC, 1972; p 137.
6. Elliot, M. Environ. Health Perspect. 1976, 14, 3.7. Norton, S. In Cassarett and Doull’s Toxicology, 3rd ed.; Klaassen, C. D.;
Amdur, M. O.; Doull, J., Eds.; MacMillan: New York, 1986; Chapter 13, p35.
8. Murphy, S. D. In Cassarett and Doull’s Toxicology, 3rd ed.; Klaassen, C.D.; Amdur, M. O.; Doull, J., Eds.; MacMillan: New York, 1986; Chapter18, p 519.
9. Office of Technology Assessment. Cancer Risk. Assessing and Reducingthe Dangers in Our Society. Summary; Westview: Boulder, CO, 1982; p3.
10. Nelson, S. D. In Burger’s Medicinal Chemistry, 4th ed.; Wolff, M. E., Ed.;Wiley: New York, 1980; Part I, Chapter 4, p 227.
11. Loomis, T. Essentials of Toxicology; Lee & Febiger: Philadelphia, PA,1978; Chapter 6, p 81.
70 Environmental Toxicology
5Chemical Carcinogenesis and Mutagenesis
Environment and Cancer
Cancer is a common name for about 200 diseases characterized by abnormal
cell growth. According to Kundson (1), the causes of cancer may be classified
into the following groups:
1. genetic predisposition2. environmental factors3. environmental factors superimposed on genetic predisposition4. unknown factors
Typical examples of the first group are childhood cancers such as retino-
blastoma (a genetically predisposed malignancy of the retina), neuroblas-
toma (a malignancy of the brain), and Wilms’ tumor (a malignancy of the
kidney). In adults, an example is polyposis of the colon, a genetic condition
that frequently leads to colon cancer.
The third group is represented by xeroderma pigmentosum, a genetic
condition characterized by a deficient DNA excision repair mechanism
(see the discussion later in this chapter). Individuals so predisposed develop
skin cancer when exposed to ultraviolet light. The variable susceptibility of
the population to the carcinogenic effects of cigarette smoke may also reflect
genetic predisposition.
Very little can be said about the fourth group because the causes of this
group of cancers are not known.
Groups 2 and 3 combined (i.e., cancer attributable to environmental
causes, with or without genetic predisposition) probably account for 60–
90% of all cancers (2). The environment, in this context, involves not only
71
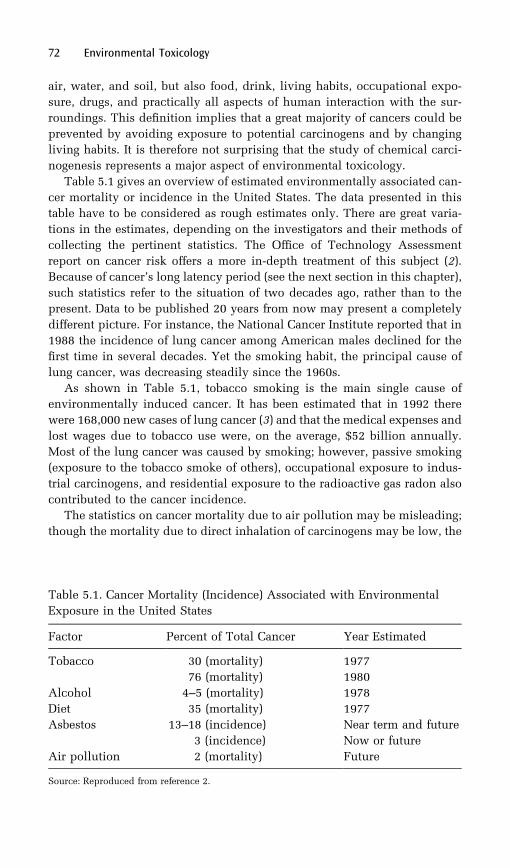
air, water, and soil, but also food, drink, living habits, occupational expo-
sure, drugs, and practically all aspects of human interaction with the sur-
roundings. This definition implies that a great majority of cancers could be
prevented by avoiding exposure to potential carcinogens and by changing
living habits. It is therefore not surprising that the study of chemical carci-
nogenesis represents a major aspect of environmental toxicology.
Table 5.1 gives an overview of estimated environmentally associated can-
cer mortality or incidence in the United States. The data presented in this
table have to be considered as rough estimates only. There are great varia-
tions in the estimates, depending on the investigators and their methods of
collecting the pertinent statistics. The Office of Technology Assessment
report on cancer risk offers a more in-depth treatment of this subject (2).
Because of cancer’s long latency period (see the next section in this chapter),
such statistics refer to the situation of two decades ago, rather than to the
present. Data to be published 20 years from now may present a completely
different picture. For instance, the National Cancer Institute reported that in
1988 the incidence of lung cancer among American males declined for the
first time in several decades. Yet the smoking habit, the principal cause of
lung cancer, was decreasing steadily since the 1960s.
As shown in Table 5.1, tobacco smoking is the main single cause of
environmentally induced cancer. It has been estimated that in 1992 there
were 168,000 new cases of lung cancer (3) and that the medical expenses and
lost wages due to tobacco use were, on the average, $52 billion annually.
Most of the lung cancer was caused by smoking; however, passive smoking
(exposure to the tobacco smoke of others), occupational exposure to indus-
trial carcinogens, and residential exposure to the radioactive gas radon also
contributed to the cancer incidence.
The statistics on cancer mortality due to air pollution may be misleading;
though the mortality due to direct inhalation of carcinogens may be low, the
72 Environmental Toxicology
Table 5.1. Cancer Mortality (Incidence) Associated with Environmental
Exposure in the United States
Factor Percent of Total Cancer Year Estimated
Tobacco 30 (mortality) 1977
76 (mortality) 1980
Alcohol 4–5 (mortality) 1978
Diet 35 (mortality) 1977
Asbestos 13–18 (incidence) Near term and future
3 (incidence) Now or future
Air pollution 2 (mortality) Future
Source: Reproduced from reference 2.
indirect effect of air pollution may be quite significant. Many air pollutants,
such as polycyclic aromatic hydrocarbons (PAHs), deposited on land or
water, enter the food chain and thus are classified as cancer caused by
food and not by air pollution. In addition, inhaled carcinogens may also
find their way, via the mucociliary escalator, to the digestive tract. The high-
est incidence of cancer caused directly by inhalation of air pollutants occurs
in highly industrialized areas and affects mostly people in certain occupa-
tions such as coke-oven and coal-tar pitch workers; such occupational expo-
sure to PAH may be 30,000 times higher than the exposure of the public at
large.
The relatively high cancer mortality associated with diet deserves com-
ment. Except for the correlation between liver cancer and the consumption
of crops contaminated with aflatoxin, no direct epidemiological evidence
linking any specific food or food contaminant to human cancer has been
presented. However, many carcinogens have been found in foods.
Nitrites, which are added to meats as preservatives, are precarcinogens.
Nitrates occur in vegetables, fruits, and drinking water, usually as a result of
the leaching of nitrate fertilizers into groundwater; although not carcinogenic
in their own right, they are reduced to nitrites by salivary enzymes. PAHs are
produced when meat or fish is broiled, fried, or smoked. In addition, fish or
shellfish from polluted waters may contain chlorinated hydrocarbon pesti-
cides, PAHs, polychlorinated biphenyls (PCBs), and other organic contami-
nants. The fact that no correlation between cancer and consumption of
specific foods has been found does not imply that none exists.
A relationship between obesity and cancer mortality has been found.
Whether this effect is due to obesity itself or the obesity is a reflection of a
certain lifestyle conducive to cancer is not known.
Multistage Development of Cancer
The concept of a multistage development of cancer goes back to the experi-
ments of Berenblum and Shubik (4). These investigators studied the carci-
nogenicity of 9,10-dimethylbenzanthracene (DMBA) and benzo[a]pyrene
(BP) in mice. When a 1.5% solution of DMBA in liquid paraffin was applied
only once to the skin of 45 mice, only one mouse developed a tumor.
However, when the single application of DMBA was followed by the appli-
cation of 5% croton oil in liquid paraffin twice weekly for 20 weeks, 20 out of
45 mice developed tumors. No tumors were observed when croton oil was
applied twice weekly for 2 weeks prior to the DMBA treatment.
Further evidence, provided by epidemiological and laboratory studies,
led to the development of the present concept of cancer initiation, promo-
tion, and progression. Initiation is caused by the interaction of a genotoxic
(see the definition later in this chapter) compound with cellular DNA. Once
the injury to the DNA has occurred and is not repaired, the cell is perma-
Chemical Carcinogenesis and Mutagenesis 73
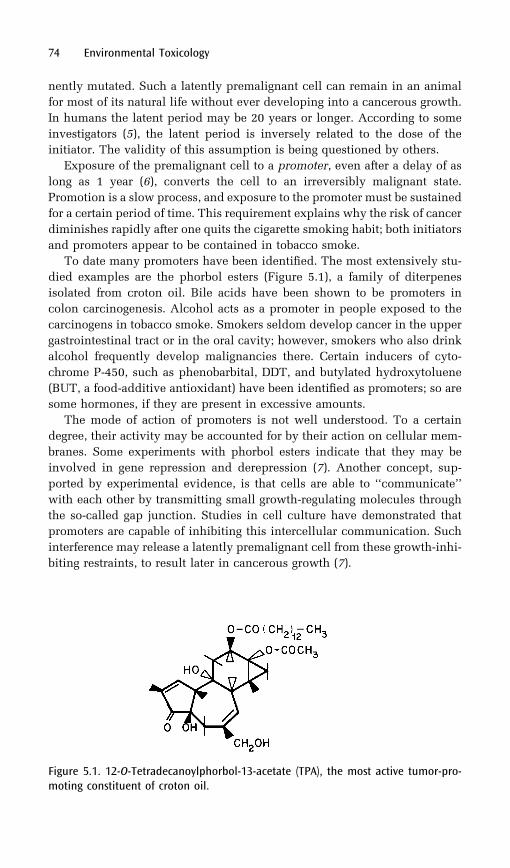
nently mutated. Such a latently premalignant cell can remain in an animal
for most of its natural life without ever developing into a cancerous growth.
In humans the latent period may be 20 years or longer. According to some
investigators (5), the latent period is inversely related to the dose of the
initiator. The validity of this assumption is being questioned by others.
Exposure of the premalignant cell to a promoter, even after a delay of as
long as 1 year (6), converts the cell to an irreversibly malignant state.
Promotion is a slow process, and exposure to the promoter must be sustained
for a certain period of time. This requirement explains why the risk of cancer
diminishes rapidly after one quits the cigarette smoking habit; both initiators
and promoters appear to be contained in tobacco smoke.
To date many promoters have been identified. The most extensively stu-
died examples are the phorbol esters (Figure 5.1), a family of diterpenes
isolated from croton oil. Bile acids have been shown to be promoters in
colon carcinogenesis. Alcohol acts as a promoter in people exposed to the
carcinogens in tobacco smoke. Smokers seldom develop cancer in the upper
gastrointestinal tract or in the oral cavity; however, smokers who also drink
alcohol frequently develop malignancies there. Certain inducers of cyto-
chrome P-450, such as phenobarbital, DDT, and butylated hydroxytoluene
(BUT, a food-additive antioxidant) have been identified as promoters; so are
some hormones, if they are present in excessive amounts.
The mode of action of promoters is not well understood. To a certain
degree, their activity may be accounted for by their action on cellular mem-
branes. Some experiments with phorbol esters indicate that they may be
involved in gene repression and derepression (7). Another concept, sup-
ported by experimental evidence, is that cells are able to ‘‘communicate’’
with each other by transmitting small growth-regulating molecules through
the so-called gap junction. Studies in cell culture have demonstrated that
promoters are capable of inhibiting this intercellular communication. Such
interference may release a latently premalignant cell from these growth-inhi-
biting restraints, to result later in cancerous growth (7).
74 Environmental Toxicology
Figure 5.1. 12-O-Tetradecanoylphorbol-13-acetate (TPA), the most active tumor-pro-moting constituent of croton oil.
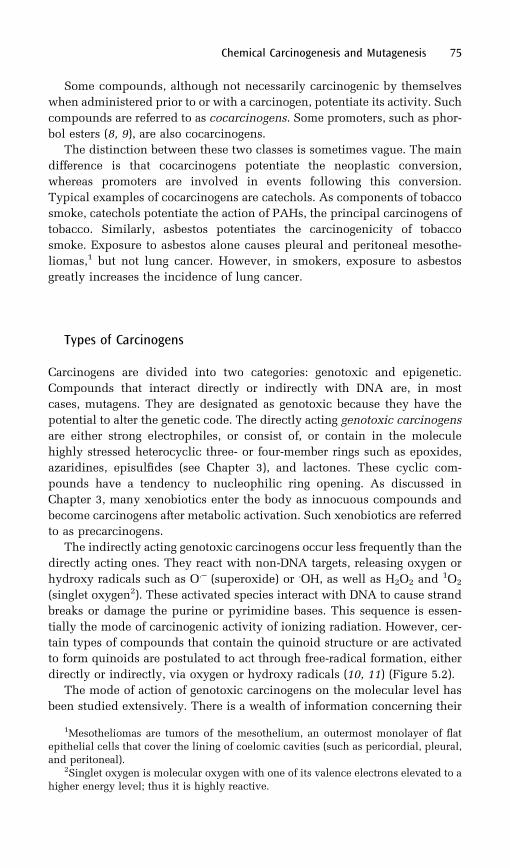
Some compounds, although not necessarily carcinogenic by themselves
when administered prior to or with a carcinogen, potentiate its activity. Such
compounds are referred to as cocarcinogens. Some promoters, such as phor-
bol esters (8, 9), are also cocarcinogens.
The distinction between these two classes is sometimes vague. The main
difference is that cocarcinogens potentiate the neoplastic conversion,
whereas promoters are involved in events following this conversion.
Typical examples of cocarcinogens are catechols. As components of tobacco
smoke, catechols potentiate the action of PAHs, the principal carcinogens of
tobacco. Similarly, asbestos potentiates the carcinogenicity of tobacco
smoke. Exposure to asbestos alone causes pleural and peritoneal mesothe-
liomas,1 but not lung cancer. However, in smokers, exposure to asbestos
greatly increases the incidence of lung cancer.
Types of Carcinogens
Carcinogens are divided into two categories: genotoxic and epigenetic.
Compounds that interact directly or indirectly with DNA are, in most
cases, mutagens. They are designated as genotoxic because they have the
potential to alter the genetic code. The directly acting genotoxic carcinogens
are either strong electrophiles, or consist of, or contain in the molecule
highly stressed heterocyclic three- or four-member rings such as epoxides,
azaridines, episulfides (see Chapter 3), and lactones. These cyclic com-
pounds have a tendency to nucleophilic ring opening. As discussed in
Chapter 3, many xenobiotics enter the body as innocuous compounds and
become carcinogens after metabolic activation. Such xenobiotics are referred
to as precarcinogens.
The indirectly acting genotoxic carcinogens occur less frequently than the
directly acting ones. They react with non-DNA targets, releasing oxygen or
hydroxy radicals such as O.– (superoxide) or .OH, as well as H2O2 and1O2
(singlet oxygen2). These activated species interact with DNA to cause strand
breaks or damage the purine or pyrimidine bases. This sequence is essen-
tially the mode of carcinogenic activity of ionizing radiation. However, cer-
tain types of compounds that contain the quinoid structure or are activated
to form quinoids are postulated to act through free-radical formation, either
directly or indirectly, via oxygen or hydroxy radicals (10, 11) (Figure 5.2).
The mode of action of genotoxic carcinogens on the molecular level has
been studied extensively. There is a wealth of information concerning their
Chemical Carcinogenesis and Mutagenesis 75
1Mesotheliomas are tumors of the mesothelium, an outermost monolayer of flatepithelial cells that cover the lining of coelomic cavities (such as pericordial, pleural,
and peritoneal).2Singlet oxygen is molecular oxygen with one of its valence electrons elevated to a
higher energy level; thus it is highly reactive.
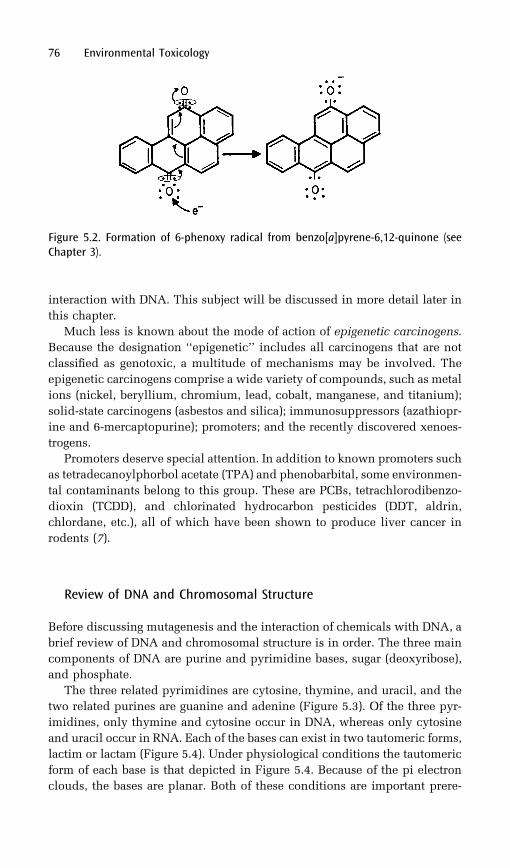
interaction with DNA. This subject will be discussed in more detail later in
this chapter.
Much less is known about the mode of action of epigenetic carcinogens.
Because the designation ‘‘epigenetic’’ includes all carcinogens that are not
classified as genotoxic, a multitude of mechanisms may be involved. The
epigenetic carcinogens comprise a wide variety of compounds, such as metal
ions (nickel, beryllium, chromium, lead, cobalt, manganese, and titanium);
solid-state carcinogens (asbestos and silica); immunosuppressors (azathiopr-
ine and 6-mercaptopurine); promoters; and the recently discovered xenoes-
trogens.
Promoters deserve special attention. In addition to known promoters such
as tetradecanoylphorbol acetate (TPA) and phenobarbital, some environmen-
tal contaminants belong to this group. These are PCBs, tetrachlorodibenzo-
dioxin (TCDD), and chlorinated hydrocarbon pesticides (DDT, aldrin,
chlordane, etc.), all of which have been shown to produce liver cancer in
rodents (7).
Review of DNA and Chromosomal Structure
Before discussing mutagenesis and the interaction of chemicals with DNA, a
brief review of DNA and chromosomal structure is in order. The three main
components of DNA are purine and pyrimidine bases, sugar (deoxyribose),
and phosphate.
The three related pyrimidines are cytosine, thymine, and uracil, and the
two related purines are guanine and adenine (Figure 5.3). Of the three pyr-
imidines, only thymine and cytosine occur in DNA, whereas only cytosine
and uracil occur in RNA. Each of the bases can exist in two tautomeric forms,
lactim or lactam (Figure 5.4). Under physiological conditions the tautomeric
form of each base is that depicted in Figure 5.4. Because of the pi electron
clouds, the bases are planar. Both of these conditions are important prere-
76 Environmental Toxicology
Figure 5.2. Formation of 6-phenoxy radical from benzo[a]pyrene-6,12-quinone (seeChapter 3).
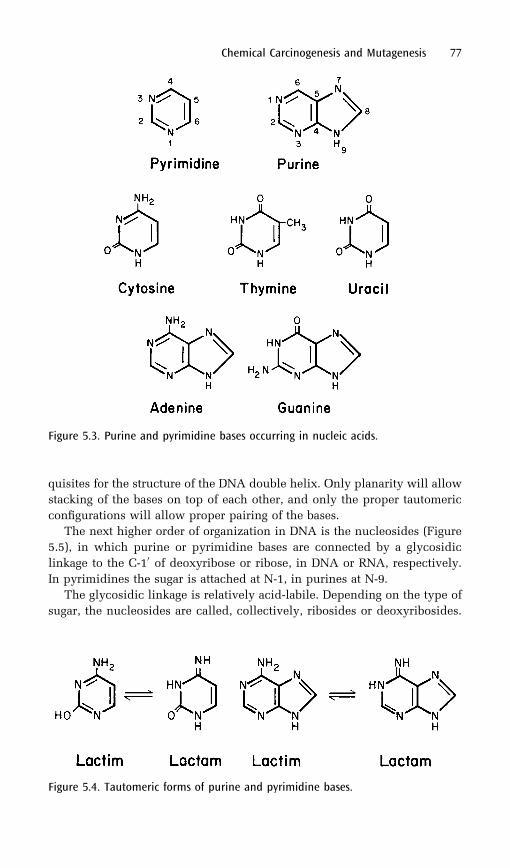
quisites for the structure of the DNA double helix. Only planarity will allow
stacking of the bases on top of each other, and only the proper tautomeric
configurations will allow proper pairing of the bases.
The next higher order of organization in DNA is the nucleosides (Figure
5.5), in which purine or pyrimidine bases are connected by a glycosidic
linkage to the C-10 of deoxyribose or ribose, in DNA or RNA, respectively.
In pyrimidines the sugar is attached at N-1, in purines at N-9.
The glycosidic linkage is relatively acid-labile. Depending on the type of
sugar, the nucleosides are called, collectively, ribosides or deoxyribosides.
Chemical Carcinogenesis and Mutagenesis 77
Figure 5.3. Purine and pyrimidine bases occurring in nucleic acids.
Figure 5.4. Tautomeric forms of purine and pyrimidine bases.
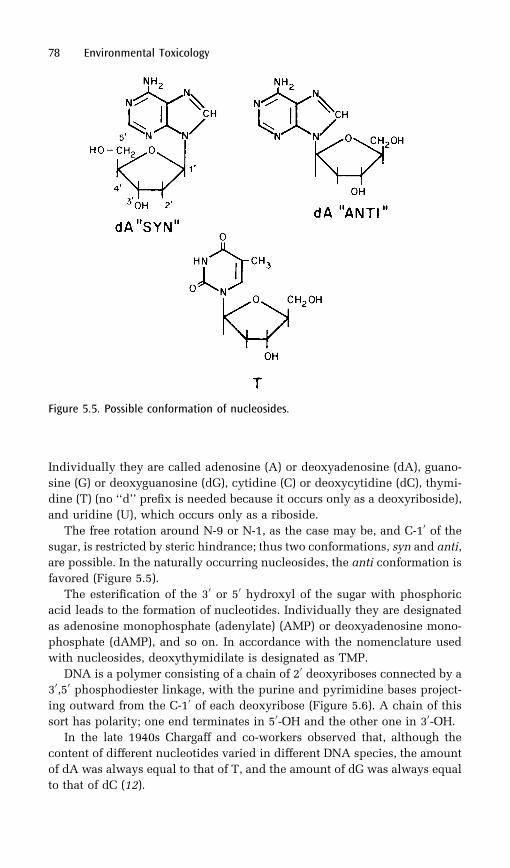
Individually they are called adenosine (A) or deoxyadenosine (dA), guano-
sine (G) or deoxyguanosine (dG), cytidine (C) or deoxycytidine (dC), thymi-
dine (T) (no ‘‘d’’ prefix is needed because it occurs only as a deoxyriboside),
and uridine (U), which occurs only as a riboside.
The free rotation around N-9 or N-1, as the case may be, and C-10 of thesugar, is restricted by steric hindrance; thus two conformations, syn and anti,
are possible. In the naturally occurring nucleosides, the anti conformation is
favored (Figure 5.5).
The esterification of the 30 or 50 hydroxyl of the sugar with phosphoric
acid leads to the formation of nucleotides. Individually they are designated
as adenosine monophosphate (adenylate) (AMP) or deoxyadenosine mono-
phosphate (dAMP), and so on. In accordance with the nomenclature used
with nucleosides, deoxythymidilate is designated as TMP.
DNA is a polymer consisting of a chain of 20 deoxyriboses connected by a
30,50 phosphodiester linkage, with the purine and pyrimidine bases project-
ing outward from the C-10 of each deoxyribose (Figure 5.6). A chain of this
sort has polarity; one end terminates in 50-OH and the other one in 30-OH.In the late 1940s Chargaff and co-workers observed that, although the
content of different nucleotides varied in different DNA species, the amount
of dA was always equal to that of T, and the amount of dG was always equal
to that of dC (12).
78 Environmental Toxicology
Figure 5.5. Possible conformation of nucleosides.
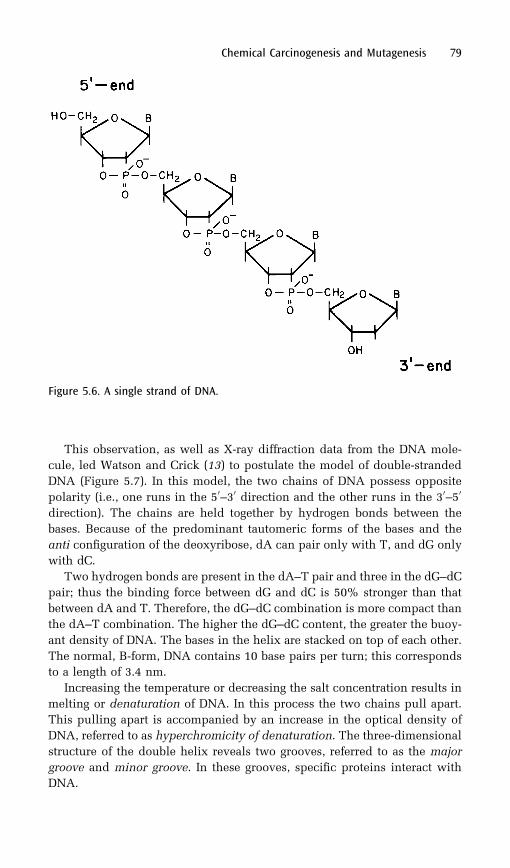
This observation, as well as X-ray diffraction data from the DNA mole-
cule, led Watson and Crick (13) to postulate the model of double-stranded
DNA (Figure 5.7). In this model, the two chains of DNA possess opposite
polarity (i.e., one runs in the 50–30 direction and the other runs in the 30–50
direction). The chains are held together by hydrogen bonds between the
bases. Because of the predominant tautomeric forms of the bases and the
anti configuration of the deoxyribose, dA can pair only with T, and dG only
with dC.
Two hydrogen bonds are present in the dA–T pair and three in the dG–dC
pair; thus the binding force between dG and dC is 50% stronger than that
between dA and T. Therefore, the dG–dC combination is more compact than
the dA–T combination. The higher the dG–dC content, the greater the buoy-
ant density of DNA. The bases in the helix are stacked on top of each other.
The normal, B-form, DNA contains 10 base pairs per turn; this corresponds
to a length of 3.4 nm.
Increasing the temperature or decreasing the salt concentration results in
melting or denaturation of DNA. In this process the two chains pull apart.
This pulling apart is accompanied by an increase in the optical density of
DNA, referred to as hyperchromicity of denaturation. The three-dimensional
structure of the double helix reveals two grooves, referred to as the major
groove and minor groove. In these grooves, specific proteins interact with
DNA.
Chemical Carcinogenesis and Mutagenesis 79
Figure 5.6. A single strand of DNA.
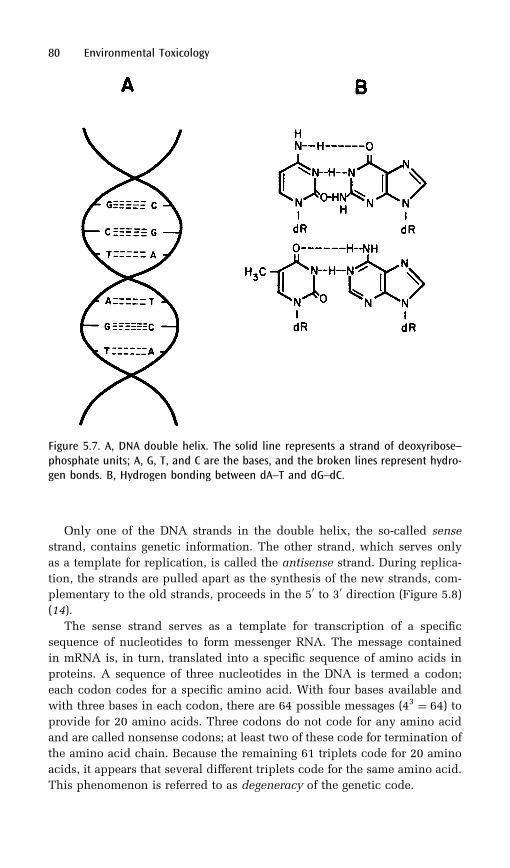
Only one of the DNA strands in the double helix, the so-called sense
strand, contains genetic information. The other strand, which serves only
as a template for replication, is called the antisense strand. During replica-
tion, the strands are pulled apart as the synthesis of the new strands, com-
plementary to the old strands, proceeds in the 50 to 30 direction (Figure 5.8)
(14).
The sense strand serves as a template for transcription of a specific
sequence of nucleotides to form messenger RNA. The message contained
in mRNA is, in turn, translated into a specific sequence of amino acids in
proteins. A sequence of three nucleotides in the DNA is termed a codon;
each codon codes for a specific amino acid. With four bases available and
with three bases in each codon, there are 64 possible messages (43 ¼ 64) to
provide for 20 amino acids. Three codons do not code for any amino acid
and are called nonsense codons; at least two of these code for termination of
the amino acid chain. Because the remaining 61 triplets code for 20 amino
acids, it appears that several different triplets code for the same amino acid.
This phenomenon is referred to as degeneracy of the genetic code.
80 Environmental Toxicology
Figure 5.7. A, DNA double helix. The solid line represents a strand of deoxyribose–phosphate units; A, G, T, and C are the bases, and the broken lines represent hydro-gen bonds. B, Hydrogen bonding between dA–T and dG–dC.
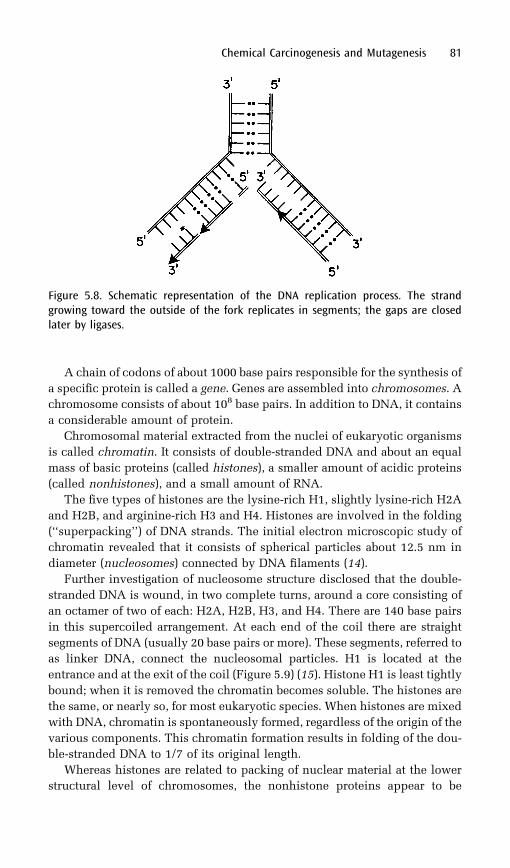
A chain of codons of about 1000 base pairs responsible for the synthesis of
a specific protein is called a gene. Genes are assembled into chromosomes. A
chromosome consists of about 108 base pairs. In addition to DNA, it contains
a considerable amount of protein.
Chromosomal material extracted from the nuclei of eukaryotic organisms
is called chromatin. It consists of double-stranded DNA and about an equal
mass of basic proteins (called histones), a smaller amount of acidic proteins
(called nonhistones), and a small amount of RNA.
The five types of histones are the lysine-rich H1, slightly lysine-rich H2A
and H2B, and arginine-rich H3 and H4. Histones are involved in the folding
(‘‘superpacking’’) of DNA strands. The initial electron microscopic study of
chromatin revealed that it consists of spherical particles about 12.5 nm in
diameter (nucleosomes) connected by DNA filaments (14).
Further investigation of nucleosome structure disclosed that the double-
stranded DNA is wound, in two complete turns, around a core consisting of
an octamer of two of each: H2A, H2B, H3, and H4. There are 140 base pairs
in this supercoiled arrangement. At each end of the coil there are straight
segments of DNA (usually 20 base pairs or more). These segments, referred to
as linker DNA, connect the nucleosomal particles. H1 is located at the
entrance and at the exit of the coil (Figure 5.9) (15). Histone H1 is least tightly
bound; when it is removed the chromatin becomes soluble. The histones are
the same, or nearly so, for most eukaryotic species. When histones are mixed
with DNA, chromatin is spontaneously formed, regardless of the origin of the
various components. This chromatin formation results in folding of the dou-
ble-stranded DNA to 1/7 of its original length.
Whereas histones are related to packing of nuclear material at the lower
structural level of chromosomes, the nonhistone proteins appear to be
Chemical Carcinogenesis and Mutagenesis 81
Figure 5.8. Schematic representation of the DNA replication process. The strandgrowing toward the outside of the fork replicates in segments; the gaps are closedlater by ligases.
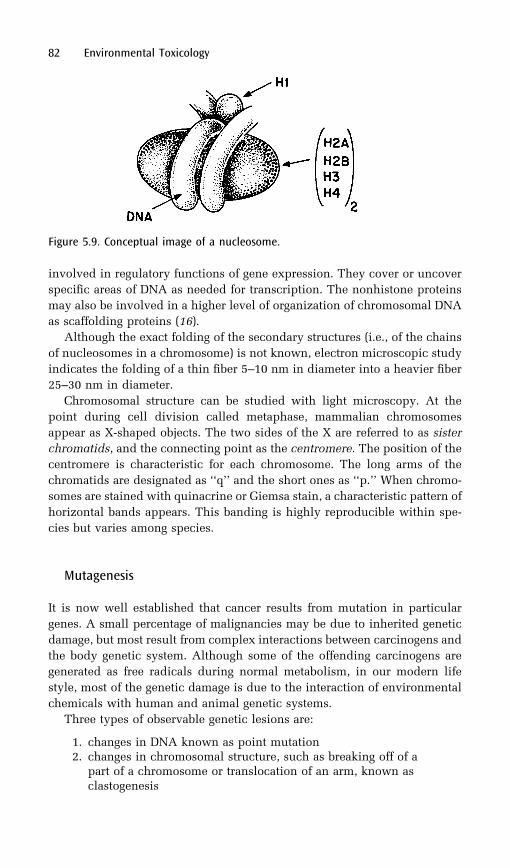
involved in regulatory functions of gene expression. They cover or uncover
specific areas of DNA as needed for transcription. The nonhistone proteins
may also be involved in a higher level of organization of chromosomal DNA
as scaffolding proteins (16).
Although the exact folding of the secondary structures (i.e., of the chains
of nucleosomes in a chromosome) is not known, electron microscopic study
indicates the folding of a thin fiber 5–10 nm in diameter into a heavier fiber
25–30 nm in diameter.
Chromosomal structure can be studied with light microscopy. At the
point during cell division called metaphase, mammalian chromosomes
appear as X-shaped objects. The two sides of the X are referred to as sister
chromatids, and the connecting point as the centromere. The position of the
centromere is characteristic for each chromosome. The long arms of the
chromatids are designated as ‘‘q’’ and the short ones as ‘‘p.’’ When chromo-
somes are stained with quinacrine or Giemsa stain, a characteristic pattern of
horizontal bands appears. This banding is highly reproducible within spe-
cies but varies among species.
Mutagenesis
It is now well established that cancer results from mutation in particular
genes. A small percentage of malignancies may be due to inherited genetic
damage, but most result from complex interactions between carcinogens and
the body genetic system. Although some of the offending carcinogens are
generated as free radicals during normal metabolism, in our modern life
style, most of the genetic damage is due to the interaction of environmental
chemicals with human and animal genetic systems.
Three types of observable genetic lesions are:
1. changes in DNA known as point mutation2. changes in chromosomal structure, such as breaking off of a
part of a chromosome or translocation of an arm, known asclastogenesis
82 Environmental Toxicology
Figure 5.9. Conceptual image of a nucleosome.
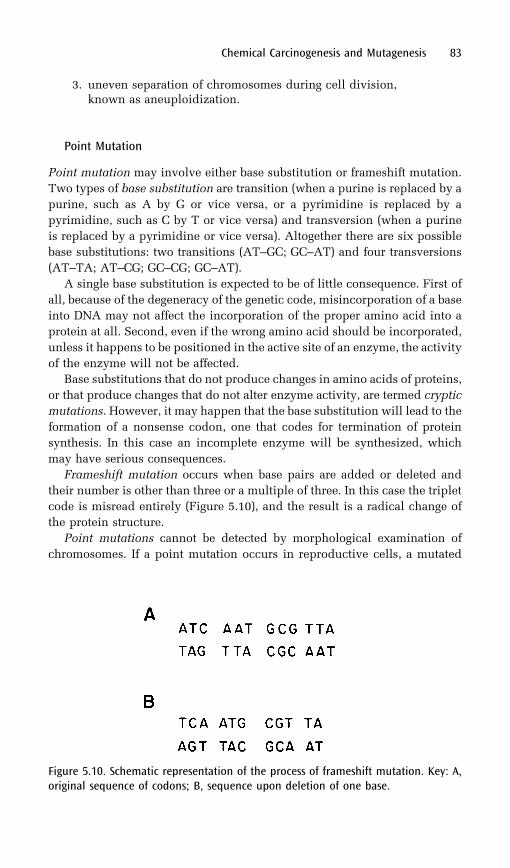
3. uneven separation of chromosomes during cell division,known as aneuploidization.
Point Mutation
Point mutation may involve either base substitution or frameshift mutation.
Two types of base substitution are transition (when a purine is replaced by a
purine, such as A by G or vice versa, or a pyrimidine is replaced by a
pyrimidine, such as C by T or vice versa) and transversion (when a purine
is replaced by a pyrimidine or vice versa). Altogether there are six possible
base substitutions: two transitions (AT–GC; GC–AT) and four transversions
(AT–TA; AT–CG; GC–CG; GC–AT).
A single base substitution is expected to be of little consequence. First of
all, because of the degeneracy of the genetic code, misincorporation of a base
into DNA may not affect the incorporation of the proper amino acid into a
protein at all. Second, even if the wrong amino acid should be incorporated,
unless it happens to be positioned in the active site of an enzyme, the activity
of the enzyme will not be affected.
Base substitutions that do not produce changes in amino acids of proteins,
or that produce changes that do not alter enzyme activity, are termed cryptic
mutations. However, it may happen that the base substitution will lead to the
formation of a nonsense codon, one that codes for termination of protein
synthesis. In this case an incomplete enzyme will be synthesized, which
may have serious consequences.
Frameshift mutation occurs when base pairs are added or deleted and
their number is other than three or a multiple of three. In this case the triplet
code is misread entirely (Figure 5.10), and the result is a radical change of
the protein structure.
Point mutations cannot be detected by morphological examination of
chromosomes. If a point mutation occurs in reproductive cells, a mutated
Chemical Carcinogenesis and Mutagenesis 83
Figure 5.10. Schematic representation of the process of frameshift mutation. Key: A,original sequence of codons; B, sequence upon deletion of one base.
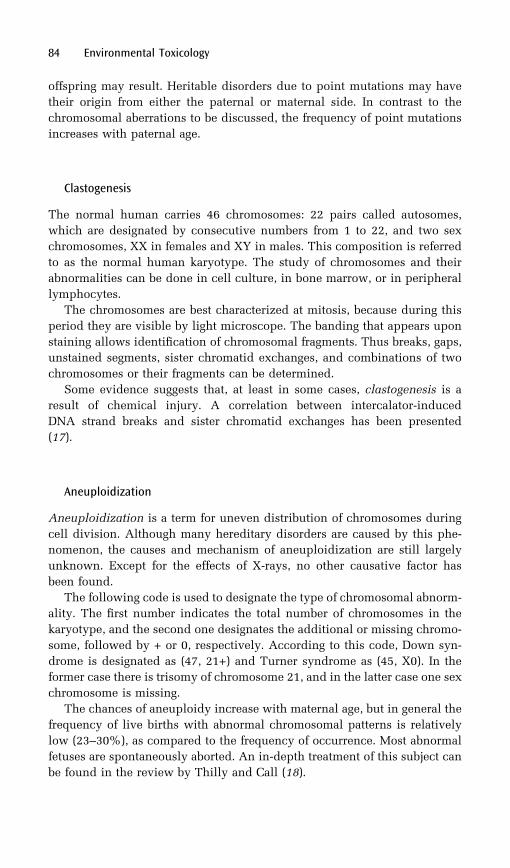
offspring may result. Heritable disorders due to point mutations may have
their origin from either the paternal or maternal side. In contrast to the
chromosomal aberrations to be discussed, the frequency of point mutations
increases with paternal age.
Clastogenesis
The normal human carries 46 chromosomes: 22 pairs called autosomes,
which are designated by consecutive numbers from 1 to 22, and two sex
chromosomes, XX in females and XY in males. This composition is referred
to as the normal human karyotype. The study of chromosomes and their
abnormalities can be done in cell culture, in bone marrow, or in peripheral
lymphocytes.
The chromosomes are best characterized at mitosis, because during this
period they are visible by light microscope. The banding that appears upon
staining allows identification of chromosomal fragments. Thus breaks, gaps,
unstained segments, sister chromatid exchanges, and combinations of two
chromosomes or their fragments can be determined.
Some evidence suggests that, at least in some cases, clastogenesis is a
result of chemical injury. A correlation between intercalator-induced
DNA strand breaks and sister chromatid exchanges has been presented
(17).
Aneuploidization
Aneuploidization is a term for uneven distribution of chromosomes during
cell division. Although many hereditary disorders are caused by this phe-
nomenon, the causes and mechanism of aneuploidization are still largely
unknown. Except for the effects of X-rays, no other causative factor has
been found.
The following code is used to designate the type of chromosomal abnorm-
ality. The first number indicates the total number of chromosomes in the
karyotype, and the second one designates the additional or missing chromo-
some, followed by + or 0, respectively. According to this code, Down syn-
drome is designated as (47, 21+) and Turner syndrome as (45, X0). In the
former case there is trisomy of chromosome 21, and in the latter case one sex
chromosome is missing.
The chances of aneuploidy increase with maternal age, but in general the
frequency of live births with abnormal chromosomal patterns is relatively
low (23–30%), as compared to the frequency of occurrence. Most abnormal
fetuses are spontaneously aborted. An in-depth treatment of this subject can
be found in the review by Thilly and Call (18).
84 Environmental Toxicology
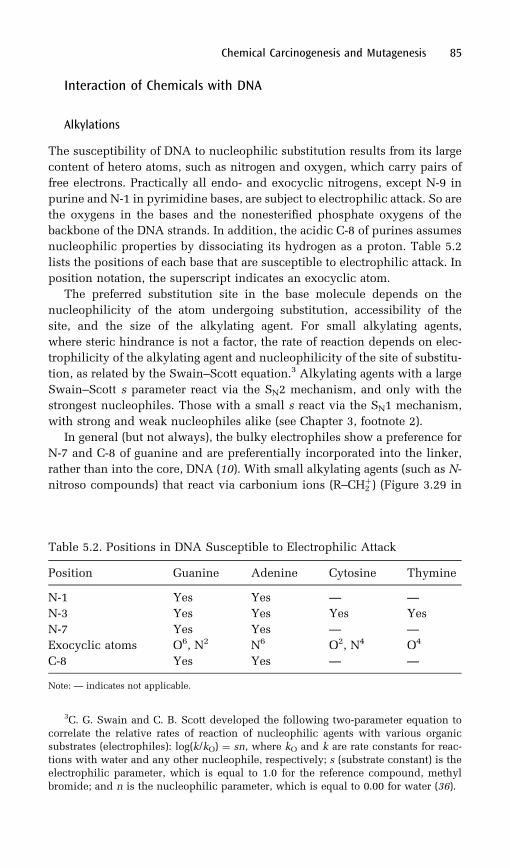
Interaction of Chemicals with DNA
Alkylations
The susceptibility of DNA to nucleophilic substitution results from its large
content of hetero atoms, such as nitrogen and oxygen, which carry pairs of
free electrons. Practically all endo- and exocyclic nitrogens, except N-9 in
purine and N-1 in pyrimidine bases, are subject to electrophilic attack. So are
the oxygens in the bases and the nonesterified phosphate oxygens of the
backbone of the DNA strands. In addition, the acidic C-8 of purines assumes
nucleophilic properties by dissociating its hydrogen as a proton. Table 5.2
lists the positions of each base that are susceptible to electrophilic attack. In
position notation, the superscript indicates an exocyclic atom.
The preferred substitution site in the base molecule depends on the
nucleophilicity of the atom undergoing substitution, accessibility of the
site, and the size of the alkylating agent. For small alkylating agents,
where steric hindrance is not a factor, the rate of reaction depends on elec-
trophilicity of the alkylating agent and nucleophilicity of the site of substitu-
tion, as related by the Swain–Scott equation.3 Alkylating agents with a large
Swain–Scott s parameter react via the SN2 mechanism, and only with the
strongest nucleophiles. Those with a small s react via the SN1 mechanism,
with strong and weak nucleophiles alike (see Chapter 3, footnote 2).
In general (but not always), the bulky electrophiles show a preference for
N-7 and C-8 of guanine and are preferentially incorporated into the linker,
rather than into the core, DNA (10). With small alkylating agents (such as N-
nitroso compounds) that react via carbonium ions (R–CHþ2 ) (Figure 3.29 in
Chemical Carcinogenesis and Mutagenesis 85
3C. G. Swain and C. B. Scott developed the following two-parameter equation to
correlate the relative rates of reaction of nucleophilic agents with various organicsubstrates (electrophiles): log(k/kO) ¼ sn, where kO and k are rate constants for reac-
tions with water and any other nucleophile, respectively; s (substrate constant) is theelectrophilic parameter, which is equal to 1.0 for the reference compound, methyl
bromide; and n is the nucleophilic parameter, which is equal to 0.00 for water (36).
Table 5.2. Positions in DNA Susceptible to Electrophilic Attack
Position Guanine Adenine Cytosine Thymine
N-1 Yes Yes — —
N-3 Yes Yes Yes Yes
N-7 Yes Yes — —
Exocyclic atoms O6, N2 N6 O2, N4 O4
C-8 Yes Yes — —
Note: — indicates not applicable.

Chapter 3), every N and O in purine and pyrimidine bases, as well as non-
esterified O in the phosphates, are potential subjects for interaction (11, 19).
The relative extent of alkylation of adenine and guanine by methylnitro-
sourea (MNU), presented in Table 5.3, indicates the relative nucleophilicity
of the hetero atoms of the purine bases. The extraordinarily strong nucleo-
philicity of N-7 of guanine is worth noting.
Some alkylations result in the formation of altered but stable products
that persist permanently or until excised in the process of repair. However,
other alkylations lead to unstable adducts that subsequently undergo a series
of rearrangements. Consequences of alkylation may vary, depending on the
type of substituent and position of alkylation, from a relatively innocuous
base substitution to a very injurious DNA strand break or removal of a base.
Methylation or ethylation at O6 of guanine causes a change in its tauto-
meric form so that it will resemble adenine (Figure 5.11). Thus, during repli-
cation of DNA or transcription of messenger RNA, 6-methylguanine will pair
with thymine (or uracil) instead of cytosine. Such base substitution, as
explained earlier, may cause a perceivable or a cryptic mutation.
The consequences of substitution on N-7 or N-3 of purines are much more
serious. Table 5.3 shows that N-7 is the most reactive atom in guanine,
whereas in adenine N-3 is the most reactive. Aflatoxin B1, upon metabolic
activation to 2,3-epoxide, reacts with N-7 of guanine (21). N-7-substituted
purines are unstable and may decompose in two ways, as depicted in Figure
5.12 (22). The pyrazine ring opening (reaction I) leads to a rather stable
product that distorts the fidelity of the genetic code. The depurination (reac-
tion II), which may also occur with N-3-substituted purines, leaves a gap in
the sequence of nucleotides leading to a frameshift mutation.
Free deoxyribose (like other sugars) exists in two forms that are in equili-
brium with each other: the cyclic furanose and the open aldose. In DNA,
because of the glycosidic linkage with the bases, there is only the furanose
form. Upon depurination, equilibrium between furanose and aldose is estab-
lished (Figure 5.13). Aldose is susceptible to base-catalyzed rearrangement
86 Environmental Toxicology
Table 5.3. Relative Extent of Alkylation of Adenine
and Guanine by Methylnitrosourea
Position Adenine Guanine
N-3 8.2 0.6
N-1 2.7 —
N-7 1.2 65.6
O6 — 6.7
Note: The values in this table represent ratios.
Source: Adapted from reference 20.
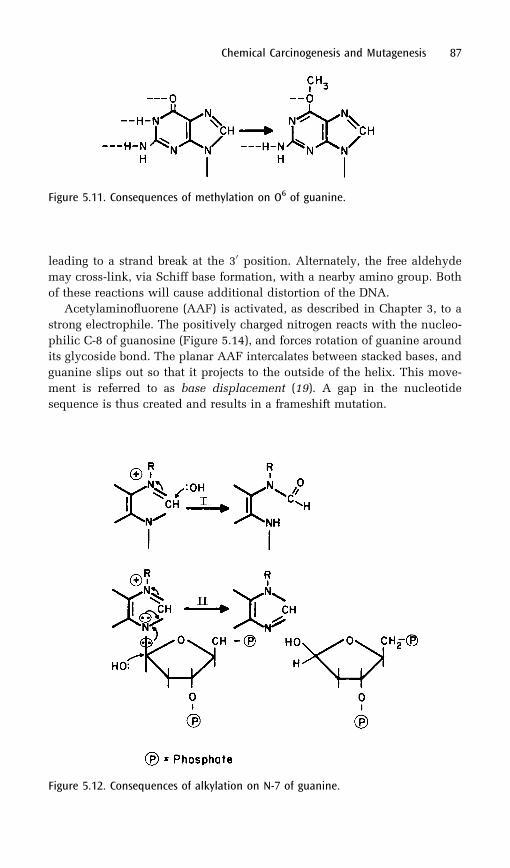
leading to a strand break at the 30 position. Alternately, the free aldehyde
may cross-link, via Schiff base formation, with a nearby amino group. Both
of these reactions will cause additional distortion of the DNA.
Acetylaminofluorene (AAF) is activated, as described in Chapter 3, to a
strong electrophile. The positively charged nitrogen reacts with the nucleo-
philic C-8 of guanosine (Figure 5.14), and forces rotation of guanine around
its glycoside bond. The planar AAF intercalates between stacked bases, and
guanine slips out so that it projects to the outside of the helix. This move-
ment is referred to as base displacement (19). A gap in the nucleotide
sequence is thus created and results in a frameshift mutation.
Chemical Carcinogenesis and Mutagenesis 87
Figure 5.11. Consequences of methylation on O6 of guanine.
Figure 5.12. Consequences of alkylation on N-7 of guanine.
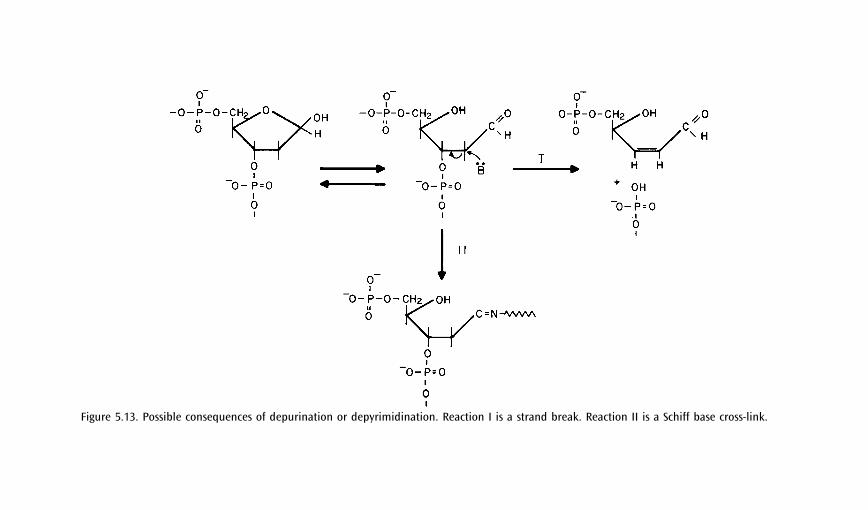
Figure 5.13. Possible consequences of depurination or depyrimidination. Reaction I is a strand break. Reaction II is a Schiff base cross-link.
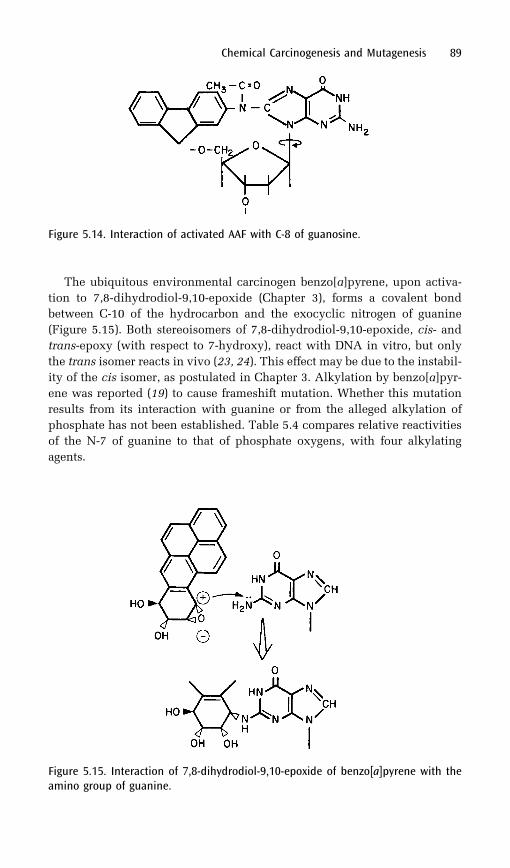
The ubiquitous environmental carcinogen benzo[a]pyrene, upon activa-
tion to 7,8-dihydrodiol-9,10-epoxide (Chapter 3), forms a covalent bond
between C-10 of the hydrocarbon and the exocyclic nitrogen of guanine
(Figure 5.15). Both stereoisomers of 7,8-dihydrodiol-9,10-epoxide, cis- and
trans-epoxy (with respect to 7-hydroxy), react with DNA in vitro, but only
the trans isomer reacts in vivo (23, 24). This effect may be due to the instabil-
ity of the cis isomer, as postulated in Chapter 3. Alkylation by benzo[a]pyr-
ene was reported (19) to cause frameshift mutation. Whether this mutation
results from its interaction with guanine or from the alleged alkylation of
phosphate has not been established. Table 5.4 compares relative reactivities
of the N-7 of guanine to that of phosphate oxygens, with four alkylating
agents.
Chemical Carcinogenesis and Mutagenesis 89
Figure 5.14. Interaction of activated AAF with C-8 of guanosine.
Figure 5.15. Interaction of 7,8-dihydrodiol-9,10-epoxide of benzo[a]pyrene with theamino group of guanine.
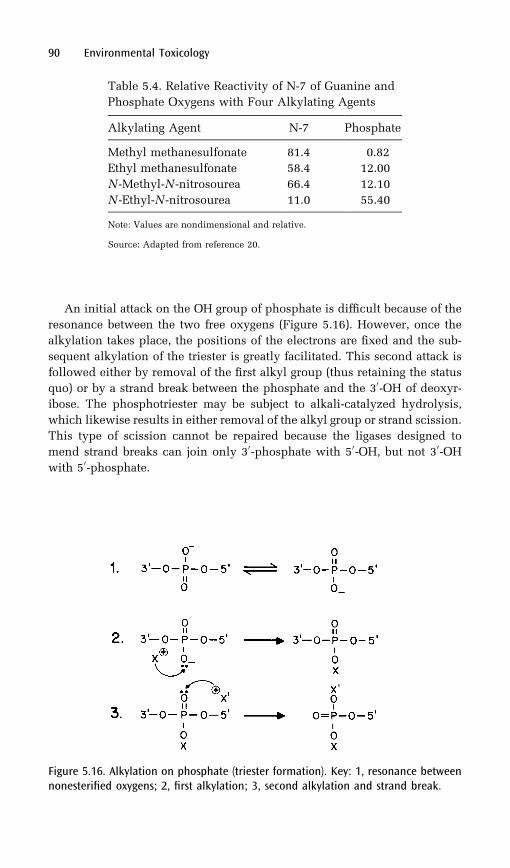
An initial attack on the OH group of phosphate is difficult because of the
resonance between the two free oxygens (Figure 5.16). However, once the
alkylation takes place, the positions of the electrons are fixed and the sub-
sequent alkylation of the triester is greatly facilitated. This second attack is
followed either by removal of the first alkyl group (thus retaining the status
quo) or by a strand break between the phosphate and the 30-OH of deoxyr-
ibose. The phosphotriester may be subject to alkali-catalyzed hydrolysis,
which likewise results in either removal of the alkyl group or strand scission.
This type of scission cannot be repaired because the ligases designed to
mend strand breaks can join only 30-phosphate with 50-OH, but not 30-OHwith 50-phosphate.
90 Environmental Toxicology
Table 5.4. Relative Reactivity of N-7 of Guanine and
Phosphate Oxygens with Four Alkylating Agents
Alkylating Agent N-7 Phosphate
Methyl methanesulfonate 81.4 0.82
Ethyl methanesulfonate 58.4 12.00
N -Methyl-N -nitrosourea 66.4 12.10
N -Ethyl-N -nitrosourea 11.0 55.40
Note: Values are nondimensional and relative.
Source: Adapted from reference 20.
Figure 5.16. Alkylation on phosphate (triester formation). Key: 1, resonance betweennonesterified oxygens; 2, first alkylation; 3, second alkylation and strand break.

Intercalating Agents
Certain aromatic or heterocyclic planar compounds are able to insert them-
selves between stacked bases of DNA. This type of interaction is called
intercalation. Intercalation results in local spreading and distortion of the
helix so that the length of the helix per turn is increased (25). Some examples
of intercalating agents are presented in Figure 5.17. All these compounds are
characterized by their dimensions, which correspond to three condensed
aromatic (or heterocyclic) rings, about the same as the diameter of the
DNA double helix.
One study (17) presents evidence that intercalators interfere with the
action of topoisomerase II. Topoisomerase II catalyzes transient double-
strand breaks of DNA for purposes such as replication and transcription.
Although strand scission occurs in the presence of intercalators, the topoi-
somerase II remains firmly bound to the nicked DNA and thus prevents
ligation of the strand.
Effect of Ultraviolet Radiation
X-rays and shortwave ultraviolet radiation cause strand breaks via free-radi-
cal formation. However, ultraviolet light of wavelengths around 290 nm,
which is in the range of light absorption of pyrimidines, causes dimerization
of neighboring pyrimidines (Figure 5.18). Such dimerization results in
unwinding of the DNA helix and disruption of hydrogen bonds between
the dimerized pyrimidines and their complementary purines.
Chemical Carcinogenesis and Mutagenesis 91
Figure 5.17. Examples of intercalating agents. Key: 1, acriflavine; 2, ethidium bro-mide; 3, actinomycin; 4, quinacrine.
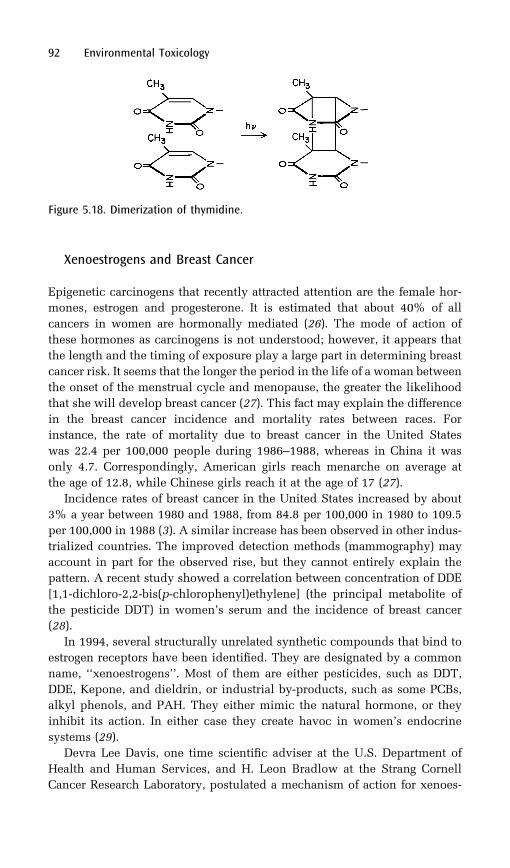
Xenoestrogens and Breast Cancer
Epigenetic carcinogens that recently attracted attention are the female hor-
mones, estrogen and progesterone. It is estimated that about 40% of all
cancers in women are hormonally mediated (26). The mode of action of
these hormones as carcinogens is not understood; however, it appears that
the length and the timing of exposure play a large part in determining breast
cancer risk. It seems that the longer the period in the life of a woman between
the onset of the menstrual cycle and menopause, the greater the likelihood
that she will develop breast cancer (27). This fact may explain the difference
in the breast cancer incidence and mortality rates between races. For
instance, the rate of mortality due to breast cancer in the United States
was 22.4 per 100,000 people during 1986–1988, whereas in China it was
only 4.7. Correspondingly, American girls reach menarche on average at
the age of 12.8, while Chinese girls reach it at the age of 17 (27).
Incidence rates of breast cancer in the United States increased by about
3% a year between 1980 and 1988, from 84.8 per 100,000 in 1980 to 109.5
per 100,000 in 1988 (3). A similar increase has been observed in other indus-
trialized countries. The improved detection methods (mammography) may
account in part for the observed rise, but they cannot entirely explain the
pattern. A recent study showed a correlation between concentration of DDE
[1,1-dichloro-2,2-bis(p-chlorophenyl)ethylene] (the principal metabolite of
the pesticide DDT) in women’s serum and the incidence of breast cancer
(28).
In 1994, several structurally unrelated synthetic compounds that bind to
estrogen receptors have been identified. They are designated by a common
name, ‘‘xenoestrogens’’. Most of them are either pesticides, such as DDT,
DDE, Kepone, and dieldrin, or industrial by-products, such as some PCBs,
alkyl phenols, and PAH. They either mimic the natural hormone, or they
inhibit its action. In either case they create havoc in women’s endocrine
systems (29).
Devra Lee Davis, one time scientific adviser at the U.S. Department of
Health and Human Services, and H. Leon Bradlow at the Strang Cornell
Cancer Research Laboratory, postulated a mechanism of action for xenoes-
92 Environmental Toxicology
Figure 5.18. Dimerization of thymidine.
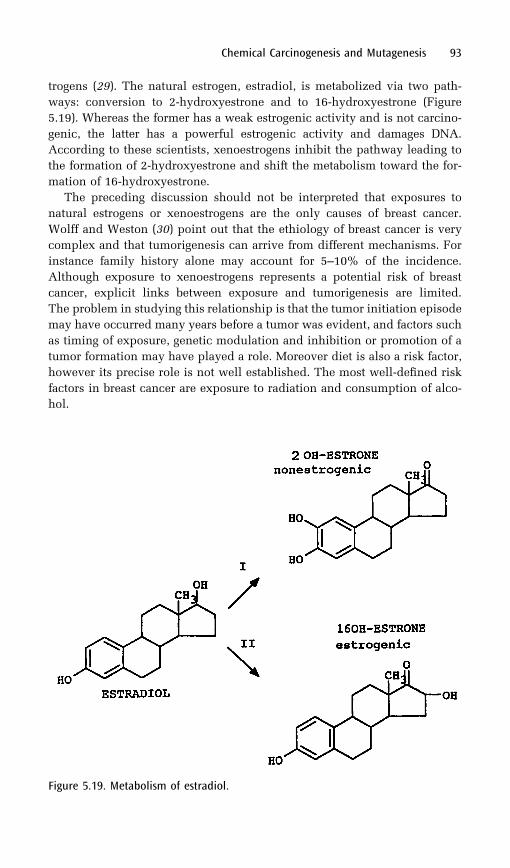
trogens (29). The natural estrogen, estradiol, is metabolized via two path-
ways: conversion to 2-hydroxyestrone and to 16-hydroxyestrone (Figure
5.19). Whereas the former has a weak estrogenic activity and is not carcino-
genic, the latter has a powerful estrogenic activity and damages DNA.
According to these scientists, xenoestrogens inhibit the pathway leading to
the formation of 2-hydroxyestrone and shift the metabolism toward the for-
mation of 16-hydroxyestrone.
The preceding discussion should not be interpreted that exposures to
natural estrogens or xenoestrogens are the only causes of breast cancer.
Wolff and Weston (30) point out that the ethiology of breast cancer is very
complex and that tumorigenesis can arrive from different mechanisms. For
instance family history alone may account for 5–10% of the incidence.
Although exposure to xenoestrogens represents a potential risk of breast
cancer, explicit links between exposure and tumorigenesis are limited.
The problem in studying this relationship is that the tumor initiation episode
may have occurred many years before a tumor was evident, and factors such
as timing of exposure, genetic modulation and inhibition or promotion of a
tumor formation may have played a role. Moreover diet is also a risk factor,
however its precise role is not well established. The most well-defined risk
factors in breast cancer are exposure to radiation and consumption of alco-
hol.
Chemical Carcinogenesis and Mutagenesis 93
Figure 5.19. Metabolism of estradiol.

Carcinogenic Effect of Low-FrequencyElectromagnetic Fields
Since the past decade there has been concern about the health effects of low-
frequency electromagnetic fields, such as those produced by power lines,
home appliances, and electric gadgetry. This concern was precipitated by
reports of clusters of elevated cancer incidence, especially childhood leuke-
mia, among people residing in the vicinity of power lines. In response to this
concern several epidemiological studies were undertaken. Whereas some of
them showed a weak association between exposure to low-frequency elec-
tromagnetic fields and childhood leukemia and other types of cancer, others
did not. Similarly, animal experiments gave contradictory results. The ani-
mal studies were complicated because there was no clear dose–response
effect, and because the effect depended on the frequency, the waveform,
and the angles between the applied field and that of the earth’s magnetic
field (31).
The more recent epidemiological study examining records of women who
died of breast cancer indicated 38% higher mortality among electrical work-
ers as compared to women employed in other occupations (32). The connec-
tion between exposure to a low-frequency electromagnetic field and breast
cancer has its theoretical bases. It has been observed that electromagnetic
fields reduce the production, by the pineal gland, of the nocturnal hormone
melatonin. Melatonin is an antagonist of estrogen and as such suppresses the
tumor-enhancing activity of this hormone. Although the study quoted above
lends support to the melatonin theory, the authors caution that their study
had serious limitations and that more research is needed to prove defini-
tively that a connection between electromagnetic-field exposure and breast
cancer really exists. An extensive review of the health effects of electromag-
netic fields has been published (31).
DNA Repair Mechanism
Chemical or radiation-induced DNA damage will lead to mutation only if it
is not properly repaired before, or immediately after, replication of the gen-
ome. The emphasis is on properly, because misrepair may cause mutation in
itself. The original alteration of a DNA base, caused by alkylation or dimer-
ization, is referred to as premutagenic change. The mutation is fixed only if
the damage is misrepaired or not repaired at all.
Several types of DNA repair occur. The best-elucidated type is excision
repair. Excision repair may involve two different mechanisms. In the case of
thymidine dimers, a nick is produced in the DNA strand near the damaged
area, the nucleotides are released, and the lesion is repaired with new
nucleotides by using the undamaged strand as a template. If a single base
is damaged, the repair involves removal of the base, followed by scission of
94 Environmental Toxicology
the strand and resynthesis of the damaged area as in the former case (18).
Excision repair usually functions with high fidelity. A positive correlation
has been found between the DNA excision repair potential of a species and
its longevity (33).
Other modes of repair that frequently occur following DNA replication are
not well understood. Some of them are error-prone and may be responsible
for establishment of mutations and the development of cancer (17).
According to some sources, certain repairs, such as demethylation of O6-
methylguanine, can be performed by a special methyltransferase (34).
Regardless of how good or how bad the repair mechanism is, mutation
will occur if the frequency and extent of injuries exceeds the capability of the
system or if the repair mechanism is deficient or suppressed.
Oncogenes and Tumor Supressor Genes
As has been mentioned earlier, malignancy arises from mutated genes.
However, not every genetic mutation leads to cancer. In order to develop
into cancerous growth, the mutation must occur in genes responsible for
regulating cell’s replication. There are two types of growth regulating
genes: proto-oncogenes and tumor supressor genes. The proto-oncogenes
come in many varieties. Some code for proteins that protrude from the cell’s
outer membrane and respond to growth factors. Others code for intracellular
proteins governing cell growth. Still others control cell division. Mutation in
any of these genes converts the proto-oncogenes into oncogenes and may
result in uncontrolled cell proliferation.
In contrast to oncogenes, tumor supressor genes code for proteins that
inhibit cell proliferation. Whereas in the case of proto-oncogenes mutations
in one allele only are dominant and may lead to cell proliferation, mutations
in tumor supressor genes are recessive and result in abnormal growth only
when both alleles are affected (35).
Study of genetically predisposed cancers, led A. G. Knudson to propose a
two hits hypothesis which applies to hereditary as well as to acquired can-
cers. This means that in order to transform a normal cell into a cancer cell at
least two mutations must occur in a single cell. When the mutated cell
divides additional mutations in daughter cells make them proliferate more
rapidly and the cells undergo structural changes displaying abnormal chro-
mosomes.
Although, mutations in proto-oncogenes and tumor supressor genes are
directly responsible for carcinogenic cell transformation, mutations in other
genes may increase chances of development of malignancies. For instance
mutation in the gene responsible for the synthesis of CYP1A1, an enzyme
which activates PAH to carcinogens (see Chapter 3), may lead to accumula-
tion of carcinogenic form of PAH, thus increasing chances of mutation of
proto-oncogenes. Similarly, mutation in the gene responsible for the synth-
Chemical Carcinogenesis and Mutagenesis 95
esis of glutathionetransferase may lead to an increase in the concentration of
electrophilic alkylating agents (36).
References
1. Kundson, A. G. In Origins of Human Cancer; Hiatt, H. H.; Watson, J. D.;Winsten, J. A., Eds.; Cold Spring Harbor Laboratory: Cold Spring Harbor,NY, 1977; Cold Spring Harbor Conference on Cell Proliferation, Vol. 4,Book A, p 45.
2. Office of Technology Assessment. Cancer Risk: Assessing and Reducingthe Dangers in Our Society; Westview: Boulder, CO, 1982.
3. Cancer Facts & Figures—1992; American Cancer Society: Atlanta, GA,1992.
4. Berenblum, I.; Shubik, P. Br. J. Cancer 1974, 1, 379.5. Chand, N.; Hoel, D. G. A Comparison of Models Determining Safe Levels
of Environmental Agents in Reliability and Biometry; Statistical Analysisof Lifelength; Society for Industrial and Applied Mathematics:Philadelphia, PA, 1974.
6. Miller, E. C. Cancer Res. 1978, 38, 1479.7. Williams, G. M.; Weisburger, J. H. In Cassarett and Doull’s Toxicology;
Klaassen, C. D.; Amdur, M. O.; Doull, J., Eds.; MacMillan: New York,1986; Chapter 5, p 99.
8. Berenblum, I. Carcinogenesis as a Biological Problem; Frontiers ofBiology, Vol. 34; North-Holland: Amsterdam, 1974.
9. Hecker, E. In Carcinogenesis, A Comprehensive Survey; Slaga, T. J.;Sivak, A.; Boutwell, R. K., Eds.; Raven: New York, 1978; Vol. 2,Mechanism of Tumor Promotion and Cocarcinogenesis, p 11.
10. Bachur, N. R.; Gordon, S. L.; Gee, M. V. Cancer Res. 1978, 38, 1795.11. Ceretti, P. A. In Chemical Carcinogenesis; Nicolini, C., Ed.; Plenum: New
York, 1982.12. Zamenhof, S.; Brawerman, G.; Chargaff, E. Biochim. Biophys. Acta 1952,
9, 402.13. Watson, J. D.; Crick, F. H. C. Nature (London) 1953, 171, 737.14. Harper, H. A.; Rodwell, V. W.; Mayers, P. A. Review of Physiological
Chemistry; Lange Medical: Los Altos, CA, 1979; Chapter 30, p 460.15. Allan, J.; Hartman, P. G.; Crane-Robinson, C.; Aviles, F. X. Nature
(London) 1980, 288, 675.16. Laemmli, U. K. Pharmacol. Rev. 1979, 30(4), 469.17. Pommier, Y.; Zwelling, L. A.; Kao-Shan, C. S.; Whang-Peng, J.; Bradley,
M. O. Cancer Res. 1985, 45, 3143.18. Thilly, W. G.; Call, M. K. In Cassarett and Doull’s Toxicology; Klaassen,
C. D.; Amdur, M. O.; Doull, J., Eds.; MacMillan: New York, 1986; Chapter6, p 174.
19. Weinstein, I. B. Bull. N. Y. Acad. Med. 1978, 54(4), 366.20. Lawley, P. D. In Chemical Carcinogenesis, 2nd ed.; Searle, C. E., Ed.;
ACS Monograph 182; American Chemical Society: Washington, DC,1984; Vol. 1, Chapter 7, p 325.
96 Environmental Toxicology
21. Essigman, J. M.; Croy, R. G.; Nadzan, A. M.; Busby, W. F., Jr.; Reinhold,V. N.; Buechi, G.; Wogan, G. N. Proc. Natl. Acad. Sci. U.S.A. 1977, 74(5),1870.
22. Wogan, G. N.; Croy, R. G.; Essigman, J. M.; Groopman, J. D.; Thilly, W. G.;Skopek, T. R.; Liber, H. L. In Environmental Carcinogenesis; Emmelot,P.; Kriek, E., Eds.; Elsevier North-Holland Biomedical: Amsterdam, theNetherlands, 1979; p 97.
23. Weinstein, I. B.; Jeffrey, A. M.; Jennette, K. W.; Blobstein, S. H.; Harvey,R. G.; Harris, C.; Antrup, H.; Kasai, H.; Nakanishi, K. Science(Washington, D.C.) 1976, 193, 592.
24. Jeffrey, A. M.; Jennette, K. W.; Blobstein, S. H.; Weinstein, I. B.; Beland,F. A.; Harvey, R. G.; Kasai, H.; Miura, I.; Nakanishi, K. J. Am. Chem. Soc.1976, 98, 5714.
25. Lerman, L. S. J. Mol. Biol. 1967, 3, 18.26. Davis, D. L.; Bradlow, H. L.; Woodruff, T.; Hoel, D. G.; Anton-Culver, H.
Environ. Health Perspect. 1993, 101(5), 372.27. Marshall, E. Science (Washington, D.C.) 1993, 259, 618.28. Wolff, M. S.; Toniolo, P. G.; Lee, E. W.; Rivera, M.; Dubin, N. J. Natl.
Cancer Inst. 1993, 85(8), 648.29. Hileman, B. Chem. Eng. News January 31, 1994, 19.30. Wolff, M. S.; Weston, A. Environ. Health Perspect. 1997, 105 Suppl. 4,
891.31. Hileman, B. Chem. Eng. News November 8, 1993, 15.32. Loomis, D. P.; Savitz, D. A.; Ananth, C. V. J. Natl. Cancer Inst. 1994,
86(12), 921.33. Hart, R. W.; Setlow, R. B. Proc. Natl. Acad. Sci. U.S.A. 1974, 71(6), 2169.34. Yarosh, B. D. Mutat. Res. 1985, 145, 1.35. Cavanee, W. K. and White, R. L., Scientific American, March 1995, 72.36. Swain, C. G.; Scott, C. B. J. Am. Chem. Soc. 1953, 75, 142.
Chemical Carcinogenesis and Mutagenesis 97
6Endocrine Disrupters
Historical Perspectives
The first indications that hormonal imbalance during pregnancy may result
in abnormal development of the fetus goes back to the 1930s. In 1939
researchers at Northwestern University Medical School reported that when
pregnant rats were given an extra dose of external estrogen, the offspring
suffered structural defects in their sex organs, both females and males (1) For
years, this phenomenon was considered by the scientific and medical com-
munity as specifically related to rodents and thus did not concern humans.
Furthermore, it had been generally believed that human placenta repre-
sented a barrier impenetrable by chemicals to which a pregnant woman
was exposed. The myth of the placental barrier was shattered by the thali-
domide tragedy.
The Thalidomide Tragedy and DES Controversy
Thalidomide (Figure 6.1) was developed in 1957 and found extensive use in
Europe and Australia as a prescription drug to be used in pregnancy as a
tranquilizer and against nausea. Soon, however, it had to be withdrawn from
the market because some babies of women who took thalidomide were born
highly deformed, lacking whole limbs or having underdeveloped limbs. Not
all babies of women taking thalidomide suffered deformities There was no
relationship between the total dose of the drug and the effect. Rather the
effect depended on timing—on the time during the pregnancy during which
98
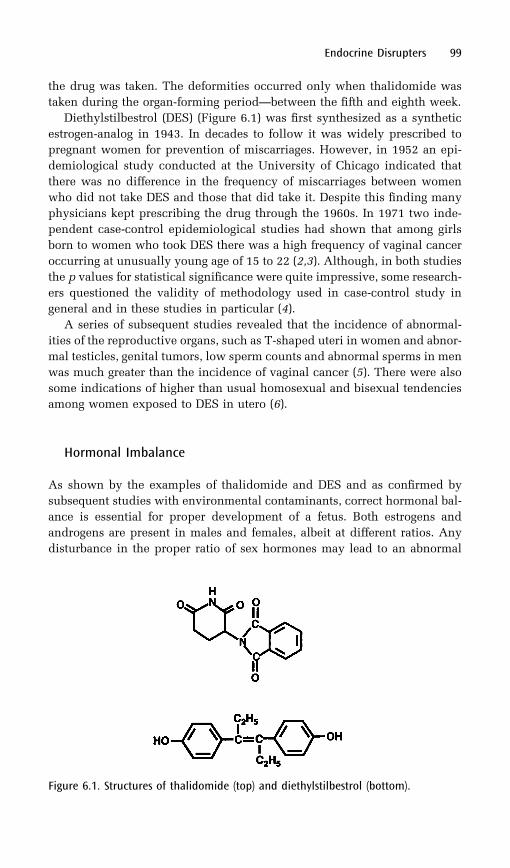
the drug was taken. The deformities occurred only when thalidomide was
taken during the organ-forming period—between the fifth and eighth week.
Diethylstilbestrol (DES) (Figure 6.1) was first synthesized as a synthetic
estrogen-analog in 1943. In decades to follow it was widely prescribed to
pregnant women for prevention of miscarriages. However, in 1952 an epi-
demiological study conducted at the University of Chicago indicated that
there was no difference in the frequency of miscarriages between women
who did not take DES and those that did take it. Despite this finding many
physicians kept prescribing the drug through the 1960s. In 1971 two inde-
pendent case-control epidemiological studies had shown that among girls
born to women who took DES there was a high frequency of vaginal cancer
occurring at unusually young age of 15 to 22 (2,3). Although, in both studies
the p values for statistical significance were quite impressive, some research-
ers questioned the validity of methodology used in case-control study in
general and in these studies in particular (4).
A series of subsequent studies revealed that the incidence of abnormal-
ities of the reproductive organs, such as T-shaped uteri in women and abnor-
mal testicles, genital tumors, low sperm counts and abnormal sperms in men
was much greater than the incidence of vaginal cancer (5). There were also
some indications of higher than usual homosexual and bisexual tendencies
among women exposed to DES in utero (6).
Hormonal Imbalance
As shown by the examples of thalidomide and DES and as confirmed by
subsequent studies with environmental contaminants, correct hormonal bal-
ance is essential for proper development of a fetus. Both estrogens and
androgens are present in males and females, albeit at different ratios. Any
disturbance in the proper ratio of sex hormones may lead to an abnormal
Endocrine Disrupters 99
Figure 6.1. Structures of thalidomide (top) and diethylstilbestrol (bottom).
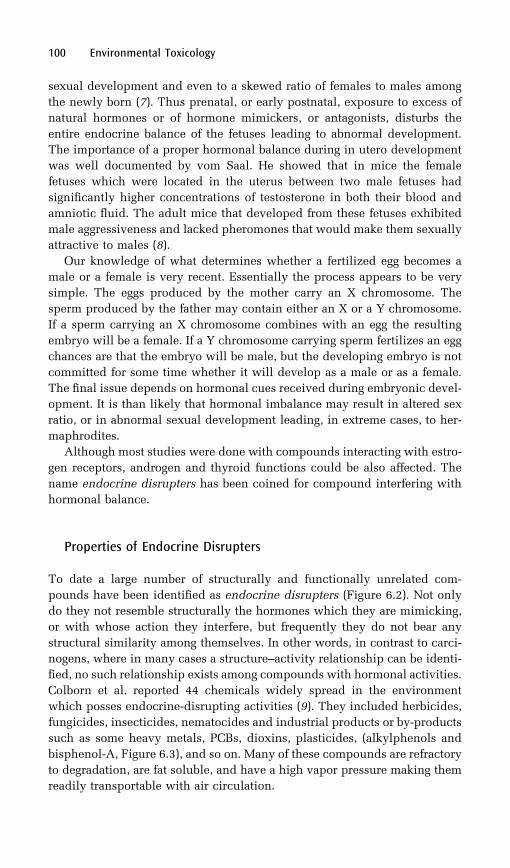
sexual development and even to a skewed ratio of females to males among
the newly born (7). Thus prenatal, or early postnatal, exposure to excess of
natural hormones or of hormone mimickers, or antagonists, disturbs the
entire endocrine balance of the fetuses leading to abnormal development.
The importance of a proper hormonal balance during in utero development
was well documented by vom Saal. He showed that in mice the female
fetuses which were located in the uterus between two male fetuses had
significantly higher concentrations of testosterone in both their blood and
amniotic fluid. The adult mice that developed from these fetuses exhibited
male aggressiveness and lacked pheromones that would make them sexually
attractive to males (8).
Our knowledge of what determines whether a fertilized egg becomes a
male or a female is very recent. Essentially the process appears to be very
simple. The eggs produced by the mother carry an X chromosome. The
sperm produced by the father may contain either an X or a Y chromosome.
If a sperm carrying an X chromosome combines with an egg the resulting
embryo will be a female. If a Y chromosome carrying sperm fertilizes an egg
chances are that the embryo will be male, but the developing embryo is not
committed for some time whether it will develop as a male or as a female.
The final issue depends on hormonal cues received during embryonic devel-
opment. It is than likely that hormonal imbalance may result in altered sex
ratio, or in abnormal sexual development leading, in extreme cases, to her-
maphrodites.
Although most studies were done with compounds interacting with estro-
gen receptors, androgen and thyroid functions could be also affected. The
name endocrine disrupters has been coined for compound interfering with
hormonal balance.
Properties of Endocrine Disrupters
To date a large number of structurally and functionally unrelated com-
pounds have been identified as endocrine disrupters (Figure 6.2). Not only
do they not resemble structurally the hormones which they are mimicking,
or with whose action they interfere, but frequently they do not bear any
structural similarity among themselves. In other words, in contrast to carci-
nogens, where in many cases a structure–activity relationship can be identi-
fied, no such relationship exists among compounds with hormonal activities.
Colborn et al. reported 44 chemicals widely spread in the environment
which posses endocrine-disrupting activities (9). They included herbicides,
fungicides, insecticides, nematocides and industrial products or by-products
such as some heavy metals, PCBs, dioxins, plasticides, (alkylphenols and
bisphenol-A, Figure 6.3), and so on. Many of these compounds are refractory
to degradation, are fat soluble, and have a high vapor pressure making them
readily transportable with air circulation.
100 Environmental Toxicology

The action of endocrine disrupters may be direct or indirect. The direct-
acting interact with hormonal receptors either by mimicking the natural
hormone or by inhibiting its action. The indirect-acting interfere with the
synthesis of sterol, the precursor of sex hormones. They exert their action at
levels comparable to those of natural hormones; at parts per trillion. Some of
them may need to be activated by the xenobiotics metabolizing system.
Whereas plasma levels of the natural hormones are finely regulated by bind-
ing any excess to plasma protein and thus rendering the hormone tempora-
rily inactive, the plasma protein is incapable of binding the hormonal
mimics, thus increasing the effective dose of the mimmic even if it may be
less potent than the natural hormone, or may occur at a lesser concentration
(5). Many of the environmental endocrine disrupters exhibit an abnormal
dose–response curve, having a shape of an inverted U.
What makes the endocrine disrupters specially insidious is that the
damage they cause is irreversible and may appear only several years after
Endocrine Disrupters 101
Figure 6.3. Structures of nonylphenol (top) a plasticizer added to polystyrene plastics,and bisphenol-A (bottom) a plasticizer added added to polycarbonate plastics.
Figure 6.2. Comparison of the structures of the natural estrogen and selected endo-crine disrupters.

exposure. Moreover the damage is not limited to the reproductive system. In
both sexes the internal and external genitalia, brain, skeleton, thyroid, liver,
kidney, and immune system are potential targets (9).
Environmental and Health Impact ofEndocrine Disrupters
Following the end of World War II, large quantities of various chemicals
began to enter the environment. Some, like pesticides and chemical fertili-
zers were applied purposefully, some were industrial products or by-pro-
ducts that escaped accidentally or were disposed of in unprotected pits. Ever
greater dependence on chemicals was a sign of progress.
It was not until 1962 that the book Silent Spring by Rachel Carson (10)
brought to light the dangers of chemical contamination of the environment.
Concerning human health, cancer was the main worry. Since that time,
many of the persistent, fat-soluble compounds such as chlorinated pesticides
(DDT, aldrin, chlordane, toxaphene), or industrial products (PCBs) have
been banned from use in the United States and in most of the industrialized
countries, but their legacy still persists. They are either the leftovers from the
previous use, or are brought by air currents from countries where they are
still in use.
The research on endocrine disrupters went on for decades, however, the
knowledge of their nature and environmental impact was confined to the
scientific community. Only after publication in 1996 of the book Our Stolen
Future by Colborn et al. (6), did the knowledge of possible environmental
and health impact of endocrine disrupters penetrate, if not the general pub-
lic, than at least the governmental authorities.
Cases of damage to wildlife inflicted by endocrine disrupters are wide-
spread all over the world. Although not in all cases could a causal effect be
definitively established, the pattern of events is highly reproducible; pol-
luted water means sickened or abnormally developed animals—mammals,
fishes, birds or reptiles.
Fish and Fish-Eating Birds
In 1981 Moccia et al. noted thyroid pathology in Great Lakes coho and
chinook salmon which appeared to have environmental ethiology (11).
Also, cases of feminization were reported to occur in male fish. It has been
observed in some rivers in the United Kingdom that male fish which con-
gregated in the vicinity of effluents from waste-water treatment plants devel-
oped vitellogenin, a protein that normally occurs only in female fish and is
needed for the development of egg yolk. The authors of this report tested a
number of chemicals known to be estrogenic in mammals and have shown
102 Environmental Toxicology
that they were also estrogenic in fish. Many of these estrogenic chemicals are
known to occur in effluents from waste-water purification plants (12). A
more recent study conducted in the United Kingdom demonstrated that
the compounds responsible for feminization of male fish were the natural
and synthetic estrogens, (estradiol and ethinyl estradiol, respectively). These
compounds, which are the main active ingredient of the conterceptive pill,
were found to be present in a very low concentration in effluents from waste-
water purification plants (13).
An extensive review providing historical data to support the hypothesis
that organochlorine chemicals introduced into Great Lakes after World War
II are the cause of reproductive failures among bald eagles was presented by
Colborn (14). An association between pollution of Great Lakes with organo-
chlorine compounds, primarily PCB, and immunosuppression in prefledg-
ling Caspian terns and herring gulls was also reported (15). A study by
scientists for the International Joint Commission reported embryo mortality,
edema and deformities syndrome in colonial fish-eating birds from Great
Lakes. Indirect evidence suggested a causal relation between the observed
syndromes and pollution of Lake Ontario with TCDD. The evidence of this
causal relation was further reinforced by the fact that the improvement of
reproduction of Lake Ontario herring gulls coincided with the decline in
organochlorine compounds and particularly TCDD and PCB (16).
Similarly, Donaldson et al. suggested that the recovery of bald eagle popula-
tion in Canadian Great Lakes is related, among other factors, to a reduction in
organochlorine levels in the waters of Great Lakes (17).
The detrimental effect of organochlorine compounds on fish-eating birds
could be further evidenced by an experiment in which gull eggs were
injected with DDT at concentrations comparable to those found in contami-
nated seabird eggs. Male birds that hatched from these eggs showed signs of
feminization; development of ovarian tissue and oviducts (18).
Mollusks
Masculinization of females has been observed in several species of mollusks
in marinas and harbors in the United Kingdom as well as along the
Connecticut coast in the United States. This phenomenon was also observed
offshore in the middle of the North Sea in the shipping lanes. The cause of
this abnormal sexual development has been traced to the paint used on boats
and ships which contained the antifouling compound (to prevent build-up of
barnacles), tributyl tin (TBT) (13).
Marine Mammals
In 1988 scientists of the Universite de Montreal described the results of
necropsies performed on carcasses of stranded beluga whales from highly
Endocrine Disrupters 103
polluted areas of the St. Lawrence River. Two animals had severe multi-
systemic lesions. In one of these two a severe necrotizing dermatitis was
associated with Herpes-like particle. Four other animals had five varieties
of tumors. High concentrations of benz(a)pyrene-DNA adducts coincided
with the high incidence of tumors. There were also high concentrations of
organochlorine compounds in the tissue of these animals (19). Occurrence of
tumors in St. Lawrence beluga whales was also reported by others (20). An
extensive review on the pathology of the dwindling population of St.
Lawrence River beluga whales has been published (21). The authors con-
cluded that ‘‘St. Lawrence belugas might well represent the risk associated
with long-term exposure to pollutants present in their environment and
might be a good model to predict health problems that could emerge in
highly exposed human population over time.’’
Reproductive failure was observed among common seals feeding on fish
from polluted waters off the coast of the Netherlands. Between 1950 and
1975 the seal population dwindled from more than 3000 to less than 500
animals. The authors of this report compared levels of PCB in the tissue of
seals from the western (the Netherlands) part with those from the northern
part of the Wadden Sea. The levels differed significantly. The reproductive
failure was thus attributed to the PCB entering the sea from the river Rhine
(22).
Suppressed immunity was blamed for the die-off of North Sea seals in
1988. The underlying cause was a distemper-like virus to which healthy
animals were resistant. However, when their immunity was compromised,
probably due to the exposure to endocrine disrupters, the animals suc-
cumbed to the virus (23).
Reptiles
In 1980 an extensive spill of the pesticide dicofol occurred in Florida at the
Tower Chemical Company located in the vicinity of Lake Apopka. The site of
the spill was placed on the EPA Superfund list. Examination of Lake Apopka
alligators revealed that 6-month-old, female alligators had plasma estrogen
concentrations almost two times greater than alligators from uncontaminated
lakes. They also exhibited abnormal ovarian morphology. The male alliga-
tors had depressed testosterone concentration, poorly organized testes and
abnormally small penises. Abnormal sexual development in both males and
females was probably responsible for reproductive failure of the species (24).
Terrestrial Mammals
Many remaining members of the dying-out population of the Florida Panther
have been found to suffer from a variety of abnormalities, such as low sperm
count, abnormal sperms, thyroid dysfunction, immunosuppression and
104 Environmental Toxicology

congenital heart defects. Many of these defects have been originally ascribed
to the lack of genetic diversity, however, current evidence seems to indicate
that environmental pollutants—DDE, PCB and mercury—may be major fac-
tors in the demise of the species (25).
Humans
The effect of endocrine disrupters in humans is not so well documented as in
wildlife. However, in a few cases the causal relation has been clearly shown,
whereas in others there was high likelihood that such relation existed.
The most significant study in this area was done by Jacobson at al. These
researchers compared 242 babies born to mothers who consumed fish from
Lake Michigan, contaminated with PCBs, with 71 control infants whose
mothers did not eat fish. The experimental group exhibited subtle behavioral
impairments, such as motor immaturity, a greater startle response, and more
abnormally weak reflexes, as compared to the controls. There was also an
inverse relationship between the mother’s fish consumption and the baby’s
birth weight and head circumference (26).
A number of IQ and achievement tests were administered to the same
children when they were 11 years of age. The exposed children showed
lower IQ than the controls and were at least two years behind in reading
comprehension (27).
Canadian health officials noted that many children in Inuit people
villages in arctic Quebec suffered from chronic ear infections and that
there were abnormalities in their immune system (28). There might be a
correlation between these symptoms and the traditional diet of people inha-
biting the arctic region, which consists, to a large extent, of fish and marine
mammals. A few studies revealed heavy dietary uptake of organochlorine
compounds and a considerable contamination of the mother’s milk with
PCBs, DDE and dieldrin (29, 30, 31). Contamination of the arctic marine
food-chain with organochlorine compounds was due to the atmospheric
transfer of these compounds from the industrialized regions further to the
south.
Studies from France (32), Denmark (33) and the United States (34) indi-
cated steady decrease in sperm count and motility among men in the United
States and industrialized countries of Europe. The Parisian study (32)
revealed 2.1% per year decrease in sperm concentration and 0.6% decrease
in motility among Parisian men between 1973 and 1992. The American
study compared the sperm concentration decreases by regions. They
reported that the decline in sperm count was seen in the United States
and in Europe, but not in non-Western countries (34). The Danish researcher
hypothesized that the increasing incidence of reproductive abnormalities in
men might be related to the exposure to endocrine disrupters in utero and
proposed a mechanism of action (33).
Endocrine Disrupters 105
References
1. Greene, R.; Burrill, M.; Ivy, A. Proc. Soc. Exp. Biol. Med. 1939, 41, 169.2. Herbst, A. L.; Ulfelder, H.; Poskanzer, D. N. Engl. J. Med. 1971, 284, 878.3. Greenwald, P.; Barlow. J. J.; Nasca, P. C.; Burnett, W. S. N. Engl. J. Med.
1971, 285, 390.4. McFarlane, M. J.; Feinstein, A. R; Horowitz, R. I. Am. J. Medicine 1986,
81, 855.5. Hileman, B. Chem. Eng. News, January 31, 1994, 19.6. Colborn, T.; Dumanoski, D.; Peterson Myers, J. Our Stolen Future,
Chapter 4; Penguin Books: New York, 1996.7. Davis, D. L. J. Am. Med. Assoc. 1998, 13, 1018.8. vom Saal, F. S.; Bromcon, F. H. Science 1980, 208, 597.9. Colborn, T.; vom Saal, F. S.; Soto, A. M. Environ. Health Perspect. 1993,
101(5), 378.10. Carson, R. Silent Spring; Houghton Mifflin: Boston, MA, 1962.11. Moccia, R. D.; Leatherland, J. F.; Sonstegard, R. A. Cancer Res. 1981,
41(6), 2200.12. Sumpter, J. P.; Jobling, S. Environ. Health Perspect. 1995, 103 Suppl. 7,
173.13. http://www.royalsoc.ac.uk/policy/index.html (search for document 06/
00)14. Colborn, T. J. Toxicol. Environ. Health 1991, 33(4), 395.15. Grasman, A. K.; Fox, G. A., Scalon, P. F.; Ludwig, G. P. Environ. Health
Perspect. 1996, 104 Suppl. 4, 829.16. Gilbertson, M.; Kubiak, T.; Ludwig, J.; Fox. G. J. Toxicol. Environ. Health
1991, 33(4), 455.17. Donaldson, G. M.; Shutt, J. L.; Hunter, P. Arch. Environ. Contam.
Toxicol. 1999, 36(1), 70.18. Fry, D. M.; Toone, C. K. Science 1981, 213, 922.19. Martineau, D.; Lagace, A.; Beland, P.; Higgins, R.; Armstrong, D.; Shugart,
L. R. J. Comp. Path. 1988, 98(3), 287.20. Dillberger, J. Veterinary Path. 1995, 32(2), 211.21. Guise, S.; Martineau, D.; Beland, P.; Fournier, M. Environ. Health
Perspect. 1995, 103 Suppl. 4, 73.22. Reijnders, P. J. Nature 1986, 324(6096), 457.23. Colborn, T.; Dumanoski, D.; Peterson Myers, J. Our Stolen Future,
Chapter 1; Penguin Books: New York, 1996.24. Guillette, L. J. Jr.; Gross, T. S.; Masson, G. R.; Matter, J. M.; Percival, H. F.;
Woodward, A. R. Environ. Health Perspect. 1994, 102(8), 680.25. Facemire, C. F.; Gross, T. S.; Guillette, L. J. Jr. Environ. Health Perspect.
1995, 103 Suppl. 4, 79.26. Jacobson, J. L.; Jacobson, S. W.; Fein, G. G.; Dowler, J. K. Dev. Psychol.
1984, 20(4), 523.27. Jacobson, J. L.; Jacobson, S. W. N. Engl. J. Med. 1996, 335(11), 783.28. Colborn, T.; Dumanoski, D.; Peterson Myers, J. Our Stolen Future,
Chapter 6; Penguin Books: New York, 1996.29. Dewailly, E.; Nantel, A.; Weber, J. P. Bull. Environ. Contam. Toxicol.
1989, 43(5), 641.
106 Environmental Toxicology

30. Kinloch, D.; Kuhnlein, H. Muir, D. C. Science Total Environ. 1992,122(1–2), 247.
31. Ayotte, P.; Dewailly, E.; Bruneau, S.; Careau, H.; Vezina, A. ScienceTotal Environ. 1995, 160–161, 529.
32. Auger, J.; Kunstmann, J. M.; Czyglik, F.; Jouannet, P. N. Engl. J. Med.1995, 332, 281.
33. Sharpe, R. M.; Skakkebaek, N. E. Lancet 1993, 341, 1392.34. Swan, S. H.; Elkin, H. P.; Fenster, L. Environ. Health Perspect. 1997,
105(11), 1228.
Endocrine Disrupters 107
7Risk Assessment
The purpose of risk assessment is estimation of the severity of harmful
effects to human health and the environment that may result from exposure
to chemicals present in the environment. The Environmental Protection
Agency (EPA) procedure of risk assessment, whether related to human
health or to the environment, involves four steps:
1. hazard assessment2. dose–response assessment3. exposure assessment4. risk characterization
Hazard Assessment
The quantity of chemicals in use today is staggering. According to the data
compiled by Hodgson and Guthrie in 1980 (1), there were then 1500 active
ingredients of pesticides, 4000 active ingredients of therapeutic drugs, 2000
drug additives to improve stability, 2500 food additives with nutritional
value, 3000 food additives to promote product life, and 50,000 additional
chemicals in common use. Considering the growth of the chemical and
pharmaceutical industries, these amounts must now be considerably larger.
Past experience has shown that some of these chemicals, although not
toxic unless ingested in large quantities, may be mutagenic and carcinogenic
with chronic exposure to minute doses, or may interfere with the reproduc-
tive or immune systems of humans and animals. To protect human health it
is necessary to determine that compounds to which people are exposed daily
108
or periodically in their daily lives (such as cosmetics, foods, and pesticides)
will not cause harm upon long-term exposure.
The discussion in this chapter will focus primarly on carcinogenicity and
mutagenicity, but also endocrine disrupters will be considered. The carci-
nogenicity of some chemicals was established through epidemiological stu-
dies. However, because of the long latency period of cancer, epidemiological
studies require many years before any conclusions can be reached. In addi-
tion, they are very expensive.
Another method that could be used is bioassay in animals. Such bioas-
says, although quite useful in predicting human cancer hazard, may take as
long as 2 years or more and require at least 600 animals per assay. This
method is also too costly in terms of time and money to be considered for
large-scale screening. For these reasons an inexpensive, short-term assay
system is needed for preliminary evaluation of potential mutagens and car-
cinogens.
Bacterial Mutagenesis Test
Several versions of the bacterial mutagenesis test exist, but by far the most
commonly used is the Ames test (2). This test uses genetically engineered
strains of Salmonella typhimurium that are incapable of synthesizing the
amino acid histidine and thus require histidine for growth. The test mea-
sures the frequency of back mutations to a histidine-independent parent
strain.
The bacteria are seeded on agar plates with minimum growth medium
that contains just enough histidine to produce a background growth, and
with the compound to be tested. The back-mutated organisms produce colo-
nies that are counted. Control plates are set to score for spontaneous muta-
tions. A dose–response curve can be traced with increasing doses of the
mutagen. Because many potential mutagens–carcinogens require metabolic
activation and bacteria do not have such an activating system, a liver micro-
somal preparation (postmitochondrial supernatant, PMS) is added to the
plates.
Several mutated strains, differing in their genetic makeup, have been
developed. This variety shows a distinction between base substitution and
frameshift mutation. In addition, supersensitive strains lack a DNA repair
system or lipopolysaccharide coating. Thus, they are more vulnerable to
exogenous chemicals.
The predictive reliability of the Ames assay has been tested experimen-
tally, and 85% of the known carcinogens tested positive. Among compounds
classified as noncarcinogens, fewer than 10% tested positive. A newer study
(3) indicated that the predictability of the Salmonella test depended greatly
on the chemical class of compounds tested. Thus only 40% of the chlori-
nated carcinogens were identified as mutagens, whereas 75% and 100% of
Risk Assessment 109
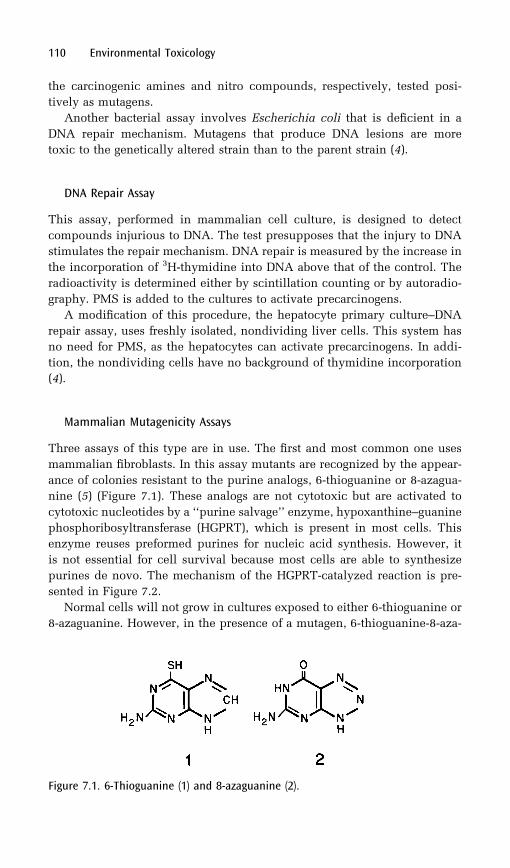
the carcinogenic amines and nitro compounds, respectively, tested posi-
tively as mutagens.
Another bacterial assay involves Escherichia coli that is deficient in a
DNA repair mechanism. Mutagens that produce DNA lesions are more
toxic to the genetically altered strain than to the parent strain (4).
DNA Repair Assay
This assay, performed in mammalian cell culture, is designed to detect
compounds injurious to DNA. The test presupposes that the injury to DNA
stimulates the repair mechanism. DNA repair is measured by the increase in
the incorporation of 3H-thymidine into DNA above that of the control. The
radioactivity is determined either by scintillation counting or by autoradio-
graphy. PMS is added to the cultures to activate precarcinogens.
A modification of this procedure, the hepatocyte primary culture–DNA
repair assay, uses freshly isolated, nondividing liver cells. This system has
no need for PMS, as the hepatocytes can activate precarcinogens. In addi-
tion, the nondividing cells have no background of thymidine incorporation
(4).
Mammalian Mutagenicity Assays
Three assays of this type are in use. The first and most common one uses
mammalian fibroblasts. In this assay mutants are recognized by the appear-
ance of colonies resistant to the purine analogs, 6-thioguanine or 8-azagua-
nine (5) (Figure 7.1). These analogs are not cytotoxic but are activated to
cytotoxic nucleotides by a ‘‘purine salvage’’ enzyme, hypoxanthine–guanine
phosphoribosyltransferase (HGPRT), which is present in most cells. This
enzyme reuses preformed purines for nucleic acid synthesis. However, it
is not essential for cell survival because most cells are able to synthesize
purines de novo. The mechanism of the HGPRT-catalyzed reaction is pre-
sented in Figure 7.2.
Normal cells will not grow in cultures exposed to either 6-thioguanine or
8-azaguanine. However, in the presence of a mutagen, 6-thioguanine-8-aza-
110 Environmental Toxicology
Figure 7.1. 6-Thioguanine (1) and 8-azaguanine (2).
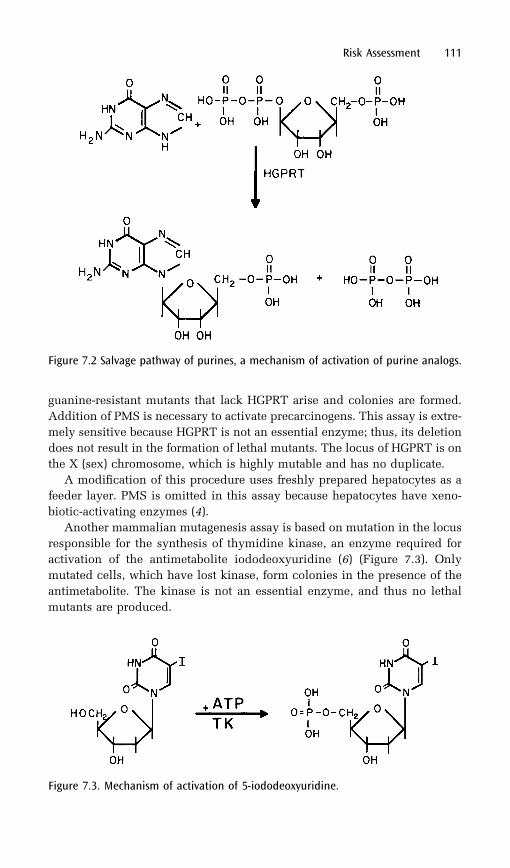
guanine-resistant mutants that lack HGPRT arise and colonies are formed.
Addition of PMS is necessary to activate precarcinogens. This assay is extre-
mely sensitive because HGPRT is not an essential enzyme; thus, its deletion
does not result in the formation of lethal mutants. The locus of HGPRT is on
the X (sex) chromosome, which is highly mutable and has no duplicate.
A modification of this procedure uses freshly prepared hepatocytes as a
feeder layer. PMS is omitted in this assay because hepatocytes have xeno-
biotic-activating enzymes (4).
Another mammalian mutagenesis assay is based on mutation in the locus
responsible for the synthesis of thymidine kinase, an enzyme required for
activation of the antimetabolite iododeoxyuridine (6) (Figure 7.3). Only
mutated cells, which have lost kinase, form colonies in the presence of the
antimetabolite. The kinase is not an essential enzyme, and thus no lethal
mutants are produced.
Risk Assessment 111
Figure 7.2 Salvage pathway of purines, a mechanism of activation of purine analogs.
Figure 7.3. Mechanism of activation of 5-iododeoxyuridine.
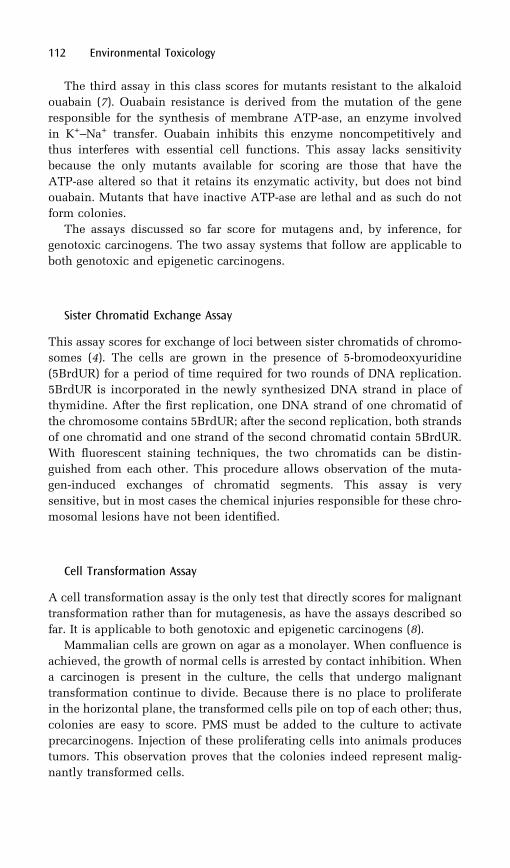
The third assay in this class scores for mutants resistant to the alkaloid
ouabain (7). Ouabain resistance is derived from the mutation of the gene
responsible for the synthesis of membrane ATP-ase, an enzyme involved
in K+–Na+ transfer. Ouabain inhibits this enzyme noncompetitively and
thus interferes with essential cell functions. This assay lacks sensitivity
because the only mutants available for scoring are those that have the
ATP-ase altered so that it retains its enzymatic activity, but does not bind
ouabain. Mutants that have inactive ATP-ase are lethal and as such do not
form colonies.
The assays discussed so far score for mutagens and, by inference, for
genotoxic carcinogens. The two assay systems that follow are applicable to
both genotoxic and epigenetic carcinogens.
Sister Chromatid Exchange Assay
This assay scores for exchange of loci between sister chromatids of chromo-
somes (4). The cells are grown in the presence of 5-bromodeoxyuridine
(5BrdUR) for a period of time required for two rounds of DNA replication.
5BrdUR is incorporated in the newly synthesized DNA strand in place of
thymidine. After the first replication, one DNA strand of one chromatid of
the chromosome contains 5BrdUR; after the second replication, both strands
of one chromatid and one strand of the second chromatid contain 5BrdUR.
With fluorescent staining techniques, the two chromatids can be distin-
guished from each other. This procedure allows observation of the muta-
gen-induced exchanges of chromatid segments. This assay is very
sensitive, but in most cases the chemical injuries responsible for these chro-
mosomal lesions have not been identified.
Cell Transformation Assay
A cell transformation assay is the only test that directly scores for malignant
transformation rather than for mutagenesis, as have the assays described so
far. It is applicable to both genotoxic and epigenetic carcinogens (8).
Mammalian cells are grown on agar as a monolayer. When confluence is
achieved, the growth of normal cells is arrested by contact inhibition. When
a carcinogen is present in the culture, the cells that undergo malignant
transformation continue to divide. Because there is no place to proliferate
in the horizontal plane, the transformed cells pile on top of each other; thus,
colonies are easy to score. PMS must be added to the culture to activate
precarcinogens. Injection of these proliferating cells into animals produces
tumors. This observation proves that the colonies indeed represent malig-
nantly transformed cells.
112 Environmental Toxicology
Carcinogenicity Testing in Fish
Several test systems for carcinogens use fish. With these systems there is no
need for elaborate cage sterilization and bedding changes. Thus, a much
larger number of animals can be used at a lower cost. A comprehensive
review of this subject has been published (9).
Biological Testing in Rodents
Bioassays (i.e., testing of chemicals in laboratory animals) give reliable infor-
mation about carcinogenicity. In spite of species differences in susceptibility
to carcinogens, every human cancer can be reproduced in animals, and most
animals are subject to cancer. Because of the cost of bioassays (EPA estimates
vary from $390,000 to $980,000 per assay) and because of the time involved
(up to 30 months), it is not realistic to test all 50,000 compounds in common
use. Therefore, a selection process for bioassay testing of chemicals has been
instituted.
Currently two such testing programs are operating in the United States.
An eight-member Interagency Testing Committee, representing different fed-
eral agencies and departments, recommends chemicals to the EPA
Administrator for testing. The National Toxicology Program (NTP)
Chemical Nomination and Selection Committee reports to the National
Cancer Institute (NCI).
Selection for bioassay is based on the results of multiple in vitro tests and
on consideration of chemical structures. Structure–activity relationship
(SAR) studies have been done with many classes of compounds and, at
least within some groups, fairly accurate predictions can be made as to the
possible carcinogenicity of a compound.
The NCI has published Guidelines for Carcinogenic Bioassay in Small
Rodents, which describes the minimum requirements for the design and
execution of a bioassay (10). The gist of these guidelines, in abridged form,
follows.
. Each chemical should be tested in at least two species and inboth sexes (rats and mice are usually used).
. Each bioassay should contain at least 50 animals in eachexperimental group.
. Exposure to chemicals should start when the animals are 6weeks old (or younger) and continue for most of their life span(for mice and rats, usually 24 months). The observation periodshould continue for 3–6 months after administration of the lastdose.
. One treatment group should receive the maximum tolerateddose (MTD), which is defined as the highest dose that can begiven that would not alter the animals’ normal life span fromeffects other than cancer. The other treatment group is treatedwith a fraction of the MTD.
Risk Assessment 113
. The route by which a chemical is administered should be thesame or as close as possible to the one by which humanexposure occurs. The chemicals may be given by any of thefollowing routes: orally (with food or water or by force-feeding),by inhalation, or topically (by application to the skin).
In some instances, two-generation bioassays are performed in which both
generations are exposed to the potential carcinogen. The advantage of this
procedure is that it exposes fetuses and very young animals, which are much
more sensitive to chemical injury than adults. The animals that die during
the study and the survivors that are killed at the completion of the study are
examined for tumors. The results are evaluated statistically with a p value of
0.05, which means that the probability that the given results were obtained
by chance is less than 5%.
The positive outcome of a bioassay indicates, but is not necessarily evi-
dence, that an agent will be carcinogenic in humans. As of 1982, the
International Agency for Research on Cancer (IARC) listed 142 substances
experimentally shown to be carcinogens in animals. Of those, only 14 have
been recognized as human carcinogens. A more in-depth treatment of this
subject is available in reference 10.
Dose–Response Assessment
When extrapolating from bioassay-generated dose–response data to obtain a
quantitative estimate of human risk, two parameters have to be considered:
biological extrapolation and numerical extrapolation.
Biological Extrapolation
Metabolic differences separate humans and test animals, and laboratory ani-
mals are usually highly inbred whereas the human population is genetically
highly heterogeneous. These contrasts generate a basic problem of how to
adjust the dose measured in bioassays to the dose experienced in humans.
Several approaches may be considered:
. Straight translation from animals to humans of milligrams perkilogram per day,
. Straight translation from animals to humans of milligram persquare meter per day,
. Straight translation from animals to humans of milligrams perkilogram per lifetime, and
. In cases where the experimental dose is measured as parts permillion (ppm) in food, water, or air, human exposure isexpressed in the same units.
114 Environmental Toxicology
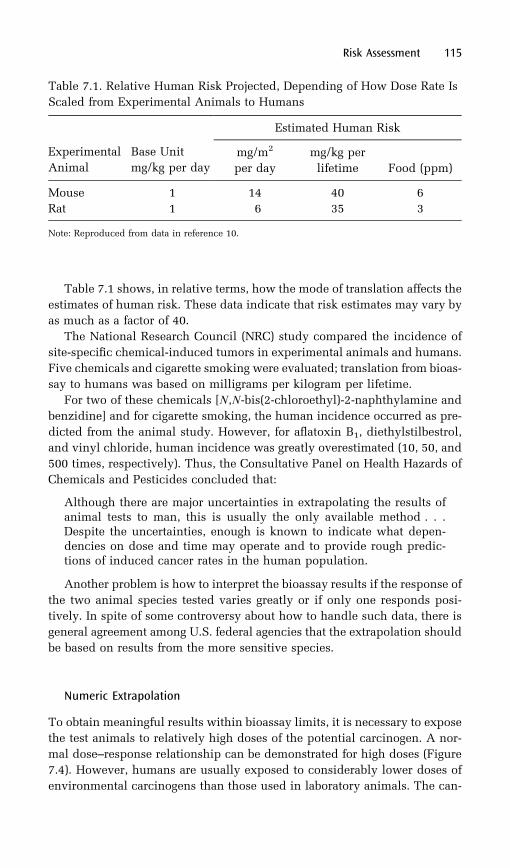
Table 7.1 shows, in relative terms, how the mode of translation affects the
estimates of human risk. These data indicate that risk estimates may vary by
as much as a factor of 40.
The National Research Council (NRC) study compared the incidence of
site-specific chemical-induced tumors in experimental animals and humans.
Five chemicals and cigarette smoking were evaluated; translation from bioas-
say to humans was based on milligrams per kilogram per lifetime.
For two of these chemicals [N,N-bis(2-chloroethyl)-2-naphthylamine and
benzidine] and for cigarette smoking, the human incidence occurred as pre-
dicted from the animal study. However, for aflatoxin B1, diethylstilbestrol,
and vinyl chloride, human incidence was greatly overestimated (10, 50, and
500 times, respectively). Thus, the Consultative Panel on Health Hazards of
Chemicals and Pesticides concluded that:
Although there are major uncertainties in extrapolating the results ofanimal tests to man, this is usually the only available method . . .Despite the uncertainties, enough is known to indicate what depen-dencies on dose and time may operate and to provide rough predic-tions of induced cancer rates in the human population.
Another problem is how to interpret the bioassay results if the response of
the two animal species tested varies greatly or if only one responds posi-
tively. In spite of some controversy about how to handle such data, there is
general agreement among U.S. federal agencies that the extrapolation should
be based on results from the more sensitive species.
Numeric Extrapolation
To obtain meaningful results within bioassay limits, it is necessary to expose
the test animals to relatively high doses of the potential carcinogen. A nor-
mal dose–response relationship can be demonstrated for high doses (Figure
7.4). However, humans are usually exposed to considerably lower doses of
environmental carcinogens than those used in laboratory animals. The can-
Risk Assessment 115
Table 7.1. Relative Human Risk Projected, Depending of How Dose Rate Is
Scaled from Experimental Animals to Humans
Experimental
Animal
Base Unit
mg/kg per day
Estimated Human Risk
mg/m2
per day
mg/kg per
lifetime Food (ppm)
Mouse 1 14 40 6
Rat 1 6 35 3
Note: Reproduced from data in reference 10.
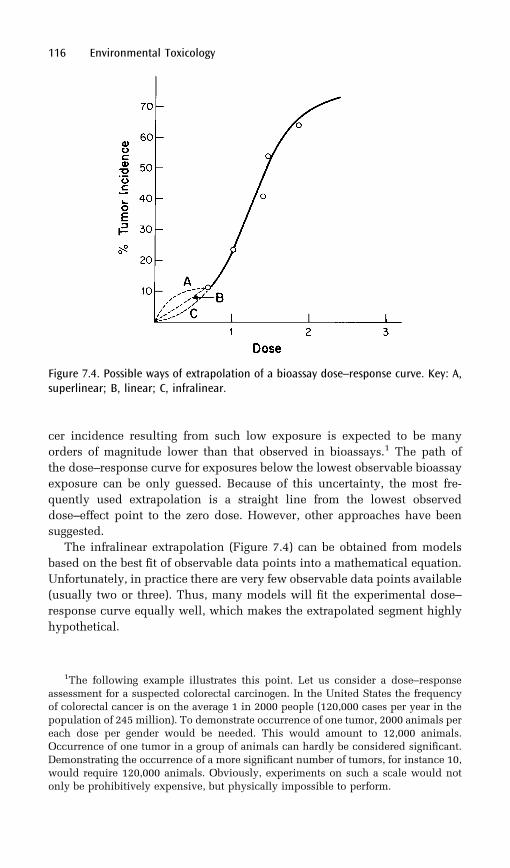
cer incidence resulting from such low exposure is expected to be many
orders of magnitude lower than that observed in bioassays.1 The path of
the dose–response curve for exposures below the lowest observable bioassay
exposure can be only guessed. Because of this uncertainty, the most fre-
quently used extrapolation is a straight line from the lowest observed
dose–effect point to the zero dose. However, other approaches have been
suggested.
The infralinear extrapolation (Figure 7.4) can be obtained from models
based on the best fit of observable data points into a mathematical equation.
Unfortunately, in practice there are very few observable data points available
(usually two or three). Thus, many models will fit the experimental dose–
response curve equally well, which makes the extrapolated segment highly
hypothetical.
116 Environmental Toxicology
1The following example illustrates this point. Let us consider a dose–response
assessment for a suspected colorectal carcinogen. In the United States the frequencyof colorectal cancer is on the average 1 in 2000 people (120,000 cases per year in the
population of 245 million). To demonstrate occurrence of one tumor, 2000 animals per
each dose per gender would be needed. This would amount to 12,000 animals.Occurrence of one tumor in a group of animals can hardly be considered significant.
Demonstrating the occurrence of a more significant number of tumors, for instance 10,
would require 120,000 animals. Obviously, experiments on such a scale would not
only be prohibitively expensive, but physically impossible to perform.
Figure 7.4. Possible ways of extrapolation of a bioassay dose–response curve. Key: A,superlinear; B, linear; C, infralinear.
Superlinear extrapolation can produce a series of hypothetical lines with-
out providing a logical reason to put more faith in any particular one. The
superlinear model concept is based on the observation that in some bioas-
says the lower doses were more effective in producing tumors than the
higher ones. The problem with this approach is that the relatively low effec-
tiveness of the higher doses was due to the agent’s toxicity. At the higher
doses many animals died before they developed tumors.
Dose–response assessment varies considerably according to the extrapo-
lation model of the dose–response curve. Compared to straight-line extrapo-
lation, the infralinear model underestimates and the superlinear model
overestimates tumor incidence.
All these models are based on a generally accepted concept that there is
no threshold dose below which there are no tumors. This point can be
neither proven nor disproven; even if tumors cannot be demonstrated
below a certain dose, perhaps if more animals were used some tumors
would appear.
Negative Results
The fact that tumors were not detected in a test population of 100 animals
does not indicate zero risk. According to statistical calculations, the absence
of tumors indicates merely that there is a 95% likelihood that the actual
incidence of tumors is no more than 0.45%. This estimate of tumor inci-
dence that might escape detection represents the upper 95% confidence
limit (see footnote 3 in Chapter 2) of an experiment with 100 animals.
It must be concluded that quantitative cancer risk assessment of environ-
mental toxins is highly hypothetical.
Exposure Assessment
The factors to be considered in exposure assessment are
. Who and what is likely to be exposed to the compound inquestion?
. How much exposure may be anticipated?
. In which way, how long, and under what circumstances willthe exposure occur?
. To make calculations of the overall human exposure possible,certain standard values of human anatomy and physiology areset (11):
. Mass (kg): man 70, woman 60, child 20.
. Skin surface area (m2): total (180 cm tall) 1.8, clothed withshort sleeves 0.3, clothed with long sleeves 0.1.
. Resting respiration rate (L/min): man 7.5, woman 6, child 4.8.
Risk Assessment 117

. Respiration rate during light activity (L/min): man 20, woman19, child 13.
. Volume of air breathed (m3/day): man 23, woman 21, child 15.
. Fluid consumption (L/day): man 2, woman 1.4, child 1.4.
. Food consumption (g/day): all humans 1,500.
The exposure assessment is not easy, not only because people move from
place to place and engage in a variety of activities, but also because all
possible routes of exposure have to be considered. Thus, for instance, to
estimate the total human exposure to a carcinogen from contaminated
groundwater, contributions of the following routes of exposure have to be
calculated:
. direct exposure through drinking;
. exposure through inhalation from showering, bathing, and otheruses of water;
. exposure through the skin by the body’s contact with thecontaminated water;
. exposure through ingestion of food that was in contact with thecontaminated water.
Moreover, at each stage of this analysis the bioavailability for each route
of entry and the metabolism of the carcinogen has to be considered.
A general criticism of the exposure assessment is that it is done for each
carcinogen separately, whereas in a real-life situation, people may be
exposed to several carcinogens at the same time. A cumulative exposure
may have an additive, synergistic, or antagonistic effect. In addition, simul-
taneous exposure to inhibitors or inducers of xenobiotic-metabolizing
enzymes may complicate the true picture even further.
Risk Characterization
The cancer risk may be expressed in several ways. The most common risk
measure is the individual lifetime risk. This expresses the probability, such
as 1 in 10,000 or 1 in 100,000 or so, that an individual will develop cancer
during his or her lifetime because of the continuous exposure to a carcino-
gen. From the straight-line extrapolation of the dose–response curve to zero,
the percentage of cancers per unit of the carcinogen is calculated. This is
called carcinogenic ‘‘potency’’ or ‘‘unit cancer risk.’’ By multiplying potency
by the exposure dose, the individual lifetime risk is obtained.
Population or societal risk is obtained by multiplying the individual risk
by the number of people exposed. It expresses the number of cases that are
due to one-year, or alternately, to lifetime exposure to a carcinogen. The time
parameter has to be defined because the results will vary greatly, depending
on whether the calculation is done for a year or for a lifetime.
118 Environmental Toxicology
The relative risk is expressed by dividing the risk (the incidence rate) in
the exposed group by the risk in the unexposed group or in the general
population.
The risk in the exposed group divided by the risk in the general popula-
tion, corrected for factors such as age and time period, is called the ‘‘stan-
dardized mortality (or morbidity) ratio.’’
Finally there is also the ‘‘loss of life expectancy.’’ This risk is calculated
by multiplying the individual lifetime risk by the average remaining lifetime
(assuming 72 years as an average life span).
Critique of Risk Assessment
Risk assessment as it is practiced in the present form was set in place in 1986
and was focusing specifically on carcinogenesis. Lately, risk assessment has
been severely criticized by both the industries and some environmental
groups. The industries were complaining that risk assessment, as it is con-
ducted under the rigid rules of the EPA, frequently imposes unnecessary
burdens on the industries for minimal benefits for protection of health and
the environment. The environmentalists, on the other hand, maintain that
risk assessment is inherently misleading. Their point is that science has no
way of evaluating the effects of exposure to several chemicals simulta-
neously. Because everyone in the real world is exposed to multiple chemi-
cals simultaneously, risk assessment is never describing the real world, yet
almost always pretends to describe the real world. Risk assessment pretends
to determine ‘‘safe’’ levels of exposure to poisons, but in fact it cannot do any
such thing. Therefore, risk assessment provides false assurances of safety
while allowing damage to occur (12). Besides, there are no agreed-upon
ways of assessing health effects other than cancer, such as damage to the
nervous system, immune system, or genes.
Ames and his co-workers (13) raised another criticism. They question the
value of the bioassay for quantitative assessment of carcinogenicity in
humans on the ground that the MTD is toxic enough to cause cells’ death.
This in turn allows neighboring cells to proliferate. In addition, the death of
cells stimulates phagocytosis, and with it, release of oxygen radicals. Both
cell proliferation and release of free radicals are important aspects of the
carcinogenic process. In other words, use of sublethal doses (MTD) in itself
potentiates the carcinogenicity of a compound.
Presently the EPA, recognizing that the conventional process of risk
assessment is outdated, is revising the process to conform with new scien-
tific information. Thus, more weight should be given to the structure–activ-
ity relationship, toxicity to genes, and mode of action. The revised process
calls for addition of a narrative summary of the hazard characterization (14).
Some researchers recommend use of biomarkers, such as for instance DNA
adduct formation, as an improved way of assessing cancer risk (15).
Risk Assessment 119
Also, a new classification of hazardous substances with respect to their
carcinogenic effect was proposed (14):
Category I. Carcinogenic risk to humans under any conditions.Category II. Carcinogenic risk to humans, but only under limitedconditions.Category III. Although carcinogenic in animals, not likely to posea carcinogenic hazard to humans.Category IV. Either a demonstrable lack of carcinogenicity, or noevidence is available.
Despite all the revisions, risk assessment presents only an approximation
of the real risk determination. Yet that is the best we have at present. Let us
hope that as our scientific knowledge increases, new and more accurate ways
of determining the risk to human health and to the environment will be
forthcoming.
Risk Assessment of Endocrine Disrupters
The 1996 amendment to the Safe Drinking Water Act (SDWA) and the, then
newly enacted, Food Quality Protection Act (FQPA) (see Chapter 15) man-
dated the EPA to implement a screening and testing program for endocrine
disrupters to be in place and operational by September 2000. An advisory
panel convened by the EPA recommended that 87,000 compounds ought to
be tested for their potential endocrine system disrupting activity. Before
testing, the chemicals would go through an initial sorting. The high priority
group will comprise all pesticides and all compounds with an annual pro-
duction volume greater than 10,000 lb. Because of the large quantity of
chemicals to be tested the screening procedure was divided into two tiers.
First tier, or pre-screening involves short-term tests designed to determine
whether the chemical interacts with estrogen, androgen, or thyroid recep-
tors. It consists of three in vitro assays and five in vivo assays in rodents,
frogs and fish.2
Compounds being positive in the pre-screening will undergo second tier
testing. This will consist of five assays: two-generation reproductive toxicity
120 Environmental Toxicology
2Examples of short-term in vitro tests are:
� E-screen which utilizes cultured cancer breast cells dependent on estrogen for
growth.� Genetically engineered yeast cells containing human estrogen receptor linked to
a gene that encodes enzyme �-galactosidase. Thus compounds that bind to the estro-
gen receptor cause increase in the synthesis of �-galactosidase.� An in vivo test involves rodents with immature or removed ovaries. The tested
chemical is given to the animals over several days. The uteri of the autopsied animals
are then compared with those of controls to determine whether the chemical has
prompted uterine growth.
study in mammals, reproductive toxicity study in birds, a fish life-cycle
assay, a crustacean life-cycle assay, and amphibian reproductive toxicity
assay. Compounds having endocrine disrupting activity in the second tier
study will undergo additional hazard assessment.
The cost of first tier screening is estimated at $15 million and that of
second tier at $25 million (16).
Ecological Risk Assessment
While human-health risk assessment, although far from perfect, has now
been firmly in place for several years, a new concern has emerged regarding
ecological risk assessment. Although ecological risk assessment is required
by government agencies before implementation of new projects, there is a
growing realization of the complexity of the problems. First of all, in contrast
to human-health risk assessment, which concerns individuals of a single
species, ecological risk assessment deals with populations of thousands of
species. Second, because of the complexity and the interwoven nature of
ecosystems, there is the problem of proper selection of an end point. An
example of this complexity is the symbiotic relationship between freshwater
mussels and fish. Larval mussels must attach to a particular fish species
during development. Thus, the demise of a fish species will result in extinc-
tion of the mussel population. Further, there is a growing realization that
degradation of an ecosystem can be due not only to chemical but also to
biological and physical factors such as introduction of exotic species or land
development. Even if chemicals alone would be considered, the multitude of
chemical agents in the environment and their possible cumulative or syner-
gistic effect make study of the adverse impact of a single chemical agent
highly speculative.
In 1992 the EPA published Framework for Ecological Risk Assessment.
However, an EPA advisory body called the Risk Assessment Forum is scru-
tinizing the field to lay the groundwork for new ecological risk assessment
guidelines (17).
The Principle of Precautionary Action
The alternative to risk assessment is the principle of precautionary action.
This principle says that if a chemical compound or a mixture may present a
health, or environmental hazard, even in the absence of scientific certainty,
the compound or the mixture should not be introduced into the environment
until it is proven that it is safe. In other words it is up to the manufacturer or
importer of the chemicals to demonstrate the safety of his products, rather
than expecting the decision-makers to present a scientific certainty of no
harm.
Risk Assessment 121
The principle of precautionary action was incorporated into the Rio
Declaration, agreed upon during the United Nations Conference on
Environment and Development, held in Rio de Janeiro in the summer of
1992. The Rio Declaration states, ‘‘In order to protect the environment, the
precautionary approach shell be widely applied by the States according to
their capabilities. Where there are threats of serious or irreversible damage,
lack of full scientific certainty shell not be used as a reason for postponing
cost-effective measures.’’ A new handbook from the Science and
Environmental Health Network how the precautionary principle can be
applied on the local level was published recently (18).
References
1. Introduction to Biochemical Toxicology; Hodgson, E.; Guthrie, F. E., Eds.Elsevier: New York, 1980; Chapter 8, p 143.
2. Ames, B. N.; McCann, J.; Yamasaki, E. Mutat. Res. 1975, 31, 347.3. Zeiger, E. Cancer Res. 1987, 47, 1287.4. Williams, G. M.; Weisburger, J. H. In Cassarett and Doull’s Toxicology;
Klaasen, C. D.; Amdur, M. O.; Doull, J., Eds.; Macmillan: New York,1986; Chapter 5, p 99.
5. Chu, E. H. Y.; Malling, H. V. Proc. Natl. Acad. Sci. U.S.A. 1968, 61, 1306.6. Clive, D.; Flamm, W. G.; Machesco, M. R.; Bernheim, N. J. Mutat. Res.
1972, 16, 77.7. Huberman, E.; Sachs, L. Proc. Natl. Acad. Sci. U.S.A. 1976, 73, 188.8. Heidelberger, C.; Freeman, A. E.; Pienta, R. J.; Sivak, A.; Bertram, J. S.;
Casto, B. C.; Dunkel, V. C.; Francis, M. W.; Kakungaj, T.; Little, J. B.;Schechtman, L. M. Mutat. Res. 1983, 114, 283.
9. Use of Small Fish Species in Carcinogenicity Testing; Hoover, K. L., Ed.;National Institutes of Health: Bethesda, MD, 1984; National CancerInstitute Monograph 65; Proceedings of a symposium held at ListerHill Center, Bethesda, MD.
10. Office of Technology Assessment. Cancer Risk: Assessing and Reducingthe Dangers to Our Society; Westview: Boulder, CO, 1982.
11. Cohrsen, J. J.; Covello, V. T. Risk Analysis: A Guide to Principles andMethods for Analyzing Health and Environmental Risk; U.S. Council onEnvironmental Quality: Washington, DC, 1989.
12. Rachel’s Environment and Health Weekly; No. 470, Nov. 30, 1995;Environmental Research Foundation, 105 Eastern Avenue, Suite 101,Annapolis, MD 21403–3300.
13. Ames, B. N.; Magaw, R.; Swirski Gold, L. Science (Washington, D.C.)1987, 236, 271.
14. Hanson, D. J. Chem. Eng. News September 26, 1994, 21.15. Golstein, B. D. Drug Metabolism Reviews 1996, 28(1&2), 225.16. Hileman, B. Chem. Eng. News, May 10, 1999, 27.17. Renner R. Environ. Sci. Technol. 1996, 30(4), 172A.18. Raffensperger, C; Tickner, J. Protecting Public Health and Environment:
Implementing the Precautionary Principle. Island Press, Washington,DC, 1999.
122 Environmental Toxicology
8Occupational Toxicology
Threshold Limit Values and Biological Exposure Indices
Industrial workers make up the segment of the population that is most vul-
nerable to chemical injury. To protect them from occupation-related harm,
the American Conference of Governmental and Industrial Hygienists pub-
lishes annually revised threshold limit values (TLVs) (1), guidelines for per-
missible chemical exposure at the work place.
TLV refers to concentrations of substances in parts per million or milli-
grams per cubic meter in the air to which most workers can be exposed on a
daily basis without harm. These values apply to the work place only. They
are not intended as guidelines for ambient air quality standards for the
population at large.
Obviously, genetic variations and diverse lifestyles (such as smoking,
alcohol use, medication, and drug use) must be considered. Hypersensitive
individuals may be adversely affected by exposure to certain chemicals even
within the limits of the TLV. Thus, TLVs should be treated as guidelines only
and not as fixed standards. The recommended goal is to minimize chemical
exposure in the work place as much as possible.
TLVs are expressed in three ways:
1. Time-weighted average (TLV–TWA) designates the averageconcentration of a chemical to which workers may safely beexposed for 8 h per day and 5 days per week.
2. Short-term exposure limit (TLV–STEL) designates permissibleexposure for no more than 15 min, and no more than fourtimes per day, with at least 60-min intervals betweenexposures.
123
3. Ceiling concentrations (TLV–C) are concentrations that shouldnot be exceeded at any time.
How protective the TLVs are is being questioned. The 1990 report that
analyzed the scientific underpinnings of the TLVs revealed that at the expo-
sure at or below the TLV, only few cases showed no adverse effect (2). In
some cases even 100% of those exposed were affected. On the other hand,
there was a good correlation between the TLVs and the measured exposure
occurring in the work place. Thus, it appears that the TLVs represent levels
of contaminants that may be encountered in the work place, rather than
protective thresholds.
Biological exposure indices (BEIs) provide another way of looking at
exposure to chemicals. This method supplements air monitoring for compli-
ance with TLV standards. BEIs are standards of permissible quantities of
chemicals in blood, urine, or exhaled air of exposed workers.
These standards are useful in testing the efficacy of personal protective
equipment and determining a chemical’s potential for dermal or gastrointest-
inal absorption. Of course, BEI findings have to be interpreted carefully. The
results may be affected by external factors such as lifestyle and exposure
outside the work place.
Respiratory Toxicity
The morphology and physiology of the respiratory system and its role as an
important route of entry for xenobiotics was discussed in Chapter 2.
Respiration, the exchange of O2 and CO2 with blood, is only one of several
functions of the lungs, albeit the most important of them. Other functions
include excretion of gaseous metabolites and metabolism and regulation of
circulating levels of vasoactive hormones such as angiotensin, biogenic
amines, and prostaglandins (3).
Any damage to the lung tissue responsible for these regulatory functions
will affect blood pressure and consequently the lungs’ perfusion with blood.
To maintain proper oxygenation of blood, a match is necessary between
alveolar ventilation1 (5250 mL of air per min) and the volume of blood
perfusing the lungs (5000 mL/min). Any change in blood flow will perturb
this ventilation–perfusion balance and result in dysfunction of the organism.
Toxins (gases, vapors, or aerosols) may injure respiratory tissue, or they
may cause systemic toxicity by penetrating the tissue and entering the cir-
culation. Injuries to the respiratory system vary in severity (depending on the
124 Environmental Toxicology
1Alveolar ventilation is defined as the volume of gas available for exchange with
blood during 1 min [alveolar ventilation¼ (tidal volume� residual volume)� (breaths
per minute)]. Residual volume is the volume of gas remaining in the lungs after max-
imal exhalation. For a definition of tidal volume, see Chapter 2.
agent and the degree of intoxication) from irritation to edema, fibrosis, or
neoplasia. The site of toxicity depends on the water solubility of a gas or on
the size of aerosol particles or droplets.
Irritation of Airways and Edema
Water-Soluble Gases
The upper respiratory system is susceptible to attack by water-soluble gases
such as ammonia, chlorine, sulfur dioxide, and hydrogen fluoride. Before a
gas can gain access to the tissue, it has to penetrate the mucous lining. This
barrier imparts some protection against very small quantities of toxic gases,
but it does not protect the tissue against large doses. Toxicity to the respira-
tory tissue in this region is most frequently manifested by irritation.
However, edema may occur in more severe cases.
Edema results from damage to the cell membrane; this damage affects
membrane permeability and causes release of cellular fluid. Swelling of
the tissue, constriction of the airways, difficulty with breathing, and
increased sensitivity to infection are manifestations of edema. The develop-
ment of edema is a slow process. Because it may take many hours before it is
fully developed, the affected individual may not be aware of the danger.
People with respiratory diseases, such as asthma or chronic bronchitis,
are affected to a greater extent than healthy individuals. Although survivors
may recover without permanent damage, very severe exposure to such
water-soluble gases may be fatal.
Large Aerosol Particles
Aerosols of particles larger than 2 mm also cause damage to the upper
respiratory system. Arsenic oxides, sulfides, and chlorides are used in a
variety of industries, such as manufacturing of colored glass, ceramics, semi-
conductors, and fireworks and in hide processing. However, upper respira-
tory exposure to these compounds is most likely to occur in ore-smelting
industries and in pesticide manufacturing.
In these cases, particles of arsenic compounds are usually too large to
penetrate into the lung alveoli and are deposited in the nasopharyngeal
region and in the upper bronchi. Their toxicity is manifested by irritation
of the airways that results in a chronic cough, laryngitis, and bronchitis-like
symptoms. Arsenic trioxide (As2O3) is a suspected human carcinogen; expo-
sure to this compound should be kept to a minimum. Compounds consid-
ered to be carcinogens are listed and described by the National Toxicology
Program in their annual report on carcinogens and in the monographs of the
International Agency for Research on Cancer (IARC).
Occupational Toxicology 125
Chromium and its compounds are used in stainless steel manufacturing,
chrome plating, pigment manufacturing, and hide processing. Hexavalent
chromium compounds such as chromate (CrO2�4 ) and bichromate (Cr2O
2�7 )
cause nasal irritation, bronchitis-like symptoms, and (on chronic exposure)
lung tumors and cancer.
Exposure to nickel and its monoxide (NiO) and subsulfide (Ni2S3) may
occur during the processing of nickel ores. Because the ore dust particles are
rather large, their toxicity is confined to the nasal mucosa and to the large
bronchi. Nickel subsulfide in the form of dust or fumes is a confirmed human
carcinogen of the nasal cavity.
Poorly Water Soluble Gases and Vapors
Examples of poorly water soluble gases that penetrate deep into the lungs,
causing damage to alveolar tissue, are ozone (O3), nitrogen dioxide (NO2),
and phosgene (COCl2). The mode of action of ozone and nitrogen dioxide is
related to their oxidizing potential.
Peroxidation of cellular membranes causes edema. In addition, NO2
reacts with alveolar fluid to form HNO2 and HNO3, corrosive acids that
also damage the cells. Exposure to ozone may occur in a variety of industrial
settings because ozone is used for bleaching waxes, textiles, and oils.
Nitrogen dioxide is widely used in chemical industries and in the manufac-
ture of explosives.
Some metals and their derivatives, such as cadmium oxide (CdO), nickel
carbonyl [Ni(CO)4], and beryllium also cause pulmonary edema. Cadmium
oxide is used in the manufacture of semiconductors, silver alloys, glass,
battery electrodes, and cadmium electroplating. The fumes of CdO consist
of extremely fine particles that penetrate alveoli. Inhalation of such fumes
leads to edema, pneumonitis, and proliferation of type I pneumocytes of the
alveolar lining. Chronic exposure may result in emphysema. CdO is also
listed by both the EPA and the International Agency for Research on
Cancer (IARC) as a carcinogen that primarily induces prostatic cancer.
Nickel carbonyl is a highly volatile liquid used in nickel refining and
nickel plating. Inhaled vapors cause pulmonary edema. In case of exposure,
48 h of surveillance is necessary.
Metallic mercury and its derivatives are widely used as catalysts and
fungicides and for numerous industrial applications. The high volatility of
metalic mercury makes exposure especially dangerous, as it may enter the
circulation easily via the respiratory route. Although inhaled mercury vapor
is primarily a toxin of the central nervous system, it also causes corrosive
bronchitis and interstitial pneumonitis.
Work-related exposure to beryllium dust may occur in the manufacture of
ceramics and alloys and during the extraction of beryllium from its ore. The
fine dust of beryllium enters alveoli and causes pulmonary edema. Chronic
126 Environmental Toxicology
exposure leads to granulomatous pulmonary disease (referred to as beryllio-
sis), which may progress to pulmonary fibrosis. Beryllium has been shown to
be a carcinogen in animals and is also a suspected human carcinogen.
Phosgene, used in the preparation of many organic chemicals, is also
manufactured as a war gas. It is highly toxic as it undergoes hydrolysis to
CO2 and HCl in the lungs. The liberated HCl causes damage to the alveolar
cells and, in turn, severe edema. The onset of the edema may be delayed for
as long as 48 h.
Paraquat
The herbicide paraquat (see Chapter 11) is highly toxic to the respiratory
system. It causes pulmonary edema regardless of the route of entry into the
system. Whether paraquat is inhaled or ingested, it enters the alveolar space
and becomes concentrated in type II pneumocytes. Its toxicity probably
results from generation of superoxide radicals (.O2) (3), which may cause
peroxidation of cellular membranes. Paraquat is eliminated from the body
by being actively secreted into the renal tubules. However, it also damages
the tubules, and thus inhibits its own secretion. As a result, it accumulates in
the blood and leads to pulmonary toxicity.
Diquat, a structural analog of paraquat, although equally toxic to cultured
lung cells, does not exert pulmonary toxicity in vivo. This difference in
activity probably occurs because diquat is not retained in the alveolar cells.
Pulmonary Fibrosis
Pulmonary fibrosis, also designated as pneumoconiosis, is another response
of lungs to respiratory toxins. The initial injury to the cells is caused by
physical rather than chemical action of minute solid particles or fibers. In
the early stages of the disease, small (1–10 mm in diameter) islets of collagen
are deposited in the pulmonary region. The islets grow progressively larger,
eventually fusing into a network of fibers pervading the whole lung and
leading to a loss of lung elasticity. In addition, blood vessels in the affected
areas narrow, and alveolar walls are destroyed; the results are decompart-
mentalization of the alveoli and emphysema. The injury is assumed to be
related to the activity of macrophages that engulf the injurious particles,
which in turn damage lysosomal membranes and release lysozymes. The
macrophages are digested by their own enzymes and release the engulfed
particles; the process may then be repeated. Thus, a single particle is capable
of destroying numerous macrophages.
Deposition of collagen probably results from the stimulation of fibroblasts
by a factor, or factors, released from broken macrophages. Simultaneously,
another factor, referred to as the lipid factor, is released and stimulates the
Occupational Toxicology 127
generation of more macrophages (4). A cascade of events seems to lead to
deposition of increasing amounts of collagen.
Silicosis
Silicosis results from chronic exposure to respirable particles of crystalline
silica; amorphous forms do not cause this disease. Animal experiments indi-
cate that inhalation of amorphous silica causes only minimal fibrosis.
However, under such conditions only a small amount of silica was retained
in the lungs. In contrast, when injected into the peritoneum or into the lungs,
amorphous silica was more fibrogenic than crystalline quartz (4). Silicosis is
frequently complicated by the onset of tuberculosis.
Black Lung Disease
Black lung disease, a common illness of coal miners, was for a long time
thought to be caused by chronic exposure to coal dust because lungs of the
deceased victims were blackened by coal. It appears now that the disease,
which has all the characteristics of lung fibrosis, is most likely caused by
silica dust produced in the process of coal mining.
Asbestosis
Asbestos is a group of hydrated fibrous silicates that are divided into two
basic families: the curly, named ‘‘serpentine,’’ and the rodlike, named
‘‘amphibole’’ (5). The types belonging to the amphibole family are the
most pathogenic; their toxicity depends on the size of the fibers and perhaps
on other physical properties. The most harmful fibers are 5 mm in length and
0.3 mm in diameter.
Asbestosis is encountered among workers employed in the mining of
asbestos or in the construction or demolition of housing that contains asbes-
tos. Cases of asbestosis have also been observed among janitors and plum-
bers working in schools and office buildings. In this case, the exposure
comes from asbestos insulation of steam pipes and boilers.
In addition to fibrosis, the symptoms of asbestosis involve calcification of
the lung and formation of mesothelial tumors. The latency period for
mesothelial tumor development is unusually long. Up to 30 years may elapse
between exposure and the clinical appearance of neoplasia. The widely
publicized high incidence of asbestosis and related mesothelial and lung
tumors that occurred during the 1970s was a result of asbestos exposure of
shipyard workers employed by the U.S. Navy during World War II.
Asbestos fibers have the potential to migrate into the peritoneal cavity and
cause tumors of the peritoneal mesothelium. Tobacco smoke potentiates the
effect of asbestos and promotes lung tumor formation (6).
128 Environmental Toxicology
Pulmonary Neoplasia
One of the frequent causes of occupationally related pulmonary neoplasia is
respiratory exposure to polycyclic aromatic hydrocarbons (PAHs). As will be
discussed in the following chapters, PAHs are carried into the lungs by
minute particles of soot and fly ash. The risk of lung cancer from this source
is greatest among coke oven and coal tar pitch workers. Tobacco smoke,
which is the main cause of lung cancer overall, increases the risk of pulmon-
ary neoplasia among the population exposed to PAHs at the work place.
The habit of smoking, which is rapidly decreasing among the more highly
educated classes of society, is still very much ingrained among blue-collar
workers. Unfortunately, the nature of their work makes this segment of the
population most vulnerable to chemical injury.
The TLV–TWA values of the compounds and substances discussed in this
section are presented in Table 8.1.
Allergic Responses
The Immune System
The immune system performs two essential roles: It provides resistance to
infectious agents and surveillance against arising neoplastic cells. These
functions are performed through several highly specialized cells collectively
referred to as leukocytes, or as they are commonly known, white blood cells.
Leukocytes originate from the stem cells of the bone marrow. As they mature
they differentiate as granulocytes, lymphocytes, and macrophages. The lym-
phocytes are further differentiated into T-lymphocytes, B-lymphocytes, and
non-T, non-B lymphocytes.2
There are two mechanisms of immune responses:
. nonspecific or constitutive
. specific
The nonspecific immune system does not require a prior contact with an
inducing agent and lacks specificity for antigens. It constitutes the orga-
nism’s primary defenses and involves two types of phagocytic cells: granu-
locytes (polymorphonuclear leukocytes, PMNs), and macrophages
(mononuclear leukocytes, MOs); and two types of non-T, non-B lymphocytic
killer cells: natural killer (NK) cells and antibody-dependent killer cells
(antibody-dependent cellular cytotoxicity, ADCC) cells. The NK cells have
a spontaneous cytolytic activity against many different tumor cells. The
ADCC killer cells require antibody to lyse the target tumor cells (see the
Occupational Toxicology 129
2The designations T and B indicate the primary lymphoid tissue where the matura-
tion of lymphocytes occurs; T stands for thymus and B for bursa-equivalent.
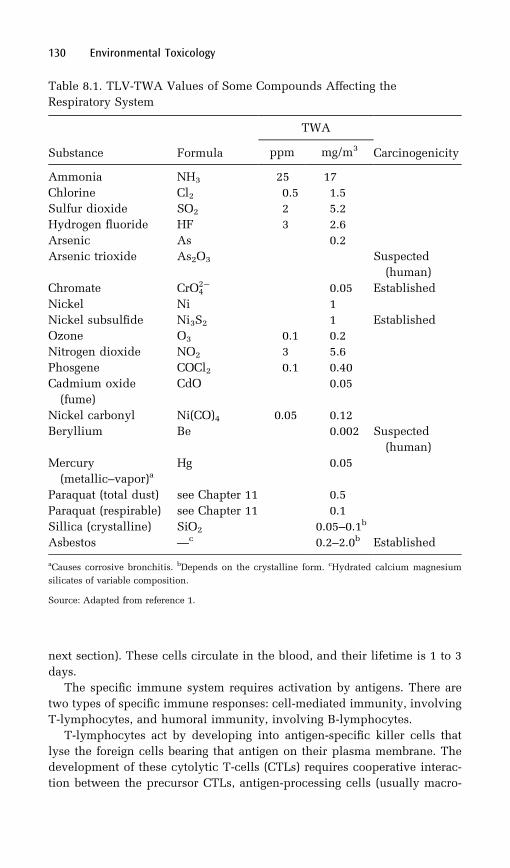
next section). These cells circulate in the blood, and their lifetime is 1 to 3
days.
The specific immune system requires activation by antigens. There are
two types of specific immune responses: cell-mediated immunity, involving
T-lymphocytes, and humoral immunity, involving B-lymphocytes.
T-lymphocytes act by developing into antigen-specific killer cells that
lyse the foreign cells bearing that antigen on their plasma membrane. The
development of these cytolytic T-cells (CTLs) requires cooperative interac-
tion between the precursor CTLs, antigen-processing cells (usually macro-
130 Environmental Toxicology
Table 8.1. TLV-TWA Values of Some Compounds Affecting the
Respiratory System
Substance Formula
TWA
Carcinogenicityppm mg/m3
Ammonia NH3 25 17
Chlorine Cl2 0.5 1.5
Sulfur dioxide SO2 2 5.2
Hydrogen fluoride HF 3 2.6
Arsenic As 0.2
Arsenic trioxide As2O3 Suspected
(human)
Chromate CrO2�4 0.05 Established
Nickel Ni 1
Nickel subsulfide Ni3S2 1 Established
Ozone O3 0.1 0.2
Nitrogen dioxide NO2 3 5.6
Phosgene COCl2 0.1 0.40
Cadmium oxide
(fume)
CdO 0.05
Nickel carbonyl Ni(CO)4 0.05 0.12
Beryllium Be 0.002 Suspected
(human)
Mercury
(metallic–vapor)aHg 0.05
Paraquat (total dust) see Chapter 11 0.5
Paraquat (respirable) see Chapter 11 0.1
Sillica (crystalline) SiO2 0.05–0.1b
Asbestos —c 0.2–2.0b Established
aCauses corrosive bronchitis. bDepends on the crystalline form. cHydrated calcium magnesium
silicates of variable composition.
Source: Adapted from reference 1.

phages), and other T-cells called T-helper cells. Humoral immunity involves
B-lymphocytes which, after sensitization by an antigen, produce antibodies.
Antibodies are proteins of a general structure consisting of two light and two
heavy chains. The chains are connected with each other by S–S linkages
(Figure 8.1). Each chain has a ‘‘variable region’’ and a ‘‘constant region.’’ The
variable region is responsible for the interaction with an antigen, whereas the
constant regions of heavy chains are responsible for biological activation of
ADCC killer cells, the granulocyte, and the macrophage.
The Antibodies’ Mode of Action
The five general classes of antibodies are IgM, IgG, IgA, IgD, and IgE, where
Ig stands for immunoglobulin. Their mode of action involves four pathways:
. neutralization of viruses;
. opsonization, that is, inactivation of viruses and bacteria bycoating;
. binding to antigens and linking them to ADCC killer cells;
. complement fixation, that is, a cascade of events involvingsequential binding to 20 serum proteins, resulting in generationof biological activities capable of cell lysing.
There are also other interactions and mutual reinforcements between the
humoral and cell-mediated immune systems that are not discussed here. For
more details on this subject, the reader is referred to reference 7.
Occupational Toxicology 131
Figure 8.1. Schematic representation of an antibody.
Dysfunctions of the Immune System
An injury to the immune system may occur at doses of toxic agents much
below those at which toxicity is apparent. Because immunocompetent cells
require continued proliferation and differentiation, the immune system is
very sensitive to agents that suppress cells’ proliferation.
Assessment of an injury to the immune system may be based on any of the
following symptoms: increased susceptibility to infections, changes in the
peripheral leukocyte count and cell differential count, alteration in histology
of lymphoid organs, and depressed cellularity of the lymphoid tissue.
Dysfunctions of the immune system may involve allergic reactions,
immune suppression, uncontrolled proliferation, and autoimmunity.
Allergic reactions occur when the immune system responds adversely to
environmental agents. The immune system, which is designed to inactivate
and eliminate foreign bodies, reacts abnormally in some individuals when
challenged with specific substances. Examples of allergies are asthma and
contact dermatitis. Examples of uncontrolled proliferation are leukemia and
lymphoma.
Immune suppression may be a genetic phenomenon, but it may also be
induced by drugs, infections, neoplasia (as in the case of leukemia), exposure
to radiation, malnutrition, and environmental or occupational exposure to
chemical agents.
Autoimmunity is the reactivity of the individual’s system against its own
tissue. It may have a genetic origin, or it may be due to exposure to environ-
mental chemicals that bind to tissue or serum products. Consequently these
modified ‘‘self-antigens’’ produce immune responses.
Common Agents
The agents that induce an allergic response vary greatly and can involve
such things as organic chemicals, metals, dusts, and bacteria. Examples of
some chemicals frequently responsible for occupation-related allergies are
toluene diisocyanate, used in plastic and resin manufacturing; formalde-
hyde, widely used in manufacturing phenolic resins, in textile finishes, in
the processing of hides, and in numerous other industrial processes; and
hexachlorophene, used in manufacturing germicidal soaps and cosmetics.
The chemical structures of these compounds are presented in Figure 8.2.
Some metals such as beryllium, chromium, and nickel can cause contact
dermatitis.
Allergies of Food Industries
A number of allergies affect workers employed in agricultural and food
industries. Farmer’s lung disease is a reaction to spores of thermophilic
fungi, which grow in damp hay at temperatures of 40–60 8C. In sensitive
132 Environmental Toxicology
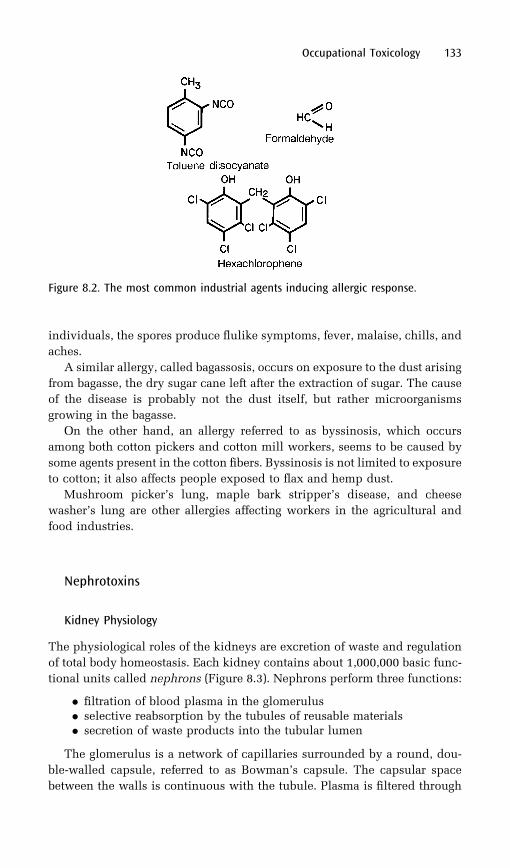
individuals, the spores produce flulike symptoms, fever, malaise, chills, and
aches.
A similar allergy, called bagassosis, occurs on exposure to the dust arising
from bagasse, the dry sugar cane left after the extraction of sugar. The cause
of the disease is probably not the dust itself, but rather microorganisms
growing in the bagasse.
On the other hand, an allergy referred to as byssinosis, which occurs
among both cotton pickers and cotton mill workers, seems to be caused by
some agents present in the cotton fibers. Byssinosis is not limited to exposure
to cotton; it also affects people exposed to flax and hemp dust.
Mushroom picker’s lung, maple bark stripper’s disease, and cheese
washer’s lung are other allergies affecting workers in the agricultural and
food industries.
Nephrotoxins
Kidney Physiology
The physiological roles of the kidneys are excretion of waste and regulation
of total body homeostasis. Each kidney contains about 1,000,000 basic func-
tional units called nephrons (Figure 8.3). Nephrons perform three functions:
. filtration of blood plasma in the glomerulus
. selective reabsorption by the tubules of reusable materials
. secretion of waste products into the tubular lumen
The glomerulus is a network of capillaries surrounded by a round, dou-
ble-walled capsule, referred to as Bowman’s capsule. The capsular space
between the walls is continuous with the tubule. Plasma is filtered through
Occupational Toxicology 133
Figure 8.2. The most common industrial agents inducing allergic response.
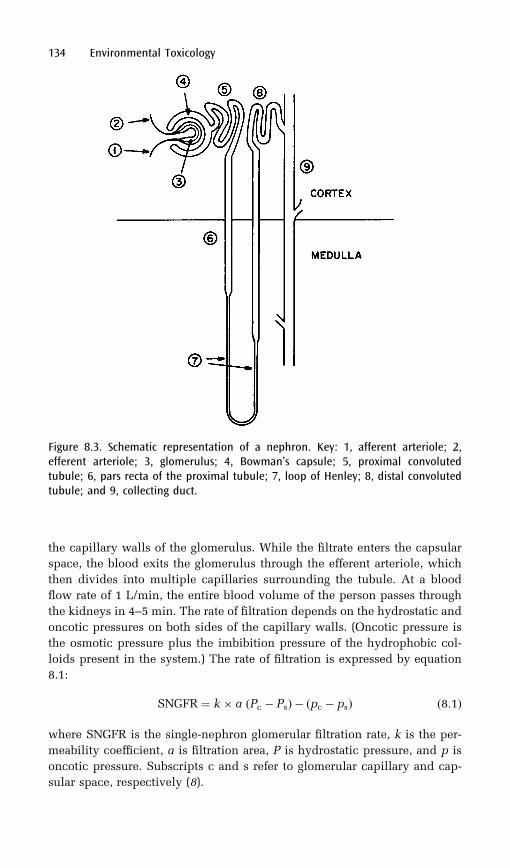
the capillary walls of the glomerulus. While the filtrate enters the capsular
space, the blood exits the glomerulus through the efferent arteriole, which
then divides into multiple capillaries surrounding the tubule. At a blood
flow rate of 1 L/min, the entire blood volume of the person passes through
the kidneys in 4–5 min. The rate of filtration depends on the hydrostatic and
oncotic pressures on both sides of the capillary walls. (Oncotic pressure is
the osmotic pressure plus the imbibition pressure of the hydrophobic col-
loids present in the system.) The rate of filtration is expressed by equation
8.1:
SNGFR ¼ k � a ðPc � PsÞ � ðpc � psÞ ð8:1Þ
where SNGFR is the single-nephron glomerular filtration rate, k is the per-
meability coefficient, a is filtration area, P is hydrostatic pressure, and p is
oncotic pressure. Subscripts c and s refer to glomerular capillary and cap-
sular space, respectively (8).
134 Environmental Toxicology
Figure 8.3. Schematic representation of a nephron. Key: 1, afferent arteriole; 2,efferent arteriole; 3, glomerulus; 4, Bowman’s capsule; 5, proximal convolutedtubule; 6, pars recta of the proximal tubule; 7, loop of Henley; 8, distal convolutedtubule; and 9, collecting duct.
Composition of Fluids
In a normally functioning kidney, the composition of the filtrate is the same
as that of the protein-free plasma; thus blood and its glomerular filtrate are
initially isosmotic. Many of the substances in the filtrate (such as glucose,
amino acids, electrolytes, and water) are reused by being selectively
absorbed in the proximal convoluted tubule. The descending segment of
the loop of Henle lacks a specialized, energy-dependent, absorption mechan-
ism; it is permeable to water but not to solutes. Thus, the tubular fluid
becomes concentrated (hyperosmotic) as water is removed by diffusion.
This situation is reversed in the ascending segment of the loop, which is
impermeable to water but permeable to NaCl. Here the fluid becomes
hypoosmotic with respect to plasma.
While the reusable materials are absorbed from the tubular fluid, hydro-
gen and potassium ions and a variety of waste products (such as urea, uric
acid, creatinine, and xenobiotics) are excreted into the tubular lumen. The
final phase of urine production takes place in the collecting tubule where,
depending upon the water–electrolyte balance in the body, urine is concen-
trated or diluted.
Autoregulation
Two regulatory systems provide for proper functioning of the kidneys. The
first one, called autoregulation, concerns maintenance of a constant glomer-
ular filtration rate, unaffected by blood pressure fluctuations. In response to
certain stimuli, such as a decreased blood flow or decreased sodium con-
centration at the distal nephron, the ‘‘juxtaglomerular apparatus’’ located at
the afferent arteriole releases the hormone renin. Renin reacts with a
humoral factor produced by the liver, angiotensinogen, to form angiotensin
I. This compound is then converted to a powerful vasoconstrictor, angioten-
sin II, by the converting enzyme located in the lungs. The result of this series
of reactions is an increase in blood pressure and restoration of normal filtra-
tion rate.
Antidiuretic Hormone
The other regulatory system concerns body water. When the body begins to
dehydrate, a sensor located in the anterior hypothalamic region of the brain
triggers the release of antidiuretic hormone (ADH, also called vasopressin)
from the pituitary gland. ADH acts via cyclic AMP (adenosine 50-monopho-
sphate) on receptors at the collecting tubule, making the tubule walls perme-
able to water. Thus, water is reabsorbed and urine is concentrated. A more
detailed treatment of this subject is given in reference 8.
Chemical injuries to the kidney can be evaluated by urinalysis, blood
analysis, or assessment of specific renal functions. The standard tests are
Occupational Toxicology 135
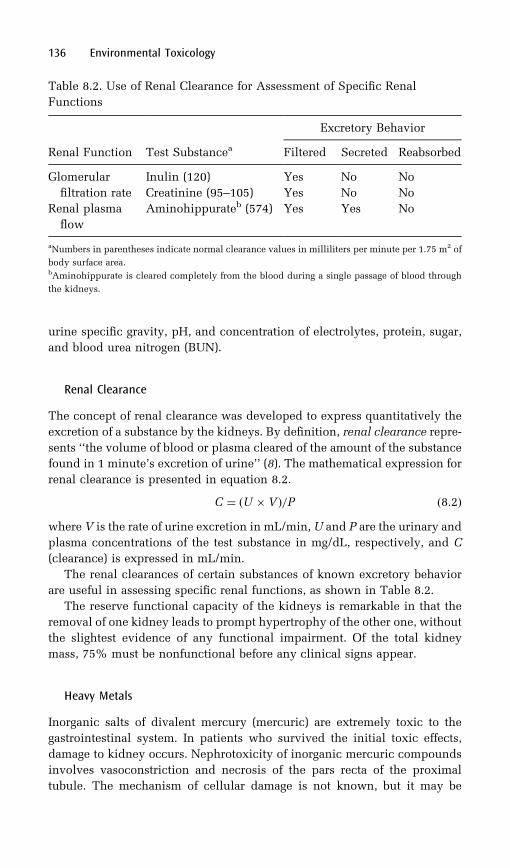
urine specific gravity, pH, and concentration of electrolytes, protein, sugar,
and blood urea nitrogen (BUN).
Renal Clearance
The concept of renal clearance was developed to express quantitatively the
excretion of a substance by the kidneys. By definition, renal clearance repre-
sents ‘‘the volume of blood or plasma cleared of the amount of the substance
found in 1 minute’s excretion of urine’’ (8). The mathematical expression for
renal clearance is presented in equation 8.2.
C ¼ ðU � V Þ=P ð8:2Þwhere V is the rate of urine excretion in mL/min, U and P are the urinary and
plasma concentrations of the test substance in mg/dL, respectively, and C
(clearance) is expressed in mL/min.
The renal clearances of certain substances of known excretory behavior
are useful in assessing specific renal functions, as shown in Table 8.2.
The reserve functional capacity of the kidneys is remarkable in that the
removal of one kidney leads to prompt hypertrophy of the other one, without
the slightest evidence of any functional impairment. Of the total kidney
mass, 75% must be nonfunctional before any clinical signs appear.
Heavy Metals
Inorganic salts of divalent mercury (mercuric) are extremely toxic to the
gastrointestinal system. In patients who survived the initial toxic effects,
damage to kidney occurs. Nephrotoxicity of inorganic mercuric compounds
involves vasoconstriction and necrosis of the pars recta of the proximal
tubule. The mechanism of cellular damage is not known, but it may be
136 Environmental Toxicology
Table 8.2. Use of Renal Clearance for Assessment of Specific Renal
Functions
Excretory Behavior
Renal Function Test Substancea Filtered Secreted Reabsorbed
Glomerular
filtration rate
Inulin (120)
Creatinine (95–105)
Yes
Yes
No
No
No
No
Renal plasma
flow
Aminohippurateb (574) Yes Yes No
aNumbers in parentheses indicate normal clearance values in milliliters per minute per 1.75 m2 of
body surface area.bAminohippurate is cleared completely from the blood during a single passage of blood through
the kidneys.
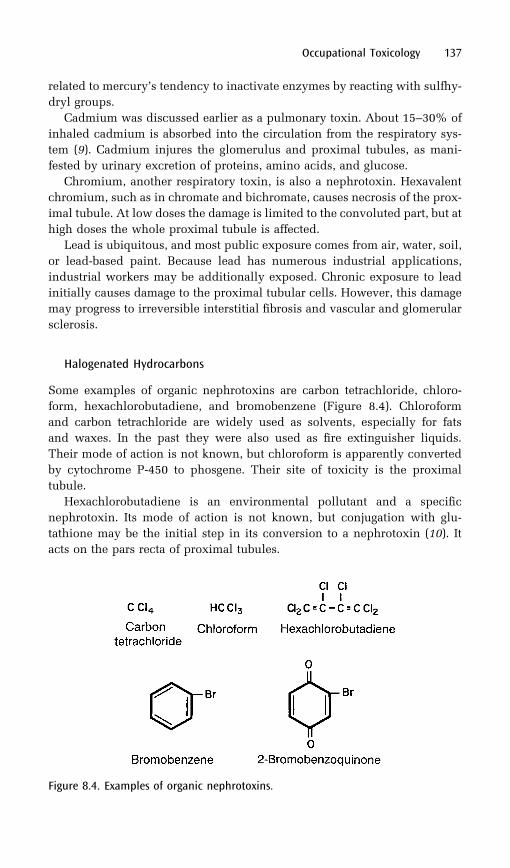
related to mercury’s tendency to inactivate enzymes by reacting with sulfhy-
dryl groups.
Cadmium was discussed earlier as a pulmonary toxin. About 15–30% of
inhaled cadmium is absorbed into the circulation from the respiratory sys-
tem (9). Cadmium injures the glomerulus and proximal tubules, as mani-
fested by urinary excretion of proteins, amino acids, and glucose.
Chromium, another respiratory toxin, is also a nephrotoxin. Hexavalent
chromium, such as in chromate and bichromate, causes necrosis of the prox-
imal tubule. At low doses the damage is limited to the convoluted part, but at
high doses the whole proximal tubule is affected.
Lead is ubiquitous, and most public exposure comes from air, water, soil,
or lead-based paint. Because lead has numerous industrial applications,
industrial workers may be additionally exposed. Chronic exposure to lead
initially causes damage to the proximal tubular cells. However, this damage
may progress to irreversible interstitial fibrosis and vascular and glomerular
sclerosis.
Halogenated Hydrocarbons
Some examples of organic nephrotoxins are carbon tetrachloride, chloro-
form, hexachlorobutadiene, and bromobenzene (Figure 8.4). Chloroform
and carbon tetrachloride are widely used as solvents, especially for fats
and waxes. In the past they were also used as fire extinguisher liquids.
Their mode of action is not known, but chloroform is apparently converted
by cytochrome P-450 to phosgene. Their site of toxicity is the proximal
tubule.
Hexachlorobutadiene is an environmental pollutant and a specific
nephrotoxin. Its mode of action is not known, but conjugation with glu-
tathione may be the initial step in its conversion to a nephrotoxin (10). It
acts on the pars recta of proximal tubules.
Occupational Toxicology 137
Figure 8.4. Examples of organic nephrotoxins.
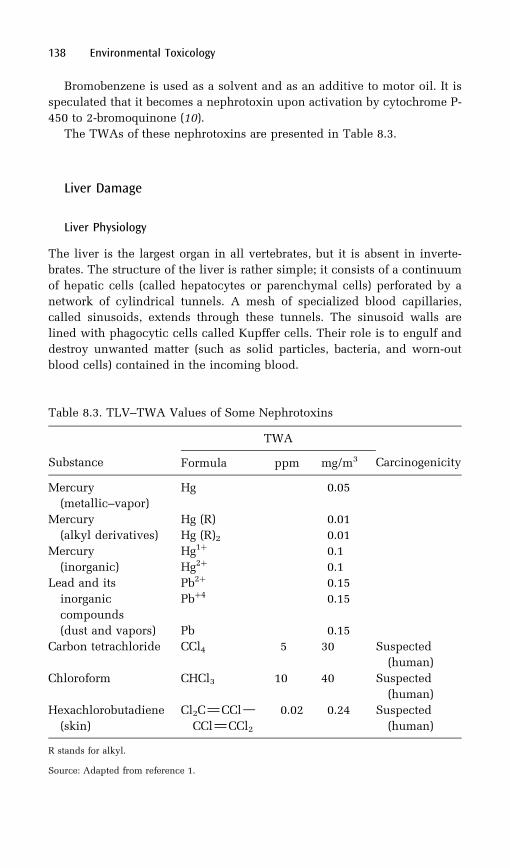
Bromobenzene is used as a solvent and as an additive to motor oil. It is
speculated that it becomes a nephrotoxin upon activation by cytochrome P-
450 to 2-bromoquinone (10).
The TWAs of these nephrotoxins are presented in Table 8.3.
Liver Damage
Liver Physiology
The liver is the largest organ in all vertebrates, but it is absent in inverte-
brates. The structure of the liver is rather simple; it consists of a continuum
of hepatic cells (called hepatocytes or parenchymal cells) perforated by a
network of cylindrical tunnels. A mesh of specialized blood capillaries,
called sinusoids, extends through these tunnels. The sinusoid walls are
lined with phagocytic cells called Kupffer cells. Their role is to engulf and
destroy unwanted matter (such as solid particles, bacteria, and worn-out
blood cells) contained in the incoming blood.
138 Environmental Toxicology
Table 8.3. TLV–TWA Values of Some Nephrotoxins
Substance
TWA
CarcinogenicityFormula ppm mg/m3
Mercury
(metallic–vapor)
Hg 0.05
Mercury Hg (R) 0.01
(alkyl derivatives) Hg (R)2 0.01
Mercury Hg1þ 0.1
(inorganic) Hg2þ 0.1
Lead and its Pb2þ 0.15
inorganic
compounds
Pbþ4 0.15
(dust and vapors) Pb 0.15
Carbon tetrachloride CCl4 5 30 Suspected
(human)
Chloroform CHCl3 10 40 Suspected
(human)
Hexachlorobutadiene
(skin)
Cl2C——CCl—
CCl——CCl2
0.02 0.24 Suspected
(human)
R stands for alkyl.
Source: Adapted from reference 1.

Both venous and arterial blood enter the liver through a large indentation
called the porta hepatis. The main blood supply comes to the liver from the
intestinal capillaries. These capillaries join into larger vessels called mesen-
teric veins, which then merge with each other, as well as with veins from the
spleen and stomach, to form the portal vein. Upon entering the liver, the
portal vein bifurcates into right and left branches that further subdivide and
eventually drain into the sinusoids. The blood perfuses the liver and exits by
the hepatic veins, which merge into the inferior vena cava that returns the
blood to the heart. The hepatic artery, which branches from the aorta, sup-
plies the liver with oxygenated blood. A constant supply is needed for the
multitude of metabolic energy-requiring activities.
Waste material is collected in bile-carrying canaliculi, which converge
into progressively larger ducts. These ducts follow the portal vein branches,
with the bile flowing in the direction opposite to that of the blood. The bile
ducts eventually merge, in the porta hepatis, into the hepatic duct. From
there the bile drains into the upper part of the small intestine, the duode-
num. Most (90%) of the bile acid is reabsorbed from the small intestine and
returned to liver. This is referred to as enterohepatic circulation. Outside of
the porta hepatis a branch separates from the bile duct. This cystic duct ends
in the gall bladder.
The nutrients and xenobiotics absorbed from the gastrointestinal tract are
carried by the portal vein to the liver, where storage, metabolism, and bio-
synthetic activities take place. Glucose is converted by insulin to glycogen
and stored. When needed for energy, it is degraded back to glucose by glu-
cagon. Fat, fat-soluble vitamins, and other nutrients are also stored. Fatty
acids are metabolized and converted to lipids, which are then conjugated
with liver-synthesized proteins and released into the bloodstream as lipo-
proteins.
The liver also synthesizes a multitude of functional proteins, such as
enzymes, antibodies, and blood-coagulating factors. As mentioned in
Chapter 3, the liver is the principal (although not the only) site of xenobiotic
metabolism. Mixed-function oxidases (cytochrome P-450), conjugating
enzymes, glutathione conjugases, and epoxide hydrolase are all located in
the liver.
The water-soluble metabolites of xenobiotics are released into the blood-
stream to be processed by the kidneys for urinary excretion. Unused nutri-
ents and some waste materials, such as degradation products of hemoglobin
(bilirubin) and lipophilic xenobiotics that escape conversion to hydrophilic
compounds, are excreted into the bile. This process returns them to the
intestine, where they are either excreted with the feces or reabsorbed and
brought back to the liver via enterohepatic circulation. Most xenobiotics that
enter the body through gastrointestinal absorption are sent directly to the
liver. Therefore, this organ is particularly sensitive to chemical injuries by
ingested toxins.
Occupational Toxicology 139
Types of Liver Damage
Chemical injuries to the liver depend on the type of toxic agent, the severity
of intoxication, and the type of exposure, whether acute or chronic. The six
basic types of liver damage are fatty liver, necrosis, hepatobiliary dysfunc-
tions, virallike hepatitis, and (on chronic exposure) cirrhosis and neoplasia.
All these types of damage except for neoplasia (liver cancer) are discussed in
this section; neoplasia is discussed in the section on Hepatotoxins below.
Fatty Liver Fatty liver refers to the abnormal accumulation of fat in hepato-
cytes. This condition is associated with a simultaneous decrease in plasma
lipids and lipoproteins. The mechanism of fat accumulation is related to
disturbances in either synthesis of lipoproteins or the mechanism of their
secretion.
The onset of lipid accumulation in the liver is accompanied by changes in
blood biochemistry; serum glutamic oxaloacetic transaminase (SGOT),
serum glutamic pyruvic transaminase (SGPT),3 alkaline phosphatase, and
50-nucleotidase are elevated, whereas blood-clotting factors and cholesterol
are lowered. Blood chemistry analysis is thus a useful diagnostic tool.
Necrosis Liver necrosis refers to a degenerative process culminating in cell
death. Necrosis can be limited to isolated foci of hepatocytes, or it may
involve a whole lobe or both lobes. When entire lobes are involved it is
referred to as massive necrosis. The mechanism of necrosis is unknown.
The changes in blood chemistry resemble those encountered with fatty
liver, except that they are quantitatively larger.
Hepatobiliary Dysfunctions Hepatobiliary dysfunctions are manifested by the
diminution or complete cessation of bile flow, referred to as cholestasis.
Retention of bile salts and bilirubin occur as a result; retention of bilirubin
leads to jaundice. The mechanism of cholestasis is not well elucidated, but
changes in membrane permeability of either hepatocytes or biliary canali-
culi, as well as canalicular plug formation, have been implicated (11).
The biochemical manifestations of cholestasis are slightly different from
those of fatty liver and necrosis. SGOT and SGPT are elevated only slightly
or not at all, but alkaline phosphatase, 50-nucleotidase, and cholesterol are
greatly elevated. These hepatobiliary dysfunctions are usually induced by
drugs (such as anabolic and contraceptive steroids) but are not likely to be
induced by occupational exposure.
140 Environmental Toxicology
3The alternate names for SGOT and SGPT are AST (aspartic transaminase) and ALT
(alanine transaminase), respectively. AST and ALT are new names, but the old names
are still in use.
Virallike Hepatitis Virallike hepatitis is an inflammation of liver with massive
necrosis caused by certain prescription drugs, such as chlorpromazine and
isoniazid. The incidence of this disease is very low and no dose–response
relationship has been established (11).
Cirrhosis Cirrhosis is characterized by deposition of collagen throughout the
liver. In most cases cirrhosis results from chronic chemical injury, but it may
also be caused by a single episode of massive destruction of liver cells.
Deposition of fibrous matter causes severe distortion of blood vessels, there-
fore restricting blood flow. The poor blood perfusion disturbs the liver’s
normal metabolic and detoxification functions. Perturbation of the detoxifi-
cation mechanism leads to accumulation of toxins, which cause further
damage and may lead to eventual liver failure.
Hepatotoxins
A number of metals, organic chemicals, and drugs induce fatty liver and
liver necrosis. In most cases, both conditions can be provoked by the same
compound; this is true for chloroform, carbon tetrachloride, bromotrichlor-
omethane, dimethylaminoazabenzene, and dimethylnitrosamine. However,
certain compounds exert a specific action. Acetaminophen, allyl alcohol,
bromobenzene, and beryllium produce necrosis but not fatty liver. On the
other hand, allyl formate, ethanol, cycloheximide, and cesium produce fatty
liver but not necrosis.
Occupationally, liver injury is most likely to occur following exposure to
vapors of volatile halogenated hydrocarbons (such as chloroform, carbon
tetrachloride, and bromobenzene), which may enter the bloodstream via
the pulmonary route. However, hepatotoxins may enter the gastrointestinal
tract, and hence the liver, in the form of fine particles. They are inhaled, then
expelled from the bronchi or trachea into the oral cavity, and swallowed
with saliva.
Animal experiments (12) have shown that cirrhosis can be induced by
chronic exposure to carbon tetrachloride and to some carcinogens. Drugs
such as methotrexate and isoniazid can also cause cirrhosis. However, the
most frequent cause of cirrhosis in humans is chronic use of large quantities
of alcohol (160 g per day for 5 years or more).
Although many naturally occurring and synthetic chemicals cause liver
cancer in animals, the incidence of primary liver cancer in humans is rather
low in the United States. Some of the naturally occurring liver carcinogens
are aflatoxin (see Chapter 3), cycasin (a glycoside from the cycad nut), and
safrole (occurring in sassafras and black pepper; Figure 8.5). Some of the
synthetic compounds that cause liver cancer in animals are dialkylnitrosa-
mines, organochlorine pesticides, some PCBs, dimethylbenzanthracene
Occupational Toxicology 141
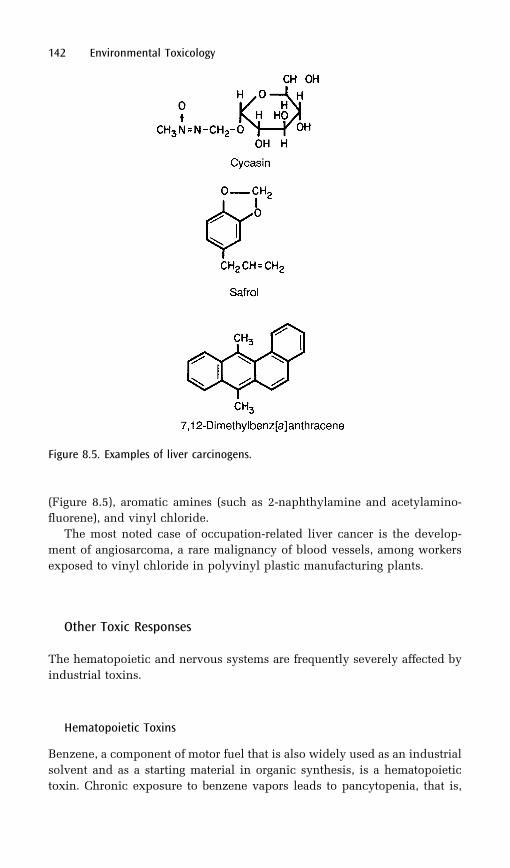
(Figure 8.5), aromatic amines (such as 2-naphthylamine and acetylamino-
fluorene), and vinyl chloride.
The most noted case of occupation-related liver cancer is the develop-
ment of angiosarcoma, a rare malignancy of blood vessels, among workers
exposed to vinyl chloride in polyvinyl plastic manufacturing plants.
Other Toxic Responses
The hematopoietic and nervous systems are frequently severely affected by
industrial toxins.
Hematopoietic Toxins
Benzene, a component of motor fuel that is also widely used as an industrial
solvent and as a starting material in organic synthesis, is a hematopoietic
toxin. Chronic exposure to benzene vapors leads to pancytopenia, that is,
142 Environmental Toxicology
Figure 8.5. Examples of liver carcinogens.
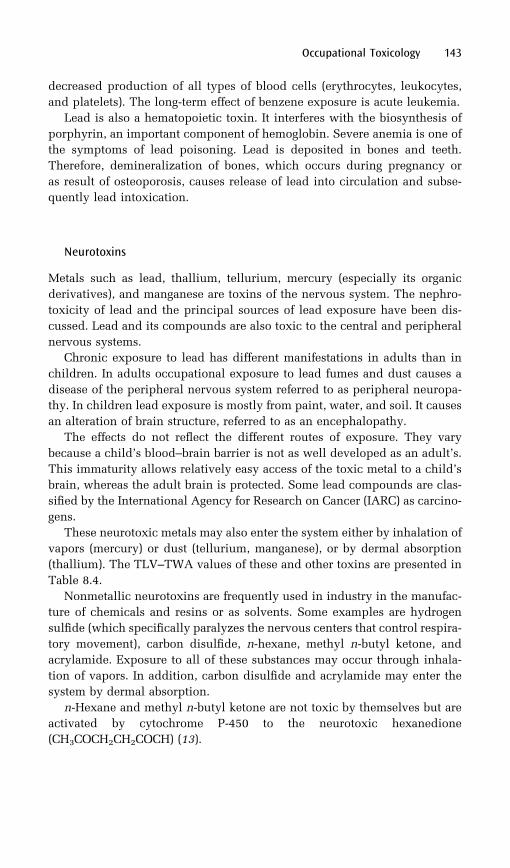
decreased production of all types of blood cells (erythrocytes, leukocytes,
and platelets). The long-term effect of benzene exposure is acute leukemia.
Lead is also a hematopoietic toxin. It interferes with the biosynthesis of
porphyrin, an important component of hemoglobin. Severe anemia is one of
the symptoms of lead poisoning. Lead is deposited in bones and teeth.
Therefore, demineralization of bones, which occurs during pregnancy or
as result of osteoporosis, causes release of lead into circulation and subse-
quently lead intoxication.
Neurotoxins
Metals such as lead, thallium, tellurium, mercury (especially its organic
derivatives), and manganese are toxins of the nervous system. The nephro-
toxicity of lead and the principal sources of lead exposure have been dis-
cussed. Lead and its compounds are also toxic to the central and peripheral
nervous systems.
Chronic exposure to lead has different manifestations in adults than in
children. In adults occupational exposure to lead fumes and dust causes a
disease of the peripheral nervous system referred to as peripheral neuropa-
thy. In children lead exposure is mostly from paint, water, and soil. It causes
an alteration of brain structure, referred to as an encephalopathy.
The effects do not reflect the different routes of exposure. They vary
because a child’s blood–brain barrier is not as well developed as an adult’s.
This immaturity allows relatively easy access of the toxic metal to a child’s
brain, whereas the adult brain is protected. Some lead compounds are clas-
sified by the International Agency for Research on Cancer (IARC) as carcino-
gens.
These neurotoxic metals may also enter the system either by inhalation of
vapors (mercury) or dust (tellurium, manganese), or by dermal absorption
(thallium). The TLV–TWA values of these and other toxins are presented in
Table 8.4.
Nonmetallic neurotoxins are frequently used in industry in the manufac-
ture of chemicals and resins or as solvents. Some examples are hydrogen
sulfide (which specifically paralyzes the nervous centers that control respira-
tory movement), carbon disulfide, n-hexane, methyl n-butyl ketone, and
acrylamide. Exposure to all of these substances may occur through inhala-
tion of vapors. In addition, carbon disulfide and acrylamide may enter the
system by dermal absorption.
n-Hexane and methyl n-butyl ketone are not toxic by themselves but are
activated by cytochrome P-450 to the neurotoxic hexanedione
(CH3COCH2CH2COCH) (13).
Occupational Toxicology 143
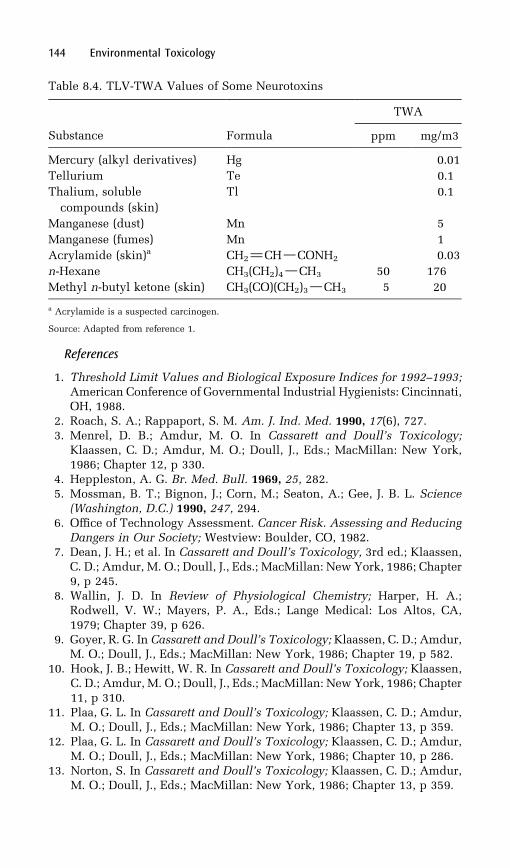
References
1. Threshold Limit Values and Biological Exposure Indices for 1992–1993;American Conference of Governmental Industrial Hygienists: Cincinnati,OH, 1988.
2. Roach, S. A.; Rappaport, S. M. Am. J. Ind. Med. 1990, 17(6), 727.3. Menrel, D. B.; Amdur, M. O. In Cassarett and Doull’s Toxicology;
Klaassen, C. D.; Amdur, M. O.; Doull, J., Eds.; MacMillan: New York,1986; Chapter 12, p 330.
4. Heppleston, A. G. Br. Med. Bull. 1969, 25, 282.5. Mossman, B. T.; Bignon, J.; Corn, M.; Seaton, A.; Gee, J. B. L. Science
(Washington, D.C.) 1990, 247, 294.6. Office of Technology Assessment. Cancer Risk. Assessing and Reducing
Dangers in Our Society; Westview: Boulder, CO, 1982.7. Dean, J. H.; et al. In Cassarett and Doull’s Toxicology, 3rd ed.; Klaassen,
C. D.; Amdur, M. O.; Doull, J., Eds.; MacMillan: New York, 1986; Chapter9, p 245.
8. Wallin, J. D. In Review of Physiological Chemistry; Harper, H. A.;Rodwell, V. W.; Mayers, P. A., Eds.; Lange Medical: Los Altos, CA,1979; Chapter 39, p 626.
9. Goyer, R. G. In Cassarett and Doull’s Toxicology; Klaassen, C. D.; Amdur,M. O.; Doull, J., Eds.; MacMillan: New York, 1986; Chapter 19, p 582.
10. Hook, J. B.; Hewitt, W. R. In Cassarett and Doull’s Toxicology; Klaassen,C. D.; Amdur, M. O.; Doull, J., Eds.; MacMillan: New York, 1986; Chapter11, p 310.
11. Plaa, G. L. In Cassarett and Doull’s Toxicology; Klaassen, C. D.; Amdur,M. O.; Doull, J., Eds.; MacMillan: New York, 1986; Chapter 13, p 359.
12. Plaa, G. L. In Cassarett and Doull’s Toxicology; Klaassen, C. D.; Amdur,M. O.; Doull, J., Eds.; MacMillan: New York, 1986; Chapter 10, p 286.
13. Norton, S. In Cassarett and Doull’s Toxicology; Klaassen, C. D.; Amdur,M. O.; Doull, J., Eds.; MacMillan: New York, 1986; Chapter 13, p 359.
144 Environmental Toxicology
Table 8.4. TLV-TWA Values of Some Neurotoxins
Substance Formula
TWA
ppm mg/m3
Mercury (alkyl derivatives) Hg 0.01
Tellurium Te 0.1
Thalium, soluble
compounds (skin)
Tl 0.1
Manganese (dust) Mn 5
Manganese (fumes) Mn 1
Acrylamide (skin)a CH2——CH—CONH2 0.03
n-Hexane CH3(CH2)4—CH3 50 176
Methyl n-butyl ketone (skin) CH3(CO)(CH2)3—CH3 5 20
a Acrylamide is a suspected carcinogen.
Source: Adapted from reference 1.

9Air Pollution
Pollutant Cycles
It is somewhat artificial to consider air, water, and soil pollution separately
because their effects are interchangeable. Chemicals emitted into the air
eventually combine with rain or snow and settle down to become water
and land pollutants. On the other hand, volatile chemicals from soil or
those that enter lakes and rivers evaporate to become air pollutants.
Pesticides sprayed on land are carried by the wind to become transient air
pollutants that eventually settle somewhere on land or water. For discussion
purposes, however, some systematic division appears to be advisable.
Although the problems of air pollution have been recognized for many
decades, they were once considered to be only of local significance,
restricted to industrial urban areas. With the current recognition of the
destruction of stratospheric ozone, the greenhouse effect, worldwide forest
destruction, and the acidification of lakes and coastal waters, air pollution
assumes global significance.
Urban Pollutants: Their Sources and Biological Effects
The sources of urban air pollution are
. power generation
. transportation
. industry, manufacturing, and processing
145
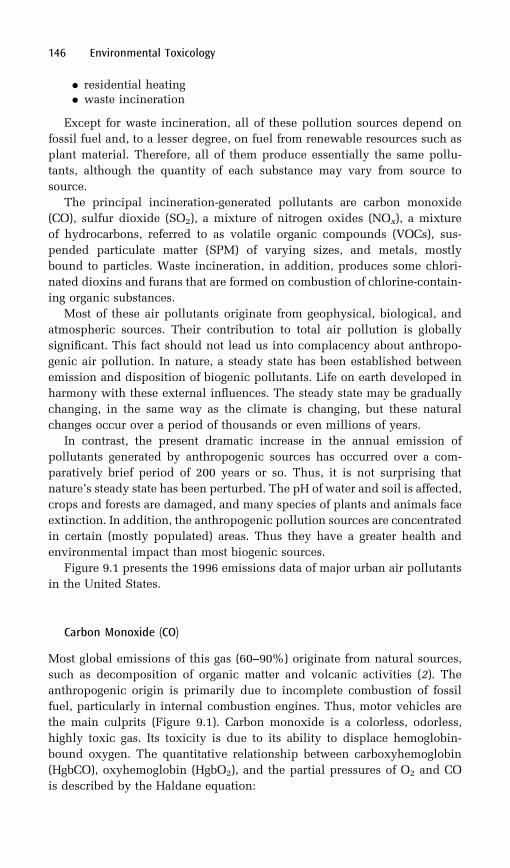
. residential heating
. waste incineration
Except for waste incineration, all of these pollution sources depend on
fossil fuel and, to a lesser degree, on fuel from renewable resources such as
plant material. Therefore, all of them produce essentially the same pollu-
tants, although the quantity of each substance may vary from source to
source.
The principal incineration-generated pollutants are carbon monoxide
(CO), sulfur dioxide (SO2), a mixture of nitrogen oxides (NOx), a mixture
of hydrocarbons, referred to as volatile organic compounds (VOCs), sus-
pended particulate matter (SPM) of varying sizes, and metals, mostly
bound to particles. Waste incineration, in addition, produces some chlori-
nated dioxins and furans that are formed on combustion of chlorine-contain-
ing organic substances.
Most of these air pollutants originate from geophysical, biological, and
atmospheric sources. Their contribution to total air pollution is globally
significant. This fact should not lead us into complacency about anthropo-
genic air pollution. In nature, a steady state has been established between
emission and disposition of biogenic pollutants. Life on earth developed in
harmony with these external influences. The steady state may be gradually
changing, in the same way as the climate is changing, but these natural
changes occur over a period of thousands or even millions of years.
In contrast, the present dramatic increase in the annual emission of
pollutants generated by anthropogenic sources has occurred over a com-
paratively brief period of 200 years or so. Thus, it is not surprising that
nature’s steady state has been perturbed. The pH of water and soil is affected,
crops and forests are damaged, and many species of plants and animals face
extinction. In addition, the anthropogenic pollution sources are concentrated
in certain (mostly populated) areas. Thus they have a greater health and
environmental impact than most biogenic sources.
Figure 9.1 presents the 1996 emissions data of major urban air pollutants
in the United States.
Carbon Monoxide (CO)
Most global emissions of this gas (60–90%) originate from natural sources,
such as decomposition of organic matter and volcanic activities (2). The
anthropogenic origin is primarily due to incomplete combustion of fossil
fuel, particularly in internal combustion engines. Thus, motor vehicles are
the main culprits (Figure 9.1). Carbon monoxide is a colorless, odorless,
highly toxic gas. Its toxicity is due to its ability to displace hemoglobin-
bound oxygen. The quantitative relationship between carboxyhemoglobin
(HgbCO), oxyhemoglobin (HgbO2), and the partial pressures of O2 and CO
is described by the Haldane equation:
146 Environmental Toxicology

HgbCO=HgbO2 ¼ K � PCO=PO2ð9:1Þ
where K is a constant (245 for human blood at pH 7.4 and body temperature),
and PCO and PO2are the ambient partial pressures of CO and O2, respectively.
Equilibration of hemoglobin with the ambient carbon monoxide is a slow
process, lasting several hours. The degree of intoxication depends on carbon
monoxide concentration, the duration of exposure, and to a certain extent on
the minute volume of respiration (see Chapter 2). Although timely removal
of an intoxicated individual from the toxic environment fully restores phy-
siological functions, the dissociation of carbon monoxide from hemoglobin
takes considerable time. At one atmosphere pressure, removal of 50% of the
gas takes 320 min.
No health effects are seen in humans at less than 2% carboxyhemoglobin
content. However, at higher levels, an effect on the central nervous system
has been noted in nonsmokers.1 Cardiovascular changes have been observed
at 5%. According to equation 8.1, 5% carboxyhemoglobin content will be
achieved upon equilibration at 45 ppm ambient CO concentration. Thus,
exposure to carbon monoxide is especially hazardous to people with heart
conditions (3). More severe carbon monoxide intoxication involves head-
ache, nausea, dizziness, and eventually death.
Air Pollution 147
1The content of carboxyhemoglobin in nonsmokers is 0.5–1%, whereas in smokers
it may be as high as 5–10%.
Figure 9.1. Emissions data of major urban air pollutants for in the United States in1996. (Source: Adapted from reference 1.)
A lethal intoxication with CO can occur only in an enclosed space. In
open spaces the effect of carbon monoxide is mitigated by dispersion.
However, in heavy urban traffic carbon monoxide concentration may range
from 10 to 40 ppm on the street and almost three times that inside the motor
vehicles (3). Concentrations as high as 80 ppm have been encountered in
tunnels and underground parking lots. Nothing is known about the health
effects of chronic exposure to small doses of carbon monoxide. However,
because exposure to CO in tobacco smoke is at least one factor contributing
to coronary heart disease in smokers, one may speculate that continuous
exposure to small quantities of CO may have a cumulative effect.
Although carbon monoxide has no direct impact on the environment, it
has an indirect one on the greenhouse gases and on stratospheric ozone (see
Chapter 10).
Sulfur Dioxide (SO2)
Sulfur dioxide is a colorless gas of a strong suffocating odor, intensely irritat-
ing to eyes and to the upper respiratory tract. Globally, the natural and
anthropogenic emissions of sulfur dioxide are more or less equal.
Anthropogenic emissions, which predominate over land and in industria-
lized regions, are mainly produced by combustion of sulfur-containing coal
and smelting of nonferrous ore. The natural sources of sulfur dioxide are
volcanoes and decaying organic matter. In addition, dimethyl sulfide, which
comes from the oceans, is converted in the atmosphere to sulfur dioxide.
The physiological effects of sulfur dioxide in experimental animals are
manifested by a thickening of the mucous layer in the trachea and a slowing
of the action of the mucociliary escalator (3). Sulfur dioxide, a water-soluble
gas, is an irritant of the upper respiratory system and it does not penetrate
significantly2 into the lungs. At high concentrations most of it is normally
detained in the upper part of the respiratory system and is eliminated by
coughing and sneezing. However, some systemic absorption occurs through
the whole respiratory system (3). Exposure to sulfur dioxide causes bron-
chial constriction and increases air-flow resistance. Thus, it is particularly
dangerous to people with respiratory problems. Sulfur dioxide also damages
plants by causing bleaching of leaves.
Sulfur dioxide is readily adsorbed on tiny particles (by-products of coal
combustion, such as charcoal, ferric oxide, and metal salts). In the presence
of moisture (i.e., in clouds or fog droplets) the particles catalyze oxidation of
SO2 to SO3, which immediately combines with water to form sulfuric acid
148 Environmental Toxicology
2The fraction of SO2 that penetrates the alveolar space is related to the concentra-
tion of gas in the inhaled air. At high concentration, 90% of it is removed in the upper
respiratory system. At low concentration (1 ppm or less), 95% of the gas penetrates
into the lungs.
(H2SO4). When the moisture evaporates, the solid particles coated with sul-
furic acid are left suspended in the air. About 80% of these particles are
smaller than 2 mm in diameter (4). When inhaled, they penetrate into the
tracheobronchial region and the alveolar spaces. SO2 in the gas phase can
also be converted to sulfuric acid, albeit at a slow rate, by reactions with free
radicals. These reactions are more pronounced in summer than in winter,
because they require sunlight for generation of free radicals from the moist-
ure in the air (5).
Animal studies (4) indicate that sulfuric acid’s irritating effect on the
respiratory system is 4–20 times stronger than that of sulfur dioxide.
Sulfuric acid on the surface of particles is readily dissolved in pulmonary
fluid. If present in a high enough concentration, it damages the respiratory
tissue (3). The involvement of atmospheric sulfuric acid in acid deposition
will be discussed in Chapter 11.
Nitrogen Oxides (NOx)
Nitric oxide (NO) is formed by natural processes such as lightning and
microbial digestion of organic matter. Microbial digestion first produces
nitrous oxide (N2O), which is then oxidized to NO. Anthropogenic formation
of nitrogen oxides results from high-temperature combustion, whereby nitro-
gen in the air combines with oxygen. Nitric oxide is readily oxidized in the
atmosphere to NO2, and the mixture of both gases is referred to as NOx. The
total amount of NOx formed during combustion and the ratio of NO to NO2
depend on the fuel-to-air ratio and on the temperature of combustion.
Nitrogen dioxide is a reddish brown, irritating, and extremely toxic gas.
When inhaled, it causes inflammation of the lungs, which after a delay of
several days may develop into edema (swelling of the tissue, see Chapter 8).
A short exposure to 100 ppm is dangerous and 200 ppm is lethal. At lower
concentrations, such as 5 ppm, nitrogen dioxide may increase susceptibility
to bronchoconstrictive agents (such as sulfur dioxide) in normal subjects,
and at concentrations as low as 0.1 ppm (189 mg/m3) in asthmatic subjects
(3). Concentrations of 0.1 ppm or higher may occur in polluted urban air. In
addition, data from animal experiments suggest that exposure to nitrogen
dioxide increases susceptibility to respiratory infections by bacterial pneu-
monia and influenza virus (3). In general, emission of NOx from stationary
sources can be controlled better than that from motor vehicles. Also, pollu-
tion generated by motor vehicles occurs at the road level, whereas industrial
pollutants are usually emitted through smokestacks and carried away by the
wind. Although this high-altitude dispersion may reduce exposure of the
urban population to NOx, it probably has no effect on ozone and smog for-
mation.
Air Pollution 149
Photochemical Chain Reactions
The photochemical chain reactions that lead to tropospheric ozone and smog
formation require both NO2 and VOCs. NO2 is split by sunlight into NO and a
free-radical oxygen.
NO2 þ h� ¼ NOþO ð9:2Þwhere h is Planck’s constant and � is the light-wave frequency. The free
radical reacts with molecular oxygen in a fast reaction to form ozone:
OþO2 ¼ O3 ð9:3ÞHowever, ozone reacts with NO to regenerate both oxygen and NO2:
O3 þNO ¼ O2 þNO2 ð9:4ÞNitrogen dioxide is split again by sunlight, and the process is repeated
over and over. Thus a steady state between NO2 and NO, which is referred to
as the photostationary state (6), determines the concentration of ozone. It is
estimated that, in the absence of VOCs, the ratio of NO2 to NO equals 1 at
noon in North American latitudes. The resulting ozone concentration of
about 20 ppb is far below the National Ambient Air Quality Standards
(NAAQS) of 120 ppb (daily 1-h average) (6).
Because of a series of photochemical reactions involving hydroxyl radi-
cals (.OH), VOCs in the air are converted to peroxy radicals that oxidize NO
to NO2.
ROOþNO ¼ ROþNO2 ð9:5ÞThe depletion of NO shifts the NO2/NO steady state in favor of ozone
formation (equations 9.2 and 9.3). One of the substances occurring at high
concentrations in polluted air is the peroxyacetyl radical. This radical,
which oxidizes NO to NO2, also reacts with nitrogen dioxide to form a
lacrimator, peroxyacetyl nitrate [CH3C(O)O2NO2] (PAN). The mixture of
ozone, PAN, and other by-products such as aldehydes and ketones creates
a haze that is referred to as photochemical smog.
Photochemical Smog
Ozone is a respiratory toxin. Because it has low water solubility, it penetrates
deep into bronchioles and alveoli. Acute exposure to ozone, which is mostly
an occupational hazard, damages the respiratory tissue and causes edema,
which may be fatal. Sublethal exposure increases sensitivity to bronchocon-
strictive agents and to infections. Chronic exposure to ozone may lead to
bronchitis and emphysema.3 In addition, photochemical smog (i.e., ozone,
150 Environmental Toxicology
3Emphysema is a condition characterized by decompartmentalization of alveoli.
The surface area available for gas exchange is decreased, which causes difficulties in
breathing.

PAN, and other by-products) is an irritant of the mucous membranes, eyes,
and skin.
The severity of photochemical smog depends, to a great extent, on cli-
matic and topographic conditions. Persistent high-pressure systems tend to
aggravate smog formation because they are characterized by intense sunlight
and stable descending air that traps pollutants near the ground. In places
surrounded by mountains, the dispersing force of wind is diminished.
Atmospheric temperature inversion also favors retention of photochemical
smog near the ground. Inversion occurs when warm air aloft overlays colder
air near the ground; thus the polluted air is prevented from rising above the
inversion boundary.
Both ozone and PAN are toxic to plants. Whereas PAN affects mostly
herbaceous4 crops, ozone injures the tissues of all plants and inhibits photo-
synthesis. In addition, it increases the susceptibility of plants to drought and
disease. With respect to plant damage, O3, NO2, and SO2 act synergistically.
Photochemical oxidation and smog formation are the main known envir-
onmental and health hazards of NOx emission. However, concern about the
direct health effect of NOx is growing. It appears that in significantly polluted
urban areas, nitrogen oxides are responsible for a high frequency of respira-
tory diseases, such as bronchitis, pneumonia, and viral infections. There is
also concern about their involvement in acid deposition; about one-third of
the acid deposited is nitric acid.
Volatile Organic Compounds
VOCs originate from both anthropogenic and natural sources. The natural
sources are vegetation, microbial decomposition, forest fires, and natural gas.
According to an editorial published in Science (7), the natural emission of
VOCs is estimated to be 30–60 million metric tons annually.
Anthropogenic emission results from incomplete combustion of fossil
fuels and from evaporation of liquid fuels and solvents during storage, refin-
ing, and handling. The type of VOC emitted with flue gases or from the
exhaust of motor vehicles varies with the type of fuel, the type of combustion
(i.e., external or internal), and the presence or absence of pollution-abating
devices.
Low-molecular-weight aliphatic, olefinic, and aromatic compounds, some
of which are formed during combustion, are prevalent. At 500–800 8C, ole-fins and dienes tend to polymerize via free-radical formation to form poly-
cyclic aromatic hydrocarbons (PAHs) (8).
Airborne PAHs are distributed between the gas phase and solid particles
(by-products of combustion, such as soot and fly ash). At least 26 airborne
PAHs, some of them potential carcinogens and mutagens, have been identi-
Air Pollution 151
4Herbaceous plants do not have a woody stem and die entirely each year.
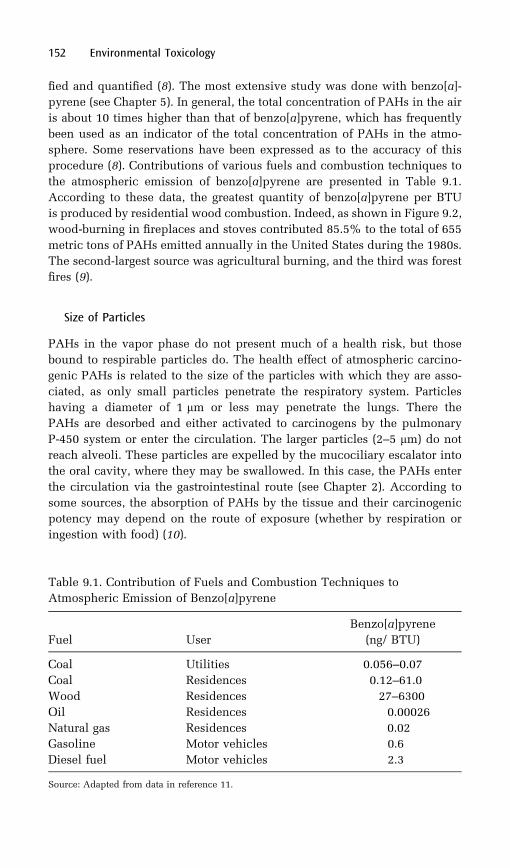
fied and quantified (8). The most extensive study was done with benzo[a]-
pyrene (see Chapter 5). In general, the total concentration of PAHs in the air
is about 10 times higher than that of benzo[a]pyrene, which has frequently
been used as an indicator of the total concentration of PAHs in the atmo-
sphere. Some reservations have been expressed as to the accuracy of this
procedure (8). Contributions of various fuels and combustion techniques to
the atmospheric emission of benzo[a]pyrene are presented in Table 9.1.
According to these data, the greatest quantity of benzo[a]pyrene per BTU
is produced by residential wood combustion. Indeed, as shown in Figure 9.2,
wood-burning in fireplaces and stoves contributed 85.5% to the total of 655
metric tons of PAHs emitted annually in the United States during the 1980s.
The second-largest source was agricultural burning, and the third was forest
fires (9).
Size of Particles
PAHs in the vapor phase do not present much of a health risk, but those
bound to respirable particles do. The health effect of atmospheric carcino-
genic PAHs is related to the size of the particles with which they are asso-
ciated, as only small particles penetrate the respiratory system. Particles
having a diameter of 1 mm or less may penetrate the lungs. There the
PAHs are desorbed and either activated to carcinogens by the pulmonary
P-450 system or enter the circulation. The larger particles (2–5 mm) do not
reach alveoli. These particles are expelled by the mucociliary escalator into
the oral cavity, where they may be swallowed. In this case, the PAHs enter
the circulation via the gastrointestinal route (see Chapter 2). According to
some sources, the absorption of PAHs by the tissue and their carcinogenic
potency may depend on the route of exposure (whether by respiration or
ingestion with food) (10).
152 Environmental Toxicology
Table 9.1. Contribution of Fuels and Combustion Techniques to
Atmospheric Emission of Benzo[a]pyrene
Fuel User
Benzo[a]pyrene
(ng/ BTU)
Coal Utilities 0.056–0.07
Coal Residences 0.12–61.0
Wood Residences 27–6300
Oil Residences 0.00026
Natural gas Residences 0.02
Gasoline Motor vehicles 0.6
Diesel fuel Motor vehicles 2.3
Source: Adapted from data in reference 11.
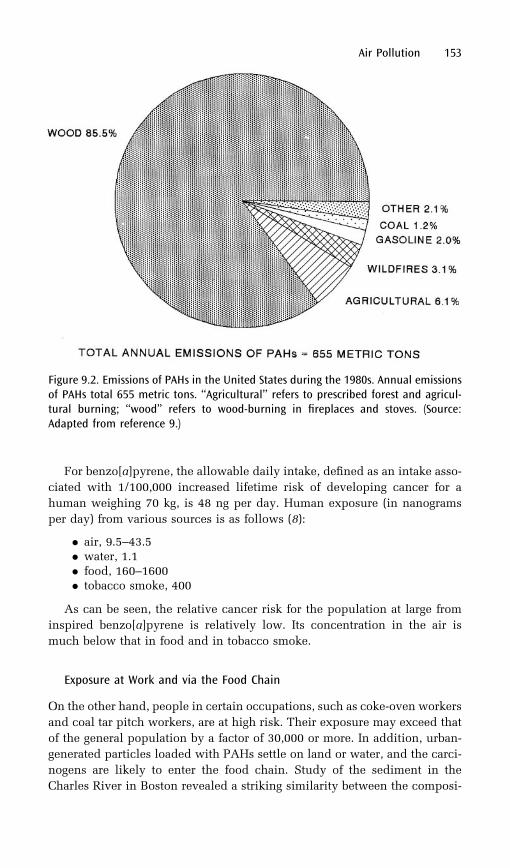
For benzo[a]pyrene, the allowable daily intake, defined as an intake asso-
ciated with 1/100,000 increased lifetime risk of developing cancer for a
human weighing 70 kg, is 48 ng per day. Human exposure (in nanograms
per day) from various sources is as follows (8):
. air, 9.5–43.5
. water, 1.1
. food, 160–1600
. tobacco smoke, 400
As can be seen, the relative cancer risk for the population at large from
inspired benzo[a]pyrene is relatively low. Its concentration in the air is
much below that in food and in tobacco smoke.
Exposure at Work and via the Food Chain
On the other hand, people in certain occupations, such as coke-oven workers
and coal tar pitch workers, are at high risk. Their exposure may exceed that
of the general population by a factor of 30,000 or more. In addition, urban-
generated particles loaded with PAHs settle on land or water, and the carci-
nogens are likely to enter the food chain. Study of the sediment in the
Charles River in Boston revealed a striking similarity between the composi-
Air Pollution 153
Figure 9.2. Emissions of PAHs in the United States during the 1980s. Annual emissionsof PAHs total 655 metric tons. ‘‘Agricultural’’ refers to prescribed forest and agricul-tural burning; ‘‘wood’’ refers to wood-burning in fireplaces and stoves. (Source:Adapted from reference 9.)
tion of PAHs in the atmosphere and that in the river sediment (12). It appears
that combustion of fossil fuels is the main source of water pollution with
PAHs.
Benzene and Ethylene
Other hydrocarbons of interest are benzene and ethylene. Benzene is a
human bone marrow poison and a carcinogen implicated as a cause of mye-
locytic and acute nonlymphocytic leukemia. Ethylene is one of the major
products of automobile exhaust, but it may also be formed by other combus-
tion processes. It contributes heavily to photochemical oxidants. Ethylene is
a normal constituent of plants; it serves as a plant growth regulator and it
induces epinasty (movement of a plant, such as folding and unfolding of a
flower petal), leaf abscission (falling of leaves), and fruit ripening. Excessive
external ethylene is therefore a plant toxin.
The involvement of hydrocarbons in photochemical smog formation was
discussed earlier.
Airborne Particles
Particles are referred to as suspended particular matter (SPM). They may be
divided into suspended solids and liquid droplets. Their effects on respira-
tory and systemic toxicity differ (see Chapter 2). The natural sources of air-
borne particles are dust, sea spray, forest fires, and volcanoes.
Anthropogenic particles include solids ranging from 0.01 to 100 mm in dia-
meter and minute droplets of sulfuric, sulfurous, and nitric acids. They are
by-products either of combustion (such as fly ash, soot, and numerous
metals) or of industrial processes (such as milling and grinding).
In the atmosphere, continuous interaction takes place among various
types of particles and between particles and the components of the gas
phase. This interaction affects both the chemical composition and the size
of the particles (6). Large particles (greater than 30 mm in diameter) may
present a nuisance, but they do not have any serious health impact and
they settle out rather quickly. In contrast, the atmospheric residence time
of particles 1 to 10 mm in diameter is 6 h to 4 days; for particles smaller than
1 mm in diameter it is even longer.
Particles smaller than 5 mm in diameter enter the tracheobronchial and
pulmonary region, where they irritate the respiratory system and aggravate
existing respiratory problems. Their role as vehicles for transporting PAHs
and sulfate and sulfite ions into the lungs has already been discussed.
Epidemiological studies conducted in a number of cities indicated an
association between daily fluctuations in the concentration of SPM in the
ambient air and daily mortality counts. However, these observations did not
154 Environmental Toxicology
answer the question whether SPM per se caused adverse health effects, or
rather served as carriers of other toxic pollutants. Most recently Dr. Morton
Lippman and his coworkers conducted study in the area of Detroit, Michigan
designed to answer this question. The results indicated that the toxicity of
SPM was not affected, at least in a two components model, by the presence of
other pollutants (O3, NOx , SO2 and CO). Also the toxicity was not affected by
the size of the particles in the range of PM10 and PM2.5 (particles smaller than
10 mm and 2.5 mm, respectively). Animal study revealed that dogs, with
induced coronary occlusion when exposed to a high concentration of SPM
exhibited one of the major ECG signs of myocardial ischemia in humans.
Also healthy dogs, when exposed to a high concentration of SPM, showed
cardiac abnormalities such as changes in heart rate variability, changes in
the average heart rate and some changes in ECG. Whether this mechanism of
toxicity may or may not be extrapolated to humans should await further
study (13).
SPM also has an environmental impact. Tiny sulfate particles, because of
their light-scattering properties, are responsible for haze formation. This
effect, which is amplified in the presence of high humidity, may persist
for as long as a week. Soot particles, which have light-absorbing properties,
also contribute to haze formation. SPM deposited on leaves inhibits absorp-
tion of carbon dioxide, plugs stomata (tiny orifices on the leaf surface for
evaporation of water), and blocks sunlight necessary for photosynthesis.
Metal Pollutants
Among the metal pollutants, lead, mercury, and beryllium are of special
interest because of their toxicity. With the gradual phasing out of leaded
gasoline, the amount of airborne lead decreased considerably. Lead emis-
sions in the United States declined from 144,000 tons in 1975 to 17,900 tons
in 1985 (14); 69% of it originated from combustion of leaded gasoline. At the
same time, the contribution of municipal waste incinerators to lead pollution
became more significant. Mercury and beryllium originate mainly from coal
combustion. Regardless of their origin, both lead and mercury are essentially
water and land pollutants. Their health and environmental impact will be
discussed in the Chapter 11.
Atmospheric emission of beryllium has been estimated (15) to be 1134
metric tons annually. The major toxic effects of beryllium are pneumonitis (a
disease characterized by lung inflammation) and berylliosis (a chronic pul-
monary disease). Epidemiological studies suggest that it is also a carcinogen.
It is not certain whether beryllium concentration in urban air is sufficient to
create a health hazard for the population at large. In any case, beryllium
represents an occupational hazard to workers involved in its production,
processing, and use (see Chapter 8).
Air Pollution 155

Nonmetal Pollutants
Fluorides and asbestos are nonmetal pollutants. Fluorine is a by-product of
coal combustion. It is released, entirely in the gas phase, in relatively large
quantities. Being a reactive element, it combines readily with other atoms
and molecules to form fluorides, which are respiratory irritants. They are
also phytotoxins (4), and their main environmental impact is on plants.
Fluorides cause leaf damage and eventual defoliation.
Airborne asbestos originates from industrial use and from the demolition
of old buildings containing asbestos. Its health effects are mostly limited to
asbestos workers and to workers who are incidentally exposed to asbestos
while performing their duties. Therefore, exposure to asbestos is considered
an occupational hazard. The health effects of this exposure are discussed in
Chapter 8.
Trends and Present Status of Air Quality
Table 9.2 lists the U.S. National Ambient Air Quality Standards (NAAQS)
and the World Health Organization (WHO) guidelines for the major urban air
pollutants. Data in Figure 9.3 show the trends in sulfur dioxide in the air of
selected cities in the United States and around the world from 1976–78
through 1990–95. The data indicate that in general, between 1976 and
1995 good progress toward abatement of sulfur dioxide pollution was
achieved in industrialized countries. It is important to note that the data
presented in Figure 9.3 are the mean values of the residential, commercial,
industrial, and suburban areas. Certain areas of a city evaluated by them-
selves may have exceed the standards. For instance, in the residential area in
the city center of New York, the mean daily concentrations of SO2 were, for
three monitoring periods, above the WHO guidelines (72 mg/m3 in 1976–78,
74 mg/m3 in 1979–81, and 65 mg/m3 in 1982–85) (2). Among the cities of the
industrialized world, Milan stood out as exceptionally polluted with SO2
during the period 1976–78, highly exceeding WHO guidelines, but by
1990–95 the levels of sulfur dioxide decreased well below WHO guidelines.
No progress in abatement of sulfur dioxide pollution has been achieved in
cities of the developing nations. In some of them, as for example Teheran,
Calcutta, and Beijing, pollution increased considerably during the monitor-
ing period. This was probably a result of an attempt at industrialization with
insufficient investment in modern technology.
Data in Figure 9.4 show the trends in mean daily concentrations of SPM
in selected cities throughout the world. In North America and, except for
Brussels, in Europe progress in pollution abatement has been achieved and
in most cases the concentrations of suspended particulate matter was within
WHO guidlines. On the other hand, in all cities of the developing world
156 Environmental Toxicology
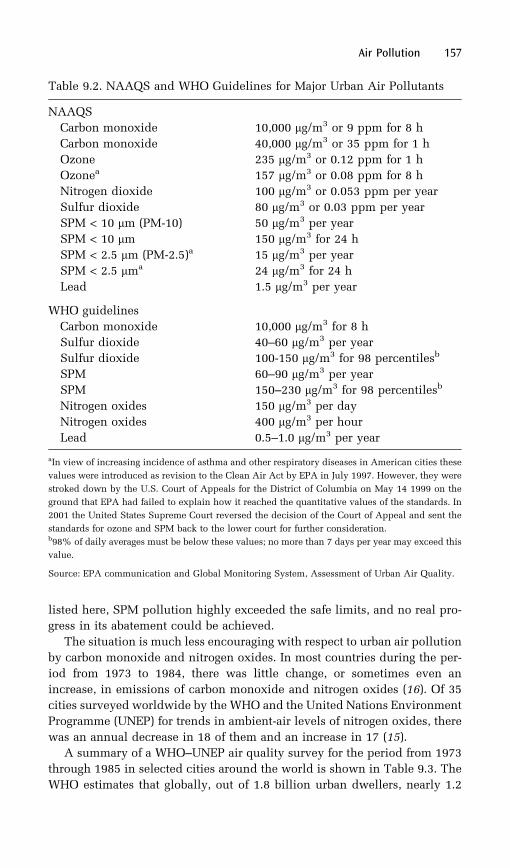
listed here, SPM pollution highly exceeded the safe limits, and no real pro-
gress in its abatement could be achieved.
The situation is much less encouraging with respect to urban air pollution
by carbon monoxide and nitrogen oxides. In most countries during the per-
iod from 1973 to 1984, there was little change, or sometimes even an
increase, in emissions of carbon monoxide and nitrogen oxides (16). Of 35
cities surveyed worldwide by the WHO and the United Nations Environment
Programme (UNEP) for trends in ambient-air levels of nitrogen oxides, there
was an annual decrease in 18 of them and an increase in 17 (15).
A summary of a WHO–UNEP air quality survey for the period from 1973
through 1985 in selected cities around the world is shown in Table 9.3. The
WHO estimates that globally, out of 1.8 billion urban dwellers, nearly 1.2
Air Pollution 157
Table 9.2. NAAQS and WHO Guidelines for Major Urban Air Pollutants
NAAQS
Carbon monoxide 10,000 mg/m3 or 9 ppm for 8 h
Carbon monoxide 40,000 mg/m3 or 35 ppm for 1 h
Ozone 235 mg/m3 or 0.12 ppm for 1 h
Ozonea 157 mg/m3 or 0.08 ppm for 8 h
Nitrogen dioxide 100 mg/m3 or 0.053 ppm per year
Sulfur dioxide 80 mg/m3 or 0.03 ppm per year
SPM < 10 mm (PM-10) 50 mg/m3 per year
SPM < 10 mm 150 mg/m3 for 24 h
SPM < 2.5 mm (PM-2.5)a 15 mg/m3 per year
SPM < 2.5 mma 24 mg/m3 for 24 h
Lead 1.5 mg/m3 per year
WHO guidelines
Carbon monoxide 10,000 mg/m3 for 8 h
Sulfur dioxide 40–60 mg/m3 per year
Sulfur dioxide 100-150 mg/m3 for 98 percentilesb
SPM 60–90 mg/m3 per year
SPM 150–230 mg/m3 for 98 percentilesb
Nitrogen oxides 150 mg/m3 per day
Nitrogen oxides 400 mg/m3 per hour
Lead 0.5–1.0 mg/m3 per year
aIn view of increasing incidence of asthma and other respiratory diseases in American cities these
values were introduced as revision to the Clean Air Act by EPA in July 1997. However, they were
stroked down by the U.S. Court of Appeals for the District of Columbia on May 14 1999 on the
ground that EPA had failed to explain how it reached the quantitative values of the standards. In
2001 the United States Supreme Court reversed the decision of the Court of Appeal and sent the
standards for ozone and SPM back to the lower court for further consideration.b98% of daily averages must be below these values; no more than 7 days per year may exceed this
value.
Source: EPA communication and Global Monitoring System, Assessment of Urban Air Quality.
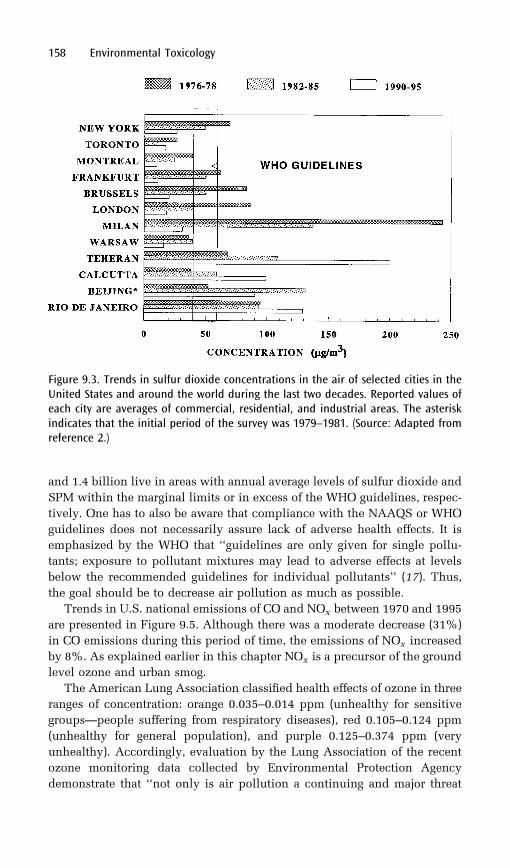
and 1.4 billion live in areas with annual average levels of sulfur dioxide and
SPM within the marginal limits or in excess of the WHO guidelines, respec-
tively. One has to also be aware that compliance with the NAAQS or WHO
guidelines does not necessarily assure lack of adverse health effects. It is
emphasized by the WHO that ‘‘guidelines are only given for single pollu-
tants; exposure to pollutant mixtures may lead to adverse effects at levels
below the recommended guidelines for individual pollutants’’ (17). Thus,
the goal should be to decrease air pollution as much as possible.
Trends in U.S. national emissions of CO and NOx between 1970 and 1995
are presented in Figure 9.5. Although there was a moderate decrease (31%)
in CO emissions during this period of time, the emissions of NOx increased
by 8%. As explained earlier in this chapter NOx is a precursor of the ground
level ozone and urban smog.
The American Lung Association classified health effects of ozone in three
ranges of concentration: orange 0.035–0.014 ppm (unhealthy for sensitive
groups—people suffering from respiratory diseases), red 0.105–0.124 ppm
(unhealthy for general population), and purple 0.125–0.374 ppm (very
unhealthy). Accordingly, evaluation by the Lung Association of the recent
ozone monitoring data collected by Environmental Protection Agency
demonstrate that ‘‘not only is air pollution a continuing and major threat
158 Environmental Toxicology
Figure 9.3. Trends in sulfur dioxide concentrations in the air of selected cities in theUnited States and around the world during the last two decades. Reported values ofeach city are averages of commercial, residential, and industrial areas. The asteriskindicates that the initial period of the survey was 1979–1981. (Source: Adapted fromreference 2.)
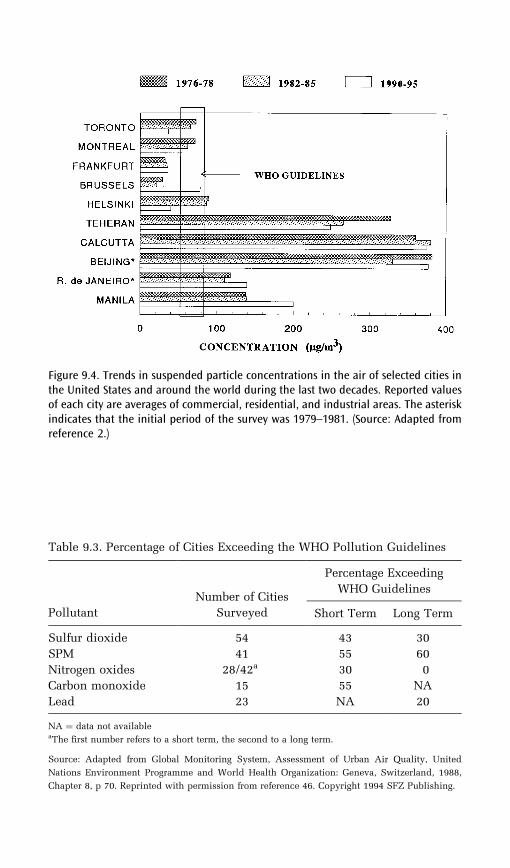
Figure 9.4. Trends in suspended particle concentrations in the air of selected cities inthe United States and around the world during the last two decades. Reported valuesof each city are averages of commercial, residential, and industrial areas. The asteriskindicates that the initial period of the survey was 1979–1981. (Source: Adapted fromreference 2.)
Table 9.3. Percentage of Cities Exceeding the WHO Pollution Guidelines
Pollutant
Number of Cities
Surveyed
Percentage Exceeding
WHO Guidelines
Short Term Long Term
Sulfur dioxide 54 43 30
SPM 41 55 60
Nitrogen oxides 28/42a 30 0
Carbon monoxide 15 55 NA
Lead 23 NA 20
NA ¼ data not availableaThe first number refers to a short term, the second to a long term.
Source: Adapted from Global Monitoring System, Assessment of Urban Air Quality, United
Nations Environment Programme and World Health Organization: Geneva, Switzerland, 1988,
Chapter 8, p 70. Reprinted with permission from reference 46. Copyright 1994 SFZ Publishing.
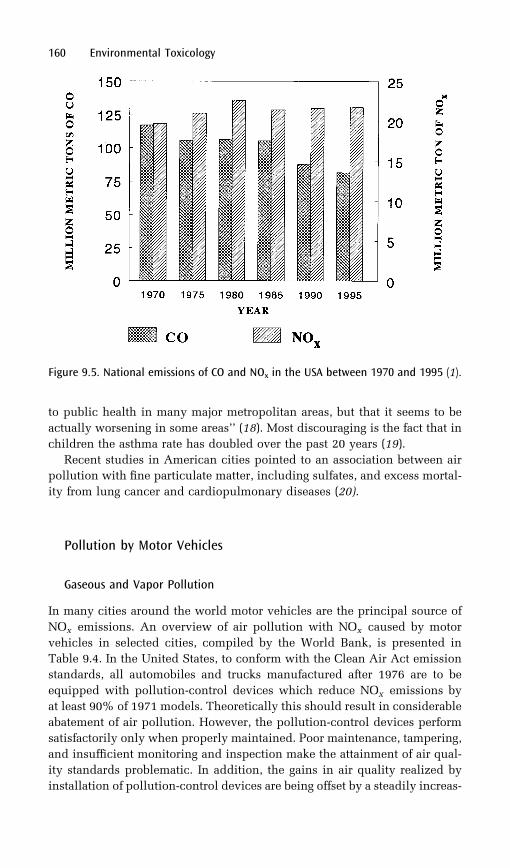
to public health in many major metropolitan areas, but that it seems to be
actually worsening in some areas’’ (18). Most discouraging is the fact that in
children the asthma rate has doubled over the past 20 years (19).
Recent studies in American cities pointed to an association between air
pollution with fine particulate matter, including sulfates, and excess mortal-
ity from lung cancer and cardiopulmonary diseases (20).
Pollution by Motor Vehicles
Gaseous and Vapor Pollution
In many cities around the world motor vehicles are the principal source of
NOx emissions. An overview of air pollution with NOx caused by motor
vehicles in selected cities, compiled by the World Bank, is presented in
Table 9.4. In the United States, to conform with the Clean Air Act emission
standards, all automobiles and trucks manufactured after 1976 are to be
equipped with pollution-control devices which reduce NOx emissions by
at least 90% of 1971 models. Theoretically this should result in considerable
abatement of air pollution. However, the pollution-control devices perform
satisfactorily only when properly maintained. Poor maintenance, tampering,
and insufficient monitoring and inspection make the attainment of air qual-
ity standards problematic. In addition, the gains in air quality realized by
installation of pollution-control devices are being offset by a steadily increas-
160 Environmental Toxicology
Figure 9.5. National emissions of CO and NOx in the USA between 1970 and 1995 (1).
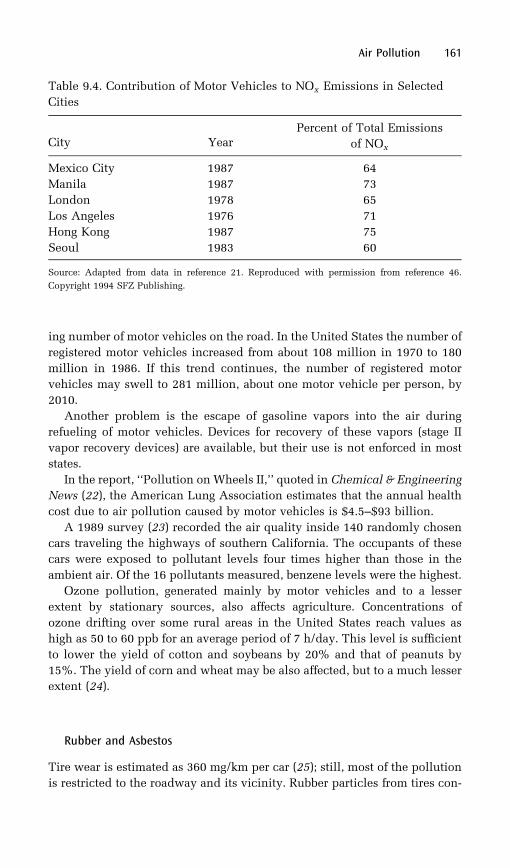
ing number of motor vehicles on the road. In the United States the number of
registered motor vehicles increased from about 108 million in 1970 to 180
million in 1986. If this trend continues, the number of registered motor
vehicles may swell to 281 million, about one motor vehicle per person, by
2010.
Another problem is the escape of gasoline vapors into the air during
refueling of motor vehicles. Devices for recovery of these vapors (stage II
vapor recovery devices) are available, but their use is not enforced in most
states.
In the report, ‘‘Pollution on Wheels II,’’ quoted in Chemical & Engineering
News (22), the American Lung Association estimates that the annual health
cost due to air pollution caused by motor vehicles is $4.5–$93 billion.
A 1989 survey (23) recorded the air quality inside 140 randomly chosen
cars traveling the highways of southern California. The occupants of these
cars were exposed to pollutant levels four times higher than those in the
ambient air. Of the 16 pollutants measured, benzene levels were the highest.
Ozone pollution, generated mainly by motor vehicles and to a lesser
extent by stationary sources, also affects agriculture. Concentrations of
ozone drifting over some rural areas in the United States reach values as
high as 50 to 60 ppb for an average period of 7 h/day. This level is sufficient
to lower the yield of cotton and soybeans by 20% and that of peanuts by
15%. The yield of corn and wheat may be also affected, but to a much lesser
extent (24).
Rubber and Asbestos
Tire wear is estimated as 360 mg/km per car (25); still, most of the pollution
is restricted to the roadway and its vicinity. Rubber particles from tires con-
Air Pollution 161
Table 9.4. Contribution of Motor Vehicles to NOx Emissions in Selected
Cities
City YearPercent of Total Emissions
of NOx
Mexico City 1987 64
Manila 1987 73
London 1978 65
Los Angeles 1976 71
Hong Kong 1987 75
Seoul 1983 60
Source: Adapted from data in reference 21. Reproduced with permission from reference 46.
Copyright 1994 SFZ Publishing.
tribute to air pollution and to water pollution as they are washed out with
storm water into the watershed.
A study in the highly urbanized area of Los Angeles indicated that tire
wear contributed 671 kg/day to aerosol organic carbon (2.4% of the total
organic carbon in the air), whereas brake lining wear was estimated to be
1480 kg/day (26). A newer study (27), which reported that urban air contains
respirable black particles, probably originating from tires, appears to confirm
the earlier findings. The major component of tires is natural latex. Proteins of
natural latex are known to be antigens capable of eliciting hypersensitivity
(28).
Around 60% of the wear products of brakes are volatile materials such as
CO, CO2, and hydrocarbons; the other 40% are particulate matter. Only
about 0.01% of this material is asbestos (25). These particulate wear products
also present an urban air and water pollution problem.
The airborne respirable particles from tires and brakes may be, in part,
responsible for the increasing incidence of asthma in the United States.
According to a report from the National Center of Health Statistics, the pre-
valence of ever having asthma among 6 to 11-year-old children increased
from 4.8% during 1971–74 to 7.6% during 1976–80 (29). The incidence was
more prevalent among urban than rural children, thus providing additional
indirect evidence that urban aerosols are the culprits.
Pollution by Industrial Chemicals
Toxic substances released into the air by industry have caused much con-
cern. Although the Clean Air Act (Chapter 15 has a toxic substances provi-
sion, until recently only seven substances were regulated by the EPA:
arsenic, asbestos, benzene, beryllium, mercury, radionuclides, and vinyl
chloride. The Clean Air Act of 1990 increased the number of regulated
toxic air pollutants to 189, but it will not be until 2003 that the law will
be fully implemented (see Chapter 15).
Toxic Release Inventory and the PollutionPrevention Act
The Superfund Amendment and Reauthorization Act (SARA) of 1986 man-
dated that all industries producing, importing, or using more than 75,000 lb
of a chemical (listed on the EPA index of toxic materials) annually have to
report the toxic releases into the environment, and transfers of the toxic
waste to other facilities. This is called the Toxic Release Inventory (TRI).
In 1987 the reporting threshold was lowered to 50,000 lb per chemical, and
in the following years to 25,000 lb. In the first year (1987) 19,000 facilities
(estimated 55–75% of all businesses required to file) complied with the
regulation; by 1998 (the last year for which data were compiled) the number
162 Environmental Toxicology
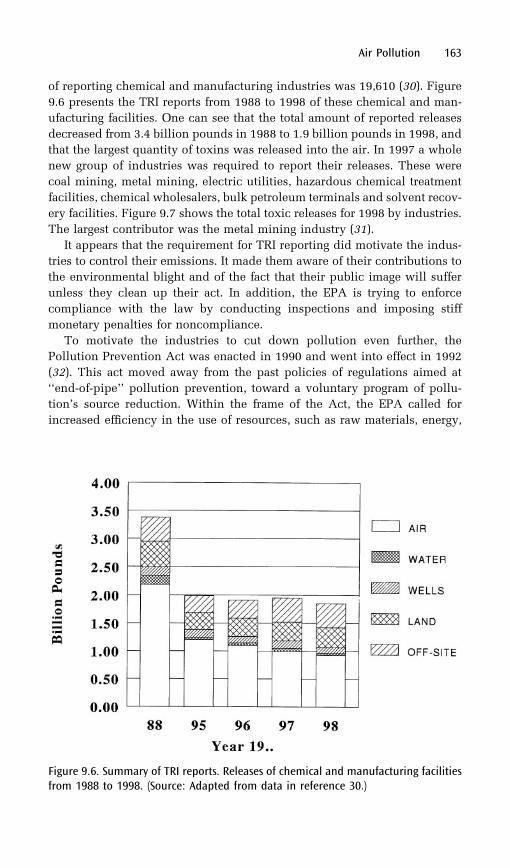
of reporting chemical and manufacturing industries was 19,610 (30). Figure
9.6 presents the TRI reports from 1988 to 1998 of these chemical and man-
ufacturing facilities. One can see that the total amount of reported releases
decreased from 3.4 billion pounds in 1988 to 1.9 billion pounds in 1998, and
that the largest quantity of toxins was released into the air. In 1997 a whole
new group of industries was required to report their releases. These were
coal mining, metal mining, electric utilities, hazardous chemical treatment
facilities, chemical wholesalers, bulk petroleum terminals and solvent recov-
ery facilities. Figure 9.7 shows the total toxic releases for 1998 by industries.
The largest contributor was the metal mining industry (31).
It appears that the requirement for TRI reporting did motivate the indus-
tries to control their emissions. It made them aware of their contributions to
the environmental blight and of the fact that their public image will suffer
unless they clean up their act. In addition, the EPA is trying to enforce
compliance with the law by conducting inspections and imposing stiff
monetary penalties for noncompliance.
To motivate the industries to cut down pollution even further, the
Pollution Prevention Act was enacted in 1990 and went into effect in 1992
(32). This act moved away from the past policies of regulations aimed at
‘‘end-of-pipe’’ pollution prevention, toward a voluntary program of pollu-
tion’s source reduction. Within the frame of the Act, the EPA called for
increased efficiency in the use of resources, such as raw materials, energy,
Air Pollution 163
Figure 9.6. Summary of TRI reports. Releases of chemical and manufacturing facilitiesfrom 1988 to 1998. (Source: Adapted from data in reference 30.)
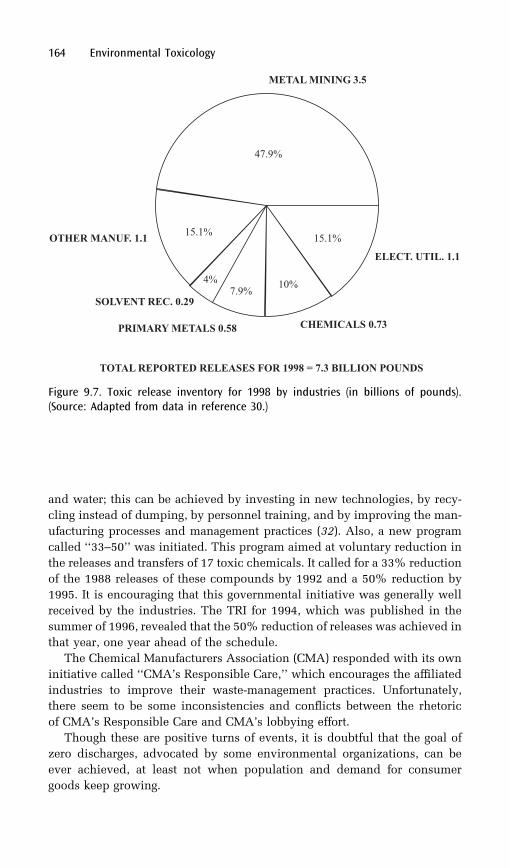
and water; this can be achieved by investing in new technologies, by recy-
cling instead of dumping, by personnel training, and by improving the man-
ufacturing processes and management practices (32). Also, a new program
called ‘‘33–50’’ was initiated. This program aimed at voluntary reduction in
the releases and transfers of 17 toxic chemicals. It called for a 33% reduction
of the 1988 releases of these compounds by 1992 and a 50% reduction by
1995. It is encouraging that this governmental initiative was generally well
received by the industries. The TRI for 1994, which was published in the
summer of 1996, revealed that the 50% reduction of releases was achieved in
that year, one year ahead of the schedule.
The Chemical Manufacturers Association (CMA) responded with its own
initiative called ‘‘CMA’s Responsible Care,’’ which encourages the affiliated
industries to improve their waste-management practices. Unfortunately,
there seem to be some inconsistencies and conflicts between the rhetoric
of CMA’s Responsible Care and CMA’s lobbying effort.
Though these are positive turns of events, it is doubtful that the goal of
zero discharges, advocated by some environmental organizations, can be
ever achieved, at least not when population and demand for consumer
goods keep growing.
164 Environmental Toxicology
Figure 9.7. Toxic release inventory for 1998 by industries (in billions of pounds).(Source: Adapted from data in reference 30.)
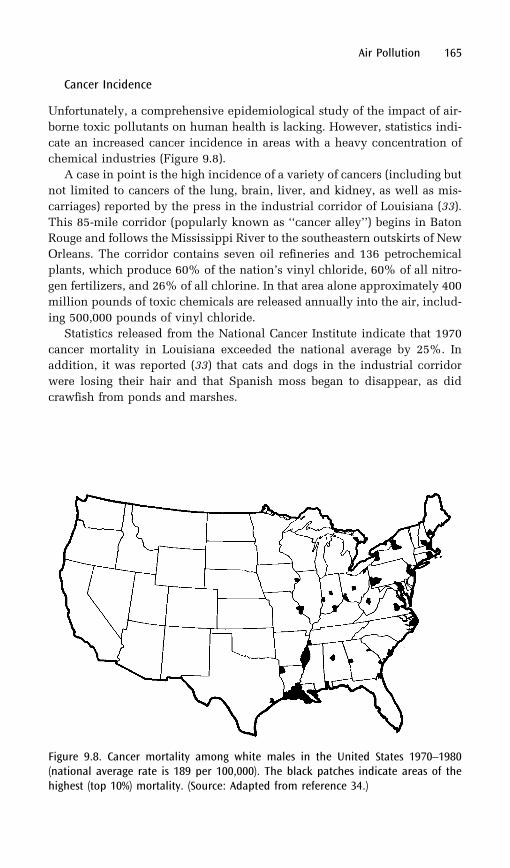
Cancer Incidence
Unfortunately, a comprehensive epidemiological study of the impact of air-
borne toxic pollutants on human health is lacking. However, statistics indi-
cate an increased cancer incidence in areas with a heavy concentration of
chemical industries (Figure 9.8).
A case in point is the high incidence of a variety of cancers (including but
not limited to cancers of the lung, brain, liver, and kidney, as well as mis-
carriages) reported by the press in the industrial corridor of Louisiana (33).
This 85-mile corridor (popularly known as ‘‘cancer alley’’) begins in Baton
Rouge and follows the Mississippi River to the southeastern outskirts of New
Orleans. The corridor contains seven oil refineries and 136 petrochemical
plants, which produce 60% of the nation’s vinyl chloride, 60% of all nitro-
gen fertilizers, and 26% of all chlorine. In that area alone approximately 400
million pounds of toxic chemicals are released annually into the air, includ-
ing 500,000 pounds of vinyl chloride.
Statistics released from the National Cancer Institute indicate that 1970
cancer mortality in Louisiana exceeded the national average by 25%. In
addition, it was reported (33) that cats and dogs in the industrial corridor
were losing their hair and that Spanish moss began to disappear, as did
crawfish from ponds and marshes.
Air Pollution 165
Figure 9.8. Cancer mortality among white males in the United States 1970–1980(national average rate is 189 per 100,000). The black patches indicate areas of thehighest (top 10%) mortality. (Source: Adapted from reference 34.)
Respiratory Problems
The National Cancer Institute’s statistical review released in 1987 (35)
recorded a 29.5% increase in the incidence rate of respiratory cancer (lung
and bronchial) between 1973 and 1985. The number of smokers decreased
between 1965 and 1985, from 43.3% to 30.8% of the population over the age
of 20. Thus, it is unlikely that this increase may be attributed to smoking.
Whether this trend is attributable to air pollution cannot easily be estab-
lished, but airborne toxins should be considered as a contributory factor.
Although the respiratory cancer is of great concern, it is not the only health
problem caused by air polluted by toxic chemicals.
The effect of urban and industrial pollutants on human health in Eastern
Europe has been documented. In the highly industrialized district of south-
western Poland, outdated industrial plants emit tons of sulfur dioxide, nitro-
gen oxides, chlorides, fluorides, vaporized solvents, and lead into the air.
Bronchitis, tuberculosis, and pulmonary fibrosis (pneumoconiosis) (see
Chapter 8) are more prevalent in this industrial district than anywhere else
in the country. In one area 35% of the children and adolescents suffer from at
least mild lead poisoning (36). In the highly polluted regions of the former
Czechoslovakia, the frequency of respiratory diseases among preschool and
school-age children was five times and three times higher, respectively, than
it was among children from the less-polluted western region (37). Similarly,
it has been noticed in Poland that the rates of chronic bronchitis were three
times higher and asthma four times higher among army recruits from areas
heavily polluted by sulfur dioxide than among recruits from the unpolluted
areas (37). Overall life expectancy at birth, during the period 1985–90, was
5% lower in Eastern than in Western Europe. On the other hand, infant
mortality was nearly twice as high in the eastern countries (Poland,
Czechoslovakia, and Hungary) than in West Germany (37).
According to a report, titled Environment in the Transition to a Market
Economy published in 1999 by the Organization for Economic Cooperation
and Development (OECD), the environment in Central and Eastern European
Countries has improved considerably during the last decade. The improve-
ment was most notable in the five countries in the first tier for acession to the
European Union (EU), namely the Czech Republic, Estonia, Hungary, Poland
and Slovenia. However the report noticed that it may take these countries 20
years or more to meet all current EU environmental requirements (38).
Pollution by Incinerators
Another concern is the emission of airborne toxins by municipal and toxic
waste incinerators. With the growing shortage of waste disposal sites and the
increase in the cost of disposal, municipalities in the United States and
166 Environmental Toxicology
around the industrialized world are tending to dispose of municipal waste
by incineration and to use the heat produced for energy generation.
Facility Effectiveness
Incinerators built during the first half of this century are no longer in use
because they do not meet present air quality standards. Although modern
incinerators may meet the air quality standards for conventional pollutants,
there is concern that incineration of chlorine-containing compounds, such as
bleached paper and poly(vinyl chloride) plastics, produces toxic (and until
recently, unregulated) dioxins and furans.
With the increasing use of disposable plastics and a variety of household
chemicals that eventually end up in the waste stream, this concern seems to
be justified. Epidemiological studies (39) point out the relatively high levels
of dioxins in the milk of nursing mothers. This contamination may be attri-
butable, at least in part, to waste incineration. In addition, waste incinerators
contribute to air pollution by emitting toxic metals such as mercury, lead,
zinc, cadmium, tin, and antimony.
Chemical Waste
Incineration of chemical waste presents a similar problem. According to
Gross and Hesketh (40), the most modern controlled-air incinerators ‘‘are
able to dispose of a wide variety of organic solid wastes.’’ However, the
efficiency of the destruction of these compounds is still open for debate.
The law requires that the hazardous waste incinerators have a destruction-
removal efficiency (DRE) of 99.99% for all hazardous waste and 99.9999%
for ‘‘waste of special concern’’ such as PCBs and dioxins. However, accord-
ing to the EPA scientists, none of the presently available incinerators can
meet the governmental standards. Although some chemicals can be
destroyed with 99.99% efficiency in test burning of a single compound,
this does not mean that all compounds in a waste mixture will be destroyed
with this efficacy, because the optimal destruction temperature may vary
from compound to compound. For safety reasons, testing for combustion
efficiency of highly toxic compounds, such as dioxins, is done with surrogate
compounds that are supposed to be harder to destroy than the actual com-
pound of interest. An assumption was made that if the 99.9999% DRE was
achieved in the test, this DRE will also apply to dioxins or PCBs in the
mixture of waste. Analysis of the results of actual burning revealed that if
the test compound was present in a mixed waste at a concentration of less
than 1000 ppm, its destruction was not nearly 99.9999% complete. Although
the phenomenon is not well understood, the fact remains that the alleged
completeness of destruction by incineration of highly toxic compounds in
the waste stream may frequently be highly overestimated.
Air Pollution 167
Several reports presented during the International Congress on Health
Effects of Hazardous Waste, held in Atlanta, GA, in May 1993 indicated
that people living downwind or in close vicinity to toxic waste incinerators
had a greater prevalence of coughing, phlegm, wheezing, sore throat, eye
irritation, emphysema, sinus trouble, and neurological diseases than those
living upwind or some distance from the incinerators. Although none of
these studies definitely proves the link between incinerators and a health
hazard, they strongly suggest that such a link may exist (41).
Tall Stacks and Their Role in Transport of Pollutants
The Clean Air Act sets standards for local air quality. However, except for
new stationary sources of pollution, which are required to install scrubbers
for removal of sulfur dioxide from flue gases, it does not specify the means by
which this air quality should be attained.
Thus, it was possible to make some smelters and coal-burning power
plants conform to local air quality standards simply by increasing the height
of their smoke stacks. Stacks over 200 feet high emit pollutants above the
ambient air monitoring level. These pollutants are propelled with the wind
for hundreds of miles. They settle, eventually, in a dry form or with rain or
snow on land and water. This is known as acid precipitation; its effects will
be discussed in Chapter 11.
Since 1970, 102 tall stacks (23 of them taller than 1000 feet) have been
erected by utility companies in the United States (42). Legal action to outlaw
tall stacks has been initiated by environmental organizations, and several
bills concerning this issue have been proposed in Congress. In 1977 a ‘‘Tall
Stacks’’ provision that prohibits the use of dispersion techniques as a means
of conforming with NAAQS was added to the Clean Air Act (see Chapter 15).
Despite this provision, the problem of airborne transport of pollutants still
exists because of either loopholes in the law or lack of enforcement.
Indoor Air Pollution
Considering the indoor concentration of pollutants and the time spent
indoors, the daily intake of some pollutants from indoor and outdoor air
could be calculated (43) (Table 9.5). The EPA survey of air quality inside
10 buildings, conducted during the 1980s, identified 500 VOCs; the
frequency of occurrence was in the following order: aliphatic hydrocarbons,
aromatic hydrocarbons, and chlorinated hydrocarbons (44). A comparison of
indoor and outdoor air quality in new hospitals, new office buildings, and
new nursing homes is shown in Figure 9.9. A ‘‘sick building syndrome,’’
which may cause a variety of illnesses, such as headaches, depression,
fatigue, irritability, allergy-like symptoms, heart disease, and cancer, is a
168 Environmental Toxicology
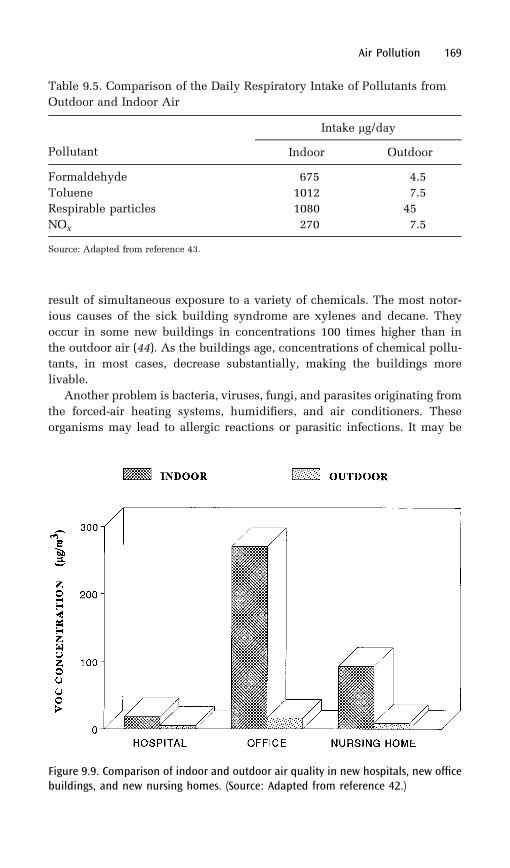
result of simultaneous exposure to a variety of chemicals. The most notor-
ious causes of the sick building syndrome are xylenes and decane. They
occur in some new buildings in concentrations 100 times higher than in
the outdoor air (44). As the buildings age, concentrations of chemical pollu-
tants, in most cases, decrease substantially, making the buildings more
livable.
Another problem is bacteria, viruses, fungi, and parasites originating from
the forced-air heating systems, humidifiers, and air conditioners. These
organisms may lead to allergic reactions or parasitic infections. It may be
Air Pollution 169
Table 9.5. Comparison of the Daily Respiratory Intake of Pollutants from
Outdoor and Indoor Air
Pollutant
Intake mg/day
Indoor Outdoor
Formaldehyde 675 4.5
Toluene 1012 7.5
Respirable particles 1080 45
NOx 270 7.5
Source: Adapted from reference 43.
Figure 9.9. Comparison of indoor and outdoor air quality in new hospitals, new officebuildings, and new nursing homes. (Source: Adapted from reference 42.)
assumed that in old American buildings and in most European buildings,
where central heating systems are based on steam or hot water circulating
through radiators rather than forced-air circulation, the problem of bacteria,
viruses, and fungi should be less critical.
In some parts of the world, including certain areas in the United States,
the radioactive gas radon creates an indoor health hazard. Radon, a noble
gas, is a product of disintegration of uranium, actinouranium, and thorium.
Because these elements occur in soil and rocks, the building materials and
soil under the buildings are the major sources of indoor radon. Water and
natural gas are additional, albeit usually minor, sources of indoor radon.
However, in certain locations, household water supply, especially from
deep wells, may contain substantial quantities of this gas. Boiling water
releases most of the radon, and that ingested by drinking cold water is
quickly eliminated from the body without doing much harm. Thus, the
main hazard of radon in household water is from breathing radon released
into the bathroom air from showers or baths (45).
Despite the seriousness of the problem, so far the indoor air pollution in
the United States remains, for the most part, unregulated. Indoor air pollu-
tion is aggravated in modern buildings because they are constructed with
energy-saving in mind. Thus, the air exchange between inside and outside is
restricted.
The main source of indoor air pollution in the developing countries is
combustion of coal or biomass (wood, dung, agricultural waste, etc.) for
heating and cooking in primitive, poorly vented stoves. The pollutants in
that case are respirable particles coated with PAHs, nitrogen dioxide, sulfur
dioxide, carbon monoxide, and a variety of VOCs. As mentioned earlier in
this chapter, most of these pollutants are either irritants of tender tissues,
respiratory and cardiovascular toxins, or both. In addition, some PAHs are
carcinogens and mutagens mostly affecting the respiratory system.
Sometimes, especially in rural houses, the concentration of certain indoor
pollutants exceeds the WHO guidelines. Because women in the agricultural
communities spend most of their time indoors performing household chores,
exposure to fumes of biomass fuels might be the single most important health
hazard for women (43).
References
1. Environmental Protection Agencyhhttp://www.epa.gov/ttn/chief/trends98/browse.htmli
Chapter 3, Table 3-132. World Resources Institute, International Institute for Environment and
Development in collaboration with U.N. Environment Programme.World Resources 1988–89, Atmosphere and Climate; Basic Books: NewYork, 1988; Chapter 23, p 333 and World Resources 1998-99, Health;Oxford University Press, New York, 1998; Chapter 8, p 264.
170 Environmental Toxicology

3. Amdur, M. O. In Cassarett and Doull’s Toxicology; Klaassen, C. D.;Amdur, M. O.; Doull, J., Eds.; MacMillan: New York, 1986; Chapter 25,p 801.
4. Waldbott, G. L. Health Effects of Environmental Pollutants, 2nd ed.; C. V.Mosby: St. Louis, MO, 1987.
5. MacKenzie, J. J.; El-Ashrey, M. T. Ill Winds: Airborne Pollution’s Toll onTrees and Crops; World Resources Institute: Washington, DC, 1988;Chapter 5, p 33.
6. Seinfeld, J. H. Science 1989, 243(4892), 745.7. Abelson, P. H. Science 1988, 241(4873), 1569.8. Santodonato, J.; Howard, P.; Basu, D. J. Environ. Pathol. Toxicol. 1981,
5(1), 1.9. Hileman, B. Chem. Eng. News February 8, 1988, 22.10. Menzie, C. A.; Potocki, B. B.; Santodonato, J. Environ. Sci. Technol.
1992, 26(7), 1278.11. Harkov, R.; Greenberg, A. J. Air Pollut. Control Assoc. 1985, 35, 238.12. Hites, R. A. In Atmospheric Aerosol: Source/Air Quality Relationships;
Macias, E. S.; Hopke, P. K., Eds.; ACS Symposium Series 167; AmericanChemical Society: Washington, DC, 1981; pp 187–196.
13. Health Effects Institute hhttp://www.healtheffects.org/news.htmiResearch reports 91 and 95.
14. Global Environment Monitoring System, Assessment of Urban AirQuality; United Nations Environment Programme and World HealthOrganization: Geneva, Switzerland, 1988; Chapter 7, p 58.
15. Goyer, R. A. In Cassarett and Doull’s Toxicology; Klaassen, C. D.;Amdur, M. O.; Doull, J., Eds.; MacMillan: New York, 1986; Chapter 19,p 582.
16. Global Environment Monitoring System, Assessment of Urban AirQuality; United Nations Environment Programme and World HealthOrganization: Geneva, Switzerland, 1988; Chapter 5, p 39 and Chapter6, p 52.
17. Global Environment Monitoring System, Assessment of Urban AirQuality; United Nations Environment Programme and World HealthOrganization: Geneva, Switzerland, 1988; Chapter 8, p 70.
18. American Lung Association hhttp://www.lungusa.org/air2000i Stateof the air 2000.
19. Hileman, B. Chem. Eng. News June 12, 2000, 31.20. Dockery, D. W.; Pope, C. A.; Xu, X. P.; Spengler, J. D.; Ware, J. H.; Fay, M.
E.; Ferris, B. G. N. Engl. J. Med. 1993, 329(24), 1753.21. World Resources Institute, International Institute for Environment and
Development in collaboration with U.N. Environment Programme.World Resources 1992–93, Atmosphere and Climate; OxfordUniversity: New York, 1992; Chapter 13, p 193.
22. Ember, L. Chem. Eng. News February 5, 1990, 23.23. Chem. Eng. News May 15, 1989, 17.24. MacKenzie, J. J.; El-Ashry, M. T. Ill Winds: Airborne Pollution’s Toll on
Trees and Crops;World Resources Institute: New York, 1988; Chapter 4,p 25.
Air Pollution 171
25. Cadle, S. H.; Nebel, G. J. In Introduction to Environmental Toxicology;Guthrie, F. E.; Perry, J. J., Eds.; Elsevier Science: New York, 1980;Chapter 32, p 420.
26. Hildeman, L. M.; Markowski, G. R.; Cass, G. R. Environ. Sci. Technol.1991, 25(4), 744.
27. Williams, B. P.; Buhr, M. P.; Weber, R. W.; Volz, M. A.; Koepke, J. W.;Selner, J. C. J. Allergy Clin. Immunol. 1995, 95(1), 88.
28. Jeager, D.; Kleinhans, D.; Czuppon, A. B.; Baur, X. J. Allergy Clin.Immunol. 1992, 89(3), 759.
29. Gergen, P. J.; Mullally, D. I.; Evans, R., 3rd. Pediatrics 1988, 81(1), 1.30. Environmental Protection Agency
hhttp://www.epa.gov/tri/tri98/data/datasum.htmi31. Hogue, C. Chem. Eng. News May 29, 2000, 46.32. Thayer, A. M. Chem. Eng. News November 16, 1992, 22.33. Maraniss, D.; Weiskopf, M. The Washington Post, National Weekly
Edition January 25–31, 1988, 5(14), 8.34. Pickle, L. W.; Mason, T. J.; Howard, N.; Hoover, R.; Fraumeni, J. F., Jr.
Atlas of U.S. Cancer Mortality Among Whites 1950–1980; NationalInstitutes of Health: Bethesda, MD, 1980; publication No. 87–2900.
35. National Cancer Institute. 1987 Annual Cancer Statistics ReviewIncluding Cancer Trends: 1950–1985; National Institutes of Health:Bethesda, MD, 1987; publication No. 88–2789.
36. Lasota, J. P. Sciences (N.Y.) 1987, July/August, 33.37. World Resources 1992–93, Central Europe; Oxford University: New
York, 1992; Chapter 5, p 57.38. Layman, P. Chem. Eng. News November 29, 1999, 18.39. Pollock, C. In State of the World 1987; Brown, L. R., Ed.; W. W. Norton:
New York, 1987; p 101.40. Cross, F. L., Jr.; Hesketh, H. E. Controlled Air Incineration; Technomic:
Lancaster, PA, 1985.41. Sci. News (Washington, D.C.) 1993, 143, 334.42. Thompson, R. In Earth’s Threatened Resources; Gimlin, H., Ed.;
Congressional Quarterly: Washington, DC, 1986; Editorial ResearchReports.
43. Global Environment Monitoring System, Assessment of Urban AirQuality; United Nations Environment Programme and World HealthOrganization: Geneva, Switzerland, 1988; Appendix I, p 81.
44. Ember, L. R. Chem. Eng. News December 5, 1988, 23.45. Radiation: Doses, Effects, Risks; United Nations Environment
Programme: Nairobi, Kenya, 1985.46. Zakrzewski, S. F. People, Health and Environment, SFZ Publishing:
Amherst, NY, 1994; p 49.
172 Environmental Toxicology
10Pollution of the Atmosphere
The Earth’s Atmosphere
The earth’s atmosphere consists of 78% (by volume) of N2; 21% O2; about
0.033% CO2; trace amounts of noble gases, NOx, and CH3; and variable
amounts of water vapor. At sea level, the amount of water vapor may vary
from 0.5 g per kg of air in polar regions to more then 20 g per kg in the
tropics.
The Standard Atmosphere
The standard atmosphere is a theoretical set of data that serves as a reference
point for calculation of atmospheric changes due to the weather. The values
are calculated for sea level conditions and correspond to a pressure of 760
mm of mercury (92.29 in., 1013.25 mbar), an air density of 1.22 kg/m3, and a
temperature of 15 8C (59 8F). The composition of the air within the tropo-
sphere, which is the lowest layer of the atmosphere, does not change with
altitude; however, the pressure and temperature decrease with altitude. The
relationship between altitude and pressure in the standard atmosphere is
shown in Figure 10.1, and the relationship between altitude and temperature
is shown in Figure 10.2. The rate of decrease of temperature with altitude
(6.49 8C per km) is referred to as the ‘‘standard lapse rate’’. This rate is a
strictly theoretical average value because the actual lapse rate varies depend-
ing on the weather. Because the air density is proportional to the pressure
and inversely proportional to the temperature, it changes at the same rate as
the pressure does.
173
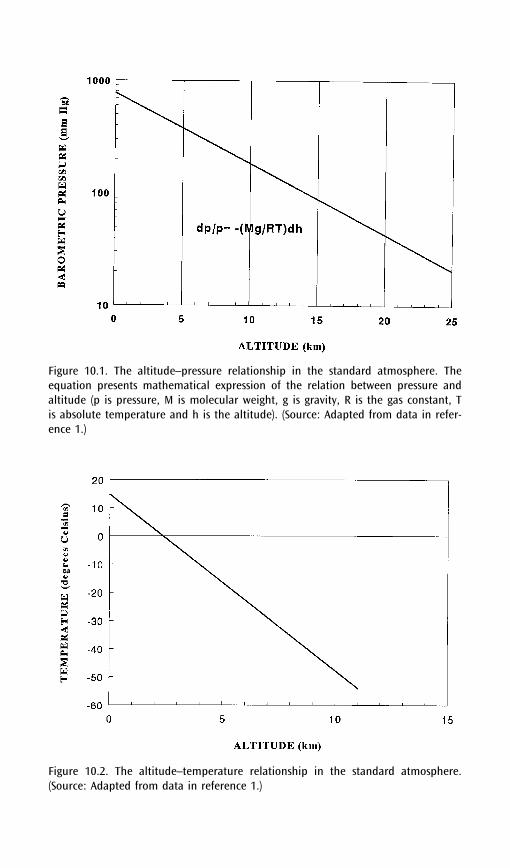
Figure 10.1. The altitude–pressure relationship in the standard atmosphere. Theequation presents mathematical expression of the relation between pressure andaltitude (p is pressure, M is molecular weight, g is gravity, R is the gas constant, Tis absolute temperature and h is the altitude). (Source: Adapted from data in refer-ence 1.)
Figure 10.2. The altitude–temperature relationship in the standard atmosphere.(Source: Adapted from data in reference 1.)
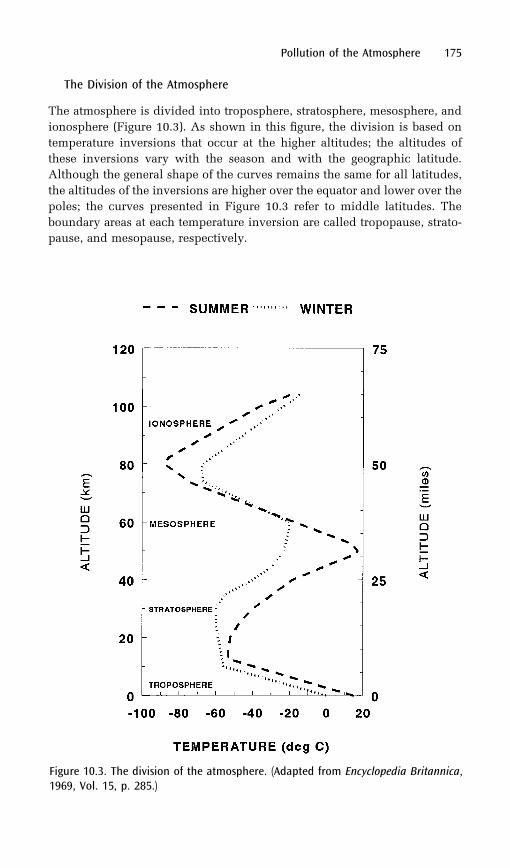
The Division of the Atmosphere
The atmosphere is divided into troposphere, stratosphere, mesosphere, and
ionosphere (Figure 10.3). As shown in this figure, the division is based on
temperature inversions that occur at the higher altitudes; the altitudes of
these inversions vary with the season and with the geographic latitude.
Although the general shape of the curves remains the same for all latitudes,
the altitudes of the inversions are higher over the equator and lower over the
poles; the curves presented in Figure 10.3 refer to middle latitudes. The
boundary areas at each temperature inversion are called tropopause, strato-
pause, and mesopause, respectively.
Pollution of the Atmosphere 175
Figure 10.3. The division of the atmosphere. (Adapted from Encyclopedia Britannica,1969, Vol. 15, p. 285.)
Pollution of the atmosphere is generally the least appreciated of all envir-
onmental issues. The reasons are that it affects us neither directly nor imme-
diately. Yet, next to overpopulation, this may be the most crucial issue
affecting the survival of our civilization.
To appreciate the fragility of the earth’s atmosphere, one has to consider
its dimension in comparison to that of the globe. Let us imagine a globe 1 m
in diameter (the earth’s equatorial diameter is 6378 km). The troposphere
would then be 1.3 to 3.0 mm thick; the outer edges of the stratosphere would
reach a height of 7.8 to 8.5 mm, and the outer edges of the mesosphere would
be 12.5 to 14.0 mm above the surface of the globe.
Formation and Sustenance of Stratospheric Ozone
The solar radiation that penetrates the earth’s upper, highly rarefied atmo-
sphere strikes the oxygen molecules in the middle stratosphere, splitting
them into single atoms. The highest concentration of the atomic oxygen
occurs at an altitude of 30 to 40 km. The atomic oxygen is a very reactive
species and interacts with the molecular oxygen forming ozone (O3):
O2 þ h� �! OþO ð10:1ÞO2 þO �! O3 ð10:2Þ
In the upper atmosphere the gases tend to separate according to their
weight. The heavier gases settle down, whereas the lighter gases rise up.
Because ozone is heavier than either oxygen or nitrogen, it tends to settle
down. This movement is partially counteracted by the continuous stirring of
the atmosphere. As the result of these competing forces, the highest concen-
tration of ozone (a few parts per million) occurs at a level of 15 to 30 km. The
increasing density of the atmosphere gradually attenuates the solar radiation,
so that at altitudes below 25 km the photochemical ozone formation becomes
extremely slow and eventually ceases completely (2). One would expect that
a consistent bombardment of oxygen by the solar radiation will result in a
continuous buildup of ozone. This does not happen, however, because as
ozone is formed it is also destroyed by interactions with nitric oxide (equa-
tion 10.3) and hydroxy radicals (equation 10.4), and by the direct effect of
solar radiation (equation 10.5) (3).
O3 þNO �! NO2 þO2
NO2 þO �! NOþO2
O3 þO �! 2O2 ð10:3ÞO3 þOH �! HO2 þO2
O3 þHO2 �! HOþ 2O2
2O3 �! 3O2 ð10:4ÞO3 þ h� �! O2 þO ð10:5Þ
176 Environmental Toxicology
Thus, in an unpolluted atmosphere the stratospheric ozone concentration
remains (within seasonal and latitudinal variations) relatively constant (2).
Although the concentration of ozone in the stratosphere is only a few parts
per million (ppm), it is sufficient to filter a part of the solar ultraviolet radia-
tion, thus reducing the amount of radiation reaching the earth’s surface.1 The
stratospheric ozone is popularly called a protective ozone layer. This name
is somehowmisleading because it reverses the cause–effect relationship. The
name ‘‘protective layer’’ implies that the ozone is there for our and other
species’ protection. In fact, life on earth is what it is because it evolved
according to the conditions imposed by the environment. If there were no
ozone layer, it is likely that only aquatic life below the ocean surface, pro-
tected from the lethal radiation by a layer of water, could exist. Therefore, it
may be expected that any perturbation of these conditions will have an effect
on living matter.
Depletion of Stratospheric Ozone
Chlorofluorocarbons
In 1974, Molina and Rowland (4) first proposed that chlorine from a class of
compounds designated as chlorofluorocarbons (CFCs) could cause strato-
spheric ozone depletion. CFCs were introduced in the 1930s and found
numerous industrial applications as propellants for aerosols, plastic-foam-
blowing agents, refrigeration and air conditioning fluids, cleaning fluids for
electronic equipment, and fire extinguisher fluids. Their advantage is that
they are chemically stable, nonflammable, and nontoxic. Ever since their
introduction into commerce, the production and consumption of CFCs
grew steadily until the 1970s. Then, because of the concern about their
ozone-destructive potential, their use as aerosol propellants was banned in
several industrialized countries, and their production declined. However,
the production of CFCs increased again after 1982 because of the growing
demand for foam insulation and for cleaning fluids in the electronic equip-
ment and microchip industries.
The chemical stability of CFCs in the troposphere is a detriment to the
environment. The two most damaging CFCs, CFCl3 (CFC-11) and CF2Cl2(CFC-12), have atmospheric lifetimes of 75 and 111 years, respectively.
Pollution of the Atmosphere 177
1The ultraviolet radiation spectrum is divided into three regions according to wave-
length: UV-A [below 200 nanometers (nm)], UV-B (280 to 315 nm), and UV-C (above
315 nm). The shortwave region, UV-a and UV-B are harmful to living organismsbecause they damage he deoxyribonucleic acids (DNA). The long-wave region, UV-
C, is relatively harmless. Because UV-A is absorbed by the atmosphere and does not
reach the earth’s surface, our concern centers on uv-B (1 nm equals one millionth part
of a millimeter).
When released into the environment they rise slowly to high altitudes. In the
lower stratosphere, they become exposed to intense ultraviolet radiation,
which breaks them down, causing release of chlorine radicals. Elemental
chlorine destroys ozone as shown in equation 10.6:
ClþO3 �! ClOþO2 ð10:6ÞThe ClO radical may further react with atomic oxygen to regenerate the
chlorine radical according to equation 10.7:
ClOþO �! ClþO2 ð10:7ÞBoth ClO and Cl can be inactivated temporarily by reacting with nitrogen
dioxide (equation 10.8) or methane (equation 10.9), respectively (5). Nitrogen
dioxide is introduced into the stratosphere by oxidation of microbially pro-
duced nitrous oxide (N2O). Methane originates from both natural sources
and human activities.
ClOþNO2 þ catalyst �! ClNO3 ð10:8Þ
Clþ CH4 �! HClþ CH3 ð10:9Þ
The Polar Vortex
During winter at the poles, a stream of air in the stratosphere (the polar
vortex) encircles the polar regions. It isolates them from the warmer air of
moderate zones. This polar vortex allows temperatures to drop to as low as
�808C and –90 8C in the arctic and antarctic regions, respectively.
The polar stratospheric clouds (PSCs) that form at such low temperatures
are the key to ozone destruction. There are two types of polar clouds: PSC I
consists of nitric acid trihydride crystals (HNO3 � 3H2O), and PSC II consists
of ice. The process of PSC I formation involves a conversion of nitrogen
oxides (NO, NO2, and NO3) into N2O5, and subsequent reaction of gaseous
N2O5 with H2O aerosol to form nitric acid (equation 10.10) (6).
N2O5 ðgasÞ þH2O ðaerosolÞ �! 2HNO3 ðgasÞ ð10:10ÞAt temperatures of about 195 K (–78 8C), nitric acid freezes out as nitric
acid trihydrate. The formation of chlorine nitrate (ClNO3) depends on the
availability of NO2; thus, removal of free NO2, referred to as denitrification,
tends to decrease the content of ClNO3 in the atmosphere. In addition, PSC I
provides a catalytic surface for a heterogeneous reaction between ClNO3 and
HCl that leads to regeneration of active chlorine (equation 10.11).
ClNO3 þHCl �! Cl2 þHNO3 ð10:11ÞAs the poles emerge from the polar night, the active chlorine species are
converted by light to chlorine radicals (equation 10.12), which in turn react
with ozone according to the following equations:
178 Environmental Toxicology
Cl2þh� �! 2Cl ð10:12Þ
2Clþ 2O3 �! 2ClOþ 2O2 ð10:13ÞClO then enters the following chain reactions:
2ClOþ catalyst �! Cl2O2 ð10:14Þ
Cl2O2þh� �! Clþ ClOO ð10:15Þ
ClOOþ catalyst �! ClþO2 ð10:16ÞAs the daylight period lengthens, the polar vortex dissipates and new air
is brought to the region. This air carries with it nitrogen oxides, which
inactivate the active chlorine (ClO) by forming ClNO3. The process will
then be repeated with the onset of polar winter. PSCs will catalyze the
decomposition of chlorine nitrate and release active chlorine.
The depletion of ozone, which was first observed over Antarctica during
austral spring, when it emerges from the winter darkness, appears to be
spreading gradually to other latitudes. Ozone has been depleted by 5% or
more since 1979 at all latitudes south of 60 8S.
Biological and Economic Implications
The depletion of stratospheric ozone affects not only the intensity of the UV-
B radiation reaching the earth, but also the wavelength composition; it shifts
more radiation toward the shorter, more damaging wavelengths. The risks to
human health and to the survival of other species posed by UV-B radiation
are estimated by a theoretical calculation of the potential for damaging the
species’ DNA (7). Using these criteria, the International Panel on Substances
that Deplete the Ozone Layer estimated that since 1979, the annual DNA
damage-dose increased 5% per decade at latitudes 308N and 308S, 10% per
decade in the arctic region, 15% per decade at latitude 558S, and 40% per
decade at latitude 858S. No significant increase was noted in the equatorial
region (8). Because the intensity of UV-B radiation reaching the earth’s sur-
face is attenuated by cloud cover, suspended particles, and tropospheric
ozone, the population in highly industrialized areas is, to a certain extent,
protected from the harmful effects of UV radiation.
The future effect of ozone depletion on terrestrial plants is difficult to
assess because many other factors, such as climatic changes associated
with the greenhouse effect, may attenuate or aggravate the effects of
increased intensity of the UV radiation. Plant species vary significantly in
their responses to UV light. Among plants tested in the laboratory, many
responded to UV radiation by exhibiting reduced growth, flowering, and
photosynthetic activity (9). Some uncertainty exists about the magnitude
of damage that may be inflicted on aquatic plants. It has been established
that UV-B radiation greatly affects aquatic phytoplankton by damaging their
Pollution of the Atmosphere 179
mobility mechanism,2 their DNA, and their photosynthetic apparatus (10).
The decrease in marine plant growth could result in the demise of marine
mammals, crustaceans, and fish species. Such changes could alter the whole
marine ecosystem and further reduce the human food supply. Moreover,
because marine phytoplankton account for more than half of the global car-
bon dioxide fixation, interference with this process may further augment the
greenhouse effect (10).
Besides the biological impact, increased UV radiation will affect the dur-
ability of materials such as wood, paints, and plastics; the EPA estimates that
a 10% depletion of the stratospheric ozone will cause $2 billion in damage to
materials.
International Cooperation
The First International Conference on Substances that Deplete the Ozone
Layer, spearheaded by the United Nations Environment Programme
(UNEP), was convened in Montreal in October 1987. An agreement signed
at the conference urged CFC producers to freeze production at the current
level and to reduce it by 50% by 1998. By mid-1989, 36 countries had
ratified this agreement.
Soon the measures approved by the Montreal convention were seen as
highly inadequate. Even if CFC production were halted entirely, there are
already enough CFCs in the stratosphere to carry on destruction of ozone for
another 100 years. Although the results of the Montreal convention were
meager, its significance should not be underrated. It marks the beginning
of international cooperation in matters concerning protection of the global
environment.
In May 1988 another conference, of a more local character, was convened
in Colorado. This conference was jointly sponsored by the National
Aeronautics and Space Administration (NASA), the National Oceanic and
Atmospheric Administration (NOAA), the National Science Foundation
(NSF), the Chemical Manufacturers Association, the World Meteorological
Association, and UNEP. The purpose of the conference was to discuss the
results of the 1987 Airborne Antarctic Ozone Expedition, a joint project of
Harvard University and NASA (11). The findings of this expedition were that
‘‘in 1987, the ozone hole was larger than ever. More than half of the ozone
column was wiped out and essentially all ozone disappeared from some
regions of the stratosphere. The hole also persisted longer than it ever did
before, not filling until the end of November.’’
Because there were some indications of perturbed atmospheric chemistry
in the north, NASA organized an airborne expedition to the arctic region
180 Environmental Toxicology
2Some phytoplankton have the ability to adjust their position within the water
column in response to changing light conditions (10).
during January and February 1989. Although the concentration of ClO in the
arctic stratosphere was almost as high as that found over Antarctica (12),
subsequent satellite observations indicated that there was no dramatic deple-
tion of ozone. The explanation for this phenomenon was that in the arctic
region the polar vortex disintegrated quickly after emergence from the polar
night (13).
Phasing Out Fluorocarbons
In preparation for the Second International Conference on Substances that
Deplete the Ozone Layer, scheduled for 1990 in London, diplomats, envir-
onmentalists, and CFC producers from the 36 nations that had signed the
Montreal agreement gathered in Helsinki, Finland, in May 1989. They
drafted the following proposal for possible total phasing out of CFCs and
other ozone-destroying chemicals:
1. to phase out production and consumption of CFCs by the year2000,
2. to phase out production and consumption of halons, carbontetrachloride, and methyl chloroform as soon as feasible,
3. to commit themselves to speedy development ofenvironmentally acceptable substitutes,
4. to make available to Third World countries all pertinentinformation, technologies, and training.
The provisions of this agreement allowed, in certain cases, production
and use of the ozone-depleting substances after the year 2000, as long as this
production did not exceed 15% of the 1986 production. This proposal was
accepted and signed by the participating nations as amendments to the
Montreal protocol during the 1990 London convention.
A significant development in this area was the announcement by DuPont,
the world’s largest producer of CFCs, that it will phase out production of
these compounds by the year 2000. Substitutes for CFCs such as HCFC-141b
(C2H3Cl2F), HCFC-123 (C2HCl2F3), HCFC-22 (CHClF2), and HFC-134a
(CH2FCH) were developed to replace fully halogenated CFCs.
Fluorocarbons that carry hydrogen atoms (HCFCs) are decomposed sig-
nificantly before reaching the stratospheric ozone layer (14). Their atmo-
spheric lifetime and ozone-depletion potential are summarized in Table
10.1. The development of HCFCs is welcome news, but the EPA cautions
that their real usefulness will depend on thorough assessment of their toxi-
city and the toxicity of their decomposition products. Although HCFCs are
less damaging to stratospheric ozone than CFCs, nevertheless they carry
some chlorine into the stratosphere. Therefore, according to EPA, they
should be considered as transition substances, for use until better substitutes
are developed (15). In addition, concern for the use of HCFCs and HFCs (that
Pollution of the Atmosphere 181

do not deplete ozone) centers on their properties as powerful greenhouse
gases (GHGs).
Substitutes for foam-blowing processes that require neither CFCs, HCFCs,
nor HFCs are also being developed. DuPont plans to use dimethyl esters to
replace CFCs in the aerosol propellants (16) that were still used in Europe.
The BASF Corporation introduced a foam-blowing process that eliminates
use of CFCs entirely (17).
In 1992 a disturbing discovery of unusually severe ozone depletion in the
northern hemisphere, over the populated areas of North America, northern
Europe, and northern Asia, was reported. Because there are no PSCs at these
latitudes, the atmospheric scientists speculated that the conversion of the
inactive chlorine species to active chlorine may have been catalyzed by
suspended sulfate particles (18). Although some sulfate particles normally
occur in the stratosphere from natural sources, their unusually high concen-
tration in 1992 was attributed to the eruption of Mount Pinatubo in the
Philippines in June 1991. This eruption ejected 15–30 metric tons of sulfur
dioxide into the atmosphere. Sulfur dioxide was promptly converted to sul-
furic acid, which reacted in the stratosphere with metal salt particles, form-
ing sulfate aerosol (6).
Because of this alarming news, the United States decided unilaterally to
move the deadline for a complete elimination of ozone-depleting substances
to the end of 1995. Shortly after, the signatories to the Montreal convention
met again in Copenhagen. They followed the example of the United States
and established 1996 as an international deadline for phaseout of ozone-
depleting substances. They also established restrictions on the use of
HCFCs, requiring a freeze in their production by 1996 and complete elim-
ination of their use by 2030.
At present, the depletion of stratospheric ozone is due mainly to the
emissions of chlorine-containing compounds, such as CFCs, carbon tetra-
chloride, and so on. However, a large-scale deployment of supersonic trans-
port may turn out to be still more destructive to the ozone layer than are
182 Environmental Toxicology
Table 10.1. Atmospheric Lifetime and Ozone-Depletion
Potential of HCFCs
Compound
Atmospheric Lifetime
(years)
Ozone Depletion
Potentiala
CH2FCH3 21 0
CHCl2CF3 1.9 0.016
CH3CCl2 8.9 0.081
CHClF3 20 0.053
aCFC-11, used as a standard, is 1.00.
Source: Adapted from data presented in reference 14.
CFCs. Fuel combustion is associated with formation of nitrogen oxides
(NOx). Although nitrogen dioxide (NO2) protects ozone by binding the active
chlorine molecules, nitric oxide (NO) has a high ozone-destroying potential,
especially when emitted in the midst of the ozone layer where the super-
sonic airplanes fly (19).
The effect of restrictions imposed on the use of ozone-depleting chemicals
by the Montreal protocol can already be perceived. The rate of increase in
the atmospheric concentration of major CFCs is on the decline. However,
one has to keep in mind that even immediate elimination of all ozone-deplet-
ing substances would leave enough chlorine radicals in the atmosphere to
continue ozone destruction, albeit at a gradually decreasing rate, for another
century.
Emission of CO2 and Models of Climatic Changes
Life on earth depends upon a fixed supply of basic elements and substances,
such as carbon, nitrogen, oxygen, and water. Because their supply is fixed,
they must be continuously recycled. This process is referred to as biogeo-
chemical cycling. At present, the biogeochemical cycling equilibria have
been greatly perturbed by human activities.
The carbon cycle involves the exchange of carbon, mostly in the form of
carbon dioxide, among the atmosphere, the biosphere (i.e., living plants and
soil), and the oceans. The latter are the largest reservoirs of dissolved carbon
dioxide. The biosphere and atmosphere hold about 2000 and 700 billion tons
of carbon, respectively (20). The oceans hold about 14 times more than the
biosphere and atmosphere combined. In addition, large amounts of carbon
are stored in a nonexchangeable form as sediment in the oceans and in lesser
amounts in the form of fossil fuels (i.e., oil, coal, and gas).
Atmospheric carbon dioxide is the mainstay of life support on earth; it is
assimilated by green plants and subsequently converted to basic foods. In
addition, O2 is released during the assimilation process so that the reserves
of oxygen in the atmosphere remain constant.
Temperature of the Earth
Carbon dioxide, together with water vapor, is responsible for maintaining the
earth’s temperature at a level that supports life as we know it. About half of
the total solar energy that strikes the earth is absorbed by the earth. The rest
is either reflected or absorbed by the atmosphere. About 50% of the absorbed
thermal energy is consumed in evaporating water from the oceans, rivers,
lakes, and soil, and about 10% by direct heating of the atmosphere. The
remaining 40% is released as long-wave radiation. Carbon dioxide, water
vapor, and small amounts of other gases in the atmosphere bounce 88% of
Pollution of the Atmosphere 183
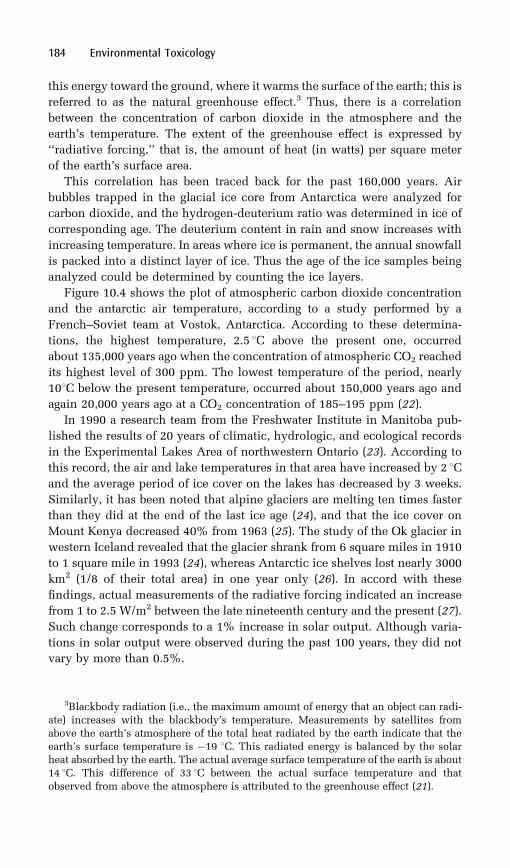
this energy toward the ground, where it warms the surface of the earth; this is
referred to as the natural greenhouse effect.3 Thus, there is a correlation
between the concentration of carbon dioxide in the atmosphere and the
earth’s temperature. The extent of the greenhouse effect is expressed by
‘‘radiative forcing,’’ that is, the amount of heat (in watts) per square meter
of the earth’s surface area.
This correlation has been traced back for the past 160,000 years. Air
bubbles trapped in the glacial ice core from Antarctica were analyzed for
carbon dioxide, and the hydrogen-deuterium ratio was determined in ice of
corresponding age. The deuterium content in rain and snow increases with
increasing temperature. In areas where ice is permanent, the annual snowfall
is packed into a distinct layer of ice. Thus the age of the ice samples being
analyzed could be determined by counting the ice layers.
Figure 10.4 shows the plot of atmospheric carbon dioxide concentration
and the antarctic air temperature, according to a study performed by a
French–Soviet team at Vostok, Antarctica. According to these determina-
tions, the highest temperature, 2.5 8C above the present one, occurred
about 135,000 years ago when the concentration of atmospheric CO2 reached
its highest level of 300 ppm. The lowest temperature of the period, nearly
108C below the present temperature, occurred about 150,000 years ago and
again 20,000 years ago at a CO2 concentration of 185–195 ppm (22).
In 1990 a research team from the Freshwater Institute in Manitoba pub-
lished the results of 20 years of climatic, hydrologic, and ecological records
in the Experimental Lakes Area of northwestern Ontario (23). According to
this record, the air and lake temperatures in that area have increased by 2 8Cand the average period of ice cover on the lakes has decreased by 3 weeks.
Similarly, it has been noted that alpine glaciers are melting ten times faster
than they did at the end of the last ice age (24), and that the ice cover on
Mount Kenya decreased 40% from 1963 (25). The study of the Ok glacier in
western Iceland revealed that the glacier shrank from 6 square miles in 1910
to 1 square mile in 1993 (24), whereas Antarctic ice shelves lost nearly 3000
km2 (1/8 of their total area) in one year only (26). In accord with these
findings, actual measurements of the radiative forcing indicated an increase
from 1 to 2.5 W/m2 between the late nineteenth century and the present (27).
Such change corresponds to a 1% increase in solar output. Although varia-
tions in solar output were observed during the past 100 years, they did not
vary by more than 0.5%.
184 Environmental Toxicology
3Blackbody radiation (i.e., the maximum amount of energy that an object can radi-
ate) increases with the blackbody’s temperature. Measurements by satellites from
above the earth’s atmosphere of the total heat radiated by the earth indicate that theearth’s surface temperature is �19 8C. This radiated energy is balanced by the solar
heat absorbed by the earth. The actual average surface temperature of the earth is about
14 8C. This difference of 33 8C between the actual surface temperature and that
observed from above the atmosphere is attributed to the greenhouse effect (21).
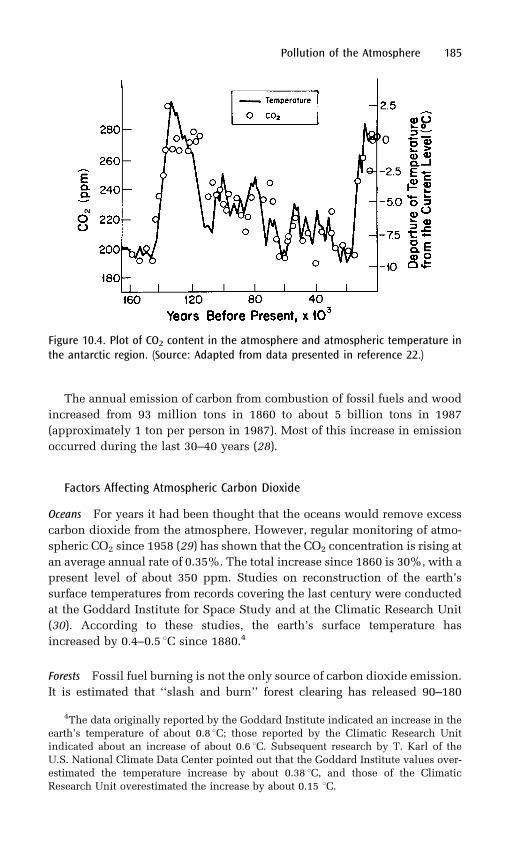
The annual emission of carbon from combustion of fossil fuels and wood
increased from 93 million tons in 1860 to about 5 billion tons in 1987
(approximately 1 ton per person in 1987). Most of this increase in emission
occurred during the last 30–40 years (28).
Factors Affecting Atmospheric Carbon Dioxide
Oceans For years it had been thought that the oceans would remove excess
carbon dioxide from the atmosphere. However, regular monitoring of atmo-
spheric CO2 since 1958 (29) has shown that the CO2 concentration is rising at
an average annual rate of 0.35%. The total increase since 1860 is 30%, with a
present level of about 350 ppm. Studies on reconstruction of the earth’s
surface temperatures from records covering the last century were conducted
at the Goddard Institute for Space Study and at the Climatic Research Unit
(30). According to these studies, the earth’s surface temperature has
increased by 0.4–0.5 8C since 1880.4
Forests Fossil fuel burning is not the only source of carbon dioxide emission.
It is estimated that ‘‘slash and burn’’ forest clearing has released 90–180
Pollution of the Atmosphere 185
Figure 10.4. Plot of CO2 content in the atmosphere and atmospheric temperature inthe antarctic region. (Source: Adapted from data presented in reference 22.)
4The data originally reported by the Goddard Institute indicated an increase in the
earth’s temperature of about 0.8 8C; those reported by the Climatic Research Unitindicated about an increase of about 0.6 8C. Subsequent research by T. Karl of the
U.S. National Climate Data Center pointed out that the Goddard Institute values over-
estimated the temperature increase by about 0.38 8C, and those of the Climatic
Research Unit overestimated the increase by about 0.15 8C.

billion tons of carbon since 1860. Presently, deforestation of tropical rain
forests causes the release of 1.0–2.6 billion tons of carbon annually. This
amount corresponds to between 20 and 50% of that released by fossil fuel
combustion (20).
Clearing trees, even without burning, contributes to the greenhouse effect.
Carbon contained in the stumps and wood left behind, as well as in the
underlying soil, is either oxidized to CO2 or digested by anaerobic micro-
organisms that release carbon in the form of methane (CH4).
Methane and nitrous oxide (N2O) are also GHGs. The estimated contribu-
tions of different gases to the greenhouse effect are as follows (31):
. CO2, 49%
. CH4, 18%
. CFC-11 and CFC-12, 14%
. N2O, 6%
. other, 13%
Nitrous oxide occurs naturally as a product of metabolic activity of deni-
trifying bacteria. With the increasing use of nitrogen-containing fertilizers,
the N2O content in the atmosphere is rising.
Projections for the future indicate that by the year 2030 the methane
contribution to the greenhouse effect may be 20–40% and the nitrous
oxide contribution may be about 10–20% (28). Because trees assimilate
atmospheric carbon dioxide, deforestation leads not only to increased emis-
sion of GHGs but also to decreased removal of carbon dioxide from the
atmosphere.
Although carbon monoxide is not a GHG in its own right, it removes
hydroxyl radicals that destroy GHGs. Thus, carbon monoxide emission con-
tributes to the increase in concentration of GHGs (32).
Models of Climatic Change
The correlation between GHGs and atmospheric temperature is beyond
doubt. However, how the increase in GHGs will affect the climate is open
for discussion.
Computer-calculated projections of the effect of GHGs on the earth’s tem-
perature, modeled for three scenarios, are presented in Figure 10.5. The
middle scenario reflects the present trend of emission of GHGs and assumes
moderate climate sensitivity. (Climate sensitivity (�t2x) is defined as a degree
of the earth’s temperature change with a doubling of the CO2 concentration.
Estimates of �t2x vary from 1.5 to 4.5 8C.) According to this scenario, the
average earth temperature should increase by 3.3 8C by 2100. The high sce-
nario reflects accelerated GHG emissions and high climate sensitivity. The
low scenario assumes radical curtailment of GHG emission and low climate
sensitivity. The models also predict that the mean rate of evaporation and
precipitation will increase by 2–3% for each degree of global warming.
186 Environmental Toxicology
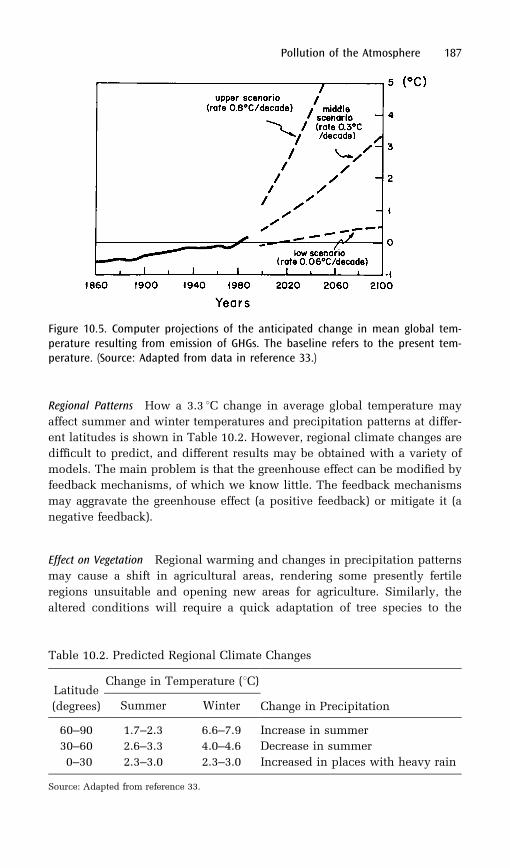
Regional Patterns How a 3.3 8C change in average global temperature may
affect summer and winter temperatures and precipitation patterns at differ-
ent latitudes is shown in Table 10.2. However, regional climate changes are
difficult to predict, and different results may be obtained with a variety of
models. The main problem is that the greenhouse effect can be modified by
feedback mechanisms, of which we know little. The feedback mechanisms
may aggravate the greenhouse effect (a positive feedback) or mitigate it (a
negative feedback).
Effect on Vegetation Regional warming and changes in precipitation patterns
may cause a shift in agricultural areas, rendering some presently fertile
regions unsuitable and opening new areas for agriculture. Similarly, the
altered conditions will require a quick adaptation of tree species to the
Pollution of the Atmosphere 187
Figure 10.5. Computer projections of the anticipated change in mean global tem-perature resulting from emission of GHGs. The baseline refers to the present tem-perature. (Source: Adapted from data in reference 33.)
Table 10.2. Predicted Regional Climate Changes
Latitude
(degrees)
Change in Temperature (8C)
Change in PrecipitationSummer Winter
60–90 1.7–2.3 6.6–7.9 Increase in summer
30–60 2.6–3.3 4.0–4.6 Decrease in summer
0–30 2.3–3.0 2.3–3.0 Increased in places with heavy rain
Source: Adapted from reference 33.
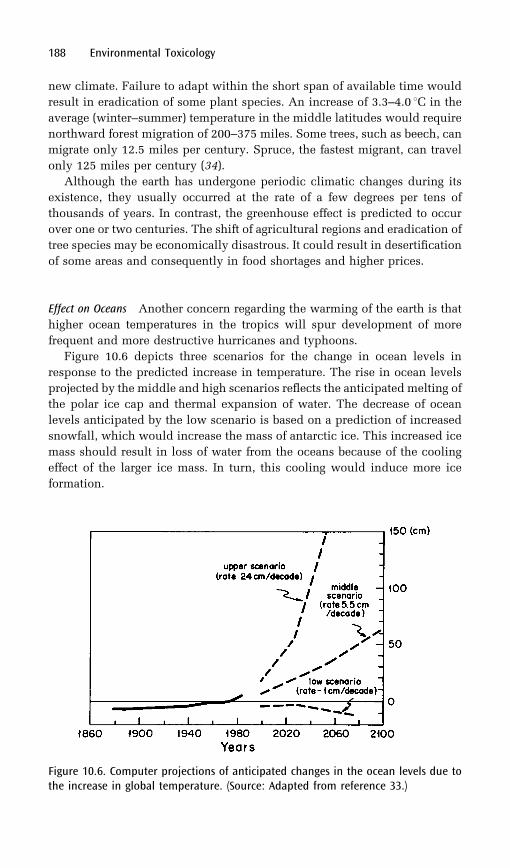
new climate. Failure to adapt within the short span of available time would
result in eradication of some plant species. An increase of 3.3–4.0 8C in the
average (winter–summer) temperature in the middle latitudes would require
northward forest migration of 200–375 miles. Some trees, such as beech, can
migrate only 12.5 miles per century. Spruce, the fastest migrant, can travel
only 125 miles per century (34).
Although the earth has undergone periodic climatic changes during its
existence, they usually occurred at the rate of a few degrees per tens of
thousands of years. In contrast, the greenhouse effect is predicted to occur
over one or two centuries. The shift of agricultural regions and eradication of
tree species may be economically disastrous. It could result in desertification
of some areas and consequently in food shortages and higher prices.
Effect on Oceans Another concern regarding the warming of the earth is that
higher ocean temperatures in the tropics will spur development of more
frequent and more destructive hurricanes and typhoons.
Figure 10.6 depicts three scenarios for the change in ocean levels in
response to the predicted increase in temperature. The rise in ocean levels
projected by the middle and high scenarios reflects the anticipated melting of
the polar ice cap and thermal expansion of water. The decrease of ocean
levels anticipated by the low scenario is based on a prediction of increased
snowfall, which would increase the mass of antarctic ice. This increased ice
mass should result in loss of water from the oceans because of the cooling
effect of the larger ice mass. In turn, this cooling would induce more ice
formation.
188 Environmental Toxicology
Figure 10.6. Computer projections of anticipated changes in the ocean levels due tothe increase in global temperature. (Source: Adapted from reference 33.)

A rise in ocean levels may have a disastrous environmental and economic
impact. Inundation of low-lying coastal areas will decrease the availability of
arable land, affect coastal infrastructure, and force abandonment of seashore
residential areas. In addition, there will be adverse environmental effects
such as salt intrusion into groundwater, rivers, wetlands, and soil. All
these will also have an impact on agriculture. Some low-lying developing
countries, such as Bangladesh or the Maldive Islands may be severely
affected; for many of their inhabitants global warming means loss of their
livelihood. Furthermore, increased frequency and destructiveness of hurri-
canes and typhoons, as mentioned earlier in this section, will cause addi-
tional damage and floods. The result would be considerable economic loss
and food shortages.
Other Factors Obviously, these forecasts contain a number of uncertainties.
Much depends on future patterns of fossil fuel combustion, deforestation and
reforestation, and other human activities. In addition, responses of global
cycles cannot be predicted with certainty.
One unknown factor is the effect of clouds. An increase in temperature
will certainly augment evaporation of water from oceans and inland waters.
This evaporation may, or may not, result in increased cloud cover. High
clouds may have a cooling effect by reflecting solar radiation, whereas low
clouds may have a warming effect by trapping the earth’s infrared radiation.
In addition to clouds, sulfate aerosols may mollify the global warming due
to the scattering of solar radiation. Sulfate aerosols are formed in the atmo-
sphere from SO2, half of which is of anthropogenic origin (see Chapter 9).
Indeed, sulfate aerosols may be responsible for the fact that the earth’s tem-
perature did not increase as much as would be expected from the concentra-
tion of greenhouse gases in the atmosphere. When sulfate aerosols were
included in an ocean-atmosphere general circulation model the agreement
between the observed and the model-predicted earth’s temperature was sub-
stantially improved (35).
Another factor in the effect of global warming are ocean currents, which
play an important role in moderating the climate of land areas. Our present
understanding is that ocean currents are a consequence of water tempera-
ture, water salinity, and the earth’s rotation. The two former factors affect
water density. The denser water sinks, and a void created by the sinking
water is replaced by the surface flow of water of lesser density. Furthermore,
the earth’s rotation creates a force, referred to as the Coriolis force, which
deflects north–south and south–north movements of water into east–west
and west–east directions. Melting of glaciers may locally affect water sali-
nity, thus changing the existing currents; these changes may have a profound
effect on the climate in different areas of the world (36). The specific case is a
possible diversion of the Gulf Stream which now acts as a heat transferring
mechanism from the tropics to the shores of Northern Europe making
Northern Europe livable.
Pollution of the Atmosphere 189
There are at present two theories concerning the response of vegetation to
global warming. One theory suggests that the increased concentration of
carbon dioxide will stimulate plants’ growth; this is called carbon dioxide
fertilization. Accelerated plant growth and augmented photosynthesis will
cause removal of carbon dioxide from the atmosphere, attenuating the green-
house effect. The contrary theory speculates that the increased temperature
will stimulate plants’ respiratory activity and soil bacteria’s metabolism,
leading to increased production of carbon dioxide (20). The effect of
increased concentration of carbon dioxide on plants has been recently scru-
tinized (37). It appears that some plants respond to ‘‘carbon dioxide fertiliza-
tion’’ but some do not. Plants are classified into C3 and C4 plants according
to the way in which they process the first product of CO2 assimilation.5 Most
trees, and crops such as rice, wheat, potatoes, and beans belong to the C3
category. Grasses in tropical and subtropical areas, maize, sorghum, and
sugarcane belong to the C4 class. C3 plants, but not C4 plants, respond to
CO2 fertilization and grow bigger and produce more foliage, provided that
more nutrients and water are also supplied. Considering all factors, it is
doubtful that the increased plant growth could compensate for the increased
release of carbon dioxide caused by augmented respiration and bacterial
activity (37). In addition, the different responses of plants to increased ten-
sion of carbon dioxide may have a negative ecological impact because many
plant species, unable to compete, may become extinct.
Current Developments
During the International Convention of Atmospheric Scientists (also
attended by representatives of the United Nations and political leaders of
some nations), held in Toronto in June 1988, a warning was issued that the
greenhouse effect had begun. Four of the previous 8 years (1980, 1981, 1983,
and 1987) had been the warmest years since the recording of global tempera-
tures began 134 years prior to the convention. The year of the convention,
1988, added to these statistics and so did subsequently hot summers in the
1990s. The fact that the frozen earth beneath the arctic tundra in Alaska had
warmed 2.2–3.9 8C over the last century (38) provides further support for the
greenhouse theory.
It is impossible to prove whether the warm summers of the 1980s and
1990s and, in particular, the heat and drought of 1988, were indeed the result
190 Environmental Toxicology
5The first step in photosynthesis involves incorporation of CO2 into a five-carbon
sugar, ribulose bisphosphate (RUBP). This reaction is catalyzed by an enzyme, RUBPcarboxylase. The six-carbon sugar thus formed is unstable and decomposes rapidly
into two three-carbon fragments in C3 plants, or into one four-carbon fragment and one
two-carbon fragment in C4 plants. In addition, C4 plants have a pump that concen-
trates CO2 near the active site of an enzyme crucial to photosynthesis (37).
of an oncoming greenhouse effect or whether they were part of periodic
climatic fluctuations.
To assess the likely consequences of climate change for the United States
the U.S. Congress promulgated in 1990 the Global Change Research Act. In
June 2000 the scientific panel working on Global Change Program issued a
draft of its report. Although the report does not address the causes of the
global warming it focuses on the regional and local effects. It warns of regio-
nal water supply problems caused by droughts in some areas and of floods in
other. It also addresses problems of rising sea levels inundating coastal areas,
warming of permafrost areas resulting in damage to the infrastructure, dis-
appearance of certain tree species and increased insect infestation. On the
positive site, the report stipulates that with modern science and technology
the society may be able to adapt to the new conditions and that agricultural
adaptation may result in increased food production. However, the research-
ers point out that many uncertainties still exist and that the society has to be
prepared for possible surprises (39).
Preventive Action
Although there are some dissenting opinions, in general the scientific com-
munity considers greenhouse warming a serious threat requiring imposition
of a system of global regulations aimed at limiting GHG emissions. Only 43
out of 300 scientists, mostly members of the American Meteorological
Society, agreed to sign a statement opposing global warming initiatives
(40). The sentiment against any formal restrictions on GHG emissions was
also expressed by representatives of President Bush’s administration on the
grounds of an unproven assumption that any such moves may hurt the
economy. The experts on economy are divided on this issue. An economist,
William D. Nordhaus, asserted that agriculture, forestry, and fishery, the
industries most likely to be affected by climate changes, represent only
10% of the U.S. economy; thus the net economic damage to the U.S. gross
national product could be only 0.25% (41). The fallacy of this position is that
food is the basic commodity for the survival of humanity. Shifting of the
agricultural areas may have serious consequences on the global scale; it may
create considerable economic chaos worldwide, especially in the developing
countries. The United States would not be immune to the global economic
and political upheaval resulting from widespread regional hunger.
Moreover, a rising sea level will cause additional damage to agricultural
land and infrastructure, resulting in hardship and expenditures.
Analysts in the U.S. Department of Energy estimate the cost of reducing
carbon dioxide emissions by 20%, by the year 2000, at $90 billion annually.
On the other hand, a private research group, the International Project for
Sustainable Energy Paths, claims that large carbon dioxide cuts would ben-
efit the economy if the carbon tax were put in investment credits or invested
Pollution of the Atmosphere 191

in energy efficiency. A similar view was expressed in an unpublished study
prepared by the Environmental Protection Agency (23). The most recent
analysis by academic researchers suggests ‘‘that a variety of energy efficiency
and other measures that are now available could reduce U.S. emissions of
greenhouse gases by roughly 10–40% of current levels at relatively low cost,
perhaps at a net cost savings’’ (42).
The conflicting points of view of how to respond to the alleged threat of
global warming are epitomized in two strategies: ‘‘No Regrets’’ and ‘‘Wait
and See’’ (43). The ‘‘No Regrets’’ strategy stipulates that energy conservation
and investment in new energy-efficiency technologies will promote eco-
nomic development, increase employment, and improve the national bal-
ance of trade. Thus, even if the dismal consequences of a rapid climate
change will not occur, the strategy will deliver demonstrable benefits. The
‘‘Wait and See’’ strategy, on the other hand, argues that, in view of the
scientific uncertainties about regional climate changes, a shift from the pre-
sent pattern of energy utilization will cause unnecessary hardship and stifle
the economy. The problem with the ‘‘Wait and See’’ strategy, frequently
embraced by the conservative policy makers, is that by the time the uncer-
tainties about climate changes are resolved, it may be too late to intervene
successfully. Thus, this strategy is a dangerous gamble with the welfare of
future generations.
Since World War II it has been an accepted policy of the superpowers to
withdraw resources from national economies to prepare for a war that may
never happen. In comparison, a nonchalant attitude toward possible (albeit
still uncertain) environmental disaster is difficult to comprehend.
Some increase in the earth’s temperature is bound to occur, but the pro-
cess of this warming can be slowed and eventually arrested. The more slowly
the climatic changes occur, the easier and less painful will be the transition
to new conditions. The way to slow this process is to decrease fossil fuel
consumption (through more efficient automobiles and utilities, and more
reliance on public transportation) and eventually to develop new nonpollut-
ing energy sources. At the same time, the deforestation trend should be
reversed by planting more trees and cutting fewer.
International Cooperation
It is encouraging that in 1988 the United Nations Environment Programme
and the World Meteorological Organization sponsored the creation of the
Intergovernmental Panel on Climate Change (IPCC). The IPCC was divided
into three working groups: Great Britain was charged with responsibility for
scientific matters, the Soviet Union with the study of the potential impact of
climatic changes, and the United States with the development of policies.
Several meetings of the IPCC have been held so far.
192 Environmental Toxicology
In November 1990, the Second World Climate Conference was convened
in Geneva. The conferees confirmed IPCC findings that without reduction of
GHGs, global warming will reach 2–5 8C by the end of the twenty-first cen-
tury. Furthermore, ‘‘If the increase of GHGs’ concentration is not limited, the
predicted climate changes would place stress on natural and social systems
unprecedented in the past 1000 years’’ (44). It is regrettable, however, that
the conference did not established any specific goals and deadlines for global
limitation of GHG emission.
Global warming was again discussed during the United Nations
Conference on Environment and Development in Rio de Janeiro during the
week of June 3–14, 1992. A treaty on global warming was signed by the
participants of the conference, but the postulates of the treaty were consid-
erably watered down, and no targets or timetables for carbon dioxide emis-
sions were set. As it was finally passed, the treaty set only nonbinding
commitments for the industrialized nations to limit their GHG emissions.
As a follow-up of the United Nations Framework Convention on Climate
Change, signed in Rio de Janeiro, representatives of 121 nations that ratified
the Convention met in Berlin between March 27 and April 7, 1995 to discuss
alterations to the treaty and ways to implement reduction of GHG emissions.
Because of the disagreement between the industrialized and developing
countries, little substantial progress was achieved. Eventually, the delegates
declared that the treaty’s current commitments are not adequate to protect
the earth’s climate. Furthermore, an agreement was achieved to begin nego-
tiation, to be completed by 1997, setting specific reductions of GHGs after the
year 2000 (45).
In the summer of 1995 the IPCC released a new report that states that the
increase in average global temperatures of 0.3–0.6 8C observed during the
past 100 years ‘‘is unlikely to be entirely due to natural causes’’ and that a
‘‘pattern of climate responses to human activities is identifiable in the cli-
matological record’’ (46). On the basis of the latest global circulation models,
which take into consideration the effect of sulfate aerosols, the IPCC projects
an increase in the earth’s average temperature over the next 100 years in the
range of 1.0–3.5 8C, with the best estimate scenario being 2 8C. This warming
is expected to raise the average sea level in the range of 15–95 cm, with the
best estimate being 50 cm.
Between December 1 and 10 of 1997 the Third Conference of Parties
(COP-3) to the Framework Convention on Climate Change took place in
Kyoto, Japan. Despite the pessimistic predictions and initial wrangling of
the parties involved, the conference ended in an agreement. Thirty-eight
industrialized countries committed themselves to cut greenhouse gases
(CO2, CH4, N2O, hydrofluorocarbons, perfluorocarbons and sulfur hexafluor-
ide) emissions within the time frame of 2008 to 2012. The United States is to
cut its emissions by 7% below 1990 level, the European Union by 8%, and
Japan by 6%. For the time being the developing countries, although encour-
aged, were not obligated to cut their emissions. The treaty will take effect 90
Pollution of the Atmosphere 193
days after ratification by at least 55 parties that account together for at least
55% of the total CO2 emissions (47). Although the commitments may be
considered meager to avert change of the climate, the fact that an agreement
has been reached represents the first step in a serious international coopera-
tion in the area of climate preservation.
The Kyoto conference was followed by two meeting of the Parties to the
Framework Convention on Climate Change to discuss methods of implemen-
tation of the Kyoto agreement and to set strict timetables for devising rules
for its enforcement. The first meeting was held in November 1998 in Buenos
Aires, Argentina and the second one in November 1999 in Bonn, Germany.
Under discussion were three market based programs:
. The Clean Development Mechanism under which industrializedcountries and private companies can sponsor and get credit forprojects that reduce emissions in developing countries.
. The Joint Implementation Program under which industrializedcountries can sponsor and get credit for projects that reduceemissions in other industrialized countries.
. Emissions Trading Program which allows industrialized nationsto purchase emissions reduction credits from each other (48).6
The first part of the three-part IPCC report released in January 2001 adds
urgency for prompt promulgation of Kyoto protocol. The report states that if
nothing is done to curb emissions of greenhouse gases, the earth’s tempera-
ture will rise by the end of this century more than estimated previously
(1995) namely to between 1.4 and 5.88C. Such a dramatic increase in the
temperature will result in rising sea-level by 9–88 cm., damage to forest and
coral reef ecosystems, increase frequency of droughts and damage to agri-
culture and water supply (49).
Early in 2001, the newly elected president of the United States, George W.
Bush, withdrew the United States from participation in the Kyoto Protocol.
Since the United States is the world’s largest emitter of CO2, this move
certainly had a detrimental effect on the global effort to curb global warming.
Nevertheless, in July 2001, 179 nations agreed in Bonn, Germany on rules for
implementation of the Kyoto Protocol with or without United States’ parti-
cipation. The signatories to the protocol intend to have it ratified quickly
enough to enter in force by 2002.
194 Environmental Toxicology
6As of 1999 only 16 countries, all of them developing nations, ratified the Kyoto
treaty (50). Although the USA signed the treaty the U.S. Senate did not ratify it. Aftertwo preliminary conferences, COP-4 in Buenos Aires, Argentina, in September 1999
and COP-5 in Bonn, Germany, October-November, 1999, the final meeting (COP-6) to
iron out the details of the Kyoto Protocol was scheduled to take place in The Hague,
The Netherlands, between November 13 and 24, 2000.

The Effects of Atmospheric Changes on Human Health
In addition to the ecological and economic repercussion of changing climate
and changing composition of the atmosphere, there are concerns about the
effect of these changes on human health. The increased intensity of UV-B
radiation reaching the earth is likely to have a variety of effects on human
health. It is estimated that worldwide sustained ozone reduction of 10% will
cause a 26% increase in non-melanoma skin cancer and a lower, but still
significant, increase in melanomas (51). But not all population will be
equally affected because the sensitivity to UV irradiation varies between
individuals, the fair-skinned individuals being much more sensitive than
those with highly pigmented skin. Although the increase in incidence of
non-melanoma skin cancer has been observed since 1970s, considering the
long latency period from exposure till occurrence, it is doubtful, that as of
now, this phenomenon could be attributed to the increased penetration of
UVB (52).
The other likely effects may be an increase in incidence of cataracts, and
damage to the immune system. It is now estimated that worldwide, for each
1% decrease in stratospheric ozone the cataract frequency will increase by
0.6 to 0.8%, whereas animal experiments suggest that exposure to UV-B
radiation will increase the frequency and severity of infectious diseases
(51). In addition, a correlation has been found between UV exposure and
salivary gland cancer (53).
Much more serious may be health effects of global warming. One may
expect direct and indirect effects. The direct effects manifest themselves by
an increased mortality of cardiovascular, cerebrovascular and some respira-
tory diseases due to the summer heat waves (54). Such cases occurring
mostly among elderly and chronically sick have been widely reported in
the news during the hot summers of the 1980s and 1990s.
The indirect effects concern mainly the spread of mosquito-transmitted
infectious diseases such as malaria, dengue fever, and viral encephalitis.
Warmer temperatures, and greater rain fall are likely to increase the hori-
zontal and vertical range of parasite-carrying mosquitoes. Thus the regions
now bordering endemic areas of these diseases are likely to be mostly
affected. It is not only the geographical and topographic distribution that is
affected by climatic changes. Higher temperatures cause mosquitoes to bite
more frequently and make the plasmodia multiply faster (55).
Still more distant, indirect effects may be related to the El Nino Southern
Oscillation (ENSO) phenomenon. ENSO is not a new phenomenon.
However, its frequency of occurrence and severity of related events (pro-
longed droughts followed by heavy precipitation) increased during the last
decade. Although there is no proven causal relationship between these phe-
nomena, there is a scientific consensus that the recently increased frequency
and severity of ENSO was related to the increased water temperature in the
Pacific which in turn was due to the global warming (56).
Pollution of the Atmosphere 195

Recent ENSO events were associated with severe downpours and with
harmful algal blooms in coastal areas. The former caused flooding increasing
hazards of water-borne diseases, the latter caused cholera outbreaks in
Bangladesh and South America (57).
Algal blooms, in turn, are associated with the proliferation of phyto- and
zooplankton, many of which release toxins and mutagens which create
hazard to human health (56, 57).
It may be expected that with the increasing global temperatures, as pre-
dicted for this and the next century, these hazards to human health will be
aggravated. The industrialized countries most likely will be able to cope with
these new challenges, but for the developing countries they may prove to be
catastrophic. However, let’s not fool ourselves that we can isolate ourselves
from the rest of the world and avoid the health-related consequences of
global warming. Economic and environmental refugees from the diseases
ravaged developing countries entering legally or illegally the industrialized
nations will create new public health challenges of global proportions.
References
1. Encyclopedia Britannica; Chicago, IL, 1969; Vol. 15, p 285.2. Scientific Assessment of Stratospheric Ozone: 1989; U.N. Environment
Programme: Nairobi, Kenya, 1990; Vol. 1, Chapter 1, p 1.3. Zurer, P. S. Chem. Eng. News May 28, 1993, 8.4. Molina, M. J.; Rowland, F. S. Nature (London) 1974, 249, 810.5. McElroy, M. B.; Salawitch, R. J. Science (Washington, D.C.) 1989, 243,
763.6. Brasseur, G.; Granier, C. Science (Washington, D.C.) 1992, 257, 1239.7. Setlow, R. B. Proc. Natl. Acad. Sci. U.S.A. 1974, 71, 3363.8. Madronich, S.; Bjorn, L. O.; Ilyas, M.; Caldwell, M. M. In Environmental
Effects of Ozone Depletion: 1991 Update; U.N. Environment Programme:Nairobi, Kenya, 1991; p 1.
9. Teramura, A. H.; Tevini, M.; Borman, J. F.; Caldwell, M. M.;Kulandaivelu, G.; Bjorn, L. O. In Environmental Effects of OzoneDepletion: 1991 Update; U.N. Environment Programme: Nairobi,Kenya, 1991; p 25.
10. Haeder, D. P.; Worrest, R. C.; Kaumar, H. D. In Environmental Effects ofOzone Depletion: 1991 Update; U.N. Environment Programme: Nairobi,Kenya, 1991; p 33.
11. Zurer, P. S. Chem. Eng. News May 30, 1988, 16.12. Zurer, P. Chem. Eng. News March 6, 1989, 29.13. Chem. Eng. News March 13, 1989, 19.14. Zurer, P. Chem. Eng. News October 9, 1989, 4.15. Zurer, P. Chem. Eng. News July 16, 1990, p 5.16. Chem. Eng. News May 29, 1989, 12.17. Stinson, S. Chem. Eng. News June 5, 1989, 5.18. Zurer, P. Chem. Eng. News May 18, 1992, 2719. Zurer, P. Chem. Eng. News June 24, 1991, 23.
196 Environmental Toxicology
20. Postel, S.; Heise, L. In State of the World 1988; Brown, L. R., Ed.; W. W.Norton: New York, 1988; p 83.
21. Schneider, S. H. Are We Entering the Greenhouse Century? GlobalWarming; Sierra Club Books: San Francisco, CA, 1989.
22. Barnola, J. M.; Raynard, D.; Korotkevich, Y. S.; Lorius, C. Nature(London) 1987, 329, 408.
23. Schindler, D. W.; Beaty, K. G.; Fee, E. J.; Cruikshank, D. R.; DeBruyn, E.R.; Findley, D. L.; Linsey, G. A.; Shearer, J. A.; Stainton, M. P.; Turner, M.A. Science (Washington, D.C.) 1990, 250, 967.
24. Denniston, D. World Watch 1993, 6(1), 34.25. Hileman, B. Chem. Eng. News April 27, 1992, 7.26. Hileman, B. Chem. Eng. News August 9, 1999, 16.27. Whigly, T. M. L.; Pearman, G. I.; Kelly, P. M. Indices and Indicators of
Climate Change in Confronting Climate Change; Mintzer, M., Ed.;Cambridge University: Cambridge, England, 1992.
28. Postel, S. In State of the World 1987; Brown, L. R., Ed.; W. W. Norton:New York, 1987; p 157.
29. Kou, C.; Lindberg, C.; Thomson, D. J. Nature (London) 1990, 343, 709.30. Schneider, S. H. Science (Washington, D.C.) 1989, 243(4892), 771.31. Zurer, P. Chem. Eng. News October 2, 1989, 15.32. World Resources Institute, International Institute for Environmental
Development in collaboration with U.N. Environment Programme.World Resources 1988–89, Atmosphere and Climate; Basic Books:New York, 1988; Chapter 23, p 333.
33. Jeager, J. Developing Policies for Responding to Climatic Changes; asummary of the discussions and recommendations of the workshopheld in Villach (September 28–October 2, 1987) and Bellagio(November 9–13, 1987) under the auspices of Beijer Institute,Stockholm; World Meteorological Organization and U.N. EnvironmentProgramme; 1988; WC 1 P–1, WM O/TD, No. 225.
34. Roberts, L. Science (Washington, D.C.) 1989, 243(4892), 735.35. Mitchell, J. F. B.; Johns, T. C.; Gregory, J. M.; and Tett, S. F. B. Nature,
1995, 376, 501.36. Hileman, B. Chem. Eng. News March 13, 1989, 25.37. Bazzaz, F. A.; Fajer, E. D. Scientific American January 1992, 68.38. Brown, L. R.; Postel, S. In State of the World 1987; Brown, L. R., Ed.; W.
W. Norton: New York, 1987; p 3.39. Hanson, D. Chem. Eng. News June 19, 2000, 13.40. Chem. Eng. News March 9, 1992, 14.41. Zurer, P. S. Chem. Eng. News April 1, 1991, 7.42. Parry, L. M.; Swaminathan, M. S. In Confronting Climate Change;
Mintzer, I. M., Ed.; Cambridge University Press: New York, 1992.43. Mintzer, I. M. In Confronting Climate Change; Mintzer, I. M., Ed.;
Cambridge University Press: New York, 1992.44. O’Sullivan, D.; Zurer, P. Chem. Eng. News November 19, 1990, 4.45. Zurer, P. Chem. Eng. News April 17, 1995, 7.46. IPCC Climate Change 1995: The IPCC Second Assessment Report;
Cambridge University Press: Cambridge, England, 1996.47. Hileman, B. Chem. Eng. News December 22, 1997, 20.
Pollution of the Atmosphere 197

48. Hileman, B. Chem. Eng. News November 23, 1998, 10.49. Hileman, B. Chem. Eng. News January 24, 2001, 9.50. Hileman, B. Chem. Eng. News November 1, 1999, 9.51. Longstreth, J. D.; de Gruijl, F. R.; Takizawa, Y.; van Leun, J. C. In
Environmental Effects of Ozone Depletion: 1991 Update; U.N.Environment Programme: Nairobi, Kenya, 1991; p 15.
52. Urbach, F. Envir. Health Perspect. 1991, 96, 75.53. Spitz, M. R.; Sider, J. G.; Newell, G. R. and Batsakis, J. G. Head Neck
Surg. 1988, 10, 305.54. Amofah, G. K. East African Med. J. 1996, August, 560.55. Patz, J. A.; Epstein, P. R.; Burke, T. A.; Balbus, J. M. J. Am. Med. Assoc.,
1996, 273(3), 217.56. Rosenkranz, H. S. Environ. Mol. Mutagen. 1996, 27, 81.57. Epstein, P. R. Biosystems, 1993, 31(2–3), 209.
198 Environmental Toxicology
11Water and Land Pollution
Freshwater Reserves
Water covers 70% of the earth’s surface. Only 3% of this is freshwater, which
is indispensable in sustaining plant and animal life. The amount of fresh-
water is maintained constant by the hydrological cycle. This cycle involves
evaporation from oceans and inland waters, transpiration from plants, pre-
cipitation, infiltration into the soil, and runoff of surface water into lakes and
rivers. The infiltrated water is used for plant growth and recharges ground-
water reserves.
Although the global supply of available freshwater is sufficient to main-
tain life, the worldwide distribution of freshwater is not even. In some areas
the supply is limited because of climatic conditions or cannot meet the
demands of high population density. In other places, although there is no
shortage of freshwater, the water supply is contaminated with industrial
chemicals and is thus unfit for human use. Moreover, fish and other aquatic
species living in chemically contaminated water become unfit for human
consumption. Thus, water pollution deprives us and other species of two
essential ingredients for survival: water and food.
An example of hydrologic changes caused by urbanization is given in
Figure 11.1. Conditions before and after urbanization were measured in
Ontario, Canada, by the Organization for Economic Cooperation and
Development (1).
In the urban setting, pervious areas are replaced with impervious ones
(such as streets, parking lots, and shopping centers). Groundwater replen-
ishment is greatly reduced and runoff is considerably increased by these
199
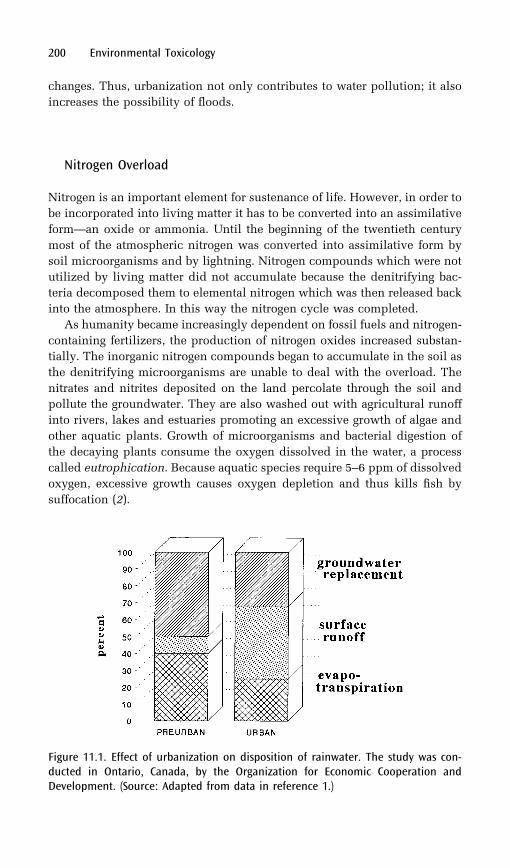
changes. Thus, urbanization not only contributes to water pollution; it also
increases the possibility of floods.
Nitrogen Overload
Nitrogen is an important element for sustenance of life. However, in order to
be incorporated into living matter it has to be converted into an assimilative
form—an oxide or ammonia. Until the beginning of the twentieth century
most of the atmospheric nitrogen was converted into assimilative form by
soil microorganisms and by lightning. Nitrogen compounds which were not
utilized by living matter did not accumulate because the denitrifying bac-
teria decomposed them to elemental nitrogen which was then released back
into the atmosphere. In this way the nitrogen cycle was completed.
As humanity became increasingly dependent on fossil fuels and nitrogen-
containing fertilizers, the production of nitrogen oxides increased substan-
tially. The inorganic nitrogen compounds began to accumulate in the soil as
the denitrifying microorganisms are unable to deal with the overload. The
nitrates and nitrites deposited on the land percolate through the soil and
pollute the groundwater. They are also washed out with agricultural runoff
into rivers, lakes and estuaries promoting an excessive growth of algae and
other aquatic plants. Growth of microorganisms and bacterial digestion of
the decaying plants consume the oxygen dissolved in the water, a process
called eutrophication. Because aquatic species require 5–6 ppm of dissolved
oxygen, excessive growth causes oxygen depletion and thus kills fish by
suffocation (2).
200 Environmental Toxicology
Figure 11.1. Effect of urbanization on disposition of rainwater. The study was con-ducted in Ontario, Canada, by the Organization for Economic Cooperation andDevelopment. (Source: Adapted from data in reference 1.)
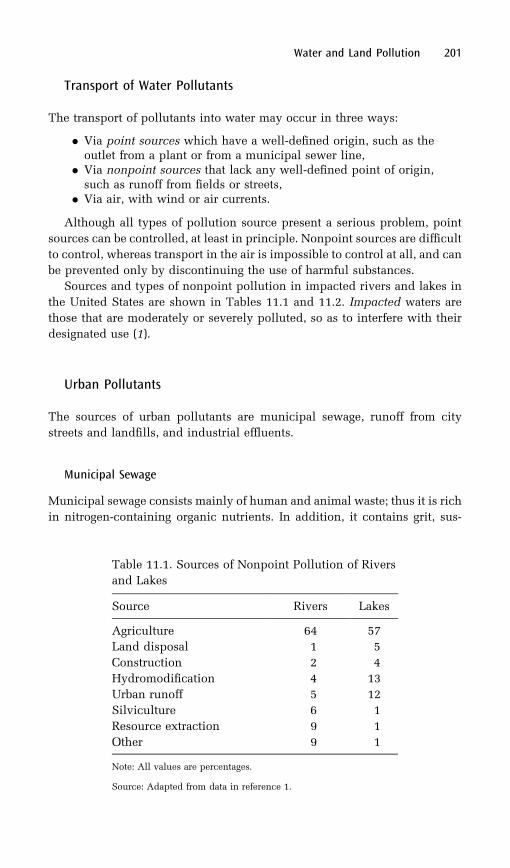
Transport of Water Pollutants
The transport of pollutants into water may occur in three ways:
. Via point sources which have a well-defined origin, such as theoutlet from a plant or from a municipal sewer line,
. Via nonpoint sources that lack any well-defined point of origin,such as runoff from fields or streets,
. Via air, with wind or air currents.
Although all types of pollution source present a serious problem, point
sources can be controlled, at least in principle. Nonpoint sources are difficult
to control, whereas transport in the air is impossible to control at all, and can
be prevented only by discontinuing the use of harmful substances.
Sources and types of nonpoint pollution in impacted rivers and lakes in
the United States are shown in Tables 11.1 and 11.2. Impacted waters are
those that are moderately or severely polluted, so as to interfere with their
designated use (1).
Urban Pollutants
The sources of urban pollutants are municipal sewage, runoff from city
streets and landfills, and industrial effluents.
Municipal Sewage
Municipal sewage consists mainly of human and animal waste; thus it is rich
in nitrogen-containing organic nutrients. In addition, it contains grit, sus-
Water and Land Pollution 201
Table 11.1. Sources of Nonpoint Pollution of Rivers
and Lakes
Source Rivers Lakes
Agriculture 64 57
Land disposal 1 5
Construction 2 4
Hydromodification 4 13
Urban runoff 5 12
Silviculture 6 1
Resource extraction 9 1
Other 9 1
Note: All values are percentages.
Source: Adapted from data in reference 1.
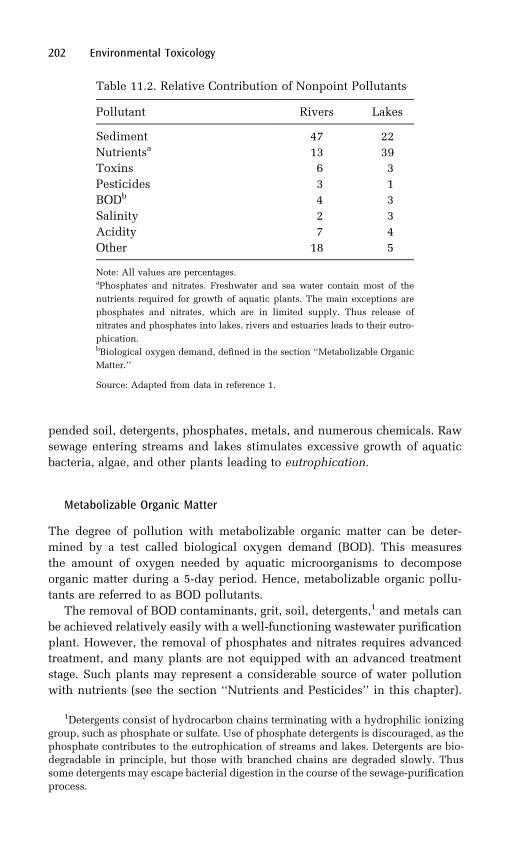
pended soil, detergents, phosphates, metals, and numerous chemicals. Raw
sewage entering streams and lakes stimulates excessive growth of aquatic
bacteria, algae, and other plants leading to eutrophication.
Metabolizable Organic Matter
The degree of pollution with metabolizable organic matter can be deter-
mined by a test called biological oxygen demand (BOD). This measures
the amount of oxygen needed by aquatic microorganisms to decompose
organic matter during a 5-day period. Hence, metabolizable organic pollu-
tants are referred to as BOD pollutants.
The removal of BOD contaminants, grit, soil, detergents,1 and metals can
be achieved relatively easily with a well-functioning wastewater purification
plant. However, the removal of phosphates and nitrates requires advanced
treatment, and many plants are not equipped with an advanced treatment
stage. Such plants may represent a considerable source of water pollution
with nutrients (see the section ‘‘Nutrients and Pesticides’’ in this chapter).
202 Environmental Toxicology
Table 11.2. Relative Contribution of Nonpoint Pollutants
Pollutant Rivers Lakes
Sediment 47 22
Nutrientsa 13 39
Toxins 6 3
Pesticides 3 1
BODb 4 3
Salinity 2 3
Acidity 7 4
Other 18 5
Note: All values are percentages.aPhosphates and nitrates. Freshwater and sea water contain most of the
nutrients required for growth of aquatic plants. The main exceptions are
phosphates and nitrates, which are in limited supply. Thus release of
nitrates and phosphates into lakes, rivers and estuaries leads to their eutro-
phication.bBiological oxygen demand, defined in the section ‘‘Metabolizable Organic
Matter.’’
Source: Adapted from data in reference 1.
1Detergents consist of hydrocarbon chains terminating with a hydrophilic ionizing
group, such as phosphate or sulfate. Use of phosphate detergents is discouraged, as thephosphate contributes to the eutrophication of streams and lakes. Detergents are bio-
degradable in principle, but those with branched chains are degraded slowly. Thus
some detergents may escape bacterial digestion in the course of the sewage-purification
process.
Thanks to the passage of the Clean Water Act in 1972, the percentage of the
U.S. population served with wastewater treatment facilities increased from
40% in 1970 to 72% in 1985 (3). The remaining 28% of people not con-
nected to sewage-treatment facilities represents rural and suburban popula-
tions that utilize septic tanks for disposal of their waste. Although septic
tanks do not present much danger to surface water, they are frequently a
source of groundwater contamination.
Synthetic Organic Chemicals
The removal of some synthetic organic chemicals from wastewater may
present a problem. The synthetic chemicals found in municipal wastewater
originate from both household use and industry.
Ordinary households in an industrialized society use substantial amounts
of organic chemicals such as cleaning fluids, pharmaceuticals, cosmetics,
and paints. Residual quantities of these substances may end up in the sew-
age. Hospitals, universities, dry cleaning establishments, garages, and other
small commercial shops are not permitted to dispose of their chemical
wastes through the sewers. Obviously, illegal dumping may occur; it is there-
fore the responsibility of municipal authorities, in charge of wastewater
treatment, to watch for improper disposal.
The problem may occur when industrial plants contract with the city to
dispose of their liquid waste through the municipal sewer system. Although
the Clean Water Act (CWA) of 1972 requires that industrial plants prepurify
their effluent before discharging it into municipal sewers, there is always
potential for contamination with toxic compounds that are not well-identi-
fied. The removal of such chemicals from wastewater may be difficult and
expensive. Furthermore, most municipal sewage-purification plants are not
equipped for this challenge. Toxic chemicals in sewage create potential
hazards to aquatic life and inhibit the biological process of degradation of
contaminants. In addition, they potentiate the toxicity of sewage sludge that
must be disposed of in landfills.
Storm Water Runoff
Storm water runoff from cities and villages presents another problem. This
runoff contains salts from road deicing, street refuse, animal waste, food
litter, residue from atmospheric deposition of sulfuric and nitric acid,
metals, asbestos from automobile brakes, rubber from tires, hydrocarbons
from motor vehicle exhaust condensates, oil and grease, soil and inorganic
nutrients from construction sites, and a variety of other chemicals.
Some localities possess a combined sanitary–storm sewer system. In such
cases, the storm sewage undergoes purification. However, a severe down-
Water and Land Pollution 203
pour may exceed the capacity of the wastewater purification plant. Rough
sewage may then drain into the receiving waters.
In the absence of a combined system, storm runoff is a nonpoint source of
pollution. As such, it is difficult to control. After a heavy downpour, the
runoff from city streets and construction sites and leachates from landfills
may bring a considerable quantity of pollutants into streams and lakes.
Research (1) shows a heavy impact of urban nonpoint pollution on fresh-
water quality. In highly urbanized areas it may even surpass the impact of
rural pollution (1).
Lead Pollution
Although lead pollution is essentially an urban problem, agricultural land,
lakes, and rivers are also frequently affected. Lead has many toxic effects,
including inhibition of red blood cell formation, kidney damage, and damage
to the nervous system (see Chapter 8).
Sources
The sources of lead pollution are leaded gasoline, lead-based paint, and
waste disposal. Except for some rural vehicles, the use of leaded gasoline
has been practically eliminated in the United States, and thus the concentra-
tion of airborne lead is insignificant. However, large quantities of lead have
accumulated in the soil as a result of decades of burning leaded gasoline.
According to Environmental Protection Agency (EPA) estimates, the lead
level in the soil along heavily traveled roads can reach 10,000 ppm or
more (4). Use of leaded gasoline by farm vehicles, which is still allowed
by law, is responsible for pollution of agricultural land. Runoff and seepage
from lead-polluted soil leads to contamination of surface and groundwater.
For years lead-based paint was considered a problem only in old dilapi-
dated tenements, where small children ingested crumbling wall paint.
Although this concept was modified by subsequent research, the theory
still prevailed, until very recently, that the primary exposure route is inhala-
tion and incidental ingestion of household dust originating from lead-based
paint (4). Accordingly, most prevention methods focused on removal of lead-
based paint from older houses. More recently, studies of lead content in
urban and suburban soil were performed in several large cities (Baltimore,
MD, Minneapolis–Saint Paul, MN, and New Orleans, LA) and numerous
smaller cities in Louisiana and Minnesota (5, 6). The results indicated a
correlation between soil contamination and geographical site of the city.
Contamination of the soil was found to be highest in the city center, decreas-
ing exponentially toward the outskirts regardless of the age of buildings (7).
Also, contamination was substantially higher in the large cities than in the
204 Environmental Toxicology
smaller ones. This pattern of contamination indicates that the most signifi-
cant sources of lead in the soil are industrial processes, waste incineration,
and decades of burning leaded gasoline (7). The fact that lead-loading in the
soil between streets and buildings is on the order of 106 times greater than
that in indoor dust lends additional support to the view that the lead-based
paint is not the major factor in lead intoxication.
Lately there has been great concern about lead in drinking water. Even if
the water source is not contaminated, lead may leach into drinking water
from lead pipes or pipe solders. High amounts of lead have been found in old
water fountains in offices and schools. Although this source of lead exposure
is not confined to children alone, exposure of children is of particular con-
cern. In view of the hazard of chronic lead exposure, the EPA has revised its
limits for lead in drinking water from 50 to 10 ppb.
Toxic Symptoms in Children
Children are particularly susceptible to low-level lead intoxication, which
creates a type of encephalopathy referred to as subclinical toxicity. No clin-
ical symptoms of intoxication are observable. The brain damage is mani-
fested by the child’s neurophysiological behavior such as hyperactivity,
unruliness, and a low IQ score. A 1986 EPA report cited 10–15 mg/dL in
blood as enough to cause neurological deficiency.
Soil Erosion
Soil erosion is a natural phenomenon caused by water and wind; the rate of
erosion depends on the degree of terrain coverage with trees or grasses, on
the intensity and seasonal distribution of rainfall, and on the slope of the
terrain. Agricultural practices that strip the plant coverage from the soil
accelerate this natural event. At present, soil erosion has become one of
the most destructive aspects of agriculture; it causes silting of lakes and
rivers, it causes pollution of surface water with nutrients and pesticides,
and it affects the fertility of the land. In the United States, the sediment
makes up 47% of all nonpoint river pollutants and 22% of all lake pollutants
(see Table 11.2). Although most of the sediment originates from rural areas,
dirt from urban centers may also contribute significantly in certain cases.
Sediment left by the runoff of topsoil from fields and dirt from urban
centers represents a major ecological and economic problem. It creates
water turbidity that reduces light penetration, decreasing plants’ growth
and diversity, it stifles the habitat by reducing the survival of eggs and
young, and it helps to transport nutrients and toxic pollutants. It also accel-
erates the demise of lakes, streams, reservoirs, harbors, and irrigation canals
by filling them with silt (3). Soil erosion may assume alarming proportions
Water and Land Pollution 205
with poor farm management, cultivation of land unsuitable for agriculture,
overgrazing, and deforestation. The problem is growing worse, especially in
developing countries, as forests are cut and more land is cleared for agricul-
ture. In Central America, for example, deforestation reduced forest cover
from 60% to 40% between 1960 and 1980. Soil erosion there has become
such a problem that siltation has clogged hydroelectric reservoirs, irrigation
canals, and coastal harbors (4). Similarly, in the Philippines deforestation of
1.4 million hectares of an upland watershed and unsuitable agricultural
practices between 1967 and 1980 were paralleled by a 121% and a 105%
increase in the annual sedimentation rate in two major reservoirs, respec-
tively (8).
Binding of Pollutants
The capability of soil to bind and transport pollutants depends on the nature
of the soil as well as on the chemical and physical properties of the pollutant.
Soil consists of inorganic components and of organic substances originating
from plant and animal material. Inorganic components of the soil are classi-
fied as follows: sand, 0.02–2 mm; silt, 0.002–0.02 mm; and clay, <0.002 mm
in diameter. Organic substances are referred to as humic substances (if com-
pletely decomposed and chemically rearranged) or as nonhumic substances
(if only incompletely decomposed). Nonhumic substances constitute only
10–15% of the soil organic matter. Although the total organic matter com-
prises 0.1–7.0% of the soil, it may coat the inorganic components and block
their adsorptive functions (9).
Soil organic matter is responsible for binding nonionic and hydrophobic
compounds. The inorganic matter interacts with ionic and polar compounds;
it also has cation-exchange capacity. The size of soil particles is important.
The large surface area associated with very small particles provides a greater
number of binding sites than the surface area of large particles. Water solu-
bility of a pollutant is another property that affects its interaction with the
soil. Water solubility, in turn, is affected by factors such as salt concentra-
tion, pH, the presence of other organic compounds, and temperature.
Cropland Fertility
Soil erosion is an important issue because it contributes to water pollution
and affects cropland fertility. This problem becomes critical when combined
with overgrazing and cultivation of agriculturally marginal land. The rate of
soil erosion in the United States is 18 metric tons per hectare per year (1982
estimate). In some developing countries it is much higher. For instance, in
Ethiopia it reaches 42 (1986 estimate) and in Kenya 72–138 (1980 estimate)
metric tons per hectare per year (10). The effect of such a rapid loss of topsoil
206 Environmental Toxicology
on the future ability of developing countries to produce enough food for their
ever-growing populations may be catastrophic.
Although the predominant effect of erosion is loss of the topsoil, in some
extreme cases soil erosion leads to terrain deformation by creation of gullies;
reclamation of land so distorted is almost impossible. Other causes of land
degradation are depletion of nutrients, compaction of the soil by cattle or
heavy machinery, waterlogging, salinization, and acidification. The other
causes notwithstanding, soil erosion is still the major cause of soil degrada-
tion. It is responsible for 84% of the loss of the agricultural land in the world
as a whole (11).
Salinization
Excessive salt accumulated in the upper layers or on the surface of the soil
inhibits plant growth, and consequently the fertility of the land declines. In
extreme cases certain areas may become sterile. Salinization may happen as
result of salt loading or salt concentration.
Salt loading occurs when fields containing excessive salt are irrigated and
properly drained; the salt may be washed into the streams that serve as the
sources of irrigation water. Thus, each successive farmer downstream uses
water of higher salinity than the upstream neighbor. Eventually, the stream
becomes polluted by high salt loads. This situation is detrimental to aquatic
life, as well as to the land.
Salt concentration, on the other hand, occurs with waterlogging in areas
where large amounts of water are lost through evaporation. Waterlogging
may occur when field drainage is impaired or when the groundwater table
is too close to the surface. Standing water elutes salt from the ground. As the
water evaporates, the salt concentration builds up near or on the surface of
the land.
Nutrients and Pesticides
Runoff from farms causes pollution by nutrients such as nitrates and phos-
phates from fertilizers and by animal waste originating from feedlots. Both
nutrients and animal waste contribute to eutrophication of lakes and
streams.
Nutrients
Nitrates are of special concern because of their potential toxicity. With their
high water solubility, they leach easily from the soil and contaminate surface
as well as groundwater. In the soil (and in the oral cavity; see Chapter 3) they
may undergo reduction to nitrites. When ingested via drinking water, nitrites
Water and Land Pollution 207
may cause methemoglobinemia2 and hypertension in children. The chemi-
cal reaction between nitrites and some pesticides may lead to formation of
nitrosamines, which are known carcinogens and mutagens. Exposure to
nitrites may cause gastrointestinal cancer, and prenatal exposure may lead
to fetal malformations.
In contrast to nitrates, phosphates move primarily with the eroding soil.
Even when applied to the field as a soluble orthophosphate, it soon reverts to
an insoluble form that is readily adsorbed to soil particles. As a result, phos-
phate builds up in the sediment. However, under some circumstances there
may be exceptions to this behavior. A study of pollution of U.S. coastal
estuaries suggests that most of the phosphate, at least in the brackish waters
of an estuary, exists in solution rather than being bound to the sediment (12).
Manure is a good fertilizer if used in moderate quantities on the fields.
Large quantities of manure that accumulate in cattle feedlots produce lea-
chate rich in organic nutrients as well as in phosphates, nitrates, and ammo-
nia, creating a hazard of groundwater and surface water pollution. An
example of a major ecological threat caused by excessive manure accumula-
tion is the pork industry in the Netherlands. The 14 million animals in the
southern part of the country have produced more manure than the country
can use for its agriculture. As a result, in many areas water is highly polluted
and surface layers of the soil are saturated with phosphates and nitrates (13).
The accumulated manure also contributes to air pollution by releasing
nitrous oxide, which is formed in the soil from ammonia by oxidizing bac-
teria. N2O is converted in the air to nitric acid and as such, it is responsible
for about 20% of acid deposition in the Netherlands (14). A similar situation
has recently developed in the United States in the state of North Carolina,
where leachates from corporate hog farms contaminate streams and ground-
water.
Pesticides
Although pesticides constitute a small percentage of total water pollutants,
one should not be lured into complacency about their use. Pesticides
(whether insecticides, herbicides, or fungicides) by their very nature and
purpose are poisons. Even if their amount is minimal in comparison to
that of silt, their impact on the environment may be considerable. Since
1962, the use of pesticides in the United States has increased more than
twofold. It now endangers groundwater quality in most of the states.
The EPA has issued policies for groundwater protection from pesticides.
These policies mandate restrictions on the use of pesticides in areas where
208 Environmental Toxicology
2A condition characterized by methemoglobin accumulation in the blood.
Methemoglobin is a form of hemoglobin in which iron is oxidized to the trivalent
state. As such, it is unable to carry oxygen.
their concentration in drinking water approaches the maximum amount
allowable under the Safe Drinking Water Act. If the contamination is severe,
the use of pesticides is outlawed (15).
Persistence in the Environment Concern with pesticides centers on their prop-
erties, such as selective toxicity, persistence in the environment, bioaccu-
mulation potential, and mobility. Persistence in the environment is perhaps
the most crucial factor in their acceptability. Accordingly, they are divided
into three groups: persistent, which decompose by 75–100% within 2–5
years; moderately persistent, which decompose within 1–18 months; and
nonpersistent, which decompose in 1–12 weeks.
Decomposition of pesticides may occur by bacterial digestion as well as
by photochemical and chemical reactions. It is frequently catalyzed by
metals, soil components, or organic compounds. The reactions involve oxi-
dations, reductions, hydrolyses, interactions with free radicals, and nucleo-
philic substitutions involving water. The fact that a pesticide ‘‘decomposes’’
(i.e., loses the activity for which it was designed) does not necessarily mean
that it becomes a harmless substance.
Food Chain Bioaccumulation is a function of the lipid–water partition coef-
ficient of a substance and its refractivity to degradation and biotransforma-
tion. Bioaccumulation potential increases with increasing lipid solubility. In
general, bioaccumulation is higher in aquatic than in terrestrial organisms.
Pesticides accumulated in a terrestrial or aquatic organism may be biomag-
nified in the food chain; the degree of biomagnification is dependent on the
length of the food chain.
Pesticides adsorbed onto soil particles may end up in the sediment at the
bottom of lakes or rivers. They may enter phytoplankton, which are then
consumed by higher organisms. These higher organisms are in turn con-
sumed by still higher organisms, and so on. At each successive step of con-
sumption, concentration of the substance increases. As an example,
bioaccumulation of polychlorinated biphenyls (PCBs) in the food chain is
presented in Table 11.3. Although PCB is not a pesticide, it has many phy-
sicochemical characteristics in common with chlorinated hydrocarbon pes-
ticides.
Another problem with pesticides is their lack of specificity. Pesticides are
designed to be more toxic for insects than for birds or mammals, but they
usually do not distinguish between different species of insects. Thus they
kill not only the pest against which they were applied but also other insects
that might be natural predators of the pest, or which may serve as food for
fish and birds. In addition, pesticides entering a watershed in high concen-
tration may be harmful to fish. Rachel Carson (17) described spectacular fish
kills caused either by aerial spraying or by release of insecticides into water-
ways. In the summer of 1950 the coniferous forests of New Brunswick
(Canada) were sprayed with DDT (dichlorodiphenyltrichloroethane) to
Water and Land Pollution 209
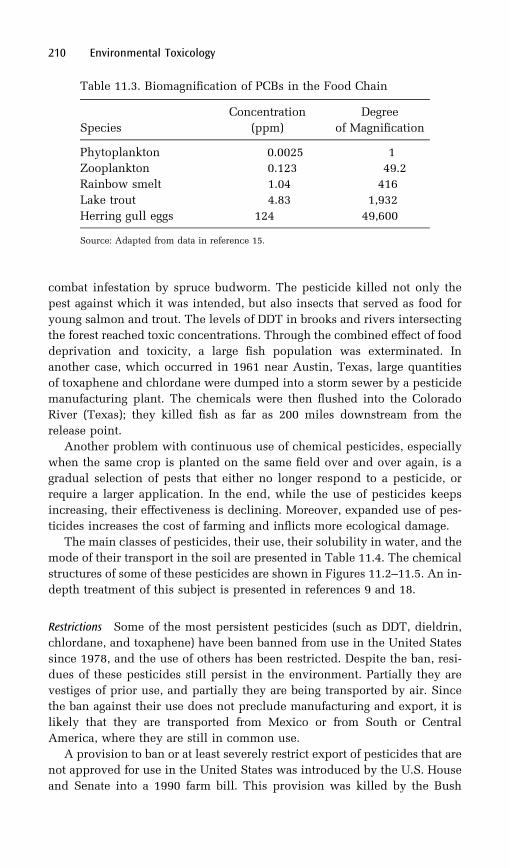
combat infestation by spruce budworm. The pesticide killed not only the
pest against which it was intended, but also insects that served as food for
young salmon and trout. The levels of DDT in brooks and rivers intersecting
the forest reached toxic concentrations. Through the combined effect of food
deprivation and toxicity, a large fish population was exterminated. In
another case, which occurred in 1961 near Austin, Texas, large quantities
of toxaphene and chlordane were dumped into a storm sewer by a pesticide
manufacturing plant. The chemicals were then flushed into the Colorado
River (Texas); they killed fish as far as 200 miles downstream from the
release point.
Another problem with continuous use of chemical pesticides, especially
when the same crop is planted on the same field over and over again, is a
gradual selection of pests that either no longer respond to a pesticide, or
require a larger application. In the end, while the use of pesticides keeps
increasing, their effectiveness is declining. Moreover, expanded use of pes-
ticides increases the cost of farming and inflicts more ecological damage.
The main classes of pesticides, their use, their solubility in water, and the
mode of their transport in the soil are presented in Table 11.4. The chemical
structures of some of these pesticides are shown in Figures 11.2–11.5. An in-
depth treatment of this subject is presented in references 9 and 18.
Restrictions Some of the most persistent pesticides (such as DDT, dieldrin,
chlordane, and toxaphene) have been banned from use in the United States
since 1978, and the use of others has been restricted. Despite the ban, resi-
dues of these pesticides still persist in the environment. Partially they are
vestiges of prior use, and partially they are being transported by air. Since
the ban against their use does not preclude manufacturing and export, it is
likely that they are transported from Mexico or from South or Central
America, where they are still in common use.
A provision to ban or at least severely restrict export of pesticides that are
not approved for use in the United States was introduced by the U.S. House
and Senate into a 1990 farm bill. This provision was killed by the Bush
210 Environmental Toxicology
Table 11.3. Biomagnification of PCBs in the Food Chain
Species
Concentration
(ppm)
Degree
of Magnification
Phytoplankton 0.0025 1
Zooplankton 0.123 49.2
Rainbow smelt 1.04 416
Lake trout 4.83 1,932
Herring gull eggs 124 49,600
Source: Adapted from data in reference 15.
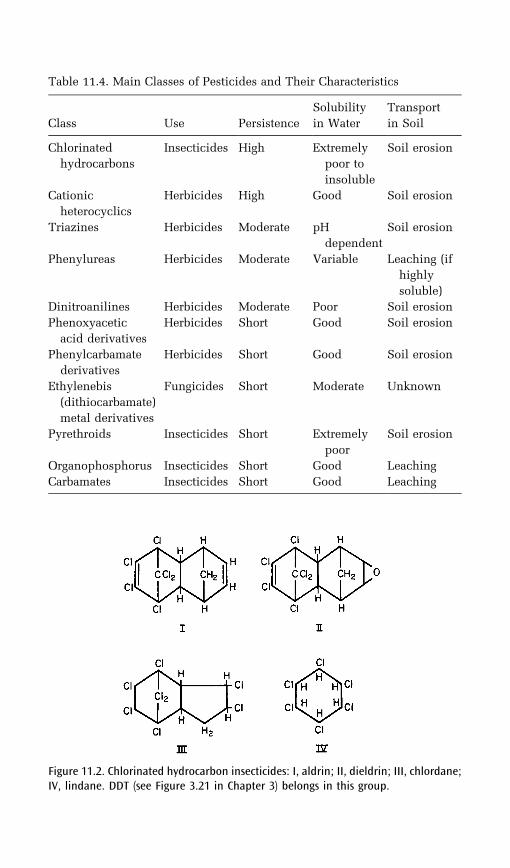
Table 11.4. Main Classes of Pesticides and Their Characteristics
Class Use Persistence
Solubility
in Water
Transport
in Soil
Chlorinated
hydrocarbons
Insecticides High Extremely
poor to
insoluble
Soil erosion
Cationic
heterocyclics
Herbicides High Good Soil erosion
Triazines Herbicides Moderate pH
dependent
Soil erosion
Phenylureas Herbicides Moderate Variable Leaching (if
highly
soluble)
Dinitroanilines Herbicides Moderate Poor Soil erosion
Phenoxyacetic
acid derivatives
Herbicides Short Good Soil erosion
Phenylcarbamate
derivatives
Herbicides Short Good Soil erosion
Ethylenebis
(dithiocarbamate)
metal derivatives
Fungicides Short Moderate Unknown
Pyrethroids Insecticides Short Extremely
poor
Soil erosion
Organophosphorus Insecticides Short Good Leaching
Carbamates Insecticides Short Good Leaching
Figure 11.2. Chlorinated hydrocarbon insecticides: I, aldrin; II, dieldrin; III, chlordane;IV, lindane. DDT (see Figure 3.21 in Chapter 3) belongs in this group.
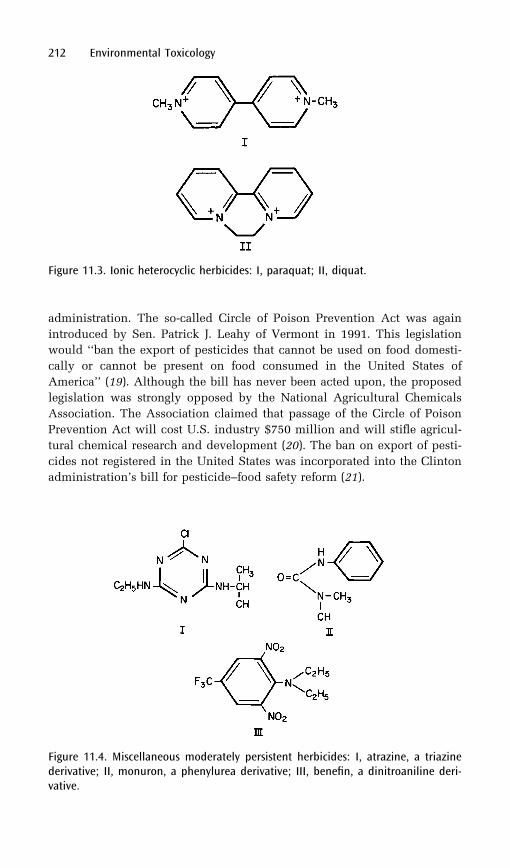
administration. The so-called Circle of Poison Prevention Act was again
introduced by Sen. Patrick J. Leahy of Vermont in 1991. This legislation
would ‘‘ban the export of pesticides that cannot be used on food domesti-
cally or cannot be present on food consumed in the United States of
America’’ (19). Although the bill has never been acted upon, the proposed
legislation was strongly opposed by the National Agricultural Chemicals
Association. The Association claimed that passage of the Circle of Poison
Prevention Act will cost U.S. industry $750 million and will stifle agricul-
tural chemical research and development (20). The ban on export of pesti-
cides not registered in the United States was incorporated into the Clinton
administration’s bill for pesticide–food safety reform (21).
212 Environmental Toxicology
Figure 11.3. Ionic heterocyclic herbicides: I, paraquat; II, diquat.
Figure 11.4. Miscellaneous moderately persistent herbicides: I, atrazine, a triazinederivative; II, monuron, a phenylurea derivative; III, benefin, a dinitroaniline deri-vative.
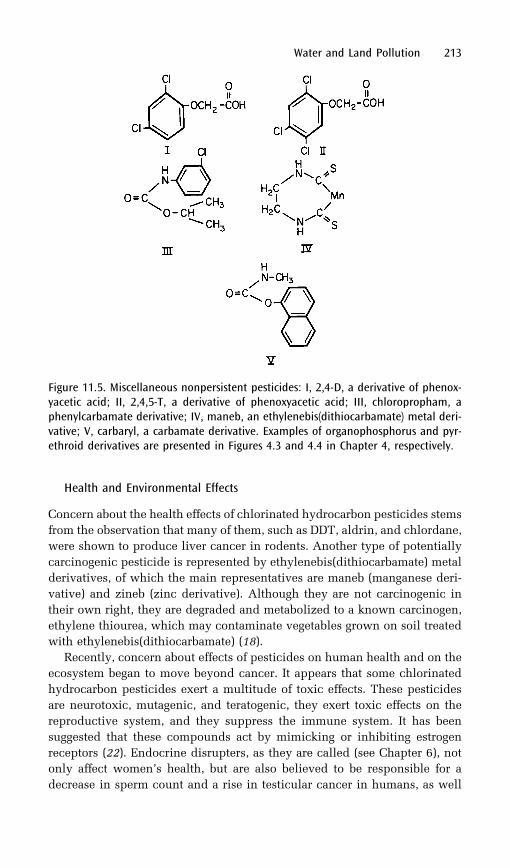
Health and Environmental Effects
Concern about the health effects of chlorinated hydrocarbon pesticides stems
from the observation that many of them, such as DDT, aldrin, and chlordane,
were shown to produce liver cancer in rodents. Another type of potentially
carcinogenic pesticide is represented by ethylenebis(dithiocarbamate) metal
derivatives, of which the main representatives are maneb (manganese deri-
vative) and zineb (zinc derivative). Although they are not carcinogenic in
their own right, they are degraded and metabolized to a known carcinogen,
ethylene thiourea, which may contaminate vegetables grown on soil treated
with ethylenebis(dithiocarbamate) (18).
Recently, concern about effects of pesticides on human health and on the
ecosystem began to move beyond cancer. It appears that some chlorinated
hydrocarbon pesticides exert a multitude of toxic effects. These pesticides
are neurotoxic, mutagenic, and teratogenic, they exert toxic effects on the
reproductive system, and they suppress the immune system. It has been
suggested that these compounds act by mimicking or inhibiting estrogen
receptors (22). Endocrine disrupters, as they are called (see Chapter 6), not
only affect women’s health, but are also believed to be responsible for a
decrease in sperm count and a rise in testicular cancer in humans, as well
Water and Land Pollution 213
Figure 11.5. Miscellaneous nonpersistent pesticides: I, 2,4-D, a derivative of phenox-yacetic acid; II, 2,4,5-T, a derivative of phenoxyacetic acid; III, chloropropham, aphenylcarbamate derivative; IV, maneb, an ethylenebis(dithiocarbamate) metal deri-vative; V, carbaryl, a carbamate derivative. Examples of organophosphorus and pyr-ethroid derivatives are presented in Figures 4.3 and 4.4 in Chapter 4, respectively.
as abnormal sexual development in some wildlife species (23). In some
cases, as for instance in the case of the chlorinated derivative of phenoxya-
cetic acid, 2,4,5-T (the defoliant ‘‘Agent Orange’’ was a mixture of 2,4-D and
2,4,5-T), the toxicity, especially its teratogenic activity, may be due in part to
the always-present by-products of its synthesis, the extremely toxic 2,3,7,8-
tetrachlorodioxin.
The direct health impact of pesticides on the human population is diffi-
cult to establish. Limited epidemiological studies showed elevated fre-
quency of some types of cancers among workers involved in
manufacturing (24) or application (25) of pesticides; however, the effect of
pesticides on the population at large has been explored only marginally. One
study suggests some correlation between levels of organochlorine pesticides
in blood and breast cancer (26). Public concern is centered on a possible
health hazard arising from traces of pesticides, as potential carcinogens, on
fruits and vegetables. How valid is this concern is a subject of controversy
within the scientific community. Some scientists claim that the carcinogenic
hazard from residues of pesticides is insignificant compared with that of the
background level of natural carcinogens (27); others disagree.
So far no link has been established between consumption of fruits and
vegetables contaminated with traces of pesticides and any adverse health
effect. However, one case of people becoming sick after eating watermelons
contaminated with a pesticide, aldicarb, has been recorded. Ever since this
incident, which was blamed on improper application of the pesticide, use of
aldicarb on watermelons has been banned by the EPA.
In 1993 two reports appeared concerning pesticides in children’s diets;
one was published by the National Research Council and the other by a
private organization called the Environmental Working Group. Both reports
urge the EPA to develop special pesticide standards for children, stricter
than those applicable to the adult population. They also recommend the
study of children’s diets to get a better idea of the actual intake of pesticides
by the children (28).
According to some scientists, the controversy about pesticides on fruits
and vegetables draws attention away from the more real potential problem:
the health hazard caused by exposure to pesticides in the air, originating
from such activities as control of mosquitoes or weeds along roads, from
spraying of golf courses and suburban lawns, and from aerial spraying of
fields and forests (29). Although the health hazard due to these activities is
difficult to determine, it cannot be disregarded. An epidemiological study
indicates that dogs of home owners who spray their lawns with the herbicide
2,4-D, or who have their lawns commercially treated, were more likely to
develop canine malignant lymphoma than dogs of home owners who do not
spray their lawns (30). This study suggests that the extensive application of
lawn herbicides may have human health implications. Also, a correlation
between childhood brain cancer and exposure to insecticides has been
reported (31, 32).
214 Environmental Toxicology
Because of the environmental problems caused by persistent pesticides,
there is now a tendency to use, whenever possible, the nonpersistent ones
that by definition decompose in 1–12 weeks. Unless a pesticide is minera-
lized (i.e., decomposes to CO2 and water), we know nothing about the envir-
onmental effects and health hazard of the decomposition products.
Moreover, the EPA’s inspector general has expressed concern about
‘‘inert’’ ingredients, which in fact constitute the bulk of commercial prepara-
tions of pesticides; there are 1400 ‘‘inerts,’’ some of them known as hazar-
dous substances and the rest of unknown toxicity (33).
The trends in the use of pesticides during the last 15 years fluctuate
greatly from country to country. For instance, whereas in the United States
there was a drop of 19%, in Canada the use of pesticides more than doubled.
A slight increase also occurred in most European countries.
Alternative Agriculture
Public concern over the presence of pesticide residues in fruits and vegeta-
bles and water pollution problems caused by conventional agricultural prac-
tices have led to a new trend in food production, alternative agriculture. The
aim of alternative agriculture is to limit dependence on fertilizers and pes-
ticides and to prevent soil erosion. The techniques involve crop rotation,
diversification of crops and livestock, use of nitrogen-fixing legumes, use
of biological pest control, new tillage procedures, and planting cover crops
after the harvest to prevent soil erosion (34). Although alternative agriculture
is at present in an experimental stage, it may eventually offer a means to
sustainable and nonpolluting food production.
A recent, large scale agricultural experiment conducted in China pro-
vided a new outlook on alternative agriculture. Farmers in Yunnan
Province, in cooperation with researchers and extension personnel, planted
genetically diversified rice crops in all the rice fields in five townships dur-
ing 1998, and in ten townships during 1999. Planting fungus-sensitive (rice
blast) and fungus-resistant varieties in alternating rows on the same plot
resulted in 89% greater yield and 94% lower infestation with the fungus
as compared to the same strains planted in monocultures (35). It would be
worthwhile to see if this practice could be also applied to crops other than
rice, such as corn and wheat.
Genetically Modified Crops
During the last decade several agribusiness companies (Monsanto, DuPont,
Novartis and many others) launched an extensive program of development
of genetically modified (GM) crops. Three types of GM crops are now being
planted on a large scale:
Water and Land Pollution 215
. herbicide-resistant soybeans
. insect- and herbicide-resistant cotton
. insect-resistant corn.
Of the globally available GM crops 72% is planted in the United States,
17% in Argentina, 10% in Canada, and 1% elsewhere (36). The acreage
planted with GM crops in the United States increased dramatically since
is inception in 1996 and has reached 54% for soybeans, 61% for cotton
and 25% (down from 37% in 1999) for corn (36). Although GM-crops pro-
duce higher yields than the conventional ones, and planting of the insecti-
cide-resistant strains reduces use of insecticides, it is doubtful that planting
of the herbicide-resistant crops would reduce need for herbicides.
Despite popularity of GM-crops with crop growers there seem to be ser-
ious problems with this technology. Proponents of GM-crops claim that high-
yield crops capable of growing under difficult agronomic conditions will
meet future food needs of growing population [36]. They also claim that
essentially, GM crops are not different from those produced by conventional
means of hybridization. Not so, claim opponents. In conventional hybridiza-
tion one introduces altered versions of the same gene in a fixed location on
the chromosome. With genetic engineering one inserts randomly genes that
frequently originate from completely unrelated organisms (37). A major
objection to GM crops used in food is concern that certain individuals
may develop allergies to foreign proteins synthesized by genes from foreign
species (37).
Another problem concerns insect-resistant crops, especially corn. Insect-
resistance is acquired by inserting into a plant a gene from the soil bacterium
Bacillus thuringiensis (Bt). This gene produces a toxin against European corn
borer. However, planting of Bt crops on a large scale may lead to develop-
ment of Bt-resistant insects, thus rendering the insect-protection ineffective,
not only in the GM-crops, but also as an insecticide presently used season-
ally for natural crop protection.
It has been thought till recently that plants transformed with the genetic
material from Bt were safe to non-target organisms. A laboratory study con-
ducted at Cornell University revealed that milkweed leaves dusted with
pollen from Bt corn were toxic to monarch butterfly larvae3 (38).
Subsequent field experiments confirmed the results of this laboratory
study (39). Another possible ecological danger concerns herbicide-resistant
crops. It is feared that they may cross-breed with surrounding weeds render-
ing them also herbicide-resistant.
One of the most promising achievements of genetic engineering is the
development of golden rice, a strain of rice enriched in �-carotene, a pre-
cursor of vitamin A (40). Rice is the staple food of one half of the world
216 Environmental Toxicology
3Leaves of milkweed which frequently growth in the vicinity of corn fields are the
exclusive diet of monarch’s larvae.
population. However, it is deficient in vitamin A and thus diet consisting of
rice without being supplemented with other nutrients is responsible for
500,000 cases of blindness in developing countries each year (40).
A controversy is being debated whether foods containing products origi-
nating from transgenic crops should be labeled as such. Right now, in the
United States no law requires labeling and Food and Drugs Administration
(FDA) policy is to regulate transgenic crops in the way ‘‘identical in princi-
ple to that applied to foods developed by traditional plant breeding’’ (41).
Several environmental and consumer organizations challenge this policy
and call for labeling to give consumers a choice.
Wetlands and Estuaries
Wetlands and estuaries represent an important ecological and economic
resource. There are two types of wetlands: freshwater wetlands, and tidal
marshes associated with the estuaries at the seashore. An estuary forms
when an inlet of a river valley is invaded by the sea tide and seawater spills
over the tributary valleys, forming an intricate network of little bays and
inlets. Estuaries are normally bordered by tidal marshes that are formed by
freshwater, but during the tide they become inundated by salty seawater; as
result their water is brackish. A tropical counterpart of tidal marshes is
mangroves. Mangroves are dense thickets of shrubs and trees characterized
by arched roots emerging from the mud and joining the trunks above the
water surface.
Both freshwater and tidal marshes have rich vegetation that abounds with
grasses that supply winter food for ducks and geese. They act as giant water-
purifying filters, attenuate floods, and provide a variety of food necessary to
maintain species diversity and ecological balance. Mangroves, besides sup-
plying food for aquatic species, also prevent coastal erosion.
The Loss of Wetlands
Estuaries are extremely rich in both land and ocean nutrients. The coastal
rivers carry fertile silt that supports vegetation, which in turn provides for a
chain of life. Estuaries are breeding shelters for many species of fish and
shellfish. The most commercially valuable ocean fish (other than tuna, lob-
ster, and haddock) depend on estuaries for food and propagation (42).
The greatest danger to wetlands comes from land development. Because
about two-thirds of the world population lives along the coastlines and most
rivers drain into coastal waters, the integrity of the tidal marshes and estu-
aries is threatened. In the United States, the population living within 50
miles of the shoreline doubled between 1940 and 1980 (43). Nearshore con-
struction, land-filling, and dredging pollute coastal waters. Many coastal and
Water and Land Pollution 217

inland wetlands are being drained or filled for residential or commercial
construction, road building, farmland, and other uses. It is estimated that
between 1956 and 1986, 11 million acres of wetlands were drained in the
United States (42).
Coastal development in the tropics may also endanger the integrity of
coral reefs. Coral plays an important role in the preservation of marine eco-
logical balance because it serves as a shelter and a breeding place for many
fishes. It also protects shores from erosion. Coral can thrive only in symbiotic
relationship with photosynthesizing organisms called zooxanthellae (zoox-
anthellae provide coral with nutrients). When the coastal waters become
turbid because of soil runoff from construction sites, light penetration is
reduced, zooxanthellae die, and so does coral.
Another danger is pollution carried by rivers. Rivers carry urban, indus-
trial, and agricultural pollutants that empty into the estuaries. The buildup of
pollutants at the coast threatens the marine life. Poorly treated sewage and
agricultural runoff introduce nutrients and BOD pollutants that stimulate
growth of algae, depleting water of oxygen. Some algae, especially those
having a red or brown color, known as red or brown tide, are toxic and
kill fish and aquatic mammals feeding on fish.
In the United States, under the Public Trust Doctrine (44), the state or
federal government may restrict development of land designated as wet-
lands. In 1991, President Bush, under pressure from land developers, land
owners, and the oil industry, proposed to reclassify the definition of wet-
lands. Because not all wetlands are under water all year round, the definition
of what is and what is not a wetland is somewhat arbitrary.4 However,
changing the existing definition to allow more development is a dangerous
precedent. When all wetlands newly opened for development are gone, there
may be renewed pressure by the developers to change the definition again;
this may lead to a gradual disappearance of all wetlands with catastrophic
ecological consequences.
Pfiesteria pesticida
In the early 1990s a new hazard to fish and human health surfaced in the
coastal waters and rivers of the eastern United States, from the Delaware Bay
to the Gulf of Mexico (45). It is Pfiesteria pesticida a one-cell microscopic
algae, that frequently lurks in red tides and other algal blooms, and excrete a
powerful fish-killing toxin. Pfiesteria pesticida has a very complicated life
cycle which allows it to exist in at least 24 flagellated, ameboid and encysted
218 Environmental Toxicology
4The official definition (established in 1989) of a wetland is as follows: ‘‘A wetland
is any depression where water accumulates for seven consecutive days during the
growing season, where certain water-loving plants are found, and where the soil is
saturated enough with water that anaerobic bacterial activity can take place.’’
stages. Most of the stages are non-toxic. However, when stimulated by sub-
stances excreted or leached from live fish, its cyst stage converts to a toxic
ameboid form (46). In this stage Pfiesteria releases a water-soluble neuro-
toxin which stuns the fish. Subsequently the microorganism attaches itself to
the incapacitated fish and releases a lipid soluble toxin that lyses the epi-
dermal tissue causing deep wounds and frequently death of the fish. During
an outbreak in spring and summer 1997 Pfiesteria killed 10,000 to 15,000
fish in Pocomoke river in Maryland. Earlier massive fish kills, attributed to
the infestation with Pfiesteria were observed in North Carolina estuaries.
People exposed to Pfiesteria toxin suffer from slowly-healing sores, diffi-
culty in breathing and a loss of short-term memory. These symptoms subside
over time. Exposure to Pfiesteria toxin occurred in laboratories, but may also
occur (and indeed occurred) when people are in contact with infested water,
even if they are in boats, since the toxin exists in a form of an aerosol above
water surface.
There is a strong evidence that outbreaks of Pfiesteria are due to over-
abundance of nutrients in rivers and coastal waters. Runoff of phosphates
and nitrogen compounds from agricultural practices, and especially from pig
farms in North Carolina (46) as well as possible airborne transport of nitrogen
oxides either directly or in the form of nitric acid in acid precipitation (see
further in this chapter) may be implicated.
The Case of Chesapeake Bay
The Chesapeake Bay is one of the largest estuaries in the world; it is 195
miles long and its width varies between 3.4 and 35 miles. The drainage area
of the bay covers 64,000 square miles, which includes six major rivers
(Susquehanna, Patuxent, Potomac, Rappahannock, York, and James) that
supply almost 90% of the freshwater input into the bay. Water quality in
the Chesapeake Bay has been deteriorating gradually since the industrial
revolution, but this decline has accelerated rapidly since the late 1950s.
Presently about 50% of the bay area is moderately to heavily polluted
with nutrients and BOD contaminants, and perhaps to a lesser extent with
heavy metals and pesticides. The ecological damage to the Chesapeake Bay
is of major concern because the bay is a valuable source of seafood, a habitat
for waterfowl, a stopover for migratory birds, and a unique recreational
resource.
The extensive study of the causes of the bay pollution conducted by the
EPA revealed that 78% of the nitrogen and 70% of the phosphates entering
the bay were carried by three major rivers from upstream sources. Most of
the phosphates originated from point sources, mainly wastewater treatment
plants, whereas most of the nitrates were derived from agriculture (3). Some
pollutants originated from as far away as Pennsylvania and New York.
Another study conducted by the Environmental Defense Fund pointed out
Water and Land Pollution 219
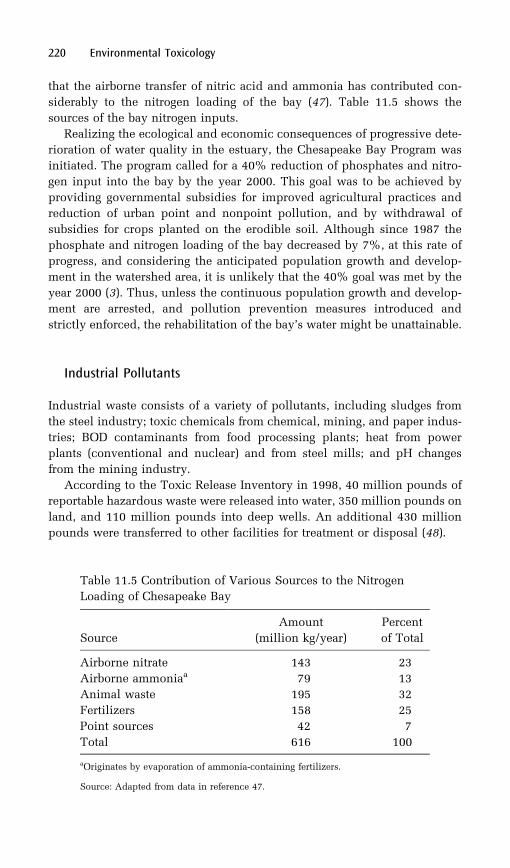
that the airborne transfer of nitric acid and ammonia has contributed con-
siderably to the nitrogen loading of the bay (47). Table 11.5 shows the
sources of the bay nitrogen inputs.
Realizing the ecological and economic consequences of progressive dete-
rioration of water quality in the estuary, the Chesapeake Bay Program was
initiated. The program called for a 40% reduction of phosphates and nitro-
gen input into the bay by the year 2000. This goal was to be achieved by
providing governmental subsidies for improved agricultural practices and
reduction of urban point and nonpoint pollution, and by withdrawal of
subsidies for crops planted on the erodible soil. Although since 1987 the
phosphate and nitrogen loading of the bay decreased by 7%, at this rate of
progress, and considering the anticipated population growth and develop-
ment in the watershed area, it is unlikely that the 40% goal was met by the
year 2000 (3). Thus, unless the continuous population growth and develop-
ment are arrested, and pollution prevention measures introduced and
strictly enforced, the rehabilitation of the bay’s water might be unattainable.
Industrial Pollutants
Industrial waste consists of a variety of pollutants, including sludges from
the steel industry; toxic chemicals from chemical, mining, and paper indus-
tries; BOD contaminants from food processing plants; heat from power
plants (conventional and nuclear) and from steel mills; and pH changes
from the mining industry.
According to the Toxic Release Inventory in 1998, 40 million pounds of
reportable hazardous waste were released into water, 350 million pounds on
land, and 110 million pounds into deep wells. An additional 430 million
pounds were transferred to other facilities for treatment or disposal (48).
220 Environmental Toxicology
Table 11.5 Contribution of Various Sources to the Nitrogen
Loading of Chesapeake Bay
Source
Amount
(million kg/year)
Percent
of Total
Airborne nitrate 143 23
Airborne ammoniaa 79 13
Animal waste 195 32
Fertilizers 158 25
Point sources 42 7
Total 616 100
aOriginates by evaporation of ammonia-containing fertilizers.
Source: Adapted from data in reference 47.
Definition of the Problem
The problem of toxic pollutants is difficult to handle because of the great
variety of chemicals involved. They represent a hazard not only to aquatic
life, but also to human health, either through direct exposure or indirectly
through consumption of contaminated fish or waterfowl. The degree of
hazard depends on the pollutants’ toxicity, rate of discharge, persistence
and distribution in the aquatic system, and bioaccumulation potential.
Persistence is a function of the toxins’ biodegradability in water and of
their vapor pressure. Some highly volatile compounds, when discharged
into water, evaporate and become air pollutants.
The health risk cannot be well defined because little or no information is
available on the toxicity of most commercial chemicals (49). According to
the data published in 1984 by the National Research Council (50), very little
is known about the toxicity of approximately 79% of commercial chemicals.
Fewer than 10% were examined for carcinogenicity, mutagenicity, and
reproductive toxicity (40). Obviously, nothing is known about pollutants
that are by-products of industrial processes and were never intended for
commercial use.
Mercury
One of the ubiquitous water pollutants is mercury. In humans, toxicity of
mercury involves severe neurological disturbances manifested (in order of
severity) by loss of sensation in the extremities, an unsteady gait, slurred
speech, tunnel vision, loss of hearing, convulsions, madness, and death. In
the past, most mercury contamination resulted from the dumping of inor-
ganic mercury into lakes, streams, and seas. Although inorganic mercury is
toxic, it is not easily assimilated by biological organisms. However, under
anaerobic conditions it is converted into extremely toxic methyl- and
dimethylmercury. These compounds penetrate biological membranes read-
ily and subsequently undergo bioaccumulation.
The most dramatic case of mass mercury poisoning attributed to con-
sumption of fish and other seafood contaminated with methylmercury
occurred in 1956 in Japan. A mercury catalyst used in a chemical plant
was discarded as waste sludge into Minamata Bay. The mercury was con-
verted by aquatic biota to methylmercury, and eventually toxic amounts of it
accumulated in fish and shellfish. The disease and its causes were not iden-
tified until 1963 (51).
During the 1960s and early 1970s, a great deal of mercury was dumped by
industrial plants into the Great Lakes. As a result, fishing in Lake Erie, Lake
St. Clair, the Detroit River, and the St. Clair River was stopped by both U.S.
and Canadian authorities (52).
After the dumping of mercury ceased, it was generally believed that the
problem of pollution by mercury was solved. However, in the late 1980s the
Water and Land Pollution 221
problem resurged, though not in quite as severe a form as before. Although
mercury in the environment originates from natural sources such as volca-
noes and geologic deposits, it turned out that the anthropogenic sources
contribute 75% to the global atmospheric load; the main sources are coal
combustion (65%) and solid waste incineration (25%) (53). Research showed
that the total concentration of mercury in the atmosphere has doubled since
the 19th century.
Atmospheric mercury is carried to the earth with rain; it settles on land
and it is carried into the lakes, ponds, and rivers with the runoff from fields.
The concern for water pollution with mercury is dwarfed in comparison to
that for pollution with chlorinated organic compounds. Nevertheless, the
problem is serious. This is best illustrated by the fact that 12 states
(Massachusetts, New York, Florida, Ohio, Connecticut, Michigan, Virginia,
Tennessee, Minnesota, Wisconsin, California, and Oklahoma) enacted a fish-
advisory for mercury. The Food and Drug Administration set the upper limit
for mercury in fish at 1 ppm (1 mg/kg or 1000 ng/kg); fish exceeding this
content of mercury may be banned from interstate commerce.
On the basis of the investigation of the Minamata Bay incident, the World
Health Organization (WHO) established the human toxic dose of mercury in
fish at 4300 ng/kg/day. To be on the safe side, WHO recommended that
human uptake of mercury should not exceed 430 ng/kg per day. Because
small children and fetuses are more sensitive than adults, they should not be
exposed even to such small doses.
Other Heavy Metals
Many heavy metals are toxic and can be taken up from soil by the plants.
Their toxicity is discussed in Chapter 8. In contrast to most organic pollu-
tants, metals do not decompose in nature, and they remain in the environ-
ment until they are physically removed. An example of pollution with heavy
metals is the contamination of the Hudson–Raritan Estuary with copper,
mercury, lead, nickel, and zinc. The main contributors of these pollutants
are the industrial plants in New York and New Jersey that discharge their
effluents through municipal sewage (54). It appears that the legally mandated
pretreatment of industrial effluents is not working satisfactorily.
Other cases of significant industrial pollution of U.S. rivers and coastal
waters have been reported. In some areas of Galveston Bay, Texas, heavy
metals exceed the EPA water quality standards. This pollution is attributed
partially to industrial effluents and partially to waste disposal (55).
Polychlorinated Biphenyls
General Electric has two plants along the upper Hudson River that manu-
facture capacitors. During the 1950s and 1960s (i.e., before discharge permits
222 Environmental Toxicology
were required; see Chapter 15), the plants discharged about 30 lb of PCBs per
day into the river. Most of this discharge was adsorbed onto soil particles and
settled to the bottom of the river with the sediment, which was retained in
place by a dam located downstream from the plants. When the obsolete dam
was removed in 1973, the disturbed sediment was swept down with the
current, and 40 miles of the Hudson River downstream from the plants
became heavily contaminated (56). Levels of PCBs in most edible fish
exceeded the 5-ppm safety limit set by the Food and Drug Administration.
As a result of high levels of contamination with PCBs, sport fishing in the
Hudson River was completely wiped out and commercial fishing was cur-
tailed to 40% of the precontamination level.
The legal battle that issued between the New York Department of
Environmental Conservation and the General Electric Company, in response
to the Hudson River pollution, was settled in September 1976. The provi-
sions of the settlement obligated the General Electric Company to reduce
emissions of PCBs as of the settlement date and cease using them completely
by July 1977. However, the problem of how to handle the contaminated
sediment remained unsolved. In 1988 General Electric researchers presented
evidence that PCBs are biodegradable under the conditions that occur in the
Hudson River sediment (57). Thus the company proposed to do nothing and
let nature take its own course. The officials of New York State, on the other
hand, being skeptical about the efficiency of the self-cleaning, were inclined
to have the most contaminated stretch of the river dredged. The cost con-
siderations notwithstanding, the problem remains of how to dispose of the
dredged sediment safely.
Although the use of PCBs is now banned in the United States, consider-
able quantities of this toxin have accumulated in the environment and are
still present in old electrical equipment, which is in use or discarded.
Being highly lipid-soluble, PCBs have a great bioaccumulation potential
(see Table 11.3). Though their acute toxicity in animals is low (Aroclor 1254
was reported to have an oral LD50 in rats between 250 and 1300 mg/kg),
chronic exposure is very harmful. PCBs have immunosuppressive activity,
are tumor promoters, and interfere with calcium utilization; thus they can
affect eggshell formation in birds (9, 56). They are classified as carcinogens
by both EPA and the International Agency for Research on Cancer. The
induction of xenobiotic-metabolizing enzymes by PCBs was discussed in
Chapter 3.
Dioxins
Since the late 1980s there has been concern about water pollution by dioxins
associated with the paper-manufacturing industry. Dioxins comprise a group
of 75 compounds with the same ring structure but varying degrees of chlor-
ination. The most toxic compound in this group is 2,3,7,8-tetrachlorodi-
Water and Land Pollution 223
benzo-p-dioxin, referred to here as TCDD (for the chemical structure see
Figure 3.21 in Chapter 3).
Health and Ecological Effects The LD50 of TCDD in rats is 0.022 and 0.045 mg/
kg in males and females, respectively. It is teratogenic and carcinogenic in
rodents. The toxicities established in humans include chloracne, porphyria,5
liver damage, and polyneuropathies6 (9). TCDD has been also implicated as a
cause of soft-tissue sarcoma (58) and lung cancer (59) in humans.
A 10-year mortality study of a population exposed to large quantities of
dioxins resulted from an explosion at the Givaudan plant, near Seveso, Italy,
on July 10, 1976. This study showed elevated mortality from several types of
cancer among the exposed people (60). In contrast, data published by the
Center for Disease Control in Atlanta, Georgia (61), indicated that no adverse
health effects, other than chloracne and other skin diseases, were noted in
the Seveso population. However, in this study, the time elapsed since this
accident was too short to allow definite conclusions to be drawn concerning
the possible carcinogenic effects of dioxins in humans.
TCDD is formed during the Kraft process of paper manufacturing, which
includes the bleaching of pulp with chlorine. A survey conducted by
Greenpeace at Crofton, Vancouver Island (62), noted that the eggs of blue
heron colonies in the vicinity of the Crofton paper mill have failed to hatch
since about 1987. The implication was that this failure resulted from water
pollution with TCDD by the Crofton mill (62).
Indeed, TCDD has been found not only in paper mill effluent and sludge,
but also, albeit in trace amounts, in chlorine-bleached paper products such
as coffee filters, toilet tissue, paper towels, paper plates, and writing paper.
In response to public concern, the EPA, the American Paper Institute, and
the National Council of the Paper Industry for Air and Stream Improvement
initiated a study of 104 U.S. paper mills that use chlorine for bleaching. The
conclusion was that the median amounts of dioxin discharged were 6 and
3.5 ppt (parts per trillion) in hardwood and softwood pulp, respectively, and
17 and 0.024 ppt in sludge and wastewater, respectively (61).
Considering dioxin toxicity, its tendency to settle with the sediment, and
its bioaccumulation potential, concern about the possible environmental
impact of even such small amounts in water was justified. Consequently,
the EPA proposed 0.014 part per quadrillion as an ambient water quality
standard for TCDD.
The tough standards for dioxin, and the clamor of the environmentalists
to replace chlorine bleaching with an oxygen bleaching process, were dis-
224 Environmental Toxicology
5Porphyria is an abnormality of porphyrin metabolism characterized by urinary
excretion of large quantities of porphyrins and by extreme sensitivity of the afflicted
subjects to light.6Noninflammatory degenerative disease of nerves.
turbing not only to the paper industry but also to the chloralkali industry that
produces chlorine. To alleviate the pressures on the industries, the Chlorine
Institute sponsored a dioxin symposium in Banbury Center, Long Island, in
October 1990. It is difficult to say whether a consensus was reached among
the attending scientists. Some participants declared that dioxin is not as
toxic for humans as originally thought and pressured the EPA to revise its
standards. In view of this controversy and in consideration of new animal
toxicity data, the EPA initiated an extensive study to reevaluate TCDD expo-
sure standards (63). In September 1994 the EPA released its long-awaited
report. According to this report a new picture of TCDD toxicity emerged. It
appears that dioxins and related chemicals are human carcinogens. At doses
much lower than those causing cancer, they may cause a wide range of toxic
effects in humans: they disrupt normal functioning of the endocrine system,
and in consequence affect reproductive function, damage the immune sys-
tem, and lead to abnormal fetal development (64). Their mode of action
seems to be related to their ability to interact with cellular receptors, espe-
cially estrogen receptors (65) (see Chapter 6).
Occurrence and Exposure Congeners of dioxins, furans, and PCBs differ in
their toxicity, depending on the number and position of chlorine atoms.
To account for differences in their biological activities, the EPA expresses
a compound’s mass in terms of its toxicity. The most toxic dioxin, namely
TCDD, is used as a reference standard. Thus, the mass of dioxin congeners
and related compounds is expressed in terms of TCDD equivalents (TEQs).
For instance, if the mass of a particular dioxin congener is equal to that of
TCDD, but its toxicity is one-tenth of it, then its mass, expressed in TEQ
units, will be only one-tenth of its actual weight. According to this system,
air emissions of dioxins in the United States amount to 30 lb/yr, 95% being
due to waste incineration (mostly municipal and medical waste) (64).
Airborne dioxins and furans settle on crops and on water. Those in water
settle down with the sediment and hence enter fish via phytoplankton.
Those that settle on crops accumulate in the fat of livestock via fodder.
Because of their chemical stability and refractivity to biotransformation,
they tend to be biomagnified in the food chain. Thus, the general public is
exposed to dioxins primarily through consumption of fish, meat, and dairy
products. It is estimated that Americans ingest daily, with food, on the aver-
age 111 picograms of TEQs. The average dioxin body burden of the U.S.
population is 40 ppt or 13 ng/kg (64). These levels may not be carcinogenic,
but they may have adverse effects on the reproductive system. Of main
concern is that being readily fat soluble, the milk content of dioxins may
be much higher than the average body burden, and nursing infants may be
exposed to highly toxic doses (66).
In 2000, EPA reevaluated its earlier data on emissions, body-burden and
carcinogenic potency of dioxin. This latest EPA report (67) states that, thanks
to regulatory controls and industrial actions, the emissions of dioxin (in
Water and Land Pollution 225

terms of TEQs) from sources that can be reasonably quantified, decreased
between 1987 and 1995 by about 80%. So did the estimated average body-
burden of general population from 40 ppt in the late 1980s to 25 ppt in the
late 1990s. However, the carcinogenic potency of TCDD was reevaluated
upwards, to 3–30 times higher than previously estimated (1985 and 1994)
on fewer data. The report stipulates that despite decrease in the body-bur-
den, the amount of dioxin found in the tissue of the general human popula-
tion closely approaches (within a factor of 10) the level at which adverse
effects might be expected to occur.
The Great Lakes
The Great Lakes, which contain 95% of the surface freshwater of the United
States and 20% worldwide, constitute a vast economic resource. Because of
their enormity, it was thought for decades that they were immune to pollu-
tion. In fact, owing to their slow water-replacement rate, the lakes, especially
the upper ones, are very sensitive to pollution. The overall annual water
outflow from the lakes is less than 1% of their total volume. The flushing
times of the individual lakes in years are (16):
. Superior, 182
. Michigan, 10
. Huron, 21
. Erie, 2.7
. Ontario, 6
During the 1960s the quality of water in the Great Lakes, especially in the
lower lakes, was visibly deteriorating. The most apparent causes were nutri-
ents and phosphate loads from untreated or insufficiently treated sewage and
farm runoffs seeping directly, or carried by the tributaries, into the lakes. A
natural phenomenon also contributed to this demise; alewives, originally a
saltwater fish, which adapted to the freshwater of the lakes, had increased in
numbers beyond the carrying capacity of the lakes. As result the fish were
dying in large numbers and the dead fish that washed ashore contaminated
the beaches. By 1970 Lake Erie had lost or experienced a great reduction of
several commercially valuable species of fish; the areas near the shores were
covered by algae.
The waters were revived through enforcement of a 1972 U.S.–Canadian
agreement that restricted discharge of nutrients and BOD effluents into the
Great Lakes.
Toxic Pollution Toxic pollution proceeded unnoticed until it was discovered
that the fish in many areas had been contaminated with toxic chemicals
(such as PCBs and heavy metals) and pesticides (such as mirex).
In response to these findings, a new agreement was signed between the
United States and Canada in 1978 and amended in 1987. This document
226 Environmental Toxicology
established a new goal: to stop the discharge of toxic chemicals into the
lakes. According to the agreement, about 350 hazardous substances should
be banned from the lakes. The most critical pollutants were identified as
PCBs, polyaromatic hydrocarbons (PAHs), TCDD, tetrachlorodibenzofuran
(TCDF), and four pesticides: mirex, DDT, dieldrin, and toxaphene (16).
The data on PCBs and dieldrin levels in herring gull eggs from the Great
Lakes colonies, shown in Figure 11.6, reflect the changes in the lakes’ che-
mical burden between 1978 and 1986. Although the initial progress in les-
sening the burden of toxins was considerable, the further advance eventually
came to a standstill. This prompted the EPA and Environment Canada to
sign amendments to the Great Lakes agreement in 1987, this time focusing
attention on the new technologies to be applied in pollution prevention and
on the stricter accountability of all parties involved.
Accumulation in Fish According to a special report in Chemical and
Engineering News of February 8, 1988 (16), ‘‘The current overall condition
of the lakes is fair to excellent in regard to phosphates, deteriorating in
regard to nitrogen, and mixed in regard to toxins.’’ Sediment and sedentary
fish from different areas of Lake Ontario were analyzed for certain fluori-
nated aromatic compounds originating from an abandoned chemical waste
dump in Hyde Park at Niagara Falls, New York. The study revealed rapid
and uniform distribution of the tracer compounds throughout the lake in
sediment and their accumulation in fish in sites remote from the point of
origin (68).
Cases of skin and liver neoplasia affecting the fish population in several
heavily contaminated areas of the Great Lakes have been linked to the pre-
sence of a heavy burden of aromatic hydrocarbons in contaminated bottom
sediments. Although the causes of the neoplasms have not been fully deter-
mined, laboratory experiments with both fish and mice have shown that
organic extracts of sediments from the affected waterways have definite car-
cinogenic potential. In addition, the carcinogenic potential of a number of
PAHs present in the sediments has been fully demonstrated in several fish
species (69).
Fish Consumption At present a fish consumption advisory recommends that
nursing mothers, pregnant women, women who anticipate bearing children,
and children under 15 years of age should not eat lake trout over a certain
size from Lakes Michigan, Superior, Huron, and Ontario. In addition, people
of both sexes and of all ages are advised against eating very large fish from all
five lakes.
The toxic pollutants in the Great Lakes also affect fish-eating birds and
mammals. In herring gulls the toxicity is manifested principally in repro-
ductive failures due to thinning of the eggshells, whereas in cormorants it is
manifested in mutational changes such as crossed bill. Obviously, different
chemicals are responsible for cancer in fish than for the toxicity in birds.
Water and Land Pollution 227

Figure 11.6. Concentrations of PCBs (A) and dieldrin (B) in herring gull eggs from GreatLakes colonies in 1978 and 1986. (Source: Adapted from data in reference 16.)
PAHs, the principal fish carcinogens, are relatively easily metabolized and
thus are not biomagnified in the food chain beyond the predatory fish. On the
other hand, compounds such as PCBs, dioxins, and chlorinated pesticides,
being refractory to biodegradation, persist further in the hierarchy of preda-
tory species. Accumulation of chlorinated organic compounds has also been
noted in mink and river otter from the Lake Ontario and Hudson River valley
areas (16).
Cleaning up toxic chemicals from the Great Lakes is difficult because of
the variety of pollution sources. Even if the discharges by the industrial and
municipal point sources and the nonpoint urban and rural runoffs were
reduced to zero, there remain the problems of atmospheric depositions
and leachates from the hazardous dumps. The EPA and Environment
Canada undertook a joint project to determine quantities of airborne toxins
over the United States and Canada. They estimated that the deposition of
airborne toxins is responsible for 90% of pollutants in Lake Superior, 63% in
Lake Huron, 57% in Lake Michigan, 7% in Lake Erie, and 6% in Lake
Ontario (15). The sources of the pollutants are numerous and frequently
very distant from the points of deposition. Evaporation from contaminated
sewage sludge deposited on land and from open lagoons of toxic waste,
exhausts from municipal and toxic waste incinerators, and exhausts from
coal-fired plants contribute to the pollution of the lakes. In addition, airborne
pesticides, banned in the United States but still used in Latin America, are
transported by the wind and deposited into the lakes.
The other problem is leaching of toxic compounds from the abandoned
hazardous waste sites. In the past the chemical waste was deposited
haphazardly, without regard to the geological structure of the land and
the proximity of a lake or a river. There were no liners and no leachate
collecting systems to prevent the leachate from flowing along the way of
least resistance. The removal of hazardous waste from old dumps or at
least confinement of the leachates is difficult, expensive, and time-consum-
ing. The fact that along a 3-mile stretch of the Niagara River alone there are
164 abandoned chemical waste sites (16) exemplifies the scope of the pro-
blem. It appears that if the present slow rate of progress of the Superfund
cleanup continues, the problem will persist for a considerable time to
come.
Zebra Mussel A relatively new phenomenon is infestation of the Great Lakes
by the zebra mussel (Dreissena polymorpha). Zebra mussel is native to wes-
tern Russia near the Caspian Sea. Hence it spread to western and central
European waterways where it existed for nearly 200 years. In the mid 1980s
it was broughtwith ship ballast to the Great Lakeswhere it spread rapidly. The
mussel produces fibers (byssal treads) that protrude from between two halves
of shell and attach with a strong glue to hard surfaces. This property makes it
an economic nuisance since it plugs water intakes to power plants and water
purification plants. But it also affects the lake environment. It kills native
Water and Land Pollution 229
species of mussels. Being filter feeders, the mussel devours nearly all particu-
late matter, including zoo- and phytoplankton which also serves as food for
small fish. The long-term effects of this food sources removal on survival of
fish in the Great Lakes is now being studied (70).
On the positive side it has to be noted that since invasion of the Great
Lakes by zebra mussel the clarity of Lake St. Claire and Lake Erie has
improved. In addition it appears that zebra mussel is able to remove a con-
siderable proportion of polycyclic aromatic hydrocarbons from both sus-
pended sediment and algae (71).
The Great Lakes is just one example of despoiled waters in the United
States. There are many other areas of concern, including Long Island
Sound and those already discussed: Galveston Bay, the Chesapeake Bay,
the lower Mississippi River, the upper Hudson River, and the Hudson–
Raritan estuary.
Europe
Water pollution is also an acute problem in Europe. An example of extensive
river pollution is the Rhine River in Germany. Although dissolved oxygen
levels have increased considerably since the 1970s, salts, chemicals, metals,
oils, pesticides, and thermal discharges from industry and power plants
remain high. Despite some improvement, the chemical burden of the river
is so high that dredged sediment from Dutch harbors is considered to be a
hazardous waste (72).
However, with the awakening of cognizance among the European govern-
ments and the population at large, of the economic consequences of envir-
onmental despoilment, with the investment in new antipollution
technologies, and with stationary or declining populations (as is now the
case in some European countries), there are good chances for environmental
improvement. The birth and relative popularity of the Green Party in the
European Community shows societal concern with the environment.
The situation in Eastern Europe is much worse than that in Western
Europe. For example, in late 1980s and early 1990s half of the Polish
communities that line the Vistula River, including Warsaw, discharged
inadequately treated sewage into the river. In addition, industrial discharges
have made the water in many sections of the Vistula unsuitable even for
industrial use; it may corrode the plants’ machinery (73). The soil in
Silesia, which is the center of Polish heavy industry, was polluted with
heavy metals (zinc, mercury, cadmium, and lead) to such an extent that
five villages have to be relocated and the government was considering a
ban on agriculture in certain areas (74). This environmental deterioration
was not limited to Poland. It occurred in most of the Eastern European
countries. The worst contaminated area was the coal-rich industrial zone
comprising the southwestern part of East Germany, the western Czech
230 Environmental Toxicology
Republic (Bohemia), and the southern part of Poland. The situation is now
improving but years of the environmental neglect took its toll on people’s
health (75) (see also Chapter 9).
Heat Pollution
Power plants, conventional as well as nuclear, and the steel industry use
large amounts of water for cooling purposes. The released water carries heat
from the plants into rivers or lakes, and this heat increases the ambient water
temperature in the vicinity of the release point.
The elevated temperature stimulates the metabolism of aquatic organ-
isms, which in turn increases the demand for oxygen. At the same time,
the amount of dissolved oxygen decreases with increasing temperature.
Thus, the effect of heat pollution is similar to that of BOD contaminants or
nutrients.
Some aquatic species have difficulty adapting to the warmer environ-
ment. Other species adapt to the warmer water and congregate around dis-
charge points in winter. If the plants are shut down temporarily, massive fish
kills from temperature shock result.
Pollution of Groundwater
Groundwater is an important natural resource. In the United States the use of
groundwater increased from 34 billion in 1950 to 88 billion gallons per day
in 1980. Of the latter amount, 54 billion gallons was used for irrigation. The
rest was used for industrial purposes and as drinking water. About half of the
U.S. population depends on groundwater for drinking. Thus, preservation of
clean groundwater is of utmost importance.
Although there are numerous sources of contaminants, they are all related
to three potential roots:
1. water-soluble products that are stored or spread on the landsurface
2. substances that are deposited or stored in the ground above thewater table
3. material that is stored, disposed of, or extracted from below thewater table
Agricultural pollutants and waste disposed on land belong to the first
category; waste disposed in landfills, leaking septic tanks, and leaking
underground storage tanks, to the second one; and waste disposed in deep
wells and waste originating from mining activities to the third.
Essentially, all chemicals that contact the ground, such as fertilizers and
pesticides spread on the fields, especially if they are water soluble, present a
potential hazard of groundwater contamination. Extensive contamination of
Water and Land Pollution 231

groundwater is also caused by animal feedlots. Although the feedlots occupy
relatively small areas, they provide an enormous amount of waste that lea-
ches nitrates, phosphates, ammonia, chlorides, and bacteria into ground-
water. Certain irrigation practices, such as use of automatic fertilizer
feeders that are attached to irrigation sprinkler systems, may also contribute
to groundwater contamination. This is because when the irrigation pump is
shut off, water flows back into the well, siphoning the fertilizer from the
feeder into the well (76).
Waste Disposal Sites
In addition to agriculture, waste dumps are also major pollutants of ground-
water. The Resource Conservation and Recovery Act (RCRA) of 1976 pre-
scribes structural features to prevent leaching of chemicals from toxic waste
disposal sites. However, according to a 1985 EPA accounting, there are
19,000 old abandoned hazardous waste dumps (77).
These dumps, established before regulation of disposal sites was enacted,
are frequently located on sites with little commercial value, such as marshes
and old gravel or strip mining pits. Such sites are most unsuitable for dis-
posal, as they provide an easy conduit for leachate.
The long-term effectiveness of the plastic and clay liners used to confine
the leachate in modern sanitary and toxic disposal sites is questionable.
Evidence is accumulating that sooner or later tears will develop in plastic
liners and cause oozing of leachate. New research (78) indicates that clay
liners, although impervious to leachate, may be penetrated by chemicals
through diffusion.
According to a new epidemiological study, toxic waste sites may also
represent public health hazards other than those caused by the contamina-
tion of groundwater. Review of New York State Department of Health data
revealed a link between an elevated risk of congenital malformations among
the newborn and their mothers’ residential proximity to a toxic waste land-
fill; children born to women residing within a mile from hazardous waste
sites had, on the average, a 20% higher frequency of congenital malforma-
tions than the controls whose mothers resided elsewhere (79). In addition,
the magnitude of the risk could be correlated with the presence of a chemical
leakage from the waste site (79).
Another source of groundwater contamination is underground storage
tanks. Of the 1.4 million underground gasoline storage tanks, 70,000–
100,000 are estimated to be leaking (77).
Deep wells, used by some industries as a relatively inexpensive and sup-
posedly environmentally safe method of chemical waste disposal, also cause
some concern. Although in this procedure liquid waste is injected through
wells below the groundwater aquifer, chemicals have been observed leaking
into groundwater through cracks in the rock.
232 Environmental Toxicology
Contamination by Leaching
Leaching of pesticides into groundwater cannot be ignored. In Long Island,
New York, aldicarb, which was used to control potato pests, leached into a
groundwater aquifer and contaminated a local source of drinking water (9).
The Office of Technology Assessment reported (77) in October 1984 that
incidences of groundwater contamination have been found in every state
and that a number of organic and inorganic chemicals were detected in
various groundwater supplies. Many of these contaminants are known toxins
and carcinogens. In addition, some microorganisms and radioactive con-
taminants were found.
The problem of groundwater contamination is magnified by the fact that
groundwater flows extremely slowly (about 1–10 ft per day). Thus, in com-
parison to surface water, there is little mixing and dispersal of contaminants.
The link between the use of contaminated groundwater and any specific
disease cannot easily be established. However, one case of such a correlation
has been reported. In Woburn, Massachusetts, the groundwater aquifer sup-
plying drinking water became contaminated with trichloro- and tetrachlor-
oethylene. A statistically significant increase was reported (80) in childhood
leukemia, birth defects, and pulmonary and urinary infections related to
immunosuppression.
Airborne Water and Land Pollution
Airborne pollutants may be divided into three categories: pollutants that
cause changes in acidity, nutrients, and toxins.
Acid Deposition
Sulfur dioxide from coal combustion is converted in the atmosphere to sul-
furic acid (Chapter 9). The sulfuric acid is then driven by the wind and
eventually comes down to the earth, either directly (dry precipitation) or
with rain or snow (wet precipitation, also referred to as acid rain), many
miles from its origin. It is estimated that about one-third of sulfur deposition
in the Eastern states originates from sources 300 miles away, one third from
sources 120–300 miles away, and the rest from sources within 120 miles
(81). Table 11.6 shows EPA estimates of annual industrial emissions of
SO2 in the United States in 1983.
Nitrogen oxides also contribute to acid deposition in the form of nitric
and nitrous acids. Although automobiles produce nearly half of the total NOx
emitted, their contribution to acid rain is less significant than that of station-
ary sources because their emissions occur at ground level and are not likely
to be carried for long distances.
Water and Land Pollution 233

Effect on Freshwater Acid deposition lowers the pH of lakes, rivers, and soil.
As of 1986 thirteen rivers in Nova Scotia, at least 1600 lakes in Ontario, and
an unspecified number of watersheds in New England and in upstate New
York were practically devoid of fish as a result of their high acidity (81).
For years the problem of acid rain had political overtones. The Reagan
administration maintained that there was not enough evidence connecting
SO2 emission with environmental damage and insisted that more study was
needed before any restrictions should be imposed. On the other hand, most
of the scientific community on both sides of the border supported the
Canadian position that the cause–effect relationship between SO2 emission
and the deterioration of the environment is a well-established fact.
The Freshwater Institute in Manitoba initiated a research project (82)
whereby a small lake in Ontario was purposefully acidified over an 8-year
period, from the lake’s original pH of 6.8 down to 5.0. At pH 5.9 the popula-
tion of a shrimp species decreased considerably, another species of crusta-
cean disappeared, and fathead minnow stopped reproducing. At pH 5.4 all
fish stopped reproducing (82).
Effect on Forests and Soil Acid rain is implicated in the destruction of forests.
Unpolluted rain generally has a pH of 5.6, but soil has the capacity to neu-
tralize it. However, the buffering capacity of soil may be exceeded when too
much acid precipitates. Although no definitive cause–effect relationship
between acid precipitation and damage to forests has been established,
there is enough evidence linking high soil acidity with damage to trees.
Most forests’ damage occurs in the areas downwind of concentrated sources
of emission of sulfur dioxide and nitrogen oxides; the damage is greatest at
high elevations where very acidic fog lingers around mountain tops.
Damage to trees has been noted in several areas in California (the San
Bernardino National Forest, the Laguna Mountains, the Sierra Nevada, and
the San Gabriel Mountains), in the eastern United States, and also in
Germany, Poland, Czechoslovakia, and Scandinavia. Since ozone is a
known plant toxin, it is difficult to distinguish between damage inflicted
234 Environmental Toxicology
Table 11.6. Estimates of 1983 Industrial SO2 Emissions in the
United States
Source
Annual Released
(million tons)
Percent
Contribution
Electric utilities 13.9 67
Industrial boilers 4.4 20
Smelters 1.1 5
Other 1.7 8
Source: Adapted from data in reference 81.
by ozone drifting from the cities and that caused by acid deposition; most
likely both factors play a substantial role, either by directly damaging the
trees or by predisposing them to natural blight, such as infections, root rot,
insects, and fungi.
It is believed that acid rain leaches Ca, Mg, and K out of the soil. Although
this leaching may cause the availability of these cations to increase tempora-
rily, eventually they are washed out, and in the long run a nutrient defi-
ciency may occur. In addition, sufficiently high concentrations of aluminum
may be released from the minerals to be toxic to plants (83). Indeed, defi-
ciencies of Ca, Mg, K, and possibly Na, as well as increased concentrations of
soluble Al, Mn, Fe, and other toxic metals, have been demonstrated in acidic
soil (84). The soluble aluminum in water is toxic to fish because it precipi-
tates in the gills and inhibits respiration. It may also have human health
effects, as aluminum has been implicated as playing a role in Alzheimer’s
disease.
In addition to damaging trees and aquatic life, acid rain damages gal-
vanized structures, and marble edifices and monuments. The damage to
galvanized structures is due to zinc being dissolved out of the surface of
the structure. Because zinc is always contaminated with very toxic cad-
mium, the runoff from such structures adds to the toxic pollution of soil
and water.
Airborne Nutrients Airborne transport of nutrients has been shown to be a
significant factor in pollution of the Chesapeake Bay (see the discussion
earlier in this chapter). Similar situations of airborne nitrate and ammonia
deposition were observed in other watersheds. Because NOx emissions are
expected to increase in the future, the problem of aerial transport and
deposition of nitric acid deserves special attention.
Airborne Transport of Toxins
In addition to SO2 and NOx, other chemicals (some of them toxic) and
numerous metals are carried aloft with the wind. They come down with
rain or snow to pollute soil and water.
The best evidence for this type of airborne pollution was brought about by
the 1982 discovery of an insecticide, toxaphene, in fish in a lake on Isle
Royale in Lake Superior (16). Isle Royale is a national park kept in a wild
and unspoiled state. There is no industry, no agriculture, and no human
settlements. Thus, the only explanation for the chemical pollution of the
park is airborne transport (see the section on the Great Lakes earlier in this
chapter).
At present there are strong indications that most of the toxic materials
found in Lake Superior come from the atmosphere. The same applies to
Lakes Michigan and Huron. The sources of these contaminants may be
Water and Land Pollution 235
hundreds of miles away. Some chemicals such as DDT, which have not
been used in the United States for many years, are found in the Great
Lakes. Because they are still used in Latin America, airborne transport is
suspected.
Vaporization of organic chemicals (such as pesticides) from soil and water
is affected by external factors as well as by the physicochemical properties of
chemicals. The external factors are temperature, type of soil, water content of
soil, and wind velocity over the evaporating surface. Low water solubility
and high vapor pressure of a chemical favor vaporization. The degree of
adsorption of a chemical to the soil and the ease of its desorption by water
molecules also play important roles.
As described earlier in this chapter, the sources of other airborne pollu-
tants may be numerous: municipal waste incinerators (the main source of
lead, cadmium, and mercury), the open lagoon treatment of toxic waste by
aeration, sewage sludge incineration or disposal on land, wood fireplaces,
and so on (16).
Another global problem related to airborne transport of pollutants is con-
tamination of oceans caused by incineration of toxins at sea. In 1969, the
West German giant chemical corporations introduced the practice of burning
their toxic waste in specially built incinerator ships. This practice was meant
as a better alternative to direct dumping of toxins into the sea. The attraction
of this technology was that there was no need for political maneuvering to
overcome the objections of communities against toxic waste incinerators in
their vicinities; after all, ‘‘fish do not vote’’ (85).
The airborne toxins resulting from incomplete combustion or formed
during the process of combustion cause considerable damage to the marine
life of the North Sea and the eastern Atlantic. Some sources suggest that the
high seal mortality from a viral infection that occurred in 1988 in the North
Sea may have been a result of water pollution with chemicals that affected
the seals’ immune systems.
In the United States the practice of burning hazardous waste in the Gulf of
Mexico began with a permit from the EPA in 1974 and was continued occa-
sionally until 1983. However, the practice was then discontinued because of
public pressure (86).
With the lifting of the Iron Curtain, the West was allowed to take a good
look at the environmental devastation of Eastern Europe caused by 45 years
of uncontrolled pollution. The results of this total environmental neglect are
horrifying: polluted air, impaired human health, dying lakes and rivers,
destroyed forests, and despoiled soil. Perhaps this is a warning of what
may happen if short-term economic gains are allowed to take precedence
over protection of the environment. It may also be a practical lesson for those
who claim that more research is needed to prove that acid precipitation
damages lakes, rivers, and forests.
236 Environmental Toxicology
References
1. World Resources Institute, International Institute for Environment andDevelopment in collaboration with U.N. Environment Programme.World Resources 1988–89, Freshwater; Basic Books: New York, 1988;Chapter 8, p 127.
2. Moffat, A. S. Science 1998, 279, 988.3. World Resources Institute, International Institute for Environment and
Development in collaboration with U.N. Environment Programme.World Resources 1992–93, Freshwater; Oxford University: New York,1992; Chapter 11, p 159.
4. Florini, K. L.; Krumbhar, G. D., Jr.; Silbergeld, E. K. Legacy of Lead:America’s Continuing Epidemic of Childhood Lead Poisoning;Environmental Defense Fund: Washington, DC, 1990.
5. Mielke, H. W. Water, Air, Soil Pollut. 1991, 57–58, 111.6. Mielke, H. W. Appl. Geochem. 1993, Suppl. Issue No. 2, 257.7. Mielke, H. W. Environ. Geochem. Health 1994, 16(3/4), 123.8. Postel, S.; Heise, L. In State of the World 1988; Brown, L. R., Ed.; W. W.
Norton: New York, 1988; Chapter 5, p 83.9. Menzer, R. E.; Nelson, J. O. In Cassarett and Doull’s Toxicology;
Klaassen, C. D.; Amdur, M. O.; Doull, J., Eds.; MacMillan: New York,1986; Chapter 26, p 825.
10. World Resources Institute, International Institute for Environment andDevelopment in collaboration with U.N. Environment Programme.World Resources 1988–89, Food and Agriculture; Basic Books: NewYork, 1988; Chapter 17, p 271.
11. World Resources Institute, International Institute for Environment andDevelopment in collaboration with U.N. Environment Programme.World Resources 1992–93, Forests and Rangelands; Oxford University:New York, 1992; Chapter 8, p 111.
12. World Resources Institute, International Institute for Environment andDevelopment in collaboration with U.N. Environment Programme.World Resources 1992–93, Oceans and Coasts; Oxford University:New York, 1992; Chapter 12, p 175.
13. Durning, A. T.; Brough, H. B. In State of the World 1992; Brown, L. R.,Ed.; Worldwatch Institute: Washington, DC, 1992; Chapter 5, p 66.
14. World Resources Institute, International Institute for Environment andDevelopment in collaboration with U.N. Environment Programme.World Resources 1992–93, Food and Agriculture; Oxford University:New York, 1992; Chapter 7, p 93.
15. Long, J. Chem. Eng. News March 7, 1988, 7.16. Hileman, B. Chem. Eng. News February 8, 1988, 22.17. Carson, R. Silent Spring; Houghton Mifflin: Boston, MA, 1962.18. Murphy, S. D. In Cassarett and Doull’s Toxicology; Klaassen, C. D.;
Amdur, M. O.; Doull, J., Eds.; MacMillan: New York, 1986; Chapter 18,p 519.
19. Hanson, D. Chem. Eng. News June 24, 1991, 19.20. Hanson, D. Chem. Eng. News August 17, 1992, 19.21. Hanson, D. Chem. Eng. News May 2, 1994, 6.
Water and Land Pollution 237
22. Hileman, B. Chem. Eng. News November 16, 1992, 6.23. Hileman, B. Chem. Eng. News January 31, 1994, 19.24. Hardell, L.; Erikson, M.; Lenner, P.; Lundgren, E. Br. J. Cancer 1981, 43,
169.25. Blair, A.; Grauman, D. J.; Lubin, J. H.; Fraumeni, J. F., Jr. J. Natl. Cancer
Inst. 1983, 71(1), 31.26. Wolff, M. S.; Toniolo, P. G.; Lee, E. W.; Rivera, M.; Dubin, N. J. Natl.
Cancer Inst. 1993, 85, 618.27. Ames, B. N.; Magaw, R.; Swirsky Gold, L. Science (Washington, D.C.)
1987, 236, 271.28. Hileman, B. Chem. Eng. News July 5, 1993, 3.29. Mayers, J. P.; Colborn, T. Chem. Eng. News January 7, 1991, 40.30. Hayes, H. M.; Tarone, R. E.; Cantor, K. P.; Jessen, C. R.; McCurnin, D. M.;
Richardson, R. C. J. Natl. Cancer Inst. 1991, 83, 1226.31. Davis, J. R.; Brownson, R. C.; Garcia, R.; Bentz, B. J.; Turner, A. Arch.
Environ. Contam. Toxicol. 1993, 24, 87.32. Gold, E.; Gordis, L.; Tonascia, J.; Szklo, M. Am. J. Epidemiol. 1979, 109,
309.33. Hanson, D. Chem. Eng. News, August 17, 1992, 19.34. Hileman, B. Chem. Eng. News, March 5, 1990, 26.35. Zhu, Y.; Chen, H.; Fan, J.; Wang, Y.; Li, Y.; Chen, J.; Fan, J. X.; Yang, S.;
Nu, L.; Leung, H.; Mew, T. W.; Teng, P S.; Wang, Z.; Mundt, C. C. Nature,2000, 406(17), 718.
36. Thayer, A. M. Chem. Eng. News, October 2000, 21.37. Hileman, B. Chem. Eng. News, May 22, 2000, 28.38. Losey, J. E.; Rayor, L. S.; Carter, M. E. Nature, 1999, 399, 21439. Hileman, B. Chem. Eng. News, August 28, 2000, 7.40. Rogers, R. Chem. Eng. News, May 22, 2000, 9.41. Hileman, B. Chem. Eng. News, December 13, 1999, 31.42. Schroeder, R. C. In The Earth’s Threatened Resources; Editorial
Research Reports; Gimlin, H., Ed.; Congressional Quarterly:Washington, DC, 1986; p 43.
43. The Global Ecology Handbook; Corson, W. H., Ed.; Beacon: Boston, MA,1990; Chapter 8, p 135.
44. Findley, R. W.; Farber, D. A. Environmental Law; West Publishing: St.Paul, MN, 1988; Chapter 6/2, p 323.
45. Kaiser, J. Science 1997, 226, 201.46. Hileman, B. Chem. Eng. News, October 37, 1997, 13.47. Fisher, D.; Cesaro, J.; Mathew, T.; Oppenheimer, M. Polluted Coastal
Waters: The Role of Acid Rain; Environmental Defense Fund: NewYork, 1988; p 38.
48. Environmental Protection Agencyhhttp://www.epa.gov/tri/tri98/data/datasum.htmi
49. Postel, S. In State of the World 1987; Brown, L. R., Ed.; W. W. Norton:New York, 1987; Chapter 9, p 157.
50. National Research Council. Toxicity Testing; National Academy Press:Washington, DC, 1984.
51. Potts, A. In Cassarett and Doull’s Toxicology; Klaassen, C. D.; Amdur, M.O.; Doull, J., Eds.; MacMillan: New York, 1986; Chapter 17, p 478.
238 Environmental Toxicology
52. Waldbott, G. L. Health Effects of Environmental Pollutants, 2nd ed.; C.V. Mosby: St. Louis, MO, 1978; Chapter 12, p 141.
53. Slemr, F.; Langer, E. Nature (London) 1992, 355, 434.54. Clark, S. L. Lurking on the Bottom: Heavy Metals in the Hudson–Raritan
Estuary; Environmental Defense Fund: New York, 1990.55. Armstrong, N. E. In Introduction to Environmental Toxicology; Guthrie,
F. E.; Perry, J. J., Eds.; Elsevier Science: New York, 1980; Chapter 19, p249.
56. Clesceri, L. S. In Introduction to Environmental Toxicology; Guthrie, F.E.; Perry, J. J., Eds.; Elsevier Science: New York, 1980; Chapter 17, p 227.
57. Zurer, P. Chem. Eng. News November 21, 1988, 5.58. Hardell, L.; Erikson, M. Cancer (Philadelphia) 1988, 62, 652.59. Blair, A.; Grauman, D. J.; Lubin, J. H.; Fraumeni, J. F. J. Natl. Cancer Inst.
1983, 71(1), 31.60. Bertazzi, P. A.; Zocchetti, C.; Pesatori, A. C.; Guercilena, S.; Sanarico, M.;
Radice, L. Am. J. Epidemiol. 1989, 129(6), 1187.61. Stinson, S. Chem. Eng. News July 24, 1989, 28.62. von Stackelberg, P. Greenpeace 1989, 14(2), 7.63. Hanson, D. Chem. Eng. News August 12, 1991, 7.64. Hileman, B. Chem. Eng. News September 19, 1994, 6.65. Colborn, T.; von Saal, F. S.; Soto, A. M. Environ. Health Perspect. 1993,
101(5), 378.66. Schmidt, K. F. Science News 1992, 141, 24.67. EPA, Office of Research and Development, Washington, DC 20460. June
12, 2000, Information Sheets 1 and 2.68. Jaffe, R.; Hites, R. A. Environ. Sci. Technol. 1986, 20, 267.69. Black, J. J. In Toxic Contaminants in Large Lakes; World Conference on
Large Lakes, Mackinac ’86; Schmidtke, N. W., Ed.; Lewis Publishers:Chelsea, MI, 1988; Vol. I, p 55.
70. Jensen, D, Minessota Sea Grant—Exotic Specieshhttp://www.d.umn.edu/seagr/areas/exotic/z_overview.htmli
71. Gossiaux, D. C,; Landrum, P. F. and Fisher, S. W. Chemosphere 1998,36(15), 3181.
72. Meadows, D. H.; Meadows, D. L.; Randers, J. Beyond the Limits; ChelseaGreen: Post Mills, VT, 1992; pp 88 and 99.
73. Lasota, J. P. Sciences (N.Y.) 1987, July–August, 23.74. Ember, L. R. Chem. Eng. News April 16, 1990, 7.75. World Resources Institute, International Institute for Environment and
Development in collaboration with U.N. Environment Programme.World Resources 1992–93, Central Europe; Oxford University: NewYork, 1992; Chapter 5, p 57.
76. EPA Handbook, Ground Water; U.S. Environmental Protection Agency,Center of Environmental Research Information: Cincinnati, OH, 1990;Vol. 1, Chapter 5, p 94.
77. Thompson, R. In The Earth’s Threatened Resources; Editorial ResearchReports; Gimlin, H., Ed.; Congressional Quarterly: Washington, DC,1986; p 121.
78. Johnson, R. L.; Cherry, J. A.; Pankow, J. F. Environ. Sci. Technol. 1989,23, 340.
Water and Land Pollution 239
79. Geschwind, S. A.; Stolwijk, J. A.; Bracken, M.; Fitzgerald, E.; Stark, A.;Olsen, C.; Melius, J. Am. J. Epidemiol. 1992, 135(11), 1197.
80. Bayers, V. S. Cancer Immunol. Immunother. 1988, 27, 77.81. Thompson, R. In The Earth’s Threatened Resources; Editorial Research
Reports; Gimlin, H., Ed.; Congressional Quarterly: Washington, DC,1986; p 1.
82. Schindler, D. W.; Mills, K. H.; Malley, D. F.; Findlay, D. L.; Shearer, J. A.;Davies, I.; Turner, M. A.; Linsey, G. A.; Cruikshank, D. R. Science(Washington, D.C.) 1985, 288(4706), 1395.
83. Hutchinson, T. C. In Effects of Acid Precipitation on TerrestrialEcosystems, NATO Conference on Acid Precipitation on Vegetationand Soils, Toronto, 1987; Hutchinson, T. C.; Havas, M., Eds.; Plenum:New York, 1978; p 481.
84. Rorison, I. H. In Effects of Acid Precipitation on Terrestrial Ecosystems,NATO Conference on Acid Precipitation on Vegetation and Soils,Toronto, 1987; Hutchinson, T. C.; Havas, M., Eds.; Plenum: New York,1978; p 283.
85. Asmus, P.; Johnston, R. Greenpeace 1988, 13(2), 6.86. Thompson, R. In The Earth’s Threatened Resources; Editorial Research
Reports; Gimlin, H., Ed.; Congressional Quarterly: Washington, DC,1986; p 101.
240 Environmental Toxicology
12Pollution Control
Clean-Coal Technology
Coal is now used mainly as fuel for the production of electricity. Worldwide
about 28% of commercial energy production depends on coal. In the United
States it is about 31% and in some coal rich but oil poor countries such as
China, Germany, Poland and the Czech Republic the figures are 73%, 56%,
95% and 86%, respectively (1). Because of the ample supply of available
coal, dependence on coal as an energy source will probably remain high for
some time to come.
However, coal is the most polluting of all fuels; its main pollutants are
sulfur dioxide and suspended particulate matter (SPM). Depending on its
origin, coal contains between 1 and 2.5% or more sulfur. This sulfur comes
in three forms: pyrite (FeS2), organic bound sulfur, and a very small amount
of sulfates (2). Upon combustion, about 15% of the total sulfur is retained in
the ashes. The rest is emitted with flue gases, mostly as SO2 but also, to a
lesser extent, as SO3. This mixture is frequently referred to as SOx (2).
The three basic approaches to the control of SOx emission are prepurifi-
cation of coal before combustion, removal of sulfur during combustion, and
purification of flue gases.
Prepurification
The first approach, referred to as a benefication process, is based on a dif-
ference in specific gravity between coal (sp gr ¼ 1.2–1.5) and pyrite (sp gr ¼5). Although the technical arrangements may vary, in essence the procedure
241

involves floating the crushed coal in a liquid of specific gravity between that
of pure coal and that of pyrite. Coal is removed from the surface while pyrite
and other minerals settle to the bottom. Coal benefication can reduce sulfur
content by about 40% (2).
Although gravity separation is presently the only procedure in use,
research was initiated on microbial purification of coal. A research project
conducted by the Institute of Gas Technology, with funding from the U.S.
Department of Energy, was aimed at the development of genetically engi-
neered bacteria capable of removing organic sulfur from coal. Inorganic sul-
fur can be removed by the naturally occurring bacteria Thiobacillus
ferrooxidans, Thiobacillus thiooxidans, and Sulfolobus acidocaldarius (3).
Clean Combustion
Gasification Combined Cycle The two procedures for the clean combustion of
coal are the coal gasification combined cycle (GCC) and fluidized-bed com-
bustion. GCC involves conversion of coal to methane by the following pro-
cedure (4).
Preheating coal to 500–800 8C removes the volatile components of coal in
the form of methane. The remaining char is treated with steam at tempera-
tures above 900 8C to produce water gas (a mixture of CO and H2). The water
gas is then converted to methane and carbon dioxide according to the fol-
lowing equations.
CþH2O �! COþH2 ð12:1Þ
Cþ 2H2 �! CH4 ð12:2Þ
COþH2O �! H2 þ CO2 ð12:3Þ
Net : 2Cþ 2H2O �! CH4 þ CO2 ð12:4Þ
Methane is burned directly to drive a turbine. The excess heat is recov-
ered to produce steam, which drives a steam turbine. This dual action led to
the name ‘‘combined cycle’’ (5).
The formation of methane from coal is a reductive process in which sulfur
is also reduced to H2S. Elemental sulfur may be recovered by reacting H2S
with SO2.
SO2 þ 2H2S �! 2H2Oþ 3S ð12:5Þ
In 1984 one 100-MW demonstration plant using the GCC process began
operation in the United States; it was operated by California Edison
Company in the Mojave Desert. The plant was very successful in removing
sulfur and in meeting the toughest environmental standards (6).
242 Environmental Toxicology
Fluidized-Bed Combustion In the fluidized-bed combustion procedure, pulver-
ized coal is mixed with limestone (CaCO3). This mixture is ignited and held
in suspension by a stream of hot air from below. The heat produced and the
velocity of air give the appearance of a boiling fluid to the mixture. Sulfur
reacts with limestone to form CaSO4.
An added advantage of this process is the extremely efficient heat transfer
as the boiler tubes are immersed directly in the fluidized bed. This, in turn,
allows the combustion temperature to remain relatively low (730–1010 8C, ascompared to 1510–1815 8C for conventional units burning pulverized coal).
Low combustion temperature reduces formation of NOx.
Purification of Flue Gases
Desulfurization Desulfurization can be achieved by the use of scrubbers. The
two types of scrubbers are nonregenerative and regenerative. The use of
scrubbers increases the cost of electricity by about 20–30% and uses 5–
15% of the plant energy output (2).
Nonregenerative Scrubbers In nonregenerative scrubbers, flue gases are guided
through a slurry of limestone; SOx reacts with CaCO3 to form CaSO3 and
CaSO4. The drawback of the limestone scrubbers is that large amounts of
sludge accumulate. This sludge has to be disposed of on land, usually in
lagoons. Leaching from such lagoons creates the danger of groundwater con-
tamination. In addition, occasional operating problems can put the scrubbers
temporarily out of commission.
Regenerative Scrubbers Regenerative scrubbers recycle the SO2-trapping
reagent and produce sulfur products of commercial value. The Wellman–
Lord process uses sodium sulfite, which reacts with SO2 to produce sodium
bisulfite.
Na2SO3 þ SO2 þH2O�!2NaHSO3 ð12:6ÞThe reaction is reversed by treating the sodium bisulfite with steam in the
presence of alkali to produce sodium sulfite and SO2. This sulfur dioxide
may be converted to elemental sulfur, liquid SO2, or sulfuric acid (2).
Suspended Particulate Matter (SPM) Another concern is removal of particulate
matter from flue gases. The particles emitted in the process of coal combus-
tion are fly ash, soot, and smoke. Fly ash consists mostly of mineral matter
contained in the coal and altered by high temperatures, whereas soot con-
sists of fine, unburned carbon particles. In practice, depending on the com-
pleteness of combustion, fly ash may contain varying amounts of admixed
soot particles. Smoke is a mixture of soot and condensed tar vapors. Because
smoke results from incomplete combustion, the combustion technique is an
important factor in eliminating smoke. The use of pulverized coal and a
Pollution Control 243

thorough mixing of fuel with an excess of air, as in modern boilers, elim-
inates smoke and soot (2).
The behavior of fly ash depends on the size of the particles. Large parti-
cles precipitate on impact with each other and any obstruction encountered,
whereas small ones are propelled by the gases. The very small particles, on
the order of magnitude of molecules, behave like gas particles (i.e., they
move like molecules and frequently collide). The removal of small and
very small (less than 1 mm in diameter) particles is important, as they are
the most damaging to human health.
Particle-Removal Techniques The four techniques for removal of particles from
flue gases are filtration, centrifugal separation, use of wet collectors, and
electrostatic precipitation.
Filtration involves either bags, mats, or columns. The efficiency of these
devices for all sizes of particles is about 99%. However, they become par-
tially plugged with time and require progressively increased gas pressures,
which consume energy. They are also sensitive to corrosion and high tem-
peratures.
Centrifugal separators are inexpensive and highly efficient. The gas enters
a conical vessel at the top and is forced into a rotating motion. Particles are
thrown by centrifugal force against the walls and slide down into a collecting
compartment.
Wet collectors involve a variety of arrangements whereby the gas passes
through a water spray and the particles are washed out. Although wet col-
lectors are very efficient, especially for the removal of small particles, they
produce a large amount of sludge and they lower the flue gas temperature.
Electrostatic precipitators are very efficient for the removal of 0.05- to 200-
�m particles. They have a low operating cost but are expensive to install.
Their operation is based on the passage of the gas through an electric field,
whereby the particles become charged and migrate to collecting electrodes.
Reference 4 provides a more complete description of technical arrange-
ments to control emission of particulates.
The efficacy of removal of air pollutants by different clean-coal technol-
ogy systems is compared in Table 12.1. The advanced technologies, GCC and
fluidized-bed combustion, compare favorably with flue purification systems.
In addition, GCC and fluidized-bed combustion operate at a lower cost than
flue gas purification systems. They eliminate problems such as sludge and
solid waste buildup and malfunctions caused by filter clogging. However,
neither of these clean-coal technologies helps to abate CO2 emission.1
244 Environmental Toxicology
1Although all fossil fuels produce CO2 on burning, the amount of this gas produced
per unit of heat generated varies. Thus, compared to natural gas, oil produces 1.35
times and coal 1.8 times the amount of CO2 per British thermal unit (Btu). Of all coalcombustion processes, the fluidized-bed process probably produces the least amount of
CO2 per Btu because of its efficient heat transfer.
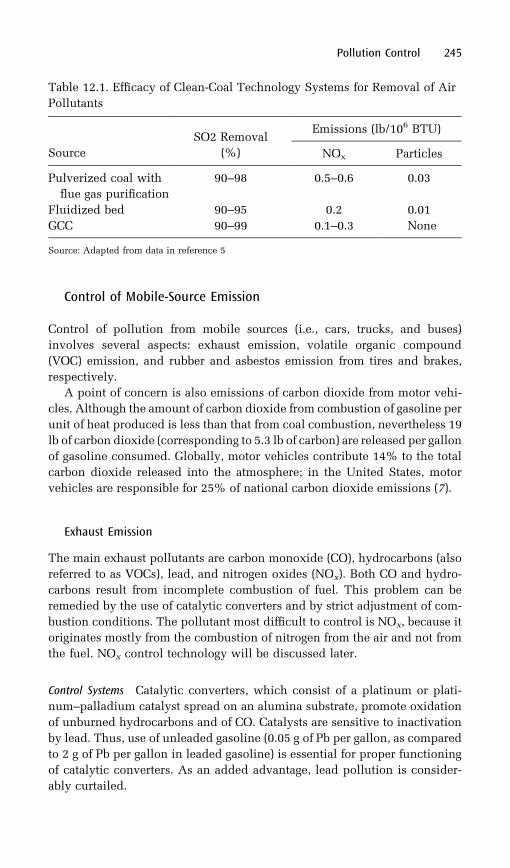
Control of Mobile-Source Emission
Control of pollution from mobile sources (i.e., cars, trucks, and buses)
involves several aspects: exhaust emission, volatile organic compound
(VOC) emission, and rubber and asbestos emission from tires and brakes,
respectively.
A point of concern is also emissions of carbon dioxide from motor vehi-
cles. Although the amount of carbon dioxide from combustion of gasoline per
unit of heat produced is less than that from coal combustion, nevertheless 19
lb of carbon dioxide (corresponding to 5.3 lb of carbon) are released per gallon
of gasoline consumed. Globally, motor vehicles contribute 14% to the total
carbon dioxide released into the atmosphere; in the United States, motor
vehicles are responsible for 25% of national carbon dioxide emissions (7).
Exhaust Emission
The main exhaust pollutants are carbon monoxide (CO), hydrocarbons (also
referred to as VOCs), lead, and nitrogen oxides (NOx). Both CO and hydro-
carbons result from incomplete combustion of fuel. This problem can be
remedied by the use of catalytic converters and by strict adjustment of com-
bustion conditions. The pollutant most difficult to control is NOx, because it
originates mostly from the combustion of nitrogen from the air and not from
the fuel. NOx control technology will be discussed later.
Control Systems Catalytic converters, which consist of a platinum or plati-
num–palladium catalyst spread on an alumina substrate, promote oxidation
of unburned hydrocarbons and of CO. Catalysts are sensitive to inactivation
by lead. Thus, use of unleaded gasoline (0.05 g of Pb per gallon, as compared
to 2 g of Pb per gallon in leaded gasoline) is essential for proper functioning
of catalytic converters. As an added advantage, lead pollution is consider-
ably curtailed.
Pollution Control 245
Table 12.1. Efficacy of Clean-Coal Technology Systems for Removal of Air
Pollutants
Source
SO2 Removal
(%)
Emissions (lb/106 BTU)
NOx Particles
Pulverized coal with
flue gas purification
90–98 0.5–0.6 0.03
Fluidized bed 90–95 0.2 0.01
GCC 90–99 0.1–0.3 None
Source: Adapted from data in reference 5
Additional pollution control is achieved by a computer-controlled
electronic system that monitors exhaust gas composition. The same system
adjusts the fuel–air ratio and spark advance as needed to minimize pollution.
Alternate Fuels Use of alternate, less-polluting fuels is presently under con-
sideration in the United States. This change would both combat pollution
and reduce dependence on imported oil. The following possibilities are
considered:
. Replacement of gasoline with compressed or liquefied naturalgas
. Replacement of gasoline with alcohols, methanol, or ethanol
. Use of oxygen-containing additives in gasoline (the additives,called oxygenates, effect more efficient combustion)
. Reformulation of gasoline to decrease evaporation of VOCsduring refueling
. A combination of some of the above (8, 9)
Natural gas is a clean-burning fuel and produces the least amount of
carbon dioxide per energy unit of all fossil fuels. The drawbacks of its use
for motor vehicle propulsion are that it requires a change of the motor
vehicle fuel system and generation of a new fuel supply network.
Presently, at the worldwide production rate of 70,770 petajoules (PJ) year,
the known global reserves of natural gas are estimated to last for about 60
years. About 60% of oil in North America (the United States and Canada),
21,482 PJ/year, is consumed as automotive fuel. Should it all be replaced by
natural gas, the production rate would have to increase by that amount to a
total of 92,252 PJ/year. Under such circumstances, the world natural gas
reserves would still last for about 45 years; however, the United States
would have to import more than 90% of it. Moreover, this does not take
into consideration the expected growth of the motor vehicle fleet and the
fact that other nations may have similar ideas. The above calculations were
based on data presented in reference 10.
Another potential fuel is methanol. Methanol is an efficient fuel, being
used extensively in racing cars. Compared to gasoline, methanol combustion
produces fewer VOCs and less carbon dioxide. However, these environ-
mental benefits are offset by emissions of carcinogenic formaldehyde and
increased emissions of nitrogen oxides (11). An important factor to consider
is the feedstock for manufacturing methanol. Coal is not practicable because
the process of preparation of methanol from coal is accompanied by
emissions of carbon dioxide. Adding carbon dioxide emissions from metha-
nol synthesis and methanol combustion, there would be an 80% increase
over emissions from combustion of gasoline. The most economical feedstock
for methanol production is natural gas; however, the economics and prac-
ticality of converting natural gas to methanol instead of using it directly as a
246 Environmental Toxicology
fuel may be questioned. Other feedstocks to be considered are wood and
agricultural waste.
Ethanol may be used as a fuel by itself or as a 10% blend with
gasoline as gasohol. Pure ethanol and gasohol are cleaner-burning fuels
than gasoline. However, there are drawbacks in using pure ethanol made
of corn:
. There is not enough corn in the world to satisfy the appetite ofthe United States for automotive fuel, let alone to provide foodfor the hungry world and fuel for the United States.
. The energy balance is unfavorable, that is, it takes almost asmuch energy to cultivate the soil, harvest the grain, and distillthe ethanol as is gained by combustion of ethanol (12).
Although the amount of carbon dioxide emitted by combustion of ethanol
is balanced by the carbon dioxide assimilated by the growing corn, the over-
all carbon dioxide balance is unfavorable. Emissions of carbon dioxide
associated with feedstock production, and product distillation (13), far out-
weigh the assimilation capacity of the growing corn. Other feedstock, such as
plant material or municipal waste, may provide better options for ethanol
production (14).
Oxygenates are gasoline fuels blended with oxygen-containing
additives to provide for cleaner burning gasoline. The additive most
frequently used is methyl tert-butyl ether (MTBE); another one is ethanol.
The disadvantage of ethanol is that it increases volatility of the gasoline,
thus augmenting emissions of VOCs during refueling; this defeats the
purpose of reformulated gasoline. The Clean Air Amendments of 1990
require that large cities that are unable to meet national ambient air
quality standards (NAAQS) ozone limits must use gasoline reformulated
to low-volatility standards. This requirement makes the value of ethanol
as an additive to reformulated gasoline highly problematic (15).2
MTBE which just a few years ago appeared to be a valuable additive to
gasoline is now likely to be phased out from use because it turned out that
being water soluble it readily pollutes groundwater, a source of drinking
water for many communities. Even at very low concentrations MTBE
makes water smell and taste unpleasantly, and in addition it is classified
by EPA as a possible human carcinogen.
An Alternative Fuel Council has been established as an advisory body to
the Department of Energy. This organization is scrutinizing arguments for
and against alternative motor fuels, taking into consideration not only fossil
fuels but also fuels of the future such as hydrogen and solar energy.
Pollution Control 247
2The purpose of reformulating gasoline is to decrease emissions of VOCs, NOx, and
toxic compounds, such as carcinogenic benzene and other aromatics. The addition of
oxygenates is meant to reduce emission of CO.

Volatile Organic Compounds
The three sources of VOC emission other than exhaust emission are fuel
evaporation through the fuel tank and carburetor vents, escape of crankcase
gases, and fuel evaporation while refueling.
Controls in the Vehicle Fuel evaporation through tank and carburetor vents is
controlled by connecting the carburetor and the fuel tank to an activated
charcoal container. The charcoal traps the fuel vapors while the car is at
rest and releases them into the induction system while the engine is
running.
During the compression stroke of the engine, some gasoline vapors escape
through the piston ring gaps into the crankcase, and hence through the
breather tube into the atmosphere. To prevent this, the breather is connected
to the intake manifold. Part of the air sucked into the air cleaner is used to
purge the crankcase, thus sweeping the gases into the intake manifold. This
system is known as positive crankcase ventilation (PCV).
Controls at the Gas Tank When gasoline is pumped into a partially empty gas
tank, the vapors contained in the tank are displaced and forced into the air.
As estimated in 1988, approximately 1.27 billion pounds of VOCs escape
annually into the atmosphere during refueling in the United States alone
(16).
This level of emission can be reduced by the installation of a stage II
vapor recovery system at the gas pump. The simplest installation, called a
vapor balance system, consists of a rubber boot on the filler nozzle
connected by a hose to the underground tank. When the boot tightly covers
the car’s filler neck, the displaced vapors are forced into the underground
tank.
A modification of the vapor balance system is a vacuum-assisted system,
in which there is no need for airtight contact between the boot and the filler
neck because a pump-generated vacuum pulls vapors from the vehicle tank
into the underground tank. With this arrangement a larger volume of air and
vapors is drawn into the underground tank than the volume of fuel delivered
to the car. Thus the underground tank must be vented, and venting requires
installation of an additional vapor-trapping device at the vent.
A hybrid system uses only a slight vacuum, created by the venturi effect
of a gasoline sidestream. The vacuum is not as strong as that created by a
pump in the vacuum-assisted system. Because little excess air is drawn into
the underground tank, a balance is maintained between volume of fuel deliv-
ered and vapor displaced. The use of stage II vapor recovery has not yet been
implemented in most states.
248 Environmental Toxicology
Control of Nitrogen Oxides
Abatement of NOx emission is difficult to achieve because NOx originates
from the air. Thus it is a by-product of any combustion process, regardless of
the fuel used. Both stationary and mobile sources contribute to NOx pollu-
tion, but their environmental impact differs somewhat. Mobile sources are
responsible primarily for urban smog, whereas stationary sources contribute
primarily to acid and nutrient precipitation. Successful abatement of photo-
chemical smog formation depends more on the control of NOx emission than
on that of hydrocarbons, because hydrocarbons of natural origin are abun-
dant in the ambient air, and thus the anthropogenic contribution is of less
importance (17).
Combustion Conditions
Control of NOx emissions from stationary sources depends on proper adjust-
ment of combustion conditions. NOx is formed in appreciable amounts only
at temperatures above 1400–1500 8C, and it decomposes slowly with cool-
ing. Therefore, control measures involve a low flame temperature and slow
cooling of the flue gases. Decreasing excess air in combustion gases is also
useful in reducing NOx formation.
Practical methods of lowering the combustion temperature involve partial
recirculation of flue gases back into the combustion chamber, addition of
moisture to the combustion air in the form of steam or water spray, and a
two-stage combustion process in which the fuel is burned initially with
insufficient air. The resulting gases, CO and hydrocarbons, are then mixed
with additional air; complete combustion is achieved in the second stage.
Control Systems
The conventional methods used for purification of flue gases will not remove
NOx. Wet scrubbers do not work because of the low water solubility of NOx.
However, a new method, referred to as selective catalytic reduction (SCR),
which can reduce NOx to N2 and H2O by 85–90%, has been developed and is
now widely used in Europe and Japan. The process involves addition of
ammonia to a nitrogen-oxide-containing exhaust stream and passage of
this mixture over a catalyst. Three types of catalysts are in use: platinum,
vanadium pentoxide on a titanium dioxide support, and zeolite catalyst (18).
Control of NOx emissions from automobiles and trucks involves the use of
three-way catalytic converters. In addition to a platinum–palladium catalyst
that oxidizes CO and hydrocarbons, these converters contain a rhodium
catalyst that reduces NOx to N2. As mentioned before, successful operation
of catalytic converters requires meticulous control of combustion conditions;
to ensure this control, proper maintenance is essential.
Pollution Control 249
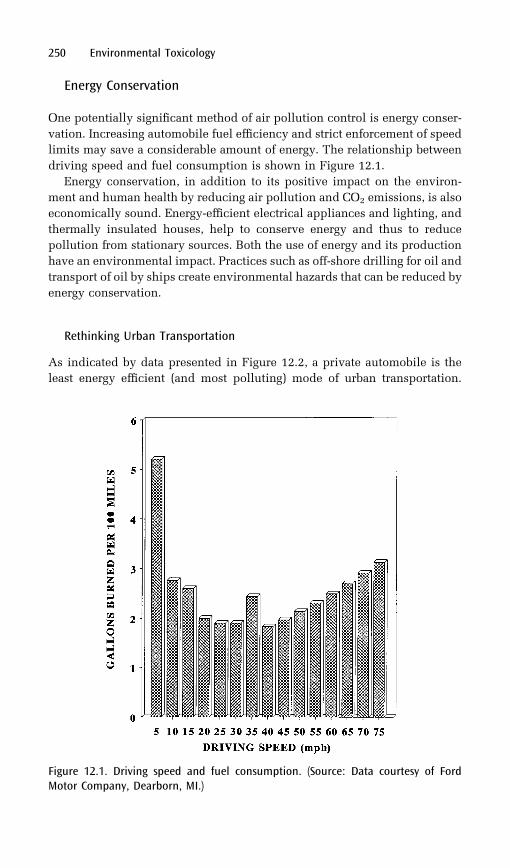
Energy Conservation
One potentially significant method of air pollution control is energy conser-
vation. Increasing automobile fuel efficiency and strict enforcement of speed
limits may save a considerable amount of energy. The relationship between
driving speed and fuel consumption is shown in Figure 12.1.
Energy conservation, in addition to its positive impact on the environ-
ment and human health by reducing air pollution and CO2 emissions, is also
economically sound. Energy-efficient electrical appliances and lighting, and
thermally insulated houses, help to conserve energy and thus to reduce
pollution from stationary sources. Both the use of energy and its production
have an environmental impact. Practices such as off-shore drilling for oil and
transport of oil by ships create environmental hazards that can be reduced by
energy conservation.
Rethinking Urban Transportation
As indicated by data presented in Figure 12.2, a private automobile is the
least energy efficient (and most polluting) mode of urban transportation.
250 Environmental Toxicology
Figure 12.1. Driving speed and fuel consumption. (Source: Data courtesy of FordMotor Company, Dearborn, MI.)
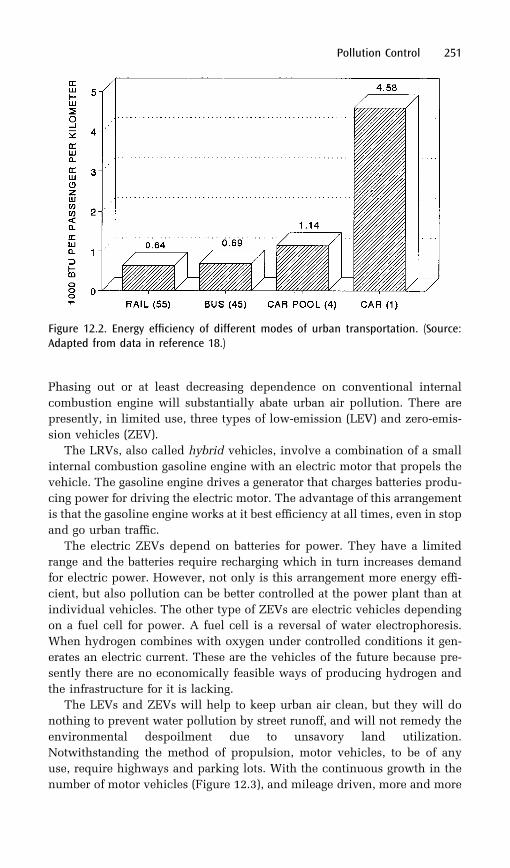
Phasing out or at least decreasing dependence on conventional internal
combustion engine will substantially abate urban air pollution. There are
presently, in limited use, three types of low-emission (LEV) and zero-emis-
sion vehicles (ZEV).
The LRVs, also called hybrid vehicles, involve a combination of a small
internal combustion gasoline engine with an electric motor that propels the
vehicle. The gasoline engine drives a generator that charges batteries produ-
cing power for driving the electric motor. The advantage of this arrangement
is that the gasoline engine works at it best efficiency at all times, even in stop
and go urban traffic.
The electric ZEVs depend on batteries for power. They have a limited
range and the batteries require recharging which in turn increases demand
for electric power. However, not only is this arrangement more energy effi-
cient, but also pollution can be better controlled at the power plant than at
individual vehicles. The other type of ZEVs are electric vehicles depending
on a fuel cell for power. A fuel cell is a reversal of water electrophoresis.
When hydrogen combines with oxygen under controlled conditions it gen-
erates an electric current. These are the vehicles of the future because pre-
sently there are no economically feasible ways of producing hydrogen and
the infrastructure for it is lacking.
The LEVs and ZEVs will help to keep urban air clean, but they will do
nothing to prevent water pollution by street runoff, and will not remedy the
environmental despoilment due to unsavory land utilization.
Notwithstanding the method of propulsion, motor vehicles, to be of any
use, require highways and parking lots. With the continuous growth in the
number of motor vehicles (Figure 12.3), and mileage driven, more and more
Pollution Control 251
Figure 12.2. Energy efficiency of different modes of urban transportation. (Source:Adapted from data in reference 18.)
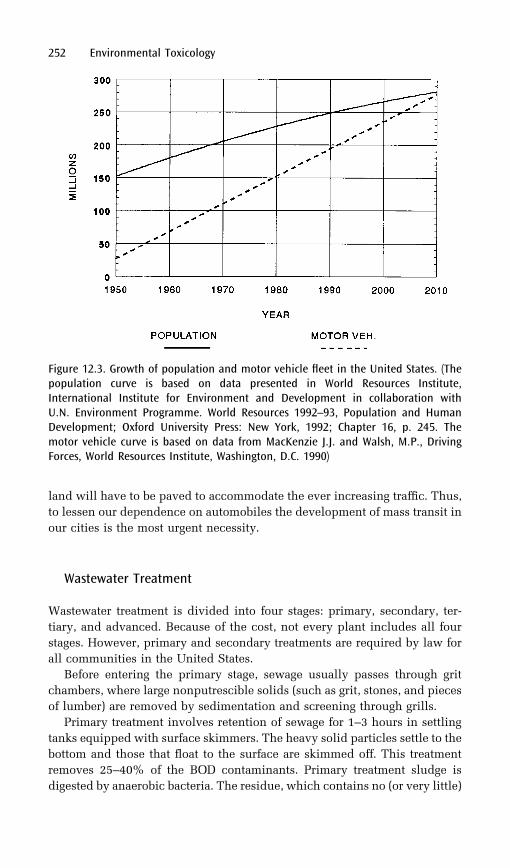
land will have to be paved to accommodate the ever increasing traffic. Thus,
to lessen our dependence on automobiles the development of mass transit in
our cities is the most urgent necessity.
Wastewater Treatment
Wastewater treatment is divided into four stages: primary, secondary, ter-
tiary, and advanced. Because of the cost, not every plant includes all four
stages. However, primary and secondary treatments are required by law for
all communities in the United States.
Before entering the primary stage, sewage usually passes through grit
chambers, where large nonputrescible solids (such as grit, stones, and pieces
of lumber) are removed by sedimentation and screening through grills.
Primary treatment involves retention of sewage for 1–3 hours in settling
tanks equipped with surface skimmers. The heavy solid particles settle to the
bottom and those that float to the surface are skimmed off. This treatment
removes 25–40% of the BOD contaminants. Primary treatment sludge is
digested by anaerobic bacteria. The residue, which contains no (or very little)
252 Environmental Toxicology
Figure 12.3. Growth of population and motor vehicle fleet in the United States. (Thepopulation curve is based on data presented in World Resources Institute,International Institute for Environment and Development in collaboration withU.N. Environment Programme. World Resources 1992–93, Population and HumanDevelopment; Oxford University Press: New York, 1992; Chapter 16, p. 245. Themotor vehicle curve is based on data from MacKenzie J.J. and Walsh, M.P., DrivingForces, World Resources Institute, Washington, D.C. 1990)
putrescible matter, is disposed of in a landfill. The water leaving primary
treatment contains putrescible matter in solution or in colloidal suspension.
During secondary treatment, the putrescible materials are digested by
aerobic microorganisms. To facilitate aerobic digestion the wastewater is
aerated or oxygenated vigorously. This stage removes 85–99% of the BOD
contaminants. The bacterial mass settles to the bottom and is collected as
sludge. Secondary treatment sludge is rich in nutrients and formerly was
dried and sold as a fertilizer. This practice has been discontinued in most
areas because heavy metals, present at low concentrations in the sewage, are
concentrated in the sludge and make its use as fertilizer hazardous.3
Secondary treatment sludge was then disposed of in landfills. However,
because of the shortage of landfill sites and increasing cost of solid waste
disposal, the trend was again reversed. The sludge may now be sold for
fertilizer if it conforms to the standards of the Environmental Protection
Agency (EPA) with respect to the content of metals and polychlorinated
biphenyls.
Tertiary treatment is designed to remove bacteria that remain suspended
in the now-purified water leaving secondary treatment tanks. This removal
may be accomplished by a combination of long-time retention in shallow
oxidation ponds (where aeration is achieved by growing algae or by mechan-
ical means), by filtration through sand, or by a combination of both methods.
The purpose of advanced treatment is to remove nutrients (such as phos-
phates, nitrates, and ammonia) and to remove salts and specific compounds
that may be present in the wastewater of certain localities. Phosphates are
best removed by precipitation with lime, whereas nitrates and ammonia may
be converted to elemental nitrogen by anaerobic or aerobic microorganisms,
respectively. Further processes, such as filtration (through activated charcoal
or ion exchangers) and chlorination, are sometimes used.
A schematic representation of a modern wastewater purification plant is
depicted in Figure 12.4. (1), At the pump station, large debris is removed
from the sewage by bar screens, and hammer mills grind it to a size that can
be handled by the 600-hp pumps. These pumps lift the sewage to a higher
level and thus make possible a gravity flow through most of the remaining
processes. (2), At the grit chamber, heavier (mainly inert) solids such as sand
and gravel settle to the bottom and are drawn off for disposal. (3), The
equalization tanks act as a ‘‘balancing reservoir.’’ They accept excess flows
and guarantee that only flows of a reasonably uniform volume and composi-
tion enter the downstream secondary process. (4), In the oxygen-transfer
basins, microorganisms consume the organic matter and stabilize the nitro-
gen in the sewage. Oxygen, required for the respiration of the microorgan-
isms, is supplied in the form of pure oxygen from the on-site cryogenic
oxygen-supply system. (5), Sludge, which consists mainly of microorganisms
Pollution Control 253
3Cadmium, a toxic metal and a carcinogen, is particularly dangerous because it is
very easily assimilated from the soil by plants.
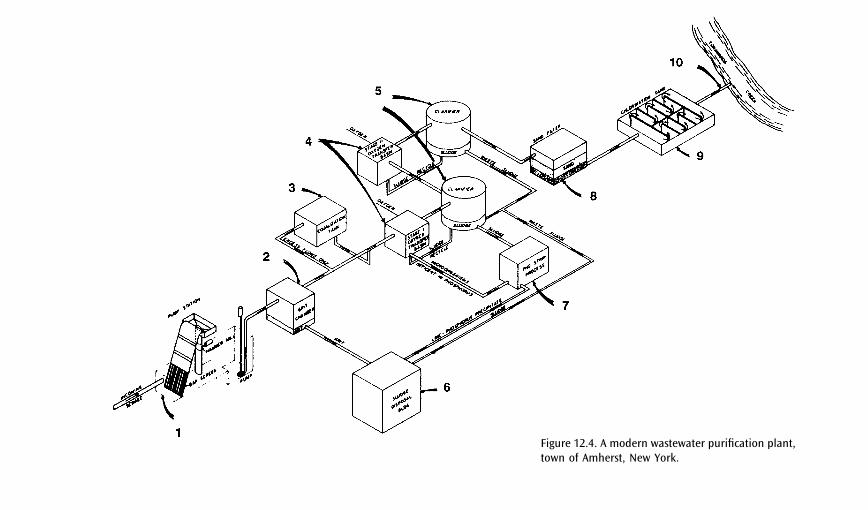
Figure 12.4. A modern wastewater purification plant,town of Amherst, New York.
with some inert material, is slightly denser than water and therefore settles to
the bottom of the clarifiers and is drawn off. Most of it is recycled to the
oxygen-transfer basins to maintain the ‘‘biological’’ secondary process. Some
is conveyed to the Pho-strip process, where phosphorus is removed. The
excess is wasted to the sludge building for disposal. (6), The grit, lime–
phosphorus precipitate, and organic sludge, which are the end products of
the treatment processes, are concentrated and incinerated in the sludge-dis-
posal building. The inert ash will then be trucked to a landfill site for dis-
posal. (7), When oxygen is absent, microorganisms release phosphorus to the
surrounding solution, and it can then be removed by precipitation with lime.
The microorganisms, stripped of phosphorus, are returned to the secondary
reactor. The lime–phosphorus precipitate is conveyed to the sludge building
for disposal. (8), The sand filter removes any remaining suspended matter.
(9), The chlorination tank, a mazelike structure, provides sufficient contact
time to allow chlorine to kill any disease-causing organisms that may be
present. (10), The treated effluent, which is environmentally safe, is dis-
charged into Tonawanda Creek. (Courtesy of Town of Amherst, New York,
Water Pollution Control Facility.)
Waste Disposal and Recycling
Currently, many industrialized countries are facing garbage crises. In the
United States, the amount of garbage rose from 87.5 million tons in 1960
to 157.7 million tons in 1986 (19), a 1.8-fold increase, whereas the popula-
tion increased in the same time by a factor of only about 1.3. These figures
indicate that the increase in the amount of waste results not only from the
growth of the population: waste production per capita has also increased. By
the year 2000, the amount of garbage produced in the United States is pre-
dicted to be 192.4 million tons per year (19). The composition of American
trash is as follows (20):
. paper and paperboard, 36%
. yard waste, 20%
. food, 9%
. metals, 9%
. glass, 8%
. plastics, 7%
. wood and fabric, 6%
. rubber and leather, 3% and
. other inorganic substances, 2%.
In industrialized countries, 30% by weight and 50% by volume of the
total trash is packaging material (21). This amount translates to 47.3 million
tons of discarded packaging materials in the United States in 1986. Not only
is the amount of packaging increasing; the material used for packaging has
Pollution Control 255
changed. Paper, glass, and metal are being replaced by plastics. The ten-
dency for overpackaging is more pronounced in the United States than any-
where else. Nearly 10% of the money spent on food and beverages goes for
packaging. The U.S. Department of Agriculture estimates that the amount of
money spent on packaging food is more than farmers earn for producing this
food (21).
Methods of Trash Disposal
Historically, landfill disposal was the most common method of disposing of
trash. With the advent of the industrial revolution and with the associated
growth of cities, municipal authorities adopted responsibility for collecting
and disposing of trash. Originally it was thrown on heaps or deposited in
pits. Presently, 90% of the refuse in the United States is disposed of in
landfills.
Hazardous-Waste Landfills Recognition of the danger of groundwater contam-
ination by leachates from hazardous-waste landfills led to a federal law,
designated as the Resources Conservation and Recovery Act (RCRA). This
law required the operators of hazardous-waste dumps to provide double clay
or plastic liners as well as a leachate-collecting system. Moreover, ground-
water in the vicinity of hazardous-waste dumpsmust bemonitored. However,
the law did not impose any restrictions on municipal-waste landfills.
A recent survey of available data on 58 municipal and hazardous-waste
disposal sites indicated that toxic chemicals were present in leachates from
all sites considered in the study. Although the composition of chemicals
varied depending on the type of site, their carcinogenic potential was similar
in all cases (22).
Since 1991 the EPA guidelines for municipal solid-waste dumps have
prescribed standards for location, design, operation, and closure (23). The
design requires double clay or plastic liners, a leachate-collecting system,
and monitoring of groundwater for 45 organic chemicals and 10 metals. Thus
the newly designed municipal waste dumps do not differ substantially from
the hazardous-waste dumps.
Figure 12.5 shows a schematic representation of a cross section of the
bottom of a modern hazardous-waste dump. The collected leachate is dis-
posed of through a municipal wastewater purification plant either directly or
(as in the case of a hazardous-dump leachate) after preliminary biological
and physical treatment. When it is retired from service, the landfill is capped
with clay or plastic to prevent spilling of the leachate over the top.
A 1987 study of clay liners was conducted for the EPA by a private
company (24). The study revealed that the clay liners, even those conforming
to EPA specifications (permeability no more than 10–7 cm/s) will, after 15
years, produce a steady leachate of 90 gallons per acre per day. The most
256 Environmental Toxicology
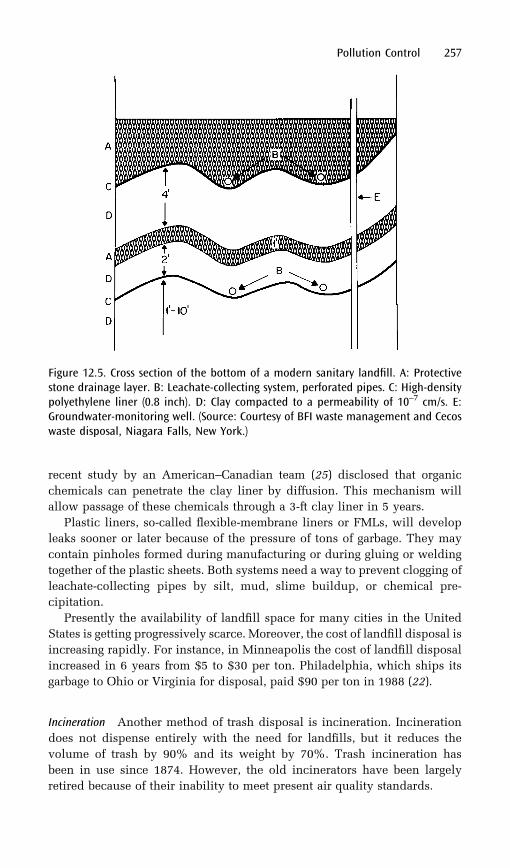
recent study by an American–Canadian team (25) disclosed that organic
chemicals can penetrate the clay liner by diffusion. This mechanism will
allow passage of these chemicals through a 3-ft clay liner in 5 years.
Plastic liners, so-called flexible-membrane liners or FMLs, will develop
leaks sooner or later because of the pressure of tons of garbage. They may
contain pinholes formed during manufacturing or during gluing or welding
together of the plastic sheets. Both systems need a way to prevent clogging of
leachate-collecting pipes by silt, mud, slime buildup, or chemical pre-
cipitation.
Presently the availability of landfill space for many cities in the United
States is getting progressively scarce. Moreover, the cost of landfill disposal is
increasing rapidly. For instance, in Minneapolis the cost of landfill disposal
increased in 6 years from $5 to $30 per ton. Philadelphia, which ships its
garbage to Ohio or Virginia for disposal, paid $90 per ton in 1988 (22).
Incineration Another method of trash disposal is incineration. Incineration
does not dispense entirely with the need for landfills, but it reduces the
volume of trash by 90% and its weight by 70%. Trash incineration has
been in use since 1874. However, the old incinerators have been largely
retired because of their inability to meet present air quality standards.
Pollution Control 257
Figure 12.5. Cross section of the bottom of a modern sanitary landfill. A: Protectivestone drainage layer. B: Leachate-collecting system, perforated pipes. C: High-densitypolyethylene liner (0.8 inch). D: Clay compacted to a permeability of 10–7 cm/s. E:Groundwater-monitoring well. (Source: Courtesy of BFI waste management and Cecoswaste disposal, Niagara Falls, New York.)
A new trend is controlled waste-to-energy incineration. The heating value
of trash is about one-third that of coal. In addition, the flue gases generated
are very low in SO2. Some modern plants segregate the garbage by removing
undesirable materials and separating iron for recycling. A 1978 federal law
requires electric utilities to purchase, at a fair price, electricity generated by
small producers. This potential profit is an additional incentive for munici-
palities to invest in waste-to-energy incinerators.
In 1986 there were 62 waste-to-energy plants in operation in the United
States and 65 others under construction or in planning. The burning of trash
is expensive, but at least part of the cost may be offset by the energy sold.
Thus, it may be less expensive than landfill disposal. Frequently, waste-to-
energy plants use the excess heat (in the form of hot steam) that remains after
generating electricity to heat plants or residential dwellings. This is referred
to as cogeneration. The term ‘‘cogeneration’’ applies whenever fuel is burned
to produce electricity and the excess heat is used either for space heating or
to provide mechanical power.
In principle, waste-to-energy incineration appears to be a good idea.
However, the exhaust gases and residual ash present serious problems.
Chlorine-containing compounds, such as polyvinyl plastics and bleached
paper, form dioxins and furans on combustion. These toxins may be emitted
into the air or retained in the ashes, depending on conditions such as tem-
perature of combustion, cooling process, and adsorption to fly ash particles.
Toxic metals such as lead, cadmium, arsenic, and mercury likewise may
become air pollutants or a landfill hazard (26). Little is known about the
chemistry of combustion, and high levels of dioxins detected in the milk
of nursing mothers are attributed to the pollution caused by trash incinera-
tors (21).
According to a newly released report by the EPA, incineration of medical
wastes is responsible for more than half of estimated U.S. dioxin emissions,
and incineration of municipal wastes for another 30%. In contrast, hazar-
dous-waste incineration produces only 0.4% of dioxins [in terms of TEQ
(tetrachlorodibenzo-p-dioxin equivalents)] (27).
Proponents of waste-to-energy incineration maintain that the emission of
dioxins can be controlled by filtering the exhaust gases. Opponents argue
that the toxins trapped on the filters have to be discarded somewhere and
will end up in landfills. Another concern is that the filters do not retain very
small particles (smaller than 2 �m). These particles are able to penetrate
deeply into the lungs and thus present a health hazard. In addition, incin-
erator ashes (which are deposited in landfills) are spiked with toxic metals.
Metals are more concentrated in ashes than in the trash being incinerated.
Moreover, ashes are a conglomeration of small particles and as such have a
large surface area. This large surface area facilitates the leaching of metals
and other toxins.
Recently, new standards for municipal waste incinerators were proposed
by the EPA. Accordingly, more-effective scrubbers will be required to
258 Environmental Toxicology
replace the presently used spray dryers and electrostatic precipitators. The
compliance threshold with the new regulations will be lowered from 250 to
40 tons of wastes incinerated per day (28). The new rules were expected to
take effect in September 1995.
Problems with Plastics
The 42 different polymers designated as plastics can be divided into two
general classes: thermoplastics and thermosetting plastics. Thermoplastics,
which constitute 87% of all plastics sold, are recyclable in principle (i.e.,
they can be melted down and remolded). Thermosetting plastics, on the
other hand, once molded, cannot be remelted into the virgin resin.
Thermoplastics, which include polyethylene, polypropylene, poly-
styrene, poly(vinyl chloride) and poly(ethylene terephthalate) (PET), are
used mostly in packaging. Plastic packaging, which accounts for 25% of
the total use of plastics, represents the largest share of the market for plastics.
The second largest use is building materials, with 20% of the market share
(29).
Environmental Persistence The major objection to plastic packaging is that it is
neither bio- nor photodegradable, and thus will persist in landfills for
centuries. Although plastics can be incinerated and have the highest heating
value of all materials in the waste stream, some of them, such as poly(vinyl
chloride), form toxic dioxanes and furans when burned. Separation of
plastics for incineration into safe-burning and toxic is not economically
feasible.
The argument against plastics based on their persistence in landfills for
400 years or so was weakened by research into the composition and biode-
gradability of waste deposited in landfills. It has been found (30) that the
total landfill refuse retained its original weight, volume, and form even after
being buried for 25 years.
However, this study was done on landfills in Arizona, where extremely
dry conditions prevail. This environment made the survival of anaerobic
bacteria, which are needed for the digestion of the waste, problematic.
Under different climatic conditions, enough moisture is present to make
bacterial fermentation possible. Indeed, subsequent investigation of Fresh
Kills, the world largest landfill in Staten Island, NY, confirmed this point.
Fresh Kills landfill covers an area more than 1200 hectares and consists of
dry and wet areas. The decomposition of paper in the wet areas was found
to be considerably faster than in the dry areas (31). Another study (32)
indicates that the average volume of waste in landfills decreases by 7%
per decade.
To overcome the antiplastic sentiment of citizen groups, some manu-
facturers have developed biodegradable plastics in which chains of poly-
Pollution Control 259
ethylene are linked by short segments of starch. The alleged advantage of this
type of plastic is that the starch links are digested by bacteria, and this
digestion breaks the integrity of plastic sheets and reduces their volume.
Although this bacterial digestion may offer an advantage by saving marine
species and waterfowl from suffocation by plastics discarded into water, it
will leave powderized polyethylene in the environment. The consequences
of this residue are still unknown.
The term ‘‘biodegradable’’ is rather misleading because no standards have
been set with regard to the time span within which the degradation must
occur. Considering that biodegradation in landfills is an extremely slow pro-
cess, the environmental benefits of biodegradable plastics are questionable.
Plastics discarded into waterways represent a real hazard to aquatic spe-
cies and waterfowl. Although the United States ratified the international
convention that prohibits discharge of refuse from ships, this law is difficult
to enforce.
Recycling of Plastics Under pressure from environmental groups and from
some local and state governments, the producers of plastics began to investi-
gate recycling possibilities. Industries dedicated to sorting, cleaning, and
shredding discarded plastic products were developed. Sorting of plastics
by their chemical nature is now facilitated by the following numeric coding
system:
1 ¼ poly(ethylene terephthalate) (PET)2 ¼ high-density polyethylene (HDPE)3 ¼ poly(vinyl chloride) (PVC)4 ¼ low-density polyethylene (LDPE)5 ¼ polyethylene (PE)6 ¼ polystyrene (PS)7 ¼ composite plastics
Presently, many communities include plastic packaging in their recycling
program for glass, aluminum, and paper. Also, supermarkets place bins for
collection of plastic bags for recycling. Despite this effort, the rate of plastic
recycling is much below that of other materials. The plastics industry tries to
make us believe that most of the plastic packaging is recycled. In fact, the
rate of plastics recycling is now only 4.8–6.5% (up from 1% in the late
1980s), and the production of plastics from virgin materials is still outpacing
recycling by almost 10 to 1 (33).
Recycling efforts are further complicated by the fact that many products
are actually a composite of several resins. Some plastics are combined with
other materials, such as paper or aluminum foil, which make them unsuita-
ble for recycling. Some plastic products, such as HDPE milk jugs or PET soda
bottles, are recycled by being shredded and used for fill in pillows and
jackets, or as packing material. Although this approach is better than direct
260 Environmental Toxicology
disposal after a single use, it can be considered only a postponement of the
problem. Eventually these products, too, will end up in dumps. Manufacture
of durable goods, such as plastic lumber or outdoor furniture, from discarded
plastics may be a better idea.
Difficulties in recycling composite products may be solved by technolo-
gical advances. For instance, a technology has been developed for recycling
composite soda bottles. These bottles consist of four components: a PET
body, an HDPE base, an aluminum cap, and a paper label. After the compo-
nents are separated, PET and HDPE chips are sent for remelting and recy-
cling into new plastic products (34).
A new recycling trend, called feedstock or chemical recycling, is now
emerging in Europe, especially in Germany. The process involves depoly-
merization of plastics to original components from which it was synthesized.
The technology of chemical depolymerization of individual types of plastics
is well-developed and presents no technical problems. More difficult,
although not impossible, is breaking down mixed plastics to basic oil feed-
stocks (35). Presently, a consortium of German chemical companies is start-
ing chemical recycling of mixed plastics on a commercial scale. Mixed-
plastics recycling dispenses with the necessity of sorting and cleaning the
individual types of plastics, thus reducing the cost of recycling from $1765 to
$190 per ton of waste (36).
Recycling
Recycling as much as possible may be the best way to handle the garbage
crisis. The advantages of recycling lie not only in diminishing the solid
waste stream, but also in conservation of virgin resources such as trees
and ores, conservation of energy, and reduction of air and water pollution.
In the United States, consumption of raw materials has doubled within 35
years (29). With finite availability of resources, this rate of consumption is
not sustainable for a prolonged period. Moreover, worldwide use of
resources may be expected to rise as the developing nations strive to achieve
living standards comparable to those of the industrialized nations.
Table 12.2 shows the environmental benefits of recycling, in terms of
energy savings and pollution reduction, as compared to production of the
same materials from virgin resources.
In the past the record of recycling in the United States was not impressive
as compared to the record in some European countries. In 1987, 28% of
aluminum, 27% of paper,4 and 10% of glass were recycled in the United
Pollution Control 261
4Although more paper products are now made from recycled paper, the designa-tion ‘‘recycled’’ does not necessarily mean what the public expects. The paper made
from the mill’s waste, which would be otherwise discarded, is referred to as precon-
sumer recycled as opposed to postconsumer recycled, that is, made of paper that has
been used.
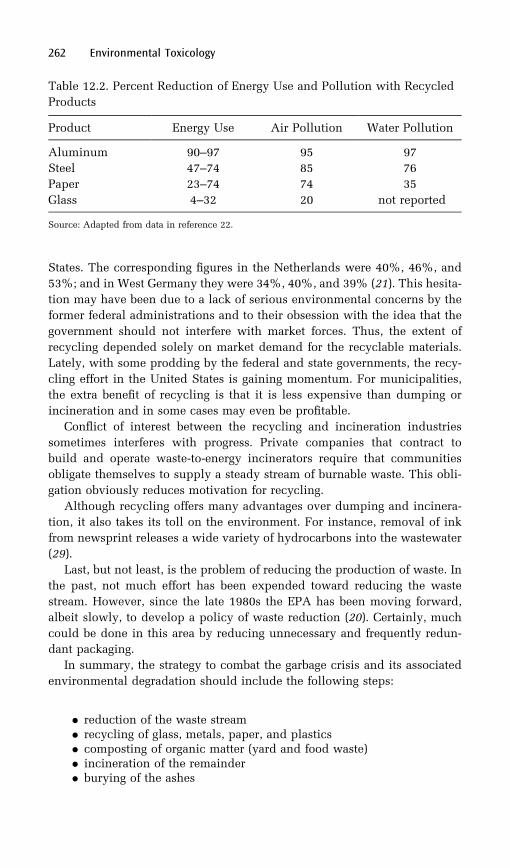
States. The corresponding figures in the Netherlands were 40%, 46%, and
53%; and in West Germany they were 34%, 40%, and 39% (21). This hesita-
tion may have been due to a lack of serious environmental concerns by the
former federal administrations and to their obsession with the idea that the
government should not interfere with market forces. Thus, the extent of
recycling depended solely on market demand for the recyclable materials.
Lately, with some prodding by the federal and state governments, the recy-
cling effort in the United States is gaining momentum. For municipalities,
the extra benefit of recycling is that it is less expensive than dumping or
incineration and in some cases may even be profitable.
Conflict of interest between the recycling and incineration industries
sometimes interferes with progress. Private companies that contract to
build and operate waste-to-energy incinerators require that communities
obligate themselves to supply a steady stream of burnable waste. This obli-
gation obviously reduces motivation for recycling.
Although recycling offers many advantages over dumping and incinera-
tion, it also takes its toll on the environment. For instance, removal of ink
from newsprint releases a wide variety of hydrocarbons into the wastewater
(29).
Last, but not least, is the problem of reducing the production of waste. In
the past, not much effort has been expended toward reducing the waste
stream. However, since the late 1980s the EPA has been moving forward,
albeit slowly, to develop a policy of waste reduction (20). Certainly, much
could be done in this area by reducing unnecessary and frequently redun-
dant packaging.
In summary, the strategy to combat the garbage crisis and its associated
environmental degradation should include the following steps:
. reduction of the waste stream
. recycling of glass, metals, paper, and plastics
. composting of organic matter (yard and food waste)
. incineration of the remainder
. burying of the ashes
262 Environmental Toxicology
Table 12.2. Percent Reduction of Energy Use and Pollution with Recycled
Products
Product Energy Use Air Pollution Water Pollution
Aluminum 90–97 95 97
Steel 47–74 85 76
Paper 23–74 74 35
Glass 4–32 20 not reported
Source: Adapted from data in reference 22.
Hazardous Waste
Superfund Projects
According to EPA estimates, as of 1989, 1163 hazardous-waste sites were on
the priority list for urgent cleanup under Superfund legislation (Chapter 14).
Another 30,000 remain to be evaluated; however, estimates by the General
Accounting Office go as high as 130,000–425,000 sites (37).
Many hazardous-waste sites have been covered over, and subsequently
housing developments, schools, or recreation areas were built on them. Such
unidentified sites may be discovered only after health problems arise in
those areas. This was the case with the Love Canal, where a housing devel-
opment was erected on an abandoned chemical dump (38). Eventually the
whole neighborhood had to be evacuated after toxic leachates began to seep
into basements and an unusually high incidence of health problems was
identified.
Since 1980 the EPA has begun cleanup at 257 sites; by 1989 cleanup was
completed at 48 sites. In addition to this slow progress, there is criticism
concerning the quality of the results. In many cases the cleanup procedure
involved containment rather than detoxification or incineration of the toxic
waste. In the short term, containment is a less expensive procedure than
complete destruction or detoxification. However, in the long run it may
turn out to be more expensive. As has been discussed, no clay or plastic
liners will contain leachates permanently. Eventually another treatment of
the contained sites will be necessary.
International Export of Hazardous Waste
With the increasing generation of toxic waste in the industrialized world,
and with the increasing cost of its disposal, many industries found it profit-
able to ship their toxic waste to financially strapped developing countries.
The amount of hazardous waste generated in the United States rose from 25
million tons/year in 1970 to 500 million tons/year in 1989. Another 40
million tons was generated annually by the other countries of the
Organization for Economic Cooperation and Development (OECD) (39). At
the same time the cost of disposal increased, between 1976 and 1991, from
$10 to $250 per metric ton for disposal as landfill, and from $50 to $2600 per
metric ton for incineration. In contrast, a metric ton of hazardous waste
could be disposed of in developing countries for $5 to $50 (39).
The export of toxic waste to developing countries has been severely
criticized by environmental groups on both ethical and environmental
grounds. The feeling was that it is highly immoral to dump our toxic
waste on impoverished people who lack the technical knowledge of how
to handle the waste safely. In addition, the developing countries have
Pollution Control 263
enough of their own, difficult-to-solve, environmental problems to be
burdened with the hazardous by-products of our extravagant lifestyle.
Greenpeace estimated the volume of hazardous waste shipped to developing
countries between 1986 and 1988 at more than three million tons (39).
Cases of illegal dumping, or attempted dumping, aroused the interna-
tional community against the practice of unregulated and uncontrolled
trade in toxic waste that frequently exploited the poor for the profit of the
rich. Accordingly, an international conference was convened, under the
auspices of the United Nations Environment Program (UNEP), in Basel,
Switzerland, in March 1989. Delegates from 116 countries drafted a treaty
titled The Basel Convention on Control of Transboundary Movements of
Hazardous Waste and Their Disposal. In essence, the postulates of the treaty
were:
. Establishment of notification procedures before the export ofhazardous waste may be permitted.
. A written consent of the importing country, and of the transitcountries involved, must be obtained before the shipment cantake place.
The treaty was hailed by UNEP executive director Mostafa Tolba as a
significant advance toward sharp reduction of transboundary movement of
toxic waste. Tolba said: ‘‘The ultimate goal is to make the movement of
hazardous waste so costly and difficult that industry will find it more profit-
able to cut down on waste production, and reuse or recycle what waste they
produce’’ (40). Greenpeace, on the other hand, disapproved of the treaty on
the grounds that it gave, de facto, a seal of approval to the trade in hazardous
waste that should be outlawed altogether. Ernst Klatte of Greenpeace put it
this way: ‘‘This convention risks involving developing countries in solving
the waste problem of industrialized countries’’ (40).
The United States participated in the Basel conference but so far has not
ratified the treaty. However, a bill designed to curb the transboundary move-
ment of hazardous waste was under consideration by the U.S. Congress. In
March 1994 the Clinton Administration recommended that the Congress
adopt the postulates of the Basel Convention.
Storage in Concrete Silos
An innovative concept for the cleanup of hazardous waste is excavation of
the waste and storage in aboveground concrete silos. The waste can be safely
stored in this way until technology for its detoxification or destruction is
developed. This type of cleanup has been suggested but has not as yet been
implemented (41).
264 Environmental Toxicology
References
1. World Resources Institute, International Institute for Environment andDevelopment in collaboration with U. N. Environment Programme;World Resources 1998–99, A Guide to the Global Environment; OxfordUniversity Press: New York, 1998; Chapter 15, Energy and Materials,p 331.
2. Schobert, H. H. Coal: The Energy Source of the Past and Future;American Chemical Society: Washington, DC, 1987.
3. Haggin, J. Chem. Eng. News August 29, 1988, 36.4. Matteson, M. J. In Introduction to Environmental Toxicology; Guthrie, F.
E.; Perry, J. J., Eds.; Elsevier Science: New York, 1980; Chapter 31, p 404.5. Braustein, L. Electric Perspectives (New York) Fall 1985, 6.6. Thompson, R. In Earth’s Threatened Resources; Gimlin, H., Ed.;
Congressional Quarterly: Washington, DC, 1986; Editorial ResearchReports; p 1.
7. MacKenzie, J. J; Walsh, M. P. Driving Forces: Motor Vehicle Trends andTheir Implications for Global Warming, Energy Strategies andTransportation Planning; World Resources Institute: New York, 1990.
8. Higgin, J. Chem. Eng. News August 14, 1989, 25.9. Renner, M. In State of the World 1989; Brown, L. R., Ed.; W. W. Norton:
New York, 1989; Chapter 6, p 97.10. World Resources Institute, International Institute for Environment and
Development in collaboration with U. N. Environment Programme;World Resources 1992–93, A Guide to the Global Environment; OxfordUniversity Press: New York, 1992; Chapter 10 Energy, p. 143.
11. Lenssen, N.; Young, J. E.World Watch (Washington, D.C.) 1990, 3(3), 19.12. Chang, T. Y.; Hammerle, R. H.; Japar, S. M.; Salmeen, I. T. Environ. Sci.
Technol. 1991, 25(7), 1190.13. Fisher, D. C. Reducing Greenhouse Gas Emissions with Alternate
Transportation Fuels; Environmental Defense Fund: Oakland, CA, 1991.14. Lynd, R. L.; Cushman, J. H.; Nichols, R. J.; Wyman, C. E. Science
(Washington, D.C.) 1991, 251, 1318.15. Anderson, E. W. Chem. Eng. News November 2, 1992, 7.16. Compliance of Selected Areas with Clean Air Act Requirements;
American Lung Association: New York, 1988.17 Abelson, P. H. Science (Washington, D.C.) 1988, 241(4873), 1569.18. Farrauto, R. J.; Heck, R. M.; Speronello, B. K. Chem. Eng. News
September 7, 1992, 34.19. Church, G. J. Time September 5, 1988, 81.20. Ember, L. Chem. Eng. News July 3, 1989, 23.21. Pollock, C. In State of the World 1987; Brown, L. R., Ed.; W. W. Norton:
New York, 1987; Chapter 6, p 101.22. Brown, K. W.; Donnelly, K. C. Hazard. Waste Hazard. Mater. 1988,
5(1), 1.23. Hanson, D. Chem. Eng. News September 16, 1991, 21.24. Geoservices, Inc. Background Document on Bottom Liner Performance
in Double-Lined Landfills and Surface Impoundments; NationalTechnical Information Service: Springfield, VA, 1987.
Pollution Control 265

25. Johnson, R. L.; Cherry, J. A.; Pankow, J. F. Environ. Sci. Technol. 1989,23(3), 340.
26. Hileman, B. Chem. Eng. News February 8, 1988, 22.27. Rose, J. Environ. Science Technol. 1994, 28(12), 512A.28. Hanson, D. Chem. Eng. News September 12, 1994, 7.29. The Economics of Recycling Municipal Waste: Background Analysis and
Policy Approaches for the State and Local Governments; staff report toNew York State Legislative Commission on Solid Waste Management:Albany, NY, 1986; p 24.
30. Rathje, W. L.; Ho, E. E. J. Am. Diet. Assoc. 1987, 87(10), 1357.31. Suflita, J. M.; Gerba, C. P.; Ham, R. K.; Palmisano, A. C.; Rathje, W. L.;
Robinson, F. A. Environ. Sci. Technol. 1992, 26(8), 1486.32. Thayer, A. M. Chem. Eng. News June 25, 1990, 7.33. Denison, R. E. EDF Letter (Washington, D.C.) 1993, XXIV(6), 4.34. Thayer, A. Chem. Eng. News January 30, 1989, 7.35. Layman, P. L. Chem. Eng. News October 4, 1993, 11.36. Layman, P. Chem. Eng. News March 28, 1994, 19.37. Young, J. E. World Watch 1989, 2(4), 8.38. Office of Public Health. Love Canal: Public Health Time Bomb; Nailor,
M. G.; Tarlton, F.; Cassidy, J. J., Eds.; New York State Department ofHealth: Albany, NY, 1978; special report to the governor and legislature.
39. Asante-Duah, D. K.; Saccomanno, F. F.; Shortreed, J. H. Environ. Sci.Technol. 1992, 26(9), 1684.
40. O’Sullivan, D. A. Chem. Eng. News April 3, 1989, 21.41. Walters, J. V.; Moffett, T. B.; Sellers, J. D.; Lovell, W. A. Environ. Prog.
1988, 7(4), 224.
266 Environmental Toxicology
13Radioactive Pollution
Ionizing Radiation
Radiation that, on passage through matter, produces ions by knocking elec-
trons out of their orbits is called ionizing radiation. This radiation is pro-
duced through decomposition of unstable, naturally occurring or synthetic
elements referred to as radionuclides.
Types of Radiation
The four types of radiation are �-particles, �-particles, �-rays, and neutrons.
The �-particles have a mass of two protons and two neutrons and a charge of
+2; �-particles are electrons with a mass of 0.00055 atomic mass unit (amu)
and a charge of –1; �-rays and X-rays are high-frequency electromagnetic
waves with no mass and no charge. The difference between �-rays and X-
rays is that �-rays occur naturally, whereas X-rays are generated. In addition,
�-rays are of higher frequency than X-rays.
Release of an �-particle leads to the formation of a daughter element with
an atomic number 2 units lower and an atomic weight 4 units lower than that
of the parent nuclide. Similarly, release of a �-particle from the nucleus
causes conversion of a neutron to a proton, producing a daughter element
with the same atomic weight as the parent nuclide but with its atomic num-
ber increased by 1 unit.
Neutron radiation does not occur naturally and is released only from
synthetic radionuclides. Neutrons, which have no charge, are formed from
protons. This conversion is accompanied by the release of an orbital electron
267
from the atom. Neutrons produce ions indirectly, by collisions with hydro-
gen atoms. The impact knocks out protons, which in turn produce ions on
passage through matter. Capture of a neutron forms an isotope of the parent
nuclide with its atomic weight increased by 1 unit.
Mode of Action and Penetration
The mode of action of particles (� and �) varies from that of photons (�- and
X-rays). When �- or �-particles travel through matter, their electric charges
(positive or negative) cause ionization of the atoms in the matter. This is
called a direct effect. Whereas the track of �-particles is short and straight,
�-particles scatter, frequently producing a wavy track. Gamma- and X-rays
act indirectly.
There are three ways by which photons can cause ionization: the photo-
electric effect, the Compton effect, and pair production. The photoelectric
effect occurs when the photon striking an electron in the innermost shell (K
shell) has energy equal to or slightly higher than that of the electron. The
electron is then released from the atom; its energy is equal to that of the
photon diminished by the K-shell binding energy. The Compton effect
occurs when a photon strikes an electron in the L-shell (the next to the
innermost shell) with energy much in excess of that of the electron. The
electron is then knocked out, but only part of the photon energy is trans-
ferred to the electron. The remainder is reradiated as a photon of lower
energy. Pair production occurs when a photon having energy greater than
1.02 MeV strikes the nucleus releasing an electron and a positron (positively
charged electron). The positron loses energy by ionizing atoms of the matter.
Eventually it collides with an electron and annihilates itself, producing two
photons, each having an energy of 0.511 MeV and traveling in opposite
directions (1).
The penetration of ionizing radiation through tissue depends on the type
of radiation (i.e., its mass and charge) and also on its energy. The amount of
damage to the tissue is related to the linear energy transfer. When a particle
or a ray travels through matter, it gradually loses energy by transferring it to
the matter.
The initial energy of the incoming radiation (Emax) divided by the thick-
ness of the matter required to dissipate all the energy is referred to as the
average linear energy transfer (LET). For equal doses of radiation, the damage
to the irradiated tissue increases with an increasing LET value.
Both �-rays and X-rays have no fixed penetration range; they attenuate
exponentially with depth of penetration. Therefore, in this case the LET is
expressed as Emax/(2 � HVL); HVL is the half-value layer, the thickness of
matter necessary to attenuate the intensity of radiation by half (2). Table 13.1
presents a comparison of different types of radiation, their LET values for
radiation of 100 keV, and their penetrability of tissue.
268 Environmental Toxicology
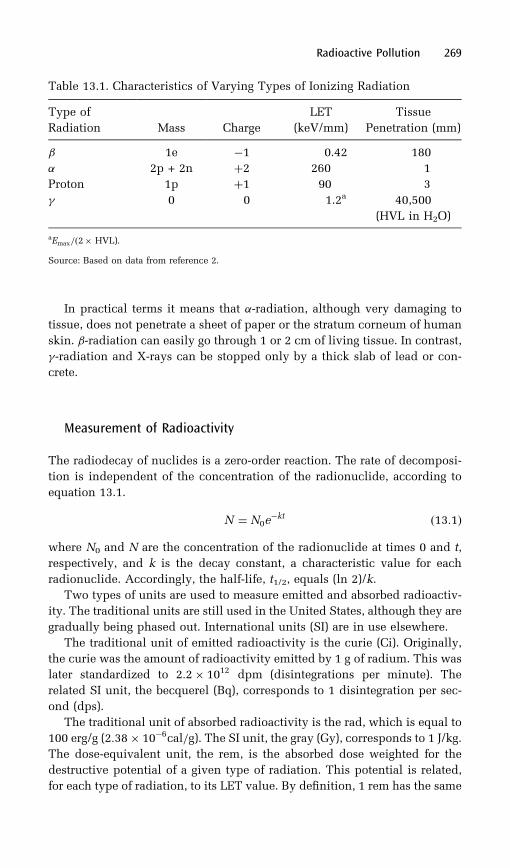
In practical terms it means that �-radiation, although very damaging to
tissue, does not penetrate a sheet of paper or the stratum corneum of human
skin. �-radiation can easily go through 1 or 2 cm of living tissue. In contrast,
�-radiation and X-rays can be stopped only by a thick slab of lead or con-
crete.
Measurement of Radioactivity
The radiodecay of nuclides is a zero-order reaction. The rate of decomposi-
tion is independent of the concentration of the radionuclide, according to
equation 13.1.
N ¼ N0e�kt ð13:1Þ
where N0 and N are the concentration of the radionuclide at times 0 and t,
respectively, and k is the decay constant, a characteristic value for each
radionuclide. Accordingly, the half-life, t1/2, equals (ln 2)/k.
Two types of units are used to measure emitted and absorbed radioactiv-
ity. The traditional units are still used in the United States, although they are
gradually being phased out. International units (SI) are in use elsewhere.
The traditional unit of emitted radioactivity is the curie (Ci). Originally,
the curie was the amount of radioactivity emitted by 1 g of radium. This was
later standardized to 2:2� 1012 dpm (disintegrations per minute). The
related SI unit, the becquerel (Bq), corresponds to 1 disintegration per sec-
ond (dps).
The traditional unit of absorbed radioactivity is the rad, which is equal to
100 erg/g (2:38� 10�6cal=g). The SI unit, the gray (Gy), corresponds to 1 J/kg.The dose-equivalent unit, the rem, is the absorbed dose weighted for the
destructive potential of a given type of radiation. This potential is related,
for each type of radiation, to its LET value. By definition, 1 rem has the same
Radioactive Pollution 269
Table 13.1. Characteristics of Varying Types of Ionizing Radiation
Type of
Radiation Mass Charge
LET
(keV/mm)
Tissue
Penetration (mm)
� 1e �1 0.42 180
� 2p + 2n þ2 260 1
Proton 1p þ1 90 3
� 0 0 1.2a 40,500
(HVL in H2O)
aEmax=ð2� HVL).
Source: Based on data from reference 2.
biological effect as 1 rad of ‘‘hard’’ X-rays. However, it must be multiplied by
the quality factor of 20 for �-radiation.1
The SI unit replacing the rem is the sievert (Sv). One sievert corresponds
to 1 J/kg multiplied by a quality factor. An earlier unit of exposure, roentgen
(R), is based on the amount of ionization produced in the air by �-rays or X-
rays. One roentgen is approximately equal to 1 rad. This unit has been
replaced in SI by coulombs per kilogram (C/kg). The relationship between
traditional and SI units is shown in Table 13.2.
Sources of Radiation
The sources of radiation can be divided into natural and anthropogenic.
Natural sources involve cosmic radiation and radioactive elements produced
by three disintegration series originating from 238U, 232Th, and, to a lesser
extent, 235U (actinouranium, also known as actinium) (Figure 13.1).
Uranium is encountered in certain rocks, soil, and phosphate deposits.
Radon, the gaseous decay product of 238U and 232Th, is of great concern. The
two isotopes of radon (222Rn and 220Rn) are responsible for 54% of the earth’s
background radiation (3).
Radon is not equally distributed around the globe. The great majority of
people live in areas where the outdoor radon exposure rate varies from 0.3 to
270 Environmental Toxicology
Table 13.2. Conversion of Traditional into SI Units
Traditional Unit SI Unit
1 Ci 37� 109 Bq
27� 10�12 Ci 1 Bq
1 rad 1� 10�2 Gy100 rad 1 Gy
1 R 285� 10�6C/kg3876 R 1 C/kg
1Energy units:erg = dyn � cm ¼ g cm2/second2
joule (J) = 107 ergs
calorie (cal) = 4.19 joules
electron volt (eV) = 1:6� 10�12 erg
Prefixes:
milli- (m) = 10�3 kilo- (k) = 103
micro- (m) = 10�6 mega- (M) = 106
nano- (n) = 10�9 giga- (G) = 109
pico- (p) = 10�12 tera- (T) = 1012
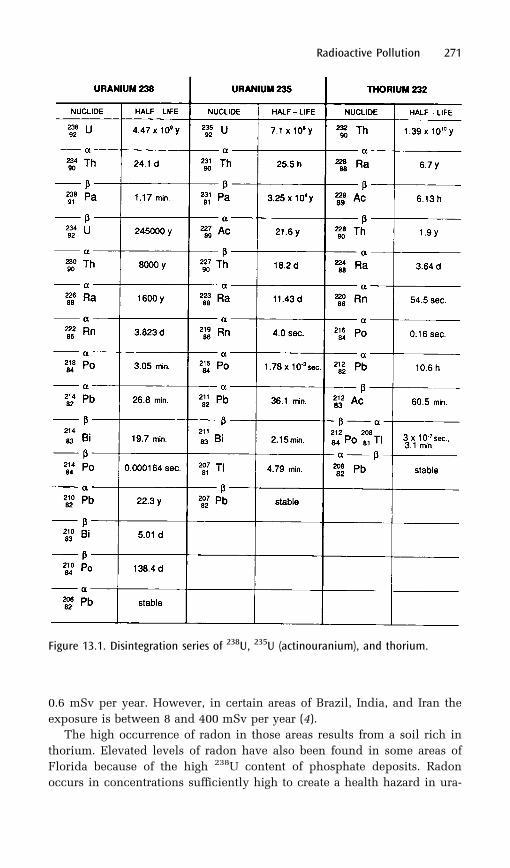
0.6 mSv per year. However, in certain areas of Brazil, India, and Iran the
exposure is between 8 and 400 mSv per year (4).
The high occurrence of radon in those areas results from a soil rich in
thorium. Elevated levels of radon have also been found in some areas of
Florida because of the high 238U content of phosphate deposits. Radon
occurs in concentrations sufficiently high to create a health hazard in ura-
Radioactive Pollution 271
Figure 13.1. Disintegration series of 238U, 235U (actinouranium), and thorium.
nium mines and mine tailings. In the basements of some residential dwell-
ings and office buildings, it can accumulate to concentrations greatly exceed-
ing those of the outdoor background.
Radon, an �-emitter, is a noble gas. As such, it is very unreactive, and
when inhaled it does not persist in the lungs long enough to cause any
damage. However, it decomposes to its daughter elements, polonium iso-
topes 218 and 216, which originate from 238U and 232Th, respectively.
These isotopes are solid �-emitters, with half-lives of 3 min and 0.16 s,
respectively. They and their disintegration products may be trapped in the
lungs and cause damage to the tissue.
Other natural sources of radioactivity are 40K and 87Rb. 40K is a �- and �-
emitter with a half-life of 1:3� 109 years. It occurs in rocks and soil, as well
as in the muscles of animals, where it represents about 0.01% of the total
potassium. 87Rb, a �-emitter with a half-life of 4.89 x 10¹⁰ years, occurs in
certain minerals, seawater, and waters of many mineral springs and salt
lakes.
Anthropogenic sources of radioactivity are related to the nuclear power
industry (mining, processing, reactors, and nuclear waste); nuclear warfare
and testing; nuclear accidents; the use of radionuclides in science and med-
icine; and medical X-rays.
Health and Biological Effects of Radiation
Ionizing radiation is highly lethal, even though the amount of energy
involved in killing an organism is negligible. Studies of the effects of the
atomic bomb explosions in Hiroshima and Nagasaki indicate that indivi-
duals exposed to 450 rad (0.00107 cal/g) died within 2 weeks of exposure
(5). However, at equal total dose, fractionated doses are less toxic than a
single large dose.
Free Radicals
The biochemical effect of radiation is believed to result from the formation of
free �OH and �H radicals arising from collisions of ionizing particles or
induced ions with water molecules.
The free radicals react with cellular macromolecules, or with each other,
to form H2O2, a strong oxidizing agent. Another type of free radical, �HO2, is
formed by interaction of the .H radical with cellular oxygen. This may then
be reduced to H2O2.
The interaction of these free radicals and H2O2 with cellular macromole-
cules such as nucleic acids, proteins, lipids, and carbohydrates leads to a
variety of damage: DNA strand breaks, point mutations, chromosomal aber-
rations, and ultimately to cell death. Some organs are more susceptible to
272 Environmental Toxicology
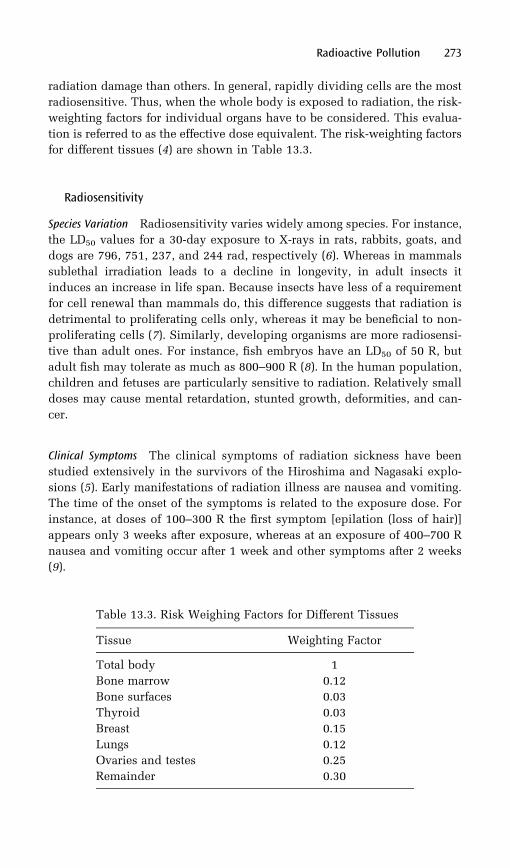
radiation damage than others. In general, rapidly dividing cells are the most
radiosensitive. Thus, when the whole body is exposed to radiation, the risk-
weighting factors for individual organs have to be considered. This evalua-
tion is referred to as the effective dose equivalent. The risk-weighting factors
for different tissues (4) are shown in Table 13.3.
Radiosensitivity
Species Variation Radiosensitivity varies widely among species. For instance,
the LD50 values for a 30-day exposure to X-rays in rats, rabbits, goats, and
dogs are 796, 751, 237, and 244 rad, respectively (6). Whereas in mammals
sublethal irradiation leads to a decline in longevity, in adult insects it
induces an increase in life span. Because insects have less of a requirement
for cell renewal than mammals do, this difference suggests that radiation is
detrimental to proliferating cells only, whereas it may be beneficial to non-
proliferating cells (7). Similarly, developing organisms are more radiosensi-
tive than adult ones. For instance, fish embryos have an LD50 of 50 R, but
adult fish may tolerate as much as 800–900 R (8). In the human population,
children and fetuses are particularly sensitive to radiation. Relatively small
doses may cause mental retardation, stunted growth, deformities, and can-
cer.
Clinical Symptoms The clinical symptoms of radiation sickness have been
studied extensively in the survivors of the Hiroshima and Nagasaki explo-
sions (5). Early manifestations of radiation illness are nausea and vomiting.
The time of the onset of the symptoms is related to the exposure dose. For
instance, at doses of 100–300 R the first symptom [epilation (loss of hair)]
appears only 3 weeks after exposure, whereas at an exposure of 400–700 R
nausea and vomiting occur after 1 week and other symptoms after 2 weeks
(9).
Radioactive Pollution 273
Table 13.3. Risk Weighing Factors for Different Tissues
Tissue Weighting Factor
Total body 1
Bone marrow 0.12
Bone surfaces 0.03
Thyroid 0.03
Breast 0.15
Lungs 0.12
Ovaries and testes 0.25
Remainder 0.30
Nausea is followed by epilation and purpura (redness of the skin). Both
onset of epilation and intensity of purpura may be correlated with the inten-
sity of the exposure. Other manifestations, such as diarrhea and hemorrhages
of the mouth, rectum, and urinary tract, are typical symptoms of damage to
the hematopoietic and gastrointestinal systems. At a very heavy exposure,
death may occur shortly after exposure. At some lower exposure, the early
symptoms are followed by a latent period and a secondary phase of illness
during which death may occur.
Chronic Exposure We have a wealth of information on the health effects of
high doses of radiation. However, very little is known about the effect of
chronic exposure to small doses such as may occur at the workplace or to
which the general public may be exposed.
Most of the information in these areas originates from studies of clinical
exposure to X-rays, occupational exposure, and animal experiments by
extrapolating from high to low doses, as was described for chemical carcino-
gens in Chapter 5. The extrapolations are usually based on the assumptions
that there is no threshold dose below which there is no risk and that the risk
is proportional to the dose. However, in the absence of reliable human data,
estimates of the health effects of low doses of radiation have to be considered
hypothetical at best.
The long-term effect of external exposure to radiation is an increase in the
incidence of certain types of cancer, such as leukemia and thyroid, breast,
and lung cancers. The frequency of incidence of each of these malignancies
(10) is as follows:
. leukemia, 1.6
. thyroid cancer, 1.2
. breast cancer, 2.1
. lung cancer, 2.0
These numbers are the excess of cancer cases per million exposed people,
per rad, per year, compared with an unexposed population. The data were
obtained from a 30-year study of Hiroshima and Nagasaki survivors.
At equal doses of exposure, the latency period is shortest for leukemia,
with the highest frequency occurring about 5–7 years after exposure, and
decreasing thereafter. In contrast, the other types of cancer begin to appear
only about 10 years after exposure (4). According to some sources, the
latency period may be inversely related to the dose and length of exposure
(11).
Radioisotopes may also be incorporated into the body and produce con-
tinuous damage to the tissues. In most cases these isotopes are produced by
nuclear fission. Strontium-90, a �-emitter with a t1/2 of 28.9 years, is incor-
porated into bones in place of calcium and thus may induce osteosarcoma.
Also incorporated into the bones is 226Ra, a member of the 238U disintegra-
274 Environmental Toxicology
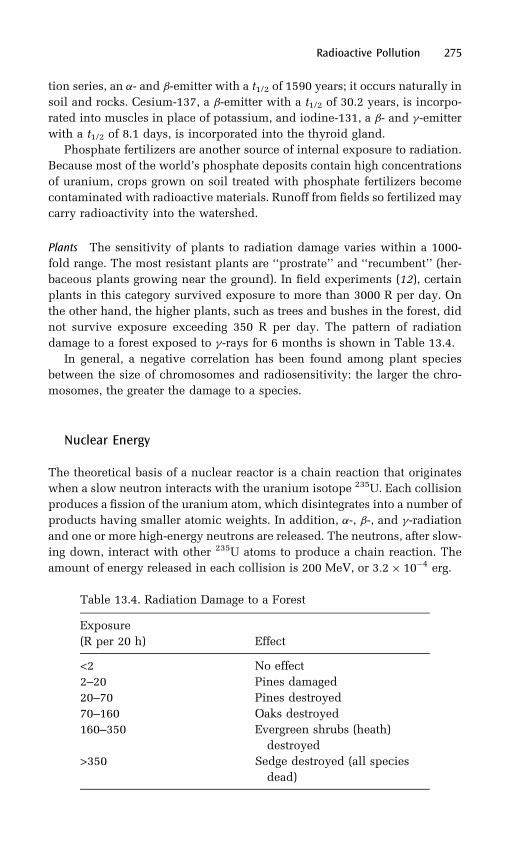
tion series, an �- and �-emitter with a t1/2 of 1590 years; it occurs naturally in
soil and rocks. Cesium-137, a �-emitter with a t1/2 of 30.2 years, is incorpo-
rated into muscles in place of potassium, and iodine-131, a �- and �-emitter
with a t1/2 of 8.1 days, is incorporated into the thyroid gland.
Phosphate fertilizers are another source of internal exposure to radiation.
Because most of the world’s phosphate deposits contain high concentrations
of uranium, crops grown on soil treated with phosphate fertilizers become
contaminated with radioactive materials. Runoff from fields so fertilized may
carry radioactivity into the watershed.
Plants The sensitivity of plants to radiation damage varies within a 1000-
fold range. The most resistant plants are ‘‘prostrate’’ and ‘‘recumbent’’ (her-
baceous plants growing near the ground). In field experiments (12), certain
plants in this category survived exposure to more than 3000 R per day. On
the other hand, the higher plants, such as trees and bushes in the forest, did
not survive exposure exceeding 350 R per day. The pattern of radiation
damage to a forest exposed to �-rays for 6 months is shown in Table 13.4.
In general, a negative correlation has been found among plant species
between the size of chromosomes and radiosensitivity: the larger the chro-
mosomes, the greater the damage to a species.
Nuclear Energy
The theoretical basis of a nuclear reactor is a chain reaction that originates
when a slow neutron interacts with the uranium isotope 235U. Each collision
produces a fission of the uranium atom, which disintegrates into a number of
products having smaller atomic weights. In addition, �-, �-, and �-radiation
and one or more high-energy neutrons are released. The neutrons, after slow-
ing down, interact with other 235U atoms to produce a chain reaction. The
amount of energy released in each collision is 200 MeV, or 3:2� 10�4 erg.
Radioactive Pollution 275
Table 13.4. Radiation Damage to a Forest
Exposure
(R per 20 h) Effect
<2 No effect
2–20 Pines damaged
20–70 Pines destroyed
70–160 Oaks destroyed
160–350 Evergreen shrubs (heath)
destroyed
>350 Sedge destroyed (all species
dead)
Because 235U represents only 0.7% of crude uranium and is enriched to
between 2 and 4% in nuclear fuel, most of the uranium (238U) remains
unused. For this reason (as well as for the production of fissionable material
for nuclear weapons), breeder reactors were developed. Breeder reactors use
the prevalent isotope of uranium. 238U per se is not a fissionable material
because it cannot sustain a chain reaction. However, it is a ‘‘fertile sub-
stance’’ that can be converted to nuclear fuel. This conversion proceeds as
depicted in equation 13.2.
nþ23892U�! 239
92U �!� 23993 Np �!� 239
94 Pu ð13:2Þ
Both conversions of uranium into neptunium and neptunium into
plutonium are fast reactions, with a t1/2 of 23 min. Plutonium is a fission-
able material. Thus, breeder reactors not only provide fission energy but
also supply their own fuel. The ratio of fuel production to fission is higher
than 1.
Nuclear Fuel
Mining The sources of fuel for nuclear reactors are two uranium ores: ura-
nium dioxide (UO2, called pitchblende) and potassium uranovanadate
(K2O � 2U2O3 � V2O5 � 3H2O called carnotite). In the United States, about
half of the supply of these ores is obtained from underground mines, and
the other half is obtained by strip mining.
Underground mining presents a health problem for the miners in the form
of exposure to radon gas. As mentioned earlier, the cause for concern is not
radon itself but rather its daughter element, 218Po. A high incidence of lung
cancer and other respiratory diseases among uranium miners has been
observed both in Europe and in the United States (6). In strip mining,
radon is of less concern because it is distributed in the atmosphere.
However, both miners and the environment may be exposed to windblown
radioactive dust.
Another environmental concern is leaching of large quantities of radio-
active materials with mine drainage. This leaching creates a hazard to the
watershed and groundwater contamination.
Processing Processing of the ore involves milling, followed by chemical
separation of uranium from the accompanying radium. Uranium is con-
verted into ammonium diuranate [(NH4)2U2O7], referred to as yellow cake,
whereas radium remains with the ore and is deposited in tailing ponds for
storage.
Tailing ponds present an environmental problem because of the
continuous radon emission. Moreover, the dry radioactive residue remain-
ing after the water has evaporated may be windblown and thus con-
276 Environmental Toxicology
taminate large areas. Tailing ponds are considered to be the main con-
tributors to radioactive pollution in the whole process of nuclear fuel pro-
duction.
The next step is enrichment of 235U to a level suitable for reactor fuel. The
conventional method involves conversion of uranium into gaseous uranium
hexafluoride (UF6). The separation of 235U from 238U is based on different
diffusion rates of the fluorides through a porous membrane. A new, more
economical separation method called atomic vapor laser separation (AVLS)
is based on selective absorption of a specific color of laser beam by the 235U
isotope. The 235U then becomes ionized and can be separated from 238U in a
magnetic field.
The enriched uranium hexafluoride is converted to uranium dioxide and
made into pellets that are loaded into zircaloy tubes. (Zircaloy is an alloy of
zirconium made especially as casing for nuclear fuel.) The finished products
are fuel rods. Very little radioactivity is released during the separation pro-
cess and the fabrication of the fuel rods.
Nuclear Reactors
The heart of a nuclear reactor is the reactor core, which is an arrangement of
several thousand fuel rods immersed in circulating water. Between the fuel
rods are boron rods, which may be moved up and down. The core is set in a
stainless steel pressure vessel through which cooling water is circulated.
A primary source of neutrons is needed to initiate the chain reaction. The
neutrons produced in the fission of 235U are highly energetic. To increase the
chance of collision with 235U atoms and thus make a sustained chain
reaction possible, part of the neutrons’ energy has to be dissipated before
they strike the next fuel rod. This dissipation of energy is referred to as
moderation; it is achieved by the interaction of neutrons with water
molecules.
The movable boron rods absorb neutrons. Their purpose is to regulate the
energy output and to allow the shutdown of the reactor when needed.
The heat produced in the fission is exchanged with water under high
pressure and circulating at high velocity through the pressure vessel of the
reactor. The water temperature reaches slightly over 300 8C. Steam, to drive a
turbine, is produced either directly (in boiling water reactors) or through
heat exchange (in pressurized water reactors). Breeder reactors, which do
not require slowing down (moderation) of neutron use liquid sodium rather
than water as the heat-exchange fluid.
The escape of some radioactivity from the reactors is unavoidable. Some
radioactive fission products leak into the cooling water through pinholes in
the fuel rod casings. Collisions of neutrons and protons with oxygen in
circulating water, and of neutrons with the corrosion products of the system,
produce additional radioisotopes that either escape or are purposely released
Radioactive Pollution 277
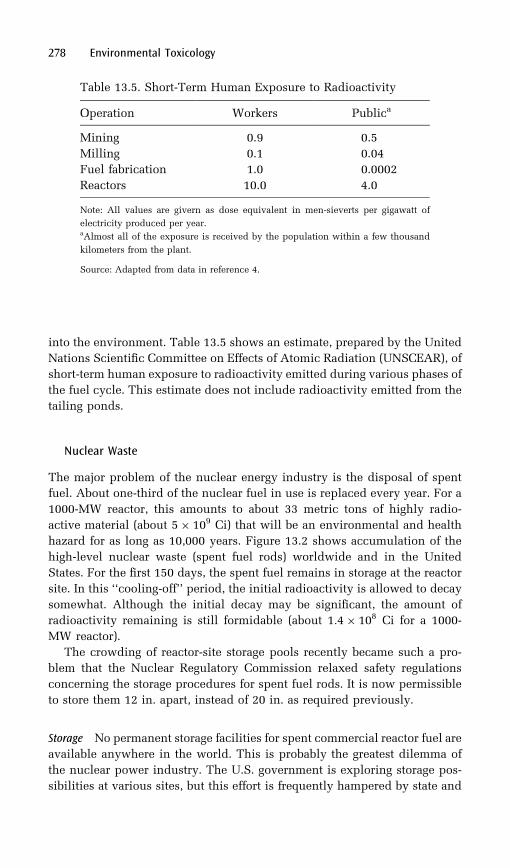
into the environment. Table 13.5 shows an estimate, prepared by the United
Nations Scientific Committee on Effects of Atomic Radiation (UNSCEAR), of
short-term human exposure to radioactivity emitted during various phases of
the fuel cycle. This estimate does not include radioactivity emitted from the
tailing ponds.
Nuclear Waste
The major problem of the nuclear energy industry is the disposal of spent
fuel. About one-third of the nuclear fuel in use is replaced every year. For a
1000-MW reactor, this amounts to about 33 metric tons of highly radio-
active material (about 5� 109 Ci) that will be an environmental and health
hazard for as long as 10,000 years. Figure 13.2 shows accumulation of the
high-level nuclear waste (spent fuel rods) worldwide and in the United
States. For the first 150 days, the spent fuel remains in storage at the reactor
site. In this ‘‘cooling-off’’ period, the initial radioactivity is allowed to decay
somewhat. Although the initial decay may be significant, the amount of
radioactivity remaining is still formidable (about 1:4� 108 Ci for a 1000-
MW reactor).
The crowding of reactor-site storage pools recently became such a pro-
blem that the Nuclear Regulatory Commission relaxed safety regulations
concerning the storage procedures for spent fuel rods. It is now permissible
to store them 12 in. apart, instead of 20 in. as required previously.
Storage No permanent storage facilities for spent commercial reactor fuel are
available anywhere in the world. This is probably the greatest dilemma of
the nuclear power industry. The U.S. government is exploring storage pos-
sibilities at various sites, but this effort is frequently hampered by state and
278 Environmental Toxicology
Table 13.5. Short-Term Human Exposure to Radioactivity
Operation Workers Publica
Mining 0.9 0.5
Milling 0.1 0.04
Fuel fabrication 1.0 0.0002
Reactors 10.0 4.0
Note: All values are givern as dose equivalent in men-sieverts per gigawatt of
electricity produced per year.aAlmost all of the exposure is received by the population within a few thousand
kilometers from the plant.
Source: Adapted from data in reference 4.
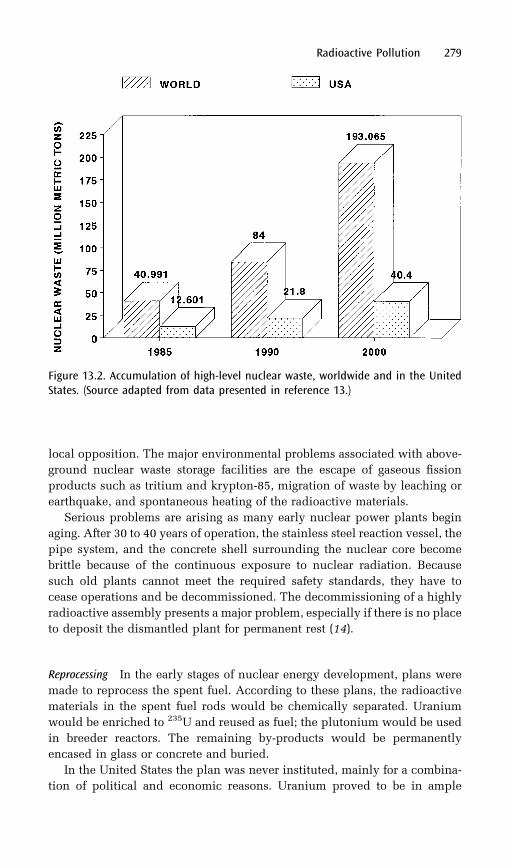
local opposition. The major environmental problems associated with above-
ground nuclear waste storage facilities are the escape of gaseous fission
products such as tritium and krypton-85, migration of waste by leaching or
earthquake, and spontaneous heating of the radioactive materials.
Serious problems are arising as many early nuclear power plants begin
aging. After 30 to 40 years of operation, the stainless steel reaction vessel, the
pipe system, and the concrete shell surrounding the nuclear core become
brittle because of the continuous exposure to nuclear radiation. Because
such old plants cannot meet the required safety standards, they have to
cease operations and be decommissioned. The decommissioning of a highly
radioactive assembly presents a major problem, especially if there is no place
to deposit the dismantled plant for permanent rest (14).
Reprocessing In the early stages of nuclear energy development, plans were
made to reprocess the spent fuel. According to these plans, the radioactive
materials in the spent fuel rods would be chemically separated. Uranium
would be enriched to 235U and reused as fuel; the plutonium would be used
in breeder reactors. The remaining by-products would be permanently
encased in glass or concrete and buried.
In the United States the plan was never instituted, mainly for a combina-
tion of political and economic reasons. Uranium proved to be in ample
Radioactive Pollution 279
Figure 13.2. Accumulation of high-level nuclear waste, worldwide and in the UnitedStates. (Source adapted from data presented in reference 13.)
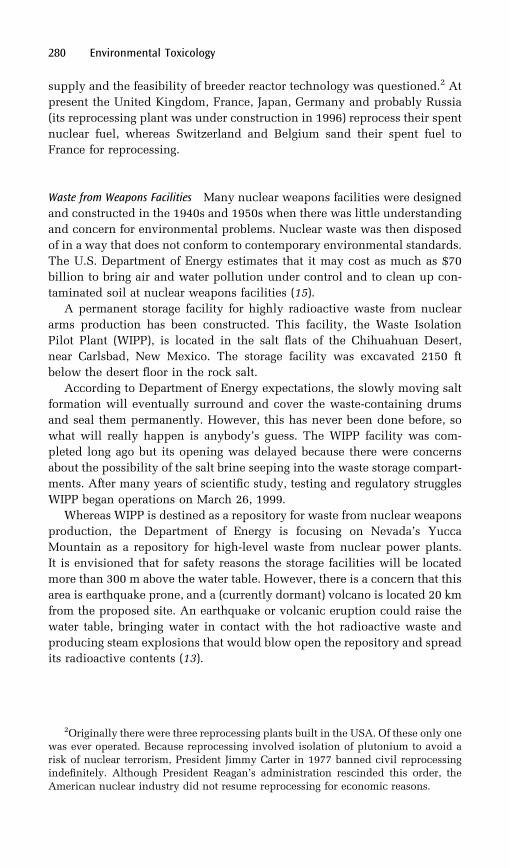
supply and the feasibility of breeder reactor technology was questioned.2 At
present the United Kingdom, France, Japan, Germany and probably Russia
(its reprocessing plant was under construction in 1996) reprocess their spent
nuclear fuel, whereas Switzerland and Belgium sand their spent fuel to
France for reprocessing.
Waste from Weapons Facilities Many nuclear weapons facilities were designed
and constructed in the 1940s and 1950s when there was little understanding
and concern for environmental problems. Nuclear waste was then disposed
of in a way that does not conform to contemporary environmental standards.
The U.S. Department of Energy estimates that it may cost as much as $70
billion to bring air and water pollution under control and to clean up con-
taminated soil at nuclear weapons facilities (15).
A permanent storage facility for highly radioactive waste from nuclear
arms production has been constructed. This facility, the Waste Isolation
Pilot Plant (WIPP), is located in the salt flats of the Chihuahuan Desert,
near Carlsbad, New Mexico. The storage facility was excavated 2150 ft
below the desert floor in the rock salt.
According to Department of Energy expectations, the slowly moving salt
formation will eventually surround and cover the waste-containing drums
and seal them permanently. However, this has never been done before, so
what will really happen is anybody’s guess. The WIPP facility was com-
pleted long ago but its opening was delayed because there were concerns
about the possibility of the salt brine seeping into the waste storage compart-
ments. After many years of scientific study, testing and regulatory struggles
WIPP began operations on March 26, 1999.
Whereas WIPP is destined as a repository for waste from nuclear weapons
production, the Department of Energy is focusing on Nevada’s Yucca
Mountain as a repository for high-level waste from nuclear power plants.
It is envisioned that for safety reasons the storage facilities will be located
more than 300 m above the water table. However, there is a concern that this
area is earthquake prone, and a (currently dormant) volcano is located 20 km
from the proposed site. An earthquake or volcanic eruption could raise the
water table, bringing water in contact with the hot radioactive waste and
producing steam explosions that would blow open the repository and spread
its radioactive contents (13).
280 Environmental Toxicology
2Originally there were three reprocessing plants built in the USA. Of these only onewas ever operated. Because reprocessing involved isolation of plutonium to avoid a
risk of nuclear terrorism, President Jimmy Carter in 1977 banned civil reprocessing
indefinitely. Although President Reagan’s administration rescinded this order, the
American nuclear industry did not resume reprocessing for economic reasons.
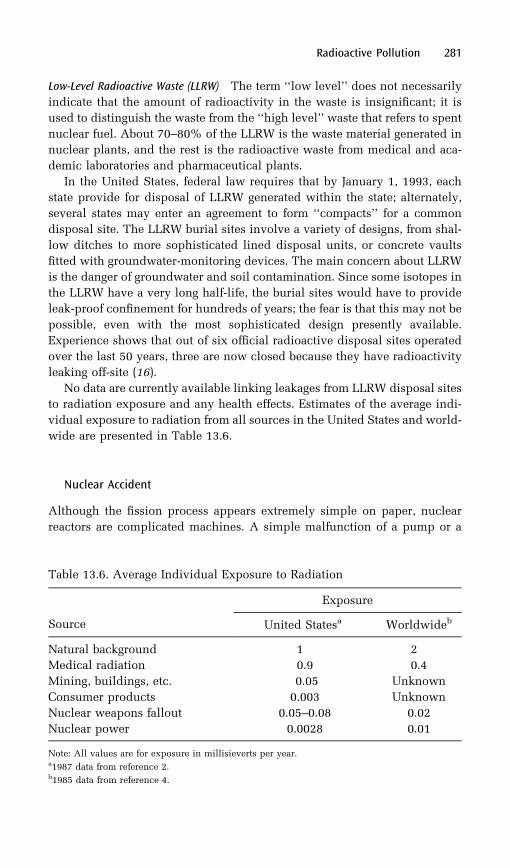
Low-Level Radioactive Waste (LLRW) The term ‘‘low level’’ does not necessarily
indicate that the amount of radioactivity in the waste is insignificant; it is
used to distinguish the waste from the ‘‘high level’’ waste that refers to spent
nuclear fuel. About 70–80% of the LLRW is the waste material generated in
nuclear plants, and the rest is the radioactive waste from medical and aca-
demic laboratories and pharmaceutical plants.
In the United States, federal law requires that by January 1, 1993, each
state provide for disposal of LLRW generated within the state; alternately,
several states may enter an agreement to form ‘‘compacts’’ for a common
disposal site. The LLRW burial sites involve a variety of designs, from shal-
low ditches to more sophisticated lined disposal units, or concrete vaults
fitted with groundwater-monitoring devices. The main concern about LLRW
is the danger of groundwater and soil contamination. Since some isotopes in
the LLRW have a very long half-life, the burial sites would have to provide
leak-proof confinement for hundreds of years; the fear is that this may not be
possible, even with the most sophisticated design presently available.
Experience shows that out of six official radioactive disposal sites operated
over the last 50 years, three are now closed because they have radioactivity
leaking off-site (16).
No data are currently available linking leakages from LLRW disposal sites
to radiation exposure and any health effects. Estimates of the average indi-
vidual exposure to radiation from all sources in the United States and world-
wide are presented in Table 13.6.
Nuclear Accident
Although the fission process appears extremely simple on paper, nuclear
reactors are complicated machines. A simple malfunction of a pump or a
Radioactive Pollution 281
Table 13.6. Average Individual Exposure to Radiation
Source
Exposure
United Statesa Worldwideb
Natural background 1 2
Medical radiation 0.9 0.4
Mining, buildings, etc. 0.05 Unknown
Consumer products 0.003 Unknown
Nuclear weapons fallout 0.05–0.08 0.02
Nuclear power 0.0028 0.01
Note: All values are for exposure in millisieverts per year.a1987 data from reference 2.b1985 data from reference 4.
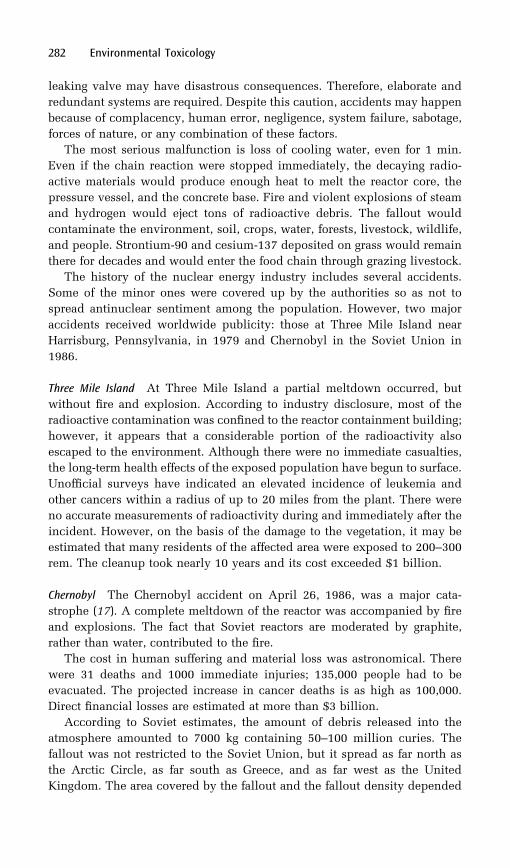
leaking valve may have disastrous consequences. Therefore, elaborate and
redundant systems are required. Despite this caution, accidents may happen
because of complacency, human error, negligence, system failure, sabotage,
forces of nature, or any combination of these factors.
The most serious malfunction is loss of cooling water, even for 1 min.
Even if the chain reaction were stopped immediately, the decaying radio-
active materials would produce enough heat to melt the reactor core, the
pressure vessel, and the concrete base. Fire and violent explosions of steam
and hydrogen would eject tons of radioactive debris. The fallout would
contaminate the environment, soil, crops, water, forests, livestock, wildlife,
and people. Strontium-90 and cesium-137 deposited on grass would remain
there for decades and would enter the food chain through grazing livestock.
The history of the nuclear energy industry includes several accidents.
Some of the minor ones were covered up by the authorities so as not to
spread antinuclear sentiment among the population. However, two major
accidents received worldwide publicity: those at Three Mile Island near
Harrisburg, Pennsylvania, in 1979 and Chernobyl in the Soviet Union in
1986.
Three Mile Island At Three Mile Island a partial meltdown occurred, but
without fire and explosion. According to industry disclosure, most of the
radioactive contamination was confined to the reactor containment building;
however, it appears that a considerable portion of the radioactivity also
escaped to the environment. Although there were no immediate casualties,
the long-term health effects of the exposed population have begun to surface.
Unofficial surveys have indicated an elevated incidence of leukemia and
other cancers within a radius of up to 20 miles from the plant. There were
no accurate measurements of radioactivity during and immediately after the
incident. However, on the basis of the damage to the vegetation, it may be
estimated that many residents of the affected area were exposed to 200–300
rem. The cleanup took nearly 10 years and its cost exceeded $1 billion.
Chernobyl The Chernobyl accident on April 26, 1986, was a major cata-
strophe (17). A complete meltdown of the reactor was accompanied by fire
and explosions. The fact that Soviet reactors are moderated by graphite,
rather than water, contributed to the fire.
The cost in human suffering and material loss was astronomical. There
were 31 deaths and 1000 immediate injuries; 135,000 people had to be
evacuated. The projected increase in cancer deaths is as high as 100,000.
Direct financial losses are estimated at more than $3 billion.
According to Soviet estimates, the amount of debris released into the
atmosphere amounted to 7000 kg containing 50–100 million curies. The
fallout was not restricted to the Soviet Union, but it spread as far north as
the Arctic Circle, as far south as Greece, and as far west as the United
Kingdom. The area covered by the fallout and the fallout density depended
282 Environmental Toxicology
on wind direction and the pattern of precipitation. Agricultural losses of the
affected European countries were considerable.
Future of Nuclear Power
As of 1995, there were 431 nuclear power plants worldwide. They had a
generating capacity of 342,554 MW. In the United States, the corresponding
figures were 109 plants with a total capacity of 99,673 MW (18).
Considering that nuclear power technology has been in existence for
slightly more than 30 years, this productivity appears to be an impressive
achievement. However, the future of the nuclear power industry is very
uncertain. In 1972 the International Atomic Energy Agency (IAEA) projected
that by the year 2000 the worldwide energy produced by nuclear fission
would reach 3,500,000 MW. In 1986 these projections were scaled down
to 500,000 MW (17).
Economics The two reasons for this decline are economics and politics.
Originally it was thought that the electricity produced by nuclear fission
would be ‘‘too cheap to bother to meter it.’’ In reality, it turned out to be
the most expensive way of producing electricity.
According to figures of the nuclear energy industry, the average cost of
electricity from nuclear plants is 12 cents per kilowatt-hour (kWh), as com-
pared to 6 cents per kilowatt-hour from coal-powered plants. In addition,
because of elaborate safety measures, the construction cost rose steadily from
$200 per kilowatt in the 1970s to $3200 per kilowatt in 1986 (17). At the
same time, the rate of growth of electricity consumption declined.
The National Energy Strategy of 1991, proposed by the Bush administra-
tion, contains provisions for stimulation of development of nuclear power.
However, there are objections to this strategy, both in the legislature (House
and Senate) and among environmental groups.
Safety Concern about safety has also contributed to the decline of the
nuclear power industry. Before the Chernobyl disaster, opposition to nuclear
power in most countries was limited to grass-roots environmental organiza-
tions. After Chernobyl the situation changed. The grass-roots opposition
increased, and the governments of many countries began to reassess the
wisdom of further development of fission energy.
Chernobyl demonstrated the transboundary characteristics of nuclear
accidents and the fact that no country has any contingency for dealing
with such disasters. In addition, attempts by governmental or corporate offi-
cials to conceal the true extent of nuclear accidents (as was the case at the
Windscale nuclear plant disaster in the United Kingdom in 1957, at Three
Mile Island in 1979, and at Chernobyl in 1986) have undermined society’s
Radioactive Pollution 283

confidence in the truthfulness and competence of its leaders. This distrust
has hardened antinuclear opposition.
Proponents of nuclear energy argue that, as compared to coal mining,
relatively few lives have been lost in nuclear accidents. Although this is
undoubtedly true, the difference is that coal mine accidents are limited to
local areas. Nuclear accidents endanger the lives and property of the general
public throughout vast areas, frequently beyond national borders.
Another argument in favor of nuclear energy is that, at present, it is the
only practical large-scale source of energy that does not contribute to the
greenhouse effect.
Inherently Safe Reactors
Even before Chernobyl, the nuclear power industry, some academic institu-
tions, and governmental bodies had begun to analyze the causes of the
nuclear power debacle. Between September 1983 and summer 1984, four
organizations (the Massachusetts Institute of Technology, the
Congressional Office of Technology Assessment, the Institute for Energy
Analysis, and the Atomic Industrial Forum) published reports on the status
of nuclear power and recommendations for a possible revival of the industry.
Three of these groups recommended, among other things, radically changing
the design of reactors (19).
Process-Inherent Ultimate-Safety Reactor Two of these ‘‘inherently safe reactors’’
were singled out as possible alternatives to the conventional LWRs (light-
water reactors) that are presently in use. The water-moderated, water-cooled
PIUS (process-inherent ultimate-safety) reactor, which was developed in
Sweden, contains several innovative safety features.
The stainless steel pressure vessel is embedded in a reinforced concrete
structure. In an emergency the core is automatically flooded with borated
water, which instantly stops the fission. The heat generated by the decay of
the radioactive fission products is dissipated by convection currents and
evaporation of a large pool of water. This reactor is designed so that the
core would be covered by water for about a week, giving enough time for
remedial action before any meltdown could occur. The power-generating
capacity of a single PIUS reactor is limited to 400 MW.
High-Temperature Gas-Cooled Reactor A graphite-moderated, helium-cooled
HTGR (high-temperature gas-cooled reactor) was developed in the United
States by GA Technologies. This small reactor is limited in its power-gen-
erating capacity to less than 100 MW per unit. The fuel consists of uranium
oxide particles embedded in chunks of graphite and scattered among gra-
phite blocks. Helium gas is used as both a coolant and a heat-transfer med-
ium. Because the fuel is widely scattered, the reactor has a high heat
284 Environmental Toxicology
capacity. Thus, it will heat up slowly in the case of coolant loss. Its operating
temperature is around 1000 8C, well below the 2000 8C that the graphite can
withstand.
The German version of HTGR is smaller. Its fuel is in the form of pebbles
coated with graphite and contained in graphite balls. New fuel is loaded
from the top, and the spent fuel emerges from the bottom. This arrangement
allows refueling without shutting the reactor down. A few HTGR reactors are
in operation in Germany, the United Kingdom, and the United States.
Power Reactor Inherently Safe Module (PRISM) This reactor, developed by
General Electric, is fundamentally different from those previously described
because it uses liquid metal rather than water or gas as the coolant. The fuel
rods are submerged in liquid sodium. Sodium boils at 900 8C and thus in the
case of overheating, the coolant pool can absorb the excess heat. In addition,
the rise in temperature causes the fuel and the coolant to expand, which
slows the fission. Each module has a power-producing capacity of only 155
MW (20).
Whether this second generation of nuclear reactors will be more accep-
table to the public is not certain. As stated in the report of the Office of
Technology Assessment, nuclear energy has no future without public sup-
port (19). In any case, no matter how safe the new reactors become, the
problem of radioactive waste disposal will remain.
References
1. Noz, M. E.; Maguire, G. O., Jr. Radiation Protection in the Radiologic andHealth Sciences; Lea and Febiger: Philadelphia, PA, 1979.
2. Low-Level Radiation Effects: A Fact Book; Brill, A. B.; Adelstein, S. J.;Saenger, E. L.; Webster, E. W., Eds.; Society of Nuclear Medicine: NewYork, 1982.
3. Hanson, D. J. Chem. Eng. News February 8, 1988, 7.4. Radiation: Doses, Effects, Risks; United Nations Environment
Programme: Nairobi, Kenya, 1985.5. Okita, T. J. Radiat. Res. Suppl., review of 30 years of study of Hiroshima
and Nagasaki atomic bomb survivors; Okada, S.; Hamilton, H. B.; Egami,V.; Okajima, S.; Russell, W. J.; Takeshita, K., Eds.; Japan RadiationSociety: Chiba, Japan, 1975; Chapter II A, p 49.
6. Hobbs, C. H.; McClellan, R. O. In Cassarett and Doull’s Toxicology;Klaassen, C. D.; Amdur, M. O.; Doull, J., Eds.; MacMillan: New York,1986; Chapter 21, p 669.
7. Ducoff, H. S. In Biological Environmental Effects of Low-Level Radiation;proceedings of a symposium organized by the International AtomicEnergy Agency and the World Health Organization; InternationalAtomic Energy Agency: Vienna, Austria, 1976; Vol. I, p 103.
8. Grosh, D. S. In Introduction to Environmental Toxicology; Guthrie, F. E.;Perry, J. J., Eds.; Elsevier Science: New York, 1980; Chapter 4, p 44.
Radioactive Pollution 285
9. Grosh, D. S.; Hopwood, L. E. Biological Effects of Radiation; Academic:New York, 1979; p 253.
10. Beebe, G. W.; Kato, H. J. Radiat. Res. Suppl., review of 30 years of studyof Hiroshima and Nagasaki atomic bomb survivors; Okada, S.; Hamilton,H. B.; Egami, V.; Okajima, S.; Russell, W. J.; Takeshita, K., Eds.; JapanRadiation Society: Chiba, Japan, 1975; Chapter II E, p 97.
11. Schilling, C. W. Atomic Energy Encyclopedia in the Life Sciences; W. B.Saunders: Philadelphia, PA, 1964; pp 235 and 239.
12. Woodwell, G. M. Science (Washington, D.C.) 1967, 156(3774), 461.13. Lenssen, N. In State of the World 1992; Brown, L. R., Ed.; W. W. Norton:
New York, 1992; Chapter 4, p 46.14. Pollock, C. Worldwatch Paper 69; Worldwatch Institute: Washington,
DC, 1986.15. Long, J. Chem. Eng. News July 11, 1988, 6.16. Rachel’s Hazardous Waste News September 9, 1992, no. 302.17. Flavin, C. In State of the World 1987; Brown, L. R., Ed.; W. W. Norton:
New York, 1987; Chapter 5, p 81.18. Nuclear Energy Dept., Hacettepe University
hhttp://www.nuke.hun.edu.tr/react/list/nation.htmli19. Manning, R. Environment 1985, 27, 12–17.20. World Resources Institute in collaboration with the United Nations
Environment Programme and the United Nations DevelopmentProgram. World Resources 1990–91; Oxford University: New York,1990; Chapter 9, p 141.
286 Environmental Toxicology
14Population, Environment, andWomen’s Issues
Present Trends in Population Growth
Ultimately, the necessity to supply food, energy, habitat, infrastructure, and
consumer goods for the ever-growing population is responsible for the
demise of the environment. Remedial actions for pollution abatement, and
further technological progress toward energy efficiency, development of new
crops, and improvements in manufacturing processes may help to mitigate
the severity of environmental deterioration. However, we can hardly hope
for restoration of a clean environment, improvement in human health, and
an end to poverty without arresting the continuous growth of the world
population.
According to the United Nations count, world population reached 6 bil-
lion in mid October 1999 (1). The rate of population growth and the fertility
rates by continent, as well as in the United States and Canada, are presented
in Table 14.1. It can be seen that the fastest population growth occurs in the
poorest countries of the world. Despite the worldwide decrease in fertility
rates between 1975–80 period and that of 1995–2000, the rate of population
growth in most developing countries changed only slightly due to the demo-
graphic momentum, which means that because of the high fertility rates in
the previous decades, the number of women of childbearing age had
increased.
Historically, the preference for large families in the developing nations
was in part a result of either cultural or religious traditions. In some cases
there were practical motivations, as children provided helping hands with
farm chores and a security in old age.
287
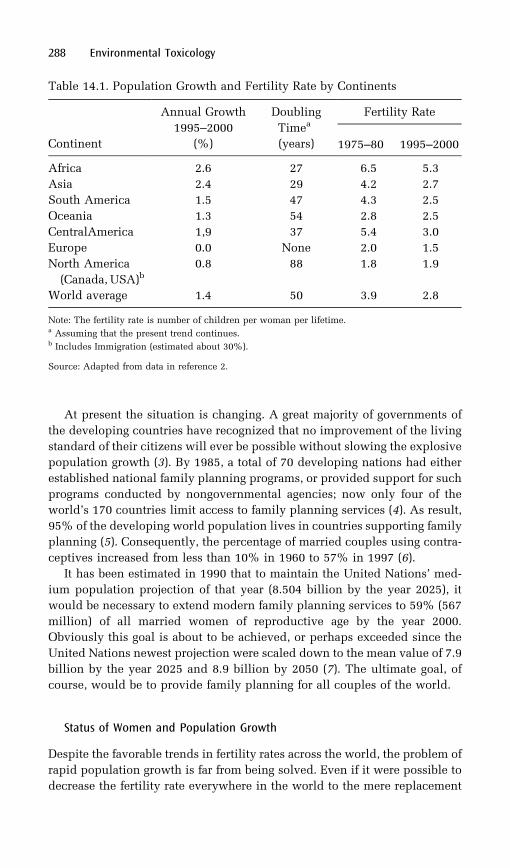
At present the situation is changing. A great majority of governments of
the developing countries have recognized that no improvement of the living
standard of their citizens will ever be possible without slowing the explosive
population growth (3). By 1985, a total of 70 developing nations had either
established national family planning programs, or provided support for such
programs conducted by nongovernmental agencies; now only four of the
world’s 170 countries limit access to family planning services (4). As result,
95% of the developing world population lives in countries supporting family
planning (5). Consequently, the percentage of married couples using contra-
ceptives increased from less than 10% in 1960 to 57% in 1997 (6).
It has been estimated in 1990 that to maintain the United Nations’ med-
ium population projection of that year (8.504 billion by the year 2025), it
would be necessary to extend modern family planning services to 59% (567
million) of all married women of reproductive age by the year 2000.
Obviously this goal is about to be achieved, or perhaps exceeded since the
United Nations newest projection were scaled down to the mean value of 7.9
billion by the year 2025 and 8.9 billion by 2050 (7). The ultimate goal, of
course, would be to provide family planning for all couples of the world.
Status of Women and Population Growth
Despite the favorable trends in fertility rates across the world, the problem of
rapid population growth is far from being solved. Even if it were possible to
decrease the fertility rate everywhere in the world to the mere replacement
288 Environmental Toxicology
Table 14.1. Population Growth and Fertility Rate by Continents
Continent
Annual Growth
1995–2000
(%)
Doubling
Timea
(years)
Fertility Rate
1975–80 1995–2000
Africa 2.6 27 6.5 5.3
Asia 2.4 29 4.2 2.7
South America 1.5 47 4.3 2.5
Oceania 1.3 54 2.8 2.5
CentralAmerica 1,9 37 5.4 3.0
Europe 0.0 None 2.0 1.5
North America
(Canada, USA)b0.8 88 1.8 1.9
World average 1.4 50 3.9 2.8
Note: The fertility rate is number of children per woman per lifetime.a Assuming that the present trend continues.b Includes Immigration (estimated about 30%).
Source: Adapted from data in reference 2.
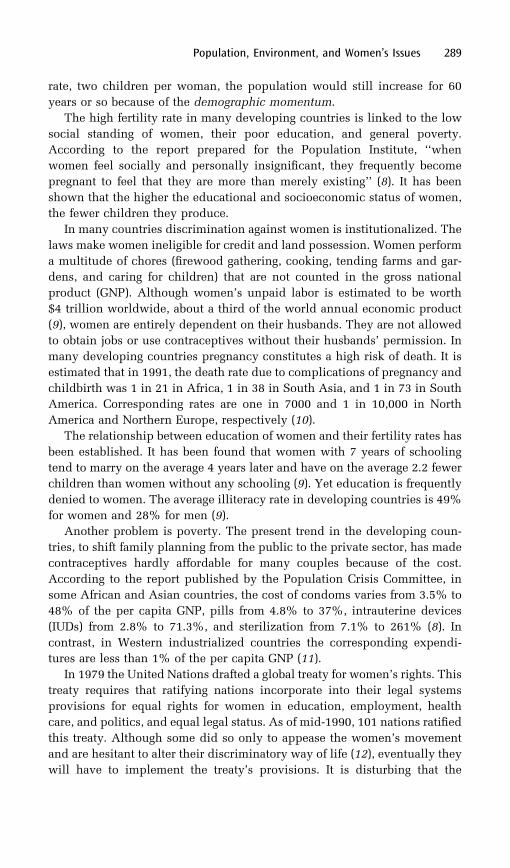
rate, two children per woman, the population would still increase for 60
years or so because of the demographic momentum.
The high fertility rate in many developing countries is linked to the low
social standing of women, their poor education, and general poverty.
According to the report prepared for the Population Institute, ‘‘when
women feel socially and personally insignificant, they frequently become
pregnant to feel that they are more than merely existing’’ (8). It has been
shown that the higher the educational and socioeconomic status of women,
the fewer children they produce.
In many countries discrimination against women is institutionalized. The
laws make women ineligible for credit and land possession. Women perform
a multitude of chores (firewood gathering, cooking, tending farms and gar-
dens, and caring for children) that are not counted in the gross national
product (GNP). Although women’s unpaid labor is estimated to be worth
$4 trillion worldwide, about a third of the world annual economic product
(9), women are entirely dependent on their husbands. They are not allowed
to obtain jobs or use contraceptives without their husbands’ permission. In
many developing countries pregnancy constitutes a high risk of death. It is
estimated that in 1991, the death rate due to complications of pregnancy and
childbirth was 1 in 21 in Africa, 1 in 38 in South Asia, and 1 in 73 in South
America. Corresponding rates are one in 7000 and 1 in 10,000 in North
America and Northern Europe, respectively (10).
The relationship between education of women and their fertility rates has
been established. It has been found that women with 7 years of schooling
tend to marry on the average 4 years later and have on the average 2.2 fewer
children than women without any schooling (9). Yet education is frequently
denied to women. The average illiteracy rate in developing countries is 49%
for women and 28% for men (9).
Another problem is poverty. The present trend in the developing coun-
tries, to shift family planning from the public to the private sector, has made
contraceptives hardly affordable for many couples because of the cost.
According to the report published by the Population Crisis Committee, in
some African and Asian countries, the cost of condoms varies from 3.5% to
48% of the per capita GNP, pills from 4.8% to 37%, intrauterine devices
(IUDs) from 2.8% to 71.3%, and sterilization from 7.1% to 261% (8). In
contrast, in Western industrialized countries the corresponding expendi-
tures are less than 1% of the per capita GNP (11).
In 1979 the United Nations drafted a global treaty for women’s rights. This
treaty requires that ratifying nations incorporate into their legal systems
provisions for equal rights for women in education, employment, health
care, and politics, and equal legal status. As of mid-1990, 101 nations ratified
this treaty. Although some did so only to appease the women’s movement
and are hesitant to alter their discriminatory way of life (12), eventually they
will have to implement the treaty’s provisions. It is disturbing that the
Population, Environment, and Women’s Issues 289

United States, the champion of human rights and civil liberties, has not yet
ratified the treaty.
Population Growth and the Global Food Supply
Grain Supply Since the mid-sixties, there has been a dramatic increase in
world food production, especially in the developing countries. This boon
in world nutrition, referred to as the green revolution, was possible thanks to
the development of high-yield grains, heavy application of fertilizers and
pesticides, irrigation, increased use of machinery, and augmentation of
land area under cultivation. Figure 14.1 presents the growth of the world
population and of cereal production from 1960, as projected to the year 2000.
Because about 50% of the calories in the human diet is supplied by cereals,
production of cereals is the best indicator of the nutritional status of the
world population.
The benefits of the green revolution were not equally distributed through-
out all countries of the world. The greatest success was achieved in the Asian
centrally planned economies, where grain production increased by 114%
between 1965 and 1988. The smallest gains were in Africa, with only a
40% increase during the same period. These small gains, coupled with a
77% increase in population, resulted in a decrease of per capita grain pro-
duction from 118 to 108 kilograms.
290 Environmental Toxicology
Figure 14.1. Growth of the world population and of cereal production between 1960and 2000. (Source: Data are from references 1 and 13.)
Although the green revolution provided food for millions, it had some
negative impact on the environment. Salinization, alkalinization, waterlog-
ging, and depletion of groundwater were results of improper or excessive
irrigation (14). Land erosion and runoff of fertilizers and pesticides caused
water pollution, and in some cases cropland expansion may have contribu-
ted to deforestation. In addition, the green revolution had socioeconomic
repercussions; the need for fertilizers and pesticides increased the cost of
farming, forcing small farmers out of business.
Despite the success of the green revolution, many of the world’s people
remained undernourished (Figure 14.2). Although big strides in decreasing
the number of undernourished have been made between 1970 and 1995 in
the developing world there still are about 790 million people who do not get
enough to eat. The problems of hunger are worst in Sub-Saharan Africa and
India with 25% and 22%, respectively, of the population undernourished
(15).
The cause of world hunger is not a food shortage but rather unequal food
distribution, poverty, and in some cases, political unrest. Poverty is certainly
the most pervasive cause, and it can hardly be remedied as long as popula-
tion growth is out of control. Present world food production could provide
Population, Environment, and Women’s Issues 291
Figure 14.2. Estimated number of undernourished people in the world. The U.N. Foodand Agriculture Organization considers people ‘‘undernourished’’ when their totaldaily caloric intake is below 1.4 times the basal metabolic rate; the basal metabolicrate is defined as the energy requirement while fasting and at complete rest. (Source:Data are from reference 15.)
nutrition, albeit a mostly vegetable diet, to more than six billion people (16).
However, about one-third of world cereal production, the staple food of large
masses, is used to feed livestock to produce high-caloric foods (eggs, dairy
products, and meat1), which are beyond the reach of the poor of the world
(17).
Although the global production of cereals is still increasing, albeit at a
slower rate than during the sixties, seventies, and early eighties, the per
capita increase shows a distinct downward trend (Figure 14.1).
It appears that the peak gains of the green revolution may have occurred
in the past. Since the strains of grains presently cultivated reached the limits
of their responsiveness to fertilizers, not much can be gained by increasing
the application rate of fertilizers (18). By 2025 the per capita cropland area is
expected to decrease by about 40% from the present (19), unless new agri-
cultural acreage is added. Asia has little potential for additional cropland
because 82% of the available land is already under cultivation. In some other
areas, such as sub-Saharan Africa and Latin America, large land reserves are
available but the soil is of marginal quality (20). Dennis Avery of the Hudson
Institute in Indianapolis argues that there is enough idle cropland in the
United States and Argentina alone to provide food for an extra 1.4 billion
people (21). Obviously this will not solve the world’s needs for very long
because at the present rate of population growth, 1.4 billion people will be
added to the earth’s population by the year 2009. Besides, Avery’s assertion
does not consider the long-term effects of land and water degradation caused
by agriculture. According to some sources, desertification, salinization,
waterlogging, and erosion may render as much agricultural land useless
each year as is added (20). Leaving no soil reserves to allow reclamation of
degraded land is a nearsighted policy. Nor does Avery take into considera-
tion the fact that there is a growing water shortage. An ample supply of
freshwater is necessary for successful agriculture, yet in many parts of the
world, including the United States, some aquifers are beginning to be
depleted owing to excessive use of groundwater for irrigation (22).
Another problem is loss of biodiversity. Modern agriculture is based on
planting high-yield, monoculture crops. The genetic similarity within each
type of grain makes the crops highly sensitive to a pest invasion, requiring
increasing use of pesticides. This not only increases the cost and the energy
requirement, but also has a detrimental effect on the environment. At the
same time, encroachment of human settlements and agriculture on fallow
land causes disappearance of native grasses, which represent genetic mate-
rial for development of new varieties of grains. Although international seed
banks have been created to preserve as much biodiversity as possible, it is
292 Environmental Toxicology
1It takes 2 kg of grain to produce 1 kg of poultry meat, 4 kg to produce 1 kg of pork,
and 7 kg to produce 1 kg of beef.
doubtful that these seed collections will completely prevent the disappear-
ance of species (21).
Meat Supply Meat production increased from 132 million tons in 1980 to 217
million ton in 1999. During the same period of time, the per capita produc-
tion increased from 29.5 kg to 36.3 kg (15). This growth was due, at least in
part, to the increased demand by the growing economy of China, and did
nothing to relieve the hunger of dispossessed.
Fish Supply Fish is an important source of protein, especially for the popula-
tion of the developing countries. Whereas in North America and Western
Europe fish consumption contributes 6.6% and 9.7%, respectively, of the
animal protein intake, it contributes 21.1% in Africa and 21.7% in Asian
centrally planned economies (23). Between 1950 and 1989 the fish catch
kept expanding, reaching 100 million tons, which translated into 19 kilo-
grams per capita. Since 1989, despite sophisticated fishing technologies and
a large number of fishing vessels prowling the seas, the catch has declined. It
picked up again in 1994, remained constant through 1997, and began to
decline thereafter (15). It is believed that the oceans have reached their
limits. There are two reasons for the declining catch. Pollution of coastal
waters, the breeding areas of many species, affected fish reproduction. At the
same time, overfishing depleted the fish stocks faster than they could be
replaced. The depletion of the fish stocks not only put many fishermen out
of work, but also raised prices, making fish less accessible to poor people.
This is specially detrimental to the population of developing countries.
The decline in fish catch was partially off-set by the growth in the output
of farmed fish. However, the cultured fish goes mostly to tables of the
wealthy. Besides aquaculture takes its toll on environment by requiring fod-
der for the fish (mostly fishmeal made from small fish, thus decreasing avail-
ability of food for the wild fish), and polluting waters.
With continuous growth of population, the outlook for the future food
supply is grim or at least very uncertain. Additional factors that threaten
future food supply are urbanization, which takes land away from agriculture;
damage to crops by excessive ultraviolet radiation (a consequence of strato-
spheric ozone depletion); and, possibly, a change of the climate caused by
emissions of greenhouse gases.
Effect of Overpopulation on the Environment
The term ‘‘overpopulation’’ is not necessarily related to population density,
but rather to the area carrying capacity. An area is considered overpopulated
if it cannot sustain its population without permanently destroying natural
resources (24).
Population, Environment, and Women’s Issues 293
Of course, the earth is resilient, and depleted resources may renew them-
selves given sufficient time and lack of interference from the human popula-
tion. However, if preservation of our society is the goal, ‘‘permanent’’ has to
be considered within the frame of a human life span. For instance, destruc-
tion of a tropical forest has to be considered permanent, even if it may regrow
itself after several hundred years. So is desertification of land or depletion of
groundwater.
The biologist Paul Ehrlich devised a formula that describes the impact of
a society on the environment: I = PAT, where I stands for impact, P for
population, A for affluence (i.e., consumption), and T for technology (25).
In developing countries, where the majority are poor and technology is
not well developed, the production and consumption of goods are low. The
environmental deterioration is mainly due to the large number of poor peo-
ple and their quest for lumber, firewood, cropland, and grazing land.
Deforestation, especially by slash and burn, contributes to an increase of
greenhouse gas emissions; it also affects the hydrological cycle and increases
soil erosion. According to a publication by the United Nations Population
Fund (14): ‘‘Between 1971 and 1986, world arable land expanded by 59
million hectares, while forest shrank by 125 million hectares. Over the
same period, land going to settlements, roads, industries, office buildings
and so on, may have expanded by more than 50 million hectares to cope
with the needs of expanding urban centers . . . Growing population may be
responsible for as much as 80% of the loss of forest cover.’’
Loss of biodiversity is a direct consequence of deforestation and of human
encroachment on the wildlife habitat. Although disappearance of species is a
natural evolutionary phenomenon, the present rate of species extinction is
estimated to be 400 times the natural rate. Such rapid extinction disrupts the
ecological balance and may greatly affect the future global economy.
Whereas in the past the reasons for extinction were competition between
species and overexploitation, presently the destruction of habitat is the pre-
dominant factor. A relationship between population growth and species loss
is shown in Figure 14.3.
Changes in precipitation patterns due to deforestation, cultivation of mar-
ginal land, and overgrazing lead to land erosion and desertification. The
problem of salinization, alkalinization, and waterlogging has been discussed
in the preceding section. The situation is frequently aggravated by pervasive
poverty, unequal land distribution between a few wealthy families and the
poverty-stricken masses, and inefficient agricultural technologies.
Other consequences of overpopulation are loss of water resources and
deterioration of water quality. Because freshwater resources are finite, the
per capita availability of water is related to the number of people competing
for the same water source. Since 1850, the global freshwater resources
declined from 33,000 cubic meters per capita per year to 8500 cubic meters
in 1991 (14). It has been determined that a society is affected by water short-
age when the amount of available freshwater declines to 500 cubic meters
294 Environmental Toxicology
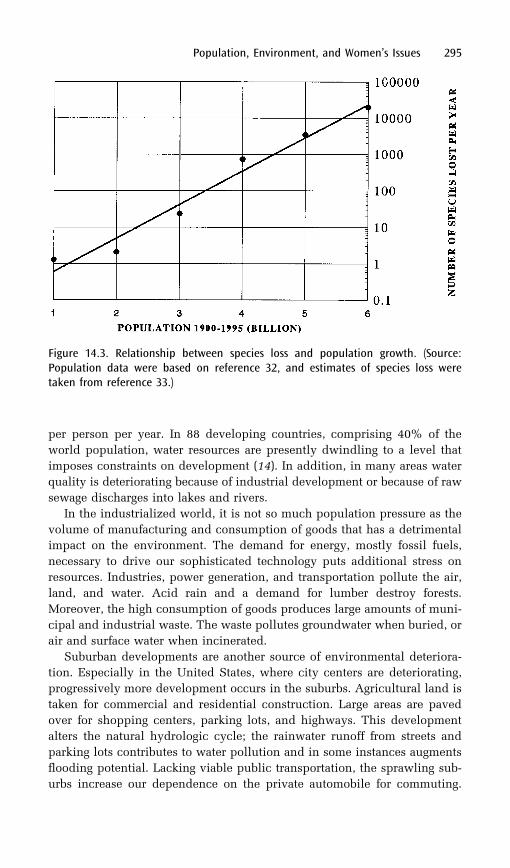
per person per year. In 88 developing countries, comprising 40% of the
world population, water resources are presently dwindling to a level that
imposes constraints on development (14). In addition, in many areas water
quality is deteriorating because of industrial development or because of raw
sewage discharges into lakes and rivers.
In the industrialized world, it is not so much population pressure as the
volume of manufacturing and consumption of goods that has a detrimental
impact on the environment. The demand for energy, mostly fossil fuels,
necessary to drive our sophisticated technology puts additional stress on
resources. Industries, power generation, and transportation pollute the air,
land, and water. Acid rain and a demand for lumber destroy forests.
Moreover, the high consumption of goods produces large amounts of muni-
cipal and industrial waste. The waste pollutes groundwater when buried, or
air and surface water when incinerated.
Suburban developments are another source of environmental deteriora-
tion. Especially in the United States, where city centers are deteriorating,
progressively more development occurs in the suburbs. Agricultural land is
taken for commercial and residential construction. Large areas are paved
over for shopping centers, parking lots, and highways. This development
alters the natural hydrologic cycle; the rainwater runoff from streets and
parking lots contributes to water pollution and in some instances augments
flooding potential. Lacking viable public transportation, the sprawling sub-
urbs increase our dependence on the private automobile for commuting.
Population, Environment, and Women’s Issues 295
Figure 14.3. Relationship between species loss and population growth. (Source:Population data were based on reference 32, and estimates of species loss weretaken from reference 33.)
This adds further to air and water pollution and carbon dioxide emissions,
and further enhances the demand for fuel.
In an industrialized society, because of the high demand for resources and
energy, even a modest rate of population growth is undesirable. The econo-
mies of the industrialized world, with their dependence on consumption for
prosperity, and geared for continuous growth, face a dilemma. A high rate of
production and consumption of goods creates a prosperous economy, but it
stresses the environment and natural resources. On the other hand, when
consumption slows down, the economy goes into recession, resulting in
unemployment and human suffering. Conventional economic theories do
not consider finiteness of natural resources and do not consider depletion
of these resources as depreciation in the GNP. It would be a challenge for
modern economists to devise a prosperous ‘‘no growth’’ economic system
based on recycling rather than depletion of resources. A treatise on this
subject has been published by the World Bank (26). The reader is also
referred to the book Beyond the Limits (27).
Overpopulation, Urban Sprawl, and Public Health
In the second half of the twentieth century, growth of cities in the developing
countries assumed catastrophic proportions. Table 14.2 shows population
growth in selected cities since 1950, and Table 14.3 gives the change of the
urban population in selected countries between 1960 and 1990. According to
296 Environmental Toxicology
Table 14.2. Population Growth in the Fastest Growing Cities in Developing
Countries
City
Population (million)Increase (%)
1950–85b1950 1951 1985 2000a
Sao Paulo 2.7 NA 15.9 24.0 489
Mexico City 3.05 NA 17.9 25.8 467
Delhi NA 1.4 7.4 13.2 429
Manila 1.78 NA 7.9 11.1 273
Jakarta 1.45 NA 7.9 13.2 279
Bombay NA 3.0 10.1 16.0 273
Cairo 2.5 NA 7.7 11.1 208
NA data not available.aProjected value.bFrom 1950 or 1952, respectively to 1985.
NA ¼ data not available.
Source: Adapted from data in reference 3.
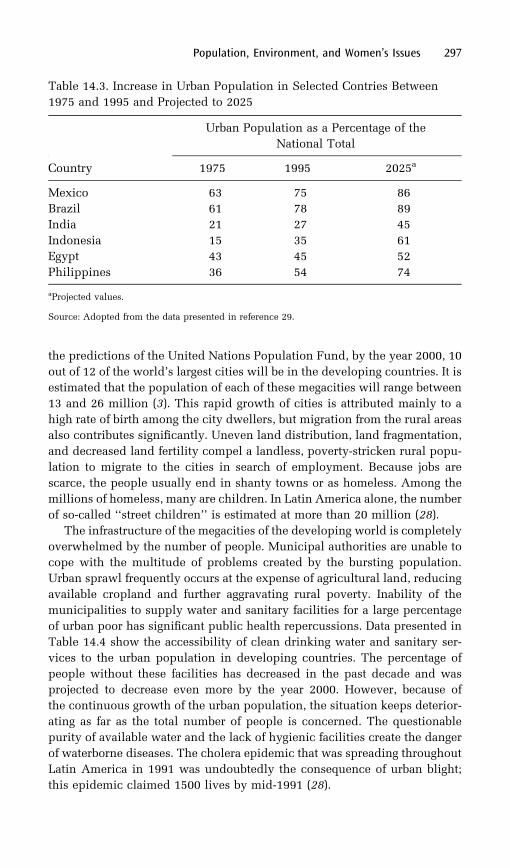
the predictions of the United Nations Population Fund, by the year 2000, 10
out of 12 of the world’s largest cities will be in the developing countries. It is
estimated that the population of each of these megacities will range between
13 and 26 million (3). This rapid growth of cities is attributed mainly to a
high rate of birth among the city dwellers, but migration from the rural areas
also contributes significantly. Uneven land distribution, land fragmentation,
and decreased land fertility compel a landless, poverty-stricken rural popu-
lation to migrate to the cities in search of employment. Because jobs are
scarce, the people usually end in shanty towns or as homeless. Among the
millions of homeless, many are children. In Latin America alone, the number
of so-called ‘‘street children’’ is estimated at more than 20 million (28).
The infrastructure of the megacities of the developing world is completely
overwhelmed by the number of people. Municipal authorities are unable to
cope with the multitude of problems created by the bursting population.
Urban sprawl frequently occurs at the expense of agricultural land, reducing
available cropland and further aggravating rural poverty. Inability of the
municipalities to supply water and sanitary facilities for a large percentage
of urban poor has significant public health repercussions. Data presented in
Table 14.4 show the accessibility of clean drinking water and sanitary ser-
vices to the urban population in developing countries. The percentage of
people without these facilities has decreased in the past decade and was
projected to decrease even more by the year 2000. However, because of
the continuous growth of the urban population, the situation keeps deterior-
ating as far as the total number of people is concerned. The questionable
purity of available water and the lack of hygienic facilities create the danger
of waterborne diseases. The cholera epidemic that was spreading throughout
Latin America in 1991 was undoubtedly the consequence of urban blight;
this epidemic claimed 1500 lives by mid-1991 (28).
Population, Environment, and Women’s Issues 297
Table 14.3. Increase in Urban Population in Selected Contries Between
1975 and 1995 and Projected to 2025
Urban Population as a Percentage of the
National Total
Country 1975 1995 2025a
Mexico 63 75 86
Brazil 61 78 89
India 21 27 45
Indonesia 15 35 61
Egypt 43 45 52
Philippines 36 54 74
aProjected values.
Source: Adopted from the data presented in reference 29.
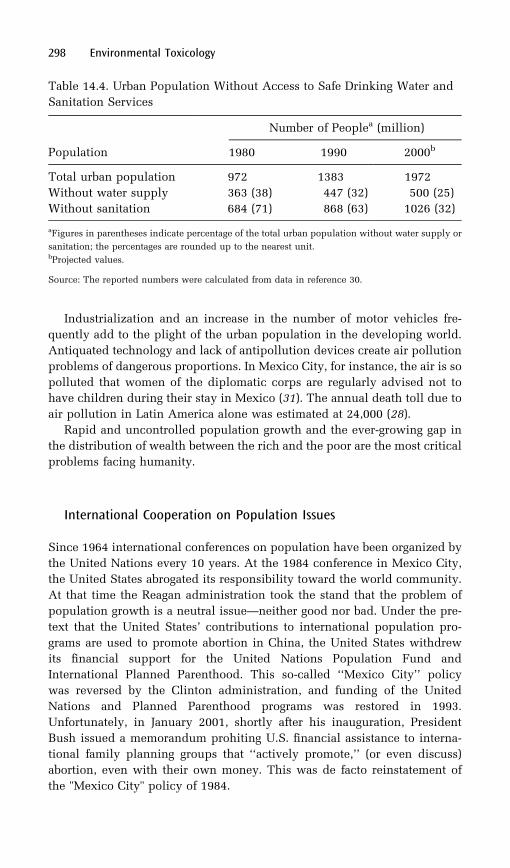
Industrialization and an increase in the number of motor vehicles fre-
quently add to the plight of the urban population in the developing world.
Antiquated technology and lack of antipollution devices create air pollution
problems of dangerous proportions. In Mexico City, for instance, the air is so
polluted that women of the diplomatic corps are regularly advised not to
have children during their stay in Mexico (31). The annual death toll due to
air pollution in Latin America alone was estimated at 24,000 (28).
Rapid and uncontrolled population growth and the ever-growing gap in
the distribution of wealth between the rich and the poor are the most critical
problems facing humanity.
International Cooperation on Population Issues
Since 1964 international conferences on population have been organized by
the United Nations every 10 years. At the 1984 conference in Mexico City,
the United States abrogated its responsibility toward the world community.
At that time the Reagan administration took the stand that the problem of
population growth is a neutral issue—neither good nor bad. Under the pre-
text that the United States’ contributions to international population pro-
grams are used to promote abortion in China, the United States withdrew
its financial support for the United Nations Population Fund and
International Planned Parenthood. This so-called ‘‘Mexico City’’ policy
was reversed by the Clinton administration, and funding of the United
Nations and Planned Parenthood programs was restored in 1993.
Unfortunately, in January 2001, shortly after his inauguration, President
Bush issued a memorandum prohiting U.S. financial assistance to interna-
tional family planning groups that ‘‘actively promote,’’ (or even discuss)
abortion, even with their own money. This was de facto reinstatement of
the "Mexico City" policy of 1984.
298 Environmental Toxicology
Table 14.4. Urban Population Without Access to Safe Drinking Water and
Sanitation Services
Number of Peoplea (million)
Population 1980 1990 2000b
Total urban population 972 1383 1972
Without water supply 363 (38) 447 (32) 500 (25)
Without sanitation 684 (71) 868 (63) 1026 (32)
aFigures in parentheses indicate percentage of the total urban population without water supply or
sanitation; the percentages are rounded up to the nearest unit.bProjected values.
Source: The reported numbers were calculated from data in reference 30.

Between September 5 and 13, 1994, representatives of 180 nations met
again, this time in Cairo, Egypt, for the United Nations International
Conference on Population and Development (ICPD). Unfortunately, the
media focused on the minor issue of a disagreement between the Vatican
and the United States about abortion, whereas the real achievements of the
conference were not publicized much. The Programme Action signed by 175
nations emphasized commitment by the signatories to promotion of repro-
ductive health services and to the empowerment of women as the best means
of stabilizing population growth. The document reiterated principles of
equality that apply to women, children, and migrants and asserted women’s
right to control their own fertility. Further, the Programme Action called for
better access to education for women and girls, elimination of violence
against women, access to family planning services, and involvement of
women in policy-making.
The annual cost for family planning services was estimated at $17 billion
by the year 2000 and $21.7 billion by 2015. One-third of the estimated $17
billion is expected to come from industrialized countries and the rest from
developing countries. Germany and Japan pledged $2 and $3 billion, respec-
tively, to be spent over the next seven years. The United States pledged $595
million for fiscal year 1995, with subsequent increases in the following years.
Time will show whether this international effort will succeed in contain-
ing the world population to 7.25 billion by the year 2015, as predicted by the
United Nations. Thereafter, the population should begin to decrease. If we
fail, a global disaster is looming for the future of humanity.
Cairo Plus Five
Five years after the International Conference on Population and
Development in Cairo, representatives of countries, signatories to the Cairo
declaration, and non-governmental organizations (NGO) met on February 6
to 12, 1999 in The Hague, The Netherlands to assess the progress and chal-
lenges since 1994. It was encouraging that some progress in curbing popula-
tion growth was achieved. For instance, in Mauritius in Eastern Africa the
population growth rate was cut from 2.4% per year to 1.2%, in the
Dominican Republic there was a dramatic raise in use of contraceptives
and in Bangladesh the fertility rate plummeted from 6.3 to 3.3 over the
period of 20 years. There was, however, disconcert about the 1998 decision
of the U.S. Congress to deny financial support to the United Nations
Population Fund (UNFPA), the world largest provider of population assis-
tance.2
Population, Environment, and Women’s Issues 299
2 Funding for UNFPA was restored by U.S. Congress in 1999.
References
1. Brown, L. R.; Renner, M. and Halweil, B. Vital Signes 2000; Starke, L.Ed.; W. W. Norton and Co., Inc.: New York, 2000; p 98.
2. World Resources Institute, International Institute for Environment andDevelopment in collaboration with U.N. Environment Programme;World Resources 1998–1999, A Guide to the Global Environment;Oxford University Press: New York, 1998; Chapter 7, p 243.
3. The Global Ecology Handbook; Corson, W. H., Ed.; Global TomorrowCoalition: Washington, DC, 1990; Chapter 3, p 23.
4. Popline May–June 1991, 13, 4; Population Institute: Washington, DC.5. ‘‘Family Planning Reduces World Population,’’ Popline January–
February, 1991, 13, 4; Population Institute: Washington, DC.6. World Resources Institute, The Guide to the Global Environment: World
Resources 1996–97; Oxford University Press: New York, 1996; Chapter 8,p 173.
7. United Nations Population Division, World Population Prospect. The1998 Revision forthcoming. hhttp://www.popin.org/pop1998/1.htmi
8. ‘‘Women’s Status a Factor in Global Warming,’’ Popline January–February, 1991, 13, 4; Population Institute: Washington, DC.
9. Great Decisions; Foreign Policy Association: New York, 1991; p 63.10. Jacobson, J. L. World Watch January–February, 1991, 4(1), 9;
Worldwatch Institute: Washington, DC.11. 1991 Report on World Progress Toward Population Stabilization: Access
to Affordable Contraceptives; Population Crisis Committee: Washington,DC, 1991.
12. McCoy-Thompson, M. World Watch May–June, 1990, 3(3), 7.10;Worldwatch Institute: Washington, DC.
13. Brown, L. R.; Renner, M. and Halweil, B. Vital Signes 2000; Starke, L. Ed;W. W. Norton and Co., Inc.: New York, NY 2000; p 34.
14. Population and the Environment: The Challenge Ahead; U.N.Population Fund: New York, 1991.
15. United Nations, Food and Agriculture Organizationhhttp://www.fao.org/FOCUS/E/SOFI/way-e.htmi
16. World Resources Institute, International Institute for Environment andDevelopment in collaboration with U.N. Environment Programme.World Resources 1988–1989; Basic Books: New York, 1988; p 51.
17. Ehrlich, P. The Population Explosion; Simon and Schuster: New York,1990; p 66.
18. Brown, L. R. In State of the World 1991; Brown, L. R., Ed.; W. W. Norton:New York, 1991; p 3.
19. World Resources Institute, International Institute for Environment andDevelopment in collaboration with U.N. Environment Programme.World Resources 1990–1991; Oxford University Press: New York,1990; Chapter 4, p 19.
20. World Resources Institute, International Institute for Environment andDevelopment in collaboration with U.N. Environment Programme.World Resources 1990–1991; Oxford University Press: New York,1990; Chapter 6, p 83.
300 Environmental Toxicology
21. Linden, E. Time August 19, 1991, 48.22. The Global Ecology Handbook; Corson, W. H., Ed.; Global Tomorrow
Coalition: Washington, DC, 1990; p 155.23. Weber, P. In State of the World 1991; Brown, L. R., Ed.; W. W. Norton:
New York, 1991; p 41.24. Ehrlich, P. The Population Explosion; Simon and Schuster: New York,
1990; p 37.25. Ehrlich, P. The Population Explosion; Simon and Schuster: New York,
1990; p 58.26. Environmentally Sustainable Economic Development Building on
Bruntland; Goodland, R.; Daly, H.; El Serafy, S., Eds.; World Bank,Environment Department: Washington, DC, 1991; EnvironmentWorking Paper No. 46.
27. Meadow, D.; Meadow, D.; Randers, J. Beyond the Limits; Chelsea Green:Post Mills, VT, 1992.
28. Popline, July–August, 1991, 13, 3; Population Institute: Washington, DC.29. World Resources Institute, The United Nations Environment
Programme, The United Nations Development Programme, The WorldBank. World Resources 1996–97; Oxford University: New York, 1996;Appendix A—Urban Data Tables; p 149.
30. World Resources Institute, International Institute for Environment andDevelopment in collaboration with U.N. Environment Programme.World Resources 1990–1991; Oxford University: New York, 1990; p 65.
31. French, H. F. World Watch 1989, 2(4), 39; Worldwatch Institute:Washington, DC.
32. Kussi, P. This World of Man; Pergamon: Oxford, England, 1985; p 191.33. Gaia, An Atlas of Planet Management; Mayers, N., Ed.; Anchor Books:
Garden City, NY, 1984.
Population, Environment, and Women’s Issues 301
15Regulatory Policies andInternational Treaties
The National Environmental Policy Act
The purpose of the National Environmental Policy Act (NEPA) is to ensure
that all federally administered or assisted programs are conducted so as to
take the environmental impact of their activity into consideration. The scope
of NEPA includes privately financed and conducted projects for which fed-
eral licensing is required. The law also establishes a presidential advisory
group called the Council on Environmental Quality (CEQ).1
The crucial section of the act (U.S. Code, Title 102, Pt. 2c), which con-
cerns the environmental impact statement (EIS), states, in part, that
The Congress authorizes and directs that, to the fullest extentpossible . . . all agencies of the Federal Government shall . . . includein every recommendation or report on proposal for legislation andother major Federal actions significantly affecting the quality of thehuman environment, a detailed statement by the responsible officialon:
. The environmental impact of the proposed action,
302
1In February 1993, President Clinton proposed replacing the CEQ with the White
House Office of Environmental Policy (OEP). At the same time he proposed elevating
the Environmental Protection Agency to Cabinet status. The functions of the CEQwould then be split between the new EPA and OEP. The bill for this reorganization
was approved by the Senate but has stalled in the House, leaving the proposed reor-
ganization in limbo. In view of this turn of events, the proposed reorganization has not
been implemented (1).
. Any adverse environmental effects which cannot be avoidedshould the proposal be implemented,
. Alternatives to the proposed action,
. The relationship between local, short-term uses of man’senvironment and maintenance and enhancement of long-termproductivity, and
. Any irreversible and irretrievable commitments of resourceswhich would be involved in the proposed action should it beimplemented.
Environment in this context refers not only to wilderness, water, air, and
other natural resources. It has a broader meaning that includes health, aes-
thetics, and pleasing surroundings.
Although the law requires an EIS, it does not say anything about what
conditions would be required in order to carry out the project. Moreover,
NEPA does not give more weight to environmental considerations than it
gives to other national goals. Thus the decision about implementation of a
program is left to the courts.
In practice, few projects have ever been halted by a court decision under
NEPA. However, some projects have been abandoned or modified, before
being challenged in court, because of NEPA (2).
Environmental Regulatory Framework
Figure 15.1 shows the framework of the federal environmental regulatory
structure. Four federal agencies cover the environmental aspects of the
national policy.
The Environmental Protection Agency (EPA) is an independent unit not
subject to the authority of any of the federal departments, but responsible
directly to the U.S. Congress. The EPA administrator is nominated by the
president.
The following acts are under the administration of EPA.
. Clean Water Act (CWA)
. Safe Drinking Water Act (SDWA)
. Clean Air Act (CAA)
. Federal Insecticide, Fungicide, and Rodenticide Act (FIFRA)
. Toxic Substances Control Act (TSCA)
. Resources Conservation and Recovery Act (RCRA)
. Comprehensive Environmental Response, Compensation, andLiability Act (CERCLA, also referred to as ‘‘Superfund’’)
. Food Quality Protection Act (FQPA)
These acts will each be discussed in this chapter.
The Occupational Safety and Health Agency (OSHA) is an agency within
the Department of Labor. The Assistant Secretary of Labor serves as the
agency’s head. OSHA is responsible for administration of the Occupational
Regulatory Policies and International Treaties 303
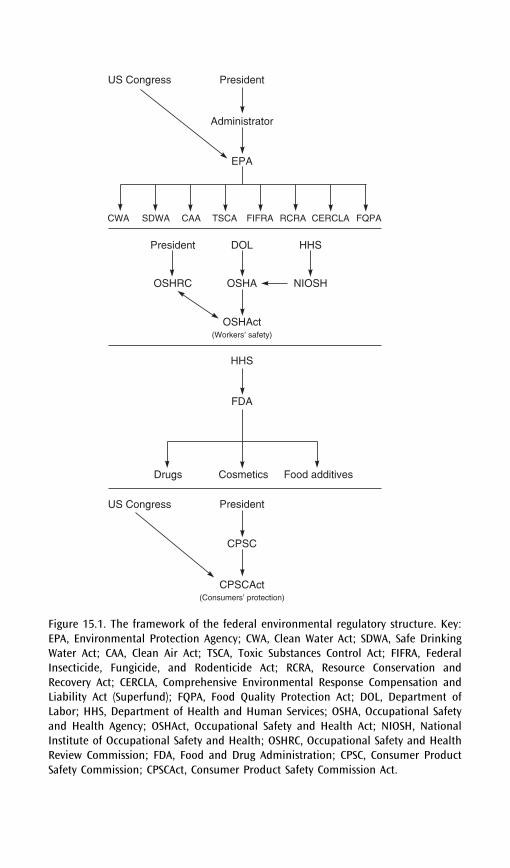
Figure 15.1. The framework of the federal environmental regulatory structure. Key:EPA, Environmental Protection Agency; CWA, Clean Water Act; SDWA, Safe DrinkingWater Act; CAA, Clean Air Act; TSCA, Toxic Substances Control Act; FIFRA, FederalInsecticide, Fungicide, and Rodenticide Act; RCRA, Resource Conservation andRecovery Act; CERCLA, Comprehensive Environmental Response Compensation andLiability Act (Superfund); FQPA, Food Quality Protection Act; DOL, Department ofLabor; HHS, Department of Health and Human Services; OSHA, Occupational Safetyand Health Agency; OSHAct, Occupational Safety and Health Act; NIOSH, NationalInstitute of Occupational Safety and Health; OSHRC, Occupational Safety and HealthReview Commission; FDA, Food and Drug Administration; CPSC, Consumer ProductSafety Commission; CPSCAct, Consumer Product Safety Commission Act.
Safety and Health Act, which is concerned with healthy and safe working
conditions. A related organization is the National Institute of Occupational
Safety and Health (NIOSH), an agency within the Department of Health and
Human Services. NIOSH is a research unit responsible for the development
and recommendation of occupational health and safety standards. The
Occupational Safety and Health Review Commission (OSHRC) is a quasi-
judicial review board consisting of three members nominated by the presi-
dent for a period of 6 years. The duty of OSHRC is to mediate disputes and
rule on challenges concerning OSHA enforcement actions.
To protect the health and safety of consumers, Congress created a
Consumer Product Safety Commission (CPSC) in 1972. The role of this
five-member commission is to ensure the safety of consumer products by
mandating labeling, restricting use, or banning unsafe products. The com-
missioners are nominated by the president.
The Food and Drug Administration (FDA) is an agency of the Department
of Health and Human Services. It serves as a controlling body concerned
with the safety and licensing of drugs, cosmetics, and food additives.
EPA and Its Responsibilities
Before EPA
Several federal environmental laws designed to protect air and water were
administered by a variety of agencies prior to 1970. The oldest federal leg-
islation prohibiting disposal of refuse into navigable rivers and into New
York Harbor is the Rivers and Harbor Act (R&HA) of 1899. The intent of
this legislation is not to protect the environment, but rather to protect navig-
able waterways for purposes of national defense. Thus the administration of
R&HA was entrusted to the Secretary of the Army.
This law assumed environmental significance only later when, in the
absence of other easily enforceable laws, it was frequently invoked by the
courts in environmental litigation. More comprehensive legislation,
designed specifically to protect water from pollution, was enacted in 1948
and amended in 1965. This amendment requires the states to classify all
waters within their territory by their intended use, to establish ambient
water quality standards as appropriate for the designated use, and to present
an implementation plan for federal approval. This legislation, known as the
Federal Water Pollution Control Act (FWPCA), turned out to be useless
because of enforcement difficulties. Frequently, several polluters discharged
pollutants into the same river or lake. This shared responsibility made it
difficult to indict any particular source.
The first federal law concerning air pollution was enacted in 1955, when
the Congress passed legislation offering technical and financial assistance to
Regulatory Policies and International Treaties 305
states to aid in pollution abatement. In 1967 the Air Quality Act (AQA) was
passed to supplement the 1955 law. This act authorizes federal agencies to
interfere directly when interstate air pollution is involved and to supervise
the enforcement of the state-imposed pollution-abatement measures. Despite
these efforts, there was not much progress in air quality improvement in the
1960s.
EPA’s Creation and Mandate
In 1970, a presidential order known as Reorganization Order No. 3 created
the EPA. The EPA is an independent unit dedicated to the implementation
and supervision of environmental laws and regulations and to the pursuit of
environmentally oriented research.
Administration of the FWPCA, the AQA, and the newly enacted Clean Air
Amendments of 1970 were entrusted to this agency. With increasing public
awareness of environmental deterioration, more and more environmental
protection legislation was enacted over the next two decades.
At times the agency has been criticized for its lack of effectiveness in
enforcing the regulations. In fact, the effectiveness of the EPA depends to a
great extent on the political climate. The law, by using such terms as ‘‘in his
opinion’’ or ‘‘as he finds necessary,’’ gives the EPA administrator consider-
able leeway in promulgating the standards and regulations. In addition,
under certain provisions of the law, the administrator may grant or refuse
exemptions to some regulations or postpone the deadlines of compliance.
Because the EPA administrator is nominated by the president, EPA atti-
tudes toward the environment usually reflect those of the federal adminis-
tration. The environmental neglect of the 1980s is the best example of
political influence on the effectiveness of the EPA.
Clean Water Act
The present Clean Water Act (CWA) was enacted in 1972 as the FWPCA. It
was amended in 1977, when it was renamed the CWA, and amended again
in 1987.
The FWPCA of 1972 states as future goals the attainment of ‘‘fishable and
swimmable waters’’ by 1983 and the complete elimination of discharges of
pollutants into navigable waters by 1985. For this purpose, the 1972 act
introduces the following measures:
. It retains the ambient water quality standards of the 1965 act.
. It superimposes on them nationally uniform, technology-based,effluent limitations for major point sources.
. It establishes deadlines for compliance.
. It introduces provisions for citizen suits that allow privatecitizens and organizations to initiate legal action against the
306 Environmental Toxicology
polluting party, as well as against the EPA for not fulfilling itsobligations by not enforcing the law.
. It outlines policies to deal with nonpoint pollution sources andgroundwater protection.
. It establishes municipal waste-treatment grants.
Point Sources of Pollution In dealing with discharges of pollutants by point
sources, the act introduces three stages of economic and technological con-
siderations (3): best practical technology (BPT), best conventional technol-
ogy (BCT), and best available technology (BAT). BPT considers the total cost
of existing technology versus effluent-reduction benefits. BCT ‘‘shall include
consideration of the reasonableness of the relationship between the cost . . .
and the effluent reduction benefits derived.’’ BAT takes into consideration
engineering aspects of control techniques, energy requirements, and non-
water environmental impact, but not the cost of application.
The law mandates that all industrial point sources must meet effluent
limitations requiring application of the BPT by 1977. The standard becomes
the BAT currently available by 1983. The act also introduces the National
Pollutant Discharge Elimination System (NPDES), which involves issuance
of permits to determine discharge limitations for each source. The adminis-
tration of these permits may be delegated to the states. However, if the
technology-based limitations are not sufficient to meet the water quality
standards of 1965, the administrator can impose additional limitations.
The law requires that all municipal wastewater purification sources must
achieve at least secondary-stage treatment by 1977 and BAT by 1983. New
sources, defined as those for which construction began after implementation
of this law, have to comply with BAT standards. Industries intending to
discharge their effluents through municipal wastewater treatment facilities
may do so, provided that the effluents are prepurified before being dis-
charged into the municipal facility.
The administrator is empowered to establish special effluent limitations
for toxic pollutants based upon toxicity, persistence, and degradability.
Nonpoint Sources of Pollution The problem of nonpoint pollution is dealt with
through federal cooperation with regional and local planning authorities. No
citizen suits are permitted under this section.
Amendments The most important amendments to the Clean Water Act of
1977 involve the following:
. Postponement for up to 6 years of the original 1977 deadline forachievement by municipalities of the secondary stage ofwastewater treatment, if construction could not be completedbecause of the delay of federal funds.
. Modification of the 1977 deadline for industrial sources toachieve BPT by allowing an industry to apply for postponement
Regulatory Policies and International Treaties 307
if it acted in ‘‘good faith.’’ Applications for postponement wereto be considered on an individual basis, with the provision thatcompliance be achieved at the earliest ‘‘possible date,’’ but inno case later than April 1979.
. Modification of 1983 BAT limitations by classifying industrialpollutants into three categories (conventional, toxic, andnonconventional) and by applying different limitations to eachcategory. Biological oxygen demand (BOD), suspended solids,fecal coliform organisms, pH changes, and waste oil areclassified as conventional pollutants. The discharge limitationfor these pollutants was set as BCT, with a compliance date ofno later than July 1, 1984. For pollutants classified as toxic(originally a list of 129 chemicals), BAT was mandated to beachieved by July 1, 1980; no exceptions were to be allowed.Nonconventional pollutants are any not classified asconventional or toxic; the limitations required BAT by July 1,1984. The compliance date with these limitations could bemodified by extending the deadline to July 1, 1987, providedthat there was consent of the state and that water qualitystandards were not compromised.
The Water Quality Act of 1987 introduced the following amendments: (1)
the deadline for compliance (achievement of BAT for nonconventional pol-
lutants) was extended until 1989, and (2) the deadline for establishment of
secondary treatment of wastewater by municipalities was postponed until
1988 in cases where construction could not be completed for reasons beyond
the control of the owner.
The definition of secondary treatment is relaxed to include all biological
treatment facilities such as oxidation ponds, lagoons, and ditches. Stricter
effluent limitations are imposed, when necessary, to attain water quality
standards. Also, procedures are provided for classification of waters as to
their intended use and needed purity.
A new section is added concerning nonpoint water pollution. This sec-
tion requires that states identify the waters where purity standards cannot be
achieved because of nonpoint sources of pollution and that management
programs be established to control nonpoint pollution.
Safe Drinking Water Act
The Safe Drinking Water Act (SDWA), enacted in 1974, directs the EPA to
establish regulations for the protection of drinking water. Two types of stan-
dards are mandated: federally enforceable primary standards designed for
health protection, and state-regulated secondary standards relating to the
aesthetic appearance of drinking water. The primary standards prescribe
either maximum contaminant levels or a treatment technique; the secondary
standards are to be developed according to state guidelines.
308 Environmental Toxicology
SDWA also introduces regulations for the protection of groundwater by
controlling underground injection of contaminants. In response to a 1984
report from the Office of Technology Assessment, which identified more
than 200 chemical contaminants in groundwater, the act was amended in
1986 to set limits for contaminant levels in public water systems.
Primary responsibility for implementation and enforcement of this law
could be delegated to the states if they request it and if they provide satis-
factory monitoring and enforcement procedures.
The 1996 amendment to the SDWA requires that the EPA implement a
screening and testing program for endocrine disrupters that may occur in
drinking water (4).
Clean Air Act
The present Clean Air Act (CAA) consists of the Air Quality Act of 1967, the
Clean Air Act of 1970, technical amendments to the Clean Air Act of 1973,
and the Clean Air Act amendments of 1977 and 1982.
Purpose The problem addressed by the CAA is stated in U.S. Code, Title 42,
Pt. 1857 et seq., Section 101(a), as follows:
that the growth in the amount and complexity of air pollution broughtabout by urbanization, industrial development and the increasing useof motor vehicles, has resulted in mounting danger to the public healthand welfare, including injury to agricultural crops and livestock,damage to and deterioration of property and hazards to air and groundtransportation.
Subsections 3 and 4 of Section 101(a) divide responsibilities between the
states and the federal government by stating that ‘‘the prevention and control
of air pollution at its source is the primary responsibility of state and local
governments,’’ whereas ‘‘Federal financial assistance and leadership is
essential for the development of cooperative Federal–State, regional, and
local programs to prevent and control air pollution.’’
To this effect, the administrator is charged to publish and from time to
time revise a list of air pollutants and to establish national ambient air qual-
ity standards (NAAQS). Two types of standards (primary standards concern-
ing human health and secondary standards concerning public welfare, such
as structures, crops, and animals) are to be established for each of the seven
pollutants [CO, SO2, NOx, O3, hydrocarbons (VOC), particulates (PM), and
Pb]. In 1982 the EPA rescinded the standard for hydrocarbons, as it was
considered unnecessary.
State Implementation Plan Within 9 months after promulgation of the
standards, each state is to submit a state implementation plan (SIP) for the
administrator’s approval. The air quality required by the primary standards
Regulatory Policies and International Treaties 309
is to be achieved no later than 3 years after the approval of the SIP, and that
required by the secondary standards must be reached within ‘‘a reasonable
time.’’ In addition, each state is to ensure that ‘‘after June 30, 1979, no major
source shall be constructed or modified in a nonattainment area.’’
Each SIP should also contain provisions for periodic inspection and test-
ing of motor vehicles ‘‘to enforce compliance with applicable emission stan-
dards’’ (see the regulations concerning mobile sources, discussed later in this
chapter).
Dispersion Techniques The Clean Air Amendments of 1977 address the issue
of dispersion techniques (i.e., the use of tall stacks as a means of compliance
with NAAQS; see Chapter 9). The ‘‘Tall Stacks’’ provision states that the
‘‘degree of emission limitation required for control of any air pollutants
shall not be affected in any manner by so much of the stack height of any
source as exceeds good engineering practice (GEP).’’ GEP is interpreted as
the height necessary to prevent excessive concentration of pollutants in the
vicinity of the source due to atmospheric downwash (5, 6). This translates, in
practical terms, to 2.5 times the height of the source.
New or Modified Sources Different rules apply to new or modified sources and
to existing ones. Existing sources have to comply with NAAQS. In addition,
new sources are required to conform to the nationally uniform emission
standards. The New Sources Performance Standards (NSPS) require that
all new or modified sources use the best available technological system for
continuous emission reduction. This standard allows consideration of the
cost, any environmental effects unrelated to air quality, and energy require-
ments.
In connection with modification, the legality of the so-called ‘‘bubble
effect’’ has been challenged in courts. The bubble effect refers to reduction
of emissions from one part of a source while simultaneously increasing
emissions from another part, so that the total emission from a source
remains constant. The lower courts decided in two cases against, and in
one case for, the legality of the bubble effect. Eventually the Supreme Court
ruled that the legal system lacks the technical expertise to rule on this
matter and that the decision should be left to the discretion of the EPA
administrator (6).
In addition to the existing regulations, the 1977 amendments require that
the emission of SO2, NOx, and particulates be reduced by a specific percen-
tage of what would be emitted if no control devices were employed.
Switching to low-sulfur coal is not considered satisfactory compliance
with the law.
Prevention of Deterioration Another innovation of the 1977 amendments is the
principle of prevention of significant deterioration (PSD). According to PSD,
the regions of the country affected by NAAQS are divided into three classes.
310 Environmental Toxicology
Varying degrees of air quality are permitted: class I (national parks and wild-
erness areas), very little deterioration of air quality is allowed; class II (all
other areas), moderate deterioration is allowed; and class III (areas destined
for industrial development), considerable deterioration is allowed as long as
NAAQS are not exceeded.
Air pollutants for which no NAAQS were set, but which may be harmful
to human health, are classified as ‘‘hazardous’’ and are subject to the
National Emission Standards for Hazardous Air Pollutants (NESHAP). The
EPA administrator is authorized to establish a list and standards for these
pollutants. Such standards are equally applicable to new and existing
sources. Until very recently (see the new Clean Air Act, later in this chapter)
there were seven substances, or classes of substances, on the list: beryllium,
asbestos, mercury, vinyl chloride, benzene, arsenic, and radionuclides.
The act provides for noncompliance penalties that are tailored individu-
ally to each case. This flexibility is intended to take away any financial
advantage of noncompliance.
Citizen suits are permitted against polluters, as well as against the EPA for
lack of enforcement.
Mobile Sources The mobile sources section (in Title II) of the CAA authorizes
the EPA administrator to establish
standards applicable to the emission of any air pollutant from any classor classes of new motor vehicles or new motor vehicle engines, whichin his judgment causes or contributes to . . . air pollution which endan-gers the public health or welfare . . . Any regulation prescribed underthis subsection shall take effect after such period as the Administratorfinds necessary to permit the development of the requisite technology,giving appropriate consideration to the cost of compliance within suchperiod.
According to this authorization, the following standards for light-duty
vehicles and engines are established. In vehicles manufactured during and
after 1975, emissions of CO and hydrocarbons are to be reduced by at least
90% of the emissions of 1970 models. In addition, in vehicles manufactured
during or after 1976, the emission of NOx is to be reduced by at least 90% of
the emission of 1971 models. The law provides that suspension of the stan-
dards may be granted if:
. such suspension is essential to the public interest,
. good-faith efforts to meet the standards have been made,
. the manufacturer establishes that the appropriate technology isnot available, and
. the study and investigation conducted by the NationalAcademy of Sciences establishes that the appropriatetechnology is not available.
Regulatory Policies and International Treaties 311
Results of the CAA The CAA succeeded in reducing urban air pollution as far
as SO2 and particulates were concerned. However, it failed in many cities to
meet NAAQS with respect to CO and ozone. In addition, the act does not
address the problem of acid deposition away from urban centers. A section
in the act deals with the interstate transport of pollutants, and attempts have
been made to use this law for control of acid rain. Nevertheless, the EPA has
refused to act on this problem, and its position has been upheld by the
courts.
The New CAA In November 1990 a new CAA was signed into the law. The
main provisions of this act are as follows:
. SO2 emission from stationary sources has to be reduced by 50%of the 1990 emission, to 10,000 tons annually, by the year2000.2 Starting in 1992, NOx emission has to be reduced by33% of the present level, to 4 million tons annually.
. Emissions of NOx and hydrocarbons from passenger cars haveto be reduced by 60% and 40%, respectively, by the year 2003.Pollution-control devices on motor vehicles must have a usefullife of no less than 10 years. Further, in the most polluted cities(Baltimore, Chicago, Hartford, Houston, Los Angeles,Milwaukee, New York, Philadelphia, and San Diego), cleaner-burning automotive fuel must be available by the year 2000. InCalifornia, 1 million vehicles must either use ‘‘cleaner’’ fuel orbe provided with special emission-reducing equipment.3
. A 90% reduction in emission of 198 toxic and carcinogenicchemicals is required by the year 2003.
. Production and use of chlorofluorocarbons and other ozone-depleting chemicals have to be eliminated completely by theyear 2000 (8).
Federal Insecticide, Fungicide, and Rodenticide Act
Whereas the regulations discussed so far deal with air and water pollution
problems, the four acts still to be discussed deal specifically with problems
of production, handling, and disposal of toxic substances.
312 Environmental Toxicology
2A provision was introduced that permits the trading of SO2 in the pollution
allowances system. Thus, a utility that reduces its emissions below required limits
may sell its allowance to another, less efficient company (7).3In July 1997, the EPA revised NAAQS for ground level ozone (0.08 ppm averaged
over a period of 8 hours) and ultrafine SPM of less than 2.5 mm in diameter (PM2.5)
(annual limit of 65 mg/m3, with daily limit of 15 mg/m3). These revisions were intro-duced to protect the public from harmful effects of air pollution (see Chapter 9).
However, the American Trucking Association together with many other industries
filed a suit against the EPA on the basis that the agency exceeded its authority by
revising the standards. The case is now under litigation (see Table 9.2 in Chapter 9).
The federal law specifically directed toward regulation of toxic sub-
stances is the Federal Insecticide, Fungicide, and Rodenticide Act (FIFRA).
The gist of the act is contained in Sections 135 and 136. Section 135, which
deals with ‘‘economic poisons,’’ requires registration with EPA and proper
labeling of these poisons, if they are to be distributed in interstate commerce.
The label must contain a warning as to the product’s effect on health and the
environment.
Section 136 deals specifically with pesticides. It authorizes the EPA to
restrict or prohibit the use of a pesticide if it finds that the pesticide presents
an unreasonable environmental risk. This determination requires considera-
tion of harm versus benefit and requires reevaluation of the registration every
5 years. In addition, the EPA is authorized to issue emergency suspension of
a registration, which takes effect immediately, if the toxicity or the environ-
mental impact of a pesticide warrants such drastic action.
Toxic Substances Control Act
This comprehensive legislation, covering all toxic substances not covered by
either the CAA, CWA, or FIFRA, was introduced in 1976.
Summary of the Law The Toxic Substances Control Act (TSCA) is summar-
ized in the following policy statement.
It is the policy of the United States that1. Adequate data should be developed with respect to the effect of
chemical substances and mixtures on health and the environmentand that the development of such data should be the responsibilityof those who manufacture and those who process such chemicalsubstances and mixtures.
2. Adequate authority should exist to regulate chemical substancesand mixtures which present an unreasonable risk of injury to healthor the environment, and to take action with respect to chemicalsubstances and mixtures which are imminent hazards.
3. Authority over chemical substances and mixtures should be exer-cised in such manner as not to impede unduly or create unneces-sary economic barriers to technological innovation while fulfillingthe primary purpose of this Act, to assure that such innovation andcommerce in such chemical substances and mixtures do not presentan unreasonable risk of injury to health or the environment.
Authority over Manufacturers In essence, the Act gives the EPA administrator
authority over manufacturers as specified in U.S. Code, Title 15, Sections
4–6. Section 4 requires manufacturers to test manufactured substances if:
. insufficient data are available,
. the substance may ‘‘present an unreasonable risk,’’
Regulatory Policies and International Treaties 313
. the substance may ‘‘enter the environment in substantialquantities,’’ or
. the substance presents the likelihood of ‘‘substantial humanexposure.’’
Section 5 requires a manufacturer to notify the EPA 90 days prior to
manufacturing or importing new substances. This premanufacturing notifi-
cation (PMN) must contain information on chemical identity, proposed use,
anticipated volume of production, expected by-products, estimated workers’
exposure during production, and methods of disposal. Toxicologic testing
data are not required (if not available), unless the substance is covered under
Section 4 or is on the EPA list of hazardous substances. In the latter case, the
manufacturer must submit data showing that the substance does not present
any unreasonable risk of injury. If the EPA is not convinced, it may request
additional data.
Section 6, which applies to new and old substances alike, authorizes the
EPA administrator to impose a number of restrictions (such as to ban man-
ufacturing, prohibit certain uses, require labeling, or require a change of the
manufacturing process). If the administrator determines that a substance to
be produced presents unreasonable risk, the proposed Section 6 rule, which
prohibits manufacturing until proper restrictions can be issued under
Section 6, may be invoked.
The act provides for enforcement of the regulations with civil and crim-
inal penalties and for citizen suits against violators and against the EPA for
lack of enforcement.
Resource Conservation and Recovery Act
The Resource Conservation and Recovery Act (RCRA) deals with the genera-
tion, transport, and disposal of hazardous waste. It was enacted in 1976 in
response to public concern over seepage of toxic substances from chemical
waste dumps into groundwater and into basements of residential dwellings
(9).
List of Hazardous Substances The act directs the EPA to establish a list of
hazardous substances ‘‘taking into account toxicity, persistence and
degradability in nature, potential for accumulation in tissue,’’ as well as
corrosiveness and flammability. Further, the EPA is authorized to establish
standards for generation, transport, and disposal of hazardous waste, and
to require record-keeping at each stage. Disposal sites are required to ob-
tain permits and to conform to certain engineering standards, such as
double liners, leachate-collection systems, and groundwater-monitoring
facilities.
314 Environmental Toxicology
Waste Disposal RCRA 1984 amendments introduce requirements that an
operator of a dump site has to provide either liability insurance or some
sort of guarantee as an assurance of financial responsibility.
The amendments also mandate the EPA to promulgate rules for treatment
of hazardous waste before such waste can be disposed of in landfills. After a
5-year effort to design such rules, the final hazardous-waste regulation came
into effect on May 8, 1990. This regulation deals with almost 350 types of
hazardous waste, including waste from industrial and academic research
laboratories. Despite its wide coverage, this regulation is being criticized
by environmental groups for being too lenient to industry by allowing dis-
posal practices that may harm the environment (10).
Underground Storage Tanks Another provision of these amendments requires
inventory, inspection, and replacement of underground storage tanks. The
responsibility for this inventory and inspection is delegated to the states.
Owners or operators are to be held responsible for any damage to the public
or environment caused by spills from leaky tanks.
Comprehensive Environmental Response,Compensation, and Liability Act
The Comprehensive Environmental Response, Compensation, and Liability
Act (CERCLA, popularly known as ‘‘Superfund’’) was enacted in 1980 and
amended by the Superfund Amendments and Reauthorization Act of 1986
(SARA). The purpose of the legislation was the cleanup of old, improperly
constructed, hazardous-waste disposal sites.
The act includes four essential elements (11). First, it establishes an infor-
mation-collecting system to enable the government to locate and character-
ize hazardous-waste disposal sites and to establish the national priority list
(NPL) for cleanup. The owners and operators of such sites are required to
notify EPA of the amount and type of hazardous substances deposited and of
any release, or suspected release, of these substances into the environment.
Remedial Action The second element of Superfund evolved from Section 311
of the Clean Water Act. This national contingency plan (NCP) concerns the
cleaning up of toxic-waste sites. It authorizes the president to revise the NCP
to include a new hazardous-substances response plan containing standards
and procedures for either removal of the hazardous substances or appropri-
ate remedial measures. The remedial actions should be cost-effective, and
priorities should be based on the relative risk to health, welfare, and the
environment. Federal remedial action is restricted to those cases in which
no party responsible for disposal of the hazardous waste can be located or in
which the responsible party takes no action.
The third element establishes the hazardous-substances trust fund to bear
the cost of removal or confinement of the hazardous waste. The original
Regulatory Policies and International Treaties 315
appropriation of funds for the first 5 years was $1.6 billion. This was
upgraded by SARA amendments in 1986 to $8.5 billion for the next 5 years.
Financial Liability The fourth element discusses financial responsibilities and
liabilities. In essence, the persons responsible for the release of hazardous
waste are made responsible for the cleanup. This includes generators, trans-
porters, and owners and operators of disposal facilities. The responsibility
covers not only the cost of cleanup incurred by federal and state govern-
ments, but also any damages to people and natural resources that may have
resulted from these activities. Except for acts of God or war, the liability law
applies, even if no negligence or faulty performance can be demonstrated.
Superfund performance has been highly criticized not only by environ-
mental groups, but also by Congress and the Office of Technology
Assessment. Critics charge that the program wastes money and does not
adequately protect the environment. Frequently, decision-making regarding
the best remedial action for site cleanup (remedial investigation, feasibility
study, or RIFS) is delegated by the EPA to the polluter. Not surprisingly, the
polluter decides in favor of personal interest rather than the community and
environment (12). The EPA is also under attack for lack of efficiency in
recovering money from polluters for cleanup costs (13).
Food Quality Protection Act
The Food Quality Protection Act (FQPA) was signed into law on August 3,
1996, and took effect as of the date of signing, with no phase-in period. The
act rescinded the 1958 amendment to the Food and Cosmetic Act of 1938,
known as the Delaney Clause, which was until then under the jurisdiction of
the U.S. Food the Drug Administration (see Chapter 4). The Delaney Clause
was replaced with a health-based standard, allowing residues of pesticides
on food, whether processed or not, if there is a reasonable certainty of no
harm. As far as cancer is concerned, this standard means no more than one
excess case of cancer in one million exposed people. However, the new law
goes beyond the requirement of testing for carcinogenicity in adults. It
requires special consideration for infants and children, and it requires the
testing of pesticides for endocrine-system disrupting activity. It also provides
for expanded consumer right to know (14).
OSHA and Its Responsibilities
In 1970 the 91st Congress passed legislation called the Occupational Safety
and Health Act (OSHAct). The purpose of this legislation was ‘‘to assure safe
and healthful working conditions for working men and women.’’ This was
the first comprehensive legislation covering all employers and employees in
316 Environmental Toxicology
all industries, commerce, and agriculture in the United States and in any
territory administered by the United States. The regulatory provisions pro-
tecting workers in certain industries, such as maritime, mining, and con-
struction, which existed prior to 1970, were taken over by this new act.
Federal and state employees covered by the Atomic Energy Act of 1954
are exempt from OSHAct.
The administration of the act is entrusted to the Department of Labor via
the Occupational Safety and Health Agency (OSHA). The administrative
structure of OSHA, discussed earlier in this chapter, is depicted schemati-
cally in Figure 15.1.
The duties of employers and employees are specified in Section 5 of the
U.S. Code as follows:
a. Each employer
1. shall furnish to each of his employees employment and a place ofemployment which are free from recognized hazards that arecausing or are likely to cause death or serious physical harm tohis employees;
2. shall comply with occupational safety and health standards pro-mulgated under this Act.
b. Each employee shall comply with occupational safety and healthstandards and all rules, regulations, and orders issued pursuant tothis Act which are applicable to his own actions and conduct.
The act requires that the Secretary of Labor promulgate, ‘‘during the period
beginning with the effective date of this Act and ending two years after such
date,’’ occupational health and safety standards. Three types of standards are
established:
1. Interim standards promulgated for a period of 2 years; theseare not subject to rule-making procedures.4
2. Permanent standards that could modify or revoke existingstandards or promulgate new standards; rule-makingprocedures are required.
3. Emergency standards that are promulgated when the secretaryestablishes that the workers may be exposed to a grave dangerfrom a newly determined hazard. Emergency standards may beissued without prior notification, but they apply for 6 monthsonly. After this period they have to be either revoked or madepermanent.
Regulatory Policies and International Treaties 317
4Federal rule-making procedures require that any new regulation or any proposed
change be published in the Federal Register as a notice of proposed rule making(NPRM). Interested parties have 30 days to respond. The agency proposing the rule
must then schedule a hearing and notify the public of the time and the place of the
meeting. Within 60 days, upon completion of the hearing, the proposed rule must be
either withdrawn or promulgated.
The employee’s exposure to toxic and hazardous substances is regulated
by Title 29 of the Code of Federal Regulations, Part 1910, Subpart z. This
section provides a list of hazardous substances and specifies the permissible
exposure limits for each compound, using TLV standards (see Chapter 7) as
guidelines.
OSHA is authorized to enforce health and safety standards through
inspections, citations, monetary penalties, and, in extreme cases, imprison-
ment. Workplace inspections may be conducted at any time without prior
notification. In situations that present imminent danger, the inspector will
issue a citation that specifies the nature of the violation and prescribe a
reasonable time for correction of the hazardous situation. The citation
must be posted by the employer at the site of violation.
The act gives the employer the right to contest citations, periods of abate-
ment, or penalties by requesting a hearing before OSHRC and to contest
OSHRC rulings by filing legal action with the U.S. Court of Appeals.
Miscellaneous Environmental Acts and Treaties
The Endangered Species Act
The Endangered Species Act was passed by the U.S. Congress in 1960. It
applied only to endangered species in the United States. The purpose of the
act was and is now the protection of biodiversity by listing the endangered
species, to protect them, and to strive to revive them.
In 1969 the U.S. Congress passed an Endangered Species Conservation
Act that extended the protection of endangered species worldwide. The 1973
conference in Washington D.C. (the Convention on International Trade in
Endangered Species—CITES) led to the signing of an agreement which
restricted international commerce in species believed to be endangered.
The Act was then amended in 1973 by extending its scope to include plants
and all classes of invertebrate. Significant amendments to strengthen the Act
were introduced in 1978, 1982, and 1988. The funding of the Act was author-
ized through fiscal year 1992 and is now being extended from year to year
(15). The future fate of the Act is uncertain because special interest groups
try to weaken it. Thus its renewal or permanency depends on the political
sentiment of Congress, which may change from election to election.
International Treaties Protecting the MarineEnvironment
Law of the Sea Convention of 1982 (LOS) The purpose of this convention was to
regulate the use of ocean resources. The main provisions of the act were as
follows:
318 Environmental Toxicology
. Establishment of Exclusive Economic Zones (EEZ), whichcomprise an area up to 200 miles from the coast. To enter EEZfor economic purposes, foreign ships must obtain permission ofthe country controlling the EEZ.
. Upholding the traditional notion of ‘‘freedom of the seas.’’
. Establishment of the principle that all nations should benefitfrom deep seabed resources, and that the resources should bemined under supervision of the International Seabed Authority.
Although 159 nations signed the treaty, several industrialized nations,
including the United States, the United Kingdom, and Germany, did not
accept the last provision of the treaty, selfishly maintaining that resources
should be available on a first-come, first-served basis.
Marpol Convention of 1973 The purpose of this convention was to establish
international laws protecting the seas from pollution. The provisions of the
convention were as follows:
. establishment of a minimum distance from the shore fordumping sewage, garbage, and toxic waste
. prohibition of the disposal of plastics from ships
. limitation on disposal of other garbage
. requirement for ports to provide facilities for trash from ships
The U.S. Navy was exempt from the dumping provision until 1994.
London Dumping Convention of 1975 This convention supplemented the
Marpol Convention by:
. banning dumping from ships and aircraft of ‘‘blacklisted’’substances (heavy metals, petroleum products, and carcinogens)
. requiring a permit for dumping of ‘‘graylisted’’ substances (lead,cyanide, and pesticides)
In 1983, the London Convention was amended by issuing a moratorium
on the dumping of low-level radioactive waste.
Persistent Organic Pollutants (POP) Treaty Early in July 1998 representatives of
120 countries met in Montreal to draft a treaty on elimination of 12 persistent
organic pollutants. The compounds in question were: PCBs, hexachloroben-
zene, dioxins, dibenzofurans, and pesticides, aldrin, chlordane, DDT, diel-
drin, endrin, heptachlor, mirex and toxaphene. Some controversy arose
about DDT because it is considered the only, presently available, low-cost
compound to fight malaria-carrying mosquitoes (16).
During the follow-up meeting in Geneva in September 1999 the delegates
agreed to the unconditional international phase-out of aldrin, endrin and
toxaphene, and severe restriction on production and use of chlordane, diel-
drin, heptachlor, mirex and hexachlorobenzene. The fate of DDT (for mos-
Regulatory Policies and International Treaties 319
quitoes control only), PCBs, dioxins and furans was deferred to subsequent
conferences in Bonn, Germany in March 2000, and in South Africa late in
2000. The signing of the final treaty took place in the spring of 2001 in
Stockholm (17).
References
1. Ember, L. Chem. Eng. News August 15, 1994, 5.2. Findley, R. W.; Farber, D. A. In Environmental Law;West Publishing: St.
Paul, MN, 1988; Chapter 1, p 22.3. Findley, R. W.; Farber, D. A. In Environmental Law;West Publishing: St.
Paul, MN, 1988; Chapter 2 C, p 108.4. Hileman, B. Chem. Eng. News September 2, 1996, 21.5. Raffle, B. I. Environment Reporter Monograph 26 1978, 8(47), 1; Bureau
of National Affairs: Washington, DC.6. Findley, R. W.; Farber, D. A. In Environmental Law;West Publishing: St.
Paul, MN, 1988; Chapter 2 B, p 66.7. Ember, L. Chem. Eng. News November 18, 1991, 20.8. Lemonick, M. D.; Blackman, A. Chem. Eng. News November 5, 1990, 33.9. Thayer, A. Chem. Eng. News January 30, 1989, 7.10. Hanson, D. Chem. Eng. News May 28, 1990, 19.11. Findley, R. W.; Farber, D. A. In Environmental Law;West Publishing: St.
Paul, MN, 1988; Chapter 3, p 169.12. Office of Technology Assessment. Cleaning Up: Superfund’s Problems
Can Be Solved; U.S. Government Printing Office: Washington, DC, 1989.13. Ember, L. Chem. Eng. News October 2, 1989, 17.14. Hanson, D. Chem. Eng. News September 23, 1996, 38.15. U.S. Fish and Wildlife Service, The Endangered Species Act of 1973
hhttp://endangered.fws.gov/esasum.htmli16. Hileman, B. Chem. Eng. News July 6, 1998, 4.17. Hileman, B. Chem. Eng. News September 20, 1999, 9.
320 Environmental Toxicology
Appendix
Subjects for Student Seminars
The following topics are important environmental problems facing today’s
world. It is suggested that students select topics from this list for indepen-
dent research and presentation in class seminars:
. ocean pollution
. overfishing of oceans and destruction of marine mammals
. nuclear energy, pro and con
. destruction of tropical forests
. loss of biodiversity
. crises in Antarctica
. energy conservation
. renewable energy sources
. freshwater crisis
. world poverty and overconsumption by industrialized nations
321
Index
In this index, f refers to figure; t refers to table.
a-particle radiation, 267–268, 269tAcetylaminofluorene, 87, 89f
Acetylation polymorphism, 69
Acid rain, 233–235
Active transport, 32, 33t
Aflatoxins, 56, 57f, 115
Age, response to xenobiotics, 69–70
Agent Orange. See 2,4,5-T
Agriculture, alternative, 215
Airborne particles, 154–155
Airborne toxins, 235–236
Air pollution, 145–170
cancer mortality, 72–73, 165f
incinerators, 166–168
indoor, 168–170
motor vehicles, 160–161
respiratory problems, 166
sources of urban pollutants, 145–146
tall stacks and pollutant transport, 168
Air quality, 5–6, 156–160, 169f
Alcohol, 19, 37f
Aldrin, structure, 211f
Alkylations, DNA, 85–90
Allergic responses, 129–133
Alternate fuels, motor vehicles, 246–247
Alveoli, 27–28
Aminofluorene, 55, 56f
Aneuploidization, 84
Antibodies, mode of action, 131
Antidiuretic hormone (ADH), 135–136
Antienvironmental movements, United
States, 14–15
Asbestos, 156
pollution by motor vehicles, 161–162
Asbestosis, 128
Atmosphere, earth’s
altitude–pressure relationship, 174f
altitude–temperature relationship, 174f
division, 175–176
pollution, 173–196
standard, 173, 174f
Atmospheric changes, human health,
195–196
Atrazine, structure, 212f
Autoimmunity, 132
Autoregulation, kidneys, 135
8-Azaguanine, 110
b-particle radiation, 267–268, 269tBacterial mutagenesis test, 109–110
Bagassosis, 133
Benefication, coal, 241–242
Benefin, structure, 212f
Benzene and ethylene, 154
Benzene, hematopoietic toxin, 142–143
Benzo[a]pyrene
atmospheric emission, 152t
carcinogenic activation, 56–57
322

DNA adducts, 104
interaction upon activation, 89
Beryllium, air pollution, 155
Bioavailability, 30
Biodegradable, 260
Biological exposure indices, 124
Biological extrapolation, dose–response
assessment, 114–115
Biological oxygen demand (BOD), 202
Biological testing, rodents, 113–114
Biotransformations, 40–42
Biphasic dose–response curve, 24, 25f
Bisphenol-A, endocrine disrupters, 100,
101f
Black lung disease, 128
Blood–brain barrier, 35
Body weight, volume of distribution vs.,
36t
Breast cancer
risk factors, 93
xenoestrogens and, 92–93
Bromobenzene, nephrotoxin, 137f, 138
2-Bromobenzoquinone, nephrotoxin,
137f, 138
Butylated hydroxytoluene (BUT), cancer
promoter, 74
Byssinosis, 133
Cadmium, nephrotoxin, 137
Cairo Plus Five, 299
Cancer
environment, 71–73
incidence, 165
initiation, 73–74
multistate development, 73–75
oncogenes and tumor suppressor
genes, 95–96
promoters, 74–75
Carbamates, characteristics, 211t
Carbaryl, structure, 213f
Carbon dioxide
emission, 183
factors affecting atmospheric,
185–186
forests, 185–186
global balance and deforestation, 11
greenhouse effect, 8
oceans, 185
temperature of earth, 183–185
Carbon monoxide
air pollution, 146–148
emissions, 147f
Haldane equation, 146–147
percentage of cities exceeding, 159t
trends in air pollution, 158, 160f
Carbon tetrachloride, nephrotoxin, 137
Carcinogenic, activation, 54–59
Carcinogenicity testing, fish, 113
Carcinogens, types, 75–76
Carson, Rachel, Silent Spring, 6, 102
Cationic heterocyclics, characteristics,
211t
Cell transformation assay, 112
Cellular uptake
mechanisms, 33t
xenobiotics, 31–32
Centrifugal separators, coal, 244
Centromere, 82
Chemical Manufacturers Association
(CMA), 164, 180–181
Chemical, storage in body, 36, 38
Chemical waste, incinerators, 167–168
Chernobyl, nuclear accident, 282–283
Chesapeake Bay, pollution, 219–220
Children
pesticides, 214
toxic symptoms of lead, 205
Chlordane
restrictions, 210
structure, 211f
Chlorinated hydrocarbons,
characteristics, 211t
Chlorofluorocarbons
depleting stratospheric ozone, 177–178
phasing out fluorocarbons, 181–183
Chloroform, nephrotoxin, 137
Chloropropham, structure, 213f
Chromatin, 81
Chromium, nephrotoxin, 137
Chromosomes, 81
Chronic exposure, radiosensitivity,
274–275
Cirrhosis, 141
Citizens for the Environment,
antienvironmental, 14
Clastogenesis, 84
Clean Air Act, 309–312
tall stacks, 168
Index 323
Clean Water Act, 306–308
Climatic change
effect of clouds, 189
effect on oceans, 188–189
effect on vegetation, 187–188
models, 186–190
ocean currents, 189
regional patterns, 187
sulfate aerosols, 189
vegetation response to global warming,
190
"wait and see" strategy, 192
Clinical symptoms, radiosensitivity,
273–274
Clouds, climatic changes, 189
Coal
benefication, 241–242
clean-coal technology, 241–244
clean combustion, 242–243
efficacy of air pollutant removal, 245t
fluidized-bed combustion, 243
gasification combined cycle, 242
prepurification, 241–242
purification of flue gases, 243–244
Cocaine, plasma levels, 30f
Cocarcinogens, 75
Codons, 80
Comprehensive Environmental
Response, Compensation, and
Liability Act (CERCLA), 315–316
Compton effect, 268
Conjugations, 44–46
Control systems, motor vehicles, 245–246
Copper, industrial pollution, 222
Cryptic mutations, 83
Cumulative dose–response curve, 21, 22f
Cycasin, liver carcinogens, 141, 142f
Cytochrome P-450
configuration, 41f
hydroxylation reactions, 41f
isozymes, 49–52
reactions catalyzed, 40–42, 43f
2,4-D, structure, 213f
DDT
cancer promoter, 74
inducer of P-450, 52–54
Persistent Organic Pollutants (POP)
treaty, 319–320
restrictions, 210
storage in fat, 36, 38
structure, 54f, 101f
Deforestation
developing world population, 10
global carbon dioxide balance, 11
industrialized countries, 10–11
See also Forest protection
Degeneracy, genetic code, 80
Delaney Clause, Food and Cosmetic Act,
67
Demand, resources, 11
Demographic momentum, 287, 289
Demographic-transition theory,
population growth, 9–10
Denaturation, DNA, 79
Dermis, 26
Desulfurization, coal, 243
Dichlorodiphenyltrichloroethane. See
DDT
Dichloroethane, 55, 56f
Dieldrin
concentration in Great Lakes, 228f
restrictions, 210
structure, 211f
Diethylstilbestrol (DES)
controversy, 99
extrapolation to man, 115
Diffusion mechanisms, 32, 33t
Diffusion rate, 28
Dimethylamine, 58, 59f
Dimethylbenzanthracene, liver
carcinogen, 141, 142f
Dinitroanilines, characteristics, 211t
Dioxins
endocrine disrupters, 100
health and ecological effects, 224–225
industrial pollution, 223–226
occurrence and exposure, 225–226
Persistent Organic Pollutants (POP)
treaty, 319–320
Diquat, structure, 212f
Distribution phase, pharmacokinetics,
33, 34f
DNA
alkylations, 85–90
degeneracy, 80
denaturation, 79
double helix, 80f
324 Index
effect of ultraviolet radiation, 91, 92f
grooves, 79
histones and nonhistones, 81–82
intercalating agents, 91
nucleosides, 77, 78f
nucleosome, 81, 82f
nucleotides, 78
purine and pyrimidine bases, 76–77
repair assay, 110
repair mechanism, 94–95
replication process, 80, 81f
sense and antisense strands, 80
single strand, 79f
Watson and Crick model, 79
Dose, definition, 20
Dose–response
applications of curve, 23
biphasic, curve, 25f
comparison of curves with different
slopes, 24f
conversion of percentage into probit
units, 22t
cumulative, curve, 22f
determination of toxicity, 20–21
probit transformation, 21–22
probit transformation of, curve, 23f
quantal, curve, 21f
relationship, 19–24
reversibility of toxicity, 23–24
Dose–response assessment
biological extrapolation, 114–115
infralinear extrapolation, 116
negative results, 117
numeric extrapolation, 115–117
superlinear extrapolation, 117
Dreissena polymorpha, 229–230
Earth, temperature, 183–185
Earth Summit
aims of Agenda 21, 13–14
United Nations conference, 12–14
Ecological risk assessment, 121
Economics, future of nuclear power, 283
Economy, environment and, 7–8
Edema, 125–127
Electromagnetic fields, low-frequency, 94
Electrostatic precipitators, coal, 244
Elimination phase, pharmacokinetics,
33–34
El Nino Southern Oscillation (ENSO),
195–196
Endangered Species Act, 318
Endocrine disrupters
diethylstilbestrol, 99
environmental and health impact,
102–105
fish and fish-eating birds, 102–103
historical, 98–99
hormonal imbalance, 99–100
humans, 105
marine mammals, 103–104
mollusks, 103
pesticides, 213–214
properties, 100–102
reptiles, 104
risk assessment, 120–121
structures, 101f
terrestrial mammals, 104–105
thalidomide, 98–99
Endocrine factors, response to
xenobiotics, 67–68
Endoplasmic reticulum, 42
Energy conservation, 250–252
Energy input, agricultural, 5, 6f
Energy sources
fossil fuels, 11–12
nuclear energy, 12
Enterohepatic circulation, 31, 139
Environment
antienvironmental movements in
United States, 14–15
deforestation, 10–11
Earth Summit, 12–14
economy and, 7–8
effect of overpopulation, 293–296
energy sources, 11–12
good life through chemistry, 5
historical perspective, 3–8
impact of global trade, 16–17
industrial revolution, 4–5
pesticide persistence, 209
population growth, 9–10
present state of world, 8–12
protective legislation, 3–4
relationship between world grain
production and agricultural energy
input, 6f
Rio Plus Five, 15–16
Index 325
Environment (cont.)
Silent Spring, 6
United Nations estimates of expected
population growth, 10f
use of resources, 11
warning signs, 5–6
Environmental factors, response to
xenobiotics, 67–68
Environmental inducers, P-450, 52–54
Environmental Protection Agency (EPA)
before EPA, 305–306
creation and mandate, 306
responsibilities, 305–316
risk assessment, 108
Superfund projects, 263
Environmental regulatory framework,
303–305
Enzyme induction, xenobiotics, 49–51
Epidermis, 26
Epigenetic carcinogens, mode of action,
76
Epoxides, disposition, 43–44
Erosion, soil, 205–207
Estradiol, metabolism, 93
b-Estradiol, structure, 101fEstuaries, 217–220
Ethanol, motor vehicles, 247
Ethylenebis(dithiocarbamate) metal
derivatives, characteristics, 211t
Europe, pollution, 230–231
Eutrophication, 200, 202
Exclusive Economic Zones (EEZ), 319
Exhaust emission, motor vehicles,
245–247
Exposure assessment, 117–118
Facilitated diffusion, 32, 33t
Fatty liver, 140
Federal Insecticide, Fungicide, and
Rodenticide Act (FIFRA), 312–313
Feminization, fish, 102–103
Filtration, coal, 244
Fish, carcinogenicity testing, 113
Fish and fish-eating birds, endocrine
disrupters, 102–103
Fish supply, population growth, 293
Flue gases, purification, 243–244
Fluidized-bed combustion, coal, 243
Fluorides, 156
Fluorocarbons, phasing out, 181–183
Food allergies, 132–133
Food and Cosmetic Act, Delaney Clause,
67
Food and Drug Administration (FDA), 66
Food chain, pesticides, 209–210
Food Quality Protection Act, 67, 316
endocrine disrupters, 120
Forest, radiation damage, 275t
Forest protection
Earth Summit, 13
See also Deforestation
Forests
acid rain, 234–235
carbon dioxide, 185–186
Formaldehyde
allergic response, 132, 133f
indoor vs. outdoor air, 169t
Fossil fuels, energy sources, 11–12
Frameshift mutation, 83, 87
Free radicals, radiation, 272–273
Freshwater, acid deposition, 234
g-rays, 267–268, 269tGas tank, controls, 248
Gasification combined cycle, coal, 242
Gasohol, motor vehicles, 247
Gasoline
ban on import of Venezuelan, 17
phaseout of lead additives, 16
Gene, 81
Genetically modified crops, 215–217
Genetics, response to xenobiotics,
68–69
Genotoxic carcinogens
direct and indirect acting, 75
mode of action, 75–76
Global 2000, warnings, 7–8
Global Change Research Act, 191
Global trade, impact on environment,
16–17
Global warming
international cooperation, 192–194
response of vegetation, 190
Glucuronidation, 45–46
Glutathione
detoxifying agent, 49
structure, 47, 48f
xenobiotic metabolism, 47–49
326 Index
Golden rice, genetic engineering,
216–217
"Good life through chemistry," slogan, 5
Grain production, history, 5, 6f
Grain supply, population growth,
290–293
Great Lakes
accumulation in fish, 227
concentrations of PCBs and dieldrin,
228f
fish consumption, 227, 229
industrial pollution, 226–230
toxic pollution, 226–227
zebra mussel, 229–230
Greenhouse effect
climate change, 190–191
increasing carbon dioxide levels, 8
preventive action, 191–192
Greenhouse gases
effect on earth’s temperature, 186, 187f
emissions, 15–16
fluorocarbons, 181–182
methane and nitrous oxide, 186
Greening the Earth Society,
antienvironmental, 15
Green revolution, 290–291
world agriculture, 5
Groundwater pollution, 231–233
leaching, 233
waste disposal sites, 232
Guanine
alkylation, 86, 87f
methylation or ethylation, 86, 87f
Guidelines for Carcinogenic Bioassay in
Small Rodents, 113–114
Hazard assessment
bacterial mutagenesis test, 109–110
biological testing in rodents, 113–114
carcinogenicity testing in fish, 113
cell transformation assay, 112
DNA repair assay, 110
mammalian mutagenicity assays,
110–112
sister chromatid exchange assay, 112
Hazardous waste
international export, 263–264
landfills, 256–257
storage in concrete silos, 264
Superfund projects, 263
Heat pollution, 231
Heavy metals
endocrine disrupters, 100
industrial pollution, 222
nephrotoxins, 136–137
neurotoxins, 143, 144t
Hematopoietic toxins, 142–143
Hepatobiliary dysfunctions, 140
Hepatotoxins, 141–142
Hexachlorobutadiene, nephrotoxin, 137
Hexachlorophene, allergic response, 132,
133f
n-Hexane, neurotoxin, 143, 144t
High-density polyethylene, recycling,
260–261
High-temperature gas-cooled reactor,
284–285
Histones, 81–82
Hormonal imbalance, 99–100
Human health, atmospheric changes,
195–196
Humans, endocrine disrupters, 105
Hunger, world, 291–292
Hydrochlorofluorocarbons (HCFCs)
ozone depletion potential, 182t
substitutes for CFCs, 181–182
Hydrogen bonds, DNA, 79, 80f
Hydrological cycle, 199
Hydroxylation, 40, 41f
Hypodermis, 26
Hypoxanthine–guanine
phosphoriboxyltransferase (HGPRT),
110–111
Immune system
allergies of food industries, 132–133
atmospheric changes, 195
common agents, 132
dysfunctions, 132
mechanisms, 129–131
Incineration, waste disposal, 257–259
Incinerators
chemical waste, 167–168
facility effectiveness, 167
pollution, 166–168
Indoor air pollution, 168–170
Induction, P-450 isozymes, 49–51, 52–54
Industrial chemicals, pollution, 162–166
Index 327

Industrial pollutants
definition, 221
dioxins, 223–226
Europe, 230–231
Great Lakes, 226–230
heat pollution, 231
heavy metals, 222
mercury, 221–222
polychlorinated biphenyls, 222–223
Industrial revolution, history, 4–5
Infralinear extrapolation, dose–response,
116
Inhibitors, cytochrome P-450, 51–52
Insect resistance, genetically modified
crops, 216
Intercalating agents, 91
Intercalation, definition, 91
Intergovernmental Panel on Climate
Change (IPCC), 192–194
5-Iododeoxyuridine, 111
Ionizing radiation, 267–269
Kepone, structure, 101f
Kidney, physiology, 133–134
Kyoto Protocol, 194
Land pollution
airborne, 233–236
lead, 204–205
nitrogen overload, 200
See also Soil
Landfills, hazardous waste, 256–257
Law of the Sea Convention of 1982 (LOS),
318–319
Leaching, groundwater pollution, 233
Lead
air pollution, 155
hematopoietic toxin, 143
industrial pollution, 222
nephrotoxin, 137
neurotoxin, 143
percentage of cities exceeding, 159t
sources of pollution, 204–205
toxic symptoms in children, 205
Legislation
historical perspective, 3
protective, 3–4
The Limits to Growth, future of humanity,
7
Lindane, structure, 211f
Lipophilic compounds, storage in body,
36, 38
Liver damage, 138–142
hepatotoxins, 141–142
types, 140–141
Liver physiology, 138–139
London Dumping Convention of 1975,
319
Low-frequency electromagnetic fields, 94
Low-level radioactive waste (LLRW), 281
Lung cancer, environmentally induced,
72
Mammalianmutagenicityassays,110–112
Mammals, endocrine disrupters
marine, 103–104
terrestrial, 104–105
Maneb, structure, 213f
Manganese, neurotoxin, 143, 144t
Manure, nutrients, 208
Margin of safety, 23
Marine environment, international
treaties protecting, 318–320
Marine mammals, endocrine disrupters,
103–104
Marpol Convention of 1973, 319
Masculinization, mollusks, 103
Meat supply, population growth, 293
Mercury
air pollution, 155
industrial pollution, 221–222
nephrotoxin, 136–137
neurotoxin, 143, 144t
Metabolism, phases, 39–40
Metal pollutants, 155
Methane, greenhouse gas, 186
Methanol, motor vehicles, 246–247
Methyl n-butyl ketone, neurotoxin, 143,
144t
Methyl t-butyl ether (MTBE), motor
vehicles, 247
3-Methylcholanthrene
cytochrome P-450 inducer, 49–51
structure, 50f
Mining, nuclear fuel, 276
Minute volume, 28
Mixed-function amine oxidases, 42, 44f
Mollusks, endocrine disrupters, 103
328 Index
Monuron, structure, 212f
Motor vehicles
alternate fuels, 246–247
control systems, 245–246
controls in gas tank, 248
controls in vehicle, 248
exhaust emission, 245–247
gaseous and vapor pollution, 160–161
oxygenates, 247
pollution, 160–162
rubber and asbestos, 161–162
urban transportation, 250–252
volatile organic compounds, 248
Municipal sewage, 201–202
Mutagenesis, 82–84
Mutations
cryptic, 83
frameshift, 83, 87
point, 83–84
NADPH. See Nicotinamine–adenine
dinucleotide phosphate (NADPH)
b-Naphthoflavonecytochrome P-450 inducer, 49–51
structure, 50f
2-Naphthylamine, 55
Nasopharyngeal canal, 27
National Aeronautics and Space
Administration (NASA), 180–181
National ambient air quality standards
(NAAQS), air pollutant guidelines,
156, 157t
National Cancer Institute (NCI), 66
National Environmental Policy Act
(NEPA), 302–303
National Oceanic and Atmospheric
Administration (NOAA), 180–181
National Science Foundation (NSF),
180–181
Natural gas, motor vehicles, 246
Necrosis, 140
Nephrons
functions, 133
schematic, 134f
Nephrotoxins
antidiuretic hormone, 135–136
autoregulation, 135
composition of fluids, 135
halogenated hydrocarbons, 137–138
heavy metals, 136–137
kidney physiology, 133–134
renal clearance, 136
threshold limit values (TLV), 138t
Neurotoxins, 143, 144t
Neutron radiation, 267–268, 269t
Nickel, industrial pollution, 222
Nicotinamine–adenine dinucleotide
phosphate (NADPH)
cytochrome P-450 catalyzed reactions,
42f
mechanism of reduction, 40, 41f
Nitrates, nutrients, 207–208
Nitrites, precarcinogens, 73
Nitrogen oxides
air pollution, 149
control, 249
emissions, 147f
indoor vs. outdoor air, 169t
motor vehicles emissions, 161t
percentage of cities exceeding, 159t
polar vortex, 178
trends in air pollution, 158, 160f
Nitrosamines, 58
Nitrous oxide, greenhouse gas, 186
Nonhistones, 81–82
Nonmetal pollutants, 156
Nonregenerative scrubbers, coal, 243
Nonylphenyl, endocrine disrupters, 100,
101f
Nuclear energy, 275–285
energy source, 12
future of nuclear power, 283–284
inherently safe reactors, 284–285
nuclear accident, 281–283
nuclear fuel, 276–277
nuclear reactors, 277–278
nuclear waste, 278–281
Nuclear waste, 278–281
Nucleosides, 77, 78f
Nucleosomes, 81, 82f
Nucleotides, 78
Numeric extrapolation, dose–response
assessment, 115–117
Nutrients, 207–208
airborne, 235
Occupational Safety and Health Act
(OSHA), responsibilities, 316–318
Index 329
Occupational toxicology
allergic responses, 129–133
biological exposure indices, 124
hematopoietic toxins, 142–143
irritation of airways and edema,
125–127
liver damage, 138–142
nephrotoxins, 133–138
neurotoxins, 143, 144t
paraquat, 127
pulmonary fibrosis, 127–128
pulmonary neoplasia, 129
respiratory toxicity, 124–125
threshold limit values, 123–124
Ocean currents, 189
Oceans
carbon dioxide, 185
climatic changes, 188–189
Oncogenes, tumor suppressor genes and,
95–96
One-compartment model,
pharmacokinetics, 34f
Oral route, toxin entry, 29–30
Oregon Lands Coalition,
antienvironmental, 14
Organic matter, metabolizable, 202–203
Organization for Economic Cooperation
and Development (OECD), 166, 263
Organophosphorus, characteristics,
211t
Ouabain resistance, 112
Our Stolen Future, Colborn, 102
Overpopulation, 296–298
effect on environment, 293–296
Oxygenates, motor vehicles, 247
Ozone
discovery of hole, 8
international cooperation, 180–181
stratospheric, depletion, 177–183
stratospheric, formation and
sustenance, 176–177
Pair production, 268
Paraquat
respiratory system, 127
structure, 212f
Particle-removal techniques, coal, 244
Parties to Framework Convention on
Climate Change, 193–194
People for the West, antienvironmental,
15
Percutaneous route, toxin entry, 26–27
Permeability, skin, 27
Persistent Organic Pollutants (POP)
treaty, 319–320
Pesticides, 208–215
airborne transport, 236
chlorinated hydrocarbon insecticides,
211f
classes and characteristics, 211t
food chain, 209–210
health and environmental effects,
213–215
ionic heterocyclic herbicides, 212f
nonpersistent, 213f
persistence in environment, 209
persistent, 212f
Persistent Organic Pollutants (POP)
treaty, 319–320
restrictions, 210, 212
Pfiesteria pesticida, 218–219
Pharmacokinetics, 32–35
Pharmacology, 19–38
Phenobarbital
cancer promoter, 74
cytochrome P-450 inducer, 49–51
structure, 50f
Phenoxyacetic acid derivatives,
characteristics, 211t
Phenylcarbamate derivatives,
characteristics, 211t
Phenylureas, characteristics, 211t
Photochemical chain reactions, air
pollution, 150
Photochemical smog, air pollution,
150–151
Photoelectric effect, 268
Plants, radiosensitivity, 275
Plasma clearance, 35
Plastics
environmental persistence, 259–260
recycling, 260–261
Point mutation, 83–84
Polar vortex, depleting stratospheric
ozone, 178–179
Pollution
groundwater, 231–233
industrial chemicals, 162–166
330 Index
motor vehicles, 160–162
radioactive, 267–285
See also Air pollution; Industrial
pollutants; Land pollution; Water
pollution
Pollution control, 241–264
clean-coal technology, 241–244
energy conservation, 250–252
hazardous waste, 263–264
mobile-source emission, 245–248
nitrogen oxides, 249
waste disposal and recycling,
255–262
wastewater treatment, 252–255
Polychlorinated biphenyls
biomagnification in food chain, 210t
concentration in Great Lakes, 228f
endocrine disrupters, 100
inducer of P-450, 53
industrial pollution, 222–223
Persistent Organic Pollutants (POP)
treaty, 319–320
structure, 54
Polycyclic aromatic hydrocarbons
(PAHs)
emissions, 153f
exposure at work and via food chain,
153–154
formation, 151
particle size, 152
pulmonary neoplasia, 129
Poly(ethylene), high-density, recycling,
260–261
Poly(ethylene terephthalate) (PET),
recycling, 260–261
Population
Cairo Plus Five, 299
Earth Summit, 13
international cooperation, 298–299
use of resources, 11
Population growth
demographic-transition theory,
9–10
global food supply, 290–293
status of women, 288–290
trends, 287–293
United Nations estimates, 9, 10f
Potency, expression, 23
Poverty and fertility rates, 289
Power reactor inherently safe module
(PRISM), 285
Precarcinogens, activation, 54–59
Premutagenic change, 94
Prepurification, coal, 241–242
Primaquine, 36, 37f
Principle of precautionary action,
121–122
PRISM (power reactor inherently safe
module), 285
Probit transformation
conversion of percentage into probit
units, 22t
dose–response curve, 23f
dose–response plot, 21–22
Process-inherent ultimate-safety reactor,
284
Protective legislation, history, 3–4
Public health, 296–298
Pulmonary fibrosis
asbestosis, 128
black lung disease, 128
pneumoconiosis, 127–128
silicosis, 128
Pulmonary neoplasia, 129
Pulmonary region, 27
Purification, flue gases, 243–244
Purine analogs, activation, 110–111
Purines, 76–77
Pyrethroids, characteristics, 211t
Pyrimidines, 76–77
dimerization, 91, 92f
Quantal dose–response curve, 20, 21f
Quinacrine, 36, 37f
Radiation
health and biological effects,
272–273
ionizing, 267–269
modes of action and penetration,
268–269
sources, 270–272
types, 267–268, 269t
ultraviolet, 91, 92f
Radioactive pollution, 267–285
Radioactivity, measurement, 269–270
Radiosensitivity, 273–275
Radon, radiation source, 270–272
Index 331
Reactors
inherently safe, 284–285
nuclear, 277–278
Receptors, concept, 25
Recycling
feedstock or chemical, 261
plastics, 260–261
waste crisis, 261–262
Regenerative scrubbers, coal, 243
Renal clearance, 136
Reptiles, endocrine disrupters, 104
Resource Conservation and Recovery Act
(RCRA), 314–315
Resources, use, 11
Respiratory route, toxin entry, 27–29
Respiratory system
irritation of airways and edema,
125–127
large aerosol particles, 125–126
paraquat, 127
poorly water soluble gases and vapors,
126–127
problems from pollution, 166
threshold limit values, 130t
toxicity, 124–125
water-soluble gases, 125
Rice, genetic engineering, 216–217
Risk assessment
critique, 119–120
dose–response assessment, 114–117
ecological, 121
endocrine disrupters, 120–121
exposure assessment, 117–118
hazard assessment, 108–114
principle of precautionary action,
121–122
risk characterization, 118–119
Risk characterization, 118–119
Rodents, biological testing, 113–114
Rubber, pollution by motor vehicles,
161–162
Safe Drinking Water Act (SDWA),
308–309
endocrine disrupters, 120
Safety, future of nuclear power, 283–284
Safrol, liver carcinogens, 141, 142f
Salinization, 207
Silent Spring, Carson, 6, 102
Silicosis, 128
Single-nephron glomerular filtration rate
(SNGFR), 134
Sister chromatid exchange assay, 112
Sister chromatids, 82
Skin permeability, 27
Smog, warning sign, 5–6
Soil
acid rain, 234–235
binding of pollutants, 206
cropland fertility, 206–207
erosion, 205–207
nutrients, 207–208
pesticides, 208–215
salinization, 207
Solubility, gas in blood, 28–29
Species variation, radiosensitivity, 273
State of the World 1987, population
growth, 9
Storage
chemicals in body, 36, 38
hazardous waste, 264
nuclear waste, 278–279
Storm water runoff, 203–204
Stratospheric ozone
depletion, 177–183
formation and sustenance, 176–177
See also Ozone
Stratum corneum, 26
Sulfate aerosols, climatic changes, 189
Sulfonamide, 36, 37f
Sulfonylurea, 36, 37f
Sulfur dioxide
acid deposition, 233–235
air pollution, 148–149
emissions, 147f
percentage of cities exceeding, 159t
trends in air pollution, 156, 158f
Superfund, 315–316
Superfund Amendment and
Reauthorization Act (SARA), 162
Superfund projects, hazardous waste,
263
Superlinear extrapolation, 117
Suspended particulate matter (SPM)
air pollution, 154–155
coal, 243–244
emissions, 147f
indoor vs. outdoor air, 169t
332 Index

percentage of cities exceeding, 159t
respiratory toxicity, 29
trends in air pollution, 156–157, 159f
Swain–Scott equation, 85
Synthetic organic chemicals, 203
2,4,5-T
health effects, 214–215
structure, 213f
Tall stacks, pollutant transport, 168
TCDD
fish and fish-eating birds, 103
health and ecology, 224–225
industrial pollution, 223–226
occurrence and exposure, 225–226
Tellurium, neurotoxin, 143, 144t
Terrestrial mammals, endocrine
disrupters, 104–105
Tetrachlorodibenzo-p-dioxin
inducer of P-450, 53
structure, 54f
Tetrahydrocannabinol, structure, 101f
Thalidomide
structure, 99f
tragedy, 98–99
Thallium, neurotoxin, 143, 144t
Therapeutic index, 23
6-Thioguanine, 110
Three Mile Island, nuclear accident, 282
Threshold limit values (TLV)
ceiling concentrations (TLV-C), 124
short-term exposure limit (STEL), 123
time-weighted average (TWA), 123,
130t, 138t, 144t
Thymidine, dimerization, 91, 92f
Tidal volume, 28
Toluene, indoor vs. outdoor air, 169t
Toluene diisocyanate, allergic response,
132, 133f
Toxaphene
airborne transport, 235
restrictions, 210
Toxic chemicals, warning sign, 6
Toxic Release Inventory (TRI), 162–164
Toxic Substances Control Act (TSCA),
313–314
Toxicity
determination, 20–21
enzyme activity, 62
exposure mode, 66–67
metabolic pathways, 62
respiratory, 124–125
reversibility, 23–24
selective, 61–62
species differences, 65–66
tests in animals, 65–67
xenobiotic metabolizing systems, 64
Toxins, airborne transport, 235–236
Toxins, mode of entry
oral route, 29–30
percutaneous route, 26–27
respiratory route, 27–29
xenobiotics, 26
Tracheobronchial region, 27
Transportation, urban, 250–252
Triazines, characteristics, 211t
Tumor suppressor genes, oncogenes and,
95–96
Two-compartment model,
pharmacokinetics, 34f
Ultraviolet radiation, 91, 92f
United Nations
Conference on Environment and
Development, 12–14
Earth Summit, 12–14
estimates of expected population
growth, 9, 10f
United Nations Conference on
Environment and Development, 193
United Nations Environment Programme
(UNEP), 180–181, 264
United Nations Framework Convention
on Climate Change, 193
United States, antienvironmental
movements, 14–15
Uranium
nuclear fuel, 276–277
radiation source, 270, 271f
Urban sprawl, 296–298
Vegetation
climatic changes, 187–188
response to global warming, 190
Vinyl chloride
carcinogenic activation, 56, 57f
extrapolation to man, 115
Virallike hepatitis, 141
Index 333
Volatile organic compounds (VOCs)
air pollution, 151–152
emissions, 147f
motor vehicles, 248
Volume of distribution, 32–35, 36t
Warfarin
hydroxylation, 51
structure, 52f
Warning signs, environment, 5–6
Waste, nuclear, 278–281
Waste disposal
groundwater pollution, 232
Waste disposal and recycling, 255–262
hazardous-waste landfills, 256–257
incineration, 257–259
plastics, 259–261
trash disposal methods, 256–259
Wastewater treatment, 252–255
modern purification plant, 254f
Water pollution
airborne, 233–236
freshwater reserves, 199–200
lead, 204–205
metabolizable organic matter, 202–203
municipal sewage, 201–202
nitrogen overload, 200
storm water runoff, 203–204
synthetic organic chemicals, 203
transport, 201
urban pollutants, 201–204
Water quality, warning sign, 5–6
Weapons facilities, waste, 280
Wet collectors, coal, 244
Wetlands, 217–220
Chesapeake Bay, 219–220
loss, 217–218
Pfiesteria pesticida, 218–219
Women, status, and population growth,
288–290
World Health Organization (WHO)
air pollutant guidelines, 156, 157t
percentage of cities exceeding, 159t
World hunger, 291–292
World Meterological Association,
180–181
Xenobiotics
active transport, 32, 33t
blood–brain barrier, 35
cellular uptake, 31–32
conjugations, 44–46
diffusion through lipid layer, 32, 33t
diffusion through pores, 32, 33t
disposition of epoxides, 43–44
distribution between plasma and
tissue, 32–35
enterohepatic circulation, 31
environmental and endocrine factors,
67–68
facilitated diffusion, 32, 33t
genetic factors, 68–69
glutathione, 47–49
influence of age, 69–70
pharmacokinetics, 32–35
phase 1 biotransformations, 40–42
phases of metabolism, 39–40
plasma clearance, 35
responses to individual variations,
67–70
storage of chemicals in body, 36, 38
term, 26
translocation, 30–38
volume of distribution (VD), 32–35
Xenoestrogens, breast cancer, 92–93
Zebra mussel, 229–230
Zinc, industrial pollution, 222
334 Index
Related Documents