September 2005 NSF 05/21/EPADWCTR EPA/600/R-05/117 Environmental Technology Verification Report Removal of Arsenic in Drinking Water Basin Water High Efficiency Ion Exchange Treatment System Prepared by NSF International Under a Cooperative Agreement with U.S. Environmental Protection Agency

Welcome message from author
This document is posted to help you gain knowledge. Please leave a comment to let me know what you think about it! Share it to your friends and learn new things together.
Transcript

September 2005 NSF 05/21/EPADWCTR
EPA/600/R-05/117
Environmental Technology Verification Report
Removal of Arsenic in Drinking Water
Basin Water High Efficiency Ion Exchange Treatment System
Prepared by
NSF International
Under a Cooperative Agreement with U.S. Environmental Protection Agency
THE ENVIRONMENTAL TECHNOLOGY VERIFICATION PROGRAM
U.S. Environmental Protection Agency NSF International
ETV Joint Verification Statement TECHNOLOGY TYPE: ION EXCHANGE USED IN DRINKING WATER
TREATMENT SYSTEMS
APPLICATION: REMOVAL OF ARSENIC TECHNOLOGY NAME: BASIN WATER HIGH EFFICIENCY ION EXCHANGE
TREATMENT SYSTEM
COMPANY: BASIN WATER
ADDRESS: 8731 PRESTIGE COURT PHONE: (951) 233-9605 RANCHO CUCAMONGA, CA 91730 FAX: (949) 631-8108
WEB SITE: www.basinwater.com EMAIL: [email protected]
The U.S. Environmental Protection Agency (EPA) supports the Environmental Technology Verification (ETV) Program to facilitate the deployment of innovative or improved environmental technologies through performance verification and dissemination of information. The goal of the ETV Program is to further environmental protection by accelerating the acceptance and use of improved and more cost-effective technologies. ETV seeks to achieve this goal by providing high-quality, peer-reviewed data on technology performance to those involved in the design, distribution, permitting, purchase, and use of environmental technologies.
ETV works in partnership with recognized standards and testing organizations, stakeholder groups (consisting of buyers, vendor organizations, and permitters), and with the full participation of individual technology developers. The program evaluates the performance of innovative technologies by developing test plans that are responsive to the needs of stakeholders, conducting field or laboratory tests (as appropriate), collecting and analyzing data, and preparing peer-reviewed reports. All evaluations are conducted in accordance with rigorous quality assurance protocols to ensure that data of known and adequate quality are generated and that the results are defensible.
NSF International (NSF) in cooperation with the EPA operates the Drinking Water Systems (DWS) Center, one of six technology areas under the ETV Program. The DWS Center recently evaluated the performance of an ion exchange (IX) system used in drinking water treatment applications. This verification statement provides a summary of the test results for the Basin Water High Efficiency Ion Exchange Treatment System (Basin Water System). MWH, an NSF-qualified field testing organization (FTO), performed the verification testing. The verification report contains a comprehensive description of the test.
05/21/EPADWCTR The accompanying notice is an integral part of this verification statement. September 2005 VS-i
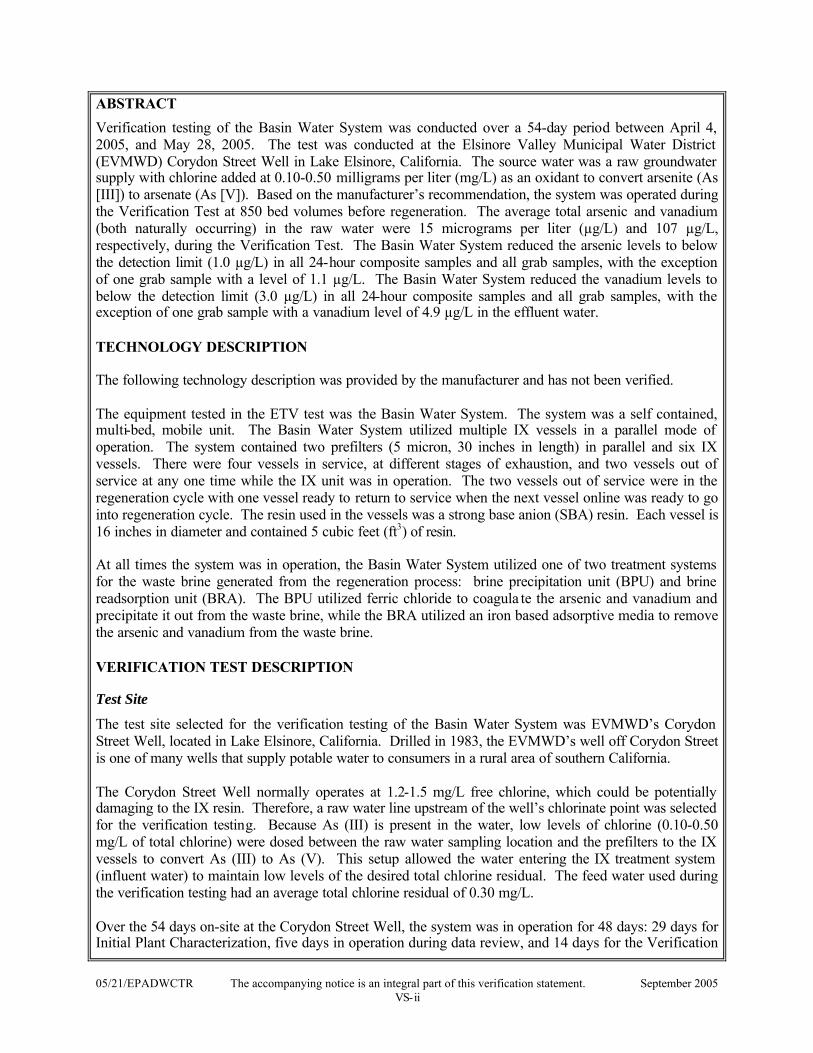
ABSTRACT Verification testing of the Basin Water System was conducted over a 54-day period between April 4, 2005, and May 28, 2005. The test was conducted at the Elsinore Valley Municipal Water District (EVMWD) Corydon Street Well in Lake Elsinore, California. The source water was a raw groundwater supply with chlorine added at 0.10-0.50 milligrams per liter (mg/L) as an oxidant to convert arsenite (As [III]) to arsenate (As [V]). Based on the manufacturer’s recommendation, the system was operated during the Verification Test at 850 bed volumes before regeneration. The average total arsenic and vanadium (both naturally occurring) in the raw water were 15 micrograms per liter (µg/L) and 107 µg/L, respectively, during the Verification Test. The Basin Water System reduced the arsenic levels to below the detection limit (1.0 µg/L) in all 24-hour composite samples and all grab samples, with the exception of one grab sample with a level of 1.1 µg/L. The Basin Water System reduced the vanadium levels to below the detection limit (3.0 µg/L) in all 24-hour composite samples and all grab samples, with the exception of one grab sample with a vanadium level of 4.9 µg/L in the effluent water.
TECHNOLOGY DESCRIPTION
The following technology description was provided by the manufacturer and has not been verified.
The equipment tested in the ETV test was the Basin Water System. The system was a self contained, multi-bed, mobile unit. The Basin Water System utilized multiple IX vessels in a parallel mode of operation. The system contained two prefilters (5 micron, 30 inches in length) in parallel and six IX vessels. There were four vessels in service, at different stages of exhaustion, and two vessels out of service at any one time while the IX unit was in operation. The two vessels out of service were in the regeneration cycle with one vessel ready to return to service when the next vessel online was ready to go into regeneration cycle. The resin used in the vessels was a strong base anion (SBA) resin. Each vessel is 16 inches in diameter and contained 5 cubic feet (ft3) of resin.
At all times the system was in operation, the Basin Water System utilized one of two treatment systems for the waste brine generated from the regeneration process: brine precipitation unit (BPU) and brine readsorption unit (BRA). The BPU utilized ferric chloride to coagula te the arsenic and vanadium and precipitate it out from the waste brine, while the BRA utilized an iron based adsorptive media to remove the arsenic and vanadium from the waste brine.
VERIFICATION TEST DESCRIPTION
Test Site
The test site selected for the verification testing of the Basin Water System was EVMWD’s Corydon Street Well, located in Lake Elsinore, California. Drilled in 1983, the EVMWD’s well off Corydon Street is one of many wells that supply potable water to consumers in a rural area of southern California.
The Corydon Street Well normally operates at 1.2-1.5 mg/L free chlorine, which could be potentially damaging to the IX resin. Therefore, a raw water line upstream of the well’s chlorinate point was selected for the verification testing. Because As (III) is present in the water, low levels of chlorine (0.10-0.50 mg/L of total chlorine) were dosed between the raw water sampling location and the prefilters to the IX vessels to convert As (III) to As (V). This setup allowed the water entering the IX treatment system (influent water) to maintain low levels of the desired total chlorine residual. The feed water used during the verification testing had an average total chlorine residual of 0.30 mg/L.
Over the 54 days on-site at the Corydon Street Well, the system was in operation for 48 days: 29 days for Initial Plant Characterization, five days in operation during data review, and 14 days for the Verification
05/21/EPADWCTR The accompanying notice is an integral part of this verification statement. September 2005 VS-ii

Test. There were three plant shutdowns (April 7, May 12, and May 14, 2005) accounting for the balance of the testing period. Each shutdown was associated with construction in the area and was not a direct result of the Basin Water System.
Methods and Procedures
Water quality was monitored from three water streams: raw water, chlorinated and filtered raw water (influent), and treated water (effluent). Measurements of free and total chlorine, pH, temperature, and conductivity were collected on-site through grab samples, using equipment set up inside the mobile Basin Water System at the EVMWD Corydon Street Well. MWH Laboratories in Monrovia, California, were also sent samples to analyze for the following: arsenic (total [24-hour composite and grab samples] and dissolved and As [III] grab samples); vanadium (24-hour composite and grab samples); and calcium, chloride, hardness, alkalinity, total dissolved solids (TDS), total suspended solids (TSS), manganese, iron, magnesium, dissolved silica, fluoride, sulfate, and nitrate (24-hour composite samples). Grab samples were also collected for N-nitrosodimethylamine (NDMA), as requested by the utility. Previous research suggests that in some IX resins, NDMA could form when a water plant uses chloramines. All laboratory samples were delivered the same day as collection in coolers filled with ice. They were analyzed using either Standard Methods for the Examination of Water and Wastewater, 20th edition or EPA-approved methods. Complete descriptions of the verification test, results, and quality assurance/quality control (QA/QC) procedures are included in the verification report.
VERIFICATION OF PERFORMANCE
System Operation
The Basin Water System used multiple IX vessels operating in parallel to remove arsenic and vanadium from the water. The IX resin beds were staggered such that all beds online were operated at different, but evenly spaced points on their respective breakthrough curves. When a vessel reached the selected absorption limit set point (the point at which the bed would no longer provide beneficial target ion removal), the bed was removed from service for regeneration. The IX resin was regenerated using a sodium chloride (brine) solution. Following regeneration, the IX resin was then rinsed using effluent water from the treatment process prior to returning to service, to maintain the desired number of beds in service. As part of the waste minimization features of the Basin Water System, cleaner portions of the rinse water were recovered to the salt tank to make up the next batch of brine for the next regeneration cycle. The entire regeneration, rinsing, and exhaustion process was automatically performed by the programmable logic controller (PLC). Regeneration of the IX vessels was performed while the Basin Water System was online and did not interrupt the production of treated water. Individual IX vessels were regenerated and rinsed while the remaining vessels were online producing treated water.
The computer automation of the exhaustion, regeneration, rinse, and waste treatment using both BPU and BRA cycles required minimal human attention, and therefore made the system easy to operate. Automated alarms (system pressure, raw water flow rate, brine flow rate, brine tank level, etc.) further enhanced the system to alert the operator of any problems or changes in operating conditions outside the system’s set points, as determined by the manufacturer. However, not all alarms worked flawlessly. Occasionally alarms (such as low and high-level tank alerts) would go off, and the appropriate actions would not automatically occur. In addition, inline sensors (pH and conductivity) could not be removed for calibration without the treatment system being taken off-line.
When changes in onsite conditions triggered a system shutdown, the IX and waste treatment systems would automatically go through shutdown procedures and wait in standby mode until the system pressure and raw water flow rates resumed to the preset points. This automatic system start-up had the option for manual override, but due to the remote nature of the test site, the system was operated in automatic mode.
05/21/EPADWCTR The accompanying notice is an integral part of this verification statement. September 2005 VS-iii

Table VS-1: 24-Hour Composite Raw, Influent, and Effluent Water Verification Test Total Arsenic and Vanadium (May 12 through May 28, 2005)
Arsenic (µg/L) Vanadium (µg/L) Raw Influent Effluent Raw Influent Effluent
Water Water Water Water Water Water
Average 15 15 <1.0 107 105 <3.0 Minimum 14 14 <1.0 99 97 <3.0 Maximum 16 16 <1.0 110 110 <3.0
Number of Samples 13 14 14 13 14 14 Standard Deviation 0.49 0.62 NC 4.9 5.6 NC
95% Confidence Interval (15-15) (15-15) NC (106-108) (104-106) NC
All alarm and operating conditions were logged by the PLC for the operator to review upon returning to the test site.
Water Quality Results
The raw water at the test site had average total arsenic and vanadium levels of 15 µg/L and 107 µg/L, respectively. From the statistical analysis of the daily, 24-hour composite data presented in the following table, the Basin Water System consistently removed the raw water arsenic and vanadium to non-detectable levels of <1.0 µg/L and <3.0 µg/L, respectively.
NC = Not Calculated.
In addition to removing arsenic and vanadium from the raw water, the BasinWater System had an impact on other water quality parameters, as expected for an IX system. On average as compared to the raw water, the Basin Water System removed 18% alkalinity and 47% nitrate, and removed sulfate to below the detection limit. The average chloride level increased 67%. All other parameters had little to no change between the raw water and effluent water quality. TSS, iron, and magnesium each had non-detectable levels in the raw water, influent water, and effluent water throughout the verification testing.
Consumables and Waste Generation
The analyses of the solid waste generated from both the BPU and the BRA brine treatment systems are presented in the verification report. During the Initial Plant Characterization No. 1 when the bed volumes were set at 1,100, the percentage of waste brine was 0.06-0.08% of the treated water flow. When the bed volumes were reduced to 850 for the Verification Test, the percentage of waste brine was 0.08-0.09% of the treated water flow.
The waste generated from the BPU was found to be classified as nonhazardous based on the results of the California waste analysis methods of Total Threshold Limit Concentration (TTLC), Soluble Threshold Limit Concentration (STLC), and the federal waste analysis method of Toxicity Characteristic Leachate Procedure (TCLP). The total mass of arsenic in the waste was 233 milligrams per kilogram (mg/kg) of waste generated, with a TTLC limit of 500 mg/kg for hazardous waste. The results of the TCLP were <1.0 mg/L, with a limit of 5.0 mg/L. The total arsenic leachate from the STLC analysis was 2.8 mg/L, with a limit of 5.0 mg/L. Therefore, based on both the state and federal waste analyses, the waste generated from the BPU would be classified as nonhazardous (based on arsenic residuals).
The waste generated from the BRA was also found to be nonhazardous, with a TTLC of <3 mg/kg, a TCLP of <0.1 mg/L, and a STLC of 2.8 mg/L for total arsenic. Additional BPU and BRA metals analyses are provided in the verification report.
05/21/EPADWCTR The accompanying notice is an integral part of this verification statement. September 2005 VS-iv

Quality Assurance/Quality Control
NSF provided technical and quality assurance oversight of the verification testing as described in the verification report, including an audit of nearly 100% of the data. NSF personnel also conducted a technical systems audit during testing to ensure the testing was in compliance with the test plan. A complete description of the QA/QC procedures is provided in the verification report.
Original Signed by Sally Gutierrez 10/3/05
Original Signed by Robert Ferguson 10/5/05
Sally Gutierrez Date Director National Risk Management Research Laboratory Office of Research and Development United States Environmental Protection Agency
Robert Ferguson Vice President Water Systems NSF International
Date
NOTICE: Verifications are based on an evaluation of technology performance under specific, predetermined criteria and the appropriate quality assurance procedures. EPA and NSF make no expressed or implied warranties as to the performance of the technology and do not certify that a technology will always operate as verified. The end-user is solely responsible for complying with any and all applicable federal, state, and local requirements. Mention of corporate names, trade names, or commercial products does not constitute endorsement or recommendation for use of specific products. This report is not an NSF Certification of the specific product mentioned herein.
Availability of Supporting Documents Copies of the ETV Protocol for Equipment Verification Testing for Arsenic Removal dated September 2003, the ETV Protocol for Equipment Verification Testing for Removal of Inorganic Constituents dated April 2002, the verification statement, and the verification report (NSF Report # 05/21/EPADWCTR) are available from the following sources: (NOTE: Appendices are not included in the verification report. Appendices are available from NSF upon request.)
1. ETV Drinking Water Systems Center Manager (order hard copy) NSF International P.O. Box 130140Ann Arbor, Michigan 48113-0140
2. NSF web site: http://www.nsf.org/etv (electronic copy)
3. EPA web site: http://www.epa.gov/etv (electronic copy)
05/21/EPADWCTR The accompanying notice is an integral part of this verification statement. September 2005 VS-v

EPA/600/R-05/117 September 2005
Environmental Technology Verification Report
Removal of Arsenic in Drinking Water
Basin Water High Efficiency Ion Exchange Treatment System
Prepared for:
NSF InternationalAnn Arbor, Michigan 48105
Prepared by:
MWHLos Angeles, California 91017
Under a cooperative agreement with the U.S. Environmental Protection Agency
Jeffrey Q. Adams, Project OfficerNational Risk Management Research Laboratory
U.S. Environmental Protection AgencyCincinnati, Ohio 45268

Notice
The U.S. Environmental Protection Agency (EPA) through its Office of Research and Development has financially supported and collaborated with NSF International (NSF) under Cooperative Agreement No. R-82833301. This verification effort was supported by the Drinking Water Systems (DWS) Center, operating under the Environmental Technology Verification (ETV) Program. This document has been peer reviewed, reviewed by NSF and EPA, and recommended for public release.
ii

Foreword
The U.S. Environmental Protection Agency (EPA) is charged by Congress with protecting the Nation’s land, air, and water resources. Under a mandate of national environmental laws, the Agency strives to formulate and implement actions leading to a compatible balance between human activities and the ability of natural systems to support and nurture life. To meet this mandate, EPA’s research program is providing data and technical support for solving environmental problems today and building a science knowledge base necessary to manage our ecological resources wisely, understand how pollutants affect our health, and prevent or reduce environmental risks in the future.
The National Risk Management Research Laboratory (NRMRL) is the Agency’s center for investigation of technological and management approaches for preventing and reducing risks from pollution that threaten human health and the environment. The focus of the Laboratory’s research program is on methods and their cost-effectiveness for prevention and control of pollution to air, land, water, and subsurface resources; protection of water quality in public water systems; remediation of contaminated sites, sediments and ground water; prevention and control of indoor air pollution; and restoration of ecosystems. NRMRL collaborates with both public and private sector partners to foster technologies that reduce the cost of compliance and to anticipate emerging problems. NRMRL’s research provides solutions to environmental problems by: developing and promoting technologies that protect and improve the environment; advancing scientific and engineering information to support regulatory and policy decisions; and providing the technical support and information transfer to ensure implementation of environmental regulations and strategies at the national, state, and community levels.
This publication has been produced as part of the Laboratory’s strategic long-term research plan. It is published and made available by EPA’s Office of Research and Development to assist the user community and to link researchers with their clients.
Sally Gutierrez, Director National Risk Management Research Laboratory
iii
Table of Contents
Section PageVerification Statement ............................................................................................................... VS-iTitle Page ..........................................................................................................................................iNotice ...............................................................................................................................................iiForeword .........................................................................................................................................iiiTable of Contents............................................................................................................................ivAbbreviations and Acronyms ..........................................................................................................xiAcknowledgements .......................................................................................................................xiii
Chapter 1 Introduction............................................................................................................11.1 ETV Purpose and Program Operation .................................................................................11.2 Testing Participants and Responsibilities ............................................................................1
1.2.1 NSF International.....................................................................................................21.2.2 Field Testing Organization.......................................................................................21.2.3 Manufacturer ............................................................................................................31.2.4 Analytical Laboratory..............................................................................................31.2.5 Elsinore Valley Water District .................................................................................41.2.6 U.S. Environmental Protection Agency...................................................................4
1.3 Verification Testing Site ......................................................................................................41.3.1 Source Water............................................................................................................41.3.2 Raw Water Supply ...................................................................................................51.3.3 Treated Water (Effluent) Discharge .........................................................................61.3.4 Discharge Permits ....................................................................................................6
Chapter 2 Equipment Description and Operating Processes ..............................................72.1 Equipment Description ........................................................................................................72.2 Engineering and Scientific Concepts ...................................................................................8
2.2.1 Effect of Sulfate on Arsenic Removal .....................................................................92.2.2 Effect of Multiple Contaminants ...........................................................................102.2.3 Low Column Effluent pH in the Early Stages of Exhaustion................................102.2.4 Spent Brine Reuse and Treatment ..........................................................................11
2.3 Description of the Unit Processes ......................................................................................112.4 Description of Physical Construction/Components ...........................................................162.5 Chemical Consumption and Production of Waste Material ..............................................16
2.5.1 Chemical Consumption..........................................................................................162.5.2 Waste Production and Physical and Chemical Nature of Wastes ..........................16
2.6 Licensing Requirements.....................................................................................................17
Chapter 3 Methods and Procedures.....................................................................................183.1 Quantitative and Qualitative Evaluation Criteria...............................................................183.2 Key Treated Water Quality Parameters .............................................................................18
3.2.1 Key Groundwater Quality Parameters the Equipment is Designed to Address.....183.2.2 Key Treated Water Quality Parameters For Evaluating Equipment Performance 19
3.3 Equations and Definitions of Operational Parameters .......................................................19
iv
3.3.1 Equations ................................................................................................................193.3.2 Definitions ..............................................................................................................20
3.4 Testing Schedule ................................................................................................................243.5 Field Operations Procedures ..............................................................................................253.6 Environmental Technology Verification Testing Plan ......................................................25
3.6.1 Task 1: Selection and Characterization of the Raw Water ....................................263.6.2 Task 2: Preparation, Coordination and Start-Up....................................................263.6.3 Task 3: Initial Plant Characterization.....................................................................263.6.4 Task 4: Verification Testing ..................................................................................263.6.5 Task 5: Data Management .....................................................................................273.6.6 Task 6: Quality Assurance Project Plan................................................................27
3.7 Task 1: Selection and Characterization of the Raw Water ................................................273.7.1 Experimental Objectives........................................................................................273.7.2 Work Plan ..............................................................................................................273.7.3 Schedule .................................................................................................................273.7.4 Evaluation Criteria .................................................................................................27
3.8 Task 2: Preparation, Coordination and Start-Up................................................................273.8.1 Experimental Objectives........................................................................................283.8.2 Work Plan ..............................................................................................................283.8.3 Steady State Operation...........................................................................................28
3.9 Task 3: Initial Plant Characterization.................................................................................293.9.1 Experimental Objectives........................................................................................293.9.2 Work Plan ..............................................................................................................293.9.3 Analytical Schedule ...............................................................................................303.9.4 Evaluation Criteria and Minimum Reporting Criteria ...........................................32
3.10 Task 4: Verification Testing ..............................................................................................323.10.1 Experimental Objectives........................................................................................323.10.2 Work Plan ..............................................................................................................323.10.3 Analytical Schedule ...............................................................................................333.10.4 Evaluation Criteria .................................................................................................38
3.11 Task 5: Data Management .................................................................................................383.11.1 Experimental Objectives........................................................................................393.11.2 Work Plan ..............................................................................................................39
3.12 Task 6: Quality Assurance Project Plan.............................................................................393.12.1 Experimental Objectives........................................................................................403.12.2 Work Plan ..............................................................................................................403.12.3 Data Correctness ....................................................................................................41
3.12.3.1 Representativeness..................................................................................413.12.3.2 Statistical Analysis ..................................................................................453.12.3.3 Methodology for Measurement of Precision and Accuracy ...................453.12.3.4 Completeness ..........................................................................................48
3.12.4 Calculation of Indicators of Data Quality..............................................................493.12.5 Corrective Action Plan...........................................................................................50
3.13 Operation and Maintenance ...............................................................................................51
v
Chapter 4 Results and Discussion.........................................................................................534.1 Introduction........................................................................................................................534.2 Task 1: Selection and Characterization of the Raw Water ................................................534.3 Task 2: Preparation, Coordination, and Start-Up...............................................................544.4 Task 3: Initial Plant Characterization.................................................................................54
4.4.1 Initial Plant Characterization No. 1........................................................................554.4.1.1 Total Arsenic and Vanadium ..................................................................554.4.1.2 Inorganic Constituents ............................................................................584.4.1.3 On-Site Laboratory Testing ....................................................................674.4.1.4 Mass Balance of Total Arsenic ...............................................................69
4.4.2 Initial Plant Characterization No. 2........................................................................704.4.2.1 Total Arsenic and Vanadium ..................................................................714.4.2.2 Inorganic Constituents ............................................................................734.4.2.3 On-Site Laboratory Testing ....................................................................734.4.2.4 Mass Balance of Total Arsenic ...............................................................76
4.5 Task 4: Verification Testing ..............................................................................................764.5.1 Raw, Influent, and Effluent Water Quality............................................................76
4.5.1.1 Verification Testing Daily Laboratory Data ...........................................774.5.1.2 NDMA ....................................................................................................904.5.1.3 LSI...........................................................................................................914.5.1.4 Verification Testing On-Site Laboratory Data........................................93
4.5.2 Arsenic Speciation Results and Special Studies ....................................................954.5.3 Online Continuous Monitoring Data during Verification Testing.......................1014.5.4 Verification Testing Operational Data .................................................................1034.5.5 Brine Treatment Operation and Waste Generation..............................................111
4.5.5.1 Waste Brine Efficiency.........................................................................1124.5.5.2 Untreated and Treated Waste Brine ......................................................1134.5.5.3 Solid Waste ...........................................................................................116
4.6 Task 5: Data Management ...............................................................................................1184.7 Task 6: Quality Assurance Project Plan...........................................................................118
4.7.1 Precision...............................................................................................................1184.7.1.1 Laboratory Duplicate Precision ............................................................1194.7.1.2 On-Site Analytical Precision.................................................................129
4.7.2 Accuracy ..............................................................................................................1334.7.3 Spikes...................................................................................................................1344.7.4 Calibrations ..........................................................................................................1354.7.5 Completeness .......................................................................................................139
4.8 Operations and Maintenance............................................................................................1404.8.1 Fluctuation in Flow Rate......................................................................................1404.8.2 Chemical Feed Systems .......................................................................................1404.8.3 Sediment Prefilters ...............................................................................................1414.8.4 Resin Depth..........................................................................................................1414.8.5 Arsenic and/or Vanadium Breakthrough .............................................................1414.8.6 Brine Reuse, Feed, and Treatment .......................................................................141
4.9 NSF Field Inspection .......................................................................................................142
vi
Chapter 5 References...........................................................................................................143
Chapter 6 Vendor Comments .............................................................................................144
List of Tables PageTable 1-1: Historical Water Quality Data for Corydon Street Well (2004) .................................5Table 3-1: Quantitative and Qualitative Evaluation CriteriaTable 3-2: Operating Range of Basin Water High Efficiency Ion Exchange Treatment
......................................................18
System.......................................................................................................................18Table 3-3: Key Treated Water Quality Parameters ....................................................................19Table 3-4: Initial Plant Characterization ....................................................................................31Table 3-5: Operating and Performance Data ..............................................................................33Table 3-6: Verification Testing Analytical Methods and Sampling Frequency.........................34Table 3-7: Sampling Frequency for Characterization of Waste Brine .......................................35Table 3-8: Methodology for Measurement of Precision and Accuracy .....................................46Table 3-9: Methodology for Use of Method Blanks ..................................................................47Table 3-10: Laboratory Water Quality Analyses Indicators ........................................................48Table 3-11: Completeness Objective Based on Sample Frequency.............................................48Table 3-12: Corrective Action Plan..............................................................................................51Table 4-1: Historical Water Quality Data for Corydon Street Well (2004) ...............................54Table 4-2: Initial Plant Characterization No. 1: Raw, Influent, and Effluent Water Total
Arsenic and Vanadium..............................................................................................58Table 4-3: Initial Plant Characterization No. 1 Daily Raw, Influent, and Effluent Water
Alkalinity, Calcium, Chloride, Fluoride, Magnesium, Sulfate Nitrate, and Hardness....................................................................................................................63
Table 4-4: Initial Plant Characterization No. 1 Twice Daily Parameters for Raw, Influent and Effluent Water Silica, TDS, TSS, Iron, and Manganese ..........................................66
Table 4-5: Initial Plant Characterization No. 1 pH and Conductivity........................................67Table 4-6: Initial Plant Characterization No. 1 Free and Total Chlorine ...................................68Table 4-7: Initial Plant Characterization No. 1 On-Site Temperature........................................69Table 4-8: Initial Plant Characterization No. 1 Arsenic Mass Balance......................................70Table 4-9: Initial Plant Characterization No. 2 Raw Water, Influent, and Effluent Water Total
Arsenic and Vanadium..............................................................................................72Table 4-10: May 5, 2005 Initial Plant Characterization No. 2 Raw, Influent, and Effluent Water
Inorganic Constituents ..............................................................................................73Table 4-11: Initial Plant Characterization No. 2 pH and Conductivity........................................74Table 4-12: Initial Plant Characterization No. 2 Free and Total Chlorine ...................................75Table 4-13: Initial Plant Characterization No. 2 Temperature .....................................................75Table 4-14: Initial Plant Characterization No. 2 Arsenic Mass Balance......................................76Table 4-15: Verification Testing 24-Hour Composite Raw, Influent, and Effluent Water Total
Arsenic and Vanadium..............................................................................................79Table 4-16: Verification Testing Daily Grab Samples for Total Arsenic and Vanadium ............81Table 4-17: Verification Testing 24-Hour Composite Data for Raw, Influent, and Effluent
Water Inorganic Parameters......................................................................................87Table 4-18: Raw, Influent, and Effluent Water NDMA...............................................................91Table 4-19: Raw, Influent, and Effluent Water LSI.....................................................................92
vii

Table 4-20: Verification Testing On-Site Analytical Results of pH and Conductivity ...............93Table 4-21: Verification Testing On-Site Analytical Results of Free and Total Chlorine...........94Table 4-22: Verification Testing On-Site Temperature ...............................................................95Table 4-23: Total Arsenic, As (III), and As (V) from the Initial Plant Characterization and the
Verification Testing ..................................................................................................98Table 4-24: Dissolved Arsenic Results from the Initial Plant Characterization and the
Verification Testing ..................................................................................................99Table 4-25: Comparison of Edwards et al. and EDTA/Acetic Acid Preservation Methods for
Arsenic Speciation ..................................................................................................100Table 4-26: Edward et al. Method for Additional Speciation Studies .......................................101Table 4-27: Raw, Influent, and Effluent Water Pressure and Influent and Effluent Flow Rate 104Table 4-28: Brine Solution Strength...........................................................................................107Table 4-29: Exhaustion Start and Finish Times and Dates ........................................................107Table 4-30: Cumulative Power Totalizer Reading During Verification Testing .......................109Table 4-31: Daily Chemical Consumption.................................................................................110Table 4-32: Waste Brine Efficiency...........................................................................................112Table 4-33: Untreated and Treated Liquid Waste Brine ............................................................114Table 4-34: Combined BRA and BPU Waste Brine Analysis ...................................................116Table 4-35: Solids Waste Analysis.............................................................................................117Table 4-36: Total Alkalinity Precision Analysis ........................................................................119Table 4-37: Total Arsenic Precision Analysis ............................................................................120Table 4-38: Vanadium Precision Analysis .................................................................................123Table 4-39: Calcium, Iron, Total Hardness, Magnesium, and Manganese Precision Analysis .125Table 4-40: Silica, TDS, TSS, and Fluoride Precision Analysis ................................................126Table 4-41: Chloride, Sulfate, and Nitrate Precision Analysis ..................................................127Table 4-42: Treated and Untreated Liquid Waste Brine Precision Analysis .............................129Table 4-43: Free and Total Chlorine Precision Analysis ...........................................................130Table 4-44: Conductivity Precision Analysis .............................................................................131Table 4-45: Precision Analysis On-Site pH ...............................................................................132Table 4-46: Chloride Spike Results............................................................................................134Table 4-47: Daily Calibration of pH Meter................................................................................135Table 4-48: Daily Calibration of Conductivity Meter................................................................136Table 4-49: Flow Rate Calibration Checks ................................................................................138Table 4-50: Completeness ..........................................................................................................140
List of Figures Page Figure 2-1: Basin Water High Efficiency Ion Exchange Treatment System detailed process
flow .............................................................................................................................8Figure 2-2: Simplified Basin Water High Efficiency Ion Exchange Treatment System process
flow ...........................................................................................................................11Figure 3-1: Verification testing schedule.....................................................................................25Figure 4-1: Temporal plot of Initial Plant Characterization No. 1 raw, influent, and effluent
water total arsenic .....................................................................................................56Figure 4-2: Temporal plot of Initial Plant Characterization No. 1 raw, influent, and effluent
water vanadium.........................................................................................................57
viii

Figure 4-3: Temporal plot of Initial Plant Characterization No. 1 of daily raw, influent, and effluent water alkalinity ............................................................................................59
Figure 4-4: Temporal plot of Initial Plant Characterization No. 1 of daily raw, influent, and
Figure 4-5: Temporal plot of Initial Plant Characterization No. 1 of daily raw, influent, and
Figure 4-6: Temporal plot of Initial Plant Characterization No. 1 of daily raw, influent, and
Figure 4-7: Temporal plot of Initial Plant Characterization No. 1 of daily raw, influent, and
Figure 4-8: Temporal plot of Initial Plant Characterization No. 1 of daily raw, influent, and
Figure 4-9: Temporal plot of Initial Plant Characterization No. 1 of daily raw, influent, and
Figure 4-10: Temporal plot of Initial Plant Characterization No. 1 of daily raw, influent, and
Figure 4-11: Temporal plot of Initial Plant Characterization No. 2 raw, influent, and effluent
Figure 4-12: Temporal plot of Initial Plant Characterization No. 2 raw, influent, and effluent
Figure 4-13: Temporal plot of verification testing 24-Hour composite raw, influent, and effluent
Figure 4-14: Temporal plot of verification testing 24-Hour composite raw, influent, and effluent
Figure 4-15: Temporal plot of verification testing raw, influent, and effluent water grab sample
Figure 4-16: Temporal plot of verification testing raw, influent, and effluent water grab sample
effluent water calcium...............................................................................................59
effluent water chloride ..............................................................................................60
effluent water fluoride...............................................................................................60
effluent water magnesium .........................................................................................61
effluent water sulfate.................................................................................................61
effluent water nitrate .................................................................................................62
effluent water total hardness .....................................................................................62
water total arsenic .....................................................................................................71
water vanadium.........................................................................................................72
water total arsenic .....................................................................................................78
water vanadium.........................................................................................................78
total arsenic ...............................................................................................................80
vanadium ..................................................................................................................80Figure 4-17: Temporal plot of verification testing raw, influent, and effluent water alkalinity....83Figure 4-18: Temporal plot of verification testing raw, influent, and effluent water chloride......83Figure 4-19: Temporal plot of verification testing raw, influent, and effluent water fluoride ......84Figure 4-20: Temporal plot of verification testing raw, influent, and effluent water nitrate.........84Figure 4-21: Temporal plot of verification testing raw, influent, and effluent water sulfate ........85Figure 4-22: Temporal plot of verification testing raw, influent, and effluent water TDS ...........85Figure 4-23: Temporal plot of verification testing raw, influent, and effluent water calcium ......86Figure 4-24: Temporal plot of verification testing raw, influent, and effluent water total
hardness.....................................................................................................................86Figure 4-25: Temporal plot of verification testing raw, influent, and effluent water magnesium 87Figure 4-26: Speciated arsenic raw water results for Initial Plant Characterization through
verification testing.....................................................................................................96Figure 4-27: Speciated arsenic influent water results for Initial Plant Characterization through
Figure 4-28: Speciated arsenic effluent water results for Initial Plant Characterization through
Figure 4-29: Trend screen during regeneration cycle of 4/4/05-4/10/05 of Initial Plant
verification testing.....................................................................................................96
verification testing.....................................................................................................97
Characterization No. 1 ............................................................................................102
ix

Figure 4-30: Trend screen during exhaustion cycle of 4/4/05-4/10/05 of Initial Plant Characterization No. 1 ............................................................................................103
Photographs PagePhotograph 1: Test Site at the Corydon Street Wall.....................................................................4Photograph 2: Interior of Basin Water High Efficiency Ion Exchange System...........................7Photograph 3: Brine Saturator ....................................................................................................13Photograph 4: Data Computer and Control System ...................................................................14Photograph 5: Inline Pressure, Flow, pH and Conductivity Meters ...........................................14Photograph 6: Brine Flow Control System ................................................................................15Photograph 7: Influent Pre-filters...............................................................................................15
Appendices Appendix A – Basin Water Operation and Maintenance Manual Appendix B – Arsenic Speciation Columns and Quality Assurance and Quality Control Data Appendix C – Field Logbook Appendix D – MWH Laboratory Data and Proficiency Test Data Appendix E – Programmable Logic Controller Screen Shots
x

Abbreviations and Acronyms
ASTM American Society of Testing and Materials As (III) arsenite As (V) arsenate BPU brine processing unit BRA brine readsorption unit BV bed volume �C degree Celsius Cl-As (V) chloride-arsenate �F degree Fahrenheit d day(s) DQO data quality objective DRC dynamic reaction cell DWS Drinking Water Systems EBCT empty bed contact time EDTA ethylenediaminetetraacetic acid EPA Environmental Protection Agency ETV Environmental Technology Verification EVMWD ft3
Elsinore Valley Municipal Water District cubic feet
FTO field testing organization g gram gpm gallon per minute H hydrogen ion HMI human to machine interface hr hour ICP/MS Inductively Coupled Plasma Mass Spectrometry IX ion exchange lb pound L liter LCS laboratory control sample LFM laboratory fortified matrix lpm liter per minute LSI Langelier Saturation Index M molar MB method blank MCL maximum contaminant limit Meq milliequivalent min minute mL milliliter mg milligram MRL minimum reporting limit NDMA N-nitrosodimethylamine NaCl sodium chloride (salt) NaOH sodium hydroxide
xi

NELAC National Environmental Laboratory Accreditation Conference NIST National Institute of Standards and Technology NSF NSF International (formerly known as the National Sanitation Foundation) NSS nitrate over sulfate selective resin O&M operation and maintenance PE performance evaluation PLC Programmable Logic Controller ppd pounds per day psi pounds per square inch psig pound per square inch gauge PSTP Product Specific Test Plan PT proficiency testing QAPP Quality Assurance Project Plan QA/QC quality assurance/quality control RCl chloride-form strong base anion resin RCRA Resource Conservation and Recovery Act SBA strong base anion SCADA Supervisory Control and Data Acquisition SDWA Safe Drinking Water Act SFR service flow rate SM Standard Methods STLC soluble threshold limited concentration T temperature TCLP Toxicity Characteristic Leachate Procedure TDS total dissolved solids TSS total suspended solids TTLC Total Threshold Limit Concentration µg microgram
xii

ACKNOWLEDGMENTS
The FTO, MWH, was responsible for all elements in the testing sequence, including collection of samples, calibration and verification of instruments, data collection and analysis, data management, data interpretation, and the preparation of this report.
MWH626 Wilshire Boulevard, Suite 850Los Angeles, California 91017Contact Person: Kristie Witter
The laboratory selected for analytical work for this study was:
MWH Laboratories750 Royal Oaks Lane, Suite 100Monrovia, California 91016Contact Person: Andrew Eaton, Ph.D.
The manufacturer of the equipment was:
Basin Water5200 River AvenueNewport Beach, California 92663Contact Person: Larry Rowe
MWH wishes to thank NSF International, especially Mr. Bruce Bartley, Project Manager, and Ms. Kristie Wilhelm and Ms. Angela Beach, Project Coordinators, for providing guidance and program management. MWH also wishes to thank the Elsinore Valley Municipal Water District for providing the site for verification testing including providing assistance in connecting to the water system and all necessary utilities (water, sewer, and electrical).
NSF wishes to thank Mr. Dale Scherger, Environmental Consultant, Scherger Associates, for providing technical guidance.
Finally, NSF and MWH thank Basin Water for their technical support and for supplying the equipment necessary for the ETV.
xiii

Chapter 1Introduction
1.1 ETV Purpose and Program Operation
The U.S. Environmental Protection Agency (EPA) has created the Environmental Technology Verification (ETV) Program to facilitate the deployment of innovative or improved environmental technologies through performance verification and dissemination of information. The goal of the ETV Program is to further environmental protection by accelerating the acceptance and use of improved and more cost-effective technologies. ETV seeks to achieve this goal by providing high-quality, peer-reviewed data on technology performance to those involved in the design, distribution, permitting, purchase, and use of environmental technologies.
ETV works in partnership with recognized standards and testing organizations; with stakeholder groups consisting of buyers, vendor organizations, and permitters; and with the full participation of individual technology developers. The program evaluates the performance of innovative technologies by developing test plans responsive to the needs of stakeholders, conducting field demonstrations, collecting and analyzing data, and preparing peer-reviewed reports. All evaluations are conducted in accordance with rigorous quality assurance protocols to ensure that data of known and adequate quality are generated and that the results are defensible.
The EPA has partnered with NSF International (NSF) under the ETV Drinking Water Systems (DWS) Center to verify the performance of small drinking water systems that serve small communities. A goal of verification testing is to enhance and facilitate the acceptance of small drinking water treatment equipment by state drinking water regulatory officials and consulting engineers, while reducing the need for testing of equipment at each location where the equipment’s use is contemplated. NSF meets this goal by working with manufacturers and NSF-qualified Field Testing Organizations (FTOs) to conduct verification testing under the approved protocols. It is important to note that verification of the equipment does not mean the equipment is “certified” by NSF or “accepted” by EPA. Rather, it recognizes that the performance of the equipment has been determined and verified by these organizations for those conditions tested by the FTO.
The DWS Center evaluated the performance of the Basin Water High Efficiency Ion Exchange Treatment System (Basin Water System), which is used in drinking water treatment system applications. The verification test evaluated the ability of the ion exchange (IX) system to remove arsenic from drinking water under specific feed water quality and cond itions. This document provides the verification test results for the Basin Water System.
1.2 Testing Participants and Responsibilities
The ETV testing of the Basin Water System was a cooperative effort between the following participants:
NSF InternationalMWH
1

Basin WaterMWH LaboratoriesElsinore Valley Municipal Water District (EVMWD)U.S. Environmental Protection Agency
The following is a brief description of each of the ETV participants and their roles and responsibilities.
1.2.1 NSF International
NSF is an independent, not- for-profit testing and certification organization dedicated to public health and safety and to the protection of the environment. Founded in 1946 and located in Ann Arbor, Michigan, NSF has been instrumental in the development of consensus standards for the protection of public health and the environment. NSF also provides testing and certification services to ensure products bearing the NSF Name, Logo and/or Mark meet those standards. The EPA partnered with NSF to verify the performance of drinking water treatment systems through the EPA’s ETV Program.
NSF provided technical oversight of the verification testing. An audit of the field analytical data gathering and recording procedures was conducted. NSF also provided review of the Product Specific Test Plan (PSTP) as well as this report.
Contact Information: NSF International 789 N. Dixboro Road Ann Arbor, Michigan 48105 Phone: (734) 769-8010 Fax: (734) 769-0109 Contact: Bruce Bartley, Project Manager Email: [email protected]
1.2.2 Field Testing Organization
MWH, an environmental engineering consulting firm, conducted the verification testing of the Basin Water System. MWH is an NSF-qualified FTO for the ETV DWS Center.
The FTO was responsible for conducting the verification testing for 54 calendar days. The FTO provided all needed logistical support, established a communications network, and scheduled and coordinated activities of all participants. The FTO prepared the PSTP; oversaw the operation of equipment; managed, evaluated, interpreted and reported on the data generated by the field operations; and evaluated and reported on the performance of the technology.
FTO employees conducted the on-site analyses and data recording during the testing. Oversight of the daily tests was provided by the FTO’s project engineer and project manager.
2

Contact Information: MWH 626 Wilshire Boulevard, Suite 850 Los Angeles, California 91017 Phone: (213) 316-7013 Fax: (213) 316-7048 Contact Person: Kristie Witter Email: [email protected]
1.2.3 Manufacturer
The treatment system was manufactured by Basin Water, a water treatment equipment manufacturer and supplier. The manufacturer was responsible for supplying a field-ready system equipped with all necessary components, including treatment equipment, instrumentation and controls, and an operations and maintenance (O&M) manual. The manufacturer was responsible for providing logistical and technical support, as needed, as well as providing technical assistance to the FTO during operation and monitoring of the equipment undergoing field verification testing.
Contact Information: Basin Water 8731 Prestige Court Rancho Cucamonga, California 91730 Phone: (909) 233-9605 Fax: (909) 631-8108 Contact Person: Larry Rowe, Vice President for Governmental Affairs Email: [email protected]
1.2.4 Analytical Laboratory
The specific responsibilities of the water quality analytical staff, MWH Laboratories, were to provide the following: all off-site water quality analyses prescribed in the PSTP according to the Quality Assurance/Quality Control (QA/QC) and the protocols contained therein, reports including analytical results to the data manager, and detailed information on the analytical procedures implemented.
Contact Information: MWH Laboratories 750 Royal Oaks, Suite 100 Monrovia, California 91016 Phone: (626) 386-1100 Fax: (626) 386-1101 Contact Person: Andrew Eaton, Ph.D. Email: [email protected]
3

1.2.5 Elsinore Valley Water District
EVMWD supported the ETV by providing access to the Corydon Street Well, raw water, treated water blow-off structure, and electrical source; modification to the wellhead to connect to the well; and support throughout the project.
1.2.6 U.S. Environmental Protection Agency
The EPA, through its Office of Research and Development, has financially supported and collaborated with NSF under Cooperative Agreement No. R-82833301. This verification effort was supported by the DWS Center operating under the ETV Program. This document has been peer reviewed, reviewed by NSF and EPA, and recommended for public release.
1.3 Verification Testing Site
The test site selected for the verification testing of the Basin Water System was EVMWD’s Corydon Street Well, located 50 feet south of Corydon and 200 feet west of Mission Trails in Lake Elsinore, California. Drilled in 1983, the EVMWD’s well off Corydon Street is one of many wells that supply potable water to consumers in a rural area of southern California. The following sections provide additional information on the test site, including source water characteristics and discharge method.
Emergency Shower
Blow off Drain
Electrical supply
Eyewash station
Raw water (unchlorinated)
tap for ETV Test
Photograph 1: Test site at the Corydon Street Well.
1.3.1 Source Water
The Corydon Street Well normally operates at 1.2-1.5 mg/L free chlorine, which could be potentially damaging to the IX resin. Therefore, a raw water line upstream of the well’s chlorinate point was selected for the verification testing. However, As (III) is present in the
4

water, and therefore, a low level of chlorine (0.10-0.50 mg/L of total chlorine) was dosed between the raw water sampling location and the prefilters to the IX vessels to convert As (III) to As (V). This setup allowed the water entering the system (influent water) to maintain low levels of the desired total chlorine residual. The feed water used during the verification testing had an average total chlorine residual of 0.30 mg/L. The chlorine source was dosed by an LMI Milton Roy PX pump. A summary of the historical water quality at the Corydon Street Well is presented in Table 1-1.
Table 1-1. Historical Water Quality Data for Corydon Street Well (2004) Collection Date
Parameters Method Units 3/25/04 4/22/04 5/20/04 6/17/04 7/22/04 Min1 Max1 Ave1
Conductivity Lab Meter µmhos/cm 506 475 478 479 481 475 506 484 pH SM 4500H+ B pH Units 9.1 9.1 9.1 9.1 9.2 9.1 9.2 9.1 Alkalinity SM 2320B mg/L 91.0 89.2 86.1 84.6 87.6 84.6 91.0 87.7 Chloride EPA 300.0 mg/L 77 72 75 72 74 72 77 74 Fluoride SM 4500F C mg/L 0.40 0.41 0.41 0.42 0.41 0.40 0.42 0.41 Nitrate EPA 300.0 mg/L 6.3 1.4 1.4 1.4 1.4 1.4 6.3 2.4 Sulfate EPA 300.0 mg/L 38 34 36 35 36 34 38 36 Calcium EPA 200.7 mg/L 6.1 6.3 6.1 6.1 6.1 6.1 6.3 6.1 Hardness SM 3120B mg/L 19.0 19.4 18.8 18.8 18.6 18.6 19.4 18.9 Magnesium EPA 200.7 mg/L <0.10 0.89 0.87 0.86 0.83 <0.10 0.89 0.71 LSI SM 2330B None 0.36 0.48 0.45 0.44 0.55 0.36 0.55 0.46 Total As2 EPA 200.8 µg/L 19 13 20 16 15 13 20 17 As (III) EPA 200.8 µg/L 16 19 16 15 12.5 12.5 19 16 As (V) EPA 200.8 µg/L 2.5 1.0 3.8 2.8 2.2 1.0 3.8 2.5 Iron EPA 200.7 mg/L <0.2 <0.2 <0.2 <0.2 <0.2 <0.2 <0.2 <0.2 Manganese EPA 200.8 mg/L <0.015 <0.015 <0.015 <0.015 <0.015 <0.015 <0.015 <0.015 Silica EPA 200.7 mg/L 12 12 12 12 13 12 13 12 Vanadium EPA 200.8 µg/L 93 110 98 120 89 89 120 102 TDS SM 2540C mg/L 300 290 300 280 290 280 300 292 Total EPA 160.2 mg/L <10 <10 <10 <10 <10 <10 <10 <10 Suspended Solids (TSS) 1 Min = Minimum value; Max = Maximum value; Ave = Average value.
1.3.2 Raw Water Supply
The raw water was delivered to the site from the discharge manifold of the Corydon Street Well at an available pressure of approximately 65 pounds per square inch (psi). The water was pumped from the well into Loop 1434 pressure zone. Previous testing at the site has shown constant pressure of approximately 65 psi. No booster pumps were required for the verification testing.
Due to construction in the area of the well site, EVMWD experienced power failures at the site that caused the well to shutdown. When this occured, a run-signal from the well to the Basin Water System enabled the Basin Water System to start-up automatically once the well was put back into service.
5

1.3.3 Treated Water (Effluent) Discharge
All treated water was sent to a blow-off drain for disposal. The treated water produced from the system was not anticipated to adversely affect the environment. The blow-off drain had sufficient capacity to accept the treated water flow rate (approximately 37.5 gallons per minute [gpm]) for the duration of the study. All residuals generated from the study were stored on-site until analysis could confirm proper disposal method. Basin Water disposed of the treated waste brine liquid waste through Remedy Environmental Services in Anaheim, California. Basin Water disposed of the solid waste generated during the verification testing through Clean Harbors, a certified solids waste disposal company.
1.3.4 Discharge Permits
No discharge permits were necessary for this verification study.
6
Chapter 2Equipment Description and Operating Processes
2.1 Equipment Description
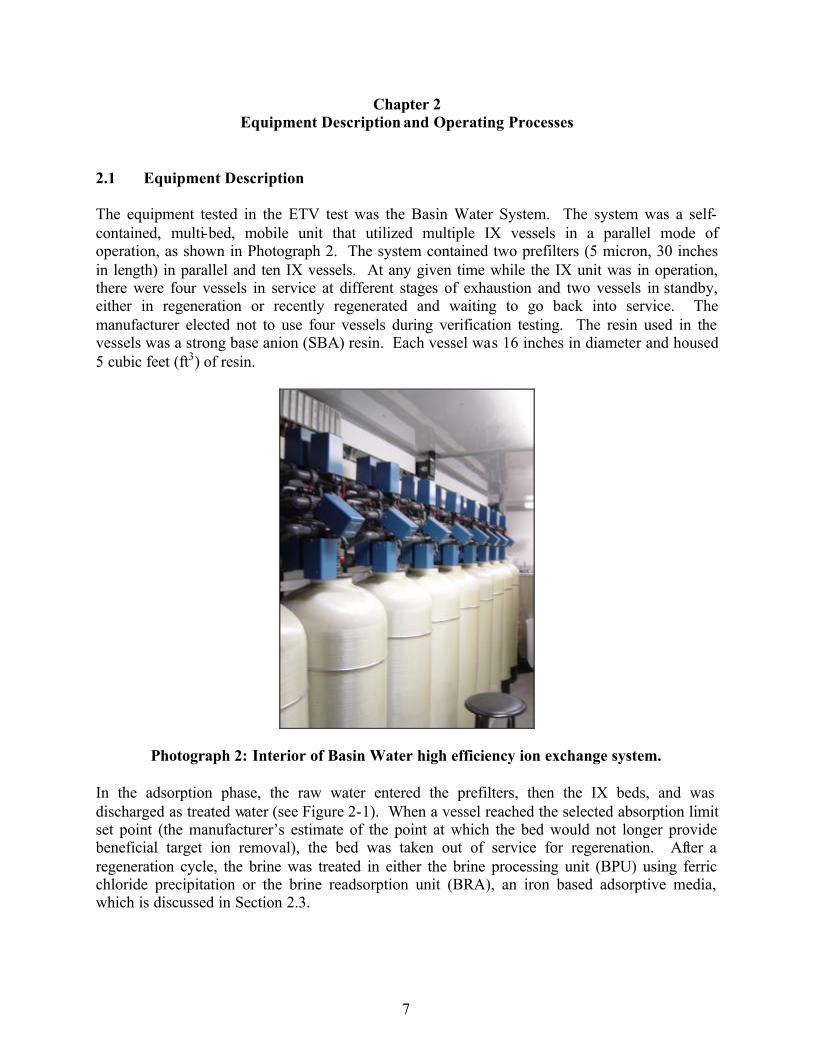
The equipment tested in the ETV test was the Basin Water System. The system was a self-contained, multi-bed, mobile unit that utilized multiple IX vessels in a parallel mode of operation, as shown in Photograph 2. The system contained two prefilters (5 micron, 30 inches in length) in parallel and ten IX vessels. At any given time while the IX unit was in operation, there were four vessels in service at different stages of exhaustion and two vessels in standby, either in regeneration or recently regenerated and waiting to go back into service. The manufacturer elected not to use four vessels during verification testing. The resin used in the vessels was a strong base anion (SBA) resin. Each vessel was 16 inches in diameter and housed 5 cubic feet (ft3) of resin.
Photograph 2: Interior of Basin Water high efficiency ion exchange system.
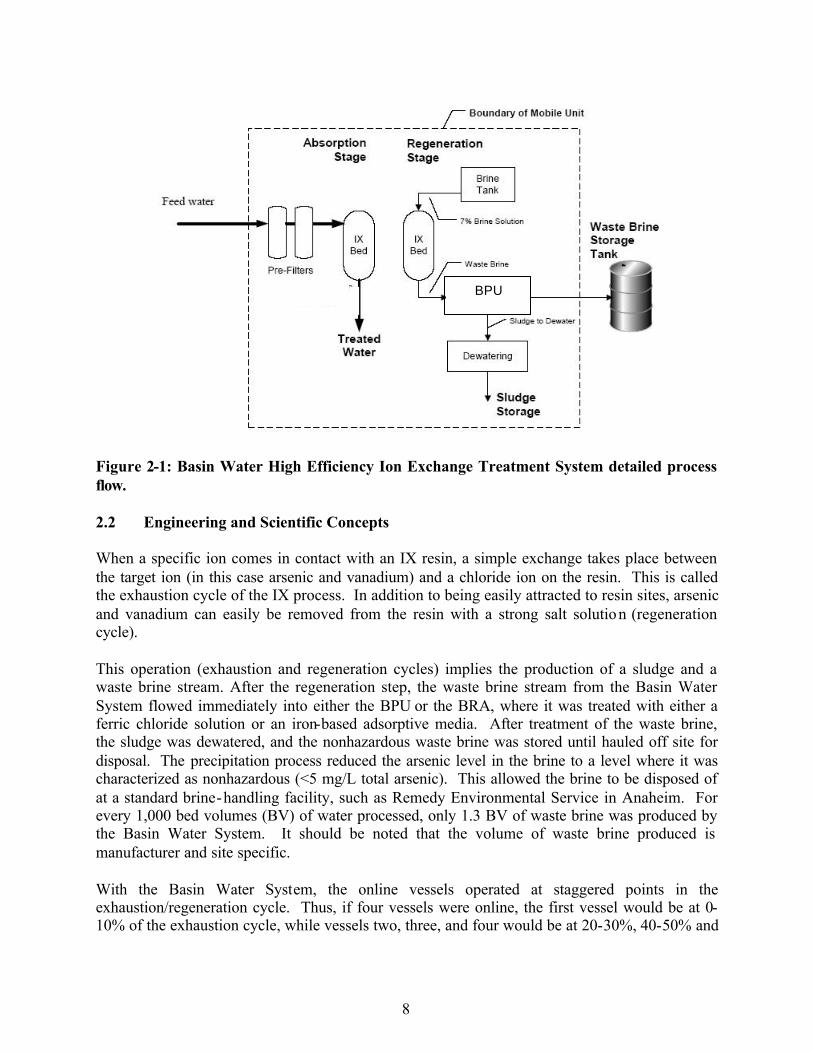
In the adsorption phase, the raw water entered the prefilters, then the IX beds, and was discharged as treated water (see Figure 2-1). When a vessel reached the selected absorption limit set point (the manufacturer’s estimate of the point at which the bed would not longer provide beneficial target ion removal), the bed was taken out of service for regerenation. After a regeneration cycle, the brine was treated in either the brine processing unit (BPU) using ferric chloride precipitation or the brine readsorption unit (BRA), an iron based adsorptive media, which is discussed in Section 2.3.
7
BPU
Figure 2-1: Basin Water High Efficiency Ion Exchange Treatment System detailed process flow.
2.2 Engineering and Scientific Concepts
When a specific ion comes in contact with an IX resin, a simple exchange takes place between the target ion (in this case arsenic and vanadium) and a chloride ion on the resin. This is called the exhaustion cycle of the IX process. In addition to being easily attracted to resin sites, arsenic and vanadium can easily be removed from the resin with a strong salt solution (regeneration cycle).
This operation (exhaustion and regeneration cycles) implies the production of a sludge and a waste brine stream. After the regeneration step, the waste brine stream from the Basin Water System flowed immediately into either the BPU or the BRA, where it was treated with either a ferric chloride solution or an iron-based adsorptive media. After treatment of the waste brine, the sludge was dewatered, and the nonhazardous waste brine was stored until hauled off site for disposal. The precipitation process reduced the arsenic level in the brine to a level where it was characterized as nonhazardous (<5 mg/L total arsenic). This allowed the brine to be disposed of at a standard brine-handling facility, such as Remedy Environmental Service in Anaheim. For every 1,000 bed volumes (BV) of water processed, only 1.3 BV of waste brine was produced by the Basin Water System. It should be noted that the volume of waste brine produced is manufacturer and site specific.
With the Basin Water System, the online vessels operated at staggered points in the exhaustion/regeneration cycle. Thus, if four vessels were online, the first vessel would be at 010% of the exhaustion cycle, while vessels two, three, and four would be at 20-30%, 40-50% and
8
60-70%, respectively. The dampening, or dilution, effect created by staggered operation allowed for more consistent (or steady-state) effluent water quality.
Total chlorine may be detrimental to the IX resin, but low doses (0.10-0.50 mg/L of total chlorine) are considered safe (i.e., not believed to cause long-term damage). Low doses of chlorine were required at this site to oxidize arsenite (As [III]) to arsenate (As [V]); otherwise the arsenic left in the arsenic (III) state would pass through the IX resin beds to the effluent water.
Oxidized and filtered raw water was passed through a bed of chloride-form SBA resin (RCl), and the chloride-arsenate (Cl-As [V]) IX reaction, Eq. (2.1), yielded resin in the As (V) form (R2HAsO4). When the column capacity for arsenic was exhausted, the arsenic “broke through” into the effluent water. The reaction was easily reversed, and regeneration, as shown in Eq. (2.2), returned the resin to the chloride form, ready for another exhaustion cycle:
2 RCl + HAsO24- = R2HAsO4 + 2 Cl- (2.1)
R2HAsO4 + 2NaCl = 2 RCl + Na2HAsO4 (2.2) Although the Cl-As (V) IX reaction appears simple, several issues must be addressed when implementing the process for drinking water treatment. Among the important factors that would be expected to influence verification testing were:
(1) Effect of competing ions such as sulfate and bicarbonate, (2) Multiple contaminants such as arsenic and vanadium, (3) Low pH of the column effluent early in the run, and (4) Waste brine reuse and treatment.
As mentioned, preoxidation to convert As (III) to As (V) was necessary (Frank and Clifford, 1986), but pH adjustment was not necessary because the chloride-arsenate exchange reaction took place readily in the ambient pH range of the Corydon Street Well.
2.2.1 Effect of Sulfate on Arsenic Removal
Because arsenic and vanadium are trace species, their concentrations do not greatly influence the run length to arsenic breakthrough. However, because sulfate, a common ion, is preferred over arsenic, vanadium, nitrate, chloride, bicarbonate, and most other common anions, its concentration largely determines the run length to arsenic breakthrough. For example, in a low-sulfate (5 mg/L) water in McFarland, California, arsenic run length exceeded 3,500 BV. In contrast, the arsenic run length of a McFarland, California, water spiked with 220 mg/L sulfate was only 250 BV. (These data are provided for informational purposes only and were not verified.) Thus, in testing the Basin Water System for arsenic removal, considerable attention was paid to the background sulfate concentration at the Corydon Street Well, which measured on average 41 mg/L during verification testing.
Not only does increasing sulfate concentration lead to shorter arsenic and vanadium removal runs, it can lead to chromatographic peaking or “dumping” of arsenic and/or vanadium. For example, arsenic process effluent concentration peaks in the range of 1.3-6 times the raw water arsenic concentration would not be unusual following arsenic breakthrough. These peaks were
9
avoided by stopping a run at or before arsenic breakthrough for the Basin Water System. Another way of coping with the potential peaking of arsenic or any other contaminant less preferred than sulfate was to exhaust several columns in parallel and in different stages of exhaustion (as with the Basin Water System). Thus, if one column ran beyond breakthrough, its effluent peak would be diluted by the effluents from the other columns.
There are two types of IX systems that exhaust multiple columns in parallel: fixed bed and rotating carousel. The Basin Water System was a fixed bed design that did not rotate. With the carousel design, IX beds are mounted on a slowly rotating carousel; the physical rotation of the carousel moves the beds slowly through the required sequence of operations, which include adsorption, regeneration and displacement.
2.2.2 Effect of Multiple Contaminants
Sub-maximum contaminant limit (MCL) levels (<10 mg nitrate as N) of nitrate were present along with arsenic or vanadium as a drinking water contaminant. For the study, the IX system removed nitrate, arsenic, and vanadium. However, nitrate will generally break through before arsenic, vanadium, and even sulfate. Additionally, a nitrate peak will appear in the effluent of the column if it is allowed to run to arsenic and/or vanadium breakthrough. To avoid the nitrate peak in the event it would exceed the nitrate MCL, the column may be stopped at a design set point for nitrate rather than arsenic breakthrough. This will lead to shorter run lengths, but will avoid exceeding the nitrate MCL even for a short time. Another approach to avoiding the nitrate peak is to exhaust multiple (fixed or moving) beds in parallel. Even if one of the beds is subject to a nitrate peak, effluents from the other beds will dilute and smooth out the peak. The Basin Water System did not experience nitrate peaking during the verification testing, due to low levels of nitrate at the verification site (between 6-16 mg/L) and the use of multiple beds in staggered-parallel operation.
2.2.3 Low Column Effluent pH in the Early Stages of Exhaustion
When an RCl is used to treat natural water, as in the arsenic and vanadium IX process, the column effluent pH during the first 50-300 BV can be significantly reduced compared with the influent pH. For example, column effluent pH values as low as 5.0 can be observed (Clifford, 1990). The pH is reduced by the conversion of bicarbonate to carbonate within the resin (Horng and Clifford, 1997). This conversion occurs with the resulting expulsion of a proton (hydrogen ion, [H+ ion]), which increases the H+ ion concentration and lowers the pH. The bicarbonate to carbonate reaction occurs because all standard SBA resins prefer divalent ions (e.g., carbonate) to monovalent (such as bicarbonate) at the typical total dissolved solid (TDS) levels found in drinking water supplies. An exception to this preference for divalent ions occurs with nitrate-selective, or nitrate over sulfate selective (NSS) resins, which are designed to prefer monovalent nitrate to divalent sulfate. The NSS resins do not exhibit the pH-lowering effect.
The extent of the pH lowering depends primarily on the characteristics of the resin and the bicarbonate concentration in the raw water. Because seriously acidic pH values must be avoided when delivering treated water into a distribution system, the pH of the IX system during verification testing for arsenic and vanadium removal was measured and recorded.
10
As in the case with potential arsenic, vanadium and nitrate peaking, the low pH values observed during the early stages of a single column anion exchanger run can be avoided by exhausting multiple columns in parallel. This way, the low-pH column effluent from one of the columns was blended with the other column effluents to produce a neutral pH water. This was the configuration of the Basin Water System.
2.2.4 Spent Brine Reuse and Treatment
Spent arsenic-contaminated IX brine can be directly reused for regeneration of the spent resin (Clifford and Ghurye, 1998). Brine reuse can substantially cut down on the volume of brine discharged and the salt (NaCl) consumption by the process. The Basin Water System reduced the volume of waste brine through a continuous regeneration process. Brine was passed over one exhausted IX bed at a time until the brine reached a theoretical exchange capacity. The spent brine was then treated prior to disposal.
2.3 Description of the Unit Processes
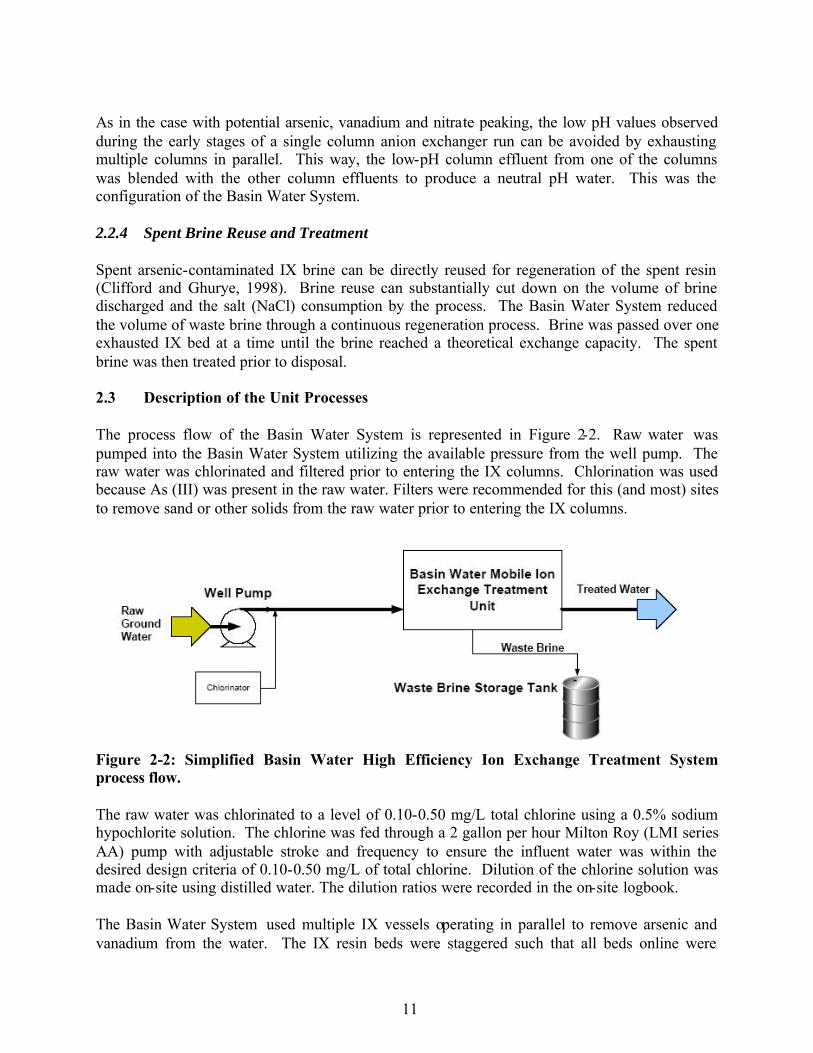
The process flow of the Basin Water System is represented in Figure 2-2. Raw water was pumped into the Basin Water System utilizing the available pressure from the well pump. The raw water was chlorinated and filtered prior to entering the IX columns. Chlorination was used because As (III) was present in the raw water. Filters were recommended for this (and most) sites to remove sand or other solids from the raw water prior to entering the IX columns.
Figure 2-2: Simplified Basin Water High Efficiency Ion Exchange Treatment System process flow.
The raw water was chlorinated to a level of 0.10-0.50 mg/L total chlorine using a 0.5% sodium hypochlorite solution. The chlorine was fed through a 2 gallon per hour Milton Roy (LMI series AA) pump with adjustable stroke and frequency to ensure the influent water was within the desired design criteria of 0.10-0.50 mg/L of total chlorine. Dilution of the chlorine solution was made on-site using distilled water. The dilution ratios were recorded in the on-site logbook.
The Basin Water System used multiple IX vessels operating in parallel to remove arsenic and vanadium from the water. The IX resin beds were staggered such that all beds online were
11

operated at different, but evenly spaced points on their respective breakthrough curves. When a vessel reached the selected absorption limit set point, defined for this system as a specific number of bed volumes processed, the bed was removed from service for regeneration. The manufacturer specified the number of bed volumes that triggered regeneration based on treated water results from the start-up and shakedown period. The IX resin was regenerated using a sodium chloride solution. Following regeneration, the resin was rinsed using effluent water from the treatment process prior to returning the bed to service. As part of the waste minimization features of the Basin Water System, cleaner portions of the rinse water were recovered to the salt tank to reduce the volume of liquid waste generated.
The entire regeneration, rinsing, and exhaustion process was automatically performed by the programmable logic controller (PLC). Individual IX vessels of the Basin Water System were regenerated and rinsed while the remaining vessels were online producing treated water. Four vessels were always online, while the other two were on standby following regeneration.
The waste brine produced by the regeneration and rinse cycles was sent to the brine treatment unit, which had two methods for treating the waste brine: the BRA, which used adsorption onto iron based media, or the BPU, which used ferric chloride precipitation. Both the adsorptive media method and the ferric chloride precipitation method of brine treatment were evaluated for removal efficiency of metals from the waste brine. The two brine treatment processes were evaluated independently (i.e., not a comparison evaluation) for effectiveness at reducing arsenic levels to below hazardous levels (i.e., less than 5.0 mg/L) in the liquid waste. Both the liquid and solid waste generated were analyzed upon completion of the verification testing for those parameters found in Table 3-7 (discussed in further detail in Chapter 3). The brine treatment method was deemed effective if successful in reducing the liquid waste to below hazardous levels for those parameters listed in Table 3-7. The on-site field engineer selected which brine treatment unit was in operation at any specific time.
The BRA used BW-33-60, an iron oxide absorptive media. This system utilized a 120-gallon batch treatment system with timed mixing of the iron oxide media with the waste liquid brine. Upon completion of the timed mixing set, the BRA system allowed the iron oxide adsorptive media to settle, and the treated waste liquid brine was decanted off and sent to a liquid waste storage tank. The media was characterized upon completion of the ETV.
The BPU system was an iron co-precipitation process. This process treated 240 gallons per batch using sulfuric acid (93% solution), caustic soda (50% solution), and ferric chloride (39.4% solution).
The raw water (pre-chlorinated water) was sampled outside of the testing unit by the raw water intake. The influent (chlorinated raw water) sample line was located inside the Basin Water trailer. There were two effluent sample lines. The effluent sample line inside the trailer was used for the 24-hour composite samples. The effluent sample line outside the trailer by the effluent blow off drain was used for grab samples. All sample lines were 1/8-inch flexible plastic. These lines were not standard for the Basin Water System, but were installed as part of the verification testing. The sample lines were allowed to purge (run) for one minute prior to collecting each sample.
12
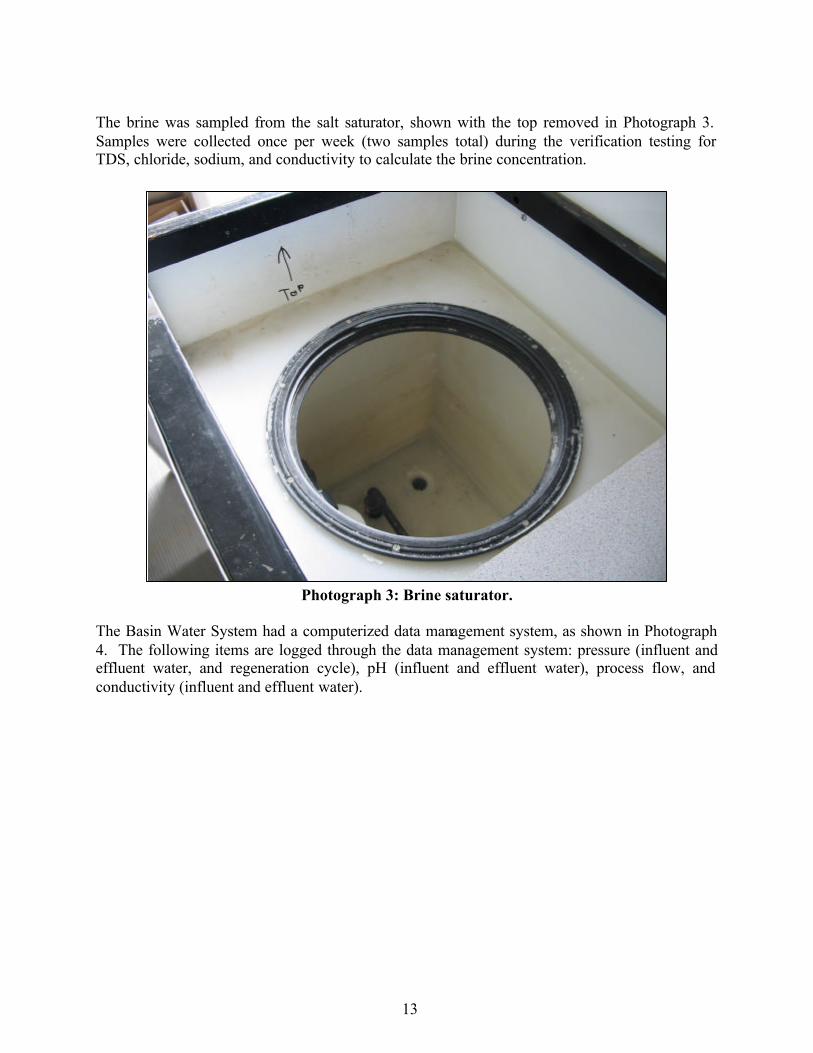
The brine was sampled from the salt saturator, shown with the top removed in Photograph 3. Samples were collected once per week (two samples total) during the verification testing for TDS, chloride, sodium, and conductivity to calculate the brine concentration.
Photograph 3: Brine saturator.
The Basin Water System had a computerized data management system, as shown in Photograph 4. The following items are logged through the data management system: pressure (influent and effluent water, and regeneration cycle), pH (influent and effluent water), process flow, and conductivity (influent and effluent water).
13

Photograph 4: Data computer and control system.
The influent flow meter and the influent and effluent inline pressure, pH, and conductivity meters are shown in Photograph 5.
Photograph 5: Inline pressure, flow, pH and conductivity me ters.
14
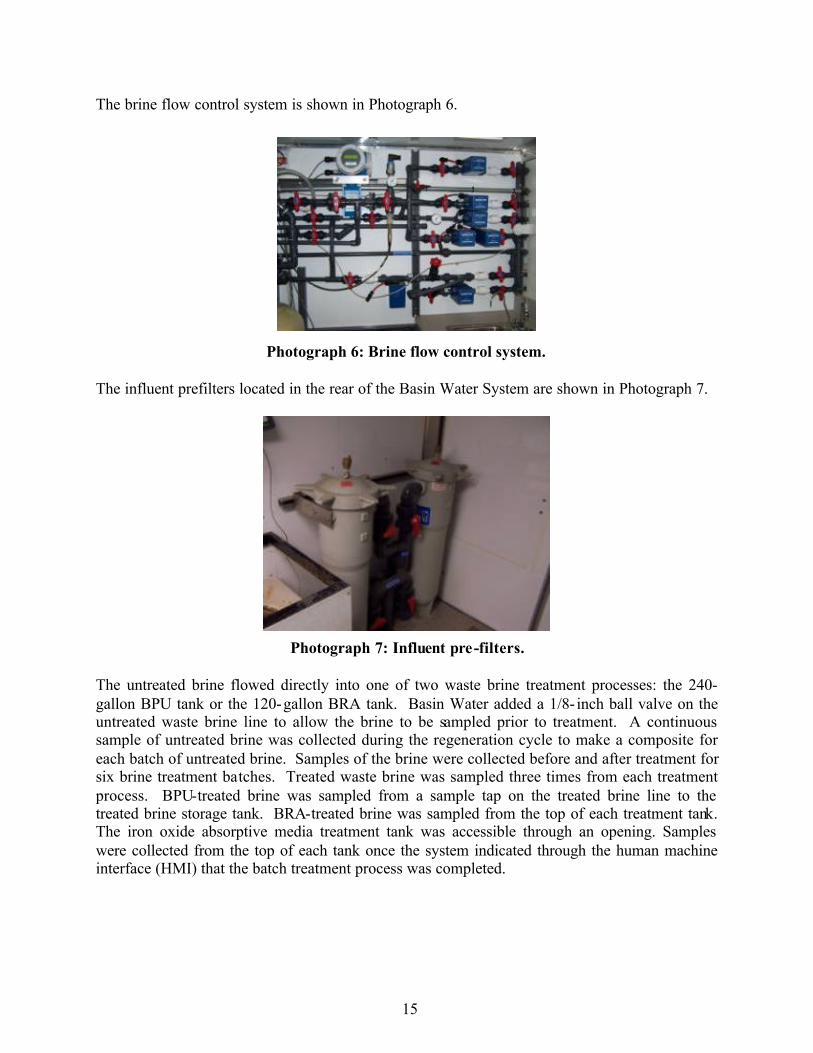
The brine flow control system is shown in Photograph 6.
Photograph 6: Brine flow control system.
The influent prefilters located in the rear of the Basin Water System are shown in Photograph 7.
Photograph 7: Influent pre-filters.
The untreated brine flowed directly into one of two waste brine treatment processes: the 240gallon BPU tank or the 120-gallon BRA tank. Basin Water added a 1/8- inch ball valve on the untreated waste brine line to allow the brine to be sampled prior to treatment. A continuous sample of untreated brine was collected during the regeneration cycle to make a composite for each batch of untreated brine. Samples of the brine were collected before and after treatment for six brine treatment batches. Treated waste brine was sampled three times from each treatment process. BPU-treated brine was sampled from a sample tap on the treated brine line to the treated brine storage tank. BRA-treated brine was sampled from the top of each treatment tank. The iron oxide absorptive media treatment tank was accessible through an opening. Samples were collected from the top of each tank once the system indicated through the human machine interface (HMI) that the batch treatment process was completed.
15

2.4 Description of Physical Construction/Components
This section summarizes the devices in the Basin Water System:
• Footprint: The footprint of the Basin Water System was eight feet wide by 27 feet long, not including storage of treated waste brine or waste solids.
• Treated brine waste tank: The treated brine waste tank was located next to the Basin Water System. This 6,500-gallon, eight foot-diameter polypropylene tank was used to store the treated waste brine from both the precipitation and adsorption waste brine treatment methods.
• Solid waste tank: The solid waste was stored on-site in a 55-gallon drum with a sealing top. • Brine treatment units: Two brine treatment units were tested. The BPU, using precipitation
with ferric chloride, was located within the treatment unit. The BRA, using absorptive media, was located adjacent to the IX system.
• Salt tank: This tank was located within the Basin Water System. It was manually filled daily. • Bag filters: There were two bag filters with a capacity of 100 gpm each (see Photograph 6).
They were in parallel flow configuration, with one in operation at a time. These filters were 30 inches long and designed to remove particles down to 5 micron.
2.5 Chemical Consumption and Production of Waste Material
2.5.1 Chemical Consumption
NaCl, ferric chloride, acid, and caustic were consumed during the ETV for the Basin Water System.
• NaCl was required for regeneration of the IX resin once the exhaustion cycle was completed.
• Ferric chloride was used for the precipitation of arsenic.
• Acid was used to drop the pH of the waste brine.
• Caustic was required after precipitation to increase brine effluent pH to noncorrosive levels.
A 0.5% sodium hypochlorite solution was fed between the raw water sampling point and the influent sampling point (prior to the prefilters) and was monitored at the influent sampling point. The sodium hypochlorite was fed at a range of 0.10-0.50 mg/L (total chlorine) through a 2-gallon per hour Milton Roy (LMI series AA) pump. The sodium hypochlorite level was monitored daily through free and total chlorine analyses. Levels of sodium hypochlorite in the feed tank and any adjustments necessary to the Milton Roy pump were recorded in the on-site logbook.
2.5.2 Waste Production and Physical and Chemical Nature of Wastes
The precipitation process enabled the separation of the waste effluent into two categories of waste: solids (sludge) and liquid. The sludge and liquid were separated through decanting, which left nonhazardous levels of arsenic (<5 mg/L) in the liquid waste brine. The brine was then disposed of at a standard brine handling facility, such as the Remedy Environmental Services in Anaheim, California. The brine waste represented less than 0.1% of the amount of water treated. It was stored in a 6,500-gallon tank (with containment) on-site until analysis could confirm proper disposal method.
16
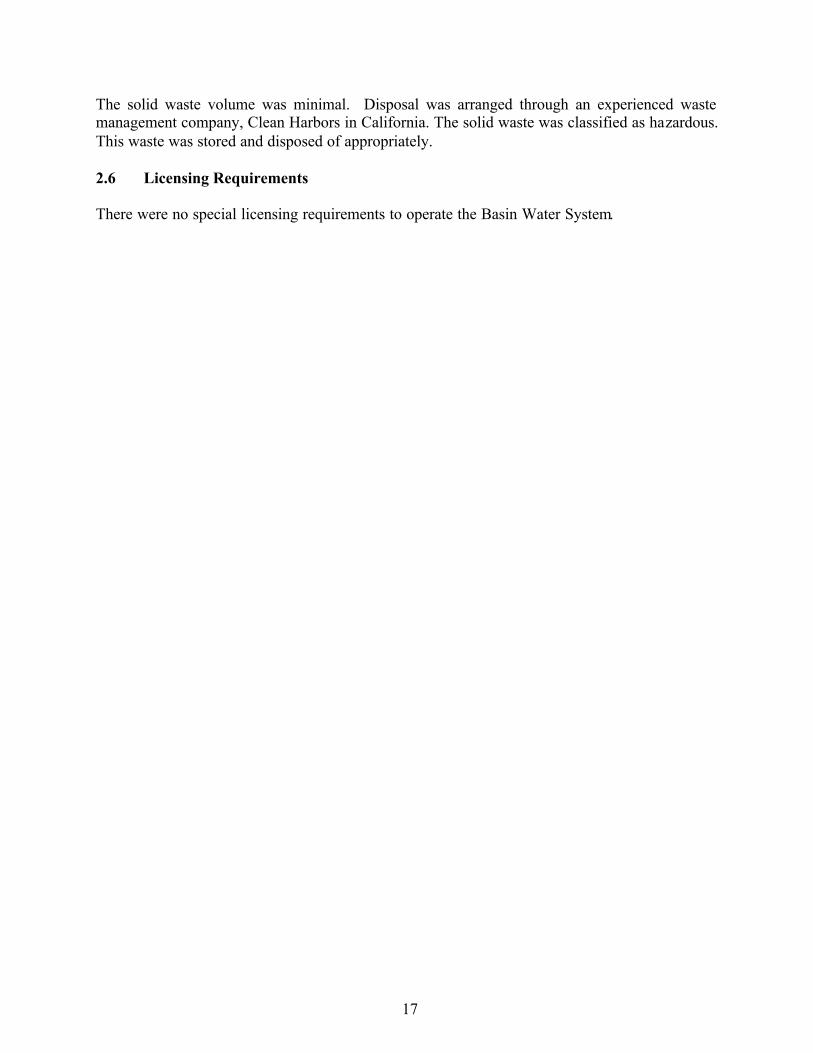
The solid waste volume was minimal. Disposal was arranged through an experienced waste management company, Clean Harbors in California. The solid waste was classified as hazardous. This waste was stored and disposed of appropriately.
2.6 Licensing Requirements
There were no special licensing requirements to operate the Basin Water System.
17
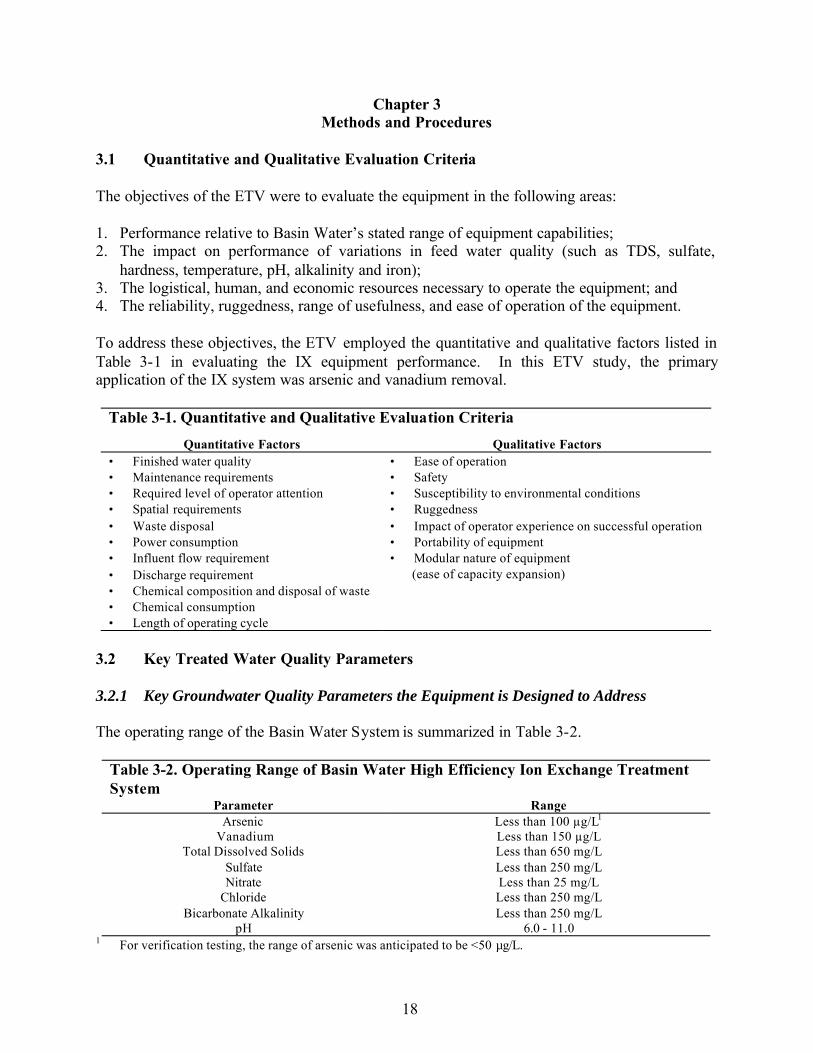
Chapter 3Methods and Procedures
3.1 Quantitative and Qualitative Evaluation Criteria
The objectives of the ETV were to evaluate the equipment in the following areas:
1. Performance relative to Basin Water’s stated range of equipment capabilities; 2. The impact on performance of variations in feed water quality (such as TDS, sulfate,
hardness, temperature, pH, alkalinity and iron); 3. The logistical, human, and economic resources necessary to operate the equipment; and 4. The reliability, ruggedness, range of usefulness, and ease of operation of the equipment.
To address these objectives, the ETV employed the quantitative and qualitative factors listed in Table 3-1 in evaluating the IX equipment performance. In this ETV study, the primary application of the IX system was arsenic and vanadium removal.
Table 3-1. Quantitative and Qualitative Evaluation Criteria Quantitative Factors Qualitative Factors
• Finished water quality • Ease of operation • Maintenance requirements • Safety • Required level of operator attention • Susceptibility to environmental conditions • Spatial requirements • Ruggedness • Waste disposal • Impact of operator experience on successful operation • Power consumption • Portability of equipment • Influent flow requirement • Modular nature of equipment • Discharge requirement (ease of capacity expansion) • Chemical composition and disposal of waste • Chemical consumption • Length of operating cycle
3.2 Key Treated Water Quality Parameters
3.2.1 Key Groundwater Quality Parameters the Equipment is Designed to Address
The operating range of the Basin Water System is summarized in Table 3-2.
Table 3-2. Operating Range of Basin Water High Efficiency Ion Exchange Treatment System
Parameter Range Arsenic Less than 100 µg/L1
Vanadium Less than 150 µg/L Total Dissolved Solids Less than 650 mg/L
Sulfate Less than 250 mg/L Nitrate Less than 25 mg/L
Chloride Less than 250 mg/LBicarbonate Alkalinity Less than 250 mg/L
pH 6.0 - 11.0For verification testing, the range of arsenic was anticipated to be <50 mg/L.
18
1
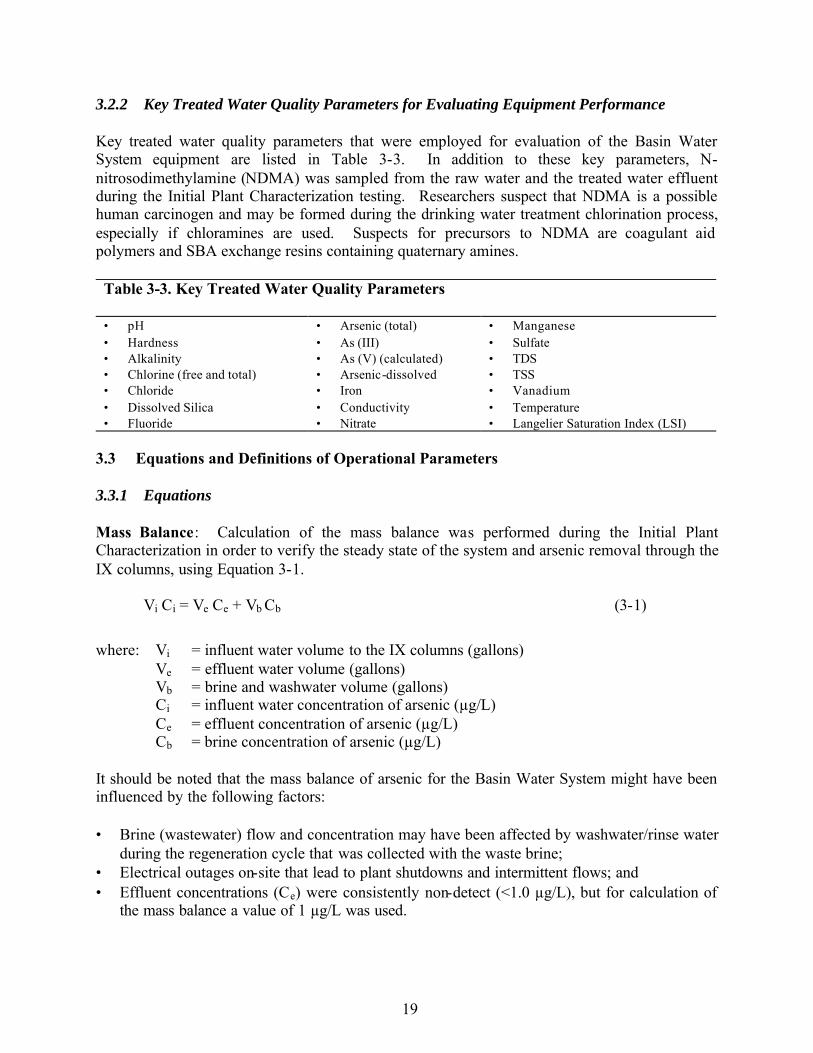
3.2.2 Key Treated Water Quality Parameters for Evaluating Equipment Performance
Key treated water quality parameters that were employed for evaluation of the Basin Water System equipment are listed in Table 3-3. In addition to these key parameters, Nnitrosodimethylamine (NDMA) was sampled from the raw water and the treated water effluent during the Initial Plant Characterization testing. Researchers suspect that NDMA is a possible human carcinogen and may be formed during the drinking water treatment chlorination process, especially if chloramines are used. Suspects for precursors to NDMA are coagulant aid polymers and SBA exchange resins containing quaternary amines.
Table 3-3. Key Treated Water Quality Parameters
• pH • Arsenic (total) • Manganese • Hardness • As (III) • Sulfate • Alkalinity • As (V) (calculated) • TDS • Chlorine (free and total) • Arsenic-dissolved • TSS • Chloride • Iron • Vanadium • Dissolved Silica • Conductivity • Temperature • Fluoride • Nitrate • Langelier Saturation Index (LSI)
3.3 Equations and Definitions of Operational Parameters
3.3.1 Equations
Mass Balance: Calculation of the mass balance was performed during the Initial Plant Characterization in order to verify the steady state of the system and arsenic removal through the IX columns, using Equation 3-1.
Vi Ci = Ve Ce + Vb Cb (3-1)
where: Vi = influent water volume to the IX columns (gallons) Ve = effluent water volume (gallons) Vb = brine and washwater volume (gallons) Ci = influent water concentration of arsenic (µg/L) Ce = effluent concentration of arsenic (µg/L) Cb = brine concentration of arsenic (µg/L)
It should be noted that the mass balance of arsenic for the Basin Water System might have been influenced by the following factors:
• Brine (wastewater) flow and concentration may have been affected by washwater/rinse water during the regeneration cycle that was collected with the waste brine;
• Electrical outages on-site that lead to plant shutdowns and intermittent flows; and • Effluent concentrations (Ce) were consistently non-detect (<1.0 µg/L), but for calculation of
the mass balance a value of 1 µg/L was used.
19

3.3.2 Definitions
The following are definitions of terms used in the evaluation:
Adsorption: The step in the IX process that removes arsenate from water by chemical or physical attraction to a medium such as an IX resin. It is also referred to as the service step or the exhaustion step. Note: In this document, the term adsorption is used in its general sense as a process for removing contaminants from a liquid by adsorbing them on a solid adsorbent by processes including IX, adsorption, and ligand exchange.
Anion: A negatively charged ion. The major anions of concern are divalent arsenate (HAsO42-), monovalent arsenate (H2AsO4-), nitrate (NO3-), sulfate (SO42-), chloride (Cl-), and bicarbonate (HCO3-).
Anion Exchange Resin: A polymeric matrix, usually polystyrene cross- linked with divinylbenzene, containing fixed positively charged functional groups that hold exchangeable anions by electrostatic attraction. During an anion-exchange reaction, a harmless ion such as chloride is exchanged for a target contaminant ion such as arsenate (HAsO42-).
Attrition: Breakage and wear of IX resin beads.
Backwashing: The upward flow of water through an IX bed to clean it of foreign material and reduce the compaction of the resin bed. Usually the bed is fluidized by the upward flow of water.
Bed: The IX material contained in a column or vessel of an operating unit.
Bed Depth: The height of the resin material in the column after the exchanger has settled into a packed-bed condition.
Bed Expansion: The effect produced during backwashing. When the bed is fluidized, the resin particles become separated and rise in the column.
Bed Volumes (BV) or Bed Volumes Treated: A dimensionless ratio that refers to the volume of water that can be treated by a bed of resin. BV = volume of water treated/volume of resin including voids.
Breakthrough: The portion of the effluent history curve that exhibits a rapid increase in effluent concentration of a substance, which signals that adsorption of the substance is near completion, and further operation of the column will not be productive. During plant operation, the adsorption cycle is terminated prior to breakthrough of the ion of interest. The breakthrough point can be defined in several ways, such as the point on the breakthrough curve where the concentration of the target contaminant reaches the MCL or a predetermined fraction of the MCL, or where the inflection point in the breakthrough curve occurs. Breakthrough can be gradual or sharp depending on several factors, including the isotherm shape, the resin particle size, mass transfer considerations, channeling in the bed, and so forth.
20

Brine Recycle: The reuse of spent brine with or without treatment to remove the target contaminant, arsenic. Direct brine reuse, or brine recycling without treatment to remove arsenic, is possible during arsenic IX because arsenate is removed as a divalent ion (HAsO42-) undergoes electroselectivity reversal and is not attracted to the resin when it is in contact with high-concentration brine.
Capacity: Generally, the advertised IX capacity expressed in milliequivalents per milliliter or equivalents per liter; the number of equivalents of exchangeable ions from the water that would be contained in one liter of an IX material. The volume is measured when the material is wet and fully saturated with adsorbed water.
Channeling: Random paths of relatively lower flow resistance in the resin bed resulting from improper operating procedures, including failure to remove particulate matter, improper backwashing, insufficient flow velocity, and so forth. Channeling, which can occur during exhaustion or regeneration, results in diminished mass transfer between the water and the resin.
Chromatography: The separation of ions, molecular species, or complexes into highly purified fractions by means of IX materials or adsorbents.
Chromatographic Peaking: The phenomenon that causes the effluent concentration of an ion to be higher than the influent concentration for a short time during the effluent history. Chromatographic peaking is also referred to as “dumping,” and it occurs immediately following the breakthrough of each ion. All ions in the column influent are subject to peaking except the most preferred ion, which is usually sulfate. During chromatographic peaking, significant amounts of the adsorbed ion are “dumped” from the resin bed into the process effluent water.
Column Operation: The most common method of employing IX materials, in which the liquid to be treated passes through a fixed bed of IX resin held within a cylindrical vessel or column.
Composite Sample: A sample that has been collected from a continuous flow sample port over a predetermined period. For example, a one-gallon sample taken for a 24-hour composite period would be collected in the appropriate sample container and preservative (if required) at a flow rate of 2.6 ml per minute.
Cycle: A complete series of operational steps. For instance, a complete cycle of arsenate IX would involve the complete adsorption step, followed by backwash, regeneration, slow rinse, fast rinse, and return to adsorption service.
Dumping: The phenomenon that causes the effluent concentration of an ion to be higher than the influent concentration for a short time during the effluent history. Dumping is also referred to as “chromatographic peaking,” and it occurs immediately following the breakthrough of an ion. All ions in the column influent are subject to peaking except the most-preferred ion, which is usually sulfate. During chromatographic peaking, significant amounts of the adsorbed ion are “dumped” from the resin bed into the effluent water.
21

Effluent: Column effluent is the treated water leaving an IX column. Process effluent is synonymous with treated water, which can be the result of blending several column effluents together to smooth out water quality variations resulting from a single column. Process effluent can also contain bypass water that has not been treated by IX. The regenerant emerging from the column after regeneration is referred to as the eluent, eluate or spent regenerant.
Effluent History Curve: An x-y plot showing the relationship between time or BV of water passed through a bed of IX resin (on the x-axis) and the effluent concentration (on the y-axis). Effluent concentration may be expressed as milliequivalents/L, mg/L, or the ratio CEffluent/CInfluent. Contaminant breakthrough occurs when the effluent history curve begins to rise sharply. The run is terminated at the breakthrough point when the effluent concentration reaches the MCL or some predetermined fraction of the MCL. Prior to contaminant breakthrough, the measurable amount of contaminant in the effluent history curve is referred to as leakage. As long as the leakage is below the predetermined MCL, it is tolerable.
Elution: The stripping of adsorbed ions from the IX resin by the regenerant solution, which is usually highly concentrated (e.g., 1-2 molar NaCl [6-12% NaCl]).
Electroselectivity Reversal: The reversal of selectivity, which occurs when the ionic strength of the aqueous solution is changed between natural water (low ionic strength [e.g., 0.005 M]) and brine solution (high ionic strength [e.g., 1.0 M]). Divalent ions such as sulfate and arsenate undergo selectivity reversal during regeneration. These are easily stripped from the resin during regeneration, even though they are strongly attracted to the resin during exhaustion, which occurs in low ionic strength water.
Empty Bed Contact Time (EBCT): The time it would take for water to pass through the volume of the column occupied by the resin bed if the resin were not present, hence "Empty Bed” Contact Time. It is calculated as the volumetric flow rate divided by the resin BV. For example, if the flow rate is 350 gpm and one BV is 700 gallons, the EBCT is 2 minutes (i.e., 2 min per BV or 0.5 BV per min, or 30 BV per hr).
Equivalent: Short for gram equivalent weight, the molecular weight of an ion divided by its ionic charge. One equivalent of ions contains Avogadro’s number (6.023 x 10²³) of ionic charges. For example one equivalent (i.e., one gram equivalent weight = 139.9/2 = 69.95 grams) of divalent arsenate (HAsO42-) anions contains 6.023 x 10²³ negative charges. Equivalents rather than grams of ions are used in IX calculations because one equivalent of chloride (35.5/2 = 17.75 grams) is replaced by exactly one equivalent of arsenate (69.95 grams).
Exhaustion: That portion of the operating cycle during which the resin adsorbs (actually, removes by IX) the contaminant from the raw water. The resin is spent or exhausted at the end of the exhaustion step.
Fouling: Any deposit or concentration of foreign material on or in an IX material that interferes with the chemical and physical processes. Typical foulants are lubricating oil from pumps, clays, silts, bacteria, algae, and so forth. Fouling can cause reduced efficiency, channeling, loss of resin during backwashing, and many other plant malfunctions.
22
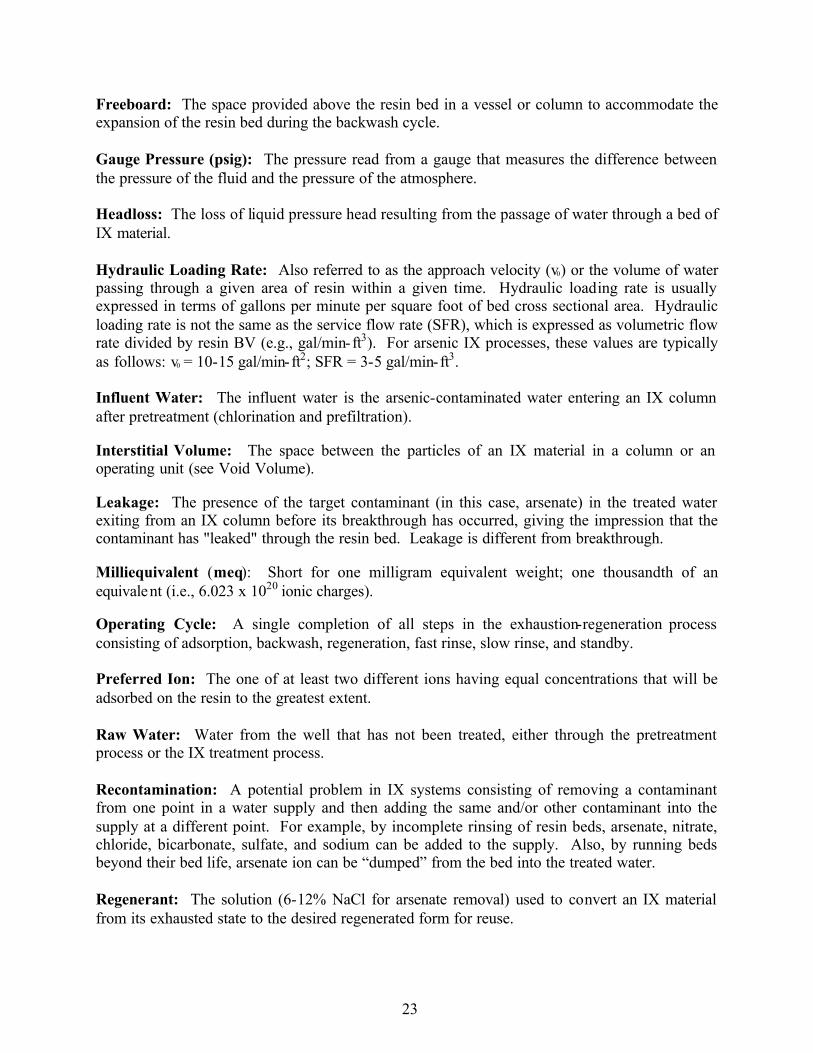
Freeboard: The space provided above the resin bed in a vessel or column to accommodate the expansion of the resin bed during the backwash cycle.
Gauge Pressure (psig): The pressure read from a gauge that measures the difference between the pressure of the fluid and the pressure of the atmosphere.
Headloss: The loss of liquid pressure head resulting from the passage of water through a bed of IX material.
Hydraulic Loading Rate: Also referred to as the approach velocity (v0) or the volume of water passing through a given area of resin within a given time. Hydraulic loading rate is usually expressed in terms of gallons per minute per square foot of bed cross sectional area. Hydraulic loading rate is not the same as the service flow rate (SFR), which is expressed as volumetric flow rate divided by resin BV (e.g., gal/min-ft3). For arsenic IX processes, these values are typically as follows: v0 = 10-15 gal/min-ft2; SFR = 3-5 gal/min-ft3.
Influent Water: The influent water is the arsenic-contaminated water entering an IX column after pretreatment (chlorination and prefiltration).
Interstitial Volume: The space between the particles of an IX material in a column or an operating unit (see Void Volume).
Leakage: The presence of the target contaminant (in this case, arsenate) in the treated water exiting from an IX column before its breakthrough has occurred, giving the impression that the contaminant has "leaked" through the resin bed. Leakage is different from breakthrough.
Milliequivalent (meq): Short for one milligram equivalent weight; one thousandth of an equivalent (i.e., 6.023 x 10²⁰ ionic charges).
Operating Cycle: A single completion of all steps in the exhaustion-regeneration process consisting of adsorption, backwash, regeneration, fast rinse, slow rinse, and standby.
Preferred Ion: The one of at least two different ions having equal concentrations that will be adsorbed on the resin to the greatest extent.
Raw Water: Water from the well that has not been treated, either through the pretreatment process or the IX treatment process.
Recontamination: A potential problem in IX systems consisting of removing a contaminant from one point in a water supply and then adding the same and/or other contaminant into the supply at a different point. For example, by incomplete rinsing of resin beds, arsenate, nitrate, chloride, bicarbonate, sulfate, and sodium can be added to the supply. Also, by running beds beyond their bed life, arsenate ion can be “dumped” from the bed into the treated water.
Regenerant: The solution (6-12% NaCl for arsenate removal) used to convert an IX material from its exhausted state to the desired regenerated form for reuse.
23
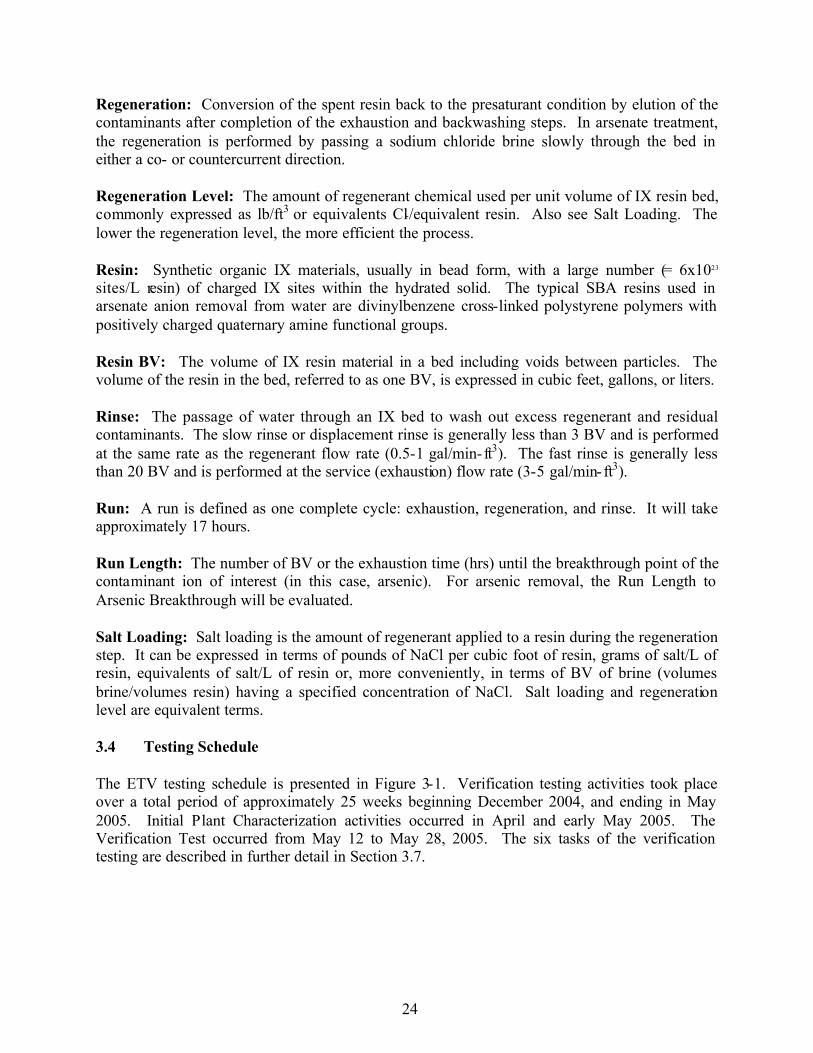
Regeneration: Conversion of the spent resin back to the presaturant condition by elution of the contaminants after completion of the exhaustion and backwashing steps. In arsenate treatment, the regeneration is performed by passing a sodium chloride brine slowly through the bed in either a co- or countercurrent direction.
Regeneration Level: The amount of regenerant chemical used per unit volume of IX resin bed, commonly expressed as lb/ft3 or equivalents Cl-/equivalent resin. Also see Salt Loading. The lower the regeneration level, the more efficient the process.
Resin: Synthetic organic IX materials, usually in bead form, with a large number (= 6x10²³
sites/L resin) of charged IX sites within the hydrated solid. The typical SBA resins used in arsenate anion removal from water are divinylbenzene cross-linked polystyrene polymers with positively charged quaternary amine functional groups.
Resin BV: The volume of IX resin material in a bed including voids between particles. The volume of the resin in the bed, referred to as one BV, is expressed in cubic feet, gallons, or liters.
Rinse: The passage of water through an IX bed to wash out excess regenerant and residual contaminants. The slow rinse or displacement rinse is generally less than 3 BV and is performed at the same rate as the regenerant flow rate (0.5-1 gal/min-ft3). The fast rinse is generally less than 20 BV and is performed at the service (exhaustion) flow rate (3-5 gal/min-ft3).
Run: A run is defined as one complete cycle: exhaustion, regeneration, and rinse. It will take approximately 17 hours.
Run Length: The number of BV or the exhaustion time (hrs) until the breakthrough point of the contaminant ion of interest (in this case, arsenic). For arsenic removal, the Run Length to Arsenic Breakthrough will be evaluated.
Salt Loading: Salt loading is the amount of regenerant applied to a resin during the regeneration step. It can be expressed in terms of pounds of NaCl per cubic foot of resin, grams of salt/L of resin, equivalents of salt/L of resin or, more conveniently, in terms of BV of brine (volumes brine/volumes resin) having a specified concentration of NaCl. Salt loading and regeneration level are equivalent terms.
3.4 Testing Schedule
The ETV testing schedule is presented in Figure 3-1. Verification testing activities took place over a total period of approximately 25 weeks beginning December 2004, and ending in May 2005. Initial Plant Characterization activities occurred in April and early May 2005. The Verification Test occurred from May 12 to May 28, 2005. The six tasks of the verification testing are described in further detail in Section 3.7.
24

Task Description Duration 12/6 12/13 12/20 12/27 4/4 4/11 4/18 4/25 5/2 5/9 5/16 5/23 1 Selection and Characterization of Raw and Influent Water 4 weeks 2 Preparation, Coordination, and Startup 17 weeks 3a Initial Plant Characterization 3 weeks 3b Second Initial Plant Characterization 2.5 weeks 4 Verification Testing 2 weeks 5 Data Management 8 weeks 6 Quality Assurance and Quality Control 8 weeks
1/3 - 3/28
*Dates denote beginning of each full week.
Figure 3-1: Verification testing schedule.
Verification testing activities included equipment setup, initial operation, verification operation, sampling, and analysis. A setup period was conducted to test equipment for proper function and to reach a steady state of operation. Setup served as the shakedown period to determine appropriate operating parameters.
3.5 Field Operations Procedures
Testing of the Basin Water System was conducted by MWH, an NSF-qualified FTO. Water quality analytical work carried out as part of the verification testing, was conducted by MWH Laboratories. Field analytical work was performed by MWH field personnel using field laboratory equipment and procedures for pH, temperature, conductivity, chlorine, and on-site speciation of arsenic.
The verificatio n unit was operated 24 hours a day, seven days a week with staff on-site each day to operate the verification unit and collect water quality data during one 8-hour shift. Tasks performed by the operations staff are described in detail below.
3.6 Environmental Technology Verification Testing Plan
The following section provides a brief overview of the tasks included in the Basin Water System verification testing at the Corydon Street Well in Lake Elsinore, California. The verification tasks included:
Task 1: Selection and Characterization of the Raw Water Task 2: Preparation, Coordination, and Start-Up Task 3: Initial Plant Characterization Task 4: Verification Testing Task 5: Data Management Task 6: Quality Assurance and Quality Control
Verification testing activities included equipment setup, initial operation, verification operation, and sampling and analysis. Initial operations were conducted so that equipment could be tested to be sure it was functioning as intended. An overview of each task is provided below with detailed information following this section of the report.
25

3.6.1 Task 1: Selection and Characterization of the Raw Water
The objective of Task 1 was to obtain a chemical and physical characterization of the raw water. The EVMWD’s Corydon Street Ground Water Well was selected for verification testing because of its representative arsenic, vanadium, sulfate, nitrate, and TDS concentrations.
3.6.2 Task 2: Preparation, Coordination, and Start-Up
Task 2 activities were conducted to test that equipment was functioning as intended and to bring the system into a steady state of operation. Initial operations allowed the manufacturer to refine the operating procedures and to make operation adjustments, as needed, to successfully treat the influent water.
Upon completion of start-up (i.e., the system had reached steady state operations), an orientation meeting was held at the verification test site. The manufacturer met with the FTO personnel to explain the process and the detailed plant design and provide training to the FTO staff.
3.6.3 Task 3: Initial Plant Characterization
The objective of this task was to provide a preliminary evaluation of the quality of water produced by the IX system at the specified operational conditions. The Initial Plant Characterization was conducted for three complete exhaustion and regeneration cycles over a period of 18 days. Mass balance for arsenic was conducted on the IX system to verify the removal of arsenic.
3.6.4 Task 4: Verification Testing
The objective of this task was to evaluate the performance of the Basin Water System at the specified operational conditions set once the Initial Plant Characterization was found to be satisfactory to the manufacturer, Basin Water. System performance was evaluated relative to the removal of arsenic and vanadium. For verification testing purposes, the equipment was operated 24 hours per day, seven days per week, for 313.35 hours total over a period of 17 days. The IX system performance was evaluated at one set of operating conditions for the evaluation period. The effluent water quality was monitored and evaluated in relation to the raw and influent water quality and operational conditions.
The following is an overview of the equipment operational and production characteristics evaluated for each task of the verification testing:
• Influent water pressure and flow rate, • Effluent water pressure and flow rate, • Brine consumption, • Power consumption, and • Chemical consumption (acid, caustic, ferric chloride, sodium hypochlorite, and
adsorptive media).
26

3.6.5 Task 5: Data Management
The objective of this task was to establish effective field protocols for data management at the field operations site and data transmission between the FTO and NSF during verification testing. Prior to the beginning of field testing, the spreadsheet design was developed by the FTO, and reviewed and approved by NSF. This ensured that the required data were collected during the testing and that results could be effectively transmitted to NSF for review.
3.6.6 Task 6: Quality Assurance Project Plan
The objective of this task was to assure accurate measurement of operational and water quality parameters during IX equipment verification testing. An important aspect of verification testing was the Quality Assurance Project Plan (QAPP).
3.7 Task 1: Selection and Characterization of the Raw Water
The manufacturer chose a groundwater location to test the IX system. The water from the Corydon Street Well at Lake Elsinore met the requirements of the ETV protocol.
3.7.1 Experimental Objective
The objective of Task 1 was to demonstrate the appropriate water conditions for the IX system at the test site. Complete chemical and physical characterization of the raw water was obtained during this task.
3.7.2 Work Plan
All water quality parameters corresponded to the expectations listed in the ETV protocol.
3.7.3 Schedule
The water characterization was performed prior to the start of the project.
3.7.4 Evaluation Criteria
The raw water was evaluated to verify that the capabilities of the equipment would be challenged, but not beyond the range of water quality suitable for the IX system.
3.8 Task 2: Preparation, Coordination, and Start-Up
Meetings of the manufacturer and the FTO were held regarding the tasks and scheduling of tasks. The manufacturer and the FTO were both present during the plant start-up to train the testing personnel in plant operation and maintenance.
27

3.8.1 Experimental Objectives
The objectives of the preparation, coordination, and start-up activities were to train the FTO to operate the plant, provide an opportunity for the manufacturer and the FTO personnel to reach a common understanding of the objectives and execution of the testing plan, and allow the manufacturer to bring the IX system into a steady state of operation. The meetings provided an opportunity to clarify any areas of concern by either party. Special attention was given to critical equipment such as alarms, controls, and safety devices. Additionally, emergency shutdown procedures were carefully reviewed.
3.8.2 Work Plan
The treatment objectives included the following:
• The effluent water arsenic and vanadium concentrations would always be less than 4 µg/L and 15 µg/L, respectively.
• The effluent water pH would be within the specified design range (6.0-11.0). • The volume of wastewater, including brine and rinses, discharged from the process would
be equal to or less than the manufacturer’s objectives (0.1% of processed water). • The regenerant salt consumption would meet the manufacturer’s objectives [2.145
pounds per 1,000 gallons (lbs/1000 gal)].
3.8.3 Steady State Operation
Prior to the Initial Plant Characterization (Task 3), the IX system was brought into steady state operation by the manufacturer. For the Basin Water System with multiple parallel columns operating simultaneously, this applied to each operating column in the system. With a flow of approximately 37.5 gpm and four beds in operation at any time, the flow through one bed was 9.38 gpm. Each bed has a volume of 40.74 gallons and an absorption capacity set point of 1,050 BVs. Thus, the time for one bed to reach its capacity set point was:
• 1,050 BV x 40.74 gal/BV / 9.38 gpm = 4560.4 min/absorption cycle or 76.01 hours (hrs) per cycle.
• Since four beds were in service and the time between regeneration cycles was evenly divided among the in-service beds, the time between beds being removed and brined and new beds added was 1,140.1 min, or 19.00 hrs.
• Since there were two additional beds that were not active at any time, but all the beds had to be equalized, the total time for steady state was: 6 beds x 19.00 hrs x 3 cycles = 342 hrs or 14.25 days.
The regeneration time was relatively short and did not contribute to the equalization time. The 14.25 days required to reach equalization was conducted by Basin Water during Task 2 prior to the Initial Plant Characterization (Task 3).
28

3.9 Task 3: Initial Plant Characterization
Upon completion of Task 2, the Initial Plant Characterization was conducted by the FTO, and the base line performance data were recorded. During this task, a preliminary assessment of plant performance was made. Initially the plant did not meet the performance objects as set by the manufacturer specification. Performance of the IX system deteriorated over the span of the Initial Plant Characterization, and arsenic breakthrough was observed in the effluent at an increasing rate (i.e., arsenic in the effluent increased over time). Additionally, a mass balance of the raw water and waste brine indicated that initially the system was not regenerating completely.
These preliminary test results were reported to the manufacturer, who chose to make NSF-approved changes in operating procedures prior to the Verification Test. Adjustments were made to the absorption capacity set point (reduced to 850 BV), salt addition during regeneration (increased to 0.7 BV), and salt contact time during regeneration (increased to 5 minutes) prior to the actual Verification Test. Due to the initial performance and adjustments to the IX systems set points, the Initial Plant Characterization period was repeated until each column had undergone two complete exhaustion cycles. The second Initial Plant Characterization took 7.69 days to perform two complete exhaustion cycles. The second Initial Plant Characterization with the new plant settings was able to meet the manufacture’s claim on arsenic removal. The performance data obtained during these preliminary tests provided baseline data for comparison with the Verification Test performance.
3.9.1 Experimental Objectives
The objectives of this task were to establish the initial plant performance characteristics and to permit NSF and the manufacturer to make approved changes in the PSTP prior to the Verification Test. Mass balances were performed as part of this task in order to evaluate the effectiveness of the regeneration of the IX columns. The approved preliminary data were used as baseline data for comparison with future plant performance.
3.9.2 Work Plan
Some of the water quality parameters described in this task were measured on-site by the FTO. These analyses included pH, conductivity, chlorine, temperature, and arsenic speciation. Analyses of the remaining water quality parameters were performed by MWH Laboratories, a state-certified laboratory. The methods used for measurement of water quality parameters are identified in Table 3-4. A number of the analytical methods utilized in this study for on-site monitoring of raw, influent, and effluent water qualities are further described in Task 6, Quality Assurance Project Plan.
For the water quality parameters submitted to MWH Laboratories, water samples were collected in appropriate containers (containing necessary preservatives as applicable) prepared by MWH Laboratories. These samples were then preserved, stored, shipped, and analyzed in accordance with appropriate procedures and holding times.
29

3.9.3 Analytical Schedule
The Initial Plant Characterization test was performed after the preparation, coordination, and start-up step (see Task 2), which included the manufacturer’s time to reach a steady state operation. Table 3-4 presents the water quality parameters, frequency, and total number of samples that were collected during the first Initial Plant Characterization. Each parameter was analyzed per the methods listed in Table 3-4. To the extent possible, analyses for inorganic water quality parameters were performed on water sample aliquots obtained simultaneously from the same sampling location, in order to ensure the maximum degree of comparability between water quality analytes.
The collection of Initial Plant Characterization data was completed over the course of two sessions. The first Initial Plant Characterization was completed over three complete exhaustion and regeneration cycles (April 4–23, 2005), which was approximately 15 days. The second Initial Plant Characterization was completed over two complete exhaustion and regeneration cycles (April 29 – May 9, 2005), which was approximately eight days. The second Initial Plant Characterization’s analytical sampling schedule was less rigorous than the first. During the second Initial Plant Characterization, sulfate, nitrate, chloride, calcium, magnesium, alkalinity, fluoride, TDS, TSS, iron, manganese, hardness, and dissolved silica, were sampled only once.
In order to perform the mass balance, the precipitation treatment method was not used during the first three days of the plant characterization tests. Twenty-four-hour composite samples were collected from the influent, effluent, and untreated waste brine and sent to MWH Laboratories with a request for 24- to 48-hour turnaround times. The data were evaluated, and a mass balance was performed. These data were provided to NSF and Basin Water prior to beginning the Verification Test. It should be noted that the waste brine also included the wastewater from the rinse process, which affected the mass balance by diluting the brine waste. It was not possible to segregate the waste brine from the waste rinse water in the Basin Water System.
Additionally, the following operating data were recorded once daily during the Initial Plant Characterization:
• Controller set points for each bed including: start time, finish time, and volume to exhaustion; flow rate, mass of salt and volume of regenerant used for each regeneration; and volume of chemicals (or adsorptive media) required for brine treatment.
• Pressure readings for the columns and pre-filter device. • Number of vessels in exhaustion, regeneration, and standby. • Visual observations of piping leaks and scaling and fouling problems.
30

Table 3-4. Initial Plant Characterization Standard EPA Hach
Parameter Frequency1 Facility Method2 Method3 Method Arsenic [As (III)]4
Dissolved Arsenic Total Arsenic
Sulfate
Nitrate
Chloride
Calcium
Magnesium
Alkalinity
Fluoride
pH
TDS
TSS
Iron
Manganese
Vanadium
Hardness5
Dissolved Silica Total Chlorine Free Chlorine Conductivity
NDMA6
2/week on raw, influent and effluent water
2/week on raw, influent and effluent water
1 composite per day on the raw, influent, and effluent water 1 composite per day on the raw, influent, and effluent water 1 composite per day on the raw, influent, and effluent water 1 composite per day on the raw, influent, and effluent water 1 composite per week on the raw, influent, and effluent water 1 composite per week on the raw, influent, and effluent water 1 composite per day on the raw, influent, and effluent water 1 composite per week on the raw, influent, and effluent water Continuous monitoring of column influent and effluent water, and 1/day on-site verification of system influent and effluent 1 composite per week on the raw, influent, and effluent water 1 composite per week on the raw, influent, and effluent water 1 composite per week on the raw, influent, and effluent water 1 composite per week on the raw, influent, and effluent water 1 composite per day on the raw, influent, and effluent water 1 composite per week on the raw, influent, and effluent water 1 composite per week on the raw, influent, and effluent water 1/day on raw, influent, and effluent water 1/day on raw, influent, and effluent water Continuous monitoring of column influent and effluent water, and 1/day on-site verification of system influent and effluent 1 grab sample on the raw water line, and 2 grab samples on the effluent (one chlorinated; one without chlorinated raw water)
Laboratory 200.8
Laboratory 200.8
Laboratory 200.8
Laboratory 300.0
Laboratory 300.0
Laboratory 300.0
Laboratory 200.7
Laboratory 200.7
Laboratory 2320B
Laboratory 4500-F C
On-site 4500-H+ B
Laboratory 2540 C
Laboratory 2540 D
Laboratory 200.7
Laboratory 200.8
Laboratory 200.8
Laboratory 2340B
Laboratory 200.7
On-site 8167 On-site 8021
2510B
1625
1 The verification plant was staffed seven days per week. 2 Standard Methods 20th Edition. 3 “Methods for the Determination of Metals in Environmental Samples-Supplement I”, EPA/600/R-94/111, May 1994.
Available at (NTIS) PB95-125472. 4 Arsenic samples were speciated in the field using arsenic speciation resin columns provided by NSF. 5 Calculated using calcium and magnesium concentrations from one composite sample per day on the raw, influent, and
effluent water. 6 NDMA samples collected per EVMWD’s request.
31

3.9.4 Evaluation Criteria and Minimum Reporting Criteria
• The following data are presented in Chapter 4: � A temporal plot of target inorganic constituents (arsenic and vanadium) in the raw,
influent, and effluent water over the period of operation. � Temporal plots of all other inorganic water quality parameters in the raw, influent,
and effluent water over the period of operation. � A table with twice-weekly values of percent removal of target inorganic constituents
(arsenic [total, As (III), As (V) and dissolved] and vanadium) and other pertinent water quality parameters (vanadium) for the period of operation.
� Mass balances through the IX system for total arsenic were conducted. The mass balance equation presented in Section 3.3.1 was used for the calculation.
� Raw, influent and effluent water concentrations of any measured water quality parameters are provided in tabular form for the period of operation.
� Power consumption over the period of operation presented in a tabular format. � A table of daily chemical consumption (salt, hypochlorite, ferric chloride, caustic
soda, sulfuric acid) for the period of operation.
3.10 Task 4: Verification Testing
This task, which included the actual Verification Test, was the core of the verification testing plan. During this task, the Basin Water System was operated 24 hours per day, seven days per week, for a total of 313 hours over a 17-day period to collect data on equipment performance and water quality for the purpose of performance verification.
3.10.1 Experimental Objectives
The objectives of the verification testing runs were to:
• Observe and record the plant operating conditions and equipment performance; • Determine the raw, influent, and effluent water quality; • Characterize the effectiveness of the brine treatment processes; and • Establish the arsenic and vanadium removal performance of the plant.
3.10.2 Work Plan
The plant was operated using the set point conditions determined in the Initial Plant Characterization test. Table 3-5 lists the operating and performance data collected during the verification testing runs.
32
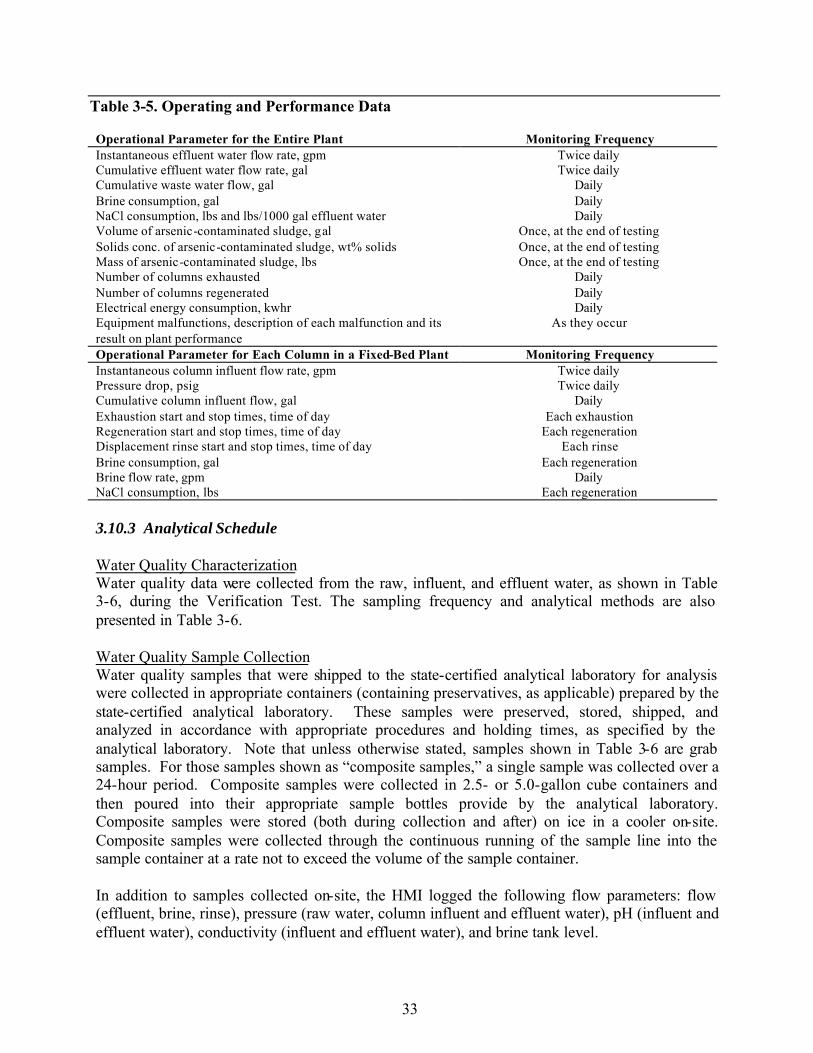
Table 3-5. Operating and Performance Data
Operational Parameter for the Entire Plant Monitoring Frequency Instantaneous effluent water flow rate, gpm Twice daily Cumulative effluent water flow rate, gal Twice daily Cumulative waste water flow, gal Daily Brine consumption, gal Daily NaCl consumption, lbs and lbs/1000 gal effluent water Daily Volume of arsenic-contaminated sludge, gal Once, at the end of testing Solids conc. of arsenic-contaminated sludge, wt% solids Once, at the end of testing Mass of arsenic-contaminated sludge, lbs Once, at the end of testing Number of columns exhausted Daily Number of columns regenerated Daily Electrical energy consumption, kwhr Daily Equipment malfunctions, description of each malfunction and its As they occur result on plant performance Operational Parameter for Each Column in a Fixed-Bed Plant Monitoring Frequency Instantaneous column influent flow rate, gpm Twice daily Pressure drop, psig Twice daily Cumulative column influent flow, gal Daily Exhaustion start and stop times, time of day Each exhaustion Regeneration start and stop times, time of day Each regeneration Displacement rinse start and stop times, time of day Each rinse Brine consumption, gal Each regeneration Brine flow rate, gpm Daily NaCl consumption, lbs Each regeneration
3.10.3 Analytical Schedule
Water Quality Characterization Water quality data were collected from the raw, influent, and effluent water, as shown in Table 3-6, during the Verification Test. The sampling frequency and analytical methods are also presented in Table 3-6.
Water Quality Sample Collection Water quality samples that were shipped to the state-certified analytical laboratory for analysis were collected in appropriate containers (containing preservatives, as applicable) prepared by the state-certified analytical laboratory. These samples were preserved, stored, shipped, and analyzed in accordance with appropriate procedures and holding times, as specified by the analytical laboratory. Note that unless otherwise stated, samples shown in Table 3-6 are grab samples. For those samples shown as “composite samples,” a single sample was collected over a 24-hour period. Composite samples were collected in 2.5- or 5.0-gallon cube containers and then poured into their appropriate sample bottles provide by the analytical laboratory. Composite samples were stored (both during collection and after) on ice in a cooler on-site. Composite samples were collected through the continuous running of the sample line into the sample container at a rate not to exceed the volume of the sample container.
In addition to samples collected on-site, the HMI logged the following flow parameters: flow (effluent, brine, rinse), pressure (raw water, column influent and effluent water), pH (influent and effluent water), conductivity (influent and effluent water), and brine tank level.
33

Table 3-6. Verification Testing Analytical Methods and Sampling Frequency
Standard EPA Hach Parameter Frequency1 Facility Method2 Method3 Method Arsenic [As (III)]4
Dissolved Arsenic Total Arsenic
Sulfate
Nitrate
Chloride
Calcium
Magnesium
Alkalinity
Fluoride
pH
TDS
TSS
Iron
Manganese
Vanadium
Hardness5
Dissolved Silica
Total Chlorine Free Chlorine Conductivity
NDMA6
2/week (grab) on the raw, influent, and effluent water
2/week (grab) on the raw, influent, and effluent water
1 composite sample per day on the raw, influent, and effluent water; 4/day (grab) on the effluent water; and 1/day (grab) on the raw and the influent water 1 composite sample per day on the raw, influent, and effluent water 1 composite sample per day on the raw, influent, and effluent water 1 composite sample per day on the raw, influent, and effluent water 1 composite sample per day on the raw, influent, and effluent water 1 composite sample per day on the raw, influent, and effluent water 1 composite sample per day on the raw, influent, and effluent water 1 composite sample per day on the raw, influent, and effluent water Continuous monitoring of influent and effluent water; and 1/day (grab) on-site verification of raw, influent, and effluent water. 1 composite sample per day on the raw, influent, and effluent water 1 composite sample per day on the raw, influent, and effluent water 1 composite sample per day on the raw, influent, and effluent water 1 composite sample per day on the raw, influent, and effluent water 1 composite sample per day on the raw water, influent, and effluent water; 4/day (grab) on the effluent water; and 1/day (grab) on the raw and the influent water 1 composite sample per day on the raw, influent, and effluent water 1 composite sample per day on the raw, influent, and effluent water 2/day (grab) on the raw, influent, and effluent water 2/day (grab) on the raw, influent, and effluent water Continuous monitoring of effluent water from each column (recorded 1/day), and 1/day (grab) on-site analysis of raw, influent, and effluent water Once at end of verification test
Laboratory 200.8
Laboratory 200.8
Laboratory 200.8
Laboratory 300.0
Laboratory 300.0
Laboratory 300.0
Laboratory 200.7
Laboratory 200.7
Laboratory 2320B
Laboratory 4500-F C
On-site 4500-H+
B
Laboratory 2540 C
Laboratory 2540 D
Laboratory 200.7
Laboratory 200.8
Laboratory 200.8
Laboratory 2340B
Laboratory 200.7
On-site 8167 On-site 8021 On-site 2510B
Laboratory 1625 1 The verification plant was staffed seven days per week. 2 Standard Methods 20th Edition. 3 “Methods for the Determination of Metals in Environmental Samples-Supplement I”, EPA/600/R-94/111, May 1994.
Available at (NTIS) PB95-125472. 4 Arsenic samples were speciated in the field using arsenic speciation resin columns provided by NSF. 5 Calculated using calcium and magnesium concentrations from one composite sample per day on the raw, influent, and
effluent water. 6 NDMA samples collected per EVMWD’s request/ suggestions to testing plan.
34
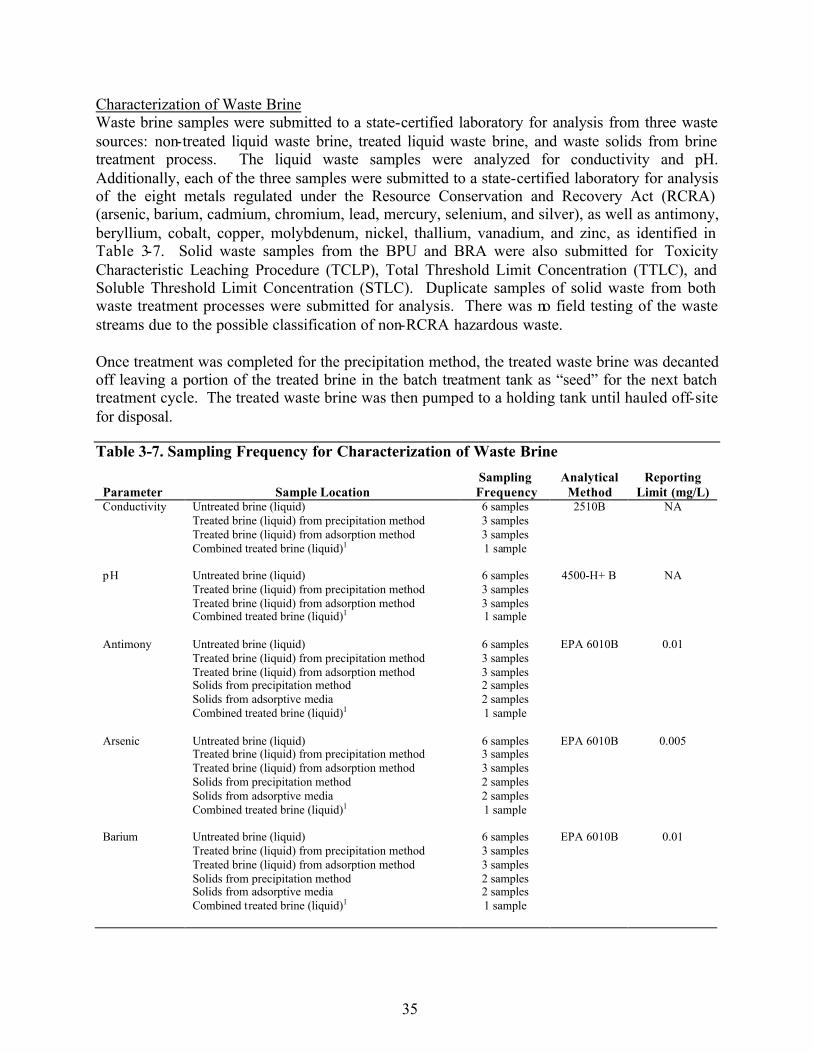
Characterization of Waste Brine Waste brine samples were submitted to a state-certified laboratory for analysis from three waste sources: non-treated liquid waste brine, treated liquid waste brine, and waste solids from brine treatment process. The liquid waste samples were analyzed for conductivity and pH. Additionally, each of the three samples were submitted to a state-certified laboratory for analysis of the eight metals regulated under the Resource Conservation and Recovery Act (RCRA) (arsenic, barium, cadmium, chromium, lead, mercury, selenium, and silver), as well as antimony, beryllium, cobalt, copper, molybdenum, nickel, thallium, vanadium, and zinc, as identified in Table 3-7. Solid waste samples from the BPU and BRA were also submitted for Toxicity Characteristic Leaching Procedure (TCLP), Total Threshold Limit Concentration (TTLC), and Soluble Threshold Limit Concentration (STLC). Duplicate samples of solid waste from both waste treatment processes were submitted for analysis. There was no field testing of the waste streams due to the possible classification of non-RCRA hazardous waste.
Once treatment was completed for the precipitation method, the treated waste brine was decanted off leaving a portion of the treated brine in the batch treatment tank as “seed” for the next batch treatment cycle. The treated waste brine was then pumped to a holding tank until hauled off-site for disposal.
Table 3-7. Sampling Frequency for Characterization of Waste Brine Sampling Analytical Reporting
Parameter Sample Location Frequency Method Limit (mg/L) Conductivity Untreated brine (liquid)
Treated brine (liquid) from precipitation method Treated brine (liquid) from adsorption method Combined treated brine (liquid)1
pH Untreated brine (liquid) Treated brine (liquid) from precipitation method Treated brine (liquid) from adsorption method Combined treated brine (liquid)1
Antimony Untreated brine (liquid) Treated brine (liquid) from precipitation method Treated brine (liquid) from adsorption method Solids from precipitation method Solids from adsorptive media Combined treated brine (liquid)1
Arsenic Untreated brine (liquid) Treated brine (liquid) from precipitation method Treated brine (liquid) from adsorption method Solids from precipitation method Solids from adsorptive media Combined treated brine (liquid)1
Barium Untreated brine (liquid) Treated brine (liquid) from precipitation method Treated brine (liquid) from adsorption method Solids from precipitation method Solids from adsorptive media Combined treated brine (liquid)1
6 samples 2510B NA 3 samples 3 samples 1 sample
6 samples 4500-H+ B NA 3 samples 3 samples 1 sample
6 samples EPA 6010B 0.01 3 samples 3 samples 2 samples 2 samples 1 sample
6 samples EPA 6010B 0.005 3 samples 3 samples 2 samples 2 samples 1 sample
6 samples EPA 6010B 0.01 3 samples 3 samples 2 samples 2 samples 1 sample
35

Table 3-7. Sampling Frequency for Characterization of Waste Brine (continued)
Sampling Analytical Reporting Parameter Sample Location Frequency Method Li mit (mg/L) Beryllium Untreated brine (liquid)
Treated brine (liquid) from precipitation method Treated brine (liquid) from adsorption method Solids from precipitation method Solids from adsorptive media Combined treated brine (liquid)1
Cadmium Untreated brine (liquid) Treated brine (liquid) from precipitation method Treated brine (liquid) from adsorption method Solids from precipitation method Solids from adsorptive media Combined treated brine (liquid)1
Chromium Untreated brine (liquid) Treated brine (liquid) from precipitation method Treated brine (liquid) from adsorption method Solids from precipitation method Solids from adsorptive media Combined treated brine (liquid)1
Cobalt Untreated brine (liquid) Treated brine (liquid) from precipitation method Treated brine (liquid) from adsorption method Solids from precipitation method Solids from adsorptive media Combined treated brine (liquid)1
Copper Untreated brine (liquid) Treated brine (liquid) from precipitation method Treated brine (liquid) from adsorption method Solids from precipitation method Solids from adsorptive media Combined treated brine (liquid)1
Lead Untreated brine (liquid) Treated brine (liquid) from precipitation method Treated brine (liquid) from adsorption method Solids from precipitation method Solids from adsorptive media Combined treated brine (liquid)1
Mercury Untreated brine (liquid) Treated brine (liquid) from precipitation method Treated brine (liquid) from adsorption method Solids from precipitation method Solids from adsorptive media Combined treated brine (liquid)1
Molybdenum Untreated brine (liquid) Treated brine (liquid) from precipitation method Treated brine (liquid) from adsorption method Solids from precipitation method Solids from adsorptive media Combined treated brine (liquid)1
6 samples EPA 6010B 0.004 3 samples 3 samples 2 samples 2 samples 1 sample
6 samples EPA 6010B 0.005 3 samples 3 samples 2 samples 2 samples 1 sample
6 samples EPA 6010B 0.005 3 samples 3 samples 2 samples 2 samples 1 sample
6 samples EPA 6010B 0.01 3 samples 3 samples 2 samples 2 samples 1 sample
6 samples EPA 6010B 0.01 3 samples 3 samples 2 samples 2 samples 1 sample
6 samples EPA 6010B 0.005 3 samples 3 samples 2 samples 2 samples 1 sample
6 samples EPA 7470A 0.0002 3 samples 3 samples 2 samples 2 samples 1 sample
6 samples EPA 6010B 0.02 3 samples 3 samples 2 samples 2 samples 1 sample
36

Table 3-7. Sampling Frequency for Characterization of Waste Brine (continued)
Sampling Analytical Reporting Parameter Sample Location Frequency Method Limit (mg/L) Nickel Untreated brine (liquid)
Treated brine (liquid) from precipitation method Treated brine (liquid) from adsorption method Solids from precipitation method Solids from adsorptive media Combined treated brine (liquid)1
Selenium Untreated brine (liquid) Treated brine (liquid) from precipitation method Treated brine (liquid) from adsorption method Solids from precipitation method Solids from adsorptive media Combined treated brine (liquid)1
Silver Untreated brine (liquid) Treated brine (liquid) from precipitation method Treated brine (liquid) from adsorption method Solids from precipitation method Solids from adsorptive media Combined treated brine (liquid)1
TSS Untreated brine (liquid) Treated brine (liquid) from precipitation method Treated brine (liquid) from adsorption method Solids from precipitation method Solids from adsorptive media Combined treated brine (liquid)1
Thallium Untreated brine (liquid) Treated brine (liquid) from precipitation method Treated brine (liquid) from adsorption method Solids from precipitation method Solids from adsorptive media Combined treated brine (liquid)1
Vanadium Untreated brine (liquid) Treated brine (liquid) from precipitation method Treated brine (liquid) from adsorption method Solids from precipitation method Solids from adsorptive media Combined treated brine (liquid)1
Zinc Untreated brine (liquid) Treated brine (liquid) from precipitation method Treated brine (liquid) from adsorption method Solids from precipitation method Solids from adsorptive media Combined treated brine (liquid)1
6 samples 3 samples 3 samples 2 samples 2 samples 1 sample
6 samples 3 samples 3 samples 2 samples 2 samples 1 sample
6 samples 3 samples 3 samples 2 samples 2 samples 1 sample
6 samples 3 samples 3 samples 2 samples 2 samples 1 sample
6 samples 3 samples 3 samples 2 samples 2 samples 1 sample
6 samples 3 samples 3 samples 2 samples 2 samples 1 sample
6 samples 3 samples 3 samples 2 samples 2 samples 1 sample
EPA 6010B 0.01
EPA 6010B 0.005
EPA 6010B 0.01
SM 2540D NA
EPA 6010B 0.005
EPA 6010B 0.01
EPA 6010B 0.02
Combined treated brine analysis was performed for characterization prior to disposal. NA = Not Applicable.
37
1

3.10.4 Evaluation Criteria
Performance of the IX system was evaluated in the context of the manufacturer's statement of performance objectives with respect to: (1) treatment equipment performance, (2) finished water quality, and (3) arsenic and vanadium removal performance.
Treatment Equipment Performance The goal of this subtask was to operate the plant within the mechanical and electrical constraints for a minimum of three complete exhaustion cycles during the verification testing runs. This included the following criteria: capacity in terms of total daily treated water production, liquid waste brine discharges, solid waste production, NaCl consumption, electrical consumption, and other relevant equipment performance criteria.
Arsenic and Vanadium Removal Performance The Verification Test was performed to demonstrate the system’s ability to remove arsenic and vanadium to below 4 µg/L and 15 µg/L, respectively (in 95% of effluent water samples).
The assessment of arsenic removal performance was not dependent on the form of arsenic fed to the plant. Regardless of whether As (III) or As (V) or a mixture of the two was fed, the performance requirements were determined by the measurement of total arsenic in the effluent water.
3.11 Task 5: Data Management
The data management system used in the verification testing involved the use of both computer spreadsheets and manual recording (on-site logbook) of operational parameters for the water treatment equipment on a daily basis. All field activities were thoroughly documented. Field documentation included field notebooks, photographs, field data sheets, and chain-of-custody forms. The following guidelines were followed:
• Field notes were kept in a bound logbook; • Field logbook was used to record all water treatment equipment operating data; • Each page was sequentially numbered; • Each page was labeled with the project name and number; • Completed pages were signed and dated by the individual responsible for the entries; and • Errors had one line drawn through them, and this line was initialed and dated.
All photographs were logged in the field logbook. These entries included the time, date, and subject of the photograph, and identified the photographer.
Original field sheets and chain-of-custody forms accompanied all samples shipped to the analytical laboratory. Copies of field sheets and chain-of-custody forms for all samples are included in Appendix C.
38
3.11.1 Experimental Objectives
The objective of this task was to establish a viable procedure for the recording and transmission of field testing data such that the FTO provided sufficient and reliable operational data for verification purposes.
3.11.2 Work Plan
FTO operators recorded data and calculations by hand in laboratory notebooks. Daily measurements were recorded on specially prepared data log sheets as appropriate. The original notebooks were stored on-site. Electronic copies were forwarded to the project manager of the FTO at least once per week during the testing period. Operating logs included a description of the IX equipment (description of test runs, names of visitors, description of any problems or issues, etc.), in addition to experimental calculations and other items.
A database for the project was set up using custom-designed spreadsheets. The spreadsheets were capable of storing and manipulating each monitored water quality and operational parameter from each task, sampling location, and sampling time. All data from the laboratory reports and data log sheets were entered into the appropriate spreadsheet. Data entry was conducted on-site by the designated field testing operators. All recorded calculations were also checked at this time. Following data entry, the spreadsheets were printed out, and the printouts were checked against the handwritten data sheets. Any corrections were noted on the hard copies and corrected on the screen, and a corrected version of the spreadsheet was printed out. Each step of the verification process was initialed by the field testing operator performing the entry or verification step. Backup of the computer databases to diskette was performed on a weekly basis.
Data from MWH Laboratories were received and reviewed by the field-testing operator. These data were entered into the data spreadsheets, corrected, and verified in the same manner as the field data. As available, electronic data storage and retrieval capabilities were employed in order to maximize data collection and minimize labor hours required for monitoring.
Data tracking included each of the following tasks:
• Data were tracked using the same system of run numbers as samples were collected and sent to state-certified analytical laboratories (MWH Laboratories).
• Data from the analytical laboratories were received and reviewed by the FTO. • These data were entered into the data spreadsheets, corrected, and verified in the same
manner as the field data.
3.12 Task 6: Quality Assurance Project Plan
QA/QC of the operation of the Basin Water System and the measured water quality parameters were maintained during verification testing through a QAPP as described in this section. A number of individuals were responsible for monitoring equipment and operating parameters, and for sampling and analysis QA/QC throughout the verification testing. Primary responsibility for
39

ensuring that both equipment operation and sampling and analysis activities complied with the QA/QC requirements rested with the FTO and the analytical laboratory.
QA/QC activities for the analytical laboratory that analyzed samples sent off-site were the responsibility of that analytical laboratory’s supervisor. If problems arose or any data appeared unusual, they were thoroughly documented and corrective actions were implemented as specified in Chapter 4.
3.12.1 Experimental Objectives
The objective of this task was to maintain strict QA/QC methods and procedures during verification testing. Maintenance of strict QA/QC procedures was important so that if a question arose when analyzing or interpreting data collected for a given experiment, it would be possible to verify exact conditions at the time of testing. The elements of the Quality Assurance Project Plan included:
• Data correctness • Methodology for use of blanks • Performance evaluation samples • Duplicate samples • Calculation of indicators of data quality • Data reporting • Measurement of precision and accuracy • Corrective action plan.
3.12.2 Work Plan
Equipment flow rates and associated signals were verified and recorded on a routine daily basis. A daily walk-through during testing verified that each piece of equipment or instrumentation was operating properly. Particular care was taken to verify that water, brine, and flow rates were correct. Inline monitoring equipment, such as flow meters and conductivity meters, were checked to verify that the readouts matched with the actual measurements (i.e., flow rate, specific conductance) and that the signals being recorded were correct.
QA/QC Verifications The effluent water pH meter was checked and calibrated daily. Additionally, the following parameters were verified daily by weight or by volume:
• NaCl, ferric chloride, sodium hypochlorite, acid and caustic consumption rates, • Saturated brine flow rate, and • Brine flow rate.
Other QA/QC checks included:
• Inline conductivity meters (calibrated prior to beginning verification testing [after the shakedown period] and daily during verification testing), and
40

• Tubing (verification of condition of all tubing and connections, and replacement if necessary).
3.12.3 Data Correctness
Data correctness refers to data quality, for which there are five indicators:
• Representativeness, • Statistical uncertainty, • Precision, • Accuracy, and • Completeness.
3.12.3.1 Representativeness
Representativeness refers to the degree to which the data accurately and precisely represent the conditions or characteristics of the parameter represented by the data. As specified by the ETV Protocol, representativeness of water quality samples for the ETV test was ensured by executing consistent sample collection procedures, including:
• Sample locations, • Timing of sample collection, • Sampling procedures, • Sample preservation, • Sample packaging, and • Sample transport.
Sample LocationsSample locations for all water quality parameters were specified in Section 2.3. Specifically, sample locations for the IX system include the raw water, influent, effluent, untreated brine, treated brine, and the solids from the waste brine treatment process.
Timing of Sample CollectionIn an IX verification study, the timing of sample collection was not as critical as in, for example, a granular media filtration verification study in which the filter run time can influence the quality of water produced by the filter. For the IX verification test, there was no filter maturation time, stable period of filter operation, or turbidity breakthrough period. To the extent possible, analyses for inorganic water quality parameters were performed on water sample aliquots obtained simultaneously from the same sampling location, in order to ensure the maximum degree of comparability between water quality analytes.
Sampling Procedures, Sample Preservation, Packaging, and Transport Sampling procedures for each water quality parameter are described below; additional information may be found in Tables 3-4 and 3-6. The samples were collected in bottles prepared by MWH Laboratories with the appropriate preservative for the analyte. For the 24-hour composite samples, 2.5- or 5-gallon cube containers were used and stored (both during and after
41

sample collection) on ice in a cooler. Field analyses were performed using portable field analytical equipment.
Once collected, all samples were stored and transported to MWH Laboratories in coolers packed with ice. Samples were analyzed within the Standard Methods or EPA recommended holding times, if not analyzed on-site (i.e., pH, conductivity, free and total chlorine, temperature, and arsenic speciation). The following parameters were sampled during verification testing:
Alkalinity Samples were collected and analyzed off-site by the analytical laboratory using SM 2320B, within the 14-day holding period. Samples were not agitated or exposed to the atmosphere for prolonged periods of time. No preservative was used for alkalinity samples.
Arsenic (As [III] and Dissolved) Samples were collected on-site and speciated using the procedures and resin columns provided by NSF (see Appendix C). The samples were collected in polyethylene bottles provided by MWH Laboratories and preserved in accordance with the ETV required procedures. The samples were analyzed using EPA Method 200.8 within the six-month holding period of the preserved samples.
Arsenic (Total)Samples were collected headspace free into polyethylene bottles provided by theanalytical laboratory, capped tightly, and transported daily to the analytical laboratory. The sample bottles from the laboratory included the preservative HNO3 for a holding period of up to six months. The samples were analyzed using EPA Method 200.8 within the holding period of the preserved samples.
Calcium Samples were collected headspace free into polyethylene bottles provided by the analytical laboratory, capped tightly, and transported daily to the analytical laboratory. The sample bottles from the laboratory included the preservative HNO3 for a holding period of up to six months. All calcium samples were analyzed using EPA Method 200.7 within the holding period of the preserved samples.
Chloride Samples were collected headspace free into polyethylene bottles provided by the analytical laboratory, capped tightly, and transported daily to the analytical laboratory. All chloride samples were analyzed using EPA Method 300.0 within the holding period of 28 days.
Chlorine (Free and Total) Samples were collected and analyzed on-site immediately using Hach Method 8021 for free chlorine and Hach Method 8167 for total chlorine per the analysis instructions in Appendix C. Instructions for on-site calibration of the chlorine analyzer are also provided in Appendix C. Calibrations were conducted weekly.
42

Conductivity Samples were collected and analyzed on-site immediately using SM 2510B. Sample agitation and prolonged exposure to air were avoided. The conductivity meter was calibrated daily on-site using a three-point calibration method and standard solutions manufactured by Hach at 180, 1000, and 1990 mmho/cm.
Fluoride Samples were collected headspace free into polyethylene bottles provided by the analytical laboratory, capped tightly, and transported daily to the analytical laboratory. The sample bottles from the laboratory did not include a preservative, and when refrigerated, had a holding period of up to 28 days. All fluoride samples were analyzed using SM 4500F C within the allowable holding period.
Hardness Samples were collected and analyzed on-site immediately using SM 2340B, with a six-month holding period using HNO3 as a preservative. Samples were not agitated or exposed to the atmosphere for prolonged periods of time.
Iron Samples were collected headspace free into polyethylene bottles provided by the analytical laboratory, capped tightly, and shipped daily to the analytical laboratory. The sample bottles from the laboratory included the preservative HNO3 for a holding period of up to six months. All iron samples were analyzed using EPA Method 200.7 within the holding period of the preserved samples.
Magnesium Samples were collected headspace free into polyethylene bottles provided by the analytical laboratory, capped tightly, and shipped daily to the analytical laboratory. The sample bottles from the laboratory included the preservative HNO3 for a holding period of up to six months. All magnesium samples were analyzed using EPA Method 200.7 within the holding period of the preserved samples.
Manganese Samples were collected headspace free into polyethylene bottles provided by the analytical laboratory, capped tightly, and shipped daily to the analytical laboratory. The sample bottles from the laboratory included the preservative HNO3 for a holding period of up to six months. All manganese samples were analyzed using EPA Method 200.8 within the holding period of the preserved samples.
NDMA Samples were collected headspace free in two one- litter bottles, each preserved with 1 milliliter thio (8%) provided by the analytical laboratory, capped tightly, and stored refrigerated. All NDMA samples were analyzed using EPA Method 1625 within the holding period of seven days of the preserved samples.
43

Nitrate Samples were collected headspace free into polyethylene bottles provided by the analytical laboratory, capped tightly, and stored refrigerated. The bottles from the laboratory did not include a preservative. All nitrate samples were analyzed using EPA Method 300.0 within the holding period of 48 hours.
pH Samples were collected and analyzed on-site immediately using SM 4500-H+B, and the temperature at which the pH reading was made was recorded. Sample agitation and prolonged exposure to air were avoided. The pH probe was calibrated daily on-site using a three-point calibration method and standard solutions manufactured by Hach at 4,0, 7.0, and 10.0. The pH probe was stored in the appropriate solution defined in the instrument manual.
Silica (Dissolved) Samples were collected headspace free into polyethylene bottles provided by the analytical laboratory, capped tightly, and shipped daily to the analytical laboratory. The sample bottles from the laboratory included the preservative HNO3 for a holding period of up to six months. All silica samples were analyzed using EPA Method 200.7 within the holding period of the preserved samples.
Sulfate Samples were collected headspace free into polye thylene bottles provided by the analytical laboratory, capped tightly, and shipped daily to the analytical laboratory. All sulfate samples were analyzed using EPA Method 300.0 within the 28-day holding period of the preserved samples.
TDS Plastic sample bottles were used, as provided by the analytical laboratory. Analyses were made as soon as possible (within the seven-day holding period) due to impracticality of preserving samples, as specified in SM 2540. Samples were refrigerated until the time of analysis.
Temperature Readings for temperature were conducted in accordance with Standard Method 2550. Raw water temperatures were obtained daily. The thermometer was a precisionthermometer certified by the National Institute of Standards and Technology (NIST).
TSS Plastic sample bottles were used, as provided by the analytical laboratory. Analyses were made as soon as possible (within the seven-day holding period) due to impracticality of preserving samples, as specified in SM 2540 D. Samples were refr igerated until the time of analysis.
Vanadium Samples were collected headspace free into polyethylene bottles provided by the analytical laboratory, capped tightly, and shipped daily to the analytical laboratory. The
44
sample bottles from the laboratory inc luded the preservative HNO3 for a holding period of up to six months. All vanadium samples were analyzed using EPA Method 200.8 within the holding period of the preserved samples.
Representativeness of Operational Parameters As specified by the ETV protocol, representativeness for operational parameters entailed collecting a sufficient quantity of data during operation to be able to detect a change in operations. As specified by the ETV protocol, detecting a –10 percent change in an operating parameter, such as pressure, was sufficient. Operational parameters including flow and pressure were recorded twice per day, which the ETV protocol specified as sufficient for tracking changes in operational conditions that exceed this 10 percent range.
Effluent Flow Rate Effluent flow rate of the Basin Water System was verified daily using a calibrated container and stopwatch method to manually verify the flow rate. While no adjustments to the HMI flow rate display was possible, the manual “check” could verify if the HMI flow rate display was accurate.
3.12.3.2 Statistical analysis
Arsenic data developed from grab samples collected according to the Analytical Schedule in Task 4 of this test plan were analyzed for statistical uncertainty. The FTO calculated 95% confidence intervals for the arsenic data obtained during verification testing as described in the EPA/NSF Protocol for Equipment Verification Testing for Arsenic Removal.
The statistics developed were helpful in demonstrating the degree of reliability with which the water treatment equipment could attain quality goals under the treatment conditions tested. The results of the statistical analysis were used to determine if the performance of the equipment was equal to or better than that given in the statement of performance objectives.
3.12.3.3 Methodology for Measurement of Precision and Accuracy
Precision and Accuracy for Water Quality Parameters Table 3-8 summarizes the methodology used for the measurement of precision and accuracy for each water quality analysis performed during verification testing. Arsenic speciation columns were QA/QC checked by NSF and were provided by NSF for the verification testing. The sampling location for each duplicate sample alternated from raw water, influent, and effluent. One duplicate was taken from each of the following: untreated brine, treated brine, and the solids from the waste brine.
Precision and Accuracy for Operational Parameters The operational parameters in the ETV test included flow rates and pressures. Effluent flow rate was verified daily using a bucket test with calibrated containers and a stopwatch. The duration of the bucket test was 15 seconds.
45
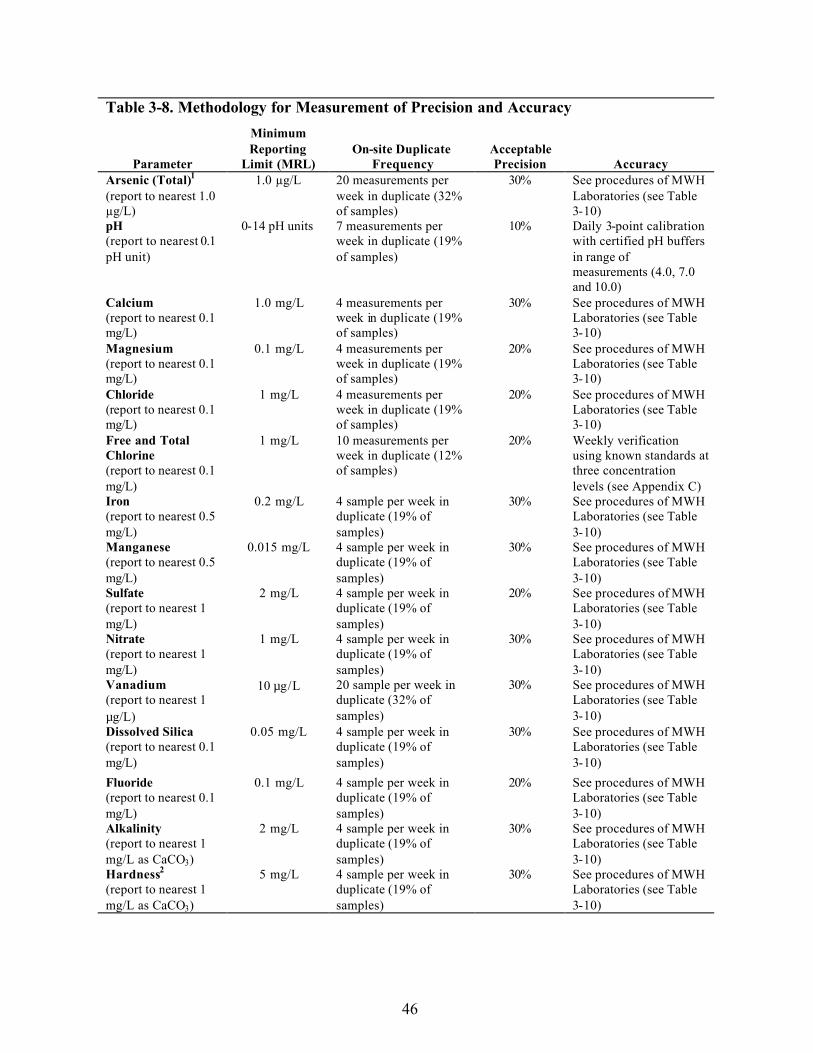
Table 3-8. Methodology for Measurement of Precision and Accuracy Minimum Reporting On-site Duplicate Acceptable
Parameter Limit (MRL) Frequency Precision Accuracy Arsenic (Total)1
(report to nearest 1.0 µg/L) pH (report to nearest 0.1 pH unit)
Calcium (report to nearest 0.1 mg/L) Magnesium (report to nearest 0.1 mg/L) Chloride (report to nearest 0.1 mg/L) Free and Total Chlorine (report to nearest 0.1 mg/L) Iron (report to nearest 0.5 mg/L) Manganese (report to nearest 0.5 mg/L) Sulfate (report to nearest 1 mg/L) Nitrate (report to nearest 1 mg/L) Vanadium (report to nearest 1 mg/L) Dissolved Silica (report to nearest 0.1 mg/L) Fluoride (report to nearest 0.1 mg/L) Alkalinity (report to nearest 1 mg/L as CaCO3) Hardness2
(report to nearest 1 mg/L as CaCO3)
1.0 µg/L
0-14 pH units
1.0 mg/L
0.1 mg/L
1 mg/L
1 mg/L
0.2 mg/L
0.015 mg/L
2 mg/L
1 mg/L
10 mg/L
0.05 mg/L
0.1 mg/L
2 mg/L
5 mg/L
20 measurements per week in duplicate (32% of samples) 7 measurements per week in duplicate (19% of samples)
4 measurements per week in duplicate (19% of samples) 4 measurements per week in duplicate (19% of samples) 4 measurements per week in duplicate (19% of samples) 10 measurements per week in duplicate (12% of samples)
4 sample per week in duplicate (19% of samples) 4 sample per week in duplicate (19% of samples) 4 sample per week in duplicate (19% of samples) 4 sample per week in duplicate (19% of samples) 20 sample per week in duplicate (32% of samples) 4 sample per week in duplicate (19% of samples) 4 sample per week in duplicate (19% of samples) 4 sample per week in duplicate (19% of samples) 4 sample per week in duplicate (19% of samples)
30%
10%
30%
20%
20%
20%
30%
30%
20%
30%
30%
30%
20%
30%
30%
See procedures of MWH Laboratories (see Table 3-10) Daily 3-point calibration with certified pH buffers in range of measurements (4.0, 7.0 and 10.0) See procedures of MWH Laboratories (see Table 3-10) See procedures of MWH Laboratories (see Table 3-10) See procedures of MWH Laboratories (see Table 3-10) Weekly verification using known standards at three concentration levels (see Appendix C) See procedures of MWH Laboratories (see Table 3-10) See procedures of MWH Laboratories (see Table 3-10) See procedures of MWH Laboratories (see Table 3-10) See procedures of MWH Laboratories (see Table 3-10) See procedures of MWH Laboratories (see Table 3-10) See procedures of MWH Laboratories (see Table 3-10) See procedures of MWH Laboratories (see Table 3-10) See procedures of MWH Laboratories (see Table 3-10) See procedures of MWH Laboratories (see Table 3-10)
46

Table 3-8. Methodology for Measurement of Precision and Accuracy (continued)
Minimum Reporting On-site Duplicate Acceptable
Parameter Limit (MRL) Frequency Precision Accuracy TDS 10 mg/L 4 sample per week in 30% See procedures of MWH (report to nearest 1 duplicate (19% of Laboratories (see Table mg/L) samples) 3-10) TSS 10 mg/L 4 sample per week in 30% See procedures of MWH (report to nearest 1 duplicate (19% of Laboratories (see Table mg/L) samples) 3-10) NDMA3 2 ng/L 1 sample 30% See procedures of MWH (report to nearest 1 Laboratories (see Table ng/L) 3-10) Conductivity 4 mmho/cm 7 samples per week in 10% Daily calibration using (report to nearest 0.1 duplicate (33% of known standards at three mmho/cm) samples) concentration levels.
Acceptable accuracy was –10%.
1 As (III) and dissolved arsenic samples were prepared on-site using arsenic speciation procedures developed by Battelle for the EPA (Edwards et al.) (see Appendix B).
2 Calculated using calcium and magnesium concentrations.3 A total of three samples for NDMA analysis were collected during the Initial Plant Characterization testing.
Method BlanksThe methodology for use of method blanks is summarized in Table 3-9.
Field Blanks Field blanks were submitted with each set of samples submitted to MWH Laboratories for each parameter collected. One field blank was collected for each parameter submitted for analysis.
Table 3-9. Methodology for Use of Method Blanks
Method Methodology for Blanks Arsenic, TDS, alkalinity, calcium, Blanks were used in accordance with the procedures of MWH magnesium, hardness, and other Laboratories1. inorganic constituents for laboratory analysis pH Purchased certified pH buffers were used - no use of blanks.
Conductivity No use of blanks.
Free and Total Chlorine A reagent-grade ultra-pure water was kept in stock at the verification site for use as a blank prior to analyzing each free or total chlorine sample.
See Table 3-10.
Spiked Samples Spiked samples were utilized at MWH Laboratories as presented in Table 3-10. Spiked samples were not applicable for the analyses performed on-site at the treatment system for conductivity or pH, but were performed for total and free chlorine at a frequency of 10%.
47
1
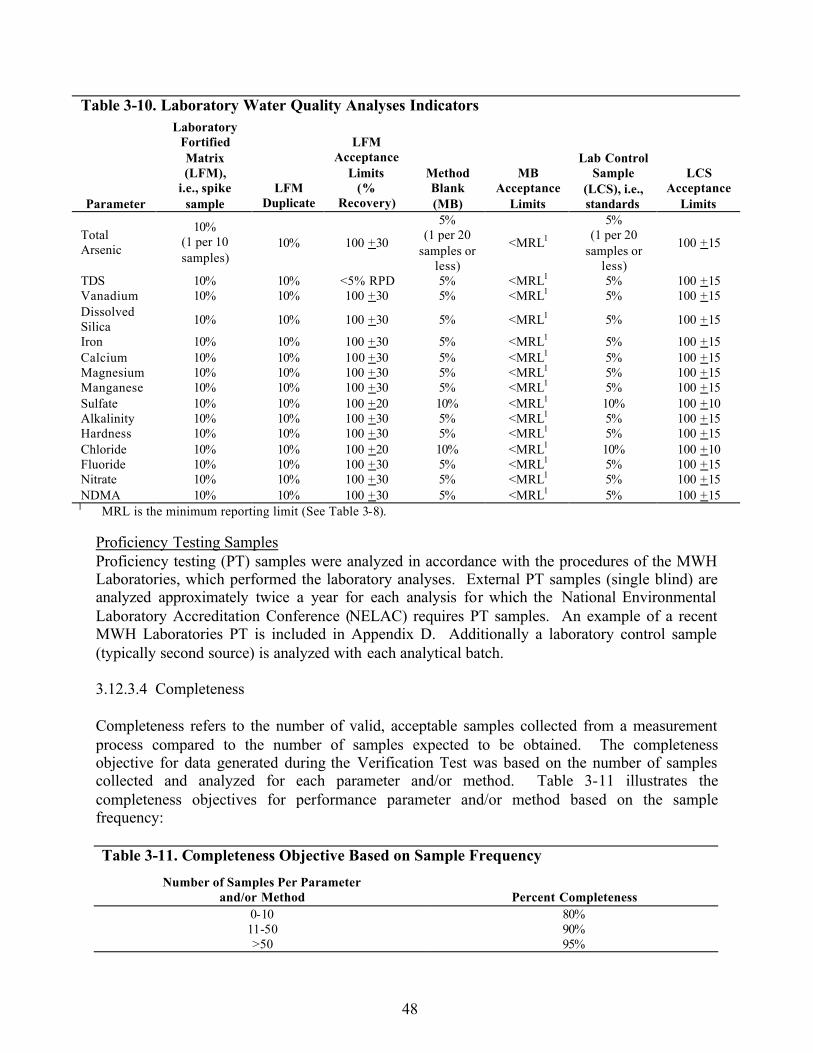
Table 3-10. Laboratory Water Quality Analyses Indicators Laboratory
Fortified LFM
Parameter
Matrix (LFM),
i.e., spike sample
LFM Duplicate
Acceptance Limits
(% Recovery)
Method Blank (MB)
MB Acceptance
Limits
Lab Control Sample
(LCS), i.e., standards
LCS Acceptance
Limits 5% 5%10%Total (1 per 10 10% 100 +30 (1 per 20 <MRL1 (1 per 20 100 +15Arsenic samples or samples orsamples) less) less)
TDS 10% 10% <5% RPD 5% <MRL1 5% 100 +15 Vanadium 10% 10% 100 +30 5% <MRL1 5% 100 +15 Dissolved 10% 10% 100 +30 5% <MRL1 5% 100 +15Silica Iron 10% 10% 100 +30 5% <MRL1 5% 100 +15 Calcium 10% 10% 100 +30 5% <MRL1 5% 100 +15 Magnesium 10% 10% 100 +30 5% <MRL1 5% 100 +15 Manganese 10% 10% 100 +30 5% <MRL1 5% 100 +15 Sulfate 10% 10% 100 +20 10% <MRL1 10% 100 +10 Alkalinity 10% 10% 100 +30 5% <MRL1 5% 100 +15 Hardness 10% 10% 100 +30 5% <MRL1 5% 100 +15 Chloride 10% 10% 100 +20 10% <MRL1 10% 100 +10 Fluoride 10% 10% 100 +30 5% <MRL1 5% 100 +15 Nitrate 10% 10% 100 +30 5% <MRL1 5% 100 +15 NDMA 10% 10% 100 +30 5% <MRL1 5% 100 +15
1 MRL is the minimum reporting limit (See Table 3-8).
Proficiency Testing Samples Proficiency testing (PT) samples were analyzed in accordance with the procedures of the MWH Laboratories, which performed the laboratory analyses. External PT samples (single blind) are analyzed approximately twice a year for each analysis for which the National Environmental Laboratory Accreditation Conference (NELAC) requires PT samples. An example of a recent MWH Laboratories PT is included in Appendix D. Additionally a laboratory control sample (typically second source) is analyzed with each analytical batch.
3.12.3.4 Completeness
Completeness refers to the number of valid, acceptable samples collected from a measurement process compared to the number of samples expected to be obtained. The completeness objective for data generated during the Verification Test was based on the number of samples collected and analyzed for each parameter and/or method. Table 3-11 illustrates the completeness objectives for performance parameter and/or method based on the sample frequency:
Table 3-11. Completeness Objective Based on Sample Frequency Number of Samples Per Parameter
and/or Method Percent Completeness 0-10 80% 11-50 90% >50 95%
48

3.12.4 Calculation of Indictors of Data Quality
Calculation of Precision As specified in Standard Method 1030 C, precision is specified by the standard deviation of the results of replicate analyses. The overall precision of a study includes the random errors involved in sampling as well as the errors in sample preparation and analysis.
nPrecision = Standard Deviation = �[� (X i - X)2 ‚ (n - 1)]
i=1
where: X = sample mean X i = ith data point in the data set n = number of data points in the data set
Precision refers to the degree of mutual agreement among individual measurements and provides an estimate of random error. Analytical precision is a measure of how far an individual measurement may be from the mean of replicate measurements. The standard deviation and relative standard deviation recorded from sample analyses were recorded as a means to quantify sample precision. The percent relative standard deviation was calculated in the following manner:
%Relative Standard Deviation = S(100)/Xaverage where S = Standard Deviation
Xaverage= the arithmetic mean of the recovery values
For acceptable analytical precision under verification testing, the percent relative standard deviation for drinking water samples must be less than the acceptance limits, as indicated in Table 3-8 and Table 3-10. If the data generated during the ETV test did not meet the data quality objectives defined in the QA/QC section, additional testing and sampling was conducted.
Calculation of Accuracy Accuracy is quantified as the percent recovery of a parameter in a sample to which a known quantity of that parameter was added. An example of an accuracy determination in this ETV was the analysis of an arsenic proficiency sample and comparison of the measured arsenic to the known level of arsenic in the sample.
Accuracy = Percent Recovery = 100 · [1- (Xknown - Xmeasured) ‚ Xknown]
where Xknown = known concentration of measured parameter Xmeasured = measured concentration of parameter
49

Statistical Uncertainty For the water quality parameters monitored, 95% confidence intervals were calculated for data sets of eight values or more. The count, average, minimum, and maximum values were tabulated for all data sets. The following equation was used for confidence interval calculation:
Confidence Interval = X – [tn-1,1 - (a/2) · (S/�n)]
where: X = sample mean S = sample standard deviation n = number of independent measurements included in the data set t = Student’s t distribution value with n-1 degrees of freedom a = significance level, defined for 95 percent confidence as: 1 - 0.95 = 0.05
According to the 95% confidence interval approach, the a term is defined to have the value of 0.05, thus simplifying the equation for the 95% confidence interval in the following manner:
95% Confidence Interval = X – [tn-1,0.975 · (S/�n)]
With input of the analytical results for pertinent water quality parameters into the 95% confidence interval equation, the output appears as the sample mean value plus or minus the second term. The results of this statistical calculation are also presented as a range of values falling within the 95% confidence interval. For example, the result of the confidence interval calculation provides the following information: 520 +/- 38.4 mg/L, with a 95% confidence interval range described as (481.6, 558.4).
Calculation of Completeness Completeness is defined as the following for all measurements:
%C = (V/T) X 100
where: %C = percent completeness V = number of measurements judged valid T = total number of measurements
3.12.5 Corrective Action Plan
The corrective action plan followed during the ETV test for water quality parameters is summarized in Table 3-12.
50

Table 3-12. Corrective Action Plan
Parameter Acceptance Criteria Sequence of Steps for Corrective Action Any Duplicate See Tables 3-8 and 3-10 • Re-sampled duplicates. Analysis • Checked instrument calibration; recalibrated
instrument.
Any Method Blank See Tables 3-9 and 3-10 • Lab analyses: performed procedures specific to each analysis as determined by MWH Laboratories.
• On-site analysis: performed procedures specific to on-site analyses.
Any Performance Within recovery specified for • Checked and verified all steps in sample collection Evaluation (PE) or each PE or proficiency and analysis. Proficiency Sample sample • Re-do PE or proficiency sampling and analysis.
pH and £10% difference from • Checked for change in column influent source or Conductivity previous day supply.
• Checked instrument calibration. • Recalibrated instrument.
Alkalinity, £20% difference from • Verified change in column influent source or Hardness, Calcium, previous reading supply. Magnesium, TDS, As (III), As (V), As(Total), Sulfate, Nitrate, Chloride, Fluoride, Iron, Manganese, Vanadium, Dissolved Silica, Free Chlorine and Total Chlorine
3.13 Operation and Maintenance
The manufacturer’s O&M documentation for the Basin Water System was reviewed by the project engineers and the verification plant operations staff prior to the verification testing. The O&M manual for the Basin Water System may be found in Appendix A. In addition, the following aspects of operability are addressed in Chapter 4:
• Fluctuation of flow rates and pressures through the IX unit – the time interval at which resetting is needed (i.e., how long could chemical feed pumps hold on a set value for the chemical feed rate?).
• Were devices present to aid the operator with flow control adjustment? • Was chemical feed paced with raw water flow? • Did the system have an indicator if sediment prefilter was changed ahead of scheduled
quarterly maintenance? • How successful was a SCADA system (i.e., complete automation and computer control) with
data acquisition as a means of operating an arsenic and vanadium removal IX plant?
51
• How did one ensure that arsenic or vanadium had not broken through the column without actually making a continuous online arsenic measurement, which is impractical?
• How did the operator ensure that the regenerant brine had actually been fed to the spent resin column?
• What was the preferred means of measuring or estimating brine consumption? • How many times could the brine be reused without treatment? • How did one automate the precipitation of arsenic from the spent brine? • Did the reuse of the brine cause any precipitation problems? • How did a plant operator check on the condition and depth of the IX media? • Was there any easily measured parameter, such as pH or conductivity, that would signal the
breakthrough of arsenic from a column? • How often was it necessary to reset the brine flow rate?
This report addresses the above questions. The issues of operability were dealt with in the portion of the reports written in response to Tasks 3 and 4 of the verification testing plan and may be found in Chapter 4.
52
Chapter 4Results and Discussion
4.1 Introduction
Verification testing of the Basin Water System performed at the EVMWD Corydon Street Well in Lake Elsinore, California, occurred over a 54-day period that began on April 4, 2005, and concluded on May 28, 2005. The system ran continuously with the exception of 13 system shutdowns due to construction in the nearby area and electrical modifications to the site. Of the 13 shutdowns, three were considered major shutdowns (i.e., lasting eight hours or longer). These shutdowns occurred on April 7, May 12, and May 14, 2005.
Over the 54-day test period, the system was in operation and treating water for 48 days: 29 days for two Initial Plant Characterizations (Task 3), five days for data review between the two Initial Plant Characterizations and the Verification Test, and 14 days for the Verification Test (Task 4). Results and discussion of the operation of the Basin Water System, brine treatment efficiency (both BRA and BPU systems), finished water quality, and data management are presented in this chapter as the following six tasks:
Task 1: Selection and Characterization of the Raw Water Task 2: Preparation, Coordination, and Start-Up Task 3: Initial Plant Characterization Task 4: Verification Testing Task 5: Data Management Task 6: Quality Assurance Project Plan
The field data (operational and water quality) were maintained in a field logbook per Section 3.11 (Task 5) and may be found in Appendix C. The corresponding off-site laboratory data may be found in Appendix D.
4.2 Task 1: Selection and Characterization of the Raw Water
The experimental objective, work plan, schedule, and evaluation criteria for Task 1 were previously presented in Section 3.7. Historical data were collected (see Table 4-1) and reviewed, and the site was determined to have appropriate conditions for the Basin Water System verification testing based on the operational parameters presented in Chapter 3 (see Table 3-2). The data provided in Table 4-1 is for informational purposes only to characterize the raw water quality and was not verified by NSF.
The average total arsenic, As (III), and As (V) concentrations in the raw water (based on the historical data available) are 17 µg/L, 16 µg/L, and 2.5 µg/L, respectively. The average historical vanadium level in the raw water was 102 µg/L.
53

Table 4-1. Historical Water Quality Data for Corydon Street Well (2004)
Collection Date Parameters Method Units 3/25/04 4/22/04 5/20/04 6/17/04 7/22/04 Min Max Ave Conductivity Lab Meter µmhos/cm 506 475 478 479 481 475 506 484 pH SM 4500H+ B pH Units 9.1 9.1 9.1 9.1 9.2 9.1 9.2 9.1 Alkalinity SM 2320B mg/L 91.0 89.2 86.1 84.6 87.6 84.6 91.0 87.7 Chloride EPA 300.0 mg/L 77 72 75 72 74 72 77 74 Fluoride SM 4500F C mg/L 0.40 0.41 0.41 0.42 0.41 0.40 0.42 0.41 Nitrate EPA 300.0 mg/L 6.3 1.4 1.4 1.4 1.4 1.4 6.3 2.4 Sulfate EPA 300.0 mg/L 38 34 36 35 36 34 38 36 Calcium EPA 200.7 mg/L 6.1 6.3 6.1 6.1 6.1 6.1 6.3 6.1 Hardness SM 3120B mg/L 19.0 19.4 18.8 18.8 18.6 18.6 19.4 18.9 Magnesium EPA 200.7 mg/L <0.10 0.89 0.87 0.86 0.83 <0.10 0.89 0.71 LSI SM 2330B None 0.36 0.48 0.45 0.44 0.55 0.36 0.55 0.46 Total As EPA 200.8 µg/L 19 13 20 16 15 13 20 17 As (III) EPA 200.8 µg/L 16 19 16 15 12.5 12.5 19 16 As (V) EPA 200.8 µg/L 2.5 1.0 3.8 2.8 2.2 1.0 3.8 2.5 Iron EPA 200.7 mg/L <0.2 <0.2 <0.2 <0.2 <0.2 <0.2 <0.2 <0.2 Manganese EPA 200.8 mg/L <0.015 <0.015 <0.015 <0.015 <0.015 <0.015 <0.015 <0.015 Silica EPA 200.7 mg/L 12 12 12 12 13 12 13 12 Vanadium EPA 200.8 µg/L 93 110 98 120 89 89 120 102 TDS SM 2540C mg/L 300 290 300 280 290 280 300 292 TSS EPA 160.2 mg/L <10 <10 <10 <10 <10 <10 <10 <10
4.3 Task 2: Preparation, Coordination, and Start-Up
The experimental objectives, work plan, schedule, and evaluation criteria for Task 2 were previously presented in Section 3.8. Basin Water performed start-up activities on-site from March 3-April 4, 2005. There are no data to present from Task 2.
4.4 Task 3: Initial Plant Characterization
The experimental objectives, work plan, schedule, and evaluation criteria for Task 3 were previously presented in Section 3.9. Water quality data were collected on the raw water, influent water, and effluent water at the frequencies provided in Table 3-4.
There were two Initial Plant Characterizations conducted as part of the ETV at the direction of Basin Water. These are discussed in sections 4.4.1 and 4.4.2. The second Initial Plant Characterization was initiated based on the percent arsenic removals and arsenic breakthrough observed in the effluent of concentrations greater than 4 µg/L during the first Initial Plant Characterization.
The on-site and laboratory data for the two Initial Plant Characterizations are provided in this section. Twenty-four-hour composite samples were collected daily for total arsenic, vanadium, alkalinity, calcium, chloride, fluoride, total hardness, magnesium, nitrate, and sulfate. The 24hour composite samples were analyzed twice per week for iron, manganese, dissolved silica, TDS, and TSS.
54

During the Initial Plant Characterization task, the system required salt, sodium hypochlorite, acid, and caustic. Discussion of operational data, including chemical and power consumption during the Initial Plant Characterization (Task 3) as well as the Verification Testing (Task 4) is provided in Section 4.5.4. A number of special studies were conducted on speciation of the arsenic concentration during both the Initial Plant Characterizations and the Verification Test; the results of these special tests are presented in Section 4.5.2.
4.4.1 Initial Plant Characterization No. 1
On April 4, 2005, the manufacturer turned the ETV site and IX system over to the FTO to characterize the raw water, influent water, and effluent water for a minimum of three complete exhaustion cycles of each IX vessel online over a period of approximately 19 days. During this 19-day period, 16 days were sampled for arsenic and vanadium. On one of the 19 days (April 7, 2005), the system was shutdown due to construction in the area. On two of the 19 days (April 18-19, 2005), the IX system was in operation but no samples were collected. During these two days, the site was not staffed while the available data were under review. In addition, other parameters were not sampled during the last three days while the FTO was waiting for laboratory results and notice to proceed with the Verification Test. The Initial Plant Characterization No. 1 concluded with the last 24-hour composite sample beginning on April 22, 2005, and collected on April 23, 2005. All composite sample data presented in the following figures and tables are shown as the ending date that the 24-hour composite was collected.
The IX system operating conditions were set at the flow rate, pressures, and regeneration rate determined during the start-up activities (March 3-April 4, 2005) by Basin Water. The total flow rate was targeted at approximately 37.5 gpm with four beds in operation at any time. The flow rate through each bed was uniform, giving a flow rate of approximately 9.38 gpm per vessel. The absorption capacity set point for the first Initial Plant Characterization was established at 1,100 BV.
The pressure and flow rate for the Basin Water system had very little variation throughout the characterization test. The average pressure drop across the system over the 19 days of the first characterization test was approximately 10.3 psi with an average effluent flow rate of 38.0 gpm. Operating data collected during the Initial Plant Characterization No. 1 are presented in Section 4.5.5 with the Verification Test data (Table 4-27).
4.4.1.1 Total Arsenic and Vanadium
The Initial Plant Characterization No. 1 did not meet the performance expectations of the manufacturer, because total arsenic breakthrough began to occur earlier than anticipated (i.e., prior to 1,100 BV). Total arsenic and vanadium data collected during Initial Plant Characterization No. 1 are presented in Figures 4-1 and 4-2, and the corresponding data are provided in Table 4-2. Due to a system shutdown on April 7, 2005, no composite samples were collected on April 8, 2005. In addition, no composite samples were collected on April 19-20, 2005, while the testing data were under review by NSF and the FTO.
55
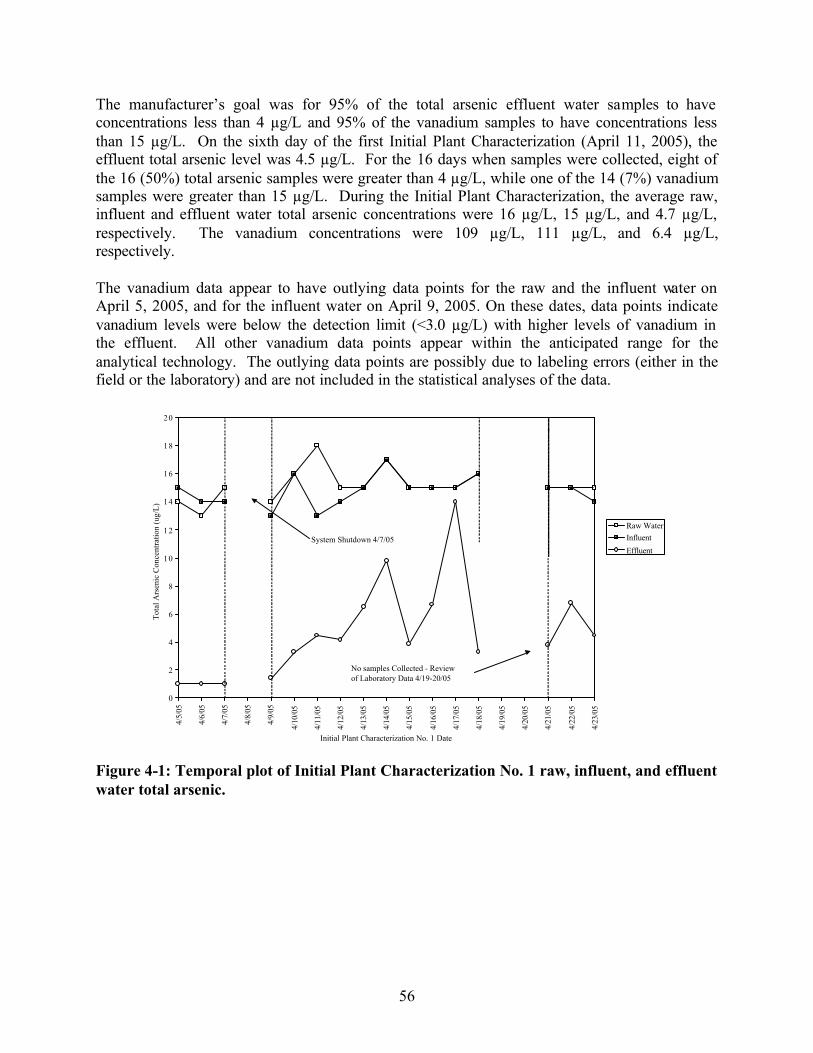
.
The manufacturer’s goal was for 95% of the total arsenic effluent water samples to have concentrations less than 4 µg/L and 95% of the vanadium samples to have concentrations less than 15 µg/L. On the sixth day of the first Initial Plant Characterization (April 11, 2005), the effluent total arsenic level was 4.5 µg/L. For the 16 days when samples were collected, eight of the 16 (50%) total arsenic samples were greater than 4 µg/L, while one of the 14 (7%) vanadium samples were greater than 15 µg/L. During the Initial Plant Characterization, the average raw, influent and effluent water total arsenic concentrations were 16 µg/L, 15 µg/L, and 4.7 µg/L, respectively. The vanadium concentrations were 109 µg/L, 111 µg/L, and 6.4 µg/L, respectively.
The vanadium data appear to have outlying data points for the raw and the influent water on April 5, 2005, and for the influent water on April 9, 2005. On these dates, data points indicate vanadium levels were below the detection limit (<3.0 µg/L) with higher levels of vanadium in the effluent. All other vanadium data points appear within the anticipated range for the analytical technology. The outlying data points are possibly due to labeling errors (either in the field or the laboratory) and are not included in the statistical analyses of the data.
0
2
4
6
8
10
12
14
16
18
20
Tota
l Ars
enic
Con
cent
ratio
n (u
g/L)
Raw Water Influent Effluent
System Shutdown 4/7/05
No samples Collected - Review of Laboratory Data 4/19-20/05
4/5/
05
4/6/
05
4/7/
05
4/8/
05
4/9/
05
4/10
/05
4/11
/05
4/12
/05
4/13
/05
4/14
/05
4/15
/05
4/16
/05
4/17
/05
4/18
/05
4/19
/05
4/20
/05
4/21
/05
4/22
/05
4/23
/05
Initial Plant Characterization No. 1 Date
Figure 4-1: Temporal plot of Initial Plant Characterization No. 1 raw, influent, and effluent water total arsenic.
56

.V
anad
ium
Con
cent
ratio
n (u
g/L)
140
120
100
80
60
40
20
0
Raw Water Influent Effluent
System Shut Down 4/7/05
No Samples Collected - Review of Laboratory Data 4/19-20/05
4/5/
05
4/6/
05
4/7/
05
4/8/
05
4/9/
05
4/10
/05
4/11
/05
4/12
/05
4/13
/05
4/14
/05
4/15
/05
4/16
/05
4/17
/05
4/18
/05
4/19
/05
4/20
/05
4/21
/05
4/22
/05
4/23
/05
Initial Plant Characterization No. 1 Date
Figure 4-2: Temporal plot of Initial Plant Characterization No. 1 raw, influent, and effluent water vanadium.
57

Table 4-2. Initial Plant Characterization No. 1: Raw, Influent, and Effluent Water Total Arsenic and Vanadium
Total Arsenic (µg/L) Raw Influent Effluent
Date Water Water Water 4/5/05 4/6/05 4/7/05 4/8/05 4/9/05 4/10/05 4/11/05 4/12/05 4/13/05 4/14/05 4/15/05 4/16/05 4/17/05 4/18/05 4/19/05 4/20/05 4/21/05 4/22/05 4/23/05
14 15 <1.0 18 19 <1.0 15 14 1.0
NA NA NA 14 13 1.4 16 16 3.3 18 13 4.5 15 14 4.2 15 15 6.5 17 17 9.8 15 15 3.9 15 15 6.7 15 15 14 16 16 3.3
NA NA NA NA NA NA 16 15 3.8 15 15 6.8 15 14 4.5 16 15 4.7 14 13 <1.0 18 19 14 16 16 16 1.2 1.5 3.5
Vanadium (µg/L) Raw Influent Effluent
Water Water Water <3.01 <3.01 4.8 100 110 <3.0 100 110 <3.0 NA NA NA 100 <3.01 951
110 110 <3.0 110 110 5.7 110 110 5.6 110 110 6.9 110 110 16 120 120 7.8 120 120 8.7 110 110 1101
110 110 3.1 NA NA NA NA NA NA 110 110 3.2 110 110 9.5 110 110 9.8 109 111 6.4 100 110 <3.0 120 120 16 15 14 14 5.9 3.6 3.7
AverageMinimumMaximum
Number of SamplesStandard Deviation
95% Confidence Interval (15-16) (15-15) (4.2-5.3) (108-110) (111-112) (5.7-7.2) 1 Data are considered aberrant and are not included in the statistical analysis. NA = Not Available.
4.4.1.2 Inorganic Constituents
In addition to the target parameters (total arsenic and vanadium), raw, influent, and effluent water samples were collected daily for alkalinity, calcium, chloride, fluoride, magnesium, sulfate, nitrate, and total hardness. Samples were collected twice weekly for dissolved silica, TDS, TSS, iron, and manganese.
Daily 24-Hour Composite Inorganic Parameters The daily 24-hour composite inorganic parameters collected during the Initial Plant Characterization No. 1 are presented in Figures 4-3 through Figure 4-10 with the corresponding data provided in Table 4-3. The results of the daily 24-hour composite samples for inorganic parameters indicated the treatment system removed very low levels of inorganic constituents from the raw water, including on average 11% alkalinity and 28% nitrate. Sulfate concentrations were reduced to less than the detection limit. However, in the case of chloride, the treatment system contributed 35 to 59% more chloride than observed in the raw water.
58

..
Initial Plant Characterization No. 1 Date
Figure 4-4: Temporal plot of Initial Plant Characterization No. 1 of daily raw, influent, and effluent water calcium.
59
4
3
2
1
0
5
6
7
Raw Water Influent Effluent
System Shut Down 4/7/05
No Samples Collected - Review of Laboratory Data 4/19-22/05
Initial Plant Characterization No. 1 Date
Figure 4-3: Temporal plot of Initial Plant Characterization No. 1 of daily raw, influent, and effluent water alkalinity.
9
8
60
40
20
0
80
100
120
Raw Water Influent Effluent
System Shut Down 4/7/05
No Samples Collected - Review of Laboratory Data 4/19-22/05
4/5/
05
4/6/
05
4/7/
05
4/8/
05
4/9/
05
4/10
/05
4/11
/05
4/12
/05
4/13
/05
4/14
/05
4/15
/05
4/16
/05
4/17
/05
4/18
/05
4/19
/05
4/20
/05
4/21
/05
4/22
/05
4/23
/05
Calc
ium
Con
cent
ratio
n (m
g/L)
4/5/
05
4/6/
05
4/7/
05
4/8/
05
4/9/
05
4/10
/05
4/11
/05
4/12
/05
4/13
/05
4/14
/05
4/15
/05
4/16
/05
4/17
/05
4/18
/05
4/19
/05
4/20
/05
4/21
/05
4/22
/05
4/23
/05
Alk
allin
ity (m
g/L)

..
Flou
ride
Con
cent
ratio
n (m
g/L)
Initial Plant Characterization No. 1 Date
Figure 4-5: Temporal plot of Initial Plant Characterization No. 1 of daily raw, influent, and effluent water chloride.
0.6
0.5
0.4
Raw Water Influent
System Shut Down 4/7/05
No Samples Collected - Review of Laboratory Data 4/19-22/05
Chl
orid
e C
once
ntra
tion
(mg/
L)
4/5/
05
4/6/
05
4/7/
05
4/8/
05
4/9/
05
4/10
/05
4/11
/05
4/12
/05
4/13
/05
4/14
/05
4/15
/05
4/16
/05
4/17
/05
4/18
/05
4/19
/05
4/20
/05
4/21
/05
4/22
/05
4/23
/05
4/5/
05
4/6/
05
4/7/
05
4/8/
05
4/9/
05
4/10
/05
4/11
/05
4/12
/05
4/13
/05
4/14
/05
4/15
/05
4/16
/05
4/17
/05
4/18
/05
4/19
/05
4/20
/05
4/21
/05
4/22
/05
4/23
/05
0.3
0.2
0.1
0
Initial Plant Characterization No. 1 Date
Figure 4-6: Temporal plot of Initial Plant Characterization No. 1 of daily raw, influent, and effluent water fluoride.
60
60
80
100
120
140
Raw Water Influent Effluent
System Shut Down 4/7/05
No Samples Collected - Review of Laboratory Data 4/19-22/05
40
20
0
Effluent

.Su
lfate
Con
cent
ratio
n (m
g/L)
4/5/
054/
5/05
4/6/
054/
6/05
4/7/
054/
7/05
4/8/
054/
8/05
4/9/
05
4/10
/05
4/11
/05
4/9/
05
4/10
/05
4/11
/05
4/12
/05
4/12
/05
4/13
/05
4/13
/05
4/14
/05
4/14
/05
4/15
/05
4/16
/05
4/15
/05
4/16
/05
4/17
/05
4/17
/05
4/18
/05
4/18
/05
4/19
/05
4/19
/05
4/20
/05
4/20
/05
4/21
/05
4/22
/05
4/21
/05
4/23
/05
4/22
/05
4/23
/05
Initial Plant Characterization No. 1 Date
Figure 4-8: Temporal plot of Initial Plant Characterization No. 1 of daily raw, influent, and effluent water sulfate.
61
20
15
10
5
0
45
40
35
25
30
Raw Water Influent Effluent
System Shut Down 4/7/05
No Samples Collected - Review of Laboratory Data 4/18-22/05
Initial Plant Characterization No. 1 Date
Figure 4-7: Temporal plot of Initial Plant Characterization No. 1 of daily raw, influent, and effluent water magnesium.
0.6
0.4
0.2
0
0.8
1
1.2
1.4
Raw Water Influent Effluent
System Shut Down 4/7/05
No Samples Collected - Review of Laboratory Data 4/18-22/05
Mag
nesi
um C
once
ntra
tion
(mg/
L)

.
.To
tal H
ardn
ess a
s CaC
O3 (
mg/
L)
Initial Plant Characterization No. 1 Date
Figure 4-10: Temporal plot of Initial Plant Characterization No. 1 of daily raw, influent, and effluent water total hardness.
62
5
0
10
15
20
25
Raw Water Influent Effluent
System Shut Down 4/7/05
No Samples Collected - Review of Laboratory Data 4/18-22/05
Initial Plant Characterization No. 1 Date
Figure 4-9: Temporal plot of Initial Plant Characterization No. 1 of daily raw, influent, and effluent water nitrate.
30
3
2
1
0
4
5
6
7
8
Raw Water Influent Effluent
System Shut Down 4/7/05
No Samples Collected - Review of Laboratory Data 4/18-22/05
4/5/
05
4/6/
054/
5/05
4/6/
05
Nitr
ate
Con
cent
ratio
n as
NO 3
(mg/
L)
4/7/
054/
7/05
4/8/
054/
8/05
4/9/
054/
9/05
4/10
/05
4/10
/05
4/11
/05
4/11
/05
4/12
/05
4/13
/05
4/14
/05
4/12
/05
4/13
/05
4/14
/05
4/15
/05
4/15
/05
4/16
/05
4/16
/05
4/17
/05
4/17
/05
4/18
/05
4/18
/05
4/19
/05
4/19
/05
4/20
/05
4/20
/05
4/21
/05
4/21
/05
4/22
/05
4/22
/05
4/23
/05
4/23
/05
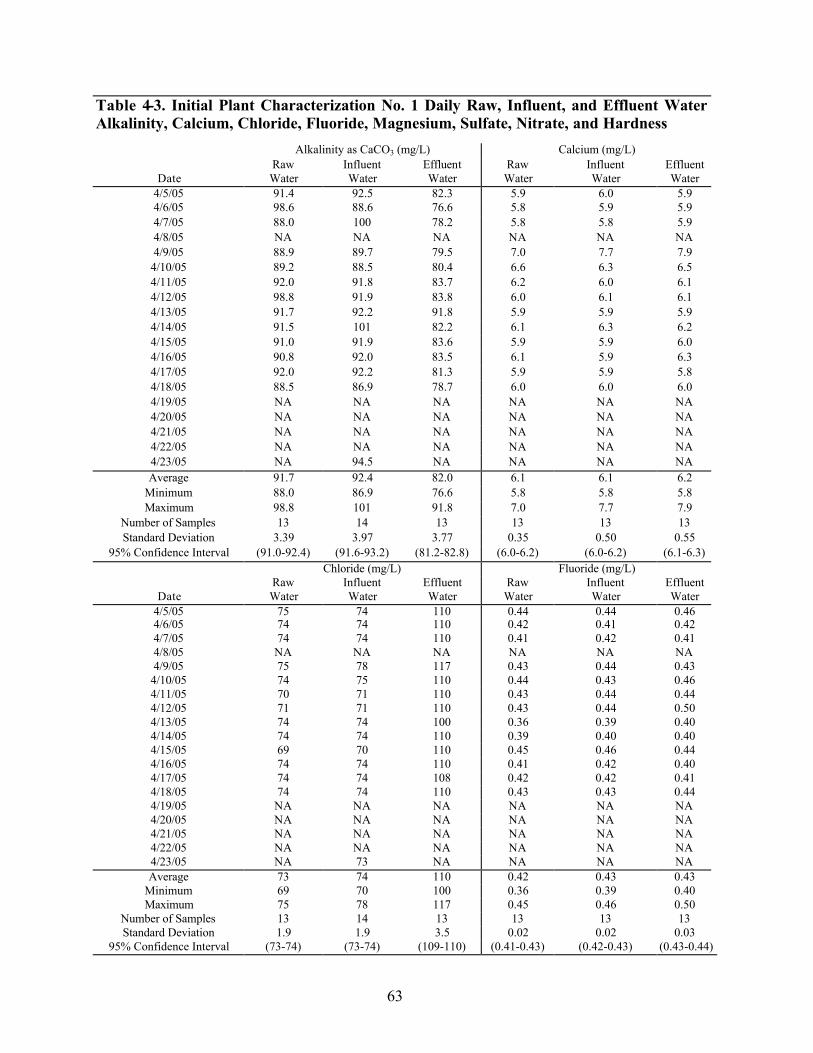
Table 4-3. Initial Plant Characterization No. 1 Daily Raw, Influent, and Effluent Water Alkalinity, Calcium, Chloride, Fluoride, Magnesium, Sulfate, Nitrate, and Hardness
Alkalinity as CaCO3 (mg/L) Raw Influent Effluent
Date Water Water Water 4/5/05 91.4 92.5 82.3 5.9 6.0 5.9 4/6/05 98.6 88.6 76.6 5.8 5.9 5.9 4/7/05 88.0 100 78.2 5.8 5.8 5.9 4/8/05 NA NA NA NA NA NA 4/9/05 88.9 89.7 79.5 7.0 7.7 7.9 4/10/05 89.2 88.5 80.4 6.6 6.3 6.5 4/11/05 92.0 91.8 83.7 6.2 6.0 6.1 4/12/05 98.8 91.9 83.8 6.0 6.1 6.1 4/13/05 91.7 92.2 91.8 5.9 5.9 5.9 4/14/05 91.5 101 82.2 6.1 6.3 6.2 4/15/05 91.0 91.9 83.6 5.9 5.9 6.0 4/16/05 90.8 92.0 83.5 6.1 5.9 6.3 4/17/05 92.0 92.2 81.3 5.9 5.9 5.8 4/18/05 88.5 86.9 78.7 6.0 6.0 6.0 4/19/05 NA NA NA NA NA NA 4/20/05 NA NA NA NA NA NA 4/21/05 NA NA NA NA NA NA 4/22/05 NA NA NA NA NA NA 4/23/05 NA 94.5 NA NA NA NA Average 91.7 92.4 82.0 6.1 6.1 6.2
Minimum 88.0 86.9 76.6 5.8 5.8 5.8 Maximum 98.8 101 91.8 7.0 7.7 7.9
Number of Samples 13 14 13 13 13 13 Standard Deviation 3.39 3.97 3.77 0.35 0.50 0.55
95% Confidence Interval (91.0-92.4) (91.6-93.2) (81.2-82.8) (6.0-6.2) (6.0-6.2) (6.1-6.3) Chloride (mg/L)
Raw Influent Effluent Date Water Water Water
4/5/05 75 74 110 4/6/05 74 74 110 4/7/05 74 74 110 4/8/05 NA NA NA 4/9/05 75 78 117 4/10/05 74 75 110 4/11/05 70 71 110 4/12/05 71 71 110 4/13/05 74 74 100 4/14/05 74 74 110 4/15/05 69 70 110 4/16/05 74 74 110 4/17/05 74 74 108 4/18/05 74 74 110 4/19/05 NA NA NA 4/20/05 NA NA NA 4/21/05 NA NA NA 4/22/05 NA NA NA 4/23/05 NA 73 NA Average 73 74 110
Minimum 69 70 100 Maximum 75 78 117
Number of Samples 13 14 13 Standard Deviation 1.9 1.9 3.5
95% Confidence Interval (73-74) (73-74) (109-110)
Calcium (mg/L) Raw Influent Effluent Water Water Water
Fluoride (mg/L) Raw Influent Effluent Water Water Water 0.44 0.44 0.46 0.42 0.41 0.42 0.41 0.42 0.41 NA NA NA 0.43 0.44 0.43 0.44 0.43 0.46 0.43 0.44 0.44 0.43 0.44 0.50 0.36 0.39 0.40 0.39 0.40 0.40 0.45 0.46 0.44 0.41 0.42 0.40 0.42 0.42 0.41 0.43 0.43 0.44 NA NA NA NA NA NA NA NA NA NA NA NA NA NA NA 0.42 0.43 0.43 0.36 0.39 0.40 0.45 0.46 0.50 13 13 13
0.02 0.02 0.03 (0.41-0.43) (0.42-0.43) (0.43-0.44)
63
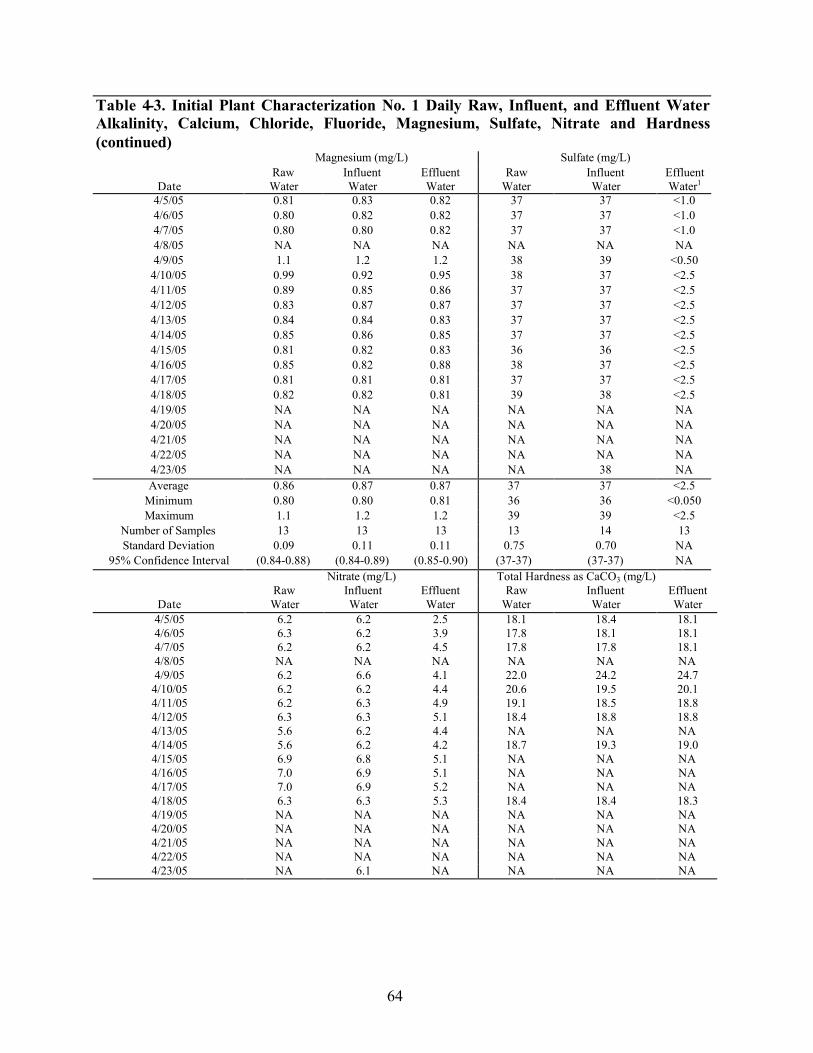
Table 4-3. Initial Plant Characterization No. 1 Daily Raw, Influent, and Effluent Water Alkalinity, Calcium, Chloride, Fluoride, Magnesium, Sulfate, Nitrate and Hardness(continued)
Magnesium (mg/L) Raw Influent Effluent
Date Water Water Water 4/5/05 0.81 0.83 0.82 37 37 <1.0 4/6/05 0.80 0.82 0.82 37 37 <1.0 4/7/05 0.80 0.80 0.82 37 37 <1.0 4/8/05 NA NA NA NA NA NA 4/9/05 1.1 1.2 1.2 38 39 <0.50 4/10/05 0.99 0.92 0.95 38 37 <2.5 4/11/05 0.89 0.85 0.86 37 37 <2.5 4/12/05 0.83 0.87 0.87 37 37 <2.5 4/13/05 0.84 0.84 0.83 37 37 <2.5 4/14/05 0.85 0.86 0.85 37 37 <2.5 4/15/05 0.81 0.82 0.83 36 36 <2.5 4/16/05 0.85 0.82 0.88 38 37 <2.5 4/17/05 0.81 0.81 0.81 37 37 <2.5 4/18/05 0.82 0.82 0.81 39 38 <2.5 4/19/05 NA NA NA NA NA NA 4/20/05 NA NA NA NA NA NA 4/21/05 NA NA NA NA NA NA 4/22/05 NA NA NA NA NA NA 4/23/05 NA NA NA NA 38 NA Average 0.86 0.87 0.87 37 37 <2.5
Minimum 0.80 0.80 0.81 36 36 <0.050 Maximum 1.1 1.2 1.2 39 39 <2.5
Number of Samples 13 13 13 13 14 13 Standard Deviation 0.09 0.11 0.11 0.75 0.70 NA
95% Confidence Interval (0.84-0.88) (0.84-0.89) (0.85-0.90) (37-37) (37-37) NA Nitrate (mg/L)
Raw Influent Effluent Date Water Water Water
4/5/05 6.2 6.2 2.5 4/6/05 6.3 6.2 3.9 4/7/05 6.2 6.2 4.5 4/8/05 NA NA NA 4/9/05 6.2 6.6 4.1 4/10/05 6.2 6.2 4.4 4/11/05 6.2 6.3 4.9 4/12/05 6.3 6.3 5.1 4/13/05 5.6 6.2 4.4 4/14/05 5.6 6.2 4.2 4/15/05 6.9 6.8 5.1 4/16/05 7.0 6.9 5.1 4/17/05 7.0 6.9 5.2 4/18/05 6.3 6.3 5.3 4/19/05 NA NA NA 4/20/05 NA NA NA 4/21/05 NA NA NA 4/22/05 NA NA NA 4/23/05 NA 6.1 NA
Sulfate (mg/L) Raw Influent Effluent
Water Water Water1
Total Hardness as CaCO3 (mg/L) Raw Influent Effluent
Water Water Water 18.1 18.4 18.1 17.8 18.1 18.1 17.8 17.8 18.1 NA NA NA 22.0 24.2 24.7 20.6 19.5 20.1 19.1 18.5 18.8 18.4 18.8 18.8 NA NA NA 18.7 19.3 19.0 NA NA NA NA NA NA NA NA NA 18.4 18.4 18.3 NA NA NA NA NA NA NA NA NA NA NA NA NA NA NA
64

1
Table 4-3. Initial Plant Characterization No. 1 Daily Raw, Influent, and Effluent Water Alkalinity, Calcium, Chloride, Fluoride, Magnesium, Sulfate, Nitrate and Hardness(continued)
Nitrate (mg/L) Raw Influent Effluent Water Water Water
Average 6.3 6.4 4.5 19.0 19.2 19.3 Minimum 5.6 6.1 2.5 17.8 17.8 18.1 Maximum 7.0 6.9 5.3 22.0 24.2 24.7
Number of Samples 13 14 13 9 9 9 Standard Deviation 0.44 0.29 0.76 1.42 1.94 2.11
95% Confidence Interval (6.2-6.4) (6.3-6.4) (4.4-4.7) (18.5-19.5) (18.6-19.9) (18.6-20.1)
Total Hardness as CaCO3 (mg/L) Raw Influent Effluent
Water Water Water
Detection limits for sulfate in effluent water are raised by the dilution factor. A dilution was made because of either a matrix interference such as high TDS, a high concentration of sulfate to bring calibration of the instrument in range, and/or a high concentration of another parameter detected in the same analysis.
NA = Not Available.
24-Hour Twice Weekly Composite Inorganic Parameters Since the historical water quality data indicated low to non-detect concentrations of silica, TDS, TSS, iron, and manganese, these parameters were collected at a reduced frequency of twice per week. These data are presented in Table 4-4. The sample collection times were targeted to collect one sample towards the beginning and one sample towards the end of a regeneration cycle. There was little to no change in the inorganic parameters between the raw water and effluent water, with the exception of an average 4% reduction in TDS. All raw, influent, and effluent water samples for TSS, iron, and manganese were below the detection limit (10 mg/L, 0.020 mg/L, and 2.0 µg/L, respectively).
65
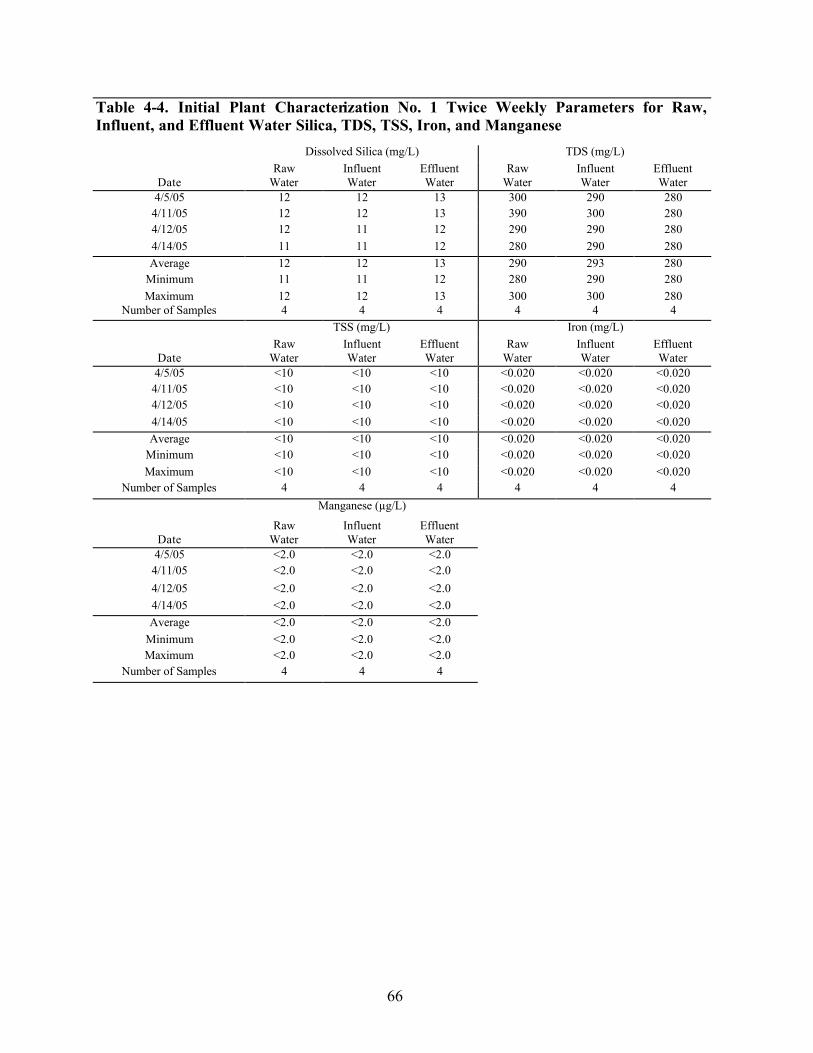
Table 4-4. Initial Plant Characterization No. 1 Twice Weekly Parameters for Raw, Influent, and Effluent Water Silica, TDS, TSS, Iron, and Manganese
Dissolved Silica (mg/L) TDS (mg/L) Raw Influent Effluent Raw Influent Effluent
Date Water Water Water Water Water Water 4/5/05 12 12 13 300 290 280 4/11/05 12 12 13 390 300 280 4/12/05 12 11 12 290 290 280 4/14/05 11 11 12 280 290 280 Average 12 12 13 290 293 280
Minimum 11 11 12 280 290 280 Maximum 12 12 13 300 300 280
Number of Samples 4 4 4 4 4 4 TSS (mg/L) Iron (mg/L)
Raw Influent Effluent Raw Influent Effluent Date Water Water Water Water Water Water 4/5/05 <10 <10 <10 <0.020 <0.020 <0.020
4/11/05 <10 <10 <10 <0.020 <0.020 <0.020 4/12/05 <10 <10 <10 <0.020 <0.020 <0.020 4/14/05 <10 <10 <10 <0.020 <0.020 <0.020 Average <10 <10 <10 <0.020 <0.020 <0.020
Minimum <10 <10 <10 <0.020 <0.020 <0.020 Maximum <10 <10 <10 <0.020 <0.020 <0.020
Number of Samples 4 4 4 4 4 4 Manganese (µg/L)
Raw Influent Effluent Date Water Water Water 4/5/05 <2.0 <2.0 <2.0 4/11/05 <2.0 <2.0 <2.0 4/12/05 <2.0 <2.0 <2.0 4/14/05 <2.0 <2.0 <2.0 Average <2.0 <2.0 <2.0
Minimum <2.0 <2.0 <2.0 Maximum <2.0 <2.0 <2.0
Number of Samples 4 4 4
66

4.4.1.3 On-Site Laboratory Testing
On-site laboratory testing during Initial Plant Characterization No. 1 included pH, conductivity, free and total chlorine, and temperature, as presented in Tables 4-5 through 4-7. There was very little difference between the influent and effluent water for pH, conductivity, and temperature. The average chlorine residuals in the influent water were 0.10 mg/L and 0.12 mg/L for free and total chlorine, respectively. These measurements were within the target range of 0.10-0.50 mg/L.
Table 4-5: Initial Plant Characterization No. 1 pH and Conductivity pH Conductivity (µmho/cm)
Raw Influent Effluent Raw Influent Effluent Date Water Water Water Water Water Water
4/4/05 9.04 9.02 8.65 564 535 543 4/5/05 9.25 9.21 8.64 537 529 541 4/6/05 9.17 9.19 8.89 503 515 508 4/8/05 8.92 8.86 9.16 595 596 581 4/9/05 9.21 9.21 8.99 530 528 542 4/10/05 9.13 9.18 9.05 527 526 529 4/11/05 8.95 9.05 9.10 512 537 543 4/12/05 8.98 9.04 9.01 527 527 547 4/13/05 9.08 9.11 9.10 521 524 523 4/14/05 8.97 9.11 9.05 533 520 522 4/15/05 9.17 9.16 8.70 540 543 556 4/16/05 9.11 9.17 8.69 533 517 532 4/17/05 9.16 9.16 8.76 520 520 530 4/18/05 9.12 9.14 9.04 526 527 530 4/20/05 9.11 9.10 9.02 541 545 550 4/21/05 9.11 9.10 9.07 540 545 551 4/22/05 9.24 9.23 9.21 536 534 525
Median/Average1 9.11 9.14 9.02 534 533 538 Minimum 8.92 8.86 8.64 503 515 508 Maximum 9.25 9.23 9.21 595 596 581
Number of Samples 17 17 17 17 17 17 Standard Deviation NA NA NA 20.5 18.6 16.6
95% Confidence Interval NA NA NA (531-538) (531-536) (536-541) 1 The median values of the pH analyses are presented. The averages were calculated for the conductivity
analyses. NA = Not Applicable.
67

Table 4-6. Initial Plant Characterization No. 1 Free and Total Chlorine Free Chlorine (mg/L)
Date Raw Influent Effluent
4/4/05 0.00 0.04 0.02 0.00 0.08 0.00 4/5/05 0.04 0.14 0.02 0.04 0.17 0.14 4/6/05 0.01 0.02 0.06 0.02 0.10 0.03 4/8/05 0.02 0.10 0.03 0.03 0.10 0.01 4/9/05 0.03 0.10 0.02 0.01 0.13 0.03 4/10/05 0.01 0.12 0.02 0.01 0.13 0.02 4/11/05 0.03 0.04 0.01 0.03 0.02 0.02 4/12/05 0.01 0.04 0.02 0.02 0.04 NA 4/13/05 0.01 0.04 0.03 0.01 0.06 0.04 4/14/05 0.01 0.09 0.00 0.01 0.10 0.02 4/15/05 0.04 0.21 0.01 0.03 0.22 0.01 4/16/05 0.02 0.10 0.01 0.01 0.12 0.01 4/17/05 0.05 0.13 0.03 0.04 0.15 0.01 4/18/05 0.02 0.12 0.03 0.01 0.11 0.01 4/20/05 NA 0.20 NA NA 0.21 NA 4/20/05 0.04 0.08 0.01 0.01 0.09 0.02 4/21/05 0.01 0.17 0.01 0.01 0.15 0.02 4/22/05 0.01 0.14 0.01 0.00 0.17 0.01
Average 0.02 0.10 0.02 Minimum 0.00 0.02 0.00 Maximum 0.05 0.21 0.06
Number of Samples 17 18 17 Standard Deviation 0.01 0.06 0.01
95% Confidence Interval (0.02-0.02) (0.10-0.11) (0.02-0.02) NA = Not Available.
Total Chlorine (mg/L)Raw Influent Effluent
0.02 0.12 0.03
0.00 0.02 0.00
0.04 0.22 0.14
17 18 16
0.01 0.05 0.03
(0.02-0.02) (0.11-0.13) (0.02-0.03)
68

Table 4-7. Initial Plant Characterization No. 1 On-Site Temperature Temperature (�C)
Date Raw Water Influent Water Effluent Water
4/15/05 27.0 27.0 27.0
4/16/05 27.0 27.0 27.0 4/17/05 27.0 27.0 27.0 4/18/05 25.0 25.0 25.0 4/19/05 NA NA NA 4/20/05 26.0 26.0 26.0 4/21/05 26.0 26.0 26.0 4/22/05 26.0 26.0 26.0 4/27/05 26.0 26.0 26.0 Average 26.3 26.3 26.3 Minimum 25.0 25.0 25.0 Maximum 27.0 27.0 27.0
Number of Samples 8 8 8
Standard Deviation 0.71 0.71 0.71
95% Confidence Interval (26.0-26.5) (26.0-26.5) (26.0-26.5)NA = Not Available.
4.4.1.4 Mass Balance of Total Arsenic
A mass balance through the Basin Water System for total arsenic was conducted for the Initial Plant Characterization No. 1. The mass balance was calculated based on the influent water, effluent water, and waste brine arsenic concentrations to ensure the arsenic was being removed from the resin during the regeneration cycles.
The equation used for the mass balance was previously presented in Equation 3-1: ViCi = VeCe + VbCb. In this equation, ViCi represents the influent water volume to the IX treatment system multiplied by the influent water total arsenic concentration. VeCe represents the effluent water volume from the IX treatment system multiplied by the effluent water total arsenic concentration. Lastly, VbCb represents the brine volume from the IX treatment system multiplied by the brine total arsenic concentration. In total, six data sets were collected to calculate the mass balance during the Initial Plant Characterization No. 1. The results are provided in Table 4-8. The influent and effluent total arsenic values for each of the dates presented in Table 4-8 were previously presented in Table 4-2. The brine total arsenic values were presented in Table 4-8 as Cb (brine concentration).
Throughout most of the Initial Plant Characterization, the total arsenic mass balance had a 1 to 45% difference between VeCe + VbCb and ViCi, with the exception of the samples collected on April 4, 2005. On that date, the arsenic concentration in the brine was 0.36 g arsenic as compared to 1.31 to 2.22 g arsenic in the remaining five samples collected. The lower arsenic level in the waste brine led to an 82% difference in the mass balance. When this data point is
69

included in the summed six data sets, the percent difference is 28%, as compared to a 17% difference when this data point is not included in the summed mass balance.
Table 4-8: Initial Plant Characterization No. 1 Arsenic Mass Balance
Date 4/4/05 4/5/05 4/6/05 4/20/05 4/21/05 4/22/05 Total
VeCe 0.21 g As 0.19 g As 0.21 g As 0.83 g As 1.39 g As 0.92 g As 3.75 g As
Cb 930 ug/L
5300 ug/L 3600 ug/L 3200 ug/L 4300 ug/L 5100 ug/L
22,430 ug/L
VbCb 0.36 g As 2.22 g As 1.48 g As 1.31 g As 1.78 g As 1.99 g As 9.15 g As
ViCi 3.08 g As 2.63 g As 2.92 g As 3.33 g As 3.08 g As 2.88 g As 17.9 g As
% Difference -82 -8 -42 -35 +3 +1 -28
Comments
Includes all data points.
Total 3.55 g As 21,500 ug/L 8.78 g As 14.84 g As -17 4/4/05 not included in total.
4.4.2 Initial Plant Characterization No. 2
Data from Initial Plant Characterization No. 1 were reviewed and discussed with the manufacturer. While the arsenic results showed that the treated water met the drinking water standard (£10 µg/L), the results did not meet the manufacturer’s goal of 95% of the total arsenic effluent water samples having a concentration less than 4 µg/L. The manufacturer returned to the site to make modifications to operational set points, and a Second Initial Plant Characterization was performed. Initial Plant Characterization No. 2 was conducted from April 29-May 9, 2005, for a total of two complete exhaustion and regeneration cycles (10 days). There were no major shutdowns during the second Initial Plant Characterization.
The only change made to the operation of the IX system was to adjust the regeneration rate from 1,100 BV to 850 BV. It was expected that increasing the frequency of regeneration (i.e., lowering the loading rate on the resin) should result in a lower total arsenic concentration in the blended water from the four operating vessels. All other operating parameters, such as pressure and flow rates, were held constant at the same conditions used during the first characterization. The target total flow rate was 37.5 gpm, with approximately 9.38 gpm per vessel.
The pressure and flow rate for the Basin Water system had very little variation throughout the second Initial Plant Characterization. The average pressure drop across the system over the 10 days of Initial Plant Characterization No. 2 was approximately 10.3 psi with an average effluent flow rate of 37.0 gpm from the treatment system. Operating data collected during the Initial Plant Characterization No. 2 are presented in Section 4.5.5 with the Verification Test data (Table 4-27).
Total arsenic and vanadium were sampled daily from 24-hour composite samples. Sulfate, nitrate, chloride, calcium, magnesium, alkalinity, fluoride, TDS, TSS, iron, manganese, hardness, and dissolved silica were collected once during the Initial Plant Characterization No. 2 on May 4, 2005, from the 24-hour composite sample. The sampling frequency for the non critical parameters was decreased during the Initial Plant Characterization No. 2 from that of the Initial Plant Characterization No. 1, because the purpose of repeating the Initial Plant Characterization test was to the evaluate the arsenic and vanadium breakthrough with a reduction of BVs.
70
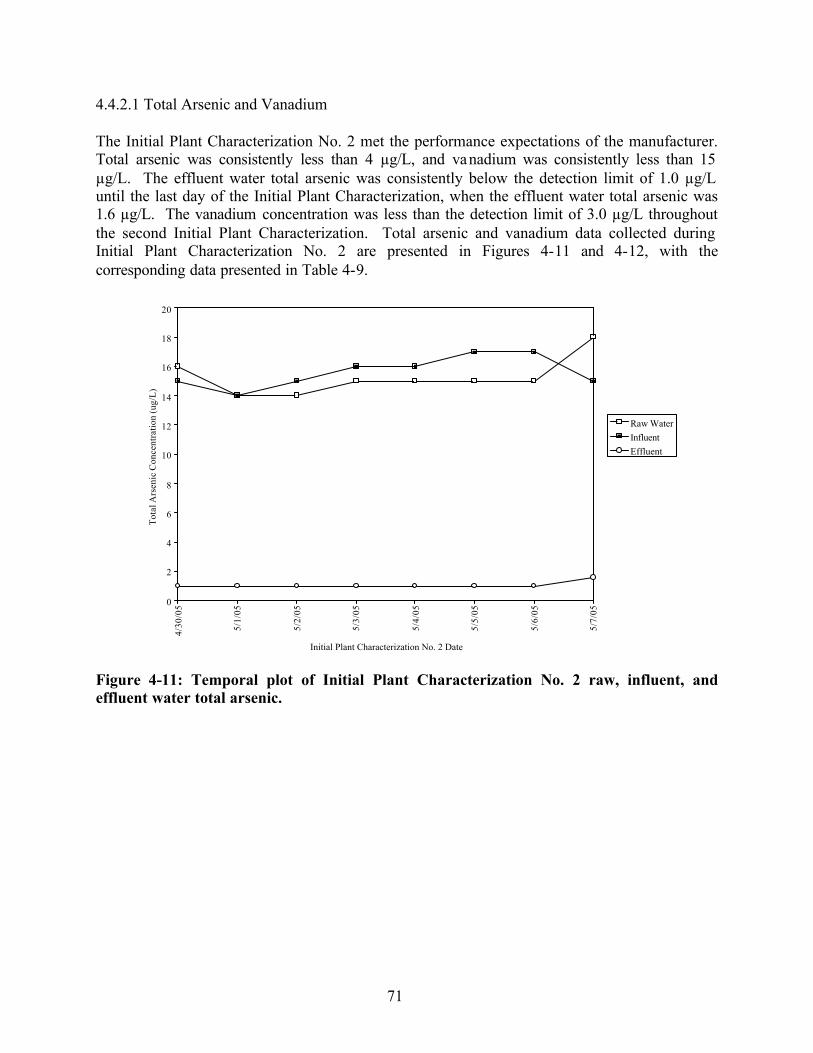
.
4.4.2.1 Total Arsenic and Vanadium
The Initial Plant Characterization No. 2 met the performance expectations of the manufacturer. Total arsenic was consistently less than 4 µg/L, and vanadium was consistently less than 15 µg/L. The effluent water total arsenic was consistently below the detection limit of 1.0 µg/L until the last day of the Initial Plant Characterization, when the effluent water total arsenic was 1.6 µg/L. The vanadium concentration was less than the detection limit of 3.0 µg/L throughout the second Initial Plant Characterization. Total arsenic and vanadium data collected during Initial Plant Characterization No. 2 are presented in Figures 4-11 and 4-12, with the corresponding data presented in Table 4-9.
0
2
4
6
8
10
12
14
16
18
20
Tota
l Ars
enic
Con
cent
ratio
n (u
g/L)
Raw Water Influent Effluent
4/30
/05
5/1/
05
5/2/
05
5/3/
05
5/4/
05
5/5/
05
5/6/
05
5/7/
05
Initial Plant Characterization No. 2 Date
Figure 4-11: Temporal plot of Initial Plant Characterization No. 2 raw, influent, and effluent water total arsenic.
71
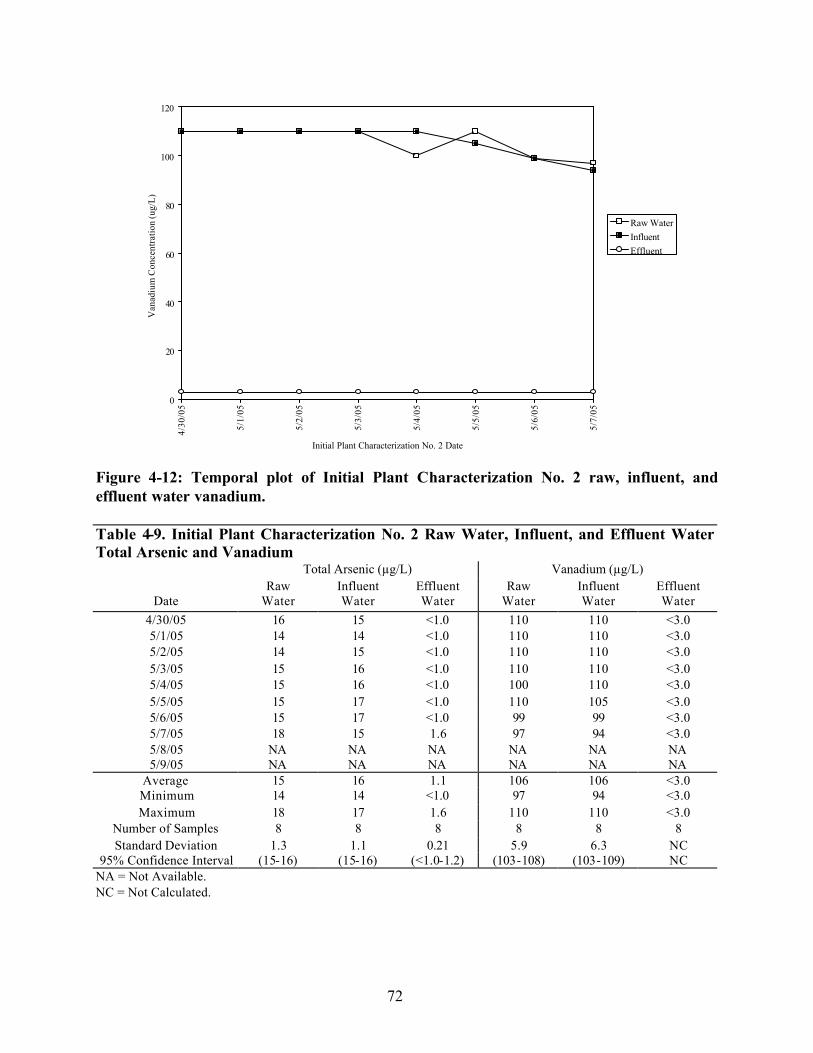
.V
anad
ium
Con
cent
ratio
n (u
g/L)
120
100
80
60
40
20
0
Raw Water Influent Effluent
4/30
/05
5/1/
05
5/2/
05
5/3/
05
5/4/
05
5/5/
05
5/6/
05
5/7/
05
Initial Plant Characterization No. 2 Date
Figure 4-12: Temporal plot of Initial Plant Characterization No. 2 raw, influent, and effluent water vanadium.
Table 4-9. Initial Plant Characterization No. 2 Raw Water, Influent, and Effluent Water Total Arsenic and Vanadium
Total Arsenic (µg/L) Vanadium (µg/L) Raw Influent Effluent Raw Influent Effluent
Date Water Water Water Water Water Water 4/30/05 5/1/05 5/2/05 5/3/05 5/4/05 5/5/05 5/6/05 5/7/05 5/8/05 5/9/05
16 15 <1.0 110 110 <3.0 14 14 <1.0 110 110 <3.0 14 15 <1.0 110 110 <3.0 15 16 <1.0 110 110 <3.0 15 16 <1.0 100 110 <3.0 15 17 <1.0 110 105 <3.0 15 17 <1.0 99 99 <3.0 18 15 1.6 97 94 <3.0
NA NA NA NA NA NA NA NA NA NA NA NA
Average 15 16 1.1 106 106 <3.0 Minimum 14 14 <1.0 97 94 <3.0 Maximum 18 17 1.6 110 110 <3.0
Number of Samples 8 8 8 8 8 8 Standard Deviation 1.3 1.1 0.21 5.9 6.3 NC
95% Confidence Interval (15-16) (15-16) (<1.0-1.2) (103-108) (103-109) NC NA = Not Available.NC = Not Calculated.
72

4.4.2.2 Inorganic Constituents
In addition to the target parameters (total arsenic and vanadium), raw, influent, and effluent water samples were collected for sulfate, nitrate, chloride, calcium, magnesium, alkalinity, fluoride, TDS, TSS, iron, manganese, hardness, and dissolved silica. The inorganic constituents collected during the Initial Plant Characterization No. 2 are provided in Table 4-10. There was little to no change in the inorganic parameters between the raw water and effluent water, with the exception of a 67% increase in chloride. Nitrate and fluoride were removed by 48 and 22%, respectively, and sulfate was removed to below the detection limit of 2.5 mg/L. Reducing the BVs from 1,100 (Initial Plant Characterization No. 1) to 850 BVs (Initial Plant Characterization No. 2) had little impact on the general water quality other than arsenic and vanadium removal.
Table 4-10. May 5, 2005 Initial Plant Characterization No. 2 Raw, Influent, and Effluent Water Inorganic Constituents
Parameter Units Raw Water Influent Water Effluent Water Sulfate mg/L 37 38 <2.5 Nitrate as NO3 mg/L 6.1 6.2 3.2 Chloride mg/L 72 73 120 Calcium mg/L 5.8 6.3 5.8 Magnesium mg/L 0.79 0.86 0.79 Alkalinity mg/L 93.6 72.8 94.4 Fluoride mg/L 0.63 0.56 0.49 TDS mg/L 300 290 310 TSS mg/L <10 <10 <10 Iron mg/L <0.020 <0.020 <0.020 Manganese ug/L <2.0 <2.0 <2.0 Hardness mg/L 17.7 19.3 17.7 Silica mg/L 12 12 12
4.4.2.3 On-Site Laboratory Testing
On-site laboratory testing during Initial Plant Characterization No. 2 included pH, conductivity, free and total chlorine, and temperature, as presented in Tables 4-11 through 4-13. As with the previous characterization test, there was very little difference between the raw and effluent water for conductivity and temperature. There was a slight reduction in pH between both the raw and influent water compared to the effluent water. The ave rage influent chlorine residuals were 0.21 mg/L and 0.25 mg/L for free and total chlorine, respectively. These averages were a little higher than the previous characterization test, but still within the target range of 0.10-0.50 mg/L.
73
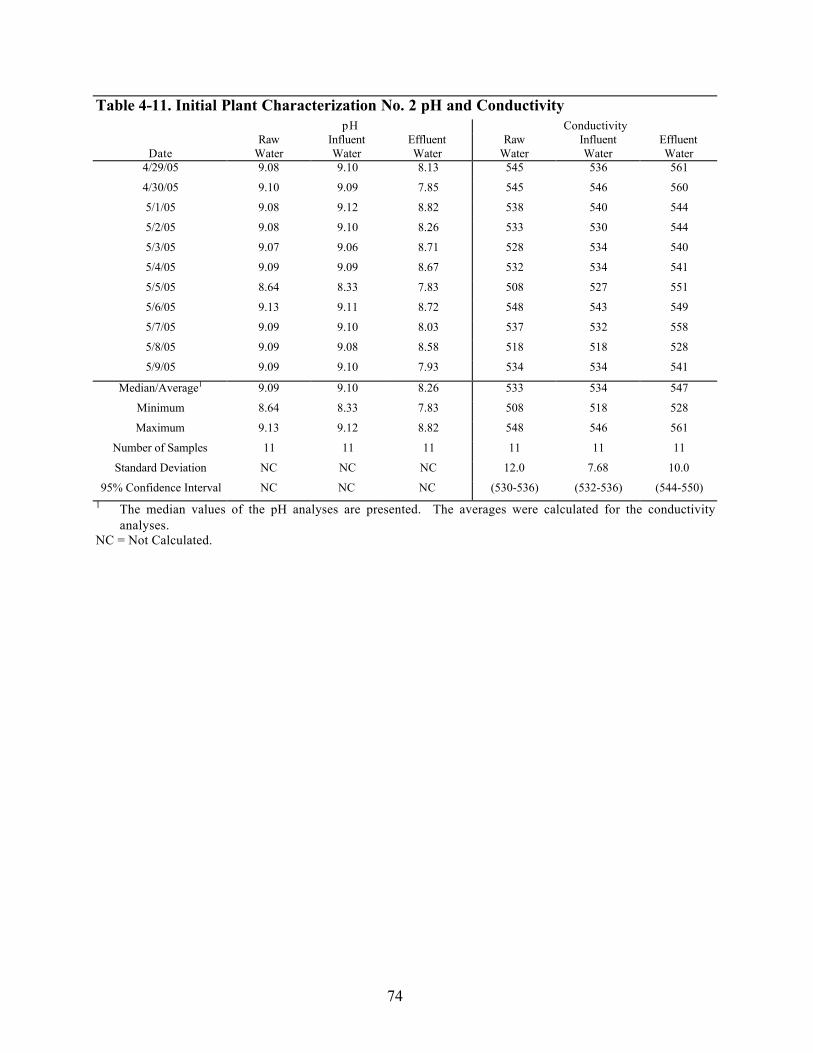
1
Table 4-11. Initial Plant Characterization No. 2 pH and Conductivity pH Conductivity
Raw Influent Effluent Raw Influent Effluent Date Water Water Water Water Water Water
4/29/05 9.08 9.10 8.13 545 536 561
4/30/05 9.10 9.09 7.85 545 546 560
5/1/05 9.08 9.12 8.82 538 540 544
5/2/05 9.08 9.10 8.26 533 530 544
5/3/05 9.07 9.06 8.71 528 534 540
5/4/05 9.09 9.09 8.67 532 534 541
5/5/05 8.64 8.33 7.83 508 527 551
5/6/05 9.13 9.11 8.72 548 543 549
5/7/05 9.09 9.10 8.03 537 532 558
5/8/05 9.09 9.08 8.58 518 518 528
5/9/05 9.09 9.10 7.93 534 534 541
Median/Average1 9.09 9.10 8.26 533 534 547
Minimum 8.64 8.33 7.83 508 518 528
Maximum 9.13 9.12 8.82 548 546 561
Number of Samples 11 11 11 11 11 11
Standard Deviation NC NC NC 12.0 7.68 10.0
95% Confidence Interval NC NC NC (530-536) (532-536) (544-550)
The median values of the pH analyses are presented. The averages were calculated for the conductivity analyses.
NC = Not Calculated.
74

Table 4-12. Initial Plant Characterization No. 2 Free and Total Chlorine Free Chlorine (mg/L) Total Chlorine (mg/L)
Date Raw Influent Effluent Raw Influent Effluent
4/29/05 0.01 0.15 0.02 0.00 0.17 0.01 4/30/05 0.01 0.15 0.05 0.02 0.19 0.02
5/1/05 0.01 0.26 0.01 0.01 0.30 0.01 5/2/05 0.04 0.26 0.02 0.00 0.27 0.02
5/3/05 0.01 0.23 0.01 0.01 0.29 0.02
5/4/05 0.01 0.24 0.01 0.01 0.30 0.02
5/5/05 0.01 0.28 0.01 0.01 0.28 0.02
5/6/05 0.01 0.14 0.00 0.00 0.25 0.00
5/7/05 0.00 0.24 0.00 0.01 0.27 0.02
5/8/05 0.01 0.20 0.00 0.01 0.23 0.02
5/9/05 0.00 0.21 0.00 0.01 0.23 0.00
Average
Minimum
Maximum
Number of Samples
Standard Deviation
95% Confidence Interval
0.01 0.21 0.01 0.01 0.25 0.01
0.00 0.14 0.00 0.00 0.17 0.00
0.04 0.28 0.05 0.02 0.30 0.02
11 11 11 11 11 11
0.01 0.05 0.01 0.01 0.04 0.01
(0.01-0.01) (0.20-0.23) (0.01-0.02) (0.01-0.01) (0.24-0.26) (0.01-0.02)
Table 4-13. Initial Plant Characterization No. 2 Temperature Temperature (�C)
Date Raw Water Influent Effluent Water Water
4/29/05 26.0 26.0 26.0
4/30/05 26.0 26.0 26.0 5/1/05 26.0 26.0 26.0 5/2/05 26.5 26.5 26.5 5/3/05 27.0 27.0 27.0 5/4/05 26.1 26.1 26.5 5/5/05 26.7 26.6 26.7 5/6/05 26.0 26.0 26.0 5/7/05 26.0 26.0 26.0 5/8/05 26.5 26.5 26.5 5/9/05 26.0 26.0 26.0
Average 26.3 26.2 26.3 Minimum 26.0 26.0 26.0 Maximum 27.0 27.0 27.0
Number of Samples 11 11 11 Standard Deviation 0.36 0.35 0.36
95% Confidence Interval (26.2-26.3) (26.2-26.3) (26.2-26.4)
75
4.4.2.4 Mass Balance of Total Arsenic
A mass balance through the Basin Water System for total arsenic was conducted for the Initial Plant Characterization No. 2 using equation 3-1, previously presented and discussed in Section 4.4.1.4. In total, three data sets were collected during the Initial Plant Characterization No. 2. The results are provided in Table 4-14. The total arsenic influent and effluent values used for the calculation of the mass balance were previously presented in Table 4-9. The total arsenic brine concentrations (Cb) are presented in Table 4-14.
When mass balance data were summed (see totals in Table 4-14), the percent difference in the influent volume and concentration (ViCi) was 13% higher than the combined effluent and brine volume and concentration (VeCe and VbCb, respectively).
Table 4-14. Initial Plant Characterization No. 2 Arsenic Mass Balance
Date VeCe Cb VbCb ViCi % Difference 5/4/05 5/5/05 5/6/05 Total
0.20 g As 0.19 g As 0.20 g As 0.59 g As
4600 ug/L 5400 ug/L 4300 ug/L
14,300 ug/L
1.78 g As 4.40 g As 1.85 g As 8.02 g As
3.21 g As 3.32 g As 3.34 g As 9.86 g As
-38 +38 -39 -13
4.5 Task 4: Verification Testing
The verification testing period for the Basin Water System was May 12-28, 2005. The experimental objectives, work plan, analytical schedule, and evaluation criteria were previously presented in Section 3.10. The objectives of the Verification Test were:
• Determine the raw, influent and effluent water quality (see Sections 4.5.1-4.5.2); • Observe and record the plant operating conditions and equipment performance (see Section
4.5.4) with additional O&M observations discussed in Section 4.8; and • Characterize the effectiveness of the brine treatment processes (BRA and BPU) (see Section
4.5.5).
4.5.1 Raw, Influent, and Effluent Water Quality
Water quality samples were collected throughout the Verification Test and analyzed by the MWH Laboratories. Daily 24-hour composite samples of the raw, influent, and effluent water were checked for the following parameters: total arsenic, vanadium, sulfate, nitrate, chloride, calcium, magnesium, alkalinity, fluoride, TDS, TSS, iron, manganese, hardness, and dissolved silica. Grab samples were collected four times per day for total arsenic and vanadium on the effluent water. Twice weekly parameters during the Verification Test included on-site speciation of arsenic (As [III] and As [V]) on the raw, influent, and effluent water.
Daily on-site testing included free and total chlorine (twice daily), conductivity (continuous online monitoring and daily grab samples), and turbidity (continuous online monitoring and daily
76

grab samples). The results of the analytical data collected during the Verification Test are presented in this section. Results of the waste generated during the Verification Test (BRA and BPU waste) are presented in Section 4.5.5.
There were two short-term system shutdowns between May 12-15, 2005. These shutdowns were not due to problems with the Basin Water System, but rather caused by construction in the area of the Corydon Street Well. The shutdowns occurred on the following dates and for the noted approximate durations:
• May 12, 2005 at 4:11 PM until May 13, 2005 at 3:53 PM, approximately 24 hours; and • May 14, 2005 at 7:07 PM until May 15, 2005 at 10:01 AM, approximately 15 hours.
4.5.1.1 Verification Testing Daily Laboratory Data
Daily 24-hour composite samples were collected from the raw, influent, and effluent water and analyzed for total arsenic and vanadium. Grab samples were also collected for total arsenic and vanadium to spot-check the effluent water quality and to collect one grab sample per day of the raw and influent water. Daily analyses were also conducted on the 24-hour composite samples from the raw, influent, and effluent water for alkalinity, chloride, fluoride, nitrate, dissolved silica, sulfate, TDS, TSS, calcium, iron, total hardness, magnesium, and manganese. The following sections present the data from these analyses.
Daily 24-Hour Composite Total Arsenic and Vanadium The 24-hour composite data shown in Figures 4-13 and 4-14 and presented in Table 4-15 indicate that the Basin Water System removed total arsenic and vanadium in the raw water to non-detectable levels in each of the sample sets collected. The detection limits were 1.0 µg/L and 3.0 µg/L for total arsenic and vanadium, respectively.
77
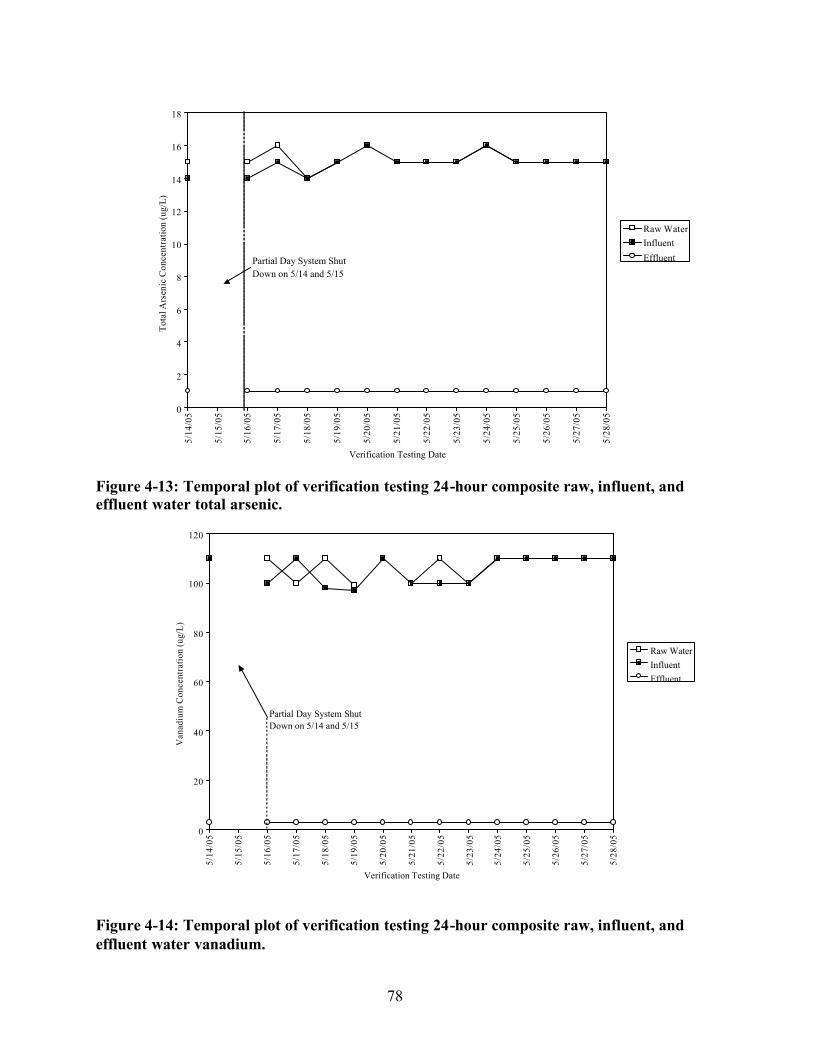
.
.
Verification Testing Date
Figure 4-13: Temporal plot of verification testing 24-hour composite raw, influent, and effluent water total arsenic.
Verification Testing Date
Figure 4-14: Temporal plot of verification testing 24-hour composite raw, influent, and effluent water vanadium.
78
5/14
/05
5/15
/05
5/16
/05
5/17
/05
5/18
/05
5/19
/05
5/20
/05
5/21
/05
5/22
/05
5/23
/05
5/24
/05
5/25
/05
5/26
/05
5/27
/05
5/28
/05 0
20
40
60
80
100
120
Van
adiu
m C
once
ntra
tion
(ug/
L)
Raw Water Influent Effluent
Partial Day System Shut Down on 5/14 and 5/15
5/14
/05
5/15
/05
5/16
/05
5/17
/05
5/18
/05
5/19
/05
5/20
/05
5/21
/05
5/22
/05
5/23
/05
5/24
/05
5/25
/05
5/26
/05
5/27
/05
5/28
/05 0
2
4
6
8
10
12
14
16
18
Tota
l Ars
enic
Con
cent
ratio
n (u
g/L)
Raw Water Influent EffluentPartial Day System Shut
Down on 5/14 and 5/15

1
Table 4-15. Verification Testing 24-Hour Composite Raw, Influent, and Effluent Water Total Arsenic and Vanadium
Total Arsenic (µg/L) Vanadium (µg/L) Date Raw Influent Effluent Raw Influent Effluent
Water Water Water Water Water Water
5/14/2005 15 14 <1.0 110 5/15/2005 NA NA NA NA 5/16/2005 15 14 <1.0 110 5/17/2005 16 15 <1.0 100 5/18/2005 14 14 <1.0 110 5/19/2005 15 15 <1.0 99 5/20/2005 <1.01 16 <1.0 <3.01
5/21/2005 15 15 <1.0 100 5/22/2005 15 15 <1.0 110 5/23/2005 15 15 <1.0 100 5/24/2005 16 16 <1.0 110 5/25/2005 15 15 <1.0 110 5/26/2005 15 15 <1.0 110 5/27/2005 15 15 <1.0 110 5/28/2005 15 15 <1.0 110 Average 15 15 <1.0 107
Minimum 14 14 <1.0 99 Maximum 16 16 <1.0 110
Number of Samples 13 14 14 13 Standard Deviation 0.49 0.62 NC 4.9
95% Confidence Interval (15-15) (15-15) NC (106-108)
110 <3.0 NA NA 100 <3.0 110 <3.0 98 <3.0 97 <3.0 110 <3.0 100 <3.0 100 <3.0 100 <3.0 110 <3.0 110 <3.0 110 <3.0 110 <3.0 110 <3.0 105 <3.0 97 <3.0 110 <3.0 14 14 5.6 NC
(104-106) NC Considered aberrant data point and removed from statistical analysis.
NA = Not Available. NC = Not Calculated.
Grab Samples of Total Arsenic and Vanadium Grab samples were collected once a day from the raw and influent water lines and four times per day from the effluent water line to analyze for total arsenic and vanadium. The grab sample data are presented in Figures 4-15 and 4-16, with the corresponding data in Table 4-16. The results of the grab sample analyses show that all total arsenic samples collected from the system effluent were at non-detectable levels (<1.0 µg/L) with the exception of one grab sample collected on May 26, 2005 with a result of 1.1 µg/L. All vanadium grab samples collected during the Verification Test were at non-detectable levels (<3.0 µg/L) with the exception of one sample collected on May 26, 2005 with a result of 4.9 µg/L.
79
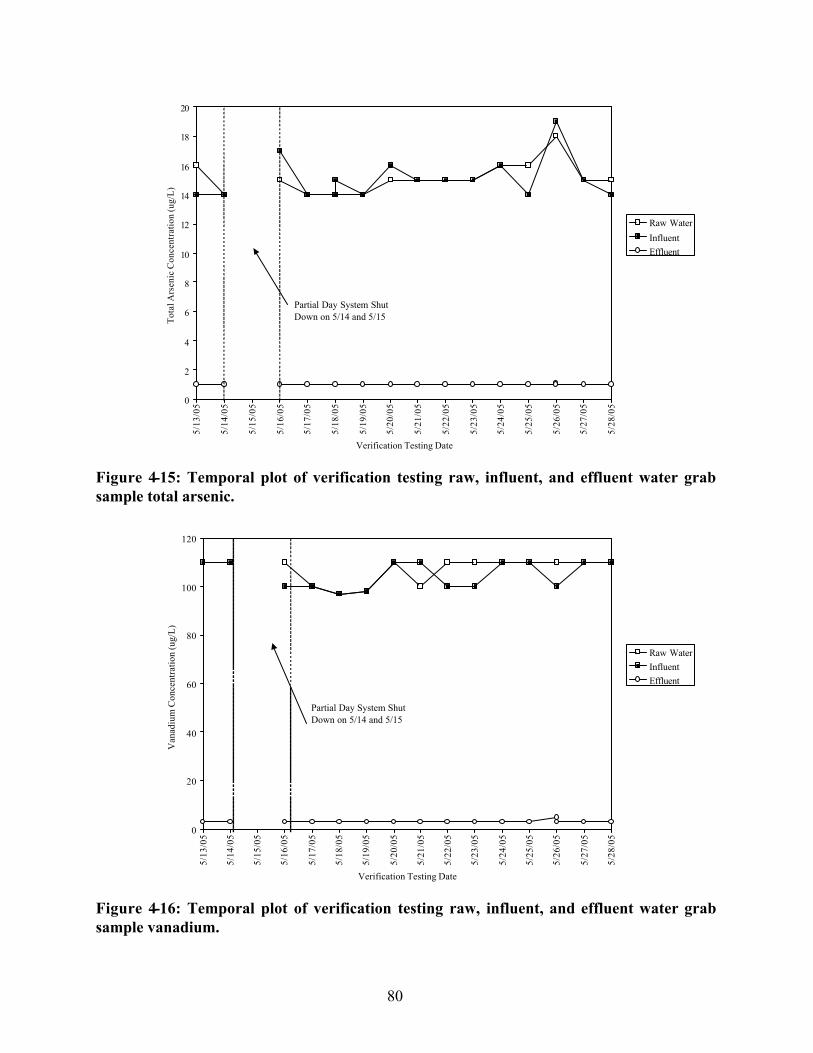
..
Verification Testing Date
Figure 4-15: Temporal plot of verification testing raw, influent, and effluent water grab sample total arsenic.
Verification Testing Date
Figure 4-16: Temporal plot of verification testing raw, influent, and effluent water grab sample vanadium.
80
5/13
/05
5/14
/05
5/15
/05
5/16
/05
5/17
/05
5/18
/05
5/19
/05
5/20
/05
5/21
/05
5/22
/05
5/23
/05
5/24
/05
5/25
/05
5/26
/05
5/27
/05
5/28
/05 0
20
40
60
80
100
120
Van
adiu
m C
once
ntra
tion
(ug/
L)
Raw Water Influent Effluent
Partial Day System Shut Down on 5/14 and 5/15
5/13
/05
5/14
/05
5/15
/05
5/16
/05
5/17
/05
5/18
/05
5/19
/05
5/20
/05
5/21
/05
5/22
/05
5/23
/05
5/24
/05
5/25
/05
5/26
/05
5/27
/05
5/28
/05 0
2
4
6
8
10
12
14
16
18
20
Tota
l Ars
enic
Con
cent
ratio
n (u
g/L)
Raw Water Influent Effluent
Partial Day System Shut Down on 5/14 and 5/15

Table 4-16. Verification Testing Daily Grab Samples for Total Arsenic and Vanadium
Date Grab Sample
No. Raw
Water
Total Arsenic (µg/L) Influent Water
Effluent Water
5/13/2005 1 2
16 14 <1.0 <1.0
3 <1.0 4 <1.0
5/14/2005 1 2
14 14 <1.0 <1.0
3 <1.0 4 <1.0
5/16/20051 1 2
15 17 <1.0 <1.0
3 <1.0 4 <1.0
5/17/2005 1 2
14 14 <1.0 <1.0
3 <1.0 4 <1.0
5/18/2005 1 2
14 14 <1.0 <1.0
32 14 15 <1.0 4 <1.0
5/19/2005 1 2
14 14 <1.0 <1.0
33 <1.0 5/20/2005 1
2 15 16 <1.0
<1.0 3 <1.0 4 <1.0
5/21/2005 1 2
15 15 <1.0 <1.0
3 <1.0 4 <1.0
5/22/2005 1 2
15 15 <1.0 <1.0
3 <1.0 4 <1.0
5/23/2005 1 2
15 15 <1.0 <1.0
3 <1.0 4 <1.0
5/24/2005 1 2
16 16 <1.0 <1.0
3 <1.0 4 <1.0
5/25/2005 1 2
16 14 <1.0 <1.0
3 <1.0 4 <1.0
Vanadium (µg/L) Raw Influent Effluent
Water Water Water 110 110 <3.0
<3.0 <3.0 <3.0
110 110 <3.0 <3.0 <3.0 <3.0
110 100 <3.0 <3.0 <3.0 <3.0
100 100 <3.0 <3.0 <3.0 <3.0
97 97 <3.0 <3.0
NA NA NA <3.0
98 98 <3.0 <3.0 <3.0
110 110 <3.0 <3.0 <3.0 <3.0
100 110 <3.0 <3.0 <3.0 <3.0
110 100 <3.0 <3.0 <3.0 <3.0
110 100 <3.0 <3.0 <3.0 <3.0
110 110 <3.0 <3.0 <3.0 <3.0
110 110 <3.0 <3.0 <3.0 <3.0
81

Table 4-16. Verification Testing Daily Grab Samples for Total Arsenic and Vanadium (continued)
Total Arsenic (µg/L) Vanadium (µg/L) Grab Raw Influent Effluent Raw Influent Effluent
Date Sample No. Water Water Water Water Water Water5/26/2005 1 18 19 <1.0 110 100 4.9
2 1.1 <3.0 3 <1.0 <3.0 4 <1.0 <3.0
5/27/2005 1 15 15 <1.0 110 110 <3.0 2 <1.0 <3.0 3 <1.0 <3.0 4 <1.0 <3.0
5/28/2005 1 15 14 <1.0 110 110 <3.0 Average 15 15 <1.0 107 105 <3.0
Minimum 14 14 <1.0 97 97 <3.0 Maximum 18 19 1.1 110 110 4.9
Number of Samples 16 16 56 15 15 54 Standard Deviation 1.1 1.4 0.01 5.2 5.6 0.26
95% Confidence Interval (15-15) (15-15) (<0.1-<0.1) (106-108) (104-106) (<3.0-<3.0) 1 Data for 5/15/05 not available due to plant shutdown. 2 Extra samples were collected on 5/18/05 due to the site audit. Regular samples were collected and then speciated for arsenic
in the afternoon for NSF. NA = Additional vanadium samples were not collected on this day. 3 Fourth grab sample for 5/19/05 not available due to plant shutdown.
Daily 24-Hour Composite Samples for Other Inorganic Parameters Samples from the raw, influent, and effluent water were collected daily from the 24-hour composite samples to analyze for sulfate, nitrate, chloride, calcium, magnesium, alkalinity, fluoride, TDS, TSS, iron, manganese, hardness, and dissolved silica. The results for sulfate, nitrate, chloride, calcium, magnesium, alkalinity, fluoride, TDS, and hardness are graphically presented in Figures 4-17 through 4-25. Corresponding data for all of the parameters are provided in Table 4-17. Data were not graphically presented for TSS, iron, and manganese because these parameters were all at non-detectable levels for the raw, influent, and effluent water samples.
On average as compared to the raw water, the Basin Water System removed 18% alkalinity and 47% nitrate, and removed sulfate to below the detection limit. Chloride levels increased from 53% to 82% (67% on average). All other parameters had little to no change in the effluent water quality as compared to the raw water quality.
82
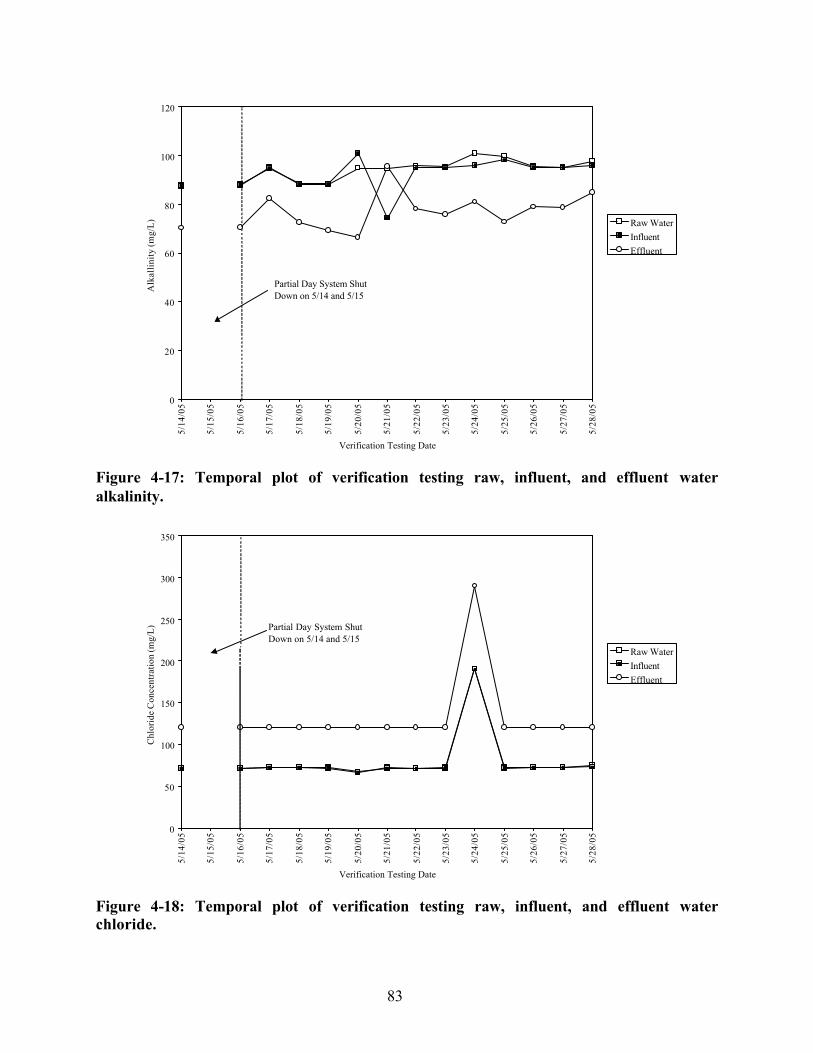
..
Verification Testing Date
Figure 4-17: Temporal plot of verification testing raw, influent, and effluent water alkalinity.
Verification Testing Date
Figure 4-18: Temporal plot of verification testing raw, influent, and effluent water chloride.
83
5/14
/05
5/15
/05
5/16
/05
5/17
/05
5/18
/05
5/19
/05
5/20
/05
5/21
/05
5/22
/05
5/23
/05
5/24
/05
5/25
/05
5/26
/05
5/27
/05
5/28
/05 0
50
100
150
200
250
300
350
Chl
orid
e C
once
ntra
tion
(mg/
L)
Raw Water Influent Effluent
Partial Day System Shut Down on 5/14 and 5/15
5/14
/05
5/15
/05
5/16
/05
5/17
/05
5/18
/05
5/19
/05
5/20
/05
5/21
/05
5/22
/05
5/23
/05
5/24
/05
5/25
/05
5/26
/05
5/27
/05
5/28
/05 0
20
40
60
80
100
120
Alk
allin
ity (m
g/L) Raw Water
Influent Effluent
Partial Day System Shut Down on 5/14 and 5/15

..
Verification Testing Date
Figure 4-19: Temporal plot of verification testing raw, influent, and effluent water fluoride.
Verification Testing Date
Figure 4-20: Temporal plot of verification testing raw, influent, and effluent water nitrate.
84
5/14
/05
5/15
/05
5/16
/05
5/17
/05
5/18
/05
5/19
/05
5/20
/05
5/21
/05
5/22
/05
5/23
/05
5/24
/05
5/25
/05
5/26
/05
5/27
/05
5/28
/05 0
2
4
6
8
10
12
14
16
18
Nitr
ate
Con
cent
ratio
n as
NO 3
(mg/
L)
Raw Water Influent Effluent
Partial Day System Shut Down on 5/14 and 5/15
5/14
/05
5/15
/05
5/16
/05
5/17
/05
5/18
/05
5/19
/05
5/20
/05
5/21
/05
5/22
/05
5/23
/05
5/24
/05
5/25
/05
5/26
/05
5/27
/05
5/28
/05 0
0.05
0.1
0.15
0.2
0.25
0.3
0.35
0.4
0.45
0.5
Fluo
ride
Con
cent
ratio
n (m
g/L)
Raw Water Influent Effluent
Partial Day System Shut Down on 5/14 and 5/15
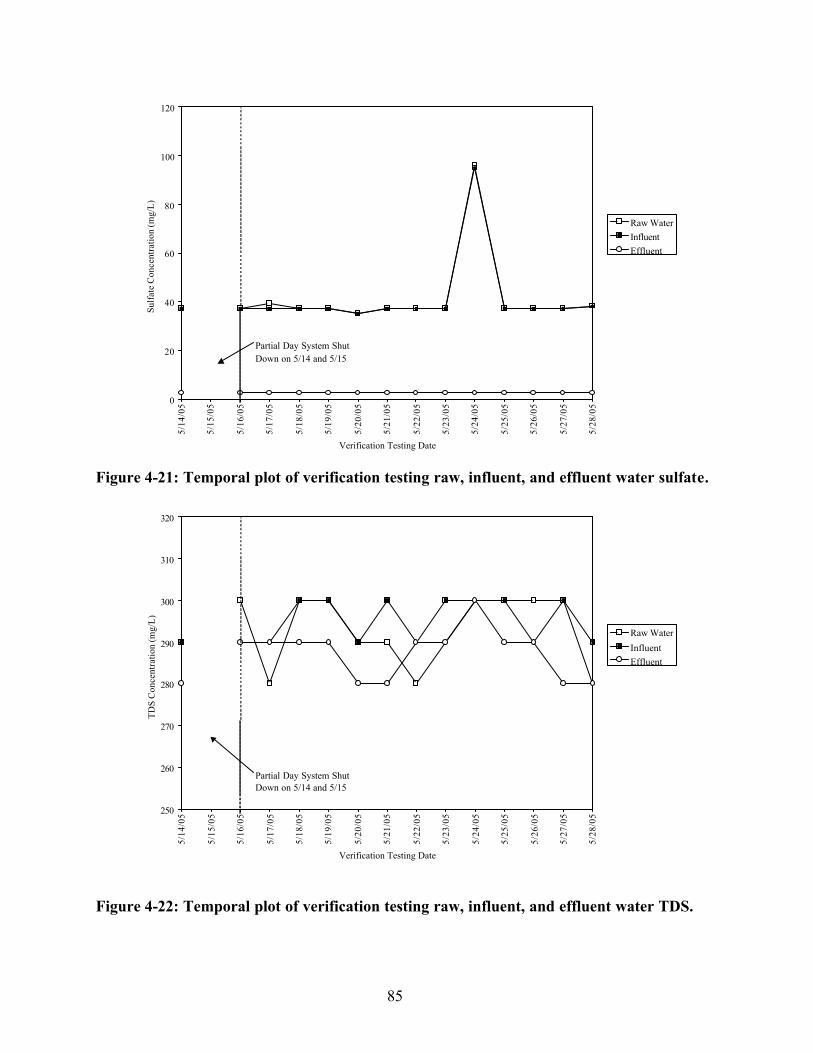
..
TDS
Con
cent
ratio
n (m
g/L)
Su
lfate
Con
cent
ratio
n (m
g/L)
5/14
/05
5/15
/05
5/16
/05
5/17
/05
5/18
/05
5/19
/05
5/20
/05
5/21
/05
5/22
/05
5/23
/05
5/24
/05
5/25
/05
5/26
/05
5/27
/05
5/28
/05
Verification Testing Date
Figure 4-21: Temporal plot of verification testing raw, influent, and effluent water sulfate.
270
280
290
300
310
320
Raw Water Influent Effluent
Partial Day System Shut Down on 5/14 and 5/15
5/14
/05
5/15
/05
5/16
/05
5/17
/05
5/18
/05
5/19
/05
5/20
/05
5/21
/05
5/22
/05
5/23
/05
5/24
/05
5/25
/05
5/26
/05
5/27
/05
5/28
/05
260
250
Verification Testing Date
Figure 4-22: Temporal plot of verification testing raw, influent, and effluent water TDS.
85
20
0
40
60
80
100
120
Raw Water Influent Effluent
Partial Day System Shut Down on 5/14 and 5/15

..
Verification Testing Date
Figure 4-23: Temporal plot of verification testing raw, influent, and effluent water calcium.
Verification Testing Date
Figure 4-24: Temporal plot of verification testing raw, influent, and effluent water total hardness.
86
5/14
/05
5/15
/05
5/16
/05
5/17
/05
5/18
/05
5/19
/05
5/20
/05
5/21
/05
5/22
/05
5/23
/05
5/24
/05
5/25
/05
5/26
/05
5/27
/05
5/28
/05 16.5
17
17.5
18
18.5
19
19.5
20
Tota
l Har
dnes
s as C
aCO 3
(mg/
L)
Raw Water Influent Effluent
Partial Day System Shut Down on 5/14 and 5/15
5/14
/05
5/15
/05
5/16
/05
5/17
/05
5/18
/05
5/19
/050
1
2
3
4
5
6
7
Cal
cium
Con
cent
ratio
n (m
g/L)
Raw Water Influent Effluent
Partial Day System Shut Down on 5/14 and 5/15
5/20
/05
5/21
/05
5/22
/05
5/23
/05
5/24
/05
5/25
/05
5/26
/05
5/27
/05
5/28
/05

.
0.74
0.76
0.78
0.8
0.82
0.84
0.86
0.88
0.9
0.92
Mag
nesi
um C
once
ntra
tion
(mg/
L)
Raw Water Influent Effluent
Partial Day System Shut Down on 5/14 and 5/15
5/14
/05
5/15
/05
5/16
/05
5/17
/05
5/18
/05
5/19
/05
5/20
/05
5/21
/05
5/22
/05
5/23
/05
5/24
/05
5/25
/05
5/26
/05
5/27
/05
5/28
/05
Verification Testing Date
Figure 4-25: Temporal plot of verification testing raw, influent, and effluent water magnesium.
Table 4-17. Verification Testing 24-Hour Composite Data for Raw, Influent, and Effluent Water Inorganic Parameters
Alkalinity (mg/L) Chloride (mg/L) Raw Influent Effluent Raw Influent Effluent
Date Water Water Water Water Water Water 5/14/05 87.4 87.7 70.4 71 71 120 5/16/05 87.8 88.2 70.6 71 71 120 5/17/05 95.1 94.7 82.4 72 72 120 5/18/05 88.3 88.5 72.6 72 72 120 5/19/05 88.3 88.5 69.3 71 72 120 5/20/05 94.9 101 66.5 66 67 120 5/21/05 94.8 74.5 95.6 72 71 120 5/22/05 95.8 95.0 78.2 71 71 120 5/23/05 95.4 95.0 76.0 71 72 120 5/24/05 101 96.0 81.1 190 190 290 5/25/05 99.8 98.3 72.9 71 72 120 5/26/05 95.6 95.3 79.0 72 72 120 5/27/05 95.0 95.1 78.8 72 72 120 5/28/05 97.6 96.0 85.0 75 73 120 Average 94.1 92.4 77.0 80 80 132
Minimum 87.4 74.5 66.5 66 67 120 Maximum 101 101 95.6 190 190 290
Number of Samples 14 14 14 14 14 14 Standard Deviation 4.42 6.56 7.63 32 32 45
95% Confidence Interval (93.2-94.6) (91.1-93.7) (75.5-78.5) (74-86) (74-86) (123-141)
87

Table 4-17. Verification Testing 24-Hour Composite Data for Raw, Influent, and Effluent Water Inorganic Parameters (continued)
Fluoride (mg/L) Raw Influent Effluent
Date Water Water Water 5/14/05 0.40 0.41 0.42 6.3 6.2 3.7 5/16/05 0.39 0.40 0.39 6.2 6.3 3.4 5/17/05 0.42 0.42 0.42 6.3 6.3 2.9 5/18/05 0.40 0.40 0.39 6.3 6.4 3.6 5/19/05 0.40 0.40 0.40 6.3 6.3 3.2 5/20/05 0.38 0.41 0.38 6.3 6.3 2.5 5/21/05 0.37 0.36 0.35 6.3 6.3 2.7 5/22/05 0.33 0.32 0.31 6.3 6.3 3.5 5/23/05 0.32 0.33 0.33 6.3 6.3 3.5 5/24/05 0.32 0.33 0.32 16 16 9.9 5/25/05 0.34 0.34 0.33 6.3 6.2 2.6 5/26/05 0.34 0.33 0.33 6.3 6.2 3.7 5/27/05 0.44 0.45 0.45 6.1 6.2 3.5 5/28/05 0.44 0.44 0.43 6.2 6.2 3.8 Average 0.38 0.38 0.38 7.0 7.0 3.8
Minimum 0.32 0.32 0.31 6.1 6.2 2.5 Maximum 0.44 0.45 0.45 16 16 9.9
Number of Samples 14 14 14 14 14 14 Standard Deviation 0.04 0.04 0.05 2.6 2.6 1.8
95% Confidence Interval (0.37-0.39) (0.37-0.39) (0.37-0.38) (6.5-7.5) (6.5-7.5) (3.4-4.1) Dissolved Silica (mg/L)
Raw Influent Effluent Date Water Water Water
5/14/05 5/16/05 5/17/05 5/18/05 5/19/05 5/20/05 5/21/05 5/22/05 5/23/05 5/24/05 5/25/05 5/26/05 5/27/05 5/28/05
12 12 13 12 12 12 12 12 13 12 12 13 12 12 12 11 12 12 11 12 12 11 11 12 11 11 12 11 11 12 11 11 12 11 11 12 12 12 12 11 12 12
Average 11 12 12 Minimum 11 11 12 Maximum 12 12 13
Number of Samples 14 14 14 Standard Deviation 0.51 0.50 0.43
95% Confidence Interval (11-12) (12-12) (12-12)
Nitrate as NO3 (mg/L) Raw Influent Effluent
Water Water Water
Sulfate (mg/L) Raw Influent Effluent
Water Water Water 37 37 <2.5 37 37 <2.5 39 37 <2.5 37 37 <2.5 37 37 <2.5 35 35 <2.5 37 37 <2.5 37 37 <2.5 37 37 <2.5 96 95 <2.5 37 37 <2.5 37 37 <2.5 37 37 <2.5 38 38 <2.5 41 41 <2.5 35 35 <2.5 96 95 <2.5 14 14 14 16 16 NC
(38-44) (38-44) NC
88

Table 4- 17. Verification Testing 24-Hour Composite Data for Raw, Influent, and Effluent Water Inorganic Parameters (continued)
Date Raw
Water
TDS (mg/L) Influent Water
Effluent Water
5/14/05 290 290 280 <10 <10 <10 5/16/05 300 290 290 <10 <10 <10 5/17/05 280 290 290 <10 <10 <10 5/18/05 300 300 290 <10 <10 <10 5/19/05 300 300 290 <10 <10 <10 5/20/05 290 290 280 <10 <10 <10 5/21/05 290 300 280 <10 <10 <10 5/22/05 280 290 290 <10 <10 <10 5/23/05 290 300 290 <10 <10 <10 5/24/05 300 300 3001 <10 <10 <10 5/25/05 3001 3001 2901 <10 <10 <10 5/26/05 300 290 290 <10 <10 <10 5/27/05 300 300 280 <10 <10 <10 5/28/05 280 290 280 <10 <10 <10 Average 293 295 287 <10 <10 <10
Minimum 280 290 280 <10 <10 <10 Maximum 300 300 300 <10 <10 <10
Number of Samples 14 14 14 14 14 14 Standard Deviation 8.3 5.2 6.1 NC NC NC
95% Confidence Interval (291-294) (294-296) (286-288) NC NC NC Calcium (mg/L)
Raw Influent Effluent Date Water Water Water
5/14/05 5.7 5.6 5.7 5/16/05 6.0 6.0 6.0 5/17/05 5.9 6.0 6.0 5/18/05 6.2 6.1 6.0 5/19/05 6.1 6.0 5.9 5/20/05 6.0 6.3 6.0 5/21/05 6.0 6.0 5.9 5/22/05 6.4 5.9 6.0 5/23/05 6.4 6.3 6.2 5/24/05 6.1 6.1 6.1 5/25/05 6.1 6.1 6.1 5/26/05 6.0 6.1 6.2 5/27/05 6.1 6.1 6.0 5/28/05 6.0 6.0 6.0 Average 6.1 6.0 6.0
Minimum 5.7 5.6 5.7 Maximum 6.4 6.3 6.2
Number of Samples 14 14 14 Standard Deviation 0.18 0.17 0.13
95% Confidence Interval (6.0-6.1) (6.0-6.1) (6.0-6.0)
TSS (mg/L) Raw Influent Effluent
Water Water Water
Iron (mg/L)
Raw Influent Effluent Water Water Water <0.020 <0.020 <0.020 <0.020 <0.020 <0.020 <0.020 <0.020 <0.020 <0.020 <0.020 <0.020 <0.020 <0.020 <0.020 <0.020 <0.020 <0.020 <0.020 <0.020 <0.020 <0.020 <0.020 <0.020 <0.020 <0.020 <0.020 <0.020 <0.020 <0.020 <0.020 <0.020 <0.020 <0.020 <0.020 <0.020 <0.020 <0.020 <0.020 <0.020 <0.020 <0.020 <0.020 <0.020 <0.020 <0.020 <0.020 <0.020 <0.020 <0.020 <0.020
14 14 14 NC NC NC NC NC NC
89

1
Table 4- 17. Verification Testing 24-Hour Composite Data for Raw, Influent, and Effluent Water Inorganic Parameters (continued)
Total Hardness as CaCO3 (mg/L) Magnesium (mg/L) Raw Influent Effluent Raw Influent Effluent
Date Water Water Water Water Water Water 5/14/05 17.5 17.1 17.5 0.79 0.76 0.79 5/16/05 18.4 18.4 18.4 0.83 0.84 0.82 5/17/05 18.0 18.3 18.2 0.79 0.81 0.79 5/18/05 18.9 18.7 18.4 0.84 0.84 0.84 5/19/05 18.8 18.4 18.2 0.86 0.84 0.83 5/20/05 18.4 19.4 18.4 0.84 0.88 0.83 5/21/05 18.3 18.4 18.1 0.81 0.83 0.82 5/22/05 19.7 18.1 18.4 0.90 0.82 0.84 5/23/05 19.7 19.4 19.0 0.90 0.88 0.86 5/24/05 18.7 18.7 18.7 0.84 0.85 0.85 5/25/05 18.7 18.8 18.7 0.85 0.86 0.85 5/26/05 18.6 18.7 19.1 0.87 0.84 0.87 5/27/05 18.7 18.4 18.5 0.84 0.76 0.85 5/28/05 18.5 18.4 18.4 0.85 0.83 0.83 Average 18.6 18.5 18.4 0.84 0.83 0.83
Minimum 17.5 17.1 17.5 0.79 0.76 0.79 M aximum 19.7 19.4 19.1 0.90 0.88 0.87
Number of Samples 14 14 14 14 14 14 Standard Deviation 0.58 0.56 0.39 0.03 0.04 0.02
95% Confidence Interval (18.5-18.7) (18.4-18.6) (18.4-18.5) (0.84-0.85) (0.82-0.84) (0.83-0.84)
Manganese (µg/L) Raw Influent Effluent
Date Water Water Water 5/14/05 <2.0 <2.0 <2.0 5/16/05 <2.0 <2.0 <2.0 5/17/05 <2.0 <2.0 <2.0 5/18/05 <2.0 <2.0 <2.0 5/19/05 <2.0 <2.0 <2.0 5/20/05 6.5 <2.0 7.0 5/21/05 <2.0 <2.0 <2.0 5/22/05 <2.0 <2.0 <2.0 5/23/05 <2.0 <2.0 <2.0 5/24/05 <2.0 <2.0 <2.0 5/25/05 <2.0 <2.0 <2.0 5/26/05 <2.0 <2.0 <2.0 5/27/05 <2.0 <2.0 <2.0 5/28/05 <2.0 <2.0 <2.0 Average 2.3 <2.0 2.4
Minimum <2.0 <2.0 <2.0Maximum 6.5 <2.0 7.0
Number of Samples 14 14 14Standard Deviation 2.1 NC 2.1
95% Confidence Interval (2.1-2.6) NC (2.1-2.6)Target analyte detected in method blank for TDS was at or above method reporting limit. Concentration found in the sample was 10 times above the concentration found in the method blank.
NC = Not Calculated.
4.5.1.2 NDMA
At the request of the water utility, NDMA was added to the ETV test plan for the evaluation of the Basin Water System. NDMA is a potential by-product from IX systems and is classified as a carcinogen. It is believed that chlorinated water sources increase the potential for NDMA in the effluent of an IX facility. Therefore, additional samples were collected at the beginning and end of verification testing for NDMA. The first two samples were collected either with or without a chlorinated water source, as presented in Table 4-18.
90
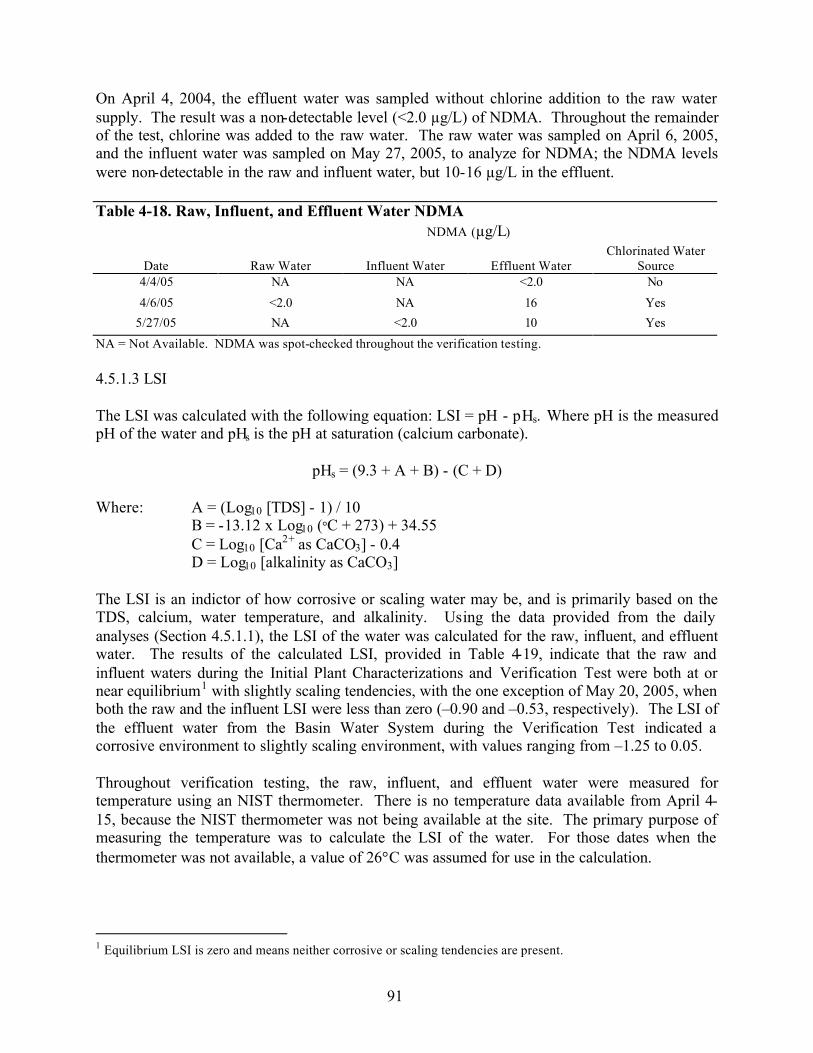
On April 4, 2004, the effluent water was sampled without chlorine addition to the raw water supply. The result was a non-detectable level (<2.0 µg/L) of NDMA. Throughout the remainder of the test, chlorine was added to the raw water. The raw water was sampled on April 6, 2005, and the influent water was sampled on May 27, 2005, to analyze for NDMA; the NDMA levels were non-detectable in the raw and influent water, but 10-16 µg/L in the effluent.
Table 4-18. Raw, Influent, and Effluent Water NDMA NDMA (µg/L)
Chlorinated Water Date Raw Water Influent Water Effluent Water Source
4/4/05 NA NA <2.0 No 4/6/05 <2.0 NA 16 Yes
5/27/05 NA <2.0 10 Yes NA = Not Available. NDMA was spot-checked throughout the verification testing.
4.5.1.3 LSI
The LSI was calculated with the following equation: LSI = pH - pHs. Where pH is the measured pH of the water and pHs is the pH at saturation (calcium carbonate).
pHs = (9.3 + A + B) - (C + D)
Where: A = (Log10 [TDS] - 1) / 10 B = -13.12 x Log10 (�C + 273) + 34.55 C = Log10 [Ca2+ as CaCO3] - 0.4 D = Log10 [alkalinity as CaCO3]
The LSI is an indictor of how corrosive or scaling water may be, and is primarily based on the TDS, calcium, water temperature, and alkalinity. Using the data provided from the daily analyses (Section 4.5.1.1), the LSI of the water was calculated for the raw, influent, and effluent water. The results of the calculated LSI, provided in Table 4-19, indicate that the raw and influent waters during the Initial Plant Characterizations and Verification Test were both at or near equilibrium1 with slightly scaling tendencies, with the one exception of May 20, 2005, when both the raw and the influent LSI were less than zero (–0.90 and –0.53, respectively). The LSI of the effluent water from the Basin Water System during the Verification Test indicated a corrosive environment to slightly scaling environment, with values ranging from –1.25 to 0.05.
Throughout verification testing, the raw, influent, and effluent water were measured for temperature using an NIST thermometer. There is no temperature data available from April 415, because the NIST thermometer was not being available at the site. The primary purpose of measuring the temperature was to calculate the LSI of the water. For those dates when the thermometer was not available, a value of 26�C was assumed for use in the calculation.
1 Equilibrium LSI is zero and means neither corrosive or scaling tendencies are present.
91

Table 4-19. Raw, Influent, and Effluent Water LSI LSI
Date Raw Water Influent Water Effluent Water Initial Plant Characterization No. 1 (4/4/05 – 4/22/05)
4/5/05 0.25 0.25 -0.18 4/6/05 0.49 0.49 -0.22 4/7/05 0.36 0.44 0.04 4/9/05 0.20 0.18 0.44 4/10/05 0.46 0.44 0.14 4/11/05 0.37 0.40 0.24 4/12/05 0.21 0.28 0.29 4/13/05 0.20 0.28 0.23 4/14/05 0.31 0.40 0.29 4/15/05 0.18 0.33 0.23 4/16/05 0.42 0.40 -0.08 4/18/05 0.39 0.38 -0.06
Initial Plant Characterization No. 2 (4/29/05 – 5/09/05) 5/5/05 0.31 0.24 -0.10
Verification Testing (5/12/05 – 5/28/05) 5/14/05 0.27 0.26 -0.41 5/16/05 0.29 0.30 -0.65 5/17/05 0.31 0.30 -0.57 5/18/05 0.28 0.29 -0.61 5/19/05 0.31 0.30 -0.80 5/20/05 -0.90 -0.53 -1.25 5/21/05 0.15 0.01 -0.78 5/22/05 0.37 0.36 -0.85 5/23/05 0.37 0.37 -0.49 5/24/05 0.37 0.36 0.05 5/25/05 0.31 0.34 -0.10 5/26/05 0.33 0.32 -0.50 5/27/05 0.32 0.31 -0.09 5/28/05 0.34 0.33 -0.56
Verification Test Statistical Analysis
Average 0.22 0.24 -0.54 Minimum -0.90 -0.53 -1.25 Maximum 0.37 0.37 0.05
Number of Samples 14 14 14 Standard Deviation 0.33 0.24 0.34
95% Confidence Interval (0.16-0.29) (0.19-0.28) (-0.61-(-)0.48)
92
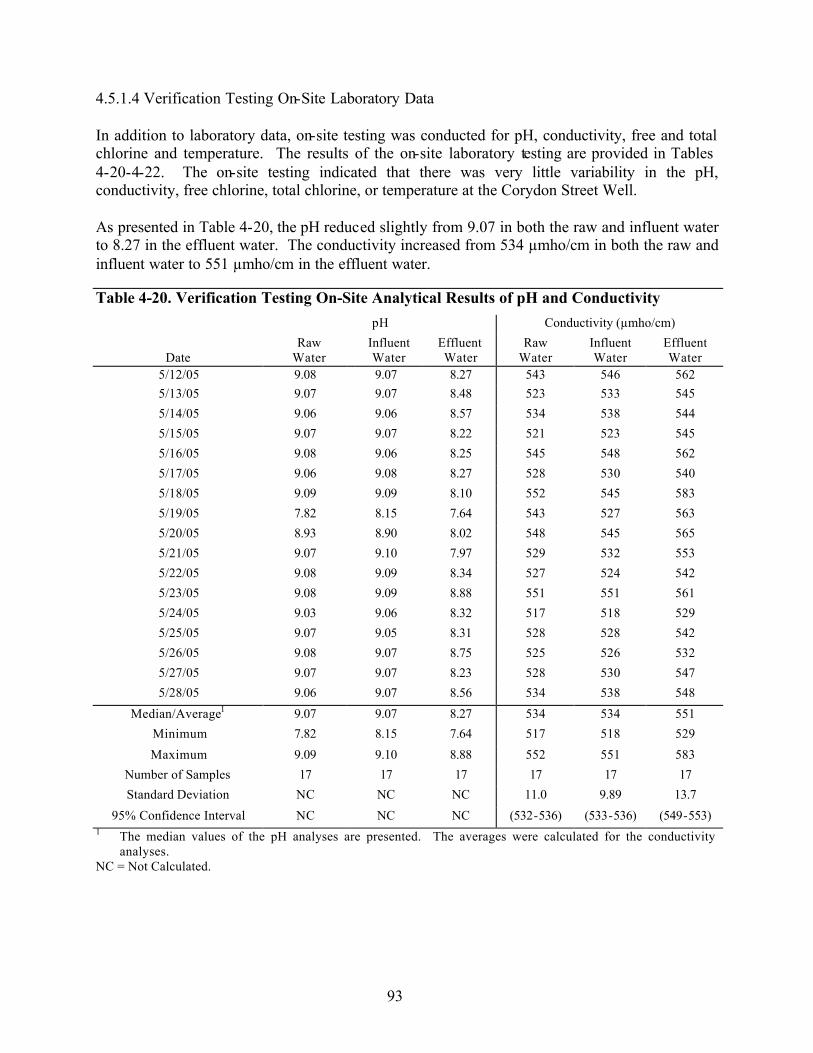
4.5.1.4 Verification Testing On-Site Laboratory Data
In addition to laboratory data, on-site testing was conducted for pH, conductivity, free and total chlorine and temperature. The results of the on-site laboratory testing are provided in Tables 4-20-4-22. The on-site testing indicated that there was very little variability in the pH, conductivity, free chlorine, total chlorine, or temperature at the Corydon Street Well.
As presented in Table 4-20, the pH reduced slightly from 9.07 in both the raw and influent water to 8.27 in the effluent water. The conductivity increased from 534 µmho/cm in both the raw and influent water to 551 µmho/cm in the effluent water.
Table 4-20. Verification Testing On-Site Analytical Results of pH and Conductivity pH Conductivity (µmho/cm)
Raw Influent Effluent Raw Influent Effluent Date Water Water Water Water Water Water
5/12/05 5/13/05 5/14/05 5/15/05 5/16/05 5/17/05 5/18/05 5/19/05 5/20/05 5/21/05 5/22/05 5/23/05 5/24/05 5/25/05 5/26/05 5/27/05 5/28/05
9.08 9.07 8.27 543 546 562 9.07 9.07 8.48 523 533 545 9.06 9.06 8.57 534 538 544 9.07 9.07 8.22 521 523 545 9.08 9.06 8.25 545 548 562 9.06 9.08 8.27 528 530 540 9.09 9.09 8.10 552 545 583 7.82 8.15 7.64 543 527 563 8.93 8.90 8.02 548 545 565 9.07 9.10 7.97 529 532 553 9.08 9.09 8.34 527 524 542 9.08 9.09 8.88 551 551 561 9.03 9.06 8.32 517 518 529 9.07 9.05 8.31 528 528 542 9.08 9.07 8.75 525 526 532 9.07 9.07 8.23 528 530 547 9.06 9.07 8.56 534 538 548
Median/Average1
Minimum
Maximum
Number of Samples
Standard Deviation
95% Confidence Interval
9.07 9.07 8.27 534 534 551 7.82 8.15 7.64 517 518 529 9.09 9.10 8.88 552 551 583 17 17 17 17 17 17 NC NC NC 11.0 9.89 13.7 NC NC NC (532-536) (533-536) (549-553)
The median values of the pH analyses are presented. The averages were calculated for the conductivity analyses.
NC = Not Calculated.
93
1
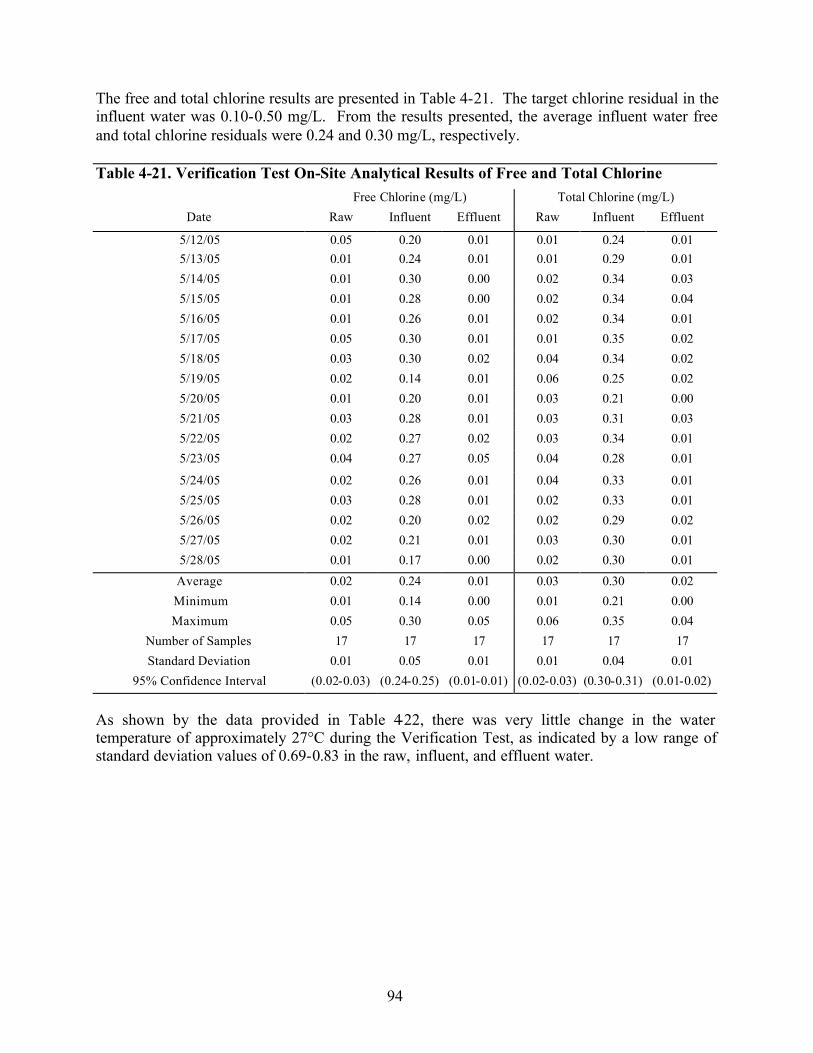
The free and total chlorine results are presented in Table 4-21. The target chlorine residual in the influent water was 0.10-0.50 mg/L. From the results presented, the average influent water free and total chlorine residuals were 0.24 and 0.30 mg/L, respectively.
Table 4-21. Verification Test On-Site Analytical Results of Free and Total Chlorine Free Chlorine (mg/L)
Date Raw Influent Effluent
5/12/05 0.05 0.20 0.01 0.01 0.24 0.01 5/13/05 0.01 0.24 0.01 0.01 0.29 0.01 5/14/05 0.01 0.30 0.00 0.02 0.34 0.03 5/15/05 0.01 0.28 0.00 0.02 0.34 0.04 5/16/05 0.01 0.26 0.01 0.02 0.34 0.01 5/17/05 0.05 0.30 0.01 0.01 0.35 0.02 5/18/05 0.03 0.30 0.02 0.04 0.34 0.02 5/19/05 0.02 0.14 0.01 0.06 0.25 0.02 5/20/05 0.01 0.20 0.01 0.03 0.21 0.00 5/21/05 0.03 0.28 0.01 0.03 0.31 0.03 5/22/05 0.02 0.27 0.02 0.03 0.34 0.01 5/23/05 0.04 0.27 0.05 0.04 0.28 0.01
5/24/05 0.02 0.26 0.01 0.04 0.33 0.01 5/25/05 0.03 0.28 0.01 0.02 0.33 0.01 5/26/05 0.02 0.20 0.02 0.02 0.29 0.02 5/27/05 0.02 0.21 0.01 0.03 0.30 0.01 5/28/05 0.01 0.17 0.00 0.02 0.30 0.01 Average 0.02 0.24 0.01 0.03 0.30 0.02 Minimum 0.01 0.14 0.00 0.01 0.21 0.00 Maximum 0.05 0.30 0.05 0.06 0.35 0.04
Number of Samples 17 17 17 17 17 17 Standard Deviation 0.01 0.05 0.01 0.01 0.04 0.01
95% Confidence Interval (0.02-0.03) (0.24-0.25) (0.01-0.01) (0.02-0.03) (0.30-0.31) (0.01-0.02)
Total Chlorine (mg/L)Raw Influent Effluent
As shown by the data provided in Table 4-22, there was very little change in the water temperature of approximately 27°C during the Verification Test, as indicated by a low range of standard deviation values of 0.69-0.83 in the raw, influent, and effluent water.
94

Table 4-22. Verification Test On-Site Temperature Temperature (�C)
Date Raw Water Influent Water Effluent Water
5/12/05 27.0 27.0 27.0 5/13/05 27.0 27.0 27.0 5/14/05 27.0 27.0 27.0 5/15/05 27.0 27.0 27.0 5/16/05 26.0 26.0 26.0 5/17/05 26.0 26.0 26.0 5/18/05 26.5 26.0 26.5 5/19/05 28.0 28.0 27.5 5/20/05 25.0 25.0 24.0 5/21/05 27.5 27.5 27.5 5/22/05 27.0 27.0 27.0 5/23/05 27.0 27.0 27.0 5/24/05 27.0 27.0 27.0 5/25/05 27.0 27.0 27.0 5/26/05 26.0 26.0 26.0 5/27/05 27.0 27.0 27.0 5/28/05 27.0 27.0 27.0
Average 26.8 26.7 26.7 Minimum 25.0 25.0 24.0 Maximum 28.0 28.0 27.5
Number of Samples 17 17 17 Standard Deviation 0.69 0.71 0.83
95% Confidence Interval (26.7-26.9) (26.6-26.8) (26.5-26.8)
4.5.2 Arsenic Speciation Results and Special Studies
Arsenic speciation data collected from April 6-May 5 during the Initial Plant Characterization task and from May 16-28 during the Verification Test are presented in Table 4-23 and illustrated in Figures 4-26-4-28. The dissolved arsenic data, presented in Table 4-24, confirm that all or most of the arsenic was in the dissolved form. Arsenic (V) concentrations were calculated by subtracting the As (III) concentration from the dissolved arsenic concentration. Arsenic speciation was performed in the field using the Edwards et al. preservation method, as required and presented in the ETV Protocol. The samples were then analyzed by MWH Laboratories using EPA Method 200.8.
Although the arsenic species data collected during the Initial Plant Characterization task are erratic, the arsenic species data during the Verification Test are consistent with the historical data (Table 4-1) where the dominant species is As (III). The raw water samples collected during the Verification Test contained more As (III) than As (V), except for the sample collected on May 25, 2005, that may have resulted from a sample mix-up. Sample collection errors or
95

.
.
Raw
Wat
er A
rsen
ic (u
g/L)
Influ
ent W
ater
Ars
enic
(ug/
L)
Verification Testing Date
Figure 4-26: Speciated arsenic raw water results for Initial Plant Characterization through verification testing.
30
35
40
Total Arsenic
As (III)
As (V)
4/9/
05
4/9/
05
4/12
/05
4/15
/05
4/18
/05
4/21
/05
4/24
/05
4/27
/05
4/30
/05
5/3/
05
5/6/
05
5/9/
05
5/12
/05
5/15
/05
5/18
/05
5/21
/05
5/24
/05
5/27
/05
4/12
/05
4/15
/05
4/18
/05
4/21
/05
4/24
/05
4/27
/05
4/30
/05
5/3/
05
5/6/
05
5/9/
05
5/12
/05
5/15
/05
5/18
/05
5/21
/05
5/24
/05
5/27
/05
transposition of samples during laboratory analysis could also explain the apparently erratic As (III) and As (V) results during the two Initial Plant Characterization periods.
50
60
Total Arsenic
As (III)
As(V)
40
30
20
10
0
25
20
15
10
5
0
Verification Testing Date
Figure 4-27: Speciated arsenic influent water results for Initial Plant Characterization through verification testing.
96

0
2
4
6
8
10
12
14
16
18
20
Efflu
ent W
ater
Ars
enic
(ug/
L)
Total Arsenic
As (III)
As (V)
4/9/
05
4/12
/05
4/15
/05
4/18
/05
4/21
/05
4/24
/05
4/27
/05
4/30
/05
5/3/
05
5/6/
05
5/9/
05
5/12
/05
5/15
/05
5/18
/05
5/21
/05
5/24
/05
5/27
/05
Verification Testing Date
Figure 4-28: Speciated arsenic effluent water results for Initial Plant Characterization through verification testing.
97

Table 4-23. Total Arsenic, As (III), and As (V) from the Initial Plant Characterization and the Verification Testing
Total Arsenic (µg/L)
Raw Influent Effluent Date Water Water Water
As (III) (µg/L)
Raw Influent Effluent Water Water Water
As (V) (µg/L) (calculated)
Raw Influent Effluent Water Water Water
Initial Plant Characterization No. 1 (04/04/05 - 04/23/05) 4/6/05 18 19 <1.0 1.5 25 <1.0 12 <1.0 <1.0 4/9/05 14 13 1.4 <1.0 21 3.7 16 <1.0 <1.0 4/14/05 17 17 9.8 5.8 20 14 14 <1.0 <1.0 4/16/05 15 15 6.7 41 24 5.3 <1.0 <1.0 2.4
Initial Plant Characterization No. 2 (04/29/05 - 05/09/05) 5/3/05 15 16 <1.0 15 23 <1.0 <1.0 <1.0 <1.0 5/5/05 18 17 <1.0 <1.0 <1.0 <1.0 21 21 <1.0
Verification Testing (05/12/05 - 05/28/05) 5/16/05 15 17 <1.0 25 2.7 <1.0 <1.0 20 <1.0 5/18/05 14 15 <1.0 25 25 <1.0 <1.0 <1.0 <1.0 5/22/05 15 15 <1.0 22 17 <1.0 <1.0 3.0 <1.0 5/25/05 16 14 <1.0 3.3 18 <1.0 17 <1.0 <1.0 5/26/05 18 19 <1.0 1.4 1.0 <1.0 20 19 <1.0 5/27/05 15 15 <1.0 34 27 1.2 <1.0 <1.0 <1.0 5/28/05 15 14 <1.0 28 27 <1.0 <1.0 <1.0 <1.0
Verification Test Statistical Analysis Average 15 16 <1.0 20 17 <1.0 6.0 6.6 <1.0 Minimum 14 14 <1.0 1.4 1.0 <1.0 <1.0 <1.0 <1.0 Maximum 18 19 <1.0 34 27 1.2 20 20 <1.0 Number of Samples 7 7 7 7 7 7 7 7 7
98
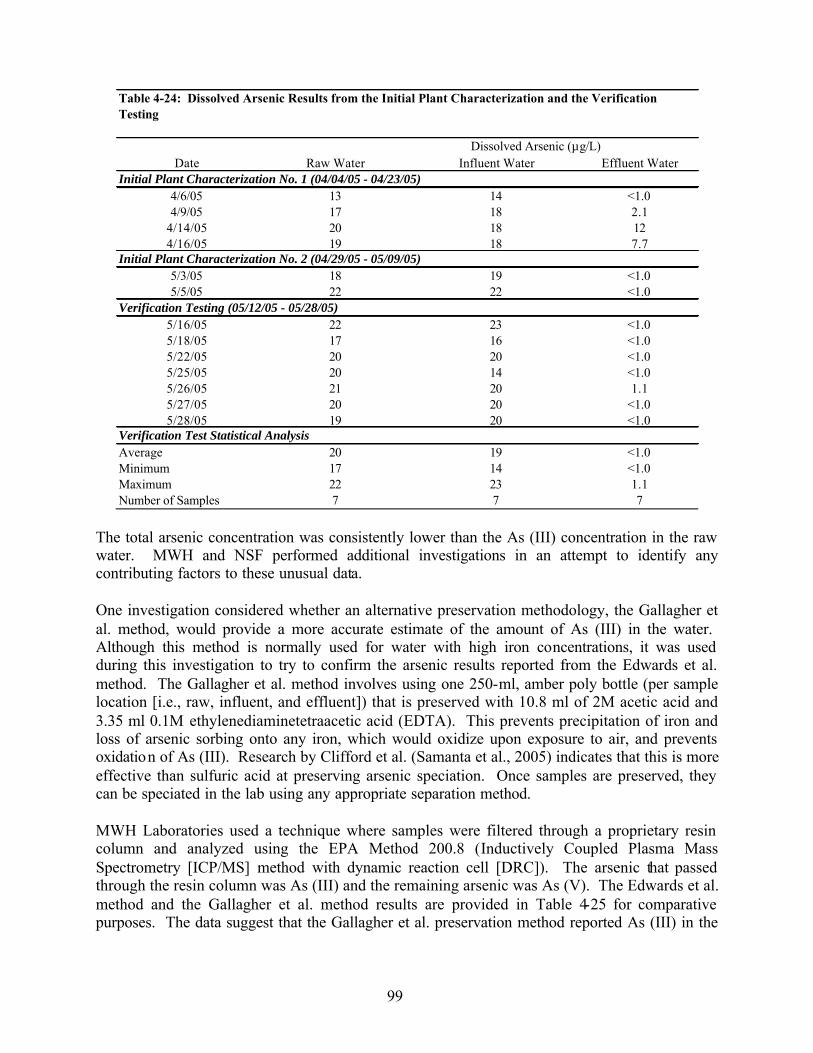
Table 4-24: Dissolved Arsenic Results from the Initial Plant Characterization and the Verification Testing
Dissolved Arsenic (mg/L) Date Raw Water Influent Water Effluent Water
Initial Plant Characterization No. 1 (04/04/05 - 04/23/05) 4/6/05 13 14 <1.0 4/9/05 17 18 2.1
4/14/05 20 18 12 4/16/05 19 18 7.7
Initial Plant Characterization No. 2 (04/29/05 - 05/09/05) 5/3/05 18 19 <1.0 5/5/05 22 22 <1.0
Verification Testing (05/12/05 - 05/28/05) 5/16/05 22 23 <1.0 5/18/05 17 16 <1.0 5/22/05 20 20 <1.0 5/25/05 20 14 <1.0 5/26/05 21 20 1.1 5/27/05 20 20 <1.0 5/28/05 19 20 <1.0
Verification Test Statistical Analysis Average 20 19 <1.0 Minimum 17 14 <1.0 Maximum 22 23 1.1 Number of Samples 7 7 7
The total arsenic concentration was consistently lower than the As (III) concentration in the raw water. MWH and NSF performed additional investigations in an attempt to identify any contributing factors to these unusual data.
One investigation considered whether an alternative preservation methodology, the Gallagher et al. method, would provide a more accurate estimate of the amount of As (III) in the water. Although this method is normally used for water with high iron concentrations, it was used during this investigation to try to confirm the arsenic results reported from the Edwards et al. method. The Gallagher et al. method involves using one 250-ml, amber poly bottle (per sample location [i.e., raw, influent, and effluent]) that is preserved with 10.8 ml of 2M acetic acid and 3.35 ml 0.1M ethylenediaminetetraacetic acid (EDTA). This prevents precipitation of iron and loss of arsenic sorbing onto any iron, which would oxidize upon exposure to air, and prevents oxidation of As (III). Research by Clifford et al. (Samanta et al., 2005) indicates that this is more effective than sulfuric acid at preserving arsenic speciation. Once samples are preserved, they can be speciated in the lab using any appropriate separation method.
MWH Laboratories used a technique where samples were filtered through a proprietary resin column and analyzed using the EPA Method 200.8 (Inductively Coupled Plasma Mass Spectrometry [ICP/MS] method with dynamic reaction cell [DRC]). The arsenic that passed through the resin column was As (III) and the remaining arsenic was As (V). The Edwards et al. method and the Gallagher et al. method results are provided in Table 4-25 for comparative purposes. The data suggest that the Gallagher et al. preservation method reported As (III) in the
99
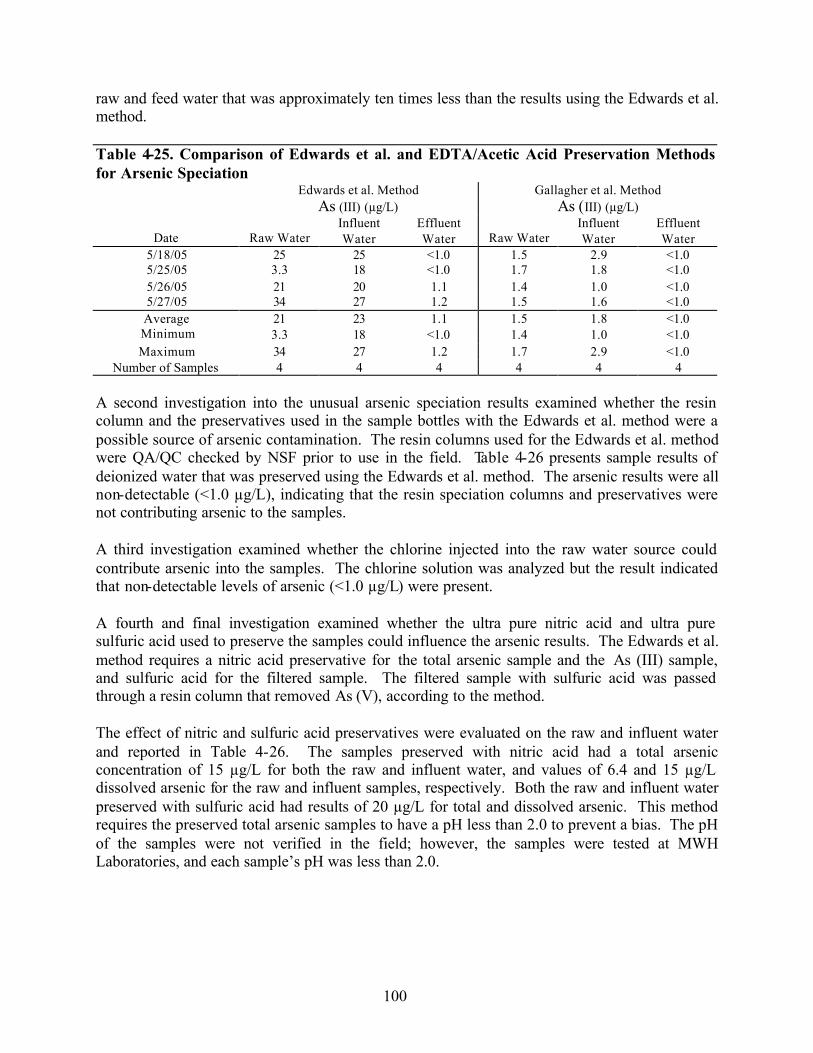
raw and feed water that was approximately ten times less than the results using the Edwards et al. method.
Table 4-25. Comparison of Edwards et al. and EDTA/Acetic Acid Preservation Methods for Arsenic Speciation
Edwards et al. Method As (III) (µg/L)
Influent Effluent Date Raw Water Water Water
5/18/05 25 25 <1.0 1.5 2.9 <1.0 5/25/05 3.3 18 <1.0 1.7 1.8 <1.0 5/26/05 21 20 1.1 1.4 1.0 <1.0 5/27/05 34 27 1.2 1.5 1.6 <1.0 Average 21 23 1.1 1.5 1.8 <1.0 Minimum 3.3 18 <1.0 1.4 1.0 <1.0 Maximum 34 27 1.2 1.7 2.9 <1.0
Number of Samples 4 4 4 4 4 4
Gallagher et al. Method As (III) (µg/L)
Influent Effluent Raw Water Water Water
A second investigation into the unusual arsenic speciation results examined whether the resin column and the preservatives used in the sample bottles with the Edwards et al. method were a possible source of arsenic contamination. The resin columns used for the Edwards et al. method were QA/QC checked by NSF prior to use in the field. Table 4-26 presents sample results of deionized water that was preserved using the Edwards et al. method. The arsenic results were all non-detectable (<1.0 µg/L), indicating that the resin speciation columns and preservatives were not contributing arsenic to the samples.
A third investigation examined whether the chlorine injected into the raw water source could contribute arsenic into the samples. The chlorine solution was analyzed but the result indicated that non-detectable levels of arsenic (<1.0 µg/L) were present.
A fourth and final investigation examined whether the ultra pure nitric acid and ultra pure sulfuric acid used to preserve the samples could influence the arsenic results. The Edwards et al. method requires a nitric acid preservative for the total arsenic sample and the As (III) sample, and sulfuric acid for the filtered sample. The filtered sample with sulfuric acid was passed through a resin column that removed As (V), according to the method.
The effect of nitric and sulfuric acid preservatives were evaluated on the raw and influent water and reported in Table 4-26. The samples preserved with nitric acid had a total arsenic concentration of 15 µg/L for both the raw and influent water, and values of 6.4 and 15 µg/L dissolved arsenic for the raw and influent samples, respectively. Both the raw and influent water preserved with sulfuric acid had results of 20 µg/L for total and dissolved arsenic. This method requires the preserved total arsenic samples to have a pH less than 2.0 to prevent a bias. The pH of the samples were not verified in the field; however, the samples were tested at MWH Laboratories, and each sample’s pH was less than 2.0.
100

Table 4-26. Edwards et al. Method for Additional Speciation Studies Edwards et al. Method
Date Sample Total As
(ug/L) Dissolved As
(ug/L) As (III) (ug/L)
5/5/05 Deionized (DI) Water <1.0 <1.0 <1.0 5/17/05 0.5% Chlorine Solution <1.0 NA NA 5/27/05 Raw Water Preserved with Nitric Acid 15 6.4 NA 5/27/05 Raw Water Preserved with Sulfuric Acid 20 20 NA 5/27/05 Influent Preserved with Sulfuric Acid 20 20 NA 5/27/05 Influent Preserved with Nitric Acid 15 15 NA
NA = Not Available
While the exact reason is unknown, these results suggest that there is a bias in the arsenic concentration depending on the acid preservative used. Since the preservatives were checked through the use of DI blanks and all results were non-detect, the data suggest the combination of the preservative and the water quality may be one contributing factor to variable arsenic results. Regardless of the erratic and unusual arsenic speciation results, the data were sufficient to suggest that As (III) was the dominant form of arsenic in the raw water, thus requiring pretreatment of raw water to oxidize As (III) to As (V). The actual amount of total arsenic or As (III) in the raw water may not be known due to the influence of the acid preservatives on either the water chemistry at this specific site and/or its influence on the ICP/MS method used by the laboratory to analyze the samples. However, the effluent As (III) results suggest that sufficient oxidant was provided to the raw water (sodium hypochlorite at 0.10-0.50 mg/L) to convert the As (III) to As (V). The results were all non-detect with the exception of two effluent As (III) samples of 1.1 µg/L and 1.2 µg/L, collected on May 26 and 27, 2005, respectively (see Table 425).
The chlorine residual data provided further proof that the water chemistry at the site may have influenced the speciation results. After liquid hypochlorite was added to the raw water, the residual chlorine ranged from 0.18–0.28 mg/L, and yet the pH did not decline, with a mean raw water pH of 9.05 and mean influent pH of 9.05. This would suggest that the raw water contained a buffering capacity to hypochlorous acid. This unexplained capacity of the water to resist change in pH from the addition of hypochlorous acid might also have contributed to the variance observed in the acid preservatives and arsenic speciation results.
The arsenic speciation studies concluded that most of the arsenic present at the Corydon Street Well was in the As (III) state and that after oxidation by chlorination, the system could remove the arsenic to non-detectable levels (<1 µg/L).
4.5.3 Online Continuous Monitoring Data during Verification Testing
In addition to laboratory and on-site analytical data, the Basin Water System recorded pH, conductivity, flow rates, and brine tank levels continuously through the PLC. Two example snapshot screens from the PLC are presented in Figures 4-29 and 4-30 from April 4-10, 2005, with additional information provided in Appendix E. The information recorded by the PLC was used to compare data with field analyses and operation parameters measured on-site.
101

The manufacturer calibrated the online pH, conductivity, and flow meters prior to beginning the test. However, it was not possible to calibrate them during the test without bringing the treatment system off- line. Comparing the PLC data to the daily-calibrated hand-held pH and conductivity meters indicated that online pH measurements were not comparable, but the conductivity measures did appear comparable. The instantaneous flow rate varied from the bucket and stopwatch test, but did provide a close estimate of the system flow rate.
Flow Rate
Brine Tank Level
Rinse Flow Rate
Brine Flow Rate
4/7/05 – 4/8/05 System Shutdown
Figure 4-29: Trend screen during regeneration cycle of 4/4/05-4/10/05 of Initial Plant Characterization No. 1.
102

Effluent Conductivity
Influent Conductivity
4/7/05 – 4/8/05 System Shutdown
Influent pH
Effluent pH Flow Rate
Figure 4-30: Trend screen during exhaustion cycle of 4/4/05-4/10/05 of Initial Plant Characterization No. 1.
4.5.4 Verification Testing Operational Data
The purpose of this task was to evaluate the general operational performance of the Basin Water System. Operational information regarding this task was collected throughout the verification testing according to the frequency presented in Chapter 3 (see Table 3-6). Operation data collected during verification testing included:
• The raw, influent, and effluent water pressure; • Water flow and waste generation rates; • Brine solution strength; • Number of columns exhausted/regenerated per day; and • Power consumption.
Each of these operation parameters is discussed in this section with the exception of waste generation. The waste flow rate and solids volumes generated during verification testing are presented in Section 4.5.5.
Pressure and Flow Rate There was very little variation in the pressure and flow rate of the Basin Water System throughout verification testing. The results of the daily pressure and flow rate readings are provided in Table 4-27. The average pressure drop across the system during the Verification Test was approximately 10.5 psi with an average effluent flow rate of 36.6 gpm from the treatment system. It was noted that the flow meter on the unit typically gave flow rates about
103

16% higher than the bucket and stopwatch measurement used to check the flow rate on a daily basis. The bucket and stopwatch data show that the average flow rate during the Verification Test was 32 gpm. While this difference may not be considered large, it does affect the regeneration bed volume calculations and other calculations that depend on the flow rate. The regeneration flow rates were based on the flow meters and not the automated flow rates.
Table 4-27. Raw, Influent, and Effluent Water Pressure and Influent and Effluent Flow Rate
Pressure Raw Influent Effluent
Water Water Water Date (psi) (psi) (psi)
Flow Rate1
Influent Calculated Calculated Water Influent Water Effluent Water (gpm) (gpm) (gpm)
Initial Plant Characterization No. 1 (04/04/05 – 04/23/05) 4/4/05 46.6 45.4 36.6 37.7 NA NA 4/4/05 45.4 46.7 36.6 NA NA NA 4/5/05 47.6 46.0 36.6 38.0 34.5 34.5 4/5/05 47.4 45.7 36.4 37.4 NA NA 4/6/05 48.0 46.6 38.1 37.7 38.3 38.3 4/6/05 48.0 46.3 38.1 NA NA NA 4/8/05 46.6 44.7 36.7 38.2 40.0 40.2 4/8/05 47.2 45.5 37.3 38.0 NA NA 4/9/05 46.7 45.0 36.4 37.2 38.6 38.6 4/9/05 46.9 44.9 36.5 36.5 NA NA 4/10/05 47.0 45.4 37.1 37.5 37.6 37.4 4/10/05 47.4 45.5 37.2 37.9 NA NA 4/11/05 46.7 44.9 36.2 37.8 37.8 38.0 4/11/05 NA 45.4 37.4 36.9 NA NA
4/12/05 46.7 NA 36.6 37.1 34.3 34.9 4/12/05 47 NA 36.3 37.6 NA NA 4/13/05 45.3 43.4 35.3 36.8 39.6 38.6 4/13/05 45.8 43.9 35.7 37.4 NA NA 4/14/05 47.1 45.3 37.2 39.1 37.9 37.8 4/14/05 47.0 44.7 36.3 39.7 NA NA 4/15/05 47.0 45.3 36.7 39.1 39.4 39.3 4/15/05 49.1 47.3 38.6 39.4 NA NA 4/16/05 48.0 46.2 37.6 38.6 40.0 39.9 4/16/05 47.2 45.6 36.9 38.3 NA NA 4/17/05 47.3 45.8 36.1 38.9 38.9 38.9 4/17/05 47.2 45.4 36.0 38.2 NA NA 4/18/05 47.2 45.6 37.5 37.4 38.1 38.8 4/18/05 49.3 47.6 38.4 36.8 NA NA 4/20/05 47.4 45.6 37.3 37.9 37.5 37.1 4/20/05 47.7 45.8 37.6 38.8 NA NA 4/21/05 46.9 45.3 37.2 37.7 37.7 37.6
104

Table 4-27. Raw, Influent and Effluent Water Pressure and Influent and Effluent Flow Rate (continued)
Pressure Raw Influent Effluent
Water Water Water Date (psi) (psi) (psi)
Flow Rate Influent Calculated Calculated Water Influent Water Effluent Water (gpm) (gpm) (gpm)
38.1 NA NA 37.4 37.7 37.6 36.9 NA NA 38.3 37.1 38.0 37.8 NA NA 35.5 38.0 37.7
Initial Plant Characterization No. 1 (04/04/05 – 04/23/05)
4/21/05 45.9 43.9 35.3 4/22/05 46.0 44.1 35.7 4/22/05 46.9 45.1 36.4 4/23/05 47.9 46.2 37.1 4/23/05 48.0 46.2 37.1 4/27/05 45.5 43.6 36.2
Initial Plant Characterization No. 2 (04/29/05 – 05/09/05)
4/29/05 47.4 45.6 37.9 36.7 37.2 37.1 4/29/05 46.2 44.2 35.9 38.6 36.6 36.6 4/30/05 47.5 45.8 38.1 36.6 37.8 37.8 4/30/05 46.3 44.3 36.0 38.5 38.0 38.0 5/1/05 47.5 45.9 37.8 37.6 37.7 37.7 5/1/05 46.7 44.8 36.7 38.7 36.9 36.9 5/2/05 47.6 46.1 37.6 36.3 36.3 36.2 5/2/05 45.7 43.7 34.8 37.4 36.4 36.4 5/3/05 45.8 44.0 36.0 35.2 36.8 36.8 5/3/05 44.7 42.8 34.5 37.1 36.1 36.1 5/4/05 45.6 43.9 36.6 35.6 35.8 35.7 5/4/05 45.3 45.0 34.4 33.3 36.1 35.9 5/5/05 46.0 43.9 34.9 39.5 36.0 35.9 5/5/05 46.0 44.1 35.0 37.7 33.5 33.5 5/6/05 48.7 47.0 38.2 37.4 39.4 39.3 5/6/05 49.5 47.8 38.5 38.3 37.8 37.8 5/7/05 47.5 45.9 37.1 36.7 39.9 39.4 5/7/05 46.3 44.3 34.9 37.9 37.4 37.4 5/8/05 48.1 46.4 38.0 37.5 38.1 38.0 5/8/05 47.1 45.4 36.3 38.1 37.6 37.6 5/9/05 46.9 45.2 37.2 36.9 37.7 37.6 5/9/05 45.6 43.5 34.9 38.0 37.2 37.2
Verification Testing (05/12/05 – 05/28/05) 5/12/05 46.2 44.4 36.3 5/12/05 45.5 43.8 34.8 5/13/05 48.2 46.4 37.3 5/13/05 48.4 46.5 37.5 5/14/05 45.8 43.9 35.0 5/14/05 44.4 46.1 36.8 5/15/05 47.8 46.2 37.3
35.0 37.6 37.5 37.9 35.9 35.9 38.1 41.7 41.7 37.7 37.5 37.5 36.1 37.3 37.3 36.3 35.9 35.9 37.4 37.4 37.2
105

Table 4-27. Raw, Influent and Effluent Water Pressure and Influent and Effluent Flow Rate (continued)
Pressure Raw Influent Effluent
Water Water Water Date (psi) (psi) (psi)
Flow Rate Influent Calculated Calculated Water Influent Water Effluent (gpm) (gpm) Water(gpm)
Verification Testing (05/12/05 – 05/28/05) 5/15/05 47.5 45.8 36.7 37.7 37.7 37.7 5/16/05 44.9 42.9 35.2 36.7 37.4 37.3 5/16/05 46.9 45.1 36.7 38.0 36.3 36.3 5/17/05 44.7 43.0 35.3 34.0 36.9 36.8 5/17/05 45.8 43.8 36.0 37.0 36.6 36.4 5/18/05 46.0 44.0 36.0 35.7 36.1 36.0 5/18/05 50.4 48.7 38.6 40.6 37.1 37.1 5/19/05 46.4 44.4 35.4 36.4 36.3 44.1 5/19/05 45.8 43.8 36.1 36.3 44.3 13.6 5/20/05 46.8 44.8 36.8 37.7 38.7 38.6 5/20/05 47.2 45.2 36.9 37.8 23.3 23.1 5/21/05 47.1 45.3 36.6 37.6 40.3 40.3 5/21/05 47.2 45.3 36.8 38.2 37.6 37.4 5/22/05 48.4 46.4 37.6 37.7 37.4 37.3 5/22/05 49.2 47.6 38.8 38.2 46.7 37.7 5/23/05 48.9 47.1 37.3 37.7 35.1 37.9 5/23/05 48.4 46.4 36.3 38.2 37.5 37.5 5/24/05 48.0 48.0 37.3 37.8 39.1 39.0 5/24/05 47.0 44.7 36.1 38.0 38.1 38.1 5/25/05 47.8 45.7 37.4 37.8 37.8 37.7 5/25/05 47.2 45.2 36.1 38.1 38.0 38.0 5/26/05 48.2 46.1 37.6 36.8 37.9 37.8 5/26/05 47.4 45.2 36.8 36.5 37.6 37.3 5/27/05 48.2 46.2 37.7 36.2 36.4 36.4 5/27/05 47.2 45.2 35.5 37.6 36.5 36.5 5/28/05 48.4 46.3 37.9 37.0 36.6 36.6 5/28/05 47.7 45.6 35.9 38.6 37.4 37.4
Verification Test Statistical Analysis
Average 47.2 45.4 36.7 37.3 37.5 36.6 Minimum 44.4 42.9 34.8 34.0 23.3 13.6 Maximum 50.4 48.7 38.8 40.6 46.7 44.1
Number of Samples 34 34 34 34 34 34 Standard Deviation 1.34 1.35 0.98 1.17 3.41 5.03
95% Confidence Interval
(47.1-47.3) (45.4-45.5) (36.6-36.7) (37.2-37.4) (37.3-37.7) (36.2-36.9)
The reported flow rates may be biased high based on manual calibration results – see Section 4.7.4 and Table 449.
NA = Not Available.
106
1

Brine Solution Strength The fresh brine was sampled once during the first Initial Plant Characterization and twice during the Verification Test to evaluate the percentage of brine used during the regeneration process. The results of the sampling are provided in Table 4-28 and indicate that there is variability in the brine strength used for the regeneration cycle, with chloride levels ranging from 67,000 to 230,000 mg/L.
Table 4-28. Brine Solution Strength Chloride Sodium TDS Conductivity
Date (mg/L) (mg/L) (mg/L) (µmho/cm) 4/17/05 67000 41000 108000 NA 5/12/05 230000 98000 319000 177000 5/18/05 200000 97000 313000 180000
NA = Not Available.
Number of columns exhausted/regenerated per day The number of columns exhausted and regenerated per day was consistent throughout verification testing. Four IX columns were online at all times, with one column in regeneration and one in standby. Table 4-29 presents the start and finish times and dates when each column was in an exhaustion (water treatment) cycle.
Table 4-29: Exhaustion Start and Finish Times and Dates Cycle.
No. Column 5
Start Finish Column 6
Start Finish Column 7
Start Finish 1 2 3 4 5 6 7 8 9 10 11
4/2/05 10:26 PM 4/5/05 6:21 PM 4/8/05 11:33 PM 4/12/05 5:33 PM 4/14/05 1:43 PM 4/18/05 3:20 AM 4/20/05 12:05 AM 4/23/05 2:52 PM 4/25/05 10:10 AM 4/28/05 4:51 PM 4/30/05 3:13 AM 5/2/05 11:35 PM 5/4/05 11:28 AM 5/8/05 5:15 AM 5/9/05 3:46 PM 5/15/05 10:01 AM 5/16/05 8:47 PM 5/19/05 9:32 AM 5/21/05 8:21 PM 5/23/05 3:32 PM 5/25/05 12:57 AM NA
4/3/05 9:40 PM 4/6/05 4:14 PM 4/9/05 9:05 PM 4/13/05 3:39 PM 4/15/05 12:47 PM 4/19/05 1:24 AM 4/20/05 9:39PM 4/24/05 11:57 AM 4/26/05 7:48 AM 4/29/05 9:50 AM 4/30/05 8:10 PM 5/3/05 5:06 PM 5/5/05 5:20 AM 5/8/05 10:12 PM 5/11/05 3:56 PM 5/16/05 2:50 AM 5/17/05 2:07 PM 5/20/05 2:55 AM 5/21/05 1:11 PM 5/24/05 7:47 AM 5/24/05 5:45 PM NA
4/4/05 9:08 AM 4/8/05 11:04 PM 4/10/05 7:32 PM 4/14/05 1:15 PM 4/16/05 9:11 AM 4/19/05 11:37 PM 4/21/05 7:39 PM 4/25/05 9:42 AM 4/27/05 6:26 AM 4/30/05 2:39 AM 5/1/05 1:14 PM 5/4/05 10:53 AM 5/5/05 9:39 PM 5/9/05 3:13 PM 5/12/05 9:16 AM 5/17/05 8:13 PM 5/19/05 7:44 AM 5/20/05 7:47 PM 5/22/05 5:52 AM 5/25/05 12:22 AM 5/26/05 1:20 PM NA
Cycle No.
Column 8 Start Finish
Column 9 Start Finish
Column 10 Start Finish
1 2 3 4 5 6 7 8 9 10 11
4/4/05 8:45 PM 4/9/05 8:37 PM 4/11/05 7:47 PM 4/15/05 12:22 PM 4/17/05 6:29 AM 4/20/05 9:12 PM 4/22/05 5:41 PM 4/26/05 7:20 AM 4/28/05 4:46 AM 4/30/05 7:36 PM 5/2/05 6:47 AM 5/5/05 4:44 AM 5/7/05 1:23 PM 5/10/05 7:49 AM 5/14/05 2:04 AM 5/17/05 1:43 PM 5/19/05 12:07 AM 5/21/05 12:36 PM 5/22/05 11:19 PM 5/25/05 5:12 PM 5/27/05 11:01 AM NA
4/5/05 7:21 PM 4/10/05 7:05 PM 4/12/05 5:57 PM 4/16/05 8:45 AM 4/18/05 3:46 AM 4/21/05 7:13 PM 4/23/05 3:18 PM 4/27/05 5:59 AM 4/28/05 5:24 PM 5/1/05 12:41 PM 5/3/05 12:07 AM 5/5/05 9:07 PM 5/8/05 5:47 AM 5/12/05 8:43 AM 5/15/05 10:30 AM 5/18/05 7:11 AM 5/19/05 10:05 AM 5/22/05 5:20 AM 5/23/05 4:04 PM 5/26/05 12:46 PM
NA NA
4/1/05 8:09 PM 4/4/05 8:15 PM 4/6/05 4:47 PM 4/11/05 7:20 PM 4/13/05 4:07 PM 4/17/05 6:03 AM 4/19/05 1:52 AM 4/22/05 5:16 PM 4/24/05 12:26 PM 4/28/05 4:20 AM 4/29/05 10:25 AM 5/2/05 6:16 AM 5/3/05 12:07 AM 5/6/05 1:48 PM 5/8/05 10:45 PM 5/14/05 1:33 AM 5/16/05 3:24 AM 5/19/05 12:09 AM 5/20/05 2:55 AM 5/22/05 10:49 PM 5/24/05 8:21 AM 5/27/05 6:13 AM
NA = Not Available.
107

Power Consumption The Basin Water System is a hydraulically driven system that required approximately 42 KW-Hrs total during the Initial Plant Characterizations and the Verification Test for a total of 48 days (0.88 KW-Hrs per day). The average daily power consumption during the first characterization test (regeneration set at 1,100 BV) was 0.84 KW-Hrs per day. The average consumption during the second Initial Plant Characterization and the Verification Test was slightly higher at 0.92 KW-Hrs per day and 0.88 KW-Hrs per day, respectively. The cumulative daily power totalizer readings are presented in Table 4-30.
108

Table 4-30. Cumulative Power Totalizer Reading During Verification Testing
Date Power Totalizer (KW-Hrs) Initial Plant Characterization No. 1 (04/04/05 – 04/23/05)
4/4/05 04/5/05 54/6/05 54/7/05 64/8/05 64/9/05 64/10/05 74/11/05 84/12/05 84/13/05 94/14/05 104/15/05 104/16/05 114/17/05 124/18/05 124/20/05 144/21/05 144/22/05 154/23/05 16
Initial Plant Characterization No. 2 (04/29/05 – 05/09/05) 4/27/05 184/29/05 204/30/05 215/1/05 215/2/05 225/3/05 235/4/05 235/5/05 245/6/05 255/7/05 255/8/05 265/9/05 27
Verification Testing (05/12/05 – 05/28/05) 5/12/05 295/13/05 295/14/05 305/15/05 315/16/05 315/17/05 325/18/05 335/19/05 335/20/05 335/21/05 345/22/05 365/23/05 385/24/05 385/25/05 395/26/05 405/27/05 415/28/05 42
109

Chemical Consumption The chemicals consumed during the Initial Plant Characterizations and the Verification Test included sodium hypochlorite for preoxidation, sodium chloride (salt) for the regeneration of the IX resin, and sulfuric acid, caustic soda, and ferric chloride for the brine treatment process. The daily chemical consumption information is provided in Table 4-31. On average throughout both Initial Plant Characterizations and the Verification Test, the Basin Water system consumed 0.11 pounds per day (ppd) of sodium hypochlorite for preoxidation, 107 ppd of sodium chloride for regeneration, and 4.10 ppd sulfuric acid, 1.83 ppd caustic soda, and 1.63 ppd ferric chloride for the brine treatment process.
Table 4-31. Daily Chemical Consumption Sodium Hypochlorite Sodium Chloride Sulfuric Acid Caustic Soda Ferric Chloride
Consumption Consumption Consumption Consumption Consumption Date (lbs) (lbs) (lbs) (lbs) (lbs)
4/4/05 NA 85.5 NA NA NA 4/5/05 0.18 97.0 NA NA NA 4/6/05 0.08 101.0 NA NA NA 4/8/05 NA 83.1 1.43 0.96 0.54 4/9/05 0.13 83.9 0.71 1.49 0.59 4/10/05 NA 87.4 1.43 0.85 0.52 4/11/05 NA 84.6 1.43 1.06 0.49 4/12/05 NA 73.3 1.90 1.06 0.52 4/13/05 0.05 81.5 1.43 1.28 0.56 4/14/05 0.06 84.2 2.75 1.92 1.77 4/15/05 0.06 83.5 3.86 2.42 0.50 4/16/05 0.17 86.6 4.64 3.11 1.26 4/17/05 0.01 89.7 3.86 2.42 1.26 4/18/05 0.08 83.9 4.64 2.42 1.26 4/19/05 NA 86.1 3.09 3.11 1.51 4/20/05 0.09 88.2 3.09 1.38 1.26 4/21/05 0.10 83.5 2.32 1.04 1.26 4/22/05 0.09 81.4 4.64 3.11 1.26 4/23/05 0.10 83.9 4.64 2.76 1.26 4/29/05 0.09 102.0 6.95 3.97 2.65 4/30/05 0.11 197.3 4.64 2.07 1.51 5/1/05 0.08 94.5 4.64 1.38 1.77 5/2/05 0.09 189.5 8.50 2.76 3.03 5/3/05 0.15 95.8 5.41 1.38 1.77 5/4/05 0.09 104.5 3.86 1.38 1.77 5/5/05 NA 200.0 3.86 3.11 3.53
5/6/05 0.10 NA 4.64 1.04 1.51 5/7/05 0.18 18.5 3.09 1.73 3.03 5/8/05 0.10 189.7 3.86 1.73 1.77
110

Table 4-31. Chemical Consumption (continued) Sodium Hypochlorite Sodium Chloride Sulfuric Acid Caustic Soda Ferric Chloride
Consumption Consumption Consumption Consumption Consumption Date (lbs) (lbs) (lbs) (lbs) (lbs)
5/9/05 0.08 95.8 3.86 1.38 1.51
5/12/05 0.10 95.9 NA NA NA 5/13/051 NA NA NA NA NA 5/14/05 0.12 97.3 3.86 1.38 2.02 5/15/05 0.07 83.7 2.32 1.04 3.28 5/16/05 0.12 93.5 3.86 0.35 1.77 5/17/05 0.12 96.5 10.05 2.76 3.03
5/18/05 0.11 94.0 4.64 1.38 1.77 5/19/05 0.10 190.9 4.64 1.04 1.26 5/20/05 0.17 195.5 NA NA NA 5/21/05 0.13 98.5 6.18 1.73 1.77 5/22/05 0.14 188.1 3.09 1.04 1.26 5/23/05 0.12 98.3 4.64 1.73 1.51 5/24/05 0.14 97.6 NA NA NA 5/25/05 0.14 193.2 NA NA NA 5/26/05 0.15 94.4 9.27 2.76 3.03 5/27/05 0.12 92.5 NA NA NA
Daily Average 0.11 107 4.10 1.83 1.63 1 Data not available because there was not a regeneration cycle on this day; a shutdown occurred on 5/12-5/13/05. NA = Not Available.
4.5.5 Brine Treatment Operation and Waste Generation
The Basin Water System generated two waste streams: solid waste (from BPU and BRA) and liquid waste. Each of these waste streams is discussed in additional detail in Section 4.5.5.1 and 4.5.5.2.
The BRA utilized one 55-gallon drum (2 cubic feet) of an iron-based adsorptive media (BW-3360). The brine circulated between a holding tank and the 55-gallon drum of adsorptive media for 10 hours prior to discharging to the waste storage tank. The settling time prior to discharge to the waste tank was two hours. The treated brine was clear, indicating the brine/adsorptive media were not difficult to separate. The results of the analysis of the treated waste brine are presented and discussed in Section 4.5.5.2
The BPU system operated in batch precipitation mode. As the waste brine was pumped into the reaction tank, ferric chloride was added at a rate of 0.041 pounds of ferric chloride per gallon of waste brine. The mixing was instantaneous, and no additional mixing mechanism was applied. Acid was then added to the reaction tank, followed by 30 minutes of slow mixing. Caustic was then added followed by 30 minutes of additional slow mixing. Upon completion of chemical additions and mixing, the reaction tank was allowed to settle for three hours. After one hour the sludge reached what appeared to be the final settled volume.
111
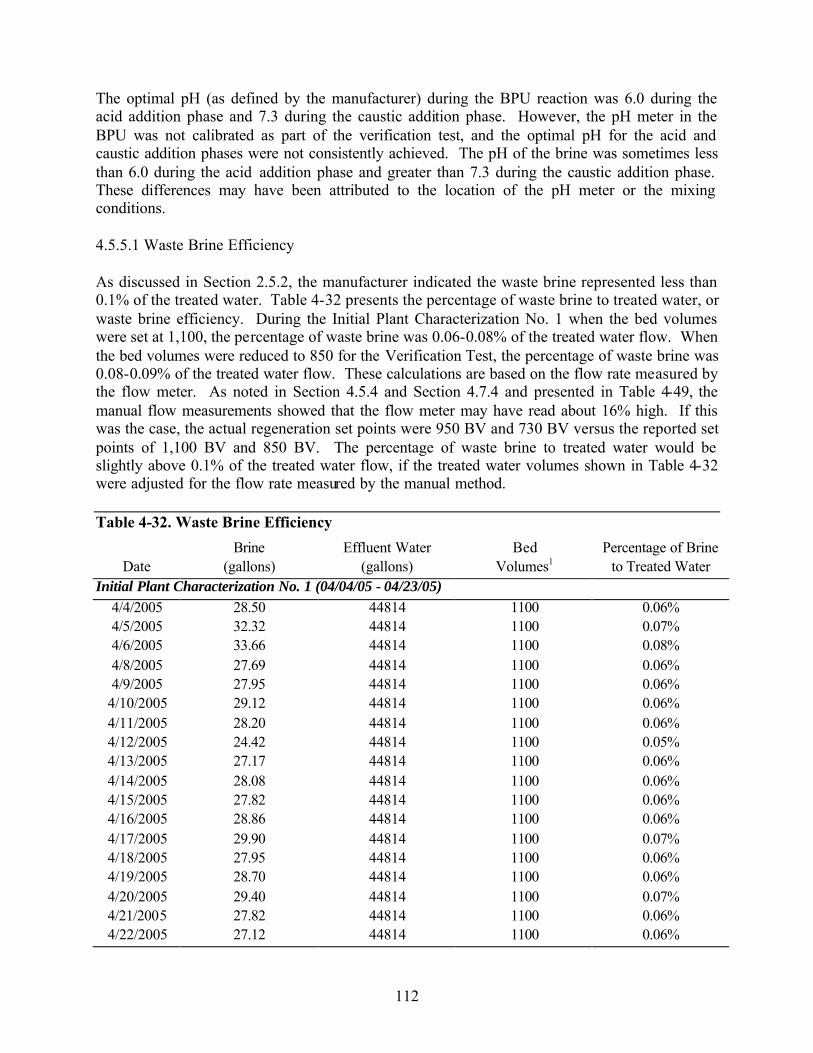
The optimal pH (as defined by the manufacturer) during the BPU reaction was 6.0 during the acid addition phase and 7.3 during the caustic addition phase. However, the pH meter in the BPU was not calibrated as part of the verification test, and the optimal pH for the acid and caustic addition phases were not consistently achieved. The pH of the brine was sometimes less than 6.0 during the acid addition phase and greater than 7.3 during the caustic addition phase. These differences may have been attributed to the location of the pH meter or the mixing conditions.
4.5.5.1 Waste Brine Efficiency
As discussed in Section 2.5.2, the manufacturer indicated the waste brine represented less than 0.1% of the treated water. Table 4-32 presents the percentage of waste brine to treated water, or waste brine efficiency. During the Initial Plant Characterization No. 1 when the bed volumes were set at 1,100, the percentage of waste brine was 0.06-0.08% of the treated water flow. When the bed volumes were reduced to 850 for the Verification Test, the percentage of waste brine was 0.08-0.09% of the treated water flow. These calculations are based on the flow rate measured by the flow meter. As noted in Section 4.5.4 and Section 4.7.4 and presented in Table 4-49, the manual flow measurements showed that the flow meter may have read about 16% high. If this was the case, the actual regeneration set points were 950 BV and 730 BV versus the reported set points of 1,100 BV and 850 BV. The percentage of waste brine to treated water would be slightly above 0.1% of the treated water flow, if the treated water volumes shown in Table 4-32 were adjusted for the flow rate measured by the manual method.
Table 4-32. Waste Brine Efficiency Brine Effluent Water Bed Percentage of Brine
Date (gallons) (gallons) Volumes1 to Treated Water Initial Plant Characterization No. 1 (04/04/05 - 04/23/05)
4/4/2005 28.50 44814 1100 0.06% 4/5/2005 32.32 44814 1100 0.07% 4/6/2005 33.66 44814 1100 0.08% 4/8/2005 27.69 44814 1100 0.06% 4/9/2005 27.95 44814 1100 0.06%
4/10/2005 29.12 44814 1100 0.06% 4/11/2005 28.20 44814 1100 0.06% 4/12/2005 24.42 44814 1100 0.05% 4/13/2005 27.17 44814 1100 0.06% 4/14/2005 28.08 44814 1100 0.06% 4/15/2005 27.82 44814 1100 0.06% 4/16/2005 28.86 44814 1100 0.06% 4/17/2005 29.90 44814 1100 0.07% 4/18/2005 27.95 44814 1100 0.06% 4/19/2005 28.70 44814 1100 0.06% 4/20/2005 29.40 44814 1100 0.07% 4/21/2005 27.82 44814 1100 0.06% 4/22/2005 27.12 44814 1100 0.06%
112
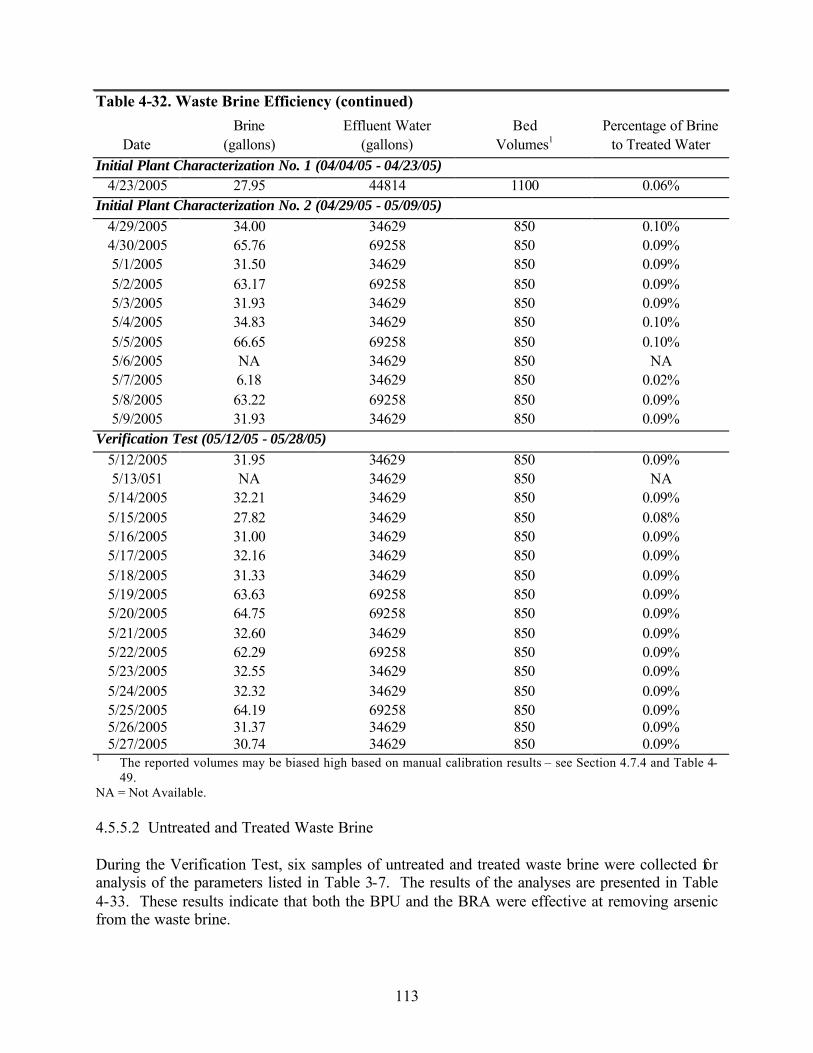
1
Table 4-32. Waste Brine Efficiency (continued) Brine Effluent Water Bed Percentage of Brine
Date (gallons) (gallons) Volumes1 to Treated Water Initial Plant Characterization No. 1 (04/04/05 - 04/23/05)
4/23/2005 27.95 44814 1100 0.06%Initial Plant Characterization No. 2 (04/29/05 - 05/09/05)
4/29/2005 34.00 34629 850 0.10% 4/30/2005 65.76 69258 850 0.09% 5/1/2005 31.50 34629 850 0.09% 5/2/2005 63.17 69258 850 0.09% 5/3/2005 31.93 34629 850 0.09% 5/4/2005 34.83 34629 850 0.10% 5/5/2005 66.65 69258 850 0.10% 5/6/2005 NA 34629 850 NA 5/7/2005 6.18 34629 850 0.02% 5/8/2005 63.22 69258 850 0.09% 5/9/2005 31.93 34629 850 0.09%
Verification Test (05/12/05 - 05/28/05) 5/12/2005 31.95 34629 850 0.09% 5/13/051 NA 34629 850 NA
5/14/2005 32.21 34629 850 0.09% 5/15/2005 27.82 34629 850 0.08% 5/16/2005 31.00 34629 850 0.09% 5/17/2005 32.16 34629 850 0.09% 5/18/2005 31.33 34629 850 0.09% 5/19/2005 63.63 69258 850 0.09% 5/20/2005 64.75 69258 850 0.09% 5/21/2005 32.60 34629 850 0.09% 5/22/2005 62.29 69258 850 0.09% 5/23/2005 32.55 34629 850 0.09% 5/24/2005 32.32 34629 850 0.09% 5/25/2005 64.19 69258 850 0.09% 5/26/2005 31.37 34629 850 0.09% 5/27/2005 30.74 34629 850 0.09%
The reported volumes may be biased high based on manual calibration results – see Section 4.7.4 and Table 449.
NA = Not Available.
4.5.5.2 Untreated and Treated Waste Brine
During the Verification Test, six samples of untreated and treated waste brine were collected for analysis of the parameters listed in Table 3-7. The results of the analyses are presented in Table 4-33. These results indicate that both the BPU and the BRA were effective at removing arsenic from the waste brine.
113

Table 4-33. Untreated and Treated Liquid Waste Brine
Conductivity 1 pH2 Total As 3 Antimony4 Barium4 Beryllium4 Cadmium4
Date Sample mmho/cm ug/L mg/L mg/L mg/L mg/L 5/16/05 Untreated Brine 99700 9.7 3800 <0.025 0.200 <0.025 <0.012 5/16/05 Treated Brine (Preciptation) 97200 8.0 1100 <0.100 <0.200 <0.100 <0.050 5/17/05 Untreated Brine 106000 9.7 4700 <0.100 0.230 <0.100 <0.050 5/17/05 Treated Brine (Preciptation) 99200 8.1 <100 <0.100 <0.200 <0.100 <0.050 5/18/05 Untreated Brine 105000 9.7 4100 <0.050 0.380 <0.050 <0.025 5/18/05 Treated Brine (Preciptation) 101000 7.9 140 <0.050 <0.100 <0.050 <0.025 5/25/05 Untreated Brine 96500 9.7 4800 <0.100 0.420 <0.100 <0.050 5/25/05 Treated Brine (Adsorption) 48600 9.8 1100 <0.100 <0.200 <0.100 <0.050 5/26/05 Untreated Brine 111000 9.6 1200 <0.100 <0.200 <0.100 <0.050 5/26/05 Treated Brine (Adsorption) 81100 9.8 1100 <0.100 <0.200 <0.100 <0.050 5/28/05 Untreated Brine 108000 9.8 2700 <0.050 0.350 <0.050 <0.025 5/28/05 Treated Brine (Adsorption) 72200 9.9 1500 <0.050 0.290 <0.050 <0.025
Average 104000 9.7 3600 <0.100 0.300 <0.100 <0.050 Minimum 96500 9.6 1200Untreated Brine <0.025 <0.200 <0.025 <0.012 Maximum 111000 9.8 4800 <0.100 0.420 <0.100 <0.050
Number of Samples 6 6 6 6 6 6 6 Average 99100 8.0 450 <0.100 <0.200 <0.100 <0.050
Minimum 97200 7.9 <100Treated Brine <0.050 <0.100 <0.050 <0.025 Maximum 101000 8.1 1100(Preciptation) <0.100 <0.200 <0.100 <0.050
Number of Samples 3 3 3 3 3 3 3 Average 67300 9.8 1200 <0.100 0.230 <0.100 <0.050
Minimum 48600 9.8 1100Treated Brine <0.050 <0.200 <0.050 <0.025 Maximum 81100 9.9 1500(Adsorption) <0.100 0.290 <0.100 <0.050
Number of Samples 3 3 3 3 3 3 3
Chromium4 Cobalt4 Copper4 Lead4 Mercury5 Molybdenum4 Nickel4
Date Sample mg/L mg/L mg/L mg/L mg/L mg/L mg/L 5/16/05 Untreated Brine <0.025 <0.050 <0.050 <0.012 <0.00020 1.400 <0.125 5/16/05 Treated Brine (Preciptation) 0.100 <0.200 <0.200 <0.050 <0.00020 4.700 <0.500 5/17/05 Untreated Brine 0.100 <0.200 <0.200 <0.050 <0.00020 4.500 <0.500 5/17/05 Treated Brine (Preciptation) <0.100 <0.200 <0.200 <0.050 <0.00020 3.500 <0.500 5/18/05 Untreated Brine <0.050 <0.100 <0.100 <0.025 <0.00020 3.500 <0.250 5/18/05 Treated Brine (Preciptation) <0.050 <0.100 <0.100 <0.025 <0.00020 3.200 <0.250 5/25/05 Untreated Brine <0.100 <0.200 <0.200 <0.050 <0.00020 4.400 <0.500 5/25/05 Treated Brine (Adsorption) 0.470 <0.200 <0.200 <0.050 <0.00020 1.200 <0.500 5/26/05 Untreated Brine 0.580 <0.200 <0.200 <0.050 <0.00020 1.300 <0.500 5/26/05 Treated Brine (Adsorption) 0.490 <0.200 <0.200 <0.050 <0.00020 0.840 <0.500 5/28/05 Untreated Brine <0.050 <0.100 <0.100 <0.025 <0.00020 3.900 <0.250 5/28/05 Treated Brine (Adsorption) 0.150 <0.100 <0.100 <0.025 <0.00020 1.900 <0.250
Average 0.150 <0.200 <0.200 <0.050 <0.00020 3.200 <0.500 Minimum <0.025 <0.050 <0.050Untreated Brine <0.012 <0.00020 1.300 <0.125 Maximum 0.580 <0.200 <0.200 <0.050 <0.00020 4.500 <0.500
Number of Samples 6 6 6 6 6 6 6 Average 0.083 <0.200 <0.200 <0.050 <0.00020 3.800 <0.500
Minimum <0.050 <0.100 <0.100Treated Brine <0.025 <0.00020 3.200 <0.250 Maximum 0.100 <0.200 <0.200(Preciptation) <0.050 <0.00020 4.700 <0.500
Number of Samples 3 3 3 3 3 3 3 Average 0.370 <0.200 <0.200 <0.050 <0.00020 1.300 <0.500
Minimum 0.150 <0.100 <0.100Treated Brine <0.025 <0.00020 0.840 <0.250 Maximum 0.490 <0.200 <0.200(Adsorption) <0.050 <0.00020 1.900 <0.500
Number of Samples 3 3 3 3 3 3 3
114

Table 4-33. Untreated and Treated Liquid Waste Brine (continued)
Selenium4 Silver4 TSS6 Thallium4 Vanadium4 Zinc4
Date Sample mg/L mg/L mg/L mg/L mg/L mg/L 5/16/05 Untreated Brine <0.500 <0.012 <10 <0.025 14.000 <0.125 5/16/05 Treated Brine (Preciptation) 0.820 <0.050 340 <0.100 1.001 <0.500 5/17/05 Untreated Brine 0.610 <0.050 76 <0.100 4.024 <0.500 5/17/05 Treated Brine (Preciptation) 0.690 <0.050 190 <0.100 0.360 <0.500 5/18/05 Untreated Brine 0.570 <0.025 26 <0.050 3.940 <0.250 5/18/05 Treated Brine (Preciptation) <0.500 0.030 24 <0.050 0.890 <0.250 5/25/05 Untreated Brine 0.550 <0.050 70 <0.100 3.954 <0.500 5/25/05 Treated Brine (Adsorption) <0.500 <0.050 <10 <0.100 9.900 <0.500 5/26/05 Untreated Brine <0.500 <0.050 47 <0.100 11.000 <0.500 5/26/05 Treated Brine (Adsorption) 0.690 <0.050 <10 <0.100 9.200 <0.500 5/28/05 Untreated Brine 0.580 <0.025 43 <0.050 4.113 <0.250 5/28/05 Treated Brine (Adsorption) 0.470 <0.025 <10 <0.050 1.996 <0.250
Average 0.550 <0.050 45 <0.100 6.839 <0.500 Untreated Brine Minimum <0.500 <0.012 <10 <0.025 3.940 <0.125
Maximum 0.610 <0.050 76 <0.100 14.000 <0.500 Number of Samples 6 6 6 6 6 6
Average 0.670 0.040 180 <0.100 0.750 <0.500 Treated Brine Minimum <0.500 0.030 24 <0.050 0.360 <0.250 (Preciptation) Maximum 0.820 <0.050 340 <0.100 1.001 <0.500
Number of Samples 3 3 3 3 3 3 Average 0.550 <0.050 <10 <0.100 7.032 <0.500
Treated Brine Minimum 0.470 <0.025 <10 <0.050 1.996 <0.250 (Adsorption) Maximum 0.690 <0.050 <10 <0.100 9.900 <0.500
1 Conductivity was measured using SW9050 analytical method instead of method 2510B, as stated in Table 3-7. 2 pH was measured using E 150 analytical method instead of method 4500-H+ B, as stated in Table 3-7. 3 Arsenic was measured using EPA 200.8 analytical method except on 05/24/05 for untreated brine, when EPA
method 200.7 was used. 4 EPA 200.8 analytical method was used instead of EPA 6010B method, as stated in Table 3-7. 5 Mercury was measured using EPA 245.1 analytical method instead of EPA 7470A method, as stated Table 3-7. 6 TSS was measured using EPA 160.2 analytical method instead of SM 2540D method, as stated Table 3-7.
The combined (BPU and BRA) treated waste was analyzed prior to disposal to characterize the liquid waste for appropriate disposal. The results of the liquid brine waste analysis are presented in Table 4-34.
115

Table 4-34: Combined BRA and BPU Waste Brine Analysis Parameter Units Results Antimony µg/L <50 Total Arsenic µg/L 580 Barium µg/L 100 Beryllium µg/L <50 Cadmium µg/L <25 Cobalt µg/L <100 Chromium, Total µg/L 56 Copper µg/L <100 Conductivity umho/cm 94,500 Mercury µg/L <0.20 Molybdenum µg/L 3400 Nickel µg/L <250 Lead µg/L <25 pH pH units 9.2 Selenium µg/L 690 Silver µg/L <25 Thallium µg/L <50 TSS mg/L <10 Vanadium µg/L 5800 Zinc µg/L <250
4.5.5.3 Solid Waste
The analysis of the solid waste generated from both the BPU and the BRA brine treatment systems is presented in Table 4-35. The waste generated from the BPU on May 19, 2005, was found to be classified as nonhazardous based on the results of the California waste analysis methods of TTLC, STLC, and the federal waste analysis method of TCLP based on the total arsenic. The total mass of arsenic in the waste was 233 milligrams per kilogram (mg/kg) of waste generated, with a TTLC limit of 500 mg/kg for hazardous waste. The result of the TCLP was <1.0 mg/L total arsenic, with a hazardous limit of 5.0 mg/L. The total arsenic leachate from the STLC analysis was 2.8 mg/L, with a limit of 5.0 mg/L for hazardous waste. The waste generated from the BRA on June 2, 2005, was also found to be classified as nonhazardous based on the results of the California waste analysis methods of TTLC, STLC, and the federal waste analysis method of TCLP based on the total arsenic. The total mass of arsenic in the waste was <3 mg/kg of waste generated, with a TTLC limit of 500 mg/kg for hazardous waste. The result of the TCLP was <1.0 mg/L total arsenic, with a hazardous limit of 5.0 mg/L. The total arsenic leachate from the STLC analysis was <0.5 mg/L, with a limit of 5.0 mg/L for hazardous waste.
Precision results are also presented in Table 4-35 for solid samples collected on both May 19, 2005, and June 2, 2005. These results show the variation possible in the TTLC samples collected. There was very little variation between the sample and duplicate collected on May 19 (approximately 4%), while there was great variation in those samples and duplicates collected on June 2 (approximately 51%). Most duplicate samples collected for the TCLP and STLC samples were <10%.
116
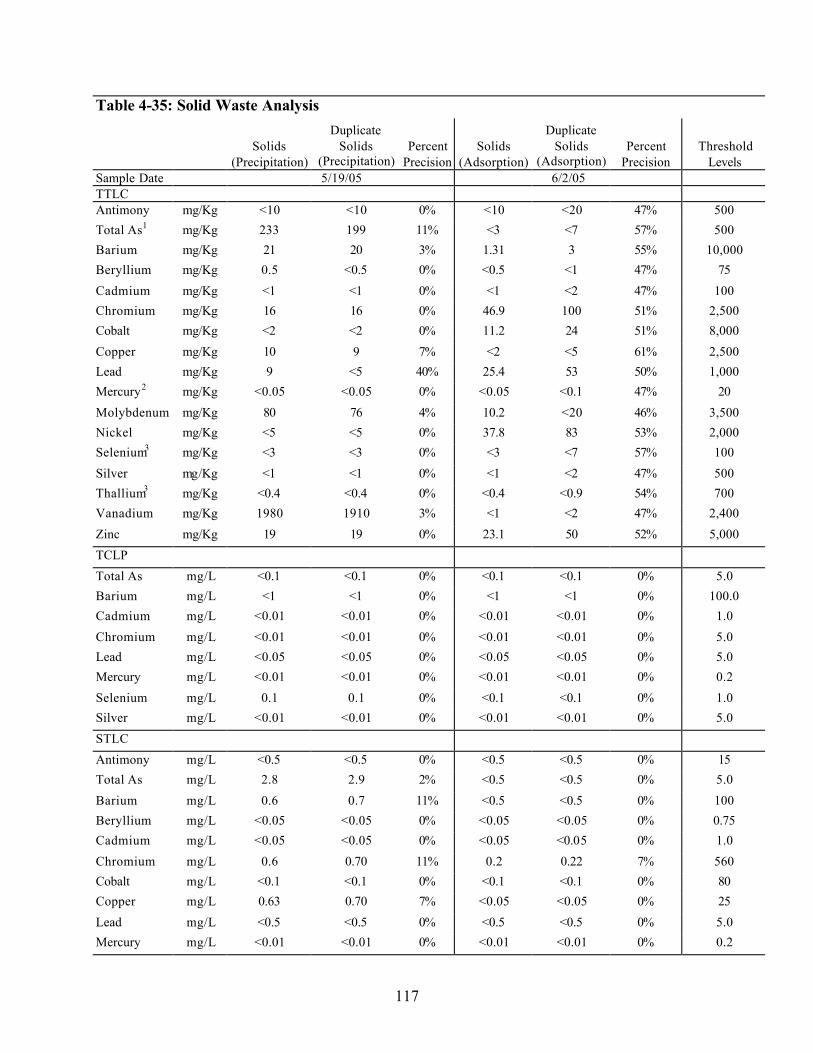
Table 4-35: Solid Waste Analysis Duplicate Duplicate
Solids Solids Percent Solids Solids Percent Threshold (Precipitation) (Precipitation) Precision (Adsorption) (Adsorption) Precision Levels
Sample Date 5/19/05 6/2/05 TTLC Antimony mg/Kg <10 <10 0% <10 <20 47% 500 Total As1 mg/Kg 233 199 11% <3 <7 57% 500 Barium mg/Kg 21 20 3% 1.31 3 55% 10,000 Beryllium mg/Kg 0.5 <0.5 0% <0.5 <1 47% 75 Cadmium mg/Kg <1 <1 0% <1 <2 47% 100 Chromium mg/Kg 16 16 0% 46.9 100 51% 2,500 Cobalt mg/Kg <2 <2 0% 11.2 24 51% 8,000 Copper mg/Kg 10 9 7% <2 <5 61% 2,500 Lead mg/Kg 9 <5 40% 25.4 53 50% 1,000 Mercury2 mg/Kg <0.05 <0.05 0% <0.05 <0.1 47% 20 Molybdenum mg/Kg 80 76 4% 10.2 <20 46% 3,500 Nickel mg/Kg <5 <5 0% 37.8 83 53% 2,000 Selenium3 mg/Kg <3 <3 0% <3 <7 57% 100 Silver mg/Kg <1 <1 0% <1 <2 47% 500 Thallium3 mg/Kg <0.4 <0.4 0% <0.4 <0.9 54% 700 Vanadium mg/Kg 1980 1910 3% <1 <2 47% 2,400 Zinc mg/Kg 19 19 0% 23.1 50 52% 5,000 TCLP Total As mg/L <0.1 <0.1 0% <0.1 <0.1 0% 5.0 Barium mg/L <1 <1 0% <1 <1 0% 100.0 Cadmium mg/L <0.01 <0.01 0% <0.01 <0.01 0% 1.0 Chromium mg/L <0.01 <0.01 0% <0.01 <0.01 0% 5.0 Lead mg/L <0.05 <0.05 0% <0.05 <0.05 0% 5.0 Mercury mg/L <0.01 <0.01 0% <0.01 <0.01 0% 0.2 Selenium mg/L 0.1 0.1 0% <0.1 <0.1 0% 1.0 Silver mg/L <0.01 <0.01 0% <0.01 <0.01 0% 5.0 STLC Antimony mg/L <0.5 <0.5 0% <0.5 <0.5 0% 15 Total As mg/L 2.8 2.9 2% <0.5 <0.5 0% 5.0 Barium mg/L 0.6 0.7 11% <0.5 <0.5 0% 100 Beryllium mg/L <0.05 <0.05 0% <0.05 <0.05 0% 0.75 Cadmium mg/L <0.05 <0.05 0% <0.05 <0.05 0% 1.0 Chromium mg/L 0.6 0.70 11% 0.2 0.22 7% 560 Cobalt mg/L <0.1 <0.1 0% <0.1 <0.1 0% 80 Copper mg/L 0.63 0.70 7% <0.05 <0.05 0% 25 Lead mg/L <0.5 <0.5 0% <0.5 <0.5 0% 5.0 Mercury mg/L <0.01 <0.01 0% <0.01 <0.01 0% 0.2
117
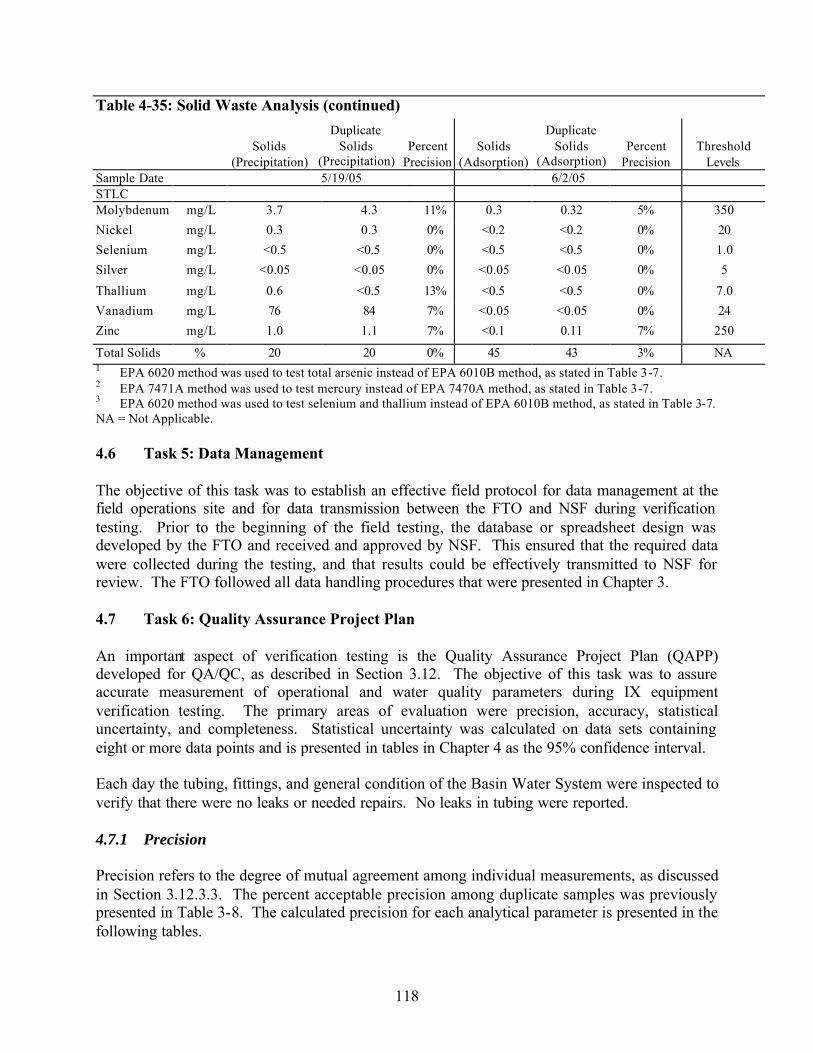
Table 4-35: Solid Waste Analysis (continued)
Solids (Precipitation)
Duplicate Solids
(Precipitation) Percent
Precision Solids
(Adsorption)
Duplicate Solids
(Adsorption) Percent
Precision Threshold
Levels Sample Date 5/19/05 6/2/05 STLC Molybdenum Nickel Selenium Silver Thallium Vanadium Zinc
mg/L mg/L mg/L mg/L mg/L mg/L mg/L
3.7 0.3 <0.5
<0.05 0.6 76 1.0
4.3 0.3
<0.5 <0.05 <0.5 84 1.1
11% 0% 0% 0% 13% 7% 7%
0.3 <0.2 <0.5 <0.05 <0.5 <0.05 <0.1
0.32 <0.2 <0.5 <0.05 <0.5 <0.05 0.11
5% 0% 0% 0% 0% 0% 7%
350 20 1.0 5
7.0 24
250
Total Solids % 20 20 0% 45 43 3% NA 1 EPA 6020 method was used to test total arsenic instead of EPA 6010B method, as stated in Table 3-7. 2 EPA 7471A method was used to test mercury instead of EPA 7470A method, as stated in Table 3-7. 3 EPA 6020 method was used to test selenium and thallium instead of EPA 6010B method, as stated in Table 3-7. NA = Not Applicable.
4.6 Task 5: Data Management
The objective of this task was to establish an effective field protocol for data management at the field operations site and for data transmission between the FTO and NSF during verification testing. Prior to the beginning of the field testing, the database or spreadsheet design was developed by the FTO and received and approved by NSF. This ensured that the required data were collected during the testing, and that results could be effectively transmitted to NSF for review. The FTO followed all data handling procedures that were presented in Chapter 3.
4.7 Task 6: Quality Assurance Project Plan
An important aspect of verification testing is the Quality Assurance Project Plan (QAPP) developed for QA/QC, as described in Section 3.12. The objective of this task was to assure accurate measurement of operational and water quality parameters during IX equipment verification testing. The primary areas of evaluation were precision, accuracy, statistical uncertainty, and completeness. Statistical uncertainty was calculated on data sets containing eight or more data points and is presented in tables in Chapter 4 as the 95% confidence interval.
Each day the tubing, fittings, and general condition of the Basin Water System were inspected to verify that there were no leaks or needed repairs. No leaks in tubing were reported.
4.7.1 Precision
Precision refers to the degree of mutual agreement among individual measurements, as discussed in Section 3.12.3.3. The percent acceptable precision among duplicate samples was previously presented in Table 3-8. The calculated precision for each analytical parameter is presented in the following tables.
118

4.7.1.1 Laboratory Duplicate Precision
The total alkalinity precision analyses for duplicates collected from the 24-hour composite samples are presented in Table 4-36. In total, there were 21 duplicates collected for total alkalinity. All samples were within the acceptable precision of 30%.
Table 4-36. Total Alkalinity Precision Analysis
Sample Alkalinity Duplicate Alkalinity Percent Date Location (mg/L of CaCO3) (mg/L of CaCO3) Precision
4/5/05 Raw Water 91.4 104 9% 4/6/05 Influent Water 88.6 87.8 1% 4/7/05 Effluent Water 78.2 78.8 1% 4/9/05 Effluent Water 79.5 78.6 1% 4/10/05 Influent Water 88.5 90.0 1% 4/11/05 Effluent Water 83.7 85.8 2% 4/12/05 Raw Water 98.8 92.9 4% 4/13/05 Raw Water 91.7 99.5 6% 4/14/05 Effluent Water 82.2 83.5 1% 4/15/05 Raw Water 91.0 92.6 1% 4/16/05 Influent Water 92.0 91.9 0% 4/17/05 Effluent Water 81.3 81.5 0% 4/18/05 Raw Water 88.5 80.6 7% 5/14/05 Influent Water 87.7 88.2 0% 5/17/05 Influent Water 94.7 95.7 1% 5/19/05 Raw Water 88.3 88.0 0% 5/20/05 Influent Water 101 94.8 4% 5/22/05 Raw Water 95.8 95.2 0% 5/24/05 Effluent Water 81.1 77.5 3% 5/26/05 Influent Water 95.3 94.9 0% 5/27/05 Effluent Water 78.8 77.9 1%
Acceptable Precision 30%
The total arsenic precision analyses for duplicates collected from the 24-hour composite samples are presented in Table 4-37. Of the 94 duplicate sets collected for arsenic, all samples were within the acceptable precision of 30%, with the exception of two on April 17, 2005, and one May 20, 2005. The two duplicate sets on April 17, 2005, that were outside the acceptable range were evaluated for possible mislabeling (e.g., effluent sample labeled as a raw or influent sample). Both sets of data appear to fall within this possible scenario. The sample arsenic result on May 20, 2005, with a percent precision of 126% is considered aberrant.
119
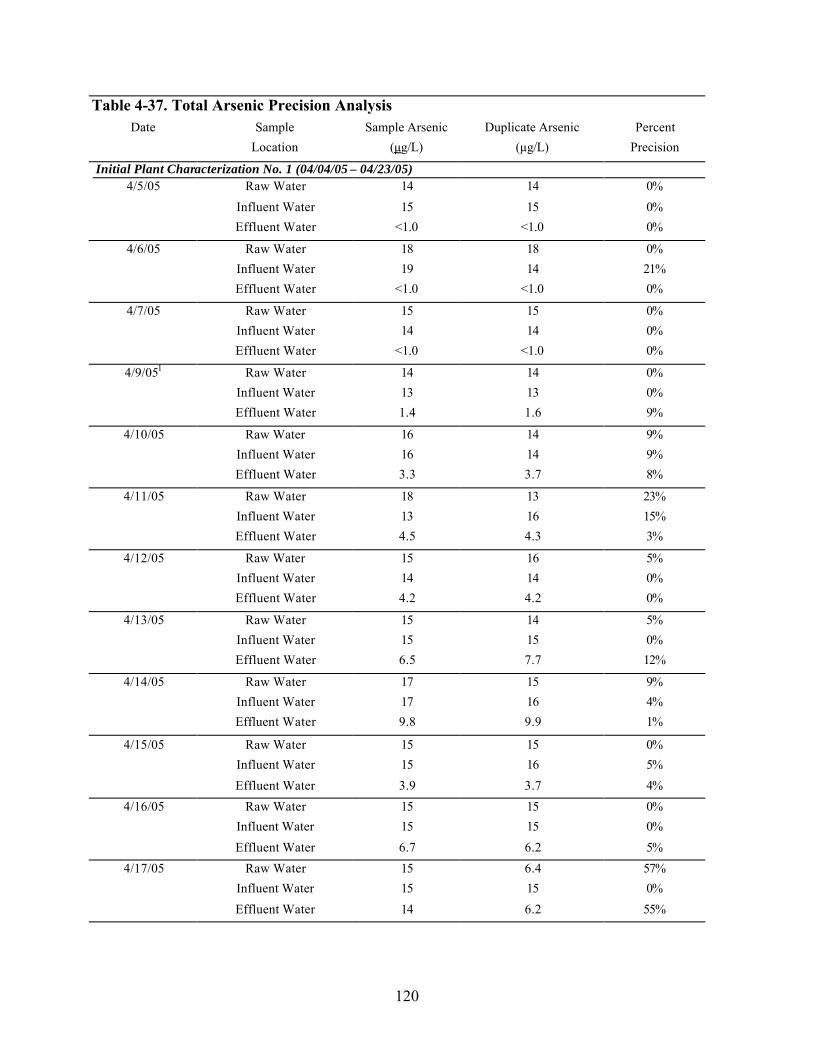
Table 4-37. Total Arsenic Precision Analysis Date Sample Sample Arsenic Duplicate Arsenic Percent
Location (µg/L) (µg/L) Precision
Initial Plant Characterization No. 1 (04/04/05 – 04/23/05) 4/5/05 Raw Water 14 14 0%
Influent Water 15 15 0% Effluent Water <1.0 <1.0 0%
4/6/05 Raw Water 18 18 0% Influent Water 19 14 21% Effluent Water <1.0 <1.0 0%
4/7/05 Raw Water 15 15 0% Influent Water 14 14 0% Effluent Water <1.0 <1.0 0%
4/9/051 Raw Water 14 14 0% Influent Water 13 13 0% Effluent Water 1.4 1.6 9%
4/10/05 Raw Water 16 14 9% Influent Water 16 14 9% Effluent Water 3.3 3.7 8%
4/11/05 Raw Water 18 13 23% Influent Water 13 16 15% Effluent Water 4.5 4.3 3%
4/12/05 Raw Water 15 16 5% Influent Water 14 14 0% Effluent Water 4.2 4.2 0%
4/13/05 Raw Water 15 14 5% Influent Water 15 15 0% Effluent Water 6.5 7.7 12%
4/14/05 Raw Water 17 15 9% Influent Water 17 16 4% Effluent Water 9.8 9.9 1%
4/15/05 Raw Water 15 15 0% Influent Water 15 16 5% Effluent Water 3.9 3.7 4%
4/16/05 Raw Water 15 15 0% Influent Water 15 15 0% Effluent Water 6.7 6.2 5%
4/17/05 Raw Water 15 6.4 57% Influent Water 15 15 0% Effluent Water 14 6.2 55%
120

Table 4-37. Total Arsenic Precision Analysis (continued) Sample Sample Arsenic Duplicate Arsenic Percent
Date Location (µg/L) (µg/L) Precision 4/18/05 Raw Water 16 15 5%
Influent Water 16 15 5% Effluent Water 3.3 2.7 14%
4/21/051 Raw Water 16 15 5% Influent Water 15 15 0% Effluent Water 3.8 4.0 4%
4/22/05 Raw Water 15 15 0% Influent Water 15 16 5% Effluent Water 6.8 7.5 7%
4/23/05 Raw Water 15 14 5% Influent Water 14 15 5% Effluent Water 4.5 4.7 3%
Initial Plant Characterization No. 2 (04/29/05 – 05/9/05) 4/30/052 Influent Water 15 14 5% 5/1/05 Effluent Water <1.0 <1.0 0%
5/2/05 Raw Water 14 16 9% 5/3/05 Raw Water 15 15 0% 5/4/05 Influent Water 16 15 5%
5/5/05 Effluent Water <1.0 <1.0 0% 5/6/05 Raw Water 15 14 5% 5/7/05 Influent Water 15 16 5%
Verification Testing (05/12/05 – 05/28/05) 5/14/053 Raw Water 15 14 5%
Influent Water 14 15 5% Effluent Water <1.0 <1.0 0%
5/16/051 Raw Water 15 14 5% Influent Water 14 15 5% Effluent Water <1.0 <1.0 0%
5/17/05 Raw Water 16 15 5% Influent Water 15 15 0% Effluent Water <1.0 <1.0 0%
5/18/05 Raw Water 14 14 0% Influent Water 14 14 0% Effluent Water <1.0 <1.0 0%
5/19/05 Raw Water 15 14 5% Influent Water 15 15 0% Effluent Water <1.0 <1.0 0%
121

Table 4-37. Total Arsenic Precision Analysis (continued) Sample Sample Arsenic Duplicate Arsenic Percent
Date Location (µg/L) (µg/L) Precision 5/20/05 Raw Water <1.0 15 124%
Influent Water 16 15 5% Effluent Water <1.0 <1.0 0%
5/21/05 Raw Water 15 14 5% Influent Water 15 15 0% Effluent Water <1.0 <1.0 0%
5/22/05 Raw Water 15 15 0% Influent Water 15 15 0% Effluent Water <1.0 <1.0 0%
5/23/05 Raw Water 15 15 0% Influent Water 15 15 0% Effluent Water <1.0 <1.0 0%
5/25/054 Raw Water 15 15 0% Influent Water 15 15 0% Effluent Water <1.0 <1.0 0%
5/26/05 Influent Water 15 15 0% Effluent Water <1.0 <1.0 0%
5/27/05 Raw Water 15 15 0% Influent Water 15 15 0% Effluent Water <1.0 <1.0 0%
5/28/05 Raw Water 15 15 0% Influent Water 15 15 0% Effluent Water <1.0 <1.0 0%
Acceptable Precision 30% 1 Missing data on 4/8, 4/19-4/20, and 5/15 due to plant shutdown. 2 Data not available 4/24-4/29 while awaiting approval from NSF to continue testing. 3 Missing data from 5/8-5/13 due to switch over from Initial Plant Characterization to the Verification Test. 4 Grab samples not collected on 5/24.
The vanadium precision analyses for duplicates collected from the 24-hour composite samples are presented in Table 4-38. Of the 62 duplicate samples collected, four duplicate sets of vanadium results were outside the acceptable precision of 30% and were evaluated for possible mislabeling. All four of the data sets (April 5: raw water, April 9: effluent water, April 17: effluent water, and May 20: raw water) appear to fall within this possible scenario.
122
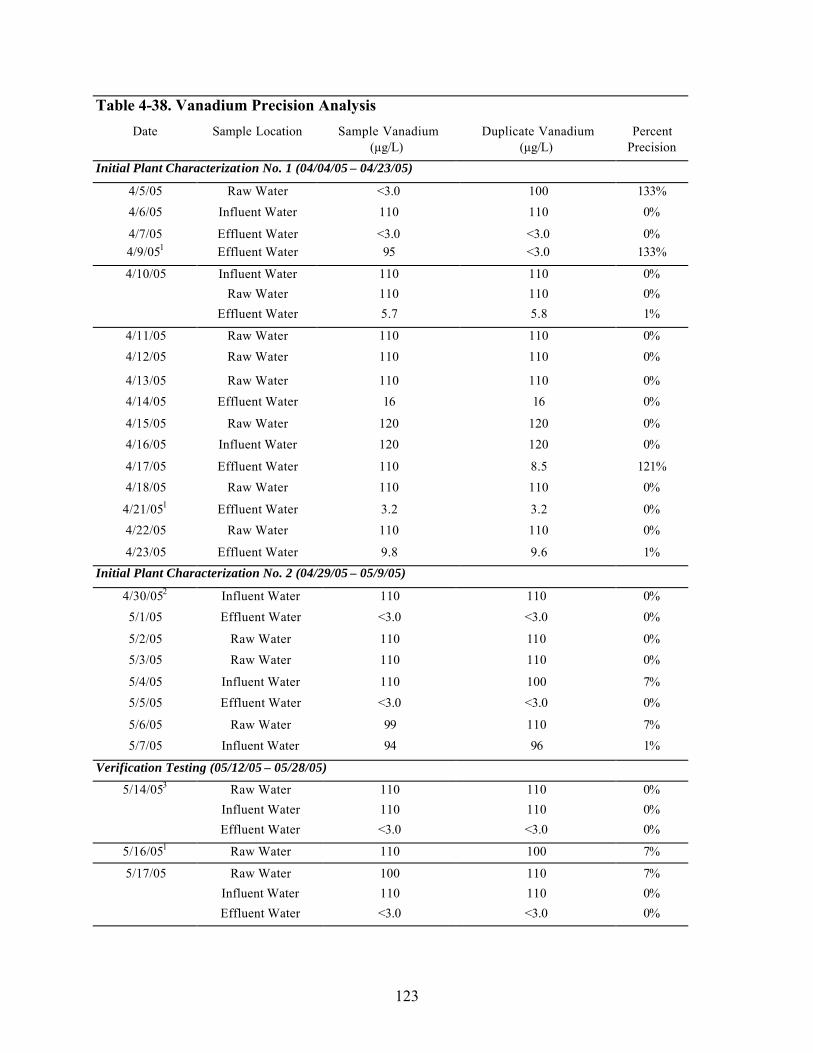
Table 4-38. Vanadium Precision Analysis Date Sample Location Sample Vanadium
(µg/L) Duplicate Vanadium
(µg/L) Percent
Precision Initial Plant Characterization No. 1 (04/04/05 – 04/23/05)
4/5/05 Raw Water <3.0 100 133% 4/6/05 Influent Water 110 110 0%
4/7/05 Effluent Water <3.0 <3.0 0% 4/9/051 Effluent Water 95 <3.0 133%
4/10/05 Influent Water 110 110 0% Raw Water 110 110 0%
Effluent Water 5.7 5.8 1%
4/11/05 Raw Water 110 110 0% 4/12/05 Raw Water 110 110 0%
4/13/05 Raw Water 110 110 0% 4/14/05 Effluent Water 16 16 0%
4/15/05 Raw Water 120 120 0% 4/16/05 Influent Water 120 120 0%
4/17/05 Effluent Water 110 8.5 121% 4/18/05 Raw Water 110 110 0%
4/21/051 Effluent Water 3.2 3.2 0% 4/22/05 Raw Water 110 110 0%
4/23/05 Effluent Water 9.8 9.6 1% Initial Plant Characterization No. 2 (04/29/05 – 05/9/05)
4/30/052 Influent Water 110 110 0% 5/1/05 Effluent Water <3.0 <3.0 0%
5/2/05 Raw Water 110 110 0% 5/3/05 Raw Water 110 110 0%
5/4/05 Influent Water 110 100 7% 5/5/05 Effluent Water <3.0 <3.0 0%
5/6/05 Raw Water 99 110 7% 5/7/05 Influent Water 94 96 1%
Verification Testing (05/12/05 – 05/28/05)
5/14/053 Raw Water 110 110 0% Influent Water 110 110 0% Effluent Water <3.0 <3.0 0%
5/16/051 Raw Water 110 100 7%
5/17/05 Raw Water 100 110 7% Influent Water 110 110 0% Effluent Water <3.0 <3.0 0%
123

Table 4-38. Vanadium Precision Analysis (continued) Date Sample Location Sample Vanadiu m Duplicate Vanadium Percent
(µg/L) (µg/L) Precision
5/18/05 Raw Water 110 99 7% 5/18/05 Influent Water 98 97 1%
Effluent Water <3.0 <3.0 0% 5/19/05 Raw Water 99 96 2%
Influent Water 97 96 1% Effluent Water <3.0 <3.0 0%
5/20/05 Raw Water <3.0 110 134% Influent Water 110 110 0% Effluent Water <3.0 <3.0 0%
5/21/05 Raw Water 100 100 0% Influent Water 100 100 0% Effluent Water <3.0 <3.0 0%
5/22/05 Raw Water 110 100 7% Influent Water 100 100 0% Effluent Water <3.0 <3.0 0%
5/23/05 Raw Water 100 100 0% Influent Water 100 100 0% Effluent Water <3.0 <3.0 0%
5/25/054 Raw Water 110 110 0% Influent Water 110 110 0% Effluent Water <3.0 <3.0 0%
5/26/05 Influent Water 110 110 0% Effluent Water <3.0 <3.0 0%
5/27/05 Raw Water 110 110 0% Influent Water 110 110 0% Effluent Water <3.0 <3.0 0%
5/28/05 Raw Water 110 110 0% Influent Water 110 110 0% Effluent Water <3.0 <3.0 0%
Acceptable Precision 30% 1 Missing data on 4/8/05, 4/19-4/20, and 5/15 due to plant shutdown.2 Data not available 4/24-4/29 while awaiting approval from NSF to continue testing.3 Missing data from 5/8-5/13 due to switch over from Initial Plant Characterization to the Verification Test.4 Grab samples not collected on 5/24/05.
124

Table 4-39 presents the calcium, iron, total hardness, magnesium, and manganese precision analyses. All of the duplicate data sets were within the acceptable precision range of 30% for each parameter.
Table 4-39. Calcium, Iron, Total Hardness, Magnesium, and Manganese Precision Analysis Sample Duplicate
Sample Calcium Calcium Percent Date Location (mg/L) (mg/L) Precision
4/5/05 Raw Water 5.9 5.8 1% <0.020 <0.020 0% 4/11/05 Effluent Water 6.1 6.0 1% <0.020 <0.020 0% 4/12/05 Raw Water 6.0 5.9 1% <0.020 <0.020 0% 4/14/05 Effluent Water 6.2 6.2 0% <0.020 <0.020 0% 5/14/05 Influent Water 5.6 6.0 5% <0.020 <0.020 0% 5/17/05 Influent Water 6.0 6.0 0% <0.020 <0.020 0% 5/19/05 Raw Water 6.1 5.8 4% <0.020 <0.020 0% 5/20/05 Influent Water 6.3 6.0 3% <0.020 <0.020 0% 5/22/05 Raw Water 6.4 6.0 5% <0.020 <0.020 0% 5/24/05 Effluent Water 6.1 6.7 7% <0.020 <0.020 0% 5/26/05 Influent Water 6.1 6.2 1% <0.020 <0.020 0% 5/27/05 Effluent Water 6.0 6.0 0% <0.020 <0.020 0%
Acceptable Precision 30% Acceptable Precision 30% Sample Duplicate
Sample Hardness Hardness Percent Date Location (mg/L) (mg/L) Precision
4/5/05 Raw Water 18.1 17.8 1% 4/11/05 Effluent Water 18.8 18.5 1% 4/12/05 Raw Water 18.4 18.2 1% 4/14/05 Effluent Water 19.0 19.0 0% 5/14/05 Influent Water 17.1 18.4 5% 5/17/05 Influent Water 18.3 18.2 0% 5/19/05 Raw Water 18.8 17.9 3% 5/20/05 Influent Water 19.4 18.4 4% 5/22/05 Raw Water 19.7 18.4 5% 5/24/05 Effluent Water 18.7 20.2 5% 5/26/05 Influent Water 18.7 19.0 1% 5/27/05 Effluent Water 18.5 18.4 0%
Acceptable Precision 30%
Sample Duplicate Iron Iron Percent
(mg/L) (mg/L) Precision
Sample Duplicate Magnesium Magnesium Percent
(mg/L) (mg/L) Precision 0.81 0.81 0% 0.86 0.85 1% 0.83 0.83 0% 0.85 0.85 0% 0.76 0.84 7% 0.81 0.79 2% 0.86 0.82 3% 0.88 0.84 3% 0.90 0.82 7% 0.85 0.84 1% 0.84 0.85 1% 0.85 0.84 1%
Acceptable Precision 30%
125

Table 4-39. Calcium, Iron, Total Hardness, Magnesium, and Manganese Precision Analysis (continued)
Sample Duplicate Sample Manganes e Manganese Percent
Date Location (mg/L) (mg/L) Precision 4/5 /05 Raw Water <2.0 <2.0 0% 4/11/05 Effluent Water <2.0 <2.0 0% 4/12/05 Raw Water <2.0 <2.0 0% 4/14/05 Effluent Water <2.0 <2.0 0% 5/14/05 Influent Water <2.0 <2.0 0% 5/17/05 Influent Water <2.0 <2.0 0% 5/19/05 Raw Water <2.0 <2.0 0% 5/20/05 Influent Water <2.0 <2.0 0% 5/22/05 Raw Water <2.0 <2.0 0%
5/24/05 Effluent Water <2.0 <2.0 0% 5/26/05 Influent Water <2.0 <2.0 0% 5/27/05 Effluent Water <2.0 <2.0 0%
Acceptable Precision 30%
Table 4-40 presents the dissolved silica, TDS, fluoride, and TSS precision analyses. All of the duplicate data sets were within the acceptable precision range for each parameter.
Table 4-40. Silica, TDS, TSS, and Fluoride Precision Analysis
Date Sample
Location
Sample Dissolved
Silica (mg/L)
Duplicate Dissolved
Silica (mg/L)
Percent Precision
Sample TDS
(mg/L)
Duplicate TDS
(mg/L) Percent
Precision 4/5/05 Raw Water 12 12 0% 300 300 0%
4/11/05 Effluent Water 13 13 0% 280 280 0% 4/12/05 Raw Water 12 11 6% 290 290 0% 4/14/05 Effluent Water 12 12 0% 280 280 0% 5/14/05 Influent Water 12 12 0% 290 290 0% 5/17/05 Influent Water 12 12 0% 290 290 0% 5/19/05 Raw Water 12 12 0% 300 290 2% 5/20/05 Influent Water 12 11 6% 290 290 0% 5/22/05 Raw Water 11 12 6% 280 290 2% 5/24/05 Effluent Water 12 12 0% 300 290 2% 5/26/05 Influent Water 11 11 0% 290 290 0% 5/27/05 Effluent Water 12 12 0% 280 280 0%
Acceptable Precision 30% Acceptable Precision 30%
126

1
Table 4-40. Silica, TDS, TSS, and Fluoride Precision Analysis (continued) Sample Duplicate
Sample Fluoride Fluoride Percent Date Location (mg/L) (mg/L) Precision
4/5/05 Raw Water 0.44 0.45 2% 4/11/05 Effluent Water 0.44 0.44 0% 4/12/05 Raw Water 0.43 0.44 2% 4/13/051 Raw Water 0.36 0.39 6% 4/1405 Effluent Water 0.40 0.40 0%
5/14/05 Influent Water 0.41 0.42 2% 5/17/05 Influent Water 0.42 0.41 2% 5/19/05 Raw Water 0.40 0.45 8% 5/20/05 Influent Water 0.41 0.44 5%
5/22/05 Raw Water 0.33 0.32 2% 5/24/05 Effluent Water 0.32 0.40 16% 5/26/05 Influent Water 0.33 0.31 4% 5/27/05 Effluent Water 0.45 0.45 0%
Acceptable Precision 20%
Sample Duplicate TSS TSS Percent
(mg/L) (mg/L) Precision <10 <10 0% <10 <10 0% <10 <10 0% NA NA NA <10 <10 0%
<10 <10 0% <10 <10 0% <10 <10 0% <10 <10 0%
<10 <10 0% <10 <10 0% <10 <10 0% <10 <10 0%
Acceptable Precision 30%
Fluoride duplicate sample collected on 4/13 was an additional sample collected during the Initia l Plant Characterization task; therefore, a TSS duplicate sample was not collected.
Table 4-41 presents the chloride, sulfate, and nitrate precision analyses. With the exception of three sample sets, all of the duplicate data sets were within the acceptable precision range. The sulfate duplicate set on April 9, 2005, had a percent precision of 47% due to a difference in the minimum detection limits of the samples. The duplicate sets for chloride and nitrate on May 24, 2005, had percent precisions of 59 and 60%, respectively, with an acceptable percent precision range of 0 to 20% for chloride and 0-30% for nitrate.
Table 4-41. Chloride, Sulfate, and Nitrate Precision Analysis
Sample Duplicate Sample Duplicate Sample Chloride Chloride Percent Sulfate Sulfate Percent
Date Location (mg/L) (mg/L) Precision (mg/L) (mg/L) Precision 4/5/05 Raw Water 4/6/05 Influent Water 4/7/05 Effluent Water 4/9/05 Effluent Water 4/10/05 Influent Water 4/11/05 Effluent Water 4/12/05 Raw Water 4/13/05 Raw Water 4/14/05 Effluent Water
75 74 1% 37 37 0% 74 75 1% 37 37 0% 110 110 0% <1.0 <1.0 0% 117 117 0% <1.0 <0.50 47% 75 74 1% 37 37 0% 110 110 0% <2.5 <2.5 0% 71 70 1% 37 37 0% 74 75 1% 37 37 0% 110 110 0% <2.5 <2.5 0%
127

Table 4-41. Chloride, Sulfate, and Nitrate Precision Analysis (continued)
Date Sample
Location
Sample Chloride (mg/L)
Duplicate Chloride (mg/L)
Percent Precision
Sample Sulfate (mg/L)
Duplicate Sulfate (mg/L)
Percent Precision
4/15/05 Raw Water 69 69 0% 36 36 0% 4/16/05 Influent Water 74 74 0% 37 37 0% 4/17/05 Effluent Water 108 110 1% <2.5 <2.5 0% 4/18/05 Raw Water 74 74 0% 39 38 2% 5/14/05 Influent Water 71 71 0% 37 37 0% 5/17/05 Influent Water 72 72 0% 37 37 0% 5/19/05 Raw Water 71 72 1% 37 37 0% 5/20/05 Influent Water 67 71 4% 35 37 4% 5/22/05 Raw Water 71 71 0% 37 37 0% 5/24/05 Effluent Water 290 120 59% <2.5 <2.5 0% 5/26/05 Influent Water 72 72 0% 37 37 0% 5/27/05 Effluent Water 120 120 0% <2.5 <2.5 0%
Acceptable Precision 20% Acceptable Precision 20%
Date Sample
Location
Sample Nitrate (mg/L)
Duplicate Nitrate (mg/L)
Percent Precision
4/5/05 Raw Water 6.2 6.2 0% 4/6/05 Influent Water 6.2 6.2 0% 4/7/05 Effluent Water 4.5 4.5 0% 4/9/05 Effluent Water 4.1 4.2 2% 4/10/05 Influent Water 6.2 6.2 0% 4/11/05 Effluent Water 4.9 4.9 0% 4/12/05 Raw Water 6.3 6.3 0% 4/13/05 Raw Water 5.6 5.7 1% 4/14/05 Effluent Water 4.2 4.1 2% 4/15/05 Raw Water 6.9 6.8 1% 4/16/05 Influent Water 6.9 6.9 0% 4/17/05 Effluent Water 5.2 5.2 0% 4/18/05 Raw Water 6.3 6.3 0% 5/14/05 Influent Water 6.2 6.4 2% 5/17/05 Influent Water 6.3 6.3 0% 5/19/05 Raw Water 6.3 6.3 0% 5/20/05 Influent Water 6.3 6.2 1% 5/22/05 Raw Water 6.3 6.3 0% 5/24/05 Effluent Water 9.9 4.0 60% 5/26/05 Influent Water 6.2 6.2 0% 5/27/05 Effluent Water 3.5 3.5 0%
Acceptable Precision 30%
128

Table 4-42 presents the precision data for the one set of duplicate samples collected on May 19, 2005 from the treated brine and the untreated brine. The high precision levels are due to a difference in the minimum detection limits of the samples. Another likely explanation for the high precision levels could be variability in the waste (i.e., non-homogeneous samples). Precision levels for detectable data ranged from 0-70%.
Table 4-42. Treated and Untreated Liquid Waste Brine Precision Analysis
Sample Duplicate Percent Sample Duplicate Percent Parameter Units Treated Brine Treated Brine Precision Untreated Brine Untreated Brine Precision
Conductivity umho/cm 101000 101000 0% 105000 105000 0% pH units 7.9 8.1 1.8% 9.7 9.7 0%
Total Arsenic µg/L 140 140 0% 4100 3500 11% Antimony µg/L <50 <20 60% <50 <20 60%
Barium µg/L <100 43 56% 380 140 65% Beryllium µg/L <50 <20 60% <50 <20 60% Cadmium µg/L <25 <10 61% <25 <10 61% Chromium µg/L <50 <20 60% <50 22 55%
Cobalt µg/L <100 <40 60% <100 <40 60% Copper µg/L <100 <40 60% <100 73 22%
Lead µg/L <25 <10 61% <25 <10 61% Mercury µg/L <0.20 0.327 34% <0.20 <0.20 0%
Molybdenum µg/L 3200 3200 0% 3500 3000 11% Nickel µg/L <250 <100 61% <250 <100 61%
Selenium µg/L <500 660 20% 570 420 21% Silver µg/L 30 <10 70% <25 <10 61% TSS mg/L 24 43 40% 26 56 52%
Thallium µg/L <50 <20 60% <50 <20 60% Vanadium µg/L 890 830 4.9% 3940 3831 2.0%
Zinc µg/L <250 <100 61% <250 <100 61%
4.7.1.2 On-Site Analytical Precision
Duplicate samples were collected and the on-site analytical precision was calculated for free and total chlorine, conductivity, and pH. The precision analyses of these parameters are presented in Tables 4-43 through 4-45.
As presented in Table 4-43, there were 31 total chlorine duplicate sets, with 14 sets above the acceptable precision value of 20%. The low number of sample sets that fell within the acceptable precision level may be attributed to the volatile nature of chlorine and/or the very low levels of chlorine being analyzed. The similar scenario was observed for free chlorine, with 14 of the 30 sample duplicates exceeding the acceptable precision of 20%.
129
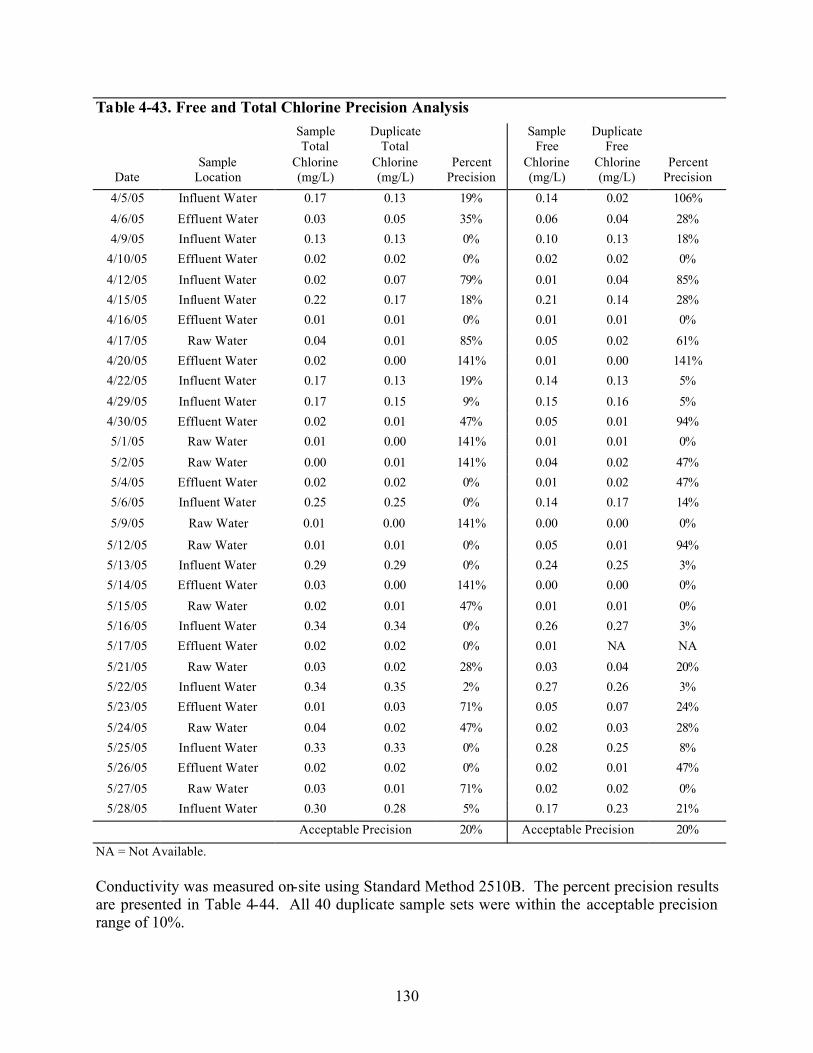
Table 4-43. Free and Total Chlorine Precision Analysis Sample Duplicate Total Total
Sample Chlorine Chlorine Percent Date Location (mg/L) (mg/L) Precision
4/5/05 Influent Water 0.17 0.13 19% 4/6/05 Effluent Water 0.03 0.05 35% 4/9/05 Influent Water 0.13 0.13 0%
4/10/05 Effluent Water 0.02 0.02 0% 4/12/05 Influent Water 0.02 0.07 79% 4/15/05 Influent Water 0.22 0.17 18% 4/16/05 Effluent Water 0.01 0.01 0% 4/17/05 Raw Water 0.04 0.01 85% 4/20/05 Effluent Water 0.02 0.00 141% 4/22/05 Influent Water 0.17 0.13 19% 4/29/05 Influent Water 0.17 0.15 9% 4/30/05 Effluent Water 0.02 0.01 47% 5/1/05 Raw Water 0.01 0.00 141% 5/2/05 Raw Water 0.00 0.01 141% 5/4/05 Effluent Water 0.02 0.02 0% 5/6/05 Influent Water 0.25 0.25 0% 5/9/05 Raw Water 0.01 0.00 141%
5/12/05 Raw Water 0.01 0.01 0% 5/13/05 Influent Water 0.29 0.29 0% 5/14/05 Effluent Water 0.03 0.00 141% 5/15/05 Raw Water 0.02 0.01 47% 5/16/05 Influent Water 0.34 0.34 0% 5/17/05 Effluent Water 0.02 0.02 0% 5/21/05 Raw Water 0.03 0.02 28% 5/22/05 Influent Water 0.34 0.35 2% 5/23/05 Effluent Water 0.01 0.03 71% 5/24/05 Raw Water 0.04 0.02 47% 5/25/05 Influent Water 0.33 0.33 0% 5/26/05 Effluent Water 0.02 0.02 0% 5/27/05 Raw Water 0.03 0.01 71% 5/28/05 Influent Water 0.30 0.28 5%
Acceptable Precision 20%
NA = Not Available.
Sample Duplicate Free Free
Chlorine Chlorine Percent (mg/L) (mg/L) Precision
0.14 0.02 106% 0.06 0.04 28% 0.10 0.13 18% 0.02 0.02 0% 0.01 0.04 85% 0.21 0.14 28% 0.01 0.01 0% 0.05 0.02 61% 0.01 0.00 141% 0.14 0.13 5% 0.15 0.16 5% 0.05 0.01 94% 0.01 0.01 0% 0.04 0.02 47% 0.01 0.02 47% 0.14 0.17 14% 0.00 0.00 0%
0.05 0.01 94% 0.24 0.25 3% 0.00 0.00 0% 0.01 0.01 0% 0.26 0.27 3% 0.01 NA NA 0.03 0.04 20% 0.27 0.26 3% 0.05 0.07 24% 0.02 0.03 28% 0.28 0.25 8% 0.02 0.01 47% 0.02 0.02 0% 0.17 0.23 21%
Acceptable Precision 20%
Conductivity was measured on-site using Standard Method 2510B. The percent precision results are presented in Table 4-44. All 40 duplicate sample sets were within the acceptable precision range of 10%.
130

Table 4-44. Conductivity Precision Analysis Sample Sample Conductivity Duplicate Conductivity Percent
Date Location (µmho/cm) (µmho/cm) Precision 4/5/05 Influent Water 529 541 2% 4/6/05 Effluent Water 508 508 0% 4/8/05 Raw Water 595 572 3% 4/9/05 Influent Water 528 529 0% 4/10/05 Effluent Water 529 540 1% 4/11/05 Raw Water 512 522 1% 4/13/05 Influent Water 527 519 1% 4/15/05 Influent Water 543 540 0% 4/16/05 Effluent Water 532 533 0% 4/17/05 Raw Water 520 526 1% 4/18/05 Influent Water 527 526 0% 4/20/05 Effluent Water 550 548 0% 4/21/05 Raw Water 540 542 0% 4/22/05 Influent Water 534 536 0% 4/29/05 Influent Water 536 533 0% 4/30/05 Effluent Water 560 562 0% 5/1/05 Raw Water 538 535 0% 5/2/05 Raw Water 533 528 1% 5/3/05 Influent Water 534 536 0% 5/4/05 Effluent Water 541 543 0% 5/5/05 Raw Water 508 507 0% 5/6/05 Influent Water 543 542 0% 5/7/05 Effluent Water 558 551 1% 5/8/05 Raw Water 518 516 0% 5/9/05 Raw Water 534 534 0% 5/12/05 Raw Water 543 541 0% 5/13/05 Influent Water 533 533 0% 5/14/05 Effluent Water 544 547 0% 5/15/05 Raw Water 521 523 0% 5/16/05 Influent Water 548 549 0% 5/17/05 Effluent Water 540 539 0% 5/18/05 Raw Water 552 545 1% 5/21/05 Raw Water 529 531 0% 5/22/05 Influent Water 524 524 0% 5/23/05 Effluent Water 561 562 0% 5/24/05 Raw Water 517 513 1% 5/25/05 Influent Water 528 532 1% 5/26/05 Effluent Water 532 535 0% 5/27/05 Raw Water 528 531 0%
131
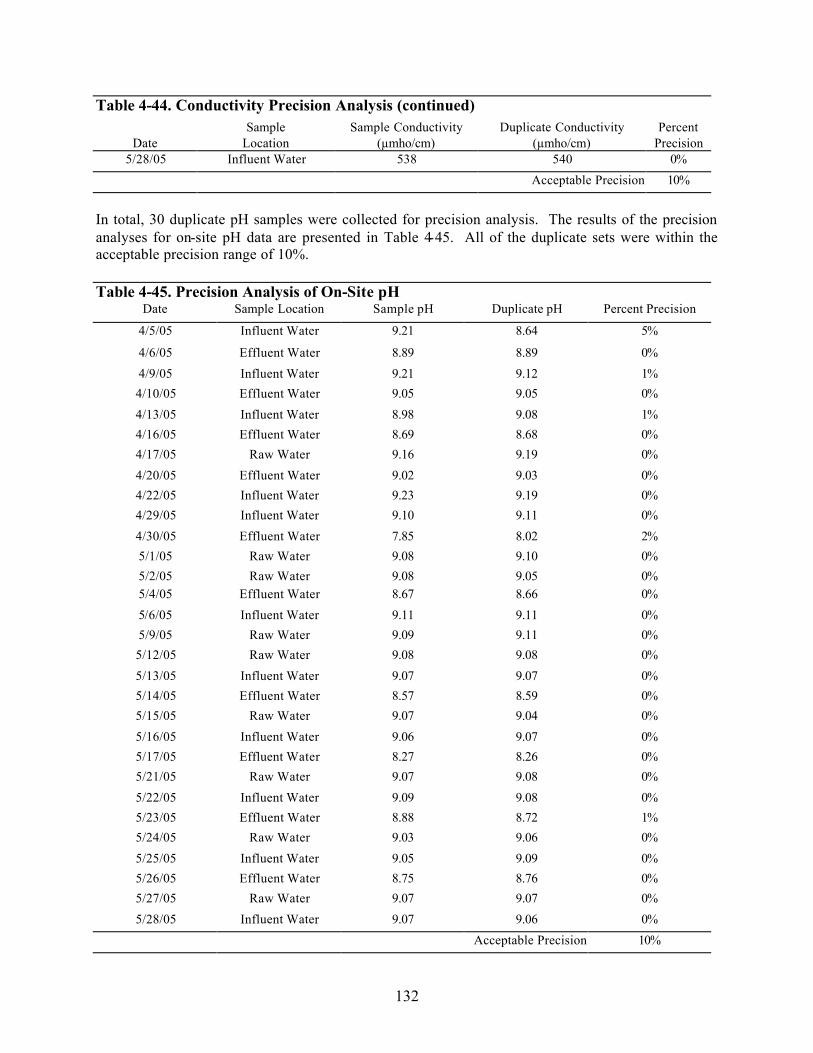
Table 4-44. Conductivity Precision Analysis (continued) Sample Sample Conductivity Duplicate Conductivity Percent
Date Location (µmho/cm) (µmho/cm) Precision 5/28/05 Influent Water 538 540 0%
Acceptable Precision 10%
In total, 30 duplicate pH samples were collected for precision analysis. The results of the precision analyses for on-site pH data are presented in Table 4-45. All of the duplicate sets were within the acceptable precision range of 10%.
Table 4-45. Precision Analysis of On-Site pH Date Sample Location Sample pH Duplicate pH Percent Precision
4/5/05 Influent Water 9.21 8.64 5%
4/6/05 Effluent Water 8.89 8.89 0% 4/9/05 Influent Water 9.21 9.12 1% 4/10/05 Effluent Water 9.05 9.05 0% 4/13/05 Influent Water 8.98 9.08 1% 4/16/05 Effluent Water 8.69 8.68 0% 4/17/05 Raw Water 9.16 9.19 0% 4/20/05 Effluent Water 9.02 9.03 0% 4/22/05 Influent Water 9.23 9.19 0% 4/29/05 Influent Water 9.10 9.11 0% 4/30/05 Effluent Water 7.85 8.02 2% 5/1/05 Raw Water 9.08 9.10 0% 5/2/05 Raw Water 9.08 9.05 0% 5/4/05 Effluent Water 8.67 8.66 0% 5/6/05 Influent Water 9.11 9.11 0% 5/9/05 Raw Water 9.09 9.11 0% 5/12/05 Raw Water 9.08 9.08 0% 5/13/05 Influent Water 9.07 9.07 0% 5/14/05 Effluent Water 8.57 8.59 0% 5/15/05 Raw Water 9.07 9.04 0% 5/16/05 Influent Water 9.06 9.07 0% 5/17/05 Effluent Water 8.27 8.26 0% 5/21/05 Raw Water 9.07 9.08 0% 5/22/05 Influent Water 9.09 9.08 0% 5/23/05 Effluent Water 8.88 8.72 1% 5/24/05 Raw Water 9.03 9.06 0% 5/25/05 Influent Water 9.05 9.09 0% 5/26/05 Effluent Water 8.75 8.76 0% 5/27/05 Raw Water 9.07 9.07 0% 5/28/05 Influent Water 9.07 9.06 0%
Acceptable Precision 10%
132

4.7.2 Accuracy
Arsenic Speciation and Analysis Total arsenic samples were collected daily and analyzed using EPA Method 200.8. Additional arsenic samples were collected twice per week for As (III) and dissolved arsenic. The field speciation columns for the dissolved arsenic and As (III) samples were provided by NSF. QA/QC evaluations of the speciation columns using known concentrations of As (III) and As (V) were conducted by the NSF laboratory prior to verification testing; this QA/QC documentation is provided in Appendix B. Additional speciation studies were previously discussed in Section 4.5.2. There is currently no explanation for the inconsistent speciation results observed during the test. However, the arsenic present at the test site appeared to be in the As (III) state, and the Basin Water System consistently removed the arsenic to non-detectable levels (<1 µg/L).
Other Laboratory Parameters Accuracy checks performed by MWH Laboratories for all samples analyzed by MWH Laboratories were within the specified acceptance limits outlined in Table 3-10.
pH Meter The pH meter was calibrated daily using certified pH solutions (4.0, 7.0, and 10.0) purchased from Hach. Analyses were made daily according to Standard Method 4500-H+B.
Pressure Gauges Basin Water indicated that the pressure gauges installed were factory-calibrated. No additional accuracy checks were performed.
Temperature Temperature was measured with a NIST-certified thermometer. Because temperature was measured daily using a NIST-certified thermometer, no accuracy checks were necessary.
Conductivity Meter The handheld conductivity meter was used according to Standard Method 2510 B. A three-point calibration with certified conductivity solutions (184, 1000, and 1990 umoh/cm) was made each day the meter was in use.
Chlorine Meter Three times during the testing the chlorine meter was checked for accuracy using known spike samples provided by Hach with the Hach 8167 method for total chlorine and Hach 8021 method for free chlorine. The accuracy of the free and total chlorine spikes is discussed in additional detail in Section 4.7.3 with corresponding data provided in Table 4-45. All results were within the acceptable accuracy range.
Flow Monitoring The Basin Water System was equipped with panel-mounted flow meters to read the influent and effluent flow rates. The effluent flow rate was also checked daily using the bucket and stopwatch method. The flow meters appeared to be accurate according to this method of calibration, with an average accuracy of 86% for the effluent flow rate. The flow meters were
133

not designed to allow adjustment or calibration, so the differences (when present) were recorded; however, no adjustments could be made to “calibrate” the flow meters.
4.7.3 Spikes
All spikes were performed and analyzed at MWH Laboratories, with the exception of chlorine. Field spikes were measured using a handheld chlorine analyzer. The results are presented in Table 4-46.
Table 4-46. Chlorine Spike Results Spike Total Chlorine Percent Free Chlorine Percent
Date (mg/L) (mg/L) Accuracy (mg/L) Accuracy
4/8/05 0.27 0.25 93% 0.18 67% 0.53 0.57 108% 0.42 79% 0.80 0.79 99% 0.74 93%
4/13/05 0.27 0.25 93% 0.16 59% 0.53 0.47 89% 0.47 89% 0.80 0.77 96% 0.68 85%
4/14/05 0.27 0.25 93% 0.21 78% 0.53 0.54 102% 0.49 92% 0.80 0.80 100% 0.77 96%
4/18/05 0.27 0.22 81% 0.22 81% 0.53 0.46 87% 0.45 85% 0.80 0.70 88% 0.69 86%
4/29/05 0.27 0.22 81% 0.22 81% 0.53 0.46 87% 0.47 89% 0.80 0.76 95% 0.75 94%
5/2/05 0.27 0.24 89% 0.18 67% 0.53 0.49 92% 0.48 91% 0.80 0.75 94% 0.76 95%
5/9/05 0.27 0.27 100% 0.28 104% 0.53 0.51 96% 0.49 92% 0.80 0.75 94% 0.73 91%
5/16/05 0.27 0.32 119% 0.26 96% 0.53 0.56 106% 0.40 75% 0.80 0.74 93% 0.73 91%
5/23/05 0.27 0.26 96% 0.22 81% 0.53 0.53 100% 0.49 92% 0.80 0.81 101% 0.74 93%
134

4.7.4 Calibrations
Calibrations of the pH meter and conductivity meter and manual checks of the flow rate using the bucket and stop watch method were completed daily. The results of the daily calibrations are presented in Tables 4-47 through 4-49. The results indicate a 99-100% degree of accuracy with each pH buffer solution used for the pH calibrations, 99-102% degree of accuracy of the conductivity meter, and approximately 86% accuracy of the flow meter.
Table 4-47. Daily Calibration of pH Meter Measurement Percent Measurement Percent Measurement Percent
Date with 4.01 Buffer Accuracy with 7.00 Buffer Accuracy with 10.01 Buffer Accuracy 4/15/05 3.97 99% 7.03 100% 9.99 100% 4/16/05 3.83 96% 7.00 100% 10.03 100% 4/17/05 3.77 94% 6.97 100% 10.01 100% 4/18/05 3.74 93% 6.97 100% 10.08 101% 4/20/051 4.00 100% 7.02 100% 10.07 101%
4/21/05 3.99 100% 7.02 100% 10.07 101% 4/22/05 4.00 100% 7.01 100% 10.04 100% 4/29/05 4.00 100% 7.01 100% 10.05 100% 4/30/05 4.01 100% 7.01 100% 10.06 100% 5/1/05 4.00 100% 7.02 100% 10.08 101% 5/2/05 4.00 100% 7.01 100% 10.05 100% 5/3/05 4.01 100% 7.00 100% 10.03 100% 5/4/05 4.00 100% 7.02 100% 10.06 100% 5/5/05 4.00 100% 7.00 100% 10.07 101% 5/6/05 4.00 100% 7.02 100% 10.07 101% 5/7/05 4.01 100% 7.01 100% 10.04 100% 5/8/05 4.01 100% 7.00 100% 10.01 100% 5/9/05 4.01 100% 7.01 100% 10.04 100% 5/12/05 4.01 100% 7.00 100% 9.99 100% 5/13/05 4.02 100% 6.99 100% 9.96 100% 5/14/05 4.02 100% 6.99 100% 9.98 100% 5/15/05 4.02 100% 6.99 100% 9.98 100% 5/16/05 4.01 100% 7.01 100% 10.03 100% 5/17/05 4.01 100% 7.00 100% 10.02 100% 5/18/05 4.00 100% 7.01 100% 10.05 100% 5/19/05 4.00 100% 7.01 100% 10.05 100% 5/20/05 4.01 100% 7.01 100% 10.00 100% 5/21/05 4.01 100% 6.99 100% 10.00 100% 5/22/05 4.01 100% 7.00 100% 10.00 100% 5/23/05 4.01 100% 6.99 100% 9.98 100% 5/24/05 4.01 100% 6.99 100% 9.99 100% 5/25/05 4.01 100% 7.00 100% 10.00 100%
135

1
Table 4-47. Daily Calibration of pH Meter (continued) Measurement Percent Measurement Percent Measurement Percent
Date with 4.01 Buffer Accuracy with 7.00 Buffer Accuracy with 10.01 Buffer Accuracy 5/26/05 4.01 100% 7.01 100% 10.04 100% 5/27/05 4.01 100% 6.99 100% 9.99 100% 5/28/05 4.01 100% 7.00 100% 10.00 100%
Average 3.99 99% 7.00 100% 10.03 100% Minimum 3.74 93% 6.97 100% 9.96 100% Maximum 4.02 100% 7.03 100% 10.08 101%
Data not available on 4/19/05 due to plant-shutdown.
Table 4-48. Daily Calibration of Conductivity Meter With 180 Percent With 1000 Percent With 1990 Percent
Date µmho/cm Sol. Accuracy µmho/cm Sol. Accuracy µmho/cm Sol. Accuracy First Conductivity Reading
4/15/05 186.2 103% 1002 100% 1940 97% 4/16/05 187.2 104% 1034 103% NA NA 4/17/05 NA NA 1015 102% NA NA 4/20/05 180.0 100% 1000 100% 2000 101% 4/21/05 182.8 102% 1002 100% 1975 99% 4/22/05 183.1 102% 1020 102% 1975 99% 4/29/05 182.5 101% 1010 101% 1989 100% 4/30/05 179.0 99% 998 100% 1977 99% 5/1/05 177.4 99% 1008 101% 1975 99% 5/2/05 182.7 102% 1003 100% 2020 102% 5/3/05 183.0 102% 992 99% 1976 99% 5/4/05 173.4 96% 1006 101% 1996 100% 5/5/05 180.7 100% 985 99% 1997 100% 5/6/05 188.1 105% 1016 102% 1811 91% 5/7/05 190.0 106% 1023 102% 1969 99% 5/8/05 185.6 103% 1023 102% 2000 101% 5/9/05 175.5 98% 975 98% 1980 99% 5/12/05 180.2 100% 995 100% 1963 99% 5/13/05 185.0 103% 1032 103% 1978 99% 5/14/05 180.5 100% 1000 100% 1973 99% 5/15/05 195.2 108% 1040 104% 1958 98% 5/16/05 177.6 99% 968 97% 1969 99% 5/17/05 185.3 103% 1035 104% 1989 100% 5/18/05 181.5 101% 1005 101% 2000 101% 5/19/05 182.3 101% 1000 100% 1995 100% 5/20/05 181.9 101% 1003 100% 1999 100% 5/21/05 178.9 99% 1016 102% 2010 101% 5/22/05 183.9 102% 1013 101% 1979 99%
136
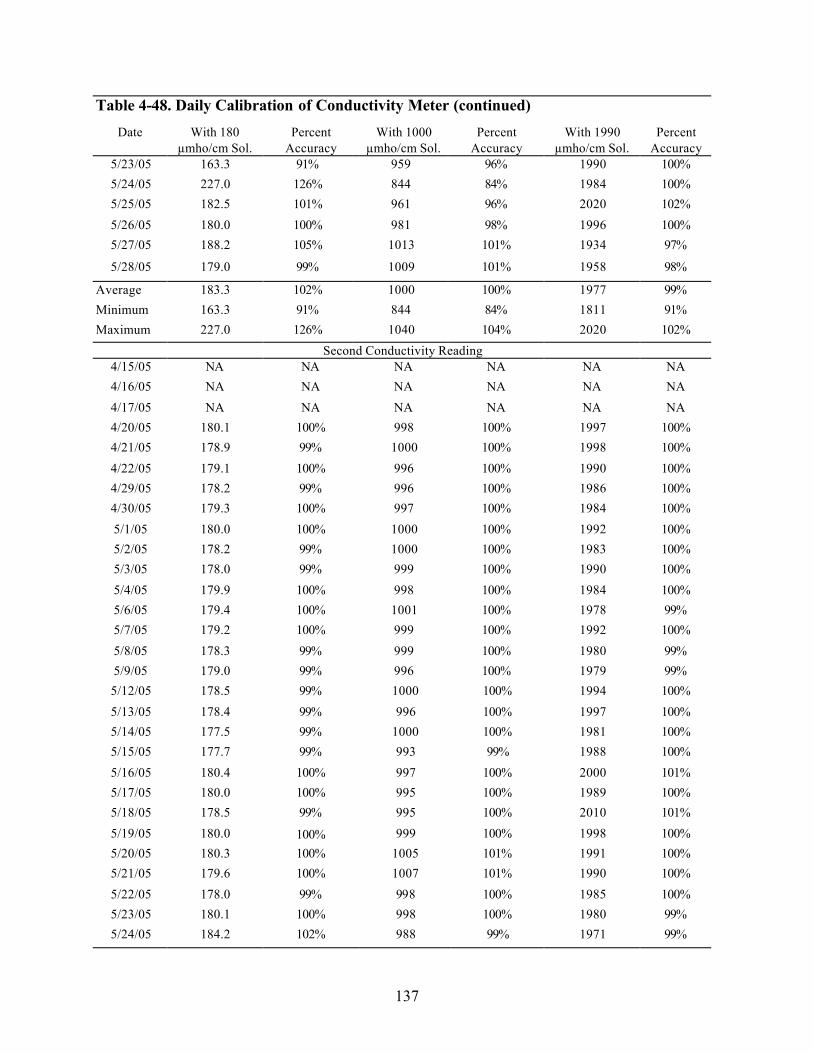
Table 4-48. Daily Calibration of Conductivity Meter (continued) Date With 180 Percent With 1000 Percent With 1990 Percent
µmho/cm Sol. Accuracy µmho/cm Sol. Accuracy µmho/cm Sol. Accuracy 5/23/05 163.3 91% 959 96% 1990 100% 5/24/05 227.0 126% 844 84% 1984 100% 5/25/05 182.5 101% 961 96% 2020 102% 5/26/05 180.0 100% 981 98% 1996 100% 5/27/05 188.2 105% 1013 101% 1934 97%
5/28/05 179.0 99% 1009 101% 1958 98%
Average 183.3 102% 1000 100% 1977 99% Minimum 163.3 91% 844 84% 1811 91% Maximum 227.0 126% 1040 104% 2020 102%
Second Conductivity Reading 4/15/05 NA NA NA NA NA NA 4/16/05 NA NA NA NA NA NA 4/17/05 NA NA NA NA NA NA 4/20/05 180.1 100% 998 100% 1997 100% 4/21/05 178.9 99% 1000 100% 1998 100% 4/22/05 179.1 100% 996 100% 1990 100% 4/29/05 178.2 99% 996 100% 1986 100% 4/30/05 179.3 100% 997 100% 1984 100% 5/1/05 180.0 100% 1000 100% 1992 100% 5/2/05 178.2 99% 1000 100% 1983 100% 5/3/05 178.0 99% 999 100% 1990 100% 5/4/05 179.9 100% 998 100% 1984 100% 5/6/05 179.4 100% 1001 100% 1978 99% 5/7/05 179.2 100% 999 100% 1992 100% 5/8/05 178.3 99% 999 100% 1980 99% 5/9/05 179.0 99% 996 100% 1979 99% 5/12/05 178.5 99% 1000 100% 1994 100% 5/13/05 178.4 99% 996 100% 1997 100% 5/14/05 177.5 99% 1000 100% 1981 100% 5/15/05 177.7 99% 993 99% 1988 100% 5/16/05 180.4 100% 997 100% 2000 101% 5/17/05 180.0 100% 995 100% 1989 100% 5/18/05 178.5 99% 995 100% 2010 101% 5/19/05 180.0 100% 999 100% 1998 100% 5/20/05 180.3 100% 1005 101% 1991 100% 5/21/05 179.6 100% 1007 101% 1990 100% 5/22/05 178.0 99% 998 100% 1985 100% 5/23/05 180.1 100% 998 100% 1980 99% 5/24/05 184.2 102% 988 99% 1971 99%
137
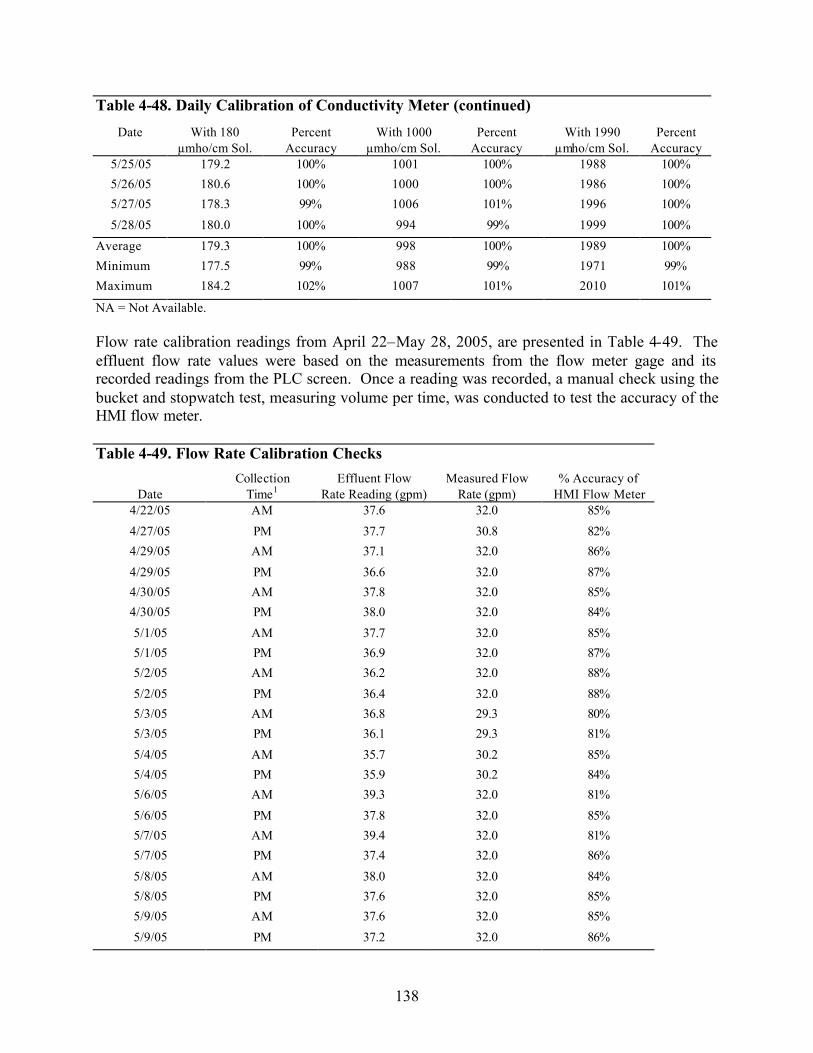
Table 4-48. Daily Calibration of Conductivity Meter (continued) Date With 180 Percent With 1000 Percent With 1990 Percent
µmho/cm Sol. Accuracy µmho/cm Sol. Accuracy µmho/cm Sol. Accuracy 5/25/05 179.2 100% 1001 100% 1988 100% 5/26/05 180.6 100% 1000 100% 1986 100% 5/27/05 178.3 99% 1006 101% 1996 100% 5/28/05 180.0 100% 994 99% 1999 100%
Average 179.3 100% 998 100% 1989 100% Minimum 177.5 99% 988 99% 1971 99% Maximum 184.2 102% 1007 101% 2010 101%
NA = Not Available.
Flow rate calibration readings from April 22–May 28, 2005, are presented in Table 4-49. The effluent flow rate values were based on the measurements from the flow meter gage and its recorded readings from the PLC screen. Once a reading was recorded, a manual check using the bucket and stopwatch test, measuring volume per time, was conducted to test the accuracy of the HMI flow meter.
Table 4-49. Flow Rate Calibration Checks
Date Collection
Time1 Effluent Flow
Rate Reading (gpm) Measured Flow
Rate (gpm) % Accuracy of
HMI Flow Meter 4/22/05 AM 37.6 32.0 85% 4/27/05 PM 37.7 30.8 82% 4/29/05 AM 37.1 32.0 86% 4/29/05 PM 36.6 32.0 87% 4/30/05 AM 37.8 32.0 85% 4/30/05 PM 38.0 32.0 84% 5/1/05 AM 37.7 32.0 85% 5/1/05 PM 36.9 32.0 87% 5/2/05 AM 36.2 32.0 88% 5/2/05 PM 36.4 32.0 88% 5/3/05 AM 36.8 29.3 80% 5/3/05 PM 36.1 29.3 81% 5/4/05 AM 35.7 30.2 85% 5/4/05 PM 35.9 30.2 84% 5/6/05 AM 39.3 32.0 81% 5/6/05 PM 37.8 32.0 85% 5/7/05 AM 39.4 32.0 81% 5/7/05 PM 37.4 32.0 86% 5/8/05 AM 38.0 32.0 84% 5/8/05 PM 37.6 32.0 85% 5/9/05 AM 37.6 32.0 85% 5/9/05 PM 37.2 32.0 86%
138

Table 4-49. Flow Rate Calibration Checks (continued) Collection Effluent Flow Measured Flow % Accuracy of
Date Time1 Rate Reading (gpm) Rate (gpm) HMI Flow Meter 5/13/05 AM 41.7 32.0 77% 5/13/05 PM 37.5 32.0 85% 5/14/05 AM 37.3 32.0 86% 5/14/05 PM 35.9 32.0 89% 5/15/05 AM 37.2 32.0 86% 5/15/05 PM 37.7 32.0 85% 5/16/05 AM 37.3 30.5 82% 5/16/05 PM 36.3 30.5 84% 5/17/05 AM 36.8 32.0 87% 5/17/05 PM 36.4 32.0 88% 5/20/05 AM 38.6 32.0 83% 5/20/05 PM 23.1 32.0 139% 5/21/05 AM 40.3 31.1 77% 5/21/05 PM 37.4 31.1 83% 5/22/05 AM 37.3 32.0 86% 5/22/05 PM 37.7 32.0 85% 5/23/05 AM 37.9 32.0 84% 5/23/05 PM 37.5 32.0 85% 5/24/05 AM 39.0 32.0 82% 5/24/05 PM 38.1 32.0 84% 5/25/05 AM 37.7 32.0 85% 5/25/05 PM 38.0 32.0 84% 5/26/05 AM 37.8 32.0 85% 5/26/05 PM 37.3 32.0 86% 5/27/05 AM 36.4 35.0 96% 5/27/05 PM 36.5 35.0 96% 5/28/05 AM 36.6 32.0 87% 5/28/05 PM 37.4 32.0 86%
1 AM/PM refers to morning (AM) and afternoon (PM) calibration checks.
4.7.5 Completeness
Calculation of data completeness was made for on-site water quality measurements and MWH Laboratories water quality measurements, as discussed in Section 3.12.3.4 and presented in Table 3-11. During the test, duplicate samples were collected in a rotating manner (i.e., duplicates were taken of the raw water during one round of duplicate analysis, then influent water, and finally effluent water). Based on the completeness goals defined in Table 3-11 and the completeness results presented in Table 4-50, all parameters were within the stated completeness goals.
139

Table 4-50. Completeness
Proposed Actual Completeness (%) Completeness Goal Parameter Results Duplicates Results Duplicates Results Duplicates Results Duplicates As (III) 24 0 36 NA >100% NA 90% 100% Dissolved As 24 0 39 NA >100% NA 90% 100% Total As 168 80 202 92 >100% >100% 95% 95% Sulfate 84 22 85 21 >100% 95% 95% 90% Nitrate 84 22 84 20 100% 91% 95% 90% Chloride 84 22 85 21 >100% 95% 95% 90% Calcium 48 10 78 11 >100% >100% 95% 90% Magnesium 48 10 78 11 >100% >100% 95% 90% Alkalinity 84 22 85 21 >100% 95% 95% 90% Fluoride 48 10 84 13 >100% >100% 95% 90% TDS 48 10 57 12 >100% >100% 95% 90% TSS 48 10 57 12 >100% >100% 95% 90% Iron 48 10 51 11 >100% >100% 95% 90% Manganese 48 10 51 11 >100% >100% 95% 90% Vanadium 168 54 196 59 >100% >100% 95% 95% Hardness 48 10 66 11 >100% >100% 95% 90% Dissolved Silica 48 10 57 12 >100% >100% 95% 90% pH 64 20 135 30 >100% >100% 95% 90% Conductivity 64 24 135 39 >100% >100% 95% 90% Free Chlorine 126 16 186 16 >100% >100% 95% 90% NA = Not Available.
4.8 Operations and Maintenance
The following section discusses the FTO’s experience with the operation and maintenance of the Basin Water System.
4.8.1 Fluctuation in Flow Rate
The Basin Water System is an automated system that may be a staffed or un-staffed system (with periodic visits to check chemical feed levels and overall system performance). The influent and effluent flow rates and pressures are continuously recorded through the system’s PLC, which logs any fluctuations. If necessary, the flow may be adjusted through settings on the PLC. During verification testing these settings were preset by Basin Water and not adjusted.
4.8.2 Chemical Feed Systems
For purposes of verification testing (which had set system flow rates), the chlorine feed rate was set during the Initial Plant Characterization phase at 0.10-0.50 mg/L and not adjusted during the testing.
Sulfuric acid, sodium hydroxide, ferric chloride, and salt were fed by batch processes associated with the regeneration phase and were not dependent upon the system flow rate. Sulfuric acid and sodium hydroxide were dosed to reach a certain brine pH and were dependent on the initial brine pH and buffering capacity. The ferric chloride and salt had a preset volume per batch. If the system flow rates were to vary, the chemical feed rates would only vary based on an increase or
140

decrease in the number of batches per day. The brine flow rate (volume per day) was set based on the number of IX bed volumes to exhaustion. The bed volumes were adjusted from 1,100 to 850 BVs between the first and second Initial Plant Characterization. The brine was sent through two IX vessels before it was sent to either the BRA or BPU for treatment.
4.8.3 Sediment Prefilters
The sediment prefilters were monitored through the differential pressure across the filters. This differential pressure was logged daily through the PLC. During verification testing, the filters did not require changing (i.e., did not exceed the set differential pressure [12 psi] as set by Basin Water).
4.8.4 Resin Depth
The depth of the resin in each IX vessel could not be measured or monitored during verification testing, because there was not a site glass or other means to measure the depth of resin in each vessel.
4.8.5 Arsenic and/or Vanadium Breakthrough
With the exception of off-site laboratory testing of arsenic and vanadium, there was no means to monitor if arsenic and/or vanadium had broken through the IX resin. Online monitoring of pH and conductivity were not indicator parameters if either ion had broken through the resin.
4.8.6 Brine Reuse, Feed, and Treatment
The on-site field engineer could monitor if brine had been fed to the IX vessels through the PLC, which recorded each step (salt addition, salt dilution, and rinse) of the regeneration. The information recorded included the particular liquid’s flow rate and duration. The brine consumption could be monitored in a number of ways, such as through the PLC, but the simplest method was through calculating the flow rate of the brine and the time the brine pump was in operation. The operator could detect an improperly regenerated IX vessel by observing the information recorded on the PLC. The regeneration step was set to utilize a certain volume of brine, dilution water, and rinse water. A deviation from the set volume of brine, dilution water, or rinse water would be recorded on the PLC and would indicate that IX vessel was not properly regenerated.
No observable issues were noted in the ability to precipitate arsenic and vanadium from the waste brine due to recycling of the brine. The BPU and the BRA were both automated treatment systems that were placed on set points by Basin Water during the Initial Plant Characterization. The only maintenance required was for the high- level indicator and waste pump on the BRA recirculation tank, which failed during the verification testing.
141
4.9 NSF Field Inspection
On May 19, 2005, NSF conducted a field inspection of the verification test and found the practices in place on-site to be in accordance with the PSTP that was approved prior to beginning the testing.
142

Chapter 5References
The following references were used in the preparation of this report:
Clifford, D. A. and G. Ghurye, “Ion Exchange With Spent Brine Recycling As A Viable Treatment Technology for Arsenic Removal From Drinking Water,” In preparation for submission to J. AWWA, April 1998.
Clifford, D.A., “Ion Exchange and Inorganic Adsorption,” Water Supply and Treatment: A Handbook of Community Water Supplies, 4th ed., McGraw-Hill, New York, 1990.
Edwards, Marc, Sapna Patel, Laurie McNeill, Hsiao-wen Chen, Michelle Frey, Andrew Eaton, Ronald C. Antweiler, and Howard E. Taylor, “Considerations in As Analysis and Speciation,” J. AWWA, 90:3:103, 1998.
Frank, P. and D. A. Clifford, Arsenic (III) Oxidation and Removal from Drinking Water, PB 86158 607/ NTIS, Springfield, Va., 1986; Summary Report, EPA/600/5286/021, U.S.EPA, Cincinnati, April 1986.
Gallagher, P.A., C.A. Schwegal, B. Parks, L. Wymer, and J. Creed, “Preservation of As (III) and As (V) in Drinking Water Supply Samples from Across the United States Using EDTA and Acetic Acid as a Means of Minimizing Iron – Arsenic Coprecipitation,” Environmental Science and Technology, 38, 2919-2927, 2004.
Horng, L. L. and D.A. Clifford, “The Behavior of Polyprotic Anions in Ion Exchange Resins,” Reactive and Functional Polymers 35 (1/2): 41-54, 1997.
Methods for Chemical Analysis of Water and Wastes (MCAWW), EPA/600/4-79-202 - Revised March 1983.
Methods for Determination of Organic Compounds in Drinking Water, EPA/600/4-88/039December 1988 (Revised July 1991).
Samanta, Gautam, and D. Clifford, “Preservation of Inorganic Arsenic Species in Groundwater,” Environ. Sci. Technol. 2005, 39, 8877-8882.
Standard Methods for the Examination of Water and Wastewater, 20th ed., APHA, AWWA, and WEF, Washington D.C., 1999.
U.S. EPA/NSF International, EPA/NSF ETV Protocol for Equipment Verification Testing for Arsenic Removal, September 2003.
U.S. EPA/NSF International, EPA/NSF ETV Protocol for Equipment Verification Testing for Removal of Inorganic Constituents, April 2002.
143
Chapter 6Vendor Comments
Basin Water submitted the following comments concerning the ETV test and report. These statements were not validated in the verification test and are the opinion of Basin Water:
“The Basin Water pre-packaged ion exchange system has been specifically designed for wellhead installation and has numerous advantages both from an operational and economic standpoint. In recognition of its unique design and high efficiency, it has been granted patent # 6,706,195 by the US Patent and Trademark Office. The Title of this patent is “High Efficiency Ion Exchange for Removing Arsenic from Water.”
Ion Exchange
The use of ion exchange for arsenic removal has been studied for many years and its performance is well known. Ion exchange has been designated as a Best Available Technology (B.A.T.) by the U.S. Environmental Protection Agency. Some of the advantages of ion exchange for arsenic removal are:
1. Not sensitive to pH. 2. Not affected by silica / phosphate. 3. Will also remove vanadium with minimal loss of capacity. 4. Can consistently remove arsenic to non-detect levels.
The negative aspect to using ion exchange has always been related to disposal of brine wastes produced during the regeneration process.
Traditional ion exchange plants consist of three large vessels, two in operation and one in regeneration. A standard ion exchange treatment plant will produce anywhere from 3 – 10% waste, which usually cannot be disposed of in a domestic sewer because of the high salt content. The disposal of these large quantities of brine waste makes wellhead installation of traditional ion exchange plants very difficult and expensive. It is precisely for this reason that ion exchange was discounted as a viable technology for arsenic removal.
Basin Water Ion Exchange System
The Basin Water IX System has incorporated the advantage of ion exchange technology into a package, which is extremely well suited to either wellhead or centralized treatment facilities. This multibed system operates continuously and has the following advantages over traditional ion exchange systems:
1. Very low waste rates – Typically less than 0.25%. 2. Consistent Effluent Quality – The staggered, multibed system allows for very consistent
effluent water quality. 3. Low power requirements – Operates off of well head pressure.
144

4. Reliability – Multiple beds provide redundancy not available with traditional ion exchange systems.
5. Operational flexibility – Can operate from 0 to 100% of well capacity while accommodating the frequent starting and stopping of the well(s).
6. Small foot print – A 1,000 GPM system can fit onto a site as small as 1,100 ft2. 7. Mobility – An entire system can be delivered and installed in 7 to 10 working days.
Comments on Elsinore EPA – ETV Testing
Both MWH and EPA/NSF did a great job in organizing the ETV test and the processing of all data collected. It is worth noting that this test utilized one of the Basin Water mobile units (T-2), which is a 10-bed system with a maximum capacity of 110 GPM. Since this test operated at 35 GPM instead of its full capacity, only 4 out of the 10 ion exchange beds were used.
The net result of this was a less consistent effluent water quality since there where far fewer beds in service to damp out changing water quality. A typical Basin Water 1,000 GPM system has 16 beds with 13 in absorption at all times. This plurality of vessels produces very consistent effluent water quality and a negligible change in pH through the system. For example, a 1,000 gpm arsenic removal system operating at the Baldy Mesa Water District in High Desert of Southern California had a pH change of less than 0.2 units with a very similar water quality.
It is also worth noting that the amount of waste produced by a Basin Water system is completely dependent on the source water quality. The test system at Elsinore Valley operated at 850 bed volumes, as predicted by Basin Water’s proprietary computer simulation model. Basin Water has seen different water qualities, which result in bed lifes ranging from 300 – 10,000 bed volumes. Basin Water has deployed an arsenic treatment system in Arizona that operates at 10,000 bed volumes and has a waste rate of 0.01%. This translates to only 100 gallons of waste per one million gallons treated, or a net recovery of 99.99%. This reduced waste rate has the added benefit of creating additional water supply for anyone choosing a Basin Water IX System over traditional ion exchange conserving a precious natural resource.
Conclusions
Basin Water wishes to thank EPA/NSF for the opportunity to demonstrate the efficiency and operational characteristics of the Basin Water “High Efficiency Arsenic Treatment System”. Basin Water also wishes to thank the MWH project team for the diligent and professional manner in which they conducted this test and operated the Basin Water Demonstration Unit.
It is Basin Water’s belief that by optimizing the use of ion exchange for arsenic treatment we have created the opportunity for the economic and conserved water benefits to be passed on to the end user.”
145
Related Documents