ISSN 1725-2237 EEA Technical report No 17/2011 Environmental tax reform in Europe: opportunities for eco-innovation

Welcome message from author
This document is posted to help you gain knowledge. Please leave a comment to let me know what you think about it! Share it to your friends and learn new things together.
Transcript
ISSN 1725-2237
EEA Technical report No 172011
Environmental tax reform in Europe opportunities for eco-innovation
X
Environmental tax reform in Europe opportunities for eco-innovation
EEA Technical report No 172011
European Environment AgencyKongens Nytorv 61050 Copenhagen KDenmarkTel +45 33 36 71 00Fax +45 33 36 71 99Web eeaeuropaeuEnquiries eeaeuropaeuenquiries
Legal noticeThe contents of this publication do not necessarily reflect the official opinions of the European Commission or other institutions of the European Union Neither the European Environment Agency nor any person or company acting on behalf of the Agency is responsible for the use that may be made of the information contained in this report
Copyright noticecopy EEA Copenhagen 2011Reproduction is authorised provided the source is acknowledged save where otherwise stated
Information about the European Union is available on the Internet It can be accessed through the Europa server (wwweuropaeu)
Luxembourg Publications Office of the European Union 2011
ISBN 978-92-9213-238-5ISSN 1725-2237doi10280084889
Cover design EEALayout Rosendahls-Schultz GrafiskEEA
3
Contents
Environmental tax reform in Europe opportunities for eco-innovation
Contents
Acknowledgements 4
Executive summary 5
1 Introduction 811 Background 812 ETR and innovation 913 Report structure 9
2 Review of literature on environmental tax reform and eco-innovation 1021 Initial screening 1122 Detailed review 1323 Environmental regulation studies 1324 Theoretical studies 1425 Empirical studies 1826 Case studies 2127 Conclusions 22
3 Modelling of ETR impacts on eco-innovation 2531 Scenarios assessing the implications of ETR for eco-innovation 2532 Overview of modelling results 2733 Macroeconomic impacts at the national level 2934 Conclusions of the scenario assessment 36
References 38
Annex 1 Classification of refereed journal articles 43
Annex 2 Classification of books and book chapters 44
Annex 3 Classification of reports 45
Environmental tax reform in Europe opportunities for eco-innovation4
Acknowledgements
The report was commissioned by the European Environment Agency in 2009 and the project manager was David Gee
The report was written by a team of consultants Chapter 2 was prepared by Roger Salmons Policy Studies Institute (PSI) London and Chapter 3
by Ulrike Lehr and Christian Lutz Gesellschaft fuumlr Wirtschaftliche Strukturforschung (GWS) Osnabruumlck Germany
The report was edited by Michael Asquith and Stefan Speck
Acknowledgements
5
Executive summary
Environmental tax reform in Europe opportunities for eco-innovation
Executive summary
Environmental taxation innovation and the green economy
Environmental taxation can spur innovation This simple compelling message was a central finding of a recent OECD study of taxation innovation and the environment (OECD 2010)
It is an insight of profound importance Environmental policy instruments are frequently characterised as obstacles to economic activity but the OECD analysis suggests that environmental taxes can in fact be the opposite mdash serving as catalysts for the creativity that underpins thriving economies
In the short term such innovation can boost efficiency and competitiveness In the long term it arguably holds the key to sustained prosperity by enabling economic growth to continue within environmental limits Innovation particularly the kinds of innovation stimulated by environmental policy is essential in the process of creating green economies that can deliver growing incomes while preserving natural systems and social equity
Environmental tax reform (ETR) appears to offer an attractive mix for policymakers It deters environmentally damaging activities by making them more costly while incentivising the creation and diffusion of new technologies For advanced economies like the EU eco-innovation can also create opportunities to export new tools and processes globally
While increasing the costs of polluting and using resources is likely by itself to subdue economic output governments can use the tax revenues accrued to reduce the fiscal burden elsewhere
(1) The project Resource productivity environmental tax reform and sustainable growth in Europe (petre) was commissioned by the Anglo-German Foundation (AGF) in 2007 It used econometric and resource flow modelling techniques surveys and interviews to explore the implications mdash for Europe and the rest of the world mdash of a large-scale ETR in Europe designed to achieve the EUs 2020 greenhouse gas reduction targets For more information see wwwpetreorguk or Ekins and Speck (2011)
Cutting labour taxes for example can help boost work incentives mdash potentially increasing employment and offsetting negative economic impacts Moreover as the recent petre project (1) has demonstrated governments can potentially enhance net benefits further by reinvesting some of the revenues secured through ETR in eco-innovation
In view of the potential gains there is clear value for policymakers and society more broadly in expanding the knowledge base on ETR and innovation The present report aims to do just that using two approaches a literature review and a scenario-based modelling exercise Together the two analyses confirm the important interplay between environmental taxes innovation and macroeconomic performance mdash and the potential role of ETR in shifting to a green economy in Europe The key findings are set out below
Key findings of the literature review
The literature review identified four relevant groups of studies assessments of environmental regulations impacts on innovation theoretical analyses of how different policy instruments influence innovation empirical studies using statistical and econometric techniques to assess the impacts of actual policy interventions and case studies providing descriptive assessments of actual experiences
In broad terms the studies confirmed that environmental regulation in general and price-based policy instruments (such as environmental taxes and investment subsidies) in particular can and do increase innovation and diffusion of environmental technologies The studies
Environmental tax reform in Europe opportunities for eco-innovation
Executive summary
6
of environmental regulations impacts on innovation suggest that greater regulatory stringency is associated with increased innovation although the effect appears small
The empirical studies and case studies reviewed provided more comprehensive evidence The empirical studies covering technology areas such as energy efficiency renewable energy and air and water pollution abatement revealed that environmental taxes and energy prices have a significant positive impact on both innovation and diffusion of existing technologies However the effects of taxes or prices may vary somewhat across sectors and innovation types The case studies likewise indicate that environmental taxes and investment subsidies have generally although not universally had a significant positive impact on innovation and diffusion
The literature also provides valuable insights on the impact of environmental taxes compared to other instruments and the conditions that can enhance or limit an ETRs impacts on innovation For example case studies focusing on the Netherlands and Germany highlighted the need for a tax rate that is sufficiently high to provide a meaningful incentive and signalling effect and that is fixed for a sufficiently long period of time to reduce uncertainty about the future benefits of investment
The theoretical studies reviewed indicate that the relative impacts of environmental taxes and other instruments on eco-innovation are far from clear cut They often depend on the competitive structures of the markets and the ability of innovator firms to appropriate the benefits accruing to other firms during diffusion Other factors also play a role however For example market failures such as information asymmetries principle-agent problems capital market failures and positive adoption spillovers can all influence technology diffusion Similarly uncertainty over future returns and the (associated) use of high discount rates for investment decisions can also undermine the effectiveness of price-based instruments in stimulating diffusion
Taken together the literature underscores the potential for environmental taxes to catalyse innovation At the same time it also highlights the complexity of the issues and the difficulties in making generalisations about the impacts of environmental taxes and alternative policy instruments The precise effects of environmental taxes and other measures on innovation are very specific to local realities and very much influenced
by the stringency and point of incidence of the policy intervention With this in mind some authors stress that any analysis of policy impacts on innovation must be very nuanced reflecting factors such as the direction type and duration of innovation Assessments of policy effectiveness require indicators that can convey an accurate and detailed picture of innovation in all its forms
Key findings of the scenario analysis
The modelling exercise builds on the findings of the petre project using the GINFORS model to assess economic and environmental impacts of using the EU Emissions Trading System (ETS) and ETR to reach the EUs 2020 GHG targets It evaluates the overall effects of a European ETR compared to a projected baseline and develops scenarios in which eco-innovation or renewable energy technologies are supported
The analysis employed three scenarios from the petre project Together these illuminate the macroeconomic impacts of implementing an ETR designed to meet the EUs 2020 GHG target with revenues recycled through reductions in income tax rates and social security contributions and through investment of 10 of revenues in eco-innovation measures
In addition the present study used two addition scenarios both based on the assumption that 10 of revenues are invested in eco-innovation The first examines the macroeconomic impacts in EU Member States arising from increased exports of renewable energy technologies which is a plausible scenario based on the strong EU policy effort to increase the share of renewable energy in final energy consumption and the possibility of very strong world market development in the sector until 2020 The second analyses the macroeconomic effects of changes in the input structure of the energy sector ie from conventional electricity production to renewables
Overall the analysis revealed that the modelled reforms delivered positive employment effects and only small negative impacts on GDP in the EU-27 Member States The economic impacts depend on the levels of international energy prices used in the scenarios the mechanism used to recycle revenues and country specifics such as carbon and energy intensity and the structure of energy consumption
At the EU level the basic ETR scenario mdash assuming that revenues are only recycled via reduced
Executive summary
Environmental tax reform in Europe opportunities for eco-innovation 7
income tax and social security contributions mdash results in EU GDP 057 below the baseline in 2020 The additional assumptions in each of the alternative scenarios (investing 10 of revenues in eco-innovation increased exports of renewable technologies and changes in energy sector inputs) each soften this negative impact on GDP
Whereas all the scenarios indicate a small negative impact on EU GDP relative to the baseline the impact on employment is positive in all scenarios The scenario design implies that the structure of the EU economy shifts from energy-intensive to labour-intensive sectors The magnitude of the employment gain is influenced by the carbon price and the tax shift the underlying energy prices and the production loss The largest part of the employment increase stems from the additional investment in eco-innovation although a shift in industry structures and additional renewable technology exports are also positive for the labour market As ETR is directly aimed at reducing labour costs it will create additional jobs in the short and medium term In the longer term the cost reduction and new technologies arising from eco-innovation will play a larger role
The results indicate that environmental tax reform can deliver environmental objectives create additional jobs and trigger eco-innovation while having negligible negative impacts on GDP These findings are particularly evident in the scenario assuming that 10 of revenues are invested in eco-innovation and EU exports of renewable technologies increase In that case EU GDP is just 004 below the baseline in 2020 and employment is 051 (or more than 1 million jobs) higher
Like all fiscal reforms a major ETR in Europe will create winners and losers At the sector level carbon- and material-intensive industries will face economic losses At the country level the carbon-intensity and overall flexibility of economies is important Clearly structural change away from carbon-intensive industries together with technological change is inherent in any successful climate mitigation policy However international cooperation and the revenues gathered through ETR and the EU ETS can help soften negative economic and social impacts
Caution is needed in relating the findings of this study to the EU policy debate In the model simulations the single carbon price is the only instrument used to reach the EUs 2020 GHG targets In reality of course other renewable energy and efficiency policies will also contribute to carbon reduction and have to be taken into account when comparing the results (especially the high carbon prices) to other studies Both reduce the potential revenues from fossil energy carriers and carbon emissions
A variety of renewable energy and efficiency policies could enable the climate and energy targets to be met while securing even better economic prospects The results of the present study clearly indicate that the discussion on market-based instruments should be intensified Ultimately however the EU will need a rich mix of policies to reach its GHG targets while maximising prosperity
Environmental tax reform in Europe opportunities for eco-innovation8
Introduction
11 Background
In 2005 the European Environment Agency (EEA) prepared a series of reports on the use of market-based instruments to achieve environmental goals Environmental tax reform mdash defined as reform of the national tax system where there is a shift of the burden of taxes for example on labour to environmentally damaging activities such as resource use or pollution mdash was identified as a key tool in this context (EEA 2006)
A central attraction of ETR is its capacity to steer incentives so that human endeavour and ingenuity can deliver maximum economic gains while preserving the environment and social equity To analyse this function further the Anglo-German Foundation (AGF) commissioned a major body of research in 2007 Creating sustainable growth in Europe One project in this context entitled Resource productivity environmental tax reform and sustainable growth in Europe (petre) started from the hypothesis that ETR could increase human well-being via two routes improving the environment and generating economic activity and employment The results of petre were presented in a final report (Ekins 2009) and in a book (Ekins and Speck 2011)
Petre used econometric and resource flow modelling techniques surveys and interviews to explore the implications mdash for Europe and the rest of the world mdash of a large-scale ETR in Europe designed to achieve the EUs 2020 greenhouse gas reduction targets ie cutting GHG emissions by 20 in the period 1990ndash2020 (or 30 in a context of global cooperation) In order to investigate whether ETR could deliver these targets six scenarios were developed and modelled using two well-known macro-econometric models E3ME and GINFORS (2)
The results suggested that ETR is an effective environmental instrument that can enable the EU to meet its CO2 targets The models produce nearly identical results concerning labour and resource productivity signalling that an ETR that meets the emissions target would raise employment lower resource consumption and have negligible effects on GDP
The petre project provided a compelling case for using ETR more widely but the findings also indicated scope to extend the analysis For example the results of one of the scenarios indicated that investment in green technologies in the EU could significantly reduce both the carbon price and GDP loss in reaching the 20 target Measures that could augment the net benefit of ETR are clearly worth exploring in more detail Similarly the petre project results also suggested that the varying national political economic institutional and cultural contexts across the EU-27 make introducing an ETR politically complex Again this suggested the need for additional analysis of ETRs social impacts to ensure that promising ideas can be translated into working policies
In view of these findings the EEA decided to commission a two-part study to analyse the issues in more detail The first part focuses on links between ETR and eco-innovation and green technologies The second addresses ETRs implications for the distribution of incomes across society
Both of these issues are of course essential determinants of an ETRs potential contribution to sustainable growth and the shift to a green economy Eco-innovation is an indispensible element in enhancing resource efficiency ie delivering greater economic outputs and wellbeing at lower environmental impacts Meanwhile distributional
1 Introduction
(2) See for more information with regard to the modelling framework the papers presented and to be downloaded at the website of the project (wwwpetreorguk) or Ekins and Speck (2011) and in particular Chapter 8 thereof
Introduction
Environmental tax reform in Europe opportunities for eco-innovation 9
impacts are central to an ETRs political acceptability and social equity mdash another essential aspect of sustainability Any serious attempts to design ETRs must therefore include a focus on eco-innovation and distributional impacts The present two-part study aims to contribute to the knowledge base for that analysis
12 ETR and innovation
Innovation is a key determinant of domestic and international competitiveness and a vital engine for generating economic growth and highly skilled jobs It also plays a central role in facilitating the shift to a green economy enabling countries to decouple economic growth from resource use and environmental impacts
Innovations contribution to solving urgent economic and social problems is being discussed more now than ever before in Europe This growing interest partly reflects a concern that some European countries may be falling behind other industrialised nations both in developing and applying new solutions in introducing modern management production and working practices and in opening up global markets Only with greater ability to innovate coupled with competence and willingness to be creative can structural economic change be catalysed enabling faster growth and creating new jobs
The interest in innovation also reflects a recognition that even the most urgent of todays environmental problems are far from being solved Innovation that specifically addresses environmental problems is needed to ensure long-term sustainable development Basic innovation should be stimulated opening up more environmentally sound development paths for products and technologies
Of course research must focus not only on technology but on the necessary framework conditions to bring about environmental innovation Policy of all sorts mdash not least environmental policy mdash can promote or restrict innovation It is perhaps surprising therefore that there has been limited focus on the interplay between environmental policy and innovation theory
In view of its huge importance there is clear value in analysing how policy instruments affect innovation
13 Report structure
The present report brings together two approaches to examining eco-innovation
Chapter 2 comprises a literature review It looks briefly at definitions of innovation and the factors driving innovation in the economy and describes the methodology used to identify relevant literature It then provides a more detailed review of four groups of studies
bull assessmentsenvironmentalregulationsimpactson innovation
bull theoreticalanalysesofhowdifferentpolicyinstruments influence innovation
bull empiricalstudiesusingstatisticalandeconometric techniques to assess the impacts of actual policy interventions
bull casestudiesprovidingdescriptiveassessmentsofactual experiences
Chapter 3 presents a modelling exercise based on scenarios in which ETR revenues are used to foster innovation The modelling builds on the petre project evaluating the overall effects of a European ETR compared to a baseline development and goes on to examine scenarios to support eco-innovation or renewable energy technologies
Environmental tax reform in Europe opportunities for eco-innovation10
Review of literature on environmental tax reform and eco-innovation
There is a relatively large and growing literature mdash both theoretical and empirical mdash on the relationship between environmental policy interventions and technological innovation While this covers a wide range of policy instruments (ie command and control regulations environmental taxes permit trading schemes and voluntary agreements) only one of the identified references explicitly considers the impacts of an environmental tax reform (ETR) programme Consequently the present literature review focused on studies that assess the impacts of environmental taxes (and in some cases factor prices) on innovation However in order to provide some context the impacts of environmental regulation more generally were also considered
The literature review employed a two-step methodology In the first step potential references were identified and screened to determine their relevance and to classify them according to four relevant criteria In the second step those references identified as having significant relevance were reviewed in detail to distil the key conclusions regarding ETRs potential implications for eco-innovation
Before proceeding it is worth clarifying what is meant by innovation in general and by eco-innovation in particular Following Schumpeter (1942) the process of technological change is typically broken down into the following three stages (3)
bull invention mdash the first development of a scientifically or technically new product or process
bull innovation mdash the commercialisation of the new product or process
bull diffusion mdash the adoption of the product or process by firms and individuals
The first two stages are closely related although not all inventions will make it through to commercialisation They typically both occur in private companies in a process that can broadly be termed research and development (RampD)
When considering the impacts of environmental policy interventions it is important to be clear which stage of the technological development process one is considering as different instruments may be more or less effective for different stages Many studies explicitly identify the technological development stage to which they relate For those that do not it is sometimes possible to infer the stage from the context or characteristics of the study (eg the measure of innovation that is used) However some studies refer only to investment in technology and it is not clear whether this means investing in the development of new products or production processes (ie invention and innovation) or purchasing new plant and equipment from other companies (ie diffusion)
The term eco-innovation is taken to mean technological development that generates products equipment or production processes that reduce environmental risk or minimise pollution and resource use As such the term encompasses all three stages of the technological development process invention innovation and diffusion
A range of different indicators can be used to measure innovation Essentially these indicators fall into three groups those that measure the inputs (or resources) devoted to the innovation process those that measure the outputs from the process and those that focus on the economic impacts of the innovations that are generated (Johnstone et al 2008)
2 Review of literature on environmental tax reform and eco-innovation
(3) Some authors break down the innovation stage into two the application of inventions in demonstration projects the development of niche applications and markets (eg Christiansen and Skjaerseth 2005)
Review of literature on environmental tax reform and eco-innovation
Environmental tax reform in Europe opportunities for eco-innovation 11
The most common input indicator is RampD expenditure but it has several shortcomings While public sector RampD expenditure data is generally available private sector data are incomplete and usually only available at the aggregate level making it difficult (or impossible) to identify environment-related RampD expenditure Furthermore given the inherent uncertainty of the innovation process the link between effort and resulting outputs is often very weak
As a result output indicators such as patent applications are likely to provide a better method to measure eco-innovation Patent application data provide a reasonably comprehensive picture of innovative outputs (4) they are based on objective standards that change slowly and they are readily available Their main advantage however is the fact that patent applications are classified into detailed technologies using the International Patent Classification (IPC) system developed by the World Intellectual Property Organisation This allows environment-related patents to be identified and broken down between different application areas such as climate change air pollution water pollution and waste management
Impact indicators (also termed progress indicators) are more relevant to the diffusion stage and include increases in market penetration of particular eco-technologies and reductions in (marginal) abatement costs (5) However it should be noted that cost reductions can be driven by a range of factors and may not necessarily imply that innovation has occurred
21 Initial screening
Potential references were identified based on a review of journal citations internet searches using keywords and recommendations from within the project team The references fall into three broad groups
bull refereedjournalarticlesbull booksandbookchaptersbull reportsbyconsultantsandexperts
In total 37 potential references were identified the majority (28) being refereed journal articles The references were then classified according to four criteria type of study policy instrument(s) covered policy area and technological development stage On the basis of this classification each reference was then assessed in terms of its relevance
Types of study
A distinction is made between five different types of study
bull Theoretical studies use mathematical models to assess the impacts of idealised policy instruments on firms innovative behaviour under alternative assumptions about market structure and different parameter values In most cases the studies consider several alternative instruments and are interested in the relative ranking of the instruments either in terms of the amount of innovation that they induce or in terms of the resulting levels of social welfare
bull Empirical studies use a range of statistical and econometric techniques to analyse quantitative performance data in order to assess the impacts of actual policy interventions Given the relative scarcity of environmental taxes in the past there are few direct empirical studies focusing on them However a number of studies consider the impacts of changes in energy prices which give an indirect indication of the potential impact of taxation
bull Reviews summarise or compare the findings of previous studies (either theoretical or empirical) and may synthesise them to draw wider conclusions
bull Case studies provide descriptive assessments of actual experiences often comparing across countries
bull Qualitative studies consider some of the issues that can affect the performance of a particular policy instrument in practice
Together these last two types of study can provide valuable insights on the practical and political economy aspects of instrument performance to supplement the theoretical and empirical analyses
(4) While a patent may prevent rival firms from using an innovation (without paying royalties) it has the disadvantage of putting it into the public domain In some cases firms may prefer to keep the innovation secret rather than apply for patent protection
(5) More precisely the indicator of abatement is a shift in the abatement cost curves which reduces the cost of a fixed amount of abatement Reductions in abatement costs due to movements along the cost curve (ie due to changes in the level of abatement) do not provide an indicator of innovation
Environmental tax reform in Europe opportunities for eco-innovation
Review of literature on environmental tax reform and eco-innovation
12
Policy instrument addressed
The second classification criterion concerns the policy instruments that are addressed by the study with a distinction being made between five specific instrument types
The first three are market-based or price-based instruments environmental taxes and charges tradable permits and investment subsidies and tax allowances All three act by changing the prices of input factors in one way or another As has been noted above some studies consider the impact of energy prices rather than energy taxes However since the findings of these studies are directly transferable they are classified under the tax heading
The fourth instrument type is voluntary or negotiated agreements under which firms or sectors enter into agreements with government to achieve certain performance targets or undertake specific actions
The fifth type is command and control regulations which encompass technology mandates emission limits and performance standards (eg for specific energy consumption)
The final classification regulation is used for studies that consider the weight or stringency of environmental regulation in general rather than a specific policy instrument
Policy area addressed
With regard to the policy area(s) covered by the studies a distinction is made between five areas including energy and climate change air pollution water pollution and other
The final classification general is used for studies that consider the impacts of environmental regulation in general rather than any specific intervention or where the policy area is not specified (eg in theoretical analyses)
Stage of technological development
The final classification criterion concerns the stage of the technological development process that is addressed by the study As has been noted above the process is typically divided into three stages invention innovation and diffusion In practice however the studies do not distinguish between the first two stages (often just referring generically to RampD) They have therefore been combined for the purposes of the classification so that the only distinction is between the innovation and diffusion stages
Results of the classification exercise
Subsequent to classifying the studies each was scored in terms of its relevance to analysing ETRs impacts on eco-innovation A three tier qualitative scoring system was used One star () indicates that the study is of only minor relevance two stars () indicates that it is of moderate relevance and three stars () that it is of significant relevance Such a scoring system is inevitably subjective but it provides a pragmatic mechanism for identifying the key references to be included in the detailed review In determining the scores particular emphasis was placed on whether the study is empirical in nature and whether it considers environmental taxes (or factor prices)
Annex 1 shows the classifications of the 28 journal articles that were identified Thirteen are empirical seven are theoretical three are case studies and four are qualitative while four provide reviews of previous work in the area (including most of the identified studies) (6) Around two-thirds of the papers consider the impact of environmental taxes (or energy prices) often comparing these with the impacts of other policy instruments Eleven consider the impact of investment subsidies
Most of the theoretical analyses are not area-specific (only discussing environmental damage in general terms) The empirical studies are spread fairly evenly across policy areas with five addressing
(6) Some studies are classified under more than one heading For example a study may contain both a theoretical model of behaviour and an empirical assessment of the model
Review of literature on environmental tax reform and eco-innovation
Environmental tax reform in Europe opportunities for eco-innovation 13
energy and climate change five addressing air pollution and three addressing water pollution In terms of the stage of the technological development process there is an even split between innovation and diffusion with many of the papers covering both stages In total eighteen of the references are included in the detailed review
Annex 2 shows the classifications of the five book chapters and Annex 3 covers the four reports (7) As might be expected these sources put less emphasis on theory with only one reference including any formal analysis They are split fairly evenly between empirical studies reviews and qualitative assessments All but one consider the impact of environmental taxes or energy prices while seven consider the impact of investment subsidies As with the journal articles there is a fairly even spread across policy areas and between innovation and diffusion Five of the references are included in the detailed review
22 Detailed review
The detailed review focuses on the impacts on eco-innovation of the two price-based policy instruments that are directly relevant to ETR environmental taxes and investment subsidies and tax incentives (eg RampD and capital allowances) (8) A priori each instrument might be expected to stimulate innovation mdash the first by increasing the benefits of innovation by reducing tax payments the second by reducing the costs of developing and adopting new technologies However in order to provide a broader context for the impacts of these two instruments the review starts by considering the relationship between innovation and the stringency of environmental regulation in general
As can be seen from the initial screening (see Annexes 1ndash3) the large majority of studies consider more than one policy instrument within a unified analytical framework mdash either comparing their relative impacts or assessing the impacts of instrument combinations (or packages)
In particular all but one of the papers that assess the impacts of investment subsidies either theoretically or empirically also assess the impacts environmental taxes (and sometimes other policy instruments) Consequently for the purposes of this review it is convenient to consider the impacts of taxes and subsidies at the same time rather than sequentially In addition to avoiding the need for any repetition (about model structures assumptions etc) this facilitates identification of potential interactions and synergies between the two instruments
Apart from Section 23 on the impact of environmental regulation in general only those references identified as being of significant relevance () in the initial screening are included in the review References are summarised in chronological order under three headings theoretical predictions (Section 24) empirical evidence (Section 25) and case studies (Section 26) At the end of each section an attempt is made to synthesise the findings of the studies but the scope of the present review did not allow for critical analysis of the studies to identify their respective strengths and weaknesses or to resolve any apparent conflicts between their findings
23 Environmental regulation studies
Lanjouw and Mody (1996) use aggregate pollution and control expenditure (PACE) data as a proxy for the stringency of environmental regulation and compare this with data on the aggregate number of environmental patent applications for Germany Japan and USA They do not perform any formal statistical or econometric analysis of the data However based on simple graphical analysis they identify a relatively clear correlation between expenditure and patents over the 1970s and 1980s with a time lag of one to two years They also find some indications in the data that patenting in one country also responds to increasing stringency of environmental regulation in the other two In addition they consider the diffusion of environmental technologies by looking at trade
(7) Two of the reports emanate from the study by Ecologic and DIW of ETR in Germany Details of the assessment of the impact on innovation and market diffusion are provided (in German) in Goumlrlach et al (2005) with a summary (in English) in Knigge and Goumlrlach (2005)
(8) While the large majority of revenues raised under an ETR are likely to be used to reduce taxes on labour a small proportion may be used to encourage innovation or promote the take-up of environmentally friendly technologies
Environmental tax reform in Europe opportunities for eco-innovation
Review of literature on environmental tax reform and eco-innovation
14
flows in capital goods used for pollution reduction and find that these too show a correlation with total abatement expenditure
Jaffe and Palmer (1997) also use PACE data as a proxy for the stringency of environmental regulation and evaluate its impact on two different measures of innovation total private expenditures on RampD and the number of successful patent applications by US manufacturing industries Unlike the previous study they undertake formal econometric analysis of the data using panel data at the two-digit and three-digit SIC code industry level for the period 1978ndash1991 and a fixed effects model They find a statistically significant positive relationship between compliance expenditures (capital expenditures only) and RampD expenditures after controlling for industry-specific effects (9) However they can find no significant impact on patenting activity This is not entirely surprising given the fact that their data is for all types of patents not just those relating to environmental technologies and products Indeed given that the same is true for the RampD expenditure data it may be more surprising that they find a significant relationship between pollution compliance and RampD
Brunnermeier and Cohen (2003) also use a panel data model to assess the impact of pollution abatement expenditures on patenting activity by US manufacturing industries However unlike the previous study they use only environmental patent applications in their analysis They also control for other potential explanatory factors such as the stringency of monitoring and enforcement (as measured by number of inspection visits) industry size (value of shipments) market structure (four-firm concentration ratio) capital intensity and exposure to overseas competition (export intensity) They estimate four different models for the period 1983ndash1992 with their preferred model being a negative binomial random effects model The coefficient for PACE is positive and statistically significant (in all four models) as are the coefficients (in the preferred model) for industry size concentration and export intensity However the magnitude of the coefficient (which represents
the semi-elasticity of patents with respect to PACE) is only 00004 Thus ceteris paribus an increase in abatement expenditure of USD 100 million results in an increase in the mean number of patents of only 4
Key findings of the environmental regulation studies
All three environmental regulation studies use PACE data as a proxy for the stringency of environmental regulation (10) While there are obvious pragmatic reasons for doing this (ie availability of data) the validity of the approach may be open to question As Brunnermeier and Cohen (2003) note expenditure may be affected by factors other than environmental regulation such as external pressures from interest groups or a desire to promote or maintain green credentials with customers Furthermore the reported data may not cover all pollution abatement costs and activities (particularly process-related activities) and may be prone to over-statement by reporting firms for strategic reasons However to the extent that the reported PACE data is correlated with the stringency of environmental regulation the analyses suggest that the latter does have an impact on innovation (at least in USA) although the scale of the impact appears to be small
24 Theoretical studies
Although several previous studies has analysed the impact of different environmental policy instruments on technological change Milliman and Prince (1989) were the first to consider the entire process of technological change encompassing innovation diffusion and optimal agency response (11) Using a relatively simple graphical analysis of shifting marginal abatement cost curves they deduce a relative ranking of five instruments (direct controls auctioned permits freely allocated permits emission reduction subsidies (12) and emission taxes) in terms of firms incentives to promote technological change They conclude that emission taxes provide greater incentives for innovation and diffusion than direct controls or
(9) When they allow the slopes of the PACE variable to vary across industries (in addition to the intercept) they find considerable variation in the estimated coefficients across industries with several being negative
(10) However the studies do not all use the same definition of PACE Lanjouw and Mody (1996) include (real) investment expenditures regulation and monitoring costs and research and development by all levels of government private manufacturing and non-manufacturing firms The other two studies both use compliance cost data for private manufacturing firms (at the industry level) only However while Jaffe and Palmer (1997) use capital cost data in their analysis Brunnermeier and Cohen (2003) use operating cost data
(11) Milliman and Prince (1989) identify a number of studies going back to 1970(12) These are payments for emission reductions not technology subsidies for environmental investments
Review of literature on environmental tax reform and eco-innovation
Environmental tax reform in Europe opportunities for eco-innovation 15
freely allocated tradable permits although not as great as auctioned permits However the optimal agency response is likely to face less opposition (and in some cases actually be favoured) under emission taxes than under auctioned permits (13)
Jaffe and Stavins (1995) develop a theoretical framework for comparing empirically the impacts of alternative policy instruments on the diffusion of a new technology (14) They model the investment decision for both an existing firm and a new entrant in each case assuming that over time the firm minimises the present value of its cost streams (operating costs investment cost net of any government subsidy emission taxes and the implicit costs of violating either a performance or technology standard if applicable) For an existing firm the problem is to choose the optimal timing of the retrofit and the authors show that the new technology will be adopted at a particular time if operating cost savings plus savings from reduced emission tax payments (plus any avoided penalties for not adopting a technology standard or exceeding a performance standard) in that period are greater than the net investment costs less the time rate of change of net investment costs For a new entrant the problem is to choose whether to use the new technology at start-up A necessary condition for doing so is that the present value of operating costs savings and reduced tax payments (plus any avoided penalties) over the entire time horizon is greater than the net investment cost Thus while the conditions differ in each case the introduction of either an emissions tax or an investment subsidy (or increases in the respective values) changes the benefit-cost balance in favour of the new technology bringing forward its adoption by existing firms and increasing the likelihood of adoption by new entrants
Kemp (1997) compares the abatement RampD expenditure levels of an individual firm under direct regulation (ie an emissions limit) an equivalent emission tax (15) and freely allocated tradable permits using a cost minimisation analytical framework and a specific functional form for the abatement cost function He shows that both the
level of RampD expenditure and the level of emissions reduction increase as the emissions tax rate increases and that both are greater under the tax than under direct regulation The corresponding levels under the tradable permit regime will be greater under the emissions tax if the (exogenous) permit price is higher than the tax rate and vice versa Kemp also considers the impact of subsidising the cost of the firms RampD effort and shows that increasing the subsidy rate causes a rise in pollution-control RampD More interestingly the impact of the subsidy is greater if it is combined with an emissions tax than with an equivalent emissions limit
Fischer et al (2003) develop the approach used by Milliman and Prince (1989) although their analysis differs in that it does not include the final agency response stage and the diffusion of the technology is determined by market forces with an equilibrium royalty price (16) They compare an emissions tax with auctioned and freely allocated permits using a three-stage model of innovation diffusion and emissions abatement In the first stage the innovating firm decides how much to invest in RampD to develop an emissions abatement technology In the second stage other firms decide whether to adopt this technology in return for a royalty fee or whether to use an (imperfect) imitation technology In the final stage all firms choose their level of abatement to minimise costs given an emissions tax or permit price They show that the level of innovation (ie the level of RampD chosen by the innovating firm) is determined by equating the marginal cost of innovation with the marginal (private) benefit The latter has four components mdash an abatement cost effect an emissions payment effect an imitation effect and an adoption price effect mdash and the last two components are negative (17) Using this model the authors demonstrate that freely allocated permits provide the lowest incentive for innovation However in contrast to Milliman and Prince they conclude that the relative ranking of the emissions tax and auctioned permits is ambiguous It depends crucially on the extent to which the technology can be imitated and hence the extent to which the innovator can appropriate the gains accruing to
(13) For an emissions tax the downward shift of the industry marginal abatement cost curve as a result of diffusion causes the agency to reduce the tax rate assuming that marginal damages are increasing in emissions For permits (auctioned or freely allocated) it causes the agency to reduce the number of permits
(14) The empirical application of this framework is summarised below under Section 25 on empirical evidence(15) That is the emissions tax is set equal to the firms marginal cost of abatement under the direct regulation(16) In addition to assessing the impacts on demand for innovation Fischer et al (1998) consider the impacts of the innovation and
diffusion processes on social welfare in order to compare the overall economic efficiency of the different instruments(17) Milliman and Prince capture only the first two effects in their analysis
Environmental tax reform in Europe opportunities for eco-innovation
Review of literature on environmental tax reform and eco-innovation
16
the other firms in the form of royalty payments If imitation is high (easy) then auctioned permits provide the greater incentive for innovation However if imitation is low (difficult) then the emissions tax provides the greatest incentive
Montero (2002) assesses the impacts of alternative policy instruments on environmental innovation (as measured by RampD expenditure) under conditions of imperfect competition In his model two firms compete in either quantities (ie Cournot duopoly) or prices (ie Bertrand duopoly) while being subject to some form of environmental regulation Where the regulation takes the form of tradable permits mdash either auctioned or freely allocated mdash the market is also assumed to be imperfect the firms competing in permit quantities The interaction between the two firms is modelled as a multi-stage game with the number of stages depending on the instrument being analysed In this framework a firms incentive to invest in RampD comprises two components a direct or cost minimising effect and a strategic effect reflecting the impact of its RampD expenditure on the other firms output decision The latter may be positive or negative depending on the market-regulatory structure Under Bertrand competition (ie where products are strategic complements) freely allocated permits provide the lowest incentive for innovation followed by the emission-standard The relative ranking of an emissions tax and auctioned permits is ambiguous depending on model parameter values Under Cournot competition (ie where products are strategic substitutes) the relative ranking of the emissions tax auctioned permits and the emissions-standard are ambiguous although all provide a greater incentive than freely allocated permits Indeed Montero provides a numerical example where the emissions standard provides the greatest incentive for innovation Finally he considers the impact of increasing competition (increasing the number of firms) and concludes that under perfect competition the emissions tax provides the greatest incentive for innovation
Millock and Nauges (2006) use a simple profit-optimisation model to analyse a firms choice of abatement effort to reduce emissions
per unit of energy used in production While they do not explicitly identify it as such this effort can be interpreted in terms of diffusion of an existing technology mdash with higher effort corresponding to greater diffusion This is consistent with the overall objective of their study which is to assess the impact of combining an emissions tax with a subsidy on (existing) abatement equipment (18) In their model the firm simultaneously chooses the levels of its energy input and abatement effort given exogenous output and energy prices and a cost function for abatement effort (19) They show that while increases in the subsidy rate (expressed as a percentage of the gross investment cost) unambiguously increases abatement effort the impact of increases in the tax rate depends on whether the direct impact of tax increase on the marginal benefit of abatement effort (shifting it up) outweighs the indirect impact via the resulting reduction in output (shifting it down) If the latter dominates then increases in the tax rate will reduce the optimal level of abatement effort The authors show that a necessary and sufficient condition for the direct impact to dominate is that the slope of the firms (inverse) demand for energy is greater than the average emissions tax payment per unit of energy in relation to total energy use (20)
McGinty and de Vries (2009) analyse the relationship between environmental subsidies the diffusion of a clean technology and the degree of product differentiation in an imperfectly competitive output market In their model a fixed number of firms can choose individually between using a clean production technology and a dirty technology Both technologies exhibit constant marginal production costs and constant emission rates (with the clean technology having a lower emission rate and higher unit cost) and consumers are assumed to be able to differentiate between products on the basis of the technology used in their production (21) The subsidy regime is different to that considered by the other studies in that it is applied to the production cost of the clean good and thus reduces the (constant) marginal cost of production for that good As such it is equivalent to an output subsidy for the clean good The authors derive the equilibrium diffusion rate for the clean technology (ie the proportion of firms using
(18) In the second half of their paper Millock and Nauges (2006) undertake an empirical evaluation of such a scheme that operated in France during the 1990s for SO2 and NOX emissions The results of this analysis are summarised under Section 25 on empirical evidence
(19) Abatement effort is assumed to exhibit decreasing returns to scale ie the cost function is increasing and convex(20) If output is held fixed in the profit maximisation problem then increases in the emissions tax rate unambiguously increase the
optimal level of abatement effort as found by Kemp (1997) who uses a cost-minimisation framework for his analysis(21) The model assumes imperfect substitution between the clean good and dirty good with the willingness-to-pay for one good being
a linear function of the quantities of both goods individually ndash ie Pk = ak ndash bYk ndash cYj
Review of literature on environmental tax reform and eco-innovation
Environmental tax reform in Europe opportunities for eco-innovation 17
that technology) and show that an increase in the subsidy value increases diffusion for all degrees of product differentiation The impact is greater as the substitutability of the two goods increases They also briefly consider the impact of a technology subsidy that reduces the fixed cost of the clean technology and conclude that this too will stimulate diffusion but will be less efficient than the output subsidy (22)
Key findings of the theoretical studies
As is often the case with theoretical analyses the specifications of the models and the underlying assumptions of the studies reviewed here significantly influence the conclusions Nevertheless there is a reasonable degree of consistency between their findings The studies can be classified into two broad groups those that consider innovation and diffusion within an industry setting and those that consider an individual firms decision whether to undertake RampD (ie innovation) and invest in an abatement technology (ie diffusion) in order to reduce its own cost of abatement
The studies in the first group conclude that under conditions of perfect competition emission taxes and auctioned permits provide greater incentives for innovation than direct controls or freely allocated permits However there is some disagreement over the relative impacts of the two instruments Under the assumption that the innovator appropriates a fixed (exogenous) proportion of the gains accruing to the technology adopters Milliman and Prince (1989) conclude that auctioned permits provide the greatest incentive although the government may find it easier to adjust emission taxes in response to the resultant downward shift in marginal abatement costs However when the proportion is determined endogenously mdash in the form of a royalty payment mdash Fischer et al (2003) find that either auctioned permits or emission taxes can provide the greater incentive Emission taxes are likely to provide the greatest incentive if the innovator can appropriate a large proportion of the gains (because the technology is difficult to imitate)
Montero (2002) uses a slightly different framework to compare the impacts of different instruments on innovation (in the form of RampD expenditure)
in a situation of imperfect competition and finds that the ranking depends on the nature of the competition (23) Under Bertrand price competition in the output market the results are the same as under perfect competition the relative ranking of auctioned permits and taxes is ambiguous but both provide greater incentives for innovation than emission standards and freely allocated permits However under Cournot quantity competition any of the instruments apart from freely allocated permits can provide the greatest incentives depending on the model parameter values
The studies looking at an individual firms decision also show that an emissions tax can stimulate innovation and diffusion Jaffe and Stavins (1995) explicitly consider the firms decision criterion for investing in a new abatement technology and show that by increasing the benefits of investing the introduction of an emissions tax should bring forward its adoption by existing firms and make its use by new entrants more likely The other two studies consider the firms choice of optimal abatement effort in the context of maximising its total profits or minimising its total cost of emissions reduction This effort can take the form of RampD (innovation) or expenditure on abatement equipment (diffusion) The decision problem is the same in each case ie to choose the optimal level of effort
Kemp (1997) assumes that the firm seeks to minimise its total cost of emissions reduction mdash implicitly assuming that its output level is fixed mdash and demonstrates both that abatement effort increases as the emissions tax increases and that the optimal effort is lower under direct regulation than under an equivalent tax However when the firms output level is allowed to vary mdash as is the case with the profit maximisation problem considered by Millock and Nauges (2006) mdash the impact of an increase in the emissions tax rate on the level of abatement effort depends on the relative magnitudes of the direct impact and the indirect impact (via changes in output levels) on the marginal benefit of abatement effort If the latter dominates then an increase in the emissions tax rate leads to a reduction in the optimal level of abatement effort
(22) McGinty and de Vries (2009) derive expressions for the necessary technology subsidy values when diffusion is 0 and when it is 100 They state mdash without proof mdash that the latter is greater than the former Provided that the relationship between the subsidy and diffusion is monotonic this is a sufficient condition for increases in the subsidy value to cause increases in diffusion
(23) Monteros model does not include diffusion However it does include spillover effects where RampD by one firm reduces the abatement costs of the others
Environmental tax reform in Europe opportunities for eco-innovation
Review of literature on environmental tax reform and eco-innovation
18
Only one of the industry models considers the impact of investment subsidies Using a product differentiation model of imperfect competition McGinty and de Vries (2009) show that subsidising the unit cost of a clean production technology can accelerate its diffusion However the impact depends on the degree of substitutability between clean and dirty products diminishing as the products become more differentiated In contrast all three of the individual firm analyses consider the impact of investment subsidies with all demonstrating that increasing subsidies induce greater abatement effort Furthermore Kemp (1997) shows that the impact of an RampD subsidy is greater in the presence of an emissions tax than it is under an equivalent emissions limit
25 Empirical studies
Jaffe and Stavins (1995) use their theoretical framework (outlined above in Section 24) as the basis for assessing the diffusion of thermal insulation in new home construction in the United States using state-level panel data for the years 1979ndash88 They derive a reduced form equation for the energy efficiency level chosen by developers from the marginal cost-benefit condition in which the explanatory variables include energy prices installation costs and the presence of a relevant building code (as a dummy variable) Separate equations are estimated for ceiling floor and wall insulation with the coefficient for energy prices being positive in all three equations Although it is only significant (at the 95 level) for floor insulation the joint hypothesis that all price coefficients are zero is strongly rejected However the coefficients for installation cost (which are all negative as expected) are around two to three times greater in magnitude and of comparable significance The coefficients for the building code dummies are consistently insignificant (and negative in two cases) indicating that this form of direct regulation had minimal impact on household energy efficiency levels over the period The authors use the estimated models in a simulation to compare the effects of a 10 increase in energy prices (ie an energy tax) with those of a 10 reduction in installation costs (ie a technology subsidy) with each applied over the whole ten-year period While
the tax increases diffusion by 2ndash6 by the end of the period the technology subsidy increases diffusion by between 4ndash15
Kemp (1997) models the diffusion of biological water treatment technology in the Dutch food and beverage industry based on a rational choice threshold model of technology adoption decisions In this model a firm chooses to adopt an abatement technology if the resulting reduction in emission-tax payments is greater than the annualised total costs of the technology where a discount factor is applied to the savings to reflect uncertainty and risk aversion on the part of the decision-maker This is translated into a probabilistic model under the assumption that both the savings and the costs follow a log-normal distribution across plants The model is estimated econometrically using data for the period 1974ndash91 under different assumptions for the functional form of the discount factor and allowing for adjustment costs (24) The estimated parameters for the preferred specification of the discount factor are all significant and of the expected sign and magnitude and the model provides a very close fit to the actual diffusion of waste-water treatment technologies over the period This leads the author to conclude that the effluent charges were a significant positive factor in the diffusion of treatment technologies Indeed he estimates that only around 4 of plants would have installed waste-water treatment equipment by the end of the period if the charge had remained at its (low) 1974 level compared to the actual figure of over 40
Newell et al (1999) estimate the impact of energy prices energy efficiency standards and other factors on the energy efficiency of three types of electrical consumer durables (room air conditioners central air conditioners and gas water heaters) in USA between the 1970s and 1990s The analysis utilises a product characteristics model in which the frontier of technologically feasible products is described by a transformation surface that relates the bundle of product characteristics to the real cost of producing that bundle In this framework innovation is represented by movements of the surface and movements along the surface In particular the authors identify three types of innovation shifts in the surface towards the origin (overall technological change) changes in the slope
(24) Adjustment costs are accounted for by estimating a partial adjustment model in which the actual change in adoption is some fixed fraction of the desired change (estimated from the threshold model)
Review of literature on environmental tax reform and eco-innovation
Environmental tax reform in Europe opportunities for eco-innovation 19
of the surface (directional technological change) and changes in the mix of products along a given surface (model substitution) They define the surface in terms of two characteristics energy flow and cooling capacity and incorporate innovation by allowing the coefficients of the two variables to vary with time and (in the case of energy flow) energy prices and efficiency standards Separate equations are estimated for each durable type with slightly differing sets of explanatory variables and time periods The authors find little evidence that either energy prices or energy efficiency standards had any impact on overall technological change While all but one of the relevant coefficients have the expected sign none are significant In contrast they do find evidence that energy prices had an impact on directional technological change with the relevant coefficients being of the correct sign and significant for both room and central air conditioners
Popp (2002) uses patent data to estimate the effect of energy prices on energy-efficiency innovations in USA between 1970 and 1994 He regresses normalised energy-efficiency-related patent applications against energy prices controlling also for lagged knowledge stock and government RampD (25) The estimated coefficient for energy prices is highly significant producing a short-run price elasticity of 006 and a long-run elasticity 0354 Thus a 10 increase in energy prices would be expected to increase the number of energy-efficiency-related patents by around 35 in the long run The estimated mean lag is less than four years leading the author to conclude that the imposition of a carbon or energy tax would lead to a fairly quick shift towards environmentally friendly innovation
Hoglund Isaksson (2005) estimates abatement cost functions for the reduction of nitrogen oxide (NOX) emissions in three industrial sectors in Sweden (energy pulp and paper chemicals and food) The analysis uses a double-hurdle model applied to a pooled sample of 114 plants across the three sectors The data cover the period 1990ndash1996 which spans the introduction of the charge on NOX emissions in 1992 The estimated cost curves have a similar shape in all three sectors with minimal (or even negative) costs over a relatively broad range of emission reductions and then a steep rise as reductions exceed
a threshold level The analysis does not explicitly consider the issue of innovation However it does find that abatement cost curves shifted downwards significantly over the period In the energy sector for example the emission rate threshold for significant cost increases fell by around 45 between 1991 and 1996 (from 550 to 300 kgGWh) The author surmises that this is due to a combination of technological development and the discovery of previously unrecognised opportunities Unfortunately while this shift coincided with the introduction of the NOX charge the analysis does not provide any evidence of a causal link
As part of their analysis of the impacts of the French tax-subsidy scheme for NOX and sulphur dioxide (SO2) emissions Millock and Nauges (2006) estimate the impact of the emission taxes on a plants decision to install end-of pipe abatement equipment While the study is not concerned with innovation per se the results of this part can be interpreted as showing the impact of emission taxes on the diffusion of abatement equipment Under the scheme taxes were imposed on the emissions of these air pollutants (and VOCs) by all plants satisfying certain criteria The revenue raised by the taxes was earmarked for subsidising the cost of qualifying abatement technologies for technical studies (ie RampD) and for investment in air quality surveillance systems Using panel data for 226 plants in three industries (iron and steel coke and chemicals) for the period 1900ndash1998 the authors estimate a Probit model for the probability that a plant will install abatement equipment They find that the total value of emissions taxes paid by the plant (ie for both pollutants) has a positive impact on its decision to invest in abatement equipment However the magnitude of the effect varies considerably across the sectors and is only significant for the iron and steel sector
Frondel et al (2008) analyse responses to an OECD survey on environmental policy tools (conducted in 2003) to identify the factors that affect a firms decision to adopt an environmental management system (EMS) voluntarily and their environmental innovation behaviour Innovation is captured by a binary variable that indicates whether the firm has undertaken significant technical measures or changes to reduce the environmental impacts of
(25) Normalised energy efficiency patent values are calculated by dividing by the total number of patents granted This accounts for exogenous changes in patenting behaviour that affect all types of patents Popp constructs a value for existing knowledge as the stock of previously granted patents weighted by estimates that he derives for knowledge productivity He demonstrates that the exclusion of this variable from the model leads to biased estimates for the energy price coefficient
Environmental tax reform in Europe opportunities for eco-innovation
Review of literature on environmental tax reform and eco-innovation
20
production (26) The analysis is based on survey responses from 899 firms in Germany Latent variable equations for EMS adoption and innovation are estimated simultaneously with each equation including the same four sets of variables relating to motivations policy instruments pressure groups and facility characteristics (27) The policy instrument variables include five dummy variables indicating the importance of different types of policy instrument including market-based instruments such as emission taxes and tradable permits While the perceived stringency of environmental policy is found to be a significant factor in the decision to innovate there is no evidence that any of the individual policy instrument variables had any impact The authors surmise that this suggests that it is stringency of environmental policy rather than the choice of specific instrument that is important for innovation However as the authors note their results reflect the perceptions of the survey respondents and should therefore be treated as correlations rather than causal relationships
Johnstone and Hascic (2008) assess the impact of a range of environmental policy instruments mdash including tax measures and investment incentives mdash on innovation in the renewable energy field They analyse the impacts for five different groups of renewable energy technologies mdash wind solar ocean biomass and waste-to-energy mdash using a panel dataset of European Patent Office (EPO) patent filings for these technologies across 26 countries over the period 1978ndash2003 A fixed effects negative binomial model is estimated controlling for electricity prices and consumption public sector RampD expenditure (as a proxy for scientific capacity) and total EPO filings (as a proxy for differenceschanges in patenting propensity) The various policy instruments are represented by dummy variables indicating whether they were in place in a particular year As such the model takes no account of the stringency of the instruments mdash in particular the differing magnitudes of the tax measures and investment incentives (28)
Initially the authors estimate the model with all of the policy instruments included individually They find that while public policy plays an important role in inducing innovation the impacts of the individual instruments vary across the different technologies In particular tax measures are significant for wind and biomass technologies with investment incentives being significant for solar and waste-to-energy technologies and obligationstradable certificates being significant for wind technologies However the authors express concerns that there may be multicolinearity between the policy variables (particularly between investment incentives tax measures and tariffs) and also that there may be interaction effects between some of the variables Consequently they estimate two alternative versions of the model the first using a composite policy variable representing the number of policy instruments in place and the second using clusters of similar policy instruments (29) The results or these two models confirm the initial findings The composite policy variable is significant for all of the technology groups while the significance of the clusters varies across technologies The price-based cluster is (highly) significant for solar biomass and waste-to-energy The quantity-based cluster is significant for wind technologies The authors surmise that this may be due to the different economic characteristics of the technologies For example the significance of investment incentives for solar and waste-to-energy may reflect the capital intensity of these technologies with large up-front investment costs
De Vries and Medhi (2008) also use patent data to investigate the relative importance of environmental regulations and fuel prices on innovation in automotive emission-control technologies distinguishing between post-combustion devices and engine redesign technologies They estimate a panel data model using data from Germany Japan and USA over the period 1978ndash2001 controlling for industry value added (as a proxy for the scope of technological opportunities) and total patent
(26) The next question on the survey asks whether these are changes in production processes or end-of-pipe technologies However no distinction is made between these two types of innovation in the present study
(27) In order to avoid identification problems some individual variables are omitted from one equation or the other(28) This shortcoming is recognised by the authors who state that it is unavoidable in any cross-comparative analysis in which multiple
instruments are included(29) The clusters are price-based instruments (investment incentives tax measures and tariffs) quantity-based instruments (obligations
and tradable certificates) and voluntary programmes
Review of literature on environmental tax reform and eco-innovation
Environmental tax reform in Europe opportunities for eco-innovation 21
applications (as a proxy for differenceschanges in patenting propensity) Environmental regulation is represented by two dummy variables indicating the introduction of on-board diagnostic (OBD) regulations in USA (30) The results of the analysis suggest that the relative impacts of regulation and market forces differ between the two types of technology For post-combustion technologies both of the regulations are significant while fuel prices have no significant impact In contrast the opposite is the case for engine redesign technologies with fuel prices having a significant impact but regulation having no discernable effect While the analysis does not explicitly consider the impact of fuel taxes it suggests that an increase in automotive fuel taxes would have a major impact on innovation in relation to engine design The estimated coefficient for fuel prices (1287) implies that a USD 010 increase in fuel prices would induce a 14 increase in patenting activity (31)
Key findings of the empirical studies
The empirical studies considered above cover a range of different technology areas spanning energy efficiency (both product and process) renewable energy and air and water pollution abatement While in some cases they assess the impact of energy prices rather than environmental taxes per se they provide a clear picture of the likely impact of environmental and energy-related taxes on eco-innovation
Three of the studies assess the impact on diffusion of existing technologies All find that environmental taxesenergy prices have a positive impact on diffusion In particular the water effluent charges in The Netherlands appear to have had a major impact on the adoption of waste-water treatment equipment by the food and beverage industry in that country However there is some evidence to suggest that the effectiveness of taxesprices may vary across sectors (eg NOXSO2 abatement in France) and that investment incentivessubsidies may be more
effective in some cases (eg thermal insulation in USA)
Three of the studies use patent data to assess the impact of environmental taxes and energy prices on innovation with one of these also assessing the impact of investment incentives All find a significant positive impact although this depends on the particular sub-sector (eg renewable energy) or the type of innovation In particular the evidence from the automotive emissions control study suggests that taxesprices may be more effective in promoting process-related innovation (eg engine redesign) than innovation in end-of-pipe technologies One of the studies takes a different approach using a product-characteristics model to decompose improvements in the energy efficiency of consumer durables This finds that while electricity prices did not appear to affect overall technological change (ie shifts in the product costenergy efficiency frontier) they did have a positive impact on directional technological change (ie the slope of the frontier)
26 Case studies
Christiansen and Skjaerseth (2005) undertake a comparative analysis of the impacts of climate change policies on the petroleum sectors in Norway and the Netherlands during the 1990s These countries were selected because of their very different policy approaches with the Norwegian petroleum sector subject to a carbon dioxide (CO2) tax since 1991 as part of a portfolio of measures (32) and the Netherlands relying on a series of voluntary agreements on energy efficiency (33) Both approaches appear to have been effective in that CO2 emissions per unit production fell by around 22 between 1990 and 2001 in Norway while energy efficiency improved by around 35 in the Netherlands over the same period However there were marked differences between the two countries in terms of the nature of the innovation that
(30) Because of the international nature of the automotive industry and the importance of the US market regulations introduced in USA appear to have been an important driver for innovation by overseas manufacturers Regulations mandating the installation of OBD systems were first introduced in California in 1988 A more sophisticated system was mandated by the 1990 US Clean Air Act Amendments taking force in 1996
(31) The coefficient represents the semi-elasticity of patent applications with respect to fuel prices While the authors do not state so explicitly the implication is that prices are expressed in US dollars (they are obtained from the IEA Energy Prices and Taxes Database) Consequently the impact of a 10 US cent increase in the fuel prices is given by exp(1287 x 01) ndash 1 = 0137
(32) In addition to the tax the portfolio included publicly funded RampD support schemes gas flaring permits and mandatory environmental impact assessments
(33) The Dutch oil and gas industry first signed a declaration of intent with the government in 1995 This was translated into a long-term agreement (LTA) on energy efficiency in the following year with an improvement target of 20 over the period 1989ndash2000 In 2001 a new LTA was signed which committed firms to implementing energy efficiency measures with a positive NPV at a 15 discount rate or a five year payback period
Environmental tax reform in Europe opportunities for eco-innovation
Review of literature on environmental tax reform and eco-innovation
22
occurred In the Netherlands technological change was incremental reflecting a steady diffusion of available (ie known) technology In contrast the authors find evidence of more radical innovations and adaptations by the Norwegian petroleum sector including the development of energy-efficient gas turbines installation of waste heat recovery units process modifications and improved use of process heat While the authors acknowledge the impossibility of proving a causal link between policy intervention and innovation (in the context of their case study) they conclude that the CO2 tax played a key role in the development and implementation of these radical innovations and the benefits of reduced tax payments provided an important incentive However they also conclude that the impacts of the two instruments were conditioned by the political contexts in which they were applied and the problem characteristics in the respective countries (eg the economic significance of the sector and the size of installations)
Knigge and Goumlrlach (2005) summarise the findings of a comprehensive analysis of the impacts of the ETR in Germany That analysis undertaken jointly by Ecologic and the German Institute for Economic Research (DIW Berlin) included the impacts on innovation and market diffusion of environmentally friendly products and technologies (34) Based on a series of case studies the study concluded that the ETR had a noticeable effect on innovation and diffusion although it was not possible to quantify the scale of that effect In particular ETR is identified as being a central factor in the development of gas-powered vehicles The study identifies a number of different routes by which the ETR produced impacts First the payback period for energy-efficient products was reduced as a result of the energy tax increases and the various exemptions favouring efficient energy use and renewable energy sources Second the predictable nature of the energy taxes (as opposed to widely fluctuating oil prices) reduced uncertainties about the benefits of energy-efficiency investments Third the reduction in employers social contribution payments tended to reduce the costs of labour intensive innovation processes such as research and development energy consultancy and technology installation Finally the ETR had a signalling effect strengthening awareness of the need for more efficient and rational energy use
Mickwitz et al (2007) examine a number of claims that have been made in the environmental policy literature about the relationship between policy instruments and innovation based on experiences in two industrial sectors in Finland pulp and paper and the manufacture of diesel engines for ships In particular they assess the claims that environmental taxes are superior to other policy instruments with respect to innovation and that RampD subsidies have limited impacts on innovation With respect to the first claim the evidence provided by the two case studies is mixed The authors conclude that energy taxation had a negligible impact on innovation in the pulp and paper industry However this is likely to have been due to the low level of the tax and the exemptions that applied to the sector In contrast they find that the differentiation of Swedish fairway and port fees (on the basis of SO2 and NOX emissions) was a significant factor driving the installation of in-engine NOX reduction equipment in ferries operating between the two countries (35) With respect to RampD subsidies the authors conclude that the evidence does not support the claim that these have little effect In particular they find that RampD subsidies accelerated the development of ship engine emissions-reduction technologies
The findings of the three case studies are consistent with those of the empirical analyses reviewed in the previous section Environmental taxes and investment subsidies have proven significant in promoting both innovation and diffusion although not universally so Furthermore the case studies provide some useful insights about the ways in which the impacts occur and the factors that may be important in promoting innovation In particular they suggest the need for a tax rate that is sufficiently high to provide a meaningful incentive and signalling effect and that is fixed for a sufficiently long period of time to reduce uncertainty about the future benefits of investment
27 Conclusions
The studies reviewed in the preceding sections suggest that environmental regulation in general and price-based policy instruments such as environmental taxes and investment subsidies in particular can (in theory) and do (in practice) have a positive impact on both innovation and diffusion
(34) A separate report in German by Goumlrlach et al (2005) provides details of the evaluation of the innovation and diffusion impacts (35) Although the tax was introduced in Sweden it was also payable by Finnish ferry operators entering Swedish ports and hence
affected their investment decisions This is another example of the cross-border impact of environmental policy interventions on innovation found by Lanjouw and Mody (1996) (see Section 23)
Review of literature on environmental tax reform and eco-innovation
Environmental tax reform in Europe opportunities for eco-innovation 23
of environmental technologies However the supporting empirical and case study evidence is not universal and the effectiveness of these instruments would appear to vary across different sectors and different types of innovation
To a certain extent such differences can be explained by the theoretical models In particular the impact of environmental taxes (relative to other instruments) is predicted to depend on the competitive structures of the markets in which the regulated firms operate and on the ability of innovator firms to appropriate the benefits accruing to other firms during diffusion However a number of other potential factors have been identified in the literature which may affect the impact of price-based policy instruments on innovation
Jaffe et al (2002) caution that the impact of price-based policy instruments on technology diffusion may be adversely affected by a number of potential market failures including information failures principle-agent problems (eg landlord-tenant) capital market failures and positive adoption spillovers In addition while not market failures as such uncertainty over future returns and the (associated) use of high discount rates for investment decisions can also undermine the effectiveness of price-based instruments in stimulating diffusion However as was noted above the findings from the case study of ETR in Germany suggest that an environmental tax may actually reduce the level of uncertainty over future returns provided that it is of sufficient magnitude and longevity
Skjaerseth and Christiansen (2005) emphasise that the relationship between policy instruments (of all types) and technological change is extremely complicated They argue that account must be taken of the politicalindustrial context in which policy instruments are introduced and the nature of the environmental problem that they are intended to address In particular they make a distinction between malign problems where technological change involves net costs for target groups and benign problems where there are widespread no-regret opportunities for change Based on a comparative analysis of four different case studies they conclude that mandatory policy instruments (including environmental taxes) are more effective
in promoting short-term technological change when the problems are malign but that low legitimacy (with the target group) may undermine long-term technological change However when problems are benign or when long-term change requires cooperation voluntary policy instruments are likely to be more effective
Johnstone (2005) questions the focus of the theoretical and empirical analyses (reviewed above) on the impact of environmental policy instruments on the rate of technological change He argues that the direction of technological change is as important if not more so In addition to the quantity of innovation it is also important that innovation be socially optimal in the sense that it minimises the cost of attaining a particular environmental goal in the long term Inappropriate innovation today may result in lock in to a suboptimal technological path for the future
With this in mind Johnstone identifies a number of issues that can adversely affect the direction of innovation and should be taken into account when selecting and designing policy instruments technological market failures (36) missing markets for certain environmental attributes of innovation policy incidence and joint production of emissions Most studies of the innovation effects of environmental policy instruments assume that the only missing market is that for the environmental good (or bad) However in practice there may be other markets that are missing (or incomplete) which can adversely affect transmission of innovation incentives This is particularly so in the area of waste and resource management where instruments applied at the end of the product life cycle may have little or no impact on product design innovation Even if all markets are complete except for the environmental externality the point of incidence of the policy intervention may be more important for the direction of innovation than the choice of a particular policy instrument For example a limit or standard applied directly to the emissions of a pollutant may be more effective in promoting optimal innovation than a tax applied to a proxy input variable Finally when there is joint production of pollutants (eg CO2 and air pollutants from vehicle engines) there is a danger that if policy instruments (of whatever type) are applied to one pollutant in isolation the resulting innovation may
(36) These are the same market failures identified by Jaffe et al (2002)
Environmental tax reform in Europe opportunities for eco-innovation
Review of literature on environmental tax reform and eco-innovation
24
reduce emissions of that pollutant at the expense of increases in the others
In a related point Johnstone highlights the importance of using appropriate indicators when assessing the impact of policy instruments on innovation emphasising the need for these to reflect both the rate of innovation and the direction A necessary condition for this is that the indicators must provide an accurate and detailed picture of actual innovation Unfortunately this is difficult to achieve in practice For example the use of patent data as a measure of innovation requires the identification of relevant environmental technologies This is likely to be easier for end-of-pipe technologies than for process-related technologies meaning that the latter tend to be under-represented relative to their actual incidence To the extent that process-related innovation is growing in importance or is more important
for certain sectors or types of environmental problem changes in the value of the indicator may significantly understate the actual rate of innovation and misrepresent the direction
All of this suggests that caution should be exercised in drawing general definitive conclusions about the impacts of price-based policy instruments such as environmental taxes and investment subsidies on innovation particularly relative to other policy instruments While it would appear that they can be effective in stimulating both innovation and diffusion in many cases mdash at least in terms of the rate of technological change mdash there may be situations in which other policy instruments may be more appropriate In general the stringency and point of incidence of an environmental policy intervention may be more important than the choice of a particular policy instrument in determining the rate and direction of eco-innovation
25
Modelling of ETR impacts on eco-innovation
Environmental tax reform in Europe opportunities for eco-innovation
31 Scenarios assessing the implications of ETR for eco-innovation
Scenario analysis provides a useful means of improving understanding of how the different revenue recycling methods and various scales of ETR can help meet different greenhouse gas emissions targets
To investigate the impacts of an ETR for Europe the petre project elaborated a range of different scenarios reflecting various tax reform options In addition to employing several of these original scenarios the present study compiled two new scenarios to analyse the implications of ETR for eco-innovation All scenarios were examined in both E3ME and GINFORS (37)
311 Original petre project scenarios
The key petre scenarios relevant for the present study are
bull scenarioBHbaselinescenariowithhighenergyprice (reference case)
bull scenarioS1HETRdesignedtomeettheEUsunilateral 2020 GHG target (high energy price) with revenue recycling
bull scenarioS2HETRdesignedtomeettheEUsunilateral 2020 GHG target (high energy price) with revenue recycling and 10 of revenues spent on eco-innovation measures
Each of the ETR scenarios has the same key taxation components
bull acarbontaxrateisintroducedtoallnon-EUEmissions Trading System (EU ETS) sectors equal to the carbon price in the EU ETS that delivers an overall 20 reduction in greenhouse gas emissions by 2020 and in the international cooperation scenario this is extended to 30
bull aviationisincludedintheEUETSattheendofPhase 2
bull powergenerationsectorEUETSpermitsare100 auctioned in Phase 3 of the EU ETS
bull allotherEUETSpermitsare50auctionedin2013 increasing to 100 in 2020
bull materialtaxesareintroducedat5oftotalpricein 2010 increasing to 15 by 2020
In scenario S1H environmental tax revenues are recycled through reductions in income tax rates and social security contributions in each of the Member States such that there is no direct change in tax revenues In scenario S2H 10 of environmental tax revenues are recycled through spending on eco-innovation measures and the remaining 90 is recycled through the same measures as in the other scenarios The eco-innovation spending is split across power generation and housing according to tax revenues from the corporate and household sector
In GINFORS (the model used for analysing the implications of ETR and eco-innovation) the share of renewable sources in electricity production is increased due to the additional investment The rest of additional investment goes to household energy efficiency spending Investment needed for a certain increase in renewable energy production or efficiency improvement is based on Austrian and German experience (Lehr et al 2008 and 2009 Grossmann et al 2008 Lutz and Meyer 2008) This assumption is quite conservative as parameters for other countries can be assumed to be more positive (meaning that less money is needed for renewable energy technology installation or energy efficiency gains)
In scenario S1H the 20 GHG target translates into a 15 reduction in energy-related carbon emissions relative to 1990 as other emissions such as methane and nitrous oxide have already been reduced by
3 Modelling of ETR impacts on eco-innovation
(37) The E3ME and GINFORS models are introduced in Chapter 1 of the present report A detailed discussion of the models and scenarios used in the present study can be found in Ekins and Speck (2011)
Environmental tax reform in Europe opportunities for eco-innovation
Modelling of ETR impacts on eco-innovation
26
more than 20 (in terms of carbon equivalents) The target is reached by a tightened EU ETS cap and the introduction of a carbon tax on the non-ETS sector The tax rate applied is equal to the carbon price in the EU ETS that will deliver a 20 GHG reduction by 2020
The burden of ETR taxes are allotted to energy outputs (ie the final use of energy) and will be based on the carbon content of each fuel Carbon prices are assumed to be fully passed on to consumers All carbon taxes are in addition to any existing unilateral carbon and energy taxes The carbon reductions in the different EU Member States will be those that result from a uniform carbon tax increase across the EU
All of the revenues including EU ETS auctioning revenues carbon tax revenues and material tax revenues will be recycled The proportion of tax raised by industry will be recycled into a reduction in employers social security contributions which will in turn reduce the cost of labour Recycling will be additional to the existing ETRs in some Member States Revenues raised from households will be recycled through standard rate income tax reductions Traditional energy tax revenues will be lower compared to their respective baselines as the tax base (energy consumption) is reduced So for an ETR revenue-neutrality does not mean budget-neutrality
312 Factors affecting the macroeconomic impacts of RES technologies
Earlier analyses (Lehr et al 2008 Fraunhofer ISI et al 2009 DTI 2004 Kammen et al 2004 Moreno and Loacutepez 2007) have studied the impacts of large renewable energy source (RES) shares in the energy mix for different countries The overall question in these studies has been the impact of increasing RES shares on the economy especially on the labour market For the present study it is interesting to note that macroeconomic impacts of higher RES shares mainly depends on the following five factors
1 additional investment in RES (minus lower investment in conventional sources ie fossil and nuclear power) with the impact increasing if a country manufactures the RES technology in question
2 additional (net) exports due to improved international competitiveness of renewable energy sources (first mover advantage)
3 lower fossil fuel needs4 the cost differences between RES and
conventional energy
5 the shift from capital- and energy-intensive industries to labour- and technology-intensive industries
All five factors are driven by international energy prices carbon prices the policy framework and RES technology development itself Innovation comes into the play at various stages First innovation drives the currently positive additional costs of RES technologies down and even into negative realms depending on the fossil fuel scenario Second innovative RES technologies are likely to have a competitive advantage in international markets Although a significant proportion of RES technology produced in Europe is traded in Europe innovation will still provide an edge in current and emerging international markets
The EmployRES study (Fraunhofer ISI et al 2009) finds for Europe that current strong investment reflected in installations in Europe and exports to the rest of the world dominate the economic impact of RES policies and therefore lead to positive overall effects The studys results suggest that this positive balance can only be kept up in the future if the competitive position of European manufacturers of RES technology is improved The authors strongly recommend policies which promote technological innovation in RES and lead to a continued and rapid reduction of their costs
Factors 1 and 2 will have substantial macroeconomic impacts in the short and medium terms whereas factor 3 accumulates and will show positive impacts mainly in the long term Factor 4 strongly depends on the global developments while factor 5 may have significant effects on employment
313 Additional scenarios
Impacts of additional investment (factor 1) have already been analysed in scenario S2H of the petre project To focus on the other impacts of eco-innovation two additional scenarios were designed building on scenario S2H of petre
bull S2HEETRwithrevenuerecyclingdesignedto meet the unilateral EUs 2020 greenhouse gas (GHG) target (high energy price) Ten per cent of revenues are spent on eco-innovation measures and trade shares of EU-27 economies with the rest of the world in machinery and electrical machinery increase by 01 due to the deployment of the fast growing RES markets This assumption is based on the strong EU policy effort to increase the share of renewable energy in final energy consumption to 20 by 2020
Modelling of ETR impacts on eco-innovation
Environmental tax reform in Europe opportunities for eco-innovation 27
(Fraunhofer ISI et al 2009) and the possibility of very strong world market development of the RES sector until 2020 (EREC 2008) which offers additional export opportunities for European RES industries
bull S2HIETRwithrevenuerecyclingdesignedto meet the unilateral EUs 2020 GHG target (high energy price) Ten per cent of revenues are spent on eco-innovation measures and input structures of the energy sector are changed according to the input structure of the German RES industry (Lehr et al 2008)
S2HE looks at the possible role of international trade S2HI analyses changes in the input structure of the energy sector ie from conventional electricity production to renewables In the petre project (as in GHK et al 2007) only the energy inputs of the energy sector were adapted to changes in the energy input mix
Both S2HE and S2HI focus on RES and efficiency technologies As mentioned above an ETR will trigger a variety of innovations Therefore the results can be thought of as conservative in the sense that innovations (eg automotive energy consumption industrial efficiency etc) are not explicitly included
32 Overview of modelling results
The main results of the simulations are presented in Table 31 In the baseline scenario BH with high energy prices EU-27 carbon emissions will be
72 below the 1990 level in 2020 (38) The EU-15 has committed in the Kyoto Protocol to reduce its GHG emissions 8 below 1990 levels in the period 2008ndash2012 As emissions in the new member states are substantially below their 1990 levels today that implies that the EU-27 will keep its emissions more or less constant over the coming decade As in the PRIMES baseline an ETS price of 18 EURt in 2008 prices is assumed in 2020
In scenario S1H the ETS price and carbon tax rate has to be increased to 68 EUR2008t of CO2 to reach the 20 GHG reduction target which is equal to a 15 reduction of CO2 emissions against 1990 as other greenhouse gases have already been reduced above average by more than 20 in terms of CO2 equivalents Compared to the baseline CO2 emissions are 84 lower in 2020 which means roughly an additional 1 reduction annually in the period 2012ndash2020 GDP will be about 06 lower compared to the baseline in 2020 This means that annual average growth rates will be less than 01 below their baseline development This is especially low compared to the current financial and economic crisis with a GDP deviation against the baseline of around 6 in 2009
As the recycling mechanism reduces labour costs and the tax burden is shifted from labour-intensive to carbon- and material-intensive sectors employment will be 036 (or more than 800 000 jobs) higher than in the baseline The ETR is not fully budget neutral potentially enabling EU economies to slightly increase their net savings If
(38) The modelling exercise in the present study was conducted in 2009 and therefore does not contain the latest data on EU-27 GHG emissions which were significantly influenced by the global economic slump of the late-2000s
Table 31 Main results under the different scenarios
Scenario Target in 2020 CO2 price GDP Employment CO2 reduction
EUR2008t pc against baseline
pc against baseline
pc against 1990
pc against baseline
in year 2020 2015 2020 2020 2020 2020
BH 18 ndash 72 00
S1H 20 GHG 68 ndash 022 ndash 057 036 ndash 151 ndash 84
S2H 20 GHG 61 ndash 013 ndash 030 041 ndash 152 ndash 85
S2HE 20 GHG 61 ndash 009 ndash 004 051 ndash 151 ndash 84
S2HI 20 GHG 61 ndash 006 ndash 024 045 ndash 152 ndash 84
Environmental tax reform in Europe opportunities for eco-innovation
Modelling of ETR impacts on eco-innovation
28
this extra saving is spent negative GDP impacts will be further reduced
In scenario S2H part of the revenues is invested in low-carbon technologies This reduces the carbon price to 61 EUR2008t in 2020 halving the GDP loss relative to scenario S1H to only 03 as the investment in renewable energies is assumed to be additional Employment impacts are also more positive than in scenario S1H The 10 investment in low-carbon technologies amounts to more than EUR 20 billion in 2020
Assuming additional EU exports of RES technologies in scenario S2HE GDP almost matches the baseline in 2020 and employment is 051 (or more than 1 million jobs) higher than in the baseline In scenario S2HI a shift in the input structure of the energy sector towards machinery
and electrical machinery reflecting the different nature of RES relative to conventional electricity generation also has smaller additional positive impacts on GDP and employment compared to scenario S2H
The following figures show impacts of the different scenarios in comparison to the baseline BH As Figure 31 illustrates all the alternative scenarios imply GDP lower than the baseline However comparing scenario S1H with the other three scenarios shows that additional RES investment (S2H) additional RES exports (S2HE) and the inclusion of different input structures of the RES industries (S2HI) each have positive GDP impacts These results are in line with model-based analysis in the EMPLOY-RES study (Fraunhofer ISI et al 2009)
Figure 31 EU-27 GDP according to four scenarios mdash deviation from the baseline (BH)
Percentage deviation from the baseline (BH)
ndash 100
ndash 080
ndash 060
ndash 040
ndash 020
0002010 2015 2020
S2HI S1H S2H S2HE
Modelling of ETR impacts on eco-innovation
Environmental tax reform in Europe opportunities for eco-innovation 29
In contrast to GDP employment increases relative to the baseline in all the alternative scenarios (Figure 32) Due to the scenario design the structure of the EU economies is shifted from energy-intensive to labour-intensive sectors The magnitude of the employment gain is influenced by the carbon price and the tax shift the underlying energy prices and the production loss The largest part of the employment increase stems from the additional RES investment (scenario S2H) although a shift in industry structures (S2HI) and additional RES exports (S2HE) are also positive for the labour market
33 Macroeconomic impacts at the national level
In general terms it is clear that national ETS and ETR impacts depend significantly on country specifics including energy use economic structure social system and behaviour (eg reactions to labour cost changes) In countries with high carbon intensity in their energy mix additional revenues and expenditures are higher than in countries with lower carbon intensity
Scenario S2H provides an interesting tool for analysing the macroeconomic impacts of ETR at the national level because 10 of the additional generated revenues are used for eco-innovation investments meaning that only 90 of the revenues are recycled back into the economy by reducing income tax rates and social security contributions
Figure 32 EU-27 employment according to four scenarios mdash deviation from the baseline (BH)
ndash 020
000
020
040
060
2010 2015 2020
S2HI S1H S2H S2HE
Percentage deviation from the baseline (BH)
Environmental tax reform in Europe opportunities for eco-innovation
Modelling of ETR impacts on eco-innovation
30
Figure 34 GDP in 2020 in EU-27 Member States under scenario S2H mdash deviation form the baseline (BH)
Figure 33 GDP in 2020 in selected countries under scenario S2H mdash deviation from the baseline (BH)
ndash 25 ndash 20 ndash 15 ndash 10 ndash 05 00 05 10 15
Romania
Bulgaria
SloveniaMalta
Lithuania
Latvia
Estonia
CyprusSlovakia
Poland
Hungary
Czech RepublicUnited Kingdom
Sweden
Spain
Portugal
Netherlands
Italy
Ireland
Greece
FranceFinland
Denmark
Luxembourg
Belgium
Austria
Germany
Percentage deviation from the baseline (BH)
Russia
South Africa
Brazil
India
China
Mexico
Japan
USA
Poland
United Kingdom
Spain
Italy
France
Germany
ndash 30 ndash 25 ndash 20 ndash 15 ndash 10 ndash 05 00 05 10
Percentage deviation from the baseline (BH)
Modelling of ETR impacts on eco-innovation
Environmental tax reform in Europe opportunities for eco-innovation 31
Figure 35 Employment in 2020 in EU-27 Member States under scenario S2H mdash deviation from baseline (BH)
EU-27EU-15
RomaniaBulgariaSloveniaMalta
LithuaniaLatvia
EstoniaCyprusSlovakia
PolandHungary
Czech RepublicUnited Kingdom
SwedenSpain
PortugalNetherlands
ItalyIrelandGreece
FranceFinlandDenmarkLuxembourg
BelgiumAustria
Germany
ndash 200 0 200 400 600 800 1 000
Percentage deviation from the baseline (BH)
Under scenario S2H the GDP of large EU economies deviates from baseline projections by between 0 and ndash 1 with the exception of Italy (Figure 33) Germanys GDP is even forecast to match the baseline level in 2020 due to the countrys strong RES industry Outside Europe some countries gain slightly against EU Member States in terms of competitiveness as export prices in most EU Member States and sectors increase and GDP in those countries exceeds the baseline projections as a result (Figure 33) This is mainly because carbon tax revenues are recycled via income tax reductions which are not part of production costs However energy exporting economies such as Russia or South Africa will lose exports if EU demand for fossil fuel imports declines The development of all EU Member States is shown in Figure 34
Employment impacts of scenario S2H are positive for almost all EU Member States as lower labour
costs increase labour demand and labour intensity (Figure 35) The highest absolute increases are shown for Germany the Netherlands Italy and the United Kingdom For EU-27 as a whole employment will be almost one million higher than in the corresponding baseline BH in 2020
The scenarios have not been designed with a view to meeting the EU renewables target of a 20 renewables share in final energy consumption in 2020 Nevertheless the scenarios provide some interesting insights The share is projected to increase from around 10 in 2009 to above 14 even in the baseline as instruments such as feed in tariffs and biofuel quotas will continue In scenario S1H the target will be missed with around 18 in 2020 Only in scenarios S2H S2HE and S2HI is the target met (approximately 20 )
Environmental tax reform in Europe opportunities for eco-innovation
Modelling of ETR impacts on eco-innovation
32
Under scenario S2H energy-related carbon emissions are reduced in all EU Member States relative to the baseline (Figure 36) The highest percentage reductions can be seen in many of the EU-12 Member States with still high energy intensity and low energy prices In these countries the relative price increase is higher than in countries like Germany or the United Kingdom with already high energy taxes and overall energy prices
Additional ETS revenues material tax revenues and carbon tax revenues from the industry sector are recycled back to industry via reductions in employers social security contributions (or wage subsidies in some countries) The revenues from the carbon tax on households set out in Table 32 (totalling 033 of GDP in Germany for example) are used to reduce income tax For the EU-27 overall revenues from ETS and ETR reach about 2 of GDP in 2020 although these figures may be excessive because additional EU efforts to increase energy
efficiency and renewable energy which will reduce the ETS price are not taken into account The use of flexible tools such as the Clean Development Mechanism will further reduce the revenues and earmarking of part of the revenues for mitigation and adaptation measures in emerging and developing countries limits the recycling into labour costs
In addition the scenarios do not take the current global economic problems into account According to the IEA (2009) the downturn will also reduce carbon emissions in the long run which will lead to lower carbon prices and revenues to reach fixed targets (or make tighter targets less costly)
The ETR will have varying effects on the prices of different sorts of products and services Material or carbon taxes increase the prices of product groups according to their direct and indirect material and carbon content The recycling mechanism reduces
Figure 36 Energy-related CO2 emissions in 2020 under scenario S2H mdash deviation from the baseline (BH)
WorldEU-27
EU-15Romania
BulgariaSlovenia
MaltaLithuania
LatviaEstonia
CyprusSlovakia
PolandHungary
Czech RepublicUnited Kingdom
SwedenSpain
PortugalNetherlands
ItalyIreland
GreeceFrance
FinlandDenmark
LuxembourgBelgium
AustriaGermany
ndash 25 ndash 20 ndash 15 ndash 10 ndash 5 0
Percentage deviation from the baseline (BH)
Modelling of ETR impacts on eco-innovation
Environmental tax reform in Europe opportunities for eco-innovation 33
Table 32 Additional ETS and environmental tax revenues in 2020 ( of GPD)
S2H Germany United Kingdom EU-27
ETS revenues 083 064 059
Carbon tax (industry) 052 044 054
Carbon tax (households) 033 041 036
Material tax 041 029 056
Sum 209 178 205
Figure 37 Total primary energy supply in 2020 under scenario S2H mdash deviation from the baseline (BH)
WorldEU-27EU-15
RomaniaBulgaria
Slovenia
MaltaLithuania
LatviaEstonia
Cyprus
SlovakiaPoland
HungaryCzech Republic
United KingdomSweden
SpainPortugal
NetherlandsItaly
IrelandGreece
FranceFinland
DenmarkLuxembourg
BelgiumAustria
Germany
ndash 24 ndash 21 ndash 18 ndash 15 ndash 12 ndash 9 ndash 6 ndash 3 0
Percentage deviation from the baseline (BH)
Environmental tax reform in Europe opportunities for eco-innovation
Modelling of ETR impacts on eco-innovation
34
Figure 38 Output price impacts of scenario S2H in Germany in 2020 mdash deviations from the baseline (BH)
Figure 39 Impacts of scenario S2H on industrial output in 2020 in Germany mdash deviations from the baseline (BH)
ndash 5
0
5
10
15
20
Output prices
Percentage deviation from the baseline (BH)
(3) F
ood
(4) T
extiles
(5) W
ood
(6) P
ulp pap
er
(7) C
oke re
fined
petro
leum
pro
ducts
(8) C
hemica
ls ex
cl pha
rma
(9) P
harm
aceu
ticals
(10)
Rub
ber a
nd plastics
(11)
Non
-metallic
miner
als
(12)
Iron
and
steel
(13)
Non
-ferrou
s metals
(14)
Met
al pro
ducts
(15)
Mac
hine
ry and
equ
ipmen
t
(16)
Office
mac
hine
ry
(17)
Electric
al m
achine
ry
(18)
Rad
io T
V
(19)
Med
ical pr
ecisi
on and
opt
ical ins
trumen
ts
(20)
Mot
or veh
icles
(21)
Ships
(22)
Airc
raft
(23)
Railro
ad
(24)
Man
ufac
turin
g n
ec r
ecyc
ling
(25)
Electric
ity g
as w
ater
sup
ply
(26)
Con
stru
ction
(27)
Tra
de r
epairs
(28)
Hot
els an
d re
stau
rant
s
(29)
Tra
nspo
rt an
d stor
age
(30)
Pos
t and
teleco
mmun
icatio
ns
(31)
Finan
ce ins
uran
ce
(32)
Rea
l estate ac
tivities
(33)
Ren
ting
(34)
Com
puter
(35)
Res
earch an
d de
velopm
ent
(36)
Oth
er bus
ines
s ac
tivities
(37)
Pub
lic ser
vice
s
(38)
Edu
catio
n
(39)
Hea
lth and
soc
ial w
ork
(40)
Oth
er ser
vice
s
(41)
Priv
ate ho
useh
olds
(1) A
gricu
lture
(2) M
ining an
d qu
arry
ing
nec not elsewhere classified
Production
ndash 100
ndash 80
ndash 60
ndash 40
ndash 20
00
20
40
60
80Percentage deviation from the baseline (BH)
(3) F
ood
(4) T
extiles
(5) W
ood
(6) P
ulp pap
er
(7) C
oke re
fined
petro
leum
pro
ducts
(8) C
hemica
ls ex
cl pha
rma
(9) P
harm
aceu
ticals
(10)
Rub
ber a
nd plastics
(11)
Non
-metallic
miner
als
(12)
Iron
and
steel
(13)
Non
-ferrou
s metals
(14)
Met
al pro
ducts
(15)
Mac
hine
ry and
equ
ipmen
t
(16)
Office
mac
hine
ry
(17)
Electric
al m
achine
ry
(18)
Rad
io T
V
(19)
Med
ical pr
ecisi
on and
opt
ical ins
trumen
ts
(20)
Mot
or veh
icles
(21)
Ships
(22)
Airc
raft
(23)
Railro
ad
(24)
Man
ufac
turin
g n
ec r
ecyc
ling
(25)
Electric
ity g
as w
ater
sup
ply
(26)
Con
stru
ction
(27)
Tra
de r
epairs
(28)
Hot
els an
d re
stau
rant
s
(29)
Tra
nspo
rt an
d stor
age
(30)
Pos
t and
teleco
mmun
icatio
ns
(31)
Finan
ce ins
uran
ce
(32)
Rea
l estate ac
tivities
(33)
Ren
ting
(34)
Com
puter
(35)
Res
earch an
d de
velopm
ent
(36)
Oth
er bus
ines
s ac
tivities
(37)
Pub
lic ser
vice
s
(38)
Edu
catio
n
(39)
Hea
lth and
soc
ial w
ork
(40)
Oth
er ser
vice
s
(41)
Priv
ate ho
useh
olds
(1) A
gricu
lture
(2) M
ining an
d qu
arry
ing
nec not elsewhere classified
Modelling of ETR impacts on eco-innovation
Environmental tax reform in Europe opportunities for eco-innovation 35
social security contributions and lowers labour costs according to the direct and indirect labour content of sector output The ETR therefore reduces output prices in labour-intensive service sectors and increases prices in carbon- and material-intensive industry sectors
The example of Germany shows insignificant impacts in the trade-intensive sectors of machinery (15ndash17) motor vehicles (20) and other transport equipment (21ndash23) (Figure 38) Iron and steel (12) and chemicals without pharmaceuticals (8) face the highest price increases of trade-intensive sectors As the German iron and steel industry primarily delivers high quality steel to the German car industry and increasingly to the German windmill industry negative competitiveness impacts will be limited Exchange rate variations against non-EU competitors have been much higher in the past
The higher prices of carbon- and material-intensive products will reduce price competitiveness on export markets and increase the market share for imports in domestic markets This loss of price competitiveness is based on an assumption of limited market development of energy efficiency and RES technologies in other part of the world It will be offset by gains in labour-intensive sectors if the ETR causes real wage costs per unit of output to fall as a result of using recycled revenues to reduce employer social security contributions
Any improvement in non-price competitiveness will also raise exports The extra employment will raise incomes raising consumption and output
The overall impact on sector output depends on countervailing effects which are negative for iron and steel and a few service sectors and positive for a few industry sectors For most industries the output effect is insignificant (Figure 39) The greatest impact is felt by producers of fossil fuels who must obviously reduce production due to lower demand for their products
Under scenario S2H employment impacts are positive for most sectors relative to the baseline as labour productivity decreases and wage rates fall in relation to consumer prices (CPI) and output prices (Table 33) The relative costs of labour are lower than in the baseline without the ETR reform Only around a quarter of the employment increase takes place in industry
Concerning the wage rate two countervailing effects have to be considered First when the labour market is characterised in terms of the real wage bargaining model as in E3ME and GINFORS with market power on both sides (employers and trade unions) consumer price increases will lead to wage increases (the econometrically estimated factor is 085 for Germany) Second labour productivity is another important factor for wage bargaining The estimated elasticity for Germany is 063 meaning that a 1 increase of labour productivity leads to wage increases of 063 Higher labour demand due to lower labour costs thus reduces the wage increase In the end the German economy is more labour intensive than without the ETR partly due to the structural change towards labour-intensive industries
Table 33 Employment impacts of scenario S2H in Germany mdash deviations from scenario S2H in 2020
Employment in 2020 Deviation from S2H () Deviation from S2Habsolute (1 000s)
Agriculture forestry 24 90
Industry 09 653
Non-metallic minerals 24 62
Iron and steel ndash 28 ndash 37
Machinery and equipment 05 56
Electrical machinery 04 18
Construction 37 449
Trade and transport 10 829
Business services 17 767
Other services ndash 02 ndash 216
Total 07 2506
Environmental tax reform in Europe opportunities for eco-innovation
Modelling of ETR impacts on eco-innovation
36
Additional exports under scenario S2HE mainly create new jobs in machinery and related business services (Table 34) Under scenario S2HI a shift in the input structure of the energy sector leads to a shift in the industry structure and creates a few jobs in the service sector (Table 35)
34 Conclusions of the scenario assessment
The foregoing analysis used the GINFORS model to assess economic and environmental impacts of using the ETS and ETR to reach the EUs 2020
GHG targets In general the results show positive employment effects and only small negative impacts on GDP in EU-27 Member States The economic impacts depend on the levels of international energy prices the mechanism used to recycle revenues and country specifics such as carbon and energy intensity and the structure of energy consumption
Although there is significant evidence that eco-innovation is positively driven by higher energy prices quantification is difficult The present study included simulations of possible impacts of a shift in the industry structure towards renewable energy in the electricity sector and an overall increase of EU
Table 34 Employment impacts of scenario S2HE in 2020 in Germany mdash deviations from scenario S2H
Employment in 2020 Deviation from S2H () Deviation from S2Habsolute (1 000s)
Agriculture forestry ndash 01 ndash 02
Industry 03 194
Non-metallic minerals 02 05
Iron and steel 04 05
Machinery and equipment 13 130
Electrical machinery 24 117
Construction 01 18
Trade and transport 00 26
Business services 07 308
Other services 01 107
Total 02 634
Table 35 Employment impacts of scenario S2HI in 2020 in Germany mdash deviations from scenario S2H
Employment in 2020 Deviation from S2H () Deviation from S2Habsolute (1 000s)
Agriculture forestry ndash 01 ndash 02
Industry 00 00
Non-metallic minerals 25 65
Iron and steel ndash 27 ndash 36
Machinery and equipment 08 78
Electrical machinery 04 19
Construction ndash 00 ndash 04
Trade and transport 00 07
Business services 02 115
Other services 0 56
Total 00 167
Modelling of ETR impacts on eco-innovation
Environmental tax reform in Europe opportunities for eco-innovation 37
exports due to higher global demand for renewable energy The main results can be summarised as follows
bull environmentaltaxreformshiftingtaxesfromlabour to energy and resources will create additional jobs and trigger eco-innovation
bull impactsofeco-innovationintheformofadditional EU exports or shifts in industry structures will have a slight positive influence on GDP and create a smaller number of additional jobs
These findings correspond to results from the EmployRES study (Fraunhofer ISI et al 2009) As ETR is directly aimed at reducing labour costs it will create additional jobs in the short and medium term In the longer term the cost reduction and new technologies arising from eco-innovation will play a larger role
Like all fiscal reforms a major ETR in Europe will create winners and losers At the sector level carbon- and material-intensive industries will face economic losses At the country level the carbon-intensity and overall flexibility of economies is important Clearly structural change away from carbon-intensive industries together with technological change is inherent in any successful climate mitigation policy
On the other hand several factors can smooth these structural adjustments International cooperation
will reduce economic pressure on countries and sectors In addition ETR together with auctioning of ETS allowances can be a major source of revenues for EU Member States in the future even if part of the revenues will have to be earmarked for adaptation and mitigation measures in developing countries Indeed future debate on grandfathering or auctioning ETS allowances should reflect the important point that giving allowances away for free denies countries the money to ease structural change and invest in low-carbon technologies
Caution is needed in relating the findings of this study to the EU policy debate In the model simulations the single carbon price is the only instrument used to reach the EUs 2020 GHG targets In reality of course other renewable energy and efficiency policies will also contribute to carbon reduction and have to be taken into account when comparing the results (especially the high carbon prices) to other studies Both reduce the potential revenues from fossil energy carriers and carbon emissions
A variety of renewable energy and efficiency policies could enable the climate and energy targets to be met while securing even better economic prospects The results of the present study clearly indicate that the discussion on market-based instruments should be intensified Ultimately however the EU will need a rich mix of policies to reach its GHG targets while maximising prosperity
Environmental tax reform in Europe opportunities for eco-innovation38
References
Almon C 1991 The INFORUM Approach to Interindustry Modeling in Economic Systems Research Vol 3 pp 1ndash7
Amin A and Cohendet P 2004 The Architecture of Knowledge Firms Capabilities and Communities Oxford University Press Oxford
Barker T Meyer B Pollitt H and Lutz C 2007a Modelling Environmental Tax Reform in Germany and the United Kingdom with E3ME and GINFORS petre Working Paper Cambridge and Osnabrueck (httpwwwpetreorgukpapershtm) accessed 15 February 2011
Barker T Junankar S Pollitt H and Summerton P 2007b Carbon leakage from unilateral environmental tax reforms in Europe 1995ndash2005 Energy Policy Vol 35 pp 6 281ndash6 292
Brunnermeier S B and Cohen M A 2003 Determinants of environmental innovation in US manufacturing industries Journal of Environmental Economics and Management Vol 45 pp 278ndash293
Buen J 2006 Danish and Norwegian wind industry The relationship between policy instruments innovation and diffusion Energy Policy Vol 34 (18) pp 3 887ndash3 897
Carlsson B and Stankiewicz R 1991 On the nature function and composition of technological systems Journal of Evolutionary Economics Vol 1 (2) pp 93ndash118
Christiansen A C and Skjaerseth J B 2005 Climate change policies in Norway and the Netherlands Different instruments similar outcome Energy and Environment Vol 16(1) pp 1ndash25
Dosi G 1988 Sources procedures and microeconomic effects of innovation Journal of Economic Literature Vol 26 pp 1 120ndash1 171
de Vries F and Medhi N 2008 Environmental regulation and international innovation in automotive emissions control technologies in Environmental Policy Technological Innovation and Patents Organisation for Economic Cooperation and Development Paris
DG TREN 2008 European energy and transport mdash trends to 2030 mdash update 2007 European Commission Luxembourg
DTI 2004 Renewable Supply Chain Gap Analysis UK Department of Trade and Industry
Edler J (ed) 2006 Nachfrageorientierte Innovationspolitik Buumlro fuumlr Technikfolgenabschaumltzung beim Deutschen Bundestag (TAB) Arbeitsbericht Nr 99 Berlin
Edquist C 2001 The system of innovation approach and innovation policy an account of the state of the art lead paper presented at the DRUID Conference 12ndash15 June 2001 Aalborg (httpwwwdruiddkconferencesnwpaper1edquistpdf) accessed 15 February 2011
EEA 2006 Using the market for cost-effective environmental policy Market-based instruments in Europe EEA Report No 12006 European Environment Agency Copenhagen
Ekins P 2009 Resource Productivity Environmental tax Reform and Sustainable Growth in Europe published by the Anglo-German Foundation for the Study of Industrial Society Final report (httpwwwpetreorgukpdfFinRepFinpdf) accessed 12 October 2011
Ekins P and Speck S (eds) 2011 Environmental Tax Reform (ETR) A Policy for Green Growth Oxford University Press
EREC 2008 Energy [r]evolution A sustainable global energy outlook Greenpeace International European Renewable Energy Council (EREC)
References
References
Environmental tax reform in Europe opportunities for eco-innovation 39
Fagerberg J Mowery D C and Nelson R R (eds) 2005 The Oxford Handbook of Innovation Oxford University Press Oxford
Fischer C Parry I W H and Pizer W A 2003 Instrument choice for environmental protection when technological innovation is endogenous Journal of Environmental Economics and Management Vol 45 pp 523ndash545
Fraunhofer ISI ECOFYS Energy Economics Group Ruumltter + Partner SEURECO and LEI 2009 EmployRES mdash The impact of renewable energy policy on economic growth and employment in the European Union European Commission Brussels
Frondel M Horbach J and Rennings K 2008 What triggers environmental management and innovation Empirical evidence for Germany Ecological Economics Vol 66(1) pp 153ndash160
GHK Cambridge Econometrics and IEEP 2007 Links between the environment economy and jobs Final Report submitted to DG Environment European Commission
Giljum S Behrens A Hinterberger F Lutz C and Meyer B 2008 Modelling scenarios towards a sustainable use of natural resources in Europe Environmental Science and Policy Vol 11 pp 204ndash216
Goumlrlach B Knigge M and Luumlckge H 2005 Wirkungen der Oumlkologischen Steuerreform auf Innovation und Marktdurchdringung Ecologic Berlin (httpecologiceudownloadprojekte1850-189918791879_5_innovationpdf) accessed 18 August 2011
Green M A 2000 Photovoltaics technology overview Energy Policy Vol 28 (14) pp 989ndash998
Grossmann A Lehr U Lutz C and Wolter MI 2008 Gesamtwirtschaftliche Effekte der Umsetzung der EU Ziele im Bereich Erneuerbare Energien und Gebaumludeeffizienz in Oumlsterreich bis 2020 Studie im Auftrag des Lebensministeriums Wien 0508
Hage J and Hollingsworth J R 2000 Idea innovation networks a strategy for integrating organizational and institutional analysis Organization Studies Vol 21 (5) pp 971ndash1 004
Hauschildt J 2004 Innovationsmanagement Vahlen Muumlnchen
Hemmelskamp J 1997 Environmental policy instruments and their effects on innovation European Planning Studies Vol 5 (2) pp 177ndash195
Hoglund Isaksson L 2005 Abatement costs in response to the Swedish charge on nitrogen oxide emissions Journal of Environmental Economics and Management Vol 50 pp 102ndash120
Hullmann A 2001 Internationaler Wissenstransfer und technischer Wandel (dissertation) Physica-Verlag Heidelberg
IEA 2008 World Energy Outlook 2008 International Energy Agency Paris
IEA 2009 World Energy Outlook 2009 International Energy Agency Paris
Jacobsson S Andersson B A and Baringngens L 2002 Transforming the energy system mdash the evolution of the German technological system for solar cells Science and Technology Policy Research University of Sussex Electronic Working Paper Series No 84 (httpideasrepecorgpsrussewps84html) accessed 18 August 2011
Jaffe A and Stavins R 1995 Dynamic incentives of environmental regulations the effects of alternative policy instruments on technology diffusion Journal of Environmental Economics and Management Vol 29(3) pp 43ndash63
Jaffe A B and Palmer K 1997 Environmental regulation and innovation a panel data study The Review of Economics and Statistics Vol 79 pp 610ndash619
Jaffe A B Newell R G and Stavins R N 2002 Environmental policy and technological change Environmental and Resource Economics Vol 22 (1ndash2) 2002 pp 41ndash70
Johnstone N and Hascic I 2008 Renewable energy policies and technological innovation energy source and instrument choice in Environmental Policy Technological Innovation and PatentsOrganisation for Economic Co-operation and Development Paris
Johnstone N 2005 The Innovation Effects of Environmental Policy Instruments in Horbach J (ed) Indicator Systems for Sustainable Innovation Physica-Verlag HD
Environmental tax reform in Europe opportunities for eco-innovation
References
40
Johnstone N Hascic I and Ostertag K 2008 Environmental policy technological innovation and patent activity in Environmental Policy Technological Innovation and Patents Organisation for Economic Co-operation and Development Paris
Jung C Krutilla K and Boyd R 1996 Incentives for advanced pollution abatement technology at the industry level an evaluation of policy alternatives Journal of Environmental Economics and Management Vol 30(1) pp 95ndash111
Kammen D M Kapidia K and Fripp M 2004 Putting renewables to work how many jobs can the clean energy industry generate University of California Berkeley
Kemp R 1997 Environmental policy and technical change ndash a comparison of the technological impact of policy instruments Edward Elgar Cheltenham
Kemp R 1998 The diffusion of biological waste-water treatment plants in the Dutch food and beverage industry Environmental and Resource Economics Vol 12 pp 113ndash136
Kemp R 2000 Technology and environmental policy ndash innovation effects of past policies and suggestions for improvement in OECD proceedings ndash innovation and the environment Organisation for Economic Co-operation and Development Paris
Kerr S and Newell R G 2003 Policy-induced technology adoption evidence from the US lead phasedown Journal of Industrial Economics Vol 51 pp 317ndash343
Klaassen G Miketa A Larsen K and Sundqvist T 2005 The impact of RampD on innovation for wind energy in Denmark Germany and the United Kingdom Ecological Economics Vol 54 pp 227ndash240
Kline S and Rosenberg N 1986 An overview of innovation in Landau R (ed) The positive sum strategy Harnessing technology for economic growth pp 275-306
Knigge M and Goumlrlach B 2005 Effects of Germanys ecological tax reforms on the environment employment and technological innovation Ecologic Berlin (httpwwwumweltbundesamtdeuba-info-presse-ehintergrundoekosteuerpdf) accessed 18 August 2011
Langniss O 2003 Governance structures for promoting renewable energy sources dissertation Lund Stuttgart
Lanjouw J O and Mody A 1996 Innovation and the international diffusion of environmentally responsive technology Research Policy Vol 25 pp 549ndash571
Lehr U Nitsch J Kratzat M Lutz C and Edler D 2008 Renewable Energy and Employment in Germany Energy Policy Vol 36 pp 108ndash117 DOI101016jenpol200709004
Lehr U Wolter MI and Groszligmann A 2009 Economic impacts of RES obligations in Austria ndash an application of the macro-econometric model e3at GWS Discussion Paper 20091 Osnabruumlck
Lundvall B-A Johnson B Andersen E S and Dalum B 2001 National systems of production innovation and competence building Research Policy Vol 31 pp 213ndash231
Lutz C and Giljum S 2009 Global resource use in a business as usual world until 2030 Updated results from the GINFORS model in Bleischwitz R Welfens Pand Zhang Z (eds) Sustainable growth and resource productivity ndash economic and global policy issues Greenleaf Publishers pp 30ndash41
Lutz C and Meyer B 2008 Beschaumlftigungseffekte des Klimaschutzes in Deutschland Untersuchungen zu gesamtwirtschaftlichen Auswirkungen ausgewaumlhlter Maszlignahmen des Energie- und Klimapakets Forschungsbericht 205 46 434 Dessau-Roszliglau
Lutz C and Meyer B 2009a Environmental and Economic Effects of Post-Kyoto Carbon Regimes Results of Simulations with the Global Model GINFORS Energy Policy Vol 37 pp 1 758ndash1 766 DOI 101016jenpol200901015
Lutz C and Meyer B 2009b Scenario results from GINFORS PETRE working paper Osnabruumlck
Lutz C Meyer B Nathani C and Schleich J 2005 Endogenous technological change and emissions The case of the German steel industry Energy Policy Vol33 pp 1 143ndash1 154
Lutz C Meyer B Nathani C and Schleich J 2007 Endogenous innovation economy and environment impacts of a technology based modelling approach for energy-intensive industries in Germany Energy Studies Review Vol 15(1) pp 2ndash18
References
Environmental tax reform in Europe opportunities for eco-innovation 41
Lutz C Meyer B and Wolter M I 2009 The global multisectormulticountry 3-E model GINFORS mdash a description of the model and a baseline forecast for global energy demand and CO2 emissions Journal of Sustainable Development forthcoming
Malerba F and Orsenigo L 1997 Technological Regimes and Sectoral Patterns of Innovative Activities Industrial and Corporate Change Vol 6 (1) pp 83ndash117
Malerba F 1992 Learning by Firms and Incremental Technical Change The Economic Journal Vol 102 (413) pp 845ndash859
Malerba F 2005 Industrial dynamics and innovation progress and challenges Presidential Address delivered at the 32nd Conference of the European Association for Research in Industrial Economics (EARIE) 1ndash4 September 2005 Porto
Malerba F 2006 Innovation and the evolution of industries Journal of Evolutionary Economics Vol 16 pp 3ndash23
McGinty M and de Vries F P 2009 Technology diffusion product differentiation and environmental subsidies The BE Journal of Economic Analysis and Policy Vol 9(1)
Meyer B and Lutz C 2007 The GINFORS model ndash model overview and evaluation Petre Working Paper Osnabruumlck (httpwwwpetreorgukpapershtm) accessed 18 August 2011
Meyer B Lutz C Schnur P and Zika G 2007 Economic policy simulations with global interdependencies a sensitivity analysis for Germany Economic Systems Research Vol 19 pp 37ndash55
Mickwitz P H Hyvaumlttinen and P Kivimaa 2008 The role of policy instruments in the innovation and diffusion of environmentally friendlier technologies popular claims versus case study experiences Journal of Cleaner Production Vol 16(1S1) 162ndash170
Miketa A and Schrattenholzer L 2004 Experiments with a methodology to model the role of RampD expenditures in energy technology learning processes first results Energy Policy Vol 32 (15) pp 1 679ndash1 692
Milliman S R and Prince R 1989 Firm incentives to promote technological change in pollution control Journal of Environmental Economics and Management Vol 17 pp 247ndash265
Millock K and Nauges C 2006 Ex-post evaluation of an earmarked tax on air pollution Land Economics Vol 82(1) pp 68ndash84
Montero J-P 2002 Market structure and environmental innovation Journal of Applied Economics Vol 2 pp 293ndash325
Moreno B and Loacutepez A J 2007 The effect of renewable energy on employment mdash The case of Asturias (Spain) Renewable and Sustainable Energy Rewiews doi 101016jrser200610011
Mowery D and Rosenberg N 1979 The influence of market demand upon innovation A critical review of some recent empirical studies Research Policy Vol 8 pp 102ndash153
Newell R G Jaffe A B and Stavins R N 1999 The induced innovation hypothesis and energy-saving technological change Quarterly Journal of Economics Vol 114 pp 941ndash975
Norberg-Bohm V 1999 Stimulating green technological innovation An analysis of alternative policy mechanisms Policy Sciences Vol 32(1) pp 13ndash38
OECD 2009 Sustainable manufacturing and eco-innovation towards a green economy Organisation for Economic Co-operation and Development Policy Brief June 2009
OECD 2010 Taxation innovation and the environment Organisation for Economic Co-operation and Development
Pavitt K 1984 Sectoral patterns of technological change Towards a taxonomy and a theory Research Policy Vol 13 pp 343ndash373
Popp D 2002 Induced innovation and energy prices The American Economic Review Vol 92(1) pp 160ndash180
Popp D 2005 Lessons from patents Using patents to measure technological change in environmental models Ecological Economics Vol 54 pp 209ndash226
Environmental tax reform in Europe opportunities for eco-innovation
References
42
Porter M and van der Linde C 1995 Toward a new conception of the environment competitiveness relationship Journal of Economic Perspectives Vol 9(4) pp 97ndash118
Rammert W 2002 The cultural shaping of technologies and the politics of technodiversity In Sorensen K and Williams R (eds) Shaping technology guiding policy concepts spaces and tools Elgar Cheltenham pp 155-172
Requate T 2005 Dynamic incentives by environmental policy instruments ndash a survey Ecological Economics Vol 54 pp 175ndash195
Roloff N Lehr U Krewitt W Fuchs G Wassermann S Weimer-Jehle W and Schmidt B 2008 Success determinants for technological innovations in the energy sector mdash the case of photovoltaics in Moumlst D Fichtner W Ragwitz M and Veit D (eds) New methods for energy market modelling mdash Proceedings of the first european workshop on energy market modelling using agent-based computational economics Universitaumltsverlag Karlsruhe
Rothwell R 1995 The fifth generation innovation process in Oppenlaumlnder KH Popp W (eds) Innovationen und wirtschaftlicher Fortschritt betriebs-und volkswirtschaftliche Perspektiven Bern pp 9ndash26
Schumpeter J 1942 Capitalism socialism and democracy New York Harper
Skjaeligrseth J B and Christiansen A C 2005 Environmental policy instruments and technological change in the energy sector findings from comparative empirical research Energy and Environment Vol 17 (2) pp 223ndash241
Snyder L D Miller N H and Stavins R N 2003 The effects of environmental regulations on pollution emissions evidence from plant-level data American Economic Review Vol 93(2) pp 431ndash435
Technopolis 2008 Eco-innovation Final Report for Sectoral Innovation Watch (httpwwwtechnopolis-groupcomresourcesdownloads661_report_finalpdf) accessed 18 August 2011
Volleburgh H 2007 Impacts of environmental policy instruments on technological change Report for Joint Meetings of Tax and Environment Experts OECD Environment Directorate February 2007 (comenvepocctpacfa(2006)36final)
Zimmermann H Wohltmann M and Hansjuumlrgens B 1996 Umweltabgaben und Innovation Analytica Marburg
43
Annex 1
Environmental tax reform in Europe opportunities for eco-innovation
Type Instrument Area Stage
Reference
Theo
retica
l
Em
piric
al
Cas
e st
udy
Rev
iew
Qual
itat
ive
Taxe
s
Perm
its
Subsi
die
s
Volu
nta
ry
Com
man
d
Reg
ula
tion
Ener
gy
Air
Wat
er
Oth
er
Gen
eral
Innov
atio
n
Diffu
sion
Rel
evan
ce
Brunnermeier amp Cohen (2003)
X X X X
Buen (2006) X X X X X X
Christiansen amp Skjaerseth (2005)
X X X X X X
Fischer et al (2003 X X X X X X
Frondel et al (2008) X X X X X X X (X) (X)
Hemmelskamp (1997)
X X X X X X X (X)
Hoglund Isaksson (2005)
X X X (X) (X)
Jaffe amp Stavins (1995)
X X X1 X X X X
Jaffe amp Palmer (1997)
X X X X
Jaffe et al (2002) X X X X X X X X X X
Jung et al (1996) X X X X X X (X) (X)
Kemp (1998) X X X X
Kerr amp Newell (2001) X X X X X
Klaassen et al (2005)
X X X X X
Lanjouw amp Mody (1996)
X X X X X X X
McGinty amp de Vries (2009)
X X X X
Mickwitz et al (2008)
X X X X X X X X X
Milliman amp Prince (1989)
X X X X X X X
Millock amp Nauges (2006)
X X X X X X
Montero (2002) X X X X X
Newell et al (1999) X X1 X X X
Norberg-Bohm (1999)
X X X X X X X
Popp (2002) X X1 X X
Popp (2005) X X X X X X
Porter amp van der Linde (1995)
X X X X X X
Requate (2005) X X X X X X X
Skjaeligrseth amp Christiansen (2005)
X X X X X X X X X
Snyder et al (2003) X X X X X
Annex 1 Classification of refereed journal articles
Environmental tax reform in Europe opportunities for eco-innovation44
Annex 2
Type Instrument Area Stage
Reference
Theo
retica
l
Em
piric
al
Cas
e st
udy
Rev
iew
Qual
itat
ive
Taxe
s
Perm
its
Subsi
die
s
Volu
nta
ry
Com
man
d
Reg
ula
tion
Ener
gy
Air
Wat
er
Oth
er
Gen
eral
Innov
atio
n
Diffu
sion
Rel
evan
ce
Johnstone (2005)
X X X X X X X
Johnstone amp Hascic (2008)
X X X X X X X X
Kemp (1997) X X X X X X X X X X X X X
Kemp (2000) X X X X X X X X X
de Vries amp Medhi (2008)
X X1 X X X
Annex 2 Classification of books and book chapters
45
Annex 3
Environmental tax reform in Europe opportunities for eco-innovation
Type Instrument Area Stage
Reference
Theo
retica
l
Em
piric
al
Cas
e st
udy
Rev
iew
Qual
itat
ive
Taxe
s
Perm
its
Subsi
die
s
Volu
nta
ry
Com
man
d
Reg
ula
tion
Ener
gy
Air
Wat
er
Oth
er
Gen
eral
Innov
atio
n
Diffu
sion
Rel
evan
ce
Goumlrlach et al (2005)
X X X X X X
Knigge amp Goumlrlach (2005)
X X X X X X
Technopolis (2008)
X X X X X X
Volleburgh (2007)
X X X X X X X X X X X
Annex 3 Classification of reports
European Environment Agency
Environmental tax reform in Europe opportunities for eco-innovation
2011 mdash 45 pp mdash 21 x 297 cm
ISBN 978-92-9213-238-5doi10280084889
How to obtain EU publications
Publications for salebull viaEUBookshop(httpbookshopeuropaeu)bull fromyourbooksellerbyquotingthetitlethepublisherandorISBNnumberbull bycontactingoneofoursalesagentsdirectlyYoucanobtaintheircontactdetails
on the Internet (httpbookshopeuropaeu) or by sending a fax to +352 2929-42758
Free publicationsbull viaEUBookshop(httpbookshopeuropaeu)bull attheEuropeanCommissionsrepresentationsordelegationsYoucanobtain
their contact details on the Internet (httpeceuropaeu) or by sending a fax to +352 2929-42758
European Environment AgencyKongens Nytorv 61050 Copenhagen KDenmark
Tel +45 33 36 71 00Fax +45 33 36 71 99
Web eeaeuropaeuEnquiries eeaeuropaeuenquiries
TH
-AK-1
1-0
17-E
N-N
doi1
02
8008
4889
- Acknowledgements
- Executive summary
- 1Introduction
-
- 11Background
- 12ETR and innovation
- 13Report structure
-
- 2Review of literature on environmental tax reform and eco‑innovation
-
- 21Initial screening
- 22Detailed review
- 23Environmental regulation studies
- 24Theoretical studies
- 25Empirical studies
- 26Case studies
- 27Conclusions
-
- 3Modelling of ETR impacts on eco‑innovation
-
- 31Scenarios assessing the implications of ETR for eco-innovation
- 32Overview of modelling results
- 33Macroeconomic impacts at the national level
- 34Conclusions of the scenario assessment
-
- References
- Annex 1 Classification of refereed journal articles
- Annex 2Classification of books and book chapters
- Annex 3Classification of reports
-
Environmental tax reform in Europe opportunities for eco-innovation
EEA Technical report No 172011
European Environment AgencyKongens Nytorv 61050 Copenhagen KDenmarkTel +45 33 36 71 00Fax +45 33 36 71 99Web eeaeuropaeuEnquiries eeaeuropaeuenquiries
Legal noticeThe contents of this publication do not necessarily reflect the official opinions of the European Commission or other institutions of the European Union Neither the European Environment Agency nor any person or company acting on behalf of the Agency is responsible for the use that may be made of the information contained in this report
Copyright noticecopy EEA Copenhagen 2011Reproduction is authorised provided the source is acknowledged save where otherwise stated
Information about the European Union is available on the Internet It can be accessed through the Europa server (wwweuropaeu)
Luxembourg Publications Office of the European Union 2011
ISBN 978-92-9213-238-5ISSN 1725-2237doi10280084889
Cover design EEALayout Rosendahls-Schultz GrafiskEEA
3
Contents
Environmental tax reform in Europe opportunities for eco-innovation
Contents
Acknowledgements 4
Executive summary 5
1 Introduction 811 Background 812 ETR and innovation 913 Report structure 9
2 Review of literature on environmental tax reform and eco-innovation 1021 Initial screening 1122 Detailed review 1323 Environmental regulation studies 1324 Theoretical studies 1425 Empirical studies 1826 Case studies 2127 Conclusions 22
3 Modelling of ETR impacts on eco-innovation 2531 Scenarios assessing the implications of ETR for eco-innovation 2532 Overview of modelling results 2733 Macroeconomic impacts at the national level 2934 Conclusions of the scenario assessment 36
References 38
Annex 1 Classification of refereed journal articles 43
Annex 2 Classification of books and book chapters 44
Annex 3 Classification of reports 45
Environmental tax reform in Europe opportunities for eco-innovation4
Acknowledgements
The report was commissioned by the European Environment Agency in 2009 and the project manager was David Gee
The report was written by a team of consultants Chapter 2 was prepared by Roger Salmons Policy Studies Institute (PSI) London and Chapter 3
by Ulrike Lehr and Christian Lutz Gesellschaft fuumlr Wirtschaftliche Strukturforschung (GWS) Osnabruumlck Germany
The report was edited by Michael Asquith and Stefan Speck
Acknowledgements
5
Executive summary
Environmental tax reform in Europe opportunities for eco-innovation
Executive summary
Environmental taxation innovation and the green economy
Environmental taxation can spur innovation This simple compelling message was a central finding of a recent OECD study of taxation innovation and the environment (OECD 2010)
It is an insight of profound importance Environmental policy instruments are frequently characterised as obstacles to economic activity but the OECD analysis suggests that environmental taxes can in fact be the opposite mdash serving as catalysts for the creativity that underpins thriving economies
In the short term such innovation can boost efficiency and competitiveness In the long term it arguably holds the key to sustained prosperity by enabling economic growth to continue within environmental limits Innovation particularly the kinds of innovation stimulated by environmental policy is essential in the process of creating green economies that can deliver growing incomes while preserving natural systems and social equity
Environmental tax reform (ETR) appears to offer an attractive mix for policymakers It deters environmentally damaging activities by making them more costly while incentivising the creation and diffusion of new technologies For advanced economies like the EU eco-innovation can also create opportunities to export new tools and processes globally
While increasing the costs of polluting and using resources is likely by itself to subdue economic output governments can use the tax revenues accrued to reduce the fiscal burden elsewhere
(1) The project Resource productivity environmental tax reform and sustainable growth in Europe (petre) was commissioned by the Anglo-German Foundation (AGF) in 2007 It used econometric and resource flow modelling techniques surveys and interviews to explore the implications mdash for Europe and the rest of the world mdash of a large-scale ETR in Europe designed to achieve the EUs 2020 greenhouse gas reduction targets For more information see wwwpetreorguk or Ekins and Speck (2011)
Cutting labour taxes for example can help boost work incentives mdash potentially increasing employment and offsetting negative economic impacts Moreover as the recent petre project (1) has demonstrated governments can potentially enhance net benefits further by reinvesting some of the revenues secured through ETR in eco-innovation
In view of the potential gains there is clear value for policymakers and society more broadly in expanding the knowledge base on ETR and innovation The present report aims to do just that using two approaches a literature review and a scenario-based modelling exercise Together the two analyses confirm the important interplay between environmental taxes innovation and macroeconomic performance mdash and the potential role of ETR in shifting to a green economy in Europe The key findings are set out below
Key findings of the literature review
The literature review identified four relevant groups of studies assessments of environmental regulations impacts on innovation theoretical analyses of how different policy instruments influence innovation empirical studies using statistical and econometric techniques to assess the impacts of actual policy interventions and case studies providing descriptive assessments of actual experiences
In broad terms the studies confirmed that environmental regulation in general and price-based policy instruments (such as environmental taxes and investment subsidies) in particular can and do increase innovation and diffusion of environmental technologies The studies
Environmental tax reform in Europe opportunities for eco-innovation
Executive summary
6
of environmental regulations impacts on innovation suggest that greater regulatory stringency is associated with increased innovation although the effect appears small
The empirical studies and case studies reviewed provided more comprehensive evidence The empirical studies covering technology areas such as energy efficiency renewable energy and air and water pollution abatement revealed that environmental taxes and energy prices have a significant positive impact on both innovation and diffusion of existing technologies However the effects of taxes or prices may vary somewhat across sectors and innovation types The case studies likewise indicate that environmental taxes and investment subsidies have generally although not universally had a significant positive impact on innovation and diffusion
The literature also provides valuable insights on the impact of environmental taxes compared to other instruments and the conditions that can enhance or limit an ETRs impacts on innovation For example case studies focusing on the Netherlands and Germany highlighted the need for a tax rate that is sufficiently high to provide a meaningful incentive and signalling effect and that is fixed for a sufficiently long period of time to reduce uncertainty about the future benefits of investment
The theoretical studies reviewed indicate that the relative impacts of environmental taxes and other instruments on eco-innovation are far from clear cut They often depend on the competitive structures of the markets and the ability of innovator firms to appropriate the benefits accruing to other firms during diffusion Other factors also play a role however For example market failures such as information asymmetries principle-agent problems capital market failures and positive adoption spillovers can all influence technology diffusion Similarly uncertainty over future returns and the (associated) use of high discount rates for investment decisions can also undermine the effectiveness of price-based instruments in stimulating diffusion
Taken together the literature underscores the potential for environmental taxes to catalyse innovation At the same time it also highlights the complexity of the issues and the difficulties in making generalisations about the impacts of environmental taxes and alternative policy instruments The precise effects of environmental taxes and other measures on innovation are very specific to local realities and very much influenced
by the stringency and point of incidence of the policy intervention With this in mind some authors stress that any analysis of policy impacts on innovation must be very nuanced reflecting factors such as the direction type and duration of innovation Assessments of policy effectiveness require indicators that can convey an accurate and detailed picture of innovation in all its forms
Key findings of the scenario analysis
The modelling exercise builds on the findings of the petre project using the GINFORS model to assess economic and environmental impacts of using the EU Emissions Trading System (ETS) and ETR to reach the EUs 2020 GHG targets It evaluates the overall effects of a European ETR compared to a projected baseline and develops scenarios in which eco-innovation or renewable energy technologies are supported
The analysis employed three scenarios from the petre project Together these illuminate the macroeconomic impacts of implementing an ETR designed to meet the EUs 2020 GHG target with revenues recycled through reductions in income tax rates and social security contributions and through investment of 10 of revenues in eco-innovation measures
In addition the present study used two addition scenarios both based on the assumption that 10 of revenues are invested in eco-innovation The first examines the macroeconomic impacts in EU Member States arising from increased exports of renewable energy technologies which is a plausible scenario based on the strong EU policy effort to increase the share of renewable energy in final energy consumption and the possibility of very strong world market development in the sector until 2020 The second analyses the macroeconomic effects of changes in the input structure of the energy sector ie from conventional electricity production to renewables
Overall the analysis revealed that the modelled reforms delivered positive employment effects and only small negative impacts on GDP in the EU-27 Member States The economic impacts depend on the levels of international energy prices used in the scenarios the mechanism used to recycle revenues and country specifics such as carbon and energy intensity and the structure of energy consumption
At the EU level the basic ETR scenario mdash assuming that revenues are only recycled via reduced
Executive summary
Environmental tax reform in Europe opportunities for eco-innovation 7
income tax and social security contributions mdash results in EU GDP 057 below the baseline in 2020 The additional assumptions in each of the alternative scenarios (investing 10 of revenues in eco-innovation increased exports of renewable technologies and changes in energy sector inputs) each soften this negative impact on GDP
Whereas all the scenarios indicate a small negative impact on EU GDP relative to the baseline the impact on employment is positive in all scenarios The scenario design implies that the structure of the EU economy shifts from energy-intensive to labour-intensive sectors The magnitude of the employment gain is influenced by the carbon price and the tax shift the underlying energy prices and the production loss The largest part of the employment increase stems from the additional investment in eco-innovation although a shift in industry structures and additional renewable technology exports are also positive for the labour market As ETR is directly aimed at reducing labour costs it will create additional jobs in the short and medium term In the longer term the cost reduction and new technologies arising from eco-innovation will play a larger role
The results indicate that environmental tax reform can deliver environmental objectives create additional jobs and trigger eco-innovation while having negligible negative impacts on GDP These findings are particularly evident in the scenario assuming that 10 of revenues are invested in eco-innovation and EU exports of renewable technologies increase In that case EU GDP is just 004 below the baseline in 2020 and employment is 051 (or more than 1 million jobs) higher
Like all fiscal reforms a major ETR in Europe will create winners and losers At the sector level carbon- and material-intensive industries will face economic losses At the country level the carbon-intensity and overall flexibility of economies is important Clearly structural change away from carbon-intensive industries together with technological change is inherent in any successful climate mitigation policy However international cooperation and the revenues gathered through ETR and the EU ETS can help soften negative economic and social impacts
Caution is needed in relating the findings of this study to the EU policy debate In the model simulations the single carbon price is the only instrument used to reach the EUs 2020 GHG targets In reality of course other renewable energy and efficiency policies will also contribute to carbon reduction and have to be taken into account when comparing the results (especially the high carbon prices) to other studies Both reduce the potential revenues from fossil energy carriers and carbon emissions
A variety of renewable energy and efficiency policies could enable the climate and energy targets to be met while securing even better economic prospects The results of the present study clearly indicate that the discussion on market-based instruments should be intensified Ultimately however the EU will need a rich mix of policies to reach its GHG targets while maximising prosperity
Environmental tax reform in Europe opportunities for eco-innovation8
Introduction
11 Background
In 2005 the European Environment Agency (EEA) prepared a series of reports on the use of market-based instruments to achieve environmental goals Environmental tax reform mdash defined as reform of the national tax system where there is a shift of the burden of taxes for example on labour to environmentally damaging activities such as resource use or pollution mdash was identified as a key tool in this context (EEA 2006)
A central attraction of ETR is its capacity to steer incentives so that human endeavour and ingenuity can deliver maximum economic gains while preserving the environment and social equity To analyse this function further the Anglo-German Foundation (AGF) commissioned a major body of research in 2007 Creating sustainable growth in Europe One project in this context entitled Resource productivity environmental tax reform and sustainable growth in Europe (petre) started from the hypothesis that ETR could increase human well-being via two routes improving the environment and generating economic activity and employment The results of petre were presented in a final report (Ekins 2009) and in a book (Ekins and Speck 2011)
Petre used econometric and resource flow modelling techniques surveys and interviews to explore the implications mdash for Europe and the rest of the world mdash of a large-scale ETR in Europe designed to achieve the EUs 2020 greenhouse gas reduction targets ie cutting GHG emissions by 20 in the period 1990ndash2020 (or 30 in a context of global cooperation) In order to investigate whether ETR could deliver these targets six scenarios were developed and modelled using two well-known macro-econometric models E3ME and GINFORS (2)
The results suggested that ETR is an effective environmental instrument that can enable the EU to meet its CO2 targets The models produce nearly identical results concerning labour and resource productivity signalling that an ETR that meets the emissions target would raise employment lower resource consumption and have negligible effects on GDP
The petre project provided a compelling case for using ETR more widely but the findings also indicated scope to extend the analysis For example the results of one of the scenarios indicated that investment in green technologies in the EU could significantly reduce both the carbon price and GDP loss in reaching the 20 target Measures that could augment the net benefit of ETR are clearly worth exploring in more detail Similarly the petre project results also suggested that the varying national political economic institutional and cultural contexts across the EU-27 make introducing an ETR politically complex Again this suggested the need for additional analysis of ETRs social impacts to ensure that promising ideas can be translated into working policies
In view of these findings the EEA decided to commission a two-part study to analyse the issues in more detail The first part focuses on links between ETR and eco-innovation and green technologies The second addresses ETRs implications for the distribution of incomes across society
Both of these issues are of course essential determinants of an ETRs potential contribution to sustainable growth and the shift to a green economy Eco-innovation is an indispensible element in enhancing resource efficiency ie delivering greater economic outputs and wellbeing at lower environmental impacts Meanwhile distributional
1 Introduction
(2) See for more information with regard to the modelling framework the papers presented and to be downloaded at the website of the project (wwwpetreorguk) or Ekins and Speck (2011) and in particular Chapter 8 thereof
Introduction
Environmental tax reform in Europe opportunities for eco-innovation 9
impacts are central to an ETRs political acceptability and social equity mdash another essential aspect of sustainability Any serious attempts to design ETRs must therefore include a focus on eco-innovation and distributional impacts The present two-part study aims to contribute to the knowledge base for that analysis
12 ETR and innovation
Innovation is a key determinant of domestic and international competitiveness and a vital engine for generating economic growth and highly skilled jobs It also plays a central role in facilitating the shift to a green economy enabling countries to decouple economic growth from resource use and environmental impacts
Innovations contribution to solving urgent economic and social problems is being discussed more now than ever before in Europe This growing interest partly reflects a concern that some European countries may be falling behind other industrialised nations both in developing and applying new solutions in introducing modern management production and working practices and in opening up global markets Only with greater ability to innovate coupled with competence and willingness to be creative can structural economic change be catalysed enabling faster growth and creating new jobs
The interest in innovation also reflects a recognition that even the most urgent of todays environmental problems are far from being solved Innovation that specifically addresses environmental problems is needed to ensure long-term sustainable development Basic innovation should be stimulated opening up more environmentally sound development paths for products and technologies
Of course research must focus not only on technology but on the necessary framework conditions to bring about environmental innovation Policy of all sorts mdash not least environmental policy mdash can promote or restrict innovation It is perhaps surprising therefore that there has been limited focus on the interplay between environmental policy and innovation theory
In view of its huge importance there is clear value in analysing how policy instruments affect innovation
13 Report structure
The present report brings together two approaches to examining eco-innovation
Chapter 2 comprises a literature review It looks briefly at definitions of innovation and the factors driving innovation in the economy and describes the methodology used to identify relevant literature It then provides a more detailed review of four groups of studies
bull assessmentsenvironmentalregulationsimpactson innovation
bull theoreticalanalysesofhowdifferentpolicyinstruments influence innovation
bull empiricalstudiesusingstatisticalandeconometric techniques to assess the impacts of actual policy interventions
bull casestudiesprovidingdescriptiveassessmentsofactual experiences
Chapter 3 presents a modelling exercise based on scenarios in which ETR revenues are used to foster innovation The modelling builds on the petre project evaluating the overall effects of a European ETR compared to a baseline development and goes on to examine scenarios to support eco-innovation or renewable energy technologies
Environmental tax reform in Europe opportunities for eco-innovation10
Review of literature on environmental tax reform and eco-innovation
There is a relatively large and growing literature mdash both theoretical and empirical mdash on the relationship between environmental policy interventions and technological innovation While this covers a wide range of policy instruments (ie command and control regulations environmental taxes permit trading schemes and voluntary agreements) only one of the identified references explicitly considers the impacts of an environmental tax reform (ETR) programme Consequently the present literature review focused on studies that assess the impacts of environmental taxes (and in some cases factor prices) on innovation However in order to provide some context the impacts of environmental regulation more generally were also considered
The literature review employed a two-step methodology In the first step potential references were identified and screened to determine their relevance and to classify them according to four relevant criteria In the second step those references identified as having significant relevance were reviewed in detail to distil the key conclusions regarding ETRs potential implications for eco-innovation
Before proceeding it is worth clarifying what is meant by innovation in general and by eco-innovation in particular Following Schumpeter (1942) the process of technological change is typically broken down into the following three stages (3)
bull invention mdash the first development of a scientifically or technically new product or process
bull innovation mdash the commercialisation of the new product or process
bull diffusion mdash the adoption of the product or process by firms and individuals
The first two stages are closely related although not all inventions will make it through to commercialisation They typically both occur in private companies in a process that can broadly be termed research and development (RampD)
When considering the impacts of environmental policy interventions it is important to be clear which stage of the technological development process one is considering as different instruments may be more or less effective for different stages Many studies explicitly identify the technological development stage to which they relate For those that do not it is sometimes possible to infer the stage from the context or characteristics of the study (eg the measure of innovation that is used) However some studies refer only to investment in technology and it is not clear whether this means investing in the development of new products or production processes (ie invention and innovation) or purchasing new plant and equipment from other companies (ie diffusion)
The term eco-innovation is taken to mean technological development that generates products equipment or production processes that reduce environmental risk or minimise pollution and resource use As such the term encompasses all three stages of the technological development process invention innovation and diffusion
A range of different indicators can be used to measure innovation Essentially these indicators fall into three groups those that measure the inputs (or resources) devoted to the innovation process those that measure the outputs from the process and those that focus on the economic impacts of the innovations that are generated (Johnstone et al 2008)
2 Review of literature on environmental tax reform and eco-innovation
(3) Some authors break down the innovation stage into two the application of inventions in demonstration projects the development of niche applications and markets (eg Christiansen and Skjaerseth 2005)
Review of literature on environmental tax reform and eco-innovation
Environmental tax reform in Europe opportunities for eco-innovation 11
The most common input indicator is RampD expenditure but it has several shortcomings While public sector RampD expenditure data is generally available private sector data are incomplete and usually only available at the aggregate level making it difficult (or impossible) to identify environment-related RampD expenditure Furthermore given the inherent uncertainty of the innovation process the link between effort and resulting outputs is often very weak
As a result output indicators such as patent applications are likely to provide a better method to measure eco-innovation Patent application data provide a reasonably comprehensive picture of innovative outputs (4) they are based on objective standards that change slowly and they are readily available Their main advantage however is the fact that patent applications are classified into detailed technologies using the International Patent Classification (IPC) system developed by the World Intellectual Property Organisation This allows environment-related patents to be identified and broken down between different application areas such as climate change air pollution water pollution and waste management
Impact indicators (also termed progress indicators) are more relevant to the diffusion stage and include increases in market penetration of particular eco-technologies and reductions in (marginal) abatement costs (5) However it should be noted that cost reductions can be driven by a range of factors and may not necessarily imply that innovation has occurred
21 Initial screening
Potential references were identified based on a review of journal citations internet searches using keywords and recommendations from within the project team The references fall into three broad groups
bull refereedjournalarticlesbull booksandbookchaptersbull reportsbyconsultantsandexperts
In total 37 potential references were identified the majority (28) being refereed journal articles The references were then classified according to four criteria type of study policy instrument(s) covered policy area and technological development stage On the basis of this classification each reference was then assessed in terms of its relevance
Types of study
A distinction is made between five different types of study
bull Theoretical studies use mathematical models to assess the impacts of idealised policy instruments on firms innovative behaviour under alternative assumptions about market structure and different parameter values In most cases the studies consider several alternative instruments and are interested in the relative ranking of the instruments either in terms of the amount of innovation that they induce or in terms of the resulting levels of social welfare
bull Empirical studies use a range of statistical and econometric techniques to analyse quantitative performance data in order to assess the impacts of actual policy interventions Given the relative scarcity of environmental taxes in the past there are few direct empirical studies focusing on them However a number of studies consider the impacts of changes in energy prices which give an indirect indication of the potential impact of taxation
bull Reviews summarise or compare the findings of previous studies (either theoretical or empirical) and may synthesise them to draw wider conclusions
bull Case studies provide descriptive assessments of actual experiences often comparing across countries
bull Qualitative studies consider some of the issues that can affect the performance of a particular policy instrument in practice
Together these last two types of study can provide valuable insights on the practical and political economy aspects of instrument performance to supplement the theoretical and empirical analyses
(4) While a patent may prevent rival firms from using an innovation (without paying royalties) it has the disadvantage of putting it into the public domain In some cases firms may prefer to keep the innovation secret rather than apply for patent protection
(5) More precisely the indicator of abatement is a shift in the abatement cost curves which reduces the cost of a fixed amount of abatement Reductions in abatement costs due to movements along the cost curve (ie due to changes in the level of abatement) do not provide an indicator of innovation
Environmental tax reform in Europe opportunities for eco-innovation
Review of literature on environmental tax reform and eco-innovation
12
Policy instrument addressed
The second classification criterion concerns the policy instruments that are addressed by the study with a distinction being made between five specific instrument types
The first three are market-based or price-based instruments environmental taxes and charges tradable permits and investment subsidies and tax allowances All three act by changing the prices of input factors in one way or another As has been noted above some studies consider the impact of energy prices rather than energy taxes However since the findings of these studies are directly transferable they are classified under the tax heading
The fourth instrument type is voluntary or negotiated agreements under which firms or sectors enter into agreements with government to achieve certain performance targets or undertake specific actions
The fifth type is command and control regulations which encompass technology mandates emission limits and performance standards (eg for specific energy consumption)
The final classification regulation is used for studies that consider the weight or stringency of environmental regulation in general rather than a specific policy instrument
Policy area addressed
With regard to the policy area(s) covered by the studies a distinction is made between five areas including energy and climate change air pollution water pollution and other
The final classification general is used for studies that consider the impacts of environmental regulation in general rather than any specific intervention or where the policy area is not specified (eg in theoretical analyses)
Stage of technological development
The final classification criterion concerns the stage of the technological development process that is addressed by the study As has been noted above the process is typically divided into three stages invention innovation and diffusion In practice however the studies do not distinguish between the first two stages (often just referring generically to RampD) They have therefore been combined for the purposes of the classification so that the only distinction is between the innovation and diffusion stages
Results of the classification exercise
Subsequent to classifying the studies each was scored in terms of its relevance to analysing ETRs impacts on eco-innovation A three tier qualitative scoring system was used One star () indicates that the study is of only minor relevance two stars () indicates that it is of moderate relevance and three stars () that it is of significant relevance Such a scoring system is inevitably subjective but it provides a pragmatic mechanism for identifying the key references to be included in the detailed review In determining the scores particular emphasis was placed on whether the study is empirical in nature and whether it considers environmental taxes (or factor prices)
Annex 1 shows the classifications of the 28 journal articles that were identified Thirteen are empirical seven are theoretical three are case studies and four are qualitative while four provide reviews of previous work in the area (including most of the identified studies) (6) Around two-thirds of the papers consider the impact of environmental taxes (or energy prices) often comparing these with the impacts of other policy instruments Eleven consider the impact of investment subsidies
Most of the theoretical analyses are not area-specific (only discussing environmental damage in general terms) The empirical studies are spread fairly evenly across policy areas with five addressing
(6) Some studies are classified under more than one heading For example a study may contain both a theoretical model of behaviour and an empirical assessment of the model
Review of literature on environmental tax reform and eco-innovation
Environmental tax reform in Europe opportunities for eco-innovation 13
energy and climate change five addressing air pollution and three addressing water pollution In terms of the stage of the technological development process there is an even split between innovation and diffusion with many of the papers covering both stages In total eighteen of the references are included in the detailed review
Annex 2 shows the classifications of the five book chapters and Annex 3 covers the four reports (7) As might be expected these sources put less emphasis on theory with only one reference including any formal analysis They are split fairly evenly between empirical studies reviews and qualitative assessments All but one consider the impact of environmental taxes or energy prices while seven consider the impact of investment subsidies As with the journal articles there is a fairly even spread across policy areas and between innovation and diffusion Five of the references are included in the detailed review
22 Detailed review
The detailed review focuses on the impacts on eco-innovation of the two price-based policy instruments that are directly relevant to ETR environmental taxes and investment subsidies and tax incentives (eg RampD and capital allowances) (8) A priori each instrument might be expected to stimulate innovation mdash the first by increasing the benefits of innovation by reducing tax payments the second by reducing the costs of developing and adopting new technologies However in order to provide a broader context for the impacts of these two instruments the review starts by considering the relationship between innovation and the stringency of environmental regulation in general
As can be seen from the initial screening (see Annexes 1ndash3) the large majority of studies consider more than one policy instrument within a unified analytical framework mdash either comparing their relative impacts or assessing the impacts of instrument combinations (or packages)
In particular all but one of the papers that assess the impacts of investment subsidies either theoretically or empirically also assess the impacts environmental taxes (and sometimes other policy instruments) Consequently for the purposes of this review it is convenient to consider the impacts of taxes and subsidies at the same time rather than sequentially In addition to avoiding the need for any repetition (about model structures assumptions etc) this facilitates identification of potential interactions and synergies between the two instruments
Apart from Section 23 on the impact of environmental regulation in general only those references identified as being of significant relevance () in the initial screening are included in the review References are summarised in chronological order under three headings theoretical predictions (Section 24) empirical evidence (Section 25) and case studies (Section 26) At the end of each section an attempt is made to synthesise the findings of the studies but the scope of the present review did not allow for critical analysis of the studies to identify their respective strengths and weaknesses or to resolve any apparent conflicts between their findings
23 Environmental regulation studies
Lanjouw and Mody (1996) use aggregate pollution and control expenditure (PACE) data as a proxy for the stringency of environmental regulation and compare this with data on the aggregate number of environmental patent applications for Germany Japan and USA They do not perform any formal statistical or econometric analysis of the data However based on simple graphical analysis they identify a relatively clear correlation between expenditure and patents over the 1970s and 1980s with a time lag of one to two years They also find some indications in the data that patenting in one country also responds to increasing stringency of environmental regulation in the other two In addition they consider the diffusion of environmental technologies by looking at trade
(7) Two of the reports emanate from the study by Ecologic and DIW of ETR in Germany Details of the assessment of the impact on innovation and market diffusion are provided (in German) in Goumlrlach et al (2005) with a summary (in English) in Knigge and Goumlrlach (2005)
(8) While the large majority of revenues raised under an ETR are likely to be used to reduce taxes on labour a small proportion may be used to encourage innovation or promote the take-up of environmentally friendly technologies
Environmental tax reform in Europe opportunities for eco-innovation
Review of literature on environmental tax reform and eco-innovation
14
flows in capital goods used for pollution reduction and find that these too show a correlation with total abatement expenditure
Jaffe and Palmer (1997) also use PACE data as a proxy for the stringency of environmental regulation and evaluate its impact on two different measures of innovation total private expenditures on RampD and the number of successful patent applications by US manufacturing industries Unlike the previous study they undertake formal econometric analysis of the data using panel data at the two-digit and three-digit SIC code industry level for the period 1978ndash1991 and a fixed effects model They find a statistically significant positive relationship between compliance expenditures (capital expenditures only) and RampD expenditures after controlling for industry-specific effects (9) However they can find no significant impact on patenting activity This is not entirely surprising given the fact that their data is for all types of patents not just those relating to environmental technologies and products Indeed given that the same is true for the RampD expenditure data it may be more surprising that they find a significant relationship between pollution compliance and RampD
Brunnermeier and Cohen (2003) also use a panel data model to assess the impact of pollution abatement expenditures on patenting activity by US manufacturing industries However unlike the previous study they use only environmental patent applications in their analysis They also control for other potential explanatory factors such as the stringency of monitoring and enforcement (as measured by number of inspection visits) industry size (value of shipments) market structure (four-firm concentration ratio) capital intensity and exposure to overseas competition (export intensity) They estimate four different models for the period 1983ndash1992 with their preferred model being a negative binomial random effects model The coefficient for PACE is positive and statistically significant (in all four models) as are the coefficients (in the preferred model) for industry size concentration and export intensity However the magnitude of the coefficient (which represents
the semi-elasticity of patents with respect to PACE) is only 00004 Thus ceteris paribus an increase in abatement expenditure of USD 100 million results in an increase in the mean number of patents of only 4
Key findings of the environmental regulation studies
All three environmental regulation studies use PACE data as a proxy for the stringency of environmental regulation (10) While there are obvious pragmatic reasons for doing this (ie availability of data) the validity of the approach may be open to question As Brunnermeier and Cohen (2003) note expenditure may be affected by factors other than environmental regulation such as external pressures from interest groups or a desire to promote or maintain green credentials with customers Furthermore the reported data may not cover all pollution abatement costs and activities (particularly process-related activities) and may be prone to over-statement by reporting firms for strategic reasons However to the extent that the reported PACE data is correlated with the stringency of environmental regulation the analyses suggest that the latter does have an impact on innovation (at least in USA) although the scale of the impact appears to be small
24 Theoretical studies
Although several previous studies has analysed the impact of different environmental policy instruments on technological change Milliman and Prince (1989) were the first to consider the entire process of technological change encompassing innovation diffusion and optimal agency response (11) Using a relatively simple graphical analysis of shifting marginal abatement cost curves they deduce a relative ranking of five instruments (direct controls auctioned permits freely allocated permits emission reduction subsidies (12) and emission taxes) in terms of firms incentives to promote technological change They conclude that emission taxes provide greater incentives for innovation and diffusion than direct controls or
(9) When they allow the slopes of the PACE variable to vary across industries (in addition to the intercept) they find considerable variation in the estimated coefficients across industries with several being negative
(10) However the studies do not all use the same definition of PACE Lanjouw and Mody (1996) include (real) investment expenditures regulation and monitoring costs and research and development by all levels of government private manufacturing and non-manufacturing firms The other two studies both use compliance cost data for private manufacturing firms (at the industry level) only However while Jaffe and Palmer (1997) use capital cost data in their analysis Brunnermeier and Cohen (2003) use operating cost data
(11) Milliman and Prince (1989) identify a number of studies going back to 1970(12) These are payments for emission reductions not technology subsidies for environmental investments
Review of literature on environmental tax reform and eco-innovation
Environmental tax reform in Europe opportunities for eco-innovation 15
freely allocated tradable permits although not as great as auctioned permits However the optimal agency response is likely to face less opposition (and in some cases actually be favoured) under emission taxes than under auctioned permits (13)
Jaffe and Stavins (1995) develop a theoretical framework for comparing empirically the impacts of alternative policy instruments on the diffusion of a new technology (14) They model the investment decision for both an existing firm and a new entrant in each case assuming that over time the firm minimises the present value of its cost streams (operating costs investment cost net of any government subsidy emission taxes and the implicit costs of violating either a performance or technology standard if applicable) For an existing firm the problem is to choose the optimal timing of the retrofit and the authors show that the new technology will be adopted at a particular time if operating cost savings plus savings from reduced emission tax payments (plus any avoided penalties for not adopting a technology standard or exceeding a performance standard) in that period are greater than the net investment costs less the time rate of change of net investment costs For a new entrant the problem is to choose whether to use the new technology at start-up A necessary condition for doing so is that the present value of operating costs savings and reduced tax payments (plus any avoided penalties) over the entire time horizon is greater than the net investment cost Thus while the conditions differ in each case the introduction of either an emissions tax or an investment subsidy (or increases in the respective values) changes the benefit-cost balance in favour of the new technology bringing forward its adoption by existing firms and increasing the likelihood of adoption by new entrants
Kemp (1997) compares the abatement RampD expenditure levels of an individual firm under direct regulation (ie an emissions limit) an equivalent emission tax (15) and freely allocated tradable permits using a cost minimisation analytical framework and a specific functional form for the abatement cost function He shows that both the
level of RampD expenditure and the level of emissions reduction increase as the emissions tax rate increases and that both are greater under the tax than under direct regulation The corresponding levels under the tradable permit regime will be greater under the emissions tax if the (exogenous) permit price is higher than the tax rate and vice versa Kemp also considers the impact of subsidising the cost of the firms RampD effort and shows that increasing the subsidy rate causes a rise in pollution-control RampD More interestingly the impact of the subsidy is greater if it is combined with an emissions tax than with an equivalent emissions limit
Fischer et al (2003) develop the approach used by Milliman and Prince (1989) although their analysis differs in that it does not include the final agency response stage and the diffusion of the technology is determined by market forces with an equilibrium royalty price (16) They compare an emissions tax with auctioned and freely allocated permits using a three-stage model of innovation diffusion and emissions abatement In the first stage the innovating firm decides how much to invest in RampD to develop an emissions abatement technology In the second stage other firms decide whether to adopt this technology in return for a royalty fee or whether to use an (imperfect) imitation technology In the final stage all firms choose their level of abatement to minimise costs given an emissions tax or permit price They show that the level of innovation (ie the level of RampD chosen by the innovating firm) is determined by equating the marginal cost of innovation with the marginal (private) benefit The latter has four components mdash an abatement cost effect an emissions payment effect an imitation effect and an adoption price effect mdash and the last two components are negative (17) Using this model the authors demonstrate that freely allocated permits provide the lowest incentive for innovation However in contrast to Milliman and Prince they conclude that the relative ranking of the emissions tax and auctioned permits is ambiguous It depends crucially on the extent to which the technology can be imitated and hence the extent to which the innovator can appropriate the gains accruing to
(13) For an emissions tax the downward shift of the industry marginal abatement cost curve as a result of diffusion causes the agency to reduce the tax rate assuming that marginal damages are increasing in emissions For permits (auctioned or freely allocated) it causes the agency to reduce the number of permits
(14) The empirical application of this framework is summarised below under Section 25 on empirical evidence(15) That is the emissions tax is set equal to the firms marginal cost of abatement under the direct regulation(16) In addition to assessing the impacts on demand for innovation Fischer et al (1998) consider the impacts of the innovation and
diffusion processes on social welfare in order to compare the overall economic efficiency of the different instruments(17) Milliman and Prince capture only the first two effects in their analysis
Environmental tax reform in Europe opportunities for eco-innovation
Review of literature on environmental tax reform and eco-innovation
16
the other firms in the form of royalty payments If imitation is high (easy) then auctioned permits provide the greater incentive for innovation However if imitation is low (difficult) then the emissions tax provides the greatest incentive
Montero (2002) assesses the impacts of alternative policy instruments on environmental innovation (as measured by RampD expenditure) under conditions of imperfect competition In his model two firms compete in either quantities (ie Cournot duopoly) or prices (ie Bertrand duopoly) while being subject to some form of environmental regulation Where the regulation takes the form of tradable permits mdash either auctioned or freely allocated mdash the market is also assumed to be imperfect the firms competing in permit quantities The interaction between the two firms is modelled as a multi-stage game with the number of stages depending on the instrument being analysed In this framework a firms incentive to invest in RampD comprises two components a direct or cost minimising effect and a strategic effect reflecting the impact of its RampD expenditure on the other firms output decision The latter may be positive or negative depending on the market-regulatory structure Under Bertrand competition (ie where products are strategic complements) freely allocated permits provide the lowest incentive for innovation followed by the emission-standard The relative ranking of an emissions tax and auctioned permits is ambiguous depending on model parameter values Under Cournot competition (ie where products are strategic substitutes) the relative ranking of the emissions tax auctioned permits and the emissions-standard are ambiguous although all provide a greater incentive than freely allocated permits Indeed Montero provides a numerical example where the emissions standard provides the greatest incentive for innovation Finally he considers the impact of increasing competition (increasing the number of firms) and concludes that under perfect competition the emissions tax provides the greatest incentive for innovation
Millock and Nauges (2006) use a simple profit-optimisation model to analyse a firms choice of abatement effort to reduce emissions
per unit of energy used in production While they do not explicitly identify it as such this effort can be interpreted in terms of diffusion of an existing technology mdash with higher effort corresponding to greater diffusion This is consistent with the overall objective of their study which is to assess the impact of combining an emissions tax with a subsidy on (existing) abatement equipment (18) In their model the firm simultaneously chooses the levels of its energy input and abatement effort given exogenous output and energy prices and a cost function for abatement effort (19) They show that while increases in the subsidy rate (expressed as a percentage of the gross investment cost) unambiguously increases abatement effort the impact of increases in the tax rate depends on whether the direct impact of tax increase on the marginal benefit of abatement effort (shifting it up) outweighs the indirect impact via the resulting reduction in output (shifting it down) If the latter dominates then increases in the tax rate will reduce the optimal level of abatement effort The authors show that a necessary and sufficient condition for the direct impact to dominate is that the slope of the firms (inverse) demand for energy is greater than the average emissions tax payment per unit of energy in relation to total energy use (20)
McGinty and de Vries (2009) analyse the relationship between environmental subsidies the diffusion of a clean technology and the degree of product differentiation in an imperfectly competitive output market In their model a fixed number of firms can choose individually between using a clean production technology and a dirty technology Both technologies exhibit constant marginal production costs and constant emission rates (with the clean technology having a lower emission rate and higher unit cost) and consumers are assumed to be able to differentiate between products on the basis of the technology used in their production (21) The subsidy regime is different to that considered by the other studies in that it is applied to the production cost of the clean good and thus reduces the (constant) marginal cost of production for that good As such it is equivalent to an output subsidy for the clean good The authors derive the equilibrium diffusion rate for the clean technology (ie the proportion of firms using
(18) In the second half of their paper Millock and Nauges (2006) undertake an empirical evaluation of such a scheme that operated in France during the 1990s for SO2 and NOX emissions The results of this analysis are summarised under Section 25 on empirical evidence
(19) Abatement effort is assumed to exhibit decreasing returns to scale ie the cost function is increasing and convex(20) If output is held fixed in the profit maximisation problem then increases in the emissions tax rate unambiguously increase the
optimal level of abatement effort as found by Kemp (1997) who uses a cost-minimisation framework for his analysis(21) The model assumes imperfect substitution between the clean good and dirty good with the willingness-to-pay for one good being
a linear function of the quantities of both goods individually ndash ie Pk = ak ndash bYk ndash cYj
Review of literature on environmental tax reform and eco-innovation
Environmental tax reform in Europe opportunities for eco-innovation 17
that technology) and show that an increase in the subsidy value increases diffusion for all degrees of product differentiation The impact is greater as the substitutability of the two goods increases They also briefly consider the impact of a technology subsidy that reduces the fixed cost of the clean technology and conclude that this too will stimulate diffusion but will be less efficient than the output subsidy (22)
Key findings of the theoretical studies
As is often the case with theoretical analyses the specifications of the models and the underlying assumptions of the studies reviewed here significantly influence the conclusions Nevertheless there is a reasonable degree of consistency between their findings The studies can be classified into two broad groups those that consider innovation and diffusion within an industry setting and those that consider an individual firms decision whether to undertake RampD (ie innovation) and invest in an abatement technology (ie diffusion) in order to reduce its own cost of abatement
The studies in the first group conclude that under conditions of perfect competition emission taxes and auctioned permits provide greater incentives for innovation than direct controls or freely allocated permits However there is some disagreement over the relative impacts of the two instruments Under the assumption that the innovator appropriates a fixed (exogenous) proportion of the gains accruing to the technology adopters Milliman and Prince (1989) conclude that auctioned permits provide the greatest incentive although the government may find it easier to adjust emission taxes in response to the resultant downward shift in marginal abatement costs However when the proportion is determined endogenously mdash in the form of a royalty payment mdash Fischer et al (2003) find that either auctioned permits or emission taxes can provide the greater incentive Emission taxes are likely to provide the greatest incentive if the innovator can appropriate a large proportion of the gains (because the technology is difficult to imitate)
Montero (2002) uses a slightly different framework to compare the impacts of different instruments on innovation (in the form of RampD expenditure)
in a situation of imperfect competition and finds that the ranking depends on the nature of the competition (23) Under Bertrand price competition in the output market the results are the same as under perfect competition the relative ranking of auctioned permits and taxes is ambiguous but both provide greater incentives for innovation than emission standards and freely allocated permits However under Cournot quantity competition any of the instruments apart from freely allocated permits can provide the greatest incentives depending on the model parameter values
The studies looking at an individual firms decision also show that an emissions tax can stimulate innovation and diffusion Jaffe and Stavins (1995) explicitly consider the firms decision criterion for investing in a new abatement technology and show that by increasing the benefits of investing the introduction of an emissions tax should bring forward its adoption by existing firms and make its use by new entrants more likely The other two studies consider the firms choice of optimal abatement effort in the context of maximising its total profits or minimising its total cost of emissions reduction This effort can take the form of RampD (innovation) or expenditure on abatement equipment (diffusion) The decision problem is the same in each case ie to choose the optimal level of effort
Kemp (1997) assumes that the firm seeks to minimise its total cost of emissions reduction mdash implicitly assuming that its output level is fixed mdash and demonstrates both that abatement effort increases as the emissions tax increases and that the optimal effort is lower under direct regulation than under an equivalent tax However when the firms output level is allowed to vary mdash as is the case with the profit maximisation problem considered by Millock and Nauges (2006) mdash the impact of an increase in the emissions tax rate on the level of abatement effort depends on the relative magnitudes of the direct impact and the indirect impact (via changes in output levels) on the marginal benefit of abatement effort If the latter dominates then an increase in the emissions tax rate leads to a reduction in the optimal level of abatement effort
(22) McGinty and de Vries (2009) derive expressions for the necessary technology subsidy values when diffusion is 0 and when it is 100 They state mdash without proof mdash that the latter is greater than the former Provided that the relationship between the subsidy and diffusion is monotonic this is a sufficient condition for increases in the subsidy value to cause increases in diffusion
(23) Monteros model does not include diffusion However it does include spillover effects where RampD by one firm reduces the abatement costs of the others
Environmental tax reform in Europe opportunities for eco-innovation
Review of literature on environmental tax reform and eco-innovation
18
Only one of the industry models considers the impact of investment subsidies Using a product differentiation model of imperfect competition McGinty and de Vries (2009) show that subsidising the unit cost of a clean production technology can accelerate its diffusion However the impact depends on the degree of substitutability between clean and dirty products diminishing as the products become more differentiated In contrast all three of the individual firm analyses consider the impact of investment subsidies with all demonstrating that increasing subsidies induce greater abatement effort Furthermore Kemp (1997) shows that the impact of an RampD subsidy is greater in the presence of an emissions tax than it is under an equivalent emissions limit
25 Empirical studies
Jaffe and Stavins (1995) use their theoretical framework (outlined above in Section 24) as the basis for assessing the diffusion of thermal insulation in new home construction in the United States using state-level panel data for the years 1979ndash88 They derive a reduced form equation for the energy efficiency level chosen by developers from the marginal cost-benefit condition in which the explanatory variables include energy prices installation costs and the presence of a relevant building code (as a dummy variable) Separate equations are estimated for ceiling floor and wall insulation with the coefficient for energy prices being positive in all three equations Although it is only significant (at the 95 level) for floor insulation the joint hypothesis that all price coefficients are zero is strongly rejected However the coefficients for installation cost (which are all negative as expected) are around two to three times greater in magnitude and of comparable significance The coefficients for the building code dummies are consistently insignificant (and negative in two cases) indicating that this form of direct regulation had minimal impact on household energy efficiency levels over the period The authors use the estimated models in a simulation to compare the effects of a 10 increase in energy prices (ie an energy tax) with those of a 10 reduction in installation costs (ie a technology subsidy) with each applied over the whole ten-year period While
the tax increases diffusion by 2ndash6 by the end of the period the technology subsidy increases diffusion by between 4ndash15
Kemp (1997) models the diffusion of biological water treatment technology in the Dutch food and beverage industry based on a rational choice threshold model of technology adoption decisions In this model a firm chooses to adopt an abatement technology if the resulting reduction in emission-tax payments is greater than the annualised total costs of the technology where a discount factor is applied to the savings to reflect uncertainty and risk aversion on the part of the decision-maker This is translated into a probabilistic model under the assumption that both the savings and the costs follow a log-normal distribution across plants The model is estimated econometrically using data for the period 1974ndash91 under different assumptions for the functional form of the discount factor and allowing for adjustment costs (24) The estimated parameters for the preferred specification of the discount factor are all significant and of the expected sign and magnitude and the model provides a very close fit to the actual diffusion of waste-water treatment technologies over the period This leads the author to conclude that the effluent charges were a significant positive factor in the diffusion of treatment technologies Indeed he estimates that only around 4 of plants would have installed waste-water treatment equipment by the end of the period if the charge had remained at its (low) 1974 level compared to the actual figure of over 40
Newell et al (1999) estimate the impact of energy prices energy efficiency standards and other factors on the energy efficiency of three types of electrical consumer durables (room air conditioners central air conditioners and gas water heaters) in USA between the 1970s and 1990s The analysis utilises a product characteristics model in which the frontier of technologically feasible products is described by a transformation surface that relates the bundle of product characteristics to the real cost of producing that bundle In this framework innovation is represented by movements of the surface and movements along the surface In particular the authors identify three types of innovation shifts in the surface towards the origin (overall technological change) changes in the slope
(24) Adjustment costs are accounted for by estimating a partial adjustment model in which the actual change in adoption is some fixed fraction of the desired change (estimated from the threshold model)
Review of literature on environmental tax reform and eco-innovation
Environmental tax reform in Europe opportunities for eco-innovation 19
of the surface (directional technological change) and changes in the mix of products along a given surface (model substitution) They define the surface in terms of two characteristics energy flow and cooling capacity and incorporate innovation by allowing the coefficients of the two variables to vary with time and (in the case of energy flow) energy prices and efficiency standards Separate equations are estimated for each durable type with slightly differing sets of explanatory variables and time periods The authors find little evidence that either energy prices or energy efficiency standards had any impact on overall technological change While all but one of the relevant coefficients have the expected sign none are significant In contrast they do find evidence that energy prices had an impact on directional technological change with the relevant coefficients being of the correct sign and significant for both room and central air conditioners
Popp (2002) uses patent data to estimate the effect of energy prices on energy-efficiency innovations in USA between 1970 and 1994 He regresses normalised energy-efficiency-related patent applications against energy prices controlling also for lagged knowledge stock and government RampD (25) The estimated coefficient for energy prices is highly significant producing a short-run price elasticity of 006 and a long-run elasticity 0354 Thus a 10 increase in energy prices would be expected to increase the number of energy-efficiency-related patents by around 35 in the long run The estimated mean lag is less than four years leading the author to conclude that the imposition of a carbon or energy tax would lead to a fairly quick shift towards environmentally friendly innovation
Hoglund Isaksson (2005) estimates abatement cost functions for the reduction of nitrogen oxide (NOX) emissions in three industrial sectors in Sweden (energy pulp and paper chemicals and food) The analysis uses a double-hurdle model applied to a pooled sample of 114 plants across the three sectors The data cover the period 1990ndash1996 which spans the introduction of the charge on NOX emissions in 1992 The estimated cost curves have a similar shape in all three sectors with minimal (or even negative) costs over a relatively broad range of emission reductions and then a steep rise as reductions exceed
a threshold level The analysis does not explicitly consider the issue of innovation However it does find that abatement cost curves shifted downwards significantly over the period In the energy sector for example the emission rate threshold for significant cost increases fell by around 45 between 1991 and 1996 (from 550 to 300 kgGWh) The author surmises that this is due to a combination of technological development and the discovery of previously unrecognised opportunities Unfortunately while this shift coincided with the introduction of the NOX charge the analysis does not provide any evidence of a causal link
As part of their analysis of the impacts of the French tax-subsidy scheme for NOX and sulphur dioxide (SO2) emissions Millock and Nauges (2006) estimate the impact of the emission taxes on a plants decision to install end-of pipe abatement equipment While the study is not concerned with innovation per se the results of this part can be interpreted as showing the impact of emission taxes on the diffusion of abatement equipment Under the scheme taxes were imposed on the emissions of these air pollutants (and VOCs) by all plants satisfying certain criteria The revenue raised by the taxes was earmarked for subsidising the cost of qualifying abatement technologies for technical studies (ie RampD) and for investment in air quality surveillance systems Using panel data for 226 plants in three industries (iron and steel coke and chemicals) for the period 1900ndash1998 the authors estimate a Probit model for the probability that a plant will install abatement equipment They find that the total value of emissions taxes paid by the plant (ie for both pollutants) has a positive impact on its decision to invest in abatement equipment However the magnitude of the effect varies considerably across the sectors and is only significant for the iron and steel sector
Frondel et al (2008) analyse responses to an OECD survey on environmental policy tools (conducted in 2003) to identify the factors that affect a firms decision to adopt an environmental management system (EMS) voluntarily and their environmental innovation behaviour Innovation is captured by a binary variable that indicates whether the firm has undertaken significant technical measures or changes to reduce the environmental impacts of
(25) Normalised energy efficiency patent values are calculated by dividing by the total number of patents granted This accounts for exogenous changes in patenting behaviour that affect all types of patents Popp constructs a value for existing knowledge as the stock of previously granted patents weighted by estimates that he derives for knowledge productivity He demonstrates that the exclusion of this variable from the model leads to biased estimates for the energy price coefficient
Environmental tax reform in Europe opportunities for eco-innovation
Review of literature on environmental tax reform and eco-innovation
20
production (26) The analysis is based on survey responses from 899 firms in Germany Latent variable equations for EMS adoption and innovation are estimated simultaneously with each equation including the same four sets of variables relating to motivations policy instruments pressure groups and facility characteristics (27) The policy instrument variables include five dummy variables indicating the importance of different types of policy instrument including market-based instruments such as emission taxes and tradable permits While the perceived stringency of environmental policy is found to be a significant factor in the decision to innovate there is no evidence that any of the individual policy instrument variables had any impact The authors surmise that this suggests that it is stringency of environmental policy rather than the choice of specific instrument that is important for innovation However as the authors note their results reflect the perceptions of the survey respondents and should therefore be treated as correlations rather than causal relationships
Johnstone and Hascic (2008) assess the impact of a range of environmental policy instruments mdash including tax measures and investment incentives mdash on innovation in the renewable energy field They analyse the impacts for five different groups of renewable energy technologies mdash wind solar ocean biomass and waste-to-energy mdash using a panel dataset of European Patent Office (EPO) patent filings for these technologies across 26 countries over the period 1978ndash2003 A fixed effects negative binomial model is estimated controlling for electricity prices and consumption public sector RampD expenditure (as a proxy for scientific capacity) and total EPO filings (as a proxy for differenceschanges in patenting propensity) The various policy instruments are represented by dummy variables indicating whether they were in place in a particular year As such the model takes no account of the stringency of the instruments mdash in particular the differing magnitudes of the tax measures and investment incentives (28)
Initially the authors estimate the model with all of the policy instruments included individually They find that while public policy plays an important role in inducing innovation the impacts of the individual instruments vary across the different technologies In particular tax measures are significant for wind and biomass technologies with investment incentives being significant for solar and waste-to-energy technologies and obligationstradable certificates being significant for wind technologies However the authors express concerns that there may be multicolinearity between the policy variables (particularly between investment incentives tax measures and tariffs) and also that there may be interaction effects between some of the variables Consequently they estimate two alternative versions of the model the first using a composite policy variable representing the number of policy instruments in place and the second using clusters of similar policy instruments (29) The results or these two models confirm the initial findings The composite policy variable is significant for all of the technology groups while the significance of the clusters varies across technologies The price-based cluster is (highly) significant for solar biomass and waste-to-energy The quantity-based cluster is significant for wind technologies The authors surmise that this may be due to the different economic characteristics of the technologies For example the significance of investment incentives for solar and waste-to-energy may reflect the capital intensity of these technologies with large up-front investment costs
De Vries and Medhi (2008) also use patent data to investigate the relative importance of environmental regulations and fuel prices on innovation in automotive emission-control technologies distinguishing between post-combustion devices and engine redesign technologies They estimate a panel data model using data from Germany Japan and USA over the period 1978ndash2001 controlling for industry value added (as a proxy for the scope of technological opportunities) and total patent
(26) The next question on the survey asks whether these are changes in production processes or end-of-pipe technologies However no distinction is made between these two types of innovation in the present study
(27) In order to avoid identification problems some individual variables are omitted from one equation or the other(28) This shortcoming is recognised by the authors who state that it is unavoidable in any cross-comparative analysis in which multiple
instruments are included(29) The clusters are price-based instruments (investment incentives tax measures and tariffs) quantity-based instruments (obligations
and tradable certificates) and voluntary programmes
Review of literature on environmental tax reform and eco-innovation
Environmental tax reform in Europe opportunities for eco-innovation 21
applications (as a proxy for differenceschanges in patenting propensity) Environmental regulation is represented by two dummy variables indicating the introduction of on-board diagnostic (OBD) regulations in USA (30) The results of the analysis suggest that the relative impacts of regulation and market forces differ between the two types of technology For post-combustion technologies both of the regulations are significant while fuel prices have no significant impact In contrast the opposite is the case for engine redesign technologies with fuel prices having a significant impact but regulation having no discernable effect While the analysis does not explicitly consider the impact of fuel taxes it suggests that an increase in automotive fuel taxes would have a major impact on innovation in relation to engine design The estimated coefficient for fuel prices (1287) implies that a USD 010 increase in fuel prices would induce a 14 increase in patenting activity (31)
Key findings of the empirical studies
The empirical studies considered above cover a range of different technology areas spanning energy efficiency (both product and process) renewable energy and air and water pollution abatement While in some cases they assess the impact of energy prices rather than environmental taxes per se they provide a clear picture of the likely impact of environmental and energy-related taxes on eco-innovation
Three of the studies assess the impact on diffusion of existing technologies All find that environmental taxesenergy prices have a positive impact on diffusion In particular the water effluent charges in The Netherlands appear to have had a major impact on the adoption of waste-water treatment equipment by the food and beverage industry in that country However there is some evidence to suggest that the effectiveness of taxesprices may vary across sectors (eg NOXSO2 abatement in France) and that investment incentivessubsidies may be more
effective in some cases (eg thermal insulation in USA)
Three of the studies use patent data to assess the impact of environmental taxes and energy prices on innovation with one of these also assessing the impact of investment incentives All find a significant positive impact although this depends on the particular sub-sector (eg renewable energy) or the type of innovation In particular the evidence from the automotive emissions control study suggests that taxesprices may be more effective in promoting process-related innovation (eg engine redesign) than innovation in end-of-pipe technologies One of the studies takes a different approach using a product-characteristics model to decompose improvements in the energy efficiency of consumer durables This finds that while electricity prices did not appear to affect overall technological change (ie shifts in the product costenergy efficiency frontier) they did have a positive impact on directional technological change (ie the slope of the frontier)
26 Case studies
Christiansen and Skjaerseth (2005) undertake a comparative analysis of the impacts of climate change policies on the petroleum sectors in Norway and the Netherlands during the 1990s These countries were selected because of their very different policy approaches with the Norwegian petroleum sector subject to a carbon dioxide (CO2) tax since 1991 as part of a portfolio of measures (32) and the Netherlands relying on a series of voluntary agreements on energy efficiency (33) Both approaches appear to have been effective in that CO2 emissions per unit production fell by around 22 between 1990 and 2001 in Norway while energy efficiency improved by around 35 in the Netherlands over the same period However there were marked differences between the two countries in terms of the nature of the innovation that
(30) Because of the international nature of the automotive industry and the importance of the US market regulations introduced in USA appear to have been an important driver for innovation by overseas manufacturers Regulations mandating the installation of OBD systems were first introduced in California in 1988 A more sophisticated system was mandated by the 1990 US Clean Air Act Amendments taking force in 1996
(31) The coefficient represents the semi-elasticity of patent applications with respect to fuel prices While the authors do not state so explicitly the implication is that prices are expressed in US dollars (they are obtained from the IEA Energy Prices and Taxes Database) Consequently the impact of a 10 US cent increase in the fuel prices is given by exp(1287 x 01) ndash 1 = 0137
(32) In addition to the tax the portfolio included publicly funded RampD support schemes gas flaring permits and mandatory environmental impact assessments
(33) The Dutch oil and gas industry first signed a declaration of intent with the government in 1995 This was translated into a long-term agreement (LTA) on energy efficiency in the following year with an improvement target of 20 over the period 1989ndash2000 In 2001 a new LTA was signed which committed firms to implementing energy efficiency measures with a positive NPV at a 15 discount rate or a five year payback period
Environmental tax reform in Europe opportunities for eco-innovation
Review of literature on environmental tax reform and eco-innovation
22
occurred In the Netherlands technological change was incremental reflecting a steady diffusion of available (ie known) technology In contrast the authors find evidence of more radical innovations and adaptations by the Norwegian petroleum sector including the development of energy-efficient gas turbines installation of waste heat recovery units process modifications and improved use of process heat While the authors acknowledge the impossibility of proving a causal link between policy intervention and innovation (in the context of their case study) they conclude that the CO2 tax played a key role in the development and implementation of these radical innovations and the benefits of reduced tax payments provided an important incentive However they also conclude that the impacts of the two instruments were conditioned by the political contexts in which they were applied and the problem characteristics in the respective countries (eg the economic significance of the sector and the size of installations)
Knigge and Goumlrlach (2005) summarise the findings of a comprehensive analysis of the impacts of the ETR in Germany That analysis undertaken jointly by Ecologic and the German Institute for Economic Research (DIW Berlin) included the impacts on innovation and market diffusion of environmentally friendly products and technologies (34) Based on a series of case studies the study concluded that the ETR had a noticeable effect on innovation and diffusion although it was not possible to quantify the scale of that effect In particular ETR is identified as being a central factor in the development of gas-powered vehicles The study identifies a number of different routes by which the ETR produced impacts First the payback period for energy-efficient products was reduced as a result of the energy tax increases and the various exemptions favouring efficient energy use and renewable energy sources Second the predictable nature of the energy taxes (as opposed to widely fluctuating oil prices) reduced uncertainties about the benefits of energy-efficiency investments Third the reduction in employers social contribution payments tended to reduce the costs of labour intensive innovation processes such as research and development energy consultancy and technology installation Finally the ETR had a signalling effect strengthening awareness of the need for more efficient and rational energy use
Mickwitz et al (2007) examine a number of claims that have been made in the environmental policy literature about the relationship between policy instruments and innovation based on experiences in two industrial sectors in Finland pulp and paper and the manufacture of diesel engines for ships In particular they assess the claims that environmental taxes are superior to other policy instruments with respect to innovation and that RampD subsidies have limited impacts on innovation With respect to the first claim the evidence provided by the two case studies is mixed The authors conclude that energy taxation had a negligible impact on innovation in the pulp and paper industry However this is likely to have been due to the low level of the tax and the exemptions that applied to the sector In contrast they find that the differentiation of Swedish fairway and port fees (on the basis of SO2 and NOX emissions) was a significant factor driving the installation of in-engine NOX reduction equipment in ferries operating between the two countries (35) With respect to RampD subsidies the authors conclude that the evidence does not support the claim that these have little effect In particular they find that RampD subsidies accelerated the development of ship engine emissions-reduction technologies
The findings of the three case studies are consistent with those of the empirical analyses reviewed in the previous section Environmental taxes and investment subsidies have proven significant in promoting both innovation and diffusion although not universally so Furthermore the case studies provide some useful insights about the ways in which the impacts occur and the factors that may be important in promoting innovation In particular they suggest the need for a tax rate that is sufficiently high to provide a meaningful incentive and signalling effect and that is fixed for a sufficiently long period of time to reduce uncertainty about the future benefits of investment
27 Conclusions
The studies reviewed in the preceding sections suggest that environmental regulation in general and price-based policy instruments such as environmental taxes and investment subsidies in particular can (in theory) and do (in practice) have a positive impact on both innovation and diffusion
(34) A separate report in German by Goumlrlach et al (2005) provides details of the evaluation of the innovation and diffusion impacts (35) Although the tax was introduced in Sweden it was also payable by Finnish ferry operators entering Swedish ports and hence
affected their investment decisions This is another example of the cross-border impact of environmental policy interventions on innovation found by Lanjouw and Mody (1996) (see Section 23)
Review of literature on environmental tax reform and eco-innovation
Environmental tax reform in Europe opportunities for eco-innovation 23
of environmental technologies However the supporting empirical and case study evidence is not universal and the effectiveness of these instruments would appear to vary across different sectors and different types of innovation
To a certain extent such differences can be explained by the theoretical models In particular the impact of environmental taxes (relative to other instruments) is predicted to depend on the competitive structures of the markets in which the regulated firms operate and on the ability of innovator firms to appropriate the benefits accruing to other firms during diffusion However a number of other potential factors have been identified in the literature which may affect the impact of price-based policy instruments on innovation
Jaffe et al (2002) caution that the impact of price-based policy instruments on technology diffusion may be adversely affected by a number of potential market failures including information failures principle-agent problems (eg landlord-tenant) capital market failures and positive adoption spillovers In addition while not market failures as such uncertainty over future returns and the (associated) use of high discount rates for investment decisions can also undermine the effectiveness of price-based instruments in stimulating diffusion However as was noted above the findings from the case study of ETR in Germany suggest that an environmental tax may actually reduce the level of uncertainty over future returns provided that it is of sufficient magnitude and longevity
Skjaerseth and Christiansen (2005) emphasise that the relationship between policy instruments (of all types) and technological change is extremely complicated They argue that account must be taken of the politicalindustrial context in which policy instruments are introduced and the nature of the environmental problem that they are intended to address In particular they make a distinction between malign problems where technological change involves net costs for target groups and benign problems where there are widespread no-regret opportunities for change Based on a comparative analysis of four different case studies they conclude that mandatory policy instruments (including environmental taxes) are more effective
in promoting short-term technological change when the problems are malign but that low legitimacy (with the target group) may undermine long-term technological change However when problems are benign or when long-term change requires cooperation voluntary policy instruments are likely to be more effective
Johnstone (2005) questions the focus of the theoretical and empirical analyses (reviewed above) on the impact of environmental policy instruments on the rate of technological change He argues that the direction of technological change is as important if not more so In addition to the quantity of innovation it is also important that innovation be socially optimal in the sense that it minimises the cost of attaining a particular environmental goal in the long term Inappropriate innovation today may result in lock in to a suboptimal technological path for the future
With this in mind Johnstone identifies a number of issues that can adversely affect the direction of innovation and should be taken into account when selecting and designing policy instruments technological market failures (36) missing markets for certain environmental attributes of innovation policy incidence and joint production of emissions Most studies of the innovation effects of environmental policy instruments assume that the only missing market is that for the environmental good (or bad) However in practice there may be other markets that are missing (or incomplete) which can adversely affect transmission of innovation incentives This is particularly so in the area of waste and resource management where instruments applied at the end of the product life cycle may have little or no impact on product design innovation Even if all markets are complete except for the environmental externality the point of incidence of the policy intervention may be more important for the direction of innovation than the choice of a particular policy instrument For example a limit or standard applied directly to the emissions of a pollutant may be more effective in promoting optimal innovation than a tax applied to a proxy input variable Finally when there is joint production of pollutants (eg CO2 and air pollutants from vehicle engines) there is a danger that if policy instruments (of whatever type) are applied to one pollutant in isolation the resulting innovation may
(36) These are the same market failures identified by Jaffe et al (2002)
Environmental tax reform in Europe opportunities for eco-innovation
Review of literature on environmental tax reform and eco-innovation
24
reduce emissions of that pollutant at the expense of increases in the others
In a related point Johnstone highlights the importance of using appropriate indicators when assessing the impact of policy instruments on innovation emphasising the need for these to reflect both the rate of innovation and the direction A necessary condition for this is that the indicators must provide an accurate and detailed picture of actual innovation Unfortunately this is difficult to achieve in practice For example the use of patent data as a measure of innovation requires the identification of relevant environmental technologies This is likely to be easier for end-of-pipe technologies than for process-related technologies meaning that the latter tend to be under-represented relative to their actual incidence To the extent that process-related innovation is growing in importance or is more important
for certain sectors or types of environmental problem changes in the value of the indicator may significantly understate the actual rate of innovation and misrepresent the direction
All of this suggests that caution should be exercised in drawing general definitive conclusions about the impacts of price-based policy instruments such as environmental taxes and investment subsidies on innovation particularly relative to other policy instruments While it would appear that they can be effective in stimulating both innovation and diffusion in many cases mdash at least in terms of the rate of technological change mdash there may be situations in which other policy instruments may be more appropriate In general the stringency and point of incidence of an environmental policy intervention may be more important than the choice of a particular policy instrument in determining the rate and direction of eco-innovation
25
Modelling of ETR impacts on eco-innovation
Environmental tax reform in Europe opportunities for eco-innovation
31 Scenarios assessing the implications of ETR for eco-innovation
Scenario analysis provides a useful means of improving understanding of how the different revenue recycling methods and various scales of ETR can help meet different greenhouse gas emissions targets
To investigate the impacts of an ETR for Europe the petre project elaborated a range of different scenarios reflecting various tax reform options In addition to employing several of these original scenarios the present study compiled two new scenarios to analyse the implications of ETR for eco-innovation All scenarios were examined in both E3ME and GINFORS (37)
311 Original petre project scenarios
The key petre scenarios relevant for the present study are
bull scenarioBHbaselinescenariowithhighenergyprice (reference case)
bull scenarioS1HETRdesignedtomeettheEUsunilateral 2020 GHG target (high energy price) with revenue recycling
bull scenarioS2HETRdesignedtomeettheEUsunilateral 2020 GHG target (high energy price) with revenue recycling and 10 of revenues spent on eco-innovation measures
Each of the ETR scenarios has the same key taxation components
bull acarbontaxrateisintroducedtoallnon-EUEmissions Trading System (EU ETS) sectors equal to the carbon price in the EU ETS that delivers an overall 20 reduction in greenhouse gas emissions by 2020 and in the international cooperation scenario this is extended to 30
bull aviationisincludedintheEUETSattheendofPhase 2
bull powergenerationsectorEUETSpermitsare100 auctioned in Phase 3 of the EU ETS
bull allotherEUETSpermitsare50auctionedin2013 increasing to 100 in 2020
bull materialtaxesareintroducedat5oftotalpricein 2010 increasing to 15 by 2020
In scenario S1H environmental tax revenues are recycled through reductions in income tax rates and social security contributions in each of the Member States such that there is no direct change in tax revenues In scenario S2H 10 of environmental tax revenues are recycled through spending on eco-innovation measures and the remaining 90 is recycled through the same measures as in the other scenarios The eco-innovation spending is split across power generation and housing according to tax revenues from the corporate and household sector
In GINFORS (the model used for analysing the implications of ETR and eco-innovation) the share of renewable sources in electricity production is increased due to the additional investment The rest of additional investment goes to household energy efficiency spending Investment needed for a certain increase in renewable energy production or efficiency improvement is based on Austrian and German experience (Lehr et al 2008 and 2009 Grossmann et al 2008 Lutz and Meyer 2008) This assumption is quite conservative as parameters for other countries can be assumed to be more positive (meaning that less money is needed for renewable energy technology installation or energy efficiency gains)
In scenario S1H the 20 GHG target translates into a 15 reduction in energy-related carbon emissions relative to 1990 as other emissions such as methane and nitrous oxide have already been reduced by
3 Modelling of ETR impacts on eco-innovation
(37) The E3ME and GINFORS models are introduced in Chapter 1 of the present report A detailed discussion of the models and scenarios used in the present study can be found in Ekins and Speck (2011)
Environmental tax reform in Europe opportunities for eco-innovation
Modelling of ETR impacts on eco-innovation
26
more than 20 (in terms of carbon equivalents) The target is reached by a tightened EU ETS cap and the introduction of a carbon tax on the non-ETS sector The tax rate applied is equal to the carbon price in the EU ETS that will deliver a 20 GHG reduction by 2020
The burden of ETR taxes are allotted to energy outputs (ie the final use of energy) and will be based on the carbon content of each fuel Carbon prices are assumed to be fully passed on to consumers All carbon taxes are in addition to any existing unilateral carbon and energy taxes The carbon reductions in the different EU Member States will be those that result from a uniform carbon tax increase across the EU
All of the revenues including EU ETS auctioning revenues carbon tax revenues and material tax revenues will be recycled The proportion of tax raised by industry will be recycled into a reduction in employers social security contributions which will in turn reduce the cost of labour Recycling will be additional to the existing ETRs in some Member States Revenues raised from households will be recycled through standard rate income tax reductions Traditional energy tax revenues will be lower compared to their respective baselines as the tax base (energy consumption) is reduced So for an ETR revenue-neutrality does not mean budget-neutrality
312 Factors affecting the macroeconomic impacts of RES technologies
Earlier analyses (Lehr et al 2008 Fraunhofer ISI et al 2009 DTI 2004 Kammen et al 2004 Moreno and Loacutepez 2007) have studied the impacts of large renewable energy source (RES) shares in the energy mix for different countries The overall question in these studies has been the impact of increasing RES shares on the economy especially on the labour market For the present study it is interesting to note that macroeconomic impacts of higher RES shares mainly depends on the following five factors
1 additional investment in RES (minus lower investment in conventional sources ie fossil and nuclear power) with the impact increasing if a country manufactures the RES technology in question
2 additional (net) exports due to improved international competitiveness of renewable energy sources (first mover advantage)
3 lower fossil fuel needs4 the cost differences between RES and
conventional energy
5 the shift from capital- and energy-intensive industries to labour- and technology-intensive industries
All five factors are driven by international energy prices carbon prices the policy framework and RES technology development itself Innovation comes into the play at various stages First innovation drives the currently positive additional costs of RES technologies down and even into negative realms depending on the fossil fuel scenario Second innovative RES technologies are likely to have a competitive advantage in international markets Although a significant proportion of RES technology produced in Europe is traded in Europe innovation will still provide an edge in current and emerging international markets
The EmployRES study (Fraunhofer ISI et al 2009) finds for Europe that current strong investment reflected in installations in Europe and exports to the rest of the world dominate the economic impact of RES policies and therefore lead to positive overall effects The studys results suggest that this positive balance can only be kept up in the future if the competitive position of European manufacturers of RES technology is improved The authors strongly recommend policies which promote technological innovation in RES and lead to a continued and rapid reduction of their costs
Factors 1 and 2 will have substantial macroeconomic impacts in the short and medium terms whereas factor 3 accumulates and will show positive impacts mainly in the long term Factor 4 strongly depends on the global developments while factor 5 may have significant effects on employment
313 Additional scenarios
Impacts of additional investment (factor 1) have already been analysed in scenario S2H of the petre project To focus on the other impacts of eco-innovation two additional scenarios were designed building on scenario S2H of petre
bull S2HEETRwithrevenuerecyclingdesignedto meet the unilateral EUs 2020 greenhouse gas (GHG) target (high energy price) Ten per cent of revenues are spent on eco-innovation measures and trade shares of EU-27 economies with the rest of the world in machinery and electrical machinery increase by 01 due to the deployment of the fast growing RES markets This assumption is based on the strong EU policy effort to increase the share of renewable energy in final energy consumption to 20 by 2020
Modelling of ETR impacts on eco-innovation
Environmental tax reform in Europe opportunities for eco-innovation 27
(Fraunhofer ISI et al 2009) and the possibility of very strong world market development of the RES sector until 2020 (EREC 2008) which offers additional export opportunities for European RES industries
bull S2HIETRwithrevenuerecyclingdesignedto meet the unilateral EUs 2020 GHG target (high energy price) Ten per cent of revenues are spent on eco-innovation measures and input structures of the energy sector are changed according to the input structure of the German RES industry (Lehr et al 2008)
S2HE looks at the possible role of international trade S2HI analyses changes in the input structure of the energy sector ie from conventional electricity production to renewables In the petre project (as in GHK et al 2007) only the energy inputs of the energy sector were adapted to changes in the energy input mix
Both S2HE and S2HI focus on RES and efficiency technologies As mentioned above an ETR will trigger a variety of innovations Therefore the results can be thought of as conservative in the sense that innovations (eg automotive energy consumption industrial efficiency etc) are not explicitly included
32 Overview of modelling results
The main results of the simulations are presented in Table 31 In the baseline scenario BH with high energy prices EU-27 carbon emissions will be
72 below the 1990 level in 2020 (38) The EU-15 has committed in the Kyoto Protocol to reduce its GHG emissions 8 below 1990 levels in the period 2008ndash2012 As emissions in the new member states are substantially below their 1990 levels today that implies that the EU-27 will keep its emissions more or less constant over the coming decade As in the PRIMES baseline an ETS price of 18 EURt in 2008 prices is assumed in 2020
In scenario S1H the ETS price and carbon tax rate has to be increased to 68 EUR2008t of CO2 to reach the 20 GHG reduction target which is equal to a 15 reduction of CO2 emissions against 1990 as other greenhouse gases have already been reduced above average by more than 20 in terms of CO2 equivalents Compared to the baseline CO2 emissions are 84 lower in 2020 which means roughly an additional 1 reduction annually in the period 2012ndash2020 GDP will be about 06 lower compared to the baseline in 2020 This means that annual average growth rates will be less than 01 below their baseline development This is especially low compared to the current financial and economic crisis with a GDP deviation against the baseline of around 6 in 2009
As the recycling mechanism reduces labour costs and the tax burden is shifted from labour-intensive to carbon- and material-intensive sectors employment will be 036 (or more than 800 000 jobs) higher than in the baseline The ETR is not fully budget neutral potentially enabling EU economies to slightly increase their net savings If
(38) The modelling exercise in the present study was conducted in 2009 and therefore does not contain the latest data on EU-27 GHG emissions which were significantly influenced by the global economic slump of the late-2000s
Table 31 Main results under the different scenarios
Scenario Target in 2020 CO2 price GDP Employment CO2 reduction
EUR2008t pc against baseline
pc against baseline
pc against 1990
pc against baseline
in year 2020 2015 2020 2020 2020 2020
BH 18 ndash 72 00
S1H 20 GHG 68 ndash 022 ndash 057 036 ndash 151 ndash 84
S2H 20 GHG 61 ndash 013 ndash 030 041 ndash 152 ndash 85
S2HE 20 GHG 61 ndash 009 ndash 004 051 ndash 151 ndash 84
S2HI 20 GHG 61 ndash 006 ndash 024 045 ndash 152 ndash 84
Environmental tax reform in Europe opportunities for eco-innovation
Modelling of ETR impacts on eco-innovation
28
this extra saving is spent negative GDP impacts will be further reduced
In scenario S2H part of the revenues is invested in low-carbon technologies This reduces the carbon price to 61 EUR2008t in 2020 halving the GDP loss relative to scenario S1H to only 03 as the investment in renewable energies is assumed to be additional Employment impacts are also more positive than in scenario S1H The 10 investment in low-carbon technologies amounts to more than EUR 20 billion in 2020
Assuming additional EU exports of RES technologies in scenario S2HE GDP almost matches the baseline in 2020 and employment is 051 (or more than 1 million jobs) higher than in the baseline In scenario S2HI a shift in the input structure of the energy sector towards machinery
and electrical machinery reflecting the different nature of RES relative to conventional electricity generation also has smaller additional positive impacts on GDP and employment compared to scenario S2H
The following figures show impacts of the different scenarios in comparison to the baseline BH As Figure 31 illustrates all the alternative scenarios imply GDP lower than the baseline However comparing scenario S1H with the other three scenarios shows that additional RES investment (S2H) additional RES exports (S2HE) and the inclusion of different input structures of the RES industries (S2HI) each have positive GDP impacts These results are in line with model-based analysis in the EMPLOY-RES study (Fraunhofer ISI et al 2009)
Figure 31 EU-27 GDP according to four scenarios mdash deviation from the baseline (BH)
Percentage deviation from the baseline (BH)
ndash 100
ndash 080
ndash 060
ndash 040
ndash 020
0002010 2015 2020
S2HI S1H S2H S2HE
Modelling of ETR impacts on eco-innovation
Environmental tax reform in Europe opportunities for eco-innovation 29
In contrast to GDP employment increases relative to the baseline in all the alternative scenarios (Figure 32) Due to the scenario design the structure of the EU economies is shifted from energy-intensive to labour-intensive sectors The magnitude of the employment gain is influenced by the carbon price and the tax shift the underlying energy prices and the production loss The largest part of the employment increase stems from the additional RES investment (scenario S2H) although a shift in industry structures (S2HI) and additional RES exports (S2HE) are also positive for the labour market
33 Macroeconomic impacts at the national level
In general terms it is clear that national ETS and ETR impacts depend significantly on country specifics including energy use economic structure social system and behaviour (eg reactions to labour cost changes) In countries with high carbon intensity in their energy mix additional revenues and expenditures are higher than in countries with lower carbon intensity
Scenario S2H provides an interesting tool for analysing the macroeconomic impacts of ETR at the national level because 10 of the additional generated revenues are used for eco-innovation investments meaning that only 90 of the revenues are recycled back into the economy by reducing income tax rates and social security contributions
Figure 32 EU-27 employment according to four scenarios mdash deviation from the baseline (BH)
ndash 020
000
020
040
060
2010 2015 2020
S2HI S1H S2H S2HE
Percentage deviation from the baseline (BH)
Environmental tax reform in Europe opportunities for eco-innovation
Modelling of ETR impacts on eco-innovation
30
Figure 34 GDP in 2020 in EU-27 Member States under scenario S2H mdash deviation form the baseline (BH)
Figure 33 GDP in 2020 in selected countries under scenario S2H mdash deviation from the baseline (BH)
ndash 25 ndash 20 ndash 15 ndash 10 ndash 05 00 05 10 15
Romania
Bulgaria
SloveniaMalta
Lithuania
Latvia
Estonia
CyprusSlovakia
Poland
Hungary
Czech RepublicUnited Kingdom
Sweden
Spain
Portugal
Netherlands
Italy
Ireland
Greece
FranceFinland
Denmark
Luxembourg
Belgium
Austria
Germany
Percentage deviation from the baseline (BH)
Russia
South Africa
Brazil
India
China
Mexico
Japan
USA
Poland
United Kingdom
Spain
Italy
France
Germany
ndash 30 ndash 25 ndash 20 ndash 15 ndash 10 ndash 05 00 05 10
Percentage deviation from the baseline (BH)
Modelling of ETR impacts on eco-innovation
Environmental tax reform in Europe opportunities for eco-innovation 31
Figure 35 Employment in 2020 in EU-27 Member States under scenario S2H mdash deviation from baseline (BH)
EU-27EU-15
RomaniaBulgariaSloveniaMalta
LithuaniaLatvia
EstoniaCyprusSlovakia
PolandHungary
Czech RepublicUnited Kingdom
SwedenSpain
PortugalNetherlands
ItalyIrelandGreece
FranceFinlandDenmarkLuxembourg
BelgiumAustria
Germany
ndash 200 0 200 400 600 800 1 000
Percentage deviation from the baseline (BH)
Under scenario S2H the GDP of large EU economies deviates from baseline projections by between 0 and ndash 1 with the exception of Italy (Figure 33) Germanys GDP is even forecast to match the baseline level in 2020 due to the countrys strong RES industry Outside Europe some countries gain slightly against EU Member States in terms of competitiveness as export prices in most EU Member States and sectors increase and GDP in those countries exceeds the baseline projections as a result (Figure 33) This is mainly because carbon tax revenues are recycled via income tax reductions which are not part of production costs However energy exporting economies such as Russia or South Africa will lose exports if EU demand for fossil fuel imports declines The development of all EU Member States is shown in Figure 34
Employment impacts of scenario S2H are positive for almost all EU Member States as lower labour
costs increase labour demand and labour intensity (Figure 35) The highest absolute increases are shown for Germany the Netherlands Italy and the United Kingdom For EU-27 as a whole employment will be almost one million higher than in the corresponding baseline BH in 2020
The scenarios have not been designed with a view to meeting the EU renewables target of a 20 renewables share in final energy consumption in 2020 Nevertheless the scenarios provide some interesting insights The share is projected to increase from around 10 in 2009 to above 14 even in the baseline as instruments such as feed in tariffs and biofuel quotas will continue In scenario S1H the target will be missed with around 18 in 2020 Only in scenarios S2H S2HE and S2HI is the target met (approximately 20 )
Environmental tax reform in Europe opportunities for eco-innovation
Modelling of ETR impacts on eco-innovation
32
Under scenario S2H energy-related carbon emissions are reduced in all EU Member States relative to the baseline (Figure 36) The highest percentage reductions can be seen in many of the EU-12 Member States with still high energy intensity and low energy prices In these countries the relative price increase is higher than in countries like Germany or the United Kingdom with already high energy taxes and overall energy prices
Additional ETS revenues material tax revenues and carbon tax revenues from the industry sector are recycled back to industry via reductions in employers social security contributions (or wage subsidies in some countries) The revenues from the carbon tax on households set out in Table 32 (totalling 033 of GDP in Germany for example) are used to reduce income tax For the EU-27 overall revenues from ETS and ETR reach about 2 of GDP in 2020 although these figures may be excessive because additional EU efforts to increase energy
efficiency and renewable energy which will reduce the ETS price are not taken into account The use of flexible tools such as the Clean Development Mechanism will further reduce the revenues and earmarking of part of the revenues for mitigation and adaptation measures in emerging and developing countries limits the recycling into labour costs
In addition the scenarios do not take the current global economic problems into account According to the IEA (2009) the downturn will also reduce carbon emissions in the long run which will lead to lower carbon prices and revenues to reach fixed targets (or make tighter targets less costly)
The ETR will have varying effects on the prices of different sorts of products and services Material or carbon taxes increase the prices of product groups according to their direct and indirect material and carbon content The recycling mechanism reduces
Figure 36 Energy-related CO2 emissions in 2020 under scenario S2H mdash deviation from the baseline (BH)
WorldEU-27
EU-15Romania
BulgariaSlovenia
MaltaLithuania
LatviaEstonia
CyprusSlovakia
PolandHungary
Czech RepublicUnited Kingdom
SwedenSpain
PortugalNetherlands
ItalyIreland
GreeceFrance
FinlandDenmark
LuxembourgBelgium
AustriaGermany
ndash 25 ndash 20 ndash 15 ndash 10 ndash 5 0
Percentage deviation from the baseline (BH)
Modelling of ETR impacts on eco-innovation
Environmental tax reform in Europe opportunities for eco-innovation 33
Table 32 Additional ETS and environmental tax revenues in 2020 ( of GPD)
S2H Germany United Kingdom EU-27
ETS revenues 083 064 059
Carbon tax (industry) 052 044 054
Carbon tax (households) 033 041 036
Material tax 041 029 056
Sum 209 178 205
Figure 37 Total primary energy supply in 2020 under scenario S2H mdash deviation from the baseline (BH)
WorldEU-27EU-15
RomaniaBulgaria
Slovenia
MaltaLithuania
LatviaEstonia
Cyprus
SlovakiaPoland
HungaryCzech Republic
United KingdomSweden
SpainPortugal
NetherlandsItaly
IrelandGreece
FranceFinland
DenmarkLuxembourg
BelgiumAustria
Germany
ndash 24 ndash 21 ndash 18 ndash 15 ndash 12 ndash 9 ndash 6 ndash 3 0
Percentage deviation from the baseline (BH)
Environmental tax reform in Europe opportunities for eco-innovation
Modelling of ETR impacts on eco-innovation
34
Figure 38 Output price impacts of scenario S2H in Germany in 2020 mdash deviations from the baseline (BH)
Figure 39 Impacts of scenario S2H on industrial output in 2020 in Germany mdash deviations from the baseline (BH)
ndash 5
0
5
10
15
20
Output prices
Percentage deviation from the baseline (BH)
(3) F
ood
(4) T
extiles
(5) W
ood
(6) P
ulp pap
er
(7) C
oke re
fined
petro
leum
pro
ducts
(8) C
hemica
ls ex
cl pha
rma
(9) P
harm
aceu
ticals
(10)
Rub
ber a
nd plastics
(11)
Non
-metallic
miner
als
(12)
Iron
and
steel
(13)
Non
-ferrou
s metals
(14)
Met
al pro
ducts
(15)
Mac
hine
ry and
equ
ipmen
t
(16)
Office
mac
hine
ry
(17)
Electric
al m
achine
ry
(18)
Rad
io T
V
(19)
Med
ical pr
ecisi
on and
opt
ical ins
trumen
ts
(20)
Mot
or veh
icles
(21)
Ships
(22)
Airc
raft
(23)
Railro
ad
(24)
Man
ufac
turin
g n
ec r
ecyc
ling
(25)
Electric
ity g
as w
ater
sup
ply
(26)
Con
stru
ction
(27)
Tra
de r
epairs
(28)
Hot
els an
d re
stau
rant
s
(29)
Tra
nspo
rt an
d stor
age
(30)
Pos
t and
teleco
mmun
icatio
ns
(31)
Finan
ce ins
uran
ce
(32)
Rea
l estate ac
tivities
(33)
Ren
ting
(34)
Com
puter
(35)
Res
earch an
d de
velopm
ent
(36)
Oth
er bus
ines
s ac
tivities
(37)
Pub
lic ser
vice
s
(38)
Edu
catio
n
(39)
Hea
lth and
soc
ial w
ork
(40)
Oth
er ser
vice
s
(41)
Priv
ate ho
useh
olds
(1) A
gricu
lture
(2) M
ining an
d qu
arry
ing
nec not elsewhere classified
Production
ndash 100
ndash 80
ndash 60
ndash 40
ndash 20
00
20
40
60
80Percentage deviation from the baseline (BH)
(3) F
ood
(4) T
extiles
(5) W
ood
(6) P
ulp pap
er
(7) C
oke re
fined
petro
leum
pro
ducts
(8) C
hemica
ls ex
cl pha
rma
(9) P
harm
aceu
ticals
(10)
Rub
ber a
nd plastics
(11)
Non
-metallic
miner
als
(12)
Iron
and
steel
(13)
Non
-ferrou
s metals
(14)
Met
al pro
ducts
(15)
Mac
hine
ry and
equ
ipmen
t
(16)
Office
mac
hine
ry
(17)
Electric
al m
achine
ry
(18)
Rad
io T
V
(19)
Med
ical pr
ecisi
on and
opt
ical ins
trumen
ts
(20)
Mot
or veh
icles
(21)
Ships
(22)
Airc
raft
(23)
Railro
ad
(24)
Man
ufac
turin
g n
ec r
ecyc
ling
(25)
Electric
ity g
as w
ater
sup
ply
(26)
Con
stru
ction
(27)
Tra
de r
epairs
(28)
Hot
els an
d re
stau
rant
s
(29)
Tra
nspo
rt an
d stor
age
(30)
Pos
t and
teleco
mmun
icatio
ns
(31)
Finan
ce ins
uran
ce
(32)
Rea
l estate ac
tivities
(33)
Ren
ting
(34)
Com
puter
(35)
Res
earch an
d de
velopm
ent
(36)
Oth
er bus
ines
s ac
tivities
(37)
Pub
lic ser
vice
s
(38)
Edu
catio
n
(39)
Hea
lth and
soc
ial w
ork
(40)
Oth
er ser
vice
s
(41)
Priv
ate ho
useh
olds
(1) A
gricu
lture
(2) M
ining an
d qu
arry
ing
nec not elsewhere classified
Modelling of ETR impacts on eco-innovation
Environmental tax reform in Europe opportunities for eco-innovation 35
social security contributions and lowers labour costs according to the direct and indirect labour content of sector output The ETR therefore reduces output prices in labour-intensive service sectors and increases prices in carbon- and material-intensive industry sectors
The example of Germany shows insignificant impacts in the trade-intensive sectors of machinery (15ndash17) motor vehicles (20) and other transport equipment (21ndash23) (Figure 38) Iron and steel (12) and chemicals without pharmaceuticals (8) face the highest price increases of trade-intensive sectors As the German iron and steel industry primarily delivers high quality steel to the German car industry and increasingly to the German windmill industry negative competitiveness impacts will be limited Exchange rate variations against non-EU competitors have been much higher in the past
The higher prices of carbon- and material-intensive products will reduce price competitiveness on export markets and increase the market share for imports in domestic markets This loss of price competitiveness is based on an assumption of limited market development of energy efficiency and RES technologies in other part of the world It will be offset by gains in labour-intensive sectors if the ETR causes real wage costs per unit of output to fall as a result of using recycled revenues to reduce employer social security contributions
Any improvement in non-price competitiveness will also raise exports The extra employment will raise incomes raising consumption and output
The overall impact on sector output depends on countervailing effects which are negative for iron and steel and a few service sectors and positive for a few industry sectors For most industries the output effect is insignificant (Figure 39) The greatest impact is felt by producers of fossil fuels who must obviously reduce production due to lower demand for their products
Under scenario S2H employment impacts are positive for most sectors relative to the baseline as labour productivity decreases and wage rates fall in relation to consumer prices (CPI) and output prices (Table 33) The relative costs of labour are lower than in the baseline without the ETR reform Only around a quarter of the employment increase takes place in industry
Concerning the wage rate two countervailing effects have to be considered First when the labour market is characterised in terms of the real wage bargaining model as in E3ME and GINFORS with market power on both sides (employers and trade unions) consumer price increases will lead to wage increases (the econometrically estimated factor is 085 for Germany) Second labour productivity is another important factor for wage bargaining The estimated elasticity for Germany is 063 meaning that a 1 increase of labour productivity leads to wage increases of 063 Higher labour demand due to lower labour costs thus reduces the wage increase In the end the German economy is more labour intensive than without the ETR partly due to the structural change towards labour-intensive industries
Table 33 Employment impacts of scenario S2H in Germany mdash deviations from scenario S2H in 2020
Employment in 2020 Deviation from S2H () Deviation from S2Habsolute (1 000s)
Agriculture forestry 24 90
Industry 09 653
Non-metallic minerals 24 62
Iron and steel ndash 28 ndash 37
Machinery and equipment 05 56
Electrical machinery 04 18
Construction 37 449
Trade and transport 10 829
Business services 17 767
Other services ndash 02 ndash 216
Total 07 2506
Environmental tax reform in Europe opportunities for eco-innovation
Modelling of ETR impacts on eco-innovation
36
Additional exports under scenario S2HE mainly create new jobs in machinery and related business services (Table 34) Under scenario S2HI a shift in the input structure of the energy sector leads to a shift in the industry structure and creates a few jobs in the service sector (Table 35)
34 Conclusions of the scenario assessment
The foregoing analysis used the GINFORS model to assess economic and environmental impacts of using the ETS and ETR to reach the EUs 2020
GHG targets In general the results show positive employment effects and only small negative impacts on GDP in EU-27 Member States The economic impacts depend on the levels of international energy prices the mechanism used to recycle revenues and country specifics such as carbon and energy intensity and the structure of energy consumption
Although there is significant evidence that eco-innovation is positively driven by higher energy prices quantification is difficult The present study included simulations of possible impacts of a shift in the industry structure towards renewable energy in the electricity sector and an overall increase of EU
Table 34 Employment impacts of scenario S2HE in 2020 in Germany mdash deviations from scenario S2H
Employment in 2020 Deviation from S2H () Deviation from S2Habsolute (1 000s)
Agriculture forestry ndash 01 ndash 02
Industry 03 194
Non-metallic minerals 02 05
Iron and steel 04 05
Machinery and equipment 13 130
Electrical machinery 24 117
Construction 01 18
Trade and transport 00 26
Business services 07 308
Other services 01 107
Total 02 634
Table 35 Employment impacts of scenario S2HI in 2020 in Germany mdash deviations from scenario S2H
Employment in 2020 Deviation from S2H () Deviation from S2Habsolute (1 000s)
Agriculture forestry ndash 01 ndash 02
Industry 00 00
Non-metallic minerals 25 65
Iron and steel ndash 27 ndash 36
Machinery and equipment 08 78
Electrical machinery 04 19
Construction ndash 00 ndash 04
Trade and transport 00 07
Business services 02 115
Other services 0 56
Total 00 167
Modelling of ETR impacts on eco-innovation
Environmental tax reform in Europe opportunities for eco-innovation 37
exports due to higher global demand for renewable energy The main results can be summarised as follows
bull environmentaltaxreformshiftingtaxesfromlabour to energy and resources will create additional jobs and trigger eco-innovation
bull impactsofeco-innovationintheformofadditional EU exports or shifts in industry structures will have a slight positive influence on GDP and create a smaller number of additional jobs
These findings correspond to results from the EmployRES study (Fraunhofer ISI et al 2009) As ETR is directly aimed at reducing labour costs it will create additional jobs in the short and medium term In the longer term the cost reduction and new technologies arising from eco-innovation will play a larger role
Like all fiscal reforms a major ETR in Europe will create winners and losers At the sector level carbon- and material-intensive industries will face economic losses At the country level the carbon-intensity and overall flexibility of economies is important Clearly structural change away from carbon-intensive industries together with technological change is inherent in any successful climate mitigation policy
On the other hand several factors can smooth these structural adjustments International cooperation
will reduce economic pressure on countries and sectors In addition ETR together with auctioning of ETS allowances can be a major source of revenues for EU Member States in the future even if part of the revenues will have to be earmarked for adaptation and mitigation measures in developing countries Indeed future debate on grandfathering or auctioning ETS allowances should reflect the important point that giving allowances away for free denies countries the money to ease structural change and invest in low-carbon technologies
Caution is needed in relating the findings of this study to the EU policy debate In the model simulations the single carbon price is the only instrument used to reach the EUs 2020 GHG targets In reality of course other renewable energy and efficiency policies will also contribute to carbon reduction and have to be taken into account when comparing the results (especially the high carbon prices) to other studies Both reduce the potential revenues from fossil energy carriers and carbon emissions
A variety of renewable energy and efficiency policies could enable the climate and energy targets to be met while securing even better economic prospects The results of the present study clearly indicate that the discussion on market-based instruments should be intensified Ultimately however the EU will need a rich mix of policies to reach its GHG targets while maximising prosperity
Environmental tax reform in Europe opportunities for eco-innovation38
References
Almon C 1991 The INFORUM Approach to Interindustry Modeling in Economic Systems Research Vol 3 pp 1ndash7
Amin A and Cohendet P 2004 The Architecture of Knowledge Firms Capabilities and Communities Oxford University Press Oxford
Barker T Meyer B Pollitt H and Lutz C 2007a Modelling Environmental Tax Reform in Germany and the United Kingdom with E3ME and GINFORS petre Working Paper Cambridge and Osnabrueck (httpwwwpetreorgukpapershtm) accessed 15 February 2011
Barker T Junankar S Pollitt H and Summerton P 2007b Carbon leakage from unilateral environmental tax reforms in Europe 1995ndash2005 Energy Policy Vol 35 pp 6 281ndash6 292
Brunnermeier S B and Cohen M A 2003 Determinants of environmental innovation in US manufacturing industries Journal of Environmental Economics and Management Vol 45 pp 278ndash293
Buen J 2006 Danish and Norwegian wind industry The relationship between policy instruments innovation and diffusion Energy Policy Vol 34 (18) pp 3 887ndash3 897
Carlsson B and Stankiewicz R 1991 On the nature function and composition of technological systems Journal of Evolutionary Economics Vol 1 (2) pp 93ndash118
Christiansen A C and Skjaerseth J B 2005 Climate change policies in Norway and the Netherlands Different instruments similar outcome Energy and Environment Vol 16(1) pp 1ndash25
Dosi G 1988 Sources procedures and microeconomic effects of innovation Journal of Economic Literature Vol 26 pp 1 120ndash1 171
de Vries F and Medhi N 2008 Environmental regulation and international innovation in automotive emissions control technologies in Environmental Policy Technological Innovation and Patents Organisation for Economic Cooperation and Development Paris
DG TREN 2008 European energy and transport mdash trends to 2030 mdash update 2007 European Commission Luxembourg
DTI 2004 Renewable Supply Chain Gap Analysis UK Department of Trade and Industry
Edler J (ed) 2006 Nachfrageorientierte Innovationspolitik Buumlro fuumlr Technikfolgenabschaumltzung beim Deutschen Bundestag (TAB) Arbeitsbericht Nr 99 Berlin
Edquist C 2001 The system of innovation approach and innovation policy an account of the state of the art lead paper presented at the DRUID Conference 12ndash15 June 2001 Aalborg (httpwwwdruiddkconferencesnwpaper1edquistpdf) accessed 15 February 2011
EEA 2006 Using the market for cost-effective environmental policy Market-based instruments in Europe EEA Report No 12006 European Environment Agency Copenhagen
Ekins P 2009 Resource Productivity Environmental tax Reform and Sustainable Growth in Europe published by the Anglo-German Foundation for the Study of Industrial Society Final report (httpwwwpetreorgukpdfFinRepFinpdf) accessed 12 October 2011
Ekins P and Speck S (eds) 2011 Environmental Tax Reform (ETR) A Policy for Green Growth Oxford University Press
EREC 2008 Energy [r]evolution A sustainable global energy outlook Greenpeace International European Renewable Energy Council (EREC)
References
References
Environmental tax reform in Europe opportunities for eco-innovation 39
Fagerberg J Mowery D C and Nelson R R (eds) 2005 The Oxford Handbook of Innovation Oxford University Press Oxford
Fischer C Parry I W H and Pizer W A 2003 Instrument choice for environmental protection when technological innovation is endogenous Journal of Environmental Economics and Management Vol 45 pp 523ndash545
Fraunhofer ISI ECOFYS Energy Economics Group Ruumltter + Partner SEURECO and LEI 2009 EmployRES mdash The impact of renewable energy policy on economic growth and employment in the European Union European Commission Brussels
Frondel M Horbach J and Rennings K 2008 What triggers environmental management and innovation Empirical evidence for Germany Ecological Economics Vol 66(1) pp 153ndash160
GHK Cambridge Econometrics and IEEP 2007 Links between the environment economy and jobs Final Report submitted to DG Environment European Commission
Giljum S Behrens A Hinterberger F Lutz C and Meyer B 2008 Modelling scenarios towards a sustainable use of natural resources in Europe Environmental Science and Policy Vol 11 pp 204ndash216
Goumlrlach B Knigge M and Luumlckge H 2005 Wirkungen der Oumlkologischen Steuerreform auf Innovation und Marktdurchdringung Ecologic Berlin (httpecologiceudownloadprojekte1850-189918791879_5_innovationpdf) accessed 18 August 2011
Green M A 2000 Photovoltaics technology overview Energy Policy Vol 28 (14) pp 989ndash998
Grossmann A Lehr U Lutz C and Wolter MI 2008 Gesamtwirtschaftliche Effekte der Umsetzung der EU Ziele im Bereich Erneuerbare Energien und Gebaumludeeffizienz in Oumlsterreich bis 2020 Studie im Auftrag des Lebensministeriums Wien 0508
Hage J and Hollingsworth J R 2000 Idea innovation networks a strategy for integrating organizational and institutional analysis Organization Studies Vol 21 (5) pp 971ndash1 004
Hauschildt J 2004 Innovationsmanagement Vahlen Muumlnchen
Hemmelskamp J 1997 Environmental policy instruments and their effects on innovation European Planning Studies Vol 5 (2) pp 177ndash195
Hoglund Isaksson L 2005 Abatement costs in response to the Swedish charge on nitrogen oxide emissions Journal of Environmental Economics and Management Vol 50 pp 102ndash120
Hullmann A 2001 Internationaler Wissenstransfer und technischer Wandel (dissertation) Physica-Verlag Heidelberg
IEA 2008 World Energy Outlook 2008 International Energy Agency Paris
IEA 2009 World Energy Outlook 2009 International Energy Agency Paris
Jacobsson S Andersson B A and Baringngens L 2002 Transforming the energy system mdash the evolution of the German technological system for solar cells Science and Technology Policy Research University of Sussex Electronic Working Paper Series No 84 (httpideasrepecorgpsrussewps84html) accessed 18 August 2011
Jaffe A and Stavins R 1995 Dynamic incentives of environmental regulations the effects of alternative policy instruments on technology diffusion Journal of Environmental Economics and Management Vol 29(3) pp 43ndash63
Jaffe A B and Palmer K 1997 Environmental regulation and innovation a panel data study The Review of Economics and Statistics Vol 79 pp 610ndash619
Jaffe A B Newell R G and Stavins R N 2002 Environmental policy and technological change Environmental and Resource Economics Vol 22 (1ndash2) 2002 pp 41ndash70
Johnstone N and Hascic I 2008 Renewable energy policies and technological innovation energy source and instrument choice in Environmental Policy Technological Innovation and PatentsOrganisation for Economic Co-operation and Development Paris
Johnstone N 2005 The Innovation Effects of Environmental Policy Instruments in Horbach J (ed) Indicator Systems for Sustainable Innovation Physica-Verlag HD
Environmental tax reform in Europe opportunities for eco-innovation
References
40
Johnstone N Hascic I and Ostertag K 2008 Environmental policy technological innovation and patent activity in Environmental Policy Technological Innovation and Patents Organisation for Economic Co-operation and Development Paris
Jung C Krutilla K and Boyd R 1996 Incentives for advanced pollution abatement technology at the industry level an evaluation of policy alternatives Journal of Environmental Economics and Management Vol 30(1) pp 95ndash111
Kammen D M Kapidia K and Fripp M 2004 Putting renewables to work how many jobs can the clean energy industry generate University of California Berkeley
Kemp R 1997 Environmental policy and technical change ndash a comparison of the technological impact of policy instruments Edward Elgar Cheltenham
Kemp R 1998 The diffusion of biological waste-water treatment plants in the Dutch food and beverage industry Environmental and Resource Economics Vol 12 pp 113ndash136
Kemp R 2000 Technology and environmental policy ndash innovation effects of past policies and suggestions for improvement in OECD proceedings ndash innovation and the environment Organisation for Economic Co-operation and Development Paris
Kerr S and Newell R G 2003 Policy-induced technology adoption evidence from the US lead phasedown Journal of Industrial Economics Vol 51 pp 317ndash343
Klaassen G Miketa A Larsen K and Sundqvist T 2005 The impact of RampD on innovation for wind energy in Denmark Germany and the United Kingdom Ecological Economics Vol 54 pp 227ndash240
Kline S and Rosenberg N 1986 An overview of innovation in Landau R (ed) The positive sum strategy Harnessing technology for economic growth pp 275-306
Knigge M and Goumlrlach B 2005 Effects of Germanys ecological tax reforms on the environment employment and technological innovation Ecologic Berlin (httpwwwumweltbundesamtdeuba-info-presse-ehintergrundoekosteuerpdf) accessed 18 August 2011
Langniss O 2003 Governance structures for promoting renewable energy sources dissertation Lund Stuttgart
Lanjouw J O and Mody A 1996 Innovation and the international diffusion of environmentally responsive technology Research Policy Vol 25 pp 549ndash571
Lehr U Nitsch J Kratzat M Lutz C and Edler D 2008 Renewable Energy and Employment in Germany Energy Policy Vol 36 pp 108ndash117 DOI101016jenpol200709004
Lehr U Wolter MI and Groszligmann A 2009 Economic impacts of RES obligations in Austria ndash an application of the macro-econometric model e3at GWS Discussion Paper 20091 Osnabruumlck
Lundvall B-A Johnson B Andersen E S and Dalum B 2001 National systems of production innovation and competence building Research Policy Vol 31 pp 213ndash231
Lutz C and Giljum S 2009 Global resource use in a business as usual world until 2030 Updated results from the GINFORS model in Bleischwitz R Welfens Pand Zhang Z (eds) Sustainable growth and resource productivity ndash economic and global policy issues Greenleaf Publishers pp 30ndash41
Lutz C and Meyer B 2008 Beschaumlftigungseffekte des Klimaschutzes in Deutschland Untersuchungen zu gesamtwirtschaftlichen Auswirkungen ausgewaumlhlter Maszlignahmen des Energie- und Klimapakets Forschungsbericht 205 46 434 Dessau-Roszliglau
Lutz C and Meyer B 2009a Environmental and Economic Effects of Post-Kyoto Carbon Regimes Results of Simulations with the Global Model GINFORS Energy Policy Vol 37 pp 1 758ndash1 766 DOI 101016jenpol200901015
Lutz C and Meyer B 2009b Scenario results from GINFORS PETRE working paper Osnabruumlck
Lutz C Meyer B Nathani C and Schleich J 2005 Endogenous technological change and emissions The case of the German steel industry Energy Policy Vol33 pp 1 143ndash1 154
Lutz C Meyer B Nathani C and Schleich J 2007 Endogenous innovation economy and environment impacts of a technology based modelling approach for energy-intensive industries in Germany Energy Studies Review Vol 15(1) pp 2ndash18
References
Environmental tax reform in Europe opportunities for eco-innovation 41
Lutz C Meyer B and Wolter M I 2009 The global multisectormulticountry 3-E model GINFORS mdash a description of the model and a baseline forecast for global energy demand and CO2 emissions Journal of Sustainable Development forthcoming
Malerba F and Orsenigo L 1997 Technological Regimes and Sectoral Patterns of Innovative Activities Industrial and Corporate Change Vol 6 (1) pp 83ndash117
Malerba F 1992 Learning by Firms and Incremental Technical Change The Economic Journal Vol 102 (413) pp 845ndash859
Malerba F 2005 Industrial dynamics and innovation progress and challenges Presidential Address delivered at the 32nd Conference of the European Association for Research in Industrial Economics (EARIE) 1ndash4 September 2005 Porto
Malerba F 2006 Innovation and the evolution of industries Journal of Evolutionary Economics Vol 16 pp 3ndash23
McGinty M and de Vries F P 2009 Technology diffusion product differentiation and environmental subsidies The BE Journal of Economic Analysis and Policy Vol 9(1)
Meyer B and Lutz C 2007 The GINFORS model ndash model overview and evaluation Petre Working Paper Osnabruumlck (httpwwwpetreorgukpapershtm) accessed 18 August 2011
Meyer B Lutz C Schnur P and Zika G 2007 Economic policy simulations with global interdependencies a sensitivity analysis for Germany Economic Systems Research Vol 19 pp 37ndash55
Mickwitz P H Hyvaumlttinen and P Kivimaa 2008 The role of policy instruments in the innovation and diffusion of environmentally friendlier technologies popular claims versus case study experiences Journal of Cleaner Production Vol 16(1S1) 162ndash170
Miketa A and Schrattenholzer L 2004 Experiments with a methodology to model the role of RampD expenditures in energy technology learning processes first results Energy Policy Vol 32 (15) pp 1 679ndash1 692
Milliman S R and Prince R 1989 Firm incentives to promote technological change in pollution control Journal of Environmental Economics and Management Vol 17 pp 247ndash265
Millock K and Nauges C 2006 Ex-post evaluation of an earmarked tax on air pollution Land Economics Vol 82(1) pp 68ndash84
Montero J-P 2002 Market structure and environmental innovation Journal of Applied Economics Vol 2 pp 293ndash325
Moreno B and Loacutepez A J 2007 The effect of renewable energy on employment mdash The case of Asturias (Spain) Renewable and Sustainable Energy Rewiews doi 101016jrser200610011
Mowery D and Rosenberg N 1979 The influence of market demand upon innovation A critical review of some recent empirical studies Research Policy Vol 8 pp 102ndash153
Newell R G Jaffe A B and Stavins R N 1999 The induced innovation hypothesis and energy-saving technological change Quarterly Journal of Economics Vol 114 pp 941ndash975
Norberg-Bohm V 1999 Stimulating green technological innovation An analysis of alternative policy mechanisms Policy Sciences Vol 32(1) pp 13ndash38
OECD 2009 Sustainable manufacturing and eco-innovation towards a green economy Organisation for Economic Co-operation and Development Policy Brief June 2009
OECD 2010 Taxation innovation and the environment Organisation for Economic Co-operation and Development
Pavitt K 1984 Sectoral patterns of technological change Towards a taxonomy and a theory Research Policy Vol 13 pp 343ndash373
Popp D 2002 Induced innovation and energy prices The American Economic Review Vol 92(1) pp 160ndash180
Popp D 2005 Lessons from patents Using patents to measure technological change in environmental models Ecological Economics Vol 54 pp 209ndash226
Environmental tax reform in Europe opportunities for eco-innovation
References
42
Porter M and van der Linde C 1995 Toward a new conception of the environment competitiveness relationship Journal of Economic Perspectives Vol 9(4) pp 97ndash118
Rammert W 2002 The cultural shaping of technologies and the politics of technodiversity In Sorensen K and Williams R (eds) Shaping technology guiding policy concepts spaces and tools Elgar Cheltenham pp 155-172
Requate T 2005 Dynamic incentives by environmental policy instruments ndash a survey Ecological Economics Vol 54 pp 175ndash195
Roloff N Lehr U Krewitt W Fuchs G Wassermann S Weimer-Jehle W and Schmidt B 2008 Success determinants for technological innovations in the energy sector mdash the case of photovoltaics in Moumlst D Fichtner W Ragwitz M and Veit D (eds) New methods for energy market modelling mdash Proceedings of the first european workshop on energy market modelling using agent-based computational economics Universitaumltsverlag Karlsruhe
Rothwell R 1995 The fifth generation innovation process in Oppenlaumlnder KH Popp W (eds) Innovationen und wirtschaftlicher Fortschritt betriebs-und volkswirtschaftliche Perspektiven Bern pp 9ndash26
Schumpeter J 1942 Capitalism socialism and democracy New York Harper
Skjaeligrseth J B and Christiansen A C 2005 Environmental policy instruments and technological change in the energy sector findings from comparative empirical research Energy and Environment Vol 17 (2) pp 223ndash241
Snyder L D Miller N H and Stavins R N 2003 The effects of environmental regulations on pollution emissions evidence from plant-level data American Economic Review Vol 93(2) pp 431ndash435
Technopolis 2008 Eco-innovation Final Report for Sectoral Innovation Watch (httpwwwtechnopolis-groupcomresourcesdownloads661_report_finalpdf) accessed 18 August 2011
Volleburgh H 2007 Impacts of environmental policy instruments on technological change Report for Joint Meetings of Tax and Environment Experts OECD Environment Directorate February 2007 (comenvepocctpacfa(2006)36final)
Zimmermann H Wohltmann M and Hansjuumlrgens B 1996 Umweltabgaben und Innovation Analytica Marburg
43
Annex 1
Environmental tax reform in Europe opportunities for eco-innovation
Type Instrument Area Stage
Reference
Theo
retica
l
Em
piric
al
Cas
e st
udy
Rev
iew
Qual
itat
ive
Taxe
s
Perm
its
Subsi
die
s
Volu
nta
ry
Com
man
d
Reg
ula
tion
Ener
gy
Air
Wat
er
Oth
er
Gen
eral
Innov
atio
n
Diffu
sion
Rel
evan
ce
Brunnermeier amp Cohen (2003)
X X X X
Buen (2006) X X X X X X
Christiansen amp Skjaerseth (2005)
X X X X X X
Fischer et al (2003 X X X X X X
Frondel et al (2008) X X X X X X X (X) (X)
Hemmelskamp (1997)
X X X X X X X (X)
Hoglund Isaksson (2005)
X X X (X) (X)
Jaffe amp Stavins (1995)
X X X1 X X X X
Jaffe amp Palmer (1997)
X X X X
Jaffe et al (2002) X X X X X X X X X X
Jung et al (1996) X X X X X X (X) (X)
Kemp (1998) X X X X
Kerr amp Newell (2001) X X X X X
Klaassen et al (2005)
X X X X X
Lanjouw amp Mody (1996)
X X X X X X X
McGinty amp de Vries (2009)
X X X X
Mickwitz et al (2008)
X X X X X X X X X
Milliman amp Prince (1989)
X X X X X X X
Millock amp Nauges (2006)
X X X X X X
Montero (2002) X X X X X
Newell et al (1999) X X1 X X X
Norberg-Bohm (1999)
X X X X X X X
Popp (2002) X X1 X X
Popp (2005) X X X X X X
Porter amp van der Linde (1995)
X X X X X X
Requate (2005) X X X X X X X
Skjaeligrseth amp Christiansen (2005)
X X X X X X X X X
Snyder et al (2003) X X X X X
Annex 1 Classification of refereed journal articles
Environmental tax reform in Europe opportunities for eco-innovation44
Annex 2
Type Instrument Area Stage
Reference
Theo
retica
l
Em
piric
al
Cas
e st
udy
Rev
iew
Qual
itat
ive
Taxe
s
Perm
its
Subsi
die
s
Volu
nta
ry
Com
man
d
Reg
ula
tion
Ener
gy
Air
Wat
er
Oth
er
Gen
eral
Innov
atio
n
Diffu
sion
Rel
evan
ce
Johnstone (2005)
X X X X X X X
Johnstone amp Hascic (2008)
X X X X X X X X
Kemp (1997) X X X X X X X X X X X X X
Kemp (2000) X X X X X X X X X
de Vries amp Medhi (2008)
X X1 X X X
Annex 2 Classification of books and book chapters
45
Annex 3
Environmental tax reform in Europe opportunities for eco-innovation
Type Instrument Area Stage
Reference
Theo
retica
l
Em
piric
al
Cas
e st
udy
Rev
iew
Qual
itat
ive
Taxe
s
Perm
its
Subsi
die
s
Volu
nta
ry
Com
man
d
Reg
ula
tion
Ener
gy
Air
Wat
er
Oth
er
Gen
eral
Innov
atio
n
Diffu
sion
Rel
evan
ce
Goumlrlach et al (2005)
X X X X X X
Knigge amp Goumlrlach (2005)
X X X X X X
Technopolis (2008)
X X X X X X
Volleburgh (2007)
X X X X X X X X X X X
Annex 3 Classification of reports
European Environment Agency
Environmental tax reform in Europe opportunities for eco-innovation
2011 mdash 45 pp mdash 21 x 297 cm
ISBN 978-92-9213-238-5doi10280084889
How to obtain EU publications
Publications for salebull viaEUBookshop(httpbookshopeuropaeu)bull fromyourbooksellerbyquotingthetitlethepublisherandorISBNnumberbull bycontactingoneofoursalesagentsdirectlyYoucanobtaintheircontactdetails
on the Internet (httpbookshopeuropaeu) or by sending a fax to +352 2929-42758
Free publicationsbull viaEUBookshop(httpbookshopeuropaeu)bull attheEuropeanCommissionsrepresentationsordelegationsYoucanobtain
their contact details on the Internet (httpeceuropaeu) or by sending a fax to +352 2929-42758
European Environment AgencyKongens Nytorv 61050 Copenhagen KDenmark
Tel +45 33 36 71 00Fax +45 33 36 71 99
Web eeaeuropaeuEnquiries eeaeuropaeuenquiries
TH
-AK-1
1-0
17-E
N-N
doi1
02
8008
4889
- Acknowledgements
- Executive summary
- 1Introduction
-
- 11Background
- 12ETR and innovation
- 13Report structure
-
- 2Review of literature on environmental tax reform and eco‑innovation
-
- 21Initial screening
- 22Detailed review
- 23Environmental regulation studies
- 24Theoretical studies
- 25Empirical studies
- 26Case studies
- 27Conclusions
-
- 3Modelling of ETR impacts on eco‑innovation
-
- 31Scenarios assessing the implications of ETR for eco-innovation
- 32Overview of modelling results
- 33Macroeconomic impacts at the national level
- 34Conclusions of the scenario assessment
-
- References
- Annex 1 Classification of refereed journal articles
- Annex 2Classification of books and book chapters
- Annex 3Classification of reports
-
5
Executive summary
Environmental tax reform in Europe opportunities for eco-innovation
Executive summary
Environmental taxation innovation and the green economy
Environmental taxation can spur innovation This simple compelling message was a central finding of a recent OECD study of taxation innovation and the environment (OECD 2010)
It is an insight of profound importance Environmental policy instruments are frequently characterised as obstacles to economic activity but the OECD analysis suggests that environmental taxes can in fact be the opposite mdash serving as catalysts for the creativity that underpins thriving economies
In the short term such innovation can boost efficiency and competitiveness In the long term it arguably holds the key to sustained prosperity by enabling economic growth to continue within environmental limits Innovation particularly the kinds of innovation stimulated by environmental policy is essential in the process of creating green economies that can deliver growing incomes while preserving natural systems and social equity
Environmental tax reform (ETR) appears to offer an attractive mix for policymakers It deters environmentally damaging activities by making them more costly while incentivising the creation and diffusion of new technologies For advanced economies like the EU eco-innovation can also create opportunities to export new tools and processes globally
While increasing the costs of polluting and using resources is likely by itself to subdue economic output governments can use the tax revenues accrued to reduce the fiscal burden elsewhere
(1) The project Resource productivity environmental tax reform and sustainable growth in Europe (petre) was commissioned by the Anglo-German Foundation (AGF) in 2007 It used econometric and resource flow modelling techniques surveys and interviews to explore the implications mdash for Europe and the rest of the world mdash of a large-scale ETR in Europe designed to achieve the EUs 2020 greenhouse gas reduction targets For more information see wwwpetreorguk or Ekins and Speck (2011)
Cutting labour taxes for example can help boost work incentives mdash potentially increasing employment and offsetting negative economic impacts Moreover as the recent petre project (1) has demonstrated governments can potentially enhance net benefits further by reinvesting some of the revenues secured through ETR in eco-innovation
In view of the potential gains there is clear value for policymakers and society more broadly in expanding the knowledge base on ETR and innovation The present report aims to do just that using two approaches a literature review and a scenario-based modelling exercise Together the two analyses confirm the important interplay between environmental taxes innovation and macroeconomic performance mdash and the potential role of ETR in shifting to a green economy in Europe The key findings are set out below
Key findings of the literature review
The literature review identified four relevant groups of studies assessments of environmental regulations impacts on innovation theoretical analyses of how different policy instruments influence innovation empirical studies using statistical and econometric techniques to assess the impacts of actual policy interventions and case studies providing descriptive assessments of actual experiences
In broad terms the studies confirmed that environmental regulation in general and price-based policy instruments (such as environmental taxes and investment subsidies) in particular can and do increase innovation and diffusion of environmental technologies The studies
Environmental tax reform in Europe opportunities for eco-innovation
Executive summary
6
of environmental regulations impacts on innovation suggest that greater regulatory stringency is associated with increased innovation although the effect appears small
The empirical studies and case studies reviewed provided more comprehensive evidence The empirical studies covering technology areas such as energy efficiency renewable energy and air and water pollution abatement revealed that environmental taxes and energy prices have a significant positive impact on both innovation and diffusion of existing technologies However the effects of taxes or prices may vary somewhat across sectors and innovation types The case studies likewise indicate that environmental taxes and investment subsidies have generally although not universally had a significant positive impact on innovation and diffusion
The literature also provides valuable insights on the impact of environmental taxes compared to other instruments and the conditions that can enhance or limit an ETRs impacts on innovation For example case studies focusing on the Netherlands and Germany highlighted the need for a tax rate that is sufficiently high to provide a meaningful incentive and signalling effect and that is fixed for a sufficiently long period of time to reduce uncertainty about the future benefits of investment
The theoretical studies reviewed indicate that the relative impacts of environmental taxes and other instruments on eco-innovation are far from clear cut They often depend on the competitive structures of the markets and the ability of innovator firms to appropriate the benefits accruing to other firms during diffusion Other factors also play a role however For example market failures such as information asymmetries principle-agent problems capital market failures and positive adoption spillovers can all influence technology diffusion Similarly uncertainty over future returns and the (associated) use of high discount rates for investment decisions can also undermine the effectiveness of price-based instruments in stimulating diffusion
Taken together the literature underscores the potential for environmental taxes to catalyse innovation At the same time it also highlights the complexity of the issues and the difficulties in making generalisations about the impacts of environmental taxes and alternative policy instruments The precise effects of environmental taxes and other measures on innovation are very specific to local realities and very much influenced
by the stringency and point of incidence of the policy intervention With this in mind some authors stress that any analysis of policy impacts on innovation must be very nuanced reflecting factors such as the direction type and duration of innovation Assessments of policy effectiveness require indicators that can convey an accurate and detailed picture of innovation in all its forms
Key findings of the scenario analysis
The modelling exercise builds on the findings of the petre project using the GINFORS model to assess economic and environmental impacts of using the EU Emissions Trading System (ETS) and ETR to reach the EUs 2020 GHG targets It evaluates the overall effects of a European ETR compared to a projected baseline and develops scenarios in which eco-innovation or renewable energy technologies are supported
The analysis employed three scenarios from the petre project Together these illuminate the macroeconomic impacts of implementing an ETR designed to meet the EUs 2020 GHG target with revenues recycled through reductions in income tax rates and social security contributions and through investment of 10 of revenues in eco-innovation measures
In addition the present study used two addition scenarios both based on the assumption that 10 of revenues are invested in eco-innovation The first examines the macroeconomic impacts in EU Member States arising from increased exports of renewable energy technologies which is a plausible scenario based on the strong EU policy effort to increase the share of renewable energy in final energy consumption and the possibility of very strong world market development in the sector until 2020 The second analyses the macroeconomic effects of changes in the input structure of the energy sector ie from conventional electricity production to renewables
Overall the analysis revealed that the modelled reforms delivered positive employment effects and only small negative impacts on GDP in the EU-27 Member States The economic impacts depend on the levels of international energy prices used in the scenarios the mechanism used to recycle revenues and country specifics such as carbon and energy intensity and the structure of energy consumption
At the EU level the basic ETR scenario mdash assuming that revenues are only recycled via reduced
Executive summary
Environmental tax reform in Europe opportunities for eco-innovation 7
income tax and social security contributions mdash results in EU GDP 057 below the baseline in 2020 The additional assumptions in each of the alternative scenarios (investing 10 of revenues in eco-innovation increased exports of renewable technologies and changes in energy sector inputs) each soften this negative impact on GDP
Whereas all the scenarios indicate a small negative impact on EU GDP relative to the baseline the impact on employment is positive in all scenarios The scenario design implies that the structure of the EU economy shifts from energy-intensive to labour-intensive sectors The magnitude of the employment gain is influenced by the carbon price and the tax shift the underlying energy prices and the production loss The largest part of the employment increase stems from the additional investment in eco-innovation although a shift in industry structures and additional renewable technology exports are also positive for the labour market As ETR is directly aimed at reducing labour costs it will create additional jobs in the short and medium term In the longer term the cost reduction and new technologies arising from eco-innovation will play a larger role
The results indicate that environmental tax reform can deliver environmental objectives create additional jobs and trigger eco-innovation while having negligible negative impacts on GDP These findings are particularly evident in the scenario assuming that 10 of revenues are invested in eco-innovation and EU exports of renewable technologies increase In that case EU GDP is just 004 below the baseline in 2020 and employment is 051 (or more than 1 million jobs) higher
Like all fiscal reforms a major ETR in Europe will create winners and losers At the sector level carbon- and material-intensive industries will face economic losses At the country level the carbon-intensity and overall flexibility of economies is important Clearly structural change away from carbon-intensive industries together with technological change is inherent in any successful climate mitigation policy However international cooperation and the revenues gathered through ETR and the EU ETS can help soften negative economic and social impacts
Caution is needed in relating the findings of this study to the EU policy debate In the model simulations the single carbon price is the only instrument used to reach the EUs 2020 GHG targets In reality of course other renewable energy and efficiency policies will also contribute to carbon reduction and have to be taken into account when comparing the results (especially the high carbon prices) to other studies Both reduce the potential revenues from fossil energy carriers and carbon emissions
A variety of renewable energy and efficiency policies could enable the climate and energy targets to be met while securing even better economic prospects The results of the present study clearly indicate that the discussion on market-based instruments should be intensified Ultimately however the EU will need a rich mix of policies to reach its GHG targets while maximising prosperity
Environmental tax reform in Europe opportunities for eco-innovation8
Introduction
11 Background
In 2005 the European Environment Agency (EEA) prepared a series of reports on the use of market-based instruments to achieve environmental goals Environmental tax reform mdash defined as reform of the national tax system where there is a shift of the burden of taxes for example on labour to environmentally damaging activities such as resource use or pollution mdash was identified as a key tool in this context (EEA 2006)
A central attraction of ETR is its capacity to steer incentives so that human endeavour and ingenuity can deliver maximum economic gains while preserving the environment and social equity To analyse this function further the Anglo-German Foundation (AGF) commissioned a major body of research in 2007 Creating sustainable growth in Europe One project in this context entitled Resource productivity environmental tax reform and sustainable growth in Europe (petre) started from the hypothesis that ETR could increase human well-being via two routes improving the environment and generating economic activity and employment The results of petre were presented in a final report (Ekins 2009) and in a book (Ekins and Speck 2011)
Petre used econometric and resource flow modelling techniques surveys and interviews to explore the implications mdash for Europe and the rest of the world mdash of a large-scale ETR in Europe designed to achieve the EUs 2020 greenhouse gas reduction targets ie cutting GHG emissions by 20 in the period 1990ndash2020 (or 30 in a context of global cooperation) In order to investigate whether ETR could deliver these targets six scenarios were developed and modelled using two well-known macro-econometric models E3ME and GINFORS (2)
The results suggested that ETR is an effective environmental instrument that can enable the EU to meet its CO2 targets The models produce nearly identical results concerning labour and resource productivity signalling that an ETR that meets the emissions target would raise employment lower resource consumption and have negligible effects on GDP
The petre project provided a compelling case for using ETR more widely but the findings also indicated scope to extend the analysis For example the results of one of the scenarios indicated that investment in green technologies in the EU could significantly reduce both the carbon price and GDP loss in reaching the 20 target Measures that could augment the net benefit of ETR are clearly worth exploring in more detail Similarly the petre project results also suggested that the varying national political economic institutional and cultural contexts across the EU-27 make introducing an ETR politically complex Again this suggested the need for additional analysis of ETRs social impacts to ensure that promising ideas can be translated into working policies
In view of these findings the EEA decided to commission a two-part study to analyse the issues in more detail The first part focuses on links between ETR and eco-innovation and green technologies The second addresses ETRs implications for the distribution of incomes across society
Both of these issues are of course essential determinants of an ETRs potential contribution to sustainable growth and the shift to a green economy Eco-innovation is an indispensible element in enhancing resource efficiency ie delivering greater economic outputs and wellbeing at lower environmental impacts Meanwhile distributional
1 Introduction
(2) See for more information with regard to the modelling framework the papers presented and to be downloaded at the website of the project (wwwpetreorguk) or Ekins and Speck (2011) and in particular Chapter 8 thereof
Introduction
Environmental tax reform in Europe opportunities for eco-innovation 9
impacts are central to an ETRs political acceptability and social equity mdash another essential aspect of sustainability Any serious attempts to design ETRs must therefore include a focus on eco-innovation and distributional impacts The present two-part study aims to contribute to the knowledge base for that analysis
12 ETR and innovation
Innovation is a key determinant of domestic and international competitiveness and a vital engine for generating economic growth and highly skilled jobs It also plays a central role in facilitating the shift to a green economy enabling countries to decouple economic growth from resource use and environmental impacts
Innovations contribution to solving urgent economic and social problems is being discussed more now than ever before in Europe This growing interest partly reflects a concern that some European countries may be falling behind other industrialised nations both in developing and applying new solutions in introducing modern management production and working practices and in opening up global markets Only with greater ability to innovate coupled with competence and willingness to be creative can structural economic change be catalysed enabling faster growth and creating new jobs
The interest in innovation also reflects a recognition that even the most urgent of todays environmental problems are far from being solved Innovation that specifically addresses environmental problems is needed to ensure long-term sustainable development Basic innovation should be stimulated opening up more environmentally sound development paths for products and technologies
Of course research must focus not only on technology but on the necessary framework conditions to bring about environmental innovation Policy of all sorts mdash not least environmental policy mdash can promote or restrict innovation It is perhaps surprising therefore that there has been limited focus on the interplay between environmental policy and innovation theory
In view of its huge importance there is clear value in analysing how policy instruments affect innovation
13 Report structure
The present report brings together two approaches to examining eco-innovation
Chapter 2 comprises a literature review It looks briefly at definitions of innovation and the factors driving innovation in the economy and describes the methodology used to identify relevant literature It then provides a more detailed review of four groups of studies
bull assessmentsenvironmentalregulationsimpactson innovation
bull theoreticalanalysesofhowdifferentpolicyinstruments influence innovation
bull empiricalstudiesusingstatisticalandeconometric techniques to assess the impacts of actual policy interventions
bull casestudiesprovidingdescriptiveassessmentsofactual experiences
Chapter 3 presents a modelling exercise based on scenarios in which ETR revenues are used to foster innovation The modelling builds on the petre project evaluating the overall effects of a European ETR compared to a baseline development and goes on to examine scenarios to support eco-innovation or renewable energy technologies
Environmental tax reform in Europe opportunities for eco-innovation10
Review of literature on environmental tax reform and eco-innovation
There is a relatively large and growing literature mdash both theoretical and empirical mdash on the relationship between environmental policy interventions and technological innovation While this covers a wide range of policy instruments (ie command and control regulations environmental taxes permit trading schemes and voluntary agreements) only one of the identified references explicitly considers the impacts of an environmental tax reform (ETR) programme Consequently the present literature review focused on studies that assess the impacts of environmental taxes (and in some cases factor prices) on innovation However in order to provide some context the impacts of environmental regulation more generally were also considered
The literature review employed a two-step methodology In the first step potential references were identified and screened to determine their relevance and to classify them according to four relevant criteria In the second step those references identified as having significant relevance were reviewed in detail to distil the key conclusions regarding ETRs potential implications for eco-innovation
Before proceeding it is worth clarifying what is meant by innovation in general and by eco-innovation in particular Following Schumpeter (1942) the process of technological change is typically broken down into the following three stages (3)
bull invention mdash the first development of a scientifically or technically new product or process
bull innovation mdash the commercialisation of the new product or process
bull diffusion mdash the adoption of the product or process by firms and individuals
The first two stages are closely related although not all inventions will make it through to commercialisation They typically both occur in private companies in a process that can broadly be termed research and development (RampD)
When considering the impacts of environmental policy interventions it is important to be clear which stage of the technological development process one is considering as different instruments may be more or less effective for different stages Many studies explicitly identify the technological development stage to which they relate For those that do not it is sometimes possible to infer the stage from the context or characteristics of the study (eg the measure of innovation that is used) However some studies refer only to investment in technology and it is not clear whether this means investing in the development of new products or production processes (ie invention and innovation) or purchasing new plant and equipment from other companies (ie diffusion)
The term eco-innovation is taken to mean technological development that generates products equipment or production processes that reduce environmental risk or minimise pollution and resource use As such the term encompasses all three stages of the technological development process invention innovation and diffusion
A range of different indicators can be used to measure innovation Essentially these indicators fall into three groups those that measure the inputs (or resources) devoted to the innovation process those that measure the outputs from the process and those that focus on the economic impacts of the innovations that are generated (Johnstone et al 2008)
2 Review of literature on environmental tax reform and eco-innovation
(3) Some authors break down the innovation stage into two the application of inventions in demonstration projects the development of niche applications and markets (eg Christiansen and Skjaerseth 2005)
Review of literature on environmental tax reform and eco-innovation
Environmental tax reform in Europe opportunities for eco-innovation 11
The most common input indicator is RampD expenditure but it has several shortcomings While public sector RampD expenditure data is generally available private sector data are incomplete and usually only available at the aggregate level making it difficult (or impossible) to identify environment-related RampD expenditure Furthermore given the inherent uncertainty of the innovation process the link between effort and resulting outputs is often very weak
As a result output indicators such as patent applications are likely to provide a better method to measure eco-innovation Patent application data provide a reasonably comprehensive picture of innovative outputs (4) they are based on objective standards that change slowly and they are readily available Their main advantage however is the fact that patent applications are classified into detailed technologies using the International Patent Classification (IPC) system developed by the World Intellectual Property Organisation This allows environment-related patents to be identified and broken down between different application areas such as climate change air pollution water pollution and waste management
Impact indicators (also termed progress indicators) are more relevant to the diffusion stage and include increases in market penetration of particular eco-technologies and reductions in (marginal) abatement costs (5) However it should be noted that cost reductions can be driven by a range of factors and may not necessarily imply that innovation has occurred
21 Initial screening
Potential references were identified based on a review of journal citations internet searches using keywords and recommendations from within the project team The references fall into three broad groups
bull refereedjournalarticlesbull booksandbookchaptersbull reportsbyconsultantsandexperts
In total 37 potential references were identified the majority (28) being refereed journal articles The references were then classified according to four criteria type of study policy instrument(s) covered policy area and technological development stage On the basis of this classification each reference was then assessed in terms of its relevance
Types of study
A distinction is made between five different types of study
bull Theoretical studies use mathematical models to assess the impacts of idealised policy instruments on firms innovative behaviour under alternative assumptions about market structure and different parameter values In most cases the studies consider several alternative instruments and are interested in the relative ranking of the instruments either in terms of the amount of innovation that they induce or in terms of the resulting levels of social welfare
bull Empirical studies use a range of statistical and econometric techniques to analyse quantitative performance data in order to assess the impacts of actual policy interventions Given the relative scarcity of environmental taxes in the past there are few direct empirical studies focusing on them However a number of studies consider the impacts of changes in energy prices which give an indirect indication of the potential impact of taxation
bull Reviews summarise or compare the findings of previous studies (either theoretical or empirical) and may synthesise them to draw wider conclusions
bull Case studies provide descriptive assessments of actual experiences often comparing across countries
bull Qualitative studies consider some of the issues that can affect the performance of a particular policy instrument in practice
Together these last two types of study can provide valuable insights on the practical and political economy aspects of instrument performance to supplement the theoretical and empirical analyses
(4) While a patent may prevent rival firms from using an innovation (without paying royalties) it has the disadvantage of putting it into the public domain In some cases firms may prefer to keep the innovation secret rather than apply for patent protection
(5) More precisely the indicator of abatement is a shift in the abatement cost curves which reduces the cost of a fixed amount of abatement Reductions in abatement costs due to movements along the cost curve (ie due to changes in the level of abatement) do not provide an indicator of innovation
Environmental tax reform in Europe opportunities for eco-innovation
Review of literature on environmental tax reform and eco-innovation
12
Policy instrument addressed
The second classification criterion concerns the policy instruments that are addressed by the study with a distinction being made between five specific instrument types
The first three are market-based or price-based instruments environmental taxes and charges tradable permits and investment subsidies and tax allowances All three act by changing the prices of input factors in one way or another As has been noted above some studies consider the impact of energy prices rather than energy taxes However since the findings of these studies are directly transferable they are classified under the tax heading
The fourth instrument type is voluntary or negotiated agreements under which firms or sectors enter into agreements with government to achieve certain performance targets or undertake specific actions
The fifth type is command and control regulations which encompass technology mandates emission limits and performance standards (eg for specific energy consumption)
The final classification regulation is used for studies that consider the weight or stringency of environmental regulation in general rather than a specific policy instrument
Policy area addressed
With regard to the policy area(s) covered by the studies a distinction is made between five areas including energy and climate change air pollution water pollution and other
The final classification general is used for studies that consider the impacts of environmental regulation in general rather than any specific intervention or where the policy area is not specified (eg in theoretical analyses)
Stage of technological development
The final classification criterion concerns the stage of the technological development process that is addressed by the study As has been noted above the process is typically divided into three stages invention innovation and diffusion In practice however the studies do not distinguish between the first two stages (often just referring generically to RampD) They have therefore been combined for the purposes of the classification so that the only distinction is between the innovation and diffusion stages
Results of the classification exercise
Subsequent to classifying the studies each was scored in terms of its relevance to analysing ETRs impacts on eco-innovation A three tier qualitative scoring system was used One star () indicates that the study is of only minor relevance two stars () indicates that it is of moderate relevance and three stars () that it is of significant relevance Such a scoring system is inevitably subjective but it provides a pragmatic mechanism for identifying the key references to be included in the detailed review In determining the scores particular emphasis was placed on whether the study is empirical in nature and whether it considers environmental taxes (or factor prices)
Annex 1 shows the classifications of the 28 journal articles that were identified Thirteen are empirical seven are theoretical three are case studies and four are qualitative while four provide reviews of previous work in the area (including most of the identified studies) (6) Around two-thirds of the papers consider the impact of environmental taxes (or energy prices) often comparing these with the impacts of other policy instruments Eleven consider the impact of investment subsidies
Most of the theoretical analyses are not area-specific (only discussing environmental damage in general terms) The empirical studies are spread fairly evenly across policy areas with five addressing
(6) Some studies are classified under more than one heading For example a study may contain both a theoretical model of behaviour and an empirical assessment of the model
Review of literature on environmental tax reform and eco-innovation
Environmental tax reform in Europe opportunities for eco-innovation 13
energy and climate change five addressing air pollution and three addressing water pollution In terms of the stage of the technological development process there is an even split between innovation and diffusion with many of the papers covering both stages In total eighteen of the references are included in the detailed review
Annex 2 shows the classifications of the five book chapters and Annex 3 covers the four reports (7) As might be expected these sources put less emphasis on theory with only one reference including any formal analysis They are split fairly evenly between empirical studies reviews and qualitative assessments All but one consider the impact of environmental taxes or energy prices while seven consider the impact of investment subsidies As with the journal articles there is a fairly even spread across policy areas and between innovation and diffusion Five of the references are included in the detailed review
22 Detailed review
The detailed review focuses on the impacts on eco-innovation of the two price-based policy instruments that are directly relevant to ETR environmental taxes and investment subsidies and tax incentives (eg RampD and capital allowances) (8) A priori each instrument might be expected to stimulate innovation mdash the first by increasing the benefits of innovation by reducing tax payments the second by reducing the costs of developing and adopting new technologies However in order to provide a broader context for the impacts of these two instruments the review starts by considering the relationship between innovation and the stringency of environmental regulation in general
As can be seen from the initial screening (see Annexes 1ndash3) the large majority of studies consider more than one policy instrument within a unified analytical framework mdash either comparing their relative impacts or assessing the impacts of instrument combinations (or packages)
In particular all but one of the papers that assess the impacts of investment subsidies either theoretically or empirically also assess the impacts environmental taxes (and sometimes other policy instruments) Consequently for the purposes of this review it is convenient to consider the impacts of taxes and subsidies at the same time rather than sequentially In addition to avoiding the need for any repetition (about model structures assumptions etc) this facilitates identification of potential interactions and synergies between the two instruments
Apart from Section 23 on the impact of environmental regulation in general only those references identified as being of significant relevance () in the initial screening are included in the review References are summarised in chronological order under three headings theoretical predictions (Section 24) empirical evidence (Section 25) and case studies (Section 26) At the end of each section an attempt is made to synthesise the findings of the studies but the scope of the present review did not allow for critical analysis of the studies to identify their respective strengths and weaknesses or to resolve any apparent conflicts between their findings
23 Environmental regulation studies
Lanjouw and Mody (1996) use aggregate pollution and control expenditure (PACE) data as a proxy for the stringency of environmental regulation and compare this with data on the aggregate number of environmental patent applications for Germany Japan and USA They do not perform any formal statistical or econometric analysis of the data However based on simple graphical analysis they identify a relatively clear correlation between expenditure and patents over the 1970s and 1980s with a time lag of one to two years They also find some indications in the data that patenting in one country also responds to increasing stringency of environmental regulation in the other two In addition they consider the diffusion of environmental technologies by looking at trade
(7) Two of the reports emanate from the study by Ecologic and DIW of ETR in Germany Details of the assessment of the impact on innovation and market diffusion are provided (in German) in Goumlrlach et al (2005) with a summary (in English) in Knigge and Goumlrlach (2005)
(8) While the large majority of revenues raised under an ETR are likely to be used to reduce taxes on labour a small proportion may be used to encourage innovation or promote the take-up of environmentally friendly technologies
Environmental tax reform in Europe opportunities for eco-innovation
Review of literature on environmental tax reform and eco-innovation
14
flows in capital goods used for pollution reduction and find that these too show a correlation with total abatement expenditure
Jaffe and Palmer (1997) also use PACE data as a proxy for the stringency of environmental regulation and evaluate its impact on two different measures of innovation total private expenditures on RampD and the number of successful patent applications by US manufacturing industries Unlike the previous study they undertake formal econometric analysis of the data using panel data at the two-digit and three-digit SIC code industry level for the period 1978ndash1991 and a fixed effects model They find a statistically significant positive relationship between compliance expenditures (capital expenditures only) and RampD expenditures after controlling for industry-specific effects (9) However they can find no significant impact on patenting activity This is not entirely surprising given the fact that their data is for all types of patents not just those relating to environmental technologies and products Indeed given that the same is true for the RampD expenditure data it may be more surprising that they find a significant relationship between pollution compliance and RampD
Brunnermeier and Cohen (2003) also use a panel data model to assess the impact of pollution abatement expenditures on patenting activity by US manufacturing industries However unlike the previous study they use only environmental patent applications in their analysis They also control for other potential explanatory factors such as the stringency of monitoring and enforcement (as measured by number of inspection visits) industry size (value of shipments) market structure (four-firm concentration ratio) capital intensity and exposure to overseas competition (export intensity) They estimate four different models for the period 1983ndash1992 with their preferred model being a negative binomial random effects model The coefficient for PACE is positive and statistically significant (in all four models) as are the coefficients (in the preferred model) for industry size concentration and export intensity However the magnitude of the coefficient (which represents
the semi-elasticity of patents with respect to PACE) is only 00004 Thus ceteris paribus an increase in abatement expenditure of USD 100 million results in an increase in the mean number of patents of only 4
Key findings of the environmental regulation studies
All three environmental regulation studies use PACE data as a proxy for the stringency of environmental regulation (10) While there are obvious pragmatic reasons for doing this (ie availability of data) the validity of the approach may be open to question As Brunnermeier and Cohen (2003) note expenditure may be affected by factors other than environmental regulation such as external pressures from interest groups or a desire to promote or maintain green credentials with customers Furthermore the reported data may not cover all pollution abatement costs and activities (particularly process-related activities) and may be prone to over-statement by reporting firms for strategic reasons However to the extent that the reported PACE data is correlated with the stringency of environmental regulation the analyses suggest that the latter does have an impact on innovation (at least in USA) although the scale of the impact appears to be small
24 Theoretical studies
Although several previous studies has analysed the impact of different environmental policy instruments on technological change Milliman and Prince (1989) were the first to consider the entire process of technological change encompassing innovation diffusion and optimal agency response (11) Using a relatively simple graphical analysis of shifting marginal abatement cost curves they deduce a relative ranking of five instruments (direct controls auctioned permits freely allocated permits emission reduction subsidies (12) and emission taxes) in terms of firms incentives to promote technological change They conclude that emission taxes provide greater incentives for innovation and diffusion than direct controls or
(9) When they allow the slopes of the PACE variable to vary across industries (in addition to the intercept) they find considerable variation in the estimated coefficients across industries with several being negative
(10) However the studies do not all use the same definition of PACE Lanjouw and Mody (1996) include (real) investment expenditures regulation and monitoring costs and research and development by all levels of government private manufacturing and non-manufacturing firms The other two studies both use compliance cost data for private manufacturing firms (at the industry level) only However while Jaffe and Palmer (1997) use capital cost data in their analysis Brunnermeier and Cohen (2003) use operating cost data
(11) Milliman and Prince (1989) identify a number of studies going back to 1970(12) These are payments for emission reductions not technology subsidies for environmental investments
Review of literature on environmental tax reform and eco-innovation
Environmental tax reform in Europe opportunities for eco-innovation 15
freely allocated tradable permits although not as great as auctioned permits However the optimal agency response is likely to face less opposition (and in some cases actually be favoured) under emission taxes than under auctioned permits (13)
Jaffe and Stavins (1995) develop a theoretical framework for comparing empirically the impacts of alternative policy instruments on the diffusion of a new technology (14) They model the investment decision for both an existing firm and a new entrant in each case assuming that over time the firm minimises the present value of its cost streams (operating costs investment cost net of any government subsidy emission taxes and the implicit costs of violating either a performance or technology standard if applicable) For an existing firm the problem is to choose the optimal timing of the retrofit and the authors show that the new technology will be adopted at a particular time if operating cost savings plus savings from reduced emission tax payments (plus any avoided penalties for not adopting a technology standard or exceeding a performance standard) in that period are greater than the net investment costs less the time rate of change of net investment costs For a new entrant the problem is to choose whether to use the new technology at start-up A necessary condition for doing so is that the present value of operating costs savings and reduced tax payments (plus any avoided penalties) over the entire time horizon is greater than the net investment cost Thus while the conditions differ in each case the introduction of either an emissions tax or an investment subsidy (or increases in the respective values) changes the benefit-cost balance in favour of the new technology bringing forward its adoption by existing firms and increasing the likelihood of adoption by new entrants
Kemp (1997) compares the abatement RampD expenditure levels of an individual firm under direct regulation (ie an emissions limit) an equivalent emission tax (15) and freely allocated tradable permits using a cost minimisation analytical framework and a specific functional form for the abatement cost function He shows that both the
level of RampD expenditure and the level of emissions reduction increase as the emissions tax rate increases and that both are greater under the tax than under direct regulation The corresponding levels under the tradable permit regime will be greater under the emissions tax if the (exogenous) permit price is higher than the tax rate and vice versa Kemp also considers the impact of subsidising the cost of the firms RampD effort and shows that increasing the subsidy rate causes a rise in pollution-control RampD More interestingly the impact of the subsidy is greater if it is combined with an emissions tax than with an equivalent emissions limit
Fischer et al (2003) develop the approach used by Milliman and Prince (1989) although their analysis differs in that it does not include the final agency response stage and the diffusion of the technology is determined by market forces with an equilibrium royalty price (16) They compare an emissions tax with auctioned and freely allocated permits using a three-stage model of innovation diffusion and emissions abatement In the first stage the innovating firm decides how much to invest in RampD to develop an emissions abatement technology In the second stage other firms decide whether to adopt this technology in return for a royalty fee or whether to use an (imperfect) imitation technology In the final stage all firms choose their level of abatement to minimise costs given an emissions tax or permit price They show that the level of innovation (ie the level of RampD chosen by the innovating firm) is determined by equating the marginal cost of innovation with the marginal (private) benefit The latter has four components mdash an abatement cost effect an emissions payment effect an imitation effect and an adoption price effect mdash and the last two components are negative (17) Using this model the authors demonstrate that freely allocated permits provide the lowest incentive for innovation However in contrast to Milliman and Prince they conclude that the relative ranking of the emissions tax and auctioned permits is ambiguous It depends crucially on the extent to which the technology can be imitated and hence the extent to which the innovator can appropriate the gains accruing to
(13) For an emissions tax the downward shift of the industry marginal abatement cost curve as a result of diffusion causes the agency to reduce the tax rate assuming that marginal damages are increasing in emissions For permits (auctioned or freely allocated) it causes the agency to reduce the number of permits
(14) The empirical application of this framework is summarised below under Section 25 on empirical evidence(15) That is the emissions tax is set equal to the firms marginal cost of abatement under the direct regulation(16) In addition to assessing the impacts on demand for innovation Fischer et al (1998) consider the impacts of the innovation and
diffusion processes on social welfare in order to compare the overall economic efficiency of the different instruments(17) Milliman and Prince capture only the first two effects in their analysis
Environmental tax reform in Europe opportunities for eco-innovation
Review of literature on environmental tax reform and eco-innovation
16
the other firms in the form of royalty payments If imitation is high (easy) then auctioned permits provide the greater incentive for innovation However if imitation is low (difficult) then the emissions tax provides the greatest incentive
Montero (2002) assesses the impacts of alternative policy instruments on environmental innovation (as measured by RampD expenditure) under conditions of imperfect competition In his model two firms compete in either quantities (ie Cournot duopoly) or prices (ie Bertrand duopoly) while being subject to some form of environmental regulation Where the regulation takes the form of tradable permits mdash either auctioned or freely allocated mdash the market is also assumed to be imperfect the firms competing in permit quantities The interaction between the two firms is modelled as a multi-stage game with the number of stages depending on the instrument being analysed In this framework a firms incentive to invest in RampD comprises two components a direct or cost minimising effect and a strategic effect reflecting the impact of its RampD expenditure on the other firms output decision The latter may be positive or negative depending on the market-regulatory structure Under Bertrand competition (ie where products are strategic complements) freely allocated permits provide the lowest incentive for innovation followed by the emission-standard The relative ranking of an emissions tax and auctioned permits is ambiguous depending on model parameter values Under Cournot competition (ie where products are strategic substitutes) the relative ranking of the emissions tax auctioned permits and the emissions-standard are ambiguous although all provide a greater incentive than freely allocated permits Indeed Montero provides a numerical example where the emissions standard provides the greatest incentive for innovation Finally he considers the impact of increasing competition (increasing the number of firms) and concludes that under perfect competition the emissions tax provides the greatest incentive for innovation
Millock and Nauges (2006) use a simple profit-optimisation model to analyse a firms choice of abatement effort to reduce emissions
per unit of energy used in production While they do not explicitly identify it as such this effort can be interpreted in terms of diffusion of an existing technology mdash with higher effort corresponding to greater diffusion This is consistent with the overall objective of their study which is to assess the impact of combining an emissions tax with a subsidy on (existing) abatement equipment (18) In their model the firm simultaneously chooses the levels of its energy input and abatement effort given exogenous output and energy prices and a cost function for abatement effort (19) They show that while increases in the subsidy rate (expressed as a percentage of the gross investment cost) unambiguously increases abatement effort the impact of increases in the tax rate depends on whether the direct impact of tax increase on the marginal benefit of abatement effort (shifting it up) outweighs the indirect impact via the resulting reduction in output (shifting it down) If the latter dominates then increases in the tax rate will reduce the optimal level of abatement effort The authors show that a necessary and sufficient condition for the direct impact to dominate is that the slope of the firms (inverse) demand for energy is greater than the average emissions tax payment per unit of energy in relation to total energy use (20)
McGinty and de Vries (2009) analyse the relationship between environmental subsidies the diffusion of a clean technology and the degree of product differentiation in an imperfectly competitive output market In their model a fixed number of firms can choose individually between using a clean production technology and a dirty technology Both technologies exhibit constant marginal production costs and constant emission rates (with the clean technology having a lower emission rate and higher unit cost) and consumers are assumed to be able to differentiate between products on the basis of the technology used in their production (21) The subsidy regime is different to that considered by the other studies in that it is applied to the production cost of the clean good and thus reduces the (constant) marginal cost of production for that good As such it is equivalent to an output subsidy for the clean good The authors derive the equilibrium diffusion rate for the clean technology (ie the proportion of firms using
(18) In the second half of their paper Millock and Nauges (2006) undertake an empirical evaluation of such a scheme that operated in France during the 1990s for SO2 and NOX emissions The results of this analysis are summarised under Section 25 on empirical evidence
(19) Abatement effort is assumed to exhibit decreasing returns to scale ie the cost function is increasing and convex(20) If output is held fixed in the profit maximisation problem then increases in the emissions tax rate unambiguously increase the
optimal level of abatement effort as found by Kemp (1997) who uses a cost-minimisation framework for his analysis(21) The model assumes imperfect substitution between the clean good and dirty good with the willingness-to-pay for one good being
a linear function of the quantities of both goods individually ndash ie Pk = ak ndash bYk ndash cYj
Review of literature on environmental tax reform and eco-innovation
Environmental tax reform in Europe opportunities for eco-innovation 17
that technology) and show that an increase in the subsidy value increases diffusion for all degrees of product differentiation The impact is greater as the substitutability of the two goods increases They also briefly consider the impact of a technology subsidy that reduces the fixed cost of the clean technology and conclude that this too will stimulate diffusion but will be less efficient than the output subsidy (22)
Key findings of the theoretical studies
As is often the case with theoretical analyses the specifications of the models and the underlying assumptions of the studies reviewed here significantly influence the conclusions Nevertheless there is a reasonable degree of consistency between their findings The studies can be classified into two broad groups those that consider innovation and diffusion within an industry setting and those that consider an individual firms decision whether to undertake RampD (ie innovation) and invest in an abatement technology (ie diffusion) in order to reduce its own cost of abatement
The studies in the first group conclude that under conditions of perfect competition emission taxes and auctioned permits provide greater incentives for innovation than direct controls or freely allocated permits However there is some disagreement over the relative impacts of the two instruments Under the assumption that the innovator appropriates a fixed (exogenous) proportion of the gains accruing to the technology adopters Milliman and Prince (1989) conclude that auctioned permits provide the greatest incentive although the government may find it easier to adjust emission taxes in response to the resultant downward shift in marginal abatement costs However when the proportion is determined endogenously mdash in the form of a royalty payment mdash Fischer et al (2003) find that either auctioned permits or emission taxes can provide the greater incentive Emission taxes are likely to provide the greatest incentive if the innovator can appropriate a large proportion of the gains (because the technology is difficult to imitate)
Montero (2002) uses a slightly different framework to compare the impacts of different instruments on innovation (in the form of RampD expenditure)
in a situation of imperfect competition and finds that the ranking depends on the nature of the competition (23) Under Bertrand price competition in the output market the results are the same as under perfect competition the relative ranking of auctioned permits and taxes is ambiguous but both provide greater incentives for innovation than emission standards and freely allocated permits However under Cournot quantity competition any of the instruments apart from freely allocated permits can provide the greatest incentives depending on the model parameter values
The studies looking at an individual firms decision also show that an emissions tax can stimulate innovation and diffusion Jaffe and Stavins (1995) explicitly consider the firms decision criterion for investing in a new abatement technology and show that by increasing the benefits of investing the introduction of an emissions tax should bring forward its adoption by existing firms and make its use by new entrants more likely The other two studies consider the firms choice of optimal abatement effort in the context of maximising its total profits or minimising its total cost of emissions reduction This effort can take the form of RampD (innovation) or expenditure on abatement equipment (diffusion) The decision problem is the same in each case ie to choose the optimal level of effort
Kemp (1997) assumes that the firm seeks to minimise its total cost of emissions reduction mdash implicitly assuming that its output level is fixed mdash and demonstrates both that abatement effort increases as the emissions tax increases and that the optimal effort is lower under direct regulation than under an equivalent tax However when the firms output level is allowed to vary mdash as is the case with the profit maximisation problem considered by Millock and Nauges (2006) mdash the impact of an increase in the emissions tax rate on the level of abatement effort depends on the relative magnitudes of the direct impact and the indirect impact (via changes in output levels) on the marginal benefit of abatement effort If the latter dominates then an increase in the emissions tax rate leads to a reduction in the optimal level of abatement effort
(22) McGinty and de Vries (2009) derive expressions for the necessary technology subsidy values when diffusion is 0 and when it is 100 They state mdash without proof mdash that the latter is greater than the former Provided that the relationship between the subsidy and diffusion is monotonic this is a sufficient condition for increases in the subsidy value to cause increases in diffusion
(23) Monteros model does not include diffusion However it does include spillover effects where RampD by one firm reduces the abatement costs of the others
Environmental tax reform in Europe opportunities for eco-innovation
Review of literature on environmental tax reform and eco-innovation
18
Only one of the industry models considers the impact of investment subsidies Using a product differentiation model of imperfect competition McGinty and de Vries (2009) show that subsidising the unit cost of a clean production technology can accelerate its diffusion However the impact depends on the degree of substitutability between clean and dirty products diminishing as the products become more differentiated In contrast all three of the individual firm analyses consider the impact of investment subsidies with all demonstrating that increasing subsidies induce greater abatement effort Furthermore Kemp (1997) shows that the impact of an RampD subsidy is greater in the presence of an emissions tax than it is under an equivalent emissions limit
25 Empirical studies
Jaffe and Stavins (1995) use their theoretical framework (outlined above in Section 24) as the basis for assessing the diffusion of thermal insulation in new home construction in the United States using state-level panel data for the years 1979ndash88 They derive a reduced form equation for the energy efficiency level chosen by developers from the marginal cost-benefit condition in which the explanatory variables include energy prices installation costs and the presence of a relevant building code (as a dummy variable) Separate equations are estimated for ceiling floor and wall insulation with the coefficient for energy prices being positive in all three equations Although it is only significant (at the 95 level) for floor insulation the joint hypothesis that all price coefficients are zero is strongly rejected However the coefficients for installation cost (which are all negative as expected) are around two to three times greater in magnitude and of comparable significance The coefficients for the building code dummies are consistently insignificant (and negative in two cases) indicating that this form of direct regulation had minimal impact on household energy efficiency levels over the period The authors use the estimated models in a simulation to compare the effects of a 10 increase in energy prices (ie an energy tax) with those of a 10 reduction in installation costs (ie a technology subsidy) with each applied over the whole ten-year period While
the tax increases diffusion by 2ndash6 by the end of the period the technology subsidy increases diffusion by between 4ndash15
Kemp (1997) models the diffusion of biological water treatment technology in the Dutch food and beverage industry based on a rational choice threshold model of technology adoption decisions In this model a firm chooses to adopt an abatement technology if the resulting reduction in emission-tax payments is greater than the annualised total costs of the technology where a discount factor is applied to the savings to reflect uncertainty and risk aversion on the part of the decision-maker This is translated into a probabilistic model under the assumption that both the savings and the costs follow a log-normal distribution across plants The model is estimated econometrically using data for the period 1974ndash91 under different assumptions for the functional form of the discount factor and allowing for adjustment costs (24) The estimated parameters for the preferred specification of the discount factor are all significant and of the expected sign and magnitude and the model provides a very close fit to the actual diffusion of waste-water treatment technologies over the period This leads the author to conclude that the effluent charges were a significant positive factor in the diffusion of treatment technologies Indeed he estimates that only around 4 of plants would have installed waste-water treatment equipment by the end of the period if the charge had remained at its (low) 1974 level compared to the actual figure of over 40
Newell et al (1999) estimate the impact of energy prices energy efficiency standards and other factors on the energy efficiency of three types of electrical consumer durables (room air conditioners central air conditioners and gas water heaters) in USA between the 1970s and 1990s The analysis utilises a product characteristics model in which the frontier of technologically feasible products is described by a transformation surface that relates the bundle of product characteristics to the real cost of producing that bundle In this framework innovation is represented by movements of the surface and movements along the surface In particular the authors identify three types of innovation shifts in the surface towards the origin (overall technological change) changes in the slope
(24) Adjustment costs are accounted for by estimating a partial adjustment model in which the actual change in adoption is some fixed fraction of the desired change (estimated from the threshold model)
Review of literature on environmental tax reform and eco-innovation
Environmental tax reform in Europe opportunities for eco-innovation 19
of the surface (directional technological change) and changes in the mix of products along a given surface (model substitution) They define the surface in terms of two characteristics energy flow and cooling capacity and incorporate innovation by allowing the coefficients of the two variables to vary with time and (in the case of energy flow) energy prices and efficiency standards Separate equations are estimated for each durable type with slightly differing sets of explanatory variables and time periods The authors find little evidence that either energy prices or energy efficiency standards had any impact on overall technological change While all but one of the relevant coefficients have the expected sign none are significant In contrast they do find evidence that energy prices had an impact on directional technological change with the relevant coefficients being of the correct sign and significant for both room and central air conditioners
Popp (2002) uses patent data to estimate the effect of energy prices on energy-efficiency innovations in USA between 1970 and 1994 He regresses normalised energy-efficiency-related patent applications against energy prices controlling also for lagged knowledge stock and government RampD (25) The estimated coefficient for energy prices is highly significant producing a short-run price elasticity of 006 and a long-run elasticity 0354 Thus a 10 increase in energy prices would be expected to increase the number of energy-efficiency-related patents by around 35 in the long run The estimated mean lag is less than four years leading the author to conclude that the imposition of a carbon or energy tax would lead to a fairly quick shift towards environmentally friendly innovation
Hoglund Isaksson (2005) estimates abatement cost functions for the reduction of nitrogen oxide (NOX) emissions in three industrial sectors in Sweden (energy pulp and paper chemicals and food) The analysis uses a double-hurdle model applied to a pooled sample of 114 plants across the three sectors The data cover the period 1990ndash1996 which spans the introduction of the charge on NOX emissions in 1992 The estimated cost curves have a similar shape in all three sectors with minimal (or even negative) costs over a relatively broad range of emission reductions and then a steep rise as reductions exceed
a threshold level The analysis does not explicitly consider the issue of innovation However it does find that abatement cost curves shifted downwards significantly over the period In the energy sector for example the emission rate threshold for significant cost increases fell by around 45 between 1991 and 1996 (from 550 to 300 kgGWh) The author surmises that this is due to a combination of technological development and the discovery of previously unrecognised opportunities Unfortunately while this shift coincided with the introduction of the NOX charge the analysis does not provide any evidence of a causal link
As part of their analysis of the impacts of the French tax-subsidy scheme for NOX and sulphur dioxide (SO2) emissions Millock and Nauges (2006) estimate the impact of the emission taxes on a plants decision to install end-of pipe abatement equipment While the study is not concerned with innovation per se the results of this part can be interpreted as showing the impact of emission taxes on the diffusion of abatement equipment Under the scheme taxes were imposed on the emissions of these air pollutants (and VOCs) by all plants satisfying certain criteria The revenue raised by the taxes was earmarked for subsidising the cost of qualifying abatement technologies for technical studies (ie RampD) and for investment in air quality surveillance systems Using panel data for 226 plants in three industries (iron and steel coke and chemicals) for the period 1900ndash1998 the authors estimate a Probit model for the probability that a plant will install abatement equipment They find that the total value of emissions taxes paid by the plant (ie for both pollutants) has a positive impact on its decision to invest in abatement equipment However the magnitude of the effect varies considerably across the sectors and is only significant for the iron and steel sector
Frondel et al (2008) analyse responses to an OECD survey on environmental policy tools (conducted in 2003) to identify the factors that affect a firms decision to adopt an environmental management system (EMS) voluntarily and their environmental innovation behaviour Innovation is captured by a binary variable that indicates whether the firm has undertaken significant technical measures or changes to reduce the environmental impacts of
(25) Normalised energy efficiency patent values are calculated by dividing by the total number of patents granted This accounts for exogenous changes in patenting behaviour that affect all types of patents Popp constructs a value for existing knowledge as the stock of previously granted patents weighted by estimates that he derives for knowledge productivity He demonstrates that the exclusion of this variable from the model leads to biased estimates for the energy price coefficient
Environmental tax reform in Europe opportunities for eco-innovation
Review of literature on environmental tax reform and eco-innovation
20
production (26) The analysis is based on survey responses from 899 firms in Germany Latent variable equations for EMS adoption and innovation are estimated simultaneously with each equation including the same four sets of variables relating to motivations policy instruments pressure groups and facility characteristics (27) The policy instrument variables include five dummy variables indicating the importance of different types of policy instrument including market-based instruments such as emission taxes and tradable permits While the perceived stringency of environmental policy is found to be a significant factor in the decision to innovate there is no evidence that any of the individual policy instrument variables had any impact The authors surmise that this suggests that it is stringency of environmental policy rather than the choice of specific instrument that is important for innovation However as the authors note their results reflect the perceptions of the survey respondents and should therefore be treated as correlations rather than causal relationships
Johnstone and Hascic (2008) assess the impact of a range of environmental policy instruments mdash including tax measures and investment incentives mdash on innovation in the renewable energy field They analyse the impacts for five different groups of renewable energy technologies mdash wind solar ocean biomass and waste-to-energy mdash using a panel dataset of European Patent Office (EPO) patent filings for these technologies across 26 countries over the period 1978ndash2003 A fixed effects negative binomial model is estimated controlling for electricity prices and consumption public sector RampD expenditure (as a proxy for scientific capacity) and total EPO filings (as a proxy for differenceschanges in patenting propensity) The various policy instruments are represented by dummy variables indicating whether they were in place in a particular year As such the model takes no account of the stringency of the instruments mdash in particular the differing magnitudes of the tax measures and investment incentives (28)
Initially the authors estimate the model with all of the policy instruments included individually They find that while public policy plays an important role in inducing innovation the impacts of the individual instruments vary across the different technologies In particular tax measures are significant for wind and biomass technologies with investment incentives being significant for solar and waste-to-energy technologies and obligationstradable certificates being significant for wind technologies However the authors express concerns that there may be multicolinearity between the policy variables (particularly between investment incentives tax measures and tariffs) and also that there may be interaction effects between some of the variables Consequently they estimate two alternative versions of the model the first using a composite policy variable representing the number of policy instruments in place and the second using clusters of similar policy instruments (29) The results or these two models confirm the initial findings The composite policy variable is significant for all of the technology groups while the significance of the clusters varies across technologies The price-based cluster is (highly) significant for solar biomass and waste-to-energy The quantity-based cluster is significant for wind technologies The authors surmise that this may be due to the different economic characteristics of the technologies For example the significance of investment incentives for solar and waste-to-energy may reflect the capital intensity of these technologies with large up-front investment costs
De Vries and Medhi (2008) also use patent data to investigate the relative importance of environmental regulations and fuel prices on innovation in automotive emission-control technologies distinguishing between post-combustion devices and engine redesign technologies They estimate a panel data model using data from Germany Japan and USA over the period 1978ndash2001 controlling for industry value added (as a proxy for the scope of technological opportunities) and total patent
(26) The next question on the survey asks whether these are changes in production processes or end-of-pipe technologies However no distinction is made between these two types of innovation in the present study
(27) In order to avoid identification problems some individual variables are omitted from one equation or the other(28) This shortcoming is recognised by the authors who state that it is unavoidable in any cross-comparative analysis in which multiple
instruments are included(29) The clusters are price-based instruments (investment incentives tax measures and tariffs) quantity-based instruments (obligations
and tradable certificates) and voluntary programmes
Review of literature on environmental tax reform and eco-innovation
Environmental tax reform in Europe opportunities for eco-innovation 21
applications (as a proxy for differenceschanges in patenting propensity) Environmental regulation is represented by two dummy variables indicating the introduction of on-board diagnostic (OBD) regulations in USA (30) The results of the analysis suggest that the relative impacts of regulation and market forces differ between the two types of technology For post-combustion technologies both of the regulations are significant while fuel prices have no significant impact In contrast the opposite is the case for engine redesign technologies with fuel prices having a significant impact but regulation having no discernable effect While the analysis does not explicitly consider the impact of fuel taxes it suggests that an increase in automotive fuel taxes would have a major impact on innovation in relation to engine design The estimated coefficient for fuel prices (1287) implies that a USD 010 increase in fuel prices would induce a 14 increase in patenting activity (31)
Key findings of the empirical studies
The empirical studies considered above cover a range of different technology areas spanning energy efficiency (both product and process) renewable energy and air and water pollution abatement While in some cases they assess the impact of energy prices rather than environmental taxes per se they provide a clear picture of the likely impact of environmental and energy-related taxes on eco-innovation
Three of the studies assess the impact on diffusion of existing technologies All find that environmental taxesenergy prices have a positive impact on diffusion In particular the water effluent charges in The Netherlands appear to have had a major impact on the adoption of waste-water treatment equipment by the food and beverage industry in that country However there is some evidence to suggest that the effectiveness of taxesprices may vary across sectors (eg NOXSO2 abatement in France) and that investment incentivessubsidies may be more
effective in some cases (eg thermal insulation in USA)
Three of the studies use patent data to assess the impact of environmental taxes and energy prices on innovation with one of these also assessing the impact of investment incentives All find a significant positive impact although this depends on the particular sub-sector (eg renewable energy) or the type of innovation In particular the evidence from the automotive emissions control study suggests that taxesprices may be more effective in promoting process-related innovation (eg engine redesign) than innovation in end-of-pipe technologies One of the studies takes a different approach using a product-characteristics model to decompose improvements in the energy efficiency of consumer durables This finds that while electricity prices did not appear to affect overall technological change (ie shifts in the product costenergy efficiency frontier) they did have a positive impact on directional technological change (ie the slope of the frontier)
26 Case studies
Christiansen and Skjaerseth (2005) undertake a comparative analysis of the impacts of climate change policies on the petroleum sectors in Norway and the Netherlands during the 1990s These countries were selected because of their very different policy approaches with the Norwegian petroleum sector subject to a carbon dioxide (CO2) tax since 1991 as part of a portfolio of measures (32) and the Netherlands relying on a series of voluntary agreements on energy efficiency (33) Both approaches appear to have been effective in that CO2 emissions per unit production fell by around 22 between 1990 and 2001 in Norway while energy efficiency improved by around 35 in the Netherlands over the same period However there were marked differences between the two countries in terms of the nature of the innovation that
(30) Because of the international nature of the automotive industry and the importance of the US market regulations introduced in USA appear to have been an important driver for innovation by overseas manufacturers Regulations mandating the installation of OBD systems were first introduced in California in 1988 A more sophisticated system was mandated by the 1990 US Clean Air Act Amendments taking force in 1996
(31) The coefficient represents the semi-elasticity of patent applications with respect to fuel prices While the authors do not state so explicitly the implication is that prices are expressed in US dollars (they are obtained from the IEA Energy Prices and Taxes Database) Consequently the impact of a 10 US cent increase in the fuel prices is given by exp(1287 x 01) ndash 1 = 0137
(32) In addition to the tax the portfolio included publicly funded RampD support schemes gas flaring permits and mandatory environmental impact assessments
(33) The Dutch oil and gas industry first signed a declaration of intent with the government in 1995 This was translated into a long-term agreement (LTA) on energy efficiency in the following year with an improvement target of 20 over the period 1989ndash2000 In 2001 a new LTA was signed which committed firms to implementing energy efficiency measures with a positive NPV at a 15 discount rate or a five year payback period
Environmental tax reform in Europe opportunities for eco-innovation
Review of literature on environmental tax reform and eco-innovation
22
occurred In the Netherlands technological change was incremental reflecting a steady diffusion of available (ie known) technology In contrast the authors find evidence of more radical innovations and adaptations by the Norwegian petroleum sector including the development of energy-efficient gas turbines installation of waste heat recovery units process modifications and improved use of process heat While the authors acknowledge the impossibility of proving a causal link between policy intervention and innovation (in the context of their case study) they conclude that the CO2 tax played a key role in the development and implementation of these radical innovations and the benefits of reduced tax payments provided an important incentive However they also conclude that the impacts of the two instruments were conditioned by the political contexts in which they were applied and the problem characteristics in the respective countries (eg the economic significance of the sector and the size of installations)
Knigge and Goumlrlach (2005) summarise the findings of a comprehensive analysis of the impacts of the ETR in Germany That analysis undertaken jointly by Ecologic and the German Institute for Economic Research (DIW Berlin) included the impacts on innovation and market diffusion of environmentally friendly products and technologies (34) Based on a series of case studies the study concluded that the ETR had a noticeable effect on innovation and diffusion although it was not possible to quantify the scale of that effect In particular ETR is identified as being a central factor in the development of gas-powered vehicles The study identifies a number of different routes by which the ETR produced impacts First the payback period for energy-efficient products was reduced as a result of the energy tax increases and the various exemptions favouring efficient energy use and renewable energy sources Second the predictable nature of the energy taxes (as opposed to widely fluctuating oil prices) reduced uncertainties about the benefits of energy-efficiency investments Third the reduction in employers social contribution payments tended to reduce the costs of labour intensive innovation processes such as research and development energy consultancy and technology installation Finally the ETR had a signalling effect strengthening awareness of the need for more efficient and rational energy use
Mickwitz et al (2007) examine a number of claims that have been made in the environmental policy literature about the relationship between policy instruments and innovation based on experiences in two industrial sectors in Finland pulp and paper and the manufacture of diesel engines for ships In particular they assess the claims that environmental taxes are superior to other policy instruments with respect to innovation and that RampD subsidies have limited impacts on innovation With respect to the first claim the evidence provided by the two case studies is mixed The authors conclude that energy taxation had a negligible impact on innovation in the pulp and paper industry However this is likely to have been due to the low level of the tax and the exemptions that applied to the sector In contrast they find that the differentiation of Swedish fairway and port fees (on the basis of SO2 and NOX emissions) was a significant factor driving the installation of in-engine NOX reduction equipment in ferries operating between the two countries (35) With respect to RampD subsidies the authors conclude that the evidence does not support the claim that these have little effect In particular they find that RampD subsidies accelerated the development of ship engine emissions-reduction technologies
The findings of the three case studies are consistent with those of the empirical analyses reviewed in the previous section Environmental taxes and investment subsidies have proven significant in promoting both innovation and diffusion although not universally so Furthermore the case studies provide some useful insights about the ways in which the impacts occur and the factors that may be important in promoting innovation In particular they suggest the need for a tax rate that is sufficiently high to provide a meaningful incentive and signalling effect and that is fixed for a sufficiently long period of time to reduce uncertainty about the future benefits of investment
27 Conclusions
The studies reviewed in the preceding sections suggest that environmental regulation in general and price-based policy instruments such as environmental taxes and investment subsidies in particular can (in theory) and do (in practice) have a positive impact on both innovation and diffusion
(34) A separate report in German by Goumlrlach et al (2005) provides details of the evaluation of the innovation and diffusion impacts (35) Although the tax was introduced in Sweden it was also payable by Finnish ferry operators entering Swedish ports and hence
affected their investment decisions This is another example of the cross-border impact of environmental policy interventions on innovation found by Lanjouw and Mody (1996) (see Section 23)
Review of literature on environmental tax reform and eco-innovation
Environmental tax reform in Europe opportunities for eco-innovation 23
of environmental technologies However the supporting empirical and case study evidence is not universal and the effectiveness of these instruments would appear to vary across different sectors and different types of innovation
To a certain extent such differences can be explained by the theoretical models In particular the impact of environmental taxes (relative to other instruments) is predicted to depend on the competitive structures of the markets in which the regulated firms operate and on the ability of innovator firms to appropriate the benefits accruing to other firms during diffusion However a number of other potential factors have been identified in the literature which may affect the impact of price-based policy instruments on innovation
Jaffe et al (2002) caution that the impact of price-based policy instruments on technology diffusion may be adversely affected by a number of potential market failures including information failures principle-agent problems (eg landlord-tenant) capital market failures and positive adoption spillovers In addition while not market failures as such uncertainty over future returns and the (associated) use of high discount rates for investment decisions can also undermine the effectiveness of price-based instruments in stimulating diffusion However as was noted above the findings from the case study of ETR in Germany suggest that an environmental tax may actually reduce the level of uncertainty over future returns provided that it is of sufficient magnitude and longevity
Skjaerseth and Christiansen (2005) emphasise that the relationship between policy instruments (of all types) and technological change is extremely complicated They argue that account must be taken of the politicalindustrial context in which policy instruments are introduced and the nature of the environmental problem that they are intended to address In particular they make a distinction between malign problems where technological change involves net costs for target groups and benign problems where there are widespread no-regret opportunities for change Based on a comparative analysis of four different case studies they conclude that mandatory policy instruments (including environmental taxes) are more effective
in promoting short-term technological change when the problems are malign but that low legitimacy (with the target group) may undermine long-term technological change However when problems are benign or when long-term change requires cooperation voluntary policy instruments are likely to be more effective
Johnstone (2005) questions the focus of the theoretical and empirical analyses (reviewed above) on the impact of environmental policy instruments on the rate of technological change He argues that the direction of technological change is as important if not more so In addition to the quantity of innovation it is also important that innovation be socially optimal in the sense that it minimises the cost of attaining a particular environmental goal in the long term Inappropriate innovation today may result in lock in to a suboptimal technological path for the future
With this in mind Johnstone identifies a number of issues that can adversely affect the direction of innovation and should be taken into account when selecting and designing policy instruments technological market failures (36) missing markets for certain environmental attributes of innovation policy incidence and joint production of emissions Most studies of the innovation effects of environmental policy instruments assume that the only missing market is that for the environmental good (or bad) However in practice there may be other markets that are missing (or incomplete) which can adversely affect transmission of innovation incentives This is particularly so in the area of waste and resource management where instruments applied at the end of the product life cycle may have little or no impact on product design innovation Even if all markets are complete except for the environmental externality the point of incidence of the policy intervention may be more important for the direction of innovation than the choice of a particular policy instrument For example a limit or standard applied directly to the emissions of a pollutant may be more effective in promoting optimal innovation than a tax applied to a proxy input variable Finally when there is joint production of pollutants (eg CO2 and air pollutants from vehicle engines) there is a danger that if policy instruments (of whatever type) are applied to one pollutant in isolation the resulting innovation may
(36) These are the same market failures identified by Jaffe et al (2002)
Environmental tax reform in Europe opportunities for eco-innovation
Review of literature on environmental tax reform and eco-innovation
24
reduce emissions of that pollutant at the expense of increases in the others
In a related point Johnstone highlights the importance of using appropriate indicators when assessing the impact of policy instruments on innovation emphasising the need for these to reflect both the rate of innovation and the direction A necessary condition for this is that the indicators must provide an accurate and detailed picture of actual innovation Unfortunately this is difficult to achieve in practice For example the use of patent data as a measure of innovation requires the identification of relevant environmental technologies This is likely to be easier for end-of-pipe technologies than for process-related technologies meaning that the latter tend to be under-represented relative to their actual incidence To the extent that process-related innovation is growing in importance or is more important
for certain sectors or types of environmental problem changes in the value of the indicator may significantly understate the actual rate of innovation and misrepresent the direction
All of this suggests that caution should be exercised in drawing general definitive conclusions about the impacts of price-based policy instruments such as environmental taxes and investment subsidies on innovation particularly relative to other policy instruments While it would appear that they can be effective in stimulating both innovation and diffusion in many cases mdash at least in terms of the rate of technological change mdash there may be situations in which other policy instruments may be more appropriate In general the stringency and point of incidence of an environmental policy intervention may be more important than the choice of a particular policy instrument in determining the rate and direction of eco-innovation
25
Modelling of ETR impacts on eco-innovation
Environmental tax reform in Europe opportunities for eco-innovation
31 Scenarios assessing the implications of ETR for eco-innovation
Scenario analysis provides a useful means of improving understanding of how the different revenue recycling methods and various scales of ETR can help meet different greenhouse gas emissions targets
To investigate the impacts of an ETR for Europe the petre project elaborated a range of different scenarios reflecting various tax reform options In addition to employing several of these original scenarios the present study compiled two new scenarios to analyse the implications of ETR for eco-innovation All scenarios were examined in both E3ME and GINFORS (37)
311 Original petre project scenarios
The key petre scenarios relevant for the present study are
bull scenarioBHbaselinescenariowithhighenergyprice (reference case)
bull scenarioS1HETRdesignedtomeettheEUsunilateral 2020 GHG target (high energy price) with revenue recycling
bull scenarioS2HETRdesignedtomeettheEUsunilateral 2020 GHG target (high energy price) with revenue recycling and 10 of revenues spent on eco-innovation measures
Each of the ETR scenarios has the same key taxation components
bull acarbontaxrateisintroducedtoallnon-EUEmissions Trading System (EU ETS) sectors equal to the carbon price in the EU ETS that delivers an overall 20 reduction in greenhouse gas emissions by 2020 and in the international cooperation scenario this is extended to 30
bull aviationisincludedintheEUETSattheendofPhase 2
bull powergenerationsectorEUETSpermitsare100 auctioned in Phase 3 of the EU ETS
bull allotherEUETSpermitsare50auctionedin2013 increasing to 100 in 2020
bull materialtaxesareintroducedat5oftotalpricein 2010 increasing to 15 by 2020
In scenario S1H environmental tax revenues are recycled through reductions in income tax rates and social security contributions in each of the Member States such that there is no direct change in tax revenues In scenario S2H 10 of environmental tax revenues are recycled through spending on eco-innovation measures and the remaining 90 is recycled through the same measures as in the other scenarios The eco-innovation spending is split across power generation and housing according to tax revenues from the corporate and household sector
In GINFORS (the model used for analysing the implications of ETR and eco-innovation) the share of renewable sources in electricity production is increased due to the additional investment The rest of additional investment goes to household energy efficiency spending Investment needed for a certain increase in renewable energy production or efficiency improvement is based on Austrian and German experience (Lehr et al 2008 and 2009 Grossmann et al 2008 Lutz and Meyer 2008) This assumption is quite conservative as parameters for other countries can be assumed to be more positive (meaning that less money is needed for renewable energy technology installation or energy efficiency gains)
In scenario S1H the 20 GHG target translates into a 15 reduction in energy-related carbon emissions relative to 1990 as other emissions such as methane and nitrous oxide have already been reduced by
3 Modelling of ETR impacts on eco-innovation
(37) The E3ME and GINFORS models are introduced in Chapter 1 of the present report A detailed discussion of the models and scenarios used in the present study can be found in Ekins and Speck (2011)
Environmental tax reform in Europe opportunities for eco-innovation
Modelling of ETR impacts on eco-innovation
26
more than 20 (in terms of carbon equivalents) The target is reached by a tightened EU ETS cap and the introduction of a carbon tax on the non-ETS sector The tax rate applied is equal to the carbon price in the EU ETS that will deliver a 20 GHG reduction by 2020
The burden of ETR taxes are allotted to energy outputs (ie the final use of energy) and will be based on the carbon content of each fuel Carbon prices are assumed to be fully passed on to consumers All carbon taxes are in addition to any existing unilateral carbon and energy taxes The carbon reductions in the different EU Member States will be those that result from a uniform carbon tax increase across the EU
All of the revenues including EU ETS auctioning revenues carbon tax revenues and material tax revenues will be recycled The proportion of tax raised by industry will be recycled into a reduction in employers social security contributions which will in turn reduce the cost of labour Recycling will be additional to the existing ETRs in some Member States Revenues raised from households will be recycled through standard rate income tax reductions Traditional energy tax revenues will be lower compared to their respective baselines as the tax base (energy consumption) is reduced So for an ETR revenue-neutrality does not mean budget-neutrality
312 Factors affecting the macroeconomic impacts of RES technologies
Earlier analyses (Lehr et al 2008 Fraunhofer ISI et al 2009 DTI 2004 Kammen et al 2004 Moreno and Loacutepez 2007) have studied the impacts of large renewable energy source (RES) shares in the energy mix for different countries The overall question in these studies has been the impact of increasing RES shares on the economy especially on the labour market For the present study it is interesting to note that macroeconomic impacts of higher RES shares mainly depends on the following five factors
1 additional investment in RES (minus lower investment in conventional sources ie fossil and nuclear power) with the impact increasing if a country manufactures the RES technology in question
2 additional (net) exports due to improved international competitiveness of renewable energy sources (first mover advantage)
3 lower fossil fuel needs4 the cost differences between RES and
conventional energy
5 the shift from capital- and energy-intensive industries to labour- and technology-intensive industries
All five factors are driven by international energy prices carbon prices the policy framework and RES technology development itself Innovation comes into the play at various stages First innovation drives the currently positive additional costs of RES technologies down and even into negative realms depending on the fossil fuel scenario Second innovative RES technologies are likely to have a competitive advantage in international markets Although a significant proportion of RES technology produced in Europe is traded in Europe innovation will still provide an edge in current and emerging international markets
The EmployRES study (Fraunhofer ISI et al 2009) finds for Europe that current strong investment reflected in installations in Europe and exports to the rest of the world dominate the economic impact of RES policies and therefore lead to positive overall effects The studys results suggest that this positive balance can only be kept up in the future if the competitive position of European manufacturers of RES technology is improved The authors strongly recommend policies which promote technological innovation in RES and lead to a continued and rapid reduction of their costs
Factors 1 and 2 will have substantial macroeconomic impacts in the short and medium terms whereas factor 3 accumulates and will show positive impacts mainly in the long term Factor 4 strongly depends on the global developments while factor 5 may have significant effects on employment
313 Additional scenarios
Impacts of additional investment (factor 1) have already been analysed in scenario S2H of the petre project To focus on the other impacts of eco-innovation two additional scenarios were designed building on scenario S2H of petre
bull S2HEETRwithrevenuerecyclingdesignedto meet the unilateral EUs 2020 greenhouse gas (GHG) target (high energy price) Ten per cent of revenues are spent on eco-innovation measures and trade shares of EU-27 economies with the rest of the world in machinery and electrical machinery increase by 01 due to the deployment of the fast growing RES markets This assumption is based on the strong EU policy effort to increase the share of renewable energy in final energy consumption to 20 by 2020
Modelling of ETR impacts on eco-innovation
Environmental tax reform in Europe opportunities for eco-innovation 27
(Fraunhofer ISI et al 2009) and the possibility of very strong world market development of the RES sector until 2020 (EREC 2008) which offers additional export opportunities for European RES industries
bull S2HIETRwithrevenuerecyclingdesignedto meet the unilateral EUs 2020 GHG target (high energy price) Ten per cent of revenues are spent on eco-innovation measures and input structures of the energy sector are changed according to the input structure of the German RES industry (Lehr et al 2008)
S2HE looks at the possible role of international trade S2HI analyses changes in the input structure of the energy sector ie from conventional electricity production to renewables In the petre project (as in GHK et al 2007) only the energy inputs of the energy sector were adapted to changes in the energy input mix
Both S2HE and S2HI focus on RES and efficiency technologies As mentioned above an ETR will trigger a variety of innovations Therefore the results can be thought of as conservative in the sense that innovations (eg automotive energy consumption industrial efficiency etc) are not explicitly included
32 Overview of modelling results
The main results of the simulations are presented in Table 31 In the baseline scenario BH with high energy prices EU-27 carbon emissions will be
72 below the 1990 level in 2020 (38) The EU-15 has committed in the Kyoto Protocol to reduce its GHG emissions 8 below 1990 levels in the period 2008ndash2012 As emissions in the new member states are substantially below their 1990 levels today that implies that the EU-27 will keep its emissions more or less constant over the coming decade As in the PRIMES baseline an ETS price of 18 EURt in 2008 prices is assumed in 2020
In scenario S1H the ETS price and carbon tax rate has to be increased to 68 EUR2008t of CO2 to reach the 20 GHG reduction target which is equal to a 15 reduction of CO2 emissions against 1990 as other greenhouse gases have already been reduced above average by more than 20 in terms of CO2 equivalents Compared to the baseline CO2 emissions are 84 lower in 2020 which means roughly an additional 1 reduction annually in the period 2012ndash2020 GDP will be about 06 lower compared to the baseline in 2020 This means that annual average growth rates will be less than 01 below their baseline development This is especially low compared to the current financial and economic crisis with a GDP deviation against the baseline of around 6 in 2009
As the recycling mechanism reduces labour costs and the tax burden is shifted from labour-intensive to carbon- and material-intensive sectors employment will be 036 (or more than 800 000 jobs) higher than in the baseline The ETR is not fully budget neutral potentially enabling EU economies to slightly increase their net savings If
(38) The modelling exercise in the present study was conducted in 2009 and therefore does not contain the latest data on EU-27 GHG emissions which were significantly influenced by the global economic slump of the late-2000s
Table 31 Main results under the different scenarios
Scenario Target in 2020 CO2 price GDP Employment CO2 reduction
EUR2008t pc against baseline
pc against baseline
pc against 1990
pc against baseline
in year 2020 2015 2020 2020 2020 2020
BH 18 ndash 72 00
S1H 20 GHG 68 ndash 022 ndash 057 036 ndash 151 ndash 84
S2H 20 GHG 61 ndash 013 ndash 030 041 ndash 152 ndash 85
S2HE 20 GHG 61 ndash 009 ndash 004 051 ndash 151 ndash 84
S2HI 20 GHG 61 ndash 006 ndash 024 045 ndash 152 ndash 84
Environmental tax reform in Europe opportunities for eco-innovation
Modelling of ETR impacts on eco-innovation
28
this extra saving is spent negative GDP impacts will be further reduced
In scenario S2H part of the revenues is invested in low-carbon technologies This reduces the carbon price to 61 EUR2008t in 2020 halving the GDP loss relative to scenario S1H to only 03 as the investment in renewable energies is assumed to be additional Employment impacts are also more positive than in scenario S1H The 10 investment in low-carbon technologies amounts to more than EUR 20 billion in 2020
Assuming additional EU exports of RES technologies in scenario S2HE GDP almost matches the baseline in 2020 and employment is 051 (or more than 1 million jobs) higher than in the baseline In scenario S2HI a shift in the input structure of the energy sector towards machinery
and electrical machinery reflecting the different nature of RES relative to conventional electricity generation also has smaller additional positive impacts on GDP and employment compared to scenario S2H
The following figures show impacts of the different scenarios in comparison to the baseline BH As Figure 31 illustrates all the alternative scenarios imply GDP lower than the baseline However comparing scenario S1H with the other three scenarios shows that additional RES investment (S2H) additional RES exports (S2HE) and the inclusion of different input structures of the RES industries (S2HI) each have positive GDP impacts These results are in line with model-based analysis in the EMPLOY-RES study (Fraunhofer ISI et al 2009)
Figure 31 EU-27 GDP according to four scenarios mdash deviation from the baseline (BH)
Percentage deviation from the baseline (BH)
ndash 100
ndash 080
ndash 060
ndash 040
ndash 020
0002010 2015 2020
S2HI S1H S2H S2HE
Modelling of ETR impacts on eco-innovation
Environmental tax reform in Europe opportunities for eco-innovation 29
In contrast to GDP employment increases relative to the baseline in all the alternative scenarios (Figure 32) Due to the scenario design the structure of the EU economies is shifted from energy-intensive to labour-intensive sectors The magnitude of the employment gain is influenced by the carbon price and the tax shift the underlying energy prices and the production loss The largest part of the employment increase stems from the additional RES investment (scenario S2H) although a shift in industry structures (S2HI) and additional RES exports (S2HE) are also positive for the labour market
33 Macroeconomic impacts at the national level
In general terms it is clear that national ETS and ETR impacts depend significantly on country specifics including energy use economic structure social system and behaviour (eg reactions to labour cost changes) In countries with high carbon intensity in their energy mix additional revenues and expenditures are higher than in countries with lower carbon intensity
Scenario S2H provides an interesting tool for analysing the macroeconomic impacts of ETR at the national level because 10 of the additional generated revenues are used for eco-innovation investments meaning that only 90 of the revenues are recycled back into the economy by reducing income tax rates and social security contributions
Figure 32 EU-27 employment according to four scenarios mdash deviation from the baseline (BH)
ndash 020
000
020
040
060
2010 2015 2020
S2HI S1H S2H S2HE
Percentage deviation from the baseline (BH)
Environmental tax reform in Europe opportunities for eco-innovation
Modelling of ETR impacts on eco-innovation
30
Figure 34 GDP in 2020 in EU-27 Member States under scenario S2H mdash deviation form the baseline (BH)
Figure 33 GDP in 2020 in selected countries under scenario S2H mdash deviation from the baseline (BH)
ndash 25 ndash 20 ndash 15 ndash 10 ndash 05 00 05 10 15
Romania
Bulgaria
SloveniaMalta
Lithuania
Latvia
Estonia
CyprusSlovakia
Poland
Hungary
Czech RepublicUnited Kingdom
Sweden
Spain
Portugal
Netherlands
Italy
Ireland
Greece
FranceFinland
Denmark
Luxembourg
Belgium
Austria
Germany
Percentage deviation from the baseline (BH)
Russia
South Africa
Brazil
India
China
Mexico
Japan
USA
Poland
United Kingdom
Spain
Italy
France
Germany
ndash 30 ndash 25 ndash 20 ndash 15 ndash 10 ndash 05 00 05 10
Percentage deviation from the baseline (BH)
Modelling of ETR impacts on eco-innovation
Environmental tax reform in Europe opportunities for eco-innovation 31
Figure 35 Employment in 2020 in EU-27 Member States under scenario S2H mdash deviation from baseline (BH)
EU-27EU-15
RomaniaBulgariaSloveniaMalta
LithuaniaLatvia
EstoniaCyprusSlovakia
PolandHungary
Czech RepublicUnited Kingdom
SwedenSpain
PortugalNetherlands
ItalyIrelandGreece
FranceFinlandDenmarkLuxembourg
BelgiumAustria
Germany
ndash 200 0 200 400 600 800 1 000
Percentage deviation from the baseline (BH)
Under scenario S2H the GDP of large EU economies deviates from baseline projections by between 0 and ndash 1 with the exception of Italy (Figure 33) Germanys GDP is even forecast to match the baseline level in 2020 due to the countrys strong RES industry Outside Europe some countries gain slightly against EU Member States in terms of competitiveness as export prices in most EU Member States and sectors increase and GDP in those countries exceeds the baseline projections as a result (Figure 33) This is mainly because carbon tax revenues are recycled via income tax reductions which are not part of production costs However energy exporting economies such as Russia or South Africa will lose exports if EU demand for fossil fuel imports declines The development of all EU Member States is shown in Figure 34
Employment impacts of scenario S2H are positive for almost all EU Member States as lower labour
costs increase labour demand and labour intensity (Figure 35) The highest absolute increases are shown for Germany the Netherlands Italy and the United Kingdom For EU-27 as a whole employment will be almost one million higher than in the corresponding baseline BH in 2020
The scenarios have not been designed with a view to meeting the EU renewables target of a 20 renewables share in final energy consumption in 2020 Nevertheless the scenarios provide some interesting insights The share is projected to increase from around 10 in 2009 to above 14 even in the baseline as instruments such as feed in tariffs and biofuel quotas will continue In scenario S1H the target will be missed with around 18 in 2020 Only in scenarios S2H S2HE and S2HI is the target met (approximately 20 )
Environmental tax reform in Europe opportunities for eco-innovation
Modelling of ETR impacts on eco-innovation
32
Under scenario S2H energy-related carbon emissions are reduced in all EU Member States relative to the baseline (Figure 36) The highest percentage reductions can be seen in many of the EU-12 Member States with still high energy intensity and low energy prices In these countries the relative price increase is higher than in countries like Germany or the United Kingdom with already high energy taxes and overall energy prices
Additional ETS revenues material tax revenues and carbon tax revenues from the industry sector are recycled back to industry via reductions in employers social security contributions (or wage subsidies in some countries) The revenues from the carbon tax on households set out in Table 32 (totalling 033 of GDP in Germany for example) are used to reduce income tax For the EU-27 overall revenues from ETS and ETR reach about 2 of GDP in 2020 although these figures may be excessive because additional EU efforts to increase energy
efficiency and renewable energy which will reduce the ETS price are not taken into account The use of flexible tools such as the Clean Development Mechanism will further reduce the revenues and earmarking of part of the revenues for mitigation and adaptation measures in emerging and developing countries limits the recycling into labour costs
In addition the scenarios do not take the current global economic problems into account According to the IEA (2009) the downturn will also reduce carbon emissions in the long run which will lead to lower carbon prices and revenues to reach fixed targets (or make tighter targets less costly)
The ETR will have varying effects on the prices of different sorts of products and services Material or carbon taxes increase the prices of product groups according to their direct and indirect material and carbon content The recycling mechanism reduces
Figure 36 Energy-related CO2 emissions in 2020 under scenario S2H mdash deviation from the baseline (BH)
WorldEU-27
EU-15Romania
BulgariaSlovenia
MaltaLithuania
LatviaEstonia
CyprusSlovakia
PolandHungary
Czech RepublicUnited Kingdom
SwedenSpain
PortugalNetherlands
ItalyIreland
GreeceFrance
FinlandDenmark
LuxembourgBelgium
AustriaGermany
ndash 25 ndash 20 ndash 15 ndash 10 ndash 5 0
Percentage deviation from the baseline (BH)
Modelling of ETR impacts on eco-innovation
Environmental tax reform in Europe opportunities for eco-innovation 33
Table 32 Additional ETS and environmental tax revenues in 2020 ( of GPD)
S2H Germany United Kingdom EU-27
ETS revenues 083 064 059
Carbon tax (industry) 052 044 054
Carbon tax (households) 033 041 036
Material tax 041 029 056
Sum 209 178 205
Figure 37 Total primary energy supply in 2020 under scenario S2H mdash deviation from the baseline (BH)
WorldEU-27EU-15
RomaniaBulgaria
Slovenia
MaltaLithuania
LatviaEstonia
Cyprus
SlovakiaPoland
HungaryCzech Republic
United KingdomSweden
SpainPortugal
NetherlandsItaly
IrelandGreece
FranceFinland
DenmarkLuxembourg
BelgiumAustria
Germany
ndash 24 ndash 21 ndash 18 ndash 15 ndash 12 ndash 9 ndash 6 ndash 3 0
Percentage deviation from the baseline (BH)
Environmental tax reform in Europe opportunities for eco-innovation
Modelling of ETR impacts on eco-innovation
34
Figure 38 Output price impacts of scenario S2H in Germany in 2020 mdash deviations from the baseline (BH)
Figure 39 Impacts of scenario S2H on industrial output in 2020 in Germany mdash deviations from the baseline (BH)
ndash 5
0
5
10
15
20
Output prices
Percentage deviation from the baseline (BH)
(3) F
ood
(4) T
extiles
(5) W
ood
(6) P
ulp pap
er
(7) C
oke re
fined
petro
leum
pro
ducts
(8) C
hemica
ls ex
cl pha
rma
(9) P
harm
aceu
ticals
(10)
Rub
ber a
nd plastics
(11)
Non
-metallic
miner
als
(12)
Iron
and
steel
(13)
Non
-ferrou
s metals
(14)
Met
al pro
ducts
(15)
Mac
hine
ry and
equ
ipmen
t
(16)
Office
mac
hine
ry
(17)
Electric
al m
achine
ry
(18)
Rad
io T
V
(19)
Med
ical pr
ecisi
on and
opt
ical ins
trumen
ts
(20)
Mot
or veh
icles
(21)
Ships
(22)
Airc
raft
(23)
Railro
ad
(24)
Man
ufac
turin
g n
ec r
ecyc
ling
(25)
Electric
ity g
as w
ater
sup
ply
(26)
Con
stru
ction
(27)
Tra
de r
epairs
(28)
Hot
els an
d re
stau
rant
s
(29)
Tra
nspo
rt an
d stor
age
(30)
Pos
t and
teleco
mmun
icatio
ns
(31)
Finan
ce ins
uran
ce
(32)
Rea
l estate ac
tivities
(33)
Ren
ting
(34)
Com
puter
(35)
Res
earch an
d de
velopm
ent
(36)
Oth
er bus
ines
s ac
tivities
(37)
Pub
lic ser
vice
s
(38)
Edu
catio
n
(39)
Hea
lth and
soc
ial w
ork
(40)
Oth
er ser
vice
s
(41)
Priv
ate ho
useh
olds
(1) A
gricu
lture
(2) M
ining an
d qu
arry
ing
nec not elsewhere classified
Production
ndash 100
ndash 80
ndash 60
ndash 40
ndash 20
00
20
40
60
80Percentage deviation from the baseline (BH)
(3) F
ood
(4) T
extiles
(5) W
ood
(6) P
ulp pap
er
(7) C
oke re
fined
petro
leum
pro
ducts
(8) C
hemica
ls ex
cl pha
rma
(9) P
harm
aceu
ticals
(10)
Rub
ber a
nd plastics
(11)
Non
-metallic
miner
als
(12)
Iron
and
steel
(13)
Non
-ferrou
s metals
(14)
Met
al pro
ducts
(15)
Mac
hine
ry and
equ
ipmen
t
(16)
Office
mac
hine
ry
(17)
Electric
al m
achine
ry
(18)
Rad
io T
V
(19)
Med
ical pr
ecisi
on and
opt
ical ins
trumen
ts
(20)
Mot
or veh
icles
(21)
Ships
(22)
Airc
raft
(23)
Railro
ad
(24)
Man
ufac
turin
g n
ec r
ecyc
ling
(25)
Electric
ity g
as w
ater
sup
ply
(26)
Con
stru
ction
(27)
Tra
de r
epairs
(28)
Hot
els an
d re
stau
rant
s
(29)
Tra
nspo
rt an
d stor
age
(30)
Pos
t and
teleco
mmun
icatio
ns
(31)
Finan
ce ins
uran
ce
(32)
Rea
l estate ac
tivities
(33)
Ren
ting
(34)
Com
puter
(35)
Res
earch an
d de
velopm
ent
(36)
Oth
er bus
ines
s ac
tivities
(37)
Pub
lic ser
vice
s
(38)
Edu
catio
n
(39)
Hea
lth and
soc
ial w
ork
(40)
Oth
er ser
vice
s
(41)
Priv
ate ho
useh
olds
(1) A
gricu
lture
(2) M
ining an
d qu
arry
ing
nec not elsewhere classified
Modelling of ETR impacts on eco-innovation
Environmental tax reform in Europe opportunities for eco-innovation 35
social security contributions and lowers labour costs according to the direct and indirect labour content of sector output The ETR therefore reduces output prices in labour-intensive service sectors and increases prices in carbon- and material-intensive industry sectors
The example of Germany shows insignificant impacts in the trade-intensive sectors of machinery (15ndash17) motor vehicles (20) and other transport equipment (21ndash23) (Figure 38) Iron and steel (12) and chemicals without pharmaceuticals (8) face the highest price increases of trade-intensive sectors As the German iron and steel industry primarily delivers high quality steel to the German car industry and increasingly to the German windmill industry negative competitiveness impacts will be limited Exchange rate variations against non-EU competitors have been much higher in the past
The higher prices of carbon- and material-intensive products will reduce price competitiveness on export markets and increase the market share for imports in domestic markets This loss of price competitiveness is based on an assumption of limited market development of energy efficiency and RES technologies in other part of the world It will be offset by gains in labour-intensive sectors if the ETR causes real wage costs per unit of output to fall as a result of using recycled revenues to reduce employer social security contributions
Any improvement in non-price competitiveness will also raise exports The extra employment will raise incomes raising consumption and output
The overall impact on sector output depends on countervailing effects which are negative for iron and steel and a few service sectors and positive for a few industry sectors For most industries the output effect is insignificant (Figure 39) The greatest impact is felt by producers of fossil fuels who must obviously reduce production due to lower demand for their products
Under scenario S2H employment impacts are positive for most sectors relative to the baseline as labour productivity decreases and wage rates fall in relation to consumer prices (CPI) and output prices (Table 33) The relative costs of labour are lower than in the baseline without the ETR reform Only around a quarter of the employment increase takes place in industry
Concerning the wage rate two countervailing effects have to be considered First when the labour market is characterised in terms of the real wage bargaining model as in E3ME and GINFORS with market power on both sides (employers and trade unions) consumer price increases will lead to wage increases (the econometrically estimated factor is 085 for Germany) Second labour productivity is another important factor for wage bargaining The estimated elasticity for Germany is 063 meaning that a 1 increase of labour productivity leads to wage increases of 063 Higher labour demand due to lower labour costs thus reduces the wage increase In the end the German economy is more labour intensive than without the ETR partly due to the structural change towards labour-intensive industries
Table 33 Employment impacts of scenario S2H in Germany mdash deviations from scenario S2H in 2020
Employment in 2020 Deviation from S2H () Deviation from S2Habsolute (1 000s)
Agriculture forestry 24 90
Industry 09 653
Non-metallic minerals 24 62
Iron and steel ndash 28 ndash 37
Machinery and equipment 05 56
Electrical machinery 04 18
Construction 37 449
Trade and transport 10 829
Business services 17 767
Other services ndash 02 ndash 216
Total 07 2506
Environmental tax reform in Europe opportunities for eco-innovation
Modelling of ETR impacts on eco-innovation
36
Additional exports under scenario S2HE mainly create new jobs in machinery and related business services (Table 34) Under scenario S2HI a shift in the input structure of the energy sector leads to a shift in the industry structure and creates a few jobs in the service sector (Table 35)
34 Conclusions of the scenario assessment
The foregoing analysis used the GINFORS model to assess economic and environmental impacts of using the ETS and ETR to reach the EUs 2020
GHG targets In general the results show positive employment effects and only small negative impacts on GDP in EU-27 Member States The economic impacts depend on the levels of international energy prices the mechanism used to recycle revenues and country specifics such as carbon and energy intensity and the structure of energy consumption
Although there is significant evidence that eco-innovation is positively driven by higher energy prices quantification is difficult The present study included simulations of possible impacts of a shift in the industry structure towards renewable energy in the electricity sector and an overall increase of EU
Table 34 Employment impacts of scenario S2HE in 2020 in Germany mdash deviations from scenario S2H
Employment in 2020 Deviation from S2H () Deviation from S2Habsolute (1 000s)
Agriculture forestry ndash 01 ndash 02
Industry 03 194
Non-metallic minerals 02 05
Iron and steel 04 05
Machinery and equipment 13 130
Electrical machinery 24 117
Construction 01 18
Trade and transport 00 26
Business services 07 308
Other services 01 107
Total 02 634
Table 35 Employment impacts of scenario S2HI in 2020 in Germany mdash deviations from scenario S2H
Employment in 2020 Deviation from S2H () Deviation from S2Habsolute (1 000s)
Agriculture forestry ndash 01 ndash 02
Industry 00 00
Non-metallic minerals 25 65
Iron and steel ndash 27 ndash 36
Machinery and equipment 08 78
Electrical machinery 04 19
Construction ndash 00 ndash 04
Trade and transport 00 07
Business services 02 115
Other services 0 56
Total 00 167
Modelling of ETR impacts on eco-innovation
Environmental tax reform in Europe opportunities for eco-innovation 37
exports due to higher global demand for renewable energy The main results can be summarised as follows
bull environmentaltaxreformshiftingtaxesfromlabour to energy and resources will create additional jobs and trigger eco-innovation
bull impactsofeco-innovationintheformofadditional EU exports or shifts in industry structures will have a slight positive influence on GDP and create a smaller number of additional jobs
These findings correspond to results from the EmployRES study (Fraunhofer ISI et al 2009) As ETR is directly aimed at reducing labour costs it will create additional jobs in the short and medium term In the longer term the cost reduction and new technologies arising from eco-innovation will play a larger role
Like all fiscal reforms a major ETR in Europe will create winners and losers At the sector level carbon- and material-intensive industries will face economic losses At the country level the carbon-intensity and overall flexibility of economies is important Clearly structural change away from carbon-intensive industries together with technological change is inherent in any successful climate mitigation policy
On the other hand several factors can smooth these structural adjustments International cooperation
will reduce economic pressure on countries and sectors In addition ETR together with auctioning of ETS allowances can be a major source of revenues for EU Member States in the future even if part of the revenues will have to be earmarked for adaptation and mitigation measures in developing countries Indeed future debate on grandfathering or auctioning ETS allowances should reflect the important point that giving allowances away for free denies countries the money to ease structural change and invest in low-carbon technologies
Caution is needed in relating the findings of this study to the EU policy debate In the model simulations the single carbon price is the only instrument used to reach the EUs 2020 GHG targets In reality of course other renewable energy and efficiency policies will also contribute to carbon reduction and have to be taken into account when comparing the results (especially the high carbon prices) to other studies Both reduce the potential revenues from fossil energy carriers and carbon emissions
A variety of renewable energy and efficiency policies could enable the climate and energy targets to be met while securing even better economic prospects The results of the present study clearly indicate that the discussion on market-based instruments should be intensified Ultimately however the EU will need a rich mix of policies to reach its GHG targets while maximising prosperity
Environmental tax reform in Europe opportunities for eco-innovation38
References
Almon C 1991 The INFORUM Approach to Interindustry Modeling in Economic Systems Research Vol 3 pp 1ndash7
Amin A and Cohendet P 2004 The Architecture of Knowledge Firms Capabilities and Communities Oxford University Press Oxford
Barker T Meyer B Pollitt H and Lutz C 2007a Modelling Environmental Tax Reform in Germany and the United Kingdom with E3ME and GINFORS petre Working Paper Cambridge and Osnabrueck (httpwwwpetreorgukpapershtm) accessed 15 February 2011
Barker T Junankar S Pollitt H and Summerton P 2007b Carbon leakage from unilateral environmental tax reforms in Europe 1995ndash2005 Energy Policy Vol 35 pp 6 281ndash6 292
Brunnermeier S B and Cohen M A 2003 Determinants of environmental innovation in US manufacturing industries Journal of Environmental Economics and Management Vol 45 pp 278ndash293
Buen J 2006 Danish and Norwegian wind industry The relationship between policy instruments innovation and diffusion Energy Policy Vol 34 (18) pp 3 887ndash3 897
Carlsson B and Stankiewicz R 1991 On the nature function and composition of technological systems Journal of Evolutionary Economics Vol 1 (2) pp 93ndash118
Christiansen A C and Skjaerseth J B 2005 Climate change policies in Norway and the Netherlands Different instruments similar outcome Energy and Environment Vol 16(1) pp 1ndash25
Dosi G 1988 Sources procedures and microeconomic effects of innovation Journal of Economic Literature Vol 26 pp 1 120ndash1 171
de Vries F and Medhi N 2008 Environmental regulation and international innovation in automotive emissions control technologies in Environmental Policy Technological Innovation and Patents Organisation for Economic Cooperation and Development Paris
DG TREN 2008 European energy and transport mdash trends to 2030 mdash update 2007 European Commission Luxembourg
DTI 2004 Renewable Supply Chain Gap Analysis UK Department of Trade and Industry
Edler J (ed) 2006 Nachfrageorientierte Innovationspolitik Buumlro fuumlr Technikfolgenabschaumltzung beim Deutschen Bundestag (TAB) Arbeitsbericht Nr 99 Berlin
Edquist C 2001 The system of innovation approach and innovation policy an account of the state of the art lead paper presented at the DRUID Conference 12ndash15 June 2001 Aalborg (httpwwwdruiddkconferencesnwpaper1edquistpdf) accessed 15 February 2011
EEA 2006 Using the market for cost-effective environmental policy Market-based instruments in Europe EEA Report No 12006 European Environment Agency Copenhagen
Ekins P 2009 Resource Productivity Environmental tax Reform and Sustainable Growth in Europe published by the Anglo-German Foundation for the Study of Industrial Society Final report (httpwwwpetreorgukpdfFinRepFinpdf) accessed 12 October 2011
Ekins P and Speck S (eds) 2011 Environmental Tax Reform (ETR) A Policy for Green Growth Oxford University Press
EREC 2008 Energy [r]evolution A sustainable global energy outlook Greenpeace International European Renewable Energy Council (EREC)
References
References
Environmental tax reform in Europe opportunities for eco-innovation 39
Fagerberg J Mowery D C and Nelson R R (eds) 2005 The Oxford Handbook of Innovation Oxford University Press Oxford
Fischer C Parry I W H and Pizer W A 2003 Instrument choice for environmental protection when technological innovation is endogenous Journal of Environmental Economics and Management Vol 45 pp 523ndash545
Fraunhofer ISI ECOFYS Energy Economics Group Ruumltter + Partner SEURECO and LEI 2009 EmployRES mdash The impact of renewable energy policy on economic growth and employment in the European Union European Commission Brussels
Frondel M Horbach J and Rennings K 2008 What triggers environmental management and innovation Empirical evidence for Germany Ecological Economics Vol 66(1) pp 153ndash160
GHK Cambridge Econometrics and IEEP 2007 Links between the environment economy and jobs Final Report submitted to DG Environment European Commission
Giljum S Behrens A Hinterberger F Lutz C and Meyer B 2008 Modelling scenarios towards a sustainable use of natural resources in Europe Environmental Science and Policy Vol 11 pp 204ndash216
Goumlrlach B Knigge M and Luumlckge H 2005 Wirkungen der Oumlkologischen Steuerreform auf Innovation und Marktdurchdringung Ecologic Berlin (httpecologiceudownloadprojekte1850-189918791879_5_innovationpdf) accessed 18 August 2011
Green M A 2000 Photovoltaics technology overview Energy Policy Vol 28 (14) pp 989ndash998
Grossmann A Lehr U Lutz C and Wolter MI 2008 Gesamtwirtschaftliche Effekte der Umsetzung der EU Ziele im Bereich Erneuerbare Energien und Gebaumludeeffizienz in Oumlsterreich bis 2020 Studie im Auftrag des Lebensministeriums Wien 0508
Hage J and Hollingsworth J R 2000 Idea innovation networks a strategy for integrating organizational and institutional analysis Organization Studies Vol 21 (5) pp 971ndash1 004
Hauschildt J 2004 Innovationsmanagement Vahlen Muumlnchen
Hemmelskamp J 1997 Environmental policy instruments and their effects on innovation European Planning Studies Vol 5 (2) pp 177ndash195
Hoglund Isaksson L 2005 Abatement costs in response to the Swedish charge on nitrogen oxide emissions Journal of Environmental Economics and Management Vol 50 pp 102ndash120
Hullmann A 2001 Internationaler Wissenstransfer und technischer Wandel (dissertation) Physica-Verlag Heidelberg
IEA 2008 World Energy Outlook 2008 International Energy Agency Paris
IEA 2009 World Energy Outlook 2009 International Energy Agency Paris
Jacobsson S Andersson B A and Baringngens L 2002 Transforming the energy system mdash the evolution of the German technological system for solar cells Science and Technology Policy Research University of Sussex Electronic Working Paper Series No 84 (httpideasrepecorgpsrussewps84html) accessed 18 August 2011
Jaffe A and Stavins R 1995 Dynamic incentives of environmental regulations the effects of alternative policy instruments on technology diffusion Journal of Environmental Economics and Management Vol 29(3) pp 43ndash63
Jaffe A B and Palmer K 1997 Environmental regulation and innovation a panel data study The Review of Economics and Statistics Vol 79 pp 610ndash619
Jaffe A B Newell R G and Stavins R N 2002 Environmental policy and technological change Environmental and Resource Economics Vol 22 (1ndash2) 2002 pp 41ndash70
Johnstone N and Hascic I 2008 Renewable energy policies and technological innovation energy source and instrument choice in Environmental Policy Technological Innovation and PatentsOrganisation for Economic Co-operation and Development Paris
Johnstone N 2005 The Innovation Effects of Environmental Policy Instruments in Horbach J (ed) Indicator Systems for Sustainable Innovation Physica-Verlag HD
Environmental tax reform in Europe opportunities for eco-innovation
References
40
Johnstone N Hascic I and Ostertag K 2008 Environmental policy technological innovation and patent activity in Environmental Policy Technological Innovation and Patents Organisation for Economic Co-operation and Development Paris
Jung C Krutilla K and Boyd R 1996 Incentives for advanced pollution abatement technology at the industry level an evaluation of policy alternatives Journal of Environmental Economics and Management Vol 30(1) pp 95ndash111
Kammen D M Kapidia K and Fripp M 2004 Putting renewables to work how many jobs can the clean energy industry generate University of California Berkeley
Kemp R 1997 Environmental policy and technical change ndash a comparison of the technological impact of policy instruments Edward Elgar Cheltenham
Kemp R 1998 The diffusion of biological waste-water treatment plants in the Dutch food and beverage industry Environmental and Resource Economics Vol 12 pp 113ndash136
Kemp R 2000 Technology and environmental policy ndash innovation effects of past policies and suggestions for improvement in OECD proceedings ndash innovation and the environment Organisation for Economic Co-operation and Development Paris
Kerr S and Newell R G 2003 Policy-induced technology adoption evidence from the US lead phasedown Journal of Industrial Economics Vol 51 pp 317ndash343
Klaassen G Miketa A Larsen K and Sundqvist T 2005 The impact of RampD on innovation for wind energy in Denmark Germany and the United Kingdom Ecological Economics Vol 54 pp 227ndash240
Kline S and Rosenberg N 1986 An overview of innovation in Landau R (ed) The positive sum strategy Harnessing technology for economic growth pp 275-306
Knigge M and Goumlrlach B 2005 Effects of Germanys ecological tax reforms on the environment employment and technological innovation Ecologic Berlin (httpwwwumweltbundesamtdeuba-info-presse-ehintergrundoekosteuerpdf) accessed 18 August 2011
Langniss O 2003 Governance structures for promoting renewable energy sources dissertation Lund Stuttgart
Lanjouw J O and Mody A 1996 Innovation and the international diffusion of environmentally responsive technology Research Policy Vol 25 pp 549ndash571
Lehr U Nitsch J Kratzat M Lutz C and Edler D 2008 Renewable Energy and Employment in Germany Energy Policy Vol 36 pp 108ndash117 DOI101016jenpol200709004
Lehr U Wolter MI and Groszligmann A 2009 Economic impacts of RES obligations in Austria ndash an application of the macro-econometric model e3at GWS Discussion Paper 20091 Osnabruumlck
Lundvall B-A Johnson B Andersen E S and Dalum B 2001 National systems of production innovation and competence building Research Policy Vol 31 pp 213ndash231
Lutz C and Giljum S 2009 Global resource use in a business as usual world until 2030 Updated results from the GINFORS model in Bleischwitz R Welfens Pand Zhang Z (eds) Sustainable growth and resource productivity ndash economic and global policy issues Greenleaf Publishers pp 30ndash41
Lutz C and Meyer B 2008 Beschaumlftigungseffekte des Klimaschutzes in Deutschland Untersuchungen zu gesamtwirtschaftlichen Auswirkungen ausgewaumlhlter Maszlignahmen des Energie- und Klimapakets Forschungsbericht 205 46 434 Dessau-Roszliglau
Lutz C and Meyer B 2009a Environmental and Economic Effects of Post-Kyoto Carbon Regimes Results of Simulations with the Global Model GINFORS Energy Policy Vol 37 pp 1 758ndash1 766 DOI 101016jenpol200901015
Lutz C and Meyer B 2009b Scenario results from GINFORS PETRE working paper Osnabruumlck
Lutz C Meyer B Nathani C and Schleich J 2005 Endogenous technological change and emissions The case of the German steel industry Energy Policy Vol33 pp 1 143ndash1 154
Lutz C Meyer B Nathani C and Schleich J 2007 Endogenous innovation economy and environment impacts of a technology based modelling approach for energy-intensive industries in Germany Energy Studies Review Vol 15(1) pp 2ndash18
References
Environmental tax reform in Europe opportunities for eco-innovation 41
Lutz C Meyer B and Wolter M I 2009 The global multisectormulticountry 3-E model GINFORS mdash a description of the model and a baseline forecast for global energy demand and CO2 emissions Journal of Sustainable Development forthcoming
Malerba F and Orsenigo L 1997 Technological Regimes and Sectoral Patterns of Innovative Activities Industrial and Corporate Change Vol 6 (1) pp 83ndash117
Malerba F 1992 Learning by Firms and Incremental Technical Change The Economic Journal Vol 102 (413) pp 845ndash859
Malerba F 2005 Industrial dynamics and innovation progress and challenges Presidential Address delivered at the 32nd Conference of the European Association for Research in Industrial Economics (EARIE) 1ndash4 September 2005 Porto
Malerba F 2006 Innovation and the evolution of industries Journal of Evolutionary Economics Vol 16 pp 3ndash23
McGinty M and de Vries F P 2009 Technology diffusion product differentiation and environmental subsidies The BE Journal of Economic Analysis and Policy Vol 9(1)
Meyer B and Lutz C 2007 The GINFORS model ndash model overview and evaluation Petre Working Paper Osnabruumlck (httpwwwpetreorgukpapershtm) accessed 18 August 2011
Meyer B Lutz C Schnur P and Zika G 2007 Economic policy simulations with global interdependencies a sensitivity analysis for Germany Economic Systems Research Vol 19 pp 37ndash55
Mickwitz P H Hyvaumlttinen and P Kivimaa 2008 The role of policy instruments in the innovation and diffusion of environmentally friendlier technologies popular claims versus case study experiences Journal of Cleaner Production Vol 16(1S1) 162ndash170
Miketa A and Schrattenholzer L 2004 Experiments with a methodology to model the role of RampD expenditures in energy technology learning processes first results Energy Policy Vol 32 (15) pp 1 679ndash1 692
Milliman S R and Prince R 1989 Firm incentives to promote technological change in pollution control Journal of Environmental Economics and Management Vol 17 pp 247ndash265
Millock K and Nauges C 2006 Ex-post evaluation of an earmarked tax on air pollution Land Economics Vol 82(1) pp 68ndash84
Montero J-P 2002 Market structure and environmental innovation Journal of Applied Economics Vol 2 pp 293ndash325
Moreno B and Loacutepez A J 2007 The effect of renewable energy on employment mdash The case of Asturias (Spain) Renewable and Sustainable Energy Rewiews doi 101016jrser200610011
Mowery D and Rosenberg N 1979 The influence of market demand upon innovation A critical review of some recent empirical studies Research Policy Vol 8 pp 102ndash153
Newell R G Jaffe A B and Stavins R N 1999 The induced innovation hypothesis and energy-saving technological change Quarterly Journal of Economics Vol 114 pp 941ndash975
Norberg-Bohm V 1999 Stimulating green technological innovation An analysis of alternative policy mechanisms Policy Sciences Vol 32(1) pp 13ndash38
OECD 2009 Sustainable manufacturing and eco-innovation towards a green economy Organisation for Economic Co-operation and Development Policy Brief June 2009
OECD 2010 Taxation innovation and the environment Organisation for Economic Co-operation and Development
Pavitt K 1984 Sectoral patterns of technological change Towards a taxonomy and a theory Research Policy Vol 13 pp 343ndash373
Popp D 2002 Induced innovation and energy prices The American Economic Review Vol 92(1) pp 160ndash180
Popp D 2005 Lessons from patents Using patents to measure technological change in environmental models Ecological Economics Vol 54 pp 209ndash226
Environmental tax reform in Europe opportunities for eco-innovation
References
42
Porter M and van der Linde C 1995 Toward a new conception of the environment competitiveness relationship Journal of Economic Perspectives Vol 9(4) pp 97ndash118
Rammert W 2002 The cultural shaping of technologies and the politics of technodiversity In Sorensen K and Williams R (eds) Shaping technology guiding policy concepts spaces and tools Elgar Cheltenham pp 155-172
Requate T 2005 Dynamic incentives by environmental policy instruments ndash a survey Ecological Economics Vol 54 pp 175ndash195
Roloff N Lehr U Krewitt W Fuchs G Wassermann S Weimer-Jehle W and Schmidt B 2008 Success determinants for technological innovations in the energy sector mdash the case of photovoltaics in Moumlst D Fichtner W Ragwitz M and Veit D (eds) New methods for energy market modelling mdash Proceedings of the first european workshop on energy market modelling using agent-based computational economics Universitaumltsverlag Karlsruhe
Rothwell R 1995 The fifth generation innovation process in Oppenlaumlnder KH Popp W (eds) Innovationen und wirtschaftlicher Fortschritt betriebs-und volkswirtschaftliche Perspektiven Bern pp 9ndash26
Schumpeter J 1942 Capitalism socialism and democracy New York Harper
Skjaeligrseth J B and Christiansen A C 2005 Environmental policy instruments and technological change in the energy sector findings from comparative empirical research Energy and Environment Vol 17 (2) pp 223ndash241
Snyder L D Miller N H and Stavins R N 2003 The effects of environmental regulations on pollution emissions evidence from plant-level data American Economic Review Vol 93(2) pp 431ndash435
Technopolis 2008 Eco-innovation Final Report for Sectoral Innovation Watch (httpwwwtechnopolis-groupcomresourcesdownloads661_report_finalpdf) accessed 18 August 2011
Volleburgh H 2007 Impacts of environmental policy instruments on technological change Report for Joint Meetings of Tax and Environment Experts OECD Environment Directorate February 2007 (comenvepocctpacfa(2006)36final)
Zimmermann H Wohltmann M and Hansjuumlrgens B 1996 Umweltabgaben und Innovation Analytica Marburg
43
Annex 1
Environmental tax reform in Europe opportunities for eco-innovation
Type Instrument Area Stage
Reference
Theo
retica
l
Em
piric
al
Cas
e st
udy
Rev
iew
Qual
itat
ive
Taxe
s
Perm
its
Subsi
die
s
Volu
nta
ry
Com
man
d
Reg
ula
tion
Ener
gy
Air
Wat
er
Oth
er
Gen
eral
Innov
atio
n
Diffu
sion
Rel
evan
ce
Brunnermeier amp Cohen (2003)
X X X X
Buen (2006) X X X X X X
Christiansen amp Skjaerseth (2005)
X X X X X X
Fischer et al (2003 X X X X X X
Frondel et al (2008) X X X X X X X (X) (X)
Hemmelskamp (1997)
X X X X X X X (X)
Hoglund Isaksson (2005)
X X X (X) (X)
Jaffe amp Stavins (1995)
X X X1 X X X X
Jaffe amp Palmer (1997)
X X X X
Jaffe et al (2002) X X X X X X X X X X
Jung et al (1996) X X X X X X (X) (X)
Kemp (1998) X X X X
Kerr amp Newell (2001) X X X X X
Klaassen et al (2005)
X X X X X
Lanjouw amp Mody (1996)
X X X X X X X
McGinty amp de Vries (2009)
X X X X
Mickwitz et al (2008)
X X X X X X X X X
Milliman amp Prince (1989)
X X X X X X X
Millock amp Nauges (2006)
X X X X X X
Montero (2002) X X X X X
Newell et al (1999) X X1 X X X
Norberg-Bohm (1999)
X X X X X X X
Popp (2002) X X1 X X
Popp (2005) X X X X X X
Porter amp van der Linde (1995)
X X X X X X
Requate (2005) X X X X X X X
Skjaeligrseth amp Christiansen (2005)
X X X X X X X X X
Snyder et al (2003) X X X X X
Annex 1 Classification of refereed journal articles
Environmental tax reform in Europe opportunities for eco-innovation44
Annex 2
Type Instrument Area Stage
Reference
Theo
retica
l
Em
piric
al
Cas
e st
udy
Rev
iew
Qual
itat
ive
Taxe
s
Perm
its
Subsi
die
s
Volu
nta
ry
Com
man
d
Reg
ula
tion
Ener
gy
Air
Wat
er
Oth
er
Gen
eral
Innov
atio
n
Diffu
sion
Rel
evan
ce
Johnstone (2005)
X X X X X X X
Johnstone amp Hascic (2008)
X X X X X X X X
Kemp (1997) X X X X X X X X X X X X X
Kemp (2000) X X X X X X X X X
de Vries amp Medhi (2008)
X X1 X X X
Annex 2 Classification of books and book chapters
45
Annex 3
Environmental tax reform in Europe opportunities for eco-innovation
Type Instrument Area Stage
Reference
Theo
retica
l
Em
piric
al
Cas
e st
udy
Rev
iew
Qual
itat
ive
Taxe
s
Perm
its
Subsi
die
s
Volu
nta
ry
Com
man
d
Reg
ula
tion
Ener
gy
Air
Wat
er
Oth
er
Gen
eral
Innov
atio
n
Diffu
sion
Rel
evan
ce
Goumlrlach et al (2005)
X X X X X X
Knigge amp Goumlrlach (2005)
X X X X X X
Technopolis (2008)
X X X X X X
Volleburgh (2007)
X X X X X X X X X X X
Annex 3 Classification of reports
European Environment Agency
Environmental tax reform in Europe opportunities for eco-innovation
2011 mdash 45 pp mdash 21 x 297 cm
ISBN 978-92-9213-238-5doi10280084889
How to obtain EU publications
Publications for salebull viaEUBookshop(httpbookshopeuropaeu)bull fromyourbooksellerbyquotingthetitlethepublisherandorISBNnumberbull bycontactingoneofoursalesagentsdirectlyYoucanobtaintheircontactdetails
on the Internet (httpbookshopeuropaeu) or by sending a fax to +352 2929-42758
Free publicationsbull viaEUBookshop(httpbookshopeuropaeu)bull attheEuropeanCommissionsrepresentationsordelegationsYoucanobtain
their contact details on the Internet (httpeceuropaeu) or by sending a fax to +352 2929-42758
European Environment AgencyKongens Nytorv 61050 Copenhagen KDenmark
Tel +45 33 36 71 00Fax +45 33 36 71 99
Web eeaeuropaeuEnquiries eeaeuropaeuenquiries
TH
-AK-1
1-0
17-E
N-N
doi1
02
8008
4889
- Acknowledgements
- Executive summary
- 1Introduction
-
- 11Background
- 12ETR and innovation
- 13Report structure
-
- 2Review of literature on environmental tax reform and eco‑innovation
-
- 21Initial screening
- 22Detailed review
- 23Environmental regulation studies
- 24Theoretical studies
- 25Empirical studies
- 26Case studies
- 27Conclusions
-
- 3Modelling of ETR impacts on eco‑innovation
-
- 31Scenarios assessing the implications of ETR for eco-innovation
- 32Overview of modelling results
- 33Macroeconomic impacts at the national level
- 34Conclusions of the scenario assessment
-
- References
- Annex 1 Classification of refereed journal articles
- Annex 2Classification of books and book chapters
- Annex 3Classification of reports
-
Environmental tax reform in Europe opportunities for eco-innovation
Executive summary
6
of environmental regulations impacts on innovation suggest that greater regulatory stringency is associated with increased innovation although the effect appears small
The empirical studies and case studies reviewed provided more comprehensive evidence The empirical studies covering technology areas such as energy efficiency renewable energy and air and water pollution abatement revealed that environmental taxes and energy prices have a significant positive impact on both innovation and diffusion of existing technologies However the effects of taxes or prices may vary somewhat across sectors and innovation types The case studies likewise indicate that environmental taxes and investment subsidies have generally although not universally had a significant positive impact on innovation and diffusion
The literature also provides valuable insights on the impact of environmental taxes compared to other instruments and the conditions that can enhance or limit an ETRs impacts on innovation For example case studies focusing on the Netherlands and Germany highlighted the need for a tax rate that is sufficiently high to provide a meaningful incentive and signalling effect and that is fixed for a sufficiently long period of time to reduce uncertainty about the future benefits of investment
The theoretical studies reviewed indicate that the relative impacts of environmental taxes and other instruments on eco-innovation are far from clear cut They often depend on the competitive structures of the markets and the ability of innovator firms to appropriate the benefits accruing to other firms during diffusion Other factors also play a role however For example market failures such as information asymmetries principle-agent problems capital market failures and positive adoption spillovers can all influence technology diffusion Similarly uncertainty over future returns and the (associated) use of high discount rates for investment decisions can also undermine the effectiveness of price-based instruments in stimulating diffusion
Taken together the literature underscores the potential for environmental taxes to catalyse innovation At the same time it also highlights the complexity of the issues and the difficulties in making generalisations about the impacts of environmental taxes and alternative policy instruments The precise effects of environmental taxes and other measures on innovation are very specific to local realities and very much influenced
by the stringency and point of incidence of the policy intervention With this in mind some authors stress that any analysis of policy impacts on innovation must be very nuanced reflecting factors such as the direction type and duration of innovation Assessments of policy effectiveness require indicators that can convey an accurate and detailed picture of innovation in all its forms
Key findings of the scenario analysis
The modelling exercise builds on the findings of the petre project using the GINFORS model to assess economic and environmental impacts of using the EU Emissions Trading System (ETS) and ETR to reach the EUs 2020 GHG targets It evaluates the overall effects of a European ETR compared to a projected baseline and develops scenarios in which eco-innovation or renewable energy technologies are supported
The analysis employed three scenarios from the petre project Together these illuminate the macroeconomic impacts of implementing an ETR designed to meet the EUs 2020 GHG target with revenues recycled through reductions in income tax rates and social security contributions and through investment of 10 of revenues in eco-innovation measures
In addition the present study used two addition scenarios both based on the assumption that 10 of revenues are invested in eco-innovation The first examines the macroeconomic impacts in EU Member States arising from increased exports of renewable energy technologies which is a plausible scenario based on the strong EU policy effort to increase the share of renewable energy in final energy consumption and the possibility of very strong world market development in the sector until 2020 The second analyses the macroeconomic effects of changes in the input structure of the energy sector ie from conventional electricity production to renewables
Overall the analysis revealed that the modelled reforms delivered positive employment effects and only small negative impacts on GDP in the EU-27 Member States The economic impacts depend on the levels of international energy prices used in the scenarios the mechanism used to recycle revenues and country specifics such as carbon and energy intensity and the structure of energy consumption
At the EU level the basic ETR scenario mdash assuming that revenues are only recycled via reduced
Executive summary
Environmental tax reform in Europe opportunities for eco-innovation 7
income tax and social security contributions mdash results in EU GDP 057 below the baseline in 2020 The additional assumptions in each of the alternative scenarios (investing 10 of revenues in eco-innovation increased exports of renewable technologies and changes in energy sector inputs) each soften this negative impact on GDP
Whereas all the scenarios indicate a small negative impact on EU GDP relative to the baseline the impact on employment is positive in all scenarios The scenario design implies that the structure of the EU economy shifts from energy-intensive to labour-intensive sectors The magnitude of the employment gain is influenced by the carbon price and the tax shift the underlying energy prices and the production loss The largest part of the employment increase stems from the additional investment in eco-innovation although a shift in industry structures and additional renewable technology exports are also positive for the labour market As ETR is directly aimed at reducing labour costs it will create additional jobs in the short and medium term In the longer term the cost reduction and new technologies arising from eco-innovation will play a larger role
The results indicate that environmental tax reform can deliver environmental objectives create additional jobs and trigger eco-innovation while having negligible negative impacts on GDP These findings are particularly evident in the scenario assuming that 10 of revenues are invested in eco-innovation and EU exports of renewable technologies increase In that case EU GDP is just 004 below the baseline in 2020 and employment is 051 (or more than 1 million jobs) higher
Like all fiscal reforms a major ETR in Europe will create winners and losers At the sector level carbon- and material-intensive industries will face economic losses At the country level the carbon-intensity and overall flexibility of economies is important Clearly structural change away from carbon-intensive industries together with technological change is inherent in any successful climate mitigation policy However international cooperation and the revenues gathered through ETR and the EU ETS can help soften negative economic and social impacts
Caution is needed in relating the findings of this study to the EU policy debate In the model simulations the single carbon price is the only instrument used to reach the EUs 2020 GHG targets In reality of course other renewable energy and efficiency policies will also contribute to carbon reduction and have to be taken into account when comparing the results (especially the high carbon prices) to other studies Both reduce the potential revenues from fossil energy carriers and carbon emissions
A variety of renewable energy and efficiency policies could enable the climate and energy targets to be met while securing even better economic prospects The results of the present study clearly indicate that the discussion on market-based instruments should be intensified Ultimately however the EU will need a rich mix of policies to reach its GHG targets while maximising prosperity
Environmental tax reform in Europe opportunities for eco-innovation8
Introduction
11 Background
In 2005 the European Environment Agency (EEA) prepared a series of reports on the use of market-based instruments to achieve environmental goals Environmental tax reform mdash defined as reform of the national tax system where there is a shift of the burden of taxes for example on labour to environmentally damaging activities such as resource use or pollution mdash was identified as a key tool in this context (EEA 2006)
A central attraction of ETR is its capacity to steer incentives so that human endeavour and ingenuity can deliver maximum economic gains while preserving the environment and social equity To analyse this function further the Anglo-German Foundation (AGF) commissioned a major body of research in 2007 Creating sustainable growth in Europe One project in this context entitled Resource productivity environmental tax reform and sustainable growth in Europe (petre) started from the hypothesis that ETR could increase human well-being via two routes improving the environment and generating economic activity and employment The results of petre were presented in a final report (Ekins 2009) and in a book (Ekins and Speck 2011)
Petre used econometric and resource flow modelling techniques surveys and interviews to explore the implications mdash for Europe and the rest of the world mdash of a large-scale ETR in Europe designed to achieve the EUs 2020 greenhouse gas reduction targets ie cutting GHG emissions by 20 in the period 1990ndash2020 (or 30 in a context of global cooperation) In order to investigate whether ETR could deliver these targets six scenarios were developed and modelled using two well-known macro-econometric models E3ME and GINFORS (2)
The results suggested that ETR is an effective environmental instrument that can enable the EU to meet its CO2 targets The models produce nearly identical results concerning labour and resource productivity signalling that an ETR that meets the emissions target would raise employment lower resource consumption and have negligible effects on GDP
The petre project provided a compelling case for using ETR more widely but the findings also indicated scope to extend the analysis For example the results of one of the scenarios indicated that investment in green technologies in the EU could significantly reduce both the carbon price and GDP loss in reaching the 20 target Measures that could augment the net benefit of ETR are clearly worth exploring in more detail Similarly the petre project results also suggested that the varying national political economic institutional and cultural contexts across the EU-27 make introducing an ETR politically complex Again this suggested the need for additional analysis of ETRs social impacts to ensure that promising ideas can be translated into working policies
In view of these findings the EEA decided to commission a two-part study to analyse the issues in more detail The first part focuses on links between ETR and eco-innovation and green technologies The second addresses ETRs implications for the distribution of incomes across society
Both of these issues are of course essential determinants of an ETRs potential contribution to sustainable growth and the shift to a green economy Eco-innovation is an indispensible element in enhancing resource efficiency ie delivering greater economic outputs and wellbeing at lower environmental impacts Meanwhile distributional
1 Introduction
(2) See for more information with regard to the modelling framework the papers presented and to be downloaded at the website of the project (wwwpetreorguk) or Ekins and Speck (2011) and in particular Chapter 8 thereof
Introduction
Environmental tax reform in Europe opportunities for eco-innovation 9
impacts are central to an ETRs political acceptability and social equity mdash another essential aspect of sustainability Any serious attempts to design ETRs must therefore include a focus on eco-innovation and distributional impacts The present two-part study aims to contribute to the knowledge base for that analysis
12 ETR and innovation
Innovation is a key determinant of domestic and international competitiveness and a vital engine for generating economic growth and highly skilled jobs It also plays a central role in facilitating the shift to a green economy enabling countries to decouple economic growth from resource use and environmental impacts
Innovations contribution to solving urgent economic and social problems is being discussed more now than ever before in Europe This growing interest partly reflects a concern that some European countries may be falling behind other industrialised nations both in developing and applying new solutions in introducing modern management production and working practices and in opening up global markets Only with greater ability to innovate coupled with competence and willingness to be creative can structural economic change be catalysed enabling faster growth and creating new jobs
The interest in innovation also reflects a recognition that even the most urgent of todays environmental problems are far from being solved Innovation that specifically addresses environmental problems is needed to ensure long-term sustainable development Basic innovation should be stimulated opening up more environmentally sound development paths for products and technologies
Of course research must focus not only on technology but on the necessary framework conditions to bring about environmental innovation Policy of all sorts mdash not least environmental policy mdash can promote or restrict innovation It is perhaps surprising therefore that there has been limited focus on the interplay between environmental policy and innovation theory
In view of its huge importance there is clear value in analysing how policy instruments affect innovation
13 Report structure
The present report brings together two approaches to examining eco-innovation
Chapter 2 comprises a literature review It looks briefly at definitions of innovation and the factors driving innovation in the economy and describes the methodology used to identify relevant literature It then provides a more detailed review of four groups of studies
bull assessmentsenvironmentalregulationsimpactson innovation
bull theoreticalanalysesofhowdifferentpolicyinstruments influence innovation
bull empiricalstudiesusingstatisticalandeconometric techniques to assess the impacts of actual policy interventions
bull casestudiesprovidingdescriptiveassessmentsofactual experiences
Chapter 3 presents a modelling exercise based on scenarios in which ETR revenues are used to foster innovation The modelling builds on the petre project evaluating the overall effects of a European ETR compared to a baseline development and goes on to examine scenarios to support eco-innovation or renewable energy technologies
Environmental tax reform in Europe opportunities for eco-innovation10
Review of literature on environmental tax reform and eco-innovation
There is a relatively large and growing literature mdash both theoretical and empirical mdash on the relationship between environmental policy interventions and technological innovation While this covers a wide range of policy instruments (ie command and control regulations environmental taxes permit trading schemes and voluntary agreements) only one of the identified references explicitly considers the impacts of an environmental tax reform (ETR) programme Consequently the present literature review focused on studies that assess the impacts of environmental taxes (and in some cases factor prices) on innovation However in order to provide some context the impacts of environmental regulation more generally were also considered
The literature review employed a two-step methodology In the first step potential references were identified and screened to determine their relevance and to classify them according to four relevant criteria In the second step those references identified as having significant relevance were reviewed in detail to distil the key conclusions regarding ETRs potential implications for eco-innovation
Before proceeding it is worth clarifying what is meant by innovation in general and by eco-innovation in particular Following Schumpeter (1942) the process of technological change is typically broken down into the following three stages (3)
bull invention mdash the first development of a scientifically or technically new product or process
bull innovation mdash the commercialisation of the new product or process
bull diffusion mdash the adoption of the product or process by firms and individuals
The first two stages are closely related although not all inventions will make it through to commercialisation They typically both occur in private companies in a process that can broadly be termed research and development (RampD)
When considering the impacts of environmental policy interventions it is important to be clear which stage of the technological development process one is considering as different instruments may be more or less effective for different stages Many studies explicitly identify the technological development stage to which they relate For those that do not it is sometimes possible to infer the stage from the context or characteristics of the study (eg the measure of innovation that is used) However some studies refer only to investment in technology and it is not clear whether this means investing in the development of new products or production processes (ie invention and innovation) or purchasing new plant and equipment from other companies (ie diffusion)
The term eco-innovation is taken to mean technological development that generates products equipment or production processes that reduce environmental risk or minimise pollution and resource use As such the term encompasses all three stages of the technological development process invention innovation and diffusion
A range of different indicators can be used to measure innovation Essentially these indicators fall into three groups those that measure the inputs (or resources) devoted to the innovation process those that measure the outputs from the process and those that focus on the economic impacts of the innovations that are generated (Johnstone et al 2008)
2 Review of literature on environmental tax reform and eco-innovation
(3) Some authors break down the innovation stage into two the application of inventions in demonstration projects the development of niche applications and markets (eg Christiansen and Skjaerseth 2005)
Review of literature on environmental tax reform and eco-innovation
Environmental tax reform in Europe opportunities for eco-innovation 11
The most common input indicator is RampD expenditure but it has several shortcomings While public sector RampD expenditure data is generally available private sector data are incomplete and usually only available at the aggregate level making it difficult (or impossible) to identify environment-related RampD expenditure Furthermore given the inherent uncertainty of the innovation process the link between effort and resulting outputs is often very weak
As a result output indicators such as patent applications are likely to provide a better method to measure eco-innovation Patent application data provide a reasonably comprehensive picture of innovative outputs (4) they are based on objective standards that change slowly and they are readily available Their main advantage however is the fact that patent applications are classified into detailed technologies using the International Patent Classification (IPC) system developed by the World Intellectual Property Organisation This allows environment-related patents to be identified and broken down between different application areas such as climate change air pollution water pollution and waste management
Impact indicators (also termed progress indicators) are more relevant to the diffusion stage and include increases in market penetration of particular eco-technologies and reductions in (marginal) abatement costs (5) However it should be noted that cost reductions can be driven by a range of factors and may not necessarily imply that innovation has occurred
21 Initial screening
Potential references were identified based on a review of journal citations internet searches using keywords and recommendations from within the project team The references fall into three broad groups
bull refereedjournalarticlesbull booksandbookchaptersbull reportsbyconsultantsandexperts
In total 37 potential references were identified the majority (28) being refereed journal articles The references were then classified according to four criteria type of study policy instrument(s) covered policy area and technological development stage On the basis of this classification each reference was then assessed in terms of its relevance
Types of study
A distinction is made between five different types of study
bull Theoretical studies use mathematical models to assess the impacts of idealised policy instruments on firms innovative behaviour under alternative assumptions about market structure and different parameter values In most cases the studies consider several alternative instruments and are interested in the relative ranking of the instruments either in terms of the amount of innovation that they induce or in terms of the resulting levels of social welfare
bull Empirical studies use a range of statistical and econometric techniques to analyse quantitative performance data in order to assess the impacts of actual policy interventions Given the relative scarcity of environmental taxes in the past there are few direct empirical studies focusing on them However a number of studies consider the impacts of changes in energy prices which give an indirect indication of the potential impact of taxation
bull Reviews summarise or compare the findings of previous studies (either theoretical or empirical) and may synthesise them to draw wider conclusions
bull Case studies provide descriptive assessments of actual experiences often comparing across countries
bull Qualitative studies consider some of the issues that can affect the performance of a particular policy instrument in practice
Together these last two types of study can provide valuable insights on the practical and political economy aspects of instrument performance to supplement the theoretical and empirical analyses
(4) While a patent may prevent rival firms from using an innovation (without paying royalties) it has the disadvantage of putting it into the public domain In some cases firms may prefer to keep the innovation secret rather than apply for patent protection
(5) More precisely the indicator of abatement is a shift in the abatement cost curves which reduces the cost of a fixed amount of abatement Reductions in abatement costs due to movements along the cost curve (ie due to changes in the level of abatement) do not provide an indicator of innovation
Environmental tax reform in Europe opportunities for eco-innovation
Review of literature on environmental tax reform and eco-innovation
12
Policy instrument addressed
The second classification criterion concerns the policy instruments that are addressed by the study with a distinction being made between five specific instrument types
The first three are market-based or price-based instruments environmental taxes and charges tradable permits and investment subsidies and tax allowances All three act by changing the prices of input factors in one way or another As has been noted above some studies consider the impact of energy prices rather than energy taxes However since the findings of these studies are directly transferable they are classified under the tax heading
The fourth instrument type is voluntary or negotiated agreements under which firms or sectors enter into agreements with government to achieve certain performance targets or undertake specific actions
The fifth type is command and control regulations which encompass technology mandates emission limits and performance standards (eg for specific energy consumption)
The final classification regulation is used for studies that consider the weight or stringency of environmental regulation in general rather than a specific policy instrument
Policy area addressed
With regard to the policy area(s) covered by the studies a distinction is made between five areas including energy and climate change air pollution water pollution and other
The final classification general is used for studies that consider the impacts of environmental regulation in general rather than any specific intervention or where the policy area is not specified (eg in theoretical analyses)
Stage of technological development
The final classification criterion concerns the stage of the technological development process that is addressed by the study As has been noted above the process is typically divided into three stages invention innovation and diffusion In practice however the studies do not distinguish between the first two stages (often just referring generically to RampD) They have therefore been combined for the purposes of the classification so that the only distinction is between the innovation and diffusion stages
Results of the classification exercise
Subsequent to classifying the studies each was scored in terms of its relevance to analysing ETRs impacts on eco-innovation A three tier qualitative scoring system was used One star () indicates that the study is of only minor relevance two stars () indicates that it is of moderate relevance and three stars () that it is of significant relevance Such a scoring system is inevitably subjective but it provides a pragmatic mechanism for identifying the key references to be included in the detailed review In determining the scores particular emphasis was placed on whether the study is empirical in nature and whether it considers environmental taxes (or factor prices)
Annex 1 shows the classifications of the 28 journal articles that were identified Thirteen are empirical seven are theoretical three are case studies and four are qualitative while four provide reviews of previous work in the area (including most of the identified studies) (6) Around two-thirds of the papers consider the impact of environmental taxes (or energy prices) often comparing these with the impacts of other policy instruments Eleven consider the impact of investment subsidies
Most of the theoretical analyses are not area-specific (only discussing environmental damage in general terms) The empirical studies are spread fairly evenly across policy areas with five addressing
(6) Some studies are classified under more than one heading For example a study may contain both a theoretical model of behaviour and an empirical assessment of the model
Review of literature on environmental tax reform and eco-innovation
Environmental tax reform in Europe opportunities for eco-innovation 13
energy and climate change five addressing air pollution and three addressing water pollution In terms of the stage of the technological development process there is an even split between innovation and diffusion with many of the papers covering both stages In total eighteen of the references are included in the detailed review
Annex 2 shows the classifications of the five book chapters and Annex 3 covers the four reports (7) As might be expected these sources put less emphasis on theory with only one reference including any formal analysis They are split fairly evenly between empirical studies reviews and qualitative assessments All but one consider the impact of environmental taxes or energy prices while seven consider the impact of investment subsidies As with the journal articles there is a fairly even spread across policy areas and between innovation and diffusion Five of the references are included in the detailed review
22 Detailed review
The detailed review focuses on the impacts on eco-innovation of the two price-based policy instruments that are directly relevant to ETR environmental taxes and investment subsidies and tax incentives (eg RampD and capital allowances) (8) A priori each instrument might be expected to stimulate innovation mdash the first by increasing the benefits of innovation by reducing tax payments the second by reducing the costs of developing and adopting new technologies However in order to provide a broader context for the impacts of these two instruments the review starts by considering the relationship between innovation and the stringency of environmental regulation in general
As can be seen from the initial screening (see Annexes 1ndash3) the large majority of studies consider more than one policy instrument within a unified analytical framework mdash either comparing their relative impacts or assessing the impacts of instrument combinations (or packages)
In particular all but one of the papers that assess the impacts of investment subsidies either theoretically or empirically also assess the impacts environmental taxes (and sometimes other policy instruments) Consequently for the purposes of this review it is convenient to consider the impacts of taxes and subsidies at the same time rather than sequentially In addition to avoiding the need for any repetition (about model structures assumptions etc) this facilitates identification of potential interactions and synergies between the two instruments
Apart from Section 23 on the impact of environmental regulation in general only those references identified as being of significant relevance () in the initial screening are included in the review References are summarised in chronological order under three headings theoretical predictions (Section 24) empirical evidence (Section 25) and case studies (Section 26) At the end of each section an attempt is made to synthesise the findings of the studies but the scope of the present review did not allow for critical analysis of the studies to identify their respective strengths and weaknesses or to resolve any apparent conflicts between their findings
23 Environmental regulation studies
Lanjouw and Mody (1996) use aggregate pollution and control expenditure (PACE) data as a proxy for the stringency of environmental regulation and compare this with data on the aggregate number of environmental patent applications for Germany Japan and USA They do not perform any formal statistical or econometric analysis of the data However based on simple graphical analysis they identify a relatively clear correlation between expenditure and patents over the 1970s and 1980s with a time lag of one to two years They also find some indications in the data that patenting in one country also responds to increasing stringency of environmental regulation in the other two In addition they consider the diffusion of environmental technologies by looking at trade
(7) Two of the reports emanate from the study by Ecologic and DIW of ETR in Germany Details of the assessment of the impact on innovation and market diffusion are provided (in German) in Goumlrlach et al (2005) with a summary (in English) in Knigge and Goumlrlach (2005)
(8) While the large majority of revenues raised under an ETR are likely to be used to reduce taxes on labour a small proportion may be used to encourage innovation or promote the take-up of environmentally friendly technologies
Environmental tax reform in Europe opportunities for eco-innovation
Review of literature on environmental tax reform and eco-innovation
14
flows in capital goods used for pollution reduction and find that these too show a correlation with total abatement expenditure
Jaffe and Palmer (1997) also use PACE data as a proxy for the stringency of environmental regulation and evaluate its impact on two different measures of innovation total private expenditures on RampD and the number of successful patent applications by US manufacturing industries Unlike the previous study they undertake formal econometric analysis of the data using panel data at the two-digit and three-digit SIC code industry level for the period 1978ndash1991 and a fixed effects model They find a statistically significant positive relationship between compliance expenditures (capital expenditures only) and RampD expenditures after controlling for industry-specific effects (9) However they can find no significant impact on patenting activity This is not entirely surprising given the fact that their data is for all types of patents not just those relating to environmental technologies and products Indeed given that the same is true for the RampD expenditure data it may be more surprising that they find a significant relationship between pollution compliance and RampD
Brunnermeier and Cohen (2003) also use a panel data model to assess the impact of pollution abatement expenditures on patenting activity by US manufacturing industries However unlike the previous study they use only environmental patent applications in their analysis They also control for other potential explanatory factors such as the stringency of monitoring and enforcement (as measured by number of inspection visits) industry size (value of shipments) market structure (four-firm concentration ratio) capital intensity and exposure to overseas competition (export intensity) They estimate four different models for the period 1983ndash1992 with their preferred model being a negative binomial random effects model The coefficient for PACE is positive and statistically significant (in all four models) as are the coefficients (in the preferred model) for industry size concentration and export intensity However the magnitude of the coefficient (which represents
the semi-elasticity of patents with respect to PACE) is only 00004 Thus ceteris paribus an increase in abatement expenditure of USD 100 million results in an increase in the mean number of patents of only 4
Key findings of the environmental regulation studies
All three environmental regulation studies use PACE data as a proxy for the stringency of environmental regulation (10) While there are obvious pragmatic reasons for doing this (ie availability of data) the validity of the approach may be open to question As Brunnermeier and Cohen (2003) note expenditure may be affected by factors other than environmental regulation such as external pressures from interest groups or a desire to promote or maintain green credentials with customers Furthermore the reported data may not cover all pollution abatement costs and activities (particularly process-related activities) and may be prone to over-statement by reporting firms for strategic reasons However to the extent that the reported PACE data is correlated with the stringency of environmental regulation the analyses suggest that the latter does have an impact on innovation (at least in USA) although the scale of the impact appears to be small
24 Theoretical studies
Although several previous studies has analysed the impact of different environmental policy instruments on technological change Milliman and Prince (1989) were the first to consider the entire process of technological change encompassing innovation diffusion and optimal agency response (11) Using a relatively simple graphical analysis of shifting marginal abatement cost curves they deduce a relative ranking of five instruments (direct controls auctioned permits freely allocated permits emission reduction subsidies (12) and emission taxes) in terms of firms incentives to promote technological change They conclude that emission taxes provide greater incentives for innovation and diffusion than direct controls or
(9) When they allow the slopes of the PACE variable to vary across industries (in addition to the intercept) they find considerable variation in the estimated coefficients across industries with several being negative
(10) However the studies do not all use the same definition of PACE Lanjouw and Mody (1996) include (real) investment expenditures regulation and monitoring costs and research and development by all levels of government private manufacturing and non-manufacturing firms The other two studies both use compliance cost data for private manufacturing firms (at the industry level) only However while Jaffe and Palmer (1997) use capital cost data in their analysis Brunnermeier and Cohen (2003) use operating cost data
(11) Milliman and Prince (1989) identify a number of studies going back to 1970(12) These are payments for emission reductions not technology subsidies for environmental investments
Review of literature on environmental tax reform and eco-innovation
Environmental tax reform in Europe opportunities for eco-innovation 15
freely allocated tradable permits although not as great as auctioned permits However the optimal agency response is likely to face less opposition (and in some cases actually be favoured) under emission taxes than under auctioned permits (13)
Jaffe and Stavins (1995) develop a theoretical framework for comparing empirically the impacts of alternative policy instruments on the diffusion of a new technology (14) They model the investment decision for both an existing firm and a new entrant in each case assuming that over time the firm minimises the present value of its cost streams (operating costs investment cost net of any government subsidy emission taxes and the implicit costs of violating either a performance or technology standard if applicable) For an existing firm the problem is to choose the optimal timing of the retrofit and the authors show that the new technology will be adopted at a particular time if operating cost savings plus savings from reduced emission tax payments (plus any avoided penalties for not adopting a technology standard or exceeding a performance standard) in that period are greater than the net investment costs less the time rate of change of net investment costs For a new entrant the problem is to choose whether to use the new technology at start-up A necessary condition for doing so is that the present value of operating costs savings and reduced tax payments (plus any avoided penalties) over the entire time horizon is greater than the net investment cost Thus while the conditions differ in each case the introduction of either an emissions tax or an investment subsidy (or increases in the respective values) changes the benefit-cost balance in favour of the new technology bringing forward its adoption by existing firms and increasing the likelihood of adoption by new entrants
Kemp (1997) compares the abatement RampD expenditure levels of an individual firm under direct regulation (ie an emissions limit) an equivalent emission tax (15) and freely allocated tradable permits using a cost minimisation analytical framework and a specific functional form for the abatement cost function He shows that both the
level of RampD expenditure and the level of emissions reduction increase as the emissions tax rate increases and that both are greater under the tax than under direct regulation The corresponding levels under the tradable permit regime will be greater under the emissions tax if the (exogenous) permit price is higher than the tax rate and vice versa Kemp also considers the impact of subsidising the cost of the firms RampD effort and shows that increasing the subsidy rate causes a rise in pollution-control RampD More interestingly the impact of the subsidy is greater if it is combined with an emissions tax than with an equivalent emissions limit
Fischer et al (2003) develop the approach used by Milliman and Prince (1989) although their analysis differs in that it does not include the final agency response stage and the diffusion of the technology is determined by market forces with an equilibrium royalty price (16) They compare an emissions tax with auctioned and freely allocated permits using a three-stage model of innovation diffusion and emissions abatement In the first stage the innovating firm decides how much to invest in RampD to develop an emissions abatement technology In the second stage other firms decide whether to adopt this technology in return for a royalty fee or whether to use an (imperfect) imitation technology In the final stage all firms choose their level of abatement to minimise costs given an emissions tax or permit price They show that the level of innovation (ie the level of RampD chosen by the innovating firm) is determined by equating the marginal cost of innovation with the marginal (private) benefit The latter has four components mdash an abatement cost effect an emissions payment effect an imitation effect and an adoption price effect mdash and the last two components are negative (17) Using this model the authors demonstrate that freely allocated permits provide the lowest incentive for innovation However in contrast to Milliman and Prince they conclude that the relative ranking of the emissions tax and auctioned permits is ambiguous It depends crucially on the extent to which the technology can be imitated and hence the extent to which the innovator can appropriate the gains accruing to
(13) For an emissions tax the downward shift of the industry marginal abatement cost curve as a result of diffusion causes the agency to reduce the tax rate assuming that marginal damages are increasing in emissions For permits (auctioned or freely allocated) it causes the agency to reduce the number of permits
(14) The empirical application of this framework is summarised below under Section 25 on empirical evidence(15) That is the emissions tax is set equal to the firms marginal cost of abatement under the direct regulation(16) In addition to assessing the impacts on demand for innovation Fischer et al (1998) consider the impacts of the innovation and
diffusion processes on social welfare in order to compare the overall economic efficiency of the different instruments(17) Milliman and Prince capture only the first two effects in their analysis
Environmental tax reform in Europe opportunities for eco-innovation
Review of literature on environmental tax reform and eco-innovation
16
the other firms in the form of royalty payments If imitation is high (easy) then auctioned permits provide the greater incentive for innovation However if imitation is low (difficult) then the emissions tax provides the greatest incentive
Montero (2002) assesses the impacts of alternative policy instruments on environmental innovation (as measured by RampD expenditure) under conditions of imperfect competition In his model two firms compete in either quantities (ie Cournot duopoly) or prices (ie Bertrand duopoly) while being subject to some form of environmental regulation Where the regulation takes the form of tradable permits mdash either auctioned or freely allocated mdash the market is also assumed to be imperfect the firms competing in permit quantities The interaction between the two firms is modelled as a multi-stage game with the number of stages depending on the instrument being analysed In this framework a firms incentive to invest in RampD comprises two components a direct or cost minimising effect and a strategic effect reflecting the impact of its RampD expenditure on the other firms output decision The latter may be positive or negative depending on the market-regulatory structure Under Bertrand competition (ie where products are strategic complements) freely allocated permits provide the lowest incentive for innovation followed by the emission-standard The relative ranking of an emissions tax and auctioned permits is ambiguous depending on model parameter values Under Cournot competition (ie where products are strategic substitutes) the relative ranking of the emissions tax auctioned permits and the emissions-standard are ambiguous although all provide a greater incentive than freely allocated permits Indeed Montero provides a numerical example where the emissions standard provides the greatest incentive for innovation Finally he considers the impact of increasing competition (increasing the number of firms) and concludes that under perfect competition the emissions tax provides the greatest incentive for innovation
Millock and Nauges (2006) use a simple profit-optimisation model to analyse a firms choice of abatement effort to reduce emissions
per unit of energy used in production While they do not explicitly identify it as such this effort can be interpreted in terms of diffusion of an existing technology mdash with higher effort corresponding to greater diffusion This is consistent with the overall objective of their study which is to assess the impact of combining an emissions tax with a subsidy on (existing) abatement equipment (18) In their model the firm simultaneously chooses the levels of its energy input and abatement effort given exogenous output and energy prices and a cost function for abatement effort (19) They show that while increases in the subsidy rate (expressed as a percentage of the gross investment cost) unambiguously increases abatement effort the impact of increases in the tax rate depends on whether the direct impact of tax increase on the marginal benefit of abatement effort (shifting it up) outweighs the indirect impact via the resulting reduction in output (shifting it down) If the latter dominates then increases in the tax rate will reduce the optimal level of abatement effort The authors show that a necessary and sufficient condition for the direct impact to dominate is that the slope of the firms (inverse) demand for energy is greater than the average emissions tax payment per unit of energy in relation to total energy use (20)
McGinty and de Vries (2009) analyse the relationship between environmental subsidies the diffusion of a clean technology and the degree of product differentiation in an imperfectly competitive output market In their model a fixed number of firms can choose individually between using a clean production technology and a dirty technology Both technologies exhibit constant marginal production costs and constant emission rates (with the clean technology having a lower emission rate and higher unit cost) and consumers are assumed to be able to differentiate between products on the basis of the technology used in their production (21) The subsidy regime is different to that considered by the other studies in that it is applied to the production cost of the clean good and thus reduces the (constant) marginal cost of production for that good As such it is equivalent to an output subsidy for the clean good The authors derive the equilibrium diffusion rate for the clean technology (ie the proportion of firms using
(18) In the second half of their paper Millock and Nauges (2006) undertake an empirical evaluation of such a scheme that operated in France during the 1990s for SO2 and NOX emissions The results of this analysis are summarised under Section 25 on empirical evidence
(19) Abatement effort is assumed to exhibit decreasing returns to scale ie the cost function is increasing and convex(20) If output is held fixed in the profit maximisation problem then increases in the emissions tax rate unambiguously increase the
optimal level of abatement effort as found by Kemp (1997) who uses a cost-minimisation framework for his analysis(21) The model assumes imperfect substitution between the clean good and dirty good with the willingness-to-pay for one good being
a linear function of the quantities of both goods individually ndash ie Pk = ak ndash bYk ndash cYj
Review of literature on environmental tax reform and eco-innovation
Environmental tax reform in Europe opportunities for eco-innovation 17
that technology) and show that an increase in the subsidy value increases diffusion for all degrees of product differentiation The impact is greater as the substitutability of the two goods increases They also briefly consider the impact of a technology subsidy that reduces the fixed cost of the clean technology and conclude that this too will stimulate diffusion but will be less efficient than the output subsidy (22)
Key findings of the theoretical studies
As is often the case with theoretical analyses the specifications of the models and the underlying assumptions of the studies reviewed here significantly influence the conclusions Nevertheless there is a reasonable degree of consistency between their findings The studies can be classified into two broad groups those that consider innovation and diffusion within an industry setting and those that consider an individual firms decision whether to undertake RampD (ie innovation) and invest in an abatement technology (ie diffusion) in order to reduce its own cost of abatement
The studies in the first group conclude that under conditions of perfect competition emission taxes and auctioned permits provide greater incentives for innovation than direct controls or freely allocated permits However there is some disagreement over the relative impacts of the two instruments Under the assumption that the innovator appropriates a fixed (exogenous) proportion of the gains accruing to the technology adopters Milliman and Prince (1989) conclude that auctioned permits provide the greatest incentive although the government may find it easier to adjust emission taxes in response to the resultant downward shift in marginal abatement costs However when the proportion is determined endogenously mdash in the form of a royalty payment mdash Fischer et al (2003) find that either auctioned permits or emission taxes can provide the greater incentive Emission taxes are likely to provide the greatest incentive if the innovator can appropriate a large proportion of the gains (because the technology is difficult to imitate)
Montero (2002) uses a slightly different framework to compare the impacts of different instruments on innovation (in the form of RampD expenditure)
in a situation of imperfect competition and finds that the ranking depends on the nature of the competition (23) Under Bertrand price competition in the output market the results are the same as under perfect competition the relative ranking of auctioned permits and taxes is ambiguous but both provide greater incentives for innovation than emission standards and freely allocated permits However under Cournot quantity competition any of the instruments apart from freely allocated permits can provide the greatest incentives depending on the model parameter values
The studies looking at an individual firms decision also show that an emissions tax can stimulate innovation and diffusion Jaffe and Stavins (1995) explicitly consider the firms decision criterion for investing in a new abatement technology and show that by increasing the benefits of investing the introduction of an emissions tax should bring forward its adoption by existing firms and make its use by new entrants more likely The other two studies consider the firms choice of optimal abatement effort in the context of maximising its total profits or minimising its total cost of emissions reduction This effort can take the form of RampD (innovation) or expenditure on abatement equipment (diffusion) The decision problem is the same in each case ie to choose the optimal level of effort
Kemp (1997) assumes that the firm seeks to minimise its total cost of emissions reduction mdash implicitly assuming that its output level is fixed mdash and demonstrates both that abatement effort increases as the emissions tax increases and that the optimal effort is lower under direct regulation than under an equivalent tax However when the firms output level is allowed to vary mdash as is the case with the profit maximisation problem considered by Millock and Nauges (2006) mdash the impact of an increase in the emissions tax rate on the level of abatement effort depends on the relative magnitudes of the direct impact and the indirect impact (via changes in output levels) on the marginal benefit of abatement effort If the latter dominates then an increase in the emissions tax rate leads to a reduction in the optimal level of abatement effort
(22) McGinty and de Vries (2009) derive expressions for the necessary technology subsidy values when diffusion is 0 and when it is 100 They state mdash without proof mdash that the latter is greater than the former Provided that the relationship between the subsidy and diffusion is monotonic this is a sufficient condition for increases in the subsidy value to cause increases in diffusion
(23) Monteros model does not include diffusion However it does include spillover effects where RampD by one firm reduces the abatement costs of the others
Environmental tax reform in Europe opportunities for eco-innovation
Review of literature on environmental tax reform and eco-innovation
18
Only one of the industry models considers the impact of investment subsidies Using a product differentiation model of imperfect competition McGinty and de Vries (2009) show that subsidising the unit cost of a clean production technology can accelerate its diffusion However the impact depends on the degree of substitutability between clean and dirty products diminishing as the products become more differentiated In contrast all three of the individual firm analyses consider the impact of investment subsidies with all demonstrating that increasing subsidies induce greater abatement effort Furthermore Kemp (1997) shows that the impact of an RampD subsidy is greater in the presence of an emissions tax than it is under an equivalent emissions limit
25 Empirical studies
Jaffe and Stavins (1995) use their theoretical framework (outlined above in Section 24) as the basis for assessing the diffusion of thermal insulation in new home construction in the United States using state-level panel data for the years 1979ndash88 They derive a reduced form equation for the energy efficiency level chosen by developers from the marginal cost-benefit condition in which the explanatory variables include energy prices installation costs and the presence of a relevant building code (as a dummy variable) Separate equations are estimated for ceiling floor and wall insulation with the coefficient for energy prices being positive in all three equations Although it is only significant (at the 95 level) for floor insulation the joint hypothesis that all price coefficients are zero is strongly rejected However the coefficients for installation cost (which are all negative as expected) are around two to three times greater in magnitude and of comparable significance The coefficients for the building code dummies are consistently insignificant (and negative in two cases) indicating that this form of direct regulation had minimal impact on household energy efficiency levels over the period The authors use the estimated models in a simulation to compare the effects of a 10 increase in energy prices (ie an energy tax) with those of a 10 reduction in installation costs (ie a technology subsidy) with each applied over the whole ten-year period While
the tax increases diffusion by 2ndash6 by the end of the period the technology subsidy increases diffusion by between 4ndash15
Kemp (1997) models the diffusion of biological water treatment technology in the Dutch food and beverage industry based on a rational choice threshold model of technology adoption decisions In this model a firm chooses to adopt an abatement technology if the resulting reduction in emission-tax payments is greater than the annualised total costs of the technology where a discount factor is applied to the savings to reflect uncertainty and risk aversion on the part of the decision-maker This is translated into a probabilistic model under the assumption that both the savings and the costs follow a log-normal distribution across plants The model is estimated econometrically using data for the period 1974ndash91 under different assumptions for the functional form of the discount factor and allowing for adjustment costs (24) The estimated parameters for the preferred specification of the discount factor are all significant and of the expected sign and magnitude and the model provides a very close fit to the actual diffusion of waste-water treatment technologies over the period This leads the author to conclude that the effluent charges were a significant positive factor in the diffusion of treatment technologies Indeed he estimates that only around 4 of plants would have installed waste-water treatment equipment by the end of the period if the charge had remained at its (low) 1974 level compared to the actual figure of over 40
Newell et al (1999) estimate the impact of energy prices energy efficiency standards and other factors on the energy efficiency of three types of electrical consumer durables (room air conditioners central air conditioners and gas water heaters) in USA between the 1970s and 1990s The analysis utilises a product characteristics model in which the frontier of technologically feasible products is described by a transformation surface that relates the bundle of product characteristics to the real cost of producing that bundle In this framework innovation is represented by movements of the surface and movements along the surface In particular the authors identify three types of innovation shifts in the surface towards the origin (overall technological change) changes in the slope
(24) Adjustment costs are accounted for by estimating a partial adjustment model in which the actual change in adoption is some fixed fraction of the desired change (estimated from the threshold model)
Review of literature on environmental tax reform and eco-innovation
Environmental tax reform in Europe opportunities for eco-innovation 19
of the surface (directional technological change) and changes in the mix of products along a given surface (model substitution) They define the surface in terms of two characteristics energy flow and cooling capacity and incorporate innovation by allowing the coefficients of the two variables to vary with time and (in the case of energy flow) energy prices and efficiency standards Separate equations are estimated for each durable type with slightly differing sets of explanatory variables and time periods The authors find little evidence that either energy prices or energy efficiency standards had any impact on overall technological change While all but one of the relevant coefficients have the expected sign none are significant In contrast they do find evidence that energy prices had an impact on directional technological change with the relevant coefficients being of the correct sign and significant for both room and central air conditioners
Popp (2002) uses patent data to estimate the effect of energy prices on energy-efficiency innovations in USA between 1970 and 1994 He regresses normalised energy-efficiency-related patent applications against energy prices controlling also for lagged knowledge stock and government RampD (25) The estimated coefficient for energy prices is highly significant producing a short-run price elasticity of 006 and a long-run elasticity 0354 Thus a 10 increase in energy prices would be expected to increase the number of energy-efficiency-related patents by around 35 in the long run The estimated mean lag is less than four years leading the author to conclude that the imposition of a carbon or energy tax would lead to a fairly quick shift towards environmentally friendly innovation
Hoglund Isaksson (2005) estimates abatement cost functions for the reduction of nitrogen oxide (NOX) emissions in three industrial sectors in Sweden (energy pulp and paper chemicals and food) The analysis uses a double-hurdle model applied to a pooled sample of 114 plants across the three sectors The data cover the period 1990ndash1996 which spans the introduction of the charge on NOX emissions in 1992 The estimated cost curves have a similar shape in all three sectors with minimal (or even negative) costs over a relatively broad range of emission reductions and then a steep rise as reductions exceed
a threshold level The analysis does not explicitly consider the issue of innovation However it does find that abatement cost curves shifted downwards significantly over the period In the energy sector for example the emission rate threshold for significant cost increases fell by around 45 between 1991 and 1996 (from 550 to 300 kgGWh) The author surmises that this is due to a combination of technological development and the discovery of previously unrecognised opportunities Unfortunately while this shift coincided with the introduction of the NOX charge the analysis does not provide any evidence of a causal link
As part of their analysis of the impacts of the French tax-subsidy scheme for NOX and sulphur dioxide (SO2) emissions Millock and Nauges (2006) estimate the impact of the emission taxes on a plants decision to install end-of pipe abatement equipment While the study is not concerned with innovation per se the results of this part can be interpreted as showing the impact of emission taxes on the diffusion of abatement equipment Under the scheme taxes were imposed on the emissions of these air pollutants (and VOCs) by all plants satisfying certain criteria The revenue raised by the taxes was earmarked for subsidising the cost of qualifying abatement technologies for technical studies (ie RampD) and for investment in air quality surveillance systems Using panel data for 226 plants in three industries (iron and steel coke and chemicals) for the period 1900ndash1998 the authors estimate a Probit model for the probability that a plant will install abatement equipment They find that the total value of emissions taxes paid by the plant (ie for both pollutants) has a positive impact on its decision to invest in abatement equipment However the magnitude of the effect varies considerably across the sectors and is only significant for the iron and steel sector
Frondel et al (2008) analyse responses to an OECD survey on environmental policy tools (conducted in 2003) to identify the factors that affect a firms decision to adopt an environmental management system (EMS) voluntarily and their environmental innovation behaviour Innovation is captured by a binary variable that indicates whether the firm has undertaken significant technical measures or changes to reduce the environmental impacts of
(25) Normalised energy efficiency patent values are calculated by dividing by the total number of patents granted This accounts for exogenous changes in patenting behaviour that affect all types of patents Popp constructs a value for existing knowledge as the stock of previously granted patents weighted by estimates that he derives for knowledge productivity He demonstrates that the exclusion of this variable from the model leads to biased estimates for the energy price coefficient
Environmental tax reform in Europe opportunities for eco-innovation
Review of literature on environmental tax reform and eco-innovation
20
production (26) The analysis is based on survey responses from 899 firms in Germany Latent variable equations for EMS adoption and innovation are estimated simultaneously with each equation including the same four sets of variables relating to motivations policy instruments pressure groups and facility characteristics (27) The policy instrument variables include five dummy variables indicating the importance of different types of policy instrument including market-based instruments such as emission taxes and tradable permits While the perceived stringency of environmental policy is found to be a significant factor in the decision to innovate there is no evidence that any of the individual policy instrument variables had any impact The authors surmise that this suggests that it is stringency of environmental policy rather than the choice of specific instrument that is important for innovation However as the authors note their results reflect the perceptions of the survey respondents and should therefore be treated as correlations rather than causal relationships
Johnstone and Hascic (2008) assess the impact of a range of environmental policy instruments mdash including tax measures and investment incentives mdash on innovation in the renewable energy field They analyse the impacts for five different groups of renewable energy technologies mdash wind solar ocean biomass and waste-to-energy mdash using a panel dataset of European Patent Office (EPO) patent filings for these technologies across 26 countries over the period 1978ndash2003 A fixed effects negative binomial model is estimated controlling for electricity prices and consumption public sector RampD expenditure (as a proxy for scientific capacity) and total EPO filings (as a proxy for differenceschanges in patenting propensity) The various policy instruments are represented by dummy variables indicating whether they were in place in a particular year As such the model takes no account of the stringency of the instruments mdash in particular the differing magnitudes of the tax measures and investment incentives (28)
Initially the authors estimate the model with all of the policy instruments included individually They find that while public policy plays an important role in inducing innovation the impacts of the individual instruments vary across the different technologies In particular tax measures are significant for wind and biomass technologies with investment incentives being significant for solar and waste-to-energy technologies and obligationstradable certificates being significant for wind technologies However the authors express concerns that there may be multicolinearity between the policy variables (particularly between investment incentives tax measures and tariffs) and also that there may be interaction effects between some of the variables Consequently they estimate two alternative versions of the model the first using a composite policy variable representing the number of policy instruments in place and the second using clusters of similar policy instruments (29) The results or these two models confirm the initial findings The composite policy variable is significant for all of the technology groups while the significance of the clusters varies across technologies The price-based cluster is (highly) significant for solar biomass and waste-to-energy The quantity-based cluster is significant for wind technologies The authors surmise that this may be due to the different economic characteristics of the technologies For example the significance of investment incentives for solar and waste-to-energy may reflect the capital intensity of these technologies with large up-front investment costs
De Vries and Medhi (2008) also use patent data to investigate the relative importance of environmental regulations and fuel prices on innovation in automotive emission-control technologies distinguishing between post-combustion devices and engine redesign technologies They estimate a panel data model using data from Germany Japan and USA over the period 1978ndash2001 controlling for industry value added (as a proxy for the scope of technological opportunities) and total patent
(26) The next question on the survey asks whether these are changes in production processes or end-of-pipe technologies However no distinction is made between these two types of innovation in the present study
(27) In order to avoid identification problems some individual variables are omitted from one equation or the other(28) This shortcoming is recognised by the authors who state that it is unavoidable in any cross-comparative analysis in which multiple
instruments are included(29) The clusters are price-based instruments (investment incentives tax measures and tariffs) quantity-based instruments (obligations
and tradable certificates) and voluntary programmes
Review of literature on environmental tax reform and eco-innovation
Environmental tax reform in Europe opportunities for eco-innovation 21
applications (as a proxy for differenceschanges in patenting propensity) Environmental regulation is represented by two dummy variables indicating the introduction of on-board diagnostic (OBD) regulations in USA (30) The results of the analysis suggest that the relative impacts of regulation and market forces differ between the two types of technology For post-combustion technologies both of the regulations are significant while fuel prices have no significant impact In contrast the opposite is the case for engine redesign technologies with fuel prices having a significant impact but regulation having no discernable effect While the analysis does not explicitly consider the impact of fuel taxes it suggests that an increase in automotive fuel taxes would have a major impact on innovation in relation to engine design The estimated coefficient for fuel prices (1287) implies that a USD 010 increase in fuel prices would induce a 14 increase in patenting activity (31)
Key findings of the empirical studies
The empirical studies considered above cover a range of different technology areas spanning energy efficiency (both product and process) renewable energy and air and water pollution abatement While in some cases they assess the impact of energy prices rather than environmental taxes per se they provide a clear picture of the likely impact of environmental and energy-related taxes on eco-innovation
Three of the studies assess the impact on diffusion of existing technologies All find that environmental taxesenergy prices have a positive impact on diffusion In particular the water effluent charges in The Netherlands appear to have had a major impact on the adoption of waste-water treatment equipment by the food and beverage industry in that country However there is some evidence to suggest that the effectiveness of taxesprices may vary across sectors (eg NOXSO2 abatement in France) and that investment incentivessubsidies may be more
effective in some cases (eg thermal insulation in USA)
Three of the studies use patent data to assess the impact of environmental taxes and energy prices on innovation with one of these also assessing the impact of investment incentives All find a significant positive impact although this depends on the particular sub-sector (eg renewable energy) or the type of innovation In particular the evidence from the automotive emissions control study suggests that taxesprices may be more effective in promoting process-related innovation (eg engine redesign) than innovation in end-of-pipe technologies One of the studies takes a different approach using a product-characteristics model to decompose improvements in the energy efficiency of consumer durables This finds that while electricity prices did not appear to affect overall technological change (ie shifts in the product costenergy efficiency frontier) they did have a positive impact on directional technological change (ie the slope of the frontier)
26 Case studies
Christiansen and Skjaerseth (2005) undertake a comparative analysis of the impacts of climate change policies on the petroleum sectors in Norway and the Netherlands during the 1990s These countries were selected because of their very different policy approaches with the Norwegian petroleum sector subject to a carbon dioxide (CO2) tax since 1991 as part of a portfolio of measures (32) and the Netherlands relying on a series of voluntary agreements on energy efficiency (33) Both approaches appear to have been effective in that CO2 emissions per unit production fell by around 22 between 1990 and 2001 in Norway while energy efficiency improved by around 35 in the Netherlands over the same period However there were marked differences between the two countries in terms of the nature of the innovation that
(30) Because of the international nature of the automotive industry and the importance of the US market regulations introduced in USA appear to have been an important driver for innovation by overseas manufacturers Regulations mandating the installation of OBD systems were first introduced in California in 1988 A more sophisticated system was mandated by the 1990 US Clean Air Act Amendments taking force in 1996
(31) The coefficient represents the semi-elasticity of patent applications with respect to fuel prices While the authors do not state so explicitly the implication is that prices are expressed in US dollars (they are obtained from the IEA Energy Prices and Taxes Database) Consequently the impact of a 10 US cent increase in the fuel prices is given by exp(1287 x 01) ndash 1 = 0137
(32) In addition to the tax the portfolio included publicly funded RampD support schemes gas flaring permits and mandatory environmental impact assessments
(33) The Dutch oil and gas industry first signed a declaration of intent with the government in 1995 This was translated into a long-term agreement (LTA) on energy efficiency in the following year with an improvement target of 20 over the period 1989ndash2000 In 2001 a new LTA was signed which committed firms to implementing energy efficiency measures with a positive NPV at a 15 discount rate or a five year payback period
Environmental tax reform in Europe opportunities for eco-innovation
Review of literature on environmental tax reform and eco-innovation
22
occurred In the Netherlands technological change was incremental reflecting a steady diffusion of available (ie known) technology In contrast the authors find evidence of more radical innovations and adaptations by the Norwegian petroleum sector including the development of energy-efficient gas turbines installation of waste heat recovery units process modifications and improved use of process heat While the authors acknowledge the impossibility of proving a causal link between policy intervention and innovation (in the context of their case study) they conclude that the CO2 tax played a key role in the development and implementation of these radical innovations and the benefits of reduced tax payments provided an important incentive However they also conclude that the impacts of the two instruments were conditioned by the political contexts in which they were applied and the problem characteristics in the respective countries (eg the economic significance of the sector and the size of installations)
Knigge and Goumlrlach (2005) summarise the findings of a comprehensive analysis of the impacts of the ETR in Germany That analysis undertaken jointly by Ecologic and the German Institute for Economic Research (DIW Berlin) included the impacts on innovation and market diffusion of environmentally friendly products and technologies (34) Based on a series of case studies the study concluded that the ETR had a noticeable effect on innovation and diffusion although it was not possible to quantify the scale of that effect In particular ETR is identified as being a central factor in the development of gas-powered vehicles The study identifies a number of different routes by which the ETR produced impacts First the payback period for energy-efficient products was reduced as a result of the energy tax increases and the various exemptions favouring efficient energy use and renewable energy sources Second the predictable nature of the energy taxes (as opposed to widely fluctuating oil prices) reduced uncertainties about the benefits of energy-efficiency investments Third the reduction in employers social contribution payments tended to reduce the costs of labour intensive innovation processes such as research and development energy consultancy and technology installation Finally the ETR had a signalling effect strengthening awareness of the need for more efficient and rational energy use
Mickwitz et al (2007) examine a number of claims that have been made in the environmental policy literature about the relationship between policy instruments and innovation based on experiences in two industrial sectors in Finland pulp and paper and the manufacture of diesel engines for ships In particular they assess the claims that environmental taxes are superior to other policy instruments with respect to innovation and that RampD subsidies have limited impacts on innovation With respect to the first claim the evidence provided by the two case studies is mixed The authors conclude that energy taxation had a negligible impact on innovation in the pulp and paper industry However this is likely to have been due to the low level of the tax and the exemptions that applied to the sector In contrast they find that the differentiation of Swedish fairway and port fees (on the basis of SO2 and NOX emissions) was a significant factor driving the installation of in-engine NOX reduction equipment in ferries operating between the two countries (35) With respect to RampD subsidies the authors conclude that the evidence does not support the claim that these have little effect In particular they find that RampD subsidies accelerated the development of ship engine emissions-reduction technologies
The findings of the three case studies are consistent with those of the empirical analyses reviewed in the previous section Environmental taxes and investment subsidies have proven significant in promoting both innovation and diffusion although not universally so Furthermore the case studies provide some useful insights about the ways in which the impacts occur and the factors that may be important in promoting innovation In particular they suggest the need for a tax rate that is sufficiently high to provide a meaningful incentive and signalling effect and that is fixed for a sufficiently long period of time to reduce uncertainty about the future benefits of investment
27 Conclusions
The studies reviewed in the preceding sections suggest that environmental regulation in general and price-based policy instruments such as environmental taxes and investment subsidies in particular can (in theory) and do (in practice) have a positive impact on both innovation and diffusion
(34) A separate report in German by Goumlrlach et al (2005) provides details of the evaluation of the innovation and diffusion impacts (35) Although the tax was introduced in Sweden it was also payable by Finnish ferry operators entering Swedish ports and hence
affected their investment decisions This is another example of the cross-border impact of environmental policy interventions on innovation found by Lanjouw and Mody (1996) (see Section 23)
Review of literature on environmental tax reform and eco-innovation
Environmental tax reform in Europe opportunities for eco-innovation 23
of environmental technologies However the supporting empirical and case study evidence is not universal and the effectiveness of these instruments would appear to vary across different sectors and different types of innovation
To a certain extent such differences can be explained by the theoretical models In particular the impact of environmental taxes (relative to other instruments) is predicted to depend on the competitive structures of the markets in which the regulated firms operate and on the ability of innovator firms to appropriate the benefits accruing to other firms during diffusion However a number of other potential factors have been identified in the literature which may affect the impact of price-based policy instruments on innovation
Jaffe et al (2002) caution that the impact of price-based policy instruments on technology diffusion may be adversely affected by a number of potential market failures including information failures principle-agent problems (eg landlord-tenant) capital market failures and positive adoption spillovers In addition while not market failures as such uncertainty over future returns and the (associated) use of high discount rates for investment decisions can also undermine the effectiveness of price-based instruments in stimulating diffusion However as was noted above the findings from the case study of ETR in Germany suggest that an environmental tax may actually reduce the level of uncertainty over future returns provided that it is of sufficient magnitude and longevity
Skjaerseth and Christiansen (2005) emphasise that the relationship between policy instruments (of all types) and technological change is extremely complicated They argue that account must be taken of the politicalindustrial context in which policy instruments are introduced and the nature of the environmental problem that they are intended to address In particular they make a distinction between malign problems where technological change involves net costs for target groups and benign problems where there are widespread no-regret opportunities for change Based on a comparative analysis of four different case studies they conclude that mandatory policy instruments (including environmental taxes) are more effective
in promoting short-term technological change when the problems are malign but that low legitimacy (with the target group) may undermine long-term technological change However when problems are benign or when long-term change requires cooperation voluntary policy instruments are likely to be more effective
Johnstone (2005) questions the focus of the theoretical and empirical analyses (reviewed above) on the impact of environmental policy instruments on the rate of technological change He argues that the direction of technological change is as important if not more so In addition to the quantity of innovation it is also important that innovation be socially optimal in the sense that it minimises the cost of attaining a particular environmental goal in the long term Inappropriate innovation today may result in lock in to a suboptimal technological path for the future
With this in mind Johnstone identifies a number of issues that can adversely affect the direction of innovation and should be taken into account when selecting and designing policy instruments technological market failures (36) missing markets for certain environmental attributes of innovation policy incidence and joint production of emissions Most studies of the innovation effects of environmental policy instruments assume that the only missing market is that for the environmental good (or bad) However in practice there may be other markets that are missing (or incomplete) which can adversely affect transmission of innovation incentives This is particularly so in the area of waste and resource management where instruments applied at the end of the product life cycle may have little or no impact on product design innovation Even if all markets are complete except for the environmental externality the point of incidence of the policy intervention may be more important for the direction of innovation than the choice of a particular policy instrument For example a limit or standard applied directly to the emissions of a pollutant may be more effective in promoting optimal innovation than a tax applied to a proxy input variable Finally when there is joint production of pollutants (eg CO2 and air pollutants from vehicle engines) there is a danger that if policy instruments (of whatever type) are applied to one pollutant in isolation the resulting innovation may
(36) These are the same market failures identified by Jaffe et al (2002)
Environmental tax reform in Europe opportunities for eco-innovation
Review of literature on environmental tax reform and eco-innovation
24
reduce emissions of that pollutant at the expense of increases in the others
In a related point Johnstone highlights the importance of using appropriate indicators when assessing the impact of policy instruments on innovation emphasising the need for these to reflect both the rate of innovation and the direction A necessary condition for this is that the indicators must provide an accurate and detailed picture of actual innovation Unfortunately this is difficult to achieve in practice For example the use of patent data as a measure of innovation requires the identification of relevant environmental technologies This is likely to be easier for end-of-pipe technologies than for process-related technologies meaning that the latter tend to be under-represented relative to their actual incidence To the extent that process-related innovation is growing in importance or is more important
for certain sectors or types of environmental problem changes in the value of the indicator may significantly understate the actual rate of innovation and misrepresent the direction
All of this suggests that caution should be exercised in drawing general definitive conclusions about the impacts of price-based policy instruments such as environmental taxes and investment subsidies on innovation particularly relative to other policy instruments While it would appear that they can be effective in stimulating both innovation and diffusion in many cases mdash at least in terms of the rate of technological change mdash there may be situations in which other policy instruments may be more appropriate In general the stringency and point of incidence of an environmental policy intervention may be more important than the choice of a particular policy instrument in determining the rate and direction of eco-innovation
25
Modelling of ETR impacts on eco-innovation
Environmental tax reform in Europe opportunities for eco-innovation
31 Scenarios assessing the implications of ETR for eco-innovation
Scenario analysis provides a useful means of improving understanding of how the different revenue recycling methods and various scales of ETR can help meet different greenhouse gas emissions targets
To investigate the impacts of an ETR for Europe the petre project elaborated a range of different scenarios reflecting various tax reform options In addition to employing several of these original scenarios the present study compiled two new scenarios to analyse the implications of ETR for eco-innovation All scenarios were examined in both E3ME and GINFORS (37)
311 Original petre project scenarios
The key petre scenarios relevant for the present study are
bull scenarioBHbaselinescenariowithhighenergyprice (reference case)
bull scenarioS1HETRdesignedtomeettheEUsunilateral 2020 GHG target (high energy price) with revenue recycling
bull scenarioS2HETRdesignedtomeettheEUsunilateral 2020 GHG target (high energy price) with revenue recycling and 10 of revenues spent on eco-innovation measures
Each of the ETR scenarios has the same key taxation components
bull acarbontaxrateisintroducedtoallnon-EUEmissions Trading System (EU ETS) sectors equal to the carbon price in the EU ETS that delivers an overall 20 reduction in greenhouse gas emissions by 2020 and in the international cooperation scenario this is extended to 30
bull aviationisincludedintheEUETSattheendofPhase 2
bull powergenerationsectorEUETSpermitsare100 auctioned in Phase 3 of the EU ETS
bull allotherEUETSpermitsare50auctionedin2013 increasing to 100 in 2020
bull materialtaxesareintroducedat5oftotalpricein 2010 increasing to 15 by 2020
In scenario S1H environmental tax revenues are recycled through reductions in income tax rates and social security contributions in each of the Member States such that there is no direct change in tax revenues In scenario S2H 10 of environmental tax revenues are recycled through spending on eco-innovation measures and the remaining 90 is recycled through the same measures as in the other scenarios The eco-innovation spending is split across power generation and housing according to tax revenues from the corporate and household sector
In GINFORS (the model used for analysing the implications of ETR and eco-innovation) the share of renewable sources in electricity production is increased due to the additional investment The rest of additional investment goes to household energy efficiency spending Investment needed for a certain increase in renewable energy production or efficiency improvement is based on Austrian and German experience (Lehr et al 2008 and 2009 Grossmann et al 2008 Lutz and Meyer 2008) This assumption is quite conservative as parameters for other countries can be assumed to be more positive (meaning that less money is needed for renewable energy technology installation or energy efficiency gains)
In scenario S1H the 20 GHG target translates into a 15 reduction in energy-related carbon emissions relative to 1990 as other emissions such as methane and nitrous oxide have already been reduced by
3 Modelling of ETR impacts on eco-innovation
(37) The E3ME and GINFORS models are introduced in Chapter 1 of the present report A detailed discussion of the models and scenarios used in the present study can be found in Ekins and Speck (2011)
Environmental tax reform in Europe opportunities for eco-innovation
Modelling of ETR impacts on eco-innovation
26
more than 20 (in terms of carbon equivalents) The target is reached by a tightened EU ETS cap and the introduction of a carbon tax on the non-ETS sector The tax rate applied is equal to the carbon price in the EU ETS that will deliver a 20 GHG reduction by 2020
The burden of ETR taxes are allotted to energy outputs (ie the final use of energy) and will be based on the carbon content of each fuel Carbon prices are assumed to be fully passed on to consumers All carbon taxes are in addition to any existing unilateral carbon and energy taxes The carbon reductions in the different EU Member States will be those that result from a uniform carbon tax increase across the EU
All of the revenues including EU ETS auctioning revenues carbon tax revenues and material tax revenues will be recycled The proportion of tax raised by industry will be recycled into a reduction in employers social security contributions which will in turn reduce the cost of labour Recycling will be additional to the existing ETRs in some Member States Revenues raised from households will be recycled through standard rate income tax reductions Traditional energy tax revenues will be lower compared to their respective baselines as the tax base (energy consumption) is reduced So for an ETR revenue-neutrality does not mean budget-neutrality
312 Factors affecting the macroeconomic impacts of RES technologies
Earlier analyses (Lehr et al 2008 Fraunhofer ISI et al 2009 DTI 2004 Kammen et al 2004 Moreno and Loacutepez 2007) have studied the impacts of large renewable energy source (RES) shares in the energy mix for different countries The overall question in these studies has been the impact of increasing RES shares on the economy especially on the labour market For the present study it is interesting to note that macroeconomic impacts of higher RES shares mainly depends on the following five factors
1 additional investment in RES (minus lower investment in conventional sources ie fossil and nuclear power) with the impact increasing if a country manufactures the RES technology in question
2 additional (net) exports due to improved international competitiveness of renewable energy sources (first mover advantage)
3 lower fossil fuel needs4 the cost differences between RES and
conventional energy
5 the shift from capital- and energy-intensive industries to labour- and technology-intensive industries
All five factors are driven by international energy prices carbon prices the policy framework and RES technology development itself Innovation comes into the play at various stages First innovation drives the currently positive additional costs of RES technologies down and even into negative realms depending on the fossil fuel scenario Second innovative RES technologies are likely to have a competitive advantage in international markets Although a significant proportion of RES technology produced in Europe is traded in Europe innovation will still provide an edge in current and emerging international markets
The EmployRES study (Fraunhofer ISI et al 2009) finds for Europe that current strong investment reflected in installations in Europe and exports to the rest of the world dominate the economic impact of RES policies and therefore lead to positive overall effects The studys results suggest that this positive balance can only be kept up in the future if the competitive position of European manufacturers of RES technology is improved The authors strongly recommend policies which promote technological innovation in RES and lead to a continued and rapid reduction of their costs
Factors 1 and 2 will have substantial macroeconomic impacts in the short and medium terms whereas factor 3 accumulates and will show positive impacts mainly in the long term Factor 4 strongly depends on the global developments while factor 5 may have significant effects on employment
313 Additional scenarios
Impacts of additional investment (factor 1) have already been analysed in scenario S2H of the petre project To focus on the other impacts of eco-innovation two additional scenarios were designed building on scenario S2H of petre
bull S2HEETRwithrevenuerecyclingdesignedto meet the unilateral EUs 2020 greenhouse gas (GHG) target (high energy price) Ten per cent of revenues are spent on eco-innovation measures and trade shares of EU-27 economies with the rest of the world in machinery and electrical machinery increase by 01 due to the deployment of the fast growing RES markets This assumption is based on the strong EU policy effort to increase the share of renewable energy in final energy consumption to 20 by 2020
Modelling of ETR impacts on eco-innovation
Environmental tax reform in Europe opportunities for eco-innovation 27
(Fraunhofer ISI et al 2009) and the possibility of very strong world market development of the RES sector until 2020 (EREC 2008) which offers additional export opportunities for European RES industries
bull S2HIETRwithrevenuerecyclingdesignedto meet the unilateral EUs 2020 GHG target (high energy price) Ten per cent of revenues are spent on eco-innovation measures and input structures of the energy sector are changed according to the input structure of the German RES industry (Lehr et al 2008)
S2HE looks at the possible role of international trade S2HI analyses changes in the input structure of the energy sector ie from conventional electricity production to renewables In the petre project (as in GHK et al 2007) only the energy inputs of the energy sector were adapted to changes in the energy input mix
Both S2HE and S2HI focus on RES and efficiency technologies As mentioned above an ETR will trigger a variety of innovations Therefore the results can be thought of as conservative in the sense that innovations (eg automotive energy consumption industrial efficiency etc) are not explicitly included
32 Overview of modelling results
The main results of the simulations are presented in Table 31 In the baseline scenario BH with high energy prices EU-27 carbon emissions will be
72 below the 1990 level in 2020 (38) The EU-15 has committed in the Kyoto Protocol to reduce its GHG emissions 8 below 1990 levels in the period 2008ndash2012 As emissions in the new member states are substantially below their 1990 levels today that implies that the EU-27 will keep its emissions more or less constant over the coming decade As in the PRIMES baseline an ETS price of 18 EURt in 2008 prices is assumed in 2020
In scenario S1H the ETS price and carbon tax rate has to be increased to 68 EUR2008t of CO2 to reach the 20 GHG reduction target which is equal to a 15 reduction of CO2 emissions against 1990 as other greenhouse gases have already been reduced above average by more than 20 in terms of CO2 equivalents Compared to the baseline CO2 emissions are 84 lower in 2020 which means roughly an additional 1 reduction annually in the period 2012ndash2020 GDP will be about 06 lower compared to the baseline in 2020 This means that annual average growth rates will be less than 01 below their baseline development This is especially low compared to the current financial and economic crisis with a GDP deviation against the baseline of around 6 in 2009
As the recycling mechanism reduces labour costs and the tax burden is shifted from labour-intensive to carbon- and material-intensive sectors employment will be 036 (or more than 800 000 jobs) higher than in the baseline The ETR is not fully budget neutral potentially enabling EU economies to slightly increase their net savings If
(38) The modelling exercise in the present study was conducted in 2009 and therefore does not contain the latest data on EU-27 GHG emissions which were significantly influenced by the global economic slump of the late-2000s
Table 31 Main results under the different scenarios
Scenario Target in 2020 CO2 price GDP Employment CO2 reduction
EUR2008t pc against baseline
pc against baseline
pc against 1990
pc against baseline
in year 2020 2015 2020 2020 2020 2020
BH 18 ndash 72 00
S1H 20 GHG 68 ndash 022 ndash 057 036 ndash 151 ndash 84
S2H 20 GHG 61 ndash 013 ndash 030 041 ndash 152 ndash 85
S2HE 20 GHG 61 ndash 009 ndash 004 051 ndash 151 ndash 84
S2HI 20 GHG 61 ndash 006 ndash 024 045 ndash 152 ndash 84
Environmental tax reform in Europe opportunities for eco-innovation
Modelling of ETR impacts on eco-innovation
28
this extra saving is spent negative GDP impacts will be further reduced
In scenario S2H part of the revenues is invested in low-carbon technologies This reduces the carbon price to 61 EUR2008t in 2020 halving the GDP loss relative to scenario S1H to only 03 as the investment in renewable energies is assumed to be additional Employment impacts are also more positive than in scenario S1H The 10 investment in low-carbon technologies amounts to more than EUR 20 billion in 2020
Assuming additional EU exports of RES technologies in scenario S2HE GDP almost matches the baseline in 2020 and employment is 051 (or more than 1 million jobs) higher than in the baseline In scenario S2HI a shift in the input structure of the energy sector towards machinery
and electrical machinery reflecting the different nature of RES relative to conventional electricity generation also has smaller additional positive impacts on GDP and employment compared to scenario S2H
The following figures show impacts of the different scenarios in comparison to the baseline BH As Figure 31 illustrates all the alternative scenarios imply GDP lower than the baseline However comparing scenario S1H with the other three scenarios shows that additional RES investment (S2H) additional RES exports (S2HE) and the inclusion of different input structures of the RES industries (S2HI) each have positive GDP impacts These results are in line with model-based analysis in the EMPLOY-RES study (Fraunhofer ISI et al 2009)
Figure 31 EU-27 GDP according to four scenarios mdash deviation from the baseline (BH)
Percentage deviation from the baseline (BH)
ndash 100
ndash 080
ndash 060
ndash 040
ndash 020
0002010 2015 2020
S2HI S1H S2H S2HE
Modelling of ETR impacts on eco-innovation
Environmental tax reform in Europe opportunities for eco-innovation 29
In contrast to GDP employment increases relative to the baseline in all the alternative scenarios (Figure 32) Due to the scenario design the structure of the EU economies is shifted from energy-intensive to labour-intensive sectors The magnitude of the employment gain is influenced by the carbon price and the tax shift the underlying energy prices and the production loss The largest part of the employment increase stems from the additional RES investment (scenario S2H) although a shift in industry structures (S2HI) and additional RES exports (S2HE) are also positive for the labour market
33 Macroeconomic impacts at the national level
In general terms it is clear that national ETS and ETR impacts depend significantly on country specifics including energy use economic structure social system and behaviour (eg reactions to labour cost changes) In countries with high carbon intensity in their energy mix additional revenues and expenditures are higher than in countries with lower carbon intensity
Scenario S2H provides an interesting tool for analysing the macroeconomic impacts of ETR at the national level because 10 of the additional generated revenues are used for eco-innovation investments meaning that only 90 of the revenues are recycled back into the economy by reducing income tax rates and social security contributions
Figure 32 EU-27 employment according to four scenarios mdash deviation from the baseline (BH)
ndash 020
000
020
040
060
2010 2015 2020
S2HI S1H S2H S2HE
Percentage deviation from the baseline (BH)
Environmental tax reform in Europe opportunities for eco-innovation
Modelling of ETR impacts on eco-innovation
30
Figure 34 GDP in 2020 in EU-27 Member States under scenario S2H mdash deviation form the baseline (BH)
Figure 33 GDP in 2020 in selected countries under scenario S2H mdash deviation from the baseline (BH)
ndash 25 ndash 20 ndash 15 ndash 10 ndash 05 00 05 10 15
Romania
Bulgaria
SloveniaMalta
Lithuania
Latvia
Estonia
CyprusSlovakia
Poland
Hungary
Czech RepublicUnited Kingdom
Sweden
Spain
Portugal
Netherlands
Italy
Ireland
Greece
FranceFinland
Denmark
Luxembourg
Belgium
Austria
Germany
Percentage deviation from the baseline (BH)
Russia
South Africa
Brazil
India
China
Mexico
Japan
USA
Poland
United Kingdom
Spain
Italy
France
Germany
ndash 30 ndash 25 ndash 20 ndash 15 ndash 10 ndash 05 00 05 10
Percentage deviation from the baseline (BH)
Modelling of ETR impacts on eco-innovation
Environmental tax reform in Europe opportunities for eco-innovation 31
Figure 35 Employment in 2020 in EU-27 Member States under scenario S2H mdash deviation from baseline (BH)
EU-27EU-15
RomaniaBulgariaSloveniaMalta
LithuaniaLatvia
EstoniaCyprusSlovakia
PolandHungary
Czech RepublicUnited Kingdom
SwedenSpain
PortugalNetherlands
ItalyIrelandGreece
FranceFinlandDenmarkLuxembourg
BelgiumAustria
Germany
ndash 200 0 200 400 600 800 1 000
Percentage deviation from the baseline (BH)
Under scenario S2H the GDP of large EU economies deviates from baseline projections by between 0 and ndash 1 with the exception of Italy (Figure 33) Germanys GDP is even forecast to match the baseline level in 2020 due to the countrys strong RES industry Outside Europe some countries gain slightly against EU Member States in terms of competitiveness as export prices in most EU Member States and sectors increase and GDP in those countries exceeds the baseline projections as a result (Figure 33) This is mainly because carbon tax revenues are recycled via income tax reductions which are not part of production costs However energy exporting economies such as Russia or South Africa will lose exports if EU demand for fossil fuel imports declines The development of all EU Member States is shown in Figure 34
Employment impacts of scenario S2H are positive for almost all EU Member States as lower labour
costs increase labour demand and labour intensity (Figure 35) The highest absolute increases are shown for Germany the Netherlands Italy and the United Kingdom For EU-27 as a whole employment will be almost one million higher than in the corresponding baseline BH in 2020
The scenarios have not been designed with a view to meeting the EU renewables target of a 20 renewables share in final energy consumption in 2020 Nevertheless the scenarios provide some interesting insights The share is projected to increase from around 10 in 2009 to above 14 even in the baseline as instruments such as feed in tariffs and biofuel quotas will continue In scenario S1H the target will be missed with around 18 in 2020 Only in scenarios S2H S2HE and S2HI is the target met (approximately 20 )
Environmental tax reform in Europe opportunities for eco-innovation
Modelling of ETR impacts on eco-innovation
32
Under scenario S2H energy-related carbon emissions are reduced in all EU Member States relative to the baseline (Figure 36) The highest percentage reductions can be seen in many of the EU-12 Member States with still high energy intensity and low energy prices In these countries the relative price increase is higher than in countries like Germany or the United Kingdom with already high energy taxes and overall energy prices
Additional ETS revenues material tax revenues and carbon tax revenues from the industry sector are recycled back to industry via reductions in employers social security contributions (or wage subsidies in some countries) The revenues from the carbon tax on households set out in Table 32 (totalling 033 of GDP in Germany for example) are used to reduce income tax For the EU-27 overall revenues from ETS and ETR reach about 2 of GDP in 2020 although these figures may be excessive because additional EU efforts to increase energy
efficiency and renewable energy which will reduce the ETS price are not taken into account The use of flexible tools such as the Clean Development Mechanism will further reduce the revenues and earmarking of part of the revenues for mitigation and adaptation measures in emerging and developing countries limits the recycling into labour costs
In addition the scenarios do not take the current global economic problems into account According to the IEA (2009) the downturn will also reduce carbon emissions in the long run which will lead to lower carbon prices and revenues to reach fixed targets (or make tighter targets less costly)
The ETR will have varying effects on the prices of different sorts of products and services Material or carbon taxes increase the prices of product groups according to their direct and indirect material and carbon content The recycling mechanism reduces
Figure 36 Energy-related CO2 emissions in 2020 under scenario S2H mdash deviation from the baseline (BH)
WorldEU-27
EU-15Romania
BulgariaSlovenia
MaltaLithuania
LatviaEstonia
CyprusSlovakia
PolandHungary
Czech RepublicUnited Kingdom
SwedenSpain
PortugalNetherlands
ItalyIreland
GreeceFrance
FinlandDenmark
LuxembourgBelgium
AustriaGermany
ndash 25 ndash 20 ndash 15 ndash 10 ndash 5 0
Percentage deviation from the baseline (BH)
Modelling of ETR impacts on eco-innovation
Environmental tax reform in Europe opportunities for eco-innovation 33
Table 32 Additional ETS and environmental tax revenues in 2020 ( of GPD)
S2H Germany United Kingdom EU-27
ETS revenues 083 064 059
Carbon tax (industry) 052 044 054
Carbon tax (households) 033 041 036
Material tax 041 029 056
Sum 209 178 205
Figure 37 Total primary energy supply in 2020 under scenario S2H mdash deviation from the baseline (BH)
WorldEU-27EU-15
RomaniaBulgaria
Slovenia
MaltaLithuania
LatviaEstonia
Cyprus
SlovakiaPoland
HungaryCzech Republic
United KingdomSweden
SpainPortugal
NetherlandsItaly
IrelandGreece
FranceFinland
DenmarkLuxembourg
BelgiumAustria
Germany
ndash 24 ndash 21 ndash 18 ndash 15 ndash 12 ndash 9 ndash 6 ndash 3 0
Percentage deviation from the baseline (BH)
Environmental tax reform in Europe opportunities for eco-innovation
Modelling of ETR impacts on eco-innovation
34
Figure 38 Output price impacts of scenario S2H in Germany in 2020 mdash deviations from the baseline (BH)
Figure 39 Impacts of scenario S2H on industrial output in 2020 in Germany mdash deviations from the baseline (BH)
ndash 5
0
5
10
15
20
Output prices
Percentage deviation from the baseline (BH)
(3) F
ood
(4) T
extiles
(5) W
ood
(6) P
ulp pap
er
(7) C
oke re
fined
petro
leum
pro
ducts
(8) C
hemica
ls ex
cl pha
rma
(9) P
harm
aceu
ticals
(10)
Rub
ber a
nd plastics
(11)
Non
-metallic
miner
als
(12)
Iron
and
steel
(13)
Non
-ferrou
s metals
(14)
Met
al pro
ducts
(15)
Mac
hine
ry and
equ
ipmen
t
(16)
Office
mac
hine
ry
(17)
Electric
al m
achine
ry
(18)
Rad
io T
V
(19)
Med
ical pr
ecisi
on and
opt
ical ins
trumen
ts
(20)
Mot
or veh
icles
(21)
Ships
(22)
Airc
raft
(23)
Railro
ad
(24)
Man
ufac
turin
g n
ec r
ecyc
ling
(25)
Electric
ity g
as w
ater
sup
ply
(26)
Con
stru
ction
(27)
Tra
de r
epairs
(28)
Hot
els an
d re
stau
rant
s
(29)
Tra
nspo
rt an
d stor
age
(30)
Pos
t and
teleco
mmun
icatio
ns
(31)
Finan
ce ins
uran
ce
(32)
Rea
l estate ac
tivities
(33)
Ren
ting
(34)
Com
puter
(35)
Res
earch an
d de
velopm
ent
(36)
Oth
er bus
ines
s ac
tivities
(37)
Pub
lic ser
vice
s
(38)
Edu
catio
n
(39)
Hea
lth and
soc
ial w
ork
(40)
Oth
er ser
vice
s
(41)
Priv
ate ho
useh
olds
(1) A
gricu
lture
(2) M
ining an
d qu
arry
ing
nec not elsewhere classified
Production
ndash 100
ndash 80
ndash 60
ndash 40
ndash 20
00
20
40
60
80Percentage deviation from the baseline (BH)
(3) F
ood
(4) T
extiles
(5) W
ood
(6) P
ulp pap
er
(7) C
oke re
fined
petro
leum
pro
ducts
(8) C
hemica
ls ex
cl pha
rma
(9) P
harm
aceu
ticals
(10)
Rub
ber a
nd plastics
(11)
Non
-metallic
miner
als
(12)
Iron
and
steel
(13)
Non
-ferrou
s metals
(14)
Met
al pro
ducts
(15)
Mac
hine
ry and
equ
ipmen
t
(16)
Office
mac
hine
ry
(17)
Electric
al m
achine
ry
(18)
Rad
io T
V
(19)
Med
ical pr
ecisi
on and
opt
ical ins
trumen
ts
(20)
Mot
or veh
icles
(21)
Ships
(22)
Airc
raft
(23)
Railro
ad
(24)
Man
ufac
turin
g n
ec r
ecyc
ling
(25)
Electric
ity g
as w
ater
sup
ply
(26)
Con
stru
ction
(27)
Tra
de r
epairs
(28)
Hot
els an
d re
stau
rant
s
(29)
Tra
nspo
rt an
d stor
age
(30)
Pos
t and
teleco
mmun
icatio
ns
(31)
Finan
ce ins
uran
ce
(32)
Rea
l estate ac
tivities
(33)
Ren
ting
(34)
Com
puter
(35)
Res
earch an
d de
velopm
ent
(36)
Oth
er bus
ines
s ac
tivities
(37)
Pub
lic ser
vice
s
(38)
Edu
catio
n
(39)
Hea
lth and
soc
ial w
ork
(40)
Oth
er ser
vice
s
(41)
Priv
ate ho
useh
olds
(1) A
gricu
lture
(2) M
ining an
d qu
arry
ing
nec not elsewhere classified
Modelling of ETR impacts on eco-innovation
Environmental tax reform in Europe opportunities for eco-innovation 35
social security contributions and lowers labour costs according to the direct and indirect labour content of sector output The ETR therefore reduces output prices in labour-intensive service sectors and increases prices in carbon- and material-intensive industry sectors
The example of Germany shows insignificant impacts in the trade-intensive sectors of machinery (15ndash17) motor vehicles (20) and other transport equipment (21ndash23) (Figure 38) Iron and steel (12) and chemicals without pharmaceuticals (8) face the highest price increases of trade-intensive sectors As the German iron and steel industry primarily delivers high quality steel to the German car industry and increasingly to the German windmill industry negative competitiveness impacts will be limited Exchange rate variations against non-EU competitors have been much higher in the past
The higher prices of carbon- and material-intensive products will reduce price competitiveness on export markets and increase the market share for imports in domestic markets This loss of price competitiveness is based on an assumption of limited market development of energy efficiency and RES technologies in other part of the world It will be offset by gains in labour-intensive sectors if the ETR causes real wage costs per unit of output to fall as a result of using recycled revenues to reduce employer social security contributions
Any improvement in non-price competitiveness will also raise exports The extra employment will raise incomes raising consumption and output
The overall impact on sector output depends on countervailing effects which are negative for iron and steel and a few service sectors and positive for a few industry sectors For most industries the output effect is insignificant (Figure 39) The greatest impact is felt by producers of fossil fuels who must obviously reduce production due to lower demand for their products
Under scenario S2H employment impacts are positive for most sectors relative to the baseline as labour productivity decreases and wage rates fall in relation to consumer prices (CPI) and output prices (Table 33) The relative costs of labour are lower than in the baseline without the ETR reform Only around a quarter of the employment increase takes place in industry
Concerning the wage rate two countervailing effects have to be considered First when the labour market is characterised in terms of the real wage bargaining model as in E3ME and GINFORS with market power on both sides (employers and trade unions) consumer price increases will lead to wage increases (the econometrically estimated factor is 085 for Germany) Second labour productivity is another important factor for wage bargaining The estimated elasticity for Germany is 063 meaning that a 1 increase of labour productivity leads to wage increases of 063 Higher labour demand due to lower labour costs thus reduces the wage increase In the end the German economy is more labour intensive than without the ETR partly due to the structural change towards labour-intensive industries
Table 33 Employment impacts of scenario S2H in Germany mdash deviations from scenario S2H in 2020
Employment in 2020 Deviation from S2H () Deviation from S2Habsolute (1 000s)
Agriculture forestry 24 90
Industry 09 653
Non-metallic minerals 24 62
Iron and steel ndash 28 ndash 37
Machinery and equipment 05 56
Electrical machinery 04 18
Construction 37 449
Trade and transport 10 829
Business services 17 767
Other services ndash 02 ndash 216
Total 07 2506
Environmental tax reform in Europe opportunities for eco-innovation
Modelling of ETR impacts on eco-innovation
36
Additional exports under scenario S2HE mainly create new jobs in machinery and related business services (Table 34) Under scenario S2HI a shift in the input structure of the energy sector leads to a shift in the industry structure and creates a few jobs in the service sector (Table 35)
34 Conclusions of the scenario assessment
The foregoing analysis used the GINFORS model to assess economic and environmental impacts of using the ETS and ETR to reach the EUs 2020
GHG targets In general the results show positive employment effects and only small negative impacts on GDP in EU-27 Member States The economic impacts depend on the levels of international energy prices the mechanism used to recycle revenues and country specifics such as carbon and energy intensity and the structure of energy consumption
Although there is significant evidence that eco-innovation is positively driven by higher energy prices quantification is difficult The present study included simulations of possible impacts of a shift in the industry structure towards renewable energy in the electricity sector and an overall increase of EU
Table 34 Employment impacts of scenario S2HE in 2020 in Germany mdash deviations from scenario S2H
Employment in 2020 Deviation from S2H () Deviation from S2Habsolute (1 000s)
Agriculture forestry ndash 01 ndash 02
Industry 03 194
Non-metallic minerals 02 05
Iron and steel 04 05
Machinery and equipment 13 130
Electrical machinery 24 117
Construction 01 18
Trade and transport 00 26
Business services 07 308
Other services 01 107
Total 02 634
Table 35 Employment impacts of scenario S2HI in 2020 in Germany mdash deviations from scenario S2H
Employment in 2020 Deviation from S2H () Deviation from S2Habsolute (1 000s)
Agriculture forestry ndash 01 ndash 02
Industry 00 00
Non-metallic minerals 25 65
Iron and steel ndash 27 ndash 36
Machinery and equipment 08 78
Electrical machinery 04 19
Construction ndash 00 ndash 04
Trade and transport 00 07
Business services 02 115
Other services 0 56
Total 00 167
Modelling of ETR impacts on eco-innovation
Environmental tax reform in Europe opportunities for eco-innovation 37
exports due to higher global demand for renewable energy The main results can be summarised as follows
bull environmentaltaxreformshiftingtaxesfromlabour to energy and resources will create additional jobs and trigger eco-innovation
bull impactsofeco-innovationintheformofadditional EU exports or shifts in industry structures will have a slight positive influence on GDP and create a smaller number of additional jobs
These findings correspond to results from the EmployRES study (Fraunhofer ISI et al 2009) As ETR is directly aimed at reducing labour costs it will create additional jobs in the short and medium term In the longer term the cost reduction and new technologies arising from eco-innovation will play a larger role
Like all fiscal reforms a major ETR in Europe will create winners and losers At the sector level carbon- and material-intensive industries will face economic losses At the country level the carbon-intensity and overall flexibility of economies is important Clearly structural change away from carbon-intensive industries together with technological change is inherent in any successful climate mitigation policy
On the other hand several factors can smooth these structural adjustments International cooperation
will reduce economic pressure on countries and sectors In addition ETR together with auctioning of ETS allowances can be a major source of revenues for EU Member States in the future even if part of the revenues will have to be earmarked for adaptation and mitigation measures in developing countries Indeed future debate on grandfathering or auctioning ETS allowances should reflect the important point that giving allowances away for free denies countries the money to ease structural change and invest in low-carbon technologies
Caution is needed in relating the findings of this study to the EU policy debate In the model simulations the single carbon price is the only instrument used to reach the EUs 2020 GHG targets In reality of course other renewable energy and efficiency policies will also contribute to carbon reduction and have to be taken into account when comparing the results (especially the high carbon prices) to other studies Both reduce the potential revenues from fossil energy carriers and carbon emissions
A variety of renewable energy and efficiency policies could enable the climate and energy targets to be met while securing even better economic prospects The results of the present study clearly indicate that the discussion on market-based instruments should be intensified Ultimately however the EU will need a rich mix of policies to reach its GHG targets while maximising prosperity
Environmental tax reform in Europe opportunities for eco-innovation38
References
Almon C 1991 The INFORUM Approach to Interindustry Modeling in Economic Systems Research Vol 3 pp 1ndash7
Amin A and Cohendet P 2004 The Architecture of Knowledge Firms Capabilities and Communities Oxford University Press Oxford
Barker T Meyer B Pollitt H and Lutz C 2007a Modelling Environmental Tax Reform in Germany and the United Kingdom with E3ME and GINFORS petre Working Paper Cambridge and Osnabrueck (httpwwwpetreorgukpapershtm) accessed 15 February 2011
Barker T Junankar S Pollitt H and Summerton P 2007b Carbon leakage from unilateral environmental tax reforms in Europe 1995ndash2005 Energy Policy Vol 35 pp 6 281ndash6 292
Brunnermeier S B and Cohen M A 2003 Determinants of environmental innovation in US manufacturing industries Journal of Environmental Economics and Management Vol 45 pp 278ndash293
Buen J 2006 Danish and Norwegian wind industry The relationship between policy instruments innovation and diffusion Energy Policy Vol 34 (18) pp 3 887ndash3 897
Carlsson B and Stankiewicz R 1991 On the nature function and composition of technological systems Journal of Evolutionary Economics Vol 1 (2) pp 93ndash118
Christiansen A C and Skjaerseth J B 2005 Climate change policies in Norway and the Netherlands Different instruments similar outcome Energy and Environment Vol 16(1) pp 1ndash25
Dosi G 1988 Sources procedures and microeconomic effects of innovation Journal of Economic Literature Vol 26 pp 1 120ndash1 171
de Vries F and Medhi N 2008 Environmental regulation and international innovation in automotive emissions control technologies in Environmental Policy Technological Innovation and Patents Organisation for Economic Cooperation and Development Paris
DG TREN 2008 European energy and transport mdash trends to 2030 mdash update 2007 European Commission Luxembourg
DTI 2004 Renewable Supply Chain Gap Analysis UK Department of Trade and Industry
Edler J (ed) 2006 Nachfrageorientierte Innovationspolitik Buumlro fuumlr Technikfolgenabschaumltzung beim Deutschen Bundestag (TAB) Arbeitsbericht Nr 99 Berlin
Edquist C 2001 The system of innovation approach and innovation policy an account of the state of the art lead paper presented at the DRUID Conference 12ndash15 June 2001 Aalborg (httpwwwdruiddkconferencesnwpaper1edquistpdf) accessed 15 February 2011
EEA 2006 Using the market for cost-effective environmental policy Market-based instruments in Europe EEA Report No 12006 European Environment Agency Copenhagen
Ekins P 2009 Resource Productivity Environmental tax Reform and Sustainable Growth in Europe published by the Anglo-German Foundation for the Study of Industrial Society Final report (httpwwwpetreorgukpdfFinRepFinpdf) accessed 12 October 2011
Ekins P and Speck S (eds) 2011 Environmental Tax Reform (ETR) A Policy for Green Growth Oxford University Press
EREC 2008 Energy [r]evolution A sustainable global energy outlook Greenpeace International European Renewable Energy Council (EREC)
References
References
Environmental tax reform in Europe opportunities for eco-innovation 39
Fagerberg J Mowery D C and Nelson R R (eds) 2005 The Oxford Handbook of Innovation Oxford University Press Oxford
Fischer C Parry I W H and Pizer W A 2003 Instrument choice for environmental protection when technological innovation is endogenous Journal of Environmental Economics and Management Vol 45 pp 523ndash545
Fraunhofer ISI ECOFYS Energy Economics Group Ruumltter + Partner SEURECO and LEI 2009 EmployRES mdash The impact of renewable energy policy on economic growth and employment in the European Union European Commission Brussels
Frondel M Horbach J and Rennings K 2008 What triggers environmental management and innovation Empirical evidence for Germany Ecological Economics Vol 66(1) pp 153ndash160
GHK Cambridge Econometrics and IEEP 2007 Links between the environment economy and jobs Final Report submitted to DG Environment European Commission
Giljum S Behrens A Hinterberger F Lutz C and Meyer B 2008 Modelling scenarios towards a sustainable use of natural resources in Europe Environmental Science and Policy Vol 11 pp 204ndash216
Goumlrlach B Knigge M and Luumlckge H 2005 Wirkungen der Oumlkologischen Steuerreform auf Innovation und Marktdurchdringung Ecologic Berlin (httpecologiceudownloadprojekte1850-189918791879_5_innovationpdf) accessed 18 August 2011
Green M A 2000 Photovoltaics technology overview Energy Policy Vol 28 (14) pp 989ndash998
Grossmann A Lehr U Lutz C and Wolter MI 2008 Gesamtwirtschaftliche Effekte der Umsetzung der EU Ziele im Bereich Erneuerbare Energien und Gebaumludeeffizienz in Oumlsterreich bis 2020 Studie im Auftrag des Lebensministeriums Wien 0508
Hage J and Hollingsworth J R 2000 Idea innovation networks a strategy for integrating organizational and institutional analysis Organization Studies Vol 21 (5) pp 971ndash1 004
Hauschildt J 2004 Innovationsmanagement Vahlen Muumlnchen
Hemmelskamp J 1997 Environmental policy instruments and their effects on innovation European Planning Studies Vol 5 (2) pp 177ndash195
Hoglund Isaksson L 2005 Abatement costs in response to the Swedish charge on nitrogen oxide emissions Journal of Environmental Economics and Management Vol 50 pp 102ndash120
Hullmann A 2001 Internationaler Wissenstransfer und technischer Wandel (dissertation) Physica-Verlag Heidelberg
IEA 2008 World Energy Outlook 2008 International Energy Agency Paris
IEA 2009 World Energy Outlook 2009 International Energy Agency Paris
Jacobsson S Andersson B A and Baringngens L 2002 Transforming the energy system mdash the evolution of the German technological system for solar cells Science and Technology Policy Research University of Sussex Electronic Working Paper Series No 84 (httpideasrepecorgpsrussewps84html) accessed 18 August 2011
Jaffe A and Stavins R 1995 Dynamic incentives of environmental regulations the effects of alternative policy instruments on technology diffusion Journal of Environmental Economics and Management Vol 29(3) pp 43ndash63
Jaffe A B and Palmer K 1997 Environmental regulation and innovation a panel data study The Review of Economics and Statistics Vol 79 pp 610ndash619
Jaffe A B Newell R G and Stavins R N 2002 Environmental policy and technological change Environmental and Resource Economics Vol 22 (1ndash2) 2002 pp 41ndash70
Johnstone N and Hascic I 2008 Renewable energy policies and technological innovation energy source and instrument choice in Environmental Policy Technological Innovation and PatentsOrganisation for Economic Co-operation and Development Paris
Johnstone N 2005 The Innovation Effects of Environmental Policy Instruments in Horbach J (ed) Indicator Systems for Sustainable Innovation Physica-Verlag HD
Environmental tax reform in Europe opportunities for eco-innovation
References
40
Johnstone N Hascic I and Ostertag K 2008 Environmental policy technological innovation and patent activity in Environmental Policy Technological Innovation and Patents Organisation for Economic Co-operation and Development Paris
Jung C Krutilla K and Boyd R 1996 Incentives for advanced pollution abatement technology at the industry level an evaluation of policy alternatives Journal of Environmental Economics and Management Vol 30(1) pp 95ndash111
Kammen D M Kapidia K and Fripp M 2004 Putting renewables to work how many jobs can the clean energy industry generate University of California Berkeley
Kemp R 1997 Environmental policy and technical change ndash a comparison of the technological impact of policy instruments Edward Elgar Cheltenham
Kemp R 1998 The diffusion of biological waste-water treatment plants in the Dutch food and beverage industry Environmental and Resource Economics Vol 12 pp 113ndash136
Kemp R 2000 Technology and environmental policy ndash innovation effects of past policies and suggestions for improvement in OECD proceedings ndash innovation and the environment Organisation for Economic Co-operation and Development Paris
Kerr S and Newell R G 2003 Policy-induced technology adoption evidence from the US lead phasedown Journal of Industrial Economics Vol 51 pp 317ndash343
Klaassen G Miketa A Larsen K and Sundqvist T 2005 The impact of RampD on innovation for wind energy in Denmark Germany and the United Kingdom Ecological Economics Vol 54 pp 227ndash240
Kline S and Rosenberg N 1986 An overview of innovation in Landau R (ed) The positive sum strategy Harnessing technology for economic growth pp 275-306
Knigge M and Goumlrlach B 2005 Effects of Germanys ecological tax reforms on the environment employment and technological innovation Ecologic Berlin (httpwwwumweltbundesamtdeuba-info-presse-ehintergrundoekosteuerpdf) accessed 18 August 2011
Langniss O 2003 Governance structures for promoting renewable energy sources dissertation Lund Stuttgart
Lanjouw J O and Mody A 1996 Innovation and the international diffusion of environmentally responsive technology Research Policy Vol 25 pp 549ndash571
Lehr U Nitsch J Kratzat M Lutz C and Edler D 2008 Renewable Energy and Employment in Germany Energy Policy Vol 36 pp 108ndash117 DOI101016jenpol200709004
Lehr U Wolter MI and Groszligmann A 2009 Economic impacts of RES obligations in Austria ndash an application of the macro-econometric model e3at GWS Discussion Paper 20091 Osnabruumlck
Lundvall B-A Johnson B Andersen E S and Dalum B 2001 National systems of production innovation and competence building Research Policy Vol 31 pp 213ndash231
Lutz C and Giljum S 2009 Global resource use in a business as usual world until 2030 Updated results from the GINFORS model in Bleischwitz R Welfens Pand Zhang Z (eds) Sustainable growth and resource productivity ndash economic and global policy issues Greenleaf Publishers pp 30ndash41
Lutz C and Meyer B 2008 Beschaumlftigungseffekte des Klimaschutzes in Deutschland Untersuchungen zu gesamtwirtschaftlichen Auswirkungen ausgewaumlhlter Maszlignahmen des Energie- und Klimapakets Forschungsbericht 205 46 434 Dessau-Roszliglau
Lutz C and Meyer B 2009a Environmental and Economic Effects of Post-Kyoto Carbon Regimes Results of Simulations with the Global Model GINFORS Energy Policy Vol 37 pp 1 758ndash1 766 DOI 101016jenpol200901015
Lutz C and Meyer B 2009b Scenario results from GINFORS PETRE working paper Osnabruumlck
Lutz C Meyer B Nathani C and Schleich J 2005 Endogenous technological change and emissions The case of the German steel industry Energy Policy Vol33 pp 1 143ndash1 154
Lutz C Meyer B Nathani C and Schleich J 2007 Endogenous innovation economy and environment impacts of a technology based modelling approach for energy-intensive industries in Germany Energy Studies Review Vol 15(1) pp 2ndash18
References
Environmental tax reform in Europe opportunities for eco-innovation 41
Lutz C Meyer B and Wolter M I 2009 The global multisectormulticountry 3-E model GINFORS mdash a description of the model and a baseline forecast for global energy demand and CO2 emissions Journal of Sustainable Development forthcoming
Malerba F and Orsenigo L 1997 Technological Regimes and Sectoral Patterns of Innovative Activities Industrial and Corporate Change Vol 6 (1) pp 83ndash117
Malerba F 1992 Learning by Firms and Incremental Technical Change The Economic Journal Vol 102 (413) pp 845ndash859
Malerba F 2005 Industrial dynamics and innovation progress and challenges Presidential Address delivered at the 32nd Conference of the European Association for Research in Industrial Economics (EARIE) 1ndash4 September 2005 Porto
Malerba F 2006 Innovation and the evolution of industries Journal of Evolutionary Economics Vol 16 pp 3ndash23
McGinty M and de Vries F P 2009 Technology diffusion product differentiation and environmental subsidies The BE Journal of Economic Analysis and Policy Vol 9(1)
Meyer B and Lutz C 2007 The GINFORS model ndash model overview and evaluation Petre Working Paper Osnabruumlck (httpwwwpetreorgukpapershtm) accessed 18 August 2011
Meyer B Lutz C Schnur P and Zika G 2007 Economic policy simulations with global interdependencies a sensitivity analysis for Germany Economic Systems Research Vol 19 pp 37ndash55
Mickwitz P H Hyvaumlttinen and P Kivimaa 2008 The role of policy instruments in the innovation and diffusion of environmentally friendlier technologies popular claims versus case study experiences Journal of Cleaner Production Vol 16(1S1) 162ndash170
Miketa A and Schrattenholzer L 2004 Experiments with a methodology to model the role of RampD expenditures in energy technology learning processes first results Energy Policy Vol 32 (15) pp 1 679ndash1 692
Milliman S R and Prince R 1989 Firm incentives to promote technological change in pollution control Journal of Environmental Economics and Management Vol 17 pp 247ndash265
Millock K and Nauges C 2006 Ex-post evaluation of an earmarked tax on air pollution Land Economics Vol 82(1) pp 68ndash84
Montero J-P 2002 Market structure and environmental innovation Journal of Applied Economics Vol 2 pp 293ndash325
Moreno B and Loacutepez A J 2007 The effect of renewable energy on employment mdash The case of Asturias (Spain) Renewable and Sustainable Energy Rewiews doi 101016jrser200610011
Mowery D and Rosenberg N 1979 The influence of market demand upon innovation A critical review of some recent empirical studies Research Policy Vol 8 pp 102ndash153
Newell R G Jaffe A B and Stavins R N 1999 The induced innovation hypothesis and energy-saving technological change Quarterly Journal of Economics Vol 114 pp 941ndash975
Norberg-Bohm V 1999 Stimulating green technological innovation An analysis of alternative policy mechanisms Policy Sciences Vol 32(1) pp 13ndash38
OECD 2009 Sustainable manufacturing and eco-innovation towards a green economy Organisation for Economic Co-operation and Development Policy Brief June 2009
OECD 2010 Taxation innovation and the environment Organisation for Economic Co-operation and Development
Pavitt K 1984 Sectoral patterns of technological change Towards a taxonomy and a theory Research Policy Vol 13 pp 343ndash373
Popp D 2002 Induced innovation and energy prices The American Economic Review Vol 92(1) pp 160ndash180
Popp D 2005 Lessons from patents Using patents to measure technological change in environmental models Ecological Economics Vol 54 pp 209ndash226
Environmental tax reform in Europe opportunities for eco-innovation
References
42
Porter M and van der Linde C 1995 Toward a new conception of the environment competitiveness relationship Journal of Economic Perspectives Vol 9(4) pp 97ndash118
Rammert W 2002 The cultural shaping of technologies and the politics of technodiversity In Sorensen K and Williams R (eds) Shaping technology guiding policy concepts spaces and tools Elgar Cheltenham pp 155-172
Requate T 2005 Dynamic incentives by environmental policy instruments ndash a survey Ecological Economics Vol 54 pp 175ndash195
Roloff N Lehr U Krewitt W Fuchs G Wassermann S Weimer-Jehle W and Schmidt B 2008 Success determinants for technological innovations in the energy sector mdash the case of photovoltaics in Moumlst D Fichtner W Ragwitz M and Veit D (eds) New methods for energy market modelling mdash Proceedings of the first european workshop on energy market modelling using agent-based computational economics Universitaumltsverlag Karlsruhe
Rothwell R 1995 The fifth generation innovation process in Oppenlaumlnder KH Popp W (eds) Innovationen und wirtschaftlicher Fortschritt betriebs-und volkswirtschaftliche Perspektiven Bern pp 9ndash26
Schumpeter J 1942 Capitalism socialism and democracy New York Harper
Skjaeligrseth J B and Christiansen A C 2005 Environmental policy instruments and technological change in the energy sector findings from comparative empirical research Energy and Environment Vol 17 (2) pp 223ndash241
Snyder L D Miller N H and Stavins R N 2003 The effects of environmental regulations on pollution emissions evidence from plant-level data American Economic Review Vol 93(2) pp 431ndash435
Technopolis 2008 Eco-innovation Final Report for Sectoral Innovation Watch (httpwwwtechnopolis-groupcomresourcesdownloads661_report_finalpdf) accessed 18 August 2011
Volleburgh H 2007 Impacts of environmental policy instruments on technological change Report for Joint Meetings of Tax and Environment Experts OECD Environment Directorate February 2007 (comenvepocctpacfa(2006)36final)
Zimmermann H Wohltmann M and Hansjuumlrgens B 1996 Umweltabgaben und Innovation Analytica Marburg
43
Annex 1
Environmental tax reform in Europe opportunities for eco-innovation
Type Instrument Area Stage
Reference
Theo
retica
l
Em
piric
al
Cas
e st
udy
Rev
iew
Qual
itat
ive
Taxe
s
Perm
its
Subsi
die
s
Volu
nta
ry
Com
man
d
Reg
ula
tion
Ener
gy
Air
Wat
er
Oth
er
Gen
eral
Innov
atio
n
Diffu
sion
Rel
evan
ce
Brunnermeier amp Cohen (2003)
X X X X
Buen (2006) X X X X X X
Christiansen amp Skjaerseth (2005)
X X X X X X
Fischer et al (2003 X X X X X X
Frondel et al (2008) X X X X X X X (X) (X)
Hemmelskamp (1997)
X X X X X X X (X)
Hoglund Isaksson (2005)
X X X (X) (X)
Jaffe amp Stavins (1995)
X X X1 X X X X
Jaffe amp Palmer (1997)
X X X X
Jaffe et al (2002) X X X X X X X X X X
Jung et al (1996) X X X X X X (X) (X)
Kemp (1998) X X X X
Kerr amp Newell (2001) X X X X X
Klaassen et al (2005)
X X X X X
Lanjouw amp Mody (1996)
X X X X X X X
McGinty amp de Vries (2009)
X X X X
Mickwitz et al (2008)
X X X X X X X X X
Milliman amp Prince (1989)
X X X X X X X
Millock amp Nauges (2006)
X X X X X X
Montero (2002) X X X X X
Newell et al (1999) X X1 X X X
Norberg-Bohm (1999)
X X X X X X X
Popp (2002) X X1 X X
Popp (2005) X X X X X X
Porter amp van der Linde (1995)
X X X X X X
Requate (2005) X X X X X X X
Skjaeligrseth amp Christiansen (2005)
X X X X X X X X X
Snyder et al (2003) X X X X X
Annex 1 Classification of refereed journal articles
Environmental tax reform in Europe opportunities for eco-innovation44
Annex 2
Type Instrument Area Stage
Reference
Theo
retica
l
Em
piric
al
Cas
e st
udy
Rev
iew
Qual
itat
ive
Taxe
s
Perm
its
Subsi
die
s
Volu
nta
ry
Com
man
d
Reg
ula
tion
Ener
gy
Air
Wat
er
Oth
er
Gen
eral
Innov
atio
n
Diffu
sion
Rel
evan
ce
Johnstone (2005)
X X X X X X X
Johnstone amp Hascic (2008)
X X X X X X X X
Kemp (1997) X X X X X X X X X X X X X
Kemp (2000) X X X X X X X X X
de Vries amp Medhi (2008)
X X1 X X X
Annex 2 Classification of books and book chapters
45
Annex 3
Environmental tax reform in Europe opportunities for eco-innovation
Type Instrument Area Stage
Reference
Theo
retica
l
Em
piric
al
Cas
e st
udy
Rev
iew
Qual
itat
ive
Taxe
s
Perm
its
Subsi
die
s
Volu
nta
ry
Com
man
d
Reg
ula
tion
Ener
gy
Air
Wat
er
Oth
er
Gen
eral
Innov
atio
n
Diffu
sion
Rel
evan
ce
Goumlrlach et al (2005)
X X X X X X
Knigge amp Goumlrlach (2005)
X X X X X X
Technopolis (2008)
X X X X X X
Volleburgh (2007)
X X X X X X X X X X X
Annex 3 Classification of reports
European Environment Agency
Environmental tax reform in Europe opportunities for eco-innovation
2011 mdash 45 pp mdash 21 x 297 cm
ISBN 978-92-9213-238-5doi10280084889
How to obtain EU publications
Publications for salebull viaEUBookshop(httpbookshopeuropaeu)bull fromyourbooksellerbyquotingthetitlethepublisherandorISBNnumberbull bycontactingoneofoursalesagentsdirectlyYoucanobtaintheircontactdetails
on the Internet (httpbookshopeuropaeu) or by sending a fax to +352 2929-42758
Free publicationsbull viaEUBookshop(httpbookshopeuropaeu)bull attheEuropeanCommissionsrepresentationsordelegationsYoucanobtain
their contact details on the Internet (httpeceuropaeu) or by sending a fax to +352 2929-42758
European Environment AgencyKongens Nytorv 61050 Copenhagen KDenmark
Tel +45 33 36 71 00Fax +45 33 36 71 99
Web eeaeuropaeuEnquiries eeaeuropaeuenquiries
TH
-AK-1
1-0
17-E
N-N
doi1
02
8008
4889
- Acknowledgements
- Executive summary
- 1Introduction
-
- 11Background
- 12ETR and innovation
- 13Report structure
-
- 2Review of literature on environmental tax reform and eco‑innovation
-
- 21Initial screening
- 22Detailed review
- 23Environmental regulation studies
- 24Theoretical studies
- 25Empirical studies
- 26Case studies
- 27Conclusions
-
- 3Modelling of ETR impacts on eco‑innovation
-
- 31Scenarios assessing the implications of ETR for eco-innovation
- 32Overview of modelling results
- 33Macroeconomic impacts at the national level
- 34Conclusions of the scenario assessment
-
- References
- Annex 1 Classification of refereed journal articles
- Annex 2Classification of books and book chapters
- Annex 3Classification of reports
-
Review of literature on environmental tax reform and eco-innovation
Environmental tax reform in Europe opportunities for eco-innovation 11
The most common input indicator is RampD expenditure but it has several shortcomings While public sector RampD expenditure data is generally available private sector data are incomplete and usually only available at the aggregate level making it difficult (or impossible) to identify environment-related RampD expenditure Furthermore given the inherent uncertainty of the innovation process the link between effort and resulting outputs is often very weak
As a result output indicators such as patent applications are likely to provide a better method to measure eco-innovation Patent application data provide a reasonably comprehensive picture of innovative outputs (4) they are based on objective standards that change slowly and they are readily available Their main advantage however is the fact that patent applications are classified into detailed technologies using the International Patent Classification (IPC) system developed by the World Intellectual Property Organisation This allows environment-related patents to be identified and broken down between different application areas such as climate change air pollution water pollution and waste management
Impact indicators (also termed progress indicators) are more relevant to the diffusion stage and include increases in market penetration of particular eco-technologies and reductions in (marginal) abatement costs (5) However it should be noted that cost reductions can be driven by a range of factors and may not necessarily imply that innovation has occurred
21 Initial screening
Potential references were identified based on a review of journal citations internet searches using keywords and recommendations from within the project team The references fall into three broad groups
bull refereedjournalarticlesbull booksandbookchaptersbull reportsbyconsultantsandexperts
In total 37 potential references were identified the majority (28) being refereed journal articles The references were then classified according to four criteria type of study policy instrument(s) covered policy area and technological development stage On the basis of this classification each reference was then assessed in terms of its relevance
Types of study
A distinction is made between five different types of study
bull Theoretical studies use mathematical models to assess the impacts of idealised policy instruments on firms innovative behaviour under alternative assumptions about market structure and different parameter values In most cases the studies consider several alternative instruments and are interested in the relative ranking of the instruments either in terms of the amount of innovation that they induce or in terms of the resulting levels of social welfare
bull Empirical studies use a range of statistical and econometric techniques to analyse quantitative performance data in order to assess the impacts of actual policy interventions Given the relative scarcity of environmental taxes in the past there are few direct empirical studies focusing on them However a number of studies consider the impacts of changes in energy prices which give an indirect indication of the potential impact of taxation
bull Reviews summarise or compare the findings of previous studies (either theoretical or empirical) and may synthesise them to draw wider conclusions
bull Case studies provide descriptive assessments of actual experiences often comparing across countries
bull Qualitative studies consider some of the issues that can affect the performance of a particular policy instrument in practice
Together these last two types of study can provide valuable insights on the practical and political economy aspects of instrument performance to supplement the theoretical and empirical analyses
(4) While a patent may prevent rival firms from using an innovation (without paying royalties) it has the disadvantage of putting it into the public domain In some cases firms may prefer to keep the innovation secret rather than apply for patent protection
(5) More precisely the indicator of abatement is a shift in the abatement cost curves which reduces the cost of a fixed amount of abatement Reductions in abatement costs due to movements along the cost curve (ie due to changes in the level of abatement) do not provide an indicator of innovation
Environmental tax reform in Europe opportunities for eco-innovation
Review of literature on environmental tax reform and eco-innovation
12
Policy instrument addressed
The second classification criterion concerns the policy instruments that are addressed by the study with a distinction being made between five specific instrument types
The first three are market-based or price-based instruments environmental taxes and charges tradable permits and investment subsidies and tax allowances All three act by changing the prices of input factors in one way or another As has been noted above some studies consider the impact of energy prices rather than energy taxes However since the findings of these studies are directly transferable they are classified under the tax heading
The fourth instrument type is voluntary or negotiated agreements under which firms or sectors enter into agreements with government to achieve certain performance targets or undertake specific actions
The fifth type is command and control regulations which encompass technology mandates emission limits and performance standards (eg for specific energy consumption)
The final classification regulation is used for studies that consider the weight or stringency of environmental regulation in general rather than a specific policy instrument
Policy area addressed
With regard to the policy area(s) covered by the studies a distinction is made between five areas including energy and climate change air pollution water pollution and other
The final classification general is used for studies that consider the impacts of environmental regulation in general rather than any specific intervention or where the policy area is not specified (eg in theoretical analyses)
Stage of technological development
The final classification criterion concerns the stage of the technological development process that is addressed by the study As has been noted above the process is typically divided into three stages invention innovation and diffusion In practice however the studies do not distinguish between the first two stages (often just referring generically to RampD) They have therefore been combined for the purposes of the classification so that the only distinction is between the innovation and diffusion stages
Results of the classification exercise
Subsequent to classifying the studies each was scored in terms of its relevance to analysing ETRs impacts on eco-innovation A three tier qualitative scoring system was used One star () indicates that the study is of only minor relevance two stars () indicates that it is of moderate relevance and three stars () that it is of significant relevance Such a scoring system is inevitably subjective but it provides a pragmatic mechanism for identifying the key references to be included in the detailed review In determining the scores particular emphasis was placed on whether the study is empirical in nature and whether it considers environmental taxes (or factor prices)
Annex 1 shows the classifications of the 28 journal articles that were identified Thirteen are empirical seven are theoretical three are case studies and four are qualitative while four provide reviews of previous work in the area (including most of the identified studies) (6) Around two-thirds of the papers consider the impact of environmental taxes (or energy prices) often comparing these with the impacts of other policy instruments Eleven consider the impact of investment subsidies
Most of the theoretical analyses are not area-specific (only discussing environmental damage in general terms) The empirical studies are spread fairly evenly across policy areas with five addressing
(6) Some studies are classified under more than one heading For example a study may contain both a theoretical model of behaviour and an empirical assessment of the model
Review of literature on environmental tax reform and eco-innovation
Environmental tax reform in Europe opportunities for eco-innovation 13
energy and climate change five addressing air pollution and three addressing water pollution In terms of the stage of the technological development process there is an even split between innovation and diffusion with many of the papers covering both stages In total eighteen of the references are included in the detailed review
Annex 2 shows the classifications of the five book chapters and Annex 3 covers the four reports (7) As might be expected these sources put less emphasis on theory with only one reference including any formal analysis They are split fairly evenly between empirical studies reviews and qualitative assessments All but one consider the impact of environmental taxes or energy prices while seven consider the impact of investment subsidies As with the journal articles there is a fairly even spread across policy areas and between innovation and diffusion Five of the references are included in the detailed review
22 Detailed review
The detailed review focuses on the impacts on eco-innovation of the two price-based policy instruments that are directly relevant to ETR environmental taxes and investment subsidies and tax incentives (eg RampD and capital allowances) (8) A priori each instrument might be expected to stimulate innovation mdash the first by increasing the benefits of innovation by reducing tax payments the second by reducing the costs of developing and adopting new technologies However in order to provide a broader context for the impacts of these two instruments the review starts by considering the relationship between innovation and the stringency of environmental regulation in general
As can be seen from the initial screening (see Annexes 1ndash3) the large majority of studies consider more than one policy instrument within a unified analytical framework mdash either comparing their relative impacts or assessing the impacts of instrument combinations (or packages)
In particular all but one of the papers that assess the impacts of investment subsidies either theoretically or empirically also assess the impacts environmental taxes (and sometimes other policy instruments) Consequently for the purposes of this review it is convenient to consider the impacts of taxes and subsidies at the same time rather than sequentially In addition to avoiding the need for any repetition (about model structures assumptions etc) this facilitates identification of potential interactions and synergies between the two instruments
Apart from Section 23 on the impact of environmental regulation in general only those references identified as being of significant relevance () in the initial screening are included in the review References are summarised in chronological order under three headings theoretical predictions (Section 24) empirical evidence (Section 25) and case studies (Section 26) At the end of each section an attempt is made to synthesise the findings of the studies but the scope of the present review did not allow for critical analysis of the studies to identify their respective strengths and weaknesses or to resolve any apparent conflicts between their findings
23 Environmental regulation studies
Lanjouw and Mody (1996) use aggregate pollution and control expenditure (PACE) data as a proxy for the stringency of environmental regulation and compare this with data on the aggregate number of environmental patent applications for Germany Japan and USA They do not perform any formal statistical or econometric analysis of the data However based on simple graphical analysis they identify a relatively clear correlation between expenditure and patents over the 1970s and 1980s with a time lag of one to two years They also find some indications in the data that patenting in one country also responds to increasing stringency of environmental regulation in the other two In addition they consider the diffusion of environmental technologies by looking at trade
(7) Two of the reports emanate from the study by Ecologic and DIW of ETR in Germany Details of the assessment of the impact on innovation and market diffusion are provided (in German) in Goumlrlach et al (2005) with a summary (in English) in Knigge and Goumlrlach (2005)
(8) While the large majority of revenues raised under an ETR are likely to be used to reduce taxes on labour a small proportion may be used to encourage innovation or promote the take-up of environmentally friendly technologies
Environmental tax reform in Europe opportunities for eco-innovation
Review of literature on environmental tax reform and eco-innovation
14
flows in capital goods used for pollution reduction and find that these too show a correlation with total abatement expenditure
Jaffe and Palmer (1997) also use PACE data as a proxy for the stringency of environmental regulation and evaluate its impact on two different measures of innovation total private expenditures on RampD and the number of successful patent applications by US manufacturing industries Unlike the previous study they undertake formal econometric analysis of the data using panel data at the two-digit and three-digit SIC code industry level for the period 1978ndash1991 and a fixed effects model They find a statistically significant positive relationship between compliance expenditures (capital expenditures only) and RampD expenditures after controlling for industry-specific effects (9) However they can find no significant impact on patenting activity This is not entirely surprising given the fact that their data is for all types of patents not just those relating to environmental technologies and products Indeed given that the same is true for the RampD expenditure data it may be more surprising that they find a significant relationship between pollution compliance and RampD
Brunnermeier and Cohen (2003) also use a panel data model to assess the impact of pollution abatement expenditures on patenting activity by US manufacturing industries However unlike the previous study they use only environmental patent applications in their analysis They also control for other potential explanatory factors such as the stringency of monitoring and enforcement (as measured by number of inspection visits) industry size (value of shipments) market structure (four-firm concentration ratio) capital intensity and exposure to overseas competition (export intensity) They estimate four different models for the period 1983ndash1992 with their preferred model being a negative binomial random effects model The coefficient for PACE is positive and statistically significant (in all four models) as are the coefficients (in the preferred model) for industry size concentration and export intensity However the magnitude of the coefficient (which represents
the semi-elasticity of patents with respect to PACE) is only 00004 Thus ceteris paribus an increase in abatement expenditure of USD 100 million results in an increase in the mean number of patents of only 4
Key findings of the environmental regulation studies
All three environmental regulation studies use PACE data as a proxy for the stringency of environmental regulation (10) While there are obvious pragmatic reasons for doing this (ie availability of data) the validity of the approach may be open to question As Brunnermeier and Cohen (2003) note expenditure may be affected by factors other than environmental regulation such as external pressures from interest groups or a desire to promote or maintain green credentials with customers Furthermore the reported data may not cover all pollution abatement costs and activities (particularly process-related activities) and may be prone to over-statement by reporting firms for strategic reasons However to the extent that the reported PACE data is correlated with the stringency of environmental regulation the analyses suggest that the latter does have an impact on innovation (at least in USA) although the scale of the impact appears to be small
24 Theoretical studies
Although several previous studies has analysed the impact of different environmental policy instruments on technological change Milliman and Prince (1989) were the first to consider the entire process of technological change encompassing innovation diffusion and optimal agency response (11) Using a relatively simple graphical analysis of shifting marginal abatement cost curves they deduce a relative ranking of five instruments (direct controls auctioned permits freely allocated permits emission reduction subsidies (12) and emission taxes) in terms of firms incentives to promote technological change They conclude that emission taxes provide greater incentives for innovation and diffusion than direct controls or
(9) When they allow the slopes of the PACE variable to vary across industries (in addition to the intercept) they find considerable variation in the estimated coefficients across industries with several being negative
(10) However the studies do not all use the same definition of PACE Lanjouw and Mody (1996) include (real) investment expenditures regulation and monitoring costs and research and development by all levels of government private manufacturing and non-manufacturing firms The other two studies both use compliance cost data for private manufacturing firms (at the industry level) only However while Jaffe and Palmer (1997) use capital cost data in their analysis Brunnermeier and Cohen (2003) use operating cost data
(11) Milliman and Prince (1989) identify a number of studies going back to 1970(12) These are payments for emission reductions not technology subsidies for environmental investments
Review of literature on environmental tax reform and eco-innovation
Environmental tax reform in Europe opportunities for eco-innovation 15
freely allocated tradable permits although not as great as auctioned permits However the optimal agency response is likely to face less opposition (and in some cases actually be favoured) under emission taxes than under auctioned permits (13)
Jaffe and Stavins (1995) develop a theoretical framework for comparing empirically the impacts of alternative policy instruments on the diffusion of a new technology (14) They model the investment decision for both an existing firm and a new entrant in each case assuming that over time the firm minimises the present value of its cost streams (operating costs investment cost net of any government subsidy emission taxes and the implicit costs of violating either a performance or technology standard if applicable) For an existing firm the problem is to choose the optimal timing of the retrofit and the authors show that the new technology will be adopted at a particular time if operating cost savings plus savings from reduced emission tax payments (plus any avoided penalties for not adopting a technology standard or exceeding a performance standard) in that period are greater than the net investment costs less the time rate of change of net investment costs For a new entrant the problem is to choose whether to use the new technology at start-up A necessary condition for doing so is that the present value of operating costs savings and reduced tax payments (plus any avoided penalties) over the entire time horizon is greater than the net investment cost Thus while the conditions differ in each case the introduction of either an emissions tax or an investment subsidy (or increases in the respective values) changes the benefit-cost balance in favour of the new technology bringing forward its adoption by existing firms and increasing the likelihood of adoption by new entrants
Kemp (1997) compares the abatement RampD expenditure levels of an individual firm under direct regulation (ie an emissions limit) an equivalent emission tax (15) and freely allocated tradable permits using a cost minimisation analytical framework and a specific functional form for the abatement cost function He shows that both the
level of RampD expenditure and the level of emissions reduction increase as the emissions tax rate increases and that both are greater under the tax than under direct regulation The corresponding levels under the tradable permit regime will be greater under the emissions tax if the (exogenous) permit price is higher than the tax rate and vice versa Kemp also considers the impact of subsidising the cost of the firms RampD effort and shows that increasing the subsidy rate causes a rise in pollution-control RampD More interestingly the impact of the subsidy is greater if it is combined with an emissions tax than with an equivalent emissions limit
Fischer et al (2003) develop the approach used by Milliman and Prince (1989) although their analysis differs in that it does not include the final agency response stage and the diffusion of the technology is determined by market forces with an equilibrium royalty price (16) They compare an emissions tax with auctioned and freely allocated permits using a three-stage model of innovation diffusion and emissions abatement In the first stage the innovating firm decides how much to invest in RampD to develop an emissions abatement technology In the second stage other firms decide whether to adopt this technology in return for a royalty fee or whether to use an (imperfect) imitation technology In the final stage all firms choose their level of abatement to minimise costs given an emissions tax or permit price They show that the level of innovation (ie the level of RampD chosen by the innovating firm) is determined by equating the marginal cost of innovation with the marginal (private) benefit The latter has four components mdash an abatement cost effect an emissions payment effect an imitation effect and an adoption price effect mdash and the last two components are negative (17) Using this model the authors demonstrate that freely allocated permits provide the lowest incentive for innovation However in contrast to Milliman and Prince they conclude that the relative ranking of the emissions tax and auctioned permits is ambiguous It depends crucially on the extent to which the technology can be imitated and hence the extent to which the innovator can appropriate the gains accruing to
(13) For an emissions tax the downward shift of the industry marginal abatement cost curve as a result of diffusion causes the agency to reduce the tax rate assuming that marginal damages are increasing in emissions For permits (auctioned or freely allocated) it causes the agency to reduce the number of permits
(14) The empirical application of this framework is summarised below under Section 25 on empirical evidence(15) That is the emissions tax is set equal to the firms marginal cost of abatement under the direct regulation(16) In addition to assessing the impacts on demand for innovation Fischer et al (1998) consider the impacts of the innovation and
diffusion processes on social welfare in order to compare the overall economic efficiency of the different instruments(17) Milliman and Prince capture only the first two effects in their analysis
Environmental tax reform in Europe opportunities for eco-innovation
Review of literature on environmental tax reform and eco-innovation
16
the other firms in the form of royalty payments If imitation is high (easy) then auctioned permits provide the greater incentive for innovation However if imitation is low (difficult) then the emissions tax provides the greatest incentive
Montero (2002) assesses the impacts of alternative policy instruments on environmental innovation (as measured by RampD expenditure) under conditions of imperfect competition In his model two firms compete in either quantities (ie Cournot duopoly) or prices (ie Bertrand duopoly) while being subject to some form of environmental regulation Where the regulation takes the form of tradable permits mdash either auctioned or freely allocated mdash the market is also assumed to be imperfect the firms competing in permit quantities The interaction between the two firms is modelled as a multi-stage game with the number of stages depending on the instrument being analysed In this framework a firms incentive to invest in RampD comprises two components a direct or cost minimising effect and a strategic effect reflecting the impact of its RampD expenditure on the other firms output decision The latter may be positive or negative depending on the market-regulatory structure Under Bertrand competition (ie where products are strategic complements) freely allocated permits provide the lowest incentive for innovation followed by the emission-standard The relative ranking of an emissions tax and auctioned permits is ambiguous depending on model parameter values Under Cournot competition (ie where products are strategic substitutes) the relative ranking of the emissions tax auctioned permits and the emissions-standard are ambiguous although all provide a greater incentive than freely allocated permits Indeed Montero provides a numerical example where the emissions standard provides the greatest incentive for innovation Finally he considers the impact of increasing competition (increasing the number of firms) and concludes that under perfect competition the emissions tax provides the greatest incentive for innovation
Millock and Nauges (2006) use a simple profit-optimisation model to analyse a firms choice of abatement effort to reduce emissions
per unit of energy used in production While they do not explicitly identify it as such this effort can be interpreted in terms of diffusion of an existing technology mdash with higher effort corresponding to greater diffusion This is consistent with the overall objective of their study which is to assess the impact of combining an emissions tax with a subsidy on (existing) abatement equipment (18) In their model the firm simultaneously chooses the levels of its energy input and abatement effort given exogenous output and energy prices and a cost function for abatement effort (19) They show that while increases in the subsidy rate (expressed as a percentage of the gross investment cost) unambiguously increases abatement effort the impact of increases in the tax rate depends on whether the direct impact of tax increase on the marginal benefit of abatement effort (shifting it up) outweighs the indirect impact via the resulting reduction in output (shifting it down) If the latter dominates then increases in the tax rate will reduce the optimal level of abatement effort The authors show that a necessary and sufficient condition for the direct impact to dominate is that the slope of the firms (inverse) demand for energy is greater than the average emissions tax payment per unit of energy in relation to total energy use (20)
McGinty and de Vries (2009) analyse the relationship between environmental subsidies the diffusion of a clean technology and the degree of product differentiation in an imperfectly competitive output market In their model a fixed number of firms can choose individually between using a clean production technology and a dirty technology Both technologies exhibit constant marginal production costs and constant emission rates (with the clean technology having a lower emission rate and higher unit cost) and consumers are assumed to be able to differentiate between products on the basis of the technology used in their production (21) The subsidy regime is different to that considered by the other studies in that it is applied to the production cost of the clean good and thus reduces the (constant) marginal cost of production for that good As such it is equivalent to an output subsidy for the clean good The authors derive the equilibrium diffusion rate for the clean technology (ie the proportion of firms using
(18) In the second half of their paper Millock and Nauges (2006) undertake an empirical evaluation of such a scheme that operated in France during the 1990s for SO2 and NOX emissions The results of this analysis are summarised under Section 25 on empirical evidence
(19) Abatement effort is assumed to exhibit decreasing returns to scale ie the cost function is increasing and convex(20) If output is held fixed in the profit maximisation problem then increases in the emissions tax rate unambiguously increase the
optimal level of abatement effort as found by Kemp (1997) who uses a cost-minimisation framework for his analysis(21) The model assumes imperfect substitution between the clean good and dirty good with the willingness-to-pay for one good being
a linear function of the quantities of both goods individually ndash ie Pk = ak ndash bYk ndash cYj
Review of literature on environmental tax reform and eco-innovation
Environmental tax reform in Europe opportunities for eco-innovation 17
that technology) and show that an increase in the subsidy value increases diffusion for all degrees of product differentiation The impact is greater as the substitutability of the two goods increases They also briefly consider the impact of a technology subsidy that reduces the fixed cost of the clean technology and conclude that this too will stimulate diffusion but will be less efficient than the output subsidy (22)
Key findings of the theoretical studies
As is often the case with theoretical analyses the specifications of the models and the underlying assumptions of the studies reviewed here significantly influence the conclusions Nevertheless there is a reasonable degree of consistency between their findings The studies can be classified into two broad groups those that consider innovation and diffusion within an industry setting and those that consider an individual firms decision whether to undertake RampD (ie innovation) and invest in an abatement technology (ie diffusion) in order to reduce its own cost of abatement
The studies in the first group conclude that under conditions of perfect competition emission taxes and auctioned permits provide greater incentives for innovation than direct controls or freely allocated permits However there is some disagreement over the relative impacts of the two instruments Under the assumption that the innovator appropriates a fixed (exogenous) proportion of the gains accruing to the technology adopters Milliman and Prince (1989) conclude that auctioned permits provide the greatest incentive although the government may find it easier to adjust emission taxes in response to the resultant downward shift in marginal abatement costs However when the proportion is determined endogenously mdash in the form of a royalty payment mdash Fischer et al (2003) find that either auctioned permits or emission taxes can provide the greater incentive Emission taxes are likely to provide the greatest incentive if the innovator can appropriate a large proportion of the gains (because the technology is difficult to imitate)
Montero (2002) uses a slightly different framework to compare the impacts of different instruments on innovation (in the form of RampD expenditure)
in a situation of imperfect competition and finds that the ranking depends on the nature of the competition (23) Under Bertrand price competition in the output market the results are the same as under perfect competition the relative ranking of auctioned permits and taxes is ambiguous but both provide greater incentives for innovation than emission standards and freely allocated permits However under Cournot quantity competition any of the instruments apart from freely allocated permits can provide the greatest incentives depending on the model parameter values
The studies looking at an individual firms decision also show that an emissions tax can stimulate innovation and diffusion Jaffe and Stavins (1995) explicitly consider the firms decision criterion for investing in a new abatement technology and show that by increasing the benefits of investing the introduction of an emissions tax should bring forward its adoption by existing firms and make its use by new entrants more likely The other two studies consider the firms choice of optimal abatement effort in the context of maximising its total profits or minimising its total cost of emissions reduction This effort can take the form of RampD (innovation) or expenditure on abatement equipment (diffusion) The decision problem is the same in each case ie to choose the optimal level of effort
Kemp (1997) assumes that the firm seeks to minimise its total cost of emissions reduction mdash implicitly assuming that its output level is fixed mdash and demonstrates both that abatement effort increases as the emissions tax increases and that the optimal effort is lower under direct regulation than under an equivalent tax However when the firms output level is allowed to vary mdash as is the case with the profit maximisation problem considered by Millock and Nauges (2006) mdash the impact of an increase in the emissions tax rate on the level of abatement effort depends on the relative magnitudes of the direct impact and the indirect impact (via changes in output levels) on the marginal benefit of abatement effort If the latter dominates then an increase in the emissions tax rate leads to a reduction in the optimal level of abatement effort
(22) McGinty and de Vries (2009) derive expressions for the necessary technology subsidy values when diffusion is 0 and when it is 100 They state mdash without proof mdash that the latter is greater than the former Provided that the relationship between the subsidy and diffusion is monotonic this is a sufficient condition for increases in the subsidy value to cause increases in diffusion
(23) Monteros model does not include diffusion However it does include spillover effects where RampD by one firm reduces the abatement costs of the others
Environmental tax reform in Europe opportunities for eco-innovation
Review of literature on environmental tax reform and eco-innovation
18
Only one of the industry models considers the impact of investment subsidies Using a product differentiation model of imperfect competition McGinty and de Vries (2009) show that subsidising the unit cost of a clean production technology can accelerate its diffusion However the impact depends on the degree of substitutability between clean and dirty products diminishing as the products become more differentiated In contrast all three of the individual firm analyses consider the impact of investment subsidies with all demonstrating that increasing subsidies induce greater abatement effort Furthermore Kemp (1997) shows that the impact of an RampD subsidy is greater in the presence of an emissions tax than it is under an equivalent emissions limit
25 Empirical studies
Jaffe and Stavins (1995) use their theoretical framework (outlined above in Section 24) as the basis for assessing the diffusion of thermal insulation in new home construction in the United States using state-level panel data for the years 1979ndash88 They derive a reduced form equation for the energy efficiency level chosen by developers from the marginal cost-benefit condition in which the explanatory variables include energy prices installation costs and the presence of a relevant building code (as a dummy variable) Separate equations are estimated for ceiling floor and wall insulation with the coefficient for energy prices being positive in all three equations Although it is only significant (at the 95 level) for floor insulation the joint hypothesis that all price coefficients are zero is strongly rejected However the coefficients for installation cost (which are all negative as expected) are around two to three times greater in magnitude and of comparable significance The coefficients for the building code dummies are consistently insignificant (and negative in two cases) indicating that this form of direct regulation had minimal impact on household energy efficiency levels over the period The authors use the estimated models in a simulation to compare the effects of a 10 increase in energy prices (ie an energy tax) with those of a 10 reduction in installation costs (ie a technology subsidy) with each applied over the whole ten-year period While
the tax increases diffusion by 2ndash6 by the end of the period the technology subsidy increases diffusion by between 4ndash15
Kemp (1997) models the diffusion of biological water treatment technology in the Dutch food and beverage industry based on a rational choice threshold model of technology adoption decisions In this model a firm chooses to adopt an abatement technology if the resulting reduction in emission-tax payments is greater than the annualised total costs of the technology where a discount factor is applied to the savings to reflect uncertainty and risk aversion on the part of the decision-maker This is translated into a probabilistic model under the assumption that both the savings and the costs follow a log-normal distribution across plants The model is estimated econometrically using data for the period 1974ndash91 under different assumptions for the functional form of the discount factor and allowing for adjustment costs (24) The estimated parameters for the preferred specification of the discount factor are all significant and of the expected sign and magnitude and the model provides a very close fit to the actual diffusion of waste-water treatment technologies over the period This leads the author to conclude that the effluent charges were a significant positive factor in the diffusion of treatment technologies Indeed he estimates that only around 4 of plants would have installed waste-water treatment equipment by the end of the period if the charge had remained at its (low) 1974 level compared to the actual figure of over 40
Newell et al (1999) estimate the impact of energy prices energy efficiency standards and other factors on the energy efficiency of three types of electrical consumer durables (room air conditioners central air conditioners and gas water heaters) in USA between the 1970s and 1990s The analysis utilises a product characteristics model in which the frontier of technologically feasible products is described by a transformation surface that relates the bundle of product characteristics to the real cost of producing that bundle In this framework innovation is represented by movements of the surface and movements along the surface In particular the authors identify three types of innovation shifts in the surface towards the origin (overall technological change) changes in the slope
(24) Adjustment costs are accounted for by estimating a partial adjustment model in which the actual change in adoption is some fixed fraction of the desired change (estimated from the threshold model)
Review of literature on environmental tax reform and eco-innovation
Environmental tax reform in Europe opportunities for eco-innovation 19
of the surface (directional technological change) and changes in the mix of products along a given surface (model substitution) They define the surface in terms of two characteristics energy flow and cooling capacity and incorporate innovation by allowing the coefficients of the two variables to vary with time and (in the case of energy flow) energy prices and efficiency standards Separate equations are estimated for each durable type with slightly differing sets of explanatory variables and time periods The authors find little evidence that either energy prices or energy efficiency standards had any impact on overall technological change While all but one of the relevant coefficients have the expected sign none are significant In contrast they do find evidence that energy prices had an impact on directional technological change with the relevant coefficients being of the correct sign and significant for both room and central air conditioners
Popp (2002) uses patent data to estimate the effect of energy prices on energy-efficiency innovations in USA between 1970 and 1994 He regresses normalised energy-efficiency-related patent applications against energy prices controlling also for lagged knowledge stock and government RampD (25) The estimated coefficient for energy prices is highly significant producing a short-run price elasticity of 006 and a long-run elasticity 0354 Thus a 10 increase in energy prices would be expected to increase the number of energy-efficiency-related patents by around 35 in the long run The estimated mean lag is less than four years leading the author to conclude that the imposition of a carbon or energy tax would lead to a fairly quick shift towards environmentally friendly innovation
Hoglund Isaksson (2005) estimates abatement cost functions for the reduction of nitrogen oxide (NOX) emissions in three industrial sectors in Sweden (energy pulp and paper chemicals and food) The analysis uses a double-hurdle model applied to a pooled sample of 114 plants across the three sectors The data cover the period 1990ndash1996 which spans the introduction of the charge on NOX emissions in 1992 The estimated cost curves have a similar shape in all three sectors with minimal (or even negative) costs over a relatively broad range of emission reductions and then a steep rise as reductions exceed
a threshold level The analysis does not explicitly consider the issue of innovation However it does find that abatement cost curves shifted downwards significantly over the period In the energy sector for example the emission rate threshold for significant cost increases fell by around 45 between 1991 and 1996 (from 550 to 300 kgGWh) The author surmises that this is due to a combination of technological development and the discovery of previously unrecognised opportunities Unfortunately while this shift coincided with the introduction of the NOX charge the analysis does not provide any evidence of a causal link
As part of their analysis of the impacts of the French tax-subsidy scheme for NOX and sulphur dioxide (SO2) emissions Millock and Nauges (2006) estimate the impact of the emission taxes on a plants decision to install end-of pipe abatement equipment While the study is not concerned with innovation per se the results of this part can be interpreted as showing the impact of emission taxes on the diffusion of abatement equipment Under the scheme taxes were imposed on the emissions of these air pollutants (and VOCs) by all plants satisfying certain criteria The revenue raised by the taxes was earmarked for subsidising the cost of qualifying abatement technologies for technical studies (ie RampD) and for investment in air quality surveillance systems Using panel data for 226 plants in three industries (iron and steel coke and chemicals) for the period 1900ndash1998 the authors estimate a Probit model for the probability that a plant will install abatement equipment They find that the total value of emissions taxes paid by the plant (ie for both pollutants) has a positive impact on its decision to invest in abatement equipment However the magnitude of the effect varies considerably across the sectors and is only significant for the iron and steel sector
Frondel et al (2008) analyse responses to an OECD survey on environmental policy tools (conducted in 2003) to identify the factors that affect a firms decision to adopt an environmental management system (EMS) voluntarily and their environmental innovation behaviour Innovation is captured by a binary variable that indicates whether the firm has undertaken significant technical measures or changes to reduce the environmental impacts of
(25) Normalised energy efficiency patent values are calculated by dividing by the total number of patents granted This accounts for exogenous changes in patenting behaviour that affect all types of patents Popp constructs a value for existing knowledge as the stock of previously granted patents weighted by estimates that he derives for knowledge productivity He demonstrates that the exclusion of this variable from the model leads to biased estimates for the energy price coefficient
Environmental tax reform in Europe opportunities for eco-innovation
Review of literature on environmental tax reform and eco-innovation
20
production (26) The analysis is based on survey responses from 899 firms in Germany Latent variable equations for EMS adoption and innovation are estimated simultaneously with each equation including the same four sets of variables relating to motivations policy instruments pressure groups and facility characteristics (27) The policy instrument variables include five dummy variables indicating the importance of different types of policy instrument including market-based instruments such as emission taxes and tradable permits While the perceived stringency of environmental policy is found to be a significant factor in the decision to innovate there is no evidence that any of the individual policy instrument variables had any impact The authors surmise that this suggests that it is stringency of environmental policy rather than the choice of specific instrument that is important for innovation However as the authors note their results reflect the perceptions of the survey respondents and should therefore be treated as correlations rather than causal relationships
Johnstone and Hascic (2008) assess the impact of a range of environmental policy instruments mdash including tax measures and investment incentives mdash on innovation in the renewable energy field They analyse the impacts for five different groups of renewable energy technologies mdash wind solar ocean biomass and waste-to-energy mdash using a panel dataset of European Patent Office (EPO) patent filings for these technologies across 26 countries over the period 1978ndash2003 A fixed effects negative binomial model is estimated controlling for electricity prices and consumption public sector RampD expenditure (as a proxy for scientific capacity) and total EPO filings (as a proxy for differenceschanges in patenting propensity) The various policy instruments are represented by dummy variables indicating whether they were in place in a particular year As such the model takes no account of the stringency of the instruments mdash in particular the differing magnitudes of the tax measures and investment incentives (28)
Initially the authors estimate the model with all of the policy instruments included individually They find that while public policy plays an important role in inducing innovation the impacts of the individual instruments vary across the different technologies In particular tax measures are significant for wind and biomass technologies with investment incentives being significant for solar and waste-to-energy technologies and obligationstradable certificates being significant for wind technologies However the authors express concerns that there may be multicolinearity between the policy variables (particularly between investment incentives tax measures and tariffs) and also that there may be interaction effects between some of the variables Consequently they estimate two alternative versions of the model the first using a composite policy variable representing the number of policy instruments in place and the second using clusters of similar policy instruments (29) The results or these two models confirm the initial findings The composite policy variable is significant for all of the technology groups while the significance of the clusters varies across technologies The price-based cluster is (highly) significant for solar biomass and waste-to-energy The quantity-based cluster is significant for wind technologies The authors surmise that this may be due to the different economic characteristics of the technologies For example the significance of investment incentives for solar and waste-to-energy may reflect the capital intensity of these technologies with large up-front investment costs
De Vries and Medhi (2008) also use patent data to investigate the relative importance of environmental regulations and fuel prices on innovation in automotive emission-control technologies distinguishing between post-combustion devices and engine redesign technologies They estimate a panel data model using data from Germany Japan and USA over the period 1978ndash2001 controlling for industry value added (as a proxy for the scope of technological opportunities) and total patent
(26) The next question on the survey asks whether these are changes in production processes or end-of-pipe technologies However no distinction is made between these two types of innovation in the present study
(27) In order to avoid identification problems some individual variables are omitted from one equation or the other(28) This shortcoming is recognised by the authors who state that it is unavoidable in any cross-comparative analysis in which multiple
instruments are included(29) The clusters are price-based instruments (investment incentives tax measures and tariffs) quantity-based instruments (obligations
and tradable certificates) and voluntary programmes
Review of literature on environmental tax reform and eco-innovation
Environmental tax reform in Europe opportunities for eco-innovation 21
applications (as a proxy for differenceschanges in patenting propensity) Environmental regulation is represented by two dummy variables indicating the introduction of on-board diagnostic (OBD) regulations in USA (30) The results of the analysis suggest that the relative impacts of regulation and market forces differ between the two types of technology For post-combustion technologies both of the regulations are significant while fuel prices have no significant impact In contrast the opposite is the case for engine redesign technologies with fuel prices having a significant impact but regulation having no discernable effect While the analysis does not explicitly consider the impact of fuel taxes it suggests that an increase in automotive fuel taxes would have a major impact on innovation in relation to engine design The estimated coefficient for fuel prices (1287) implies that a USD 010 increase in fuel prices would induce a 14 increase in patenting activity (31)
Key findings of the empirical studies
The empirical studies considered above cover a range of different technology areas spanning energy efficiency (both product and process) renewable energy and air and water pollution abatement While in some cases they assess the impact of energy prices rather than environmental taxes per se they provide a clear picture of the likely impact of environmental and energy-related taxes on eco-innovation
Three of the studies assess the impact on diffusion of existing technologies All find that environmental taxesenergy prices have a positive impact on diffusion In particular the water effluent charges in The Netherlands appear to have had a major impact on the adoption of waste-water treatment equipment by the food and beverage industry in that country However there is some evidence to suggest that the effectiveness of taxesprices may vary across sectors (eg NOXSO2 abatement in France) and that investment incentivessubsidies may be more
effective in some cases (eg thermal insulation in USA)
Three of the studies use patent data to assess the impact of environmental taxes and energy prices on innovation with one of these also assessing the impact of investment incentives All find a significant positive impact although this depends on the particular sub-sector (eg renewable energy) or the type of innovation In particular the evidence from the automotive emissions control study suggests that taxesprices may be more effective in promoting process-related innovation (eg engine redesign) than innovation in end-of-pipe technologies One of the studies takes a different approach using a product-characteristics model to decompose improvements in the energy efficiency of consumer durables This finds that while electricity prices did not appear to affect overall technological change (ie shifts in the product costenergy efficiency frontier) they did have a positive impact on directional technological change (ie the slope of the frontier)
26 Case studies
Christiansen and Skjaerseth (2005) undertake a comparative analysis of the impacts of climate change policies on the petroleum sectors in Norway and the Netherlands during the 1990s These countries were selected because of their very different policy approaches with the Norwegian petroleum sector subject to a carbon dioxide (CO2) tax since 1991 as part of a portfolio of measures (32) and the Netherlands relying on a series of voluntary agreements on energy efficiency (33) Both approaches appear to have been effective in that CO2 emissions per unit production fell by around 22 between 1990 and 2001 in Norway while energy efficiency improved by around 35 in the Netherlands over the same period However there were marked differences between the two countries in terms of the nature of the innovation that
(30) Because of the international nature of the automotive industry and the importance of the US market regulations introduced in USA appear to have been an important driver for innovation by overseas manufacturers Regulations mandating the installation of OBD systems were first introduced in California in 1988 A more sophisticated system was mandated by the 1990 US Clean Air Act Amendments taking force in 1996
(31) The coefficient represents the semi-elasticity of patent applications with respect to fuel prices While the authors do not state so explicitly the implication is that prices are expressed in US dollars (they are obtained from the IEA Energy Prices and Taxes Database) Consequently the impact of a 10 US cent increase in the fuel prices is given by exp(1287 x 01) ndash 1 = 0137
(32) In addition to the tax the portfolio included publicly funded RampD support schemes gas flaring permits and mandatory environmental impact assessments
(33) The Dutch oil and gas industry first signed a declaration of intent with the government in 1995 This was translated into a long-term agreement (LTA) on energy efficiency in the following year with an improvement target of 20 over the period 1989ndash2000 In 2001 a new LTA was signed which committed firms to implementing energy efficiency measures with a positive NPV at a 15 discount rate or a five year payback period
Environmental tax reform in Europe opportunities for eco-innovation
Review of literature on environmental tax reform and eco-innovation
22
occurred In the Netherlands technological change was incremental reflecting a steady diffusion of available (ie known) technology In contrast the authors find evidence of more radical innovations and adaptations by the Norwegian petroleum sector including the development of energy-efficient gas turbines installation of waste heat recovery units process modifications and improved use of process heat While the authors acknowledge the impossibility of proving a causal link between policy intervention and innovation (in the context of their case study) they conclude that the CO2 tax played a key role in the development and implementation of these radical innovations and the benefits of reduced tax payments provided an important incentive However they also conclude that the impacts of the two instruments were conditioned by the political contexts in which they were applied and the problem characteristics in the respective countries (eg the economic significance of the sector and the size of installations)
Knigge and Goumlrlach (2005) summarise the findings of a comprehensive analysis of the impacts of the ETR in Germany That analysis undertaken jointly by Ecologic and the German Institute for Economic Research (DIW Berlin) included the impacts on innovation and market diffusion of environmentally friendly products and technologies (34) Based on a series of case studies the study concluded that the ETR had a noticeable effect on innovation and diffusion although it was not possible to quantify the scale of that effect In particular ETR is identified as being a central factor in the development of gas-powered vehicles The study identifies a number of different routes by which the ETR produced impacts First the payback period for energy-efficient products was reduced as a result of the energy tax increases and the various exemptions favouring efficient energy use and renewable energy sources Second the predictable nature of the energy taxes (as opposed to widely fluctuating oil prices) reduced uncertainties about the benefits of energy-efficiency investments Third the reduction in employers social contribution payments tended to reduce the costs of labour intensive innovation processes such as research and development energy consultancy and technology installation Finally the ETR had a signalling effect strengthening awareness of the need for more efficient and rational energy use
Mickwitz et al (2007) examine a number of claims that have been made in the environmental policy literature about the relationship between policy instruments and innovation based on experiences in two industrial sectors in Finland pulp and paper and the manufacture of diesel engines for ships In particular they assess the claims that environmental taxes are superior to other policy instruments with respect to innovation and that RampD subsidies have limited impacts on innovation With respect to the first claim the evidence provided by the two case studies is mixed The authors conclude that energy taxation had a negligible impact on innovation in the pulp and paper industry However this is likely to have been due to the low level of the tax and the exemptions that applied to the sector In contrast they find that the differentiation of Swedish fairway and port fees (on the basis of SO2 and NOX emissions) was a significant factor driving the installation of in-engine NOX reduction equipment in ferries operating between the two countries (35) With respect to RampD subsidies the authors conclude that the evidence does not support the claim that these have little effect In particular they find that RampD subsidies accelerated the development of ship engine emissions-reduction technologies
The findings of the three case studies are consistent with those of the empirical analyses reviewed in the previous section Environmental taxes and investment subsidies have proven significant in promoting both innovation and diffusion although not universally so Furthermore the case studies provide some useful insights about the ways in which the impacts occur and the factors that may be important in promoting innovation In particular they suggest the need for a tax rate that is sufficiently high to provide a meaningful incentive and signalling effect and that is fixed for a sufficiently long period of time to reduce uncertainty about the future benefits of investment
27 Conclusions
The studies reviewed in the preceding sections suggest that environmental regulation in general and price-based policy instruments such as environmental taxes and investment subsidies in particular can (in theory) and do (in practice) have a positive impact on both innovation and diffusion
(34) A separate report in German by Goumlrlach et al (2005) provides details of the evaluation of the innovation and diffusion impacts (35) Although the tax was introduced in Sweden it was also payable by Finnish ferry operators entering Swedish ports and hence
affected their investment decisions This is another example of the cross-border impact of environmental policy interventions on innovation found by Lanjouw and Mody (1996) (see Section 23)
Review of literature on environmental tax reform and eco-innovation
Environmental tax reform in Europe opportunities for eco-innovation 23
of environmental technologies However the supporting empirical and case study evidence is not universal and the effectiveness of these instruments would appear to vary across different sectors and different types of innovation
To a certain extent such differences can be explained by the theoretical models In particular the impact of environmental taxes (relative to other instruments) is predicted to depend on the competitive structures of the markets in which the regulated firms operate and on the ability of innovator firms to appropriate the benefits accruing to other firms during diffusion However a number of other potential factors have been identified in the literature which may affect the impact of price-based policy instruments on innovation
Jaffe et al (2002) caution that the impact of price-based policy instruments on technology diffusion may be adversely affected by a number of potential market failures including information failures principle-agent problems (eg landlord-tenant) capital market failures and positive adoption spillovers In addition while not market failures as such uncertainty over future returns and the (associated) use of high discount rates for investment decisions can also undermine the effectiveness of price-based instruments in stimulating diffusion However as was noted above the findings from the case study of ETR in Germany suggest that an environmental tax may actually reduce the level of uncertainty over future returns provided that it is of sufficient magnitude and longevity
Skjaerseth and Christiansen (2005) emphasise that the relationship between policy instruments (of all types) and technological change is extremely complicated They argue that account must be taken of the politicalindustrial context in which policy instruments are introduced and the nature of the environmental problem that they are intended to address In particular they make a distinction between malign problems where technological change involves net costs for target groups and benign problems where there are widespread no-regret opportunities for change Based on a comparative analysis of four different case studies they conclude that mandatory policy instruments (including environmental taxes) are more effective
in promoting short-term technological change when the problems are malign but that low legitimacy (with the target group) may undermine long-term technological change However when problems are benign or when long-term change requires cooperation voluntary policy instruments are likely to be more effective
Johnstone (2005) questions the focus of the theoretical and empirical analyses (reviewed above) on the impact of environmental policy instruments on the rate of technological change He argues that the direction of technological change is as important if not more so In addition to the quantity of innovation it is also important that innovation be socially optimal in the sense that it minimises the cost of attaining a particular environmental goal in the long term Inappropriate innovation today may result in lock in to a suboptimal technological path for the future
With this in mind Johnstone identifies a number of issues that can adversely affect the direction of innovation and should be taken into account when selecting and designing policy instruments technological market failures (36) missing markets for certain environmental attributes of innovation policy incidence and joint production of emissions Most studies of the innovation effects of environmental policy instruments assume that the only missing market is that for the environmental good (or bad) However in practice there may be other markets that are missing (or incomplete) which can adversely affect transmission of innovation incentives This is particularly so in the area of waste and resource management where instruments applied at the end of the product life cycle may have little or no impact on product design innovation Even if all markets are complete except for the environmental externality the point of incidence of the policy intervention may be more important for the direction of innovation than the choice of a particular policy instrument For example a limit or standard applied directly to the emissions of a pollutant may be more effective in promoting optimal innovation than a tax applied to a proxy input variable Finally when there is joint production of pollutants (eg CO2 and air pollutants from vehicle engines) there is a danger that if policy instruments (of whatever type) are applied to one pollutant in isolation the resulting innovation may
(36) These are the same market failures identified by Jaffe et al (2002)
Environmental tax reform in Europe opportunities for eco-innovation
Review of literature on environmental tax reform and eco-innovation
24
reduce emissions of that pollutant at the expense of increases in the others
In a related point Johnstone highlights the importance of using appropriate indicators when assessing the impact of policy instruments on innovation emphasising the need for these to reflect both the rate of innovation and the direction A necessary condition for this is that the indicators must provide an accurate and detailed picture of actual innovation Unfortunately this is difficult to achieve in practice For example the use of patent data as a measure of innovation requires the identification of relevant environmental technologies This is likely to be easier for end-of-pipe technologies than for process-related technologies meaning that the latter tend to be under-represented relative to their actual incidence To the extent that process-related innovation is growing in importance or is more important
for certain sectors or types of environmental problem changes in the value of the indicator may significantly understate the actual rate of innovation and misrepresent the direction
All of this suggests that caution should be exercised in drawing general definitive conclusions about the impacts of price-based policy instruments such as environmental taxes and investment subsidies on innovation particularly relative to other policy instruments While it would appear that they can be effective in stimulating both innovation and diffusion in many cases mdash at least in terms of the rate of technological change mdash there may be situations in which other policy instruments may be more appropriate In general the stringency and point of incidence of an environmental policy intervention may be more important than the choice of a particular policy instrument in determining the rate and direction of eco-innovation
25
Modelling of ETR impacts on eco-innovation
Environmental tax reform in Europe opportunities for eco-innovation
31 Scenarios assessing the implications of ETR for eco-innovation
Scenario analysis provides a useful means of improving understanding of how the different revenue recycling methods and various scales of ETR can help meet different greenhouse gas emissions targets
To investigate the impacts of an ETR for Europe the petre project elaborated a range of different scenarios reflecting various tax reform options In addition to employing several of these original scenarios the present study compiled two new scenarios to analyse the implications of ETR for eco-innovation All scenarios were examined in both E3ME and GINFORS (37)
311 Original petre project scenarios
The key petre scenarios relevant for the present study are
bull scenarioBHbaselinescenariowithhighenergyprice (reference case)
bull scenarioS1HETRdesignedtomeettheEUsunilateral 2020 GHG target (high energy price) with revenue recycling
bull scenarioS2HETRdesignedtomeettheEUsunilateral 2020 GHG target (high energy price) with revenue recycling and 10 of revenues spent on eco-innovation measures
Each of the ETR scenarios has the same key taxation components
bull acarbontaxrateisintroducedtoallnon-EUEmissions Trading System (EU ETS) sectors equal to the carbon price in the EU ETS that delivers an overall 20 reduction in greenhouse gas emissions by 2020 and in the international cooperation scenario this is extended to 30
bull aviationisincludedintheEUETSattheendofPhase 2
bull powergenerationsectorEUETSpermitsare100 auctioned in Phase 3 of the EU ETS
bull allotherEUETSpermitsare50auctionedin2013 increasing to 100 in 2020
bull materialtaxesareintroducedat5oftotalpricein 2010 increasing to 15 by 2020
In scenario S1H environmental tax revenues are recycled through reductions in income tax rates and social security contributions in each of the Member States such that there is no direct change in tax revenues In scenario S2H 10 of environmental tax revenues are recycled through spending on eco-innovation measures and the remaining 90 is recycled through the same measures as in the other scenarios The eco-innovation spending is split across power generation and housing according to tax revenues from the corporate and household sector
In GINFORS (the model used for analysing the implications of ETR and eco-innovation) the share of renewable sources in electricity production is increased due to the additional investment The rest of additional investment goes to household energy efficiency spending Investment needed for a certain increase in renewable energy production or efficiency improvement is based on Austrian and German experience (Lehr et al 2008 and 2009 Grossmann et al 2008 Lutz and Meyer 2008) This assumption is quite conservative as parameters for other countries can be assumed to be more positive (meaning that less money is needed for renewable energy technology installation or energy efficiency gains)
In scenario S1H the 20 GHG target translates into a 15 reduction in energy-related carbon emissions relative to 1990 as other emissions such as methane and nitrous oxide have already been reduced by
3 Modelling of ETR impacts on eco-innovation
(37) The E3ME and GINFORS models are introduced in Chapter 1 of the present report A detailed discussion of the models and scenarios used in the present study can be found in Ekins and Speck (2011)
Environmental tax reform in Europe opportunities for eco-innovation
Modelling of ETR impacts on eco-innovation
26
more than 20 (in terms of carbon equivalents) The target is reached by a tightened EU ETS cap and the introduction of a carbon tax on the non-ETS sector The tax rate applied is equal to the carbon price in the EU ETS that will deliver a 20 GHG reduction by 2020
The burden of ETR taxes are allotted to energy outputs (ie the final use of energy) and will be based on the carbon content of each fuel Carbon prices are assumed to be fully passed on to consumers All carbon taxes are in addition to any existing unilateral carbon and energy taxes The carbon reductions in the different EU Member States will be those that result from a uniform carbon tax increase across the EU
All of the revenues including EU ETS auctioning revenues carbon tax revenues and material tax revenues will be recycled The proportion of tax raised by industry will be recycled into a reduction in employers social security contributions which will in turn reduce the cost of labour Recycling will be additional to the existing ETRs in some Member States Revenues raised from households will be recycled through standard rate income tax reductions Traditional energy tax revenues will be lower compared to their respective baselines as the tax base (energy consumption) is reduced So for an ETR revenue-neutrality does not mean budget-neutrality
312 Factors affecting the macroeconomic impacts of RES technologies
Earlier analyses (Lehr et al 2008 Fraunhofer ISI et al 2009 DTI 2004 Kammen et al 2004 Moreno and Loacutepez 2007) have studied the impacts of large renewable energy source (RES) shares in the energy mix for different countries The overall question in these studies has been the impact of increasing RES shares on the economy especially on the labour market For the present study it is interesting to note that macroeconomic impacts of higher RES shares mainly depends on the following five factors
1 additional investment in RES (minus lower investment in conventional sources ie fossil and nuclear power) with the impact increasing if a country manufactures the RES technology in question
2 additional (net) exports due to improved international competitiveness of renewable energy sources (first mover advantage)
3 lower fossil fuel needs4 the cost differences between RES and
conventional energy
5 the shift from capital- and energy-intensive industries to labour- and technology-intensive industries
All five factors are driven by international energy prices carbon prices the policy framework and RES technology development itself Innovation comes into the play at various stages First innovation drives the currently positive additional costs of RES technologies down and even into negative realms depending on the fossil fuel scenario Second innovative RES technologies are likely to have a competitive advantage in international markets Although a significant proportion of RES technology produced in Europe is traded in Europe innovation will still provide an edge in current and emerging international markets
The EmployRES study (Fraunhofer ISI et al 2009) finds for Europe that current strong investment reflected in installations in Europe and exports to the rest of the world dominate the economic impact of RES policies and therefore lead to positive overall effects The studys results suggest that this positive balance can only be kept up in the future if the competitive position of European manufacturers of RES technology is improved The authors strongly recommend policies which promote technological innovation in RES and lead to a continued and rapid reduction of their costs
Factors 1 and 2 will have substantial macroeconomic impacts in the short and medium terms whereas factor 3 accumulates and will show positive impacts mainly in the long term Factor 4 strongly depends on the global developments while factor 5 may have significant effects on employment
313 Additional scenarios
Impacts of additional investment (factor 1) have already been analysed in scenario S2H of the petre project To focus on the other impacts of eco-innovation two additional scenarios were designed building on scenario S2H of petre
bull S2HEETRwithrevenuerecyclingdesignedto meet the unilateral EUs 2020 greenhouse gas (GHG) target (high energy price) Ten per cent of revenues are spent on eco-innovation measures and trade shares of EU-27 economies with the rest of the world in machinery and electrical machinery increase by 01 due to the deployment of the fast growing RES markets This assumption is based on the strong EU policy effort to increase the share of renewable energy in final energy consumption to 20 by 2020
Modelling of ETR impacts on eco-innovation
Environmental tax reform in Europe opportunities for eco-innovation 27
(Fraunhofer ISI et al 2009) and the possibility of very strong world market development of the RES sector until 2020 (EREC 2008) which offers additional export opportunities for European RES industries
bull S2HIETRwithrevenuerecyclingdesignedto meet the unilateral EUs 2020 GHG target (high energy price) Ten per cent of revenues are spent on eco-innovation measures and input structures of the energy sector are changed according to the input structure of the German RES industry (Lehr et al 2008)
S2HE looks at the possible role of international trade S2HI analyses changes in the input structure of the energy sector ie from conventional electricity production to renewables In the petre project (as in GHK et al 2007) only the energy inputs of the energy sector were adapted to changes in the energy input mix
Both S2HE and S2HI focus on RES and efficiency technologies As mentioned above an ETR will trigger a variety of innovations Therefore the results can be thought of as conservative in the sense that innovations (eg automotive energy consumption industrial efficiency etc) are not explicitly included
32 Overview of modelling results
The main results of the simulations are presented in Table 31 In the baseline scenario BH with high energy prices EU-27 carbon emissions will be
72 below the 1990 level in 2020 (38) The EU-15 has committed in the Kyoto Protocol to reduce its GHG emissions 8 below 1990 levels in the period 2008ndash2012 As emissions in the new member states are substantially below their 1990 levels today that implies that the EU-27 will keep its emissions more or less constant over the coming decade As in the PRIMES baseline an ETS price of 18 EURt in 2008 prices is assumed in 2020
In scenario S1H the ETS price and carbon tax rate has to be increased to 68 EUR2008t of CO2 to reach the 20 GHG reduction target which is equal to a 15 reduction of CO2 emissions against 1990 as other greenhouse gases have already been reduced above average by more than 20 in terms of CO2 equivalents Compared to the baseline CO2 emissions are 84 lower in 2020 which means roughly an additional 1 reduction annually in the period 2012ndash2020 GDP will be about 06 lower compared to the baseline in 2020 This means that annual average growth rates will be less than 01 below their baseline development This is especially low compared to the current financial and economic crisis with a GDP deviation against the baseline of around 6 in 2009
As the recycling mechanism reduces labour costs and the tax burden is shifted from labour-intensive to carbon- and material-intensive sectors employment will be 036 (or more than 800 000 jobs) higher than in the baseline The ETR is not fully budget neutral potentially enabling EU economies to slightly increase their net savings If
(38) The modelling exercise in the present study was conducted in 2009 and therefore does not contain the latest data on EU-27 GHG emissions which were significantly influenced by the global economic slump of the late-2000s
Table 31 Main results under the different scenarios
Scenario Target in 2020 CO2 price GDP Employment CO2 reduction
EUR2008t pc against baseline
pc against baseline
pc against 1990
pc against baseline
in year 2020 2015 2020 2020 2020 2020
BH 18 ndash 72 00
S1H 20 GHG 68 ndash 022 ndash 057 036 ndash 151 ndash 84
S2H 20 GHG 61 ndash 013 ndash 030 041 ndash 152 ndash 85
S2HE 20 GHG 61 ndash 009 ndash 004 051 ndash 151 ndash 84
S2HI 20 GHG 61 ndash 006 ndash 024 045 ndash 152 ndash 84
Environmental tax reform in Europe opportunities for eco-innovation
Modelling of ETR impacts on eco-innovation
28
this extra saving is spent negative GDP impacts will be further reduced
In scenario S2H part of the revenues is invested in low-carbon technologies This reduces the carbon price to 61 EUR2008t in 2020 halving the GDP loss relative to scenario S1H to only 03 as the investment in renewable energies is assumed to be additional Employment impacts are also more positive than in scenario S1H The 10 investment in low-carbon technologies amounts to more than EUR 20 billion in 2020
Assuming additional EU exports of RES technologies in scenario S2HE GDP almost matches the baseline in 2020 and employment is 051 (or more than 1 million jobs) higher than in the baseline In scenario S2HI a shift in the input structure of the energy sector towards machinery
and electrical machinery reflecting the different nature of RES relative to conventional electricity generation also has smaller additional positive impacts on GDP and employment compared to scenario S2H
The following figures show impacts of the different scenarios in comparison to the baseline BH As Figure 31 illustrates all the alternative scenarios imply GDP lower than the baseline However comparing scenario S1H with the other three scenarios shows that additional RES investment (S2H) additional RES exports (S2HE) and the inclusion of different input structures of the RES industries (S2HI) each have positive GDP impacts These results are in line with model-based analysis in the EMPLOY-RES study (Fraunhofer ISI et al 2009)
Figure 31 EU-27 GDP according to four scenarios mdash deviation from the baseline (BH)
Percentage deviation from the baseline (BH)
ndash 100
ndash 080
ndash 060
ndash 040
ndash 020
0002010 2015 2020
S2HI S1H S2H S2HE
Modelling of ETR impacts on eco-innovation
Environmental tax reform in Europe opportunities for eco-innovation 29
In contrast to GDP employment increases relative to the baseline in all the alternative scenarios (Figure 32) Due to the scenario design the structure of the EU economies is shifted from energy-intensive to labour-intensive sectors The magnitude of the employment gain is influenced by the carbon price and the tax shift the underlying energy prices and the production loss The largest part of the employment increase stems from the additional RES investment (scenario S2H) although a shift in industry structures (S2HI) and additional RES exports (S2HE) are also positive for the labour market
33 Macroeconomic impacts at the national level
In general terms it is clear that national ETS and ETR impacts depend significantly on country specifics including energy use economic structure social system and behaviour (eg reactions to labour cost changes) In countries with high carbon intensity in their energy mix additional revenues and expenditures are higher than in countries with lower carbon intensity
Scenario S2H provides an interesting tool for analysing the macroeconomic impacts of ETR at the national level because 10 of the additional generated revenues are used for eco-innovation investments meaning that only 90 of the revenues are recycled back into the economy by reducing income tax rates and social security contributions
Figure 32 EU-27 employment according to four scenarios mdash deviation from the baseline (BH)
ndash 020
000
020
040
060
2010 2015 2020
S2HI S1H S2H S2HE
Percentage deviation from the baseline (BH)
Environmental tax reform in Europe opportunities for eco-innovation
Modelling of ETR impacts on eco-innovation
30
Figure 34 GDP in 2020 in EU-27 Member States under scenario S2H mdash deviation form the baseline (BH)
Figure 33 GDP in 2020 in selected countries under scenario S2H mdash deviation from the baseline (BH)
ndash 25 ndash 20 ndash 15 ndash 10 ndash 05 00 05 10 15
Romania
Bulgaria
SloveniaMalta
Lithuania
Latvia
Estonia
CyprusSlovakia
Poland
Hungary
Czech RepublicUnited Kingdom
Sweden
Spain
Portugal
Netherlands
Italy
Ireland
Greece
FranceFinland
Denmark
Luxembourg
Belgium
Austria
Germany
Percentage deviation from the baseline (BH)
Russia
South Africa
Brazil
India
China
Mexico
Japan
USA
Poland
United Kingdom
Spain
Italy
France
Germany
ndash 30 ndash 25 ndash 20 ndash 15 ndash 10 ndash 05 00 05 10
Percentage deviation from the baseline (BH)
Modelling of ETR impacts on eco-innovation
Environmental tax reform in Europe opportunities for eco-innovation 31
Figure 35 Employment in 2020 in EU-27 Member States under scenario S2H mdash deviation from baseline (BH)
EU-27EU-15
RomaniaBulgariaSloveniaMalta
LithuaniaLatvia
EstoniaCyprusSlovakia
PolandHungary
Czech RepublicUnited Kingdom
SwedenSpain
PortugalNetherlands
ItalyIrelandGreece
FranceFinlandDenmarkLuxembourg
BelgiumAustria
Germany
ndash 200 0 200 400 600 800 1 000
Percentage deviation from the baseline (BH)
Under scenario S2H the GDP of large EU economies deviates from baseline projections by between 0 and ndash 1 with the exception of Italy (Figure 33) Germanys GDP is even forecast to match the baseline level in 2020 due to the countrys strong RES industry Outside Europe some countries gain slightly against EU Member States in terms of competitiveness as export prices in most EU Member States and sectors increase and GDP in those countries exceeds the baseline projections as a result (Figure 33) This is mainly because carbon tax revenues are recycled via income tax reductions which are not part of production costs However energy exporting economies such as Russia or South Africa will lose exports if EU demand for fossil fuel imports declines The development of all EU Member States is shown in Figure 34
Employment impacts of scenario S2H are positive for almost all EU Member States as lower labour
costs increase labour demand and labour intensity (Figure 35) The highest absolute increases are shown for Germany the Netherlands Italy and the United Kingdom For EU-27 as a whole employment will be almost one million higher than in the corresponding baseline BH in 2020
The scenarios have not been designed with a view to meeting the EU renewables target of a 20 renewables share in final energy consumption in 2020 Nevertheless the scenarios provide some interesting insights The share is projected to increase from around 10 in 2009 to above 14 even in the baseline as instruments such as feed in tariffs and biofuel quotas will continue In scenario S1H the target will be missed with around 18 in 2020 Only in scenarios S2H S2HE and S2HI is the target met (approximately 20 )
Environmental tax reform in Europe opportunities for eco-innovation
Modelling of ETR impacts on eco-innovation
32
Under scenario S2H energy-related carbon emissions are reduced in all EU Member States relative to the baseline (Figure 36) The highest percentage reductions can be seen in many of the EU-12 Member States with still high energy intensity and low energy prices In these countries the relative price increase is higher than in countries like Germany or the United Kingdom with already high energy taxes and overall energy prices
Additional ETS revenues material tax revenues and carbon tax revenues from the industry sector are recycled back to industry via reductions in employers social security contributions (or wage subsidies in some countries) The revenues from the carbon tax on households set out in Table 32 (totalling 033 of GDP in Germany for example) are used to reduce income tax For the EU-27 overall revenues from ETS and ETR reach about 2 of GDP in 2020 although these figures may be excessive because additional EU efforts to increase energy
efficiency and renewable energy which will reduce the ETS price are not taken into account The use of flexible tools such as the Clean Development Mechanism will further reduce the revenues and earmarking of part of the revenues for mitigation and adaptation measures in emerging and developing countries limits the recycling into labour costs
In addition the scenarios do not take the current global economic problems into account According to the IEA (2009) the downturn will also reduce carbon emissions in the long run which will lead to lower carbon prices and revenues to reach fixed targets (or make tighter targets less costly)
The ETR will have varying effects on the prices of different sorts of products and services Material or carbon taxes increase the prices of product groups according to their direct and indirect material and carbon content The recycling mechanism reduces
Figure 36 Energy-related CO2 emissions in 2020 under scenario S2H mdash deviation from the baseline (BH)
WorldEU-27
EU-15Romania
BulgariaSlovenia
MaltaLithuania
LatviaEstonia
CyprusSlovakia
PolandHungary
Czech RepublicUnited Kingdom
SwedenSpain
PortugalNetherlands
ItalyIreland
GreeceFrance
FinlandDenmark
LuxembourgBelgium
AustriaGermany
ndash 25 ndash 20 ndash 15 ndash 10 ndash 5 0
Percentage deviation from the baseline (BH)
Modelling of ETR impacts on eco-innovation
Environmental tax reform in Europe opportunities for eco-innovation 33
Table 32 Additional ETS and environmental tax revenues in 2020 ( of GPD)
S2H Germany United Kingdom EU-27
ETS revenues 083 064 059
Carbon tax (industry) 052 044 054
Carbon tax (households) 033 041 036
Material tax 041 029 056
Sum 209 178 205
Figure 37 Total primary energy supply in 2020 under scenario S2H mdash deviation from the baseline (BH)
WorldEU-27EU-15
RomaniaBulgaria
Slovenia
MaltaLithuania
LatviaEstonia
Cyprus
SlovakiaPoland
HungaryCzech Republic
United KingdomSweden
SpainPortugal
NetherlandsItaly
IrelandGreece
FranceFinland
DenmarkLuxembourg
BelgiumAustria
Germany
ndash 24 ndash 21 ndash 18 ndash 15 ndash 12 ndash 9 ndash 6 ndash 3 0
Percentage deviation from the baseline (BH)
Environmental tax reform in Europe opportunities for eco-innovation
Modelling of ETR impacts on eco-innovation
34
Figure 38 Output price impacts of scenario S2H in Germany in 2020 mdash deviations from the baseline (BH)
Figure 39 Impacts of scenario S2H on industrial output in 2020 in Germany mdash deviations from the baseline (BH)
ndash 5
0
5
10
15
20
Output prices
Percentage deviation from the baseline (BH)
(3) F
ood
(4) T
extiles
(5) W
ood
(6) P
ulp pap
er
(7) C
oke re
fined
petro
leum
pro
ducts
(8) C
hemica
ls ex
cl pha
rma
(9) P
harm
aceu
ticals
(10)
Rub
ber a
nd plastics
(11)
Non
-metallic
miner
als
(12)
Iron
and
steel
(13)
Non
-ferrou
s metals
(14)
Met
al pro
ducts
(15)
Mac
hine
ry and
equ
ipmen
t
(16)
Office
mac
hine
ry
(17)
Electric
al m
achine
ry
(18)
Rad
io T
V
(19)
Med
ical pr
ecisi
on and
opt
ical ins
trumen
ts
(20)
Mot
or veh
icles
(21)
Ships
(22)
Airc
raft
(23)
Railro
ad
(24)
Man
ufac
turin
g n
ec r
ecyc
ling
(25)
Electric
ity g
as w
ater
sup
ply
(26)
Con
stru
ction
(27)
Tra
de r
epairs
(28)
Hot
els an
d re
stau
rant
s
(29)
Tra
nspo
rt an
d stor
age
(30)
Pos
t and
teleco
mmun
icatio
ns
(31)
Finan
ce ins
uran
ce
(32)
Rea
l estate ac
tivities
(33)
Ren
ting
(34)
Com
puter
(35)
Res
earch an
d de
velopm
ent
(36)
Oth
er bus
ines
s ac
tivities
(37)
Pub
lic ser
vice
s
(38)
Edu
catio
n
(39)
Hea
lth and
soc
ial w
ork
(40)
Oth
er ser
vice
s
(41)
Priv
ate ho
useh
olds
(1) A
gricu
lture
(2) M
ining an
d qu
arry
ing
nec not elsewhere classified
Production
ndash 100
ndash 80
ndash 60
ndash 40
ndash 20
00
20
40
60
80Percentage deviation from the baseline (BH)
(3) F
ood
(4) T
extiles
(5) W
ood
(6) P
ulp pap
er
(7) C
oke re
fined
petro
leum
pro
ducts
(8) C
hemica
ls ex
cl pha
rma
(9) P
harm
aceu
ticals
(10)
Rub
ber a
nd plastics
(11)
Non
-metallic
miner
als
(12)
Iron
and
steel
(13)
Non
-ferrou
s metals
(14)
Met
al pro
ducts
(15)
Mac
hine
ry and
equ
ipmen
t
(16)
Office
mac
hine
ry
(17)
Electric
al m
achine
ry
(18)
Rad
io T
V
(19)
Med
ical pr
ecisi
on and
opt
ical ins
trumen
ts
(20)
Mot
or veh
icles
(21)
Ships
(22)
Airc
raft
(23)
Railro
ad
(24)
Man
ufac
turin
g n
ec r
ecyc
ling
(25)
Electric
ity g
as w
ater
sup
ply
(26)
Con
stru
ction
(27)
Tra
de r
epairs
(28)
Hot
els an
d re
stau
rant
s
(29)
Tra
nspo
rt an
d stor
age
(30)
Pos
t and
teleco
mmun
icatio
ns
(31)
Finan
ce ins
uran
ce
(32)
Rea
l estate ac
tivities
(33)
Ren
ting
(34)
Com
puter
(35)
Res
earch an
d de
velopm
ent
(36)
Oth
er bus
ines
s ac
tivities
(37)
Pub
lic ser
vice
s
(38)
Edu
catio
n
(39)
Hea
lth and
soc
ial w
ork
(40)
Oth
er ser
vice
s
(41)
Priv
ate ho
useh
olds
(1) A
gricu
lture
(2) M
ining an
d qu
arry
ing
nec not elsewhere classified
Modelling of ETR impacts on eco-innovation
Environmental tax reform in Europe opportunities for eco-innovation 35
social security contributions and lowers labour costs according to the direct and indirect labour content of sector output The ETR therefore reduces output prices in labour-intensive service sectors and increases prices in carbon- and material-intensive industry sectors
The example of Germany shows insignificant impacts in the trade-intensive sectors of machinery (15ndash17) motor vehicles (20) and other transport equipment (21ndash23) (Figure 38) Iron and steel (12) and chemicals without pharmaceuticals (8) face the highest price increases of trade-intensive sectors As the German iron and steel industry primarily delivers high quality steel to the German car industry and increasingly to the German windmill industry negative competitiveness impacts will be limited Exchange rate variations against non-EU competitors have been much higher in the past
The higher prices of carbon- and material-intensive products will reduce price competitiveness on export markets and increase the market share for imports in domestic markets This loss of price competitiveness is based on an assumption of limited market development of energy efficiency and RES technologies in other part of the world It will be offset by gains in labour-intensive sectors if the ETR causes real wage costs per unit of output to fall as a result of using recycled revenues to reduce employer social security contributions
Any improvement in non-price competitiveness will also raise exports The extra employment will raise incomes raising consumption and output
The overall impact on sector output depends on countervailing effects which are negative for iron and steel and a few service sectors and positive for a few industry sectors For most industries the output effect is insignificant (Figure 39) The greatest impact is felt by producers of fossil fuels who must obviously reduce production due to lower demand for their products
Under scenario S2H employment impacts are positive for most sectors relative to the baseline as labour productivity decreases and wage rates fall in relation to consumer prices (CPI) and output prices (Table 33) The relative costs of labour are lower than in the baseline without the ETR reform Only around a quarter of the employment increase takes place in industry
Concerning the wage rate two countervailing effects have to be considered First when the labour market is characterised in terms of the real wage bargaining model as in E3ME and GINFORS with market power on both sides (employers and trade unions) consumer price increases will lead to wage increases (the econometrically estimated factor is 085 for Germany) Second labour productivity is another important factor for wage bargaining The estimated elasticity for Germany is 063 meaning that a 1 increase of labour productivity leads to wage increases of 063 Higher labour demand due to lower labour costs thus reduces the wage increase In the end the German economy is more labour intensive than without the ETR partly due to the structural change towards labour-intensive industries
Table 33 Employment impacts of scenario S2H in Germany mdash deviations from scenario S2H in 2020
Employment in 2020 Deviation from S2H () Deviation from S2Habsolute (1 000s)
Agriculture forestry 24 90
Industry 09 653
Non-metallic minerals 24 62
Iron and steel ndash 28 ndash 37
Machinery and equipment 05 56
Electrical machinery 04 18
Construction 37 449
Trade and transport 10 829
Business services 17 767
Other services ndash 02 ndash 216
Total 07 2506
Environmental tax reform in Europe opportunities for eco-innovation
Modelling of ETR impacts on eco-innovation
36
Additional exports under scenario S2HE mainly create new jobs in machinery and related business services (Table 34) Under scenario S2HI a shift in the input structure of the energy sector leads to a shift in the industry structure and creates a few jobs in the service sector (Table 35)
34 Conclusions of the scenario assessment
The foregoing analysis used the GINFORS model to assess economic and environmental impacts of using the ETS and ETR to reach the EUs 2020
GHG targets In general the results show positive employment effects and only small negative impacts on GDP in EU-27 Member States The economic impacts depend on the levels of international energy prices the mechanism used to recycle revenues and country specifics such as carbon and energy intensity and the structure of energy consumption
Although there is significant evidence that eco-innovation is positively driven by higher energy prices quantification is difficult The present study included simulations of possible impacts of a shift in the industry structure towards renewable energy in the electricity sector and an overall increase of EU
Table 34 Employment impacts of scenario S2HE in 2020 in Germany mdash deviations from scenario S2H
Employment in 2020 Deviation from S2H () Deviation from S2Habsolute (1 000s)
Agriculture forestry ndash 01 ndash 02
Industry 03 194
Non-metallic minerals 02 05
Iron and steel 04 05
Machinery and equipment 13 130
Electrical machinery 24 117
Construction 01 18
Trade and transport 00 26
Business services 07 308
Other services 01 107
Total 02 634
Table 35 Employment impacts of scenario S2HI in 2020 in Germany mdash deviations from scenario S2H
Employment in 2020 Deviation from S2H () Deviation from S2Habsolute (1 000s)
Agriculture forestry ndash 01 ndash 02
Industry 00 00
Non-metallic minerals 25 65
Iron and steel ndash 27 ndash 36
Machinery and equipment 08 78
Electrical machinery 04 19
Construction ndash 00 ndash 04
Trade and transport 00 07
Business services 02 115
Other services 0 56
Total 00 167
Modelling of ETR impacts on eco-innovation
Environmental tax reform in Europe opportunities for eco-innovation 37
exports due to higher global demand for renewable energy The main results can be summarised as follows
bull environmentaltaxreformshiftingtaxesfromlabour to energy and resources will create additional jobs and trigger eco-innovation
bull impactsofeco-innovationintheformofadditional EU exports or shifts in industry structures will have a slight positive influence on GDP and create a smaller number of additional jobs
These findings correspond to results from the EmployRES study (Fraunhofer ISI et al 2009) As ETR is directly aimed at reducing labour costs it will create additional jobs in the short and medium term In the longer term the cost reduction and new technologies arising from eco-innovation will play a larger role
Like all fiscal reforms a major ETR in Europe will create winners and losers At the sector level carbon- and material-intensive industries will face economic losses At the country level the carbon-intensity and overall flexibility of economies is important Clearly structural change away from carbon-intensive industries together with technological change is inherent in any successful climate mitigation policy
On the other hand several factors can smooth these structural adjustments International cooperation
will reduce economic pressure on countries and sectors In addition ETR together with auctioning of ETS allowances can be a major source of revenues for EU Member States in the future even if part of the revenues will have to be earmarked for adaptation and mitigation measures in developing countries Indeed future debate on grandfathering or auctioning ETS allowances should reflect the important point that giving allowances away for free denies countries the money to ease structural change and invest in low-carbon technologies
Caution is needed in relating the findings of this study to the EU policy debate In the model simulations the single carbon price is the only instrument used to reach the EUs 2020 GHG targets In reality of course other renewable energy and efficiency policies will also contribute to carbon reduction and have to be taken into account when comparing the results (especially the high carbon prices) to other studies Both reduce the potential revenues from fossil energy carriers and carbon emissions
A variety of renewable energy and efficiency policies could enable the climate and energy targets to be met while securing even better economic prospects The results of the present study clearly indicate that the discussion on market-based instruments should be intensified Ultimately however the EU will need a rich mix of policies to reach its GHG targets while maximising prosperity
Environmental tax reform in Europe opportunities for eco-innovation38
References
Almon C 1991 The INFORUM Approach to Interindustry Modeling in Economic Systems Research Vol 3 pp 1ndash7
Amin A and Cohendet P 2004 The Architecture of Knowledge Firms Capabilities and Communities Oxford University Press Oxford
Barker T Meyer B Pollitt H and Lutz C 2007a Modelling Environmental Tax Reform in Germany and the United Kingdom with E3ME and GINFORS petre Working Paper Cambridge and Osnabrueck (httpwwwpetreorgukpapershtm) accessed 15 February 2011
Barker T Junankar S Pollitt H and Summerton P 2007b Carbon leakage from unilateral environmental tax reforms in Europe 1995ndash2005 Energy Policy Vol 35 pp 6 281ndash6 292
Brunnermeier S B and Cohen M A 2003 Determinants of environmental innovation in US manufacturing industries Journal of Environmental Economics and Management Vol 45 pp 278ndash293
Buen J 2006 Danish and Norwegian wind industry The relationship between policy instruments innovation and diffusion Energy Policy Vol 34 (18) pp 3 887ndash3 897
Carlsson B and Stankiewicz R 1991 On the nature function and composition of technological systems Journal of Evolutionary Economics Vol 1 (2) pp 93ndash118
Christiansen A C and Skjaerseth J B 2005 Climate change policies in Norway and the Netherlands Different instruments similar outcome Energy and Environment Vol 16(1) pp 1ndash25
Dosi G 1988 Sources procedures and microeconomic effects of innovation Journal of Economic Literature Vol 26 pp 1 120ndash1 171
de Vries F and Medhi N 2008 Environmental regulation and international innovation in automotive emissions control technologies in Environmental Policy Technological Innovation and Patents Organisation for Economic Cooperation and Development Paris
DG TREN 2008 European energy and transport mdash trends to 2030 mdash update 2007 European Commission Luxembourg
DTI 2004 Renewable Supply Chain Gap Analysis UK Department of Trade and Industry
Edler J (ed) 2006 Nachfrageorientierte Innovationspolitik Buumlro fuumlr Technikfolgenabschaumltzung beim Deutschen Bundestag (TAB) Arbeitsbericht Nr 99 Berlin
Edquist C 2001 The system of innovation approach and innovation policy an account of the state of the art lead paper presented at the DRUID Conference 12ndash15 June 2001 Aalborg (httpwwwdruiddkconferencesnwpaper1edquistpdf) accessed 15 February 2011
EEA 2006 Using the market for cost-effective environmental policy Market-based instruments in Europe EEA Report No 12006 European Environment Agency Copenhagen
Ekins P 2009 Resource Productivity Environmental tax Reform and Sustainable Growth in Europe published by the Anglo-German Foundation for the Study of Industrial Society Final report (httpwwwpetreorgukpdfFinRepFinpdf) accessed 12 October 2011
Ekins P and Speck S (eds) 2011 Environmental Tax Reform (ETR) A Policy for Green Growth Oxford University Press
EREC 2008 Energy [r]evolution A sustainable global energy outlook Greenpeace International European Renewable Energy Council (EREC)
References
References
Environmental tax reform in Europe opportunities for eco-innovation 39
Fagerberg J Mowery D C and Nelson R R (eds) 2005 The Oxford Handbook of Innovation Oxford University Press Oxford
Fischer C Parry I W H and Pizer W A 2003 Instrument choice for environmental protection when technological innovation is endogenous Journal of Environmental Economics and Management Vol 45 pp 523ndash545
Fraunhofer ISI ECOFYS Energy Economics Group Ruumltter + Partner SEURECO and LEI 2009 EmployRES mdash The impact of renewable energy policy on economic growth and employment in the European Union European Commission Brussels
Frondel M Horbach J and Rennings K 2008 What triggers environmental management and innovation Empirical evidence for Germany Ecological Economics Vol 66(1) pp 153ndash160
GHK Cambridge Econometrics and IEEP 2007 Links between the environment economy and jobs Final Report submitted to DG Environment European Commission
Giljum S Behrens A Hinterberger F Lutz C and Meyer B 2008 Modelling scenarios towards a sustainable use of natural resources in Europe Environmental Science and Policy Vol 11 pp 204ndash216
Goumlrlach B Knigge M and Luumlckge H 2005 Wirkungen der Oumlkologischen Steuerreform auf Innovation und Marktdurchdringung Ecologic Berlin (httpecologiceudownloadprojekte1850-189918791879_5_innovationpdf) accessed 18 August 2011
Green M A 2000 Photovoltaics technology overview Energy Policy Vol 28 (14) pp 989ndash998
Grossmann A Lehr U Lutz C and Wolter MI 2008 Gesamtwirtschaftliche Effekte der Umsetzung der EU Ziele im Bereich Erneuerbare Energien und Gebaumludeeffizienz in Oumlsterreich bis 2020 Studie im Auftrag des Lebensministeriums Wien 0508
Hage J and Hollingsworth J R 2000 Idea innovation networks a strategy for integrating organizational and institutional analysis Organization Studies Vol 21 (5) pp 971ndash1 004
Hauschildt J 2004 Innovationsmanagement Vahlen Muumlnchen
Hemmelskamp J 1997 Environmental policy instruments and their effects on innovation European Planning Studies Vol 5 (2) pp 177ndash195
Hoglund Isaksson L 2005 Abatement costs in response to the Swedish charge on nitrogen oxide emissions Journal of Environmental Economics and Management Vol 50 pp 102ndash120
Hullmann A 2001 Internationaler Wissenstransfer und technischer Wandel (dissertation) Physica-Verlag Heidelberg
IEA 2008 World Energy Outlook 2008 International Energy Agency Paris
IEA 2009 World Energy Outlook 2009 International Energy Agency Paris
Jacobsson S Andersson B A and Baringngens L 2002 Transforming the energy system mdash the evolution of the German technological system for solar cells Science and Technology Policy Research University of Sussex Electronic Working Paper Series No 84 (httpideasrepecorgpsrussewps84html) accessed 18 August 2011
Jaffe A and Stavins R 1995 Dynamic incentives of environmental regulations the effects of alternative policy instruments on technology diffusion Journal of Environmental Economics and Management Vol 29(3) pp 43ndash63
Jaffe A B and Palmer K 1997 Environmental regulation and innovation a panel data study The Review of Economics and Statistics Vol 79 pp 610ndash619
Jaffe A B Newell R G and Stavins R N 2002 Environmental policy and technological change Environmental and Resource Economics Vol 22 (1ndash2) 2002 pp 41ndash70
Johnstone N and Hascic I 2008 Renewable energy policies and technological innovation energy source and instrument choice in Environmental Policy Technological Innovation and PatentsOrganisation for Economic Co-operation and Development Paris
Johnstone N 2005 The Innovation Effects of Environmental Policy Instruments in Horbach J (ed) Indicator Systems for Sustainable Innovation Physica-Verlag HD
Environmental tax reform in Europe opportunities for eco-innovation
References
40
Johnstone N Hascic I and Ostertag K 2008 Environmental policy technological innovation and patent activity in Environmental Policy Technological Innovation and Patents Organisation for Economic Co-operation and Development Paris
Jung C Krutilla K and Boyd R 1996 Incentives for advanced pollution abatement technology at the industry level an evaluation of policy alternatives Journal of Environmental Economics and Management Vol 30(1) pp 95ndash111
Kammen D M Kapidia K and Fripp M 2004 Putting renewables to work how many jobs can the clean energy industry generate University of California Berkeley
Kemp R 1997 Environmental policy and technical change ndash a comparison of the technological impact of policy instruments Edward Elgar Cheltenham
Kemp R 1998 The diffusion of biological waste-water treatment plants in the Dutch food and beverage industry Environmental and Resource Economics Vol 12 pp 113ndash136
Kemp R 2000 Technology and environmental policy ndash innovation effects of past policies and suggestions for improvement in OECD proceedings ndash innovation and the environment Organisation for Economic Co-operation and Development Paris
Kerr S and Newell R G 2003 Policy-induced technology adoption evidence from the US lead phasedown Journal of Industrial Economics Vol 51 pp 317ndash343
Klaassen G Miketa A Larsen K and Sundqvist T 2005 The impact of RampD on innovation for wind energy in Denmark Germany and the United Kingdom Ecological Economics Vol 54 pp 227ndash240
Kline S and Rosenberg N 1986 An overview of innovation in Landau R (ed) The positive sum strategy Harnessing technology for economic growth pp 275-306
Knigge M and Goumlrlach B 2005 Effects of Germanys ecological tax reforms on the environment employment and technological innovation Ecologic Berlin (httpwwwumweltbundesamtdeuba-info-presse-ehintergrundoekosteuerpdf) accessed 18 August 2011
Langniss O 2003 Governance structures for promoting renewable energy sources dissertation Lund Stuttgart
Lanjouw J O and Mody A 1996 Innovation and the international diffusion of environmentally responsive technology Research Policy Vol 25 pp 549ndash571
Lehr U Nitsch J Kratzat M Lutz C and Edler D 2008 Renewable Energy and Employment in Germany Energy Policy Vol 36 pp 108ndash117 DOI101016jenpol200709004
Lehr U Wolter MI and Groszligmann A 2009 Economic impacts of RES obligations in Austria ndash an application of the macro-econometric model e3at GWS Discussion Paper 20091 Osnabruumlck
Lundvall B-A Johnson B Andersen E S and Dalum B 2001 National systems of production innovation and competence building Research Policy Vol 31 pp 213ndash231
Lutz C and Giljum S 2009 Global resource use in a business as usual world until 2030 Updated results from the GINFORS model in Bleischwitz R Welfens Pand Zhang Z (eds) Sustainable growth and resource productivity ndash economic and global policy issues Greenleaf Publishers pp 30ndash41
Lutz C and Meyer B 2008 Beschaumlftigungseffekte des Klimaschutzes in Deutschland Untersuchungen zu gesamtwirtschaftlichen Auswirkungen ausgewaumlhlter Maszlignahmen des Energie- und Klimapakets Forschungsbericht 205 46 434 Dessau-Roszliglau
Lutz C and Meyer B 2009a Environmental and Economic Effects of Post-Kyoto Carbon Regimes Results of Simulations with the Global Model GINFORS Energy Policy Vol 37 pp 1 758ndash1 766 DOI 101016jenpol200901015
Lutz C and Meyer B 2009b Scenario results from GINFORS PETRE working paper Osnabruumlck
Lutz C Meyer B Nathani C and Schleich J 2005 Endogenous technological change and emissions The case of the German steel industry Energy Policy Vol33 pp 1 143ndash1 154
Lutz C Meyer B Nathani C and Schleich J 2007 Endogenous innovation economy and environment impacts of a technology based modelling approach for energy-intensive industries in Germany Energy Studies Review Vol 15(1) pp 2ndash18
References
Environmental tax reform in Europe opportunities for eco-innovation 41
Lutz C Meyer B and Wolter M I 2009 The global multisectormulticountry 3-E model GINFORS mdash a description of the model and a baseline forecast for global energy demand and CO2 emissions Journal of Sustainable Development forthcoming
Malerba F and Orsenigo L 1997 Technological Regimes and Sectoral Patterns of Innovative Activities Industrial and Corporate Change Vol 6 (1) pp 83ndash117
Malerba F 1992 Learning by Firms and Incremental Technical Change The Economic Journal Vol 102 (413) pp 845ndash859
Malerba F 2005 Industrial dynamics and innovation progress and challenges Presidential Address delivered at the 32nd Conference of the European Association for Research in Industrial Economics (EARIE) 1ndash4 September 2005 Porto
Malerba F 2006 Innovation and the evolution of industries Journal of Evolutionary Economics Vol 16 pp 3ndash23
McGinty M and de Vries F P 2009 Technology diffusion product differentiation and environmental subsidies The BE Journal of Economic Analysis and Policy Vol 9(1)
Meyer B and Lutz C 2007 The GINFORS model ndash model overview and evaluation Petre Working Paper Osnabruumlck (httpwwwpetreorgukpapershtm) accessed 18 August 2011
Meyer B Lutz C Schnur P and Zika G 2007 Economic policy simulations with global interdependencies a sensitivity analysis for Germany Economic Systems Research Vol 19 pp 37ndash55
Mickwitz P H Hyvaumlttinen and P Kivimaa 2008 The role of policy instruments in the innovation and diffusion of environmentally friendlier technologies popular claims versus case study experiences Journal of Cleaner Production Vol 16(1S1) 162ndash170
Miketa A and Schrattenholzer L 2004 Experiments with a methodology to model the role of RampD expenditures in energy technology learning processes first results Energy Policy Vol 32 (15) pp 1 679ndash1 692
Milliman S R and Prince R 1989 Firm incentives to promote technological change in pollution control Journal of Environmental Economics and Management Vol 17 pp 247ndash265
Millock K and Nauges C 2006 Ex-post evaluation of an earmarked tax on air pollution Land Economics Vol 82(1) pp 68ndash84
Montero J-P 2002 Market structure and environmental innovation Journal of Applied Economics Vol 2 pp 293ndash325
Moreno B and Loacutepez A J 2007 The effect of renewable energy on employment mdash The case of Asturias (Spain) Renewable and Sustainable Energy Rewiews doi 101016jrser200610011
Mowery D and Rosenberg N 1979 The influence of market demand upon innovation A critical review of some recent empirical studies Research Policy Vol 8 pp 102ndash153
Newell R G Jaffe A B and Stavins R N 1999 The induced innovation hypothesis and energy-saving technological change Quarterly Journal of Economics Vol 114 pp 941ndash975
Norberg-Bohm V 1999 Stimulating green technological innovation An analysis of alternative policy mechanisms Policy Sciences Vol 32(1) pp 13ndash38
OECD 2009 Sustainable manufacturing and eco-innovation towards a green economy Organisation for Economic Co-operation and Development Policy Brief June 2009
OECD 2010 Taxation innovation and the environment Organisation for Economic Co-operation and Development
Pavitt K 1984 Sectoral patterns of technological change Towards a taxonomy and a theory Research Policy Vol 13 pp 343ndash373
Popp D 2002 Induced innovation and energy prices The American Economic Review Vol 92(1) pp 160ndash180
Popp D 2005 Lessons from patents Using patents to measure technological change in environmental models Ecological Economics Vol 54 pp 209ndash226
Environmental tax reform in Europe opportunities for eco-innovation
References
42
Porter M and van der Linde C 1995 Toward a new conception of the environment competitiveness relationship Journal of Economic Perspectives Vol 9(4) pp 97ndash118
Rammert W 2002 The cultural shaping of technologies and the politics of technodiversity In Sorensen K and Williams R (eds) Shaping technology guiding policy concepts spaces and tools Elgar Cheltenham pp 155-172
Requate T 2005 Dynamic incentives by environmental policy instruments ndash a survey Ecological Economics Vol 54 pp 175ndash195
Roloff N Lehr U Krewitt W Fuchs G Wassermann S Weimer-Jehle W and Schmidt B 2008 Success determinants for technological innovations in the energy sector mdash the case of photovoltaics in Moumlst D Fichtner W Ragwitz M and Veit D (eds) New methods for energy market modelling mdash Proceedings of the first european workshop on energy market modelling using agent-based computational economics Universitaumltsverlag Karlsruhe
Rothwell R 1995 The fifth generation innovation process in Oppenlaumlnder KH Popp W (eds) Innovationen und wirtschaftlicher Fortschritt betriebs-und volkswirtschaftliche Perspektiven Bern pp 9ndash26
Schumpeter J 1942 Capitalism socialism and democracy New York Harper
Skjaeligrseth J B and Christiansen A C 2005 Environmental policy instruments and technological change in the energy sector findings from comparative empirical research Energy and Environment Vol 17 (2) pp 223ndash241
Snyder L D Miller N H and Stavins R N 2003 The effects of environmental regulations on pollution emissions evidence from plant-level data American Economic Review Vol 93(2) pp 431ndash435
Technopolis 2008 Eco-innovation Final Report for Sectoral Innovation Watch (httpwwwtechnopolis-groupcomresourcesdownloads661_report_finalpdf) accessed 18 August 2011
Volleburgh H 2007 Impacts of environmental policy instruments on technological change Report for Joint Meetings of Tax and Environment Experts OECD Environment Directorate February 2007 (comenvepocctpacfa(2006)36final)
Zimmermann H Wohltmann M and Hansjuumlrgens B 1996 Umweltabgaben und Innovation Analytica Marburg
43
Annex 1
Environmental tax reform in Europe opportunities for eco-innovation
Type Instrument Area Stage
Reference
Theo
retica
l
Em
piric
al
Cas
e st
udy
Rev
iew
Qual
itat
ive
Taxe
s
Perm
its
Subsi
die
s
Volu
nta
ry
Com
man
d
Reg
ula
tion
Ener
gy
Air
Wat
er
Oth
er
Gen
eral
Innov
atio
n
Diffu
sion
Rel
evan
ce
Brunnermeier amp Cohen (2003)
X X X X
Buen (2006) X X X X X X
Christiansen amp Skjaerseth (2005)
X X X X X X
Fischer et al (2003 X X X X X X
Frondel et al (2008) X X X X X X X (X) (X)
Hemmelskamp (1997)
X X X X X X X (X)
Hoglund Isaksson (2005)
X X X (X) (X)
Jaffe amp Stavins (1995)
X X X1 X X X X
Jaffe amp Palmer (1997)
X X X X
Jaffe et al (2002) X X X X X X X X X X
Jung et al (1996) X X X X X X (X) (X)
Kemp (1998) X X X X
Kerr amp Newell (2001) X X X X X
Klaassen et al (2005)
X X X X X
Lanjouw amp Mody (1996)
X X X X X X X
McGinty amp de Vries (2009)
X X X X
Mickwitz et al (2008)
X X X X X X X X X
Milliman amp Prince (1989)
X X X X X X X
Millock amp Nauges (2006)
X X X X X X
Montero (2002) X X X X X
Newell et al (1999) X X1 X X X
Norberg-Bohm (1999)
X X X X X X X
Popp (2002) X X1 X X
Popp (2005) X X X X X X
Porter amp van der Linde (1995)
X X X X X X
Requate (2005) X X X X X X X
Skjaeligrseth amp Christiansen (2005)
X X X X X X X X X
Snyder et al (2003) X X X X X
Annex 1 Classification of refereed journal articles
Environmental tax reform in Europe opportunities for eco-innovation44
Annex 2
Type Instrument Area Stage
Reference
Theo
retica
l
Em
piric
al
Cas
e st
udy
Rev
iew
Qual
itat
ive
Taxe
s
Perm
its
Subsi
die
s
Volu
nta
ry
Com
man
d
Reg
ula
tion
Ener
gy
Air
Wat
er
Oth
er
Gen
eral
Innov
atio
n
Diffu
sion
Rel
evan
ce
Johnstone (2005)
X X X X X X X
Johnstone amp Hascic (2008)
X X X X X X X X
Kemp (1997) X X X X X X X X X X X X X
Kemp (2000) X X X X X X X X X
de Vries amp Medhi (2008)
X X1 X X X
Annex 2 Classification of books and book chapters
45
Annex 3
Environmental tax reform in Europe opportunities for eco-innovation
Type Instrument Area Stage
Reference
Theo
retica
l
Em
piric
al
Cas
e st
udy
Rev
iew
Qual
itat
ive
Taxe
s
Perm
its
Subsi
die
s
Volu
nta
ry
Com
man
d
Reg
ula
tion
Ener
gy
Air
Wat
er
Oth
er
Gen
eral
Innov
atio
n
Diffu
sion
Rel
evan
ce
Goumlrlach et al (2005)
X X X X X X
Knigge amp Goumlrlach (2005)
X X X X X X
Technopolis (2008)
X X X X X X
Volleburgh (2007)
X X X X X X X X X X X
Annex 3 Classification of reports
European Environment Agency
Environmental tax reform in Europe opportunities for eco-innovation
2011 mdash 45 pp mdash 21 x 297 cm
ISBN 978-92-9213-238-5doi10280084889
How to obtain EU publications
Publications for salebull viaEUBookshop(httpbookshopeuropaeu)bull fromyourbooksellerbyquotingthetitlethepublisherandorISBNnumberbull bycontactingoneofoursalesagentsdirectlyYoucanobtaintheircontactdetails
on the Internet (httpbookshopeuropaeu) or by sending a fax to +352 2929-42758
Free publicationsbull viaEUBookshop(httpbookshopeuropaeu)bull attheEuropeanCommissionsrepresentationsordelegationsYoucanobtain
their contact details on the Internet (httpeceuropaeu) or by sending a fax to +352 2929-42758
European Environment AgencyKongens Nytorv 61050 Copenhagen KDenmark
Tel +45 33 36 71 00Fax +45 33 36 71 99
Web eeaeuropaeuEnquiries eeaeuropaeuenquiries
TH
-AK-1
1-0
17-E
N-N
doi1
02
8008
4889
- Acknowledgements
- Executive summary
- 1Introduction
-
- 11Background
- 12ETR and innovation
- 13Report structure
-
- 2Review of literature on environmental tax reform and eco‑innovation
-
- 21Initial screening
- 22Detailed review
- 23Environmental regulation studies
- 24Theoretical studies
- 25Empirical studies
- 26Case studies
- 27Conclusions
-
- 3Modelling of ETR impacts on eco‑innovation
-
- 31Scenarios assessing the implications of ETR for eco-innovation
- 32Overview of modelling results
- 33Macroeconomic impacts at the national level
- 34Conclusions of the scenario assessment
-
- References
- Annex 1 Classification of refereed journal articles
- Annex 2Classification of books and book chapters
- Annex 3Classification of reports
-
Environmental tax reform in Europe opportunities for eco-innovation
Review of literature on environmental tax reform and eco-innovation
12
Policy instrument addressed
The second classification criterion concerns the policy instruments that are addressed by the study with a distinction being made between five specific instrument types
The first three are market-based or price-based instruments environmental taxes and charges tradable permits and investment subsidies and tax allowances All three act by changing the prices of input factors in one way or another As has been noted above some studies consider the impact of energy prices rather than energy taxes However since the findings of these studies are directly transferable they are classified under the tax heading
The fourth instrument type is voluntary or negotiated agreements under which firms or sectors enter into agreements with government to achieve certain performance targets or undertake specific actions
The fifth type is command and control regulations which encompass technology mandates emission limits and performance standards (eg for specific energy consumption)
The final classification regulation is used for studies that consider the weight or stringency of environmental regulation in general rather than a specific policy instrument
Policy area addressed
With regard to the policy area(s) covered by the studies a distinction is made between five areas including energy and climate change air pollution water pollution and other
The final classification general is used for studies that consider the impacts of environmental regulation in general rather than any specific intervention or where the policy area is not specified (eg in theoretical analyses)
Stage of technological development
The final classification criterion concerns the stage of the technological development process that is addressed by the study As has been noted above the process is typically divided into three stages invention innovation and diffusion In practice however the studies do not distinguish between the first two stages (often just referring generically to RampD) They have therefore been combined for the purposes of the classification so that the only distinction is between the innovation and diffusion stages
Results of the classification exercise
Subsequent to classifying the studies each was scored in terms of its relevance to analysing ETRs impacts on eco-innovation A three tier qualitative scoring system was used One star () indicates that the study is of only minor relevance two stars () indicates that it is of moderate relevance and three stars () that it is of significant relevance Such a scoring system is inevitably subjective but it provides a pragmatic mechanism for identifying the key references to be included in the detailed review In determining the scores particular emphasis was placed on whether the study is empirical in nature and whether it considers environmental taxes (or factor prices)
Annex 1 shows the classifications of the 28 journal articles that were identified Thirteen are empirical seven are theoretical three are case studies and four are qualitative while four provide reviews of previous work in the area (including most of the identified studies) (6) Around two-thirds of the papers consider the impact of environmental taxes (or energy prices) often comparing these with the impacts of other policy instruments Eleven consider the impact of investment subsidies
Most of the theoretical analyses are not area-specific (only discussing environmental damage in general terms) The empirical studies are spread fairly evenly across policy areas with five addressing
(6) Some studies are classified under more than one heading For example a study may contain both a theoretical model of behaviour and an empirical assessment of the model
Review of literature on environmental tax reform and eco-innovation
Environmental tax reform in Europe opportunities for eco-innovation 13
energy and climate change five addressing air pollution and three addressing water pollution In terms of the stage of the technological development process there is an even split between innovation and diffusion with many of the papers covering both stages In total eighteen of the references are included in the detailed review
Annex 2 shows the classifications of the five book chapters and Annex 3 covers the four reports (7) As might be expected these sources put less emphasis on theory with only one reference including any formal analysis They are split fairly evenly between empirical studies reviews and qualitative assessments All but one consider the impact of environmental taxes or energy prices while seven consider the impact of investment subsidies As with the journal articles there is a fairly even spread across policy areas and between innovation and diffusion Five of the references are included in the detailed review
22 Detailed review
The detailed review focuses on the impacts on eco-innovation of the two price-based policy instruments that are directly relevant to ETR environmental taxes and investment subsidies and tax incentives (eg RampD and capital allowances) (8) A priori each instrument might be expected to stimulate innovation mdash the first by increasing the benefits of innovation by reducing tax payments the second by reducing the costs of developing and adopting new technologies However in order to provide a broader context for the impacts of these two instruments the review starts by considering the relationship between innovation and the stringency of environmental regulation in general
As can be seen from the initial screening (see Annexes 1ndash3) the large majority of studies consider more than one policy instrument within a unified analytical framework mdash either comparing their relative impacts or assessing the impacts of instrument combinations (or packages)
In particular all but one of the papers that assess the impacts of investment subsidies either theoretically or empirically also assess the impacts environmental taxes (and sometimes other policy instruments) Consequently for the purposes of this review it is convenient to consider the impacts of taxes and subsidies at the same time rather than sequentially In addition to avoiding the need for any repetition (about model structures assumptions etc) this facilitates identification of potential interactions and synergies between the two instruments
Apart from Section 23 on the impact of environmental regulation in general only those references identified as being of significant relevance () in the initial screening are included in the review References are summarised in chronological order under three headings theoretical predictions (Section 24) empirical evidence (Section 25) and case studies (Section 26) At the end of each section an attempt is made to synthesise the findings of the studies but the scope of the present review did not allow for critical analysis of the studies to identify their respective strengths and weaknesses or to resolve any apparent conflicts between their findings
23 Environmental regulation studies
Lanjouw and Mody (1996) use aggregate pollution and control expenditure (PACE) data as a proxy for the stringency of environmental regulation and compare this with data on the aggregate number of environmental patent applications for Germany Japan and USA They do not perform any formal statistical or econometric analysis of the data However based on simple graphical analysis they identify a relatively clear correlation between expenditure and patents over the 1970s and 1980s with a time lag of one to two years They also find some indications in the data that patenting in one country also responds to increasing stringency of environmental regulation in the other two In addition they consider the diffusion of environmental technologies by looking at trade
(7) Two of the reports emanate from the study by Ecologic and DIW of ETR in Germany Details of the assessment of the impact on innovation and market diffusion are provided (in German) in Goumlrlach et al (2005) with a summary (in English) in Knigge and Goumlrlach (2005)
(8) While the large majority of revenues raised under an ETR are likely to be used to reduce taxes on labour a small proportion may be used to encourage innovation or promote the take-up of environmentally friendly technologies
Environmental tax reform in Europe opportunities for eco-innovation
Review of literature on environmental tax reform and eco-innovation
14
flows in capital goods used for pollution reduction and find that these too show a correlation with total abatement expenditure
Jaffe and Palmer (1997) also use PACE data as a proxy for the stringency of environmental regulation and evaluate its impact on two different measures of innovation total private expenditures on RampD and the number of successful patent applications by US manufacturing industries Unlike the previous study they undertake formal econometric analysis of the data using panel data at the two-digit and three-digit SIC code industry level for the period 1978ndash1991 and a fixed effects model They find a statistically significant positive relationship between compliance expenditures (capital expenditures only) and RampD expenditures after controlling for industry-specific effects (9) However they can find no significant impact on patenting activity This is not entirely surprising given the fact that their data is for all types of patents not just those relating to environmental technologies and products Indeed given that the same is true for the RampD expenditure data it may be more surprising that they find a significant relationship between pollution compliance and RampD
Brunnermeier and Cohen (2003) also use a panel data model to assess the impact of pollution abatement expenditures on patenting activity by US manufacturing industries However unlike the previous study they use only environmental patent applications in their analysis They also control for other potential explanatory factors such as the stringency of monitoring and enforcement (as measured by number of inspection visits) industry size (value of shipments) market structure (four-firm concentration ratio) capital intensity and exposure to overseas competition (export intensity) They estimate four different models for the period 1983ndash1992 with their preferred model being a negative binomial random effects model The coefficient for PACE is positive and statistically significant (in all four models) as are the coefficients (in the preferred model) for industry size concentration and export intensity However the magnitude of the coefficient (which represents
the semi-elasticity of patents with respect to PACE) is only 00004 Thus ceteris paribus an increase in abatement expenditure of USD 100 million results in an increase in the mean number of patents of only 4
Key findings of the environmental regulation studies
All three environmental regulation studies use PACE data as a proxy for the stringency of environmental regulation (10) While there are obvious pragmatic reasons for doing this (ie availability of data) the validity of the approach may be open to question As Brunnermeier and Cohen (2003) note expenditure may be affected by factors other than environmental regulation such as external pressures from interest groups or a desire to promote or maintain green credentials with customers Furthermore the reported data may not cover all pollution abatement costs and activities (particularly process-related activities) and may be prone to over-statement by reporting firms for strategic reasons However to the extent that the reported PACE data is correlated with the stringency of environmental regulation the analyses suggest that the latter does have an impact on innovation (at least in USA) although the scale of the impact appears to be small
24 Theoretical studies
Although several previous studies has analysed the impact of different environmental policy instruments on technological change Milliman and Prince (1989) were the first to consider the entire process of technological change encompassing innovation diffusion and optimal agency response (11) Using a relatively simple graphical analysis of shifting marginal abatement cost curves they deduce a relative ranking of five instruments (direct controls auctioned permits freely allocated permits emission reduction subsidies (12) and emission taxes) in terms of firms incentives to promote technological change They conclude that emission taxes provide greater incentives for innovation and diffusion than direct controls or
(9) When they allow the slopes of the PACE variable to vary across industries (in addition to the intercept) they find considerable variation in the estimated coefficients across industries with several being negative
(10) However the studies do not all use the same definition of PACE Lanjouw and Mody (1996) include (real) investment expenditures regulation and monitoring costs and research and development by all levels of government private manufacturing and non-manufacturing firms The other two studies both use compliance cost data for private manufacturing firms (at the industry level) only However while Jaffe and Palmer (1997) use capital cost data in their analysis Brunnermeier and Cohen (2003) use operating cost data
(11) Milliman and Prince (1989) identify a number of studies going back to 1970(12) These are payments for emission reductions not technology subsidies for environmental investments
Review of literature on environmental tax reform and eco-innovation
Environmental tax reform in Europe opportunities for eco-innovation 15
freely allocated tradable permits although not as great as auctioned permits However the optimal agency response is likely to face less opposition (and in some cases actually be favoured) under emission taxes than under auctioned permits (13)
Jaffe and Stavins (1995) develop a theoretical framework for comparing empirically the impacts of alternative policy instruments on the diffusion of a new technology (14) They model the investment decision for both an existing firm and a new entrant in each case assuming that over time the firm minimises the present value of its cost streams (operating costs investment cost net of any government subsidy emission taxes and the implicit costs of violating either a performance or technology standard if applicable) For an existing firm the problem is to choose the optimal timing of the retrofit and the authors show that the new technology will be adopted at a particular time if operating cost savings plus savings from reduced emission tax payments (plus any avoided penalties for not adopting a technology standard or exceeding a performance standard) in that period are greater than the net investment costs less the time rate of change of net investment costs For a new entrant the problem is to choose whether to use the new technology at start-up A necessary condition for doing so is that the present value of operating costs savings and reduced tax payments (plus any avoided penalties) over the entire time horizon is greater than the net investment cost Thus while the conditions differ in each case the introduction of either an emissions tax or an investment subsidy (or increases in the respective values) changes the benefit-cost balance in favour of the new technology bringing forward its adoption by existing firms and increasing the likelihood of adoption by new entrants
Kemp (1997) compares the abatement RampD expenditure levels of an individual firm under direct regulation (ie an emissions limit) an equivalent emission tax (15) and freely allocated tradable permits using a cost minimisation analytical framework and a specific functional form for the abatement cost function He shows that both the
level of RampD expenditure and the level of emissions reduction increase as the emissions tax rate increases and that both are greater under the tax than under direct regulation The corresponding levels under the tradable permit regime will be greater under the emissions tax if the (exogenous) permit price is higher than the tax rate and vice versa Kemp also considers the impact of subsidising the cost of the firms RampD effort and shows that increasing the subsidy rate causes a rise in pollution-control RampD More interestingly the impact of the subsidy is greater if it is combined with an emissions tax than with an equivalent emissions limit
Fischer et al (2003) develop the approach used by Milliman and Prince (1989) although their analysis differs in that it does not include the final agency response stage and the diffusion of the technology is determined by market forces with an equilibrium royalty price (16) They compare an emissions tax with auctioned and freely allocated permits using a three-stage model of innovation diffusion and emissions abatement In the first stage the innovating firm decides how much to invest in RampD to develop an emissions abatement technology In the second stage other firms decide whether to adopt this technology in return for a royalty fee or whether to use an (imperfect) imitation technology In the final stage all firms choose their level of abatement to minimise costs given an emissions tax or permit price They show that the level of innovation (ie the level of RampD chosen by the innovating firm) is determined by equating the marginal cost of innovation with the marginal (private) benefit The latter has four components mdash an abatement cost effect an emissions payment effect an imitation effect and an adoption price effect mdash and the last two components are negative (17) Using this model the authors demonstrate that freely allocated permits provide the lowest incentive for innovation However in contrast to Milliman and Prince they conclude that the relative ranking of the emissions tax and auctioned permits is ambiguous It depends crucially on the extent to which the technology can be imitated and hence the extent to which the innovator can appropriate the gains accruing to
(13) For an emissions tax the downward shift of the industry marginal abatement cost curve as a result of diffusion causes the agency to reduce the tax rate assuming that marginal damages are increasing in emissions For permits (auctioned or freely allocated) it causes the agency to reduce the number of permits
(14) The empirical application of this framework is summarised below under Section 25 on empirical evidence(15) That is the emissions tax is set equal to the firms marginal cost of abatement under the direct regulation(16) In addition to assessing the impacts on demand for innovation Fischer et al (1998) consider the impacts of the innovation and
diffusion processes on social welfare in order to compare the overall economic efficiency of the different instruments(17) Milliman and Prince capture only the first two effects in their analysis
Environmental tax reform in Europe opportunities for eco-innovation
Review of literature on environmental tax reform and eco-innovation
16
the other firms in the form of royalty payments If imitation is high (easy) then auctioned permits provide the greater incentive for innovation However if imitation is low (difficult) then the emissions tax provides the greatest incentive
Montero (2002) assesses the impacts of alternative policy instruments on environmental innovation (as measured by RampD expenditure) under conditions of imperfect competition In his model two firms compete in either quantities (ie Cournot duopoly) or prices (ie Bertrand duopoly) while being subject to some form of environmental regulation Where the regulation takes the form of tradable permits mdash either auctioned or freely allocated mdash the market is also assumed to be imperfect the firms competing in permit quantities The interaction between the two firms is modelled as a multi-stage game with the number of stages depending on the instrument being analysed In this framework a firms incentive to invest in RampD comprises two components a direct or cost minimising effect and a strategic effect reflecting the impact of its RampD expenditure on the other firms output decision The latter may be positive or negative depending on the market-regulatory structure Under Bertrand competition (ie where products are strategic complements) freely allocated permits provide the lowest incentive for innovation followed by the emission-standard The relative ranking of an emissions tax and auctioned permits is ambiguous depending on model parameter values Under Cournot competition (ie where products are strategic substitutes) the relative ranking of the emissions tax auctioned permits and the emissions-standard are ambiguous although all provide a greater incentive than freely allocated permits Indeed Montero provides a numerical example where the emissions standard provides the greatest incentive for innovation Finally he considers the impact of increasing competition (increasing the number of firms) and concludes that under perfect competition the emissions tax provides the greatest incentive for innovation
Millock and Nauges (2006) use a simple profit-optimisation model to analyse a firms choice of abatement effort to reduce emissions
per unit of energy used in production While they do not explicitly identify it as such this effort can be interpreted in terms of diffusion of an existing technology mdash with higher effort corresponding to greater diffusion This is consistent with the overall objective of their study which is to assess the impact of combining an emissions tax with a subsidy on (existing) abatement equipment (18) In their model the firm simultaneously chooses the levels of its energy input and abatement effort given exogenous output and energy prices and a cost function for abatement effort (19) They show that while increases in the subsidy rate (expressed as a percentage of the gross investment cost) unambiguously increases abatement effort the impact of increases in the tax rate depends on whether the direct impact of tax increase on the marginal benefit of abatement effort (shifting it up) outweighs the indirect impact via the resulting reduction in output (shifting it down) If the latter dominates then increases in the tax rate will reduce the optimal level of abatement effort The authors show that a necessary and sufficient condition for the direct impact to dominate is that the slope of the firms (inverse) demand for energy is greater than the average emissions tax payment per unit of energy in relation to total energy use (20)
McGinty and de Vries (2009) analyse the relationship between environmental subsidies the diffusion of a clean technology and the degree of product differentiation in an imperfectly competitive output market In their model a fixed number of firms can choose individually between using a clean production technology and a dirty technology Both technologies exhibit constant marginal production costs and constant emission rates (with the clean technology having a lower emission rate and higher unit cost) and consumers are assumed to be able to differentiate between products on the basis of the technology used in their production (21) The subsidy regime is different to that considered by the other studies in that it is applied to the production cost of the clean good and thus reduces the (constant) marginal cost of production for that good As such it is equivalent to an output subsidy for the clean good The authors derive the equilibrium diffusion rate for the clean technology (ie the proportion of firms using
(18) In the second half of their paper Millock and Nauges (2006) undertake an empirical evaluation of such a scheme that operated in France during the 1990s for SO2 and NOX emissions The results of this analysis are summarised under Section 25 on empirical evidence
(19) Abatement effort is assumed to exhibit decreasing returns to scale ie the cost function is increasing and convex(20) If output is held fixed in the profit maximisation problem then increases in the emissions tax rate unambiguously increase the
optimal level of abatement effort as found by Kemp (1997) who uses a cost-minimisation framework for his analysis(21) The model assumes imperfect substitution between the clean good and dirty good with the willingness-to-pay for one good being
a linear function of the quantities of both goods individually ndash ie Pk = ak ndash bYk ndash cYj
Review of literature on environmental tax reform and eco-innovation
Environmental tax reform in Europe opportunities for eco-innovation 17
that technology) and show that an increase in the subsidy value increases diffusion for all degrees of product differentiation The impact is greater as the substitutability of the two goods increases They also briefly consider the impact of a technology subsidy that reduces the fixed cost of the clean technology and conclude that this too will stimulate diffusion but will be less efficient than the output subsidy (22)
Key findings of the theoretical studies
As is often the case with theoretical analyses the specifications of the models and the underlying assumptions of the studies reviewed here significantly influence the conclusions Nevertheless there is a reasonable degree of consistency between their findings The studies can be classified into two broad groups those that consider innovation and diffusion within an industry setting and those that consider an individual firms decision whether to undertake RampD (ie innovation) and invest in an abatement technology (ie diffusion) in order to reduce its own cost of abatement
The studies in the first group conclude that under conditions of perfect competition emission taxes and auctioned permits provide greater incentives for innovation than direct controls or freely allocated permits However there is some disagreement over the relative impacts of the two instruments Under the assumption that the innovator appropriates a fixed (exogenous) proportion of the gains accruing to the technology adopters Milliman and Prince (1989) conclude that auctioned permits provide the greatest incentive although the government may find it easier to adjust emission taxes in response to the resultant downward shift in marginal abatement costs However when the proportion is determined endogenously mdash in the form of a royalty payment mdash Fischer et al (2003) find that either auctioned permits or emission taxes can provide the greater incentive Emission taxes are likely to provide the greatest incentive if the innovator can appropriate a large proportion of the gains (because the technology is difficult to imitate)
Montero (2002) uses a slightly different framework to compare the impacts of different instruments on innovation (in the form of RampD expenditure)
in a situation of imperfect competition and finds that the ranking depends on the nature of the competition (23) Under Bertrand price competition in the output market the results are the same as under perfect competition the relative ranking of auctioned permits and taxes is ambiguous but both provide greater incentives for innovation than emission standards and freely allocated permits However under Cournot quantity competition any of the instruments apart from freely allocated permits can provide the greatest incentives depending on the model parameter values
The studies looking at an individual firms decision also show that an emissions tax can stimulate innovation and diffusion Jaffe and Stavins (1995) explicitly consider the firms decision criterion for investing in a new abatement technology and show that by increasing the benefits of investing the introduction of an emissions tax should bring forward its adoption by existing firms and make its use by new entrants more likely The other two studies consider the firms choice of optimal abatement effort in the context of maximising its total profits or minimising its total cost of emissions reduction This effort can take the form of RampD (innovation) or expenditure on abatement equipment (diffusion) The decision problem is the same in each case ie to choose the optimal level of effort
Kemp (1997) assumes that the firm seeks to minimise its total cost of emissions reduction mdash implicitly assuming that its output level is fixed mdash and demonstrates both that abatement effort increases as the emissions tax increases and that the optimal effort is lower under direct regulation than under an equivalent tax However when the firms output level is allowed to vary mdash as is the case with the profit maximisation problem considered by Millock and Nauges (2006) mdash the impact of an increase in the emissions tax rate on the level of abatement effort depends on the relative magnitudes of the direct impact and the indirect impact (via changes in output levels) on the marginal benefit of abatement effort If the latter dominates then an increase in the emissions tax rate leads to a reduction in the optimal level of abatement effort
(22) McGinty and de Vries (2009) derive expressions for the necessary technology subsidy values when diffusion is 0 and when it is 100 They state mdash without proof mdash that the latter is greater than the former Provided that the relationship between the subsidy and diffusion is monotonic this is a sufficient condition for increases in the subsidy value to cause increases in diffusion
(23) Monteros model does not include diffusion However it does include spillover effects where RampD by one firm reduces the abatement costs of the others
Environmental tax reform in Europe opportunities for eco-innovation
Review of literature on environmental tax reform and eco-innovation
18
Only one of the industry models considers the impact of investment subsidies Using a product differentiation model of imperfect competition McGinty and de Vries (2009) show that subsidising the unit cost of a clean production technology can accelerate its diffusion However the impact depends on the degree of substitutability between clean and dirty products diminishing as the products become more differentiated In contrast all three of the individual firm analyses consider the impact of investment subsidies with all demonstrating that increasing subsidies induce greater abatement effort Furthermore Kemp (1997) shows that the impact of an RampD subsidy is greater in the presence of an emissions tax than it is under an equivalent emissions limit
25 Empirical studies
Jaffe and Stavins (1995) use their theoretical framework (outlined above in Section 24) as the basis for assessing the diffusion of thermal insulation in new home construction in the United States using state-level panel data for the years 1979ndash88 They derive a reduced form equation for the energy efficiency level chosen by developers from the marginal cost-benefit condition in which the explanatory variables include energy prices installation costs and the presence of a relevant building code (as a dummy variable) Separate equations are estimated for ceiling floor and wall insulation with the coefficient for energy prices being positive in all three equations Although it is only significant (at the 95 level) for floor insulation the joint hypothesis that all price coefficients are zero is strongly rejected However the coefficients for installation cost (which are all negative as expected) are around two to three times greater in magnitude and of comparable significance The coefficients for the building code dummies are consistently insignificant (and negative in two cases) indicating that this form of direct regulation had minimal impact on household energy efficiency levels over the period The authors use the estimated models in a simulation to compare the effects of a 10 increase in energy prices (ie an energy tax) with those of a 10 reduction in installation costs (ie a technology subsidy) with each applied over the whole ten-year period While
the tax increases diffusion by 2ndash6 by the end of the period the technology subsidy increases diffusion by between 4ndash15
Kemp (1997) models the diffusion of biological water treatment technology in the Dutch food and beverage industry based on a rational choice threshold model of technology adoption decisions In this model a firm chooses to adopt an abatement technology if the resulting reduction in emission-tax payments is greater than the annualised total costs of the technology where a discount factor is applied to the savings to reflect uncertainty and risk aversion on the part of the decision-maker This is translated into a probabilistic model under the assumption that both the savings and the costs follow a log-normal distribution across plants The model is estimated econometrically using data for the period 1974ndash91 under different assumptions for the functional form of the discount factor and allowing for adjustment costs (24) The estimated parameters for the preferred specification of the discount factor are all significant and of the expected sign and magnitude and the model provides a very close fit to the actual diffusion of waste-water treatment technologies over the period This leads the author to conclude that the effluent charges were a significant positive factor in the diffusion of treatment technologies Indeed he estimates that only around 4 of plants would have installed waste-water treatment equipment by the end of the period if the charge had remained at its (low) 1974 level compared to the actual figure of over 40
Newell et al (1999) estimate the impact of energy prices energy efficiency standards and other factors on the energy efficiency of three types of electrical consumer durables (room air conditioners central air conditioners and gas water heaters) in USA between the 1970s and 1990s The analysis utilises a product characteristics model in which the frontier of technologically feasible products is described by a transformation surface that relates the bundle of product characteristics to the real cost of producing that bundle In this framework innovation is represented by movements of the surface and movements along the surface In particular the authors identify three types of innovation shifts in the surface towards the origin (overall technological change) changes in the slope
(24) Adjustment costs are accounted for by estimating a partial adjustment model in which the actual change in adoption is some fixed fraction of the desired change (estimated from the threshold model)
Review of literature on environmental tax reform and eco-innovation
Environmental tax reform in Europe opportunities for eco-innovation 19
of the surface (directional technological change) and changes in the mix of products along a given surface (model substitution) They define the surface in terms of two characteristics energy flow and cooling capacity and incorporate innovation by allowing the coefficients of the two variables to vary with time and (in the case of energy flow) energy prices and efficiency standards Separate equations are estimated for each durable type with slightly differing sets of explanatory variables and time periods The authors find little evidence that either energy prices or energy efficiency standards had any impact on overall technological change While all but one of the relevant coefficients have the expected sign none are significant In contrast they do find evidence that energy prices had an impact on directional technological change with the relevant coefficients being of the correct sign and significant for both room and central air conditioners
Popp (2002) uses patent data to estimate the effect of energy prices on energy-efficiency innovations in USA between 1970 and 1994 He regresses normalised energy-efficiency-related patent applications against energy prices controlling also for lagged knowledge stock and government RampD (25) The estimated coefficient for energy prices is highly significant producing a short-run price elasticity of 006 and a long-run elasticity 0354 Thus a 10 increase in energy prices would be expected to increase the number of energy-efficiency-related patents by around 35 in the long run The estimated mean lag is less than four years leading the author to conclude that the imposition of a carbon or energy tax would lead to a fairly quick shift towards environmentally friendly innovation
Hoglund Isaksson (2005) estimates abatement cost functions for the reduction of nitrogen oxide (NOX) emissions in three industrial sectors in Sweden (energy pulp and paper chemicals and food) The analysis uses a double-hurdle model applied to a pooled sample of 114 plants across the three sectors The data cover the period 1990ndash1996 which spans the introduction of the charge on NOX emissions in 1992 The estimated cost curves have a similar shape in all three sectors with minimal (or even negative) costs over a relatively broad range of emission reductions and then a steep rise as reductions exceed
a threshold level The analysis does not explicitly consider the issue of innovation However it does find that abatement cost curves shifted downwards significantly over the period In the energy sector for example the emission rate threshold for significant cost increases fell by around 45 between 1991 and 1996 (from 550 to 300 kgGWh) The author surmises that this is due to a combination of technological development and the discovery of previously unrecognised opportunities Unfortunately while this shift coincided with the introduction of the NOX charge the analysis does not provide any evidence of a causal link
As part of their analysis of the impacts of the French tax-subsidy scheme for NOX and sulphur dioxide (SO2) emissions Millock and Nauges (2006) estimate the impact of the emission taxes on a plants decision to install end-of pipe abatement equipment While the study is not concerned with innovation per se the results of this part can be interpreted as showing the impact of emission taxes on the diffusion of abatement equipment Under the scheme taxes were imposed on the emissions of these air pollutants (and VOCs) by all plants satisfying certain criteria The revenue raised by the taxes was earmarked for subsidising the cost of qualifying abatement technologies for technical studies (ie RampD) and for investment in air quality surveillance systems Using panel data for 226 plants in three industries (iron and steel coke and chemicals) for the period 1900ndash1998 the authors estimate a Probit model for the probability that a plant will install abatement equipment They find that the total value of emissions taxes paid by the plant (ie for both pollutants) has a positive impact on its decision to invest in abatement equipment However the magnitude of the effect varies considerably across the sectors and is only significant for the iron and steel sector
Frondel et al (2008) analyse responses to an OECD survey on environmental policy tools (conducted in 2003) to identify the factors that affect a firms decision to adopt an environmental management system (EMS) voluntarily and their environmental innovation behaviour Innovation is captured by a binary variable that indicates whether the firm has undertaken significant technical measures or changes to reduce the environmental impacts of
(25) Normalised energy efficiency patent values are calculated by dividing by the total number of patents granted This accounts for exogenous changes in patenting behaviour that affect all types of patents Popp constructs a value for existing knowledge as the stock of previously granted patents weighted by estimates that he derives for knowledge productivity He demonstrates that the exclusion of this variable from the model leads to biased estimates for the energy price coefficient
Environmental tax reform in Europe opportunities for eco-innovation
Review of literature on environmental tax reform and eco-innovation
20
production (26) The analysis is based on survey responses from 899 firms in Germany Latent variable equations for EMS adoption and innovation are estimated simultaneously with each equation including the same four sets of variables relating to motivations policy instruments pressure groups and facility characteristics (27) The policy instrument variables include five dummy variables indicating the importance of different types of policy instrument including market-based instruments such as emission taxes and tradable permits While the perceived stringency of environmental policy is found to be a significant factor in the decision to innovate there is no evidence that any of the individual policy instrument variables had any impact The authors surmise that this suggests that it is stringency of environmental policy rather than the choice of specific instrument that is important for innovation However as the authors note their results reflect the perceptions of the survey respondents and should therefore be treated as correlations rather than causal relationships
Johnstone and Hascic (2008) assess the impact of a range of environmental policy instruments mdash including tax measures and investment incentives mdash on innovation in the renewable energy field They analyse the impacts for five different groups of renewable energy technologies mdash wind solar ocean biomass and waste-to-energy mdash using a panel dataset of European Patent Office (EPO) patent filings for these technologies across 26 countries over the period 1978ndash2003 A fixed effects negative binomial model is estimated controlling for electricity prices and consumption public sector RampD expenditure (as a proxy for scientific capacity) and total EPO filings (as a proxy for differenceschanges in patenting propensity) The various policy instruments are represented by dummy variables indicating whether they were in place in a particular year As such the model takes no account of the stringency of the instruments mdash in particular the differing magnitudes of the tax measures and investment incentives (28)
Initially the authors estimate the model with all of the policy instruments included individually They find that while public policy plays an important role in inducing innovation the impacts of the individual instruments vary across the different technologies In particular tax measures are significant for wind and biomass technologies with investment incentives being significant for solar and waste-to-energy technologies and obligationstradable certificates being significant for wind technologies However the authors express concerns that there may be multicolinearity between the policy variables (particularly between investment incentives tax measures and tariffs) and also that there may be interaction effects between some of the variables Consequently they estimate two alternative versions of the model the first using a composite policy variable representing the number of policy instruments in place and the second using clusters of similar policy instruments (29) The results or these two models confirm the initial findings The composite policy variable is significant for all of the technology groups while the significance of the clusters varies across technologies The price-based cluster is (highly) significant for solar biomass and waste-to-energy The quantity-based cluster is significant for wind technologies The authors surmise that this may be due to the different economic characteristics of the technologies For example the significance of investment incentives for solar and waste-to-energy may reflect the capital intensity of these technologies with large up-front investment costs
De Vries and Medhi (2008) also use patent data to investigate the relative importance of environmental regulations and fuel prices on innovation in automotive emission-control technologies distinguishing between post-combustion devices and engine redesign technologies They estimate a panel data model using data from Germany Japan and USA over the period 1978ndash2001 controlling for industry value added (as a proxy for the scope of technological opportunities) and total patent
(26) The next question on the survey asks whether these are changes in production processes or end-of-pipe technologies However no distinction is made between these two types of innovation in the present study
(27) In order to avoid identification problems some individual variables are omitted from one equation or the other(28) This shortcoming is recognised by the authors who state that it is unavoidable in any cross-comparative analysis in which multiple
instruments are included(29) The clusters are price-based instruments (investment incentives tax measures and tariffs) quantity-based instruments (obligations
and tradable certificates) and voluntary programmes
Review of literature on environmental tax reform and eco-innovation
Environmental tax reform in Europe opportunities for eco-innovation 21
applications (as a proxy for differenceschanges in patenting propensity) Environmental regulation is represented by two dummy variables indicating the introduction of on-board diagnostic (OBD) regulations in USA (30) The results of the analysis suggest that the relative impacts of regulation and market forces differ between the two types of technology For post-combustion technologies both of the regulations are significant while fuel prices have no significant impact In contrast the opposite is the case for engine redesign technologies with fuel prices having a significant impact but regulation having no discernable effect While the analysis does not explicitly consider the impact of fuel taxes it suggests that an increase in automotive fuel taxes would have a major impact on innovation in relation to engine design The estimated coefficient for fuel prices (1287) implies that a USD 010 increase in fuel prices would induce a 14 increase in patenting activity (31)
Key findings of the empirical studies
The empirical studies considered above cover a range of different technology areas spanning energy efficiency (both product and process) renewable energy and air and water pollution abatement While in some cases they assess the impact of energy prices rather than environmental taxes per se they provide a clear picture of the likely impact of environmental and energy-related taxes on eco-innovation
Three of the studies assess the impact on diffusion of existing technologies All find that environmental taxesenergy prices have a positive impact on diffusion In particular the water effluent charges in The Netherlands appear to have had a major impact on the adoption of waste-water treatment equipment by the food and beverage industry in that country However there is some evidence to suggest that the effectiveness of taxesprices may vary across sectors (eg NOXSO2 abatement in France) and that investment incentivessubsidies may be more
effective in some cases (eg thermal insulation in USA)
Three of the studies use patent data to assess the impact of environmental taxes and energy prices on innovation with one of these also assessing the impact of investment incentives All find a significant positive impact although this depends on the particular sub-sector (eg renewable energy) or the type of innovation In particular the evidence from the automotive emissions control study suggests that taxesprices may be more effective in promoting process-related innovation (eg engine redesign) than innovation in end-of-pipe technologies One of the studies takes a different approach using a product-characteristics model to decompose improvements in the energy efficiency of consumer durables This finds that while electricity prices did not appear to affect overall technological change (ie shifts in the product costenergy efficiency frontier) they did have a positive impact on directional technological change (ie the slope of the frontier)
26 Case studies
Christiansen and Skjaerseth (2005) undertake a comparative analysis of the impacts of climate change policies on the petroleum sectors in Norway and the Netherlands during the 1990s These countries were selected because of their very different policy approaches with the Norwegian petroleum sector subject to a carbon dioxide (CO2) tax since 1991 as part of a portfolio of measures (32) and the Netherlands relying on a series of voluntary agreements on energy efficiency (33) Both approaches appear to have been effective in that CO2 emissions per unit production fell by around 22 between 1990 and 2001 in Norway while energy efficiency improved by around 35 in the Netherlands over the same period However there were marked differences between the two countries in terms of the nature of the innovation that
(30) Because of the international nature of the automotive industry and the importance of the US market regulations introduced in USA appear to have been an important driver for innovation by overseas manufacturers Regulations mandating the installation of OBD systems were first introduced in California in 1988 A more sophisticated system was mandated by the 1990 US Clean Air Act Amendments taking force in 1996
(31) The coefficient represents the semi-elasticity of patent applications with respect to fuel prices While the authors do not state so explicitly the implication is that prices are expressed in US dollars (they are obtained from the IEA Energy Prices and Taxes Database) Consequently the impact of a 10 US cent increase in the fuel prices is given by exp(1287 x 01) ndash 1 = 0137
(32) In addition to the tax the portfolio included publicly funded RampD support schemes gas flaring permits and mandatory environmental impact assessments
(33) The Dutch oil and gas industry first signed a declaration of intent with the government in 1995 This was translated into a long-term agreement (LTA) on energy efficiency in the following year with an improvement target of 20 over the period 1989ndash2000 In 2001 a new LTA was signed which committed firms to implementing energy efficiency measures with a positive NPV at a 15 discount rate or a five year payback period
Environmental tax reform in Europe opportunities for eco-innovation
Review of literature on environmental tax reform and eco-innovation
22
occurred In the Netherlands technological change was incremental reflecting a steady diffusion of available (ie known) technology In contrast the authors find evidence of more radical innovations and adaptations by the Norwegian petroleum sector including the development of energy-efficient gas turbines installation of waste heat recovery units process modifications and improved use of process heat While the authors acknowledge the impossibility of proving a causal link between policy intervention and innovation (in the context of their case study) they conclude that the CO2 tax played a key role in the development and implementation of these radical innovations and the benefits of reduced tax payments provided an important incentive However they also conclude that the impacts of the two instruments were conditioned by the political contexts in which they were applied and the problem characteristics in the respective countries (eg the economic significance of the sector and the size of installations)
Knigge and Goumlrlach (2005) summarise the findings of a comprehensive analysis of the impacts of the ETR in Germany That analysis undertaken jointly by Ecologic and the German Institute for Economic Research (DIW Berlin) included the impacts on innovation and market diffusion of environmentally friendly products and technologies (34) Based on a series of case studies the study concluded that the ETR had a noticeable effect on innovation and diffusion although it was not possible to quantify the scale of that effect In particular ETR is identified as being a central factor in the development of gas-powered vehicles The study identifies a number of different routes by which the ETR produced impacts First the payback period for energy-efficient products was reduced as a result of the energy tax increases and the various exemptions favouring efficient energy use and renewable energy sources Second the predictable nature of the energy taxes (as opposed to widely fluctuating oil prices) reduced uncertainties about the benefits of energy-efficiency investments Third the reduction in employers social contribution payments tended to reduce the costs of labour intensive innovation processes such as research and development energy consultancy and technology installation Finally the ETR had a signalling effect strengthening awareness of the need for more efficient and rational energy use
Mickwitz et al (2007) examine a number of claims that have been made in the environmental policy literature about the relationship between policy instruments and innovation based on experiences in two industrial sectors in Finland pulp and paper and the manufacture of diesel engines for ships In particular they assess the claims that environmental taxes are superior to other policy instruments with respect to innovation and that RampD subsidies have limited impacts on innovation With respect to the first claim the evidence provided by the two case studies is mixed The authors conclude that energy taxation had a negligible impact on innovation in the pulp and paper industry However this is likely to have been due to the low level of the tax and the exemptions that applied to the sector In contrast they find that the differentiation of Swedish fairway and port fees (on the basis of SO2 and NOX emissions) was a significant factor driving the installation of in-engine NOX reduction equipment in ferries operating between the two countries (35) With respect to RampD subsidies the authors conclude that the evidence does not support the claim that these have little effect In particular they find that RampD subsidies accelerated the development of ship engine emissions-reduction technologies
The findings of the three case studies are consistent with those of the empirical analyses reviewed in the previous section Environmental taxes and investment subsidies have proven significant in promoting both innovation and diffusion although not universally so Furthermore the case studies provide some useful insights about the ways in which the impacts occur and the factors that may be important in promoting innovation In particular they suggest the need for a tax rate that is sufficiently high to provide a meaningful incentive and signalling effect and that is fixed for a sufficiently long period of time to reduce uncertainty about the future benefits of investment
27 Conclusions
The studies reviewed in the preceding sections suggest that environmental regulation in general and price-based policy instruments such as environmental taxes and investment subsidies in particular can (in theory) and do (in practice) have a positive impact on both innovation and diffusion
(34) A separate report in German by Goumlrlach et al (2005) provides details of the evaluation of the innovation and diffusion impacts (35) Although the tax was introduced in Sweden it was also payable by Finnish ferry operators entering Swedish ports and hence
affected their investment decisions This is another example of the cross-border impact of environmental policy interventions on innovation found by Lanjouw and Mody (1996) (see Section 23)
Review of literature on environmental tax reform and eco-innovation
Environmental tax reform in Europe opportunities for eco-innovation 23
of environmental technologies However the supporting empirical and case study evidence is not universal and the effectiveness of these instruments would appear to vary across different sectors and different types of innovation
To a certain extent such differences can be explained by the theoretical models In particular the impact of environmental taxes (relative to other instruments) is predicted to depend on the competitive structures of the markets in which the regulated firms operate and on the ability of innovator firms to appropriate the benefits accruing to other firms during diffusion However a number of other potential factors have been identified in the literature which may affect the impact of price-based policy instruments on innovation
Jaffe et al (2002) caution that the impact of price-based policy instruments on technology diffusion may be adversely affected by a number of potential market failures including information failures principle-agent problems (eg landlord-tenant) capital market failures and positive adoption spillovers In addition while not market failures as such uncertainty over future returns and the (associated) use of high discount rates for investment decisions can also undermine the effectiveness of price-based instruments in stimulating diffusion However as was noted above the findings from the case study of ETR in Germany suggest that an environmental tax may actually reduce the level of uncertainty over future returns provided that it is of sufficient magnitude and longevity
Skjaerseth and Christiansen (2005) emphasise that the relationship between policy instruments (of all types) and technological change is extremely complicated They argue that account must be taken of the politicalindustrial context in which policy instruments are introduced and the nature of the environmental problem that they are intended to address In particular they make a distinction between malign problems where technological change involves net costs for target groups and benign problems where there are widespread no-regret opportunities for change Based on a comparative analysis of four different case studies they conclude that mandatory policy instruments (including environmental taxes) are more effective
in promoting short-term technological change when the problems are malign but that low legitimacy (with the target group) may undermine long-term technological change However when problems are benign or when long-term change requires cooperation voluntary policy instruments are likely to be more effective
Johnstone (2005) questions the focus of the theoretical and empirical analyses (reviewed above) on the impact of environmental policy instruments on the rate of technological change He argues that the direction of technological change is as important if not more so In addition to the quantity of innovation it is also important that innovation be socially optimal in the sense that it minimises the cost of attaining a particular environmental goal in the long term Inappropriate innovation today may result in lock in to a suboptimal technological path for the future
With this in mind Johnstone identifies a number of issues that can adversely affect the direction of innovation and should be taken into account when selecting and designing policy instruments technological market failures (36) missing markets for certain environmental attributes of innovation policy incidence and joint production of emissions Most studies of the innovation effects of environmental policy instruments assume that the only missing market is that for the environmental good (or bad) However in practice there may be other markets that are missing (or incomplete) which can adversely affect transmission of innovation incentives This is particularly so in the area of waste and resource management where instruments applied at the end of the product life cycle may have little or no impact on product design innovation Even if all markets are complete except for the environmental externality the point of incidence of the policy intervention may be more important for the direction of innovation than the choice of a particular policy instrument For example a limit or standard applied directly to the emissions of a pollutant may be more effective in promoting optimal innovation than a tax applied to a proxy input variable Finally when there is joint production of pollutants (eg CO2 and air pollutants from vehicle engines) there is a danger that if policy instruments (of whatever type) are applied to one pollutant in isolation the resulting innovation may
(36) These are the same market failures identified by Jaffe et al (2002)
Environmental tax reform in Europe opportunities for eco-innovation
Review of literature on environmental tax reform and eco-innovation
24
reduce emissions of that pollutant at the expense of increases in the others
In a related point Johnstone highlights the importance of using appropriate indicators when assessing the impact of policy instruments on innovation emphasising the need for these to reflect both the rate of innovation and the direction A necessary condition for this is that the indicators must provide an accurate and detailed picture of actual innovation Unfortunately this is difficult to achieve in practice For example the use of patent data as a measure of innovation requires the identification of relevant environmental technologies This is likely to be easier for end-of-pipe technologies than for process-related technologies meaning that the latter tend to be under-represented relative to their actual incidence To the extent that process-related innovation is growing in importance or is more important
for certain sectors or types of environmental problem changes in the value of the indicator may significantly understate the actual rate of innovation and misrepresent the direction
All of this suggests that caution should be exercised in drawing general definitive conclusions about the impacts of price-based policy instruments such as environmental taxes and investment subsidies on innovation particularly relative to other policy instruments While it would appear that they can be effective in stimulating both innovation and diffusion in many cases mdash at least in terms of the rate of technological change mdash there may be situations in which other policy instruments may be more appropriate In general the stringency and point of incidence of an environmental policy intervention may be more important than the choice of a particular policy instrument in determining the rate and direction of eco-innovation
25
Modelling of ETR impacts on eco-innovation
Environmental tax reform in Europe opportunities for eco-innovation
31 Scenarios assessing the implications of ETR for eco-innovation
Scenario analysis provides a useful means of improving understanding of how the different revenue recycling methods and various scales of ETR can help meet different greenhouse gas emissions targets
To investigate the impacts of an ETR for Europe the petre project elaborated a range of different scenarios reflecting various tax reform options In addition to employing several of these original scenarios the present study compiled two new scenarios to analyse the implications of ETR for eco-innovation All scenarios were examined in both E3ME and GINFORS (37)
311 Original petre project scenarios
The key petre scenarios relevant for the present study are
bull scenarioBHbaselinescenariowithhighenergyprice (reference case)
bull scenarioS1HETRdesignedtomeettheEUsunilateral 2020 GHG target (high energy price) with revenue recycling
bull scenarioS2HETRdesignedtomeettheEUsunilateral 2020 GHG target (high energy price) with revenue recycling and 10 of revenues spent on eco-innovation measures
Each of the ETR scenarios has the same key taxation components
bull acarbontaxrateisintroducedtoallnon-EUEmissions Trading System (EU ETS) sectors equal to the carbon price in the EU ETS that delivers an overall 20 reduction in greenhouse gas emissions by 2020 and in the international cooperation scenario this is extended to 30
bull aviationisincludedintheEUETSattheendofPhase 2
bull powergenerationsectorEUETSpermitsare100 auctioned in Phase 3 of the EU ETS
bull allotherEUETSpermitsare50auctionedin2013 increasing to 100 in 2020
bull materialtaxesareintroducedat5oftotalpricein 2010 increasing to 15 by 2020
In scenario S1H environmental tax revenues are recycled through reductions in income tax rates and social security contributions in each of the Member States such that there is no direct change in tax revenues In scenario S2H 10 of environmental tax revenues are recycled through spending on eco-innovation measures and the remaining 90 is recycled through the same measures as in the other scenarios The eco-innovation spending is split across power generation and housing according to tax revenues from the corporate and household sector
In GINFORS (the model used for analysing the implications of ETR and eco-innovation) the share of renewable sources in electricity production is increased due to the additional investment The rest of additional investment goes to household energy efficiency spending Investment needed for a certain increase in renewable energy production or efficiency improvement is based on Austrian and German experience (Lehr et al 2008 and 2009 Grossmann et al 2008 Lutz and Meyer 2008) This assumption is quite conservative as parameters for other countries can be assumed to be more positive (meaning that less money is needed for renewable energy technology installation or energy efficiency gains)
In scenario S1H the 20 GHG target translates into a 15 reduction in energy-related carbon emissions relative to 1990 as other emissions such as methane and nitrous oxide have already been reduced by
3 Modelling of ETR impacts on eco-innovation
(37) The E3ME and GINFORS models are introduced in Chapter 1 of the present report A detailed discussion of the models and scenarios used in the present study can be found in Ekins and Speck (2011)
Environmental tax reform in Europe opportunities for eco-innovation
Modelling of ETR impacts on eco-innovation
26
more than 20 (in terms of carbon equivalents) The target is reached by a tightened EU ETS cap and the introduction of a carbon tax on the non-ETS sector The tax rate applied is equal to the carbon price in the EU ETS that will deliver a 20 GHG reduction by 2020
The burden of ETR taxes are allotted to energy outputs (ie the final use of energy) and will be based on the carbon content of each fuel Carbon prices are assumed to be fully passed on to consumers All carbon taxes are in addition to any existing unilateral carbon and energy taxes The carbon reductions in the different EU Member States will be those that result from a uniform carbon tax increase across the EU
All of the revenues including EU ETS auctioning revenues carbon tax revenues and material tax revenues will be recycled The proportion of tax raised by industry will be recycled into a reduction in employers social security contributions which will in turn reduce the cost of labour Recycling will be additional to the existing ETRs in some Member States Revenues raised from households will be recycled through standard rate income tax reductions Traditional energy tax revenues will be lower compared to their respective baselines as the tax base (energy consumption) is reduced So for an ETR revenue-neutrality does not mean budget-neutrality
312 Factors affecting the macroeconomic impacts of RES technologies
Earlier analyses (Lehr et al 2008 Fraunhofer ISI et al 2009 DTI 2004 Kammen et al 2004 Moreno and Loacutepez 2007) have studied the impacts of large renewable energy source (RES) shares in the energy mix for different countries The overall question in these studies has been the impact of increasing RES shares on the economy especially on the labour market For the present study it is interesting to note that macroeconomic impacts of higher RES shares mainly depends on the following five factors
1 additional investment in RES (minus lower investment in conventional sources ie fossil and nuclear power) with the impact increasing if a country manufactures the RES technology in question
2 additional (net) exports due to improved international competitiveness of renewable energy sources (first mover advantage)
3 lower fossil fuel needs4 the cost differences between RES and
conventional energy
5 the shift from capital- and energy-intensive industries to labour- and technology-intensive industries
All five factors are driven by international energy prices carbon prices the policy framework and RES technology development itself Innovation comes into the play at various stages First innovation drives the currently positive additional costs of RES technologies down and even into negative realms depending on the fossil fuel scenario Second innovative RES technologies are likely to have a competitive advantage in international markets Although a significant proportion of RES technology produced in Europe is traded in Europe innovation will still provide an edge in current and emerging international markets
The EmployRES study (Fraunhofer ISI et al 2009) finds for Europe that current strong investment reflected in installations in Europe and exports to the rest of the world dominate the economic impact of RES policies and therefore lead to positive overall effects The studys results suggest that this positive balance can only be kept up in the future if the competitive position of European manufacturers of RES technology is improved The authors strongly recommend policies which promote technological innovation in RES and lead to a continued and rapid reduction of their costs
Factors 1 and 2 will have substantial macroeconomic impacts in the short and medium terms whereas factor 3 accumulates and will show positive impacts mainly in the long term Factor 4 strongly depends on the global developments while factor 5 may have significant effects on employment
313 Additional scenarios
Impacts of additional investment (factor 1) have already been analysed in scenario S2H of the petre project To focus on the other impacts of eco-innovation two additional scenarios were designed building on scenario S2H of petre
bull S2HEETRwithrevenuerecyclingdesignedto meet the unilateral EUs 2020 greenhouse gas (GHG) target (high energy price) Ten per cent of revenues are spent on eco-innovation measures and trade shares of EU-27 economies with the rest of the world in machinery and electrical machinery increase by 01 due to the deployment of the fast growing RES markets This assumption is based on the strong EU policy effort to increase the share of renewable energy in final energy consumption to 20 by 2020
Modelling of ETR impacts on eco-innovation
Environmental tax reform in Europe opportunities for eco-innovation 27
(Fraunhofer ISI et al 2009) and the possibility of very strong world market development of the RES sector until 2020 (EREC 2008) which offers additional export opportunities for European RES industries
bull S2HIETRwithrevenuerecyclingdesignedto meet the unilateral EUs 2020 GHG target (high energy price) Ten per cent of revenues are spent on eco-innovation measures and input structures of the energy sector are changed according to the input structure of the German RES industry (Lehr et al 2008)
S2HE looks at the possible role of international trade S2HI analyses changes in the input structure of the energy sector ie from conventional electricity production to renewables In the petre project (as in GHK et al 2007) only the energy inputs of the energy sector were adapted to changes in the energy input mix
Both S2HE and S2HI focus on RES and efficiency technologies As mentioned above an ETR will trigger a variety of innovations Therefore the results can be thought of as conservative in the sense that innovations (eg automotive energy consumption industrial efficiency etc) are not explicitly included
32 Overview of modelling results
The main results of the simulations are presented in Table 31 In the baseline scenario BH with high energy prices EU-27 carbon emissions will be
72 below the 1990 level in 2020 (38) The EU-15 has committed in the Kyoto Protocol to reduce its GHG emissions 8 below 1990 levels in the period 2008ndash2012 As emissions in the new member states are substantially below their 1990 levels today that implies that the EU-27 will keep its emissions more or less constant over the coming decade As in the PRIMES baseline an ETS price of 18 EURt in 2008 prices is assumed in 2020
In scenario S1H the ETS price and carbon tax rate has to be increased to 68 EUR2008t of CO2 to reach the 20 GHG reduction target which is equal to a 15 reduction of CO2 emissions against 1990 as other greenhouse gases have already been reduced above average by more than 20 in terms of CO2 equivalents Compared to the baseline CO2 emissions are 84 lower in 2020 which means roughly an additional 1 reduction annually in the period 2012ndash2020 GDP will be about 06 lower compared to the baseline in 2020 This means that annual average growth rates will be less than 01 below their baseline development This is especially low compared to the current financial and economic crisis with a GDP deviation against the baseline of around 6 in 2009
As the recycling mechanism reduces labour costs and the tax burden is shifted from labour-intensive to carbon- and material-intensive sectors employment will be 036 (or more than 800 000 jobs) higher than in the baseline The ETR is not fully budget neutral potentially enabling EU economies to slightly increase their net savings If
(38) The modelling exercise in the present study was conducted in 2009 and therefore does not contain the latest data on EU-27 GHG emissions which were significantly influenced by the global economic slump of the late-2000s
Table 31 Main results under the different scenarios
Scenario Target in 2020 CO2 price GDP Employment CO2 reduction
EUR2008t pc against baseline
pc against baseline
pc against 1990
pc against baseline
in year 2020 2015 2020 2020 2020 2020
BH 18 ndash 72 00
S1H 20 GHG 68 ndash 022 ndash 057 036 ndash 151 ndash 84
S2H 20 GHG 61 ndash 013 ndash 030 041 ndash 152 ndash 85
S2HE 20 GHG 61 ndash 009 ndash 004 051 ndash 151 ndash 84
S2HI 20 GHG 61 ndash 006 ndash 024 045 ndash 152 ndash 84
Environmental tax reform in Europe opportunities for eco-innovation
Modelling of ETR impacts on eco-innovation
28
this extra saving is spent negative GDP impacts will be further reduced
In scenario S2H part of the revenues is invested in low-carbon technologies This reduces the carbon price to 61 EUR2008t in 2020 halving the GDP loss relative to scenario S1H to only 03 as the investment in renewable energies is assumed to be additional Employment impacts are also more positive than in scenario S1H The 10 investment in low-carbon technologies amounts to more than EUR 20 billion in 2020
Assuming additional EU exports of RES technologies in scenario S2HE GDP almost matches the baseline in 2020 and employment is 051 (or more than 1 million jobs) higher than in the baseline In scenario S2HI a shift in the input structure of the energy sector towards machinery
and electrical machinery reflecting the different nature of RES relative to conventional electricity generation also has smaller additional positive impacts on GDP and employment compared to scenario S2H
The following figures show impacts of the different scenarios in comparison to the baseline BH As Figure 31 illustrates all the alternative scenarios imply GDP lower than the baseline However comparing scenario S1H with the other three scenarios shows that additional RES investment (S2H) additional RES exports (S2HE) and the inclusion of different input structures of the RES industries (S2HI) each have positive GDP impacts These results are in line with model-based analysis in the EMPLOY-RES study (Fraunhofer ISI et al 2009)
Figure 31 EU-27 GDP according to four scenarios mdash deviation from the baseline (BH)
Percentage deviation from the baseline (BH)
ndash 100
ndash 080
ndash 060
ndash 040
ndash 020
0002010 2015 2020
S2HI S1H S2H S2HE
Modelling of ETR impacts on eco-innovation
Environmental tax reform in Europe opportunities for eco-innovation 29
In contrast to GDP employment increases relative to the baseline in all the alternative scenarios (Figure 32) Due to the scenario design the structure of the EU economies is shifted from energy-intensive to labour-intensive sectors The magnitude of the employment gain is influenced by the carbon price and the tax shift the underlying energy prices and the production loss The largest part of the employment increase stems from the additional RES investment (scenario S2H) although a shift in industry structures (S2HI) and additional RES exports (S2HE) are also positive for the labour market
33 Macroeconomic impacts at the national level
In general terms it is clear that national ETS and ETR impacts depend significantly on country specifics including energy use economic structure social system and behaviour (eg reactions to labour cost changes) In countries with high carbon intensity in their energy mix additional revenues and expenditures are higher than in countries with lower carbon intensity
Scenario S2H provides an interesting tool for analysing the macroeconomic impacts of ETR at the national level because 10 of the additional generated revenues are used for eco-innovation investments meaning that only 90 of the revenues are recycled back into the economy by reducing income tax rates and social security contributions
Figure 32 EU-27 employment according to four scenarios mdash deviation from the baseline (BH)
ndash 020
000
020
040
060
2010 2015 2020
S2HI S1H S2H S2HE
Percentage deviation from the baseline (BH)
Environmental tax reform in Europe opportunities for eco-innovation
Modelling of ETR impacts on eco-innovation
30
Figure 34 GDP in 2020 in EU-27 Member States under scenario S2H mdash deviation form the baseline (BH)
Figure 33 GDP in 2020 in selected countries under scenario S2H mdash deviation from the baseline (BH)
ndash 25 ndash 20 ndash 15 ndash 10 ndash 05 00 05 10 15
Romania
Bulgaria
SloveniaMalta
Lithuania
Latvia
Estonia
CyprusSlovakia
Poland
Hungary
Czech RepublicUnited Kingdom
Sweden
Spain
Portugal
Netherlands
Italy
Ireland
Greece
FranceFinland
Denmark
Luxembourg
Belgium
Austria
Germany
Percentage deviation from the baseline (BH)
Russia
South Africa
Brazil
India
China
Mexico
Japan
USA
Poland
United Kingdom
Spain
Italy
France
Germany
ndash 30 ndash 25 ndash 20 ndash 15 ndash 10 ndash 05 00 05 10
Percentage deviation from the baseline (BH)
Modelling of ETR impacts on eco-innovation
Environmental tax reform in Europe opportunities for eco-innovation 31
Figure 35 Employment in 2020 in EU-27 Member States under scenario S2H mdash deviation from baseline (BH)
EU-27EU-15
RomaniaBulgariaSloveniaMalta
LithuaniaLatvia
EstoniaCyprusSlovakia
PolandHungary
Czech RepublicUnited Kingdom
SwedenSpain
PortugalNetherlands
ItalyIrelandGreece
FranceFinlandDenmarkLuxembourg
BelgiumAustria
Germany
ndash 200 0 200 400 600 800 1 000
Percentage deviation from the baseline (BH)
Under scenario S2H the GDP of large EU economies deviates from baseline projections by between 0 and ndash 1 with the exception of Italy (Figure 33) Germanys GDP is even forecast to match the baseline level in 2020 due to the countrys strong RES industry Outside Europe some countries gain slightly against EU Member States in terms of competitiveness as export prices in most EU Member States and sectors increase and GDP in those countries exceeds the baseline projections as a result (Figure 33) This is mainly because carbon tax revenues are recycled via income tax reductions which are not part of production costs However energy exporting economies such as Russia or South Africa will lose exports if EU demand for fossil fuel imports declines The development of all EU Member States is shown in Figure 34
Employment impacts of scenario S2H are positive for almost all EU Member States as lower labour
costs increase labour demand and labour intensity (Figure 35) The highest absolute increases are shown for Germany the Netherlands Italy and the United Kingdom For EU-27 as a whole employment will be almost one million higher than in the corresponding baseline BH in 2020
The scenarios have not been designed with a view to meeting the EU renewables target of a 20 renewables share in final energy consumption in 2020 Nevertheless the scenarios provide some interesting insights The share is projected to increase from around 10 in 2009 to above 14 even in the baseline as instruments such as feed in tariffs and biofuel quotas will continue In scenario S1H the target will be missed with around 18 in 2020 Only in scenarios S2H S2HE and S2HI is the target met (approximately 20 )
Environmental tax reform in Europe opportunities for eco-innovation
Modelling of ETR impacts on eco-innovation
32
Under scenario S2H energy-related carbon emissions are reduced in all EU Member States relative to the baseline (Figure 36) The highest percentage reductions can be seen in many of the EU-12 Member States with still high energy intensity and low energy prices In these countries the relative price increase is higher than in countries like Germany or the United Kingdom with already high energy taxes and overall energy prices
Additional ETS revenues material tax revenues and carbon tax revenues from the industry sector are recycled back to industry via reductions in employers social security contributions (or wage subsidies in some countries) The revenues from the carbon tax on households set out in Table 32 (totalling 033 of GDP in Germany for example) are used to reduce income tax For the EU-27 overall revenues from ETS and ETR reach about 2 of GDP in 2020 although these figures may be excessive because additional EU efforts to increase energy
efficiency and renewable energy which will reduce the ETS price are not taken into account The use of flexible tools such as the Clean Development Mechanism will further reduce the revenues and earmarking of part of the revenues for mitigation and adaptation measures in emerging and developing countries limits the recycling into labour costs
In addition the scenarios do not take the current global economic problems into account According to the IEA (2009) the downturn will also reduce carbon emissions in the long run which will lead to lower carbon prices and revenues to reach fixed targets (or make tighter targets less costly)
The ETR will have varying effects on the prices of different sorts of products and services Material or carbon taxes increase the prices of product groups according to their direct and indirect material and carbon content The recycling mechanism reduces
Figure 36 Energy-related CO2 emissions in 2020 under scenario S2H mdash deviation from the baseline (BH)
WorldEU-27
EU-15Romania
BulgariaSlovenia
MaltaLithuania
LatviaEstonia
CyprusSlovakia
PolandHungary
Czech RepublicUnited Kingdom
SwedenSpain
PortugalNetherlands
ItalyIreland
GreeceFrance
FinlandDenmark
LuxembourgBelgium
AustriaGermany
ndash 25 ndash 20 ndash 15 ndash 10 ndash 5 0
Percentage deviation from the baseline (BH)
Modelling of ETR impacts on eco-innovation
Environmental tax reform in Europe opportunities for eco-innovation 33
Table 32 Additional ETS and environmental tax revenues in 2020 ( of GPD)
S2H Germany United Kingdom EU-27
ETS revenues 083 064 059
Carbon tax (industry) 052 044 054
Carbon tax (households) 033 041 036
Material tax 041 029 056
Sum 209 178 205
Figure 37 Total primary energy supply in 2020 under scenario S2H mdash deviation from the baseline (BH)
WorldEU-27EU-15
RomaniaBulgaria
Slovenia
MaltaLithuania
LatviaEstonia
Cyprus
SlovakiaPoland
HungaryCzech Republic
United KingdomSweden
SpainPortugal
NetherlandsItaly
IrelandGreece
FranceFinland
DenmarkLuxembourg
BelgiumAustria
Germany
ndash 24 ndash 21 ndash 18 ndash 15 ndash 12 ndash 9 ndash 6 ndash 3 0
Percentage deviation from the baseline (BH)
Environmental tax reform in Europe opportunities for eco-innovation
Modelling of ETR impacts on eco-innovation
34
Figure 38 Output price impacts of scenario S2H in Germany in 2020 mdash deviations from the baseline (BH)
Figure 39 Impacts of scenario S2H on industrial output in 2020 in Germany mdash deviations from the baseline (BH)
ndash 5
0
5
10
15
20
Output prices
Percentage deviation from the baseline (BH)
(3) F
ood
(4) T
extiles
(5) W
ood
(6) P
ulp pap
er
(7) C
oke re
fined
petro
leum
pro
ducts
(8) C
hemica
ls ex
cl pha
rma
(9) P
harm
aceu
ticals
(10)
Rub
ber a
nd plastics
(11)
Non
-metallic
miner
als
(12)
Iron
and
steel
(13)
Non
-ferrou
s metals
(14)
Met
al pro
ducts
(15)
Mac
hine
ry and
equ
ipmen
t
(16)
Office
mac
hine
ry
(17)
Electric
al m
achine
ry
(18)
Rad
io T
V
(19)
Med
ical pr
ecisi
on and
opt
ical ins
trumen
ts
(20)
Mot
or veh
icles
(21)
Ships
(22)
Airc
raft
(23)
Railro
ad
(24)
Man
ufac
turin
g n
ec r
ecyc
ling
(25)
Electric
ity g
as w
ater
sup
ply
(26)
Con
stru
ction
(27)
Tra
de r
epairs
(28)
Hot
els an
d re
stau
rant
s
(29)
Tra
nspo
rt an
d stor
age
(30)
Pos
t and
teleco
mmun
icatio
ns
(31)
Finan
ce ins
uran
ce
(32)
Rea
l estate ac
tivities
(33)
Ren
ting
(34)
Com
puter
(35)
Res
earch an
d de
velopm
ent
(36)
Oth
er bus
ines
s ac
tivities
(37)
Pub
lic ser
vice
s
(38)
Edu
catio
n
(39)
Hea
lth and
soc
ial w
ork
(40)
Oth
er ser
vice
s
(41)
Priv
ate ho
useh
olds
(1) A
gricu
lture
(2) M
ining an
d qu
arry
ing
nec not elsewhere classified
Production
ndash 100
ndash 80
ndash 60
ndash 40
ndash 20
00
20
40
60
80Percentage deviation from the baseline (BH)
(3) F
ood
(4) T
extiles
(5) W
ood
(6) P
ulp pap
er
(7) C
oke re
fined
petro
leum
pro
ducts
(8) C
hemica
ls ex
cl pha
rma
(9) P
harm
aceu
ticals
(10)
Rub
ber a
nd plastics
(11)
Non
-metallic
miner
als
(12)
Iron
and
steel
(13)
Non
-ferrou
s metals
(14)
Met
al pro
ducts
(15)
Mac
hine
ry and
equ
ipmen
t
(16)
Office
mac
hine
ry
(17)
Electric
al m
achine
ry
(18)
Rad
io T
V
(19)
Med
ical pr
ecisi
on and
opt
ical ins
trumen
ts
(20)
Mot
or veh
icles
(21)
Ships
(22)
Airc
raft
(23)
Railro
ad
(24)
Man
ufac
turin
g n
ec r
ecyc
ling
(25)
Electric
ity g
as w
ater
sup
ply
(26)
Con
stru
ction
(27)
Tra
de r
epairs
(28)
Hot
els an
d re
stau
rant
s
(29)
Tra
nspo
rt an
d stor
age
(30)
Pos
t and
teleco
mmun
icatio
ns
(31)
Finan
ce ins
uran
ce
(32)
Rea
l estate ac
tivities
(33)
Ren
ting
(34)
Com
puter
(35)
Res
earch an
d de
velopm
ent
(36)
Oth
er bus
ines
s ac
tivities
(37)
Pub
lic ser
vice
s
(38)
Edu
catio
n
(39)
Hea
lth and
soc
ial w
ork
(40)
Oth
er ser
vice
s
(41)
Priv
ate ho
useh
olds
(1) A
gricu
lture
(2) M
ining an
d qu
arry
ing
nec not elsewhere classified
Modelling of ETR impacts on eco-innovation
Environmental tax reform in Europe opportunities for eco-innovation 35
social security contributions and lowers labour costs according to the direct and indirect labour content of sector output The ETR therefore reduces output prices in labour-intensive service sectors and increases prices in carbon- and material-intensive industry sectors
The example of Germany shows insignificant impacts in the trade-intensive sectors of machinery (15ndash17) motor vehicles (20) and other transport equipment (21ndash23) (Figure 38) Iron and steel (12) and chemicals without pharmaceuticals (8) face the highest price increases of trade-intensive sectors As the German iron and steel industry primarily delivers high quality steel to the German car industry and increasingly to the German windmill industry negative competitiveness impacts will be limited Exchange rate variations against non-EU competitors have been much higher in the past
The higher prices of carbon- and material-intensive products will reduce price competitiveness on export markets and increase the market share for imports in domestic markets This loss of price competitiveness is based on an assumption of limited market development of energy efficiency and RES technologies in other part of the world It will be offset by gains in labour-intensive sectors if the ETR causes real wage costs per unit of output to fall as a result of using recycled revenues to reduce employer social security contributions
Any improvement in non-price competitiveness will also raise exports The extra employment will raise incomes raising consumption and output
The overall impact on sector output depends on countervailing effects which are negative for iron and steel and a few service sectors and positive for a few industry sectors For most industries the output effect is insignificant (Figure 39) The greatest impact is felt by producers of fossil fuels who must obviously reduce production due to lower demand for their products
Under scenario S2H employment impacts are positive for most sectors relative to the baseline as labour productivity decreases and wage rates fall in relation to consumer prices (CPI) and output prices (Table 33) The relative costs of labour are lower than in the baseline without the ETR reform Only around a quarter of the employment increase takes place in industry
Concerning the wage rate two countervailing effects have to be considered First when the labour market is characterised in terms of the real wage bargaining model as in E3ME and GINFORS with market power on both sides (employers and trade unions) consumer price increases will lead to wage increases (the econometrically estimated factor is 085 for Germany) Second labour productivity is another important factor for wage bargaining The estimated elasticity for Germany is 063 meaning that a 1 increase of labour productivity leads to wage increases of 063 Higher labour demand due to lower labour costs thus reduces the wage increase In the end the German economy is more labour intensive than without the ETR partly due to the structural change towards labour-intensive industries
Table 33 Employment impacts of scenario S2H in Germany mdash deviations from scenario S2H in 2020
Employment in 2020 Deviation from S2H () Deviation from S2Habsolute (1 000s)
Agriculture forestry 24 90
Industry 09 653
Non-metallic minerals 24 62
Iron and steel ndash 28 ndash 37
Machinery and equipment 05 56
Electrical machinery 04 18
Construction 37 449
Trade and transport 10 829
Business services 17 767
Other services ndash 02 ndash 216
Total 07 2506
Environmental tax reform in Europe opportunities for eco-innovation
Modelling of ETR impacts on eco-innovation
36
Additional exports under scenario S2HE mainly create new jobs in machinery and related business services (Table 34) Under scenario S2HI a shift in the input structure of the energy sector leads to a shift in the industry structure and creates a few jobs in the service sector (Table 35)
34 Conclusions of the scenario assessment
The foregoing analysis used the GINFORS model to assess economic and environmental impacts of using the ETS and ETR to reach the EUs 2020
GHG targets In general the results show positive employment effects and only small negative impacts on GDP in EU-27 Member States The economic impacts depend on the levels of international energy prices the mechanism used to recycle revenues and country specifics such as carbon and energy intensity and the structure of energy consumption
Although there is significant evidence that eco-innovation is positively driven by higher energy prices quantification is difficult The present study included simulations of possible impacts of a shift in the industry structure towards renewable energy in the electricity sector and an overall increase of EU
Table 34 Employment impacts of scenario S2HE in 2020 in Germany mdash deviations from scenario S2H
Employment in 2020 Deviation from S2H () Deviation from S2Habsolute (1 000s)
Agriculture forestry ndash 01 ndash 02
Industry 03 194
Non-metallic minerals 02 05
Iron and steel 04 05
Machinery and equipment 13 130
Electrical machinery 24 117
Construction 01 18
Trade and transport 00 26
Business services 07 308
Other services 01 107
Total 02 634
Table 35 Employment impacts of scenario S2HI in 2020 in Germany mdash deviations from scenario S2H
Employment in 2020 Deviation from S2H () Deviation from S2Habsolute (1 000s)
Agriculture forestry ndash 01 ndash 02
Industry 00 00
Non-metallic minerals 25 65
Iron and steel ndash 27 ndash 36
Machinery and equipment 08 78
Electrical machinery 04 19
Construction ndash 00 ndash 04
Trade and transport 00 07
Business services 02 115
Other services 0 56
Total 00 167
Modelling of ETR impacts on eco-innovation
Environmental tax reform in Europe opportunities for eco-innovation 37
exports due to higher global demand for renewable energy The main results can be summarised as follows
bull environmentaltaxreformshiftingtaxesfromlabour to energy and resources will create additional jobs and trigger eco-innovation
bull impactsofeco-innovationintheformofadditional EU exports or shifts in industry structures will have a slight positive influence on GDP and create a smaller number of additional jobs
These findings correspond to results from the EmployRES study (Fraunhofer ISI et al 2009) As ETR is directly aimed at reducing labour costs it will create additional jobs in the short and medium term In the longer term the cost reduction and new technologies arising from eco-innovation will play a larger role
Like all fiscal reforms a major ETR in Europe will create winners and losers At the sector level carbon- and material-intensive industries will face economic losses At the country level the carbon-intensity and overall flexibility of economies is important Clearly structural change away from carbon-intensive industries together with technological change is inherent in any successful climate mitigation policy
On the other hand several factors can smooth these structural adjustments International cooperation
will reduce economic pressure on countries and sectors In addition ETR together with auctioning of ETS allowances can be a major source of revenues for EU Member States in the future even if part of the revenues will have to be earmarked for adaptation and mitigation measures in developing countries Indeed future debate on grandfathering or auctioning ETS allowances should reflect the important point that giving allowances away for free denies countries the money to ease structural change and invest in low-carbon technologies
Caution is needed in relating the findings of this study to the EU policy debate In the model simulations the single carbon price is the only instrument used to reach the EUs 2020 GHG targets In reality of course other renewable energy and efficiency policies will also contribute to carbon reduction and have to be taken into account when comparing the results (especially the high carbon prices) to other studies Both reduce the potential revenues from fossil energy carriers and carbon emissions
A variety of renewable energy and efficiency policies could enable the climate and energy targets to be met while securing even better economic prospects The results of the present study clearly indicate that the discussion on market-based instruments should be intensified Ultimately however the EU will need a rich mix of policies to reach its GHG targets while maximising prosperity
Environmental tax reform in Europe opportunities for eco-innovation38
References
Almon C 1991 The INFORUM Approach to Interindustry Modeling in Economic Systems Research Vol 3 pp 1ndash7
Amin A and Cohendet P 2004 The Architecture of Knowledge Firms Capabilities and Communities Oxford University Press Oxford
Barker T Meyer B Pollitt H and Lutz C 2007a Modelling Environmental Tax Reform in Germany and the United Kingdom with E3ME and GINFORS petre Working Paper Cambridge and Osnabrueck (httpwwwpetreorgukpapershtm) accessed 15 February 2011
Barker T Junankar S Pollitt H and Summerton P 2007b Carbon leakage from unilateral environmental tax reforms in Europe 1995ndash2005 Energy Policy Vol 35 pp 6 281ndash6 292
Brunnermeier S B and Cohen M A 2003 Determinants of environmental innovation in US manufacturing industries Journal of Environmental Economics and Management Vol 45 pp 278ndash293
Buen J 2006 Danish and Norwegian wind industry The relationship between policy instruments innovation and diffusion Energy Policy Vol 34 (18) pp 3 887ndash3 897
Carlsson B and Stankiewicz R 1991 On the nature function and composition of technological systems Journal of Evolutionary Economics Vol 1 (2) pp 93ndash118
Christiansen A C and Skjaerseth J B 2005 Climate change policies in Norway and the Netherlands Different instruments similar outcome Energy and Environment Vol 16(1) pp 1ndash25
Dosi G 1988 Sources procedures and microeconomic effects of innovation Journal of Economic Literature Vol 26 pp 1 120ndash1 171
de Vries F and Medhi N 2008 Environmental regulation and international innovation in automotive emissions control technologies in Environmental Policy Technological Innovation and Patents Organisation for Economic Cooperation and Development Paris
DG TREN 2008 European energy and transport mdash trends to 2030 mdash update 2007 European Commission Luxembourg
DTI 2004 Renewable Supply Chain Gap Analysis UK Department of Trade and Industry
Edler J (ed) 2006 Nachfrageorientierte Innovationspolitik Buumlro fuumlr Technikfolgenabschaumltzung beim Deutschen Bundestag (TAB) Arbeitsbericht Nr 99 Berlin
Edquist C 2001 The system of innovation approach and innovation policy an account of the state of the art lead paper presented at the DRUID Conference 12ndash15 June 2001 Aalborg (httpwwwdruiddkconferencesnwpaper1edquistpdf) accessed 15 February 2011
EEA 2006 Using the market for cost-effective environmental policy Market-based instruments in Europe EEA Report No 12006 European Environment Agency Copenhagen
Ekins P 2009 Resource Productivity Environmental tax Reform and Sustainable Growth in Europe published by the Anglo-German Foundation for the Study of Industrial Society Final report (httpwwwpetreorgukpdfFinRepFinpdf) accessed 12 October 2011
Ekins P and Speck S (eds) 2011 Environmental Tax Reform (ETR) A Policy for Green Growth Oxford University Press
EREC 2008 Energy [r]evolution A sustainable global energy outlook Greenpeace International European Renewable Energy Council (EREC)
References
References
Environmental tax reform in Europe opportunities for eco-innovation 39
Fagerberg J Mowery D C and Nelson R R (eds) 2005 The Oxford Handbook of Innovation Oxford University Press Oxford
Fischer C Parry I W H and Pizer W A 2003 Instrument choice for environmental protection when technological innovation is endogenous Journal of Environmental Economics and Management Vol 45 pp 523ndash545
Fraunhofer ISI ECOFYS Energy Economics Group Ruumltter + Partner SEURECO and LEI 2009 EmployRES mdash The impact of renewable energy policy on economic growth and employment in the European Union European Commission Brussels
Frondel M Horbach J and Rennings K 2008 What triggers environmental management and innovation Empirical evidence for Germany Ecological Economics Vol 66(1) pp 153ndash160
GHK Cambridge Econometrics and IEEP 2007 Links between the environment economy and jobs Final Report submitted to DG Environment European Commission
Giljum S Behrens A Hinterberger F Lutz C and Meyer B 2008 Modelling scenarios towards a sustainable use of natural resources in Europe Environmental Science and Policy Vol 11 pp 204ndash216
Goumlrlach B Knigge M and Luumlckge H 2005 Wirkungen der Oumlkologischen Steuerreform auf Innovation und Marktdurchdringung Ecologic Berlin (httpecologiceudownloadprojekte1850-189918791879_5_innovationpdf) accessed 18 August 2011
Green M A 2000 Photovoltaics technology overview Energy Policy Vol 28 (14) pp 989ndash998
Grossmann A Lehr U Lutz C and Wolter MI 2008 Gesamtwirtschaftliche Effekte der Umsetzung der EU Ziele im Bereich Erneuerbare Energien und Gebaumludeeffizienz in Oumlsterreich bis 2020 Studie im Auftrag des Lebensministeriums Wien 0508
Hage J and Hollingsworth J R 2000 Idea innovation networks a strategy for integrating organizational and institutional analysis Organization Studies Vol 21 (5) pp 971ndash1 004
Hauschildt J 2004 Innovationsmanagement Vahlen Muumlnchen
Hemmelskamp J 1997 Environmental policy instruments and their effects on innovation European Planning Studies Vol 5 (2) pp 177ndash195
Hoglund Isaksson L 2005 Abatement costs in response to the Swedish charge on nitrogen oxide emissions Journal of Environmental Economics and Management Vol 50 pp 102ndash120
Hullmann A 2001 Internationaler Wissenstransfer und technischer Wandel (dissertation) Physica-Verlag Heidelberg
IEA 2008 World Energy Outlook 2008 International Energy Agency Paris
IEA 2009 World Energy Outlook 2009 International Energy Agency Paris
Jacobsson S Andersson B A and Baringngens L 2002 Transforming the energy system mdash the evolution of the German technological system for solar cells Science and Technology Policy Research University of Sussex Electronic Working Paper Series No 84 (httpideasrepecorgpsrussewps84html) accessed 18 August 2011
Jaffe A and Stavins R 1995 Dynamic incentives of environmental regulations the effects of alternative policy instruments on technology diffusion Journal of Environmental Economics and Management Vol 29(3) pp 43ndash63
Jaffe A B and Palmer K 1997 Environmental regulation and innovation a panel data study The Review of Economics and Statistics Vol 79 pp 610ndash619
Jaffe A B Newell R G and Stavins R N 2002 Environmental policy and technological change Environmental and Resource Economics Vol 22 (1ndash2) 2002 pp 41ndash70
Johnstone N and Hascic I 2008 Renewable energy policies and technological innovation energy source and instrument choice in Environmental Policy Technological Innovation and PatentsOrganisation for Economic Co-operation and Development Paris
Johnstone N 2005 The Innovation Effects of Environmental Policy Instruments in Horbach J (ed) Indicator Systems for Sustainable Innovation Physica-Verlag HD
Environmental tax reform in Europe opportunities for eco-innovation
References
40
Johnstone N Hascic I and Ostertag K 2008 Environmental policy technological innovation and patent activity in Environmental Policy Technological Innovation and Patents Organisation for Economic Co-operation and Development Paris
Jung C Krutilla K and Boyd R 1996 Incentives for advanced pollution abatement technology at the industry level an evaluation of policy alternatives Journal of Environmental Economics and Management Vol 30(1) pp 95ndash111
Kammen D M Kapidia K and Fripp M 2004 Putting renewables to work how many jobs can the clean energy industry generate University of California Berkeley
Kemp R 1997 Environmental policy and technical change ndash a comparison of the technological impact of policy instruments Edward Elgar Cheltenham
Kemp R 1998 The diffusion of biological waste-water treatment plants in the Dutch food and beverage industry Environmental and Resource Economics Vol 12 pp 113ndash136
Kemp R 2000 Technology and environmental policy ndash innovation effects of past policies and suggestions for improvement in OECD proceedings ndash innovation and the environment Organisation for Economic Co-operation and Development Paris
Kerr S and Newell R G 2003 Policy-induced technology adoption evidence from the US lead phasedown Journal of Industrial Economics Vol 51 pp 317ndash343
Klaassen G Miketa A Larsen K and Sundqvist T 2005 The impact of RampD on innovation for wind energy in Denmark Germany and the United Kingdom Ecological Economics Vol 54 pp 227ndash240
Kline S and Rosenberg N 1986 An overview of innovation in Landau R (ed) The positive sum strategy Harnessing technology for economic growth pp 275-306
Knigge M and Goumlrlach B 2005 Effects of Germanys ecological tax reforms on the environment employment and technological innovation Ecologic Berlin (httpwwwumweltbundesamtdeuba-info-presse-ehintergrundoekosteuerpdf) accessed 18 August 2011
Langniss O 2003 Governance structures for promoting renewable energy sources dissertation Lund Stuttgart
Lanjouw J O and Mody A 1996 Innovation and the international diffusion of environmentally responsive technology Research Policy Vol 25 pp 549ndash571
Lehr U Nitsch J Kratzat M Lutz C and Edler D 2008 Renewable Energy and Employment in Germany Energy Policy Vol 36 pp 108ndash117 DOI101016jenpol200709004
Lehr U Wolter MI and Groszligmann A 2009 Economic impacts of RES obligations in Austria ndash an application of the macro-econometric model e3at GWS Discussion Paper 20091 Osnabruumlck
Lundvall B-A Johnson B Andersen E S and Dalum B 2001 National systems of production innovation and competence building Research Policy Vol 31 pp 213ndash231
Lutz C and Giljum S 2009 Global resource use in a business as usual world until 2030 Updated results from the GINFORS model in Bleischwitz R Welfens Pand Zhang Z (eds) Sustainable growth and resource productivity ndash economic and global policy issues Greenleaf Publishers pp 30ndash41
Lutz C and Meyer B 2008 Beschaumlftigungseffekte des Klimaschutzes in Deutschland Untersuchungen zu gesamtwirtschaftlichen Auswirkungen ausgewaumlhlter Maszlignahmen des Energie- und Klimapakets Forschungsbericht 205 46 434 Dessau-Roszliglau
Lutz C and Meyer B 2009a Environmental and Economic Effects of Post-Kyoto Carbon Regimes Results of Simulations with the Global Model GINFORS Energy Policy Vol 37 pp 1 758ndash1 766 DOI 101016jenpol200901015
Lutz C and Meyer B 2009b Scenario results from GINFORS PETRE working paper Osnabruumlck
Lutz C Meyer B Nathani C and Schleich J 2005 Endogenous technological change and emissions The case of the German steel industry Energy Policy Vol33 pp 1 143ndash1 154
Lutz C Meyer B Nathani C and Schleich J 2007 Endogenous innovation economy and environment impacts of a technology based modelling approach for energy-intensive industries in Germany Energy Studies Review Vol 15(1) pp 2ndash18
References
Environmental tax reform in Europe opportunities for eco-innovation 41
Lutz C Meyer B and Wolter M I 2009 The global multisectormulticountry 3-E model GINFORS mdash a description of the model and a baseline forecast for global energy demand and CO2 emissions Journal of Sustainable Development forthcoming
Malerba F and Orsenigo L 1997 Technological Regimes and Sectoral Patterns of Innovative Activities Industrial and Corporate Change Vol 6 (1) pp 83ndash117
Malerba F 1992 Learning by Firms and Incremental Technical Change The Economic Journal Vol 102 (413) pp 845ndash859
Malerba F 2005 Industrial dynamics and innovation progress and challenges Presidential Address delivered at the 32nd Conference of the European Association for Research in Industrial Economics (EARIE) 1ndash4 September 2005 Porto
Malerba F 2006 Innovation and the evolution of industries Journal of Evolutionary Economics Vol 16 pp 3ndash23
McGinty M and de Vries F P 2009 Technology diffusion product differentiation and environmental subsidies The BE Journal of Economic Analysis and Policy Vol 9(1)
Meyer B and Lutz C 2007 The GINFORS model ndash model overview and evaluation Petre Working Paper Osnabruumlck (httpwwwpetreorgukpapershtm) accessed 18 August 2011
Meyer B Lutz C Schnur P and Zika G 2007 Economic policy simulations with global interdependencies a sensitivity analysis for Germany Economic Systems Research Vol 19 pp 37ndash55
Mickwitz P H Hyvaumlttinen and P Kivimaa 2008 The role of policy instruments in the innovation and diffusion of environmentally friendlier technologies popular claims versus case study experiences Journal of Cleaner Production Vol 16(1S1) 162ndash170
Miketa A and Schrattenholzer L 2004 Experiments with a methodology to model the role of RampD expenditures in energy technology learning processes first results Energy Policy Vol 32 (15) pp 1 679ndash1 692
Milliman S R and Prince R 1989 Firm incentives to promote technological change in pollution control Journal of Environmental Economics and Management Vol 17 pp 247ndash265
Millock K and Nauges C 2006 Ex-post evaluation of an earmarked tax on air pollution Land Economics Vol 82(1) pp 68ndash84
Montero J-P 2002 Market structure and environmental innovation Journal of Applied Economics Vol 2 pp 293ndash325
Moreno B and Loacutepez A J 2007 The effect of renewable energy on employment mdash The case of Asturias (Spain) Renewable and Sustainable Energy Rewiews doi 101016jrser200610011
Mowery D and Rosenberg N 1979 The influence of market demand upon innovation A critical review of some recent empirical studies Research Policy Vol 8 pp 102ndash153
Newell R G Jaffe A B and Stavins R N 1999 The induced innovation hypothesis and energy-saving technological change Quarterly Journal of Economics Vol 114 pp 941ndash975
Norberg-Bohm V 1999 Stimulating green technological innovation An analysis of alternative policy mechanisms Policy Sciences Vol 32(1) pp 13ndash38
OECD 2009 Sustainable manufacturing and eco-innovation towards a green economy Organisation for Economic Co-operation and Development Policy Brief June 2009
OECD 2010 Taxation innovation and the environment Organisation for Economic Co-operation and Development
Pavitt K 1984 Sectoral patterns of technological change Towards a taxonomy and a theory Research Policy Vol 13 pp 343ndash373
Popp D 2002 Induced innovation and energy prices The American Economic Review Vol 92(1) pp 160ndash180
Popp D 2005 Lessons from patents Using patents to measure technological change in environmental models Ecological Economics Vol 54 pp 209ndash226
Environmental tax reform in Europe opportunities for eco-innovation
References
42
Porter M and van der Linde C 1995 Toward a new conception of the environment competitiveness relationship Journal of Economic Perspectives Vol 9(4) pp 97ndash118
Rammert W 2002 The cultural shaping of technologies and the politics of technodiversity In Sorensen K and Williams R (eds) Shaping technology guiding policy concepts spaces and tools Elgar Cheltenham pp 155-172
Requate T 2005 Dynamic incentives by environmental policy instruments ndash a survey Ecological Economics Vol 54 pp 175ndash195
Roloff N Lehr U Krewitt W Fuchs G Wassermann S Weimer-Jehle W and Schmidt B 2008 Success determinants for technological innovations in the energy sector mdash the case of photovoltaics in Moumlst D Fichtner W Ragwitz M and Veit D (eds) New methods for energy market modelling mdash Proceedings of the first european workshop on energy market modelling using agent-based computational economics Universitaumltsverlag Karlsruhe
Rothwell R 1995 The fifth generation innovation process in Oppenlaumlnder KH Popp W (eds) Innovationen und wirtschaftlicher Fortschritt betriebs-und volkswirtschaftliche Perspektiven Bern pp 9ndash26
Schumpeter J 1942 Capitalism socialism and democracy New York Harper
Skjaeligrseth J B and Christiansen A C 2005 Environmental policy instruments and technological change in the energy sector findings from comparative empirical research Energy and Environment Vol 17 (2) pp 223ndash241
Snyder L D Miller N H and Stavins R N 2003 The effects of environmental regulations on pollution emissions evidence from plant-level data American Economic Review Vol 93(2) pp 431ndash435
Technopolis 2008 Eco-innovation Final Report for Sectoral Innovation Watch (httpwwwtechnopolis-groupcomresourcesdownloads661_report_finalpdf) accessed 18 August 2011
Volleburgh H 2007 Impacts of environmental policy instruments on technological change Report for Joint Meetings of Tax and Environment Experts OECD Environment Directorate February 2007 (comenvepocctpacfa(2006)36final)
Zimmermann H Wohltmann M and Hansjuumlrgens B 1996 Umweltabgaben und Innovation Analytica Marburg
43
Annex 1
Environmental tax reform in Europe opportunities for eco-innovation
Type Instrument Area Stage
Reference
Theo
retica
l
Em
piric
al
Cas
e st
udy
Rev
iew
Qual
itat
ive
Taxe
s
Perm
its
Subsi
die
s
Volu
nta
ry
Com
man
d
Reg
ula
tion
Ener
gy
Air
Wat
er
Oth
er
Gen
eral
Innov
atio
n
Diffu
sion
Rel
evan
ce
Brunnermeier amp Cohen (2003)
X X X X
Buen (2006) X X X X X X
Christiansen amp Skjaerseth (2005)
X X X X X X
Fischer et al (2003 X X X X X X
Frondel et al (2008) X X X X X X X (X) (X)
Hemmelskamp (1997)
X X X X X X X (X)
Hoglund Isaksson (2005)
X X X (X) (X)
Jaffe amp Stavins (1995)
X X X1 X X X X
Jaffe amp Palmer (1997)
X X X X
Jaffe et al (2002) X X X X X X X X X X
Jung et al (1996) X X X X X X (X) (X)
Kemp (1998) X X X X
Kerr amp Newell (2001) X X X X X
Klaassen et al (2005)
X X X X X
Lanjouw amp Mody (1996)
X X X X X X X
McGinty amp de Vries (2009)
X X X X
Mickwitz et al (2008)
X X X X X X X X X
Milliman amp Prince (1989)
X X X X X X X
Millock amp Nauges (2006)
X X X X X X
Montero (2002) X X X X X
Newell et al (1999) X X1 X X X
Norberg-Bohm (1999)
X X X X X X X
Popp (2002) X X1 X X
Popp (2005) X X X X X X
Porter amp van der Linde (1995)
X X X X X X
Requate (2005) X X X X X X X
Skjaeligrseth amp Christiansen (2005)
X X X X X X X X X
Snyder et al (2003) X X X X X
Annex 1 Classification of refereed journal articles
Environmental tax reform in Europe opportunities for eco-innovation44
Annex 2
Type Instrument Area Stage
Reference
Theo
retica
l
Em
piric
al
Cas
e st
udy
Rev
iew
Qual
itat
ive
Taxe
s
Perm
its
Subsi
die
s
Volu
nta
ry
Com
man
d
Reg
ula
tion
Ener
gy
Air
Wat
er
Oth
er
Gen
eral
Innov
atio
n
Diffu
sion
Rel
evan
ce
Johnstone (2005)
X X X X X X X
Johnstone amp Hascic (2008)
X X X X X X X X
Kemp (1997) X X X X X X X X X X X X X
Kemp (2000) X X X X X X X X X
de Vries amp Medhi (2008)
X X1 X X X
Annex 2 Classification of books and book chapters
45
Annex 3
Environmental tax reform in Europe opportunities for eco-innovation
Type Instrument Area Stage
Reference
Theo
retica
l
Em
piric
al
Cas
e st
udy
Rev
iew
Qual
itat
ive
Taxe
s
Perm
its
Subsi
die
s
Volu
nta
ry
Com
man
d
Reg
ula
tion
Ener
gy
Air
Wat
er
Oth
er
Gen
eral
Innov
atio
n
Diffu
sion
Rel
evan
ce
Goumlrlach et al (2005)
X X X X X X
Knigge amp Goumlrlach (2005)
X X X X X X
Technopolis (2008)
X X X X X X
Volleburgh (2007)
X X X X X X X X X X X
Annex 3 Classification of reports
European Environment Agency
Environmental tax reform in Europe opportunities for eco-innovation
2011 mdash 45 pp mdash 21 x 297 cm
ISBN 978-92-9213-238-5doi10280084889
How to obtain EU publications
Publications for salebull viaEUBookshop(httpbookshopeuropaeu)bull fromyourbooksellerbyquotingthetitlethepublisherandorISBNnumberbull bycontactingoneofoursalesagentsdirectlyYoucanobtaintheircontactdetails
on the Internet (httpbookshopeuropaeu) or by sending a fax to +352 2929-42758
Free publicationsbull viaEUBookshop(httpbookshopeuropaeu)bull attheEuropeanCommissionsrepresentationsordelegationsYoucanobtain
their contact details on the Internet (httpeceuropaeu) or by sending a fax to +352 2929-42758
European Environment AgencyKongens Nytorv 61050 Copenhagen KDenmark
Tel +45 33 36 71 00Fax +45 33 36 71 99
Web eeaeuropaeuEnquiries eeaeuropaeuenquiries
TH
-AK-1
1-0
17-E
N-N
doi1
02
8008
4889
- Acknowledgements
- Executive summary
- 1Introduction
-
- 11Background
- 12ETR and innovation
- 13Report structure
-
- 2Review of literature on environmental tax reform and eco‑innovation
-
- 21Initial screening
- 22Detailed review
- 23Environmental regulation studies
- 24Theoretical studies
- 25Empirical studies
- 26Case studies
- 27Conclusions
-
- 3Modelling of ETR impacts on eco‑innovation
-
- 31Scenarios assessing the implications of ETR for eco-innovation
- 32Overview of modelling results
- 33Macroeconomic impacts at the national level
- 34Conclusions of the scenario assessment
-
- References
- Annex 1 Classification of refereed journal articles
- Annex 2Classification of books and book chapters
- Annex 3Classification of reports
-
Review of literature on environmental tax reform and eco-innovation
Environmental tax reform in Europe opportunities for eco-innovation 13
energy and climate change five addressing air pollution and three addressing water pollution In terms of the stage of the technological development process there is an even split between innovation and diffusion with many of the papers covering both stages In total eighteen of the references are included in the detailed review
Annex 2 shows the classifications of the five book chapters and Annex 3 covers the four reports (7) As might be expected these sources put less emphasis on theory with only one reference including any formal analysis They are split fairly evenly between empirical studies reviews and qualitative assessments All but one consider the impact of environmental taxes or energy prices while seven consider the impact of investment subsidies As with the journal articles there is a fairly even spread across policy areas and between innovation and diffusion Five of the references are included in the detailed review
22 Detailed review
The detailed review focuses on the impacts on eco-innovation of the two price-based policy instruments that are directly relevant to ETR environmental taxes and investment subsidies and tax incentives (eg RampD and capital allowances) (8) A priori each instrument might be expected to stimulate innovation mdash the first by increasing the benefits of innovation by reducing tax payments the second by reducing the costs of developing and adopting new technologies However in order to provide a broader context for the impacts of these two instruments the review starts by considering the relationship between innovation and the stringency of environmental regulation in general
As can be seen from the initial screening (see Annexes 1ndash3) the large majority of studies consider more than one policy instrument within a unified analytical framework mdash either comparing their relative impacts or assessing the impacts of instrument combinations (or packages)
In particular all but one of the papers that assess the impacts of investment subsidies either theoretically or empirically also assess the impacts environmental taxes (and sometimes other policy instruments) Consequently for the purposes of this review it is convenient to consider the impacts of taxes and subsidies at the same time rather than sequentially In addition to avoiding the need for any repetition (about model structures assumptions etc) this facilitates identification of potential interactions and synergies between the two instruments
Apart from Section 23 on the impact of environmental regulation in general only those references identified as being of significant relevance () in the initial screening are included in the review References are summarised in chronological order under three headings theoretical predictions (Section 24) empirical evidence (Section 25) and case studies (Section 26) At the end of each section an attempt is made to synthesise the findings of the studies but the scope of the present review did not allow for critical analysis of the studies to identify their respective strengths and weaknesses or to resolve any apparent conflicts between their findings
23 Environmental regulation studies
Lanjouw and Mody (1996) use aggregate pollution and control expenditure (PACE) data as a proxy for the stringency of environmental regulation and compare this with data on the aggregate number of environmental patent applications for Germany Japan and USA They do not perform any formal statistical or econometric analysis of the data However based on simple graphical analysis they identify a relatively clear correlation between expenditure and patents over the 1970s and 1980s with a time lag of one to two years They also find some indications in the data that patenting in one country also responds to increasing stringency of environmental regulation in the other two In addition they consider the diffusion of environmental technologies by looking at trade
(7) Two of the reports emanate from the study by Ecologic and DIW of ETR in Germany Details of the assessment of the impact on innovation and market diffusion are provided (in German) in Goumlrlach et al (2005) with a summary (in English) in Knigge and Goumlrlach (2005)
(8) While the large majority of revenues raised under an ETR are likely to be used to reduce taxes on labour a small proportion may be used to encourage innovation or promote the take-up of environmentally friendly technologies
Environmental tax reform in Europe opportunities for eco-innovation
Review of literature on environmental tax reform and eco-innovation
14
flows in capital goods used for pollution reduction and find that these too show a correlation with total abatement expenditure
Jaffe and Palmer (1997) also use PACE data as a proxy for the stringency of environmental regulation and evaluate its impact on two different measures of innovation total private expenditures on RampD and the number of successful patent applications by US manufacturing industries Unlike the previous study they undertake formal econometric analysis of the data using panel data at the two-digit and three-digit SIC code industry level for the period 1978ndash1991 and a fixed effects model They find a statistically significant positive relationship between compliance expenditures (capital expenditures only) and RampD expenditures after controlling for industry-specific effects (9) However they can find no significant impact on patenting activity This is not entirely surprising given the fact that their data is for all types of patents not just those relating to environmental technologies and products Indeed given that the same is true for the RampD expenditure data it may be more surprising that they find a significant relationship between pollution compliance and RampD
Brunnermeier and Cohen (2003) also use a panel data model to assess the impact of pollution abatement expenditures on patenting activity by US manufacturing industries However unlike the previous study they use only environmental patent applications in their analysis They also control for other potential explanatory factors such as the stringency of monitoring and enforcement (as measured by number of inspection visits) industry size (value of shipments) market structure (four-firm concentration ratio) capital intensity and exposure to overseas competition (export intensity) They estimate four different models for the period 1983ndash1992 with their preferred model being a negative binomial random effects model The coefficient for PACE is positive and statistically significant (in all four models) as are the coefficients (in the preferred model) for industry size concentration and export intensity However the magnitude of the coefficient (which represents
the semi-elasticity of patents with respect to PACE) is only 00004 Thus ceteris paribus an increase in abatement expenditure of USD 100 million results in an increase in the mean number of patents of only 4
Key findings of the environmental regulation studies
All three environmental regulation studies use PACE data as a proxy for the stringency of environmental regulation (10) While there are obvious pragmatic reasons for doing this (ie availability of data) the validity of the approach may be open to question As Brunnermeier and Cohen (2003) note expenditure may be affected by factors other than environmental regulation such as external pressures from interest groups or a desire to promote or maintain green credentials with customers Furthermore the reported data may not cover all pollution abatement costs and activities (particularly process-related activities) and may be prone to over-statement by reporting firms for strategic reasons However to the extent that the reported PACE data is correlated with the stringency of environmental regulation the analyses suggest that the latter does have an impact on innovation (at least in USA) although the scale of the impact appears to be small
24 Theoretical studies
Although several previous studies has analysed the impact of different environmental policy instruments on technological change Milliman and Prince (1989) were the first to consider the entire process of technological change encompassing innovation diffusion and optimal agency response (11) Using a relatively simple graphical analysis of shifting marginal abatement cost curves they deduce a relative ranking of five instruments (direct controls auctioned permits freely allocated permits emission reduction subsidies (12) and emission taxes) in terms of firms incentives to promote technological change They conclude that emission taxes provide greater incentives for innovation and diffusion than direct controls or
(9) When they allow the slopes of the PACE variable to vary across industries (in addition to the intercept) they find considerable variation in the estimated coefficients across industries with several being negative
(10) However the studies do not all use the same definition of PACE Lanjouw and Mody (1996) include (real) investment expenditures regulation and monitoring costs and research and development by all levels of government private manufacturing and non-manufacturing firms The other two studies both use compliance cost data for private manufacturing firms (at the industry level) only However while Jaffe and Palmer (1997) use capital cost data in their analysis Brunnermeier and Cohen (2003) use operating cost data
(11) Milliman and Prince (1989) identify a number of studies going back to 1970(12) These are payments for emission reductions not technology subsidies for environmental investments
Review of literature on environmental tax reform and eco-innovation
Environmental tax reform in Europe opportunities for eco-innovation 15
freely allocated tradable permits although not as great as auctioned permits However the optimal agency response is likely to face less opposition (and in some cases actually be favoured) under emission taxes than under auctioned permits (13)
Jaffe and Stavins (1995) develop a theoretical framework for comparing empirically the impacts of alternative policy instruments on the diffusion of a new technology (14) They model the investment decision for both an existing firm and a new entrant in each case assuming that over time the firm minimises the present value of its cost streams (operating costs investment cost net of any government subsidy emission taxes and the implicit costs of violating either a performance or technology standard if applicable) For an existing firm the problem is to choose the optimal timing of the retrofit and the authors show that the new technology will be adopted at a particular time if operating cost savings plus savings from reduced emission tax payments (plus any avoided penalties for not adopting a technology standard or exceeding a performance standard) in that period are greater than the net investment costs less the time rate of change of net investment costs For a new entrant the problem is to choose whether to use the new technology at start-up A necessary condition for doing so is that the present value of operating costs savings and reduced tax payments (plus any avoided penalties) over the entire time horizon is greater than the net investment cost Thus while the conditions differ in each case the introduction of either an emissions tax or an investment subsidy (or increases in the respective values) changes the benefit-cost balance in favour of the new technology bringing forward its adoption by existing firms and increasing the likelihood of adoption by new entrants
Kemp (1997) compares the abatement RampD expenditure levels of an individual firm under direct regulation (ie an emissions limit) an equivalent emission tax (15) and freely allocated tradable permits using a cost minimisation analytical framework and a specific functional form for the abatement cost function He shows that both the
level of RampD expenditure and the level of emissions reduction increase as the emissions tax rate increases and that both are greater under the tax than under direct regulation The corresponding levels under the tradable permit regime will be greater under the emissions tax if the (exogenous) permit price is higher than the tax rate and vice versa Kemp also considers the impact of subsidising the cost of the firms RampD effort and shows that increasing the subsidy rate causes a rise in pollution-control RampD More interestingly the impact of the subsidy is greater if it is combined with an emissions tax than with an equivalent emissions limit
Fischer et al (2003) develop the approach used by Milliman and Prince (1989) although their analysis differs in that it does not include the final agency response stage and the diffusion of the technology is determined by market forces with an equilibrium royalty price (16) They compare an emissions tax with auctioned and freely allocated permits using a three-stage model of innovation diffusion and emissions abatement In the first stage the innovating firm decides how much to invest in RampD to develop an emissions abatement technology In the second stage other firms decide whether to adopt this technology in return for a royalty fee or whether to use an (imperfect) imitation technology In the final stage all firms choose their level of abatement to minimise costs given an emissions tax or permit price They show that the level of innovation (ie the level of RampD chosen by the innovating firm) is determined by equating the marginal cost of innovation with the marginal (private) benefit The latter has four components mdash an abatement cost effect an emissions payment effect an imitation effect and an adoption price effect mdash and the last two components are negative (17) Using this model the authors demonstrate that freely allocated permits provide the lowest incentive for innovation However in contrast to Milliman and Prince they conclude that the relative ranking of the emissions tax and auctioned permits is ambiguous It depends crucially on the extent to which the technology can be imitated and hence the extent to which the innovator can appropriate the gains accruing to
(13) For an emissions tax the downward shift of the industry marginal abatement cost curve as a result of diffusion causes the agency to reduce the tax rate assuming that marginal damages are increasing in emissions For permits (auctioned or freely allocated) it causes the agency to reduce the number of permits
(14) The empirical application of this framework is summarised below under Section 25 on empirical evidence(15) That is the emissions tax is set equal to the firms marginal cost of abatement under the direct regulation(16) In addition to assessing the impacts on demand for innovation Fischer et al (1998) consider the impacts of the innovation and
diffusion processes on social welfare in order to compare the overall economic efficiency of the different instruments(17) Milliman and Prince capture only the first two effects in their analysis
Environmental tax reform in Europe opportunities for eco-innovation
Review of literature on environmental tax reform and eco-innovation
16
the other firms in the form of royalty payments If imitation is high (easy) then auctioned permits provide the greater incentive for innovation However if imitation is low (difficult) then the emissions tax provides the greatest incentive
Montero (2002) assesses the impacts of alternative policy instruments on environmental innovation (as measured by RampD expenditure) under conditions of imperfect competition In his model two firms compete in either quantities (ie Cournot duopoly) or prices (ie Bertrand duopoly) while being subject to some form of environmental regulation Where the regulation takes the form of tradable permits mdash either auctioned or freely allocated mdash the market is also assumed to be imperfect the firms competing in permit quantities The interaction between the two firms is modelled as a multi-stage game with the number of stages depending on the instrument being analysed In this framework a firms incentive to invest in RampD comprises two components a direct or cost minimising effect and a strategic effect reflecting the impact of its RampD expenditure on the other firms output decision The latter may be positive or negative depending on the market-regulatory structure Under Bertrand competition (ie where products are strategic complements) freely allocated permits provide the lowest incentive for innovation followed by the emission-standard The relative ranking of an emissions tax and auctioned permits is ambiguous depending on model parameter values Under Cournot competition (ie where products are strategic substitutes) the relative ranking of the emissions tax auctioned permits and the emissions-standard are ambiguous although all provide a greater incentive than freely allocated permits Indeed Montero provides a numerical example where the emissions standard provides the greatest incentive for innovation Finally he considers the impact of increasing competition (increasing the number of firms) and concludes that under perfect competition the emissions tax provides the greatest incentive for innovation
Millock and Nauges (2006) use a simple profit-optimisation model to analyse a firms choice of abatement effort to reduce emissions
per unit of energy used in production While they do not explicitly identify it as such this effort can be interpreted in terms of diffusion of an existing technology mdash with higher effort corresponding to greater diffusion This is consistent with the overall objective of their study which is to assess the impact of combining an emissions tax with a subsidy on (existing) abatement equipment (18) In their model the firm simultaneously chooses the levels of its energy input and abatement effort given exogenous output and energy prices and a cost function for abatement effort (19) They show that while increases in the subsidy rate (expressed as a percentage of the gross investment cost) unambiguously increases abatement effort the impact of increases in the tax rate depends on whether the direct impact of tax increase on the marginal benefit of abatement effort (shifting it up) outweighs the indirect impact via the resulting reduction in output (shifting it down) If the latter dominates then increases in the tax rate will reduce the optimal level of abatement effort The authors show that a necessary and sufficient condition for the direct impact to dominate is that the slope of the firms (inverse) demand for energy is greater than the average emissions tax payment per unit of energy in relation to total energy use (20)
McGinty and de Vries (2009) analyse the relationship between environmental subsidies the diffusion of a clean technology and the degree of product differentiation in an imperfectly competitive output market In their model a fixed number of firms can choose individually between using a clean production technology and a dirty technology Both technologies exhibit constant marginal production costs and constant emission rates (with the clean technology having a lower emission rate and higher unit cost) and consumers are assumed to be able to differentiate between products on the basis of the technology used in their production (21) The subsidy regime is different to that considered by the other studies in that it is applied to the production cost of the clean good and thus reduces the (constant) marginal cost of production for that good As such it is equivalent to an output subsidy for the clean good The authors derive the equilibrium diffusion rate for the clean technology (ie the proportion of firms using
(18) In the second half of their paper Millock and Nauges (2006) undertake an empirical evaluation of such a scheme that operated in France during the 1990s for SO2 and NOX emissions The results of this analysis are summarised under Section 25 on empirical evidence
(19) Abatement effort is assumed to exhibit decreasing returns to scale ie the cost function is increasing and convex(20) If output is held fixed in the profit maximisation problem then increases in the emissions tax rate unambiguously increase the
optimal level of abatement effort as found by Kemp (1997) who uses a cost-minimisation framework for his analysis(21) The model assumes imperfect substitution between the clean good and dirty good with the willingness-to-pay for one good being
a linear function of the quantities of both goods individually ndash ie Pk = ak ndash bYk ndash cYj
Review of literature on environmental tax reform and eco-innovation
Environmental tax reform in Europe opportunities for eco-innovation 17
that technology) and show that an increase in the subsidy value increases diffusion for all degrees of product differentiation The impact is greater as the substitutability of the two goods increases They also briefly consider the impact of a technology subsidy that reduces the fixed cost of the clean technology and conclude that this too will stimulate diffusion but will be less efficient than the output subsidy (22)
Key findings of the theoretical studies
As is often the case with theoretical analyses the specifications of the models and the underlying assumptions of the studies reviewed here significantly influence the conclusions Nevertheless there is a reasonable degree of consistency between their findings The studies can be classified into two broad groups those that consider innovation and diffusion within an industry setting and those that consider an individual firms decision whether to undertake RampD (ie innovation) and invest in an abatement technology (ie diffusion) in order to reduce its own cost of abatement
The studies in the first group conclude that under conditions of perfect competition emission taxes and auctioned permits provide greater incentives for innovation than direct controls or freely allocated permits However there is some disagreement over the relative impacts of the two instruments Under the assumption that the innovator appropriates a fixed (exogenous) proportion of the gains accruing to the technology adopters Milliman and Prince (1989) conclude that auctioned permits provide the greatest incentive although the government may find it easier to adjust emission taxes in response to the resultant downward shift in marginal abatement costs However when the proportion is determined endogenously mdash in the form of a royalty payment mdash Fischer et al (2003) find that either auctioned permits or emission taxes can provide the greater incentive Emission taxes are likely to provide the greatest incentive if the innovator can appropriate a large proportion of the gains (because the technology is difficult to imitate)
Montero (2002) uses a slightly different framework to compare the impacts of different instruments on innovation (in the form of RampD expenditure)
in a situation of imperfect competition and finds that the ranking depends on the nature of the competition (23) Under Bertrand price competition in the output market the results are the same as under perfect competition the relative ranking of auctioned permits and taxes is ambiguous but both provide greater incentives for innovation than emission standards and freely allocated permits However under Cournot quantity competition any of the instruments apart from freely allocated permits can provide the greatest incentives depending on the model parameter values
The studies looking at an individual firms decision also show that an emissions tax can stimulate innovation and diffusion Jaffe and Stavins (1995) explicitly consider the firms decision criterion for investing in a new abatement technology and show that by increasing the benefits of investing the introduction of an emissions tax should bring forward its adoption by existing firms and make its use by new entrants more likely The other two studies consider the firms choice of optimal abatement effort in the context of maximising its total profits or minimising its total cost of emissions reduction This effort can take the form of RampD (innovation) or expenditure on abatement equipment (diffusion) The decision problem is the same in each case ie to choose the optimal level of effort
Kemp (1997) assumes that the firm seeks to minimise its total cost of emissions reduction mdash implicitly assuming that its output level is fixed mdash and demonstrates both that abatement effort increases as the emissions tax increases and that the optimal effort is lower under direct regulation than under an equivalent tax However when the firms output level is allowed to vary mdash as is the case with the profit maximisation problem considered by Millock and Nauges (2006) mdash the impact of an increase in the emissions tax rate on the level of abatement effort depends on the relative magnitudes of the direct impact and the indirect impact (via changes in output levels) on the marginal benefit of abatement effort If the latter dominates then an increase in the emissions tax rate leads to a reduction in the optimal level of abatement effort
(22) McGinty and de Vries (2009) derive expressions for the necessary technology subsidy values when diffusion is 0 and when it is 100 They state mdash without proof mdash that the latter is greater than the former Provided that the relationship between the subsidy and diffusion is monotonic this is a sufficient condition for increases in the subsidy value to cause increases in diffusion
(23) Monteros model does not include diffusion However it does include spillover effects where RampD by one firm reduces the abatement costs of the others
Environmental tax reform in Europe opportunities for eco-innovation
Review of literature on environmental tax reform and eco-innovation
18
Only one of the industry models considers the impact of investment subsidies Using a product differentiation model of imperfect competition McGinty and de Vries (2009) show that subsidising the unit cost of a clean production technology can accelerate its diffusion However the impact depends on the degree of substitutability between clean and dirty products diminishing as the products become more differentiated In contrast all three of the individual firm analyses consider the impact of investment subsidies with all demonstrating that increasing subsidies induce greater abatement effort Furthermore Kemp (1997) shows that the impact of an RampD subsidy is greater in the presence of an emissions tax than it is under an equivalent emissions limit
25 Empirical studies
Jaffe and Stavins (1995) use their theoretical framework (outlined above in Section 24) as the basis for assessing the diffusion of thermal insulation in new home construction in the United States using state-level panel data for the years 1979ndash88 They derive a reduced form equation for the energy efficiency level chosen by developers from the marginal cost-benefit condition in which the explanatory variables include energy prices installation costs and the presence of a relevant building code (as a dummy variable) Separate equations are estimated for ceiling floor and wall insulation with the coefficient for energy prices being positive in all three equations Although it is only significant (at the 95 level) for floor insulation the joint hypothesis that all price coefficients are zero is strongly rejected However the coefficients for installation cost (which are all negative as expected) are around two to three times greater in magnitude and of comparable significance The coefficients for the building code dummies are consistently insignificant (and negative in two cases) indicating that this form of direct regulation had minimal impact on household energy efficiency levels over the period The authors use the estimated models in a simulation to compare the effects of a 10 increase in energy prices (ie an energy tax) with those of a 10 reduction in installation costs (ie a technology subsidy) with each applied over the whole ten-year period While
the tax increases diffusion by 2ndash6 by the end of the period the technology subsidy increases diffusion by between 4ndash15
Kemp (1997) models the diffusion of biological water treatment technology in the Dutch food and beverage industry based on a rational choice threshold model of technology adoption decisions In this model a firm chooses to adopt an abatement technology if the resulting reduction in emission-tax payments is greater than the annualised total costs of the technology where a discount factor is applied to the savings to reflect uncertainty and risk aversion on the part of the decision-maker This is translated into a probabilistic model under the assumption that both the savings and the costs follow a log-normal distribution across plants The model is estimated econometrically using data for the period 1974ndash91 under different assumptions for the functional form of the discount factor and allowing for adjustment costs (24) The estimated parameters for the preferred specification of the discount factor are all significant and of the expected sign and magnitude and the model provides a very close fit to the actual diffusion of waste-water treatment technologies over the period This leads the author to conclude that the effluent charges were a significant positive factor in the diffusion of treatment technologies Indeed he estimates that only around 4 of plants would have installed waste-water treatment equipment by the end of the period if the charge had remained at its (low) 1974 level compared to the actual figure of over 40
Newell et al (1999) estimate the impact of energy prices energy efficiency standards and other factors on the energy efficiency of three types of electrical consumer durables (room air conditioners central air conditioners and gas water heaters) in USA between the 1970s and 1990s The analysis utilises a product characteristics model in which the frontier of technologically feasible products is described by a transformation surface that relates the bundle of product characteristics to the real cost of producing that bundle In this framework innovation is represented by movements of the surface and movements along the surface In particular the authors identify three types of innovation shifts in the surface towards the origin (overall technological change) changes in the slope
(24) Adjustment costs are accounted for by estimating a partial adjustment model in which the actual change in adoption is some fixed fraction of the desired change (estimated from the threshold model)
Review of literature on environmental tax reform and eco-innovation
Environmental tax reform in Europe opportunities for eco-innovation 19
of the surface (directional technological change) and changes in the mix of products along a given surface (model substitution) They define the surface in terms of two characteristics energy flow and cooling capacity and incorporate innovation by allowing the coefficients of the two variables to vary with time and (in the case of energy flow) energy prices and efficiency standards Separate equations are estimated for each durable type with slightly differing sets of explanatory variables and time periods The authors find little evidence that either energy prices or energy efficiency standards had any impact on overall technological change While all but one of the relevant coefficients have the expected sign none are significant In contrast they do find evidence that energy prices had an impact on directional technological change with the relevant coefficients being of the correct sign and significant for both room and central air conditioners
Popp (2002) uses patent data to estimate the effect of energy prices on energy-efficiency innovations in USA between 1970 and 1994 He regresses normalised energy-efficiency-related patent applications against energy prices controlling also for lagged knowledge stock and government RampD (25) The estimated coefficient for energy prices is highly significant producing a short-run price elasticity of 006 and a long-run elasticity 0354 Thus a 10 increase in energy prices would be expected to increase the number of energy-efficiency-related patents by around 35 in the long run The estimated mean lag is less than four years leading the author to conclude that the imposition of a carbon or energy tax would lead to a fairly quick shift towards environmentally friendly innovation
Hoglund Isaksson (2005) estimates abatement cost functions for the reduction of nitrogen oxide (NOX) emissions in three industrial sectors in Sweden (energy pulp and paper chemicals and food) The analysis uses a double-hurdle model applied to a pooled sample of 114 plants across the three sectors The data cover the period 1990ndash1996 which spans the introduction of the charge on NOX emissions in 1992 The estimated cost curves have a similar shape in all three sectors with minimal (or even negative) costs over a relatively broad range of emission reductions and then a steep rise as reductions exceed
a threshold level The analysis does not explicitly consider the issue of innovation However it does find that abatement cost curves shifted downwards significantly over the period In the energy sector for example the emission rate threshold for significant cost increases fell by around 45 between 1991 and 1996 (from 550 to 300 kgGWh) The author surmises that this is due to a combination of technological development and the discovery of previously unrecognised opportunities Unfortunately while this shift coincided with the introduction of the NOX charge the analysis does not provide any evidence of a causal link
As part of their analysis of the impacts of the French tax-subsidy scheme for NOX and sulphur dioxide (SO2) emissions Millock and Nauges (2006) estimate the impact of the emission taxes on a plants decision to install end-of pipe abatement equipment While the study is not concerned with innovation per se the results of this part can be interpreted as showing the impact of emission taxes on the diffusion of abatement equipment Under the scheme taxes were imposed on the emissions of these air pollutants (and VOCs) by all plants satisfying certain criteria The revenue raised by the taxes was earmarked for subsidising the cost of qualifying abatement technologies for technical studies (ie RampD) and for investment in air quality surveillance systems Using panel data for 226 plants in three industries (iron and steel coke and chemicals) for the period 1900ndash1998 the authors estimate a Probit model for the probability that a plant will install abatement equipment They find that the total value of emissions taxes paid by the plant (ie for both pollutants) has a positive impact on its decision to invest in abatement equipment However the magnitude of the effect varies considerably across the sectors and is only significant for the iron and steel sector
Frondel et al (2008) analyse responses to an OECD survey on environmental policy tools (conducted in 2003) to identify the factors that affect a firms decision to adopt an environmental management system (EMS) voluntarily and their environmental innovation behaviour Innovation is captured by a binary variable that indicates whether the firm has undertaken significant technical measures or changes to reduce the environmental impacts of
(25) Normalised energy efficiency patent values are calculated by dividing by the total number of patents granted This accounts for exogenous changes in patenting behaviour that affect all types of patents Popp constructs a value for existing knowledge as the stock of previously granted patents weighted by estimates that he derives for knowledge productivity He demonstrates that the exclusion of this variable from the model leads to biased estimates for the energy price coefficient
Environmental tax reform in Europe opportunities for eco-innovation
Review of literature on environmental tax reform and eco-innovation
20
production (26) The analysis is based on survey responses from 899 firms in Germany Latent variable equations for EMS adoption and innovation are estimated simultaneously with each equation including the same four sets of variables relating to motivations policy instruments pressure groups and facility characteristics (27) The policy instrument variables include five dummy variables indicating the importance of different types of policy instrument including market-based instruments such as emission taxes and tradable permits While the perceived stringency of environmental policy is found to be a significant factor in the decision to innovate there is no evidence that any of the individual policy instrument variables had any impact The authors surmise that this suggests that it is stringency of environmental policy rather than the choice of specific instrument that is important for innovation However as the authors note their results reflect the perceptions of the survey respondents and should therefore be treated as correlations rather than causal relationships
Johnstone and Hascic (2008) assess the impact of a range of environmental policy instruments mdash including tax measures and investment incentives mdash on innovation in the renewable energy field They analyse the impacts for five different groups of renewable energy technologies mdash wind solar ocean biomass and waste-to-energy mdash using a panel dataset of European Patent Office (EPO) patent filings for these technologies across 26 countries over the period 1978ndash2003 A fixed effects negative binomial model is estimated controlling for electricity prices and consumption public sector RampD expenditure (as a proxy for scientific capacity) and total EPO filings (as a proxy for differenceschanges in patenting propensity) The various policy instruments are represented by dummy variables indicating whether they were in place in a particular year As such the model takes no account of the stringency of the instruments mdash in particular the differing magnitudes of the tax measures and investment incentives (28)
Initially the authors estimate the model with all of the policy instruments included individually They find that while public policy plays an important role in inducing innovation the impacts of the individual instruments vary across the different technologies In particular tax measures are significant for wind and biomass technologies with investment incentives being significant for solar and waste-to-energy technologies and obligationstradable certificates being significant for wind technologies However the authors express concerns that there may be multicolinearity between the policy variables (particularly between investment incentives tax measures and tariffs) and also that there may be interaction effects between some of the variables Consequently they estimate two alternative versions of the model the first using a composite policy variable representing the number of policy instruments in place and the second using clusters of similar policy instruments (29) The results or these two models confirm the initial findings The composite policy variable is significant for all of the technology groups while the significance of the clusters varies across technologies The price-based cluster is (highly) significant for solar biomass and waste-to-energy The quantity-based cluster is significant for wind technologies The authors surmise that this may be due to the different economic characteristics of the technologies For example the significance of investment incentives for solar and waste-to-energy may reflect the capital intensity of these technologies with large up-front investment costs
De Vries and Medhi (2008) also use patent data to investigate the relative importance of environmental regulations and fuel prices on innovation in automotive emission-control technologies distinguishing between post-combustion devices and engine redesign technologies They estimate a panel data model using data from Germany Japan and USA over the period 1978ndash2001 controlling for industry value added (as a proxy for the scope of technological opportunities) and total patent
(26) The next question on the survey asks whether these are changes in production processes or end-of-pipe technologies However no distinction is made between these two types of innovation in the present study
(27) In order to avoid identification problems some individual variables are omitted from one equation or the other(28) This shortcoming is recognised by the authors who state that it is unavoidable in any cross-comparative analysis in which multiple
instruments are included(29) The clusters are price-based instruments (investment incentives tax measures and tariffs) quantity-based instruments (obligations
and tradable certificates) and voluntary programmes
Review of literature on environmental tax reform and eco-innovation
Environmental tax reform in Europe opportunities for eco-innovation 21
applications (as a proxy for differenceschanges in patenting propensity) Environmental regulation is represented by two dummy variables indicating the introduction of on-board diagnostic (OBD) regulations in USA (30) The results of the analysis suggest that the relative impacts of regulation and market forces differ between the two types of technology For post-combustion technologies both of the regulations are significant while fuel prices have no significant impact In contrast the opposite is the case for engine redesign technologies with fuel prices having a significant impact but regulation having no discernable effect While the analysis does not explicitly consider the impact of fuel taxes it suggests that an increase in automotive fuel taxes would have a major impact on innovation in relation to engine design The estimated coefficient for fuel prices (1287) implies that a USD 010 increase in fuel prices would induce a 14 increase in patenting activity (31)
Key findings of the empirical studies
The empirical studies considered above cover a range of different technology areas spanning energy efficiency (both product and process) renewable energy and air and water pollution abatement While in some cases they assess the impact of energy prices rather than environmental taxes per se they provide a clear picture of the likely impact of environmental and energy-related taxes on eco-innovation
Three of the studies assess the impact on diffusion of existing technologies All find that environmental taxesenergy prices have a positive impact on diffusion In particular the water effluent charges in The Netherlands appear to have had a major impact on the adoption of waste-water treatment equipment by the food and beverage industry in that country However there is some evidence to suggest that the effectiveness of taxesprices may vary across sectors (eg NOXSO2 abatement in France) and that investment incentivessubsidies may be more
effective in some cases (eg thermal insulation in USA)
Three of the studies use patent data to assess the impact of environmental taxes and energy prices on innovation with one of these also assessing the impact of investment incentives All find a significant positive impact although this depends on the particular sub-sector (eg renewable energy) or the type of innovation In particular the evidence from the automotive emissions control study suggests that taxesprices may be more effective in promoting process-related innovation (eg engine redesign) than innovation in end-of-pipe technologies One of the studies takes a different approach using a product-characteristics model to decompose improvements in the energy efficiency of consumer durables This finds that while electricity prices did not appear to affect overall technological change (ie shifts in the product costenergy efficiency frontier) they did have a positive impact on directional technological change (ie the slope of the frontier)
26 Case studies
Christiansen and Skjaerseth (2005) undertake a comparative analysis of the impacts of climate change policies on the petroleum sectors in Norway and the Netherlands during the 1990s These countries were selected because of their very different policy approaches with the Norwegian petroleum sector subject to a carbon dioxide (CO2) tax since 1991 as part of a portfolio of measures (32) and the Netherlands relying on a series of voluntary agreements on energy efficiency (33) Both approaches appear to have been effective in that CO2 emissions per unit production fell by around 22 between 1990 and 2001 in Norway while energy efficiency improved by around 35 in the Netherlands over the same period However there were marked differences between the two countries in terms of the nature of the innovation that
(30) Because of the international nature of the automotive industry and the importance of the US market regulations introduced in USA appear to have been an important driver for innovation by overseas manufacturers Regulations mandating the installation of OBD systems were first introduced in California in 1988 A more sophisticated system was mandated by the 1990 US Clean Air Act Amendments taking force in 1996
(31) The coefficient represents the semi-elasticity of patent applications with respect to fuel prices While the authors do not state so explicitly the implication is that prices are expressed in US dollars (they are obtained from the IEA Energy Prices and Taxes Database) Consequently the impact of a 10 US cent increase in the fuel prices is given by exp(1287 x 01) ndash 1 = 0137
(32) In addition to the tax the portfolio included publicly funded RampD support schemes gas flaring permits and mandatory environmental impact assessments
(33) The Dutch oil and gas industry first signed a declaration of intent with the government in 1995 This was translated into a long-term agreement (LTA) on energy efficiency in the following year with an improvement target of 20 over the period 1989ndash2000 In 2001 a new LTA was signed which committed firms to implementing energy efficiency measures with a positive NPV at a 15 discount rate or a five year payback period
Environmental tax reform in Europe opportunities for eco-innovation
Review of literature on environmental tax reform and eco-innovation
22
occurred In the Netherlands technological change was incremental reflecting a steady diffusion of available (ie known) technology In contrast the authors find evidence of more radical innovations and adaptations by the Norwegian petroleum sector including the development of energy-efficient gas turbines installation of waste heat recovery units process modifications and improved use of process heat While the authors acknowledge the impossibility of proving a causal link between policy intervention and innovation (in the context of their case study) they conclude that the CO2 tax played a key role in the development and implementation of these radical innovations and the benefits of reduced tax payments provided an important incentive However they also conclude that the impacts of the two instruments were conditioned by the political contexts in which they were applied and the problem characteristics in the respective countries (eg the economic significance of the sector and the size of installations)
Knigge and Goumlrlach (2005) summarise the findings of a comprehensive analysis of the impacts of the ETR in Germany That analysis undertaken jointly by Ecologic and the German Institute for Economic Research (DIW Berlin) included the impacts on innovation and market diffusion of environmentally friendly products and technologies (34) Based on a series of case studies the study concluded that the ETR had a noticeable effect on innovation and diffusion although it was not possible to quantify the scale of that effect In particular ETR is identified as being a central factor in the development of gas-powered vehicles The study identifies a number of different routes by which the ETR produced impacts First the payback period for energy-efficient products was reduced as a result of the energy tax increases and the various exemptions favouring efficient energy use and renewable energy sources Second the predictable nature of the energy taxes (as opposed to widely fluctuating oil prices) reduced uncertainties about the benefits of energy-efficiency investments Third the reduction in employers social contribution payments tended to reduce the costs of labour intensive innovation processes such as research and development energy consultancy and technology installation Finally the ETR had a signalling effect strengthening awareness of the need for more efficient and rational energy use
Mickwitz et al (2007) examine a number of claims that have been made in the environmental policy literature about the relationship between policy instruments and innovation based on experiences in two industrial sectors in Finland pulp and paper and the manufacture of diesel engines for ships In particular they assess the claims that environmental taxes are superior to other policy instruments with respect to innovation and that RampD subsidies have limited impacts on innovation With respect to the first claim the evidence provided by the two case studies is mixed The authors conclude that energy taxation had a negligible impact on innovation in the pulp and paper industry However this is likely to have been due to the low level of the tax and the exemptions that applied to the sector In contrast they find that the differentiation of Swedish fairway and port fees (on the basis of SO2 and NOX emissions) was a significant factor driving the installation of in-engine NOX reduction equipment in ferries operating between the two countries (35) With respect to RampD subsidies the authors conclude that the evidence does not support the claim that these have little effect In particular they find that RampD subsidies accelerated the development of ship engine emissions-reduction technologies
The findings of the three case studies are consistent with those of the empirical analyses reviewed in the previous section Environmental taxes and investment subsidies have proven significant in promoting both innovation and diffusion although not universally so Furthermore the case studies provide some useful insights about the ways in which the impacts occur and the factors that may be important in promoting innovation In particular they suggest the need for a tax rate that is sufficiently high to provide a meaningful incentive and signalling effect and that is fixed for a sufficiently long period of time to reduce uncertainty about the future benefits of investment
27 Conclusions
The studies reviewed in the preceding sections suggest that environmental regulation in general and price-based policy instruments such as environmental taxes and investment subsidies in particular can (in theory) and do (in practice) have a positive impact on both innovation and diffusion
(34) A separate report in German by Goumlrlach et al (2005) provides details of the evaluation of the innovation and diffusion impacts (35) Although the tax was introduced in Sweden it was also payable by Finnish ferry operators entering Swedish ports and hence
affected their investment decisions This is another example of the cross-border impact of environmental policy interventions on innovation found by Lanjouw and Mody (1996) (see Section 23)
Review of literature on environmental tax reform and eco-innovation
Environmental tax reform in Europe opportunities for eco-innovation 23
of environmental technologies However the supporting empirical and case study evidence is not universal and the effectiveness of these instruments would appear to vary across different sectors and different types of innovation
To a certain extent such differences can be explained by the theoretical models In particular the impact of environmental taxes (relative to other instruments) is predicted to depend on the competitive structures of the markets in which the regulated firms operate and on the ability of innovator firms to appropriate the benefits accruing to other firms during diffusion However a number of other potential factors have been identified in the literature which may affect the impact of price-based policy instruments on innovation
Jaffe et al (2002) caution that the impact of price-based policy instruments on technology diffusion may be adversely affected by a number of potential market failures including information failures principle-agent problems (eg landlord-tenant) capital market failures and positive adoption spillovers In addition while not market failures as such uncertainty over future returns and the (associated) use of high discount rates for investment decisions can also undermine the effectiveness of price-based instruments in stimulating diffusion However as was noted above the findings from the case study of ETR in Germany suggest that an environmental tax may actually reduce the level of uncertainty over future returns provided that it is of sufficient magnitude and longevity
Skjaerseth and Christiansen (2005) emphasise that the relationship between policy instruments (of all types) and technological change is extremely complicated They argue that account must be taken of the politicalindustrial context in which policy instruments are introduced and the nature of the environmental problem that they are intended to address In particular they make a distinction between malign problems where technological change involves net costs for target groups and benign problems where there are widespread no-regret opportunities for change Based on a comparative analysis of four different case studies they conclude that mandatory policy instruments (including environmental taxes) are more effective
in promoting short-term technological change when the problems are malign but that low legitimacy (with the target group) may undermine long-term technological change However when problems are benign or when long-term change requires cooperation voluntary policy instruments are likely to be more effective
Johnstone (2005) questions the focus of the theoretical and empirical analyses (reviewed above) on the impact of environmental policy instruments on the rate of technological change He argues that the direction of technological change is as important if not more so In addition to the quantity of innovation it is also important that innovation be socially optimal in the sense that it minimises the cost of attaining a particular environmental goal in the long term Inappropriate innovation today may result in lock in to a suboptimal technological path for the future
With this in mind Johnstone identifies a number of issues that can adversely affect the direction of innovation and should be taken into account when selecting and designing policy instruments technological market failures (36) missing markets for certain environmental attributes of innovation policy incidence and joint production of emissions Most studies of the innovation effects of environmental policy instruments assume that the only missing market is that for the environmental good (or bad) However in practice there may be other markets that are missing (or incomplete) which can adversely affect transmission of innovation incentives This is particularly so in the area of waste and resource management where instruments applied at the end of the product life cycle may have little or no impact on product design innovation Even if all markets are complete except for the environmental externality the point of incidence of the policy intervention may be more important for the direction of innovation than the choice of a particular policy instrument For example a limit or standard applied directly to the emissions of a pollutant may be more effective in promoting optimal innovation than a tax applied to a proxy input variable Finally when there is joint production of pollutants (eg CO2 and air pollutants from vehicle engines) there is a danger that if policy instruments (of whatever type) are applied to one pollutant in isolation the resulting innovation may
(36) These are the same market failures identified by Jaffe et al (2002)
Environmental tax reform in Europe opportunities for eco-innovation
Review of literature on environmental tax reform and eco-innovation
24
reduce emissions of that pollutant at the expense of increases in the others
In a related point Johnstone highlights the importance of using appropriate indicators when assessing the impact of policy instruments on innovation emphasising the need for these to reflect both the rate of innovation and the direction A necessary condition for this is that the indicators must provide an accurate and detailed picture of actual innovation Unfortunately this is difficult to achieve in practice For example the use of patent data as a measure of innovation requires the identification of relevant environmental technologies This is likely to be easier for end-of-pipe technologies than for process-related technologies meaning that the latter tend to be under-represented relative to their actual incidence To the extent that process-related innovation is growing in importance or is more important
for certain sectors or types of environmental problem changes in the value of the indicator may significantly understate the actual rate of innovation and misrepresent the direction
All of this suggests that caution should be exercised in drawing general definitive conclusions about the impacts of price-based policy instruments such as environmental taxes and investment subsidies on innovation particularly relative to other policy instruments While it would appear that they can be effective in stimulating both innovation and diffusion in many cases mdash at least in terms of the rate of technological change mdash there may be situations in which other policy instruments may be more appropriate In general the stringency and point of incidence of an environmental policy intervention may be more important than the choice of a particular policy instrument in determining the rate and direction of eco-innovation
25
Modelling of ETR impacts on eco-innovation
Environmental tax reform in Europe opportunities for eco-innovation
31 Scenarios assessing the implications of ETR for eco-innovation
Scenario analysis provides a useful means of improving understanding of how the different revenue recycling methods and various scales of ETR can help meet different greenhouse gas emissions targets
To investigate the impacts of an ETR for Europe the petre project elaborated a range of different scenarios reflecting various tax reform options In addition to employing several of these original scenarios the present study compiled two new scenarios to analyse the implications of ETR for eco-innovation All scenarios were examined in both E3ME and GINFORS (37)
311 Original petre project scenarios
The key petre scenarios relevant for the present study are
bull scenarioBHbaselinescenariowithhighenergyprice (reference case)
bull scenarioS1HETRdesignedtomeettheEUsunilateral 2020 GHG target (high energy price) with revenue recycling
bull scenarioS2HETRdesignedtomeettheEUsunilateral 2020 GHG target (high energy price) with revenue recycling and 10 of revenues spent on eco-innovation measures
Each of the ETR scenarios has the same key taxation components
bull acarbontaxrateisintroducedtoallnon-EUEmissions Trading System (EU ETS) sectors equal to the carbon price in the EU ETS that delivers an overall 20 reduction in greenhouse gas emissions by 2020 and in the international cooperation scenario this is extended to 30
bull aviationisincludedintheEUETSattheendofPhase 2
bull powergenerationsectorEUETSpermitsare100 auctioned in Phase 3 of the EU ETS
bull allotherEUETSpermitsare50auctionedin2013 increasing to 100 in 2020
bull materialtaxesareintroducedat5oftotalpricein 2010 increasing to 15 by 2020
In scenario S1H environmental tax revenues are recycled through reductions in income tax rates and social security contributions in each of the Member States such that there is no direct change in tax revenues In scenario S2H 10 of environmental tax revenues are recycled through spending on eco-innovation measures and the remaining 90 is recycled through the same measures as in the other scenarios The eco-innovation spending is split across power generation and housing according to tax revenues from the corporate and household sector
In GINFORS (the model used for analysing the implications of ETR and eco-innovation) the share of renewable sources in electricity production is increased due to the additional investment The rest of additional investment goes to household energy efficiency spending Investment needed for a certain increase in renewable energy production or efficiency improvement is based on Austrian and German experience (Lehr et al 2008 and 2009 Grossmann et al 2008 Lutz and Meyer 2008) This assumption is quite conservative as parameters for other countries can be assumed to be more positive (meaning that less money is needed for renewable energy technology installation or energy efficiency gains)
In scenario S1H the 20 GHG target translates into a 15 reduction in energy-related carbon emissions relative to 1990 as other emissions such as methane and nitrous oxide have already been reduced by
3 Modelling of ETR impacts on eco-innovation
(37) The E3ME and GINFORS models are introduced in Chapter 1 of the present report A detailed discussion of the models and scenarios used in the present study can be found in Ekins and Speck (2011)
Environmental tax reform in Europe opportunities for eco-innovation
Modelling of ETR impacts on eco-innovation
26
more than 20 (in terms of carbon equivalents) The target is reached by a tightened EU ETS cap and the introduction of a carbon tax on the non-ETS sector The tax rate applied is equal to the carbon price in the EU ETS that will deliver a 20 GHG reduction by 2020
The burden of ETR taxes are allotted to energy outputs (ie the final use of energy) and will be based on the carbon content of each fuel Carbon prices are assumed to be fully passed on to consumers All carbon taxes are in addition to any existing unilateral carbon and energy taxes The carbon reductions in the different EU Member States will be those that result from a uniform carbon tax increase across the EU
All of the revenues including EU ETS auctioning revenues carbon tax revenues and material tax revenues will be recycled The proportion of tax raised by industry will be recycled into a reduction in employers social security contributions which will in turn reduce the cost of labour Recycling will be additional to the existing ETRs in some Member States Revenues raised from households will be recycled through standard rate income tax reductions Traditional energy tax revenues will be lower compared to their respective baselines as the tax base (energy consumption) is reduced So for an ETR revenue-neutrality does not mean budget-neutrality
312 Factors affecting the macroeconomic impacts of RES technologies
Earlier analyses (Lehr et al 2008 Fraunhofer ISI et al 2009 DTI 2004 Kammen et al 2004 Moreno and Loacutepez 2007) have studied the impacts of large renewable energy source (RES) shares in the energy mix for different countries The overall question in these studies has been the impact of increasing RES shares on the economy especially on the labour market For the present study it is interesting to note that macroeconomic impacts of higher RES shares mainly depends on the following five factors
1 additional investment in RES (minus lower investment in conventional sources ie fossil and nuclear power) with the impact increasing if a country manufactures the RES technology in question
2 additional (net) exports due to improved international competitiveness of renewable energy sources (first mover advantage)
3 lower fossil fuel needs4 the cost differences between RES and
conventional energy
5 the shift from capital- and energy-intensive industries to labour- and technology-intensive industries
All five factors are driven by international energy prices carbon prices the policy framework and RES technology development itself Innovation comes into the play at various stages First innovation drives the currently positive additional costs of RES technologies down and even into negative realms depending on the fossil fuel scenario Second innovative RES technologies are likely to have a competitive advantage in international markets Although a significant proportion of RES technology produced in Europe is traded in Europe innovation will still provide an edge in current and emerging international markets
The EmployRES study (Fraunhofer ISI et al 2009) finds for Europe that current strong investment reflected in installations in Europe and exports to the rest of the world dominate the economic impact of RES policies and therefore lead to positive overall effects The studys results suggest that this positive balance can only be kept up in the future if the competitive position of European manufacturers of RES technology is improved The authors strongly recommend policies which promote technological innovation in RES and lead to a continued and rapid reduction of their costs
Factors 1 and 2 will have substantial macroeconomic impacts in the short and medium terms whereas factor 3 accumulates and will show positive impacts mainly in the long term Factor 4 strongly depends on the global developments while factor 5 may have significant effects on employment
313 Additional scenarios
Impacts of additional investment (factor 1) have already been analysed in scenario S2H of the petre project To focus on the other impacts of eco-innovation two additional scenarios were designed building on scenario S2H of petre
bull S2HEETRwithrevenuerecyclingdesignedto meet the unilateral EUs 2020 greenhouse gas (GHG) target (high energy price) Ten per cent of revenues are spent on eco-innovation measures and trade shares of EU-27 economies with the rest of the world in machinery and electrical machinery increase by 01 due to the deployment of the fast growing RES markets This assumption is based on the strong EU policy effort to increase the share of renewable energy in final energy consumption to 20 by 2020
Modelling of ETR impacts on eco-innovation
Environmental tax reform in Europe opportunities for eco-innovation 27
(Fraunhofer ISI et al 2009) and the possibility of very strong world market development of the RES sector until 2020 (EREC 2008) which offers additional export opportunities for European RES industries
bull S2HIETRwithrevenuerecyclingdesignedto meet the unilateral EUs 2020 GHG target (high energy price) Ten per cent of revenues are spent on eco-innovation measures and input structures of the energy sector are changed according to the input structure of the German RES industry (Lehr et al 2008)
S2HE looks at the possible role of international trade S2HI analyses changes in the input structure of the energy sector ie from conventional electricity production to renewables In the petre project (as in GHK et al 2007) only the energy inputs of the energy sector were adapted to changes in the energy input mix
Both S2HE and S2HI focus on RES and efficiency technologies As mentioned above an ETR will trigger a variety of innovations Therefore the results can be thought of as conservative in the sense that innovations (eg automotive energy consumption industrial efficiency etc) are not explicitly included
32 Overview of modelling results
The main results of the simulations are presented in Table 31 In the baseline scenario BH with high energy prices EU-27 carbon emissions will be
72 below the 1990 level in 2020 (38) The EU-15 has committed in the Kyoto Protocol to reduce its GHG emissions 8 below 1990 levels in the period 2008ndash2012 As emissions in the new member states are substantially below their 1990 levels today that implies that the EU-27 will keep its emissions more or less constant over the coming decade As in the PRIMES baseline an ETS price of 18 EURt in 2008 prices is assumed in 2020
In scenario S1H the ETS price and carbon tax rate has to be increased to 68 EUR2008t of CO2 to reach the 20 GHG reduction target which is equal to a 15 reduction of CO2 emissions against 1990 as other greenhouse gases have already been reduced above average by more than 20 in terms of CO2 equivalents Compared to the baseline CO2 emissions are 84 lower in 2020 which means roughly an additional 1 reduction annually in the period 2012ndash2020 GDP will be about 06 lower compared to the baseline in 2020 This means that annual average growth rates will be less than 01 below their baseline development This is especially low compared to the current financial and economic crisis with a GDP deviation against the baseline of around 6 in 2009
As the recycling mechanism reduces labour costs and the tax burden is shifted from labour-intensive to carbon- and material-intensive sectors employment will be 036 (or more than 800 000 jobs) higher than in the baseline The ETR is not fully budget neutral potentially enabling EU economies to slightly increase their net savings If
(38) The modelling exercise in the present study was conducted in 2009 and therefore does not contain the latest data on EU-27 GHG emissions which were significantly influenced by the global economic slump of the late-2000s
Table 31 Main results under the different scenarios
Scenario Target in 2020 CO2 price GDP Employment CO2 reduction
EUR2008t pc against baseline
pc against baseline
pc against 1990
pc against baseline
in year 2020 2015 2020 2020 2020 2020
BH 18 ndash 72 00
S1H 20 GHG 68 ndash 022 ndash 057 036 ndash 151 ndash 84
S2H 20 GHG 61 ndash 013 ndash 030 041 ndash 152 ndash 85
S2HE 20 GHG 61 ndash 009 ndash 004 051 ndash 151 ndash 84
S2HI 20 GHG 61 ndash 006 ndash 024 045 ndash 152 ndash 84
Environmental tax reform in Europe opportunities for eco-innovation
Modelling of ETR impacts on eco-innovation
28
this extra saving is spent negative GDP impacts will be further reduced
In scenario S2H part of the revenues is invested in low-carbon technologies This reduces the carbon price to 61 EUR2008t in 2020 halving the GDP loss relative to scenario S1H to only 03 as the investment in renewable energies is assumed to be additional Employment impacts are also more positive than in scenario S1H The 10 investment in low-carbon technologies amounts to more than EUR 20 billion in 2020
Assuming additional EU exports of RES technologies in scenario S2HE GDP almost matches the baseline in 2020 and employment is 051 (or more than 1 million jobs) higher than in the baseline In scenario S2HI a shift in the input structure of the energy sector towards machinery
and electrical machinery reflecting the different nature of RES relative to conventional electricity generation also has smaller additional positive impacts on GDP and employment compared to scenario S2H
The following figures show impacts of the different scenarios in comparison to the baseline BH As Figure 31 illustrates all the alternative scenarios imply GDP lower than the baseline However comparing scenario S1H with the other three scenarios shows that additional RES investment (S2H) additional RES exports (S2HE) and the inclusion of different input structures of the RES industries (S2HI) each have positive GDP impacts These results are in line with model-based analysis in the EMPLOY-RES study (Fraunhofer ISI et al 2009)
Figure 31 EU-27 GDP according to four scenarios mdash deviation from the baseline (BH)
Percentage deviation from the baseline (BH)
ndash 100
ndash 080
ndash 060
ndash 040
ndash 020
0002010 2015 2020
S2HI S1H S2H S2HE
Modelling of ETR impacts on eco-innovation
Environmental tax reform in Europe opportunities for eco-innovation 29
In contrast to GDP employment increases relative to the baseline in all the alternative scenarios (Figure 32) Due to the scenario design the structure of the EU economies is shifted from energy-intensive to labour-intensive sectors The magnitude of the employment gain is influenced by the carbon price and the tax shift the underlying energy prices and the production loss The largest part of the employment increase stems from the additional RES investment (scenario S2H) although a shift in industry structures (S2HI) and additional RES exports (S2HE) are also positive for the labour market
33 Macroeconomic impacts at the national level
In general terms it is clear that national ETS and ETR impacts depend significantly on country specifics including energy use economic structure social system and behaviour (eg reactions to labour cost changes) In countries with high carbon intensity in their energy mix additional revenues and expenditures are higher than in countries with lower carbon intensity
Scenario S2H provides an interesting tool for analysing the macroeconomic impacts of ETR at the national level because 10 of the additional generated revenues are used for eco-innovation investments meaning that only 90 of the revenues are recycled back into the economy by reducing income tax rates and social security contributions
Figure 32 EU-27 employment according to four scenarios mdash deviation from the baseline (BH)
ndash 020
000
020
040
060
2010 2015 2020
S2HI S1H S2H S2HE
Percentage deviation from the baseline (BH)
Environmental tax reform in Europe opportunities for eco-innovation
Modelling of ETR impacts on eco-innovation
30
Figure 34 GDP in 2020 in EU-27 Member States under scenario S2H mdash deviation form the baseline (BH)
Figure 33 GDP in 2020 in selected countries under scenario S2H mdash deviation from the baseline (BH)
ndash 25 ndash 20 ndash 15 ndash 10 ndash 05 00 05 10 15
Romania
Bulgaria
SloveniaMalta
Lithuania
Latvia
Estonia
CyprusSlovakia
Poland
Hungary
Czech RepublicUnited Kingdom
Sweden
Spain
Portugal
Netherlands
Italy
Ireland
Greece
FranceFinland
Denmark
Luxembourg
Belgium
Austria
Germany
Percentage deviation from the baseline (BH)
Russia
South Africa
Brazil
India
China
Mexico
Japan
USA
Poland
United Kingdom
Spain
Italy
France
Germany
ndash 30 ndash 25 ndash 20 ndash 15 ndash 10 ndash 05 00 05 10
Percentage deviation from the baseline (BH)
Modelling of ETR impacts on eco-innovation
Environmental tax reform in Europe opportunities for eco-innovation 31
Figure 35 Employment in 2020 in EU-27 Member States under scenario S2H mdash deviation from baseline (BH)
EU-27EU-15
RomaniaBulgariaSloveniaMalta
LithuaniaLatvia
EstoniaCyprusSlovakia
PolandHungary
Czech RepublicUnited Kingdom
SwedenSpain
PortugalNetherlands
ItalyIrelandGreece
FranceFinlandDenmarkLuxembourg
BelgiumAustria
Germany
ndash 200 0 200 400 600 800 1 000
Percentage deviation from the baseline (BH)
Under scenario S2H the GDP of large EU economies deviates from baseline projections by between 0 and ndash 1 with the exception of Italy (Figure 33) Germanys GDP is even forecast to match the baseline level in 2020 due to the countrys strong RES industry Outside Europe some countries gain slightly against EU Member States in terms of competitiveness as export prices in most EU Member States and sectors increase and GDP in those countries exceeds the baseline projections as a result (Figure 33) This is mainly because carbon tax revenues are recycled via income tax reductions which are not part of production costs However energy exporting economies such as Russia or South Africa will lose exports if EU demand for fossil fuel imports declines The development of all EU Member States is shown in Figure 34
Employment impacts of scenario S2H are positive for almost all EU Member States as lower labour
costs increase labour demand and labour intensity (Figure 35) The highest absolute increases are shown for Germany the Netherlands Italy and the United Kingdom For EU-27 as a whole employment will be almost one million higher than in the corresponding baseline BH in 2020
The scenarios have not been designed with a view to meeting the EU renewables target of a 20 renewables share in final energy consumption in 2020 Nevertheless the scenarios provide some interesting insights The share is projected to increase from around 10 in 2009 to above 14 even in the baseline as instruments such as feed in tariffs and biofuel quotas will continue In scenario S1H the target will be missed with around 18 in 2020 Only in scenarios S2H S2HE and S2HI is the target met (approximately 20 )
Environmental tax reform in Europe opportunities for eco-innovation
Modelling of ETR impacts on eco-innovation
32
Under scenario S2H energy-related carbon emissions are reduced in all EU Member States relative to the baseline (Figure 36) The highest percentage reductions can be seen in many of the EU-12 Member States with still high energy intensity and low energy prices In these countries the relative price increase is higher than in countries like Germany or the United Kingdom with already high energy taxes and overall energy prices
Additional ETS revenues material tax revenues and carbon tax revenues from the industry sector are recycled back to industry via reductions in employers social security contributions (or wage subsidies in some countries) The revenues from the carbon tax on households set out in Table 32 (totalling 033 of GDP in Germany for example) are used to reduce income tax For the EU-27 overall revenues from ETS and ETR reach about 2 of GDP in 2020 although these figures may be excessive because additional EU efforts to increase energy
efficiency and renewable energy which will reduce the ETS price are not taken into account The use of flexible tools such as the Clean Development Mechanism will further reduce the revenues and earmarking of part of the revenues for mitigation and adaptation measures in emerging and developing countries limits the recycling into labour costs
In addition the scenarios do not take the current global economic problems into account According to the IEA (2009) the downturn will also reduce carbon emissions in the long run which will lead to lower carbon prices and revenues to reach fixed targets (or make tighter targets less costly)
The ETR will have varying effects on the prices of different sorts of products and services Material or carbon taxes increase the prices of product groups according to their direct and indirect material and carbon content The recycling mechanism reduces
Figure 36 Energy-related CO2 emissions in 2020 under scenario S2H mdash deviation from the baseline (BH)
WorldEU-27
EU-15Romania
BulgariaSlovenia
MaltaLithuania
LatviaEstonia
CyprusSlovakia
PolandHungary
Czech RepublicUnited Kingdom
SwedenSpain
PortugalNetherlands
ItalyIreland
GreeceFrance
FinlandDenmark
LuxembourgBelgium
AustriaGermany
ndash 25 ndash 20 ndash 15 ndash 10 ndash 5 0
Percentage deviation from the baseline (BH)
Modelling of ETR impacts on eco-innovation
Environmental tax reform in Europe opportunities for eco-innovation 33
Table 32 Additional ETS and environmental tax revenues in 2020 ( of GPD)
S2H Germany United Kingdom EU-27
ETS revenues 083 064 059
Carbon tax (industry) 052 044 054
Carbon tax (households) 033 041 036
Material tax 041 029 056
Sum 209 178 205
Figure 37 Total primary energy supply in 2020 under scenario S2H mdash deviation from the baseline (BH)
WorldEU-27EU-15
RomaniaBulgaria
Slovenia
MaltaLithuania
LatviaEstonia
Cyprus
SlovakiaPoland
HungaryCzech Republic
United KingdomSweden
SpainPortugal
NetherlandsItaly
IrelandGreece
FranceFinland
DenmarkLuxembourg
BelgiumAustria
Germany
ndash 24 ndash 21 ndash 18 ndash 15 ndash 12 ndash 9 ndash 6 ndash 3 0
Percentage deviation from the baseline (BH)
Environmental tax reform in Europe opportunities for eco-innovation
Modelling of ETR impacts on eco-innovation
34
Figure 38 Output price impacts of scenario S2H in Germany in 2020 mdash deviations from the baseline (BH)
Figure 39 Impacts of scenario S2H on industrial output in 2020 in Germany mdash deviations from the baseline (BH)
ndash 5
0
5
10
15
20
Output prices
Percentage deviation from the baseline (BH)
(3) F
ood
(4) T
extiles
(5) W
ood
(6) P
ulp pap
er
(7) C
oke re
fined
petro
leum
pro
ducts
(8) C
hemica
ls ex
cl pha
rma
(9) P
harm
aceu
ticals
(10)
Rub
ber a
nd plastics
(11)
Non
-metallic
miner
als
(12)
Iron
and
steel
(13)
Non
-ferrou
s metals
(14)
Met
al pro
ducts
(15)
Mac
hine
ry and
equ
ipmen
t
(16)
Office
mac
hine
ry
(17)
Electric
al m
achine
ry
(18)
Rad
io T
V
(19)
Med
ical pr
ecisi
on and
opt
ical ins
trumen
ts
(20)
Mot
or veh
icles
(21)
Ships
(22)
Airc
raft
(23)
Railro
ad
(24)
Man
ufac
turin
g n
ec r
ecyc
ling
(25)
Electric
ity g
as w
ater
sup
ply
(26)
Con
stru
ction
(27)
Tra
de r
epairs
(28)
Hot
els an
d re
stau
rant
s
(29)
Tra
nspo
rt an
d stor
age
(30)
Pos
t and
teleco
mmun
icatio
ns
(31)
Finan
ce ins
uran
ce
(32)
Rea
l estate ac
tivities
(33)
Ren
ting
(34)
Com
puter
(35)
Res
earch an
d de
velopm
ent
(36)
Oth
er bus
ines
s ac
tivities
(37)
Pub
lic ser
vice
s
(38)
Edu
catio
n
(39)
Hea
lth and
soc
ial w
ork
(40)
Oth
er ser
vice
s
(41)
Priv
ate ho
useh
olds
(1) A
gricu
lture
(2) M
ining an
d qu
arry
ing
nec not elsewhere classified
Production
ndash 100
ndash 80
ndash 60
ndash 40
ndash 20
00
20
40
60
80Percentage deviation from the baseline (BH)
(3) F
ood
(4) T
extiles
(5) W
ood
(6) P
ulp pap
er
(7) C
oke re
fined
petro
leum
pro
ducts
(8) C
hemica
ls ex
cl pha
rma
(9) P
harm
aceu
ticals
(10)
Rub
ber a
nd plastics
(11)
Non
-metallic
miner
als
(12)
Iron
and
steel
(13)
Non
-ferrou
s metals
(14)
Met
al pro
ducts
(15)
Mac
hine
ry and
equ
ipmen
t
(16)
Office
mac
hine
ry
(17)
Electric
al m
achine
ry
(18)
Rad
io T
V
(19)
Med
ical pr
ecisi
on and
opt
ical ins
trumen
ts
(20)
Mot
or veh
icles
(21)
Ships
(22)
Airc
raft
(23)
Railro
ad
(24)
Man
ufac
turin
g n
ec r
ecyc
ling
(25)
Electric
ity g
as w
ater
sup
ply
(26)
Con
stru
ction
(27)
Tra
de r
epairs
(28)
Hot
els an
d re
stau
rant
s
(29)
Tra
nspo
rt an
d stor
age
(30)
Pos
t and
teleco
mmun
icatio
ns
(31)
Finan
ce ins
uran
ce
(32)
Rea
l estate ac
tivities
(33)
Ren
ting
(34)
Com
puter
(35)
Res
earch an
d de
velopm
ent
(36)
Oth
er bus
ines
s ac
tivities
(37)
Pub
lic ser
vice
s
(38)
Edu
catio
n
(39)
Hea
lth and
soc
ial w
ork
(40)
Oth
er ser
vice
s
(41)
Priv
ate ho
useh
olds
(1) A
gricu
lture
(2) M
ining an
d qu
arry
ing
nec not elsewhere classified
Modelling of ETR impacts on eco-innovation
Environmental tax reform in Europe opportunities for eco-innovation 35
social security contributions and lowers labour costs according to the direct and indirect labour content of sector output The ETR therefore reduces output prices in labour-intensive service sectors and increases prices in carbon- and material-intensive industry sectors
The example of Germany shows insignificant impacts in the trade-intensive sectors of machinery (15ndash17) motor vehicles (20) and other transport equipment (21ndash23) (Figure 38) Iron and steel (12) and chemicals without pharmaceuticals (8) face the highest price increases of trade-intensive sectors As the German iron and steel industry primarily delivers high quality steel to the German car industry and increasingly to the German windmill industry negative competitiveness impacts will be limited Exchange rate variations against non-EU competitors have been much higher in the past
The higher prices of carbon- and material-intensive products will reduce price competitiveness on export markets and increase the market share for imports in domestic markets This loss of price competitiveness is based on an assumption of limited market development of energy efficiency and RES technologies in other part of the world It will be offset by gains in labour-intensive sectors if the ETR causes real wage costs per unit of output to fall as a result of using recycled revenues to reduce employer social security contributions
Any improvement in non-price competitiveness will also raise exports The extra employment will raise incomes raising consumption and output
The overall impact on sector output depends on countervailing effects which are negative for iron and steel and a few service sectors and positive for a few industry sectors For most industries the output effect is insignificant (Figure 39) The greatest impact is felt by producers of fossil fuels who must obviously reduce production due to lower demand for their products
Under scenario S2H employment impacts are positive for most sectors relative to the baseline as labour productivity decreases and wage rates fall in relation to consumer prices (CPI) and output prices (Table 33) The relative costs of labour are lower than in the baseline without the ETR reform Only around a quarter of the employment increase takes place in industry
Concerning the wage rate two countervailing effects have to be considered First when the labour market is characterised in terms of the real wage bargaining model as in E3ME and GINFORS with market power on both sides (employers and trade unions) consumer price increases will lead to wage increases (the econometrically estimated factor is 085 for Germany) Second labour productivity is another important factor for wage bargaining The estimated elasticity for Germany is 063 meaning that a 1 increase of labour productivity leads to wage increases of 063 Higher labour demand due to lower labour costs thus reduces the wage increase In the end the German economy is more labour intensive than without the ETR partly due to the structural change towards labour-intensive industries
Table 33 Employment impacts of scenario S2H in Germany mdash deviations from scenario S2H in 2020
Employment in 2020 Deviation from S2H () Deviation from S2Habsolute (1 000s)
Agriculture forestry 24 90
Industry 09 653
Non-metallic minerals 24 62
Iron and steel ndash 28 ndash 37
Machinery and equipment 05 56
Electrical machinery 04 18
Construction 37 449
Trade and transport 10 829
Business services 17 767
Other services ndash 02 ndash 216
Total 07 2506
Environmental tax reform in Europe opportunities for eco-innovation
Modelling of ETR impacts on eco-innovation
36
Additional exports under scenario S2HE mainly create new jobs in machinery and related business services (Table 34) Under scenario S2HI a shift in the input structure of the energy sector leads to a shift in the industry structure and creates a few jobs in the service sector (Table 35)
34 Conclusions of the scenario assessment
The foregoing analysis used the GINFORS model to assess economic and environmental impacts of using the ETS and ETR to reach the EUs 2020
GHG targets In general the results show positive employment effects and only small negative impacts on GDP in EU-27 Member States The economic impacts depend on the levels of international energy prices the mechanism used to recycle revenues and country specifics such as carbon and energy intensity and the structure of energy consumption
Although there is significant evidence that eco-innovation is positively driven by higher energy prices quantification is difficult The present study included simulations of possible impacts of a shift in the industry structure towards renewable energy in the electricity sector and an overall increase of EU
Table 34 Employment impacts of scenario S2HE in 2020 in Germany mdash deviations from scenario S2H
Employment in 2020 Deviation from S2H () Deviation from S2Habsolute (1 000s)
Agriculture forestry ndash 01 ndash 02
Industry 03 194
Non-metallic minerals 02 05
Iron and steel 04 05
Machinery and equipment 13 130
Electrical machinery 24 117
Construction 01 18
Trade and transport 00 26
Business services 07 308
Other services 01 107
Total 02 634
Table 35 Employment impacts of scenario S2HI in 2020 in Germany mdash deviations from scenario S2H
Employment in 2020 Deviation from S2H () Deviation from S2Habsolute (1 000s)
Agriculture forestry ndash 01 ndash 02
Industry 00 00
Non-metallic minerals 25 65
Iron and steel ndash 27 ndash 36
Machinery and equipment 08 78
Electrical machinery 04 19
Construction ndash 00 ndash 04
Trade and transport 00 07
Business services 02 115
Other services 0 56
Total 00 167
Modelling of ETR impacts on eco-innovation
Environmental tax reform in Europe opportunities for eco-innovation 37
exports due to higher global demand for renewable energy The main results can be summarised as follows
bull environmentaltaxreformshiftingtaxesfromlabour to energy and resources will create additional jobs and trigger eco-innovation
bull impactsofeco-innovationintheformofadditional EU exports or shifts in industry structures will have a slight positive influence on GDP and create a smaller number of additional jobs
These findings correspond to results from the EmployRES study (Fraunhofer ISI et al 2009) As ETR is directly aimed at reducing labour costs it will create additional jobs in the short and medium term In the longer term the cost reduction and new technologies arising from eco-innovation will play a larger role
Like all fiscal reforms a major ETR in Europe will create winners and losers At the sector level carbon- and material-intensive industries will face economic losses At the country level the carbon-intensity and overall flexibility of economies is important Clearly structural change away from carbon-intensive industries together with technological change is inherent in any successful climate mitigation policy
On the other hand several factors can smooth these structural adjustments International cooperation
will reduce economic pressure on countries and sectors In addition ETR together with auctioning of ETS allowances can be a major source of revenues for EU Member States in the future even if part of the revenues will have to be earmarked for adaptation and mitigation measures in developing countries Indeed future debate on grandfathering or auctioning ETS allowances should reflect the important point that giving allowances away for free denies countries the money to ease structural change and invest in low-carbon technologies
Caution is needed in relating the findings of this study to the EU policy debate In the model simulations the single carbon price is the only instrument used to reach the EUs 2020 GHG targets In reality of course other renewable energy and efficiency policies will also contribute to carbon reduction and have to be taken into account when comparing the results (especially the high carbon prices) to other studies Both reduce the potential revenues from fossil energy carriers and carbon emissions
A variety of renewable energy and efficiency policies could enable the climate and energy targets to be met while securing even better economic prospects The results of the present study clearly indicate that the discussion on market-based instruments should be intensified Ultimately however the EU will need a rich mix of policies to reach its GHG targets while maximising prosperity
Environmental tax reform in Europe opportunities for eco-innovation38
References
Almon C 1991 The INFORUM Approach to Interindustry Modeling in Economic Systems Research Vol 3 pp 1ndash7
Amin A and Cohendet P 2004 The Architecture of Knowledge Firms Capabilities and Communities Oxford University Press Oxford
Barker T Meyer B Pollitt H and Lutz C 2007a Modelling Environmental Tax Reform in Germany and the United Kingdom with E3ME and GINFORS petre Working Paper Cambridge and Osnabrueck (httpwwwpetreorgukpapershtm) accessed 15 February 2011
Barker T Junankar S Pollitt H and Summerton P 2007b Carbon leakage from unilateral environmental tax reforms in Europe 1995ndash2005 Energy Policy Vol 35 pp 6 281ndash6 292
Brunnermeier S B and Cohen M A 2003 Determinants of environmental innovation in US manufacturing industries Journal of Environmental Economics and Management Vol 45 pp 278ndash293
Buen J 2006 Danish and Norwegian wind industry The relationship between policy instruments innovation and diffusion Energy Policy Vol 34 (18) pp 3 887ndash3 897
Carlsson B and Stankiewicz R 1991 On the nature function and composition of technological systems Journal of Evolutionary Economics Vol 1 (2) pp 93ndash118
Christiansen A C and Skjaerseth J B 2005 Climate change policies in Norway and the Netherlands Different instruments similar outcome Energy and Environment Vol 16(1) pp 1ndash25
Dosi G 1988 Sources procedures and microeconomic effects of innovation Journal of Economic Literature Vol 26 pp 1 120ndash1 171
de Vries F and Medhi N 2008 Environmental regulation and international innovation in automotive emissions control technologies in Environmental Policy Technological Innovation and Patents Organisation for Economic Cooperation and Development Paris
DG TREN 2008 European energy and transport mdash trends to 2030 mdash update 2007 European Commission Luxembourg
DTI 2004 Renewable Supply Chain Gap Analysis UK Department of Trade and Industry
Edler J (ed) 2006 Nachfrageorientierte Innovationspolitik Buumlro fuumlr Technikfolgenabschaumltzung beim Deutschen Bundestag (TAB) Arbeitsbericht Nr 99 Berlin
Edquist C 2001 The system of innovation approach and innovation policy an account of the state of the art lead paper presented at the DRUID Conference 12ndash15 June 2001 Aalborg (httpwwwdruiddkconferencesnwpaper1edquistpdf) accessed 15 February 2011
EEA 2006 Using the market for cost-effective environmental policy Market-based instruments in Europe EEA Report No 12006 European Environment Agency Copenhagen
Ekins P 2009 Resource Productivity Environmental tax Reform and Sustainable Growth in Europe published by the Anglo-German Foundation for the Study of Industrial Society Final report (httpwwwpetreorgukpdfFinRepFinpdf) accessed 12 October 2011
Ekins P and Speck S (eds) 2011 Environmental Tax Reform (ETR) A Policy for Green Growth Oxford University Press
EREC 2008 Energy [r]evolution A sustainable global energy outlook Greenpeace International European Renewable Energy Council (EREC)
References
References
Environmental tax reform in Europe opportunities for eco-innovation 39
Fagerberg J Mowery D C and Nelson R R (eds) 2005 The Oxford Handbook of Innovation Oxford University Press Oxford
Fischer C Parry I W H and Pizer W A 2003 Instrument choice for environmental protection when technological innovation is endogenous Journal of Environmental Economics and Management Vol 45 pp 523ndash545
Fraunhofer ISI ECOFYS Energy Economics Group Ruumltter + Partner SEURECO and LEI 2009 EmployRES mdash The impact of renewable energy policy on economic growth and employment in the European Union European Commission Brussels
Frondel M Horbach J and Rennings K 2008 What triggers environmental management and innovation Empirical evidence for Germany Ecological Economics Vol 66(1) pp 153ndash160
GHK Cambridge Econometrics and IEEP 2007 Links between the environment economy and jobs Final Report submitted to DG Environment European Commission
Giljum S Behrens A Hinterberger F Lutz C and Meyer B 2008 Modelling scenarios towards a sustainable use of natural resources in Europe Environmental Science and Policy Vol 11 pp 204ndash216
Goumlrlach B Knigge M and Luumlckge H 2005 Wirkungen der Oumlkologischen Steuerreform auf Innovation und Marktdurchdringung Ecologic Berlin (httpecologiceudownloadprojekte1850-189918791879_5_innovationpdf) accessed 18 August 2011
Green M A 2000 Photovoltaics technology overview Energy Policy Vol 28 (14) pp 989ndash998
Grossmann A Lehr U Lutz C and Wolter MI 2008 Gesamtwirtschaftliche Effekte der Umsetzung der EU Ziele im Bereich Erneuerbare Energien und Gebaumludeeffizienz in Oumlsterreich bis 2020 Studie im Auftrag des Lebensministeriums Wien 0508
Hage J and Hollingsworth J R 2000 Idea innovation networks a strategy for integrating organizational and institutional analysis Organization Studies Vol 21 (5) pp 971ndash1 004
Hauschildt J 2004 Innovationsmanagement Vahlen Muumlnchen
Hemmelskamp J 1997 Environmental policy instruments and their effects on innovation European Planning Studies Vol 5 (2) pp 177ndash195
Hoglund Isaksson L 2005 Abatement costs in response to the Swedish charge on nitrogen oxide emissions Journal of Environmental Economics and Management Vol 50 pp 102ndash120
Hullmann A 2001 Internationaler Wissenstransfer und technischer Wandel (dissertation) Physica-Verlag Heidelberg
IEA 2008 World Energy Outlook 2008 International Energy Agency Paris
IEA 2009 World Energy Outlook 2009 International Energy Agency Paris
Jacobsson S Andersson B A and Baringngens L 2002 Transforming the energy system mdash the evolution of the German technological system for solar cells Science and Technology Policy Research University of Sussex Electronic Working Paper Series No 84 (httpideasrepecorgpsrussewps84html) accessed 18 August 2011
Jaffe A and Stavins R 1995 Dynamic incentives of environmental regulations the effects of alternative policy instruments on technology diffusion Journal of Environmental Economics and Management Vol 29(3) pp 43ndash63
Jaffe A B and Palmer K 1997 Environmental regulation and innovation a panel data study The Review of Economics and Statistics Vol 79 pp 610ndash619
Jaffe A B Newell R G and Stavins R N 2002 Environmental policy and technological change Environmental and Resource Economics Vol 22 (1ndash2) 2002 pp 41ndash70
Johnstone N and Hascic I 2008 Renewable energy policies and technological innovation energy source and instrument choice in Environmental Policy Technological Innovation and PatentsOrganisation for Economic Co-operation and Development Paris
Johnstone N 2005 The Innovation Effects of Environmental Policy Instruments in Horbach J (ed) Indicator Systems for Sustainable Innovation Physica-Verlag HD
Environmental tax reform in Europe opportunities for eco-innovation
References
40
Johnstone N Hascic I and Ostertag K 2008 Environmental policy technological innovation and patent activity in Environmental Policy Technological Innovation and Patents Organisation for Economic Co-operation and Development Paris
Jung C Krutilla K and Boyd R 1996 Incentives for advanced pollution abatement technology at the industry level an evaluation of policy alternatives Journal of Environmental Economics and Management Vol 30(1) pp 95ndash111
Kammen D M Kapidia K and Fripp M 2004 Putting renewables to work how many jobs can the clean energy industry generate University of California Berkeley
Kemp R 1997 Environmental policy and technical change ndash a comparison of the technological impact of policy instruments Edward Elgar Cheltenham
Kemp R 1998 The diffusion of biological waste-water treatment plants in the Dutch food and beverage industry Environmental and Resource Economics Vol 12 pp 113ndash136
Kemp R 2000 Technology and environmental policy ndash innovation effects of past policies and suggestions for improvement in OECD proceedings ndash innovation and the environment Organisation for Economic Co-operation and Development Paris
Kerr S and Newell R G 2003 Policy-induced technology adoption evidence from the US lead phasedown Journal of Industrial Economics Vol 51 pp 317ndash343
Klaassen G Miketa A Larsen K and Sundqvist T 2005 The impact of RampD on innovation for wind energy in Denmark Germany and the United Kingdom Ecological Economics Vol 54 pp 227ndash240
Kline S and Rosenberg N 1986 An overview of innovation in Landau R (ed) The positive sum strategy Harnessing technology for economic growth pp 275-306
Knigge M and Goumlrlach B 2005 Effects of Germanys ecological tax reforms on the environment employment and technological innovation Ecologic Berlin (httpwwwumweltbundesamtdeuba-info-presse-ehintergrundoekosteuerpdf) accessed 18 August 2011
Langniss O 2003 Governance structures for promoting renewable energy sources dissertation Lund Stuttgart
Lanjouw J O and Mody A 1996 Innovation and the international diffusion of environmentally responsive technology Research Policy Vol 25 pp 549ndash571
Lehr U Nitsch J Kratzat M Lutz C and Edler D 2008 Renewable Energy and Employment in Germany Energy Policy Vol 36 pp 108ndash117 DOI101016jenpol200709004
Lehr U Wolter MI and Groszligmann A 2009 Economic impacts of RES obligations in Austria ndash an application of the macro-econometric model e3at GWS Discussion Paper 20091 Osnabruumlck
Lundvall B-A Johnson B Andersen E S and Dalum B 2001 National systems of production innovation and competence building Research Policy Vol 31 pp 213ndash231
Lutz C and Giljum S 2009 Global resource use in a business as usual world until 2030 Updated results from the GINFORS model in Bleischwitz R Welfens Pand Zhang Z (eds) Sustainable growth and resource productivity ndash economic and global policy issues Greenleaf Publishers pp 30ndash41
Lutz C and Meyer B 2008 Beschaumlftigungseffekte des Klimaschutzes in Deutschland Untersuchungen zu gesamtwirtschaftlichen Auswirkungen ausgewaumlhlter Maszlignahmen des Energie- und Klimapakets Forschungsbericht 205 46 434 Dessau-Roszliglau
Lutz C and Meyer B 2009a Environmental and Economic Effects of Post-Kyoto Carbon Regimes Results of Simulations with the Global Model GINFORS Energy Policy Vol 37 pp 1 758ndash1 766 DOI 101016jenpol200901015
Lutz C and Meyer B 2009b Scenario results from GINFORS PETRE working paper Osnabruumlck
Lutz C Meyer B Nathani C and Schleich J 2005 Endogenous technological change and emissions The case of the German steel industry Energy Policy Vol33 pp 1 143ndash1 154
Lutz C Meyer B Nathani C and Schleich J 2007 Endogenous innovation economy and environment impacts of a technology based modelling approach for energy-intensive industries in Germany Energy Studies Review Vol 15(1) pp 2ndash18
References
Environmental tax reform in Europe opportunities for eco-innovation 41
Lutz C Meyer B and Wolter M I 2009 The global multisectormulticountry 3-E model GINFORS mdash a description of the model and a baseline forecast for global energy demand and CO2 emissions Journal of Sustainable Development forthcoming
Malerba F and Orsenigo L 1997 Technological Regimes and Sectoral Patterns of Innovative Activities Industrial and Corporate Change Vol 6 (1) pp 83ndash117
Malerba F 1992 Learning by Firms and Incremental Technical Change The Economic Journal Vol 102 (413) pp 845ndash859
Malerba F 2005 Industrial dynamics and innovation progress and challenges Presidential Address delivered at the 32nd Conference of the European Association for Research in Industrial Economics (EARIE) 1ndash4 September 2005 Porto
Malerba F 2006 Innovation and the evolution of industries Journal of Evolutionary Economics Vol 16 pp 3ndash23
McGinty M and de Vries F P 2009 Technology diffusion product differentiation and environmental subsidies The BE Journal of Economic Analysis and Policy Vol 9(1)
Meyer B and Lutz C 2007 The GINFORS model ndash model overview and evaluation Petre Working Paper Osnabruumlck (httpwwwpetreorgukpapershtm) accessed 18 August 2011
Meyer B Lutz C Schnur P and Zika G 2007 Economic policy simulations with global interdependencies a sensitivity analysis for Germany Economic Systems Research Vol 19 pp 37ndash55
Mickwitz P H Hyvaumlttinen and P Kivimaa 2008 The role of policy instruments in the innovation and diffusion of environmentally friendlier technologies popular claims versus case study experiences Journal of Cleaner Production Vol 16(1S1) 162ndash170
Miketa A and Schrattenholzer L 2004 Experiments with a methodology to model the role of RampD expenditures in energy technology learning processes first results Energy Policy Vol 32 (15) pp 1 679ndash1 692
Milliman S R and Prince R 1989 Firm incentives to promote technological change in pollution control Journal of Environmental Economics and Management Vol 17 pp 247ndash265
Millock K and Nauges C 2006 Ex-post evaluation of an earmarked tax on air pollution Land Economics Vol 82(1) pp 68ndash84
Montero J-P 2002 Market structure and environmental innovation Journal of Applied Economics Vol 2 pp 293ndash325
Moreno B and Loacutepez A J 2007 The effect of renewable energy on employment mdash The case of Asturias (Spain) Renewable and Sustainable Energy Rewiews doi 101016jrser200610011
Mowery D and Rosenberg N 1979 The influence of market demand upon innovation A critical review of some recent empirical studies Research Policy Vol 8 pp 102ndash153
Newell R G Jaffe A B and Stavins R N 1999 The induced innovation hypothesis and energy-saving technological change Quarterly Journal of Economics Vol 114 pp 941ndash975
Norberg-Bohm V 1999 Stimulating green technological innovation An analysis of alternative policy mechanisms Policy Sciences Vol 32(1) pp 13ndash38
OECD 2009 Sustainable manufacturing and eco-innovation towards a green economy Organisation for Economic Co-operation and Development Policy Brief June 2009
OECD 2010 Taxation innovation and the environment Organisation for Economic Co-operation and Development
Pavitt K 1984 Sectoral patterns of technological change Towards a taxonomy and a theory Research Policy Vol 13 pp 343ndash373
Popp D 2002 Induced innovation and energy prices The American Economic Review Vol 92(1) pp 160ndash180
Popp D 2005 Lessons from patents Using patents to measure technological change in environmental models Ecological Economics Vol 54 pp 209ndash226
Environmental tax reform in Europe opportunities for eco-innovation
References
42
Porter M and van der Linde C 1995 Toward a new conception of the environment competitiveness relationship Journal of Economic Perspectives Vol 9(4) pp 97ndash118
Rammert W 2002 The cultural shaping of technologies and the politics of technodiversity In Sorensen K and Williams R (eds) Shaping technology guiding policy concepts spaces and tools Elgar Cheltenham pp 155-172
Requate T 2005 Dynamic incentives by environmental policy instruments ndash a survey Ecological Economics Vol 54 pp 175ndash195
Roloff N Lehr U Krewitt W Fuchs G Wassermann S Weimer-Jehle W and Schmidt B 2008 Success determinants for technological innovations in the energy sector mdash the case of photovoltaics in Moumlst D Fichtner W Ragwitz M and Veit D (eds) New methods for energy market modelling mdash Proceedings of the first european workshop on energy market modelling using agent-based computational economics Universitaumltsverlag Karlsruhe
Rothwell R 1995 The fifth generation innovation process in Oppenlaumlnder KH Popp W (eds) Innovationen und wirtschaftlicher Fortschritt betriebs-und volkswirtschaftliche Perspektiven Bern pp 9ndash26
Schumpeter J 1942 Capitalism socialism and democracy New York Harper
Skjaeligrseth J B and Christiansen A C 2005 Environmental policy instruments and technological change in the energy sector findings from comparative empirical research Energy and Environment Vol 17 (2) pp 223ndash241
Snyder L D Miller N H and Stavins R N 2003 The effects of environmental regulations on pollution emissions evidence from plant-level data American Economic Review Vol 93(2) pp 431ndash435
Technopolis 2008 Eco-innovation Final Report for Sectoral Innovation Watch (httpwwwtechnopolis-groupcomresourcesdownloads661_report_finalpdf) accessed 18 August 2011
Volleburgh H 2007 Impacts of environmental policy instruments on technological change Report for Joint Meetings of Tax and Environment Experts OECD Environment Directorate February 2007 (comenvepocctpacfa(2006)36final)
Zimmermann H Wohltmann M and Hansjuumlrgens B 1996 Umweltabgaben und Innovation Analytica Marburg
43
Annex 1
Environmental tax reform in Europe opportunities for eco-innovation
Type Instrument Area Stage
Reference
Theo
retica
l
Em
piric
al
Cas
e st
udy
Rev
iew
Qual
itat
ive
Taxe
s
Perm
its
Subsi
die
s
Volu
nta
ry
Com
man
d
Reg
ula
tion
Ener
gy
Air
Wat
er
Oth
er
Gen
eral
Innov
atio
n
Diffu
sion
Rel
evan
ce
Brunnermeier amp Cohen (2003)
X X X X
Buen (2006) X X X X X X
Christiansen amp Skjaerseth (2005)
X X X X X X
Fischer et al (2003 X X X X X X
Frondel et al (2008) X X X X X X X (X) (X)
Hemmelskamp (1997)
X X X X X X X (X)
Hoglund Isaksson (2005)
X X X (X) (X)
Jaffe amp Stavins (1995)
X X X1 X X X X
Jaffe amp Palmer (1997)
X X X X
Jaffe et al (2002) X X X X X X X X X X
Jung et al (1996) X X X X X X (X) (X)
Kemp (1998) X X X X
Kerr amp Newell (2001) X X X X X
Klaassen et al (2005)
X X X X X
Lanjouw amp Mody (1996)
X X X X X X X
McGinty amp de Vries (2009)
X X X X
Mickwitz et al (2008)
X X X X X X X X X
Milliman amp Prince (1989)
X X X X X X X
Millock amp Nauges (2006)
X X X X X X
Montero (2002) X X X X X
Newell et al (1999) X X1 X X X
Norberg-Bohm (1999)
X X X X X X X
Popp (2002) X X1 X X
Popp (2005) X X X X X X
Porter amp van der Linde (1995)
X X X X X X
Requate (2005) X X X X X X X
Skjaeligrseth amp Christiansen (2005)
X X X X X X X X X
Snyder et al (2003) X X X X X
Annex 1 Classification of refereed journal articles
Environmental tax reform in Europe opportunities for eco-innovation44
Annex 2
Type Instrument Area Stage
Reference
Theo
retica
l
Em
piric
al
Cas
e st
udy
Rev
iew
Qual
itat
ive
Taxe
s
Perm
its
Subsi
die
s
Volu
nta
ry
Com
man
d
Reg
ula
tion
Ener
gy
Air
Wat
er
Oth
er
Gen
eral
Innov
atio
n
Diffu
sion
Rel
evan
ce
Johnstone (2005)
X X X X X X X
Johnstone amp Hascic (2008)
X X X X X X X X
Kemp (1997) X X X X X X X X X X X X X
Kemp (2000) X X X X X X X X X
de Vries amp Medhi (2008)
X X1 X X X
Annex 2 Classification of books and book chapters
45
Annex 3
Environmental tax reform in Europe opportunities for eco-innovation
Type Instrument Area Stage
Reference
Theo
retica
l
Em
piric
al
Cas
e st
udy
Rev
iew
Qual
itat
ive
Taxe
s
Perm
its
Subsi
die
s
Volu
nta
ry
Com
man
d
Reg
ula
tion
Ener
gy
Air
Wat
er
Oth
er
Gen
eral
Innov
atio
n
Diffu
sion
Rel
evan
ce
Goumlrlach et al (2005)
X X X X X X
Knigge amp Goumlrlach (2005)
X X X X X X
Technopolis (2008)
X X X X X X
Volleburgh (2007)
X X X X X X X X X X X
Annex 3 Classification of reports
European Environment Agency
Environmental tax reform in Europe opportunities for eco-innovation
2011 mdash 45 pp mdash 21 x 297 cm
ISBN 978-92-9213-238-5doi10280084889
How to obtain EU publications
Publications for salebull viaEUBookshop(httpbookshopeuropaeu)bull fromyourbooksellerbyquotingthetitlethepublisherandorISBNnumberbull bycontactingoneofoursalesagentsdirectlyYoucanobtaintheircontactdetails
on the Internet (httpbookshopeuropaeu) or by sending a fax to +352 2929-42758
Free publicationsbull viaEUBookshop(httpbookshopeuropaeu)bull attheEuropeanCommissionsrepresentationsordelegationsYoucanobtain
their contact details on the Internet (httpeceuropaeu) or by sending a fax to +352 2929-42758
European Environment AgencyKongens Nytorv 61050 Copenhagen KDenmark
Tel +45 33 36 71 00Fax +45 33 36 71 99
Web eeaeuropaeuEnquiries eeaeuropaeuenquiries
TH
-AK-1
1-0
17-E
N-N
doi1
02
8008
4889
- Acknowledgements
- Executive summary
- 1Introduction
-
- 11Background
- 12ETR and innovation
- 13Report structure
-
- 2Review of literature on environmental tax reform and eco‑innovation
-
- 21Initial screening
- 22Detailed review
- 23Environmental regulation studies
- 24Theoretical studies
- 25Empirical studies
- 26Case studies
- 27Conclusions
-
- 3Modelling of ETR impacts on eco‑innovation
-
- 31Scenarios assessing the implications of ETR for eco-innovation
- 32Overview of modelling results
- 33Macroeconomic impacts at the national level
- 34Conclusions of the scenario assessment
-
- References
- Annex 1 Classification of refereed journal articles
- Annex 2Classification of books and book chapters
- Annex 3Classification of reports
-
Environmental tax reform in Europe opportunities for eco-innovation
Review of literature on environmental tax reform and eco-innovation
14
flows in capital goods used for pollution reduction and find that these too show a correlation with total abatement expenditure
Jaffe and Palmer (1997) also use PACE data as a proxy for the stringency of environmental regulation and evaluate its impact on two different measures of innovation total private expenditures on RampD and the number of successful patent applications by US manufacturing industries Unlike the previous study they undertake formal econometric analysis of the data using panel data at the two-digit and three-digit SIC code industry level for the period 1978ndash1991 and a fixed effects model They find a statistically significant positive relationship between compliance expenditures (capital expenditures only) and RampD expenditures after controlling for industry-specific effects (9) However they can find no significant impact on patenting activity This is not entirely surprising given the fact that their data is for all types of patents not just those relating to environmental technologies and products Indeed given that the same is true for the RampD expenditure data it may be more surprising that they find a significant relationship between pollution compliance and RampD
Brunnermeier and Cohen (2003) also use a panel data model to assess the impact of pollution abatement expenditures on patenting activity by US manufacturing industries However unlike the previous study they use only environmental patent applications in their analysis They also control for other potential explanatory factors such as the stringency of monitoring and enforcement (as measured by number of inspection visits) industry size (value of shipments) market structure (four-firm concentration ratio) capital intensity and exposure to overseas competition (export intensity) They estimate four different models for the period 1983ndash1992 with their preferred model being a negative binomial random effects model The coefficient for PACE is positive and statistically significant (in all four models) as are the coefficients (in the preferred model) for industry size concentration and export intensity However the magnitude of the coefficient (which represents
the semi-elasticity of patents with respect to PACE) is only 00004 Thus ceteris paribus an increase in abatement expenditure of USD 100 million results in an increase in the mean number of patents of only 4
Key findings of the environmental regulation studies
All three environmental regulation studies use PACE data as a proxy for the stringency of environmental regulation (10) While there are obvious pragmatic reasons for doing this (ie availability of data) the validity of the approach may be open to question As Brunnermeier and Cohen (2003) note expenditure may be affected by factors other than environmental regulation such as external pressures from interest groups or a desire to promote or maintain green credentials with customers Furthermore the reported data may not cover all pollution abatement costs and activities (particularly process-related activities) and may be prone to over-statement by reporting firms for strategic reasons However to the extent that the reported PACE data is correlated with the stringency of environmental regulation the analyses suggest that the latter does have an impact on innovation (at least in USA) although the scale of the impact appears to be small
24 Theoretical studies
Although several previous studies has analysed the impact of different environmental policy instruments on technological change Milliman and Prince (1989) were the first to consider the entire process of technological change encompassing innovation diffusion and optimal agency response (11) Using a relatively simple graphical analysis of shifting marginal abatement cost curves they deduce a relative ranking of five instruments (direct controls auctioned permits freely allocated permits emission reduction subsidies (12) and emission taxes) in terms of firms incentives to promote technological change They conclude that emission taxes provide greater incentives for innovation and diffusion than direct controls or
(9) When they allow the slopes of the PACE variable to vary across industries (in addition to the intercept) they find considerable variation in the estimated coefficients across industries with several being negative
(10) However the studies do not all use the same definition of PACE Lanjouw and Mody (1996) include (real) investment expenditures regulation and monitoring costs and research and development by all levels of government private manufacturing and non-manufacturing firms The other two studies both use compliance cost data for private manufacturing firms (at the industry level) only However while Jaffe and Palmer (1997) use capital cost data in their analysis Brunnermeier and Cohen (2003) use operating cost data
(11) Milliman and Prince (1989) identify a number of studies going back to 1970(12) These are payments for emission reductions not technology subsidies for environmental investments
Review of literature on environmental tax reform and eco-innovation
Environmental tax reform in Europe opportunities for eco-innovation 15
freely allocated tradable permits although not as great as auctioned permits However the optimal agency response is likely to face less opposition (and in some cases actually be favoured) under emission taxes than under auctioned permits (13)
Jaffe and Stavins (1995) develop a theoretical framework for comparing empirically the impacts of alternative policy instruments on the diffusion of a new technology (14) They model the investment decision for both an existing firm and a new entrant in each case assuming that over time the firm minimises the present value of its cost streams (operating costs investment cost net of any government subsidy emission taxes and the implicit costs of violating either a performance or technology standard if applicable) For an existing firm the problem is to choose the optimal timing of the retrofit and the authors show that the new technology will be adopted at a particular time if operating cost savings plus savings from reduced emission tax payments (plus any avoided penalties for not adopting a technology standard or exceeding a performance standard) in that period are greater than the net investment costs less the time rate of change of net investment costs For a new entrant the problem is to choose whether to use the new technology at start-up A necessary condition for doing so is that the present value of operating costs savings and reduced tax payments (plus any avoided penalties) over the entire time horizon is greater than the net investment cost Thus while the conditions differ in each case the introduction of either an emissions tax or an investment subsidy (or increases in the respective values) changes the benefit-cost balance in favour of the new technology bringing forward its adoption by existing firms and increasing the likelihood of adoption by new entrants
Kemp (1997) compares the abatement RampD expenditure levels of an individual firm under direct regulation (ie an emissions limit) an equivalent emission tax (15) and freely allocated tradable permits using a cost minimisation analytical framework and a specific functional form for the abatement cost function He shows that both the
level of RampD expenditure and the level of emissions reduction increase as the emissions tax rate increases and that both are greater under the tax than under direct regulation The corresponding levels under the tradable permit regime will be greater under the emissions tax if the (exogenous) permit price is higher than the tax rate and vice versa Kemp also considers the impact of subsidising the cost of the firms RampD effort and shows that increasing the subsidy rate causes a rise in pollution-control RampD More interestingly the impact of the subsidy is greater if it is combined with an emissions tax than with an equivalent emissions limit
Fischer et al (2003) develop the approach used by Milliman and Prince (1989) although their analysis differs in that it does not include the final agency response stage and the diffusion of the technology is determined by market forces with an equilibrium royalty price (16) They compare an emissions tax with auctioned and freely allocated permits using a three-stage model of innovation diffusion and emissions abatement In the first stage the innovating firm decides how much to invest in RampD to develop an emissions abatement technology In the second stage other firms decide whether to adopt this technology in return for a royalty fee or whether to use an (imperfect) imitation technology In the final stage all firms choose their level of abatement to minimise costs given an emissions tax or permit price They show that the level of innovation (ie the level of RampD chosen by the innovating firm) is determined by equating the marginal cost of innovation with the marginal (private) benefit The latter has four components mdash an abatement cost effect an emissions payment effect an imitation effect and an adoption price effect mdash and the last two components are negative (17) Using this model the authors demonstrate that freely allocated permits provide the lowest incentive for innovation However in contrast to Milliman and Prince they conclude that the relative ranking of the emissions tax and auctioned permits is ambiguous It depends crucially on the extent to which the technology can be imitated and hence the extent to which the innovator can appropriate the gains accruing to
(13) For an emissions tax the downward shift of the industry marginal abatement cost curve as a result of diffusion causes the agency to reduce the tax rate assuming that marginal damages are increasing in emissions For permits (auctioned or freely allocated) it causes the agency to reduce the number of permits
(14) The empirical application of this framework is summarised below under Section 25 on empirical evidence(15) That is the emissions tax is set equal to the firms marginal cost of abatement under the direct regulation(16) In addition to assessing the impacts on demand for innovation Fischer et al (1998) consider the impacts of the innovation and
diffusion processes on social welfare in order to compare the overall economic efficiency of the different instruments(17) Milliman and Prince capture only the first two effects in their analysis
Environmental tax reform in Europe opportunities for eco-innovation
Review of literature on environmental tax reform and eco-innovation
16
the other firms in the form of royalty payments If imitation is high (easy) then auctioned permits provide the greater incentive for innovation However if imitation is low (difficult) then the emissions tax provides the greatest incentive
Montero (2002) assesses the impacts of alternative policy instruments on environmental innovation (as measured by RampD expenditure) under conditions of imperfect competition In his model two firms compete in either quantities (ie Cournot duopoly) or prices (ie Bertrand duopoly) while being subject to some form of environmental regulation Where the regulation takes the form of tradable permits mdash either auctioned or freely allocated mdash the market is also assumed to be imperfect the firms competing in permit quantities The interaction between the two firms is modelled as a multi-stage game with the number of stages depending on the instrument being analysed In this framework a firms incentive to invest in RampD comprises two components a direct or cost minimising effect and a strategic effect reflecting the impact of its RampD expenditure on the other firms output decision The latter may be positive or negative depending on the market-regulatory structure Under Bertrand competition (ie where products are strategic complements) freely allocated permits provide the lowest incentive for innovation followed by the emission-standard The relative ranking of an emissions tax and auctioned permits is ambiguous depending on model parameter values Under Cournot competition (ie where products are strategic substitutes) the relative ranking of the emissions tax auctioned permits and the emissions-standard are ambiguous although all provide a greater incentive than freely allocated permits Indeed Montero provides a numerical example where the emissions standard provides the greatest incentive for innovation Finally he considers the impact of increasing competition (increasing the number of firms) and concludes that under perfect competition the emissions tax provides the greatest incentive for innovation
Millock and Nauges (2006) use a simple profit-optimisation model to analyse a firms choice of abatement effort to reduce emissions
per unit of energy used in production While they do not explicitly identify it as such this effort can be interpreted in terms of diffusion of an existing technology mdash with higher effort corresponding to greater diffusion This is consistent with the overall objective of their study which is to assess the impact of combining an emissions tax with a subsidy on (existing) abatement equipment (18) In their model the firm simultaneously chooses the levels of its energy input and abatement effort given exogenous output and energy prices and a cost function for abatement effort (19) They show that while increases in the subsidy rate (expressed as a percentage of the gross investment cost) unambiguously increases abatement effort the impact of increases in the tax rate depends on whether the direct impact of tax increase on the marginal benefit of abatement effort (shifting it up) outweighs the indirect impact via the resulting reduction in output (shifting it down) If the latter dominates then increases in the tax rate will reduce the optimal level of abatement effort The authors show that a necessary and sufficient condition for the direct impact to dominate is that the slope of the firms (inverse) demand for energy is greater than the average emissions tax payment per unit of energy in relation to total energy use (20)
McGinty and de Vries (2009) analyse the relationship between environmental subsidies the diffusion of a clean technology and the degree of product differentiation in an imperfectly competitive output market In their model a fixed number of firms can choose individually between using a clean production technology and a dirty technology Both technologies exhibit constant marginal production costs and constant emission rates (with the clean technology having a lower emission rate and higher unit cost) and consumers are assumed to be able to differentiate between products on the basis of the technology used in their production (21) The subsidy regime is different to that considered by the other studies in that it is applied to the production cost of the clean good and thus reduces the (constant) marginal cost of production for that good As such it is equivalent to an output subsidy for the clean good The authors derive the equilibrium diffusion rate for the clean technology (ie the proportion of firms using
(18) In the second half of their paper Millock and Nauges (2006) undertake an empirical evaluation of such a scheme that operated in France during the 1990s for SO2 and NOX emissions The results of this analysis are summarised under Section 25 on empirical evidence
(19) Abatement effort is assumed to exhibit decreasing returns to scale ie the cost function is increasing and convex(20) If output is held fixed in the profit maximisation problem then increases in the emissions tax rate unambiguously increase the
optimal level of abatement effort as found by Kemp (1997) who uses a cost-minimisation framework for his analysis(21) The model assumes imperfect substitution between the clean good and dirty good with the willingness-to-pay for one good being
a linear function of the quantities of both goods individually ndash ie Pk = ak ndash bYk ndash cYj
Review of literature on environmental tax reform and eco-innovation
Environmental tax reform in Europe opportunities for eco-innovation 17
that technology) and show that an increase in the subsidy value increases diffusion for all degrees of product differentiation The impact is greater as the substitutability of the two goods increases They also briefly consider the impact of a technology subsidy that reduces the fixed cost of the clean technology and conclude that this too will stimulate diffusion but will be less efficient than the output subsidy (22)
Key findings of the theoretical studies
As is often the case with theoretical analyses the specifications of the models and the underlying assumptions of the studies reviewed here significantly influence the conclusions Nevertheless there is a reasonable degree of consistency between their findings The studies can be classified into two broad groups those that consider innovation and diffusion within an industry setting and those that consider an individual firms decision whether to undertake RampD (ie innovation) and invest in an abatement technology (ie diffusion) in order to reduce its own cost of abatement
The studies in the first group conclude that under conditions of perfect competition emission taxes and auctioned permits provide greater incentives for innovation than direct controls or freely allocated permits However there is some disagreement over the relative impacts of the two instruments Under the assumption that the innovator appropriates a fixed (exogenous) proportion of the gains accruing to the technology adopters Milliman and Prince (1989) conclude that auctioned permits provide the greatest incentive although the government may find it easier to adjust emission taxes in response to the resultant downward shift in marginal abatement costs However when the proportion is determined endogenously mdash in the form of a royalty payment mdash Fischer et al (2003) find that either auctioned permits or emission taxes can provide the greater incentive Emission taxes are likely to provide the greatest incentive if the innovator can appropriate a large proportion of the gains (because the technology is difficult to imitate)
Montero (2002) uses a slightly different framework to compare the impacts of different instruments on innovation (in the form of RampD expenditure)
in a situation of imperfect competition and finds that the ranking depends on the nature of the competition (23) Under Bertrand price competition in the output market the results are the same as under perfect competition the relative ranking of auctioned permits and taxes is ambiguous but both provide greater incentives for innovation than emission standards and freely allocated permits However under Cournot quantity competition any of the instruments apart from freely allocated permits can provide the greatest incentives depending on the model parameter values
The studies looking at an individual firms decision also show that an emissions tax can stimulate innovation and diffusion Jaffe and Stavins (1995) explicitly consider the firms decision criterion for investing in a new abatement technology and show that by increasing the benefits of investing the introduction of an emissions tax should bring forward its adoption by existing firms and make its use by new entrants more likely The other two studies consider the firms choice of optimal abatement effort in the context of maximising its total profits or minimising its total cost of emissions reduction This effort can take the form of RampD (innovation) or expenditure on abatement equipment (diffusion) The decision problem is the same in each case ie to choose the optimal level of effort
Kemp (1997) assumes that the firm seeks to minimise its total cost of emissions reduction mdash implicitly assuming that its output level is fixed mdash and demonstrates both that abatement effort increases as the emissions tax increases and that the optimal effort is lower under direct regulation than under an equivalent tax However when the firms output level is allowed to vary mdash as is the case with the profit maximisation problem considered by Millock and Nauges (2006) mdash the impact of an increase in the emissions tax rate on the level of abatement effort depends on the relative magnitudes of the direct impact and the indirect impact (via changes in output levels) on the marginal benefit of abatement effort If the latter dominates then an increase in the emissions tax rate leads to a reduction in the optimal level of abatement effort
(22) McGinty and de Vries (2009) derive expressions for the necessary technology subsidy values when diffusion is 0 and when it is 100 They state mdash without proof mdash that the latter is greater than the former Provided that the relationship between the subsidy and diffusion is monotonic this is a sufficient condition for increases in the subsidy value to cause increases in diffusion
(23) Monteros model does not include diffusion However it does include spillover effects where RampD by one firm reduces the abatement costs of the others
Environmental tax reform in Europe opportunities for eco-innovation
Review of literature on environmental tax reform and eco-innovation
18
Only one of the industry models considers the impact of investment subsidies Using a product differentiation model of imperfect competition McGinty and de Vries (2009) show that subsidising the unit cost of a clean production technology can accelerate its diffusion However the impact depends on the degree of substitutability between clean and dirty products diminishing as the products become more differentiated In contrast all three of the individual firm analyses consider the impact of investment subsidies with all demonstrating that increasing subsidies induce greater abatement effort Furthermore Kemp (1997) shows that the impact of an RampD subsidy is greater in the presence of an emissions tax than it is under an equivalent emissions limit
25 Empirical studies
Jaffe and Stavins (1995) use their theoretical framework (outlined above in Section 24) as the basis for assessing the diffusion of thermal insulation in new home construction in the United States using state-level panel data for the years 1979ndash88 They derive a reduced form equation for the energy efficiency level chosen by developers from the marginal cost-benefit condition in which the explanatory variables include energy prices installation costs and the presence of a relevant building code (as a dummy variable) Separate equations are estimated for ceiling floor and wall insulation with the coefficient for energy prices being positive in all three equations Although it is only significant (at the 95 level) for floor insulation the joint hypothesis that all price coefficients are zero is strongly rejected However the coefficients for installation cost (which are all negative as expected) are around two to three times greater in magnitude and of comparable significance The coefficients for the building code dummies are consistently insignificant (and negative in two cases) indicating that this form of direct regulation had minimal impact on household energy efficiency levels over the period The authors use the estimated models in a simulation to compare the effects of a 10 increase in energy prices (ie an energy tax) with those of a 10 reduction in installation costs (ie a technology subsidy) with each applied over the whole ten-year period While
the tax increases diffusion by 2ndash6 by the end of the period the technology subsidy increases diffusion by between 4ndash15
Kemp (1997) models the diffusion of biological water treatment technology in the Dutch food and beverage industry based on a rational choice threshold model of technology adoption decisions In this model a firm chooses to adopt an abatement technology if the resulting reduction in emission-tax payments is greater than the annualised total costs of the technology where a discount factor is applied to the savings to reflect uncertainty and risk aversion on the part of the decision-maker This is translated into a probabilistic model under the assumption that both the savings and the costs follow a log-normal distribution across plants The model is estimated econometrically using data for the period 1974ndash91 under different assumptions for the functional form of the discount factor and allowing for adjustment costs (24) The estimated parameters for the preferred specification of the discount factor are all significant and of the expected sign and magnitude and the model provides a very close fit to the actual diffusion of waste-water treatment technologies over the period This leads the author to conclude that the effluent charges were a significant positive factor in the diffusion of treatment technologies Indeed he estimates that only around 4 of plants would have installed waste-water treatment equipment by the end of the period if the charge had remained at its (low) 1974 level compared to the actual figure of over 40
Newell et al (1999) estimate the impact of energy prices energy efficiency standards and other factors on the energy efficiency of three types of electrical consumer durables (room air conditioners central air conditioners and gas water heaters) in USA between the 1970s and 1990s The analysis utilises a product characteristics model in which the frontier of technologically feasible products is described by a transformation surface that relates the bundle of product characteristics to the real cost of producing that bundle In this framework innovation is represented by movements of the surface and movements along the surface In particular the authors identify three types of innovation shifts in the surface towards the origin (overall technological change) changes in the slope
(24) Adjustment costs are accounted for by estimating a partial adjustment model in which the actual change in adoption is some fixed fraction of the desired change (estimated from the threshold model)
Review of literature on environmental tax reform and eco-innovation
Environmental tax reform in Europe opportunities for eco-innovation 19
of the surface (directional technological change) and changes in the mix of products along a given surface (model substitution) They define the surface in terms of two characteristics energy flow and cooling capacity and incorporate innovation by allowing the coefficients of the two variables to vary with time and (in the case of energy flow) energy prices and efficiency standards Separate equations are estimated for each durable type with slightly differing sets of explanatory variables and time periods The authors find little evidence that either energy prices or energy efficiency standards had any impact on overall technological change While all but one of the relevant coefficients have the expected sign none are significant In contrast they do find evidence that energy prices had an impact on directional technological change with the relevant coefficients being of the correct sign and significant for both room and central air conditioners
Popp (2002) uses patent data to estimate the effect of energy prices on energy-efficiency innovations in USA between 1970 and 1994 He regresses normalised energy-efficiency-related patent applications against energy prices controlling also for lagged knowledge stock and government RampD (25) The estimated coefficient for energy prices is highly significant producing a short-run price elasticity of 006 and a long-run elasticity 0354 Thus a 10 increase in energy prices would be expected to increase the number of energy-efficiency-related patents by around 35 in the long run The estimated mean lag is less than four years leading the author to conclude that the imposition of a carbon or energy tax would lead to a fairly quick shift towards environmentally friendly innovation
Hoglund Isaksson (2005) estimates abatement cost functions for the reduction of nitrogen oxide (NOX) emissions in three industrial sectors in Sweden (energy pulp and paper chemicals and food) The analysis uses a double-hurdle model applied to a pooled sample of 114 plants across the three sectors The data cover the period 1990ndash1996 which spans the introduction of the charge on NOX emissions in 1992 The estimated cost curves have a similar shape in all three sectors with minimal (or even negative) costs over a relatively broad range of emission reductions and then a steep rise as reductions exceed
a threshold level The analysis does not explicitly consider the issue of innovation However it does find that abatement cost curves shifted downwards significantly over the period In the energy sector for example the emission rate threshold for significant cost increases fell by around 45 between 1991 and 1996 (from 550 to 300 kgGWh) The author surmises that this is due to a combination of technological development and the discovery of previously unrecognised opportunities Unfortunately while this shift coincided with the introduction of the NOX charge the analysis does not provide any evidence of a causal link
As part of their analysis of the impacts of the French tax-subsidy scheme for NOX and sulphur dioxide (SO2) emissions Millock and Nauges (2006) estimate the impact of the emission taxes on a plants decision to install end-of pipe abatement equipment While the study is not concerned with innovation per se the results of this part can be interpreted as showing the impact of emission taxes on the diffusion of abatement equipment Under the scheme taxes were imposed on the emissions of these air pollutants (and VOCs) by all plants satisfying certain criteria The revenue raised by the taxes was earmarked for subsidising the cost of qualifying abatement technologies for technical studies (ie RampD) and for investment in air quality surveillance systems Using panel data for 226 plants in three industries (iron and steel coke and chemicals) for the period 1900ndash1998 the authors estimate a Probit model for the probability that a plant will install abatement equipment They find that the total value of emissions taxes paid by the plant (ie for both pollutants) has a positive impact on its decision to invest in abatement equipment However the magnitude of the effect varies considerably across the sectors and is only significant for the iron and steel sector
Frondel et al (2008) analyse responses to an OECD survey on environmental policy tools (conducted in 2003) to identify the factors that affect a firms decision to adopt an environmental management system (EMS) voluntarily and their environmental innovation behaviour Innovation is captured by a binary variable that indicates whether the firm has undertaken significant technical measures or changes to reduce the environmental impacts of
(25) Normalised energy efficiency patent values are calculated by dividing by the total number of patents granted This accounts for exogenous changes in patenting behaviour that affect all types of patents Popp constructs a value for existing knowledge as the stock of previously granted patents weighted by estimates that he derives for knowledge productivity He demonstrates that the exclusion of this variable from the model leads to biased estimates for the energy price coefficient
Environmental tax reform in Europe opportunities for eco-innovation
Review of literature on environmental tax reform and eco-innovation
20
production (26) The analysis is based on survey responses from 899 firms in Germany Latent variable equations for EMS adoption and innovation are estimated simultaneously with each equation including the same four sets of variables relating to motivations policy instruments pressure groups and facility characteristics (27) The policy instrument variables include five dummy variables indicating the importance of different types of policy instrument including market-based instruments such as emission taxes and tradable permits While the perceived stringency of environmental policy is found to be a significant factor in the decision to innovate there is no evidence that any of the individual policy instrument variables had any impact The authors surmise that this suggests that it is stringency of environmental policy rather than the choice of specific instrument that is important for innovation However as the authors note their results reflect the perceptions of the survey respondents and should therefore be treated as correlations rather than causal relationships
Johnstone and Hascic (2008) assess the impact of a range of environmental policy instruments mdash including tax measures and investment incentives mdash on innovation in the renewable energy field They analyse the impacts for five different groups of renewable energy technologies mdash wind solar ocean biomass and waste-to-energy mdash using a panel dataset of European Patent Office (EPO) patent filings for these technologies across 26 countries over the period 1978ndash2003 A fixed effects negative binomial model is estimated controlling for electricity prices and consumption public sector RampD expenditure (as a proxy for scientific capacity) and total EPO filings (as a proxy for differenceschanges in patenting propensity) The various policy instruments are represented by dummy variables indicating whether they were in place in a particular year As such the model takes no account of the stringency of the instruments mdash in particular the differing magnitudes of the tax measures and investment incentives (28)
Initially the authors estimate the model with all of the policy instruments included individually They find that while public policy plays an important role in inducing innovation the impacts of the individual instruments vary across the different technologies In particular tax measures are significant for wind and biomass technologies with investment incentives being significant for solar and waste-to-energy technologies and obligationstradable certificates being significant for wind technologies However the authors express concerns that there may be multicolinearity between the policy variables (particularly between investment incentives tax measures and tariffs) and also that there may be interaction effects between some of the variables Consequently they estimate two alternative versions of the model the first using a composite policy variable representing the number of policy instruments in place and the second using clusters of similar policy instruments (29) The results or these two models confirm the initial findings The composite policy variable is significant for all of the technology groups while the significance of the clusters varies across technologies The price-based cluster is (highly) significant for solar biomass and waste-to-energy The quantity-based cluster is significant for wind technologies The authors surmise that this may be due to the different economic characteristics of the technologies For example the significance of investment incentives for solar and waste-to-energy may reflect the capital intensity of these technologies with large up-front investment costs
De Vries and Medhi (2008) also use patent data to investigate the relative importance of environmental regulations and fuel prices on innovation in automotive emission-control technologies distinguishing between post-combustion devices and engine redesign technologies They estimate a panel data model using data from Germany Japan and USA over the period 1978ndash2001 controlling for industry value added (as a proxy for the scope of technological opportunities) and total patent
(26) The next question on the survey asks whether these are changes in production processes or end-of-pipe technologies However no distinction is made between these two types of innovation in the present study
(27) In order to avoid identification problems some individual variables are omitted from one equation or the other(28) This shortcoming is recognised by the authors who state that it is unavoidable in any cross-comparative analysis in which multiple
instruments are included(29) The clusters are price-based instruments (investment incentives tax measures and tariffs) quantity-based instruments (obligations
and tradable certificates) and voluntary programmes
Review of literature on environmental tax reform and eco-innovation
Environmental tax reform in Europe opportunities for eco-innovation 21
applications (as a proxy for differenceschanges in patenting propensity) Environmental regulation is represented by two dummy variables indicating the introduction of on-board diagnostic (OBD) regulations in USA (30) The results of the analysis suggest that the relative impacts of regulation and market forces differ between the two types of technology For post-combustion technologies both of the regulations are significant while fuel prices have no significant impact In contrast the opposite is the case for engine redesign technologies with fuel prices having a significant impact but regulation having no discernable effect While the analysis does not explicitly consider the impact of fuel taxes it suggests that an increase in automotive fuel taxes would have a major impact on innovation in relation to engine design The estimated coefficient for fuel prices (1287) implies that a USD 010 increase in fuel prices would induce a 14 increase in patenting activity (31)
Key findings of the empirical studies
The empirical studies considered above cover a range of different technology areas spanning energy efficiency (both product and process) renewable energy and air and water pollution abatement While in some cases they assess the impact of energy prices rather than environmental taxes per se they provide a clear picture of the likely impact of environmental and energy-related taxes on eco-innovation
Three of the studies assess the impact on diffusion of existing technologies All find that environmental taxesenergy prices have a positive impact on diffusion In particular the water effluent charges in The Netherlands appear to have had a major impact on the adoption of waste-water treatment equipment by the food and beverage industry in that country However there is some evidence to suggest that the effectiveness of taxesprices may vary across sectors (eg NOXSO2 abatement in France) and that investment incentivessubsidies may be more
effective in some cases (eg thermal insulation in USA)
Three of the studies use patent data to assess the impact of environmental taxes and energy prices on innovation with one of these also assessing the impact of investment incentives All find a significant positive impact although this depends on the particular sub-sector (eg renewable energy) or the type of innovation In particular the evidence from the automotive emissions control study suggests that taxesprices may be more effective in promoting process-related innovation (eg engine redesign) than innovation in end-of-pipe technologies One of the studies takes a different approach using a product-characteristics model to decompose improvements in the energy efficiency of consumer durables This finds that while electricity prices did not appear to affect overall technological change (ie shifts in the product costenergy efficiency frontier) they did have a positive impact on directional technological change (ie the slope of the frontier)
26 Case studies
Christiansen and Skjaerseth (2005) undertake a comparative analysis of the impacts of climate change policies on the petroleum sectors in Norway and the Netherlands during the 1990s These countries were selected because of their very different policy approaches with the Norwegian petroleum sector subject to a carbon dioxide (CO2) tax since 1991 as part of a portfolio of measures (32) and the Netherlands relying on a series of voluntary agreements on energy efficiency (33) Both approaches appear to have been effective in that CO2 emissions per unit production fell by around 22 between 1990 and 2001 in Norway while energy efficiency improved by around 35 in the Netherlands over the same period However there were marked differences between the two countries in terms of the nature of the innovation that
(30) Because of the international nature of the automotive industry and the importance of the US market regulations introduced in USA appear to have been an important driver for innovation by overseas manufacturers Regulations mandating the installation of OBD systems were first introduced in California in 1988 A more sophisticated system was mandated by the 1990 US Clean Air Act Amendments taking force in 1996
(31) The coefficient represents the semi-elasticity of patent applications with respect to fuel prices While the authors do not state so explicitly the implication is that prices are expressed in US dollars (they are obtained from the IEA Energy Prices and Taxes Database) Consequently the impact of a 10 US cent increase in the fuel prices is given by exp(1287 x 01) ndash 1 = 0137
(32) In addition to the tax the portfolio included publicly funded RampD support schemes gas flaring permits and mandatory environmental impact assessments
(33) The Dutch oil and gas industry first signed a declaration of intent with the government in 1995 This was translated into a long-term agreement (LTA) on energy efficiency in the following year with an improvement target of 20 over the period 1989ndash2000 In 2001 a new LTA was signed which committed firms to implementing energy efficiency measures with a positive NPV at a 15 discount rate or a five year payback period
Environmental tax reform in Europe opportunities for eco-innovation
Review of literature on environmental tax reform and eco-innovation
22
occurred In the Netherlands technological change was incremental reflecting a steady diffusion of available (ie known) technology In contrast the authors find evidence of more radical innovations and adaptations by the Norwegian petroleum sector including the development of energy-efficient gas turbines installation of waste heat recovery units process modifications and improved use of process heat While the authors acknowledge the impossibility of proving a causal link between policy intervention and innovation (in the context of their case study) they conclude that the CO2 tax played a key role in the development and implementation of these radical innovations and the benefits of reduced tax payments provided an important incentive However they also conclude that the impacts of the two instruments were conditioned by the political contexts in which they were applied and the problem characteristics in the respective countries (eg the economic significance of the sector and the size of installations)
Knigge and Goumlrlach (2005) summarise the findings of a comprehensive analysis of the impacts of the ETR in Germany That analysis undertaken jointly by Ecologic and the German Institute for Economic Research (DIW Berlin) included the impacts on innovation and market diffusion of environmentally friendly products and technologies (34) Based on a series of case studies the study concluded that the ETR had a noticeable effect on innovation and diffusion although it was not possible to quantify the scale of that effect In particular ETR is identified as being a central factor in the development of gas-powered vehicles The study identifies a number of different routes by which the ETR produced impacts First the payback period for energy-efficient products was reduced as a result of the energy tax increases and the various exemptions favouring efficient energy use and renewable energy sources Second the predictable nature of the energy taxes (as opposed to widely fluctuating oil prices) reduced uncertainties about the benefits of energy-efficiency investments Third the reduction in employers social contribution payments tended to reduce the costs of labour intensive innovation processes such as research and development energy consultancy and technology installation Finally the ETR had a signalling effect strengthening awareness of the need for more efficient and rational energy use
Mickwitz et al (2007) examine a number of claims that have been made in the environmental policy literature about the relationship between policy instruments and innovation based on experiences in two industrial sectors in Finland pulp and paper and the manufacture of diesel engines for ships In particular they assess the claims that environmental taxes are superior to other policy instruments with respect to innovation and that RampD subsidies have limited impacts on innovation With respect to the first claim the evidence provided by the two case studies is mixed The authors conclude that energy taxation had a negligible impact on innovation in the pulp and paper industry However this is likely to have been due to the low level of the tax and the exemptions that applied to the sector In contrast they find that the differentiation of Swedish fairway and port fees (on the basis of SO2 and NOX emissions) was a significant factor driving the installation of in-engine NOX reduction equipment in ferries operating between the two countries (35) With respect to RampD subsidies the authors conclude that the evidence does not support the claim that these have little effect In particular they find that RampD subsidies accelerated the development of ship engine emissions-reduction technologies
The findings of the three case studies are consistent with those of the empirical analyses reviewed in the previous section Environmental taxes and investment subsidies have proven significant in promoting both innovation and diffusion although not universally so Furthermore the case studies provide some useful insights about the ways in which the impacts occur and the factors that may be important in promoting innovation In particular they suggest the need for a tax rate that is sufficiently high to provide a meaningful incentive and signalling effect and that is fixed for a sufficiently long period of time to reduce uncertainty about the future benefits of investment
27 Conclusions
The studies reviewed in the preceding sections suggest that environmental regulation in general and price-based policy instruments such as environmental taxes and investment subsidies in particular can (in theory) and do (in practice) have a positive impact on both innovation and diffusion
(34) A separate report in German by Goumlrlach et al (2005) provides details of the evaluation of the innovation and diffusion impacts (35) Although the tax was introduced in Sweden it was also payable by Finnish ferry operators entering Swedish ports and hence
affected their investment decisions This is another example of the cross-border impact of environmental policy interventions on innovation found by Lanjouw and Mody (1996) (see Section 23)
Review of literature on environmental tax reform and eco-innovation
Environmental tax reform in Europe opportunities for eco-innovation 23
of environmental technologies However the supporting empirical and case study evidence is not universal and the effectiveness of these instruments would appear to vary across different sectors and different types of innovation
To a certain extent such differences can be explained by the theoretical models In particular the impact of environmental taxes (relative to other instruments) is predicted to depend on the competitive structures of the markets in which the regulated firms operate and on the ability of innovator firms to appropriate the benefits accruing to other firms during diffusion However a number of other potential factors have been identified in the literature which may affect the impact of price-based policy instruments on innovation
Jaffe et al (2002) caution that the impact of price-based policy instruments on technology diffusion may be adversely affected by a number of potential market failures including information failures principle-agent problems (eg landlord-tenant) capital market failures and positive adoption spillovers In addition while not market failures as such uncertainty over future returns and the (associated) use of high discount rates for investment decisions can also undermine the effectiveness of price-based instruments in stimulating diffusion However as was noted above the findings from the case study of ETR in Germany suggest that an environmental tax may actually reduce the level of uncertainty over future returns provided that it is of sufficient magnitude and longevity
Skjaerseth and Christiansen (2005) emphasise that the relationship between policy instruments (of all types) and technological change is extremely complicated They argue that account must be taken of the politicalindustrial context in which policy instruments are introduced and the nature of the environmental problem that they are intended to address In particular they make a distinction between malign problems where technological change involves net costs for target groups and benign problems where there are widespread no-regret opportunities for change Based on a comparative analysis of four different case studies they conclude that mandatory policy instruments (including environmental taxes) are more effective
in promoting short-term technological change when the problems are malign but that low legitimacy (with the target group) may undermine long-term technological change However when problems are benign or when long-term change requires cooperation voluntary policy instruments are likely to be more effective
Johnstone (2005) questions the focus of the theoretical and empirical analyses (reviewed above) on the impact of environmental policy instruments on the rate of technological change He argues that the direction of technological change is as important if not more so In addition to the quantity of innovation it is also important that innovation be socially optimal in the sense that it minimises the cost of attaining a particular environmental goal in the long term Inappropriate innovation today may result in lock in to a suboptimal technological path for the future
With this in mind Johnstone identifies a number of issues that can adversely affect the direction of innovation and should be taken into account when selecting and designing policy instruments technological market failures (36) missing markets for certain environmental attributes of innovation policy incidence and joint production of emissions Most studies of the innovation effects of environmental policy instruments assume that the only missing market is that for the environmental good (or bad) However in practice there may be other markets that are missing (or incomplete) which can adversely affect transmission of innovation incentives This is particularly so in the area of waste and resource management where instruments applied at the end of the product life cycle may have little or no impact on product design innovation Even if all markets are complete except for the environmental externality the point of incidence of the policy intervention may be more important for the direction of innovation than the choice of a particular policy instrument For example a limit or standard applied directly to the emissions of a pollutant may be more effective in promoting optimal innovation than a tax applied to a proxy input variable Finally when there is joint production of pollutants (eg CO2 and air pollutants from vehicle engines) there is a danger that if policy instruments (of whatever type) are applied to one pollutant in isolation the resulting innovation may
(36) These are the same market failures identified by Jaffe et al (2002)
Environmental tax reform in Europe opportunities for eco-innovation
Review of literature on environmental tax reform and eco-innovation
24
reduce emissions of that pollutant at the expense of increases in the others
In a related point Johnstone highlights the importance of using appropriate indicators when assessing the impact of policy instruments on innovation emphasising the need for these to reflect both the rate of innovation and the direction A necessary condition for this is that the indicators must provide an accurate and detailed picture of actual innovation Unfortunately this is difficult to achieve in practice For example the use of patent data as a measure of innovation requires the identification of relevant environmental technologies This is likely to be easier for end-of-pipe technologies than for process-related technologies meaning that the latter tend to be under-represented relative to their actual incidence To the extent that process-related innovation is growing in importance or is more important
for certain sectors or types of environmental problem changes in the value of the indicator may significantly understate the actual rate of innovation and misrepresent the direction
All of this suggests that caution should be exercised in drawing general definitive conclusions about the impacts of price-based policy instruments such as environmental taxes and investment subsidies on innovation particularly relative to other policy instruments While it would appear that they can be effective in stimulating both innovation and diffusion in many cases mdash at least in terms of the rate of technological change mdash there may be situations in which other policy instruments may be more appropriate In general the stringency and point of incidence of an environmental policy intervention may be more important than the choice of a particular policy instrument in determining the rate and direction of eco-innovation
25
Modelling of ETR impacts on eco-innovation
Environmental tax reform in Europe opportunities for eco-innovation
31 Scenarios assessing the implications of ETR for eco-innovation
Scenario analysis provides a useful means of improving understanding of how the different revenue recycling methods and various scales of ETR can help meet different greenhouse gas emissions targets
To investigate the impacts of an ETR for Europe the petre project elaborated a range of different scenarios reflecting various tax reform options In addition to employing several of these original scenarios the present study compiled two new scenarios to analyse the implications of ETR for eco-innovation All scenarios were examined in both E3ME and GINFORS (37)
311 Original petre project scenarios
The key petre scenarios relevant for the present study are
bull scenarioBHbaselinescenariowithhighenergyprice (reference case)
bull scenarioS1HETRdesignedtomeettheEUsunilateral 2020 GHG target (high energy price) with revenue recycling
bull scenarioS2HETRdesignedtomeettheEUsunilateral 2020 GHG target (high energy price) with revenue recycling and 10 of revenues spent on eco-innovation measures
Each of the ETR scenarios has the same key taxation components
bull acarbontaxrateisintroducedtoallnon-EUEmissions Trading System (EU ETS) sectors equal to the carbon price in the EU ETS that delivers an overall 20 reduction in greenhouse gas emissions by 2020 and in the international cooperation scenario this is extended to 30
bull aviationisincludedintheEUETSattheendofPhase 2
bull powergenerationsectorEUETSpermitsare100 auctioned in Phase 3 of the EU ETS
bull allotherEUETSpermitsare50auctionedin2013 increasing to 100 in 2020
bull materialtaxesareintroducedat5oftotalpricein 2010 increasing to 15 by 2020
In scenario S1H environmental tax revenues are recycled through reductions in income tax rates and social security contributions in each of the Member States such that there is no direct change in tax revenues In scenario S2H 10 of environmental tax revenues are recycled through spending on eco-innovation measures and the remaining 90 is recycled through the same measures as in the other scenarios The eco-innovation spending is split across power generation and housing according to tax revenues from the corporate and household sector
In GINFORS (the model used for analysing the implications of ETR and eco-innovation) the share of renewable sources in electricity production is increased due to the additional investment The rest of additional investment goes to household energy efficiency spending Investment needed for a certain increase in renewable energy production or efficiency improvement is based on Austrian and German experience (Lehr et al 2008 and 2009 Grossmann et al 2008 Lutz and Meyer 2008) This assumption is quite conservative as parameters for other countries can be assumed to be more positive (meaning that less money is needed for renewable energy technology installation or energy efficiency gains)
In scenario S1H the 20 GHG target translates into a 15 reduction in energy-related carbon emissions relative to 1990 as other emissions such as methane and nitrous oxide have already been reduced by
3 Modelling of ETR impacts on eco-innovation
(37) The E3ME and GINFORS models are introduced in Chapter 1 of the present report A detailed discussion of the models and scenarios used in the present study can be found in Ekins and Speck (2011)
Environmental tax reform in Europe opportunities for eco-innovation
Modelling of ETR impacts on eco-innovation
26
more than 20 (in terms of carbon equivalents) The target is reached by a tightened EU ETS cap and the introduction of a carbon tax on the non-ETS sector The tax rate applied is equal to the carbon price in the EU ETS that will deliver a 20 GHG reduction by 2020
The burden of ETR taxes are allotted to energy outputs (ie the final use of energy) and will be based on the carbon content of each fuel Carbon prices are assumed to be fully passed on to consumers All carbon taxes are in addition to any existing unilateral carbon and energy taxes The carbon reductions in the different EU Member States will be those that result from a uniform carbon tax increase across the EU
All of the revenues including EU ETS auctioning revenues carbon tax revenues and material tax revenues will be recycled The proportion of tax raised by industry will be recycled into a reduction in employers social security contributions which will in turn reduce the cost of labour Recycling will be additional to the existing ETRs in some Member States Revenues raised from households will be recycled through standard rate income tax reductions Traditional energy tax revenues will be lower compared to their respective baselines as the tax base (energy consumption) is reduced So for an ETR revenue-neutrality does not mean budget-neutrality
312 Factors affecting the macroeconomic impacts of RES technologies
Earlier analyses (Lehr et al 2008 Fraunhofer ISI et al 2009 DTI 2004 Kammen et al 2004 Moreno and Loacutepez 2007) have studied the impacts of large renewable energy source (RES) shares in the energy mix for different countries The overall question in these studies has been the impact of increasing RES shares on the economy especially on the labour market For the present study it is interesting to note that macroeconomic impacts of higher RES shares mainly depends on the following five factors
1 additional investment in RES (minus lower investment in conventional sources ie fossil and nuclear power) with the impact increasing if a country manufactures the RES technology in question
2 additional (net) exports due to improved international competitiveness of renewable energy sources (first mover advantage)
3 lower fossil fuel needs4 the cost differences between RES and
conventional energy
5 the shift from capital- and energy-intensive industries to labour- and technology-intensive industries
All five factors are driven by international energy prices carbon prices the policy framework and RES technology development itself Innovation comes into the play at various stages First innovation drives the currently positive additional costs of RES technologies down and even into negative realms depending on the fossil fuel scenario Second innovative RES technologies are likely to have a competitive advantage in international markets Although a significant proportion of RES technology produced in Europe is traded in Europe innovation will still provide an edge in current and emerging international markets
The EmployRES study (Fraunhofer ISI et al 2009) finds for Europe that current strong investment reflected in installations in Europe and exports to the rest of the world dominate the economic impact of RES policies and therefore lead to positive overall effects The studys results suggest that this positive balance can only be kept up in the future if the competitive position of European manufacturers of RES technology is improved The authors strongly recommend policies which promote technological innovation in RES and lead to a continued and rapid reduction of their costs
Factors 1 and 2 will have substantial macroeconomic impacts in the short and medium terms whereas factor 3 accumulates and will show positive impacts mainly in the long term Factor 4 strongly depends on the global developments while factor 5 may have significant effects on employment
313 Additional scenarios
Impacts of additional investment (factor 1) have already been analysed in scenario S2H of the petre project To focus on the other impacts of eco-innovation two additional scenarios were designed building on scenario S2H of petre
bull S2HEETRwithrevenuerecyclingdesignedto meet the unilateral EUs 2020 greenhouse gas (GHG) target (high energy price) Ten per cent of revenues are spent on eco-innovation measures and trade shares of EU-27 economies with the rest of the world in machinery and electrical machinery increase by 01 due to the deployment of the fast growing RES markets This assumption is based on the strong EU policy effort to increase the share of renewable energy in final energy consumption to 20 by 2020
Modelling of ETR impacts on eco-innovation
Environmental tax reform in Europe opportunities for eco-innovation 27
(Fraunhofer ISI et al 2009) and the possibility of very strong world market development of the RES sector until 2020 (EREC 2008) which offers additional export opportunities for European RES industries
bull S2HIETRwithrevenuerecyclingdesignedto meet the unilateral EUs 2020 GHG target (high energy price) Ten per cent of revenues are spent on eco-innovation measures and input structures of the energy sector are changed according to the input structure of the German RES industry (Lehr et al 2008)
S2HE looks at the possible role of international trade S2HI analyses changes in the input structure of the energy sector ie from conventional electricity production to renewables In the petre project (as in GHK et al 2007) only the energy inputs of the energy sector were adapted to changes in the energy input mix
Both S2HE and S2HI focus on RES and efficiency technologies As mentioned above an ETR will trigger a variety of innovations Therefore the results can be thought of as conservative in the sense that innovations (eg automotive energy consumption industrial efficiency etc) are not explicitly included
32 Overview of modelling results
The main results of the simulations are presented in Table 31 In the baseline scenario BH with high energy prices EU-27 carbon emissions will be
72 below the 1990 level in 2020 (38) The EU-15 has committed in the Kyoto Protocol to reduce its GHG emissions 8 below 1990 levels in the period 2008ndash2012 As emissions in the new member states are substantially below their 1990 levels today that implies that the EU-27 will keep its emissions more or less constant over the coming decade As in the PRIMES baseline an ETS price of 18 EURt in 2008 prices is assumed in 2020
In scenario S1H the ETS price and carbon tax rate has to be increased to 68 EUR2008t of CO2 to reach the 20 GHG reduction target which is equal to a 15 reduction of CO2 emissions against 1990 as other greenhouse gases have already been reduced above average by more than 20 in terms of CO2 equivalents Compared to the baseline CO2 emissions are 84 lower in 2020 which means roughly an additional 1 reduction annually in the period 2012ndash2020 GDP will be about 06 lower compared to the baseline in 2020 This means that annual average growth rates will be less than 01 below their baseline development This is especially low compared to the current financial and economic crisis with a GDP deviation against the baseline of around 6 in 2009
As the recycling mechanism reduces labour costs and the tax burden is shifted from labour-intensive to carbon- and material-intensive sectors employment will be 036 (or more than 800 000 jobs) higher than in the baseline The ETR is not fully budget neutral potentially enabling EU economies to slightly increase their net savings If
(38) The modelling exercise in the present study was conducted in 2009 and therefore does not contain the latest data on EU-27 GHG emissions which were significantly influenced by the global economic slump of the late-2000s
Table 31 Main results under the different scenarios
Scenario Target in 2020 CO2 price GDP Employment CO2 reduction
EUR2008t pc against baseline
pc against baseline
pc against 1990
pc against baseline
in year 2020 2015 2020 2020 2020 2020
BH 18 ndash 72 00
S1H 20 GHG 68 ndash 022 ndash 057 036 ndash 151 ndash 84
S2H 20 GHG 61 ndash 013 ndash 030 041 ndash 152 ndash 85
S2HE 20 GHG 61 ndash 009 ndash 004 051 ndash 151 ndash 84
S2HI 20 GHG 61 ndash 006 ndash 024 045 ndash 152 ndash 84
Environmental tax reform in Europe opportunities for eco-innovation
Modelling of ETR impacts on eco-innovation
28
this extra saving is spent negative GDP impacts will be further reduced
In scenario S2H part of the revenues is invested in low-carbon technologies This reduces the carbon price to 61 EUR2008t in 2020 halving the GDP loss relative to scenario S1H to only 03 as the investment in renewable energies is assumed to be additional Employment impacts are also more positive than in scenario S1H The 10 investment in low-carbon technologies amounts to more than EUR 20 billion in 2020
Assuming additional EU exports of RES technologies in scenario S2HE GDP almost matches the baseline in 2020 and employment is 051 (or more than 1 million jobs) higher than in the baseline In scenario S2HI a shift in the input structure of the energy sector towards machinery
and electrical machinery reflecting the different nature of RES relative to conventional electricity generation also has smaller additional positive impacts on GDP and employment compared to scenario S2H
The following figures show impacts of the different scenarios in comparison to the baseline BH As Figure 31 illustrates all the alternative scenarios imply GDP lower than the baseline However comparing scenario S1H with the other three scenarios shows that additional RES investment (S2H) additional RES exports (S2HE) and the inclusion of different input structures of the RES industries (S2HI) each have positive GDP impacts These results are in line with model-based analysis in the EMPLOY-RES study (Fraunhofer ISI et al 2009)
Figure 31 EU-27 GDP according to four scenarios mdash deviation from the baseline (BH)
Percentage deviation from the baseline (BH)
ndash 100
ndash 080
ndash 060
ndash 040
ndash 020
0002010 2015 2020
S2HI S1H S2H S2HE
Modelling of ETR impacts on eco-innovation
Environmental tax reform in Europe opportunities for eco-innovation 29
In contrast to GDP employment increases relative to the baseline in all the alternative scenarios (Figure 32) Due to the scenario design the structure of the EU economies is shifted from energy-intensive to labour-intensive sectors The magnitude of the employment gain is influenced by the carbon price and the tax shift the underlying energy prices and the production loss The largest part of the employment increase stems from the additional RES investment (scenario S2H) although a shift in industry structures (S2HI) and additional RES exports (S2HE) are also positive for the labour market
33 Macroeconomic impacts at the national level
In general terms it is clear that national ETS and ETR impacts depend significantly on country specifics including energy use economic structure social system and behaviour (eg reactions to labour cost changes) In countries with high carbon intensity in their energy mix additional revenues and expenditures are higher than in countries with lower carbon intensity
Scenario S2H provides an interesting tool for analysing the macroeconomic impacts of ETR at the national level because 10 of the additional generated revenues are used for eco-innovation investments meaning that only 90 of the revenues are recycled back into the economy by reducing income tax rates and social security contributions
Figure 32 EU-27 employment according to four scenarios mdash deviation from the baseline (BH)
ndash 020
000
020
040
060
2010 2015 2020
S2HI S1H S2H S2HE
Percentage deviation from the baseline (BH)
Environmental tax reform in Europe opportunities for eco-innovation
Modelling of ETR impacts on eco-innovation
30
Figure 34 GDP in 2020 in EU-27 Member States under scenario S2H mdash deviation form the baseline (BH)
Figure 33 GDP in 2020 in selected countries under scenario S2H mdash deviation from the baseline (BH)
ndash 25 ndash 20 ndash 15 ndash 10 ndash 05 00 05 10 15
Romania
Bulgaria
SloveniaMalta
Lithuania
Latvia
Estonia
CyprusSlovakia
Poland
Hungary
Czech RepublicUnited Kingdom
Sweden
Spain
Portugal
Netherlands
Italy
Ireland
Greece
FranceFinland
Denmark
Luxembourg
Belgium
Austria
Germany
Percentage deviation from the baseline (BH)
Russia
South Africa
Brazil
India
China
Mexico
Japan
USA
Poland
United Kingdom
Spain
Italy
France
Germany
ndash 30 ndash 25 ndash 20 ndash 15 ndash 10 ndash 05 00 05 10
Percentage deviation from the baseline (BH)
Modelling of ETR impacts on eco-innovation
Environmental tax reform in Europe opportunities for eco-innovation 31
Figure 35 Employment in 2020 in EU-27 Member States under scenario S2H mdash deviation from baseline (BH)
EU-27EU-15
RomaniaBulgariaSloveniaMalta
LithuaniaLatvia
EstoniaCyprusSlovakia
PolandHungary
Czech RepublicUnited Kingdom
SwedenSpain
PortugalNetherlands
ItalyIrelandGreece
FranceFinlandDenmarkLuxembourg
BelgiumAustria
Germany
ndash 200 0 200 400 600 800 1 000
Percentage deviation from the baseline (BH)
Under scenario S2H the GDP of large EU economies deviates from baseline projections by between 0 and ndash 1 with the exception of Italy (Figure 33) Germanys GDP is even forecast to match the baseline level in 2020 due to the countrys strong RES industry Outside Europe some countries gain slightly against EU Member States in terms of competitiveness as export prices in most EU Member States and sectors increase and GDP in those countries exceeds the baseline projections as a result (Figure 33) This is mainly because carbon tax revenues are recycled via income tax reductions which are not part of production costs However energy exporting economies such as Russia or South Africa will lose exports if EU demand for fossil fuel imports declines The development of all EU Member States is shown in Figure 34
Employment impacts of scenario S2H are positive for almost all EU Member States as lower labour
costs increase labour demand and labour intensity (Figure 35) The highest absolute increases are shown for Germany the Netherlands Italy and the United Kingdom For EU-27 as a whole employment will be almost one million higher than in the corresponding baseline BH in 2020
The scenarios have not been designed with a view to meeting the EU renewables target of a 20 renewables share in final energy consumption in 2020 Nevertheless the scenarios provide some interesting insights The share is projected to increase from around 10 in 2009 to above 14 even in the baseline as instruments such as feed in tariffs and biofuel quotas will continue In scenario S1H the target will be missed with around 18 in 2020 Only in scenarios S2H S2HE and S2HI is the target met (approximately 20 )
Environmental tax reform in Europe opportunities for eco-innovation
Modelling of ETR impacts on eco-innovation
32
Under scenario S2H energy-related carbon emissions are reduced in all EU Member States relative to the baseline (Figure 36) The highest percentage reductions can be seen in many of the EU-12 Member States with still high energy intensity and low energy prices In these countries the relative price increase is higher than in countries like Germany or the United Kingdom with already high energy taxes and overall energy prices
Additional ETS revenues material tax revenues and carbon tax revenues from the industry sector are recycled back to industry via reductions in employers social security contributions (or wage subsidies in some countries) The revenues from the carbon tax on households set out in Table 32 (totalling 033 of GDP in Germany for example) are used to reduce income tax For the EU-27 overall revenues from ETS and ETR reach about 2 of GDP in 2020 although these figures may be excessive because additional EU efforts to increase energy
efficiency and renewable energy which will reduce the ETS price are not taken into account The use of flexible tools such as the Clean Development Mechanism will further reduce the revenues and earmarking of part of the revenues for mitigation and adaptation measures in emerging and developing countries limits the recycling into labour costs
In addition the scenarios do not take the current global economic problems into account According to the IEA (2009) the downturn will also reduce carbon emissions in the long run which will lead to lower carbon prices and revenues to reach fixed targets (or make tighter targets less costly)
The ETR will have varying effects on the prices of different sorts of products and services Material or carbon taxes increase the prices of product groups according to their direct and indirect material and carbon content The recycling mechanism reduces
Figure 36 Energy-related CO2 emissions in 2020 under scenario S2H mdash deviation from the baseline (BH)
WorldEU-27
EU-15Romania
BulgariaSlovenia
MaltaLithuania
LatviaEstonia
CyprusSlovakia
PolandHungary
Czech RepublicUnited Kingdom
SwedenSpain
PortugalNetherlands
ItalyIreland
GreeceFrance
FinlandDenmark
LuxembourgBelgium
AustriaGermany
ndash 25 ndash 20 ndash 15 ndash 10 ndash 5 0
Percentage deviation from the baseline (BH)
Modelling of ETR impacts on eco-innovation
Environmental tax reform in Europe opportunities for eco-innovation 33
Table 32 Additional ETS and environmental tax revenues in 2020 ( of GPD)
S2H Germany United Kingdom EU-27
ETS revenues 083 064 059
Carbon tax (industry) 052 044 054
Carbon tax (households) 033 041 036
Material tax 041 029 056
Sum 209 178 205
Figure 37 Total primary energy supply in 2020 under scenario S2H mdash deviation from the baseline (BH)
WorldEU-27EU-15
RomaniaBulgaria
Slovenia
MaltaLithuania
LatviaEstonia
Cyprus
SlovakiaPoland
HungaryCzech Republic
United KingdomSweden
SpainPortugal
NetherlandsItaly
IrelandGreece
FranceFinland
DenmarkLuxembourg
BelgiumAustria
Germany
ndash 24 ndash 21 ndash 18 ndash 15 ndash 12 ndash 9 ndash 6 ndash 3 0
Percentage deviation from the baseline (BH)
Environmental tax reform in Europe opportunities for eco-innovation
Modelling of ETR impacts on eco-innovation
34
Figure 38 Output price impacts of scenario S2H in Germany in 2020 mdash deviations from the baseline (BH)
Figure 39 Impacts of scenario S2H on industrial output in 2020 in Germany mdash deviations from the baseline (BH)
ndash 5
0
5
10
15
20
Output prices
Percentage deviation from the baseline (BH)
(3) F
ood
(4) T
extiles
(5) W
ood
(6) P
ulp pap
er
(7) C
oke re
fined
petro
leum
pro
ducts
(8) C
hemica
ls ex
cl pha
rma
(9) P
harm
aceu
ticals
(10)
Rub
ber a
nd plastics
(11)
Non
-metallic
miner
als
(12)
Iron
and
steel
(13)
Non
-ferrou
s metals
(14)
Met
al pro
ducts
(15)
Mac
hine
ry and
equ
ipmen
t
(16)
Office
mac
hine
ry
(17)
Electric
al m
achine
ry
(18)
Rad
io T
V
(19)
Med
ical pr
ecisi
on and
opt
ical ins
trumen
ts
(20)
Mot
or veh
icles
(21)
Ships
(22)
Airc
raft
(23)
Railro
ad
(24)
Man
ufac
turin
g n
ec r
ecyc
ling
(25)
Electric
ity g
as w
ater
sup
ply
(26)
Con
stru
ction
(27)
Tra
de r
epairs
(28)
Hot
els an
d re
stau
rant
s
(29)
Tra
nspo
rt an
d stor
age
(30)
Pos
t and
teleco
mmun
icatio
ns
(31)
Finan
ce ins
uran
ce
(32)
Rea
l estate ac
tivities
(33)
Ren
ting
(34)
Com
puter
(35)
Res
earch an
d de
velopm
ent
(36)
Oth
er bus
ines
s ac
tivities
(37)
Pub
lic ser
vice
s
(38)
Edu
catio
n
(39)
Hea
lth and
soc
ial w
ork
(40)
Oth
er ser
vice
s
(41)
Priv
ate ho
useh
olds
(1) A
gricu
lture
(2) M
ining an
d qu
arry
ing
nec not elsewhere classified
Production
ndash 100
ndash 80
ndash 60
ndash 40
ndash 20
00
20
40
60
80Percentage deviation from the baseline (BH)
(3) F
ood
(4) T
extiles
(5) W
ood
(6) P
ulp pap
er
(7) C
oke re
fined
petro
leum
pro
ducts
(8) C
hemica
ls ex
cl pha
rma
(9) P
harm
aceu
ticals
(10)
Rub
ber a
nd plastics
(11)
Non
-metallic
miner
als
(12)
Iron
and
steel
(13)
Non
-ferrou
s metals
(14)
Met
al pro
ducts
(15)
Mac
hine
ry and
equ
ipmen
t
(16)
Office
mac
hine
ry
(17)
Electric
al m
achine
ry
(18)
Rad
io T
V
(19)
Med
ical pr
ecisi
on and
opt
ical ins
trumen
ts
(20)
Mot
or veh
icles
(21)
Ships
(22)
Airc
raft
(23)
Railro
ad
(24)
Man
ufac
turin
g n
ec r
ecyc
ling
(25)
Electric
ity g
as w
ater
sup
ply
(26)
Con
stru
ction
(27)
Tra
de r
epairs
(28)
Hot
els an
d re
stau
rant
s
(29)
Tra
nspo
rt an
d stor
age
(30)
Pos
t and
teleco
mmun
icatio
ns
(31)
Finan
ce ins
uran
ce
(32)
Rea
l estate ac
tivities
(33)
Ren
ting
(34)
Com
puter
(35)
Res
earch an
d de
velopm
ent
(36)
Oth
er bus
ines
s ac
tivities
(37)
Pub
lic ser
vice
s
(38)
Edu
catio
n
(39)
Hea
lth and
soc
ial w
ork
(40)
Oth
er ser
vice
s
(41)
Priv
ate ho
useh
olds
(1) A
gricu
lture
(2) M
ining an
d qu
arry
ing
nec not elsewhere classified
Modelling of ETR impacts on eco-innovation
Environmental tax reform in Europe opportunities for eco-innovation 35
social security contributions and lowers labour costs according to the direct and indirect labour content of sector output The ETR therefore reduces output prices in labour-intensive service sectors and increases prices in carbon- and material-intensive industry sectors
The example of Germany shows insignificant impacts in the trade-intensive sectors of machinery (15ndash17) motor vehicles (20) and other transport equipment (21ndash23) (Figure 38) Iron and steel (12) and chemicals without pharmaceuticals (8) face the highest price increases of trade-intensive sectors As the German iron and steel industry primarily delivers high quality steel to the German car industry and increasingly to the German windmill industry negative competitiveness impacts will be limited Exchange rate variations against non-EU competitors have been much higher in the past
The higher prices of carbon- and material-intensive products will reduce price competitiveness on export markets and increase the market share for imports in domestic markets This loss of price competitiveness is based on an assumption of limited market development of energy efficiency and RES technologies in other part of the world It will be offset by gains in labour-intensive sectors if the ETR causes real wage costs per unit of output to fall as a result of using recycled revenues to reduce employer social security contributions
Any improvement in non-price competitiveness will also raise exports The extra employment will raise incomes raising consumption and output
The overall impact on sector output depends on countervailing effects which are negative for iron and steel and a few service sectors and positive for a few industry sectors For most industries the output effect is insignificant (Figure 39) The greatest impact is felt by producers of fossil fuels who must obviously reduce production due to lower demand for their products
Under scenario S2H employment impacts are positive for most sectors relative to the baseline as labour productivity decreases and wage rates fall in relation to consumer prices (CPI) and output prices (Table 33) The relative costs of labour are lower than in the baseline without the ETR reform Only around a quarter of the employment increase takes place in industry
Concerning the wage rate two countervailing effects have to be considered First when the labour market is characterised in terms of the real wage bargaining model as in E3ME and GINFORS with market power on both sides (employers and trade unions) consumer price increases will lead to wage increases (the econometrically estimated factor is 085 for Germany) Second labour productivity is another important factor for wage bargaining The estimated elasticity for Germany is 063 meaning that a 1 increase of labour productivity leads to wage increases of 063 Higher labour demand due to lower labour costs thus reduces the wage increase In the end the German economy is more labour intensive than without the ETR partly due to the structural change towards labour-intensive industries
Table 33 Employment impacts of scenario S2H in Germany mdash deviations from scenario S2H in 2020
Employment in 2020 Deviation from S2H () Deviation from S2Habsolute (1 000s)
Agriculture forestry 24 90
Industry 09 653
Non-metallic minerals 24 62
Iron and steel ndash 28 ndash 37
Machinery and equipment 05 56
Electrical machinery 04 18
Construction 37 449
Trade and transport 10 829
Business services 17 767
Other services ndash 02 ndash 216
Total 07 2506
Environmental tax reform in Europe opportunities for eco-innovation
Modelling of ETR impacts on eco-innovation
36
Additional exports under scenario S2HE mainly create new jobs in machinery and related business services (Table 34) Under scenario S2HI a shift in the input structure of the energy sector leads to a shift in the industry structure and creates a few jobs in the service sector (Table 35)
34 Conclusions of the scenario assessment
The foregoing analysis used the GINFORS model to assess economic and environmental impacts of using the ETS and ETR to reach the EUs 2020
GHG targets In general the results show positive employment effects and only small negative impacts on GDP in EU-27 Member States The economic impacts depend on the levels of international energy prices the mechanism used to recycle revenues and country specifics such as carbon and energy intensity and the structure of energy consumption
Although there is significant evidence that eco-innovation is positively driven by higher energy prices quantification is difficult The present study included simulations of possible impacts of a shift in the industry structure towards renewable energy in the electricity sector and an overall increase of EU
Table 34 Employment impacts of scenario S2HE in 2020 in Germany mdash deviations from scenario S2H
Employment in 2020 Deviation from S2H () Deviation from S2Habsolute (1 000s)
Agriculture forestry ndash 01 ndash 02
Industry 03 194
Non-metallic minerals 02 05
Iron and steel 04 05
Machinery and equipment 13 130
Electrical machinery 24 117
Construction 01 18
Trade and transport 00 26
Business services 07 308
Other services 01 107
Total 02 634
Table 35 Employment impacts of scenario S2HI in 2020 in Germany mdash deviations from scenario S2H
Employment in 2020 Deviation from S2H () Deviation from S2Habsolute (1 000s)
Agriculture forestry ndash 01 ndash 02
Industry 00 00
Non-metallic minerals 25 65
Iron and steel ndash 27 ndash 36
Machinery and equipment 08 78
Electrical machinery 04 19
Construction ndash 00 ndash 04
Trade and transport 00 07
Business services 02 115
Other services 0 56
Total 00 167
Modelling of ETR impacts on eco-innovation
Environmental tax reform in Europe opportunities for eco-innovation 37
exports due to higher global demand for renewable energy The main results can be summarised as follows
bull environmentaltaxreformshiftingtaxesfromlabour to energy and resources will create additional jobs and trigger eco-innovation
bull impactsofeco-innovationintheformofadditional EU exports or shifts in industry structures will have a slight positive influence on GDP and create a smaller number of additional jobs
These findings correspond to results from the EmployRES study (Fraunhofer ISI et al 2009) As ETR is directly aimed at reducing labour costs it will create additional jobs in the short and medium term In the longer term the cost reduction and new technologies arising from eco-innovation will play a larger role
Like all fiscal reforms a major ETR in Europe will create winners and losers At the sector level carbon- and material-intensive industries will face economic losses At the country level the carbon-intensity and overall flexibility of economies is important Clearly structural change away from carbon-intensive industries together with technological change is inherent in any successful climate mitigation policy
On the other hand several factors can smooth these structural adjustments International cooperation
will reduce economic pressure on countries and sectors In addition ETR together with auctioning of ETS allowances can be a major source of revenues for EU Member States in the future even if part of the revenues will have to be earmarked for adaptation and mitigation measures in developing countries Indeed future debate on grandfathering or auctioning ETS allowances should reflect the important point that giving allowances away for free denies countries the money to ease structural change and invest in low-carbon technologies
Caution is needed in relating the findings of this study to the EU policy debate In the model simulations the single carbon price is the only instrument used to reach the EUs 2020 GHG targets In reality of course other renewable energy and efficiency policies will also contribute to carbon reduction and have to be taken into account when comparing the results (especially the high carbon prices) to other studies Both reduce the potential revenues from fossil energy carriers and carbon emissions
A variety of renewable energy and efficiency policies could enable the climate and energy targets to be met while securing even better economic prospects The results of the present study clearly indicate that the discussion on market-based instruments should be intensified Ultimately however the EU will need a rich mix of policies to reach its GHG targets while maximising prosperity
Environmental tax reform in Europe opportunities for eco-innovation38
References
Almon C 1991 The INFORUM Approach to Interindustry Modeling in Economic Systems Research Vol 3 pp 1ndash7
Amin A and Cohendet P 2004 The Architecture of Knowledge Firms Capabilities and Communities Oxford University Press Oxford
Barker T Meyer B Pollitt H and Lutz C 2007a Modelling Environmental Tax Reform in Germany and the United Kingdom with E3ME and GINFORS petre Working Paper Cambridge and Osnabrueck (httpwwwpetreorgukpapershtm) accessed 15 February 2011
Barker T Junankar S Pollitt H and Summerton P 2007b Carbon leakage from unilateral environmental tax reforms in Europe 1995ndash2005 Energy Policy Vol 35 pp 6 281ndash6 292
Brunnermeier S B and Cohen M A 2003 Determinants of environmental innovation in US manufacturing industries Journal of Environmental Economics and Management Vol 45 pp 278ndash293
Buen J 2006 Danish and Norwegian wind industry The relationship between policy instruments innovation and diffusion Energy Policy Vol 34 (18) pp 3 887ndash3 897
Carlsson B and Stankiewicz R 1991 On the nature function and composition of technological systems Journal of Evolutionary Economics Vol 1 (2) pp 93ndash118
Christiansen A C and Skjaerseth J B 2005 Climate change policies in Norway and the Netherlands Different instruments similar outcome Energy and Environment Vol 16(1) pp 1ndash25
Dosi G 1988 Sources procedures and microeconomic effects of innovation Journal of Economic Literature Vol 26 pp 1 120ndash1 171
de Vries F and Medhi N 2008 Environmental regulation and international innovation in automotive emissions control technologies in Environmental Policy Technological Innovation and Patents Organisation for Economic Cooperation and Development Paris
DG TREN 2008 European energy and transport mdash trends to 2030 mdash update 2007 European Commission Luxembourg
DTI 2004 Renewable Supply Chain Gap Analysis UK Department of Trade and Industry
Edler J (ed) 2006 Nachfrageorientierte Innovationspolitik Buumlro fuumlr Technikfolgenabschaumltzung beim Deutschen Bundestag (TAB) Arbeitsbericht Nr 99 Berlin
Edquist C 2001 The system of innovation approach and innovation policy an account of the state of the art lead paper presented at the DRUID Conference 12ndash15 June 2001 Aalborg (httpwwwdruiddkconferencesnwpaper1edquistpdf) accessed 15 February 2011
EEA 2006 Using the market for cost-effective environmental policy Market-based instruments in Europe EEA Report No 12006 European Environment Agency Copenhagen
Ekins P 2009 Resource Productivity Environmental tax Reform and Sustainable Growth in Europe published by the Anglo-German Foundation for the Study of Industrial Society Final report (httpwwwpetreorgukpdfFinRepFinpdf) accessed 12 October 2011
Ekins P and Speck S (eds) 2011 Environmental Tax Reform (ETR) A Policy for Green Growth Oxford University Press
EREC 2008 Energy [r]evolution A sustainable global energy outlook Greenpeace International European Renewable Energy Council (EREC)
References
References
Environmental tax reform in Europe opportunities for eco-innovation 39
Fagerberg J Mowery D C and Nelson R R (eds) 2005 The Oxford Handbook of Innovation Oxford University Press Oxford
Fischer C Parry I W H and Pizer W A 2003 Instrument choice for environmental protection when technological innovation is endogenous Journal of Environmental Economics and Management Vol 45 pp 523ndash545
Fraunhofer ISI ECOFYS Energy Economics Group Ruumltter + Partner SEURECO and LEI 2009 EmployRES mdash The impact of renewable energy policy on economic growth and employment in the European Union European Commission Brussels
Frondel M Horbach J and Rennings K 2008 What triggers environmental management and innovation Empirical evidence for Germany Ecological Economics Vol 66(1) pp 153ndash160
GHK Cambridge Econometrics and IEEP 2007 Links between the environment economy and jobs Final Report submitted to DG Environment European Commission
Giljum S Behrens A Hinterberger F Lutz C and Meyer B 2008 Modelling scenarios towards a sustainable use of natural resources in Europe Environmental Science and Policy Vol 11 pp 204ndash216
Goumlrlach B Knigge M and Luumlckge H 2005 Wirkungen der Oumlkologischen Steuerreform auf Innovation und Marktdurchdringung Ecologic Berlin (httpecologiceudownloadprojekte1850-189918791879_5_innovationpdf) accessed 18 August 2011
Green M A 2000 Photovoltaics technology overview Energy Policy Vol 28 (14) pp 989ndash998
Grossmann A Lehr U Lutz C and Wolter MI 2008 Gesamtwirtschaftliche Effekte der Umsetzung der EU Ziele im Bereich Erneuerbare Energien und Gebaumludeeffizienz in Oumlsterreich bis 2020 Studie im Auftrag des Lebensministeriums Wien 0508
Hage J and Hollingsworth J R 2000 Idea innovation networks a strategy for integrating organizational and institutional analysis Organization Studies Vol 21 (5) pp 971ndash1 004
Hauschildt J 2004 Innovationsmanagement Vahlen Muumlnchen
Hemmelskamp J 1997 Environmental policy instruments and their effects on innovation European Planning Studies Vol 5 (2) pp 177ndash195
Hoglund Isaksson L 2005 Abatement costs in response to the Swedish charge on nitrogen oxide emissions Journal of Environmental Economics and Management Vol 50 pp 102ndash120
Hullmann A 2001 Internationaler Wissenstransfer und technischer Wandel (dissertation) Physica-Verlag Heidelberg
IEA 2008 World Energy Outlook 2008 International Energy Agency Paris
IEA 2009 World Energy Outlook 2009 International Energy Agency Paris
Jacobsson S Andersson B A and Baringngens L 2002 Transforming the energy system mdash the evolution of the German technological system for solar cells Science and Technology Policy Research University of Sussex Electronic Working Paper Series No 84 (httpideasrepecorgpsrussewps84html) accessed 18 August 2011
Jaffe A and Stavins R 1995 Dynamic incentives of environmental regulations the effects of alternative policy instruments on technology diffusion Journal of Environmental Economics and Management Vol 29(3) pp 43ndash63
Jaffe A B and Palmer K 1997 Environmental regulation and innovation a panel data study The Review of Economics and Statistics Vol 79 pp 610ndash619
Jaffe A B Newell R G and Stavins R N 2002 Environmental policy and technological change Environmental and Resource Economics Vol 22 (1ndash2) 2002 pp 41ndash70
Johnstone N and Hascic I 2008 Renewable energy policies and technological innovation energy source and instrument choice in Environmental Policy Technological Innovation and PatentsOrganisation for Economic Co-operation and Development Paris
Johnstone N 2005 The Innovation Effects of Environmental Policy Instruments in Horbach J (ed) Indicator Systems for Sustainable Innovation Physica-Verlag HD
Environmental tax reform in Europe opportunities for eco-innovation
References
40
Johnstone N Hascic I and Ostertag K 2008 Environmental policy technological innovation and patent activity in Environmental Policy Technological Innovation and Patents Organisation for Economic Co-operation and Development Paris
Jung C Krutilla K and Boyd R 1996 Incentives for advanced pollution abatement technology at the industry level an evaluation of policy alternatives Journal of Environmental Economics and Management Vol 30(1) pp 95ndash111
Kammen D M Kapidia K and Fripp M 2004 Putting renewables to work how many jobs can the clean energy industry generate University of California Berkeley
Kemp R 1997 Environmental policy and technical change ndash a comparison of the technological impact of policy instruments Edward Elgar Cheltenham
Kemp R 1998 The diffusion of biological waste-water treatment plants in the Dutch food and beverage industry Environmental and Resource Economics Vol 12 pp 113ndash136
Kemp R 2000 Technology and environmental policy ndash innovation effects of past policies and suggestions for improvement in OECD proceedings ndash innovation and the environment Organisation for Economic Co-operation and Development Paris
Kerr S and Newell R G 2003 Policy-induced technology adoption evidence from the US lead phasedown Journal of Industrial Economics Vol 51 pp 317ndash343
Klaassen G Miketa A Larsen K and Sundqvist T 2005 The impact of RampD on innovation for wind energy in Denmark Germany and the United Kingdom Ecological Economics Vol 54 pp 227ndash240
Kline S and Rosenberg N 1986 An overview of innovation in Landau R (ed) The positive sum strategy Harnessing technology for economic growth pp 275-306
Knigge M and Goumlrlach B 2005 Effects of Germanys ecological tax reforms on the environment employment and technological innovation Ecologic Berlin (httpwwwumweltbundesamtdeuba-info-presse-ehintergrundoekosteuerpdf) accessed 18 August 2011
Langniss O 2003 Governance structures for promoting renewable energy sources dissertation Lund Stuttgart
Lanjouw J O and Mody A 1996 Innovation and the international diffusion of environmentally responsive technology Research Policy Vol 25 pp 549ndash571
Lehr U Nitsch J Kratzat M Lutz C and Edler D 2008 Renewable Energy and Employment in Germany Energy Policy Vol 36 pp 108ndash117 DOI101016jenpol200709004
Lehr U Wolter MI and Groszligmann A 2009 Economic impacts of RES obligations in Austria ndash an application of the macro-econometric model e3at GWS Discussion Paper 20091 Osnabruumlck
Lundvall B-A Johnson B Andersen E S and Dalum B 2001 National systems of production innovation and competence building Research Policy Vol 31 pp 213ndash231
Lutz C and Giljum S 2009 Global resource use in a business as usual world until 2030 Updated results from the GINFORS model in Bleischwitz R Welfens Pand Zhang Z (eds) Sustainable growth and resource productivity ndash economic and global policy issues Greenleaf Publishers pp 30ndash41
Lutz C and Meyer B 2008 Beschaumlftigungseffekte des Klimaschutzes in Deutschland Untersuchungen zu gesamtwirtschaftlichen Auswirkungen ausgewaumlhlter Maszlignahmen des Energie- und Klimapakets Forschungsbericht 205 46 434 Dessau-Roszliglau
Lutz C and Meyer B 2009a Environmental and Economic Effects of Post-Kyoto Carbon Regimes Results of Simulations with the Global Model GINFORS Energy Policy Vol 37 pp 1 758ndash1 766 DOI 101016jenpol200901015
Lutz C and Meyer B 2009b Scenario results from GINFORS PETRE working paper Osnabruumlck
Lutz C Meyer B Nathani C and Schleich J 2005 Endogenous technological change and emissions The case of the German steel industry Energy Policy Vol33 pp 1 143ndash1 154
Lutz C Meyer B Nathani C and Schleich J 2007 Endogenous innovation economy and environment impacts of a technology based modelling approach for energy-intensive industries in Germany Energy Studies Review Vol 15(1) pp 2ndash18
References
Environmental tax reform in Europe opportunities for eco-innovation 41
Lutz C Meyer B and Wolter M I 2009 The global multisectormulticountry 3-E model GINFORS mdash a description of the model and a baseline forecast for global energy demand and CO2 emissions Journal of Sustainable Development forthcoming
Malerba F and Orsenigo L 1997 Technological Regimes and Sectoral Patterns of Innovative Activities Industrial and Corporate Change Vol 6 (1) pp 83ndash117
Malerba F 1992 Learning by Firms and Incremental Technical Change The Economic Journal Vol 102 (413) pp 845ndash859
Malerba F 2005 Industrial dynamics and innovation progress and challenges Presidential Address delivered at the 32nd Conference of the European Association for Research in Industrial Economics (EARIE) 1ndash4 September 2005 Porto
Malerba F 2006 Innovation and the evolution of industries Journal of Evolutionary Economics Vol 16 pp 3ndash23
McGinty M and de Vries F P 2009 Technology diffusion product differentiation and environmental subsidies The BE Journal of Economic Analysis and Policy Vol 9(1)
Meyer B and Lutz C 2007 The GINFORS model ndash model overview and evaluation Petre Working Paper Osnabruumlck (httpwwwpetreorgukpapershtm) accessed 18 August 2011
Meyer B Lutz C Schnur P and Zika G 2007 Economic policy simulations with global interdependencies a sensitivity analysis for Germany Economic Systems Research Vol 19 pp 37ndash55
Mickwitz P H Hyvaumlttinen and P Kivimaa 2008 The role of policy instruments in the innovation and diffusion of environmentally friendlier technologies popular claims versus case study experiences Journal of Cleaner Production Vol 16(1S1) 162ndash170
Miketa A and Schrattenholzer L 2004 Experiments with a methodology to model the role of RampD expenditures in energy technology learning processes first results Energy Policy Vol 32 (15) pp 1 679ndash1 692
Milliman S R and Prince R 1989 Firm incentives to promote technological change in pollution control Journal of Environmental Economics and Management Vol 17 pp 247ndash265
Millock K and Nauges C 2006 Ex-post evaluation of an earmarked tax on air pollution Land Economics Vol 82(1) pp 68ndash84
Montero J-P 2002 Market structure and environmental innovation Journal of Applied Economics Vol 2 pp 293ndash325
Moreno B and Loacutepez A J 2007 The effect of renewable energy on employment mdash The case of Asturias (Spain) Renewable and Sustainable Energy Rewiews doi 101016jrser200610011
Mowery D and Rosenberg N 1979 The influence of market demand upon innovation A critical review of some recent empirical studies Research Policy Vol 8 pp 102ndash153
Newell R G Jaffe A B and Stavins R N 1999 The induced innovation hypothesis and energy-saving technological change Quarterly Journal of Economics Vol 114 pp 941ndash975
Norberg-Bohm V 1999 Stimulating green technological innovation An analysis of alternative policy mechanisms Policy Sciences Vol 32(1) pp 13ndash38
OECD 2009 Sustainable manufacturing and eco-innovation towards a green economy Organisation for Economic Co-operation and Development Policy Brief June 2009
OECD 2010 Taxation innovation and the environment Organisation for Economic Co-operation and Development
Pavitt K 1984 Sectoral patterns of technological change Towards a taxonomy and a theory Research Policy Vol 13 pp 343ndash373
Popp D 2002 Induced innovation and energy prices The American Economic Review Vol 92(1) pp 160ndash180
Popp D 2005 Lessons from patents Using patents to measure technological change in environmental models Ecological Economics Vol 54 pp 209ndash226
Environmental tax reform in Europe opportunities for eco-innovation
References
42
Porter M and van der Linde C 1995 Toward a new conception of the environment competitiveness relationship Journal of Economic Perspectives Vol 9(4) pp 97ndash118
Rammert W 2002 The cultural shaping of technologies and the politics of technodiversity In Sorensen K and Williams R (eds) Shaping technology guiding policy concepts spaces and tools Elgar Cheltenham pp 155-172
Requate T 2005 Dynamic incentives by environmental policy instruments ndash a survey Ecological Economics Vol 54 pp 175ndash195
Roloff N Lehr U Krewitt W Fuchs G Wassermann S Weimer-Jehle W and Schmidt B 2008 Success determinants for technological innovations in the energy sector mdash the case of photovoltaics in Moumlst D Fichtner W Ragwitz M and Veit D (eds) New methods for energy market modelling mdash Proceedings of the first european workshop on energy market modelling using agent-based computational economics Universitaumltsverlag Karlsruhe
Rothwell R 1995 The fifth generation innovation process in Oppenlaumlnder KH Popp W (eds) Innovationen und wirtschaftlicher Fortschritt betriebs-und volkswirtschaftliche Perspektiven Bern pp 9ndash26
Schumpeter J 1942 Capitalism socialism and democracy New York Harper
Skjaeligrseth J B and Christiansen A C 2005 Environmental policy instruments and technological change in the energy sector findings from comparative empirical research Energy and Environment Vol 17 (2) pp 223ndash241
Snyder L D Miller N H and Stavins R N 2003 The effects of environmental regulations on pollution emissions evidence from plant-level data American Economic Review Vol 93(2) pp 431ndash435
Technopolis 2008 Eco-innovation Final Report for Sectoral Innovation Watch (httpwwwtechnopolis-groupcomresourcesdownloads661_report_finalpdf) accessed 18 August 2011
Volleburgh H 2007 Impacts of environmental policy instruments on technological change Report for Joint Meetings of Tax and Environment Experts OECD Environment Directorate February 2007 (comenvepocctpacfa(2006)36final)
Zimmermann H Wohltmann M and Hansjuumlrgens B 1996 Umweltabgaben und Innovation Analytica Marburg
43
Annex 1
Environmental tax reform in Europe opportunities for eco-innovation
Type Instrument Area Stage
Reference
Theo
retica
l
Em
piric
al
Cas
e st
udy
Rev
iew
Qual
itat
ive
Taxe
s
Perm
its
Subsi
die
s
Volu
nta
ry
Com
man
d
Reg
ula
tion
Ener
gy
Air
Wat
er
Oth
er
Gen
eral
Innov
atio
n
Diffu
sion
Rel
evan
ce
Brunnermeier amp Cohen (2003)
X X X X
Buen (2006) X X X X X X
Christiansen amp Skjaerseth (2005)
X X X X X X
Fischer et al (2003 X X X X X X
Frondel et al (2008) X X X X X X X (X) (X)
Hemmelskamp (1997)
X X X X X X X (X)
Hoglund Isaksson (2005)
X X X (X) (X)
Jaffe amp Stavins (1995)
X X X1 X X X X
Jaffe amp Palmer (1997)
X X X X
Jaffe et al (2002) X X X X X X X X X X
Jung et al (1996) X X X X X X (X) (X)
Kemp (1998) X X X X
Kerr amp Newell (2001) X X X X X
Klaassen et al (2005)
X X X X X
Lanjouw amp Mody (1996)
X X X X X X X
McGinty amp de Vries (2009)
X X X X
Mickwitz et al (2008)
X X X X X X X X X
Milliman amp Prince (1989)
X X X X X X X
Millock amp Nauges (2006)
X X X X X X
Montero (2002) X X X X X
Newell et al (1999) X X1 X X X
Norberg-Bohm (1999)
X X X X X X X
Popp (2002) X X1 X X
Popp (2005) X X X X X X
Porter amp van der Linde (1995)
X X X X X X
Requate (2005) X X X X X X X
Skjaeligrseth amp Christiansen (2005)
X X X X X X X X X
Snyder et al (2003) X X X X X
Annex 1 Classification of refereed journal articles
Environmental tax reform in Europe opportunities for eco-innovation44
Annex 2
Type Instrument Area Stage
Reference
Theo
retica
l
Em
piric
al
Cas
e st
udy
Rev
iew
Qual
itat
ive
Taxe
s
Perm
its
Subsi
die
s
Volu
nta
ry
Com
man
d
Reg
ula
tion
Ener
gy
Air
Wat
er
Oth
er
Gen
eral
Innov
atio
n
Diffu
sion
Rel
evan
ce
Johnstone (2005)
X X X X X X X
Johnstone amp Hascic (2008)
X X X X X X X X
Kemp (1997) X X X X X X X X X X X X X
Kemp (2000) X X X X X X X X X
de Vries amp Medhi (2008)
X X1 X X X
Annex 2 Classification of books and book chapters
45
Annex 3
Environmental tax reform in Europe opportunities for eco-innovation
Type Instrument Area Stage
Reference
Theo
retica
l
Em
piric
al
Cas
e st
udy
Rev
iew
Qual
itat
ive
Taxe
s
Perm
its
Subsi
die
s
Volu
nta
ry
Com
man
d
Reg
ula
tion
Ener
gy
Air
Wat
er
Oth
er
Gen
eral
Innov
atio
n
Diffu
sion
Rel
evan
ce
Goumlrlach et al (2005)
X X X X X X
Knigge amp Goumlrlach (2005)
X X X X X X
Technopolis (2008)
X X X X X X
Volleburgh (2007)
X X X X X X X X X X X
Annex 3 Classification of reports
European Environment Agency
Environmental tax reform in Europe opportunities for eco-innovation
2011 mdash 45 pp mdash 21 x 297 cm
ISBN 978-92-9213-238-5doi10280084889
How to obtain EU publications
Publications for salebull viaEUBookshop(httpbookshopeuropaeu)bull fromyourbooksellerbyquotingthetitlethepublisherandorISBNnumberbull bycontactingoneofoursalesagentsdirectlyYoucanobtaintheircontactdetails
on the Internet (httpbookshopeuropaeu) or by sending a fax to +352 2929-42758
Free publicationsbull viaEUBookshop(httpbookshopeuropaeu)bull attheEuropeanCommissionsrepresentationsordelegationsYoucanobtain
their contact details on the Internet (httpeceuropaeu) or by sending a fax to +352 2929-42758
European Environment AgencyKongens Nytorv 61050 Copenhagen KDenmark
Tel +45 33 36 71 00Fax +45 33 36 71 99
Web eeaeuropaeuEnquiries eeaeuropaeuenquiries
TH
-AK-1
1-0
17-E
N-N
doi1
02
8008
4889
- Acknowledgements
- Executive summary
- 1Introduction
-
- 11Background
- 12ETR and innovation
- 13Report structure
-
- 2Review of literature on environmental tax reform and eco‑innovation
-
- 21Initial screening
- 22Detailed review
- 23Environmental regulation studies
- 24Theoretical studies
- 25Empirical studies
- 26Case studies
- 27Conclusions
-
- 3Modelling of ETR impacts on eco‑innovation
-
- 31Scenarios assessing the implications of ETR for eco-innovation
- 32Overview of modelling results
- 33Macroeconomic impacts at the national level
- 34Conclusions of the scenario assessment
-
- References
- Annex 1 Classification of refereed journal articles
- Annex 2Classification of books and book chapters
- Annex 3Classification of reports
-
Review of literature on environmental tax reform and eco-innovation
Environmental tax reform in Europe opportunities for eco-innovation 15
freely allocated tradable permits although not as great as auctioned permits However the optimal agency response is likely to face less opposition (and in some cases actually be favoured) under emission taxes than under auctioned permits (13)
Jaffe and Stavins (1995) develop a theoretical framework for comparing empirically the impacts of alternative policy instruments on the diffusion of a new technology (14) They model the investment decision for both an existing firm and a new entrant in each case assuming that over time the firm minimises the present value of its cost streams (operating costs investment cost net of any government subsidy emission taxes and the implicit costs of violating either a performance or technology standard if applicable) For an existing firm the problem is to choose the optimal timing of the retrofit and the authors show that the new technology will be adopted at a particular time if operating cost savings plus savings from reduced emission tax payments (plus any avoided penalties for not adopting a technology standard or exceeding a performance standard) in that period are greater than the net investment costs less the time rate of change of net investment costs For a new entrant the problem is to choose whether to use the new technology at start-up A necessary condition for doing so is that the present value of operating costs savings and reduced tax payments (plus any avoided penalties) over the entire time horizon is greater than the net investment cost Thus while the conditions differ in each case the introduction of either an emissions tax or an investment subsidy (or increases in the respective values) changes the benefit-cost balance in favour of the new technology bringing forward its adoption by existing firms and increasing the likelihood of adoption by new entrants
Kemp (1997) compares the abatement RampD expenditure levels of an individual firm under direct regulation (ie an emissions limit) an equivalent emission tax (15) and freely allocated tradable permits using a cost minimisation analytical framework and a specific functional form for the abatement cost function He shows that both the
level of RampD expenditure and the level of emissions reduction increase as the emissions tax rate increases and that both are greater under the tax than under direct regulation The corresponding levels under the tradable permit regime will be greater under the emissions tax if the (exogenous) permit price is higher than the tax rate and vice versa Kemp also considers the impact of subsidising the cost of the firms RampD effort and shows that increasing the subsidy rate causes a rise in pollution-control RampD More interestingly the impact of the subsidy is greater if it is combined with an emissions tax than with an equivalent emissions limit
Fischer et al (2003) develop the approach used by Milliman and Prince (1989) although their analysis differs in that it does not include the final agency response stage and the diffusion of the technology is determined by market forces with an equilibrium royalty price (16) They compare an emissions tax with auctioned and freely allocated permits using a three-stage model of innovation diffusion and emissions abatement In the first stage the innovating firm decides how much to invest in RampD to develop an emissions abatement technology In the second stage other firms decide whether to adopt this technology in return for a royalty fee or whether to use an (imperfect) imitation technology In the final stage all firms choose their level of abatement to minimise costs given an emissions tax or permit price They show that the level of innovation (ie the level of RampD chosen by the innovating firm) is determined by equating the marginal cost of innovation with the marginal (private) benefit The latter has four components mdash an abatement cost effect an emissions payment effect an imitation effect and an adoption price effect mdash and the last two components are negative (17) Using this model the authors demonstrate that freely allocated permits provide the lowest incentive for innovation However in contrast to Milliman and Prince they conclude that the relative ranking of the emissions tax and auctioned permits is ambiguous It depends crucially on the extent to which the technology can be imitated and hence the extent to which the innovator can appropriate the gains accruing to
(13) For an emissions tax the downward shift of the industry marginal abatement cost curve as a result of diffusion causes the agency to reduce the tax rate assuming that marginal damages are increasing in emissions For permits (auctioned or freely allocated) it causes the agency to reduce the number of permits
(14) The empirical application of this framework is summarised below under Section 25 on empirical evidence(15) That is the emissions tax is set equal to the firms marginal cost of abatement under the direct regulation(16) In addition to assessing the impacts on demand for innovation Fischer et al (1998) consider the impacts of the innovation and
diffusion processes on social welfare in order to compare the overall economic efficiency of the different instruments(17) Milliman and Prince capture only the first two effects in their analysis
Environmental tax reform in Europe opportunities for eco-innovation
Review of literature on environmental tax reform and eco-innovation
16
the other firms in the form of royalty payments If imitation is high (easy) then auctioned permits provide the greater incentive for innovation However if imitation is low (difficult) then the emissions tax provides the greatest incentive
Montero (2002) assesses the impacts of alternative policy instruments on environmental innovation (as measured by RampD expenditure) under conditions of imperfect competition In his model two firms compete in either quantities (ie Cournot duopoly) or prices (ie Bertrand duopoly) while being subject to some form of environmental regulation Where the regulation takes the form of tradable permits mdash either auctioned or freely allocated mdash the market is also assumed to be imperfect the firms competing in permit quantities The interaction between the two firms is modelled as a multi-stage game with the number of stages depending on the instrument being analysed In this framework a firms incentive to invest in RampD comprises two components a direct or cost minimising effect and a strategic effect reflecting the impact of its RampD expenditure on the other firms output decision The latter may be positive or negative depending on the market-regulatory structure Under Bertrand competition (ie where products are strategic complements) freely allocated permits provide the lowest incentive for innovation followed by the emission-standard The relative ranking of an emissions tax and auctioned permits is ambiguous depending on model parameter values Under Cournot competition (ie where products are strategic substitutes) the relative ranking of the emissions tax auctioned permits and the emissions-standard are ambiguous although all provide a greater incentive than freely allocated permits Indeed Montero provides a numerical example where the emissions standard provides the greatest incentive for innovation Finally he considers the impact of increasing competition (increasing the number of firms) and concludes that under perfect competition the emissions tax provides the greatest incentive for innovation
Millock and Nauges (2006) use a simple profit-optimisation model to analyse a firms choice of abatement effort to reduce emissions
per unit of energy used in production While they do not explicitly identify it as such this effort can be interpreted in terms of diffusion of an existing technology mdash with higher effort corresponding to greater diffusion This is consistent with the overall objective of their study which is to assess the impact of combining an emissions tax with a subsidy on (existing) abatement equipment (18) In their model the firm simultaneously chooses the levels of its energy input and abatement effort given exogenous output and energy prices and a cost function for abatement effort (19) They show that while increases in the subsidy rate (expressed as a percentage of the gross investment cost) unambiguously increases abatement effort the impact of increases in the tax rate depends on whether the direct impact of tax increase on the marginal benefit of abatement effort (shifting it up) outweighs the indirect impact via the resulting reduction in output (shifting it down) If the latter dominates then increases in the tax rate will reduce the optimal level of abatement effort The authors show that a necessary and sufficient condition for the direct impact to dominate is that the slope of the firms (inverse) demand for energy is greater than the average emissions tax payment per unit of energy in relation to total energy use (20)
McGinty and de Vries (2009) analyse the relationship between environmental subsidies the diffusion of a clean technology and the degree of product differentiation in an imperfectly competitive output market In their model a fixed number of firms can choose individually between using a clean production technology and a dirty technology Both technologies exhibit constant marginal production costs and constant emission rates (with the clean technology having a lower emission rate and higher unit cost) and consumers are assumed to be able to differentiate between products on the basis of the technology used in their production (21) The subsidy regime is different to that considered by the other studies in that it is applied to the production cost of the clean good and thus reduces the (constant) marginal cost of production for that good As such it is equivalent to an output subsidy for the clean good The authors derive the equilibrium diffusion rate for the clean technology (ie the proportion of firms using
(18) In the second half of their paper Millock and Nauges (2006) undertake an empirical evaluation of such a scheme that operated in France during the 1990s for SO2 and NOX emissions The results of this analysis are summarised under Section 25 on empirical evidence
(19) Abatement effort is assumed to exhibit decreasing returns to scale ie the cost function is increasing and convex(20) If output is held fixed in the profit maximisation problem then increases in the emissions tax rate unambiguously increase the
optimal level of abatement effort as found by Kemp (1997) who uses a cost-minimisation framework for his analysis(21) The model assumes imperfect substitution between the clean good and dirty good with the willingness-to-pay for one good being
a linear function of the quantities of both goods individually ndash ie Pk = ak ndash bYk ndash cYj
Review of literature on environmental tax reform and eco-innovation
Environmental tax reform in Europe opportunities for eco-innovation 17
that technology) and show that an increase in the subsidy value increases diffusion for all degrees of product differentiation The impact is greater as the substitutability of the two goods increases They also briefly consider the impact of a technology subsidy that reduces the fixed cost of the clean technology and conclude that this too will stimulate diffusion but will be less efficient than the output subsidy (22)
Key findings of the theoretical studies
As is often the case with theoretical analyses the specifications of the models and the underlying assumptions of the studies reviewed here significantly influence the conclusions Nevertheless there is a reasonable degree of consistency between their findings The studies can be classified into two broad groups those that consider innovation and diffusion within an industry setting and those that consider an individual firms decision whether to undertake RampD (ie innovation) and invest in an abatement technology (ie diffusion) in order to reduce its own cost of abatement
The studies in the first group conclude that under conditions of perfect competition emission taxes and auctioned permits provide greater incentives for innovation than direct controls or freely allocated permits However there is some disagreement over the relative impacts of the two instruments Under the assumption that the innovator appropriates a fixed (exogenous) proportion of the gains accruing to the technology adopters Milliman and Prince (1989) conclude that auctioned permits provide the greatest incentive although the government may find it easier to adjust emission taxes in response to the resultant downward shift in marginal abatement costs However when the proportion is determined endogenously mdash in the form of a royalty payment mdash Fischer et al (2003) find that either auctioned permits or emission taxes can provide the greater incentive Emission taxes are likely to provide the greatest incentive if the innovator can appropriate a large proportion of the gains (because the technology is difficult to imitate)
Montero (2002) uses a slightly different framework to compare the impacts of different instruments on innovation (in the form of RampD expenditure)
in a situation of imperfect competition and finds that the ranking depends on the nature of the competition (23) Under Bertrand price competition in the output market the results are the same as under perfect competition the relative ranking of auctioned permits and taxes is ambiguous but both provide greater incentives for innovation than emission standards and freely allocated permits However under Cournot quantity competition any of the instruments apart from freely allocated permits can provide the greatest incentives depending on the model parameter values
The studies looking at an individual firms decision also show that an emissions tax can stimulate innovation and diffusion Jaffe and Stavins (1995) explicitly consider the firms decision criterion for investing in a new abatement technology and show that by increasing the benefits of investing the introduction of an emissions tax should bring forward its adoption by existing firms and make its use by new entrants more likely The other two studies consider the firms choice of optimal abatement effort in the context of maximising its total profits or minimising its total cost of emissions reduction This effort can take the form of RampD (innovation) or expenditure on abatement equipment (diffusion) The decision problem is the same in each case ie to choose the optimal level of effort
Kemp (1997) assumes that the firm seeks to minimise its total cost of emissions reduction mdash implicitly assuming that its output level is fixed mdash and demonstrates both that abatement effort increases as the emissions tax increases and that the optimal effort is lower under direct regulation than under an equivalent tax However when the firms output level is allowed to vary mdash as is the case with the profit maximisation problem considered by Millock and Nauges (2006) mdash the impact of an increase in the emissions tax rate on the level of abatement effort depends on the relative magnitudes of the direct impact and the indirect impact (via changes in output levels) on the marginal benefit of abatement effort If the latter dominates then an increase in the emissions tax rate leads to a reduction in the optimal level of abatement effort
(22) McGinty and de Vries (2009) derive expressions for the necessary technology subsidy values when diffusion is 0 and when it is 100 They state mdash without proof mdash that the latter is greater than the former Provided that the relationship between the subsidy and diffusion is monotonic this is a sufficient condition for increases in the subsidy value to cause increases in diffusion
(23) Monteros model does not include diffusion However it does include spillover effects where RampD by one firm reduces the abatement costs of the others
Environmental tax reform in Europe opportunities for eco-innovation
Review of literature on environmental tax reform and eco-innovation
18
Only one of the industry models considers the impact of investment subsidies Using a product differentiation model of imperfect competition McGinty and de Vries (2009) show that subsidising the unit cost of a clean production technology can accelerate its diffusion However the impact depends on the degree of substitutability between clean and dirty products diminishing as the products become more differentiated In contrast all three of the individual firm analyses consider the impact of investment subsidies with all demonstrating that increasing subsidies induce greater abatement effort Furthermore Kemp (1997) shows that the impact of an RampD subsidy is greater in the presence of an emissions tax than it is under an equivalent emissions limit
25 Empirical studies
Jaffe and Stavins (1995) use their theoretical framework (outlined above in Section 24) as the basis for assessing the diffusion of thermal insulation in new home construction in the United States using state-level panel data for the years 1979ndash88 They derive a reduced form equation for the energy efficiency level chosen by developers from the marginal cost-benefit condition in which the explanatory variables include energy prices installation costs and the presence of a relevant building code (as a dummy variable) Separate equations are estimated for ceiling floor and wall insulation with the coefficient for energy prices being positive in all three equations Although it is only significant (at the 95 level) for floor insulation the joint hypothesis that all price coefficients are zero is strongly rejected However the coefficients for installation cost (which are all negative as expected) are around two to three times greater in magnitude and of comparable significance The coefficients for the building code dummies are consistently insignificant (and negative in two cases) indicating that this form of direct regulation had minimal impact on household energy efficiency levels over the period The authors use the estimated models in a simulation to compare the effects of a 10 increase in energy prices (ie an energy tax) with those of a 10 reduction in installation costs (ie a technology subsidy) with each applied over the whole ten-year period While
the tax increases diffusion by 2ndash6 by the end of the period the technology subsidy increases diffusion by between 4ndash15
Kemp (1997) models the diffusion of biological water treatment technology in the Dutch food and beverage industry based on a rational choice threshold model of technology adoption decisions In this model a firm chooses to adopt an abatement technology if the resulting reduction in emission-tax payments is greater than the annualised total costs of the technology where a discount factor is applied to the savings to reflect uncertainty and risk aversion on the part of the decision-maker This is translated into a probabilistic model under the assumption that both the savings and the costs follow a log-normal distribution across plants The model is estimated econometrically using data for the period 1974ndash91 under different assumptions for the functional form of the discount factor and allowing for adjustment costs (24) The estimated parameters for the preferred specification of the discount factor are all significant and of the expected sign and magnitude and the model provides a very close fit to the actual diffusion of waste-water treatment technologies over the period This leads the author to conclude that the effluent charges were a significant positive factor in the diffusion of treatment technologies Indeed he estimates that only around 4 of plants would have installed waste-water treatment equipment by the end of the period if the charge had remained at its (low) 1974 level compared to the actual figure of over 40
Newell et al (1999) estimate the impact of energy prices energy efficiency standards and other factors on the energy efficiency of three types of electrical consumer durables (room air conditioners central air conditioners and gas water heaters) in USA between the 1970s and 1990s The analysis utilises a product characteristics model in which the frontier of technologically feasible products is described by a transformation surface that relates the bundle of product characteristics to the real cost of producing that bundle In this framework innovation is represented by movements of the surface and movements along the surface In particular the authors identify three types of innovation shifts in the surface towards the origin (overall technological change) changes in the slope
(24) Adjustment costs are accounted for by estimating a partial adjustment model in which the actual change in adoption is some fixed fraction of the desired change (estimated from the threshold model)
Review of literature on environmental tax reform and eco-innovation
Environmental tax reform in Europe opportunities for eco-innovation 19
of the surface (directional technological change) and changes in the mix of products along a given surface (model substitution) They define the surface in terms of two characteristics energy flow and cooling capacity and incorporate innovation by allowing the coefficients of the two variables to vary with time and (in the case of energy flow) energy prices and efficiency standards Separate equations are estimated for each durable type with slightly differing sets of explanatory variables and time periods The authors find little evidence that either energy prices or energy efficiency standards had any impact on overall technological change While all but one of the relevant coefficients have the expected sign none are significant In contrast they do find evidence that energy prices had an impact on directional technological change with the relevant coefficients being of the correct sign and significant for both room and central air conditioners
Popp (2002) uses patent data to estimate the effect of energy prices on energy-efficiency innovations in USA between 1970 and 1994 He regresses normalised energy-efficiency-related patent applications against energy prices controlling also for lagged knowledge stock and government RampD (25) The estimated coefficient for energy prices is highly significant producing a short-run price elasticity of 006 and a long-run elasticity 0354 Thus a 10 increase in energy prices would be expected to increase the number of energy-efficiency-related patents by around 35 in the long run The estimated mean lag is less than four years leading the author to conclude that the imposition of a carbon or energy tax would lead to a fairly quick shift towards environmentally friendly innovation
Hoglund Isaksson (2005) estimates abatement cost functions for the reduction of nitrogen oxide (NOX) emissions in three industrial sectors in Sweden (energy pulp and paper chemicals and food) The analysis uses a double-hurdle model applied to a pooled sample of 114 plants across the three sectors The data cover the period 1990ndash1996 which spans the introduction of the charge on NOX emissions in 1992 The estimated cost curves have a similar shape in all three sectors with minimal (or even negative) costs over a relatively broad range of emission reductions and then a steep rise as reductions exceed
a threshold level The analysis does not explicitly consider the issue of innovation However it does find that abatement cost curves shifted downwards significantly over the period In the energy sector for example the emission rate threshold for significant cost increases fell by around 45 between 1991 and 1996 (from 550 to 300 kgGWh) The author surmises that this is due to a combination of technological development and the discovery of previously unrecognised opportunities Unfortunately while this shift coincided with the introduction of the NOX charge the analysis does not provide any evidence of a causal link
As part of their analysis of the impacts of the French tax-subsidy scheme for NOX and sulphur dioxide (SO2) emissions Millock and Nauges (2006) estimate the impact of the emission taxes on a plants decision to install end-of pipe abatement equipment While the study is not concerned with innovation per se the results of this part can be interpreted as showing the impact of emission taxes on the diffusion of abatement equipment Under the scheme taxes were imposed on the emissions of these air pollutants (and VOCs) by all plants satisfying certain criteria The revenue raised by the taxes was earmarked for subsidising the cost of qualifying abatement technologies for technical studies (ie RampD) and for investment in air quality surveillance systems Using panel data for 226 plants in three industries (iron and steel coke and chemicals) for the period 1900ndash1998 the authors estimate a Probit model for the probability that a plant will install abatement equipment They find that the total value of emissions taxes paid by the plant (ie for both pollutants) has a positive impact on its decision to invest in abatement equipment However the magnitude of the effect varies considerably across the sectors and is only significant for the iron and steel sector
Frondel et al (2008) analyse responses to an OECD survey on environmental policy tools (conducted in 2003) to identify the factors that affect a firms decision to adopt an environmental management system (EMS) voluntarily and their environmental innovation behaviour Innovation is captured by a binary variable that indicates whether the firm has undertaken significant technical measures or changes to reduce the environmental impacts of
(25) Normalised energy efficiency patent values are calculated by dividing by the total number of patents granted This accounts for exogenous changes in patenting behaviour that affect all types of patents Popp constructs a value for existing knowledge as the stock of previously granted patents weighted by estimates that he derives for knowledge productivity He demonstrates that the exclusion of this variable from the model leads to biased estimates for the energy price coefficient
Environmental tax reform in Europe opportunities for eco-innovation
Review of literature on environmental tax reform and eco-innovation
20
production (26) The analysis is based on survey responses from 899 firms in Germany Latent variable equations for EMS adoption and innovation are estimated simultaneously with each equation including the same four sets of variables relating to motivations policy instruments pressure groups and facility characteristics (27) The policy instrument variables include five dummy variables indicating the importance of different types of policy instrument including market-based instruments such as emission taxes and tradable permits While the perceived stringency of environmental policy is found to be a significant factor in the decision to innovate there is no evidence that any of the individual policy instrument variables had any impact The authors surmise that this suggests that it is stringency of environmental policy rather than the choice of specific instrument that is important for innovation However as the authors note their results reflect the perceptions of the survey respondents and should therefore be treated as correlations rather than causal relationships
Johnstone and Hascic (2008) assess the impact of a range of environmental policy instruments mdash including tax measures and investment incentives mdash on innovation in the renewable energy field They analyse the impacts for five different groups of renewable energy technologies mdash wind solar ocean biomass and waste-to-energy mdash using a panel dataset of European Patent Office (EPO) patent filings for these technologies across 26 countries over the period 1978ndash2003 A fixed effects negative binomial model is estimated controlling for electricity prices and consumption public sector RampD expenditure (as a proxy for scientific capacity) and total EPO filings (as a proxy for differenceschanges in patenting propensity) The various policy instruments are represented by dummy variables indicating whether they were in place in a particular year As such the model takes no account of the stringency of the instruments mdash in particular the differing magnitudes of the tax measures and investment incentives (28)
Initially the authors estimate the model with all of the policy instruments included individually They find that while public policy plays an important role in inducing innovation the impacts of the individual instruments vary across the different technologies In particular tax measures are significant for wind and biomass technologies with investment incentives being significant for solar and waste-to-energy technologies and obligationstradable certificates being significant for wind technologies However the authors express concerns that there may be multicolinearity between the policy variables (particularly between investment incentives tax measures and tariffs) and also that there may be interaction effects between some of the variables Consequently they estimate two alternative versions of the model the first using a composite policy variable representing the number of policy instruments in place and the second using clusters of similar policy instruments (29) The results or these two models confirm the initial findings The composite policy variable is significant for all of the technology groups while the significance of the clusters varies across technologies The price-based cluster is (highly) significant for solar biomass and waste-to-energy The quantity-based cluster is significant for wind technologies The authors surmise that this may be due to the different economic characteristics of the technologies For example the significance of investment incentives for solar and waste-to-energy may reflect the capital intensity of these technologies with large up-front investment costs
De Vries and Medhi (2008) also use patent data to investigate the relative importance of environmental regulations and fuel prices on innovation in automotive emission-control technologies distinguishing between post-combustion devices and engine redesign technologies They estimate a panel data model using data from Germany Japan and USA over the period 1978ndash2001 controlling for industry value added (as a proxy for the scope of technological opportunities) and total patent
(26) The next question on the survey asks whether these are changes in production processes or end-of-pipe technologies However no distinction is made between these two types of innovation in the present study
(27) In order to avoid identification problems some individual variables are omitted from one equation or the other(28) This shortcoming is recognised by the authors who state that it is unavoidable in any cross-comparative analysis in which multiple
instruments are included(29) The clusters are price-based instruments (investment incentives tax measures and tariffs) quantity-based instruments (obligations
and tradable certificates) and voluntary programmes
Review of literature on environmental tax reform and eco-innovation
Environmental tax reform in Europe opportunities for eco-innovation 21
applications (as a proxy for differenceschanges in patenting propensity) Environmental regulation is represented by two dummy variables indicating the introduction of on-board diagnostic (OBD) regulations in USA (30) The results of the analysis suggest that the relative impacts of regulation and market forces differ between the two types of technology For post-combustion technologies both of the regulations are significant while fuel prices have no significant impact In contrast the opposite is the case for engine redesign technologies with fuel prices having a significant impact but regulation having no discernable effect While the analysis does not explicitly consider the impact of fuel taxes it suggests that an increase in automotive fuel taxes would have a major impact on innovation in relation to engine design The estimated coefficient for fuel prices (1287) implies that a USD 010 increase in fuel prices would induce a 14 increase in patenting activity (31)
Key findings of the empirical studies
The empirical studies considered above cover a range of different technology areas spanning energy efficiency (both product and process) renewable energy and air and water pollution abatement While in some cases they assess the impact of energy prices rather than environmental taxes per se they provide a clear picture of the likely impact of environmental and energy-related taxes on eco-innovation
Three of the studies assess the impact on diffusion of existing technologies All find that environmental taxesenergy prices have a positive impact on diffusion In particular the water effluent charges in The Netherlands appear to have had a major impact on the adoption of waste-water treatment equipment by the food and beverage industry in that country However there is some evidence to suggest that the effectiveness of taxesprices may vary across sectors (eg NOXSO2 abatement in France) and that investment incentivessubsidies may be more
effective in some cases (eg thermal insulation in USA)
Three of the studies use patent data to assess the impact of environmental taxes and energy prices on innovation with one of these also assessing the impact of investment incentives All find a significant positive impact although this depends on the particular sub-sector (eg renewable energy) or the type of innovation In particular the evidence from the automotive emissions control study suggests that taxesprices may be more effective in promoting process-related innovation (eg engine redesign) than innovation in end-of-pipe technologies One of the studies takes a different approach using a product-characteristics model to decompose improvements in the energy efficiency of consumer durables This finds that while electricity prices did not appear to affect overall technological change (ie shifts in the product costenergy efficiency frontier) they did have a positive impact on directional technological change (ie the slope of the frontier)
26 Case studies
Christiansen and Skjaerseth (2005) undertake a comparative analysis of the impacts of climate change policies on the petroleum sectors in Norway and the Netherlands during the 1990s These countries were selected because of their very different policy approaches with the Norwegian petroleum sector subject to a carbon dioxide (CO2) tax since 1991 as part of a portfolio of measures (32) and the Netherlands relying on a series of voluntary agreements on energy efficiency (33) Both approaches appear to have been effective in that CO2 emissions per unit production fell by around 22 between 1990 and 2001 in Norway while energy efficiency improved by around 35 in the Netherlands over the same period However there were marked differences between the two countries in terms of the nature of the innovation that
(30) Because of the international nature of the automotive industry and the importance of the US market regulations introduced in USA appear to have been an important driver for innovation by overseas manufacturers Regulations mandating the installation of OBD systems were first introduced in California in 1988 A more sophisticated system was mandated by the 1990 US Clean Air Act Amendments taking force in 1996
(31) The coefficient represents the semi-elasticity of patent applications with respect to fuel prices While the authors do not state so explicitly the implication is that prices are expressed in US dollars (they are obtained from the IEA Energy Prices and Taxes Database) Consequently the impact of a 10 US cent increase in the fuel prices is given by exp(1287 x 01) ndash 1 = 0137
(32) In addition to the tax the portfolio included publicly funded RampD support schemes gas flaring permits and mandatory environmental impact assessments
(33) The Dutch oil and gas industry first signed a declaration of intent with the government in 1995 This was translated into a long-term agreement (LTA) on energy efficiency in the following year with an improvement target of 20 over the period 1989ndash2000 In 2001 a new LTA was signed which committed firms to implementing energy efficiency measures with a positive NPV at a 15 discount rate or a five year payback period
Environmental tax reform in Europe opportunities for eco-innovation
Review of literature on environmental tax reform and eco-innovation
22
occurred In the Netherlands technological change was incremental reflecting a steady diffusion of available (ie known) technology In contrast the authors find evidence of more radical innovations and adaptations by the Norwegian petroleum sector including the development of energy-efficient gas turbines installation of waste heat recovery units process modifications and improved use of process heat While the authors acknowledge the impossibility of proving a causal link between policy intervention and innovation (in the context of their case study) they conclude that the CO2 tax played a key role in the development and implementation of these radical innovations and the benefits of reduced tax payments provided an important incentive However they also conclude that the impacts of the two instruments were conditioned by the political contexts in which they were applied and the problem characteristics in the respective countries (eg the economic significance of the sector and the size of installations)
Knigge and Goumlrlach (2005) summarise the findings of a comprehensive analysis of the impacts of the ETR in Germany That analysis undertaken jointly by Ecologic and the German Institute for Economic Research (DIW Berlin) included the impacts on innovation and market diffusion of environmentally friendly products and technologies (34) Based on a series of case studies the study concluded that the ETR had a noticeable effect on innovation and diffusion although it was not possible to quantify the scale of that effect In particular ETR is identified as being a central factor in the development of gas-powered vehicles The study identifies a number of different routes by which the ETR produced impacts First the payback period for energy-efficient products was reduced as a result of the energy tax increases and the various exemptions favouring efficient energy use and renewable energy sources Second the predictable nature of the energy taxes (as opposed to widely fluctuating oil prices) reduced uncertainties about the benefits of energy-efficiency investments Third the reduction in employers social contribution payments tended to reduce the costs of labour intensive innovation processes such as research and development energy consultancy and technology installation Finally the ETR had a signalling effect strengthening awareness of the need for more efficient and rational energy use
Mickwitz et al (2007) examine a number of claims that have been made in the environmental policy literature about the relationship between policy instruments and innovation based on experiences in two industrial sectors in Finland pulp and paper and the manufacture of diesel engines for ships In particular they assess the claims that environmental taxes are superior to other policy instruments with respect to innovation and that RampD subsidies have limited impacts on innovation With respect to the first claim the evidence provided by the two case studies is mixed The authors conclude that energy taxation had a negligible impact on innovation in the pulp and paper industry However this is likely to have been due to the low level of the tax and the exemptions that applied to the sector In contrast they find that the differentiation of Swedish fairway and port fees (on the basis of SO2 and NOX emissions) was a significant factor driving the installation of in-engine NOX reduction equipment in ferries operating between the two countries (35) With respect to RampD subsidies the authors conclude that the evidence does not support the claim that these have little effect In particular they find that RampD subsidies accelerated the development of ship engine emissions-reduction technologies
The findings of the three case studies are consistent with those of the empirical analyses reviewed in the previous section Environmental taxes and investment subsidies have proven significant in promoting both innovation and diffusion although not universally so Furthermore the case studies provide some useful insights about the ways in which the impacts occur and the factors that may be important in promoting innovation In particular they suggest the need for a tax rate that is sufficiently high to provide a meaningful incentive and signalling effect and that is fixed for a sufficiently long period of time to reduce uncertainty about the future benefits of investment
27 Conclusions
The studies reviewed in the preceding sections suggest that environmental regulation in general and price-based policy instruments such as environmental taxes and investment subsidies in particular can (in theory) and do (in practice) have a positive impact on both innovation and diffusion
(34) A separate report in German by Goumlrlach et al (2005) provides details of the evaluation of the innovation and diffusion impacts (35) Although the tax was introduced in Sweden it was also payable by Finnish ferry operators entering Swedish ports and hence
affected their investment decisions This is another example of the cross-border impact of environmental policy interventions on innovation found by Lanjouw and Mody (1996) (see Section 23)
Review of literature on environmental tax reform and eco-innovation
Environmental tax reform in Europe opportunities for eco-innovation 23
of environmental technologies However the supporting empirical and case study evidence is not universal and the effectiveness of these instruments would appear to vary across different sectors and different types of innovation
To a certain extent such differences can be explained by the theoretical models In particular the impact of environmental taxes (relative to other instruments) is predicted to depend on the competitive structures of the markets in which the regulated firms operate and on the ability of innovator firms to appropriate the benefits accruing to other firms during diffusion However a number of other potential factors have been identified in the literature which may affect the impact of price-based policy instruments on innovation
Jaffe et al (2002) caution that the impact of price-based policy instruments on technology diffusion may be adversely affected by a number of potential market failures including information failures principle-agent problems (eg landlord-tenant) capital market failures and positive adoption spillovers In addition while not market failures as such uncertainty over future returns and the (associated) use of high discount rates for investment decisions can also undermine the effectiveness of price-based instruments in stimulating diffusion However as was noted above the findings from the case study of ETR in Germany suggest that an environmental tax may actually reduce the level of uncertainty over future returns provided that it is of sufficient magnitude and longevity
Skjaerseth and Christiansen (2005) emphasise that the relationship between policy instruments (of all types) and technological change is extremely complicated They argue that account must be taken of the politicalindustrial context in which policy instruments are introduced and the nature of the environmental problem that they are intended to address In particular they make a distinction between malign problems where technological change involves net costs for target groups and benign problems where there are widespread no-regret opportunities for change Based on a comparative analysis of four different case studies they conclude that mandatory policy instruments (including environmental taxes) are more effective
in promoting short-term technological change when the problems are malign but that low legitimacy (with the target group) may undermine long-term technological change However when problems are benign or when long-term change requires cooperation voluntary policy instruments are likely to be more effective
Johnstone (2005) questions the focus of the theoretical and empirical analyses (reviewed above) on the impact of environmental policy instruments on the rate of technological change He argues that the direction of technological change is as important if not more so In addition to the quantity of innovation it is also important that innovation be socially optimal in the sense that it minimises the cost of attaining a particular environmental goal in the long term Inappropriate innovation today may result in lock in to a suboptimal technological path for the future
With this in mind Johnstone identifies a number of issues that can adversely affect the direction of innovation and should be taken into account when selecting and designing policy instruments technological market failures (36) missing markets for certain environmental attributes of innovation policy incidence and joint production of emissions Most studies of the innovation effects of environmental policy instruments assume that the only missing market is that for the environmental good (or bad) However in practice there may be other markets that are missing (or incomplete) which can adversely affect transmission of innovation incentives This is particularly so in the area of waste and resource management where instruments applied at the end of the product life cycle may have little or no impact on product design innovation Even if all markets are complete except for the environmental externality the point of incidence of the policy intervention may be more important for the direction of innovation than the choice of a particular policy instrument For example a limit or standard applied directly to the emissions of a pollutant may be more effective in promoting optimal innovation than a tax applied to a proxy input variable Finally when there is joint production of pollutants (eg CO2 and air pollutants from vehicle engines) there is a danger that if policy instruments (of whatever type) are applied to one pollutant in isolation the resulting innovation may
(36) These are the same market failures identified by Jaffe et al (2002)
Environmental tax reform in Europe opportunities for eco-innovation
Review of literature on environmental tax reform and eco-innovation
24
reduce emissions of that pollutant at the expense of increases in the others
In a related point Johnstone highlights the importance of using appropriate indicators when assessing the impact of policy instruments on innovation emphasising the need for these to reflect both the rate of innovation and the direction A necessary condition for this is that the indicators must provide an accurate and detailed picture of actual innovation Unfortunately this is difficult to achieve in practice For example the use of patent data as a measure of innovation requires the identification of relevant environmental technologies This is likely to be easier for end-of-pipe technologies than for process-related technologies meaning that the latter tend to be under-represented relative to their actual incidence To the extent that process-related innovation is growing in importance or is more important
for certain sectors or types of environmental problem changes in the value of the indicator may significantly understate the actual rate of innovation and misrepresent the direction
All of this suggests that caution should be exercised in drawing general definitive conclusions about the impacts of price-based policy instruments such as environmental taxes and investment subsidies on innovation particularly relative to other policy instruments While it would appear that they can be effective in stimulating both innovation and diffusion in many cases mdash at least in terms of the rate of technological change mdash there may be situations in which other policy instruments may be more appropriate In general the stringency and point of incidence of an environmental policy intervention may be more important than the choice of a particular policy instrument in determining the rate and direction of eco-innovation
25
Modelling of ETR impacts on eco-innovation
Environmental tax reform in Europe opportunities for eco-innovation
31 Scenarios assessing the implications of ETR for eco-innovation
Scenario analysis provides a useful means of improving understanding of how the different revenue recycling methods and various scales of ETR can help meet different greenhouse gas emissions targets
To investigate the impacts of an ETR for Europe the petre project elaborated a range of different scenarios reflecting various tax reform options In addition to employing several of these original scenarios the present study compiled two new scenarios to analyse the implications of ETR for eco-innovation All scenarios were examined in both E3ME and GINFORS (37)
311 Original petre project scenarios
The key petre scenarios relevant for the present study are
bull scenarioBHbaselinescenariowithhighenergyprice (reference case)
bull scenarioS1HETRdesignedtomeettheEUsunilateral 2020 GHG target (high energy price) with revenue recycling
bull scenarioS2HETRdesignedtomeettheEUsunilateral 2020 GHG target (high energy price) with revenue recycling and 10 of revenues spent on eco-innovation measures
Each of the ETR scenarios has the same key taxation components
bull acarbontaxrateisintroducedtoallnon-EUEmissions Trading System (EU ETS) sectors equal to the carbon price in the EU ETS that delivers an overall 20 reduction in greenhouse gas emissions by 2020 and in the international cooperation scenario this is extended to 30
bull aviationisincludedintheEUETSattheendofPhase 2
bull powergenerationsectorEUETSpermitsare100 auctioned in Phase 3 of the EU ETS
bull allotherEUETSpermitsare50auctionedin2013 increasing to 100 in 2020
bull materialtaxesareintroducedat5oftotalpricein 2010 increasing to 15 by 2020
In scenario S1H environmental tax revenues are recycled through reductions in income tax rates and social security contributions in each of the Member States such that there is no direct change in tax revenues In scenario S2H 10 of environmental tax revenues are recycled through spending on eco-innovation measures and the remaining 90 is recycled through the same measures as in the other scenarios The eco-innovation spending is split across power generation and housing according to tax revenues from the corporate and household sector
In GINFORS (the model used for analysing the implications of ETR and eco-innovation) the share of renewable sources in electricity production is increased due to the additional investment The rest of additional investment goes to household energy efficiency spending Investment needed for a certain increase in renewable energy production or efficiency improvement is based on Austrian and German experience (Lehr et al 2008 and 2009 Grossmann et al 2008 Lutz and Meyer 2008) This assumption is quite conservative as parameters for other countries can be assumed to be more positive (meaning that less money is needed for renewable energy technology installation or energy efficiency gains)
In scenario S1H the 20 GHG target translates into a 15 reduction in energy-related carbon emissions relative to 1990 as other emissions such as methane and nitrous oxide have already been reduced by
3 Modelling of ETR impacts on eco-innovation
(37) The E3ME and GINFORS models are introduced in Chapter 1 of the present report A detailed discussion of the models and scenarios used in the present study can be found in Ekins and Speck (2011)
Environmental tax reform in Europe opportunities for eco-innovation
Modelling of ETR impacts on eco-innovation
26
more than 20 (in terms of carbon equivalents) The target is reached by a tightened EU ETS cap and the introduction of a carbon tax on the non-ETS sector The tax rate applied is equal to the carbon price in the EU ETS that will deliver a 20 GHG reduction by 2020
The burden of ETR taxes are allotted to energy outputs (ie the final use of energy) and will be based on the carbon content of each fuel Carbon prices are assumed to be fully passed on to consumers All carbon taxes are in addition to any existing unilateral carbon and energy taxes The carbon reductions in the different EU Member States will be those that result from a uniform carbon tax increase across the EU
All of the revenues including EU ETS auctioning revenues carbon tax revenues and material tax revenues will be recycled The proportion of tax raised by industry will be recycled into a reduction in employers social security contributions which will in turn reduce the cost of labour Recycling will be additional to the existing ETRs in some Member States Revenues raised from households will be recycled through standard rate income tax reductions Traditional energy tax revenues will be lower compared to their respective baselines as the tax base (energy consumption) is reduced So for an ETR revenue-neutrality does not mean budget-neutrality
312 Factors affecting the macroeconomic impacts of RES technologies
Earlier analyses (Lehr et al 2008 Fraunhofer ISI et al 2009 DTI 2004 Kammen et al 2004 Moreno and Loacutepez 2007) have studied the impacts of large renewable energy source (RES) shares in the energy mix for different countries The overall question in these studies has been the impact of increasing RES shares on the economy especially on the labour market For the present study it is interesting to note that macroeconomic impacts of higher RES shares mainly depends on the following five factors
1 additional investment in RES (minus lower investment in conventional sources ie fossil and nuclear power) with the impact increasing if a country manufactures the RES technology in question
2 additional (net) exports due to improved international competitiveness of renewable energy sources (first mover advantage)
3 lower fossil fuel needs4 the cost differences between RES and
conventional energy
5 the shift from capital- and energy-intensive industries to labour- and technology-intensive industries
All five factors are driven by international energy prices carbon prices the policy framework and RES technology development itself Innovation comes into the play at various stages First innovation drives the currently positive additional costs of RES technologies down and even into negative realms depending on the fossil fuel scenario Second innovative RES technologies are likely to have a competitive advantage in international markets Although a significant proportion of RES technology produced in Europe is traded in Europe innovation will still provide an edge in current and emerging international markets
The EmployRES study (Fraunhofer ISI et al 2009) finds for Europe that current strong investment reflected in installations in Europe and exports to the rest of the world dominate the economic impact of RES policies and therefore lead to positive overall effects The studys results suggest that this positive balance can only be kept up in the future if the competitive position of European manufacturers of RES technology is improved The authors strongly recommend policies which promote technological innovation in RES and lead to a continued and rapid reduction of their costs
Factors 1 and 2 will have substantial macroeconomic impacts in the short and medium terms whereas factor 3 accumulates and will show positive impacts mainly in the long term Factor 4 strongly depends on the global developments while factor 5 may have significant effects on employment
313 Additional scenarios
Impacts of additional investment (factor 1) have already been analysed in scenario S2H of the petre project To focus on the other impacts of eco-innovation two additional scenarios were designed building on scenario S2H of petre
bull S2HEETRwithrevenuerecyclingdesignedto meet the unilateral EUs 2020 greenhouse gas (GHG) target (high energy price) Ten per cent of revenues are spent on eco-innovation measures and trade shares of EU-27 economies with the rest of the world in machinery and electrical machinery increase by 01 due to the deployment of the fast growing RES markets This assumption is based on the strong EU policy effort to increase the share of renewable energy in final energy consumption to 20 by 2020
Modelling of ETR impacts on eco-innovation
Environmental tax reform in Europe opportunities for eco-innovation 27
(Fraunhofer ISI et al 2009) and the possibility of very strong world market development of the RES sector until 2020 (EREC 2008) which offers additional export opportunities for European RES industries
bull S2HIETRwithrevenuerecyclingdesignedto meet the unilateral EUs 2020 GHG target (high energy price) Ten per cent of revenues are spent on eco-innovation measures and input structures of the energy sector are changed according to the input structure of the German RES industry (Lehr et al 2008)
S2HE looks at the possible role of international trade S2HI analyses changes in the input structure of the energy sector ie from conventional electricity production to renewables In the petre project (as in GHK et al 2007) only the energy inputs of the energy sector were adapted to changes in the energy input mix
Both S2HE and S2HI focus on RES and efficiency technologies As mentioned above an ETR will trigger a variety of innovations Therefore the results can be thought of as conservative in the sense that innovations (eg automotive energy consumption industrial efficiency etc) are not explicitly included
32 Overview of modelling results
The main results of the simulations are presented in Table 31 In the baseline scenario BH with high energy prices EU-27 carbon emissions will be
72 below the 1990 level in 2020 (38) The EU-15 has committed in the Kyoto Protocol to reduce its GHG emissions 8 below 1990 levels in the period 2008ndash2012 As emissions in the new member states are substantially below their 1990 levels today that implies that the EU-27 will keep its emissions more or less constant over the coming decade As in the PRIMES baseline an ETS price of 18 EURt in 2008 prices is assumed in 2020
In scenario S1H the ETS price and carbon tax rate has to be increased to 68 EUR2008t of CO2 to reach the 20 GHG reduction target which is equal to a 15 reduction of CO2 emissions against 1990 as other greenhouse gases have already been reduced above average by more than 20 in terms of CO2 equivalents Compared to the baseline CO2 emissions are 84 lower in 2020 which means roughly an additional 1 reduction annually in the period 2012ndash2020 GDP will be about 06 lower compared to the baseline in 2020 This means that annual average growth rates will be less than 01 below their baseline development This is especially low compared to the current financial and economic crisis with a GDP deviation against the baseline of around 6 in 2009
As the recycling mechanism reduces labour costs and the tax burden is shifted from labour-intensive to carbon- and material-intensive sectors employment will be 036 (or more than 800 000 jobs) higher than in the baseline The ETR is not fully budget neutral potentially enabling EU economies to slightly increase their net savings If
(38) The modelling exercise in the present study was conducted in 2009 and therefore does not contain the latest data on EU-27 GHG emissions which were significantly influenced by the global economic slump of the late-2000s
Table 31 Main results under the different scenarios
Scenario Target in 2020 CO2 price GDP Employment CO2 reduction
EUR2008t pc against baseline
pc against baseline
pc against 1990
pc against baseline
in year 2020 2015 2020 2020 2020 2020
BH 18 ndash 72 00
S1H 20 GHG 68 ndash 022 ndash 057 036 ndash 151 ndash 84
S2H 20 GHG 61 ndash 013 ndash 030 041 ndash 152 ndash 85
S2HE 20 GHG 61 ndash 009 ndash 004 051 ndash 151 ndash 84
S2HI 20 GHG 61 ndash 006 ndash 024 045 ndash 152 ndash 84
Environmental tax reform in Europe opportunities for eco-innovation
Modelling of ETR impacts on eco-innovation
28
this extra saving is spent negative GDP impacts will be further reduced
In scenario S2H part of the revenues is invested in low-carbon technologies This reduces the carbon price to 61 EUR2008t in 2020 halving the GDP loss relative to scenario S1H to only 03 as the investment in renewable energies is assumed to be additional Employment impacts are also more positive than in scenario S1H The 10 investment in low-carbon technologies amounts to more than EUR 20 billion in 2020
Assuming additional EU exports of RES technologies in scenario S2HE GDP almost matches the baseline in 2020 and employment is 051 (or more than 1 million jobs) higher than in the baseline In scenario S2HI a shift in the input structure of the energy sector towards machinery
and electrical machinery reflecting the different nature of RES relative to conventional electricity generation also has smaller additional positive impacts on GDP and employment compared to scenario S2H
The following figures show impacts of the different scenarios in comparison to the baseline BH As Figure 31 illustrates all the alternative scenarios imply GDP lower than the baseline However comparing scenario S1H with the other three scenarios shows that additional RES investment (S2H) additional RES exports (S2HE) and the inclusion of different input structures of the RES industries (S2HI) each have positive GDP impacts These results are in line with model-based analysis in the EMPLOY-RES study (Fraunhofer ISI et al 2009)
Figure 31 EU-27 GDP according to four scenarios mdash deviation from the baseline (BH)
Percentage deviation from the baseline (BH)
ndash 100
ndash 080
ndash 060
ndash 040
ndash 020
0002010 2015 2020
S2HI S1H S2H S2HE
Modelling of ETR impacts on eco-innovation
Environmental tax reform in Europe opportunities for eco-innovation 29
In contrast to GDP employment increases relative to the baseline in all the alternative scenarios (Figure 32) Due to the scenario design the structure of the EU economies is shifted from energy-intensive to labour-intensive sectors The magnitude of the employment gain is influenced by the carbon price and the tax shift the underlying energy prices and the production loss The largest part of the employment increase stems from the additional RES investment (scenario S2H) although a shift in industry structures (S2HI) and additional RES exports (S2HE) are also positive for the labour market
33 Macroeconomic impacts at the national level
In general terms it is clear that national ETS and ETR impacts depend significantly on country specifics including energy use economic structure social system and behaviour (eg reactions to labour cost changes) In countries with high carbon intensity in their energy mix additional revenues and expenditures are higher than in countries with lower carbon intensity
Scenario S2H provides an interesting tool for analysing the macroeconomic impacts of ETR at the national level because 10 of the additional generated revenues are used for eco-innovation investments meaning that only 90 of the revenues are recycled back into the economy by reducing income tax rates and social security contributions
Figure 32 EU-27 employment according to four scenarios mdash deviation from the baseline (BH)
ndash 020
000
020
040
060
2010 2015 2020
S2HI S1H S2H S2HE
Percentage deviation from the baseline (BH)
Environmental tax reform in Europe opportunities for eco-innovation
Modelling of ETR impacts on eco-innovation
30
Figure 34 GDP in 2020 in EU-27 Member States under scenario S2H mdash deviation form the baseline (BH)
Figure 33 GDP in 2020 in selected countries under scenario S2H mdash deviation from the baseline (BH)
ndash 25 ndash 20 ndash 15 ndash 10 ndash 05 00 05 10 15
Romania
Bulgaria
SloveniaMalta
Lithuania
Latvia
Estonia
CyprusSlovakia
Poland
Hungary
Czech RepublicUnited Kingdom
Sweden
Spain
Portugal
Netherlands
Italy
Ireland
Greece
FranceFinland
Denmark
Luxembourg
Belgium
Austria
Germany
Percentage deviation from the baseline (BH)
Russia
South Africa
Brazil
India
China
Mexico
Japan
USA
Poland
United Kingdom
Spain
Italy
France
Germany
ndash 30 ndash 25 ndash 20 ndash 15 ndash 10 ndash 05 00 05 10
Percentage deviation from the baseline (BH)
Modelling of ETR impacts on eco-innovation
Environmental tax reform in Europe opportunities for eco-innovation 31
Figure 35 Employment in 2020 in EU-27 Member States under scenario S2H mdash deviation from baseline (BH)
EU-27EU-15
RomaniaBulgariaSloveniaMalta
LithuaniaLatvia
EstoniaCyprusSlovakia
PolandHungary
Czech RepublicUnited Kingdom
SwedenSpain
PortugalNetherlands
ItalyIrelandGreece
FranceFinlandDenmarkLuxembourg
BelgiumAustria
Germany
ndash 200 0 200 400 600 800 1 000
Percentage deviation from the baseline (BH)
Under scenario S2H the GDP of large EU economies deviates from baseline projections by between 0 and ndash 1 with the exception of Italy (Figure 33) Germanys GDP is even forecast to match the baseline level in 2020 due to the countrys strong RES industry Outside Europe some countries gain slightly against EU Member States in terms of competitiveness as export prices in most EU Member States and sectors increase and GDP in those countries exceeds the baseline projections as a result (Figure 33) This is mainly because carbon tax revenues are recycled via income tax reductions which are not part of production costs However energy exporting economies such as Russia or South Africa will lose exports if EU demand for fossil fuel imports declines The development of all EU Member States is shown in Figure 34
Employment impacts of scenario S2H are positive for almost all EU Member States as lower labour
costs increase labour demand and labour intensity (Figure 35) The highest absolute increases are shown for Germany the Netherlands Italy and the United Kingdom For EU-27 as a whole employment will be almost one million higher than in the corresponding baseline BH in 2020
The scenarios have not been designed with a view to meeting the EU renewables target of a 20 renewables share in final energy consumption in 2020 Nevertheless the scenarios provide some interesting insights The share is projected to increase from around 10 in 2009 to above 14 even in the baseline as instruments such as feed in tariffs and biofuel quotas will continue In scenario S1H the target will be missed with around 18 in 2020 Only in scenarios S2H S2HE and S2HI is the target met (approximately 20 )
Environmental tax reform in Europe opportunities for eco-innovation
Modelling of ETR impacts on eco-innovation
32
Under scenario S2H energy-related carbon emissions are reduced in all EU Member States relative to the baseline (Figure 36) The highest percentage reductions can be seen in many of the EU-12 Member States with still high energy intensity and low energy prices In these countries the relative price increase is higher than in countries like Germany or the United Kingdom with already high energy taxes and overall energy prices
Additional ETS revenues material tax revenues and carbon tax revenues from the industry sector are recycled back to industry via reductions in employers social security contributions (or wage subsidies in some countries) The revenues from the carbon tax on households set out in Table 32 (totalling 033 of GDP in Germany for example) are used to reduce income tax For the EU-27 overall revenues from ETS and ETR reach about 2 of GDP in 2020 although these figures may be excessive because additional EU efforts to increase energy
efficiency and renewable energy which will reduce the ETS price are not taken into account The use of flexible tools such as the Clean Development Mechanism will further reduce the revenues and earmarking of part of the revenues for mitigation and adaptation measures in emerging and developing countries limits the recycling into labour costs
In addition the scenarios do not take the current global economic problems into account According to the IEA (2009) the downturn will also reduce carbon emissions in the long run which will lead to lower carbon prices and revenues to reach fixed targets (or make tighter targets less costly)
The ETR will have varying effects on the prices of different sorts of products and services Material or carbon taxes increase the prices of product groups according to their direct and indirect material and carbon content The recycling mechanism reduces
Figure 36 Energy-related CO2 emissions in 2020 under scenario S2H mdash deviation from the baseline (BH)
WorldEU-27
EU-15Romania
BulgariaSlovenia
MaltaLithuania
LatviaEstonia
CyprusSlovakia
PolandHungary
Czech RepublicUnited Kingdom
SwedenSpain
PortugalNetherlands
ItalyIreland
GreeceFrance
FinlandDenmark
LuxembourgBelgium
AustriaGermany
ndash 25 ndash 20 ndash 15 ndash 10 ndash 5 0
Percentage deviation from the baseline (BH)
Modelling of ETR impacts on eco-innovation
Environmental tax reform in Europe opportunities for eco-innovation 33
Table 32 Additional ETS and environmental tax revenues in 2020 ( of GPD)
S2H Germany United Kingdom EU-27
ETS revenues 083 064 059
Carbon tax (industry) 052 044 054
Carbon tax (households) 033 041 036
Material tax 041 029 056
Sum 209 178 205
Figure 37 Total primary energy supply in 2020 under scenario S2H mdash deviation from the baseline (BH)
WorldEU-27EU-15
RomaniaBulgaria
Slovenia
MaltaLithuania
LatviaEstonia
Cyprus
SlovakiaPoland
HungaryCzech Republic
United KingdomSweden
SpainPortugal
NetherlandsItaly
IrelandGreece
FranceFinland
DenmarkLuxembourg
BelgiumAustria
Germany
ndash 24 ndash 21 ndash 18 ndash 15 ndash 12 ndash 9 ndash 6 ndash 3 0
Percentage deviation from the baseline (BH)
Environmental tax reform in Europe opportunities for eco-innovation
Modelling of ETR impacts on eco-innovation
34
Figure 38 Output price impacts of scenario S2H in Germany in 2020 mdash deviations from the baseline (BH)
Figure 39 Impacts of scenario S2H on industrial output in 2020 in Germany mdash deviations from the baseline (BH)
ndash 5
0
5
10
15
20
Output prices
Percentage deviation from the baseline (BH)
(3) F
ood
(4) T
extiles
(5) W
ood
(6) P
ulp pap
er
(7) C
oke re
fined
petro
leum
pro
ducts
(8) C
hemica
ls ex
cl pha
rma
(9) P
harm
aceu
ticals
(10)
Rub
ber a
nd plastics
(11)
Non
-metallic
miner
als
(12)
Iron
and
steel
(13)
Non
-ferrou
s metals
(14)
Met
al pro
ducts
(15)
Mac
hine
ry and
equ
ipmen
t
(16)
Office
mac
hine
ry
(17)
Electric
al m
achine
ry
(18)
Rad
io T
V
(19)
Med
ical pr
ecisi
on and
opt
ical ins
trumen
ts
(20)
Mot
or veh
icles
(21)
Ships
(22)
Airc
raft
(23)
Railro
ad
(24)
Man
ufac
turin
g n
ec r
ecyc
ling
(25)
Electric
ity g
as w
ater
sup
ply
(26)
Con
stru
ction
(27)
Tra
de r
epairs
(28)
Hot
els an
d re
stau
rant
s
(29)
Tra
nspo
rt an
d stor
age
(30)
Pos
t and
teleco
mmun
icatio
ns
(31)
Finan
ce ins
uran
ce
(32)
Rea
l estate ac
tivities
(33)
Ren
ting
(34)
Com
puter
(35)
Res
earch an
d de
velopm
ent
(36)
Oth
er bus
ines
s ac
tivities
(37)
Pub
lic ser
vice
s
(38)
Edu
catio
n
(39)
Hea
lth and
soc
ial w
ork
(40)
Oth
er ser
vice
s
(41)
Priv
ate ho
useh
olds
(1) A
gricu
lture
(2) M
ining an
d qu
arry
ing
nec not elsewhere classified
Production
ndash 100
ndash 80
ndash 60
ndash 40
ndash 20
00
20
40
60
80Percentage deviation from the baseline (BH)
(3) F
ood
(4) T
extiles
(5) W
ood
(6) P
ulp pap
er
(7) C
oke re
fined
petro
leum
pro
ducts
(8) C
hemica
ls ex
cl pha
rma
(9) P
harm
aceu
ticals
(10)
Rub
ber a
nd plastics
(11)
Non
-metallic
miner
als
(12)
Iron
and
steel
(13)
Non
-ferrou
s metals
(14)
Met
al pro
ducts
(15)
Mac
hine
ry and
equ
ipmen
t
(16)
Office
mac
hine
ry
(17)
Electric
al m
achine
ry
(18)
Rad
io T
V
(19)
Med
ical pr
ecisi
on and
opt
ical ins
trumen
ts
(20)
Mot
or veh
icles
(21)
Ships
(22)
Airc
raft
(23)
Railro
ad
(24)
Man
ufac
turin
g n
ec r
ecyc
ling
(25)
Electric
ity g
as w
ater
sup
ply
(26)
Con
stru
ction
(27)
Tra
de r
epairs
(28)
Hot
els an
d re
stau
rant
s
(29)
Tra
nspo
rt an
d stor
age
(30)
Pos
t and
teleco
mmun
icatio
ns
(31)
Finan
ce ins
uran
ce
(32)
Rea
l estate ac
tivities
(33)
Ren
ting
(34)
Com
puter
(35)
Res
earch an
d de
velopm
ent
(36)
Oth
er bus
ines
s ac
tivities
(37)
Pub
lic ser
vice
s
(38)
Edu
catio
n
(39)
Hea
lth and
soc
ial w
ork
(40)
Oth
er ser
vice
s
(41)
Priv
ate ho
useh
olds
(1) A
gricu
lture
(2) M
ining an
d qu
arry
ing
nec not elsewhere classified
Modelling of ETR impacts on eco-innovation
Environmental tax reform in Europe opportunities for eco-innovation 35
social security contributions and lowers labour costs according to the direct and indirect labour content of sector output The ETR therefore reduces output prices in labour-intensive service sectors and increases prices in carbon- and material-intensive industry sectors
The example of Germany shows insignificant impacts in the trade-intensive sectors of machinery (15ndash17) motor vehicles (20) and other transport equipment (21ndash23) (Figure 38) Iron and steel (12) and chemicals without pharmaceuticals (8) face the highest price increases of trade-intensive sectors As the German iron and steel industry primarily delivers high quality steel to the German car industry and increasingly to the German windmill industry negative competitiveness impacts will be limited Exchange rate variations against non-EU competitors have been much higher in the past
The higher prices of carbon- and material-intensive products will reduce price competitiveness on export markets and increase the market share for imports in domestic markets This loss of price competitiveness is based on an assumption of limited market development of energy efficiency and RES technologies in other part of the world It will be offset by gains in labour-intensive sectors if the ETR causes real wage costs per unit of output to fall as a result of using recycled revenues to reduce employer social security contributions
Any improvement in non-price competitiveness will also raise exports The extra employment will raise incomes raising consumption and output
The overall impact on sector output depends on countervailing effects which are negative for iron and steel and a few service sectors and positive for a few industry sectors For most industries the output effect is insignificant (Figure 39) The greatest impact is felt by producers of fossil fuels who must obviously reduce production due to lower demand for their products
Under scenario S2H employment impacts are positive for most sectors relative to the baseline as labour productivity decreases and wage rates fall in relation to consumer prices (CPI) and output prices (Table 33) The relative costs of labour are lower than in the baseline without the ETR reform Only around a quarter of the employment increase takes place in industry
Concerning the wage rate two countervailing effects have to be considered First when the labour market is characterised in terms of the real wage bargaining model as in E3ME and GINFORS with market power on both sides (employers and trade unions) consumer price increases will lead to wage increases (the econometrically estimated factor is 085 for Germany) Second labour productivity is another important factor for wage bargaining The estimated elasticity for Germany is 063 meaning that a 1 increase of labour productivity leads to wage increases of 063 Higher labour demand due to lower labour costs thus reduces the wage increase In the end the German economy is more labour intensive than without the ETR partly due to the structural change towards labour-intensive industries
Table 33 Employment impacts of scenario S2H in Germany mdash deviations from scenario S2H in 2020
Employment in 2020 Deviation from S2H () Deviation from S2Habsolute (1 000s)
Agriculture forestry 24 90
Industry 09 653
Non-metallic minerals 24 62
Iron and steel ndash 28 ndash 37
Machinery and equipment 05 56
Electrical machinery 04 18
Construction 37 449
Trade and transport 10 829
Business services 17 767
Other services ndash 02 ndash 216
Total 07 2506
Environmental tax reform in Europe opportunities for eco-innovation
Modelling of ETR impacts on eco-innovation
36
Additional exports under scenario S2HE mainly create new jobs in machinery and related business services (Table 34) Under scenario S2HI a shift in the input structure of the energy sector leads to a shift in the industry structure and creates a few jobs in the service sector (Table 35)
34 Conclusions of the scenario assessment
The foregoing analysis used the GINFORS model to assess economic and environmental impacts of using the ETS and ETR to reach the EUs 2020
GHG targets In general the results show positive employment effects and only small negative impacts on GDP in EU-27 Member States The economic impacts depend on the levels of international energy prices the mechanism used to recycle revenues and country specifics such as carbon and energy intensity and the structure of energy consumption
Although there is significant evidence that eco-innovation is positively driven by higher energy prices quantification is difficult The present study included simulations of possible impacts of a shift in the industry structure towards renewable energy in the electricity sector and an overall increase of EU
Table 34 Employment impacts of scenario S2HE in 2020 in Germany mdash deviations from scenario S2H
Employment in 2020 Deviation from S2H () Deviation from S2Habsolute (1 000s)
Agriculture forestry ndash 01 ndash 02
Industry 03 194
Non-metallic minerals 02 05
Iron and steel 04 05
Machinery and equipment 13 130
Electrical machinery 24 117
Construction 01 18
Trade and transport 00 26
Business services 07 308
Other services 01 107
Total 02 634
Table 35 Employment impacts of scenario S2HI in 2020 in Germany mdash deviations from scenario S2H
Employment in 2020 Deviation from S2H () Deviation from S2Habsolute (1 000s)
Agriculture forestry ndash 01 ndash 02
Industry 00 00
Non-metallic minerals 25 65
Iron and steel ndash 27 ndash 36
Machinery and equipment 08 78
Electrical machinery 04 19
Construction ndash 00 ndash 04
Trade and transport 00 07
Business services 02 115
Other services 0 56
Total 00 167
Modelling of ETR impacts on eco-innovation
Environmental tax reform in Europe opportunities for eco-innovation 37
exports due to higher global demand for renewable energy The main results can be summarised as follows
bull environmentaltaxreformshiftingtaxesfromlabour to energy and resources will create additional jobs and trigger eco-innovation
bull impactsofeco-innovationintheformofadditional EU exports or shifts in industry structures will have a slight positive influence on GDP and create a smaller number of additional jobs
These findings correspond to results from the EmployRES study (Fraunhofer ISI et al 2009) As ETR is directly aimed at reducing labour costs it will create additional jobs in the short and medium term In the longer term the cost reduction and new technologies arising from eco-innovation will play a larger role
Like all fiscal reforms a major ETR in Europe will create winners and losers At the sector level carbon- and material-intensive industries will face economic losses At the country level the carbon-intensity and overall flexibility of economies is important Clearly structural change away from carbon-intensive industries together with technological change is inherent in any successful climate mitigation policy
On the other hand several factors can smooth these structural adjustments International cooperation
will reduce economic pressure on countries and sectors In addition ETR together with auctioning of ETS allowances can be a major source of revenues for EU Member States in the future even if part of the revenues will have to be earmarked for adaptation and mitigation measures in developing countries Indeed future debate on grandfathering or auctioning ETS allowances should reflect the important point that giving allowances away for free denies countries the money to ease structural change and invest in low-carbon technologies
Caution is needed in relating the findings of this study to the EU policy debate In the model simulations the single carbon price is the only instrument used to reach the EUs 2020 GHG targets In reality of course other renewable energy and efficiency policies will also contribute to carbon reduction and have to be taken into account when comparing the results (especially the high carbon prices) to other studies Both reduce the potential revenues from fossil energy carriers and carbon emissions
A variety of renewable energy and efficiency policies could enable the climate and energy targets to be met while securing even better economic prospects The results of the present study clearly indicate that the discussion on market-based instruments should be intensified Ultimately however the EU will need a rich mix of policies to reach its GHG targets while maximising prosperity
Environmental tax reform in Europe opportunities for eco-innovation38
References
Almon C 1991 The INFORUM Approach to Interindustry Modeling in Economic Systems Research Vol 3 pp 1ndash7
Amin A and Cohendet P 2004 The Architecture of Knowledge Firms Capabilities and Communities Oxford University Press Oxford
Barker T Meyer B Pollitt H and Lutz C 2007a Modelling Environmental Tax Reform in Germany and the United Kingdom with E3ME and GINFORS petre Working Paper Cambridge and Osnabrueck (httpwwwpetreorgukpapershtm) accessed 15 February 2011
Barker T Junankar S Pollitt H and Summerton P 2007b Carbon leakage from unilateral environmental tax reforms in Europe 1995ndash2005 Energy Policy Vol 35 pp 6 281ndash6 292
Brunnermeier S B and Cohen M A 2003 Determinants of environmental innovation in US manufacturing industries Journal of Environmental Economics and Management Vol 45 pp 278ndash293
Buen J 2006 Danish and Norwegian wind industry The relationship between policy instruments innovation and diffusion Energy Policy Vol 34 (18) pp 3 887ndash3 897
Carlsson B and Stankiewicz R 1991 On the nature function and composition of technological systems Journal of Evolutionary Economics Vol 1 (2) pp 93ndash118
Christiansen A C and Skjaerseth J B 2005 Climate change policies in Norway and the Netherlands Different instruments similar outcome Energy and Environment Vol 16(1) pp 1ndash25
Dosi G 1988 Sources procedures and microeconomic effects of innovation Journal of Economic Literature Vol 26 pp 1 120ndash1 171
de Vries F and Medhi N 2008 Environmental regulation and international innovation in automotive emissions control technologies in Environmental Policy Technological Innovation and Patents Organisation for Economic Cooperation and Development Paris
DG TREN 2008 European energy and transport mdash trends to 2030 mdash update 2007 European Commission Luxembourg
DTI 2004 Renewable Supply Chain Gap Analysis UK Department of Trade and Industry
Edler J (ed) 2006 Nachfrageorientierte Innovationspolitik Buumlro fuumlr Technikfolgenabschaumltzung beim Deutschen Bundestag (TAB) Arbeitsbericht Nr 99 Berlin
Edquist C 2001 The system of innovation approach and innovation policy an account of the state of the art lead paper presented at the DRUID Conference 12ndash15 June 2001 Aalborg (httpwwwdruiddkconferencesnwpaper1edquistpdf) accessed 15 February 2011
EEA 2006 Using the market for cost-effective environmental policy Market-based instruments in Europe EEA Report No 12006 European Environment Agency Copenhagen
Ekins P 2009 Resource Productivity Environmental tax Reform and Sustainable Growth in Europe published by the Anglo-German Foundation for the Study of Industrial Society Final report (httpwwwpetreorgukpdfFinRepFinpdf) accessed 12 October 2011
Ekins P and Speck S (eds) 2011 Environmental Tax Reform (ETR) A Policy for Green Growth Oxford University Press
EREC 2008 Energy [r]evolution A sustainable global energy outlook Greenpeace International European Renewable Energy Council (EREC)
References
References
Environmental tax reform in Europe opportunities for eco-innovation 39
Fagerberg J Mowery D C and Nelson R R (eds) 2005 The Oxford Handbook of Innovation Oxford University Press Oxford
Fischer C Parry I W H and Pizer W A 2003 Instrument choice for environmental protection when technological innovation is endogenous Journal of Environmental Economics and Management Vol 45 pp 523ndash545
Fraunhofer ISI ECOFYS Energy Economics Group Ruumltter + Partner SEURECO and LEI 2009 EmployRES mdash The impact of renewable energy policy on economic growth and employment in the European Union European Commission Brussels
Frondel M Horbach J and Rennings K 2008 What triggers environmental management and innovation Empirical evidence for Germany Ecological Economics Vol 66(1) pp 153ndash160
GHK Cambridge Econometrics and IEEP 2007 Links between the environment economy and jobs Final Report submitted to DG Environment European Commission
Giljum S Behrens A Hinterberger F Lutz C and Meyer B 2008 Modelling scenarios towards a sustainable use of natural resources in Europe Environmental Science and Policy Vol 11 pp 204ndash216
Goumlrlach B Knigge M and Luumlckge H 2005 Wirkungen der Oumlkologischen Steuerreform auf Innovation und Marktdurchdringung Ecologic Berlin (httpecologiceudownloadprojekte1850-189918791879_5_innovationpdf) accessed 18 August 2011
Green M A 2000 Photovoltaics technology overview Energy Policy Vol 28 (14) pp 989ndash998
Grossmann A Lehr U Lutz C and Wolter MI 2008 Gesamtwirtschaftliche Effekte der Umsetzung der EU Ziele im Bereich Erneuerbare Energien und Gebaumludeeffizienz in Oumlsterreich bis 2020 Studie im Auftrag des Lebensministeriums Wien 0508
Hage J and Hollingsworth J R 2000 Idea innovation networks a strategy for integrating organizational and institutional analysis Organization Studies Vol 21 (5) pp 971ndash1 004
Hauschildt J 2004 Innovationsmanagement Vahlen Muumlnchen
Hemmelskamp J 1997 Environmental policy instruments and their effects on innovation European Planning Studies Vol 5 (2) pp 177ndash195
Hoglund Isaksson L 2005 Abatement costs in response to the Swedish charge on nitrogen oxide emissions Journal of Environmental Economics and Management Vol 50 pp 102ndash120
Hullmann A 2001 Internationaler Wissenstransfer und technischer Wandel (dissertation) Physica-Verlag Heidelberg
IEA 2008 World Energy Outlook 2008 International Energy Agency Paris
IEA 2009 World Energy Outlook 2009 International Energy Agency Paris
Jacobsson S Andersson B A and Baringngens L 2002 Transforming the energy system mdash the evolution of the German technological system for solar cells Science and Technology Policy Research University of Sussex Electronic Working Paper Series No 84 (httpideasrepecorgpsrussewps84html) accessed 18 August 2011
Jaffe A and Stavins R 1995 Dynamic incentives of environmental regulations the effects of alternative policy instruments on technology diffusion Journal of Environmental Economics and Management Vol 29(3) pp 43ndash63
Jaffe A B and Palmer K 1997 Environmental regulation and innovation a panel data study The Review of Economics and Statistics Vol 79 pp 610ndash619
Jaffe A B Newell R G and Stavins R N 2002 Environmental policy and technological change Environmental and Resource Economics Vol 22 (1ndash2) 2002 pp 41ndash70
Johnstone N and Hascic I 2008 Renewable energy policies and technological innovation energy source and instrument choice in Environmental Policy Technological Innovation and PatentsOrganisation for Economic Co-operation and Development Paris
Johnstone N 2005 The Innovation Effects of Environmental Policy Instruments in Horbach J (ed) Indicator Systems for Sustainable Innovation Physica-Verlag HD
Environmental tax reform in Europe opportunities for eco-innovation
References
40
Johnstone N Hascic I and Ostertag K 2008 Environmental policy technological innovation and patent activity in Environmental Policy Technological Innovation and Patents Organisation for Economic Co-operation and Development Paris
Jung C Krutilla K and Boyd R 1996 Incentives for advanced pollution abatement technology at the industry level an evaluation of policy alternatives Journal of Environmental Economics and Management Vol 30(1) pp 95ndash111
Kammen D M Kapidia K and Fripp M 2004 Putting renewables to work how many jobs can the clean energy industry generate University of California Berkeley
Kemp R 1997 Environmental policy and technical change ndash a comparison of the technological impact of policy instruments Edward Elgar Cheltenham
Kemp R 1998 The diffusion of biological waste-water treatment plants in the Dutch food and beverage industry Environmental and Resource Economics Vol 12 pp 113ndash136
Kemp R 2000 Technology and environmental policy ndash innovation effects of past policies and suggestions for improvement in OECD proceedings ndash innovation and the environment Organisation for Economic Co-operation and Development Paris
Kerr S and Newell R G 2003 Policy-induced technology adoption evidence from the US lead phasedown Journal of Industrial Economics Vol 51 pp 317ndash343
Klaassen G Miketa A Larsen K and Sundqvist T 2005 The impact of RampD on innovation for wind energy in Denmark Germany and the United Kingdom Ecological Economics Vol 54 pp 227ndash240
Kline S and Rosenberg N 1986 An overview of innovation in Landau R (ed) The positive sum strategy Harnessing technology for economic growth pp 275-306
Knigge M and Goumlrlach B 2005 Effects of Germanys ecological tax reforms on the environment employment and technological innovation Ecologic Berlin (httpwwwumweltbundesamtdeuba-info-presse-ehintergrundoekosteuerpdf) accessed 18 August 2011
Langniss O 2003 Governance structures for promoting renewable energy sources dissertation Lund Stuttgart
Lanjouw J O and Mody A 1996 Innovation and the international diffusion of environmentally responsive technology Research Policy Vol 25 pp 549ndash571
Lehr U Nitsch J Kratzat M Lutz C and Edler D 2008 Renewable Energy and Employment in Germany Energy Policy Vol 36 pp 108ndash117 DOI101016jenpol200709004
Lehr U Wolter MI and Groszligmann A 2009 Economic impacts of RES obligations in Austria ndash an application of the macro-econometric model e3at GWS Discussion Paper 20091 Osnabruumlck
Lundvall B-A Johnson B Andersen E S and Dalum B 2001 National systems of production innovation and competence building Research Policy Vol 31 pp 213ndash231
Lutz C and Giljum S 2009 Global resource use in a business as usual world until 2030 Updated results from the GINFORS model in Bleischwitz R Welfens Pand Zhang Z (eds) Sustainable growth and resource productivity ndash economic and global policy issues Greenleaf Publishers pp 30ndash41
Lutz C and Meyer B 2008 Beschaumlftigungseffekte des Klimaschutzes in Deutschland Untersuchungen zu gesamtwirtschaftlichen Auswirkungen ausgewaumlhlter Maszlignahmen des Energie- und Klimapakets Forschungsbericht 205 46 434 Dessau-Roszliglau
Lutz C and Meyer B 2009a Environmental and Economic Effects of Post-Kyoto Carbon Regimes Results of Simulations with the Global Model GINFORS Energy Policy Vol 37 pp 1 758ndash1 766 DOI 101016jenpol200901015
Lutz C and Meyer B 2009b Scenario results from GINFORS PETRE working paper Osnabruumlck
Lutz C Meyer B Nathani C and Schleich J 2005 Endogenous technological change and emissions The case of the German steel industry Energy Policy Vol33 pp 1 143ndash1 154
Lutz C Meyer B Nathani C and Schleich J 2007 Endogenous innovation economy and environment impacts of a technology based modelling approach for energy-intensive industries in Germany Energy Studies Review Vol 15(1) pp 2ndash18
References
Environmental tax reform in Europe opportunities for eco-innovation 41
Lutz C Meyer B and Wolter M I 2009 The global multisectormulticountry 3-E model GINFORS mdash a description of the model and a baseline forecast for global energy demand and CO2 emissions Journal of Sustainable Development forthcoming
Malerba F and Orsenigo L 1997 Technological Regimes and Sectoral Patterns of Innovative Activities Industrial and Corporate Change Vol 6 (1) pp 83ndash117
Malerba F 1992 Learning by Firms and Incremental Technical Change The Economic Journal Vol 102 (413) pp 845ndash859
Malerba F 2005 Industrial dynamics and innovation progress and challenges Presidential Address delivered at the 32nd Conference of the European Association for Research in Industrial Economics (EARIE) 1ndash4 September 2005 Porto
Malerba F 2006 Innovation and the evolution of industries Journal of Evolutionary Economics Vol 16 pp 3ndash23
McGinty M and de Vries F P 2009 Technology diffusion product differentiation and environmental subsidies The BE Journal of Economic Analysis and Policy Vol 9(1)
Meyer B and Lutz C 2007 The GINFORS model ndash model overview and evaluation Petre Working Paper Osnabruumlck (httpwwwpetreorgukpapershtm) accessed 18 August 2011
Meyer B Lutz C Schnur P and Zika G 2007 Economic policy simulations with global interdependencies a sensitivity analysis for Germany Economic Systems Research Vol 19 pp 37ndash55
Mickwitz P H Hyvaumlttinen and P Kivimaa 2008 The role of policy instruments in the innovation and diffusion of environmentally friendlier technologies popular claims versus case study experiences Journal of Cleaner Production Vol 16(1S1) 162ndash170
Miketa A and Schrattenholzer L 2004 Experiments with a methodology to model the role of RampD expenditures in energy technology learning processes first results Energy Policy Vol 32 (15) pp 1 679ndash1 692
Milliman S R and Prince R 1989 Firm incentives to promote technological change in pollution control Journal of Environmental Economics and Management Vol 17 pp 247ndash265
Millock K and Nauges C 2006 Ex-post evaluation of an earmarked tax on air pollution Land Economics Vol 82(1) pp 68ndash84
Montero J-P 2002 Market structure and environmental innovation Journal of Applied Economics Vol 2 pp 293ndash325
Moreno B and Loacutepez A J 2007 The effect of renewable energy on employment mdash The case of Asturias (Spain) Renewable and Sustainable Energy Rewiews doi 101016jrser200610011
Mowery D and Rosenberg N 1979 The influence of market demand upon innovation A critical review of some recent empirical studies Research Policy Vol 8 pp 102ndash153
Newell R G Jaffe A B and Stavins R N 1999 The induced innovation hypothesis and energy-saving technological change Quarterly Journal of Economics Vol 114 pp 941ndash975
Norberg-Bohm V 1999 Stimulating green technological innovation An analysis of alternative policy mechanisms Policy Sciences Vol 32(1) pp 13ndash38
OECD 2009 Sustainable manufacturing and eco-innovation towards a green economy Organisation for Economic Co-operation and Development Policy Brief June 2009
OECD 2010 Taxation innovation and the environment Organisation for Economic Co-operation and Development
Pavitt K 1984 Sectoral patterns of technological change Towards a taxonomy and a theory Research Policy Vol 13 pp 343ndash373
Popp D 2002 Induced innovation and energy prices The American Economic Review Vol 92(1) pp 160ndash180
Popp D 2005 Lessons from patents Using patents to measure technological change in environmental models Ecological Economics Vol 54 pp 209ndash226
Environmental tax reform in Europe opportunities for eco-innovation
References
42
Porter M and van der Linde C 1995 Toward a new conception of the environment competitiveness relationship Journal of Economic Perspectives Vol 9(4) pp 97ndash118
Rammert W 2002 The cultural shaping of technologies and the politics of technodiversity In Sorensen K and Williams R (eds) Shaping technology guiding policy concepts spaces and tools Elgar Cheltenham pp 155-172
Requate T 2005 Dynamic incentives by environmental policy instruments ndash a survey Ecological Economics Vol 54 pp 175ndash195
Roloff N Lehr U Krewitt W Fuchs G Wassermann S Weimer-Jehle W and Schmidt B 2008 Success determinants for technological innovations in the energy sector mdash the case of photovoltaics in Moumlst D Fichtner W Ragwitz M and Veit D (eds) New methods for energy market modelling mdash Proceedings of the first european workshop on energy market modelling using agent-based computational economics Universitaumltsverlag Karlsruhe
Rothwell R 1995 The fifth generation innovation process in Oppenlaumlnder KH Popp W (eds) Innovationen und wirtschaftlicher Fortschritt betriebs-und volkswirtschaftliche Perspektiven Bern pp 9ndash26
Schumpeter J 1942 Capitalism socialism and democracy New York Harper
Skjaeligrseth J B and Christiansen A C 2005 Environmental policy instruments and technological change in the energy sector findings from comparative empirical research Energy and Environment Vol 17 (2) pp 223ndash241
Snyder L D Miller N H and Stavins R N 2003 The effects of environmental regulations on pollution emissions evidence from plant-level data American Economic Review Vol 93(2) pp 431ndash435
Technopolis 2008 Eco-innovation Final Report for Sectoral Innovation Watch (httpwwwtechnopolis-groupcomresourcesdownloads661_report_finalpdf) accessed 18 August 2011
Volleburgh H 2007 Impacts of environmental policy instruments on technological change Report for Joint Meetings of Tax and Environment Experts OECD Environment Directorate February 2007 (comenvepocctpacfa(2006)36final)
Zimmermann H Wohltmann M and Hansjuumlrgens B 1996 Umweltabgaben und Innovation Analytica Marburg
43
Annex 1
Environmental tax reform in Europe opportunities for eco-innovation
Type Instrument Area Stage
Reference
Theo
retica
l
Em
piric
al
Cas
e st
udy
Rev
iew
Qual
itat
ive
Taxe
s
Perm
its
Subsi
die
s
Volu
nta
ry
Com
man
d
Reg
ula
tion
Ener
gy
Air
Wat
er
Oth
er
Gen
eral
Innov
atio
n
Diffu
sion
Rel
evan
ce
Brunnermeier amp Cohen (2003)
X X X X
Buen (2006) X X X X X X
Christiansen amp Skjaerseth (2005)
X X X X X X
Fischer et al (2003 X X X X X X
Frondel et al (2008) X X X X X X X (X) (X)
Hemmelskamp (1997)
X X X X X X X (X)
Hoglund Isaksson (2005)
X X X (X) (X)
Jaffe amp Stavins (1995)
X X X1 X X X X
Jaffe amp Palmer (1997)
X X X X
Jaffe et al (2002) X X X X X X X X X X
Jung et al (1996) X X X X X X (X) (X)
Kemp (1998) X X X X
Kerr amp Newell (2001) X X X X X
Klaassen et al (2005)
X X X X X
Lanjouw amp Mody (1996)
X X X X X X X
McGinty amp de Vries (2009)
X X X X
Mickwitz et al (2008)
X X X X X X X X X
Milliman amp Prince (1989)
X X X X X X X
Millock amp Nauges (2006)
X X X X X X
Montero (2002) X X X X X
Newell et al (1999) X X1 X X X
Norberg-Bohm (1999)
X X X X X X X
Popp (2002) X X1 X X
Popp (2005) X X X X X X
Porter amp van der Linde (1995)
X X X X X X
Requate (2005) X X X X X X X
Skjaeligrseth amp Christiansen (2005)
X X X X X X X X X
Snyder et al (2003) X X X X X
Annex 1 Classification of refereed journal articles
Environmental tax reform in Europe opportunities for eco-innovation44
Annex 2
Type Instrument Area Stage
Reference
Theo
retica
l
Em
piric
al
Cas
e st
udy
Rev
iew
Qual
itat
ive
Taxe
s
Perm
its
Subsi
die
s
Volu
nta
ry
Com
man
d
Reg
ula
tion
Ener
gy
Air
Wat
er
Oth
er
Gen
eral
Innov
atio
n
Diffu
sion
Rel
evan
ce
Johnstone (2005)
X X X X X X X
Johnstone amp Hascic (2008)
X X X X X X X X
Kemp (1997) X X X X X X X X X X X X X
Kemp (2000) X X X X X X X X X
de Vries amp Medhi (2008)
X X1 X X X
Annex 2 Classification of books and book chapters
45
Annex 3
Environmental tax reform in Europe opportunities for eco-innovation
Type Instrument Area Stage
Reference
Theo
retica
l
Em
piric
al
Cas
e st
udy
Rev
iew
Qual
itat
ive
Taxe
s
Perm
its
Subsi
die
s
Volu
nta
ry
Com
man
d
Reg
ula
tion
Ener
gy
Air
Wat
er
Oth
er
Gen
eral
Innov
atio
n
Diffu
sion
Rel
evan
ce
Goumlrlach et al (2005)
X X X X X X
Knigge amp Goumlrlach (2005)
X X X X X X
Technopolis (2008)
X X X X X X
Volleburgh (2007)
X X X X X X X X X X X
Annex 3 Classification of reports
European Environment Agency
Environmental tax reform in Europe opportunities for eco-innovation
2011 mdash 45 pp mdash 21 x 297 cm
ISBN 978-92-9213-238-5doi10280084889
How to obtain EU publications
Publications for salebull viaEUBookshop(httpbookshopeuropaeu)bull fromyourbooksellerbyquotingthetitlethepublisherandorISBNnumberbull bycontactingoneofoursalesagentsdirectlyYoucanobtaintheircontactdetails
on the Internet (httpbookshopeuropaeu) or by sending a fax to +352 2929-42758
Free publicationsbull viaEUBookshop(httpbookshopeuropaeu)bull attheEuropeanCommissionsrepresentationsordelegationsYoucanobtain
their contact details on the Internet (httpeceuropaeu) or by sending a fax to +352 2929-42758
European Environment AgencyKongens Nytorv 61050 Copenhagen KDenmark
Tel +45 33 36 71 00Fax +45 33 36 71 99
Web eeaeuropaeuEnquiries eeaeuropaeuenquiries
TH
-AK-1
1-0
17-E
N-N
doi1
02
8008
4889
- Acknowledgements
- Executive summary
- 1Introduction
-
- 11Background
- 12ETR and innovation
- 13Report structure
-
- 2Review of literature on environmental tax reform and eco‑innovation
-
- 21Initial screening
- 22Detailed review
- 23Environmental regulation studies
- 24Theoretical studies
- 25Empirical studies
- 26Case studies
- 27Conclusions
-
- 3Modelling of ETR impacts on eco‑innovation
-
- 31Scenarios assessing the implications of ETR for eco-innovation
- 32Overview of modelling results
- 33Macroeconomic impacts at the national level
- 34Conclusions of the scenario assessment
-
- References
- Annex 1 Classification of refereed journal articles
- Annex 2Classification of books and book chapters
- Annex 3Classification of reports
-
Environmental tax reform in Europe opportunities for eco-innovation
Review of literature on environmental tax reform and eco-innovation
16
the other firms in the form of royalty payments If imitation is high (easy) then auctioned permits provide the greater incentive for innovation However if imitation is low (difficult) then the emissions tax provides the greatest incentive
Montero (2002) assesses the impacts of alternative policy instruments on environmental innovation (as measured by RampD expenditure) under conditions of imperfect competition In his model two firms compete in either quantities (ie Cournot duopoly) or prices (ie Bertrand duopoly) while being subject to some form of environmental regulation Where the regulation takes the form of tradable permits mdash either auctioned or freely allocated mdash the market is also assumed to be imperfect the firms competing in permit quantities The interaction between the two firms is modelled as a multi-stage game with the number of stages depending on the instrument being analysed In this framework a firms incentive to invest in RampD comprises two components a direct or cost minimising effect and a strategic effect reflecting the impact of its RampD expenditure on the other firms output decision The latter may be positive or negative depending on the market-regulatory structure Under Bertrand competition (ie where products are strategic complements) freely allocated permits provide the lowest incentive for innovation followed by the emission-standard The relative ranking of an emissions tax and auctioned permits is ambiguous depending on model parameter values Under Cournot competition (ie where products are strategic substitutes) the relative ranking of the emissions tax auctioned permits and the emissions-standard are ambiguous although all provide a greater incentive than freely allocated permits Indeed Montero provides a numerical example where the emissions standard provides the greatest incentive for innovation Finally he considers the impact of increasing competition (increasing the number of firms) and concludes that under perfect competition the emissions tax provides the greatest incentive for innovation
Millock and Nauges (2006) use a simple profit-optimisation model to analyse a firms choice of abatement effort to reduce emissions
per unit of energy used in production While they do not explicitly identify it as such this effort can be interpreted in terms of diffusion of an existing technology mdash with higher effort corresponding to greater diffusion This is consistent with the overall objective of their study which is to assess the impact of combining an emissions tax with a subsidy on (existing) abatement equipment (18) In their model the firm simultaneously chooses the levels of its energy input and abatement effort given exogenous output and energy prices and a cost function for abatement effort (19) They show that while increases in the subsidy rate (expressed as a percentage of the gross investment cost) unambiguously increases abatement effort the impact of increases in the tax rate depends on whether the direct impact of tax increase on the marginal benefit of abatement effort (shifting it up) outweighs the indirect impact via the resulting reduction in output (shifting it down) If the latter dominates then increases in the tax rate will reduce the optimal level of abatement effort The authors show that a necessary and sufficient condition for the direct impact to dominate is that the slope of the firms (inverse) demand for energy is greater than the average emissions tax payment per unit of energy in relation to total energy use (20)
McGinty and de Vries (2009) analyse the relationship between environmental subsidies the diffusion of a clean technology and the degree of product differentiation in an imperfectly competitive output market In their model a fixed number of firms can choose individually between using a clean production technology and a dirty technology Both technologies exhibit constant marginal production costs and constant emission rates (with the clean technology having a lower emission rate and higher unit cost) and consumers are assumed to be able to differentiate between products on the basis of the technology used in their production (21) The subsidy regime is different to that considered by the other studies in that it is applied to the production cost of the clean good and thus reduces the (constant) marginal cost of production for that good As such it is equivalent to an output subsidy for the clean good The authors derive the equilibrium diffusion rate for the clean technology (ie the proportion of firms using
(18) In the second half of their paper Millock and Nauges (2006) undertake an empirical evaluation of such a scheme that operated in France during the 1990s for SO2 and NOX emissions The results of this analysis are summarised under Section 25 on empirical evidence
(19) Abatement effort is assumed to exhibit decreasing returns to scale ie the cost function is increasing and convex(20) If output is held fixed in the profit maximisation problem then increases in the emissions tax rate unambiguously increase the
optimal level of abatement effort as found by Kemp (1997) who uses a cost-minimisation framework for his analysis(21) The model assumes imperfect substitution between the clean good and dirty good with the willingness-to-pay for one good being
a linear function of the quantities of both goods individually ndash ie Pk = ak ndash bYk ndash cYj
Review of literature on environmental tax reform and eco-innovation
Environmental tax reform in Europe opportunities for eco-innovation 17
that technology) and show that an increase in the subsidy value increases diffusion for all degrees of product differentiation The impact is greater as the substitutability of the two goods increases They also briefly consider the impact of a technology subsidy that reduces the fixed cost of the clean technology and conclude that this too will stimulate diffusion but will be less efficient than the output subsidy (22)
Key findings of the theoretical studies
As is often the case with theoretical analyses the specifications of the models and the underlying assumptions of the studies reviewed here significantly influence the conclusions Nevertheless there is a reasonable degree of consistency between their findings The studies can be classified into two broad groups those that consider innovation and diffusion within an industry setting and those that consider an individual firms decision whether to undertake RampD (ie innovation) and invest in an abatement technology (ie diffusion) in order to reduce its own cost of abatement
The studies in the first group conclude that under conditions of perfect competition emission taxes and auctioned permits provide greater incentives for innovation than direct controls or freely allocated permits However there is some disagreement over the relative impacts of the two instruments Under the assumption that the innovator appropriates a fixed (exogenous) proportion of the gains accruing to the technology adopters Milliman and Prince (1989) conclude that auctioned permits provide the greatest incentive although the government may find it easier to adjust emission taxes in response to the resultant downward shift in marginal abatement costs However when the proportion is determined endogenously mdash in the form of a royalty payment mdash Fischer et al (2003) find that either auctioned permits or emission taxes can provide the greater incentive Emission taxes are likely to provide the greatest incentive if the innovator can appropriate a large proportion of the gains (because the technology is difficult to imitate)
Montero (2002) uses a slightly different framework to compare the impacts of different instruments on innovation (in the form of RampD expenditure)
in a situation of imperfect competition and finds that the ranking depends on the nature of the competition (23) Under Bertrand price competition in the output market the results are the same as under perfect competition the relative ranking of auctioned permits and taxes is ambiguous but both provide greater incentives for innovation than emission standards and freely allocated permits However under Cournot quantity competition any of the instruments apart from freely allocated permits can provide the greatest incentives depending on the model parameter values
The studies looking at an individual firms decision also show that an emissions tax can stimulate innovation and diffusion Jaffe and Stavins (1995) explicitly consider the firms decision criterion for investing in a new abatement technology and show that by increasing the benefits of investing the introduction of an emissions tax should bring forward its adoption by existing firms and make its use by new entrants more likely The other two studies consider the firms choice of optimal abatement effort in the context of maximising its total profits or minimising its total cost of emissions reduction This effort can take the form of RampD (innovation) or expenditure on abatement equipment (diffusion) The decision problem is the same in each case ie to choose the optimal level of effort
Kemp (1997) assumes that the firm seeks to minimise its total cost of emissions reduction mdash implicitly assuming that its output level is fixed mdash and demonstrates both that abatement effort increases as the emissions tax increases and that the optimal effort is lower under direct regulation than under an equivalent tax However when the firms output level is allowed to vary mdash as is the case with the profit maximisation problem considered by Millock and Nauges (2006) mdash the impact of an increase in the emissions tax rate on the level of abatement effort depends on the relative magnitudes of the direct impact and the indirect impact (via changes in output levels) on the marginal benefit of abatement effort If the latter dominates then an increase in the emissions tax rate leads to a reduction in the optimal level of abatement effort
(22) McGinty and de Vries (2009) derive expressions for the necessary technology subsidy values when diffusion is 0 and when it is 100 They state mdash without proof mdash that the latter is greater than the former Provided that the relationship between the subsidy and diffusion is monotonic this is a sufficient condition for increases in the subsidy value to cause increases in diffusion
(23) Monteros model does not include diffusion However it does include spillover effects where RampD by one firm reduces the abatement costs of the others
Environmental tax reform in Europe opportunities for eco-innovation
Review of literature on environmental tax reform and eco-innovation
18
Only one of the industry models considers the impact of investment subsidies Using a product differentiation model of imperfect competition McGinty and de Vries (2009) show that subsidising the unit cost of a clean production technology can accelerate its diffusion However the impact depends on the degree of substitutability between clean and dirty products diminishing as the products become more differentiated In contrast all three of the individual firm analyses consider the impact of investment subsidies with all demonstrating that increasing subsidies induce greater abatement effort Furthermore Kemp (1997) shows that the impact of an RampD subsidy is greater in the presence of an emissions tax than it is under an equivalent emissions limit
25 Empirical studies
Jaffe and Stavins (1995) use their theoretical framework (outlined above in Section 24) as the basis for assessing the diffusion of thermal insulation in new home construction in the United States using state-level panel data for the years 1979ndash88 They derive a reduced form equation for the energy efficiency level chosen by developers from the marginal cost-benefit condition in which the explanatory variables include energy prices installation costs and the presence of a relevant building code (as a dummy variable) Separate equations are estimated for ceiling floor and wall insulation with the coefficient for energy prices being positive in all three equations Although it is only significant (at the 95 level) for floor insulation the joint hypothesis that all price coefficients are zero is strongly rejected However the coefficients for installation cost (which are all negative as expected) are around two to three times greater in magnitude and of comparable significance The coefficients for the building code dummies are consistently insignificant (and negative in two cases) indicating that this form of direct regulation had minimal impact on household energy efficiency levels over the period The authors use the estimated models in a simulation to compare the effects of a 10 increase in energy prices (ie an energy tax) with those of a 10 reduction in installation costs (ie a technology subsidy) with each applied over the whole ten-year period While
the tax increases diffusion by 2ndash6 by the end of the period the technology subsidy increases diffusion by between 4ndash15
Kemp (1997) models the diffusion of biological water treatment technology in the Dutch food and beverage industry based on a rational choice threshold model of technology adoption decisions In this model a firm chooses to adopt an abatement technology if the resulting reduction in emission-tax payments is greater than the annualised total costs of the technology where a discount factor is applied to the savings to reflect uncertainty and risk aversion on the part of the decision-maker This is translated into a probabilistic model under the assumption that both the savings and the costs follow a log-normal distribution across plants The model is estimated econometrically using data for the period 1974ndash91 under different assumptions for the functional form of the discount factor and allowing for adjustment costs (24) The estimated parameters for the preferred specification of the discount factor are all significant and of the expected sign and magnitude and the model provides a very close fit to the actual diffusion of waste-water treatment technologies over the period This leads the author to conclude that the effluent charges were a significant positive factor in the diffusion of treatment technologies Indeed he estimates that only around 4 of plants would have installed waste-water treatment equipment by the end of the period if the charge had remained at its (low) 1974 level compared to the actual figure of over 40
Newell et al (1999) estimate the impact of energy prices energy efficiency standards and other factors on the energy efficiency of three types of electrical consumer durables (room air conditioners central air conditioners and gas water heaters) in USA between the 1970s and 1990s The analysis utilises a product characteristics model in which the frontier of technologically feasible products is described by a transformation surface that relates the bundle of product characteristics to the real cost of producing that bundle In this framework innovation is represented by movements of the surface and movements along the surface In particular the authors identify three types of innovation shifts in the surface towards the origin (overall technological change) changes in the slope
(24) Adjustment costs are accounted for by estimating a partial adjustment model in which the actual change in adoption is some fixed fraction of the desired change (estimated from the threshold model)
Review of literature on environmental tax reform and eco-innovation
Environmental tax reform in Europe opportunities for eco-innovation 19
of the surface (directional technological change) and changes in the mix of products along a given surface (model substitution) They define the surface in terms of two characteristics energy flow and cooling capacity and incorporate innovation by allowing the coefficients of the two variables to vary with time and (in the case of energy flow) energy prices and efficiency standards Separate equations are estimated for each durable type with slightly differing sets of explanatory variables and time periods The authors find little evidence that either energy prices or energy efficiency standards had any impact on overall technological change While all but one of the relevant coefficients have the expected sign none are significant In contrast they do find evidence that energy prices had an impact on directional technological change with the relevant coefficients being of the correct sign and significant for both room and central air conditioners
Popp (2002) uses patent data to estimate the effect of energy prices on energy-efficiency innovations in USA between 1970 and 1994 He regresses normalised energy-efficiency-related patent applications against energy prices controlling also for lagged knowledge stock and government RampD (25) The estimated coefficient for energy prices is highly significant producing a short-run price elasticity of 006 and a long-run elasticity 0354 Thus a 10 increase in energy prices would be expected to increase the number of energy-efficiency-related patents by around 35 in the long run The estimated mean lag is less than four years leading the author to conclude that the imposition of a carbon or energy tax would lead to a fairly quick shift towards environmentally friendly innovation
Hoglund Isaksson (2005) estimates abatement cost functions for the reduction of nitrogen oxide (NOX) emissions in three industrial sectors in Sweden (energy pulp and paper chemicals and food) The analysis uses a double-hurdle model applied to a pooled sample of 114 plants across the three sectors The data cover the period 1990ndash1996 which spans the introduction of the charge on NOX emissions in 1992 The estimated cost curves have a similar shape in all three sectors with minimal (or even negative) costs over a relatively broad range of emission reductions and then a steep rise as reductions exceed
a threshold level The analysis does not explicitly consider the issue of innovation However it does find that abatement cost curves shifted downwards significantly over the period In the energy sector for example the emission rate threshold for significant cost increases fell by around 45 between 1991 and 1996 (from 550 to 300 kgGWh) The author surmises that this is due to a combination of technological development and the discovery of previously unrecognised opportunities Unfortunately while this shift coincided with the introduction of the NOX charge the analysis does not provide any evidence of a causal link
As part of their analysis of the impacts of the French tax-subsidy scheme for NOX and sulphur dioxide (SO2) emissions Millock and Nauges (2006) estimate the impact of the emission taxes on a plants decision to install end-of pipe abatement equipment While the study is not concerned with innovation per se the results of this part can be interpreted as showing the impact of emission taxes on the diffusion of abatement equipment Under the scheme taxes were imposed on the emissions of these air pollutants (and VOCs) by all plants satisfying certain criteria The revenue raised by the taxes was earmarked for subsidising the cost of qualifying abatement technologies for technical studies (ie RampD) and for investment in air quality surveillance systems Using panel data for 226 plants in three industries (iron and steel coke and chemicals) for the period 1900ndash1998 the authors estimate a Probit model for the probability that a plant will install abatement equipment They find that the total value of emissions taxes paid by the plant (ie for both pollutants) has a positive impact on its decision to invest in abatement equipment However the magnitude of the effect varies considerably across the sectors and is only significant for the iron and steel sector
Frondel et al (2008) analyse responses to an OECD survey on environmental policy tools (conducted in 2003) to identify the factors that affect a firms decision to adopt an environmental management system (EMS) voluntarily and their environmental innovation behaviour Innovation is captured by a binary variable that indicates whether the firm has undertaken significant technical measures or changes to reduce the environmental impacts of
(25) Normalised energy efficiency patent values are calculated by dividing by the total number of patents granted This accounts for exogenous changes in patenting behaviour that affect all types of patents Popp constructs a value for existing knowledge as the stock of previously granted patents weighted by estimates that he derives for knowledge productivity He demonstrates that the exclusion of this variable from the model leads to biased estimates for the energy price coefficient
Environmental tax reform in Europe opportunities for eco-innovation
Review of literature on environmental tax reform and eco-innovation
20
production (26) The analysis is based on survey responses from 899 firms in Germany Latent variable equations for EMS adoption and innovation are estimated simultaneously with each equation including the same four sets of variables relating to motivations policy instruments pressure groups and facility characteristics (27) The policy instrument variables include five dummy variables indicating the importance of different types of policy instrument including market-based instruments such as emission taxes and tradable permits While the perceived stringency of environmental policy is found to be a significant factor in the decision to innovate there is no evidence that any of the individual policy instrument variables had any impact The authors surmise that this suggests that it is stringency of environmental policy rather than the choice of specific instrument that is important for innovation However as the authors note their results reflect the perceptions of the survey respondents and should therefore be treated as correlations rather than causal relationships
Johnstone and Hascic (2008) assess the impact of a range of environmental policy instruments mdash including tax measures and investment incentives mdash on innovation in the renewable energy field They analyse the impacts for five different groups of renewable energy technologies mdash wind solar ocean biomass and waste-to-energy mdash using a panel dataset of European Patent Office (EPO) patent filings for these technologies across 26 countries over the period 1978ndash2003 A fixed effects negative binomial model is estimated controlling for electricity prices and consumption public sector RampD expenditure (as a proxy for scientific capacity) and total EPO filings (as a proxy for differenceschanges in patenting propensity) The various policy instruments are represented by dummy variables indicating whether they were in place in a particular year As such the model takes no account of the stringency of the instruments mdash in particular the differing magnitudes of the tax measures and investment incentives (28)
Initially the authors estimate the model with all of the policy instruments included individually They find that while public policy plays an important role in inducing innovation the impacts of the individual instruments vary across the different technologies In particular tax measures are significant for wind and biomass technologies with investment incentives being significant for solar and waste-to-energy technologies and obligationstradable certificates being significant for wind technologies However the authors express concerns that there may be multicolinearity between the policy variables (particularly between investment incentives tax measures and tariffs) and also that there may be interaction effects between some of the variables Consequently they estimate two alternative versions of the model the first using a composite policy variable representing the number of policy instruments in place and the second using clusters of similar policy instruments (29) The results or these two models confirm the initial findings The composite policy variable is significant for all of the technology groups while the significance of the clusters varies across technologies The price-based cluster is (highly) significant for solar biomass and waste-to-energy The quantity-based cluster is significant for wind technologies The authors surmise that this may be due to the different economic characteristics of the technologies For example the significance of investment incentives for solar and waste-to-energy may reflect the capital intensity of these technologies with large up-front investment costs
De Vries and Medhi (2008) also use patent data to investigate the relative importance of environmental regulations and fuel prices on innovation in automotive emission-control technologies distinguishing between post-combustion devices and engine redesign technologies They estimate a panel data model using data from Germany Japan and USA over the period 1978ndash2001 controlling for industry value added (as a proxy for the scope of technological opportunities) and total patent
(26) The next question on the survey asks whether these are changes in production processes or end-of-pipe technologies However no distinction is made between these two types of innovation in the present study
(27) In order to avoid identification problems some individual variables are omitted from one equation or the other(28) This shortcoming is recognised by the authors who state that it is unavoidable in any cross-comparative analysis in which multiple
instruments are included(29) The clusters are price-based instruments (investment incentives tax measures and tariffs) quantity-based instruments (obligations
and tradable certificates) and voluntary programmes
Review of literature on environmental tax reform and eco-innovation
Environmental tax reform in Europe opportunities for eco-innovation 21
applications (as a proxy for differenceschanges in patenting propensity) Environmental regulation is represented by two dummy variables indicating the introduction of on-board diagnostic (OBD) regulations in USA (30) The results of the analysis suggest that the relative impacts of regulation and market forces differ between the two types of technology For post-combustion technologies both of the regulations are significant while fuel prices have no significant impact In contrast the opposite is the case for engine redesign technologies with fuel prices having a significant impact but regulation having no discernable effect While the analysis does not explicitly consider the impact of fuel taxes it suggests that an increase in automotive fuel taxes would have a major impact on innovation in relation to engine design The estimated coefficient for fuel prices (1287) implies that a USD 010 increase in fuel prices would induce a 14 increase in patenting activity (31)
Key findings of the empirical studies
The empirical studies considered above cover a range of different technology areas spanning energy efficiency (both product and process) renewable energy and air and water pollution abatement While in some cases they assess the impact of energy prices rather than environmental taxes per se they provide a clear picture of the likely impact of environmental and energy-related taxes on eco-innovation
Three of the studies assess the impact on diffusion of existing technologies All find that environmental taxesenergy prices have a positive impact on diffusion In particular the water effluent charges in The Netherlands appear to have had a major impact on the adoption of waste-water treatment equipment by the food and beverage industry in that country However there is some evidence to suggest that the effectiveness of taxesprices may vary across sectors (eg NOXSO2 abatement in France) and that investment incentivessubsidies may be more
effective in some cases (eg thermal insulation in USA)
Three of the studies use patent data to assess the impact of environmental taxes and energy prices on innovation with one of these also assessing the impact of investment incentives All find a significant positive impact although this depends on the particular sub-sector (eg renewable energy) or the type of innovation In particular the evidence from the automotive emissions control study suggests that taxesprices may be more effective in promoting process-related innovation (eg engine redesign) than innovation in end-of-pipe technologies One of the studies takes a different approach using a product-characteristics model to decompose improvements in the energy efficiency of consumer durables This finds that while electricity prices did not appear to affect overall technological change (ie shifts in the product costenergy efficiency frontier) they did have a positive impact on directional technological change (ie the slope of the frontier)
26 Case studies
Christiansen and Skjaerseth (2005) undertake a comparative analysis of the impacts of climate change policies on the petroleum sectors in Norway and the Netherlands during the 1990s These countries were selected because of their very different policy approaches with the Norwegian petroleum sector subject to a carbon dioxide (CO2) tax since 1991 as part of a portfolio of measures (32) and the Netherlands relying on a series of voluntary agreements on energy efficiency (33) Both approaches appear to have been effective in that CO2 emissions per unit production fell by around 22 between 1990 and 2001 in Norway while energy efficiency improved by around 35 in the Netherlands over the same period However there were marked differences between the two countries in terms of the nature of the innovation that
(30) Because of the international nature of the automotive industry and the importance of the US market regulations introduced in USA appear to have been an important driver for innovation by overseas manufacturers Regulations mandating the installation of OBD systems were first introduced in California in 1988 A more sophisticated system was mandated by the 1990 US Clean Air Act Amendments taking force in 1996
(31) The coefficient represents the semi-elasticity of patent applications with respect to fuel prices While the authors do not state so explicitly the implication is that prices are expressed in US dollars (they are obtained from the IEA Energy Prices and Taxes Database) Consequently the impact of a 10 US cent increase in the fuel prices is given by exp(1287 x 01) ndash 1 = 0137
(32) In addition to the tax the portfolio included publicly funded RampD support schemes gas flaring permits and mandatory environmental impact assessments
(33) The Dutch oil and gas industry first signed a declaration of intent with the government in 1995 This was translated into a long-term agreement (LTA) on energy efficiency in the following year with an improvement target of 20 over the period 1989ndash2000 In 2001 a new LTA was signed which committed firms to implementing energy efficiency measures with a positive NPV at a 15 discount rate or a five year payback period
Environmental tax reform in Europe opportunities for eco-innovation
Review of literature on environmental tax reform and eco-innovation
22
occurred In the Netherlands technological change was incremental reflecting a steady diffusion of available (ie known) technology In contrast the authors find evidence of more radical innovations and adaptations by the Norwegian petroleum sector including the development of energy-efficient gas turbines installation of waste heat recovery units process modifications and improved use of process heat While the authors acknowledge the impossibility of proving a causal link between policy intervention and innovation (in the context of their case study) they conclude that the CO2 tax played a key role in the development and implementation of these radical innovations and the benefits of reduced tax payments provided an important incentive However they also conclude that the impacts of the two instruments were conditioned by the political contexts in which they were applied and the problem characteristics in the respective countries (eg the economic significance of the sector and the size of installations)
Knigge and Goumlrlach (2005) summarise the findings of a comprehensive analysis of the impacts of the ETR in Germany That analysis undertaken jointly by Ecologic and the German Institute for Economic Research (DIW Berlin) included the impacts on innovation and market diffusion of environmentally friendly products and technologies (34) Based on a series of case studies the study concluded that the ETR had a noticeable effect on innovation and diffusion although it was not possible to quantify the scale of that effect In particular ETR is identified as being a central factor in the development of gas-powered vehicles The study identifies a number of different routes by which the ETR produced impacts First the payback period for energy-efficient products was reduced as a result of the energy tax increases and the various exemptions favouring efficient energy use and renewable energy sources Second the predictable nature of the energy taxes (as opposed to widely fluctuating oil prices) reduced uncertainties about the benefits of energy-efficiency investments Third the reduction in employers social contribution payments tended to reduce the costs of labour intensive innovation processes such as research and development energy consultancy and technology installation Finally the ETR had a signalling effect strengthening awareness of the need for more efficient and rational energy use
Mickwitz et al (2007) examine a number of claims that have been made in the environmental policy literature about the relationship between policy instruments and innovation based on experiences in two industrial sectors in Finland pulp and paper and the manufacture of diesel engines for ships In particular they assess the claims that environmental taxes are superior to other policy instruments with respect to innovation and that RampD subsidies have limited impacts on innovation With respect to the first claim the evidence provided by the two case studies is mixed The authors conclude that energy taxation had a negligible impact on innovation in the pulp and paper industry However this is likely to have been due to the low level of the tax and the exemptions that applied to the sector In contrast they find that the differentiation of Swedish fairway and port fees (on the basis of SO2 and NOX emissions) was a significant factor driving the installation of in-engine NOX reduction equipment in ferries operating between the two countries (35) With respect to RampD subsidies the authors conclude that the evidence does not support the claim that these have little effect In particular they find that RampD subsidies accelerated the development of ship engine emissions-reduction technologies
The findings of the three case studies are consistent with those of the empirical analyses reviewed in the previous section Environmental taxes and investment subsidies have proven significant in promoting both innovation and diffusion although not universally so Furthermore the case studies provide some useful insights about the ways in which the impacts occur and the factors that may be important in promoting innovation In particular they suggest the need for a tax rate that is sufficiently high to provide a meaningful incentive and signalling effect and that is fixed for a sufficiently long period of time to reduce uncertainty about the future benefits of investment
27 Conclusions
The studies reviewed in the preceding sections suggest that environmental regulation in general and price-based policy instruments such as environmental taxes and investment subsidies in particular can (in theory) and do (in practice) have a positive impact on both innovation and diffusion
(34) A separate report in German by Goumlrlach et al (2005) provides details of the evaluation of the innovation and diffusion impacts (35) Although the tax was introduced in Sweden it was also payable by Finnish ferry operators entering Swedish ports and hence
affected their investment decisions This is another example of the cross-border impact of environmental policy interventions on innovation found by Lanjouw and Mody (1996) (see Section 23)
Review of literature on environmental tax reform and eco-innovation
Environmental tax reform in Europe opportunities for eco-innovation 23
of environmental technologies However the supporting empirical and case study evidence is not universal and the effectiveness of these instruments would appear to vary across different sectors and different types of innovation
To a certain extent such differences can be explained by the theoretical models In particular the impact of environmental taxes (relative to other instruments) is predicted to depend on the competitive structures of the markets in which the regulated firms operate and on the ability of innovator firms to appropriate the benefits accruing to other firms during diffusion However a number of other potential factors have been identified in the literature which may affect the impact of price-based policy instruments on innovation
Jaffe et al (2002) caution that the impact of price-based policy instruments on technology diffusion may be adversely affected by a number of potential market failures including information failures principle-agent problems (eg landlord-tenant) capital market failures and positive adoption spillovers In addition while not market failures as such uncertainty over future returns and the (associated) use of high discount rates for investment decisions can also undermine the effectiveness of price-based instruments in stimulating diffusion However as was noted above the findings from the case study of ETR in Germany suggest that an environmental tax may actually reduce the level of uncertainty over future returns provided that it is of sufficient magnitude and longevity
Skjaerseth and Christiansen (2005) emphasise that the relationship between policy instruments (of all types) and technological change is extremely complicated They argue that account must be taken of the politicalindustrial context in which policy instruments are introduced and the nature of the environmental problem that they are intended to address In particular they make a distinction between malign problems where technological change involves net costs for target groups and benign problems where there are widespread no-regret opportunities for change Based on a comparative analysis of four different case studies they conclude that mandatory policy instruments (including environmental taxes) are more effective
in promoting short-term technological change when the problems are malign but that low legitimacy (with the target group) may undermine long-term technological change However when problems are benign or when long-term change requires cooperation voluntary policy instruments are likely to be more effective
Johnstone (2005) questions the focus of the theoretical and empirical analyses (reviewed above) on the impact of environmental policy instruments on the rate of technological change He argues that the direction of technological change is as important if not more so In addition to the quantity of innovation it is also important that innovation be socially optimal in the sense that it minimises the cost of attaining a particular environmental goal in the long term Inappropriate innovation today may result in lock in to a suboptimal technological path for the future
With this in mind Johnstone identifies a number of issues that can adversely affect the direction of innovation and should be taken into account when selecting and designing policy instruments technological market failures (36) missing markets for certain environmental attributes of innovation policy incidence and joint production of emissions Most studies of the innovation effects of environmental policy instruments assume that the only missing market is that for the environmental good (or bad) However in practice there may be other markets that are missing (or incomplete) which can adversely affect transmission of innovation incentives This is particularly so in the area of waste and resource management where instruments applied at the end of the product life cycle may have little or no impact on product design innovation Even if all markets are complete except for the environmental externality the point of incidence of the policy intervention may be more important for the direction of innovation than the choice of a particular policy instrument For example a limit or standard applied directly to the emissions of a pollutant may be more effective in promoting optimal innovation than a tax applied to a proxy input variable Finally when there is joint production of pollutants (eg CO2 and air pollutants from vehicle engines) there is a danger that if policy instruments (of whatever type) are applied to one pollutant in isolation the resulting innovation may
(36) These are the same market failures identified by Jaffe et al (2002)
Environmental tax reform in Europe opportunities for eco-innovation
Review of literature on environmental tax reform and eco-innovation
24
reduce emissions of that pollutant at the expense of increases in the others
In a related point Johnstone highlights the importance of using appropriate indicators when assessing the impact of policy instruments on innovation emphasising the need for these to reflect both the rate of innovation and the direction A necessary condition for this is that the indicators must provide an accurate and detailed picture of actual innovation Unfortunately this is difficult to achieve in practice For example the use of patent data as a measure of innovation requires the identification of relevant environmental technologies This is likely to be easier for end-of-pipe technologies than for process-related technologies meaning that the latter tend to be under-represented relative to their actual incidence To the extent that process-related innovation is growing in importance or is more important
for certain sectors or types of environmental problem changes in the value of the indicator may significantly understate the actual rate of innovation and misrepresent the direction
All of this suggests that caution should be exercised in drawing general definitive conclusions about the impacts of price-based policy instruments such as environmental taxes and investment subsidies on innovation particularly relative to other policy instruments While it would appear that they can be effective in stimulating both innovation and diffusion in many cases mdash at least in terms of the rate of technological change mdash there may be situations in which other policy instruments may be more appropriate In general the stringency and point of incidence of an environmental policy intervention may be more important than the choice of a particular policy instrument in determining the rate and direction of eco-innovation
25
Modelling of ETR impacts on eco-innovation
Environmental tax reform in Europe opportunities for eco-innovation
31 Scenarios assessing the implications of ETR for eco-innovation
Scenario analysis provides a useful means of improving understanding of how the different revenue recycling methods and various scales of ETR can help meet different greenhouse gas emissions targets
To investigate the impacts of an ETR for Europe the petre project elaborated a range of different scenarios reflecting various tax reform options In addition to employing several of these original scenarios the present study compiled two new scenarios to analyse the implications of ETR for eco-innovation All scenarios were examined in both E3ME and GINFORS (37)
311 Original petre project scenarios
The key petre scenarios relevant for the present study are
bull scenarioBHbaselinescenariowithhighenergyprice (reference case)
bull scenarioS1HETRdesignedtomeettheEUsunilateral 2020 GHG target (high energy price) with revenue recycling
bull scenarioS2HETRdesignedtomeettheEUsunilateral 2020 GHG target (high energy price) with revenue recycling and 10 of revenues spent on eco-innovation measures
Each of the ETR scenarios has the same key taxation components
bull acarbontaxrateisintroducedtoallnon-EUEmissions Trading System (EU ETS) sectors equal to the carbon price in the EU ETS that delivers an overall 20 reduction in greenhouse gas emissions by 2020 and in the international cooperation scenario this is extended to 30
bull aviationisincludedintheEUETSattheendofPhase 2
bull powergenerationsectorEUETSpermitsare100 auctioned in Phase 3 of the EU ETS
bull allotherEUETSpermitsare50auctionedin2013 increasing to 100 in 2020
bull materialtaxesareintroducedat5oftotalpricein 2010 increasing to 15 by 2020
In scenario S1H environmental tax revenues are recycled through reductions in income tax rates and social security contributions in each of the Member States such that there is no direct change in tax revenues In scenario S2H 10 of environmental tax revenues are recycled through spending on eco-innovation measures and the remaining 90 is recycled through the same measures as in the other scenarios The eco-innovation spending is split across power generation and housing according to tax revenues from the corporate and household sector
In GINFORS (the model used for analysing the implications of ETR and eco-innovation) the share of renewable sources in electricity production is increased due to the additional investment The rest of additional investment goes to household energy efficiency spending Investment needed for a certain increase in renewable energy production or efficiency improvement is based on Austrian and German experience (Lehr et al 2008 and 2009 Grossmann et al 2008 Lutz and Meyer 2008) This assumption is quite conservative as parameters for other countries can be assumed to be more positive (meaning that less money is needed for renewable energy technology installation or energy efficiency gains)
In scenario S1H the 20 GHG target translates into a 15 reduction in energy-related carbon emissions relative to 1990 as other emissions such as methane and nitrous oxide have already been reduced by
3 Modelling of ETR impacts on eco-innovation
(37) The E3ME and GINFORS models are introduced in Chapter 1 of the present report A detailed discussion of the models and scenarios used in the present study can be found in Ekins and Speck (2011)
Environmental tax reform in Europe opportunities for eco-innovation
Modelling of ETR impacts on eco-innovation
26
more than 20 (in terms of carbon equivalents) The target is reached by a tightened EU ETS cap and the introduction of a carbon tax on the non-ETS sector The tax rate applied is equal to the carbon price in the EU ETS that will deliver a 20 GHG reduction by 2020
The burden of ETR taxes are allotted to energy outputs (ie the final use of energy) and will be based on the carbon content of each fuel Carbon prices are assumed to be fully passed on to consumers All carbon taxes are in addition to any existing unilateral carbon and energy taxes The carbon reductions in the different EU Member States will be those that result from a uniform carbon tax increase across the EU
All of the revenues including EU ETS auctioning revenues carbon tax revenues and material tax revenues will be recycled The proportion of tax raised by industry will be recycled into a reduction in employers social security contributions which will in turn reduce the cost of labour Recycling will be additional to the existing ETRs in some Member States Revenues raised from households will be recycled through standard rate income tax reductions Traditional energy tax revenues will be lower compared to their respective baselines as the tax base (energy consumption) is reduced So for an ETR revenue-neutrality does not mean budget-neutrality
312 Factors affecting the macroeconomic impacts of RES technologies
Earlier analyses (Lehr et al 2008 Fraunhofer ISI et al 2009 DTI 2004 Kammen et al 2004 Moreno and Loacutepez 2007) have studied the impacts of large renewable energy source (RES) shares in the energy mix for different countries The overall question in these studies has been the impact of increasing RES shares on the economy especially on the labour market For the present study it is interesting to note that macroeconomic impacts of higher RES shares mainly depends on the following five factors
1 additional investment in RES (minus lower investment in conventional sources ie fossil and nuclear power) with the impact increasing if a country manufactures the RES technology in question
2 additional (net) exports due to improved international competitiveness of renewable energy sources (first mover advantage)
3 lower fossil fuel needs4 the cost differences between RES and
conventional energy
5 the shift from capital- and energy-intensive industries to labour- and technology-intensive industries
All five factors are driven by international energy prices carbon prices the policy framework and RES technology development itself Innovation comes into the play at various stages First innovation drives the currently positive additional costs of RES technologies down and even into negative realms depending on the fossil fuel scenario Second innovative RES technologies are likely to have a competitive advantage in international markets Although a significant proportion of RES technology produced in Europe is traded in Europe innovation will still provide an edge in current and emerging international markets
The EmployRES study (Fraunhofer ISI et al 2009) finds for Europe that current strong investment reflected in installations in Europe and exports to the rest of the world dominate the economic impact of RES policies and therefore lead to positive overall effects The studys results suggest that this positive balance can only be kept up in the future if the competitive position of European manufacturers of RES technology is improved The authors strongly recommend policies which promote technological innovation in RES and lead to a continued and rapid reduction of their costs
Factors 1 and 2 will have substantial macroeconomic impacts in the short and medium terms whereas factor 3 accumulates and will show positive impacts mainly in the long term Factor 4 strongly depends on the global developments while factor 5 may have significant effects on employment
313 Additional scenarios
Impacts of additional investment (factor 1) have already been analysed in scenario S2H of the petre project To focus on the other impacts of eco-innovation two additional scenarios were designed building on scenario S2H of petre
bull S2HEETRwithrevenuerecyclingdesignedto meet the unilateral EUs 2020 greenhouse gas (GHG) target (high energy price) Ten per cent of revenues are spent on eco-innovation measures and trade shares of EU-27 economies with the rest of the world in machinery and electrical machinery increase by 01 due to the deployment of the fast growing RES markets This assumption is based on the strong EU policy effort to increase the share of renewable energy in final energy consumption to 20 by 2020
Modelling of ETR impacts on eco-innovation
Environmental tax reform in Europe opportunities for eco-innovation 27
(Fraunhofer ISI et al 2009) and the possibility of very strong world market development of the RES sector until 2020 (EREC 2008) which offers additional export opportunities for European RES industries
bull S2HIETRwithrevenuerecyclingdesignedto meet the unilateral EUs 2020 GHG target (high energy price) Ten per cent of revenues are spent on eco-innovation measures and input structures of the energy sector are changed according to the input structure of the German RES industry (Lehr et al 2008)
S2HE looks at the possible role of international trade S2HI analyses changes in the input structure of the energy sector ie from conventional electricity production to renewables In the petre project (as in GHK et al 2007) only the energy inputs of the energy sector were adapted to changes in the energy input mix
Both S2HE and S2HI focus on RES and efficiency technologies As mentioned above an ETR will trigger a variety of innovations Therefore the results can be thought of as conservative in the sense that innovations (eg automotive energy consumption industrial efficiency etc) are not explicitly included
32 Overview of modelling results
The main results of the simulations are presented in Table 31 In the baseline scenario BH with high energy prices EU-27 carbon emissions will be
72 below the 1990 level in 2020 (38) The EU-15 has committed in the Kyoto Protocol to reduce its GHG emissions 8 below 1990 levels in the period 2008ndash2012 As emissions in the new member states are substantially below their 1990 levels today that implies that the EU-27 will keep its emissions more or less constant over the coming decade As in the PRIMES baseline an ETS price of 18 EURt in 2008 prices is assumed in 2020
In scenario S1H the ETS price and carbon tax rate has to be increased to 68 EUR2008t of CO2 to reach the 20 GHG reduction target which is equal to a 15 reduction of CO2 emissions against 1990 as other greenhouse gases have already been reduced above average by more than 20 in terms of CO2 equivalents Compared to the baseline CO2 emissions are 84 lower in 2020 which means roughly an additional 1 reduction annually in the period 2012ndash2020 GDP will be about 06 lower compared to the baseline in 2020 This means that annual average growth rates will be less than 01 below their baseline development This is especially low compared to the current financial and economic crisis with a GDP deviation against the baseline of around 6 in 2009
As the recycling mechanism reduces labour costs and the tax burden is shifted from labour-intensive to carbon- and material-intensive sectors employment will be 036 (or more than 800 000 jobs) higher than in the baseline The ETR is not fully budget neutral potentially enabling EU economies to slightly increase their net savings If
(38) The modelling exercise in the present study was conducted in 2009 and therefore does not contain the latest data on EU-27 GHG emissions which were significantly influenced by the global economic slump of the late-2000s
Table 31 Main results under the different scenarios
Scenario Target in 2020 CO2 price GDP Employment CO2 reduction
EUR2008t pc against baseline
pc against baseline
pc against 1990
pc against baseline
in year 2020 2015 2020 2020 2020 2020
BH 18 ndash 72 00
S1H 20 GHG 68 ndash 022 ndash 057 036 ndash 151 ndash 84
S2H 20 GHG 61 ndash 013 ndash 030 041 ndash 152 ndash 85
S2HE 20 GHG 61 ndash 009 ndash 004 051 ndash 151 ndash 84
S2HI 20 GHG 61 ndash 006 ndash 024 045 ndash 152 ndash 84
Environmental tax reform in Europe opportunities for eco-innovation
Modelling of ETR impacts on eco-innovation
28
this extra saving is spent negative GDP impacts will be further reduced
In scenario S2H part of the revenues is invested in low-carbon technologies This reduces the carbon price to 61 EUR2008t in 2020 halving the GDP loss relative to scenario S1H to only 03 as the investment in renewable energies is assumed to be additional Employment impacts are also more positive than in scenario S1H The 10 investment in low-carbon technologies amounts to more than EUR 20 billion in 2020
Assuming additional EU exports of RES technologies in scenario S2HE GDP almost matches the baseline in 2020 and employment is 051 (or more than 1 million jobs) higher than in the baseline In scenario S2HI a shift in the input structure of the energy sector towards machinery
and electrical machinery reflecting the different nature of RES relative to conventional electricity generation also has smaller additional positive impacts on GDP and employment compared to scenario S2H
The following figures show impacts of the different scenarios in comparison to the baseline BH As Figure 31 illustrates all the alternative scenarios imply GDP lower than the baseline However comparing scenario S1H with the other three scenarios shows that additional RES investment (S2H) additional RES exports (S2HE) and the inclusion of different input structures of the RES industries (S2HI) each have positive GDP impacts These results are in line with model-based analysis in the EMPLOY-RES study (Fraunhofer ISI et al 2009)
Figure 31 EU-27 GDP according to four scenarios mdash deviation from the baseline (BH)
Percentage deviation from the baseline (BH)
ndash 100
ndash 080
ndash 060
ndash 040
ndash 020
0002010 2015 2020
S2HI S1H S2H S2HE
Modelling of ETR impacts on eco-innovation
Environmental tax reform in Europe opportunities for eco-innovation 29
In contrast to GDP employment increases relative to the baseline in all the alternative scenarios (Figure 32) Due to the scenario design the structure of the EU economies is shifted from energy-intensive to labour-intensive sectors The magnitude of the employment gain is influenced by the carbon price and the tax shift the underlying energy prices and the production loss The largest part of the employment increase stems from the additional RES investment (scenario S2H) although a shift in industry structures (S2HI) and additional RES exports (S2HE) are also positive for the labour market
33 Macroeconomic impacts at the national level
In general terms it is clear that national ETS and ETR impacts depend significantly on country specifics including energy use economic structure social system and behaviour (eg reactions to labour cost changes) In countries with high carbon intensity in their energy mix additional revenues and expenditures are higher than in countries with lower carbon intensity
Scenario S2H provides an interesting tool for analysing the macroeconomic impacts of ETR at the national level because 10 of the additional generated revenues are used for eco-innovation investments meaning that only 90 of the revenues are recycled back into the economy by reducing income tax rates and social security contributions
Figure 32 EU-27 employment according to four scenarios mdash deviation from the baseline (BH)
ndash 020
000
020
040
060
2010 2015 2020
S2HI S1H S2H S2HE
Percentage deviation from the baseline (BH)
Environmental tax reform in Europe opportunities for eco-innovation
Modelling of ETR impacts on eco-innovation
30
Figure 34 GDP in 2020 in EU-27 Member States under scenario S2H mdash deviation form the baseline (BH)
Figure 33 GDP in 2020 in selected countries under scenario S2H mdash deviation from the baseline (BH)
ndash 25 ndash 20 ndash 15 ndash 10 ndash 05 00 05 10 15
Romania
Bulgaria
SloveniaMalta
Lithuania
Latvia
Estonia
CyprusSlovakia
Poland
Hungary
Czech RepublicUnited Kingdom
Sweden
Spain
Portugal
Netherlands
Italy
Ireland
Greece
FranceFinland
Denmark
Luxembourg
Belgium
Austria
Germany
Percentage deviation from the baseline (BH)
Russia
South Africa
Brazil
India
China
Mexico
Japan
USA
Poland
United Kingdom
Spain
Italy
France
Germany
ndash 30 ndash 25 ndash 20 ndash 15 ndash 10 ndash 05 00 05 10
Percentage deviation from the baseline (BH)
Modelling of ETR impacts on eco-innovation
Environmental tax reform in Europe opportunities for eco-innovation 31
Figure 35 Employment in 2020 in EU-27 Member States under scenario S2H mdash deviation from baseline (BH)
EU-27EU-15
RomaniaBulgariaSloveniaMalta
LithuaniaLatvia
EstoniaCyprusSlovakia
PolandHungary
Czech RepublicUnited Kingdom
SwedenSpain
PortugalNetherlands
ItalyIrelandGreece
FranceFinlandDenmarkLuxembourg
BelgiumAustria
Germany
ndash 200 0 200 400 600 800 1 000
Percentage deviation from the baseline (BH)
Under scenario S2H the GDP of large EU economies deviates from baseline projections by between 0 and ndash 1 with the exception of Italy (Figure 33) Germanys GDP is even forecast to match the baseline level in 2020 due to the countrys strong RES industry Outside Europe some countries gain slightly against EU Member States in terms of competitiveness as export prices in most EU Member States and sectors increase and GDP in those countries exceeds the baseline projections as a result (Figure 33) This is mainly because carbon tax revenues are recycled via income tax reductions which are not part of production costs However energy exporting economies such as Russia or South Africa will lose exports if EU demand for fossil fuel imports declines The development of all EU Member States is shown in Figure 34
Employment impacts of scenario S2H are positive for almost all EU Member States as lower labour
costs increase labour demand and labour intensity (Figure 35) The highest absolute increases are shown for Germany the Netherlands Italy and the United Kingdom For EU-27 as a whole employment will be almost one million higher than in the corresponding baseline BH in 2020
The scenarios have not been designed with a view to meeting the EU renewables target of a 20 renewables share in final energy consumption in 2020 Nevertheless the scenarios provide some interesting insights The share is projected to increase from around 10 in 2009 to above 14 even in the baseline as instruments such as feed in tariffs and biofuel quotas will continue In scenario S1H the target will be missed with around 18 in 2020 Only in scenarios S2H S2HE and S2HI is the target met (approximately 20 )
Environmental tax reform in Europe opportunities for eco-innovation
Modelling of ETR impacts on eco-innovation
32
Under scenario S2H energy-related carbon emissions are reduced in all EU Member States relative to the baseline (Figure 36) The highest percentage reductions can be seen in many of the EU-12 Member States with still high energy intensity and low energy prices In these countries the relative price increase is higher than in countries like Germany or the United Kingdom with already high energy taxes and overall energy prices
Additional ETS revenues material tax revenues and carbon tax revenues from the industry sector are recycled back to industry via reductions in employers social security contributions (or wage subsidies in some countries) The revenues from the carbon tax on households set out in Table 32 (totalling 033 of GDP in Germany for example) are used to reduce income tax For the EU-27 overall revenues from ETS and ETR reach about 2 of GDP in 2020 although these figures may be excessive because additional EU efforts to increase energy
efficiency and renewable energy which will reduce the ETS price are not taken into account The use of flexible tools such as the Clean Development Mechanism will further reduce the revenues and earmarking of part of the revenues for mitigation and adaptation measures in emerging and developing countries limits the recycling into labour costs
In addition the scenarios do not take the current global economic problems into account According to the IEA (2009) the downturn will also reduce carbon emissions in the long run which will lead to lower carbon prices and revenues to reach fixed targets (or make tighter targets less costly)
The ETR will have varying effects on the prices of different sorts of products and services Material or carbon taxes increase the prices of product groups according to their direct and indirect material and carbon content The recycling mechanism reduces
Figure 36 Energy-related CO2 emissions in 2020 under scenario S2H mdash deviation from the baseline (BH)
WorldEU-27
EU-15Romania
BulgariaSlovenia
MaltaLithuania
LatviaEstonia
CyprusSlovakia
PolandHungary
Czech RepublicUnited Kingdom
SwedenSpain
PortugalNetherlands
ItalyIreland
GreeceFrance
FinlandDenmark
LuxembourgBelgium
AustriaGermany
ndash 25 ndash 20 ndash 15 ndash 10 ndash 5 0
Percentage deviation from the baseline (BH)
Modelling of ETR impacts on eco-innovation
Environmental tax reform in Europe opportunities for eco-innovation 33
Table 32 Additional ETS and environmental tax revenues in 2020 ( of GPD)
S2H Germany United Kingdom EU-27
ETS revenues 083 064 059
Carbon tax (industry) 052 044 054
Carbon tax (households) 033 041 036
Material tax 041 029 056
Sum 209 178 205
Figure 37 Total primary energy supply in 2020 under scenario S2H mdash deviation from the baseline (BH)
WorldEU-27EU-15
RomaniaBulgaria
Slovenia
MaltaLithuania
LatviaEstonia
Cyprus
SlovakiaPoland
HungaryCzech Republic
United KingdomSweden
SpainPortugal
NetherlandsItaly
IrelandGreece
FranceFinland
DenmarkLuxembourg
BelgiumAustria
Germany
ndash 24 ndash 21 ndash 18 ndash 15 ndash 12 ndash 9 ndash 6 ndash 3 0
Percentage deviation from the baseline (BH)
Environmental tax reform in Europe opportunities for eco-innovation
Modelling of ETR impacts on eco-innovation
34
Figure 38 Output price impacts of scenario S2H in Germany in 2020 mdash deviations from the baseline (BH)
Figure 39 Impacts of scenario S2H on industrial output in 2020 in Germany mdash deviations from the baseline (BH)
ndash 5
0
5
10
15
20
Output prices
Percentage deviation from the baseline (BH)
(3) F
ood
(4) T
extiles
(5) W
ood
(6) P
ulp pap
er
(7) C
oke re
fined
petro
leum
pro
ducts
(8) C
hemica
ls ex
cl pha
rma
(9) P
harm
aceu
ticals
(10)
Rub
ber a
nd plastics
(11)
Non
-metallic
miner
als
(12)
Iron
and
steel
(13)
Non
-ferrou
s metals
(14)
Met
al pro
ducts
(15)
Mac
hine
ry and
equ
ipmen
t
(16)
Office
mac
hine
ry
(17)
Electric
al m
achine
ry
(18)
Rad
io T
V
(19)
Med
ical pr
ecisi
on and
opt
ical ins
trumen
ts
(20)
Mot
or veh
icles
(21)
Ships
(22)
Airc
raft
(23)
Railro
ad
(24)
Man
ufac
turin
g n
ec r
ecyc
ling
(25)
Electric
ity g
as w
ater
sup
ply
(26)
Con
stru
ction
(27)
Tra
de r
epairs
(28)
Hot
els an
d re
stau
rant
s
(29)
Tra
nspo
rt an
d stor
age
(30)
Pos
t and
teleco
mmun
icatio
ns
(31)
Finan
ce ins
uran
ce
(32)
Rea
l estate ac
tivities
(33)
Ren
ting
(34)
Com
puter
(35)
Res
earch an
d de
velopm
ent
(36)
Oth
er bus
ines
s ac
tivities
(37)
Pub
lic ser
vice
s
(38)
Edu
catio
n
(39)
Hea
lth and
soc
ial w
ork
(40)
Oth
er ser
vice
s
(41)
Priv
ate ho
useh
olds
(1) A
gricu
lture
(2) M
ining an
d qu
arry
ing
nec not elsewhere classified
Production
ndash 100
ndash 80
ndash 60
ndash 40
ndash 20
00
20
40
60
80Percentage deviation from the baseline (BH)
(3) F
ood
(4) T
extiles
(5) W
ood
(6) P
ulp pap
er
(7) C
oke re
fined
petro
leum
pro
ducts
(8) C
hemica
ls ex
cl pha
rma
(9) P
harm
aceu
ticals
(10)
Rub
ber a
nd plastics
(11)
Non
-metallic
miner
als
(12)
Iron
and
steel
(13)
Non
-ferrou
s metals
(14)
Met
al pro
ducts
(15)
Mac
hine
ry and
equ
ipmen
t
(16)
Office
mac
hine
ry
(17)
Electric
al m
achine
ry
(18)
Rad
io T
V
(19)
Med
ical pr
ecisi
on and
opt
ical ins
trumen
ts
(20)
Mot
or veh
icles
(21)
Ships
(22)
Airc
raft
(23)
Railro
ad
(24)
Man
ufac
turin
g n
ec r
ecyc
ling
(25)
Electric
ity g
as w
ater
sup
ply
(26)
Con
stru
ction
(27)
Tra
de r
epairs
(28)
Hot
els an
d re
stau
rant
s
(29)
Tra
nspo
rt an
d stor
age
(30)
Pos
t and
teleco
mmun
icatio
ns
(31)
Finan
ce ins
uran
ce
(32)
Rea
l estate ac
tivities
(33)
Ren
ting
(34)
Com
puter
(35)
Res
earch an
d de
velopm
ent
(36)
Oth
er bus
ines
s ac
tivities
(37)
Pub
lic ser
vice
s
(38)
Edu
catio
n
(39)
Hea
lth and
soc
ial w
ork
(40)
Oth
er ser
vice
s
(41)
Priv
ate ho
useh
olds
(1) A
gricu
lture
(2) M
ining an
d qu
arry
ing
nec not elsewhere classified
Modelling of ETR impacts on eco-innovation
Environmental tax reform in Europe opportunities for eco-innovation 35
social security contributions and lowers labour costs according to the direct and indirect labour content of sector output The ETR therefore reduces output prices in labour-intensive service sectors and increases prices in carbon- and material-intensive industry sectors
The example of Germany shows insignificant impacts in the trade-intensive sectors of machinery (15ndash17) motor vehicles (20) and other transport equipment (21ndash23) (Figure 38) Iron and steel (12) and chemicals without pharmaceuticals (8) face the highest price increases of trade-intensive sectors As the German iron and steel industry primarily delivers high quality steel to the German car industry and increasingly to the German windmill industry negative competitiveness impacts will be limited Exchange rate variations against non-EU competitors have been much higher in the past
The higher prices of carbon- and material-intensive products will reduce price competitiveness on export markets and increase the market share for imports in domestic markets This loss of price competitiveness is based on an assumption of limited market development of energy efficiency and RES technologies in other part of the world It will be offset by gains in labour-intensive sectors if the ETR causes real wage costs per unit of output to fall as a result of using recycled revenues to reduce employer social security contributions
Any improvement in non-price competitiveness will also raise exports The extra employment will raise incomes raising consumption and output
The overall impact on sector output depends on countervailing effects which are negative for iron and steel and a few service sectors and positive for a few industry sectors For most industries the output effect is insignificant (Figure 39) The greatest impact is felt by producers of fossil fuels who must obviously reduce production due to lower demand for their products
Under scenario S2H employment impacts are positive for most sectors relative to the baseline as labour productivity decreases and wage rates fall in relation to consumer prices (CPI) and output prices (Table 33) The relative costs of labour are lower than in the baseline without the ETR reform Only around a quarter of the employment increase takes place in industry
Concerning the wage rate two countervailing effects have to be considered First when the labour market is characterised in terms of the real wage bargaining model as in E3ME and GINFORS with market power on both sides (employers and trade unions) consumer price increases will lead to wage increases (the econometrically estimated factor is 085 for Germany) Second labour productivity is another important factor for wage bargaining The estimated elasticity for Germany is 063 meaning that a 1 increase of labour productivity leads to wage increases of 063 Higher labour demand due to lower labour costs thus reduces the wage increase In the end the German economy is more labour intensive than without the ETR partly due to the structural change towards labour-intensive industries
Table 33 Employment impacts of scenario S2H in Germany mdash deviations from scenario S2H in 2020
Employment in 2020 Deviation from S2H () Deviation from S2Habsolute (1 000s)
Agriculture forestry 24 90
Industry 09 653
Non-metallic minerals 24 62
Iron and steel ndash 28 ndash 37
Machinery and equipment 05 56
Electrical machinery 04 18
Construction 37 449
Trade and transport 10 829
Business services 17 767
Other services ndash 02 ndash 216
Total 07 2506
Environmental tax reform in Europe opportunities for eco-innovation
Modelling of ETR impacts on eco-innovation
36
Additional exports under scenario S2HE mainly create new jobs in machinery and related business services (Table 34) Under scenario S2HI a shift in the input structure of the energy sector leads to a shift in the industry structure and creates a few jobs in the service sector (Table 35)
34 Conclusions of the scenario assessment
The foregoing analysis used the GINFORS model to assess economic and environmental impacts of using the ETS and ETR to reach the EUs 2020
GHG targets In general the results show positive employment effects and only small negative impacts on GDP in EU-27 Member States The economic impacts depend on the levels of international energy prices the mechanism used to recycle revenues and country specifics such as carbon and energy intensity and the structure of energy consumption
Although there is significant evidence that eco-innovation is positively driven by higher energy prices quantification is difficult The present study included simulations of possible impacts of a shift in the industry structure towards renewable energy in the electricity sector and an overall increase of EU
Table 34 Employment impacts of scenario S2HE in 2020 in Germany mdash deviations from scenario S2H
Employment in 2020 Deviation from S2H () Deviation from S2Habsolute (1 000s)
Agriculture forestry ndash 01 ndash 02
Industry 03 194
Non-metallic minerals 02 05
Iron and steel 04 05
Machinery and equipment 13 130
Electrical machinery 24 117
Construction 01 18
Trade and transport 00 26
Business services 07 308
Other services 01 107
Total 02 634
Table 35 Employment impacts of scenario S2HI in 2020 in Germany mdash deviations from scenario S2H
Employment in 2020 Deviation from S2H () Deviation from S2Habsolute (1 000s)
Agriculture forestry ndash 01 ndash 02
Industry 00 00
Non-metallic minerals 25 65
Iron and steel ndash 27 ndash 36
Machinery and equipment 08 78
Electrical machinery 04 19
Construction ndash 00 ndash 04
Trade and transport 00 07
Business services 02 115
Other services 0 56
Total 00 167
Modelling of ETR impacts on eco-innovation
Environmental tax reform in Europe opportunities for eco-innovation 37
exports due to higher global demand for renewable energy The main results can be summarised as follows
bull environmentaltaxreformshiftingtaxesfromlabour to energy and resources will create additional jobs and trigger eco-innovation
bull impactsofeco-innovationintheformofadditional EU exports or shifts in industry structures will have a slight positive influence on GDP and create a smaller number of additional jobs
These findings correspond to results from the EmployRES study (Fraunhofer ISI et al 2009) As ETR is directly aimed at reducing labour costs it will create additional jobs in the short and medium term In the longer term the cost reduction and new technologies arising from eco-innovation will play a larger role
Like all fiscal reforms a major ETR in Europe will create winners and losers At the sector level carbon- and material-intensive industries will face economic losses At the country level the carbon-intensity and overall flexibility of economies is important Clearly structural change away from carbon-intensive industries together with technological change is inherent in any successful climate mitigation policy
On the other hand several factors can smooth these structural adjustments International cooperation
will reduce economic pressure on countries and sectors In addition ETR together with auctioning of ETS allowances can be a major source of revenues for EU Member States in the future even if part of the revenues will have to be earmarked for adaptation and mitigation measures in developing countries Indeed future debate on grandfathering or auctioning ETS allowances should reflect the important point that giving allowances away for free denies countries the money to ease structural change and invest in low-carbon technologies
Caution is needed in relating the findings of this study to the EU policy debate In the model simulations the single carbon price is the only instrument used to reach the EUs 2020 GHG targets In reality of course other renewable energy and efficiency policies will also contribute to carbon reduction and have to be taken into account when comparing the results (especially the high carbon prices) to other studies Both reduce the potential revenues from fossil energy carriers and carbon emissions
A variety of renewable energy and efficiency policies could enable the climate and energy targets to be met while securing even better economic prospects The results of the present study clearly indicate that the discussion on market-based instruments should be intensified Ultimately however the EU will need a rich mix of policies to reach its GHG targets while maximising prosperity
Environmental tax reform in Europe opportunities for eco-innovation38
References
Almon C 1991 The INFORUM Approach to Interindustry Modeling in Economic Systems Research Vol 3 pp 1ndash7
Amin A and Cohendet P 2004 The Architecture of Knowledge Firms Capabilities and Communities Oxford University Press Oxford
Barker T Meyer B Pollitt H and Lutz C 2007a Modelling Environmental Tax Reform in Germany and the United Kingdom with E3ME and GINFORS petre Working Paper Cambridge and Osnabrueck (httpwwwpetreorgukpapershtm) accessed 15 February 2011
Barker T Junankar S Pollitt H and Summerton P 2007b Carbon leakage from unilateral environmental tax reforms in Europe 1995ndash2005 Energy Policy Vol 35 pp 6 281ndash6 292
Brunnermeier S B and Cohen M A 2003 Determinants of environmental innovation in US manufacturing industries Journal of Environmental Economics and Management Vol 45 pp 278ndash293
Buen J 2006 Danish and Norwegian wind industry The relationship between policy instruments innovation and diffusion Energy Policy Vol 34 (18) pp 3 887ndash3 897
Carlsson B and Stankiewicz R 1991 On the nature function and composition of technological systems Journal of Evolutionary Economics Vol 1 (2) pp 93ndash118
Christiansen A C and Skjaerseth J B 2005 Climate change policies in Norway and the Netherlands Different instruments similar outcome Energy and Environment Vol 16(1) pp 1ndash25
Dosi G 1988 Sources procedures and microeconomic effects of innovation Journal of Economic Literature Vol 26 pp 1 120ndash1 171
de Vries F and Medhi N 2008 Environmental regulation and international innovation in automotive emissions control technologies in Environmental Policy Technological Innovation and Patents Organisation for Economic Cooperation and Development Paris
DG TREN 2008 European energy and transport mdash trends to 2030 mdash update 2007 European Commission Luxembourg
DTI 2004 Renewable Supply Chain Gap Analysis UK Department of Trade and Industry
Edler J (ed) 2006 Nachfrageorientierte Innovationspolitik Buumlro fuumlr Technikfolgenabschaumltzung beim Deutschen Bundestag (TAB) Arbeitsbericht Nr 99 Berlin
Edquist C 2001 The system of innovation approach and innovation policy an account of the state of the art lead paper presented at the DRUID Conference 12ndash15 June 2001 Aalborg (httpwwwdruiddkconferencesnwpaper1edquistpdf) accessed 15 February 2011
EEA 2006 Using the market for cost-effective environmental policy Market-based instruments in Europe EEA Report No 12006 European Environment Agency Copenhagen
Ekins P 2009 Resource Productivity Environmental tax Reform and Sustainable Growth in Europe published by the Anglo-German Foundation for the Study of Industrial Society Final report (httpwwwpetreorgukpdfFinRepFinpdf) accessed 12 October 2011
Ekins P and Speck S (eds) 2011 Environmental Tax Reform (ETR) A Policy for Green Growth Oxford University Press
EREC 2008 Energy [r]evolution A sustainable global energy outlook Greenpeace International European Renewable Energy Council (EREC)
References
References
Environmental tax reform in Europe opportunities for eco-innovation 39
Fagerberg J Mowery D C and Nelson R R (eds) 2005 The Oxford Handbook of Innovation Oxford University Press Oxford
Fischer C Parry I W H and Pizer W A 2003 Instrument choice for environmental protection when technological innovation is endogenous Journal of Environmental Economics and Management Vol 45 pp 523ndash545
Fraunhofer ISI ECOFYS Energy Economics Group Ruumltter + Partner SEURECO and LEI 2009 EmployRES mdash The impact of renewable energy policy on economic growth and employment in the European Union European Commission Brussels
Frondel M Horbach J and Rennings K 2008 What triggers environmental management and innovation Empirical evidence for Germany Ecological Economics Vol 66(1) pp 153ndash160
GHK Cambridge Econometrics and IEEP 2007 Links between the environment economy and jobs Final Report submitted to DG Environment European Commission
Giljum S Behrens A Hinterberger F Lutz C and Meyer B 2008 Modelling scenarios towards a sustainable use of natural resources in Europe Environmental Science and Policy Vol 11 pp 204ndash216
Goumlrlach B Knigge M and Luumlckge H 2005 Wirkungen der Oumlkologischen Steuerreform auf Innovation und Marktdurchdringung Ecologic Berlin (httpecologiceudownloadprojekte1850-189918791879_5_innovationpdf) accessed 18 August 2011
Green M A 2000 Photovoltaics technology overview Energy Policy Vol 28 (14) pp 989ndash998
Grossmann A Lehr U Lutz C and Wolter MI 2008 Gesamtwirtschaftliche Effekte der Umsetzung der EU Ziele im Bereich Erneuerbare Energien und Gebaumludeeffizienz in Oumlsterreich bis 2020 Studie im Auftrag des Lebensministeriums Wien 0508
Hage J and Hollingsworth J R 2000 Idea innovation networks a strategy for integrating organizational and institutional analysis Organization Studies Vol 21 (5) pp 971ndash1 004
Hauschildt J 2004 Innovationsmanagement Vahlen Muumlnchen
Hemmelskamp J 1997 Environmental policy instruments and their effects on innovation European Planning Studies Vol 5 (2) pp 177ndash195
Hoglund Isaksson L 2005 Abatement costs in response to the Swedish charge on nitrogen oxide emissions Journal of Environmental Economics and Management Vol 50 pp 102ndash120
Hullmann A 2001 Internationaler Wissenstransfer und technischer Wandel (dissertation) Physica-Verlag Heidelberg
IEA 2008 World Energy Outlook 2008 International Energy Agency Paris
IEA 2009 World Energy Outlook 2009 International Energy Agency Paris
Jacobsson S Andersson B A and Baringngens L 2002 Transforming the energy system mdash the evolution of the German technological system for solar cells Science and Technology Policy Research University of Sussex Electronic Working Paper Series No 84 (httpideasrepecorgpsrussewps84html) accessed 18 August 2011
Jaffe A and Stavins R 1995 Dynamic incentives of environmental regulations the effects of alternative policy instruments on technology diffusion Journal of Environmental Economics and Management Vol 29(3) pp 43ndash63
Jaffe A B and Palmer K 1997 Environmental regulation and innovation a panel data study The Review of Economics and Statistics Vol 79 pp 610ndash619
Jaffe A B Newell R G and Stavins R N 2002 Environmental policy and technological change Environmental and Resource Economics Vol 22 (1ndash2) 2002 pp 41ndash70
Johnstone N and Hascic I 2008 Renewable energy policies and technological innovation energy source and instrument choice in Environmental Policy Technological Innovation and PatentsOrganisation for Economic Co-operation and Development Paris
Johnstone N 2005 The Innovation Effects of Environmental Policy Instruments in Horbach J (ed) Indicator Systems for Sustainable Innovation Physica-Verlag HD
Environmental tax reform in Europe opportunities for eco-innovation
References
40
Johnstone N Hascic I and Ostertag K 2008 Environmental policy technological innovation and patent activity in Environmental Policy Technological Innovation and Patents Organisation for Economic Co-operation and Development Paris
Jung C Krutilla K and Boyd R 1996 Incentives for advanced pollution abatement technology at the industry level an evaluation of policy alternatives Journal of Environmental Economics and Management Vol 30(1) pp 95ndash111
Kammen D M Kapidia K and Fripp M 2004 Putting renewables to work how many jobs can the clean energy industry generate University of California Berkeley
Kemp R 1997 Environmental policy and technical change ndash a comparison of the technological impact of policy instruments Edward Elgar Cheltenham
Kemp R 1998 The diffusion of biological waste-water treatment plants in the Dutch food and beverage industry Environmental and Resource Economics Vol 12 pp 113ndash136
Kemp R 2000 Technology and environmental policy ndash innovation effects of past policies and suggestions for improvement in OECD proceedings ndash innovation and the environment Organisation for Economic Co-operation and Development Paris
Kerr S and Newell R G 2003 Policy-induced technology adoption evidence from the US lead phasedown Journal of Industrial Economics Vol 51 pp 317ndash343
Klaassen G Miketa A Larsen K and Sundqvist T 2005 The impact of RampD on innovation for wind energy in Denmark Germany and the United Kingdom Ecological Economics Vol 54 pp 227ndash240
Kline S and Rosenberg N 1986 An overview of innovation in Landau R (ed) The positive sum strategy Harnessing technology for economic growth pp 275-306
Knigge M and Goumlrlach B 2005 Effects of Germanys ecological tax reforms on the environment employment and technological innovation Ecologic Berlin (httpwwwumweltbundesamtdeuba-info-presse-ehintergrundoekosteuerpdf) accessed 18 August 2011
Langniss O 2003 Governance structures for promoting renewable energy sources dissertation Lund Stuttgart
Lanjouw J O and Mody A 1996 Innovation and the international diffusion of environmentally responsive technology Research Policy Vol 25 pp 549ndash571
Lehr U Nitsch J Kratzat M Lutz C and Edler D 2008 Renewable Energy and Employment in Germany Energy Policy Vol 36 pp 108ndash117 DOI101016jenpol200709004
Lehr U Wolter MI and Groszligmann A 2009 Economic impacts of RES obligations in Austria ndash an application of the macro-econometric model e3at GWS Discussion Paper 20091 Osnabruumlck
Lundvall B-A Johnson B Andersen E S and Dalum B 2001 National systems of production innovation and competence building Research Policy Vol 31 pp 213ndash231
Lutz C and Giljum S 2009 Global resource use in a business as usual world until 2030 Updated results from the GINFORS model in Bleischwitz R Welfens Pand Zhang Z (eds) Sustainable growth and resource productivity ndash economic and global policy issues Greenleaf Publishers pp 30ndash41
Lutz C and Meyer B 2008 Beschaumlftigungseffekte des Klimaschutzes in Deutschland Untersuchungen zu gesamtwirtschaftlichen Auswirkungen ausgewaumlhlter Maszlignahmen des Energie- und Klimapakets Forschungsbericht 205 46 434 Dessau-Roszliglau
Lutz C and Meyer B 2009a Environmental and Economic Effects of Post-Kyoto Carbon Regimes Results of Simulations with the Global Model GINFORS Energy Policy Vol 37 pp 1 758ndash1 766 DOI 101016jenpol200901015
Lutz C and Meyer B 2009b Scenario results from GINFORS PETRE working paper Osnabruumlck
Lutz C Meyer B Nathani C and Schleich J 2005 Endogenous technological change and emissions The case of the German steel industry Energy Policy Vol33 pp 1 143ndash1 154
Lutz C Meyer B Nathani C and Schleich J 2007 Endogenous innovation economy and environment impacts of a technology based modelling approach for energy-intensive industries in Germany Energy Studies Review Vol 15(1) pp 2ndash18
References
Environmental tax reform in Europe opportunities for eco-innovation 41
Lutz C Meyer B and Wolter M I 2009 The global multisectormulticountry 3-E model GINFORS mdash a description of the model and a baseline forecast for global energy demand and CO2 emissions Journal of Sustainable Development forthcoming
Malerba F and Orsenigo L 1997 Technological Regimes and Sectoral Patterns of Innovative Activities Industrial and Corporate Change Vol 6 (1) pp 83ndash117
Malerba F 1992 Learning by Firms and Incremental Technical Change The Economic Journal Vol 102 (413) pp 845ndash859
Malerba F 2005 Industrial dynamics and innovation progress and challenges Presidential Address delivered at the 32nd Conference of the European Association for Research in Industrial Economics (EARIE) 1ndash4 September 2005 Porto
Malerba F 2006 Innovation and the evolution of industries Journal of Evolutionary Economics Vol 16 pp 3ndash23
McGinty M and de Vries F P 2009 Technology diffusion product differentiation and environmental subsidies The BE Journal of Economic Analysis and Policy Vol 9(1)
Meyer B and Lutz C 2007 The GINFORS model ndash model overview and evaluation Petre Working Paper Osnabruumlck (httpwwwpetreorgukpapershtm) accessed 18 August 2011
Meyer B Lutz C Schnur P and Zika G 2007 Economic policy simulations with global interdependencies a sensitivity analysis for Germany Economic Systems Research Vol 19 pp 37ndash55
Mickwitz P H Hyvaumlttinen and P Kivimaa 2008 The role of policy instruments in the innovation and diffusion of environmentally friendlier technologies popular claims versus case study experiences Journal of Cleaner Production Vol 16(1S1) 162ndash170
Miketa A and Schrattenholzer L 2004 Experiments with a methodology to model the role of RampD expenditures in energy technology learning processes first results Energy Policy Vol 32 (15) pp 1 679ndash1 692
Milliman S R and Prince R 1989 Firm incentives to promote technological change in pollution control Journal of Environmental Economics and Management Vol 17 pp 247ndash265
Millock K and Nauges C 2006 Ex-post evaluation of an earmarked tax on air pollution Land Economics Vol 82(1) pp 68ndash84
Montero J-P 2002 Market structure and environmental innovation Journal of Applied Economics Vol 2 pp 293ndash325
Moreno B and Loacutepez A J 2007 The effect of renewable energy on employment mdash The case of Asturias (Spain) Renewable and Sustainable Energy Rewiews doi 101016jrser200610011
Mowery D and Rosenberg N 1979 The influence of market demand upon innovation A critical review of some recent empirical studies Research Policy Vol 8 pp 102ndash153
Newell R G Jaffe A B and Stavins R N 1999 The induced innovation hypothesis and energy-saving technological change Quarterly Journal of Economics Vol 114 pp 941ndash975
Norberg-Bohm V 1999 Stimulating green technological innovation An analysis of alternative policy mechanisms Policy Sciences Vol 32(1) pp 13ndash38
OECD 2009 Sustainable manufacturing and eco-innovation towards a green economy Organisation for Economic Co-operation and Development Policy Brief June 2009
OECD 2010 Taxation innovation and the environment Organisation for Economic Co-operation and Development
Pavitt K 1984 Sectoral patterns of technological change Towards a taxonomy and a theory Research Policy Vol 13 pp 343ndash373
Popp D 2002 Induced innovation and energy prices The American Economic Review Vol 92(1) pp 160ndash180
Popp D 2005 Lessons from patents Using patents to measure technological change in environmental models Ecological Economics Vol 54 pp 209ndash226
Environmental tax reform in Europe opportunities for eco-innovation
References
42
Porter M and van der Linde C 1995 Toward a new conception of the environment competitiveness relationship Journal of Economic Perspectives Vol 9(4) pp 97ndash118
Rammert W 2002 The cultural shaping of technologies and the politics of technodiversity In Sorensen K and Williams R (eds) Shaping technology guiding policy concepts spaces and tools Elgar Cheltenham pp 155-172
Requate T 2005 Dynamic incentives by environmental policy instruments ndash a survey Ecological Economics Vol 54 pp 175ndash195
Roloff N Lehr U Krewitt W Fuchs G Wassermann S Weimer-Jehle W and Schmidt B 2008 Success determinants for technological innovations in the energy sector mdash the case of photovoltaics in Moumlst D Fichtner W Ragwitz M and Veit D (eds) New methods for energy market modelling mdash Proceedings of the first european workshop on energy market modelling using agent-based computational economics Universitaumltsverlag Karlsruhe
Rothwell R 1995 The fifth generation innovation process in Oppenlaumlnder KH Popp W (eds) Innovationen und wirtschaftlicher Fortschritt betriebs-und volkswirtschaftliche Perspektiven Bern pp 9ndash26
Schumpeter J 1942 Capitalism socialism and democracy New York Harper
Skjaeligrseth J B and Christiansen A C 2005 Environmental policy instruments and technological change in the energy sector findings from comparative empirical research Energy and Environment Vol 17 (2) pp 223ndash241
Snyder L D Miller N H and Stavins R N 2003 The effects of environmental regulations on pollution emissions evidence from plant-level data American Economic Review Vol 93(2) pp 431ndash435
Technopolis 2008 Eco-innovation Final Report for Sectoral Innovation Watch (httpwwwtechnopolis-groupcomresourcesdownloads661_report_finalpdf) accessed 18 August 2011
Volleburgh H 2007 Impacts of environmental policy instruments on technological change Report for Joint Meetings of Tax and Environment Experts OECD Environment Directorate February 2007 (comenvepocctpacfa(2006)36final)
Zimmermann H Wohltmann M and Hansjuumlrgens B 1996 Umweltabgaben und Innovation Analytica Marburg
43
Annex 1
Environmental tax reform in Europe opportunities for eco-innovation
Type Instrument Area Stage
Reference
Theo
retica
l
Em
piric
al
Cas
e st
udy
Rev
iew
Qual
itat
ive
Taxe
s
Perm
its
Subsi
die
s
Volu
nta
ry
Com
man
d
Reg
ula
tion
Ener
gy
Air
Wat
er
Oth
er
Gen
eral
Innov
atio
n
Diffu
sion
Rel
evan
ce
Brunnermeier amp Cohen (2003)
X X X X
Buen (2006) X X X X X X
Christiansen amp Skjaerseth (2005)
X X X X X X
Fischer et al (2003 X X X X X X
Frondel et al (2008) X X X X X X X (X) (X)
Hemmelskamp (1997)
X X X X X X X (X)
Hoglund Isaksson (2005)
X X X (X) (X)
Jaffe amp Stavins (1995)
X X X1 X X X X
Jaffe amp Palmer (1997)
X X X X
Jaffe et al (2002) X X X X X X X X X X
Jung et al (1996) X X X X X X (X) (X)
Kemp (1998) X X X X
Kerr amp Newell (2001) X X X X X
Klaassen et al (2005)
X X X X X
Lanjouw amp Mody (1996)
X X X X X X X
McGinty amp de Vries (2009)
X X X X
Mickwitz et al (2008)
X X X X X X X X X
Milliman amp Prince (1989)
X X X X X X X
Millock amp Nauges (2006)
X X X X X X
Montero (2002) X X X X X
Newell et al (1999) X X1 X X X
Norberg-Bohm (1999)
X X X X X X X
Popp (2002) X X1 X X
Popp (2005) X X X X X X
Porter amp van der Linde (1995)
X X X X X X
Requate (2005) X X X X X X X
Skjaeligrseth amp Christiansen (2005)
X X X X X X X X X
Snyder et al (2003) X X X X X
Annex 1 Classification of refereed journal articles
Environmental tax reform in Europe opportunities for eco-innovation44
Annex 2
Type Instrument Area Stage
Reference
Theo
retica
l
Em
piric
al
Cas
e st
udy
Rev
iew
Qual
itat
ive
Taxe
s
Perm
its
Subsi
die
s
Volu
nta
ry
Com
man
d
Reg
ula
tion
Ener
gy
Air
Wat
er
Oth
er
Gen
eral
Innov
atio
n
Diffu
sion
Rel
evan
ce
Johnstone (2005)
X X X X X X X
Johnstone amp Hascic (2008)
X X X X X X X X
Kemp (1997) X X X X X X X X X X X X X
Kemp (2000) X X X X X X X X X
de Vries amp Medhi (2008)
X X1 X X X
Annex 2 Classification of books and book chapters
45
Annex 3
Environmental tax reform in Europe opportunities for eco-innovation
Type Instrument Area Stage
Reference
Theo
retica
l
Em
piric
al
Cas
e st
udy
Rev
iew
Qual
itat
ive
Taxe
s
Perm
its
Subsi
die
s
Volu
nta
ry
Com
man
d
Reg
ula
tion
Ener
gy
Air
Wat
er
Oth
er
Gen
eral
Innov
atio
n
Diffu
sion
Rel
evan
ce
Goumlrlach et al (2005)
X X X X X X
Knigge amp Goumlrlach (2005)
X X X X X X
Technopolis (2008)
X X X X X X
Volleburgh (2007)
X X X X X X X X X X X
Annex 3 Classification of reports
European Environment Agency
Environmental tax reform in Europe opportunities for eco-innovation
2011 mdash 45 pp mdash 21 x 297 cm
ISBN 978-92-9213-238-5doi10280084889
How to obtain EU publications
Publications for salebull viaEUBookshop(httpbookshopeuropaeu)bull fromyourbooksellerbyquotingthetitlethepublisherandorISBNnumberbull bycontactingoneofoursalesagentsdirectlyYoucanobtaintheircontactdetails
on the Internet (httpbookshopeuropaeu) or by sending a fax to +352 2929-42758
Free publicationsbull viaEUBookshop(httpbookshopeuropaeu)bull attheEuropeanCommissionsrepresentationsordelegationsYoucanobtain
their contact details on the Internet (httpeceuropaeu) or by sending a fax to +352 2929-42758
European Environment AgencyKongens Nytorv 61050 Copenhagen KDenmark
Tel +45 33 36 71 00Fax +45 33 36 71 99
Web eeaeuropaeuEnquiries eeaeuropaeuenquiries
TH
-AK-1
1-0
17-E
N-N
doi1
02
8008
4889
- Acknowledgements
- Executive summary
- 1Introduction
-
- 11Background
- 12ETR and innovation
- 13Report structure
-
- 2Review of literature on environmental tax reform and eco‑innovation
-
- 21Initial screening
- 22Detailed review
- 23Environmental regulation studies
- 24Theoretical studies
- 25Empirical studies
- 26Case studies
- 27Conclusions
-
- 3Modelling of ETR impacts on eco‑innovation
-
- 31Scenarios assessing the implications of ETR for eco-innovation
- 32Overview of modelling results
- 33Macroeconomic impacts at the national level
- 34Conclusions of the scenario assessment
-
- References
- Annex 1 Classification of refereed journal articles
- Annex 2Classification of books and book chapters
- Annex 3Classification of reports
-
Review of literature on environmental tax reform and eco-innovation
Environmental tax reform in Europe opportunities for eco-innovation 17
that technology) and show that an increase in the subsidy value increases diffusion for all degrees of product differentiation The impact is greater as the substitutability of the two goods increases They also briefly consider the impact of a technology subsidy that reduces the fixed cost of the clean technology and conclude that this too will stimulate diffusion but will be less efficient than the output subsidy (22)
Key findings of the theoretical studies
As is often the case with theoretical analyses the specifications of the models and the underlying assumptions of the studies reviewed here significantly influence the conclusions Nevertheless there is a reasonable degree of consistency between their findings The studies can be classified into two broad groups those that consider innovation and diffusion within an industry setting and those that consider an individual firms decision whether to undertake RampD (ie innovation) and invest in an abatement technology (ie diffusion) in order to reduce its own cost of abatement
The studies in the first group conclude that under conditions of perfect competition emission taxes and auctioned permits provide greater incentives for innovation than direct controls or freely allocated permits However there is some disagreement over the relative impacts of the two instruments Under the assumption that the innovator appropriates a fixed (exogenous) proportion of the gains accruing to the technology adopters Milliman and Prince (1989) conclude that auctioned permits provide the greatest incentive although the government may find it easier to adjust emission taxes in response to the resultant downward shift in marginal abatement costs However when the proportion is determined endogenously mdash in the form of a royalty payment mdash Fischer et al (2003) find that either auctioned permits or emission taxes can provide the greater incentive Emission taxes are likely to provide the greatest incentive if the innovator can appropriate a large proportion of the gains (because the technology is difficult to imitate)
Montero (2002) uses a slightly different framework to compare the impacts of different instruments on innovation (in the form of RampD expenditure)
in a situation of imperfect competition and finds that the ranking depends on the nature of the competition (23) Under Bertrand price competition in the output market the results are the same as under perfect competition the relative ranking of auctioned permits and taxes is ambiguous but both provide greater incentives for innovation than emission standards and freely allocated permits However under Cournot quantity competition any of the instruments apart from freely allocated permits can provide the greatest incentives depending on the model parameter values
The studies looking at an individual firms decision also show that an emissions tax can stimulate innovation and diffusion Jaffe and Stavins (1995) explicitly consider the firms decision criterion for investing in a new abatement technology and show that by increasing the benefits of investing the introduction of an emissions tax should bring forward its adoption by existing firms and make its use by new entrants more likely The other two studies consider the firms choice of optimal abatement effort in the context of maximising its total profits or minimising its total cost of emissions reduction This effort can take the form of RampD (innovation) or expenditure on abatement equipment (diffusion) The decision problem is the same in each case ie to choose the optimal level of effort
Kemp (1997) assumes that the firm seeks to minimise its total cost of emissions reduction mdash implicitly assuming that its output level is fixed mdash and demonstrates both that abatement effort increases as the emissions tax increases and that the optimal effort is lower under direct regulation than under an equivalent tax However when the firms output level is allowed to vary mdash as is the case with the profit maximisation problem considered by Millock and Nauges (2006) mdash the impact of an increase in the emissions tax rate on the level of abatement effort depends on the relative magnitudes of the direct impact and the indirect impact (via changes in output levels) on the marginal benefit of abatement effort If the latter dominates then an increase in the emissions tax rate leads to a reduction in the optimal level of abatement effort
(22) McGinty and de Vries (2009) derive expressions for the necessary technology subsidy values when diffusion is 0 and when it is 100 They state mdash without proof mdash that the latter is greater than the former Provided that the relationship between the subsidy and diffusion is monotonic this is a sufficient condition for increases in the subsidy value to cause increases in diffusion
(23) Monteros model does not include diffusion However it does include spillover effects where RampD by one firm reduces the abatement costs of the others
Environmental tax reform in Europe opportunities for eco-innovation
Review of literature on environmental tax reform and eco-innovation
18
Only one of the industry models considers the impact of investment subsidies Using a product differentiation model of imperfect competition McGinty and de Vries (2009) show that subsidising the unit cost of a clean production technology can accelerate its diffusion However the impact depends on the degree of substitutability between clean and dirty products diminishing as the products become more differentiated In contrast all three of the individual firm analyses consider the impact of investment subsidies with all demonstrating that increasing subsidies induce greater abatement effort Furthermore Kemp (1997) shows that the impact of an RampD subsidy is greater in the presence of an emissions tax than it is under an equivalent emissions limit
25 Empirical studies
Jaffe and Stavins (1995) use their theoretical framework (outlined above in Section 24) as the basis for assessing the diffusion of thermal insulation in new home construction in the United States using state-level panel data for the years 1979ndash88 They derive a reduced form equation for the energy efficiency level chosen by developers from the marginal cost-benefit condition in which the explanatory variables include energy prices installation costs and the presence of a relevant building code (as a dummy variable) Separate equations are estimated for ceiling floor and wall insulation with the coefficient for energy prices being positive in all three equations Although it is only significant (at the 95 level) for floor insulation the joint hypothesis that all price coefficients are zero is strongly rejected However the coefficients for installation cost (which are all negative as expected) are around two to three times greater in magnitude and of comparable significance The coefficients for the building code dummies are consistently insignificant (and negative in two cases) indicating that this form of direct regulation had minimal impact on household energy efficiency levels over the period The authors use the estimated models in a simulation to compare the effects of a 10 increase in energy prices (ie an energy tax) with those of a 10 reduction in installation costs (ie a technology subsidy) with each applied over the whole ten-year period While
the tax increases diffusion by 2ndash6 by the end of the period the technology subsidy increases diffusion by between 4ndash15
Kemp (1997) models the diffusion of biological water treatment technology in the Dutch food and beverage industry based on a rational choice threshold model of technology adoption decisions In this model a firm chooses to adopt an abatement technology if the resulting reduction in emission-tax payments is greater than the annualised total costs of the technology where a discount factor is applied to the savings to reflect uncertainty and risk aversion on the part of the decision-maker This is translated into a probabilistic model under the assumption that both the savings and the costs follow a log-normal distribution across plants The model is estimated econometrically using data for the period 1974ndash91 under different assumptions for the functional form of the discount factor and allowing for adjustment costs (24) The estimated parameters for the preferred specification of the discount factor are all significant and of the expected sign and magnitude and the model provides a very close fit to the actual diffusion of waste-water treatment technologies over the period This leads the author to conclude that the effluent charges were a significant positive factor in the diffusion of treatment technologies Indeed he estimates that only around 4 of plants would have installed waste-water treatment equipment by the end of the period if the charge had remained at its (low) 1974 level compared to the actual figure of over 40
Newell et al (1999) estimate the impact of energy prices energy efficiency standards and other factors on the energy efficiency of three types of electrical consumer durables (room air conditioners central air conditioners and gas water heaters) in USA between the 1970s and 1990s The analysis utilises a product characteristics model in which the frontier of technologically feasible products is described by a transformation surface that relates the bundle of product characteristics to the real cost of producing that bundle In this framework innovation is represented by movements of the surface and movements along the surface In particular the authors identify three types of innovation shifts in the surface towards the origin (overall technological change) changes in the slope
(24) Adjustment costs are accounted for by estimating a partial adjustment model in which the actual change in adoption is some fixed fraction of the desired change (estimated from the threshold model)
Review of literature on environmental tax reform and eco-innovation
Environmental tax reform in Europe opportunities for eco-innovation 19
of the surface (directional technological change) and changes in the mix of products along a given surface (model substitution) They define the surface in terms of two characteristics energy flow and cooling capacity and incorporate innovation by allowing the coefficients of the two variables to vary with time and (in the case of energy flow) energy prices and efficiency standards Separate equations are estimated for each durable type with slightly differing sets of explanatory variables and time periods The authors find little evidence that either energy prices or energy efficiency standards had any impact on overall technological change While all but one of the relevant coefficients have the expected sign none are significant In contrast they do find evidence that energy prices had an impact on directional technological change with the relevant coefficients being of the correct sign and significant for both room and central air conditioners
Popp (2002) uses patent data to estimate the effect of energy prices on energy-efficiency innovations in USA between 1970 and 1994 He regresses normalised energy-efficiency-related patent applications against energy prices controlling also for lagged knowledge stock and government RampD (25) The estimated coefficient for energy prices is highly significant producing a short-run price elasticity of 006 and a long-run elasticity 0354 Thus a 10 increase in energy prices would be expected to increase the number of energy-efficiency-related patents by around 35 in the long run The estimated mean lag is less than four years leading the author to conclude that the imposition of a carbon or energy tax would lead to a fairly quick shift towards environmentally friendly innovation
Hoglund Isaksson (2005) estimates abatement cost functions for the reduction of nitrogen oxide (NOX) emissions in three industrial sectors in Sweden (energy pulp and paper chemicals and food) The analysis uses a double-hurdle model applied to a pooled sample of 114 plants across the three sectors The data cover the period 1990ndash1996 which spans the introduction of the charge on NOX emissions in 1992 The estimated cost curves have a similar shape in all three sectors with minimal (or even negative) costs over a relatively broad range of emission reductions and then a steep rise as reductions exceed
a threshold level The analysis does not explicitly consider the issue of innovation However it does find that abatement cost curves shifted downwards significantly over the period In the energy sector for example the emission rate threshold for significant cost increases fell by around 45 between 1991 and 1996 (from 550 to 300 kgGWh) The author surmises that this is due to a combination of technological development and the discovery of previously unrecognised opportunities Unfortunately while this shift coincided with the introduction of the NOX charge the analysis does not provide any evidence of a causal link
As part of their analysis of the impacts of the French tax-subsidy scheme for NOX and sulphur dioxide (SO2) emissions Millock and Nauges (2006) estimate the impact of the emission taxes on a plants decision to install end-of pipe abatement equipment While the study is not concerned with innovation per se the results of this part can be interpreted as showing the impact of emission taxes on the diffusion of abatement equipment Under the scheme taxes were imposed on the emissions of these air pollutants (and VOCs) by all plants satisfying certain criteria The revenue raised by the taxes was earmarked for subsidising the cost of qualifying abatement technologies for technical studies (ie RampD) and for investment in air quality surveillance systems Using panel data for 226 plants in three industries (iron and steel coke and chemicals) for the period 1900ndash1998 the authors estimate a Probit model for the probability that a plant will install abatement equipment They find that the total value of emissions taxes paid by the plant (ie for both pollutants) has a positive impact on its decision to invest in abatement equipment However the magnitude of the effect varies considerably across the sectors and is only significant for the iron and steel sector
Frondel et al (2008) analyse responses to an OECD survey on environmental policy tools (conducted in 2003) to identify the factors that affect a firms decision to adopt an environmental management system (EMS) voluntarily and their environmental innovation behaviour Innovation is captured by a binary variable that indicates whether the firm has undertaken significant technical measures or changes to reduce the environmental impacts of
(25) Normalised energy efficiency patent values are calculated by dividing by the total number of patents granted This accounts for exogenous changes in patenting behaviour that affect all types of patents Popp constructs a value for existing knowledge as the stock of previously granted patents weighted by estimates that he derives for knowledge productivity He demonstrates that the exclusion of this variable from the model leads to biased estimates for the energy price coefficient
Environmental tax reform in Europe opportunities for eco-innovation
Review of literature on environmental tax reform and eco-innovation
20
production (26) The analysis is based on survey responses from 899 firms in Germany Latent variable equations for EMS adoption and innovation are estimated simultaneously with each equation including the same four sets of variables relating to motivations policy instruments pressure groups and facility characteristics (27) The policy instrument variables include five dummy variables indicating the importance of different types of policy instrument including market-based instruments such as emission taxes and tradable permits While the perceived stringency of environmental policy is found to be a significant factor in the decision to innovate there is no evidence that any of the individual policy instrument variables had any impact The authors surmise that this suggests that it is stringency of environmental policy rather than the choice of specific instrument that is important for innovation However as the authors note their results reflect the perceptions of the survey respondents and should therefore be treated as correlations rather than causal relationships
Johnstone and Hascic (2008) assess the impact of a range of environmental policy instruments mdash including tax measures and investment incentives mdash on innovation in the renewable energy field They analyse the impacts for five different groups of renewable energy technologies mdash wind solar ocean biomass and waste-to-energy mdash using a panel dataset of European Patent Office (EPO) patent filings for these technologies across 26 countries over the period 1978ndash2003 A fixed effects negative binomial model is estimated controlling for electricity prices and consumption public sector RampD expenditure (as a proxy for scientific capacity) and total EPO filings (as a proxy for differenceschanges in patenting propensity) The various policy instruments are represented by dummy variables indicating whether they were in place in a particular year As such the model takes no account of the stringency of the instruments mdash in particular the differing magnitudes of the tax measures and investment incentives (28)
Initially the authors estimate the model with all of the policy instruments included individually They find that while public policy plays an important role in inducing innovation the impacts of the individual instruments vary across the different technologies In particular tax measures are significant for wind and biomass technologies with investment incentives being significant for solar and waste-to-energy technologies and obligationstradable certificates being significant for wind technologies However the authors express concerns that there may be multicolinearity between the policy variables (particularly between investment incentives tax measures and tariffs) and also that there may be interaction effects between some of the variables Consequently they estimate two alternative versions of the model the first using a composite policy variable representing the number of policy instruments in place and the second using clusters of similar policy instruments (29) The results or these two models confirm the initial findings The composite policy variable is significant for all of the technology groups while the significance of the clusters varies across technologies The price-based cluster is (highly) significant for solar biomass and waste-to-energy The quantity-based cluster is significant for wind technologies The authors surmise that this may be due to the different economic characteristics of the technologies For example the significance of investment incentives for solar and waste-to-energy may reflect the capital intensity of these technologies with large up-front investment costs
De Vries and Medhi (2008) also use patent data to investigate the relative importance of environmental regulations and fuel prices on innovation in automotive emission-control technologies distinguishing between post-combustion devices and engine redesign technologies They estimate a panel data model using data from Germany Japan and USA over the period 1978ndash2001 controlling for industry value added (as a proxy for the scope of technological opportunities) and total patent
(26) The next question on the survey asks whether these are changes in production processes or end-of-pipe technologies However no distinction is made between these two types of innovation in the present study
(27) In order to avoid identification problems some individual variables are omitted from one equation or the other(28) This shortcoming is recognised by the authors who state that it is unavoidable in any cross-comparative analysis in which multiple
instruments are included(29) The clusters are price-based instruments (investment incentives tax measures and tariffs) quantity-based instruments (obligations
and tradable certificates) and voluntary programmes
Review of literature on environmental tax reform and eco-innovation
Environmental tax reform in Europe opportunities for eco-innovation 21
applications (as a proxy for differenceschanges in patenting propensity) Environmental regulation is represented by two dummy variables indicating the introduction of on-board diagnostic (OBD) regulations in USA (30) The results of the analysis suggest that the relative impacts of regulation and market forces differ between the two types of technology For post-combustion technologies both of the regulations are significant while fuel prices have no significant impact In contrast the opposite is the case for engine redesign technologies with fuel prices having a significant impact but regulation having no discernable effect While the analysis does not explicitly consider the impact of fuel taxes it suggests that an increase in automotive fuel taxes would have a major impact on innovation in relation to engine design The estimated coefficient for fuel prices (1287) implies that a USD 010 increase in fuel prices would induce a 14 increase in patenting activity (31)
Key findings of the empirical studies
The empirical studies considered above cover a range of different technology areas spanning energy efficiency (both product and process) renewable energy and air and water pollution abatement While in some cases they assess the impact of energy prices rather than environmental taxes per se they provide a clear picture of the likely impact of environmental and energy-related taxes on eco-innovation
Three of the studies assess the impact on diffusion of existing technologies All find that environmental taxesenergy prices have a positive impact on diffusion In particular the water effluent charges in The Netherlands appear to have had a major impact on the adoption of waste-water treatment equipment by the food and beverage industry in that country However there is some evidence to suggest that the effectiveness of taxesprices may vary across sectors (eg NOXSO2 abatement in France) and that investment incentivessubsidies may be more
effective in some cases (eg thermal insulation in USA)
Three of the studies use patent data to assess the impact of environmental taxes and energy prices on innovation with one of these also assessing the impact of investment incentives All find a significant positive impact although this depends on the particular sub-sector (eg renewable energy) or the type of innovation In particular the evidence from the automotive emissions control study suggests that taxesprices may be more effective in promoting process-related innovation (eg engine redesign) than innovation in end-of-pipe technologies One of the studies takes a different approach using a product-characteristics model to decompose improvements in the energy efficiency of consumer durables This finds that while electricity prices did not appear to affect overall technological change (ie shifts in the product costenergy efficiency frontier) they did have a positive impact on directional technological change (ie the slope of the frontier)
26 Case studies
Christiansen and Skjaerseth (2005) undertake a comparative analysis of the impacts of climate change policies on the petroleum sectors in Norway and the Netherlands during the 1990s These countries were selected because of their very different policy approaches with the Norwegian petroleum sector subject to a carbon dioxide (CO2) tax since 1991 as part of a portfolio of measures (32) and the Netherlands relying on a series of voluntary agreements on energy efficiency (33) Both approaches appear to have been effective in that CO2 emissions per unit production fell by around 22 between 1990 and 2001 in Norway while energy efficiency improved by around 35 in the Netherlands over the same period However there were marked differences between the two countries in terms of the nature of the innovation that
(30) Because of the international nature of the automotive industry and the importance of the US market regulations introduced in USA appear to have been an important driver for innovation by overseas manufacturers Regulations mandating the installation of OBD systems were first introduced in California in 1988 A more sophisticated system was mandated by the 1990 US Clean Air Act Amendments taking force in 1996
(31) The coefficient represents the semi-elasticity of patent applications with respect to fuel prices While the authors do not state so explicitly the implication is that prices are expressed in US dollars (they are obtained from the IEA Energy Prices and Taxes Database) Consequently the impact of a 10 US cent increase in the fuel prices is given by exp(1287 x 01) ndash 1 = 0137
(32) In addition to the tax the portfolio included publicly funded RampD support schemes gas flaring permits and mandatory environmental impact assessments
(33) The Dutch oil and gas industry first signed a declaration of intent with the government in 1995 This was translated into a long-term agreement (LTA) on energy efficiency in the following year with an improvement target of 20 over the period 1989ndash2000 In 2001 a new LTA was signed which committed firms to implementing energy efficiency measures with a positive NPV at a 15 discount rate or a five year payback period
Environmental tax reform in Europe opportunities for eco-innovation
Review of literature on environmental tax reform and eco-innovation
22
occurred In the Netherlands technological change was incremental reflecting a steady diffusion of available (ie known) technology In contrast the authors find evidence of more radical innovations and adaptations by the Norwegian petroleum sector including the development of energy-efficient gas turbines installation of waste heat recovery units process modifications and improved use of process heat While the authors acknowledge the impossibility of proving a causal link between policy intervention and innovation (in the context of their case study) they conclude that the CO2 tax played a key role in the development and implementation of these radical innovations and the benefits of reduced tax payments provided an important incentive However they also conclude that the impacts of the two instruments were conditioned by the political contexts in which they were applied and the problem characteristics in the respective countries (eg the economic significance of the sector and the size of installations)
Knigge and Goumlrlach (2005) summarise the findings of a comprehensive analysis of the impacts of the ETR in Germany That analysis undertaken jointly by Ecologic and the German Institute for Economic Research (DIW Berlin) included the impacts on innovation and market diffusion of environmentally friendly products and technologies (34) Based on a series of case studies the study concluded that the ETR had a noticeable effect on innovation and diffusion although it was not possible to quantify the scale of that effect In particular ETR is identified as being a central factor in the development of gas-powered vehicles The study identifies a number of different routes by which the ETR produced impacts First the payback period for energy-efficient products was reduced as a result of the energy tax increases and the various exemptions favouring efficient energy use and renewable energy sources Second the predictable nature of the energy taxes (as opposed to widely fluctuating oil prices) reduced uncertainties about the benefits of energy-efficiency investments Third the reduction in employers social contribution payments tended to reduce the costs of labour intensive innovation processes such as research and development energy consultancy and technology installation Finally the ETR had a signalling effect strengthening awareness of the need for more efficient and rational energy use
Mickwitz et al (2007) examine a number of claims that have been made in the environmental policy literature about the relationship between policy instruments and innovation based on experiences in two industrial sectors in Finland pulp and paper and the manufacture of diesel engines for ships In particular they assess the claims that environmental taxes are superior to other policy instruments with respect to innovation and that RampD subsidies have limited impacts on innovation With respect to the first claim the evidence provided by the two case studies is mixed The authors conclude that energy taxation had a negligible impact on innovation in the pulp and paper industry However this is likely to have been due to the low level of the tax and the exemptions that applied to the sector In contrast they find that the differentiation of Swedish fairway and port fees (on the basis of SO2 and NOX emissions) was a significant factor driving the installation of in-engine NOX reduction equipment in ferries operating between the two countries (35) With respect to RampD subsidies the authors conclude that the evidence does not support the claim that these have little effect In particular they find that RampD subsidies accelerated the development of ship engine emissions-reduction technologies
The findings of the three case studies are consistent with those of the empirical analyses reviewed in the previous section Environmental taxes and investment subsidies have proven significant in promoting both innovation and diffusion although not universally so Furthermore the case studies provide some useful insights about the ways in which the impacts occur and the factors that may be important in promoting innovation In particular they suggest the need for a tax rate that is sufficiently high to provide a meaningful incentive and signalling effect and that is fixed for a sufficiently long period of time to reduce uncertainty about the future benefits of investment
27 Conclusions
The studies reviewed in the preceding sections suggest that environmental regulation in general and price-based policy instruments such as environmental taxes and investment subsidies in particular can (in theory) and do (in practice) have a positive impact on both innovation and diffusion
(34) A separate report in German by Goumlrlach et al (2005) provides details of the evaluation of the innovation and diffusion impacts (35) Although the tax was introduced in Sweden it was also payable by Finnish ferry operators entering Swedish ports and hence
affected their investment decisions This is another example of the cross-border impact of environmental policy interventions on innovation found by Lanjouw and Mody (1996) (see Section 23)
Review of literature on environmental tax reform and eco-innovation
Environmental tax reform in Europe opportunities for eco-innovation 23
of environmental technologies However the supporting empirical and case study evidence is not universal and the effectiveness of these instruments would appear to vary across different sectors and different types of innovation
To a certain extent such differences can be explained by the theoretical models In particular the impact of environmental taxes (relative to other instruments) is predicted to depend on the competitive structures of the markets in which the regulated firms operate and on the ability of innovator firms to appropriate the benefits accruing to other firms during diffusion However a number of other potential factors have been identified in the literature which may affect the impact of price-based policy instruments on innovation
Jaffe et al (2002) caution that the impact of price-based policy instruments on technology diffusion may be adversely affected by a number of potential market failures including information failures principle-agent problems (eg landlord-tenant) capital market failures and positive adoption spillovers In addition while not market failures as such uncertainty over future returns and the (associated) use of high discount rates for investment decisions can also undermine the effectiveness of price-based instruments in stimulating diffusion However as was noted above the findings from the case study of ETR in Germany suggest that an environmental tax may actually reduce the level of uncertainty over future returns provided that it is of sufficient magnitude and longevity
Skjaerseth and Christiansen (2005) emphasise that the relationship between policy instruments (of all types) and technological change is extremely complicated They argue that account must be taken of the politicalindustrial context in which policy instruments are introduced and the nature of the environmental problem that they are intended to address In particular they make a distinction between malign problems where technological change involves net costs for target groups and benign problems where there are widespread no-regret opportunities for change Based on a comparative analysis of four different case studies they conclude that mandatory policy instruments (including environmental taxes) are more effective
in promoting short-term technological change when the problems are malign but that low legitimacy (with the target group) may undermine long-term technological change However when problems are benign or when long-term change requires cooperation voluntary policy instruments are likely to be more effective
Johnstone (2005) questions the focus of the theoretical and empirical analyses (reviewed above) on the impact of environmental policy instruments on the rate of technological change He argues that the direction of technological change is as important if not more so In addition to the quantity of innovation it is also important that innovation be socially optimal in the sense that it minimises the cost of attaining a particular environmental goal in the long term Inappropriate innovation today may result in lock in to a suboptimal technological path for the future
With this in mind Johnstone identifies a number of issues that can adversely affect the direction of innovation and should be taken into account when selecting and designing policy instruments technological market failures (36) missing markets for certain environmental attributes of innovation policy incidence and joint production of emissions Most studies of the innovation effects of environmental policy instruments assume that the only missing market is that for the environmental good (or bad) However in practice there may be other markets that are missing (or incomplete) which can adversely affect transmission of innovation incentives This is particularly so in the area of waste and resource management where instruments applied at the end of the product life cycle may have little or no impact on product design innovation Even if all markets are complete except for the environmental externality the point of incidence of the policy intervention may be more important for the direction of innovation than the choice of a particular policy instrument For example a limit or standard applied directly to the emissions of a pollutant may be more effective in promoting optimal innovation than a tax applied to a proxy input variable Finally when there is joint production of pollutants (eg CO2 and air pollutants from vehicle engines) there is a danger that if policy instruments (of whatever type) are applied to one pollutant in isolation the resulting innovation may
(36) These are the same market failures identified by Jaffe et al (2002)
Environmental tax reform in Europe opportunities for eco-innovation
Review of literature on environmental tax reform and eco-innovation
24
reduce emissions of that pollutant at the expense of increases in the others
In a related point Johnstone highlights the importance of using appropriate indicators when assessing the impact of policy instruments on innovation emphasising the need for these to reflect both the rate of innovation and the direction A necessary condition for this is that the indicators must provide an accurate and detailed picture of actual innovation Unfortunately this is difficult to achieve in practice For example the use of patent data as a measure of innovation requires the identification of relevant environmental technologies This is likely to be easier for end-of-pipe technologies than for process-related technologies meaning that the latter tend to be under-represented relative to their actual incidence To the extent that process-related innovation is growing in importance or is more important
for certain sectors or types of environmental problem changes in the value of the indicator may significantly understate the actual rate of innovation and misrepresent the direction
All of this suggests that caution should be exercised in drawing general definitive conclusions about the impacts of price-based policy instruments such as environmental taxes and investment subsidies on innovation particularly relative to other policy instruments While it would appear that they can be effective in stimulating both innovation and diffusion in many cases mdash at least in terms of the rate of technological change mdash there may be situations in which other policy instruments may be more appropriate In general the stringency and point of incidence of an environmental policy intervention may be more important than the choice of a particular policy instrument in determining the rate and direction of eco-innovation
25
Modelling of ETR impacts on eco-innovation
Environmental tax reform in Europe opportunities for eco-innovation
31 Scenarios assessing the implications of ETR for eco-innovation
Scenario analysis provides a useful means of improving understanding of how the different revenue recycling methods and various scales of ETR can help meet different greenhouse gas emissions targets
To investigate the impacts of an ETR for Europe the petre project elaborated a range of different scenarios reflecting various tax reform options In addition to employing several of these original scenarios the present study compiled two new scenarios to analyse the implications of ETR for eco-innovation All scenarios were examined in both E3ME and GINFORS (37)
311 Original petre project scenarios
The key petre scenarios relevant for the present study are
bull scenarioBHbaselinescenariowithhighenergyprice (reference case)
bull scenarioS1HETRdesignedtomeettheEUsunilateral 2020 GHG target (high energy price) with revenue recycling
bull scenarioS2HETRdesignedtomeettheEUsunilateral 2020 GHG target (high energy price) with revenue recycling and 10 of revenues spent on eco-innovation measures
Each of the ETR scenarios has the same key taxation components
bull acarbontaxrateisintroducedtoallnon-EUEmissions Trading System (EU ETS) sectors equal to the carbon price in the EU ETS that delivers an overall 20 reduction in greenhouse gas emissions by 2020 and in the international cooperation scenario this is extended to 30
bull aviationisincludedintheEUETSattheendofPhase 2
bull powergenerationsectorEUETSpermitsare100 auctioned in Phase 3 of the EU ETS
bull allotherEUETSpermitsare50auctionedin2013 increasing to 100 in 2020
bull materialtaxesareintroducedat5oftotalpricein 2010 increasing to 15 by 2020
In scenario S1H environmental tax revenues are recycled through reductions in income tax rates and social security contributions in each of the Member States such that there is no direct change in tax revenues In scenario S2H 10 of environmental tax revenues are recycled through spending on eco-innovation measures and the remaining 90 is recycled through the same measures as in the other scenarios The eco-innovation spending is split across power generation and housing according to tax revenues from the corporate and household sector
In GINFORS (the model used for analysing the implications of ETR and eco-innovation) the share of renewable sources in electricity production is increased due to the additional investment The rest of additional investment goes to household energy efficiency spending Investment needed for a certain increase in renewable energy production or efficiency improvement is based on Austrian and German experience (Lehr et al 2008 and 2009 Grossmann et al 2008 Lutz and Meyer 2008) This assumption is quite conservative as parameters for other countries can be assumed to be more positive (meaning that less money is needed for renewable energy technology installation or energy efficiency gains)
In scenario S1H the 20 GHG target translates into a 15 reduction in energy-related carbon emissions relative to 1990 as other emissions such as methane and nitrous oxide have already been reduced by
3 Modelling of ETR impacts on eco-innovation
(37) The E3ME and GINFORS models are introduced in Chapter 1 of the present report A detailed discussion of the models and scenarios used in the present study can be found in Ekins and Speck (2011)
Environmental tax reform in Europe opportunities for eco-innovation
Modelling of ETR impacts on eco-innovation
26
more than 20 (in terms of carbon equivalents) The target is reached by a tightened EU ETS cap and the introduction of a carbon tax on the non-ETS sector The tax rate applied is equal to the carbon price in the EU ETS that will deliver a 20 GHG reduction by 2020
The burden of ETR taxes are allotted to energy outputs (ie the final use of energy) and will be based on the carbon content of each fuel Carbon prices are assumed to be fully passed on to consumers All carbon taxes are in addition to any existing unilateral carbon and energy taxes The carbon reductions in the different EU Member States will be those that result from a uniform carbon tax increase across the EU
All of the revenues including EU ETS auctioning revenues carbon tax revenues and material tax revenues will be recycled The proportion of tax raised by industry will be recycled into a reduction in employers social security contributions which will in turn reduce the cost of labour Recycling will be additional to the existing ETRs in some Member States Revenues raised from households will be recycled through standard rate income tax reductions Traditional energy tax revenues will be lower compared to their respective baselines as the tax base (energy consumption) is reduced So for an ETR revenue-neutrality does not mean budget-neutrality
312 Factors affecting the macroeconomic impacts of RES technologies
Earlier analyses (Lehr et al 2008 Fraunhofer ISI et al 2009 DTI 2004 Kammen et al 2004 Moreno and Loacutepez 2007) have studied the impacts of large renewable energy source (RES) shares in the energy mix for different countries The overall question in these studies has been the impact of increasing RES shares on the economy especially on the labour market For the present study it is interesting to note that macroeconomic impacts of higher RES shares mainly depends on the following five factors
1 additional investment in RES (minus lower investment in conventional sources ie fossil and nuclear power) with the impact increasing if a country manufactures the RES technology in question
2 additional (net) exports due to improved international competitiveness of renewable energy sources (first mover advantage)
3 lower fossil fuel needs4 the cost differences between RES and
conventional energy
5 the shift from capital- and energy-intensive industries to labour- and technology-intensive industries
All five factors are driven by international energy prices carbon prices the policy framework and RES technology development itself Innovation comes into the play at various stages First innovation drives the currently positive additional costs of RES technologies down and even into negative realms depending on the fossil fuel scenario Second innovative RES technologies are likely to have a competitive advantage in international markets Although a significant proportion of RES technology produced in Europe is traded in Europe innovation will still provide an edge in current and emerging international markets
The EmployRES study (Fraunhofer ISI et al 2009) finds for Europe that current strong investment reflected in installations in Europe and exports to the rest of the world dominate the economic impact of RES policies and therefore lead to positive overall effects The studys results suggest that this positive balance can only be kept up in the future if the competitive position of European manufacturers of RES technology is improved The authors strongly recommend policies which promote technological innovation in RES and lead to a continued and rapid reduction of their costs
Factors 1 and 2 will have substantial macroeconomic impacts in the short and medium terms whereas factor 3 accumulates and will show positive impacts mainly in the long term Factor 4 strongly depends on the global developments while factor 5 may have significant effects on employment
313 Additional scenarios
Impacts of additional investment (factor 1) have already been analysed in scenario S2H of the petre project To focus on the other impacts of eco-innovation two additional scenarios were designed building on scenario S2H of petre
bull S2HEETRwithrevenuerecyclingdesignedto meet the unilateral EUs 2020 greenhouse gas (GHG) target (high energy price) Ten per cent of revenues are spent on eco-innovation measures and trade shares of EU-27 economies with the rest of the world in machinery and electrical machinery increase by 01 due to the deployment of the fast growing RES markets This assumption is based on the strong EU policy effort to increase the share of renewable energy in final energy consumption to 20 by 2020
Modelling of ETR impacts on eco-innovation
Environmental tax reform in Europe opportunities for eco-innovation 27
(Fraunhofer ISI et al 2009) and the possibility of very strong world market development of the RES sector until 2020 (EREC 2008) which offers additional export opportunities for European RES industries
bull S2HIETRwithrevenuerecyclingdesignedto meet the unilateral EUs 2020 GHG target (high energy price) Ten per cent of revenues are spent on eco-innovation measures and input structures of the energy sector are changed according to the input structure of the German RES industry (Lehr et al 2008)
S2HE looks at the possible role of international trade S2HI analyses changes in the input structure of the energy sector ie from conventional electricity production to renewables In the petre project (as in GHK et al 2007) only the energy inputs of the energy sector were adapted to changes in the energy input mix
Both S2HE and S2HI focus on RES and efficiency technologies As mentioned above an ETR will trigger a variety of innovations Therefore the results can be thought of as conservative in the sense that innovations (eg automotive energy consumption industrial efficiency etc) are not explicitly included
32 Overview of modelling results
The main results of the simulations are presented in Table 31 In the baseline scenario BH with high energy prices EU-27 carbon emissions will be
72 below the 1990 level in 2020 (38) The EU-15 has committed in the Kyoto Protocol to reduce its GHG emissions 8 below 1990 levels in the period 2008ndash2012 As emissions in the new member states are substantially below their 1990 levels today that implies that the EU-27 will keep its emissions more or less constant over the coming decade As in the PRIMES baseline an ETS price of 18 EURt in 2008 prices is assumed in 2020
In scenario S1H the ETS price and carbon tax rate has to be increased to 68 EUR2008t of CO2 to reach the 20 GHG reduction target which is equal to a 15 reduction of CO2 emissions against 1990 as other greenhouse gases have already been reduced above average by more than 20 in terms of CO2 equivalents Compared to the baseline CO2 emissions are 84 lower in 2020 which means roughly an additional 1 reduction annually in the period 2012ndash2020 GDP will be about 06 lower compared to the baseline in 2020 This means that annual average growth rates will be less than 01 below their baseline development This is especially low compared to the current financial and economic crisis with a GDP deviation against the baseline of around 6 in 2009
As the recycling mechanism reduces labour costs and the tax burden is shifted from labour-intensive to carbon- and material-intensive sectors employment will be 036 (or more than 800 000 jobs) higher than in the baseline The ETR is not fully budget neutral potentially enabling EU economies to slightly increase their net savings If
(38) The modelling exercise in the present study was conducted in 2009 and therefore does not contain the latest data on EU-27 GHG emissions which were significantly influenced by the global economic slump of the late-2000s
Table 31 Main results under the different scenarios
Scenario Target in 2020 CO2 price GDP Employment CO2 reduction
EUR2008t pc against baseline
pc against baseline
pc against 1990
pc against baseline
in year 2020 2015 2020 2020 2020 2020
BH 18 ndash 72 00
S1H 20 GHG 68 ndash 022 ndash 057 036 ndash 151 ndash 84
S2H 20 GHG 61 ndash 013 ndash 030 041 ndash 152 ndash 85
S2HE 20 GHG 61 ndash 009 ndash 004 051 ndash 151 ndash 84
S2HI 20 GHG 61 ndash 006 ndash 024 045 ndash 152 ndash 84
Environmental tax reform in Europe opportunities for eco-innovation
Modelling of ETR impacts on eco-innovation
28
this extra saving is spent negative GDP impacts will be further reduced
In scenario S2H part of the revenues is invested in low-carbon technologies This reduces the carbon price to 61 EUR2008t in 2020 halving the GDP loss relative to scenario S1H to only 03 as the investment in renewable energies is assumed to be additional Employment impacts are also more positive than in scenario S1H The 10 investment in low-carbon technologies amounts to more than EUR 20 billion in 2020
Assuming additional EU exports of RES technologies in scenario S2HE GDP almost matches the baseline in 2020 and employment is 051 (or more than 1 million jobs) higher than in the baseline In scenario S2HI a shift in the input structure of the energy sector towards machinery
and electrical machinery reflecting the different nature of RES relative to conventional electricity generation also has smaller additional positive impacts on GDP and employment compared to scenario S2H
The following figures show impacts of the different scenarios in comparison to the baseline BH As Figure 31 illustrates all the alternative scenarios imply GDP lower than the baseline However comparing scenario S1H with the other three scenarios shows that additional RES investment (S2H) additional RES exports (S2HE) and the inclusion of different input structures of the RES industries (S2HI) each have positive GDP impacts These results are in line with model-based analysis in the EMPLOY-RES study (Fraunhofer ISI et al 2009)
Figure 31 EU-27 GDP according to four scenarios mdash deviation from the baseline (BH)
Percentage deviation from the baseline (BH)
ndash 100
ndash 080
ndash 060
ndash 040
ndash 020
0002010 2015 2020
S2HI S1H S2H S2HE
Modelling of ETR impacts on eco-innovation
Environmental tax reform in Europe opportunities for eco-innovation 29
In contrast to GDP employment increases relative to the baseline in all the alternative scenarios (Figure 32) Due to the scenario design the structure of the EU economies is shifted from energy-intensive to labour-intensive sectors The magnitude of the employment gain is influenced by the carbon price and the tax shift the underlying energy prices and the production loss The largest part of the employment increase stems from the additional RES investment (scenario S2H) although a shift in industry structures (S2HI) and additional RES exports (S2HE) are also positive for the labour market
33 Macroeconomic impacts at the national level
In general terms it is clear that national ETS and ETR impacts depend significantly on country specifics including energy use economic structure social system and behaviour (eg reactions to labour cost changes) In countries with high carbon intensity in their energy mix additional revenues and expenditures are higher than in countries with lower carbon intensity
Scenario S2H provides an interesting tool for analysing the macroeconomic impacts of ETR at the national level because 10 of the additional generated revenues are used for eco-innovation investments meaning that only 90 of the revenues are recycled back into the economy by reducing income tax rates and social security contributions
Figure 32 EU-27 employment according to four scenarios mdash deviation from the baseline (BH)
ndash 020
000
020
040
060
2010 2015 2020
S2HI S1H S2H S2HE
Percentage deviation from the baseline (BH)
Environmental tax reform in Europe opportunities for eco-innovation
Modelling of ETR impacts on eco-innovation
30
Figure 34 GDP in 2020 in EU-27 Member States under scenario S2H mdash deviation form the baseline (BH)
Figure 33 GDP in 2020 in selected countries under scenario S2H mdash deviation from the baseline (BH)
ndash 25 ndash 20 ndash 15 ndash 10 ndash 05 00 05 10 15
Romania
Bulgaria
SloveniaMalta
Lithuania
Latvia
Estonia
CyprusSlovakia
Poland
Hungary
Czech RepublicUnited Kingdom
Sweden
Spain
Portugal
Netherlands
Italy
Ireland
Greece
FranceFinland
Denmark
Luxembourg
Belgium
Austria
Germany
Percentage deviation from the baseline (BH)
Russia
South Africa
Brazil
India
China
Mexico
Japan
USA
Poland
United Kingdom
Spain
Italy
France
Germany
ndash 30 ndash 25 ndash 20 ndash 15 ndash 10 ndash 05 00 05 10
Percentage deviation from the baseline (BH)
Modelling of ETR impacts on eco-innovation
Environmental tax reform in Europe opportunities for eco-innovation 31
Figure 35 Employment in 2020 in EU-27 Member States under scenario S2H mdash deviation from baseline (BH)
EU-27EU-15
RomaniaBulgariaSloveniaMalta
LithuaniaLatvia
EstoniaCyprusSlovakia
PolandHungary
Czech RepublicUnited Kingdom
SwedenSpain
PortugalNetherlands
ItalyIrelandGreece
FranceFinlandDenmarkLuxembourg
BelgiumAustria
Germany
ndash 200 0 200 400 600 800 1 000
Percentage deviation from the baseline (BH)
Under scenario S2H the GDP of large EU economies deviates from baseline projections by between 0 and ndash 1 with the exception of Italy (Figure 33) Germanys GDP is even forecast to match the baseline level in 2020 due to the countrys strong RES industry Outside Europe some countries gain slightly against EU Member States in terms of competitiveness as export prices in most EU Member States and sectors increase and GDP in those countries exceeds the baseline projections as a result (Figure 33) This is mainly because carbon tax revenues are recycled via income tax reductions which are not part of production costs However energy exporting economies such as Russia or South Africa will lose exports if EU demand for fossil fuel imports declines The development of all EU Member States is shown in Figure 34
Employment impacts of scenario S2H are positive for almost all EU Member States as lower labour
costs increase labour demand and labour intensity (Figure 35) The highest absolute increases are shown for Germany the Netherlands Italy and the United Kingdom For EU-27 as a whole employment will be almost one million higher than in the corresponding baseline BH in 2020
The scenarios have not been designed with a view to meeting the EU renewables target of a 20 renewables share in final energy consumption in 2020 Nevertheless the scenarios provide some interesting insights The share is projected to increase from around 10 in 2009 to above 14 even in the baseline as instruments such as feed in tariffs and biofuel quotas will continue In scenario S1H the target will be missed with around 18 in 2020 Only in scenarios S2H S2HE and S2HI is the target met (approximately 20 )
Environmental tax reform in Europe opportunities for eco-innovation
Modelling of ETR impacts on eco-innovation
32
Under scenario S2H energy-related carbon emissions are reduced in all EU Member States relative to the baseline (Figure 36) The highest percentage reductions can be seen in many of the EU-12 Member States with still high energy intensity and low energy prices In these countries the relative price increase is higher than in countries like Germany or the United Kingdom with already high energy taxes and overall energy prices
Additional ETS revenues material tax revenues and carbon tax revenues from the industry sector are recycled back to industry via reductions in employers social security contributions (or wage subsidies in some countries) The revenues from the carbon tax on households set out in Table 32 (totalling 033 of GDP in Germany for example) are used to reduce income tax For the EU-27 overall revenues from ETS and ETR reach about 2 of GDP in 2020 although these figures may be excessive because additional EU efforts to increase energy
efficiency and renewable energy which will reduce the ETS price are not taken into account The use of flexible tools such as the Clean Development Mechanism will further reduce the revenues and earmarking of part of the revenues for mitigation and adaptation measures in emerging and developing countries limits the recycling into labour costs
In addition the scenarios do not take the current global economic problems into account According to the IEA (2009) the downturn will also reduce carbon emissions in the long run which will lead to lower carbon prices and revenues to reach fixed targets (or make tighter targets less costly)
The ETR will have varying effects on the prices of different sorts of products and services Material or carbon taxes increase the prices of product groups according to their direct and indirect material and carbon content The recycling mechanism reduces
Figure 36 Energy-related CO2 emissions in 2020 under scenario S2H mdash deviation from the baseline (BH)
WorldEU-27
EU-15Romania
BulgariaSlovenia
MaltaLithuania
LatviaEstonia
CyprusSlovakia
PolandHungary
Czech RepublicUnited Kingdom
SwedenSpain
PortugalNetherlands
ItalyIreland
GreeceFrance
FinlandDenmark
LuxembourgBelgium
AustriaGermany
ndash 25 ndash 20 ndash 15 ndash 10 ndash 5 0
Percentage deviation from the baseline (BH)
Modelling of ETR impacts on eco-innovation
Environmental tax reform in Europe opportunities for eco-innovation 33
Table 32 Additional ETS and environmental tax revenues in 2020 ( of GPD)
S2H Germany United Kingdom EU-27
ETS revenues 083 064 059
Carbon tax (industry) 052 044 054
Carbon tax (households) 033 041 036
Material tax 041 029 056
Sum 209 178 205
Figure 37 Total primary energy supply in 2020 under scenario S2H mdash deviation from the baseline (BH)
WorldEU-27EU-15
RomaniaBulgaria
Slovenia
MaltaLithuania
LatviaEstonia
Cyprus
SlovakiaPoland
HungaryCzech Republic
United KingdomSweden
SpainPortugal
NetherlandsItaly
IrelandGreece
FranceFinland
DenmarkLuxembourg
BelgiumAustria
Germany
ndash 24 ndash 21 ndash 18 ndash 15 ndash 12 ndash 9 ndash 6 ndash 3 0
Percentage deviation from the baseline (BH)
Environmental tax reform in Europe opportunities for eco-innovation
Modelling of ETR impacts on eco-innovation
34
Figure 38 Output price impacts of scenario S2H in Germany in 2020 mdash deviations from the baseline (BH)
Figure 39 Impacts of scenario S2H on industrial output in 2020 in Germany mdash deviations from the baseline (BH)
ndash 5
0
5
10
15
20
Output prices
Percentage deviation from the baseline (BH)
(3) F
ood
(4) T
extiles
(5) W
ood
(6) P
ulp pap
er
(7) C
oke re
fined
petro
leum
pro
ducts
(8) C
hemica
ls ex
cl pha
rma
(9) P
harm
aceu
ticals
(10)
Rub
ber a
nd plastics
(11)
Non
-metallic
miner
als
(12)
Iron
and
steel
(13)
Non
-ferrou
s metals
(14)
Met
al pro
ducts
(15)
Mac
hine
ry and
equ
ipmen
t
(16)
Office
mac
hine
ry
(17)
Electric
al m
achine
ry
(18)
Rad
io T
V
(19)
Med
ical pr
ecisi
on and
opt
ical ins
trumen
ts
(20)
Mot
or veh
icles
(21)
Ships
(22)
Airc
raft
(23)
Railro
ad
(24)
Man
ufac
turin
g n
ec r
ecyc
ling
(25)
Electric
ity g
as w
ater
sup
ply
(26)
Con
stru
ction
(27)
Tra
de r
epairs
(28)
Hot
els an
d re
stau
rant
s
(29)
Tra
nspo
rt an
d stor
age
(30)
Pos
t and
teleco
mmun
icatio
ns
(31)
Finan
ce ins
uran
ce
(32)
Rea
l estate ac
tivities
(33)
Ren
ting
(34)
Com
puter
(35)
Res
earch an
d de
velopm
ent
(36)
Oth
er bus
ines
s ac
tivities
(37)
Pub
lic ser
vice
s
(38)
Edu
catio
n
(39)
Hea
lth and
soc
ial w
ork
(40)
Oth
er ser
vice
s
(41)
Priv
ate ho
useh
olds
(1) A
gricu
lture
(2) M
ining an
d qu
arry
ing
nec not elsewhere classified
Production
ndash 100
ndash 80
ndash 60
ndash 40
ndash 20
00
20
40
60
80Percentage deviation from the baseline (BH)
(3) F
ood
(4) T
extiles
(5) W
ood
(6) P
ulp pap
er
(7) C
oke re
fined
petro
leum
pro
ducts
(8) C
hemica
ls ex
cl pha
rma
(9) P
harm
aceu
ticals
(10)
Rub
ber a
nd plastics
(11)
Non
-metallic
miner
als
(12)
Iron
and
steel
(13)
Non
-ferrou
s metals
(14)
Met
al pro
ducts
(15)
Mac
hine
ry and
equ
ipmen
t
(16)
Office
mac
hine
ry
(17)
Electric
al m
achine
ry
(18)
Rad
io T
V
(19)
Med
ical pr
ecisi
on and
opt
ical ins
trumen
ts
(20)
Mot
or veh
icles
(21)
Ships
(22)
Airc
raft
(23)
Railro
ad
(24)
Man
ufac
turin
g n
ec r
ecyc
ling
(25)
Electric
ity g
as w
ater
sup
ply
(26)
Con
stru
ction
(27)
Tra
de r
epairs
(28)
Hot
els an
d re
stau
rant
s
(29)
Tra
nspo
rt an
d stor
age
(30)
Pos
t and
teleco
mmun
icatio
ns
(31)
Finan
ce ins
uran
ce
(32)
Rea
l estate ac
tivities
(33)
Ren
ting
(34)
Com
puter
(35)
Res
earch an
d de
velopm
ent
(36)
Oth
er bus
ines
s ac
tivities
(37)
Pub
lic ser
vice
s
(38)
Edu
catio
n
(39)
Hea
lth and
soc
ial w
ork
(40)
Oth
er ser
vice
s
(41)
Priv
ate ho
useh
olds
(1) A
gricu
lture
(2) M
ining an
d qu
arry
ing
nec not elsewhere classified
Modelling of ETR impacts on eco-innovation
Environmental tax reform in Europe opportunities for eco-innovation 35
social security contributions and lowers labour costs according to the direct and indirect labour content of sector output The ETR therefore reduces output prices in labour-intensive service sectors and increases prices in carbon- and material-intensive industry sectors
The example of Germany shows insignificant impacts in the trade-intensive sectors of machinery (15ndash17) motor vehicles (20) and other transport equipment (21ndash23) (Figure 38) Iron and steel (12) and chemicals without pharmaceuticals (8) face the highest price increases of trade-intensive sectors As the German iron and steel industry primarily delivers high quality steel to the German car industry and increasingly to the German windmill industry negative competitiveness impacts will be limited Exchange rate variations against non-EU competitors have been much higher in the past
The higher prices of carbon- and material-intensive products will reduce price competitiveness on export markets and increase the market share for imports in domestic markets This loss of price competitiveness is based on an assumption of limited market development of energy efficiency and RES technologies in other part of the world It will be offset by gains in labour-intensive sectors if the ETR causes real wage costs per unit of output to fall as a result of using recycled revenues to reduce employer social security contributions
Any improvement in non-price competitiveness will also raise exports The extra employment will raise incomes raising consumption and output
The overall impact on sector output depends on countervailing effects which are negative for iron and steel and a few service sectors and positive for a few industry sectors For most industries the output effect is insignificant (Figure 39) The greatest impact is felt by producers of fossil fuels who must obviously reduce production due to lower demand for their products
Under scenario S2H employment impacts are positive for most sectors relative to the baseline as labour productivity decreases and wage rates fall in relation to consumer prices (CPI) and output prices (Table 33) The relative costs of labour are lower than in the baseline without the ETR reform Only around a quarter of the employment increase takes place in industry
Concerning the wage rate two countervailing effects have to be considered First when the labour market is characterised in terms of the real wage bargaining model as in E3ME and GINFORS with market power on both sides (employers and trade unions) consumer price increases will lead to wage increases (the econometrically estimated factor is 085 for Germany) Second labour productivity is another important factor for wage bargaining The estimated elasticity for Germany is 063 meaning that a 1 increase of labour productivity leads to wage increases of 063 Higher labour demand due to lower labour costs thus reduces the wage increase In the end the German economy is more labour intensive than without the ETR partly due to the structural change towards labour-intensive industries
Table 33 Employment impacts of scenario S2H in Germany mdash deviations from scenario S2H in 2020
Employment in 2020 Deviation from S2H () Deviation from S2Habsolute (1 000s)
Agriculture forestry 24 90
Industry 09 653
Non-metallic minerals 24 62
Iron and steel ndash 28 ndash 37
Machinery and equipment 05 56
Electrical machinery 04 18
Construction 37 449
Trade and transport 10 829
Business services 17 767
Other services ndash 02 ndash 216
Total 07 2506
Environmental tax reform in Europe opportunities for eco-innovation
Modelling of ETR impacts on eco-innovation
36
Additional exports under scenario S2HE mainly create new jobs in machinery and related business services (Table 34) Under scenario S2HI a shift in the input structure of the energy sector leads to a shift in the industry structure and creates a few jobs in the service sector (Table 35)
34 Conclusions of the scenario assessment
The foregoing analysis used the GINFORS model to assess economic and environmental impacts of using the ETS and ETR to reach the EUs 2020
GHG targets In general the results show positive employment effects and only small negative impacts on GDP in EU-27 Member States The economic impacts depend on the levels of international energy prices the mechanism used to recycle revenues and country specifics such as carbon and energy intensity and the structure of energy consumption
Although there is significant evidence that eco-innovation is positively driven by higher energy prices quantification is difficult The present study included simulations of possible impacts of a shift in the industry structure towards renewable energy in the electricity sector and an overall increase of EU
Table 34 Employment impacts of scenario S2HE in 2020 in Germany mdash deviations from scenario S2H
Employment in 2020 Deviation from S2H () Deviation from S2Habsolute (1 000s)
Agriculture forestry ndash 01 ndash 02
Industry 03 194
Non-metallic minerals 02 05
Iron and steel 04 05
Machinery and equipment 13 130
Electrical machinery 24 117
Construction 01 18
Trade and transport 00 26
Business services 07 308
Other services 01 107
Total 02 634
Table 35 Employment impacts of scenario S2HI in 2020 in Germany mdash deviations from scenario S2H
Employment in 2020 Deviation from S2H () Deviation from S2Habsolute (1 000s)
Agriculture forestry ndash 01 ndash 02
Industry 00 00
Non-metallic minerals 25 65
Iron and steel ndash 27 ndash 36
Machinery and equipment 08 78
Electrical machinery 04 19
Construction ndash 00 ndash 04
Trade and transport 00 07
Business services 02 115
Other services 0 56
Total 00 167
Modelling of ETR impacts on eco-innovation
Environmental tax reform in Europe opportunities for eco-innovation 37
exports due to higher global demand for renewable energy The main results can be summarised as follows
bull environmentaltaxreformshiftingtaxesfromlabour to energy and resources will create additional jobs and trigger eco-innovation
bull impactsofeco-innovationintheformofadditional EU exports or shifts in industry structures will have a slight positive influence on GDP and create a smaller number of additional jobs
These findings correspond to results from the EmployRES study (Fraunhofer ISI et al 2009) As ETR is directly aimed at reducing labour costs it will create additional jobs in the short and medium term In the longer term the cost reduction and new technologies arising from eco-innovation will play a larger role
Like all fiscal reforms a major ETR in Europe will create winners and losers At the sector level carbon- and material-intensive industries will face economic losses At the country level the carbon-intensity and overall flexibility of economies is important Clearly structural change away from carbon-intensive industries together with technological change is inherent in any successful climate mitigation policy
On the other hand several factors can smooth these structural adjustments International cooperation
will reduce economic pressure on countries and sectors In addition ETR together with auctioning of ETS allowances can be a major source of revenues for EU Member States in the future even if part of the revenues will have to be earmarked for adaptation and mitigation measures in developing countries Indeed future debate on grandfathering or auctioning ETS allowances should reflect the important point that giving allowances away for free denies countries the money to ease structural change and invest in low-carbon technologies
Caution is needed in relating the findings of this study to the EU policy debate In the model simulations the single carbon price is the only instrument used to reach the EUs 2020 GHG targets In reality of course other renewable energy and efficiency policies will also contribute to carbon reduction and have to be taken into account when comparing the results (especially the high carbon prices) to other studies Both reduce the potential revenues from fossil energy carriers and carbon emissions
A variety of renewable energy and efficiency policies could enable the climate and energy targets to be met while securing even better economic prospects The results of the present study clearly indicate that the discussion on market-based instruments should be intensified Ultimately however the EU will need a rich mix of policies to reach its GHG targets while maximising prosperity
Environmental tax reform in Europe opportunities for eco-innovation38
References
Almon C 1991 The INFORUM Approach to Interindustry Modeling in Economic Systems Research Vol 3 pp 1ndash7
Amin A and Cohendet P 2004 The Architecture of Knowledge Firms Capabilities and Communities Oxford University Press Oxford
Barker T Meyer B Pollitt H and Lutz C 2007a Modelling Environmental Tax Reform in Germany and the United Kingdom with E3ME and GINFORS petre Working Paper Cambridge and Osnabrueck (httpwwwpetreorgukpapershtm) accessed 15 February 2011
Barker T Junankar S Pollitt H and Summerton P 2007b Carbon leakage from unilateral environmental tax reforms in Europe 1995ndash2005 Energy Policy Vol 35 pp 6 281ndash6 292
Brunnermeier S B and Cohen M A 2003 Determinants of environmental innovation in US manufacturing industries Journal of Environmental Economics and Management Vol 45 pp 278ndash293
Buen J 2006 Danish and Norwegian wind industry The relationship between policy instruments innovation and diffusion Energy Policy Vol 34 (18) pp 3 887ndash3 897
Carlsson B and Stankiewicz R 1991 On the nature function and composition of technological systems Journal of Evolutionary Economics Vol 1 (2) pp 93ndash118
Christiansen A C and Skjaerseth J B 2005 Climate change policies in Norway and the Netherlands Different instruments similar outcome Energy and Environment Vol 16(1) pp 1ndash25
Dosi G 1988 Sources procedures and microeconomic effects of innovation Journal of Economic Literature Vol 26 pp 1 120ndash1 171
de Vries F and Medhi N 2008 Environmental regulation and international innovation in automotive emissions control technologies in Environmental Policy Technological Innovation and Patents Organisation for Economic Cooperation and Development Paris
DG TREN 2008 European energy and transport mdash trends to 2030 mdash update 2007 European Commission Luxembourg
DTI 2004 Renewable Supply Chain Gap Analysis UK Department of Trade and Industry
Edler J (ed) 2006 Nachfrageorientierte Innovationspolitik Buumlro fuumlr Technikfolgenabschaumltzung beim Deutschen Bundestag (TAB) Arbeitsbericht Nr 99 Berlin
Edquist C 2001 The system of innovation approach and innovation policy an account of the state of the art lead paper presented at the DRUID Conference 12ndash15 June 2001 Aalborg (httpwwwdruiddkconferencesnwpaper1edquistpdf) accessed 15 February 2011
EEA 2006 Using the market for cost-effective environmental policy Market-based instruments in Europe EEA Report No 12006 European Environment Agency Copenhagen
Ekins P 2009 Resource Productivity Environmental tax Reform and Sustainable Growth in Europe published by the Anglo-German Foundation for the Study of Industrial Society Final report (httpwwwpetreorgukpdfFinRepFinpdf) accessed 12 October 2011
Ekins P and Speck S (eds) 2011 Environmental Tax Reform (ETR) A Policy for Green Growth Oxford University Press
EREC 2008 Energy [r]evolution A sustainable global energy outlook Greenpeace International European Renewable Energy Council (EREC)
References
References
Environmental tax reform in Europe opportunities for eco-innovation 39
Fagerberg J Mowery D C and Nelson R R (eds) 2005 The Oxford Handbook of Innovation Oxford University Press Oxford
Fischer C Parry I W H and Pizer W A 2003 Instrument choice for environmental protection when technological innovation is endogenous Journal of Environmental Economics and Management Vol 45 pp 523ndash545
Fraunhofer ISI ECOFYS Energy Economics Group Ruumltter + Partner SEURECO and LEI 2009 EmployRES mdash The impact of renewable energy policy on economic growth and employment in the European Union European Commission Brussels
Frondel M Horbach J and Rennings K 2008 What triggers environmental management and innovation Empirical evidence for Germany Ecological Economics Vol 66(1) pp 153ndash160
GHK Cambridge Econometrics and IEEP 2007 Links between the environment economy and jobs Final Report submitted to DG Environment European Commission
Giljum S Behrens A Hinterberger F Lutz C and Meyer B 2008 Modelling scenarios towards a sustainable use of natural resources in Europe Environmental Science and Policy Vol 11 pp 204ndash216
Goumlrlach B Knigge M and Luumlckge H 2005 Wirkungen der Oumlkologischen Steuerreform auf Innovation und Marktdurchdringung Ecologic Berlin (httpecologiceudownloadprojekte1850-189918791879_5_innovationpdf) accessed 18 August 2011
Green M A 2000 Photovoltaics technology overview Energy Policy Vol 28 (14) pp 989ndash998
Grossmann A Lehr U Lutz C and Wolter MI 2008 Gesamtwirtschaftliche Effekte der Umsetzung der EU Ziele im Bereich Erneuerbare Energien und Gebaumludeeffizienz in Oumlsterreich bis 2020 Studie im Auftrag des Lebensministeriums Wien 0508
Hage J and Hollingsworth J R 2000 Idea innovation networks a strategy for integrating organizational and institutional analysis Organization Studies Vol 21 (5) pp 971ndash1 004
Hauschildt J 2004 Innovationsmanagement Vahlen Muumlnchen
Hemmelskamp J 1997 Environmental policy instruments and their effects on innovation European Planning Studies Vol 5 (2) pp 177ndash195
Hoglund Isaksson L 2005 Abatement costs in response to the Swedish charge on nitrogen oxide emissions Journal of Environmental Economics and Management Vol 50 pp 102ndash120
Hullmann A 2001 Internationaler Wissenstransfer und technischer Wandel (dissertation) Physica-Verlag Heidelberg
IEA 2008 World Energy Outlook 2008 International Energy Agency Paris
IEA 2009 World Energy Outlook 2009 International Energy Agency Paris
Jacobsson S Andersson B A and Baringngens L 2002 Transforming the energy system mdash the evolution of the German technological system for solar cells Science and Technology Policy Research University of Sussex Electronic Working Paper Series No 84 (httpideasrepecorgpsrussewps84html) accessed 18 August 2011
Jaffe A and Stavins R 1995 Dynamic incentives of environmental regulations the effects of alternative policy instruments on technology diffusion Journal of Environmental Economics and Management Vol 29(3) pp 43ndash63
Jaffe A B and Palmer K 1997 Environmental regulation and innovation a panel data study The Review of Economics and Statistics Vol 79 pp 610ndash619
Jaffe A B Newell R G and Stavins R N 2002 Environmental policy and technological change Environmental and Resource Economics Vol 22 (1ndash2) 2002 pp 41ndash70
Johnstone N and Hascic I 2008 Renewable energy policies and technological innovation energy source and instrument choice in Environmental Policy Technological Innovation and PatentsOrganisation for Economic Co-operation and Development Paris
Johnstone N 2005 The Innovation Effects of Environmental Policy Instruments in Horbach J (ed) Indicator Systems for Sustainable Innovation Physica-Verlag HD
Environmental tax reform in Europe opportunities for eco-innovation
References
40
Johnstone N Hascic I and Ostertag K 2008 Environmental policy technological innovation and patent activity in Environmental Policy Technological Innovation and Patents Organisation for Economic Co-operation and Development Paris
Jung C Krutilla K and Boyd R 1996 Incentives for advanced pollution abatement technology at the industry level an evaluation of policy alternatives Journal of Environmental Economics and Management Vol 30(1) pp 95ndash111
Kammen D M Kapidia K and Fripp M 2004 Putting renewables to work how many jobs can the clean energy industry generate University of California Berkeley
Kemp R 1997 Environmental policy and technical change ndash a comparison of the technological impact of policy instruments Edward Elgar Cheltenham
Kemp R 1998 The diffusion of biological waste-water treatment plants in the Dutch food and beverage industry Environmental and Resource Economics Vol 12 pp 113ndash136
Kemp R 2000 Technology and environmental policy ndash innovation effects of past policies and suggestions for improvement in OECD proceedings ndash innovation and the environment Organisation for Economic Co-operation and Development Paris
Kerr S and Newell R G 2003 Policy-induced technology adoption evidence from the US lead phasedown Journal of Industrial Economics Vol 51 pp 317ndash343
Klaassen G Miketa A Larsen K and Sundqvist T 2005 The impact of RampD on innovation for wind energy in Denmark Germany and the United Kingdom Ecological Economics Vol 54 pp 227ndash240
Kline S and Rosenberg N 1986 An overview of innovation in Landau R (ed) The positive sum strategy Harnessing technology for economic growth pp 275-306
Knigge M and Goumlrlach B 2005 Effects of Germanys ecological tax reforms on the environment employment and technological innovation Ecologic Berlin (httpwwwumweltbundesamtdeuba-info-presse-ehintergrundoekosteuerpdf) accessed 18 August 2011
Langniss O 2003 Governance structures for promoting renewable energy sources dissertation Lund Stuttgart
Lanjouw J O and Mody A 1996 Innovation and the international diffusion of environmentally responsive technology Research Policy Vol 25 pp 549ndash571
Lehr U Nitsch J Kratzat M Lutz C and Edler D 2008 Renewable Energy and Employment in Germany Energy Policy Vol 36 pp 108ndash117 DOI101016jenpol200709004
Lehr U Wolter MI and Groszligmann A 2009 Economic impacts of RES obligations in Austria ndash an application of the macro-econometric model e3at GWS Discussion Paper 20091 Osnabruumlck
Lundvall B-A Johnson B Andersen E S and Dalum B 2001 National systems of production innovation and competence building Research Policy Vol 31 pp 213ndash231
Lutz C and Giljum S 2009 Global resource use in a business as usual world until 2030 Updated results from the GINFORS model in Bleischwitz R Welfens Pand Zhang Z (eds) Sustainable growth and resource productivity ndash economic and global policy issues Greenleaf Publishers pp 30ndash41
Lutz C and Meyer B 2008 Beschaumlftigungseffekte des Klimaschutzes in Deutschland Untersuchungen zu gesamtwirtschaftlichen Auswirkungen ausgewaumlhlter Maszlignahmen des Energie- und Klimapakets Forschungsbericht 205 46 434 Dessau-Roszliglau
Lutz C and Meyer B 2009a Environmental and Economic Effects of Post-Kyoto Carbon Regimes Results of Simulations with the Global Model GINFORS Energy Policy Vol 37 pp 1 758ndash1 766 DOI 101016jenpol200901015
Lutz C and Meyer B 2009b Scenario results from GINFORS PETRE working paper Osnabruumlck
Lutz C Meyer B Nathani C and Schleich J 2005 Endogenous technological change and emissions The case of the German steel industry Energy Policy Vol33 pp 1 143ndash1 154
Lutz C Meyer B Nathani C and Schleich J 2007 Endogenous innovation economy and environment impacts of a technology based modelling approach for energy-intensive industries in Germany Energy Studies Review Vol 15(1) pp 2ndash18
References
Environmental tax reform in Europe opportunities for eco-innovation 41
Lutz C Meyer B and Wolter M I 2009 The global multisectormulticountry 3-E model GINFORS mdash a description of the model and a baseline forecast for global energy demand and CO2 emissions Journal of Sustainable Development forthcoming
Malerba F and Orsenigo L 1997 Technological Regimes and Sectoral Patterns of Innovative Activities Industrial and Corporate Change Vol 6 (1) pp 83ndash117
Malerba F 1992 Learning by Firms and Incremental Technical Change The Economic Journal Vol 102 (413) pp 845ndash859
Malerba F 2005 Industrial dynamics and innovation progress and challenges Presidential Address delivered at the 32nd Conference of the European Association for Research in Industrial Economics (EARIE) 1ndash4 September 2005 Porto
Malerba F 2006 Innovation and the evolution of industries Journal of Evolutionary Economics Vol 16 pp 3ndash23
McGinty M and de Vries F P 2009 Technology diffusion product differentiation and environmental subsidies The BE Journal of Economic Analysis and Policy Vol 9(1)
Meyer B and Lutz C 2007 The GINFORS model ndash model overview and evaluation Petre Working Paper Osnabruumlck (httpwwwpetreorgukpapershtm) accessed 18 August 2011
Meyer B Lutz C Schnur P and Zika G 2007 Economic policy simulations with global interdependencies a sensitivity analysis for Germany Economic Systems Research Vol 19 pp 37ndash55
Mickwitz P H Hyvaumlttinen and P Kivimaa 2008 The role of policy instruments in the innovation and diffusion of environmentally friendlier technologies popular claims versus case study experiences Journal of Cleaner Production Vol 16(1S1) 162ndash170
Miketa A and Schrattenholzer L 2004 Experiments with a methodology to model the role of RampD expenditures in energy technology learning processes first results Energy Policy Vol 32 (15) pp 1 679ndash1 692
Milliman S R and Prince R 1989 Firm incentives to promote technological change in pollution control Journal of Environmental Economics and Management Vol 17 pp 247ndash265
Millock K and Nauges C 2006 Ex-post evaluation of an earmarked tax on air pollution Land Economics Vol 82(1) pp 68ndash84
Montero J-P 2002 Market structure and environmental innovation Journal of Applied Economics Vol 2 pp 293ndash325
Moreno B and Loacutepez A J 2007 The effect of renewable energy on employment mdash The case of Asturias (Spain) Renewable and Sustainable Energy Rewiews doi 101016jrser200610011
Mowery D and Rosenberg N 1979 The influence of market demand upon innovation A critical review of some recent empirical studies Research Policy Vol 8 pp 102ndash153
Newell R G Jaffe A B and Stavins R N 1999 The induced innovation hypothesis and energy-saving technological change Quarterly Journal of Economics Vol 114 pp 941ndash975
Norberg-Bohm V 1999 Stimulating green technological innovation An analysis of alternative policy mechanisms Policy Sciences Vol 32(1) pp 13ndash38
OECD 2009 Sustainable manufacturing and eco-innovation towards a green economy Organisation for Economic Co-operation and Development Policy Brief June 2009
OECD 2010 Taxation innovation and the environment Organisation for Economic Co-operation and Development
Pavitt K 1984 Sectoral patterns of technological change Towards a taxonomy and a theory Research Policy Vol 13 pp 343ndash373
Popp D 2002 Induced innovation and energy prices The American Economic Review Vol 92(1) pp 160ndash180
Popp D 2005 Lessons from patents Using patents to measure technological change in environmental models Ecological Economics Vol 54 pp 209ndash226
Environmental tax reform in Europe opportunities for eco-innovation
References
42
Porter M and van der Linde C 1995 Toward a new conception of the environment competitiveness relationship Journal of Economic Perspectives Vol 9(4) pp 97ndash118
Rammert W 2002 The cultural shaping of technologies and the politics of technodiversity In Sorensen K and Williams R (eds) Shaping technology guiding policy concepts spaces and tools Elgar Cheltenham pp 155-172
Requate T 2005 Dynamic incentives by environmental policy instruments ndash a survey Ecological Economics Vol 54 pp 175ndash195
Roloff N Lehr U Krewitt W Fuchs G Wassermann S Weimer-Jehle W and Schmidt B 2008 Success determinants for technological innovations in the energy sector mdash the case of photovoltaics in Moumlst D Fichtner W Ragwitz M and Veit D (eds) New methods for energy market modelling mdash Proceedings of the first european workshop on energy market modelling using agent-based computational economics Universitaumltsverlag Karlsruhe
Rothwell R 1995 The fifth generation innovation process in Oppenlaumlnder KH Popp W (eds) Innovationen und wirtschaftlicher Fortschritt betriebs-und volkswirtschaftliche Perspektiven Bern pp 9ndash26
Schumpeter J 1942 Capitalism socialism and democracy New York Harper
Skjaeligrseth J B and Christiansen A C 2005 Environmental policy instruments and technological change in the energy sector findings from comparative empirical research Energy and Environment Vol 17 (2) pp 223ndash241
Snyder L D Miller N H and Stavins R N 2003 The effects of environmental regulations on pollution emissions evidence from plant-level data American Economic Review Vol 93(2) pp 431ndash435
Technopolis 2008 Eco-innovation Final Report for Sectoral Innovation Watch (httpwwwtechnopolis-groupcomresourcesdownloads661_report_finalpdf) accessed 18 August 2011
Volleburgh H 2007 Impacts of environmental policy instruments on technological change Report for Joint Meetings of Tax and Environment Experts OECD Environment Directorate February 2007 (comenvepocctpacfa(2006)36final)
Zimmermann H Wohltmann M and Hansjuumlrgens B 1996 Umweltabgaben und Innovation Analytica Marburg
43
Annex 1
Environmental tax reform in Europe opportunities for eco-innovation
Type Instrument Area Stage
Reference
Theo
retica
l
Em
piric
al
Cas
e st
udy
Rev
iew
Qual
itat
ive
Taxe
s
Perm
its
Subsi
die
s
Volu
nta
ry
Com
man
d
Reg
ula
tion
Ener
gy
Air
Wat
er
Oth
er
Gen
eral
Innov
atio
n
Diffu
sion
Rel
evan
ce
Brunnermeier amp Cohen (2003)
X X X X
Buen (2006) X X X X X X
Christiansen amp Skjaerseth (2005)
X X X X X X
Fischer et al (2003 X X X X X X
Frondel et al (2008) X X X X X X X (X) (X)
Hemmelskamp (1997)
X X X X X X X (X)
Hoglund Isaksson (2005)
X X X (X) (X)
Jaffe amp Stavins (1995)
X X X1 X X X X
Jaffe amp Palmer (1997)
X X X X
Jaffe et al (2002) X X X X X X X X X X
Jung et al (1996) X X X X X X (X) (X)
Kemp (1998) X X X X
Kerr amp Newell (2001) X X X X X
Klaassen et al (2005)
X X X X X
Lanjouw amp Mody (1996)
X X X X X X X
McGinty amp de Vries (2009)
X X X X
Mickwitz et al (2008)
X X X X X X X X X
Milliman amp Prince (1989)
X X X X X X X
Millock amp Nauges (2006)
X X X X X X
Montero (2002) X X X X X
Newell et al (1999) X X1 X X X
Norberg-Bohm (1999)
X X X X X X X
Popp (2002) X X1 X X
Popp (2005) X X X X X X
Porter amp van der Linde (1995)
X X X X X X
Requate (2005) X X X X X X X
Skjaeligrseth amp Christiansen (2005)
X X X X X X X X X
Snyder et al (2003) X X X X X
Annex 1 Classification of refereed journal articles
Environmental tax reform in Europe opportunities for eco-innovation44
Annex 2
Type Instrument Area Stage
Reference
Theo
retica
l
Em
piric
al
Cas
e st
udy
Rev
iew
Qual
itat
ive
Taxe
s
Perm
its
Subsi
die
s
Volu
nta
ry
Com
man
d
Reg
ula
tion
Ener
gy
Air
Wat
er
Oth
er
Gen
eral
Innov
atio
n
Diffu
sion
Rel
evan
ce
Johnstone (2005)
X X X X X X X
Johnstone amp Hascic (2008)
X X X X X X X X
Kemp (1997) X X X X X X X X X X X X X
Kemp (2000) X X X X X X X X X
de Vries amp Medhi (2008)
X X1 X X X
Annex 2 Classification of books and book chapters
45
Annex 3
Environmental tax reform in Europe opportunities for eco-innovation
Type Instrument Area Stage
Reference
Theo
retica
l
Em
piric
al
Cas
e st
udy
Rev
iew
Qual
itat
ive
Taxe
s
Perm
its
Subsi
die
s
Volu
nta
ry
Com
man
d
Reg
ula
tion
Ener
gy
Air
Wat
er
Oth
er
Gen
eral
Innov
atio
n
Diffu
sion
Rel
evan
ce
Goumlrlach et al (2005)
X X X X X X
Knigge amp Goumlrlach (2005)
X X X X X X
Technopolis (2008)
X X X X X X
Volleburgh (2007)
X X X X X X X X X X X
Annex 3 Classification of reports
European Environment Agency
Environmental tax reform in Europe opportunities for eco-innovation
2011 mdash 45 pp mdash 21 x 297 cm
ISBN 978-92-9213-238-5doi10280084889
How to obtain EU publications
Publications for salebull viaEUBookshop(httpbookshopeuropaeu)bull fromyourbooksellerbyquotingthetitlethepublisherandorISBNnumberbull bycontactingoneofoursalesagentsdirectlyYoucanobtaintheircontactdetails
on the Internet (httpbookshopeuropaeu) or by sending a fax to +352 2929-42758
Free publicationsbull viaEUBookshop(httpbookshopeuropaeu)bull attheEuropeanCommissionsrepresentationsordelegationsYoucanobtain
their contact details on the Internet (httpeceuropaeu) or by sending a fax to +352 2929-42758
European Environment AgencyKongens Nytorv 61050 Copenhagen KDenmark
Tel +45 33 36 71 00Fax +45 33 36 71 99
Web eeaeuropaeuEnquiries eeaeuropaeuenquiries
TH
-AK-1
1-0
17-E
N-N
doi1
02
8008
4889
- Acknowledgements
- Executive summary
- 1Introduction
-
- 11Background
- 12ETR and innovation
- 13Report structure
-
- 2Review of literature on environmental tax reform and eco‑innovation
-
- 21Initial screening
- 22Detailed review
- 23Environmental regulation studies
- 24Theoretical studies
- 25Empirical studies
- 26Case studies
- 27Conclusions
-
- 3Modelling of ETR impacts on eco‑innovation
-
- 31Scenarios assessing the implications of ETR for eco-innovation
- 32Overview of modelling results
- 33Macroeconomic impacts at the national level
- 34Conclusions of the scenario assessment
-
- References
- Annex 1 Classification of refereed journal articles
- Annex 2Classification of books and book chapters
- Annex 3Classification of reports
-
Environmental tax reform in Europe opportunities for eco-innovation
Review of literature on environmental tax reform and eco-innovation
18
Only one of the industry models considers the impact of investment subsidies Using a product differentiation model of imperfect competition McGinty and de Vries (2009) show that subsidising the unit cost of a clean production technology can accelerate its diffusion However the impact depends on the degree of substitutability between clean and dirty products diminishing as the products become more differentiated In contrast all three of the individual firm analyses consider the impact of investment subsidies with all demonstrating that increasing subsidies induce greater abatement effort Furthermore Kemp (1997) shows that the impact of an RampD subsidy is greater in the presence of an emissions tax than it is under an equivalent emissions limit
25 Empirical studies
Jaffe and Stavins (1995) use their theoretical framework (outlined above in Section 24) as the basis for assessing the diffusion of thermal insulation in new home construction in the United States using state-level panel data for the years 1979ndash88 They derive a reduced form equation for the energy efficiency level chosen by developers from the marginal cost-benefit condition in which the explanatory variables include energy prices installation costs and the presence of a relevant building code (as a dummy variable) Separate equations are estimated for ceiling floor and wall insulation with the coefficient for energy prices being positive in all three equations Although it is only significant (at the 95 level) for floor insulation the joint hypothesis that all price coefficients are zero is strongly rejected However the coefficients for installation cost (which are all negative as expected) are around two to three times greater in magnitude and of comparable significance The coefficients for the building code dummies are consistently insignificant (and negative in two cases) indicating that this form of direct regulation had minimal impact on household energy efficiency levels over the period The authors use the estimated models in a simulation to compare the effects of a 10 increase in energy prices (ie an energy tax) with those of a 10 reduction in installation costs (ie a technology subsidy) with each applied over the whole ten-year period While
the tax increases diffusion by 2ndash6 by the end of the period the technology subsidy increases diffusion by between 4ndash15
Kemp (1997) models the diffusion of biological water treatment technology in the Dutch food and beverage industry based on a rational choice threshold model of technology adoption decisions In this model a firm chooses to adopt an abatement technology if the resulting reduction in emission-tax payments is greater than the annualised total costs of the technology where a discount factor is applied to the savings to reflect uncertainty and risk aversion on the part of the decision-maker This is translated into a probabilistic model under the assumption that both the savings and the costs follow a log-normal distribution across plants The model is estimated econometrically using data for the period 1974ndash91 under different assumptions for the functional form of the discount factor and allowing for adjustment costs (24) The estimated parameters for the preferred specification of the discount factor are all significant and of the expected sign and magnitude and the model provides a very close fit to the actual diffusion of waste-water treatment technologies over the period This leads the author to conclude that the effluent charges were a significant positive factor in the diffusion of treatment technologies Indeed he estimates that only around 4 of plants would have installed waste-water treatment equipment by the end of the period if the charge had remained at its (low) 1974 level compared to the actual figure of over 40
Newell et al (1999) estimate the impact of energy prices energy efficiency standards and other factors on the energy efficiency of three types of electrical consumer durables (room air conditioners central air conditioners and gas water heaters) in USA between the 1970s and 1990s The analysis utilises a product characteristics model in which the frontier of technologically feasible products is described by a transformation surface that relates the bundle of product characteristics to the real cost of producing that bundle In this framework innovation is represented by movements of the surface and movements along the surface In particular the authors identify three types of innovation shifts in the surface towards the origin (overall technological change) changes in the slope
(24) Adjustment costs are accounted for by estimating a partial adjustment model in which the actual change in adoption is some fixed fraction of the desired change (estimated from the threshold model)
Review of literature on environmental tax reform and eco-innovation
Environmental tax reform in Europe opportunities for eco-innovation 19
of the surface (directional technological change) and changes in the mix of products along a given surface (model substitution) They define the surface in terms of two characteristics energy flow and cooling capacity and incorporate innovation by allowing the coefficients of the two variables to vary with time and (in the case of energy flow) energy prices and efficiency standards Separate equations are estimated for each durable type with slightly differing sets of explanatory variables and time periods The authors find little evidence that either energy prices or energy efficiency standards had any impact on overall technological change While all but one of the relevant coefficients have the expected sign none are significant In contrast they do find evidence that energy prices had an impact on directional technological change with the relevant coefficients being of the correct sign and significant for both room and central air conditioners
Popp (2002) uses patent data to estimate the effect of energy prices on energy-efficiency innovations in USA between 1970 and 1994 He regresses normalised energy-efficiency-related patent applications against energy prices controlling also for lagged knowledge stock and government RampD (25) The estimated coefficient for energy prices is highly significant producing a short-run price elasticity of 006 and a long-run elasticity 0354 Thus a 10 increase in energy prices would be expected to increase the number of energy-efficiency-related patents by around 35 in the long run The estimated mean lag is less than four years leading the author to conclude that the imposition of a carbon or energy tax would lead to a fairly quick shift towards environmentally friendly innovation
Hoglund Isaksson (2005) estimates abatement cost functions for the reduction of nitrogen oxide (NOX) emissions in three industrial sectors in Sweden (energy pulp and paper chemicals and food) The analysis uses a double-hurdle model applied to a pooled sample of 114 plants across the three sectors The data cover the period 1990ndash1996 which spans the introduction of the charge on NOX emissions in 1992 The estimated cost curves have a similar shape in all three sectors with minimal (or even negative) costs over a relatively broad range of emission reductions and then a steep rise as reductions exceed
a threshold level The analysis does not explicitly consider the issue of innovation However it does find that abatement cost curves shifted downwards significantly over the period In the energy sector for example the emission rate threshold for significant cost increases fell by around 45 between 1991 and 1996 (from 550 to 300 kgGWh) The author surmises that this is due to a combination of technological development and the discovery of previously unrecognised opportunities Unfortunately while this shift coincided with the introduction of the NOX charge the analysis does not provide any evidence of a causal link
As part of their analysis of the impacts of the French tax-subsidy scheme for NOX and sulphur dioxide (SO2) emissions Millock and Nauges (2006) estimate the impact of the emission taxes on a plants decision to install end-of pipe abatement equipment While the study is not concerned with innovation per se the results of this part can be interpreted as showing the impact of emission taxes on the diffusion of abatement equipment Under the scheme taxes were imposed on the emissions of these air pollutants (and VOCs) by all plants satisfying certain criteria The revenue raised by the taxes was earmarked for subsidising the cost of qualifying abatement technologies for technical studies (ie RampD) and for investment in air quality surveillance systems Using panel data for 226 plants in three industries (iron and steel coke and chemicals) for the period 1900ndash1998 the authors estimate a Probit model for the probability that a plant will install abatement equipment They find that the total value of emissions taxes paid by the plant (ie for both pollutants) has a positive impact on its decision to invest in abatement equipment However the magnitude of the effect varies considerably across the sectors and is only significant for the iron and steel sector
Frondel et al (2008) analyse responses to an OECD survey on environmental policy tools (conducted in 2003) to identify the factors that affect a firms decision to adopt an environmental management system (EMS) voluntarily and their environmental innovation behaviour Innovation is captured by a binary variable that indicates whether the firm has undertaken significant technical measures or changes to reduce the environmental impacts of
(25) Normalised energy efficiency patent values are calculated by dividing by the total number of patents granted This accounts for exogenous changes in patenting behaviour that affect all types of patents Popp constructs a value for existing knowledge as the stock of previously granted patents weighted by estimates that he derives for knowledge productivity He demonstrates that the exclusion of this variable from the model leads to biased estimates for the energy price coefficient
Environmental tax reform in Europe opportunities for eco-innovation
Review of literature on environmental tax reform and eco-innovation
20
production (26) The analysis is based on survey responses from 899 firms in Germany Latent variable equations for EMS adoption and innovation are estimated simultaneously with each equation including the same four sets of variables relating to motivations policy instruments pressure groups and facility characteristics (27) The policy instrument variables include five dummy variables indicating the importance of different types of policy instrument including market-based instruments such as emission taxes and tradable permits While the perceived stringency of environmental policy is found to be a significant factor in the decision to innovate there is no evidence that any of the individual policy instrument variables had any impact The authors surmise that this suggests that it is stringency of environmental policy rather than the choice of specific instrument that is important for innovation However as the authors note their results reflect the perceptions of the survey respondents and should therefore be treated as correlations rather than causal relationships
Johnstone and Hascic (2008) assess the impact of a range of environmental policy instruments mdash including tax measures and investment incentives mdash on innovation in the renewable energy field They analyse the impacts for five different groups of renewable energy technologies mdash wind solar ocean biomass and waste-to-energy mdash using a panel dataset of European Patent Office (EPO) patent filings for these technologies across 26 countries over the period 1978ndash2003 A fixed effects negative binomial model is estimated controlling for electricity prices and consumption public sector RampD expenditure (as a proxy for scientific capacity) and total EPO filings (as a proxy for differenceschanges in patenting propensity) The various policy instruments are represented by dummy variables indicating whether they were in place in a particular year As such the model takes no account of the stringency of the instruments mdash in particular the differing magnitudes of the tax measures and investment incentives (28)
Initially the authors estimate the model with all of the policy instruments included individually They find that while public policy plays an important role in inducing innovation the impacts of the individual instruments vary across the different technologies In particular tax measures are significant for wind and biomass technologies with investment incentives being significant for solar and waste-to-energy technologies and obligationstradable certificates being significant for wind technologies However the authors express concerns that there may be multicolinearity between the policy variables (particularly between investment incentives tax measures and tariffs) and also that there may be interaction effects between some of the variables Consequently they estimate two alternative versions of the model the first using a composite policy variable representing the number of policy instruments in place and the second using clusters of similar policy instruments (29) The results or these two models confirm the initial findings The composite policy variable is significant for all of the technology groups while the significance of the clusters varies across technologies The price-based cluster is (highly) significant for solar biomass and waste-to-energy The quantity-based cluster is significant for wind technologies The authors surmise that this may be due to the different economic characteristics of the technologies For example the significance of investment incentives for solar and waste-to-energy may reflect the capital intensity of these technologies with large up-front investment costs
De Vries and Medhi (2008) also use patent data to investigate the relative importance of environmental regulations and fuel prices on innovation in automotive emission-control technologies distinguishing between post-combustion devices and engine redesign technologies They estimate a panel data model using data from Germany Japan and USA over the period 1978ndash2001 controlling for industry value added (as a proxy for the scope of technological opportunities) and total patent
(26) The next question on the survey asks whether these are changes in production processes or end-of-pipe technologies However no distinction is made between these two types of innovation in the present study
(27) In order to avoid identification problems some individual variables are omitted from one equation or the other(28) This shortcoming is recognised by the authors who state that it is unavoidable in any cross-comparative analysis in which multiple
instruments are included(29) The clusters are price-based instruments (investment incentives tax measures and tariffs) quantity-based instruments (obligations
and tradable certificates) and voluntary programmes
Review of literature on environmental tax reform and eco-innovation
Environmental tax reform in Europe opportunities for eco-innovation 21
applications (as a proxy for differenceschanges in patenting propensity) Environmental regulation is represented by two dummy variables indicating the introduction of on-board diagnostic (OBD) regulations in USA (30) The results of the analysis suggest that the relative impacts of regulation and market forces differ between the two types of technology For post-combustion technologies both of the regulations are significant while fuel prices have no significant impact In contrast the opposite is the case for engine redesign technologies with fuel prices having a significant impact but regulation having no discernable effect While the analysis does not explicitly consider the impact of fuel taxes it suggests that an increase in automotive fuel taxes would have a major impact on innovation in relation to engine design The estimated coefficient for fuel prices (1287) implies that a USD 010 increase in fuel prices would induce a 14 increase in patenting activity (31)
Key findings of the empirical studies
The empirical studies considered above cover a range of different technology areas spanning energy efficiency (both product and process) renewable energy and air and water pollution abatement While in some cases they assess the impact of energy prices rather than environmental taxes per se they provide a clear picture of the likely impact of environmental and energy-related taxes on eco-innovation
Three of the studies assess the impact on diffusion of existing technologies All find that environmental taxesenergy prices have a positive impact on diffusion In particular the water effluent charges in The Netherlands appear to have had a major impact on the adoption of waste-water treatment equipment by the food and beverage industry in that country However there is some evidence to suggest that the effectiveness of taxesprices may vary across sectors (eg NOXSO2 abatement in France) and that investment incentivessubsidies may be more
effective in some cases (eg thermal insulation in USA)
Three of the studies use patent data to assess the impact of environmental taxes and energy prices on innovation with one of these also assessing the impact of investment incentives All find a significant positive impact although this depends on the particular sub-sector (eg renewable energy) or the type of innovation In particular the evidence from the automotive emissions control study suggests that taxesprices may be more effective in promoting process-related innovation (eg engine redesign) than innovation in end-of-pipe technologies One of the studies takes a different approach using a product-characteristics model to decompose improvements in the energy efficiency of consumer durables This finds that while electricity prices did not appear to affect overall technological change (ie shifts in the product costenergy efficiency frontier) they did have a positive impact on directional technological change (ie the slope of the frontier)
26 Case studies
Christiansen and Skjaerseth (2005) undertake a comparative analysis of the impacts of climate change policies on the petroleum sectors in Norway and the Netherlands during the 1990s These countries were selected because of their very different policy approaches with the Norwegian petroleum sector subject to a carbon dioxide (CO2) tax since 1991 as part of a portfolio of measures (32) and the Netherlands relying on a series of voluntary agreements on energy efficiency (33) Both approaches appear to have been effective in that CO2 emissions per unit production fell by around 22 between 1990 and 2001 in Norway while energy efficiency improved by around 35 in the Netherlands over the same period However there were marked differences between the two countries in terms of the nature of the innovation that
(30) Because of the international nature of the automotive industry and the importance of the US market regulations introduced in USA appear to have been an important driver for innovation by overseas manufacturers Regulations mandating the installation of OBD systems were first introduced in California in 1988 A more sophisticated system was mandated by the 1990 US Clean Air Act Amendments taking force in 1996
(31) The coefficient represents the semi-elasticity of patent applications with respect to fuel prices While the authors do not state so explicitly the implication is that prices are expressed in US dollars (they are obtained from the IEA Energy Prices and Taxes Database) Consequently the impact of a 10 US cent increase in the fuel prices is given by exp(1287 x 01) ndash 1 = 0137
(32) In addition to the tax the portfolio included publicly funded RampD support schemes gas flaring permits and mandatory environmental impact assessments
(33) The Dutch oil and gas industry first signed a declaration of intent with the government in 1995 This was translated into a long-term agreement (LTA) on energy efficiency in the following year with an improvement target of 20 over the period 1989ndash2000 In 2001 a new LTA was signed which committed firms to implementing energy efficiency measures with a positive NPV at a 15 discount rate or a five year payback period
Environmental tax reform in Europe opportunities for eco-innovation
Review of literature on environmental tax reform and eco-innovation
22
occurred In the Netherlands technological change was incremental reflecting a steady diffusion of available (ie known) technology In contrast the authors find evidence of more radical innovations and adaptations by the Norwegian petroleum sector including the development of energy-efficient gas turbines installation of waste heat recovery units process modifications and improved use of process heat While the authors acknowledge the impossibility of proving a causal link between policy intervention and innovation (in the context of their case study) they conclude that the CO2 tax played a key role in the development and implementation of these radical innovations and the benefits of reduced tax payments provided an important incentive However they also conclude that the impacts of the two instruments were conditioned by the political contexts in which they were applied and the problem characteristics in the respective countries (eg the economic significance of the sector and the size of installations)
Knigge and Goumlrlach (2005) summarise the findings of a comprehensive analysis of the impacts of the ETR in Germany That analysis undertaken jointly by Ecologic and the German Institute for Economic Research (DIW Berlin) included the impacts on innovation and market diffusion of environmentally friendly products and technologies (34) Based on a series of case studies the study concluded that the ETR had a noticeable effect on innovation and diffusion although it was not possible to quantify the scale of that effect In particular ETR is identified as being a central factor in the development of gas-powered vehicles The study identifies a number of different routes by which the ETR produced impacts First the payback period for energy-efficient products was reduced as a result of the energy tax increases and the various exemptions favouring efficient energy use and renewable energy sources Second the predictable nature of the energy taxes (as opposed to widely fluctuating oil prices) reduced uncertainties about the benefits of energy-efficiency investments Third the reduction in employers social contribution payments tended to reduce the costs of labour intensive innovation processes such as research and development energy consultancy and technology installation Finally the ETR had a signalling effect strengthening awareness of the need for more efficient and rational energy use
Mickwitz et al (2007) examine a number of claims that have been made in the environmental policy literature about the relationship between policy instruments and innovation based on experiences in two industrial sectors in Finland pulp and paper and the manufacture of diesel engines for ships In particular they assess the claims that environmental taxes are superior to other policy instruments with respect to innovation and that RampD subsidies have limited impacts on innovation With respect to the first claim the evidence provided by the two case studies is mixed The authors conclude that energy taxation had a negligible impact on innovation in the pulp and paper industry However this is likely to have been due to the low level of the tax and the exemptions that applied to the sector In contrast they find that the differentiation of Swedish fairway and port fees (on the basis of SO2 and NOX emissions) was a significant factor driving the installation of in-engine NOX reduction equipment in ferries operating between the two countries (35) With respect to RampD subsidies the authors conclude that the evidence does not support the claim that these have little effect In particular they find that RampD subsidies accelerated the development of ship engine emissions-reduction technologies
The findings of the three case studies are consistent with those of the empirical analyses reviewed in the previous section Environmental taxes and investment subsidies have proven significant in promoting both innovation and diffusion although not universally so Furthermore the case studies provide some useful insights about the ways in which the impacts occur and the factors that may be important in promoting innovation In particular they suggest the need for a tax rate that is sufficiently high to provide a meaningful incentive and signalling effect and that is fixed for a sufficiently long period of time to reduce uncertainty about the future benefits of investment
27 Conclusions
The studies reviewed in the preceding sections suggest that environmental regulation in general and price-based policy instruments such as environmental taxes and investment subsidies in particular can (in theory) and do (in practice) have a positive impact on both innovation and diffusion
(34) A separate report in German by Goumlrlach et al (2005) provides details of the evaluation of the innovation and diffusion impacts (35) Although the tax was introduced in Sweden it was also payable by Finnish ferry operators entering Swedish ports and hence
affected their investment decisions This is another example of the cross-border impact of environmental policy interventions on innovation found by Lanjouw and Mody (1996) (see Section 23)
Review of literature on environmental tax reform and eco-innovation
Environmental tax reform in Europe opportunities for eco-innovation 23
of environmental technologies However the supporting empirical and case study evidence is not universal and the effectiveness of these instruments would appear to vary across different sectors and different types of innovation
To a certain extent such differences can be explained by the theoretical models In particular the impact of environmental taxes (relative to other instruments) is predicted to depend on the competitive structures of the markets in which the regulated firms operate and on the ability of innovator firms to appropriate the benefits accruing to other firms during diffusion However a number of other potential factors have been identified in the literature which may affect the impact of price-based policy instruments on innovation
Jaffe et al (2002) caution that the impact of price-based policy instruments on technology diffusion may be adversely affected by a number of potential market failures including information failures principle-agent problems (eg landlord-tenant) capital market failures and positive adoption spillovers In addition while not market failures as such uncertainty over future returns and the (associated) use of high discount rates for investment decisions can also undermine the effectiveness of price-based instruments in stimulating diffusion However as was noted above the findings from the case study of ETR in Germany suggest that an environmental tax may actually reduce the level of uncertainty over future returns provided that it is of sufficient magnitude and longevity
Skjaerseth and Christiansen (2005) emphasise that the relationship between policy instruments (of all types) and technological change is extremely complicated They argue that account must be taken of the politicalindustrial context in which policy instruments are introduced and the nature of the environmental problem that they are intended to address In particular they make a distinction between malign problems where technological change involves net costs for target groups and benign problems where there are widespread no-regret opportunities for change Based on a comparative analysis of four different case studies they conclude that mandatory policy instruments (including environmental taxes) are more effective
in promoting short-term technological change when the problems are malign but that low legitimacy (with the target group) may undermine long-term technological change However when problems are benign or when long-term change requires cooperation voluntary policy instruments are likely to be more effective
Johnstone (2005) questions the focus of the theoretical and empirical analyses (reviewed above) on the impact of environmental policy instruments on the rate of technological change He argues that the direction of technological change is as important if not more so In addition to the quantity of innovation it is also important that innovation be socially optimal in the sense that it minimises the cost of attaining a particular environmental goal in the long term Inappropriate innovation today may result in lock in to a suboptimal technological path for the future
With this in mind Johnstone identifies a number of issues that can adversely affect the direction of innovation and should be taken into account when selecting and designing policy instruments technological market failures (36) missing markets for certain environmental attributes of innovation policy incidence and joint production of emissions Most studies of the innovation effects of environmental policy instruments assume that the only missing market is that for the environmental good (or bad) However in practice there may be other markets that are missing (or incomplete) which can adversely affect transmission of innovation incentives This is particularly so in the area of waste and resource management where instruments applied at the end of the product life cycle may have little or no impact on product design innovation Even if all markets are complete except for the environmental externality the point of incidence of the policy intervention may be more important for the direction of innovation than the choice of a particular policy instrument For example a limit or standard applied directly to the emissions of a pollutant may be more effective in promoting optimal innovation than a tax applied to a proxy input variable Finally when there is joint production of pollutants (eg CO2 and air pollutants from vehicle engines) there is a danger that if policy instruments (of whatever type) are applied to one pollutant in isolation the resulting innovation may
(36) These are the same market failures identified by Jaffe et al (2002)
Environmental tax reform in Europe opportunities for eco-innovation
Review of literature on environmental tax reform and eco-innovation
24
reduce emissions of that pollutant at the expense of increases in the others
In a related point Johnstone highlights the importance of using appropriate indicators when assessing the impact of policy instruments on innovation emphasising the need for these to reflect both the rate of innovation and the direction A necessary condition for this is that the indicators must provide an accurate and detailed picture of actual innovation Unfortunately this is difficult to achieve in practice For example the use of patent data as a measure of innovation requires the identification of relevant environmental technologies This is likely to be easier for end-of-pipe technologies than for process-related technologies meaning that the latter tend to be under-represented relative to their actual incidence To the extent that process-related innovation is growing in importance or is more important
for certain sectors or types of environmental problem changes in the value of the indicator may significantly understate the actual rate of innovation and misrepresent the direction
All of this suggests that caution should be exercised in drawing general definitive conclusions about the impacts of price-based policy instruments such as environmental taxes and investment subsidies on innovation particularly relative to other policy instruments While it would appear that they can be effective in stimulating both innovation and diffusion in many cases mdash at least in terms of the rate of technological change mdash there may be situations in which other policy instruments may be more appropriate In general the stringency and point of incidence of an environmental policy intervention may be more important than the choice of a particular policy instrument in determining the rate and direction of eco-innovation
25
Modelling of ETR impacts on eco-innovation
Environmental tax reform in Europe opportunities for eco-innovation
31 Scenarios assessing the implications of ETR for eco-innovation
Scenario analysis provides a useful means of improving understanding of how the different revenue recycling methods and various scales of ETR can help meet different greenhouse gas emissions targets
To investigate the impacts of an ETR for Europe the petre project elaborated a range of different scenarios reflecting various tax reform options In addition to employing several of these original scenarios the present study compiled two new scenarios to analyse the implications of ETR for eco-innovation All scenarios were examined in both E3ME and GINFORS (37)
311 Original petre project scenarios
The key petre scenarios relevant for the present study are
bull scenarioBHbaselinescenariowithhighenergyprice (reference case)
bull scenarioS1HETRdesignedtomeettheEUsunilateral 2020 GHG target (high energy price) with revenue recycling
bull scenarioS2HETRdesignedtomeettheEUsunilateral 2020 GHG target (high energy price) with revenue recycling and 10 of revenues spent on eco-innovation measures
Each of the ETR scenarios has the same key taxation components
bull acarbontaxrateisintroducedtoallnon-EUEmissions Trading System (EU ETS) sectors equal to the carbon price in the EU ETS that delivers an overall 20 reduction in greenhouse gas emissions by 2020 and in the international cooperation scenario this is extended to 30
bull aviationisincludedintheEUETSattheendofPhase 2
bull powergenerationsectorEUETSpermitsare100 auctioned in Phase 3 of the EU ETS
bull allotherEUETSpermitsare50auctionedin2013 increasing to 100 in 2020
bull materialtaxesareintroducedat5oftotalpricein 2010 increasing to 15 by 2020
In scenario S1H environmental tax revenues are recycled through reductions in income tax rates and social security contributions in each of the Member States such that there is no direct change in tax revenues In scenario S2H 10 of environmental tax revenues are recycled through spending on eco-innovation measures and the remaining 90 is recycled through the same measures as in the other scenarios The eco-innovation spending is split across power generation and housing according to tax revenues from the corporate and household sector
In GINFORS (the model used for analysing the implications of ETR and eco-innovation) the share of renewable sources in electricity production is increased due to the additional investment The rest of additional investment goes to household energy efficiency spending Investment needed for a certain increase in renewable energy production or efficiency improvement is based on Austrian and German experience (Lehr et al 2008 and 2009 Grossmann et al 2008 Lutz and Meyer 2008) This assumption is quite conservative as parameters for other countries can be assumed to be more positive (meaning that less money is needed for renewable energy technology installation or energy efficiency gains)
In scenario S1H the 20 GHG target translates into a 15 reduction in energy-related carbon emissions relative to 1990 as other emissions such as methane and nitrous oxide have already been reduced by
3 Modelling of ETR impacts on eco-innovation
(37) The E3ME and GINFORS models are introduced in Chapter 1 of the present report A detailed discussion of the models and scenarios used in the present study can be found in Ekins and Speck (2011)
Environmental tax reform in Europe opportunities for eco-innovation
Modelling of ETR impacts on eco-innovation
26
more than 20 (in terms of carbon equivalents) The target is reached by a tightened EU ETS cap and the introduction of a carbon tax on the non-ETS sector The tax rate applied is equal to the carbon price in the EU ETS that will deliver a 20 GHG reduction by 2020
The burden of ETR taxes are allotted to energy outputs (ie the final use of energy) and will be based on the carbon content of each fuel Carbon prices are assumed to be fully passed on to consumers All carbon taxes are in addition to any existing unilateral carbon and energy taxes The carbon reductions in the different EU Member States will be those that result from a uniform carbon tax increase across the EU
All of the revenues including EU ETS auctioning revenues carbon tax revenues and material tax revenues will be recycled The proportion of tax raised by industry will be recycled into a reduction in employers social security contributions which will in turn reduce the cost of labour Recycling will be additional to the existing ETRs in some Member States Revenues raised from households will be recycled through standard rate income tax reductions Traditional energy tax revenues will be lower compared to their respective baselines as the tax base (energy consumption) is reduced So for an ETR revenue-neutrality does not mean budget-neutrality
312 Factors affecting the macroeconomic impacts of RES technologies
Earlier analyses (Lehr et al 2008 Fraunhofer ISI et al 2009 DTI 2004 Kammen et al 2004 Moreno and Loacutepez 2007) have studied the impacts of large renewable energy source (RES) shares in the energy mix for different countries The overall question in these studies has been the impact of increasing RES shares on the economy especially on the labour market For the present study it is interesting to note that macroeconomic impacts of higher RES shares mainly depends on the following five factors
1 additional investment in RES (minus lower investment in conventional sources ie fossil and nuclear power) with the impact increasing if a country manufactures the RES technology in question
2 additional (net) exports due to improved international competitiveness of renewable energy sources (first mover advantage)
3 lower fossil fuel needs4 the cost differences between RES and
conventional energy
5 the shift from capital- and energy-intensive industries to labour- and technology-intensive industries
All five factors are driven by international energy prices carbon prices the policy framework and RES technology development itself Innovation comes into the play at various stages First innovation drives the currently positive additional costs of RES technologies down and even into negative realms depending on the fossil fuel scenario Second innovative RES technologies are likely to have a competitive advantage in international markets Although a significant proportion of RES technology produced in Europe is traded in Europe innovation will still provide an edge in current and emerging international markets
The EmployRES study (Fraunhofer ISI et al 2009) finds for Europe that current strong investment reflected in installations in Europe and exports to the rest of the world dominate the economic impact of RES policies and therefore lead to positive overall effects The studys results suggest that this positive balance can only be kept up in the future if the competitive position of European manufacturers of RES technology is improved The authors strongly recommend policies which promote technological innovation in RES and lead to a continued and rapid reduction of their costs
Factors 1 and 2 will have substantial macroeconomic impacts in the short and medium terms whereas factor 3 accumulates and will show positive impacts mainly in the long term Factor 4 strongly depends on the global developments while factor 5 may have significant effects on employment
313 Additional scenarios
Impacts of additional investment (factor 1) have already been analysed in scenario S2H of the petre project To focus on the other impacts of eco-innovation two additional scenarios were designed building on scenario S2H of petre
bull S2HEETRwithrevenuerecyclingdesignedto meet the unilateral EUs 2020 greenhouse gas (GHG) target (high energy price) Ten per cent of revenues are spent on eco-innovation measures and trade shares of EU-27 economies with the rest of the world in machinery and electrical machinery increase by 01 due to the deployment of the fast growing RES markets This assumption is based on the strong EU policy effort to increase the share of renewable energy in final energy consumption to 20 by 2020
Modelling of ETR impacts on eco-innovation
Environmental tax reform in Europe opportunities for eco-innovation 27
(Fraunhofer ISI et al 2009) and the possibility of very strong world market development of the RES sector until 2020 (EREC 2008) which offers additional export opportunities for European RES industries
bull S2HIETRwithrevenuerecyclingdesignedto meet the unilateral EUs 2020 GHG target (high energy price) Ten per cent of revenues are spent on eco-innovation measures and input structures of the energy sector are changed according to the input structure of the German RES industry (Lehr et al 2008)
S2HE looks at the possible role of international trade S2HI analyses changes in the input structure of the energy sector ie from conventional electricity production to renewables In the petre project (as in GHK et al 2007) only the energy inputs of the energy sector were adapted to changes in the energy input mix
Both S2HE and S2HI focus on RES and efficiency technologies As mentioned above an ETR will trigger a variety of innovations Therefore the results can be thought of as conservative in the sense that innovations (eg automotive energy consumption industrial efficiency etc) are not explicitly included
32 Overview of modelling results
The main results of the simulations are presented in Table 31 In the baseline scenario BH with high energy prices EU-27 carbon emissions will be
72 below the 1990 level in 2020 (38) The EU-15 has committed in the Kyoto Protocol to reduce its GHG emissions 8 below 1990 levels in the period 2008ndash2012 As emissions in the new member states are substantially below their 1990 levels today that implies that the EU-27 will keep its emissions more or less constant over the coming decade As in the PRIMES baseline an ETS price of 18 EURt in 2008 prices is assumed in 2020
In scenario S1H the ETS price and carbon tax rate has to be increased to 68 EUR2008t of CO2 to reach the 20 GHG reduction target which is equal to a 15 reduction of CO2 emissions against 1990 as other greenhouse gases have already been reduced above average by more than 20 in terms of CO2 equivalents Compared to the baseline CO2 emissions are 84 lower in 2020 which means roughly an additional 1 reduction annually in the period 2012ndash2020 GDP will be about 06 lower compared to the baseline in 2020 This means that annual average growth rates will be less than 01 below their baseline development This is especially low compared to the current financial and economic crisis with a GDP deviation against the baseline of around 6 in 2009
As the recycling mechanism reduces labour costs and the tax burden is shifted from labour-intensive to carbon- and material-intensive sectors employment will be 036 (or more than 800 000 jobs) higher than in the baseline The ETR is not fully budget neutral potentially enabling EU economies to slightly increase their net savings If
(38) The modelling exercise in the present study was conducted in 2009 and therefore does not contain the latest data on EU-27 GHG emissions which were significantly influenced by the global economic slump of the late-2000s
Table 31 Main results under the different scenarios
Scenario Target in 2020 CO2 price GDP Employment CO2 reduction
EUR2008t pc against baseline
pc against baseline
pc against 1990
pc against baseline
in year 2020 2015 2020 2020 2020 2020
BH 18 ndash 72 00
S1H 20 GHG 68 ndash 022 ndash 057 036 ndash 151 ndash 84
S2H 20 GHG 61 ndash 013 ndash 030 041 ndash 152 ndash 85
S2HE 20 GHG 61 ndash 009 ndash 004 051 ndash 151 ndash 84
S2HI 20 GHG 61 ndash 006 ndash 024 045 ndash 152 ndash 84
Environmental tax reform in Europe opportunities for eco-innovation
Modelling of ETR impacts on eco-innovation
28
this extra saving is spent negative GDP impacts will be further reduced
In scenario S2H part of the revenues is invested in low-carbon technologies This reduces the carbon price to 61 EUR2008t in 2020 halving the GDP loss relative to scenario S1H to only 03 as the investment in renewable energies is assumed to be additional Employment impacts are also more positive than in scenario S1H The 10 investment in low-carbon technologies amounts to more than EUR 20 billion in 2020
Assuming additional EU exports of RES technologies in scenario S2HE GDP almost matches the baseline in 2020 and employment is 051 (or more than 1 million jobs) higher than in the baseline In scenario S2HI a shift in the input structure of the energy sector towards machinery
and electrical machinery reflecting the different nature of RES relative to conventional electricity generation also has smaller additional positive impacts on GDP and employment compared to scenario S2H
The following figures show impacts of the different scenarios in comparison to the baseline BH As Figure 31 illustrates all the alternative scenarios imply GDP lower than the baseline However comparing scenario S1H with the other three scenarios shows that additional RES investment (S2H) additional RES exports (S2HE) and the inclusion of different input structures of the RES industries (S2HI) each have positive GDP impacts These results are in line with model-based analysis in the EMPLOY-RES study (Fraunhofer ISI et al 2009)
Figure 31 EU-27 GDP according to four scenarios mdash deviation from the baseline (BH)
Percentage deviation from the baseline (BH)
ndash 100
ndash 080
ndash 060
ndash 040
ndash 020
0002010 2015 2020
S2HI S1H S2H S2HE
Modelling of ETR impacts on eco-innovation
Environmental tax reform in Europe opportunities for eco-innovation 29
In contrast to GDP employment increases relative to the baseline in all the alternative scenarios (Figure 32) Due to the scenario design the structure of the EU economies is shifted from energy-intensive to labour-intensive sectors The magnitude of the employment gain is influenced by the carbon price and the tax shift the underlying energy prices and the production loss The largest part of the employment increase stems from the additional RES investment (scenario S2H) although a shift in industry structures (S2HI) and additional RES exports (S2HE) are also positive for the labour market
33 Macroeconomic impacts at the national level
In general terms it is clear that national ETS and ETR impacts depend significantly on country specifics including energy use economic structure social system and behaviour (eg reactions to labour cost changes) In countries with high carbon intensity in their energy mix additional revenues and expenditures are higher than in countries with lower carbon intensity
Scenario S2H provides an interesting tool for analysing the macroeconomic impacts of ETR at the national level because 10 of the additional generated revenues are used for eco-innovation investments meaning that only 90 of the revenues are recycled back into the economy by reducing income tax rates and social security contributions
Figure 32 EU-27 employment according to four scenarios mdash deviation from the baseline (BH)
ndash 020
000
020
040
060
2010 2015 2020
S2HI S1H S2H S2HE
Percentage deviation from the baseline (BH)
Environmental tax reform in Europe opportunities for eco-innovation
Modelling of ETR impacts on eco-innovation
30
Figure 34 GDP in 2020 in EU-27 Member States under scenario S2H mdash deviation form the baseline (BH)
Figure 33 GDP in 2020 in selected countries under scenario S2H mdash deviation from the baseline (BH)
ndash 25 ndash 20 ndash 15 ndash 10 ndash 05 00 05 10 15
Romania
Bulgaria
SloveniaMalta
Lithuania
Latvia
Estonia
CyprusSlovakia
Poland
Hungary
Czech RepublicUnited Kingdom
Sweden
Spain
Portugal
Netherlands
Italy
Ireland
Greece
FranceFinland
Denmark
Luxembourg
Belgium
Austria
Germany
Percentage deviation from the baseline (BH)
Russia
South Africa
Brazil
India
China
Mexico
Japan
USA
Poland
United Kingdom
Spain
Italy
France
Germany
ndash 30 ndash 25 ndash 20 ndash 15 ndash 10 ndash 05 00 05 10
Percentage deviation from the baseline (BH)
Modelling of ETR impacts on eco-innovation
Environmental tax reform in Europe opportunities for eco-innovation 31
Figure 35 Employment in 2020 in EU-27 Member States under scenario S2H mdash deviation from baseline (BH)
EU-27EU-15
RomaniaBulgariaSloveniaMalta
LithuaniaLatvia
EstoniaCyprusSlovakia
PolandHungary
Czech RepublicUnited Kingdom
SwedenSpain
PortugalNetherlands
ItalyIrelandGreece
FranceFinlandDenmarkLuxembourg
BelgiumAustria
Germany
ndash 200 0 200 400 600 800 1 000
Percentage deviation from the baseline (BH)
Under scenario S2H the GDP of large EU economies deviates from baseline projections by between 0 and ndash 1 with the exception of Italy (Figure 33) Germanys GDP is even forecast to match the baseline level in 2020 due to the countrys strong RES industry Outside Europe some countries gain slightly against EU Member States in terms of competitiveness as export prices in most EU Member States and sectors increase and GDP in those countries exceeds the baseline projections as a result (Figure 33) This is mainly because carbon tax revenues are recycled via income tax reductions which are not part of production costs However energy exporting economies such as Russia or South Africa will lose exports if EU demand for fossil fuel imports declines The development of all EU Member States is shown in Figure 34
Employment impacts of scenario S2H are positive for almost all EU Member States as lower labour
costs increase labour demand and labour intensity (Figure 35) The highest absolute increases are shown for Germany the Netherlands Italy and the United Kingdom For EU-27 as a whole employment will be almost one million higher than in the corresponding baseline BH in 2020
The scenarios have not been designed with a view to meeting the EU renewables target of a 20 renewables share in final energy consumption in 2020 Nevertheless the scenarios provide some interesting insights The share is projected to increase from around 10 in 2009 to above 14 even in the baseline as instruments such as feed in tariffs and biofuel quotas will continue In scenario S1H the target will be missed with around 18 in 2020 Only in scenarios S2H S2HE and S2HI is the target met (approximately 20 )
Environmental tax reform in Europe opportunities for eco-innovation
Modelling of ETR impacts on eco-innovation
32
Under scenario S2H energy-related carbon emissions are reduced in all EU Member States relative to the baseline (Figure 36) The highest percentage reductions can be seen in many of the EU-12 Member States with still high energy intensity and low energy prices In these countries the relative price increase is higher than in countries like Germany or the United Kingdom with already high energy taxes and overall energy prices
Additional ETS revenues material tax revenues and carbon tax revenues from the industry sector are recycled back to industry via reductions in employers social security contributions (or wage subsidies in some countries) The revenues from the carbon tax on households set out in Table 32 (totalling 033 of GDP in Germany for example) are used to reduce income tax For the EU-27 overall revenues from ETS and ETR reach about 2 of GDP in 2020 although these figures may be excessive because additional EU efforts to increase energy
efficiency and renewable energy which will reduce the ETS price are not taken into account The use of flexible tools such as the Clean Development Mechanism will further reduce the revenues and earmarking of part of the revenues for mitigation and adaptation measures in emerging and developing countries limits the recycling into labour costs
In addition the scenarios do not take the current global economic problems into account According to the IEA (2009) the downturn will also reduce carbon emissions in the long run which will lead to lower carbon prices and revenues to reach fixed targets (or make tighter targets less costly)
The ETR will have varying effects on the prices of different sorts of products and services Material or carbon taxes increase the prices of product groups according to their direct and indirect material and carbon content The recycling mechanism reduces
Figure 36 Energy-related CO2 emissions in 2020 under scenario S2H mdash deviation from the baseline (BH)
WorldEU-27
EU-15Romania
BulgariaSlovenia
MaltaLithuania
LatviaEstonia
CyprusSlovakia
PolandHungary
Czech RepublicUnited Kingdom
SwedenSpain
PortugalNetherlands
ItalyIreland
GreeceFrance
FinlandDenmark
LuxembourgBelgium
AustriaGermany
ndash 25 ndash 20 ndash 15 ndash 10 ndash 5 0
Percentage deviation from the baseline (BH)
Modelling of ETR impacts on eco-innovation
Environmental tax reform in Europe opportunities for eco-innovation 33
Table 32 Additional ETS and environmental tax revenues in 2020 ( of GPD)
S2H Germany United Kingdom EU-27
ETS revenues 083 064 059
Carbon tax (industry) 052 044 054
Carbon tax (households) 033 041 036
Material tax 041 029 056
Sum 209 178 205
Figure 37 Total primary energy supply in 2020 under scenario S2H mdash deviation from the baseline (BH)
WorldEU-27EU-15
RomaniaBulgaria
Slovenia
MaltaLithuania
LatviaEstonia
Cyprus
SlovakiaPoland
HungaryCzech Republic
United KingdomSweden
SpainPortugal
NetherlandsItaly
IrelandGreece
FranceFinland
DenmarkLuxembourg
BelgiumAustria
Germany
ndash 24 ndash 21 ndash 18 ndash 15 ndash 12 ndash 9 ndash 6 ndash 3 0
Percentage deviation from the baseline (BH)
Environmental tax reform in Europe opportunities for eco-innovation
Modelling of ETR impacts on eco-innovation
34
Figure 38 Output price impacts of scenario S2H in Germany in 2020 mdash deviations from the baseline (BH)
Figure 39 Impacts of scenario S2H on industrial output in 2020 in Germany mdash deviations from the baseline (BH)
ndash 5
0
5
10
15
20
Output prices
Percentage deviation from the baseline (BH)
(3) F
ood
(4) T
extiles
(5) W
ood
(6) P
ulp pap
er
(7) C
oke re
fined
petro
leum
pro
ducts
(8) C
hemica
ls ex
cl pha
rma
(9) P
harm
aceu
ticals
(10)
Rub
ber a
nd plastics
(11)
Non
-metallic
miner
als
(12)
Iron
and
steel
(13)
Non
-ferrou
s metals
(14)
Met
al pro
ducts
(15)
Mac
hine
ry and
equ
ipmen
t
(16)
Office
mac
hine
ry
(17)
Electric
al m
achine
ry
(18)
Rad
io T
V
(19)
Med
ical pr
ecisi
on and
opt
ical ins
trumen
ts
(20)
Mot
or veh
icles
(21)
Ships
(22)
Airc
raft
(23)
Railro
ad
(24)
Man
ufac
turin
g n
ec r
ecyc
ling
(25)
Electric
ity g
as w
ater
sup
ply
(26)
Con
stru
ction
(27)
Tra
de r
epairs
(28)
Hot
els an
d re
stau
rant
s
(29)
Tra
nspo
rt an
d stor
age
(30)
Pos
t and
teleco
mmun
icatio
ns
(31)
Finan
ce ins
uran
ce
(32)
Rea
l estate ac
tivities
(33)
Ren
ting
(34)
Com
puter
(35)
Res
earch an
d de
velopm
ent
(36)
Oth
er bus
ines
s ac
tivities
(37)
Pub
lic ser
vice
s
(38)
Edu
catio
n
(39)
Hea
lth and
soc
ial w
ork
(40)
Oth
er ser
vice
s
(41)
Priv
ate ho
useh
olds
(1) A
gricu
lture
(2) M
ining an
d qu
arry
ing
nec not elsewhere classified
Production
ndash 100
ndash 80
ndash 60
ndash 40
ndash 20
00
20
40
60
80Percentage deviation from the baseline (BH)
(3) F
ood
(4) T
extiles
(5) W
ood
(6) P
ulp pap
er
(7) C
oke re
fined
petro
leum
pro
ducts
(8) C
hemica
ls ex
cl pha
rma
(9) P
harm
aceu
ticals
(10)
Rub
ber a
nd plastics
(11)
Non
-metallic
miner
als
(12)
Iron
and
steel
(13)
Non
-ferrou
s metals
(14)
Met
al pro
ducts
(15)
Mac
hine
ry and
equ
ipmen
t
(16)
Office
mac
hine
ry
(17)
Electric
al m
achine
ry
(18)
Rad
io T
V
(19)
Med
ical pr
ecisi
on and
opt
ical ins
trumen
ts
(20)
Mot
or veh
icles
(21)
Ships
(22)
Airc
raft
(23)
Railro
ad
(24)
Man
ufac
turin
g n
ec r
ecyc
ling
(25)
Electric
ity g
as w
ater
sup
ply
(26)
Con
stru
ction
(27)
Tra
de r
epairs
(28)
Hot
els an
d re
stau
rant
s
(29)
Tra
nspo
rt an
d stor
age
(30)
Pos
t and
teleco
mmun
icatio
ns
(31)
Finan
ce ins
uran
ce
(32)
Rea
l estate ac
tivities
(33)
Ren
ting
(34)
Com
puter
(35)
Res
earch an
d de
velopm
ent
(36)
Oth
er bus
ines
s ac
tivities
(37)
Pub
lic ser
vice
s
(38)
Edu
catio
n
(39)
Hea
lth and
soc
ial w
ork
(40)
Oth
er ser
vice
s
(41)
Priv
ate ho
useh
olds
(1) A
gricu
lture
(2) M
ining an
d qu
arry
ing
nec not elsewhere classified
Modelling of ETR impacts on eco-innovation
Environmental tax reform in Europe opportunities for eco-innovation 35
social security contributions and lowers labour costs according to the direct and indirect labour content of sector output The ETR therefore reduces output prices in labour-intensive service sectors and increases prices in carbon- and material-intensive industry sectors
The example of Germany shows insignificant impacts in the trade-intensive sectors of machinery (15ndash17) motor vehicles (20) and other transport equipment (21ndash23) (Figure 38) Iron and steel (12) and chemicals without pharmaceuticals (8) face the highest price increases of trade-intensive sectors As the German iron and steel industry primarily delivers high quality steel to the German car industry and increasingly to the German windmill industry negative competitiveness impacts will be limited Exchange rate variations against non-EU competitors have been much higher in the past
The higher prices of carbon- and material-intensive products will reduce price competitiveness on export markets and increase the market share for imports in domestic markets This loss of price competitiveness is based on an assumption of limited market development of energy efficiency and RES technologies in other part of the world It will be offset by gains in labour-intensive sectors if the ETR causes real wage costs per unit of output to fall as a result of using recycled revenues to reduce employer social security contributions
Any improvement in non-price competitiveness will also raise exports The extra employment will raise incomes raising consumption and output
The overall impact on sector output depends on countervailing effects which are negative for iron and steel and a few service sectors and positive for a few industry sectors For most industries the output effect is insignificant (Figure 39) The greatest impact is felt by producers of fossil fuels who must obviously reduce production due to lower demand for their products
Under scenario S2H employment impacts are positive for most sectors relative to the baseline as labour productivity decreases and wage rates fall in relation to consumer prices (CPI) and output prices (Table 33) The relative costs of labour are lower than in the baseline without the ETR reform Only around a quarter of the employment increase takes place in industry
Concerning the wage rate two countervailing effects have to be considered First when the labour market is characterised in terms of the real wage bargaining model as in E3ME and GINFORS with market power on both sides (employers and trade unions) consumer price increases will lead to wage increases (the econometrically estimated factor is 085 for Germany) Second labour productivity is another important factor for wage bargaining The estimated elasticity for Germany is 063 meaning that a 1 increase of labour productivity leads to wage increases of 063 Higher labour demand due to lower labour costs thus reduces the wage increase In the end the German economy is more labour intensive than without the ETR partly due to the structural change towards labour-intensive industries
Table 33 Employment impacts of scenario S2H in Germany mdash deviations from scenario S2H in 2020
Employment in 2020 Deviation from S2H () Deviation from S2Habsolute (1 000s)
Agriculture forestry 24 90
Industry 09 653
Non-metallic minerals 24 62
Iron and steel ndash 28 ndash 37
Machinery and equipment 05 56
Electrical machinery 04 18
Construction 37 449
Trade and transport 10 829
Business services 17 767
Other services ndash 02 ndash 216
Total 07 2506
Environmental tax reform in Europe opportunities for eco-innovation
Modelling of ETR impacts on eco-innovation
36
Additional exports under scenario S2HE mainly create new jobs in machinery and related business services (Table 34) Under scenario S2HI a shift in the input structure of the energy sector leads to a shift in the industry structure and creates a few jobs in the service sector (Table 35)
34 Conclusions of the scenario assessment
The foregoing analysis used the GINFORS model to assess economic and environmental impacts of using the ETS and ETR to reach the EUs 2020
GHG targets In general the results show positive employment effects and only small negative impacts on GDP in EU-27 Member States The economic impacts depend on the levels of international energy prices the mechanism used to recycle revenues and country specifics such as carbon and energy intensity and the structure of energy consumption
Although there is significant evidence that eco-innovation is positively driven by higher energy prices quantification is difficult The present study included simulations of possible impacts of a shift in the industry structure towards renewable energy in the electricity sector and an overall increase of EU
Table 34 Employment impacts of scenario S2HE in 2020 in Germany mdash deviations from scenario S2H
Employment in 2020 Deviation from S2H () Deviation from S2Habsolute (1 000s)
Agriculture forestry ndash 01 ndash 02
Industry 03 194
Non-metallic minerals 02 05
Iron and steel 04 05
Machinery and equipment 13 130
Electrical machinery 24 117
Construction 01 18
Trade and transport 00 26
Business services 07 308
Other services 01 107
Total 02 634
Table 35 Employment impacts of scenario S2HI in 2020 in Germany mdash deviations from scenario S2H
Employment in 2020 Deviation from S2H () Deviation from S2Habsolute (1 000s)
Agriculture forestry ndash 01 ndash 02
Industry 00 00
Non-metallic minerals 25 65
Iron and steel ndash 27 ndash 36
Machinery and equipment 08 78
Electrical machinery 04 19
Construction ndash 00 ndash 04
Trade and transport 00 07
Business services 02 115
Other services 0 56
Total 00 167
Modelling of ETR impacts on eco-innovation
Environmental tax reform in Europe opportunities for eco-innovation 37
exports due to higher global demand for renewable energy The main results can be summarised as follows
bull environmentaltaxreformshiftingtaxesfromlabour to energy and resources will create additional jobs and trigger eco-innovation
bull impactsofeco-innovationintheformofadditional EU exports or shifts in industry structures will have a slight positive influence on GDP and create a smaller number of additional jobs
These findings correspond to results from the EmployRES study (Fraunhofer ISI et al 2009) As ETR is directly aimed at reducing labour costs it will create additional jobs in the short and medium term In the longer term the cost reduction and new technologies arising from eco-innovation will play a larger role
Like all fiscal reforms a major ETR in Europe will create winners and losers At the sector level carbon- and material-intensive industries will face economic losses At the country level the carbon-intensity and overall flexibility of economies is important Clearly structural change away from carbon-intensive industries together with technological change is inherent in any successful climate mitigation policy
On the other hand several factors can smooth these structural adjustments International cooperation
will reduce economic pressure on countries and sectors In addition ETR together with auctioning of ETS allowances can be a major source of revenues for EU Member States in the future even if part of the revenues will have to be earmarked for adaptation and mitigation measures in developing countries Indeed future debate on grandfathering or auctioning ETS allowances should reflect the important point that giving allowances away for free denies countries the money to ease structural change and invest in low-carbon technologies
Caution is needed in relating the findings of this study to the EU policy debate In the model simulations the single carbon price is the only instrument used to reach the EUs 2020 GHG targets In reality of course other renewable energy and efficiency policies will also contribute to carbon reduction and have to be taken into account when comparing the results (especially the high carbon prices) to other studies Both reduce the potential revenues from fossil energy carriers and carbon emissions
A variety of renewable energy and efficiency policies could enable the climate and energy targets to be met while securing even better economic prospects The results of the present study clearly indicate that the discussion on market-based instruments should be intensified Ultimately however the EU will need a rich mix of policies to reach its GHG targets while maximising prosperity
Environmental tax reform in Europe opportunities for eco-innovation38
References
Almon C 1991 The INFORUM Approach to Interindustry Modeling in Economic Systems Research Vol 3 pp 1ndash7
Amin A and Cohendet P 2004 The Architecture of Knowledge Firms Capabilities and Communities Oxford University Press Oxford
Barker T Meyer B Pollitt H and Lutz C 2007a Modelling Environmental Tax Reform in Germany and the United Kingdom with E3ME and GINFORS petre Working Paper Cambridge and Osnabrueck (httpwwwpetreorgukpapershtm) accessed 15 February 2011
Barker T Junankar S Pollitt H and Summerton P 2007b Carbon leakage from unilateral environmental tax reforms in Europe 1995ndash2005 Energy Policy Vol 35 pp 6 281ndash6 292
Brunnermeier S B and Cohen M A 2003 Determinants of environmental innovation in US manufacturing industries Journal of Environmental Economics and Management Vol 45 pp 278ndash293
Buen J 2006 Danish and Norwegian wind industry The relationship between policy instruments innovation and diffusion Energy Policy Vol 34 (18) pp 3 887ndash3 897
Carlsson B and Stankiewicz R 1991 On the nature function and composition of technological systems Journal of Evolutionary Economics Vol 1 (2) pp 93ndash118
Christiansen A C and Skjaerseth J B 2005 Climate change policies in Norway and the Netherlands Different instruments similar outcome Energy and Environment Vol 16(1) pp 1ndash25
Dosi G 1988 Sources procedures and microeconomic effects of innovation Journal of Economic Literature Vol 26 pp 1 120ndash1 171
de Vries F and Medhi N 2008 Environmental regulation and international innovation in automotive emissions control technologies in Environmental Policy Technological Innovation and Patents Organisation for Economic Cooperation and Development Paris
DG TREN 2008 European energy and transport mdash trends to 2030 mdash update 2007 European Commission Luxembourg
DTI 2004 Renewable Supply Chain Gap Analysis UK Department of Trade and Industry
Edler J (ed) 2006 Nachfrageorientierte Innovationspolitik Buumlro fuumlr Technikfolgenabschaumltzung beim Deutschen Bundestag (TAB) Arbeitsbericht Nr 99 Berlin
Edquist C 2001 The system of innovation approach and innovation policy an account of the state of the art lead paper presented at the DRUID Conference 12ndash15 June 2001 Aalborg (httpwwwdruiddkconferencesnwpaper1edquistpdf) accessed 15 February 2011
EEA 2006 Using the market for cost-effective environmental policy Market-based instruments in Europe EEA Report No 12006 European Environment Agency Copenhagen
Ekins P 2009 Resource Productivity Environmental tax Reform and Sustainable Growth in Europe published by the Anglo-German Foundation for the Study of Industrial Society Final report (httpwwwpetreorgukpdfFinRepFinpdf) accessed 12 October 2011
Ekins P and Speck S (eds) 2011 Environmental Tax Reform (ETR) A Policy for Green Growth Oxford University Press
EREC 2008 Energy [r]evolution A sustainable global energy outlook Greenpeace International European Renewable Energy Council (EREC)
References
References
Environmental tax reform in Europe opportunities for eco-innovation 39
Fagerberg J Mowery D C and Nelson R R (eds) 2005 The Oxford Handbook of Innovation Oxford University Press Oxford
Fischer C Parry I W H and Pizer W A 2003 Instrument choice for environmental protection when technological innovation is endogenous Journal of Environmental Economics and Management Vol 45 pp 523ndash545
Fraunhofer ISI ECOFYS Energy Economics Group Ruumltter + Partner SEURECO and LEI 2009 EmployRES mdash The impact of renewable energy policy on economic growth and employment in the European Union European Commission Brussels
Frondel M Horbach J and Rennings K 2008 What triggers environmental management and innovation Empirical evidence for Germany Ecological Economics Vol 66(1) pp 153ndash160
GHK Cambridge Econometrics and IEEP 2007 Links between the environment economy and jobs Final Report submitted to DG Environment European Commission
Giljum S Behrens A Hinterberger F Lutz C and Meyer B 2008 Modelling scenarios towards a sustainable use of natural resources in Europe Environmental Science and Policy Vol 11 pp 204ndash216
Goumlrlach B Knigge M and Luumlckge H 2005 Wirkungen der Oumlkologischen Steuerreform auf Innovation und Marktdurchdringung Ecologic Berlin (httpecologiceudownloadprojekte1850-189918791879_5_innovationpdf) accessed 18 August 2011
Green M A 2000 Photovoltaics technology overview Energy Policy Vol 28 (14) pp 989ndash998
Grossmann A Lehr U Lutz C and Wolter MI 2008 Gesamtwirtschaftliche Effekte der Umsetzung der EU Ziele im Bereich Erneuerbare Energien und Gebaumludeeffizienz in Oumlsterreich bis 2020 Studie im Auftrag des Lebensministeriums Wien 0508
Hage J and Hollingsworth J R 2000 Idea innovation networks a strategy for integrating organizational and institutional analysis Organization Studies Vol 21 (5) pp 971ndash1 004
Hauschildt J 2004 Innovationsmanagement Vahlen Muumlnchen
Hemmelskamp J 1997 Environmental policy instruments and their effects on innovation European Planning Studies Vol 5 (2) pp 177ndash195
Hoglund Isaksson L 2005 Abatement costs in response to the Swedish charge on nitrogen oxide emissions Journal of Environmental Economics and Management Vol 50 pp 102ndash120
Hullmann A 2001 Internationaler Wissenstransfer und technischer Wandel (dissertation) Physica-Verlag Heidelberg
IEA 2008 World Energy Outlook 2008 International Energy Agency Paris
IEA 2009 World Energy Outlook 2009 International Energy Agency Paris
Jacobsson S Andersson B A and Baringngens L 2002 Transforming the energy system mdash the evolution of the German technological system for solar cells Science and Technology Policy Research University of Sussex Electronic Working Paper Series No 84 (httpideasrepecorgpsrussewps84html) accessed 18 August 2011
Jaffe A and Stavins R 1995 Dynamic incentives of environmental regulations the effects of alternative policy instruments on technology diffusion Journal of Environmental Economics and Management Vol 29(3) pp 43ndash63
Jaffe A B and Palmer K 1997 Environmental regulation and innovation a panel data study The Review of Economics and Statistics Vol 79 pp 610ndash619
Jaffe A B Newell R G and Stavins R N 2002 Environmental policy and technological change Environmental and Resource Economics Vol 22 (1ndash2) 2002 pp 41ndash70
Johnstone N and Hascic I 2008 Renewable energy policies and technological innovation energy source and instrument choice in Environmental Policy Technological Innovation and PatentsOrganisation for Economic Co-operation and Development Paris
Johnstone N 2005 The Innovation Effects of Environmental Policy Instruments in Horbach J (ed) Indicator Systems for Sustainable Innovation Physica-Verlag HD
Environmental tax reform in Europe opportunities for eco-innovation
References
40
Johnstone N Hascic I and Ostertag K 2008 Environmental policy technological innovation and patent activity in Environmental Policy Technological Innovation and Patents Organisation for Economic Co-operation and Development Paris
Jung C Krutilla K and Boyd R 1996 Incentives for advanced pollution abatement technology at the industry level an evaluation of policy alternatives Journal of Environmental Economics and Management Vol 30(1) pp 95ndash111
Kammen D M Kapidia K and Fripp M 2004 Putting renewables to work how many jobs can the clean energy industry generate University of California Berkeley
Kemp R 1997 Environmental policy and technical change ndash a comparison of the technological impact of policy instruments Edward Elgar Cheltenham
Kemp R 1998 The diffusion of biological waste-water treatment plants in the Dutch food and beverage industry Environmental and Resource Economics Vol 12 pp 113ndash136
Kemp R 2000 Technology and environmental policy ndash innovation effects of past policies and suggestions for improvement in OECD proceedings ndash innovation and the environment Organisation for Economic Co-operation and Development Paris
Kerr S and Newell R G 2003 Policy-induced technology adoption evidence from the US lead phasedown Journal of Industrial Economics Vol 51 pp 317ndash343
Klaassen G Miketa A Larsen K and Sundqvist T 2005 The impact of RampD on innovation for wind energy in Denmark Germany and the United Kingdom Ecological Economics Vol 54 pp 227ndash240
Kline S and Rosenberg N 1986 An overview of innovation in Landau R (ed) The positive sum strategy Harnessing technology for economic growth pp 275-306
Knigge M and Goumlrlach B 2005 Effects of Germanys ecological tax reforms on the environment employment and technological innovation Ecologic Berlin (httpwwwumweltbundesamtdeuba-info-presse-ehintergrundoekosteuerpdf) accessed 18 August 2011
Langniss O 2003 Governance structures for promoting renewable energy sources dissertation Lund Stuttgart
Lanjouw J O and Mody A 1996 Innovation and the international diffusion of environmentally responsive technology Research Policy Vol 25 pp 549ndash571
Lehr U Nitsch J Kratzat M Lutz C and Edler D 2008 Renewable Energy and Employment in Germany Energy Policy Vol 36 pp 108ndash117 DOI101016jenpol200709004
Lehr U Wolter MI and Groszligmann A 2009 Economic impacts of RES obligations in Austria ndash an application of the macro-econometric model e3at GWS Discussion Paper 20091 Osnabruumlck
Lundvall B-A Johnson B Andersen E S and Dalum B 2001 National systems of production innovation and competence building Research Policy Vol 31 pp 213ndash231
Lutz C and Giljum S 2009 Global resource use in a business as usual world until 2030 Updated results from the GINFORS model in Bleischwitz R Welfens Pand Zhang Z (eds) Sustainable growth and resource productivity ndash economic and global policy issues Greenleaf Publishers pp 30ndash41
Lutz C and Meyer B 2008 Beschaumlftigungseffekte des Klimaschutzes in Deutschland Untersuchungen zu gesamtwirtschaftlichen Auswirkungen ausgewaumlhlter Maszlignahmen des Energie- und Klimapakets Forschungsbericht 205 46 434 Dessau-Roszliglau
Lutz C and Meyer B 2009a Environmental and Economic Effects of Post-Kyoto Carbon Regimes Results of Simulations with the Global Model GINFORS Energy Policy Vol 37 pp 1 758ndash1 766 DOI 101016jenpol200901015
Lutz C and Meyer B 2009b Scenario results from GINFORS PETRE working paper Osnabruumlck
Lutz C Meyer B Nathani C and Schleich J 2005 Endogenous technological change and emissions The case of the German steel industry Energy Policy Vol33 pp 1 143ndash1 154
Lutz C Meyer B Nathani C and Schleich J 2007 Endogenous innovation economy and environment impacts of a technology based modelling approach for energy-intensive industries in Germany Energy Studies Review Vol 15(1) pp 2ndash18
References
Environmental tax reform in Europe opportunities for eco-innovation 41
Lutz C Meyer B and Wolter M I 2009 The global multisectormulticountry 3-E model GINFORS mdash a description of the model and a baseline forecast for global energy demand and CO2 emissions Journal of Sustainable Development forthcoming
Malerba F and Orsenigo L 1997 Technological Regimes and Sectoral Patterns of Innovative Activities Industrial and Corporate Change Vol 6 (1) pp 83ndash117
Malerba F 1992 Learning by Firms and Incremental Technical Change The Economic Journal Vol 102 (413) pp 845ndash859
Malerba F 2005 Industrial dynamics and innovation progress and challenges Presidential Address delivered at the 32nd Conference of the European Association for Research in Industrial Economics (EARIE) 1ndash4 September 2005 Porto
Malerba F 2006 Innovation and the evolution of industries Journal of Evolutionary Economics Vol 16 pp 3ndash23
McGinty M and de Vries F P 2009 Technology diffusion product differentiation and environmental subsidies The BE Journal of Economic Analysis and Policy Vol 9(1)
Meyer B and Lutz C 2007 The GINFORS model ndash model overview and evaluation Petre Working Paper Osnabruumlck (httpwwwpetreorgukpapershtm) accessed 18 August 2011
Meyer B Lutz C Schnur P and Zika G 2007 Economic policy simulations with global interdependencies a sensitivity analysis for Germany Economic Systems Research Vol 19 pp 37ndash55
Mickwitz P H Hyvaumlttinen and P Kivimaa 2008 The role of policy instruments in the innovation and diffusion of environmentally friendlier technologies popular claims versus case study experiences Journal of Cleaner Production Vol 16(1S1) 162ndash170
Miketa A and Schrattenholzer L 2004 Experiments with a methodology to model the role of RampD expenditures in energy technology learning processes first results Energy Policy Vol 32 (15) pp 1 679ndash1 692
Milliman S R and Prince R 1989 Firm incentives to promote technological change in pollution control Journal of Environmental Economics and Management Vol 17 pp 247ndash265
Millock K and Nauges C 2006 Ex-post evaluation of an earmarked tax on air pollution Land Economics Vol 82(1) pp 68ndash84
Montero J-P 2002 Market structure and environmental innovation Journal of Applied Economics Vol 2 pp 293ndash325
Moreno B and Loacutepez A J 2007 The effect of renewable energy on employment mdash The case of Asturias (Spain) Renewable and Sustainable Energy Rewiews doi 101016jrser200610011
Mowery D and Rosenberg N 1979 The influence of market demand upon innovation A critical review of some recent empirical studies Research Policy Vol 8 pp 102ndash153
Newell R G Jaffe A B and Stavins R N 1999 The induced innovation hypothesis and energy-saving technological change Quarterly Journal of Economics Vol 114 pp 941ndash975
Norberg-Bohm V 1999 Stimulating green technological innovation An analysis of alternative policy mechanisms Policy Sciences Vol 32(1) pp 13ndash38
OECD 2009 Sustainable manufacturing and eco-innovation towards a green economy Organisation for Economic Co-operation and Development Policy Brief June 2009
OECD 2010 Taxation innovation and the environment Organisation for Economic Co-operation and Development
Pavitt K 1984 Sectoral patterns of technological change Towards a taxonomy and a theory Research Policy Vol 13 pp 343ndash373
Popp D 2002 Induced innovation and energy prices The American Economic Review Vol 92(1) pp 160ndash180
Popp D 2005 Lessons from patents Using patents to measure technological change in environmental models Ecological Economics Vol 54 pp 209ndash226
Environmental tax reform in Europe opportunities for eco-innovation
References
42
Porter M and van der Linde C 1995 Toward a new conception of the environment competitiveness relationship Journal of Economic Perspectives Vol 9(4) pp 97ndash118
Rammert W 2002 The cultural shaping of technologies and the politics of technodiversity In Sorensen K and Williams R (eds) Shaping technology guiding policy concepts spaces and tools Elgar Cheltenham pp 155-172
Requate T 2005 Dynamic incentives by environmental policy instruments ndash a survey Ecological Economics Vol 54 pp 175ndash195
Roloff N Lehr U Krewitt W Fuchs G Wassermann S Weimer-Jehle W and Schmidt B 2008 Success determinants for technological innovations in the energy sector mdash the case of photovoltaics in Moumlst D Fichtner W Ragwitz M and Veit D (eds) New methods for energy market modelling mdash Proceedings of the first european workshop on energy market modelling using agent-based computational economics Universitaumltsverlag Karlsruhe
Rothwell R 1995 The fifth generation innovation process in Oppenlaumlnder KH Popp W (eds) Innovationen und wirtschaftlicher Fortschritt betriebs-und volkswirtschaftliche Perspektiven Bern pp 9ndash26
Schumpeter J 1942 Capitalism socialism and democracy New York Harper
Skjaeligrseth J B and Christiansen A C 2005 Environmental policy instruments and technological change in the energy sector findings from comparative empirical research Energy and Environment Vol 17 (2) pp 223ndash241
Snyder L D Miller N H and Stavins R N 2003 The effects of environmental regulations on pollution emissions evidence from plant-level data American Economic Review Vol 93(2) pp 431ndash435
Technopolis 2008 Eco-innovation Final Report for Sectoral Innovation Watch (httpwwwtechnopolis-groupcomresourcesdownloads661_report_finalpdf) accessed 18 August 2011
Volleburgh H 2007 Impacts of environmental policy instruments on technological change Report for Joint Meetings of Tax and Environment Experts OECD Environment Directorate February 2007 (comenvepocctpacfa(2006)36final)
Zimmermann H Wohltmann M and Hansjuumlrgens B 1996 Umweltabgaben und Innovation Analytica Marburg
43
Annex 1
Environmental tax reform in Europe opportunities for eco-innovation
Type Instrument Area Stage
Reference
Theo
retica
l
Em
piric
al
Cas
e st
udy
Rev
iew
Qual
itat
ive
Taxe
s
Perm
its
Subsi
die
s
Volu
nta
ry
Com
man
d
Reg
ula
tion
Ener
gy
Air
Wat
er
Oth
er
Gen
eral
Innov
atio
n
Diffu
sion
Rel
evan
ce
Brunnermeier amp Cohen (2003)
X X X X
Buen (2006) X X X X X X
Christiansen amp Skjaerseth (2005)
X X X X X X
Fischer et al (2003 X X X X X X
Frondel et al (2008) X X X X X X X (X) (X)
Hemmelskamp (1997)
X X X X X X X (X)
Hoglund Isaksson (2005)
X X X (X) (X)
Jaffe amp Stavins (1995)
X X X1 X X X X
Jaffe amp Palmer (1997)
X X X X
Jaffe et al (2002) X X X X X X X X X X
Jung et al (1996) X X X X X X (X) (X)
Kemp (1998) X X X X
Kerr amp Newell (2001) X X X X X
Klaassen et al (2005)
X X X X X
Lanjouw amp Mody (1996)
X X X X X X X
McGinty amp de Vries (2009)
X X X X
Mickwitz et al (2008)
X X X X X X X X X
Milliman amp Prince (1989)
X X X X X X X
Millock amp Nauges (2006)
X X X X X X
Montero (2002) X X X X X
Newell et al (1999) X X1 X X X
Norberg-Bohm (1999)
X X X X X X X
Popp (2002) X X1 X X
Popp (2005) X X X X X X
Porter amp van der Linde (1995)
X X X X X X
Requate (2005) X X X X X X X
Skjaeligrseth amp Christiansen (2005)
X X X X X X X X X
Snyder et al (2003) X X X X X
Annex 1 Classification of refereed journal articles
Environmental tax reform in Europe opportunities for eco-innovation44
Annex 2
Type Instrument Area Stage
Reference
Theo
retica
l
Em
piric
al
Cas
e st
udy
Rev
iew
Qual
itat
ive
Taxe
s
Perm
its
Subsi
die
s
Volu
nta
ry
Com
man
d
Reg
ula
tion
Ener
gy
Air
Wat
er
Oth
er
Gen
eral
Innov
atio
n
Diffu
sion
Rel
evan
ce
Johnstone (2005)
X X X X X X X
Johnstone amp Hascic (2008)
X X X X X X X X
Kemp (1997) X X X X X X X X X X X X X
Kemp (2000) X X X X X X X X X
de Vries amp Medhi (2008)
X X1 X X X
Annex 2 Classification of books and book chapters
45
Annex 3
Environmental tax reform in Europe opportunities for eco-innovation
Type Instrument Area Stage
Reference
Theo
retica
l
Em
piric
al
Cas
e st
udy
Rev
iew
Qual
itat
ive
Taxe
s
Perm
its
Subsi
die
s
Volu
nta
ry
Com
man
d
Reg
ula
tion
Ener
gy
Air
Wat
er
Oth
er
Gen
eral
Innov
atio
n
Diffu
sion
Rel
evan
ce
Goumlrlach et al (2005)
X X X X X X
Knigge amp Goumlrlach (2005)
X X X X X X
Technopolis (2008)
X X X X X X
Volleburgh (2007)
X X X X X X X X X X X
Annex 3 Classification of reports
European Environment Agency
Environmental tax reform in Europe opportunities for eco-innovation
2011 mdash 45 pp mdash 21 x 297 cm
ISBN 978-92-9213-238-5doi10280084889
How to obtain EU publications
Publications for salebull viaEUBookshop(httpbookshopeuropaeu)bull fromyourbooksellerbyquotingthetitlethepublisherandorISBNnumberbull bycontactingoneofoursalesagentsdirectlyYoucanobtaintheircontactdetails
on the Internet (httpbookshopeuropaeu) or by sending a fax to +352 2929-42758
Free publicationsbull viaEUBookshop(httpbookshopeuropaeu)bull attheEuropeanCommissionsrepresentationsordelegationsYoucanobtain
their contact details on the Internet (httpeceuropaeu) or by sending a fax to +352 2929-42758
European Environment AgencyKongens Nytorv 61050 Copenhagen KDenmark
Tel +45 33 36 71 00Fax +45 33 36 71 99
Web eeaeuropaeuEnquiries eeaeuropaeuenquiries
TH
-AK-1
1-0
17-E
N-N
doi1
02
8008
4889
- Acknowledgements
- Executive summary
- 1Introduction
-
- 11Background
- 12ETR and innovation
- 13Report structure
-
- 2Review of literature on environmental tax reform and eco‑innovation
-
- 21Initial screening
- 22Detailed review
- 23Environmental regulation studies
- 24Theoretical studies
- 25Empirical studies
- 26Case studies
- 27Conclusions
-
- 3Modelling of ETR impacts on eco‑innovation
-
- 31Scenarios assessing the implications of ETR for eco-innovation
- 32Overview of modelling results
- 33Macroeconomic impacts at the national level
- 34Conclusions of the scenario assessment
-
- References
- Annex 1 Classification of refereed journal articles
- Annex 2Classification of books and book chapters
- Annex 3Classification of reports
-
Review of literature on environmental tax reform and eco-innovation
Environmental tax reform in Europe opportunities for eco-innovation 19
of the surface (directional technological change) and changes in the mix of products along a given surface (model substitution) They define the surface in terms of two characteristics energy flow and cooling capacity and incorporate innovation by allowing the coefficients of the two variables to vary with time and (in the case of energy flow) energy prices and efficiency standards Separate equations are estimated for each durable type with slightly differing sets of explanatory variables and time periods The authors find little evidence that either energy prices or energy efficiency standards had any impact on overall technological change While all but one of the relevant coefficients have the expected sign none are significant In contrast they do find evidence that energy prices had an impact on directional technological change with the relevant coefficients being of the correct sign and significant for both room and central air conditioners
Popp (2002) uses patent data to estimate the effect of energy prices on energy-efficiency innovations in USA between 1970 and 1994 He regresses normalised energy-efficiency-related patent applications against energy prices controlling also for lagged knowledge stock and government RampD (25) The estimated coefficient for energy prices is highly significant producing a short-run price elasticity of 006 and a long-run elasticity 0354 Thus a 10 increase in energy prices would be expected to increase the number of energy-efficiency-related patents by around 35 in the long run The estimated mean lag is less than four years leading the author to conclude that the imposition of a carbon or energy tax would lead to a fairly quick shift towards environmentally friendly innovation
Hoglund Isaksson (2005) estimates abatement cost functions for the reduction of nitrogen oxide (NOX) emissions in three industrial sectors in Sweden (energy pulp and paper chemicals and food) The analysis uses a double-hurdle model applied to a pooled sample of 114 plants across the three sectors The data cover the period 1990ndash1996 which spans the introduction of the charge on NOX emissions in 1992 The estimated cost curves have a similar shape in all three sectors with minimal (or even negative) costs over a relatively broad range of emission reductions and then a steep rise as reductions exceed
a threshold level The analysis does not explicitly consider the issue of innovation However it does find that abatement cost curves shifted downwards significantly over the period In the energy sector for example the emission rate threshold for significant cost increases fell by around 45 between 1991 and 1996 (from 550 to 300 kgGWh) The author surmises that this is due to a combination of technological development and the discovery of previously unrecognised opportunities Unfortunately while this shift coincided with the introduction of the NOX charge the analysis does not provide any evidence of a causal link
As part of their analysis of the impacts of the French tax-subsidy scheme for NOX and sulphur dioxide (SO2) emissions Millock and Nauges (2006) estimate the impact of the emission taxes on a plants decision to install end-of pipe abatement equipment While the study is not concerned with innovation per se the results of this part can be interpreted as showing the impact of emission taxes on the diffusion of abatement equipment Under the scheme taxes were imposed on the emissions of these air pollutants (and VOCs) by all plants satisfying certain criteria The revenue raised by the taxes was earmarked for subsidising the cost of qualifying abatement technologies for technical studies (ie RampD) and for investment in air quality surveillance systems Using panel data for 226 plants in three industries (iron and steel coke and chemicals) for the period 1900ndash1998 the authors estimate a Probit model for the probability that a plant will install abatement equipment They find that the total value of emissions taxes paid by the plant (ie for both pollutants) has a positive impact on its decision to invest in abatement equipment However the magnitude of the effect varies considerably across the sectors and is only significant for the iron and steel sector
Frondel et al (2008) analyse responses to an OECD survey on environmental policy tools (conducted in 2003) to identify the factors that affect a firms decision to adopt an environmental management system (EMS) voluntarily and their environmental innovation behaviour Innovation is captured by a binary variable that indicates whether the firm has undertaken significant technical measures or changes to reduce the environmental impacts of
(25) Normalised energy efficiency patent values are calculated by dividing by the total number of patents granted This accounts for exogenous changes in patenting behaviour that affect all types of patents Popp constructs a value for existing knowledge as the stock of previously granted patents weighted by estimates that he derives for knowledge productivity He demonstrates that the exclusion of this variable from the model leads to biased estimates for the energy price coefficient
Environmental tax reform in Europe opportunities for eco-innovation
Review of literature on environmental tax reform and eco-innovation
20
production (26) The analysis is based on survey responses from 899 firms in Germany Latent variable equations for EMS adoption and innovation are estimated simultaneously with each equation including the same four sets of variables relating to motivations policy instruments pressure groups and facility characteristics (27) The policy instrument variables include five dummy variables indicating the importance of different types of policy instrument including market-based instruments such as emission taxes and tradable permits While the perceived stringency of environmental policy is found to be a significant factor in the decision to innovate there is no evidence that any of the individual policy instrument variables had any impact The authors surmise that this suggests that it is stringency of environmental policy rather than the choice of specific instrument that is important for innovation However as the authors note their results reflect the perceptions of the survey respondents and should therefore be treated as correlations rather than causal relationships
Johnstone and Hascic (2008) assess the impact of a range of environmental policy instruments mdash including tax measures and investment incentives mdash on innovation in the renewable energy field They analyse the impacts for five different groups of renewable energy technologies mdash wind solar ocean biomass and waste-to-energy mdash using a panel dataset of European Patent Office (EPO) patent filings for these technologies across 26 countries over the period 1978ndash2003 A fixed effects negative binomial model is estimated controlling for electricity prices and consumption public sector RampD expenditure (as a proxy for scientific capacity) and total EPO filings (as a proxy for differenceschanges in patenting propensity) The various policy instruments are represented by dummy variables indicating whether they were in place in a particular year As such the model takes no account of the stringency of the instruments mdash in particular the differing magnitudes of the tax measures and investment incentives (28)
Initially the authors estimate the model with all of the policy instruments included individually They find that while public policy plays an important role in inducing innovation the impacts of the individual instruments vary across the different technologies In particular tax measures are significant for wind and biomass technologies with investment incentives being significant for solar and waste-to-energy technologies and obligationstradable certificates being significant for wind technologies However the authors express concerns that there may be multicolinearity between the policy variables (particularly between investment incentives tax measures and tariffs) and also that there may be interaction effects between some of the variables Consequently they estimate two alternative versions of the model the first using a composite policy variable representing the number of policy instruments in place and the second using clusters of similar policy instruments (29) The results or these two models confirm the initial findings The composite policy variable is significant for all of the technology groups while the significance of the clusters varies across technologies The price-based cluster is (highly) significant for solar biomass and waste-to-energy The quantity-based cluster is significant for wind technologies The authors surmise that this may be due to the different economic characteristics of the technologies For example the significance of investment incentives for solar and waste-to-energy may reflect the capital intensity of these technologies with large up-front investment costs
De Vries and Medhi (2008) also use patent data to investigate the relative importance of environmental regulations and fuel prices on innovation in automotive emission-control technologies distinguishing between post-combustion devices and engine redesign technologies They estimate a panel data model using data from Germany Japan and USA over the period 1978ndash2001 controlling for industry value added (as a proxy for the scope of technological opportunities) and total patent
(26) The next question on the survey asks whether these are changes in production processes or end-of-pipe technologies However no distinction is made between these two types of innovation in the present study
(27) In order to avoid identification problems some individual variables are omitted from one equation or the other(28) This shortcoming is recognised by the authors who state that it is unavoidable in any cross-comparative analysis in which multiple
instruments are included(29) The clusters are price-based instruments (investment incentives tax measures and tariffs) quantity-based instruments (obligations
and tradable certificates) and voluntary programmes
Review of literature on environmental tax reform and eco-innovation
Environmental tax reform in Europe opportunities for eco-innovation 21
applications (as a proxy for differenceschanges in patenting propensity) Environmental regulation is represented by two dummy variables indicating the introduction of on-board diagnostic (OBD) regulations in USA (30) The results of the analysis suggest that the relative impacts of regulation and market forces differ between the two types of technology For post-combustion technologies both of the regulations are significant while fuel prices have no significant impact In contrast the opposite is the case for engine redesign technologies with fuel prices having a significant impact but regulation having no discernable effect While the analysis does not explicitly consider the impact of fuel taxes it suggests that an increase in automotive fuel taxes would have a major impact on innovation in relation to engine design The estimated coefficient for fuel prices (1287) implies that a USD 010 increase in fuel prices would induce a 14 increase in patenting activity (31)
Key findings of the empirical studies
The empirical studies considered above cover a range of different technology areas spanning energy efficiency (both product and process) renewable energy and air and water pollution abatement While in some cases they assess the impact of energy prices rather than environmental taxes per se they provide a clear picture of the likely impact of environmental and energy-related taxes on eco-innovation
Three of the studies assess the impact on diffusion of existing technologies All find that environmental taxesenergy prices have a positive impact on diffusion In particular the water effluent charges in The Netherlands appear to have had a major impact on the adoption of waste-water treatment equipment by the food and beverage industry in that country However there is some evidence to suggest that the effectiveness of taxesprices may vary across sectors (eg NOXSO2 abatement in France) and that investment incentivessubsidies may be more
effective in some cases (eg thermal insulation in USA)
Three of the studies use patent data to assess the impact of environmental taxes and energy prices on innovation with one of these also assessing the impact of investment incentives All find a significant positive impact although this depends on the particular sub-sector (eg renewable energy) or the type of innovation In particular the evidence from the automotive emissions control study suggests that taxesprices may be more effective in promoting process-related innovation (eg engine redesign) than innovation in end-of-pipe technologies One of the studies takes a different approach using a product-characteristics model to decompose improvements in the energy efficiency of consumer durables This finds that while electricity prices did not appear to affect overall technological change (ie shifts in the product costenergy efficiency frontier) they did have a positive impact on directional technological change (ie the slope of the frontier)
26 Case studies
Christiansen and Skjaerseth (2005) undertake a comparative analysis of the impacts of climate change policies on the petroleum sectors in Norway and the Netherlands during the 1990s These countries were selected because of their very different policy approaches with the Norwegian petroleum sector subject to a carbon dioxide (CO2) tax since 1991 as part of a portfolio of measures (32) and the Netherlands relying on a series of voluntary agreements on energy efficiency (33) Both approaches appear to have been effective in that CO2 emissions per unit production fell by around 22 between 1990 and 2001 in Norway while energy efficiency improved by around 35 in the Netherlands over the same period However there were marked differences between the two countries in terms of the nature of the innovation that
(30) Because of the international nature of the automotive industry and the importance of the US market regulations introduced in USA appear to have been an important driver for innovation by overseas manufacturers Regulations mandating the installation of OBD systems were first introduced in California in 1988 A more sophisticated system was mandated by the 1990 US Clean Air Act Amendments taking force in 1996
(31) The coefficient represents the semi-elasticity of patent applications with respect to fuel prices While the authors do not state so explicitly the implication is that prices are expressed in US dollars (they are obtained from the IEA Energy Prices and Taxes Database) Consequently the impact of a 10 US cent increase in the fuel prices is given by exp(1287 x 01) ndash 1 = 0137
(32) In addition to the tax the portfolio included publicly funded RampD support schemes gas flaring permits and mandatory environmental impact assessments
(33) The Dutch oil and gas industry first signed a declaration of intent with the government in 1995 This was translated into a long-term agreement (LTA) on energy efficiency in the following year with an improvement target of 20 over the period 1989ndash2000 In 2001 a new LTA was signed which committed firms to implementing energy efficiency measures with a positive NPV at a 15 discount rate or a five year payback period
Environmental tax reform in Europe opportunities for eco-innovation
Review of literature on environmental tax reform and eco-innovation
22
occurred In the Netherlands technological change was incremental reflecting a steady diffusion of available (ie known) technology In contrast the authors find evidence of more radical innovations and adaptations by the Norwegian petroleum sector including the development of energy-efficient gas turbines installation of waste heat recovery units process modifications and improved use of process heat While the authors acknowledge the impossibility of proving a causal link between policy intervention and innovation (in the context of their case study) they conclude that the CO2 tax played a key role in the development and implementation of these radical innovations and the benefits of reduced tax payments provided an important incentive However they also conclude that the impacts of the two instruments were conditioned by the political contexts in which they were applied and the problem characteristics in the respective countries (eg the economic significance of the sector and the size of installations)
Knigge and Goumlrlach (2005) summarise the findings of a comprehensive analysis of the impacts of the ETR in Germany That analysis undertaken jointly by Ecologic and the German Institute for Economic Research (DIW Berlin) included the impacts on innovation and market diffusion of environmentally friendly products and technologies (34) Based on a series of case studies the study concluded that the ETR had a noticeable effect on innovation and diffusion although it was not possible to quantify the scale of that effect In particular ETR is identified as being a central factor in the development of gas-powered vehicles The study identifies a number of different routes by which the ETR produced impacts First the payback period for energy-efficient products was reduced as a result of the energy tax increases and the various exemptions favouring efficient energy use and renewable energy sources Second the predictable nature of the energy taxes (as opposed to widely fluctuating oil prices) reduced uncertainties about the benefits of energy-efficiency investments Third the reduction in employers social contribution payments tended to reduce the costs of labour intensive innovation processes such as research and development energy consultancy and technology installation Finally the ETR had a signalling effect strengthening awareness of the need for more efficient and rational energy use
Mickwitz et al (2007) examine a number of claims that have been made in the environmental policy literature about the relationship between policy instruments and innovation based on experiences in two industrial sectors in Finland pulp and paper and the manufacture of diesel engines for ships In particular they assess the claims that environmental taxes are superior to other policy instruments with respect to innovation and that RampD subsidies have limited impacts on innovation With respect to the first claim the evidence provided by the two case studies is mixed The authors conclude that energy taxation had a negligible impact on innovation in the pulp and paper industry However this is likely to have been due to the low level of the tax and the exemptions that applied to the sector In contrast they find that the differentiation of Swedish fairway and port fees (on the basis of SO2 and NOX emissions) was a significant factor driving the installation of in-engine NOX reduction equipment in ferries operating between the two countries (35) With respect to RampD subsidies the authors conclude that the evidence does not support the claim that these have little effect In particular they find that RampD subsidies accelerated the development of ship engine emissions-reduction technologies
The findings of the three case studies are consistent with those of the empirical analyses reviewed in the previous section Environmental taxes and investment subsidies have proven significant in promoting both innovation and diffusion although not universally so Furthermore the case studies provide some useful insights about the ways in which the impacts occur and the factors that may be important in promoting innovation In particular they suggest the need for a tax rate that is sufficiently high to provide a meaningful incentive and signalling effect and that is fixed for a sufficiently long period of time to reduce uncertainty about the future benefits of investment
27 Conclusions
The studies reviewed in the preceding sections suggest that environmental regulation in general and price-based policy instruments such as environmental taxes and investment subsidies in particular can (in theory) and do (in practice) have a positive impact on both innovation and diffusion
(34) A separate report in German by Goumlrlach et al (2005) provides details of the evaluation of the innovation and diffusion impacts (35) Although the tax was introduced in Sweden it was also payable by Finnish ferry operators entering Swedish ports and hence
affected their investment decisions This is another example of the cross-border impact of environmental policy interventions on innovation found by Lanjouw and Mody (1996) (see Section 23)
Review of literature on environmental tax reform and eco-innovation
Environmental tax reform in Europe opportunities for eco-innovation 23
of environmental technologies However the supporting empirical and case study evidence is not universal and the effectiveness of these instruments would appear to vary across different sectors and different types of innovation
To a certain extent such differences can be explained by the theoretical models In particular the impact of environmental taxes (relative to other instruments) is predicted to depend on the competitive structures of the markets in which the regulated firms operate and on the ability of innovator firms to appropriate the benefits accruing to other firms during diffusion However a number of other potential factors have been identified in the literature which may affect the impact of price-based policy instruments on innovation
Jaffe et al (2002) caution that the impact of price-based policy instruments on technology diffusion may be adversely affected by a number of potential market failures including information failures principle-agent problems (eg landlord-tenant) capital market failures and positive adoption spillovers In addition while not market failures as such uncertainty over future returns and the (associated) use of high discount rates for investment decisions can also undermine the effectiveness of price-based instruments in stimulating diffusion However as was noted above the findings from the case study of ETR in Germany suggest that an environmental tax may actually reduce the level of uncertainty over future returns provided that it is of sufficient magnitude and longevity
Skjaerseth and Christiansen (2005) emphasise that the relationship between policy instruments (of all types) and technological change is extremely complicated They argue that account must be taken of the politicalindustrial context in which policy instruments are introduced and the nature of the environmental problem that they are intended to address In particular they make a distinction between malign problems where technological change involves net costs for target groups and benign problems where there are widespread no-regret opportunities for change Based on a comparative analysis of four different case studies they conclude that mandatory policy instruments (including environmental taxes) are more effective
in promoting short-term technological change when the problems are malign but that low legitimacy (with the target group) may undermine long-term technological change However when problems are benign or when long-term change requires cooperation voluntary policy instruments are likely to be more effective
Johnstone (2005) questions the focus of the theoretical and empirical analyses (reviewed above) on the impact of environmental policy instruments on the rate of technological change He argues that the direction of technological change is as important if not more so In addition to the quantity of innovation it is also important that innovation be socially optimal in the sense that it minimises the cost of attaining a particular environmental goal in the long term Inappropriate innovation today may result in lock in to a suboptimal technological path for the future
With this in mind Johnstone identifies a number of issues that can adversely affect the direction of innovation and should be taken into account when selecting and designing policy instruments technological market failures (36) missing markets for certain environmental attributes of innovation policy incidence and joint production of emissions Most studies of the innovation effects of environmental policy instruments assume that the only missing market is that for the environmental good (or bad) However in practice there may be other markets that are missing (or incomplete) which can adversely affect transmission of innovation incentives This is particularly so in the area of waste and resource management where instruments applied at the end of the product life cycle may have little or no impact on product design innovation Even if all markets are complete except for the environmental externality the point of incidence of the policy intervention may be more important for the direction of innovation than the choice of a particular policy instrument For example a limit or standard applied directly to the emissions of a pollutant may be more effective in promoting optimal innovation than a tax applied to a proxy input variable Finally when there is joint production of pollutants (eg CO2 and air pollutants from vehicle engines) there is a danger that if policy instruments (of whatever type) are applied to one pollutant in isolation the resulting innovation may
(36) These are the same market failures identified by Jaffe et al (2002)
Environmental tax reform in Europe opportunities for eco-innovation
Review of literature on environmental tax reform and eco-innovation
24
reduce emissions of that pollutant at the expense of increases in the others
In a related point Johnstone highlights the importance of using appropriate indicators when assessing the impact of policy instruments on innovation emphasising the need for these to reflect both the rate of innovation and the direction A necessary condition for this is that the indicators must provide an accurate and detailed picture of actual innovation Unfortunately this is difficult to achieve in practice For example the use of patent data as a measure of innovation requires the identification of relevant environmental technologies This is likely to be easier for end-of-pipe technologies than for process-related technologies meaning that the latter tend to be under-represented relative to their actual incidence To the extent that process-related innovation is growing in importance or is more important
for certain sectors or types of environmental problem changes in the value of the indicator may significantly understate the actual rate of innovation and misrepresent the direction
All of this suggests that caution should be exercised in drawing general definitive conclusions about the impacts of price-based policy instruments such as environmental taxes and investment subsidies on innovation particularly relative to other policy instruments While it would appear that they can be effective in stimulating both innovation and diffusion in many cases mdash at least in terms of the rate of technological change mdash there may be situations in which other policy instruments may be more appropriate In general the stringency and point of incidence of an environmental policy intervention may be more important than the choice of a particular policy instrument in determining the rate and direction of eco-innovation
25
Modelling of ETR impacts on eco-innovation
Environmental tax reform in Europe opportunities for eco-innovation
31 Scenarios assessing the implications of ETR for eco-innovation
Scenario analysis provides a useful means of improving understanding of how the different revenue recycling methods and various scales of ETR can help meet different greenhouse gas emissions targets
To investigate the impacts of an ETR for Europe the petre project elaborated a range of different scenarios reflecting various tax reform options In addition to employing several of these original scenarios the present study compiled two new scenarios to analyse the implications of ETR for eco-innovation All scenarios were examined in both E3ME and GINFORS (37)
311 Original petre project scenarios
The key petre scenarios relevant for the present study are
bull scenarioBHbaselinescenariowithhighenergyprice (reference case)
bull scenarioS1HETRdesignedtomeettheEUsunilateral 2020 GHG target (high energy price) with revenue recycling
bull scenarioS2HETRdesignedtomeettheEUsunilateral 2020 GHG target (high energy price) with revenue recycling and 10 of revenues spent on eco-innovation measures
Each of the ETR scenarios has the same key taxation components
bull acarbontaxrateisintroducedtoallnon-EUEmissions Trading System (EU ETS) sectors equal to the carbon price in the EU ETS that delivers an overall 20 reduction in greenhouse gas emissions by 2020 and in the international cooperation scenario this is extended to 30
bull aviationisincludedintheEUETSattheendofPhase 2
bull powergenerationsectorEUETSpermitsare100 auctioned in Phase 3 of the EU ETS
bull allotherEUETSpermitsare50auctionedin2013 increasing to 100 in 2020
bull materialtaxesareintroducedat5oftotalpricein 2010 increasing to 15 by 2020
In scenario S1H environmental tax revenues are recycled through reductions in income tax rates and social security contributions in each of the Member States such that there is no direct change in tax revenues In scenario S2H 10 of environmental tax revenues are recycled through spending on eco-innovation measures and the remaining 90 is recycled through the same measures as in the other scenarios The eco-innovation spending is split across power generation and housing according to tax revenues from the corporate and household sector
In GINFORS (the model used for analysing the implications of ETR and eco-innovation) the share of renewable sources in electricity production is increased due to the additional investment The rest of additional investment goes to household energy efficiency spending Investment needed for a certain increase in renewable energy production or efficiency improvement is based on Austrian and German experience (Lehr et al 2008 and 2009 Grossmann et al 2008 Lutz and Meyer 2008) This assumption is quite conservative as parameters for other countries can be assumed to be more positive (meaning that less money is needed for renewable energy technology installation or energy efficiency gains)
In scenario S1H the 20 GHG target translates into a 15 reduction in energy-related carbon emissions relative to 1990 as other emissions such as methane and nitrous oxide have already been reduced by
3 Modelling of ETR impacts on eco-innovation
(37) The E3ME and GINFORS models are introduced in Chapter 1 of the present report A detailed discussion of the models and scenarios used in the present study can be found in Ekins and Speck (2011)
Environmental tax reform in Europe opportunities for eco-innovation
Modelling of ETR impacts on eco-innovation
26
more than 20 (in terms of carbon equivalents) The target is reached by a tightened EU ETS cap and the introduction of a carbon tax on the non-ETS sector The tax rate applied is equal to the carbon price in the EU ETS that will deliver a 20 GHG reduction by 2020
The burden of ETR taxes are allotted to energy outputs (ie the final use of energy) and will be based on the carbon content of each fuel Carbon prices are assumed to be fully passed on to consumers All carbon taxes are in addition to any existing unilateral carbon and energy taxes The carbon reductions in the different EU Member States will be those that result from a uniform carbon tax increase across the EU
All of the revenues including EU ETS auctioning revenues carbon tax revenues and material tax revenues will be recycled The proportion of tax raised by industry will be recycled into a reduction in employers social security contributions which will in turn reduce the cost of labour Recycling will be additional to the existing ETRs in some Member States Revenues raised from households will be recycled through standard rate income tax reductions Traditional energy tax revenues will be lower compared to their respective baselines as the tax base (energy consumption) is reduced So for an ETR revenue-neutrality does not mean budget-neutrality
312 Factors affecting the macroeconomic impacts of RES technologies
Earlier analyses (Lehr et al 2008 Fraunhofer ISI et al 2009 DTI 2004 Kammen et al 2004 Moreno and Loacutepez 2007) have studied the impacts of large renewable energy source (RES) shares in the energy mix for different countries The overall question in these studies has been the impact of increasing RES shares on the economy especially on the labour market For the present study it is interesting to note that macroeconomic impacts of higher RES shares mainly depends on the following five factors
1 additional investment in RES (minus lower investment in conventional sources ie fossil and nuclear power) with the impact increasing if a country manufactures the RES technology in question
2 additional (net) exports due to improved international competitiveness of renewable energy sources (first mover advantage)
3 lower fossil fuel needs4 the cost differences between RES and
conventional energy
5 the shift from capital- and energy-intensive industries to labour- and technology-intensive industries
All five factors are driven by international energy prices carbon prices the policy framework and RES technology development itself Innovation comes into the play at various stages First innovation drives the currently positive additional costs of RES technologies down and even into negative realms depending on the fossil fuel scenario Second innovative RES technologies are likely to have a competitive advantage in international markets Although a significant proportion of RES technology produced in Europe is traded in Europe innovation will still provide an edge in current and emerging international markets
The EmployRES study (Fraunhofer ISI et al 2009) finds for Europe that current strong investment reflected in installations in Europe and exports to the rest of the world dominate the economic impact of RES policies and therefore lead to positive overall effects The studys results suggest that this positive balance can only be kept up in the future if the competitive position of European manufacturers of RES technology is improved The authors strongly recommend policies which promote technological innovation in RES and lead to a continued and rapid reduction of their costs
Factors 1 and 2 will have substantial macroeconomic impacts in the short and medium terms whereas factor 3 accumulates and will show positive impacts mainly in the long term Factor 4 strongly depends on the global developments while factor 5 may have significant effects on employment
313 Additional scenarios
Impacts of additional investment (factor 1) have already been analysed in scenario S2H of the petre project To focus on the other impacts of eco-innovation two additional scenarios were designed building on scenario S2H of petre
bull S2HEETRwithrevenuerecyclingdesignedto meet the unilateral EUs 2020 greenhouse gas (GHG) target (high energy price) Ten per cent of revenues are spent on eco-innovation measures and trade shares of EU-27 economies with the rest of the world in machinery and electrical machinery increase by 01 due to the deployment of the fast growing RES markets This assumption is based on the strong EU policy effort to increase the share of renewable energy in final energy consumption to 20 by 2020
Modelling of ETR impacts on eco-innovation
Environmental tax reform in Europe opportunities for eco-innovation 27
(Fraunhofer ISI et al 2009) and the possibility of very strong world market development of the RES sector until 2020 (EREC 2008) which offers additional export opportunities for European RES industries
bull S2HIETRwithrevenuerecyclingdesignedto meet the unilateral EUs 2020 GHG target (high energy price) Ten per cent of revenues are spent on eco-innovation measures and input structures of the energy sector are changed according to the input structure of the German RES industry (Lehr et al 2008)
S2HE looks at the possible role of international trade S2HI analyses changes in the input structure of the energy sector ie from conventional electricity production to renewables In the petre project (as in GHK et al 2007) only the energy inputs of the energy sector were adapted to changes in the energy input mix
Both S2HE and S2HI focus on RES and efficiency technologies As mentioned above an ETR will trigger a variety of innovations Therefore the results can be thought of as conservative in the sense that innovations (eg automotive energy consumption industrial efficiency etc) are not explicitly included
32 Overview of modelling results
The main results of the simulations are presented in Table 31 In the baseline scenario BH with high energy prices EU-27 carbon emissions will be
72 below the 1990 level in 2020 (38) The EU-15 has committed in the Kyoto Protocol to reduce its GHG emissions 8 below 1990 levels in the period 2008ndash2012 As emissions in the new member states are substantially below their 1990 levels today that implies that the EU-27 will keep its emissions more or less constant over the coming decade As in the PRIMES baseline an ETS price of 18 EURt in 2008 prices is assumed in 2020
In scenario S1H the ETS price and carbon tax rate has to be increased to 68 EUR2008t of CO2 to reach the 20 GHG reduction target which is equal to a 15 reduction of CO2 emissions against 1990 as other greenhouse gases have already been reduced above average by more than 20 in terms of CO2 equivalents Compared to the baseline CO2 emissions are 84 lower in 2020 which means roughly an additional 1 reduction annually in the period 2012ndash2020 GDP will be about 06 lower compared to the baseline in 2020 This means that annual average growth rates will be less than 01 below their baseline development This is especially low compared to the current financial and economic crisis with a GDP deviation against the baseline of around 6 in 2009
As the recycling mechanism reduces labour costs and the tax burden is shifted from labour-intensive to carbon- and material-intensive sectors employment will be 036 (or more than 800 000 jobs) higher than in the baseline The ETR is not fully budget neutral potentially enabling EU economies to slightly increase their net savings If
(38) The modelling exercise in the present study was conducted in 2009 and therefore does not contain the latest data on EU-27 GHG emissions which were significantly influenced by the global economic slump of the late-2000s
Table 31 Main results under the different scenarios
Scenario Target in 2020 CO2 price GDP Employment CO2 reduction
EUR2008t pc against baseline
pc against baseline
pc against 1990
pc against baseline
in year 2020 2015 2020 2020 2020 2020
BH 18 ndash 72 00
S1H 20 GHG 68 ndash 022 ndash 057 036 ndash 151 ndash 84
S2H 20 GHG 61 ndash 013 ndash 030 041 ndash 152 ndash 85
S2HE 20 GHG 61 ndash 009 ndash 004 051 ndash 151 ndash 84
S2HI 20 GHG 61 ndash 006 ndash 024 045 ndash 152 ndash 84
Environmental tax reform in Europe opportunities for eco-innovation
Modelling of ETR impacts on eco-innovation
28
this extra saving is spent negative GDP impacts will be further reduced
In scenario S2H part of the revenues is invested in low-carbon technologies This reduces the carbon price to 61 EUR2008t in 2020 halving the GDP loss relative to scenario S1H to only 03 as the investment in renewable energies is assumed to be additional Employment impacts are also more positive than in scenario S1H The 10 investment in low-carbon technologies amounts to more than EUR 20 billion in 2020
Assuming additional EU exports of RES technologies in scenario S2HE GDP almost matches the baseline in 2020 and employment is 051 (or more than 1 million jobs) higher than in the baseline In scenario S2HI a shift in the input structure of the energy sector towards machinery
and electrical machinery reflecting the different nature of RES relative to conventional electricity generation also has smaller additional positive impacts on GDP and employment compared to scenario S2H
The following figures show impacts of the different scenarios in comparison to the baseline BH As Figure 31 illustrates all the alternative scenarios imply GDP lower than the baseline However comparing scenario S1H with the other three scenarios shows that additional RES investment (S2H) additional RES exports (S2HE) and the inclusion of different input structures of the RES industries (S2HI) each have positive GDP impacts These results are in line with model-based analysis in the EMPLOY-RES study (Fraunhofer ISI et al 2009)
Figure 31 EU-27 GDP according to four scenarios mdash deviation from the baseline (BH)
Percentage deviation from the baseline (BH)
ndash 100
ndash 080
ndash 060
ndash 040
ndash 020
0002010 2015 2020
S2HI S1H S2H S2HE
Modelling of ETR impacts on eco-innovation
Environmental tax reform in Europe opportunities for eco-innovation 29
In contrast to GDP employment increases relative to the baseline in all the alternative scenarios (Figure 32) Due to the scenario design the structure of the EU economies is shifted from energy-intensive to labour-intensive sectors The magnitude of the employment gain is influenced by the carbon price and the tax shift the underlying energy prices and the production loss The largest part of the employment increase stems from the additional RES investment (scenario S2H) although a shift in industry structures (S2HI) and additional RES exports (S2HE) are also positive for the labour market
33 Macroeconomic impacts at the national level
In general terms it is clear that national ETS and ETR impacts depend significantly on country specifics including energy use economic structure social system and behaviour (eg reactions to labour cost changes) In countries with high carbon intensity in their energy mix additional revenues and expenditures are higher than in countries with lower carbon intensity
Scenario S2H provides an interesting tool for analysing the macroeconomic impacts of ETR at the national level because 10 of the additional generated revenues are used for eco-innovation investments meaning that only 90 of the revenues are recycled back into the economy by reducing income tax rates and social security contributions
Figure 32 EU-27 employment according to four scenarios mdash deviation from the baseline (BH)
ndash 020
000
020
040
060
2010 2015 2020
S2HI S1H S2H S2HE
Percentage deviation from the baseline (BH)
Environmental tax reform in Europe opportunities for eco-innovation
Modelling of ETR impacts on eco-innovation
30
Figure 34 GDP in 2020 in EU-27 Member States under scenario S2H mdash deviation form the baseline (BH)
Figure 33 GDP in 2020 in selected countries under scenario S2H mdash deviation from the baseline (BH)
ndash 25 ndash 20 ndash 15 ndash 10 ndash 05 00 05 10 15
Romania
Bulgaria
SloveniaMalta
Lithuania
Latvia
Estonia
CyprusSlovakia
Poland
Hungary
Czech RepublicUnited Kingdom
Sweden
Spain
Portugal
Netherlands
Italy
Ireland
Greece
FranceFinland
Denmark
Luxembourg
Belgium
Austria
Germany
Percentage deviation from the baseline (BH)
Russia
South Africa
Brazil
India
China
Mexico
Japan
USA
Poland
United Kingdom
Spain
Italy
France
Germany
ndash 30 ndash 25 ndash 20 ndash 15 ndash 10 ndash 05 00 05 10
Percentage deviation from the baseline (BH)
Modelling of ETR impacts on eco-innovation
Environmental tax reform in Europe opportunities for eco-innovation 31
Figure 35 Employment in 2020 in EU-27 Member States under scenario S2H mdash deviation from baseline (BH)
EU-27EU-15
RomaniaBulgariaSloveniaMalta
LithuaniaLatvia
EstoniaCyprusSlovakia
PolandHungary
Czech RepublicUnited Kingdom
SwedenSpain
PortugalNetherlands
ItalyIrelandGreece
FranceFinlandDenmarkLuxembourg
BelgiumAustria
Germany
ndash 200 0 200 400 600 800 1 000
Percentage deviation from the baseline (BH)
Under scenario S2H the GDP of large EU economies deviates from baseline projections by between 0 and ndash 1 with the exception of Italy (Figure 33) Germanys GDP is even forecast to match the baseline level in 2020 due to the countrys strong RES industry Outside Europe some countries gain slightly against EU Member States in terms of competitiveness as export prices in most EU Member States and sectors increase and GDP in those countries exceeds the baseline projections as a result (Figure 33) This is mainly because carbon tax revenues are recycled via income tax reductions which are not part of production costs However energy exporting economies such as Russia or South Africa will lose exports if EU demand for fossil fuel imports declines The development of all EU Member States is shown in Figure 34
Employment impacts of scenario S2H are positive for almost all EU Member States as lower labour
costs increase labour demand and labour intensity (Figure 35) The highest absolute increases are shown for Germany the Netherlands Italy and the United Kingdom For EU-27 as a whole employment will be almost one million higher than in the corresponding baseline BH in 2020
The scenarios have not been designed with a view to meeting the EU renewables target of a 20 renewables share in final energy consumption in 2020 Nevertheless the scenarios provide some interesting insights The share is projected to increase from around 10 in 2009 to above 14 even in the baseline as instruments such as feed in tariffs and biofuel quotas will continue In scenario S1H the target will be missed with around 18 in 2020 Only in scenarios S2H S2HE and S2HI is the target met (approximately 20 )
Environmental tax reform in Europe opportunities for eco-innovation
Modelling of ETR impacts on eco-innovation
32
Under scenario S2H energy-related carbon emissions are reduced in all EU Member States relative to the baseline (Figure 36) The highest percentage reductions can be seen in many of the EU-12 Member States with still high energy intensity and low energy prices In these countries the relative price increase is higher than in countries like Germany or the United Kingdom with already high energy taxes and overall energy prices
Additional ETS revenues material tax revenues and carbon tax revenues from the industry sector are recycled back to industry via reductions in employers social security contributions (or wage subsidies in some countries) The revenues from the carbon tax on households set out in Table 32 (totalling 033 of GDP in Germany for example) are used to reduce income tax For the EU-27 overall revenues from ETS and ETR reach about 2 of GDP in 2020 although these figures may be excessive because additional EU efforts to increase energy
efficiency and renewable energy which will reduce the ETS price are not taken into account The use of flexible tools such as the Clean Development Mechanism will further reduce the revenues and earmarking of part of the revenues for mitigation and adaptation measures in emerging and developing countries limits the recycling into labour costs
In addition the scenarios do not take the current global economic problems into account According to the IEA (2009) the downturn will also reduce carbon emissions in the long run which will lead to lower carbon prices and revenues to reach fixed targets (or make tighter targets less costly)
The ETR will have varying effects on the prices of different sorts of products and services Material or carbon taxes increase the prices of product groups according to their direct and indirect material and carbon content The recycling mechanism reduces
Figure 36 Energy-related CO2 emissions in 2020 under scenario S2H mdash deviation from the baseline (BH)
WorldEU-27
EU-15Romania
BulgariaSlovenia
MaltaLithuania
LatviaEstonia
CyprusSlovakia
PolandHungary
Czech RepublicUnited Kingdom
SwedenSpain
PortugalNetherlands
ItalyIreland
GreeceFrance
FinlandDenmark
LuxembourgBelgium
AustriaGermany
ndash 25 ndash 20 ndash 15 ndash 10 ndash 5 0
Percentage deviation from the baseline (BH)
Modelling of ETR impacts on eco-innovation
Environmental tax reform in Europe opportunities for eco-innovation 33
Table 32 Additional ETS and environmental tax revenues in 2020 ( of GPD)
S2H Germany United Kingdom EU-27
ETS revenues 083 064 059
Carbon tax (industry) 052 044 054
Carbon tax (households) 033 041 036
Material tax 041 029 056
Sum 209 178 205
Figure 37 Total primary energy supply in 2020 under scenario S2H mdash deviation from the baseline (BH)
WorldEU-27EU-15
RomaniaBulgaria
Slovenia
MaltaLithuania
LatviaEstonia
Cyprus
SlovakiaPoland
HungaryCzech Republic
United KingdomSweden
SpainPortugal
NetherlandsItaly
IrelandGreece
FranceFinland
DenmarkLuxembourg
BelgiumAustria
Germany
ndash 24 ndash 21 ndash 18 ndash 15 ndash 12 ndash 9 ndash 6 ndash 3 0
Percentage deviation from the baseline (BH)
Environmental tax reform in Europe opportunities for eco-innovation
Modelling of ETR impacts on eco-innovation
34
Figure 38 Output price impacts of scenario S2H in Germany in 2020 mdash deviations from the baseline (BH)
Figure 39 Impacts of scenario S2H on industrial output in 2020 in Germany mdash deviations from the baseline (BH)
ndash 5
0
5
10
15
20
Output prices
Percentage deviation from the baseline (BH)
(3) F
ood
(4) T
extiles
(5) W
ood
(6) P
ulp pap
er
(7) C
oke re
fined
petro
leum
pro
ducts
(8) C
hemica
ls ex
cl pha
rma
(9) P
harm
aceu
ticals
(10)
Rub
ber a
nd plastics
(11)
Non
-metallic
miner
als
(12)
Iron
and
steel
(13)
Non
-ferrou
s metals
(14)
Met
al pro
ducts
(15)
Mac
hine
ry and
equ
ipmen
t
(16)
Office
mac
hine
ry
(17)
Electric
al m
achine
ry
(18)
Rad
io T
V
(19)
Med
ical pr
ecisi
on and
opt
ical ins
trumen
ts
(20)
Mot
or veh
icles
(21)
Ships
(22)
Airc
raft
(23)
Railro
ad
(24)
Man
ufac
turin
g n
ec r
ecyc
ling
(25)
Electric
ity g
as w
ater
sup
ply
(26)
Con
stru
ction
(27)
Tra
de r
epairs
(28)
Hot
els an
d re
stau
rant
s
(29)
Tra
nspo
rt an
d stor
age
(30)
Pos
t and
teleco
mmun
icatio
ns
(31)
Finan
ce ins
uran
ce
(32)
Rea
l estate ac
tivities
(33)
Ren
ting
(34)
Com
puter
(35)
Res
earch an
d de
velopm
ent
(36)
Oth
er bus
ines
s ac
tivities
(37)
Pub
lic ser
vice
s
(38)
Edu
catio
n
(39)
Hea
lth and
soc
ial w
ork
(40)
Oth
er ser
vice
s
(41)
Priv
ate ho
useh
olds
(1) A
gricu
lture
(2) M
ining an
d qu
arry
ing
nec not elsewhere classified
Production
ndash 100
ndash 80
ndash 60
ndash 40
ndash 20
00
20
40
60
80Percentage deviation from the baseline (BH)
(3) F
ood
(4) T
extiles
(5) W
ood
(6) P
ulp pap
er
(7) C
oke re
fined
petro
leum
pro
ducts
(8) C
hemica
ls ex
cl pha
rma
(9) P
harm
aceu
ticals
(10)
Rub
ber a
nd plastics
(11)
Non
-metallic
miner
als
(12)
Iron
and
steel
(13)
Non
-ferrou
s metals
(14)
Met
al pro
ducts
(15)
Mac
hine
ry and
equ
ipmen
t
(16)
Office
mac
hine
ry
(17)
Electric
al m
achine
ry
(18)
Rad
io T
V
(19)
Med
ical pr
ecisi
on and
opt
ical ins
trumen
ts
(20)
Mot
or veh
icles
(21)
Ships
(22)
Airc
raft
(23)
Railro
ad
(24)
Man
ufac
turin
g n
ec r
ecyc
ling
(25)
Electric
ity g
as w
ater
sup
ply
(26)
Con
stru
ction
(27)
Tra
de r
epairs
(28)
Hot
els an
d re
stau
rant
s
(29)
Tra
nspo
rt an
d stor
age
(30)
Pos
t and
teleco
mmun
icatio
ns
(31)
Finan
ce ins
uran
ce
(32)
Rea
l estate ac
tivities
(33)
Ren
ting
(34)
Com
puter
(35)
Res
earch an
d de
velopm
ent
(36)
Oth
er bus
ines
s ac
tivities
(37)
Pub
lic ser
vice
s
(38)
Edu
catio
n
(39)
Hea
lth and
soc
ial w
ork
(40)
Oth
er ser
vice
s
(41)
Priv
ate ho
useh
olds
(1) A
gricu
lture
(2) M
ining an
d qu
arry
ing
nec not elsewhere classified
Modelling of ETR impacts on eco-innovation
Environmental tax reform in Europe opportunities for eco-innovation 35
social security contributions and lowers labour costs according to the direct and indirect labour content of sector output The ETR therefore reduces output prices in labour-intensive service sectors and increases prices in carbon- and material-intensive industry sectors
The example of Germany shows insignificant impacts in the trade-intensive sectors of machinery (15ndash17) motor vehicles (20) and other transport equipment (21ndash23) (Figure 38) Iron and steel (12) and chemicals without pharmaceuticals (8) face the highest price increases of trade-intensive sectors As the German iron and steel industry primarily delivers high quality steel to the German car industry and increasingly to the German windmill industry negative competitiveness impacts will be limited Exchange rate variations against non-EU competitors have been much higher in the past
The higher prices of carbon- and material-intensive products will reduce price competitiveness on export markets and increase the market share for imports in domestic markets This loss of price competitiveness is based on an assumption of limited market development of energy efficiency and RES technologies in other part of the world It will be offset by gains in labour-intensive sectors if the ETR causes real wage costs per unit of output to fall as a result of using recycled revenues to reduce employer social security contributions
Any improvement in non-price competitiveness will also raise exports The extra employment will raise incomes raising consumption and output
The overall impact on sector output depends on countervailing effects which are negative for iron and steel and a few service sectors and positive for a few industry sectors For most industries the output effect is insignificant (Figure 39) The greatest impact is felt by producers of fossil fuels who must obviously reduce production due to lower demand for their products
Under scenario S2H employment impacts are positive for most sectors relative to the baseline as labour productivity decreases and wage rates fall in relation to consumer prices (CPI) and output prices (Table 33) The relative costs of labour are lower than in the baseline without the ETR reform Only around a quarter of the employment increase takes place in industry
Concerning the wage rate two countervailing effects have to be considered First when the labour market is characterised in terms of the real wage bargaining model as in E3ME and GINFORS with market power on both sides (employers and trade unions) consumer price increases will lead to wage increases (the econometrically estimated factor is 085 for Germany) Second labour productivity is another important factor for wage bargaining The estimated elasticity for Germany is 063 meaning that a 1 increase of labour productivity leads to wage increases of 063 Higher labour demand due to lower labour costs thus reduces the wage increase In the end the German economy is more labour intensive than without the ETR partly due to the structural change towards labour-intensive industries
Table 33 Employment impacts of scenario S2H in Germany mdash deviations from scenario S2H in 2020
Employment in 2020 Deviation from S2H () Deviation from S2Habsolute (1 000s)
Agriculture forestry 24 90
Industry 09 653
Non-metallic minerals 24 62
Iron and steel ndash 28 ndash 37
Machinery and equipment 05 56
Electrical machinery 04 18
Construction 37 449
Trade and transport 10 829
Business services 17 767
Other services ndash 02 ndash 216
Total 07 2506
Environmental tax reform in Europe opportunities for eco-innovation
Modelling of ETR impacts on eco-innovation
36
Additional exports under scenario S2HE mainly create new jobs in machinery and related business services (Table 34) Under scenario S2HI a shift in the input structure of the energy sector leads to a shift in the industry structure and creates a few jobs in the service sector (Table 35)
34 Conclusions of the scenario assessment
The foregoing analysis used the GINFORS model to assess economic and environmental impacts of using the ETS and ETR to reach the EUs 2020
GHG targets In general the results show positive employment effects and only small negative impacts on GDP in EU-27 Member States The economic impacts depend on the levels of international energy prices the mechanism used to recycle revenues and country specifics such as carbon and energy intensity and the structure of energy consumption
Although there is significant evidence that eco-innovation is positively driven by higher energy prices quantification is difficult The present study included simulations of possible impacts of a shift in the industry structure towards renewable energy in the electricity sector and an overall increase of EU
Table 34 Employment impacts of scenario S2HE in 2020 in Germany mdash deviations from scenario S2H
Employment in 2020 Deviation from S2H () Deviation from S2Habsolute (1 000s)
Agriculture forestry ndash 01 ndash 02
Industry 03 194
Non-metallic minerals 02 05
Iron and steel 04 05
Machinery and equipment 13 130
Electrical machinery 24 117
Construction 01 18
Trade and transport 00 26
Business services 07 308
Other services 01 107
Total 02 634
Table 35 Employment impacts of scenario S2HI in 2020 in Germany mdash deviations from scenario S2H
Employment in 2020 Deviation from S2H () Deviation from S2Habsolute (1 000s)
Agriculture forestry ndash 01 ndash 02
Industry 00 00
Non-metallic minerals 25 65
Iron and steel ndash 27 ndash 36
Machinery and equipment 08 78
Electrical machinery 04 19
Construction ndash 00 ndash 04
Trade and transport 00 07
Business services 02 115
Other services 0 56
Total 00 167
Modelling of ETR impacts on eco-innovation
Environmental tax reform in Europe opportunities for eco-innovation 37
exports due to higher global demand for renewable energy The main results can be summarised as follows
bull environmentaltaxreformshiftingtaxesfromlabour to energy and resources will create additional jobs and trigger eco-innovation
bull impactsofeco-innovationintheformofadditional EU exports or shifts in industry structures will have a slight positive influence on GDP and create a smaller number of additional jobs
These findings correspond to results from the EmployRES study (Fraunhofer ISI et al 2009) As ETR is directly aimed at reducing labour costs it will create additional jobs in the short and medium term In the longer term the cost reduction and new technologies arising from eco-innovation will play a larger role
Like all fiscal reforms a major ETR in Europe will create winners and losers At the sector level carbon- and material-intensive industries will face economic losses At the country level the carbon-intensity and overall flexibility of economies is important Clearly structural change away from carbon-intensive industries together with technological change is inherent in any successful climate mitigation policy
On the other hand several factors can smooth these structural adjustments International cooperation
will reduce economic pressure on countries and sectors In addition ETR together with auctioning of ETS allowances can be a major source of revenues for EU Member States in the future even if part of the revenues will have to be earmarked for adaptation and mitigation measures in developing countries Indeed future debate on grandfathering or auctioning ETS allowances should reflect the important point that giving allowances away for free denies countries the money to ease structural change and invest in low-carbon technologies
Caution is needed in relating the findings of this study to the EU policy debate In the model simulations the single carbon price is the only instrument used to reach the EUs 2020 GHG targets In reality of course other renewable energy and efficiency policies will also contribute to carbon reduction and have to be taken into account when comparing the results (especially the high carbon prices) to other studies Both reduce the potential revenues from fossil energy carriers and carbon emissions
A variety of renewable energy and efficiency policies could enable the climate and energy targets to be met while securing even better economic prospects The results of the present study clearly indicate that the discussion on market-based instruments should be intensified Ultimately however the EU will need a rich mix of policies to reach its GHG targets while maximising prosperity
Environmental tax reform in Europe opportunities for eco-innovation38
References
Almon C 1991 The INFORUM Approach to Interindustry Modeling in Economic Systems Research Vol 3 pp 1ndash7
Amin A and Cohendet P 2004 The Architecture of Knowledge Firms Capabilities and Communities Oxford University Press Oxford
Barker T Meyer B Pollitt H and Lutz C 2007a Modelling Environmental Tax Reform in Germany and the United Kingdom with E3ME and GINFORS petre Working Paper Cambridge and Osnabrueck (httpwwwpetreorgukpapershtm) accessed 15 February 2011
Barker T Junankar S Pollitt H and Summerton P 2007b Carbon leakage from unilateral environmental tax reforms in Europe 1995ndash2005 Energy Policy Vol 35 pp 6 281ndash6 292
Brunnermeier S B and Cohen M A 2003 Determinants of environmental innovation in US manufacturing industries Journal of Environmental Economics and Management Vol 45 pp 278ndash293
Buen J 2006 Danish and Norwegian wind industry The relationship between policy instruments innovation and diffusion Energy Policy Vol 34 (18) pp 3 887ndash3 897
Carlsson B and Stankiewicz R 1991 On the nature function and composition of technological systems Journal of Evolutionary Economics Vol 1 (2) pp 93ndash118
Christiansen A C and Skjaerseth J B 2005 Climate change policies in Norway and the Netherlands Different instruments similar outcome Energy and Environment Vol 16(1) pp 1ndash25
Dosi G 1988 Sources procedures and microeconomic effects of innovation Journal of Economic Literature Vol 26 pp 1 120ndash1 171
de Vries F and Medhi N 2008 Environmental regulation and international innovation in automotive emissions control technologies in Environmental Policy Technological Innovation and Patents Organisation for Economic Cooperation and Development Paris
DG TREN 2008 European energy and transport mdash trends to 2030 mdash update 2007 European Commission Luxembourg
DTI 2004 Renewable Supply Chain Gap Analysis UK Department of Trade and Industry
Edler J (ed) 2006 Nachfrageorientierte Innovationspolitik Buumlro fuumlr Technikfolgenabschaumltzung beim Deutschen Bundestag (TAB) Arbeitsbericht Nr 99 Berlin
Edquist C 2001 The system of innovation approach and innovation policy an account of the state of the art lead paper presented at the DRUID Conference 12ndash15 June 2001 Aalborg (httpwwwdruiddkconferencesnwpaper1edquistpdf) accessed 15 February 2011
EEA 2006 Using the market for cost-effective environmental policy Market-based instruments in Europe EEA Report No 12006 European Environment Agency Copenhagen
Ekins P 2009 Resource Productivity Environmental tax Reform and Sustainable Growth in Europe published by the Anglo-German Foundation for the Study of Industrial Society Final report (httpwwwpetreorgukpdfFinRepFinpdf) accessed 12 October 2011
Ekins P and Speck S (eds) 2011 Environmental Tax Reform (ETR) A Policy for Green Growth Oxford University Press
EREC 2008 Energy [r]evolution A sustainable global energy outlook Greenpeace International European Renewable Energy Council (EREC)
References
References
Environmental tax reform in Europe opportunities for eco-innovation 39
Fagerberg J Mowery D C and Nelson R R (eds) 2005 The Oxford Handbook of Innovation Oxford University Press Oxford
Fischer C Parry I W H and Pizer W A 2003 Instrument choice for environmental protection when technological innovation is endogenous Journal of Environmental Economics and Management Vol 45 pp 523ndash545
Fraunhofer ISI ECOFYS Energy Economics Group Ruumltter + Partner SEURECO and LEI 2009 EmployRES mdash The impact of renewable energy policy on economic growth and employment in the European Union European Commission Brussels
Frondel M Horbach J and Rennings K 2008 What triggers environmental management and innovation Empirical evidence for Germany Ecological Economics Vol 66(1) pp 153ndash160
GHK Cambridge Econometrics and IEEP 2007 Links between the environment economy and jobs Final Report submitted to DG Environment European Commission
Giljum S Behrens A Hinterberger F Lutz C and Meyer B 2008 Modelling scenarios towards a sustainable use of natural resources in Europe Environmental Science and Policy Vol 11 pp 204ndash216
Goumlrlach B Knigge M and Luumlckge H 2005 Wirkungen der Oumlkologischen Steuerreform auf Innovation und Marktdurchdringung Ecologic Berlin (httpecologiceudownloadprojekte1850-189918791879_5_innovationpdf) accessed 18 August 2011
Green M A 2000 Photovoltaics technology overview Energy Policy Vol 28 (14) pp 989ndash998
Grossmann A Lehr U Lutz C and Wolter MI 2008 Gesamtwirtschaftliche Effekte der Umsetzung der EU Ziele im Bereich Erneuerbare Energien und Gebaumludeeffizienz in Oumlsterreich bis 2020 Studie im Auftrag des Lebensministeriums Wien 0508
Hage J and Hollingsworth J R 2000 Idea innovation networks a strategy for integrating organizational and institutional analysis Organization Studies Vol 21 (5) pp 971ndash1 004
Hauschildt J 2004 Innovationsmanagement Vahlen Muumlnchen
Hemmelskamp J 1997 Environmental policy instruments and their effects on innovation European Planning Studies Vol 5 (2) pp 177ndash195
Hoglund Isaksson L 2005 Abatement costs in response to the Swedish charge on nitrogen oxide emissions Journal of Environmental Economics and Management Vol 50 pp 102ndash120
Hullmann A 2001 Internationaler Wissenstransfer und technischer Wandel (dissertation) Physica-Verlag Heidelberg
IEA 2008 World Energy Outlook 2008 International Energy Agency Paris
IEA 2009 World Energy Outlook 2009 International Energy Agency Paris
Jacobsson S Andersson B A and Baringngens L 2002 Transforming the energy system mdash the evolution of the German technological system for solar cells Science and Technology Policy Research University of Sussex Electronic Working Paper Series No 84 (httpideasrepecorgpsrussewps84html) accessed 18 August 2011
Jaffe A and Stavins R 1995 Dynamic incentives of environmental regulations the effects of alternative policy instruments on technology diffusion Journal of Environmental Economics and Management Vol 29(3) pp 43ndash63
Jaffe A B and Palmer K 1997 Environmental regulation and innovation a panel data study The Review of Economics and Statistics Vol 79 pp 610ndash619
Jaffe A B Newell R G and Stavins R N 2002 Environmental policy and technological change Environmental and Resource Economics Vol 22 (1ndash2) 2002 pp 41ndash70
Johnstone N and Hascic I 2008 Renewable energy policies and technological innovation energy source and instrument choice in Environmental Policy Technological Innovation and PatentsOrganisation for Economic Co-operation and Development Paris
Johnstone N 2005 The Innovation Effects of Environmental Policy Instruments in Horbach J (ed) Indicator Systems for Sustainable Innovation Physica-Verlag HD
Environmental tax reform in Europe opportunities for eco-innovation
References
40
Johnstone N Hascic I and Ostertag K 2008 Environmental policy technological innovation and patent activity in Environmental Policy Technological Innovation and Patents Organisation for Economic Co-operation and Development Paris
Jung C Krutilla K and Boyd R 1996 Incentives for advanced pollution abatement technology at the industry level an evaluation of policy alternatives Journal of Environmental Economics and Management Vol 30(1) pp 95ndash111
Kammen D M Kapidia K and Fripp M 2004 Putting renewables to work how many jobs can the clean energy industry generate University of California Berkeley
Kemp R 1997 Environmental policy and technical change ndash a comparison of the technological impact of policy instruments Edward Elgar Cheltenham
Kemp R 1998 The diffusion of biological waste-water treatment plants in the Dutch food and beverage industry Environmental and Resource Economics Vol 12 pp 113ndash136
Kemp R 2000 Technology and environmental policy ndash innovation effects of past policies and suggestions for improvement in OECD proceedings ndash innovation and the environment Organisation for Economic Co-operation and Development Paris
Kerr S and Newell R G 2003 Policy-induced technology adoption evidence from the US lead phasedown Journal of Industrial Economics Vol 51 pp 317ndash343
Klaassen G Miketa A Larsen K and Sundqvist T 2005 The impact of RampD on innovation for wind energy in Denmark Germany and the United Kingdom Ecological Economics Vol 54 pp 227ndash240
Kline S and Rosenberg N 1986 An overview of innovation in Landau R (ed) The positive sum strategy Harnessing technology for economic growth pp 275-306
Knigge M and Goumlrlach B 2005 Effects of Germanys ecological tax reforms on the environment employment and technological innovation Ecologic Berlin (httpwwwumweltbundesamtdeuba-info-presse-ehintergrundoekosteuerpdf) accessed 18 August 2011
Langniss O 2003 Governance structures for promoting renewable energy sources dissertation Lund Stuttgart
Lanjouw J O and Mody A 1996 Innovation and the international diffusion of environmentally responsive technology Research Policy Vol 25 pp 549ndash571
Lehr U Nitsch J Kratzat M Lutz C and Edler D 2008 Renewable Energy and Employment in Germany Energy Policy Vol 36 pp 108ndash117 DOI101016jenpol200709004
Lehr U Wolter MI and Groszligmann A 2009 Economic impacts of RES obligations in Austria ndash an application of the macro-econometric model e3at GWS Discussion Paper 20091 Osnabruumlck
Lundvall B-A Johnson B Andersen E S and Dalum B 2001 National systems of production innovation and competence building Research Policy Vol 31 pp 213ndash231
Lutz C and Giljum S 2009 Global resource use in a business as usual world until 2030 Updated results from the GINFORS model in Bleischwitz R Welfens Pand Zhang Z (eds) Sustainable growth and resource productivity ndash economic and global policy issues Greenleaf Publishers pp 30ndash41
Lutz C and Meyer B 2008 Beschaumlftigungseffekte des Klimaschutzes in Deutschland Untersuchungen zu gesamtwirtschaftlichen Auswirkungen ausgewaumlhlter Maszlignahmen des Energie- und Klimapakets Forschungsbericht 205 46 434 Dessau-Roszliglau
Lutz C and Meyer B 2009a Environmental and Economic Effects of Post-Kyoto Carbon Regimes Results of Simulations with the Global Model GINFORS Energy Policy Vol 37 pp 1 758ndash1 766 DOI 101016jenpol200901015
Lutz C and Meyer B 2009b Scenario results from GINFORS PETRE working paper Osnabruumlck
Lutz C Meyer B Nathani C and Schleich J 2005 Endogenous technological change and emissions The case of the German steel industry Energy Policy Vol33 pp 1 143ndash1 154
Lutz C Meyer B Nathani C and Schleich J 2007 Endogenous innovation economy and environment impacts of a technology based modelling approach for energy-intensive industries in Germany Energy Studies Review Vol 15(1) pp 2ndash18
References
Environmental tax reform in Europe opportunities for eco-innovation 41
Lutz C Meyer B and Wolter M I 2009 The global multisectormulticountry 3-E model GINFORS mdash a description of the model and a baseline forecast for global energy demand and CO2 emissions Journal of Sustainable Development forthcoming
Malerba F and Orsenigo L 1997 Technological Regimes and Sectoral Patterns of Innovative Activities Industrial and Corporate Change Vol 6 (1) pp 83ndash117
Malerba F 1992 Learning by Firms and Incremental Technical Change The Economic Journal Vol 102 (413) pp 845ndash859
Malerba F 2005 Industrial dynamics and innovation progress and challenges Presidential Address delivered at the 32nd Conference of the European Association for Research in Industrial Economics (EARIE) 1ndash4 September 2005 Porto
Malerba F 2006 Innovation and the evolution of industries Journal of Evolutionary Economics Vol 16 pp 3ndash23
McGinty M and de Vries F P 2009 Technology diffusion product differentiation and environmental subsidies The BE Journal of Economic Analysis and Policy Vol 9(1)
Meyer B and Lutz C 2007 The GINFORS model ndash model overview and evaluation Petre Working Paper Osnabruumlck (httpwwwpetreorgukpapershtm) accessed 18 August 2011
Meyer B Lutz C Schnur P and Zika G 2007 Economic policy simulations with global interdependencies a sensitivity analysis for Germany Economic Systems Research Vol 19 pp 37ndash55
Mickwitz P H Hyvaumlttinen and P Kivimaa 2008 The role of policy instruments in the innovation and diffusion of environmentally friendlier technologies popular claims versus case study experiences Journal of Cleaner Production Vol 16(1S1) 162ndash170
Miketa A and Schrattenholzer L 2004 Experiments with a methodology to model the role of RampD expenditures in energy technology learning processes first results Energy Policy Vol 32 (15) pp 1 679ndash1 692
Milliman S R and Prince R 1989 Firm incentives to promote technological change in pollution control Journal of Environmental Economics and Management Vol 17 pp 247ndash265
Millock K and Nauges C 2006 Ex-post evaluation of an earmarked tax on air pollution Land Economics Vol 82(1) pp 68ndash84
Montero J-P 2002 Market structure and environmental innovation Journal of Applied Economics Vol 2 pp 293ndash325
Moreno B and Loacutepez A J 2007 The effect of renewable energy on employment mdash The case of Asturias (Spain) Renewable and Sustainable Energy Rewiews doi 101016jrser200610011
Mowery D and Rosenberg N 1979 The influence of market demand upon innovation A critical review of some recent empirical studies Research Policy Vol 8 pp 102ndash153
Newell R G Jaffe A B and Stavins R N 1999 The induced innovation hypothesis and energy-saving technological change Quarterly Journal of Economics Vol 114 pp 941ndash975
Norberg-Bohm V 1999 Stimulating green technological innovation An analysis of alternative policy mechanisms Policy Sciences Vol 32(1) pp 13ndash38
OECD 2009 Sustainable manufacturing and eco-innovation towards a green economy Organisation for Economic Co-operation and Development Policy Brief June 2009
OECD 2010 Taxation innovation and the environment Organisation for Economic Co-operation and Development
Pavitt K 1984 Sectoral patterns of technological change Towards a taxonomy and a theory Research Policy Vol 13 pp 343ndash373
Popp D 2002 Induced innovation and energy prices The American Economic Review Vol 92(1) pp 160ndash180
Popp D 2005 Lessons from patents Using patents to measure technological change in environmental models Ecological Economics Vol 54 pp 209ndash226
Environmental tax reform in Europe opportunities for eco-innovation
References
42
Porter M and van der Linde C 1995 Toward a new conception of the environment competitiveness relationship Journal of Economic Perspectives Vol 9(4) pp 97ndash118
Rammert W 2002 The cultural shaping of technologies and the politics of technodiversity In Sorensen K and Williams R (eds) Shaping technology guiding policy concepts spaces and tools Elgar Cheltenham pp 155-172
Requate T 2005 Dynamic incentives by environmental policy instruments ndash a survey Ecological Economics Vol 54 pp 175ndash195
Roloff N Lehr U Krewitt W Fuchs G Wassermann S Weimer-Jehle W and Schmidt B 2008 Success determinants for technological innovations in the energy sector mdash the case of photovoltaics in Moumlst D Fichtner W Ragwitz M and Veit D (eds) New methods for energy market modelling mdash Proceedings of the first european workshop on energy market modelling using agent-based computational economics Universitaumltsverlag Karlsruhe
Rothwell R 1995 The fifth generation innovation process in Oppenlaumlnder KH Popp W (eds) Innovationen und wirtschaftlicher Fortschritt betriebs-und volkswirtschaftliche Perspektiven Bern pp 9ndash26
Schumpeter J 1942 Capitalism socialism and democracy New York Harper
Skjaeligrseth J B and Christiansen A C 2005 Environmental policy instruments and technological change in the energy sector findings from comparative empirical research Energy and Environment Vol 17 (2) pp 223ndash241
Snyder L D Miller N H and Stavins R N 2003 The effects of environmental regulations on pollution emissions evidence from plant-level data American Economic Review Vol 93(2) pp 431ndash435
Technopolis 2008 Eco-innovation Final Report for Sectoral Innovation Watch (httpwwwtechnopolis-groupcomresourcesdownloads661_report_finalpdf) accessed 18 August 2011
Volleburgh H 2007 Impacts of environmental policy instruments on technological change Report for Joint Meetings of Tax and Environment Experts OECD Environment Directorate February 2007 (comenvepocctpacfa(2006)36final)
Zimmermann H Wohltmann M and Hansjuumlrgens B 1996 Umweltabgaben und Innovation Analytica Marburg
43
Annex 1
Environmental tax reform in Europe opportunities for eco-innovation
Type Instrument Area Stage
Reference
Theo
retica
l
Em
piric
al
Cas
e st
udy
Rev
iew
Qual
itat
ive
Taxe
s
Perm
its
Subsi
die
s
Volu
nta
ry
Com
man
d
Reg
ula
tion
Ener
gy
Air
Wat
er
Oth
er
Gen
eral
Innov
atio
n
Diffu
sion
Rel
evan
ce
Brunnermeier amp Cohen (2003)
X X X X
Buen (2006) X X X X X X
Christiansen amp Skjaerseth (2005)
X X X X X X
Fischer et al (2003 X X X X X X
Frondel et al (2008) X X X X X X X (X) (X)
Hemmelskamp (1997)
X X X X X X X (X)
Hoglund Isaksson (2005)
X X X (X) (X)
Jaffe amp Stavins (1995)
X X X1 X X X X
Jaffe amp Palmer (1997)
X X X X
Jaffe et al (2002) X X X X X X X X X X
Jung et al (1996) X X X X X X (X) (X)
Kemp (1998) X X X X
Kerr amp Newell (2001) X X X X X
Klaassen et al (2005)
X X X X X
Lanjouw amp Mody (1996)
X X X X X X X
McGinty amp de Vries (2009)
X X X X
Mickwitz et al (2008)
X X X X X X X X X
Milliman amp Prince (1989)
X X X X X X X
Millock amp Nauges (2006)
X X X X X X
Montero (2002) X X X X X
Newell et al (1999) X X1 X X X
Norberg-Bohm (1999)
X X X X X X X
Popp (2002) X X1 X X
Popp (2005) X X X X X X
Porter amp van der Linde (1995)
X X X X X X
Requate (2005) X X X X X X X
Skjaeligrseth amp Christiansen (2005)
X X X X X X X X X
Snyder et al (2003) X X X X X
Annex 1 Classification of refereed journal articles
Environmental tax reform in Europe opportunities for eco-innovation44
Annex 2
Type Instrument Area Stage
Reference
Theo
retica
l
Em
piric
al
Cas
e st
udy
Rev
iew
Qual
itat
ive
Taxe
s
Perm
its
Subsi
die
s
Volu
nta
ry
Com
man
d
Reg
ula
tion
Ener
gy
Air
Wat
er
Oth
er
Gen
eral
Innov
atio
n
Diffu
sion
Rel
evan
ce
Johnstone (2005)
X X X X X X X
Johnstone amp Hascic (2008)
X X X X X X X X
Kemp (1997) X X X X X X X X X X X X X
Kemp (2000) X X X X X X X X X
de Vries amp Medhi (2008)
X X1 X X X
Annex 2 Classification of books and book chapters
45
Annex 3
Environmental tax reform in Europe opportunities for eco-innovation
Type Instrument Area Stage
Reference
Theo
retica
l
Em
piric
al
Cas
e st
udy
Rev
iew
Qual
itat
ive
Taxe
s
Perm
its
Subsi
die
s
Volu
nta
ry
Com
man
d
Reg
ula
tion
Ener
gy
Air
Wat
er
Oth
er
Gen
eral
Innov
atio
n
Diffu
sion
Rel
evan
ce
Goumlrlach et al (2005)
X X X X X X
Knigge amp Goumlrlach (2005)
X X X X X X
Technopolis (2008)
X X X X X X
Volleburgh (2007)
X X X X X X X X X X X
Annex 3 Classification of reports
European Environment Agency
Environmental tax reform in Europe opportunities for eco-innovation
2011 mdash 45 pp mdash 21 x 297 cm
ISBN 978-92-9213-238-5doi10280084889
How to obtain EU publications
Publications for salebull viaEUBookshop(httpbookshopeuropaeu)bull fromyourbooksellerbyquotingthetitlethepublisherandorISBNnumberbull bycontactingoneofoursalesagentsdirectlyYoucanobtaintheircontactdetails
on the Internet (httpbookshopeuropaeu) or by sending a fax to +352 2929-42758
Free publicationsbull viaEUBookshop(httpbookshopeuropaeu)bull attheEuropeanCommissionsrepresentationsordelegationsYoucanobtain
their contact details on the Internet (httpeceuropaeu) or by sending a fax to +352 2929-42758
European Environment AgencyKongens Nytorv 61050 Copenhagen KDenmark
Tel +45 33 36 71 00Fax +45 33 36 71 99
Web eeaeuropaeuEnquiries eeaeuropaeuenquiries
TH
-AK-1
1-0
17-E
N-N
doi1
02
8008
4889
- Acknowledgements
- Executive summary
- 1Introduction
-
- 11Background
- 12ETR and innovation
- 13Report structure
-
- 2Review of literature on environmental tax reform and eco‑innovation
-
- 21Initial screening
- 22Detailed review
- 23Environmental regulation studies
- 24Theoretical studies
- 25Empirical studies
- 26Case studies
- 27Conclusions
-
- 3Modelling of ETR impacts on eco‑innovation
-
- 31Scenarios assessing the implications of ETR for eco-innovation
- 32Overview of modelling results
- 33Macroeconomic impacts at the national level
- 34Conclusions of the scenario assessment
-
- References
- Annex 1 Classification of refereed journal articles
- Annex 2Classification of books and book chapters
- Annex 3Classification of reports
-
Environmental tax reform in Europe opportunities for eco-innovation
Review of literature on environmental tax reform and eco-innovation
20
production (26) The analysis is based on survey responses from 899 firms in Germany Latent variable equations for EMS adoption and innovation are estimated simultaneously with each equation including the same four sets of variables relating to motivations policy instruments pressure groups and facility characteristics (27) The policy instrument variables include five dummy variables indicating the importance of different types of policy instrument including market-based instruments such as emission taxes and tradable permits While the perceived stringency of environmental policy is found to be a significant factor in the decision to innovate there is no evidence that any of the individual policy instrument variables had any impact The authors surmise that this suggests that it is stringency of environmental policy rather than the choice of specific instrument that is important for innovation However as the authors note their results reflect the perceptions of the survey respondents and should therefore be treated as correlations rather than causal relationships
Johnstone and Hascic (2008) assess the impact of a range of environmental policy instruments mdash including tax measures and investment incentives mdash on innovation in the renewable energy field They analyse the impacts for five different groups of renewable energy technologies mdash wind solar ocean biomass and waste-to-energy mdash using a panel dataset of European Patent Office (EPO) patent filings for these technologies across 26 countries over the period 1978ndash2003 A fixed effects negative binomial model is estimated controlling for electricity prices and consumption public sector RampD expenditure (as a proxy for scientific capacity) and total EPO filings (as a proxy for differenceschanges in patenting propensity) The various policy instruments are represented by dummy variables indicating whether they were in place in a particular year As such the model takes no account of the stringency of the instruments mdash in particular the differing magnitudes of the tax measures and investment incentives (28)
Initially the authors estimate the model with all of the policy instruments included individually They find that while public policy plays an important role in inducing innovation the impacts of the individual instruments vary across the different technologies In particular tax measures are significant for wind and biomass technologies with investment incentives being significant for solar and waste-to-energy technologies and obligationstradable certificates being significant for wind technologies However the authors express concerns that there may be multicolinearity between the policy variables (particularly between investment incentives tax measures and tariffs) and also that there may be interaction effects between some of the variables Consequently they estimate two alternative versions of the model the first using a composite policy variable representing the number of policy instruments in place and the second using clusters of similar policy instruments (29) The results or these two models confirm the initial findings The composite policy variable is significant for all of the technology groups while the significance of the clusters varies across technologies The price-based cluster is (highly) significant for solar biomass and waste-to-energy The quantity-based cluster is significant for wind technologies The authors surmise that this may be due to the different economic characteristics of the technologies For example the significance of investment incentives for solar and waste-to-energy may reflect the capital intensity of these technologies with large up-front investment costs
De Vries and Medhi (2008) also use patent data to investigate the relative importance of environmental regulations and fuel prices on innovation in automotive emission-control technologies distinguishing between post-combustion devices and engine redesign technologies They estimate a panel data model using data from Germany Japan and USA over the period 1978ndash2001 controlling for industry value added (as a proxy for the scope of technological opportunities) and total patent
(26) The next question on the survey asks whether these are changes in production processes or end-of-pipe technologies However no distinction is made between these two types of innovation in the present study
(27) In order to avoid identification problems some individual variables are omitted from one equation or the other(28) This shortcoming is recognised by the authors who state that it is unavoidable in any cross-comparative analysis in which multiple
instruments are included(29) The clusters are price-based instruments (investment incentives tax measures and tariffs) quantity-based instruments (obligations
and tradable certificates) and voluntary programmes
Review of literature on environmental tax reform and eco-innovation
Environmental tax reform in Europe opportunities for eco-innovation 21
applications (as a proxy for differenceschanges in patenting propensity) Environmental regulation is represented by two dummy variables indicating the introduction of on-board diagnostic (OBD) regulations in USA (30) The results of the analysis suggest that the relative impacts of regulation and market forces differ between the two types of technology For post-combustion technologies both of the regulations are significant while fuel prices have no significant impact In contrast the opposite is the case for engine redesign technologies with fuel prices having a significant impact but regulation having no discernable effect While the analysis does not explicitly consider the impact of fuel taxes it suggests that an increase in automotive fuel taxes would have a major impact on innovation in relation to engine design The estimated coefficient for fuel prices (1287) implies that a USD 010 increase in fuel prices would induce a 14 increase in patenting activity (31)
Key findings of the empirical studies
The empirical studies considered above cover a range of different technology areas spanning energy efficiency (both product and process) renewable energy and air and water pollution abatement While in some cases they assess the impact of energy prices rather than environmental taxes per se they provide a clear picture of the likely impact of environmental and energy-related taxes on eco-innovation
Three of the studies assess the impact on diffusion of existing technologies All find that environmental taxesenergy prices have a positive impact on diffusion In particular the water effluent charges in The Netherlands appear to have had a major impact on the adoption of waste-water treatment equipment by the food and beverage industry in that country However there is some evidence to suggest that the effectiveness of taxesprices may vary across sectors (eg NOXSO2 abatement in France) and that investment incentivessubsidies may be more
effective in some cases (eg thermal insulation in USA)
Three of the studies use patent data to assess the impact of environmental taxes and energy prices on innovation with one of these also assessing the impact of investment incentives All find a significant positive impact although this depends on the particular sub-sector (eg renewable energy) or the type of innovation In particular the evidence from the automotive emissions control study suggests that taxesprices may be more effective in promoting process-related innovation (eg engine redesign) than innovation in end-of-pipe technologies One of the studies takes a different approach using a product-characteristics model to decompose improvements in the energy efficiency of consumer durables This finds that while electricity prices did not appear to affect overall technological change (ie shifts in the product costenergy efficiency frontier) they did have a positive impact on directional technological change (ie the slope of the frontier)
26 Case studies
Christiansen and Skjaerseth (2005) undertake a comparative analysis of the impacts of climate change policies on the petroleum sectors in Norway and the Netherlands during the 1990s These countries were selected because of their very different policy approaches with the Norwegian petroleum sector subject to a carbon dioxide (CO2) tax since 1991 as part of a portfolio of measures (32) and the Netherlands relying on a series of voluntary agreements on energy efficiency (33) Both approaches appear to have been effective in that CO2 emissions per unit production fell by around 22 between 1990 and 2001 in Norway while energy efficiency improved by around 35 in the Netherlands over the same period However there were marked differences between the two countries in terms of the nature of the innovation that
(30) Because of the international nature of the automotive industry and the importance of the US market regulations introduced in USA appear to have been an important driver for innovation by overseas manufacturers Regulations mandating the installation of OBD systems were first introduced in California in 1988 A more sophisticated system was mandated by the 1990 US Clean Air Act Amendments taking force in 1996
(31) The coefficient represents the semi-elasticity of patent applications with respect to fuel prices While the authors do not state so explicitly the implication is that prices are expressed in US dollars (they are obtained from the IEA Energy Prices and Taxes Database) Consequently the impact of a 10 US cent increase in the fuel prices is given by exp(1287 x 01) ndash 1 = 0137
(32) In addition to the tax the portfolio included publicly funded RampD support schemes gas flaring permits and mandatory environmental impact assessments
(33) The Dutch oil and gas industry first signed a declaration of intent with the government in 1995 This was translated into a long-term agreement (LTA) on energy efficiency in the following year with an improvement target of 20 over the period 1989ndash2000 In 2001 a new LTA was signed which committed firms to implementing energy efficiency measures with a positive NPV at a 15 discount rate or a five year payback period
Environmental tax reform in Europe opportunities for eco-innovation
Review of literature on environmental tax reform and eco-innovation
22
occurred In the Netherlands technological change was incremental reflecting a steady diffusion of available (ie known) technology In contrast the authors find evidence of more radical innovations and adaptations by the Norwegian petroleum sector including the development of energy-efficient gas turbines installation of waste heat recovery units process modifications and improved use of process heat While the authors acknowledge the impossibility of proving a causal link between policy intervention and innovation (in the context of their case study) they conclude that the CO2 tax played a key role in the development and implementation of these radical innovations and the benefits of reduced tax payments provided an important incentive However they also conclude that the impacts of the two instruments were conditioned by the political contexts in which they were applied and the problem characteristics in the respective countries (eg the economic significance of the sector and the size of installations)
Knigge and Goumlrlach (2005) summarise the findings of a comprehensive analysis of the impacts of the ETR in Germany That analysis undertaken jointly by Ecologic and the German Institute for Economic Research (DIW Berlin) included the impacts on innovation and market diffusion of environmentally friendly products and technologies (34) Based on a series of case studies the study concluded that the ETR had a noticeable effect on innovation and diffusion although it was not possible to quantify the scale of that effect In particular ETR is identified as being a central factor in the development of gas-powered vehicles The study identifies a number of different routes by which the ETR produced impacts First the payback period for energy-efficient products was reduced as a result of the energy tax increases and the various exemptions favouring efficient energy use and renewable energy sources Second the predictable nature of the energy taxes (as opposed to widely fluctuating oil prices) reduced uncertainties about the benefits of energy-efficiency investments Third the reduction in employers social contribution payments tended to reduce the costs of labour intensive innovation processes such as research and development energy consultancy and technology installation Finally the ETR had a signalling effect strengthening awareness of the need for more efficient and rational energy use
Mickwitz et al (2007) examine a number of claims that have been made in the environmental policy literature about the relationship between policy instruments and innovation based on experiences in two industrial sectors in Finland pulp and paper and the manufacture of diesel engines for ships In particular they assess the claims that environmental taxes are superior to other policy instruments with respect to innovation and that RampD subsidies have limited impacts on innovation With respect to the first claim the evidence provided by the two case studies is mixed The authors conclude that energy taxation had a negligible impact on innovation in the pulp and paper industry However this is likely to have been due to the low level of the tax and the exemptions that applied to the sector In contrast they find that the differentiation of Swedish fairway and port fees (on the basis of SO2 and NOX emissions) was a significant factor driving the installation of in-engine NOX reduction equipment in ferries operating between the two countries (35) With respect to RampD subsidies the authors conclude that the evidence does not support the claim that these have little effect In particular they find that RampD subsidies accelerated the development of ship engine emissions-reduction technologies
The findings of the three case studies are consistent with those of the empirical analyses reviewed in the previous section Environmental taxes and investment subsidies have proven significant in promoting both innovation and diffusion although not universally so Furthermore the case studies provide some useful insights about the ways in which the impacts occur and the factors that may be important in promoting innovation In particular they suggest the need for a tax rate that is sufficiently high to provide a meaningful incentive and signalling effect and that is fixed for a sufficiently long period of time to reduce uncertainty about the future benefits of investment
27 Conclusions
The studies reviewed in the preceding sections suggest that environmental regulation in general and price-based policy instruments such as environmental taxes and investment subsidies in particular can (in theory) and do (in practice) have a positive impact on both innovation and diffusion
(34) A separate report in German by Goumlrlach et al (2005) provides details of the evaluation of the innovation and diffusion impacts (35) Although the tax was introduced in Sweden it was also payable by Finnish ferry operators entering Swedish ports and hence
affected their investment decisions This is another example of the cross-border impact of environmental policy interventions on innovation found by Lanjouw and Mody (1996) (see Section 23)
Review of literature on environmental tax reform and eco-innovation
Environmental tax reform in Europe opportunities for eco-innovation 23
of environmental technologies However the supporting empirical and case study evidence is not universal and the effectiveness of these instruments would appear to vary across different sectors and different types of innovation
To a certain extent such differences can be explained by the theoretical models In particular the impact of environmental taxes (relative to other instruments) is predicted to depend on the competitive structures of the markets in which the regulated firms operate and on the ability of innovator firms to appropriate the benefits accruing to other firms during diffusion However a number of other potential factors have been identified in the literature which may affect the impact of price-based policy instruments on innovation
Jaffe et al (2002) caution that the impact of price-based policy instruments on technology diffusion may be adversely affected by a number of potential market failures including information failures principle-agent problems (eg landlord-tenant) capital market failures and positive adoption spillovers In addition while not market failures as such uncertainty over future returns and the (associated) use of high discount rates for investment decisions can also undermine the effectiveness of price-based instruments in stimulating diffusion However as was noted above the findings from the case study of ETR in Germany suggest that an environmental tax may actually reduce the level of uncertainty over future returns provided that it is of sufficient magnitude and longevity
Skjaerseth and Christiansen (2005) emphasise that the relationship between policy instruments (of all types) and technological change is extremely complicated They argue that account must be taken of the politicalindustrial context in which policy instruments are introduced and the nature of the environmental problem that they are intended to address In particular they make a distinction between malign problems where technological change involves net costs for target groups and benign problems where there are widespread no-regret opportunities for change Based on a comparative analysis of four different case studies they conclude that mandatory policy instruments (including environmental taxes) are more effective
in promoting short-term technological change when the problems are malign but that low legitimacy (with the target group) may undermine long-term technological change However when problems are benign or when long-term change requires cooperation voluntary policy instruments are likely to be more effective
Johnstone (2005) questions the focus of the theoretical and empirical analyses (reviewed above) on the impact of environmental policy instruments on the rate of technological change He argues that the direction of technological change is as important if not more so In addition to the quantity of innovation it is also important that innovation be socially optimal in the sense that it minimises the cost of attaining a particular environmental goal in the long term Inappropriate innovation today may result in lock in to a suboptimal technological path for the future
With this in mind Johnstone identifies a number of issues that can adversely affect the direction of innovation and should be taken into account when selecting and designing policy instruments technological market failures (36) missing markets for certain environmental attributes of innovation policy incidence and joint production of emissions Most studies of the innovation effects of environmental policy instruments assume that the only missing market is that for the environmental good (or bad) However in practice there may be other markets that are missing (or incomplete) which can adversely affect transmission of innovation incentives This is particularly so in the area of waste and resource management where instruments applied at the end of the product life cycle may have little or no impact on product design innovation Even if all markets are complete except for the environmental externality the point of incidence of the policy intervention may be more important for the direction of innovation than the choice of a particular policy instrument For example a limit or standard applied directly to the emissions of a pollutant may be more effective in promoting optimal innovation than a tax applied to a proxy input variable Finally when there is joint production of pollutants (eg CO2 and air pollutants from vehicle engines) there is a danger that if policy instruments (of whatever type) are applied to one pollutant in isolation the resulting innovation may
(36) These are the same market failures identified by Jaffe et al (2002)
Environmental tax reform in Europe opportunities for eco-innovation
Review of literature on environmental tax reform and eco-innovation
24
reduce emissions of that pollutant at the expense of increases in the others
In a related point Johnstone highlights the importance of using appropriate indicators when assessing the impact of policy instruments on innovation emphasising the need for these to reflect both the rate of innovation and the direction A necessary condition for this is that the indicators must provide an accurate and detailed picture of actual innovation Unfortunately this is difficult to achieve in practice For example the use of patent data as a measure of innovation requires the identification of relevant environmental technologies This is likely to be easier for end-of-pipe technologies than for process-related technologies meaning that the latter tend to be under-represented relative to their actual incidence To the extent that process-related innovation is growing in importance or is more important
for certain sectors or types of environmental problem changes in the value of the indicator may significantly understate the actual rate of innovation and misrepresent the direction
All of this suggests that caution should be exercised in drawing general definitive conclusions about the impacts of price-based policy instruments such as environmental taxes and investment subsidies on innovation particularly relative to other policy instruments While it would appear that they can be effective in stimulating both innovation and diffusion in many cases mdash at least in terms of the rate of technological change mdash there may be situations in which other policy instruments may be more appropriate In general the stringency and point of incidence of an environmental policy intervention may be more important than the choice of a particular policy instrument in determining the rate and direction of eco-innovation
25
Modelling of ETR impacts on eco-innovation
Environmental tax reform in Europe opportunities for eco-innovation
31 Scenarios assessing the implications of ETR for eco-innovation
Scenario analysis provides a useful means of improving understanding of how the different revenue recycling methods and various scales of ETR can help meet different greenhouse gas emissions targets
To investigate the impacts of an ETR for Europe the petre project elaborated a range of different scenarios reflecting various tax reform options In addition to employing several of these original scenarios the present study compiled two new scenarios to analyse the implications of ETR for eco-innovation All scenarios were examined in both E3ME and GINFORS (37)
311 Original petre project scenarios
The key petre scenarios relevant for the present study are
bull scenarioBHbaselinescenariowithhighenergyprice (reference case)
bull scenarioS1HETRdesignedtomeettheEUsunilateral 2020 GHG target (high energy price) with revenue recycling
bull scenarioS2HETRdesignedtomeettheEUsunilateral 2020 GHG target (high energy price) with revenue recycling and 10 of revenues spent on eco-innovation measures
Each of the ETR scenarios has the same key taxation components
bull acarbontaxrateisintroducedtoallnon-EUEmissions Trading System (EU ETS) sectors equal to the carbon price in the EU ETS that delivers an overall 20 reduction in greenhouse gas emissions by 2020 and in the international cooperation scenario this is extended to 30
bull aviationisincludedintheEUETSattheendofPhase 2
bull powergenerationsectorEUETSpermitsare100 auctioned in Phase 3 of the EU ETS
bull allotherEUETSpermitsare50auctionedin2013 increasing to 100 in 2020
bull materialtaxesareintroducedat5oftotalpricein 2010 increasing to 15 by 2020
In scenario S1H environmental tax revenues are recycled through reductions in income tax rates and social security contributions in each of the Member States such that there is no direct change in tax revenues In scenario S2H 10 of environmental tax revenues are recycled through spending on eco-innovation measures and the remaining 90 is recycled through the same measures as in the other scenarios The eco-innovation spending is split across power generation and housing according to tax revenues from the corporate and household sector
In GINFORS (the model used for analysing the implications of ETR and eco-innovation) the share of renewable sources in electricity production is increased due to the additional investment The rest of additional investment goes to household energy efficiency spending Investment needed for a certain increase in renewable energy production or efficiency improvement is based on Austrian and German experience (Lehr et al 2008 and 2009 Grossmann et al 2008 Lutz and Meyer 2008) This assumption is quite conservative as parameters for other countries can be assumed to be more positive (meaning that less money is needed for renewable energy technology installation or energy efficiency gains)
In scenario S1H the 20 GHG target translates into a 15 reduction in energy-related carbon emissions relative to 1990 as other emissions such as methane and nitrous oxide have already been reduced by
3 Modelling of ETR impacts on eco-innovation
(37) The E3ME and GINFORS models are introduced in Chapter 1 of the present report A detailed discussion of the models and scenarios used in the present study can be found in Ekins and Speck (2011)
Environmental tax reform in Europe opportunities for eco-innovation
Modelling of ETR impacts on eco-innovation
26
more than 20 (in terms of carbon equivalents) The target is reached by a tightened EU ETS cap and the introduction of a carbon tax on the non-ETS sector The tax rate applied is equal to the carbon price in the EU ETS that will deliver a 20 GHG reduction by 2020
The burden of ETR taxes are allotted to energy outputs (ie the final use of energy) and will be based on the carbon content of each fuel Carbon prices are assumed to be fully passed on to consumers All carbon taxes are in addition to any existing unilateral carbon and energy taxes The carbon reductions in the different EU Member States will be those that result from a uniform carbon tax increase across the EU
All of the revenues including EU ETS auctioning revenues carbon tax revenues and material tax revenues will be recycled The proportion of tax raised by industry will be recycled into a reduction in employers social security contributions which will in turn reduce the cost of labour Recycling will be additional to the existing ETRs in some Member States Revenues raised from households will be recycled through standard rate income tax reductions Traditional energy tax revenues will be lower compared to their respective baselines as the tax base (energy consumption) is reduced So for an ETR revenue-neutrality does not mean budget-neutrality
312 Factors affecting the macroeconomic impacts of RES technologies
Earlier analyses (Lehr et al 2008 Fraunhofer ISI et al 2009 DTI 2004 Kammen et al 2004 Moreno and Loacutepez 2007) have studied the impacts of large renewable energy source (RES) shares in the energy mix for different countries The overall question in these studies has been the impact of increasing RES shares on the economy especially on the labour market For the present study it is interesting to note that macroeconomic impacts of higher RES shares mainly depends on the following five factors
1 additional investment in RES (minus lower investment in conventional sources ie fossil and nuclear power) with the impact increasing if a country manufactures the RES technology in question
2 additional (net) exports due to improved international competitiveness of renewable energy sources (first mover advantage)
3 lower fossil fuel needs4 the cost differences between RES and
conventional energy
5 the shift from capital- and energy-intensive industries to labour- and technology-intensive industries
All five factors are driven by international energy prices carbon prices the policy framework and RES technology development itself Innovation comes into the play at various stages First innovation drives the currently positive additional costs of RES technologies down and even into negative realms depending on the fossil fuel scenario Second innovative RES technologies are likely to have a competitive advantage in international markets Although a significant proportion of RES technology produced in Europe is traded in Europe innovation will still provide an edge in current and emerging international markets
The EmployRES study (Fraunhofer ISI et al 2009) finds for Europe that current strong investment reflected in installations in Europe and exports to the rest of the world dominate the economic impact of RES policies and therefore lead to positive overall effects The studys results suggest that this positive balance can only be kept up in the future if the competitive position of European manufacturers of RES technology is improved The authors strongly recommend policies which promote technological innovation in RES and lead to a continued and rapid reduction of their costs
Factors 1 and 2 will have substantial macroeconomic impacts in the short and medium terms whereas factor 3 accumulates and will show positive impacts mainly in the long term Factor 4 strongly depends on the global developments while factor 5 may have significant effects on employment
313 Additional scenarios
Impacts of additional investment (factor 1) have already been analysed in scenario S2H of the petre project To focus on the other impacts of eco-innovation two additional scenarios were designed building on scenario S2H of petre
bull S2HEETRwithrevenuerecyclingdesignedto meet the unilateral EUs 2020 greenhouse gas (GHG) target (high energy price) Ten per cent of revenues are spent on eco-innovation measures and trade shares of EU-27 economies with the rest of the world in machinery and electrical machinery increase by 01 due to the deployment of the fast growing RES markets This assumption is based on the strong EU policy effort to increase the share of renewable energy in final energy consumption to 20 by 2020
Modelling of ETR impacts on eco-innovation
Environmental tax reform in Europe opportunities for eco-innovation 27
(Fraunhofer ISI et al 2009) and the possibility of very strong world market development of the RES sector until 2020 (EREC 2008) which offers additional export opportunities for European RES industries
bull S2HIETRwithrevenuerecyclingdesignedto meet the unilateral EUs 2020 GHG target (high energy price) Ten per cent of revenues are spent on eco-innovation measures and input structures of the energy sector are changed according to the input structure of the German RES industry (Lehr et al 2008)
S2HE looks at the possible role of international trade S2HI analyses changes in the input structure of the energy sector ie from conventional electricity production to renewables In the petre project (as in GHK et al 2007) only the energy inputs of the energy sector were adapted to changes in the energy input mix
Both S2HE and S2HI focus on RES and efficiency technologies As mentioned above an ETR will trigger a variety of innovations Therefore the results can be thought of as conservative in the sense that innovations (eg automotive energy consumption industrial efficiency etc) are not explicitly included
32 Overview of modelling results
The main results of the simulations are presented in Table 31 In the baseline scenario BH with high energy prices EU-27 carbon emissions will be
72 below the 1990 level in 2020 (38) The EU-15 has committed in the Kyoto Protocol to reduce its GHG emissions 8 below 1990 levels in the period 2008ndash2012 As emissions in the new member states are substantially below their 1990 levels today that implies that the EU-27 will keep its emissions more or less constant over the coming decade As in the PRIMES baseline an ETS price of 18 EURt in 2008 prices is assumed in 2020
In scenario S1H the ETS price and carbon tax rate has to be increased to 68 EUR2008t of CO2 to reach the 20 GHG reduction target which is equal to a 15 reduction of CO2 emissions against 1990 as other greenhouse gases have already been reduced above average by more than 20 in terms of CO2 equivalents Compared to the baseline CO2 emissions are 84 lower in 2020 which means roughly an additional 1 reduction annually in the period 2012ndash2020 GDP will be about 06 lower compared to the baseline in 2020 This means that annual average growth rates will be less than 01 below their baseline development This is especially low compared to the current financial and economic crisis with a GDP deviation against the baseline of around 6 in 2009
As the recycling mechanism reduces labour costs and the tax burden is shifted from labour-intensive to carbon- and material-intensive sectors employment will be 036 (or more than 800 000 jobs) higher than in the baseline The ETR is not fully budget neutral potentially enabling EU economies to slightly increase their net savings If
(38) The modelling exercise in the present study was conducted in 2009 and therefore does not contain the latest data on EU-27 GHG emissions which were significantly influenced by the global economic slump of the late-2000s
Table 31 Main results under the different scenarios
Scenario Target in 2020 CO2 price GDP Employment CO2 reduction
EUR2008t pc against baseline
pc against baseline
pc against 1990
pc against baseline
in year 2020 2015 2020 2020 2020 2020
BH 18 ndash 72 00
S1H 20 GHG 68 ndash 022 ndash 057 036 ndash 151 ndash 84
S2H 20 GHG 61 ndash 013 ndash 030 041 ndash 152 ndash 85
S2HE 20 GHG 61 ndash 009 ndash 004 051 ndash 151 ndash 84
S2HI 20 GHG 61 ndash 006 ndash 024 045 ndash 152 ndash 84
Environmental tax reform in Europe opportunities for eco-innovation
Modelling of ETR impacts on eco-innovation
28
this extra saving is spent negative GDP impacts will be further reduced
In scenario S2H part of the revenues is invested in low-carbon technologies This reduces the carbon price to 61 EUR2008t in 2020 halving the GDP loss relative to scenario S1H to only 03 as the investment in renewable energies is assumed to be additional Employment impacts are also more positive than in scenario S1H The 10 investment in low-carbon technologies amounts to more than EUR 20 billion in 2020
Assuming additional EU exports of RES technologies in scenario S2HE GDP almost matches the baseline in 2020 and employment is 051 (or more than 1 million jobs) higher than in the baseline In scenario S2HI a shift in the input structure of the energy sector towards machinery
and electrical machinery reflecting the different nature of RES relative to conventional electricity generation also has smaller additional positive impacts on GDP and employment compared to scenario S2H
The following figures show impacts of the different scenarios in comparison to the baseline BH As Figure 31 illustrates all the alternative scenarios imply GDP lower than the baseline However comparing scenario S1H with the other three scenarios shows that additional RES investment (S2H) additional RES exports (S2HE) and the inclusion of different input structures of the RES industries (S2HI) each have positive GDP impacts These results are in line with model-based analysis in the EMPLOY-RES study (Fraunhofer ISI et al 2009)
Figure 31 EU-27 GDP according to four scenarios mdash deviation from the baseline (BH)
Percentage deviation from the baseline (BH)
ndash 100
ndash 080
ndash 060
ndash 040
ndash 020
0002010 2015 2020
S2HI S1H S2H S2HE
Modelling of ETR impacts on eco-innovation
Environmental tax reform in Europe opportunities for eco-innovation 29
In contrast to GDP employment increases relative to the baseline in all the alternative scenarios (Figure 32) Due to the scenario design the structure of the EU economies is shifted from energy-intensive to labour-intensive sectors The magnitude of the employment gain is influenced by the carbon price and the tax shift the underlying energy prices and the production loss The largest part of the employment increase stems from the additional RES investment (scenario S2H) although a shift in industry structures (S2HI) and additional RES exports (S2HE) are also positive for the labour market
33 Macroeconomic impacts at the national level
In general terms it is clear that national ETS and ETR impacts depend significantly on country specifics including energy use economic structure social system and behaviour (eg reactions to labour cost changes) In countries with high carbon intensity in their energy mix additional revenues and expenditures are higher than in countries with lower carbon intensity
Scenario S2H provides an interesting tool for analysing the macroeconomic impacts of ETR at the national level because 10 of the additional generated revenues are used for eco-innovation investments meaning that only 90 of the revenues are recycled back into the economy by reducing income tax rates and social security contributions
Figure 32 EU-27 employment according to four scenarios mdash deviation from the baseline (BH)
ndash 020
000
020
040
060
2010 2015 2020
S2HI S1H S2H S2HE
Percentage deviation from the baseline (BH)
Environmental tax reform in Europe opportunities for eco-innovation
Modelling of ETR impacts on eco-innovation
30
Figure 34 GDP in 2020 in EU-27 Member States under scenario S2H mdash deviation form the baseline (BH)
Figure 33 GDP in 2020 in selected countries under scenario S2H mdash deviation from the baseline (BH)
ndash 25 ndash 20 ndash 15 ndash 10 ndash 05 00 05 10 15
Romania
Bulgaria
SloveniaMalta
Lithuania
Latvia
Estonia
CyprusSlovakia
Poland
Hungary
Czech RepublicUnited Kingdom
Sweden
Spain
Portugal
Netherlands
Italy
Ireland
Greece
FranceFinland
Denmark
Luxembourg
Belgium
Austria
Germany
Percentage deviation from the baseline (BH)
Russia
South Africa
Brazil
India
China
Mexico
Japan
USA
Poland
United Kingdom
Spain
Italy
France
Germany
ndash 30 ndash 25 ndash 20 ndash 15 ndash 10 ndash 05 00 05 10
Percentage deviation from the baseline (BH)
Modelling of ETR impacts on eco-innovation
Environmental tax reform in Europe opportunities for eco-innovation 31
Figure 35 Employment in 2020 in EU-27 Member States under scenario S2H mdash deviation from baseline (BH)
EU-27EU-15
RomaniaBulgariaSloveniaMalta
LithuaniaLatvia
EstoniaCyprusSlovakia
PolandHungary
Czech RepublicUnited Kingdom
SwedenSpain
PortugalNetherlands
ItalyIrelandGreece
FranceFinlandDenmarkLuxembourg
BelgiumAustria
Germany
ndash 200 0 200 400 600 800 1 000
Percentage deviation from the baseline (BH)
Under scenario S2H the GDP of large EU economies deviates from baseline projections by between 0 and ndash 1 with the exception of Italy (Figure 33) Germanys GDP is even forecast to match the baseline level in 2020 due to the countrys strong RES industry Outside Europe some countries gain slightly against EU Member States in terms of competitiveness as export prices in most EU Member States and sectors increase and GDP in those countries exceeds the baseline projections as a result (Figure 33) This is mainly because carbon tax revenues are recycled via income tax reductions which are not part of production costs However energy exporting economies such as Russia or South Africa will lose exports if EU demand for fossil fuel imports declines The development of all EU Member States is shown in Figure 34
Employment impacts of scenario S2H are positive for almost all EU Member States as lower labour
costs increase labour demand and labour intensity (Figure 35) The highest absolute increases are shown for Germany the Netherlands Italy and the United Kingdom For EU-27 as a whole employment will be almost one million higher than in the corresponding baseline BH in 2020
The scenarios have not been designed with a view to meeting the EU renewables target of a 20 renewables share in final energy consumption in 2020 Nevertheless the scenarios provide some interesting insights The share is projected to increase from around 10 in 2009 to above 14 even in the baseline as instruments such as feed in tariffs and biofuel quotas will continue In scenario S1H the target will be missed with around 18 in 2020 Only in scenarios S2H S2HE and S2HI is the target met (approximately 20 )
Environmental tax reform in Europe opportunities for eco-innovation
Modelling of ETR impacts on eco-innovation
32
Under scenario S2H energy-related carbon emissions are reduced in all EU Member States relative to the baseline (Figure 36) The highest percentage reductions can be seen in many of the EU-12 Member States with still high energy intensity and low energy prices In these countries the relative price increase is higher than in countries like Germany or the United Kingdom with already high energy taxes and overall energy prices
Additional ETS revenues material tax revenues and carbon tax revenues from the industry sector are recycled back to industry via reductions in employers social security contributions (or wage subsidies in some countries) The revenues from the carbon tax on households set out in Table 32 (totalling 033 of GDP in Germany for example) are used to reduce income tax For the EU-27 overall revenues from ETS and ETR reach about 2 of GDP in 2020 although these figures may be excessive because additional EU efforts to increase energy
efficiency and renewable energy which will reduce the ETS price are not taken into account The use of flexible tools such as the Clean Development Mechanism will further reduce the revenues and earmarking of part of the revenues for mitigation and adaptation measures in emerging and developing countries limits the recycling into labour costs
In addition the scenarios do not take the current global economic problems into account According to the IEA (2009) the downturn will also reduce carbon emissions in the long run which will lead to lower carbon prices and revenues to reach fixed targets (or make tighter targets less costly)
The ETR will have varying effects on the prices of different sorts of products and services Material or carbon taxes increase the prices of product groups according to their direct and indirect material and carbon content The recycling mechanism reduces
Figure 36 Energy-related CO2 emissions in 2020 under scenario S2H mdash deviation from the baseline (BH)
WorldEU-27
EU-15Romania
BulgariaSlovenia
MaltaLithuania
LatviaEstonia
CyprusSlovakia
PolandHungary
Czech RepublicUnited Kingdom
SwedenSpain
PortugalNetherlands
ItalyIreland
GreeceFrance
FinlandDenmark
LuxembourgBelgium
AustriaGermany
ndash 25 ndash 20 ndash 15 ndash 10 ndash 5 0
Percentage deviation from the baseline (BH)
Modelling of ETR impacts on eco-innovation
Environmental tax reform in Europe opportunities for eco-innovation 33
Table 32 Additional ETS and environmental tax revenues in 2020 ( of GPD)
S2H Germany United Kingdom EU-27
ETS revenues 083 064 059
Carbon tax (industry) 052 044 054
Carbon tax (households) 033 041 036
Material tax 041 029 056
Sum 209 178 205
Figure 37 Total primary energy supply in 2020 under scenario S2H mdash deviation from the baseline (BH)
WorldEU-27EU-15
RomaniaBulgaria
Slovenia
MaltaLithuania
LatviaEstonia
Cyprus
SlovakiaPoland
HungaryCzech Republic
United KingdomSweden
SpainPortugal
NetherlandsItaly
IrelandGreece
FranceFinland
DenmarkLuxembourg
BelgiumAustria
Germany
ndash 24 ndash 21 ndash 18 ndash 15 ndash 12 ndash 9 ndash 6 ndash 3 0
Percentage deviation from the baseline (BH)
Environmental tax reform in Europe opportunities for eco-innovation
Modelling of ETR impacts on eco-innovation
34
Figure 38 Output price impacts of scenario S2H in Germany in 2020 mdash deviations from the baseline (BH)
Figure 39 Impacts of scenario S2H on industrial output in 2020 in Germany mdash deviations from the baseline (BH)
ndash 5
0
5
10
15
20
Output prices
Percentage deviation from the baseline (BH)
(3) F
ood
(4) T
extiles
(5) W
ood
(6) P
ulp pap
er
(7) C
oke re
fined
petro
leum
pro
ducts
(8) C
hemica
ls ex
cl pha
rma
(9) P
harm
aceu
ticals
(10)
Rub
ber a
nd plastics
(11)
Non
-metallic
miner
als
(12)
Iron
and
steel
(13)
Non
-ferrou
s metals
(14)
Met
al pro
ducts
(15)
Mac
hine
ry and
equ
ipmen
t
(16)
Office
mac
hine
ry
(17)
Electric
al m
achine
ry
(18)
Rad
io T
V
(19)
Med
ical pr
ecisi
on and
opt
ical ins
trumen
ts
(20)
Mot
or veh
icles
(21)
Ships
(22)
Airc
raft
(23)
Railro
ad
(24)
Man
ufac
turin
g n
ec r
ecyc
ling
(25)
Electric
ity g
as w
ater
sup
ply
(26)
Con
stru
ction
(27)
Tra
de r
epairs
(28)
Hot
els an
d re
stau
rant
s
(29)
Tra
nspo
rt an
d stor
age
(30)
Pos
t and
teleco
mmun
icatio
ns
(31)
Finan
ce ins
uran
ce
(32)
Rea
l estate ac
tivities
(33)
Ren
ting
(34)
Com
puter
(35)
Res
earch an
d de
velopm
ent
(36)
Oth
er bus
ines
s ac
tivities
(37)
Pub
lic ser
vice
s
(38)
Edu
catio
n
(39)
Hea
lth and
soc
ial w
ork
(40)
Oth
er ser
vice
s
(41)
Priv
ate ho
useh
olds
(1) A
gricu
lture
(2) M
ining an
d qu
arry
ing
nec not elsewhere classified
Production
ndash 100
ndash 80
ndash 60
ndash 40
ndash 20
00
20
40
60
80Percentage deviation from the baseline (BH)
(3) F
ood
(4) T
extiles
(5) W
ood
(6) P
ulp pap
er
(7) C
oke re
fined
petro
leum
pro
ducts
(8) C
hemica
ls ex
cl pha
rma
(9) P
harm
aceu
ticals
(10)
Rub
ber a
nd plastics
(11)
Non
-metallic
miner
als
(12)
Iron
and
steel
(13)
Non
-ferrou
s metals
(14)
Met
al pro
ducts
(15)
Mac
hine
ry and
equ
ipmen
t
(16)
Office
mac
hine
ry
(17)
Electric
al m
achine
ry
(18)
Rad
io T
V
(19)
Med
ical pr
ecisi
on and
opt
ical ins
trumen
ts
(20)
Mot
or veh
icles
(21)
Ships
(22)
Airc
raft
(23)
Railro
ad
(24)
Man
ufac
turin
g n
ec r
ecyc
ling
(25)
Electric
ity g
as w
ater
sup
ply
(26)
Con
stru
ction
(27)
Tra
de r
epairs
(28)
Hot
els an
d re
stau
rant
s
(29)
Tra
nspo
rt an
d stor
age
(30)
Pos
t and
teleco
mmun
icatio
ns
(31)
Finan
ce ins
uran
ce
(32)
Rea
l estate ac
tivities
(33)
Ren
ting
(34)
Com
puter
(35)
Res
earch an
d de
velopm
ent
(36)
Oth
er bus
ines
s ac
tivities
(37)
Pub
lic ser
vice
s
(38)
Edu
catio
n
(39)
Hea
lth and
soc
ial w
ork
(40)
Oth
er ser
vice
s
(41)
Priv
ate ho
useh
olds
(1) A
gricu
lture
(2) M
ining an
d qu
arry
ing
nec not elsewhere classified
Modelling of ETR impacts on eco-innovation
Environmental tax reform in Europe opportunities for eco-innovation 35
social security contributions and lowers labour costs according to the direct and indirect labour content of sector output The ETR therefore reduces output prices in labour-intensive service sectors and increases prices in carbon- and material-intensive industry sectors
The example of Germany shows insignificant impacts in the trade-intensive sectors of machinery (15ndash17) motor vehicles (20) and other transport equipment (21ndash23) (Figure 38) Iron and steel (12) and chemicals without pharmaceuticals (8) face the highest price increases of trade-intensive sectors As the German iron and steel industry primarily delivers high quality steel to the German car industry and increasingly to the German windmill industry negative competitiveness impacts will be limited Exchange rate variations against non-EU competitors have been much higher in the past
The higher prices of carbon- and material-intensive products will reduce price competitiveness on export markets and increase the market share for imports in domestic markets This loss of price competitiveness is based on an assumption of limited market development of energy efficiency and RES technologies in other part of the world It will be offset by gains in labour-intensive sectors if the ETR causes real wage costs per unit of output to fall as a result of using recycled revenues to reduce employer social security contributions
Any improvement in non-price competitiveness will also raise exports The extra employment will raise incomes raising consumption and output
The overall impact on sector output depends on countervailing effects which are negative for iron and steel and a few service sectors and positive for a few industry sectors For most industries the output effect is insignificant (Figure 39) The greatest impact is felt by producers of fossil fuels who must obviously reduce production due to lower demand for their products
Under scenario S2H employment impacts are positive for most sectors relative to the baseline as labour productivity decreases and wage rates fall in relation to consumer prices (CPI) and output prices (Table 33) The relative costs of labour are lower than in the baseline without the ETR reform Only around a quarter of the employment increase takes place in industry
Concerning the wage rate two countervailing effects have to be considered First when the labour market is characterised in terms of the real wage bargaining model as in E3ME and GINFORS with market power on both sides (employers and trade unions) consumer price increases will lead to wage increases (the econometrically estimated factor is 085 for Germany) Second labour productivity is another important factor for wage bargaining The estimated elasticity for Germany is 063 meaning that a 1 increase of labour productivity leads to wage increases of 063 Higher labour demand due to lower labour costs thus reduces the wage increase In the end the German economy is more labour intensive than without the ETR partly due to the structural change towards labour-intensive industries
Table 33 Employment impacts of scenario S2H in Germany mdash deviations from scenario S2H in 2020
Employment in 2020 Deviation from S2H () Deviation from S2Habsolute (1 000s)
Agriculture forestry 24 90
Industry 09 653
Non-metallic minerals 24 62
Iron and steel ndash 28 ndash 37
Machinery and equipment 05 56
Electrical machinery 04 18
Construction 37 449
Trade and transport 10 829
Business services 17 767
Other services ndash 02 ndash 216
Total 07 2506
Environmental tax reform in Europe opportunities for eco-innovation
Modelling of ETR impacts on eco-innovation
36
Additional exports under scenario S2HE mainly create new jobs in machinery and related business services (Table 34) Under scenario S2HI a shift in the input structure of the energy sector leads to a shift in the industry structure and creates a few jobs in the service sector (Table 35)
34 Conclusions of the scenario assessment
The foregoing analysis used the GINFORS model to assess economic and environmental impacts of using the ETS and ETR to reach the EUs 2020
GHG targets In general the results show positive employment effects and only small negative impacts on GDP in EU-27 Member States The economic impacts depend on the levels of international energy prices the mechanism used to recycle revenues and country specifics such as carbon and energy intensity and the structure of energy consumption
Although there is significant evidence that eco-innovation is positively driven by higher energy prices quantification is difficult The present study included simulations of possible impacts of a shift in the industry structure towards renewable energy in the electricity sector and an overall increase of EU
Table 34 Employment impacts of scenario S2HE in 2020 in Germany mdash deviations from scenario S2H
Employment in 2020 Deviation from S2H () Deviation from S2Habsolute (1 000s)
Agriculture forestry ndash 01 ndash 02
Industry 03 194
Non-metallic minerals 02 05
Iron and steel 04 05
Machinery and equipment 13 130
Electrical machinery 24 117
Construction 01 18
Trade and transport 00 26
Business services 07 308
Other services 01 107
Total 02 634
Table 35 Employment impacts of scenario S2HI in 2020 in Germany mdash deviations from scenario S2H
Employment in 2020 Deviation from S2H () Deviation from S2Habsolute (1 000s)
Agriculture forestry ndash 01 ndash 02
Industry 00 00
Non-metallic minerals 25 65
Iron and steel ndash 27 ndash 36
Machinery and equipment 08 78
Electrical machinery 04 19
Construction ndash 00 ndash 04
Trade and transport 00 07
Business services 02 115
Other services 0 56
Total 00 167
Modelling of ETR impacts on eco-innovation
Environmental tax reform in Europe opportunities for eco-innovation 37
exports due to higher global demand for renewable energy The main results can be summarised as follows
bull environmentaltaxreformshiftingtaxesfromlabour to energy and resources will create additional jobs and trigger eco-innovation
bull impactsofeco-innovationintheformofadditional EU exports or shifts in industry structures will have a slight positive influence on GDP and create a smaller number of additional jobs
These findings correspond to results from the EmployRES study (Fraunhofer ISI et al 2009) As ETR is directly aimed at reducing labour costs it will create additional jobs in the short and medium term In the longer term the cost reduction and new technologies arising from eco-innovation will play a larger role
Like all fiscal reforms a major ETR in Europe will create winners and losers At the sector level carbon- and material-intensive industries will face economic losses At the country level the carbon-intensity and overall flexibility of economies is important Clearly structural change away from carbon-intensive industries together with technological change is inherent in any successful climate mitigation policy
On the other hand several factors can smooth these structural adjustments International cooperation
will reduce economic pressure on countries and sectors In addition ETR together with auctioning of ETS allowances can be a major source of revenues for EU Member States in the future even if part of the revenues will have to be earmarked for adaptation and mitigation measures in developing countries Indeed future debate on grandfathering or auctioning ETS allowances should reflect the important point that giving allowances away for free denies countries the money to ease structural change and invest in low-carbon technologies
Caution is needed in relating the findings of this study to the EU policy debate In the model simulations the single carbon price is the only instrument used to reach the EUs 2020 GHG targets In reality of course other renewable energy and efficiency policies will also contribute to carbon reduction and have to be taken into account when comparing the results (especially the high carbon prices) to other studies Both reduce the potential revenues from fossil energy carriers and carbon emissions
A variety of renewable energy and efficiency policies could enable the climate and energy targets to be met while securing even better economic prospects The results of the present study clearly indicate that the discussion on market-based instruments should be intensified Ultimately however the EU will need a rich mix of policies to reach its GHG targets while maximising prosperity
Environmental tax reform in Europe opportunities for eco-innovation38
References
Almon C 1991 The INFORUM Approach to Interindustry Modeling in Economic Systems Research Vol 3 pp 1ndash7
Amin A and Cohendet P 2004 The Architecture of Knowledge Firms Capabilities and Communities Oxford University Press Oxford
Barker T Meyer B Pollitt H and Lutz C 2007a Modelling Environmental Tax Reform in Germany and the United Kingdom with E3ME and GINFORS petre Working Paper Cambridge and Osnabrueck (httpwwwpetreorgukpapershtm) accessed 15 February 2011
Barker T Junankar S Pollitt H and Summerton P 2007b Carbon leakage from unilateral environmental tax reforms in Europe 1995ndash2005 Energy Policy Vol 35 pp 6 281ndash6 292
Brunnermeier S B and Cohen M A 2003 Determinants of environmental innovation in US manufacturing industries Journal of Environmental Economics and Management Vol 45 pp 278ndash293
Buen J 2006 Danish and Norwegian wind industry The relationship between policy instruments innovation and diffusion Energy Policy Vol 34 (18) pp 3 887ndash3 897
Carlsson B and Stankiewicz R 1991 On the nature function and composition of technological systems Journal of Evolutionary Economics Vol 1 (2) pp 93ndash118
Christiansen A C and Skjaerseth J B 2005 Climate change policies in Norway and the Netherlands Different instruments similar outcome Energy and Environment Vol 16(1) pp 1ndash25
Dosi G 1988 Sources procedures and microeconomic effects of innovation Journal of Economic Literature Vol 26 pp 1 120ndash1 171
de Vries F and Medhi N 2008 Environmental regulation and international innovation in automotive emissions control technologies in Environmental Policy Technological Innovation and Patents Organisation for Economic Cooperation and Development Paris
DG TREN 2008 European energy and transport mdash trends to 2030 mdash update 2007 European Commission Luxembourg
DTI 2004 Renewable Supply Chain Gap Analysis UK Department of Trade and Industry
Edler J (ed) 2006 Nachfrageorientierte Innovationspolitik Buumlro fuumlr Technikfolgenabschaumltzung beim Deutschen Bundestag (TAB) Arbeitsbericht Nr 99 Berlin
Edquist C 2001 The system of innovation approach and innovation policy an account of the state of the art lead paper presented at the DRUID Conference 12ndash15 June 2001 Aalborg (httpwwwdruiddkconferencesnwpaper1edquistpdf) accessed 15 February 2011
EEA 2006 Using the market for cost-effective environmental policy Market-based instruments in Europe EEA Report No 12006 European Environment Agency Copenhagen
Ekins P 2009 Resource Productivity Environmental tax Reform and Sustainable Growth in Europe published by the Anglo-German Foundation for the Study of Industrial Society Final report (httpwwwpetreorgukpdfFinRepFinpdf) accessed 12 October 2011
Ekins P and Speck S (eds) 2011 Environmental Tax Reform (ETR) A Policy for Green Growth Oxford University Press
EREC 2008 Energy [r]evolution A sustainable global energy outlook Greenpeace International European Renewable Energy Council (EREC)
References
References
Environmental tax reform in Europe opportunities for eco-innovation 39
Fagerberg J Mowery D C and Nelson R R (eds) 2005 The Oxford Handbook of Innovation Oxford University Press Oxford
Fischer C Parry I W H and Pizer W A 2003 Instrument choice for environmental protection when technological innovation is endogenous Journal of Environmental Economics and Management Vol 45 pp 523ndash545
Fraunhofer ISI ECOFYS Energy Economics Group Ruumltter + Partner SEURECO and LEI 2009 EmployRES mdash The impact of renewable energy policy on economic growth and employment in the European Union European Commission Brussels
Frondel M Horbach J and Rennings K 2008 What triggers environmental management and innovation Empirical evidence for Germany Ecological Economics Vol 66(1) pp 153ndash160
GHK Cambridge Econometrics and IEEP 2007 Links between the environment economy and jobs Final Report submitted to DG Environment European Commission
Giljum S Behrens A Hinterberger F Lutz C and Meyer B 2008 Modelling scenarios towards a sustainable use of natural resources in Europe Environmental Science and Policy Vol 11 pp 204ndash216
Goumlrlach B Knigge M and Luumlckge H 2005 Wirkungen der Oumlkologischen Steuerreform auf Innovation und Marktdurchdringung Ecologic Berlin (httpecologiceudownloadprojekte1850-189918791879_5_innovationpdf) accessed 18 August 2011
Green M A 2000 Photovoltaics technology overview Energy Policy Vol 28 (14) pp 989ndash998
Grossmann A Lehr U Lutz C and Wolter MI 2008 Gesamtwirtschaftliche Effekte der Umsetzung der EU Ziele im Bereich Erneuerbare Energien und Gebaumludeeffizienz in Oumlsterreich bis 2020 Studie im Auftrag des Lebensministeriums Wien 0508
Hage J and Hollingsworth J R 2000 Idea innovation networks a strategy for integrating organizational and institutional analysis Organization Studies Vol 21 (5) pp 971ndash1 004
Hauschildt J 2004 Innovationsmanagement Vahlen Muumlnchen
Hemmelskamp J 1997 Environmental policy instruments and their effects on innovation European Planning Studies Vol 5 (2) pp 177ndash195
Hoglund Isaksson L 2005 Abatement costs in response to the Swedish charge on nitrogen oxide emissions Journal of Environmental Economics and Management Vol 50 pp 102ndash120
Hullmann A 2001 Internationaler Wissenstransfer und technischer Wandel (dissertation) Physica-Verlag Heidelberg
IEA 2008 World Energy Outlook 2008 International Energy Agency Paris
IEA 2009 World Energy Outlook 2009 International Energy Agency Paris
Jacobsson S Andersson B A and Baringngens L 2002 Transforming the energy system mdash the evolution of the German technological system for solar cells Science and Technology Policy Research University of Sussex Electronic Working Paper Series No 84 (httpideasrepecorgpsrussewps84html) accessed 18 August 2011
Jaffe A and Stavins R 1995 Dynamic incentives of environmental regulations the effects of alternative policy instruments on technology diffusion Journal of Environmental Economics and Management Vol 29(3) pp 43ndash63
Jaffe A B and Palmer K 1997 Environmental regulation and innovation a panel data study The Review of Economics and Statistics Vol 79 pp 610ndash619
Jaffe A B Newell R G and Stavins R N 2002 Environmental policy and technological change Environmental and Resource Economics Vol 22 (1ndash2) 2002 pp 41ndash70
Johnstone N and Hascic I 2008 Renewable energy policies and technological innovation energy source and instrument choice in Environmental Policy Technological Innovation and PatentsOrganisation for Economic Co-operation and Development Paris
Johnstone N 2005 The Innovation Effects of Environmental Policy Instruments in Horbach J (ed) Indicator Systems for Sustainable Innovation Physica-Verlag HD
Environmental tax reform in Europe opportunities for eco-innovation
References
40
Johnstone N Hascic I and Ostertag K 2008 Environmental policy technological innovation and patent activity in Environmental Policy Technological Innovation and Patents Organisation for Economic Co-operation and Development Paris
Jung C Krutilla K and Boyd R 1996 Incentives for advanced pollution abatement technology at the industry level an evaluation of policy alternatives Journal of Environmental Economics and Management Vol 30(1) pp 95ndash111
Kammen D M Kapidia K and Fripp M 2004 Putting renewables to work how many jobs can the clean energy industry generate University of California Berkeley
Kemp R 1997 Environmental policy and technical change ndash a comparison of the technological impact of policy instruments Edward Elgar Cheltenham
Kemp R 1998 The diffusion of biological waste-water treatment plants in the Dutch food and beverage industry Environmental and Resource Economics Vol 12 pp 113ndash136
Kemp R 2000 Technology and environmental policy ndash innovation effects of past policies and suggestions for improvement in OECD proceedings ndash innovation and the environment Organisation for Economic Co-operation and Development Paris
Kerr S and Newell R G 2003 Policy-induced technology adoption evidence from the US lead phasedown Journal of Industrial Economics Vol 51 pp 317ndash343
Klaassen G Miketa A Larsen K and Sundqvist T 2005 The impact of RampD on innovation for wind energy in Denmark Germany and the United Kingdom Ecological Economics Vol 54 pp 227ndash240
Kline S and Rosenberg N 1986 An overview of innovation in Landau R (ed) The positive sum strategy Harnessing technology for economic growth pp 275-306
Knigge M and Goumlrlach B 2005 Effects of Germanys ecological tax reforms on the environment employment and technological innovation Ecologic Berlin (httpwwwumweltbundesamtdeuba-info-presse-ehintergrundoekosteuerpdf) accessed 18 August 2011
Langniss O 2003 Governance structures for promoting renewable energy sources dissertation Lund Stuttgart
Lanjouw J O and Mody A 1996 Innovation and the international diffusion of environmentally responsive technology Research Policy Vol 25 pp 549ndash571
Lehr U Nitsch J Kratzat M Lutz C and Edler D 2008 Renewable Energy and Employment in Germany Energy Policy Vol 36 pp 108ndash117 DOI101016jenpol200709004
Lehr U Wolter MI and Groszligmann A 2009 Economic impacts of RES obligations in Austria ndash an application of the macro-econometric model e3at GWS Discussion Paper 20091 Osnabruumlck
Lundvall B-A Johnson B Andersen E S and Dalum B 2001 National systems of production innovation and competence building Research Policy Vol 31 pp 213ndash231
Lutz C and Giljum S 2009 Global resource use in a business as usual world until 2030 Updated results from the GINFORS model in Bleischwitz R Welfens Pand Zhang Z (eds) Sustainable growth and resource productivity ndash economic and global policy issues Greenleaf Publishers pp 30ndash41
Lutz C and Meyer B 2008 Beschaumlftigungseffekte des Klimaschutzes in Deutschland Untersuchungen zu gesamtwirtschaftlichen Auswirkungen ausgewaumlhlter Maszlignahmen des Energie- und Klimapakets Forschungsbericht 205 46 434 Dessau-Roszliglau
Lutz C and Meyer B 2009a Environmental and Economic Effects of Post-Kyoto Carbon Regimes Results of Simulations with the Global Model GINFORS Energy Policy Vol 37 pp 1 758ndash1 766 DOI 101016jenpol200901015
Lutz C and Meyer B 2009b Scenario results from GINFORS PETRE working paper Osnabruumlck
Lutz C Meyer B Nathani C and Schleich J 2005 Endogenous technological change and emissions The case of the German steel industry Energy Policy Vol33 pp 1 143ndash1 154
Lutz C Meyer B Nathani C and Schleich J 2007 Endogenous innovation economy and environment impacts of a technology based modelling approach for energy-intensive industries in Germany Energy Studies Review Vol 15(1) pp 2ndash18
References
Environmental tax reform in Europe opportunities for eco-innovation 41
Lutz C Meyer B and Wolter M I 2009 The global multisectormulticountry 3-E model GINFORS mdash a description of the model and a baseline forecast for global energy demand and CO2 emissions Journal of Sustainable Development forthcoming
Malerba F and Orsenigo L 1997 Technological Regimes and Sectoral Patterns of Innovative Activities Industrial and Corporate Change Vol 6 (1) pp 83ndash117
Malerba F 1992 Learning by Firms and Incremental Technical Change The Economic Journal Vol 102 (413) pp 845ndash859
Malerba F 2005 Industrial dynamics and innovation progress and challenges Presidential Address delivered at the 32nd Conference of the European Association for Research in Industrial Economics (EARIE) 1ndash4 September 2005 Porto
Malerba F 2006 Innovation and the evolution of industries Journal of Evolutionary Economics Vol 16 pp 3ndash23
McGinty M and de Vries F P 2009 Technology diffusion product differentiation and environmental subsidies The BE Journal of Economic Analysis and Policy Vol 9(1)
Meyer B and Lutz C 2007 The GINFORS model ndash model overview and evaluation Petre Working Paper Osnabruumlck (httpwwwpetreorgukpapershtm) accessed 18 August 2011
Meyer B Lutz C Schnur P and Zika G 2007 Economic policy simulations with global interdependencies a sensitivity analysis for Germany Economic Systems Research Vol 19 pp 37ndash55
Mickwitz P H Hyvaumlttinen and P Kivimaa 2008 The role of policy instruments in the innovation and diffusion of environmentally friendlier technologies popular claims versus case study experiences Journal of Cleaner Production Vol 16(1S1) 162ndash170
Miketa A and Schrattenholzer L 2004 Experiments with a methodology to model the role of RampD expenditures in energy technology learning processes first results Energy Policy Vol 32 (15) pp 1 679ndash1 692
Milliman S R and Prince R 1989 Firm incentives to promote technological change in pollution control Journal of Environmental Economics and Management Vol 17 pp 247ndash265
Millock K and Nauges C 2006 Ex-post evaluation of an earmarked tax on air pollution Land Economics Vol 82(1) pp 68ndash84
Montero J-P 2002 Market structure and environmental innovation Journal of Applied Economics Vol 2 pp 293ndash325
Moreno B and Loacutepez A J 2007 The effect of renewable energy on employment mdash The case of Asturias (Spain) Renewable and Sustainable Energy Rewiews doi 101016jrser200610011
Mowery D and Rosenberg N 1979 The influence of market demand upon innovation A critical review of some recent empirical studies Research Policy Vol 8 pp 102ndash153
Newell R G Jaffe A B and Stavins R N 1999 The induced innovation hypothesis and energy-saving technological change Quarterly Journal of Economics Vol 114 pp 941ndash975
Norberg-Bohm V 1999 Stimulating green technological innovation An analysis of alternative policy mechanisms Policy Sciences Vol 32(1) pp 13ndash38
OECD 2009 Sustainable manufacturing and eco-innovation towards a green economy Organisation for Economic Co-operation and Development Policy Brief June 2009
OECD 2010 Taxation innovation and the environment Organisation for Economic Co-operation and Development
Pavitt K 1984 Sectoral patterns of technological change Towards a taxonomy and a theory Research Policy Vol 13 pp 343ndash373
Popp D 2002 Induced innovation and energy prices The American Economic Review Vol 92(1) pp 160ndash180
Popp D 2005 Lessons from patents Using patents to measure technological change in environmental models Ecological Economics Vol 54 pp 209ndash226
Environmental tax reform in Europe opportunities for eco-innovation
References
42
Porter M and van der Linde C 1995 Toward a new conception of the environment competitiveness relationship Journal of Economic Perspectives Vol 9(4) pp 97ndash118
Rammert W 2002 The cultural shaping of technologies and the politics of technodiversity In Sorensen K and Williams R (eds) Shaping technology guiding policy concepts spaces and tools Elgar Cheltenham pp 155-172
Requate T 2005 Dynamic incentives by environmental policy instruments ndash a survey Ecological Economics Vol 54 pp 175ndash195
Roloff N Lehr U Krewitt W Fuchs G Wassermann S Weimer-Jehle W and Schmidt B 2008 Success determinants for technological innovations in the energy sector mdash the case of photovoltaics in Moumlst D Fichtner W Ragwitz M and Veit D (eds) New methods for energy market modelling mdash Proceedings of the first european workshop on energy market modelling using agent-based computational economics Universitaumltsverlag Karlsruhe
Rothwell R 1995 The fifth generation innovation process in Oppenlaumlnder KH Popp W (eds) Innovationen und wirtschaftlicher Fortschritt betriebs-und volkswirtschaftliche Perspektiven Bern pp 9ndash26
Schumpeter J 1942 Capitalism socialism and democracy New York Harper
Skjaeligrseth J B and Christiansen A C 2005 Environmental policy instruments and technological change in the energy sector findings from comparative empirical research Energy and Environment Vol 17 (2) pp 223ndash241
Snyder L D Miller N H and Stavins R N 2003 The effects of environmental regulations on pollution emissions evidence from plant-level data American Economic Review Vol 93(2) pp 431ndash435
Technopolis 2008 Eco-innovation Final Report for Sectoral Innovation Watch (httpwwwtechnopolis-groupcomresourcesdownloads661_report_finalpdf) accessed 18 August 2011
Volleburgh H 2007 Impacts of environmental policy instruments on technological change Report for Joint Meetings of Tax and Environment Experts OECD Environment Directorate February 2007 (comenvepocctpacfa(2006)36final)
Zimmermann H Wohltmann M and Hansjuumlrgens B 1996 Umweltabgaben und Innovation Analytica Marburg
43
Annex 1
Environmental tax reform in Europe opportunities for eco-innovation
Type Instrument Area Stage
Reference
Theo
retica
l
Em
piric
al
Cas
e st
udy
Rev
iew
Qual
itat
ive
Taxe
s
Perm
its
Subsi
die
s
Volu
nta
ry
Com
man
d
Reg
ula
tion
Ener
gy
Air
Wat
er
Oth
er
Gen
eral
Innov
atio
n
Diffu
sion
Rel
evan
ce
Brunnermeier amp Cohen (2003)
X X X X
Buen (2006) X X X X X X
Christiansen amp Skjaerseth (2005)
X X X X X X
Fischer et al (2003 X X X X X X
Frondel et al (2008) X X X X X X X (X) (X)
Hemmelskamp (1997)
X X X X X X X (X)
Hoglund Isaksson (2005)
X X X (X) (X)
Jaffe amp Stavins (1995)
X X X1 X X X X
Jaffe amp Palmer (1997)
X X X X
Jaffe et al (2002) X X X X X X X X X X
Jung et al (1996) X X X X X X (X) (X)
Kemp (1998) X X X X
Kerr amp Newell (2001) X X X X X
Klaassen et al (2005)
X X X X X
Lanjouw amp Mody (1996)
X X X X X X X
McGinty amp de Vries (2009)
X X X X
Mickwitz et al (2008)
X X X X X X X X X
Milliman amp Prince (1989)
X X X X X X X
Millock amp Nauges (2006)
X X X X X X
Montero (2002) X X X X X
Newell et al (1999) X X1 X X X
Norberg-Bohm (1999)
X X X X X X X
Popp (2002) X X1 X X
Popp (2005) X X X X X X
Porter amp van der Linde (1995)
X X X X X X
Requate (2005) X X X X X X X
Skjaeligrseth amp Christiansen (2005)
X X X X X X X X X
Snyder et al (2003) X X X X X
Annex 1 Classification of refereed journal articles
Environmental tax reform in Europe opportunities for eco-innovation44
Annex 2
Type Instrument Area Stage
Reference
Theo
retica
l
Em
piric
al
Cas
e st
udy
Rev
iew
Qual
itat
ive
Taxe
s
Perm
its
Subsi
die
s
Volu
nta
ry
Com
man
d
Reg
ula
tion
Ener
gy
Air
Wat
er
Oth
er
Gen
eral
Innov
atio
n
Diffu
sion
Rel
evan
ce
Johnstone (2005)
X X X X X X X
Johnstone amp Hascic (2008)
X X X X X X X X
Kemp (1997) X X X X X X X X X X X X X
Kemp (2000) X X X X X X X X X
de Vries amp Medhi (2008)
X X1 X X X
Annex 2 Classification of books and book chapters
45
Annex 3
Environmental tax reform in Europe opportunities for eco-innovation
Type Instrument Area Stage
Reference
Theo
retica
l
Em
piric
al
Cas
e st
udy
Rev
iew
Qual
itat
ive
Taxe
s
Perm
its
Subsi
die
s
Volu
nta
ry
Com
man
d
Reg
ula
tion
Ener
gy
Air
Wat
er
Oth
er
Gen
eral
Innov
atio
n
Diffu
sion
Rel
evan
ce
Goumlrlach et al (2005)
X X X X X X
Knigge amp Goumlrlach (2005)
X X X X X X
Technopolis (2008)
X X X X X X
Volleburgh (2007)
X X X X X X X X X X X
Annex 3 Classification of reports
European Environment Agency
Environmental tax reform in Europe opportunities for eco-innovation
2011 mdash 45 pp mdash 21 x 297 cm
ISBN 978-92-9213-238-5doi10280084889
How to obtain EU publications
Publications for salebull viaEUBookshop(httpbookshopeuropaeu)bull fromyourbooksellerbyquotingthetitlethepublisherandorISBNnumberbull bycontactingoneofoursalesagentsdirectlyYoucanobtaintheircontactdetails
on the Internet (httpbookshopeuropaeu) or by sending a fax to +352 2929-42758
Free publicationsbull viaEUBookshop(httpbookshopeuropaeu)bull attheEuropeanCommissionsrepresentationsordelegationsYoucanobtain
their contact details on the Internet (httpeceuropaeu) or by sending a fax to +352 2929-42758
European Environment AgencyKongens Nytorv 61050 Copenhagen KDenmark
Tel +45 33 36 71 00Fax +45 33 36 71 99
Web eeaeuropaeuEnquiries eeaeuropaeuenquiries
TH
-AK-1
1-0
17-E
N-N
doi1
02
8008
4889
- Acknowledgements
- Executive summary
- 1Introduction
-
- 11Background
- 12ETR and innovation
- 13Report structure
-
- 2Review of literature on environmental tax reform and eco‑innovation
-
- 21Initial screening
- 22Detailed review
- 23Environmental regulation studies
- 24Theoretical studies
- 25Empirical studies
- 26Case studies
- 27Conclusions
-
- 3Modelling of ETR impacts on eco‑innovation
-
- 31Scenarios assessing the implications of ETR for eco-innovation
- 32Overview of modelling results
- 33Macroeconomic impacts at the national level
- 34Conclusions of the scenario assessment
-
- References
- Annex 1 Classification of refereed journal articles
- Annex 2Classification of books and book chapters
- Annex 3Classification of reports
-
Review of literature on environmental tax reform and eco-innovation
Environmental tax reform in Europe opportunities for eco-innovation 21
applications (as a proxy for differenceschanges in patenting propensity) Environmental regulation is represented by two dummy variables indicating the introduction of on-board diagnostic (OBD) regulations in USA (30) The results of the analysis suggest that the relative impacts of regulation and market forces differ between the two types of technology For post-combustion technologies both of the regulations are significant while fuel prices have no significant impact In contrast the opposite is the case for engine redesign technologies with fuel prices having a significant impact but regulation having no discernable effect While the analysis does not explicitly consider the impact of fuel taxes it suggests that an increase in automotive fuel taxes would have a major impact on innovation in relation to engine design The estimated coefficient for fuel prices (1287) implies that a USD 010 increase in fuel prices would induce a 14 increase in patenting activity (31)
Key findings of the empirical studies
The empirical studies considered above cover a range of different technology areas spanning energy efficiency (both product and process) renewable energy and air and water pollution abatement While in some cases they assess the impact of energy prices rather than environmental taxes per se they provide a clear picture of the likely impact of environmental and energy-related taxes on eco-innovation
Three of the studies assess the impact on diffusion of existing technologies All find that environmental taxesenergy prices have a positive impact on diffusion In particular the water effluent charges in The Netherlands appear to have had a major impact on the adoption of waste-water treatment equipment by the food and beverage industry in that country However there is some evidence to suggest that the effectiveness of taxesprices may vary across sectors (eg NOXSO2 abatement in France) and that investment incentivessubsidies may be more
effective in some cases (eg thermal insulation in USA)
Three of the studies use patent data to assess the impact of environmental taxes and energy prices on innovation with one of these also assessing the impact of investment incentives All find a significant positive impact although this depends on the particular sub-sector (eg renewable energy) or the type of innovation In particular the evidence from the automotive emissions control study suggests that taxesprices may be more effective in promoting process-related innovation (eg engine redesign) than innovation in end-of-pipe technologies One of the studies takes a different approach using a product-characteristics model to decompose improvements in the energy efficiency of consumer durables This finds that while electricity prices did not appear to affect overall technological change (ie shifts in the product costenergy efficiency frontier) they did have a positive impact on directional technological change (ie the slope of the frontier)
26 Case studies
Christiansen and Skjaerseth (2005) undertake a comparative analysis of the impacts of climate change policies on the petroleum sectors in Norway and the Netherlands during the 1990s These countries were selected because of their very different policy approaches with the Norwegian petroleum sector subject to a carbon dioxide (CO2) tax since 1991 as part of a portfolio of measures (32) and the Netherlands relying on a series of voluntary agreements on energy efficiency (33) Both approaches appear to have been effective in that CO2 emissions per unit production fell by around 22 between 1990 and 2001 in Norway while energy efficiency improved by around 35 in the Netherlands over the same period However there were marked differences between the two countries in terms of the nature of the innovation that
(30) Because of the international nature of the automotive industry and the importance of the US market regulations introduced in USA appear to have been an important driver for innovation by overseas manufacturers Regulations mandating the installation of OBD systems were first introduced in California in 1988 A more sophisticated system was mandated by the 1990 US Clean Air Act Amendments taking force in 1996
(31) The coefficient represents the semi-elasticity of patent applications with respect to fuel prices While the authors do not state so explicitly the implication is that prices are expressed in US dollars (they are obtained from the IEA Energy Prices and Taxes Database) Consequently the impact of a 10 US cent increase in the fuel prices is given by exp(1287 x 01) ndash 1 = 0137
(32) In addition to the tax the portfolio included publicly funded RampD support schemes gas flaring permits and mandatory environmental impact assessments
(33) The Dutch oil and gas industry first signed a declaration of intent with the government in 1995 This was translated into a long-term agreement (LTA) on energy efficiency in the following year with an improvement target of 20 over the period 1989ndash2000 In 2001 a new LTA was signed which committed firms to implementing energy efficiency measures with a positive NPV at a 15 discount rate or a five year payback period
Environmental tax reform in Europe opportunities for eco-innovation
Review of literature on environmental tax reform and eco-innovation
22
occurred In the Netherlands technological change was incremental reflecting a steady diffusion of available (ie known) technology In contrast the authors find evidence of more radical innovations and adaptations by the Norwegian petroleum sector including the development of energy-efficient gas turbines installation of waste heat recovery units process modifications and improved use of process heat While the authors acknowledge the impossibility of proving a causal link between policy intervention and innovation (in the context of their case study) they conclude that the CO2 tax played a key role in the development and implementation of these radical innovations and the benefits of reduced tax payments provided an important incentive However they also conclude that the impacts of the two instruments were conditioned by the political contexts in which they were applied and the problem characteristics in the respective countries (eg the economic significance of the sector and the size of installations)
Knigge and Goumlrlach (2005) summarise the findings of a comprehensive analysis of the impacts of the ETR in Germany That analysis undertaken jointly by Ecologic and the German Institute for Economic Research (DIW Berlin) included the impacts on innovation and market diffusion of environmentally friendly products and technologies (34) Based on a series of case studies the study concluded that the ETR had a noticeable effect on innovation and diffusion although it was not possible to quantify the scale of that effect In particular ETR is identified as being a central factor in the development of gas-powered vehicles The study identifies a number of different routes by which the ETR produced impacts First the payback period for energy-efficient products was reduced as a result of the energy tax increases and the various exemptions favouring efficient energy use and renewable energy sources Second the predictable nature of the energy taxes (as opposed to widely fluctuating oil prices) reduced uncertainties about the benefits of energy-efficiency investments Third the reduction in employers social contribution payments tended to reduce the costs of labour intensive innovation processes such as research and development energy consultancy and technology installation Finally the ETR had a signalling effect strengthening awareness of the need for more efficient and rational energy use
Mickwitz et al (2007) examine a number of claims that have been made in the environmental policy literature about the relationship between policy instruments and innovation based on experiences in two industrial sectors in Finland pulp and paper and the manufacture of diesel engines for ships In particular they assess the claims that environmental taxes are superior to other policy instruments with respect to innovation and that RampD subsidies have limited impacts on innovation With respect to the first claim the evidence provided by the two case studies is mixed The authors conclude that energy taxation had a negligible impact on innovation in the pulp and paper industry However this is likely to have been due to the low level of the tax and the exemptions that applied to the sector In contrast they find that the differentiation of Swedish fairway and port fees (on the basis of SO2 and NOX emissions) was a significant factor driving the installation of in-engine NOX reduction equipment in ferries operating between the two countries (35) With respect to RampD subsidies the authors conclude that the evidence does not support the claim that these have little effect In particular they find that RampD subsidies accelerated the development of ship engine emissions-reduction technologies
The findings of the three case studies are consistent with those of the empirical analyses reviewed in the previous section Environmental taxes and investment subsidies have proven significant in promoting both innovation and diffusion although not universally so Furthermore the case studies provide some useful insights about the ways in which the impacts occur and the factors that may be important in promoting innovation In particular they suggest the need for a tax rate that is sufficiently high to provide a meaningful incentive and signalling effect and that is fixed for a sufficiently long period of time to reduce uncertainty about the future benefits of investment
27 Conclusions
The studies reviewed in the preceding sections suggest that environmental regulation in general and price-based policy instruments such as environmental taxes and investment subsidies in particular can (in theory) and do (in practice) have a positive impact on both innovation and diffusion
(34) A separate report in German by Goumlrlach et al (2005) provides details of the evaluation of the innovation and diffusion impacts (35) Although the tax was introduced in Sweden it was also payable by Finnish ferry operators entering Swedish ports and hence
affected their investment decisions This is another example of the cross-border impact of environmental policy interventions on innovation found by Lanjouw and Mody (1996) (see Section 23)
Review of literature on environmental tax reform and eco-innovation
Environmental tax reform in Europe opportunities for eco-innovation 23
of environmental technologies However the supporting empirical and case study evidence is not universal and the effectiveness of these instruments would appear to vary across different sectors and different types of innovation
To a certain extent such differences can be explained by the theoretical models In particular the impact of environmental taxes (relative to other instruments) is predicted to depend on the competitive structures of the markets in which the regulated firms operate and on the ability of innovator firms to appropriate the benefits accruing to other firms during diffusion However a number of other potential factors have been identified in the literature which may affect the impact of price-based policy instruments on innovation
Jaffe et al (2002) caution that the impact of price-based policy instruments on technology diffusion may be adversely affected by a number of potential market failures including information failures principle-agent problems (eg landlord-tenant) capital market failures and positive adoption spillovers In addition while not market failures as such uncertainty over future returns and the (associated) use of high discount rates for investment decisions can also undermine the effectiveness of price-based instruments in stimulating diffusion However as was noted above the findings from the case study of ETR in Germany suggest that an environmental tax may actually reduce the level of uncertainty over future returns provided that it is of sufficient magnitude and longevity
Skjaerseth and Christiansen (2005) emphasise that the relationship between policy instruments (of all types) and technological change is extremely complicated They argue that account must be taken of the politicalindustrial context in which policy instruments are introduced and the nature of the environmental problem that they are intended to address In particular they make a distinction between malign problems where technological change involves net costs for target groups and benign problems where there are widespread no-regret opportunities for change Based on a comparative analysis of four different case studies they conclude that mandatory policy instruments (including environmental taxes) are more effective
in promoting short-term technological change when the problems are malign but that low legitimacy (with the target group) may undermine long-term technological change However when problems are benign or when long-term change requires cooperation voluntary policy instruments are likely to be more effective
Johnstone (2005) questions the focus of the theoretical and empirical analyses (reviewed above) on the impact of environmental policy instruments on the rate of technological change He argues that the direction of technological change is as important if not more so In addition to the quantity of innovation it is also important that innovation be socially optimal in the sense that it minimises the cost of attaining a particular environmental goal in the long term Inappropriate innovation today may result in lock in to a suboptimal technological path for the future
With this in mind Johnstone identifies a number of issues that can adversely affect the direction of innovation and should be taken into account when selecting and designing policy instruments technological market failures (36) missing markets for certain environmental attributes of innovation policy incidence and joint production of emissions Most studies of the innovation effects of environmental policy instruments assume that the only missing market is that for the environmental good (or bad) However in practice there may be other markets that are missing (or incomplete) which can adversely affect transmission of innovation incentives This is particularly so in the area of waste and resource management where instruments applied at the end of the product life cycle may have little or no impact on product design innovation Even if all markets are complete except for the environmental externality the point of incidence of the policy intervention may be more important for the direction of innovation than the choice of a particular policy instrument For example a limit or standard applied directly to the emissions of a pollutant may be more effective in promoting optimal innovation than a tax applied to a proxy input variable Finally when there is joint production of pollutants (eg CO2 and air pollutants from vehicle engines) there is a danger that if policy instruments (of whatever type) are applied to one pollutant in isolation the resulting innovation may
(36) These are the same market failures identified by Jaffe et al (2002)
Environmental tax reform in Europe opportunities for eco-innovation
Review of literature on environmental tax reform and eco-innovation
24
reduce emissions of that pollutant at the expense of increases in the others
In a related point Johnstone highlights the importance of using appropriate indicators when assessing the impact of policy instruments on innovation emphasising the need for these to reflect both the rate of innovation and the direction A necessary condition for this is that the indicators must provide an accurate and detailed picture of actual innovation Unfortunately this is difficult to achieve in practice For example the use of patent data as a measure of innovation requires the identification of relevant environmental technologies This is likely to be easier for end-of-pipe technologies than for process-related technologies meaning that the latter tend to be under-represented relative to their actual incidence To the extent that process-related innovation is growing in importance or is more important
for certain sectors or types of environmental problem changes in the value of the indicator may significantly understate the actual rate of innovation and misrepresent the direction
All of this suggests that caution should be exercised in drawing general definitive conclusions about the impacts of price-based policy instruments such as environmental taxes and investment subsidies on innovation particularly relative to other policy instruments While it would appear that they can be effective in stimulating both innovation and diffusion in many cases mdash at least in terms of the rate of technological change mdash there may be situations in which other policy instruments may be more appropriate In general the stringency and point of incidence of an environmental policy intervention may be more important than the choice of a particular policy instrument in determining the rate and direction of eco-innovation
25
Modelling of ETR impacts on eco-innovation
Environmental tax reform in Europe opportunities for eco-innovation
31 Scenarios assessing the implications of ETR for eco-innovation
Scenario analysis provides a useful means of improving understanding of how the different revenue recycling methods and various scales of ETR can help meet different greenhouse gas emissions targets
To investigate the impacts of an ETR for Europe the petre project elaborated a range of different scenarios reflecting various tax reform options In addition to employing several of these original scenarios the present study compiled two new scenarios to analyse the implications of ETR for eco-innovation All scenarios were examined in both E3ME and GINFORS (37)
311 Original petre project scenarios
The key petre scenarios relevant for the present study are
bull scenarioBHbaselinescenariowithhighenergyprice (reference case)
bull scenarioS1HETRdesignedtomeettheEUsunilateral 2020 GHG target (high energy price) with revenue recycling
bull scenarioS2HETRdesignedtomeettheEUsunilateral 2020 GHG target (high energy price) with revenue recycling and 10 of revenues spent on eco-innovation measures
Each of the ETR scenarios has the same key taxation components
bull acarbontaxrateisintroducedtoallnon-EUEmissions Trading System (EU ETS) sectors equal to the carbon price in the EU ETS that delivers an overall 20 reduction in greenhouse gas emissions by 2020 and in the international cooperation scenario this is extended to 30
bull aviationisincludedintheEUETSattheendofPhase 2
bull powergenerationsectorEUETSpermitsare100 auctioned in Phase 3 of the EU ETS
bull allotherEUETSpermitsare50auctionedin2013 increasing to 100 in 2020
bull materialtaxesareintroducedat5oftotalpricein 2010 increasing to 15 by 2020
In scenario S1H environmental tax revenues are recycled through reductions in income tax rates and social security contributions in each of the Member States such that there is no direct change in tax revenues In scenario S2H 10 of environmental tax revenues are recycled through spending on eco-innovation measures and the remaining 90 is recycled through the same measures as in the other scenarios The eco-innovation spending is split across power generation and housing according to tax revenues from the corporate and household sector
In GINFORS (the model used for analysing the implications of ETR and eco-innovation) the share of renewable sources in electricity production is increased due to the additional investment The rest of additional investment goes to household energy efficiency spending Investment needed for a certain increase in renewable energy production or efficiency improvement is based on Austrian and German experience (Lehr et al 2008 and 2009 Grossmann et al 2008 Lutz and Meyer 2008) This assumption is quite conservative as parameters for other countries can be assumed to be more positive (meaning that less money is needed for renewable energy technology installation or energy efficiency gains)
In scenario S1H the 20 GHG target translates into a 15 reduction in energy-related carbon emissions relative to 1990 as other emissions such as methane and nitrous oxide have already been reduced by
3 Modelling of ETR impacts on eco-innovation
(37) The E3ME and GINFORS models are introduced in Chapter 1 of the present report A detailed discussion of the models and scenarios used in the present study can be found in Ekins and Speck (2011)
Environmental tax reform in Europe opportunities for eco-innovation
Modelling of ETR impacts on eco-innovation
26
more than 20 (in terms of carbon equivalents) The target is reached by a tightened EU ETS cap and the introduction of a carbon tax on the non-ETS sector The tax rate applied is equal to the carbon price in the EU ETS that will deliver a 20 GHG reduction by 2020
The burden of ETR taxes are allotted to energy outputs (ie the final use of energy) and will be based on the carbon content of each fuel Carbon prices are assumed to be fully passed on to consumers All carbon taxes are in addition to any existing unilateral carbon and energy taxes The carbon reductions in the different EU Member States will be those that result from a uniform carbon tax increase across the EU
All of the revenues including EU ETS auctioning revenues carbon tax revenues and material tax revenues will be recycled The proportion of tax raised by industry will be recycled into a reduction in employers social security contributions which will in turn reduce the cost of labour Recycling will be additional to the existing ETRs in some Member States Revenues raised from households will be recycled through standard rate income tax reductions Traditional energy tax revenues will be lower compared to their respective baselines as the tax base (energy consumption) is reduced So for an ETR revenue-neutrality does not mean budget-neutrality
312 Factors affecting the macroeconomic impacts of RES technologies
Earlier analyses (Lehr et al 2008 Fraunhofer ISI et al 2009 DTI 2004 Kammen et al 2004 Moreno and Loacutepez 2007) have studied the impacts of large renewable energy source (RES) shares in the energy mix for different countries The overall question in these studies has been the impact of increasing RES shares on the economy especially on the labour market For the present study it is interesting to note that macroeconomic impacts of higher RES shares mainly depends on the following five factors
1 additional investment in RES (minus lower investment in conventional sources ie fossil and nuclear power) with the impact increasing if a country manufactures the RES technology in question
2 additional (net) exports due to improved international competitiveness of renewable energy sources (first mover advantage)
3 lower fossil fuel needs4 the cost differences between RES and
conventional energy
5 the shift from capital- and energy-intensive industries to labour- and technology-intensive industries
All five factors are driven by international energy prices carbon prices the policy framework and RES technology development itself Innovation comes into the play at various stages First innovation drives the currently positive additional costs of RES technologies down and even into negative realms depending on the fossil fuel scenario Second innovative RES technologies are likely to have a competitive advantage in international markets Although a significant proportion of RES technology produced in Europe is traded in Europe innovation will still provide an edge in current and emerging international markets
The EmployRES study (Fraunhofer ISI et al 2009) finds for Europe that current strong investment reflected in installations in Europe and exports to the rest of the world dominate the economic impact of RES policies and therefore lead to positive overall effects The studys results suggest that this positive balance can only be kept up in the future if the competitive position of European manufacturers of RES technology is improved The authors strongly recommend policies which promote technological innovation in RES and lead to a continued and rapid reduction of their costs
Factors 1 and 2 will have substantial macroeconomic impacts in the short and medium terms whereas factor 3 accumulates and will show positive impacts mainly in the long term Factor 4 strongly depends on the global developments while factor 5 may have significant effects on employment
313 Additional scenarios
Impacts of additional investment (factor 1) have already been analysed in scenario S2H of the petre project To focus on the other impacts of eco-innovation two additional scenarios were designed building on scenario S2H of petre
bull S2HEETRwithrevenuerecyclingdesignedto meet the unilateral EUs 2020 greenhouse gas (GHG) target (high energy price) Ten per cent of revenues are spent on eco-innovation measures and trade shares of EU-27 economies with the rest of the world in machinery and electrical machinery increase by 01 due to the deployment of the fast growing RES markets This assumption is based on the strong EU policy effort to increase the share of renewable energy in final energy consumption to 20 by 2020
Modelling of ETR impacts on eco-innovation
Environmental tax reform in Europe opportunities for eco-innovation 27
(Fraunhofer ISI et al 2009) and the possibility of very strong world market development of the RES sector until 2020 (EREC 2008) which offers additional export opportunities for European RES industries
bull S2HIETRwithrevenuerecyclingdesignedto meet the unilateral EUs 2020 GHG target (high energy price) Ten per cent of revenues are spent on eco-innovation measures and input structures of the energy sector are changed according to the input structure of the German RES industry (Lehr et al 2008)
S2HE looks at the possible role of international trade S2HI analyses changes in the input structure of the energy sector ie from conventional electricity production to renewables In the petre project (as in GHK et al 2007) only the energy inputs of the energy sector were adapted to changes in the energy input mix
Both S2HE and S2HI focus on RES and efficiency technologies As mentioned above an ETR will trigger a variety of innovations Therefore the results can be thought of as conservative in the sense that innovations (eg automotive energy consumption industrial efficiency etc) are not explicitly included
32 Overview of modelling results
The main results of the simulations are presented in Table 31 In the baseline scenario BH with high energy prices EU-27 carbon emissions will be
72 below the 1990 level in 2020 (38) The EU-15 has committed in the Kyoto Protocol to reduce its GHG emissions 8 below 1990 levels in the period 2008ndash2012 As emissions in the new member states are substantially below their 1990 levels today that implies that the EU-27 will keep its emissions more or less constant over the coming decade As in the PRIMES baseline an ETS price of 18 EURt in 2008 prices is assumed in 2020
In scenario S1H the ETS price and carbon tax rate has to be increased to 68 EUR2008t of CO2 to reach the 20 GHG reduction target which is equal to a 15 reduction of CO2 emissions against 1990 as other greenhouse gases have already been reduced above average by more than 20 in terms of CO2 equivalents Compared to the baseline CO2 emissions are 84 lower in 2020 which means roughly an additional 1 reduction annually in the period 2012ndash2020 GDP will be about 06 lower compared to the baseline in 2020 This means that annual average growth rates will be less than 01 below their baseline development This is especially low compared to the current financial and economic crisis with a GDP deviation against the baseline of around 6 in 2009
As the recycling mechanism reduces labour costs and the tax burden is shifted from labour-intensive to carbon- and material-intensive sectors employment will be 036 (or more than 800 000 jobs) higher than in the baseline The ETR is not fully budget neutral potentially enabling EU economies to slightly increase their net savings If
(38) The modelling exercise in the present study was conducted in 2009 and therefore does not contain the latest data on EU-27 GHG emissions which were significantly influenced by the global economic slump of the late-2000s
Table 31 Main results under the different scenarios
Scenario Target in 2020 CO2 price GDP Employment CO2 reduction
EUR2008t pc against baseline
pc against baseline
pc against 1990
pc against baseline
in year 2020 2015 2020 2020 2020 2020
BH 18 ndash 72 00
S1H 20 GHG 68 ndash 022 ndash 057 036 ndash 151 ndash 84
S2H 20 GHG 61 ndash 013 ndash 030 041 ndash 152 ndash 85
S2HE 20 GHG 61 ndash 009 ndash 004 051 ndash 151 ndash 84
S2HI 20 GHG 61 ndash 006 ndash 024 045 ndash 152 ndash 84
Environmental tax reform in Europe opportunities for eco-innovation
Modelling of ETR impacts on eco-innovation
28
this extra saving is spent negative GDP impacts will be further reduced
In scenario S2H part of the revenues is invested in low-carbon technologies This reduces the carbon price to 61 EUR2008t in 2020 halving the GDP loss relative to scenario S1H to only 03 as the investment in renewable energies is assumed to be additional Employment impacts are also more positive than in scenario S1H The 10 investment in low-carbon technologies amounts to more than EUR 20 billion in 2020
Assuming additional EU exports of RES technologies in scenario S2HE GDP almost matches the baseline in 2020 and employment is 051 (or more than 1 million jobs) higher than in the baseline In scenario S2HI a shift in the input structure of the energy sector towards machinery
and electrical machinery reflecting the different nature of RES relative to conventional electricity generation also has smaller additional positive impacts on GDP and employment compared to scenario S2H
The following figures show impacts of the different scenarios in comparison to the baseline BH As Figure 31 illustrates all the alternative scenarios imply GDP lower than the baseline However comparing scenario S1H with the other three scenarios shows that additional RES investment (S2H) additional RES exports (S2HE) and the inclusion of different input structures of the RES industries (S2HI) each have positive GDP impacts These results are in line with model-based analysis in the EMPLOY-RES study (Fraunhofer ISI et al 2009)
Figure 31 EU-27 GDP according to four scenarios mdash deviation from the baseline (BH)
Percentage deviation from the baseline (BH)
ndash 100
ndash 080
ndash 060
ndash 040
ndash 020
0002010 2015 2020
S2HI S1H S2H S2HE
Modelling of ETR impacts on eco-innovation
Environmental tax reform in Europe opportunities for eco-innovation 29
In contrast to GDP employment increases relative to the baseline in all the alternative scenarios (Figure 32) Due to the scenario design the structure of the EU economies is shifted from energy-intensive to labour-intensive sectors The magnitude of the employment gain is influenced by the carbon price and the tax shift the underlying energy prices and the production loss The largest part of the employment increase stems from the additional RES investment (scenario S2H) although a shift in industry structures (S2HI) and additional RES exports (S2HE) are also positive for the labour market
33 Macroeconomic impacts at the national level
In general terms it is clear that national ETS and ETR impacts depend significantly on country specifics including energy use economic structure social system and behaviour (eg reactions to labour cost changes) In countries with high carbon intensity in their energy mix additional revenues and expenditures are higher than in countries with lower carbon intensity
Scenario S2H provides an interesting tool for analysing the macroeconomic impacts of ETR at the national level because 10 of the additional generated revenues are used for eco-innovation investments meaning that only 90 of the revenues are recycled back into the economy by reducing income tax rates and social security contributions
Figure 32 EU-27 employment according to four scenarios mdash deviation from the baseline (BH)
ndash 020
000
020
040
060
2010 2015 2020
S2HI S1H S2H S2HE
Percentage deviation from the baseline (BH)
Environmental tax reform in Europe opportunities for eco-innovation
Modelling of ETR impacts on eco-innovation
30
Figure 34 GDP in 2020 in EU-27 Member States under scenario S2H mdash deviation form the baseline (BH)
Figure 33 GDP in 2020 in selected countries under scenario S2H mdash deviation from the baseline (BH)
ndash 25 ndash 20 ndash 15 ndash 10 ndash 05 00 05 10 15
Romania
Bulgaria
SloveniaMalta
Lithuania
Latvia
Estonia
CyprusSlovakia
Poland
Hungary
Czech RepublicUnited Kingdom
Sweden
Spain
Portugal
Netherlands
Italy
Ireland
Greece
FranceFinland
Denmark
Luxembourg
Belgium
Austria
Germany
Percentage deviation from the baseline (BH)
Russia
South Africa
Brazil
India
China
Mexico
Japan
USA
Poland
United Kingdom
Spain
Italy
France
Germany
ndash 30 ndash 25 ndash 20 ndash 15 ndash 10 ndash 05 00 05 10
Percentage deviation from the baseline (BH)
Modelling of ETR impacts on eco-innovation
Environmental tax reform in Europe opportunities for eco-innovation 31
Figure 35 Employment in 2020 in EU-27 Member States under scenario S2H mdash deviation from baseline (BH)
EU-27EU-15
RomaniaBulgariaSloveniaMalta
LithuaniaLatvia
EstoniaCyprusSlovakia
PolandHungary
Czech RepublicUnited Kingdom
SwedenSpain
PortugalNetherlands
ItalyIrelandGreece
FranceFinlandDenmarkLuxembourg
BelgiumAustria
Germany
ndash 200 0 200 400 600 800 1 000
Percentage deviation from the baseline (BH)
Under scenario S2H the GDP of large EU economies deviates from baseline projections by between 0 and ndash 1 with the exception of Italy (Figure 33) Germanys GDP is even forecast to match the baseline level in 2020 due to the countrys strong RES industry Outside Europe some countries gain slightly against EU Member States in terms of competitiveness as export prices in most EU Member States and sectors increase and GDP in those countries exceeds the baseline projections as a result (Figure 33) This is mainly because carbon tax revenues are recycled via income tax reductions which are not part of production costs However energy exporting economies such as Russia or South Africa will lose exports if EU demand for fossil fuel imports declines The development of all EU Member States is shown in Figure 34
Employment impacts of scenario S2H are positive for almost all EU Member States as lower labour
costs increase labour demand and labour intensity (Figure 35) The highest absolute increases are shown for Germany the Netherlands Italy and the United Kingdom For EU-27 as a whole employment will be almost one million higher than in the corresponding baseline BH in 2020
The scenarios have not been designed with a view to meeting the EU renewables target of a 20 renewables share in final energy consumption in 2020 Nevertheless the scenarios provide some interesting insights The share is projected to increase from around 10 in 2009 to above 14 even in the baseline as instruments such as feed in tariffs and biofuel quotas will continue In scenario S1H the target will be missed with around 18 in 2020 Only in scenarios S2H S2HE and S2HI is the target met (approximately 20 )
Environmental tax reform in Europe opportunities for eco-innovation
Modelling of ETR impacts on eco-innovation
32
Under scenario S2H energy-related carbon emissions are reduced in all EU Member States relative to the baseline (Figure 36) The highest percentage reductions can be seen in many of the EU-12 Member States with still high energy intensity and low energy prices In these countries the relative price increase is higher than in countries like Germany or the United Kingdom with already high energy taxes and overall energy prices
Additional ETS revenues material tax revenues and carbon tax revenues from the industry sector are recycled back to industry via reductions in employers social security contributions (or wage subsidies in some countries) The revenues from the carbon tax on households set out in Table 32 (totalling 033 of GDP in Germany for example) are used to reduce income tax For the EU-27 overall revenues from ETS and ETR reach about 2 of GDP in 2020 although these figures may be excessive because additional EU efforts to increase energy
efficiency and renewable energy which will reduce the ETS price are not taken into account The use of flexible tools such as the Clean Development Mechanism will further reduce the revenues and earmarking of part of the revenues for mitigation and adaptation measures in emerging and developing countries limits the recycling into labour costs
In addition the scenarios do not take the current global economic problems into account According to the IEA (2009) the downturn will also reduce carbon emissions in the long run which will lead to lower carbon prices and revenues to reach fixed targets (or make tighter targets less costly)
The ETR will have varying effects on the prices of different sorts of products and services Material or carbon taxes increase the prices of product groups according to their direct and indirect material and carbon content The recycling mechanism reduces
Figure 36 Energy-related CO2 emissions in 2020 under scenario S2H mdash deviation from the baseline (BH)
WorldEU-27
EU-15Romania
BulgariaSlovenia
MaltaLithuania
LatviaEstonia
CyprusSlovakia
PolandHungary
Czech RepublicUnited Kingdom
SwedenSpain
PortugalNetherlands
ItalyIreland
GreeceFrance
FinlandDenmark
LuxembourgBelgium
AustriaGermany
ndash 25 ndash 20 ndash 15 ndash 10 ndash 5 0
Percentage deviation from the baseline (BH)
Modelling of ETR impacts on eco-innovation
Environmental tax reform in Europe opportunities for eco-innovation 33
Table 32 Additional ETS and environmental tax revenues in 2020 ( of GPD)
S2H Germany United Kingdom EU-27
ETS revenues 083 064 059
Carbon tax (industry) 052 044 054
Carbon tax (households) 033 041 036
Material tax 041 029 056
Sum 209 178 205
Figure 37 Total primary energy supply in 2020 under scenario S2H mdash deviation from the baseline (BH)
WorldEU-27EU-15
RomaniaBulgaria
Slovenia
MaltaLithuania
LatviaEstonia
Cyprus
SlovakiaPoland
HungaryCzech Republic
United KingdomSweden
SpainPortugal
NetherlandsItaly
IrelandGreece
FranceFinland
DenmarkLuxembourg
BelgiumAustria
Germany
ndash 24 ndash 21 ndash 18 ndash 15 ndash 12 ndash 9 ndash 6 ndash 3 0
Percentage deviation from the baseline (BH)
Environmental tax reform in Europe opportunities for eco-innovation
Modelling of ETR impacts on eco-innovation
34
Figure 38 Output price impacts of scenario S2H in Germany in 2020 mdash deviations from the baseline (BH)
Figure 39 Impacts of scenario S2H on industrial output in 2020 in Germany mdash deviations from the baseline (BH)
ndash 5
0
5
10
15
20
Output prices
Percentage deviation from the baseline (BH)
(3) F
ood
(4) T
extiles
(5) W
ood
(6) P
ulp pap
er
(7) C
oke re
fined
petro
leum
pro
ducts
(8) C
hemica
ls ex
cl pha
rma
(9) P
harm
aceu
ticals
(10)
Rub
ber a
nd plastics
(11)
Non
-metallic
miner
als
(12)
Iron
and
steel
(13)
Non
-ferrou
s metals
(14)
Met
al pro
ducts
(15)
Mac
hine
ry and
equ
ipmen
t
(16)
Office
mac
hine
ry
(17)
Electric
al m
achine
ry
(18)
Rad
io T
V
(19)
Med
ical pr
ecisi
on and
opt
ical ins
trumen
ts
(20)
Mot
or veh
icles
(21)
Ships
(22)
Airc
raft
(23)
Railro
ad
(24)
Man
ufac
turin
g n
ec r
ecyc
ling
(25)
Electric
ity g
as w
ater
sup
ply
(26)
Con
stru
ction
(27)
Tra
de r
epairs
(28)
Hot
els an
d re
stau
rant
s
(29)
Tra
nspo
rt an
d stor
age
(30)
Pos
t and
teleco
mmun
icatio
ns
(31)
Finan
ce ins
uran
ce
(32)
Rea
l estate ac
tivities
(33)
Ren
ting
(34)
Com
puter
(35)
Res
earch an
d de
velopm
ent
(36)
Oth
er bus
ines
s ac
tivities
(37)
Pub
lic ser
vice
s
(38)
Edu
catio
n
(39)
Hea
lth and
soc
ial w
ork
(40)
Oth
er ser
vice
s
(41)
Priv
ate ho
useh
olds
(1) A
gricu
lture
(2) M
ining an
d qu
arry
ing
nec not elsewhere classified
Production
ndash 100
ndash 80
ndash 60
ndash 40
ndash 20
00
20
40
60
80Percentage deviation from the baseline (BH)
(3) F
ood
(4) T
extiles
(5) W
ood
(6) P
ulp pap
er
(7) C
oke re
fined
petro
leum
pro
ducts
(8) C
hemica
ls ex
cl pha
rma
(9) P
harm
aceu
ticals
(10)
Rub
ber a
nd plastics
(11)
Non
-metallic
miner
als
(12)
Iron
and
steel
(13)
Non
-ferrou
s metals
(14)
Met
al pro
ducts
(15)
Mac
hine
ry and
equ
ipmen
t
(16)
Office
mac
hine
ry
(17)
Electric
al m
achine
ry
(18)
Rad
io T
V
(19)
Med
ical pr
ecisi
on and
opt
ical ins
trumen
ts
(20)
Mot
or veh
icles
(21)
Ships
(22)
Airc
raft
(23)
Railro
ad
(24)
Man
ufac
turin
g n
ec r
ecyc
ling
(25)
Electric
ity g
as w
ater
sup
ply
(26)
Con
stru
ction
(27)
Tra
de r
epairs
(28)
Hot
els an
d re
stau
rant
s
(29)
Tra
nspo
rt an
d stor
age
(30)
Pos
t and
teleco
mmun
icatio
ns
(31)
Finan
ce ins
uran
ce
(32)
Rea
l estate ac
tivities
(33)
Ren
ting
(34)
Com
puter
(35)
Res
earch an
d de
velopm
ent
(36)
Oth
er bus
ines
s ac
tivities
(37)
Pub
lic ser
vice
s
(38)
Edu
catio
n
(39)
Hea
lth and
soc
ial w
ork
(40)
Oth
er ser
vice
s
(41)
Priv
ate ho
useh
olds
(1) A
gricu
lture
(2) M
ining an
d qu
arry
ing
nec not elsewhere classified
Modelling of ETR impacts on eco-innovation
Environmental tax reform in Europe opportunities for eco-innovation 35
social security contributions and lowers labour costs according to the direct and indirect labour content of sector output The ETR therefore reduces output prices in labour-intensive service sectors and increases prices in carbon- and material-intensive industry sectors
The example of Germany shows insignificant impacts in the trade-intensive sectors of machinery (15ndash17) motor vehicles (20) and other transport equipment (21ndash23) (Figure 38) Iron and steel (12) and chemicals without pharmaceuticals (8) face the highest price increases of trade-intensive sectors As the German iron and steel industry primarily delivers high quality steel to the German car industry and increasingly to the German windmill industry negative competitiveness impacts will be limited Exchange rate variations against non-EU competitors have been much higher in the past
The higher prices of carbon- and material-intensive products will reduce price competitiveness on export markets and increase the market share for imports in domestic markets This loss of price competitiveness is based on an assumption of limited market development of energy efficiency and RES technologies in other part of the world It will be offset by gains in labour-intensive sectors if the ETR causes real wage costs per unit of output to fall as a result of using recycled revenues to reduce employer social security contributions
Any improvement in non-price competitiveness will also raise exports The extra employment will raise incomes raising consumption and output
The overall impact on sector output depends on countervailing effects which are negative for iron and steel and a few service sectors and positive for a few industry sectors For most industries the output effect is insignificant (Figure 39) The greatest impact is felt by producers of fossil fuels who must obviously reduce production due to lower demand for their products
Under scenario S2H employment impacts are positive for most sectors relative to the baseline as labour productivity decreases and wage rates fall in relation to consumer prices (CPI) and output prices (Table 33) The relative costs of labour are lower than in the baseline without the ETR reform Only around a quarter of the employment increase takes place in industry
Concerning the wage rate two countervailing effects have to be considered First when the labour market is characterised in terms of the real wage bargaining model as in E3ME and GINFORS with market power on both sides (employers and trade unions) consumer price increases will lead to wage increases (the econometrically estimated factor is 085 for Germany) Second labour productivity is another important factor for wage bargaining The estimated elasticity for Germany is 063 meaning that a 1 increase of labour productivity leads to wage increases of 063 Higher labour demand due to lower labour costs thus reduces the wage increase In the end the German economy is more labour intensive than without the ETR partly due to the structural change towards labour-intensive industries
Table 33 Employment impacts of scenario S2H in Germany mdash deviations from scenario S2H in 2020
Employment in 2020 Deviation from S2H () Deviation from S2Habsolute (1 000s)
Agriculture forestry 24 90
Industry 09 653
Non-metallic minerals 24 62
Iron and steel ndash 28 ndash 37
Machinery and equipment 05 56
Electrical machinery 04 18
Construction 37 449
Trade and transport 10 829
Business services 17 767
Other services ndash 02 ndash 216
Total 07 2506
Environmental tax reform in Europe opportunities for eco-innovation
Modelling of ETR impacts on eco-innovation
36
Additional exports under scenario S2HE mainly create new jobs in machinery and related business services (Table 34) Under scenario S2HI a shift in the input structure of the energy sector leads to a shift in the industry structure and creates a few jobs in the service sector (Table 35)
34 Conclusions of the scenario assessment
The foregoing analysis used the GINFORS model to assess economic and environmental impacts of using the ETS and ETR to reach the EUs 2020
GHG targets In general the results show positive employment effects and only small negative impacts on GDP in EU-27 Member States The economic impacts depend on the levels of international energy prices the mechanism used to recycle revenues and country specifics such as carbon and energy intensity and the structure of energy consumption
Although there is significant evidence that eco-innovation is positively driven by higher energy prices quantification is difficult The present study included simulations of possible impacts of a shift in the industry structure towards renewable energy in the electricity sector and an overall increase of EU
Table 34 Employment impacts of scenario S2HE in 2020 in Germany mdash deviations from scenario S2H
Employment in 2020 Deviation from S2H () Deviation from S2Habsolute (1 000s)
Agriculture forestry ndash 01 ndash 02
Industry 03 194
Non-metallic minerals 02 05
Iron and steel 04 05
Machinery and equipment 13 130
Electrical machinery 24 117
Construction 01 18
Trade and transport 00 26
Business services 07 308
Other services 01 107
Total 02 634
Table 35 Employment impacts of scenario S2HI in 2020 in Germany mdash deviations from scenario S2H
Employment in 2020 Deviation from S2H () Deviation from S2Habsolute (1 000s)
Agriculture forestry ndash 01 ndash 02
Industry 00 00
Non-metallic minerals 25 65
Iron and steel ndash 27 ndash 36
Machinery and equipment 08 78
Electrical machinery 04 19
Construction ndash 00 ndash 04
Trade and transport 00 07
Business services 02 115
Other services 0 56
Total 00 167
Modelling of ETR impacts on eco-innovation
Environmental tax reform in Europe opportunities for eco-innovation 37
exports due to higher global demand for renewable energy The main results can be summarised as follows
bull environmentaltaxreformshiftingtaxesfromlabour to energy and resources will create additional jobs and trigger eco-innovation
bull impactsofeco-innovationintheformofadditional EU exports or shifts in industry structures will have a slight positive influence on GDP and create a smaller number of additional jobs
These findings correspond to results from the EmployRES study (Fraunhofer ISI et al 2009) As ETR is directly aimed at reducing labour costs it will create additional jobs in the short and medium term In the longer term the cost reduction and new technologies arising from eco-innovation will play a larger role
Like all fiscal reforms a major ETR in Europe will create winners and losers At the sector level carbon- and material-intensive industries will face economic losses At the country level the carbon-intensity and overall flexibility of economies is important Clearly structural change away from carbon-intensive industries together with technological change is inherent in any successful climate mitigation policy
On the other hand several factors can smooth these structural adjustments International cooperation
will reduce economic pressure on countries and sectors In addition ETR together with auctioning of ETS allowances can be a major source of revenues for EU Member States in the future even if part of the revenues will have to be earmarked for adaptation and mitigation measures in developing countries Indeed future debate on grandfathering or auctioning ETS allowances should reflect the important point that giving allowances away for free denies countries the money to ease structural change and invest in low-carbon technologies
Caution is needed in relating the findings of this study to the EU policy debate In the model simulations the single carbon price is the only instrument used to reach the EUs 2020 GHG targets In reality of course other renewable energy and efficiency policies will also contribute to carbon reduction and have to be taken into account when comparing the results (especially the high carbon prices) to other studies Both reduce the potential revenues from fossil energy carriers and carbon emissions
A variety of renewable energy and efficiency policies could enable the climate and energy targets to be met while securing even better economic prospects The results of the present study clearly indicate that the discussion on market-based instruments should be intensified Ultimately however the EU will need a rich mix of policies to reach its GHG targets while maximising prosperity
Environmental tax reform in Europe opportunities for eco-innovation38
References
Almon C 1991 The INFORUM Approach to Interindustry Modeling in Economic Systems Research Vol 3 pp 1ndash7
Amin A and Cohendet P 2004 The Architecture of Knowledge Firms Capabilities and Communities Oxford University Press Oxford
Barker T Meyer B Pollitt H and Lutz C 2007a Modelling Environmental Tax Reform in Germany and the United Kingdom with E3ME and GINFORS petre Working Paper Cambridge and Osnabrueck (httpwwwpetreorgukpapershtm) accessed 15 February 2011
Barker T Junankar S Pollitt H and Summerton P 2007b Carbon leakage from unilateral environmental tax reforms in Europe 1995ndash2005 Energy Policy Vol 35 pp 6 281ndash6 292
Brunnermeier S B and Cohen M A 2003 Determinants of environmental innovation in US manufacturing industries Journal of Environmental Economics and Management Vol 45 pp 278ndash293
Buen J 2006 Danish and Norwegian wind industry The relationship between policy instruments innovation and diffusion Energy Policy Vol 34 (18) pp 3 887ndash3 897
Carlsson B and Stankiewicz R 1991 On the nature function and composition of technological systems Journal of Evolutionary Economics Vol 1 (2) pp 93ndash118
Christiansen A C and Skjaerseth J B 2005 Climate change policies in Norway and the Netherlands Different instruments similar outcome Energy and Environment Vol 16(1) pp 1ndash25
Dosi G 1988 Sources procedures and microeconomic effects of innovation Journal of Economic Literature Vol 26 pp 1 120ndash1 171
de Vries F and Medhi N 2008 Environmental regulation and international innovation in automotive emissions control technologies in Environmental Policy Technological Innovation and Patents Organisation for Economic Cooperation and Development Paris
DG TREN 2008 European energy and transport mdash trends to 2030 mdash update 2007 European Commission Luxembourg
DTI 2004 Renewable Supply Chain Gap Analysis UK Department of Trade and Industry
Edler J (ed) 2006 Nachfrageorientierte Innovationspolitik Buumlro fuumlr Technikfolgenabschaumltzung beim Deutschen Bundestag (TAB) Arbeitsbericht Nr 99 Berlin
Edquist C 2001 The system of innovation approach and innovation policy an account of the state of the art lead paper presented at the DRUID Conference 12ndash15 June 2001 Aalborg (httpwwwdruiddkconferencesnwpaper1edquistpdf) accessed 15 February 2011
EEA 2006 Using the market for cost-effective environmental policy Market-based instruments in Europe EEA Report No 12006 European Environment Agency Copenhagen
Ekins P 2009 Resource Productivity Environmental tax Reform and Sustainable Growth in Europe published by the Anglo-German Foundation for the Study of Industrial Society Final report (httpwwwpetreorgukpdfFinRepFinpdf) accessed 12 October 2011
Ekins P and Speck S (eds) 2011 Environmental Tax Reform (ETR) A Policy for Green Growth Oxford University Press
EREC 2008 Energy [r]evolution A sustainable global energy outlook Greenpeace International European Renewable Energy Council (EREC)
References
References
Environmental tax reform in Europe opportunities for eco-innovation 39
Fagerberg J Mowery D C and Nelson R R (eds) 2005 The Oxford Handbook of Innovation Oxford University Press Oxford
Fischer C Parry I W H and Pizer W A 2003 Instrument choice for environmental protection when technological innovation is endogenous Journal of Environmental Economics and Management Vol 45 pp 523ndash545
Fraunhofer ISI ECOFYS Energy Economics Group Ruumltter + Partner SEURECO and LEI 2009 EmployRES mdash The impact of renewable energy policy on economic growth and employment in the European Union European Commission Brussels
Frondel M Horbach J and Rennings K 2008 What triggers environmental management and innovation Empirical evidence for Germany Ecological Economics Vol 66(1) pp 153ndash160
GHK Cambridge Econometrics and IEEP 2007 Links between the environment economy and jobs Final Report submitted to DG Environment European Commission
Giljum S Behrens A Hinterberger F Lutz C and Meyer B 2008 Modelling scenarios towards a sustainable use of natural resources in Europe Environmental Science and Policy Vol 11 pp 204ndash216
Goumlrlach B Knigge M and Luumlckge H 2005 Wirkungen der Oumlkologischen Steuerreform auf Innovation und Marktdurchdringung Ecologic Berlin (httpecologiceudownloadprojekte1850-189918791879_5_innovationpdf) accessed 18 August 2011
Green M A 2000 Photovoltaics technology overview Energy Policy Vol 28 (14) pp 989ndash998
Grossmann A Lehr U Lutz C and Wolter MI 2008 Gesamtwirtschaftliche Effekte der Umsetzung der EU Ziele im Bereich Erneuerbare Energien und Gebaumludeeffizienz in Oumlsterreich bis 2020 Studie im Auftrag des Lebensministeriums Wien 0508
Hage J and Hollingsworth J R 2000 Idea innovation networks a strategy for integrating organizational and institutional analysis Organization Studies Vol 21 (5) pp 971ndash1 004
Hauschildt J 2004 Innovationsmanagement Vahlen Muumlnchen
Hemmelskamp J 1997 Environmental policy instruments and their effects on innovation European Planning Studies Vol 5 (2) pp 177ndash195
Hoglund Isaksson L 2005 Abatement costs in response to the Swedish charge on nitrogen oxide emissions Journal of Environmental Economics and Management Vol 50 pp 102ndash120
Hullmann A 2001 Internationaler Wissenstransfer und technischer Wandel (dissertation) Physica-Verlag Heidelberg
IEA 2008 World Energy Outlook 2008 International Energy Agency Paris
IEA 2009 World Energy Outlook 2009 International Energy Agency Paris
Jacobsson S Andersson B A and Baringngens L 2002 Transforming the energy system mdash the evolution of the German technological system for solar cells Science and Technology Policy Research University of Sussex Electronic Working Paper Series No 84 (httpideasrepecorgpsrussewps84html) accessed 18 August 2011
Jaffe A and Stavins R 1995 Dynamic incentives of environmental regulations the effects of alternative policy instruments on technology diffusion Journal of Environmental Economics and Management Vol 29(3) pp 43ndash63
Jaffe A B and Palmer K 1997 Environmental regulation and innovation a panel data study The Review of Economics and Statistics Vol 79 pp 610ndash619
Jaffe A B Newell R G and Stavins R N 2002 Environmental policy and technological change Environmental and Resource Economics Vol 22 (1ndash2) 2002 pp 41ndash70
Johnstone N and Hascic I 2008 Renewable energy policies and technological innovation energy source and instrument choice in Environmental Policy Technological Innovation and PatentsOrganisation for Economic Co-operation and Development Paris
Johnstone N 2005 The Innovation Effects of Environmental Policy Instruments in Horbach J (ed) Indicator Systems for Sustainable Innovation Physica-Verlag HD
Environmental tax reform in Europe opportunities for eco-innovation
References
40
Johnstone N Hascic I and Ostertag K 2008 Environmental policy technological innovation and patent activity in Environmental Policy Technological Innovation and Patents Organisation for Economic Co-operation and Development Paris
Jung C Krutilla K and Boyd R 1996 Incentives for advanced pollution abatement technology at the industry level an evaluation of policy alternatives Journal of Environmental Economics and Management Vol 30(1) pp 95ndash111
Kammen D M Kapidia K and Fripp M 2004 Putting renewables to work how many jobs can the clean energy industry generate University of California Berkeley
Kemp R 1997 Environmental policy and technical change ndash a comparison of the technological impact of policy instruments Edward Elgar Cheltenham
Kemp R 1998 The diffusion of biological waste-water treatment plants in the Dutch food and beverage industry Environmental and Resource Economics Vol 12 pp 113ndash136
Kemp R 2000 Technology and environmental policy ndash innovation effects of past policies and suggestions for improvement in OECD proceedings ndash innovation and the environment Organisation for Economic Co-operation and Development Paris
Kerr S and Newell R G 2003 Policy-induced technology adoption evidence from the US lead phasedown Journal of Industrial Economics Vol 51 pp 317ndash343
Klaassen G Miketa A Larsen K and Sundqvist T 2005 The impact of RampD on innovation for wind energy in Denmark Germany and the United Kingdom Ecological Economics Vol 54 pp 227ndash240
Kline S and Rosenberg N 1986 An overview of innovation in Landau R (ed) The positive sum strategy Harnessing technology for economic growth pp 275-306
Knigge M and Goumlrlach B 2005 Effects of Germanys ecological tax reforms on the environment employment and technological innovation Ecologic Berlin (httpwwwumweltbundesamtdeuba-info-presse-ehintergrundoekosteuerpdf) accessed 18 August 2011
Langniss O 2003 Governance structures for promoting renewable energy sources dissertation Lund Stuttgart
Lanjouw J O and Mody A 1996 Innovation and the international diffusion of environmentally responsive technology Research Policy Vol 25 pp 549ndash571
Lehr U Nitsch J Kratzat M Lutz C and Edler D 2008 Renewable Energy and Employment in Germany Energy Policy Vol 36 pp 108ndash117 DOI101016jenpol200709004
Lehr U Wolter MI and Groszligmann A 2009 Economic impacts of RES obligations in Austria ndash an application of the macro-econometric model e3at GWS Discussion Paper 20091 Osnabruumlck
Lundvall B-A Johnson B Andersen E S and Dalum B 2001 National systems of production innovation and competence building Research Policy Vol 31 pp 213ndash231
Lutz C and Giljum S 2009 Global resource use in a business as usual world until 2030 Updated results from the GINFORS model in Bleischwitz R Welfens Pand Zhang Z (eds) Sustainable growth and resource productivity ndash economic and global policy issues Greenleaf Publishers pp 30ndash41
Lutz C and Meyer B 2008 Beschaumlftigungseffekte des Klimaschutzes in Deutschland Untersuchungen zu gesamtwirtschaftlichen Auswirkungen ausgewaumlhlter Maszlignahmen des Energie- und Klimapakets Forschungsbericht 205 46 434 Dessau-Roszliglau
Lutz C and Meyer B 2009a Environmental and Economic Effects of Post-Kyoto Carbon Regimes Results of Simulations with the Global Model GINFORS Energy Policy Vol 37 pp 1 758ndash1 766 DOI 101016jenpol200901015
Lutz C and Meyer B 2009b Scenario results from GINFORS PETRE working paper Osnabruumlck
Lutz C Meyer B Nathani C and Schleich J 2005 Endogenous technological change and emissions The case of the German steel industry Energy Policy Vol33 pp 1 143ndash1 154
Lutz C Meyer B Nathani C and Schleich J 2007 Endogenous innovation economy and environment impacts of a technology based modelling approach for energy-intensive industries in Germany Energy Studies Review Vol 15(1) pp 2ndash18
References
Environmental tax reform in Europe opportunities for eco-innovation 41
Lutz C Meyer B and Wolter M I 2009 The global multisectormulticountry 3-E model GINFORS mdash a description of the model and a baseline forecast for global energy demand and CO2 emissions Journal of Sustainable Development forthcoming
Malerba F and Orsenigo L 1997 Technological Regimes and Sectoral Patterns of Innovative Activities Industrial and Corporate Change Vol 6 (1) pp 83ndash117
Malerba F 1992 Learning by Firms and Incremental Technical Change The Economic Journal Vol 102 (413) pp 845ndash859
Malerba F 2005 Industrial dynamics and innovation progress and challenges Presidential Address delivered at the 32nd Conference of the European Association for Research in Industrial Economics (EARIE) 1ndash4 September 2005 Porto
Malerba F 2006 Innovation and the evolution of industries Journal of Evolutionary Economics Vol 16 pp 3ndash23
McGinty M and de Vries F P 2009 Technology diffusion product differentiation and environmental subsidies The BE Journal of Economic Analysis and Policy Vol 9(1)
Meyer B and Lutz C 2007 The GINFORS model ndash model overview and evaluation Petre Working Paper Osnabruumlck (httpwwwpetreorgukpapershtm) accessed 18 August 2011
Meyer B Lutz C Schnur P and Zika G 2007 Economic policy simulations with global interdependencies a sensitivity analysis for Germany Economic Systems Research Vol 19 pp 37ndash55
Mickwitz P H Hyvaumlttinen and P Kivimaa 2008 The role of policy instruments in the innovation and diffusion of environmentally friendlier technologies popular claims versus case study experiences Journal of Cleaner Production Vol 16(1S1) 162ndash170
Miketa A and Schrattenholzer L 2004 Experiments with a methodology to model the role of RampD expenditures in energy technology learning processes first results Energy Policy Vol 32 (15) pp 1 679ndash1 692
Milliman S R and Prince R 1989 Firm incentives to promote technological change in pollution control Journal of Environmental Economics and Management Vol 17 pp 247ndash265
Millock K and Nauges C 2006 Ex-post evaluation of an earmarked tax on air pollution Land Economics Vol 82(1) pp 68ndash84
Montero J-P 2002 Market structure and environmental innovation Journal of Applied Economics Vol 2 pp 293ndash325
Moreno B and Loacutepez A J 2007 The effect of renewable energy on employment mdash The case of Asturias (Spain) Renewable and Sustainable Energy Rewiews doi 101016jrser200610011
Mowery D and Rosenberg N 1979 The influence of market demand upon innovation A critical review of some recent empirical studies Research Policy Vol 8 pp 102ndash153
Newell R G Jaffe A B and Stavins R N 1999 The induced innovation hypothesis and energy-saving technological change Quarterly Journal of Economics Vol 114 pp 941ndash975
Norberg-Bohm V 1999 Stimulating green technological innovation An analysis of alternative policy mechanisms Policy Sciences Vol 32(1) pp 13ndash38
OECD 2009 Sustainable manufacturing and eco-innovation towards a green economy Organisation for Economic Co-operation and Development Policy Brief June 2009
OECD 2010 Taxation innovation and the environment Organisation for Economic Co-operation and Development
Pavitt K 1984 Sectoral patterns of technological change Towards a taxonomy and a theory Research Policy Vol 13 pp 343ndash373
Popp D 2002 Induced innovation and energy prices The American Economic Review Vol 92(1) pp 160ndash180
Popp D 2005 Lessons from patents Using patents to measure technological change in environmental models Ecological Economics Vol 54 pp 209ndash226
Environmental tax reform in Europe opportunities for eco-innovation
References
42
Porter M and van der Linde C 1995 Toward a new conception of the environment competitiveness relationship Journal of Economic Perspectives Vol 9(4) pp 97ndash118
Rammert W 2002 The cultural shaping of technologies and the politics of technodiversity In Sorensen K and Williams R (eds) Shaping technology guiding policy concepts spaces and tools Elgar Cheltenham pp 155-172
Requate T 2005 Dynamic incentives by environmental policy instruments ndash a survey Ecological Economics Vol 54 pp 175ndash195
Roloff N Lehr U Krewitt W Fuchs G Wassermann S Weimer-Jehle W and Schmidt B 2008 Success determinants for technological innovations in the energy sector mdash the case of photovoltaics in Moumlst D Fichtner W Ragwitz M and Veit D (eds) New methods for energy market modelling mdash Proceedings of the first european workshop on energy market modelling using agent-based computational economics Universitaumltsverlag Karlsruhe
Rothwell R 1995 The fifth generation innovation process in Oppenlaumlnder KH Popp W (eds) Innovationen und wirtschaftlicher Fortschritt betriebs-und volkswirtschaftliche Perspektiven Bern pp 9ndash26
Schumpeter J 1942 Capitalism socialism and democracy New York Harper
Skjaeligrseth J B and Christiansen A C 2005 Environmental policy instruments and technological change in the energy sector findings from comparative empirical research Energy and Environment Vol 17 (2) pp 223ndash241
Snyder L D Miller N H and Stavins R N 2003 The effects of environmental regulations on pollution emissions evidence from plant-level data American Economic Review Vol 93(2) pp 431ndash435
Technopolis 2008 Eco-innovation Final Report for Sectoral Innovation Watch (httpwwwtechnopolis-groupcomresourcesdownloads661_report_finalpdf) accessed 18 August 2011
Volleburgh H 2007 Impacts of environmental policy instruments on technological change Report for Joint Meetings of Tax and Environment Experts OECD Environment Directorate February 2007 (comenvepocctpacfa(2006)36final)
Zimmermann H Wohltmann M and Hansjuumlrgens B 1996 Umweltabgaben und Innovation Analytica Marburg
43
Annex 1
Environmental tax reform in Europe opportunities for eco-innovation
Type Instrument Area Stage
Reference
Theo
retica
l
Em
piric
al
Cas
e st
udy
Rev
iew
Qual
itat
ive
Taxe
s
Perm
its
Subsi
die
s
Volu
nta
ry
Com
man
d
Reg
ula
tion
Ener
gy
Air
Wat
er
Oth
er
Gen
eral
Innov
atio
n
Diffu
sion
Rel
evan
ce
Brunnermeier amp Cohen (2003)
X X X X
Buen (2006) X X X X X X
Christiansen amp Skjaerseth (2005)
X X X X X X
Fischer et al (2003 X X X X X X
Frondel et al (2008) X X X X X X X (X) (X)
Hemmelskamp (1997)
X X X X X X X (X)
Hoglund Isaksson (2005)
X X X (X) (X)
Jaffe amp Stavins (1995)
X X X1 X X X X
Jaffe amp Palmer (1997)
X X X X
Jaffe et al (2002) X X X X X X X X X X
Jung et al (1996) X X X X X X (X) (X)
Kemp (1998) X X X X
Kerr amp Newell (2001) X X X X X
Klaassen et al (2005)
X X X X X
Lanjouw amp Mody (1996)
X X X X X X X
McGinty amp de Vries (2009)
X X X X
Mickwitz et al (2008)
X X X X X X X X X
Milliman amp Prince (1989)
X X X X X X X
Millock amp Nauges (2006)
X X X X X X
Montero (2002) X X X X X
Newell et al (1999) X X1 X X X
Norberg-Bohm (1999)
X X X X X X X
Popp (2002) X X1 X X
Popp (2005) X X X X X X
Porter amp van der Linde (1995)
X X X X X X
Requate (2005) X X X X X X X
Skjaeligrseth amp Christiansen (2005)
X X X X X X X X X
Snyder et al (2003) X X X X X
Annex 1 Classification of refereed journal articles
Environmental tax reform in Europe opportunities for eco-innovation44
Annex 2
Type Instrument Area Stage
Reference
Theo
retica
l
Em
piric
al
Cas
e st
udy
Rev
iew
Qual
itat
ive
Taxe
s
Perm
its
Subsi
die
s
Volu
nta
ry
Com
man
d
Reg
ula
tion
Ener
gy
Air
Wat
er
Oth
er
Gen
eral
Innov
atio
n
Diffu
sion
Rel
evan
ce
Johnstone (2005)
X X X X X X X
Johnstone amp Hascic (2008)
X X X X X X X X
Kemp (1997) X X X X X X X X X X X X X
Kemp (2000) X X X X X X X X X
de Vries amp Medhi (2008)
X X1 X X X
Annex 2 Classification of books and book chapters
45
Annex 3
Environmental tax reform in Europe opportunities for eco-innovation
Type Instrument Area Stage
Reference
Theo
retica
l
Em
piric
al
Cas
e st
udy
Rev
iew
Qual
itat
ive
Taxe
s
Perm
its
Subsi
die
s
Volu
nta
ry
Com
man
d
Reg
ula
tion
Ener
gy
Air
Wat
er
Oth
er
Gen
eral
Innov
atio
n
Diffu
sion
Rel
evan
ce
Goumlrlach et al (2005)
X X X X X X
Knigge amp Goumlrlach (2005)
X X X X X X
Technopolis (2008)
X X X X X X
Volleburgh (2007)
X X X X X X X X X X X
Annex 3 Classification of reports
European Environment Agency
Environmental tax reform in Europe opportunities for eco-innovation
2011 mdash 45 pp mdash 21 x 297 cm
ISBN 978-92-9213-238-5doi10280084889
How to obtain EU publications
Publications for salebull viaEUBookshop(httpbookshopeuropaeu)bull fromyourbooksellerbyquotingthetitlethepublisherandorISBNnumberbull bycontactingoneofoursalesagentsdirectlyYoucanobtaintheircontactdetails
on the Internet (httpbookshopeuropaeu) or by sending a fax to +352 2929-42758
Free publicationsbull viaEUBookshop(httpbookshopeuropaeu)bull attheEuropeanCommissionsrepresentationsordelegationsYoucanobtain
their contact details on the Internet (httpeceuropaeu) or by sending a fax to +352 2929-42758
European Environment AgencyKongens Nytorv 61050 Copenhagen KDenmark
Tel +45 33 36 71 00Fax +45 33 36 71 99
Web eeaeuropaeuEnquiries eeaeuropaeuenquiries
TH
-AK-1
1-0
17-E
N-N
doi1
02
8008
4889
- Acknowledgements
- Executive summary
- 1Introduction
-
- 11Background
- 12ETR and innovation
- 13Report structure
-
- 2Review of literature on environmental tax reform and eco‑innovation
-
- 21Initial screening
- 22Detailed review
- 23Environmental regulation studies
- 24Theoretical studies
- 25Empirical studies
- 26Case studies
- 27Conclusions
-
- 3Modelling of ETR impacts on eco‑innovation
-
- 31Scenarios assessing the implications of ETR for eco-innovation
- 32Overview of modelling results
- 33Macroeconomic impacts at the national level
- 34Conclusions of the scenario assessment
-
- References
- Annex 1 Classification of refereed journal articles
- Annex 2Classification of books and book chapters
- Annex 3Classification of reports
-
Environmental tax reform in Europe opportunities for eco-innovation
Review of literature on environmental tax reform and eco-innovation
22
occurred In the Netherlands technological change was incremental reflecting a steady diffusion of available (ie known) technology In contrast the authors find evidence of more radical innovations and adaptations by the Norwegian petroleum sector including the development of energy-efficient gas turbines installation of waste heat recovery units process modifications and improved use of process heat While the authors acknowledge the impossibility of proving a causal link between policy intervention and innovation (in the context of their case study) they conclude that the CO2 tax played a key role in the development and implementation of these radical innovations and the benefits of reduced tax payments provided an important incentive However they also conclude that the impacts of the two instruments were conditioned by the political contexts in which they were applied and the problem characteristics in the respective countries (eg the economic significance of the sector and the size of installations)
Knigge and Goumlrlach (2005) summarise the findings of a comprehensive analysis of the impacts of the ETR in Germany That analysis undertaken jointly by Ecologic and the German Institute for Economic Research (DIW Berlin) included the impacts on innovation and market diffusion of environmentally friendly products and technologies (34) Based on a series of case studies the study concluded that the ETR had a noticeable effect on innovation and diffusion although it was not possible to quantify the scale of that effect In particular ETR is identified as being a central factor in the development of gas-powered vehicles The study identifies a number of different routes by which the ETR produced impacts First the payback period for energy-efficient products was reduced as a result of the energy tax increases and the various exemptions favouring efficient energy use and renewable energy sources Second the predictable nature of the energy taxes (as opposed to widely fluctuating oil prices) reduced uncertainties about the benefits of energy-efficiency investments Third the reduction in employers social contribution payments tended to reduce the costs of labour intensive innovation processes such as research and development energy consultancy and technology installation Finally the ETR had a signalling effect strengthening awareness of the need for more efficient and rational energy use
Mickwitz et al (2007) examine a number of claims that have been made in the environmental policy literature about the relationship between policy instruments and innovation based on experiences in two industrial sectors in Finland pulp and paper and the manufacture of diesel engines for ships In particular they assess the claims that environmental taxes are superior to other policy instruments with respect to innovation and that RampD subsidies have limited impacts on innovation With respect to the first claim the evidence provided by the two case studies is mixed The authors conclude that energy taxation had a negligible impact on innovation in the pulp and paper industry However this is likely to have been due to the low level of the tax and the exemptions that applied to the sector In contrast they find that the differentiation of Swedish fairway and port fees (on the basis of SO2 and NOX emissions) was a significant factor driving the installation of in-engine NOX reduction equipment in ferries operating between the two countries (35) With respect to RampD subsidies the authors conclude that the evidence does not support the claim that these have little effect In particular they find that RampD subsidies accelerated the development of ship engine emissions-reduction technologies
The findings of the three case studies are consistent with those of the empirical analyses reviewed in the previous section Environmental taxes and investment subsidies have proven significant in promoting both innovation and diffusion although not universally so Furthermore the case studies provide some useful insights about the ways in which the impacts occur and the factors that may be important in promoting innovation In particular they suggest the need for a tax rate that is sufficiently high to provide a meaningful incentive and signalling effect and that is fixed for a sufficiently long period of time to reduce uncertainty about the future benefits of investment
27 Conclusions
The studies reviewed in the preceding sections suggest that environmental regulation in general and price-based policy instruments such as environmental taxes and investment subsidies in particular can (in theory) and do (in practice) have a positive impact on both innovation and diffusion
(34) A separate report in German by Goumlrlach et al (2005) provides details of the evaluation of the innovation and diffusion impacts (35) Although the tax was introduced in Sweden it was also payable by Finnish ferry operators entering Swedish ports and hence
affected their investment decisions This is another example of the cross-border impact of environmental policy interventions on innovation found by Lanjouw and Mody (1996) (see Section 23)
Review of literature on environmental tax reform and eco-innovation
Environmental tax reform in Europe opportunities for eco-innovation 23
of environmental technologies However the supporting empirical and case study evidence is not universal and the effectiveness of these instruments would appear to vary across different sectors and different types of innovation
To a certain extent such differences can be explained by the theoretical models In particular the impact of environmental taxes (relative to other instruments) is predicted to depend on the competitive structures of the markets in which the regulated firms operate and on the ability of innovator firms to appropriate the benefits accruing to other firms during diffusion However a number of other potential factors have been identified in the literature which may affect the impact of price-based policy instruments on innovation
Jaffe et al (2002) caution that the impact of price-based policy instruments on technology diffusion may be adversely affected by a number of potential market failures including information failures principle-agent problems (eg landlord-tenant) capital market failures and positive adoption spillovers In addition while not market failures as such uncertainty over future returns and the (associated) use of high discount rates for investment decisions can also undermine the effectiveness of price-based instruments in stimulating diffusion However as was noted above the findings from the case study of ETR in Germany suggest that an environmental tax may actually reduce the level of uncertainty over future returns provided that it is of sufficient magnitude and longevity
Skjaerseth and Christiansen (2005) emphasise that the relationship between policy instruments (of all types) and technological change is extremely complicated They argue that account must be taken of the politicalindustrial context in which policy instruments are introduced and the nature of the environmental problem that they are intended to address In particular they make a distinction between malign problems where technological change involves net costs for target groups and benign problems where there are widespread no-regret opportunities for change Based on a comparative analysis of four different case studies they conclude that mandatory policy instruments (including environmental taxes) are more effective
in promoting short-term technological change when the problems are malign but that low legitimacy (with the target group) may undermine long-term technological change However when problems are benign or when long-term change requires cooperation voluntary policy instruments are likely to be more effective
Johnstone (2005) questions the focus of the theoretical and empirical analyses (reviewed above) on the impact of environmental policy instruments on the rate of technological change He argues that the direction of technological change is as important if not more so In addition to the quantity of innovation it is also important that innovation be socially optimal in the sense that it minimises the cost of attaining a particular environmental goal in the long term Inappropriate innovation today may result in lock in to a suboptimal technological path for the future
With this in mind Johnstone identifies a number of issues that can adversely affect the direction of innovation and should be taken into account when selecting and designing policy instruments technological market failures (36) missing markets for certain environmental attributes of innovation policy incidence and joint production of emissions Most studies of the innovation effects of environmental policy instruments assume that the only missing market is that for the environmental good (or bad) However in practice there may be other markets that are missing (or incomplete) which can adversely affect transmission of innovation incentives This is particularly so in the area of waste and resource management where instruments applied at the end of the product life cycle may have little or no impact on product design innovation Even if all markets are complete except for the environmental externality the point of incidence of the policy intervention may be more important for the direction of innovation than the choice of a particular policy instrument For example a limit or standard applied directly to the emissions of a pollutant may be more effective in promoting optimal innovation than a tax applied to a proxy input variable Finally when there is joint production of pollutants (eg CO2 and air pollutants from vehicle engines) there is a danger that if policy instruments (of whatever type) are applied to one pollutant in isolation the resulting innovation may
(36) These are the same market failures identified by Jaffe et al (2002)
Environmental tax reform in Europe opportunities for eco-innovation
Review of literature on environmental tax reform and eco-innovation
24
reduce emissions of that pollutant at the expense of increases in the others
In a related point Johnstone highlights the importance of using appropriate indicators when assessing the impact of policy instruments on innovation emphasising the need for these to reflect both the rate of innovation and the direction A necessary condition for this is that the indicators must provide an accurate and detailed picture of actual innovation Unfortunately this is difficult to achieve in practice For example the use of patent data as a measure of innovation requires the identification of relevant environmental technologies This is likely to be easier for end-of-pipe technologies than for process-related technologies meaning that the latter tend to be under-represented relative to their actual incidence To the extent that process-related innovation is growing in importance or is more important
for certain sectors or types of environmental problem changes in the value of the indicator may significantly understate the actual rate of innovation and misrepresent the direction
All of this suggests that caution should be exercised in drawing general definitive conclusions about the impacts of price-based policy instruments such as environmental taxes and investment subsidies on innovation particularly relative to other policy instruments While it would appear that they can be effective in stimulating both innovation and diffusion in many cases mdash at least in terms of the rate of technological change mdash there may be situations in which other policy instruments may be more appropriate In general the stringency and point of incidence of an environmental policy intervention may be more important than the choice of a particular policy instrument in determining the rate and direction of eco-innovation
25
Modelling of ETR impacts on eco-innovation
Environmental tax reform in Europe opportunities for eco-innovation
31 Scenarios assessing the implications of ETR for eco-innovation
Scenario analysis provides a useful means of improving understanding of how the different revenue recycling methods and various scales of ETR can help meet different greenhouse gas emissions targets
To investigate the impacts of an ETR for Europe the petre project elaborated a range of different scenarios reflecting various tax reform options In addition to employing several of these original scenarios the present study compiled two new scenarios to analyse the implications of ETR for eco-innovation All scenarios were examined in both E3ME and GINFORS (37)
311 Original petre project scenarios
The key petre scenarios relevant for the present study are
bull scenarioBHbaselinescenariowithhighenergyprice (reference case)
bull scenarioS1HETRdesignedtomeettheEUsunilateral 2020 GHG target (high energy price) with revenue recycling
bull scenarioS2HETRdesignedtomeettheEUsunilateral 2020 GHG target (high energy price) with revenue recycling and 10 of revenues spent on eco-innovation measures
Each of the ETR scenarios has the same key taxation components
bull acarbontaxrateisintroducedtoallnon-EUEmissions Trading System (EU ETS) sectors equal to the carbon price in the EU ETS that delivers an overall 20 reduction in greenhouse gas emissions by 2020 and in the international cooperation scenario this is extended to 30
bull aviationisincludedintheEUETSattheendofPhase 2
bull powergenerationsectorEUETSpermitsare100 auctioned in Phase 3 of the EU ETS
bull allotherEUETSpermitsare50auctionedin2013 increasing to 100 in 2020
bull materialtaxesareintroducedat5oftotalpricein 2010 increasing to 15 by 2020
In scenario S1H environmental tax revenues are recycled through reductions in income tax rates and social security contributions in each of the Member States such that there is no direct change in tax revenues In scenario S2H 10 of environmental tax revenues are recycled through spending on eco-innovation measures and the remaining 90 is recycled through the same measures as in the other scenarios The eco-innovation spending is split across power generation and housing according to tax revenues from the corporate and household sector
In GINFORS (the model used for analysing the implications of ETR and eco-innovation) the share of renewable sources in electricity production is increased due to the additional investment The rest of additional investment goes to household energy efficiency spending Investment needed for a certain increase in renewable energy production or efficiency improvement is based on Austrian and German experience (Lehr et al 2008 and 2009 Grossmann et al 2008 Lutz and Meyer 2008) This assumption is quite conservative as parameters for other countries can be assumed to be more positive (meaning that less money is needed for renewable energy technology installation or energy efficiency gains)
In scenario S1H the 20 GHG target translates into a 15 reduction in energy-related carbon emissions relative to 1990 as other emissions such as methane and nitrous oxide have already been reduced by
3 Modelling of ETR impacts on eco-innovation
(37) The E3ME and GINFORS models are introduced in Chapter 1 of the present report A detailed discussion of the models and scenarios used in the present study can be found in Ekins and Speck (2011)
Environmental tax reform in Europe opportunities for eco-innovation
Modelling of ETR impacts on eco-innovation
26
more than 20 (in terms of carbon equivalents) The target is reached by a tightened EU ETS cap and the introduction of a carbon tax on the non-ETS sector The tax rate applied is equal to the carbon price in the EU ETS that will deliver a 20 GHG reduction by 2020
The burden of ETR taxes are allotted to energy outputs (ie the final use of energy) and will be based on the carbon content of each fuel Carbon prices are assumed to be fully passed on to consumers All carbon taxes are in addition to any existing unilateral carbon and energy taxes The carbon reductions in the different EU Member States will be those that result from a uniform carbon tax increase across the EU
All of the revenues including EU ETS auctioning revenues carbon tax revenues and material tax revenues will be recycled The proportion of tax raised by industry will be recycled into a reduction in employers social security contributions which will in turn reduce the cost of labour Recycling will be additional to the existing ETRs in some Member States Revenues raised from households will be recycled through standard rate income tax reductions Traditional energy tax revenues will be lower compared to their respective baselines as the tax base (energy consumption) is reduced So for an ETR revenue-neutrality does not mean budget-neutrality
312 Factors affecting the macroeconomic impacts of RES technologies
Earlier analyses (Lehr et al 2008 Fraunhofer ISI et al 2009 DTI 2004 Kammen et al 2004 Moreno and Loacutepez 2007) have studied the impacts of large renewable energy source (RES) shares in the energy mix for different countries The overall question in these studies has been the impact of increasing RES shares on the economy especially on the labour market For the present study it is interesting to note that macroeconomic impacts of higher RES shares mainly depends on the following five factors
1 additional investment in RES (minus lower investment in conventional sources ie fossil and nuclear power) with the impact increasing if a country manufactures the RES technology in question
2 additional (net) exports due to improved international competitiveness of renewable energy sources (first mover advantage)
3 lower fossil fuel needs4 the cost differences between RES and
conventional energy
5 the shift from capital- and energy-intensive industries to labour- and technology-intensive industries
All five factors are driven by international energy prices carbon prices the policy framework and RES technology development itself Innovation comes into the play at various stages First innovation drives the currently positive additional costs of RES technologies down and even into negative realms depending on the fossil fuel scenario Second innovative RES technologies are likely to have a competitive advantage in international markets Although a significant proportion of RES technology produced in Europe is traded in Europe innovation will still provide an edge in current and emerging international markets
The EmployRES study (Fraunhofer ISI et al 2009) finds for Europe that current strong investment reflected in installations in Europe and exports to the rest of the world dominate the economic impact of RES policies and therefore lead to positive overall effects The studys results suggest that this positive balance can only be kept up in the future if the competitive position of European manufacturers of RES technology is improved The authors strongly recommend policies which promote technological innovation in RES and lead to a continued and rapid reduction of their costs
Factors 1 and 2 will have substantial macroeconomic impacts in the short and medium terms whereas factor 3 accumulates and will show positive impacts mainly in the long term Factor 4 strongly depends on the global developments while factor 5 may have significant effects on employment
313 Additional scenarios
Impacts of additional investment (factor 1) have already been analysed in scenario S2H of the petre project To focus on the other impacts of eco-innovation two additional scenarios were designed building on scenario S2H of petre
bull S2HEETRwithrevenuerecyclingdesignedto meet the unilateral EUs 2020 greenhouse gas (GHG) target (high energy price) Ten per cent of revenues are spent on eco-innovation measures and trade shares of EU-27 economies with the rest of the world in machinery and electrical machinery increase by 01 due to the deployment of the fast growing RES markets This assumption is based on the strong EU policy effort to increase the share of renewable energy in final energy consumption to 20 by 2020
Modelling of ETR impacts on eco-innovation
Environmental tax reform in Europe opportunities for eco-innovation 27
(Fraunhofer ISI et al 2009) and the possibility of very strong world market development of the RES sector until 2020 (EREC 2008) which offers additional export opportunities for European RES industries
bull S2HIETRwithrevenuerecyclingdesignedto meet the unilateral EUs 2020 GHG target (high energy price) Ten per cent of revenues are spent on eco-innovation measures and input structures of the energy sector are changed according to the input structure of the German RES industry (Lehr et al 2008)
S2HE looks at the possible role of international trade S2HI analyses changes in the input structure of the energy sector ie from conventional electricity production to renewables In the petre project (as in GHK et al 2007) only the energy inputs of the energy sector were adapted to changes in the energy input mix
Both S2HE and S2HI focus on RES and efficiency technologies As mentioned above an ETR will trigger a variety of innovations Therefore the results can be thought of as conservative in the sense that innovations (eg automotive energy consumption industrial efficiency etc) are not explicitly included
32 Overview of modelling results
The main results of the simulations are presented in Table 31 In the baseline scenario BH with high energy prices EU-27 carbon emissions will be
72 below the 1990 level in 2020 (38) The EU-15 has committed in the Kyoto Protocol to reduce its GHG emissions 8 below 1990 levels in the period 2008ndash2012 As emissions in the new member states are substantially below their 1990 levels today that implies that the EU-27 will keep its emissions more or less constant over the coming decade As in the PRIMES baseline an ETS price of 18 EURt in 2008 prices is assumed in 2020
In scenario S1H the ETS price and carbon tax rate has to be increased to 68 EUR2008t of CO2 to reach the 20 GHG reduction target which is equal to a 15 reduction of CO2 emissions against 1990 as other greenhouse gases have already been reduced above average by more than 20 in terms of CO2 equivalents Compared to the baseline CO2 emissions are 84 lower in 2020 which means roughly an additional 1 reduction annually in the period 2012ndash2020 GDP will be about 06 lower compared to the baseline in 2020 This means that annual average growth rates will be less than 01 below their baseline development This is especially low compared to the current financial and economic crisis with a GDP deviation against the baseline of around 6 in 2009
As the recycling mechanism reduces labour costs and the tax burden is shifted from labour-intensive to carbon- and material-intensive sectors employment will be 036 (or more than 800 000 jobs) higher than in the baseline The ETR is not fully budget neutral potentially enabling EU economies to slightly increase their net savings If
(38) The modelling exercise in the present study was conducted in 2009 and therefore does not contain the latest data on EU-27 GHG emissions which were significantly influenced by the global economic slump of the late-2000s
Table 31 Main results under the different scenarios
Scenario Target in 2020 CO2 price GDP Employment CO2 reduction
EUR2008t pc against baseline
pc against baseline
pc against 1990
pc against baseline
in year 2020 2015 2020 2020 2020 2020
BH 18 ndash 72 00
S1H 20 GHG 68 ndash 022 ndash 057 036 ndash 151 ndash 84
S2H 20 GHG 61 ndash 013 ndash 030 041 ndash 152 ndash 85
S2HE 20 GHG 61 ndash 009 ndash 004 051 ndash 151 ndash 84
S2HI 20 GHG 61 ndash 006 ndash 024 045 ndash 152 ndash 84
Environmental tax reform in Europe opportunities for eco-innovation
Modelling of ETR impacts on eco-innovation
28
this extra saving is spent negative GDP impacts will be further reduced
In scenario S2H part of the revenues is invested in low-carbon technologies This reduces the carbon price to 61 EUR2008t in 2020 halving the GDP loss relative to scenario S1H to only 03 as the investment in renewable energies is assumed to be additional Employment impacts are also more positive than in scenario S1H The 10 investment in low-carbon technologies amounts to more than EUR 20 billion in 2020
Assuming additional EU exports of RES technologies in scenario S2HE GDP almost matches the baseline in 2020 and employment is 051 (or more than 1 million jobs) higher than in the baseline In scenario S2HI a shift in the input structure of the energy sector towards machinery
and electrical machinery reflecting the different nature of RES relative to conventional electricity generation also has smaller additional positive impacts on GDP and employment compared to scenario S2H
The following figures show impacts of the different scenarios in comparison to the baseline BH As Figure 31 illustrates all the alternative scenarios imply GDP lower than the baseline However comparing scenario S1H with the other three scenarios shows that additional RES investment (S2H) additional RES exports (S2HE) and the inclusion of different input structures of the RES industries (S2HI) each have positive GDP impacts These results are in line with model-based analysis in the EMPLOY-RES study (Fraunhofer ISI et al 2009)
Figure 31 EU-27 GDP according to four scenarios mdash deviation from the baseline (BH)
Percentage deviation from the baseline (BH)
ndash 100
ndash 080
ndash 060
ndash 040
ndash 020
0002010 2015 2020
S2HI S1H S2H S2HE
Modelling of ETR impacts on eco-innovation
Environmental tax reform in Europe opportunities for eco-innovation 29
In contrast to GDP employment increases relative to the baseline in all the alternative scenarios (Figure 32) Due to the scenario design the structure of the EU economies is shifted from energy-intensive to labour-intensive sectors The magnitude of the employment gain is influenced by the carbon price and the tax shift the underlying energy prices and the production loss The largest part of the employment increase stems from the additional RES investment (scenario S2H) although a shift in industry structures (S2HI) and additional RES exports (S2HE) are also positive for the labour market
33 Macroeconomic impacts at the national level
In general terms it is clear that national ETS and ETR impacts depend significantly on country specifics including energy use economic structure social system and behaviour (eg reactions to labour cost changes) In countries with high carbon intensity in their energy mix additional revenues and expenditures are higher than in countries with lower carbon intensity
Scenario S2H provides an interesting tool for analysing the macroeconomic impacts of ETR at the national level because 10 of the additional generated revenues are used for eco-innovation investments meaning that only 90 of the revenues are recycled back into the economy by reducing income tax rates and social security contributions
Figure 32 EU-27 employment according to four scenarios mdash deviation from the baseline (BH)
ndash 020
000
020
040
060
2010 2015 2020
S2HI S1H S2H S2HE
Percentage deviation from the baseline (BH)
Environmental tax reform in Europe opportunities for eco-innovation
Modelling of ETR impacts on eco-innovation
30
Figure 34 GDP in 2020 in EU-27 Member States under scenario S2H mdash deviation form the baseline (BH)
Figure 33 GDP in 2020 in selected countries under scenario S2H mdash deviation from the baseline (BH)
ndash 25 ndash 20 ndash 15 ndash 10 ndash 05 00 05 10 15
Romania
Bulgaria
SloveniaMalta
Lithuania
Latvia
Estonia
CyprusSlovakia
Poland
Hungary
Czech RepublicUnited Kingdom
Sweden
Spain
Portugal
Netherlands
Italy
Ireland
Greece
FranceFinland
Denmark
Luxembourg
Belgium
Austria
Germany
Percentage deviation from the baseline (BH)
Russia
South Africa
Brazil
India
China
Mexico
Japan
USA
Poland
United Kingdom
Spain
Italy
France
Germany
ndash 30 ndash 25 ndash 20 ndash 15 ndash 10 ndash 05 00 05 10
Percentage deviation from the baseline (BH)
Modelling of ETR impacts on eco-innovation
Environmental tax reform in Europe opportunities for eco-innovation 31
Figure 35 Employment in 2020 in EU-27 Member States under scenario S2H mdash deviation from baseline (BH)
EU-27EU-15
RomaniaBulgariaSloveniaMalta
LithuaniaLatvia
EstoniaCyprusSlovakia
PolandHungary
Czech RepublicUnited Kingdom
SwedenSpain
PortugalNetherlands
ItalyIrelandGreece
FranceFinlandDenmarkLuxembourg
BelgiumAustria
Germany
ndash 200 0 200 400 600 800 1 000
Percentage deviation from the baseline (BH)
Under scenario S2H the GDP of large EU economies deviates from baseline projections by between 0 and ndash 1 with the exception of Italy (Figure 33) Germanys GDP is even forecast to match the baseline level in 2020 due to the countrys strong RES industry Outside Europe some countries gain slightly against EU Member States in terms of competitiveness as export prices in most EU Member States and sectors increase and GDP in those countries exceeds the baseline projections as a result (Figure 33) This is mainly because carbon tax revenues are recycled via income tax reductions which are not part of production costs However energy exporting economies such as Russia or South Africa will lose exports if EU demand for fossil fuel imports declines The development of all EU Member States is shown in Figure 34
Employment impacts of scenario S2H are positive for almost all EU Member States as lower labour
costs increase labour demand and labour intensity (Figure 35) The highest absolute increases are shown for Germany the Netherlands Italy and the United Kingdom For EU-27 as a whole employment will be almost one million higher than in the corresponding baseline BH in 2020
The scenarios have not been designed with a view to meeting the EU renewables target of a 20 renewables share in final energy consumption in 2020 Nevertheless the scenarios provide some interesting insights The share is projected to increase from around 10 in 2009 to above 14 even in the baseline as instruments such as feed in tariffs and biofuel quotas will continue In scenario S1H the target will be missed with around 18 in 2020 Only in scenarios S2H S2HE and S2HI is the target met (approximately 20 )
Environmental tax reform in Europe opportunities for eco-innovation
Modelling of ETR impacts on eco-innovation
32
Under scenario S2H energy-related carbon emissions are reduced in all EU Member States relative to the baseline (Figure 36) The highest percentage reductions can be seen in many of the EU-12 Member States with still high energy intensity and low energy prices In these countries the relative price increase is higher than in countries like Germany or the United Kingdom with already high energy taxes and overall energy prices
Additional ETS revenues material tax revenues and carbon tax revenues from the industry sector are recycled back to industry via reductions in employers social security contributions (or wage subsidies in some countries) The revenues from the carbon tax on households set out in Table 32 (totalling 033 of GDP in Germany for example) are used to reduce income tax For the EU-27 overall revenues from ETS and ETR reach about 2 of GDP in 2020 although these figures may be excessive because additional EU efforts to increase energy
efficiency and renewable energy which will reduce the ETS price are not taken into account The use of flexible tools such as the Clean Development Mechanism will further reduce the revenues and earmarking of part of the revenues for mitigation and adaptation measures in emerging and developing countries limits the recycling into labour costs
In addition the scenarios do not take the current global economic problems into account According to the IEA (2009) the downturn will also reduce carbon emissions in the long run which will lead to lower carbon prices and revenues to reach fixed targets (or make tighter targets less costly)
The ETR will have varying effects on the prices of different sorts of products and services Material or carbon taxes increase the prices of product groups according to their direct and indirect material and carbon content The recycling mechanism reduces
Figure 36 Energy-related CO2 emissions in 2020 under scenario S2H mdash deviation from the baseline (BH)
WorldEU-27
EU-15Romania
BulgariaSlovenia
MaltaLithuania
LatviaEstonia
CyprusSlovakia
PolandHungary
Czech RepublicUnited Kingdom
SwedenSpain
PortugalNetherlands
ItalyIreland
GreeceFrance
FinlandDenmark
LuxembourgBelgium
AustriaGermany
ndash 25 ndash 20 ndash 15 ndash 10 ndash 5 0
Percentage deviation from the baseline (BH)
Modelling of ETR impacts on eco-innovation
Environmental tax reform in Europe opportunities for eco-innovation 33
Table 32 Additional ETS and environmental tax revenues in 2020 ( of GPD)
S2H Germany United Kingdom EU-27
ETS revenues 083 064 059
Carbon tax (industry) 052 044 054
Carbon tax (households) 033 041 036
Material tax 041 029 056
Sum 209 178 205
Figure 37 Total primary energy supply in 2020 under scenario S2H mdash deviation from the baseline (BH)
WorldEU-27EU-15
RomaniaBulgaria
Slovenia
MaltaLithuania
LatviaEstonia
Cyprus
SlovakiaPoland
HungaryCzech Republic
United KingdomSweden
SpainPortugal
NetherlandsItaly
IrelandGreece
FranceFinland
DenmarkLuxembourg
BelgiumAustria
Germany
ndash 24 ndash 21 ndash 18 ndash 15 ndash 12 ndash 9 ndash 6 ndash 3 0
Percentage deviation from the baseline (BH)
Environmental tax reform in Europe opportunities for eco-innovation
Modelling of ETR impacts on eco-innovation
34
Figure 38 Output price impacts of scenario S2H in Germany in 2020 mdash deviations from the baseline (BH)
Figure 39 Impacts of scenario S2H on industrial output in 2020 in Germany mdash deviations from the baseline (BH)
ndash 5
0
5
10
15
20
Output prices
Percentage deviation from the baseline (BH)
(3) F
ood
(4) T
extiles
(5) W
ood
(6) P
ulp pap
er
(7) C
oke re
fined
petro
leum
pro
ducts
(8) C
hemica
ls ex
cl pha
rma
(9) P
harm
aceu
ticals
(10)
Rub
ber a
nd plastics
(11)
Non
-metallic
miner
als
(12)
Iron
and
steel
(13)
Non
-ferrou
s metals
(14)
Met
al pro
ducts
(15)
Mac
hine
ry and
equ
ipmen
t
(16)
Office
mac
hine
ry
(17)
Electric
al m
achine
ry
(18)
Rad
io T
V
(19)
Med
ical pr
ecisi
on and
opt
ical ins
trumen
ts
(20)
Mot
or veh
icles
(21)
Ships
(22)
Airc
raft
(23)
Railro
ad
(24)
Man
ufac
turin
g n
ec r
ecyc
ling
(25)
Electric
ity g
as w
ater
sup
ply
(26)
Con
stru
ction
(27)
Tra
de r
epairs
(28)
Hot
els an
d re
stau
rant
s
(29)
Tra
nspo
rt an
d stor
age
(30)
Pos
t and
teleco
mmun
icatio
ns
(31)
Finan
ce ins
uran
ce
(32)
Rea
l estate ac
tivities
(33)
Ren
ting
(34)
Com
puter
(35)
Res
earch an
d de
velopm
ent
(36)
Oth
er bus
ines
s ac
tivities
(37)
Pub
lic ser
vice
s
(38)
Edu
catio
n
(39)
Hea
lth and
soc
ial w
ork
(40)
Oth
er ser
vice
s
(41)
Priv
ate ho
useh
olds
(1) A
gricu
lture
(2) M
ining an
d qu
arry
ing
nec not elsewhere classified
Production
ndash 100
ndash 80
ndash 60
ndash 40
ndash 20
00
20
40
60
80Percentage deviation from the baseline (BH)
(3) F
ood
(4) T
extiles
(5) W
ood
(6) P
ulp pap
er
(7) C
oke re
fined
petro
leum
pro
ducts
(8) C
hemica
ls ex
cl pha
rma
(9) P
harm
aceu
ticals
(10)
Rub
ber a
nd plastics
(11)
Non
-metallic
miner
als
(12)
Iron
and
steel
(13)
Non
-ferrou
s metals
(14)
Met
al pro
ducts
(15)
Mac
hine
ry and
equ
ipmen
t
(16)
Office
mac
hine
ry
(17)
Electric
al m
achine
ry
(18)
Rad
io T
V
(19)
Med
ical pr
ecisi
on and
opt
ical ins
trumen
ts
(20)
Mot
or veh
icles
(21)
Ships
(22)
Airc
raft
(23)
Railro
ad
(24)
Man
ufac
turin
g n
ec r
ecyc
ling
(25)
Electric
ity g
as w
ater
sup
ply
(26)
Con
stru
ction
(27)
Tra
de r
epairs
(28)
Hot
els an
d re
stau
rant
s
(29)
Tra
nspo
rt an
d stor
age
(30)
Pos
t and
teleco
mmun
icatio
ns
(31)
Finan
ce ins
uran
ce
(32)
Rea
l estate ac
tivities
(33)
Ren
ting
(34)
Com
puter
(35)
Res
earch an
d de
velopm
ent
(36)
Oth
er bus
ines
s ac
tivities
(37)
Pub
lic ser
vice
s
(38)
Edu
catio
n
(39)
Hea
lth and
soc
ial w
ork
(40)
Oth
er ser
vice
s
(41)
Priv
ate ho
useh
olds
(1) A
gricu
lture
(2) M
ining an
d qu
arry
ing
nec not elsewhere classified
Modelling of ETR impacts on eco-innovation
Environmental tax reform in Europe opportunities for eco-innovation 35
social security contributions and lowers labour costs according to the direct and indirect labour content of sector output The ETR therefore reduces output prices in labour-intensive service sectors and increases prices in carbon- and material-intensive industry sectors
The example of Germany shows insignificant impacts in the trade-intensive sectors of machinery (15ndash17) motor vehicles (20) and other transport equipment (21ndash23) (Figure 38) Iron and steel (12) and chemicals without pharmaceuticals (8) face the highest price increases of trade-intensive sectors As the German iron and steel industry primarily delivers high quality steel to the German car industry and increasingly to the German windmill industry negative competitiveness impacts will be limited Exchange rate variations against non-EU competitors have been much higher in the past
The higher prices of carbon- and material-intensive products will reduce price competitiveness on export markets and increase the market share for imports in domestic markets This loss of price competitiveness is based on an assumption of limited market development of energy efficiency and RES technologies in other part of the world It will be offset by gains in labour-intensive sectors if the ETR causes real wage costs per unit of output to fall as a result of using recycled revenues to reduce employer social security contributions
Any improvement in non-price competitiveness will also raise exports The extra employment will raise incomes raising consumption and output
The overall impact on sector output depends on countervailing effects which are negative for iron and steel and a few service sectors and positive for a few industry sectors For most industries the output effect is insignificant (Figure 39) The greatest impact is felt by producers of fossil fuels who must obviously reduce production due to lower demand for their products
Under scenario S2H employment impacts are positive for most sectors relative to the baseline as labour productivity decreases and wage rates fall in relation to consumer prices (CPI) and output prices (Table 33) The relative costs of labour are lower than in the baseline without the ETR reform Only around a quarter of the employment increase takes place in industry
Concerning the wage rate two countervailing effects have to be considered First when the labour market is characterised in terms of the real wage bargaining model as in E3ME and GINFORS with market power on both sides (employers and trade unions) consumer price increases will lead to wage increases (the econometrically estimated factor is 085 for Germany) Second labour productivity is another important factor for wage bargaining The estimated elasticity for Germany is 063 meaning that a 1 increase of labour productivity leads to wage increases of 063 Higher labour demand due to lower labour costs thus reduces the wage increase In the end the German economy is more labour intensive than without the ETR partly due to the structural change towards labour-intensive industries
Table 33 Employment impacts of scenario S2H in Germany mdash deviations from scenario S2H in 2020
Employment in 2020 Deviation from S2H () Deviation from S2Habsolute (1 000s)
Agriculture forestry 24 90
Industry 09 653
Non-metallic minerals 24 62
Iron and steel ndash 28 ndash 37
Machinery and equipment 05 56
Electrical machinery 04 18
Construction 37 449
Trade and transport 10 829
Business services 17 767
Other services ndash 02 ndash 216
Total 07 2506
Environmental tax reform in Europe opportunities for eco-innovation
Modelling of ETR impacts on eco-innovation
36
Additional exports under scenario S2HE mainly create new jobs in machinery and related business services (Table 34) Under scenario S2HI a shift in the input structure of the energy sector leads to a shift in the industry structure and creates a few jobs in the service sector (Table 35)
34 Conclusions of the scenario assessment
The foregoing analysis used the GINFORS model to assess economic and environmental impacts of using the ETS and ETR to reach the EUs 2020
GHG targets In general the results show positive employment effects and only small negative impacts on GDP in EU-27 Member States The economic impacts depend on the levels of international energy prices the mechanism used to recycle revenues and country specifics such as carbon and energy intensity and the structure of energy consumption
Although there is significant evidence that eco-innovation is positively driven by higher energy prices quantification is difficult The present study included simulations of possible impacts of a shift in the industry structure towards renewable energy in the electricity sector and an overall increase of EU
Table 34 Employment impacts of scenario S2HE in 2020 in Germany mdash deviations from scenario S2H
Employment in 2020 Deviation from S2H () Deviation from S2Habsolute (1 000s)
Agriculture forestry ndash 01 ndash 02
Industry 03 194
Non-metallic minerals 02 05
Iron and steel 04 05
Machinery and equipment 13 130
Electrical machinery 24 117
Construction 01 18
Trade and transport 00 26
Business services 07 308
Other services 01 107
Total 02 634
Table 35 Employment impacts of scenario S2HI in 2020 in Germany mdash deviations from scenario S2H
Employment in 2020 Deviation from S2H () Deviation from S2Habsolute (1 000s)
Agriculture forestry ndash 01 ndash 02
Industry 00 00
Non-metallic minerals 25 65
Iron and steel ndash 27 ndash 36
Machinery and equipment 08 78
Electrical machinery 04 19
Construction ndash 00 ndash 04
Trade and transport 00 07
Business services 02 115
Other services 0 56
Total 00 167
Modelling of ETR impacts on eco-innovation
Environmental tax reform in Europe opportunities for eco-innovation 37
exports due to higher global demand for renewable energy The main results can be summarised as follows
bull environmentaltaxreformshiftingtaxesfromlabour to energy and resources will create additional jobs and trigger eco-innovation
bull impactsofeco-innovationintheformofadditional EU exports or shifts in industry structures will have a slight positive influence on GDP and create a smaller number of additional jobs
These findings correspond to results from the EmployRES study (Fraunhofer ISI et al 2009) As ETR is directly aimed at reducing labour costs it will create additional jobs in the short and medium term In the longer term the cost reduction and new technologies arising from eco-innovation will play a larger role
Like all fiscal reforms a major ETR in Europe will create winners and losers At the sector level carbon- and material-intensive industries will face economic losses At the country level the carbon-intensity and overall flexibility of economies is important Clearly structural change away from carbon-intensive industries together with technological change is inherent in any successful climate mitigation policy
On the other hand several factors can smooth these structural adjustments International cooperation
will reduce economic pressure on countries and sectors In addition ETR together with auctioning of ETS allowances can be a major source of revenues for EU Member States in the future even if part of the revenues will have to be earmarked for adaptation and mitigation measures in developing countries Indeed future debate on grandfathering or auctioning ETS allowances should reflect the important point that giving allowances away for free denies countries the money to ease structural change and invest in low-carbon technologies
Caution is needed in relating the findings of this study to the EU policy debate In the model simulations the single carbon price is the only instrument used to reach the EUs 2020 GHG targets In reality of course other renewable energy and efficiency policies will also contribute to carbon reduction and have to be taken into account when comparing the results (especially the high carbon prices) to other studies Both reduce the potential revenues from fossil energy carriers and carbon emissions
A variety of renewable energy and efficiency policies could enable the climate and energy targets to be met while securing even better economic prospects The results of the present study clearly indicate that the discussion on market-based instruments should be intensified Ultimately however the EU will need a rich mix of policies to reach its GHG targets while maximising prosperity
Environmental tax reform in Europe opportunities for eco-innovation38
References
Almon C 1991 The INFORUM Approach to Interindustry Modeling in Economic Systems Research Vol 3 pp 1ndash7
Amin A and Cohendet P 2004 The Architecture of Knowledge Firms Capabilities and Communities Oxford University Press Oxford
Barker T Meyer B Pollitt H and Lutz C 2007a Modelling Environmental Tax Reform in Germany and the United Kingdom with E3ME and GINFORS petre Working Paper Cambridge and Osnabrueck (httpwwwpetreorgukpapershtm) accessed 15 February 2011
Barker T Junankar S Pollitt H and Summerton P 2007b Carbon leakage from unilateral environmental tax reforms in Europe 1995ndash2005 Energy Policy Vol 35 pp 6 281ndash6 292
Brunnermeier S B and Cohen M A 2003 Determinants of environmental innovation in US manufacturing industries Journal of Environmental Economics and Management Vol 45 pp 278ndash293
Buen J 2006 Danish and Norwegian wind industry The relationship between policy instruments innovation and diffusion Energy Policy Vol 34 (18) pp 3 887ndash3 897
Carlsson B and Stankiewicz R 1991 On the nature function and composition of technological systems Journal of Evolutionary Economics Vol 1 (2) pp 93ndash118
Christiansen A C and Skjaerseth J B 2005 Climate change policies in Norway and the Netherlands Different instruments similar outcome Energy and Environment Vol 16(1) pp 1ndash25
Dosi G 1988 Sources procedures and microeconomic effects of innovation Journal of Economic Literature Vol 26 pp 1 120ndash1 171
de Vries F and Medhi N 2008 Environmental regulation and international innovation in automotive emissions control technologies in Environmental Policy Technological Innovation and Patents Organisation for Economic Cooperation and Development Paris
DG TREN 2008 European energy and transport mdash trends to 2030 mdash update 2007 European Commission Luxembourg
DTI 2004 Renewable Supply Chain Gap Analysis UK Department of Trade and Industry
Edler J (ed) 2006 Nachfrageorientierte Innovationspolitik Buumlro fuumlr Technikfolgenabschaumltzung beim Deutschen Bundestag (TAB) Arbeitsbericht Nr 99 Berlin
Edquist C 2001 The system of innovation approach and innovation policy an account of the state of the art lead paper presented at the DRUID Conference 12ndash15 June 2001 Aalborg (httpwwwdruiddkconferencesnwpaper1edquistpdf) accessed 15 February 2011
EEA 2006 Using the market for cost-effective environmental policy Market-based instruments in Europe EEA Report No 12006 European Environment Agency Copenhagen
Ekins P 2009 Resource Productivity Environmental tax Reform and Sustainable Growth in Europe published by the Anglo-German Foundation for the Study of Industrial Society Final report (httpwwwpetreorgukpdfFinRepFinpdf) accessed 12 October 2011
Ekins P and Speck S (eds) 2011 Environmental Tax Reform (ETR) A Policy for Green Growth Oxford University Press
EREC 2008 Energy [r]evolution A sustainable global energy outlook Greenpeace International European Renewable Energy Council (EREC)
References
References
Environmental tax reform in Europe opportunities for eco-innovation 39
Fagerberg J Mowery D C and Nelson R R (eds) 2005 The Oxford Handbook of Innovation Oxford University Press Oxford
Fischer C Parry I W H and Pizer W A 2003 Instrument choice for environmental protection when technological innovation is endogenous Journal of Environmental Economics and Management Vol 45 pp 523ndash545
Fraunhofer ISI ECOFYS Energy Economics Group Ruumltter + Partner SEURECO and LEI 2009 EmployRES mdash The impact of renewable energy policy on economic growth and employment in the European Union European Commission Brussels
Frondel M Horbach J and Rennings K 2008 What triggers environmental management and innovation Empirical evidence for Germany Ecological Economics Vol 66(1) pp 153ndash160
GHK Cambridge Econometrics and IEEP 2007 Links between the environment economy and jobs Final Report submitted to DG Environment European Commission
Giljum S Behrens A Hinterberger F Lutz C and Meyer B 2008 Modelling scenarios towards a sustainable use of natural resources in Europe Environmental Science and Policy Vol 11 pp 204ndash216
Goumlrlach B Knigge M and Luumlckge H 2005 Wirkungen der Oumlkologischen Steuerreform auf Innovation und Marktdurchdringung Ecologic Berlin (httpecologiceudownloadprojekte1850-189918791879_5_innovationpdf) accessed 18 August 2011
Green M A 2000 Photovoltaics technology overview Energy Policy Vol 28 (14) pp 989ndash998
Grossmann A Lehr U Lutz C and Wolter MI 2008 Gesamtwirtschaftliche Effekte der Umsetzung der EU Ziele im Bereich Erneuerbare Energien und Gebaumludeeffizienz in Oumlsterreich bis 2020 Studie im Auftrag des Lebensministeriums Wien 0508
Hage J and Hollingsworth J R 2000 Idea innovation networks a strategy for integrating organizational and institutional analysis Organization Studies Vol 21 (5) pp 971ndash1 004
Hauschildt J 2004 Innovationsmanagement Vahlen Muumlnchen
Hemmelskamp J 1997 Environmental policy instruments and their effects on innovation European Planning Studies Vol 5 (2) pp 177ndash195
Hoglund Isaksson L 2005 Abatement costs in response to the Swedish charge on nitrogen oxide emissions Journal of Environmental Economics and Management Vol 50 pp 102ndash120
Hullmann A 2001 Internationaler Wissenstransfer und technischer Wandel (dissertation) Physica-Verlag Heidelberg
IEA 2008 World Energy Outlook 2008 International Energy Agency Paris
IEA 2009 World Energy Outlook 2009 International Energy Agency Paris
Jacobsson S Andersson B A and Baringngens L 2002 Transforming the energy system mdash the evolution of the German technological system for solar cells Science and Technology Policy Research University of Sussex Electronic Working Paper Series No 84 (httpideasrepecorgpsrussewps84html) accessed 18 August 2011
Jaffe A and Stavins R 1995 Dynamic incentives of environmental regulations the effects of alternative policy instruments on technology diffusion Journal of Environmental Economics and Management Vol 29(3) pp 43ndash63
Jaffe A B and Palmer K 1997 Environmental regulation and innovation a panel data study The Review of Economics and Statistics Vol 79 pp 610ndash619
Jaffe A B Newell R G and Stavins R N 2002 Environmental policy and technological change Environmental and Resource Economics Vol 22 (1ndash2) 2002 pp 41ndash70
Johnstone N and Hascic I 2008 Renewable energy policies and technological innovation energy source and instrument choice in Environmental Policy Technological Innovation and PatentsOrganisation for Economic Co-operation and Development Paris
Johnstone N 2005 The Innovation Effects of Environmental Policy Instruments in Horbach J (ed) Indicator Systems for Sustainable Innovation Physica-Verlag HD
Environmental tax reform in Europe opportunities for eco-innovation
References
40
Johnstone N Hascic I and Ostertag K 2008 Environmental policy technological innovation and patent activity in Environmental Policy Technological Innovation and Patents Organisation for Economic Co-operation and Development Paris
Jung C Krutilla K and Boyd R 1996 Incentives for advanced pollution abatement technology at the industry level an evaluation of policy alternatives Journal of Environmental Economics and Management Vol 30(1) pp 95ndash111
Kammen D M Kapidia K and Fripp M 2004 Putting renewables to work how many jobs can the clean energy industry generate University of California Berkeley
Kemp R 1997 Environmental policy and technical change ndash a comparison of the technological impact of policy instruments Edward Elgar Cheltenham
Kemp R 1998 The diffusion of biological waste-water treatment plants in the Dutch food and beverage industry Environmental and Resource Economics Vol 12 pp 113ndash136
Kemp R 2000 Technology and environmental policy ndash innovation effects of past policies and suggestions for improvement in OECD proceedings ndash innovation and the environment Organisation for Economic Co-operation and Development Paris
Kerr S and Newell R G 2003 Policy-induced technology adoption evidence from the US lead phasedown Journal of Industrial Economics Vol 51 pp 317ndash343
Klaassen G Miketa A Larsen K and Sundqvist T 2005 The impact of RampD on innovation for wind energy in Denmark Germany and the United Kingdom Ecological Economics Vol 54 pp 227ndash240
Kline S and Rosenberg N 1986 An overview of innovation in Landau R (ed) The positive sum strategy Harnessing technology for economic growth pp 275-306
Knigge M and Goumlrlach B 2005 Effects of Germanys ecological tax reforms on the environment employment and technological innovation Ecologic Berlin (httpwwwumweltbundesamtdeuba-info-presse-ehintergrundoekosteuerpdf) accessed 18 August 2011
Langniss O 2003 Governance structures for promoting renewable energy sources dissertation Lund Stuttgart
Lanjouw J O and Mody A 1996 Innovation and the international diffusion of environmentally responsive technology Research Policy Vol 25 pp 549ndash571
Lehr U Nitsch J Kratzat M Lutz C and Edler D 2008 Renewable Energy and Employment in Germany Energy Policy Vol 36 pp 108ndash117 DOI101016jenpol200709004
Lehr U Wolter MI and Groszligmann A 2009 Economic impacts of RES obligations in Austria ndash an application of the macro-econometric model e3at GWS Discussion Paper 20091 Osnabruumlck
Lundvall B-A Johnson B Andersen E S and Dalum B 2001 National systems of production innovation and competence building Research Policy Vol 31 pp 213ndash231
Lutz C and Giljum S 2009 Global resource use in a business as usual world until 2030 Updated results from the GINFORS model in Bleischwitz R Welfens Pand Zhang Z (eds) Sustainable growth and resource productivity ndash economic and global policy issues Greenleaf Publishers pp 30ndash41
Lutz C and Meyer B 2008 Beschaumlftigungseffekte des Klimaschutzes in Deutschland Untersuchungen zu gesamtwirtschaftlichen Auswirkungen ausgewaumlhlter Maszlignahmen des Energie- und Klimapakets Forschungsbericht 205 46 434 Dessau-Roszliglau
Lutz C and Meyer B 2009a Environmental and Economic Effects of Post-Kyoto Carbon Regimes Results of Simulations with the Global Model GINFORS Energy Policy Vol 37 pp 1 758ndash1 766 DOI 101016jenpol200901015
Lutz C and Meyer B 2009b Scenario results from GINFORS PETRE working paper Osnabruumlck
Lutz C Meyer B Nathani C and Schleich J 2005 Endogenous technological change and emissions The case of the German steel industry Energy Policy Vol33 pp 1 143ndash1 154
Lutz C Meyer B Nathani C and Schleich J 2007 Endogenous innovation economy and environment impacts of a technology based modelling approach for energy-intensive industries in Germany Energy Studies Review Vol 15(1) pp 2ndash18
References
Environmental tax reform in Europe opportunities for eco-innovation 41
Lutz C Meyer B and Wolter M I 2009 The global multisectormulticountry 3-E model GINFORS mdash a description of the model and a baseline forecast for global energy demand and CO2 emissions Journal of Sustainable Development forthcoming
Malerba F and Orsenigo L 1997 Technological Regimes and Sectoral Patterns of Innovative Activities Industrial and Corporate Change Vol 6 (1) pp 83ndash117
Malerba F 1992 Learning by Firms and Incremental Technical Change The Economic Journal Vol 102 (413) pp 845ndash859
Malerba F 2005 Industrial dynamics and innovation progress and challenges Presidential Address delivered at the 32nd Conference of the European Association for Research in Industrial Economics (EARIE) 1ndash4 September 2005 Porto
Malerba F 2006 Innovation and the evolution of industries Journal of Evolutionary Economics Vol 16 pp 3ndash23
McGinty M and de Vries F P 2009 Technology diffusion product differentiation and environmental subsidies The BE Journal of Economic Analysis and Policy Vol 9(1)
Meyer B and Lutz C 2007 The GINFORS model ndash model overview and evaluation Petre Working Paper Osnabruumlck (httpwwwpetreorgukpapershtm) accessed 18 August 2011
Meyer B Lutz C Schnur P and Zika G 2007 Economic policy simulations with global interdependencies a sensitivity analysis for Germany Economic Systems Research Vol 19 pp 37ndash55
Mickwitz P H Hyvaumlttinen and P Kivimaa 2008 The role of policy instruments in the innovation and diffusion of environmentally friendlier technologies popular claims versus case study experiences Journal of Cleaner Production Vol 16(1S1) 162ndash170
Miketa A and Schrattenholzer L 2004 Experiments with a methodology to model the role of RampD expenditures in energy technology learning processes first results Energy Policy Vol 32 (15) pp 1 679ndash1 692
Milliman S R and Prince R 1989 Firm incentives to promote technological change in pollution control Journal of Environmental Economics and Management Vol 17 pp 247ndash265
Millock K and Nauges C 2006 Ex-post evaluation of an earmarked tax on air pollution Land Economics Vol 82(1) pp 68ndash84
Montero J-P 2002 Market structure and environmental innovation Journal of Applied Economics Vol 2 pp 293ndash325
Moreno B and Loacutepez A J 2007 The effect of renewable energy on employment mdash The case of Asturias (Spain) Renewable and Sustainable Energy Rewiews doi 101016jrser200610011
Mowery D and Rosenberg N 1979 The influence of market demand upon innovation A critical review of some recent empirical studies Research Policy Vol 8 pp 102ndash153
Newell R G Jaffe A B and Stavins R N 1999 The induced innovation hypothesis and energy-saving technological change Quarterly Journal of Economics Vol 114 pp 941ndash975
Norberg-Bohm V 1999 Stimulating green technological innovation An analysis of alternative policy mechanisms Policy Sciences Vol 32(1) pp 13ndash38
OECD 2009 Sustainable manufacturing and eco-innovation towards a green economy Organisation for Economic Co-operation and Development Policy Brief June 2009
OECD 2010 Taxation innovation and the environment Organisation for Economic Co-operation and Development
Pavitt K 1984 Sectoral patterns of technological change Towards a taxonomy and a theory Research Policy Vol 13 pp 343ndash373
Popp D 2002 Induced innovation and energy prices The American Economic Review Vol 92(1) pp 160ndash180
Popp D 2005 Lessons from patents Using patents to measure technological change in environmental models Ecological Economics Vol 54 pp 209ndash226
Environmental tax reform in Europe opportunities for eco-innovation
References
42
Porter M and van der Linde C 1995 Toward a new conception of the environment competitiveness relationship Journal of Economic Perspectives Vol 9(4) pp 97ndash118
Rammert W 2002 The cultural shaping of technologies and the politics of technodiversity In Sorensen K and Williams R (eds) Shaping technology guiding policy concepts spaces and tools Elgar Cheltenham pp 155-172
Requate T 2005 Dynamic incentives by environmental policy instruments ndash a survey Ecological Economics Vol 54 pp 175ndash195
Roloff N Lehr U Krewitt W Fuchs G Wassermann S Weimer-Jehle W and Schmidt B 2008 Success determinants for technological innovations in the energy sector mdash the case of photovoltaics in Moumlst D Fichtner W Ragwitz M and Veit D (eds) New methods for energy market modelling mdash Proceedings of the first european workshop on energy market modelling using agent-based computational economics Universitaumltsverlag Karlsruhe
Rothwell R 1995 The fifth generation innovation process in Oppenlaumlnder KH Popp W (eds) Innovationen und wirtschaftlicher Fortschritt betriebs-und volkswirtschaftliche Perspektiven Bern pp 9ndash26
Schumpeter J 1942 Capitalism socialism and democracy New York Harper
Skjaeligrseth J B and Christiansen A C 2005 Environmental policy instruments and technological change in the energy sector findings from comparative empirical research Energy and Environment Vol 17 (2) pp 223ndash241
Snyder L D Miller N H and Stavins R N 2003 The effects of environmental regulations on pollution emissions evidence from plant-level data American Economic Review Vol 93(2) pp 431ndash435
Technopolis 2008 Eco-innovation Final Report for Sectoral Innovation Watch (httpwwwtechnopolis-groupcomresourcesdownloads661_report_finalpdf) accessed 18 August 2011
Volleburgh H 2007 Impacts of environmental policy instruments on technological change Report for Joint Meetings of Tax and Environment Experts OECD Environment Directorate February 2007 (comenvepocctpacfa(2006)36final)
Zimmermann H Wohltmann M and Hansjuumlrgens B 1996 Umweltabgaben und Innovation Analytica Marburg
43
Annex 1
Environmental tax reform in Europe opportunities for eco-innovation
Type Instrument Area Stage
Reference
Theo
retica
l
Em
piric
al
Cas
e st
udy
Rev
iew
Qual
itat
ive
Taxe
s
Perm
its
Subsi
die
s
Volu
nta
ry
Com
man
d
Reg
ula
tion
Ener
gy
Air
Wat
er
Oth
er
Gen
eral
Innov
atio
n
Diffu
sion
Rel
evan
ce
Brunnermeier amp Cohen (2003)
X X X X
Buen (2006) X X X X X X
Christiansen amp Skjaerseth (2005)
X X X X X X
Fischer et al (2003 X X X X X X
Frondel et al (2008) X X X X X X X (X) (X)
Hemmelskamp (1997)
X X X X X X X (X)
Hoglund Isaksson (2005)
X X X (X) (X)
Jaffe amp Stavins (1995)
X X X1 X X X X
Jaffe amp Palmer (1997)
X X X X
Jaffe et al (2002) X X X X X X X X X X
Jung et al (1996) X X X X X X (X) (X)
Kemp (1998) X X X X
Kerr amp Newell (2001) X X X X X
Klaassen et al (2005)
X X X X X
Lanjouw amp Mody (1996)
X X X X X X X
McGinty amp de Vries (2009)
X X X X
Mickwitz et al (2008)
X X X X X X X X X
Milliman amp Prince (1989)
X X X X X X X
Millock amp Nauges (2006)
X X X X X X
Montero (2002) X X X X X
Newell et al (1999) X X1 X X X
Norberg-Bohm (1999)
X X X X X X X
Popp (2002) X X1 X X
Popp (2005) X X X X X X
Porter amp van der Linde (1995)
X X X X X X
Requate (2005) X X X X X X X
Skjaeligrseth amp Christiansen (2005)
X X X X X X X X X
Snyder et al (2003) X X X X X
Annex 1 Classification of refereed journal articles
Environmental tax reform in Europe opportunities for eco-innovation44
Annex 2
Type Instrument Area Stage
Reference
Theo
retica
l
Em
piric
al
Cas
e st
udy
Rev
iew
Qual
itat
ive
Taxe
s
Perm
its
Subsi
die
s
Volu
nta
ry
Com
man
d
Reg
ula
tion
Ener
gy
Air
Wat
er
Oth
er
Gen
eral
Innov
atio
n
Diffu
sion
Rel
evan
ce
Johnstone (2005)
X X X X X X X
Johnstone amp Hascic (2008)
X X X X X X X X
Kemp (1997) X X X X X X X X X X X X X
Kemp (2000) X X X X X X X X X
de Vries amp Medhi (2008)
X X1 X X X
Annex 2 Classification of books and book chapters
45
Annex 3
Environmental tax reform in Europe opportunities for eco-innovation
Type Instrument Area Stage
Reference
Theo
retica
l
Em
piric
al
Cas
e st
udy
Rev
iew
Qual
itat
ive
Taxe
s
Perm
its
Subsi
die
s
Volu
nta
ry
Com
man
d
Reg
ula
tion
Ener
gy
Air
Wat
er
Oth
er
Gen
eral
Innov
atio
n
Diffu
sion
Rel
evan
ce
Goumlrlach et al (2005)
X X X X X X
Knigge amp Goumlrlach (2005)
X X X X X X
Technopolis (2008)
X X X X X X
Volleburgh (2007)
X X X X X X X X X X X
Annex 3 Classification of reports
European Environment Agency
Environmental tax reform in Europe opportunities for eco-innovation
2011 mdash 45 pp mdash 21 x 297 cm
ISBN 978-92-9213-238-5doi10280084889
How to obtain EU publications
Publications for salebull viaEUBookshop(httpbookshopeuropaeu)bull fromyourbooksellerbyquotingthetitlethepublisherandorISBNnumberbull bycontactingoneofoursalesagentsdirectlyYoucanobtaintheircontactdetails
on the Internet (httpbookshopeuropaeu) or by sending a fax to +352 2929-42758
Free publicationsbull viaEUBookshop(httpbookshopeuropaeu)bull attheEuropeanCommissionsrepresentationsordelegationsYoucanobtain
their contact details on the Internet (httpeceuropaeu) or by sending a fax to +352 2929-42758
European Environment AgencyKongens Nytorv 61050 Copenhagen KDenmark
Tel +45 33 36 71 00Fax +45 33 36 71 99
Web eeaeuropaeuEnquiries eeaeuropaeuenquiries
TH
-AK-1
1-0
17-E
N-N
doi1
02
8008
4889
- Acknowledgements
- Executive summary
- 1Introduction
-
- 11Background
- 12ETR and innovation
- 13Report structure
-
- 2Review of literature on environmental tax reform and eco‑innovation
-
- 21Initial screening
- 22Detailed review
- 23Environmental regulation studies
- 24Theoretical studies
- 25Empirical studies
- 26Case studies
- 27Conclusions
-
- 3Modelling of ETR impacts on eco‑innovation
-
- 31Scenarios assessing the implications of ETR for eco-innovation
- 32Overview of modelling results
- 33Macroeconomic impacts at the national level
- 34Conclusions of the scenario assessment
-
- References
- Annex 1 Classification of refereed journal articles
- Annex 2Classification of books and book chapters
- Annex 3Classification of reports
-
Review of literature on environmental tax reform and eco-innovation
Environmental tax reform in Europe opportunities for eco-innovation 23
of environmental technologies However the supporting empirical and case study evidence is not universal and the effectiveness of these instruments would appear to vary across different sectors and different types of innovation
To a certain extent such differences can be explained by the theoretical models In particular the impact of environmental taxes (relative to other instruments) is predicted to depend on the competitive structures of the markets in which the regulated firms operate and on the ability of innovator firms to appropriate the benefits accruing to other firms during diffusion However a number of other potential factors have been identified in the literature which may affect the impact of price-based policy instruments on innovation
Jaffe et al (2002) caution that the impact of price-based policy instruments on technology diffusion may be adversely affected by a number of potential market failures including information failures principle-agent problems (eg landlord-tenant) capital market failures and positive adoption spillovers In addition while not market failures as such uncertainty over future returns and the (associated) use of high discount rates for investment decisions can also undermine the effectiveness of price-based instruments in stimulating diffusion However as was noted above the findings from the case study of ETR in Germany suggest that an environmental tax may actually reduce the level of uncertainty over future returns provided that it is of sufficient magnitude and longevity
Skjaerseth and Christiansen (2005) emphasise that the relationship between policy instruments (of all types) and technological change is extremely complicated They argue that account must be taken of the politicalindustrial context in which policy instruments are introduced and the nature of the environmental problem that they are intended to address In particular they make a distinction between malign problems where technological change involves net costs for target groups and benign problems where there are widespread no-regret opportunities for change Based on a comparative analysis of four different case studies they conclude that mandatory policy instruments (including environmental taxes) are more effective
in promoting short-term technological change when the problems are malign but that low legitimacy (with the target group) may undermine long-term technological change However when problems are benign or when long-term change requires cooperation voluntary policy instruments are likely to be more effective
Johnstone (2005) questions the focus of the theoretical and empirical analyses (reviewed above) on the impact of environmental policy instruments on the rate of technological change He argues that the direction of technological change is as important if not more so In addition to the quantity of innovation it is also important that innovation be socially optimal in the sense that it minimises the cost of attaining a particular environmental goal in the long term Inappropriate innovation today may result in lock in to a suboptimal technological path for the future
With this in mind Johnstone identifies a number of issues that can adversely affect the direction of innovation and should be taken into account when selecting and designing policy instruments technological market failures (36) missing markets for certain environmental attributes of innovation policy incidence and joint production of emissions Most studies of the innovation effects of environmental policy instruments assume that the only missing market is that for the environmental good (or bad) However in practice there may be other markets that are missing (or incomplete) which can adversely affect transmission of innovation incentives This is particularly so in the area of waste and resource management where instruments applied at the end of the product life cycle may have little or no impact on product design innovation Even if all markets are complete except for the environmental externality the point of incidence of the policy intervention may be more important for the direction of innovation than the choice of a particular policy instrument For example a limit or standard applied directly to the emissions of a pollutant may be more effective in promoting optimal innovation than a tax applied to a proxy input variable Finally when there is joint production of pollutants (eg CO2 and air pollutants from vehicle engines) there is a danger that if policy instruments (of whatever type) are applied to one pollutant in isolation the resulting innovation may
(36) These are the same market failures identified by Jaffe et al (2002)
Environmental tax reform in Europe opportunities for eco-innovation
Review of literature on environmental tax reform and eco-innovation
24
reduce emissions of that pollutant at the expense of increases in the others
In a related point Johnstone highlights the importance of using appropriate indicators when assessing the impact of policy instruments on innovation emphasising the need for these to reflect both the rate of innovation and the direction A necessary condition for this is that the indicators must provide an accurate and detailed picture of actual innovation Unfortunately this is difficult to achieve in practice For example the use of patent data as a measure of innovation requires the identification of relevant environmental technologies This is likely to be easier for end-of-pipe technologies than for process-related technologies meaning that the latter tend to be under-represented relative to their actual incidence To the extent that process-related innovation is growing in importance or is more important
for certain sectors or types of environmental problem changes in the value of the indicator may significantly understate the actual rate of innovation and misrepresent the direction
All of this suggests that caution should be exercised in drawing general definitive conclusions about the impacts of price-based policy instruments such as environmental taxes and investment subsidies on innovation particularly relative to other policy instruments While it would appear that they can be effective in stimulating both innovation and diffusion in many cases mdash at least in terms of the rate of technological change mdash there may be situations in which other policy instruments may be more appropriate In general the stringency and point of incidence of an environmental policy intervention may be more important than the choice of a particular policy instrument in determining the rate and direction of eco-innovation
25
Modelling of ETR impacts on eco-innovation
Environmental tax reform in Europe opportunities for eco-innovation
31 Scenarios assessing the implications of ETR for eco-innovation
Scenario analysis provides a useful means of improving understanding of how the different revenue recycling methods and various scales of ETR can help meet different greenhouse gas emissions targets
To investigate the impacts of an ETR for Europe the petre project elaborated a range of different scenarios reflecting various tax reform options In addition to employing several of these original scenarios the present study compiled two new scenarios to analyse the implications of ETR for eco-innovation All scenarios were examined in both E3ME and GINFORS (37)
311 Original petre project scenarios
The key petre scenarios relevant for the present study are
bull scenarioBHbaselinescenariowithhighenergyprice (reference case)
bull scenarioS1HETRdesignedtomeettheEUsunilateral 2020 GHG target (high energy price) with revenue recycling
bull scenarioS2HETRdesignedtomeettheEUsunilateral 2020 GHG target (high energy price) with revenue recycling and 10 of revenues spent on eco-innovation measures
Each of the ETR scenarios has the same key taxation components
bull acarbontaxrateisintroducedtoallnon-EUEmissions Trading System (EU ETS) sectors equal to the carbon price in the EU ETS that delivers an overall 20 reduction in greenhouse gas emissions by 2020 and in the international cooperation scenario this is extended to 30
bull aviationisincludedintheEUETSattheendofPhase 2
bull powergenerationsectorEUETSpermitsare100 auctioned in Phase 3 of the EU ETS
bull allotherEUETSpermitsare50auctionedin2013 increasing to 100 in 2020
bull materialtaxesareintroducedat5oftotalpricein 2010 increasing to 15 by 2020
In scenario S1H environmental tax revenues are recycled through reductions in income tax rates and social security contributions in each of the Member States such that there is no direct change in tax revenues In scenario S2H 10 of environmental tax revenues are recycled through spending on eco-innovation measures and the remaining 90 is recycled through the same measures as in the other scenarios The eco-innovation spending is split across power generation and housing according to tax revenues from the corporate and household sector
In GINFORS (the model used for analysing the implications of ETR and eco-innovation) the share of renewable sources in electricity production is increased due to the additional investment The rest of additional investment goes to household energy efficiency spending Investment needed for a certain increase in renewable energy production or efficiency improvement is based on Austrian and German experience (Lehr et al 2008 and 2009 Grossmann et al 2008 Lutz and Meyer 2008) This assumption is quite conservative as parameters for other countries can be assumed to be more positive (meaning that less money is needed for renewable energy technology installation or energy efficiency gains)
In scenario S1H the 20 GHG target translates into a 15 reduction in energy-related carbon emissions relative to 1990 as other emissions such as methane and nitrous oxide have already been reduced by
3 Modelling of ETR impacts on eco-innovation
(37) The E3ME and GINFORS models are introduced in Chapter 1 of the present report A detailed discussion of the models and scenarios used in the present study can be found in Ekins and Speck (2011)
Environmental tax reform in Europe opportunities for eco-innovation
Modelling of ETR impacts on eco-innovation
26
more than 20 (in terms of carbon equivalents) The target is reached by a tightened EU ETS cap and the introduction of a carbon tax on the non-ETS sector The tax rate applied is equal to the carbon price in the EU ETS that will deliver a 20 GHG reduction by 2020
The burden of ETR taxes are allotted to energy outputs (ie the final use of energy) and will be based on the carbon content of each fuel Carbon prices are assumed to be fully passed on to consumers All carbon taxes are in addition to any existing unilateral carbon and energy taxes The carbon reductions in the different EU Member States will be those that result from a uniform carbon tax increase across the EU
All of the revenues including EU ETS auctioning revenues carbon tax revenues and material tax revenues will be recycled The proportion of tax raised by industry will be recycled into a reduction in employers social security contributions which will in turn reduce the cost of labour Recycling will be additional to the existing ETRs in some Member States Revenues raised from households will be recycled through standard rate income tax reductions Traditional energy tax revenues will be lower compared to their respective baselines as the tax base (energy consumption) is reduced So for an ETR revenue-neutrality does not mean budget-neutrality
312 Factors affecting the macroeconomic impacts of RES technologies
Earlier analyses (Lehr et al 2008 Fraunhofer ISI et al 2009 DTI 2004 Kammen et al 2004 Moreno and Loacutepez 2007) have studied the impacts of large renewable energy source (RES) shares in the energy mix for different countries The overall question in these studies has been the impact of increasing RES shares on the economy especially on the labour market For the present study it is interesting to note that macroeconomic impacts of higher RES shares mainly depends on the following five factors
1 additional investment in RES (minus lower investment in conventional sources ie fossil and nuclear power) with the impact increasing if a country manufactures the RES technology in question
2 additional (net) exports due to improved international competitiveness of renewable energy sources (first mover advantage)
3 lower fossil fuel needs4 the cost differences between RES and
conventional energy
5 the shift from capital- and energy-intensive industries to labour- and technology-intensive industries
All five factors are driven by international energy prices carbon prices the policy framework and RES technology development itself Innovation comes into the play at various stages First innovation drives the currently positive additional costs of RES technologies down and even into negative realms depending on the fossil fuel scenario Second innovative RES technologies are likely to have a competitive advantage in international markets Although a significant proportion of RES technology produced in Europe is traded in Europe innovation will still provide an edge in current and emerging international markets
The EmployRES study (Fraunhofer ISI et al 2009) finds for Europe that current strong investment reflected in installations in Europe and exports to the rest of the world dominate the economic impact of RES policies and therefore lead to positive overall effects The studys results suggest that this positive balance can only be kept up in the future if the competitive position of European manufacturers of RES technology is improved The authors strongly recommend policies which promote technological innovation in RES and lead to a continued and rapid reduction of their costs
Factors 1 and 2 will have substantial macroeconomic impacts in the short and medium terms whereas factor 3 accumulates and will show positive impacts mainly in the long term Factor 4 strongly depends on the global developments while factor 5 may have significant effects on employment
313 Additional scenarios
Impacts of additional investment (factor 1) have already been analysed in scenario S2H of the petre project To focus on the other impacts of eco-innovation two additional scenarios were designed building on scenario S2H of petre
bull S2HEETRwithrevenuerecyclingdesignedto meet the unilateral EUs 2020 greenhouse gas (GHG) target (high energy price) Ten per cent of revenues are spent on eco-innovation measures and trade shares of EU-27 economies with the rest of the world in machinery and electrical machinery increase by 01 due to the deployment of the fast growing RES markets This assumption is based on the strong EU policy effort to increase the share of renewable energy in final energy consumption to 20 by 2020
Modelling of ETR impacts on eco-innovation
Environmental tax reform in Europe opportunities for eco-innovation 27
(Fraunhofer ISI et al 2009) and the possibility of very strong world market development of the RES sector until 2020 (EREC 2008) which offers additional export opportunities for European RES industries
bull S2HIETRwithrevenuerecyclingdesignedto meet the unilateral EUs 2020 GHG target (high energy price) Ten per cent of revenues are spent on eco-innovation measures and input structures of the energy sector are changed according to the input structure of the German RES industry (Lehr et al 2008)
S2HE looks at the possible role of international trade S2HI analyses changes in the input structure of the energy sector ie from conventional electricity production to renewables In the petre project (as in GHK et al 2007) only the energy inputs of the energy sector were adapted to changes in the energy input mix
Both S2HE and S2HI focus on RES and efficiency technologies As mentioned above an ETR will trigger a variety of innovations Therefore the results can be thought of as conservative in the sense that innovations (eg automotive energy consumption industrial efficiency etc) are not explicitly included
32 Overview of modelling results
The main results of the simulations are presented in Table 31 In the baseline scenario BH with high energy prices EU-27 carbon emissions will be
72 below the 1990 level in 2020 (38) The EU-15 has committed in the Kyoto Protocol to reduce its GHG emissions 8 below 1990 levels in the period 2008ndash2012 As emissions in the new member states are substantially below their 1990 levels today that implies that the EU-27 will keep its emissions more or less constant over the coming decade As in the PRIMES baseline an ETS price of 18 EURt in 2008 prices is assumed in 2020
In scenario S1H the ETS price and carbon tax rate has to be increased to 68 EUR2008t of CO2 to reach the 20 GHG reduction target which is equal to a 15 reduction of CO2 emissions against 1990 as other greenhouse gases have already been reduced above average by more than 20 in terms of CO2 equivalents Compared to the baseline CO2 emissions are 84 lower in 2020 which means roughly an additional 1 reduction annually in the period 2012ndash2020 GDP will be about 06 lower compared to the baseline in 2020 This means that annual average growth rates will be less than 01 below their baseline development This is especially low compared to the current financial and economic crisis with a GDP deviation against the baseline of around 6 in 2009
As the recycling mechanism reduces labour costs and the tax burden is shifted from labour-intensive to carbon- and material-intensive sectors employment will be 036 (or more than 800 000 jobs) higher than in the baseline The ETR is not fully budget neutral potentially enabling EU economies to slightly increase their net savings If
(38) The modelling exercise in the present study was conducted in 2009 and therefore does not contain the latest data on EU-27 GHG emissions which were significantly influenced by the global economic slump of the late-2000s
Table 31 Main results under the different scenarios
Scenario Target in 2020 CO2 price GDP Employment CO2 reduction
EUR2008t pc against baseline
pc against baseline
pc against 1990
pc against baseline
in year 2020 2015 2020 2020 2020 2020
BH 18 ndash 72 00
S1H 20 GHG 68 ndash 022 ndash 057 036 ndash 151 ndash 84
S2H 20 GHG 61 ndash 013 ndash 030 041 ndash 152 ndash 85
S2HE 20 GHG 61 ndash 009 ndash 004 051 ndash 151 ndash 84
S2HI 20 GHG 61 ndash 006 ndash 024 045 ndash 152 ndash 84
Environmental tax reform in Europe opportunities for eco-innovation
Modelling of ETR impacts on eco-innovation
28
this extra saving is spent negative GDP impacts will be further reduced
In scenario S2H part of the revenues is invested in low-carbon technologies This reduces the carbon price to 61 EUR2008t in 2020 halving the GDP loss relative to scenario S1H to only 03 as the investment in renewable energies is assumed to be additional Employment impacts are also more positive than in scenario S1H The 10 investment in low-carbon technologies amounts to more than EUR 20 billion in 2020
Assuming additional EU exports of RES technologies in scenario S2HE GDP almost matches the baseline in 2020 and employment is 051 (or more than 1 million jobs) higher than in the baseline In scenario S2HI a shift in the input structure of the energy sector towards machinery
and electrical machinery reflecting the different nature of RES relative to conventional electricity generation also has smaller additional positive impacts on GDP and employment compared to scenario S2H
The following figures show impacts of the different scenarios in comparison to the baseline BH As Figure 31 illustrates all the alternative scenarios imply GDP lower than the baseline However comparing scenario S1H with the other three scenarios shows that additional RES investment (S2H) additional RES exports (S2HE) and the inclusion of different input structures of the RES industries (S2HI) each have positive GDP impacts These results are in line with model-based analysis in the EMPLOY-RES study (Fraunhofer ISI et al 2009)
Figure 31 EU-27 GDP according to four scenarios mdash deviation from the baseline (BH)
Percentage deviation from the baseline (BH)
ndash 100
ndash 080
ndash 060
ndash 040
ndash 020
0002010 2015 2020
S2HI S1H S2H S2HE
Modelling of ETR impacts on eco-innovation
Environmental tax reform in Europe opportunities for eco-innovation 29
In contrast to GDP employment increases relative to the baseline in all the alternative scenarios (Figure 32) Due to the scenario design the structure of the EU economies is shifted from energy-intensive to labour-intensive sectors The magnitude of the employment gain is influenced by the carbon price and the tax shift the underlying energy prices and the production loss The largest part of the employment increase stems from the additional RES investment (scenario S2H) although a shift in industry structures (S2HI) and additional RES exports (S2HE) are also positive for the labour market
33 Macroeconomic impacts at the national level
In general terms it is clear that national ETS and ETR impacts depend significantly on country specifics including energy use economic structure social system and behaviour (eg reactions to labour cost changes) In countries with high carbon intensity in their energy mix additional revenues and expenditures are higher than in countries with lower carbon intensity
Scenario S2H provides an interesting tool for analysing the macroeconomic impacts of ETR at the national level because 10 of the additional generated revenues are used for eco-innovation investments meaning that only 90 of the revenues are recycled back into the economy by reducing income tax rates and social security contributions
Figure 32 EU-27 employment according to four scenarios mdash deviation from the baseline (BH)
ndash 020
000
020
040
060
2010 2015 2020
S2HI S1H S2H S2HE
Percentage deviation from the baseline (BH)
Environmental tax reform in Europe opportunities for eco-innovation
Modelling of ETR impacts on eco-innovation
30
Figure 34 GDP in 2020 in EU-27 Member States under scenario S2H mdash deviation form the baseline (BH)
Figure 33 GDP in 2020 in selected countries under scenario S2H mdash deviation from the baseline (BH)
ndash 25 ndash 20 ndash 15 ndash 10 ndash 05 00 05 10 15
Romania
Bulgaria
SloveniaMalta
Lithuania
Latvia
Estonia
CyprusSlovakia
Poland
Hungary
Czech RepublicUnited Kingdom
Sweden
Spain
Portugal
Netherlands
Italy
Ireland
Greece
FranceFinland
Denmark
Luxembourg
Belgium
Austria
Germany
Percentage deviation from the baseline (BH)
Russia
South Africa
Brazil
India
China
Mexico
Japan
USA
Poland
United Kingdom
Spain
Italy
France
Germany
ndash 30 ndash 25 ndash 20 ndash 15 ndash 10 ndash 05 00 05 10
Percentage deviation from the baseline (BH)
Modelling of ETR impacts on eco-innovation
Environmental tax reform in Europe opportunities for eco-innovation 31
Figure 35 Employment in 2020 in EU-27 Member States under scenario S2H mdash deviation from baseline (BH)
EU-27EU-15
RomaniaBulgariaSloveniaMalta
LithuaniaLatvia
EstoniaCyprusSlovakia
PolandHungary
Czech RepublicUnited Kingdom
SwedenSpain
PortugalNetherlands
ItalyIrelandGreece
FranceFinlandDenmarkLuxembourg
BelgiumAustria
Germany
ndash 200 0 200 400 600 800 1 000
Percentage deviation from the baseline (BH)
Under scenario S2H the GDP of large EU economies deviates from baseline projections by between 0 and ndash 1 with the exception of Italy (Figure 33) Germanys GDP is even forecast to match the baseline level in 2020 due to the countrys strong RES industry Outside Europe some countries gain slightly against EU Member States in terms of competitiveness as export prices in most EU Member States and sectors increase and GDP in those countries exceeds the baseline projections as a result (Figure 33) This is mainly because carbon tax revenues are recycled via income tax reductions which are not part of production costs However energy exporting economies such as Russia or South Africa will lose exports if EU demand for fossil fuel imports declines The development of all EU Member States is shown in Figure 34
Employment impacts of scenario S2H are positive for almost all EU Member States as lower labour
costs increase labour demand and labour intensity (Figure 35) The highest absolute increases are shown for Germany the Netherlands Italy and the United Kingdom For EU-27 as a whole employment will be almost one million higher than in the corresponding baseline BH in 2020
The scenarios have not been designed with a view to meeting the EU renewables target of a 20 renewables share in final energy consumption in 2020 Nevertheless the scenarios provide some interesting insights The share is projected to increase from around 10 in 2009 to above 14 even in the baseline as instruments such as feed in tariffs and biofuel quotas will continue In scenario S1H the target will be missed with around 18 in 2020 Only in scenarios S2H S2HE and S2HI is the target met (approximately 20 )
Environmental tax reform in Europe opportunities for eco-innovation
Modelling of ETR impacts on eco-innovation
32
Under scenario S2H energy-related carbon emissions are reduced in all EU Member States relative to the baseline (Figure 36) The highest percentage reductions can be seen in many of the EU-12 Member States with still high energy intensity and low energy prices In these countries the relative price increase is higher than in countries like Germany or the United Kingdom with already high energy taxes and overall energy prices
Additional ETS revenues material tax revenues and carbon tax revenues from the industry sector are recycled back to industry via reductions in employers social security contributions (or wage subsidies in some countries) The revenues from the carbon tax on households set out in Table 32 (totalling 033 of GDP in Germany for example) are used to reduce income tax For the EU-27 overall revenues from ETS and ETR reach about 2 of GDP in 2020 although these figures may be excessive because additional EU efforts to increase energy
efficiency and renewable energy which will reduce the ETS price are not taken into account The use of flexible tools such as the Clean Development Mechanism will further reduce the revenues and earmarking of part of the revenues for mitigation and adaptation measures in emerging and developing countries limits the recycling into labour costs
In addition the scenarios do not take the current global economic problems into account According to the IEA (2009) the downturn will also reduce carbon emissions in the long run which will lead to lower carbon prices and revenues to reach fixed targets (or make tighter targets less costly)
The ETR will have varying effects on the prices of different sorts of products and services Material or carbon taxes increase the prices of product groups according to their direct and indirect material and carbon content The recycling mechanism reduces
Figure 36 Energy-related CO2 emissions in 2020 under scenario S2H mdash deviation from the baseline (BH)
WorldEU-27
EU-15Romania
BulgariaSlovenia
MaltaLithuania
LatviaEstonia
CyprusSlovakia
PolandHungary
Czech RepublicUnited Kingdom
SwedenSpain
PortugalNetherlands
ItalyIreland
GreeceFrance
FinlandDenmark
LuxembourgBelgium
AustriaGermany
ndash 25 ndash 20 ndash 15 ndash 10 ndash 5 0
Percentage deviation from the baseline (BH)
Modelling of ETR impacts on eco-innovation
Environmental tax reform in Europe opportunities for eco-innovation 33
Table 32 Additional ETS and environmental tax revenues in 2020 ( of GPD)
S2H Germany United Kingdom EU-27
ETS revenues 083 064 059
Carbon tax (industry) 052 044 054
Carbon tax (households) 033 041 036
Material tax 041 029 056
Sum 209 178 205
Figure 37 Total primary energy supply in 2020 under scenario S2H mdash deviation from the baseline (BH)
WorldEU-27EU-15
RomaniaBulgaria
Slovenia
MaltaLithuania
LatviaEstonia
Cyprus
SlovakiaPoland
HungaryCzech Republic
United KingdomSweden
SpainPortugal
NetherlandsItaly
IrelandGreece
FranceFinland
DenmarkLuxembourg
BelgiumAustria
Germany
ndash 24 ndash 21 ndash 18 ndash 15 ndash 12 ndash 9 ndash 6 ndash 3 0
Percentage deviation from the baseline (BH)
Environmental tax reform in Europe opportunities for eco-innovation
Modelling of ETR impacts on eco-innovation
34
Figure 38 Output price impacts of scenario S2H in Germany in 2020 mdash deviations from the baseline (BH)
Figure 39 Impacts of scenario S2H on industrial output in 2020 in Germany mdash deviations from the baseline (BH)
ndash 5
0
5
10
15
20
Output prices
Percentage deviation from the baseline (BH)
(3) F
ood
(4) T
extiles
(5) W
ood
(6) P
ulp pap
er
(7) C
oke re
fined
petro
leum
pro
ducts
(8) C
hemica
ls ex
cl pha
rma
(9) P
harm
aceu
ticals
(10)
Rub
ber a
nd plastics
(11)
Non
-metallic
miner
als
(12)
Iron
and
steel
(13)
Non
-ferrou
s metals
(14)
Met
al pro
ducts
(15)
Mac
hine
ry and
equ
ipmen
t
(16)
Office
mac
hine
ry
(17)
Electric
al m
achine
ry
(18)
Rad
io T
V
(19)
Med
ical pr
ecisi
on and
opt
ical ins
trumen
ts
(20)
Mot
or veh
icles
(21)
Ships
(22)
Airc
raft
(23)
Railro
ad
(24)
Man
ufac
turin
g n
ec r
ecyc
ling
(25)
Electric
ity g
as w
ater
sup
ply
(26)
Con
stru
ction
(27)
Tra
de r
epairs
(28)
Hot
els an
d re
stau
rant
s
(29)
Tra
nspo
rt an
d stor
age
(30)
Pos
t and
teleco
mmun
icatio
ns
(31)
Finan
ce ins
uran
ce
(32)
Rea
l estate ac
tivities
(33)
Ren
ting
(34)
Com
puter
(35)
Res
earch an
d de
velopm
ent
(36)
Oth
er bus
ines
s ac
tivities
(37)
Pub
lic ser
vice
s
(38)
Edu
catio
n
(39)
Hea
lth and
soc
ial w
ork
(40)
Oth
er ser
vice
s
(41)
Priv
ate ho
useh
olds
(1) A
gricu
lture
(2) M
ining an
d qu
arry
ing
nec not elsewhere classified
Production
ndash 100
ndash 80
ndash 60
ndash 40
ndash 20
00
20
40
60
80Percentage deviation from the baseline (BH)
(3) F
ood
(4) T
extiles
(5) W
ood
(6) P
ulp pap
er
(7) C
oke re
fined
petro
leum
pro
ducts
(8) C
hemica
ls ex
cl pha
rma
(9) P
harm
aceu
ticals
(10)
Rub
ber a
nd plastics
(11)
Non
-metallic
miner
als
(12)
Iron
and
steel
(13)
Non
-ferrou
s metals
(14)
Met
al pro
ducts
(15)
Mac
hine
ry and
equ
ipmen
t
(16)
Office
mac
hine
ry
(17)
Electric
al m
achine
ry
(18)
Rad
io T
V
(19)
Med
ical pr
ecisi
on and
opt
ical ins
trumen
ts
(20)
Mot
or veh
icles
(21)
Ships
(22)
Airc
raft
(23)
Railro
ad
(24)
Man
ufac
turin
g n
ec r
ecyc
ling
(25)
Electric
ity g
as w
ater
sup
ply
(26)
Con
stru
ction
(27)
Tra
de r
epairs
(28)
Hot
els an
d re
stau
rant
s
(29)
Tra
nspo
rt an
d stor
age
(30)
Pos
t and
teleco
mmun
icatio
ns
(31)
Finan
ce ins
uran
ce
(32)
Rea
l estate ac
tivities
(33)
Ren
ting
(34)
Com
puter
(35)
Res
earch an
d de
velopm
ent
(36)
Oth
er bus
ines
s ac
tivities
(37)
Pub
lic ser
vice
s
(38)
Edu
catio
n
(39)
Hea
lth and
soc
ial w
ork
(40)
Oth
er ser
vice
s
(41)
Priv
ate ho
useh
olds
(1) A
gricu
lture
(2) M
ining an
d qu
arry
ing
nec not elsewhere classified
Modelling of ETR impacts on eco-innovation
Environmental tax reform in Europe opportunities for eco-innovation 35
social security contributions and lowers labour costs according to the direct and indirect labour content of sector output The ETR therefore reduces output prices in labour-intensive service sectors and increases prices in carbon- and material-intensive industry sectors
The example of Germany shows insignificant impacts in the trade-intensive sectors of machinery (15ndash17) motor vehicles (20) and other transport equipment (21ndash23) (Figure 38) Iron and steel (12) and chemicals without pharmaceuticals (8) face the highest price increases of trade-intensive sectors As the German iron and steel industry primarily delivers high quality steel to the German car industry and increasingly to the German windmill industry negative competitiveness impacts will be limited Exchange rate variations against non-EU competitors have been much higher in the past
The higher prices of carbon- and material-intensive products will reduce price competitiveness on export markets and increase the market share for imports in domestic markets This loss of price competitiveness is based on an assumption of limited market development of energy efficiency and RES technologies in other part of the world It will be offset by gains in labour-intensive sectors if the ETR causes real wage costs per unit of output to fall as a result of using recycled revenues to reduce employer social security contributions
Any improvement in non-price competitiveness will also raise exports The extra employment will raise incomes raising consumption and output
The overall impact on sector output depends on countervailing effects which are negative for iron and steel and a few service sectors and positive for a few industry sectors For most industries the output effect is insignificant (Figure 39) The greatest impact is felt by producers of fossil fuels who must obviously reduce production due to lower demand for their products
Under scenario S2H employment impacts are positive for most sectors relative to the baseline as labour productivity decreases and wage rates fall in relation to consumer prices (CPI) and output prices (Table 33) The relative costs of labour are lower than in the baseline without the ETR reform Only around a quarter of the employment increase takes place in industry
Concerning the wage rate two countervailing effects have to be considered First when the labour market is characterised in terms of the real wage bargaining model as in E3ME and GINFORS with market power on both sides (employers and trade unions) consumer price increases will lead to wage increases (the econometrically estimated factor is 085 for Germany) Second labour productivity is another important factor for wage bargaining The estimated elasticity for Germany is 063 meaning that a 1 increase of labour productivity leads to wage increases of 063 Higher labour demand due to lower labour costs thus reduces the wage increase In the end the German economy is more labour intensive than without the ETR partly due to the structural change towards labour-intensive industries
Table 33 Employment impacts of scenario S2H in Germany mdash deviations from scenario S2H in 2020
Employment in 2020 Deviation from S2H () Deviation from S2Habsolute (1 000s)
Agriculture forestry 24 90
Industry 09 653
Non-metallic minerals 24 62
Iron and steel ndash 28 ndash 37
Machinery and equipment 05 56
Electrical machinery 04 18
Construction 37 449
Trade and transport 10 829
Business services 17 767
Other services ndash 02 ndash 216
Total 07 2506
Environmental tax reform in Europe opportunities for eco-innovation
Modelling of ETR impacts on eco-innovation
36
Additional exports under scenario S2HE mainly create new jobs in machinery and related business services (Table 34) Under scenario S2HI a shift in the input structure of the energy sector leads to a shift in the industry structure and creates a few jobs in the service sector (Table 35)
34 Conclusions of the scenario assessment
The foregoing analysis used the GINFORS model to assess economic and environmental impacts of using the ETS and ETR to reach the EUs 2020
GHG targets In general the results show positive employment effects and only small negative impacts on GDP in EU-27 Member States The economic impacts depend on the levels of international energy prices the mechanism used to recycle revenues and country specifics such as carbon and energy intensity and the structure of energy consumption
Although there is significant evidence that eco-innovation is positively driven by higher energy prices quantification is difficult The present study included simulations of possible impacts of a shift in the industry structure towards renewable energy in the electricity sector and an overall increase of EU
Table 34 Employment impacts of scenario S2HE in 2020 in Germany mdash deviations from scenario S2H
Employment in 2020 Deviation from S2H () Deviation from S2Habsolute (1 000s)
Agriculture forestry ndash 01 ndash 02
Industry 03 194
Non-metallic minerals 02 05
Iron and steel 04 05
Machinery and equipment 13 130
Electrical machinery 24 117
Construction 01 18
Trade and transport 00 26
Business services 07 308
Other services 01 107
Total 02 634
Table 35 Employment impacts of scenario S2HI in 2020 in Germany mdash deviations from scenario S2H
Employment in 2020 Deviation from S2H () Deviation from S2Habsolute (1 000s)
Agriculture forestry ndash 01 ndash 02
Industry 00 00
Non-metallic minerals 25 65
Iron and steel ndash 27 ndash 36
Machinery and equipment 08 78
Electrical machinery 04 19
Construction ndash 00 ndash 04
Trade and transport 00 07
Business services 02 115
Other services 0 56
Total 00 167
Modelling of ETR impacts on eco-innovation
Environmental tax reform in Europe opportunities for eco-innovation 37
exports due to higher global demand for renewable energy The main results can be summarised as follows
bull environmentaltaxreformshiftingtaxesfromlabour to energy and resources will create additional jobs and trigger eco-innovation
bull impactsofeco-innovationintheformofadditional EU exports or shifts in industry structures will have a slight positive influence on GDP and create a smaller number of additional jobs
These findings correspond to results from the EmployRES study (Fraunhofer ISI et al 2009) As ETR is directly aimed at reducing labour costs it will create additional jobs in the short and medium term In the longer term the cost reduction and new technologies arising from eco-innovation will play a larger role
Like all fiscal reforms a major ETR in Europe will create winners and losers At the sector level carbon- and material-intensive industries will face economic losses At the country level the carbon-intensity and overall flexibility of economies is important Clearly structural change away from carbon-intensive industries together with technological change is inherent in any successful climate mitigation policy
On the other hand several factors can smooth these structural adjustments International cooperation
will reduce economic pressure on countries and sectors In addition ETR together with auctioning of ETS allowances can be a major source of revenues for EU Member States in the future even if part of the revenues will have to be earmarked for adaptation and mitigation measures in developing countries Indeed future debate on grandfathering or auctioning ETS allowances should reflect the important point that giving allowances away for free denies countries the money to ease structural change and invest in low-carbon technologies
Caution is needed in relating the findings of this study to the EU policy debate In the model simulations the single carbon price is the only instrument used to reach the EUs 2020 GHG targets In reality of course other renewable energy and efficiency policies will also contribute to carbon reduction and have to be taken into account when comparing the results (especially the high carbon prices) to other studies Both reduce the potential revenues from fossil energy carriers and carbon emissions
A variety of renewable energy and efficiency policies could enable the climate and energy targets to be met while securing even better economic prospects The results of the present study clearly indicate that the discussion on market-based instruments should be intensified Ultimately however the EU will need a rich mix of policies to reach its GHG targets while maximising prosperity
Environmental tax reform in Europe opportunities for eco-innovation38
References
Almon C 1991 The INFORUM Approach to Interindustry Modeling in Economic Systems Research Vol 3 pp 1ndash7
Amin A and Cohendet P 2004 The Architecture of Knowledge Firms Capabilities and Communities Oxford University Press Oxford
Barker T Meyer B Pollitt H and Lutz C 2007a Modelling Environmental Tax Reform in Germany and the United Kingdom with E3ME and GINFORS petre Working Paper Cambridge and Osnabrueck (httpwwwpetreorgukpapershtm) accessed 15 February 2011
Barker T Junankar S Pollitt H and Summerton P 2007b Carbon leakage from unilateral environmental tax reforms in Europe 1995ndash2005 Energy Policy Vol 35 pp 6 281ndash6 292
Brunnermeier S B and Cohen M A 2003 Determinants of environmental innovation in US manufacturing industries Journal of Environmental Economics and Management Vol 45 pp 278ndash293
Buen J 2006 Danish and Norwegian wind industry The relationship between policy instruments innovation and diffusion Energy Policy Vol 34 (18) pp 3 887ndash3 897
Carlsson B and Stankiewicz R 1991 On the nature function and composition of technological systems Journal of Evolutionary Economics Vol 1 (2) pp 93ndash118
Christiansen A C and Skjaerseth J B 2005 Climate change policies in Norway and the Netherlands Different instruments similar outcome Energy and Environment Vol 16(1) pp 1ndash25
Dosi G 1988 Sources procedures and microeconomic effects of innovation Journal of Economic Literature Vol 26 pp 1 120ndash1 171
de Vries F and Medhi N 2008 Environmental regulation and international innovation in automotive emissions control technologies in Environmental Policy Technological Innovation and Patents Organisation for Economic Cooperation and Development Paris
DG TREN 2008 European energy and transport mdash trends to 2030 mdash update 2007 European Commission Luxembourg
DTI 2004 Renewable Supply Chain Gap Analysis UK Department of Trade and Industry
Edler J (ed) 2006 Nachfrageorientierte Innovationspolitik Buumlro fuumlr Technikfolgenabschaumltzung beim Deutschen Bundestag (TAB) Arbeitsbericht Nr 99 Berlin
Edquist C 2001 The system of innovation approach and innovation policy an account of the state of the art lead paper presented at the DRUID Conference 12ndash15 June 2001 Aalborg (httpwwwdruiddkconferencesnwpaper1edquistpdf) accessed 15 February 2011
EEA 2006 Using the market for cost-effective environmental policy Market-based instruments in Europe EEA Report No 12006 European Environment Agency Copenhagen
Ekins P 2009 Resource Productivity Environmental tax Reform and Sustainable Growth in Europe published by the Anglo-German Foundation for the Study of Industrial Society Final report (httpwwwpetreorgukpdfFinRepFinpdf) accessed 12 October 2011
Ekins P and Speck S (eds) 2011 Environmental Tax Reform (ETR) A Policy for Green Growth Oxford University Press
EREC 2008 Energy [r]evolution A sustainable global energy outlook Greenpeace International European Renewable Energy Council (EREC)
References
References
Environmental tax reform in Europe opportunities for eco-innovation 39
Fagerberg J Mowery D C and Nelson R R (eds) 2005 The Oxford Handbook of Innovation Oxford University Press Oxford
Fischer C Parry I W H and Pizer W A 2003 Instrument choice for environmental protection when technological innovation is endogenous Journal of Environmental Economics and Management Vol 45 pp 523ndash545
Fraunhofer ISI ECOFYS Energy Economics Group Ruumltter + Partner SEURECO and LEI 2009 EmployRES mdash The impact of renewable energy policy on economic growth and employment in the European Union European Commission Brussels
Frondel M Horbach J and Rennings K 2008 What triggers environmental management and innovation Empirical evidence for Germany Ecological Economics Vol 66(1) pp 153ndash160
GHK Cambridge Econometrics and IEEP 2007 Links between the environment economy and jobs Final Report submitted to DG Environment European Commission
Giljum S Behrens A Hinterberger F Lutz C and Meyer B 2008 Modelling scenarios towards a sustainable use of natural resources in Europe Environmental Science and Policy Vol 11 pp 204ndash216
Goumlrlach B Knigge M and Luumlckge H 2005 Wirkungen der Oumlkologischen Steuerreform auf Innovation und Marktdurchdringung Ecologic Berlin (httpecologiceudownloadprojekte1850-189918791879_5_innovationpdf) accessed 18 August 2011
Green M A 2000 Photovoltaics technology overview Energy Policy Vol 28 (14) pp 989ndash998
Grossmann A Lehr U Lutz C and Wolter MI 2008 Gesamtwirtschaftliche Effekte der Umsetzung der EU Ziele im Bereich Erneuerbare Energien und Gebaumludeeffizienz in Oumlsterreich bis 2020 Studie im Auftrag des Lebensministeriums Wien 0508
Hage J and Hollingsworth J R 2000 Idea innovation networks a strategy for integrating organizational and institutional analysis Organization Studies Vol 21 (5) pp 971ndash1 004
Hauschildt J 2004 Innovationsmanagement Vahlen Muumlnchen
Hemmelskamp J 1997 Environmental policy instruments and their effects on innovation European Planning Studies Vol 5 (2) pp 177ndash195
Hoglund Isaksson L 2005 Abatement costs in response to the Swedish charge on nitrogen oxide emissions Journal of Environmental Economics and Management Vol 50 pp 102ndash120
Hullmann A 2001 Internationaler Wissenstransfer und technischer Wandel (dissertation) Physica-Verlag Heidelberg
IEA 2008 World Energy Outlook 2008 International Energy Agency Paris
IEA 2009 World Energy Outlook 2009 International Energy Agency Paris
Jacobsson S Andersson B A and Baringngens L 2002 Transforming the energy system mdash the evolution of the German technological system for solar cells Science and Technology Policy Research University of Sussex Electronic Working Paper Series No 84 (httpideasrepecorgpsrussewps84html) accessed 18 August 2011
Jaffe A and Stavins R 1995 Dynamic incentives of environmental regulations the effects of alternative policy instruments on technology diffusion Journal of Environmental Economics and Management Vol 29(3) pp 43ndash63
Jaffe A B and Palmer K 1997 Environmental regulation and innovation a panel data study The Review of Economics and Statistics Vol 79 pp 610ndash619
Jaffe A B Newell R G and Stavins R N 2002 Environmental policy and technological change Environmental and Resource Economics Vol 22 (1ndash2) 2002 pp 41ndash70
Johnstone N and Hascic I 2008 Renewable energy policies and technological innovation energy source and instrument choice in Environmental Policy Technological Innovation and PatentsOrganisation for Economic Co-operation and Development Paris
Johnstone N 2005 The Innovation Effects of Environmental Policy Instruments in Horbach J (ed) Indicator Systems for Sustainable Innovation Physica-Verlag HD
Environmental tax reform in Europe opportunities for eco-innovation
References
40
Johnstone N Hascic I and Ostertag K 2008 Environmental policy technological innovation and patent activity in Environmental Policy Technological Innovation and Patents Organisation for Economic Co-operation and Development Paris
Jung C Krutilla K and Boyd R 1996 Incentives for advanced pollution abatement technology at the industry level an evaluation of policy alternatives Journal of Environmental Economics and Management Vol 30(1) pp 95ndash111
Kammen D M Kapidia K and Fripp M 2004 Putting renewables to work how many jobs can the clean energy industry generate University of California Berkeley
Kemp R 1997 Environmental policy and technical change ndash a comparison of the technological impact of policy instruments Edward Elgar Cheltenham
Kemp R 1998 The diffusion of biological waste-water treatment plants in the Dutch food and beverage industry Environmental and Resource Economics Vol 12 pp 113ndash136
Kemp R 2000 Technology and environmental policy ndash innovation effects of past policies and suggestions for improvement in OECD proceedings ndash innovation and the environment Organisation for Economic Co-operation and Development Paris
Kerr S and Newell R G 2003 Policy-induced technology adoption evidence from the US lead phasedown Journal of Industrial Economics Vol 51 pp 317ndash343
Klaassen G Miketa A Larsen K and Sundqvist T 2005 The impact of RampD on innovation for wind energy in Denmark Germany and the United Kingdom Ecological Economics Vol 54 pp 227ndash240
Kline S and Rosenberg N 1986 An overview of innovation in Landau R (ed) The positive sum strategy Harnessing technology for economic growth pp 275-306
Knigge M and Goumlrlach B 2005 Effects of Germanys ecological tax reforms on the environment employment and technological innovation Ecologic Berlin (httpwwwumweltbundesamtdeuba-info-presse-ehintergrundoekosteuerpdf) accessed 18 August 2011
Langniss O 2003 Governance structures for promoting renewable energy sources dissertation Lund Stuttgart
Lanjouw J O and Mody A 1996 Innovation and the international diffusion of environmentally responsive technology Research Policy Vol 25 pp 549ndash571
Lehr U Nitsch J Kratzat M Lutz C and Edler D 2008 Renewable Energy and Employment in Germany Energy Policy Vol 36 pp 108ndash117 DOI101016jenpol200709004
Lehr U Wolter MI and Groszligmann A 2009 Economic impacts of RES obligations in Austria ndash an application of the macro-econometric model e3at GWS Discussion Paper 20091 Osnabruumlck
Lundvall B-A Johnson B Andersen E S and Dalum B 2001 National systems of production innovation and competence building Research Policy Vol 31 pp 213ndash231
Lutz C and Giljum S 2009 Global resource use in a business as usual world until 2030 Updated results from the GINFORS model in Bleischwitz R Welfens Pand Zhang Z (eds) Sustainable growth and resource productivity ndash economic and global policy issues Greenleaf Publishers pp 30ndash41
Lutz C and Meyer B 2008 Beschaumlftigungseffekte des Klimaschutzes in Deutschland Untersuchungen zu gesamtwirtschaftlichen Auswirkungen ausgewaumlhlter Maszlignahmen des Energie- und Klimapakets Forschungsbericht 205 46 434 Dessau-Roszliglau
Lutz C and Meyer B 2009a Environmental and Economic Effects of Post-Kyoto Carbon Regimes Results of Simulations with the Global Model GINFORS Energy Policy Vol 37 pp 1 758ndash1 766 DOI 101016jenpol200901015
Lutz C and Meyer B 2009b Scenario results from GINFORS PETRE working paper Osnabruumlck
Lutz C Meyer B Nathani C and Schleich J 2005 Endogenous technological change and emissions The case of the German steel industry Energy Policy Vol33 pp 1 143ndash1 154
Lutz C Meyer B Nathani C and Schleich J 2007 Endogenous innovation economy and environment impacts of a technology based modelling approach for energy-intensive industries in Germany Energy Studies Review Vol 15(1) pp 2ndash18
References
Environmental tax reform in Europe opportunities for eco-innovation 41
Lutz C Meyer B and Wolter M I 2009 The global multisectormulticountry 3-E model GINFORS mdash a description of the model and a baseline forecast for global energy demand and CO2 emissions Journal of Sustainable Development forthcoming
Malerba F and Orsenigo L 1997 Technological Regimes and Sectoral Patterns of Innovative Activities Industrial and Corporate Change Vol 6 (1) pp 83ndash117
Malerba F 1992 Learning by Firms and Incremental Technical Change The Economic Journal Vol 102 (413) pp 845ndash859
Malerba F 2005 Industrial dynamics and innovation progress and challenges Presidential Address delivered at the 32nd Conference of the European Association for Research in Industrial Economics (EARIE) 1ndash4 September 2005 Porto
Malerba F 2006 Innovation and the evolution of industries Journal of Evolutionary Economics Vol 16 pp 3ndash23
McGinty M and de Vries F P 2009 Technology diffusion product differentiation and environmental subsidies The BE Journal of Economic Analysis and Policy Vol 9(1)
Meyer B and Lutz C 2007 The GINFORS model ndash model overview and evaluation Petre Working Paper Osnabruumlck (httpwwwpetreorgukpapershtm) accessed 18 August 2011
Meyer B Lutz C Schnur P and Zika G 2007 Economic policy simulations with global interdependencies a sensitivity analysis for Germany Economic Systems Research Vol 19 pp 37ndash55
Mickwitz P H Hyvaumlttinen and P Kivimaa 2008 The role of policy instruments in the innovation and diffusion of environmentally friendlier technologies popular claims versus case study experiences Journal of Cleaner Production Vol 16(1S1) 162ndash170
Miketa A and Schrattenholzer L 2004 Experiments with a methodology to model the role of RampD expenditures in energy technology learning processes first results Energy Policy Vol 32 (15) pp 1 679ndash1 692
Milliman S R and Prince R 1989 Firm incentives to promote technological change in pollution control Journal of Environmental Economics and Management Vol 17 pp 247ndash265
Millock K and Nauges C 2006 Ex-post evaluation of an earmarked tax on air pollution Land Economics Vol 82(1) pp 68ndash84
Montero J-P 2002 Market structure and environmental innovation Journal of Applied Economics Vol 2 pp 293ndash325
Moreno B and Loacutepez A J 2007 The effect of renewable energy on employment mdash The case of Asturias (Spain) Renewable and Sustainable Energy Rewiews doi 101016jrser200610011
Mowery D and Rosenberg N 1979 The influence of market demand upon innovation A critical review of some recent empirical studies Research Policy Vol 8 pp 102ndash153
Newell R G Jaffe A B and Stavins R N 1999 The induced innovation hypothesis and energy-saving technological change Quarterly Journal of Economics Vol 114 pp 941ndash975
Norberg-Bohm V 1999 Stimulating green technological innovation An analysis of alternative policy mechanisms Policy Sciences Vol 32(1) pp 13ndash38
OECD 2009 Sustainable manufacturing and eco-innovation towards a green economy Organisation for Economic Co-operation and Development Policy Brief June 2009
OECD 2010 Taxation innovation and the environment Organisation for Economic Co-operation and Development
Pavitt K 1984 Sectoral patterns of technological change Towards a taxonomy and a theory Research Policy Vol 13 pp 343ndash373
Popp D 2002 Induced innovation and energy prices The American Economic Review Vol 92(1) pp 160ndash180
Popp D 2005 Lessons from patents Using patents to measure technological change in environmental models Ecological Economics Vol 54 pp 209ndash226
Environmental tax reform in Europe opportunities for eco-innovation
References
42
Porter M and van der Linde C 1995 Toward a new conception of the environment competitiveness relationship Journal of Economic Perspectives Vol 9(4) pp 97ndash118
Rammert W 2002 The cultural shaping of technologies and the politics of technodiversity In Sorensen K and Williams R (eds) Shaping technology guiding policy concepts spaces and tools Elgar Cheltenham pp 155-172
Requate T 2005 Dynamic incentives by environmental policy instruments ndash a survey Ecological Economics Vol 54 pp 175ndash195
Roloff N Lehr U Krewitt W Fuchs G Wassermann S Weimer-Jehle W and Schmidt B 2008 Success determinants for technological innovations in the energy sector mdash the case of photovoltaics in Moumlst D Fichtner W Ragwitz M and Veit D (eds) New methods for energy market modelling mdash Proceedings of the first european workshop on energy market modelling using agent-based computational economics Universitaumltsverlag Karlsruhe
Rothwell R 1995 The fifth generation innovation process in Oppenlaumlnder KH Popp W (eds) Innovationen und wirtschaftlicher Fortschritt betriebs-und volkswirtschaftliche Perspektiven Bern pp 9ndash26
Schumpeter J 1942 Capitalism socialism and democracy New York Harper
Skjaeligrseth J B and Christiansen A C 2005 Environmental policy instruments and technological change in the energy sector findings from comparative empirical research Energy and Environment Vol 17 (2) pp 223ndash241
Snyder L D Miller N H and Stavins R N 2003 The effects of environmental regulations on pollution emissions evidence from plant-level data American Economic Review Vol 93(2) pp 431ndash435
Technopolis 2008 Eco-innovation Final Report for Sectoral Innovation Watch (httpwwwtechnopolis-groupcomresourcesdownloads661_report_finalpdf) accessed 18 August 2011
Volleburgh H 2007 Impacts of environmental policy instruments on technological change Report for Joint Meetings of Tax and Environment Experts OECD Environment Directorate February 2007 (comenvepocctpacfa(2006)36final)
Zimmermann H Wohltmann M and Hansjuumlrgens B 1996 Umweltabgaben und Innovation Analytica Marburg
43
Annex 1
Environmental tax reform in Europe opportunities for eco-innovation
Type Instrument Area Stage
Reference
Theo
retica
l
Em
piric
al
Cas
e st
udy
Rev
iew
Qual
itat
ive
Taxe
s
Perm
its
Subsi
die
s
Volu
nta
ry
Com
man
d
Reg
ula
tion
Ener
gy
Air
Wat
er
Oth
er
Gen
eral
Innov
atio
n
Diffu
sion
Rel
evan
ce
Brunnermeier amp Cohen (2003)
X X X X
Buen (2006) X X X X X X
Christiansen amp Skjaerseth (2005)
X X X X X X
Fischer et al (2003 X X X X X X
Frondel et al (2008) X X X X X X X (X) (X)
Hemmelskamp (1997)
X X X X X X X (X)
Hoglund Isaksson (2005)
X X X (X) (X)
Jaffe amp Stavins (1995)
X X X1 X X X X
Jaffe amp Palmer (1997)
X X X X
Jaffe et al (2002) X X X X X X X X X X
Jung et al (1996) X X X X X X (X) (X)
Kemp (1998) X X X X
Kerr amp Newell (2001) X X X X X
Klaassen et al (2005)
X X X X X
Lanjouw amp Mody (1996)
X X X X X X X
McGinty amp de Vries (2009)
X X X X
Mickwitz et al (2008)
X X X X X X X X X
Milliman amp Prince (1989)
X X X X X X X
Millock amp Nauges (2006)
X X X X X X
Montero (2002) X X X X X
Newell et al (1999) X X1 X X X
Norberg-Bohm (1999)
X X X X X X X
Popp (2002) X X1 X X
Popp (2005) X X X X X X
Porter amp van der Linde (1995)
X X X X X X
Requate (2005) X X X X X X X
Skjaeligrseth amp Christiansen (2005)
X X X X X X X X X
Snyder et al (2003) X X X X X
Annex 1 Classification of refereed journal articles
Environmental tax reform in Europe opportunities for eco-innovation44
Annex 2
Type Instrument Area Stage
Reference
Theo
retica
l
Em
piric
al
Cas
e st
udy
Rev
iew
Qual
itat
ive
Taxe
s
Perm
its
Subsi
die
s
Volu
nta
ry
Com
man
d
Reg
ula
tion
Ener
gy
Air
Wat
er
Oth
er
Gen
eral
Innov
atio
n
Diffu
sion
Rel
evan
ce
Johnstone (2005)
X X X X X X X
Johnstone amp Hascic (2008)
X X X X X X X X
Kemp (1997) X X X X X X X X X X X X X
Kemp (2000) X X X X X X X X X
de Vries amp Medhi (2008)
X X1 X X X
Annex 2 Classification of books and book chapters
45
Annex 3
Environmental tax reform in Europe opportunities for eco-innovation
Type Instrument Area Stage
Reference
Theo
retica
l
Em
piric
al
Cas
e st
udy
Rev
iew
Qual
itat
ive
Taxe
s
Perm
its
Subsi
die
s
Volu
nta
ry
Com
man
d
Reg
ula
tion
Ener
gy
Air
Wat
er
Oth
er
Gen
eral
Innov
atio
n
Diffu
sion
Rel
evan
ce
Goumlrlach et al (2005)
X X X X X X
Knigge amp Goumlrlach (2005)
X X X X X X
Technopolis (2008)
X X X X X X
Volleburgh (2007)
X X X X X X X X X X X
Annex 3 Classification of reports
European Environment Agency
Environmental tax reform in Europe opportunities for eco-innovation
2011 mdash 45 pp mdash 21 x 297 cm
ISBN 978-92-9213-238-5doi10280084889
How to obtain EU publications
Publications for salebull viaEUBookshop(httpbookshopeuropaeu)bull fromyourbooksellerbyquotingthetitlethepublisherandorISBNnumberbull bycontactingoneofoursalesagentsdirectlyYoucanobtaintheircontactdetails
on the Internet (httpbookshopeuropaeu) or by sending a fax to +352 2929-42758
Free publicationsbull viaEUBookshop(httpbookshopeuropaeu)bull attheEuropeanCommissionsrepresentationsordelegationsYoucanobtain
their contact details on the Internet (httpeceuropaeu) or by sending a fax to +352 2929-42758
European Environment AgencyKongens Nytorv 61050 Copenhagen KDenmark
Tel +45 33 36 71 00Fax +45 33 36 71 99
Web eeaeuropaeuEnquiries eeaeuropaeuenquiries
TH
-AK-1
1-0
17-E
N-N
doi1
02
8008
4889
- Acknowledgements
- Executive summary
- 1Introduction
-
- 11Background
- 12ETR and innovation
- 13Report structure
-
- 2Review of literature on environmental tax reform and eco‑innovation
-
- 21Initial screening
- 22Detailed review
- 23Environmental regulation studies
- 24Theoretical studies
- 25Empirical studies
- 26Case studies
- 27Conclusions
-
- 3Modelling of ETR impacts on eco‑innovation
-
- 31Scenarios assessing the implications of ETR for eco-innovation
- 32Overview of modelling results
- 33Macroeconomic impacts at the national level
- 34Conclusions of the scenario assessment
-
- References
- Annex 1 Classification of refereed journal articles
- Annex 2Classification of books and book chapters
- Annex 3Classification of reports
-
Environmental tax reform in Europe opportunities for eco-innovation
Review of literature on environmental tax reform and eco-innovation
24
reduce emissions of that pollutant at the expense of increases in the others
In a related point Johnstone highlights the importance of using appropriate indicators when assessing the impact of policy instruments on innovation emphasising the need for these to reflect both the rate of innovation and the direction A necessary condition for this is that the indicators must provide an accurate and detailed picture of actual innovation Unfortunately this is difficult to achieve in practice For example the use of patent data as a measure of innovation requires the identification of relevant environmental technologies This is likely to be easier for end-of-pipe technologies than for process-related technologies meaning that the latter tend to be under-represented relative to their actual incidence To the extent that process-related innovation is growing in importance or is more important
for certain sectors or types of environmental problem changes in the value of the indicator may significantly understate the actual rate of innovation and misrepresent the direction
All of this suggests that caution should be exercised in drawing general definitive conclusions about the impacts of price-based policy instruments such as environmental taxes and investment subsidies on innovation particularly relative to other policy instruments While it would appear that they can be effective in stimulating both innovation and diffusion in many cases mdash at least in terms of the rate of technological change mdash there may be situations in which other policy instruments may be more appropriate In general the stringency and point of incidence of an environmental policy intervention may be more important than the choice of a particular policy instrument in determining the rate and direction of eco-innovation
25
Modelling of ETR impacts on eco-innovation
Environmental tax reform in Europe opportunities for eco-innovation
31 Scenarios assessing the implications of ETR for eco-innovation
Scenario analysis provides a useful means of improving understanding of how the different revenue recycling methods and various scales of ETR can help meet different greenhouse gas emissions targets
To investigate the impacts of an ETR for Europe the petre project elaborated a range of different scenarios reflecting various tax reform options In addition to employing several of these original scenarios the present study compiled two new scenarios to analyse the implications of ETR for eco-innovation All scenarios were examined in both E3ME and GINFORS (37)
311 Original petre project scenarios
The key petre scenarios relevant for the present study are
bull scenarioBHbaselinescenariowithhighenergyprice (reference case)
bull scenarioS1HETRdesignedtomeettheEUsunilateral 2020 GHG target (high energy price) with revenue recycling
bull scenarioS2HETRdesignedtomeettheEUsunilateral 2020 GHG target (high energy price) with revenue recycling and 10 of revenues spent on eco-innovation measures
Each of the ETR scenarios has the same key taxation components
bull acarbontaxrateisintroducedtoallnon-EUEmissions Trading System (EU ETS) sectors equal to the carbon price in the EU ETS that delivers an overall 20 reduction in greenhouse gas emissions by 2020 and in the international cooperation scenario this is extended to 30
bull aviationisincludedintheEUETSattheendofPhase 2
bull powergenerationsectorEUETSpermitsare100 auctioned in Phase 3 of the EU ETS
bull allotherEUETSpermitsare50auctionedin2013 increasing to 100 in 2020
bull materialtaxesareintroducedat5oftotalpricein 2010 increasing to 15 by 2020
In scenario S1H environmental tax revenues are recycled through reductions in income tax rates and social security contributions in each of the Member States such that there is no direct change in tax revenues In scenario S2H 10 of environmental tax revenues are recycled through spending on eco-innovation measures and the remaining 90 is recycled through the same measures as in the other scenarios The eco-innovation spending is split across power generation and housing according to tax revenues from the corporate and household sector
In GINFORS (the model used for analysing the implications of ETR and eco-innovation) the share of renewable sources in electricity production is increased due to the additional investment The rest of additional investment goes to household energy efficiency spending Investment needed for a certain increase in renewable energy production or efficiency improvement is based on Austrian and German experience (Lehr et al 2008 and 2009 Grossmann et al 2008 Lutz and Meyer 2008) This assumption is quite conservative as parameters for other countries can be assumed to be more positive (meaning that less money is needed for renewable energy technology installation or energy efficiency gains)
In scenario S1H the 20 GHG target translates into a 15 reduction in energy-related carbon emissions relative to 1990 as other emissions such as methane and nitrous oxide have already been reduced by
3 Modelling of ETR impacts on eco-innovation
(37) The E3ME and GINFORS models are introduced in Chapter 1 of the present report A detailed discussion of the models and scenarios used in the present study can be found in Ekins and Speck (2011)
Environmental tax reform in Europe opportunities for eco-innovation
Modelling of ETR impacts on eco-innovation
26
more than 20 (in terms of carbon equivalents) The target is reached by a tightened EU ETS cap and the introduction of a carbon tax on the non-ETS sector The tax rate applied is equal to the carbon price in the EU ETS that will deliver a 20 GHG reduction by 2020
The burden of ETR taxes are allotted to energy outputs (ie the final use of energy) and will be based on the carbon content of each fuel Carbon prices are assumed to be fully passed on to consumers All carbon taxes are in addition to any existing unilateral carbon and energy taxes The carbon reductions in the different EU Member States will be those that result from a uniform carbon tax increase across the EU
All of the revenues including EU ETS auctioning revenues carbon tax revenues and material tax revenues will be recycled The proportion of tax raised by industry will be recycled into a reduction in employers social security contributions which will in turn reduce the cost of labour Recycling will be additional to the existing ETRs in some Member States Revenues raised from households will be recycled through standard rate income tax reductions Traditional energy tax revenues will be lower compared to their respective baselines as the tax base (energy consumption) is reduced So for an ETR revenue-neutrality does not mean budget-neutrality
312 Factors affecting the macroeconomic impacts of RES technologies
Earlier analyses (Lehr et al 2008 Fraunhofer ISI et al 2009 DTI 2004 Kammen et al 2004 Moreno and Loacutepez 2007) have studied the impacts of large renewable energy source (RES) shares in the energy mix for different countries The overall question in these studies has been the impact of increasing RES shares on the economy especially on the labour market For the present study it is interesting to note that macroeconomic impacts of higher RES shares mainly depends on the following five factors
1 additional investment in RES (minus lower investment in conventional sources ie fossil and nuclear power) with the impact increasing if a country manufactures the RES technology in question
2 additional (net) exports due to improved international competitiveness of renewable energy sources (first mover advantage)
3 lower fossil fuel needs4 the cost differences between RES and
conventional energy
5 the shift from capital- and energy-intensive industries to labour- and technology-intensive industries
All five factors are driven by international energy prices carbon prices the policy framework and RES technology development itself Innovation comes into the play at various stages First innovation drives the currently positive additional costs of RES technologies down and even into negative realms depending on the fossil fuel scenario Second innovative RES technologies are likely to have a competitive advantage in international markets Although a significant proportion of RES technology produced in Europe is traded in Europe innovation will still provide an edge in current and emerging international markets
The EmployRES study (Fraunhofer ISI et al 2009) finds for Europe that current strong investment reflected in installations in Europe and exports to the rest of the world dominate the economic impact of RES policies and therefore lead to positive overall effects The studys results suggest that this positive balance can only be kept up in the future if the competitive position of European manufacturers of RES technology is improved The authors strongly recommend policies which promote technological innovation in RES and lead to a continued and rapid reduction of their costs
Factors 1 and 2 will have substantial macroeconomic impacts in the short and medium terms whereas factor 3 accumulates and will show positive impacts mainly in the long term Factor 4 strongly depends on the global developments while factor 5 may have significant effects on employment
313 Additional scenarios
Impacts of additional investment (factor 1) have already been analysed in scenario S2H of the petre project To focus on the other impacts of eco-innovation two additional scenarios were designed building on scenario S2H of petre
bull S2HEETRwithrevenuerecyclingdesignedto meet the unilateral EUs 2020 greenhouse gas (GHG) target (high energy price) Ten per cent of revenues are spent on eco-innovation measures and trade shares of EU-27 economies with the rest of the world in machinery and electrical machinery increase by 01 due to the deployment of the fast growing RES markets This assumption is based on the strong EU policy effort to increase the share of renewable energy in final energy consumption to 20 by 2020
Modelling of ETR impacts on eco-innovation
Environmental tax reform in Europe opportunities for eco-innovation 27
(Fraunhofer ISI et al 2009) and the possibility of very strong world market development of the RES sector until 2020 (EREC 2008) which offers additional export opportunities for European RES industries
bull S2HIETRwithrevenuerecyclingdesignedto meet the unilateral EUs 2020 GHG target (high energy price) Ten per cent of revenues are spent on eco-innovation measures and input structures of the energy sector are changed according to the input structure of the German RES industry (Lehr et al 2008)
S2HE looks at the possible role of international trade S2HI analyses changes in the input structure of the energy sector ie from conventional electricity production to renewables In the petre project (as in GHK et al 2007) only the energy inputs of the energy sector were adapted to changes in the energy input mix
Both S2HE and S2HI focus on RES and efficiency technologies As mentioned above an ETR will trigger a variety of innovations Therefore the results can be thought of as conservative in the sense that innovations (eg automotive energy consumption industrial efficiency etc) are not explicitly included
32 Overview of modelling results
The main results of the simulations are presented in Table 31 In the baseline scenario BH with high energy prices EU-27 carbon emissions will be
72 below the 1990 level in 2020 (38) The EU-15 has committed in the Kyoto Protocol to reduce its GHG emissions 8 below 1990 levels in the period 2008ndash2012 As emissions in the new member states are substantially below their 1990 levels today that implies that the EU-27 will keep its emissions more or less constant over the coming decade As in the PRIMES baseline an ETS price of 18 EURt in 2008 prices is assumed in 2020
In scenario S1H the ETS price and carbon tax rate has to be increased to 68 EUR2008t of CO2 to reach the 20 GHG reduction target which is equal to a 15 reduction of CO2 emissions against 1990 as other greenhouse gases have already been reduced above average by more than 20 in terms of CO2 equivalents Compared to the baseline CO2 emissions are 84 lower in 2020 which means roughly an additional 1 reduction annually in the period 2012ndash2020 GDP will be about 06 lower compared to the baseline in 2020 This means that annual average growth rates will be less than 01 below their baseline development This is especially low compared to the current financial and economic crisis with a GDP deviation against the baseline of around 6 in 2009
As the recycling mechanism reduces labour costs and the tax burden is shifted from labour-intensive to carbon- and material-intensive sectors employment will be 036 (or more than 800 000 jobs) higher than in the baseline The ETR is not fully budget neutral potentially enabling EU economies to slightly increase their net savings If
(38) The modelling exercise in the present study was conducted in 2009 and therefore does not contain the latest data on EU-27 GHG emissions which were significantly influenced by the global economic slump of the late-2000s
Table 31 Main results under the different scenarios
Scenario Target in 2020 CO2 price GDP Employment CO2 reduction
EUR2008t pc against baseline
pc against baseline
pc against 1990
pc against baseline
in year 2020 2015 2020 2020 2020 2020
BH 18 ndash 72 00
S1H 20 GHG 68 ndash 022 ndash 057 036 ndash 151 ndash 84
S2H 20 GHG 61 ndash 013 ndash 030 041 ndash 152 ndash 85
S2HE 20 GHG 61 ndash 009 ndash 004 051 ndash 151 ndash 84
S2HI 20 GHG 61 ndash 006 ndash 024 045 ndash 152 ndash 84
Environmental tax reform in Europe opportunities for eco-innovation
Modelling of ETR impacts on eco-innovation
28
this extra saving is spent negative GDP impacts will be further reduced
In scenario S2H part of the revenues is invested in low-carbon technologies This reduces the carbon price to 61 EUR2008t in 2020 halving the GDP loss relative to scenario S1H to only 03 as the investment in renewable energies is assumed to be additional Employment impacts are also more positive than in scenario S1H The 10 investment in low-carbon technologies amounts to more than EUR 20 billion in 2020
Assuming additional EU exports of RES technologies in scenario S2HE GDP almost matches the baseline in 2020 and employment is 051 (or more than 1 million jobs) higher than in the baseline In scenario S2HI a shift in the input structure of the energy sector towards machinery
and electrical machinery reflecting the different nature of RES relative to conventional electricity generation also has smaller additional positive impacts on GDP and employment compared to scenario S2H
The following figures show impacts of the different scenarios in comparison to the baseline BH As Figure 31 illustrates all the alternative scenarios imply GDP lower than the baseline However comparing scenario S1H with the other three scenarios shows that additional RES investment (S2H) additional RES exports (S2HE) and the inclusion of different input structures of the RES industries (S2HI) each have positive GDP impacts These results are in line with model-based analysis in the EMPLOY-RES study (Fraunhofer ISI et al 2009)
Figure 31 EU-27 GDP according to four scenarios mdash deviation from the baseline (BH)
Percentage deviation from the baseline (BH)
ndash 100
ndash 080
ndash 060
ndash 040
ndash 020
0002010 2015 2020
S2HI S1H S2H S2HE
Modelling of ETR impacts on eco-innovation
Environmental tax reform in Europe opportunities for eco-innovation 29
In contrast to GDP employment increases relative to the baseline in all the alternative scenarios (Figure 32) Due to the scenario design the structure of the EU economies is shifted from energy-intensive to labour-intensive sectors The magnitude of the employment gain is influenced by the carbon price and the tax shift the underlying energy prices and the production loss The largest part of the employment increase stems from the additional RES investment (scenario S2H) although a shift in industry structures (S2HI) and additional RES exports (S2HE) are also positive for the labour market
33 Macroeconomic impacts at the national level
In general terms it is clear that national ETS and ETR impacts depend significantly on country specifics including energy use economic structure social system and behaviour (eg reactions to labour cost changes) In countries with high carbon intensity in their energy mix additional revenues and expenditures are higher than in countries with lower carbon intensity
Scenario S2H provides an interesting tool for analysing the macroeconomic impacts of ETR at the national level because 10 of the additional generated revenues are used for eco-innovation investments meaning that only 90 of the revenues are recycled back into the economy by reducing income tax rates and social security contributions
Figure 32 EU-27 employment according to four scenarios mdash deviation from the baseline (BH)
ndash 020
000
020
040
060
2010 2015 2020
S2HI S1H S2H S2HE
Percentage deviation from the baseline (BH)
Environmental tax reform in Europe opportunities for eco-innovation
Modelling of ETR impacts on eco-innovation
30
Figure 34 GDP in 2020 in EU-27 Member States under scenario S2H mdash deviation form the baseline (BH)
Figure 33 GDP in 2020 in selected countries under scenario S2H mdash deviation from the baseline (BH)
ndash 25 ndash 20 ndash 15 ndash 10 ndash 05 00 05 10 15
Romania
Bulgaria
SloveniaMalta
Lithuania
Latvia
Estonia
CyprusSlovakia
Poland
Hungary
Czech RepublicUnited Kingdom
Sweden
Spain
Portugal
Netherlands
Italy
Ireland
Greece
FranceFinland
Denmark
Luxembourg
Belgium
Austria
Germany
Percentage deviation from the baseline (BH)
Russia
South Africa
Brazil
India
China
Mexico
Japan
USA
Poland
United Kingdom
Spain
Italy
France
Germany
ndash 30 ndash 25 ndash 20 ndash 15 ndash 10 ndash 05 00 05 10
Percentage deviation from the baseline (BH)
Modelling of ETR impacts on eco-innovation
Environmental tax reform in Europe opportunities for eco-innovation 31
Figure 35 Employment in 2020 in EU-27 Member States under scenario S2H mdash deviation from baseline (BH)
EU-27EU-15
RomaniaBulgariaSloveniaMalta
LithuaniaLatvia
EstoniaCyprusSlovakia
PolandHungary
Czech RepublicUnited Kingdom
SwedenSpain
PortugalNetherlands
ItalyIrelandGreece
FranceFinlandDenmarkLuxembourg
BelgiumAustria
Germany
ndash 200 0 200 400 600 800 1 000
Percentage deviation from the baseline (BH)
Under scenario S2H the GDP of large EU economies deviates from baseline projections by between 0 and ndash 1 with the exception of Italy (Figure 33) Germanys GDP is even forecast to match the baseline level in 2020 due to the countrys strong RES industry Outside Europe some countries gain slightly against EU Member States in terms of competitiveness as export prices in most EU Member States and sectors increase and GDP in those countries exceeds the baseline projections as a result (Figure 33) This is mainly because carbon tax revenues are recycled via income tax reductions which are not part of production costs However energy exporting economies such as Russia or South Africa will lose exports if EU demand for fossil fuel imports declines The development of all EU Member States is shown in Figure 34
Employment impacts of scenario S2H are positive for almost all EU Member States as lower labour
costs increase labour demand and labour intensity (Figure 35) The highest absolute increases are shown for Germany the Netherlands Italy and the United Kingdom For EU-27 as a whole employment will be almost one million higher than in the corresponding baseline BH in 2020
The scenarios have not been designed with a view to meeting the EU renewables target of a 20 renewables share in final energy consumption in 2020 Nevertheless the scenarios provide some interesting insights The share is projected to increase from around 10 in 2009 to above 14 even in the baseline as instruments such as feed in tariffs and biofuel quotas will continue In scenario S1H the target will be missed with around 18 in 2020 Only in scenarios S2H S2HE and S2HI is the target met (approximately 20 )
Environmental tax reform in Europe opportunities for eco-innovation
Modelling of ETR impacts on eco-innovation
32
Under scenario S2H energy-related carbon emissions are reduced in all EU Member States relative to the baseline (Figure 36) The highest percentage reductions can be seen in many of the EU-12 Member States with still high energy intensity and low energy prices In these countries the relative price increase is higher than in countries like Germany or the United Kingdom with already high energy taxes and overall energy prices
Additional ETS revenues material tax revenues and carbon tax revenues from the industry sector are recycled back to industry via reductions in employers social security contributions (or wage subsidies in some countries) The revenues from the carbon tax on households set out in Table 32 (totalling 033 of GDP in Germany for example) are used to reduce income tax For the EU-27 overall revenues from ETS and ETR reach about 2 of GDP in 2020 although these figures may be excessive because additional EU efforts to increase energy
efficiency and renewable energy which will reduce the ETS price are not taken into account The use of flexible tools such as the Clean Development Mechanism will further reduce the revenues and earmarking of part of the revenues for mitigation and adaptation measures in emerging and developing countries limits the recycling into labour costs
In addition the scenarios do not take the current global economic problems into account According to the IEA (2009) the downturn will also reduce carbon emissions in the long run which will lead to lower carbon prices and revenues to reach fixed targets (or make tighter targets less costly)
The ETR will have varying effects on the prices of different sorts of products and services Material or carbon taxes increase the prices of product groups according to their direct and indirect material and carbon content The recycling mechanism reduces
Figure 36 Energy-related CO2 emissions in 2020 under scenario S2H mdash deviation from the baseline (BH)
WorldEU-27
EU-15Romania
BulgariaSlovenia
MaltaLithuania
LatviaEstonia
CyprusSlovakia
PolandHungary
Czech RepublicUnited Kingdom
SwedenSpain
PortugalNetherlands
ItalyIreland
GreeceFrance
FinlandDenmark
LuxembourgBelgium
AustriaGermany
ndash 25 ndash 20 ndash 15 ndash 10 ndash 5 0
Percentage deviation from the baseline (BH)
Modelling of ETR impacts on eco-innovation
Environmental tax reform in Europe opportunities for eco-innovation 33
Table 32 Additional ETS and environmental tax revenues in 2020 ( of GPD)
S2H Germany United Kingdom EU-27
ETS revenues 083 064 059
Carbon tax (industry) 052 044 054
Carbon tax (households) 033 041 036
Material tax 041 029 056
Sum 209 178 205
Figure 37 Total primary energy supply in 2020 under scenario S2H mdash deviation from the baseline (BH)
WorldEU-27EU-15
RomaniaBulgaria
Slovenia
MaltaLithuania
LatviaEstonia
Cyprus
SlovakiaPoland
HungaryCzech Republic
United KingdomSweden
SpainPortugal
NetherlandsItaly
IrelandGreece
FranceFinland
DenmarkLuxembourg
BelgiumAustria
Germany
ndash 24 ndash 21 ndash 18 ndash 15 ndash 12 ndash 9 ndash 6 ndash 3 0
Percentage deviation from the baseline (BH)
Environmental tax reform in Europe opportunities for eco-innovation
Modelling of ETR impacts on eco-innovation
34
Figure 38 Output price impacts of scenario S2H in Germany in 2020 mdash deviations from the baseline (BH)
Figure 39 Impacts of scenario S2H on industrial output in 2020 in Germany mdash deviations from the baseline (BH)
ndash 5
0
5
10
15
20
Output prices
Percentage deviation from the baseline (BH)
(3) F
ood
(4) T
extiles
(5) W
ood
(6) P
ulp pap
er
(7) C
oke re
fined
petro
leum
pro
ducts
(8) C
hemica
ls ex
cl pha
rma
(9) P
harm
aceu
ticals
(10)
Rub
ber a
nd plastics
(11)
Non
-metallic
miner
als
(12)
Iron
and
steel
(13)
Non
-ferrou
s metals
(14)
Met
al pro
ducts
(15)
Mac
hine
ry and
equ
ipmen
t
(16)
Office
mac
hine
ry
(17)
Electric
al m
achine
ry
(18)
Rad
io T
V
(19)
Med
ical pr
ecisi
on and
opt
ical ins
trumen
ts
(20)
Mot
or veh
icles
(21)
Ships
(22)
Airc
raft
(23)
Railro
ad
(24)
Man
ufac
turin
g n
ec r
ecyc
ling
(25)
Electric
ity g
as w
ater
sup
ply
(26)
Con
stru
ction
(27)
Tra
de r
epairs
(28)
Hot
els an
d re
stau
rant
s
(29)
Tra
nspo
rt an
d stor
age
(30)
Pos
t and
teleco
mmun
icatio
ns
(31)
Finan
ce ins
uran
ce
(32)
Rea
l estate ac
tivities
(33)
Ren
ting
(34)
Com
puter
(35)
Res
earch an
d de
velopm
ent
(36)
Oth
er bus
ines
s ac
tivities
(37)
Pub
lic ser
vice
s
(38)
Edu
catio
n
(39)
Hea
lth and
soc
ial w
ork
(40)
Oth
er ser
vice
s
(41)
Priv
ate ho
useh
olds
(1) A
gricu
lture
(2) M
ining an
d qu
arry
ing
nec not elsewhere classified
Production
ndash 100
ndash 80
ndash 60
ndash 40
ndash 20
00
20
40
60
80Percentage deviation from the baseline (BH)
(3) F
ood
(4) T
extiles
(5) W
ood
(6) P
ulp pap
er
(7) C
oke re
fined
petro
leum
pro
ducts
(8) C
hemica
ls ex
cl pha
rma
(9) P
harm
aceu
ticals
(10)
Rub
ber a
nd plastics
(11)
Non
-metallic
miner
als
(12)
Iron
and
steel
(13)
Non
-ferrou
s metals
(14)
Met
al pro
ducts
(15)
Mac
hine
ry and
equ
ipmen
t
(16)
Office
mac
hine
ry
(17)
Electric
al m
achine
ry
(18)
Rad
io T
V
(19)
Med
ical pr
ecisi
on and
opt
ical ins
trumen
ts
(20)
Mot
or veh
icles
(21)
Ships
(22)
Airc
raft
(23)
Railro
ad
(24)
Man
ufac
turin
g n
ec r
ecyc
ling
(25)
Electric
ity g
as w
ater
sup
ply
(26)
Con
stru
ction
(27)
Tra
de r
epairs
(28)
Hot
els an
d re
stau
rant
s
(29)
Tra
nspo
rt an
d stor
age
(30)
Pos
t and
teleco
mmun
icatio
ns
(31)
Finan
ce ins
uran
ce
(32)
Rea
l estate ac
tivities
(33)
Ren
ting
(34)
Com
puter
(35)
Res
earch an
d de
velopm
ent
(36)
Oth
er bus
ines
s ac
tivities
(37)
Pub
lic ser
vice
s
(38)
Edu
catio
n
(39)
Hea
lth and
soc
ial w
ork
(40)
Oth
er ser
vice
s
(41)
Priv
ate ho
useh
olds
(1) A
gricu
lture
(2) M
ining an
d qu
arry
ing
nec not elsewhere classified
Modelling of ETR impacts on eco-innovation
Environmental tax reform in Europe opportunities for eco-innovation 35
social security contributions and lowers labour costs according to the direct and indirect labour content of sector output The ETR therefore reduces output prices in labour-intensive service sectors and increases prices in carbon- and material-intensive industry sectors
The example of Germany shows insignificant impacts in the trade-intensive sectors of machinery (15ndash17) motor vehicles (20) and other transport equipment (21ndash23) (Figure 38) Iron and steel (12) and chemicals without pharmaceuticals (8) face the highest price increases of trade-intensive sectors As the German iron and steel industry primarily delivers high quality steel to the German car industry and increasingly to the German windmill industry negative competitiveness impacts will be limited Exchange rate variations against non-EU competitors have been much higher in the past
The higher prices of carbon- and material-intensive products will reduce price competitiveness on export markets and increase the market share for imports in domestic markets This loss of price competitiveness is based on an assumption of limited market development of energy efficiency and RES technologies in other part of the world It will be offset by gains in labour-intensive sectors if the ETR causes real wage costs per unit of output to fall as a result of using recycled revenues to reduce employer social security contributions
Any improvement in non-price competitiveness will also raise exports The extra employment will raise incomes raising consumption and output
The overall impact on sector output depends on countervailing effects which are negative for iron and steel and a few service sectors and positive for a few industry sectors For most industries the output effect is insignificant (Figure 39) The greatest impact is felt by producers of fossil fuels who must obviously reduce production due to lower demand for their products
Under scenario S2H employment impacts are positive for most sectors relative to the baseline as labour productivity decreases and wage rates fall in relation to consumer prices (CPI) and output prices (Table 33) The relative costs of labour are lower than in the baseline without the ETR reform Only around a quarter of the employment increase takes place in industry
Concerning the wage rate two countervailing effects have to be considered First when the labour market is characterised in terms of the real wage bargaining model as in E3ME and GINFORS with market power on both sides (employers and trade unions) consumer price increases will lead to wage increases (the econometrically estimated factor is 085 for Germany) Second labour productivity is another important factor for wage bargaining The estimated elasticity for Germany is 063 meaning that a 1 increase of labour productivity leads to wage increases of 063 Higher labour demand due to lower labour costs thus reduces the wage increase In the end the German economy is more labour intensive than without the ETR partly due to the structural change towards labour-intensive industries
Table 33 Employment impacts of scenario S2H in Germany mdash deviations from scenario S2H in 2020
Employment in 2020 Deviation from S2H () Deviation from S2Habsolute (1 000s)
Agriculture forestry 24 90
Industry 09 653
Non-metallic minerals 24 62
Iron and steel ndash 28 ndash 37
Machinery and equipment 05 56
Electrical machinery 04 18
Construction 37 449
Trade and transport 10 829
Business services 17 767
Other services ndash 02 ndash 216
Total 07 2506
Environmental tax reform in Europe opportunities for eco-innovation
Modelling of ETR impacts on eco-innovation
36
Additional exports under scenario S2HE mainly create new jobs in machinery and related business services (Table 34) Under scenario S2HI a shift in the input structure of the energy sector leads to a shift in the industry structure and creates a few jobs in the service sector (Table 35)
34 Conclusions of the scenario assessment
The foregoing analysis used the GINFORS model to assess economic and environmental impacts of using the ETS and ETR to reach the EUs 2020
GHG targets In general the results show positive employment effects and only small negative impacts on GDP in EU-27 Member States The economic impacts depend on the levels of international energy prices the mechanism used to recycle revenues and country specifics such as carbon and energy intensity and the structure of energy consumption
Although there is significant evidence that eco-innovation is positively driven by higher energy prices quantification is difficult The present study included simulations of possible impacts of a shift in the industry structure towards renewable energy in the electricity sector and an overall increase of EU
Table 34 Employment impacts of scenario S2HE in 2020 in Germany mdash deviations from scenario S2H
Employment in 2020 Deviation from S2H () Deviation from S2Habsolute (1 000s)
Agriculture forestry ndash 01 ndash 02
Industry 03 194
Non-metallic minerals 02 05
Iron and steel 04 05
Machinery and equipment 13 130
Electrical machinery 24 117
Construction 01 18
Trade and transport 00 26
Business services 07 308
Other services 01 107
Total 02 634
Table 35 Employment impacts of scenario S2HI in 2020 in Germany mdash deviations from scenario S2H
Employment in 2020 Deviation from S2H () Deviation from S2Habsolute (1 000s)
Agriculture forestry ndash 01 ndash 02
Industry 00 00
Non-metallic minerals 25 65
Iron and steel ndash 27 ndash 36
Machinery and equipment 08 78
Electrical machinery 04 19
Construction ndash 00 ndash 04
Trade and transport 00 07
Business services 02 115
Other services 0 56
Total 00 167
Modelling of ETR impacts on eco-innovation
Environmental tax reform in Europe opportunities for eco-innovation 37
exports due to higher global demand for renewable energy The main results can be summarised as follows
bull environmentaltaxreformshiftingtaxesfromlabour to energy and resources will create additional jobs and trigger eco-innovation
bull impactsofeco-innovationintheformofadditional EU exports or shifts in industry structures will have a slight positive influence on GDP and create a smaller number of additional jobs
These findings correspond to results from the EmployRES study (Fraunhofer ISI et al 2009) As ETR is directly aimed at reducing labour costs it will create additional jobs in the short and medium term In the longer term the cost reduction and new technologies arising from eco-innovation will play a larger role
Like all fiscal reforms a major ETR in Europe will create winners and losers At the sector level carbon- and material-intensive industries will face economic losses At the country level the carbon-intensity and overall flexibility of economies is important Clearly structural change away from carbon-intensive industries together with technological change is inherent in any successful climate mitigation policy
On the other hand several factors can smooth these structural adjustments International cooperation
will reduce economic pressure on countries and sectors In addition ETR together with auctioning of ETS allowances can be a major source of revenues for EU Member States in the future even if part of the revenues will have to be earmarked for adaptation and mitigation measures in developing countries Indeed future debate on grandfathering or auctioning ETS allowances should reflect the important point that giving allowances away for free denies countries the money to ease structural change and invest in low-carbon technologies
Caution is needed in relating the findings of this study to the EU policy debate In the model simulations the single carbon price is the only instrument used to reach the EUs 2020 GHG targets In reality of course other renewable energy and efficiency policies will also contribute to carbon reduction and have to be taken into account when comparing the results (especially the high carbon prices) to other studies Both reduce the potential revenues from fossil energy carriers and carbon emissions
A variety of renewable energy and efficiency policies could enable the climate and energy targets to be met while securing even better economic prospects The results of the present study clearly indicate that the discussion on market-based instruments should be intensified Ultimately however the EU will need a rich mix of policies to reach its GHG targets while maximising prosperity
Environmental tax reform in Europe opportunities for eco-innovation38
References
Almon C 1991 The INFORUM Approach to Interindustry Modeling in Economic Systems Research Vol 3 pp 1ndash7
Amin A and Cohendet P 2004 The Architecture of Knowledge Firms Capabilities and Communities Oxford University Press Oxford
Barker T Meyer B Pollitt H and Lutz C 2007a Modelling Environmental Tax Reform in Germany and the United Kingdom with E3ME and GINFORS petre Working Paper Cambridge and Osnabrueck (httpwwwpetreorgukpapershtm) accessed 15 February 2011
Barker T Junankar S Pollitt H and Summerton P 2007b Carbon leakage from unilateral environmental tax reforms in Europe 1995ndash2005 Energy Policy Vol 35 pp 6 281ndash6 292
Brunnermeier S B and Cohen M A 2003 Determinants of environmental innovation in US manufacturing industries Journal of Environmental Economics and Management Vol 45 pp 278ndash293
Buen J 2006 Danish and Norwegian wind industry The relationship between policy instruments innovation and diffusion Energy Policy Vol 34 (18) pp 3 887ndash3 897
Carlsson B and Stankiewicz R 1991 On the nature function and composition of technological systems Journal of Evolutionary Economics Vol 1 (2) pp 93ndash118
Christiansen A C and Skjaerseth J B 2005 Climate change policies in Norway and the Netherlands Different instruments similar outcome Energy and Environment Vol 16(1) pp 1ndash25
Dosi G 1988 Sources procedures and microeconomic effects of innovation Journal of Economic Literature Vol 26 pp 1 120ndash1 171
de Vries F and Medhi N 2008 Environmental regulation and international innovation in automotive emissions control technologies in Environmental Policy Technological Innovation and Patents Organisation for Economic Cooperation and Development Paris
DG TREN 2008 European energy and transport mdash trends to 2030 mdash update 2007 European Commission Luxembourg
DTI 2004 Renewable Supply Chain Gap Analysis UK Department of Trade and Industry
Edler J (ed) 2006 Nachfrageorientierte Innovationspolitik Buumlro fuumlr Technikfolgenabschaumltzung beim Deutschen Bundestag (TAB) Arbeitsbericht Nr 99 Berlin
Edquist C 2001 The system of innovation approach and innovation policy an account of the state of the art lead paper presented at the DRUID Conference 12ndash15 June 2001 Aalborg (httpwwwdruiddkconferencesnwpaper1edquistpdf) accessed 15 February 2011
EEA 2006 Using the market for cost-effective environmental policy Market-based instruments in Europe EEA Report No 12006 European Environment Agency Copenhagen
Ekins P 2009 Resource Productivity Environmental tax Reform and Sustainable Growth in Europe published by the Anglo-German Foundation for the Study of Industrial Society Final report (httpwwwpetreorgukpdfFinRepFinpdf) accessed 12 October 2011
Ekins P and Speck S (eds) 2011 Environmental Tax Reform (ETR) A Policy for Green Growth Oxford University Press
EREC 2008 Energy [r]evolution A sustainable global energy outlook Greenpeace International European Renewable Energy Council (EREC)
References
References
Environmental tax reform in Europe opportunities for eco-innovation 39
Fagerberg J Mowery D C and Nelson R R (eds) 2005 The Oxford Handbook of Innovation Oxford University Press Oxford
Fischer C Parry I W H and Pizer W A 2003 Instrument choice for environmental protection when technological innovation is endogenous Journal of Environmental Economics and Management Vol 45 pp 523ndash545
Fraunhofer ISI ECOFYS Energy Economics Group Ruumltter + Partner SEURECO and LEI 2009 EmployRES mdash The impact of renewable energy policy on economic growth and employment in the European Union European Commission Brussels
Frondel M Horbach J and Rennings K 2008 What triggers environmental management and innovation Empirical evidence for Germany Ecological Economics Vol 66(1) pp 153ndash160
GHK Cambridge Econometrics and IEEP 2007 Links between the environment economy and jobs Final Report submitted to DG Environment European Commission
Giljum S Behrens A Hinterberger F Lutz C and Meyer B 2008 Modelling scenarios towards a sustainable use of natural resources in Europe Environmental Science and Policy Vol 11 pp 204ndash216
Goumlrlach B Knigge M and Luumlckge H 2005 Wirkungen der Oumlkologischen Steuerreform auf Innovation und Marktdurchdringung Ecologic Berlin (httpecologiceudownloadprojekte1850-189918791879_5_innovationpdf) accessed 18 August 2011
Green M A 2000 Photovoltaics technology overview Energy Policy Vol 28 (14) pp 989ndash998
Grossmann A Lehr U Lutz C and Wolter MI 2008 Gesamtwirtschaftliche Effekte der Umsetzung der EU Ziele im Bereich Erneuerbare Energien und Gebaumludeeffizienz in Oumlsterreich bis 2020 Studie im Auftrag des Lebensministeriums Wien 0508
Hage J and Hollingsworth J R 2000 Idea innovation networks a strategy for integrating organizational and institutional analysis Organization Studies Vol 21 (5) pp 971ndash1 004
Hauschildt J 2004 Innovationsmanagement Vahlen Muumlnchen
Hemmelskamp J 1997 Environmental policy instruments and their effects on innovation European Planning Studies Vol 5 (2) pp 177ndash195
Hoglund Isaksson L 2005 Abatement costs in response to the Swedish charge on nitrogen oxide emissions Journal of Environmental Economics and Management Vol 50 pp 102ndash120
Hullmann A 2001 Internationaler Wissenstransfer und technischer Wandel (dissertation) Physica-Verlag Heidelberg
IEA 2008 World Energy Outlook 2008 International Energy Agency Paris
IEA 2009 World Energy Outlook 2009 International Energy Agency Paris
Jacobsson S Andersson B A and Baringngens L 2002 Transforming the energy system mdash the evolution of the German technological system for solar cells Science and Technology Policy Research University of Sussex Electronic Working Paper Series No 84 (httpideasrepecorgpsrussewps84html) accessed 18 August 2011
Jaffe A and Stavins R 1995 Dynamic incentives of environmental regulations the effects of alternative policy instruments on technology diffusion Journal of Environmental Economics and Management Vol 29(3) pp 43ndash63
Jaffe A B and Palmer K 1997 Environmental regulation and innovation a panel data study The Review of Economics and Statistics Vol 79 pp 610ndash619
Jaffe A B Newell R G and Stavins R N 2002 Environmental policy and technological change Environmental and Resource Economics Vol 22 (1ndash2) 2002 pp 41ndash70
Johnstone N and Hascic I 2008 Renewable energy policies and technological innovation energy source and instrument choice in Environmental Policy Technological Innovation and PatentsOrganisation for Economic Co-operation and Development Paris
Johnstone N 2005 The Innovation Effects of Environmental Policy Instruments in Horbach J (ed) Indicator Systems for Sustainable Innovation Physica-Verlag HD
Environmental tax reform in Europe opportunities for eco-innovation
References
40
Johnstone N Hascic I and Ostertag K 2008 Environmental policy technological innovation and patent activity in Environmental Policy Technological Innovation and Patents Organisation for Economic Co-operation and Development Paris
Jung C Krutilla K and Boyd R 1996 Incentives for advanced pollution abatement technology at the industry level an evaluation of policy alternatives Journal of Environmental Economics and Management Vol 30(1) pp 95ndash111
Kammen D M Kapidia K and Fripp M 2004 Putting renewables to work how many jobs can the clean energy industry generate University of California Berkeley
Kemp R 1997 Environmental policy and technical change ndash a comparison of the technological impact of policy instruments Edward Elgar Cheltenham
Kemp R 1998 The diffusion of biological waste-water treatment plants in the Dutch food and beverage industry Environmental and Resource Economics Vol 12 pp 113ndash136
Kemp R 2000 Technology and environmental policy ndash innovation effects of past policies and suggestions for improvement in OECD proceedings ndash innovation and the environment Organisation for Economic Co-operation and Development Paris
Kerr S and Newell R G 2003 Policy-induced technology adoption evidence from the US lead phasedown Journal of Industrial Economics Vol 51 pp 317ndash343
Klaassen G Miketa A Larsen K and Sundqvist T 2005 The impact of RampD on innovation for wind energy in Denmark Germany and the United Kingdom Ecological Economics Vol 54 pp 227ndash240
Kline S and Rosenberg N 1986 An overview of innovation in Landau R (ed) The positive sum strategy Harnessing technology for economic growth pp 275-306
Knigge M and Goumlrlach B 2005 Effects of Germanys ecological tax reforms on the environment employment and technological innovation Ecologic Berlin (httpwwwumweltbundesamtdeuba-info-presse-ehintergrundoekosteuerpdf) accessed 18 August 2011
Langniss O 2003 Governance structures for promoting renewable energy sources dissertation Lund Stuttgart
Lanjouw J O and Mody A 1996 Innovation and the international diffusion of environmentally responsive technology Research Policy Vol 25 pp 549ndash571
Lehr U Nitsch J Kratzat M Lutz C and Edler D 2008 Renewable Energy and Employment in Germany Energy Policy Vol 36 pp 108ndash117 DOI101016jenpol200709004
Lehr U Wolter MI and Groszligmann A 2009 Economic impacts of RES obligations in Austria ndash an application of the macro-econometric model e3at GWS Discussion Paper 20091 Osnabruumlck
Lundvall B-A Johnson B Andersen E S and Dalum B 2001 National systems of production innovation and competence building Research Policy Vol 31 pp 213ndash231
Lutz C and Giljum S 2009 Global resource use in a business as usual world until 2030 Updated results from the GINFORS model in Bleischwitz R Welfens Pand Zhang Z (eds) Sustainable growth and resource productivity ndash economic and global policy issues Greenleaf Publishers pp 30ndash41
Lutz C and Meyer B 2008 Beschaumlftigungseffekte des Klimaschutzes in Deutschland Untersuchungen zu gesamtwirtschaftlichen Auswirkungen ausgewaumlhlter Maszlignahmen des Energie- und Klimapakets Forschungsbericht 205 46 434 Dessau-Roszliglau
Lutz C and Meyer B 2009a Environmental and Economic Effects of Post-Kyoto Carbon Regimes Results of Simulations with the Global Model GINFORS Energy Policy Vol 37 pp 1 758ndash1 766 DOI 101016jenpol200901015
Lutz C and Meyer B 2009b Scenario results from GINFORS PETRE working paper Osnabruumlck
Lutz C Meyer B Nathani C and Schleich J 2005 Endogenous technological change and emissions The case of the German steel industry Energy Policy Vol33 pp 1 143ndash1 154
Lutz C Meyer B Nathani C and Schleich J 2007 Endogenous innovation economy and environment impacts of a technology based modelling approach for energy-intensive industries in Germany Energy Studies Review Vol 15(1) pp 2ndash18
References
Environmental tax reform in Europe opportunities for eco-innovation 41
Lutz C Meyer B and Wolter M I 2009 The global multisectormulticountry 3-E model GINFORS mdash a description of the model and a baseline forecast for global energy demand and CO2 emissions Journal of Sustainable Development forthcoming
Malerba F and Orsenigo L 1997 Technological Regimes and Sectoral Patterns of Innovative Activities Industrial and Corporate Change Vol 6 (1) pp 83ndash117
Malerba F 1992 Learning by Firms and Incremental Technical Change The Economic Journal Vol 102 (413) pp 845ndash859
Malerba F 2005 Industrial dynamics and innovation progress and challenges Presidential Address delivered at the 32nd Conference of the European Association for Research in Industrial Economics (EARIE) 1ndash4 September 2005 Porto
Malerba F 2006 Innovation and the evolution of industries Journal of Evolutionary Economics Vol 16 pp 3ndash23
McGinty M and de Vries F P 2009 Technology diffusion product differentiation and environmental subsidies The BE Journal of Economic Analysis and Policy Vol 9(1)
Meyer B and Lutz C 2007 The GINFORS model ndash model overview and evaluation Petre Working Paper Osnabruumlck (httpwwwpetreorgukpapershtm) accessed 18 August 2011
Meyer B Lutz C Schnur P and Zika G 2007 Economic policy simulations with global interdependencies a sensitivity analysis for Germany Economic Systems Research Vol 19 pp 37ndash55
Mickwitz P H Hyvaumlttinen and P Kivimaa 2008 The role of policy instruments in the innovation and diffusion of environmentally friendlier technologies popular claims versus case study experiences Journal of Cleaner Production Vol 16(1S1) 162ndash170
Miketa A and Schrattenholzer L 2004 Experiments with a methodology to model the role of RampD expenditures in energy technology learning processes first results Energy Policy Vol 32 (15) pp 1 679ndash1 692
Milliman S R and Prince R 1989 Firm incentives to promote technological change in pollution control Journal of Environmental Economics and Management Vol 17 pp 247ndash265
Millock K and Nauges C 2006 Ex-post evaluation of an earmarked tax on air pollution Land Economics Vol 82(1) pp 68ndash84
Montero J-P 2002 Market structure and environmental innovation Journal of Applied Economics Vol 2 pp 293ndash325
Moreno B and Loacutepez A J 2007 The effect of renewable energy on employment mdash The case of Asturias (Spain) Renewable and Sustainable Energy Rewiews doi 101016jrser200610011
Mowery D and Rosenberg N 1979 The influence of market demand upon innovation A critical review of some recent empirical studies Research Policy Vol 8 pp 102ndash153
Newell R G Jaffe A B and Stavins R N 1999 The induced innovation hypothesis and energy-saving technological change Quarterly Journal of Economics Vol 114 pp 941ndash975
Norberg-Bohm V 1999 Stimulating green technological innovation An analysis of alternative policy mechanisms Policy Sciences Vol 32(1) pp 13ndash38
OECD 2009 Sustainable manufacturing and eco-innovation towards a green economy Organisation for Economic Co-operation and Development Policy Brief June 2009
OECD 2010 Taxation innovation and the environment Organisation for Economic Co-operation and Development
Pavitt K 1984 Sectoral patterns of technological change Towards a taxonomy and a theory Research Policy Vol 13 pp 343ndash373
Popp D 2002 Induced innovation and energy prices The American Economic Review Vol 92(1) pp 160ndash180
Popp D 2005 Lessons from patents Using patents to measure technological change in environmental models Ecological Economics Vol 54 pp 209ndash226
Environmental tax reform in Europe opportunities for eco-innovation
References
42
Porter M and van der Linde C 1995 Toward a new conception of the environment competitiveness relationship Journal of Economic Perspectives Vol 9(4) pp 97ndash118
Rammert W 2002 The cultural shaping of technologies and the politics of technodiversity In Sorensen K and Williams R (eds) Shaping technology guiding policy concepts spaces and tools Elgar Cheltenham pp 155-172
Requate T 2005 Dynamic incentives by environmental policy instruments ndash a survey Ecological Economics Vol 54 pp 175ndash195
Roloff N Lehr U Krewitt W Fuchs G Wassermann S Weimer-Jehle W and Schmidt B 2008 Success determinants for technological innovations in the energy sector mdash the case of photovoltaics in Moumlst D Fichtner W Ragwitz M and Veit D (eds) New methods for energy market modelling mdash Proceedings of the first european workshop on energy market modelling using agent-based computational economics Universitaumltsverlag Karlsruhe
Rothwell R 1995 The fifth generation innovation process in Oppenlaumlnder KH Popp W (eds) Innovationen und wirtschaftlicher Fortschritt betriebs-und volkswirtschaftliche Perspektiven Bern pp 9ndash26
Schumpeter J 1942 Capitalism socialism and democracy New York Harper
Skjaeligrseth J B and Christiansen A C 2005 Environmental policy instruments and technological change in the energy sector findings from comparative empirical research Energy and Environment Vol 17 (2) pp 223ndash241
Snyder L D Miller N H and Stavins R N 2003 The effects of environmental regulations on pollution emissions evidence from plant-level data American Economic Review Vol 93(2) pp 431ndash435
Technopolis 2008 Eco-innovation Final Report for Sectoral Innovation Watch (httpwwwtechnopolis-groupcomresourcesdownloads661_report_finalpdf) accessed 18 August 2011
Volleburgh H 2007 Impacts of environmental policy instruments on technological change Report for Joint Meetings of Tax and Environment Experts OECD Environment Directorate February 2007 (comenvepocctpacfa(2006)36final)
Zimmermann H Wohltmann M and Hansjuumlrgens B 1996 Umweltabgaben und Innovation Analytica Marburg
43
Annex 1
Environmental tax reform in Europe opportunities for eco-innovation
Type Instrument Area Stage
Reference
Theo
retica
l
Em
piric
al
Cas
e st
udy
Rev
iew
Qual
itat
ive
Taxe
s
Perm
its
Subsi
die
s
Volu
nta
ry
Com
man
d
Reg
ula
tion
Ener
gy
Air
Wat
er
Oth
er
Gen
eral
Innov
atio
n
Diffu
sion
Rel
evan
ce
Brunnermeier amp Cohen (2003)
X X X X
Buen (2006) X X X X X X
Christiansen amp Skjaerseth (2005)
X X X X X X
Fischer et al (2003 X X X X X X
Frondel et al (2008) X X X X X X X (X) (X)
Hemmelskamp (1997)
X X X X X X X (X)
Hoglund Isaksson (2005)
X X X (X) (X)
Jaffe amp Stavins (1995)
X X X1 X X X X
Jaffe amp Palmer (1997)
X X X X
Jaffe et al (2002) X X X X X X X X X X
Jung et al (1996) X X X X X X (X) (X)
Kemp (1998) X X X X
Kerr amp Newell (2001) X X X X X
Klaassen et al (2005)
X X X X X
Lanjouw amp Mody (1996)
X X X X X X X
McGinty amp de Vries (2009)
X X X X
Mickwitz et al (2008)
X X X X X X X X X
Milliman amp Prince (1989)
X X X X X X X
Millock amp Nauges (2006)
X X X X X X
Montero (2002) X X X X X
Newell et al (1999) X X1 X X X
Norberg-Bohm (1999)
X X X X X X X
Popp (2002) X X1 X X
Popp (2005) X X X X X X
Porter amp van der Linde (1995)
X X X X X X
Requate (2005) X X X X X X X
Skjaeligrseth amp Christiansen (2005)
X X X X X X X X X
Snyder et al (2003) X X X X X
Annex 1 Classification of refereed journal articles
Environmental tax reform in Europe opportunities for eco-innovation44
Annex 2
Type Instrument Area Stage
Reference
Theo
retica
l
Em
piric
al
Cas
e st
udy
Rev
iew
Qual
itat
ive
Taxe
s
Perm
its
Subsi
die
s
Volu
nta
ry
Com
man
d
Reg
ula
tion
Ener
gy
Air
Wat
er
Oth
er
Gen
eral
Innov
atio
n
Diffu
sion
Rel
evan
ce
Johnstone (2005)
X X X X X X X
Johnstone amp Hascic (2008)
X X X X X X X X
Kemp (1997) X X X X X X X X X X X X X
Kemp (2000) X X X X X X X X X
de Vries amp Medhi (2008)
X X1 X X X
Annex 2 Classification of books and book chapters
45
Annex 3
Environmental tax reform in Europe opportunities for eco-innovation
Type Instrument Area Stage
Reference
Theo
retica
l
Em
piric
al
Cas
e st
udy
Rev
iew
Qual
itat
ive
Taxe
s
Perm
its
Subsi
die
s
Volu
nta
ry
Com
man
d
Reg
ula
tion
Ener
gy
Air
Wat
er
Oth
er
Gen
eral
Innov
atio
n
Diffu
sion
Rel
evan
ce
Goumlrlach et al (2005)
X X X X X X
Knigge amp Goumlrlach (2005)
X X X X X X
Technopolis (2008)
X X X X X X
Volleburgh (2007)
X X X X X X X X X X X
Annex 3 Classification of reports
European Environment Agency
Environmental tax reform in Europe opportunities for eco-innovation
2011 mdash 45 pp mdash 21 x 297 cm
ISBN 978-92-9213-238-5doi10280084889
How to obtain EU publications
Publications for salebull viaEUBookshop(httpbookshopeuropaeu)bull fromyourbooksellerbyquotingthetitlethepublisherandorISBNnumberbull bycontactingoneofoursalesagentsdirectlyYoucanobtaintheircontactdetails
on the Internet (httpbookshopeuropaeu) or by sending a fax to +352 2929-42758
Free publicationsbull viaEUBookshop(httpbookshopeuropaeu)bull attheEuropeanCommissionsrepresentationsordelegationsYoucanobtain
their contact details on the Internet (httpeceuropaeu) or by sending a fax to +352 2929-42758
European Environment AgencyKongens Nytorv 61050 Copenhagen KDenmark
Tel +45 33 36 71 00Fax +45 33 36 71 99
Web eeaeuropaeuEnquiries eeaeuropaeuenquiries
TH
-AK-1
1-0
17-E
N-N
doi1
02
8008
4889
- Acknowledgements
- Executive summary
- 1Introduction
-
- 11Background
- 12ETR and innovation
- 13Report structure
-
- 2Review of literature on environmental tax reform and eco‑innovation
-
- 21Initial screening
- 22Detailed review
- 23Environmental regulation studies
- 24Theoretical studies
- 25Empirical studies
- 26Case studies
- 27Conclusions
-
- 3Modelling of ETR impacts on eco‑innovation
-
- 31Scenarios assessing the implications of ETR for eco-innovation
- 32Overview of modelling results
- 33Macroeconomic impacts at the national level
- 34Conclusions of the scenario assessment
-
- References
- Annex 1 Classification of refereed journal articles
- Annex 2Classification of books and book chapters
- Annex 3Classification of reports
-
Environmental tax reform in Europe opportunities for eco-innovation
Modelling of ETR impacts on eco-innovation
26
more than 20 (in terms of carbon equivalents) The target is reached by a tightened EU ETS cap and the introduction of a carbon tax on the non-ETS sector The tax rate applied is equal to the carbon price in the EU ETS that will deliver a 20 GHG reduction by 2020
The burden of ETR taxes are allotted to energy outputs (ie the final use of energy) and will be based on the carbon content of each fuel Carbon prices are assumed to be fully passed on to consumers All carbon taxes are in addition to any existing unilateral carbon and energy taxes The carbon reductions in the different EU Member States will be those that result from a uniform carbon tax increase across the EU
All of the revenues including EU ETS auctioning revenues carbon tax revenues and material tax revenues will be recycled The proportion of tax raised by industry will be recycled into a reduction in employers social security contributions which will in turn reduce the cost of labour Recycling will be additional to the existing ETRs in some Member States Revenues raised from households will be recycled through standard rate income tax reductions Traditional energy tax revenues will be lower compared to their respective baselines as the tax base (energy consumption) is reduced So for an ETR revenue-neutrality does not mean budget-neutrality
312 Factors affecting the macroeconomic impacts of RES technologies
Earlier analyses (Lehr et al 2008 Fraunhofer ISI et al 2009 DTI 2004 Kammen et al 2004 Moreno and Loacutepez 2007) have studied the impacts of large renewable energy source (RES) shares in the energy mix for different countries The overall question in these studies has been the impact of increasing RES shares on the economy especially on the labour market For the present study it is interesting to note that macroeconomic impacts of higher RES shares mainly depends on the following five factors
1 additional investment in RES (minus lower investment in conventional sources ie fossil and nuclear power) with the impact increasing if a country manufactures the RES technology in question
2 additional (net) exports due to improved international competitiveness of renewable energy sources (first mover advantage)
3 lower fossil fuel needs4 the cost differences between RES and
conventional energy
5 the shift from capital- and energy-intensive industries to labour- and technology-intensive industries
All five factors are driven by international energy prices carbon prices the policy framework and RES technology development itself Innovation comes into the play at various stages First innovation drives the currently positive additional costs of RES technologies down and even into negative realms depending on the fossil fuel scenario Second innovative RES technologies are likely to have a competitive advantage in international markets Although a significant proportion of RES technology produced in Europe is traded in Europe innovation will still provide an edge in current and emerging international markets
The EmployRES study (Fraunhofer ISI et al 2009) finds for Europe that current strong investment reflected in installations in Europe and exports to the rest of the world dominate the economic impact of RES policies and therefore lead to positive overall effects The studys results suggest that this positive balance can only be kept up in the future if the competitive position of European manufacturers of RES technology is improved The authors strongly recommend policies which promote technological innovation in RES and lead to a continued and rapid reduction of their costs
Factors 1 and 2 will have substantial macroeconomic impacts in the short and medium terms whereas factor 3 accumulates and will show positive impacts mainly in the long term Factor 4 strongly depends on the global developments while factor 5 may have significant effects on employment
313 Additional scenarios
Impacts of additional investment (factor 1) have already been analysed in scenario S2H of the petre project To focus on the other impacts of eco-innovation two additional scenarios were designed building on scenario S2H of petre
bull S2HEETRwithrevenuerecyclingdesignedto meet the unilateral EUs 2020 greenhouse gas (GHG) target (high energy price) Ten per cent of revenues are spent on eco-innovation measures and trade shares of EU-27 economies with the rest of the world in machinery and electrical machinery increase by 01 due to the deployment of the fast growing RES markets This assumption is based on the strong EU policy effort to increase the share of renewable energy in final energy consumption to 20 by 2020
Modelling of ETR impacts on eco-innovation
Environmental tax reform in Europe opportunities for eco-innovation 27
(Fraunhofer ISI et al 2009) and the possibility of very strong world market development of the RES sector until 2020 (EREC 2008) which offers additional export opportunities for European RES industries
bull S2HIETRwithrevenuerecyclingdesignedto meet the unilateral EUs 2020 GHG target (high energy price) Ten per cent of revenues are spent on eco-innovation measures and input structures of the energy sector are changed according to the input structure of the German RES industry (Lehr et al 2008)
S2HE looks at the possible role of international trade S2HI analyses changes in the input structure of the energy sector ie from conventional electricity production to renewables In the petre project (as in GHK et al 2007) only the energy inputs of the energy sector were adapted to changes in the energy input mix
Both S2HE and S2HI focus on RES and efficiency technologies As mentioned above an ETR will trigger a variety of innovations Therefore the results can be thought of as conservative in the sense that innovations (eg automotive energy consumption industrial efficiency etc) are not explicitly included
32 Overview of modelling results
The main results of the simulations are presented in Table 31 In the baseline scenario BH with high energy prices EU-27 carbon emissions will be
72 below the 1990 level in 2020 (38) The EU-15 has committed in the Kyoto Protocol to reduce its GHG emissions 8 below 1990 levels in the period 2008ndash2012 As emissions in the new member states are substantially below their 1990 levels today that implies that the EU-27 will keep its emissions more or less constant over the coming decade As in the PRIMES baseline an ETS price of 18 EURt in 2008 prices is assumed in 2020
In scenario S1H the ETS price and carbon tax rate has to be increased to 68 EUR2008t of CO2 to reach the 20 GHG reduction target which is equal to a 15 reduction of CO2 emissions against 1990 as other greenhouse gases have already been reduced above average by more than 20 in terms of CO2 equivalents Compared to the baseline CO2 emissions are 84 lower in 2020 which means roughly an additional 1 reduction annually in the period 2012ndash2020 GDP will be about 06 lower compared to the baseline in 2020 This means that annual average growth rates will be less than 01 below their baseline development This is especially low compared to the current financial and economic crisis with a GDP deviation against the baseline of around 6 in 2009
As the recycling mechanism reduces labour costs and the tax burden is shifted from labour-intensive to carbon- and material-intensive sectors employment will be 036 (or more than 800 000 jobs) higher than in the baseline The ETR is not fully budget neutral potentially enabling EU economies to slightly increase their net savings If
(38) The modelling exercise in the present study was conducted in 2009 and therefore does not contain the latest data on EU-27 GHG emissions which were significantly influenced by the global economic slump of the late-2000s
Table 31 Main results under the different scenarios
Scenario Target in 2020 CO2 price GDP Employment CO2 reduction
EUR2008t pc against baseline
pc against baseline
pc against 1990
pc against baseline
in year 2020 2015 2020 2020 2020 2020
BH 18 ndash 72 00
S1H 20 GHG 68 ndash 022 ndash 057 036 ndash 151 ndash 84
S2H 20 GHG 61 ndash 013 ndash 030 041 ndash 152 ndash 85
S2HE 20 GHG 61 ndash 009 ndash 004 051 ndash 151 ndash 84
S2HI 20 GHG 61 ndash 006 ndash 024 045 ndash 152 ndash 84
Environmental tax reform in Europe opportunities for eco-innovation
Modelling of ETR impacts on eco-innovation
28
this extra saving is spent negative GDP impacts will be further reduced
In scenario S2H part of the revenues is invested in low-carbon technologies This reduces the carbon price to 61 EUR2008t in 2020 halving the GDP loss relative to scenario S1H to only 03 as the investment in renewable energies is assumed to be additional Employment impacts are also more positive than in scenario S1H The 10 investment in low-carbon technologies amounts to more than EUR 20 billion in 2020
Assuming additional EU exports of RES technologies in scenario S2HE GDP almost matches the baseline in 2020 and employment is 051 (or more than 1 million jobs) higher than in the baseline In scenario S2HI a shift in the input structure of the energy sector towards machinery
and electrical machinery reflecting the different nature of RES relative to conventional electricity generation also has smaller additional positive impacts on GDP and employment compared to scenario S2H
The following figures show impacts of the different scenarios in comparison to the baseline BH As Figure 31 illustrates all the alternative scenarios imply GDP lower than the baseline However comparing scenario S1H with the other three scenarios shows that additional RES investment (S2H) additional RES exports (S2HE) and the inclusion of different input structures of the RES industries (S2HI) each have positive GDP impacts These results are in line with model-based analysis in the EMPLOY-RES study (Fraunhofer ISI et al 2009)
Figure 31 EU-27 GDP according to four scenarios mdash deviation from the baseline (BH)
Percentage deviation from the baseline (BH)
ndash 100
ndash 080
ndash 060
ndash 040
ndash 020
0002010 2015 2020
S2HI S1H S2H S2HE
Modelling of ETR impacts on eco-innovation
Environmental tax reform in Europe opportunities for eco-innovation 29
In contrast to GDP employment increases relative to the baseline in all the alternative scenarios (Figure 32) Due to the scenario design the structure of the EU economies is shifted from energy-intensive to labour-intensive sectors The magnitude of the employment gain is influenced by the carbon price and the tax shift the underlying energy prices and the production loss The largest part of the employment increase stems from the additional RES investment (scenario S2H) although a shift in industry structures (S2HI) and additional RES exports (S2HE) are also positive for the labour market
33 Macroeconomic impacts at the national level
In general terms it is clear that national ETS and ETR impacts depend significantly on country specifics including energy use economic structure social system and behaviour (eg reactions to labour cost changes) In countries with high carbon intensity in their energy mix additional revenues and expenditures are higher than in countries with lower carbon intensity
Scenario S2H provides an interesting tool for analysing the macroeconomic impacts of ETR at the national level because 10 of the additional generated revenues are used for eco-innovation investments meaning that only 90 of the revenues are recycled back into the economy by reducing income tax rates and social security contributions
Figure 32 EU-27 employment according to four scenarios mdash deviation from the baseline (BH)
ndash 020
000
020
040
060
2010 2015 2020
S2HI S1H S2H S2HE
Percentage deviation from the baseline (BH)
Environmental tax reform in Europe opportunities for eco-innovation
Modelling of ETR impacts on eco-innovation
30
Figure 34 GDP in 2020 in EU-27 Member States under scenario S2H mdash deviation form the baseline (BH)
Figure 33 GDP in 2020 in selected countries under scenario S2H mdash deviation from the baseline (BH)
ndash 25 ndash 20 ndash 15 ndash 10 ndash 05 00 05 10 15
Romania
Bulgaria
SloveniaMalta
Lithuania
Latvia
Estonia
CyprusSlovakia
Poland
Hungary
Czech RepublicUnited Kingdom
Sweden
Spain
Portugal
Netherlands
Italy
Ireland
Greece
FranceFinland
Denmark
Luxembourg
Belgium
Austria
Germany
Percentage deviation from the baseline (BH)
Russia
South Africa
Brazil
India
China
Mexico
Japan
USA
Poland
United Kingdom
Spain
Italy
France
Germany
ndash 30 ndash 25 ndash 20 ndash 15 ndash 10 ndash 05 00 05 10
Percentage deviation from the baseline (BH)
Modelling of ETR impacts on eco-innovation
Environmental tax reform in Europe opportunities for eco-innovation 31
Figure 35 Employment in 2020 in EU-27 Member States under scenario S2H mdash deviation from baseline (BH)
EU-27EU-15
RomaniaBulgariaSloveniaMalta
LithuaniaLatvia
EstoniaCyprusSlovakia
PolandHungary
Czech RepublicUnited Kingdom
SwedenSpain
PortugalNetherlands
ItalyIrelandGreece
FranceFinlandDenmarkLuxembourg
BelgiumAustria
Germany
ndash 200 0 200 400 600 800 1 000
Percentage deviation from the baseline (BH)
Under scenario S2H the GDP of large EU economies deviates from baseline projections by between 0 and ndash 1 with the exception of Italy (Figure 33) Germanys GDP is even forecast to match the baseline level in 2020 due to the countrys strong RES industry Outside Europe some countries gain slightly against EU Member States in terms of competitiveness as export prices in most EU Member States and sectors increase and GDP in those countries exceeds the baseline projections as a result (Figure 33) This is mainly because carbon tax revenues are recycled via income tax reductions which are not part of production costs However energy exporting economies such as Russia or South Africa will lose exports if EU demand for fossil fuel imports declines The development of all EU Member States is shown in Figure 34
Employment impacts of scenario S2H are positive for almost all EU Member States as lower labour
costs increase labour demand and labour intensity (Figure 35) The highest absolute increases are shown for Germany the Netherlands Italy and the United Kingdom For EU-27 as a whole employment will be almost one million higher than in the corresponding baseline BH in 2020
The scenarios have not been designed with a view to meeting the EU renewables target of a 20 renewables share in final energy consumption in 2020 Nevertheless the scenarios provide some interesting insights The share is projected to increase from around 10 in 2009 to above 14 even in the baseline as instruments such as feed in tariffs and biofuel quotas will continue In scenario S1H the target will be missed with around 18 in 2020 Only in scenarios S2H S2HE and S2HI is the target met (approximately 20 )
Environmental tax reform in Europe opportunities for eco-innovation
Modelling of ETR impacts on eco-innovation
32
Under scenario S2H energy-related carbon emissions are reduced in all EU Member States relative to the baseline (Figure 36) The highest percentage reductions can be seen in many of the EU-12 Member States with still high energy intensity and low energy prices In these countries the relative price increase is higher than in countries like Germany or the United Kingdom with already high energy taxes and overall energy prices
Additional ETS revenues material tax revenues and carbon tax revenues from the industry sector are recycled back to industry via reductions in employers social security contributions (or wage subsidies in some countries) The revenues from the carbon tax on households set out in Table 32 (totalling 033 of GDP in Germany for example) are used to reduce income tax For the EU-27 overall revenues from ETS and ETR reach about 2 of GDP in 2020 although these figures may be excessive because additional EU efforts to increase energy
efficiency and renewable energy which will reduce the ETS price are not taken into account The use of flexible tools such as the Clean Development Mechanism will further reduce the revenues and earmarking of part of the revenues for mitigation and adaptation measures in emerging and developing countries limits the recycling into labour costs
In addition the scenarios do not take the current global economic problems into account According to the IEA (2009) the downturn will also reduce carbon emissions in the long run which will lead to lower carbon prices and revenues to reach fixed targets (or make tighter targets less costly)
The ETR will have varying effects on the prices of different sorts of products and services Material or carbon taxes increase the prices of product groups according to their direct and indirect material and carbon content The recycling mechanism reduces
Figure 36 Energy-related CO2 emissions in 2020 under scenario S2H mdash deviation from the baseline (BH)
WorldEU-27
EU-15Romania
BulgariaSlovenia
MaltaLithuania
LatviaEstonia
CyprusSlovakia
PolandHungary
Czech RepublicUnited Kingdom
SwedenSpain
PortugalNetherlands
ItalyIreland
GreeceFrance
FinlandDenmark
LuxembourgBelgium
AustriaGermany
ndash 25 ndash 20 ndash 15 ndash 10 ndash 5 0
Percentage deviation from the baseline (BH)
Modelling of ETR impacts on eco-innovation
Environmental tax reform in Europe opportunities for eco-innovation 33
Table 32 Additional ETS and environmental tax revenues in 2020 ( of GPD)
S2H Germany United Kingdom EU-27
ETS revenues 083 064 059
Carbon tax (industry) 052 044 054
Carbon tax (households) 033 041 036
Material tax 041 029 056
Sum 209 178 205
Figure 37 Total primary energy supply in 2020 under scenario S2H mdash deviation from the baseline (BH)
WorldEU-27EU-15
RomaniaBulgaria
Slovenia
MaltaLithuania
LatviaEstonia
Cyprus
SlovakiaPoland
HungaryCzech Republic
United KingdomSweden
SpainPortugal
NetherlandsItaly
IrelandGreece
FranceFinland
DenmarkLuxembourg
BelgiumAustria
Germany
ndash 24 ndash 21 ndash 18 ndash 15 ndash 12 ndash 9 ndash 6 ndash 3 0
Percentage deviation from the baseline (BH)
Environmental tax reform in Europe opportunities for eco-innovation
Modelling of ETR impacts on eco-innovation
34
Figure 38 Output price impacts of scenario S2H in Germany in 2020 mdash deviations from the baseline (BH)
Figure 39 Impacts of scenario S2H on industrial output in 2020 in Germany mdash deviations from the baseline (BH)
ndash 5
0
5
10
15
20
Output prices
Percentage deviation from the baseline (BH)
(3) F
ood
(4) T
extiles
(5) W
ood
(6) P
ulp pap
er
(7) C
oke re
fined
petro
leum
pro
ducts
(8) C
hemica
ls ex
cl pha
rma
(9) P
harm
aceu
ticals
(10)
Rub
ber a
nd plastics
(11)
Non
-metallic
miner
als
(12)
Iron
and
steel
(13)
Non
-ferrou
s metals
(14)
Met
al pro
ducts
(15)
Mac
hine
ry and
equ
ipmen
t
(16)
Office
mac
hine
ry
(17)
Electric
al m
achine
ry
(18)
Rad
io T
V
(19)
Med
ical pr
ecisi
on and
opt
ical ins
trumen
ts
(20)
Mot
or veh
icles
(21)
Ships
(22)
Airc
raft
(23)
Railro
ad
(24)
Man
ufac
turin
g n
ec r
ecyc
ling
(25)
Electric
ity g
as w
ater
sup
ply
(26)
Con
stru
ction
(27)
Tra
de r
epairs
(28)
Hot
els an
d re
stau
rant
s
(29)
Tra
nspo
rt an
d stor
age
(30)
Pos
t and
teleco
mmun
icatio
ns
(31)
Finan
ce ins
uran
ce
(32)
Rea
l estate ac
tivities
(33)
Ren
ting
(34)
Com
puter
(35)
Res
earch an
d de
velopm
ent
(36)
Oth
er bus
ines
s ac
tivities
(37)
Pub
lic ser
vice
s
(38)
Edu
catio
n
(39)
Hea
lth and
soc
ial w
ork
(40)
Oth
er ser
vice
s
(41)
Priv
ate ho
useh
olds
(1) A
gricu
lture
(2) M
ining an
d qu
arry
ing
nec not elsewhere classified
Production
ndash 100
ndash 80
ndash 60
ndash 40
ndash 20
00
20
40
60
80Percentage deviation from the baseline (BH)
(3) F
ood
(4) T
extiles
(5) W
ood
(6) P
ulp pap
er
(7) C
oke re
fined
petro
leum
pro
ducts
(8) C
hemica
ls ex
cl pha
rma
(9) P
harm
aceu
ticals
(10)
Rub
ber a
nd plastics
(11)
Non
-metallic
miner
als
(12)
Iron
and
steel
(13)
Non
-ferrou
s metals
(14)
Met
al pro
ducts
(15)
Mac
hine
ry and
equ
ipmen
t
(16)
Office
mac
hine
ry
(17)
Electric
al m
achine
ry
(18)
Rad
io T
V
(19)
Med
ical pr
ecisi
on and
opt
ical ins
trumen
ts
(20)
Mot
or veh
icles
(21)
Ships
(22)
Airc
raft
(23)
Railro
ad
(24)
Man
ufac
turin
g n
ec r
ecyc
ling
(25)
Electric
ity g
as w
ater
sup
ply
(26)
Con
stru
ction
(27)
Tra
de r
epairs
(28)
Hot
els an
d re
stau
rant
s
(29)
Tra
nspo
rt an
d stor
age
(30)
Pos
t and
teleco
mmun
icatio
ns
(31)
Finan
ce ins
uran
ce
(32)
Rea
l estate ac
tivities
(33)
Ren
ting
(34)
Com
puter
(35)
Res
earch an
d de
velopm
ent
(36)
Oth
er bus
ines
s ac
tivities
(37)
Pub
lic ser
vice
s
(38)
Edu
catio
n
(39)
Hea
lth and
soc
ial w
ork
(40)
Oth
er ser
vice
s
(41)
Priv
ate ho
useh
olds
(1) A
gricu
lture
(2) M
ining an
d qu
arry
ing
nec not elsewhere classified
Modelling of ETR impacts on eco-innovation
Environmental tax reform in Europe opportunities for eco-innovation 35
social security contributions and lowers labour costs according to the direct and indirect labour content of sector output The ETR therefore reduces output prices in labour-intensive service sectors and increases prices in carbon- and material-intensive industry sectors
The example of Germany shows insignificant impacts in the trade-intensive sectors of machinery (15ndash17) motor vehicles (20) and other transport equipment (21ndash23) (Figure 38) Iron and steel (12) and chemicals without pharmaceuticals (8) face the highest price increases of trade-intensive sectors As the German iron and steel industry primarily delivers high quality steel to the German car industry and increasingly to the German windmill industry negative competitiveness impacts will be limited Exchange rate variations against non-EU competitors have been much higher in the past
The higher prices of carbon- and material-intensive products will reduce price competitiveness on export markets and increase the market share for imports in domestic markets This loss of price competitiveness is based on an assumption of limited market development of energy efficiency and RES technologies in other part of the world It will be offset by gains in labour-intensive sectors if the ETR causes real wage costs per unit of output to fall as a result of using recycled revenues to reduce employer social security contributions
Any improvement in non-price competitiveness will also raise exports The extra employment will raise incomes raising consumption and output
The overall impact on sector output depends on countervailing effects which are negative for iron and steel and a few service sectors and positive for a few industry sectors For most industries the output effect is insignificant (Figure 39) The greatest impact is felt by producers of fossil fuels who must obviously reduce production due to lower demand for their products
Under scenario S2H employment impacts are positive for most sectors relative to the baseline as labour productivity decreases and wage rates fall in relation to consumer prices (CPI) and output prices (Table 33) The relative costs of labour are lower than in the baseline without the ETR reform Only around a quarter of the employment increase takes place in industry
Concerning the wage rate two countervailing effects have to be considered First when the labour market is characterised in terms of the real wage bargaining model as in E3ME and GINFORS with market power on both sides (employers and trade unions) consumer price increases will lead to wage increases (the econometrically estimated factor is 085 for Germany) Second labour productivity is another important factor for wage bargaining The estimated elasticity for Germany is 063 meaning that a 1 increase of labour productivity leads to wage increases of 063 Higher labour demand due to lower labour costs thus reduces the wage increase In the end the German economy is more labour intensive than without the ETR partly due to the structural change towards labour-intensive industries
Table 33 Employment impacts of scenario S2H in Germany mdash deviations from scenario S2H in 2020
Employment in 2020 Deviation from S2H () Deviation from S2Habsolute (1 000s)
Agriculture forestry 24 90
Industry 09 653
Non-metallic minerals 24 62
Iron and steel ndash 28 ndash 37
Machinery and equipment 05 56
Electrical machinery 04 18
Construction 37 449
Trade and transport 10 829
Business services 17 767
Other services ndash 02 ndash 216
Total 07 2506
Environmental tax reform in Europe opportunities for eco-innovation
Modelling of ETR impacts on eco-innovation
36
Additional exports under scenario S2HE mainly create new jobs in machinery and related business services (Table 34) Under scenario S2HI a shift in the input structure of the energy sector leads to a shift in the industry structure and creates a few jobs in the service sector (Table 35)
34 Conclusions of the scenario assessment
The foregoing analysis used the GINFORS model to assess economic and environmental impacts of using the ETS and ETR to reach the EUs 2020
GHG targets In general the results show positive employment effects and only small negative impacts on GDP in EU-27 Member States The economic impacts depend on the levels of international energy prices the mechanism used to recycle revenues and country specifics such as carbon and energy intensity and the structure of energy consumption
Although there is significant evidence that eco-innovation is positively driven by higher energy prices quantification is difficult The present study included simulations of possible impacts of a shift in the industry structure towards renewable energy in the electricity sector and an overall increase of EU
Table 34 Employment impacts of scenario S2HE in 2020 in Germany mdash deviations from scenario S2H
Employment in 2020 Deviation from S2H () Deviation from S2Habsolute (1 000s)
Agriculture forestry ndash 01 ndash 02
Industry 03 194
Non-metallic minerals 02 05
Iron and steel 04 05
Machinery and equipment 13 130
Electrical machinery 24 117
Construction 01 18
Trade and transport 00 26
Business services 07 308
Other services 01 107
Total 02 634
Table 35 Employment impacts of scenario S2HI in 2020 in Germany mdash deviations from scenario S2H
Employment in 2020 Deviation from S2H () Deviation from S2Habsolute (1 000s)
Agriculture forestry ndash 01 ndash 02
Industry 00 00
Non-metallic minerals 25 65
Iron and steel ndash 27 ndash 36
Machinery and equipment 08 78
Electrical machinery 04 19
Construction ndash 00 ndash 04
Trade and transport 00 07
Business services 02 115
Other services 0 56
Total 00 167
Modelling of ETR impacts on eco-innovation
Environmental tax reform in Europe opportunities for eco-innovation 37
exports due to higher global demand for renewable energy The main results can be summarised as follows
bull environmentaltaxreformshiftingtaxesfromlabour to energy and resources will create additional jobs and trigger eco-innovation
bull impactsofeco-innovationintheformofadditional EU exports or shifts in industry structures will have a slight positive influence on GDP and create a smaller number of additional jobs
These findings correspond to results from the EmployRES study (Fraunhofer ISI et al 2009) As ETR is directly aimed at reducing labour costs it will create additional jobs in the short and medium term In the longer term the cost reduction and new technologies arising from eco-innovation will play a larger role
Like all fiscal reforms a major ETR in Europe will create winners and losers At the sector level carbon- and material-intensive industries will face economic losses At the country level the carbon-intensity and overall flexibility of economies is important Clearly structural change away from carbon-intensive industries together with technological change is inherent in any successful climate mitigation policy
On the other hand several factors can smooth these structural adjustments International cooperation
will reduce economic pressure on countries and sectors In addition ETR together with auctioning of ETS allowances can be a major source of revenues for EU Member States in the future even if part of the revenues will have to be earmarked for adaptation and mitigation measures in developing countries Indeed future debate on grandfathering or auctioning ETS allowances should reflect the important point that giving allowances away for free denies countries the money to ease structural change and invest in low-carbon technologies
Caution is needed in relating the findings of this study to the EU policy debate In the model simulations the single carbon price is the only instrument used to reach the EUs 2020 GHG targets In reality of course other renewable energy and efficiency policies will also contribute to carbon reduction and have to be taken into account when comparing the results (especially the high carbon prices) to other studies Both reduce the potential revenues from fossil energy carriers and carbon emissions
A variety of renewable energy and efficiency policies could enable the climate and energy targets to be met while securing even better economic prospects The results of the present study clearly indicate that the discussion on market-based instruments should be intensified Ultimately however the EU will need a rich mix of policies to reach its GHG targets while maximising prosperity
Environmental tax reform in Europe opportunities for eco-innovation38
References
Almon C 1991 The INFORUM Approach to Interindustry Modeling in Economic Systems Research Vol 3 pp 1ndash7
Amin A and Cohendet P 2004 The Architecture of Knowledge Firms Capabilities and Communities Oxford University Press Oxford
Barker T Meyer B Pollitt H and Lutz C 2007a Modelling Environmental Tax Reform in Germany and the United Kingdom with E3ME and GINFORS petre Working Paper Cambridge and Osnabrueck (httpwwwpetreorgukpapershtm) accessed 15 February 2011
Barker T Junankar S Pollitt H and Summerton P 2007b Carbon leakage from unilateral environmental tax reforms in Europe 1995ndash2005 Energy Policy Vol 35 pp 6 281ndash6 292
Brunnermeier S B and Cohen M A 2003 Determinants of environmental innovation in US manufacturing industries Journal of Environmental Economics and Management Vol 45 pp 278ndash293
Buen J 2006 Danish and Norwegian wind industry The relationship between policy instruments innovation and diffusion Energy Policy Vol 34 (18) pp 3 887ndash3 897
Carlsson B and Stankiewicz R 1991 On the nature function and composition of technological systems Journal of Evolutionary Economics Vol 1 (2) pp 93ndash118
Christiansen A C and Skjaerseth J B 2005 Climate change policies in Norway and the Netherlands Different instruments similar outcome Energy and Environment Vol 16(1) pp 1ndash25
Dosi G 1988 Sources procedures and microeconomic effects of innovation Journal of Economic Literature Vol 26 pp 1 120ndash1 171
de Vries F and Medhi N 2008 Environmental regulation and international innovation in automotive emissions control technologies in Environmental Policy Technological Innovation and Patents Organisation for Economic Cooperation and Development Paris
DG TREN 2008 European energy and transport mdash trends to 2030 mdash update 2007 European Commission Luxembourg
DTI 2004 Renewable Supply Chain Gap Analysis UK Department of Trade and Industry
Edler J (ed) 2006 Nachfrageorientierte Innovationspolitik Buumlro fuumlr Technikfolgenabschaumltzung beim Deutschen Bundestag (TAB) Arbeitsbericht Nr 99 Berlin
Edquist C 2001 The system of innovation approach and innovation policy an account of the state of the art lead paper presented at the DRUID Conference 12ndash15 June 2001 Aalborg (httpwwwdruiddkconferencesnwpaper1edquistpdf) accessed 15 February 2011
EEA 2006 Using the market for cost-effective environmental policy Market-based instruments in Europe EEA Report No 12006 European Environment Agency Copenhagen
Ekins P 2009 Resource Productivity Environmental tax Reform and Sustainable Growth in Europe published by the Anglo-German Foundation for the Study of Industrial Society Final report (httpwwwpetreorgukpdfFinRepFinpdf) accessed 12 October 2011
Ekins P and Speck S (eds) 2011 Environmental Tax Reform (ETR) A Policy for Green Growth Oxford University Press
EREC 2008 Energy [r]evolution A sustainable global energy outlook Greenpeace International European Renewable Energy Council (EREC)
References
References
Environmental tax reform in Europe opportunities for eco-innovation 39
Fagerberg J Mowery D C and Nelson R R (eds) 2005 The Oxford Handbook of Innovation Oxford University Press Oxford
Fischer C Parry I W H and Pizer W A 2003 Instrument choice for environmental protection when technological innovation is endogenous Journal of Environmental Economics and Management Vol 45 pp 523ndash545
Fraunhofer ISI ECOFYS Energy Economics Group Ruumltter + Partner SEURECO and LEI 2009 EmployRES mdash The impact of renewable energy policy on economic growth and employment in the European Union European Commission Brussels
Frondel M Horbach J and Rennings K 2008 What triggers environmental management and innovation Empirical evidence for Germany Ecological Economics Vol 66(1) pp 153ndash160
GHK Cambridge Econometrics and IEEP 2007 Links between the environment economy and jobs Final Report submitted to DG Environment European Commission
Giljum S Behrens A Hinterberger F Lutz C and Meyer B 2008 Modelling scenarios towards a sustainable use of natural resources in Europe Environmental Science and Policy Vol 11 pp 204ndash216
Goumlrlach B Knigge M and Luumlckge H 2005 Wirkungen der Oumlkologischen Steuerreform auf Innovation und Marktdurchdringung Ecologic Berlin (httpecologiceudownloadprojekte1850-189918791879_5_innovationpdf) accessed 18 August 2011
Green M A 2000 Photovoltaics technology overview Energy Policy Vol 28 (14) pp 989ndash998
Grossmann A Lehr U Lutz C and Wolter MI 2008 Gesamtwirtschaftliche Effekte der Umsetzung der EU Ziele im Bereich Erneuerbare Energien und Gebaumludeeffizienz in Oumlsterreich bis 2020 Studie im Auftrag des Lebensministeriums Wien 0508
Hage J and Hollingsworth J R 2000 Idea innovation networks a strategy for integrating organizational and institutional analysis Organization Studies Vol 21 (5) pp 971ndash1 004
Hauschildt J 2004 Innovationsmanagement Vahlen Muumlnchen
Hemmelskamp J 1997 Environmental policy instruments and their effects on innovation European Planning Studies Vol 5 (2) pp 177ndash195
Hoglund Isaksson L 2005 Abatement costs in response to the Swedish charge on nitrogen oxide emissions Journal of Environmental Economics and Management Vol 50 pp 102ndash120
Hullmann A 2001 Internationaler Wissenstransfer und technischer Wandel (dissertation) Physica-Verlag Heidelberg
IEA 2008 World Energy Outlook 2008 International Energy Agency Paris
IEA 2009 World Energy Outlook 2009 International Energy Agency Paris
Jacobsson S Andersson B A and Baringngens L 2002 Transforming the energy system mdash the evolution of the German technological system for solar cells Science and Technology Policy Research University of Sussex Electronic Working Paper Series No 84 (httpideasrepecorgpsrussewps84html) accessed 18 August 2011
Jaffe A and Stavins R 1995 Dynamic incentives of environmental regulations the effects of alternative policy instruments on technology diffusion Journal of Environmental Economics and Management Vol 29(3) pp 43ndash63
Jaffe A B and Palmer K 1997 Environmental regulation and innovation a panel data study The Review of Economics and Statistics Vol 79 pp 610ndash619
Jaffe A B Newell R G and Stavins R N 2002 Environmental policy and technological change Environmental and Resource Economics Vol 22 (1ndash2) 2002 pp 41ndash70
Johnstone N and Hascic I 2008 Renewable energy policies and technological innovation energy source and instrument choice in Environmental Policy Technological Innovation and PatentsOrganisation for Economic Co-operation and Development Paris
Johnstone N 2005 The Innovation Effects of Environmental Policy Instruments in Horbach J (ed) Indicator Systems for Sustainable Innovation Physica-Verlag HD
Environmental tax reform in Europe opportunities for eco-innovation
References
40
Johnstone N Hascic I and Ostertag K 2008 Environmental policy technological innovation and patent activity in Environmental Policy Technological Innovation and Patents Organisation for Economic Co-operation and Development Paris
Jung C Krutilla K and Boyd R 1996 Incentives for advanced pollution abatement technology at the industry level an evaluation of policy alternatives Journal of Environmental Economics and Management Vol 30(1) pp 95ndash111
Kammen D M Kapidia K and Fripp M 2004 Putting renewables to work how many jobs can the clean energy industry generate University of California Berkeley
Kemp R 1997 Environmental policy and technical change ndash a comparison of the technological impact of policy instruments Edward Elgar Cheltenham
Kemp R 1998 The diffusion of biological waste-water treatment plants in the Dutch food and beverage industry Environmental and Resource Economics Vol 12 pp 113ndash136
Kemp R 2000 Technology and environmental policy ndash innovation effects of past policies and suggestions for improvement in OECD proceedings ndash innovation and the environment Organisation for Economic Co-operation and Development Paris
Kerr S and Newell R G 2003 Policy-induced technology adoption evidence from the US lead phasedown Journal of Industrial Economics Vol 51 pp 317ndash343
Klaassen G Miketa A Larsen K and Sundqvist T 2005 The impact of RampD on innovation for wind energy in Denmark Germany and the United Kingdom Ecological Economics Vol 54 pp 227ndash240
Kline S and Rosenberg N 1986 An overview of innovation in Landau R (ed) The positive sum strategy Harnessing technology for economic growth pp 275-306
Knigge M and Goumlrlach B 2005 Effects of Germanys ecological tax reforms on the environment employment and technological innovation Ecologic Berlin (httpwwwumweltbundesamtdeuba-info-presse-ehintergrundoekosteuerpdf) accessed 18 August 2011
Langniss O 2003 Governance structures for promoting renewable energy sources dissertation Lund Stuttgart
Lanjouw J O and Mody A 1996 Innovation and the international diffusion of environmentally responsive technology Research Policy Vol 25 pp 549ndash571
Lehr U Nitsch J Kratzat M Lutz C and Edler D 2008 Renewable Energy and Employment in Germany Energy Policy Vol 36 pp 108ndash117 DOI101016jenpol200709004
Lehr U Wolter MI and Groszligmann A 2009 Economic impacts of RES obligations in Austria ndash an application of the macro-econometric model e3at GWS Discussion Paper 20091 Osnabruumlck
Lundvall B-A Johnson B Andersen E S and Dalum B 2001 National systems of production innovation and competence building Research Policy Vol 31 pp 213ndash231
Lutz C and Giljum S 2009 Global resource use in a business as usual world until 2030 Updated results from the GINFORS model in Bleischwitz R Welfens Pand Zhang Z (eds) Sustainable growth and resource productivity ndash economic and global policy issues Greenleaf Publishers pp 30ndash41
Lutz C and Meyer B 2008 Beschaumlftigungseffekte des Klimaschutzes in Deutschland Untersuchungen zu gesamtwirtschaftlichen Auswirkungen ausgewaumlhlter Maszlignahmen des Energie- und Klimapakets Forschungsbericht 205 46 434 Dessau-Roszliglau
Lutz C and Meyer B 2009a Environmental and Economic Effects of Post-Kyoto Carbon Regimes Results of Simulations with the Global Model GINFORS Energy Policy Vol 37 pp 1 758ndash1 766 DOI 101016jenpol200901015
Lutz C and Meyer B 2009b Scenario results from GINFORS PETRE working paper Osnabruumlck
Lutz C Meyer B Nathani C and Schleich J 2005 Endogenous technological change and emissions The case of the German steel industry Energy Policy Vol33 pp 1 143ndash1 154
Lutz C Meyer B Nathani C and Schleich J 2007 Endogenous innovation economy and environment impacts of a technology based modelling approach for energy-intensive industries in Germany Energy Studies Review Vol 15(1) pp 2ndash18
References
Environmental tax reform in Europe opportunities for eco-innovation 41
Lutz C Meyer B and Wolter M I 2009 The global multisectormulticountry 3-E model GINFORS mdash a description of the model and a baseline forecast for global energy demand and CO2 emissions Journal of Sustainable Development forthcoming
Malerba F and Orsenigo L 1997 Technological Regimes and Sectoral Patterns of Innovative Activities Industrial and Corporate Change Vol 6 (1) pp 83ndash117
Malerba F 1992 Learning by Firms and Incremental Technical Change The Economic Journal Vol 102 (413) pp 845ndash859
Malerba F 2005 Industrial dynamics and innovation progress and challenges Presidential Address delivered at the 32nd Conference of the European Association for Research in Industrial Economics (EARIE) 1ndash4 September 2005 Porto
Malerba F 2006 Innovation and the evolution of industries Journal of Evolutionary Economics Vol 16 pp 3ndash23
McGinty M and de Vries F P 2009 Technology diffusion product differentiation and environmental subsidies The BE Journal of Economic Analysis and Policy Vol 9(1)
Meyer B and Lutz C 2007 The GINFORS model ndash model overview and evaluation Petre Working Paper Osnabruumlck (httpwwwpetreorgukpapershtm) accessed 18 August 2011
Meyer B Lutz C Schnur P and Zika G 2007 Economic policy simulations with global interdependencies a sensitivity analysis for Germany Economic Systems Research Vol 19 pp 37ndash55
Mickwitz P H Hyvaumlttinen and P Kivimaa 2008 The role of policy instruments in the innovation and diffusion of environmentally friendlier technologies popular claims versus case study experiences Journal of Cleaner Production Vol 16(1S1) 162ndash170
Miketa A and Schrattenholzer L 2004 Experiments with a methodology to model the role of RampD expenditures in energy technology learning processes first results Energy Policy Vol 32 (15) pp 1 679ndash1 692
Milliman S R and Prince R 1989 Firm incentives to promote technological change in pollution control Journal of Environmental Economics and Management Vol 17 pp 247ndash265
Millock K and Nauges C 2006 Ex-post evaluation of an earmarked tax on air pollution Land Economics Vol 82(1) pp 68ndash84
Montero J-P 2002 Market structure and environmental innovation Journal of Applied Economics Vol 2 pp 293ndash325
Moreno B and Loacutepez A J 2007 The effect of renewable energy on employment mdash The case of Asturias (Spain) Renewable and Sustainable Energy Rewiews doi 101016jrser200610011
Mowery D and Rosenberg N 1979 The influence of market demand upon innovation A critical review of some recent empirical studies Research Policy Vol 8 pp 102ndash153
Newell R G Jaffe A B and Stavins R N 1999 The induced innovation hypothesis and energy-saving technological change Quarterly Journal of Economics Vol 114 pp 941ndash975
Norberg-Bohm V 1999 Stimulating green technological innovation An analysis of alternative policy mechanisms Policy Sciences Vol 32(1) pp 13ndash38
OECD 2009 Sustainable manufacturing and eco-innovation towards a green economy Organisation for Economic Co-operation and Development Policy Brief June 2009
OECD 2010 Taxation innovation and the environment Organisation for Economic Co-operation and Development
Pavitt K 1984 Sectoral patterns of technological change Towards a taxonomy and a theory Research Policy Vol 13 pp 343ndash373
Popp D 2002 Induced innovation and energy prices The American Economic Review Vol 92(1) pp 160ndash180
Popp D 2005 Lessons from patents Using patents to measure technological change in environmental models Ecological Economics Vol 54 pp 209ndash226
Environmental tax reform in Europe opportunities for eco-innovation
References
42
Porter M and van der Linde C 1995 Toward a new conception of the environment competitiveness relationship Journal of Economic Perspectives Vol 9(4) pp 97ndash118
Rammert W 2002 The cultural shaping of technologies and the politics of technodiversity In Sorensen K and Williams R (eds) Shaping technology guiding policy concepts spaces and tools Elgar Cheltenham pp 155-172
Requate T 2005 Dynamic incentives by environmental policy instruments ndash a survey Ecological Economics Vol 54 pp 175ndash195
Roloff N Lehr U Krewitt W Fuchs G Wassermann S Weimer-Jehle W and Schmidt B 2008 Success determinants for technological innovations in the energy sector mdash the case of photovoltaics in Moumlst D Fichtner W Ragwitz M and Veit D (eds) New methods for energy market modelling mdash Proceedings of the first european workshop on energy market modelling using agent-based computational economics Universitaumltsverlag Karlsruhe
Rothwell R 1995 The fifth generation innovation process in Oppenlaumlnder KH Popp W (eds) Innovationen und wirtschaftlicher Fortschritt betriebs-und volkswirtschaftliche Perspektiven Bern pp 9ndash26
Schumpeter J 1942 Capitalism socialism and democracy New York Harper
Skjaeligrseth J B and Christiansen A C 2005 Environmental policy instruments and technological change in the energy sector findings from comparative empirical research Energy and Environment Vol 17 (2) pp 223ndash241
Snyder L D Miller N H and Stavins R N 2003 The effects of environmental regulations on pollution emissions evidence from plant-level data American Economic Review Vol 93(2) pp 431ndash435
Technopolis 2008 Eco-innovation Final Report for Sectoral Innovation Watch (httpwwwtechnopolis-groupcomresourcesdownloads661_report_finalpdf) accessed 18 August 2011
Volleburgh H 2007 Impacts of environmental policy instruments on technological change Report for Joint Meetings of Tax and Environment Experts OECD Environment Directorate February 2007 (comenvepocctpacfa(2006)36final)
Zimmermann H Wohltmann M and Hansjuumlrgens B 1996 Umweltabgaben und Innovation Analytica Marburg
43
Annex 1
Environmental tax reform in Europe opportunities for eco-innovation
Type Instrument Area Stage
Reference
Theo
retica
l
Em
piric
al
Cas
e st
udy
Rev
iew
Qual
itat
ive
Taxe
s
Perm
its
Subsi
die
s
Volu
nta
ry
Com
man
d
Reg
ula
tion
Ener
gy
Air
Wat
er
Oth
er
Gen
eral
Innov
atio
n
Diffu
sion
Rel
evan
ce
Brunnermeier amp Cohen (2003)
X X X X
Buen (2006) X X X X X X
Christiansen amp Skjaerseth (2005)
X X X X X X
Fischer et al (2003 X X X X X X
Frondel et al (2008) X X X X X X X (X) (X)
Hemmelskamp (1997)
X X X X X X X (X)
Hoglund Isaksson (2005)
X X X (X) (X)
Jaffe amp Stavins (1995)
X X X1 X X X X
Jaffe amp Palmer (1997)
X X X X
Jaffe et al (2002) X X X X X X X X X X
Jung et al (1996) X X X X X X (X) (X)
Kemp (1998) X X X X
Kerr amp Newell (2001) X X X X X
Klaassen et al (2005)
X X X X X
Lanjouw amp Mody (1996)
X X X X X X X
McGinty amp de Vries (2009)
X X X X
Mickwitz et al (2008)
X X X X X X X X X
Milliman amp Prince (1989)
X X X X X X X
Millock amp Nauges (2006)
X X X X X X
Montero (2002) X X X X X
Newell et al (1999) X X1 X X X
Norberg-Bohm (1999)
X X X X X X X
Popp (2002) X X1 X X
Popp (2005) X X X X X X
Porter amp van der Linde (1995)
X X X X X X
Requate (2005) X X X X X X X
Skjaeligrseth amp Christiansen (2005)
X X X X X X X X X
Snyder et al (2003) X X X X X
Annex 1 Classification of refereed journal articles
Environmental tax reform in Europe opportunities for eco-innovation44
Annex 2
Type Instrument Area Stage
Reference
Theo
retica
l
Em
piric
al
Cas
e st
udy
Rev
iew
Qual
itat
ive
Taxe
s
Perm
its
Subsi
die
s
Volu
nta
ry
Com
man
d
Reg
ula
tion
Ener
gy
Air
Wat
er
Oth
er
Gen
eral
Innov
atio
n
Diffu
sion
Rel
evan
ce
Johnstone (2005)
X X X X X X X
Johnstone amp Hascic (2008)
X X X X X X X X
Kemp (1997) X X X X X X X X X X X X X
Kemp (2000) X X X X X X X X X
de Vries amp Medhi (2008)
X X1 X X X
Annex 2 Classification of books and book chapters
45
Annex 3
Environmental tax reform in Europe opportunities for eco-innovation
Type Instrument Area Stage
Reference
Theo
retica
l
Em
piric
al
Cas
e st
udy
Rev
iew
Qual
itat
ive
Taxe
s
Perm
its
Subsi
die
s
Volu
nta
ry
Com
man
d
Reg
ula
tion
Ener
gy
Air
Wat
er
Oth
er
Gen
eral
Innov
atio
n
Diffu
sion
Rel
evan
ce
Goumlrlach et al (2005)
X X X X X X
Knigge amp Goumlrlach (2005)
X X X X X X
Technopolis (2008)
X X X X X X
Volleburgh (2007)
X X X X X X X X X X X
Annex 3 Classification of reports
European Environment Agency
Environmental tax reform in Europe opportunities for eco-innovation
2011 mdash 45 pp mdash 21 x 297 cm
ISBN 978-92-9213-238-5doi10280084889
How to obtain EU publications
Publications for salebull viaEUBookshop(httpbookshopeuropaeu)bull fromyourbooksellerbyquotingthetitlethepublisherandorISBNnumberbull bycontactingoneofoursalesagentsdirectlyYoucanobtaintheircontactdetails
on the Internet (httpbookshopeuropaeu) or by sending a fax to +352 2929-42758
Free publicationsbull viaEUBookshop(httpbookshopeuropaeu)bull attheEuropeanCommissionsrepresentationsordelegationsYoucanobtain
their contact details on the Internet (httpeceuropaeu) or by sending a fax to +352 2929-42758
European Environment AgencyKongens Nytorv 61050 Copenhagen KDenmark
Tel +45 33 36 71 00Fax +45 33 36 71 99
Web eeaeuropaeuEnquiries eeaeuropaeuenquiries
TH
-AK-1
1-0
17-E
N-N
doi1
02
8008
4889
- Acknowledgements
- Executive summary
- 1Introduction
-
- 11Background
- 12ETR and innovation
- 13Report structure
-
- 2Review of literature on environmental tax reform and eco‑innovation
-
- 21Initial screening
- 22Detailed review
- 23Environmental regulation studies
- 24Theoretical studies
- 25Empirical studies
- 26Case studies
- 27Conclusions
-
- 3Modelling of ETR impacts on eco‑innovation
-
- 31Scenarios assessing the implications of ETR for eco-innovation
- 32Overview of modelling results
- 33Macroeconomic impacts at the national level
- 34Conclusions of the scenario assessment
-
- References
- Annex 1 Classification of refereed journal articles
- Annex 2Classification of books and book chapters
- Annex 3Classification of reports
-
Modelling of ETR impacts on eco-innovation
Environmental tax reform in Europe opportunities for eco-innovation 27
(Fraunhofer ISI et al 2009) and the possibility of very strong world market development of the RES sector until 2020 (EREC 2008) which offers additional export opportunities for European RES industries
bull S2HIETRwithrevenuerecyclingdesignedto meet the unilateral EUs 2020 GHG target (high energy price) Ten per cent of revenues are spent on eco-innovation measures and input structures of the energy sector are changed according to the input structure of the German RES industry (Lehr et al 2008)
S2HE looks at the possible role of international trade S2HI analyses changes in the input structure of the energy sector ie from conventional electricity production to renewables In the petre project (as in GHK et al 2007) only the energy inputs of the energy sector were adapted to changes in the energy input mix
Both S2HE and S2HI focus on RES and efficiency technologies As mentioned above an ETR will trigger a variety of innovations Therefore the results can be thought of as conservative in the sense that innovations (eg automotive energy consumption industrial efficiency etc) are not explicitly included
32 Overview of modelling results
The main results of the simulations are presented in Table 31 In the baseline scenario BH with high energy prices EU-27 carbon emissions will be
72 below the 1990 level in 2020 (38) The EU-15 has committed in the Kyoto Protocol to reduce its GHG emissions 8 below 1990 levels in the period 2008ndash2012 As emissions in the new member states are substantially below their 1990 levels today that implies that the EU-27 will keep its emissions more or less constant over the coming decade As in the PRIMES baseline an ETS price of 18 EURt in 2008 prices is assumed in 2020
In scenario S1H the ETS price and carbon tax rate has to be increased to 68 EUR2008t of CO2 to reach the 20 GHG reduction target which is equal to a 15 reduction of CO2 emissions against 1990 as other greenhouse gases have already been reduced above average by more than 20 in terms of CO2 equivalents Compared to the baseline CO2 emissions are 84 lower in 2020 which means roughly an additional 1 reduction annually in the period 2012ndash2020 GDP will be about 06 lower compared to the baseline in 2020 This means that annual average growth rates will be less than 01 below their baseline development This is especially low compared to the current financial and economic crisis with a GDP deviation against the baseline of around 6 in 2009
As the recycling mechanism reduces labour costs and the tax burden is shifted from labour-intensive to carbon- and material-intensive sectors employment will be 036 (or more than 800 000 jobs) higher than in the baseline The ETR is not fully budget neutral potentially enabling EU economies to slightly increase their net savings If
(38) The modelling exercise in the present study was conducted in 2009 and therefore does not contain the latest data on EU-27 GHG emissions which were significantly influenced by the global economic slump of the late-2000s
Table 31 Main results under the different scenarios
Scenario Target in 2020 CO2 price GDP Employment CO2 reduction
EUR2008t pc against baseline
pc against baseline
pc against 1990
pc against baseline
in year 2020 2015 2020 2020 2020 2020
BH 18 ndash 72 00
S1H 20 GHG 68 ndash 022 ndash 057 036 ndash 151 ndash 84
S2H 20 GHG 61 ndash 013 ndash 030 041 ndash 152 ndash 85
S2HE 20 GHG 61 ndash 009 ndash 004 051 ndash 151 ndash 84
S2HI 20 GHG 61 ndash 006 ndash 024 045 ndash 152 ndash 84
Environmental tax reform in Europe opportunities for eco-innovation
Modelling of ETR impacts on eco-innovation
28
this extra saving is spent negative GDP impacts will be further reduced
In scenario S2H part of the revenues is invested in low-carbon technologies This reduces the carbon price to 61 EUR2008t in 2020 halving the GDP loss relative to scenario S1H to only 03 as the investment in renewable energies is assumed to be additional Employment impacts are also more positive than in scenario S1H The 10 investment in low-carbon technologies amounts to more than EUR 20 billion in 2020
Assuming additional EU exports of RES technologies in scenario S2HE GDP almost matches the baseline in 2020 and employment is 051 (or more than 1 million jobs) higher than in the baseline In scenario S2HI a shift in the input structure of the energy sector towards machinery
and electrical machinery reflecting the different nature of RES relative to conventional electricity generation also has smaller additional positive impacts on GDP and employment compared to scenario S2H
The following figures show impacts of the different scenarios in comparison to the baseline BH As Figure 31 illustrates all the alternative scenarios imply GDP lower than the baseline However comparing scenario S1H with the other three scenarios shows that additional RES investment (S2H) additional RES exports (S2HE) and the inclusion of different input structures of the RES industries (S2HI) each have positive GDP impacts These results are in line with model-based analysis in the EMPLOY-RES study (Fraunhofer ISI et al 2009)
Figure 31 EU-27 GDP according to four scenarios mdash deviation from the baseline (BH)
Percentage deviation from the baseline (BH)
ndash 100
ndash 080
ndash 060
ndash 040
ndash 020
0002010 2015 2020
S2HI S1H S2H S2HE
Modelling of ETR impacts on eco-innovation
Environmental tax reform in Europe opportunities for eco-innovation 29
In contrast to GDP employment increases relative to the baseline in all the alternative scenarios (Figure 32) Due to the scenario design the structure of the EU economies is shifted from energy-intensive to labour-intensive sectors The magnitude of the employment gain is influenced by the carbon price and the tax shift the underlying energy prices and the production loss The largest part of the employment increase stems from the additional RES investment (scenario S2H) although a shift in industry structures (S2HI) and additional RES exports (S2HE) are also positive for the labour market
33 Macroeconomic impacts at the national level
In general terms it is clear that national ETS and ETR impacts depend significantly on country specifics including energy use economic structure social system and behaviour (eg reactions to labour cost changes) In countries with high carbon intensity in their energy mix additional revenues and expenditures are higher than in countries with lower carbon intensity
Scenario S2H provides an interesting tool for analysing the macroeconomic impacts of ETR at the national level because 10 of the additional generated revenues are used for eco-innovation investments meaning that only 90 of the revenues are recycled back into the economy by reducing income tax rates and social security contributions
Figure 32 EU-27 employment according to four scenarios mdash deviation from the baseline (BH)
ndash 020
000
020
040
060
2010 2015 2020
S2HI S1H S2H S2HE
Percentage deviation from the baseline (BH)
Environmental tax reform in Europe opportunities for eco-innovation
Modelling of ETR impacts on eco-innovation
30
Figure 34 GDP in 2020 in EU-27 Member States under scenario S2H mdash deviation form the baseline (BH)
Figure 33 GDP in 2020 in selected countries under scenario S2H mdash deviation from the baseline (BH)
ndash 25 ndash 20 ndash 15 ndash 10 ndash 05 00 05 10 15
Romania
Bulgaria
SloveniaMalta
Lithuania
Latvia
Estonia
CyprusSlovakia
Poland
Hungary
Czech RepublicUnited Kingdom
Sweden
Spain
Portugal
Netherlands
Italy
Ireland
Greece
FranceFinland
Denmark
Luxembourg
Belgium
Austria
Germany
Percentage deviation from the baseline (BH)
Russia
South Africa
Brazil
India
China
Mexico
Japan
USA
Poland
United Kingdom
Spain
Italy
France
Germany
ndash 30 ndash 25 ndash 20 ndash 15 ndash 10 ndash 05 00 05 10
Percentage deviation from the baseline (BH)
Modelling of ETR impacts on eco-innovation
Environmental tax reform in Europe opportunities for eco-innovation 31
Figure 35 Employment in 2020 in EU-27 Member States under scenario S2H mdash deviation from baseline (BH)
EU-27EU-15
RomaniaBulgariaSloveniaMalta
LithuaniaLatvia
EstoniaCyprusSlovakia
PolandHungary
Czech RepublicUnited Kingdom
SwedenSpain
PortugalNetherlands
ItalyIrelandGreece
FranceFinlandDenmarkLuxembourg
BelgiumAustria
Germany
ndash 200 0 200 400 600 800 1 000
Percentage deviation from the baseline (BH)
Under scenario S2H the GDP of large EU economies deviates from baseline projections by between 0 and ndash 1 with the exception of Italy (Figure 33) Germanys GDP is even forecast to match the baseline level in 2020 due to the countrys strong RES industry Outside Europe some countries gain slightly against EU Member States in terms of competitiveness as export prices in most EU Member States and sectors increase and GDP in those countries exceeds the baseline projections as a result (Figure 33) This is mainly because carbon tax revenues are recycled via income tax reductions which are not part of production costs However energy exporting economies such as Russia or South Africa will lose exports if EU demand for fossil fuel imports declines The development of all EU Member States is shown in Figure 34
Employment impacts of scenario S2H are positive for almost all EU Member States as lower labour
costs increase labour demand and labour intensity (Figure 35) The highest absolute increases are shown for Germany the Netherlands Italy and the United Kingdom For EU-27 as a whole employment will be almost one million higher than in the corresponding baseline BH in 2020
The scenarios have not been designed with a view to meeting the EU renewables target of a 20 renewables share in final energy consumption in 2020 Nevertheless the scenarios provide some interesting insights The share is projected to increase from around 10 in 2009 to above 14 even in the baseline as instruments such as feed in tariffs and biofuel quotas will continue In scenario S1H the target will be missed with around 18 in 2020 Only in scenarios S2H S2HE and S2HI is the target met (approximately 20 )
Environmental tax reform in Europe opportunities for eco-innovation
Modelling of ETR impacts on eco-innovation
32
Under scenario S2H energy-related carbon emissions are reduced in all EU Member States relative to the baseline (Figure 36) The highest percentage reductions can be seen in many of the EU-12 Member States with still high energy intensity and low energy prices In these countries the relative price increase is higher than in countries like Germany or the United Kingdom with already high energy taxes and overall energy prices
Additional ETS revenues material tax revenues and carbon tax revenues from the industry sector are recycled back to industry via reductions in employers social security contributions (or wage subsidies in some countries) The revenues from the carbon tax on households set out in Table 32 (totalling 033 of GDP in Germany for example) are used to reduce income tax For the EU-27 overall revenues from ETS and ETR reach about 2 of GDP in 2020 although these figures may be excessive because additional EU efforts to increase energy
efficiency and renewable energy which will reduce the ETS price are not taken into account The use of flexible tools such as the Clean Development Mechanism will further reduce the revenues and earmarking of part of the revenues for mitigation and adaptation measures in emerging and developing countries limits the recycling into labour costs
In addition the scenarios do not take the current global economic problems into account According to the IEA (2009) the downturn will also reduce carbon emissions in the long run which will lead to lower carbon prices and revenues to reach fixed targets (or make tighter targets less costly)
The ETR will have varying effects on the prices of different sorts of products and services Material or carbon taxes increase the prices of product groups according to their direct and indirect material and carbon content The recycling mechanism reduces
Figure 36 Energy-related CO2 emissions in 2020 under scenario S2H mdash deviation from the baseline (BH)
WorldEU-27
EU-15Romania
BulgariaSlovenia
MaltaLithuania
LatviaEstonia
CyprusSlovakia
PolandHungary
Czech RepublicUnited Kingdom
SwedenSpain
PortugalNetherlands
ItalyIreland
GreeceFrance
FinlandDenmark
LuxembourgBelgium
AustriaGermany
ndash 25 ndash 20 ndash 15 ndash 10 ndash 5 0
Percentage deviation from the baseline (BH)
Modelling of ETR impacts on eco-innovation
Environmental tax reform in Europe opportunities for eco-innovation 33
Table 32 Additional ETS and environmental tax revenues in 2020 ( of GPD)
S2H Germany United Kingdom EU-27
ETS revenues 083 064 059
Carbon tax (industry) 052 044 054
Carbon tax (households) 033 041 036
Material tax 041 029 056
Sum 209 178 205
Figure 37 Total primary energy supply in 2020 under scenario S2H mdash deviation from the baseline (BH)
WorldEU-27EU-15
RomaniaBulgaria
Slovenia
MaltaLithuania
LatviaEstonia
Cyprus
SlovakiaPoland
HungaryCzech Republic
United KingdomSweden
SpainPortugal
NetherlandsItaly
IrelandGreece
FranceFinland
DenmarkLuxembourg
BelgiumAustria
Germany
ndash 24 ndash 21 ndash 18 ndash 15 ndash 12 ndash 9 ndash 6 ndash 3 0
Percentage deviation from the baseline (BH)
Environmental tax reform in Europe opportunities for eco-innovation
Modelling of ETR impacts on eco-innovation
34
Figure 38 Output price impacts of scenario S2H in Germany in 2020 mdash deviations from the baseline (BH)
Figure 39 Impacts of scenario S2H on industrial output in 2020 in Germany mdash deviations from the baseline (BH)
ndash 5
0
5
10
15
20
Output prices
Percentage deviation from the baseline (BH)
(3) F
ood
(4) T
extiles
(5) W
ood
(6) P
ulp pap
er
(7) C
oke re
fined
petro
leum
pro
ducts
(8) C
hemica
ls ex
cl pha
rma
(9) P
harm
aceu
ticals
(10)
Rub
ber a
nd plastics
(11)
Non
-metallic
miner
als
(12)
Iron
and
steel
(13)
Non
-ferrou
s metals
(14)
Met
al pro
ducts
(15)
Mac
hine
ry and
equ
ipmen
t
(16)
Office
mac
hine
ry
(17)
Electric
al m
achine
ry
(18)
Rad
io T
V
(19)
Med
ical pr
ecisi
on and
opt
ical ins
trumen
ts
(20)
Mot
or veh
icles
(21)
Ships
(22)
Airc
raft
(23)
Railro
ad
(24)
Man
ufac
turin
g n
ec r
ecyc
ling
(25)
Electric
ity g
as w
ater
sup
ply
(26)
Con
stru
ction
(27)
Tra
de r
epairs
(28)
Hot
els an
d re
stau
rant
s
(29)
Tra
nspo
rt an
d stor
age
(30)
Pos
t and
teleco
mmun
icatio
ns
(31)
Finan
ce ins
uran
ce
(32)
Rea
l estate ac
tivities
(33)
Ren
ting
(34)
Com
puter
(35)
Res
earch an
d de
velopm
ent
(36)
Oth
er bus
ines
s ac
tivities
(37)
Pub
lic ser
vice
s
(38)
Edu
catio
n
(39)
Hea
lth and
soc
ial w
ork
(40)
Oth
er ser
vice
s
(41)
Priv
ate ho
useh
olds
(1) A
gricu
lture
(2) M
ining an
d qu
arry
ing
nec not elsewhere classified
Production
ndash 100
ndash 80
ndash 60
ndash 40
ndash 20
00
20
40
60
80Percentage deviation from the baseline (BH)
(3) F
ood
(4) T
extiles
(5) W
ood
(6) P
ulp pap
er
(7) C
oke re
fined
petro
leum
pro
ducts
(8) C
hemica
ls ex
cl pha
rma
(9) P
harm
aceu
ticals
(10)
Rub
ber a
nd plastics
(11)
Non
-metallic
miner
als
(12)
Iron
and
steel
(13)
Non
-ferrou
s metals
(14)
Met
al pro
ducts
(15)
Mac
hine
ry and
equ
ipmen
t
(16)
Office
mac
hine
ry
(17)
Electric
al m
achine
ry
(18)
Rad
io T
V
(19)
Med
ical pr
ecisi
on and
opt
ical ins
trumen
ts
(20)
Mot
or veh
icles
(21)
Ships
(22)
Airc
raft
(23)
Railro
ad
(24)
Man
ufac
turin
g n
ec r
ecyc
ling
(25)
Electric
ity g
as w
ater
sup
ply
(26)
Con
stru
ction
(27)
Tra
de r
epairs
(28)
Hot
els an
d re
stau
rant
s
(29)
Tra
nspo
rt an
d stor
age
(30)
Pos
t and
teleco
mmun
icatio
ns
(31)
Finan
ce ins
uran
ce
(32)
Rea
l estate ac
tivities
(33)
Ren
ting
(34)
Com
puter
(35)
Res
earch an
d de
velopm
ent
(36)
Oth
er bus
ines
s ac
tivities
(37)
Pub
lic ser
vice
s
(38)
Edu
catio
n
(39)
Hea
lth and
soc
ial w
ork
(40)
Oth
er ser
vice
s
(41)
Priv
ate ho
useh
olds
(1) A
gricu
lture
(2) M
ining an
d qu
arry
ing
nec not elsewhere classified
Modelling of ETR impacts on eco-innovation
Environmental tax reform in Europe opportunities for eco-innovation 35
social security contributions and lowers labour costs according to the direct and indirect labour content of sector output The ETR therefore reduces output prices in labour-intensive service sectors and increases prices in carbon- and material-intensive industry sectors
The example of Germany shows insignificant impacts in the trade-intensive sectors of machinery (15ndash17) motor vehicles (20) and other transport equipment (21ndash23) (Figure 38) Iron and steel (12) and chemicals without pharmaceuticals (8) face the highest price increases of trade-intensive sectors As the German iron and steel industry primarily delivers high quality steel to the German car industry and increasingly to the German windmill industry negative competitiveness impacts will be limited Exchange rate variations against non-EU competitors have been much higher in the past
The higher prices of carbon- and material-intensive products will reduce price competitiveness on export markets and increase the market share for imports in domestic markets This loss of price competitiveness is based on an assumption of limited market development of energy efficiency and RES technologies in other part of the world It will be offset by gains in labour-intensive sectors if the ETR causes real wage costs per unit of output to fall as a result of using recycled revenues to reduce employer social security contributions
Any improvement in non-price competitiveness will also raise exports The extra employment will raise incomes raising consumption and output
The overall impact on sector output depends on countervailing effects which are negative for iron and steel and a few service sectors and positive for a few industry sectors For most industries the output effect is insignificant (Figure 39) The greatest impact is felt by producers of fossil fuels who must obviously reduce production due to lower demand for their products
Under scenario S2H employment impacts are positive for most sectors relative to the baseline as labour productivity decreases and wage rates fall in relation to consumer prices (CPI) and output prices (Table 33) The relative costs of labour are lower than in the baseline without the ETR reform Only around a quarter of the employment increase takes place in industry
Concerning the wage rate two countervailing effects have to be considered First when the labour market is characterised in terms of the real wage bargaining model as in E3ME and GINFORS with market power on both sides (employers and trade unions) consumer price increases will lead to wage increases (the econometrically estimated factor is 085 for Germany) Second labour productivity is another important factor for wage bargaining The estimated elasticity for Germany is 063 meaning that a 1 increase of labour productivity leads to wage increases of 063 Higher labour demand due to lower labour costs thus reduces the wage increase In the end the German economy is more labour intensive than without the ETR partly due to the structural change towards labour-intensive industries
Table 33 Employment impacts of scenario S2H in Germany mdash deviations from scenario S2H in 2020
Employment in 2020 Deviation from S2H () Deviation from S2Habsolute (1 000s)
Agriculture forestry 24 90
Industry 09 653
Non-metallic minerals 24 62
Iron and steel ndash 28 ndash 37
Machinery and equipment 05 56
Electrical machinery 04 18
Construction 37 449
Trade and transport 10 829
Business services 17 767
Other services ndash 02 ndash 216
Total 07 2506
Environmental tax reform in Europe opportunities for eco-innovation
Modelling of ETR impacts on eco-innovation
36
Additional exports under scenario S2HE mainly create new jobs in machinery and related business services (Table 34) Under scenario S2HI a shift in the input structure of the energy sector leads to a shift in the industry structure and creates a few jobs in the service sector (Table 35)
34 Conclusions of the scenario assessment
The foregoing analysis used the GINFORS model to assess economic and environmental impacts of using the ETS and ETR to reach the EUs 2020
GHG targets In general the results show positive employment effects and only small negative impacts on GDP in EU-27 Member States The economic impacts depend on the levels of international energy prices the mechanism used to recycle revenues and country specifics such as carbon and energy intensity and the structure of energy consumption
Although there is significant evidence that eco-innovation is positively driven by higher energy prices quantification is difficult The present study included simulations of possible impacts of a shift in the industry structure towards renewable energy in the electricity sector and an overall increase of EU
Table 34 Employment impacts of scenario S2HE in 2020 in Germany mdash deviations from scenario S2H
Employment in 2020 Deviation from S2H () Deviation from S2Habsolute (1 000s)
Agriculture forestry ndash 01 ndash 02
Industry 03 194
Non-metallic minerals 02 05
Iron and steel 04 05
Machinery and equipment 13 130
Electrical machinery 24 117
Construction 01 18
Trade and transport 00 26
Business services 07 308
Other services 01 107
Total 02 634
Table 35 Employment impacts of scenario S2HI in 2020 in Germany mdash deviations from scenario S2H
Employment in 2020 Deviation from S2H () Deviation from S2Habsolute (1 000s)
Agriculture forestry ndash 01 ndash 02
Industry 00 00
Non-metallic minerals 25 65
Iron and steel ndash 27 ndash 36
Machinery and equipment 08 78
Electrical machinery 04 19
Construction ndash 00 ndash 04
Trade and transport 00 07
Business services 02 115
Other services 0 56
Total 00 167
Modelling of ETR impacts on eco-innovation
Environmental tax reform in Europe opportunities for eco-innovation 37
exports due to higher global demand for renewable energy The main results can be summarised as follows
bull environmentaltaxreformshiftingtaxesfromlabour to energy and resources will create additional jobs and trigger eco-innovation
bull impactsofeco-innovationintheformofadditional EU exports or shifts in industry structures will have a slight positive influence on GDP and create a smaller number of additional jobs
These findings correspond to results from the EmployRES study (Fraunhofer ISI et al 2009) As ETR is directly aimed at reducing labour costs it will create additional jobs in the short and medium term In the longer term the cost reduction and new technologies arising from eco-innovation will play a larger role
Like all fiscal reforms a major ETR in Europe will create winners and losers At the sector level carbon- and material-intensive industries will face economic losses At the country level the carbon-intensity and overall flexibility of economies is important Clearly structural change away from carbon-intensive industries together with technological change is inherent in any successful climate mitigation policy
On the other hand several factors can smooth these structural adjustments International cooperation
will reduce economic pressure on countries and sectors In addition ETR together with auctioning of ETS allowances can be a major source of revenues for EU Member States in the future even if part of the revenues will have to be earmarked for adaptation and mitigation measures in developing countries Indeed future debate on grandfathering or auctioning ETS allowances should reflect the important point that giving allowances away for free denies countries the money to ease structural change and invest in low-carbon technologies
Caution is needed in relating the findings of this study to the EU policy debate In the model simulations the single carbon price is the only instrument used to reach the EUs 2020 GHG targets In reality of course other renewable energy and efficiency policies will also contribute to carbon reduction and have to be taken into account when comparing the results (especially the high carbon prices) to other studies Both reduce the potential revenues from fossil energy carriers and carbon emissions
A variety of renewable energy and efficiency policies could enable the climate and energy targets to be met while securing even better economic prospects The results of the present study clearly indicate that the discussion on market-based instruments should be intensified Ultimately however the EU will need a rich mix of policies to reach its GHG targets while maximising prosperity
Environmental tax reform in Europe opportunities for eco-innovation38
References
Almon C 1991 The INFORUM Approach to Interindustry Modeling in Economic Systems Research Vol 3 pp 1ndash7
Amin A and Cohendet P 2004 The Architecture of Knowledge Firms Capabilities and Communities Oxford University Press Oxford
Barker T Meyer B Pollitt H and Lutz C 2007a Modelling Environmental Tax Reform in Germany and the United Kingdom with E3ME and GINFORS petre Working Paper Cambridge and Osnabrueck (httpwwwpetreorgukpapershtm) accessed 15 February 2011
Barker T Junankar S Pollitt H and Summerton P 2007b Carbon leakage from unilateral environmental tax reforms in Europe 1995ndash2005 Energy Policy Vol 35 pp 6 281ndash6 292
Brunnermeier S B and Cohen M A 2003 Determinants of environmental innovation in US manufacturing industries Journal of Environmental Economics and Management Vol 45 pp 278ndash293
Buen J 2006 Danish and Norwegian wind industry The relationship between policy instruments innovation and diffusion Energy Policy Vol 34 (18) pp 3 887ndash3 897
Carlsson B and Stankiewicz R 1991 On the nature function and composition of technological systems Journal of Evolutionary Economics Vol 1 (2) pp 93ndash118
Christiansen A C and Skjaerseth J B 2005 Climate change policies in Norway and the Netherlands Different instruments similar outcome Energy and Environment Vol 16(1) pp 1ndash25
Dosi G 1988 Sources procedures and microeconomic effects of innovation Journal of Economic Literature Vol 26 pp 1 120ndash1 171
de Vries F and Medhi N 2008 Environmental regulation and international innovation in automotive emissions control technologies in Environmental Policy Technological Innovation and Patents Organisation for Economic Cooperation and Development Paris
DG TREN 2008 European energy and transport mdash trends to 2030 mdash update 2007 European Commission Luxembourg
DTI 2004 Renewable Supply Chain Gap Analysis UK Department of Trade and Industry
Edler J (ed) 2006 Nachfrageorientierte Innovationspolitik Buumlro fuumlr Technikfolgenabschaumltzung beim Deutschen Bundestag (TAB) Arbeitsbericht Nr 99 Berlin
Edquist C 2001 The system of innovation approach and innovation policy an account of the state of the art lead paper presented at the DRUID Conference 12ndash15 June 2001 Aalborg (httpwwwdruiddkconferencesnwpaper1edquistpdf) accessed 15 February 2011
EEA 2006 Using the market for cost-effective environmental policy Market-based instruments in Europe EEA Report No 12006 European Environment Agency Copenhagen
Ekins P 2009 Resource Productivity Environmental tax Reform and Sustainable Growth in Europe published by the Anglo-German Foundation for the Study of Industrial Society Final report (httpwwwpetreorgukpdfFinRepFinpdf) accessed 12 October 2011
Ekins P and Speck S (eds) 2011 Environmental Tax Reform (ETR) A Policy for Green Growth Oxford University Press
EREC 2008 Energy [r]evolution A sustainable global energy outlook Greenpeace International European Renewable Energy Council (EREC)
References
References
Environmental tax reform in Europe opportunities for eco-innovation 39
Fagerberg J Mowery D C and Nelson R R (eds) 2005 The Oxford Handbook of Innovation Oxford University Press Oxford
Fischer C Parry I W H and Pizer W A 2003 Instrument choice for environmental protection when technological innovation is endogenous Journal of Environmental Economics and Management Vol 45 pp 523ndash545
Fraunhofer ISI ECOFYS Energy Economics Group Ruumltter + Partner SEURECO and LEI 2009 EmployRES mdash The impact of renewable energy policy on economic growth and employment in the European Union European Commission Brussels
Frondel M Horbach J and Rennings K 2008 What triggers environmental management and innovation Empirical evidence for Germany Ecological Economics Vol 66(1) pp 153ndash160
GHK Cambridge Econometrics and IEEP 2007 Links between the environment economy and jobs Final Report submitted to DG Environment European Commission
Giljum S Behrens A Hinterberger F Lutz C and Meyer B 2008 Modelling scenarios towards a sustainable use of natural resources in Europe Environmental Science and Policy Vol 11 pp 204ndash216
Goumlrlach B Knigge M and Luumlckge H 2005 Wirkungen der Oumlkologischen Steuerreform auf Innovation und Marktdurchdringung Ecologic Berlin (httpecologiceudownloadprojekte1850-189918791879_5_innovationpdf) accessed 18 August 2011
Green M A 2000 Photovoltaics technology overview Energy Policy Vol 28 (14) pp 989ndash998
Grossmann A Lehr U Lutz C and Wolter MI 2008 Gesamtwirtschaftliche Effekte der Umsetzung der EU Ziele im Bereich Erneuerbare Energien und Gebaumludeeffizienz in Oumlsterreich bis 2020 Studie im Auftrag des Lebensministeriums Wien 0508
Hage J and Hollingsworth J R 2000 Idea innovation networks a strategy for integrating organizational and institutional analysis Organization Studies Vol 21 (5) pp 971ndash1 004
Hauschildt J 2004 Innovationsmanagement Vahlen Muumlnchen
Hemmelskamp J 1997 Environmental policy instruments and their effects on innovation European Planning Studies Vol 5 (2) pp 177ndash195
Hoglund Isaksson L 2005 Abatement costs in response to the Swedish charge on nitrogen oxide emissions Journal of Environmental Economics and Management Vol 50 pp 102ndash120
Hullmann A 2001 Internationaler Wissenstransfer und technischer Wandel (dissertation) Physica-Verlag Heidelberg
IEA 2008 World Energy Outlook 2008 International Energy Agency Paris
IEA 2009 World Energy Outlook 2009 International Energy Agency Paris
Jacobsson S Andersson B A and Baringngens L 2002 Transforming the energy system mdash the evolution of the German technological system for solar cells Science and Technology Policy Research University of Sussex Electronic Working Paper Series No 84 (httpideasrepecorgpsrussewps84html) accessed 18 August 2011
Jaffe A and Stavins R 1995 Dynamic incentives of environmental regulations the effects of alternative policy instruments on technology diffusion Journal of Environmental Economics and Management Vol 29(3) pp 43ndash63
Jaffe A B and Palmer K 1997 Environmental regulation and innovation a panel data study The Review of Economics and Statistics Vol 79 pp 610ndash619
Jaffe A B Newell R G and Stavins R N 2002 Environmental policy and technological change Environmental and Resource Economics Vol 22 (1ndash2) 2002 pp 41ndash70
Johnstone N and Hascic I 2008 Renewable energy policies and technological innovation energy source and instrument choice in Environmental Policy Technological Innovation and PatentsOrganisation for Economic Co-operation and Development Paris
Johnstone N 2005 The Innovation Effects of Environmental Policy Instruments in Horbach J (ed) Indicator Systems for Sustainable Innovation Physica-Verlag HD
Environmental tax reform in Europe opportunities for eco-innovation
References
40
Johnstone N Hascic I and Ostertag K 2008 Environmental policy technological innovation and patent activity in Environmental Policy Technological Innovation and Patents Organisation for Economic Co-operation and Development Paris
Jung C Krutilla K and Boyd R 1996 Incentives for advanced pollution abatement technology at the industry level an evaluation of policy alternatives Journal of Environmental Economics and Management Vol 30(1) pp 95ndash111
Kammen D M Kapidia K and Fripp M 2004 Putting renewables to work how many jobs can the clean energy industry generate University of California Berkeley
Kemp R 1997 Environmental policy and technical change ndash a comparison of the technological impact of policy instruments Edward Elgar Cheltenham
Kemp R 1998 The diffusion of biological waste-water treatment plants in the Dutch food and beverage industry Environmental and Resource Economics Vol 12 pp 113ndash136
Kemp R 2000 Technology and environmental policy ndash innovation effects of past policies and suggestions for improvement in OECD proceedings ndash innovation and the environment Organisation for Economic Co-operation and Development Paris
Kerr S and Newell R G 2003 Policy-induced technology adoption evidence from the US lead phasedown Journal of Industrial Economics Vol 51 pp 317ndash343
Klaassen G Miketa A Larsen K and Sundqvist T 2005 The impact of RampD on innovation for wind energy in Denmark Germany and the United Kingdom Ecological Economics Vol 54 pp 227ndash240
Kline S and Rosenberg N 1986 An overview of innovation in Landau R (ed) The positive sum strategy Harnessing technology for economic growth pp 275-306
Knigge M and Goumlrlach B 2005 Effects of Germanys ecological tax reforms on the environment employment and technological innovation Ecologic Berlin (httpwwwumweltbundesamtdeuba-info-presse-ehintergrundoekosteuerpdf) accessed 18 August 2011
Langniss O 2003 Governance structures for promoting renewable energy sources dissertation Lund Stuttgart
Lanjouw J O and Mody A 1996 Innovation and the international diffusion of environmentally responsive technology Research Policy Vol 25 pp 549ndash571
Lehr U Nitsch J Kratzat M Lutz C and Edler D 2008 Renewable Energy and Employment in Germany Energy Policy Vol 36 pp 108ndash117 DOI101016jenpol200709004
Lehr U Wolter MI and Groszligmann A 2009 Economic impacts of RES obligations in Austria ndash an application of the macro-econometric model e3at GWS Discussion Paper 20091 Osnabruumlck
Lundvall B-A Johnson B Andersen E S and Dalum B 2001 National systems of production innovation and competence building Research Policy Vol 31 pp 213ndash231
Lutz C and Giljum S 2009 Global resource use in a business as usual world until 2030 Updated results from the GINFORS model in Bleischwitz R Welfens Pand Zhang Z (eds) Sustainable growth and resource productivity ndash economic and global policy issues Greenleaf Publishers pp 30ndash41
Lutz C and Meyer B 2008 Beschaumlftigungseffekte des Klimaschutzes in Deutschland Untersuchungen zu gesamtwirtschaftlichen Auswirkungen ausgewaumlhlter Maszlignahmen des Energie- und Klimapakets Forschungsbericht 205 46 434 Dessau-Roszliglau
Lutz C and Meyer B 2009a Environmental and Economic Effects of Post-Kyoto Carbon Regimes Results of Simulations with the Global Model GINFORS Energy Policy Vol 37 pp 1 758ndash1 766 DOI 101016jenpol200901015
Lutz C and Meyer B 2009b Scenario results from GINFORS PETRE working paper Osnabruumlck
Lutz C Meyer B Nathani C and Schleich J 2005 Endogenous technological change and emissions The case of the German steel industry Energy Policy Vol33 pp 1 143ndash1 154
Lutz C Meyer B Nathani C and Schleich J 2007 Endogenous innovation economy and environment impacts of a technology based modelling approach for energy-intensive industries in Germany Energy Studies Review Vol 15(1) pp 2ndash18
References
Environmental tax reform in Europe opportunities for eco-innovation 41
Lutz C Meyer B and Wolter M I 2009 The global multisectormulticountry 3-E model GINFORS mdash a description of the model and a baseline forecast for global energy demand and CO2 emissions Journal of Sustainable Development forthcoming
Malerba F and Orsenigo L 1997 Technological Regimes and Sectoral Patterns of Innovative Activities Industrial and Corporate Change Vol 6 (1) pp 83ndash117
Malerba F 1992 Learning by Firms and Incremental Technical Change The Economic Journal Vol 102 (413) pp 845ndash859
Malerba F 2005 Industrial dynamics and innovation progress and challenges Presidential Address delivered at the 32nd Conference of the European Association for Research in Industrial Economics (EARIE) 1ndash4 September 2005 Porto
Malerba F 2006 Innovation and the evolution of industries Journal of Evolutionary Economics Vol 16 pp 3ndash23
McGinty M and de Vries F P 2009 Technology diffusion product differentiation and environmental subsidies The BE Journal of Economic Analysis and Policy Vol 9(1)
Meyer B and Lutz C 2007 The GINFORS model ndash model overview and evaluation Petre Working Paper Osnabruumlck (httpwwwpetreorgukpapershtm) accessed 18 August 2011
Meyer B Lutz C Schnur P and Zika G 2007 Economic policy simulations with global interdependencies a sensitivity analysis for Germany Economic Systems Research Vol 19 pp 37ndash55
Mickwitz P H Hyvaumlttinen and P Kivimaa 2008 The role of policy instruments in the innovation and diffusion of environmentally friendlier technologies popular claims versus case study experiences Journal of Cleaner Production Vol 16(1S1) 162ndash170
Miketa A and Schrattenholzer L 2004 Experiments with a methodology to model the role of RampD expenditures in energy technology learning processes first results Energy Policy Vol 32 (15) pp 1 679ndash1 692
Milliman S R and Prince R 1989 Firm incentives to promote technological change in pollution control Journal of Environmental Economics and Management Vol 17 pp 247ndash265
Millock K and Nauges C 2006 Ex-post evaluation of an earmarked tax on air pollution Land Economics Vol 82(1) pp 68ndash84
Montero J-P 2002 Market structure and environmental innovation Journal of Applied Economics Vol 2 pp 293ndash325
Moreno B and Loacutepez A J 2007 The effect of renewable energy on employment mdash The case of Asturias (Spain) Renewable and Sustainable Energy Rewiews doi 101016jrser200610011
Mowery D and Rosenberg N 1979 The influence of market demand upon innovation A critical review of some recent empirical studies Research Policy Vol 8 pp 102ndash153
Newell R G Jaffe A B and Stavins R N 1999 The induced innovation hypothesis and energy-saving technological change Quarterly Journal of Economics Vol 114 pp 941ndash975
Norberg-Bohm V 1999 Stimulating green technological innovation An analysis of alternative policy mechanisms Policy Sciences Vol 32(1) pp 13ndash38
OECD 2009 Sustainable manufacturing and eco-innovation towards a green economy Organisation for Economic Co-operation and Development Policy Brief June 2009
OECD 2010 Taxation innovation and the environment Organisation for Economic Co-operation and Development
Pavitt K 1984 Sectoral patterns of technological change Towards a taxonomy and a theory Research Policy Vol 13 pp 343ndash373
Popp D 2002 Induced innovation and energy prices The American Economic Review Vol 92(1) pp 160ndash180
Popp D 2005 Lessons from patents Using patents to measure technological change in environmental models Ecological Economics Vol 54 pp 209ndash226
Environmental tax reform in Europe opportunities for eco-innovation
References
42
Porter M and van der Linde C 1995 Toward a new conception of the environment competitiveness relationship Journal of Economic Perspectives Vol 9(4) pp 97ndash118
Rammert W 2002 The cultural shaping of technologies and the politics of technodiversity In Sorensen K and Williams R (eds) Shaping technology guiding policy concepts spaces and tools Elgar Cheltenham pp 155-172
Requate T 2005 Dynamic incentives by environmental policy instruments ndash a survey Ecological Economics Vol 54 pp 175ndash195
Roloff N Lehr U Krewitt W Fuchs G Wassermann S Weimer-Jehle W and Schmidt B 2008 Success determinants for technological innovations in the energy sector mdash the case of photovoltaics in Moumlst D Fichtner W Ragwitz M and Veit D (eds) New methods for energy market modelling mdash Proceedings of the first european workshop on energy market modelling using agent-based computational economics Universitaumltsverlag Karlsruhe
Rothwell R 1995 The fifth generation innovation process in Oppenlaumlnder KH Popp W (eds) Innovationen und wirtschaftlicher Fortschritt betriebs-und volkswirtschaftliche Perspektiven Bern pp 9ndash26
Schumpeter J 1942 Capitalism socialism and democracy New York Harper
Skjaeligrseth J B and Christiansen A C 2005 Environmental policy instruments and technological change in the energy sector findings from comparative empirical research Energy and Environment Vol 17 (2) pp 223ndash241
Snyder L D Miller N H and Stavins R N 2003 The effects of environmental regulations on pollution emissions evidence from plant-level data American Economic Review Vol 93(2) pp 431ndash435
Technopolis 2008 Eco-innovation Final Report for Sectoral Innovation Watch (httpwwwtechnopolis-groupcomresourcesdownloads661_report_finalpdf) accessed 18 August 2011
Volleburgh H 2007 Impacts of environmental policy instruments on technological change Report for Joint Meetings of Tax and Environment Experts OECD Environment Directorate February 2007 (comenvepocctpacfa(2006)36final)
Zimmermann H Wohltmann M and Hansjuumlrgens B 1996 Umweltabgaben und Innovation Analytica Marburg
43
Annex 1
Environmental tax reform in Europe opportunities for eco-innovation
Type Instrument Area Stage
Reference
Theo
retica
l
Em
piric
al
Cas
e st
udy
Rev
iew
Qual
itat
ive
Taxe
s
Perm
its
Subsi
die
s
Volu
nta
ry
Com
man
d
Reg
ula
tion
Ener
gy
Air
Wat
er
Oth
er
Gen
eral
Innov
atio
n
Diffu
sion
Rel
evan
ce
Brunnermeier amp Cohen (2003)
X X X X
Buen (2006) X X X X X X
Christiansen amp Skjaerseth (2005)
X X X X X X
Fischer et al (2003 X X X X X X
Frondel et al (2008) X X X X X X X (X) (X)
Hemmelskamp (1997)
X X X X X X X (X)
Hoglund Isaksson (2005)
X X X (X) (X)
Jaffe amp Stavins (1995)
X X X1 X X X X
Jaffe amp Palmer (1997)
X X X X
Jaffe et al (2002) X X X X X X X X X X
Jung et al (1996) X X X X X X (X) (X)
Kemp (1998) X X X X
Kerr amp Newell (2001) X X X X X
Klaassen et al (2005)
X X X X X
Lanjouw amp Mody (1996)
X X X X X X X
McGinty amp de Vries (2009)
X X X X
Mickwitz et al (2008)
X X X X X X X X X
Milliman amp Prince (1989)
X X X X X X X
Millock amp Nauges (2006)
X X X X X X
Montero (2002) X X X X X
Newell et al (1999) X X1 X X X
Norberg-Bohm (1999)
X X X X X X X
Popp (2002) X X1 X X
Popp (2005) X X X X X X
Porter amp van der Linde (1995)
X X X X X X
Requate (2005) X X X X X X X
Skjaeligrseth amp Christiansen (2005)
X X X X X X X X X
Snyder et al (2003) X X X X X
Annex 1 Classification of refereed journal articles
Environmental tax reform in Europe opportunities for eco-innovation44
Annex 2
Type Instrument Area Stage
Reference
Theo
retica
l
Em
piric
al
Cas
e st
udy
Rev
iew
Qual
itat
ive
Taxe
s
Perm
its
Subsi
die
s
Volu
nta
ry
Com
man
d
Reg
ula
tion
Ener
gy
Air
Wat
er
Oth
er
Gen
eral
Innov
atio
n
Diffu
sion
Rel
evan
ce
Johnstone (2005)
X X X X X X X
Johnstone amp Hascic (2008)
X X X X X X X X
Kemp (1997) X X X X X X X X X X X X X
Kemp (2000) X X X X X X X X X
de Vries amp Medhi (2008)
X X1 X X X
Annex 2 Classification of books and book chapters
45
Annex 3
Environmental tax reform in Europe opportunities for eco-innovation
Type Instrument Area Stage
Reference
Theo
retica
l
Em
piric
al
Cas
e st
udy
Rev
iew
Qual
itat
ive
Taxe
s
Perm
its
Subsi
die
s
Volu
nta
ry
Com
man
d
Reg
ula
tion
Ener
gy
Air
Wat
er
Oth
er
Gen
eral
Innov
atio
n
Diffu
sion
Rel
evan
ce
Goumlrlach et al (2005)
X X X X X X
Knigge amp Goumlrlach (2005)
X X X X X X
Technopolis (2008)
X X X X X X
Volleburgh (2007)
X X X X X X X X X X X
Annex 3 Classification of reports
European Environment Agency
Environmental tax reform in Europe opportunities for eco-innovation
2011 mdash 45 pp mdash 21 x 297 cm
ISBN 978-92-9213-238-5doi10280084889
How to obtain EU publications
Publications for salebull viaEUBookshop(httpbookshopeuropaeu)bull fromyourbooksellerbyquotingthetitlethepublisherandorISBNnumberbull bycontactingoneofoursalesagentsdirectlyYoucanobtaintheircontactdetails
on the Internet (httpbookshopeuropaeu) or by sending a fax to +352 2929-42758
Free publicationsbull viaEUBookshop(httpbookshopeuropaeu)bull attheEuropeanCommissionsrepresentationsordelegationsYoucanobtain
their contact details on the Internet (httpeceuropaeu) or by sending a fax to +352 2929-42758
European Environment AgencyKongens Nytorv 61050 Copenhagen KDenmark
Tel +45 33 36 71 00Fax +45 33 36 71 99
Web eeaeuropaeuEnquiries eeaeuropaeuenquiries
TH
-AK-1
1-0
17-E
N-N
doi1
02
8008
4889
- Acknowledgements
- Executive summary
- 1Introduction
-
- 11Background
- 12ETR and innovation
- 13Report structure
-
- 2Review of literature on environmental tax reform and eco‑innovation
-
- 21Initial screening
- 22Detailed review
- 23Environmental regulation studies
- 24Theoretical studies
- 25Empirical studies
- 26Case studies
- 27Conclusions
-
- 3Modelling of ETR impacts on eco‑innovation
-
- 31Scenarios assessing the implications of ETR for eco-innovation
- 32Overview of modelling results
- 33Macroeconomic impacts at the national level
- 34Conclusions of the scenario assessment
-
- References
- Annex 1 Classification of refereed journal articles
- Annex 2Classification of books and book chapters
- Annex 3Classification of reports
-
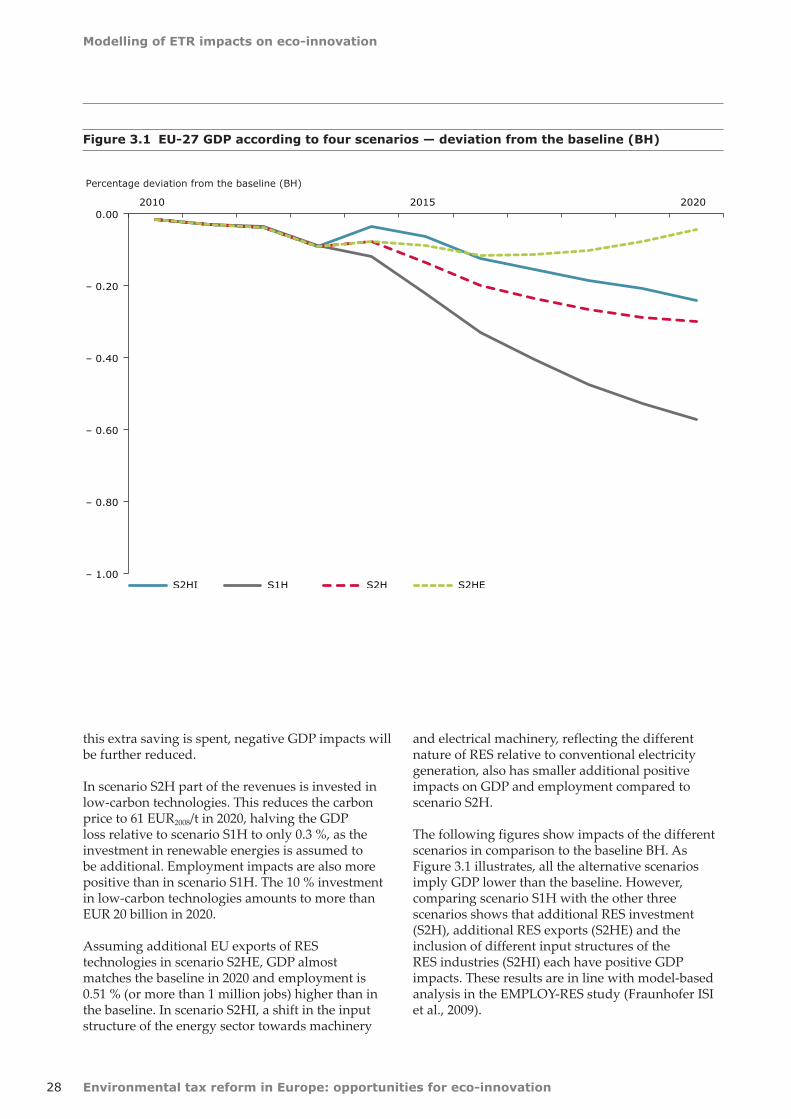
Environmental tax reform in Europe opportunities for eco-innovation
Modelling of ETR impacts on eco-innovation
28
this extra saving is spent negative GDP impacts will be further reduced
In scenario S2H part of the revenues is invested in low-carbon technologies This reduces the carbon price to 61 EUR2008t in 2020 halving the GDP loss relative to scenario S1H to only 03 as the investment in renewable energies is assumed to be additional Employment impacts are also more positive than in scenario S1H The 10 investment in low-carbon technologies amounts to more than EUR 20 billion in 2020
Assuming additional EU exports of RES technologies in scenario S2HE GDP almost matches the baseline in 2020 and employment is 051 (or more than 1 million jobs) higher than in the baseline In scenario S2HI a shift in the input structure of the energy sector towards machinery
and electrical machinery reflecting the different nature of RES relative to conventional electricity generation also has smaller additional positive impacts on GDP and employment compared to scenario S2H
The following figures show impacts of the different scenarios in comparison to the baseline BH As Figure 31 illustrates all the alternative scenarios imply GDP lower than the baseline However comparing scenario S1H with the other three scenarios shows that additional RES investment (S2H) additional RES exports (S2HE) and the inclusion of different input structures of the RES industries (S2HI) each have positive GDP impacts These results are in line with model-based analysis in the EMPLOY-RES study (Fraunhofer ISI et al 2009)
Figure 31 EU-27 GDP according to four scenarios mdash deviation from the baseline (BH)
Percentage deviation from the baseline (BH)
ndash 100
ndash 080
ndash 060
ndash 040
ndash 020
0002010 2015 2020
S2HI S1H S2H S2HE
Modelling of ETR impacts on eco-innovation
Environmental tax reform in Europe opportunities for eco-innovation 29
In contrast to GDP employment increases relative to the baseline in all the alternative scenarios (Figure 32) Due to the scenario design the structure of the EU economies is shifted from energy-intensive to labour-intensive sectors The magnitude of the employment gain is influenced by the carbon price and the tax shift the underlying energy prices and the production loss The largest part of the employment increase stems from the additional RES investment (scenario S2H) although a shift in industry structures (S2HI) and additional RES exports (S2HE) are also positive for the labour market
33 Macroeconomic impacts at the national level
In general terms it is clear that national ETS and ETR impacts depend significantly on country specifics including energy use economic structure social system and behaviour (eg reactions to labour cost changes) In countries with high carbon intensity in their energy mix additional revenues and expenditures are higher than in countries with lower carbon intensity
Scenario S2H provides an interesting tool for analysing the macroeconomic impacts of ETR at the national level because 10 of the additional generated revenues are used for eco-innovation investments meaning that only 90 of the revenues are recycled back into the economy by reducing income tax rates and social security contributions
Figure 32 EU-27 employment according to four scenarios mdash deviation from the baseline (BH)
ndash 020
000
020
040
060
2010 2015 2020
S2HI S1H S2H S2HE
Percentage deviation from the baseline (BH)
Environmental tax reform in Europe opportunities for eco-innovation
Modelling of ETR impacts on eco-innovation
30
Figure 34 GDP in 2020 in EU-27 Member States under scenario S2H mdash deviation form the baseline (BH)
Figure 33 GDP in 2020 in selected countries under scenario S2H mdash deviation from the baseline (BH)
ndash 25 ndash 20 ndash 15 ndash 10 ndash 05 00 05 10 15
Romania
Bulgaria
SloveniaMalta
Lithuania
Latvia
Estonia
CyprusSlovakia
Poland
Hungary
Czech RepublicUnited Kingdom
Sweden
Spain
Portugal
Netherlands
Italy
Ireland
Greece
FranceFinland
Denmark
Luxembourg
Belgium
Austria
Germany
Percentage deviation from the baseline (BH)
Russia
South Africa
Brazil
India
China
Mexico
Japan
USA
Poland
United Kingdom
Spain
Italy
France
Germany
ndash 30 ndash 25 ndash 20 ndash 15 ndash 10 ndash 05 00 05 10
Percentage deviation from the baseline (BH)
Modelling of ETR impacts on eco-innovation
Environmental tax reform in Europe opportunities for eco-innovation 31
Figure 35 Employment in 2020 in EU-27 Member States under scenario S2H mdash deviation from baseline (BH)
EU-27EU-15
RomaniaBulgariaSloveniaMalta
LithuaniaLatvia
EstoniaCyprusSlovakia
PolandHungary
Czech RepublicUnited Kingdom
SwedenSpain
PortugalNetherlands
ItalyIrelandGreece
FranceFinlandDenmarkLuxembourg
BelgiumAustria
Germany
ndash 200 0 200 400 600 800 1 000
Percentage deviation from the baseline (BH)
Under scenario S2H the GDP of large EU economies deviates from baseline projections by between 0 and ndash 1 with the exception of Italy (Figure 33) Germanys GDP is even forecast to match the baseline level in 2020 due to the countrys strong RES industry Outside Europe some countries gain slightly against EU Member States in terms of competitiveness as export prices in most EU Member States and sectors increase and GDP in those countries exceeds the baseline projections as a result (Figure 33) This is mainly because carbon tax revenues are recycled via income tax reductions which are not part of production costs However energy exporting economies such as Russia or South Africa will lose exports if EU demand for fossil fuel imports declines The development of all EU Member States is shown in Figure 34
Employment impacts of scenario S2H are positive for almost all EU Member States as lower labour
costs increase labour demand and labour intensity (Figure 35) The highest absolute increases are shown for Germany the Netherlands Italy and the United Kingdom For EU-27 as a whole employment will be almost one million higher than in the corresponding baseline BH in 2020
The scenarios have not been designed with a view to meeting the EU renewables target of a 20 renewables share in final energy consumption in 2020 Nevertheless the scenarios provide some interesting insights The share is projected to increase from around 10 in 2009 to above 14 even in the baseline as instruments such as feed in tariffs and biofuel quotas will continue In scenario S1H the target will be missed with around 18 in 2020 Only in scenarios S2H S2HE and S2HI is the target met (approximately 20 )
Environmental tax reform in Europe opportunities for eco-innovation
Modelling of ETR impacts on eco-innovation
32
Under scenario S2H energy-related carbon emissions are reduced in all EU Member States relative to the baseline (Figure 36) The highest percentage reductions can be seen in many of the EU-12 Member States with still high energy intensity and low energy prices In these countries the relative price increase is higher than in countries like Germany or the United Kingdom with already high energy taxes and overall energy prices
Additional ETS revenues material tax revenues and carbon tax revenues from the industry sector are recycled back to industry via reductions in employers social security contributions (or wage subsidies in some countries) The revenues from the carbon tax on households set out in Table 32 (totalling 033 of GDP in Germany for example) are used to reduce income tax For the EU-27 overall revenues from ETS and ETR reach about 2 of GDP in 2020 although these figures may be excessive because additional EU efforts to increase energy
efficiency and renewable energy which will reduce the ETS price are not taken into account The use of flexible tools such as the Clean Development Mechanism will further reduce the revenues and earmarking of part of the revenues for mitigation and adaptation measures in emerging and developing countries limits the recycling into labour costs
In addition the scenarios do not take the current global economic problems into account According to the IEA (2009) the downturn will also reduce carbon emissions in the long run which will lead to lower carbon prices and revenues to reach fixed targets (or make tighter targets less costly)
The ETR will have varying effects on the prices of different sorts of products and services Material or carbon taxes increase the prices of product groups according to their direct and indirect material and carbon content The recycling mechanism reduces
Figure 36 Energy-related CO2 emissions in 2020 under scenario S2H mdash deviation from the baseline (BH)
WorldEU-27
EU-15Romania
BulgariaSlovenia
MaltaLithuania
LatviaEstonia
CyprusSlovakia
PolandHungary
Czech RepublicUnited Kingdom
SwedenSpain
PortugalNetherlands
ItalyIreland
GreeceFrance
FinlandDenmark
LuxembourgBelgium
AustriaGermany
ndash 25 ndash 20 ndash 15 ndash 10 ndash 5 0
Percentage deviation from the baseline (BH)
Modelling of ETR impacts on eco-innovation
Environmental tax reform in Europe opportunities for eco-innovation 33
Table 32 Additional ETS and environmental tax revenues in 2020 ( of GPD)
S2H Germany United Kingdom EU-27
ETS revenues 083 064 059
Carbon tax (industry) 052 044 054
Carbon tax (households) 033 041 036
Material tax 041 029 056
Sum 209 178 205
Figure 37 Total primary energy supply in 2020 under scenario S2H mdash deviation from the baseline (BH)
WorldEU-27EU-15
RomaniaBulgaria
Slovenia
MaltaLithuania
LatviaEstonia
Cyprus
SlovakiaPoland
HungaryCzech Republic
United KingdomSweden
SpainPortugal
NetherlandsItaly
IrelandGreece
FranceFinland
DenmarkLuxembourg
BelgiumAustria
Germany
ndash 24 ndash 21 ndash 18 ndash 15 ndash 12 ndash 9 ndash 6 ndash 3 0
Percentage deviation from the baseline (BH)
Environmental tax reform in Europe opportunities for eco-innovation
Modelling of ETR impacts on eco-innovation
34
Figure 38 Output price impacts of scenario S2H in Germany in 2020 mdash deviations from the baseline (BH)
Figure 39 Impacts of scenario S2H on industrial output in 2020 in Germany mdash deviations from the baseline (BH)
ndash 5
0
5
10
15
20
Output prices
Percentage deviation from the baseline (BH)
(3) F
ood
(4) T
extiles
(5) W
ood
(6) P
ulp pap
er
(7) C
oke re
fined
petro
leum
pro
ducts
(8) C
hemica
ls ex
cl pha
rma
(9) P
harm
aceu
ticals
(10)
Rub
ber a
nd plastics
(11)
Non
-metallic
miner
als
(12)
Iron
and
steel
(13)
Non
-ferrou
s metals
(14)
Met
al pro
ducts
(15)
Mac
hine
ry and
equ
ipmen
t
(16)
Office
mac
hine
ry
(17)
Electric
al m
achine
ry
(18)
Rad
io T
V
(19)
Med
ical pr
ecisi
on and
opt
ical ins
trumen
ts
(20)
Mot
or veh
icles
(21)
Ships
(22)
Airc
raft
(23)
Railro
ad
(24)
Man
ufac
turin
g n
ec r
ecyc
ling
(25)
Electric
ity g
as w
ater
sup
ply
(26)
Con
stru
ction
(27)
Tra
de r
epairs
(28)
Hot
els an
d re
stau
rant
s
(29)
Tra
nspo
rt an
d stor
age
(30)
Pos
t and
teleco
mmun
icatio
ns
(31)
Finan
ce ins
uran
ce
(32)
Rea
l estate ac
tivities
(33)
Ren
ting
(34)
Com
puter
(35)
Res
earch an
d de
velopm
ent
(36)
Oth
er bus
ines
s ac
tivities
(37)
Pub
lic ser
vice
s
(38)
Edu
catio
n
(39)
Hea
lth and
soc
ial w
ork
(40)
Oth
er ser
vice
s
(41)
Priv
ate ho
useh
olds
(1) A
gricu
lture
(2) M
ining an
d qu
arry
ing
nec not elsewhere classified
Production
ndash 100
ndash 80
ndash 60
ndash 40
ndash 20
00
20
40
60
80Percentage deviation from the baseline (BH)
(3) F
ood
(4) T
extiles
(5) W
ood
(6) P
ulp pap
er
(7) C
oke re
fined
petro
leum
pro
ducts
(8) C
hemica
ls ex
cl pha
rma
(9) P
harm
aceu
ticals
(10)
Rub
ber a
nd plastics
(11)
Non
-metallic
miner
als
(12)
Iron
and
steel
(13)
Non
-ferrou
s metals
(14)
Met
al pro
ducts
(15)
Mac
hine
ry and
equ
ipmen
t
(16)
Office
mac
hine
ry
(17)
Electric
al m
achine
ry
(18)
Rad
io T
V
(19)
Med
ical pr
ecisi
on and
opt
ical ins
trumen
ts
(20)
Mot
or veh
icles
(21)
Ships
(22)
Airc
raft
(23)
Railro
ad
(24)
Man
ufac
turin
g n
ec r
ecyc
ling
(25)
Electric
ity g
as w
ater
sup
ply
(26)
Con
stru
ction
(27)
Tra
de r
epairs
(28)
Hot
els an
d re
stau
rant
s
(29)
Tra
nspo
rt an
d stor
age
(30)
Pos
t and
teleco
mmun
icatio
ns
(31)
Finan
ce ins
uran
ce
(32)
Rea
l estate ac
tivities
(33)
Ren
ting
(34)
Com
puter
(35)
Res
earch an
d de
velopm
ent
(36)
Oth
er bus
ines
s ac
tivities
(37)
Pub
lic ser
vice
s
(38)
Edu
catio
n
(39)
Hea
lth and
soc
ial w
ork
(40)
Oth
er ser
vice
s
(41)
Priv
ate ho
useh
olds
(1) A
gricu
lture
(2) M
ining an
d qu
arry
ing
nec not elsewhere classified
Modelling of ETR impacts on eco-innovation
Environmental tax reform in Europe opportunities for eco-innovation 35
social security contributions and lowers labour costs according to the direct and indirect labour content of sector output The ETR therefore reduces output prices in labour-intensive service sectors and increases prices in carbon- and material-intensive industry sectors
The example of Germany shows insignificant impacts in the trade-intensive sectors of machinery (15ndash17) motor vehicles (20) and other transport equipment (21ndash23) (Figure 38) Iron and steel (12) and chemicals without pharmaceuticals (8) face the highest price increases of trade-intensive sectors As the German iron and steel industry primarily delivers high quality steel to the German car industry and increasingly to the German windmill industry negative competitiveness impacts will be limited Exchange rate variations against non-EU competitors have been much higher in the past
The higher prices of carbon- and material-intensive products will reduce price competitiveness on export markets and increase the market share for imports in domestic markets This loss of price competitiveness is based on an assumption of limited market development of energy efficiency and RES technologies in other part of the world It will be offset by gains in labour-intensive sectors if the ETR causes real wage costs per unit of output to fall as a result of using recycled revenues to reduce employer social security contributions
Any improvement in non-price competitiveness will also raise exports The extra employment will raise incomes raising consumption and output
The overall impact on sector output depends on countervailing effects which are negative for iron and steel and a few service sectors and positive for a few industry sectors For most industries the output effect is insignificant (Figure 39) The greatest impact is felt by producers of fossil fuels who must obviously reduce production due to lower demand for their products
Under scenario S2H employment impacts are positive for most sectors relative to the baseline as labour productivity decreases and wage rates fall in relation to consumer prices (CPI) and output prices (Table 33) The relative costs of labour are lower than in the baseline without the ETR reform Only around a quarter of the employment increase takes place in industry
Concerning the wage rate two countervailing effects have to be considered First when the labour market is characterised in terms of the real wage bargaining model as in E3ME and GINFORS with market power on both sides (employers and trade unions) consumer price increases will lead to wage increases (the econometrically estimated factor is 085 for Germany) Second labour productivity is another important factor for wage bargaining The estimated elasticity for Germany is 063 meaning that a 1 increase of labour productivity leads to wage increases of 063 Higher labour demand due to lower labour costs thus reduces the wage increase In the end the German economy is more labour intensive than without the ETR partly due to the structural change towards labour-intensive industries
Table 33 Employment impacts of scenario S2H in Germany mdash deviations from scenario S2H in 2020
Employment in 2020 Deviation from S2H () Deviation from S2Habsolute (1 000s)
Agriculture forestry 24 90
Industry 09 653
Non-metallic minerals 24 62
Iron and steel ndash 28 ndash 37
Machinery and equipment 05 56
Electrical machinery 04 18
Construction 37 449
Trade and transport 10 829
Business services 17 767
Other services ndash 02 ndash 216
Total 07 2506
Environmental tax reform in Europe opportunities for eco-innovation
Modelling of ETR impacts on eco-innovation
36
Additional exports under scenario S2HE mainly create new jobs in machinery and related business services (Table 34) Under scenario S2HI a shift in the input structure of the energy sector leads to a shift in the industry structure and creates a few jobs in the service sector (Table 35)
34 Conclusions of the scenario assessment
The foregoing analysis used the GINFORS model to assess economic and environmental impacts of using the ETS and ETR to reach the EUs 2020
GHG targets In general the results show positive employment effects and only small negative impacts on GDP in EU-27 Member States The economic impacts depend on the levels of international energy prices the mechanism used to recycle revenues and country specifics such as carbon and energy intensity and the structure of energy consumption
Although there is significant evidence that eco-innovation is positively driven by higher energy prices quantification is difficult The present study included simulations of possible impacts of a shift in the industry structure towards renewable energy in the electricity sector and an overall increase of EU
Table 34 Employment impacts of scenario S2HE in 2020 in Germany mdash deviations from scenario S2H
Employment in 2020 Deviation from S2H () Deviation from S2Habsolute (1 000s)
Agriculture forestry ndash 01 ndash 02
Industry 03 194
Non-metallic minerals 02 05
Iron and steel 04 05
Machinery and equipment 13 130
Electrical machinery 24 117
Construction 01 18
Trade and transport 00 26
Business services 07 308
Other services 01 107
Total 02 634
Table 35 Employment impacts of scenario S2HI in 2020 in Germany mdash deviations from scenario S2H
Employment in 2020 Deviation from S2H () Deviation from S2Habsolute (1 000s)
Agriculture forestry ndash 01 ndash 02
Industry 00 00
Non-metallic minerals 25 65
Iron and steel ndash 27 ndash 36
Machinery and equipment 08 78
Electrical machinery 04 19
Construction ndash 00 ndash 04
Trade and transport 00 07
Business services 02 115
Other services 0 56
Total 00 167
Modelling of ETR impacts on eco-innovation
Environmental tax reform in Europe opportunities for eco-innovation 37
exports due to higher global demand for renewable energy The main results can be summarised as follows
bull environmentaltaxreformshiftingtaxesfromlabour to energy and resources will create additional jobs and trigger eco-innovation
bull impactsofeco-innovationintheformofadditional EU exports or shifts in industry structures will have a slight positive influence on GDP and create a smaller number of additional jobs
These findings correspond to results from the EmployRES study (Fraunhofer ISI et al 2009) As ETR is directly aimed at reducing labour costs it will create additional jobs in the short and medium term In the longer term the cost reduction and new technologies arising from eco-innovation will play a larger role
Like all fiscal reforms a major ETR in Europe will create winners and losers At the sector level carbon- and material-intensive industries will face economic losses At the country level the carbon-intensity and overall flexibility of economies is important Clearly structural change away from carbon-intensive industries together with technological change is inherent in any successful climate mitigation policy
On the other hand several factors can smooth these structural adjustments International cooperation
will reduce economic pressure on countries and sectors In addition ETR together with auctioning of ETS allowances can be a major source of revenues for EU Member States in the future even if part of the revenues will have to be earmarked for adaptation and mitigation measures in developing countries Indeed future debate on grandfathering or auctioning ETS allowances should reflect the important point that giving allowances away for free denies countries the money to ease structural change and invest in low-carbon technologies
Caution is needed in relating the findings of this study to the EU policy debate In the model simulations the single carbon price is the only instrument used to reach the EUs 2020 GHG targets In reality of course other renewable energy and efficiency policies will also contribute to carbon reduction and have to be taken into account when comparing the results (especially the high carbon prices) to other studies Both reduce the potential revenues from fossil energy carriers and carbon emissions
A variety of renewable energy and efficiency policies could enable the climate and energy targets to be met while securing even better economic prospects The results of the present study clearly indicate that the discussion on market-based instruments should be intensified Ultimately however the EU will need a rich mix of policies to reach its GHG targets while maximising prosperity
Environmental tax reform in Europe opportunities for eco-innovation38
References
Almon C 1991 The INFORUM Approach to Interindustry Modeling in Economic Systems Research Vol 3 pp 1ndash7
Amin A and Cohendet P 2004 The Architecture of Knowledge Firms Capabilities and Communities Oxford University Press Oxford
Barker T Meyer B Pollitt H and Lutz C 2007a Modelling Environmental Tax Reform in Germany and the United Kingdom with E3ME and GINFORS petre Working Paper Cambridge and Osnabrueck (httpwwwpetreorgukpapershtm) accessed 15 February 2011
Barker T Junankar S Pollitt H and Summerton P 2007b Carbon leakage from unilateral environmental tax reforms in Europe 1995ndash2005 Energy Policy Vol 35 pp 6 281ndash6 292
Brunnermeier S B and Cohen M A 2003 Determinants of environmental innovation in US manufacturing industries Journal of Environmental Economics and Management Vol 45 pp 278ndash293
Buen J 2006 Danish and Norwegian wind industry The relationship between policy instruments innovation and diffusion Energy Policy Vol 34 (18) pp 3 887ndash3 897
Carlsson B and Stankiewicz R 1991 On the nature function and composition of technological systems Journal of Evolutionary Economics Vol 1 (2) pp 93ndash118
Christiansen A C and Skjaerseth J B 2005 Climate change policies in Norway and the Netherlands Different instruments similar outcome Energy and Environment Vol 16(1) pp 1ndash25
Dosi G 1988 Sources procedures and microeconomic effects of innovation Journal of Economic Literature Vol 26 pp 1 120ndash1 171
de Vries F and Medhi N 2008 Environmental regulation and international innovation in automotive emissions control technologies in Environmental Policy Technological Innovation and Patents Organisation for Economic Cooperation and Development Paris
DG TREN 2008 European energy and transport mdash trends to 2030 mdash update 2007 European Commission Luxembourg
DTI 2004 Renewable Supply Chain Gap Analysis UK Department of Trade and Industry
Edler J (ed) 2006 Nachfrageorientierte Innovationspolitik Buumlro fuumlr Technikfolgenabschaumltzung beim Deutschen Bundestag (TAB) Arbeitsbericht Nr 99 Berlin
Edquist C 2001 The system of innovation approach and innovation policy an account of the state of the art lead paper presented at the DRUID Conference 12ndash15 June 2001 Aalborg (httpwwwdruiddkconferencesnwpaper1edquistpdf) accessed 15 February 2011
EEA 2006 Using the market for cost-effective environmental policy Market-based instruments in Europe EEA Report No 12006 European Environment Agency Copenhagen
Ekins P 2009 Resource Productivity Environmental tax Reform and Sustainable Growth in Europe published by the Anglo-German Foundation for the Study of Industrial Society Final report (httpwwwpetreorgukpdfFinRepFinpdf) accessed 12 October 2011
Ekins P and Speck S (eds) 2011 Environmental Tax Reform (ETR) A Policy for Green Growth Oxford University Press
EREC 2008 Energy [r]evolution A sustainable global energy outlook Greenpeace International European Renewable Energy Council (EREC)
References
References
Environmental tax reform in Europe opportunities for eco-innovation 39
Fagerberg J Mowery D C and Nelson R R (eds) 2005 The Oxford Handbook of Innovation Oxford University Press Oxford
Fischer C Parry I W H and Pizer W A 2003 Instrument choice for environmental protection when technological innovation is endogenous Journal of Environmental Economics and Management Vol 45 pp 523ndash545
Fraunhofer ISI ECOFYS Energy Economics Group Ruumltter + Partner SEURECO and LEI 2009 EmployRES mdash The impact of renewable energy policy on economic growth and employment in the European Union European Commission Brussels
Frondel M Horbach J and Rennings K 2008 What triggers environmental management and innovation Empirical evidence for Germany Ecological Economics Vol 66(1) pp 153ndash160
GHK Cambridge Econometrics and IEEP 2007 Links between the environment economy and jobs Final Report submitted to DG Environment European Commission
Giljum S Behrens A Hinterberger F Lutz C and Meyer B 2008 Modelling scenarios towards a sustainable use of natural resources in Europe Environmental Science and Policy Vol 11 pp 204ndash216
Goumlrlach B Knigge M and Luumlckge H 2005 Wirkungen der Oumlkologischen Steuerreform auf Innovation und Marktdurchdringung Ecologic Berlin (httpecologiceudownloadprojekte1850-189918791879_5_innovationpdf) accessed 18 August 2011
Green M A 2000 Photovoltaics technology overview Energy Policy Vol 28 (14) pp 989ndash998
Grossmann A Lehr U Lutz C and Wolter MI 2008 Gesamtwirtschaftliche Effekte der Umsetzung der EU Ziele im Bereich Erneuerbare Energien und Gebaumludeeffizienz in Oumlsterreich bis 2020 Studie im Auftrag des Lebensministeriums Wien 0508
Hage J and Hollingsworth J R 2000 Idea innovation networks a strategy for integrating organizational and institutional analysis Organization Studies Vol 21 (5) pp 971ndash1 004
Hauschildt J 2004 Innovationsmanagement Vahlen Muumlnchen
Hemmelskamp J 1997 Environmental policy instruments and their effects on innovation European Planning Studies Vol 5 (2) pp 177ndash195
Hoglund Isaksson L 2005 Abatement costs in response to the Swedish charge on nitrogen oxide emissions Journal of Environmental Economics and Management Vol 50 pp 102ndash120
Hullmann A 2001 Internationaler Wissenstransfer und technischer Wandel (dissertation) Physica-Verlag Heidelberg
IEA 2008 World Energy Outlook 2008 International Energy Agency Paris
IEA 2009 World Energy Outlook 2009 International Energy Agency Paris
Jacobsson S Andersson B A and Baringngens L 2002 Transforming the energy system mdash the evolution of the German technological system for solar cells Science and Technology Policy Research University of Sussex Electronic Working Paper Series No 84 (httpideasrepecorgpsrussewps84html) accessed 18 August 2011
Jaffe A and Stavins R 1995 Dynamic incentives of environmental regulations the effects of alternative policy instruments on technology diffusion Journal of Environmental Economics and Management Vol 29(3) pp 43ndash63
Jaffe A B and Palmer K 1997 Environmental regulation and innovation a panel data study The Review of Economics and Statistics Vol 79 pp 610ndash619
Jaffe A B Newell R G and Stavins R N 2002 Environmental policy and technological change Environmental and Resource Economics Vol 22 (1ndash2) 2002 pp 41ndash70
Johnstone N and Hascic I 2008 Renewable energy policies and technological innovation energy source and instrument choice in Environmental Policy Technological Innovation and PatentsOrganisation for Economic Co-operation and Development Paris
Johnstone N 2005 The Innovation Effects of Environmental Policy Instruments in Horbach J (ed) Indicator Systems for Sustainable Innovation Physica-Verlag HD
Environmental tax reform in Europe opportunities for eco-innovation
References
40
Johnstone N Hascic I and Ostertag K 2008 Environmental policy technological innovation and patent activity in Environmental Policy Technological Innovation and Patents Organisation for Economic Co-operation and Development Paris
Jung C Krutilla K and Boyd R 1996 Incentives for advanced pollution abatement technology at the industry level an evaluation of policy alternatives Journal of Environmental Economics and Management Vol 30(1) pp 95ndash111
Kammen D M Kapidia K and Fripp M 2004 Putting renewables to work how many jobs can the clean energy industry generate University of California Berkeley
Kemp R 1997 Environmental policy and technical change ndash a comparison of the technological impact of policy instruments Edward Elgar Cheltenham
Kemp R 1998 The diffusion of biological waste-water treatment plants in the Dutch food and beverage industry Environmental and Resource Economics Vol 12 pp 113ndash136
Kemp R 2000 Technology and environmental policy ndash innovation effects of past policies and suggestions for improvement in OECD proceedings ndash innovation and the environment Organisation for Economic Co-operation and Development Paris
Kerr S and Newell R G 2003 Policy-induced technology adoption evidence from the US lead phasedown Journal of Industrial Economics Vol 51 pp 317ndash343
Klaassen G Miketa A Larsen K and Sundqvist T 2005 The impact of RampD on innovation for wind energy in Denmark Germany and the United Kingdom Ecological Economics Vol 54 pp 227ndash240
Kline S and Rosenberg N 1986 An overview of innovation in Landau R (ed) The positive sum strategy Harnessing technology for economic growth pp 275-306
Knigge M and Goumlrlach B 2005 Effects of Germanys ecological tax reforms on the environment employment and technological innovation Ecologic Berlin (httpwwwumweltbundesamtdeuba-info-presse-ehintergrundoekosteuerpdf) accessed 18 August 2011
Langniss O 2003 Governance structures for promoting renewable energy sources dissertation Lund Stuttgart
Lanjouw J O and Mody A 1996 Innovation and the international diffusion of environmentally responsive technology Research Policy Vol 25 pp 549ndash571
Lehr U Nitsch J Kratzat M Lutz C and Edler D 2008 Renewable Energy and Employment in Germany Energy Policy Vol 36 pp 108ndash117 DOI101016jenpol200709004
Lehr U Wolter MI and Groszligmann A 2009 Economic impacts of RES obligations in Austria ndash an application of the macro-econometric model e3at GWS Discussion Paper 20091 Osnabruumlck
Lundvall B-A Johnson B Andersen E S and Dalum B 2001 National systems of production innovation and competence building Research Policy Vol 31 pp 213ndash231
Lutz C and Giljum S 2009 Global resource use in a business as usual world until 2030 Updated results from the GINFORS model in Bleischwitz R Welfens Pand Zhang Z (eds) Sustainable growth and resource productivity ndash economic and global policy issues Greenleaf Publishers pp 30ndash41
Lutz C and Meyer B 2008 Beschaumlftigungseffekte des Klimaschutzes in Deutschland Untersuchungen zu gesamtwirtschaftlichen Auswirkungen ausgewaumlhlter Maszlignahmen des Energie- und Klimapakets Forschungsbericht 205 46 434 Dessau-Roszliglau
Lutz C and Meyer B 2009a Environmental and Economic Effects of Post-Kyoto Carbon Regimes Results of Simulations with the Global Model GINFORS Energy Policy Vol 37 pp 1 758ndash1 766 DOI 101016jenpol200901015
Lutz C and Meyer B 2009b Scenario results from GINFORS PETRE working paper Osnabruumlck
Lutz C Meyer B Nathani C and Schleich J 2005 Endogenous technological change and emissions The case of the German steel industry Energy Policy Vol33 pp 1 143ndash1 154
Lutz C Meyer B Nathani C and Schleich J 2007 Endogenous innovation economy and environment impacts of a technology based modelling approach for energy-intensive industries in Germany Energy Studies Review Vol 15(1) pp 2ndash18
References
Environmental tax reform in Europe opportunities for eco-innovation 41
Lutz C Meyer B and Wolter M I 2009 The global multisectormulticountry 3-E model GINFORS mdash a description of the model and a baseline forecast for global energy demand and CO2 emissions Journal of Sustainable Development forthcoming
Malerba F and Orsenigo L 1997 Technological Regimes and Sectoral Patterns of Innovative Activities Industrial and Corporate Change Vol 6 (1) pp 83ndash117
Malerba F 1992 Learning by Firms and Incremental Technical Change The Economic Journal Vol 102 (413) pp 845ndash859
Malerba F 2005 Industrial dynamics and innovation progress and challenges Presidential Address delivered at the 32nd Conference of the European Association for Research in Industrial Economics (EARIE) 1ndash4 September 2005 Porto
Malerba F 2006 Innovation and the evolution of industries Journal of Evolutionary Economics Vol 16 pp 3ndash23
McGinty M and de Vries F P 2009 Technology diffusion product differentiation and environmental subsidies The BE Journal of Economic Analysis and Policy Vol 9(1)
Meyer B and Lutz C 2007 The GINFORS model ndash model overview and evaluation Petre Working Paper Osnabruumlck (httpwwwpetreorgukpapershtm) accessed 18 August 2011
Meyer B Lutz C Schnur P and Zika G 2007 Economic policy simulations with global interdependencies a sensitivity analysis for Germany Economic Systems Research Vol 19 pp 37ndash55
Mickwitz P H Hyvaumlttinen and P Kivimaa 2008 The role of policy instruments in the innovation and diffusion of environmentally friendlier technologies popular claims versus case study experiences Journal of Cleaner Production Vol 16(1S1) 162ndash170
Miketa A and Schrattenholzer L 2004 Experiments with a methodology to model the role of RampD expenditures in energy technology learning processes first results Energy Policy Vol 32 (15) pp 1 679ndash1 692
Milliman S R and Prince R 1989 Firm incentives to promote technological change in pollution control Journal of Environmental Economics and Management Vol 17 pp 247ndash265
Millock K and Nauges C 2006 Ex-post evaluation of an earmarked tax on air pollution Land Economics Vol 82(1) pp 68ndash84
Montero J-P 2002 Market structure and environmental innovation Journal of Applied Economics Vol 2 pp 293ndash325
Moreno B and Loacutepez A J 2007 The effect of renewable energy on employment mdash The case of Asturias (Spain) Renewable and Sustainable Energy Rewiews doi 101016jrser200610011
Mowery D and Rosenberg N 1979 The influence of market demand upon innovation A critical review of some recent empirical studies Research Policy Vol 8 pp 102ndash153
Newell R G Jaffe A B and Stavins R N 1999 The induced innovation hypothesis and energy-saving technological change Quarterly Journal of Economics Vol 114 pp 941ndash975
Norberg-Bohm V 1999 Stimulating green technological innovation An analysis of alternative policy mechanisms Policy Sciences Vol 32(1) pp 13ndash38
OECD 2009 Sustainable manufacturing and eco-innovation towards a green economy Organisation for Economic Co-operation and Development Policy Brief June 2009
OECD 2010 Taxation innovation and the environment Organisation for Economic Co-operation and Development
Pavitt K 1984 Sectoral patterns of technological change Towards a taxonomy and a theory Research Policy Vol 13 pp 343ndash373
Popp D 2002 Induced innovation and energy prices The American Economic Review Vol 92(1) pp 160ndash180
Popp D 2005 Lessons from patents Using patents to measure technological change in environmental models Ecological Economics Vol 54 pp 209ndash226
Environmental tax reform in Europe opportunities for eco-innovation
References
42
Porter M and van der Linde C 1995 Toward a new conception of the environment competitiveness relationship Journal of Economic Perspectives Vol 9(4) pp 97ndash118
Rammert W 2002 The cultural shaping of technologies and the politics of technodiversity In Sorensen K and Williams R (eds) Shaping technology guiding policy concepts spaces and tools Elgar Cheltenham pp 155-172
Requate T 2005 Dynamic incentives by environmental policy instruments ndash a survey Ecological Economics Vol 54 pp 175ndash195
Roloff N Lehr U Krewitt W Fuchs G Wassermann S Weimer-Jehle W and Schmidt B 2008 Success determinants for technological innovations in the energy sector mdash the case of photovoltaics in Moumlst D Fichtner W Ragwitz M and Veit D (eds) New methods for energy market modelling mdash Proceedings of the first european workshop on energy market modelling using agent-based computational economics Universitaumltsverlag Karlsruhe
Rothwell R 1995 The fifth generation innovation process in Oppenlaumlnder KH Popp W (eds) Innovationen und wirtschaftlicher Fortschritt betriebs-und volkswirtschaftliche Perspektiven Bern pp 9ndash26
Schumpeter J 1942 Capitalism socialism and democracy New York Harper
Skjaeligrseth J B and Christiansen A C 2005 Environmental policy instruments and technological change in the energy sector findings from comparative empirical research Energy and Environment Vol 17 (2) pp 223ndash241
Snyder L D Miller N H and Stavins R N 2003 The effects of environmental regulations on pollution emissions evidence from plant-level data American Economic Review Vol 93(2) pp 431ndash435
Technopolis 2008 Eco-innovation Final Report for Sectoral Innovation Watch (httpwwwtechnopolis-groupcomresourcesdownloads661_report_finalpdf) accessed 18 August 2011
Volleburgh H 2007 Impacts of environmental policy instruments on technological change Report for Joint Meetings of Tax and Environment Experts OECD Environment Directorate February 2007 (comenvepocctpacfa(2006)36final)
Zimmermann H Wohltmann M and Hansjuumlrgens B 1996 Umweltabgaben und Innovation Analytica Marburg
43
Annex 1
Environmental tax reform in Europe opportunities for eco-innovation
Type Instrument Area Stage
Reference
Theo
retica
l
Em
piric
al
Cas
e st
udy
Rev
iew
Qual
itat
ive
Taxe
s
Perm
its
Subsi
die
s
Volu
nta
ry
Com
man
d
Reg
ula
tion
Ener
gy
Air
Wat
er
Oth
er
Gen
eral
Innov
atio
n
Diffu
sion
Rel
evan
ce
Brunnermeier amp Cohen (2003)
X X X X
Buen (2006) X X X X X X
Christiansen amp Skjaerseth (2005)
X X X X X X
Fischer et al (2003 X X X X X X
Frondel et al (2008) X X X X X X X (X) (X)
Hemmelskamp (1997)
X X X X X X X (X)
Hoglund Isaksson (2005)
X X X (X) (X)
Jaffe amp Stavins (1995)
X X X1 X X X X
Jaffe amp Palmer (1997)
X X X X
Jaffe et al (2002) X X X X X X X X X X
Jung et al (1996) X X X X X X (X) (X)
Kemp (1998) X X X X
Kerr amp Newell (2001) X X X X X
Klaassen et al (2005)
X X X X X
Lanjouw amp Mody (1996)
X X X X X X X
McGinty amp de Vries (2009)
X X X X
Mickwitz et al (2008)
X X X X X X X X X
Milliman amp Prince (1989)
X X X X X X X
Millock amp Nauges (2006)
X X X X X X
Montero (2002) X X X X X
Newell et al (1999) X X1 X X X
Norberg-Bohm (1999)
X X X X X X X
Popp (2002) X X1 X X
Popp (2005) X X X X X X
Porter amp van der Linde (1995)
X X X X X X
Requate (2005) X X X X X X X
Skjaeligrseth amp Christiansen (2005)
X X X X X X X X X
Snyder et al (2003) X X X X X
Annex 1 Classification of refereed journal articles
Environmental tax reform in Europe opportunities for eco-innovation44
Annex 2
Type Instrument Area Stage
Reference
Theo
retica
l
Em
piric
al
Cas
e st
udy
Rev
iew
Qual
itat
ive
Taxe
s
Perm
its
Subsi
die
s
Volu
nta
ry
Com
man
d
Reg
ula
tion
Ener
gy
Air
Wat
er
Oth
er
Gen
eral
Innov
atio
n
Diffu
sion
Rel
evan
ce
Johnstone (2005)
X X X X X X X
Johnstone amp Hascic (2008)
X X X X X X X X
Kemp (1997) X X X X X X X X X X X X X
Kemp (2000) X X X X X X X X X
de Vries amp Medhi (2008)
X X1 X X X
Annex 2 Classification of books and book chapters
45
Annex 3
Environmental tax reform in Europe opportunities for eco-innovation
Type Instrument Area Stage
Reference
Theo
retica
l
Em
piric
al
Cas
e st
udy
Rev
iew
Qual
itat
ive
Taxe
s
Perm
its
Subsi
die
s
Volu
nta
ry
Com
man
d
Reg
ula
tion
Ener
gy
Air
Wat
er
Oth
er
Gen
eral
Innov
atio
n
Diffu
sion
Rel
evan
ce
Goumlrlach et al (2005)
X X X X X X
Knigge amp Goumlrlach (2005)
X X X X X X
Technopolis (2008)
X X X X X X
Volleburgh (2007)
X X X X X X X X X X X
Annex 3 Classification of reports
European Environment Agency
Environmental tax reform in Europe opportunities for eco-innovation
2011 mdash 45 pp mdash 21 x 297 cm
ISBN 978-92-9213-238-5doi10280084889
How to obtain EU publications
Publications for salebull viaEUBookshop(httpbookshopeuropaeu)bull fromyourbooksellerbyquotingthetitlethepublisherandorISBNnumberbull bycontactingoneofoursalesagentsdirectlyYoucanobtaintheircontactdetails
on the Internet (httpbookshopeuropaeu) or by sending a fax to +352 2929-42758
Free publicationsbull viaEUBookshop(httpbookshopeuropaeu)bull attheEuropeanCommissionsrepresentationsordelegationsYoucanobtain
their contact details on the Internet (httpeceuropaeu) or by sending a fax to +352 2929-42758
European Environment AgencyKongens Nytorv 61050 Copenhagen KDenmark
Tel +45 33 36 71 00Fax +45 33 36 71 99
Web eeaeuropaeuEnquiries eeaeuropaeuenquiries
TH
-AK-1
1-0
17-E
N-N
doi1
02
8008
4889
- Acknowledgements
- Executive summary
- 1Introduction
-
- 11Background
- 12ETR and innovation
- 13Report structure
-
- 2Review of literature on environmental tax reform and eco‑innovation
-
- 21Initial screening
- 22Detailed review
- 23Environmental regulation studies
- 24Theoretical studies
- 25Empirical studies
- 26Case studies
- 27Conclusions
-
- 3Modelling of ETR impacts on eco‑innovation
-
- 31Scenarios assessing the implications of ETR for eco-innovation
- 32Overview of modelling results
- 33Macroeconomic impacts at the national level
- 34Conclusions of the scenario assessment
-
- References
- Annex 1 Classification of refereed journal articles
- Annex 2Classification of books and book chapters
- Annex 3Classification of reports
-
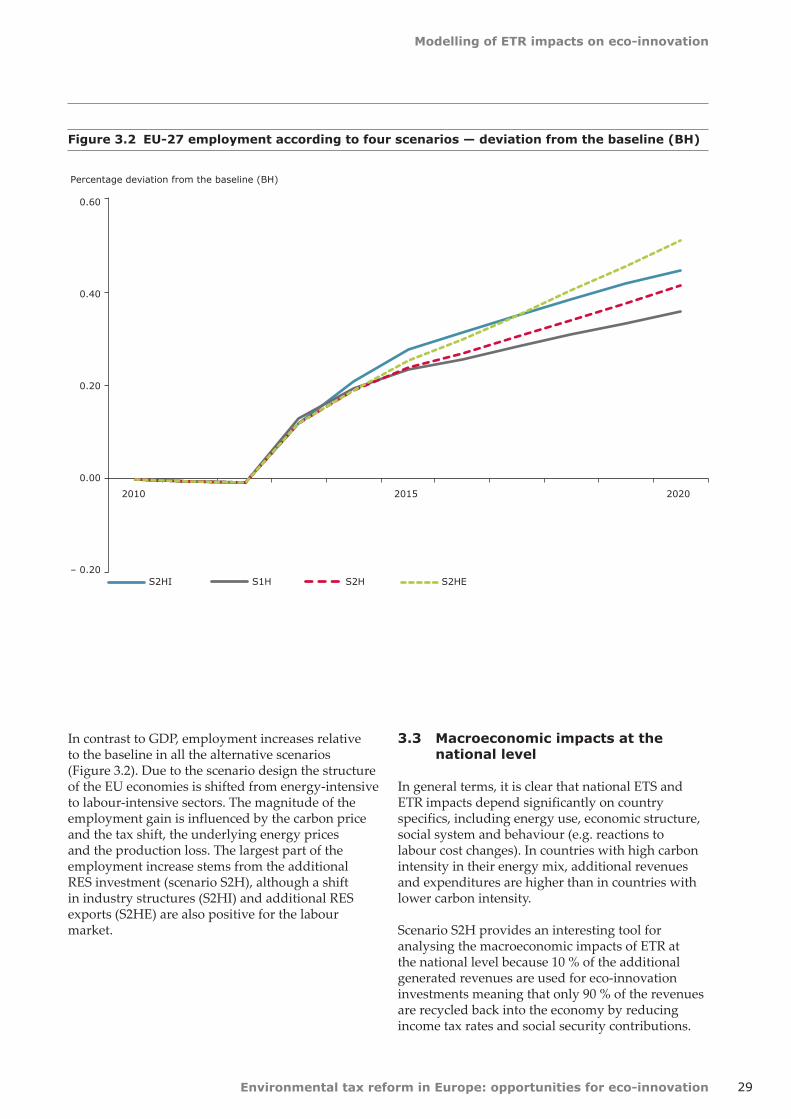
Modelling of ETR impacts on eco-innovation
Environmental tax reform in Europe opportunities for eco-innovation 29
In contrast to GDP employment increases relative to the baseline in all the alternative scenarios (Figure 32) Due to the scenario design the structure of the EU economies is shifted from energy-intensive to labour-intensive sectors The magnitude of the employment gain is influenced by the carbon price and the tax shift the underlying energy prices and the production loss The largest part of the employment increase stems from the additional RES investment (scenario S2H) although a shift in industry structures (S2HI) and additional RES exports (S2HE) are also positive for the labour market
33 Macroeconomic impacts at the national level
In general terms it is clear that national ETS and ETR impacts depend significantly on country specifics including energy use economic structure social system and behaviour (eg reactions to labour cost changes) In countries with high carbon intensity in their energy mix additional revenues and expenditures are higher than in countries with lower carbon intensity
Scenario S2H provides an interesting tool for analysing the macroeconomic impacts of ETR at the national level because 10 of the additional generated revenues are used for eco-innovation investments meaning that only 90 of the revenues are recycled back into the economy by reducing income tax rates and social security contributions
Figure 32 EU-27 employment according to four scenarios mdash deviation from the baseline (BH)
ndash 020
000
020
040
060
2010 2015 2020
S2HI S1H S2H S2HE
Percentage deviation from the baseline (BH)
Environmental tax reform in Europe opportunities for eco-innovation
Modelling of ETR impacts on eco-innovation
30
Figure 34 GDP in 2020 in EU-27 Member States under scenario S2H mdash deviation form the baseline (BH)
Figure 33 GDP in 2020 in selected countries under scenario S2H mdash deviation from the baseline (BH)
ndash 25 ndash 20 ndash 15 ndash 10 ndash 05 00 05 10 15
Romania
Bulgaria
SloveniaMalta
Lithuania
Latvia
Estonia
CyprusSlovakia
Poland
Hungary
Czech RepublicUnited Kingdom
Sweden
Spain
Portugal
Netherlands
Italy
Ireland
Greece
FranceFinland
Denmark
Luxembourg
Belgium
Austria
Germany
Percentage deviation from the baseline (BH)
Russia
South Africa
Brazil
India
China
Mexico
Japan
USA
Poland
United Kingdom
Spain
Italy
France
Germany
ndash 30 ndash 25 ndash 20 ndash 15 ndash 10 ndash 05 00 05 10
Percentage deviation from the baseline (BH)
Modelling of ETR impacts on eco-innovation
Environmental tax reform in Europe opportunities for eco-innovation 31
Figure 35 Employment in 2020 in EU-27 Member States under scenario S2H mdash deviation from baseline (BH)
EU-27EU-15
RomaniaBulgariaSloveniaMalta
LithuaniaLatvia
EstoniaCyprusSlovakia
PolandHungary
Czech RepublicUnited Kingdom
SwedenSpain
PortugalNetherlands
ItalyIrelandGreece
FranceFinlandDenmarkLuxembourg
BelgiumAustria
Germany
ndash 200 0 200 400 600 800 1 000
Percentage deviation from the baseline (BH)
Under scenario S2H the GDP of large EU economies deviates from baseline projections by between 0 and ndash 1 with the exception of Italy (Figure 33) Germanys GDP is even forecast to match the baseline level in 2020 due to the countrys strong RES industry Outside Europe some countries gain slightly against EU Member States in terms of competitiveness as export prices in most EU Member States and sectors increase and GDP in those countries exceeds the baseline projections as a result (Figure 33) This is mainly because carbon tax revenues are recycled via income tax reductions which are not part of production costs However energy exporting economies such as Russia or South Africa will lose exports if EU demand for fossil fuel imports declines The development of all EU Member States is shown in Figure 34
Employment impacts of scenario S2H are positive for almost all EU Member States as lower labour
costs increase labour demand and labour intensity (Figure 35) The highest absolute increases are shown for Germany the Netherlands Italy and the United Kingdom For EU-27 as a whole employment will be almost one million higher than in the corresponding baseline BH in 2020
The scenarios have not been designed with a view to meeting the EU renewables target of a 20 renewables share in final energy consumption in 2020 Nevertheless the scenarios provide some interesting insights The share is projected to increase from around 10 in 2009 to above 14 even in the baseline as instruments such as feed in tariffs and biofuel quotas will continue In scenario S1H the target will be missed with around 18 in 2020 Only in scenarios S2H S2HE and S2HI is the target met (approximately 20 )
Environmental tax reform in Europe opportunities for eco-innovation
Modelling of ETR impacts on eco-innovation
32
Under scenario S2H energy-related carbon emissions are reduced in all EU Member States relative to the baseline (Figure 36) The highest percentage reductions can be seen in many of the EU-12 Member States with still high energy intensity and low energy prices In these countries the relative price increase is higher than in countries like Germany or the United Kingdom with already high energy taxes and overall energy prices
Additional ETS revenues material tax revenues and carbon tax revenues from the industry sector are recycled back to industry via reductions in employers social security contributions (or wage subsidies in some countries) The revenues from the carbon tax on households set out in Table 32 (totalling 033 of GDP in Germany for example) are used to reduce income tax For the EU-27 overall revenues from ETS and ETR reach about 2 of GDP in 2020 although these figures may be excessive because additional EU efforts to increase energy
efficiency and renewable energy which will reduce the ETS price are not taken into account The use of flexible tools such as the Clean Development Mechanism will further reduce the revenues and earmarking of part of the revenues for mitigation and adaptation measures in emerging and developing countries limits the recycling into labour costs
In addition the scenarios do not take the current global economic problems into account According to the IEA (2009) the downturn will also reduce carbon emissions in the long run which will lead to lower carbon prices and revenues to reach fixed targets (or make tighter targets less costly)
The ETR will have varying effects on the prices of different sorts of products and services Material or carbon taxes increase the prices of product groups according to their direct and indirect material and carbon content The recycling mechanism reduces
Figure 36 Energy-related CO2 emissions in 2020 under scenario S2H mdash deviation from the baseline (BH)
WorldEU-27
EU-15Romania
BulgariaSlovenia
MaltaLithuania
LatviaEstonia
CyprusSlovakia
PolandHungary
Czech RepublicUnited Kingdom
SwedenSpain
PortugalNetherlands
ItalyIreland
GreeceFrance
FinlandDenmark
LuxembourgBelgium
AustriaGermany
ndash 25 ndash 20 ndash 15 ndash 10 ndash 5 0
Percentage deviation from the baseline (BH)
Modelling of ETR impacts on eco-innovation
Environmental tax reform in Europe opportunities for eco-innovation 33
Table 32 Additional ETS and environmental tax revenues in 2020 ( of GPD)
S2H Germany United Kingdom EU-27
ETS revenues 083 064 059
Carbon tax (industry) 052 044 054
Carbon tax (households) 033 041 036
Material tax 041 029 056
Sum 209 178 205
Figure 37 Total primary energy supply in 2020 under scenario S2H mdash deviation from the baseline (BH)
WorldEU-27EU-15
RomaniaBulgaria
Slovenia
MaltaLithuania
LatviaEstonia
Cyprus
SlovakiaPoland
HungaryCzech Republic
United KingdomSweden
SpainPortugal
NetherlandsItaly
IrelandGreece
FranceFinland
DenmarkLuxembourg
BelgiumAustria
Germany
ndash 24 ndash 21 ndash 18 ndash 15 ndash 12 ndash 9 ndash 6 ndash 3 0
Percentage deviation from the baseline (BH)
Environmental tax reform in Europe opportunities for eco-innovation
Modelling of ETR impacts on eco-innovation
34
Figure 38 Output price impacts of scenario S2H in Germany in 2020 mdash deviations from the baseline (BH)
Figure 39 Impacts of scenario S2H on industrial output in 2020 in Germany mdash deviations from the baseline (BH)
ndash 5
0
5
10
15
20
Output prices
Percentage deviation from the baseline (BH)
(3) F
ood
(4) T
extiles
(5) W
ood
(6) P
ulp pap
er
(7) C
oke re
fined
petro
leum
pro
ducts
(8) C
hemica
ls ex
cl pha
rma
(9) P
harm
aceu
ticals
(10)
Rub
ber a
nd plastics
(11)
Non
-metallic
miner
als
(12)
Iron
and
steel
(13)
Non
-ferrou
s metals
(14)
Met
al pro
ducts
(15)
Mac
hine
ry and
equ
ipmen
t
(16)
Office
mac
hine
ry
(17)
Electric
al m
achine
ry
(18)
Rad
io T
V
(19)
Med
ical pr
ecisi
on and
opt
ical ins
trumen
ts
(20)
Mot
or veh
icles
(21)
Ships
(22)
Airc
raft
(23)
Railro
ad
(24)
Man
ufac
turin
g n
ec r
ecyc
ling
(25)
Electric
ity g
as w
ater
sup
ply
(26)
Con
stru
ction
(27)
Tra
de r
epairs
(28)
Hot
els an
d re
stau
rant
s
(29)
Tra
nspo
rt an
d stor
age
(30)
Pos
t and
teleco
mmun
icatio
ns
(31)
Finan
ce ins
uran
ce
(32)
Rea
l estate ac
tivities
(33)
Ren
ting
(34)
Com
puter
(35)
Res
earch an
d de
velopm
ent
(36)
Oth
er bus
ines
s ac
tivities
(37)
Pub
lic ser
vice
s
(38)
Edu
catio
n
(39)
Hea
lth and
soc
ial w
ork
(40)
Oth
er ser
vice
s
(41)
Priv
ate ho
useh
olds
(1) A
gricu
lture
(2) M
ining an
d qu
arry
ing
nec not elsewhere classified
Production
ndash 100
ndash 80
ndash 60
ndash 40
ndash 20
00
20
40
60
80Percentage deviation from the baseline (BH)
(3) F
ood
(4) T
extiles
(5) W
ood
(6) P
ulp pap
er
(7) C
oke re
fined
petro
leum
pro
ducts
(8) C
hemica
ls ex
cl pha
rma
(9) P
harm
aceu
ticals
(10)
Rub
ber a
nd plastics
(11)
Non
-metallic
miner
als
(12)
Iron
and
steel
(13)
Non
-ferrou
s metals
(14)
Met
al pro
ducts
(15)
Mac
hine
ry and
equ
ipmen
t
(16)
Office
mac
hine
ry
(17)
Electric
al m
achine
ry
(18)
Rad
io T
V
(19)
Med
ical pr
ecisi
on and
opt
ical ins
trumen
ts
(20)
Mot
or veh
icles
(21)
Ships
(22)
Airc
raft
(23)
Railro
ad
(24)
Man
ufac
turin
g n
ec r
ecyc
ling
(25)
Electric
ity g
as w
ater
sup
ply
(26)
Con
stru
ction
(27)
Tra
de r
epairs
(28)
Hot
els an
d re
stau
rant
s
(29)
Tra
nspo
rt an
d stor
age
(30)
Pos
t and
teleco
mmun
icatio
ns
(31)
Finan
ce ins
uran
ce
(32)
Rea
l estate ac
tivities
(33)
Ren
ting
(34)
Com
puter
(35)
Res
earch an
d de
velopm
ent
(36)
Oth
er bus
ines
s ac
tivities
(37)
Pub
lic ser
vice
s
(38)
Edu
catio
n
(39)
Hea
lth and
soc
ial w
ork
(40)
Oth
er ser
vice
s
(41)
Priv
ate ho
useh
olds
(1) A
gricu
lture
(2) M
ining an
d qu
arry
ing
nec not elsewhere classified
Modelling of ETR impacts on eco-innovation
Environmental tax reform in Europe opportunities for eco-innovation 35
social security contributions and lowers labour costs according to the direct and indirect labour content of sector output The ETR therefore reduces output prices in labour-intensive service sectors and increases prices in carbon- and material-intensive industry sectors
The example of Germany shows insignificant impacts in the trade-intensive sectors of machinery (15ndash17) motor vehicles (20) and other transport equipment (21ndash23) (Figure 38) Iron and steel (12) and chemicals without pharmaceuticals (8) face the highest price increases of trade-intensive sectors As the German iron and steel industry primarily delivers high quality steel to the German car industry and increasingly to the German windmill industry negative competitiveness impacts will be limited Exchange rate variations against non-EU competitors have been much higher in the past
The higher prices of carbon- and material-intensive products will reduce price competitiveness on export markets and increase the market share for imports in domestic markets This loss of price competitiveness is based on an assumption of limited market development of energy efficiency and RES technologies in other part of the world It will be offset by gains in labour-intensive sectors if the ETR causes real wage costs per unit of output to fall as a result of using recycled revenues to reduce employer social security contributions
Any improvement in non-price competitiveness will also raise exports The extra employment will raise incomes raising consumption and output
The overall impact on sector output depends on countervailing effects which are negative for iron and steel and a few service sectors and positive for a few industry sectors For most industries the output effect is insignificant (Figure 39) The greatest impact is felt by producers of fossil fuels who must obviously reduce production due to lower demand for their products
Under scenario S2H employment impacts are positive for most sectors relative to the baseline as labour productivity decreases and wage rates fall in relation to consumer prices (CPI) and output prices (Table 33) The relative costs of labour are lower than in the baseline without the ETR reform Only around a quarter of the employment increase takes place in industry
Concerning the wage rate two countervailing effects have to be considered First when the labour market is characterised in terms of the real wage bargaining model as in E3ME and GINFORS with market power on both sides (employers and trade unions) consumer price increases will lead to wage increases (the econometrically estimated factor is 085 for Germany) Second labour productivity is another important factor for wage bargaining The estimated elasticity for Germany is 063 meaning that a 1 increase of labour productivity leads to wage increases of 063 Higher labour demand due to lower labour costs thus reduces the wage increase In the end the German economy is more labour intensive than without the ETR partly due to the structural change towards labour-intensive industries
Table 33 Employment impacts of scenario S2H in Germany mdash deviations from scenario S2H in 2020
Employment in 2020 Deviation from S2H () Deviation from S2Habsolute (1 000s)
Agriculture forestry 24 90
Industry 09 653
Non-metallic minerals 24 62
Iron and steel ndash 28 ndash 37
Machinery and equipment 05 56
Electrical machinery 04 18
Construction 37 449
Trade and transport 10 829
Business services 17 767
Other services ndash 02 ndash 216
Total 07 2506
Environmental tax reform in Europe opportunities for eco-innovation
Modelling of ETR impacts on eco-innovation
36
Additional exports under scenario S2HE mainly create new jobs in machinery and related business services (Table 34) Under scenario S2HI a shift in the input structure of the energy sector leads to a shift in the industry structure and creates a few jobs in the service sector (Table 35)
34 Conclusions of the scenario assessment
The foregoing analysis used the GINFORS model to assess economic and environmental impacts of using the ETS and ETR to reach the EUs 2020
GHG targets In general the results show positive employment effects and only small negative impacts on GDP in EU-27 Member States The economic impacts depend on the levels of international energy prices the mechanism used to recycle revenues and country specifics such as carbon and energy intensity and the structure of energy consumption
Although there is significant evidence that eco-innovation is positively driven by higher energy prices quantification is difficult The present study included simulations of possible impacts of a shift in the industry structure towards renewable energy in the electricity sector and an overall increase of EU
Table 34 Employment impacts of scenario S2HE in 2020 in Germany mdash deviations from scenario S2H
Employment in 2020 Deviation from S2H () Deviation from S2Habsolute (1 000s)
Agriculture forestry ndash 01 ndash 02
Industry 03 194
Non-metallic minerals 02 05
Iron and steel 04 05
Machinery and equipment 13 130
Electrical machinery 24 117
Construction 01 18
Trade and transport 00 26
Business services 07 308
Other services 01 107
Total 02 634
Table 35 Employment impacts of scenario S2HI in 2020 in Germany mdash deviations from scenario S2H
Employment in 2020 Deviation from S2H () Deviation from S2Habsolute (1 000s)
Agriculture forestry ndash 01 ndash 02
Industry 00 00
Non-metallic minerals 25 65
Iron and steel ndash 27 ndash 36
Machinery and equipment 08 78
Electrical machinery 04 19
Construction ndash 00 ndash 04
Trade and transport 00 07
Business services 02 115
Other services 0 56
Total 00 167
Modelling of ETR impacts on eco-innovation
Environmental tax reform in Europe opportunities for eco-innovation 37
exports due to higher global demand for renewable energy The main results can be summarised as follows
bull environmentaltaxreformshiftingtaxesfromlabour to energy and resources will create additional jobs and trigger eco-innovation
bull impactsofeco-innovationintheformofadditional EU exports or shifts in industry structures will have a slight positive influence on GDP and create a smaller number of additional jobs
These findings correspond to results from the EmployRES study (Fraunhofer ISI et al 2009) As ETR is directly aimed at reducing labour costs it will create additional jobs in the short and medium term In the longer term the cost reduction and new technologies arising from eco-innovation will play a larger role
Like all fiscal reforms a major ETR in Europe will create winners and losers At the sector level carbon- and material-intensive industries will face economic losses At the country level the carbon-intensity and overall flexibility of economies is important Clearly structural change away from carbon-intensive industries together with technological change is inherent in any successful climate mitigation policy
On the other hand several factors can smooth these structural adjustments International cooperation
will reduce economic pressure on countries and sectors In addition ETR together with auctioning of ETS allowances can be a major source of revenues for EU Member States in the future even if part of the revenues will have to be earmarked for adaptation and mitigation measures in developing countries Indeed future debate on grandfathering or auctioning ETS allowances should reflect the important point that giving allowances away for free denies countries the money to ease structural change and invest in low-carbon technologies
Caution is needed in relating the findings of this study to the EU policy debate In the model simulations the single carbon price is the only instrument used to reach the EUs 2020 GHG targets In reality of course other renewable energy and efficiency policies will also contribute to carbon reduction and have to be taken into account when comparing the results (especially the high carbon prices) to other studies Both reduce the potential revenues from fossil energy carriers and carbon emissions
A variety of renewable energy and efficiency policies could enable the climate and energy targets to be met while securing even better economic prospects The results of the present study clearly indicate that the discussion on market-based instruments should be intensified Ultimately however the EU will need a rich mix of policies to reach its GHG targets while maximising prosperity
Environmental tax reform in Europe opportunities for eco-innovation38
References
Almon C 1991 The INFORUM Approach to Interindustry Modeling in Economic Systems Research Vol 3 pp 1ndash7
Amin A and Cohendet P 2004 The Architecture of Knowledge Firms Capabilities and Communities Oxford University Press Oxford
Barker T Meyer B Pollitt H and Lutz C 2007a Modelling Environmental Tax Reform in Germany and the United Kingdom with E3ME and GINFORS petre Working Paper Cambridge and Osnabrueck (httpwwwpetreorgukpapershtm) accessed 15 February 2011
Barker T Junankar S Pollitt H and Summerton P 2007b Carbon leakage from unilateral environmental tax reforms in Europe 1995ndash2005 Energy Policy Vol 35 pp 6 281ndash6 292
Brunnermeier S B and Cohen M A 2003 Determinants of environmental innovation in US manufacturing industries Journal of Environmental Economics and Management Vol 45 pp 278ndash293
Buen J 2006 Danish and Norwegian wind industry The relationship between policy instruments innovation and diffusion Energy Policy Vol 34 (18) pp 3 887ndash3 897
Carlsson B and Stankiewicz R 1991 On the nature function and composition of technological systems Journal of Evolutionary Economics Vol 1 (2) pp 93ndash118
Christiansen A C and Skjaerseth J B 2005 Climate change policies in Norway and the Netherlands Different instruments similar outcome Energy and Environment Vol 16(1) pp 1ndash25
Dosi G 1988 Sources procedures and microeconomic effects of innovation Journal of Economic Literature Vol 26 pp 1 120ndash1 171
de Vries F and Medhi N 2008 Environmental regulation and international innovation in automotive emissions control technologies in Environmental Policy Technological Innovation and Patents Organisation for Economic Cooperation and Development Paris
DG TREN 2008 European energy and transport mdash trends to 2030 mdash update 2007 European Commission Luxembourg
DTI 2004 Renewable Supply Chain Gap Analysis UK Department of Trade and Industry
Edler J (ed) 2006 Nachfrageorientierte Innovationspolitik Buumlro fuumlr Technikfolgenabschaumltzung beim Deutschen Bundestag (TAB) Arbeitsbericht Nr 99 Berlin
Edquist C 2001 The system of innovation approach and innovation policy an account of the state of the art lead paper presented at the DRUID Conference 12ndash15 June 2001 Aalborg (httpwwwdruiddkconferencesnwpaper1edquistpdf) accessed 15 February 2011
EEA 2006 Using the market for cost-effective environmental policy Market-based instruments in Europe EEA Report No 12006 European Environment Agency Copenhagen
Ekins P 2009 Resource Productivity Environmental tax Reform and Sustainable Growth in Europe published by the Anglo-German Foundation for the Study of Industrial Society Final report (httpwwwpetreorgukpdfFinRepFinpdf) accessed 12 October 2011
Ekins P and Speck S (eds) 2011 Environmental Tax Reform (ETR) A Policy for Green Growth Oxford University Press
EREC 2008 Energy [r]evolution A sustainable global energy outlook Greenpeace International European Renewable Energy Council (EREC)
References
References
Environmental tax reform in Europe opportunities for eco-innovation 39
Fagerberg J Mowery D C and Nelson R R (eds) 2005 The Oxford Handbook of Innovation Oxford University Press Oxford
Fischer C Parry I W H and Pizer W A 2003 Instrument choice for environmental protection when technological innovation is endogenous Journal of Environmental Economics and Management Vol 45 pp 523ndash545
Fraunhofer ISI ECOFYS Energy Economics Group Ruumltter + Partner SEURECO and LEI 2009 EmployRES mdash The impact of renewable energy policy on economic growth and employment in the European Union European Commission Brussels
Frondel M Horbach J and Rennings K 2008 What triggers environmental management and innovation Empirical evidence for Germany Ecological Economics Vol 66(1) pp 153ndash160
GHK Cambridge Econometrics and IEEP 2007 Links between the environment economy and jobs Final Report submitted to DG Environment European Commission
Giljum S Behrens A Hinterberger F Lutz C and Meyer B 2008 Modelling scenarios towards a sustainable use of natural resources in Europe Environmental Science and Policy Vol 11 pp 204ndash216
Goumlrlach B Knigge M and Luumlckge H 2005 Wirkungen der Oumlkologischen Steuerreform auf Innovation und Marktdurchdringung Ecologic Berlin (httpecologiceudownloadprojekte1850-189918791879_5_innovationpdf) accessed 18 August 2011
Green M A 2000 Photovoltaics technology overview Energy Policy Vol 28 (14) pp 989ndash998
Grossmann A Lehr U Lutz C and Wolter MI 2008 Gesamtwirtschaftliche Effekte der Umsetzung der EU Ziele im Bereich Erneuerbare Energien und Gebaumludeeffizienz in Oumlsterreich bis 2020 Studie im Auftrag des Lebensministeriums Wien 0508
Hage J and Hollingsworth J R 2000 Idea innovation networks a strategy for integrating organizational and institutional analysis Organization Studies Vol 21 (5) pp 971ndash1 004
Hauschildt J 2004 Innovationsmanagement Vahlen Muumlnchen
Hemmelskamp J 1997 Environmental policy instruments and their effects on innovation European Planning Studies Vol 5 (2) pp 177ndash195
Hoglund Isaksson L 2005 Abatement costs in response to the Swedish charge on nitrogen oxide emissions Journal of Environmental Economics and Management Vol 50 pp 102ndash120
Hullmann A 2001 Internationaler Wissenstransfer und technischer Wandel (dissertation) Physica-Verlag Heidelberg
IEA 2008 World Energy Outlook 2008 International Energy Agency Paris
IEA 2009 World Energy Outlook 2009 International Energy Agency Paris
Jacobsson S Andersson B A and Baringngens L 2002 Transforming the energy system mdash the evolution of the German technological system for solar cells Science and Technology Policy Research University of Sussex Electronic Working Paper Series No 84 (httpideasrepecorgpsrussewps84html) accessed 18 August 2011
Jaffe A and Stavins R 1995 Dynamic incentives of environmental regulations the effects of alternative policy instruments on technology diffusion Journal of Environmental Economics and Management Vol 29(3) pp 43ndash63
Jaffe A B and Palmer K 1997 Environmental regulation and innovation a panel data study The Review of Economics and Statistics Vol 79 pp 610ndash619
Jaffe A B Newell R G and Stavins R N 2002 Environmental policy and technological change Environmental and Resource Economics Vol 22 (1ndash2) 2002 pp 41ndash70
Johnstone N and Hascic I 2008 Renewable energy policies and technological innovation energy source and instrument choice in Environmental Policy Technological Innovation and PatentsOrganisation for Economic Co-operation and Development Paris
Johnstone N 2005 The Innovation Effects of Environmental Policy Instruments in Horbach J (ed) Indicator Systems for Sustainable Innovation Physica-Verlag HD
Environmental tax reform in Europe opportunities for eco-innovation
References
40
Johnstone N Hascic I and Ostertag K 2008 Environmental policy technological innovation and patent activity in Environmental Policy Technological Innovation and Patents Organisation for Economic Co-operation and Development Paris
Jung C Krutilla K and Boyd R 1996 Incentives for advanced pollution abatement technology at the industry level an evaluation of policy alternatives Journal of Environmental Economics and Management Vol 30(1) pp 95ndash111
Kammen D M Kapidia K and Fripp M 2004 Putting renewables to work how many jobs can the clean energy industry generate University of California Berkeley
Kemp R 1997 Environmental policy and technical change ndash a comparison of the technological impact of policy instruments Edward Elgar Cheltenham
Kemp R 1998 The diffusion of biological waste-water treatment plants in the Dutch food and beverage industry Environmental and Resource Economics Vol 12 pp 113ndash136
Kemp R 2000 Technology and environmental policy ndash innovation effects of past policies and suggestions for improvement in OECD proceedings ndash innovation and the environment Organisation for Economic Co-operation and Development Paris
Kerr S and Newell R G 2003 Policy-induced technology adoption evidence from the US lead phasedown Journal of Industrial Economics Vol 51 pp 317ndash343
Klaassen G Miketa A Larsen K and Sundqvist T 2005 The impact of RampD on innovation for wind energy in Denmark Germany and the United Kingdom Ecological Economics Vol 54 pp 227ndash240
Kline S and Rosenberg N 1986 An overview of innovation in Landau R (ed) The positive sum strategy Harnessing technology for economic growth pp 275-306
Knigge M and Goumlrlach B 2005 Effects of Germanys ecological tax reforms on the environment employment and technological innovation Ecologic Berlin (httpwwwumweltbundesamtdeuba-info-presse-ehintergrundoekosteuerpdf) accessed 18 August 2011
Langniss O 2003 Governance structures for promoting renewable energy sources dissertation Lund Stuttgart
Lanjouw J O and Mody A 1996 Innovation and the international diffusion of environmentally responsive technology Research Policy Vol 25 pp 549ndash571
Lehr U Nitsch J Kratzat M Lutz C and Edler D 2008 Renewable Energy and Employment in Germany Energy Policy Vol 36 pp 108ndash117 DOI101016jenpol200709004
Lehr U Wolter MI and Groszligmann A 2009 Economic impacts of RES obligations in Austria ndash an application of the macro-econometric model e3at GWS Discussion Paper 20091 Osnabruumlck
Lundvall B-A Johnson B Andersen E S and Dalum B 2001 National systems of production innovation and competence building Research Policy Vol 31 pp 213ndash231
Lutz C and Giljum S 2009 Global resource use in a business as usual world until 2030 Updated results from the GINFORS model in Bleischwitz R Welfens Pand Zhang Z (eds) Sustainable growth and resource productivity ndash economic and global policy issues Greenleaf Publishers pp 30ndash41
Lutz C and Meyer B 2008 Beschaumlftigungseffekte des Klimaschutzes in Deutschland Untersuchungen zu gesamtwirtschaftlichen Auswirkungen ausgewaumlhlter Maszlignahmen des Energie- und Klimapakets Forschungsbericht 205 46 434 Dessau-Roszliglau
Lutz C and Meyer B 2009a Environmental and Economic Effects of Post-Kyoto Carbon Regimes Results of Simulations with the Global Model GINFORS Energy Policy Vol 37 pp 1 758ndash1 766 DOI 101016jenpol200901015
Lutz C and Meyer B 2009b Scenario results from GINFORS PETRE working paper Osnabruumlck
Lutz C Meyer B Nathani C and Schleich J 2005 Endogenous technological change and emissions The case of the German steel industry Energy Policy Vol33 pp 1 143ndash1 154
Lutz C Meyer B Nathani C and Schleich J 2007 Endogenous innovation economy and environment impacts of a technology based modelling approach for energy-intensive industries in Germany Energy Studies Review Vol 15(1) pp 2ndash18
References
Environmental tax reform in Europe opportunities for eco-innovation 41
Lutz C Meyer B and Wolter M I 2009 The global multisectormulticountry 3-E model GINFORS mdash a description of the model and a baseline forecast for global energy demand and CO2 emissions Journal of Sustainable Development forthcoming
Malerba F and Orsenigo L 1997 Technological Regimes and Sectoral Patterns of Innovative Activities Industrial and Corporate Change Vol 6 (1) pp 83ndash117
Malerba F 1992 Learning by Firms and Incremental Technical Change The Economic Journal Vol 102 (413) pp 845ndash859
Malerba F 2005 Industrial dynamics and innovation progress and challenges Presidential Address delivered at the 32nd Conference of the European Association for Research in Industrial Economics (EARIE) 1ndash4 September 2005 Porto
Malerba F 2006 Innovation and the evolution of industries Journal of Evolutionary Economics Vol 16 pp 3ndash23
McGinty M and de Vries F P 2009 Technology diffusion product differentiation and environmental subsidies The BE Journal of Economic Analysis and Policy Vol 9(1)
Meyer B and Lutz C 2007 The GINFORS model ndash model overview and evaluation Petre Working Paper Osnabruumlck (httpwwwpetreorgukpapershtm) accessed 18 August 2011
Meyer B Lutz C Schnur P and Zika G 2007 Economic policy simulations with global interdependencies a sensitivity analysis for Germany Economic Systems Research Vol 19 pp 37ndash55
Mickwitz P H Hyvaumlttinen and P Kivimaa 2008 The role of policy instruments in the innovation and diffusion of environmentally friendlier technologies popular claims versus case study experiences Journal of Cleaner Production Vol 16(1S1) 162ndash170
Miketa A and Schrattenholzer L 2004 Experiments with a methodology to model the role of RampD expenditures in energy technology learning processes first results Energy Policy Vol 32 (15) pp 1 679ndash1 692
Milliman S R and Prince R 1989 Firm incentives to promote technological change in pollution control Journal of Environmental Economics and Management Vol 17 pp 247ndash265
Millock K and Nauges C 2006 Ex-post evaluation of an earmarked tax on air pollution Land Economics Vol 82(1) pp 68ndash84
Montero J-P 2002 Market structure and environmental innovation Journal of Applied Economics Vol 2 pp 293ndash325
Moreno B and Loacutepez A J 2007 The effect of renewable energy on employment mdash The case of Asturias (Spain) Renewable and Sustainable Energy Rewiews doi 101016jrser200610011
Mowery D and Rosenberg N 1979 The influence of market demand upon innovation A critical review of some recent empirical studies Research Policy Vol 8 pp 102ndash153
Newell R G Jaffe A B and Stavins R N 1999 The induced innovation hypothesis and energy-saving technological change Quarterly Journal of Economics Vol 114 pp 941ndash975
Norberg-Bohm V 1999 Stimulating green technological innovation An analysis of alternative policy mechanisms Policy Sciences Vol 32(1) pp 13ndash38
OECD 2009 Sustainable manufacturing and eco-innovation towards a green economy Organisation for Economic Co-operation and Development Policy Brief June 2009
OECD 2010 Taxation innovation and the environment Organisation for Economic Co-operation and Development
Pavitt K 1984 Sectoral patterns of technological change Towards a taxonomy and a theory Research Policy Vol 13 pp 343ndash373
Popp D 2002 Induced innovation and energy prices The American Economic Review Vol 92(1) pp 160ndash180
Popp D 2005 Lessons from patents Using patents to measure technological change in environmental models Ecological Economics Vol 54 pp 209ndash226
Environmental tax reform in Europe opportunities for eco-innovation
References
42
Porter M and van der Linde C 1995 Toward a new conception of the environment competitiveness relationship Journal of Economic Perspectives Vol 9(4) pp 97ndash118
Rammert W 2002 The cultural shaping of technologies and the politics of technodiversity In Sorensen K and Williams R (eds) Shaping technology guiding policy concepts spaces and tools Elgar Cheltenham pp 155-172
Requate T 2005 Dynamic incentives by environmental policy instruments ndash a survey Ecological Economics Vol 54 pp 175ndash195
Roloff N Lehr U Krewitt W Fuchs G Wassermann S Weimer-Jehle W and Schmidt B 2008 Success determinants for technological innovations in the energy sector mdash the case of photovoltaics in Moumlst D Fichtner W Ragwitz M and Veit D (eds) New methods for energy market modelling mdash Proceedings of the first european workshop on energy market modelling using agent-based computational economics Universitaumltsverlag Karlsruhe
Rothwell R 1995 The fifth generation innovation process in Oppenlaumlnder KH Popp W (eds) Innovationen und wirtschaftlicher Fortschritt betriebs-und volkswirtschaftliche Perspektiven Bern pp 9ndash26
Schumpeter J 1942 Capitalism socialism and democracy New York Harper
Skjaeligrseth J B and Christiansen A C 2005 Environmental policy instruments and technological change in the energy sector findings from comparative empirical research Energy and Environment Vol 17 (2) pp 223ndash241
Snyder L D Miller N H and Stavins R N 2003 The effects of environmental regulations on pollution emissions evidence from plant-level data American Economic Review Vol 93(2) pp 431ndash435
Technopolis 2008 Eco-innovation Final Report for Sectoral Innovation Watch (httpwwwtechnopolis-groupcomresourcesdownloads661_report_finalpdf) accessed 18 August 2011
Volleburgh H 2007 Impacts of environmental policy instruments on technological change Report for Joint Meetings of Tax and Environment Experts OECD Environment Directorate February 2007 (comenvepocctpacfa(2006)36final)
Zimmermann H Wohltmann M and Hansjuumlrgens B 1996 Umweltabgaben und Innovation Analytica Marburg
43
Annex 1
Environmental tax reform in Europe opportunities for eco-innovation
Type Instrument Area Stage
Reference
Theo
retica
l
Em
piric
al
Cas
e st
udy
Rev
iew
Qual
itat
ive
Taxe
s
Perm
its
Subsi
die
s
Volu
nta
ry
Com
man
d
Reg
ula
tion
Ener
gy
Air
Wat
er
Oth
er
Gen
eral
Innov
atio
n
Diffu
sion
Rel
evan
ce
Brunnermeier amp Cohen (2003)
X X X X
Buen (2006) X X X X X X
Christiansen amp Skjaerseth (2005)
X X X X X X
Fischer et al (2003 X X X X X X
Frondel et al (2008) X X X X X X X (X) (X)
Hemmelskamp (1997)
X X X X X X X (X)
Hoglund Isaksson (2005)
X X X (X) (X)
Jaffe amp Stavins (1995)
X X X1 X X X X
Jaffe amp Palmer (1997)
X X X X
Jaffe et al (2002) X X X X X X X X X X
Jung et al (1996) X X X X X X (X) (X)
Kemp (1998) X X X X
Kerr amp Newell (2001) X X X X X
Klaassen et al (2005)
X X X X X
Lanjouw amp Mody (1996)
X X X X X X X
McGinty amp de Vries (2009)
X X X X
Mickwitz et al (2008)
X X X X X X X X X
Milliman amp Prince (1989)
X X X X X X X
Millock amp Nauges (2006)
X X X X X X
Montero (2002) X X X X X
Newell et al (1999) X X1 X X X
Norberg-Bohm (1999)
X X X X X X X
Popp (2002) X X1 X X
Popp (2005) X X X X X X
Porter amp van der Linde (1995)
X X X X X X
Requate (2005) X X X X X X X
Skjaeligrseth amp Christiansen (2005)
X X X X X X X X X
Snyder et al (2003) X X X X X
Annex 1 Classification of refereed journal articles
Environmental tax reform in Europe opportunities for eco-innovation44
Annex 2
Type Instrument Area Stage
Reference
Theo
retica
l
Em
piric
al
Cas
e st
udy
Rev
iew
Qual
itat
ive
Taxe
s
Perm
its
Subsi
die
s
Volu
nta
ry
Com
man
d
Reg
ula
tion
Ener
gy
Air
Wat
er
Oth
er
Gen
eral
Innov
atio
n
Diffu
sion
Rel
evan
ce
Johnstone (2005)
X X X X X X X
Johnstone amp Hascic (2008)
X X X X X X X X
Kemp (1997) X X X X X X X X X X X X X
Kemp (2000) X X X X X X X X X
de Vries amp Medhi (2008)
X X1 X X X
Annex 2 Classification of books and book chapters
45
Annex 3
Environmental tax reform in Europe opportunities for eco-innovation
Type Instrument Area Stage
Reference
Theo
retica
l
Em
piric
al
Cas
e st
udy
Rev
iew
Qual
itat
ive
Taxe
s
Perm
its
Subsi
die
s
Volu
nta
ry
Com
man
d
Reg
ula
tion
Ener
gy
Air
Wat
er
Oth
er
Gen
eral
Innov
atio
n
Diffu
sion
Rel
evan
ce
Goumlrlach et al (2005)
X X X X X X
Knigge amp Goumlrlach (2005)
X X X X X X
Technopolis (2008)
X X X X X X
Volleburgh (2007)
X X X X X X X X X X X
Annex 3 Classification of reports
European Environment Agency
Environmental tax reform in Europe opportunities for eco-innovation
2011 mdash 45 pp mdash 21 x 297 cm
ISBN 978-92-9213-238-5doi10280084889
How to obtain EU publications
Publications for salebull viaEUBookshop(httpbookshopeuropaeu)bull fromyourbooksellerbyquotingthetitlethepublisherandorISBNnumberbull bycontactingoneofoursalesagentsdirectlyYoucanobtaintheircontactdetails
on the Internet (httpbookshopeuropaeu) or by sending a fax to +352 2929-42758
Free publicationsbull viaEUBookshop(httpbookshopeuropaeu)bull attheEuropeanCommissionsrepresentationsordelegationsYoucanobtain
their contact details on the Internet (httpeceuropaeu) or by sending a fax to +352 2929-42758
European Environment AgencyKongens Nytorv 61050 Copenhagen KDenmark
Tel +45 33 36 71 00Fax +45 33 36 71 99
Web eeaeuropaeuEnquiries eeaeuropaeuenquiries
TH
-AK-1
1-0
17-E
N-N
doi1
02
8008
4889
- Acknowledgements
- Executive summary
- 1Introduction
-
- 11Background
- 12ETR and innovation
- 13Report structure
-
- 2Review of literature on environmental tax reform and eco‑innovation
-
- 21Initial screening
- 22Detailed review
- 23Environmental regulation studies
- 24Theoretical studies
- 25Empirical studies
- 26Case studies
- 27Conclusions
-
- 3Modelling of ETR impacts on eco‑innovation
-
- 31Scenarios assessing the implications of ETR for eco-innovation
- 32Overview of modelling results
- 33Macroeconomic impacts at the national level
- 34Conclusions of the scenario assessment
-
- References
- Annex 1 Classification of refereed journal articles
- Annex 2Classification of books and book chapters
- Annex 3Classification of reports
-
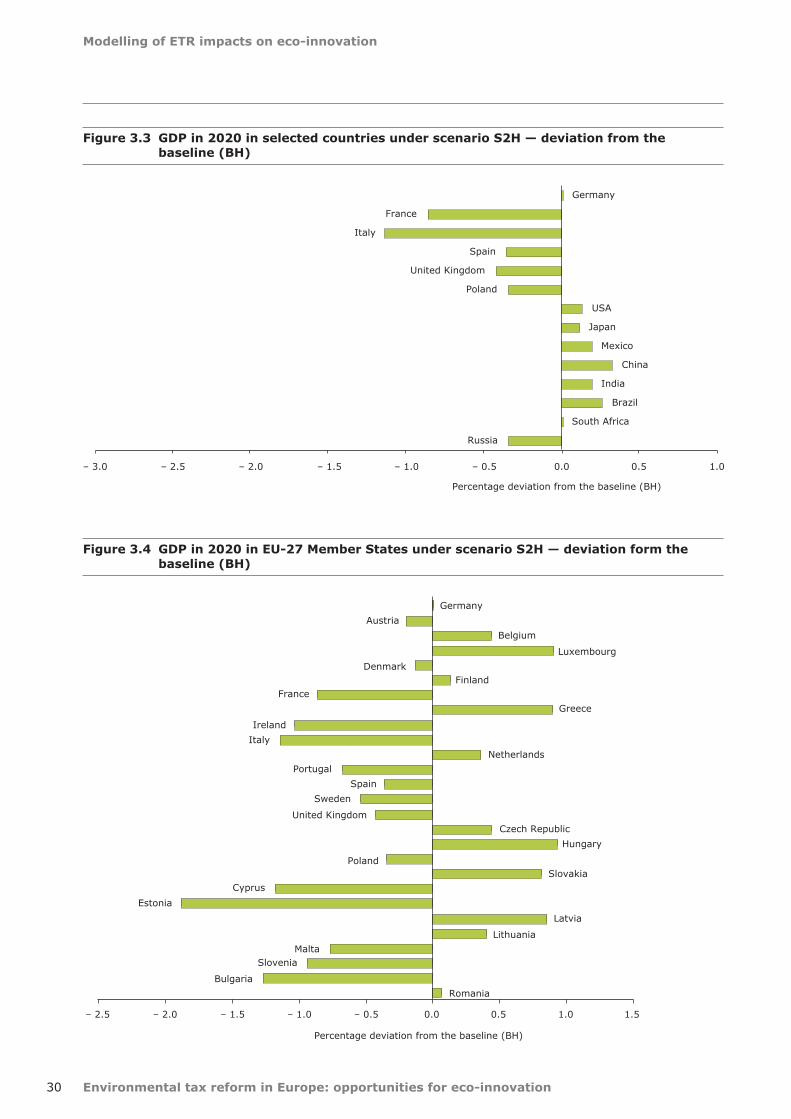
Environmental tax reform in Europe opportunities for eco-innovation
Modelling of ETR impacts on eco-innovation
30
Figure 34 GDP in 2020 in EU-27 Member States under scenario S2H mdash deviation form the baseline (BH)
Figure 33 GDP in 2020 in selected countries under scenario S2H mdash deviation from the baseline (BH)
ndash 25 ndash 20 ndash 15 ndash 10 ndash 05 00 05 10 15
Romania
Bulgaria
SloveniaMalta
Lithuania
Latvia
Estonia
CyprusSlovakia
Poland
Hungary
Czech RepublicUnited Kingdom
Sweden
Spain
Portugal
Netherlands
Italy
Ireland
Greece
FranceFinland
Denmark
Luxembourg
Belgium
Austria
Germany
Percentage deviation from the baseline (BH)
Russia
South Africa
Brazil
India
China
Mexico
Japan
USA
Poland
United Kingdom
Spain
Italy
France
Germany
ndash 30 ndash 25 ndash 20 ndash 15 ndash 10 ndash 05 00 05 10
Percentage deviation from the baseline (BH)
Modelling of ETR impacts on eco-innovation
Environmental tax reform in Europe opportunities for eco-innovation 31
Figure 35 Employment in 2020 in EU-27 Member States under scenario S2H mdash deviation from baseline (BH)
EU-27EU-15
RomaniaBulgariaSloveniaMalta
LithuaniaLatvia
EstoniaCyprusSlovakia
PolandHungary
Czech RepublicUnited Kingdom
SwedenSpain
PortugalNetherlands
ItalyIrelandGreece
FranceFinlandDenmarkLuxembourg
BelgiumAustria
Germany
ndash 200 0 200 400 600 800 1 000
Percentage deviation from the baseline (BH)
Under scenario S2H the GDP of large EU economies deviates from baseline projections by between 0 and ndash 1 with the exception of Italy (Figure 33) Germanys GDP is even forecast to match the baseline level in 2020 due to the countrys strong RES industry Outside Europe some countries gain slightly against EU Member States in terms of competitiveness as export prices in most EU Member States and sectors increase and GDP in those countries exceeds the baseline projections as a result (Figure 33) This is mainly because carbon tax revenues are recycled via income tax reductions which are not part of production costs However energy exporting economies such as Russia or South Africa will lose exports if EU demand for fossil fuel imports declines The development of all EU Member States is shown in Figure 34
Employment impacts of scenario S2H are positive for almost all EU Member States as lower labour
costs increase labour demand and labour intensity (Figure 35) The highest absolute increases are shown for Germany the Netherlands Italy and the United Kingdom For EU-27 as a whole employment will be almost one million higher than in the corresponding baseline BH in 2020
The scenarios have not been designed with a view to meeting the EU renewables target of a 20 renewables share in final energy consumption in 2020 Nevertheless the scenarios provide some interesting insights The share is projected to increase from around 10 in 2009 to above 14 even in the baseline as instruments such as feed in tariffs and biofuel quotas will continue In scenario S1H the target will be missed with around 18 in 2020 Only in scenarios S2H S2HE and S2HI is the target met (approximately 20 )
Environmental tax reform in Europe opportunities for eco-innovation
Modelling of ETR impacts on eco-innovation
32
Under scenario S2H energy-related carbon emissions are reduced in all EU Member States relative to the baseline (Figure 36) The highest percentage reductions can be seen in many of the EU-12 Member States with still high energy intensity and low energy prices In these countries the relative price increase is higher than in countries like Germany or the United Kingdom with already high energy taxes and overall energy prices
Additional ETS revenues material tax revenues and carbon tax revenues from the industry sector are recycled back to industry via reductions in employers social security contributions (or wage subsidies in some countries) The revenues from the carbon tax on households set out in Table 32 (totalling 033 of GDP in Germany for example) are used to reduce income tax For the EU-27 overall revenues from ETS and ETR reach about 2 of GDP in 2020 although these figures may be excessive because additional EU efforts to increase energy
efficiency and renewable energy which will reduce the ETS price are not taken into account The use of flexible tools such as the Clean Development Mechanism will further reduce the revenues and earmarking of part of the revenues for mitigation and adaptation measures in emerging and developing countries limits the recycling into labour costs
In addition the scenarios do not take the current global economic problems into account According to the IEA (2009) the downturn will also reduce carbon emissions in the long run which will lead to lower carbon prices and revenues to reach fixed targets (or make tighter targets less costly)
The ETR will have varying effects on the prices of different sorts of products and services Material or carbon taxes increase the prices of product groups according to their direct and indirect material and carbon content The recycling mechanism reduces
Figure 36 Energy-related CO2 emissions in 2020 under scenario S2H mdash deviation from the baseline (BH)
WorldEU-27
EU-15Romania
BulgariaSlovenia
MaltaLithuania
LatviaEstonia
CyprusSlovakia
PolandHungary
Czech RepublicUnited Kingdom
SwedenSpain
PortugalNetherlands
ItalyIreland
GreeceFrance
FinlandDenmark
LuxembourgBelgium
AustriaGermany
ndash 25 ndash 20 ndash 15 ndash 10 ndash 5 0
Percentage deviation from the baseline (BH)
Modelling of ETR impacts on eco-innovation
Environmental tax reform in Europe opportunities for eco-innovation 33
Table 32 Additional ETS and environmental tax revenues in 2020 ( of GPD)
S2H Germany United Kingdom EU-27
ETS revenues 083 064 059
Carbon tax (industry) 052 044 054
Carbon tax (households) 033 041 036
Material tax 041 029 056
Sum 209 178 205
Figure 37 Total primary energy supply in 2020 under scenario S2H mdash deviation from the baseline (BH)
WorldEU-27EU-15
RomaniaBulgaria
Slovenia
MaltaLithuania
LatviaEstonia
Cyprus
SlovakiaPoland
HungaryCzech Republic
United KingdomSweden
SpainPortugal
NetherlandsItaly
IrelandGreece
FranceFinland
DenmarkLuxembourg
BelgiumAustria
Germany
ndash 24 ndash 21 ndash 18 ndash 15 ndash 12 ndash 9 ndash 6 ndash 3 0
Percentage deviation from the baseline (BH)
Environmental tax reform in Europe opportunities for eco-innovation
Modelling of ETR impacts on eco-innovation
34
Figure 38 Output price impacts of scenario S2H in Germany in 2020 mdash deviations from the baseline (BH)
Figure 39 Impacts of scenario S2H on industrial output in 2020 in Germany mdash deviations from the baseline (BH)
ndash 5
0
5
10
15
20
Output prices
Percentage deviation from the baseline (BH)
(3) F
ood
(4) T
extiles
(5) W
ood
(6) P
ulp pap
er
(7) C
oke re
fined
petro
leum
pro
ducts
(8) C
hemica
ls ex
cl pha
rma
(9) P
harm
aceu
ticals
(10)
Rub
ber a
nd plastics
(11)
Non
-metallic
miner
als
(12)
Iron
and
steel
(13)
Non
-ferrou
s metals
(14)
Met
al pro
ducts
(15)
Mac
hine
ry and
equ
ipmen
t
(16)
Office
mac
hine
ry
(17)
Electric
al m
achine
ry
(18)
Rad
io T
V
(19)
Med
ical pr
ecisi
on and
opt
ical ins
trumen
ts
(20)
Mot
or veh
icles
(21)
Ships
(22)
Airc
raft
(23)
Railro
ad
(24)
Man
ufac
turin
g n
ec r
ecyc
ling
(25)
Electric
ity g
as w
ater
sup
ply
(26)
Con
stru
ction
(27)
Tra
de r
epairs
(28)
Hot
els an
d re
stau
rant
s
(29)
Tra
nspo
rt an
d stor
age
(30)
Pos
t and
teleco
mmun
icatio
ns
(31)
Finan
ce ins
uran
ce
(32)
Rea
l estate ac
tivities
(33)
Ren
ting
(34)
Com
puter
(35)
Res
earch an
d de
velopm
ent
(36)
Oth
er bus
ines
s ac
tivities
(37)
Pub
lic ser
vice
s
(38)
Edu
catio
n
(39)
Hea
lth and
soc
ial w
ork
(40)
Oth
er ser
vice
s
(41)
Priv
ate ho
useh
olds
(1) A
gricu
lture
(2) M
ining an
d qu
arry
ing
nec not elsewhere classified
Production
ndash 100
ndash 80
ndash 60
ndash 40
ndash 20
00
20
40
60
80Percentage deviation from the baseline (BH)
(3) F
ood
(4) T
extiles
(5) W
ood
(6) P
ulp pap
er
(7) C
oke re
fined
petro
leum
pro
ducts
(8) C
hemica
ls ex
cl pha
rma
(9) P
harm
aceu
ticals
(10)
Rub
ber a
nd plastics
(11)
Non
-metallic
miner
als
(12)
Iron
and
steel
(13)
Non
-ferrou
s metals
(14)
Met
al pro
ducts
(15)
Mac
hine
ry and
equ
ipmen
t
(16)
Office
mac
hine
ry
(17)
Electric
al m
achine
ry
(18)
Rad
io T
V
(19)
Med
ical pr
ecisi
on and
opt
ical ins
trumen
ts
(20)
Mot
or veh
icles
(21)
Ships
(22)
Airc
raft
(23)
Railro
ad
(24)
Man
ufac
turin
g n
ec r
ecyc
ling
(25)
Electric
ity g
as w
ater
sup
ply
(26)
Con
stru
ction
(27)
Tra
de r
epairs
(28)
Hot
els an
d re
stau
rant
s
(29)
Tra
nspo
rt an
d stor
age
(30)
Pos
t and
teleco
mmun
icatio
ns
(31)
Finan
ce ins
uran
ce
(32)
Rea
l estate ac
tivities
(33)
Ren
ting
(34)
Com
puter
(35)
Res
earch an
d de
velopm
ent
(36)
Oth
er bus
ines
s ac
tivities
(37)
Pub
lic ser
vice
s
(38)
Edu
catio
n
(39)
Hea
lth and
soc
ial w
ork
(40)
Oth
er ser
vice
s
(41)
Priv
ate ho
useh
olds
(1) A
gricu
lture
(2) M
ining an
d qu
arry
ing
nec not elsewhere classified
Modelling of ETR impacts on eco-innovation
Environmental tax reform in Europe opportunities for eco-innovation 35
social security contributions and lowers labour costs according to the direct and indirect labour content of sector output The ETR therefore reduces output prices in labour-intensive service sectors and increases prices in carbon- and material-intensive industry sectors
The example of Germany shows insignificant impacts in the trade-intensive sectors of machinery (15ndash17) motor vehicles (20) and other transport equipment (21ndash23) (Figure 38) Iron and steel (12) and chemicals without pharmaceuticals (8) face the highest price increases of trade-intensive sectors As the German iron and steel industry primarily delivers high quality steel to the German car industry and increasingly to the German windmill industry negative competitiveness impacts will be limited Exchange rate variations against non-EU competitors have been much higher in the past
The higher prices of carbon- and material-intensive products will reduce price competitiveness on export markets and increase the market share for imports in domestic markets This loss of price competitiveness is based on an assumption of limited market development of energy efficiency and RES technologies in other part of the world It will be offset by gains in labour-intensive sectors if the ETR causes real wage costs per unit of output to fall as a result of using recycled revenues to reduce employer social security contributions
Any improvement in non-price competitiveness will also raise exports The extra employment will raise incomes raising consumption and output
The overall impact on sector output depends on countervailing effects which are negative for iron and steel and a few service sectors and positive for a few industry sectors For most industries the output effect is insignificant (Figure 39) The greatest impact is felt by producers of fossil fuels who must obviously reduce production due to lower demand for their products
Under scenario S2H employment impacts are positive for most sectors relative to the baseline as labour productivity decreases and wage rates fall in relation to consumer prices (CPI) and output prices (Table 33) The relative costs of labour are lower than in the baseline without the ETR reform Only around a quarter of the employment increase takes place in industry
Concerning the wage rate two countervailing effects have to be considered First when the labour market is characterised in terms of the real wage bargaining model as in E3ME and GINFORS with market power on both sides (employers and trade unions) consumer price increases will lead to wage increases (the econometrically estimated factor is 085 for Germany) Second labour productivity is another important factor for wage bargaining The estimated elasticity for Germany is 063 meaning that a 1 increase of labour productivity leads to wage increases of 063 Higher labour demand due to lower labour costs thus reduces the wage increase In the end the German economy is more labour intensive than without the ETR partly due to the structural change towards labour-intensive industries
Table 33 Employment impacts of scenario S2H in Germany mdash deviations from scenario S2H in 2020
Employment in 2020 Deviation from S2H () Deviation from S2Habsolute (1 000s)
Agriculture forestry 24 90
Industry 09 653
Non-metallic minerals 24 62
Iron and steel ndash 28 ndash 37
Machinery and equipment 05 56
Electrical machinery 04 18
Construction 37 449
Trade and transport 10 829
Business services 17 767
Other services ndash 02 ndash 216
Total 07 2506
Environmental tax reform in Europe opportunities for eco-innovation
Modelling of ETR impacts on eco-innovation
36
Additional exports under scenario S2HE mainly create new jobs in machinery and related business services (Table 34) Under scenario S2HI a shift in the input structure of the energy sector leads to a shift in the industry structure and creates a few jobs in the service sector (Table 35)
34 Conclusions of the scenario assessment
The foregoing analysis used the GINFORS model to assess economic and environmental impacts of using the ETS and ETR to reach the EUs 2020
GHG targets In general the results show positive employment effects and only small negative impacts on GDP in EU-27 Member States The economic impacts depend on the levels of international energy prices the mechanism used to recycle revenues and country specifics such as carbon and energy intensity and the structure of energy consumption
Although there is significant evidence that eco-innovation is positively driven by higher energy prices quantification is difficult The present study included simulations of possible impacts of a shift in the industry structure towards renewable energy in the electricity sector and an overall increase of EU
Table 34 Employment impacts of scenario S2HE in 2020 in Germany mdash deviations from scenario S2H
Employment in 2020 Deviation from S2H () Deviation from S2Habsolute (1 000s)
Agriculture forestry ndash 01 ndash 02
Industry 03 194
Non-metallic minerals 02 05
Iron and steel 04 05
Machinery and equipment 13 130
Electrical machinery 24 117
Construction 01 18
Trade and transport 00 26
Business services 07 308
Other services 01 107
Total 02 634
Table 35 Employment impacts of scenario S2HI in 2020 in Germany mdash deviations from scenario S2H
Employment in 2020 Deviation from S2H () Deviation from S2Habsolute (1 000s)
Agriculture forestry ndash 01 ndash 02
Industry 00 00
Non-metallic minerals 25 65
Iron and steel ndash 27 ndash 36
Machinery and equipment 08 78
Electrical machinery 04 19
Construction ndash 00 ndash 04
Trade and transport 00 07
Business services 02 115
Other services 0 56
Total 00 167
Modelling of ETR impacts on eco-innovation
Environmental tax reform in Europe opportunities for eco-innovation 37
exports due to higher global demand for renewable energy The main results can be summarised as follows
bull environmentaltaxreformshiftingtaxesfromlabour to energy and resources will create additional jobs and trigger eco-innovation
bull impactsofeco-innovationintheformofadditional EU exports or shifts in industry structures will have a slight positive influence on GDP and create a smaller number of additional jobs
These findings correspond to results from the EmployRES study (Fraunhofer ISI et al 2009) As ETR is directly aimed at reducing labour costs it will create additional jobs in the short and medium term In the longer term the cost reduction and new technologies arising from eco-innovation will play a larger role
Like all fiscal reforms a major ETR in Europe will create winners and losers At the sector level carbon- and material-intensive industries will face economic losses At the country level the carbon-intensity and overall flexibility of economies is important Clearly structural change away from carbon-intensive industries together with technological change is inherent in any successful climate mitigation policy
On the other hand several factors can smooth these structural adjustments International cooperation
will reduce economic pressure on countries and sectors In addition ETR together with auctioning of ETS allowances can be a major source of revenues for EU Member States in the future even if part of the revenues will have to be earmarked for adaptation and mitigation measures in developing countries Indeed future debate on grandfathering or auctioning ETS allowances should reflect the important point that giving allowances away for free denies countries the money to ease structural change and invest in low-carbon technologies
Caution is needed in relating the findings of this study to the EU policy debate In the model simulations the single carbon price is the only instrument used to reach the EUs 2020 GHG targets In reality of course other renewable energy and efficiency policies will also contribute to carbon reduction and have to be taken into account when comparing the results (especially the high carbon prices) to other studies Both reduce the potential revenues from fossil energy carriers and carbon emissions
A variety of renewable energy and efficiency policies could enable the climate and energy targets to be met while securing even better economic prospects The results of the present study clearly indicate that the discussion on market-based instruments should be intensified Ultimately however the EU will need a rich mix of policies to reach its GHG targets while maximising prosperity
Environmental tax reform in Europe opportunities for eco-innovation38
References
Almon C 1991 The INFORUM Approach to Interindustry Modeling in Economic Systems Research Vol 3 pp 1ndash7
Amin A and Cohendet P 2004 The Architecture of Knowledge Firms Capabilities and Communities Oxford University Press Oxford
Barker T Meyer B Pollitt H and Lutz C 2007a Modelling Environmental Tax Reform in Germany and the United Kingdom with E3ME and GINFORS petre Working Paper Cambridge and Osnabrueck (httpwwwpetreorgukpapershtm) accessed 15 February 2011
Barker T Junankar S Pollitt H and Summerton P 2007b Carbon leakage from unilateral environmental tax reforms in Europe 1995ndash2005 Energy Policy Vol 35 pp 6 281ndash6 292
Brunnermeier S B and Cohen M A 2003 Determinants of environmental innovation in US manufacturing industries Journal of Environmental Economics and Management Vol 45 pp 278ndash293
Buen J 2006 Danish and Norwegian wind industry The relationship between policy instruments innovation and diffusion Energy Policy Vol 34 (18) pp 3 887ndash3 897
Carlsson B and Stankiewicz R 1991 On the nature function and composition of technological systems Journal of Evolutionary Economics Vol 1 (2) pp 93ndash118
Christiansen A C and Skjaerseth J B 2005 Climate change policies in Norway and the Netherlands Different instruments similar outcome Energy and Environment Vol 16(1) pp 1ndash25
Dosi G 1988 Sources procedures and microeconomic effects of innovation Journal of Economic Literature Vol 26 pp 1 120ndash1 171
de Vries F and Medhi N 2008 Environmental regulation and international innovation in automotive emissions control technologies in Environmental Policy Technological Innovation and Patents Organisation for Economic Cooperation and Development Paris
DG TREN 2008 European energy and transport mdash trends to 2030 mdash update 2007 European Commission Luxembourg
DTI 2004 Renewable Supply Chain Gap Analysis UK Department of Trade and Industry
Edler J (ed) 2006 Nachfrageorientierte Innovationspolitik Buumlro fuumlr Technikfolgenabschaumltzung beim Deutschen Bundestag (TAB) Arbeitsbericht Nr 99 Berlin
Edquist C 2001 The system of innovation approach and innovation policy an account of the state of the art lead paper presented at the DRUID Conference 12ndash15 June 2001 Aalborg (httpwwwdruiddkconferencesnwpaper1edquistpdf) accessed 15 February 2011
EEA 2006 Using the market for cost-effective environmental policy Market-based instruments in Europe EEA Report No 12006 European Environment Agency Copenhagen
Ekins P 2009 Resource Productivity Environmental tax Reform and Sustainable Growth in Europe published by the Anglo-German Foundation for the Study of Industrial Society Final report (httpwwwpetreorgukpdfFinRepFinpdf) accessed 12 October 2011
Ekins P and Speck S (eds) 2011 Environmental Tax Reform (ETR) A Policy for Green Growth Oxford University Press
EREC 2008 Energy [r]evolution A sustainable global energy outlook Greenpeace International European Renewable Energy Council (EREC)
References
References
Environmental tax reform in Europe opportunities for eco-innovation 39
Fagerberg J Mowery D C and Nelson R R (eds) 2005 The Oxford Handbook of Innovation Oxford University Press Oxford
Fischer C Parry I W H and Pizer W A 2003 Instrument choice for environmental protection when technological innovation is endogenous Journal of Environmental Economics and Management Vol 45 pp 523ndash545
Fraunhofer ISI ECOFYS Energy Economics Group Ruumltter + Partner SEURECO and LEI 2009 EmployRES mdash The impact of renewable energy policy on economic growth and employment in the European Union European Commission Brussels
Frondel M Horbach J and Rennings K 2008 What triggers environmental management and innovation Empirical evidence for Germany Ecological Economics Vol 66(1) pp 153ndash160
GHK Cambridge Econometrics and IEEP 2007 Links between the environment economy and jobs Final Report submitted to DG Environment European Commission
Giljum S Behrens A Hinterberger F Lutz C and Meyer B 2008 Modelling scenarios towards a sustainable use of natural resources in Europe Environmental Science and Policy Vol 11 pp 204ndash216
Goumlrlach B Knigge M and Luumlckge H 2005 Wirkungen der Oumlkologischen Steuerreform auf Innovation und Marktdurchdringung Ecologic Berlin (httpecologiceudownloadprojekte1850-189918791879_5_innovationpdf) accessed 18 August 2011
Green M A 2000 Photovoltaics technology overview Energy Policy Vol 28 (14) pp 989ndash998
Grossmann A Lehr U Lutz C and Wolter MI 2008 Gesamtwirtschaftliche Effekte der Umsetzung der EU Ziele im Bereich Erneuerbare Energien und Gebaumludeeffizienz in Oumlsterreich bis 2020 Studie im Auftrag des Lebensministeriums Wien 0508
Hage J and Hollingsworth J R 2000 Idea innovation networks a strategy for integrating organizational and institutional analysis Organization Studies Vol 21 (5) pp 971ndash1 004
Hauschildt J 2004 Innovationsmanagement Vahlen Muumlnchen
Hemmelskamp J 1997 Environmental policy instruments and their effects on innovation European Planning Studies Vol 5 (2) pp 177ndash195
Hoglund Isaksson L 2005 Abatement costs in response to the Swedish charge on nitrogen oxide emissions Journal of Environmental Economics and Management Vol 50 pp 102ndash120
Hullmann A 2001 Internationaler Wissenstransfer und technischer Wandel (dissertation) Physica-Verlag Heidelberg
IEA 2008 World Energy Outlook 2008 International Energy Agency Paris
IEA 2009 World Energy Outlook 2009 International Energy Agency Paris
Jacobsson S Andersson B A and Baringngens L 2002 Transforming the energy system mdash the evolution of the German technological system for solar cells Science and Technology Policy Research University of Sussex Electronic Working Paper Series No 84 (httpideasrepecorgpsrussewps84html) accessed 18 August 2011
Jaffe A and Stavins R 1995 Dynamic incentives of environmental regulations the effects of alternative policy instruments on technology diffusion Journal of Environmental Economics and Management Vol 29(3) pp 43ndash63
Jaffe A B and Palmer K 1997 Environmental regulation and innovation a panel data study The Review of Economics and Statistics Vol 79 pp 610ndash619
Jaffe A B Newell R G and Stavins R N 2002 Environmental policy and technological change Environmental and Resource Economics Vol 22 (1ndash2) 2002 pp 41ndash70
Johnstone N and Hascic I 2008 Renewable energy policies and technological innovation energy source and instrument choice in Environmental Policy Technological Innovation and PatentsOrganisation for Economic Co-operation and Development Paris
Johnstone N 2005 The Innovation Effects of Environmental Policy Instruments in Horbach J (ed) Indicator Systems for Sustainable Innovation Physica-Verlag HD
Environmental tax reform in Europe opportunities for eco-innovation
References
40
Johnstone N Hascic I and Ostertag K 2008 Environmental policy technological innovation and patent activity in Environmental Policy Technological Innovation and Patents Organisation for Economic Co-operation and Development Paris
Jung C Krutilla K and Boyd R 1996 Incentives for advanced pollution abatement technology at the industry level an evaluation of policy alternatives Journal of Environmental Economics and Management Vol 30(1) pp 95ndash111
Kammen D M Kapidia K and Fripp M 2004 Putting renewables to work how many jobs can the clean energy industry generate University of California Berkeley
Kemp R 1997 Environmental policy and technical change ndash a comparison of the technological impact of policy instruments Edward Elgar Cheltenham
Kemp R 1998 The diffusion of biological waste-water treatment plants in the Dutch food and beverage industry Environmental and Resource Economics Vol 12 pp 113ndash136
Kemp R 2000 Technology and environmental policy ndash innovation effects of past policies and suggestions for improvement in OECD proceedings ndash innovation and the environment Organisation for Economic Co-operation and Development Paris
Kerr S and Newell R G 2003 Policy-induced technology adoption evidence from the US lead phasedown Journal of Industrial Economics Vol 51 pp 317ndash343
Klaassen G Miketa A Larsen K and Sundqvist T 2005 The impact of RampD on innovation for wind energy in Denmark Germany and the United Kingdom Ecological Economics Vol 54 pp 227ndash240
Kline S and Rosenberg N 1986 An overview of innovation in Landau R (ed) The positive sum strategy Harnessing technology for economic growth pp 275-306
Knigge M and Goumlrlach B 2005 Effects of Germanys ecological tax reforms on the environment employment and technological innovation Ecologic Berlin (httpwwwumweltbundesamtdeuba-info-presse-ehintergrundoekosteuerpdf) accessed 18 August 2011
Langniss O 2003 Governance structures for promoting renewable energy sources dissertation Lund Stuttgart
Lanjouw J O and Mody A 1996 Innovation and the international diffusion of environmentally responsive technology Research Policy Vol 25 pp 549ndash571
Lehr U Nitsch J Kratzat M Lutz C and Edler D 2008 Renewable Energy and Employment in Germany Energy Policy Vol 36 pp 108ndash117 DOI101016jenpol200709004
Lehr U Wolter MI and Groszligmann A 2009 Economic impacts of RES obligations in Austria ndash an application of the macro-econometric model e3at GWS Discussion Paper 20091 Osnabruumlck
Lundvall B-A Johnson B Andersen E S and Dalum B 2001 National systems of production innovation and competence building Research Policy Vol 31 pp 213ndash231
Lutz C and Giljum S 2009 Global resource use in a business as usual world until 2030 Updated results from the GINFORS model in Bleischwitz R Welfens Pand Zhang Z (eds) Sustainable growth and resource productivity ndash economic and global policy issues Greenleaf Publishers pp 30ndash41
Lutz C and Meyer B 2008 Beschaumlftigungseffekte des Klimaschutzes in Deutschland Untersuchungen zu gesamtwirtschaftlichen Auswirkungen ausgewaumlhlter Maszlignahmen des Energie- und Klimapakets Forschungsbericht 205 46 434 Dessau-Roszliglau
Lutz C and Meyer B 2009a Environmental and Economic Effects of Post-Kyoto Carbon Regimes Results of Simulations with the Global Model GINFORS Energy Policy Vol 37 pp 1 758ndash1 766 DOI 101016jenpol200901015
Lutz C and Meyer B 2009b Scenario results from GINFORS PETRE working paper Osnabruumlck
Lutz C Meyer B Nathani C and Schleich J 2005 Endogenous technological change and emissions The case of the German steel industry Energy Policy Vol33 pp 1 143ndash1 154
Lutz C Meyer B Nathani C and Schleich J 2007 Endogenous innovation economy and environment impacts of a technology based modelling approach for energy-intensive industries in Germany Energy Studies Review Vol 15(1) pp 2ndash18
References
Environmental tax reform in Europe opportunities for eco-innovation 41
Lutz C Meyer B and Wolter M I 2009 The global multisectormulticountry 3-E model GINFORS mdash a description of the model and a baseline forecast for global energy demand and CO2 emissions Journal of Sustainable Development forthcoming
Malerba F and Orsenigo L 1997 Technological Regimes and Sectoral Patterns of Innovative Activities Industrial and Corporate Change Vol 6 (1) pp 83ndash117
Malerba F 1992 Learning by Firms and Incremental Technical Change The Economic Journal Vol 102 (413) pp 845ndash859
Malerba F 2005 Industrial dynamics and innovation progress and challenges Presidential Address delivered at the 32nd Conference of the European Association for Research in Industrial Economics (EARIE) 1ndash4 September 2005 Porto
Malerba F 2006 Innovation and the evolution of industries Journal of Evolutionary Economics Vol 16 pp 3ndash23
McGinty M and de Vries F P 2009 Technology diffusion product differentiation and environmental subsidies The BE Journal of Economic Analysis and Policy Vol 9(1)
Meyer B and Lutz C 2007 The GINFORS model ndash model overview and evaluation Petre Working Paper Osnabruumlck (httpwwwpetreorgukpapershtm) accessed 18 August 2011
Meyer B Lutz C Schnur P and Zika G 2007 Economic policy simulations with global interdependencies a sensitivity analysis for Germany Economic Systems Research Vol 19 pp 37ndash55
Mickwitz P H Hyvaumlttinen and P Kivimaa 2008 The role of policy instruments in the innovation and diffusion of environmentally friendlier technologies popular claims versus case study experiences Journal of Cleaner Production Vol 16(1S1) 162ndash170
Miketa A and Schrattenholzer L 2004 Experiments with a methodology to model the role of RampD expenditures in energy technology learning processes first results Energy Policy Vol 32 (15) pp 1 679ndash1 692
Milliman S R and Prince R 1989 Firm incentives to promote technological change in pollution control Journal of Environmental Economics and Management Vol 17 pp 247ndash265
Millock K and Nauges C 2006 Ex-post evaluation of an earmarked tax on air pollution Land Economics Vol 82(1) pp 68ndash84
Montero J-P 2002 Market structure and environmental innovation Journal of Applied Economics Vol 2 pp 293ndash325
Moreno B and Loacutepez A J 2007 The effect of renewable energy on employment mdash The case of Asturias (Spain) Renewable and Sustainable Energy Rewiews doi 101016jrser200610011
Mowery D and Rosenberg N 1979 The influence of market demand upon innovation A critical review of some recent empirical studies Research Policy Vol 8 pp 102ndash153
Newell R G Jaffe A B and Stavins R N 1999 The induced innovation hypothesis and energy-saving technological change Quarterly Journal of Economics Vol 114 pp 941ndash975
Norberg-Bohm V 1999 Stimulating green technological innovation An analysis of alternative policy mechanisms Policy Sciences Vol 32(1) pp 13ndash38
OECD 2009 Sustainable manufacturing and eco-innovation towards a green economy Organisation for Economic Co-operation and Development Policy Brief June 2009
OECD 2010 Taxation innovation and the environment Organisation for Economic Co-operation and Development
Pavitt K 1984 Sectoral patterns of technological change Towards a taxonomy and a theory Research Policy Vol 13 pp 343ndash373
Popp D 2002 Induced innovation and energy prices The American Economic Review Vol 92(1) pp 160ndash180
Popp D 2005 Lessons from patents Using patents to measure technological change in environmental models Ecological Economics Vol 54 pp 209ndash226
Environmental tax reform in Europe opportunities for eco-innovation
References
42
Porter M and van der Linde C 1995 Toward a new conception of the environment competitiveness relationship Journal of Economic Perspectives Vol 9(4) pp 97ndash118
Rammert W 2002 The cultural shaping of technologies and the politics of technodiversity In Sorensen K and Williams R (eds) Shaping technology guiding policy concepts spaces and tools Elgar Cheltenham pp 155-172
Requate T 2005 Dynamic incentives by environmental policy instruments ndash a survey Ecological Economics Vol 54 pp 175ndash195
Roloff N Lehr U Krewitt W Fuchs G Wassermann S Weimer-Jehle W and Schmidt B 2008 Success determinants for technological innovations in the energy sector mdash the case of photovoltaics in Moumlst D Fichtner W Ragwitz M and Veit D (eds) New methods for energy market modelling mdash Proceedings of the first european workshop on energy market modelling using agent-based computational economics Universitaumltsverlag Karlsruhe
Rothwell R 1995 The fifth generation innovation process in Oppenlaumlnder KH Popp W (eds) Innovationen und wirtschaftlicher Fortschritt betriebs-und volkswirtschaftliche Perspektiven Bern pp 9ndash26
Schumpeter J 1942 Capitalism socialism and democracy New York Harper
Skjaeligrseth J B and Christiansen A C 2005 Environmental policy instruments and technological change in the energy sector findings from comparative empirical research Energy and Environment Vol 17 (2) pp 223ndash241
Snyder L D Miller N H and Stavins R N 2003 The effects of environmental regulations on pollution emissions evidence from plant-level data American Economic Review Vol 93(2) pp 431ndash435
Technopolis 2008 Eco-innovation Final Report for Sectoral Innovation Watch (httpwwwtechnopolis-groupcomresourcesdownloads661_report_finalpdf) accessed 18 August 2011
Volleburgh H 2007 Impacts of environmental policy instruments on technological change Report for Joint Meetings of Tax and Environment Experts OECD Environment Directorate February 2007 (comenvepocctpacfa(2006)36final)
Zimmermann H Wohltmann M and Hansjuumlrgens B 1996 Umweltabgaben und Innovation Analytica Marburg
43
Annex 1
Environmental tax reform in Europe opportunities for eco-innovation
Type Instrument Area Stage
Reference
Theo
retica
l
Em
piric
al
Cas
e st
udy
Rev
iew
Qual
itat
ive
Taxe
s
Perm
its
Subsi
die
s
Volu
nta
ry
Com
man
d
Reg
ula
tion
Ener
gy
Air
Wat
er
Oth
er
Gen
eral
Innov
atio
n
Diffu
sion
Rel
evan
ce
Brunnermeier amp Cohen (2003)
X X X X
Buen (2006) X X X X X X
Christiansen amp Skjaerseth (2005)
X X X X X X
Fischer et al (2003 X X X X X X
Frondel et al (2008) X X X X X X X (X) (X)
Hemmelskamp (1997)
X X X X X X X (X)
Hoglund Isaksson (2005)
X X X (X) (X)
Jaffe amp Stavins (1995)
X X X1 X X X X
Jaffe amp Palmer (1997)
X X X X
Jaffe et al (2002) X X X X X X X X X X
Jung et al (1996) X X X X X X (X) (X)
Kemp (1998) X X X X
Kerr amp Newell (2001) X X X X X
Klaassen et al (2005)
X X X X X
Lanjouw amp Mody (1996)
X X X X X X X
McGinty amp de Vries (2009)
X X X X
Mickwitz et al (2008)
X X X X X X X X X
Milliman amp Prince (1989)
X X X X X X X
Millock amp Nauges (2006)
X X X X X X
Montero (2002) X X X X X
Newell et al (1999) X X1 X X X
Norberg-Bohm (1999)
X X X X X X X
Popp (2002) X X1 X X
Popp (2005) X X X X X X
Porter amp van der Linde (1995)
X X X X X X
Requate (2005) X X X X X X X
Skjaeligrseth amp Christiansen (2005)
X X X X X X X X X
Snyder et al (2003) X X X X X
Annex 1 Classification of refereed journal articles
Environmental tax reform in Europe opportunities for eco-innovation44
Annex 2
Type Instrument Area Stage
Reference
Theo
retica
l
Em
piric
al
Cas
e st
udy
Rev
iew
Qual
itat
ive
Taxe
s
Perm
its
Subsi
die
s
Volu
nta
ry
Com
man
d
Reg
ula
tion
Ener
gy
Air
Wat
er
Oth
er
Gen
eral
Innov
atio
n
Diffu
sion
Rel
evan
ce
Johnstone (2005)
X X X X X X X
Johnstone amp Hascic (2008)
X X X X X X X X
Kemp (1997) X X X X X X X X X X X X X
Kemp (2000) X X X X X X X X X
de Vries amp Medhi (2008)
X X1 X X X
Annex 2 Classification of books and book chapters
45
Annex 3
Environmental tax reform in Europe opportunities for eco-innovation
Type Instrument Area Stage
Reference
Theo
retica
l
Em
piric
al
Cas
e st
udy
Rev
iew
Qual
itat
ive
Taxe
s
Perm
its
Subsi
die
s
Volu
nta
ry
Com
man
d
Reg
ula
tion
Ener
gy
Air
Wat
er
Oth
er
Gen
eral
Innov
atio
n
Diffu
sion
Rel
evan
ce
Goumlrlach et al (2005)
X X X X X X
Knigge amp Goumlrlach (2005)
X X X X X X
Technopolis (2008)
X X X X X X
Volleburgh (2007)
X X X X X X X X X X X
Annex 3 Classification of reports
European Environment Agency
Environmental tax reform in Europe opportunities for eco-innovation
2011 mdash 45 pp mdash 21 x 297 cm
ISBN 978-92-9213-238-5doi10280084889
How to obtain EU publications
Publications for salebull viaEUBookshop(httpbookshopeuropaeu)bull fromyourbooksellerbyquotingthetitlethepublisherandorISBNnumberbull bycontactingoneofoursalesagentsdirectlyYoucanobtaintheircontactdetails
on the Internet (httpbookshopeuropaeu) or by sending a fax to +352 2929-42758
Free publicationsbull viaEUBookshop(httpbookshopeuropaeu)bull attheEuropeanCommissionsrepresentationsordelegationsYoucanobtain
their contact details on the Internet (httpeceuropaeu) or by sending a fax to +352 2929-42758
European Environment AgencyKongens Nytorv 61050 Copenhagen KDenmark
Tel +45 33 36 71 00Fax +45 33 36 71 99
Web eeaeuropaeuEnquiries eeaeuropaeuenquiries
TH
-AK-1
1-0
17-E
N-N
doi1
02
8008
4889
- Acknowledgements
- Executive summary
- 1Introduction
-
- 11Background
- 12ETR and innovation
- 13Report structure
-
- 2Review of literature on environmental tax reform and eco‑innovation
-
- 21Initial screening
- 22Detailed review
- 23Environmental regulation studies
- 24Theoretical studies
- 25Empirical studies
- 26Case studies
- 27Conclusions
-
- 3Modelling of ETR impacts on eco‑innovation
-
- 31Scenarios assessing the implications of ETR for eco-innovation
- 32Overview of modelling results
- 33Macroeconomic impacts at the national level
- 34Conclusions of the scenario assessment
-
- References
- Annex 1 Classification of refereed journal articles
- Annex 2Classification of books and book chapters
- Annex 3Classification of reports
-
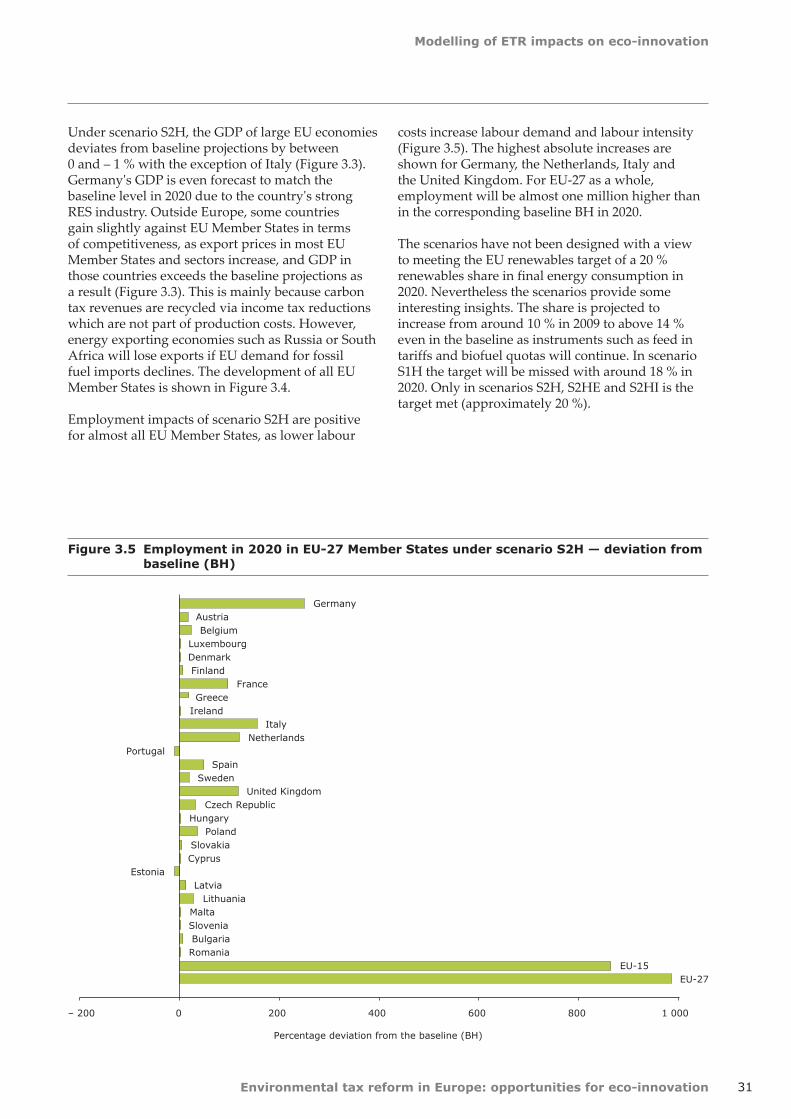
Modelling of ETR impacts on eco-innovation
Environmental tax reform in Europe opportunities for eco-innovation 31
Figure 35 Employment in 2020 in EU-27 Member States under scenario S2H mdash deviation from baseline (BH)
EU-27EU-15
RomaniaBulgariaSloveniaMalta
LithuaniaLatvia
EstoniaCyprusSlovakia
PolandHungary
Czech RepublicUnited Kingdom
SwedenSpain
PortugalNetherlands
ItalyIrelandGreece
FranceFinlandDenmarkLuxembourg
BelgiumAustria
Germany
ndash 200 0 200 400 600 800 1 000
Percentage deviation from the baseline (BH)
Under scenario S2H the GDP of large EU economies deviates from baseline projections by between 0 and ndash 1 with the exception of Italy (Figure 33) Germanys GDP is even forecast to match the baseline level in 2020 due to the countrys strong RES industry Outside Europe some countries gain slightly against EU Member States in terms of competitiveness as export prices in most EU Member States and sectors increase and GDP in those countries exceeds the baseline projections as a result (Figure 33) This is mainly because carbon tax revenues are recycled via income tax reductions which are not part of production costs However energy exporting economies such as Russia or South Africa will lose exports if EU demand for fossil fuel imports declines The development of all EU Member States is shown in Figure 34
Employment impacts of scenario S2H are positive for almost all EU Member States as lower labour
costs increase labour demand and labour intensity (Figure 35) The highest absolute increases are shown for Germany the Netherlands Italy and the United Kingdom For EU-27 as a whole employment will be almost one million higher than in the corresponding baseline BH in 2020
The scenarios have not been designed with a view to meeting the EU renewables target of a 20 renewables share in final energy consumption in 2020 Nevertheless the scenarios provide some interesting insights The share is projected to increase from around 10 in 2009 to above 14 even in the baseline as instruments such as feed in tariffs and biofuel quotas will continue In scenario S1H the target will be missed with around 18 in 2020 Only in scenarios S2H S2HE and S2HI is the target met (approximately 20 )
Environmental tax reform in Europe opportunities for eco-innovation
Modelling of ETR impacts on eco-innovation
32
Under scenario S2H energy-related carbon emissions are reduced in all EU Member States relative to the baseline (Figure 36) The highest percentage reductions can be seen in many of the EU-12 Member States with still high energy intensity and low energy prices In these countries the relative price increase is higher than in countries like Germany or the United Kingdom with already high energy taxes and overall energy prices
Additional ETS revenues material tax revenues and carbon tax revenues from the industry sector are recycled back to industry via reductions in employers social security contributions (or wage subsidies in some countries) The revenues from the carbon tax on households set out in Table 32 (totalling 033 of GDP in Germany for example) are used to reduce income tax For the EU-27 overall revenues from ETS and ETR reach about 2 of GDP in 2020 although these figures may be excessive because additional EU efforts to increase energy
efficiency and renewable energy which will reduce the ETS price are not taken into account The use of flexible tools such as the Clean Development Mechanism will further reduce the revenues and earmarking of part of the revenues for mitigation and adaptation measures in emerging and developing countries limits the recycling into labour costs
In addition the scenarios do not take the current global economic problems into account According to the IEA (2009) the downturn will also reduce carbon emissions in the long run which will lead to lower carbon prices and revenues to reach fixed targets (or make tighter targets less costly)
The ETR will have varying effects on the prices of different sorts of products and services Material or carbon taxes increase the prices of product groups according to their direct and indirect material and carbon content The recycling mechanism reduces
Figure 36 Energy-related CO2 emissions in 2020 under scenario S2H mdash deviation from the baseline (BH)
WorldEU-27
EU-15Romania
BulgariaSlovenia
MaltaLithuania
LatviaEstonia
CyprusSlovakia
PolandHungary
Czech RepublicUnited Kingdom
SwedenSpain
PortugalNetherlands
ItalyIreland
GreeceFrance
FinlandDenmark
LuxembourgBelgium
AustriaGermany
ndash 25 ndash 20 ndash 15 ndash 10 ndash 5 0
Percentage deviation from the baseline (BH)
Modelling of ETR impacts on eco-innovation
Environmental tax reform in Europe opportunities for eco-innovation 33
Table 32 Additional ETS and environmental tax revenues in 2020 ( of GPD)
S2H Germany United Kingdom EU-27
ETS revenues 083 064 059
Carbon tax (industry) 052 044 054
Carbon tax (households) 033 041 036
Material tax 041 029 056
Sum 209 178 205
Figure 37 Total primary energy supply in 2020 under scenario S2H mdash deviation from the baseline (BH)
WorldEU-27EU-15
RomaniaBulgaria
Slovenia
MaltaLithuania
LatviaEstonia
Cyprus
SlovakiaPoland
HungaryCzech Republic
United KingdomSweden
SpainPortugal
NetherlandsItaly
IrelandGreece
FranceFinland
DenmarkLuxembourg
BelgiumAustria
Germany
ndash 24 ndash 21 ndash 18 ndash 15 ndash 12 ndash 9 ndash 6 ndash 3 0
Percentage deviation from the baseline (BH)
Environmental tax reform in Europe opportunities for eco-innovation
Modelling of ETR impacts on eco-innovation
34
Figure 38 Output price impacts of scenario S2H in Germany in 2020 mdash deviations from the baseline (BH)
Figure 39 Impacts of scenario S2H on industrial output in 2020 in Germany mdash deviations from the baseline (BH)
ndash 5
0
5
10
15
20
Output prices
Percentage deviation from the baseline (BH)
(3) F
ood
(4) T
extiles
(5) W
ood
(6) P
ulp pap
er
(7) C
oke re
fined
petro
leum
pro
ducts
(8) C
hemica
ls ex
cl pha
rma
(9) P
harm
aceu
ticals
(10)
Rub
ber a
nd plastics
(11)
Non
-metallic
miner
als
(12)
Iron
and
steel
(13)
Non
-ferrou
s metals
(14)
Met
al pro
ducts
(15)
Mac
hine
ry and
equ
ipmen
t
(16)
Office
mac
hine
ry
(17)
Electric
al m
achine
ry
(18)
Rad
io T
V
(19)
Med
ical pr
ecisi
on and
opt
ical ins
trumen
ts
(20)
Mot
or veh
icles
(21)
Ships
(22)
Airc
raft
(23)
Railro
ad
(24)
Man
ufac
turin
g n
ec r
ecyc
ling
(25)
Electric
ity g
as w
ater
sup
ply
(26)
Con
stru
ction
(27)
Tra
de r
epairs
(28)
Hot
els an
d re
stau
rant
s
(29)
Tra
nspo
rt an
d stor
age
(30)
Pos
t and
teleco
mmun
icatio
ns
(31)
Finan
ce ins
uran
ce
(32)
Rea
l estate ac
tivities
(33)
Ren
ting
(34)
Com
puter
(35)
Res
earch an
d de
velopm
ent
(36)
Oth
er bus
ines
s ac
tivities
(37)
Pub
lic ser
vice
s
(38)
Edu
catio
n
(39)
Hea
lth and
soc
ial w
ork
(40)
Oth
er ser
vice
s
(41)
Priv
ate ho
useh
olds
(1) A
gricu
lture
(2) M
ining an
d qu
arry
ing
nec not elsewhere classified
Production
ndash 100
ndash 80
ndash 60
ndash 40
ndash 20
00
20
40
60
80Percentage deviation from the baseline (BH)
(3) F
ood
(4) T
extiles
(5) W
ood
(6) P
ulp pap
er
(7) C
oke re
fined
petro
leum
pro
ducts
(8) C
hemica
ls ex
cl pha
rma
(9) P
harm
aceu
ticals
(10)
Rub
ber a
nd plastics
(11)
Non
-metallic
miner
als
(12)
Iron
and
steel
(13)
Non
-ferrou
s metals
(14)
Met
al pro
ducts
(15)
Mac
hine
ry and
equ
ipmen
t
(16)
Office
mac
hine
ry
(17)
Electric
al m
achine
ry
(18)
Rad
io T
V
(19)
Med
ical pr
ecisi
on and
opt
ical ins
trumen
ts
(20)
Mot
or veh
icles
(21)
Ships
(22)
Airc
raft
(23)
Railro
ad
(24)
Man
ufac
turin
g n
ec r
ecyc
ling
(25)
Electric
ity g
as w
ater
sup
ply
(26)
Con
stru
ction
(27)
Tra
de r
epairs
(28)
Hot
els an
d re
stau
rant
s
(29)
Tra
nspo
rt an
d stor
age
(30)
Pos
t and
teleco
mmun
icatio
ns
(31)
Finan
ce ins
uran
ce
(32)
Rea
l estate ac
tivities
(33)
Ren
ting
(34)
Com
puter
(35)
Res
earch an
d de
velopm
ent
(36)
Oth
er bus
ines
s ac
tivities
(37)
Pub
lic ser
vice
s
(38)
Edu
catio
n
(39)
Hea
lth and
soc
ial w
ork
(40)
Oth
er ser
vice
s
(41)
Priv
ate ho
useh
olds
(1) A
gricu
lture
(2) M
ining an
d qu
arry
ing
nec not elsewhere classified
Modelling of ETR impacts on eco-innovation
Environmental tax reform in Europe opportunities for eco-innovation 35
social security contributions and lowers labour costs according to the direct and indirect labour content of sector output The ETR therefore reduces output prices in labour-intensive service sectors and increases prices in carbon- and material-intensive industry sectors
The example of Germany shows insignificant impacts in the trade-intensive sectors of machinery (15ndash17) motor vehicles (20) and other transport equipment (21ndash23) (Figure 38) Iron and steel (12) and chemicals without pharmaceuticals (8) face the highest price increases of trade-intensive sectors As the German iron and steel industry primarily delivers high quality steel to the German car industry and increasingly to the German windmill industry negative competitiveness impacts will be limited Exchange rate variations against non-EU competitors have been much higher in the past
The higher prices of carbon- and material-intensive products will reduce price competitiveness on export markets and increase the market share for imports in domestic markets This loss of price competitiveness is based on an assumption of limited market development of energy efficiency and RES technologies in other part of the world It will be offset by gains in labour-intensive sectors if the ETR causes real wage costs per unit of output to fall as a result of using recycled revenues to reduce employer social security contributions
Any improvement in non-price competitiveness will also raise exports The extra employment will raise incomes raising consumption and output
The overall impact on sector output depends on countervailing effects which are negative for iron and steel and a few service sectors and positive for a few industry sectors For most industries the output effect is insignificant (Figure 39) The greatest impact is felt by producers of fossil fuels who must obviously reduce production due to lower demand for their products
Under scenario S2H employment impacts are positive for most sectors relative to the baseline as labour productivity decreases and wage rates fall in relation to consumer prices (CPI) and output prices (Table 33) The relative costs of labour are lower than in the baseline without the ETR reform Only around a quarter of the employment increase takes place in industry
Concerning the wage rate two countervailing effects have to be considered First when the labour market is characterised in terms of the real wage bargaining model as in E3ME and GINFORS with market power on both sides (employers and trade unions) consumer price increases will lead to wage increases (the econometrically estimated factor is 085 for Germany) Second labour productivity is another important factor for wage bargaining The estimated elasticity for Germany is 063 meaning that a 1 increase of labour productivity leads to wage increases of 063 Higher labour demand due to lower labour costs thus reduces the wage increase In the end the German economy is more labour intensive than without the ETR partly due to the structural change towards labour-intensive industries
Table 33 Employment impacts of scenario S2H in Germany mdash deviations from scenario S2H in 2020
Employment in 2020 Deviation from S2H () Deviation from S2Habsolute (1 000s)
Agriculture forestry 24 90
Industry 09 653
Non-metallic minerals 24 62
Iron and steel ndash 28 ndash 37
Machinery and equipment 05 56
Electrical machinery 04 18
Construction 37 449
Trade and transport 10 829
Business services 17 767
Other services ndash 02 ndash 216
Total 07 2506
Environmental tax reform in Europe opportunities for eco-innovation
Modelling of ETR impacts on eco-innovation
36
Additional exports under scenario S2HE mainly create new jobs in machinery and related business services (Table 34) Under scenario S2HI a shift in the input structure of the energy sector leads to a shift in the industry structure and creates a few jobs in the service sector (Table 35)
34 Conclusions of the scenario assessment
The foregoing analysis used the GINFORS model to assess economic and environmental impacts of using the ETS and ETR to reach the EUs 2020
GHG targets In general the results show positive employment effects and only small negative impacts on GDP in EU-27 Member States The economic impacts depend on the levels of international energy prices the mechanism used to recycle revenues and country specifics such as carbon and energy intensity and the structure of energy consumption
Although there is significant evidence that eco-innovation is positively driven by higher energy prices quantification is difficult The present study included simulations of possible impacts of a shift in the industry structure towards renewable energy in the electricity sector and an overall increase of EU
Table 34 Employment impacts of scenario S2HE in 2020 in Germany mdash deviations from scenario S2H
Employment in 2020 Deviation from S2H () Deviation from S2Habsolute (1 000s)
Agriculture forestry ndash 01 ndash 02
Industry 03 194
Non-metallic minerals 02 05
Iron and steel 04 05
Machinery and equipment 13 130
Electrical machinery 24 117
Construction 01 18
Trade and transport 00 26
Business services 07 308
Other services 01 107
Total 02 634
Table 35 Employment impacts of scenario S2HI in 2020 in Germany mdash deviations from scenario S2H
Employment in 2020 Deviation from S2H () Deviation from S2Habsolute (1 000s)
Agriculture forestry ndash 01 ndash 02
Industry 00 00
Non-metallic minerals 25 65
Iron and steel ndash 27 ndash 36
Machinery and equipment 08 78
Electrical machinery 04 19
Construction ndash 00 ndash 04
Trade and transport 00 07
Business services 02 115
Other services 0 56
Total 00 167
Modelling of ETR impacts on eco-innovation
Environmental tax reform in Europe opportunities for eco-innovation 37
exports due to higher global demand for renewable energy The main results can be summarised as follows
bull environmentaltaxreformshiftingtaxesfromlabour to energy and resources will create additional jobs and trigger eco-innovation
bull impactsofeco-innovationintheformofadditional EU exports or shifts in industry structures will have a slight positive influence on GDP and create a smaller number of additional jobs
These findings correspond to results from the EmployRES study (Fraunhofer ISI et al 2009) As ETR is directly aimed at reducing labour costs it will create additional jobs in the short and medium term In the longer term the cost reduction and new technologies arising from eco-innovation will play a larger role
Like all fiscal reforms a major ETR in Europe will create winners and losers At the sector level carbon- and material-intensive industries will face economic losses At the country level the carbon-intensity and overall flexibility of economies is important Clearly structural change away from carbon-intensive industries together with technological change is inherent in any successful climate mitigation policy
On the other hand several factors can smooth these structural adjustments International cooperation
will reduce economic pressure on countries and sectors In addition ETR together with auctioning of ETS allowances can be a major source of revenues for EU Member States in the future even if part of the revenues will have to be earmarked for adaptation and mitigation measures in developing countries Indeed future debate on grandfathering or auctioning ETS allowances should reflect the important point that giving allowances away for free denies countries the money to ease structural change and invest in low-carbon technologies
Caution is needed in relating the findings of this study to the EU policy debate In the model simulations the single carbon price is the only instrument used to reach the EUs 2020 GHG targets In reality of course other renewable energy and efficiency policies will also contribute to carbon reduction and have to be taken into account when comparing the results (especially the high carbon prices) to other studies Both reduce the potential revenues from fossil energy carriers and carbon emissions
A variety of renewable energy and efficiency policies could enable the climate and energy targets to be met while securing even better economic prospects The results of the present study clearly indicate that the discussion on market-based instruments should be intensified Ultimately however the EU will need a rich mix of policies to reach its GHG targets while maximising prosperity
Environmental tax reform in Europe opportunities for eco-innovation38
References
Almon C 1991 The INFORUM Approach to Interindustry Modeling in Economic Systems Research Vol 3 pp 1ndash7
Amin A and Cohendet P 2004 The Architecture of Knowledge Firms Capabilities and Communities Oxford University Press Oxford
Barker T Meyer B Pollitt H and Lutz C 2007a Modelling Environmental Tax Reform in Germany and the United Kingdom with E3ME and GINFORS petre Working Paper Cambridge and Osnabrueck (httpwwwpetreorgukpapershtm) accessed 15 February 2011
Barker T Junankar S Pollitt H and Summerton P 2007b Carbon leakage from unilateral environmental tax reforms in Europe 1995ndash2005 Energy Policy Vol 35 pp 6 281ndash6 292
Brunnermeier S B and Cohen M A 2003 Determinants of environmental innovation in US manufacturing industries Journal of Environmental Economics and Management Vol 45 pp 278ndash293
Buen J 2006 Danish and Norwegian wind industry The relationship between policy instruments innovation and diffusion Energy Policy Vol 34 (18) pp 3 887ndash3 897
Carlsson B and Stankiewicz R 1991 On the nature function and composition of technological systems Journal of Evolutionary Economics Vol 1 (2) pp 93ndash118
Christiansen A C and Skjaerseth J B 2005 Climate change policies in Norway and the Netherlands Different instruments similar outcome Energy and Environment Vol 16(1) pp 1ndash25
Dosi G 1988 Sources procedures and microeconomic effects of innovation Journal of Economic Literature Vol 26 pp 1 120ndash1 171
de Vries F and Medhi N 2008 Environmental regulation and international innovation in automotive emissions control technologies in Environmental Policy Technological Innovation and Patents Organisation for Economic Cooperation and Development Paris
DG TREN 2008 European energy and transport mdash trends to 2030 mdash update 2007 European Commission Luxembourg
DTI 2004 Renewable Supply Chain Gap Analysis UK Department of Trade and Industry
Edler J (ed) 2006 Nachfrageorientierte Innovationspolitik Buumlro fuumlr Technikfolgenabschaumltzung beim Deutschen Bundestag (TAB) Arbeitsbericht Nr 99 Berlin
Edquist C 2001 The system of innovation approach and innovation policy an account of the state of the art lead paper presented at the DRUID Conference 12ndash15 June 2001 Aalborg (httpwwwdruiddkconferencesnwpaper1edquistpdf) accessed 15 February 2011
EEA 2006 Using the market for cost-effective environmental policy Market-based instruments in Europe EEA Report No 12006 European Environment Agency Copenhagen
Ekins P 2009 Resource Productivity Environmental tax Reform and Sustainable Growth in Europe published by the Anglo-German Foundation for the Study of Industrial Society Final report (httpwwwpetreorgukpdfFinRepFinpdf) accessed 12 October 2011
Ekins P and Speck S (eds) 2011 Environmental Tax Reform (ETR) A Policy for Green Growth Oxford University Press
EREC 2008 Energy [r]evolution A sustainable global energy outlook Greenpeace International European Renewable Energy Council (EREC)
References
References
Environmental tax reform in Europe opportunities for eco-innovation 39
Fagerberg J Mowery D C and Nelson R R (eds) 2005 The Oxford Handbook of Innovation Oxford University Press Oxford
Fischer C Parry I W H and Pizer W A 2003 Instrument choice for environmental protection when technological innovation is endogenous Journal of Environmental Economics and Management Vol 45 pp 523ndash545
Fraunhofer ISI ECOFYS Energy Economics Group Ruumltter + Partner SEURECO and LEI 2009 EmployRES mdash The impact of renewable energy policy on economic growth and employment in the European Union European Commission Brussels
Frondel M Horbach J and Rennings K 2008 What triggers environmental management and innovation Empirical evidence for Germany Ecological Economics Vol 66(1) pp 153ndash160
GHK Cambridge Econometrics and IEEP 2007 Links between the environment economy and jobs Final Report submitted to DG Environment European Commission
Giljum S Behrens A Hinterberger F Lutz C and Meyer B 2008 Modelling scenarios towards a sustainable use of natural resources in Europe Environmental Science and Policy Vol 11 pp 204ndash216
Goumlrlach B Knigge M and Luumlckge H 2005 Wirkungen der Oumlkologischen Steuerreform auf Innovation und Marktdurchdringung Ecologic Berlin (httpecologiceudownloadprojekte1850-189918791879_5_innovationpdf) accessed 18 August 2011
Green M A 2000 Photovoltaics technology overview Energy Policy Vol 28 (14) pp 989ndash998
Grossmann A Lehr U Lutz C and Wolter MI 2008 Gesamtwirtschaftliche Effekte der Umsetzung der EU Ziele im Bereich Erneuerbare Energien und Gebaumludeeffizienz in Oumlsterreich bis 2020 Studie im Auftrag des Lebensministeriums Wien 0508
Hage J and Hollingsworth J R 2000 Idea innovation networks a strategy for integrating organizational and institutional analysis Organization Studies Vol 21 (5) pp 971ndash1 004
Hauschildt J 2004 Innovationsmanagement Vahlen Muumlnchen
Hemmelskamp J 1997 Environmental policy instruments and their effects on innovation European Planning Studies Vol 5 (2) pp 177ndash195
Hoglund Isaksson L 2005 Abatement costs in response to the Swedish charge on nitrogen oxide emissions Journal of Environmental Economics and Management Vol 50 pp 102ndash120
Hullmann A 2001 Internationaler Wissenstransfer und technischer Wandel (dissertation) Physica-Verlag Heidelberg
IEA 2008 World Energy Outlook 2008 International Energy Agency Paris
IEA 2009 World Energy Outlook 2009 International Energy Agency Paris
Jacobsson S Andersson B A and Baringngens L 2002 Transforming the energy system mdash the evolution of the German technological system for solar cells Science and Technology Policy Research University of Sussex Electronic Working Paper Series No 84 (httpideasrepecorgpsrussewps84html) accessed 18 August 2011
Jaffe A and Stavins R 1995 Dynamic incentives of environmental regulations the effects of alternative policy instruments on technology diffusion Journal of Environmental Economics and Management Vol 29(3) pp 43ndash63
Jaffe A B and Palmer K 1997 Environmental regulation and innovation a panel data study The Review of Economics and Statistics Vol 79 pp 610ndash619
Jaffe A B Newell R G and Stavins R N 2002 Environmental policy and technological change Environmental and Resource Economics Vol 22 (1ndash2) 2002 pp 41ndash70
Johnstone N and Hascic I 2008 Renewable energy policies and technological innovation energy source and instrument choice in Environmental Policy Technological Innovation and PatentsOrganisation for Economic Co-operation and Development Paris
Johnstone N 2005 The Innovation Effects of Environmental Policy Instruments in Horbach J (ed) Indicator Systems for Sustainable Innovation Physica-Verlag HD
Environmental tax reform in Europe opportunities for eco-innovation
References
40
Johnstone N Hascic I and Ostertag K 2008 Environmental policy technological innovation and patent activity in Environmental Policy Technological Innovation and Patents Organisation for Economic Co-operation and Development Paris
Jung C Krutilla K and Boyd R 1996 Incentives for advanced pollution abatement technology at the industry level an evaluation of policy alternatives Journal of Environmental Economics and Management Vol 30(1) pp 95ndash111
Kammen D M Kapidia K and Fripp M 2004 Putting renewables to work how many jobs can the clean energy industry generate University of California Berkeley
Kemp R 1997 Environmental policy and technical change ndash a comparison of the technological impact of policy instruments Edward Elgar Cheltenham
Kemp R 1998 The diffusion of biological waste-water treatment plants in the Dutch food and beverage industry Environmental and Resource Economics Vol 12 pp 113ndash136
Kemp R 2000 Technology and environmental policy ndash innovation effects of past policies and suggestions for improvement in OECD proceedings ndash innovation and the environment Organisation for Economic Co-operation and Development Paris
Kerr S and Newell R G 2003 Policy-induced technology adoption evidence from the US lead phasedown Journal of Industrial Economics Vol 51 pp 317ndash343
Klaassen G Miketa A Larsen K and Sundqvist T 2005 The impact of RampD on innovation for wind energy in Denmark Germany and the United Kingdom Ecological Economics Vol 54 pp 227ndash240
Kline S and Rosenberg N 1986 An overview of innovation in Landau R (ed) The positive sum strategy Harnessing technology for economic growth pp 275-306
Knigge M and Goumlrlach B 2005 Effects of Germanys ecological tax reforms on the environment employment and technological innovation Ecologic Berlin (httpwwwumweltbundesamtdeuba-info-presse-ehintergrundoekosteuerpdf) accessed 18 August 2011
Langniss O 2003 Governance structures for promoting renewable energy sources dissertation Lund Stuttgart
Lanjouw J O and Mody A 1996 Innovation and the international diffusion of environmentally responsive technology Research Policy Vol 25 pp 549ndash571
Lehr U Nitsch J Kratzat M Lutz C and Edler D 2008 Renewable Energy and Employment in Germany Energy Policy Vol 36 pp 108ndash117 DOI101016jenpol200709004
Lehr U Wolter MI and Groszligmann A 2009 Economic impacts of RES obligations in Austria ndash an application of the macro-econometric model e3at GWS Discussion Paper 20091 Osnabruumlck
Lundvall B-A Johnson B Andersen E S and Dalum B 2001 National systems of production innovation and competence building Research Policy Vol 31 pp 213ndash231
Lutz C and Giljum S 2009 Global resource use in a business as usual world until 2030 Updated results from the GINFORS model in Bleischwitz R Welfens Pand Zhang Z (eds) Sustainable growth and resource productivity ndash economic and global policy issues Greenleaf Publishers pp 30ndash41
Lutz C and Meyer B 2008 Beschaumlftigungseffekte des Klimaschutzes in Deutschland Untersuchungen zu gesamtwirtschaftlichen Auswirkungen ausgewaumlhlter Maszlignahmen des Energie- und Klimapakets Forschungsbericht 205 46 434 Dessau-Roszliglau
Lutz C and Meyer B 2009a Environmental and Economic Effects of Post-Kyoto Carbon Regimes Results of Simulations with the Global Model GINFORS Energy Policy Vol 37 pp 1 758ndash1 766 DOI 101016jenpol200901015
Lutz C and Meyer B 2009b Scenario results from GINFORS PETRE working paper Osnabruumlck
Lutz C Meyer B Nathani C and Schleich J 2005 Endogenous technological change and emissions The case of the German steel industry Energy Policy Vol33 pp 1 143ndash1 154
Lutz C Meyer B Nathani C and Schleich J 2007 Endogenous innovation economy and environment impacts of a technology based modelling approach for energy-intensive industries in Germany Energy Studies Review Vol 15(1) pp 2ndash18
References
Environmental tax reform in Europe opportunities for eco-innovation 41
Lutz C Meyer B and Wolter M I 2009 The global multisectormulticountry 3-E model GINFORS mdash a description of the model and a baseline forecast for global energy demand and CO2 emissions Journal of Sustainable Development forthcoming
Malerba F and Orsenigo L 1997 Technological Regimes and Sectoral Patterns of Innovative Activities Industrial and Corporate Change Vol 6 (1) pp 83ndash117
Malerba F 1992 Learning by Firms and Incremental Technical Change The Economic Journal Vol 102 (413) pp 845ndash859
Malerba F 2005 Industrial dynamics and innovation progress and challenges Presidential Address delivered at the 32nd Conference of the European Association for Research in Industrial Economics (EARIE) 1ndash4 September 2005 Porto
Malerba F 2006 Innovation and the evolution of industries Journal of Evolutionary Economics Vol 16 pp 3ndash23
McGinty M and de Vries F P 2009 Technology diffusion product differentiation and environmental subsidies The BE Journal of Economic Analysis and Policy Vol 9(1)
Meyer B and Lutz C 2007 The GINFORS model ndash model overview and evaluation Petre Working Paper Osnabruumlck (httpwwwpetreorgukpapershtm) accessed 18 August 2011
Meyer B Lutz C Schnur P and Zika G 2007 Economic policy simulations with global interdependencies a sensitivity analysis for Germany Economic Systems Research Vol 19 pp 37ndash55
Mickwitz P H Hyvaumlttinen and P Kivimaa 2008 The role of policy instruments in the innovation and diffusion of environmentally friendlier technologies popular claims versus case study experiences Journal of Cleaner Production Vol 16(1S1) 162ndash170
Miketa A and Schrattenholzer L 2004 Experiments with a methodology to model the role of RampD expenditures in energy technology learning processes first results Energy Policy Vol 32 (15) pp 1 679ndash1 692
Milliman S R and Prince R 1989 Firm incentives to promote technological change in pollution control Journal of Environmental Economics and Management Vol 17 pp 247ndash265
Millock K and Nauges C 2006 Ex-post evaluation of an earmarked tax on air pollution Land Economics Vol 82(1) pp 68ndash84
Montero J-P 2002 Market structure and environmental innovation Journal of Applied Economics Vol 2 pp 293ndash325
Moreno B and Loacutepez A J 2007 The effect of renewable energy on employment mdash The case of Asturias (Spain) Renewable and Sustainable Energy Rewiews doi 101016jrser200610011
Mowery D and Rosenberg N 1979 The influence of market demand upon innovation A critical review of some recent empirical studies Research Policy Vol 8 pp 102ndash153
Newell R G Jaffe A B and Stavins R N 1999 The induced innovation hypothesis and energy-saving technological change Quarterly Journal of Economics Vol 114 pp 941ndash975
Norberg-Bohm V 1999 Stimulating green technological innovation An analysis of alternative policy mechanisms Policy Sciences Vol 32(1) pp 13ndash38
OECD 2009 Sustainable manufacturing and eco-innovation towards a green economy Organisation for Economic Co-operation and Development Policy Brief June 2009
OECD 2010 Taxation innovation and the environment Organisation for Economic Co-operation and Development
Pavitt K 1984 Sectoral patterns of technological change Towards a taxonomy and a theory Research Policy Vol 13 pp 343ndash373
Popp D 2002 Induced innovation and energy prices The American Economic Review Vol 92(1) pp 160ndash180
Popp D 2005 Lessons from patents Using patents to measure technological change in environmental models Ecological Economics Vol 54 pp 209ndash226
Environmental tax reform in Europe opportunities for eco-innovation
References
42
Porter M and van der Linde C 1995 Toward a new conception of the environment competitiveness relationship Journal of Economic Perspectives Vol 9(4) pp 97ndash118
Rammert W 2002 The cultural shaping of technologies and the politics of technodiversity In Sorensen K and Williams R (eds) Shaping technology guiding policy concepts spaces and tools Elgar Cheltenham pp 155-172
Requate T 2005 Dynamic incentives by environmental policy instruments ndash a survey Ecological Economics Vol 54 pp 175ndash195
Roloff N Lehr U Krewitt W Fuchs G Wassermann S Weimer-Jehle W and Schmidt B 2008 Success determinants for technological innovations in the energy sector mdash the case of photovoltaics in Moumlst D Fichtner W Ragwitz M and Veit D (eds) New methods for energy market modelling mdash Proceedings of the first european workshop on energy market modelling using agent-based computational economics Universitaumltsverlag Karlsruhe
Rothwell R 1995 The fifth generation innovation process in Oppenlaumlnder KH Popp W (eds) Innovationen und wirtschaftlicher Fortschritt betriebs-und volkswirtschaftliche Perspektiven Bern pp 9ndash26
Schumpeter J 1942 Capitalism socialism and democracy New York Harper
Skjaeligrseth J B and Christiansen A C 2005 Environmental policy instruments and technological change in the energy sector findings from comparative empirical research Energy and Environment Vol 17 (2) pp 223ndash241
Snyder L D Miller N H and Stavins R N 2003 The effects of environmental regulations on pollution emissions evidence from plant-level data American Economic Review Vol 93(2) pp 431ndash435
Technopolis 2008 Eco-innovation Final Report for Sectoral Innovation Watch (httpwwwtechnopolis-groupcomresourcesdownloads661_report_finalpdf) accessed 18 August 2011
Volleburgh H 2007 Impacts of environmental policy instruments on technological change Report for Joint Meetings of Tax and Environment Experts OECD Environment Directorate February 2007 (comenvepocctpacfa(2006)36final)
Zimmermann H Wohltmann M and Hansjuumlrgens B 1996 Umweltabgaben und Innovation Analytica Marburg
43
Annex 1
Environmental tax reform in Europe opportunities for eco-innovation
Type Instrument Area Stage
Reference
Theo
retica
l
Em
piric
al
Cas
e st
udy
Rev
iew
Qual
itat
ive
Taxe
s
Perm
its
Subsi
die
s
Volu
nta
ry
Com
man
d
Reg
ula
tion
Ener
gy
Air
Wat
er
Oth
er
Gen
eral
Innov
atio
n
Diffu
sion
Rel
evan
ce
Brunnermeier amp Cohen (2003)
X X X X
Buen (2006) X X X X X X
Christiansen amp Skjaerseth (2005)
X X X X X X
Fischer et al (2003 X X X X X X
Frondel et al (2008) X X X X X X X (X) (X)
Hemmelskamp (1997)
X X X X X X X (X)
Hoglund Isaksson (2005)
X X X (X) (X)
Jaffe amp Stavins (1995)
X X X1 X X X X
Jaffe amp Palmer (1997)
X X X X
Jaffe et al (2002) X X X X X X X X X X
Jung et al (1996) X X X X X X (X) (X)
Kemp (1998) X X X X
Kerr amp Newell (2001) X X X X X
Klaassen et al (2005)
X X X X X
Lanjouw amp Mody (1996)
X X X X X X X
McGinty amp de Vries (2009)
X X X X
Mickwitz et al (2008)
X X X X X X X X X
Milliman amp Prince (1989)
X X X X X X X
Millock amp Nauges (2006)
X X X X X X
Montero (2002) X X X X X
Newell et al (1999) X X1 X X X
Norberg-Bohm (1999)
X X X X X X X
Popp (2002) X X1 X X
Popp (2005) X X X X X X
Porter amp van der Linde (1995)
X X X X X X
Requate (2005) X X X X X X X
Skjaeligrseth amp Christiansen (2005)
X X X X X X X X X
Snyder et al (2003) X X X X X
Annex 1 Classification of refereed journal articles
Environmental tax reform in Europe opportunities for eco-innovation44
Annex 2
Type Instrument Area Stage
Reference
Theo
retica
l
Em
piric
al
Cas
e st
udy
Rev
iew
Qual
itat
ive
Taxe
s
Perm
its
Subsi
die
s
Volu
nta
ry
Com
man
d
Reg
ula
tion
Ener
gy
Air
Wat
er
Oth
er
Gen
eral
Innov
atio
n
Diffu
sion
Rel
evan
ce
Johnstone (2005)
X X X X X X X
Johnstone amp Hascic (2008)
X X X X X X X X
Kemp (1997) X X X X X X X X X X X X X
Kemp (2000) X X X X X X X X X
de Vries amp Medhi (2008)
X X1 X X X
Annex 2 Classification of books and book chapters
45
Annex 3
Environmental tax reform in Europe opportunities for eco-innovation
Type Instrument Area Stage
Reference
Theo
retica
l
Em
piric
al
Cas
e st
udy
Rev
iew
Qual
itat
ive
Taxe
s
Perm
its
Subsi
die
s
Volu
nta
ry
Com
man
d
Reg
ula
tion
Ener
gy
Air
Wat
er
Oth
er
Gen
eral
Innov
atio
n
Diffu
sion
Rel
evan
ce
Goumlrlach et al (2005)
X X X X X X
Knigge amp Goumlrlach (2005)
X X X X X X
Technopolis (2008)
X X X X X X
Volleburgh (2007)
X X X X X X X X X X X
Annex 3 Classification of reports
European Environment Agency
Environmental tax reform in Europe opportunities for eco-innovation
2011 mdash 45 pp mdash 21 x 297 cm
ISBN 978-92-9213-238-5doi10280084889
How to obtain EU publications
Publications for salebull viaEUBookshop(httpbookshopeuropaeu)bull fromyourbooksellerbyquotingthetitlethepublisherandorISBNnumberbull bycontactingoneofoursalesagentsdirectlyYoucanobtaintheircontactdetails
on the Internet (httpbookshopeuropaeu) or by sending a fax to +352 2929-42758
Free publicationsbull viaEUBookshop(httpbookshopeuropaeu)bull attheEuropeanCommissionsrepresentationsordelegationsYoucanobtain
their contact details on the Internet (httpeceuropaeu) or by sending a fax to +352 2929-42758
European Environment AgencyKongens Nytorv 61050 Copenhagen KDenmark
Tel +45 33 36 71 00Fax +45 33 36 71 99
Web eeaeuropaeuEnquiries eeaeuropaeuenquiries
TH
-AK-1
1-0
17-E
N-N
doi1
02
8008
4889
- Acknowledgements
- Executive summary
- 1Introduction
-
- 11Background
- 12ETR and innovation
- 13Report structure
-
- 2Review of literature on environmental tax reform and eco‑innovation
-
- 21Initial screening
- 22Detailed review
- 23Environmental regulation studies
- 24Theoretical studies
- 25Empirical studies
- 26Case studies
- 27Conclusions
-
- 3Modelling of ETR impacts on eco‑innovation
-
- 31Scenarios assessing the implications of ETR for eco-innovation
- 32Overview of modelling results
- 33Macroeconomic impacts at the national level
- 34Conclusions of the scenario assessment
-
- References
- Annex 1 Classification of refereed journal articles
- Annex 2Classification of books and book chapters
- Annex 3Classification of reports
-
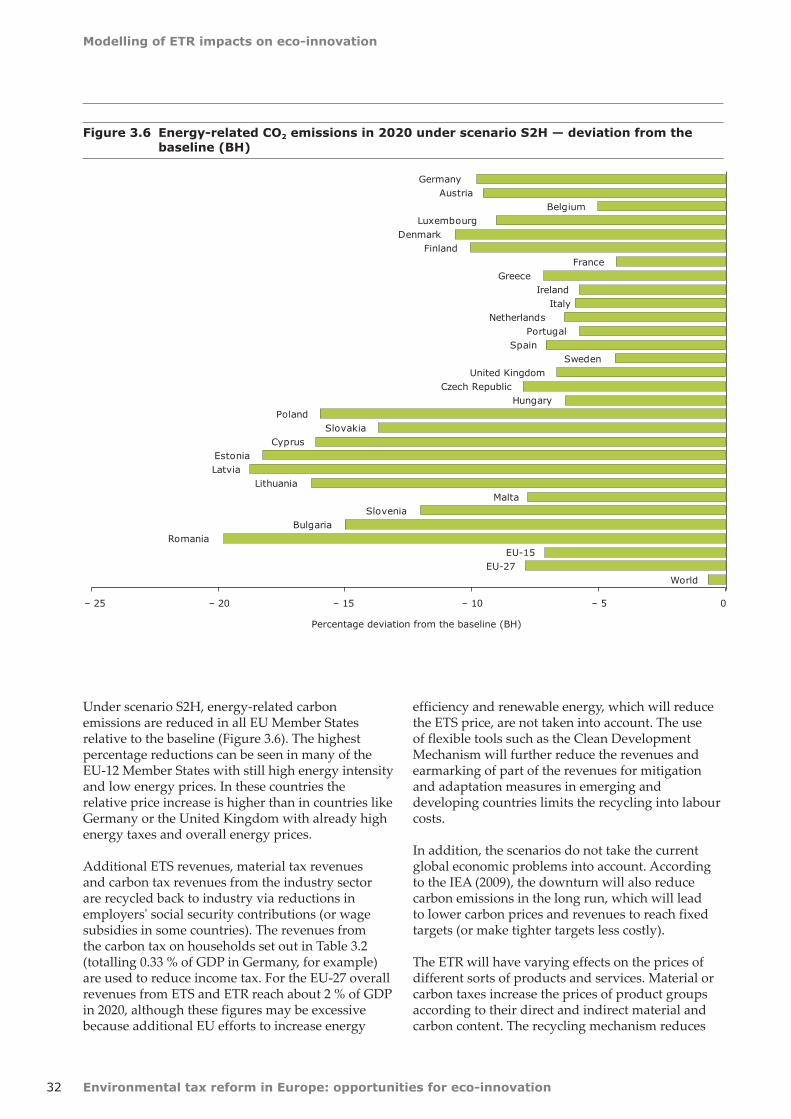
Environmental tax reform in Europe opportunities for eco-innovation
Modelling of ETR impacts on eco-innovation
32
Under scenario S2H energy-related carbon emissions are reduced in all EU Member States relative to the baseline (Figure 36) The highest percentage reductions can be seen in many of the EU-12 Member States with still high energy intensity and low energy prices In these countries the relative price increase is higher than in countries like Germany or the United Kingdom with already high energy taxes and overall energy prices
Additional ETS revenues material tax revenues and carbon tax revenues from the industry sector are recycled back to industry via reductions in employers social security contributions (or wage subsidies in some countries) The revenues from the carbon tax on households set out in Table 32 (totalling 033 of GDP in Germany for example) are used to reduce income tax For the EU-27 overall revenues from ETS and ETR reach about 2 of GDP in 2020 although these figures may be excessive because additional EU efforts to increase energy
efficiency and renewable energy which will reduce the ETS price are not taken into account The use of flexible tools such as the Clean Development Mechanism will further reduce the revenues and earmarking of part of the revenues for mitigation and adaptation measures in emerging and developing countries limits the recycling into labour costs
In addition the scenarios do not take the current global economic problems into account According to the IEA (2009) the downturn will also reduce carbon emissions in the long run which will lead to lower carbon prices and revenues to reach fixed targets (or make tighter targets less costly)
The ETR will have varying effects on the prices of different sorts of products and services Material or carbon taxes increase the prices of product groups according to their direct and indirect material and carbon content The recycling mechanism reduces
Figure 36 Energy-related CO2 emissions in 2020 under scenario S2H mdash deviation from the baseline (BH)
WorldEU-27
EU-15Romania
BulgariaSlovenia
MaltaLithuania
LatviaEstonia
CyprusSlovakia
PolandHungary
Czech RepublicUnited Kingdom
SwedenSpain
PortugalNetherlands
ItalyIreland
GreeceFrance
FinlandDenmark
LuxembourgBelgium
AustriaGermany
ndash 25 ndash 20 ndash 15 ndash 10 ndash 5 0
Percentage deviation from the baseline (BH)
Modelling of ETR impacts on eco-innovation
Environmental tax reform in Europe opportunities for eco-innovation 33
Table 32 Additional ETS and environmental tax revenues in 2020 ( of GPD)
S2H Germany United Kingdom EU-27
ETS revenues 083 064 059
Carbon tax (industry) 052 044 054
Carbon tax (households) 033 041 036
Material tax 041 029 056
Sum 209 178 205
Figure 37 Total primary energy supply in 2020 under scenario S2H mdash deviation from the baseline (BH)
WorldEU-27EU-15
RomaniaBulgaria
Slovenia
MaltaLithuania
LatviaEstonia
Cyprus
SlovakiaPoland
HungaryCzech Republic
United KingdomSweden
SpainPortugal
NetherlandsItaly
IrelandGreece
FranceFinland
DenmarkLuxembourg
BelgiumAustria
Germany
ndash 24 ndash 21 ndash 18 ndash 15 ndash 12 ndash 9 ndash 6 ndash 3 0
Percentage deviation from the baseline (BH)
Environmental tax reform in Europe opportunities for eco-innovation
Modelling of ETR impacts on eco-innovation
34
Figure 38 Output price impacts of scenario S2H in Germany in 2020 mdash deviations from the baseline (BH)
Figure 39 Impacts of scenario S2H on industrial output in 2020 in Germany mdash deviations from the baseline (BH)
ndash 5
0
5
10
15
20
Output prices
Percentage deviation from the baseline (BH)
(3) F
ood
(4) T
extiles
(5) W
ood
(6) P
ulp pap
er
(7) C
oke re
fined
petro
leum
pro
ducts
(8) C
hemica
ls ex
cl pha
rma
(9) P
harm
aceu
ticals
(10)
Rub
ber a
nd plastics
(11)
Non
-metallic
miner
als
(12)
Iron
and
steel
(13)
Non
-ferrou
s metals
(14)
Met
al pro
ducts
(15)
Mac
hine
ry and
equ
ipmen
t
(16)
Office
mac
hine
ry
(17)
Electric
al m
achine
ry
(18)
Rad
io T
V
(19)
Med
ical pr
ecisi
on and
opt
ical ins
trumen
ts
(20)
Mot
or veh
icles
(21)
Ships
(22)
Airc
raft
(23)
Railro
ad
(24)
Man
ufac
turin
g n
ec r
ecyc
ling
(25)
Electric
ity g
as w
ater
sup
ply
(26)
Con
stru
ction
(27)
Tra
de r
epairs
(28)
Hot
els an
d re
stau
rant
s
(29)
Tra
nspo
rt an
d stor
age
(30)
Pos
t and
teleco
mmun
icatio
ns
(31)
Finan
ce ins
uran
ce
(32)
Rea
l estate ac
tivities
(33)
Ren
ting
(34)
Com
puter
(35)
Res
earch an
d de
velopm
ent
(36)
Oth
er bus
ines
s ac
tivities
(37)
Pub
lic ser
vice
s
(38)
Edu
catio
n
(39)
Hea
lth and
soc
ial w
ork
(40)
Oth
er ser
vice
s
(41)
Priv
ate ho
useh
olds
(1) A
gricu
lture
(2) M
ining an
d qu
arry
ing
nec not elsewhere classified
Production
ndash 100
ndash 80
ndash 60
ndash 40
ndash 20
00
20
40
60
80Percentage deviation from the baseline (BH)
(3) F
ood
(4) T
extiles
(5) W
ood
(6) P
ulp pap
er
(7) C
oke re
fined
petro
leum
pro
ducts
(8) C
hemica
ls ex
cl pha
rma
(9) P
harm
aceu
ticals
(10)
Rub
ber a
nd plastics
(11)
Non
-metallic
miner
als
(12)
Iron
and
steel
(13)
Non
-ferrou
s metals
(14)
Met
al pro
ducts
(15)
Mac
hine
ry and
equ
ipmen
t
(16)
Office
mac
hine
ry
(17)
Electric
al m
achine
ry
(18)
Rad
io T
V
(19)
Med
ical pr
ecisi
on and
opt
ical ins
trumen
ts
(20)
Mot
or veh
icles
(21)
Ships
(22)
Airc
raft
(23)
Railro
ad
(24)
Man
ufac
turin
g n
ec r
ecyc
ling
(25)
Electric
ity g
as w
ater
sup
ply
(26)
Con
stru
ction
(27)
Tra
de r
epairs
(28)
Hot
els an
d re
stau
rant
s
(29)
Tra
nspo
rt an
d stor
age
(30)
Pos
t and
teleco
mmun
icatio
ns
(31)
Finan
ce ins
uran
ce
(32)
Rea
l estate ac
tivities
(33)
Ren
ting
(34)
Com
puter
(35)
Res
earch an
d de
velopm
ent
(36)
Oth
er bus
ines
s ac
tivities
(37)
Pub
lic ser
vice
s
(38)
Edu
catio
n
(39)
Hea
lth and
soc
ial w
ork
(40)
Oth
er ser
vice
s
(41)
Priv
ate ho
useh
olds
(1) A
gricu
lture
(2) M
ining an
d qu
arry
ing
nec not elsewhere classified
Modelling of ETR impacts on eco-innovation
Environmental tax reform in Europe opportunities for eco-innovation 35
social security contributions and lowers labour costs according to the direct and indirect labour content of sector output The ETR therefore reduces output prices in labour-intensive service sectors and increases prices in carbon- and material-intensive industry sectors
The example of Germany shows insignificant impacts in the trade-intensive sectors of machinery (15ndash17) motor vehicles (20) and other transport equipment (21ndash23) (Figure 38) Iron and steel (12) and chemicals without pharmaceuticals (8) face the highest price increases of trade-intensive sectors As the German iron and steel industry primarily delivers high quality steel to the German car industry and increasingly to the German windmill industry negative competitiveness impacts will be limited Exchange rate variations against non-EU competitors have been much higher in the past
The higher prices of carbon- and material-intensive products will reduce price competitiveness on export markets and increase the market share for imports in domestic markets This loss of price competitiveness is based on an assumption of limited market development of energy efficiency and RES technologies in other part of the world It will be offset by gains in labour-intensive sectors if the ETR causes real wage costs per unit of output to fall as a result of using recycled revenues to reduce employer social security contributions
Any improvement in non-price competitiveness will also raise exports The extra employment will raise incomes raising consumption and output
The overall impact on sector output depends on countervailing effects which are negative for iron and steel and a few service sectors and positive for a few industry sectors For most industries the output effect is insignificant (Figure 39) The greatest impact is felt by producers of fossil fuels who must obviously reduce production due to lower demand for their products
Under scenario S2H employment impacts are positive for most sectors relative to the baseline as labour productivity decreases and wage rates fall in relation to consumer prices (CPI) and output prices (Table 33) The relative costs of labour are lower than in the baseline without the ETR reform Only around a quarter of the employment increase takes place in industry
Concerning the wage rate two countervailing effects have to be considered First when the labour market is characterised in terms of the real wage bargaining model as in E3ME and GINFORS with market power on both sides (employers and trade unions) consumer price increases will lead to wage increases (the econometrically estimated factor is 085 for Germany) Second labour productivity is another important factor for wage bargaining The estimated elasticity for Germany is 063 meaning that a 1 increase of labour productivity leads to wage increases of 063 Higher labour demand due to lower labour costs thus reduces the wage increase In the end the German economy is more labour intensive than without the ETR partly due to the structural change towards labour-intensive industries
Table 33 Employment impacts of scenario S2H in Germany mdash deviations from scenario S2H in 2020
Employment in 2020 Deviation from S2H () Deviation from S2Habsolute (1 000s)
Agriculture forestry 24 90
Industry 09 653
Non-metallic minerals 24 62
Iron and steel ndash 28 ndash 37
Machinery and equipment 05 56
Electrical machinery 04 18
Construction 37 449
Trade and transport 10 829
Business services 17 767
Other services ndash 02 ndash 216
Total 07 2506
Environmental tax reform in Europe opportunities for eco-innovation
Modelling of ETR impacts on eco-innovation
36
Additional exports under scenario S2HE mainly create new jobs in machinery and related business services (Table 34) Under scenario S2HI a shift in the input structure of the energy sector leads to a shift in the industry structure and creates a few jobs in the service sector (Table 35)
34 Conclusions of the scenario assessment
The foregoing analysis used the GINFORS model to assess economic and environmental impacts of using the ETS and ETR to reach the EUs 2020
GHG targets In general the results show positive employment effects and only small negative impacts on GDP in EU-27 Member States The economic impacts depend on the levels of international energy prices the mechanism used to recycle revenues and country specifics such as carbon and energy intensity and the structure of energy consumption
Although there is significant evidence that eco-innovation is positively driven by higher energy prices quantification is difficult The present study included simulations of possible impacts of a shift in the industry structure towards renewable energy in the electricity sector and an overall increase of EU
Table 34 Employment impacts of scenario S2HE in 2020 in Germany mdash deviations from scenario S2H
Employment in 2020 Deviation from S2H () Deviation from S2Habsolute (1 000s)
Agriculture forestry ndash 01 ndash 02
Industry 03 194
Non-metallic minerals 02 05
Iron and steel 04 05
Machinery and equipment 13 130
Electrical machinery 24 117
Construction 01 18
Trade and transport 00 26
Business services 07 308
Other services 01 107
Total 02 634
Table 35 Employment impacts of scenario S2HI in 2020 in Germany mdash deviations from scenario S2H
Employment in 2020 Deviation from S2H () Deviation from S2Habsolute (1 000s)
Agriculture forestry ndash 01 ndash 02
Industry 00 00
Non-metallic minerals 25 65
Iron and steel ndash 27 ndash 36
Machinery and equipment 08 78
Electrical machinery 04 19
Construction ndash 00 ndash 04
Trade and transport 00 07
Business services 02 115
Other services 0 56
Total 00 167
Modelling of ETR impacts on eco-innovation
Environmental tax reform in Europe opportunities for eco-innovation 37
exports due to higher global demand for renewable energy The main results can be summarised as follows
bull environmentaltaxreformshiftingtaxesfromlabour to energy and resources will create additional jobs and trigger eco-innovation
bull impactsofeco-innovationintheformofadditional EU exports or shifts in industry structures will have a slight positive influence on GDP and create a smaller number of additional jobs
These findings correspond to results from the EmployRES study (Fraunhofer ISI et al 2009) As ETR is directly aimed at reducing labour costs it will create additional jobs in the short and medium term In the longer term the cost reduction and new technologies arising from eco-innovation will play a larger role
Like all fiscal reforms a major ETR in Europe will create winners and losers At the sector level carbon- and material-intensive industries will face economic losses At the country level the carbon-intensity and overall flexibility of economies is important Clearly structural change away from carbon-intensive industries together with technological change is inherent in any successful climate mitigation policy
On the other hand several factors can smooth these structural adjustments International cooperation
will reduce economic pressure on countries and sectors In addition ETR together with auctioning of ETS allowances can be a major source of revenues for EU Member States in the future even if part of the revenues will have to be earmarked for adaptation and mitigation measures in developing countries Indeed future debate on grandfathering or auctioning ETS allowances should reflect the important point that giving allowances away for free denies countries the money to ease structural change and invest in low-carbon technologies
Caution is needed in relating the findings of this study to the EU policy debate In the model simulations the single carbon price is the only instrument used to reach the EUs 2020 GHG targets In reality of course other renewable energy and efficiency policies will also contribute to carbon reduction and have to be taken into account when comparing the results (especially the high carbon prices) to other studies Both reduce the potential revenues from fossil energy carriers and carbon emissions
A variety of renewable energy and efficiency policies could enable the climate and energy targets to be met while securing even better economic prospects The results of the present study clearly indicate that the discussion on market-based instruments should be intensified Ultimately however the EU will need a rich mix of policies to reach its GHG targets while maximising prosperity
Environmental tax reform in Europe opportunities for eco-innovation38
References
Almon C 1991 The INFORUM Approach to Interindustry Modeling in Economic Systems Research Vol 3 pp 1ndash7
Amin A and Cohendet P 2004 The Architecture of Knowledge Firms Capabilities and Communities Oxford University Press Oxford
Barker T Meyer B Pollitt H and Lutz C 2007a Modelling Environmental Tax Reform in Germany and the United Kingdom with E3ME and GINFORS petre Working Paper Cambridge and Osnabrueck (httpwwwpetreorgukpapershtm) accessed 15 February 2011
Barker T Junankar S Pollitt H and Summerton P 2007b Carbon leakage from unilateral environmental tax reforms in Europe 1995ndash2005 Energy Policy Vol 35 pp 6 281ndash6 292
Brunnermeier S B and Cohen M A 2003 Determinants of environmental innovation in US manufacturing industries Journal of Environmental Economics and Management Vol 45 pp 278ndash293
Buen J 2006 Danish and Norwegian wind industry The relationship between policy instruments innovation and diffusion Energy Policy Vol 34 (18) pp 3 887ndash3 897
Carlsson B and Stankiewicz R 1991 On the nature function and composition of technological systems Journal of Evolutionary Economics Vol 1 (2) pp 93ndash118
Christiansen A C and Skjaerseth J B 2005 Climate change policies in Norway and the Netherlands Different instruments similar outcome Energy and Environment Vol 16(1) pp 1ndash25
Dosi G 1988 Sources procedures and microeconomic effects of innovation Journal of Economic Literature Vol 26 pp 1 120ndash1 171
de Vries F and Medhi N 2008 Environmental regulation and international innovation in automotive emissions control technologies in Environmental Policy Technological Innovation and Patents Organisation for Economic Cooperation and Development Paris
DG TREN 2008 European energy and transport mdash trends to 2030 mdash update 2007 European Commission Luxembourg
DTI 2004 Renewable Supply Chain Gap Analysis UK Department of Trade and Industry
Edler J (ed) 2006 Nachfrageorientierte Innovationspolitik Buumlro fuumlr Technikfolgenabschaumltzung beim Deutschen Bundestag (TAB) Arbeitsbericht Nr 99 Berlin
Edquist C 2001 The system of innovation approach and innovation policy an account of the state of the art lead paper presented at the DRUID Conference 12ndash15 June 2001 Aalborg (httpwwwdruiddkconferencesnwpaper1edquistpdf) accessed 15 February 2011
EEA 2006 Using the market for cost-effective environmental policy Market-based instruments in Europe EEA Report No 12006 European Environment Agency Copenhagen
Ekins P 2009 Resource Productivity Environmental tax Reform and Sustainable Growth in Europe published by the Anglo-German Foundation for the Study of Industrial Society Final report (httpwwwpetreorgukpdfFinRepFinpdf) accessed 12 October 2011
Ekins P and Speck S (eds) 2011 Environmental Tax Reform (ETR) A Policy for Green Growth Oxford University Press
EREC 2008 Energy [r]evolution A sustainable global energy outlook Greenpeace International European Renewable Energy Council (EREC)
References
References
Environmental tax reform in Europe opportunities for eco-innovation 39
Fagerberg J Mowery D C and Nelson R R (eds) 2005 The Oxford Handbook of Innovation Oxford University Press Oxford
Fischer C Parry I W H and Pizer W A 2003 Instrument choice for environmental protection when technological innovation is endogenous Journal of Environmental Economics and Management Vol 45 pp 523ndash545
Fraunhofer ISI ECOFYS Energy Economics Group Ruumltter + Partner SEURECO and LEI 2009 EmployRES mdash The impact of renewable energy policy on economic growth and employment in the European Union European Commission Brussels
Frondel M Horbach J and Rennings K 2008 What triggers environmental management and innovation Empirical evidence for Germany Ecological Economics Vol 66(1) pp 153ndash160
GHK Cambridge Econometrics and IEEP 2007 Links between the environment economy and jobs Final Report submitted to DG Environment European Commission
Giljum S Behrens A Hinterberger F Lutz C and Meyer B 2008 Modelling scenarios towards a sustainable use of natural resources in Europe Environmental Science and Policy Vol 11 pp 204ndash216
Goumlrlach B Knigge M and Luumlckge H 2005 Wirkungen der Oumlkologischen Steuerreform auf Innovation und Marktdurchdringung Ecologic Berlin (httpecologiceudownloadprojekte1850-189918791879_5_innovationpdf) accessed 18 August 2011
Green M A 2000 Photovoltaics technology overview Energy Policy Vol 28 (14) pp 989ndash998
Grossmann A Lehr U Lutz C and Wolter MI 2008 Gesamtwirtschaftliche Effekte der Umsetzung der EU Ziele im Bereich Erneuerbare Energien und Gebaumludeeffizienz in Oumlsterreich bis 2020 Studie im Auftrag des Lebensministeriums Wien 0508
Hage J and Hollingsworth J R 2000 Idea innovation networks a strategy for integrating organizational and institutional analysis Organization Studies Vol 21 (5) pp 971ndash1 004
Hauschildt J 2004 Innovationsmanagement Vahlen Muumlnchen
Hemmelskamp J 1997 Environmental policy instruments and their effects on innovation European Planning Studies Vol 5 (2) pp 177ndash195
Hoglund Isaksson L 2005 Abatement costs in response to the Swedish charge on nitrogen oxide emissions Journal of Environmental Economics and Management Vol 50 pp 102ndash120
Hullmann A 2001 Internationaler Wissenstransfer und technischer Wandel (dissertation) Physica-Verlag Heidelberg
IEA 2008 World Energy Outlook 2008 International Energy Agency Paris
IEA 2009 World Energy Outlook 2009 International Energy Agency Paris
Jacobsson S Andersson B A and Baringngens L 2002 Transforming the energy system mdash the evolution of the German technological system for solar cells Science and Technology Policy Research University of Sussex Electronic Working Paper Series No 84 (httpideasrepecorgpsrussewps84html) accessed 18 August 2011
Jaffe A and Stavins R 1995 Dynamic incentives of environmental regulations the effects of alternative policy instruments on technology diffusion Journal of Environmental Economics and Management Vol 29(3) pp 43ndash63
Jaffe A B and Palmer K 1997 Environmental regulation and innovation a panel data study The Review of Economics and Statistics Vol 79 pp 610ndash619
Jaffe A B Newell R G and Stavins R N 2002 Environmental policy and technological change Environmental and Resource Economics Vol 22 (1ndash2) 2002 pp 41ndash70
Johnstone N and Hascic I 2008 Renewable energy policies and technological innovation energy source and instrument choice in Environmental Policy Technological Innovation and PatentsOrganisation for Economic Co-operation and Development Paris
Johnstone N 2005 The Innovation Effects of Environmental Policy Instruments in Horbach J (ed) Indicator Systems for Sustainable Innovation Physica-Verlag HD
Environmental tax reform in Europe opportunities for eco-innovation
References
40
Johnstone N Hascic I and Ostertag K 2008 Environmental policy technological innovation and patent activity in Environmental Policy Technological Innovation and Patents Organisation for Economic Co-operation and Development Paris
Jung C Krutilla K and Boyd R 1996 Incentives for advanced pollution abatement technology at the industry level an evaluation of policy alternatives Journal of Environmental Economics and Management Vol 30(1) pp 95ndash111
Kammen D M Kapidia K and Fripp M 2004 Putting renewables to work how many jobs can the clean energy industry generate University of California Berkeley
Kemp R 1997 Environmental policy and technical change ndash a comparison of the technological impact of policy instruments Edward Elgar Cheltenham
Kemp R 1998 The diffusion of biological waste-water treatment plants in the Dutch food and beverage industry Environmental and Resource Economics Vol 12 pp 113ndash136
Kemp R 2000 Technology and environmental policy ndash innovation effects of past policies and suggestions for improvement in OECD proceedings ndash innovation and the environment Organisation for Economic Co-operation and Development Paris
Kerr S and Newell R G 2003 Policy-induced technology adoption evidence from the US lead phasedown Journal of Industrial Economics Vol 51 pp 317ndash343
Klaassen G Miketa A Larsen K and Sundqvist T 2005 The impact of RampD on innovation for wind energy in Denmark Germany and the United Kingdom Ecological Economics Vol 54 pp 227ndash240
Kline S and Rosenberg N 1986 An overview of innovation in Landau R (ed) The positive sum strategy Harnessing technology for economic growth pp 275-306
Knigge M and Goumlrlach B 2005 Effects of Germanys ecological tax reforms on the environment employment and technological innovation Ecologic Berlin (httpwwwumweltbundesamtdeuba-info-presse-ehintergrundoekosteuerpdf) accessed 18 August 2011
Langniss O 2003 Governance structures for promoting renewable energy sources dissertation Lund Stuttgart
Lanjouw J O and Mody A 1996 Innovation and the international diffusion of environmentally responsive technology Research Policy Vol 25 pp 549ndash571
Lehr U Nitsch J Kratzat M Lutz C and Edler D 2008 Renewable Energy and Employment in Germany Energy Policy Vol 36 pp 108ndash117 DOI101016jenpol200709004
Lehr U Wolter MI and Groszligmann A 2009 Economic impacts of RES obligations in Austria ndash an application of the macro-econometric model e3at GWS Discussion Paper 20091 Osnabruumlck
Lundvall B-A Johnson B Andersen E S and Dalum B 2001 National systems of production innovation and competence building Research Policy Vol 31 pp 213ndash231
Lutz C and Giljum S 2009 Global resource use in a business as usual world until 2030 Updated results from the GINFORS model in Bleischwitz R Welfens Pand Zhang Z (eds) Sustainable growth and resource productivity ndash economic and global policy issues Greenleaf Publishers pp 30ndash41
Lutz C and Meyer B 2008 Beschaumlftigungseffekte des Klimaschutzes in Deutschland Untersuchungen zu gesamtwirtschaftlichen Auswirkungen ausgewaumlhlter Maszlignahmen des Energie- und Klimapakets Forschungsbericht 205 46 434 Dessau-Roszliglau
Lutz C and Meyer B 2009a Environmental and Economic Effects of Post-Kyoto Carbon Regimes Results of Simulations with the Global Model GINFORS Energy Policy Vol 37 pp 1 758ndash1 766 DOI 101016jenpol200901015
Lutz C and Meyer B 2009b Scenario results from GINFORS PETRE working paper Osnabruumlck
Lutz C Meyer B Nathani C and Schleich J 2005 Endogenous technological change and emissions The case of the German steel industry Energy Policy Vol33 pp 1 143ndash1 154
Lutz C Meyer B Nathani C and Schleich J 2007 Endogenous innovation economy and environment impacts of a technology based modelling approach for energy-intensive industries in Germany Energy Studies Review Vol 15(1) pp 2ndash18
References
Environmental tax reform in Europe opportunities for eco-innovation 41
Lutz C Meyer B and Wolter M I 2009 The global multisectormulticountry 3-E model GINFORS mdash a description of the model and a baseline forecast for global energy demand and CO2 emissions Journal of Sustainable Development forthcoming
Malerba F and Orsenigo L 1997 Technological Regimes and Sectoral Patterns of Innovative Activities Industrial and Corporate Change Vol 6 (1) pp 83ndash117
Malerba F 1992 Learning by Firms and Incremental Technical Change The Economic Journal Vol 102 (413) pp 845ndash859
Malerba F 2005 Industrial dynamics and innovation progress and challenges Presidential Address delivered at the 32nd Conference of the European Association for Research in Industrial Economics (EARIE) 1ndash4 September 2005 Porto
Malerba F 2006 Innovation and the evolution of industries Journal of Evolutionary Economics Vol 16 pp 3ndash23
McGinty M and de Vries F P 2009 Technology diffusion product differentiation and environmental subsidies The BE Journal of Economic Analysis and Policy Vol 9(1)
Meyer B and Lutz C 2007 The GINFORS model ndash model overview and evaluation Petre Working Paper Osnabruumlck (httpwwwpetreorgukpapershtm) accessed 18 August 2011
Meyer B Lutz C Schnur P and Zika G 2007 Economic policy simulations with global interdependencies a sensitivity analysis for Germany Economic Systems Research Vol 19 pp 37ndash55
Mickwitz P H Hyvaumlttinen and P Kivimaa 2008 The role of policy instruments in the innovation and diffusion of environmentally friendlier technologies popular claims versus case study experiences Journal of Cleaner Production Vol 16(1S1) 162ndash170
Miketa A and Schrattenholzer L 2004 Experiments with a methodology to model the role of RampD expenditures in energy technology learning processes first results Energy Policy Vol 32 (15) pp 1 679ndash1 692
Milliman S R and Prince R 1989 Firm incentives to promote technological change in pollution control Journal of Environmental Economics and Management Vol 17 pp 247ndash265
Millock K and Nauges C 2006 Ex-post evaluation of an earmarked tax on air pollution Land Economics Vol 82(1) pp 68ndash84
Montero J-P 2002 Market structure and environmental innovation Journal of Applied Economics Vol 2 pp 293ndash325
Moreno B and Loacutepez A J 2007 The effect of renewable energy on employment mdash The case of Asturias (Spain) Renewable and Sustainable Energy Rewiews doi 101016jrser200610011
Mowery D and Rosenberg N 1979 The influence of market demand upon innovation A critical review of some recent empirical studies Research Policy Vol 8 pp 102ndash153
Newell R G Jaffe A B and Stavins R N 1999 The induced innovation hypothesis and energy-saving technological change Quarterly Journal of Economics Vol 114 pp 941ndash975
Norberg-Bohm V 1999 Stimulating green technological innovation An analysis of alternative policy mechanisms Policy Sciences Vol 32(1) pp 13ndash38
OECD 2009 Sustainable manufacturing and eco-innovation towards a green economy Organisation for Economic Co-operation and Development Policy Brief June 2009
OECD 2010 Taxation innovation and the environment Organisation for Economic Co-operation and Development
Pavitt K 1984 Sectoral patterns of technological change Towards a taxonomy and a theory Research Policy Vol 13 pp 343ndash373
Popp D 2002 Induced innovation and energy prices The American Economic Review Vol 92(1) pp 160ndash180
Popp D 2005 Lessons from patents Using patents to measure technological change in environmental models Ecological Economics Vol 54 pp 209ndash226
Environmental tax reform in Europe opportunities for eco-innovation
References
42
Porter M and van der Linde C 1995 Toward a new conception of the environment competitiveness relationship Journal of Economic Perspectives Vol 9(4) pp 97ndash118
Rammert W 2002 The cultural shaping of technologies and the politics of technodiversity In Sorensen K and Williams R (eds) Shaping technology guiding policy concepts spaces and tools Elgar Cheltenham pp 155-172
Requate T 2005 Dynamic incentives by environmental policy instruments ndash a survey Ecological Economics Vol 54 pp 175ndash195
Roloff N Lehr U Krewitt W Fuchs G Wassermann S Weimer-Jehle W and Schmidt B 2008 Success determinants for technological innovations in the energy sector mdash the case of photovoltaics in Moumlst D Fichtner W Ragwitz M and Veit D (eds) New methods for energy market modelling mdash Proceedings of the first european workshop on energy market modelling using agent-based computational economics Universitaumltsverlag Karlsruhe
Rothwell R 1995 The fifth generation innovation process in Oppenlaumlnder KH Popp W (eds) Innovationen und wirtschaftlicher Fortschritt betriebs-und volkswirtschaftliche Perspektiven Bern pp 9ndash26
Schumpeter J 1942 Capitalism socialism and democracy New York Harper
Skjaeligrseth J B and Christiansen A C 2005 Environmental policy instruments and technological change in the energy sector findings from comparative empirical research Energy and Environment Vol 17 (2) pp 223ndash241
Snyder L D Miller N H and Stavins R N 2003 The effects of environmental regulations on pollution emissions evidence from plant-level data American Economic Review Vol 93(2) pp 431ndash435
Technopolis 2008 Eco-innovation Final Report for Sectoral Innovation Watch (httpwwwtechnopolis-groupcomresourcesdownloads661_report_finalpdf) accessed 18 August 2011
Volleburgh H 2007 Impacts of environmental policy instruments on technological change Report for Joint Meetings of Tax and Environment Experts OECD Environment Directorate February 2007 (comenvepocctpacfa(2006)36final)
Zimmermann H Wohltmann M and Hansjuumlrgens B 1996 Umweltabgaben und Innovation Analytica Marburg
43
Annex 1
Environmental tax reform in Europe opportunities for eco-innovation
Type Instrument Area Stage
Reference
Theo
retica
l
Em
piric
al
Cas
e st
udy
Rev
iew
Qual
itat
ive
Taxe
s
Perm
its
Subsi
die
s
Volu
nta
ry
Com
man
d
Reg
ula
tion
Ener
gy
Air
Wat
er
Oth
er
Gen
eral
Innov
atio
n
Diffu
sion
Rel
evan
ce
Brunnermeier amp Cohen (2003)
X X X X
Buen (2006) X X X X X X
Christiansen amp Skjaerseth (2005)
X X X X X X
Fischer et al (2003 X X X X X X
Frondel et al (2008) X X X X X X X (X) (X)
Hemmelskamp (1997)
X X X X X X X (X)
Hoglund Isaksson (2005)
X X X (X) (X)
Jaffe amp Stavins (1995)
X X X1 X X X X
Jaffe amp Palmer (1997)
X X X X
Jaffe et al (2002) X X X X X X X X X X
Jung et al (1996) X X X X X X (X) (X)
Kemp (1998) X X X X
Kerr amp Newell (2001) X X X X X
Klaassen et al (2005)
X X X X X
Lanjouw amp Mody (1996)
X X X X X X X
McGinty amp de Vries (2009)
X X X X
Mickwitz et al (2008)
X X X X X X X X X
Milliman amp Prince (1989)
X X X X X X X
Millock amp Nauges (2006)
X X X X X X
Montero (2002) X X X X X
Newell et al (1999) X X1 X X X
Norberg-Bohm (1999)
X X X X X X X
Popp (2002) X X1 X X
Popp (2005) X X X X X X
Porter amp van der Linde (1995)
X X X X X X
Requate (2005) X X X X X X X
Skjaeligrseth amp Christiansen (2005)
X X X X X X X X X
Snyder et al (2003) X X X X X
Annex 1 Classification of refereed journal articles
Environmental tax reform in Europe opportunities for eco-innovation44
Annex 2
Type Instrument Area Stage
Reference
Theo
retica
l
Em
piric
al
Cas
e st
udy
Rev
iew
Qual
itat
ive
Taxe
s
Perm
its
Subsi
die
s
Volu
nta
ry
Com
man
d
Reg
ula
tion
Ener
gy
Air
Wat
er
Oth
er
Gen
eral
Innov
atio
n
Diffu
sion
Rel
evan
ce
Johnstone (2005)
X X X X X X X
Johnstone amp Hascic (2008)
X X X X X X X X
Kemp (1997) X X X X X X X X X X X X X
Kemp (2000) X X X X X X X X X
de Vries amp Medhi (2008)
X X1 X X X
Annex 2 Classification of books and book chapters
45
Annex 3
Environmental tax reform in Europe opportunities for eco-innovation
Type Instrument Area Stage
Reference
Theo
retica
l
Em
piric
al
Cas
e st
udy
Rev
iew
Qual
itat
ive
Taxe
s
Perm
its
Subsi
die
s
Volu
nta
ry
Com
man
d
Reg
ula
tion
Ener
gy
Air
Wat
er
Oth
er
Gen
eral
Innov
atio
n
Diffu
sion
Rel
evan
ce
Goumlrlach et al (2005)
X X X X X X
Knigge amp Goumlrlach (2005)
X X X X X X
Technopolis (2008)
X X X X X X
Volleburgh (2007)
X X X X X X X X X X X
Annex 3 Classification of reports
European Environment Agency
Environmental tax reform in Europe opportunities for eco-innovation
2011 mdash 45 pp mdash 21 x 297 cm
ISBN 978-92-9213-238-5doi10280084889
How to obtain EU publications
Publications for salebull viaEUBookshop(httpbookshopeuropaeu)bull fromyourbooksellerbyquotingthetitlethepublisherandorISBNnumberbull bycontactingoneofoursalesagentsdirectlyYoucanobtaintheircontactdetails
on the Internet (httpbookshopeuropaeu) or by sending a fax to +352 2929-42758
Free publicationsbull viaEUBookshop(httpbookshopeuropaeu)bull attheEuropeanCommissionsrepresentationsordelegationsYoucanobtain
their contact details on the Internet (httpeceuropaeu) or by sending a fax to +352 2929-42758
European Environment AgencyKongens Nytorv 61050 Copenhagen KDenmark
Tel +45 33 36 71 00Fax +45 33 36 71 99
Web eeaeuropaeuEnquiries eeaeuropaeuenquiries
TH
-AK-1
1-0
17-E
N-N
doi1
02
8008
4889
- Acknowledgements
- Executive summary
- 1Introduction
-
- 11Background
- 12ETR and innovation
- 13Report structure
-
- 2Review of literature on environmental tax reform and eco‑innovation
-
- 21Initial screening
- 22Detailed review
- 23Environmental regulation studies
- 24Theoretical studies
- 25Empirical studies
- 26Case studies
- 27Conclusions
-
- 3Modelling of ETR impacts on eco‑innovation
-
- 31Scenarios assessing the implications of ETR for eco-innovation
- 32Overview of modelling results
- 33Macroeconomic impacts at the national level
- 34Conclusions of the scenario assessment
-
- References
- Annex 1 Classification of refereed journal articles
- Annex 2Classification of books and book chapters
- Annex 3Classification of reports
-
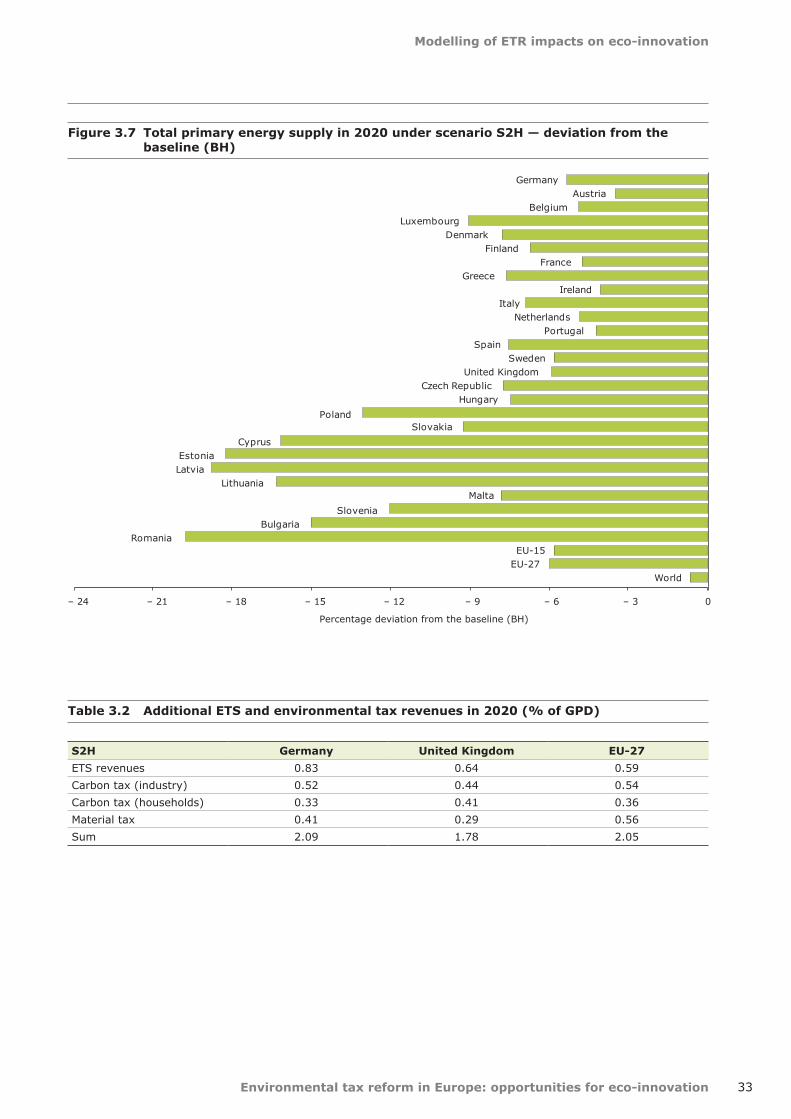
Modelling of ETR impacts on eco-innovation
Environmental tax reform in Europe opportunities for eco-innovation 33
Table 32 Additional ETS and environmental tax revenues in 2020 ( of GPD)
S2H Germany United Kingdom EU-27
ETS revenues 083 064 059
Carbon tax (industry) 052 044 054
Carbon tax (households) 033 041 036
Material tax 041 029 056
Sum 209 178 205
Figure 37 Total primary energy supply in 2020 under scenario S2H mdash deviation from the baseline (BH)
WorldEU-27EU-15
RomaniaBulgaria
Slovenia
MaltaLithuania
LatviaEstonia
Cyprus
SlovakiaPoland
HungaryCzech Republic
United KingdomSweden
SpainPortugal
NetherlandsItaly
IrelandGreece
FranceFinland
DenmarkLuxembourg
BelgiumAustria
Germany
ndash 24 ndash 21 ndash 18 ndash 15 ndash 12 ndash 9 ndash 6 ndash 3 0
Percentage deviation from the baseline (BH)
Environmental tax reform in Europe opportunities for eco-innovation
Modelling of ETR impacts on eco-innovation
34
Figure 38 Output price impacts of scenario S2H in Germany in 2020 mdash deviations from the baseline (BH)
Figure 39 Impacts of scenario S2H on industrial output in 2020 in Germany mdash deviations from the baseline (BH)
ndash 5
0
5
10
15
20
Output prices
Percentage deviation from the baseline (BH)
(3) F
ood
(4) T
extiles
(5) W
ood
(6) P
ulp pap
er
(7) C
oke re
fined
petro
leum
pro
ducts
(8) C
hemica
ls ex
cl pha
rma
(9) P
harm
aceu
ticals
(10)
Rub
ber a
nd plastics
(11)
Non
-metallic
miner
als
(12)
Iron
and
steel
(13)
Non
-ferrou
s metals
(14)
Met
al pro
ducts
(15)
Mac
hine
ry and
equ
ipmen
t
(16)
Office
mac
hine
ry
(17)
Electric
al m
achine
ry
(18)
Rad
io T
V
(19)
Med
ical pr
ecisi
on and
opt
ical ins
trumen
ts
(20)
Mot
or veh
icles
(21)
Ships
(22)
Airc
raft
(23)
Railro
ad
(24)
Man
ufac
turin
g n
ec r
ecyc
ling
(25)
Electric
ity g
as w
ater
sup
ply
(26)
Con
stru
ction
(27)
Tra
de r
epairs
(28)
Hot
els an
d re
stau
rant
s
(29)
Tra
nspo
rt an
d stor
age
(30)
Pos
t and
teleco
mmun
icatio
ns
(31)
Finan
ce ins
uran
ce
(32)
Rea
l estate ac
tivities
(33)
Ren
ting
(34)
Com
puter
(35)
Res
earch an
d de
velopm
ent
(36)
Oth
er bus
ines
s ac
tivities
(37)
Pub
lic ser
vice
s
(38)
Edu
catio
n
(39)
Hea
lth and
soc
ial w
ork
(40)
Oth
er ser
vice
s
(41)
Priv
ate ho
useh
olds
(1) A
gricu
lture
(2) M
ining an
d qu
arry
ing
nec not elsewhere classified
Production
ndash 100
ndash 80
ndash 60
ndash 40
ndash 20
00
20
40
60
80Percentage deviation from the baseline (BH)
(3) F
ood
(4) T
extiles
(5) W
ood
(6) P
ulp pap
er
(7) C
oke re
fined
petro
leum
pro
ducts
(8) C
hemica
ls ex
cl pha
rma
(9) P
harm
aceu
ticals
(10)
Rub
ber a
nd plastics
(11)
Non
-metallic
miner
als
(12)
Iron
and
steel
(13)
Non
-ferrou
s metals
(14)
Met
al pro
ducts
(15)
Mac
hine
ry and
equ
ipmen
t
(16)
Office
mac
hine
ry
(17)
Electric
al m
achine
ry
(18)
Rad
io T
V
(19)
Med
ical pr
ecisi
on and
opt
ical ins
trumen
ts
(20)
Mot
or veh
icles
(21)
Ships
(22)
Airc
raft
(23)
Railro
ad
(24)
Man
ufac
turin
g n
ec r
ecyc
ling
(25)
Electric
ity g
as w
ater
sup
ply
(26)
Con
stru
ction
(27)
Tra
de r
epairs
(28)
Hot
els an
d re
stau
rant
s
(29)
Tra
nspo
rt an
d stor
age
(30)
Pos
t and
teleco
mmun
icatio
ns
(31)
Finan
ce ins
uran
ce
(32)
Rea
l estate ac
tivities
(33)
Ren
ting
(34)
Com
puter
(35)
Res
earch an
d de
velopm
ent
(36)
Oth
er bus
ines
s ac
tivities
(37)
Pub
lic ser
vice
s
(38)
Edu
catio
n
(39)
Hea
lth and
soc
ial w
ork
(40)
Oth
er ser
vice
s
(41)
Priv
ate ho
useh
olds
(1) A
gricu
lture
(2) M
ining an
d qu
arry
ing
nec not elsewhere classified
Modelling of ETR impacts on eco-innovation
Environmental tax reform in Europe opportunities for eco-innovation 35
social security contributions and lowers labour costs according to the direct and indirect labour content of sector output The ETR therefore reduces output prices in labour-intensive service sectors and increases prices in carbon- and material-intensive industry sectors
The example of Germany shows insignificant impacts in the trade-intensive sectors of machinery (15ndash17) motor vehicles (20) and other transport equipment (21ndash23) (Figure 38) Iron and steel (12) and chemicals without pharmaceuticals (8) face the highest price increases of trade-intensive sectors As the German iron and steel industry primarily delivers high quality steel to the German car industry and increasingly to the German windmill industry negative competitiveness impacts will be limited Exchange rate variations against non-EU competitors have been much higher in the past
The higher prices of carbon- and material-intensive products will reduce price competitiveness on export markets and increase the market share for imports in domestic markets This loss of price competitiveness is based on an assumption of limited market development of energy efficiency and RES technologies in other part of the world It will be offset by gains in labour-intensive sectors if the ETR causes real wage costs per unit of output to fall as a result of using recycled revenues to reduce employer social security contributions
Any improvement in non-price competitiveness will also raise exports The extra employment will raise incomes raising consumption and output
The overall impact on sector output depends on countervailing effects which are negative for iron and steel and a few service sectors and positive for a few industry sectors For most industries the output effect is insignificant (Figure 39) The greatest impact is felt by producers of fossil fuels who must obviously reduce production due to lower demand for their products
Under scenario S2H employment impacts are positive for most sectors relative to the baseline as labour productivity decreases and wage rates fall in relation to consumer prices (CPI) and output prices (Table 33) The relative costs of labour are lower than in the baseline without the ETR reform Only around a quarter of the employment increase takes place in industry
Concerning the wage rate two countervailing effects have to be considered First when the labour market is characterised in terms of the real wage bargaining model as in E3ME and GINFORS with market power on both sides (employers and trade unions) consumer price increases will lead to wage increases (the econometrically estimated factor is 085 for Germany) Second labour productivity is another important factor for wage bargaining The estimated elasticity for Germany is 063 meaning that a 1 increase of labour productivity leads to wage increases of 063 Higher labour demand due to lower labour costs thus reduces the wage increase In the end the German economy is more labour intensive than without the ETR partly due to the structural change towards labour-intensive industries
Table 33 Employment impacts of scenario S2H in Germany mdash deviations from scenario S2H in 2020
Employment in 2020 Deviation from S2H () Deviation from S2Habsolute (1 000s)
Agriculture forestry 24 90
Industry 09 653
Non-metallic minerals 24 62
Iron and steel ndash 28 ndash 37
Machinery and equipment 05 56
Electrical machinery 04 18
Construction 37 449
Trade and transport 10 829
Business services 17 767
Other services ndash 02 ndash 216
Total 07 2506
Environmental tax reform in Europe opportunities for eco-innovation
Modelling of ETR impacts on eco-innovation
36
Additional exports under scenario S2HE mainly create new jobs in machinery and related business services (Table 34) Under scenario S2HI a shift in the input structure of the energy sector leads to a shift in the industry structure and creates a few jobs in the service sector (Table 35)
34 Conclusions of the scenario assessment
The foregoing analysis used the GINFORS model to assess economic and environmental impacts of using the ETS and ETR to reach the EUs 2020
GHG targets In general the results show positive employment effects and only small negative impacts on GDP in EU-27 Member States The economic impacts depend on the levels of international energy prices the mechanism used to recycle revenues and country specifics such as carbon and energy intensity and the structure of energy consumption
Although there is significant evidence that eco-innovation is positively driven by higher energy prices quantification is difficult The present study included simulations of possible impacts of a shift in the industry structure towards renewable energy in the electricity sector and an overall increase of EU
Table 34 Employment impacts of scenario S2HE in 2020 in Germany mdash deviations from scenario S2H
Employment in 2020 Deviation from S2H () Deviation from S2Habsolute (1 000s)
Agriculture forestry ndash 01 ndash 02
Industry 03 194
Non-metallic minerals 02 05
Iron and steel 04 05
Machinery and equipment 13 130
Electrical machinery 24 117
Construction 01 18
Trade and transport 00 26
Business services 07 308
Other services 01 107
Total 02 634
Table 35 Employment impacts of scenario S2HI in 2020 in Germany mdash deviations from scenario S2H
Employment in 2020 Deviation from S2H () Deviation from S2Habsolute (1 000s)
Agriculture forestry ndash 01 ndash 02
Industry 00 00
Non-metallic minerals 25 65
Iron and steel ndash 27 ndash 36
Machinery and equipment 08 78
Electrical machinery 04 19
Construction ndash 00 ndash 04
Trade and transport 00 07
Business services 02 115
Other services 0 56
Total 00 167
Modelling of ETR impacts on eco-innovation
Environmental tax reform in Europe opportunities for eco-innovation 37
exports due to higher global demand for renewable energy The main results can be summarised as follows
bull environmentaltaxreformshiftingtaxesfromlabour to energy and resources will create additional jobs and trigger eco-innovation
bull impactsofeco-innovationintheformofadditional EU exports or shifts in industry structures will have a slight positive influence on GDP and create a smaller number of additional jobs
These findings correspond to results from the EmployRES study (Fraunhofer ISI et al 2009) As ETR is directly aimed at reducing labour costs it will create additional jobs in the short and medium term In the longer term the cost reduction and new technologies arising from eco-innovation will play a larger role
Like all fiscal reforms a major ETR in Europe will create winners and losers At the sector level carbon- and material-intensive industries will face economic losses At the country level the carbon-intensity and overall flexibility of economies is important Clearly structural change away from carbon-intensive industries together with technological change is inherent in any successful climate mitigation policy
On the other hand several factors can smooth these structural adjustments International cooperation
will reduce economic pressure on countries and sectors In addition ETR together with auctioning of ETS allowances can be a major source of revenues for EU Member States in the future even if part of the revenues will have to be earmarked for adaptation and mitigation measures in developing countries Indeed future debate on grandfathering or auctioning ETS allowances should reflect the important point that giving allowances away for free denies countries the money to ease structural change and invest in low-carbon technologies
Caution is needed in relating the findings of this study to the EU policy debate In the model simulations the single carbon price is the only instrument used to reach the EUs 2020 GHG targets In reality of course other renewable energy and efficiency policies will also contribute to carbon reduction and have to be taken into account when comparing the results (especially the high carbon prices) to other studies Both reduce the potential revenues from fossil energy carriers and carbon emissions
A variety of renewable energy and efficiency policies could enable the climate and energy targets to be met while securing even better economic prospects The results of the present study clearly indicate that the discussion on market-based instruments should be intensified Ultimately however the EU will need a rich mix of policies to reach its GHG targets while maximising prosperity
Environmental tax reform in Europe opportunities for eco-innovation38
References
Almon C 1991 The INFORUM Approach to Interindustry Modeling in Economic Systems Research Vol 3 pp 1ndash7
Amin A and Cohendet P 2004 The Architecture of Knowledge Firms Capabilities and Communities Oxford University Press Oxford
Barker T Meyer B Pollitt H and Lutz C 2007a Modelling Environmental Tax Reform in Germany and the United Kingdom with E3ME and GINFORS petre Working Paper Cambridge and Osnabrueck (httpwwwpetreorgukpapershtm) accessed 15 February 2011
Barker T Junankar S Pollitt H and Summerton P 2007b Carbon leakage from unilateral environmental tax reforms in Europe 1995ndash2005 Energy Policy Vol 35 pp 6 281ndash6 292
Brunnermeier S B and Cohen M A 2003 Determinants of environmental innovation in US manufacturing industries Journal of Environmental Economics and Management Vol 45 pp 278ndash293
Buen J 2006 Danish and Norwegian wind industry The relationship between policy instruments innovation and diffusion Energy Policy Vol 34 (18) pp 3 887ndash3 897
Carlsson B and Stankiewicz R 1991 On the nature function and composition of technological systems Journal of Evolutionary Economics Vol 1 (2) pp 93ndash118
Christiansen A C and Skjaerseth J B 2005 Climate change policies in Norway and the Netherlands Different instruments similar outcome Energy and Environment Vol 16(1) pp 1ndash25
Dosi G 1988 Sources procedures and microeconomic effects of innovation Journal of Economic Literature Vol 26 pp 1 120ndash1 171
de Vries F and Medhi N 2008 Environmental regulation and international innovation in automotive emissions control technologies in Environmental Policy Technological Innovation and Patents Organisation for Economic Cooperation and Development Paris
DG TREN 2008 European energy and transport mdash trends to 2030 mdash update 2007 European Commission Luxembourg
DTI 2004 Renewable Supply Chain Gap Analysis UK Department of Trade and Industry
Edler J (ed) 2006 Nachfrageorientierte Innovationspolitik Buumlro fuumlr Technikfolgenabschaumltzung beim Deutschen Bundestag (TAB) Arbeitsbericht Nr 99 Berlin
Edquist C 2001 The system of innovation approach and innovation policy an account of the state of the art lead paper presented at the DRUID Conference 12ndash15 June 2001 Aalborg (httpwwwdruiddkconferencesnwpaper1edquistpdf) accessed 15 February 2011
EEA 2006 Using the market for cost-effective environmental policy Market-based instruments in Europe EEA Report No 12006 European Environment Agency Copenhagen
Ekins P 2009 Resource Productivity Environmental tax Reform and Sustainable Growth in Europe published by the Anglo-German Foundation for the Study of Industrial Society Final report (httpwwwpetreorgukpdfFinRepFinpdf) accessed 12 October 2011
Ekins P and Speck S (eds) 2011 Environmental Tax Reform (ETR) A Policy for Green Growth Oxford University Press
EREC 2008 Energy [r]evolution A sustainable global energy outlook Greenpeace International European Renewable Energy Council (EREC)
References
References
Environmental tax reform in Europe opportunities for eco-innovation 39
Fagerberg J Mowery D C and Nelson R R (eds) 2005 The Oxford Handbook of Innovation Oxford University Press Oxford
Fischer C Parry I W H and Pizer W A 2003 Instrument choice for environmental protection when technological innovation is endogenous Journal of Environmental Economics and Management Vol 45 pp 523ndash545
Fraunhofer ISI ECOFYS Energy Economics Group Ruumltter + Partner SEURECO and LEI 2009 EmployRES mdash The impact of renewable energy policy on economic growth and employment in the European Union European Commission Brussels
Frondel M Horbach J and Rennings K 2008 What triggers environmental management and innovation Empirical evidence for Germany Ecological Economics Vol 66(1) pp 153ndash160
GHK Cambridge Econometrics and IEEP 2007 Links between the environment economy and jobs Final Report submitted to DG Environment European Commission
Giljum S Behrens A Hinterberger F Lutz C and Meyer B 2008 Modelling scenarios towards a sustainable use of natural resources in Europe Environmental Science and Policy Vol 11 pp 204ndash216
Goumlrlach B Knigge M and Luumlckge H 2005 Wirkungen der Oumlkologischen Steuerreform auf Innovation und Marktdurchdringung Ecologic Berlin (httpecologiceudownloadprojekte1850-189918791879_5_innovationpdf) accessed 18 August 2011
Green M A 2000 Photovoltaics technology overview Energy Policy Vol 28 (14) pp 989ndash998
Grossmann A Lehr U Lutz C and Wolter MI 2008 Gesamtwirtschaftliche Effekte der Umsetzung der EU Ziele im Bereich Erneuerbare Energien und Gebaumludeeffizienz in Oumlsterreich bis 2020 Studie im Auftrag des Lebensministeriums Wien 0508
Hage J and Hollingsworth J R 2000 Idea innovation networks a strategy for integrating organizational and institutional analysis Organization Studies Vol 21 (5) pp 971ndash1 004
Hauschildt J 2004 Innovationsmanagement Vahlen Muumlnchen
Hemmelskamp J 1997 Environmental policy instruments and their effects on innovation European Planning Studies Vol 5 (2) pp 177ndash195
Hoglund Isaksson L 2005 Abatement costs in response to the Swedish charge on nitrogen oxide emissions Journal of Environmental Economics and Management Vol 50 pp 102ndash120
Hullmann A 2001 Internationaler Wissenstransfer und technischer Wandel (dissertation) Physica-Verlag Heidelberg
IEA 2008 World Energy Outlook 2008 International Energy Agency Paris
IEA 2009 World Energy Outlook 2009 International Energy Agency Paris
Jacobsson S Andersson B A and Baringngens L 2002 Transforming the energy system mdash the evolution of the German technological system for solar cells Science and Technology Policy Research University of Sussex Electronic Working Paper Series No 84 (httpideasrepecorgpsrussewps84html) accessed 18 August 2011
Jaffe A and Stavins R 1995 Dynamic incentives of environmental regulations the effects of alternative policy instruments on technology diffusion Journal of Environmental Economics and Management Vol 29(3) pp 43ndash63
Jaffe A B and Palmer K 1997 Environmental regulation and innovation a panel data study The Review of Economics and Statistics Vol 79 pp 610ndash619
Jaffe A B Newell R G and Stavins R N 2002 Environmental policy and technological change Environmental and Resource Economics Vol 22 (1ndash2) 2002 pp 41ndash70
Johnstone N and Hascic I 2008 Renewable energy policies and technological innovation energy source and instrument choice in Environmental Policy Technological Innovation and PatentsOrganisation for Economic Co-operation and Development Paris
Johnstone N 2005 The Innovation Effects of Environmental Policy Instruments in Horbach J (ed) Indicator Systems for Sustainable Innovation Physica-Verlag HD
Environmental tax reform in Europe opportunities for eco-innovation
References
40
Johnstone N Hascic I and Ostertag K 2008 Environmental policy technological innovation and patent activity in Environmental Policy Technological Innovation and Patents Organisation for Economic Co-operation and Development Paris
Jung C Krutilla K and Boyd R 1996 Incentives for advanced pollution abatement technology at the industry level an evaluation of policy alternatives Journal of Environmental Economics and Management Vol 30(1) pp 95ndash111
Kammen D M Kapidia K and Fripp M 2004 Putting renewables to work how many jobs can the clean energy industry generate University of California Berkeley
Kemp R 1997 Environmental policy and technical change ndash a comparison of the technological impact of policy instruments Edward Elgar Cheltenham
Kemp R 1998 The diffusion of biological waste-water treatment plants in the Dutch food and beverage industry Environmental and Resource Economics Vol 12 pp 113ndash136
Kemp R 2000 Technology and environmental policy ndash innovation effects of past policies and suggestions for improvement in OECD proceedings ndash innovation and the environment Organisation for Economic Co-operation and Development Paris
Kerr S and Newell R G 2003 Policy-induced technology adoption evidence from the US lead phasedown Journal of Industrial Economics Vol 51 pp 317ndash343
Klaassen G Miketa A Larsen K and Sundqvist T 2005 The impact of RampD on innovation for wind energy in Denmark Germany and the United Kingdom Ecological Economics Vol 54 pp 227ndash240
Kline S and Rosenberg N 1986 An overview of innovation in Landau R (ed) The positive sum strategy Harnessing technology for economic growth pp 275-306
Knigge M and Goumlrlach B 2005 Effects of Germanys ecological tax reforms on the environment employment and technological innovation Ecologic Berlin (httpwwwumweltbundesamtdeuba-info-presse-ehintergrundoekosteuerpdf) accessed 18 August 2011
Langniss O 2003 Governance structures for promoting renewable energy sources dissertation Lund Stuttgart
Lanjouw J O and Mody A 1996 Innovation and the international diffusion of environmentally responsive technology Research Policy Vol 25 pp 549ndash571
Lehr U Nitsch J Kratzat M Lutz C and Edler D 2008 Renewable Energy and Employment in Germany Energy Policy Vol 36 pp 108ndash117 DOI101016jenpol200709004
Lehr U Wolter MI and Groszligmann A 2009 Economic impacts of RES obligations in Austria ndash an application of the macro-econometric model e3at GWS Discussion Paper 20091 Osnabruumlck
Lundvall B-A Johnson B Andersen E S and Dalum B 2001 National systems of production innovation and competence building Research Policy Vol 31 pp 213ndash231
Lutz C and Giljum S 2009 Global resource use in a business as usual world until 2030 Updated results from the GINFORS model in Bleischwitz R Welfens Pand Zhang Z (eds) Sustainable growth and resource productivity ndash economic and global policy issues Greenleaf Publishers pp 30ndash41
Lutz C and Meyer B 2008 Beschaumlftigungseffekte des Klimaschutzes in Deutschland Untersuchungen zu gesamtwirtschaftlichen Auswirkungen ausgewaumlhlter Maszlignahmen des Energie- und Klimapakets Forschungsbericht 205 46 434 Dessau-Roszliglau
Lutz C and Meyer B 2009a Environmental and Economic Effects of Post-Kyoto Carbon Regimes Results of Simulations with the Global Model GINFORS Energy Policy Vol 37 pp 1 758ndash1 766 DOI 101016jenpol200901015
Lutz C and Meyer B 2009b Scenario results from GINFORS PETRE working paper Osnabruumlck
Lutz C Meyer B Nathani C and Schleich J 2005 Endogenous technological change and emissions The case of the German steel industry Energy Policy Vol33 pp 1 143ndash1 154
Lutz C Meyer B Nathani C and Schleich J 2007 Endogenous innovation economy and environment impacts of a technology based modelling approach for energy-intensive industries in Germany Energy Studies Review Vol 15(1) pp 2ndash18
References
Environmental tax reform in Europe opportunities for eco-innovation 41
Lutz C Meyer B and Wolter M I 2009 The global multisectormulticountry 3-E model GINFORS mdash a description of the model and a baseline forecast for global energy demand and CO2 emissions Journal of Sustainable Development forthcoming
Malerba F and Orsenigo L 1997 Technological Regimes and Sectoral Patterns of Innovative Activities Industrial and Corporate Change Vol 6 (1) pp 83ndash117
Malerba F 1992 Learning by Firms and Incremental Technical Change The Economic Journal Vol 102 (413) pp 845ndash859
Malerba F 2005 Industrial dynamics and innovation progress and challenges Presidential Address delivered at the 32nd Conference of the European Association for Research in Industrial Economics (EARIE) 1ndash4 September 2005 Porto
Malerba F 2006 Innovation and the evolution of industries Journal of Evolutionary Economics Vol 16 pp 3ndash23
McGinty M and de Vries F P 2009 Technology diffusion product differentiation and environmental subsidies The BE Journal of Economic Analysis and Policy Vol 9(1)
Meyer B and Lutz C 2007 The GINFORS model ndash model overview and evaluation Petre Working Paper Osnabruumlck (httpwwwpetreorgukpapershtm) accessed 18 August 2011
Meyer B Lutz C Schnur P and Zika G 2007 Economic policy simulations with global interdependencies a sensitivity analysis for Germany Economic Systems Research Vol 19 pp 37ndash55
Mickwitz P H Hyvaumlttinen and P Kivimaa 2008 The role of policy instruments in the innovation and diffusion of environmentally friendlier technologies popular claims versus case study experiences Journal of Cleaner Production Vol 16(1S1) 162ndash170
Miketa A and Schrattenholzer L 2004 Experiments with a methodology to model the role of RampD expenditures in energy technology learning processes first results Energy Policy Vol 32 (15) pp 1 679ndash1 692
Milliman S R and Prince R 1989 Firm incentives to promote technological change in pollution control Journal of Environmental Economics and Management Vol 17 pp 247ndash265
Millock K and Nauges C 2006 Ex-post evaluation of an earmarked tax on air pollution Land Economics Vol 82(1) pp 68ndash84
Montero J-P 2002 Market structure and environmental innovation Journal of Applied Economics Vol 2 pp 293ndash325
Moreno B and Loacutepez A J 2007 The effect of renewable energy on employment mdash The case of Asturias (Spain) Renewable and Sustainable Energy Rewiews doi 101016jrser200610011
Mowery D and Rosenberg N 1979 The influence of market demand upon innovation A critical review of some recent empirical studies Research Policy Vol 8 pp 102ndash153
Newell R G Jaffe A B and Stavins R N 1999 The induced innovation hypothesis and energy-saving technological change Quarterly Journal of Economics Vol 114 pp 941ndash975
Norberg-Bohm V 1999 Stimulating green technological innovation An analysis of alternative policy mechanisms Policy Sciences Vol 32(1) pp 13ndash38
OECD 2009 Sustainable manufacturing and eco-innovation towards a green economy Organisation for Economic Co-operation and Development Policy Brief June 2009
OECD 2010 Taxation innovation and the environment Organisation for Economic Co-operation and Development
Pavitt K 1984 Sectoral patterns of technological change Towards a taxonomy and a theory Research Policy Vol 13 pp 343ndash373
Popp D 2002 Induced innovation and energy prices The American Economic Review Vol 92(1) pp 160ndash180
Popp D 2005 Lessons from patents Using patents to measure technological change in environmental models Ecological Economics Vol 54 pp 209ndash226
Environmental tax reform in Europe opportunities for eco-innovation
References
42
Porter M and van der Linde C 1995 Toward a new conception of the environment competitiveness relationship Journal of Economic Perspectives Vol 9(4) pp 97ndash118
Rammert W 2002 The cultural shaping of technologies and the politics of technodiversity In Sorensen K and Williams R (eds) Shaping technology guiding policy concepts spaces and tools Elgar Cheltenham pp 155-172
Requate T 2005 Dynamic incentives by environmental policy instruments ndash a survey Ecological Economics Vol 54 pp 175ndash195
Roloff N Lehr U Krewitt W Fuchs G Wassermann S Weimer-Jehle W and Schmidt B 2008 Success determinants for technological innovations in the energy sector mdash the case of photovoltaics in Moumlst D Fichtner W Ragwitz M and Veit D (eds) New methods for energy market modelling mdash Proceedings of the first european workshop on energy market modelling using agent-based computational economics Universitaumltsverlag Karlsruhe
Rothwell R 1995 The fifth generation innovation process in Oppenlaumlnder KH Popp W (eds) Innovationen und wirtschaftlicher Fortschritt betriebs-und volkswirtschaftliche Perspektiven Bern pp 9ndash26
Schumpeter J 1942 Capitalism socialism and democracy New York Harper
Skjaeligrseth J B and Christiansen A C 2005 Environmental policy instruments and technological change in the energy sector findings from comparative empirical research Energy and Environment Vol 17 (2) pp 223ndash241
Snyder L D Miller N H and Stavins R N 2003 The effects of environmental regulations on pollution emissions evidence from plant-level data American Economic Review Vol 93(2) pp 431ndash435
Technopolis 2008 Eco-innovation Final Report for Sectoral Innovation Watch (httpwwwtechnopolis-groupcomresourcesdownloads661_report_finalpdf) accessed 18 August 2011
Volleburgh H 2007 Impacts of environmental policy instruments on technological change Report for Joint Meetings of Tax and Environment Experts OECD Environment Directorate February 2007 (comenvepocctpacfa(2006)36final)
Zimmermann H Wohltmann M and Hansjuumlrgens B 1996 Umweltabgaben und Innovation Analytica Marburg
43
Annex 1
Environmental tax reform in Europe opportunities for eco-innovation
Type Instrument Area Stage
Reference
Theo
retica
l
Em
piric
al
Cas
e st
udy
Rev
iew
Qual
itat
ive
Taxe
s
Perm
its
Subsi
die
s
Volu
nta
ry
Com
man
d
Reg
ula
tion
Ener
gy
Air
Wat
er
Oth
er
Gen
eral
Innov
atio
n
Diffu
sion
Rel
evan
ce
Brunnermeier amp Cohen (2003)
X X X X
Buen (2006) X X X X X X
Christiansen amp Skjaerseth (2005)
X X X X X X
Fischer et al (2003 X X X X X X
Frondel et al (2008) X X X X X X X (X) (X)
Hemmelskamp (1997)
X X X X X X X (X)
Hoglund Isaksson (2005)
X X X (X) (X)
Jaffe amp Stavins (1995)
X X X1 X X X X
Jaffe amp Palmer (1997)
X X X X
Jaffe et al (2002) X X X X X X X X X X
Jung et al (1996) X X X X X X (X) (X)
Kemp (1998) X X X X
Kerr amp Newell (2001) X X X X X
Klaassen et al (2005)
X X X X X
Lanjouw amp Mody (1996)
X X X X X X X
McGinty amp de Vries (2009)
X X X X
Mickwitz et al (2008)
X X X X X X X X X
Milliman amp Prince (1989)
X X X X X X X
Millock amp Nauges (2006)
X X X X X X
Montero (2002) X X X X X
Newell et al (1999) X X1 X X X
Norberg-Bohm (1999)
X X X X X X X
Popp (2002) X X1 X X
Popp (2005) X X X X X X
Porter amp van der Linde (1995)
X X X X X X
Requate (2005) X X X X X X X
Skjaeligrseth amp Christiansen (2005)
X X X X X X X X X
Snyder et al (2003) X X X X X
Annex 1 Classification of refereed journal articles
Environmental tax reform in Europe opportunities for eco-innovation44
Annex 2
Type Instrument Area Stage
Reference
Theo
retica
l
Em
piric
al
Cas
e st
udy
Rev
iew
Qual
itat
ive
Taxe
s
Perm
its
Subsi
die
s
Volu
nta
ry
Com
man
d
Reg
ula
tion
Ener
gy
Air
Wat
er
Oth
er
Gen
eral
Innov
atio
n
Diffu
sion
Rel
evan
ce
Johnstone (2005)
X X X X X X X
Johnstone amp Hascic (2008)
X X X X X X X X
Kemp (1997) X X X X X X X X X X X X X
Kemp (2000) X X X X X X X X X
de Vries amp Medhi (2008)
X X1 X X X
Annex 2 Classification of books and book chapters
45
Annex 3
Environmental tax reform in Europe opportunities for eco-innovation
Type Instrument Area Stage
Reference
Theo
retica
l
Em
piric
al
Cas
e st
udy
Rev
iew
Qual
itat
ive
Taxe
s
Perm
its
Subsi
die
s
Volu
nta
ry
Com
man
d
Reg
ula
tion
Ener
gy
Air
Wat
er
Oth
er
Gen
eral
Innov
atio
n
Diffu
sion
Rel
evan
ce
Goumlrlach et al (2005)
X X X X X X
Knigge amp Goumlrlach (2005)
X X X X X X
Technopolis (2008)
X X X X X X
Volleburgh (2007)
X X X X X X X X X X X
Annex 3 Classification of reports
European Environment Agency
Environmental tax reform in Europe opportunities for eco-innovation
2011 mdash 45 pp mdash 21 x 297 cm
ISBN 978-92-9213-238-5doi10280084889
How to obtain EU publications
Publications for salebull viaEUBookshop(httpbookshopeuropaeu)bull fromyourbooksellerbyquotingthetitlethepublisherandorISBNnumberbull bycontactingoneofoursalesagentsdirectlyYoucanobtaintheircontactdetails
on the Internet (httpbookshopeuropaeu) or by sending a fax to +352 2929-42758
Free publicationsbull viaEUBookshop(httpbookshopeuropaeu)bull attheEuropeanCommissionsrepresentationsordelegationsYoucanobtain
their contact details on the Internet (httpeceuropaeu) or by sending a fax to +352 2929-42758
European Environment AgencyKongens Nytorv 61050 Copenhagen KDenmark
Tel +45 33 36 71 00Fax +45 33 36 71 99
Web eeaeuropaeuEnquiries eeaeuropaeuenquiries
TH
-AK-1
1-0
17-E
N-N
doi1
02
8008
4889
- Acknowledgements
- Executive summary
- 1Introduction
-
- 11Background
- 12ETR and innovation
- 13Report structure
-
- 2Review of literature on environmental tax reform and eco‑innovation
-
- 21Initial screening
- 22Detailed review
- 23Environmental regulation studies
- 24Theoretical studies
- 25Empirical studies
- 26Case studies
- 27Conclusions
-
- 3Modelling of ETR impacts on eco‑innovation
-
- 31Scenarios assessing the implications of ETR for eco-innovation
- 32Overview of modelling results
- 33Macroeconomic impacts at the national level
- 34Conclusions of the scenario assessment
-
- References
- Annex 1 Classification of refereed journal articles
- Annex 2Classification of books and book chapters
- Annex 3Classification of reports
-
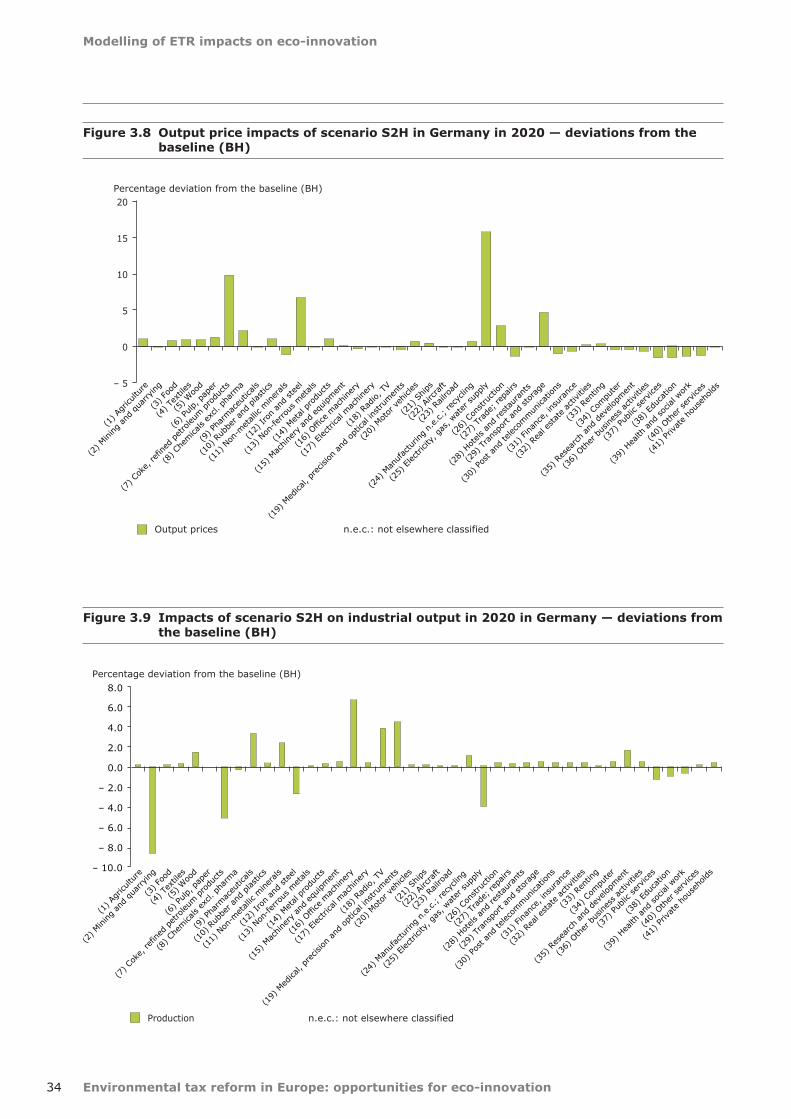
Environmental tax reform in Europe opportunities for eco-innovation
Modelling of ETR impacts on eco-innovation
34
Figure 38 Output price impacts of scenario S2H in Germany in 2020 mdash deviations from the baseline (BH)
Figure 39 Impacts of scenario S2H on industrial output in 2020 in Germany mdash deviations from the baseline (BH)
ndash 5
0
5
10
15
20
Output prices
Percentage deviation from the baseline (BH)
(3) F
ood
(4) T
extiles
(5) W
ood
(6) P
ulp pap
er
(7) C
oke re
fined
petro
leum
pro
ducts
(8) C
hemica
ls ex
cl pha
rma
(9) P
harm
aceu
ticals
(10)
Rub
ber a
nd plastics
(11)
Non
-metallic
miner
als
(12)
Iron
and
steel
(13)
Non
-ferrou
s metals
(14)
Met
al pro
ducts
(15)
Mac
hine
ry and
equ
ipmen
t
(16)
Office
mac
hine
ry
(17)
Electric
al m
achine
ry
(18)
Rad
io T
V
(19)
Med
ical pr
ecisi
on and
opt
ical ins
trumen
ts
(20)
Mot
or veh
icles
(21)
Ships
(22)
Airc
raft
(23)
Railro
ad
(24)
Man
ufac
turin
g n
ec r
ecyc
ling
(25)
Electric
ity g
as w
ater
sup
ply
(26)
Con
stru
ction
(27)
Tra
de r
epairs
(28)
Hot
els an
d re
stau
rant
s
(29)
Tra
nspo
rt an
d stor
age
(30)
Pos
t and
teleco
mmun
icatio
ns
(31)
Finan
ce ins
uran
ce
(32)
Rea
l estate ac
tivities
(33)
Ren
ting
(34)
Com
puter
(35)
Res
earch an
d de
velopm
ent
(36)
Oth
er bus
ines
s ac
tivities
(37)
Pub
lic ser
vice
s
(38)
Edu
catio
n
(39)
Hea
lth and
soc
ial w
ork
(40)
Oth
er ser
vice
s
(41)
Priv
ate ho
useh
olds
(1) A
gricu
lture
(2) M
ining an
d qu
arry
ing
nec not elsewhere classified
Production
ndash 100
ndash 80
ndash 60
ndash 40
ndash 20
00
20
40
60
80Percentage deviation from the baseline (BH)
(3) F
ood
(4) T
extiles
(5) W
ood
(6) P
ulp pap
er
(7) C
oke re
fined
petro
leum
pro
ducts
(8) C
hemica
ls ex
cl pha
rma
(9) P
harm
aceu
ticals
(10)
Rub
ber a
nd plastics
(11)
Non
-metallic
miner
als
(12)
Iron
and
steel
(13)
Non
-ferrou
s metals
(14)
Met
al pro
ducts
(15)
Mac
hine
ry and
equ
ipmen
t
(16)
Office
mac
hine
ry
(17)
Electric
al m
achine
ry
(18)
Rad
io T
V
(19)
Med
ical pr
ecisi
on and
opt
ical ins
trumen
ts
(20)
Mot
or veh
icles
(21)
Ships
(22)
Airc
raft
(23)
Railro
ad
(24)
Man
ufac
turin
g n
ec r
ecyc
ling
(25)
Electric
ity g
as w
ater
sup
ply
(26)
Con
stru
ction
(27)
Tra
de r
epairs
(28)
Hot
els an
d re
stau
rant
s
(29)
Tra
nspo
rt an
d stor
age
(30)
Pos
t and
teleco
mmun
icatio
ns
(31)
Finan
ce ins
uran
ce
(32)
Rea
l estate ac
tivities
(33)
Ren
ting
(34)
Com
puter
(35)
Res
earch an
d de
velopm
ent
(36)
Oth
er bus
ines
s ac
tivities
(37)
Pub
lic ser
vice
s
(38)
Edu
catio
n
(39)
Hea
lth and
soc
ial w
ork
(40)
Oth
er ser
vice
s
(41)
Priv
ate ho
useh
olds
(1) A
gricu
lture
(2) M
ining an
d qu
arry
ing
nec not elsewhere classified
Modelling of ETR impacts on eco-innovation
Environmental tax reform in Europe opportunities for eco-innovation 35
social security contributions and lowers labour costs according to the direct and indirect labour content of sector output The ETR therefore reduces output prices in labour-intensive service sectors and increases prices in carbon- and material-intensive industry sectors
The example of Germany shows insignificant impacts in the trade-intensive sectors of machinery (15ndash17) motor vehicles (20) and other transport equipment (21ndash23) (Figure 38) Iron and steel (12) and chemicals without pharmaceuticals (8) face the highest price increases of trade-intensive sectors As the German iron and steel industry primarily delivers high quality steel to the German car industry and increasingly to the German windmill industry negative competitiveness impacts will be limited Exchange rate variations against non-EU competitors have been much higher in the past
The higher prices of carbon- and material-intensive products will reduce price competitiveness on export markets and increase the market share for imports in domestic markets This loss of price competitiveness is based on an assumption of limited market development of energy efficiency and RES technologies in other part of the world It will be offset by gains in labour-intensive sectors if the ETR causes real wage costs per unit of output to fall as a result of using recycled revenues to reduce employer social security contributions
Any improvement in non-price competitiveness will also raise exports The extra employment will raise incomes raising consumption and output
The overall impact on sector output depends on countervailing effects which are negative for iron and steel and a few service sectors and positive for a few industry sectors For most industries the output effect is insignificant (Figure 39) The greatest impact is felt by producers of fossil fuels who must obviously reduce production due to lower demand for their products
Under scenario S2H employment impacts are positive for most sectors relative to the baseline as labour productivity decreases and wage rates fall in relation to consumer prices (CPI) and output prices (Table 33) The relative costs of labour are lower than in the baseline without the ETR reform Only around a quarter of the employment increase takes place in industry
Concerning the wage rate two countervailing effects have to be considered First when the labour market is characterised in terms of the real wage bargaining model as in E3ME and GINFORS with market power on both sides (employers and trade unions) consumer price increases will lead to wage increases (the econometrically estimated factor is 085 for Germany) Second labour productivity is another important factor for wage bargaining The estimated elasticity for Germany is 063 meaning that a 1 increase of labour productivity leads to wage increases of 063 Higher labour demand due to lower labour costs thus reduces the wage increase In the end the German economy is more labour intensive than without the ETR partly due to the structural change towards labour-intensive industries
Table 33 Employment impacts of scenario S2H in Germany mdash deviations from scenario S2H in 2020
Employment in 2020 Deviation from S2H () Deviation from S2Habsolute (1 000s)
Agriculture forestry 24 90
Industry 09 653
Non-metallic minerals 24 62
Iron and steel ndash 28 ndash 37
Machinery and equipment 05 56
Electrical machinery 04 18
Construction 37 449
Trade and transport 10 829
Business services 17 767
Other services ndash 02 ndash 216
Total 07 2506
Environmental tax reform in Europe opportunities for eco-innovation
Modelling of ETR impacts on eco-innovation
36
Additional exports under scenario S2HE mainly create new jobs in machinery and related business services (Table 34) Under scenario S2HI a shift in the input structure of the energy sector leads to a shift in the industry structure and creates a few jobs in the service sector (Table 35)
34 Conclusions of the scenario assessment
The foregoing analysis used the GINFORS model to assess economic and environmental impacts of using the ETS and ETR to reach the EUs 2020
GHG targets In general the results show positive employment effects and only small negative impacts on GDP in EU-27 Member States The economic impacts depend on the levels of international energy prices the mechanism used to recycle revenues and country specifics such as carbon and energy intensity and the structure of energy consumption
Although there is significant evidence that eco-innovation is positively driven by higher energy prices quantification is difficult The present study included simulations of possible impacts of a shift in the industry structure towards renewable energy in the electricity sector and an overall increase of EU
Table 34 Employment impacts of scenario S2HE in 2020 in Germany mdash deviations from scenario S2H
Employment in 2020 Deviation from S2H () Deviation from S2Habsolute (1 000s)
Agriculture forestry ndash 01 ndash 02
Industry 03 194
Non-metallic minerals 02 05
Iron and steel 04 05
Machinery and equipment 13 130
Electrical machinery 24 117
Construction 01 18
Trade and transport 00 26
Business services 07 308
Other services 01 107
Total 02 634
Table 35 Employment impacts of scenario S2HI in 2020 in Germany mdash deviations from scenario S2H
Employment in 2020 Deviation from S2H () Deviation from S2Habsolute (1 000s)
Agriculture forestry ndash 01 ndash 02
Industry 00 00
Non-metallic minerals 25 65
Iron and steel ndash 27 ndash 36
Machinery and equipment 08 78
Electrical machinery 04 19
Construction ndash 00 ndash 04
Trade and transport 00 07
Business services 02 115
Other services 0 56
Total 00 167
Modelling of ETR impacts on eco-innovation
Environmental tax reform in Europe opportunities for eco-innovation 37
exports due to higher global demand for renewable energy The main results can be summarised as follows
bull environmentaltaxreformshiftingtaxesfromlabour to energy and resources will create additional jobs and trigger eco-innovation
bull impactsofeco-innovationintheformofadditional EU exports or shifts in industry structures will have a slight positive influence on GDP and create a smaller number of additional jobs
These findings correspond to results from the EmployRES study (Fraunhofer ISI et al 2009) As ETR is directly aimed at reducing labour costs it will create additional jobs in the short and medium term In the longer term the cost reduction and new technologies arising from eco-innovation will play a larger role
Like all fiscal reforms a major ETR in Europe will create winners and losers At the sector level carbon- and material-intensive industries will face economic losses At the country level the carbon-intensity and overall flexibility of economies is important Clearly structural change away from carbon-intensive industries together with technological change is inherent in any successful climate mitigation policy
On the other hand several factors can smooth these structural adjustments International cooperation
will reduce economic pressure on countries and sectors In addition ETR together with auctioning of ETS allowances can be a major source of revenues for EU Member States in the future even if part of the revenues will have to be earmarked for adaptation and mitigation measures in developing countries Indeed future debate on grandfathering or auctioning ETS allowances should reflect the important point that giving allowances away for free denies countries the money to ease structural change and invest in low-carbon technologies
Caution is needed in relating the findings of this study to the EU policy debate In the model simulations the single carbon price is the only instrument used to reach the EUs 2020 GHG targets In reality of course other renewable energy and efficiency policies will also contribute to carbon reduction and have to be taken into account when comparing the results (especially the high carbon prices) to other studies Both reduce the potential revenues from fossil energy carriers and carbon emissions
A variety of renewable energy and efficiency policies could enable the climate and energy targets to be met while securing even better economic prospects The results of the present study clearly indicate that the discussion on market-based instruments should be intensified Ultimately however the EU will need a rich mix of policies to reach its GHG targets while maximising prosperity
Environmental tax reform in Europe opportunities for eco-innovation38
References
Almon C 1991 The INFORUM Approach to Interindustry Modeling in Economic Systems Research Vol 3 pp 1ndash7
Amin A and Cohendet P 2004 The Architecture of Knowledge Firms Capabilities and Communities Oxford University Press Oxford
Barker T Meyer B Pollitt H and Lutz C 2007a Modelling Environmental Tax Reform in Germany and the United Kingdom with E3ME and GINFORS petre Working Paper Cambridge and Osnabrueck (httpwwwpetreorgukpapershtm) accessed 15 February 2011
Barker T Junankar S Pollitt H and Summerton P 2007b Carbon leakage from unilateral environmental tax reforms in Europe 1995ndash2005 Energy Policy Vol 35 pp 6 281ndash6 292
Brunnermeier S B and Cohen M A 2003 Determinants of environmental innovation in US manufacturing industries Journal of Environmental Economics and Management Vol 45 pp 278ndash293
Buen J 2006 Danish and Norwegian wind industry The relationship between policy instruments innovation and diffusion Energy Policy Vol 34 (18) pp 3 887ndash3 897
Carlsson B and Stankiewicz R 1991 On the nature function and composition of technological systems Journal of Evolutionary Economics Vol 1 (2) pp 93ndash118
Christiansen A C and Skjaerseth J B 2005 Climate change policies in Norway and the Netherlands Different instruments similar outcome Energy and Environment Vol 16(1) pp 1ndash25
Dosi G 1988 Sources procedures and microeconomic effects of innovation Journal of Economic Literature Vol 26 pp 1 120ndash1 171
de Vries F and Medhi N 2008 Environmental regulation and international innovation in automotive emissions control technologies in Environmental Policy Technological Innovation and Patents Organisation for Economic Cooperation and Development Paris
DG TREN 2008 European energy and transport mdash trends to 2030 mdash update 2007 European Commission Luxembourg
DTI 2004 Renewable Supply Chain Gap Analysis UK Department of Trade and Industry
Edler J (ed) 2006 Nachfrageorientierte Innovationspolitik Buumlro fuumlr Technikfolgenabschaumltzung beim Deutschen Bundestag (TAB) Arbeitsbericht Nr 99 Berlin
Edquist C 2001 The system of innovation approach and innovation policy an account of the state of the art lead paper presented at the DRUID Conference 12ndash15 June 2001 Aalborg (httpwwwdruiddkconferencesnwpaper1edquistpdf) accessed 15 February 2011
EEA 2006 Using the market for cost-effective environmental policy Market-based instruments in Europe EEA Report No 12006 European Environment Agency Copenhagen
Ekins P 2009 Resource Productivity Environmental tax Reform and Sustainable Growth in Europe published by the Anglo-German Foundation for the Study of Industrial Society Final report (httpwwwpetreorgukpdfFinRepFinpdf) accessed 12 October 2011
Ekins P and Speck S (eds) 2011 Environmental Tax Reform (ETR) A Policy for Green Growth Oxford University Press
EREC 2008 Energy [r]evolution A sustainable global energy outlook Greenpeace International European Renewable Energy Council (EREC)
References
References
Environmental tax reform in Europe opportunities for eco-innovation 39
Fagerberg J Mowery D C and Nelson R R (eds) 2005 The Oxford Handbook of Innovation Oxford University Press Oxford
Fischer C Parry I W H and Pizer W A 2003 Instrument choice for environmental protection when technological innovation is endogenous Journal of Environmental Economics and Management Vol 45 pp 523ndash545
Fraunhofer ISI ECOFYS Energy Economics Group Ruumltter + Partner SEURECO and LEI 2009 EmployRES mdash The impact of renewable energy policy on economic growth and employment in the European Union European Commission Brussels
Frondel M Horbach J and Rennings K 2008 What triggers environmental management and innovation Empirical evidence for Germany Ecological Economics Vol 66(1) pp 153ndash160
GHK Cambridge Econometrics and IEEP 2007 Links between the environment economy and jobs Final Report submitted to DG Environment European Commission
Giljum S Behrens A Hinterberger F Lutz C and Meyer B 2008 Modelling scenarios towards a sustainable use of natural resources in Europe Environmental Science and Policy Vol 11 pp 204ndash216
Goumlrlach B Knigge M and Luumlckge H 2005 Wirkungen der Oumlkologischen Steuerreform auf Innovation und Marktdurchdringung Ecologic Berlin (httpecologiceudownloadprojekte1850-189918791879_5_innovationpdf) accessed 18 August 2011
Green M A 2000 Photovoltaics technology overview Energy Policy Vol 28 (14) pp 989ndash998
Grossmann A Lehr U Lutz C and Wolter MI 2008 Gesamtwirtschaftliche Effekte der Umsetzung der EU Ziele im Bereich Erneuerbare Energien und Gebaumludeeffizienz in Oumlsterreich bis 2020 Studie im Auftrag des Lebensministeriums Wien 0508
Hage J and Hollingsworth J R 2000 Idea innovation networks a strategy for integrating organizational and institutional analysis Organization Studies Vol 21 (5) pp 971ndash1 004
Hauschildt J 2004 Innovationsmanagement Vahlen Muumlnchen
Hemmelskamp J 1997 Environmental policy instruments and their effects on innovation European Planning Studies Vol 5 (2) pp 177ndash195
Hoglund Isaksson L 2005 Abatement costs in response to the Swedish charge on nitrogen oxide emissions Journal of Environmental Economics and Management Vol 50 pp 102ndash120
Hullmann A 2001 Internationaler Wissenstransfer und technischer Wandel (dissertation) Physica-Verlag Heidelberg
IEA 2008 World Energy Outlook 2008 International Energy Agency Paris
IEA 2009 World Energy Outlook 2009 International Energy Agency Paris
Jacobsson S Andersson B A and Baringngens L 2002 Transforming the energy system mdash the evolution of the German technological system for solar cells Science and Technology Policy Research University of Sussex Electronic Working Paper Series No 84 (httpideasrepecorgpsrussewps84html) accessed 18 August 2011
Jaffe A and Stavins R 1995 Dynamic incentives of environmental regulations the effects of alternative policy instruments on technology diffusion Journal of Environmental Economics and Management Vol 29(3) pp 43ndash63
Jaffe A B and Palmer K 1997 Environmental regulation and innovation a panel data study The Review of Economics and Statistics Vol 79 pp 610ndash619
Jaffe A B Newell R G and Stavins R N 2002 Environmental policy and technological change Environmental and Resource Economics Vol 22 (1ndash2) 2002 pp 41ndash70
Johnstone N and Hascic I 2008 Renewable energy policies and technological innovation energy source and instrument choice in Environmental Policy Technological Innovation and PatentsOrganisation for Economic Co-operation and Development Paris
Johnstone N 2005 The Innovation Effects of Environmental Policy Instruments in Horbach J (ed) Indicator Systems for Sustainable Innovation Physica-Verlag HD
Environmental tax reform in Europe opportunities for eco-innovation
References
40
Johnstone N Hascic I and Ostertag K 2008 Environmental policy technological innovation and patent activity in Environmental Policy Technological Innovation and Patents Organisation for Economic Co-operation and Development Paris
Jung C Krutilla K and Boyd R 1996 Incentives for advanced pollution abatement technology at the industry level an evaluation of policy alternatives Journal of Environmental Economics and Management Vol 30(1) pp 95ndash111
Kammen D M Kapidia K and Fripp M 2004 Putting renewables to work how many jobs can the clean energy industry generate University of California Berkeley
Kemp R 1997 Environmental policy and technical change ndash a comparison of the technological impact of policy instruments Edward Elgar Cheltenham
Kemp R 1998 The diffusion of biological waste-water treatment plants in the Dutch food and beverage industry Environmental and Resource Economics Vol 12 pp 113ndash136
Kemp R 2000 Technology and environmental policy ndash innovation effects of past policies and suggestions for improvement in OECD proceedings ndash innovation and the environment Organisation for Economic Co-operation and Development Paris
Kerr S and Newell R G 2003 Policy-induced technology adoption evidence from the US lead phasedown Journal of Industrial Economics Vol 51 pp 317ndash343
Klaassen G Miketa A Larsen K and Sundqvist T 2005 The impact of RampD on innovation for wind energy in Denmark Germany and the United Kingdom Ecological Economics Vol 54 pp 227ndash240
Kline S and Rosenberg N 1986 An overview of innovation in Landau R (ed) The positive sum strategy Harnessing technology for economic growth pp 275-306
Knigge M and Goumlrlach B 2005 Effects of Germanys ecological tax reforms on the environment employment and technological innovation Ecologic Berlin (httpwwwumweltbundesamtdeuba-info-presse-ehintergrundoekosteuerpdf) accessed 18 August 2011
Langniss O 2003 Governance structures for promoting renewable energy sources dissertation Lund Stuttgart
Lanjouw J O and Mody A 1996 Innovation and the international diffusion of environmentally responsive technology Research Policy Vol 25 pp 549ndash571
Lehr U Nitsch J Kratzat M Lutz C and Edler D 2008 Renewable Energy and Employment in Germany Energy Policy Vol 36 pp 108ndash117 DOI101016jenpol200709004
Lehr U Wolter MI and Groszligmann A 2009 Economic impacts of RES obligations in Austria ndash an application of the macro-econometric model e3at GWS Discussion Paper 20091 Osnabruumlck
Lundvall B-A Johnson B Andersen E S and Dalum B 2001 National systems of production innovation and competence building Research Policy Vol 31 pp 213ndash231
Lutz C and Giljum S 2009 Global resource use in a business as usual world until 2030 Updated results from the GINFORS model in Bleischwitz R Welfens Pand Zhang Z (eds) Sustainable growth and resource productivity ndash economic and global policy issues Greenleaf Publishers pp 30ndash41
Lutz C and Meyer B 2008 Beschaumlftigungseffekte des Klimaschutzes in Deutschland Untersuchungen zu gesamtwirtschaftlichen Auswirkungen ausgewaumlhlter Maszlignahmen des Energie- und Klimapakets Forschungsbericht 205 46 434 Dessau-Roszliglau
Lutz C and Meyer B 2009a Environmental and Economic Effects of Post-Kyoto Carbon Regimes Results of Simulations with the Global Model GINFORS Energy Policy Vol 37 pp 1 758ndash1 766 DOI 101016jenpol200901015
Lutz C and Meyer B 2009b Scenario results from GINFORS PETRE working paper Osnabruumlck
Lutz C Meyer B Nathani C and Schleich J 2005 Endogenous technological change and emissions The case of the German steel industry Energy Policy Vol33 pp 1 143ndash1 154
Lutz C Meyer B Nathani C and Schleich J 2007 Endogenous innovation economy and environment impacts of a technology based modelling approach for energy-intensive industries in Germany Energy Studies Review Vol 15(1) pp 2ndash18
References
Environmental tax reform in Europe opportunities for eco-innovation 41
Lutz C Meyer B and Wolter M I 2009 The global multisectormulticountry 3-E model GINFORS mdash a description of the model and a baseline forecast for global energy demand and CO2 emissions Journal of Sustainable Development forthcoming
Malerba F and Orsenigo L 1997 Technological Regimes and Sectoral Patterns of Innovative Activities Industrial and Corporate Change Vol 6 (1) pp 83ndash117
Malerba F 1992 Learning by Firms and Incremental Technical Change The Economic Journal Vol 102 (413) pp 845ndash859
Malerba F 2005 Industrial dynamics and innovation progress and challenges Presidential Address delivered at the 32nd Conference of the European Association for Research in Industrial Economics (EARIE) 1ndash4 September 2005 Porto
Malerba F 2006 Innovation and the evolution of industries Journal of Evolutionary Economics Vol 16 pp 3ndash23
McGinty M and de Vries F P 2009 Technology diffusion product differentiation and environmental subsidies The BE Journal of Economic Analysis and Policy Vol 9(1)
Meyer B and Lutz C 2007 The GINFORS model ndash model overview and evaluation Petre Working Paper Osnabruumlck (httpwwwpetreorgukpapershtm) accessed 18 August 2011
Meyer B Lutz C Schnur P and Zika G 2007 Economic policy simulations with global interdependencies a sensitivity analysis for Germany Economic Systems Research Vol 19 pp 37ndash55
Mickwitz P H Hyvaumlttinen and P Kivimaa 2008 The role of policy instruments in the innovation and diffusion of environmentally friendlier technologies popular claims versus case study experiences Journal of Cleaner Production Vol 16(1S1) 162ndash170
Miketa A and Schrattenholzer L 2004 Experiments with a methodology to model the role of RampD expenditures in energy technology learning processes first results Energy Policy Vol 32 (15) pp 1 679ndash1 692
Milliman S R and Prince R 1989 Firm incentives to promote technological change in pollution control Journal of Environmental Economics and Management Vol 17 pp 247ndash265
Millock K and Nauges C 2006 Ex-post evaluation of an earmarked tax on air pollution Land Economics Vol 82(1) pp 68ndash84
Montero J-P 2002 Market structure and environmental innovation Journal of Applied Economics Vol 2 pp 293ndash325
Moreno B and Loacutepez A J 2007 The effect of renewable energy on employment mdash The case of Asturias (Spain) Renewable and Sustainable Energy Rewiews doi 101016jrser200610011
Mowery D and Rosenberg N 1979 The influence of market demand upon innovation A critical review of some recent empirical studies Research Policy Vol 8 pp 102ndash153
Newell R G Jaffe A B and Stavins R N 1999 The induced innovation hypothesis and energy-saving technological change Quarterly Journal of Economics Vol 114 pp 941ndash975
Norberg-Bohm V 1999 Stimulating green technological innovation An analysis of alternative policy mechanisms Policy Sciences Vol 32(1) pp 13ndash38
OECD 2009 Sustainable manufacturing and eco-innovation towards a green economy Organisation for Economic Co-operation and Development Policy Brief June 2009
OECD 2010 Taxation innovation and the environment Organisation for Economic Co-operation and Development
Pavitt K 1984 Sectoral patterns of technological change Towards a taxonomy and a theory Research Policy Vol 13 pp 343ndash373
Popp D 2002 Induced innovation and energy prices The American Economic Review Vol 92(1) pp 160ndash180
Popp D 2005 Lessons from patents Using patents to measure technological change in environmental models Ecological Economics Vol 54 pp 209ndash226
Environmental tax reform in Europe opportunities for eco-innovation
References
42
Porter M and van der Linde C 1995 Toward a new conception of the environment competitiveness relationship Journal of Economic Perspectives Vol 9(4) pp 97ndash118
Rammert W 2002 The cultural shaping of technologies and the politics of technodiversity In Sorensen K and Williams R (eds) Shaping technology guiding policy concepts spaces and tools Elgar Cheltenham pp 155-172
Requate T 2005 Dynamic incentives by environmental policy instruments ndash a survey Ecological Economics Vol 54 pp 175ndash195
Roloff N Lehr U Krewitt W Fuchs G Wassermann S Weimer-Jehle W and Schmidt B 2008 Success determinants for technological innovations in the energy sector mdash the case of photovoltaics in Moumlst D Fichtner W Ragwitz M and Veit D (eds) New methods for energy market modelling mdash Proceedings of the first european workshop on energy market modelling using agent-based computational economics Universitaumltsverlag Karlsruhe
Rothwell R 1995 The fifth generation innovation process in Oppenlaumlnder KH Popp W (eds) Innovationen und wirtschaftlicher Fortschritt betriebs-und volkswirtschaftliche Perspektiven Bern pp 9ndash26
Schumpeter J 1942 Capitalism socialism and democracy New York Harper
Skjaeligrseth J B and Christiansen A C 2005 Environmental policy instruments and technological change in the energy sector findings from comparative empirical research Energy and Environment Vol 17 (2) pp 223ndash241
Snyder L D Miller N H and Stavins R N 2003 The effects of environmental regulations on pollution emissions evidence from plant-level data American Economic Review Vol 93(2) pp 431ndash435
Technopolis 2008 Eco-innovation Final Report for Sectoral Innovation Watch (httpwwwtechnopolis-groupcomresourcesdownloads661_report_finalpdf) accessed 18 August 2011
Volleburgh H 2007 Impacts of environmental policy instruments on technological change Report for Joint Meetings of Tax and Environment Experts OECD Environment Directorate February 2007 (comenvepocctpacfa(2006)36final)
Zimmermann H Wohltmann M and Hansjuumlrgens B 1996 Umweltabgaben und Innovation Analytica Marburg
43
Annex 1
Environmental tax reform in Europe opportunities for eco-innovation
Type Instrument Area Stage
Reference
Theo
retica
l
Em
piric
al
Cas
e st
udy
Rev
iew
Qual
itat
ive
Taxe
s
Perm
its
Subsi
die
s
Volu
nta
ry
Com
man
d
Reg
ula
tion
Ener
gy
Air
Wat
er
Oth
er
Gen
eral
Innov
atio
n
Diffu
sion
Rel
evan
ce
Brunnermeier amp Cohen (2003)
X X X X
Buen (2006) X X X X X X
Christiansen amp Skjaerseth (2005)
X X X X X X
Fischer et al (2003 X X X X X X
Frondel et al (2008) X X X X X X X (X) (X)
Hemmelskamp (1997)
X X X X X X X (X)
Hoglund Isaksson (2005)
X X X (X) (X)
Jaffe amp Stavins (1995)
X X X1 X X X X
Jaffe amp Palmer (1997)
X X X X
Jaffe et al (2002) X X X X X X X X X X
Jung et al (1996) X X X X X X (X) (X)
Kemp (1998) X X X X
Kerr amp Newell (2001) X X X X X
Klaassen et al (2005)
X X X X X
Lanjouw amp Mody (1996)
X X X X X X X
McGinty amp de Vries (2009)
X X X X
Mickwitz et al (2008)
X X X X X X X X X
Milliman amp Prince (1989)
X X X X X X X
Millock amp Nauges (2006)
X X X X X X
Montero (2002) X X X X X
Newell et al (1999) X X1 X X X
Norberg-Bohm (1999)
X X X X X X X
Popp (2002) X X1 X X
Popp (2005) X X X X X X
Porter amp van der Linde (1995)
X X X X X X
Requate (2005) X X X X X X X
Skjaeligrseth amp Christiansen (2005)
X X X X X X X X X
Snyder et al (2003) X X X X X
Annex 1 Classification of refereed journal articles
Environmental tax reform in Europe opportunities for eco-innovation44
Annex 2
Type Instrument Area Stage
Reference
Theo
retica
l
Em
piric
al
Cas
e st
udy
Rev
iew
Qual
itat
ive
Taxe
s
Perm
its
Subsi
die
s
Volu
nta
ry
Com
man
d
Reg
ula
tion
Ener
gy
Air
Wat
er
Oth
er
Gen
eral
Innov
atio
n
Diffu
sion
Rel
evan
ce
Johnstone (2005)
X X X X X X X
Johnstone amp Hascic (2008)
X X X X X X X X
Kemp (1997) X X X X X X X X X X X X X
Kemp (2000) X X X X X X X X X
de Vries amp Medhi (2008)
X X1 X X X
Annex 2 Classification of books and book chapters
45
Annex 3
Environmental tax reform in Europe opportunities for eco-innovation
Type Instrument Area Stage
Reference
Theo
retica
l
Em
piric
al
Cas
e st
udy
Rev
iew
Qual
itat
ive
Taxe
s
Perm
its
Subsi
die
s
Volu
nta
ry
Com
man
d
Reg
ula
tion
Ener
gy
Air
Wat
er
Oth
er
Gen
eral
Innov
atio
n
Diffu
sion
Rel
evan
ce
Goumlrlach et al (2005)
X X X X X X
Knigge amp Goumlrlach (2005)
X X X X X X
Technopolis (2008)
X X X X X X
Volleburgh (2007)
X X X X X X X X X X X
Annex 3 Classification of reports
European Environment Agency
Environmental tax reform in Europe opportunities for eco-innovation
2011 mdash 45 pp mdash 21 x 297 cm
ISBN 978-92-9213-238-5doi10280084889
How to obtain EU publications
Publications for salebull viaEUBookshop(httpbookshopeuropaeu)bull fromyourbooksellerbyquotingthetitlethepublisherandorISBNnumberbull bycontactingoneofoursalesagentsdirectlyYoucanobtaintheircontactdetails
on the Internet (httpbookshopeuropaeu) or by sending a fax to +352 2929-42758
Free publicationsbull viaEUBookshop(httpbookshopeuropaeu)bull attheEuropeanCommissionsrepresentationsordelegationsYoucanobtain
their contact details on the Internet (httpeceuropaeu) or by sending a fax to +352 2929-42758
European Environment AgencyKongens Nytorv 61050 Copenhagen KDenmark
Tel +45 33 36 71 00Fax +45 33 36 71 99
Web eeaeuropaeuEnquiries eeaeuropaeuenquiries
TH
-AK-1
1-0
17-E
N-N
doi1
02
8008
4889
- Acknowledgements
- Executive summary
- 1Introduction
-
- 11Background
- 12ETR and innovation
- 13Report structure
-
- 2Review of literature on environmental tax reform and eco‑innovation
-
- 21Initial screening
- 22Detailed review
- 23Environmental regulation studies
- 24Theoretical studies
- 25Empirical studies
- 26Case studies
- 27Conclusions
-
- 3Modelling of ETR impacts on eco‑innovation
-
- 31Scenarios assessing the implications of ETR for eco-innovation
- 32Overview of modelling results
- 33Macroeconomic impacts at the national level
- 34Conclusions of the scenario assessment
-
- References
- Annex 1 Classification of refereed journal articles
- Annex 2Classification of books and book chapters
- Annex 3Classification of reports
-
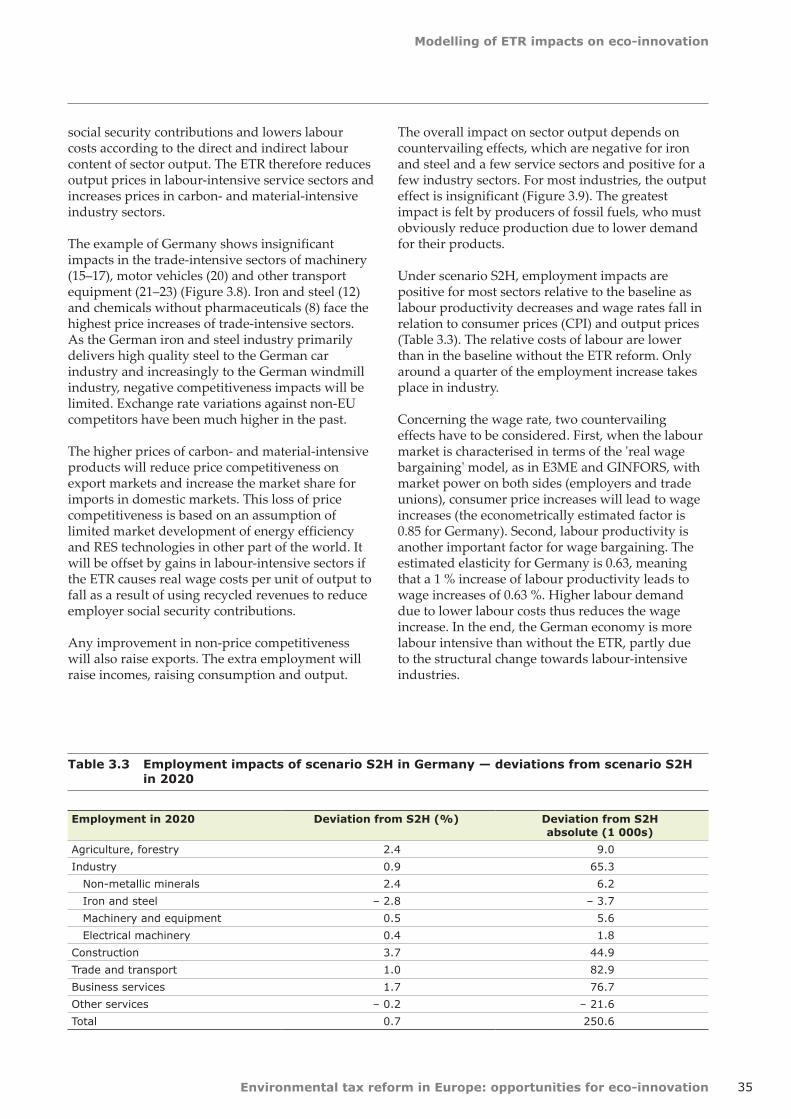
Modelling of ETR impacts on eco-innovation
Environmental tax reform in Europe opportunities for eco-innovation 35
social security contributions and lowers labour costs according to the direct and indirect labour content of sector output The ETR therefore reduces output prices in labour-intensive service sectors and increases prices in carbon- and material-intensive industry sectors
The example of Germany shows insignificant impacts in the trade-intensive sectors of machinery (15ndash17) motor vehicles (20) and other transport equipment (21ndash23) (Figure 38) Iron and steel (12) and chemicals without pharmaceuticals (8) face the highest price increases of trade-intensive sectors As the German iron and steel industry primarily delivers high quality steel to the German car industry and increasingly to the German windmill industry negative competitiveness impacts will be limited Exchange rate variations against non-EU competitors have been much higher in the past
The higher prices of carbon- and material-intensive products will reduce price competitiveness on export markets and increase the market share for imports in domestic markets This loss of price competitiveness is based on an assumption of limited market development of energy efficiency and RES technologies in other part of the world It will be offset by gains in labour-intensive sectors if the ETR causes real wage costs per unit of output to fall as a result of using recycled revenues to reduce employer social security contributions
Any improvement in non-price competitiveness will also raise exports The extra employment will raise incomes raising consumption and output
The overall impact on sector output depends on countervailing effects which are negative for iron and steel and a few service sectors and positive for a few industry sectors For most industries the output effect is insignificant (Figure 39) The greatest impact is felt by producers of fossil fuels who must obviously reduce production due to lower demand for their products
Under scenario S2H employment impacts are positive for most sectors relative to the baseline as labour productivity decreases and wage rates fall in relation to consumer prices (CPI) and output prices (Table 33) The relative costs of labour are lower than in the baseline without the ETR reform Only around a quarter of the employment increase takes place in industry
Concerning the wage rate two countervailing effects have to be considered First when the labour market is characterised in terms of the real wage bargaining model as in E3ME and GINFORS with market power on both sides (employers and trade unions) consumer price increases will lead to wage increases (the econometrically estimated factor is 085 for Germany) Second labour productivity is another important factor for wage bargaining The estimated elasticity for Germany is 063 meaning that a 1 increase of labour productivity leads to wage increases of 063 Higher labour demand due to lower labour costs thus reduces the wage increase In the end the German economy is more labour intensive than without the ETR partly due to the structural change towards labour-intensive industries
Table 33 Employment impacts of scenario S2H in Germany mdash deviations from scenario S2H in 2020
Employment in 2020 Deviation from S2H () Deviation from S2Habsolute (1 000s)
Agriculture forestry 24 90
Industry 09 653
Non-metallic minerals 24 62
Iron and steel ndash 28 ndash 37
Machinery and equipment 05 56
Electrical machinery 04 18
Construction 37 449
Trade and transport 10 829
Business services 17 767
Other services ndash 02 ndash 216
Total 07 2506
Environmental tax reform in Europe opportunities for eco-innovation
Modelling of ETR impacts on eco-innovation
36
Additional exports under scenario S2HE mainly create new jobs in machinery and related business services (Table 34) Under scenario S2HI a shift in the input structure of the energy sector leads to a shift in the industry structure and creates a few jobs in the service sector (Table 35)
34 Conclusions of the scenario assessment
The foregoing analysis used the GINFORS model to assess economic and environmental impacts of using the ETS and ETR to reach the EUs 2020
GHG targets In general the results show positive employment effects and only small negative impacts on GDP in EU-27 Member States The economic impacts depend on the levels of international energy prices the mechanism used to recycle revenues and country specifics such as carbon and energy intensity and the structure of energy consumption
Although there is significant evidence that eco-innovation is positively driven by higher energy prices quantification is difficult The present study included simulations of possible impacts of a shift in the industry structure towards renewable energy in the electricity sector and an overall increase of EU
Table 34 Employment impacts of scenario S2HE in 2020 in Germany mdash deviations from scenario S2H
Employment in 2020 Deviation from S2H () Deviation from S2Habsolute (1 000s)
Agriculture forestry ndash 01 ndash 02
Industry 03 194
Non-metallic minerals 02 05
Iron and steel 04 05
Machinery and equipment 13 130
Electrical machinery 24 117
Construction 01 18
Trade and transport 00 26
Business services 07 308
Other services 01 107
Total 02 634
Table 35 Employment impacts of scenario S2HI in 2020 in Germany mdash deviations from scenario S2H
Employment in 2020 Deviation from S2H () Deviation from S2Habsolute (1 000s)
Agriculture forestry ndash 01 ndash 02
Industry 00 00
Non-metallic minerals 25 65
Iron and steel ndash 27 ndash 36
Machinery and equipment 08 78
Electrical machinery 04 19
Construction ndash 00 ndash 04
Trade and transport 00 07
Business services 02 115
Other services 0 56
Total 00 167
Modelling of ETR impacts on eco-innovation
Environmental tax reform in Europe opportunities for eco-innovation 37
exports due to higher global demand for renewable energy The main results can be summarised as follows
bull environmentaltaxreformshiftingtaxesfromlabour to energy and resources will create additional jobs and trigger eco-innovation
bull impactsofeco-innovationintheformofadditional EU exports or shifts in industry structures will have a slight positive influence on GDP and create a smaller number of additional jobs
These findings correspond to results from the EmployRES study (Fraunhofer ISI et al 2009) As ETR is directly aimed at reducing labour costs it will create additional jobs in the short and medium term In the longer term the cost reduction and new technologies arising from eco-innovation will play a larger role
Like all fiscal reforms a major ETR in Europe will create winners and losers At the sector level carbon- and material-intensive industries will face economic losses At the country level the carbon-intensity and overall flexibility of economies is important Clearly structural change away from carbon-intensive industries together with technological change is inherent in any successful climate mitigation policy
On the other hand several factors can smooth these structural adjustments International cooperation
will reduce economic pressure on countries and sectors In addition ETR together with auctioning of ETS allowances can be a major source of revenues for EU Member States in the future even if part of the revenues will have to be earmarked for adaptation and mitigation measures in developing countries Indeed future debate on grandfathering or auctioning ETS allowances should reflect the important point that giving allowances away for free denies countries the money to ease structural change and invest in low-carbon technologies
Caution is needed in relating the findings of this study to the EU policy debate In the model simulations the single carbon price is the only instrument used to reach the EUs 2020 GHG targets In reality of course other renewable energy and efficiency policies will also contribute to carbon reduction and have to be taken into account when comparing the results (especially the high carbon prices) to other studies Both reduce the potential revenues from fossil energy carriers and carbon emissions
A variety of renewable energy and efficiency policies could enable the climate and energy targets to be met while securing even better economic prospects The results of the present study clearly indicate that the discussion on market-based instruments should be intensified Ultimately however the EU will need a rich mix of policies to reach its GHG targets while maximising prosperity
Environmental tax reform in Europe opportunities for eco-innovation38
References
Almon C 1991 The INFORUM Approach to Interindustry Modeling in Economic Systems Research Vol 3 pp 1ndash7
Amin A and Cohendet P 2004 The Architecture of Knowledge Firms Capabilities and Communities Oxford University Press Oxford
Barker T Meyer B Pollitt H and Lutz C 2007a Modelling Environmental Tax Reform in Germany and the United Kingdom with E3ME and GINFORS petre Working Paper Cambridge and Osnabrueck (httpwwwpetreorgukpapershtm) accessed 15 February 2011
Barker T Junankar S Pollitt H and Summerton P 2007b Carbon leakage from unilateral environmental tax reforms in Europe 1995ndash2005 Energy Policy Vol 35 pp 6 281ndash6 292
Brunnermeier S B and Cohen M A 2003 Determinants of environmental innovation in US manufacturing industries Journal of Environmental Economics and Management Vol 45 pp 278ndash293
Buen J 2006 Danish and Norwegian wind industry The relationship between policy instruments innovation and diffusion Energy Policy Vol 34 (18) pp 3 887ndash3 897
Carlsson B and Stankiewicz R 1991 On the nature function and composition of technological systems Journal of Evolutionary Economics Vol 1 (2) pp 93ndash118
Christiansen A C and Skjaerseth J B 2005 Climate change policies in Norway and the Netherlands Different instruments similar outcome Energy and Environment Vol 16(1) pp 1ndash25
Dosi G 1988 Sources procedures and microeconomic effects of innovation Journal of Economic Literature Vol 26 pp 1 120ndash1 171
de Vries F and Medhi N 2008 Environmental regulation and international innovation in automotive emissions control technologies in Environmental Policy Technological Innovation and Patents Organisation for Economic Cooperation and Development Paris
DG TREN 2008 European energy and transport mdash trends to 2030 mdash update 2007 European Commission Luxembourg
DTI 2004 Renewable Supply Chain Gap Analysis UK Department of Trade and Industry
Edler J (ed) 2006 Nachfrageorientierte Innovationspolitik Buumlro fuumlr Technikfolgenabschaumltzung beim Deutschen Bundestag (TAB) Arbeitsbericht Nr 99 Berlin
Edquist C 2001 The system of innovation approach and innovation policy an account of the state of the art lead paper presented at the DRUID Conference 12ndash15 June 2001 Aalborg (httpwwwdruiddkconferencesnwpaper1edquistpdf) accessed 15 February 2011
EEA 2006 Using the market for cost-effective environmental policy Market-based instruments in Europe EEA Report No 12006 European Environment Agency Copenhagen
Ekins P 2009 Resource Productivity Environmental tax Reform and Sustainable Growth in Europe published by the Anglo-German Foundation for the Study of Industrial Society Final report (httpwwwpetreorgukpdfFinRepFinpdf) accessed 12 October 2011
Ekins P and Speck S (eds) 2011 Environmental Tax Reform (ETR) A Policy for Green Growth Oxford University Press
EREC 2008 Energy [r]evolution A sustainable global energy outlook Greenpeace International European Renewable Energy Council (EREC)
References
References
Environmental tax reform in Europe opportunities for eco-innovation 39
Fagerberg J Mowery D C and Nelson R R (eds) 2005 The Oxford Handbook of Innovation Oxford University Press Oxford
Fischer C Parry I W H and Pizer W A 2003 Instrument choice for environmental protection when technological innovation is endogenous Journal of Environmental Economics and Management Vol 45 pp 523ndash545
Fraunhofer ISI ECOFYS Energy Economics Group Ruumltter + Partner SEURECO and LEI 2009 EmployRES mdash The impact of renewable energy policy on economic growth and employment in the European Union European Commission Brussels
Frondel M Horbach J and Rennings K 2008 What triggers environmental management and innovation Empirical evidence for Germany Ecological Economics Vol 66(1) pp 153ndash160
GHK Cambridge Econometrics and IEEP 2007 Links between the environment economy and jobs Final Report submitted to DG Environment European Commission
Giljum S Behrens A Hinterberger F Lutz C and Meyer B 2008 Modelling scenarios towards a sustainable use of natural resources in Europe Environmental Science and Policy Vol 11 pp 204ndash216
Goumlrlach B Knigge M and Luumlckge H 2005 Wirkungen der Oumlkologischen Steuerreform auf Innovation und Marktdurchdringung Ecologic Berlin (httpecologiceudownloadprojekte1850-189918791879_5_innovationpdf) accessed 18 August 2011
Green M A 2000 Photovoltaics technology overview Energy Policy Vol 28 (14) pp 989ndash998
Grossmann A Lehr U Lutz C and Wolter MI 2008 Gesamtwirtschaftliche Effekte der Umsetzung der EU Ziele im Bereich Erneuerbare Energien und Gebaumludeeffizienz in Oumlsterreich bis 2020 Studie im Auftrag des Lebensministeriums Wien 0508
Hage J and Hollingsworth J R 2000 Idea innovation networks a strategy for integrating organizational and institutional analysis Organization Studies Vol 21 (5) pp 971ndash1 004
Hauschildt J 2004 Innovationsmanagement Vahlen Muumlnchen
Hemmelskamp J 1997 Environmental policy instruments and their effects on innovation European Planning Studies Vol 5 (2) pp 177ndash195
Hoglund Isaksson L 2005 Abatement costs in response to the Swedish charge on nitrogen oxide emissions Journal of Environmental Economics and Management Vol 50 pp 102ndash120
Hullmann A 2001 Internationaler Wissenstransfer und technischer Wandel (dissertation) Physica-Verlag Heidelberg
IEA 2008 World Energy Outlook 2008 International Energy Agency Paris
IEA 2009 World Energy Outlook 2009 International Energy Agency Paris
Jacobsson S Andersson B A and Baringngens L 2002 Transforming the energy system mdash the evolution of the German technological system for solar cells Science and Technology Policy Research University of Sussex Electronic Working Paper Series No 84 (httpideasrepecorgpsrussewps84html) accessed 18 August 2011
Jaffe A and Stavins R 1995 Dynamic incentives of environmental regulations the effects of alternative policy instruments on technology diffusion Journal of Environmental Economics and Management Vol 29(3) pp 43ndash63
Jaffe A B and Palmer K 1997 Environmental regulation and innovation a panel data study The Review of Economics and Statistics Vol 79 pp 610ndash619
Jaffe A B Newell R G and Stavins R N 2002 Environmental policy and technological change Environmental and Resource Economics Vol 22 (1ndash2) 2002 pp 41ndash70
Johnstone N and Hascic I 2008 Renewable energy policies and technological innovation energy source and instrument choice in Environmental Policy Technological Innovation and PatentsOrganisation for Economic Co-operation and Development Paris
Johnstone N 2005 The Innovation Effects of Environmental Policy Instruments in Horbach J (ed) Indicator Systems for Sustainable Innovation Physica-Verlag HD
Environmental tax reform in Europe opportunities for eco-innovation
References
40
Johnstone N Hascic I and Ostertag K 2008 Environmental policy technological innovation and patent activity in Environmental Policy Technological Innovation and Patents Organisation for Economic Co-operation and Development Paris
Jung C Krutilla K and Boyd R 1996 Incentives for advanced pollution abatement technology at the industry level an evaluation of policy alternatives Journal of Environmental Economics and Management Vol 30(1) pp 95ndash111
Kammen D M Kapidia K and Fripp M 2004 Putting renewables to work how many jobs can the clean energy industry generate University of California Berkeley
Kemp R 1997 Environmental policy and technical change ndash a comparison of the technological impact of policy instruments Edward Elgar Cheltenham
Kemp R 1998 The diffusion of biological waste-water treatment plants in the Dutch food and beverage industry Environmental and Resource Economics Vol 12 pp 113ndash136
Kemp R 2000 Technology and environmental policy ndash innovation effects of past policies and suggestions for improvement in OECD proceedings ndash innovation and the environment Organisation for Economic Co-operation and Development Paris
Kerr S and Newell R G 2003 Policy-induced technology adoption evidence from the US lead phasedown Journal of Industrial Economics Vol 51 pp 317ndash343
Klaassen G Miketa A Larsen K and Sundqvist T 2005 The impact of RampD on innovation for wind energy in Denmark Germany and the United Kingdom Ecological Economics Vol 54 pp 227ndash240
Kline S and Rosenberg N 1986 An overview of innovation in Landau R (ed) The positive sum strategy Harnessing technology for economic growth pp 275-306
Knigge M and Goumlrlach B 2005 Effects of Germanys ecological tax reforms on the environment employment and technological innovation Ecologic Berlin (httpwwwumweltbundesamtdeuba-info-presse-ehintergrundoekosteuerpdf) accessed 18 August 2011
Langniss O 2003 Governance structures for promoting renewable energy sources dissertation Lund Stuttgart
Lanjouw J O and Mody A 1996 Innovation and the international diffusion of environmentally responsive technology Research Policy Vol 25 pp 549ndash571
Lehr U Nitsch J Kratzat M Lutz C and Edler D 2008 Renewable Energy and Employment in Germany Energy Policy Vol 36 pp 108ndash117 DOI101016jenpol200709004
Lehr U Wolter MI and Groszligmann A 2009 Economic impacts of RES obligations in Austria ndash an application of the macro-econometric model e3at GWS Discussion Paper 20091 Osnabruumlck
Lundvall B-A Johnson B Andersen E S and Dalum B 2001 National systems of production innovation and competence building Research Policy Vol 31 pp 213ndash231
Lutz C and Giljum S 2009 Global resource use in a business as usual world until 2030 Updated results from the GINFORS model in Bleischwitz R Welfens Pand Zhang Z (eds) Sustainable growth and resource productivity ndash economic and global policy issues Greenleaf Publishers pp 30ndash41
Lutz C and Meyer B 2008 Beschaumlftigungseffekte des Klimaschutzes in Deutschland Untersuchungen zu gesamtwirtschaftlichen Auswirkungen ausgewaumlhlter Maszlignahmen des Energie- und Klimapakets Forschungsbericht 205 46 434 Dessau-Roszliglau
Lutz C and Meyer B 2009a Environmental and Economic Effects of Post-Kyoto Carbon Regimes Results of Simulations with the Global Model GINFORS Energy Policy Vol 37 pp 1 758ndash1 766 DOI 101016jenpol200901015
Lutz C and Meyer B 2009b Scenario results from GINFORS PETRE working paper Osnabruumlck
Lutz C Meyer B Nathani C and Schleich J 2005 Endogenous technological change and emissions The case of the German steel industry Energy Policy Vol33 pp 1 143ndash1 154
Lutz C Meyer B Nathani C and Schleich J 2007 Endogenous innovation economy and environment impacts of a technology based modelling approach for energy-intensive industries in Germany Energy Studies Review Vol 15(1) pp 2ndash18
References
Environmental tax reform in Europe opportunities for eco-innovation 41
Lutz C Meyer B and Wolter M I 2009 The global multisectormulticountry 3-E model GINFORS mdash a description of the model and a baseline forecast for global energy demand and CO2 emissions Journal of Sustainable Development forthcoming
Malerba F and Orsenigo L 1997 Technological Regimes and Sectoral Patterns of Innovative Activities Industrial and Corporate Change Vol 6 (1) pp 83ndash117
Malerba F 1992 Learning by Firms and Incremental Technical Change The Economic Journal Vol 102 (413) pp 845ndash859
Malerba F 2005 Industrial dynamics and innovation progress and challenges Presidential Address delivered at the 32nd Conference of the European Association for Research in Industrial Economics (EARIE) 1ndash4 September 2005 Porto
Malerba F 2006 Innovation and the evolution of industries Journal of Evolutionary Economics Vol 16 pp 3ndash23
McGinty M and de Vries F P 2009 Technology diffusion product differentiation and environmental subsidies The BE Journal of Economic Analysis and Policy Vol 9(1)
Meyer B and Lutz C 2007 The GINFORS model ndash model overview and evaluation Petre Working Paper Osnabruumlck (httpwwwpetreorgukpapershtm) accessed 18 August 2011
Meyer B Lutz C Schnur P and Zika G 2007 Economic policy simulations with global interdependencies a sensitivity analysis for Germany Economic Systems Research Vol 19 pp 37ndash55
Mickwitz P H Hyvaumlttinen and P Kivimaa 2008 The role of policy instruments in the innovation and diffusion of environmentally friendlier technologies popular claims versus case study experiences Journal of Cleaner Production Vol 16(1S1) 162ndash170
Miketa A and Schrattenholzer L 2004 Experiments with a methodology to model the role of RampD expenditures in energy technology learning processes first results Energy Policy Vol 32 (15) pp 1 679ndash1 692
Milliman S R and Prince R 1989 Firm incentives to promote technological change in pollution control Journal of Environmental Economics and Management Vol 17 pp 247ndash265
Millock K and Nauges C 2006 Ex-post evaluation of an earmarked tax on air pollution Land Economics Vol 82(1) pp 68ndash84
Montero J-P 2002 Market structure and environmental innovation Journal of Applied Economics Vol 2 pp 293ndash325
Moreno B and Loacutepez A J 2007 The effect of renewable energy on employment mdash The case of Asturias (Spain) Renewable and Sustainable Energy Rewiews doi 101016jrser200610011
Mowery D and Rosenberg N 1979 The influence of market demand upon innovation A critical review of some recent empirical studies Research Policy Vol 8 pp 102ndash153
Newell R G Jaffe A B and Stavins R N 1999 The induced innovation hypothesis and energy-saving technological change Quarterly Journal of Economics Vol 114 pp 941ndash975
Norberg-Bohm V 1999 Stimulating green technological innovation An analysis of alternative policy mechanisms Policy Sciences Vol 32(1) pp 13ndash38
OECD 2009 Sustainable manufacturing and eco-innovation towards a green economy Organisation for Economic Co-operation and Development Policy Brief June 2009
OECD 2010 Taxation innovation and the environment Organisation for Economic Co-operation and Development
Pavitt K 1984 Sectoral patterns of technological change Towards a taxonomy and a theory Research Policy Vol 13 pp 343ndash373
Popp D 2002 Induced innovation and energy prices The American Economic Review Vol 92(1) pp 160ndash180
Popp D 2005 Lessons from patents Using patents to measure technological change in environmental models Ecological Economics Vol 54 pp 209ndash226
Environmental tax reform in Europe opportunities for eco-innovation
References
42
Porter M and van der Linde C 1995 Toward a new conception of the environment competitiveness relationship Journal of Economic Perspectives Vol 9(4) pp 97ndash118
Rammert W 2002 The cultural shaping of technologies and the politics of technodiversity In Sorensen K and Williams R (eds) Shaping technology guiding policy concepts spaces and tools Elgar Cheltenham pp 155-172
Requate T 2005 Dynamic incentives by environmental policy instruments ndash a survey Ecological Economics Vol 54 pp 175ndash195
Roloff N Lehr U Krewitt W Fuchs G Wassermann S Weimer-Jehle W and Schmidt B 2008 Success determinants for technological innovations in the energy sector mdash the case of photovoltaics in Moumlst D Fichtner W Ragwitz M and Veit D (eds) New methods for energy market modelling mdash Proceedings of the first european workshop on energy market modelling using agent-based computational economics Universitaumltsverlag Karlsruhe
Rothwell R 1995 The fifth generation innovation process in Oppenlaumlnder KH Popp W (eds) Innovationen und wirtschaftlicher Fortschritt betriebs-und volkswirtschaftliche Perspektiven Bern pp 9ndash26
Schumpeter J 1942 Capitalism socialism and democracy New York Harper
Skjaeligrseth J B and Christiansen A C 2005 Environmental policy instruments and technological change in the energy sector findings from comparative empirical research Energy and Environment Vol 17 (2) pp 223ndash241
Snyder L D Miller N H and Stavins R N 2003 The effects of environmental regulations on pollution emissions evidence from plant-level data American Economic Review Vol 93(2) pp 431ndash435
Technopolis 2008 Eco-innovation Final Report for Sectoral Innovation Watch (httpwwwtechnopolis-groupcomresourcesdownloads661_report_finalpdf) accessed 18 August 2011
Volleburgh H 2007 Impacts of environmental policy instruments on technological change Report for Joint Meetings of Tax and Environment Experts OECD Environment Directorate February 2007 (comenvepocctpacfa(2006)36final)
Zimmermann H Wohltmann M and Hansjuumlrgens B 1996 Umweltabgaben und Innovation Analytica Marburg
43
Annex 1
Environmental tax reform in Europe opportunities for eco-innovation
Type Instrument Area Stage
Reference
Theo
retica
l
Em
piric
al
Cas
e st
udy
Rev
iew
Qual
itat
ive
Taxe
s
Perm
its
Subsi
die
s
Volu
nta
ry
Com
man
d
Reg
ula
tion
Ener
gy
Air
Wat
er
Oth
er
Gen
eral
Innov
atio
n
Diffu
sion
Rel
evan
ce
Brunnermeier amp Cohen (2003)
X X X X
Buen (2006) X X X X X X
Christiansen amp Skjaerseth (2005)
X X X X X X
Fischer et al (2003 X X X X X X
Frondel et al (2008) X X X X X X X (X) (X)
Hemmelskamp (1997)
X X X X X X X (X)
Hoglund Isaksson (2005)
X X X (X) (X)
Jaffe amp Stavins (1995)
X X X1 X X X X
Jaffe amp Palmer (1997)
X X X X
Jaffe et al (2002) X X X X X X X X X X
Jung et al (1996) X X X X X X (X) (X)
Kemp (1998) X X X X
Kerr amp Newell (2001) X X X X X
Klaassen et al (2005)
X X X X X
Lanjouw amp Mody (1996)
X X X X X X X
McGinty amp de Vries (2009)
X X X X
Mickwitz et al (2008)
X X X X X X X X X
Milliman amp Prince (1989)
X X X X X X X
Millock amp Nauges (2006)
X X X X X X
Montero (2002) X X X X X
Newell et al (1999) X X1 X X X
Norberg-Bohm (1999)
X X X X X X X
Popp (2002) X X1 X X
Popp (2005) X X X X X X
Porter amp van der Linde (1995)
X X X X X X
Requate (2005) X X X X X X X
Skjaeligrseth amp Christiansen (2005)
X X X X X X X X X
Snyder et al (2003) X X X X X
Annex 1 Classification of refereed journal articles
Environmental tax reform in Europe opportunities for eco-innovation44
Annex 2
Type Instrument Area Stage
Reference
Theo
retica
l
Em
piric
al
Cas
e st
udy
Rev
iew
Qual
itat
ive
Taxe
s
Perm
its
Subsi
die
s
Volu
nta
ry
Com
man
d
Reg
ula
tion
Ener
gy
Air
Wat
er
Oth
er
Gen
eral
Innov
atio
n
Diffu
sion
Rel
evan
ce
Johnstone (2005)
X X X X X X X
Johnstone amp Hascic (2008)
X X X X X X X X
Kemp (1997) X X X X X X X X X X X X X
Kemp (2000) X X X X X X X X X
de Vries amp Medhi (2008)
X X1 X X X
Annex 2 Classification of books and book chapters
45
Annex 3
Environmental tax reform in Europe opportunities for eco-innovation
Type Instrument Area Stage
Reference
Theo
retica
l
Em
piric
al
Cas
e st
udy
Rev
iew
Qual
itat
ive
Taxe
s
Perm
its
Subsi
die
s
Volu
nta
ry
Com
man
d
Reg
ula
tion
Ener
gy
Air
Wat
er
Oth
er
Gen
eral
Innov
atio
n
Diffu
sion
Rel
evan
ce
Goumlrlach et al (2005)
X X X X X X
Knigge amp Goumlrlach (2005)
X X X X X X
Technopolis (2008)
X X X X X X
Volleburgh (2007)
X X X X X X X X X X X
Annex 3 Classification of reports
European Environment Agency
Environmental tax reform in Europe opportunities for eco-innovation
2011 mdash 45 pp mdash 21 x 297 cm
ISBN 978-92-9213-238-5doi10280084889
How to obtain EU publications
Publications for salebull viaEUBookshop(httpbookshopeuropaeu)bull fromyourbooksellerbyquotingthetitlethepublisherandorISBNnumberbull bycontactingoneofoursalesagentsdirectlyYoucanobtaintheircontactdetails
on the Internet (httpbookshopeuropaeu) or by sending a fax to +352 2929-42758
Free publicationsbull viaEUBookshop(httpbookshopeuropaeu)bull attheEuropeanCommissionsrepresentationsordelegationsYoucanobtain
their contact details on the Internet (httpeceuropaeu) or by sending a fax to +352 2929-42758
European Environment AgencyKongens Nytorv 61050 Copenhagen KDenmark
Tel +45 33 36 71 00Fax +45 33 36 71 99
Web eeaeuropaeuEnquiries eeaeuropaeuenquiries
TH
-AK-1
1-0
17-E
N-N
doi1
02
8008
4889
- Acknowledgements
- Executive summary
- 1Introduction
-
- 11Background
- 12ETR and innovation
- 13Report structure
-
- 2Review of literature on environmental tax reform and eco‑innovation
-
- 21Initial screening
- 22Detailed review
- 23Environmental regulation studies
- 24Theoretical studies
- 25Empirical studies
- 26Case studies
- 27Conclusions
-
- 3Modelling of ETR impacts on eco‑innovation
-
- 31Scenarios assessing the implications of ETR for eco-innovation
- 32Overview of modelling results
- 33Macroeconomic impacts at the national level
- 34Conclusions of the scenario assessment
-
- References
- Annex 1 Classification of refereed journal articles
- Annex 2Classification of books and book chapters
- Annex 3Classification of reports
-
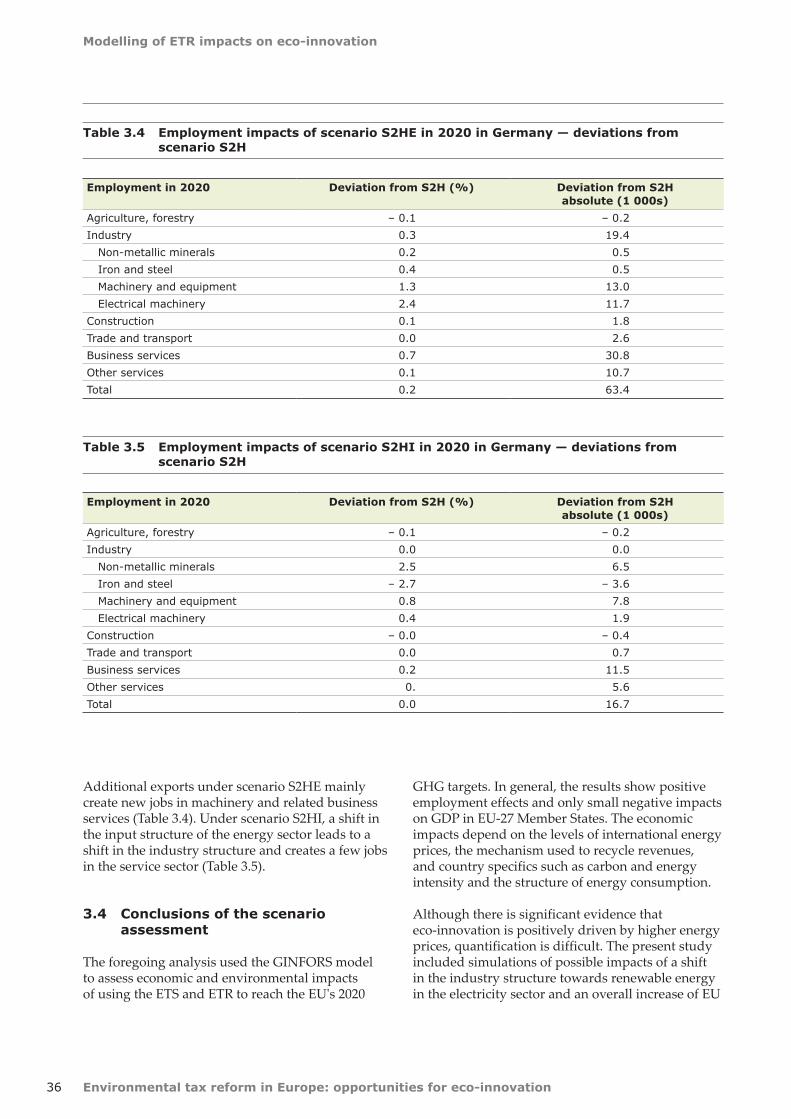
Environmental tax reform in Europe opportunities for eco-innovation
Modelling of ETR impacts on eco-innovation
36
Additional exports under scenario S2HE mainly create new jobs in machinery and related business services (Table 34) Under scenario S2HI a shift in the input structure of the energy sector leads to a shift in the industry structure and creates a few jobs in the service sector (Table 35)
34 Conclusions of the scenario assessment
The foregoing analysis used the GINFORS model to assess economic and environmental impacts of using the ETS and ETR to reach the EUs 2020
GHG targets In general the results show positive employment effects and only small negative impacts on GDP in EU-27 Member States The economic impacts depend on the levels of international energy prices the mechanism used to recycle revenues and country specifics such as carbon and energy intensity and the structure of energy consumption
Although there is significant evidence that eco-innovation is positively driven by higher energy prices quantification is difficult The present study included simulations of possible impacts of a shift in the industry structure towards renewable energy in the electricity sector and an overall increase of EU
Table 34 Employment impacts of scenario S2HE in 2020 in Germany mdash deviations from scenario S2H
Employment in 2020 Deviation from S2H () Deviation from S2Habsolute (1 000s)
Agriculture forestry ndash 01 ndash 02
Industry 03 194
Non-metallic minerals 02 05
Iron and steel 04 05
Machinery and equipment 13 130
Electrical machinery 24 117
Construction 01 18
Trade and transport 00 26
Business services 07 308
Other services 01 107
Total 02 634
Table 35 Employment impacts of scenario S2HI in 2020 in Germany mdash deviations from scenario S2H
Employment in 2020 Deviation from S2H () Deviation from S2Habsolute (1 000s)
Agriculture forestry ndash 01 ndash 02
Industry 00 00
Non-metallic minerals 25 65
Iron and steel ndash 27 ndash 36
Machinery and equipment 08 78
Electrical machinery 04 19
Construction ndash 00 ndash 04
Trade and transport 00 07
Business services 02 115
Other services 0 56
Total 00 167
Modelling of ETR impacts on eco-innovation
Environmental tax reform in Europe opportunities for eco-innovation 37
exports due to higher global demand for renewable energy The main results can be summarised as follows
bull environmentaltaxreformshiftingtaxesfromlabour to energy and resources will create additional jobs and trigger eco-innovation
bull impactsofeco-innovationintheformofadditional EU exports or shifts in industry structures will have a slight positive influence on GDP and create a smaller number of additional jobs
These findings correspond to results from the EmployRES study (Fraunhofer ISI et al 2009) As ETR is directly aimed at reducing labour costs it will create additional jobs in the short and medium term In the longer term the cost reduction and new technologies arising from eco-innovation will play a larger role
Like all fiscal reforms a major ETR in Europe will create winners and losers At the sector level carbon- and material-intensive industries will face economic losses At the country level the carbon-intensity and overall flexibility of economies is important Clearly structural change away from carbon-intensive industries together with technological change is inherent in any successful climate mitigation policy
On the other hand several factors can smooth these structural adjustments International cooperation
will reduce economic pressure on countries and sectors In addition ETR together with auctioning of ETS allowances can be a major source of revenues for EU Member States in the future even if part of the revenues will have to be earmarked for adaptation and mitigation measures in developing countries Indeed future debate on grandfathering or auctioning ETS allowances should reflect the important point that giving allowances away for free denies countries the money to ease structural change and invest in low-carbon technologies
Caution is needed in relating the findings of this study to the EU policy debate In the model simulations the single carbon price is the only instrument used to reach the EUs 2020 GHG targets In reality of course other renewable energy and efficiency policies will also contribute to carbon reduction and have to be taken into account when comparing the results (especially the high carbon prices) to other studies Both reduce the potential revenues from fossil energy carriers and carbon emissions
A variety of renewable energy and efficiency policies could enable the climate and energy targets to be met while securing even better economic prospects The results of the present study clearly indicate that the discussion on market-based instruments should be intensified Ultimately however the EU will need a rich mix of policies to reach its GHG targets while maximising prosperity
Environmental tax reform in Europe opportunities for eco-innovation38
References
Almon C 1991 The INFORUM Approach to Interindustry Modeling in Economic Systems Research Vol 3 pp 1ndash7
Amin A and Cohendet P 2004 The Architecture of Knowledge Firms Capabilities and Communities Oxford University Press Oxford
Barker T Meyer B Pollitt H and Lutz C 2007a Modelling Environmental Tax Reform in Germany and the United Kingdom with E3ME and GINFORS petre Working Paper Cambridge and Osnabrueck (httpwwwpetreorgukpapershtm) accessed 15 February 2011
Barker T Junankar S Pollitt H and Summerton P 2007b Carbon leakage from unilateral environmental tax reforms in Europe 1995ndash2005 Energy Policy Vol 35 pp 6 281ndash6 292
Brunnermeier S B and Cohen M A 2003 Determinants of environmental innovation in US manufacturing industries Journal of Environmental Economics and Management Vol 45 pp 278ndash293
Buen J 2006 Danish and Norwegian wind industry The relationship between policy instruments innovation and diffusion Energy Policy Vol 34 (18) pp 3 887ndash3 897
Carlsson B and Stankiewicz R 1991 On the nature function and composition of technological systems Journal of Evolutionary Economics Vol 1 (2) pp 93ndash118
Christiansen A C and Skjaerseth J B 2005 Climate change policies in Norway and the Netherlands Different instruments similar outcome Energy and Environment Vol 16(1) pp 1ndash25
Dosi G 1988 Sources procedures and microeconomic effects of innovation Journal of Economic Literature Vol 26 pp 1 120ndash1 171
de Vries F and Medhi N 2008 Environmental regulation and international innovation in automotive emissions control technologies in Environmental Policy Technological Innovation and Patents Organisation for Economic Cooperation and Development Paris
DG TREN 2008 European energy and transport mdash trends to 2030 mdash update 2007 European Commission Luxembourg
DTI 2004 Renewable Supply Chain Gap Analysis UK Department of Trade and Industry
Edler J (ed) 2006 Nachfrageorientierte Innovationspolitik Buumlro fuumlr Technikfolgenabschaumltzung beim Deutschen Bundestag (TAB) Arbeitsbericht Nr 99 Berlin
Edquist C 2001 The system of innovation approach and innovation policy an account of the state of the art lead paper presented at the DRUID Conference 12ndash15 June 2001 Aalborg (httpwwwdruiddkconferencesnwpaper1edquistpdf) accessed 15 February 2011
EEA 2006 Using the market for cost-effective environmental policy Market-based instruments in Europe EEA Report No 12006 European Environment Agency Copenhagen
Ekins P 2009 Resource Productivity Environmental tax Reform and Sustainable Growth in Europe published by the Anglo-German Foundation for the Study of Industrial Society Final report (httpwwwpetreorgukpdfFinRepFinpdf) accessed 12 October 2011
Ekins P and Speck S (eds) 2011 Environmental Tax Reform (ETR) A Policy for Green Growth Oxford University Press
EREC 2008 Energy [r]evolution A sustainable global energy outlook Greenpeace International European Renewable Energy Council (EREC)
References
References
Environmental tax reform in Europe opportunities for eco-innovation 39
Fagerberg J Mowery D C and Nelson R R (eds) 2005 The Oxford Handbook of Innovation Oxford University Press Oxford
Fischer C Parry I W H and Pizer W A 2003 Instrument choice for environmental protection when technological innovation is endogenous Journal of Environmental Economics and Management Vol 45 pp 523ndash545
Fraunhofer ISI ECOFYS Energy Economics Group Ruumltter + Partner SEURECO and LEI 2009 EmployRES mdash The impact of renewable energy policy on economic growth and employment in the European Union European Commission Brussels
Frondel M Horbach J and Rennings K 2008 What triggers environmental management and innovation Empirical evidence for Germany Ecological Economics Vol 66(1) pp 153ndash160
GHK Cambridge Econometrics and IEEP 2007 Links between the environment economy and jobs Final Report submitted to DG Environment European Commission
Giljum S Behrens A Hinterberger F Lutz C and Meyer B 2008 Modelling scenarios towards a sustainable use of natural resources in Europe Environmental Science and Policy Vol 11 pp 204ndash216
Goumlrlach B Knigge M and Luumlckge H 2005 Wirkungen der Oumlkologischen Steuerreform auf Innovation und Marktdurchdringung Ecologic Berlin (httpecologiceudownloadprojekte1850-189918791879_5_innovationpdf) accessed 18 August 2011
Green M A 2000 Photovoltaics technology overview Energy Policy Vol 28 (14) pp 989ndash998
Grossmann A Lehr U Lutz C and Wolter MI 2008 Gesamtwirtschaftliche Effekte der Umsetzung der EU Ziele im Bereich Erneuerbare Energien und Gebaumludeeffizienz in Oumlsterreich bis 2020 Studie im Auftrag des Lebensministeriums Wien 0508
Hage J and Hollingsworth J R 2000 Idea innovation networks a strategy for integrating organizational and institutional analysis Organization Studies Vol 21 (5) pp 971ndash1 004
Hauschildt J 2004 Innovationsmanagement Vahlen Muumlnchen
Hemmelskamp J 1997 Environmental policy instruments and their effects on innovation European Planning Studies Vol 5 (2) pp 177ndash195
Hoglund Isaksson L 2005 Abatement costs in response to the Swedish charge on nitrogen oxide emissions Journal of Environmental Economics and Management Vol 50 pp 102ndash120
Hullmann A 2001 Internationaler Wissenstransfer und technischer Wandel (dissertation) Physica-Verlag Heidelberg
IEA 2008 World Energy Outlook 2008 International Energy Agency Paris
IEA 2009 World Energy Outlook 2009 International Energy Agency Paris
Jacobsson S Andersson B A and Baringngens L 2002 Transforming the energy system mdash the evolution of the German technological system for solar cells Science and Technology Policy Research University of Sussex Electronic Working Paper Series No 84 (httpideasrepecorgpsrussewps84html) accessed 18 August 2011
Jaffe A and Stavins R 1995 Dynamic incentives of environmental regulations the effects of alternative policy instruments on technology diffusion Journal of Environmental Economics and Management Vol 29(3) pp 43ndash63
Jaffe A B and Palmer K 1997 Environmental regulation and innovation a panel data study The Review of Economics and Statistics Vol 79 pp 610ndash619
Jaffe A B Newell R G and Stavins R N 2002 Environmental policy and technological change Environmental and Resource Economics Vol 22 (1ndash2) 2002 pp 41ndash70
Johnstone N and Hascic I 2008 Renewable energy policies and technological innovation energy source and instrument choice in Environmental Policy Technological Innovation and PatentsOrganisation for Economic Co-operation and Development Paris
Johnstone N 2005 The Innovation Effects of Environmental Policy Instruments in Horbach J (ed) Indicator Systems for Sustainable Innovation Physica-Verlag HD
Environmental tax reform in Europe opportunities for eco-innovation
References
40
Johnstone N Hascic I and Ostertag K 2008 Environmental policy technological innovation and patent activity in Environmental Policy Technological Innovation and Patents Organisation for Economic Co-operation and Development Paris
Jung C Krutilla K and Boyd R 1996 Incentives for advanced pollution abatement technology at the industry level an evaluation of policy alternatives Journal of Environmental Economics and Management Vol 30(1) pp 95ndash111
Kammen D M Kapidia K and Fripp M 2004 Putting renewables to work how many jobs can the clean energy industry generate University of California Berkeley
Kemp R 1997 Environmental policy and technical change ndash a comparison of the technological impact of policy instruments Edward Elgar Cheltenham
Kemp R 1998 The diffusion of biological waste-water treatment plants in the Dutch food and beverage industry Environmental and Resource Economics Vol 12 pp 113ndash136
Kemp R 2000 Technology and environmental policy ndash innovation effects of past policies and suggestions for improvement in OECD proceedings ndash innovation and the environment Organisation for Economic Co-operation and Development Paris
Kerr S and Newell R G 2003 Policy-induced technology adoption evidence from the US lead phasedown Journal of Industrial Economics Vol 51 pp 317ndash343
Klaassen G Miketa A Larsen K and Sundqvist T 2005 The impact of RampD on innovation for wind energy in Denmark Germany and the United Kingdom Ecological Economics Vol 54 pp 227ndash240
Kline S and Rosenberg N 1986 An overview of innovation in Landau R (ed) The positive sum strategy Harnessing technology for economic growth pp 275-306
Knigge M and Goumlrlach B 2005 Effects of Germanys ecological tax reforms on the environment employment and technological innovation Ecologic Berlin (httpwwwumweltbundesamtdeuba-info-presse-ehintergrundoekosteuerpdf) accessed 18 August 2011
Langniss O 2003 Governance structures for promoting renewable energy sources dissertation Lund Stuttgart
Lanjouw J O and Mody A 1996 Innovation and the international diffusion of environmentally responsive technology Research Policy Vol 25 pp 549ndash571
Lehr U Nitsch J Kratzat M Lutz C and Edler D 2008 Renewable Energy and Employment in Germany Energy Policy Vol 36 pp 108ndash117 DOI101016jenpol200709004
Lehr U Wolter MI and Groszligmann A 2009 Economic impacts of RES obligations in Austria ndash an application of the macro-econometric model e3at GWS Discussion Paper 20091 Osnabruumlck
Lundvall B-A Johnson B Andersen E S and Dalum B 2001 National systems of production innovation and competence building Research Policy Vol 31 pp 213ndash231
Lutz C and Giljum S 2009 Global resource use in a business as usual world until 2030 Updated results from the GINFORS model in Bleischwitz R Welfens Pand Zhang Z (eds) Sustainable growth and resource productivity ndash economic and global policy issues Greenleaf Publishers pp 30ndash41
Lutz C and Meyer B 2008 Beschaumlftigungseffekte des Klimaschutzes in Deutschland Untersuchungen zu gesamtwirtschaftlichen Auswirkungen ausgewaumlhlter Maszlignahmen des Energie- und Klimapakets Forschungsbericht 205 46 434 Dessau-Roszliglau
Lutz C and Meyer B 2009a Environmental and Economic Effects of Post-Kyoto Carbon Regimes Results of Simulations with the Global Model GINFORS Energy Policy Vol 37 pp 1 758ndash1 766 DOI 101016jenpol200901015
Lutz C and Meyer B 2009b Scenario results from GINFORS PETRE working paper Osnabruumlck
Lutz C Meyer B Nathani C and Schleich J 2005 Endogenous technological change and emissions The case of the German steel industry Energy Policy Vol33 pp 1 143ndash1 154
Lutz C Meyer B Nathani C and Schleich J 2007 Endogenous innovation economy and environment impacts of a technology based modelling approach for energy-intensive industries in Germany Energy Studies Review Vol 15(1) pp 2ndash18
References
Environmental tax reform in Europe opportunities for eco-innovation 41
Lutz C Meyer B and Wolter M I 2009 The global multisectormulticountry 3-E model GINFORS mdash a description of the model and a baseline forecast for global energy demand and CO2 emissions Journal of Sustainable Development forthcoming
Malerba F and Orsenigo L 1997 Technological Regimes and Sectoral Patterns of Innovative Activities Industrial and Corporate Change Vol 6 (1) pp 83ndash117
Malerba F 1992 Learning by Firms and Incremental Technical Change The Economic Journal Vol 102 (413) pp 845ndash859
Malerba F 2005 Industrial dynamics and innovation progress and challenges Presidential Address delivered at the 32nd Conference of the European Association for Research in Industrial Economics (EARIE) 1ndash4 September 2005 Porto
Malerba F 2006 Innovation and the evolution of industries Journal of Evolutionary Economics Vol 16 pp 3ndash23
McGinty M and de Vries F P 2009 Technology diffusion product differentiation and environmental subsidies The BE Journal of Economic Analysis and Policy Vol 9(1)
Meyer B and Lutz C 2007 The GINFORS model ndash model overview and evaluation Petre Working Paper Osnabruumlck (httpwwwpetreorgukpapershtm) accessed 18 August 2011
Meyer B Lutz C Schnur P and Zika G 2007 Economic policy simulations with global interdependencies a sensitivity analysis for Germany Economic Systems Research Vol 19 pp 37ndash55
Mickwitz P H Hyvaumlttinen and P Kivimaa 2008 The role of policy instruments in the innovation and diffusion of environmentally friendlier technologies popular claims versus case study experiences Journal of Cleaner Production Vol 16(1S1) 162ndash170
Miketa A and Schrattenholzer L 2004 Experiments with a methodology to model the role of RampD expenditures in energy technology learning processes first results Energy Policy Vol 32 (15) pp 1 679ndash1 692
Milliman S R and Prince R 1989 Firm incentives to promote technological change in pollution control Journal of Environmental Economics and Management Vol 17 pp 247ndash265
Millock K and Nauges C 2006 Ex-post evaluation of an earmarked tax on air pollution Land Economics Vol 82(1) pp 68ndash84
Montero J-P 2002 Market structure and environmental innovation Journal of Applied Economics Vol 2 pp 293ndash325
Moreno B and Loacutepez A J 2007 The effect of renewable energy on employment mdash The case of Asturias (Spain) Renewable and Sustainable Energy Rewiews doi 101016jrser200610011
Mowery D and Rosenberg N 1979 The influence of market demand upon innovation A critical review of some recent empirical studies Research Policy Vol 8 pp 102ndash153
Newell R G Jaffe A B and Stavins R N 1999 The induced innovation hypothesis and energy-saving technological change Quarterly Journal of Economics Vol 114 pp 941ndash975
Norberg-Bohm V 1999 Stimulating green technological innovation An analysis of alternative policy mechanisms Policy Sciences Vol 32(1) pp 13ndash38
OECD 2009 Sustainable manufacturing and eco-innovation towards a green economy Organisation for Economic Co-operation and Development Policy Brief June 2009
OECD 2010 Taxation innovation and the environment Organisation for Economic Co-operation and Development
Pavitt K 1984 Sectoral patterns of technological change Towards a taxonomy and a theory Research Policy Vol 13 pp 343ndash373
Popp D 2002 Induced innovation and energy prices The American Economic Review Vol 92(1) pp 160ndash180
Popp D 2005 Lessons from patents Using patents to measure technological change in environmental models Ecological Economics Vol 54 pp 209ndash226
Environmental tax reform in Europe opportunities for eco-innovation
References
42
Porter M and van der Linde C 1995 Toward a new conception of the environment competitiveness relationship Journal of Economic Perspectives Vol 9(4) pp 97ndash118
Rammert W 2002 The cultural shaping of technologies and the politics of technodiversity In Sorensen K and Williams R (eds) Shaping technology guiding policy concepts spaces and tools Elgar Cheltenham pp 155-172
Requate T 2005 Dynamic incentives by environmental policy instruments ndash a survey Ecological Economics Vol 54 pp 175ndash195
Roloff N Lehr U Krewitt W Fuchs G Wassermann S Weimer-Jehle W and Schmidt B 2008 Success determinants for technological innovations in the energy sector mdash the case of photovoltaics in Moumlst D Fichtner W Ragwitz M and Veit D (eds) New methods for energy market modelling mdash Proceedings of the first european workshop on energy market modelling using agent-based computational economics Universitaumltsverlag Karlsruhe
Rothwell R 1995 The fifth generation innovation process in Oppenlaumlnder KH Popp W (eds) Innovationen und wirtschaftlicher Fortschritt betriebs-und volkswirtschaftliche Perspektiven Bern pp 9ndash26
Schumpeter J 1942 Capitalism socialism and democracy New York Harper
Skjaeligrseth J B and Christiansen A C 2005 Environmental policy instruments and technological change in the energy sector findings from comparative empirical research Energy and Environment Vol 17 (2) pp 223ndash241
Snyder L D Miller N H and Stavins R N 2003 The effects of environmental regulations on pollution emissions evidence from plant-level data American Economic Review Vol 93(2) pp 431ndash435
Technopolis 2008 Eco-innovation Final Report for Sectoral Innovation Watch (httpwwwtechnopolis-groupcomresourcesdownloads661_report_finalpdf) accessed 18 August 2011
Volleburgh H 2007 Impacts of environmental policy instruments on technological change Report for Joint Meetings of Tax and Environment Experts OECD Environment Directorate February 2007 (comenvepocctpacfa(2006)36final)
Zimmermann H Wohltmann M and Hansjuumlrgens B 1996 Umweltabgaben und Innovation Analytica Marburg
43
Annex 1
Environmental tax reform in Europe opportunities for eco-innovation
Type Instrument Area Stage
Reference
Theo
retica
l
Em
piric
al
Cas
e st
udy
Rev
iew
Qual
itat
ive
Taxe
s
Perm
its
Subsi
die
s
Volu
nta
ry
Com
man
d
Reg
ula
tion
Ener
gy
Air
Wat
er
Oth
er
Gen
eral
Innov
atio
n
Diffu
sion
Rel
evan
ce
Brunnermeier amp Cohen (2003)
X X X X
Buen (2006) X X X X X X
Christiansen amp Skjaerseth (2005)
X X X X X X
Fischer et al (2003 X X X X X X
Frondel et al (2008) X X X X X X X (X) (X)
Hemmelskamp (1997)
X X X X X X X (X)
Hoglund Isaksson (2005)
X X X (X) (X)
Jaffe amp Stavins (1995)
X X X1 X X X X
Jaffe amp Palmer (1997)
X X X X
Jaffe et al (2002) X X X X X X X X X X
Jung et al (1996) X X X X X X (X) (X)
Kemp (1998) X X X X
Kerr amp Newell (2001) X X X X X
Klaassen et al (2005)
X X X X X
Lanjouw amp Mody (1996)
X X X X X X X
McGinty amp de Vries (2009)
X X X X
Mickwitz et al (2008)
X X X X X X X X X
Milliman amp Prince (1989)
X X X X X X X
Millock amp Nauges (2006)
X X X X X X
Montero (2002) X X X X X
Newell et al (1999) X X1 X X X
Norberg-Bohm (1999)
X X X X X X X
Popp (2002) X X1 X X
Popp (2005) X X X X X X
Porter amp van der Linde (1995)
X X X X X X
Requate (2005) X X X X X X X
Skjaeligrseth amp Christiansen (2005)
X X X X X X X X X
Snyder et al (2003) X X X X X
Annex 1 Classification of refereed journal articles
Environmental tax reform in Europe opportunities for eco-innovation44
Annex 2
Type Instrument Area Stage
Reference
Theo
retica
l
Em
piric
al
Cas
e st
udy
Rev
iew
Qual
itat
ive
Taxe
s
Perm
its
Subsi
die
s
Volu
nta
ry
Com
man
d
Reg
ula
tion
Ener
gy
Air
Wat
er
Oth
er
Gen
eral
Innov
atio
n
Diffu
sion
Rel
evan
ce
Johnstone (2005)
X X X X X X X
Johnstone amp Hascic (2008)
X X X X X X X X
Kemp (1997) X X X X X X X X X X X X X
Kemp (2000) X X X X X X X X X
de Vries amp Medhi (2008)
X X1 X X X
Annex 2 Classification of books and book chapters
45
Annex 3
Environmental tax reform in Europe opportunities for eco-innovation
Type Instrument Area Stage
Reference
Theo
retica
l
Em
piric
al
Cas
e st
udy
Rev
iew
Qual
itat
ive
Taxe
s
Perm
its
Subsi
die
s
Volu
nta
ry
Com
man
d
Reg
ula
tion
Ener
gy
Air
Wat
er
Oth
er
Gen
eral
Innov
atio
n
Diffu
sion
Rel
evan
ce
Goumlrlach et al (2005)
X X X X X X
Knigge amp Goumlrlach (2005)
X X X X X X
Technopolis (2008)
X X X X X X
Volleburgh (2007)
X X X X X X X X X X X
Annex 3 Classification of reports
European Environment Agency
Environmental tax reform in Europe opportunities for eco-innovation
2011 mdash 45 pp mdash 21 x 297 cm
ISBN 978-92-9213-238-5doi10280084889
How to obtain EU publications
Publications for salebull viaEUBookshop(httpbookshopeuropaeu)bull fromyourbooksellerbyquotingthetitlethepublisherandorISBNnumberbull bycontactingoneofoursalesagentsdirectlyYoucanobtaintheircontactdetails
on the Internet (httpbookshopeuropaeu) or by sending a fax to +352 2929-42758
Free publicationsbull viaEUBookshop(httpbookshopeuropaeu)bull attheEuropeanCommissionsrepresentationsordelegationsYoucanobtain
their contact details on the Internet (httpeceuropaeu) or by sending a fax to +352 2929-42758
European Environment AgencyKongens Nytorv 61050 Copenhagen KDenmark
Tel +45 33 36 71 00Fax +45 33 36 71 99
Web eeaeuropaeuEnquiries eeaeuropaeuenquiries
TH
-AK-1
1-0
17-E
N-N
doi1
02
8008
4889
- Acknowledgements
- Executive summary
- 1Introduction
-
- 11Background
- 12ETR and innovation
- 13Report structure
-
- 2Review of literature on environmental tax reform and eco‑innovation
-
- 21Initial screening
- 22Detailed review
- 23Environmental regulation studies
- 24Theoretical studies
- 25Empirical studies
- 26Case studies
- 27Conclusions
-
- 3Modelling of ETR impacts on eco‑innovation
-
- 31Scenarios assessing the implications of ETR for eco-innovation
- 32Overview of modelling results
- 33Macroeconomic impacts at the national level
- 34Conclusions of the scenario assessment
-
- References
- Annex 1 Classification of refereed journal articles
- Annex 2Classification of books and book chapters
- Annex 3Classification of reports
-
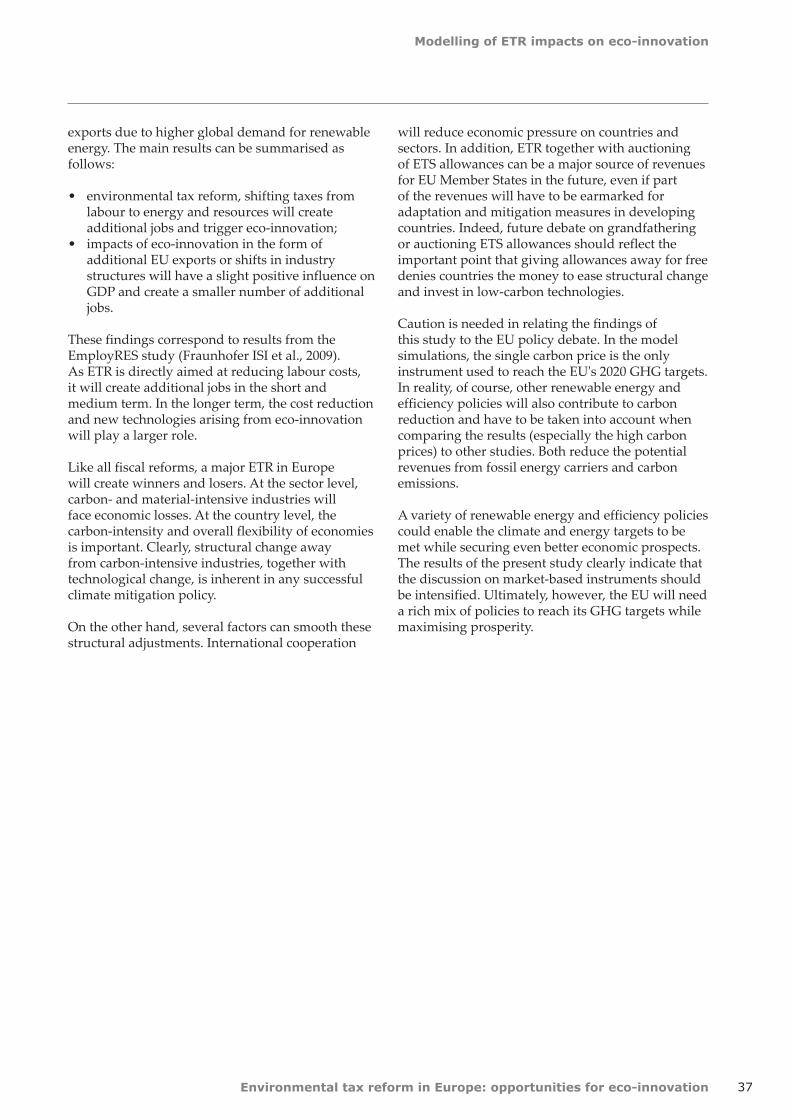
References
Environmental tax reform in Europe opportunities for eco-innovation 39
Fagerberg J Mowery D C and Nelson R R (eds) 2005 The Oxford Handbook of Innovation Oxford University Press Oxford
Fischer C Parry I W H and Pizer W A 2003 Instrument choice for environmental protection when technological innovation is endogenous Journal of Environmental Economics and Management Vol 45 pp 523ndash545
Fraunhofer ISI ECOFYS Energy Economics Group Ruumltter + Partner SEURECO and LEI 2009 EmployRES mdash The impact of renewable energy policy on economic growth and employment in the European Union European Commission Brussels
Frondel M Horbach J and Rennings K 2008 What triggers environmental management and innovation Empirical evidence for Germany Ecological Economics Vol 66(1) pp 153ndash160
GHK Cambridge Econometrics and IEEP 2007 Links between the environment economy and jobs Final Report submitted to DG Environment European Commission
Giljum S Behrens A Hinterberger F Lutz C and Meyer B 2008 Modelling scenarios towards a sustainable use of natural resources in Europe Environmental Science and Policy Vol 11 pp 204ndash216
Goumlrlach B Knigge M and Luumlckge H 2005 Wirkungen der Oumlkologischen Steuerreform auf Innovation und Marktdurchdringung Ecologic Berlin (httpecologiceudownloadprojekte1850-189918791879_5_innovationpdf) accessed 18 August 2011
Green M A 2000 Photovoltaics technology overview Energy Policy Vol 28 (14) pp 989ndash998
Grossmann A Lehr U Lutz C and Wolter MI 2008 Gesamtwirtschaftliche Effekte der Umsetzung der EU Ziele im Bereich Erneuerbare Energien und Gebaumludeeffizienz in Oumlsterreich bis 2020 Studie im Auftrag des Lebensministeriums Wien 0508
Hage J and Hollingsworth J R 2000 Idea innovation networks a strategy for integrating organizational and institutional analysis Organization Studies Vol 21 (5) pp 971ndash1 004
Hauschildt J 2004 Innovationsmanagement Vahlen Muumlnchen
Hemmelskamp J 1997 Environmental policy instruments and their effects on innovation European Planning Studies Vol 5 (2) pp 177ndash195
Hoglund Isaksson L 2005 Abatement costs in response to the Swedish charge on nitrogen oxide emissions Journal of Environmental Economics and Management Vol 50 pp 102ndash120
Hullmann A 2001 Internationaler Wissenstransfer und technischer Wandel (dissertation) Physica-Verlag Heidelberg
IEA 2008 World Energy Outlook 2008 International Energy Agency Paris
IEA 2009 World Energy Outlook 2009 International Energy Agency Paris
Jacobsson S Andersson B A and Baringngens L 2002 Transforming the energy system mdash the evolution of the German technological system for solar cells Science and Technology Policy Research University of Sussex Electronic Working Paper Series No 84 (httpideasrepecorgpsrussewps84html) accessed 18 August 2011
Jaffe A and Stavins R 1995 Dynamic incentives of environmental regulations the effects of alternative policy instruments on technology diffusion Journal of Environmental Economics and Management Vol 29(3) pp 43ndash63
Jaffe A B and Palmer K 1997 Environmental regulation and innovation a panel data study The Review of Economics and Statistics Vol 79 pp 610ndash619
Jaffe A B Newell R G and Stavins R N 2002 Environmental policy and technological change Environmental and Resource Economics Vol 22 (1ndash2) 2002 pp 41ndash70
Johnstone N and Hascic I 2008 Renewable energy policies and technological innovation energy source and instrument choice in Environmental Policy Technological Innovation and PatentsOrganisation for Economic Co-operation and Development Paris
Johnstone N 2005 The Innovation Effects of Environmental Policy Instruments in Horbach J (ed) Indicator Systems for Sustainable Innovation Physica-Verlag HD
Environmental tax reform in Europe opportunities for eco-innovation
References
40
Johnstone N Hascic I and Ostertag K 2008 Environmental policy technological innovation and patent activity in Environmental Policy Technological Innovation and Patents Organisation for Economic Co-operation and Development Paris
Jung C Krutilla K and Boyd R 1996 Incentives for advanced pollution abatement technology at the industry level an evaluation of policy alternatives Journal of Environmental Economics and Management Vol 30(1) pp 95ndash111
Kammen D M Kapidia K and Fripp M 2004 Putting renewables to work how many jobs can the clean energy industry generate University of California Berkeley
Kemp R 1997 Environmental policy and technical change ndash a comparison of the technological impact of policy instruments Edward Elgar Cheltenham
Kemp R 1998 The diffusion of biological waste-water treatment plants in the Dutch food and beverage industry Environmental and Resource Economics Vol 12 pp 113ndash136
Kemp R 2000 Technology and environmental policy ndash innovation effects of past policies and suggestions for improvement in OECD proceedings ndash innovation and the environment Organisation for Economic Co-operation and Development Paris
Kerr S and Newell R G 2003 Policy-induced technology adoption evidence from the US lead phasedown Journal of Industrial Economics Vol 51 pp 317ndash343
Klaassen G Miketa A Larsen K and Sundqvist T 2005 The impact of RampD on innovation for wind energy in Denmark Germany and the United Kingdom Ecological Economics Vol 54 pp 227ndash240
Kline S and Rosenberg N 1986 An overview of innovation in Landau R (ed) The positive sum strategy Harnessing technology for economic growth pp 275-306
Knigge M and Goumlrlach B 2005 Effects of Germanys ecological tax reforms on the environment employment and technological innovation Ecologic Berlin (httpwwwumweltbundesamtdeuba-info-presse-ehintergrundoekosteuerpdf) accessed 18 August 2011
Langniss O 2003 Governance structures for promoting renewable energy sources dissertation Lund Stuttgart
Lanjouw J O and Mody A 1996 Innovation and the international diffusion of environmentally responsive technology Research Policy Vol 25 pp 549ndash571
Lehr U Nitsch J Kratzat M Lutz C and Edler D 2008 Renewable Energy and Employment in Germany Energy Policy Vol 36 pp 108ndash117 DOI101016jenpol200709004
Lehr U Wolter MI and Groszligmann A 2009 Economic impacts of RES obligations in Austria ndash an application of the macro-econometric model e3at GWS Discussion Paper 20091 Osnabruumlck
Lundvall B-A Johnson B Andersen E S and Dalum B 2001 National systems of production innovation and competence building Research Policy Vol 31 pp 213ndash231
Lutz C and Giljum S 2009 Global resource use in a business as usual world until 2030 Updated results from the GINFORS model in Bleischwitz R Welfens Pand Zhang Z (eds) Sustainable growth and resource productivity ndash economic and global policy issues Greenleaf Publishers pp 30ndash41
Lutz C and Meyer B 2008 Beschaumlftigungseffekte des Klimaschutzes in Deutschland Untersuchungen zu gesamtwirtschaftlichen Auswirkungen ausgewaumlhlter Maszlignahmen des Energie- und Klimapakets Forschungsbericht 205 46 434 Dessau-Roszliglau
Lutz C and Meyer B 2009a Environmental and Economic Effects of Post-Kyoto Carbon Regimes Results of Simulations with the Global Model GINFORS Energy Policy Vol 37 pp 1 758ndash1 766 DOI 101016jenpol200901015
Lutz C and Meyer B 2009b Scenario results from GINFORS PETRE working paper Osnabruumlck
Lutz C Meyer B Nathani C and Schleich J 2005 Endogenous technological change and emissions The case of the German steel industry Energy Policy Vol33 pp 1 143ndash1 154
Lutz C Meyer B Nathani C and Schleich J 2007 Endogenous innovation economy and environment impacts of a technology based modelling approach for energy-intensive industries in Germany Energy Studies Review Vol 15(1) pp 2ndash18
References
Environmental tax reform in Europe opportunities for eco-innovation 41
Lutz C Meyer B and Wolter M I 2009 The global multisectormulticountry 3-E model GINFORS mdash a description of the model and a baseline forecast for global energy demand and CO2 emissions Journal of Sustainable Development forthcoming
Malerba F and Orsenigo L 1997 Technological Regimes and Sectoral Patterns of Innovative Activities Industrial and Corporate Change Vol 6 (1) pp 83ndash117
Malerba F 1992 Learning by Firms and Incremental Technical Change The Economic Journal Vol 102 (413) pp 845ndash859
Malerba F 2005 Industrial dynamics and innovation progress and challenges Presidential Address delivered at the 32nd Conference of the European Association for Research in Industrial Economics (EARIE) 1ndash4 September 2005 Porto
Malerba F 2006 Innovation and the evolution of industries Journal of Evolutionary Economics Vol 16 pp 3ndash23
McGinty M and de Vries F P 2009 Technology diffusion product differentiation and environmental subsidies The BE Journal of Economic Analysis and Policy Vol 9(1)
Meyer B and Lutz C 2007 The GINFORS model ndash model overview and evaluation Petre Working Paper Osnabruumlck (httpwwwpetreorgukpapershtm) accessed 18 August 2011
Meyer B Lutz C Schnur P and Zika G 2007 Economic policy simulations with global interdependencies a sensitivity analysis for Germany Economic Systems Research Vol 19 pp 37ndash55
Mickwitz P H Hyvaumlttinen and P Kivimaa 2008 The role of policy instruments in the innovation and diffusion of environmentally friendlier technologies popular claims versus case study experiences Journal of Cleaner Production Vol 16(1S1) 162ndash170
Miketa A and Schrattenholzer L 2004 Experiments with a methodology to model the role of RampD expenditures in energy technology learning processes first results Energy Policy Vol 32 (15) pp 1 679ndash1 692
Milliman S R and Prince R 1989 Firm incentives to promote technological change in pollution control Journal of Environmental Economics and Management Vol 17 pp 247ndash265
Millock K and Nauges C 2006 Ex-post evaluation of an earmarked tax on air pollution Land Economics Vol 82(1) pp 68ndash84
Montero J-P 2002 Market structure and environmental innovation Journal of Applied Economics Vol 2 pp 293ndash325
Moreno B and Loacutepez A J 2007 The effect of renewable energy on employment mdash The case of Asturias (Spain) Renewable and Sustainable Energy Rewiews doi 101016jrser200610011
Mowery D and Rosenberg N 1979 The influence of market demand upon innovation A critical review of some recent empirical studies Research Policy Vol 8 pp 102ndash153
Newell R G Jaffe A B and Stavins R N 1999 The induced innovation hypothesis and energy-saving technological change Quarterly Journal of Economics Vol 114 pp 941ndash975
Norberg-Bohm V 1999 Stimulating green technological innovation An analysis of alternative policy mechanisms Policy Sciences Vol 32(1) pp 13ndash38
OECD 2009 Sustainable manufacturing and eco-innovation towards a green economy Organisation for Economic Co-operation and Development Policy Brief June 2009
OECD 2010 Taxation innovation and the environment Organisation for Economic Co-operation and Development
Pavitt K 1984 Sectoral patterns of technological change Towards a taxonomy and a theory Research Policy Vol 13 pp 343ndash373
Popp D 2002 Induced innovation and energy prices The American Economic Review Vol 92(1) pp 160ndash180
Popp D 2005 Lessons from patents Using patents to measure technological change in environmental models Ecological Economics Vol 54 pp 209ndash226
Environmental tax reform in Europe opportunities for eco-innovation
References
42
Porter M and van der Linde C 1995 Toward a new conception of the environment competitiveness relationship Journal of Economic Perspectives Vol 9(4) pp 97ndash118
Rammert W 2002 The cultural shaping of technologies and the politics of technodiversity In Sorensen K and Williams R (eds) Shaping technology guiding policy concepts spaces and tools Elgar Cheltenham pp 155-172
Requate T 2005 Dynamic incentives by environmental policy instruments ndash a survey Ecological Economics Vol 54 pp 175ndash195
Roloff N Lehr U Krewitt W Fuchs G Wassermann S Weimer-Jehle W and Schmidt B 2008 Success determinants for technological innovations in the energy sector mdash the case of photovoltaics in Moumlst D Fichtner W Ragwitz M and Veit D (eds) New methods for energy market modelling mdash Proceedings of the first european workshop on energy market modelling using agent-based computational economics Universitaumltsverlag Karlsruhe
Rothwell R 1995 The fifth generation innovation process in Oppenlaumlnder KH Popp W (eds) Innovationen und wirtschaftlicher Fortschritt betriebs-und volkswirtschaftliche Perspektiven Bern pp 9ndash26
Schumpeter J 1942 Capitalism socialism and democracy New York Harper
Skjaeligrseth J B and Christiansen A C 2005 Environmental policy instruments and technological change in the energy sector findings from comparative empirical research Energy and Environment Vol 17 (2) pp 223ndash241
Snyder L D Miller N H and Stavins R N 2003 The effects of environmental regulations on pollution emissions evidence from plant-level data American Economic Review Vol 93(2) pp 431ndash435
Technopolis 2008 Eco-innovation Final Report for Sectoral Innovation Watch (httpwwwtechnopolis-groupcomresourcesdownloads661_report_finalpdf) accessed 18 August 2011
Volleburgh H 2007 Impacts of environmental policy instruments on technological change Report for Joint Meetings of Tax and Environment Experts OECD Environment Directorate February 2007 (comenvepocctpacfa(2006)36final)
Zimmermann H Wohltmann M and Hansjuumlrgens B 1996 Umweltabgaben und Innovation Analytica Marburg
43
Annex 1
Environmental tax reform in Europe opportunities for eco-innovation
Type Instrument Area Stage
Reference
Theo
retica
l
Em
piric
al
Cas
e st
udy
Rev
iew
Qual
itat
ive
Taxe
s
Perm
its
Subsi
die
s
Volu
nta
ry
Com
man
d
Reg
ula
tion
Ener
gy
Air
Wat
er
Oth
er
Gen
eral
Innov
atio
n
Diffu
sion
Rel
evan
ce
Brunnermeier amp Cohen (2003)
X X X X
Buen (2006) X X X X X X
Christiansen amp Skjaerseth (2005)
X X X X X X
Fischer et al (2003 X X X X X X
Frondel et al (2008) X X X X X X X (X) (X)
Hemmelskamp (1997)
X X X X X X X (X)
Hoglund Isaksson (2005)
X X X (X) (X)
Jaffe amp Stavins (1995)
X X X1 X X X X
Jaffe amp Palmer (1997)
X X X X
Jaffe et al (2002) X X X X X X X X X X
Jung et al (1996) X X X X X X (X) (X)
Kemp (1998) X X X X
Kerr amp Newell (2001) X X X X X
Klaassen et al (2005)
X X X X X
Lanjouw amp Mody (1996)
X X X X X X X
McGinty amp de Vries (2009)
X X X X
Mickwitz et al (2008)
X X X X X X X X X
Milliman amp Prince (1989)
X X X X X X X
Millock amp Nauges (2006)
X X X X X X
Montero (2002) X X X X X
Newell et al (1999) X X1 X X X
Norberg-Bohm (1999)
X X X X X X X
Popp (2002) X X1 X X
Popp (2005) X X X X X X
Porter amp van der Linde (1995)
X X X X X X
Requate (2005) X X X X X X X
Skjaeligrseth amp Christiansen (2005)
X X X X X X X X X
Snyder et al (2003) X X X X X
Annex 1 Classification of refereed journal articles
Environmental tax reform in Europe opportunities for eco-innovation44
Annex 2
Type Instrument Area Stage
Reference
Theo
retica
l
Em
piric
al
Cas
e st
udy
Rev
iew
Qual
itat
ive
Taxe
s
Perm
its
Subsi
die
s
Volu
nta
ry
Com
man
d
Reg
ula
tion
Ener
gy
Air
Wat
er
Oth
er
Gen
eral
Innov
atio
n
Diffu
sion
Rel
evan
ce
Johnstone (2005)
X X X X X X X
Johnstone amp Hascic (2008)
X X X X X X X X
Kemp (1997) X X X X X X X X X X X X X
Kemp (2000) X X X X X X X X X
de Vries amp Medhi (2008)
X X1 X X X
Annex 2 Classification of books and book chapters
45
Annex 3
Environmental tax reform in Europe opportunities for eco-innovation
Type Instrument Area Stage
Reference
Theo
retica
l
Em
piric
al
Cas
e st
udy
Rev
iew
Qual
itat
ive
Taxe
s
Perm
its
Subsi
die
s
Volu
nta
ry
Com
man
d
Reg
ula
tion
Ener
gy
Air
Wat
er
Oth
er
Gen
eral
Innov
atio
n
Diffu
sion
Rel
evan
ce
Goumlrlach et al (2005)
X X X X X X
Knigge amp Goumlrlach (2005)
X X X X X X
Technopolis (2008)
X X X X X X
Volleburgh (2007)
X X X X X X X X X X X
Annex 3 Classification of reports
European Environment Agency
Environmental tax reform in Europe opportunities for eco-innovation
2011 mdash 45 pp mdash 21 x 297 cm
ISBN 978-92-9213-238-5doi10280084889
How to obtain EU publications
Publications for salebull viaEUBookshop(httpbookshopeuropaeu)bull fromyourbooksellerbyquotingthetitlethepublisherandorISBNnumberbull bycontactingoneofoursalesagentsdirectlyYoucanobtaintheircontactdetails
on the Internet (httpbookshopeuropaeu) or by sending a fax to +352 2929-42758
Free publicationsbull viaEUBookshop(httpbookshopeuropaeu)bull attheEuropeanCommissionsrepresentationsordelegationsYoucanobtain
their contact details on the Internet (httpeceuropaeu) or by sending a fax to +352 2929-42758
European Environment AgencyKongens Nytorv 61050 Copenhagen KDenmark
Tel +45 33 36 71 00Fax +45 33 36 71 99
Web eeaeuropaeuEnquiries eeaeuropaeuenquiries
TH
-AK-1
1-0
17-E
N-N
doi1
02
8008
4889
- Acknowledgements
- Executive summary
- 1Introduction
-
- 11Background
- 12ETR and innovation
- 13Report structure
-
- 2Review of literature on environmental tax reform and eco‑innovation
-
- 21Initial screening
- 22Detailed review
- 23Environmental regulation studies
- 24Theoretical studies
- 25Empirical studies
- 26Case studies
- 27Conclusions
-
- 3Modelling of ETR impacts on eco‑innovation
-
- 31Scenarios assessing the implications of ETR for eco-innovation
- 32Overview of modelling results
- 33Macroeconomic impacts at the national level
- 34Conclusions of the scenario assessment
-
- References
- Annex 1 Classification of refereed journal articles
- Annex 2Classification of books and book chapters
- Annex 3Classification of reports
-
Environmental tax reform in Europe opportunities for eco-innovation
References
40
Johnstone N Hascic I and Ostertag K 2008 Environmental policy technological innovation and patent activity in Environmental Policy Technological Innovation and Patents Organisation for Economic Co-operation and Development Paris
Jung C Krutilla K and Boyd R 1996 Incentives for advanced pollution abatement technology at the industry level an evaluation of policy alternatives Journal of Environmental Economics and Management Vol 30(1) pp 95ndash111
Kammen D M Kapidia K and Fripp M 2004 Putting renewables to work how many jobs can the clean energy industry generate University of California Berkeley
Kemp R 1997 Environmental policy and technical change ndash a comparison of the technological impact of policy instruments Edward Elgar Cheltenham
Kemp R 1998 The diffusion of biological waste-water treatment plants in the Dutch food and beverage industry Environmental and Resource Economics Vol 12 pp 113ndash136
Kemp R 2000 Technology and environmental policy ndash innovation effects of past policies and suggestions for improvement in OECD proceedings ndash innovation and the environment Organisation for Economic Co-operation and Development Paris
Kerr S and Newell R G 2003 Policy-induced technology adoption evidence from the US lead phasedown Journal of Industrial Economics Vol 51 pp 317ndash343
Klaassen G Miketa A Larsen K and Sundqvist T 2005 The impact of RampD on innovation for wind energy in Denmark Germany and the United Kingdom Ecological Economics Vol 54 pp 227ndash240
Kline S and Rosenberg N 1986 An overview of innovation in Landau R (ed) The positive sum strategy Harnessing technology for economic growth pp 275-306
Knigge M and Goumlrlach B 2005 Effects of Germanys ecological tax reforms on the environment employment and technological innovation Ecologic Berlin (httpwwwumweltbundesamtdeuba-info-presse-ehintergrundoekosteuerpdf) accessed 18 August 2011
Langniss O 2003 Governance structures for promoting renewable energy sources dissertation Lund Stuttgart
Lanjouw J O and Mody A 1996 Innovation and the international diffusion of environmentally responsive technology Research Policy Vol 25 pp 549ndash571
Lehr U Nitsch J Kratzat M Lutz C and Edler D 2008 Renewable Energy and Employment in Germany Energy Policy Vol 36 pp 108ndash117 DOI101016jenpol200709004
Lehr U Wolter MI and Groszligmann A 2009 Economic impacts of RES obligations in Austria ndash an application of the macro-econometric model e3at GWS Discussion Paper 20091 Osnabruumlck
Lundvall B-A Johnson B Andersen E S and Dalum B 2001 National systems of production innovation and competence building Research Policy Vol 31 pp 213ndash231
Lutz C and Giljum S 2009 Global resource use in a business as usual world until 2030 Updated results from the GINFORS model in Bleischwitz R Welfens Pand Zhang Z (eds) Sustainable growth and resource productivity ndash economic and global policy issues Greenleaf Publishers pp 30ndash41
Lutz C and Meyer B 2008 Beschaumlftigungseffekte des Klimaschutzes in Deutschland Untersuchungen zu gesamtwirtschaftlichen Auswirkungen ausgewaumlhlter Maszlignahmen des Energie- und Klimapakets Forschungsbericht 205 46 434 Dessau-Roszliglau
Lutz C and Meyer B 2009a Environmental and Economic Effects of Post-Kyoto Carbon Regimes Results of Simulations with the Global Model GINFORS Energy Policy Vol 37 pp 1 758ndash1 766 DOI 101016jenpol200901015
Lutz C and Meyer B 2009b Scenario results from GINFORS PETRE working paper Osnabruumlck
Lutz C Meyer B Nathani C and Schleich J 2005 Endogenous technological change and emissions The case of the German steel industry Energy Policy Vol33 pp 1 143ndash1 154
Lutz C Meyer B Nathani C and Schleich J 2007 Endogenous innovation economy and environment impacts of a technology based modelling approach for energy-intensive industries in Germany Energy Studies Review Vol 15(1) pp 2ndash18
References
Environmental tax reform in Europe opportunities for eco-innovation 41
Lutz C Meyer B and Wolter M I 2009 The global multisectormulticountry 3-E model GINFORS mdash a description of the model and a baseline forecast for global energy demand and CO2 emissions Journal of Sustainable Development forthcoming
Malerba F and Orsenigo L 1997 Technological Regimes and Sectoral Patterns of Innovative Activities Industrial and Corporate Change Vol 6 (1) pp 83ndash117
Malerba F 1992 Learning by Firms and Incremental Technical Change The Economic Journal Vol 102 (413) pp 845ndash859
Malerba F 2005 Industrial dynamics and innovation progress and challenges Presidential Address delivered at the 32nd Conference of the European Association for Research in Industrial Economics (EARIE) 1ndash4 September 2005 Porto
Malerba F 2006 Innovation and the evolution of industries Journal of Evolutionary Economics Vol 16 pp 3ndash23
McGinty M and de Vries F P 2009 Technology diffusion product differentiation and environmental subsidies The BE Journal of Economic Analysis and Policy Vol 9(1)
Meyer B and Lutz C 2007 The GINFORS model ndash model overview and evaluation Petre Working Paper Osnabruumlck (httpwwwpetreorgukpapershtm) accessed 18 August 2011
Meyer B Lutz C Schnur P and Zika G 2007 Economic policy simulations with global interdependencies a sensitivity analysis for Germany Economic Systems Research Vol 19 pp 37ndash55
Mickwitz P H Hyvaumlttinen and P Kivimaa 2008 The role of policy instruments in the innovation and diffusion of environmentally friendlier technologies popular claims versus case study experiences Journal of Cleaner Production Vol 16(1S1) 162ndash170
Miketa A and Schrattenholzer L 2004 Experiments with a methodology to model the role of RampD expenditures in energy technology learning processes first results Energy Policy Vol 32 (15) pp 1 679ndash1 692
Milliman S R and Prince R 1989 Firm incentives to promote technological change in pollution control Journal of Environmental Economics and Management Vol 17 pp 247ndash265
Millock K and Nauges C 2006 Ex-post evaluation of an earmarked tax on air pollution Land Economics Vol 82(1) pp 68ndash84
Montero J-P 2002 Market structure and environmental innovation Journal of Applied Economics Vol 2 pp 293ndash325
Moreno B and Loacutepez A J 2007 The effect of renewable energy on employment mdash The case of Asturias (Spain) Renewable and Sustainable Energy Rewiews doi 101016jrser200610011
Mowery D and Rosenberg N 1979 The influence of market demand upon innovation A critical review of some recent empirical studies Research Policy Vol 8 pp 102ndash153
Newell R G Jaffe A B and Stavins R N 1999 The induced innovation hypothesis and energy-saving technological change Quarterly Journal of Economics Vol 114 pp 941ndash975
Norberg-Bohm V 1999 Stimulating green technological innovation An analysis of alternative policy mechanisms Policy Sciences Vol 32(1) pp 13ndash38
OECD 2009 Sustainable manufacturing and eco-innovation towards a green economy Organisation for Economic Co-operation and Development Policy Brief June 2009
OECD 2010 Taxation innovation and the environment Organisation for Economic Co-operation and Development
Pavitt K 1984 Sectoral patterns of technological change Towards a taxonomy and a theory Research Policy Vol 13 pp 343ndash373
Popp D 2002 Induced innovation and energy prices The American Economic Review Vol 92(1) pp 160ndash180
Popp D 2005 Lessons from patents Using patents to measure technological change in environmental models Ecological Economics Vol 54 pp 209ndash226
Environmental tax reform in Europe opportunities for eco-innovation
References
42
Porter M and van der Linde C 1995 Toward a new conception of the environment competitiveness relationship Journal of Economic Perspectives Vol 9(4) pp 97ndash118
Rammert W 2002 The cultural shaping of technologies and the politics of technodiversity In Sorensen K and Williams R (eds) Shaping technology guiding policy concepts spaces and tools Elgar Cheltenham pp 155-172
Requate T 2005 Dynamic incentives by environmental policy instruments ndash a survey Ecological Economics Vol 54 pp 175ndash195
Roloff N Lehr U Krewitt W Fuchs G Wassermann S Weimer-Jehle W and Schmidt B 2008 Success determinants for technological innovations in the energy sector mdash the case of photovoltaics in Moumlst D Fichtner W Ragwitz M and Veit D (eds) New methods for energy market modelling mdash Proceedings of the first european workshop on energy market modelling using agent-based computational economics Universitaumltsverlag Karlsruhe
Rothwell R 1995 The fifth generation innovation process in Oppenlaumlnder KH Popp W (eds) Innovationen und wirtschaftlicher Fortschritt betriebs-und volkswirtschaftliche Perspektiven Bern pp 9ndash26
Schumpeter J 1942 Capitalism socialism and democracy New York Harper
Skjaeligrseth J B and Christiansen A C 2005 Environmental policy instruments and technological change in the energy sector findings from comparative empirical research Energy and Environment Vol 17 (2) pp 223ndash241
Snyder L D Miller N H and Stavins R N 2003 The effects of environmental regulations on pollution emissions evidence from plant-level data American Economic Review Vol 93(2) pp 431ndash435
Technopolis 2008 Eco-innovation Final Report for Sectoral Innovation Watch (httpwwwtechnopolis-groupcomresourcesdownloads661_report_finalpdf) accessed 18 August 2011
Volleburgh H 2007 Impacts of environmental policy instruments on technological change Report for Joint Meetings of Tax and Environment Experts OECD Environment Directorate February 2007 (comenvepocctpacfa(2006)36final)
Zimmermann H Wohltmann M and Hansjuumlrgens B 1996 Umweltabgaben und Innovation Analytica Marburg
43
Annex 1
Environmental tax reform in Europe opportunities for eco-innovation
Type Instrument Area Stage
Reference
Theo
retica
l
Em
piric
al
Cas
e st
udy
Rev
iew
Qual
itat
ive
Taxe
s
Perm
its
Subsi
die
s
Volu
nta
ry
Com
man
d
Reg
ula
tion
Ener
gy
Air
Wat
er
Oth
er
Gen
eral
Innov
atio
n
Diffu
sion
Rel
evan
ce
Brunnermeier amp Cohen (2003)
X X X X
Buen (2006) X X X X X X
Christiansen amp Skjaerseth (2005)
X X X X X X
Fischer et al (2003 X X X X X X
Frondel et al (2008) X X X X X X X (X) (X)
Hemmelskamp (1997)
X X X X X X X (X)
Hoglund Isaksson (2005)
X X X (X) (X)
Jaffe amp Stavins (1995)
X X X1 X X X X
Jaffe amp Palmer (1997)
X X X X
Jaffe et al (2002) X X X X X X X X X X
Jung et al (1996) X X X X X X (X) (X)
Kemp (1998) X X X X
Kerr amp Newell (2001) X X X X X
Klaassen et al (2005)
X X X X X
Lanjouw amp Mody (1996)
X X X X X X X
McGinty amp de Vries (2009)
X X X X
Mickwitz et al (2008)
X X X X X X X X X
Milliman amp Prince (1989)
X X X X X X X
Millock amp Nauges (2006)
X X X X X X
Montero (2002) X X X X X
Newell et al (1999) X X1 X X X
Norberg-Bohm (1999)
X X X X X X X
Popp (2002) X X1 X X
Popp (2005) X X X X X X
Porter amp van der Linde (1995)
X X X X X X
Requate (2005) X X X X X X X
Skjaeligrseth amp Christiansen (2005)
X X X X X X X X X
Snyder et al (2003) X X X X X
Annex 1 Classification of refereed journal articles
Environmental tax reform in Europe opportunities for eco-innovation44
Annex 2
Type Instrument Area Stage
Reference
Theo
retica
l
Em
piric
al
Cas
e st
udy
Rev
iew
Qual
itat
ive
Taxe
s
Perm
its
Subsi
die
s
Volu
nta
ry
Com
man
d
Reg
ula
tion
Ener
gy
Air
Wat
er
Oth
er
Gen
eral
Innov
atio
n
Diffu
sion
Rel
evan
ce
Johnstone (2005)
X X X X X X X
Johnstone amp Hascic (2008)
X X X X X X X X
Kemp (1997) X X X X X X X X X X X X X
Kemp (2000) X X X X X X X X X
de Vries amp Medhi (2008)
X X1 X X X
Annex 2 Classification of books and book chapters
45
Annex 3
Environmental tax reform in Europe opportunities for eco-innovation
Type Instrument Area Stage
Reference
Theo
retica
l
Em
piric
al
Cas
e st
udy
Rev
iew
Qual
itat
ive
Taxe
s
Perm
its
Subsi
die
s
Volu
nta
ry
Com
man
d
Reg
ula
tion
Ener
gy
Air
Wat
er
Oth
er
Gen
eral
Innov
atio
n
Diffu
sion
Rel
evan
ce
Goumlrlach et al (2005)
X X X X X X
Knigge amp Goumlrlach (2005)
X X X X X X
Technopolis (2008)
X X X X X X
Volleburgh (2007)
X X X X X X X X X X X
Annex 3 Classification of reports
European Environment Agency
Environmental tax reform in Europe opportunities for eco-innovation
2011 mdash 45 pp mdash 21 x 297 cm
ISBN 978-92-9213-238-5doi10280084889
How to obtain EU publications
Publications for salebull viaEUBookshop(httpbookshopeuropaeu)bull fromyourbooksellerbyquotingthetitlethepublisherandorISBNnumberbull bycontactingoneofoursalesagentsdirectlyYoucanobtaintheircontactdetails
on the Internet (httpbookshopeuropaeu) or by sending a fax to +352 2929-42758
Free publicationsbull viaEUBookshop(httpbookshopeuropaeu)bull attheEuropeanCommissionsrepresentationsordelegationsYoucanobtain
their contact details on the Internet (httpeceuropaeu) or by sending a fax to +352 2929-42758
European Environment AgencyKongens Nytorv 61050 Copenhagen KDenmark
Tel +45 33 36 71 00Fax +45 33 36 71 99
Web eeaeuropaeuEnquiries eeaeuropaeuenquiries
TH
-AK-1
1-0
17-E
N-N
doi1
02
8008
4889
- Acknowledgements
- Executive summary
- 1Introduction
-
- 11Background
- 12ETR and innovation
- 13Report structure
-
- 2Review of literature on environmental tax reform and eco‑innovation
-
- 21Initial screening
- 22Detailed review
- 23Environmental regulation studies
- 24Theoretical studies
- 25Empirical studies
- 26Case studies
- 27Conclusions
-
- 3Modelling of ETR impacts on eco‑innovation
-
- 31Scenarios assessing the implications of ETR for eco-innovation
- 32Overview of modelling results
- 33Macroeconomic impacts at the national level
- 34Conclusions of the scenario assessment
-
- References
- Annex 1 Classification of refereed journal articles
- Annex 2Classification of books and book chapters
- Annex 3Classification of reports
-
References
Environmental tax reform in Europe opportunities for eco-innovation 41
Lutz C Meyer B and Wolter M I 2009 The global multisectormulticountry 3-E model GINFORS mdash a description of the model and a baseline forecast for global energy demand and CO2 emissions Journal of Sustainable Development forthcoming
Malerba F and Orsenigo L 1997 Technological Regimes and Sectoral Patterns of Innovative Activities Industrial and Corporate Change Vol 6 (1) pp 83ndash117
Malerba F 1992 Learning by Firms and Incremental Technical Change The Economic Journal Vol 102 (413) pp 845ndash859
Malerba F 2005 Industrial dynamics and innovation progress and challenges Presidential Address delivered at the 32nd Conference of the European Association for Research in Industrial Economics (EARIE) 1ndash4 September 2005 Porto
Malerba F 2006 Innovation and the evolution of industries Journal of Evolutionary Economics Vol 16 pp 3ndash23
McGinty M and de Vries F P 2009 Technology diffusion product differentiation and environmental subsidies The BE Journal of Economic Analysis and Policy Vol 9(1)
Meyer B and Lutz C 2007 The GINFORS model ndash model overview and evaluation Petre Working Paper Osnabruumlck (httpwwwpetreorgukpapershtm) accessed 18 August 2011
Meyer B Lutz C Schnur P and Zika G 2007 Economic policy simulations with global interdependencies a sensitivity analysis for Germany Economic Systems Research Vol 19 pp 37ndash55
Mickwitz P H Hyvaumlttinen and P Kivimaa 2008 The role of policy instruments in the innovation and diffusion of environmentally friendlier technologies popular claims versus case study experiences Journal of Cleaner Production Vol 16(1S1) 162ndash170
Miketa A and Schrattenholzer L 2004 Experiments with a methodology to model the role of RampD expenditures in energy technology learning processes first results Energy Policy Vol 32 (15) pp 1 679ndash1 692
Milliman S R and Prince R 1989 Firm incentives to promote technological change in pollution control Journal of Environmental Economics and Management Vol 17 pp 247ndash265
Millock K and Nauges C 2006 Ex-post evaluation of an earmarked tax on air pollution Land Economics Vol 82(1) pp 68ndash84
Montero J-P 2002 Market structure and environmental innovation Journal of Applied Economics Vol 2 pp 293ndash325
Moreno B and Loacutepez A J 2007 The effect of renewable energy on employment mdash The case of Asturias (Spain) Renewable and Sustainable Energy Rewiews doi 101016jrser200610011
Mowery D and Rosenberg N 1979 The influence of market demand upon innovation A critical review of some recent empirical studies Research Policy Vol 8 pp 102ndash153
Newell R G Jaffe A B and Stavins R N 1999 The induced innovation hypothesis and energy-saving technological change Quarterly Journal of Economics Vol 114 pp 941ndash975
Norberg-Bohm V 1999 Stimulating green technological innovation An analysis of alternative policy mechanisms Policy Sciences Vol 32(1) pp 13ndash38
OECD 2009 Sustainable manufacturing and eco-innovation towards a green economy Organisation for Economic Co-operation and Development Policy Brief June 2009
OECD 2010 Taxation innovation and the environment Organisation for Economic Co-operation and Development
Pavitt K 1984 Sectoral patterns of technological change Towards a taxonomy and a theory Research Policy Vol 13 pp 343ndash373
Popp D 2002 Induced innovation and energy prices The American Economic Review Vol 92(1) pp 160ndash180
Popp D 2005 Lessons from patents Using patents to measure technological change in environmental models Ecological Economics Vol 54 pp 209ndash226
Environmental tax reform in Europe opportunities for eco-innovation
References
42
Porter M and van der Linde C 1995 Toward a new conception of the environment competitiveness relationship Journal of Economic Perspectives Vol 9(4) pp 97ndash118
Rammert W 2002 The cultural shaping of technologies and the politics of technodiversity In Sorensen K and Williams R (eds) Shaping technology guiding policy concepts spaces and tools Elgar Cheltenham pp 155-172
Requate T 2005 Dynamic incentives by environmental policy instruments ndash a survey Ecological Economics Vol 54 pp 175ndash195
Roloff N Lehr U Krewitt W Fuchs G Wassermann S Weimer-Jehle W and Schmidt B 2008 Success determinants for technological innovations in the energy sector mdash the case of photovoltaics in Moumlst D Fichtner W Ragwitz M and Veit D (eds) New methods for energy market modelling mdash Proceedings of the first european workshop on energy market modelling using agent-based computational economics Universitaumltsverlag Karlsruhe
Rothwell R 1995 The fifth generation innovation process in Oppenlaumlnder KH Popp W (eds) Innovationen und wirtschaftlicher Fortschritt betriebs-und volkswirtschaftliche Perspektiven Bern pp 9ndash26
Schumpeter J 1942 Capitalism socialism and democracy New York Harper
Skjaeligrseth J B and Christiansen A C 2005 Environmental policy instruments and technological change in the energy sector findings from comparative empirical research Energy and Environment Vol 17 (2) pp 223ndash241
Snyder L D Miller N H and Stavins R N 2003 The effects of environmental regulations on pollution emissions evidence from plant-level data American Economic Review Vol 93(2) pp 431ndash435
Technopolis 2008 Eco-innovation Final Report for Sectoral Innovation Watch (httpwwwtechnopolis-groupcomresourcesdownloads661_report_finalpdf) accessed 18 August 2011
Volleburgh H 2007 Impacts of environmental policy instruments on technological change Report for Joint Meetings of Tax and Environment Experts OECD Environment Directorate February 2007 (comenvepocctpacfa(2006)36final)
Zimmermann H Wohltmann M and Hansjuumlrgens B 1996 Umweltabgaben und Innovation Analytica Marburg
43
Annex 1
Environmental tax reform in Europe opportunities for eco-innovation
Type Instrument Area Stage
Reference
Theo
retica
l
Em
piric
al
Cas
e st
udy
Rev
iew
Qual
itat
ive
Taxe
s
Perm
its
Subsi
die
s
Volu
nta
ry
Com
man
d
Reg
ula
tion
Ener
gy
Air
Wat
er
Oth
er
Gen
eral
Innov
atio
n
Diffu
sion
Rel
evan
ce
Brunnermeier amp Cohen (2003)
X X X X
Buen (2006) X X X X X X
Christiansen amp Skjaerseth (2005)
X X X X X X
Fischer et al (2003 X X X X X X
Frondel et al (2008) X X X X X X X (X) (X)
Hemmelskamp (1997)
X X X X X X X (X)
Hoglund Isaksson (2005)
X X X (X) (X)
Jaffe amp Stavins (1995)
X X X1 X X X X
Jaffe amp Palmer (1997)
X X X X
Jaffe et al (2002) X X X X X X X X X X
Jung et al (1996) X X X X X X (X) (X)
Kemp (1998) X X X X
Kerr amp Newell (2001) X X X X X
Klaassen et al (2005)
X X X X X
Lanjouw amp Mody (1996)
X X X X X X X
McGinty amp de Vries (2009)
X X X X
Mickwitz et al (2008)
X X X X X X X X X
Milliman amp Prince (1989)
X X X X X X X
Millock amp Nauges (2006)
X X X X X X
Montero (2002) X X X X X
Newell et al (1999) X X1 X X X
Norberg-Bohm (1999)
X X X X X X X
Popp (2002) X X1 X X
Popp (2005) X X X X X X
Porter amp van der Linde (1995)
X X X X X X
Requate (2005) X X X X X X X
Skjaeligrseth amp Christiansen (2005)
X X X X X X X X X
Snyder et al (2003) X X X X X
Annex 1 Classification of refereed journal articles
Environmental tax reform in Europe opportunities for eco-innovation44
Annex 2
Type Instrument Area Stage
Reference
Theo
retica
l
Em
piric
al
Cas
e st
udy
Rev
iew
Qual
itat
ive
Taxe
s
Perm
its
Subsi
die
s
Volu
nta
ry
Com
man
d
Reg
ula
tion
Ener
gy
Air
Wat
er
Oth
er
Gen
eral
Innov
atio
n
Diffu
sion
Rel
evan
ce
Johnstone (2005)
X X X X X X X
Johnstone amp Hascic (2008)
X X X X X X X X
Kemp (1997) X X X X X X X X X X X X X
Kemp (2000) X X X X X X X X X
de Vries amp Medhi (2008)
X X1 X X X
Annex 2 Classification of books and book chapters
45
Annex 3
Environmental tax reform in Europe opportunities for eco-innovation
Type Instrument Area Stage
Reference
Theo
retica
l
Em
piric
al
Cas
e st
udy
Rev
iew
Qual
itat
ive
Taxe
s
Perm
its
Subsi
die
s
Volu
nta
ry
Com
man
d
Reg
ula
tion
Ener
gy
Air
Wat
er
Oth
er
Gen
eral
Innov
atio
n
Diffu
sion
Rel
evan
ce
Goumlrlach et al (2005)
X X X X X X
Knigge amp Goumlrlach (2005)
X X X X X X
Technopolis (2008)
X X X X X X
Volleburgh (2007)
X X X X X X X X X X X
Annex 3 Classification of reports
European Environment Agency
Environmental tax reform in Europe opportunities for eco-innovation
2011 mdash 45 pp mdash 21 x 297 cm
ISBN 978-92-9213-238-5doi10280084889
How to obtain EU publications
Publications for salebull viaEUBookshop(httpbookshopeuropaeu)bull fromyourbooksellerbyquotingthetitlethepublisherandorISBNnumberbull bycontactingoneofoursalesagentsdirectlyYoucanobtaintheircontactdetails
on the Internet (httpbookshopeuropaeu) or by sending a fax to +352 2929-42758
Free publicationsbull viaEUBookshop(httpbookshopeuropaeu)bull attheEuropeanCommissionsrepresentationsordelegationsYoucanobtain
their contact details on the Internet (httpeceuropaeu) or by sending a fax to +352 2929-42758
European Environment AgencyKongens Nytorv 61050 Copenhagen KDenmark
Tel +45 33 36 71 00Fax +45 33 36 71 99
Web eeaeuropaeuEnquiries eeaeuropaeuenquiries
TH
-AK-1
1-0
17-E
N-N
doi1
02
8008
4889
- Acknowledgements
- Executive summary
- 1Introduction
-
- 11Background
- 12ETR and innovation
- 13Report structure
-
- 2Review of literature on environmental tax reform and eco‑innovation
-
- 21Initial screening
- 22Detailed review
- 23Environmental regulation studies
- 24Theoretical studies
- 25Empirical studies
- 26Case studies
- 27Conclusions
-
- 3Modelling of ETR impacts on eco‑innovation
-
- 31Scenarios assessing the implications of ETR for eco-innovation
- 32Overview of modelling results
- 33Macroeconomic impacts at the national level
- 34Conclusions of the scenario assessment
-
- References
- Annex 1 Classification of refereed journal articles
- Annex 2Classification of books and book chapters
- Annex 3Classification of reports
-
Environmental tax reform in Europe opportunities for eco-innovation
References
42
Porter M and van der Linde C 1995 Toward a new conception of the environment competitiveness relationship Journal of Economic Perspectives Vol 9(4) pp 97ndash118
Rammert W 2002 The cultural shaping of technologies and the politics of technodiversity In Sorensen K and Williams R (eds) Shaping technology guiding policy concepts spaces and tools Elgar Cheltenham pp 155-172
Requate T 2005 Dynamic incentives by environmental policy instruments ndash a survey Ecological Economics Vol 54 pp 175ndash195
Roloff N Lehr U Krewitt W Fuchs G Wassermann S Weimer-Jehle W and Schmidt B 2008 Success determinants for technological innovations in the energy sector mdash the case of photovoltaics in Moumlst D Fichtner W Ragwitz M and Veit D (eds) New methods for energy market modelling mdash Proceedings of the first european workshop on energy market modelling using agent-based computational economics Universitaumltsverlag Karlsruhe
Rothwell R 1995 The fifth generation innovation process in Oppenlaumlnder KH Popp W (eds) Innovationen und wirtschaftlicher Fortschritt betriebs-und volkswirtschaftliche Perspektiven Bern pp 9ndash26
Schumpeter J 1942 Capitalism socialism and democracy New York Harper
Skjaeligrseth J B and Christiansen A C 2005 Environmental policy instruments and technological change in the energy sector findings from comparative empirical research Energy and Environment Vol 17 (2) pp 223ndash241
Snyder L D Miller N H and Stavins R N 2003 The effects of environmental regulations on pollution emissions evidence from plant-level data American Economic Review Vol 93(2) pp 431ndash435
Technopolis 2008 Eco-innovation Final Report for Sectoral Innovation Watch (httpwwwtechnopolis-groupcomresourcesdownloads661_report_finalpdf) accessed 18 August 2011
Volleburgh H 2007 Impacts of environmental policy instruments on technological change Report for Joint Meetings of Tax and Environment Experts OECD Environment Directorate February 2007 (comenvepocctpacfa(2006)36final)
Zimmermann H Wohltmann M and Hansjuumlrgens B 1996 Umweltabgaben und Innovation Analytica Marburg
43
Annex 1
Environmental tax reform in Europe opportunities for eco-innovation
Type Instrument Area Stage
Reference
Theo
retica
l
Em
piric
al
Cas
e st
udy
Rev
iew
Qual
itat
ive
Taxe
s
Perm
its
Subsi
die
s
Volu
nta
ry
Com
man
d
Reg
ula
tion
Ener
gy
Air
Wat
er
Oth
er
Gen
eral
Innov
atio
n
Diffu
sion
Rel
evan
ce
Brunnermeier amp Cohen (2003)
X X X X
Buen (2006) X X X X X X
Christiansen amp Skjaerseth (2005)
X X X X X X
Fischer et al (2003 X X X X X X
Frondel et al (2008) X X X X X X X (X) (X)
Hemmelskamp (1997)
X X X X X X X (X)
Hoglund Isaksson (2005)
X X X (X) (X)
Jaffe amp Stavins (1995)
X X X1 X X X X
Jaffe amp Palmer (1997)
X X X X
Jaffe et al (2002) X X X X X X X X X X
Jung et al (1996) X X X X X X (X) (X)
Kemp (1998) X X X X
Kerr amp Newell (2001) X X X X X
Klaassen et al (2005)
X X X X X
Lanjouw amp Mody (1996)
X X X X X X X
McGinty amp de Vries (2009)
X X X X
Mickwitz et al (2008)
X X X X X X X X X
Milliman amp Prince (1989)
X X X X X X X
Millock amp Nauges (2006)
X X X X X X
Montero (2002) X X X X X
Newell et al (1999) X X1 X X X
Norberg-Bohm (1999)
X X X X X X X
Popp (2002) X X1 X X
Popp (2005) X X X X X X
Porter amp van der Linde (1995)
X X X X X X
Requate (2005) X X X X X X X
Skjaeligrseth amp Christiansen (2005)
X X X X X X X X X
Snyder et al (2003) X X X X X
Annex 1 Classification of refereed journal articles
Environmental tax reform in Europe opportunities for eco-innovation44
Annex 2
Type Instrument Area Stage
Reference
Theo
retica
l
Em
piric
al
Cas
e st
udy
Rev
iew
Qual
itat
ive
Taxe
s
Perm
its
Subsi
die
s
Volu
nta
ry
Com
man
d
Reg
ula
tion
Ener
gy
Air
Wat
er
Oth
er
Gen
eral
Innov
atio
n
Diffu
sion
Rel
evan
ce
Johnstone (2005)
X X X X X X X
Johnstone amp Hascic (2008)
X X X X X X X X
Kemp (1997) X X X X X X X X X X X X X
Kemp (2000) X X X X X X X X X
de Vries amp Medhi (2008)
X X1 X X X
Annex 2 Classification of books and book chapters
45
Annex 3
Environmental tax reform in Europe opportunities for eco-innovation
Type Instrument Area Stage
Reference
Theo
retica
l
Em
piric
al
Cas
e st
udy
Rev
iew
Qual
itat
ive
Taxe
s
Perm
its
Subsi
die
s
Volu
nta
ry
Com
man
d
Reg
ula
tion
Ener
gy
Air
Wat
er
Oth
er
Gen
eral
Innov
atio
n
Diffu
sion
Rel
evan
ce
Goumlrlach et al (2005)
X X X X X X
Knigge amp Goumlrlach (2005)
X X X X X X
Technopolis (2008)
X X X X X X
Volleburgh (2007)
X X X X X X X X X X X
Annex 3 Classification of reports
European Environment Agency
Environmental tax reform in Europe opportunities for eco-innovation
2011 mdash 45 pp mdash 21 x 297 cm
ISBN 978-92-9213-238-5doi10280084889
How to obtain EU publications
Publications for salebull viaEUBookshop(httpbookshopeuropaeu)bull fromyourbooksellerbyquotingthetitlethepublisherandorISBNnumberbull bycontactingoneofoursalesagentsdirectlyYoucanobtaintheircontactdetails
on the Internet (httpbookshopeuropaeu) or by sending a fax to +352 2929-42758
Free publicationsbull viaEUBookshop(httpbookshopeuropaeu)bull attheEuropeanCommissionsrepresentationsordelegationsYoucanobtain
their contact details on the Internet (httpeceuropaeu) or by sending a fax to +352 2929-42758
European Environment AgencyKongens Nytorv 61050 Copenhagen KDenmark
Tel +45 33 36 71 00Fax +45 33 36 71 99
Web eeaeuropaeuEnquiries eeaeuropaeuenquiries
TH
-AK-1
1-0
17-E
N-N
doi1
02
8008
4889
- Acknowledgements
- Executive summary
- 1Introduction
-
- 11Background
- 12ETR and innovation
- 13Report structure
-
- 2Review of literature on environmental tax reform and eco‑innovation
-
- 21Initial screening
- 22Detailed review
- 23Environmental regulation studies
- 24Theoretical studies
- 25Empirical studies
- 26Case studies
- 27Conclusions
-
- 3Modelling of ETR impacts on eco‑innovation
-
- 31Scenarios assessing the implications of ETR for eco-innovation
- 32Overview of modelling results
- 33Macroeconomic impacts at the national level
- 34Conclusions of the scenario assessment
-
- References
- Annex 1 Classification of refereed journal articles
- Annex 2Classification of books and book chapters
- Annex 3Classification of reports
-
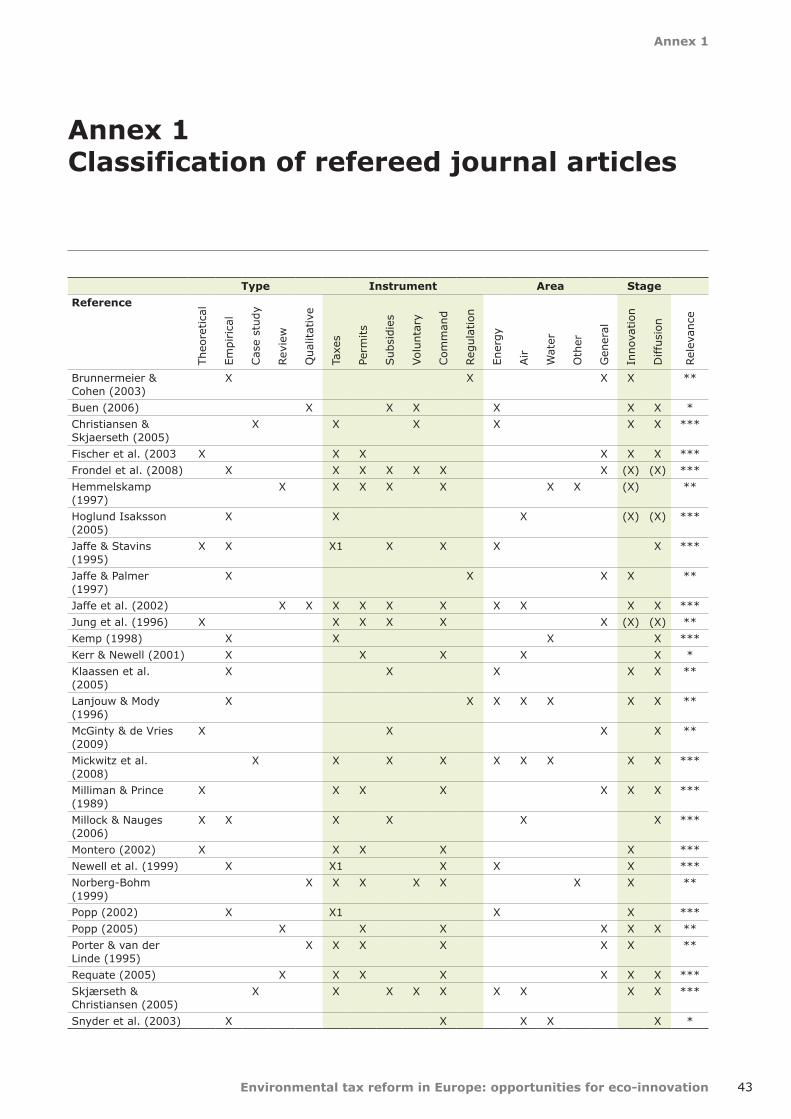
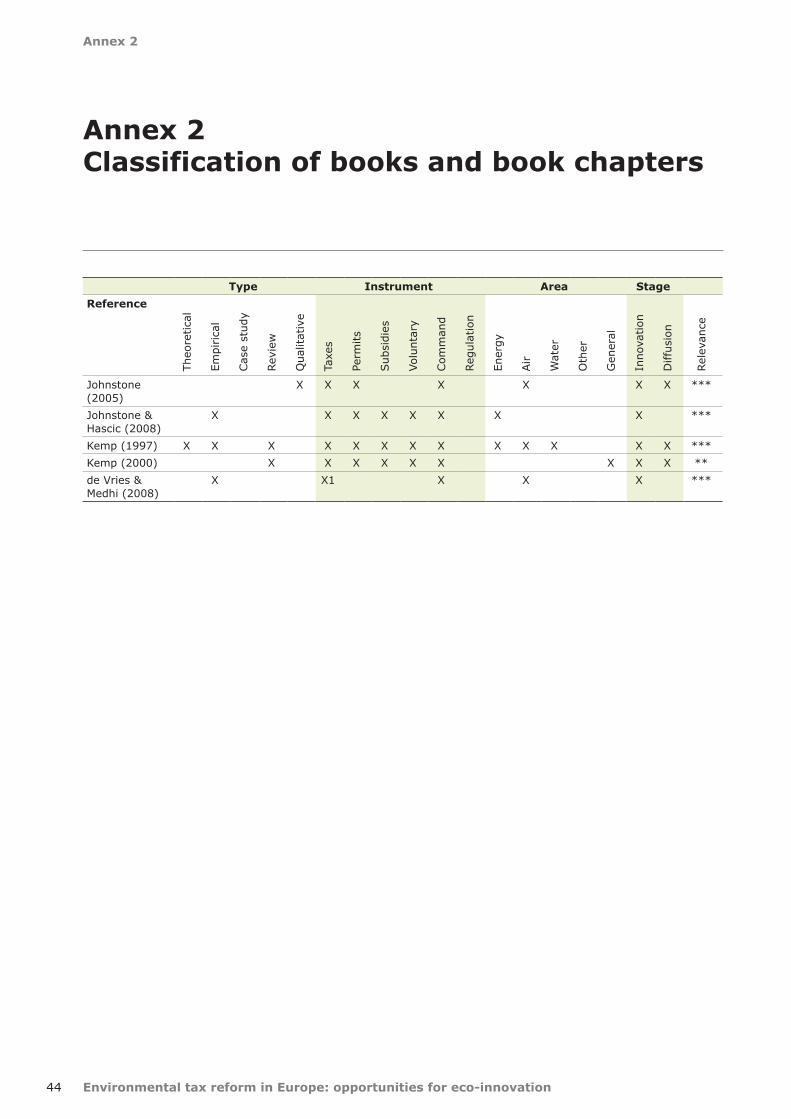
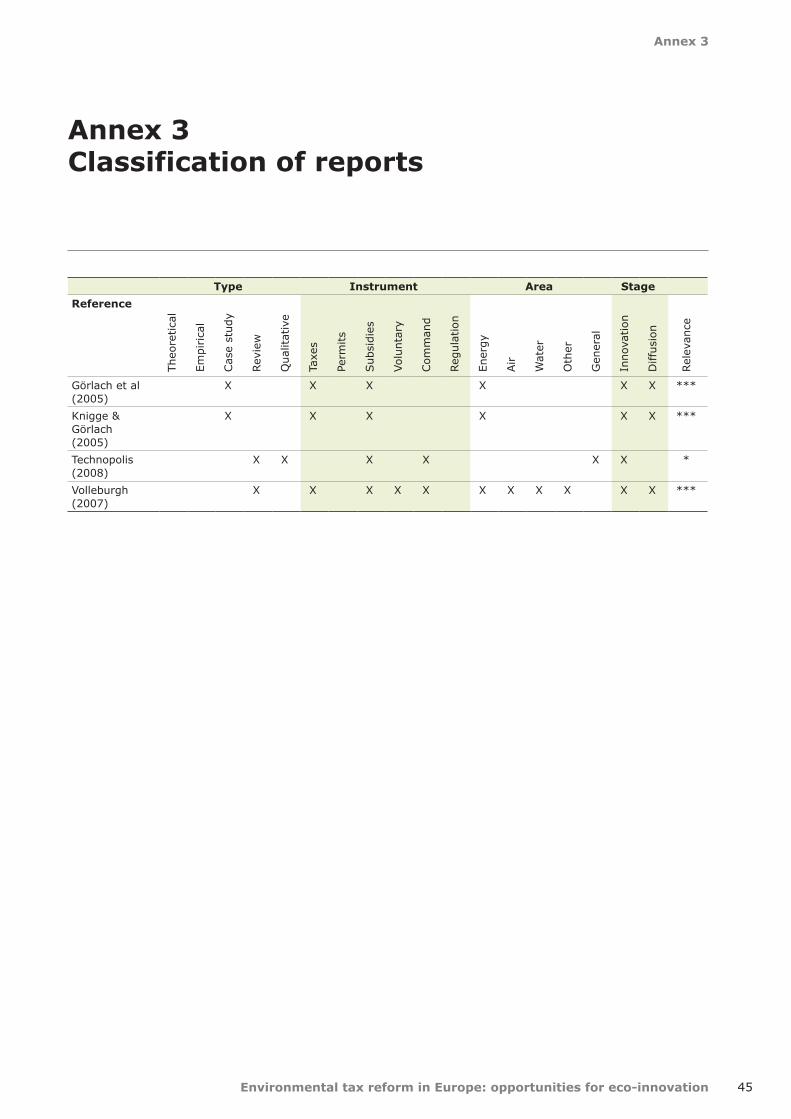
Related Documents


