Environmental Studies Research Funds December 2010 188 Mapping the Spatial Distribution of Juvenile and Spawning Activities for Five Selected Finfish Species off the Labrador and Northeastern Newfoundland Shelf

Welcome message from author
This document is posted to help you gain knowledge. Please leave a comment to let me know what you think about it! Share it to your friends and learn new things together.
Transcript

EnvironmentalStudiesResearchFunds
December 2010
188 Mapping the Spatial Distribution of Juvenile and Spawning Activities for Five Selected Finfish Species off the Labrador and Northeastern Newfoundland Shelf

Correct citation for this report is: L.M.N. Ollerhead and E.B.S. French. 2010. Mapping the Spatial Distribution of Juvenile and Spawning Activities for Five Selected Finfish Species off the Labrador and Northeastern Newfoundland Shelf. Environmental Studies Research Funds Report No. 188. St. John’s, NL 31 p. The Environmental Studies Research Funds are financed from special levies on the oil and gas industry and administered by Natural Resources Canada for the Minister of Natural Resources Canada and the Minister of Indian Affairs and Northern Development. The Environmental Studies Research Funds and any person acting on their behalf assume no liability arising from the use of the information contained in this document. The opinions expressed are those of the authors and do not necessarily reflect those of the Environmental Studies Research Funds agencies. The use of trade names or identification of specific products does not constitute an endorsement or recommendation for use. Published under the auspices of the Environmental Studies Research Funds NE22-4/188E-PDF

Environmental Research Studies Funds
Report No. 188
December 2010
Mapping the Spatial Distribution of Juvenile and Spawning Activities for Five Selected Finfish Species off the Labrador and Northeastern
Newfoundland Shelf
L.M.N. Ollerhead and E.B.S. French Science Branch
Fisheries and Oceans Canada P.O. Box 5667
St. John’s, NL, Canada, A1C 5X1
2
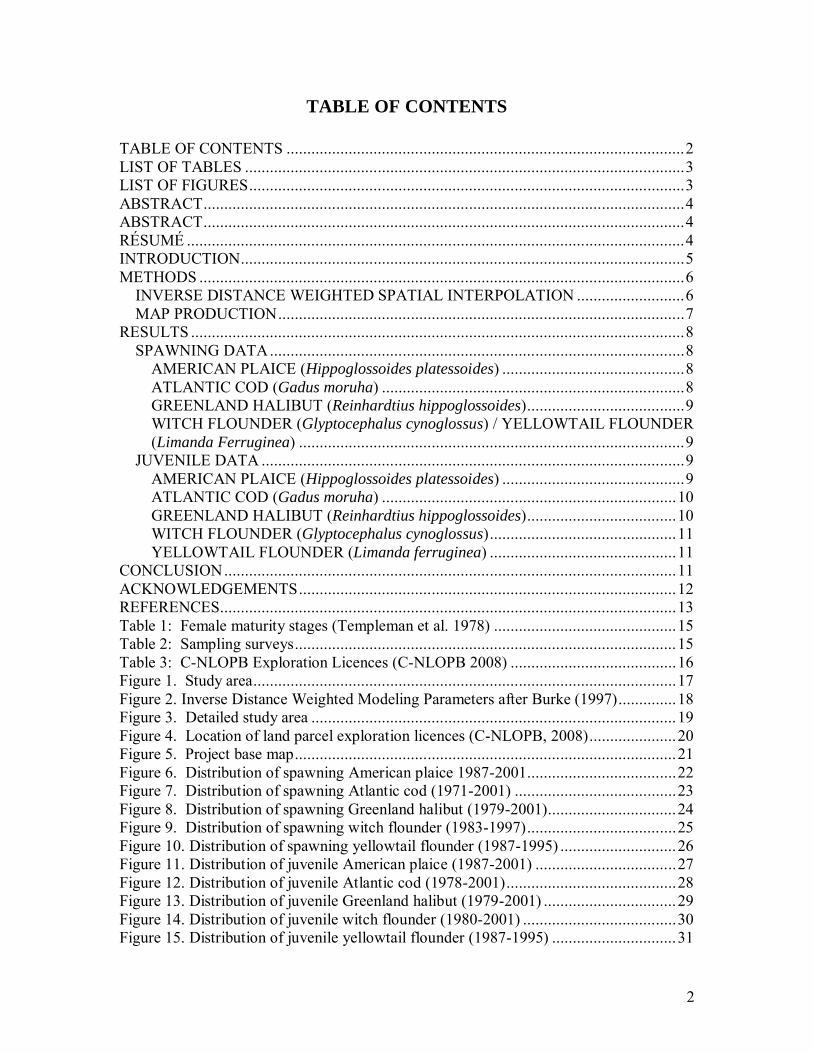
TABLE OF CONTENTS TABLE OF CONTENTS ................................................................................................2 LIST OF TABLES ..........................................................................................................3 LIST OF FIGURES.........................................................................................................3 ABSTRACT....................................................................................................................4 ABSTRACT....................................................................................................................4 RÉSUMÉ ........................................................................................................................4 INTRODUCTION...........................................................................................................5 METHODS .....................................................................................................................6
INVERSE DISTANCE WEIGHTED SPATIAL INTERPOLATION ..........................6 MAP PRODUCTION..................................................................................................7
RESULTS .......................................................................................................................8 SPAWNING DATA....................................................................................................8
AMERICAN PLAICE (Hippoglossoides platessoides) ............................................8 ATLANTIC COD (Gadus moruha) .........................................................................8 GREENLAND HALIBUT (Reinhardtius hippoglossoides)......................................9 WITCH FLOUNDER (Glyptocephalus cynoglossus) / YELLOWTAIL FLOUNDER (Limanda Ferruginea) .............................................................................................9
JUVENILE DATA ......................................................................................................9 AMERICAN PLAICE (Hippoglossoides platessoides) ............................................9 ATLANTIC COD (Gadus moruha) .......................................................................10 GREENLAND HALIBUT (Reinhardtius hippoglossoides)....................................10 WITCH FLOUNDER (Glyptocephalus cynoglossus).............................................11 YELLOWTAIL FLOUNDER (Limanda ferruginea) .............................................11
CONCLUSION.............................................................................................................11 ACKNOWLEDGEMENTS...........................................................................................12 REFERENCES..............................................................................................................13 Table 1: Female maturity stages (Templeman et al. 1978) ............................................15 Table 2: Sampling surveys............................................................................................15 Table 3: C-NLOPB Exploration Licences (C-NLOPB 2008) ........................................16 Figure 1. Study area......................................................................................................17 Figure 2. Inverse Distance Weighted Modeling Parameters after Burke (1997)..............18 Figure 3. Detailed study area ........................................................................................19 Figure 4. Location of land parcel exploration licences (C-NLOPB, 2008).....................20 Figure 5. Project base map............................................................................................21 Figure 6. Distribution of spawning American plaice 1987-2001....................................22 Figure 7. Distribution of spawning Atlantic cod (1971-2001) .......................................23 Figure 8. Distribution of spawning Greenland halibut (1979-2001)...............................24 Figure 9. Distribution of spawning witch flounder (1983-1997)....................................25 Figure 10. Distribution of spawning yellowtail flounder (1987-1995) ............................26 Figure 11. Distribution of juvenile American plaice (1987-2001) ..................................27 Figure 12. Distribution of juvenile Atlantic cod (1978-2001).........................................28 Figure 13. Distribution of juvenile Greenland halibut (1979-2001) ................................29 Figure 14. Distribution of juvenile witch flounder (1980-2001) .....................................30 Figure 15. Distribution of juvenile yellowtail flounder (1987-1995) ..............................31

3
LIST OF TABLES Table 1. Female maturity stages....................................................................................15 Table 2. Spawning sampling surveys. ...........................................................................15 Table 3. C-NLOPB Exploration Licences .....................................................................16
LIST OF FIGURES TABLE OF CONTENTS ................................................................................................2 LIST OF TABLES ..........................................................................................................3 LIST OF FIGURES.........................................................................................................3 ABSTRACT....................................................................................................................4 RÉSUMÉ ........................................................................................................................4 INTRODUCTION...........................................................................................................5 METHODS .....................................................................................................................6 RESULTS .......................................................................................................................8 CONCLUSION.............................................................................................................11 ACKNOWLEDGEMENTS...........................................................................................12 REFERENCES..............................................................................................................13 Table 1: Female maturity stages (Templeman et al. 1978) ............................................15 Table 2: Sampling surveys............................................................................................15 Table 3: C-NLOPB Exploration Licences (C-NLOPB 2008) ........................................16 Figure 1. Study area......................................................................................................17 Figure 2. Inverse Distance Weighted Modeling Parameters after Burke (1997)..............18 Figure 3. Detailed study area ........................................................................................19 Figure 4. Location of land parcel exploration licences (C-NLOPB, 2008).....................20 Figure 5. Project base map............................................................................................21 Figure 6. Distribution of spawning American plaice 1987-2001....................................22 Figure 7. Distribution of spawning Atlantic cod (1971-2001) .......................................23 Figure 8. Distribution of spawning Greenland halibut (1979-2001)...............................24 Figure 9. Distribution of spawning witch flounder (1983-1997)....................................25 Figure 10. Distribution of spawning yellowtail flounder (1987-1995) ............................26 Figure 11. Distribution of juvenile American plaice (1987-2001) ..................................27 Figure 12. Distribution of juvenile Atlantic cod (1978-2001).........................................28 Figure 13. Distribution of juvenile Greenland halibut (1979-2001) ................................29 Figure 14. Distribution of juvenile witch flounder (1980-2001) .....................................30 Figure 15. Distribution of juvenile yellowtail flounder (1987-1995) ..............................31
4
ABSTRACT This study used a Geographic Information System (GIS) and historical Department of Fisheries and Oceans (DFO) research vessel (RV) data to map the spatial distributions of five commercially important finfish species on the Labrador Bank and off the northeast coast of Newfoundland for both the spawning and juvenile life stages. Though limited data were available for the spawning distributions in the study area, some general trends were observed. The analysis revealed that the greatest concentrations of spawning fish were found in 2J and 3K along the shelf edge, although some species were also found further north in 2G and 2H. The juvenile data analysis showed that the greatest concentrations were also found in 2J and 3K and were distributed patchily in shallower waters. Areas of high concentrations were also found further north in 2H in coastal waters. These maps highlight the highest spawning and juvenile distributions within the study area and may be used as a reference when planning activities that may have an adverse impact on these important habitats.
RÉSUMÉ Cette étude a fait appel au Système d’information géographique (SIG) et aux données historiques du navire océanographique (NO) du Ministère des Pêches et des Océans (MPO) pour cartographier les distributions spatiales de cinq espèces de poissons à nageoires aux étapes juvéniles et de fraie de leur cycle de vie, présentant un intérêt commercial sur le Grand Banc du Labrador et au large de la côte du nord-est de Terre-Neuve. Bien que les données disponibles relativement aux distributions de fraie étaient limitées dans la région de l’étude, certaines tendances générales ont pu être observées. L’analyse a révélé que l’on trouvait les plus grandes concentrations de poissons en fraie dans les divisions 2J et 3K le long de l’extrémité du plateau, bien que l’on ait également découvert certaines espèces plus au nord dans les divisions 2G et 2H. L’analyse des données au stade juvénile a indiqué que les plus grandes concentrations se trouvaient également dans les divisions 2J et 3K et elles étaient distribuées par bancs dans les eaux plus profondes. On a également découvert des régions de fortes concentrations plus au nord, dans la division 2H des eaux côtières. Ces cartes indiquent les plus grandes distributions de poissons aux states juvéniles et de fraie à l’intérieur de la région à l’étude et peuvent être utilisées à titre de référence lors de la planification d’activités qui pourraient avoir des répercussions négatives sur ces importants habitats.
5
INTRODUCTION
The continuous supply of fossil fuels required to support our planet’s ever-growing economic needs demands that the world’s oil and gas suppliers be in constant search for new hydrocarbon sources. Advanced exploration techniques (i.e. seismic reflection) are crucial in helping the oil/gas industry understand and map the subsurface in an attempt to identify new natural gas and petroleum reservoirs. Since its introduction in 1921, seismic exploration has become the most prevalent geophysical aid in the search for hydrocarbons (Pendleton and Cleveland, 2008). The potential environmental impact of such exploration techniques has been a priority issue for years (Gausland, 2000). Attempts to explore or exploit those areas should be guided by knowledge of the distributions of these susceptible marine habitats and precautions should be taken to avoid or minimize any environmental impacts.
This study used historical Department of Fisheries and Oceans research vessel
data to model the juvenile and spawning spatial distributions for five selected finfish species. These maps will aid industry, government, and regulatory bodies to minimize potential environmental impacts that may result from any oil/gas exploration. Having knowledge of the spatial distribution of fisheries in a region that has an active oil/gas program may help lessen any potential disruption of the life history of those species (Ollerhead, 2007).
The study area covers the entire Labrador shelf and the northern portion of the
Newfoundland shelf, extending easterly to the shelf edges into water depths of 2000 m and has an area of approximately 408,000 km2 . It lies between 49° and 61° N and 48° and 64° W, and includes NAFO divisions 2GHJ and 3K (Figure 1).
This project analyzes both the spawning and juvenile spatial distributions of five
commercially valuable finfish species common to the northwest Atlantic: American plaice (Hippoglossoides platessoides), Atlantic cod (Gadus morupha), Greenland halibut (Reinhardtius hippoglossoides), witch flounder (Glyptocephalus cynoglossus), and the yellowtail flounder (Limanda ferruginea). These were the only species in the RV data archives that had sufficient data for modeling.
6
METHODS
This study used a methodology adopted from Kulka et al. (2003), where a GIS was used to create interpolated surfaces to analyze the spatial distribution of 18 demersal fish species found on the Grand Banks. The Kulka et al. study used SPANS GIS (PCI Geomatics) potential mapping to create trend surfaces by calculating a weighted average of the sample points falling within a defined neighbourhood around each surface cell. Other studies have used the Kulka et al. method to map juvenile and spawning fish distributions in Atlantic Canada (Ollerhead et al. 2004; Ollerhead 2007; Ollerhead, 2007).
The Department of Fisheries and Oceans (DFO), Newfoundland and Labrador
region, began conducting stratified-random research vessel (RV) surveys in 1971 (McCallum and Walsh 1996). Both the spawning and juvenile data sets in this analysis used the Length-Sex-Maturity (LSM) data collected on the RV surveys. The LSM data classifies the maturity of individuals based on a visual inspection of the gonads and places them into one of the nine maturity categories shown in Table 1 (Templeman et al. 1978). These data were queried to create two data sets: spawning females, found to contain hydrated eggs (Kjesbu et al. 1990) and classified as Mat B-P, Mat C-P, or partly spent; and juveniles, classified as immature. These maturity levels are explained in Table 1. The volume of data available for each species and life stage varied greatly, which made it necessary to aggregate the data across survey years. Table 2 lists the species included in this study, the years for which data were available as well as the total number of sets for the LSM missions.
The LSM data used to model the spawning and juvenile fish distributions were
extracted from DFO archives and imported into an Oracle database. Oracle (Oracle Corp.) is a database management system that was used to query the data and organize it into a GIS compatible format. Data were extracted from the Oracle database and imported into ArcGIS 9.3 for analysis, modelling, and map production.
INVERSE DISTANCE WEIGHTED SPATIAL INTERPOLATION
Spatial interpolation is the process of estimating the value of a given phenomena at unsampled sites within an area of measured observations. Spatial interpolation assumes that events spatially closer together are more likely to have similar values than those farther apart. This distance-dependent relationship is known as autocorrelation (Babish, 2006) and is used by spatial interpolation methods to help calculate surfaces.
As the SPANS GIS software used in the Kulka et al. (2003) study was no longer
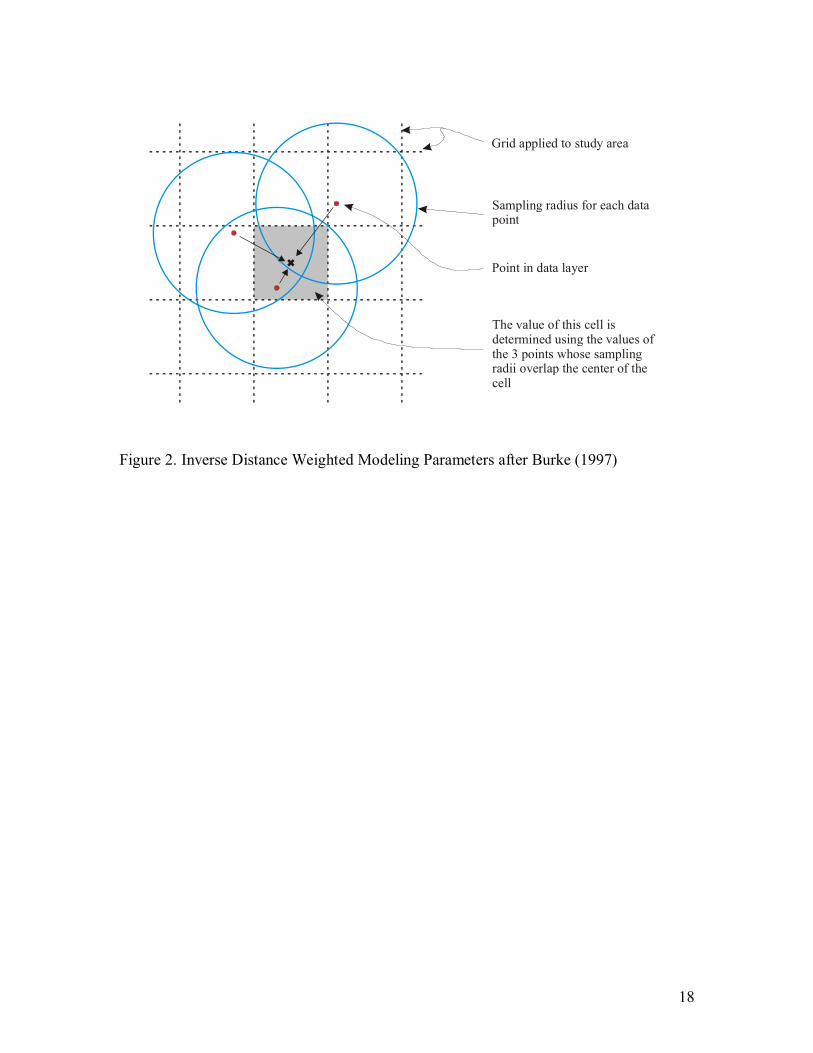
in use at DFO, this project used the ArcGIS 9.3 (ArcGIS) inverse distance weighted (IDW) analysis to generate the interpolated surfaces. Although the ArcGIS IDW and the SPANS potential mapping are not exactly the same, they are very similar. They both compute a surface by calculating a weighted average of the values of the sample data points within a specified neighbourhood around each interpolated cell (Figure 2) where
7
the weight assigned to an input data point is inversely related to its distance from that cell. Considering the goal of this study to identify localized areas of higher intensity of spawning fish and juvenile activity, any differences between the two techniques is negligible. This technique is appropriate to model highly variable, interval or ratio data (ArcGIS 9.3 Webhelp) such as the data collected on DFO RV surveys.
There are two model parameters that dictate how the cells of an ArcGIS IDW
interpolated surface are calculated. The first is the search radius and determines how the model selects the data points to use in the calculation and the second is the decay function and dictates how the weight of the points diminishes with increasing distance from the target cell (ArcGIS 9.3 Webhelp).
To choose appropriate search radii, a nearest-neighbour analysis was performed
on each of the juvenile and spawning datasets. This analysis calculated the average distance between neighbours in a statistically representative sample of 30 observations. The juvenile data analysis calculated an average search radius of 32 km to find 30 neighbours, which was then rounded to 30 km. The nearest-neighbour analysis of the spawning data calculated a search radius of 398 km. Because the spawning datasets were considerably smaller and the data points more dispersed the calculated search radius was much larger. After considering the size of the search radius relative to the size of the study area, 394 km was deemed unsuitable. Using the spawning datasets, IDW surfaces were created using search radii from 10 to 30 km in 5 km increments. After evaluating each of the surfaces it was determined that a 30 km search radius best illustrated the high concentration areas but did not mask any trends in the data. Kulka, et al. (2003) used a series of similar trials to determine the optimum sampling radius for the volume and distribution of similar data.
The decay function parameter dictates how the weight of an input point
diminishes with increasing distance from the target cell. Using a higher power (e.g. IDW3) places more emphasis on the nearest points, creating a more detailed surface, while using a lower power (e.g. IDW2) gives more weight to points farther away and produces a smoother surface (ArcGIS 9.3 Webhelp). As the goal of this study was to model and identify the general trends in the spatial distribution, a power of 2 was chosen for all IDW models. Additionally, the power of 2 is most commonly used with the IDW and is the default value (ArcGIS 9.3 Webhelp).
MAP PRODUCTION Once the IDW surfaces had been created, they were classified and maps were produced to illustrate the distributions relative to physical features and political and regulatory boundaries in the study area. Framework data from various sources was used to place the surfaces in a geographic frame of reference and to facilitate discussions of the juvenile and spawning distributions.

8
The IDW images were divided into six classes using the geometric interval classification method. Geometric intervals are typically used to visualize continuous data and work well on data that are not normally distributed (ArcGIS 9.3 Webhelp). The data sets for this study were all negatively skewed, making this method a suitable choice. The number of classes and colour scheme were chosen to create a visual representation of the data that placed emphasis on the highs and lows of the interpolated surfaces. Additionally, in order to illustrate fishing efforts, a zero-catch layer was created and added to each map and is shown in grey.
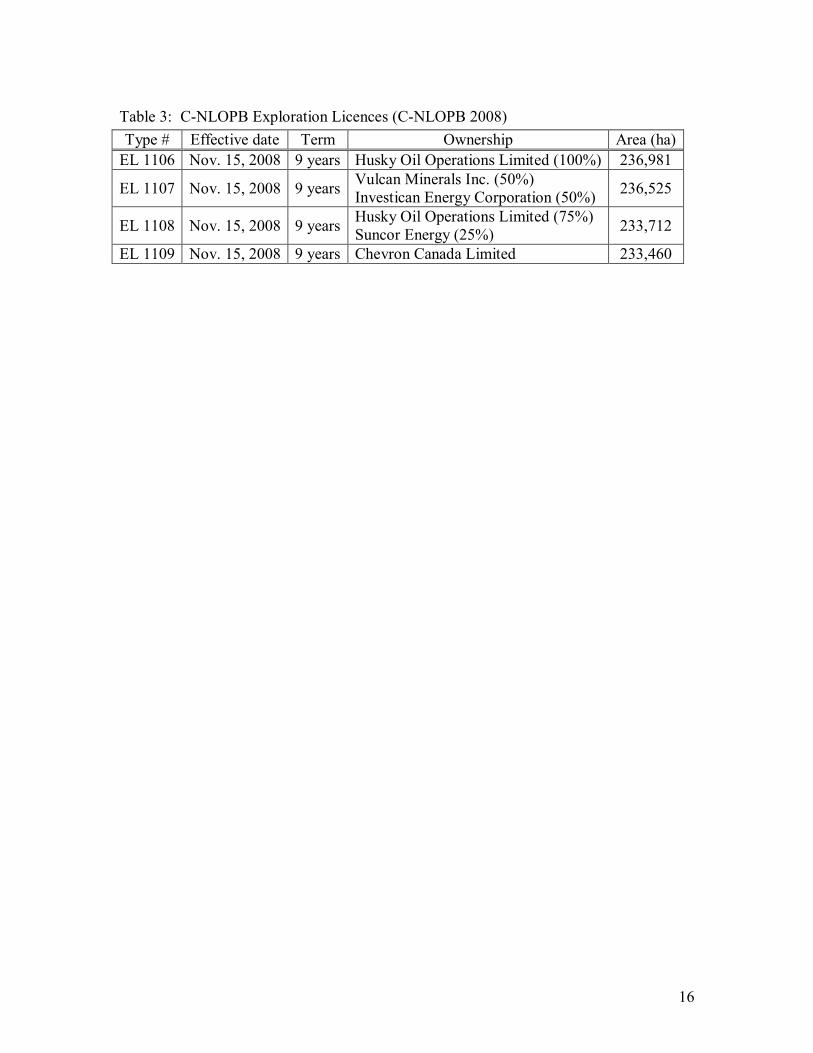
Using the General Bathymetric Chart of the Oceans (GEBCO) (IOC et al. 2003) a surface was generated to identify and map the bathymetric features in the study areas (Figure 2). The GEBCO data was also used to create bathymetric contours at 200, 1000, 2000 and 3000 m for inclusion in the project base map. The 2008 C-NLOPB land parcel exploration licences (C-NLOPB) are shown in Figure 3 and identify regions of active oil and gas exploration within the study area. Land polygons, provincial boundaries, NAFO division boundaries and the 200-mile limit were taken from DFO archival data sets. These layers were used as background data (Figure 4) in all the distribution maps to show relevant physical and regulatory boundaries in the study area.
RESULTS
SPAWNING DATA
AMERICAN PLAICE (Hippoglossoides platessoides)
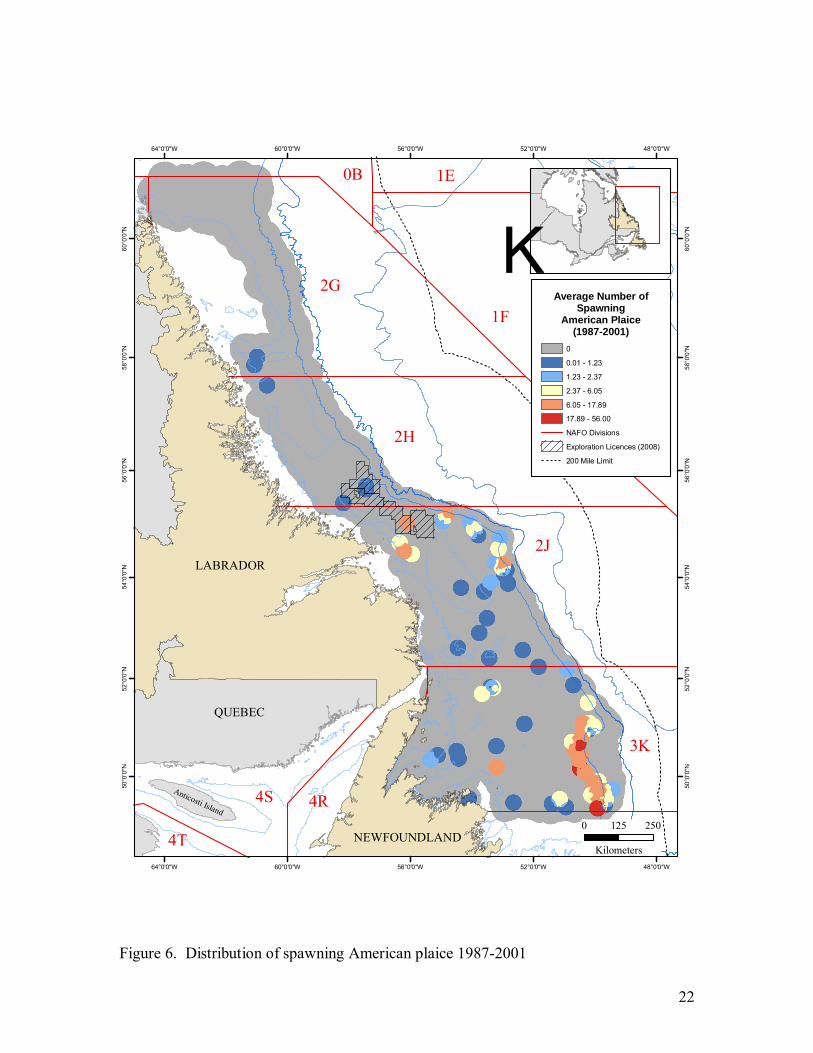
The most abundant spawning of American plaice was confined to the southern portions of the study area. Three separate areas of higher intensity spawning were identified in 2J and 3K. However, limited data were available for the northern portion of the study area.
The largest and most significant area of abundant spawning American plaice was found off the northeast coast of Newfoundland in 3K. Most spawning was found to occur in a north-south direction along the 1000-m shelf edge lying just east of Funk Island Bank. Two other smaller areas with abundant catches were found in the central portion of division 2J. The first lay just off the Labrador shelf, northwest of Hamilton Bank in approximately 200-m waters, while the other, in slightly deeper waters, lay just northeast of Hamilton Bank along the 1000-m isobath (see Figure 6).
ATLANTIC COD (Gadus moruha)

9
The highest numbers of spawning Atlantic cod were found primarily in the southern and central portions of the study area in 2J and 3K. The highest spawning abundances were not found in one specific area, but rather were randomly distributed over the two divisions.
In each of 2J and 3K, two concentrations of higher abundances of Atlantic cod were identified. In 2J, spawning activity was observed just in the shallower waters off Hamilton Bank with the higher abundances found to the northeast in slightly deeper waters than those to the southeast. The highest spawning abundances for Atlantic cod in 3K were located near the Funk Island Bank in the deeper waters to the east and in the slightly shallower waters to the southwest (see Figure 7).
GREENLAND HALIBUT (Reinhardtius hippoglossoides)
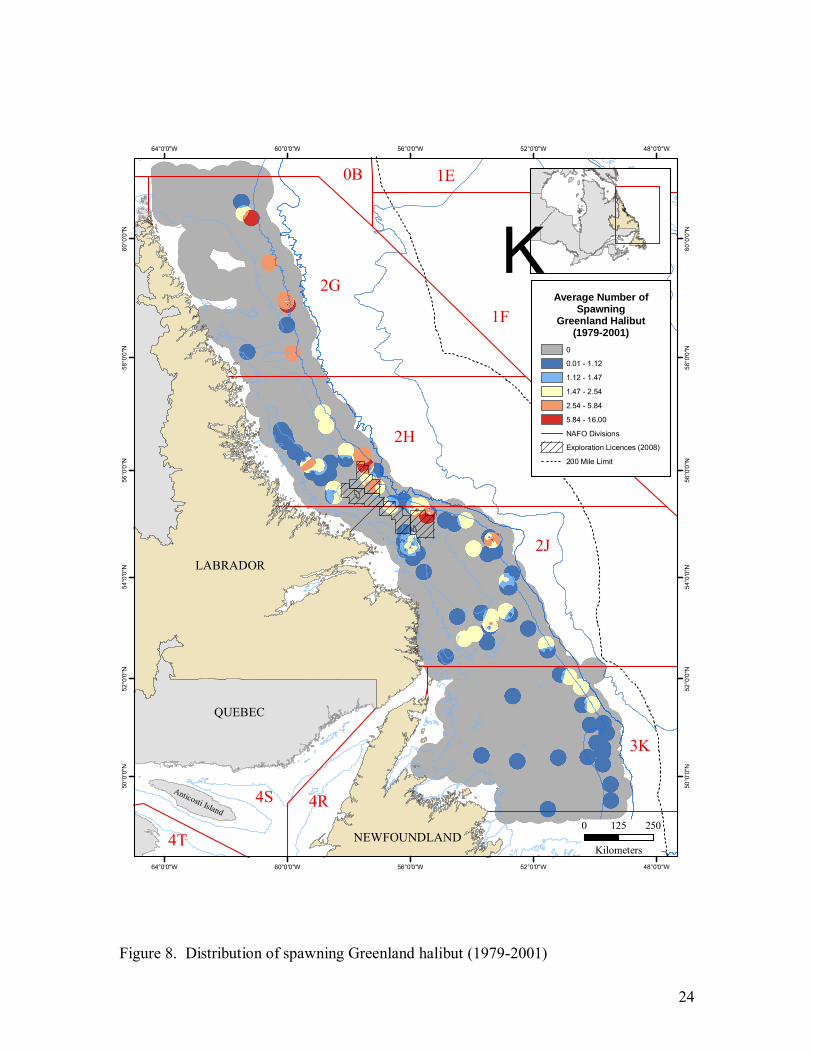
High concentrations of spawning Greenland halibut were found primarily in the central and northern portions of the study area, although a single isolated large catch was observed among much smaller catches. The southern portion of the surveyed area, 3K, and the southern portion of 2J showed the lowest spawning activity.
Spawning Greenland halibut were found in water depths of approximately 600 to 1000 m with the highest abundances along the shelf edge. The highest spawning abundances were located in three different areas. They were found east of Saglek Bank in 2G, north of Makkovik Bank in 2H, and to the east of Harrison Bank in 2J (see Figure 8).
WITCH FLOUNDER (Glyptocephalus cynoglossus) / YELLOWTAIL FLOUNDER (Limanda Ferruginea) No results can be discussed regarding the witch and yellowtail distributions due to the very limited data available for these species. There were 9 and 10 successful catches available in the witch and yellowtail data sets, respectively, with each set catching only one fish. Refer to Figures 9 and 10.
JUVENILE DATA
AMERICAN PLAICE (Hippoglossoides platessoides)
American plaice juvenile abundances were heavily concentrated in the southern portion of the study area in 2J and 3K extending into 2H. Lesser concentrations of juvenile American plaice were also found in 2G.
10
Several areas of higher concentrations were identified in the study area. The first
two areas lay to the southwest and southeast of the Funk Island Bank in 3K in the shallower shelf waters of 200 to 350 m. A third area was found in 2J, east of Hamilton Bank, in waters 200 to 250 m in depth. In the north, the highest concentrations were found on the Nain Bank in waters approximately 100 to 150 m deep and to the northeast along the Labrador shelf edge in water depths of up to 1000 m. Additional areas of higher concentrations were found on the boundary between 2H and 2J as well as on and around the Makkovik and Harrison Banks in water depths of approximately 200 to 350 meters. Refer to Figure 11.
ATLANTIC COD (Gadus moruha)
Juvenile Atlantic cod concentrations were found almost exclusively in the southern portion of the study area in 2J and 3K. The northern portion of the study area had relatively low juvenile abundances.
Four areas of high juvenile concentrations were identified from the IDW surface analysis. In 3K, the highest concentrations were located to the east of Funk Island Bank in waters 350 to 1000 m deep. 2J contained the highest concentrations of juvenile Atlantic cod southeast of Hamilton Bank and north of Belle Island Bank in 250 to 350 m of water. Another concentration was also identified northeast of Hamilton Bank in approximately 350-m depths. Further north in 2J, a concentration of juvenile Atlantic cod was found on Harrison Bank in water depths of 200 to 250 m. Refer to Figure 12.
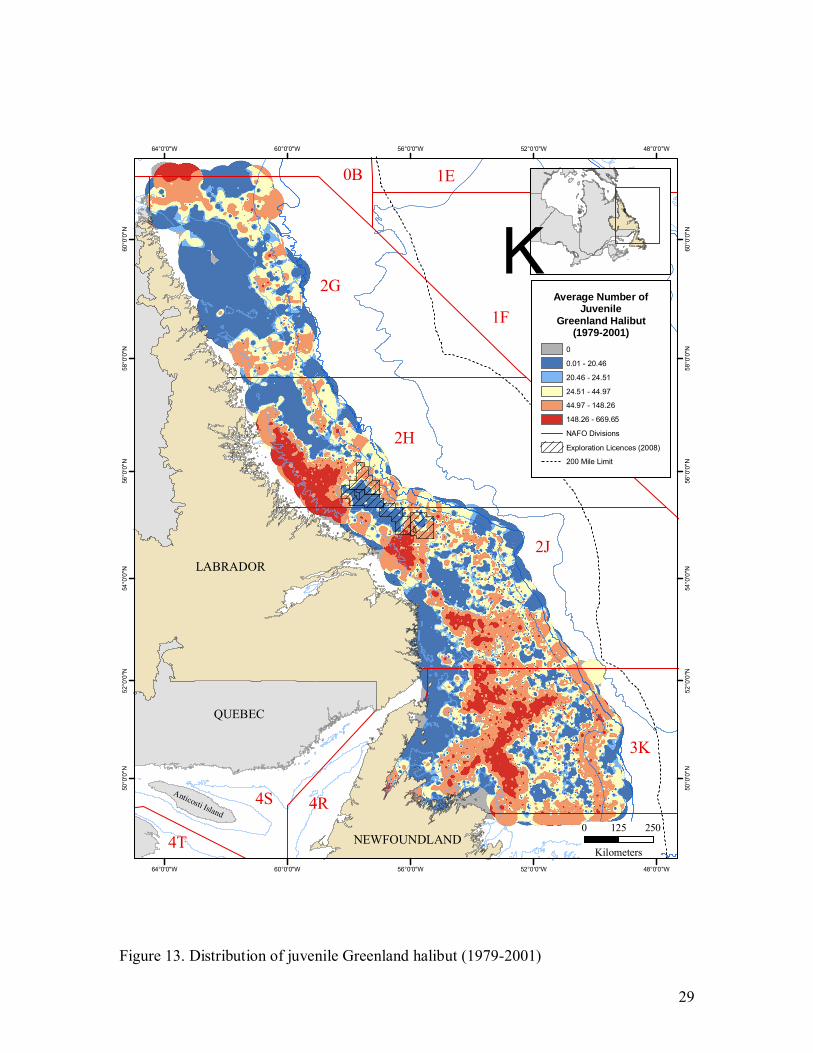
GREENLAND HALIBUT (Reinhardtius hippoglossoides)
High abundances of juvenile Greenland halibut were found over much of the study area. 2G lacks any major concentrations except for an isolated region north of Saglek Bank. This concentration may be misrepresented and may not be considered accurate as the higher values in that area may have been exaggerated as a result of edge effects of the interpolation process.
In the southern part of the study area, in 3K, two concentrated areas of higher abundances were identified. The first surrounded much of the Funk Island Bank in water depths of approximately 350 to 400 m, while the second area lay in similar water depths southwest of Belle Island Bank. 2J contained two areas of high concentrations. The first was found northwest of Belle Island bank and southwest of Hamilton Bank in water depths of approximately 350 m. The second area was identified northwest of Hamilton Bank and south of Harrison Bank, in depths approximately 200 to 350 m. There was one higher concentration in 2H, located on the inner Labrador shelf that extended between Nain Bank to Makkovik Bank into water depths of 350 to 400 m. Refer to Figure 13.
11
WITCH FLOUNDER (Glyptocephalus cynoglossus)
The higher concentrations of juvenile witch flounder were primarily found in the southern portions of the study area in 2J and 3K with an isolated concentration of juveniles found in the southern portion of 2G. Generally speaking the central and northern portions of the study area were absent of juvenile witch flounder activity.
Three areas of higher concentrations were identified from the IDW analysis. In 3K two areas of higher abundances were identified to the west and south of Funk Island Bank. The westerly concentration ran north to south in a deeper trough (water depths approximately 400m) between the bank and the Newfoundland shelf. The southern concentration was found in coastal waters of approximately 200 to 250m. In 2J, higher juvenile concentrations were found along the shelf edge. They were found north of Belle Island Bank extending to the south of Hamilton Bank on the steeply dipped shelf edge in water depths ranging from 500 to 2000m. There was a small isolated juvenile concentration in 2G located to the east of Okak Bank in water depths of approximately 500 to 1000m. Refer to Figure 14.
YELLOWTAIL FLOUNDER (Limanda ferruginea)
The highest concentrations of juvenile Yellowtail flounder were predominately found in the south in 2J and 3K. Divisions 2GH generally had low juvenile abundances except for small isolated highs found in 2H to the east of Nain Bank.
Two areas of higher abundance were identified in 3K. The first was on the Funk Island Bank in waters approximately 350m deep with the second to the west of the bank in water depths of approximately 200 to 350m. In 2J there were two areas of higher concentrations, east of Hamilton Bank in waters approximately 200 to 350m as well as in the northern portion of division 2J. An additional isolated concentration was identified east of Harrison Bank. Refer to Figure 15.
CONCLUSION This study has successfully identified the areas of highest historical intensities of
spawning and juvenile concentrations for five commercially valuable finfish species off the coast of Labrador and northeastern Newfoundland. This area supports a biologically diverse ecosystem as well as potentially valuable oil and gas reserves. Seismic exploration tools have become the most important technique in searching for valuable hydrocarbon deposits, and in an area with such a rich community of fish species, it is important that such exploration methods do not interfere with their normal life cycle. It is the purpose of this study to provide stakeholders with the historical distribution of spawning and juvenile abundances in hopes that during exploration the areas of highest abundances may be avoided.

12
ACKNOWLEDGEMENTS
The authors would like to thank the Environmental Studies Research Fund (ESRF) for providing the resources to make this project possible. Additional thanks to the C-NLOPB for supplying the GIS data for the land parcel licence areas as well as to Gary Smith of DFO, NL region, for his much-appreciated help with identifying bathymetric features in the study area.

13
REFERENCES ArcGIS [computer program]. Version 9.3.1. Redlands, CA: esri; May 2009. Babish, G., 2006. Geo-statistics without tears. A Practical Guide
to Geostatistics. 4.81 Environment Canada, Ecological Research Division, Environmental Conservation Branch, Regina, SK.
Burke, D. 1997. SPANS Prospector Manual. Tydac Research Inc. 106p. C-NLOPB. “Labrador Offshore License Information” [map]. 1:50,000. http://www.cnlopb.nl.ca/maps/ol_2008.pdf (November 15, 2008). Gausland, Ingebret. 2000. Impact of seismic surveys on marine life. Leading Edge. 19(8): 903-905. IOC, IHO and BODC, 2003. Centenary Edition of the GEBCO Digital Atlas, published on CD-ROM on behalf of the Intergovernmental Oceanographic Commission and the International Hydrographic Organization as part of the General Bathymetric Chart of the Oceans, British Oceanographic Data Centre, Liverpool, U.K. Kjesbu, O.S., Whitthames P.R., Solemdal, P., and Greer Walker, M. 1990.
Ovulatory rhythm and a method to determine stage for spawning Atlantic cod (Gadus morhua). Can. J. Fish. Aquatic Sciences, 47: 1185-1193.
Kulka, D.W., Antle, N.C., and Simms J.M. 2003. Spatial analysis of 18 demersal
species in relation to petroleum license areas on the Grand Banks (1980-2000). Can. Tech. Rep. Fish. Aquat. Sci. 2473: xix + 182p.
Kulka, D.W. 1998. SPANdex – Spans geographic information system process manual for creation of biomass indices and distributions using potential mapping. DFO Can. Stock Access. Sec. Res. Doc. 98/60. 28p. McCallum, B.R., and Walsh, S.J. 1996. Groundfish survey trawls used at the Northwest Atlantic Fisheries Center, 1971-present. NAFO SCR Doc. 96/50. 4p. Ollerhead, L.M.N., Morgan, M.J., Scruton, D.A., and Marrie, B. 2004. Mapping
spawning times and locations for 10 commercially important fish species found on the Grand Banks of Newfoundland. Can. Tech. Rep. Fish. Aquat. Sci. 2522: iv + 45p.
Ollerhead, L.M.N. June 2007. Mapping Spatial and Temporal Distribution of Spawning Areas for Eight Finfish Species Found on the Scotian Shelf. Environmental Studies Research Funds Report No. 168. St. John’s, NL. 54p.

14
Ollerhead, L.M.N. June 2007. Mapping the Spatial Distribution of Juveniles for Nine Selected Finfish Species Found in the Gulf of St. Lawrence. Environmental Studies Research Funds Report No. 169. St. John’s, NL. 64 p. Oracle [computer program]. Version 8.1.3. Redwood Shores, CA: Oracle Corporation; Mar 99. Pendleton, V., and Cleveland, C. 2008. Seismic Exploration. Encyclopedia of Earth, http://www.eoearth.org/article/Seismic_exploration. SPANS GIS [computer program]. Version 7.0. Richmond Hill, ON: PCI Geomatics; Sept. 97. Templeman W., Hodder, V.M., and Wells, R. 1978. Sexual maturity and spawning in
haddock, Melanogrammus aeglefinus, of the southern Grand Bank. ICNAF Res. Bull. 13: 53-66.

15
Table 1: Female maturity stages (Templeman et al. 1978) Maturity
Code Description
Immature Ovary small, grey to pink in colour: membrane thin and translucent; eggs not visible to the naked eye.
Spent L Ovary thick-walled with no new eggs visible to the naked eye; spent in the previous year.
Mat A-P Eggs visible to the naked eye in the actual ovary; all eggs are opaque; maturing to spawn in the present year.
Mat B-P Opaque and clear eggs present with less than 50% of the volume being clear eggs; spawning in the present year.
Mat C-P 50% or more volume are clear eggs; this stage also includes the ripe condition where the ovarian content is almost clear liquid with clear eggs; spawning in the present year.
Partly Spent P
Ovary not full as in Mat C-P; some eggs extruded but many clear eggs remaining.
Spent P Spawning completed in the present year but possibly a few clear eggs remaining; no new opaque eggs visible to the naked eye.
Spent P Mat N
Spawning completed in present year; new opaque eggs for spawning in the next year visible to the naked eye; this stage becomes Mat A-P in January of the next year.
Mat A-N No evidence of previous spawning; but new opaque eggs for spawning in the next year visible to the naked eye; this stage becomes Mat A-P in January of the next year.
Table 2: Sampling surveys Species Total sets Successful sets Years surveyed
American plaice 2022 80 1987-2001 Atlantic cod 2057 271 1971-2001 Greenland halibut 2246 111 1979-1995 Witch flounder 908 9 1983-1997
Spawning Data
Yellowtail flounder 998 10 1987-1995 American plaice 9304 3364 1987-2001 Atlantic cod 8583 2098 1978-2001 Greenland halibut 11467 5153 1979-2001 Witch flounder 8407 1289 1980-2001
Juvenile Data
Yellowtail flounder 5472 1984 1987-1996
16
Table 3: C-NLOPB Exploration Licences (C-NLOPB 2008) Type # Effective date Term Ownership Area (ha)
EL 1106 Nov. 15, 2008 9 years Husky Oil Operations Limited (100%) 236,981
EL 1107 Nov. 15, 2008 9 years Vulcan Minerals Inc. (50%) Investican Energy Corporation (50%) 236,525
EL 1108 Nov. 15, 2008 9 years Husky Oil Operations Limited (75%) Suncor Energy (25%) 233,712
EL 1109 Nov. 15, 2008 9 years Chevron Canada Limited 233,460

17
Figure 1. Study area
48°0'0"W
48°0'0"W
52°0'0"W
52°0'0"W
56°0'0"W
56°0'0"W
60°0'0"W
60°0'0"W
64°0'0"W
64°0'0"W
60°0
'0"N
60°0
'0"N
58°0
'0"N
58°0
'0"N
56°0
'0"N
56°0
'0"N
54°0
'0"N
54°0
'0"N
52°0
'0"N
52°0
'0"N
50°0
'0"N
50°0
'0"N
LABRADOR
NEWFOUNDLAND
QUEBEC
Anticosti Island
Labrador Sea
0 125 250
Kilometers
KLA
BRA
DO
R BA
SIN
2G
2H
2J
3K
0B 1E
1F
4R4S
4T
Study Area
Exploration Licences (2008)
NAFO Divisions
200 Mile Limit
18
Point in data layer
Sampling radius for each data point
Grid applied to study area
The value of this cell is determined using the values of the 3 points whose sampling radii overlap the center of the cell
Figure 2. Inverse Distance Weighted Modeling Parameters after Burke (1997)

19
Figure 3. Detailed study area
48°0'0"W
48°0'0"W
52°0'0"W
52°0'0"W
56°0'0"W
56°0'0"W
60°0'0"W
60°0'0"W
64°0'0"W
64°0'0"W
60°0
'0"N
60°0
'0"N
58°0
'0"N
58°0
'0"N
56°0
'0"N
56°0
'0"N
54°0
'0"N
54°0
'0"N
52°0
'0"N
52°0
'0"N
50°0
'0"N
50°0
'0"N
LABRADOR
NEWFOUNDLAND
QUEBEC
Anticosti Island
Labrador Sea
0 125 250
Kilometers
KLA
BRAD
OR
BASIN
2G
2H
2J
3K
0B 1E
1F
4R4S
4T
200 Mile Limit
NAFO Divisions
Okak Bank
Saglek Bank
Nain Bank
Hamilton Bank
FunkIslandBank
BelleIsle
Bank
Makkovik Bank
Harrison Bank

20
Figure 4. Location of land parcel exploration licences (C-NLOPB, 2008)
56°0'0"W
56°0'0"W
58°0'0"W
58°0'0"W
56°0
'0"N
56°0
'0"N
55°0
'0"N
55°0
'0"N
54°0
'0"N
54°0
'0"N
LABRADOR
0 25 50
Kilometers
K2H
2J
Exploration Licences (2008)
NAFO Divisions
1106
1107
1108
1109

21
Figure 5. Project base map
48°0'0"W
48°0'0"W
52°0'0"W
52°0'0"W
56°0'0"W
56°0'0"W
60°0'0"W
60°0'0"W
64°0'0"W
64°0'0"W
60°0
'0"N
60°0
'0"N
58°0
'0"N
58°0
'0"N
56°0
'0"N
56°0
'0"N
54°0
'0"N
54°0
'0"N
52°0
'0"N
52°0
'0"N
50°0
'0"N
50°0
'0"N
LABRADOR
NEWFOUNDLAND
QUEBEC
Anticosti Island
Labrador Sea
0 125 250
Kilometers
KLA
BRA
DO
R BA
SIN
2G
2H
2J
3K
0B 1E
1F
4R4S
4T
NAFO Divisions
Exploration Licences (2008)
200 Mile Limit
22
Figure 6. Distribution of spawning American plaice 1987-2001
48°0'0"W
48°0'0"W
52°0'0"W
52°0'0"W
56°0'0"W
56°0'0"W
60°0'0"W
60°0'0"W
64°0'0"W
64°0'0"W
60°0
'0"N
60°0
'0"N
58°0
'0"N
58°0
'0"N
56°0
'0"N
56°0
'0"N
54°0
'0"N
54°0
'0"N
52°0
'0"N
52°0
'0"N
50°0
'0"N
50°0
'0"N
LABRADOR
NEWFOUNDLAND
QUEBEC
Anticosti Island
Labrador Sea
0 125 250
Kilometers
KLA
BRAD
OR
BASIN
2G
2H
2J
3K
0B 1E
1F
4R4S
4T
Average Number ofSpawning
American Plaice(1987-2001)
0
0.01 - 1.23
1.23 - 2.37
2.37 - 6.05
6.05 - 17.89
17.89 - 56.00
NAFO Divisions
Exploration Licences (2008)
200 Mile Limit

23
Figure 7. Distribution of spawning Atlantic cod (1971-2001)
48°0'0"W
48°0'0"W
52°0'0"W
52°0'0"W
56°0'0"W
56°0'0"W
60°0'0"W
60°0'0"W
64°0'0"W
64°0'0"W
60°0
'0"N
60°0
'0"N
58°0
'0"N
58°0
'0"N
56°0
'0"N
56°0
'0"N
54°0
'0"N
54°0
'0"N
52°0
'0"N
52°0
'0"N
50°0
'0"N
50°0
'0"N
LABRADOR
NEWFOUNDLAND
QUEBEC
Anticosti Island
Labrador Sea
0 125 250
Kilometers
KLA
BRAD
OR
BASIN
2G
2H
2J
3K
0B 1E
1F
4R4S
4T
Average Number ofSpawning
Atlantic Cod(1971-2001)
0
0.01 - 1.59
1.59 - 3.66
3.66 - 13.67
13.67 - 61.95
61.95 - 295.00
NAFO Divisions
Exploration Licences (2008)
200 Mile Limit
24
Figure 8. Distribution of spawning Greenland halibut (1979-2001)
48°0'0"W
48°0'0"W
52°0'0"W
52°0'0"W
56°0'0"W
56°0'0"W
60°0'0"W
60°0'0"W
64°0'0"W
64°0'0"W
60°0
'0"N
60°0
'0"N
58°0
'0"N
58°0
'0"N
56°0
'0"N
56°0
'0"N
54°0
'0"N
54°0
'0"N
52°0
'0"N
52°0
'0"N
50°0
'0"N
50°0
'0"N
LABRADOR
NEWFOUNDLAND
QUEBEC
Anticosti Island
Labrador Sea
0 125 250
Kilometers
KLA
BRAD
OR
BASIN
2G
2H
2J
3K
0B 1E
1F
4R4S
4T
Average Number ofSpawning
Greenland Halibut(1979-2001)
0
0.01 - 1.12
1.12 - 1.47
1.47 - 2.54
2.54 - 5.84
5.84 - 16.00
NAFO Divisions
Exploration Licences (2008)
200 Mile Limit
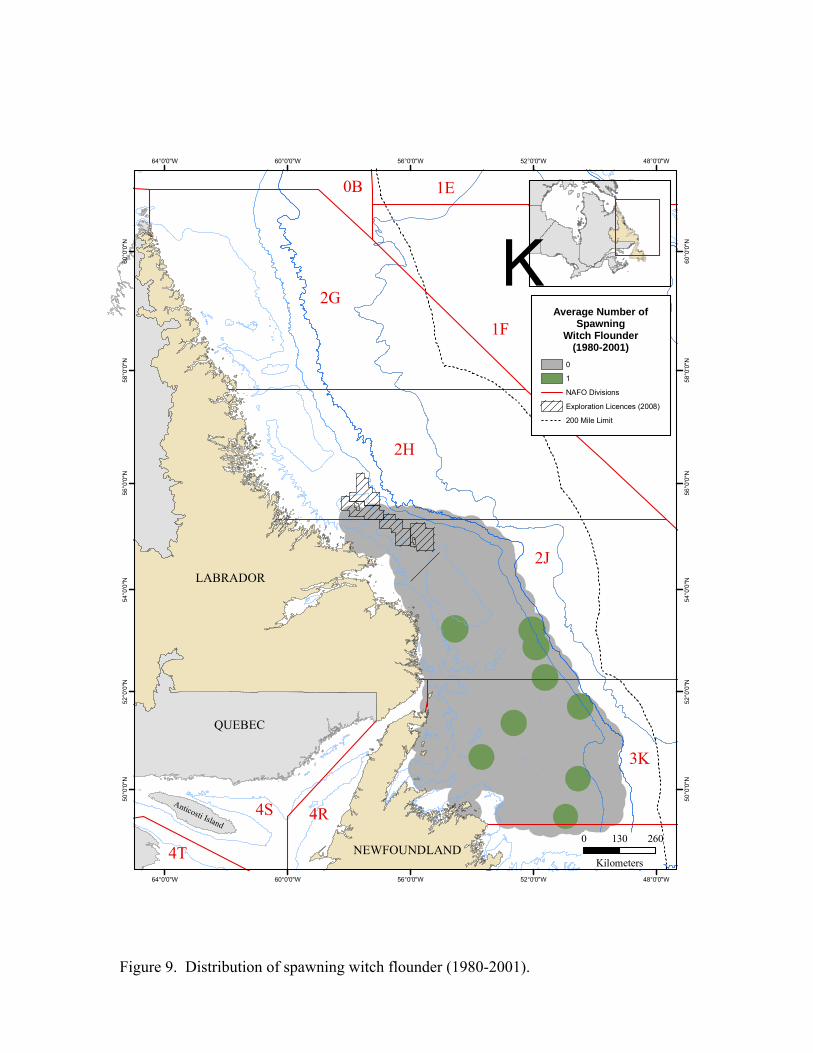
Figure 9. Distribution of spawning witch flounder (1980-2001).
48°0'0"W
48°0'0"W
52°0'0"W
52°0'0"W
56°0'0"W
56°0'0"W
60°0'0"W
60°0'0"W
64°0'0"W
64°0'0"W
60°0
'0"N
60°0
'0"N
58°0
'0"N
58°0
'0"N
56°0
'0"N
56°0
'0"N
54°0
'0"N
54°0
'0"N
52°0
'0"N
52°0
'0"N
50°0
'0"N
50°0
'0"N
LABRADOR
NEWFOUNDLAND
QUEBEC
Anticosti Island
Labrador Sea
0 130 260
Kilometers
KLA
BRA
DO
R BASIN
2G
2H
2J
3K
0B 1E
1F
4R4S
4T
Average Number ofSpawning
Witch Flounder(1980-2001)
0
1
NAFO Divisions
Exploration Licences (2008)
200 Mile Limit

Figure 10. Distribution of spawning yellowtail flounder (1987-1995)
48°0'0"W
48°0'0"W
52°0'0"W
52°0'0"W
56°0'0"W
56°0'0"W
60°0'0"W
60°0'0"W
64°0'0"W
64°0'0"W
60°0
'0"N
60°0
'0"N
58°0
'0"N
58°0
'0"N
56°0
'0"N
56°0
'0"N
54°0
'0"N
54°0
'0"N
52°0
'0"N
52°0
'0"N
50°0
'0"N
50°0
'0"N
LABRADOR
NEWFOUNDLAND
QUEBEC
Anticosti Island
Labrador Sea
0 125 250
Kilometers
KLA
BRA
DO
R BASIN
2G
2H
2J
3K
0B 1E
1F
4R4S
4T
Average Number ofSpawning
Yellowtail Flounder(1987-1995)
0
1
NAFO Divisions
Exploration Licences (2008)
200 Mile Limit

27
Figure 11. Distribution of juvenile American plaice (1987-2001)
48°0'0"W
48°0'0"W
52°0'0"W
52°0'0"W
56°0'0"W
56°0'0"W
60°0'0"W
60°0'0"W
64°0'0"W
64°0'0"W
60°0
'0"N
60°0
'0"N
58°0
'0"N
58°0
'0"N
56°0
'0"N
56°0
'0"N
54°0
'0"N
54°0
'0"N
52°0
'0"N
52°0
'0"N
50°0
'0"N
50°0
'0"N
LABRADOR
NEWFOUNDLAND
QUEBEC
Anticosti Island
Labrador Sea
0 125 250
Kilometers
KLA
BRA
DO
R BA
SIN
2G
2H
2J
3K
0B 1E
1F
4R4S
4T
Average Number ofJuvenile
American Plaice(1987-2001)
0
0.01 - 2.46
2.46 - 2.95
2.95- 5.42
5.42 - 17.86
17.86 - 80.67
NAFO Divisions
Exploration Licences (2008)
200 Mile Limit

28
Figure 12. Distribution of juvenile Atlantic cod (1978-2001)
48°0'0"W
48°0'0"W
52°0'0"W
52°0'0"W
56°0'0"W
56°0'0"W
60°0'0"W
60°0'0"W
64°0'0"W
64°0'0"W
60°0
'0"N
60°0
'0"N
58°0
'0"N
58°0
'0"N
56°0
'0"N
56°0
'0"N
54°0
'0"N
54°0
'0"N
52°0
'0"N
52°0
'0"N
50°0
'0"N
50°0
'0"N
LABRADOR
NEWFOUNDLAND
QUEBEC
Anticosti Island
Labrador Sea
0 125 250
Kilometers
KLA
BRA
DO
R BA
SIN
2G
2H
2J
3K
0B 1E
1F
4R4S
4T
Average Number ofJuvenile
Atlantic Cod(1978-2001)
0
0.01 - 97.57
97.57 - 100.68
100.70 - 148.98
148.98 - 899.57
899.57 - 12,562.53
NAFO Divisions
Exploration Licences (2008)
200 Mile Limit
29
Figure 13. Distribution of juvenile Greenland halibut (1979-2001)
48°0'0"W
48°0'0"W
52°0'0"W
52°0'0"W
56°0'0"W
56°0'0"W
60°0'0"W
60°0'0"W
64°0'0"W
64°0'0"W
60°0
'0"N
60°0
'0"N
58°0
'0"N
58°0
'0"N
56°0
'0"N
56°0
'0"N
54°0
'0"N
54°0
'0"N
52°0
'0"N
52°0
'0"N
50°0
'0"N
50°0
'0"N
LABRADOR
NEWFOUNDLAND
QUEBEC
Anticosti Island
Labrador Sea
0 125 250
Kilometers
KLA
BRA
DO
R BA
SIN
2G
2H
2J
3K
0B 1E
1F
4R4S
4T
Average Number ofJuvenile
Greenland Halibut(1979-2001)
0
0.01 - 20.46
20.46 - 24.51
24.51 - 44.97
44.97 - 148.26
148.26 - 669.65
NAFO Divisions
Exploration Licences (2008)
200 Mile Limit

30
Figure 14. Distribution of juvenile witch flounder (1980-2001)
48°0'0"W
48°0'0"W
52°0'0"W
52°0'0"W
56°0'0"W
56°0'0"W
60°0'0"W
60°0'0"W
64°0'0"W
64°0'0"W
60°0
'0"N
60°0
'0"N
58°0
'0"N
58°0
'0"N
56°0
'0"N
56°0
'0"N
54°0
'0"N
54°0
'0"N
52°0
'0"N
52°0
'0"N
50°0
'0"N
50°0
'0"N
LABRADOR
NEWFOUNDLAND
QUEBEC
Anticosti Island
Labrador Sea
0 125 250
Kilometers
KLA
BRA
DO
R BA
SIN
2G
2H
2J
3K
0B 1E
1F
4R4S
4T
Average Number ofJuvenile
Witch Flounder(1980-2001)
0
0.01 - 1.41
1.41 - 1.48
1.48 - 2.17
2.17 - 9.72
9.72 - 91.56
NAFO Divisions
Exploration Licences (2008)
200 Mile Limit

31
Figure 15. Distribution of juvenile yellowtail flounder (1987-1996)
48°0'0"W
48°0'0"W
52°0'0"W
52°0'0"W
56°0'0"W
56°0'0"W
60°0'0"W
60°0'0"W
64°0'0"W
64°0'0"W
60°0
'0"N
60°0
'0"N
58°0
'0"N
58°0
'0"N
56°0
'0"N
56°0
'0"N
54°0
'0"N
54°0
'0"N
52°0
'0"N
52°0
'0"N
50°0
'0"N
50°0
'0"N
LABRADOR
NEWFOUNDLAND
QUEBEC
Anticosti Island
Labrador Sea
0 125 250
Kilometers
KLA
BRA
DO
R BASIN
2G
2H
2J
3K
0B 1E
1F
4R4S
4T
Average Number ofJuvenile
Yellowtail Flounder(1987-1996)
0
0.01 - 1.44
1.44 - 2.90
2.90 - 7.84
7.84 - 24.46
24.46 - 80.46
NAFO Divisions
Exploration Licences (2008)
200 Mile Limit
Related Documents