www.defra.gov.uk Environmental Statistics – Key Facts Jan 2013

Welcome message from author
This document is posted to help you gain knowledge. Please leave a comment to let me know what you think about it! Share it to your friends and learn new things together.
Transcript
www.defra.gov.uk
Environmental Statistics – Key Facts
Jan 2013

© Crown copyright 2012 ISSN:2051-0179
You may re-use this information (not including logos) free of charge in any format or medium, under the terms of the Open Government Licence. To view this licence, visit www.nationalarchives.gov.uk/doc/open-government-licence/ or write to the Information Policy Team, The National Archives, Kew, London TW9 4DU, or e-mail: [email protected] This document/publication is also available on our website at:
http://www.defra.gov.uk/statistics/environment/
Any enquiries regarding this document/publication should be sent to us at:
PB 13671

Department for Environment, Food and Rural Affairs
Contents
Introduction .................................................................................................................................. 1
Levels of particulates and ozone .............................................................................................. 2
Days when pollution is moderate or higher ............................................................................... 4
Emissions of sulphur dioxide .................................................................................................... 6
Emissions of non-methane volatile organic compounds ........................................................... 8
Emissions of ammonia ............................................................................................................. 9
Emissions of nitrogen oxides .................................................................................................. 11
Air Quality - Further Information ............................................................................................. 13
Coastal and marine waters ........................................................................................................ 14
North Sea fish stocks and stocks of North East Atlantic mackerel ......................................... 14
Sustainability of fish stocks around the UK ............................................................................. 15
Bathing water surveys, mandatory standards ......................................................................... 17
Bathing water surveys, Guideline Standards .......................................................................... 18
Coastal and marine waters - Further Information ................................................................... 19
Inland water ............................................................................................................................... 20
Chemical river water quality ....................................................................................................... 20
Biological river water quality ................................................................................................... 22
Abstractions from non-tidal surface water and groundwater ................................................... 23
Water leakage ........................................................................................................................ 24
Drinking water quality ............................................................................................................. 25
Number of properties at risk of flooding .................................................................................. 26
Sensitive habitats where critical loads for acidification and eutrophication were exceeded.... 27
Average annual rainfall ........................................................................................................... 28
Inland water - Further information........................................................................................... 29
Green Economy, Green Business .............................................................................................. 30
UK‟s Carbon Footprint – Carbon dioxide emissions relating to UK consumption ....................... 30
Electricity consumption by households ................................................................................... 31
Water use by industry ............................................................................................................. 32
CO2 emissions by different sub-groups in manufacturing sector ............................................ 34
Sustainable Operations on the Government Estate ............................................................... 35
Central Government carbon footprint ..................................................................................... 36
Market value of low carbon and environmental goods and services ...................................... 37
Green economy, green business- Further information ........................................................... 38
Supplementary Information ........................................................................................................ 39
Serious pollution incidents affecting water, air and land ......................................................... 39
Department for Environment, Food and Rural Affairs
Category 1 and 2 pollution incidents by source to air, land and water .................................... 40
Column ozone measurement in the UK: 1979-2011 .................................................................. 41
Expenditure on UK biodiversity .............................................................................................. 42
Expenditure on global biodiversity .......................................................................................... 43
Supplementary - Further information ...................................................................................... 44
Waste and Recycling ................................................................................................................. 45
UK waste data ........................................................................................................................ 45
UK waste management .......................................................................................................... 46
Commercial and industrial waste generation and management ............................................. 47
Household waste and recycling in the UK .............................................................................. 49
Municipal waste management in the European Union............................................................ 50
Construction and demolition waste, England .......................................................................... 51
Local Authority Collected waste management ........................................................................ 53
Household waste recycling, by material - England ................................................................. 54
Household waste: green and dry recycling rates .................................................................... 55
Recycling and recovery from packaging ................................................................................. 56
Composition of local authority collected waste ....................................................................... 57
Local authority collected waste generation ............................................................................. 58
Local authority collected waste for England ........................................................................... 59
annual statistics .................................................................................................................. 59
Waste and Recycling - Further information ........................................................................... 60
Biodiversity and wildlife .............................................................................................................. 61
Wild bird population in UK, 1970-2010 ....................................................................................... 61
Regional farmland species indices ............................................................................................. 63
Regional woodland species indices ........................................................................................... 65
Biodiversity and wildlife further information ................................................................................ 67
Annexe ....................................................................................................................................... 68
Department for Environment, Food and Rural Affairs
1
Introduction
Welcome to the second edition of our key environmental statistics 2012. This is a replacement for the Environment In Your Pocket printed publications which we have had to discontinue in 2009. The new publication has a number of advantages over the old printed publication. It will be regularly updated to provide the most recent figures on a whole range of environmental issues. Retaining the hyperlinks in the text allow you to more easily navigate to more information. It is more in keeping with the modern teaching resources and conforms to the wider government agenda of making data more accessible and transparent.
The key facts are based on the pages available on the Defra website. However, if you have any suggestion of how to improve this publication please contact us at:
Email: [email protected]
Environment Statistics Service,
Defra, Area 6E, Ergon House,
Horseferry Road, London
SW1P 2AL
Or fill in our online questionnaire at: feedback form
To support our sustainability agenda we do not normally supply publications in hard copy format. However should you require a printed copy please contact Defra Library [email protected] telephone 020 7238 6575 for further information.
Department for Environment, Food and Rural Affairs
2
Air Quality
Levels of particulates and ozone
Our air quality is monitored by a national network of monitoring sites, which continuously captures ambient air quality levels for selected pollutants throughout the UK. This monitoring helps to assess the risks to people’s health and to the environment.
Statistics can be derived for the average concentrations of pollutants
Air quality statistics in the UK, 1987 to 2011 – Final: Statistical release
These statistics include concentrations of particulates (PM10) and Ozone (O3), which are the two pollutants thought to have the greatest health impacts.
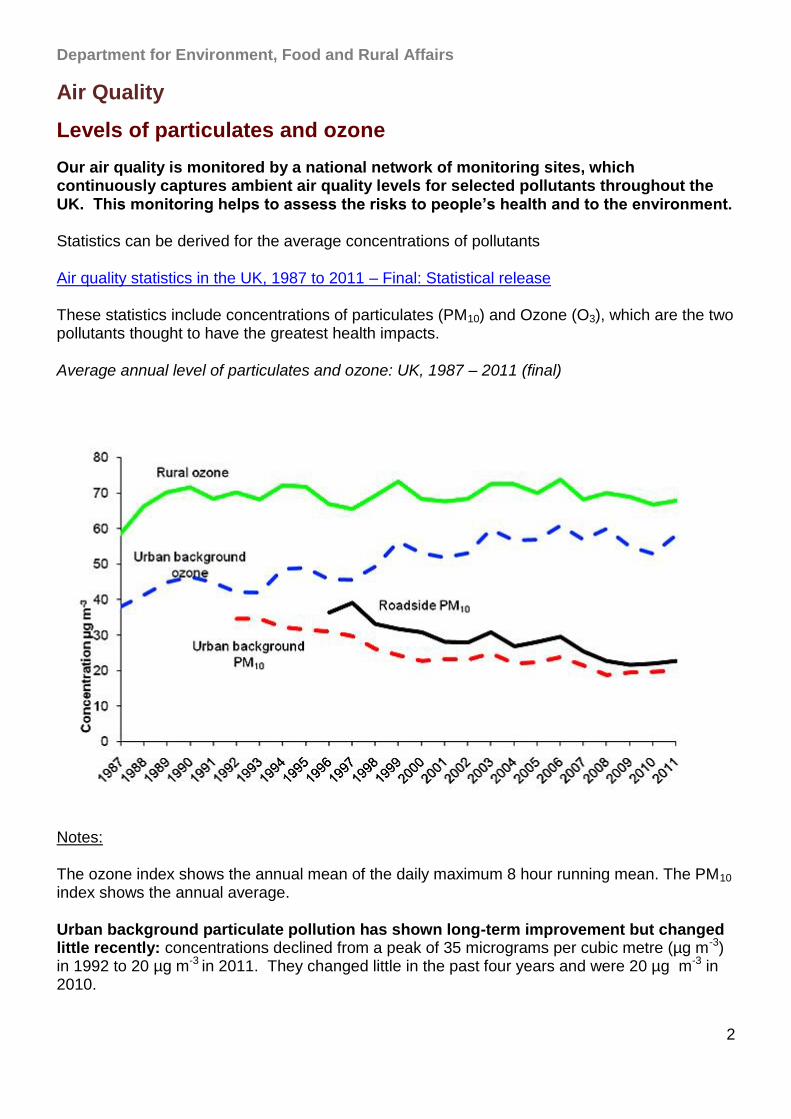
Average annual level of particulates and ozone: UK, 1987 – 2011 (final)
Notes:
The ozone index shows the annual mean of the daily maximum 8 hour running mean. The PM10 index shows the annual average.
Urban background particulate pollution has shown long-term improvement but changed little recently: concentrations declined from a peak of 35 micrograms per cubic metre (µg m-3) in 1992 to 20 µg m-3 in 2011. They changed little in the past four years and were 20 µg m-3 in 2010.
Department for Environment, Food and Rural Affairs
3
Roadside particulate pollution has shown long-term improvement but changed little recently: concentrations declined from a peak of 39 µg m-3 in 1997 to 22 µg m-3 in 2011. They changed little in the past four years and were 22 µgm-3 in 2010.
Urban background ozone pollution has shown a long-term increase: concentrations increased from a low of 38 µg m-3 in 1987 to 58 µg m-3 in 2011 and increased from 53 µg m-3 in 2010 after declining from a peak of 61 µg m-3 in 2006.
Rural background ozone pollution has shown no clear long-term trend and changed little recently: concentrations increased from a low of 58 µg m-3 in 1987 to 68 µg m-3 in 2011, but changed little in the past five years, fluctuating between 67 and 70 µg m-3 after declining from a peak of 74 µg m-3 in 2006.
Data download
Department for Environment, Food and Rural Affairs
4
Days when pollution is moderate or higher
Our air quality is monitored by a national network of monitoring sites, which continuously captures ambient air quality levels for selected pollutants throughout the UK. This monitoring helps to assess the risks to people‟s health and to the environment.
Statistics can be derived for the average number of days when pollution is moderate or higher.
Air quality statistics in the UK, 1987 to 2011 – Final: Statistical release
The statistics are based on concentrations of pollutants and the resulting „pollution days‟ for the following:
carbon monoxide (CO) nitrogen dioxide (NO2) ozone (O3) particulates (PM10) sulphur dioxide (SO2)
At the moderate level, the effects of pollution may start to be noticeable to people with respiratory and other health problems, with greater risks to health at higher levels.
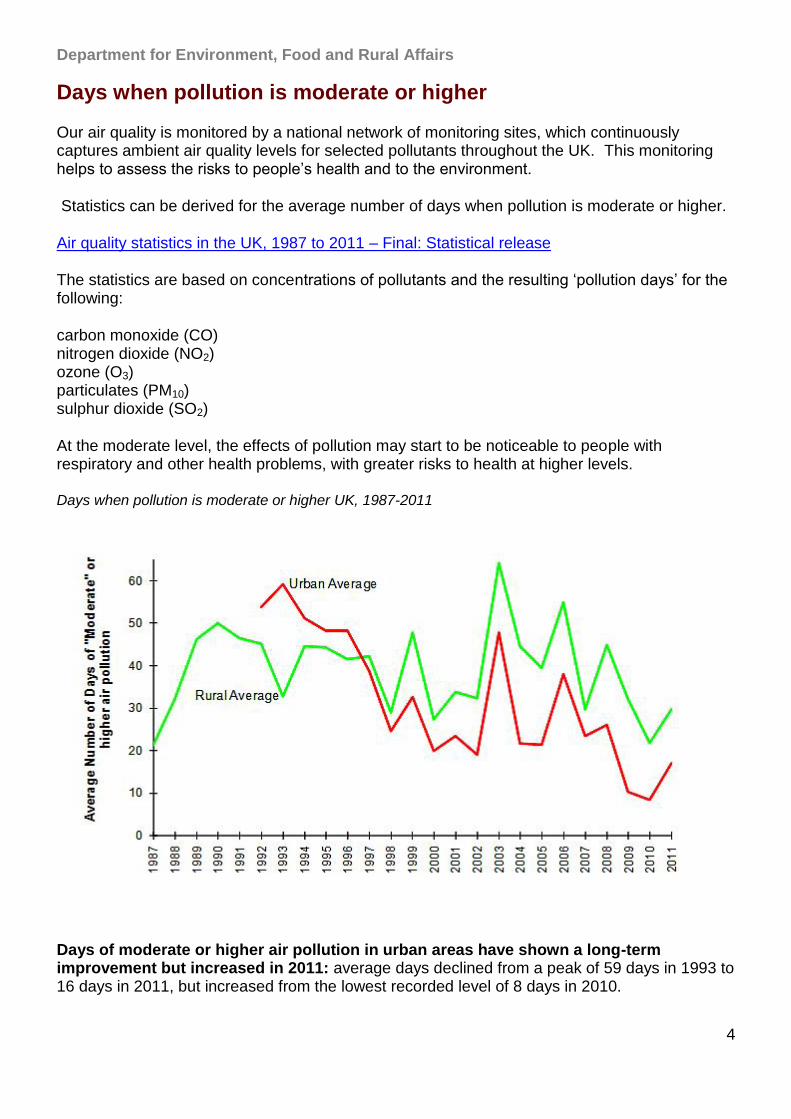
Days when pollution is moderate or higher UK, 1987-2011
Days of moderate or higher air pollution in urban areas have shown a long-term improvement but increased in 2011: average days declined from a peak of 59 days in 1993 to 16 days in 2011, but increased from the lowest recorded level of 8 days in 2010.
Department for Environment, Food and Rural Affairs
5
Days of moderate or higher air pollution for rural areas have shown no clear trend but increased in 2011: average days declined from a peak of 64 days in 2003 to 30 days in 2011, but increased from a low of 22 days in 2010.
Note on Methodology
Urban sites must have monitored PM10 and achieved 75% data capture for this pollutant. If not, the site is not counted in the indicator even if there are “moderate or higher” days for a different pollutant.
Rural sites must have monitored O3 and achieved 75% data capture for this pollutant. If not, again, the site is not counted even if there are “moderate or higher” days for a different pollutant.
Data download
Individual site data
Department for Environment, Food and Rural Affairs
6
Emissions of sulphur dioxide
Emissions of sulphur dioxide have fallen by 89 per cent between 1990 and 2010, but increased by 2 per cent between 2009 and 2010. Emissions in 2010 were 31 per cent below the lowest international target for the UK.
The UK has met current international targets set in the National Emission Ceilings Directive (NECD) and the Gothenburg Protocol under the Convention on Long Range Transboundary Air Pollution (CLRTAP) to reduce total emissions by 2010.
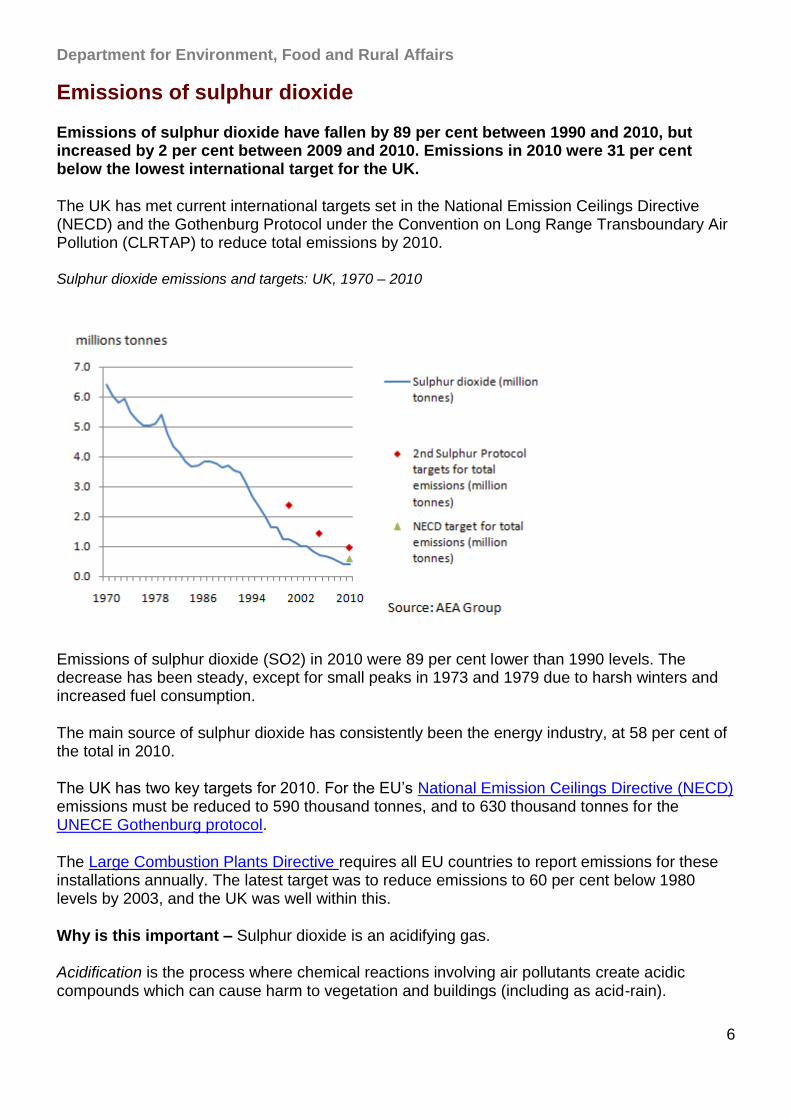
Sulphur dioxide emissions and targets: UK, 1970 – 2010
Emissions of sulphur dioxide (SO2) in 2010 were 89 per cent lower than 1990 levels. The decrease has been steady, except for small peaks in 1973 and 1979 due to harsh winters and increased fuel consumption.
The main source of sulphur dioxide has consistently been the energy industry, at 58 per cent of the total in 2010.
The UK has two key targets for 2010. For the EU‟s National Emission Ceilings Directive (NECD) emissions must be reduced to 590 thousand tonnes, and to 630 thousand tonnes for the UNECE Gothenburg protocol.
The Large Combustion Plants Directive requires all EU countries to report emissions for these installations annually. The latest target was to reduce emissions to 60 per cent below 1980 levels by 2003, and the UK was well within this.
Why is this important – Sulphur dioxide is an acidifying gas.
Acidification is the process where chemical reactions involving air pollutants create acidic compounds which can cause harm to vegetation and buildings (including as acid-rain).

Department for Environment, Food and Rural Affairs
7
This pollutant can also react in the atmosphere to form secondary particulate matter (PM), which can adversely impact human health. Chronic exposure to PM can contribute to the risk of developing cardiovascular and respiratory diseases.
Data download
Department for Environment, Food and Rural Affairs
8
Emissions of non-methane volatile organic compounds
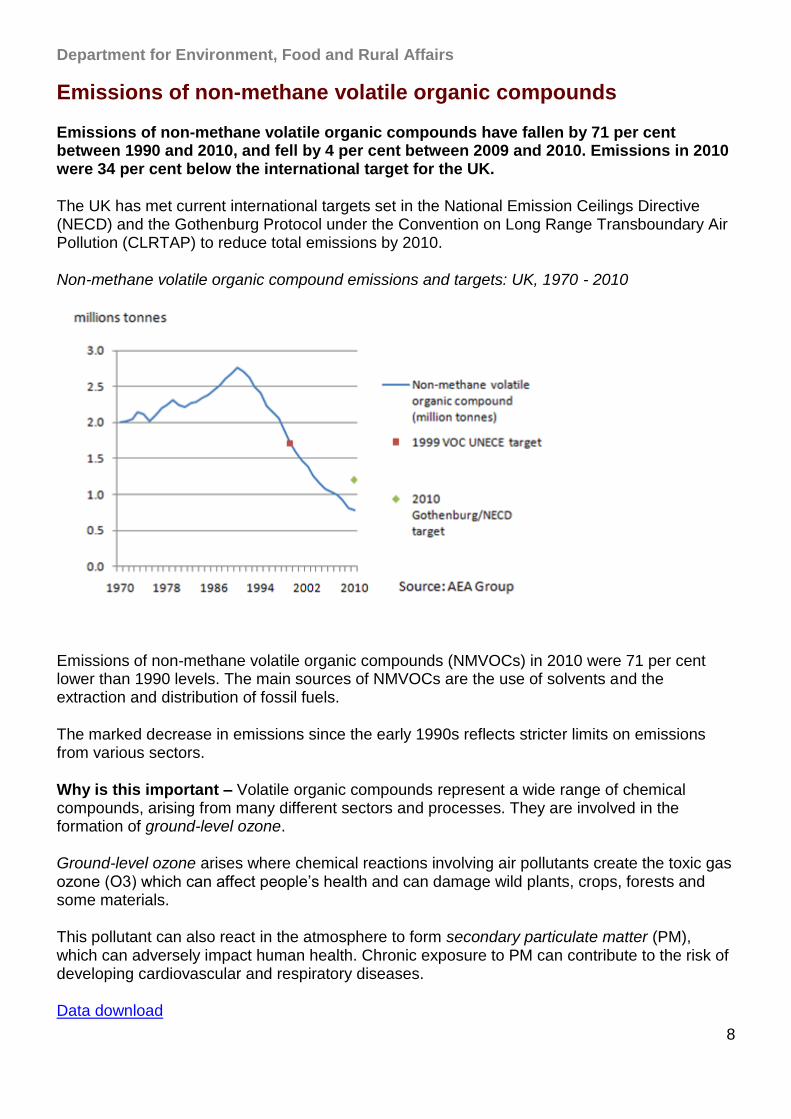
Emissions of non-methane volatile organic compounds have fallen by 71 per cent between 1990 and 2010, and fell by 4 per cent between 2009 and 2010. Emissions in 2010 were 34 per cent below the international target for the UK.
The UK has met current international targets set in the National Emission Ceilings Directive (NECD) and the Gothenburg Protocol under the Convention on Long Range Transboundary Air Pollution (CLRTAP) to reduce total emissions by 2010.
Non-methane volatile organic compound emissions and targets: UK, 1970 - 2010
Emissions of non-methane volatile organic compounds (NMVOCs) in 2010 were 71 per cent lower than 1990 levels. The main sources of NMVOCs are the use of solvents and the extraction and distribution of fossil fuels.
The marked decrease in emissions since the early 1990s reflects stricter limits on emissions from various sectors.
Why is this important – Volatile organic compounds represent a wide range of chemical compounds, arising from many different sectors and processes. They are involved in the formation of ground-level ozone.
Ground-level ozone arises where chemical reactions involving air pollutants create the toxic gas ozone (O3) which can affect people‟s health and can damage wild plants, crops, forests and some materials.
This pollutant can also react in the atmosphere to form secondary particulate matter (PM), which can adversely impact human health. Chronic exposure to PM can contribute to the risk of developing cardiovascular and respiratory diseases.
Data download
Department for Environment, Food and Rural Affairs
9
Emissions of ammonia
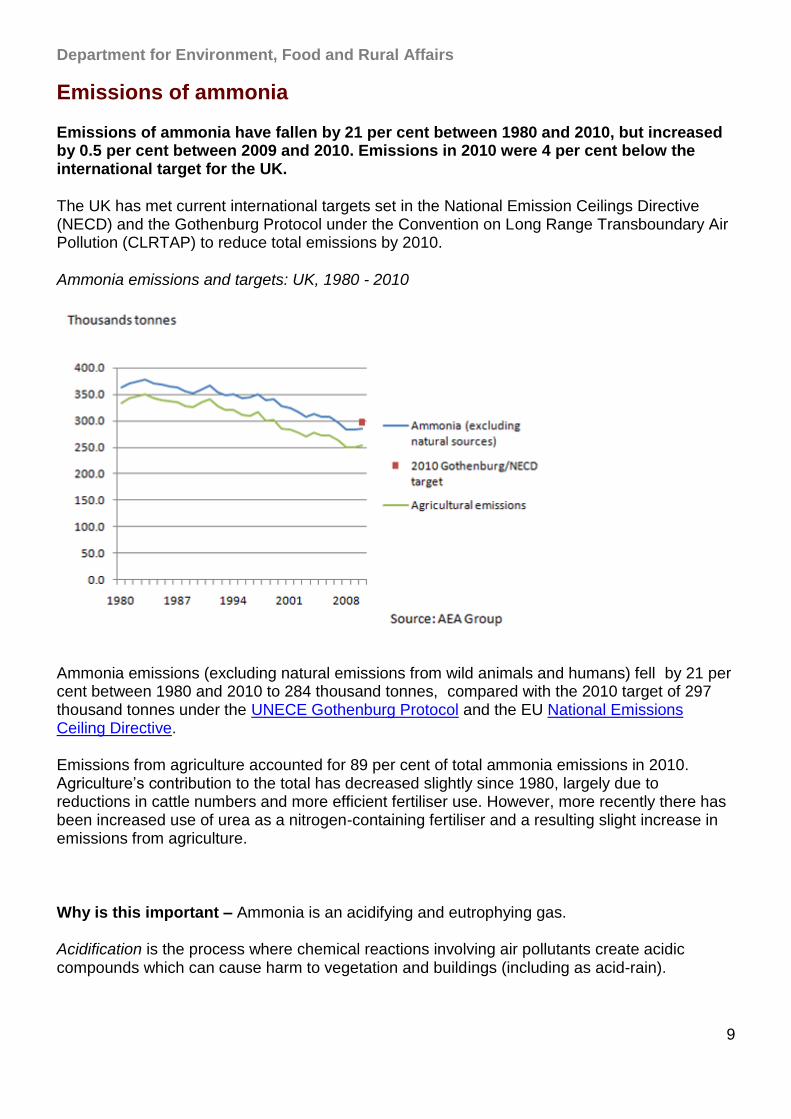
Emissions of ammonia have fallen by 21 per cent between 1980 and 2010, but increased by 0.5 per cent between 2009 and 2010. Emissions in 2010 were 4 per cent below the international target for the UK.
The UK has met current international targets set in the National Emission Ceilings Directive (NECD) and the Gothenburg Protocol under the Convention on Long Range Transboundary Air Pollution (CLRTAP) to reduce total emissions by 2010.
Ammonia emissions and targets: UK, 1980 - 2010
Ammonia emissions (excluding natural emissions from wild animals and humans) fell by 21 per cent between 1980 and 2010 to 284 thousand tonnes, compared with the 2010 target of 297 thousand tonnes under the UNECE Gothenburg Protocol and the EU National Emissions Ceiling Directive.
Emissions from agriculture accounted for 89 per cent of total ammonia emissions in 2010. Agriculture‟s contribution to the total has decreased slightly since 1980, largely due to reductions in cattle numbers and more efficient fertiliser use. However, more recently there has been increased use of urea as a nitrogen-containing fertiliser and a resulting slight increase in emissions from agriculture.
Why is this important – Ammonia is an acidifying and eutrophying gas.
Acidification is the process where chemical reactions involving air pollutants create acidic compounds which can cause harm to vegetation and buildings (including as acid-rain).
Department for Environment, Food and Rural Affairs
10
Eutrophication is the process where nitrogen is deposited in soils or in rivers and lakes through rain and affects the nutrient levels and diversity of species in sensitive environments, for example encouraging algae growth in lakes and water courses.
This pollutant can also react in the atmosphere to form secondary particulate matter (PM), which can adversely impact human health. Chronic exposure to PM can contribute to the risk of developing cardiovascular and respiratory diseases.
Data download
Department for Environment, Food and Rural Affairs
11
Emissions of nitrogen oxides
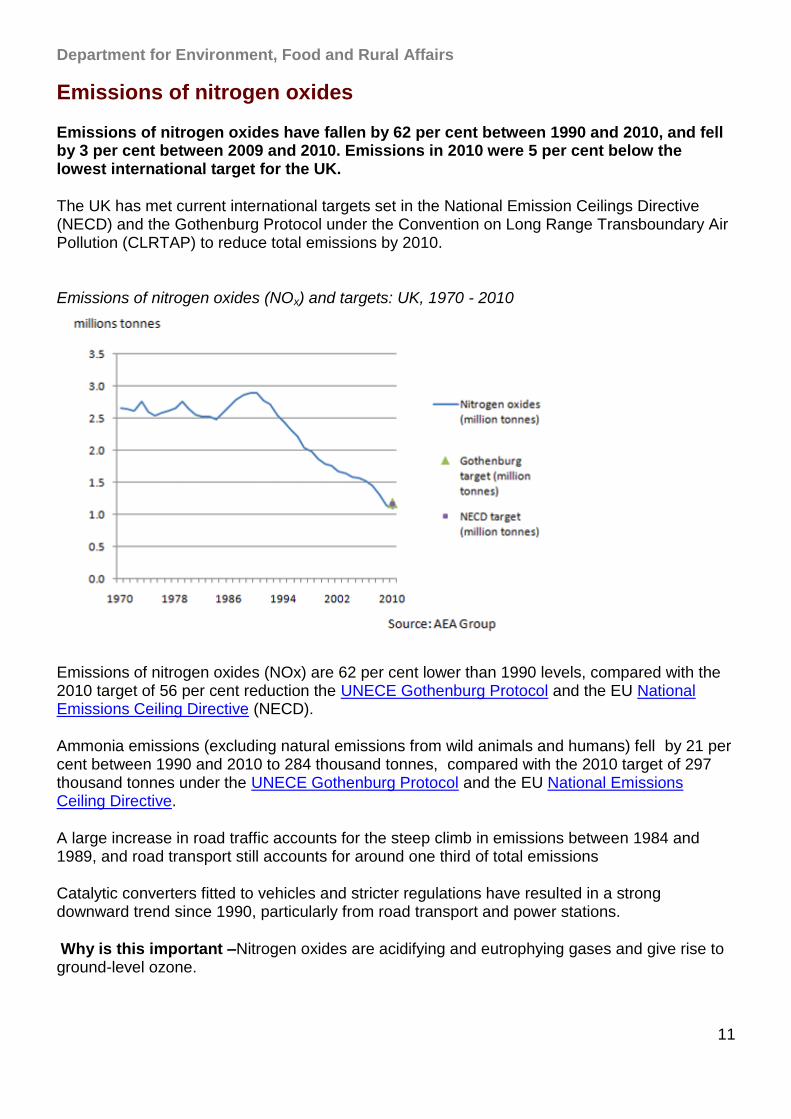
Emissions of nitrogen oxides have fallen by 62 per cent between 1990 and 2010, and fell by 3 per cent between 2009 and 2010. Emissions in 2010 were 5 per cent below the lowest international target for the UK.
The UK has met current international targets set in the National Emission Ceilings Directive (NECD) and the Gothenburg Protocol under the Convention on Long Range Transboundary Air Pollution (CLRTAP) to reduce total emissions by 2010.
Emissions of nitrogen oxides (NOx) and targets: UK, 1970 - 2010
Emissions of nitrogen oxides (NOx) are 62 per cent lower than 1990 levels, compared with the 2010 target of 56 per cent reduction the UNECE Gothenburg Protocol and the EU National Emissions Ceiling Directive (NECD).
Ammonia emissions (excluding natural emissions from wild animals and humans) fell by 21 per cent between 1990 and 2010 to 284 thousand tonnes, compared with the 2010 target of 297 thousand tonnes under the UNECE Gothenburg Protocol and the EU National Emissions Ceiling Directive.
A large increase in road traffic accounts for the steep climb in emissions between 1984 and 1989, and road transport still accounts for around one third of total emissions
Catalytic converters fitted to vehicles and stricter regulations have resulted in a strong downward trend since 1990, particularly from road transport and power stations.
Why is this important –Nitrogen oxides are acidifying and eutrophying gases and give rise to ground-level ozone.
Department for Environment, Food and Rural Affairs
12
Acidification is the process where chemical reactions involving air pollutants create acidic compounds which can cause harm to vegetation and buildings (including as acid-rain).
Eutrophication is the process where nitrogen is deposited in soils or in rivers and lakes through rain and affects the nutrient levels and diversity of species in sensitive environments, for example encouraging algae growth in lakes and water courses.
Ground-level ozone arises where chemical reactions involving air pollutants create the toxic gas ozone (O3) which can affect people‟s health and can damage wild plants, crops, forests and some materials.
This pollutant can also react in the atmosphere to form secondary particulate matter (PM), which can adversely impact human health. Chronic exposure to PM can contribute to the risk of developing cardiovascular and respiratory diseases.
Data download

Department for Environment, Food and Rural Affairs
13
Air Quality - Further Information
Government policy on air quality Air pollutant emissions methodology Air quality in Scotland, Wales, Northern Ireland and Europe Additional information on air quality. Air Quality monitoring networks and methodology
Department for Environment, Food and Rural Affairs
14
Coastal and marine waters
North Sea fish stocks and stocks of North East Atlantic mackerel
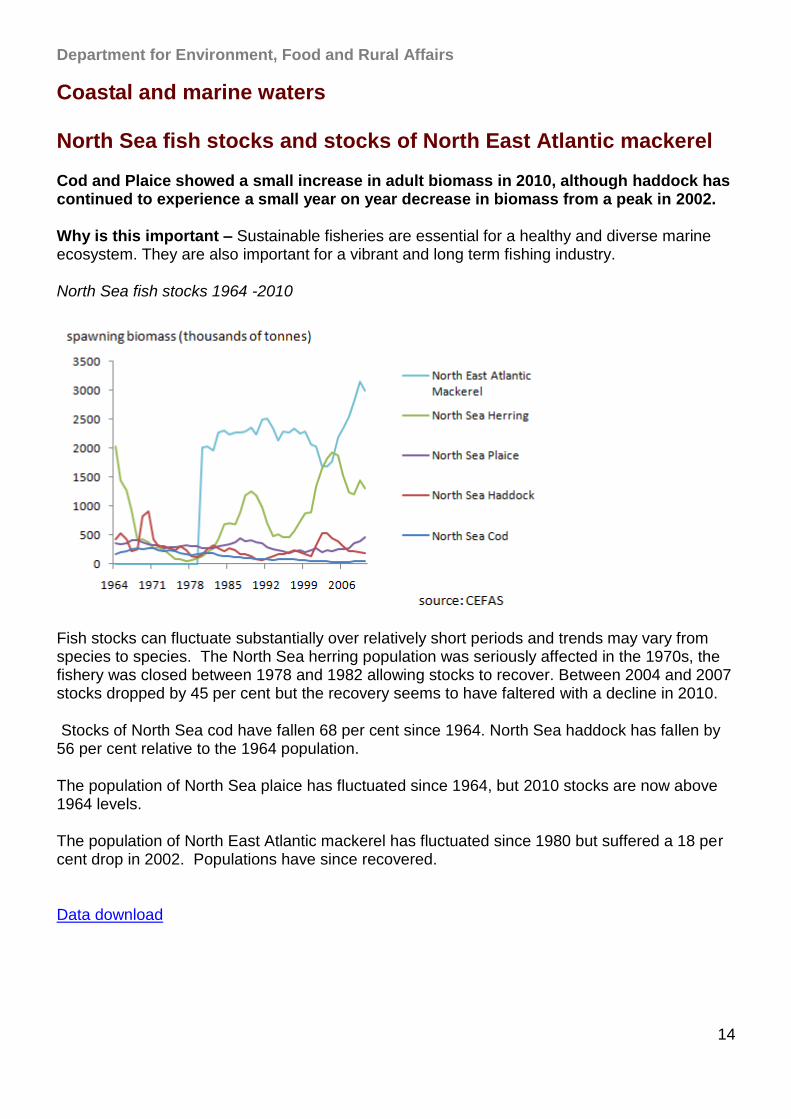
Cod and Plaice showed a small increase in adult biomass in 2010, although haddock has continued to experience a small year on year decrease in biomass from a peak in 2002.
Why is this important – Sustainable fisheries are essential for a healthy and diverse marine ecosystem. They are also important for a vibrant and long term fishing industry.
North Sea fish stocks 1964 -2010
Fish stocks can fluctuate substantially over relatively short periods and trends may vary from species to species. The North Sea herring population was seriously affected in the 1970s, the fishery was closed between 1978 and 1982 allowing stocks to recover. Between 2004 and 2007 stocks dropped by 45 per cent but the recovery seems to have faltered with a decline in 2010.
Stocks of North Sea cod have fallen 68 per cent since 1964. North Sea haddock has fallen by 56 per cent relative to the 1964 population.
The population of North Sea plaice has fluctuated since 1964, but 2010 stocks are now above 1964 levels.
The population of North East Atlantic mackerel has fluctuated since 1980 but suffered a 18 per cent drop in 2002. Populations have since recovered.
Data download
Department for Environment, Food and Rural Affairs
15
Sustainability of fish stocks around the UK
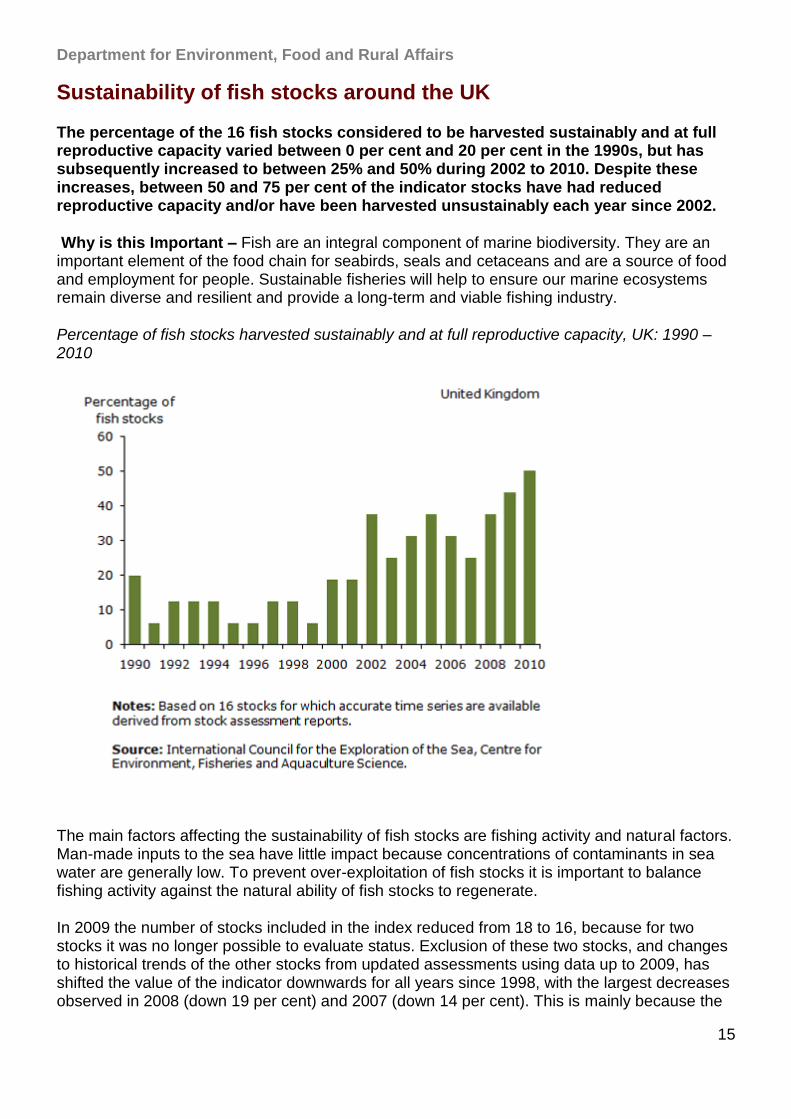
The percentage of the 16 fish stocks considered to be harvested sustainably and at full reproductive capacity varied between 0 per cent and 20 per cent in the 1990s, but has subsequently increased to between 25% and 50% during 2002 to 2010. Despite these increases, between 50 and 75 per cent of the indicator stocks have had reduced reproductive capacity and/or have been harvested unsustainably each year since 2002.
Why is this Important – Fish are an integral component of marine biodiversity. They are an important element of the food chain for seabirds, seals and cetaceans and are a source of food and employment for people. Sustainable fisheries will help to ensure our marine ecosystems remain diverse and resilient and provide a long-term and viable fishing industry.
Percentage of fish stocks harvested sustainably and at full reproductive capacity, UK: 1990 – 2010
The main factors affecting the sustainability of fish stocks are fishing activity and natural factors. Man-made inputs to the sea have little impact because concentrations of contaminants in sea water are generally low. To prevent over-exploitation of fish stocks it is important to balance fishing activity against the natural ability of fish stocks to regenerate.
In 2009 the number of stocks included in the index reduced from 18 to 16, because for two stocks it was no longer possible to evaluate status. Exclusion of these two stocks, and changes to historical trends of the other stocks from updated assessments using data up to 2009, has shifted the value of the indicator downwards for all years since 1998, with the largest decreases observed in 2008 (down 19 per cent) and 2007 (down 14 per cent). This is mainly because the

Department for Environment, Food and Rural Affairs
16
excluded stocks were previously included in the indicator and assessed as being fished sustainably in recent years.
Data download
Department for Environment, Food and Rural Affairs
17
Bathing water surveys, mandatory standards
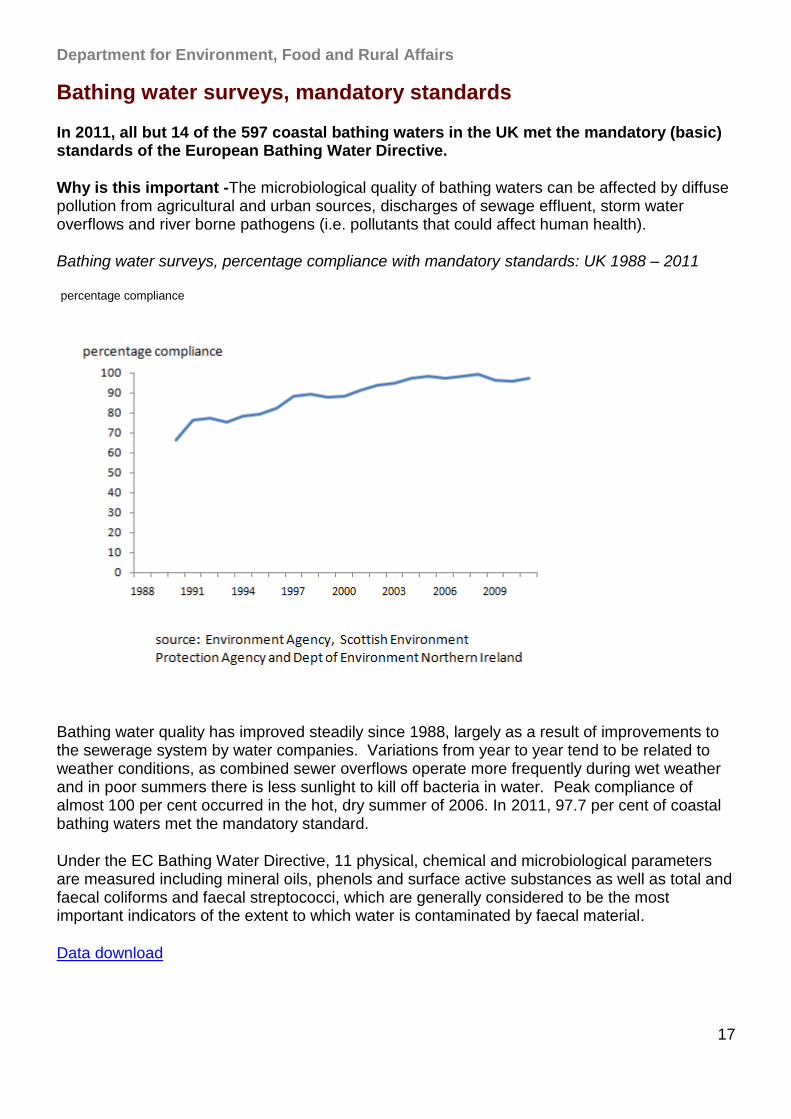
In 2011, all but 14 of the 597 coastal bathing waters in the UK met the mandatory (basic) standards of the European Bathing Water Directive.
Why is this important -The microbiological quality of bathing waters can be affected by diffuse pollution from agricultural and urban sources, discharges of sewage effluent, storm water overflows and river borne pathogens (i.e. pollutants that could affect human health).
Bathing water surveys, percentage compliance with mandatory standards: UK 1988 – 2011
Bathing water quality has improved steadily since 1988, largely as a result of improvements to the sewerage system by water companies. Variations from year to year tend to be related to weather conditions, as combined sewer overflows operate more frequently during wet weather and in poor summers there is less sunlight to kill off bacteria in water. Peak compliance of almost 100 per cent occurred in the hot, dry summer of 2006. In 2011, 97.7 per cent of coastal bathing waters met the mandatory standard.
Under the EC Bathing Water Directive, 11 physical, chemical and microbiological parameters are measured including mineral oils, phenols and surface active substances as well as total and faecal coliforms and faecal streptococci, which are generally considered to be the most important indicators of the extent to which water is contaminated by faecal material.
Data download
percentage compliance

Department for Environment, Food and Rural Affairs
18
Bathing water surveys, Guideline Standards
In 2011, 76.9 per cent of UK coastal bathing waters met the more stringent UK guideline standards of the Bathing Water Directive (one of the requirements for Blue Flag status). This standard is tighter than the guideline standard used by the European Commission in its annual bathing water report and from 2012 will be the sole guideline standard.
Why is this important – The EC Bathing Water Directive sets more stringent guideline standards with the tighter limit values including faecal coliforms (100 per 100ml) and total coliforms (500 per 100ml). At least 80 per cent of bathing water samples must meet the limit values and the mandatory standard to achieve guideline compliance.
Compliance with EC Bathing Water Directive UK Guidelines standards: UK 1994-2011
The number of UK waters reaching guideline standards improved from 190 out of 464 coastal bathing waters in 1995 to 459 out of 597 in 2011. The biggest improvement in bathing water quality has been in the North eastern region from single figures in 1999 to over 90 per cent in 2011. Compliance in England has increased from 41 per cent in 1995 to 79 per cent in 2011.
During the same period, compliance in Scotland increased from 22 per cent to 49 per cent and in Wales from 38 per cent to 89 per cent. Compliance in Northern Ireland reached 83 per cent in 2011. There has been considerable variation over time in Northern Ireland because it has only 24 bathing waters compared with 597 coastal bathing waters in the UK as a whole, so even one failure has a significant impact on percentage compliance.
Data download
Department for Environment, Food and Rural Affairs
19
Coastal and marine waters - Further Information
Government policy on Fisheries
Government policy on coastal and marine waters
Additional data: fish stocks in the North Sea.
International Council for the Exploration of the Sea (ICES)
Marine Management Organisation
EC Bathing Water Directive (76/160/EEC)
Bathing water in Scotland, Northern Ireland and Europe
Additional data and information on Bathing Water Quality
Blue Flag awards
Department for Environment, Food and Rural Affairs
20
Inland water
Chemical river water quality
The EU Water Framework Directive has resulted in the need to change the way in which surface water quality is monitored and reported. It is not currently possible to produce an indicator of water quality that is consistent across the countries of the UK or provides a long-term indicator of change. Defra, the Environment Agency for England and Wales, the Scottish Environment Protection Agency and the Department of the Environment for Northern Ireland are considering reporting options and methodologies. This indicator will be updated once a new methodology has been established.
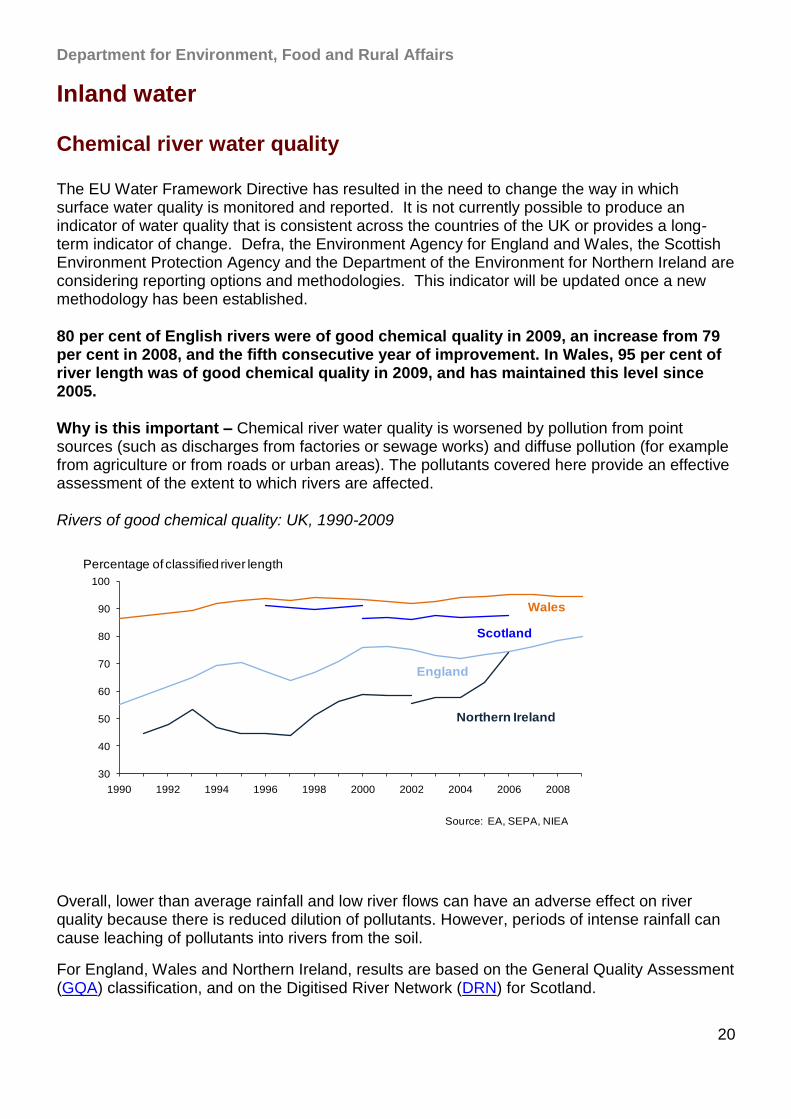
80 per cent of English rivers were of good chemical quality in 2009, an increase from 79 per cent in 2008, and the fifth consecutive year of improvement. In Wales, 95 per cent of river length was of good chemical quality in 2009, and has maintained this level since 2005.
Why is this important – Chemical river water quality is worsened by pollution from point sources (such as discharges from factories or sewage works) and diffuse pollution (for example from agriculture or from roads or urban areas). The pollutants covered here provide an effective assessment of the extent to which rivers are affected.
Rivers of good chemical quality: UK, 1990-2009
30
40
50
60
70
80
90
100
1990 1992 1994 1996 1998 2000 2002 2004 2006 2008
Source: EA, SEPA, NIEA
Northern Ireland
Scotland
Wales
England
Percentage of classified river length
Overall, lower than average rainfall and low river flows can have an adverse effect on river quality because there is reduced dilution of pollutants. However, periods of intense rainfall can cause leaching of pollutants into rivers from the soil.
For England, Wales and Northern Ireland, results are based on the General Quality Assessment (GQA) classification, and on the Digitised River Network (DRN) for Scotland.

Department for Environment, Food and Rural Affairs
21
In 2011, a new indicator will be published based on the monitoring network for the EU‟s Water Framework Directive (WFD)
Data download
Department for Environment, Food and Rural Affairs
22
Biological river water quality
The EU Water Framework Directive has resulted in the need to change the way in which surface water quality is monitored and reported. It is not currently possible to produce an indicator of water quality that is consistent across the countries of the UK or provides a long-term indicator of change. Defra, the Environment Agency for England and Wales, the Scottish Environment Protection Agency and the Department of the Environment for Northern Ireland are considering reporting options and methodologies. This indicator will be updated once a new methodology has been established.
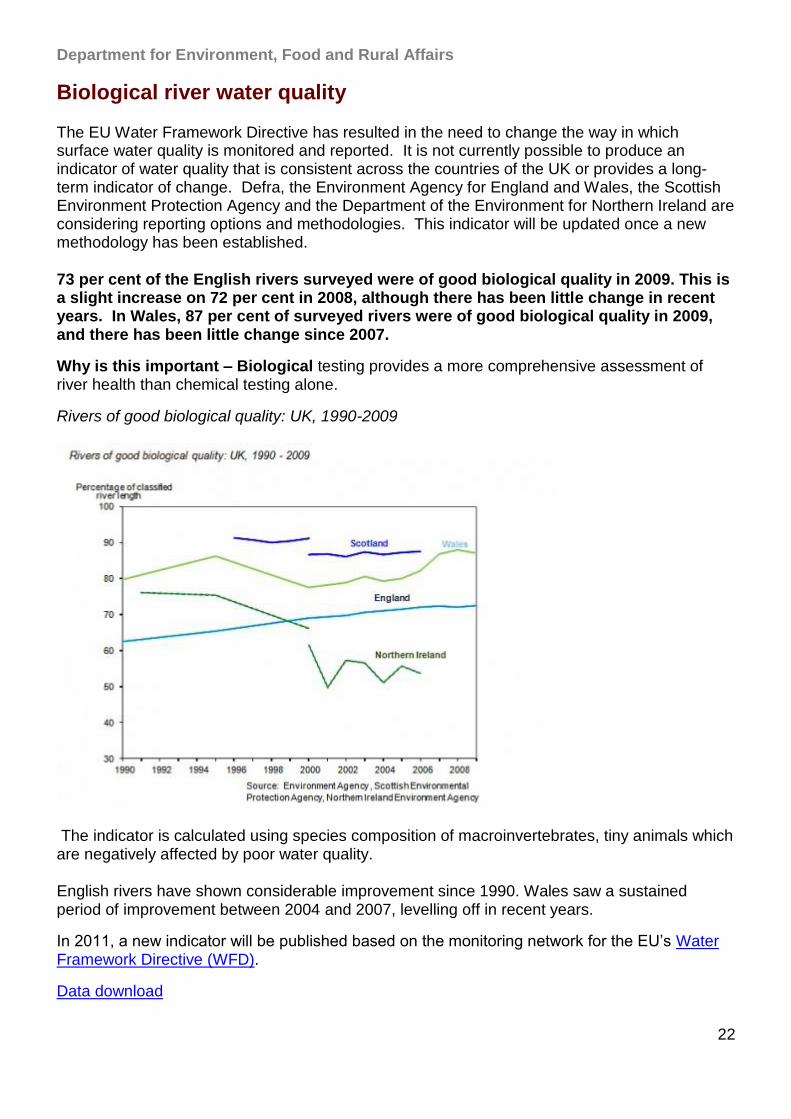
73 per cent of the English rivers surveyed were of good biological quality in 2009. This is a slight increase on 72 per cent in 2008, although there has been little change in recent years. In Wales, 87 per cent of surveyed rivers were of good biological quality in 2009, and there has been little change since 2007.
Why is this important – Biological testing provides a more comprehensive assessment of river health than chemical testing alone.
Rivers of good biological quality: UK, 1990-2009
The indicator is calculated using species composition of macroinvertebrates, tiny animals which are negatively affected by poor water quality.
English rivers have shown considerable improvement since 1990. Wales saw a sustained period of improvement between 2004 and 2007, levelling off in recent years.
In 2011, a new indicator will be published based on the monitoring network for the EU‟s Water Framework Directive (WFD).
Data download
Department for Environment, Food and Rural Affairs
23
Abstractions from non-tidal surface water and groundwater
Water Abstraction estimates
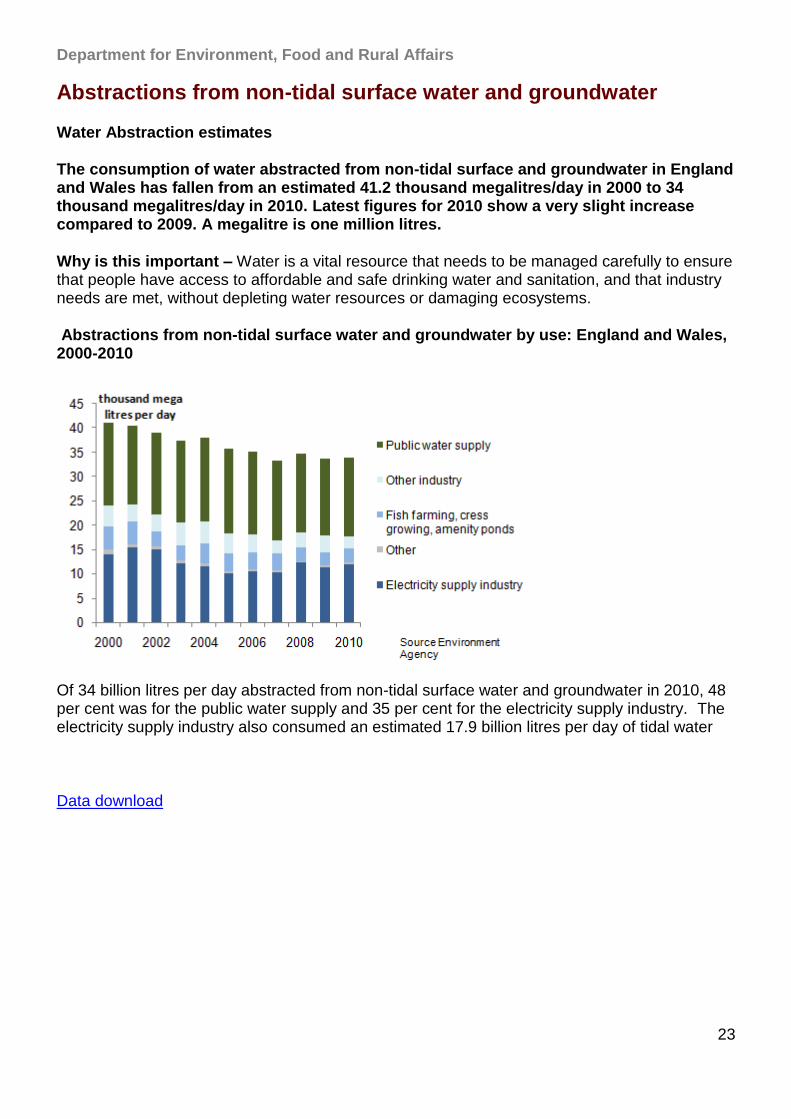
The consumption of water abstracted from non-tidal surface and groundwater in England and Wales has fallen from an estimated 41.2 thousand megalitres/day in 2000 to 34 thousand megalitres/day in 2010. Latest figures for 2010 show a very slight increase compared to 2009. A megalitre is one million litres.
Why is this important – Water is a vital resource that needs to be managed carefully to ensure that people have access to affordable and safe drinking water and sanitation, and that industry needs are met, without depleting water resources or damaging ecosystems.
Abstractions from non-tidal surface water and groundwater by use: England and Wales, 2000-2010
Of 34 billion litres per day abstracted from non-tidal surface water and groundwater in 2010, 48 per cent was for the public water supply and 35 per cent for the electricity supply industry. The electricity supply industry also consumed an estimated 17.9 billion litres per day of tidal water
Data download
Department for Environment, Food and Rural Affairs
24
Water leakage
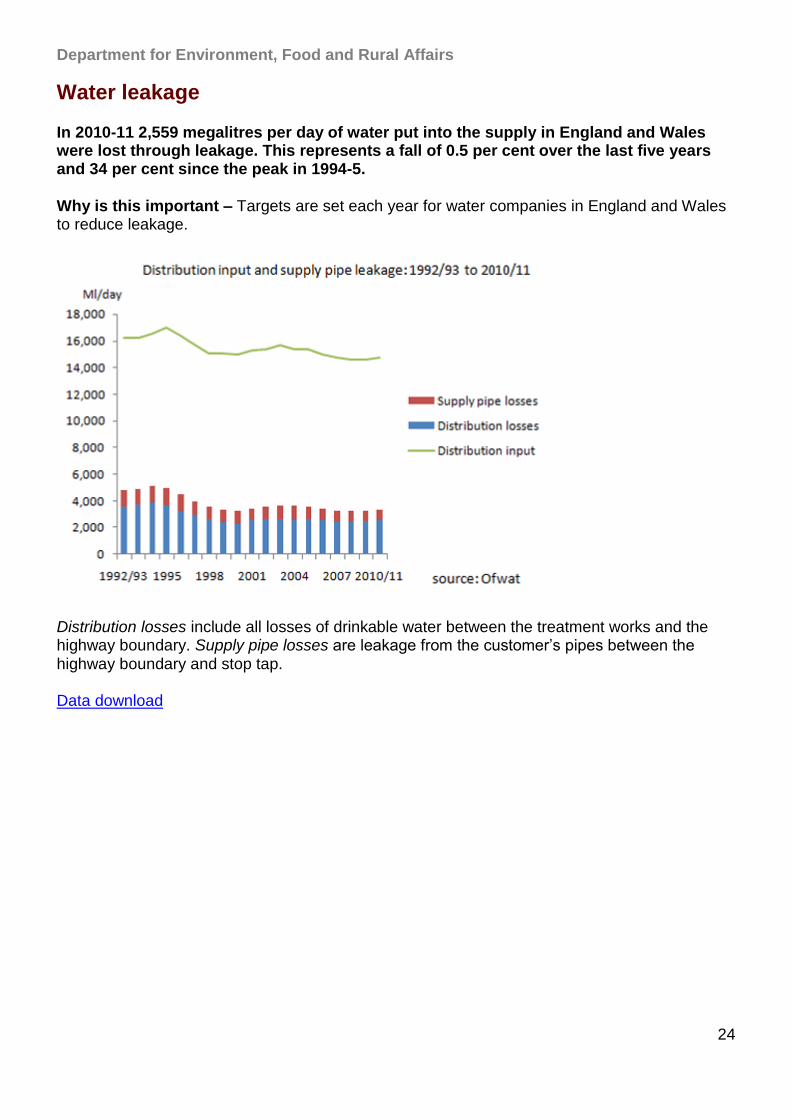
In 2010-11 2,559 megalitres per day of water put into the supply in England and Wales were lost through leakage. This represents a fall of 0.5 per cent over the last five years and 34 per cent since the peak in 1994-5.
Why is this important – Targets are set each year for water companies in England and Wales to reduce leakage.
Distribution losses include all losses of drinkable water between the treatment works and the highway boundary. Supply pipe losses are leakage from the customer‟s pipes between the highway boundary and stop tap.
Data download
Department for Environment, Food and Rural Affairs
25
Drinking water quality
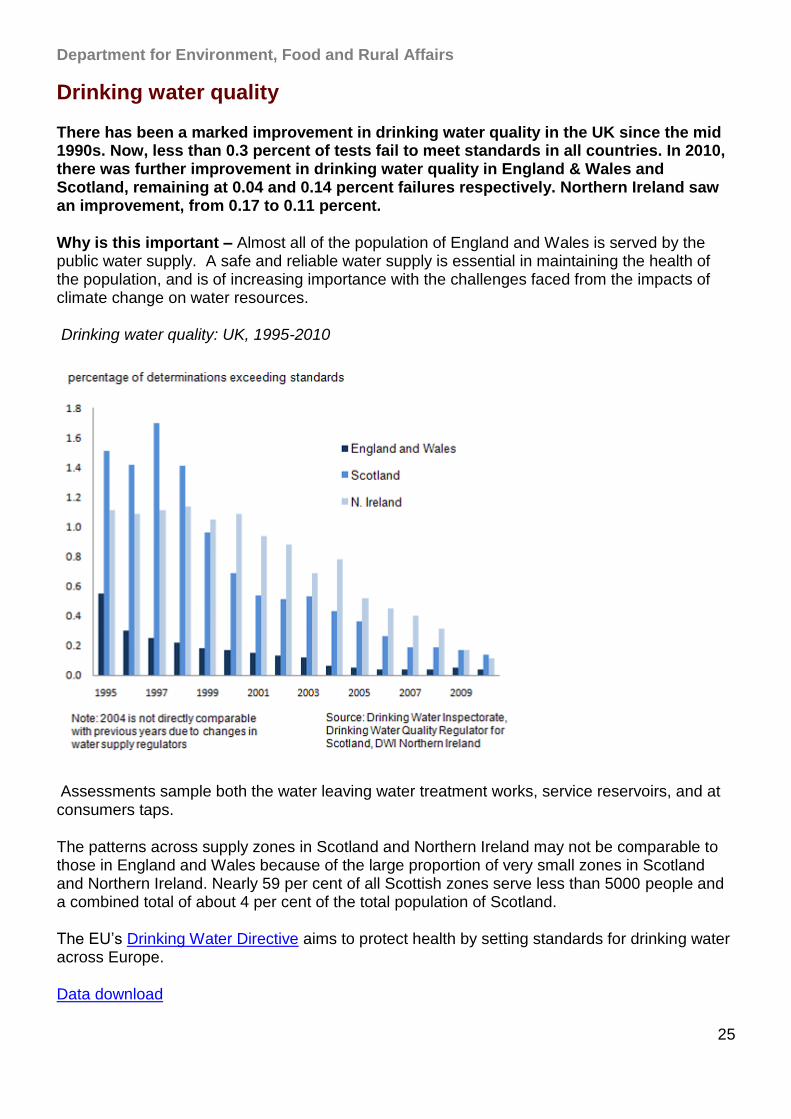
There has been a marked improvement in drinking water quality in the UK since the mid 1990s. Now, less than 0.3 percent of tests fail to meet standards in all countries. In 2010, there was further improvement in drinking water quality in England & Wales and Scotland, remaining at 0.04 and 0.14 percent failures respectively. Northern Ireland saw an improvement, from 0.17 to 0.11 percent.
Why is this important – Almost all of the population of England and Wales is served by the public water supply. A safe and reliable water supply is essential in maintaining the health of the population, and is of increasing importance with the challenges faced from the impacts of climate change on water resources.
Drinking water quality: UK, 1995-2010
Assessments sample both the water leaving water treatment works, service reservoirs, and at consumers taps.
The patterns across supply zones in Scotland and Northern Ireland may not be comparable to those in England and Wales because of the large proportion of very small zones in Scotland and Northern Ireland. Nearly 59 per cent of all Scottish zones serve less than 5000 people and a combined total of about 4 per cent of the total population of Scotland.
The EU‟s Drinking Water Directive aims to protect health by setting standards for drinking water across Europe.
Data download
Department for Environment, Food and Rural Affairs
26
Number of properties at risk of flooding
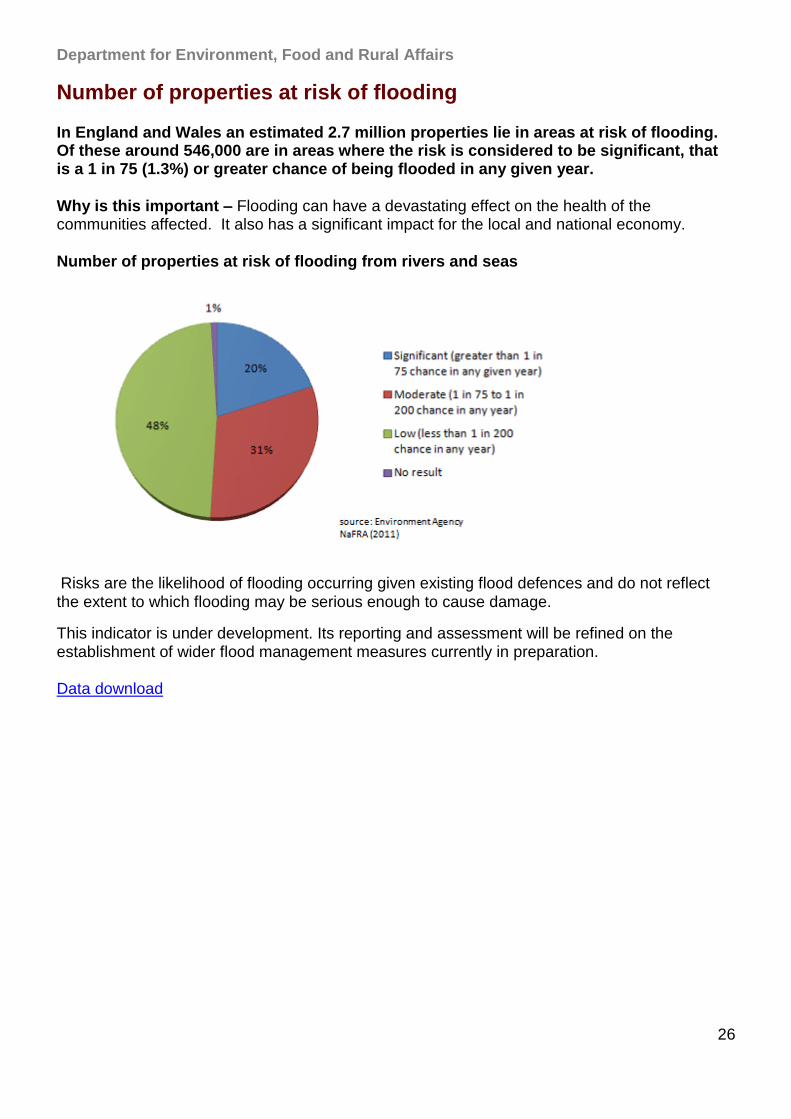
In England and Wales an estimated 2.7 million properties lie in areas at risk of flooding. Of these around 546,000 are in areas where the risk is considered to be significant, that is a 1 in 75 (1.3%) or greater chance of being flooded in any given year.
Why is this important – Flooding can have a devastating effect on the health of the communities affected. It also has a significant impact for the local and national economy.
Number of properties at risk of flooding from rivers and seas
Risks are the likelihood of flooding occurring given existing flood defences and do not reflect the extent to which flooding may be serious enough to cause damage.
This indicator is under development. Its reporting and assessment will be refined on the establishment of wider flood management measures currently in preparation.
Data download
Department for Environment, Food and Rural Affairs
27
Sensitive habitats where critical loads for acidification and eutrophication were exceeded
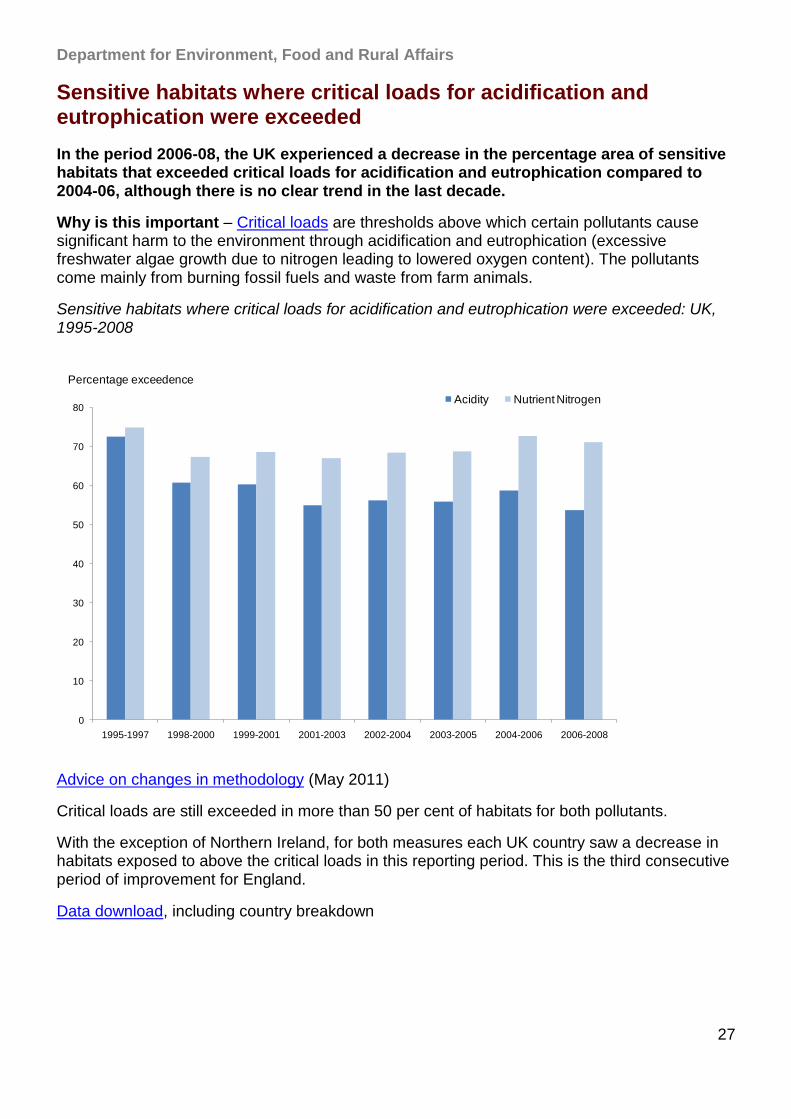
In the period 2006-08, the UK experienced a decrease in the percentage area of sensitive habitats that exceeded critical loads for acidification and eutrophication compared to 2004-06, although there is no clear trend in the last decade.
Why is this important – Critical loads are thresholds above which certain pollutants cause significant harm to the environment through acidification and eutrophication (excessive freshwater algae growth due to nitrogen leading to lowered oxygen content). The pollutants come mainly from burning fossil fuels and waste from farm animals.
Sensitive habitats where critical loads for acidification and eutrophication were exceeded: UK, 1995-2008
0
10
20
30
40
50
60
70
80
1995-1997 1998-2000 1999-2001 2001-2003 2002-2004 2003-2005 2004-2006 2006-2008
Acidity Nutrient Nitrogen
Percentage exceedence
Advice on changes in methodology (May 2011)
Critical loads are still exceeded in more than 50 per cent of habitats for both pollutants.
With the exception of Northern Ireland, for both measures each UK country saw a decrease in habitats exposed to above the critical loads in this reporting period. This is the third consecutive period of improvement for England.
Data download, including country breakdown
Department for Environment, Food and Rural Affairs
28
Average annual rainfall
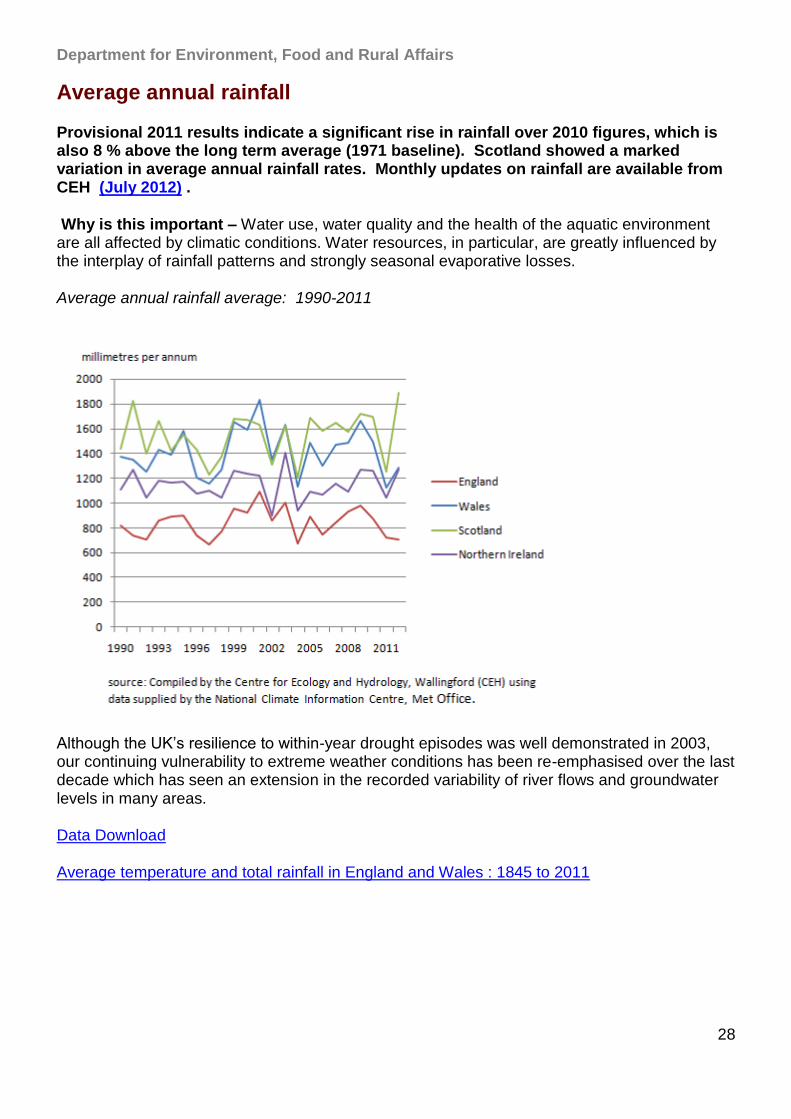
Provisional 2011 results indicate a significant rise in rainfall over 2010 figures, which is also 8 % above the long term average (1971 baseline). Scotland showed a marked variation in average annual rainfall rates. Monthly updates on rainfall are available from CEH (July 2012) .
Why is this important – Water use, water quality and the health of the aquatic environment are all affected by climatic conditions. Water resources, in particular, are greatly influenced by the interplay of rainfall patterns and strongly seasonal evaporative losses.
Average annual rainfall average: 1990-2011
Although the UK‟s resilience to within-year drought episodes was well demonstrated in 2003, our continuing vulnerability to extreme weather conditions has been re-emphasised over the last decade which has seen an extension in the recorded variability of river flows and groundwater levels in many areas.
Data Download
Average temperature and total rainfall in England and Wales : 1845 to 2011
Department for Environment, Food and Rural Affairs
29
Inland water - Further information
Government policy on water quality and abstraction
EU Water Framework Directive
Water quality in Scotland and Northern Ireland Additional data on: river water quality
Further information on monitoring water leakage Water leakage in Scotland and Northern Ireland
Drinking Water Inspectorate for England and Wales
Drinking water quality in Scotland and Northern Ireland Drinking water quality in Europe Additional data on: drinking water quality
Environment Agency Floodline information and Managing flood risk Flooding in Wales and Scotland
UK climate summaries European comparisons Flooding in England
Further information on acidification and eutrophication in the UK International action to reduce acidification and eutrophication
Nitrate and phosphate in European rivers
Department for Environment, Food and Rural Affairs
30
Green Economy, Green Business
UK’s Carbon Footprint – Carbon dioxide emissions relating to UK consumption
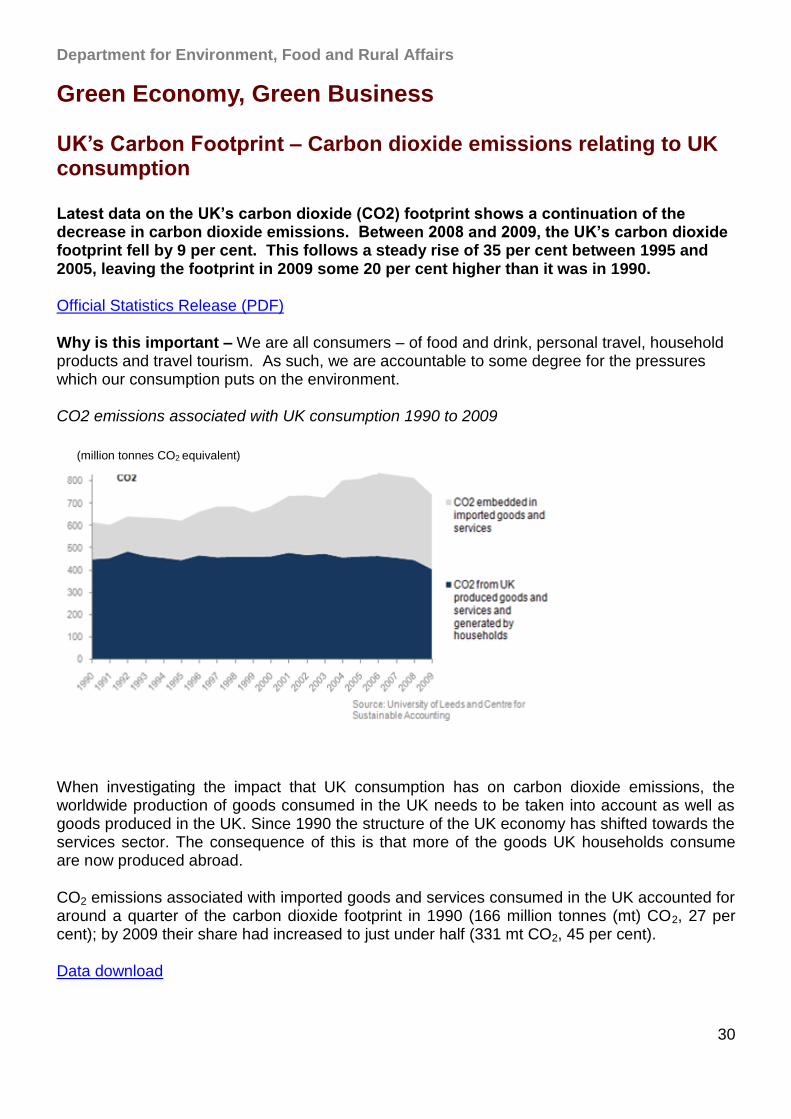
Latest data on the UK’s carbon dioxide (CO2) footprint shows a continuation of the decrease in carbon dioxide emissions. Between 2008 and 2009, the UK’s carbon dioxide footprint fell by 9 per cent. This follows a steady rise of 35 per cent between 1995 and 2005, leaving the footprint in 2009 some 20 per cent higher than it was in 1990.
Official Statistics Release (PDF)
Why is this important – We are all consumers – of food and drink, personal travel, household products and travel tourism. As such, we are accountable to some degree for the pressures which our consumption puts on the environment.
CO2 emissions associated with UK consumption 1990 to 2009
When investigating the impact that UK consumption has on carbon dioxide emissions, the worldwide production of goods consumed in the UK needs to be taken into account as well as goods produced in the UK. Since 1990 the structure of the UK economy has shifted towards the services sector. The consequence of this is that more of the goods UK households consume are now produced abroad.
CO2 emissions associated with imported goods and services consumed in the UK accounted for around a quarter of the carbon dioxide footprint in 1990 (166 million tonnes (mt) CO2, 27 per cent); by 2009 their share had increased to just under half (331 mt CO2, 45 per cent).
Data download
(million tonnes CO2 equivalent)
Department for Environment, Food and Rural Affairs
31
Electricity consumption by households
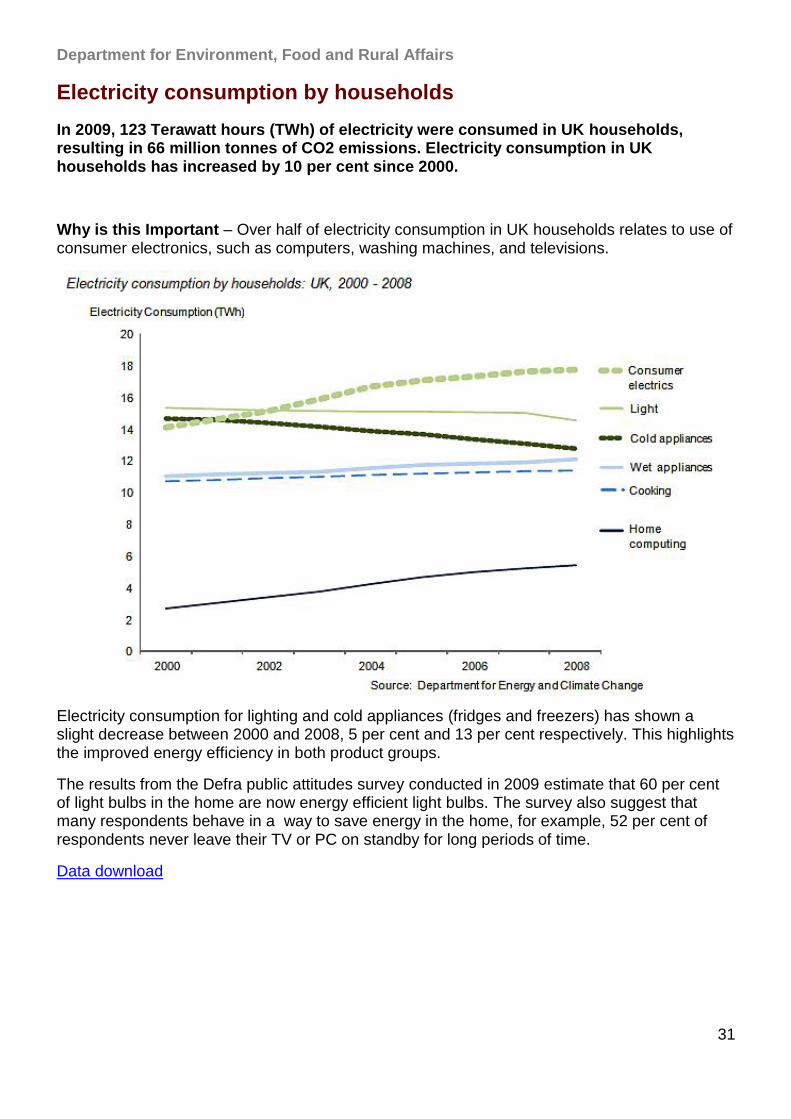
In 2009, 123 Terawatt hours (TWh) of electricity were consumed in UK households, resulting in 66 million tonnes of CO2 emissions. Electricity consumption in UK households has increased by 10 per cent since 2000.
Why is this Important – Over half of electricity consumption in UK households relates to use of consumer electronics, such as computers, washing machines, and televisions.
Electricity consumption for lighting and cold appliances (fridges and freezers) has shown a slight decrease between 2000 and 2008, 5 per cent and 13 per cent respectively. This highlights the improved energy efficiency in both product groups.
The results from the Defra public attitudes survey conducted in 2009 estimate that 60 per cent of light bulbs in the home are now energy efficient light bulbs. The survey also suggest that many respondents behave in a way to save energy in the home, for example, 52 per cent of respondents never leave their TV or PC on standby for long periods of time.
Data download
Department for Environment, Food and Rural Affairs
32
Water use by industry
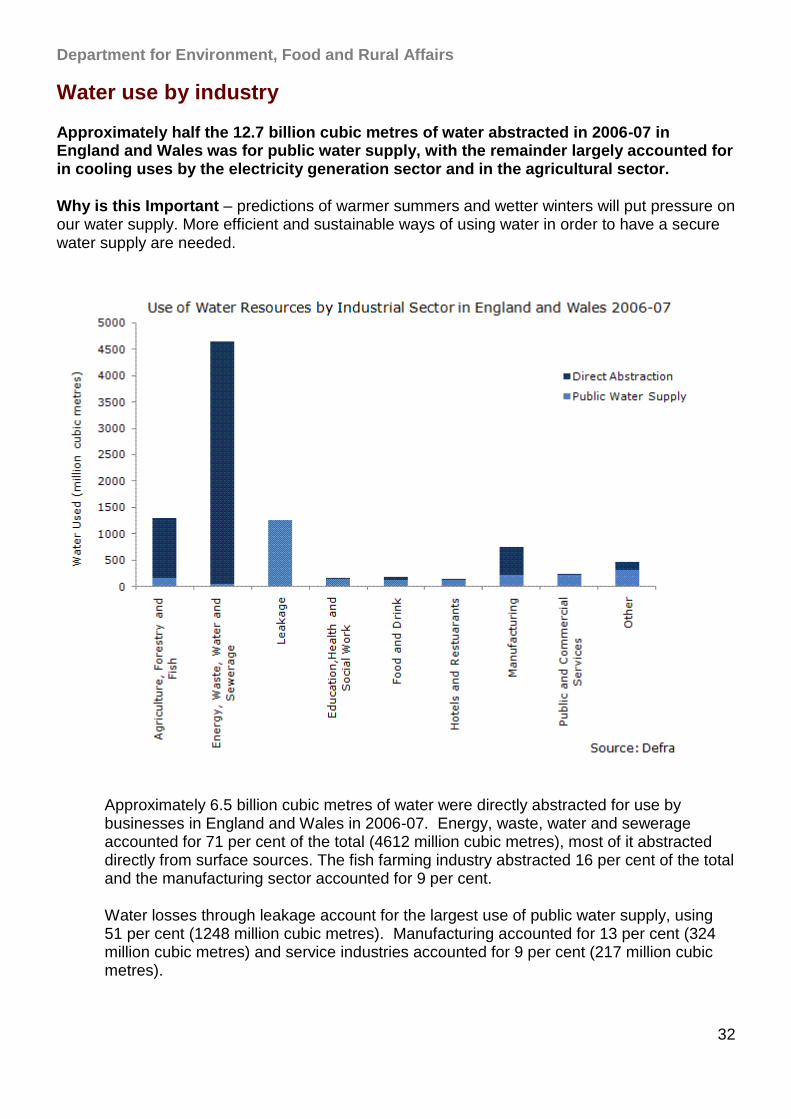
Approximately half the 12.7 billion cubic metres of water abstracted in 2006-07 in England and Wales was for public water supply, with the remainder largely accounted for in cooling uses by the electricity generation sector and in the agricultural sector.
Why is this Important – predictions of warmer summers and wetter winters will put pressure on our water supply. More efficient and sustainable ways of using water in order to have a secure water supply are needed.
Approximately 6.5 billion cubic metres of water were directly abstracted for use by businesses in England and Wales in 2006-07. Energy, waste, water and sewerage accounted for 71 per cent of the total (4612 million cubic metres), most of it abstracted directly from surface sources. The fish farming industry abstracted 16 per cent of the total and the manufacturing sector accounted for 9 per cent.
Water losses through leakage account for the largest use of public water supply, using 51 per cent (1248 million cubic metres). Manufacturing accounted for 13 per cent (324 million cubic metres) and service industries accounted for 9 per cent (217 million cubic metres).

Department for Environment, Food and Rural Affairs
33
The chart shown below does not include water abstracted for household use. Households in England and Wales account for approximately half of the water abstracted for public water supply, including leakage.
Data download
Department for Environment, Food and Rural Affairs
34
CO2 emissions by different sub-groups in manufacturing sector
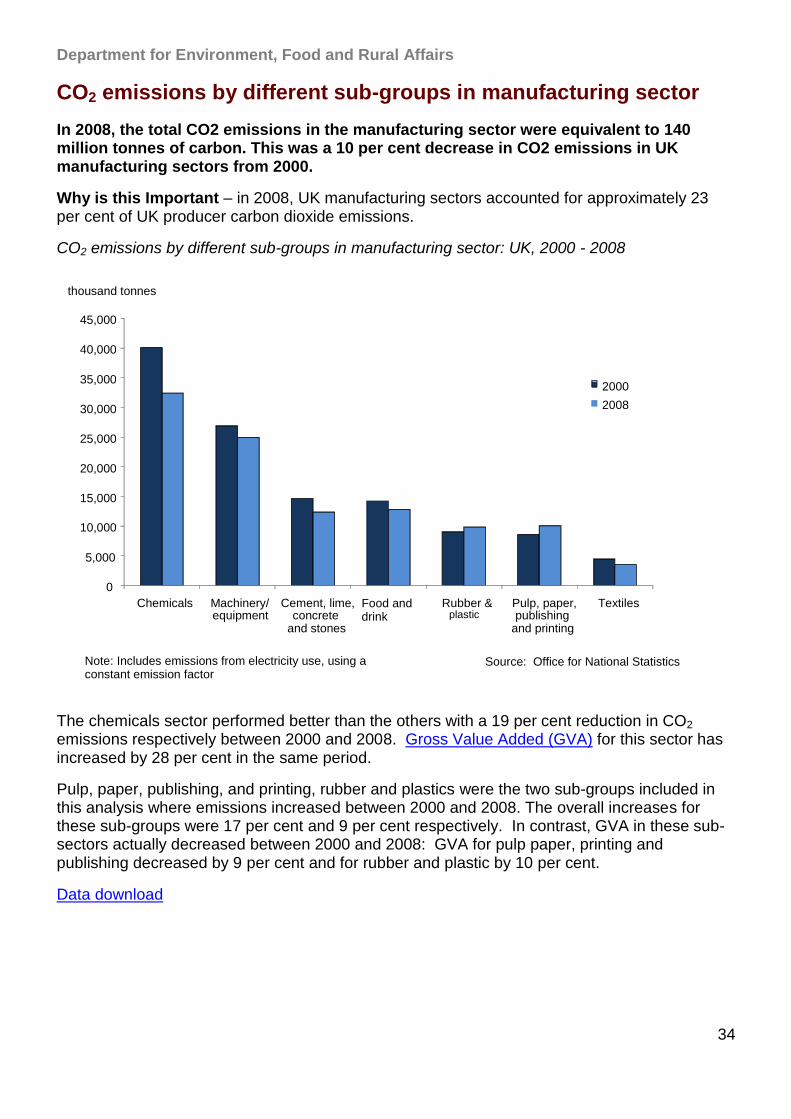
In 2008, the total CO2 emissions in the manufacturing sector were equivalent to 140 million tonnes of carbon. This was a 10 per cent decrease in CO2 emissions in UK manufacturing sectors from 2000.
Why is this Important – in 2008, UK manufacturing sectors accounted for approximately 23 per cent of UK producer carbon dioxide emissions.
CO2 emissions by different sub-groups in manufacturing sector: UK, 2000 - 2008
The chemicals sector performed better than the others with a 19 per cent reduction in CO2 emissions respectively between 2000 and 2008. Gross Value Added (GVA) for this sector has increased by 28 per cent in the same period.
Pulp, paper, publishing, and printing, rubber and plastics were the two sub-groups included in this analysis where emissions increased between 2000 and 2008. The overall increases for these sub-groups were 17 per cent and 9 per cent respectively. In contrast, GVA in these sub-sectors actually decreased between 2000 and 2008: GVA for pulp paper, printing and publishing decreased by 9 per cent and for rubber and plastic by 10 per cent.
Data download
0
5,000
10,000
15,000
20,000
25,000
30,000
35,000
40,000
45,000
Chemicals Machinery/ equipment
Cement, lime, concrete
and stones
Food and drink
Rubber & plastic
Pulp, paper, publishing
and printing
Textiles
thousand tonnes
2000
2008
Note: Includes emissions from electricity use, using a constant emission factor
Source: Office for National Statistics
Department for Environment, Food and Rural Affairs
35
Sustainable Operations on the Government Estate
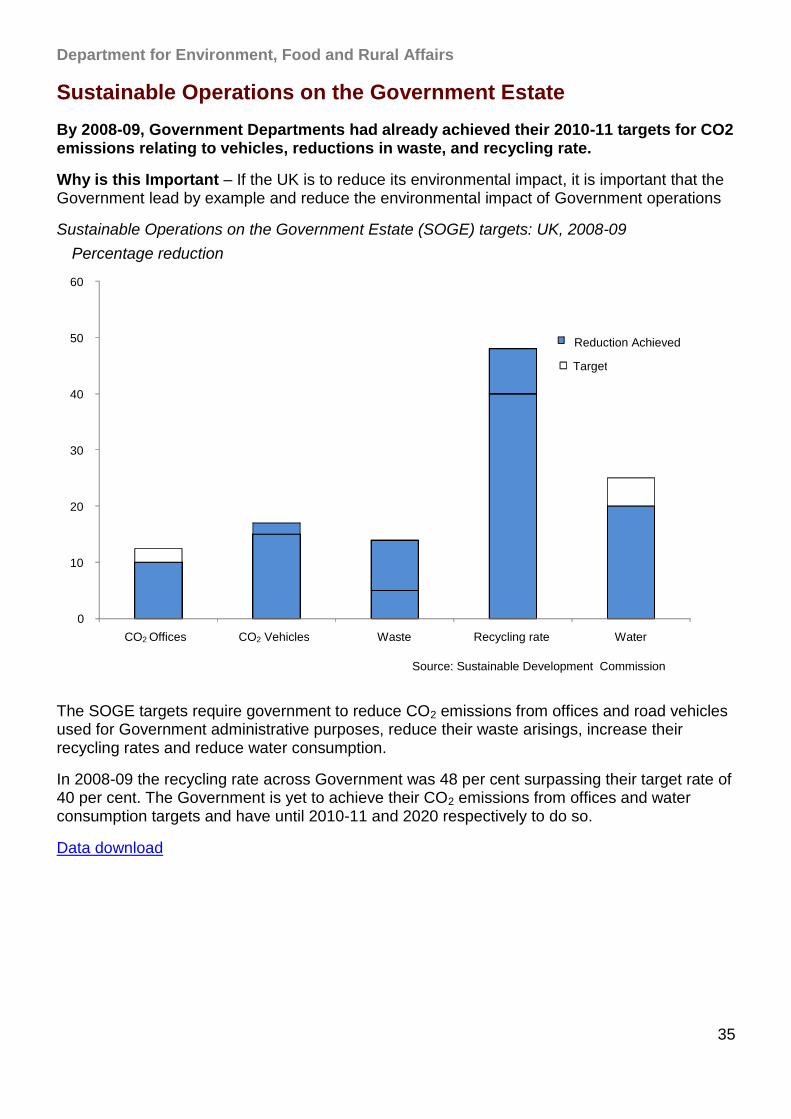
By 2008-09, Government Departments had already achieved their 2010-11 targets for CO2 emissions relating to vehicles, reductions in waste, and recycling rate.
Why is this Important – If the UK is to reduce its environmental impact, it is important that the Government lead by example and reduce the environmental impact of Government operations
Sustainable Operations on the Government Estate (SOGE) targets: UK, 2008-09
The SOGE targets require government to reduce CO2 emissions from offices and road vehicles used for Government administrative purposes, reduce their waste arisings, increase their recycling rates and reduce water consumption.
In 2008-09 the recycling rate across Government was 48 per cent surpassing their target rate of 40 per cent. The Government is yet to achieve their CO2 emissions from offices and water consumption targets and have until 2010-11 and 2020 respectively to do so.
Data download
0
10
20
30
40
50
60
CO2 Offices CO2 Vehicles Waste Recycling rate Water
Target
Reduction Achieved
Source: Sustainable Development Commission
Percentage reduction
Department for Environment, Food and Rural Affairs
36
Central Government carbon footprint
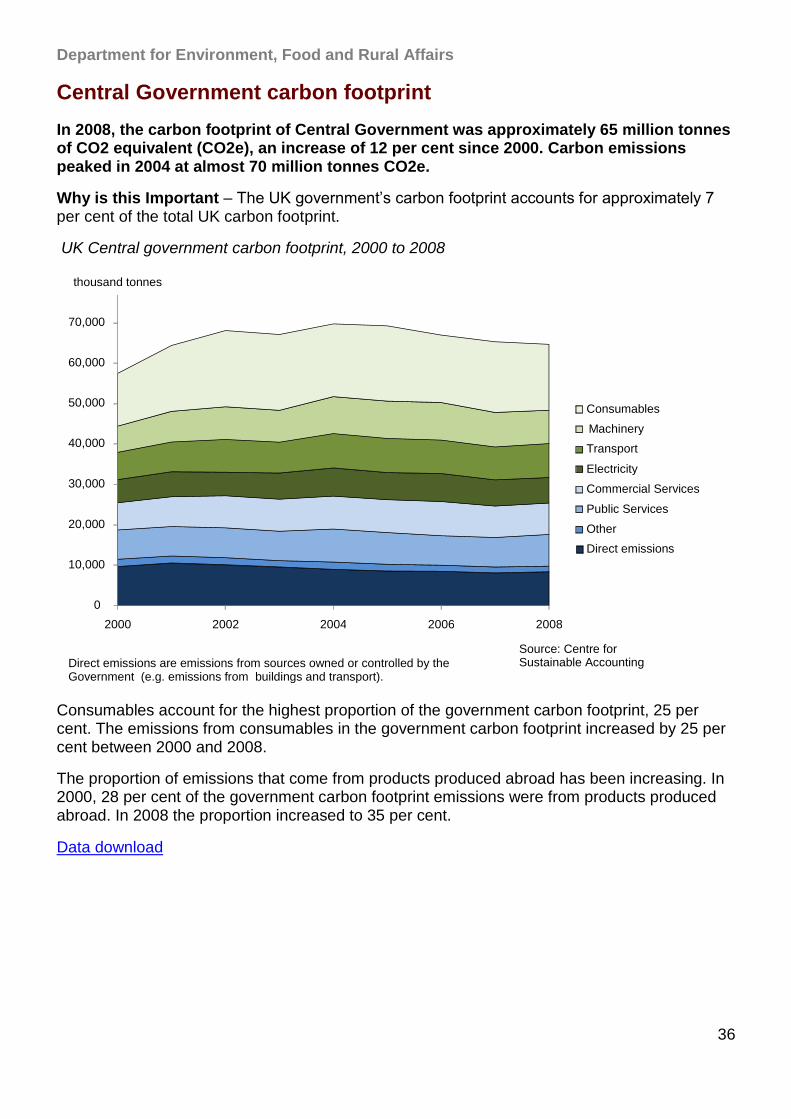
In 2008, the carbon footprint of Central Government was approximately 65 million tonnes of CO2 equivalent (CO2e), an increase of 12 per cent since 2000. Carbon emissions peaked in 2004 at almost 70 million tonnes CO2e.
Why is this Important – The UK government‟s carbon footprint accounts for approximately 7 per cent of the total UK carbon footprint.
UK Central government carbon footprint, 2000 to 2008
Consumables account for the highest proportion of the government carbon footprint, 25 per cent. The emissions from consumables in the government carbon footprint increased by 25 per cent between 2000 and 2008.
The proportion of emissions that come from products produced abroad has been increasing. In 2000, 28 per cent of the government carbon footprint emissions were from products produced abroad. In 2008 the proportion increased to 35 per cent.
Data download
0
10,000
20,000
30,000
40,000
50,000
60,000
70,000
80,000
2000 2002 2004 2006 2008
Consumables
Machinery
Transport
Electricity
Commercial Services
Public Services
Other
Direct emissions
Source: Centre for Sustainable Accounting Direct emissions are emissions from sources owned or controlled by the
Government (e.g. emissions from buildings and transport).
thousand tonnes
Department for Environment, Food and Rural Affairs
37
Market value of low carbon and environmental goods and services
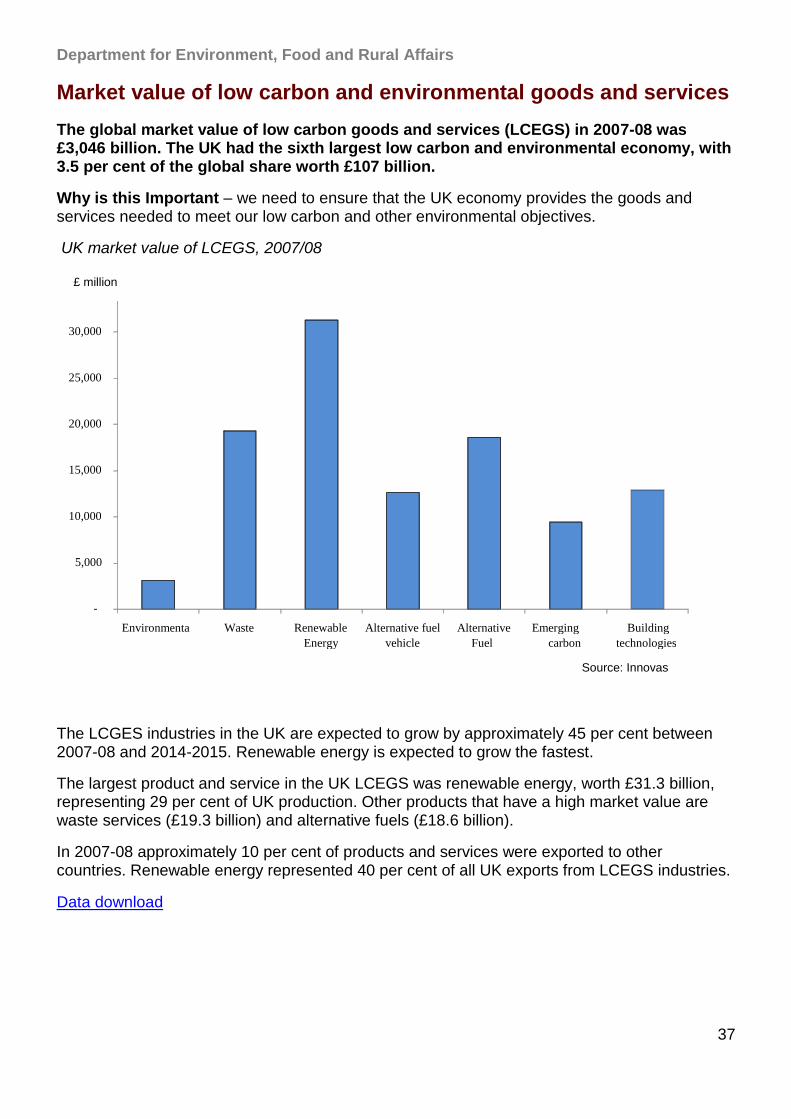
The global market value of low carbon goods and services (LCEGS) in 2007-08 was £3,046 billion. The UK had the sixth largest low carbon and environmental economy, with 3.5 per cent of the global share worth £107 billion.
Why is this Important – we need to ensure that the UK economy provides the goods and services needed to meet our low carbon and other environmental objectives.
UK market value of LCEGS, 2007/08
The LCGES industries in the UK are expected to grow by approximately 45 per cent between 2007-08 and 2014-2015. Renewable energy is expected to grow the fastest.
The largest product and service in the UK LCEGS was renewable energy, worth £31.3 billion, representing 29 per cent of UK production. Other products that have a high market value are waste services (£19.3 billion) and alternative fuels (£18.6 billion).
In 2007-08 approximately 10 per cent of products and services were exported to other countries. Renewable energy represented 40 per cent of all UK exports from LCEGS industries.
Data download
-
5,000
10,000
15,000
20,000
25,000
30,000
35,000
Environmenta
l Waste Renewable
Energy Alternative fuel
vehicle Alternative
Fuel
s
Emerging
low carbon Building
technologies
Source: Innovas
£ million
Department for Environment, Food and Rural Affairs
38
Green economy, green business- Further information
Government policy on Green economy, green business
Sustainable Consumption and Production Indicators
Centre for Sustainable Accounting
Office for National Statistics
EU Environmental Policy
Innovas Report into LCGES
Environment Agency
Scottish Environment Protection Agency
Welsh Government
Department for Energy and Climate Change
Department for Environment, Food and Rural Affairs
39
Supplementary Information
Serious pollution incidents affecting water, air and land
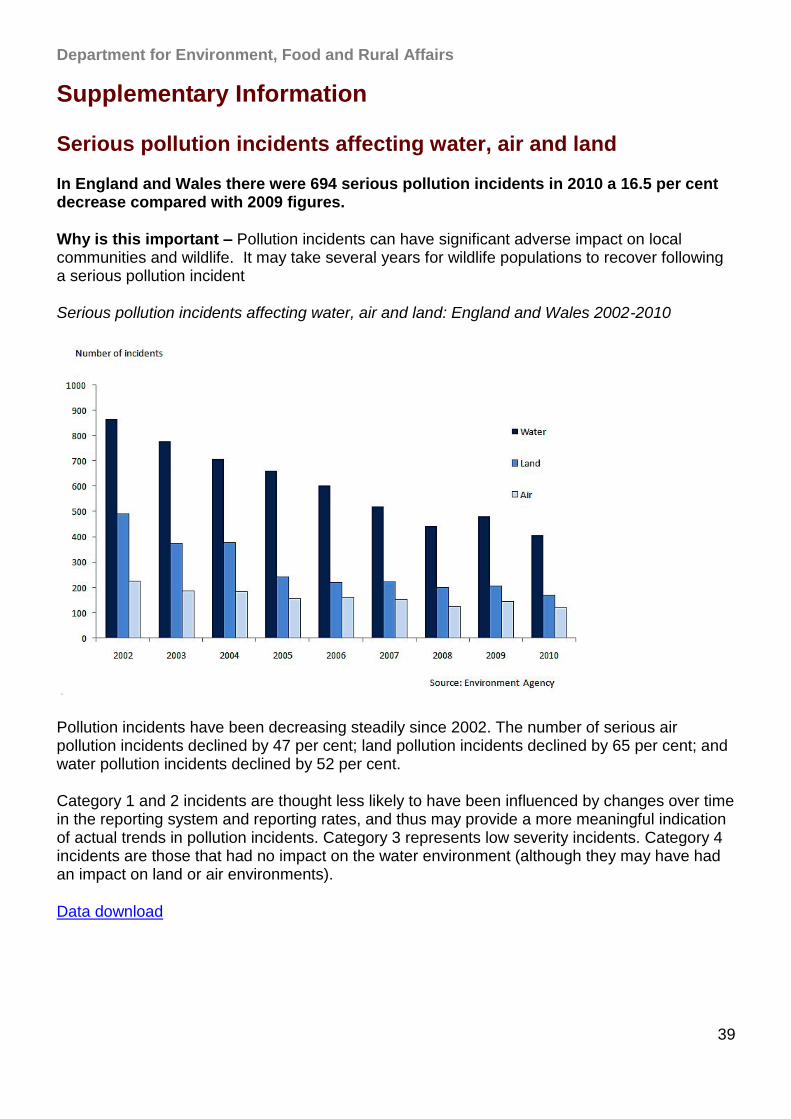
In England and Wales there were 694 serious pollution incidents in 2010 a 16.5 per cent decrease compared with 2009 figures.
Why is this important – Pollution incidents can have significant adverse impact on local communities and wildlife. It may take several years for wildlife populations to recover following a serious pollution incident
Serious pollution incidents affecting water, air and land: England and Wales 2002-2010
Pollution incidents have been decreasing steadily since 2002. The number of serious air pollution incidents declined by 47 per cent; land pollution incidents declined by 65 per cent; and water pollution incidents declined by 52 per cent.
Category 1 and 2 incidents are thought less likely to have been influenced by changes over time in the reporting system and reporting rates, and thus may provide a more meaningful indication of actual trends in pollution incidents. Category 3 represents low severity incidents. Category 4 incidents are those that had no impact on the water environment (although they may have had an impact on land or air environments).
Data download
Department for Environment, Food and Rural Affairs
40
Category 1 and 2 pollution incidents by source to air, land and water
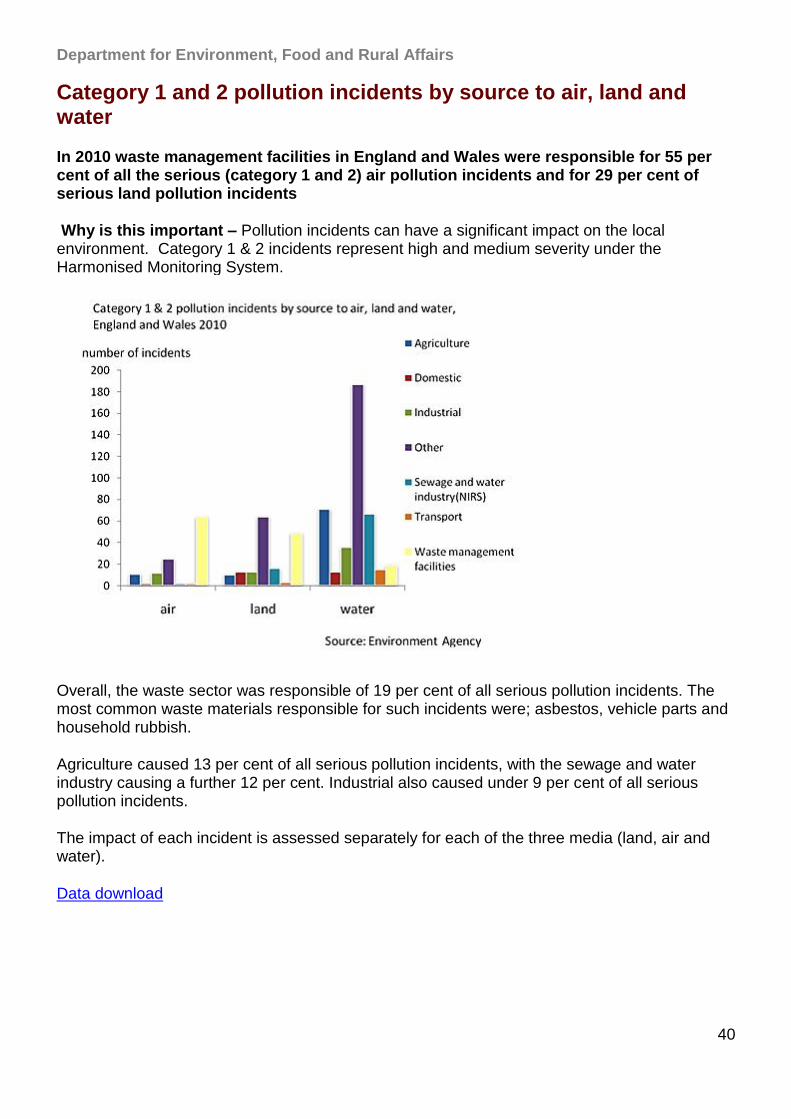
In 2010 waste management facilities in England and Wales were responsible for 55 per cent of all the serious (category 1 and 2) air pollution incidents and for 29 per cent of serious land pollution incidents
Why is this important – Pollution incidents can have a significant impact on the local environment. Category 1 & 2 incidents represent high and medium severity under the Harmonised Monitoring System.
Overall, the waste sector was responsible of 19 per cent of all serious pollution incidents. The most common waste materials responsible for such incidents were; asbestos, vehicle parts and household rubbish.
Agriculture caused 13 per cent of all serious pollution incidents, with the sewage and water industry causing a further 12 per cent. Industrial also caused under 9 per cent of all serious pollution incidents.
The impact of each incident is assessed separately for each of the three media (land, air and water).
Data download
Department for Environment, Food and Rural Affairs
41
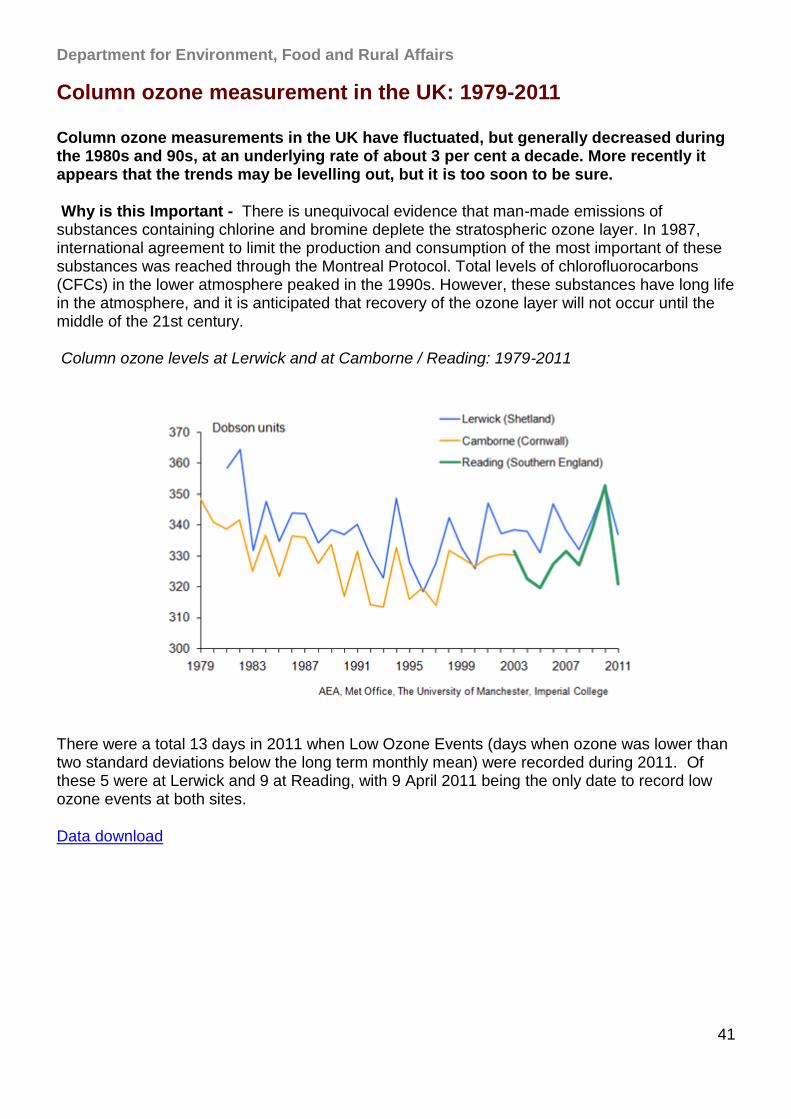
Column ozone measurement in the UK: 1979-2011
Column ozone measurements in the UK have fluctuated, but generally decreased during the 1980s and 90s, at an underlying rate of about 3 per cent a decade. More recently it appears that the trends may be levelling out, but it is too soon to be sure.
Why is this Important - There is unequivocal evidence that man-made emissions of substances containing chlorine and bromine deplete the stratospheric ozone layer. In 1987, international agreement to limit the production and consumption of the most important of these substances was reached through the Montreal Protocol. Total levels of chlorofluorocarbons (CFCs) in the lower atmosphere peaked in the 1990s. However, these substances have long life in the atmosphere, and it is anticipated that recovery of the ozone layer will not occur until the middle of the 21st century.
Column ozone levels at Lerwick and at Camborne / Reading: 1979-2011
There were a total 13 days in 2011 when Low Ozone Events (days when ozone was lower than two standard deviations below the long term monthly mean) were recorded during 2011. Of these 5 were at Lerwick and 9 at Reading, with 9 April 2011 being the only date to record low ozone events at both sites.
Data download
Department for Environment, Food and Rural Affairs
42
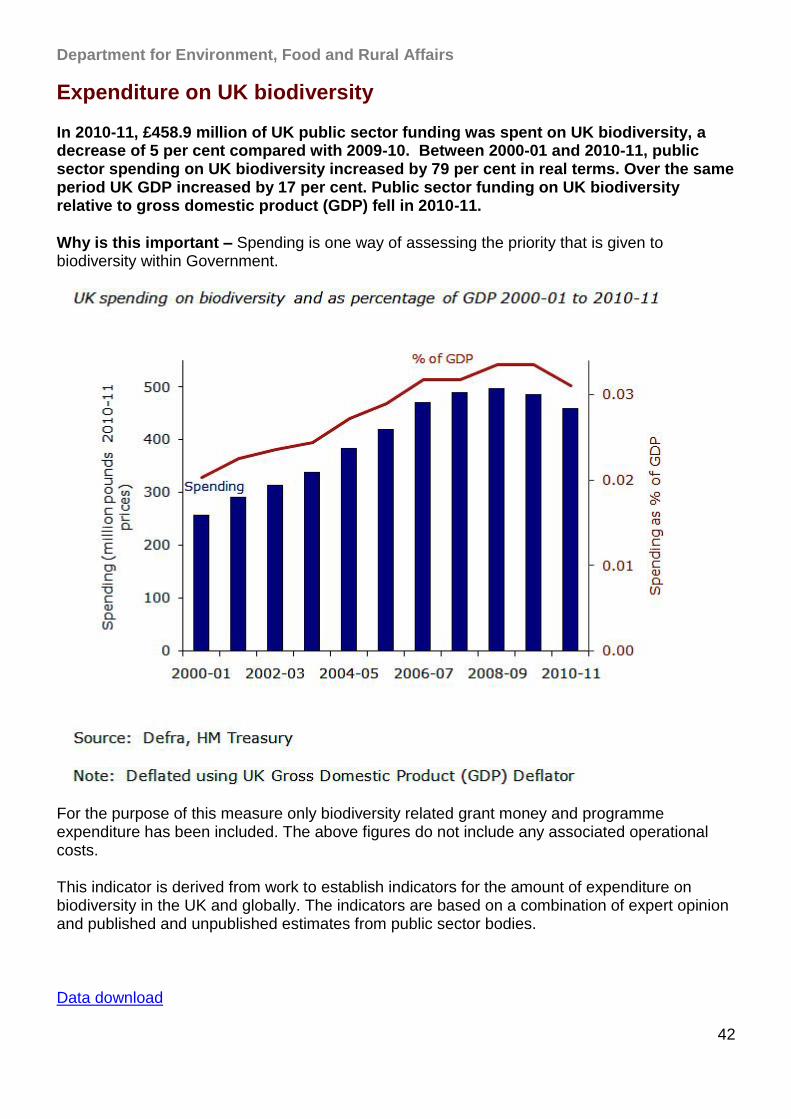
Expenditure on UK biodiversity
In 2010-11, £458.9 million of UK public sector funding was spent on UK biodiversity, a decrease of 5 per cent compared with 2009-10. Between 2000-01 and 2010-11, public sector spending on UK biodiversity increased by 79 per cent in real terms. Over the same period UK GDP increased by 17 per cent. Public sector funding on UK biodiversity relative to gross domestic product (GDP) fell in 2010-11.
Why is this important – Spending is one way of assessing the priority that is given to biodiversity within Government.
For the purpose of this measure only biodiversity related grant money and programme expenditure has been included. The above figures do not include any associated operational costs.
This indicator is derived from work to establish indicators for the amount of expenditure on biodiversity in the UK and globally. The indicators are based on a combination of expert opinion and published and unpublished estimates from public sector bodies.
Data download
Department for Environment, Food and Rural Affairs
43
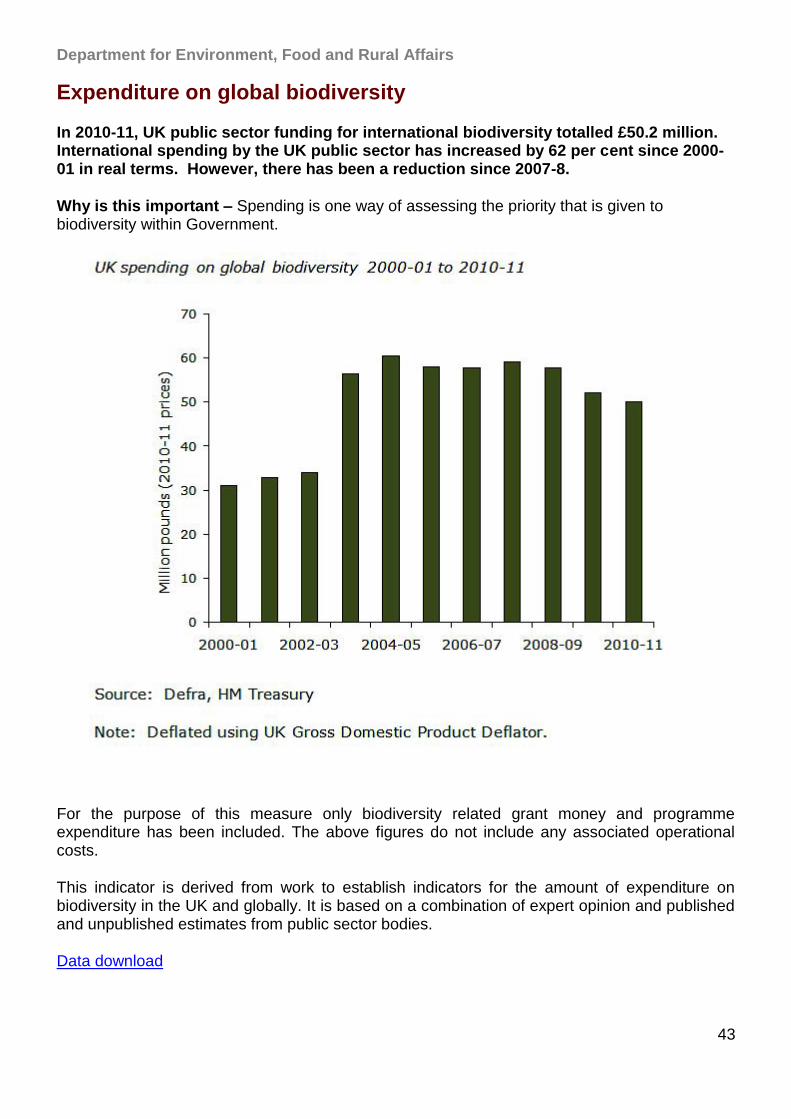
Expenditure on global biodiversity
In 2010-11, UK public sector funding for international biodiversity totalled £50.2 million. International spending by the UK public sector has increased by 62 per cent since 2000-01 in real terms. However, there has been a reduction since 2007-8.
Why is this important – Spending is one way of assessing the priority that is given to biodiversity within Government.
For the purpose of this measure only biodiversity related grant money and programme expenditure has been included. The above figures do not include any associated operational costs.
This indicator is derived from work to establish indicators for the amount of expenditure on biodiversity in the UK and globally. It is based on a combination of expert opinion and published and unpublished estimates from public sector bodies.
Data download

Department for Environment, Food and Rural Affairs
44
Supplementary - Further information
Environment Agency - Pollution incidents Pollution incidents in Scotland and Northern Ireland
How to participate in the EPE Programme Forms and guidance
Sustainable Development Indicators
Department for Environment, Food and Rural Affairs
45
Waste and Recycling
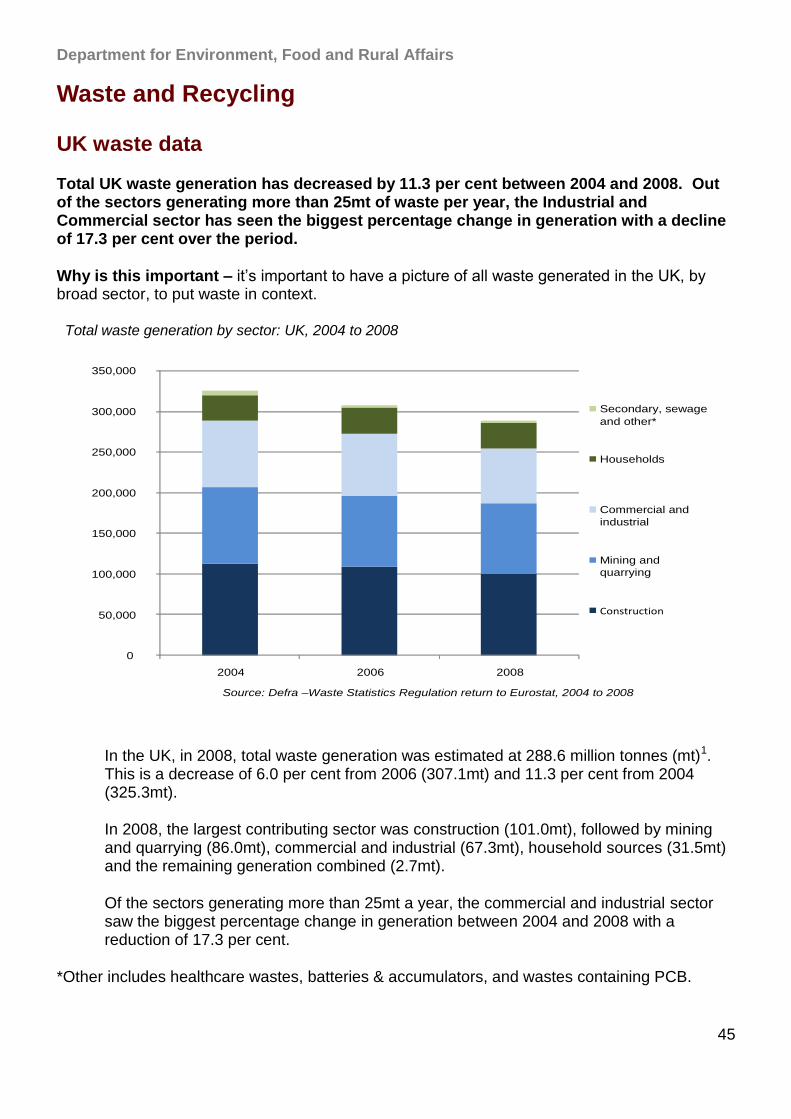
UK waste data
Total UK waste generation has decreased by 11.3 per cent between 2004 and 2008. Out of the sectors generating more than 25mt of waste per year, the Industrial and Commercial sector has seen the biggest percentage change in generation with a decline of 17.3 per cent over the period.
Why is this important – it‟s important to have a picture of all waste generated in the UK, by broad sector, to put waste in context.
Total waste generation by sector: UK, 2004 to 2008
0
50,000
100,000
150,000
200,000
250,000
300,000
350,000
2004 2006 2008
Secondary, sewage and other*
Households
Commercial and industrial
Mining and quarrying
Construction
Source: Defra –Waste Statistics Regulation return to Eurostat, 2004 to 2008
In the UK, in 2008, total waste generation was estimated at 288.6 million tonnes (mt)1. This is a decrease of 6.0 per cent from 2006 (307.1mt) and 11.3 per cent from 2004 (325.3mt).
In 2008, the largest contributing sector was construction (101.0mt), followed by mining and quarrying (86.0mt), commercial and industrial (67.3mt), household sources (31.5mt) and the remaining generation combined (2.7mt).
Of the sectors generating more than 25mt a year, the commercial and industrial sector saw the biggest percentage change in generation between 2004 and 2008 with a reduction of 17.3 per cent.
*Other includes healthcare wastes, batteries & accumulators, and wastes containing PCB.
Department for Environment, Food and Rural Affairs
46
Defra considers this double counting of waste generation and hence exclude such wastes from national reporting.
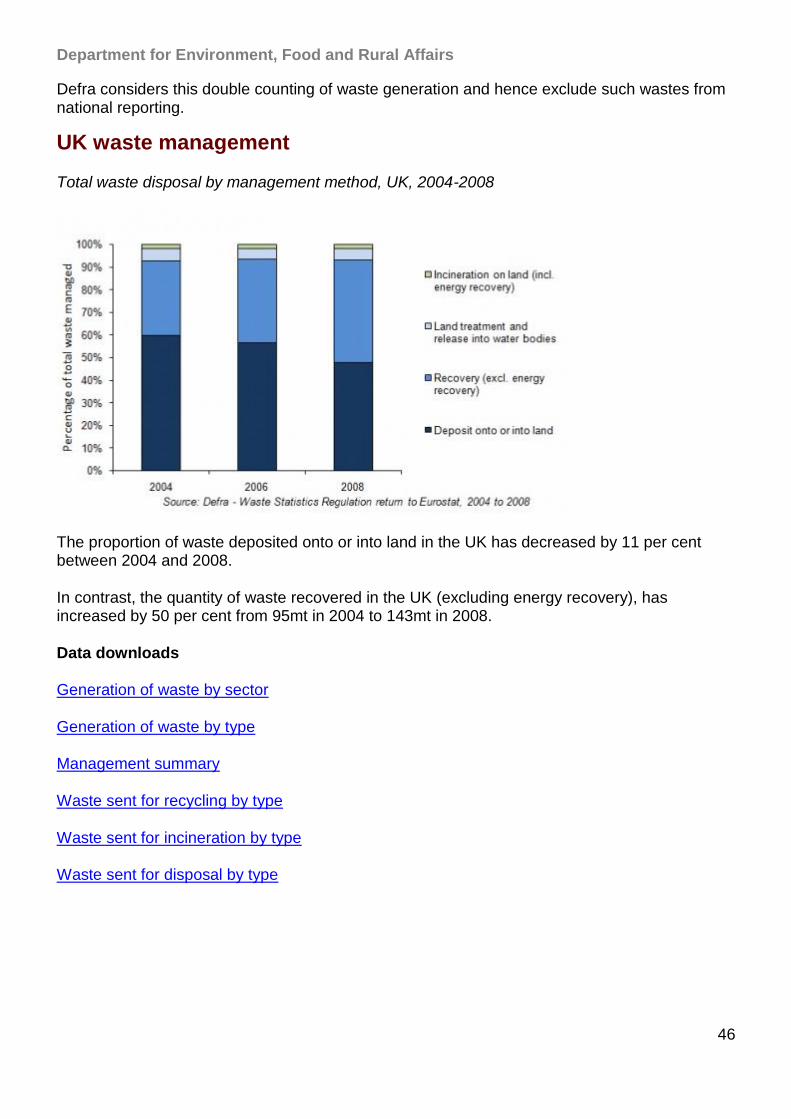
UK waste management
Total waste disposal by management method, UK, 2004-2008
The proportion of waste deposited onto or into land in the UK has decreased by 11 per cent between 2004 and 2008.
In contrast, the quantity of waste recovered in the UK (excluding energy recovery), has increased by 50 per cent from 95mt in 2004 to 143mt in 2008.
Data downloads
Generation of waste by sector
Generation of waste by type
Management summary
Waste sent for recycling by type
Waste sent for incineration by type
Waste sent for disposal by type
Department for Environment, Food and Rural Affairs
47
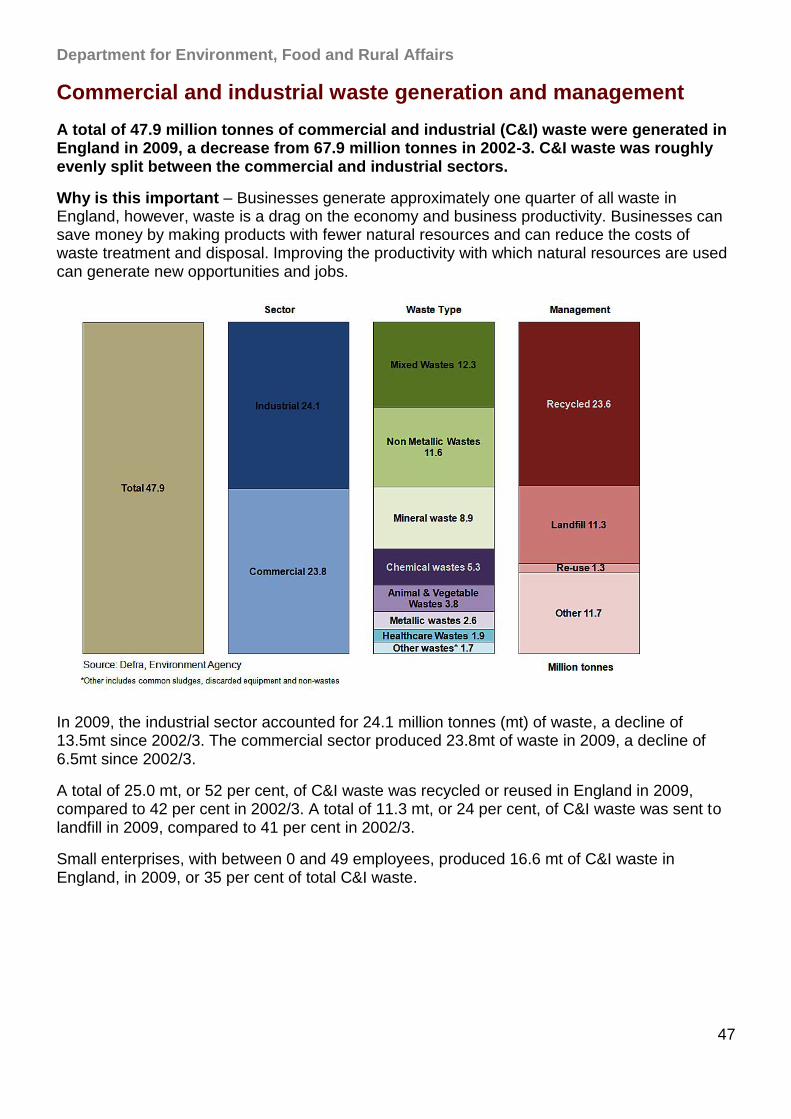
Commercial and industrial waste generation and management
A total of 47.9 million tonnes of commercial and industrial (C&I) waste were generated in England in 2009, a decrease from 67.9 million tonnes in 2002-3. C&I waste was roughly evenly split between the commercial and industrial sectors.
Why is this important – Businesses generate approximately one quarter of all waste in England, however, waste is a drag on the economy and business productivity. Businesses can save money by making products with fewer natural resources and can reduce the costs of waste treatment and disposal. Improving the productivity with which natural resources are used can generate new opportunities and jobs.
In 2009, the industrial sector accounted for 24.1 million tonnes (mt) of waste, a decline of 13.5mt since 2002/3. The commercial sector produced 23.8mt of waste in 2009, a decline of 6.5mt since 2002/3.
A total of 25.0 mt, or 52 per cent, of C&I waste was recycled or reused in England in 2009, compared to 42 per cent in 2002/3. A total of 11.3 mt, or 24 per cent, of C&I waste was sent to landfill in 2009, compared to 41 per cent in 2002/3.
Small enterprises, with between 0 and 49 employees, produced 16.6 mt of C&I waste in England, in 2009, or 35 per cent of total C&I waste.
Department for Environment, Food and Rural Affairs
48
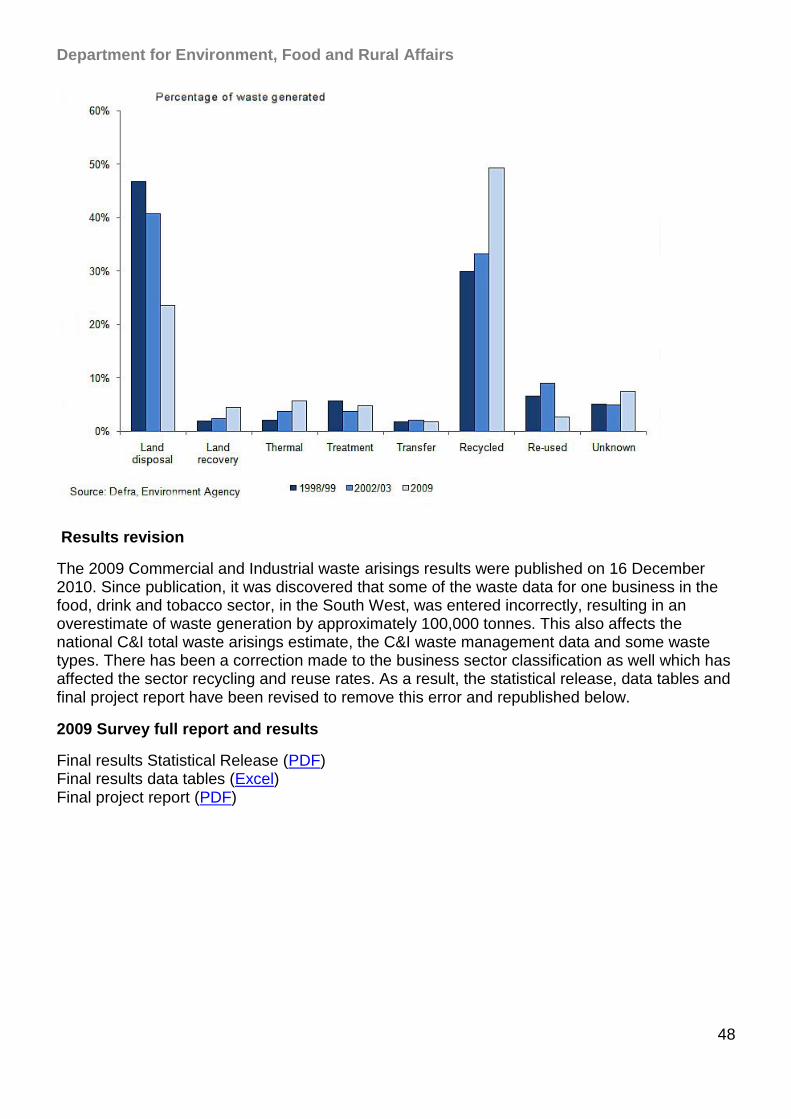
Results revision
The 2009 Commercial and Industrial waste arisings results were published on 16 December 2010. Since publication, it was discovered that some of the waste data for one business in the food, drink and tobacco sector, in the South West, was entered incorrectly, resulting in an overestimate of waste generation by approximately 100,000 tonnes. This also affects the national C&I total waste arisings estimate, the C&I waste management data and some waste types. There has been a correction made to the business sector classification as well which has affected the sector recycling and reuse rates. As a result, the statistical release, data tables and final project report have been revised to remove this error and republished below.
2009 Survey full report and results
Final results Statistical Release (PDF) Final results data tables (Excel) Final project report (PDF)
Department for Environment, Food and Rural Affairs
49
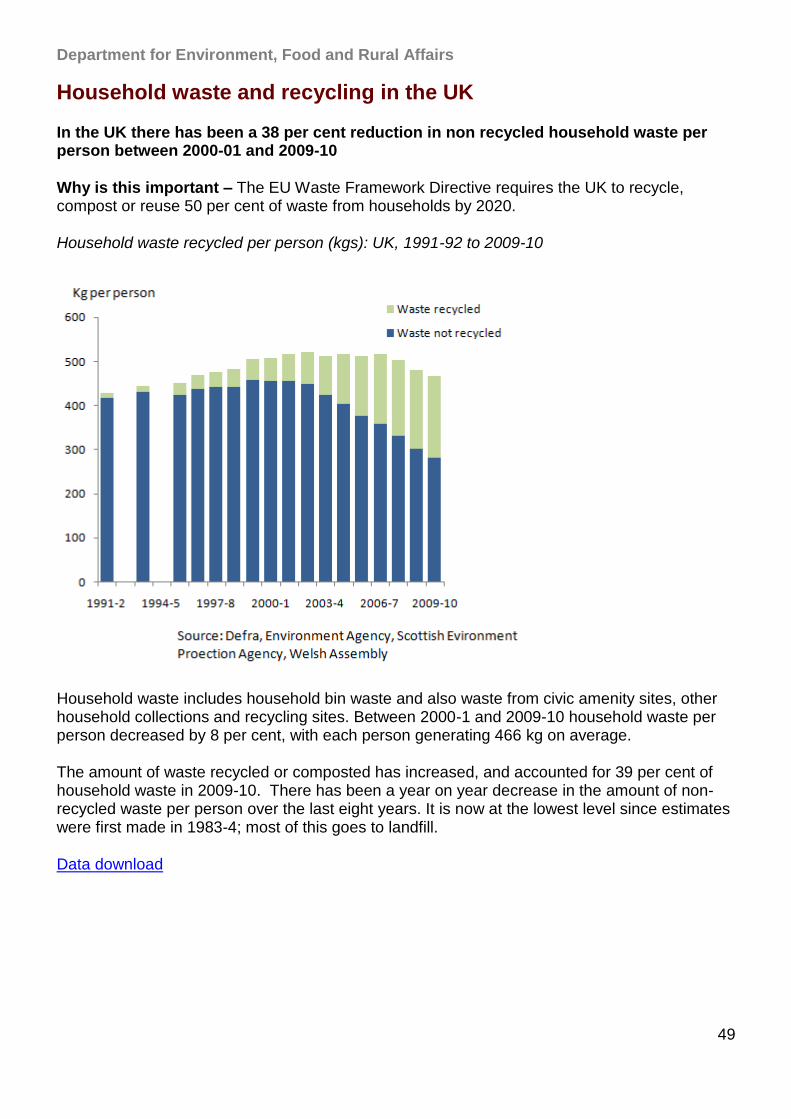
Household waste and recycling in the UK
In the UK there has been a 38 per cent reduction in non recycled household waste per person between 2000-01 and 2009-10
Why is this important – The EU Waste Framework Directive requires the UK to recycle, compost or reuse 50 per cent of waste from households by 2020.
Household waste recycled per person (kgs): UK, 1991-92 to 2009-10
Household waste includes household bin waste and also waste from civic amenity sites, other household collections and recycling sites. Between 2000-1 and 2009-10 household waste per person decreased by 8 per cent, with each person generating 466 kg on average.
The amount of waste recycled or composted has increased, and accounted for 39 per cent of household waste in 2009-10. There has been a year on year decrease in the amount of non-recycled waste per person over the last eight years. It is now at the lowest level since estimates were first made in 1983-4; most of this goes to landfill.
Data download
Department for Environment, Food and Rural Affairs
50
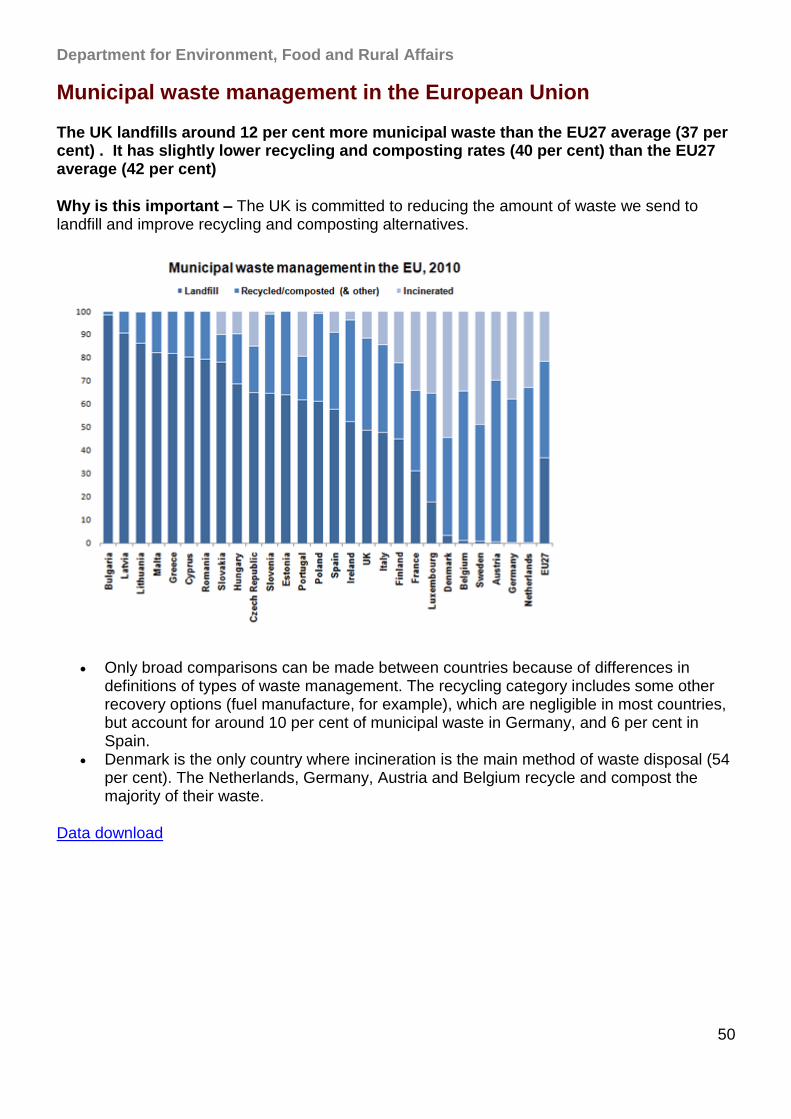
Municipal waste management in the European Union
The UK landfills around 12 per cent more municipal waste than the EU27 average (37 per cent) . It has slightly lower recycling and composting rates (40 per cent) than the EU27 average (42 per cent)
Why is this important – The UK is committed to reducing the amount of waste we send to landfill and improve recycling and composting alternatives.
Only broad comparisons can be made between countries because of differences in definitions of types of waste management. The recycling category includes some other recovery options (fuel manufacture, for example), which are negligible in most countries, but account for around 10 per cent of municipal waste in Germany, and 6 per cent in Spain.
Denmark is the only country where incineration is the main method of waste disposal (54 per cent). The Netherlands, Germany, Austria and Belgium recycle and compost the majority of their waste.
Data download
Department for Environment, Food and Rural Affairs
51
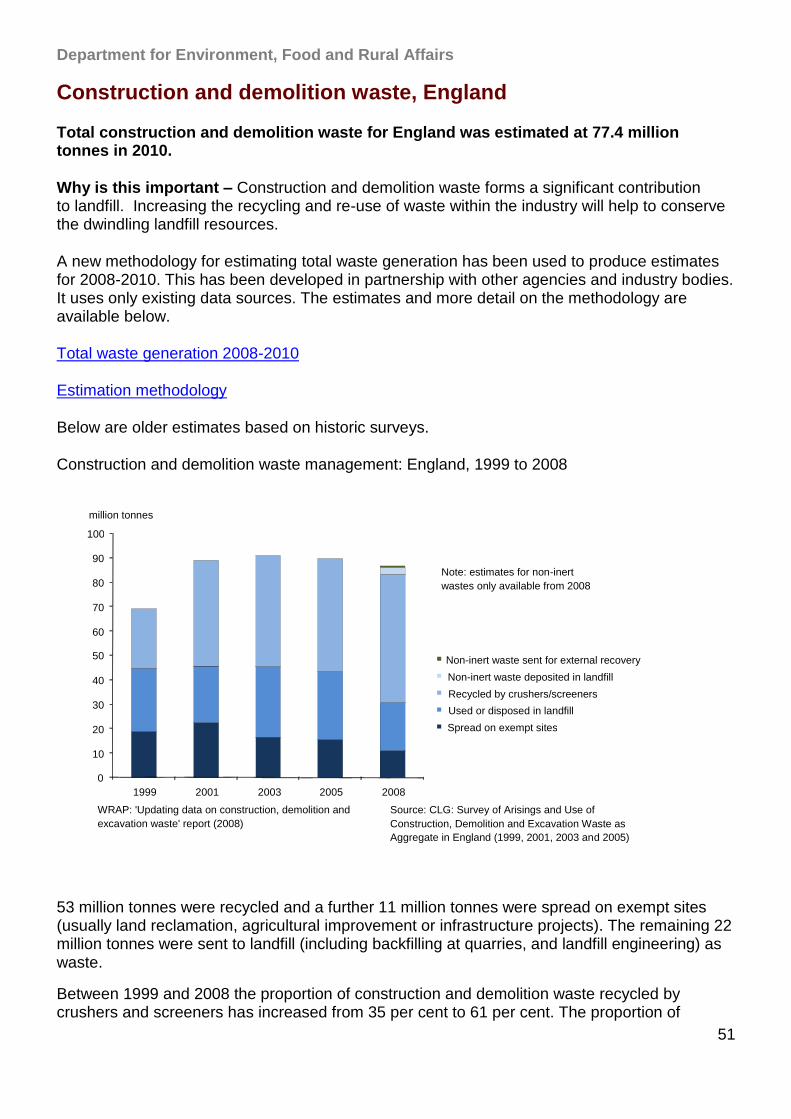
Construction and demolition waste, England
Total construction and demolition waste for England was estimated at 77.4 million tonnes in 2010.
Why is this important – Construction and demolition waste forms a significant contribution to landfill. Increasing the recycling and re-use of waste within the industry will help to conserve the dwindling landfill resources.
A new methodology for estimating total waste generation has been used to produce estimates for 2008-2010. This has been developed in partnership with other agencies and industry bodies. It uses only existing data sources. The estimates and more detail on the methodology are available below.
Total waste generation 2008-2010
Estimation methodology
Below are older estimates based on historic surveys.
Construction and demolition waste management: England, 1999 to 2008
0
10
20
30
40
50
60
70
80
90
100
1999 2001 2003 2005 2008
million tonnes
Non-inert waste sent for external recovery
Non-inert waste deposited in landfill
Recycled by crushers/screeners
Used or disposed in landfill
Spread on exempt sites
Source: CLG: Survey of Arisings and Use of
Construction, Demolition and Excavation Waste as
Aggregate in England (1999, 2001, 2003 and 2005)
Note: estimates for non-inert
wastes only available from 2008
WRAP: 'Updating data on construction, demolition and
excavation waste' report (2008)
53 million tonnes were recycled and a further 11 million tonnes were spread on exempt sites (usually land reclamation, agricultural improvement or infrastructure projects). The remaining 22 million tonnes were sent to landfill (including backfilling at quarries, and landfill engineering) as waste.
Between 1999 and 2008 the proportion of construction and demolition waste recycled by crushers and screeners has increased from 35 per cent to 61 per cent. The proportion of

Department for Environment, Food and Rural Affairs
52
construction and demolition waste sent to landfill has decreased from 37 per cent to 22 per cent and the amount of waste going to exempt sites has fallen from 27 per cent to 13 per cent.
Data download
Department for Environment, Food and Rural Affairs
53
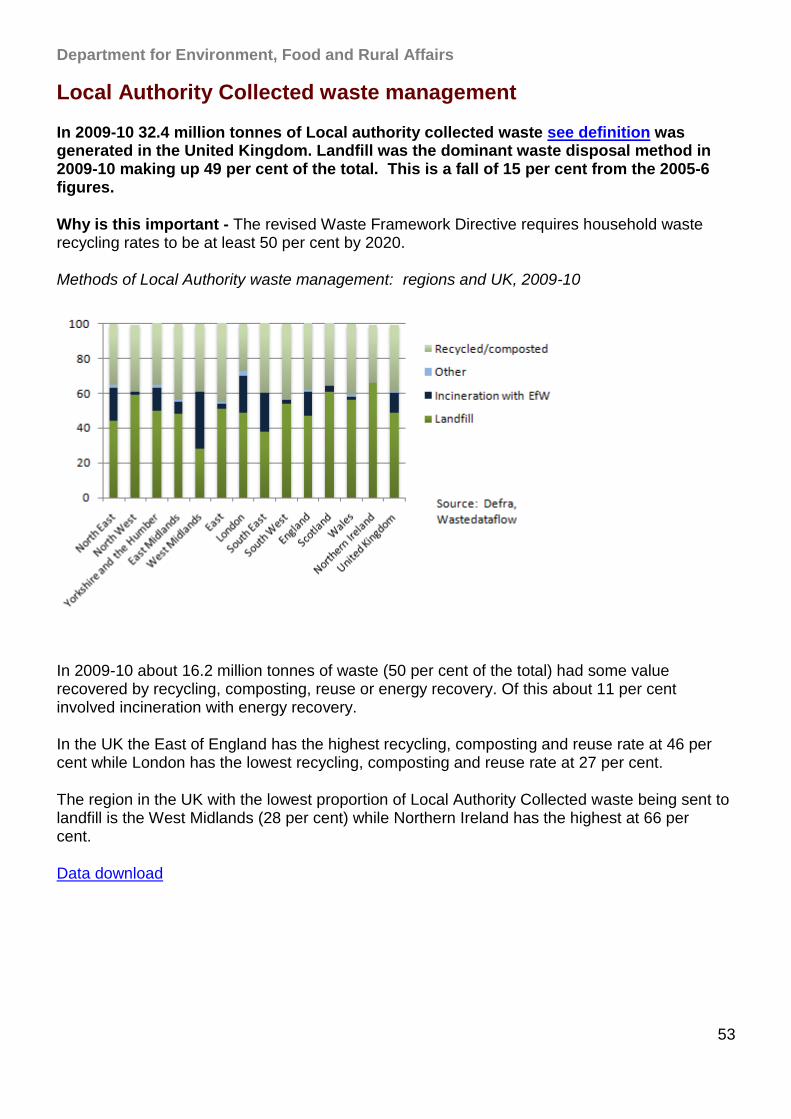
Local Authority Collected waste management
In 2009-10 32.4 million tonnes of Local authority collected waste see definition was generated in the United Kingdom. Landfill was the dominant waste disposal method in 2009-10 making up 49 per cent of the total. This is a fall of 15 per cent from the 2005-6 figures.
Why is this important - The revised Waste Framework Directive requires household waste recycling rates to be at least 50 per cent by 2020.
Methods of Local Authority waste management: regions and UK, 2009-10
In 2009-10 about 16.2 million tonnes of waste (50 per cent of the total) had some value recovered by recycling, composting, reuse or energy recovery. Of this about 11 per cent involved incineration with energy recovery.
In the UK the East of England has the highest recycling, composting and reuse rate at 46 per cent while London has the lowest recycling, composting and reuse rate at 27 per cent.
The region in the UK with the lowest proportion of Local Authority Collected waste being sent to landfill is the West Midlands (28 per cent) while Northern Ireland has the highest at 66 per cent.
Data download
Department for Environment, Food and Rural Affairs
54
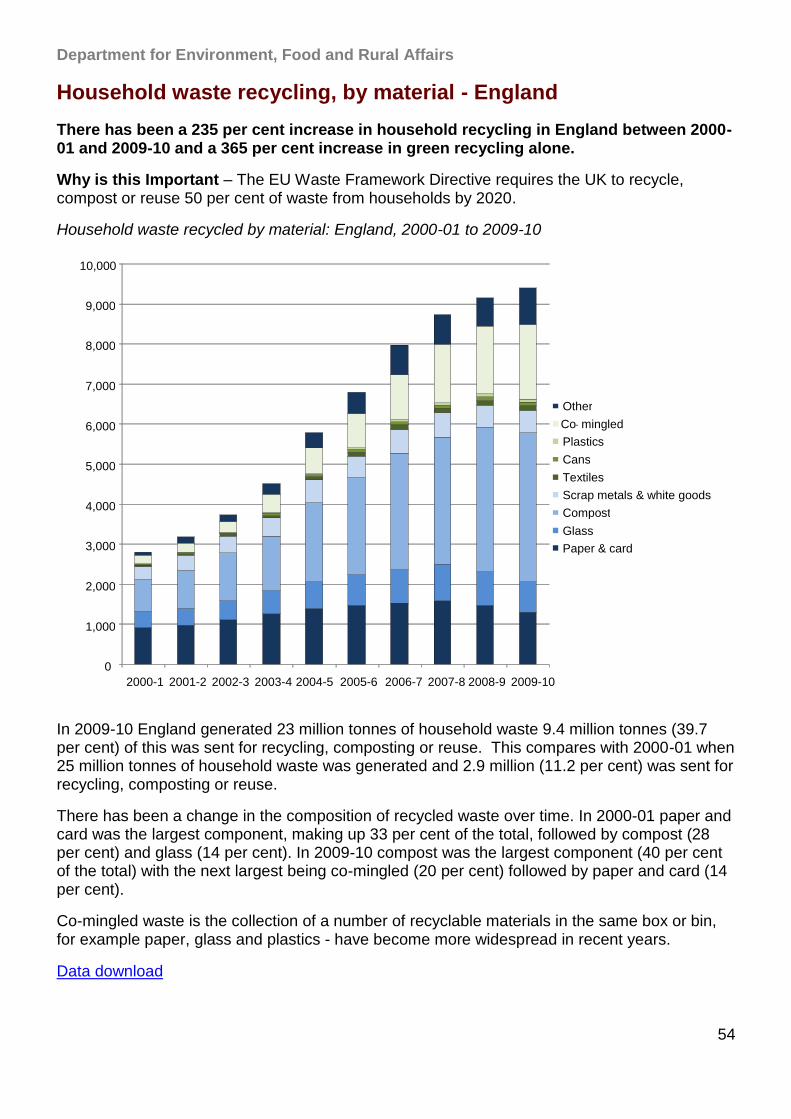
Household waste recycling, by material - England
There has been a 235 per cent increase in household recycling in England between 2000-01 and 2009-10 and a 365 per cent increase in green recycling alone.
Why is this Important – The EU Waste Framework Directive requires the UK to recycle, compost or reuse 50 per cent of waste from households by 2020.
Household waste recycled by material: England, 2000-01 to 2009-10
In 2009-10 England generated 23 million tonnes of household waste 9.4 million tonnes (39.7 per cent) of this was sent for recycling, composting or reuse. This compares with 2000-01 when 25 million tonnes of household waste was generated and 2.9 million (11.2 per cent) was sent for recycling, composting or reuse.
There has been a change in the composition of recycled waste over time. In 2000-01 paper and card was the largest component, making up 33 per cent of the total, followed by compost (28 per cent) and glass (14 per cent). In 2009-10 compost was the largest component (40 per cent of the total) with the next largest being co-mingled (20 per cent) followed by paper and card (14 per cent).
Co-mingled waste is the collection of a number of recyclable materials in the same box or bin, for example paper, glass and plastics - have become more widespread in recent years.
Data download
0
1,000
2,000
3,000
4,000
5,000
6,000
7,000
8,000
9,000
10,000
2000-1 2001-2 2002-3 2003-4 2004-5 2005-6 2006-7 2007-8 2008-9 2009-10
- mingled Co
Paper & card
Glass
Compost
Scrap metals & white goods
Textiles
Cans
Plastics
Other
Department for Environment, Food and Rural Affairs
55
Household waste: green and dry recycling rates
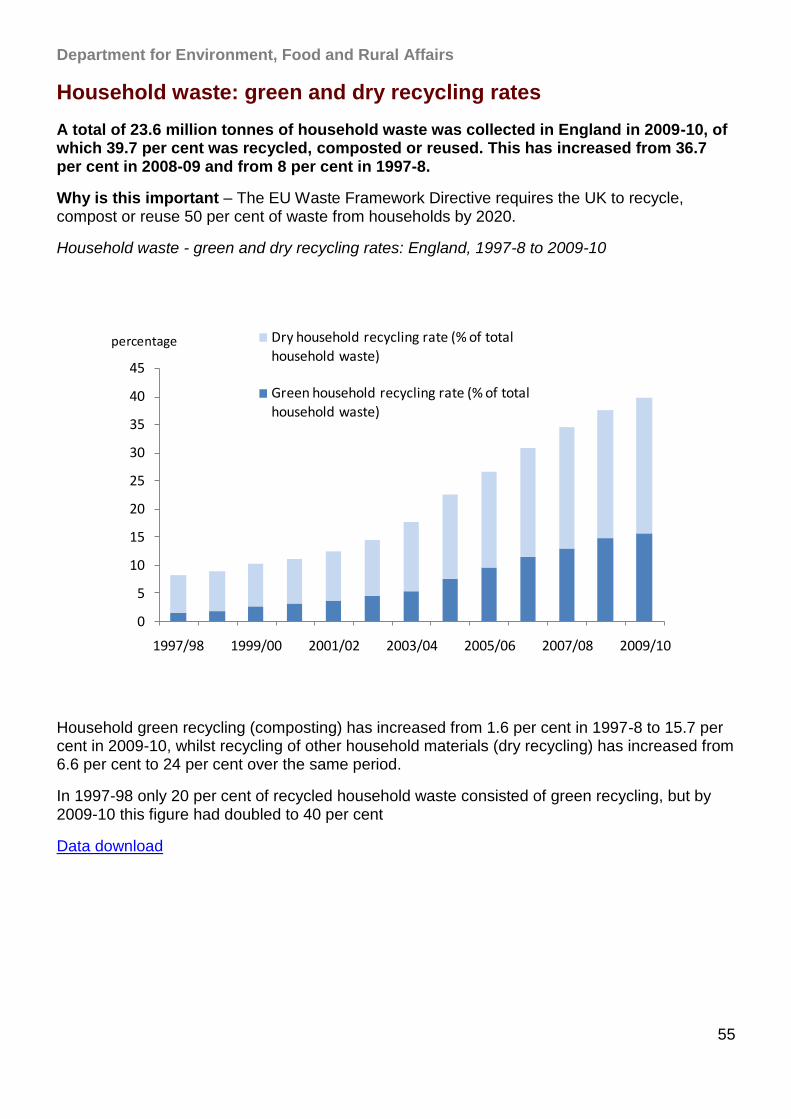
A total of 23.6 million tonnes of household waste was collected in England in 2009-10, of which 39.7 per cent was recycled, composted or reused. This has increased from 36.7 per cent in 2008-09 and from 8 per cent in 1997-8.
Why is this important – The EU Waste Framework Directive requires the UK to recycle, compost or reuse 50 per cent of waste from households by 2020.
Household waste - green and dry recycling rates: England, 1997-8 to 2009-10
0
5
10
15
20
25
30
35
40
45
1997/98 1999/00 2001/02 2003/04 2005/06 2007/08 2009/10
Dry household recycling rate (% of total household waste)
Green household recycling rate (% of total
household waste)
percentage
Household green recycling (composting) has increased from 1.6 per cent in 1997-8 to 15.7 per cent in 2009-10, whilst recycling of other household materials (dry recycling) has increased from 6.6 per cent to 24 per cent over the same period.
In 1997-98 only 20 per cent of recycled household waste consisted of green recycling, but by 2009-10 this figure had doubled to 40 per cent
Data download
Department for Environment, Food and Rural Affairs
56
Recycling and recovery from packaging
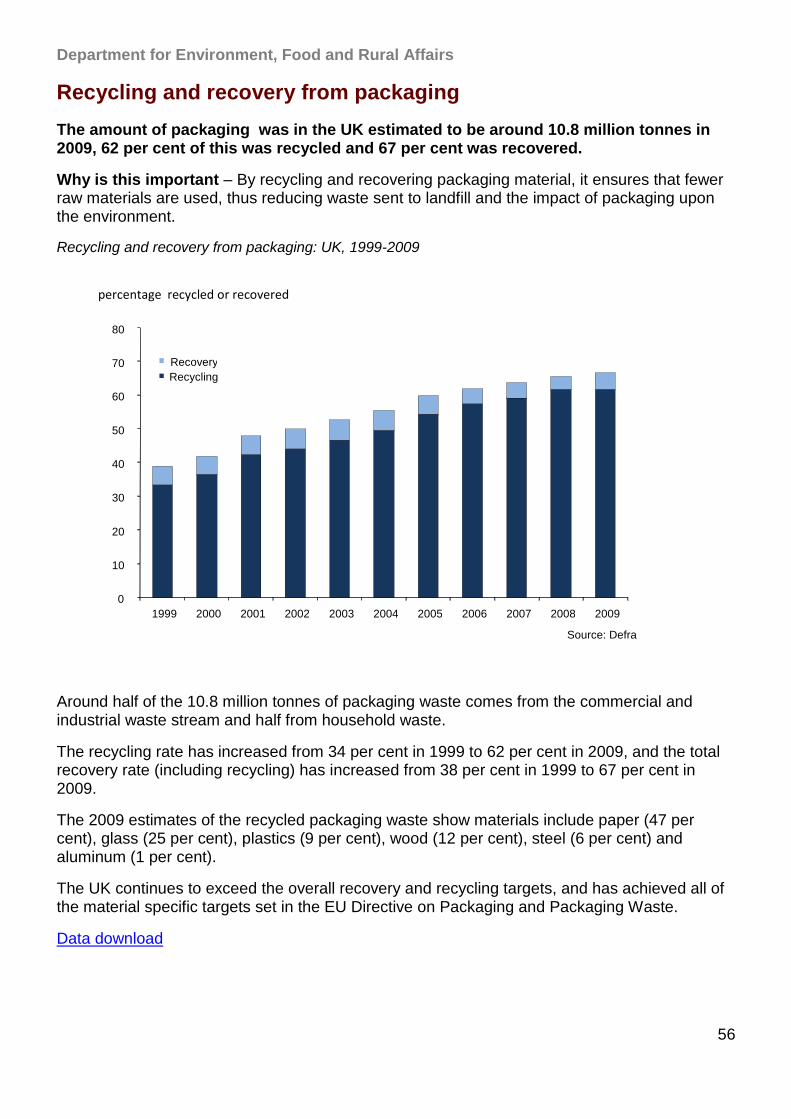
The amount of packaging was in the UK estimated to be around 10.8 million tonnes in 2009, 62 per cent of this was recycled and 67 per cent was recovered.
Why is this important – By recycling and recovering packaging material, it ensures that fewer raw materials are used, thus reducing waste sent to landfill and the impact of packaging upon the environment.
Recycling and recovery from packaging: UK, 1999-2009
0
10
20
30
40
50
60
70
80
1999 2000 2001 2002 2003 2004 2005 2006 2007 2008 2009
Recovery Recycling
Source: Defra
percentage recycled or recovered
Around half of the 10.8 million tonnes of packaging waste comes from the commercial and industrial waste stream and half from household waste.
The recycling rate has increased from 34 per cent in 1999 to 62 per cent in 2009, and the total recovery rate (including recycling) has increased from 38 per cent in 1999 to 67 per cent in 2009.
The 2009 estimates of the recycled packaging waste show materials include paper (47 per cent), glass (25 per cent), plastics (9 per cent), wood (12 per cent), steel (6 per cent) and aluminum (1 per cent).
The UK continues to exceed the overall recovery and recycling targets, and has achieved all of the material specific targets set in the EU Directive on Packaging and Packaging Waste.
Data download
Department for Environment, Food and Rural Affairs
57
Composition of local authority collected waste
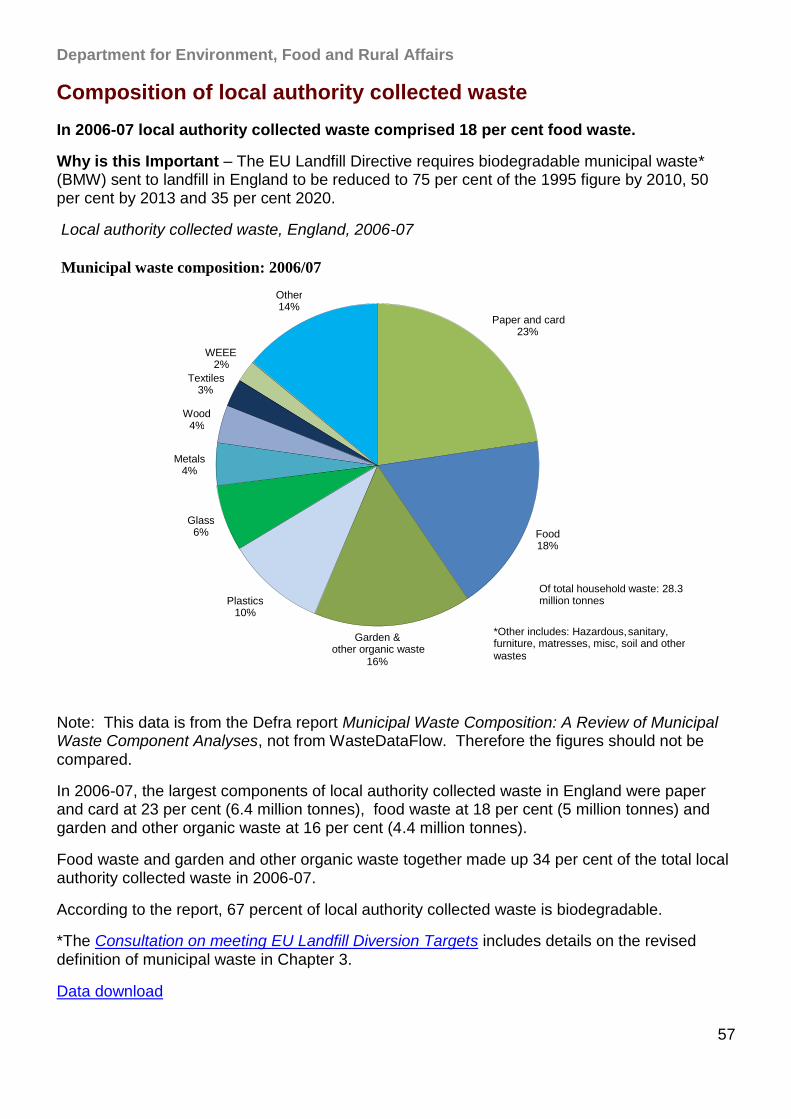
In 2006-07 local authority collected waste comprised 18 per cent food waste.
Why is this Important – The EU Landfill Directive requires biodegradable municipal waste* (BMW) sent to landfill in England to be reduced to 75 per cent of the 1995 figure by 2010, 50 per cent by 2013 and 35 per cent 2020.
Local authority collected waste, England, 2006-07
Note: This data is from the Defra report Municipal Waste Composition: A Review of Municipal Waste Component Analyses, not from WasteDataFlow. Therefore the figures should not be compared.
In 2006-07, the largest components of local authority collected waste in England were paper and card at 23 per cent (6.4 million tonnes), food waste at 18 per cent (5 million tonnes) and garden and other organic waste at 16 per cent (4.4 million tonnes).
Food waste and garden and other organic waste together made up 34 per cent of the total local authority collected waste in 2006-07.
According to the report, 67 percent of local authority collected waste is biodegradable.
*The Consultation on meeting EU Landfill Diversion Targets includes details on the revised definition of municipal waste in Chapter 3.
Data download
Paper and card 23%
Food 18%
Garden & other organic waste
16%
Plastics 10%
Glass 6%
Metals 4%
Wood 4%
Textiles 3%
WEEE 2%
Other 14%
Municipal waste composition: 2006/07
*Other includes: Hazardous, sanitary, furniture, matresses, misc, soil and other wastes
Of total household waste: 28.3 million tonnes
Department for Environment, Food and Rural Affairs
58
Local authority collected waste generation
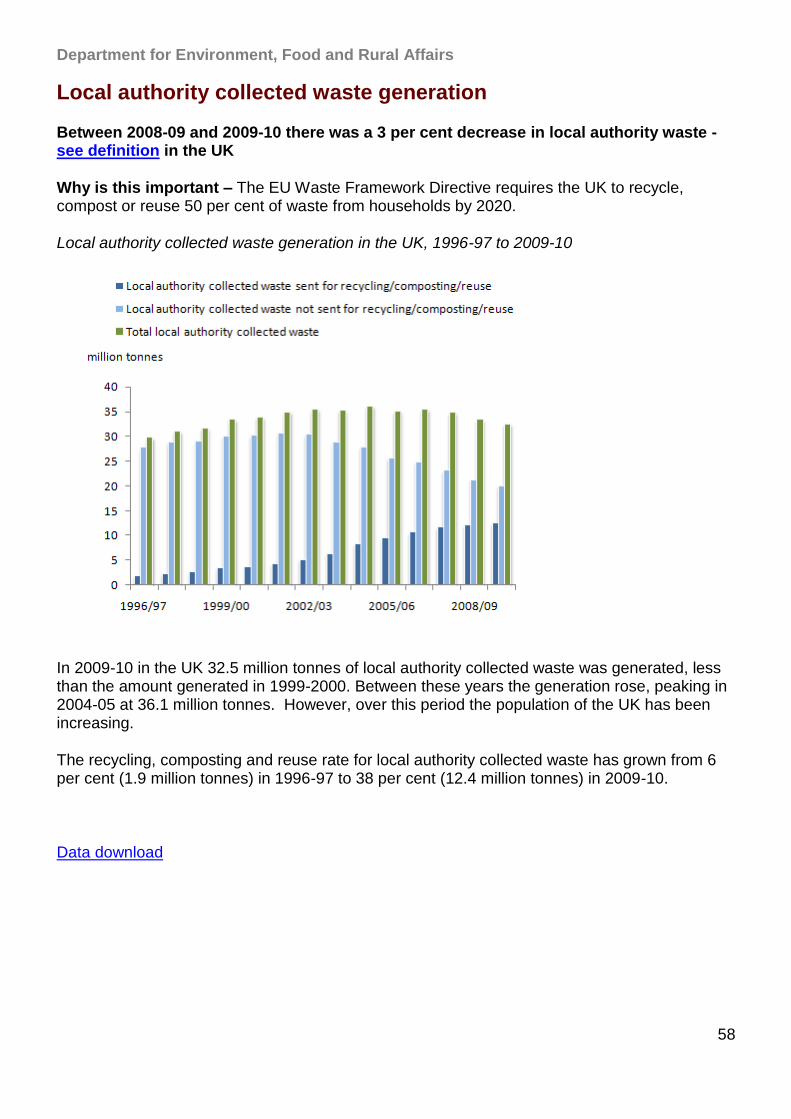
Between 2008-09 and 2009-10 there was a 3 per cent decrease in local authority waste - see definition in the UK
Why is this important – The EU Waste Framework Directive requires the UK to recycle, compost or reuse 50 per cent of waste from households by 2020.
Local authority collected waste generation in the UK, 1996-97 to 2009-10
In 2009-10 in the UK 32.5 million tonnes of local authority collected waste was generated, less than the amount generated in 1999-2000. Between these years the generation rose, peaking in 2004-05 at 36.1 million tonnes. However, over this period the population of the UK has been increasing.
The recycling, composting and reuse rate for local authority collected waste has grown from 6 per cent (1.9 million tonnes) in 1996-97 to 38 per cent (12.4 million tonnes) in 2009-10.
Data download
Department for Environment, Food and Rural Affairs
59
Local authority collected waste for England
annual statistics
Local authority collected waste being sent to landfill has decreased by 8.8 per cent between the financial years 2009/10 and 2010/11 to 11.4 million tonnes.
2010-11 Final Annual Estimates
Final estimates of local authority collected waste generation and management for England and the regions in 2010-11 were published on 3rd November 2011 Statistical Release 2010-11.
These statistics are based on data submitted by all local authorities in England to WasteDataFlow on the waste they collect and manage, and replace the provisional estimates published for the first three quarters of 2010-11 in February, May and August 2011. Quarterly figures can be found here .
Headline results
Household recycling has increased The proportion of household waste sent for recycling, composting or reuse between April 2010 to March 2011 in England was 41.2 per cent, increasing from 39.7 per cent in the year April 2009 and March 2010.
Household waste production has decreased The generation of household waste continued to decrease between the financial years 2009/10 and 2010/11, with a 0.9 per cent reduction to 23.5 million tonnes.
Waste generation per person has decreased The weight of household waste generated in the year April 2010 to March 2011 in England, in kilograms per person, was 449 kg per person. Of this total, 185 kg was recycled, composted or reused whilst 264 kg was not.
Local authority collected waste sent to landfill has declined The tonnage of local authority collected waste being sent to landfill by local authorities has decreased by 8.8 per cent between the financial years 2009/10 and 2010/11 to 11.4 million tonnes.
Ongoing reporting issues mean that we have been unable to produce the usual detailed local authority level data. Complete local authority level reports can be produced from the Wastedataflow website. Limited local authority level data for 2010-11 is available here.
Data revision
Due to minor calculation errors in the original data a revised statistics release for 2010/11 was published on 3rd May 2012. Most of the data is unchanged. The household recycling rate has changed from 41.2% to 41.5%. The total weight of household waste generated per person is unchanged, but the weight per person of recycling has changed from 185kg to 186kg while the weight per person of waste not recycled has changed from 264kg to 263kg.
Statistical release for 2010-11
Department for Environment, Food and Rural Affairs
60
Waste and Recycling - Further information
Government policy on waste and recycling
WasteDataFlow
Household waste statistics in Wales, Scotland and Northern Ireland
EuroStat - Themes and Data
WRAP report: Construction, demolition and excavation waste arisings, use and disposal for England 2008
Defra – Packaging and waste page
Sustainable Development Indicators – Waste
Sustainable Development Indicators – Household waste and recycling
Definition of local authority collected waste
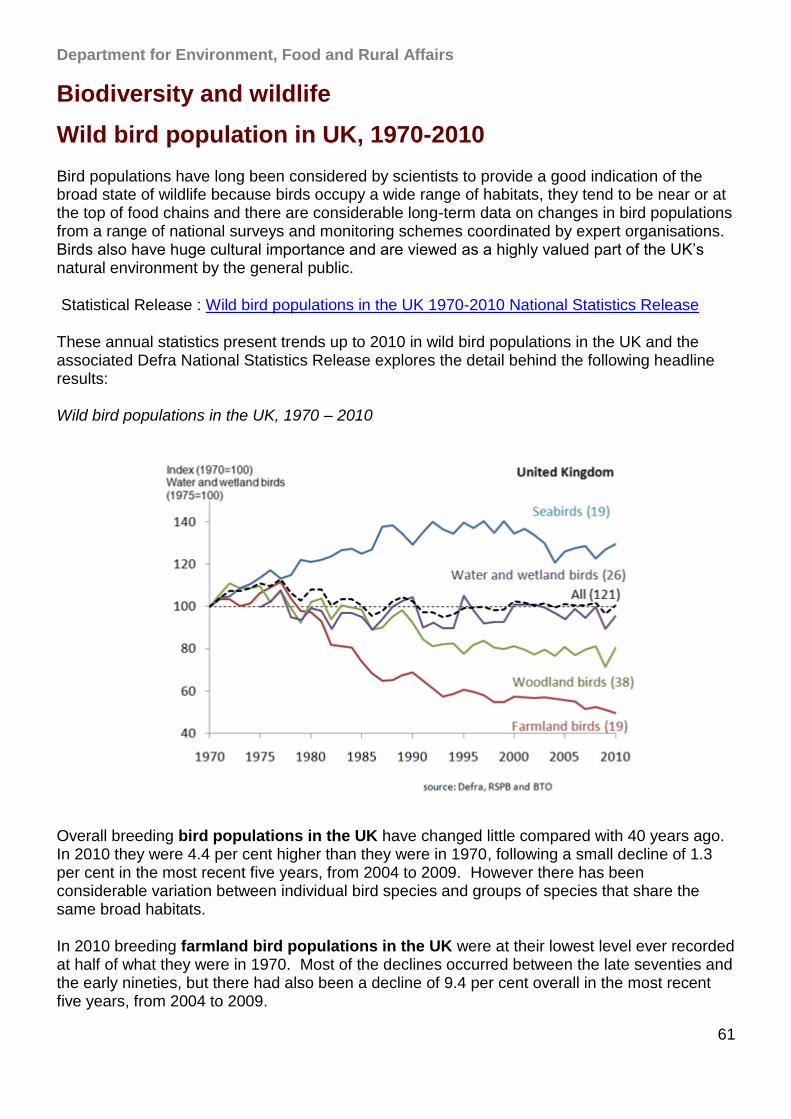
Department for Environment, Food and Rural Affairs
61
Biodiversity and wildlife
Wild bird population in UK, 1970-2010
Bird populations have long been considered by scientists to provide a good indication of the broad state of wildlife because birds occupy a wide range of habitats, they tend to be near or at the top of food chains and there are considerable long-term data on changes in bird populations from a range of national surveys and monitoring schemes coordinated by expert organisations. Birds also have huge cultural importance and are viewed as a highly valued part of the UK‟s natural environment by the general public.
Statistical Release : Wild bird populations in the UK 1970-2010 National Statistics Release
These annual statistics present trends up to 2010 in wild bird populations in the UK and the associated Defra National Statistics Release explores the detail behind the following headline results:
Wild bird populations in the UK, 1970 – 2010
Overall breeding bird populations in the UK have changed little compared with 40 years ago. In 2010 they were 4.4 per cent higher than they were in 1970, following a small decline of 1.3 per cent in the most recent five years, from 2004 to 2009. However there has been considerable variation between individual bird species and groups of species that share the same broad habitats.
In 2010 breeding farmland bird populations in the UK were at their lowest level ever recorded at half of what they were in 1970. Most of the declines occurred between the late seventies and the early nineties, but there had also been a decline of 9.4 per cent overall in the most recent five years, from 2004 to 2009.
Department for Environment, Food and Rural Affairs
62
Breeding woodland bird populations in the UK were 19.4 per cent lower in 2010 than what they were in 1970. The greatest decline of woodland birds occurred from the late eighties until the mid nineties, but there had been little change in the most recent five years, from 2004 to 2009.
In 2010 breeding water and wetland bird populations in the UK were 4.3 per cent lower than they were in 1975 and had shown a decline of 3.6 per cent overall in the most recent five years, 2004 to 2009.
Breeding seabird populations in the UK in 2010 were 30 per cent higher than in 1970 and had increased by 5 per cent overall in the most recent five years, 2003-4 to 2008-9.
In the winter of 2009-10 populations of wintering waterbirds in the UK were 83 per cent higher than in the winter of 1975-6. However, populations had been higher and had shown an overall decline of 5.6 per cent over the most recent five winters, from 2003-4 to 2008-9.
The bird population indices have been compiled in conjunction with the Royal Society for the Protection of Birds (RSPB), the British Trust for Ornithology (BTO) and the Joint Nature Conservation Committee (JNCC).
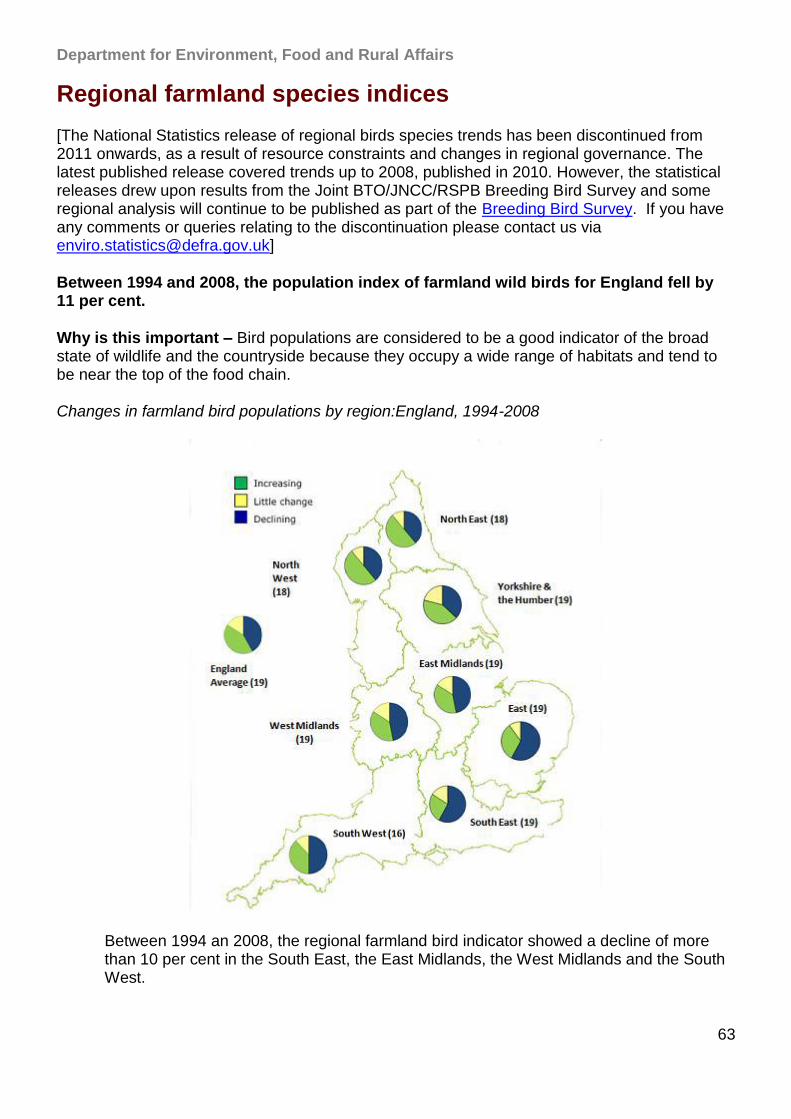
Department for Environment, Food and Rural Affairs
63
Regional farmland species indices
[The National Statistics release of regional birds species trends has been discontinued from 2011 onwards, as a result of resource constraints and changes in regional governance. The latest published release covered trends up to 2008, published in 2010. However, the statistical releases drew upon results from the Joint BTO/JNCC/RSPB Breeding Bird Survey and some regional analysis will continue to be published as part of the Breeding Bird Survey. If you have any comments or queries relating to the discontinuation please contact us via [email protected]]
Between 1994 and 2008, the population index of farmland wild birds for England fell by 11 per cent.
Why is this important – Bird populations are considered to be a good indicator of the broad state of wildlife and the countryside because they occupy a wide range of habitats and tend to be near the top of the food chain.
Changes in farmland bird populations by region:England, 1994-2008
Between 1994 an 2008, the regional farmland bird indicator showed a decline of more than 10 per cent in the South East, the East Midlands, the West Midlands and the South West.

Department for Environment, Food and Rural Affairs
64
Comparisons between regions should be treated with caution because each regional indicator covers different species.
Data download
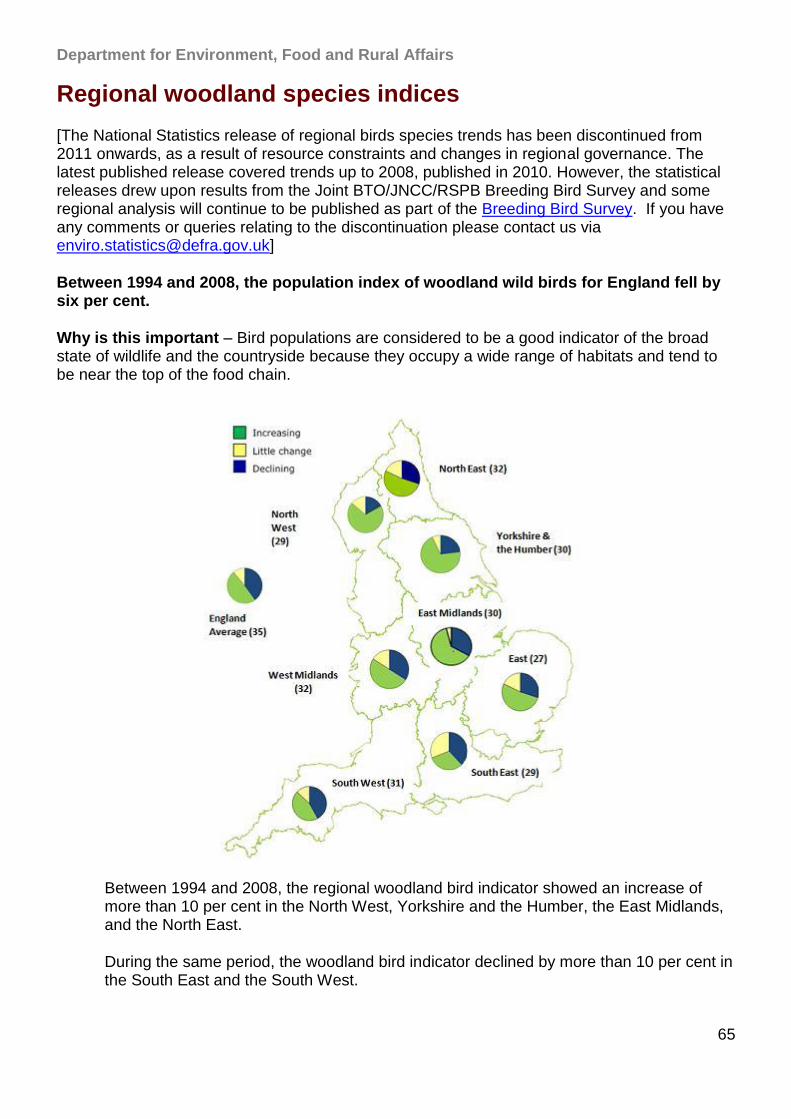
Department for Environment, Food and Rural Affairs
65
Regional woodland species indices
[The National Statistics release of regional birds species trends has been discontinued from 2011 onwards, as a result of resource constraints and changes in regional governance. The latest published release covered trends up to 2008, published in 2010. However, the statistical releases drew upon results from the Joint BTO/JNCC/RSPB Breeding Bird Survey and some regional analysis will continue to be published as part of the Breeding Bird Survey. If you have any comments or queries relating to the discontinuation please contact us via [email protected]]
Between 1994 and 2008, the population index of woodland wild birds for England fell by six per cent.
Why is this important – Bird populations are considered to be a good indicator of the broad state of wildlife and the countryside because they occupy a wide range of habitats and tend to be near the top of the food chain.
Between 1994 and 2008, the regional woodland bird indicator showed an increase of more than 10 per cent in the North West, Yorkshire and the Humber, the East Midlands, and the North East.
During the same period, the woodland bird indicator declined by more than 10 per cent in the South East and the South West.

Department for Environment, Food and Rural Affairs
66
Comparisons between regions should be treated with caution because each regional indicator covers different species.
Data download
Department for Environment, Food and Rural Affairs
67
Biodiversity and wildlife further information
Biodiversity Indicators in Your Pocket 2012
Government policy on wildlife and biodiversity
Provisional technical document on data collection and indicator methodology
UK Government Sustainable Development Strategy indicators
Royal Society for the Protection of Birds
British Trust for Ornithology
Joint Nature Conservation Committee
Biodiversity Indicators in Your Pocket 2011
Breeding Bird Survey
Department for Environment, Food and Rural Affairs
68
Annexe
Some of the statistics included in this publication are designated as National Statistics. Such statistics were originally identified as National Statistics owing to their importance as measures relating to nationally important issues, and owing to the rigorous processes in place to ensure their quality and integrity. National Statistics are produced to high professional standards set out in the Code of Practice for Official Statistics. They undergo regular quality assurance reviews to ensure they meet customer needs. Other statistics that are not designated as National Statistics, may not be designated merely because Defra does not have full control of the data collection or reporting processes, and hence Defra cannot fully comply with the Code of Practice. However, these statistics are reviewed carefully before inclusion and are regarded as the best available and fit for purpose. Indeed in many cases the data are compiled to high degrees of rigor by Defra‟s agencies or by non-governmental organisations, involved leading experts, such that were they produced directly by Defra they would be regarded as meeting the standards of the Code of Practice and would be considered fit for designation as National Statistics. The following statistics are designated as National Statistics: Levels of particulates and ozone. Page 2 Days when pollution is moderate or higher. Page 4 Emissions of sulphur dioxide. Page 6 Emissions of non-methane volatile organic compounds. Page 8 Emissions of ammonia. Page 9 Emissions of nitrogen oxides. Page 11 Chemical river water quality. Page 20 Biological river water quality. Page 22 Household waste: green and dry recycling rates. Page 55 Local Authority collected waste generation. Page 58 Local Authority collected waste for England : annual statistics. Page 59 Populations of wild birds. Page 61 Regional farmland species indices. Page 63 Regional woodland species indices. Page 65
Related Documents