ENVIRONMENTAL, SOCIAL AND GOVERNANCE REPORT 2020

Welcome message from author
This document is posted to help you gain knowledge. Please leave a comment to let me know what you think about it! Share it to your friends and learn new things together.
Transcript

WHITECAP IS COMMITTED
TO GROWING OUR BUSINESSIN A HEALTHY, SAFEAND ENVIRONMENTALLYRESPONSIBLE MANNER.
2

LETTER TO STAKEHOLDERS .................... 5
ABOUT THIS REPORT .............................. 6
ABOUT WHITECAP .................................. 7
GOVERNANCE .......................................... 9
CLIMATE ............................................... 12
WEYBURN .............................................. 13
WATER ................................................... 14
LAND ..................................................... 15
HEALTH AND SAFETY ............................ 16
TABLE OF CONTENTS
DATA TABLE .......................................... 18
REPORTING STANDARD INDEXES ......... 23
ADVISORIES .......................................... 27
ABOUT WHITECAPPAGES 5 - 7
ESG PERFORMANCEPAGES 9 - 16
THE DATAPAGES 18 - 28
3 WHITECAP RESOURCES INC.
ESG REPORT 2020
ABOUTWHITECAP
4 WHITECAP RESOURCES INC.
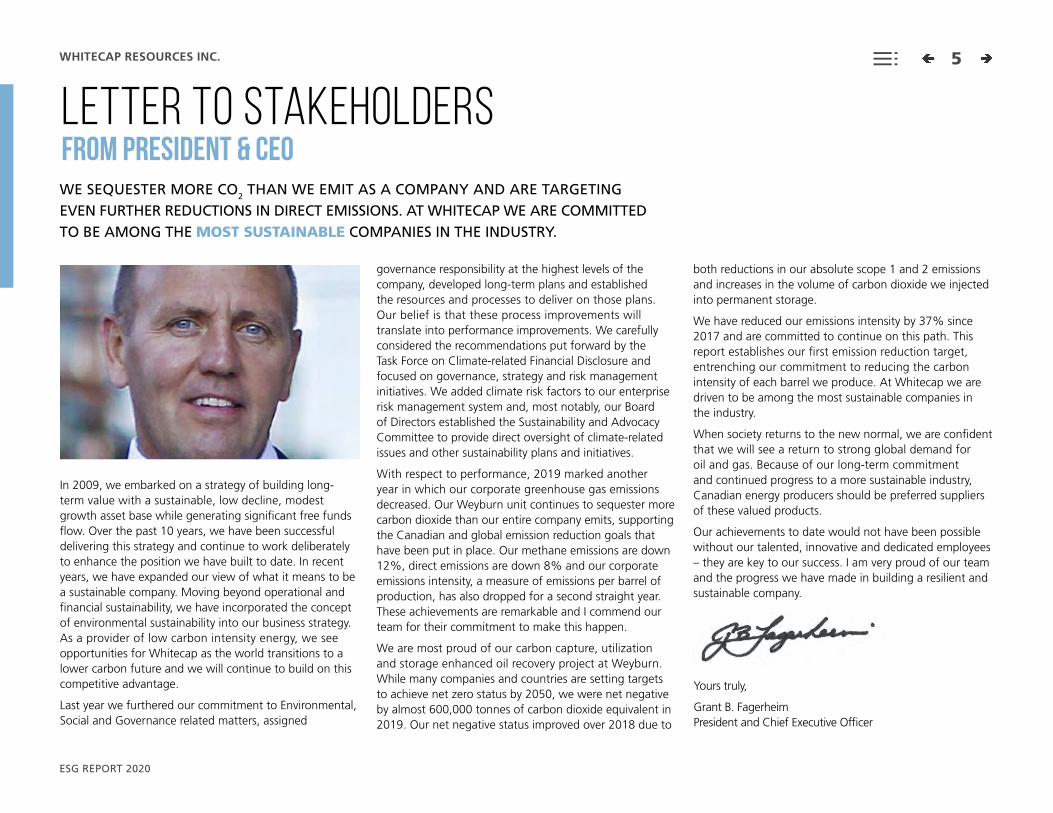
In 2009, we embarked on a strategy of building long-term value with a sustainable, low decline, modest growth asset base while generating significant free funds flow. Over the past 10 years, we have been successful delivering this strategy and continue to work deliberately to enhance the position we have built to date. In recent years, we have expanded our view of what it means to be a sustainable company. Moving beyond operational and financial sustainability, we have incorporated the concept of environmental sustainability into our business strategy. As a provider of low carbon intensity energy, we see opportunities for Whitecap as the world transitions to a lower carbon future and we will continue to build on this competitive advantage.
Last year we furthered our commitment to Environmental, Social and Governance related matters, assigned
governance responsibility at the highest levels of the company, developed long-term plans and established the resources and processes to deliver on those plans. Our belief is that these process improvements will translate into performance improvements. We carefully considered the recommendations put forward by the Task Force on Climate-related Financial Disclosure and focused on governance, strategy and risk management initiatives. We added climate risk factors to our enterprise risk management system and, most notably, our Board of Directors established the Sustainability and Advocacy Committee to provide direct oversight of climate-related issues and other sustainability plans and initiatives.
With respect to performance, 2019 marked another year in which our corporate greenhouse gas emissions decreased. Our Weyburn unit continues to sequester more carbon dioxide than our entire company emits, supporting the Canadian and global emission reduction goals that have been put in place. Our methane emissions are down 12%, direct emissions are down 8% and our corporate emissions intensity, a measure of emissions per barrel of production, has also dropped for a second straight year. These achievements are remarkable and I commend our team for their commitment to make this happen.
We are most proud of our carbon capture, utilization and storage enhanced oil recovery project at Weyburn. While many companies and countries are setting targets to achieve net zero status by 2050, we were net negative by almost 600,000 tonnes of carbon dioxide equivalent in 2019. Our net negative status improved over 2018 due to
both reductions in our absolute scope 1 and 2 emissions and increases in the volume of carbon dioxide we injected into permanent storage.
We have reduced our emissions intensity by 37% since 2017 and are committed to continue on this path. This report establishes our first emission reduction target, entrenching our commitment to reducing the carbon intensity of each barrel we produce. At Whitecap we are driven to be among the most sustainable companies in the industry.
When society returns to the new normal, we are confident that we will see a return to strong global demand for oil and gas. Because of our long-term commitment and continued progress to a more sustainable industry, Canadian energy producers should be preferred suppliers of these valued products.
Our achievements to date would not have been possible without our talented, innovative and dedicated employees – they are key to our success. I am very proud of our team and the progress we have made in building a resilient and sustainable company.
WE SEQUESTER MORE CO2 THAN WE EMIT AS A COMPANY AND ARE TARGETING EVEN FURTHER REDUCTIONS IN DIRECT EMISSIONS. AT WHITECAP WE ARE COMMITTED TO BE AMONG THE MOST SUSTAINABLE COMPANIES IN THE INDUSTRY.
LETTER TO STAKEHOLDERS FROM PRESIDENT & CEO
Yours truly,
Grant B. Fagerheim President and Chief Executive Officer
5
ESG REPORT 2020
WHITECAP RESOURCES INC.

2020 is a year marked by unprecedented change for the global economy and society at large. Despite the challenges now faced by our industry, we remain committed to continuously improving our ESG profile. We believe that financial performance is inextricably linked to ESG performance.
This report provides an expanded set of performance metrics and short narratives of topics most relevant to our company and stakeholders. The following notes are important for readers to consider when interpreting the information herein.
• The report content, format and reporting methodology are informed by the Sustainability Accounting Standards Board (SASB) Oil & Gas – Exploration & Production standard, recommendations from the Task Force on Climate-related Financial Disclosures (TCFD) and the Global Reporting Initiative (GRI).
• Aligning with the International Petroleum Industry Environmental Conservation Association (IPIECA) Petroleum Industry Guidelines for Reporting GHG Emissions, the Greenhouse Gas Protocol Corporate Standard and consistent with peers, we define the boundary for all reported data based on "Operational Control," unless stated otherwise. This means we account for these metrics during the months in which we operate the asset, regardless of equity ownership.
• In 2019, Whitecap incorporated additional state-of-the-art data measurement and management tools to increase the granularity and accuracy of our emissions. To maintain the integrity of trend analysis and for consistency, we show historical performance on the same basis in this report.
• In prior years, as operator of record at year-end, full-year emissions for properties acquired prior to December 31 of a given year were reported as Whitecap emissions for the entire calendar year. Historical emissions have been recalculated using the Operational Control boundaries for the actual period of Whitecap operation.
• Consistent with showing emissions under Operational Control, production values applied to corresponding intensity calculations are “operated gross product sales” and are not discounted to account for fractional ownership.
• “Economic Stakeholder Benefits” and “Net Product Sales,” as referenced in the data table, are displayed in accordance with our financial reporting.
• The data table provides data on all sustainability metrics that are relevant to Whitecap. This ESG report provides new information and highlights significant developments and is not intended to be an all-inclusive report. The data table and previous sustainability disclosures should also be consulted for information on a broader range of topics.
• We established the ESG factors most applicable to Whitecap in the 2018 Corporate Sustainability Report and continue to refresh our assessment on an annual basis. Attendance at industry sustainability workshops, interviews and discussions with stakeholders, peer reports and consideration of SASB and other industry focused guidance are collectively considered, and adjustments are made accordingly.
• The terms “Whitecap”, “we”, “us”, or “our” means Whitecap Resources Inc., and where the context requires, also means our controlled entities on a consolidated basis.
ABOUT THIS REPORTTHIS SUSTAINABILITY REPORT FOCUSES ON THE 2019 CALENDAR YEAR AND MARKS THE FOURTH CONSECUTIVE YEAR WE HAVE PUBLISHED INFORMATION ABOUT OUR ENVIRONMENTAL, SOCIAL AND GOVERNANCE (“ESG”) COMMITMENTS AND PERFORMANCE.
6 WHITECAP RESOURCES INC.
ESG REPORT 2020

ABOUT WHITECAP RESOURCES INC.We are a Calgary-based public company focused on the acquisition, development and production of oil and natural gas assets in Western Canada. The primary areas of focus of our development program are in West Central Alberta, Northwest Alberta and British Columbia, Southeast Saskatchewan, West Central Saskatchewan and Southwest Saskatchewan. We have a disciplined and sustainable business model of self-funded production growth and dividend payments. Our company is publicly traded on the Toronto Stock Exchange (TSX: WCP).
There were no significant operational changes in 2019.
71,050
55,413
4,503 4,923
66,801
OPERATIONAL
VALUE CREATION
*Includes capital and operating expenses
Total production, net (boe/d)
Oil (bbl/d)
Natural gas liquids (bbl/d)
Gross producing well count
Conventional natural gas (Mcf/d)
SALES1,454 MM
LOCAL SPENDING*
$725 MM
OTHER$304 MM
ROYALTIES$254 MM
DIVIDENDS$138 MM
SALARIES & BENEFITS $33 MM
7 WHITECAP RESOURCES INC.
ESG REPORT 2020

ESG PERFORMANCE
8 WHITECAP RESOURCES INC.

GOVERNANCESUSTAINABLE GROWTHWE RECOGNIZE THAT PREDICTABLE, CONTINUOUS AND TOP QUARTILE PERFORMANCE REQUIRES CORPORATE COMMITMENT AND FOCUS FROM THE HIGHEST LEVEL.
In 2019, Whitecap looked to the recommendations provided by the TCFD and carefully considered our overall governance of sustainability issues. The result of this effort is a wholistic approach to sustainability that starts with our Board of Directors and lays the groundwork for long-term performance and risk management.
Governance of Sustainability IssuesThis past year we advanced our adoption of the TCFD recommendations by expanding our governance structure, evaluating our corporate sustainability strategy, improving our risk management processes and overhauling internal management systems.
In recognition of the key role that sustainability plays in our business, Whitecap created the Sustainability and Advocacy Committee (“S&A Committee”) of the Board of Directors. This committee has oversight of climate-related and other sustainability-based risks and opportunities and provides direction to our management team. The S&A Committee meets quarterly to receive and review reports from management regarding sustainability performance, initiatives, risks and opportunities. The committee reports to the board with respect to the consideration and integration of climate-related issues into our company’s business strategies and plans. The formal committee mandate can be found on our corporate website.
BOARD OF DIRECTORS
MANAGEMENT
EXECUTION
Board of Directors → New Sustainability & Advocacy ("S&A") Committee with oversight of climate-related and other sustainability risks and opportunities
Management → Addresses climate-related risks and opportunities through effective management systems and processes; accountable to the S&A Committee for delivering results
Execution → Creation of a new, dedicated role to steward our sustainability effort; establishment of a 3 year sustainability strategy; improve data quality and enhance disclosures
I AM PROUD TO BE THE COMMITTEE CHAIR OF THE NEWLY FORMED WHITECAP S&A COMMITTEE. THIS COMMITTEE DEMONSTRATES THE IMPORTANCE OF THESE ISSUES FOR WHITECAP AND PROVIDES THE FOCUS REQUIRED TO MANAGE RISK AND CAPITALIZE ON OPPORTUNITIES.
- Grant Zawalsky Chair, Sustainability & Advocacy Committee
9 WHITECAP RESOURCES INC.
ESG REPORT 2020
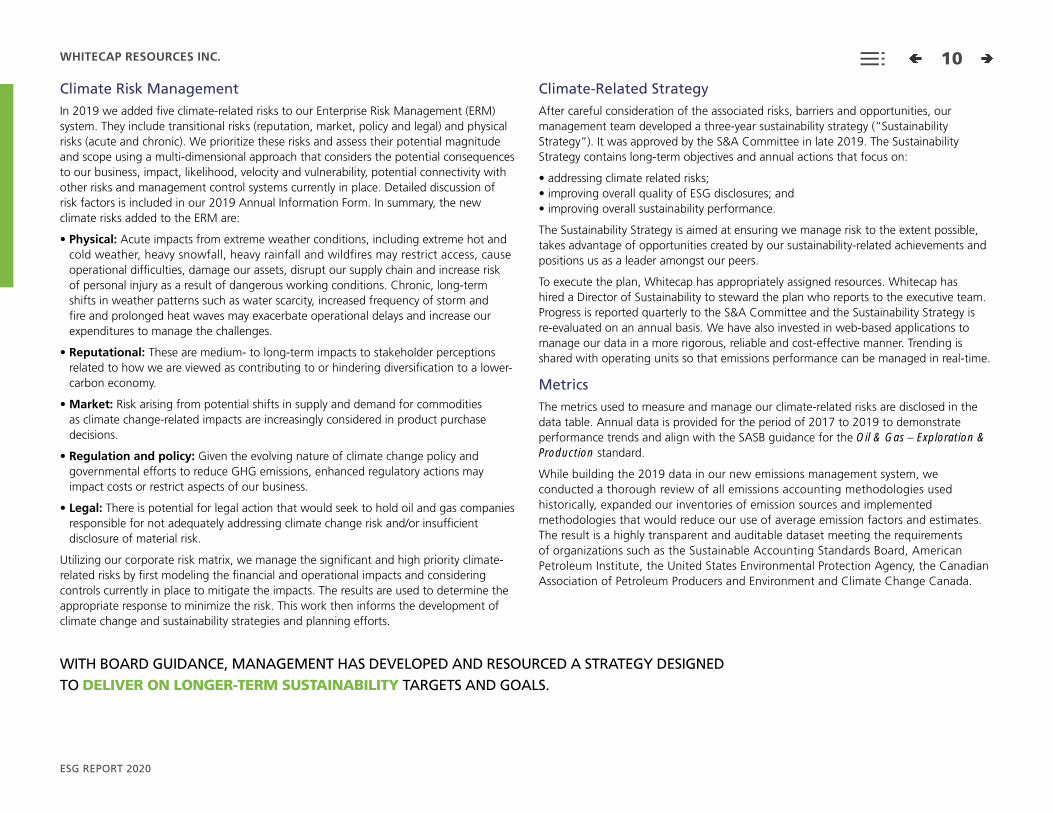
Climate Risk ManagementIn 2019 we added five climate-related risks to our Enterprise Risk Management (ERM) system. They include transitional risks (reputation, market, policy and legal) and physical risks (acute and chronic). We prioritize these risks and assess their potential magnitude and scope using a multi-dimensional approach that considers the potential consequences to our business, impact, likelihood, velocity and vulnerability, potential connectivity with other risks and management control systems currently in place. Detailed discussion of risk factors is included in our 2019 Annual Information Form. In summary, the new climate risks added to the ERM are:
• Physical: Acute impacts from extreme weather conditions, including extreme hot and cold weather, heavy snowfall, heavy rainfall and wildfires may restrict access, cause operational difficulties, damage our assets, disrupt our supply chain and increase risk of personal injury as a result of dangerous working conditions. Chronic, long-term shifts in weather patterns such as water scarcity, increased frequency of storm and fire and prolonged heat waves may exacerbate operational delays and increase our expenditures to manage the challenges.
• Reputational: These are medium- to long-term impacts to stakeholder perceptions related to how we are viewed as contributing to or hindering diversification to a lower-carbon economy.
• Market: Risk arising from potential shifts in supply and demand for commodities as climate change-related impacts are increasingly considered in product purchase decisions.
• Regulation and policy: Given the evolving nature of climate change policy and governmental efforts to reduce GHG emissions, enhanced regulatory actions may impact costs or restrict aspects of our business.
• Legal: There is potential for legal action that would seek to hold oil and gas companies responsible for not adequately addressing climate change risk and/or insufficient disclosure of material risk.
Utilizing our corporate risk matrix, we manage the significant and high priority climate-related risks by first modeling the financial and operational impacts and considering controls currently in place to mitigate the impacts. The results are used to determine the appropriate response to minimize the risk. This work then informs the development of climate change and sustainability strategies and planning efforts.
Climate-Related StrategyAfter careful consideration of the associated risks, barriers and opportunities, our management team developed a three-year sustainability strategy (“Sustainability Strategy”). It was approved by the S&A Committee in late 2019. The Sustainability Strategy contains long-term objectives and annual actions that focus on:
• addressing climate related risks;• improving overall quality of ESG disclosures; and• improving overall sustainability performance.
The Sustainability Strategy is aimed at ensuring we manage risk to the extent possible, takes advantage of opportunities created by our sustainability-related achievements and positions us as a leader amongst our peers.
To execute the plan, Whitecap has appropriately assigned resources. Whitecap has hired a Director of Sustainability to steward the plan who reports to the executive team. Progress is reported quarterly to the S&A Committee and the Sustainability Strategy is re-evaluated on an annual basis. We have also invested in web-based applications to manage our data in a more rigorous, reliable and cost-effective manner. Trending is shared with operating units so that emissions performance can be managed in real-time.
Metrics The metrics used to measure and manage our climate-related risks are disclosed in the data table. Annual data is provided for the period of 2017 to 2019 to demonstrate performance trends and align with the SASB guidance for the Oil & Gas – Exploration & Production standard.
While building the 2019 data in our new emissions management system, we conducted a thorough review of all emissions accounting methodologies used historically, expanded our inventories of emission sources and implemented methodologies that would reduce our use of average emission factors and estimates. The result is a highly transparent and auditable dataset meeting the requirements of organizations such as the Sustainable Accounting Standards Board, American Petroleum Institute, the United States Environmental Protection Agency, the Canadian Association of Petroleum Producers and Environment and Climate Change Canada.
WITH BOARD GUIDANCE, MANAGEMENT HAS DEVELOPED AND RESOURCED A STRATEGY DESIGNED TO DELIVER ON LONGER-TERM SUSTAINABILITY TARGETS AND GOALS.
10 WHITECAP RESOURCES INC.
ESG REPORT 2020

While many organizations have disclosed goals of carbon neutrality, we currently sequester more CO2 that we emit. This is an enviable position, though we believe more can be done. We have chosen to focus emission reductions on direct, or scope 1, emissions. By reducing these emissions on an intensity basis, we can continue to improve the carbon profile of each barrel we produce. Whitecap is currently a direct emissions intensity leader among oil-weighted peers in Canada. We intend to maintain this position and realize that further improvements will be necessary to do so.
Footnote:
• 2018 direct (scope 1) emissions per barrel of oil equivalent as reported.
• Peers were selected based on production weighting (>50% liquids), operations in Canada and public emissions and production disclosure.
• Peers include, in alphabetical order: Baytex Energy Corp., Canadian Natural Resources Limited (non-oil sands), Cenovus Energy Inc. (excl. oil sands), Crescent Point Energy Corp., Enerplus Corporation, Seven Generations Energy Ltd., TORC Oil & Gas Ltd. and Vermilion Energy.
• Whitecap intensity is not adjusted for the CO2 sequestered by the Weyburn Unit.
PEER DIRECT EMISSION INTENSITIES EMISSION INTENSITY TARGET
0.0451 CO2/ boe
0.0227 CO2/ boe
GH
G In
tens
ity (t
CO
2/b
oe)
0.020
0.040
0.060
0.080
202320192017
50%
Past performance Target improvement
WHITECAP HAS SET A TARGET TO REDUCE OUR DIRECT EMISSIONS INTENSITY 20% BY 2023.
Targets
We have established a target to reduce our direct emissions intensity by 20% by 2023 from 2019 levels. We chose 2019 as a base year for this target to focus on new reductions rather than accounting for reductions already achieved. Since 2017 we have reduced our emissions intensity by 37%, and when we reach this target in 2023, we will have reduced our direct emissions intensity by 50% over the 6-year period.
EMISSION REDUCTION GOAL BY 2023
TOTAL EMISSIONS REDUCED IN A 6-YEAR PERIOD
EMISSIONS REDUCED SINCE 2017
20% 50%37%
→ →→
High GHG Intensity Low GHG Intensity
0.08
07
0.05
90
0.03
210.04
26
0.03
80
0.03
60
0.02
85
0.02
33
0.01
4337%
20%
11 WHITECAP RESOURCES INC.
ESG REPORT 2020
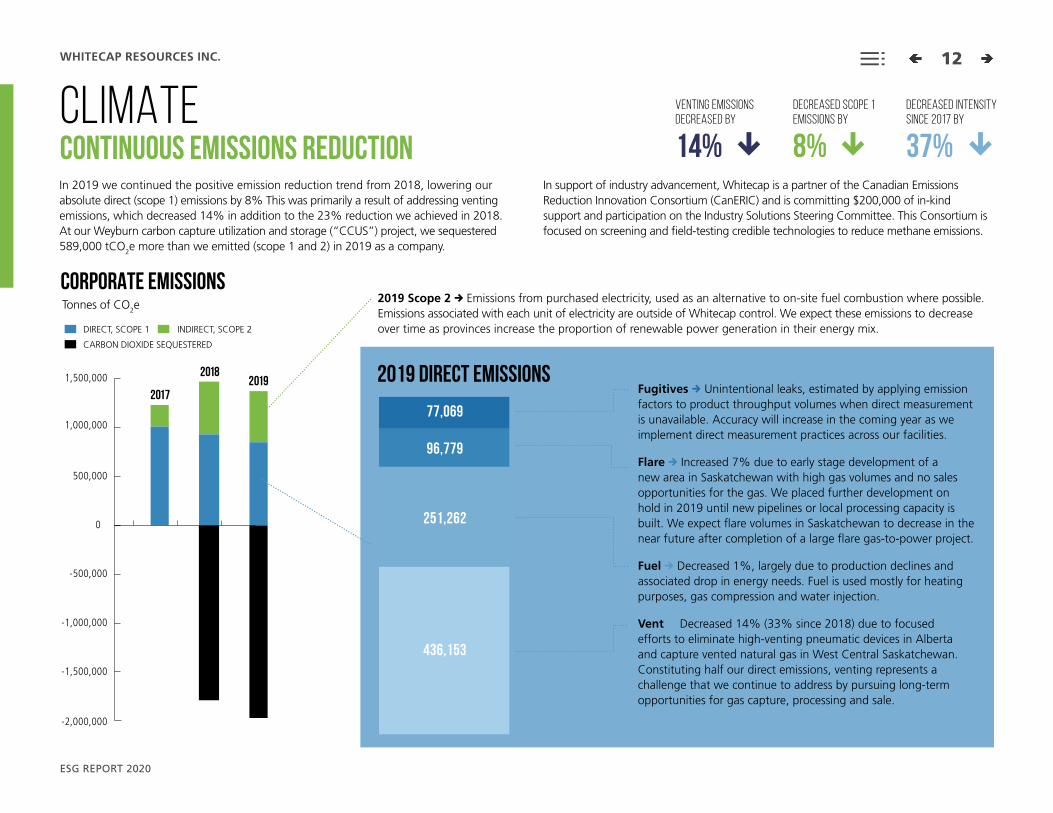
CLIMATECONTINUOUS EMISSIONS REDUCTIONIn 2019 we continued the positive emission reduction trend from 2018, lowering our absolute direct (scope 1) emissions by 8% This was primarily a result of addressing venting emissions, which decreased 14% in addition to the 23% reduction we achieved in 2018. At our Weyburn carbon capture utilization and storage (“CCUS”) project, we sequestered 589,000 tCO2e more than we emitted (scope 1 and 2) in 2019 as a company.
In support of industry advancement, Whitecap is a partner of the Canadian Emissions Reduction Innovation Consortium (CanERIC) and is committing $200,000 of in-kind support and participation on the Industry Solutions Steering Committee. This Consortium is focused on screening and field-testing credible technologies to reduce methane emissions.
Fugitives → Unintentional leaks, estimated by applying emission factors to product throughput volumes when direct measurement is unavailable. Accuracy will increase in the coming year as we implement direct measurement practices across our facilities.
Flare → Increased 7% due to early stage development of a new area in Saskatchewan with high gas volumes and no sales opportunities for the gas. We placed further development on hold in 2019 until new pipelines or local processing capacity is built. We expect flare volumes in Saskatchewan to decrease in the near future after completion of a large flare gas-to-power project.
Fuel → Decreased 1%, largely due to production declines and associated drop in energy needs. Fuel is used mostly for heating purposes, gas compression and water injection.
Vent → Decreased 14% (33% since 2018) due to focused efforts to eliminate high-venting pneumatic devices in Alberta and capture vented natural gas in West Central Saskatchewan. Constituting half our direct emissions, venting represents a challenge that we continue to address by pursuing long-term opportunities for gas capture, processing and sale.
DECREASED SCOPE 1 EMISSIONS BY
DECREASED INTENSITY SINCE 2017 BY
VENTING EMISSIONS DECREASED BY
8% 37%14%
→ →→
77,069
96,779
251,262
436,153
2017
201820191,500,000
-1,500,000
-2,000,000
1,000,000
-1,000,000
500,000
-500,000
0
CORPORATE EMISSIONS
2019 DIRECT EMISSIONS
2019 Scope 2 → Emissions from purchased electricity, used as an alternative to on-site fuel combustion where possible. Emissions associated with each unit of electricity are outside of Whitecap control. We expect these emissions to decrease over time as provinces increase the proportion of renewable power generation in their energy mix.DIRECT, SCOPE 1 INDIRECT, SCOPE 2
CARBON DIOXIDE SEQUESTERED
Tonnes of CO2e
12 WHITECAP RESOURCES INC.
ESG REPORT 2020
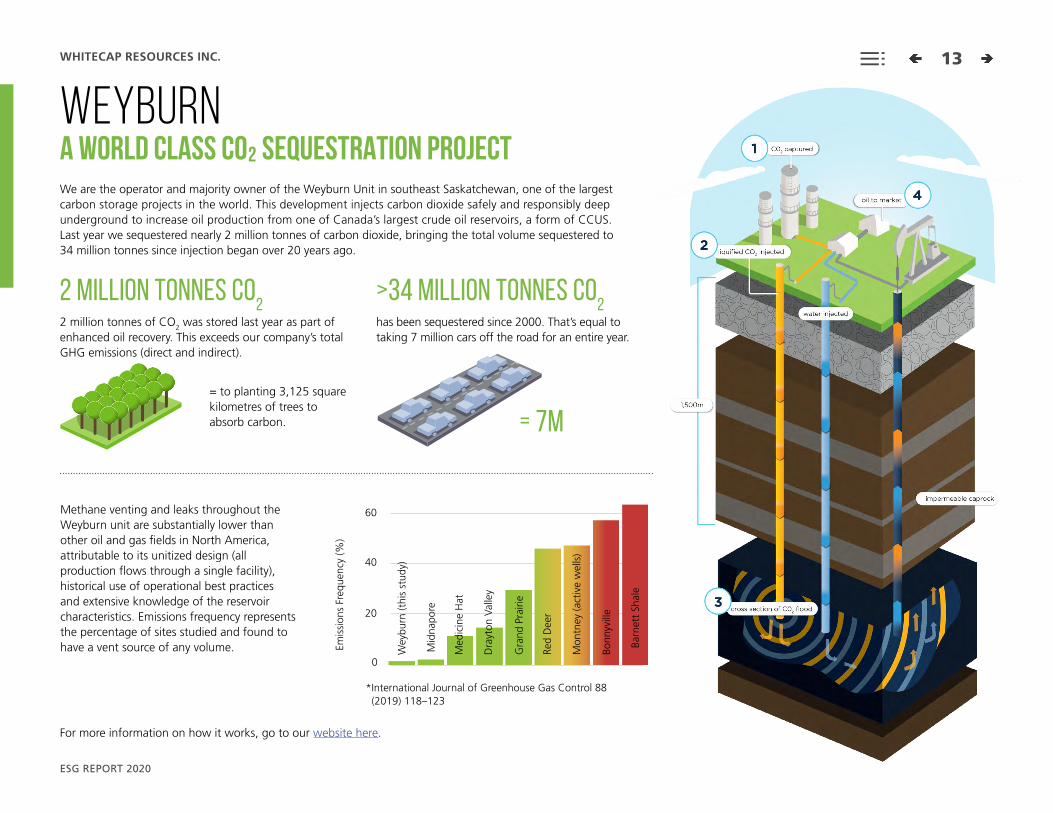
Methane venting and leaks throughout the Weyburn unit are substantially lower than other oil and gas fields in North America, attributable to its unitized design (all production flows through a single facility), historical use of operational best practices and extensive knowledge of the reservoir characteristics. Emissions frequency represents the percentage of sites studied and found to have a vent source of any volume.
* International Journal of Greenhouse Gas Control 88 (2019) 118–123
Emis
sion
s Fr
eque
ncy
(%)
0
20
40
Wey
burn
(thi
s st
udy)
Mid
napo
re
Med
icin
e H
at
Dra
yton
Val
ley
Gra
nd P
rairi
e
Red
Dee
r
Bonn
yvill
e
Mon
tney
(act
ive
wel
ls)
60
WEYBURN A WORLD CLASS CO₂ SEQUESTRATION PROJECTWe are the operator and majority owner of the Weyburn Unit in southeast Saskatchewan, one of the largest carbon storage projects in the world. This development injects carbon dioxide safely and responsibly deep underground to increase oil production from one of Canada’s largest crude oil reservoirs, a form of CCUS. Last year we sequestered nearly 2 million tonnes of carbon dioxide, bringing the total volume sequestered to 34 million tonnes since injection began over 20 years ago.
2 million tonnes CO2 >34 million tonnes CO
2
has been sequestered since 2000. That’s equal to taking 7 million cars off the road for an entire year.
= 7M
For more information on how it works, go to our website here.
Barn
ett
Shal
e
2 million tonnes of CO2 was stored last year as part of enhanced oil recovery. This exceeds our company’s total GHG emissions (direct and indirect).
= to planting 3,125 square kilometres of trees to absorb carbon.
13 WHITECAP RESOURCES INC.
ESG REPORT 2020
WATEROPTIMIZING USAGE
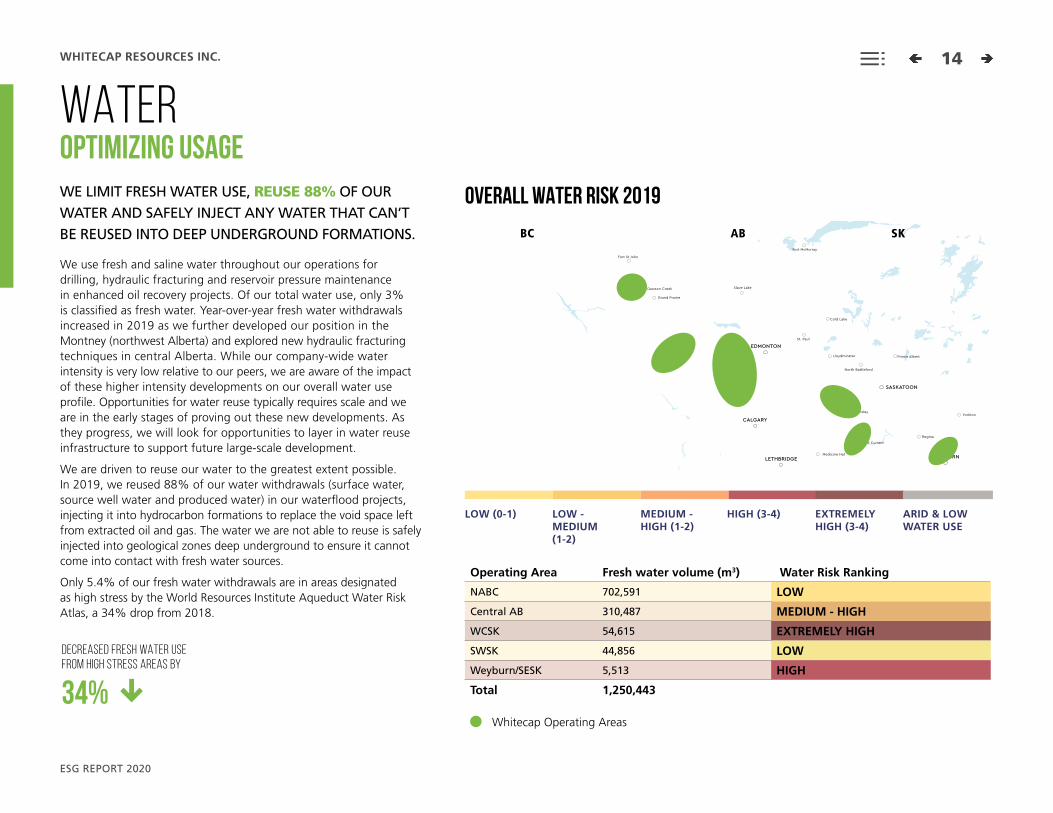
We use fresh and saline water throughout our operations for drilling, hydraulic fracturing and reservoir pressure maintenance in enhanced oil recovery projects. Of our total water use, only 3% is classified as fresh water. Year-over-year fresh water withdrawals increased in 2019 as we further developed our position in the Montney (northwest Alberta) and explored new hydraulic fracturing techniques in central Alberta. While our company-wide water intensity is very low relative to our peers, we are aware of the impact of these higher intensity developments on our overall water use profile. Opportunities for water reuse typically requires scale and we are in the early stages of proving out these new developments. As they progress, we will look for opportunities to layer in water reuse infrastructure to support future large-scale development.
We are driven to reuse our water to the greatest extent possible. In 2019, we reused 88% of our water withdrawals (surface water, source well water and produced water) in our waterflood projects, injecting it into hydrocarbon formations to replace the void space left from extracted oil and gas. The water we are not able to reuse is safely injected into geological zones deep underground to ensure it cannot come into contact with fresh water sources.
Only 5.4% of our fresh water withdrawals are in areas designated as high stress by the World Resources Institute Aqueduct Water Risk Atlas, a 34% drop from 2018.
Dawson Creek
Grand Prairie
Fort St John
Medicine Hat
Regina
Yorkton
Swift Current
North Battleford
Prince Albert
Kindersley
Lloydminster
Slave Lake
St. Paul
Fort McMurray
Cold Lake
EDMONTON
ABBC SK
CALGARY
SASKATOON
LETHBRIDGE WEYBURN
LOW (0-1)
Whitecap Operating Areas
LOW - MEDIUM (1-2)
MEDIUM -HIGH (1-2)
HIGH (3-4) EXTREMELYHIGH (3-4)
ARID & LOWWATER USE
Operating Area Fresh water volume (m3) Water Risk Ranking
NABC 702,591 LOW
Central AB 310,487 MEDIUM - HIGH
WCSK 54,615 EXTREMELY HIGH
SWSK 44,856 LOW
Weyburn/SESK 5,513 HIGH
Total 1,250,443
OVERALL WATER RISK 2019WE LIMIT FRESH WATER USE, REUSE 88% OF OUR WATER AND SAFELY INJECT ANY WATER THAT CAN’T BE REUSED INTO DEEP UNDERGROUND FORMATIONS.
DECREASED FRESH WATER USE FROM HIGH STRESS AREAS BY
34%
→
14 WHITECAP RESOURCES INC.
ESG REPORT 2020

LANDREDUCING ASSET RETIREMENTWHITECAP HAS MADE SIGNIFICANT STRIDES IN RECENT YEARS RESTORING LANDS TO THEIR FORMER USE AND PRODUCTIVITY, WHILE REDUCING LONG-TERM ASSET RETIREMENT LIABILITY.
The development of oil and gas assets involves temporary land disturbance. Whitecap is obligated and committed to return the land we use to a capability that is equal to or better than pre-disturbance conditions. We use in-house and consulting expertise across our three operating provinces to achieve the restoration standards that are in place. When standards are achieved, the applicable province issues certificates to effectively release Whitecap of its obligation to restore.
Once a well becomes inactive at the end of its useful life, the asset retirement process can begin. Closure of the wellbore, known as “well abandonment” is the first step. Abandonment processes ensure that the well is left in a secure state and does not impose risk on the public or environment. Once the well is safely abandoned, surface restoration work can begin. This process of surface restoration may include assessment, remediation, recontouring, soil treatment and revegetation. Success is achieved over multiple growing seasons and the entire process can take from 2-5 years before certification requirements can be met. We have made significant progress in recent years, increasing the number of wells abandoned, the number of sites under restoration and the number of certificates received.
INACTIVE WELLS ABANDONED SITES UNDER ACTIVE RESTORATION RECLAMATION CERTIFICATES RECEIVED
120
2017 2017 20172018 2018 20182019 2019 2019
100
600
30
35
80
500
25
60400
20
40300
15
20 20010
0 100 5
9
103
18
30
41587
32552116
Plugged, sealed and cemented. Sites currently being restored to original conditions. Sites reclaimed to current regulatory standards.
15 WHITECAP RESOURCES INC.
ESG REPORT 2020

HEALTH & SAFETYIMPROVING SYSTEMS AND PROCESS
With great sadness we report that one of our third-party contractors was involved in a fatal accident on a Whitecap location in northern Alberta – the only worksite fatality of a contractor or employee in the history of our company. We continue to participate with Occupational Health and Safety as required in their ongoing investigation and have made every effort to prevent a recurrence of a similar incident in the future.
Our historical health and safety performance is a source of pride for us. We departed 2018 with a total recordable injury frequency (“TRIF”) of 0.26 for all employees and contractors combined, which was one of the best corporate safety records in the North American exploration and production industry that year.
2019 performance was below our high standards: our TRIF was significantly higher than 2018 and slightly above our historical average. Analysis of our 2019 recordable injuries showed us that nearly half occurred during well servicing activities. In response, we focused efforts by meeting with our well servicing supervisors and contractors to discuss the trend and request cooperation to reduce incident frequency. Whitecap leadership also met with senior management from these contractors to discuss measures that can be taken to reduce incidents. Early observation of trends in late 2019 show that our efforts are having a positive impact and we expect significant improvement in 2020.
We have an extensive health and safety management system in place. In addition to policies, resources, processes, training and other key elements, we utilize a comprehensive web-based incident management system to track a broad set of leading and lagging indicators, worker observations, hazard identifications, corrective actions and other key metrics. This system provides a focal point for continuous improvement and the basis for demonstrating management system implementation to the Board of Directors’ Health, Safety and Environment Committee.
3466400 7702
38113168
ERP exercises and drills
correction actions addressed
inspections
hazards identified and resolved
worker safety observations
2019 INJURIES BY DEPARTMENT
9
4
3
21 Well Servicing
Drilling
Completions
Construction
Operations
OUR HEALTH AND SAFETY MANAGEMENT SYSTEM IS BUILT ON THE PRINCIPLE OF CONTINUOUS IMPROVEMENT AND THE RELENTLESS PURSUIT OF AN INJURY-FREE WORKPLACE.
Leading Indicators
16 WHITECAP RESOURCES INC.
ESG REPORT 2020

THE DATA
WHITECAP RESOURCES INC. 17

DATA TABLEUNITS 2017 2018 2019
Economic Stakeholder Benefits
Petroleum and natural gas sales $ Thousands CAD 1,001,343 1,525,299 1,454,239
Royalties $ Thousands CAD 144,563 268,090 253,763
Expenditures on property, plant and equipment $ Thousands CAD 339,761 440,499 403,977
Operating expenses $ Thousands CAD 222,437 327,160 320,960
Salaries and benefits $ Thousands CAD 26,306 33,823 32,791
Dividends $ Thousands CAD 104,926 132,295 138,341
Community investment $ Thousands CAD 128 318 451
Production1
Net, sales boe/d 57,450 74,415 71,050
Oil bbl/d 43,589 58,511 55,413
Natural gas liquids bbl/d 3,415 4,397 4,503
Conventional natural gas Mcf/d 62,676 69,042 66,801
Operated gross wellhead production boe/d 60,490 87,504 83,609
Operated gross product sales2 boe/d 61,471 89,619 83,327
Produced water bbl/d 411,063 597,979 614,304
Sites, onshore operated facilities 774 837 793
Environment
Emissions
Direct, scope 1 CO2e tonnes 1,011,329 932,095 861,263
Carbon dioxide (CO2) CO2e tonnes 267,857 320,955 323,220
Methane (CH4) CO2e tonnes 29,690 24,374 21,451
Nitrous Oxide (N2O) CO2e tonnes 4 6 6
% Methane % 73% 65% 62%
% covered by emissions-limiting regulations3 % 13% 21% 100%
18 WHITECAP RESOURCES INC.
ESG REPORT 2020
UNITS 2017 2018 2019
Emissions
Direct, by activity
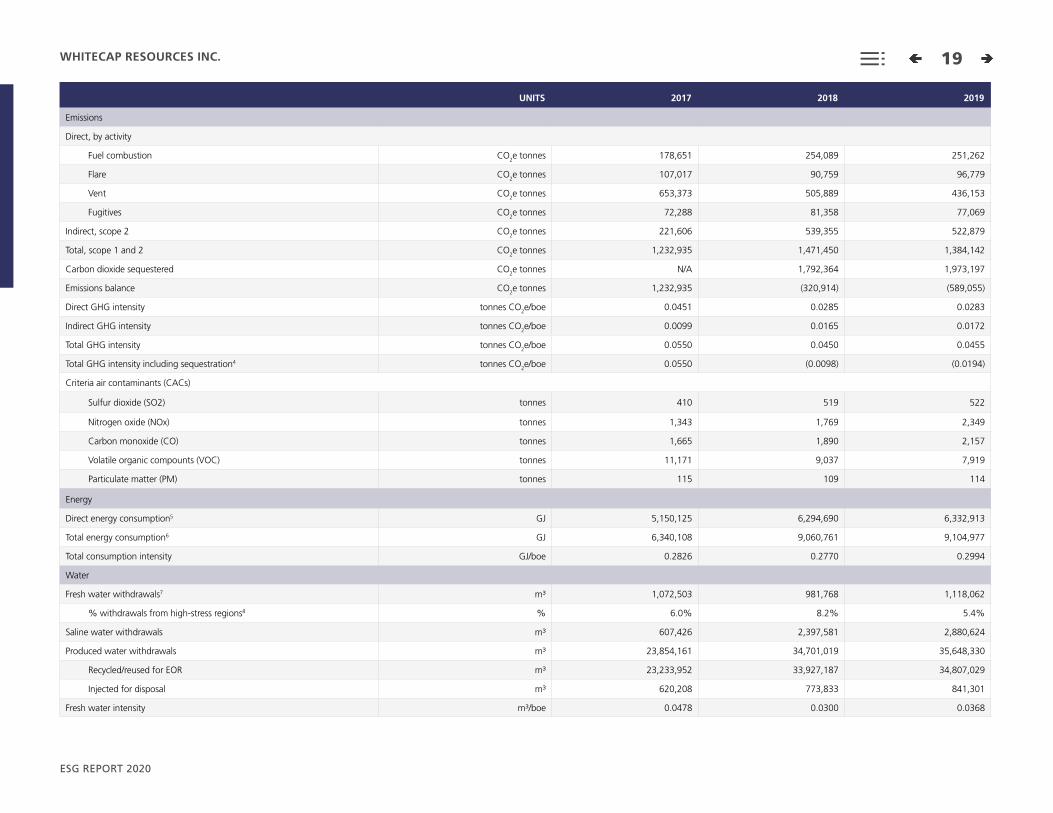
Fuel combustion CO2e tonnes 178,651 254,089 251,262
Flare CO2e tonnes 107,017 90,759 96,779
Vent CO2e tonnes 653,373 505,889 436,153
Fugitives CO2e tonnes 72,288 81,358 77,069
Indirect, scope 2 CO2e tonnes 221,606 539,355 522,879
Total, scope 1 and 2 CO2e tonnes 1,232,935 1,471,450 1,384,142
Carbon dioxide sequestered CO2e tonnes N/A 1,792,364 1,973,197
Emissions balance CO2e tonnes 1,232,935 (320,914) (589,055)
Direct GHG intensity tonnes CO2e/boe 0.0451 0.0285 0.0283
Indirect GHG intensity tonnes CO2e/boe 0.0099 0.0165 0.0172
Total GHG intensity tonnes CO2e/boe 0.0550 0.0450 0.0455
Total GHG intensity including sequestration4 tonnes CO2e/boe 0.0550 (0.0098) (0.0194)
Criteria air contaminants (CACs)
Sulfur dioxide (SO2) tonnes 410 519 522
Nitrogen oxide (NOx) tonnes 1,343 1,769 2,349
Carbon monoxide (CO) tonnes 1,665 1,890 2,157
Volatile organic compounts (VOC) tonnes 11,171 9,037 7,919
Particulate matter (PM) tonnes 115 109 114
Energy
Direct energy consumption5 GJ 5,150,125 6,294,690 6,332,913
Total energy consumption6 GJ 6,340,108 9,060,761 9,104,977
Total consumption intensity GJ/boe 0.2826 0.2770 0.2994
Water
Fresh water withdrawals7 m3 1,072,503 981,768 1,118,062
% withdrawals from high-stress regions8 % 6.0% 8.2% 5.4%
Saline water withdrawals m3 607,426 2,397,581 2,880,624
Produced water withdrawals m3 23,854,161 34,701,019 35,648,330
Recycled/reused for EOR m3 23,233,952 33,927,187 34,807,029
Injected for disposal m3 620,208 773,833 841,301
Fresh water intensity m3/boe 0.0478 0.0300 0.0368
19 WHITECAP RESOURCES INC.
ESG REPORT 2020
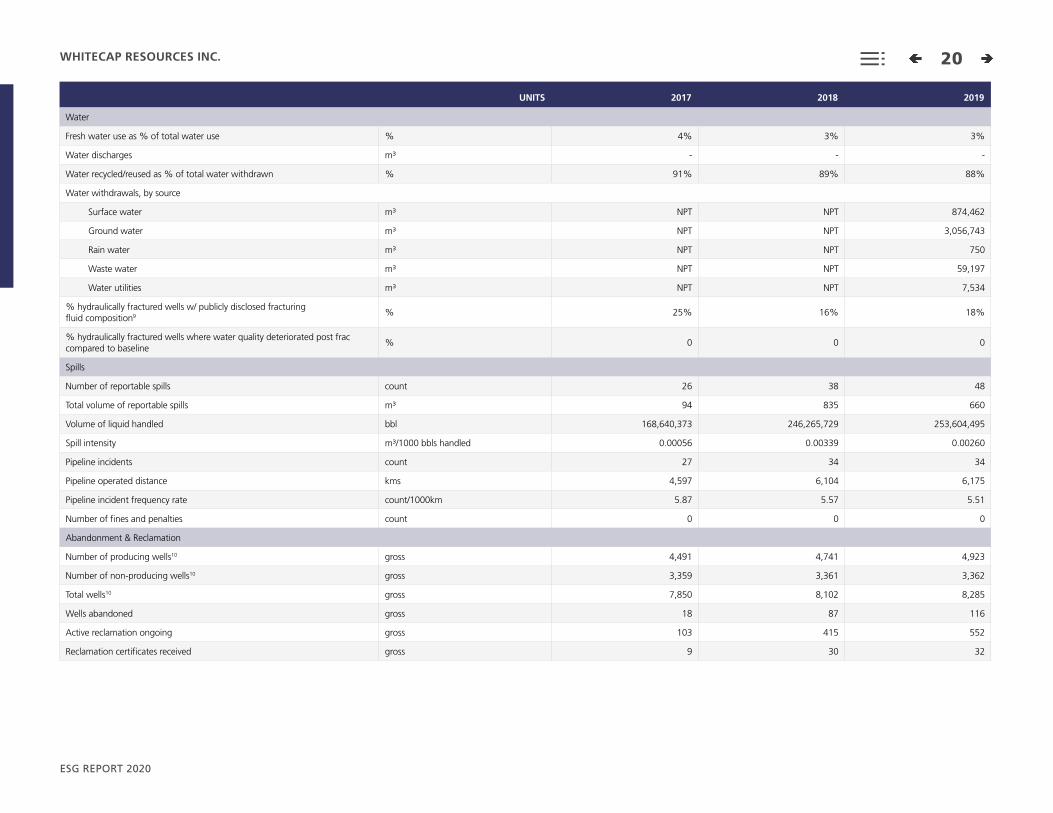
UNITS 2017 2018 2019
Water
Fresh water use as % of total water use % 4% 3% 3%
Water discharges m3 - - -
Water recycled/reused as % of total water withdrawn % 91% 89% 88%
Water withdrawals, by source
Surface water m3 NPT NPT 874,462
Ground water m3 NPT NPT 3,056,743
Rain water m3 NPT NPT 750
Waste water m3 NPT NPT 59,197
Water utilities m3 NPT NPT 7,534
% hydraulically fractured wells w/ publicly disclosed fracturing fluid composition9 % 25% 16% 18%
% hydraulically fractured wells where water quality deteriorated post frac compared to baseline
% 0 0 0
Spills
Number of reportable spills count 26 38 48
Total volume of reportable spills m3 94 835 660
Volume of liquid handled bbl 168,640,373 246,265,729 253,604,495
Spill intensity m3/1000 bbls handled 0.00056 0.00339 0.00260
Pipeline incidents count 27 34 34
Pipeline operated distance kms 4,597 6,104 6,175
Pipeline incident frequency rate count/1000km 5.87 5.57 5.51
Number of fines and penalties count 0 0 0
Abandonment & Reclamation
Number of producing wells10 gross 4,491 4,741 4,923
Number of non-producing wells10 gross 3,359 3,361 3,362
Total wells10 gross 7,850 8,102 8,285
Wells abandoned gross 18 87 116
Active reclamation ongoing gross 103 415 552
Reclamation certificates received gross 9 30 32
20 WHITECAP RESOURCES INC.
ESG REPORT 2020
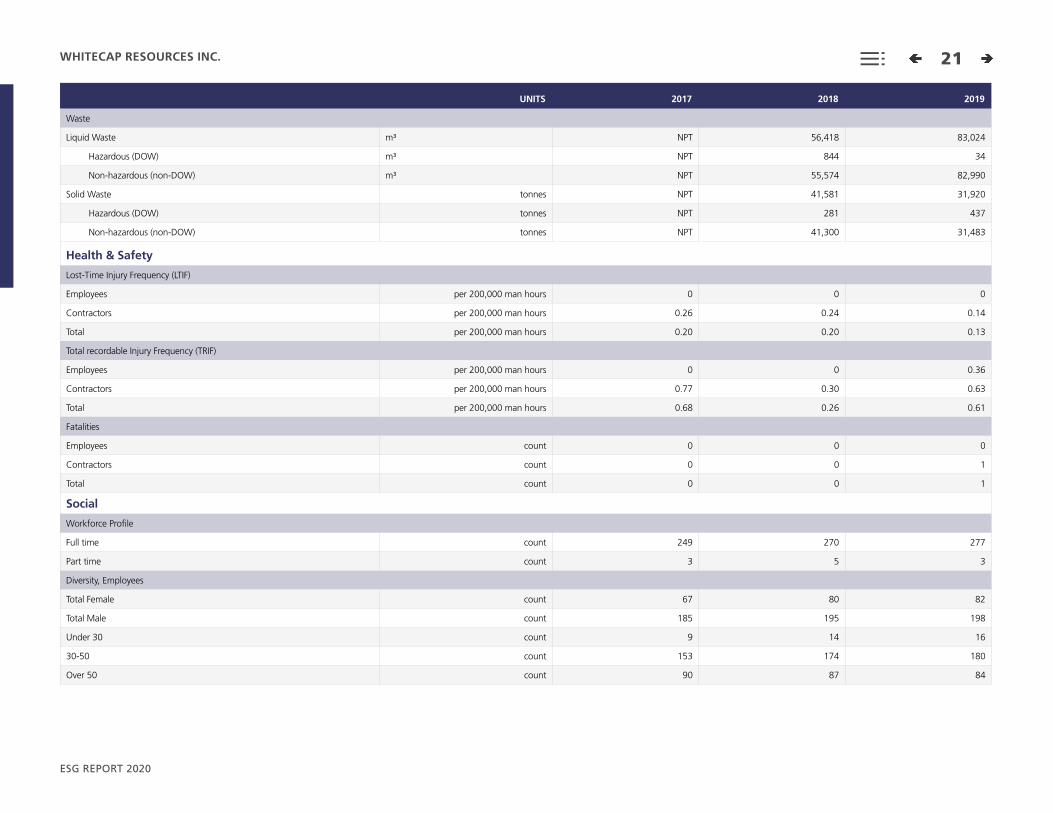
UNITS 2017 2018 2019
Waste
Liquid Waste m3 NPT 56,418 83,024
Hazardous (DOW) m3 NPT 844 34
Non-hazardous (non-DOW) m3 NPT 55,574 82,990
Solid Waste tonnes NPT 41,581 31,920
Hazardous (DOW) tonnes NPT 281 437
Non-hazardous (non-DOW) tonnes NPT 41,300 31,483
Health & Safety
Lost-Time Injury Frequency (LTIF)
Employees per 200,000 man hours 0 0 0
Contractors per 200,000 man hours 0.26 0.24 0.14
Total per 200,000 man hours 0.20 0.20 0.13
Total recordable Injury Frequency (TRIF)
Employees per 200,000 man hours 0 0 0.36
Contractors per 200,000 man hours 0.77 0.30 0.63
Total per 200,000 man hours 0.68 0.26 0.61
Fatalities
Employees count 0 0 0
Contractors count 0 0 1
Total count 0 0 1
Social
Workforce Profile
Full time count 249 270 277
Part time count 3 5 3
Diversity, Employees
Total Female count 67 80 82
Total Male count 185 195 198
Under 30 count 9 14 16
30-50 count 153 174 180
Over 50 count 90 87 84
21 WHITECAP RESOURCES INC.
ESG REPORT 2020

UNITS 2017 2018 2019
Diversity, Board of Directors
Female count 1 1 1
Male count 7 7 8
% female % 13% 13% 11%
Under 30 count - - -
30-50 count 1 - -
Over 50 count 7 8 9
NPT: Not previously tracked
1. Production: Multiple production values provided to enable performance comparisons with peers who may use different production definitions for intensity calculations.
2. Operated gross product sales: All intensity calculations use the annual “Operated gross product sales” volume.
3. % covered by emissions-limiting regulations: Regulations intended to limit or reduce emissions, such as carbon taxes, output-based performance standards and prescribed facility or equipment emission limits. Includes all assets in British Columbia and Alberta in 2017 and 2018. Saskatchewan assets added in 2019.
4. Total GHG intensity including sequestration: An increasingly negative value represents better performance.
5. Direct energy consumption: Includes produced or purchased fuel, such as natural gas and propane.
6. Total energy consumption: Includes “direct energy consumption” and purchased electricity.
7. Fresh water withdrawals: Defined as having a total dissolved solids (TDS) content of equal to or less than 1,000mg/L as established by SASB and the United States Geological Survey.
8. % withdrawals from high-stress regions: Defined by the World Resources Institute (WRI) Aqueduct Water Risk Atlas.
9. % wells w/publicly disclosed frac fluid composition: We are required to report frac fluid compositions to FracFocus in British Columbia and Alberta only.
10. Number of producing wells, Number of non-producing wells, Total wells: Includes only oil and gas production wells.
22 WHITECAP RESOURCES INC.
ESG REPORT 2020
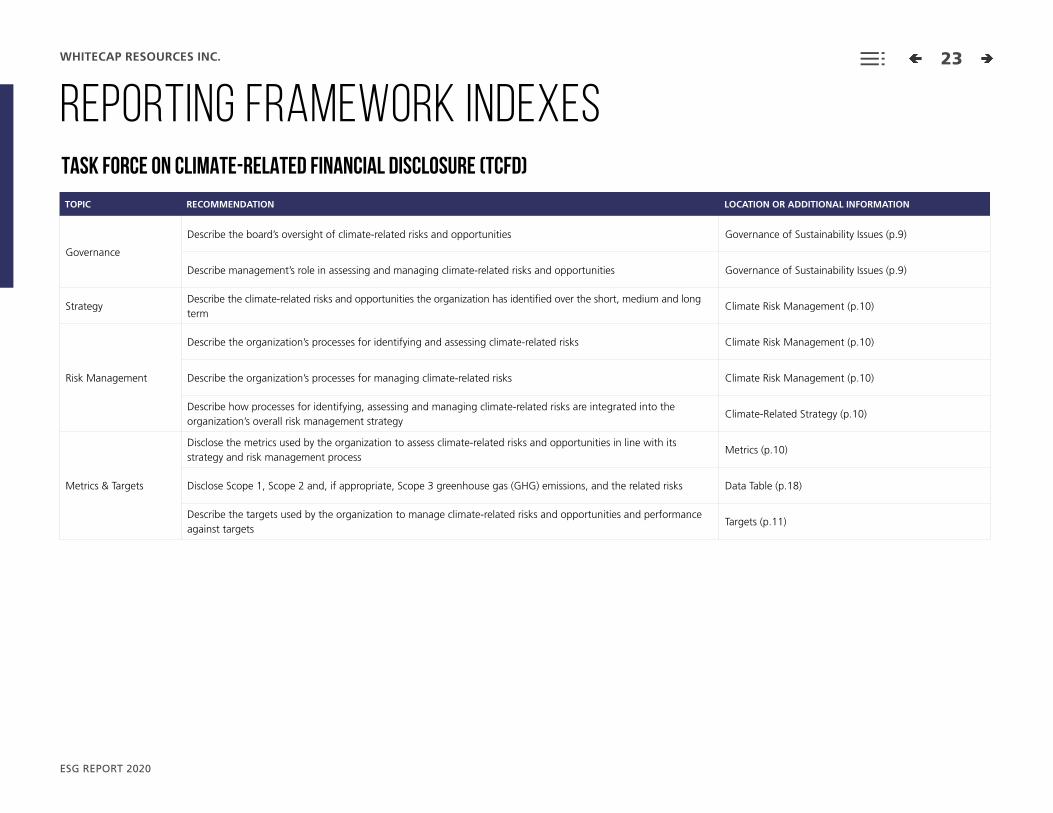
REPORTING FRAMEWORK INDEXES
TOPIC RECOMMENDATION LOCATION OR ADDITIONAL INFORMATION
Governance
Describe the board’s oversight of climate-related risks and opportunities Governance of Sustainability Issues (p.9)
Describe management’s role in assessing and managing climate-related risks and opportunities Governance of Sustainability Issues (p.9)
StrategyDescribe the climate-related risks and opportunities the organization has identified over the short, medium and long term
Climate Risk Management (p.10)
Risk Management
Describe the organization’s processes for identifying and assessing climate-related risks Climate Risk Management (p.10)
Describe the organization’s processes for managing climate-related risks Climate Risk Management (p.10)
Describe how processes for identifying, assessing and managing climate-related risks are integrated into the organization’s overall risk management strategy
Climate-Related Strategy (p.10)
Metrics & Targets
Disclose the metrics used by the organization to assess climate-related risks and opportunities in line with its strategy and risk management process
Metrics (p.10)
Disclose Scope 1, Scope 2 and, if appropriate, Scope 3 greenhouse gas (GHG) emissions, and the related risks Data Table (p.18)
Describe the targets used by the organization to manage climate-related risks and opportunities and performance against targets
Targets (p.11)
TASK FORCE ON CLIMATE-RELATED FINANCIAL DISCLOSURE (TCFD)
23 WHITECAP RESOURCES INC.
ESG REPORT 2020
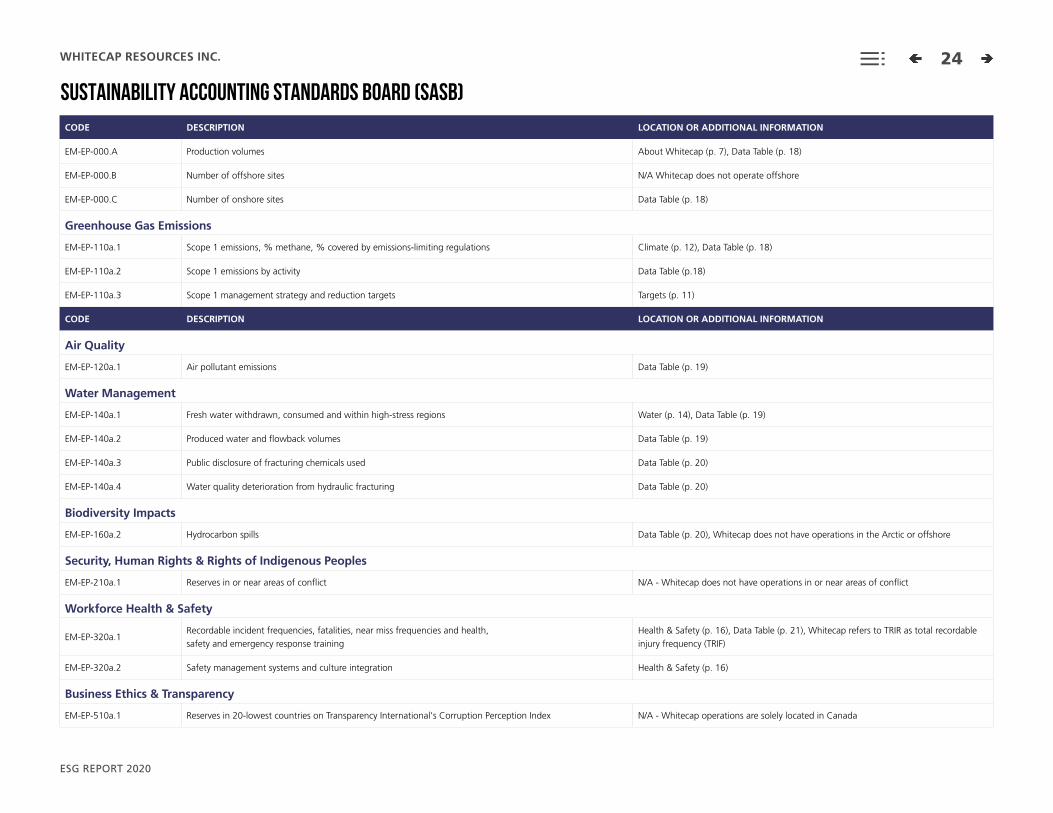
CODE DESCRIPTION LOCATION OR ADDITIONAL INFORMATION
EM-EP-000.A Production volumes About Whitecap (p. 7), Data Table (p. 18)
EM-EP-000.B Number of offshore sites N/A Whitecap does not operate offshore
EM-EP-000.C Number of onshore sites Data Table (p. 18)
Greenhouse Gas Emissions
EM-EP-110a.1 Scope 1 emissions, % methane, % covered by emissions-limiting regulations Climate (p. 12), Data Table (p. 18)
EM-EP-110a.2 Scope 1 emissions by activity Data Table (p.18)
EM-EP-110a.3 Scope 1 management strategy and reduction targets Targets (p. 11)
CODE DESCRIPTION LOCATION OR ADDITIONAL INFORMATION
Air Quality
EM-EP-120a.1 Air pollutant emissions Data Table (p. 19)
Water Management
EM-EP-140a.1 Fresh water withdrawn, consumed and within high-stress regions Water (p. 14), Data Table (p. 19)
EM-EP-140a.2 Produced water and flowback volumes Data Table (p. 19)
EM-EP-140a.3 Public disclosure of fracturing chemicals used Data Table (p. 20)
EM-EP-140a.4 Water quality deterioration from hydraulic fracturing Data Table (p. 20)
Biodiversity Impacts
EM-EP-160a.2 Hydrocarbon spills Data Table (p. 20), Whitecap does not have operations in the Arctic or offshore
Security, Human Rights & Rights of Indigenous Peoples
EM-EP-210a.1 Reserves in or near areas of conflict N/A - Whitecap does not have operations in or near areas of conflict
Workforce Health & Safety
EM-EP-320a.1Recordable incident frequencies, fatalities, near miss frequencies and health, safety and emergency response training
Health & Safety (p. 16), Data Table (p. 21), Whitecap refers to TRIR as total recordable injury frequency (TRIF)
EM-EP-320a.2 Safety management systems and culture integration Health & Safety (p. 16)
Business Ethics & Transparency
EM-EP-510a.1 Reserves in 20-lowest countries on Transparency International's Corruption Perception Index N/A - Whitecap operations are solely located in Canada
SUSTAINABILITY ACCOUNTING STANDARDS BOARD (SASB)
24 WHITECAP RESOURCES INC.
ESG REPORT 2020

GLOBAL REPORTING INITIATIVE (GRI)
CODE DESCRIPTION LOCATION OR ADDITIONAL INFORMATION
Organization & Governance
102-1 Name of the organization About Whitecap (p. 7)
102-2a Description of the organization’s activities About Whitecap (p. 7)
102-2b Primary products About Whitecap (p. 7)
102-3 Location of headquarters About Whitecap (p. 7)
102-4 Number and names of countries where the organization operates About Whitecap (p. 7)
102-5 Nature of ownership and legal form About Whitecap (p. 7)
102-6 Markets served About Whitecap (p. 7)
102-7 Scale of the organization Data Table (p. 18)
102-8c Employee demographics Data Table (p. 21)
102-8e Significant disclosure variations No variations to disclosures 102-8a,b,c
102-10 Significant organizational changes About Whitecap (p. 7)
102-14 CEO sustainability statement CEO Letter (p. 5)
102-15 Description of key impacts, risks and opportunities Governance (p. 9)
102-18a Governance structure Governance (p. 9)
102-18b Committees responsible for decision-making on economic, environmental and social topics Governance (p. 9)
102-19 Delegation of authority from the Board for economic, environmental and social topics Governance (p. 9)
102-20a Executive-level responsibility for economic, environmental and social topics Governance (p. 9)
102-20b Whether post holders report directly to the Board Governance (p. 9)
102-22 Composition of the Board and it’s committees 2020 Information Circular*
102-23a Whether the chair of the Board is also an executive officer 2020 Information Circular*
102-23b If the chair is also an executive officer, describe their function and reasons for this arrangement N/A - The Whitecap Board chair is not an executive officer
102-24a Nomination and selection processes for the Board and its committees 2020 Information Circular*
102-24b Criteria used for nominating and selecting Board members 2020 Information Circular*
102-25a Processes for the Board to ensure conflicts of interest are avoided Alberta Business Corporations Act
102-28a Process for evaluating the Board’s performance 2020 Information Circular*
102-28b Whether such evaluation is independent 2020 Information Circular*
102-28c Whether such evaluation is a self-assessment 2020 Information Circular*
102-29a Board's role in identifying and managing economic, environmental and social topics and impacts S&A Committee Mandate and Terms of Reference*
102-29bUse of stakeholder consultation in Board's identification and management of economic, environmental and social topics and impacts
S&A Committee Mandate and Terms of Reference*
102-30 Board’s role in reviewing the effectiveness of the organization’s risk management processes Audit Committee Mandate and Terms of Reference*
102-31 Frequency of Board's economic, environmental and social topic reviews S&A Committee Mandate and Terms of Reference*
102-32 Board committee that formally reviews and approves the organization's sustainability report S&A Committee Mandate and Terms of Reference*
25 WHITECAP RESOURCES INC.
ESG REPORT 2020

CODE DESCRIPTION LOCATION OR ADDITIONAL INFORMATION
102-35b Board and senior executive remuneration policies in relation to economic, environmental and social topics 2020 Information Circular*
102-36a Process for determining remuneration 2020 Information Circular*
102-36b Whether remuneration consultants are involved and independence from management 2020 Information Circular*
102-37b If applicable, the results of votes on remuneration policies and proposals 2020 Information Circular*
102-41 Employees covered by collective bargaining agreements No employees are covered by collective bargaining agreements
102-45b Whether any entity is not covered by the report All Whitecap entities are covered by the report
102-46a Process for defining report content and topic boundaries About This Report (p. 6)
102-48 Information restatement reasons and effect About This Report (p. 6)
102-49 Significant changes to material topics and boundaries from previous reporting periods About This Report (p. 6)
102-50 Reporting period for the information provided About This Report (p. 6)
102-52 Reporting cycle About This Report (p. 6)
102-53 Contact point for questions regarding the report and its contents Back cover (p.28)
102-55 GRI content index GRI Index (p. 25)
Economic201-1 Direct economic value generated and distributed About Whitecap (p. 7), Data Table (p. 18)
201-2 Climate change risks and opportunities Governance (p. 10)
Environment302-1 Energy consumption within the organization Data Table (p. 19)
302-2 Energy consumption outside the organization Data Table (p. 19)
302-3 Energy intensity Data Table (p. 19)
303-1 Water withdrawal by source Data Table (p. 19)
303-3 Water recycled and reused Data Table (p. 20)
305-1 Direct (scope 1) GHG emissions Data Table (p. 18)
305-2 Energy indirect (scope 2) GHG emissions Data Table (p. 19)
305-4 GHG emissions intensity Data Table (p. 19)
305-5 Reduction of GHG emissions Climate (p. 12)
305-7 Significant air emissions Data Table (p. 19)
306-2 Waste by type and disposal method Data Table (p. 20)
306-3 Significant spills Data Table (p. 20)
Social403-2 Injury rates and work-related fatalities Health & Safety (p. 16), Data Table (p. 21)
405-1 Board and employee diversity Data Table (p. 22)
*Can be found on our corporate website.
26 WHITECAP RESOURCES INC.
ESG REPORT 2020
ADVISORIES We have taken care to ensure the information in this document is accurate. However, the data presented includes aspirational goals, approximations and estimates, which will differ from actual results, and is for informational purposes only. We disclaim any liability whatsoever for errors or omissions. Further, some information in this document may have been disclosed previously in other Whitecap public disclosure, and such disclosure is not intended in any way to be qualified, amended, modified or supplemented by information herein.
“Material” may be used within this report to describe issues for voluntary sustainability reporting that are considered to have the potential to significantly affect sustainability performance in our view and may be important in the eyes of internal or external stakeholders. However, material for the purposes of this document should not be read as equating to any use of the word in other Whitecap public reporting or filings.
With this document, we hope to increase your knowledge of Whitecap and our operations. However, this document does not provide investment advice, and readers are responsible for making their own financial and investment decisions.
There is no single standard system that applies across companies for compiling and calculating the quantity of greenhouse gas (GHG) emissions and other sustainability metrics attributable to our operations. Accordingly, such information may not be comparable with similar information reported by other companies. Our GHG emissions are derived from various internal reporting systems that are generally different from those applicable to the financial information presented in our consolidated financial statements and are, in particular, subject to less sophisticated internal documentation as well as preparation and review requirements, including the general internal control environment. We may change our policies for calculating these GHG emissions in the future without prior notice.
This report contains certain forward-looking statements – that is, statements related to future, not past events and circumstances – which may relate to our ambitions, aims, targets, plans and objectives. The use of any of the words “expect”, “anticipate”, “continue”, “estimate”, “objective”, “ongoing”, “may”, “will”, “project”, “should”, “believe”,
“plans”, “intends” and similar expressions are intended to identify these forward-looking information or statements. Forward-looking statements involve risk and uncertainty because they relate to events and depend on circumstances that will or may occur in the future and are outside of our control. These statements are only predictions. Actual results or outcomes may differ from those expressed in such statements. Although we believe that the expectations reflected in the forward-looking statements are reasonable, we cannot guarantee future results, levels of activity, performance or achievement since such expectations are inherently subject to significant business, economic, competitive, political and social uncertainties and contingencies. Many factors could cause our actual results to differ materially from those expressed or implied in any forward-looking statements made by, or on our behalf, in this report.
More particularly and without limitation, this report contains forward-looking information and statements about our strategy, plans and focus; our production decline rates; targeted emission reductions; the impact of CO
2 limits on our operations and proposed GHG regulations; our plans to reduce power costs, improve operating efficiencies and reduce overall emissions; our future reclamation plans; our plans to strengthen our relationships with stakeholders; our intentions to apply best practices in indigenous relations for consultation in the future and our future sustainability goals, plans and reporting.
These forward-looking statements are subject to numerous risks and uncertainties, most of which are beyond our control, including the impact of general economic conditions; industry conditions; liabilities inherent in crude oil and natural gas operations; environmental risks; hazards such as fire, explosion, blowouts, cratering, and spills, any of which could result in substantial damage to wells, production facilities, other property and the environment or in personal injury. Our Management’s Discussion and Analysis for the first quarter of 2020 dated April 30, 2020 and our Annual Information Form dated February 26, 2020, and other documents we file from time to time with securities regulatory authorities describe the risks, uncertainties, material assumptions and other factors that could influence actual results and such factors are incorporated herein by reference. Copies of these documents
are available without charge from us at Suite 3800, 525 – 8 Avenue S.W., Calgary, Alberta, T2P 1G1 or by referring to our profile on SEDAR at www.sedar.com.
We have included the above summary of assumptions and risks related to forward-looking information provided in this report in order to provide readers with an understanding of our future operations and such information may not be appropriate for other purposes. Readers are cautioned that the foregoing lists of factors are not exhaustive. These forward-looking statements are made as of the date of this document and the Company disclaims any intent or obligation to update publicly any forward-looking statements, whether as a result of new information, future events or results or otherwise, other than as required by applicable securities laws.
Certain financial measures in this report – including free funds flow, funds flow and development capital, – are not prescribed by International Financial Reporting Standards (“IFRS”) or, alternatively, Canadian generally accepted accounting principles (“GAAP”). These non-GAAP measures are defined and/or reconciled in our Management’s Discussion and Analysis for the year ended December 31, 2019.
We have adopted the standard of 6 Mcf:1 barrel when converting natural gas to barrels of oil equivalent (“boe”) when reporting net product sales in this document, which is aligned with our consolidated financial statements. We have adopted the CAPP-published standard of 6.1074 Mcf:1 boe for converting natural gas volumes included in our reported gross wellhead production and gross product sales.
Boe may be misleading, particularly if used in isolation. A boe conversion ratio of six Mcf per barrel is based on an energy equivalency conversion method primarily applicable at the burner tip and does not represent a value equivalency at the wellhead. Given that the value ratio based on the current price of crude oil as compared to natural gas is significantly different than the energy equivalency of the 6:1 conversion ratio, utilizing the 6:1 conversion ratio may be misleading as an indication of value.
27 WHITECAP RESOURCES INC.
ESG REPORT 2020

wcap.ca
3800, 525 – 8th Avenue SW
Eighth Avenue Place, East Tower
Calgary, Alberta, Canada T2P 1G1
Related Documents