Environmental Resources Document National Aeronautics and Space Administration Ames Research Center Moffett Field, CA March 2015

Welcome message from author
This document is posted to help you gain knowledge. Please leave a comment to let me know what you think about it! Share it to your friends and learn new things together.
Transcript
Environmental Resources Document
National Aeronautics and Space Administration Ames Research Center
Moffett Field, CA
March 2015
National Aeronautics and Space Administration
NASA Ames Research Center Environmental Resources Document Environmental Management Division March 2015 File: 2015 ARC ERD_FINAL.doc
Environmental Resources Document
Prepared for:
NASA Ames Research Center Environmental Management Division
Code JQ Moffett Field, CA
Contact: Hugo Hoffman
Prepared by:
Earth Resources Technology, Inc. NASA Ames Research Center
Moffett Field, California 94035-1000 Contact: Andrew Martin
March 2015
National Aeronautics and Space Administration
NASA Ames Research Center Environmental Resources Document Environmental Management Division March 2015 File: 2015 ARC ERD_FINAL.doc
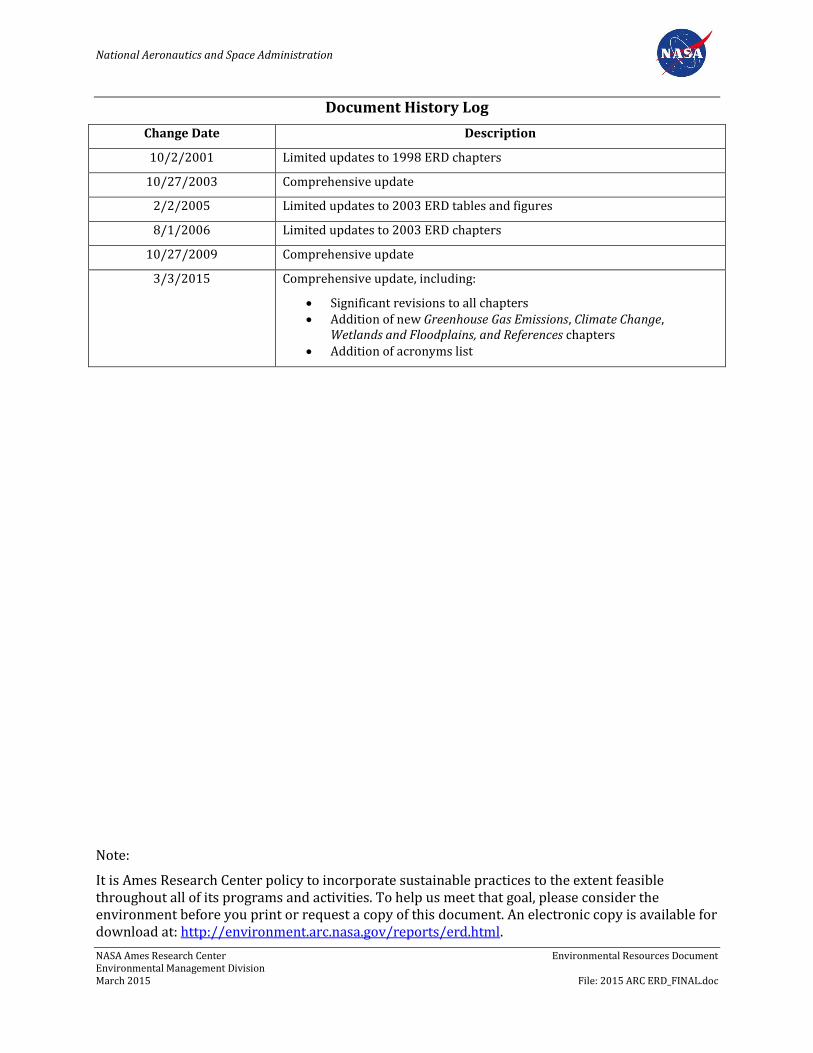
Document History Log
Change Date Description
10/2/2001 Limited updates to 1998 ERD chapters
10/27/2003 Comprehensive update
2/2/2005 Limited updates to 2003 ERD tables and figures
8/1/2006 Limited updates to 2003 ERD chapters
10/27/2009 Comprehensive update
3/3/2015 Comprehensive update, including:
Significant revisions to all chapters Addition of new Greenhouse Gas Emissions, Climate Change,
Wetlands and Floodplains, and References chapters Addition of acronyms list
Note:
It is Ames Research Center policy to incorporate sustainable practices to the extent feasible throughout all of its programs and activities. To help us meet that goal, please consider the environment before you print or request a copy of this document. An electronic copy is available for download at: http://environment.arc.nasa.gov/reports/erd.html.

National Aeronautics and Space Administration
NASA Ames Research Center Environmental Resources Document Environmental Management Division March 2015 File: 2015 ARC ERD_FINAL.doc
Pg i
Table of Contents
Chapter 1. Introduction
1.1 Overview ________________________________________________________________________________________ 1
1.2 Regulatory Background________________________________________________________________________ 1
1.3 Regional Setting ________________________________________________________________________________ 1
1.4 History of NASA Ames Research Center ______________________________________________________ 3
1.5 Existing Conditions ____________________________________________________________________________ 5
Chapter 2. Existing Facilities, Operations, and Their Impacts
2.1 Overview ________________________________________________________________________________________ 8
2.2 Major Environmental Laws, Regulations, and Policies ______________________________________ 8
2.3 NASA Ames Research Center Operations ___________________________________________________ 12
2.4 Facilities in Code A: Office of the Director of Aerospace ___________________________________ 13
2.5 Facilities in Code I: Office of the Director of Information Technology Directorate ______ 15
2.6 Facilities in Code J: Office of the Director of Center Operations __________________________ 16
2.7 Facilities in Code JQ: Environmental Management Division _______________________________ 17
2.8 Facilities in Code R: Office of the Director of Engineering _________________________________ 17
2.9 Facilities in Code S: Office of the Director of Astrobiology and Space Research _________ 18
2.10 Facilities in Code T: Office of the Director of Exploration Technology ____________________ 20
2.11 Facilities in Code Y: Aeroflight dynamics Directorate, Aviation and Missile Research Development and Engineering Center, US Army Research Development and Engineering Command _______________________________________________________________________ 23
2.12 Other Facilities at NASA Ames Research Center ____________________________________________ 24
2.13 Research and Development partners at Ames Research Center __________________________ 24
2.14 NASA Research Aircraft _______________________________________________________________________ 27
2.15 Significant Aspects Summary ________________________________________________________________ 28
2.16 NASA Ames Research Park and Eastside Airfield Operations _____________________________ 41
Chapter 3. Socioeconomics
3.1 Overview _______________________________________________________________________________________ 43
3.2 Regulatory Background_______________________________________________________________________ 43
3.3 Regional setting _______________________________________________________________________________ 44
3.4 Existing Site Conditions_______________________________________________________________________ 62
3.5 Environmental Requirements ________________________________________________________________ 62
Chapter 4. Land Use
4.1 Overview _______________________________________________________________________________________ 65
4.2 Regulatory Background_______________________________________________________________________ 65
4.3 Regional Setting _______________________________________________________________________________ 72
4.4 Existing Site Conditions_______________________________________________________________________ 73
4.5 Environmental Requirements ________________________________________________________________ 78
Chapter 5. Recreation
5.1 Overview _______________________________________________________________________________________ 82
National Aeronautics and Space Administration
NASA Ames Research Center Environmental Resources Document Environmental Management Division March 2015 File: 2015 ARC ERD_FINAL.doc
Pg ii
5.2 Regulatory Background_______________________________________________________________________ 82
5.3 Regional Setting _______________________________________________________________________________ 85
5.4 Existing Site Conditions_______________________________________________________________________ 87
5.5 Environmental Requirements ________________________________________________________________ 88
Chapter 6. Aesthetics
6.1 Overview _______________________________________________________________________________________ 90
6.2 Regulatory Background_______________________________________________________________________ 90
6.3 Regional Setting _______________________________________________________________________________ 90
6.4 Existing Site Conditions_______________________________________________________________________ 91
6.5 Environmental Requirements ______________________________________________________________ 116
Chapter 7. Cultural Resources
7.1 Overview _____________________________________________________________________________________ 121
7.2 Regulatory Background_____________________________________________________________________ 121
7.3 Regional Prehistoric and Historic Setting _________________________________________________ 122
7.4 Existing Site Conditions_____________________________________________________________________ 123
7.5 Environmental Requirements ______________________________________________________________ 131
Chapter 8. Air Quality
8.1 Overview _____________________________________________________________________________________ 135
8.2 Regulatory Background_____________________________________________________________________ 135
8.3 Regional Setting _____________________________________________________________________________ 140
8.4 Existing Site Conditions_____________________________________________________________________ 144
8.5 Environmental Requirements ______________________________________________________________ 153
Chapter 9. Greenhouse Gas Emissions
9.1 Overview _____________________________________________________________________________________ 162
9.2 Regulatory Background_____________________________________________________________________ 162
9.3 Regional Setting _____________________________________________________________________________ 163
9.4 Existing Site Conditions_____________________________________________________________________ 164
9.5 Environmental Requirements ______________________________________________________________ 165
Chapter 10. Climate Change
10.1 Overview _____________________________________________________________________________________ 169
10.2 Regulatory Background_____________________________________________________________________ 169
10.3 Global and Regional Setting ________________________________________________________________ 170
10.4 Current and Future Site Conditions________________________________________________________ 171
10.5 Environmental Requirements ______________________________________________________________ 186
Chapter 11. Geology, Seismicity, Soils, and Mineral Resources
11.1 Overview _____________________________________________________________________________________ 189
11.2 Regulatory Background_____________________________________________________________________ 189
11.3 Regional Setting _____________________________________________________________________________ 192
11.4 Existing Site Conditions_____________________________________________________________________ 193
National Aeronautics and Space Administration
NASA Ames Research Center Environmental Resources Document Environmental Management Division March 2015 File: 2015 ARC ERD_FINAL.doc
Pg iii
11.5 Environmental Requirements ______________________________________________________________ 197
Chapter 12. Hydrology and Water Quality
12.1 Overview _____________________________________________________________________________________ 201
12.2 Regulatory Background_____________________________________________________________________ 201
12.3 Regional setting _____________________________________________________________________________ 213
12.4 Existing Site Conditions_____________________________________________________________________ 216
12.5 Environmental Requirements ______________________________________________________________ 225
Chapter 13. Prime and Unique Farmlands
13.1 Overview _____________________________________________________________________________________ 242
13.2 Regulatory Background_____________________________________________________________________ 242
13.3 Regional Setting _____________________________________________________________________________ 243
13.4 Existing Site Conditions_____________________________________________________________________ 243
13.5 Environmental Requirements ______________________________________________________________ 243
Chapter 14. Wetlands and Floodplains
14.1 Overview _____________________________________________________________________________________ 244
14.2 Regulatory Background_____________________________________________________________________ 244
14.3 Regional Setting _____________________________________________________________________________ 248
14.4 Existing Site Conditions_____________________________________________________________________ 249
14.5 Environmental Requirements ______________________________________________________________ 254
Chapter 15. Biological Resources
15.1 Overview _____________________________________________________________________________________ 257
15.2 Regulatory Background_____________________________________________________________________ 257
15.3 Regional Setting _____________________________________________________________________________ 260
15.4 Existing Site Conditions_____________________________________________________________________ 261
15.5 Environmental Requirements ______________________________________________________________ 280
Chapter 16. Transportation and Circulation
16.1 Overview _____________________________________________________________________________________ 287
16.2 Regulatory Background_____________________________________________________________________ 287
16.3 Regional Setting _____________________________________________________________________________ 289
16.4 Existing Conditions _________________________________________________________________________ 290
16.5 Environmental Requirements ______________________________________________________________ 297
Chapter 17. Public Services, Utilities, and Energy
17.1 Overview _____________________________________________________________________________________ 304
17.2 Regulatory Background_____________________________________________________________________ 304
17.3 Regional Setting _____________________________________________________________________________ 305
17.4 Existing Site Conditions_____________________________________________________________________ 305
17.5 Environmental Requirements ______________________________________________________________ 325
National Aeronautics and Space Administration
NASA Ames Research Center Environmental Resources Document Environmental Management Division March 2015 File: 2015 ARC ERD_FINAL.doc
Pg iv
Chapter 18. Noise and Vibration
18.1 Overview _____________________________________________________________________________________ 330
18.2 Regulatory Background_____________________________________________________________________ 330
18.3 Regional Setting _____________________________________________________________________________ 335
18.4 Existing Site Conditions_____________________________________________________________________ 335
18.5 Environmental Requirements ______________________________________________________________ 338
Chapter 19. Hazardous Materials and Site Contamination
19.1 Overview _____________________________________________________________________________________ 352
19.2 Regulatory Background_____________________________________________________________________ 352
19.3 Regional Setting _____________________________________________________________________________ 356
19.4 Existing Site Conditions_____________________________________________________________________ 357
19.5 Environmental Requirements ______________________________________________________________ 371
Chapter 20. Environmental Justice
20.1 Overview _____________________________________________________________________________________ 386
20.2 Regulatory Background_____________________________________________________________________ 386
20.3 Regional Setting _____________________________________________________________________________ 386
20.4 Existing Site Conditions_____________________________________________________________________ 393
20.5 Environmental Requirements ______________________________________________________________ 394
Chapter 21. Sustainability
21.1 Overview _____________________________________________________________________________________ 397
21.2 Regulatory Background_____________________________________________________________________ 397
21.3 Current Sustainability Strategies and Practices __________________________________________ 398
Chapter 22. Land Use Controls
22.1 Overview _____________________________________________________________________________________ 405
22.2 Regulatory Background_____________________________________________________________________ 405
22.3 Current Agreements and Land Use Controls ______________________________________________ 406
Chapter 23. References 410
National Aeronautics and Space Administration
NASA Ames Research Center Environmental Resources Document Environmental Management Division March 2015 File: 2015 ARC ERD_FINAL.doc
Pg v
Table of Figures
Figure 1-1. Regional Context Map _________________________________________________________________________ 2
Figure 1-2. Local Context Map _____________________________________________________________________________ 3
Figure 1-3. Planning Areas ________________________________________________________________________________ 6
Figure 4-1. Existing Land Use ____________________________________________________________________________ 74
Figure 4-2. Minimum Operating Clearances Runway 32 Left and Right ______________________________ 76
Figure 5-1. Recreational Facilities in the Vicinity _______________________________________________________ 87
Figure 6-1. Location of Visual Units ______________________________________________________________________ 91
Figure 6-2. Visual Unit 17. Undeveloped Land to the West ____________________________________________ 92
Figure 6-3. Visual Unit 18 Offices/Industrial Park to the Northwest__________________________________ 93
Figure 6-4. Visual Unit 19 Mobile Home Park to the West _____________________________________________ 94
Figure 6-5. Visual Unit 21. The Lockheed Martin Complex ____________________________________________ 95
Figure 6-6. Visual Unit 22. Residential Neighborhood across Highway 101 __________________________ 96
Figure 6-7. Visual Unit 23. Mixed-Use Strip across Highway 101 _____________________________________ 97
Figure 6-8. Visual Unit 24. Whisman Industrial Area across Highway 101 ___________________________ 98
Figure 6-9. Visual Unit 25. The Sunnyvale Municipal Golf Course _____________________________________ 99
Figure 6-10. Visual Unit 1. Western End of Shenandoah Plaza ______________________________________ 101
Figure 6-11. Visual Unit 2. Eastern End of Shenandoah Plaza _______________________________________ 102
Figure 6-12. Visual Unit 3. Southeastern Perimeter of the NASA Research Park Area _____________ 103
Figure 6-13. Visual Unit 4. The Barracks ______________________________________________________________ 104
Figure 6-14. Visual Unit 5. Exchange Area ____________________________________________________________ 105
Figure 6-15. Visual Unit 6. Main Entry _________________________________________________________________ 106
Figure 6-16. Visual Unit 7. Ames Campus Area _______________________________________________________ 107
Figure 6-17. Visual Unit 8. Bay View and North of Bay View ________________________________________ 108
Figure 6-18. Visual Unit 9. Storm water Retention Pond _____________________________________________ 109
Figure 6-19. Visual Unit 10. The Airfield ______________________________________________________________ 110
Figure 6-20. Visual Unit 11. California Air National Guard Area _____________________________________ 111
Figure 6-21. Visual Unit 12. Hangars 2 and 3 _________________________________________________________ 112
Figure 6-22. Visual Unit 13. The Golf Course and Munitions Bunkers ______________________________ 113
Figure 6-23. Visual Unit 14. Wescoat Village Military Housing Area ________________________________ 114
Figure 6-24. Visual Unit 16. Military Office and Hotel Buildings ____________________________________ 115
Figure 8-1. Regional Groundwater Contamination Plume ___________________________________________ 148
Figure 8-2. Vapor Intrusion Study Area and Areas of Responsibility _______________________________ 150
Figure 10-1. Summary of Hourly Observations of Water Height at San Francisco by Golden Gate (Gauge # 9414290) ___________________________________________________________________ 171
Figure 10-2. Low, Medium, and High Sea Level Rise Projections ____________________________________ 176
Figure 10-3. Bay Area Vulnerability to Sea Level Rise________________________________________________ 177
Figure 10-4. Stevens Creek during 2012 Yearly Maximum (King tide) and Average Tidal Conditions ___________________________________________________________________________________ 178
Figure 10-5. Historical and Projected Water Height at San Francisco, Golden Gate Bridge _______ 179
Figure 10-6. Estimated Water Height at the San Francisco Bridge, and Three South Bay Locations, Including NASA ARC ____________________________________________________________ 180
Figure 10-7. Extreme Storm Inundation Vulnerability at NASA ARC _______________________________ 182
National Aeronautics and Space Administration
NASA Ames Research Center Environmental Resources Document Environmental Management Division March 2015 File: 2015 ARC ERD_FINAL.doc
Pg vi
Figure 10-8. Flood Depth at NASA ARC from an Extreme Storm ____________________________________ 183
Figure 10-9. Projections of Extreme Runoff from the SWRP _________________________________________ 184
Figure 10-10. TOPS Simulations of Upper Tuolumne Watershed under Present and End-of-Century Conditions _________________________________________________________________________ 185
Figure 12-1. Baseline Conditions - Storm Drain System _____________________________________________ 217
Figure 12-2. Hazardous Materials Sites and Plumes _________________________________________________ 224
Figure 14-1. Army Corps of Engineers’ 2009 Wetlands Delineation ________________________________ 251
Figure 14-2. Flood Risk at ARC _________________________________________________________________________ 253
Figure 15-1. Distribution of Vegetation Areas ________________________________________________________ 270
Figure 16-1. Primary Access Points ____________________________________________________________________ 290
Figure 16-2. Existing Bicycle Facilities ________________________________________________________________ 295
Figure 16-3. Existing Transit Service __________________________________________________________________ 297
Figure 17-1. Baseline Conditions Water System ______________________________________________________ 309
Figure 17-2. Baseline Conditions Reclaimed Water System _________________________________________ 312
Figure 17-3. Baseline Conditions Sanitary Sewer System ____________________________________________ 315
Figure 17-4. Baseline Conditions Electric System ____________________________________________________ 319
Figure 17-5. Baseline Conditions Gas System _________________________________________________________ 323
Figure 18-1. Land Use Compatibility for Community Noise Environments ________________________ 334
Figure 18-2. Existing 40-By-80-Foot Wind Tunnel Operations: Annual Ldn Noise Exposure Contours (dB) _______________________________________________________________________________ 342
Figure 18-3. Existing 80-By-120-Foot Wind Tunnel Operations: Annual Ldn Noise Exposure Contours (dB) _______________________________________________________________________________ 343
Figure 18-4. Unitary Plan Wind Tunnel: Annual Ldn Noise Exposure Contours (dB) _____________ 344
Figure 18-5. 12 Foot Pressure Wind Tunnel: Annual Ldn Noise Exposure Contours (dB) ________ 345
Figure 18-6. Arc Jets: Annual Ldn Noise Exposure Contours (dB) __________________________________ 346
Figure 18-7. Airfield CNEL Noise Exposure (dB) (Applicable to both 1999 and 2010) ____________ 347
Figure 18-8. Location of Ambient Traffic Noise Measurements _____________________________________ 348
Figure 18-9. Ambient Highway 101 Traffic: Annual Ldn Noise Exposure Contours (dB) _________ 349
Figure 18-10. Composite Annual Ldn Noise Exposure Contours (dB) ______________________________ 350
Figure 18-11. Hybrid Rocket Fuel Test Facility Noise Levels ________________________________________ 351
Figure 19-1. Extent of Regional Plume (right) and Orion Park Plume (left) ________________________ 383
Figure 19-2. Restoration Sites __________________________________________________________________________ 384
Figure 19-3. MEW Regional Plume and Vapor Intrusion Study Area _______________________________ 385
Figure 20-1. ARC Environmental Justice Study Area _________________________________________________ 393
National Aeronautics and Space Administration
NASA Ames Research Center Environmental Resources Document Environmental Management Division March 2015 File: 2015 ARC ERD_FINAL.doc
Pg vii
Table of Tables
Table 2-1. Environmental Regulatory Agencies Overseeing NASA Ames Research Center Operations _____________________________________________________________________________________ 12
Table 2-2. ARC Research and Development Partners __________________________________________________ 25
Table 2-3. Significant Aspects Summary for NASA Ames Research Center ___________________________ 29
Table 3-1. Population and Household Trends ___________________________________________________________ 44
Table 3-2. Population and Household Projections ______________________________________________________ 45
Table 3-3. Median Household Income ___________________________________________________________________ 46
Table 3-4. Estimated 2012 Household Income Distribution ___________________________________________ 46
Table 3-5. Age Distribution 2000 AND 2010 ____________________________________________________________ 47
Table 3-6. Employment Projections by Industry Sector ________________________________________________ 48
Table 3-7. Employment Projections by Industry Sector, Ames Research Center Area _______________ 51
Table 3-8. Commuters to Sunnyvale/Mountain View Superdistrict___________________________________ 52
Table 3-9. Definition of the Housing Impact Area ______________________________________________________ 54
Table 3-10. Housing Impact Area Characteristics ______________________________________________________ 55
Table 3-11. Housing Stock in Housing Impact Area ____________________________________________________ 56
Table 3-12. Overview of the Housing Impact Area Rental Housing Market __________________________ 57
Table 3-13. Average Rent and Occupancy in the Housing Impact Area _______________________________ 57
Table 3-14. Rental Housing Affordability Analysis _____________________________________________________ 58
Table 3-15. Overview of Housing Impact Area For-Sale Housing Market ____________________________ 58
Table 3-16. For-Sale Housing Affordability Analysis ___________________________________________________ 59
Table 7-1. Contributing Buildings, Structures, and Objects within the Shenandoah Plaza Historic District (NASA Stewardship Only) _______________________________________________ 125
Table 7-2. Non-Contributing Buildings within the Shenandoah Plaza Historic District (NASA Stewardship Only) __________________________________________________________________________ 127
Table 7-3. Historic Buildings at the Ames Campus ___________________________________________________ 130
Table 8-1. Federal and State Air Quality Standards __________________________________________________ 136
Table 8-2. Air Pollutant Concentrations near Ames Research Center _______________________________ 144
Table 8-3. Summary of Local Air Quality Exceedances _______________________________________________ 144
Table 8-4. Summary of ARC Potential Emission Rates in 2010 ______________________________________ 146
Table 8-5. Major Air Pollution Sources at ARC ________________________________________________________ 146
Table 8-6. Maximum Concentrations Detected in Shallow Groundwater and Indoor Air – Commercial Area ____________________________________________________________________________ 149
Table 9-1. Bay Area 2007 GHG Emissions by Pollutant ______________________________________________ 164
Table 9-2. Bay Area 2007 GHG Emissions by Sector __________________________________________________ 164
Table 10-1. Baseline Temperature Variables from the Moffett Airfield Meteorological Station and Projected Temperatures from downscaled CMIP5 models _________________________ 175
Table 10-2. Baseline Precipitation Variables from the Moffett Airfield Meteorological Station and Projected Precipitation Variables from downscaled CMIP5 models _______________ 175
Table 12-1. Beneficial Uses of Surface and Ground Waters at NASA Ames _________________________ 203
Table 12-2. Surface Water Quality Objectives_________________________________________________________ 204
Table 12-3. Secondary Maximum Contaminant Levels _______________________________________________ 206
Table 12-4. Secondary Maximum Contaminant Level Ranges _______________________________________ 206
National Aeronautics and Space Administration
NASA Ames Research Center Environmental Resources Document Environmental Management Division March 2015 File: 2015 ARC ERD_FINAL.doc
Pg viii
Table 12-5. Maximum Contaminant Levels for Inorganic Chemicals _______________________________ 206
Table 12-6. Maximum Contaminant Levels for Organic Chemicals__________________________________ 207
Table 12-7. Maximum Contaminant Levels for Radioactivity ________________________________________ 208
Table 14-1. Wetlands and Other Waters of the U.S. Present at ARC _________________________________ 250
Table 14-2. FEMA Flood Hazard Zones Present at ARC ______________________________________________ 252
Table 15-1. Special-Status Wildlife That Potentially Occur at NASA Ames Research Center ______ 262
Table 15-2. Special-Status Plants That Potentially Occur at NASA Ames Research Center ________ 269
Table 16-1. Signalized Intersection Criteria ___________________________________________________________ 292
Table 16-2. Level of Service Criteria for Unsignalized Intersections ________________________________ 293
Table 16-3. Freeway Level of Service Criteria ________________________________________________________ 293
Table 17-1. Capacity and Enrollment at Schools near ARC __________________________________________ 307
Table 18-1. Exposure Limits for Noise According to NASA’s Hearing Conservation Program ____ 330
Table 18-2. Land Use Compatibility Noise Exposure Criteria ________________________________________ 333
Table 18-3. Ambient Traffic Noise Levels _____________________________________________________________ 337
Table 19-1. Weight of PCB (kilograms) in PCB-Containing Equipment at NASA Ames, 2010- 2012 __________________________________________________________________________________________ 368
Table 19-2. Herbicide Usage at NASA Ames ___________________________________________________________ 368
Table 19-3. Pesticide Usage at NASA Ames ___________________________________________________________ 369
Table 19-4. Sources of Radiation at NASA Ames ______________________________________________________ 369
Table 20-1. Race and Ethnicity in the Environmental Justice Study Area __________________________ 389
Table 20-2. Minority Populations in the Environmental Justice Study Area________________________ 390
Table 20-3. Low-Income Populations in the Environmental Justice Study Area ___________________ 392
Table 21-1. Materials Recycled and Reused in 2013 _________________________________________________ 402
National Aeronautics and Space Administration
NASA Ames Research Center Environmental Resources Document Environmental Management Division March 2015 File: 2015 ARC ERD_FINAL.doc
Pg ix
List of Acronyms
AB Assembly Bill
ABAG Association of Bay Area Governments
ACAP Ames Commute Alternatives Program
ACE Ames Chemical Exchange
ACMS Asbestos-Containing Materials
ACS American Community Survey
ADD U.S. Army Aviation Development Directorate
AFDD Aeroflight Dynamics Directorate
AFS Air Force Station
ALUC Santa Clara County Airport Land Use Commission
AMD Advanced Micro Devices
AOI Area of Investigation
APR Ames Procedural Requirements
ARC NASA Ames Research Center
ARPA Archaeological Resources Protection Act of 1979
AST Aboveground Storage Tank
AVR Average Vehicle Ridership
BAAQMD Bay Area Air Quality Management District
BCDC Bay Conservation and Development Commission
BCSD Bias Correction Statistical Downscaling
BFE Base Flood Elevation
bgs Below Ground Surface
BMP Best Management Practice
BOHMP Burrowing Owl Habitat Management Plan
BRAC Base Closure and Realignment Commission
C2H3CL Vinyl Chloride
CAA Clean Air Act of 1970
CAAQS California Ambient Air Quality Standards
CAL/OSHA California Occupational Safety and Health Administration
Caltrans California Department of Transportation
CANG California Air National Guard
CAP Bay Area Clean Air Plan
CARB California Air Resources Board
CASI Climate Adaptation Science Investigators
National Aeronautics and Space Administration
NASA Ames Research Center Environmental Resources Document Environmental Management Division March 2015 File: 2015 ARC ERD_FINAL.doc
Pg x
CBSC California Building Standards Code
CCAA California Clean Air Act
CCR California Code of Regulations
CD Consent Decree
CDA California Division of Aeronautics
CDFW California Department of Fish and Wildlife
CEMP Construction Emissions Mitigation Plan
CEQ Council on Environmental Quality
CEQA California Environmental Quality Act
CERCLA Comprehensive Environmental Response, Compensation, and Liability Act
CESA California Endangered Species Act
CFCs Chlorofluorocarbons
CFR Code of Federal Regulations
CH4 Methane
CMIP5 Coupled Model Intercomparison Project Phase 5
CMP Congestion Management Program
CNEL Community Noise Equivalent Level
CNPPA California Native Plant Protection Act of 1977
CO Carbon Monoxide
CO2E Carbon Dioxide Equivalent
COC Chemical of Concern
COR Contract Officer Representative
CRM Cultural Resources Management
CUP Comprehensive Use Plan
CVSRF Crew Vehicle Systems Research Facility
CWA Clean Water Act
CWSAP Center-Wide Sampling and Analysis Program
CY Calendar Year
CZMA Coastal Zone Management Act
CZMP Coastal Zone Management Program
DART Disaster Area Relief Team
dB Decibel
dBA A-Weighted Decibel
DCA 1,1- Dichloroethane
DCE Cis- and Trans-1,2-Dichloroethene
DOC California Department of Conservation
National Aeronautics and Space Administration
NASA Ames Research Center Environmental Resources Document Environmental Management Division March 2015 File: 2015 ARC ERD_FINAL.doc
Pg xi
DOD Department of Defense
DOE Department of Energy
EA Environmental Assessment
EATS East-Side Aquifer Treatment System
EC Engineering Control
EIMP Environmental Issues Management Plan
EIS Environmental Impact Statements
EJIP Environmental Justice Implementation Plan
EMS Environmental Management System
EO Executive Order
EPA U.S. Environmental Protection Agency
EPCRA Emergency Planning and Community Right-to-Know Act
ERD Environmental Resource Document
ESA Endangered Species Act
EWIS Environmental Work Instructions
FAA Federal Aviation Administration
FAR Floor Area Ratio
FEMA Federal Emergency Management Agency
FFA Federal Facility Agreement
FIRM Flood Insurance Rate Map
FMMP Farmland Mapping and Monitoring Program
FPPA Farmland Protection Policy Act
FSFA Former Soil Fill Area
FY Fiscal Year
GCM Global Circulation Models
GHG Greenhouse Gas
GHGRP Greenhouse Gas Reporting Program
gpd Gallons Per Day
gpm Gallons Per Minute
GPP Gross Primary Productivity
GROF Groundwater Reverse Osmosis Facility
H2S Hydrogen Sulfide
HAP Hazardous Air Pollutants
HCFCS Hydrochlorofluorocarbons
HFFAF Hypervelocity Free-Flight Aerodynamic Facility
HFFF Hypervelocity Free-Flight Facilities
National Aeronautics and Space Administration
NASA Ames Research Center Environmental Resources Document Environmental Management Division March 2015 File: 2015 ARC ERD_FINAL.doc
Pg xii
HFFGDF Hypervelocity Free-Flight Gun Development Facility
HHRA Human Health Risk Assessment
HHS U.S. Department of Health and Human Services
HI Hazard Index
HIA Housing Impact Area
HMIS Hazardous Materials Inventory Statements
HOV High Occupancy Vehicle
HPSR Historic Property Survey Report
HRPP Historic Resources Protection Plan
HSP Health and Safety Plan
HUD U.S. Department of Housing and Urban Development
HVAC Heating, Ventilation, and Air Conditioning
I-680 Interstate 680
I-880 Interstate 880
ICRMP Integrated Cultural Resources Management Plan
ICs Institutional Controls
IPM Integrated Pest Management
IR Installation Restoration
IT Information Technology
IVM Integrated Vegetation Management
IWWTF Industrial Wastewater Treatment Facility
kPA kilopascals
kV kilovolts
Ldn A-Weighted Noise Level
LEED Leadership in Energy and Environmental Design
Leq Equivalent Noise Level
LESA Land Evaluation and Site Assessment
LOS Level of Service
LUCs Land Use Controls
MBTA Migratory Bird Treaty Act
MCL Maximum Contaminant Level
MEW Middlefield-Ellis-Whisman
MFA Moffett Federal Airfield
MFFD Moffett Field Fire Department
MGD Million Gallons Per Day
µg/m3 Micrograms Per Cubic Meter
National Aeronautics and Space Administration
NASA Ames Research Center Environmental Resources Document Environmental Management Division March 2015 File: 2015 ARC ERD_FINAL.doc
Pg xiii
MT Metric Tons
MOA Memorandum of Agreement
MOE Measure of Effectiveness
MOU Memorandum of Understanding
MROSD Midpeninsula Regional Open Space District
MRZ Mineral Resource Zone
MSDS Material Safety Data Sheet
MSL Mean Sea Level
MTC Metropolitan Transportation Commission
MVA Megavolt Amperes
MW Megawatts
N2E2 NASA’s NEPA Emission Estimation Tool
N2O Nitrous Oxide
NAAQS National Ambient Air Quality Standards
NACA National Advisory Committee For Aeronautics
NADP NASA Ames Development Plan
NADP EIS NASA Ames Development Plan Final Programmatic Environmental Impact Statement
NAGPRA Native American Graves and Protection and Repatriation Act of 1990
NAS Naval Air Station
NASA National Aeronautics and Space Administration
NAVD88 North American Datum of 1988
NCP National Contingency Plan
NECPA National Energy Conservation Policy Act of 1978
NEPA National Environmental Policy Act
NFA No Further Action
NFAC National Full-Scale Aerodynamics Complex
NFIP National Flood Insurance Program
NHPA National Historic Preservation Act
NLR Noise Level Reduction
NO2 Nitrogen Dioxide
NOX Nitrogen Oxide
NPD NASA Procedural Directive
NPDES National Pollutant Discharge Elimination System
NPL National Priorities List
NPL National Priorities List
NPR NASA Procedural Requirement
National Aeronautics and Space Administration
NASA Ames Research Center Environmental Resources Document Environmental Management Division March 2015 File: 2015 ARC ERD_FINAL.doc
Pg xiv
NRC Nuclear Regulatory Commission
NRCS Natural Resources Conservation Service
NRHP National Register of Historic Places
NRP NASA Research Park
O3 Ozone
OARF Outdoor Aerodynamic Research Facility
ODS Ozone-Depleting Substance
OU Operable Unit
PARWQCP Palo Alto Regional Water Quality Control Plant
PB Lead
ppb Part Per Billion
PBT Persistent, Bioaccumulative, and Toxic
PCB Polychlorinated Biphenyl
PCE Perchloroethene
PDO Pacific Decadal Oscillation
PDOI Pacific Decadal Oscillation Index
PG&E Pacific Gas & Electric
PM10 Particulate Matter With A Diameter 10 Microns Or Less
PM2.5 Particulate Matter With A Diameter 2.5 Microns Or Less
POC Precursor Organic Compounds
POTW Publicly-Owned Treatment Works
ppm Parts Per Million
PRP Potentially Responsible Party
psi Pounds Per Square Inch
psig Pounds Per Square Inch Gauge
PV Planetary Ventures, LLC
R&D Research and Development
RASCAL Rotorcraft-Aircrew Systems Concepts Airborne Laboratory
RCP Representative Concentration Pathway
RCRA Resource Conservation and Recovery Act
RMP Risk Management Plan
ROD Record of Decision
RWQCB Regional Water Quality Control Board
SARA Superfund Amendments and Reauthorization Act
SBSPRP South Bay Salt Pond Restoration Project
SCVWD Santa Clara Valley Water District
National Aeronautics and Space Administration
NASA Ames Research Center Environmental Resources Document Environmental Management Division March 2015 File: 2015 ARC ERD_FINAL.doc
Pg xv
SF6 Sulfur Hexafluoride
SF Bay San Francisco Bay
SFPUC San Francisco Public Utilities Commission
SFWD San Francisco Water Department
SHPO State Historic Preservation Officer
SIPS State Implementation Plans
SIU Significant Industrial User
SMARA Surface Mining and Reclamation Act of 1975
SMOP Synthetic Minor Operating Permit
SO2 Sulfur Dioxide
SO4 Sulfates
SOW Statement of Work
SPCC Spill Prevention Control and Countermeasure Plan
SR State Routes
SSPP Strategic Sustainability Performance Plan
SWEA Site-Wide Ecological Assessment
SWPCP Sunnyvale Water Pollution Control Plant
SWPPP Storm Water Pollution Prevention Plan
SWRCB State Water Resources Control Board
SWRP Storm Water Retention Pond
SWSB Stormwater Settling Basin
TCE Trichloroethene
TDM Transportation Demand Management
TMDL Total Maximum Daily Load
TOPS Terrestrial Observation and Prediction System
TRI Toxic Release Inventory
UAO Unilateral Administrative Order
UAV Unmanned Aerial Vehicle
US-101 U.S. Highway 101
USC United States Code
USFWS U.S. Fish and Wildlife Service
USGBC United States Green Building Council
UST Underground Storage Tank
UV Ultraviolet
V/STOL Vertical/Short Take-Off and Landing
VI Vapor Intrusion
National Aeronautics and Space Administration
NASA Ames Research Center Environmental Resources Document Environmental Management Division March 2015 File: 2015 ARC ERD_FINAL.doc
Pg xvi
VMS Vertical Motion Simulator
VOCS Volatile Organic Compounds
VTA Santa Clara Valley Transportation Authority
WAPA Western Area Power Administration
WATS Westside Aquifer Treatment System
National Aeronautics and Space Administration Chap 1. Introduction
NASA Ames Research Center Environmental Resources Document Environmental Management Division March 2015 File: 2015 ARC ERD_FINAL.doc
Pg 1
Chapter 1. Introduction
1.1 Overview
This chapter discusses the use of Environmental Resource Documents (ERDs) by the National Aeronautics and Space Administration (NASA), and NASA Ames Research Center (ARC) specifically, to address environmental effects associated with current facility operations. It also provides a geographic and historical overview of ARC and the surrounding region. The information presented in this chapter was drawn from the November 2009 NASA ARC ERD (NASA 2009) and the NASA Ames Development Plan (NADP) Final Programmatic Environmental Impact Statement (EIS) (Design, Community & Environment 2002).
1.2 Regulatory Background
ERDs are specific to NASA and are not required by the National Environmental Policy Act (NEPA) or by Council on Environmental Quality (CEQ) regulations. NASA regulations (Title 14 of the Code of Federal Regulations [CFR], Section 1216.319, and NASA Procedural Requirements [NPR] 8580.1A) require each NASA Center or Component Facility to prepare an ERD to serve as a succinct baseline description of all environmental aspects of the operations of that facility at the time of the ERD’s preparation. In essence, an ERD forms a baseline environment description against which the effects of subsequent proposed actions may be judged to determine significance. Each installation’s ERD is to be updated every five years and as Center conditions change, in accordance with the procedures outlined in NPR 8580.1A.
The purposes of this ERD are to:
Describe the existing environmental setting at ARC
Document the effects of the facility and its current operation on the physical, biological, and social environment
Document a baseline of conditions against which new and proposed actions can be compared and assessed as part of the decision-making process
Facilitate the preparation of future EISs and environmental assessments (EAs) that are required by NEPA for proposed major federal actions
This ERD is a revision of the 2009 ERD, which expanded upon the preceding 2003 document and also incorporated information from the 2002 NADP EIS. The EIS is discussed in more detail in Chapter 4, “Land Use.”
1.3 Regional Setting
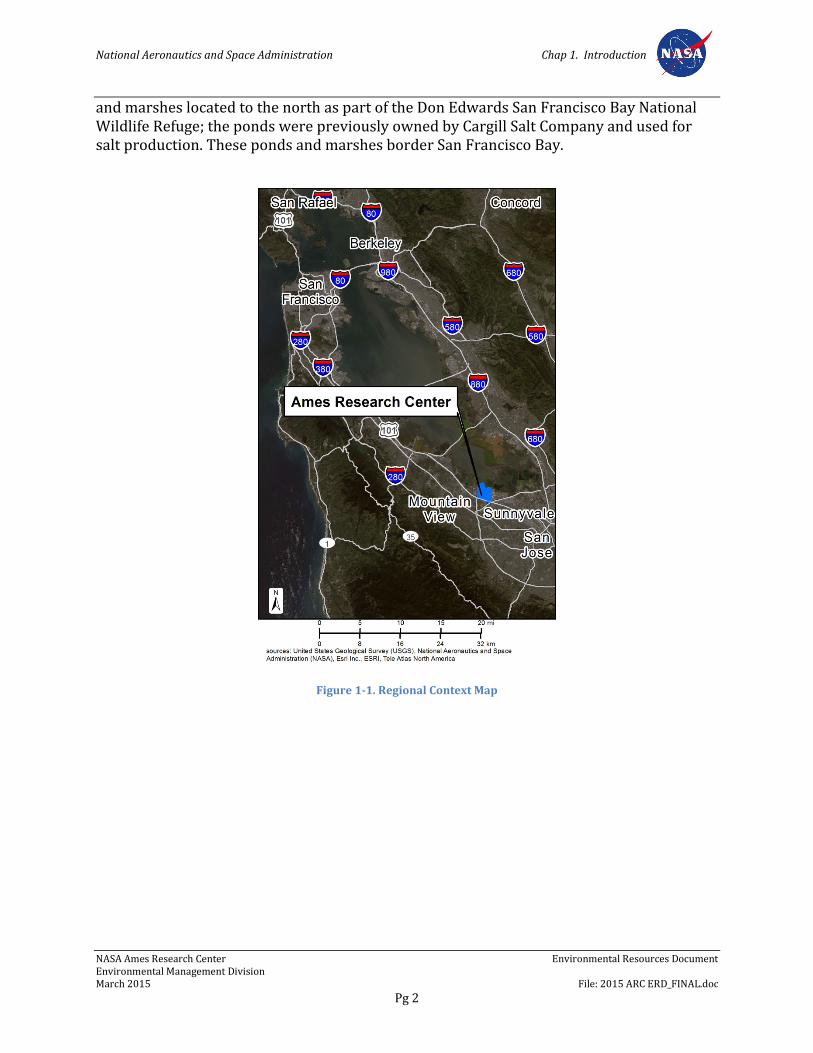
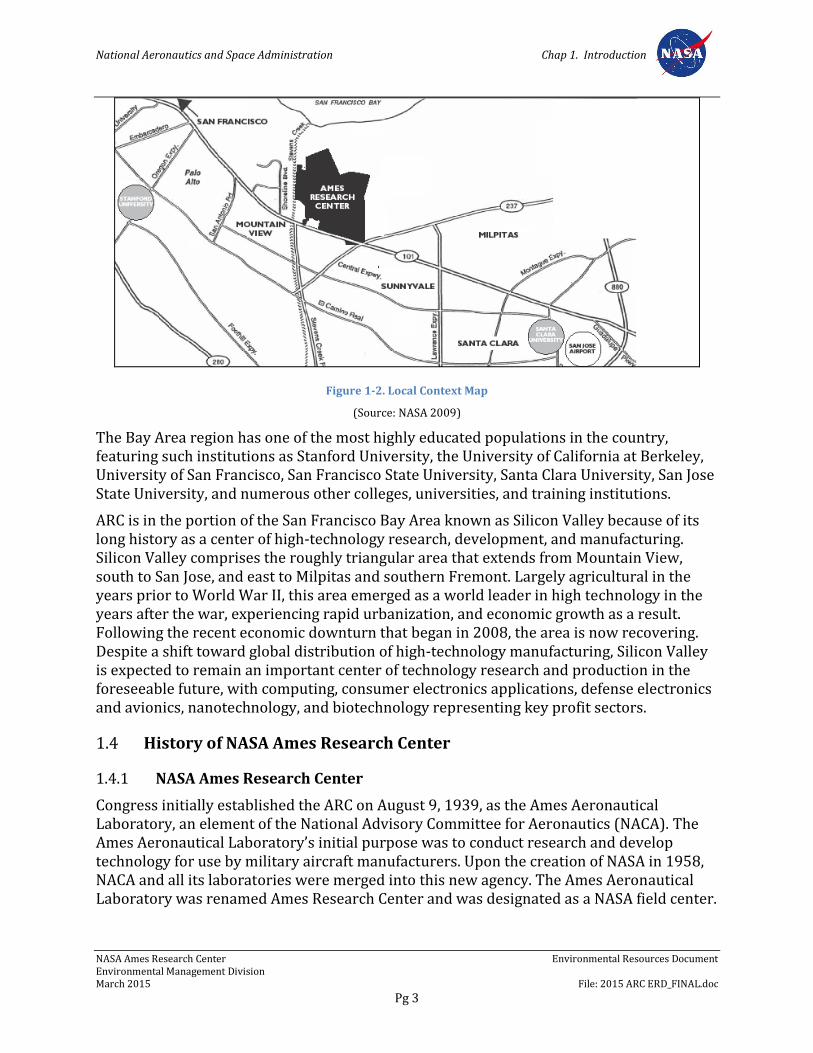
ARC is located in northern Santa Clara County, at the south end of San Francisco Bay (Figure 1-1). The City of San Francisco is 65 kilometers (40 miles) to the northwest, and the City of San Jose is 16 kilometers (10 miles) to the southeast (Figure 1-2). The Cities of Mountain View and Sunnyvale are adjacent to the ARC site, Mountain View to the west and Sunnyvale to the east. The U.S. Fish and Wildlife Service (USFWS) administers salt ponds
National Aeronautics and Space Administration Chap 1. Introduction
NASA Ames Research Center Environmental Resources Document Environmental Management Division March 2015 File: 2015 ARC ERD_FINAL.doc
Pg 2
and marshes located to the north as part of the Don Edwards San Francisco Bay National Wildlife Refuge; the ponds were previously owned by Cargill Salt Company and used for salt production. These ponds and marshes border San Francisco Bay.
Figure 1-1. Regional Context Map
National Aeronautics and Space Administration Chap 1. Introduction
NASA Ames Research Center Environmental Resources Document Environmental Management Division March 2015 File: 2015 ARC ERD_FINAL.doc
Pg 3
Figure 1-2. Local Context Map
(Source: NASA 2009)
The Bay Area region has one of the most highly educated populations in the country, featuring such institutions as Stanford University, the University of California at Berkeley, University of San Francisco, San Francisco State University, Santa Clara University, San Jose State University, and numerous other colleges, universities, and training institutions.
ARC is in the portion of the San Francisco Bay Area known as Silicon Valley because of its long history as a center of high-technology research, development, and manufacturing. Silicon Valley comprises the roughly triangular area that extends from Mountain View, south to San Jose, and east to Milpitas and southern Fremont. Largely agricultural in the years prior to World War II, this area emerged as a world leader in high technology in the years after the war, experiencing rapid urbanization, and economic growth as a result. Following the recent economic downturn that began in 2008, the area is now recovering. Despite a shift toward global distribution of high-technology manufacturing, Silicon Valley is expected to remain an important center of technology research and production in the foreseeable future, with computing, consumer electronics applications, defense electronics and avionics, nanotechnology, and biotechnology representing key profit sectors.
1.4 History of NASA Ames Research Center
1.4.1 NASA Ames Research Center
Congress initially established the ARC on August 9, 1939, as the Ames Aeronautical Laboratory, an element of the National Advisory Committee for Aeronautics (NACA). The Ames Aeronautical Laboratory’s initial purpose was to conduct research and develop technology for use by military aircraft manufacturers. Upon the creation of NASA in 1958, NACA and all its laboratories were merged into this new agency. The Ames Aeronautical Laboratory was renamed Ames Research Center and was designated as a NASA field center.
National Aeronautics and Space Administration Chap 1. Introduction
NASA Ames Research Center Environmental Resources Document Environmental Management Division March 2015 File: 2015 ARC ERD_FINAL.doc
Pg 4
ARC’s extensive experience in fluid mechanics and aerodynamics became an integral part in supporting NASA’s missions (see Chapter 2, Existing Facilities, Operations, and Their Impacts, for information about ARC’s missions). Today ARC continues in this role, and its responsibilities have expanded into the fields of aeronautics, reentry physics, space science, space research, technology development, astrobiology, life sciences, human factors (as applied to both aeronautical and space issues), earth sciences, and information systems (computer technology). Many current programs at ARC are directed toward research and development (R&D) of nanomaterials, biotechnology, and information technology in support of NASA’s exploration mission. This research also benefits society by addressing problems ranging from human disease and environmental pollution to agricultural pests and global climate change.
1.4.2 Naval Air Station Moffett Field
In 1930, in one of the first cooperative regional economic development campaigns, Santa Clara, San Mateo, San Francisco, and Alameda Counties set up a joint program to find a site for a new Navy base, purchase it, and donate it to the Navy. The counties eventually purchased approximately 400 hectares (1,000 acres) at a cost of almost $500,000 and offered it to the Navy for $1. The counties’ goal was to establish a west coast Naval Air Station (NAS). On December 12, 1930, this goal was realized when President Herbert Hoover signed the bill allowing the Navy to accept the site and appropriating $5 million for construction. The base officially opened in 1933. On April 12, 1933, the base was commissioned as NAS Sunnyvale. In 1942, the station was named “Moffett Field” in honor of Rear Admiral William A. Moffett.
During its history, the station has served as a home base for dirigibles, the west coast headquarters for coastal patrol blimps, the west coast’s largest Naval air transport base, the home base for the Navy’s Pacific fighter planes, and the Pacific headquarters for all P-3 anti-submarine efforts, including training, administration, and operations.
1.4.3 Moffett Federal Airfield
In October 1991, Congress and President Bush accepted the recommendations of the Base Closure and Realignment Commission (BRAC) to disestablish NAS Moffett Field. Because the availability of the airfield has become essential to ARC’s mission, the BRAC recommended that the site remain a federal property and that the Department of Defense (DOD) negotiate a transfer of responsibility for the airfield to NASA. This suggestion was well received by the neighboring communities.
Moffett Field was closed as a military base on July 1, 1994, and the property was transferred to ARC. It included 578 hectares (1427 acres) of land, three aircraft hangars, and over 325,150 square meters (3.5 million square feet) of buildings and other facilities. It did not include the family housing areas and several related facilities located near Onizuka Air Station, which were retained by the DOD for administration.
The area formerly known as NAS Moffett Field was known for a time as Moffett Federal Airfield (MFA). The former NAS Moffett Field now includes the two planning areas known as the NASA Research Park (NRP) and the Eastside/Airfield as well as the current and
National Aeronautics and Space Administration Chap 1. Introduction
NASA Ames Research Center Environmental Resources Document Environmental Management Division March 2015 File: 2015 ARC ERD_FINAL.doc
Pg 5
former military housing areas at Wescoat Village, Orion Park, and Shenandoah Park that transferred directly to the Air Force and then to the Army. NAS Moffett Field also included Crows Landing, an auxiliary landing strip in Stanislaus County, that Congress has directed NASA to transfer to the County once Navy cleanup is completed. Further, NAS Moffett Field also included several holes in the City of Sunnyvale Golf Course, located to the south across U.S. Highway 101. This land provides a clear zone for the airfield. The term "Moffett Field" continues to apply to the postal zone encompassed by the zip code 94035.
1.5 Existing Conditions
Consistent with the planning concepts presented in the NADP (discussed in Chapter 4, Land Use), ARC is divided herein into four major planning areas: the 86-hectare (213-acre) NRP, the 95-hectare (234-acre) ARC campus, the 385-hectare (952-acre) Eastside/Airfield, and the 38-hectare (95-acre) Bay View area. The remaining 144 hectares (357 acres) of NASA-administered land consists of wetland areas along the northern boundary of ARC. Figure 1-3 shows the location of these planning areas within ARC.

National Aeronautics and Space Administration Chap 1. Introduction
NASA Ames Research Center Environmental Resources Document Environmental Management Division March 2015 File: 2015 ARC ERD_FINAL.doc
Pg 6
Figure 1-3. Planning Areas
(Source: NASA 2009)
1.5.1 NASA Research Park
The NRP is an 86-hectare (213-acre) roughly triangular site located between the airfield, Highway 101, and the original ARC campus (Figure 1-3). This area includes most of the Shenandoah Plaza National Historic District, except for the Wescoat Village military
National Aeronautics and Space Administration Chap 1. Introduction
NASA Ames Research Center Environmental Resources Document Environmental Management Division March 2015 File: 2015 ARC ERD_FINAL.doc
Pg 7
housing area and Hangars 2 and 3. Current uses in the NRP area include office space, educational facilities, retail and business services, airfield operations, vehicle maintenance, research facilities, and storage. Some of these facilities are used by the Army Reserve, DOD Commissary and Exchange, Air Force, and California Air National Guard (CANG), as well as numerous Space Act Partners engaged in R&D-related activities. The 140 existing buildings within the NRP area contain approximately 150,000 square meters (1.6 million square feet of space).
1.5.2 Eastside-Airfield
The airfield and the lands to the east of it occupy 385 hectares (952 acres). Current uses of this area include the airfield operations, fueling, and munitions storage facilities of the CANG; a golf course; and Hangars 2 and 3.
1.5.3 Bay View
The Bay View area is a 38-hectare (95-acre) site immediately north of the original ARC campus. Most of the land in the eastern portion of the planning area is comprised of undeveloped upland grassland supporting a few research facilities such as the Outdoor Aerodynamic Research Facility (OARF). On the western side of the planning area, approximately 42 acres of leased property in Bay View Parcels 1, 2, and 4 is currently under development for Google’s Bay View campus. The property is under lease to Planetary Ventures, LLC (PV), a wholly-owned subsidiary of Google, pursuant to a 2008 Enhanced Use Lease between PV and NASA. Development of the Bay View area was evaluated in the NADP EIS, for which a Record of Decision (ROD) was signed in November 2002.
1.5.4 Ames Research Center Campus
The Ames campus is the developed portion of the original 94-hectare (234-acre) ARC site. Current uses in the Ames campus area include offices, R&D, and storage. The existing buildings in the ARC campus area contain approximately 268,000 square meters (2.89 million square feet) of space.
National Aeronautics and Space Administration Chap 2. Existing Facilities, Operations, and Their Impacts
NASA Ames Research Center Environmental Resources Document Environmental Management Division March 2015 File: 2015 ARC ERD_FINAL.doc
Pg 8
Chapter 2. Existing Facilities, Operations, and Their Impacts
2.1 Overview
This chapter discusses current missions and goals for NASA and ARC. It also presents an overview of environmental regulatory requirements, as well as an overview of the effects of ARC facilities and operations on the environment. Specific environmental conditions related to facilities and operations are discussed in subsequent chapters in this document. The information presented in this chapter was obtained from the November 2009 NASA ARC ERD (NASA 2009), various internal documents, and other sources.
2.1.1 NASA Vision and Mission
The NASA Vision is “To reach for new heights and reveal the unknown, so that what we do and learn will benefit all humankind.” The NASA Mission is to “Drive advances in science, technology, and exploration to enhance knowledge, education, innovation, economic vitality, and stewardship of Earth.” In practice, the execution of NASA’s Vision and Mission involves undertaking a wide range of space exploration and aeronautical activities; conducting and supporting research to expand knowledge of the Earth and of phenomena in the atmosphere and space; and reaching out to provide educational opportunities and materials related to NASA activities (NASA 2011a).
2.1.2 Missions of NASA Ames Research Center
ARC enables exploration through selected development, innovative technologies, and interdisciplinary scientific discovery. Ames provides leadership in astrobiology; robotic lunar exploration; technologies for the Crew Exploration Vehicle, the Crew Launch Vehicle, and the Heavy Lift Vehicle; the search for habitable planets; supercomputing; intelligent/adaptive systems; advanced thermal protection; and airborne astronomy. Ames develops tools for a safer, more efficient national airspace and unique partnerships benefiting NASA's mission (NASA 2008).
2.2 Major Environmental Laws, Regulations, and Policies
As a major federal facility, ARC is governed by a variety of laws, regulations, policies, and other guidance. These regulatory directives are enforced by federal, state, regional, and local agencies. Following is a selected list of regulatory directives that are applicable to facility operations.
2.2.1 Federal
Migratory Bird Treaty Act of 1918 (16 USC §701-715)
Fish and Wildlife Coordination Act of 1958 (16 USC §661–666c)
Wilderness Act of 1964 (16 USC §1131 et seq.)
Wild and Scenic Rivers Act of 1965 (16 USC §1271 et seq.)
National Aeronautics and Space Administration Chap 2. Existing Facilities, Operations, and Their Impacts
NASA Ames Research Center Environmental Resources Document Environmental Management Division March 2015 File: 2015 ARC ERD_FINAL.doc
Pg 9
National Historic Preservation Act of 1966
National Environmental Policy Act of 1969
Clean Air Act of 1970
Marine Mammal Protection, Research, and Sanctuaries Act of 1972 (16 USC §1361 et seq.)
Coastal Zone Management Act of 1972 (16 USC §1451 et seq.)
Federal Water Pollution Control Act (Clean Water Act) of 1972, as amended (33 USC §1251–1376 et seq.)
Noise Pollution and Abatement Act of 1972 (42 USC §7641)
Endangered Species Act of 1973
Safe Drinking Water Act of 1974
Archeological and Historic Preservation Act of 1974 (16 USC §469–469c)
Toxic Substances Control Act of 1976
Resource Conservation and Recovery Act of 1976 (42 USC § 6901-6993 et seq.)
Archaeological Resources Protection Act of 1979
Fish and Wildlife Conservation Act of 1980
Farmland Protection Policy Act of 1981 (7 USC §4201 et seq.)
Comprehensive Environmental Response, Compensation, and Liability Act of 1980
Emergency Planning and Community Right-To-Know Act of 1986
Hazardous Waste Source Reduction and Management Review Act of 1989
Native American Graves Protection and Repatriation Act of 1990 (25 USC §3001–3013)
Pollution Prevention Act of 1990
Oil Pollution Control Act of 1990 (33 USC §2701 et seq.)
Federal Facilities Compliance Act of 1992
Presidential Executive Order 11514 (amended by Presidential Executive Order 11991), Protection and Enhancement of Environmental Quality
Presidential Executive Order 11593, Protection and Enhancement of the Cultural Environment
Presidential Executive Order 11738, Providing for Administration of the CAA and the Federal Water Pollution Control Act with Respect to Federal Contracts, Grants or Loans
National Aeronautics and Space Administration Chap 2. Existing Facilities, Operations, and Their Impacts
NASA Ames Research Center Environmental Resources Document Environmental Management Division March 2015 File: 2015 ARC ERD_FINAL.doc
Pg 10
Presidential Executive Order 11988 (amended by Presidential Executive Order 12148), Floodplain Management
Presidential Executive Order 11990, Protection of Wetlands
Presidential Executive Order 12088 (amended by Presidential Executive Order 12580), Federal Compliance with Pollution Control Standards
Presidential Executive Order 12114, Effects of Major Federal Actions Abroad
Presidential Executive Order 12843, Procurement Requirements and Policies for Federal Agencies for Ozone-Depleting Substances
Presidential Executive Order 12898, Federal Actions to Address Environmental Justice in Minority Populations and Low-Income Populations
Presidential Executive Order 12969, Federal Acquisition and Community Right-To-Know
Presidential Executive Order 13287, Preserve America
Presidential Executive Order 13423, Strengthening Federal Environmental, Energy, and Transportation Management
Presidential Executive Order 13514, Federal Leadership in Environmental, Energy, and Economic Performance
2.2.2 California
California Aboveground Petroleum Storage Act
California Clean Air Act
California Endangered Species Act of 1984
California Fish and Game Code
California Health and Safety Code
California Native Plant Protection Act of 1977
California Oil Pollution Control Act
California Porter-Cologne Water Quality Control Act
CCR Title 17, Drinking Water Supplies
CCR Title 22, Environmental Health
CCR Title 23, Waters
CCR Title 26, Toxics
Medical Waste Management Act
State noise guidelines and regulations
National Aeronautics and Space Administration Chap 2. Existing Facilities, Operations, and Their Impacts
NASA Ames Research Center Environmental Resources Document Environmental Management Division March 2015 File: 2015 ARC ERD_FINAL.doc
Pg 11
2.2.3 Local Regulations and Locally Enforced Codes
Bay Area Air Quality Management District Rules and Regulations
Bay Conservation and Development Commission Bay Plan
San Francisco Bay Basin Water Quality Control Plan (Basin Plan)
Santa Clara County Hazardous Materials Storage Ordinance
Santa Clara County Toxic Gas Ordinance
Santa Clara County Medical Waste Management Plan Guidelines
Santa Clara Valley Water District Well Standards
City of Palo Alto Sewer Use Ordinance
Palo Alto Industrial Wastewater Ordinance
City of Sunnyvale Industrial Wastewater Ordinance
Uniform Fire Code
Uniform Plumbing Code
2.2.4 NASA’s Procedural Requirements
NPD 8500.1C, NASA Environmental Management
NPD 8510.1, Cultural Resources Management
NPR 8530.1A, Affirmative Procurement Program and Plan for Environmentally Preferable Products
NPR 8553.1B, NASA Environmental Management System
NPR 8570.1A, NASA Energy Management Program
NPR 8580.1A, Implementing the National Environmental Policy Act and Executive Order 12114
NPR 8570.1, Energy Efficiency and Water Conservation
NPR 8590.1A, Environmental Compliance and Restoration Program
2.2.5 NASA Ames Research Center’s Procedural Requirements
APD 8500.1, Ames Environmental Policy
APR 8500. 1, Ames Environmental Procedural Requirements
APR 8553.1, Ames Environmental Management System
National Aeronautics and Space Administration Chap 2. Existing Facilities, Operations, and Their Impacts
NASA Ames Research Center Environmental Resources Document Environmental Management Division March 2015 File: 2015 ARC ERD_FINAL.doc
Pg 12
Table 2-1. Environmental Regulatory Agencies Overseeing NASA Ames Research Center Operations
Federal U.S. Environmental Protection Agency U.S. Army Corps of Engineers U.S. Fish and Wildlife Service U.S. Department of Transportation Advisory Council of Historic Preservation
State of California
Office of Emergency Services California Environmental Protection Agency California Department of Fish and Game Department of Toxic Substances Control
Regional Bay Area Air Quality Management District Regional Water Quality Control Board, San Francisco Bay Region Bay Conservation and Development Commission
Local Santa Clara County Health Department Palo Alto Regional Water Quality Control Plant Sunnyvale Wastewater Treatment Plant
Source: NASA 2009.
2.3 NASA Ames Research Center Operations
NASA’s facilities include the Unitary Plan Wind Tunnels, motion-based flight simulators, atmosphere-entry heat simulators, advanced digital computation systems, and free-flight ballistic test facilities. In addition, there are a wide range of well-equipped ground-based and airborne laboratories that are dedicated to the study of solar and geophysical phenomena, life synthesis, life detection, and life environmental factors. ARC has a number of support buildings as well, including aircraft hangars, machine shops, warehouses, a cafeteria, post office, and numerous office buildings.
A description of each building’s specific function follows in the sections below, listed by organizational code. ARC is divided into directorates, each designated by a letter code. The directorates that make up ARC are:
D. Office of the Director
A. Office of the Director of Aeronautics
B. Office of the Director of New Partnerships
C. Office of the Chief Financial Officer
J. Office of the Director of Center Operations
H. Office of the Director of Resource Capital
I. Office of the Director of Information Technology
P. Office of the Director of Program and Projects
Q. Office of the Director of Safety and Mission Assurance
R. Office of the Director of Engineering
S. Office of the Director of Science
T. Office of the Director of Exploration Technology
National Aeronautics and Space Administration Chap 2. Existing Facilities, Operations, and Their Impacts
NASA Ames Research Center Environmental Resources Document Environmental Management Division March 2015 File: 2015 ARC ERD_FINAL.doc
Pg 13
U. U.S. Air Force Full-Scale Aerodynamics Complex
V. Office of the Director of Strategic Communications and Education
W. NASA Office of Inspector General
Y. Aeroflight Dynamics Directorate, Aviation and Missile Research Development and Engineering Center, U.S. Army Research Development and Engineering Command
V. Strategic Communications
For completeness, all of the Codes are listed here, but not all are currently active. Codes B, C, D, H, P, Q, V, and W are primarily involved in administrative and computer-related functions that do not have environmental impacts. The following sections describe the potential impacts associated with the facilities administered by other directorates.
2.4 Facilities in Code A: Office of the Director of Aerospace
2.4.1 Flight Systems Research Laboratory, N-210
The Flight Systems Research Laboratory contains offices and computer laboratories for developing air traffic management automation tools and rotorcraft flight performance analysis software. The computer labs contain high-performance computer workstations in systems furniture to provide an interactive environment for software development and scientific analysis. At the north end of the building there is a high bay that is used for storage. The work conducted in the Flight Systems Research Laboratory is the core of NASA’s contribution to the fields of airspace operations.
2.4.2 Flight and Guidance Simulation Laboratory, N-243 and N-243A
The Flight and Guidance Simulation Laboratory, houses the Vertical Motion Simulator (VMS), with its 18.3-meter- (60-foot) vertical motion capability, is the world’s largest motion-based simulator. The VMS was designed to provide large-amplitude motion to aid in the study of helicopter and Vertical/Short Take-Off and Landing (V/STOL) issues specifically relating to research in controls, guidance, displays, automation, and handling qualities of existing or proposed aircraft. The VMS was used extensively to train space shuttle pilots on landing and roll-out. The VMS is also used to develop new techniques for flight simulation and to define the requirements and develop the technology for both training and research simulators.
2.4.3 Crew-Vehicle Systems Research Facility, N-257
Crew-Vehicle Systems Research Facility (CVSRF) is an unparalleled national resource that supports NASA, the Federal Aviation Administration (FAA), and many industry research programs. Designed to provide researchers with an environment where they can study how and why aviation errors occur, CVSRF stands out in the area of human factors research. The goal for this facility and operations is to offer researchers a suite of simulation facilities and utilities that can be used to analyze flight crew performance and to develop and improve new simulation and training tools.
National Aeronautics and Space Administration Chap 2. Existing Facilities, Operations, and Their Impacts
NASA Ames Research Center Environmental Resources Document Environmental Management Division March 2015 File: 2015 ARC ERD_FINAL.doc
Pg 14
The CVSRF houses several simulators capable of full-mission simulation. These simulators interact with each other (as well as with other SimLabs facilities) by means of a High Level Architecture, allowing for enormous flexibility and customization. Using CVSRF’s highly sophisticated simulators (the Boeing 747-400, the Advanced Concepts Flight Simulator, and the Air Traffic Control Laboratory), researchers are able to study the effects of automation and advanced instrumentation on human performance.
2.4.4 Fluid Mechanics Laboratory, N-260
The NASA Ames Fluid Mechanics Laboratory houses small scale wind tunnels and a water channel that are used for aerodynamics testing and flow visualization. The low cost of testing and short lead-time for facility availability provide crucial information to guide design decisions and fundamental research. The Fluid Mechanics Laboratory also develops flow-visualization techniques for wind tunnel testing such as: Pressure Sensitive Paint, Particle Image Velocimetry, High-Speed Schlieren Imaging, Retroreflective Background Oriented Schlieren and Fringe Imaging Skin Friction. They also develop low-cost techniques for aeroacoustic measurement and analysis.
2.4.5 3.5-Foot Hypersonic Wind Tunnel Auxiliaries, N-229A
This facility contains two large (5,500-horsepower) reciprocating compressors and the auxiliary equipment required to operate the compressors. Included in N-229A is the control room for distribution of high-pressure air across ARC, a mechanic shop, a switchgear room, a welding shop, and a boiler room.
2.4.6 Outdoor Aerodynamic Research Facility, N-249
Originally built in 1969 and upgraded in 1994, the OARF is currently mothballed. It was used for static testing of V/STOL models and rotary wing models, for acoustic testing, and for the analysis of aircraft models prior to testing in the 40- by 80-foot or 80- by 120-foot wind tunnels.
The OARF consists of an open-air test facility with a model mounting test pad, data acquisition equipment, control room, and other necessary support equipment for remote model or aircraft operation.
2.4.7 12-Foot Pressure Wind Tunnel, N-206 and N-206A
Restored in 1994, this tunnel was the only large-scale, pressurized, low turbulence, subsonic wind tunnel in the United States. It provided unique high-Reynolds number testing capabilities for the development of high-lift systems on commercial transport and military aircraft, and for high angle-of-attack testing of maneuvering aircraft. This facility was closed in 2003 due to budgetary constraints. The model preparation rooms in N-206 provide support for the Unitary Plan Wind Tunnels. Also N206A provides make-up air for the Unitary Plan Wind Tunnels.
National Aeronautics and Space Administration Chap 2. Existing Facilities, Operations, and Their Impacts
NASA Ames Research Center Environmental Resources Document Environmental Management Division March 2015 File: 2015 ARC ERD_FINAL.doc
Pg 15
2.4.8 Balance Calibration Laboratory, N-207
Operations at the lab include calibrating balances for the ARC Wind Tunnels, as well as for outside projects. NASA Ames is setup to calibrate taper sting balances, single piece cylindrical fit balances, rotor balances, flow through balances and custom configurations. NASA Ames has a Sandberg Serrell Automated Balance Calibration Machine which can apply multiple combined loads on a wind tunnel balance. The lab's current inventory of machine-to-balance adapters can accommodate 2.5 to 4.0 inch TASK balances. The machine is a unique tool in wind tunnel balance calibration technology. It can generate simultaneous combinations of three forces and three moments within its load envelope. Without the physical limitations of dead weight manual loading, the Automated Balance Calibration Machine can be used to bring calibration load schedules closer to real tunnel load conditions, thus increasing the accuracy of the calibration.
2.4.9 Unitary Plan Wind Tunnel, N-227 and N-227A-D
The Unitary Plan Wind Tunnel facility is one of the most heavily used wind tunnel in all of NASA. The Unitary Plan Wind Tunnel facility has been instrumental in the development of virtually every domestic commercial transport and military fixed-wing airframe since the 1960’s and is one of the busiest wind tunnels in NASA. Researchers use the Unitary Plan Wind Tunnel facility extensively for airframe testing and aerodynamic studies and the facility has played a vital role in every manned spaceflight program, including testing of models of the Mercury, Gemini, and Apollo capsules. Models of the space shuttle and NASA’s Orion space capsule were tested here.
This facility is a unique system of wind tunnels comprised of three test sections: the 11- by 11-Foot Transonic Wind Tunnel, the 9- by 7-Foot Supersonic Wind Tunnel, and the 8- by 7-Foot Supersonic Wind Tunnel. The 8-by 7-Foot Supersonic Wind Tunnel is currently mothballed. Subsonic, transonic, and supersonic aerodynamics research is performed at this facility. The major common element of the tunnel complex is its electric power plant, which consists of four interconnected motors capable of producing a total of 134-megawatt (180,000-horsepower) continuously or 161-megawatt (216,000-horsepower) for 1 hour.
The wind tunnel represents a unique national asset of vital importance to the nation’s defense and its competitive position in the world aerospace market. In 1985, the Unitary Plan Wind Tunnel facility was designated as a National Historic Landmark by the National Park Service because of “its significant associations with the development of the American Space Program.” The Unitary Plan Wind Tunnel facility has undergone major modernization, including automatic controls, a new data system, and other improvements to increase productivity.
2.5 Facilities in Code I: Office of the Director of Information Technology Directorate
2.5.1 Central Computer Facility, N-233 and N-233A
The Central Computer Facility houses the computer and networking systems that provide the basic IT infrastructure for the day-to-day operation of ARC. Included in this suite of
National Aeronautics and Space Administration Chap 2. Existing Facilities, Operations, and Their Impacts
NASA Ames Research Center Environmental Resources Document Environmental Management Division March 2015 File: 2015 ARC ERD_FINAL.doc
Pg 16
systems are a large number of UNIX–based servers that provide the center’s email and messaging services, the internal (intranet) web sites, and external web sites used for public outreach. This facility also houses the Network Operations Center from which the center’s ARCLAN campus network is managed and operated, along with its related server systems and user help desk. The Central Computer Facility also houses ARC’s business data processing and database systems, which support personnel and financial resource management functions throughout the center. The N-233A wing of this facility houses an archival data storage system used by the Numerical Aerospace Simulation Supercomputer Facility (located in N-258). This storage system utilizes robotic magnetic tape storage “silos” to provide very high-capacity file storage for their R&D users. This storage system is linked to the N-258 supercomputers via a high-speed fiber optic communications system. In addition, N-233A houses an IT systems development and integration laboratory supporting the activities of the Central Computer Facility and the advanced computer-networking projects.
2.5.2 Telecommunications Facility N-254
This facility houses office space and telecommunications equipment. It originally had an area of 7,967 square feet. A 2,000 square foot addition was constructed in 2003.
2.6 Facilities in Code J: Office of the Director of Center Operations
2.6.1 Imaging Technology Laboratory, N-203
This facility contained offices and laboratories for the processing of color (AR-5) and black and white aerial film for the Airborne Remote Sensing Research Program. Four persons operate and maintain the 1811 and 11CM Versamat film processors located on the second floor and the effluent treatment plant located in the basement. Photo processing no longer takes places within this facility. Facility currently houses administrative support staff for center.
2.6.2 Magnetic Standards Laboratory and Test Facility, N-217 and N-217A
Two magnetic test facilities are located at ARC in Buildings N-217 and N-217A. They were used infrequently during the late 1990s and were being considered for closure in 2000. The 3.7-meter (12-foot) facility located in Building N-217 is designed to calibrate magnetic sensor systems, determine magnetic cleanliness, and measure low-frequency electromagnetic radiation of items not exceeding 1 meter (3.3 feet) in any dimension. The 6-meter (20-foot) coil facility, located in N-217A, was built to accommodate testing of items that are too large for the 3.7-meter (12-foot) facility. In addition to the capabilities of the 3.7-meter (12-foot) facility, the 6-meter (20-foot) facility can duplicate the strength and direction of the earth’s magnetic field anywhere on earth, in earth orbit, or in deep space. The ambient field in the working area of the coils can be canceled to permit engineering or biological studies in near-zero fields. Noninvasive measurements of the magnetic field produced by the human heart, for example, were performed in this facility. This facility has measurement sensitivities of less than 1 microgauss.
National Aeronautics and Space Administration Chap 2. Existing Facilities, Operations, and Their Impacts
NASA Ames Research Center Environmental Resources Document Environmental Management Division March 2015 File: 2015 ARC ERD_FINAL.doc
Pg 17
2.6.3 Motor Pool, N-251
The Motor Pool contains facilities for the management of ARC’s transportation needs. It includes a fuel station, offices, equipment repair bays, vehicle wash area, and parking areas for conducting the operation, maintenance, and repair of the diverse vehicular fleet.
2.6.4 Facility Supply Support Center N-255
This 81,639 square foot building houses the postal and supplies operations for Ames Research Center.
2.6.5 Disaster Area Relief Team, N-267
This 6,367 square foot building houses the Disaster Area Relief Team (DART) facilities. Training and exercise drills are conducted at this facility.
2.7 Facilities in Code JQ: Environmental Management Division
2.7.1 Hazardous Substances Transfer Site, N-265
This facility serves as an accumulation and packaging area for hazardous wastes generated at various locations throughout the center. Hazardous wastes are accumulated and packaged in areas segregated by hazard class and type.
2.8 Facilities in Code R: Office of the Director of Engineering
2.8.1 Model Development, Advanced Composites Group, N-212
This facility houses the Advanced Composites Group. The Advanced Composites Group is a technical support group for all research disciplines at ARC. Its capabilities include composite fabrication, plastic fabrication, and other non-metallic fabrication processes. The Advanced Composites Group contributes to the design and manufacturing of a variety of test equipment and models. The Advanced Composites Group’s expertise with many materials and processes has made this facility vital to the success of many high-profile projects at ARC. This facility contains spray booths for finish applications, autoclaves for composite fabrication, and many machine tools.
2.8.2 Technical Services, N-220
The Development Machining and Electromechanical Instrumentation Branch, in Building N-220, is a branch of the Aeronautics and Space Flight Hardware Development Division. Machining, instrumentation, mechanical inspection, electronic, and CAD/CAM services occur at this facility. This facility primarily develops prototype hardware for the ARC Research Community. That hardware includes experimental scientific apparatus for shuttle or airborne missions, aerospace wind tunnel models, facility modifications, and biosensors. The personnel at this facility consist of highly skilled engineering technicians that assist with designs and perform all fabrication on complex scientific instruments and models.
National Aeronautics and Space Administration Chap 2. Existing Facilities, Operations, and Their Impacts
NASA Ames Research Center Environmental Resources Document Environmental Management Division March 2015 File: 2015 ARC ERD_FINAL.doc
Pg 18
2.8.3 Airborne Missions and Applications Laboratory, N-240 and N-240A
The Airborne Missions and Applications Laboratory is occupied by the Life Sciences Division offices, the C-130 Data Facility, and the wet chemistry lab. This facility contains offices and laboratories supporting the NASA Space Station Biological Research Payload Office, which performs planning, testing, and hardware integration for life sciences payloads. Biology laboratories and a high-bay test area are used for experiment verification tests in which payload experiments are performed by the experiment science teams and space lab crew using flight hardware, ground operations procedures, and space-lab crew procedures. Flight hardware is prepared and shipped from this site to Kennedy Space Center. The wet chemistry laboratory houses a variety of testing equipment for environmental testing. The wet chemistry laboratory is equipped with thermograin metric analysis and digital scanning calorimetry capabilities for materials characterization. Projects of interest that have been conducted by the materials group in the wet chemistry area include hygrothermal analysis of composite specimens and exposure testing of aluminum.
2.8.4 Space Projects Facility N-244
The Space Projects Facility contains the offices and laboratories for developing and managing space projects. It includes facilities for conducting mission operations and laboratories for developing infrared detectors, cryogenics, control systems, communication systems, data systems, and other support systems and experiments for space projects. It also includes a clean room facility and an environmental test laboratory.
2.9 Facilities in Code S: Office of the Director of Astrobiology and Space Research
2.9.1 20-G Centrifuge, N-221A
The 20-G Centrifuge is 17.7 meters (58 feet) in diameter and can be used to evaluate flight hardware and test the effects of hyper-gravity on humans, other animals, and plants. Mounted on the centrifuge are three enclosed cabs. Cab A, mounted at one end of the rotating arm, contains a modified jet fighter ejection seat in which a human volunteer sits during tests. Cab B, at the other end of the rotating arm, contains a swing frame often used for non-human subjects or can be configured to meet an investigator’s needs. Cab C, located near the center of the arm (the center of rotation), can be adapted to an investigator’s needs or can be used as a near-center control for angular velocity or to study the effects of gravity gradients. The 20-G Centrifuge is capable of producing forces up to 20 times that of terrestrial gravity. During centrifuge operations, a combination of 47 control and 56 instrumentation slip rings allows control of onboard experiments from the control room and communication between control room operators and onboard subjects. The centrifuge speed is computer-controlled, allowing for the development of preprogrammed gravity profiles. A programmable logic controller monitors all critical mechanical and electrical systems to ensure that the systems are within design specification limits.
National Aeronautics and Space Administration Chap 2. Existing Facilities, Operations, and Their Impacts
NASA Ames Research Center Environmental Resources Document Environmental Management Division March 2015 File: 2015 ARC ERD_FINAL.doc
Pg 19
2.9.2 Biosciences Laboratory, N-236 and N-236A-E
The Biosciences Laboratory is used for biomedical research and animal care.
2.9.3 Life Sciences Research Laboratory, N-239 and N-239A
The Life Sciences Research Laboratory contains the human environmental test facility and environmental chamber. Research conducted at this facility includes, biomedical, extraterrestrial research, ecosystem science, closed ecological life-support systems, nanotechnology research, and search for extraterrestrial intelligence. Some laboratories in this facility are operated by Code A personnel.
2.9.4 Vestibular Research Facility, N-242
The Vestibular Research Facility contains state-of-the-art equipment for ground-based studies of vestibular function (which affects one’s sense of balance). This facility hardware enables the study of responses to smooth, linear motion, or to combinations of linear and angular motion over the frequency range of natural head movement.
The Vestibular Research Facility permits the study of how complex linear and/or rotational accelerations are transduced, encoded by the vestibular system, and processed by the brain. Interactions between linear and angular vestibular stimuli, and visual and proprioceptive inputs (peripheral, central, and motor), are examined using electrophysiological, reflexive, and behavioral methods.
2.9.5 Space Sciences Research Laboratory, N-245
The Space Sciences Research Laboratory is dedicated to research in astrophysics, exobiology, and planetary science. These research programs are structured around the study of origins and evolution of stars, planets, planetary atmospheres, and biological organisms.
The Space Science Division’s programs include: (1) the study of interstellar gas and dust that form the raw material for stars, planets, and life; (2) the processes of star and planet formation; (3) the search for planetary systems around other stars; (4) the evolution of planets and their atmospheres; (5) the structure, dynamics, and chemistry of planetary atmospheres; (6) the origin of the biogenic elements and molecules and their distribution in space; (7) the origin of life and its early evolution on Earth; and (8) the search for past or present life throughout the solar system.
2.9.6 Biomedical Research Facility, N-261
The Biomedical Research Facility is utilized for neuroscience research. This facility contains a darkroom, electron microscopy facilities, computer areas, testing booths, and surgery facilities.
National Aeronautics and Space Administration Chap 2. Existing Facilities, Operations, and Their Impacts
NASA Ames Research Center Environmental Resources Document Environmental Management Division March 2015 File: 2015 ARC ERD_FINAL.doc
Pg 20
2.10 Facilities in Code T: Office of the Director of Exploration Technology
2.10.1 Space Technology, N-204A
This facility conducts R&D on arc jets and thermal protection systems that enable hypervelocity flight in planetary atmospheres. Such R&D was essential for the Apollo, Shuttle, and Galileo Probe vehicles. Advances in thermal protection also support the ongoing exploration of Mars and the outer planets, as well as the development of reusable launch vehicles (for example, the X-33 experimental aircraft). Also under development are aerobraking and advanced regenerative life support technology to permit human exploration of Mars without the need for new, larger launch vehicles.
Other R&D at this facility includes sensor development, particularly in the infrared, and the application of information technology (IT) in intelligent systems, integrated design systems, computational fluid dynamics, and nanotechnology for electronics.
2.10.2 Research Facility, N-223
This facility supports materials development for thermal protection systems and plasma experiments.
2.10.3 Electric Arc Shock Tube East, N-229
The Electric Arc Shock Tube is used for basic science research on flow phenomena at hypervelocity speeds. The electric arc driven shock tube facility consists of one driver system and two parallel-driven tubes. The driver can be operated in a variety of configurations depending on test requirements. The energy to the driver is supplied by a capacitor energy storage system consisting of 220 capacitors. By using different combinations of series-parallel connections, the capacitance of the bank can be varied. This facility contains two large (5,500-horsepower) reciprocating compressors and the auxiliary equipment required to operate the compressors. Included in N-229 is the control room for distribution of high-pressure air across ARC, a mechanic shop, a switchgear room, a welding shop, and a boiler room.
2.10.4 Physical Sciences Research Laboratory, N-230
This facility houses the Photophysics, Materials Research, and ISP Sensor Development Laboratories.
The Photophysics Laboratory includes two laser-application laboratories for spectroscopic research and optical instrumentation development, a small supersonic wind tunnel facility for the demonstration of laser diagnostic techniques in high-speed flows, and a large stratosphere-simulation vacuum chamber where laser diagnostic methods were developed for use during space shuttle flight. The lab’s high-energy pulsed lasers include ultraviolet (UV) excimer gas lasers, multi-wavelength Nd:YAG (neodymium-yttrium, aluminum, and garnet) lasers, and tunable dye lasers.
Research at the Materials Research Laboratory includes an investigation of graphite-epoxy composites and metal matrix composites. The laboratory’s hydraulic testing machines are used for mechanical experiments on composite materials used in aeronautic applications.
National Aeronautics and Space Administration Chap 2. Existing Facilities, Operations, and Their Impacts
NASA Ames Research Center Environmental Resources Document Environmental Management Division March 2015 File: 2015 ARC ERD_FINAL.doc
Pg 21
The ISP Sensor Development Laboratory supports the manufacture of heat flux gauges approximately 0.5 inch in diameter and 0.022 inch thick, used in the Arc Jet Facility, Building 234. To produce the gauges, screen-printed sensors are fired in a furnace to 1550º Celsius to eliminate organics and achieve a solid metal film. The laboratory is used for material inspections and calibration. The calibration process involves repeated temperature steps of up to 1100° Celsius.
2.10.5 Arc Jet Complex, N-238, N-234, and N-234A
ARC currently operates a variety of arc-heated facilities within the Arc Jet Complex. These facilities are used to generate flow environments that simulate the aerothermal environment that an object experiences when traversing the atmosphere of a planet. They are used primarily to test heat shield materials and thermal protection system components for planetary entry vehicles, planetary probes, and hypersonic flight vehicles, although other investigative studies are performed in some of these facilities. In the arc jet facilities, thermal protection system components are exposed to the aerothermodynamic heating conditions that they will encounter during high-speed flight.
The facilities of the Arc Jet Complex are located in Buildings N-234 and N-238. The Aerodynamic Heating Facility and the Turbulent Flow Duct Facility are located in Building N-234; the Panel Test Facility and the Interaction Heating Facility are located in Building N-238; Building N-234A houses the boiler for the Steam Vacuum System.
The arc jet facilities are serviced by common facility support equipment, including two direct-current power supplies, a steam-ejector vacuum system, a de-ionized water cooling system, high-pressure gas systems, a data acquisition system, and other auxiliary systems. The magnitude and capacity of these support systems distinguishes the Arc Jet Complex as unique in the aerospace testing world. In particular, the large power supply can deliver 75 megawatts for 30 minutes. High-power capability, in combination with the high-volume steam-ejector vacuum system, yields a unique suite of facilities that simulate high-altitude atmospheric flight on relatively large test objects.
2.10.6 Hypervelocity Free-Flight Facility, N-237
The Hypervelocity Free-Flight Facilities (HFFF) provide a unique suite of testing capabilities to study the aerodynamics of hypervelocity flight, atmospheric entry, and the response of materials to hypervelocity impact. The HFFF comprise two ballistic ranges: the Hypervelocity Free-Flight Aerodynamic Facility (HFFAF) and the Hypervelocity Free-Flight Gun Development Facility (HFFGDF).
The HFFAF is NASA’s only Aeroballistic Range and consists of a model launching gun, a sabot separation tank/vacuum chamber, a test section with 16 orthogonal photo stations, a test cabin, and the largest combustion-driven shock tube in the United States. This multifaceted facility can be configured to perform shock tunnel testing, aeroballistic testing, counterflow aeroballistic testing, or hypervelocity impact testing. The 22.9-meter (75-ft) long test section can be filled with various gases to simulate flight in planetary atmospheres. The 40.6-cm (16-in) diameter shock tube is capable of producing high-enthalpy airflow at Mach 7. This flow may be used for fixed-model testing or as a counter-
National Aeronautics and Space Administration Chap 2. Existing Facilities, Operations, and Their Impacts
NASA Ames Research Center Environmental Resources Document Environmental Management Division March 2015 File: 2015 ARC ERD_FINAL.doc
Pg 22
current to the gun-launched models for combined velocities up to 11 kilometers/second (36,000 feet/second).
The HFFGDF consists of a model launching gun, a sabot separation tank/vacuum chamber, a flight tube, and an impact chamber. This facility is primarily used to expand and enhance the performance characteristics of the model launching guns used in the HFFF. This range can also be used to perform hypervelocity impact studies to simulate micro-meteoroid and orbital debris impact.
Both ranges were constructed in 1964 and utilize an arsenal of light-gas and powder guns to accelerate particles that range in size from 3.2 to 25.4 millimeters (0.125 to 1 inches) in diameter to velocities ranging from 0.5 to 8.5 kilometers/second (1,500 to 28,000 feet/second).
2.10.7 Mars Unit, N-242
This facility supports testing in a small wind tunnel simulating surface conditions on Mars. It also houses production of thermal protection tiles primarily used in support of the arc jet facility.
2.10.8 Numerical Aerodynamic Simulation Facility, N-258
Since 1984, the Numerical Aerodynamic Simulation Facility has provided innovative supercomputing technology solutions and services for aeronautics scientists and engineers at NASA, universities, and in industry. The Numerical Aerodynamic Simulation Facility plays a major role in NASA programs dedicated to researching, developing, and transferring IT to support NASA’s missions.
This facility houses unique supercomputing resources that are constantly being updated and augmented. These computers are used on a nationwide timesharing basis to perform calculation-intensive programs for simulation of aerodynamic flows, chemical reactions, and atmospheric physics. This building is home to NASA’s Columbia Super Computer.
2.10.9 Human Performance Research Laboratory, N-262
Research at the Human Performance Research Laboratory focuses on human performance and automation in aerospace systems. Areas of study include human vision, audition, attention, motor control, fatigue, human factors maintenance, communication, team problem-solving, training, human workload, control theory, virtual reality, and virtual environments. Areas of development include: (1) computational models of human perceptual, cognitive, and decision systems; (2) perceptual optimization of visual displays and imaging systems; (3) three-dimensional auditory displays; (4) machine vision algorithms for autonomous vehicle control; (5) advanced human-centered IT; and (6) human factors expertise to address high-priority aerospace challenges.
2.10.10 Automation Sciences Research Facility, N-269
The Automation Sciences Research Facility provides an integrated environment for investigating the interaction between humans and highly automated systems. Within the Automation Sciences Research Facility, the neuro-engineering library is used to support
National Aeronautics and Space Administration Chap 2. Existing Facilities, Operations, and Their Impacts
NASA Ames Research Center Environmental Resources Document Environmental Management Division March 2015 File: 2015 ARC ERD_FINAL.doc
Pg 23
intelligent flight control (neural networks applied to flight systems). The DARWIN testbed connects the wind tunnels with the aircraft manufacturers for better design and testing control and result dissemination. The intelligent mechanism laboratory has been the site of several field missions demonstrating remote/telecontrol and presence. The photonics laboratory supports the study of bacteriorhodopsin for optical processing.
N-269 also houses the Future Flight Central facility, administered by Code A. The Future Flight Central facility provides a 360-degree view/simulation of an air traffic control tower. Examples of current projects at this facility include: (1) implementation of terrain mapping visualization systems for remotely operated vehicles; (2) acquisition, processing, and visualization of acoustic data in wind tunnel tests; and (3) investigation of bacteriorhodopsin (an experimental protein) as an optical processing and sensing medium.
2.10.11 Groundwater Reverse Osmosis Facility, N-271
The Industrial Wastewater Treatment Facility (IWWTF) was reconfigured into the Groundwater Reverse Osmosis Facility (GROF). The GROF produces two streams from the groundwater, the permeate (or purified stream) which is used for boiler feed water for the Arc Jet Facility, and a concentrate that is currently discharged to the Palo Alto Publicly-Owned Treatment Works (POTW) as waste. Under the Permit with Palo Alto NASA Ames is obligated to continue to pursue an environmental discharge for the concentrate since Palo Alto would prefer not to accept this waste stream. Treatment and reuse of ARC’s treated groundwater lessens the demand for San Francisco Water Department potable water supply. Additional information on the GROF is provided in Chapter 15 (“Public Services, Utilities, and Energy”).
2.11 Facilities in Code Y: Aeroflight dynamics Directorate, Aviation and Missile Research Development and Engineering Center, US Army Research Development and Engineering Command
2.11.1 AEROMECHANICS LAB AND 7- BY 10-FOOT WIND TUNNEL NO. 1, N-215AND N-216
The tunnel is closed circuit, low speed, and operates at atmospheric temperature and pressure. Tunnel No. 1 is used for research in support of low-speed aerodynamics, using small-scale aircraft, V/STOL aircraft, and space vehicle reentry body models. Wind speeds within the tunnel are continuously variable up to 402.5 kilometers per hour (250 miles per hour). This facility is currently operated by the Aeroflight Dynamics Directorate (AFDD).
2.11.2 Model Preparation Area, N-216A and B
This area is a shop used in the development of models to be run in the 7- by 10-Foot Wind Tunnel and the development of parts for the tunnel. Facilities in Code U: US Air Force National Full-Scale Aerodynamics Complex
National Aeronautics and Space Administration Chap 2. Existing Facilities, Operations, and Their Impacts
NASA Ames Research Center Environmental Resources Document Environmental Management Division March 2015 File: 2015 ARC ERD_FINAL.doc
Pg 24
2.11.3 National Full-Scale Aerodynamic Complex, N-221 and N-221B – Air Force Lease
The National Full-Scale Aerodynamics Complex (NFAC) is the largest wind tunnel complex in the world and consists of the 40- by 80-Foot Wind Tunnel, 80- by 120-Foot Wind Tunnel, and OARF. The NFAC was primarily used to determine the low- and medium-speed aerodynamic characteristics of high-performance aircraft, rotorcraft, and fixed wing, powered-lift V/STOL aircraft. Operated and used by NASA, the NFAC was also used by industry, the DOD, and other government agencies. The NFAC is currently being used by the Air Force. The 40- by 80-foot wind tunnel has been determined to be eligible for listing in the National Register of Historic Places.
2.12 Other Facilities at NASA Ames Research Center
2.12.1 Hangar 1
Hangar 1, built in 1933, is the dominant structure at ARC. The 35,767-square-meter (385,000-square-foot) building was originally built for maintenance and storage of lighter-than-air craft. More recently, it has been used for instruction, administration, and aircraft maintenance. Hangar 1 was recently found to be the source of polychlorinated biphenyl (PCB) contamination of sediments transported by storm water runoff. The Navy has agreed to make Hangar 1 part of the Navy’s site remediation program and began work on Hangar 1 in 2003. Hangar 1 is closed pending successful remediation of PCB contamination.
2.12.2 Hangars 2 and 3
Hangars 2 and 3, built in 1942, are 32,226 square meters (346,875 square feet) and 40,296 square meters (433,738 square feet) respectively. Both hangars today contain office space and are used for light industrial uses such as aircraft maintenance and storage.
2.12.3 Runways
The two parallel runways at the airfield are situated northwest to southeast between Hangar 1 and Hangars 2 and 3. The runways were constructed in 1933. Their area is 150 hectares (370 acres).
2.12.4 Maintenance and Other Support Facilities
Numerous other facilities include ordnance storage, maintenance, personnel support facilities, housing, public works facility, boilers, cafeteria, other laboratories, and administrative offices.
2.13 Research and Development partners at Ames Research Center
R&D partners include Carnegie Mellon University Silicon Valley, Santa Clara University, Singularity Education Group and numerous business and industry concerns. Table 2-2 lists R&D partners along with their key activities and/or areas of research.
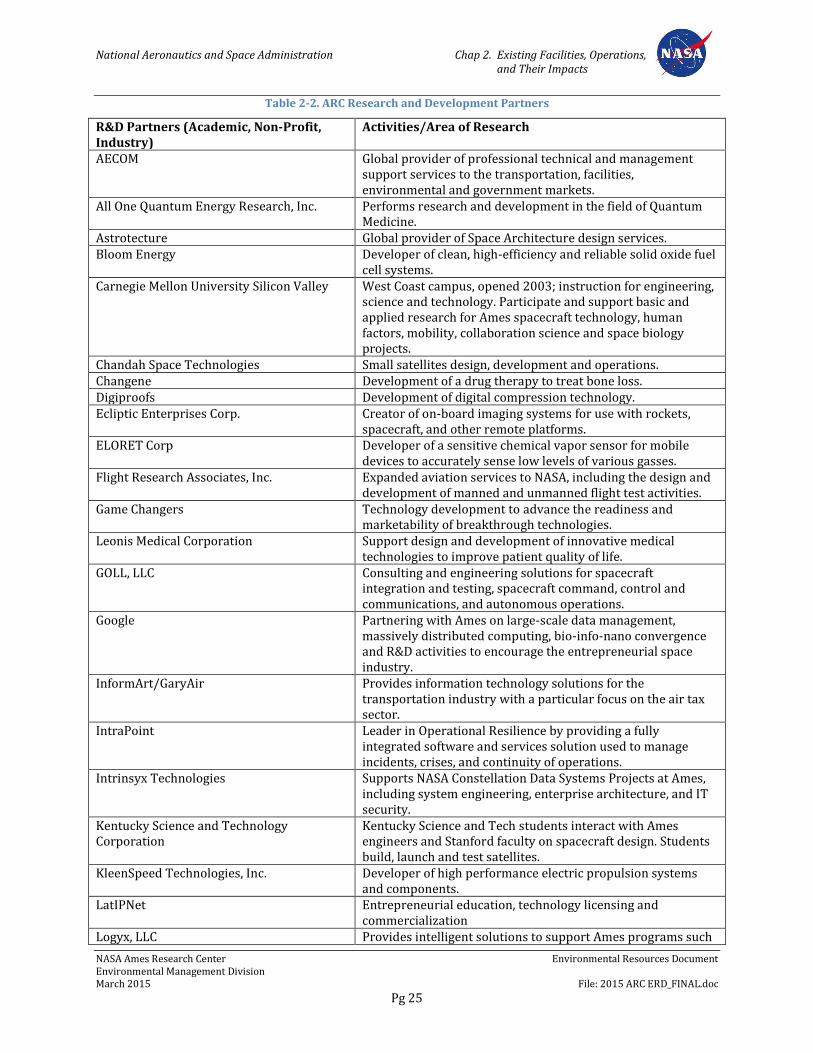
National Aeronautics and Space Administration Chap 2. Existing Facilities, Operations, and Their Impacts
NASA Ames Research Center Environmental Resources Document Environmental Management Division March 2015 File: 2015 ARC ERD_FINAL.doc
Pg 25
Table 2-2. ARC Research and Development Partners
R&D Partners (Academic, Non-Profit, Industry)
Activities/Area of Research
AECOM Global provider of professional technical and management support services to the transportation, facilities, environmental and government markets.
All One Quantum Energy Research, Inc. Performs research and development in the field of Quantum Medicine.
Astrotecture Global provider of Space Architecture design services. Bloom Energy Developer of clean, high-efficiency and reliable solid oxide fuel
cell systems. Carnegie Mellon University Silicon Valley West Coast campus, opened 2003; instruction for engineering,
science and technology. Participate and support basic and applied research for Ames spacecraft technology, human factors, mobility, collaboration science and space biology projects.
Chandah Space Technologies Small satellites design, development and operations. Changene Development of a drug therapy to treat bone loss. Digiproofs Development of digital compression technology. Ecliptic Enterprises Corp. Creator of on-board imaging systems for use with rockets,
spacecraft, and other remote platforms. ELORET Corp Developer of a sensitive chemical vapor sensor for mobile
devices to accurately sense low levels of various gasses. Flight Research Associates, Inc. Expanded aviation services to NASA, including the design and
development of manned and unmanned flight test activities. Game Changers Technology development to advance the readiness and
marketability of breakthrough technologies. Leonis Medical Corporation Support design and development of innovative medical
technologies to improve patient quality of life. GOLL, LLC Consulting and engineering solutions for spacecraft
integration and testing, spacecraft command, control and communications, and autonomous operations.
Google Partnering with Ames on large-scale data management, massively distributed computing, bio-info-nano convergence and R&D activities to encourage the entrepreneurial space industry.
InformArt/GaryAir Provides information technology solutions for the transportation industry with a particular focus on the air tax sector.
IntraPoint Leader in Operational Resilience by providing a fully integrated software and services solution used to manage incidents, crises, and continuity of operations.
Intrinsyx Technologies Supports NASA Constellation Data Systems Projects at Ames, including system engineering, enterprise architecture, and IT security.
Kentucky Science and Technology Corporation
Kentucky Science and Tech students interact with Ames engineers and Stanford faculty on spacecraft design. Students build, launch and test satellites.
KleenSpeed Technologies, Inc. Developer of high performance electric propulsion systems and components.
LatIPNet Entrepreneurial education, technology licensing and commercialization
Logyx, LLC Provides intelligent solutions to support Ames programs such
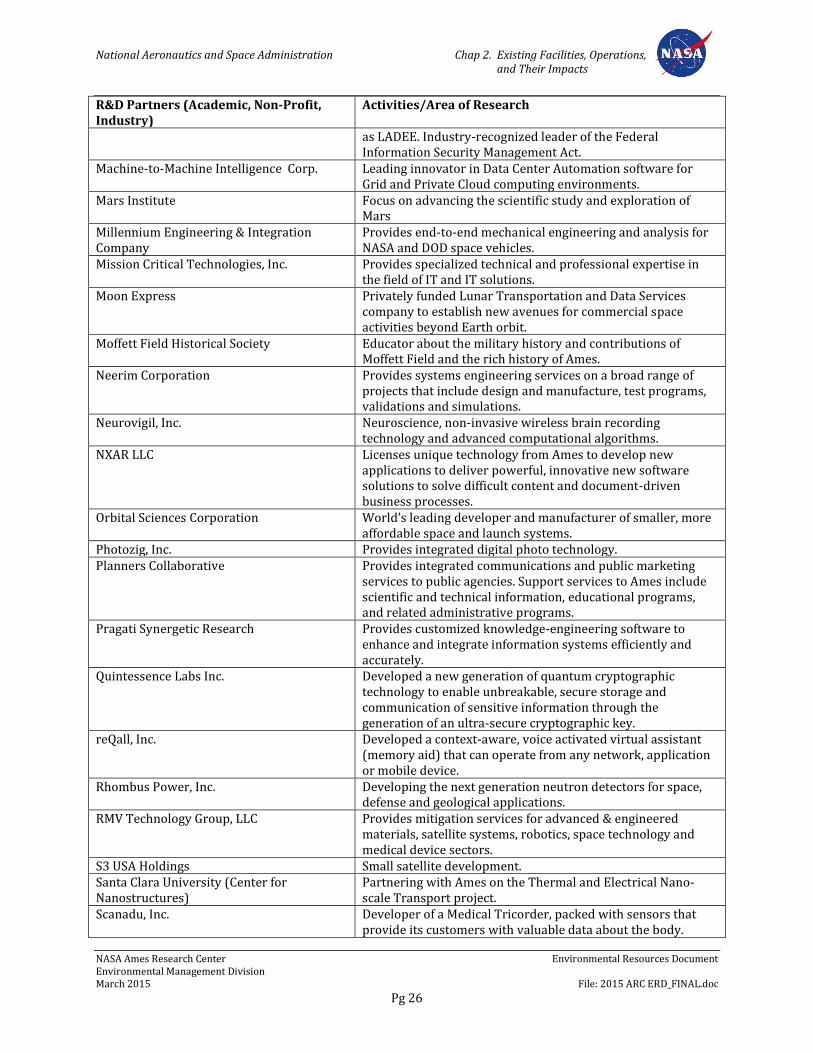
National Aeronautics and Space Administration Chap 2. Existing Facilities, Operations, and Their Impacts
NASA Ames Research Center Environmental Resources Document Environmental Management Division March 2015 File: 2015 ARC ERD_FINAL.doc
Pg 26
R&D Partners (Academic, Non-Profit, Industry)
Activities/Area of Research
as LADEE. Industry-recognized leader of the Federal Information Security Management Act.
Machine-to-Machine Intelligence Corp. Leading innovator in Data Center Automation software for Grid and Private Cloud computing environments.
Mars Institute Focus on advancing the scientific study and exploration of Mars
Millennium Engineering & Integration Company
Provides end-to-end mechanical engineering and analysis for NASA and DOD space vehicles.
Mission Critical Technologies, Inc. Provides specialized technical and professional expertise in the field of IT and IT solutions.
Moon Express Privately funded Lunar Transportation and Data Services company to establish new avenues for commercial space activities beyond Earth orbit.
Moffett Field Historical Society Educator about the military history and contributions of Moffett Field and the rich history of Ames.
Neerim Corporation Provides systems engineering services on a broad range of projects that include design and manufacture, test programs, validations and simulations.
Neurovigil, Inc. Neuroscience, non-invasive wireless brain recording technology and advanced computational algorithms.
NXAR LLC Licenses unique technology from Ames to develop new applications to deliver powerful, innovative new software solutions to solve difficult content and document-driven business processes.
Orbital Sciences Corporation World’s leading developer and manufacturer of smaller, more affordable space and launch systems.
Photozig, Inc. Provides integrated digital photo technology. Planners Collaborative Provides integrated communications and public marketing
services to public agencies. Support services to Ames include scientific and technical information, educational programs, and related administrative programs.
Pragati Synergetic Research Provides customized knowledge-engineering software to enhance and integrate information systems efficiently and accurately.
Quintessence Labs Inc. Developed a new generation of quantum cryptographic technology to enable unbreakable, secure storage and communication of sensitive information through the generation of an ultra-secure cryptographic key.
reQall, Inc. Developed a context-aware, voice activated virtual assistant (memory aid) that can operate from any network, application or mobile device.
Rhombus Power, Inc. Developing the next generation neutron detectors for space, defense and geological applications.
RMV Technology Group, LLC Provides mitigation services for advanced & engineered materials, satellite systems, robotics, space technology and medical device sectors.
S3 USA Holdings Small satellite development. Santa Clara University (Center for Nanostructures)
Partnering with Ames on the Thermal and Electrical Nano-scale Transport project.
Scanadu, Inc. Developer of a Medical Tricorder, packed with sensors that provide its customers with valuable data about the body.
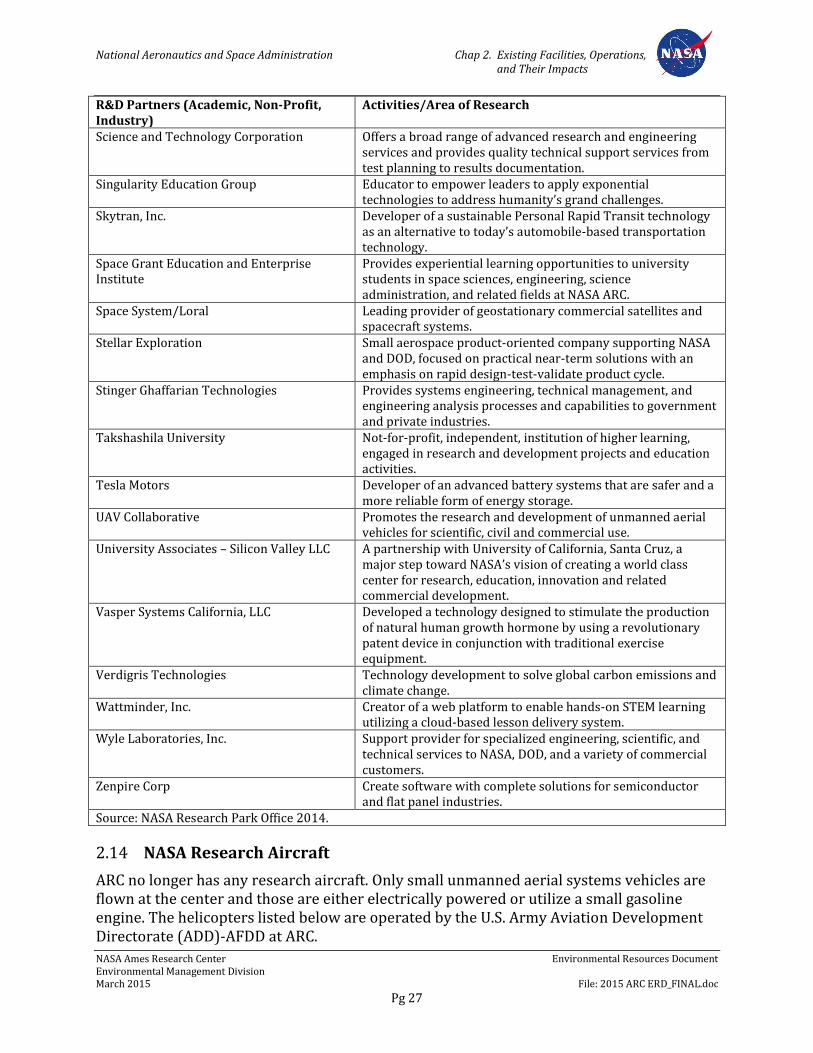
National Aeronautics and Space Administration Chap 2. Existing Facilities, Operations, and Their Impacts
NASA Ames Research Center Environmental Resources Document Environmental Management Division March 2015 File: 2015 ARC ERD_FINAL.doc
Pg 27
R&D Partners (Academic, Non-Profit, Industry)
Activities/Area of Research
Science and Technology Corporation Offers a broad range of advanced research and engineering services and provides quality technical support services from test planning to results documentation.
Singularity Education Group Educator to empower leaders to apply exponential technologies to address humanity’s grand challenges.
Skytran, Inc. Developer of a sustainable Personal Rapid Transit technology as an alternative to today’s automobile-based transportation technology.
Space Grant Education and Enterprise Institute
Provides experiential learning opportunities to university students in space sciences, engineering, science administration, and related fields at NASA ARC.
Space System/Loral Leading provider of geostationary commercial satellites and spacecraft systems.
Stellar Exploration Small aerospace product-oriented company supporting NASA and DOD, focused on practical near-term solutions with an emphasis on rapid design-test-validate product cycle.
Stinger Ghaffarian Technologies Provides systems engineering, technical management, and engineering analysis processes and capabilities to government and private industries.
Takshashila University Not-for-profit, independent, institution of higher learning, engaged in research and development projects and education activities.
Tesla Motors Developer of an advanced battery systems that are safer and a more reliable form of energy storage.
UAV Collaborative Promotes the research and development of unmanned aerial vehicles for scientific, civil and commercial use.
University Associates – Silicon Valley LLC A partnership with University of California, Santa Cruz, a major step toward NASA’s vision of creating a world class center for research, education, innovation and related commercial development.
Vasper Systems California, LLC Developed a technology designed to stimulate the production of natural human growth hormone by using a revolutionary patent device in conjunction with traditional exercise equipment.
Verdigris Technologies Technology development to solve global carbon emissions and climate change.
Wattminder, Inc. Creator of a web platform to enable hands-on STEM learning utilizing a cloud-based lesson delivery system.
Wyle Laboratories, Inc. Support provider for specialized engineering, scientific, and technical services to NASA, DOD, and a variety of commercial customers.
Zenpire Corp Create software with complete solutions for semiconductor and flat panel industries.
Source: NASA Research Park Office 2014.
2.14 NASA Research Aircraft
ARC no longer has any research aircraft. Only small unmanned aerial systems vehicles are flown at the center and those are either electrically powered or utilize a small gasoline engine. The helicopters listed below are operated by the U.S. Army Aviation Development Directorate (ADD)-AFDD at ARC.
National Aeronautics and Space Administration Chap 2. Existing Facilities, Operations, and Their Impacts
NASA Ames Research Center Environmental Resources Document Environmental Management Division March 2015 File: 2015 ARC ERD_FINAL.doc
Pg 28
2.14.1 EH-60L Blackhawk
The Blackhawk helicopter is a twin-turbine, single main rotor modified for aeronautical research. Recently conducted research has consisted of development and testing modernized flight control laws, full spectrum technology approaches for safe operations in degraded visual environments (such as brownout conditions), stabilization of externally slung loads, and autonomous formation flight. Typical annual usage of the EH-60L is 120 flight hours
2.14.2 JUH-60A Rotorcraft-Aircrew Systems Concepts Airborne Laboratory
The Rotorcraft-Aircrew Systems Concepts Airborne Laboratory (RASCAL) is a highly modified UH-60A Black Hawk helicopter developed for advanced flight control research. Its purpose is to provide the capability for in-flight investigations of advanced control, guidance, and display systems that allow both high agility and maneuverability and the ability to fly close to the ground in poor visibility conditions. The RASCAL contains a full-authority, programmable, digital fly-by-wire control system, advanced sensors in the fixed and rotating systems for health and usage monitoring research, and active flight controllers for envelop limiting and cueing work. This facility is presently used by Army researchers. Annual usage of the RASCAL is typically 120 flight hours.
2.14.3 OH-58C Kiowa
The Kiowa is a two-seat, side-by-side, single-engine helicopter used at ADD-AFDD for pilot proficiency and chase operations during the conduct of flight tests. Typical annual usage of the OH-58C is 60 flight hours.
2.15 Significant Aspects Summary
Table 2-3 contains a listing of the significant aspects and environmental impacts resulting from Ames Research Center Operations.
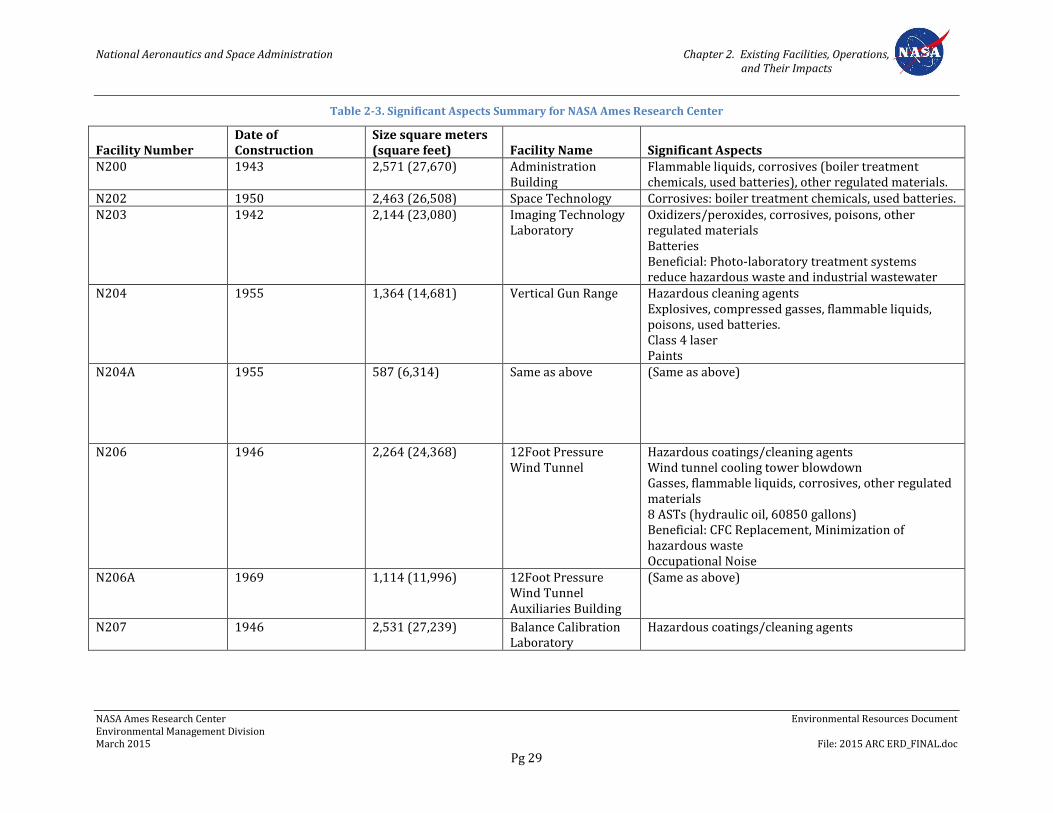
National Aeronautics and Space Administration Chapter 2. Existing Facilities, Operations, and Their Impacts
NASA Ames Research Center Environmental Resources Document Environmental Management Division March 2015 File: 2015 ARC ERD_FINAL.doc
Pg 29
Table 2-3. Significant Aspects Summary for NASA Ames Research Center
Facility Number Date of Construction
Size square meters (square feet) Facility Name Significant Aspects
N200 1943 2,571 (27,670) Administration Building
Flammable liquids, corrosives (boiler treatment chemicals, used batteries), other regulated materials.
N202 1950 2,463 (26,508) Space Technology Corrosives: boiler treatment chemicals, used batteries. N203 1942 2,144 (23,080) Imaging Technology
Laboratory Oxidizers/peroxides, corrosives, poisons, other regulated materials Batteries Beneficial: Photo-laboratory treatment systems reduce hazardous waste and industrial wastewater
N204 1955 1,364 (14,681) Vertical Gun Range Hazardous cleaning agents Explosives, compressed gasses, flammable liquids, poisons, used batteries. Class 4 laser Paints
N204A 1955 587 (6,314) Same as above (Same as above)
N206 1946 2,264 (24,368) 12Foot Pressure Wind Tunnel
Hazardous coatings/cleaning agents Wind tunnel cooling tower blowdown Gasses, flammable liquids, corrosives, other regulated materials 8 ASTs (hydraulic oil, 60850 gallons) Beneficial: CFC Replacement, Minimization of hazardous waste Occupational Noise
N206A 1969 1,114 (11,996) 12Foot Pressure Wind Tunnel Auxiliaries Building
(Same as above)
N207 1946 2,531 (27,239) Balance Calibration Laboratory
Hazardous coatings/cleaning agents
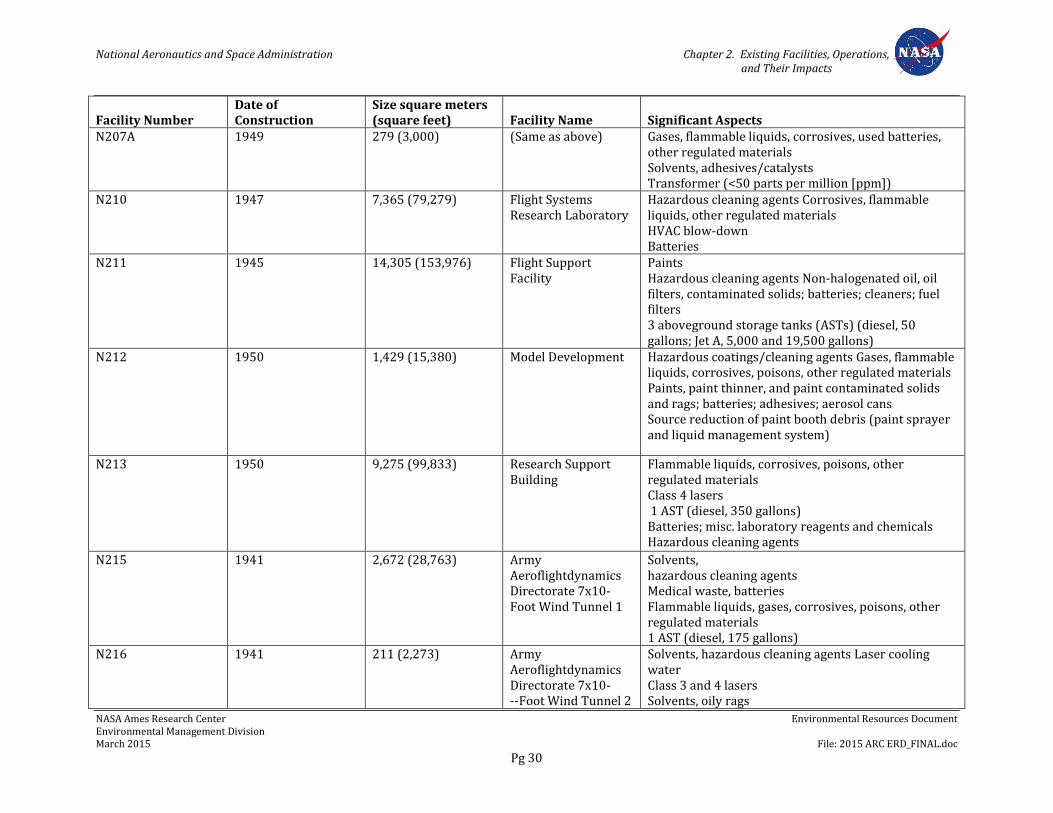
National Aeronautics and Space Administration Chapter 2. Existing Facilities, Operations, and Their Impacts
NASA Ames Research Center Environmental Resources Document Environmental Management Division March 2015 File: 2015 ARC ERD_FINAL.doc
Pg 30
Facility Number Date of Construction
Size square meters (square feet) Facility Name Significant Aspects
N207A 1949 279 (3,000) (Same as above) Gases, flammable liquids, corrosives, used batteries, other regulated materials Solvents, adhesives/catalysts Transformer (<50 parts per million [ppm])
N210 1947 7,365 (79,279) Flight Systems Research Laboratory
Hazardous cleaning agents Corrosives, flammable liquids, other regulated materials HVAC blow-down Batteries
N211 1945 14,305 (153,976) Flight Support Facility
Paints Hazardous cleaning agents Non-halogenated oil, oil filters, contaminated solids; batteries; cleaners; fuel filters 3 aboveground storage tanks (ASTs) (diesel, 50 gallons; Jet A, 5,000 and 19,500 gallons)
N212 1950 1,429 (15,380) Model Development Hazardous coatings/cleaning agents Gases, flammable liquids, corrosives, poisons, other regulated materials Paints, paint thinner, and paint contaminated solids and rags; batteries; adhesives; aerosol cans Source reduction of paint booth debris (paint sprayer and liquid management system)
N213 1950 9,275 (99,833) Research Support Building
Flammable liquids, corrosives, poisons, other regulated materials Class 4 lasers 1 AST (diesel, 350 gallons) Batteries; misc. laboratory reagents and chemicals Hazardous cleaning agents
N215 1941 2,672 (28,763) Army Aeroflightdynamics Directorate 7x10-Foot Wind Tunnel 1
Solvents, hazardous cleaning agents Medical waste, batteries Flammable liquids, gases, corrosives, poisons, other regulated materials 1 AST (diesel, 175 gallons)
N216 1941 211 (2,273) Army Aeroflightdynamics Directorate 7x10-Foot Wind Tunnel 2
Solvents, hazardous cleaning agents Laser cooling water Class 3 and 4 lasers Solvents, oily rags
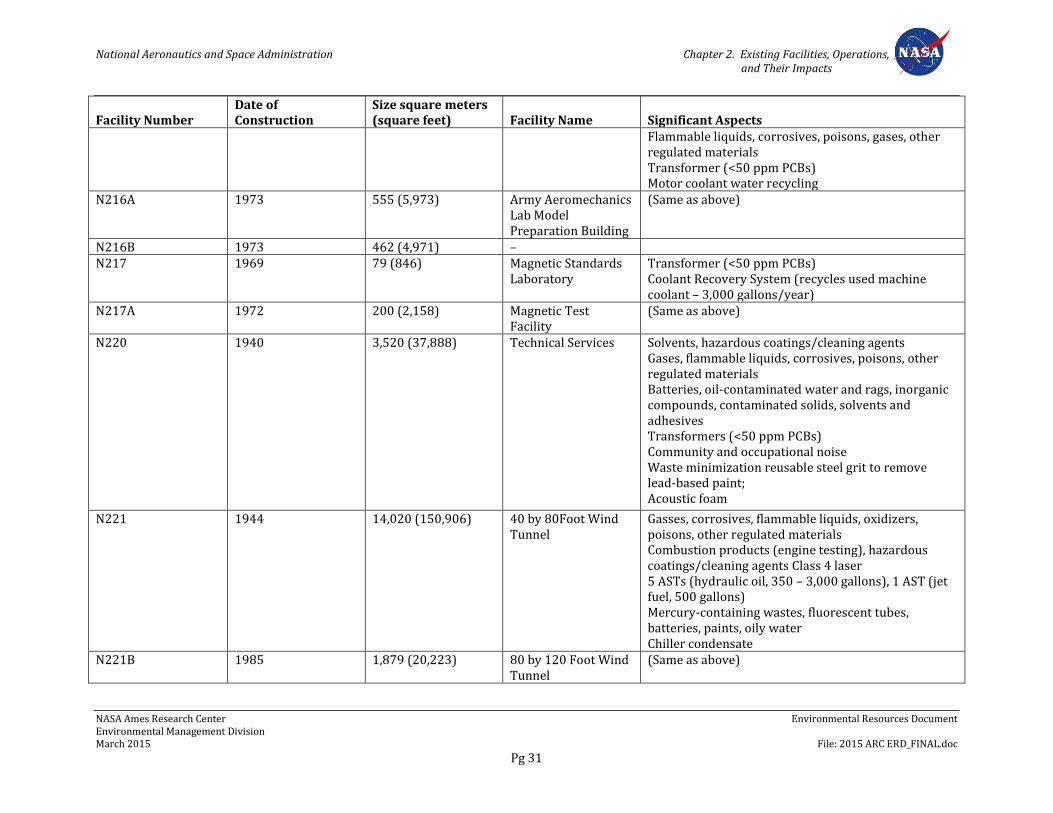
National Aeronautics and Space Administration Chapter 2. Existing Facilities, Operations, and Their Impacts
NASA Ames Research Center Environmental Resources Document Environmental Management Division March 2015 File: 2015 ARC ERD_FINAL.doc
Pg 31
Facility Number Date of Construction
Size square meters (square feet) Facility Name Significant Aspects
Flammable liquids, corrosives, poisons, gases, other regulated materials Transformer (<50 ppm PCBs) Motor coolant water recycling
N216A 1973 555 (5,973) Army Aeromechanics Lab Model Preparation Building
(Same as above)
N216B 1973 462 (4,971) – N217 1969 79 (846) Magnetic Standards
Laboratory Transformer (<50 ppm PCBs) Coolant Recovery System (recycles used machine coolant – 3,000 gallons/year)
N217A 1972 200 (2,158) Magnetic Test Facility
(Same as above)
N220 1940 3,520 (37,888) Technical Services Solvents, hazardous coatings/cleaning agents Gases, flammable liquids, corrosives, poisons, other regulated materials Batteries, oil-contaminated water and rags, inorganic compounds, contaminated solids, solvents and adhesives Transformers (<50 ppm PCBs) Community and occupational noise Waste minimization reusable steel grit to remove lead-based paint; Acoustic foam
N221 1944 14,020 (150,906) 40 by 80Foot Wind Tunnel
Gasses, corrosives, flammable liquids, oxidizers, poisons, other regulated materials Combustion products (engine testing), hazardous coatings/cleaning agents Class 4 laser 5 ASTs (hydraulic oil, 350 – 3,000 gallons), 1 AST (jet fuel, 500 gallons) Mercury-containing wastes, fluorescent tubes, batteries, paints, oily water Chiller condensate
N221B 1985 1,879 (20,223) 80 by 120 Foot Wind Tunnel
(Same as above)
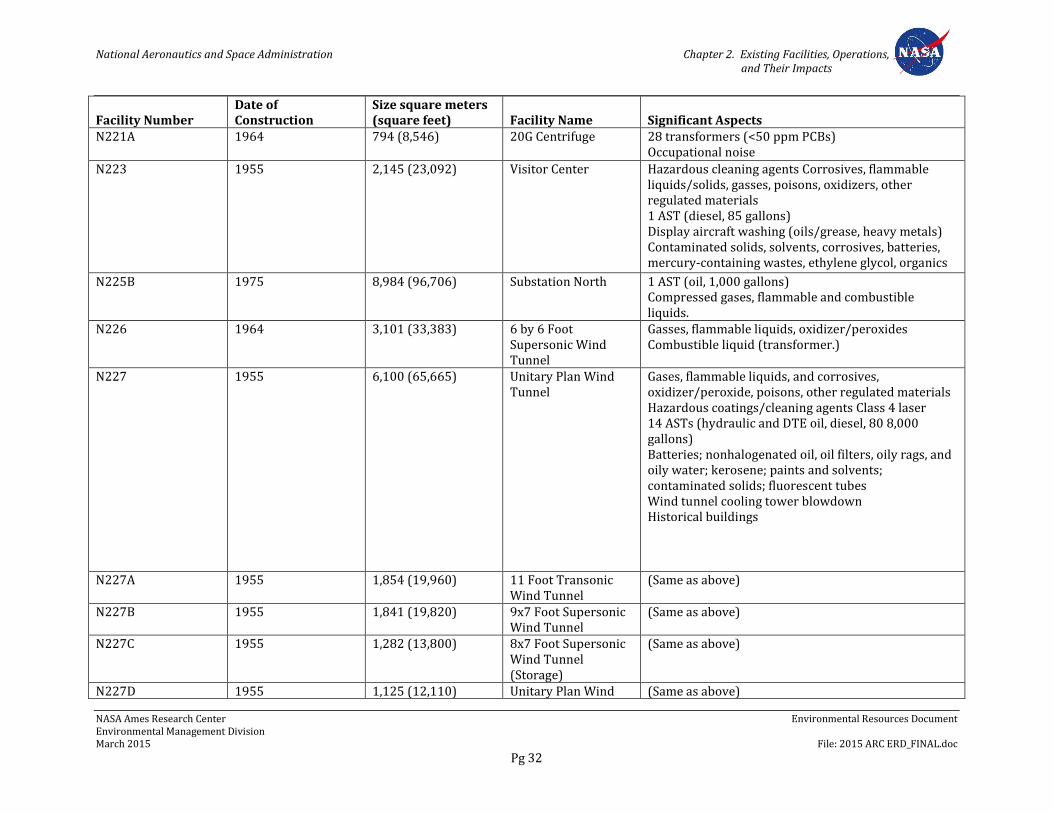
National Aeronautics and Space Administration Chapter 2. Existing Facilities, Operations, and Their Impacts
NASA Ames Research Center Environmental Resources Document Environmental Management Division March 2015 File: 2015 ARC ERD_FINAL.doc
Pg 32
Facility Number Date of Construction
Size square meters (square feet) Facility Name Significant Aspects
N221A 1964 794 (8,546) 20G Centrifuge 28 transformers (<50 ppm PCBs) Occupational noise
N223 1955 2,145 (23,092) Visitor Center Hazardous cleaning agents Corrosives, flammable liquids/solids, gasses, poisons, oxidizers, other regulated materials 1 AST (diesel, 85 gallons) Display aircraft washing (oils/grease, heavy metals) Contaminated solids, solvents, corrosives, batteries, mercury-containing wastes, ethylene glycol, organics
N225B 1975 8,984 (96,706) Substation North 1 AST (oil, 1,000 gallons) Compressed gases, flammable and combustible liquids.
N226 1964 3,101 (33,383) 6 by 6 Foot Supersonic Wind Tunnel
Gasses, flammable liquids, oxidizer/peroxides Combustible liquid (transformer.)
N227 1955 6,100 (65,665) Unitary Plan Wind Tunnel
Gases, flammable liquids, and corrosives, oxidizer/peroxide, poisons, other regulated materials Hazardous coatings/cleaning agents Class 4 laser 14 ASTs (hydraulic and DTE oil, diesel, 80 8,000 gallons) Batteries; nonhalogenated oil, oil filters, oily rags, and oily water; kerosene; paints and solvents; contaminated solids; fluorescent tubes Wind tunnel cooling tower blowdown Historical buildings
N227A 1955 1,854 (19,960) 11 Foot Transonic Wind Tunnel
(Same as above)
N227B 1955 1,841 (19,820) 9x7 Foot Supersonic Wind Tunnel
(Same as above)
N227C 1955 1,282 (13,800) 8x7 Foot Supersonic Wind Tunnel (Storage)
(Same as above)
N227D 1955 1,125 (12,110) Unitary Plan Wind (Same as above)
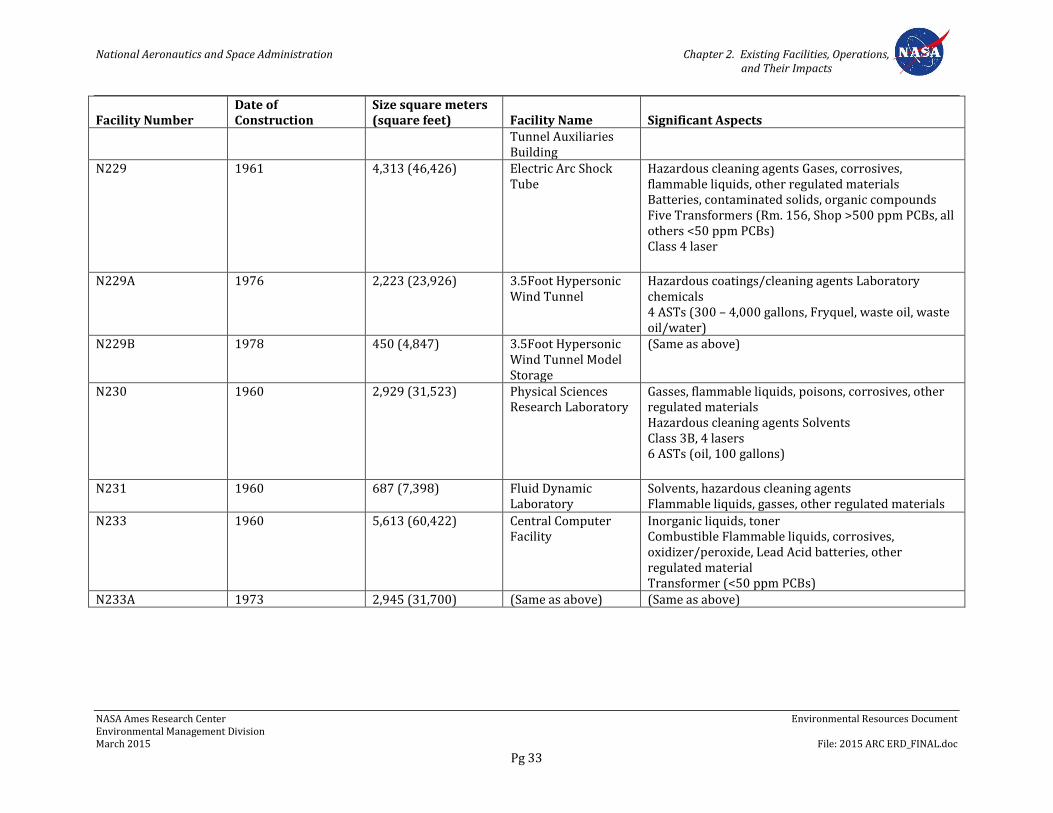
National Aeronautics and Space Administration Chapter 2. Existing Facilities, Operations, and Their Impacts
NASA Ames Research Center Environmental Resources Document Environmental Management Division March 2015 File: 2015 ARC ERD_FINAL.doc
Pg 33
Facility Number Date of Construction
Size square meters (square feet) Facility Name Significant Aspects
Tunnel Auxiliaries Building
N229 1961 4,313 (46,426) Electric Arc Shock Tube
Hazardous cleaning agents Gases, corrosives, flammable liquids, other regulated materials Batteries, contaminated solids, organic compounds Five Transformers (Rm. 156, Shop >500 ppm PCBs, all others <50 ppm PCBs) Class 4 laser
N229A 1976 2,223 (23,926) 3.5Foot Hypersonic Wind Tunnel
Hazardous coatings/cleaning agents Laboratory chemicals 4 ASTs (300 – 4,000 gallons, Fryquel, waste oil, waste oil/water)
N229B 1978 450 (4,847) 3.5Foot Hypersonic Wind Tunnel Model Storage
(Same as above)
N230 1960 2,929 (31,523) Physical Sciences Research Laboratory
Gasses, flammable liquids, poisons, corrosives, other regulated materials Hazardous cleaning agents Solvents Class 3B, 4 lasers 6 ASTs (oil, 100 gallons)
N231 1960 687 (7,398) Fluid Dynamic Laboratory
Solvents, hazardous cleaning agents Flammable liquids, gasses, other regulated materials
N233 1960 5,613 (60,422) Central Computer Facility
Inorganic liquids, toner Combustible Flammable liquids, corrosives, oxidizer/peroxide, Lead Acid batteries, other regulated material Transformer (<50 ppm PCBs)
N233A 1973 2,945 (31,700) (Same as above) (Same as above)
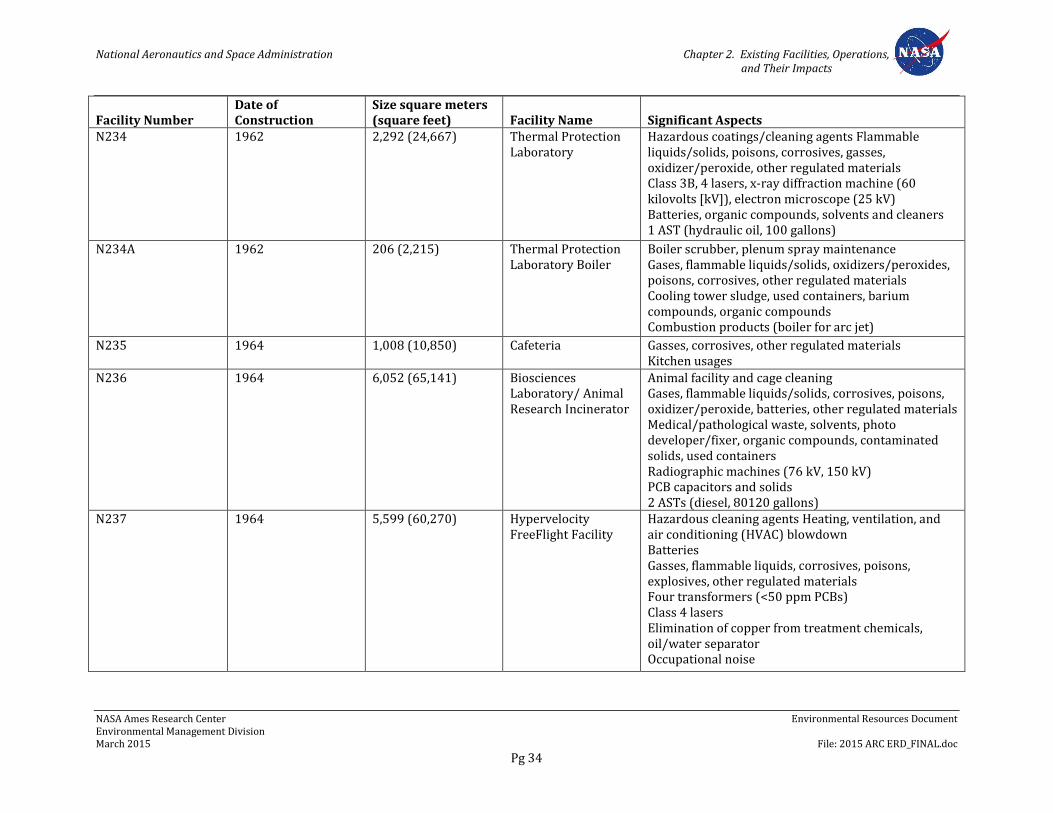
National Aeronautics and Space Administration Chapter 2. Existing Facilities, Operations, and Their Impacts
NASA Ames Research Center Environmental Resources Document Environmental Management Division March 2015 File: 2015 ARC ERD_FINAL.doc
Pg 34
Facility Number Date of Construction
Size square meters (square feet) Facility Name Significant Aspects
N234 1962 2,292 (24,667) Thermal Protection Laboratory
Hazardous coatings/cleaning agents Flammable liquids/solids, poisons, corrosives, gasses, oxidizer/peroxide, other regulated materials Class 3B, 4 lasers, x-ray diffraction machine (60 kilovolts [kV]), electron microscope (25 kV) Batteries, organic compounds, solvents and cleaners 1 AST (hydraulic oil, 100 gallons)
N234A 1962 206 (2,215) Thermal Protection Laboratory Boiler
Boiler scrubber, plenum spray maintenance Gases, flammable liquids/solids, oxidizers/peroxides, poisons, corrosives, other regulated materials Cooling tower sludge, used containers, barium compounds, organic compounds Combustion products (boiler for arc jet)
N235 1964 1,008 (10,850) Cafeteria Gasses, corrosives, other regulated materials Kitchen usages
N236 1964 6,052 (65,141) Biosciences Laboratory/ Animal Research Incinerator
Animal facility and cage cleaning Gases, flammable liquids/solids, corrosives, poisons, oxidizer/peroxide, batteries, other regulated materials Medical/pathological waste, solvents, photo developer/fixer, organic compounds, contaminated solids, used containers Radiographic machines (76 kV, 150 kV) PCB capacitors and solids 2 ASTs (diesel, 80120 gallons)
N237 1964 5,599 (60,270) Hypervelocity FreeFlight Facility
Hazardous cleaning agents Heating, ventilation, and air conditioning (HVAC) blowdown Batteries Gasses, flammable liquids, corrosives, poisons, explosives, other regulated materials Four transformers (<50 ppm PCBs) Class 4 lasers Elimination of copper from treatment chemicals, oil/water separator Occupational noise
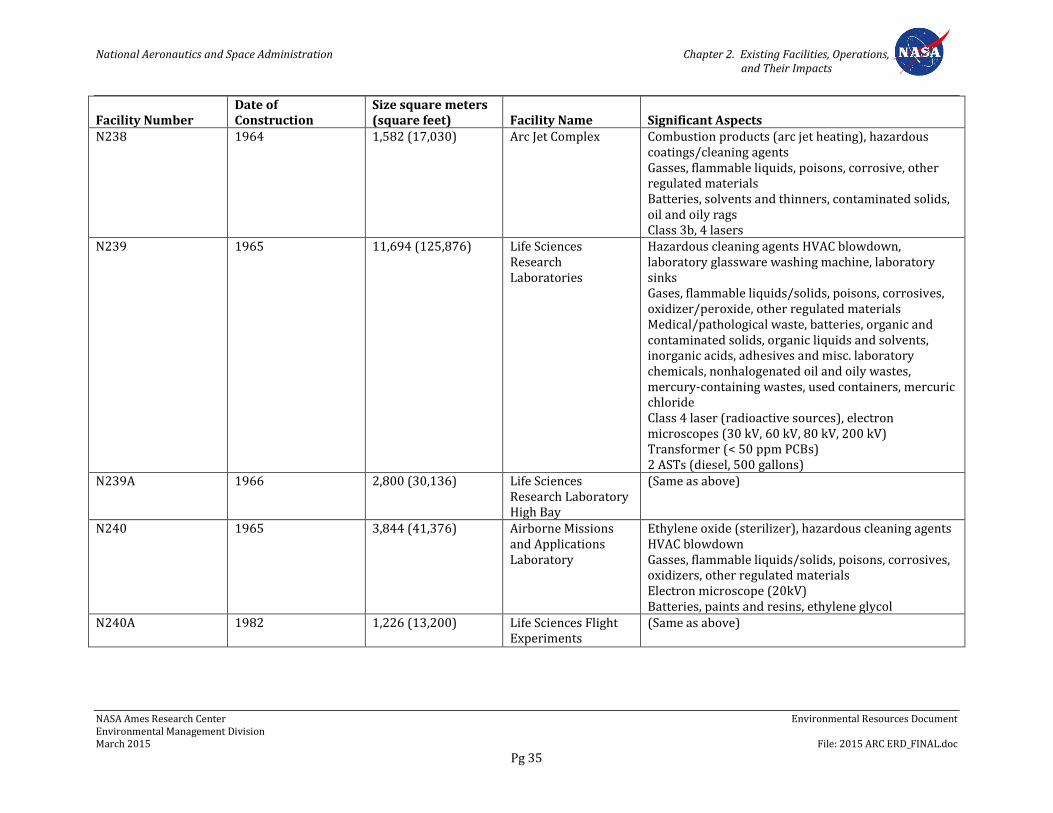
National Aeronautics and Space Administration Chapter 2. Existing Facilities, Operations, and Their Impacts
NASA Ames Research Center Environmental Resources Document Environmental Management Division March 2015 File: 2015 ARC ERD_FINAL.doc
Pg 35
Facility Number Date of Construction
Size square meters (square feet) Facility Name Significant Aspects
N238 1964 1,582 (17,030) Arc Jet Complex Combustion products (arc jet heating), hazardous coatings/cleaning agents Gasses, flammable liquids, poisons, corrosive, other regulated materials Batteries, solvents and thinners, contaminated solids, oil and oily rags Class 3b, 4 lasers
N239 1965 11,694 (125,876) Life Sciences Research Laboratories
Hazardous cleaning agents HVAC blowdown, laboratory glassware washing machine, laboratory sinks Gases, flammable liquids/solids, poisons, corrosives, oxidizer/peroxide, other regulated materials Medical/pathological waste, batteries, organic and contaminated solids, organic liquids and solvents, inorganic acids, adhesives and misc. laboratory chemicals, nonhalogenated oil and oily wastes, mercury-containing wastes, used containers, mercuric chloride Class 4 laser (radioactive sources), electron microscopes (30 kV, 60 kV, 80 kV, 200 kV) Transformer (< 50 ppm PCBs) 2 ASTs (diesel, 500 gallons)
N239A 1966 2,800 (30,136) Life Sciences Research Laboratory High Bay
(Same as above)
N240 1965 3,844 (41,376) Airborne Missions and Applications Laboratory
Ethylene oxide (sterilizer), hazardous cleaning agents HVAC blowdown Gasses, flammable liquids/solids, poisons, corrosives, oxidizers, other regulated materials Electron microscope (20kV) Batteries, paints and resins, ethylene glycol
N240A 1982 1,226 (13,200) Life Sciences Flight Experiments
(Same as above)

National Aeronautics and Space Administration Chapter 2. Existing Facilities, Operations, and Their Impacts
NASA Ames Research Center Environmental Resources Document Environmental Management Division March 2015 File: 2015 ARC ERD_FINAL.doc
Pg 36
Facility Number Date of Construction
Size square meters (square feet) Facility Name Significant Aspects
N241 1965 5,794 (62,370) Administrative Management Building
Flammable liquids, corrosives 1 AST (diesel, 250 gallons) Oily water, contaminated solids, paints, batteries, lead-containing debris HVAC blowdown
N242 1966 2,582 (27,794) Vestibular Research Solvent usage, hazardous cleaning agents Gasses, flammable liquids/solids, corrosives, oxidizers, poisons, other regulated materials Contaminated solids, batteries, used containers Three Transformers (<50 ppm PCBs) Source Reduction of Paint Booth Debris (includes High Volume Low Pressure paint sprayer and Liquid Management System), 3 Air Compressor Oil/Water Separators Class 3b laser
N243 1967 12,263 (132,000) Flight and Guidance Simulation Laboratory
Hazardous cleaning agents HVAC blowdown Gasses, flammable liquids, oxidizers/peroxides, poisons, corrosives, other regulated materials 1 AST (hydraulic oil, 800 gallons) Batteries, paints, oily water and rags
N243A 1967 920 (9,900) Simulation Equipment Building
(Same as above)–
N244 1967 7,583 (81,626) Space Projects Facility
Hazardous coatings/cleaning agents HVAC blowdown Gasses, flammable liquids, poisons, corrosives, other regulated materials Batteries, adhesives and solvents, oils 2 Transformers (<50 ppm PCBs) Class 3b lasers (radioactive sources)
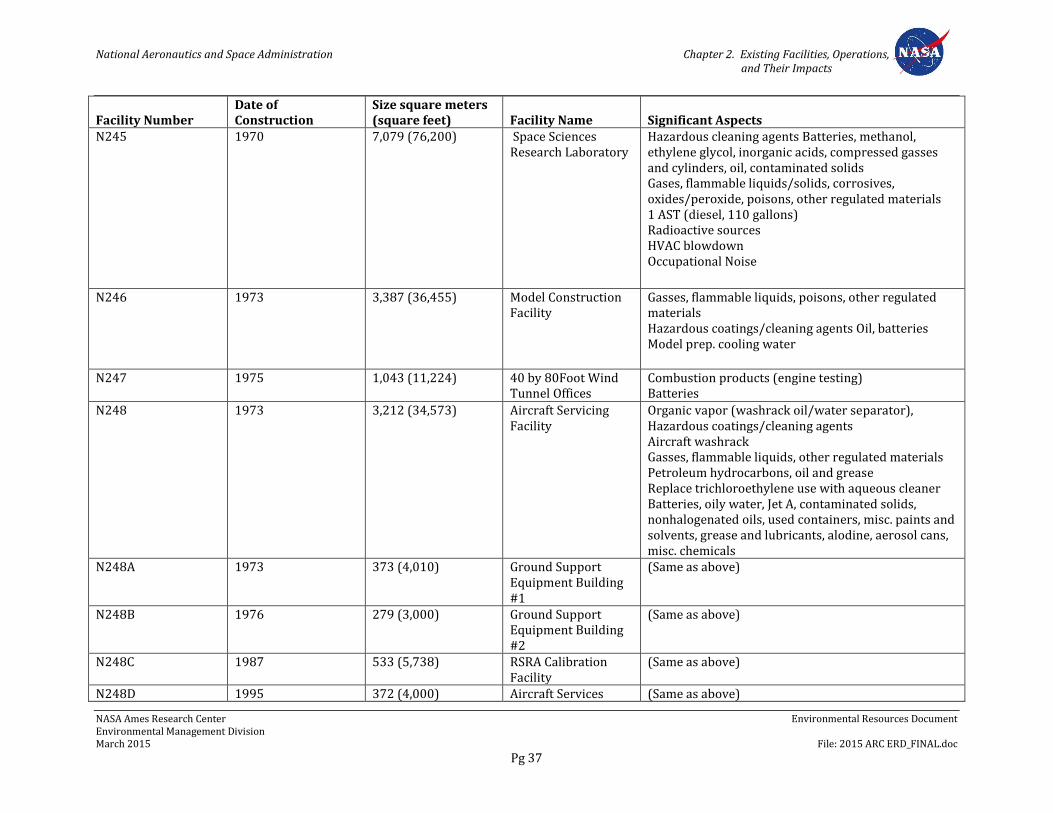
National Aeronautics and Space Administration Chapter 2. Existing Facilities, Operations, and Their Impacts
NASA Ames Research Center Environmental Resources Document Environmental Management Division March 2015 File: 2015 ARC ERD_FINAL.doc
Pg 37
Facility Number Date of Construction
Size square meters (square feet) Facility Name Significant Aspects
N245 1970 7,079 (76,200) Space Sciences Research Laboratory
Hazardous cleaning agents Batteries, methanol, ethylene glycol, inorganic acids, compressed gasses and cylinders, oil, contaminated solids Gases, flammable liquids/solids, corrosives, oxides/peroxide, poisons, other regulated materials 1 AST (diesel, 110 gallons) Radioactive sources HVAC blowdown Occupational Noise
N246 1973 3,387 (36,455) Model Construction Facility
Gasses, flammable liquids, poisons, other regulated materials Hazardous coatings/cleaning agents Oil, batteries Model prep. cooling water
N247 1975 1,043 (11,224) 40 by 80Foot Wind Tunnel Offices
Combustion products (engine testing) Batteries
N248 1973 3,212 (34,573) Aircraft Servicing Facility
Organic vapor (washrack oil/water separator), Hazardous coatings/cleaning agents Aircraft washrack Gasses, flammable liquids, other regulated materials Petroleum hydrocarbons, oil and grease Replace trichloroethylene use with aqueous cleaner Batteries, oily water, Jet A, contaminated solids, nonhalogenated oils, used containers, misc. paints and solvents, grease and lubricants, alodine, aerosol cans, misc. chemicals
N248A 1973 373 (4,010) Ground Support Equipment Building #1
(Same as above)
N248B 1976 279 (3,000) Ground Support Equipment Building #2
(Same as above)
N248C 1987 533 (5,738) RSRA Calibration Facility
(Same as above)
N248D 1995 372 (4,000) Aircraft Services (Same as above)
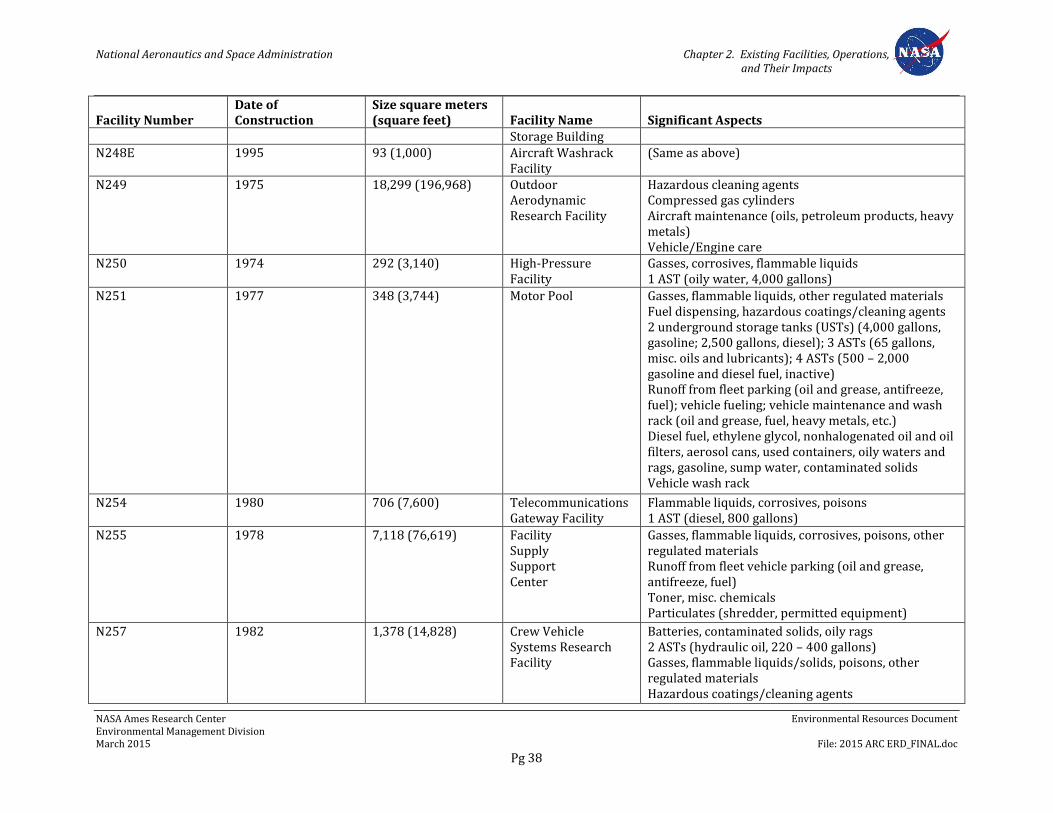
National Aeronautics and Space Administration Chapter 2. Existing Facilities, Operations, and Their Impacts
NASA Ames Research Center Environmental Resources Document Environmental Management Division March 2015 File: 2015 ARC ERD_FINAL.doc
Pg 38
Facility Number Date of Construction
Size square meters (square feet) Facility Name Significant Aspects
Storage Building N248E 1995 93 (1,000) Aircraft Washrack
Facility (Same as above)
N249 1975 18,299 (196,968)
Outdoor Aerodynamic Research Facility
Hazardous cleaning agents Compressed gas cylinders Aircraft maintenance (oils, petroleum products, heavy metals) Vehicle/Engine care
N250 1974 292 (3,140) High-Pressure Facility
Gasses, corrosives, flammable liquids 1 AST (oily water, 4,000 gallons)
N251 1977 348 (3,744) Motor Pool Gasses, flammable liquids, other regulated materials Fuel dispensing, hazardous coatings/cleaning agents 2 underground storage tanks (USTs) (4,000 gallons, gasoline; 2,500 gallons, diesel); 3 ASTs (65 gallons, misc. oils and lubricants); 4 ASTs (500 – 2,000 gasoline and diesel fuel, inactive) Runoff from fleet parking (oil and grease, antifreeze, fuel); vehicle fueling; vehicle maintenance and wash rack (oil and grease, fuel, heavy metals, etc.) Diesel fuel, ethylene glycol, nonhalogenated oil and oil filters, aerosol cans, used containers, oily waters and rags, gasoline, sump water, contaminated solids Vehicle wash rack
N254 1980 706 (7,600) Telecommunications Gateway Facility
Flammable liquids, corrosives, poisons 1 AST (diesel, 800 gallons)
N255 1978 7,118 (76,619) Facility Supply Support Center
Gasses, flammable liquids, corrosives, poisons, other regulated materials Runoff from fleet vehicle parking (oil and grease, antifreeze, fuel) Toner, misc. chemicals Particulates (shredder, permitted equipment)
N257 1982 1,378 (14,828) Crew Vehicle Systems Research Facility
Batteries, contaminated solids, oily rags 2 ASTs (hydraulic oil, 220 – 400 gallons) Gasses, flammable liquids/solids, poisons, other regulated materials Hazardous coatings/cleaning agents
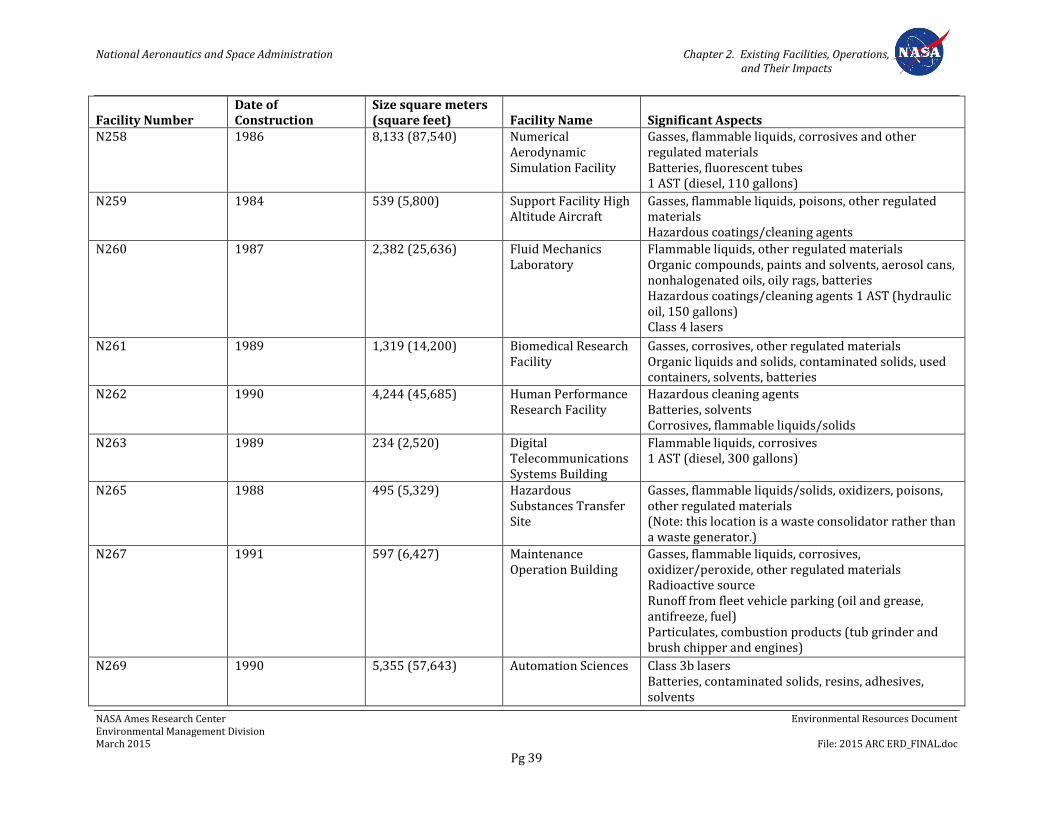
National Aeronautics and Space Administration Chapter 2. Existing Facilities, Operations, and Their Impacts
NASA Ames Research Center Environmental Resources Document Environmental Management Division March 2015 File: 2015 ARC ERD_FINAL.doc
Pg 39
Facility Number Date of Construction
Size square meters (square feet) Facility Name Significant Aspects
N258 1986 8,133 (87,540) Numerical Aerodynamic Simulation Facility
Gasses, flammable liquids, corrosives and other regulated materials Batteries, fluorescent tubes 1 AST (diesel, 110 gallons)
N259 1984 539 (5,800) Support Facility High Altitude Aircraft
Gasses, flammable liquids, poisons, other regulated materials Hazardous coatings/cleaning agents
N260 1987 2,382 (25,636) Fluid Mechanics Laboratory
Flammable liquids, other regulated materials Organic compounds, paints and solvents, aerosol cans, nonhalogenated oils, oily rags, batteries Hazardous coatings/cleaning agents 1 AST (hydraulic oil, 150 gallons) Class 4 lasers
N261 1989 1,319 (14,200) Biomedical Research Facility
Gasses, corrosives, other regulated materials Organic liquids and solids, contaminated solids, used containers, solvents, batteries
N262 1990 4,244 (45,685) Human Performance Research Facility
Hazardous cleaning agents Batteries, solvents Corrosives, flammable liquids/solids
N263 1989 234 (2,520) Digital Telecommunications Systems Building
Flammable liquids, corrosives 1 AST (diesel, 300 gallons)
N265 1988 495 (5,329) Hazardous Substances Transfer Site
Gasses, flammable liquids/solids, oxidizers, poisons, other regulated materials (Note: this location is a waste consolidator rather than a waste generator.)
N267 1991 597 (6,427) Maintenance Operation Building
Gasses, flammable liquids, corrosives, oxidizer/peroxide, other regulated materials Radioactive source Runoff from fleet vehicle parking (oil and grease, antifreeze, fuel) Particulates, combustion products (tub grinder and brush chipper and engines)
N269 1990 5,355 (57,643) Automation Sciences Class 3b lasers Batteries, contaminated solids, resins, adhesives, solvents
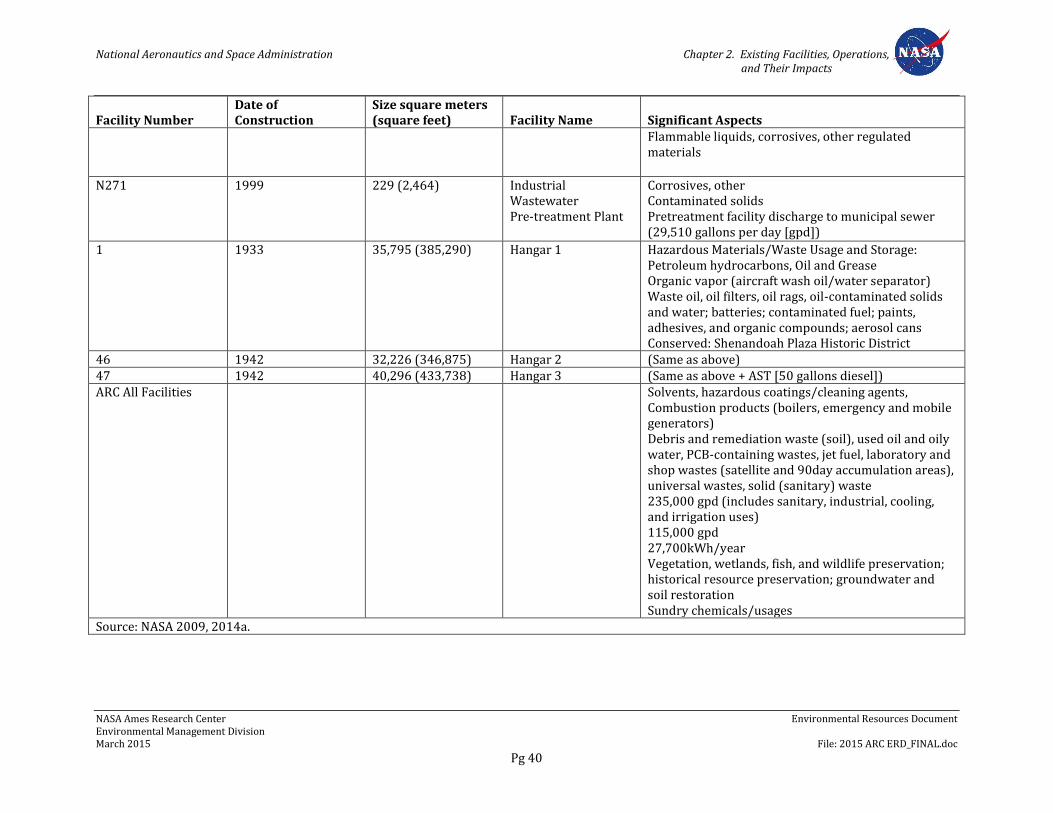
National Aeronautics and Space Administration Chapter 2. Existing Facilities, Operations, and Their Impacts
NASA Ames Research Center Environmental Resources Document Environmental Management Division March 2015 File: 2015 ARC ERD_FINAL.doc
Pg 40
Facility Number Date of Construction
Size square meters (square feet) Facility Name Significant Aspects
Flammable liquids, corrosives, other regulated materials
N271 1999 229 (2,464) Industrial Wastewater Pre-treatment Plant
Corrosives, other Contaminated solids Pretreatment facility discharge to municipal sewer (29,510 gallons per day [gpd])
1 1933 35,795 (385,290) Hangar 1 Hazardous Materials/Waste Usage and Storage: Petroleum hydrocarbons, Oil and Grease Organic vapor (aircraft wash oil/water separator) Waste oil, oil filters, oil rags, oil-contaminated solids and water; batteries; contaminated fuel; paints, adhesives, and organic compounds; aerosol cans Conserved: Shenandoah Plaza Historic District
46 1942 32,226 (346,875) Hangar 2 (Same as above) 47 1942 40,296 (433,738) Hangar 3 (Same as above + AST [50 gallons diesel]) ARC All Facilities Solvents, hazardous coatings/cleaning agents,
Combustion products (boilers, emergency and mobile generators) Debris and remediation waste (soil), used oil and oily water, PCB-containing wastes, jet fuel, laboratory and shop wastes (satellite and 90day accumulation areas), universal wastes, solid (sanitary) waste 235,000 gpd (includes sanitary, industrial, cooling, and irrigation uses) 115,000 gpd 27,700kWh/year Vegetation, wetlands, fish, and wildlife preservation; historical resource preservation; groundwater and soil restoration Sundry chemicals/usages
Source: NASA 2009, 2014a.
National Aeronautics and Space Administration Chap 2. Existing Facilities, Operations, and Their Impacts
NASA Ames Research Center Environmental Resources Document Environmental Management Division March 2015 File: 2015 ARC ERD_FINAL.doc
Pg 41
2.16 NASA Ames Research Park and Eastside Airfield Operations
2.16.1 Facility Usage
ARC contains many specialized and unique facilities that support the mission of ARC and the missions of the resident agencies. Resident agency organizations use dedicated facilities for specified periods of time, ranging from a few days to years. Presently, there are more than a dozen different resident agencies using ARC facilities.
2.16.2 Resident Agencies
Under NASA’s oversight, the family of resident agencies at ARC has grown considerably. The different organizations using a variety of facilities include:
CANG, 129th Rescue Wing
Defense Energy Supply Center
Defense Commissary
Federal Emergency Management Agency
U.S. Postal Service
2.16.3 Airfield Operations
The airfield at ARC is a fully functional federal airport with all the necessary facilities needed for aircraft operations. Aircraft facilities include:
Two parallel runways, 2,804 meters (9,200 feet) and 2,469 meters (8,100 feet) long
Three large hangars, approximately 305 by 91 meters (1,000 by 300 feet)
Aircraft wash facilities
Aircraft fuel terminal facility
24-hour crash, fire, and rescue
16-hour air traffic control tower
More than 70 structures related to airfield operations
Extensive ramp space
Instrument landing system
Pilot weather briefings
Flight planning service
Hangar 1 is a contributing element in the Shenandoah Plaza Historic District. It is one of the largest hangars in the world, and until recently housed hangar, administrative, warehouse, maintenance, and classroom space. Hangar 1 is one of the buildings contributing to the historic Shenandoah Plaza District.
National Aeronautics and Space Administration Chap 2. Existing Facilities, Operations, and Their Impacts
NASA Ames Research Center Environmental Resources Document Environmental Management Division March 2015 File: 2015 ARC ERD_FINAL.doc
Pg 42
2.16.4 Military Facilities
Military facilities at the Center include the CANG facilities located in the Eastside/Airfield area and Army Reserve military housing (Wescoat Village) located south of the NRP area. These facilities are discussed in more detail in Chapter 4, “Land Use.”
2.16.5 Multipurpose Facilities
ARC has a wide range of facilities suitable for administration activities, aircraft and vehicle maintenance, warehouse space, and living quarters. With varying degrees of alterations, these facilities can be tailored for many different uses. Almost 400,000 square meters (4.3 million square feet) of space are available, including:
Storage/hangar space/maintenance/shops, 135,856 square meters (1,462,344 square feet)
Office space, 246,886 square meters (2,657,464 square feet)
The NADP includes planning for more office space and additional housing.
2.16.6 Amenities Infrastructure
Other facilities and infrastructure that support the quality of life at NASA include:
Bike/hiking trail access
U.S. Post Office
Golden Bay Federal Credit Union
Cafeteria/deli
Moffett Training and Conference Center
Base police/security force
World-class communication infrastructure
Satellite and fiber optic links
Recreation and fitness facilities
National Aeronautics and Space Administration Chap 3. Socioeconomics
NASA Ames Research Center Environmental Resources Document Environmental Management Division March 2015 File: 2015 ARC ERD_FINAL.doc
Pg 43
Chapter 3. Socioeconomics
3.1 Overview
This chapter describes existing socioeconomic conditions in and around ARC. Information regarding population and employment at the regional, county, and local levels; the local housing market and fiscal conditions of the county; local jurisdictions; school districts; and ARC are analyzed. Applicable regulations are discussed as well as relevant policies and measures that address potential socioeconomic impacts of operations and future development at ARC. Information presented in this chapter was obtained from the November 2009 NASA ARC ERD (NASA 2009), NADP EIS (Design, Community & Environment 2002), U.S. Census, and other sources.
3.2 Regulatory Background
3.2.1 Federal Regulations
3.2.1.1 National Environmental Policy Act
Under NEPA, an EIS must consider social and economic effects if they are interrelated to natural or physical environmental effects, and its definition of effects includes social and economic factors (40 CFR 1508.8 and 1508.14). However, social and economic effects do not, by themselves, require preparation of an EIS.
3.2.2 Local Regulations
3.2.2.1 Santa Clara County
The Growth and Development and Economic Well-Being chapters of the County’s General Plan contain a number of socioeconomic goals, strategies, and policies that are relevant to ARC (Santa Clara County 1994). Additionally, the County’s updated 2009-2014 Housing Chapter, adopted in August 2010, addresses projected growth in the County’s housing need and identifies the future development of housing at ARC as a potential source of housing credits to help the County meet its state-mandated regional housing allocation (Santa Clara County 2010).
3.2.2.2 City of Mountain View
The City’s General Plan contains themes and overarching strategies for improving the City’s overall health and wellness and economic prosperity (City of Mountain View 2012). Strategies include enhancing the City’s stock of affordable housing, improving the overall economic base and diversity of businesses, and increasing land use intensities in key planning areas to support continued growth. Relevant socioeconomic policies are found in the Land Use and Design and Housing Elements of the General Plan.
National Aeronautics and Space Administration Chap 3. Socioeconomics
NASA Ames Research Center Environmental Resources Document Environmental Management Division March 2015 File: 2015 ARC ERD_FINAL.doc
Pg 44
3.2.2.3 City of Sunnyvale
The City of Sunnyvale’s 2011 Consolidated General Plan includes Citywide Vision Goals that that cover the full range of the City’s social and economic aspirations, as well as individual goals that affect certain neighborhoods or business areas of the City (City of Sunnyvale 2011a). Relevant socioeconomic goals and policies are found in the Community Vision, Land Use and Transportation, and Housing Chapters.
3.3 Regional setting
3.3.1 Population Characteristics
This section describes regional, county, and local population characteristics. Based on the 2010 Census data, the cities of Mountain View and Sunnyvale had estimated populations of 74,066 and 140,081, respectively.
3.3.1.1 San Francisco Bay Area
Based on the 2010 Census, the Bay Area has a population of 7,150,739, approximately one fifth of the state’s population. The Bay Area includes the counties of Alameda, Contra Costa, Marin, Napa, San Francisco, San Mateo, Santa Clara, Solano, and Sonoma. Although Santa Cruz is sometimes included as a 10th county, ARC adheres to a nine-county definition as set forth by the Association of Bay Area Governments (ABAG).
Table 3-1 shows the population growth experienced in the Bay Area between 2000 and 2010, increasing at an average annual rate of 0.5%. Santa Clara, Alameda, and Contra Costa counties are the largest counties and make up 60% of the Bay Area population and account for 72% of the growth. The Bay Area is expected to grow by approximately 13% between 2010 and 2025, to an expected population of 8.1 million.
Table 3-1. Population and Household Trends
2000 2010 Average Annual Change 2000-2010
Ames Research Center Area1
Population2 202,468 214,147 0.6% Households2 83,781 85,341 0.2% Average Household Size2 2.40 2.50 0.4% Employed Residents per Household2 1.36 1.25 -0.8% Household Type–Families2 58% 62% 0.7% Household Type–Non-Families2 42% 38% -1.0% Tenure–Owner2 45% 46% 0.1% Tenure–Renter2 55% 54% -0.1%
Santa Clara County
Population 1,682,585 1,781,642 0.6% Households 565,863 604,204 0.7% Average Household Size 2.92 2.90 -0.1% Employed Residents per Household 1.49 1.33 -1.2% Household Type–Families 70% 71% 0.1% Household Type–Non-Families 30% 29% -0.2%
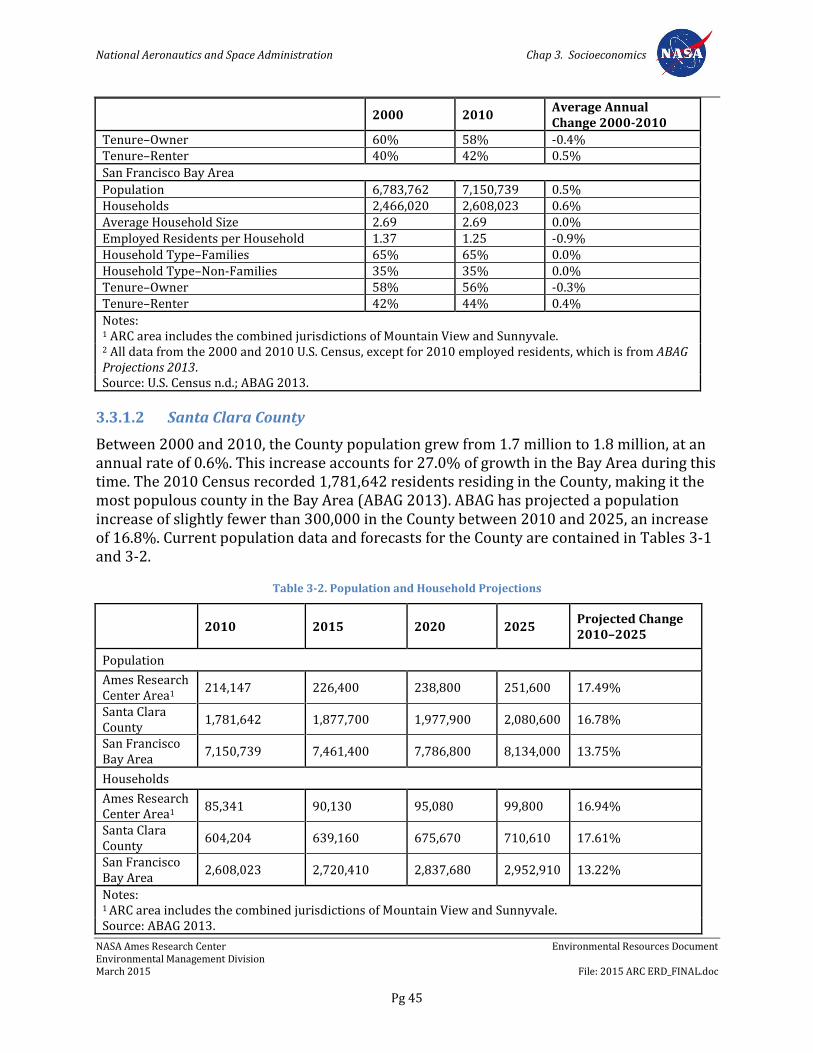
National Aeronautics and Space Administration Chap 3. Socioeconomics
NASA Ames Research Center Environmental Resources Document Environmental Management Division March 2015 File: 2015 ARC ERD_FINAL.doc
Pg 45
2000 2010 Average Annual Change 2000-2010
Tenure–Owner 60% 58% -0.4% Tenure–Renter 40% 42% 0.5%
San Francisco Bay Area
Population 6,783,762 7,150,739 0.5% Households 2,466,020 2,608,023 0.6% Average Household Size 2.69 2.69 0.0% Employed Residents per Household 1.37 1.25 -0.9% Household Type–Families 65% 65% 0.0% Household Type–Non-Families 35% 35% 0.0% Tenure–Owner 58% 56% -0.3% Tenure–Renter 42% 44% 0.4%
Notes: 1 ARC area includes the combined jurisdictions of Mountain View and Sunnyvale. 2 All data from the 2000 and 2010 U.S. Census, except for 2010 employed residents, which is from ABAG Projections 2013. Source: U.S. Census n.d.; ABAG 2013.
3.3.1.2 Santa Clara County
Between 2000 and 2010, the County population grew from 1.7 million to 1.8 million, at an annual rate of 0.6%. This increase accounts for 27.0% of growth in the Bay Area during this time. The 2010 Census recorded 1,781,642 residents residing in the County, making it the most populous county in the Bay Area (ABAG 2013). ABAG has projected a population increase of slightly fewer than 300,000 in the County between 2010 and 2025, an increase of 16.8%. Current population data and forecasts for the County are contained in Tables 3-1 and 3-2.
Table 3-2. Population and Household Projections
2010 2015 2020 2025 Projected Change 2010–2025
Population
Ames Research Center Area1
214,147 226,400 238,800 251,600 17.49%
Santa Clara County
1,781,642 1,877,700 1,977,900 2,080,600 16.78%
San Francisco Bay Area
7,150,739 7,461,400 7,786,800 8,134,000 13.75%
Households
Ames Research Center Area1
85,341 90,130 95,080 99,800 16.94%
Santa Clara County
604,204 639,160 675,670 710,610 17.61%
San Francisco Bay Area
2,608,023 2,720,410 2,837,680 2,952,910 13.22%
Notes: 1 ARC area includes the combined jurisdictions of Mountain View and Sunnyvale. Source: ABAG 2013.
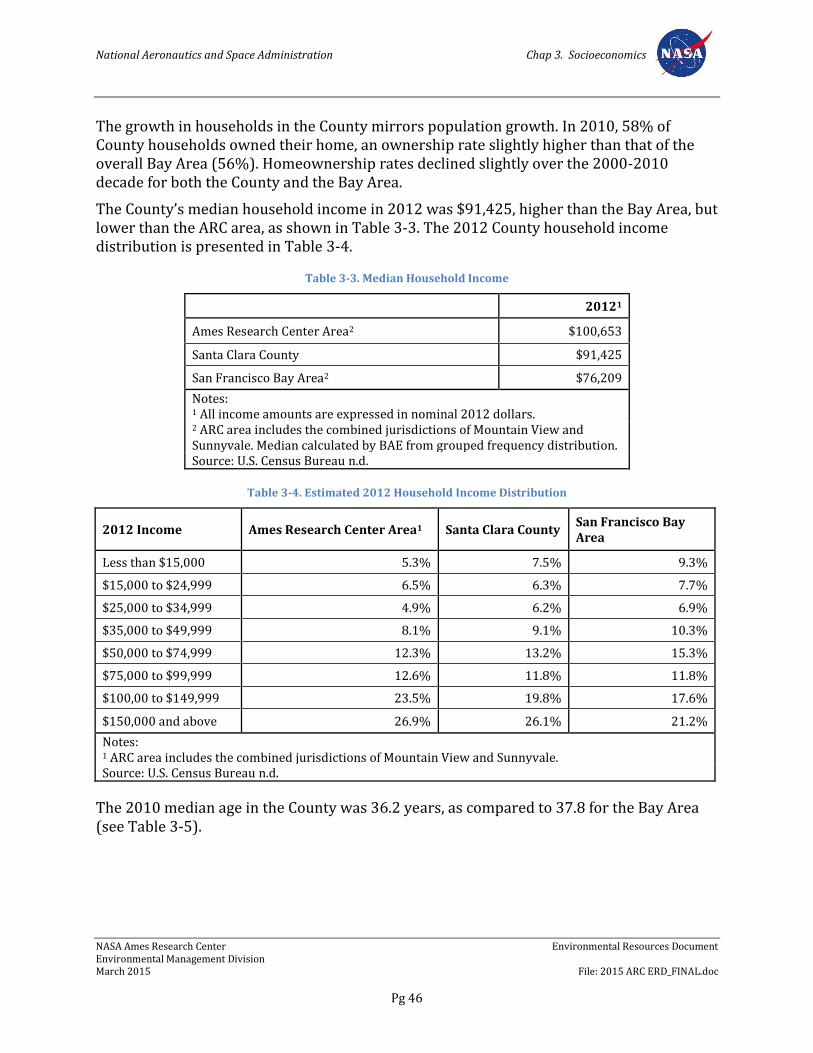
National Aeronautics and Space Administration Chap 3. Socioeconomics
NASA Ames Research Center Environmental Resources Document Environmental Management Division March 2015 File: 2015 ARC ERD_FINAL.doc
Pg 46
The growth in households in the County mirrors population growth. In 2010, 58% of County households owned their home, an ownership rate slightly higher than that of the overall Bay Area (56%). Homeownership rates declined slightly over the 2000-2010 decade for both the County and the Bay Area.
The County’s median household income in 2012 was $91,425, higher than the Bay Area, but lower than the ARC area, as shown in Table 3-3. The 2012 County household income distribution is presented in Table 3-4.
Table 3-3. Median Household Income
20121
Ames Research Center Area2 $100,653
Santa Clara County $91,425
San Francisco Bay Area2 $76,209
Notes: 1 All income amounts are expressed in nominal 2012 dollars. 2 ARC area includes the combined jurisdictions of Mountain View and Sunnyvale. Median calculated by BAE from grouped frequency distribution. Source: U.S. Census Bureau n.d.
Table 3-4. Estimated 2012 Household Income Distribution
2012 Income Ames Research Center Area1 Santa Clara County San Francisco Bay Area
Less than $15,000 5.3% 7.5% 9.3%
$15,000 to $24,999 6.5% 6.3% 7.7%
$25,000 to $34,999 4.9% 6.2% 6.9%
$35,000 to $49,999 8.1% 9.1% 10.3%
$50,000 to $74,999 12.3% 13.2% 15.3%
$75,000 to $99,999 12.6% 11.8% 11.8%
$100,00 to $149,999 23.5% 19.8% 17.6%
$150,000 and above 26.9% 26.1% 21.2%
Notes: 1 ARC area includes the combined jurisdictions of Mountain View and Sunnyvale. Source: U.S. Census Bureau n.d.
The 2010 median age in the County was 36.2 years, as compared to 37.8 for the Bay Area (see Table 3-5).
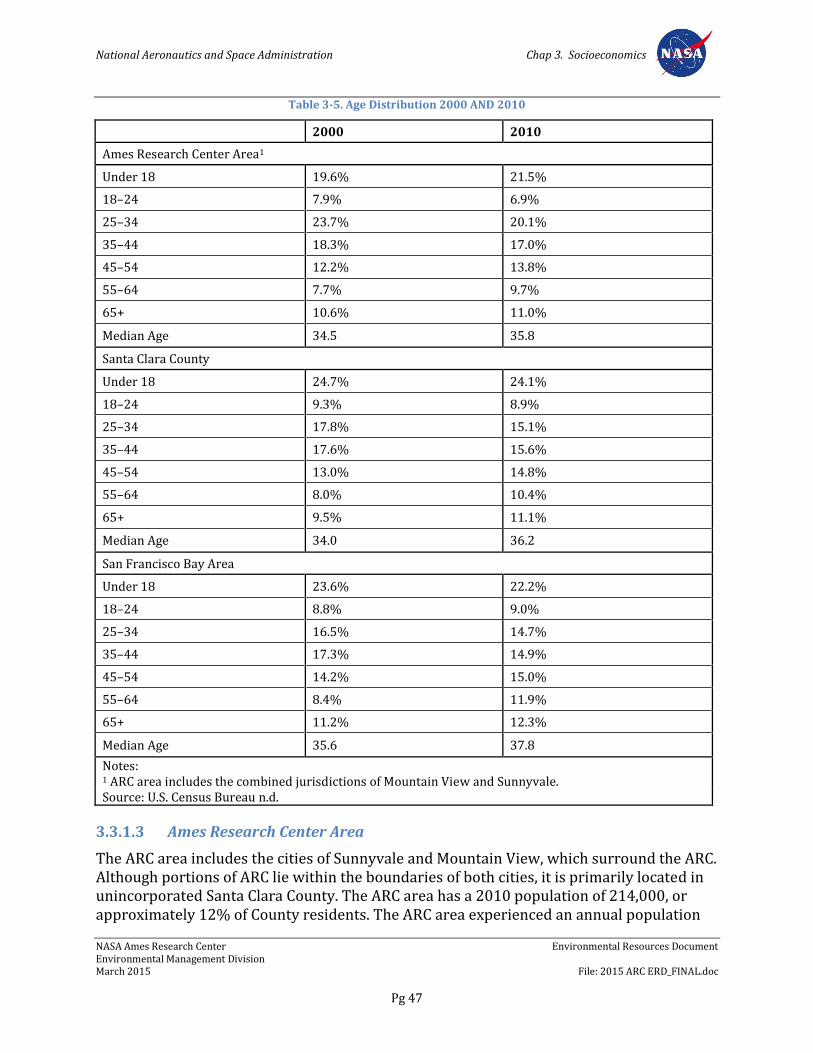
National Aeronautics and Space Administration Chap 3. Socioeconomics
NASA Ames Research Center Environmental Resources Document Environmental Management Division March 2015 File: 2015 ARC ERD_FINAL.doc
Pg 47
Table 3-5. Age Distribution 2000 AND 2010
2000 2010
Ames Research Center Area1
Under 18 19.6% 21.5%
18–24 7.9% 6.9%
25–34 23.7% 20.1%
35–44 18.3% 17.0%
45–54 12.2% 13.8%
55–64 7.7% 9.7%
65+ 10.6% 11.0%
Median Age 34.5 35.8
Santa Clara County
Under 18 24.7% 24.1%
18–24 9.3% 8.9%
25–34 17.8% 15.1%
35–44 17.6% 15.6%
45–54 13.0% 14.8%
55–64 8.0% 10.4%
65+ 9.5% 11.1%
Median Age 34.0 36.2
San Francisco Bay Area
Under 18 23.6% 22.2%
18–24 8.8% 9.0%
25–34 16.5% 14.7%
35–44 17.3% 14.9%
45–54 14.2% 15.0%
55–64 8.4% 11.9%
65+ 11.2% 12.3%
Median Age 35.6 37.8
Notes: 1 ARC area includes the combined jurisdictions of Mountain View and Sunnyvale. Source: U.S. Census Bureau n.d.
3.3.1.3 Ames Research Center Area
The ARC area includes the cities of Sunnyvale and Mountain View, which surround the ARC. Although portions of ARC lie within the boundaries of both cities, it is primarily located in unincorporated Santa Clara County. The ARC area has a 2010 population of 214,000, or approximately 12% of County residents. The ARC area experienced an annual population
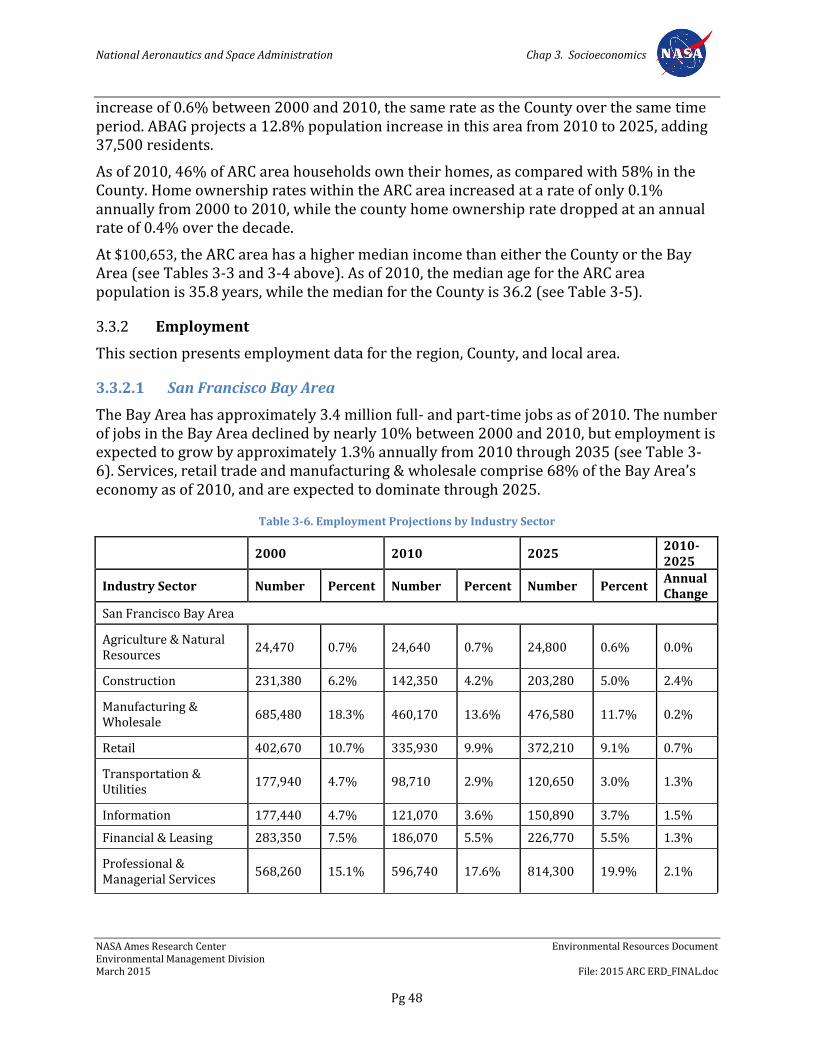
National Aeronautics and Space Administration Chap 3. Socioeconomics
NASA Ames Research Center Environmental Resources Document Environmental Management Division March 2015 File: 2015 ARC ERD_FINAL.doc
Pg 48
increase of 0.6% between 2000 and 2010, the same rate as the County over the same time period. ABAG projects a 12.8% population increase in this area from 2010 to 2025, adding 37,500 residents.
As of 2010, 46% of ARC area households own their homes, as compared with 58% in the County. Home ownership rates within the ARC area increased at a rate of only 0.1% annually from 2000 to 2010, while the county home ownership rate dropped at an annual rate of 0.4% over the decade.
At $100,653, the ARC area has a higher median income than either the County or the Bay Area (see Tables 3-3 and 3-4 above). As of 2010, the median age for the ARC area population is 35.8 years, while the median for the County is 36.2 (see Table 3-5).
3.3.2 Employment
This section presents employment data for the region, County, and local area.
3.3.2.1 San Francisco Bay Area
The Bay Area has approximately 3.4 million full- and part-time jobs as of 2010. The number of jobs in the Bay Area declined by nearly 10% between 2000 and 2010, but employment is expected to grow by approximately 1.3% annually from 2010 through 2035 (see Table 3-6). Services, retail trade and manufacturing & wholesale comprise 68% of the Bay Area’s economy as of 2010, and are expected to dominate through 2025.
Table 3-6. Employment Projections by Industry Sector
2000 2010 2025 2010-2025
Industry Sector Number Percent Number Percent Number Percent Annual Change
San Francisco Bay Area
Agriculture & Natural Resources
24,470 0.7% 24,640 0.7% 24,800 0.6% 0.0%
Construction 231,380 6.2% 142,350 4.2% 203,280 5.0% 2.4%
Manufacturing & Wholesale
685,480 18.3% 460,170 13.6% 476,580 11.7% 0.2%
Retail 402,670 10.7% 335,930 9.9% 372,210 9.1% 0.7%
Transportation & Utilities
177,940 4.7% 98,710 2.9% 120,650 3.0% 1.3%
Information 177,440 4.7% 121,070 3.6% 150,890 3.7% 1.5%
Financial & Leasing 283,350 7.5% 186,070 5.5% 226,770 5.5% 1.3%
Professional & Managerial Services
568,260 15.1% 596,740 17.6% 814,300 19.9% 2.1%
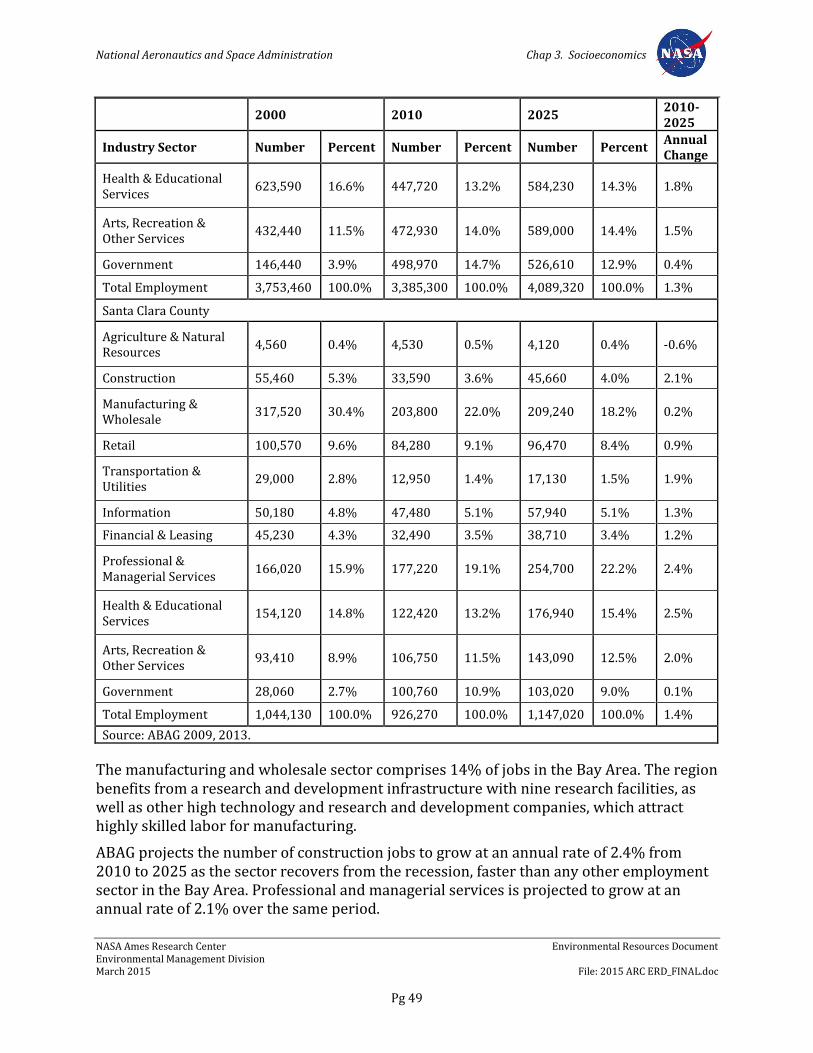
National Aeronautics and Space Administration Chap 3. Socioeconomics
NASA Ames Research Center Environmental Resources Document Environmental Management Division March 2015 File: 2015 ARC ERD_FINAL.doc
Pg 49
2000 2010 2025 2010-2025
Industry Sector Number Percent Number Percent Number Percent Annual Change
Health & Educational Services
623,590 16.6% 447,720 13.2% 584,230 14.3% 1.8%
Arts, Recreation & Other Services
432,440 11.5% 472,930 14.0% 589,000 14.4% 1.5%
Government 146,440 3.9% 498,970 14.7% 526,610 12.9% 0.4%
Total Employment 3,753,460 100.0% 3,385,300 100.0% 4,089,320 100.0% 1.3%
Santa Clara County
Agriculture & Natural Resources
4,560 0.4% 4,530 0.5% 4,120 0.4% -0.6%
Construction 55,460 5.3% 33,590 3.6% 45,660 4.0% 2.1%
Manufacturing & Wholesale
317,520 30.4% 203,800 22.0% 209,240 18.2% 0.2%
Retail 100,570 9.6% 84,280 9.1% 96,470 8.4% 0.9%
Transportation & Utilities
29,000 2.8% 12,950 1.4% 17,130 1.5% 1.9%
Information 50,180 4.8% 47,480 5.1% 57,940 5.1% 1.3%
Financial & Leasing 45,230 4.3% 32,490 3.5% 38,710 3.4% 1.2%
Professional & Managerial Services
166,020 15.9% 177,220 19.1% 254,700 22.2% 2.4%
Health & Educational Services
154,120 14.8% 122,420 13.2% 176,940 15.4% 2.5%
Arts, Recreation & Other Services
93,410 8.9% 106,750 11.5% 143,090 12.5% 2.0%
Government 28,060 2.7% 100,760 10.9% 103,020 9.0% 0.1%
Total Employment 1,044,130 100.0% 926,270 100.0% 1,147,020 100.0% 1.4%
Source: ABAG 2009, 2013.
The manufacturing and wholesale sector comprises 14% of jobs in the Bay Area. The region benefits from a research and development infrastructure with nine research facilities, as well as other high technology and research and development companies, which attract highly skilled labor for manufacturing.
ABAG projects the number of construction jobs to grow at an annual rate of 2.4% from 2010 to 2025 as the sector recovers from the recession, faster than any other employment sector in the Bay Area. Professional and managerial services is projected to grow at an annual rate of 2.1% over the same period.
National Aeronautics and Space Administration Chap 3. Socioeconomics
NASA Ames Research Center Environmental Resources Document Environmental Management Division March 2015 File: 2015 ARC ERD_FINAL.doc
Pg 50
3.3.2.2 Santa Clara County
The County is recognized worldwide as a major center for high technology development, which includes the following high-profile firms:
Adobe Systems, Inc.
Apple Computer
Applied Materials, Inc.
Advanced Micro Devices (AMD)
Cisco Systems, Inc.
Hewlett-Packard Company
Intel Corporation
Lockheed-Martin Missiles and Space
VM Software
Tesla Motors
In 2010, manufacturing, service, wholesale, and retail trade sectors comprised 78% of all jobs in the County. The manufacturing and wholesale sector is particularly large in Santa Clara County, albeit smaller than in 2000. Employment in this sector is expected to grow minimally from 2010 through 2025 (see Table 3-6 above).
As of 2013, there were 951,600 wage and salary workers in the County (State of California EDD 2014); in 2010 County employment represented 27% of total employment in the Bay Area (ABAG 2013). By 2025, the number of workers in the County is projected to increase by 24% from 2010 levels.
3.3.2.3 Ames Research Center Area
As of 2010, 13 percent of all jobs in the County are in the ARC area (Table 3-7), 28% of which are in the manufacturing and wholesale and transportation sector. Major technology firms in the ARC area include Google, Symantec, Intuit, Yahoo!, Juniper Networks, Network Appliances, and AMD.
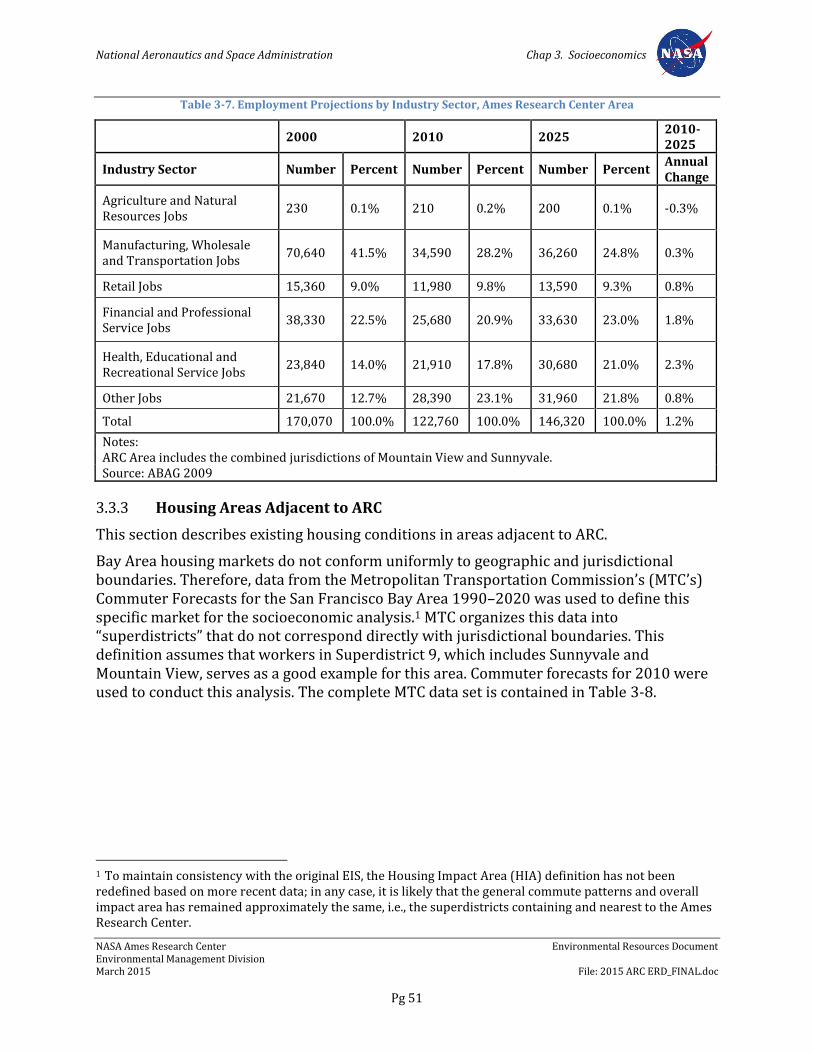
National Aeronautics and Space Administration Chap 3. Socioeconomics
NASA Ames Research Center Environmental Resources Document Environmental Management Division March 2015 File: 2015 ARC ERD_FINAL.doc
Pg 51
Table 3-7. Employment Projections by Industry Sector, Ames Research Center Area
2000 2010 2025 2010-2025
Industry Sector Number Percent Number Percent Number Percent Annual Change
Agriculture and Natural Resources Jobs
230 0.1% 210 0.2% 200 0.1% -0.3%
Manufacturing, Wholesale and Transportation Jobs
70,640 41.5% 34,590 28.2% 36,260 24.8% 0.3%
Retail Jobs 15,360 9.0% 11,980 9.8% 13,590 9.3% 0.8%
Financial and Professional Service Jobs
38,330 22.5% 25,680 20.9% 33,630 23.0% 1.8%
Health, Educational and Recreational Service Jobs
23,840 14.0% 21,910 17.8% 30,680 21.0% 2.3%
Other Jobs 21,670 12.7% 28,390 23.1% 31,960 21.8% 0.8%
Total 170,070 100.0% 122,760 100.0% 146,320 100.0% 1.2%
Notes: ARC Area includes the combined jurisdictions of Mountain View and Sunnyvale. Source: ABAG 2009
3.3.3 Housing Areas Adjacent to ARC
This section describes existing housing conditions in areas adjacent to ARC.
Bay Area housing markets do not conform uniformly to geographic and jurisdictional boundaries. Therefore, data from the Metropolitan Transportation Commission’s (MTC’s) Commuter Forecasts for the San Francisco Bay Area 1990–2020 was used to define this specific market for the socioeconomic analysis.1 MTC organizes this data into “superdistricts” that do not correspond directly with jurisdictional boundaries. This definition assumes that workers in Superdistrict 9, which includes Sunnyvale and Mountain View, serves as a good example for this area. Commuter forecasts for 2010 were used to conduct this analysis. The complete MTC data set is contained in Table 3-8.
1 To maintain consistency with the original EIS, the Housing Impact Area (HIA) definition has not been redefined based on more recent data; in any case, it is likely that the general commute patterns and overall impact area has remained approximately the same, i.e., the superdistricts containing and nearest to the Ames Research Center.
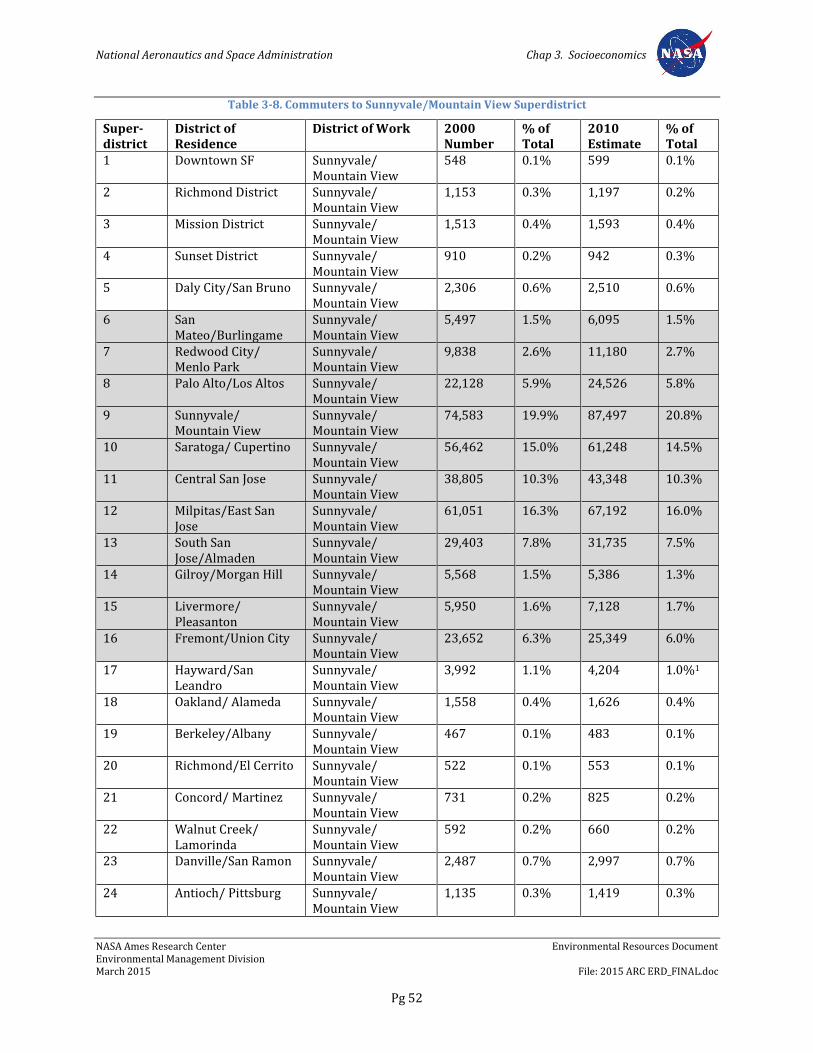
National Aeronautics and Space Administration Chap 3. Socioeconomics
NASA Ames Research Center Environmental Resources Document Environmental Management Division March 2015 File: 2015 ARC ERD_FINAL.doc
Pg 52
Table 3-8. Commuters to Sunnyvale/Mountain View Superdistrict
Super-district
District of Residence
District of Work 2000 Number
% of Total
2010 Estimate
% of Total
1 Downtown SF Sunnyvale/ Mountain View
548 0.1% 599 0.1%
2 Richmond District Sunnyvale/ Mountain View
1,153 0.3% 1,197 0.2%
3 Mission District Sunnyvale/ Mountain View
1,513 0.4% 1,593 0.4%
4 Sunset District Sunnyvale/ Mountain View
910 0.2% 942 0.3%
5 Daly City/San Bruno Sunnyvale/ Mountain View
2,306 0.6% 2,510 0.6%
6 San Mateo/Burlingame
Sunnyvale/ Mountain View
5,497 1.5% 6,095 1.5%
7 Redwood City/ Menlo Park
Sunnyvale/ Mountain View
9,838 2.6% 11,180 2.7%
8 Palo Alto/Los Altos Sunnyvale/ Mountain View
22,128 5.9% 24,526 5.8%
9 Sunnyvale/ Mountain View
Sunnyvale/ Mountain View
74,583 19.9% 87,497 20.8%
10 Saratoga/ Cupertino Sunnyvale/ Mountain View
56,462 15.0% 61,248 14.5%
11 Central San Jose Sunnyvale/ Mountain View
38,805 10.3% 43,348 10.3%
12 Milpitas/East San Jose
Sunnyvale/ Mountain View
61,051 16.3% 67,192 16.0%
13 South San Jose/Almaden
Sunnyvale/ Mountain View
29,403 7.8% 31,735 7.5%
14 Gilroy/Morgan Hill Sunnyvale/ Mountain View
5,568 1.5% 5,386 1.3%
15 Livermore/ Pleasanton
Sunnyvale/ Mountain View
5,950 1.6% 7,128 1.7%
16 Fremont/Union City Sunnyvale/ Mountain View
23,652 6.3% 25,349 6.0%
17 Hayward/San Leandro
Sunnyvale/ Mountain View
3,992 1.1% 4,204 1.0%1
18 Oakland/ Alameda Sunnyvale/ Mountain View
1,558 0.4% 1,626 0.4%
19 Berkeley/Albany Sunnyvale/ Mountain View
467 0.1% 483 0.1%
20 Richmond/El Cerrito Sunnyvale/ Mountain View
522 0.1% 553 0.1%
21 Concord/ Martinez Sunnyvale/ Mountain View
731 0.2% 825 0.2%
22 Walnut Creek/ Lamorinda
Sunnyvale/ Mountain View
592 0.2% 660 0.2%
23 Danville/San Ramon Sunnyvale/ Mountain View
2,487 0.7% 2,997 0.7%
24 Antioch/ Pittsburg Sunnyvale/ Mountain View
1,135 0.3% 1,419 0.3%
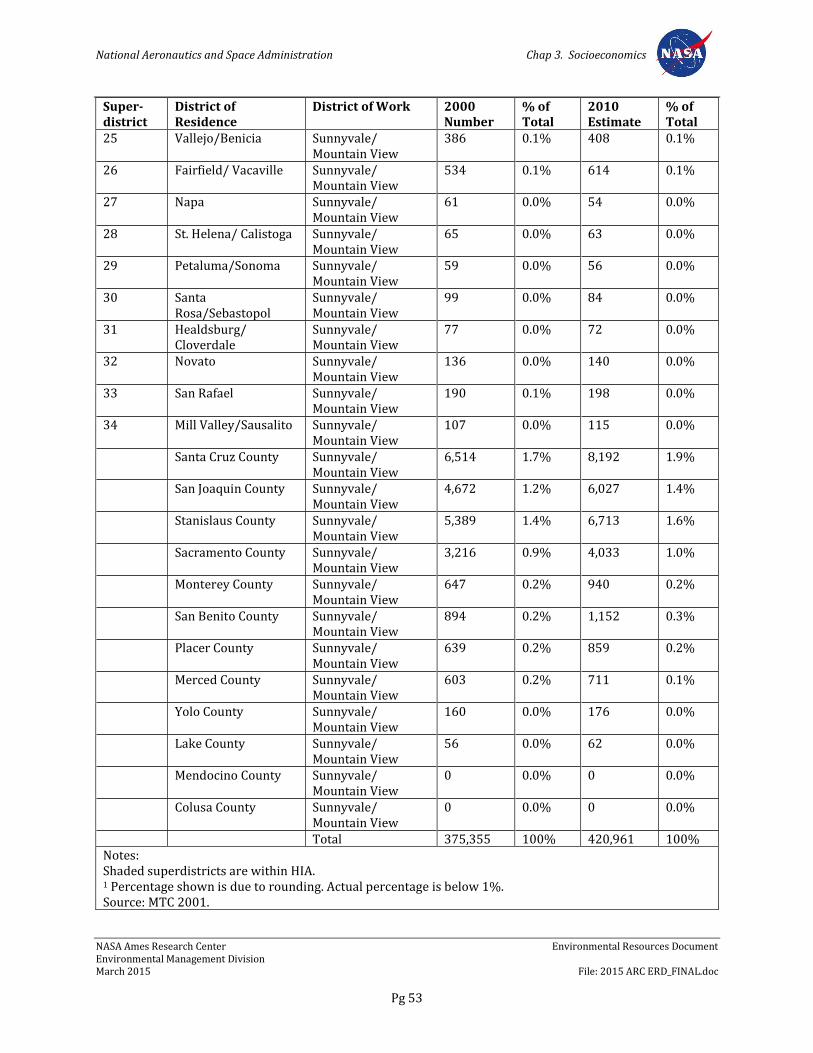
National Aeronautics and Space Administration Chap 3. Socioeconomics
NASA Ames Research Center Environmental Resources Document Environmental Management Division March 2015 File: 2015 ARC ERD_FINAL.doc
Pg 53
Super-district
District of Residence
District of Work 2000 Number
% of Total
2010 Estimate
% of Total
25 Vallejo/Benicia Sunnyvale/ Mountain View
386 0.1% 408 0.1%
26 Fairfield/ Vacaville Sunnyvale/ Mountain View
534 0.1% 614 0.1%
27 Napa Sunnyvale/ Mountain View
61 0.0% 54 0.0%
28 St. Helena/ Calistoga Sunnyvale/ Mountain View
65 0.0% 63 0.0%
29 Petaluma/Sonoma Sunnyvale/ Mountain View
59 0.0% 56 0.0%
30 Santa Rosa/Sebastopol
Sunnyvale/ Mountain View
99 0.0% 84 0.0%
31 Healdsburg/ Cloverdale
Sunnyvale/ Mountain View
77 0.0% 72 0.0%
32 Novato Sunnyvale/ Mountain View
136 0.0% 140 0.0%
33 San Rafael Sunnyvale/ Mountain View
190 0.1% 198 0.0%
34 Mill Valley/Sausalito Sunnyvale/ Mountain View
107 0.0% 115 0.0%
Santa Cruz County Sunnyvale/ Mountain View
6,514 1.7% 8,192 1.9%
San Joaquin County Sunnyvale/ Mountain View
4,672 1.2% 6,027 1.4%
Stanislaus County Sunnyvale/ Mountain View
5,389 1.4% 6,713 1.6%
Sacramento County Sunnyvale/ Mountain View
3,216 0.9% 4,033 1.0%
Monterey County Sunnyvale/ Mountain View
647 0.2% 940 0.2%
San Benito County Sunnyvale/ Mountain View
894 0.2% 1,152 0.3%
Placer County Sunnyvale/ Mountain View
639 0.2% 859 0.2%
Merced County Sunnyvale/ Mountain View
603 0.2% 711 0.1%
Yolo County Sunnyvale/ Mountain View
160 0.0% 176 0.0%
Lake County Sunnyvale/ Mountain View
56 0.0% 62 0.0%
Mendocino County Sunnyvale/ Mountain View
0 0.0% 0 0.0%
Colusa County Sunnyvale/ Mountain View
0 0.0% 0 0.0%
Total 375,355 100% 420,961 100% Notes: Shaded superdistricts are within HIA. 1 Percentage shown is due to rounding. Actual percentage is below 1%. Source: MTC 2001.
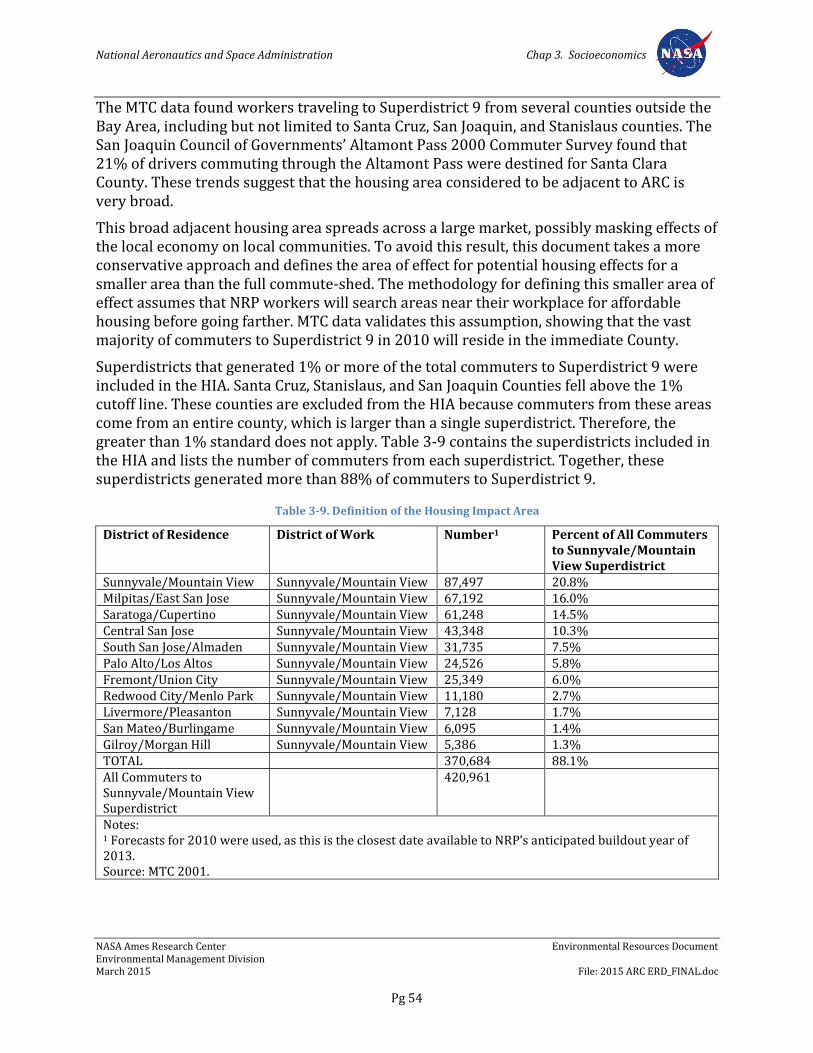
National Aeronautics and Space Administration Chap 3. Socioeconomics
NASA Ames Research Center Environmental Resources Document Environmental Management Division March 2015 File: 2015 ARC ERD_FINAL.doc
Pg 54
The MTC data found workers traveling to Superdistrict 9 from several counties outside the Bay Area, including but not limited to Santa Cruz, San Joaquin, and Stanislaus counties. The San Joaquin Council of Governments’ Altamont Pass 2000 Commuter Survey found that 21% of drivers commuting through the Altamont Pass were destined for Santa Clara County. These trends suggest that the housing area considered to be adjacent to ARC is very broad.
This broad adjacent housing area spreads across a large market, possibly masking effects of the local economy on local communities. To avoid this result, this document takes a more conservative approach and defines the area of effect for potential housing effects for a smaller area than the full commute-shed. The methodology for defining this smaller area of effect assumes that NRP workers will search areas near their workplace for affordable housing before going farther. MTC data validates this assumption, showing that the vast majority of commuters to Superdistrict 9 in 2010 will reside in the immediate County.
Superdistricts that generated 1% or more of the total commuters to Superdistrict 9 were included in the HIA. Santa Cruz, Stanislaus, and San Joaquin Counties fell above the 1% cutoff line. These counties are excluded from the HIA because commuters from these areas come from an entire county, which is larger than a single superdistrict. Therefore, the greater than 1% standard does not apply. Table 3-9 contains the superdistricts included in the HIA and lists the number of commuters from each superdistrict. Together, these superdistricts generated more than 88% of commuters to Superdistrict 9.
Table 3-9. Definition of the Housing Impact Area
District of Residence District of Work Number1 Percent of All Commuters to Sunnyvale/Mountain View Superdistrict
Sunnyvale/Mountain View Sunnyvale/Mountain View 87,497 20.8% Milpitas/East San Jose Sunnyvale/Mountain View 67,192 16.0% Saratoga/Cupertino Sunnyvale/Mountain View 61,248 14.5% Central San Jose Sunnyvale/Mountain View 43,348 10.3% South San Jose/Almaden Sunnyvale/Mountain View 31,735 7.5% Palo Alto/Los Altos Sunnyvale/Mountain View 24,526 5.8% Fremont/Union City Sunnyvale/Mountain View 25,349 6.0% Redwood City/Menlo Park Sunnyvale/Mountain View 11,180 2.7% Livermore/Pleasanton Sunnyvale/Mountain View 7,128 1.7% San Mateo/Burlingame Sunnyvale/Mountain View 6,095 1.4% Gilroy/Morgan Hill Sunnyvale/Mountain View 5,386 1.3% TOTAL 370,684 88.1% All Commuters to Sunnyvale/Mountain View Superdistrict
420,961
Notes: 1 Forecasts for 2010 were used, as this is the closest date available to NRP’s anticipated buildout year of 2013. Source: MTC 2001.
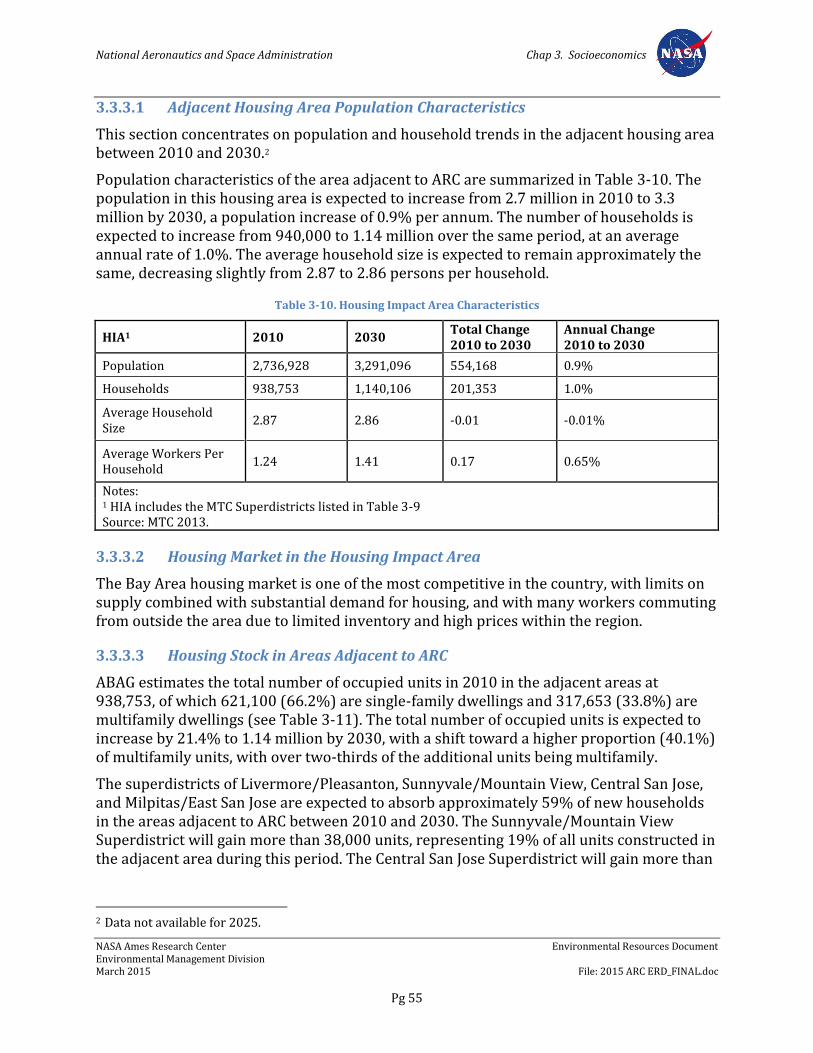
National Aeronautics and Space Administration Chap 3. Socioeconomics
NASA Ames Research Center Environmental Resources Document Environmental Management Division March 2015 File: 2015 ARC ERD_FINAL.doc
Pg 55
3.3.3.1 Adjacent Housing Area Population Characteristics
This section concentrates on population and household trends in the adjacent housing area between 2010 and 2030.2
Population characteristics of the area adjacent to ARC are summarized in Table 3-10. The population in this housing area is expected to increase from 2.7 million in 2010 to 3.3 million by 2030, a population increase of 0.9% per annum. The number of households is expected to increase from 940,000 to 1.14 million over the same period, at an average annual rate of 1.0%. The average household size is expected to remain approximately the same, decreasing slightly from 2.87 to 2.86 persons per household.
Table 3-10. Housing Impact Area Characteristics
HIA1 2010 2030 Total Change 2010 to 2030
Annual Change 2010 to 2030
Population 2,736,928 3,291,096 554,168 0.9%
Households 938,753 1,140,106 201,353 1.0%
Average Household Size
2.87 2.86 -0.01 -0.01%
Average Workers Per Household
1.24 1.41 0.17 0.65%
Notes: 1 HIA includes the MTC Superdistricts listed in Table 3-9 Source: MTC 2013.
3.3.3.2 Housing Market in the Housing Impact Area
The Bay Area housing market is one of the most competitive in the country, with limits on supply combined with substantial demand for housing, and with many workers commuting from outside the area due to limited inventory and high prices within the region.
3.3.3.3 Housing Stock in Areas Adjacent to ARC
ABAG estimates the total number of occupied units in 2010 in the adjacent areas at 938,753, of which 621,100 (66.2%) are single-family dwellings and 317,653 (33.8%) are multifamily dwellings (see Table 3-11). The total number of occupied units is expected to increase by 21.4% to 1.14 million by 2030, with a shift toward a higher proportion (40.1%) of multifamily units, with over two-thirds of the additional units being multifamily.
The superdistricts of Livermore/Pleasanton, Sunnyvale/Mountain View, Central San Jose, and Milpitas/East San Jose are expected to absorb approximately 59% of new households in the areas adjacent to ARC between 2010 and 2030. The Sunnyvale/Mountain View Superdistrict will gain more than 38,000 units, representing 19% of all units constructed in the adjacent area during this period. The Central San Jose Superdistrict will gain more than
2 Data not available for 2025.
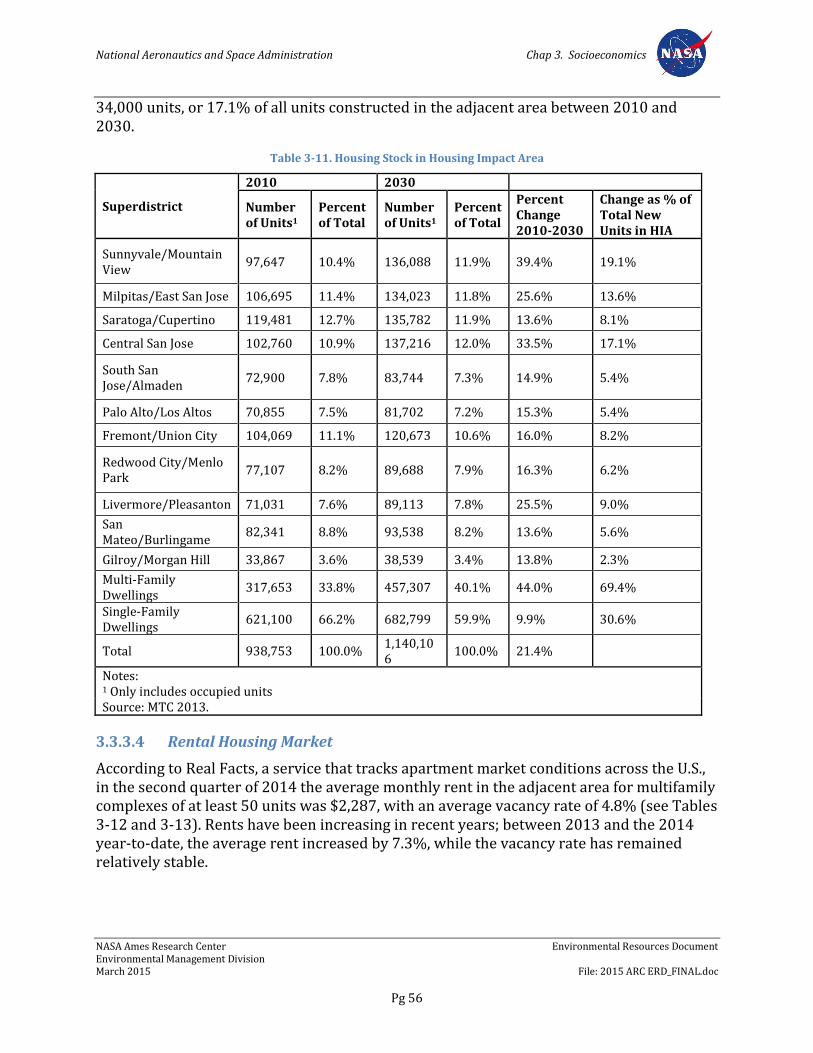
National Aeronautics and Space Administration Chap 3. Socioeconomics
NASA Ames Research Center Environmental Resources Document Environmental Management Division March 2015 File: 2015 ARC ERD_FINAL.doc
Pg 56
34,000 units, or 17.1% of all units constructed in the adjacent area between 2010 and 2030.
Table 3-11. Housing Stock in Housing Impact Area
Superdistrict
2010 2030
Number of Units1
Percent of Total
Number of Units1
Percent of Total
Percent Change 2010-2030
Change as % of Total New Units in HIA
Sunnyvale/Mountain View
97,647 10.4% 136,088 11.9% 39.4% 19.1%
Milpitas/East San Jose 106,695 11.4% 134,023 11.8% 25.6% 13.6%
Saratoga/Cupertino 119,481 12.7% 135,782 11.9% 13.6% 8.1%
Central San Jose 102,760 10.9% 137,216 12.0% 33.5% 17.1%
South San Jose/Almaden
72,900 7.8% 83,744 7.3% 14.9% 5.4%
Palo Alto/Los Altos 70,855 7.5% 81,702 7.2% 15.3% 5.4%
Fremont/Union City 104,069 11.1% 120,673 10.6% 16.0% 8.2%
Redwood City/Menlo Park
77,107 8.2% 89,688 7.9% 16.3% 6.2%
Livermore/Pleasanton 71,031 7.6% 89,113 7.8% 25.5% 9.0%
San Mateo/Burlingame
82,341 8.8% 93,538 8.2% 13.6% 5.6%
Gilroy/Morgan Hill 33,867 3.6% 38,539 3.4% 13.8% 2.3%
Multi-Family Dwellings
317,653 33.8% 457,307 40.1% 44.0% 69.4%
Single-Family Dwellings
621,100 66.2% 682,799 59.9% 9.9% 30.6%
Total 938,753 100.0% 1,140,106
100.0% 21.4%
Notes: 1 Only includes occupied units Source: MTC 2013.
3.3.3.4 Rental Housing Market
According to Real Facts, a service that tracks apartment market conditions across the U.S., in the second quarter of 2014 the average monthly rent in the adjacent area for multifamily complexes of at least 50 units was $2,287, with an average vacancy rate of 4.8% (see Tables 3-12 and 3-13). Rents have been increasing in recent years; between 2013 and the 2014 year-to-date, the average rent increased by 7.3%, while the vacancy rate has remained relatively stable.
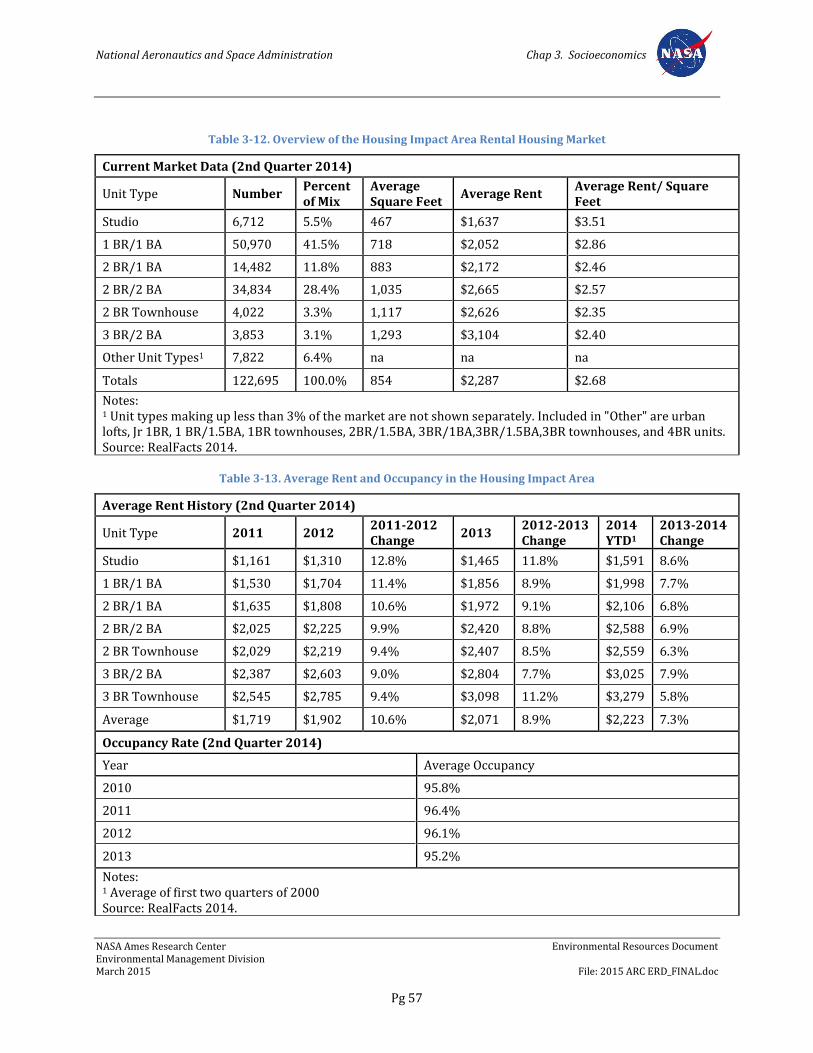
National Aeronautics and Space Administration Chap 3. Socioeconomics
NASA Ames Research Center Environmental Resources Document Environmental Management Division March 2015 File: 2015 ARC ERD_FINAL.doc
Pg 57
Table 3-12. Overview of the Housing Impact Area Rental Housing Market
Current Market Data (2nd Quarter 2014)
Unit Type Number Percent of Mix
Average Square Feet
Average Rent Average Rent/ Square Feet
Studio 6,712 5.5% 467 $1,637 $3.51
1 BR/1 BA 50,970 41.5% 718 $2,052 $2.86
2 BR/1 BA 14,482 11.8% 883 $2,172 $2.46
2 BR/2 BA 34,834 28.4% 1,035 $2,665 $2.57
2 BR Townhouse 4,022 3.3% 1,117 $2,626 $2.35
3 BR/2 BA 3,853 3.1% 1,293 $3,104 $2.40
Other Unit Types1 7,822 6.4% na na na
Totals 122,695 100.0% 854 $2,287 $2.68
Notes: 1 Unit types making up less than 3% of the market are not shown separately. Included in "Other" are urban lofts, Jr 1BR, 1 BR/1.5BA, 1BR townhouses, 2BR/1.5BA, 3BR/1BA,3BR/1.5BA,3BR townhouses, and 4BR units. Source: RealFacts 2014.
Table 3-13. Average Rent and Occupancy in the Housing Impact Area
Average Rent History (2nd Quarter 2014)
Unit Type 2011 2012 2011-2012 Change
2013 2012-2013 Change
2014 YTD1
2013-2014 Change
Studio $1,161 $1,310 12.8% $1,465 11.8% $1,591 8.6%
1 BR/1 BA $1,530 $1,704 11.4% $1,856 8.9% $1,998 7.7%
2 BR/1 BA $1,635 $1,808 10.6% $1,972 9.1% $2,106 6.8%
2 BR/2 BA $2,025 $2,225 9.9% $2,420 8.8% $2,588 6.9%
2 BR Townhouse $2,029 $2,219 9.4% $2,407 8.5% $2,559 6.3%
3 BR/2 BA $2,387 $2,603 9.0% $2,804 7.7% $3,025 7.9%
3 BR Townhouse $2,545 $2,785 9.4% $3,098 11.2% $3,279 5.8%
Average $1,719 $1,902 10.6% $2,071 8.9% $2,223 7.3%
Occupancy Rate (2nd Quarter 2014)
Year Average Occupancy
2010 95.8%
2011 96.4%
2012 96.1%
2013 95.2%
Notes: 1 Average of first two quarters of 2000 Source: RealFacts 2014.
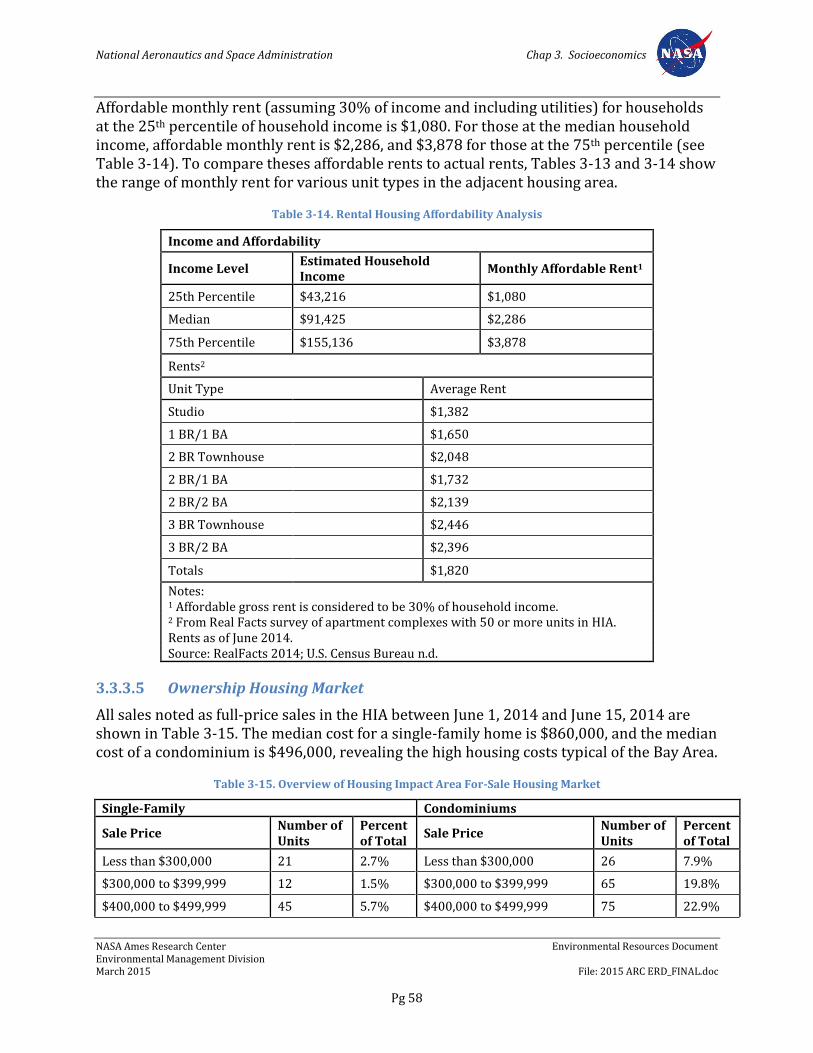
National Aeronautics and Space Administration Chap 3. Socioeconomics
NASA Ames Research Center Environmental Resources Document Environmental Management Division March 2015 File: 2015 ARC ERD_FINAL.doc
Pg 58
Affordable monthly rent (assuming 30% of income and including utilities) for households at the 25th percentile of household income is $1,080. For those at the median household income, affordable monthly rent is $2,286, and $3,878 for those at the 75th percentile (see Table 3-14). To compare theses affordable rents to actual rents, Tables 3-13 and 3-14 show the range of monthly rent for various unit types in the adjacent housing area.
Table 3-14. Rental Housing Affordability Analysis
Income and Affordability
Income Level Estimated Household Income
Monthly Affordable Rent1
25th Percentile $43,216 $1,080
Median $91,425 $2,286
75th Percentile $155,136 $3,878
Rents2
Unit Type Average Rent
Studio $1,382
1 BR/1 BA $1,650
2 BR Townhouse $2,048
2 BR/1 BA $1,732
2 BR/2 BA $2,139
3 BR Townhouse $2,446
3 BR/2 BA $2,396
Totals $1,820
Notes: 1 Affordable gross rent is considered to be 30% of household income. 2 From Real Facts survey of apartment complexes with 50 or more units in HIA. Rents as of June 2014. Source: RealFacts 2014; U.S. Census Bureau n.d.
3.3.3.5 Ownership Housing Market
All sales noted as full-price sales in the HIA between June 1, 2014 and June 15, 2014 are shown in Table 3-15. The median cost for a single-family home is $860,000, and the median cost of a condominium is $496,000, revealing the high housing costs typical of the Bay Area.
Table 3-15. Overview of Housing Impact Area For-Sale Housing Market
Single-Family Condominiums
Sale Price Number of Units
Percent of Total
Sale Price Number of Units
Percent of Total
Less than $300,000 21 2.7% Less than $300,000 26 7.9%
$300,000 to $399,999 12 1.5% $300,000 to $399,999 65 19.8%
$400,000 to $499,999 45 5.7% $400,000 to $499,999 75 22.9%
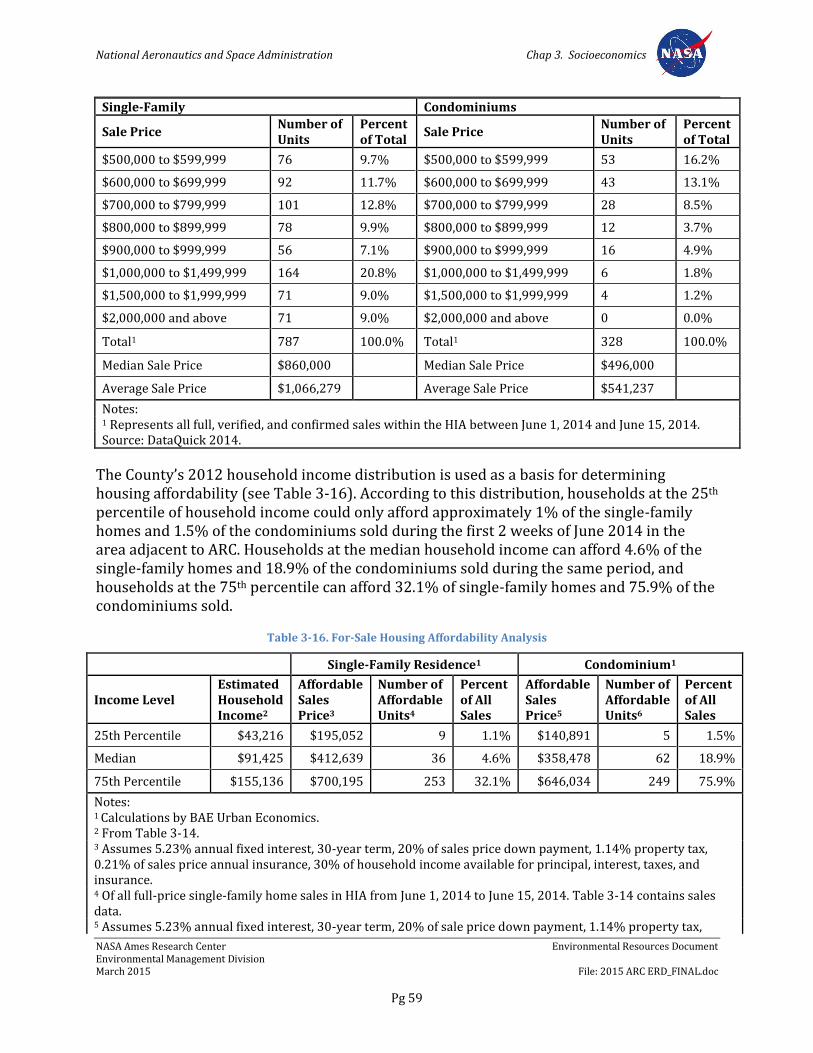
National Aeronautics and Space Administration Chap 3. Socioeconomics
NASA Ames Research Center Environmental Resources Document Environmental Management Division March 2015 File: 2015 ARC ERD_FINAL.doc
Pg 59
Single-Family Condominiums
Sale Price Number of Units
Percent of Total
Sale Price Number of Units
Percent of Total
$500,000 to $599,999 76 9.7% $500,000 to $599,999 53 16.2%
$600,000 to $699,999 92 11.7% $600,000 to $699,999 43 13.1%
$700,000 to $799,999 101 12.8% $700,000 to $799,999 28 8.5%
$800,000 to $899,999 78 9.9% $800,000 to $899,999 12 3.7%
$900,000 to $999,999 56 7.1% $900,000 to $999,999 16 4.9%
$1,000,000 to $1,499,999 164 20.8% $1,000,000 to $1,499,999 6 1.8%
$1,500,000 to $1,999,999 71 9.0% $1,500,000 to $1,999,999 4 1.2%
$2,000,000 and above 71 9.0% $2,000,000 and above 0 0.0%
Total1 787 100.0% Total1 328 100.0%
Median Sale Price $860,000 Median Sale Price $496,000
Average Sale Price $1,066,279 Average Sale Price $541,237
Notes: 1 Represents all full, verified, and confirmed sales within the HIA between June 1, 2014 and June 15, 2014. Source: DataQuick 2014.
The County’s 2012 household income distribution is used as a basis for determining housing affordability (see Table 3-16). According to this distribution, households at the 25th percentile of household income could only afford approximately 1% of the single-family homes and 1.5% of the condominiums sold during the first 2 weeks of June 2014 in the area adjacent to ARC. Households at the median household income can afford 4.6% of the single-family homes and 18.9% of the condominiums sold during the same period, and households at the 75th percentile can afford 32.1% of single-family homes and 75.9% of the condominiums sold.
Table 3-16. For-Sale Housing Affordability Analysis
Single-Family Residence1 Condominium1
Income Level Estimated Household Income2
Affordable Sales Price3
Number of Affordable Units4
Percent of All Sales
Affordable Sales Price5
Number of Affordable Units6
Percent of All Sales
25th Percentile $43,216 $195,052 9 1.1% $140,891 5 1.5%
Median $91,425 $412,639 36 4.6% $358,478 62 18.9%
75th Percentile $155,136 $700,195 253 32.1% $646,034 249 75.9%
Notes: 1 Calculations by BAE Urban Economics. 2 From Table 3-14. 3 Assumes 5.23% annual fixed interest, 30-year term, 20% of sales price down payment, 1.14% property tax, 0.21% of sales price annual insurance, 30% of household income available for principal, interest, taxes, and insurance. 4 Of all full-price single-family home sales in HIA from June 1, 2014 to June 15, 2014. Table 3-14 contains sales data. 5 Assumes 5.23% annual fixed interest, 30-year term, 20% of sale price down payment, 1.14% property tax,
National Aeronautics and Space Administration Chap 3. Socioeconomics
NASA Ames Research Center Environmental Resources Document Environmental Management Division March 2015 File: 2015 ARC ERD_FINAL.doc
Pg 60
$300/month homeowners dues, 30% of household income available for principal, interest, taxes, and insurance. 6 Of all full-price condominium sales in HIA from June 1, 2014 through June 15, 2014. Source: U.S. Census Bureau n.d.
3.3.4 Fiscal Environment
This section discusses the existing fiscal conditions in the County, the cities of Sunnyvale and Mountain View, and the school districts serving Moffett Field.
3.3.4.1 Ames Research Center
Portions of ARC are located within the cities of Sunnyvale (specifically parcel 015-36-009) and Mountain View (parcels 116-07-010 and 116-12-008). However, the majority of the ARC lies within unincorporated Santa Clara County. These multiple jurisdictions within the ARC create a complex tax system. More than 1/2 of Moffett Field is under federal exclusive jurisdiction.
Most of the Bay View area exists on lands over which the federal government has a proprietary interest, but has no legislative jurisdiction. Although this designation generally allows cities to provide law enforcement and public safety, the federal government has historically provided these services and is expected to continue to do so. Regardless of whether property is owned by the federal government or a non-federal entity, areas under exclusive federal legislative jurisdiction are not subject to property taxes.
However, Congress has waived the sovereign immunity of the federal government on exclusive jurisdiction land for other taxes. Under the Buck Act, 4 United States Code(USC)105-110, state and local sales taxes, income taxes, and use taxes are applicable within areas of exclusive federal legislative jurisdiction. Such taxes may not be levied on the federal government or any federal instrumentality. However, private for-profit corporations in exclusive federal legislative jurisdiction and nonprofit entities are subject to these taxes.
Areas under partial legislative jurisdiction or proprietary interest are subject to state and local taxes. Therefore, nonfederal entities in these areas are subject to all taxes, including property tax, unless the entities have another status (e.g., nonprofit or state entities) that would otherwise leave them exempt.
3.3.4.2 Santa Clara County
According to the Fiscal Year (FY) 2015 Recommended Budget (FY 2015 Budget), the County anticipates $883 million in General Fund Unallocated Revenues for FY 2015. Motor vehicle in-lieu fees and secured property taxes represent the two largest unallocated revenue sources, with $345 million and $207 million, respectively, in revenues for FY 2015.
The FY 2015 Budget reports that County revenue has grown in conjunction as the Silicon Valley economy recovers from the recent recession. Three of the largest revenue sources of the County General Fund are secured property tax, motor vehicle in-lieu fees, and the Measure A sales tax, all of which are expected to increase between FYs 2014 and 2015; the projected budget surplus in FY 2015 is $34.3 million. However, the FY 2015 Budget reports

National Aeronautics and Space Administration Chap 3. Socioeconomics
NASA Ames Research Center Environmental Resources Document Environmental Management Division March 2015 File: 2015 ARC ERD_FINAL.doc
Pg 61
that the Affordable Care Act and reductions in funding for the public safety realignment from Assembly Bill (AB) 209 leave a certain amount of uncertainty in the projections.
3.3.4.3 The City of Sunnyvale
The FY 2014/2015 Budget) for the City of Sunnyvale projects total revenue of $321 million, and a general fund revenue of $154 million. The two largest sources of general fund revenue are property tax, which comprises 34% of total general fund revenue, and sales tax, which comprises 20% of total general fund revenue. Transient occupancy tax and utility tax encompass 11% of the total revenue. Total expenditures for FY 2014/2015 are projected at $321 million, with a total operating budget of $235 million.
3.3.4.4 The City of Mountain View
The proposed FY 2014/2015 Budget for the City of Mountain View projects $236 million in total revenue and $100 million in General Fund revenues for FY 2014/2015. Property tax and sales tax, the two largest revenue sources, comprise 27% and 7% of the city’s total revenue, respectively. Transient occupancy tax, business license tax, and utility user’s tax make up another 6%, while other revenue sources, including but not limited to intergovernmental revenue, permits and fees, and interfund revenues and transfers, comprises 18% of total revenue for the city budget. The city estimates $256 million in total expenditures in FY 2014/2015, $98 million of which is for general operations. The general fund of the city has stabilized in recent years, but future trends are tied to the success of the regional economy.
3.3.4.5 Mountain View-Whisman School District
The Mountain View-Whisman School District serves elementary and middle school students from Moffett Field. In FY 2013/2014, the district projected $42.8 million in revenue and $45.9 million in expenditures for its general fund. Taking into account reserves and interfund transfers, the district will have an ending balance of $16.9 million.
The revenue limit, which is determined by dividing average daily attendance by the total number of school days in the school year, comprises $28.5 million, or 67% of the general fund. The general fund also receives federal funds of $1.4 million and state funds of $4.8 million. Local income sources, including a parcel tax, comprise the final $3.7 million, or 19%, of the general fund.
3.3.4.6 Mountain View-Los Altos Union High School District
The Mountain View-Los Altos Union High School District serves high school students from Moffett Field. The FY 2013-2014 Budget for the district projects $58.4 million in revenue and $54.3 million in expenditures for its general fund, with a net increase in the general fund balance of $897,589 after interfund transfers.
The revenue limit funding of $47.5 million makes up more than 80% of total general fund income. As a State Basic Aid District, the district’s revenue limit funding fluctuates with
National Aeronautics and Space Administration Chap 3. Socioeconomics
NASA Ames Research Center Environmental Resources Document Environmental Management Division March 2015 File: 2015 ARC ERD_FINAL.doc
Pg 62
changes in property tax collections. For the fiscal year, federal sources contribute $833,946 to the general fund.
3.4 Existing Site Conditions
3.4.1 Employee Population and Income Levels at NASA Ames Research Center
In June 2014, 2,487 people were employed at ARC. Resident agencies and tenants include an additional 751 people employed at the Center (Lopez 2014). The average salary of ARC civil service employees was $133,000 in FY 2014 (Selby 2014). In 2014, the median household income in the County was $91,425, and $100,653 in the Ames Research Center Area (Mountain View and Sunnyvale).
3.5 Environmental Requirements
NASA has identified the following environmental policies and measures that address potential socioeconomic impacts of operations and future development at ARC.
3.5.1 NASA Procedural Directive 8500.1, NASA Environmental Management
Per NASA Procedural Directive (NPD) 8500.1, it is NASA policy to: maintain compliance with all applicable federal, state, and local environmental requirements; to incorporate environmental risk reduction and sustainable practices to the extent practicable throughout NASA’s programs, projects, and activities; and to consider environmental factors throughout the life cycle of programs, projects, and activities (as defined in NPD 7120.4, NASA Engineering and Program/Project Management Policy, and related documents), including planning, development, execution, and disposition activities. Examples of environmental factors include consideration of environmental impacts as required by the NEPA and National Historic Preservation Act (NHPA); the proposed use of hazardous materials; the potential for waste generation; the need to acquire necessary permits, waivers, and authorizations; and the use of environmentally-preferable materials and processes wherever practicable.
3.5.2 Ames Procedural Requirements 8500.1, Ames Environmental Procedural Requirements
Ames Procedural Requirements (APR) 8500.1 sets forth general procedural requirements to ensure compliance with applicable federal, state, and local environmental laws; regulations and executive orders (EOs); and NASA policies and procedures. Organizational directors, division chiefs, branch chiefs, section heads, supervisors, managers, and Contract Officer Representatives (CORs) are responsible for planning, designing, constructing, managing, operating, and maintaining facilities in conformance with applicable regulatory directives, and should obtain environmental review from the Environmental Management Division early in project planning consistent with NASA's NEPA implementing procedures (NPR 8580.1 and EO 12114), NASA policies and procedures for programs and projects (NPR 7120), and NASA regulations related to environmental quality (14 CFR 1216). Program and project managers should coordinate with the Environmental Management
National Aeronautics and Space Administration Chap 3. Socioeconomics
NASA Ames Research Center Environmental Resources Document Environmental Management Division March 2015 File: 2015 ARC ERD_FINAL.doc
Pg 63
Division in a timely manner to ensure that any new or modified programs, projects, and activities comply with regulatory requirements.
3.5.3 Ames Environmental Work Instructions
Ames’s Environmental Work Instructions (EWIs), which replace the previous Ames Environmental Handbook (APR 8800.3), set forth requirements to ensure that programs, projects, and activities at ARC comply with applicable federal, state, and local laws; regulations and EOs; and NASA policies and procedures. Each EWI lists relevant regulatory authorities and documents, assigns individual and organizational responsibilities within ARC, and identifies specific requirements applicable to the work being performed.
The following EWIs are relevant to operations and future development at ARC with potential socioeconomic impacts.
EWI 12, Public Involvement
EWI 14, NEPA and Environmental Justice
EWI 18, Environmental Requirements for Construction Projects (Under review)
3.5.4 NASA Ames Development Plan Final Programmatic Environmental Impact Statement
The NADP EIS identifies the following mitigation measure to address potential socioeconomic impacts from build out of NADP Mitigated Alternative 5.
3.5.4.1 Mitigation Measure SOCIO-1a
NASA will continue to attempt to acquire the rights to occupy as much of the Department of Defense (DOD) housing located at Moffett Field as possible to bolster the projected supply provided under each of the alternatives.
3.5.4.2 Mitigation Measure SOCIO-1b
In the Mitigated Alternative 5, NASA would require the provision of 1,120 townhome and apartment units in the Bay View area, and 810 student apartment and dormitory units in the NRP area. If this level of housing development could not be achieved, NASA would commensurately scale back the employment and student generating components of the project.
3.5.4.3 Mitigation Measure SOCIO-1c
NASA would continue to evaluate the possibility of constructing housing above retail uses proposed in the NRP area.
3.5.4.4 Mitigation Measure SOCIO-3
NASA and the Mountain View-Los Altos Union High School District will negotiate an agreement whereby in any given year, should the Mountain
National Aeronautics and Space Administration Chap 3. Socioeconomics
NASA Ames Research Center Environmental Resources Document Environmental Management Division March 2015 File: 2015 ARC ERD_FINAL.doc
Pg 64
View-Los Altos Union High School District’s per student operating revenues decrease below a pre-determined baseline as a direct result of enrollment generated by the NADP, NASA or its partners will compensate the District for the shortfall associated with these students. The baseline would be set to the District’s per student operating revenues in the year prior to when students residing at ARC first begin attending classes in the District, and would be adjusted for cost of living and inflationary changes over time.
National Aeronautics and Space Administration Chap 4. Land Use
NASA Ames Research Center Environmental Resources Document Environmental Management Division March 2015 File: 2015 ARC ERD_FINAL.doc
Pg 65
Chapter 4. Land Use
4.1 Overview
This chapter describes existing and planned land uses within ARC as a whole, and in the surrounding area. It also includes a discussion of existing conditions relative to airfield land uses. Applicable regulations are discussed as well as relevant policies that address ARC’s conformance with federal, state, and local land use plans and regulations. The information presented in this chapter was drawn from the November 2009 NASA ARC ERD (NASA 2009), NADP EIS (Design, Community & Environment 2002), local planning documents, and other sources.
4.2 Regulatory Background
4.2.1 Federal Regulations
4.2.1.1 National Aeronautics and Space Administration
4.2.1.1.1 NASA Ames Development Plan
The NADP, the operative planning document for ARC, is a result of a five-year planning effort involving NASA, local cities, community groups, and planned NRP partners. The NADP provides a framework to guide the future use, renovation, management and development of facilities at ARC. It also provides for collaboration among NASA, universities, and businesses to develop a shared-use R&D campus that comprises academia, industry, and non-profit organizations.
The Final Programmatic EIS for the NADP, which NASA published in 2002, evaluated five development alternatives within four areas of ARC, including: NRP, Eastside/Airfield, Bay View, and the Ames Campus. In November 2002, NASA issued a ROD approving implementation of the Preferred Alternative (Mitigated Alternative 5). Mitigated Alternative 5 under the NADP provides for new construction of approximately 2.5 million square feet of educational, office, R&D, museum, conference center, housing and retail space in the NRP area. The NADP also included the addition of approximately 1.2 million square feet of new development (primarily housing) in the Bay View area, and approximately 500,000 square feet of new high-density office and R&D space in the Ames Campus. It was estimated that implementation of planned development activities under the NADP would generate 7,088 new employees, approximately 3,000 students, and house 4,909 residents in 1,930 housing units.
To comply with the Clean Air Act (42USC Sections 7401 et seq.), ARC maintains a Construction Emissions Mitigation Plan (CEMP) that limits construction and operational emissions from NADP development to no more than 91,000 kilograms (100 tons) each of ozone precursors per year. The CEMP also includes measures to control emissions of diesel particulate matter, which is regulated by the state as a toxic air contaminant. See Chapter 8, Air Quality, for more information.
National Aeronautics and Space Administration Chap 4. Land Use
NASA Ames Research Center Environmental Resources Document Environmental Management Division March 2015 File: 2015 ARC ERD_FINAL.doc
Pg 66
4.2.1.1.2 Comprehensive Use Plan
NASA’s first plan for ARC after the closure of NAS Moffett Field was the Comprehensive Use Plan (CUP). The CUP and its EA were adopted as official NASA policy in 1994. They were developed by NASA in order to effectively implement the transfer of the former NAS Moffett Field, with the exception of the military housing areas, which were transferred to the DOD.
The 1994 CUP EA was approved with a mitigated Finding of No Significant Impact in 1994, and was the controlling environmental document for ARC until the ROD for the NADP EIS was signed. The CUP foresaw a program of demolition and new construction, with a total of just over 93,000 square meters (1 million square feet) of new building space across the entire base constructed over a period of 15 years. Under the CUP, the airfield was to remain restricted to government use, although operations were allowed to increase to up to 80,000 flights per year. Administrative and operational support services were to increase slightly. The largest change on the base was foreseen to be in R&D activity, with just over 79,000 square meters (800,000 square feet) of new R&D space for laboratories, wind tunnels and other related facilities. Approximately 72,000 square meters (777,000 new square feet) of building space under the CUP EA was included in the baseline for the NADP EIS, described above.
4.2.1.2 Federal Aviation Administration
The airfield at ARC is owned by NASA and is currently used by NASA and CANG, with some limited use by other resident agencies and tenants. Since taking over the airfield from the Navy, NASA has primarily used the facility for Rotorcraft and transient research aircraft. ARC has applied FAA civilian standards to determine adjacent land uses and airport operating clearances for Moffett Field. The controlling documentation regarding such clearances and design criteria are based on FAA Regulations Part 77. The following regulations govern other aspects of airfield operations: Part 99, which covers security control of air traffic, and Part 150, which governs airport noise compatibility planning and contains both Noise Exposure Maps and a Noise Compatibility Program to reduce and prevent noise exposure impacts.
Part 77 addresses maximum building heights adjacent to the runways. Specifically, no obstruction may penetrate the “Transitional Surface,” which is determined by calculating a slope of 7:1 extending from the edge of the “Primary Surface,” which is an imaginary surface extending 152 meters (500 feet) on either side of the centerline of the runway. For example, building heights at the eastern edge of NRP Parcels 7 and 8 may not exceed 22 meters (73 feet), according to the transitional surface slope. At the western edge of the parcels, building heights may not exceed 36 meters (120 feet). Furthermore, no buildings may be constructed within the “Building Restriction Line,” which is located 234 meters (769 feet) from the centerline of the runway, and the taxiway Object Free Area prohibits the placement of buildings within 59 meters (193 feet) of the taxiway centerline.
MFA generally operates in accordance with Federal Aviation Regulation Part 139, which describes the procedures, standards, equipment, facilities, and personnel at the airfield.
National Aeronautics and Space Administration Chap 4. Land Use
NASA Ames Research Center Environmental Resources Document Environmental Management Division March 2015 File: 2015 ARC ERD_FINAL.doc
Pg 67
While MFA is not currently certified under Federal Aviation Regulation Part 139, nor is it required to be, NASA strives to meet Part 139 standards to the extent feasible and practicable.
4.2.1.3 The Coastal Zone Management Act
The coastal zone was specifically mapped by the state legislature and covers a large area. On land, the coastal zone varies in width from several hundred feet in highly urbanized areas up to 8 kilometers (5 miles) in certain rural areas, and offshore the coastal zone includes a 4.8-mile (3-mile)-wide band of ocean. The Coastal Commission was established by the Coastal Zone Management Act (CZMA) but does not include San Francisco Bay, where development is regulated by the Bay Conservation and Development Commission (BCDC). The BCDC, in addition to the Coastal Commission, is one of California's two designated coastal management agencies for administering the federal CZMA in California.
The most significant provisions of the federal CZMA give state coastal management agencies regulatory control (federal consistency review authority) over all federal activities and federally licensed, permitted, or assisted activities, wherever they may occur (that is, landward or seaward of the respective coastal zone boundaries fixed under state law) if the activity affects coastal resources. Examples of such federal activities include outer continental shelf oil and gas leasing, exploration, and development; designation of dredge material disposal sites in the ocean; military projects at coastal locations; U.S. Army Corps of Engineers (Corps) fill permits; certain USFWS permits; national park projects; highway improvement projects assisted with federal funds; and commercial space launch projects on federal lands. Federal consistency is an important coastal management tool because it is often the only review authority over federal activities affecting coastal resources given to any state agency.
4.2.1.4 National Environmental Policy Act
NEPA requires federal agencies to include in their decision-making process appropriate and careful consideration of all environmental effects of a proposed action and of possible alternative actions. Measures to avoid or minimize the adverse effects of proposed actions and to restore and enhance environmental quality as much as possible must be developed and discussed where feasible.
4.2.2 State Regulations
4.2.2.1 McAteer-Petris Act and San Francisco Bay Plan
BCDC is a California state agency that was established to accomplish two primary goals: first, to prevent the unnecessary filling of San Francisco Bay, and second, to increase public access to and along the Bay shoreline. The commission is responsible for carrying out the McAteer-Petris Act and the San Francisco Bay Plan (Bay Plan). These laws and plans were adopted to protect the Bay as a great natural resources for the benefit of the public and to encourage development compatible with this protection.
It is necessary to obtain BCDC approval prior to undertaking any of the following activities:
National Aeronautics and Space Administration Chap 4. Land Use
NASA Ames Research Center Environmental Resources Document Environmental Management Division March 2015 File: 2015 ARC ERD_FINAL.doc
Pg 68
Filling. Placing solid material, building pile-supported or cantilevered structures, disposing of material, or permanently mooring vessels in the Bay or in certain tributaries of the Bay
Dredging. Extracting material from the Bay bottom
Shoreline Projects. Nearly all work, including grading, on the land within 30 meters (100 feet) of the Bay shoreline
Other Projects. Any filling, new construction, major remodeling, substantial change in use, and many land subdivisions in the Bay, along the shoreline, in salt ponds, duck hunting preserves, or other managed wetlands adjacent to the Bay
Since portions of ARC are within this area, proposed activities by NASA are referred to BCDC for consistency with the Bay Plan. The Bay Plan contains policies regarding development of the Bay coastal areas, and NASA operations are consistent with these policies. ARC has been designated as an Airport Priority Use Area by BCDC. Work within 30 meters (100 feet) south of the BCDC line or any activity that would affect the airfield priority use requires a consistency determination by BCDC.
4.2.3 Local Regulations
4.2.3.1 Santa Clara County
4.2.3.1.1 Santa Clara County General Plan and Zoning
ARC is located mostly in unincorporated Santa Clara County. The MFA and runway approach in Sunnyvale3 are designated Transportation Facility in the County’s General Plan and are zoned A-1, General Use. The areas west of the airfield, including the current and former military housing areas, have a General Plan land use designation of Major Public Facility and a zoning designation of A-1, General Use. All other areas on ARC’s borders, with the exception of a small strip of land along ARC’s southern border that is zoned CG, General Commercial, are within the urban service areas of Mountain View and Sunnyvale and are not assigned specific land use or zoning designations by the County (Santa Clara County 1994, 2012).
The Growth and Development Chapter of the General Plan contains goals, strategies, and policies that define allowable land uses and development potential for unincorporated lands in the County. Additionally, the County’s updated 2009-2014 Housing Chapter, adopted in August 2010, addresses projected growth in the County’s housing need and identifies the future development of housing at ARC as a potential source of housing credits to help the County meet its state-mandated regional housing allocation (Santa Clara County 2010). Other discussions and/or policies that are relevant to ARC can be found in the Transportation, Resource Conservation, and Health and Safety Chapters of the General Plan.
3 NASA owns several holes at the City of Sunnyvale Golf Course and pays the City to top trees to maintain the clear zone and support approach lighting systems to the south of the runway.
National Aeronautics and Space Administration Chap 4. Land Use
NASA Ames Research Center Environmental Resources Document Environmental Management Division March 2015 File: 2015 ARC ERD_FINAL.doc
Pg 69
ARC is not subject to the County’s land use or zoning regulations because it is a federal facility; however, it does cooperate with the County on matters of mutual concern and attempts to meet the City’s guidelines and standards whenever possible.
4.2.3.1.2 Santa Clara County Comprehensive Land Use Plan
The Santa Clara County Airport Land Use Commission (ALUC) is charged by the County Board of Supervisors with a variety of functions, including assisting local jurisdictions with planning for compatible land uses around airports, coordinating air transportation planning at the state, regional and local levels, and developing the countywide airport master plan.
Since ARC is a federal facility, it is not subject to the jurisdiction of the County’s ALUC. Although the ALUC may regulate development adjacent to ARC, no portion of the site is within its jurisdiction.
4.2.3.2 City of Mountain View
4.2.3.2.1 City of Mountain View General Plan and Zoning
The City of Mountain View borders ARC to the south and west. ARC is partially within Mountain View’s city limits and partially in the City’s sphere of influence. For planning purposes, ARC is designated Institutional in the City’s 2030 General Plan and is zoned PF, Public Facility (City of Mountain View 2012; City of Mountain View 2013a).
Areas to the west of ARC in Mountain View have General Plan designations of High Intensity Office, Regional Park, and Mobile Home Park. Zoning designations in this area include P, Planned Community/Precise Plan; A, Agriculture; R1, Single Family Residential; R2, One and Two Family Residential; R3, Multiple Family Residential; R4, High Density Residential; MM, General Industrial; and ML, Limited Industrial.
Areas to the south of ARC have General Plan land use designations of Low-, Medium-, and High-Density Residential; Neighborhood Commercial; Mixed-Use Corridor; General Mixed Use; and High –Intensity Office; Parks, Schools, and City Facilities; and Regional Park. Zoning designations in this area include P, Planned Community/Precise Plan; PF, Public facility; A, Agriculture; F, Floodplain; RMH, Mobile Home; and ML, Limited Industrial.
The Land Use and Design Element of the General Plan contains land use goals and policies, both citywide and for specific change areas, where major growth and development are expected to occur until 2030, the Plan’s horizon. Additionally, the Mobility; Infrastructure and Conservation; Parks, Open Space and Community Facilities; Noise; and Public Safety Elements contain policies that are relevant to ARC.
ARC is not subject to the City’s land use or zoning regulations because it is a federal facility; however, it does cooperate with the City on matters of mutual concern and attempts to meet the City’s guidelines and standards whenever possible.
National Aeronautics and Space Administration Chap 4. Land Use
NASA Ames Research Center Environmental Resources Document Environmental Management Division March 2015 File: 2015 ARC ERD_FINAL.doc
Pg 70
4.2.3.2.2 North Bayshore Precise Plan
The City of Mountain View is currently in the process of developing the North Bayshore Precise Plan, which builds off of recent General Plan analysis and studies for the North Bayshore Change Area, located immediately west of ARC and north of Highway 101. The Plan includes specific land use and development standards with the objective of providing more diverse land uses; revitalizing North Shoreline Boulevard; incentivizing highly sustainable development; improving mobility; increasing economic competitiveness; and streamlining the land use administration process in the North Bayshore Area (City of Mountain View 2012).
In July 2014, Mountain View released a public draft of the Precise Plan that would add up to 3.4 million square feet of new development, concentrated in several key areas of North Bayshore. Each area would have its own character and identity, form, interface with habitat and open space, development intensity and scale, and building massing. Areas would include:
The Gateway Area, a mixed-use center at North Shoreline Boulevard and Highway 101 that supports a broad range of uses, including entertainment, retail, office and R&D, service, and hotels.
The Core Area, a pedestrian-oriented office/R&D area focused on Shoreline Boulevard and located near both public and private high-frequency transit that provides space for retail, services, and small start-up businesses.
The General Area, a campus-like environment with office and R&D buildings surrounded by usable open space.
The Edge Area, an area comprised of lower-scale office and R&D uses to serve as a transition between other character areas and sensitive habitat areas.
Buildings within the Precise Plan area would be between two and eight stories high, with floor area ratios (FARs) ranging from 0.45 to 2.35 (City of Mountain View 2014a). Adoption of the plan by the City is expected by the end of 2014 (City of Mountain View 2014b).
4.2.3.3 City of Sunnyvale
4.2.3.3.1 City of Sunnyvale General Plan and Zoning
The City of Sunnyvale borders ARC to the south and east. ARC is partially within the Sunnyvale’s city limits and partially within the City’s sphere of influence, as discussed in the City’s General Plan (City of Sunnyvale 2011a). No land uses within ARC are assigned specific General Plan or zoning designations (City of Sunnyvale 2014a). Land within the Specific Plan area east of ARC has a General Plan land use designation of Moffett Park with a zoning designation of Moffett Park Industrial and Moffett Park TOD. The Sunnyvale Golf Course, south of ARC, has a General Plan land use designation of Park and a zoning designation of PF, Public Facilities.
Because Sunnyvale is under the airfield approach path for the ARC airfield, the Safety and Noise Element of the General Plan includes policies that address specific aviation hazards
National Aeronautics and Space Administration Chap 4. Land Use
NASA Ames Research Center Environmental Resources Document Environmental Management Division March 2015 File: 2015 ARC ERD_FINAL.doc
Pg 71
and noise associated with operation of the airfield. Additionally, the Land Use and Transportation, Community Character, Housing, and Environmental Management Elements contain policies that are relevant to ARC.
ARC is not subject to the City’s land use or zoning regulations because it is a federal facility; however, it does cooperate with the City on matters of mutual concern and attempts to meet the City’s guidelines and standards whenever possible.
4.2.3.3.2 Lockheed Site Master Use Permit
The Lockheed Site Master Use Permit was approved in 1994 and revised in 1998. The Master Use Permit functions as a Master Plan for the Lockheed Martin Missiles and Space Company’s (Lockheed Martin’s) industrial campus site in northern Sunnyvale. The Master Permit guides all phases of development of the existing site until 2024. The site is bounded by ARC to the west, San Francisco Bay to the north, 11th Avenue to the south, and Mathilda Avenue to the east.
The detailed site plan for the Site Master Use Permit proposes the addition of 2.9 million square feet of new building space. Office space will comprise 55 percent of new development while manufacturing buildings will comprise the other 45 percent. At total build-out, the site will have 78,200 square meters (8.4 million square feet) of building area at a floor area ratio of 0.35, the maximum allowed under the M-3 zoning designation.
4.2.3.3.3 Onizuka Air Force Station Redevelopment Plan
The Onizuka Air Force Station (AFS) Redevelopment Plan, prepared by the City in December 2011, set forth the recommendations of the City of Sunnyvale’s Onizuka AFS Local Redevelopment Authority for the reuse of the Onizuka AFS at North Mathilda Avenue and California Highway 237, which was closed in 2011 as part of a Defense Base Closure and Realignment Commission action (City of Sunnyvale 2011b). At the time of its closure, the 18-acre site contained 507,457 square feet of space in 33 buildings. The site is located less than ½-mile east of ARC and is immediately bounded by Innovation Way to the north and west, Highway 237 to the south, and Mathilda Avenue to the east.
4.2.3.3.4 Moffett Park Specific Plan
The Moffett Park Specific Plan, adopted by the City Council on April 27, 2004 and amended in 2006, 2009, 2011, and 2013, proposes redevelopment of 24.3 million square feet of former industrial and military uses to R&D, Class “A” development, Corporate Headquarters, general industrial, and support services (City of Sunnyvale 2013). The 1,156-acre Specific Plan Area, which includes Lockheed Martin’s industrial campus and the Onizuka AFS (described above) is bounded by ARC to the west, the closed Sunnyvale Landfill and the Sunnyvale Materials Recovery and Transfer Station to the north, Highway 237 to the south, and Sunnyvale Baylands Park to the east.
The Specific Plan Area is divided into three zoning subdistricts, with FARs ranging from 35% to 70%, and a development reserve. Based on FAR limitations, only 18.9 million square feet of the total is assigned to the three sub-districts, while the remaining 5.4 million
National Aeronautics and Space Administration Chap 4. Land Use
NASA Ames Research Center Environmental Resources Document Environmental Management Division March 2015 File: 2015 ARC ERD_FINAL.doc
Pg 72
square feet is allocated to a development reserve to encourage higher intensity development of targeted uses.
4.2.3.4 Midpeninsula Regional Open Space District
The Midpeninsula Regional Open Space District (MROSD) owns the salt marsh adjacent to and northwest of ARC (Figure 1-3). This area is designated as open space for recreational use, and includes the 21-hectare (54-acre) Stevens Creek Shoreline Nature Study Area.
Conceptual plans for the area were first defined in a 1980 report commissioned by the City of Mountain View, Santa Clara Valley Water District (SCVWD), and MROSD. The report, entitled "Stevens Creek: A Plan of Opportunities," describes a basic plan for the portion of the creek adjacent to Shoreline Park and is aimed at integrating Shoreline Park with the creek and the marsh refuge of the MROSD within a uniform concept for flood protection, recreational use, and public access (Planning Collaborative, Inc. 1980).
In order to create a strong functional and physical relationship between the creek, Shoreline Park, and the MROSD’s marsh preserve, the plan proposes that the linear dikes on the east and west side of the creek be breached to create a broad, common marshland restoration area. The plan acknowledges that, although breach of the east side levee would allow incorporation of the MROSD marsh refuge into the channel scheme, some flood containment to the east of the refuge may be necessary. Levees could be designed to maximize public use of the marsh refuge area.
4.3 Regional Setting
Land uses in the area surrounding ARC are illustrated in Figure 4-1 (Figure 3.2-1 from the NADP EIS) and described below.
Immediately west of ARC are the former Orion Park military housing area; Stevens Creek; and a Pacific Gas & Electric (PG&E) transmission line corridor, a portion of which is subleased to a commercial tree nursery. Farther to the west is a mixture of office and light industrial buildings including existing office developments for high tech companies such as Google, Microsoft, LinkedIn, and Intuit. Some supporting commercial, retail, and entertainment services are located in the area and provide services for nearby workers. Residential use is limited, with the largest being the Santiago Villa Mobile Home Park, located across Stevens Creek from ARC (City of Mountain View 2012a).
The area east of ARC, in Sunnyvale, is characterized by industrial and office uses. Lockheed Martin’s 414-acre industrial campus is directly east of ARC and flanks the majority of the airfield. It is mostly developed with office, manufacturing, and R&D buildings, including high-bay facilities. The Moffett Towers complex, which abuts the airfield at the northeast quadrant of Manila Drive and Enterprise Way, is a relatively new 1.96-million square foot office park development consisting of seven 8-story towers. Other prominent industrial/office developments in the area include the existing Yahoo Inc., Network Appliances, and Technology Corners campuses; the former Onizuka AFS (discussed above); and Juniper Networks’ future 2.3-million-square-foot campus, currently under construction (City of Sunnyvale 2014b).
National Aeronautics and Space Administration Chap 4. Land Use
NASA Ames Research Center Environmental Resources Document Environmental Management Division March 2015 File: 2015 ARC ERD_FINAL.doc
Pg 73
South of ARC, at the southwest quadrant of Highway 101 and Moffett Boulevard, is a large, undeveloped parcel that is jointly owned by the City of Mountain View and the California Department of Transportation (Caltrans) and contains a PG&E substation (City of Mountain View 2013b). Farther to the south and east, between Highway 101 and Middlefield Road, is a mix of office, light industrial, commercial, residential, educational, and park uses, including several existing large-scale office complexes along Fairchild Drive, directly across U.S. Highway 101 from ARC, which are occupied by high tech companies such as Google, Locus, and Audience. Construction of the future 385,000-square foot Samsung R&D campus is also underway near the junction of Fairchild Drive and Clyde Avenue, across U.S. Highway 101 from the ARC Airfield (City of Mountain View 2014b).
Southeast of ARC, on the south side of Highway 101, is the Sunnyvale Municipal Golf Course, which is dedicated as parkland. Fourteen hectares (35 acres) of the Sunnyvale Municipal Golf Course belongs to ARC. Surrounding the golf course is a mix of industrial land uses, including large office developments owned by high tech companies such as Apple, Hewlett Packard, and Synopsis.
Open space near ARC includes the wetlands and tidal marshes of the Don Edwards National Wildlife Refuge, MROSD Stevens Creek Nature Study Area, San Francisco Bay Trail, Stevens Creek Regional Trail, Shoreline Park at Mountain View, Sunnyvale Baylands Park, various neighborhood parks, and several private recreational areas.
4.4 Existing Site Conditions
4.4.1 Ames Research Center
ARC consists of the 752-hectare (1,857-acre) NASA-administered portion of the former NAS Moffett Field and the original NASA Ames Campus. ARC is composed of the original ARC campus, the airfield, airfield support facilities, Bay View planning area, barracks, support facilities for current and former military personnel, and open space. Portions of the former NAS Moffett Field that are not under NASA control include two DOD-administered housing areas: the Wescoat Village military housing area and the former Orion Park military housing area. The Army Reserve demolished the Orion Park housing facilities to allow for the construction of an Armed Forces Reserve Center Complex, the Army Reserve Regional Readiness Sustainment Command Headquarters, an organizational maintenance shop, two storage buildings, and a fitness center (USACE 2007).
Under the NADP, ARC has been divided into four major planning areas: the 86-hectare (213-acre) NRP, the 95-hectare (234-acre) Ames Campus, the 385-hectare (952-acre) Eastside/Airfield, and the 38-hectare (95-acre) Bay View area. The remaining 144 hectares (357 acres) of NASA-administered land consists of wetlands areas along the northern boundary of ARC. Figure 4-1 shows the land uses within ARC.
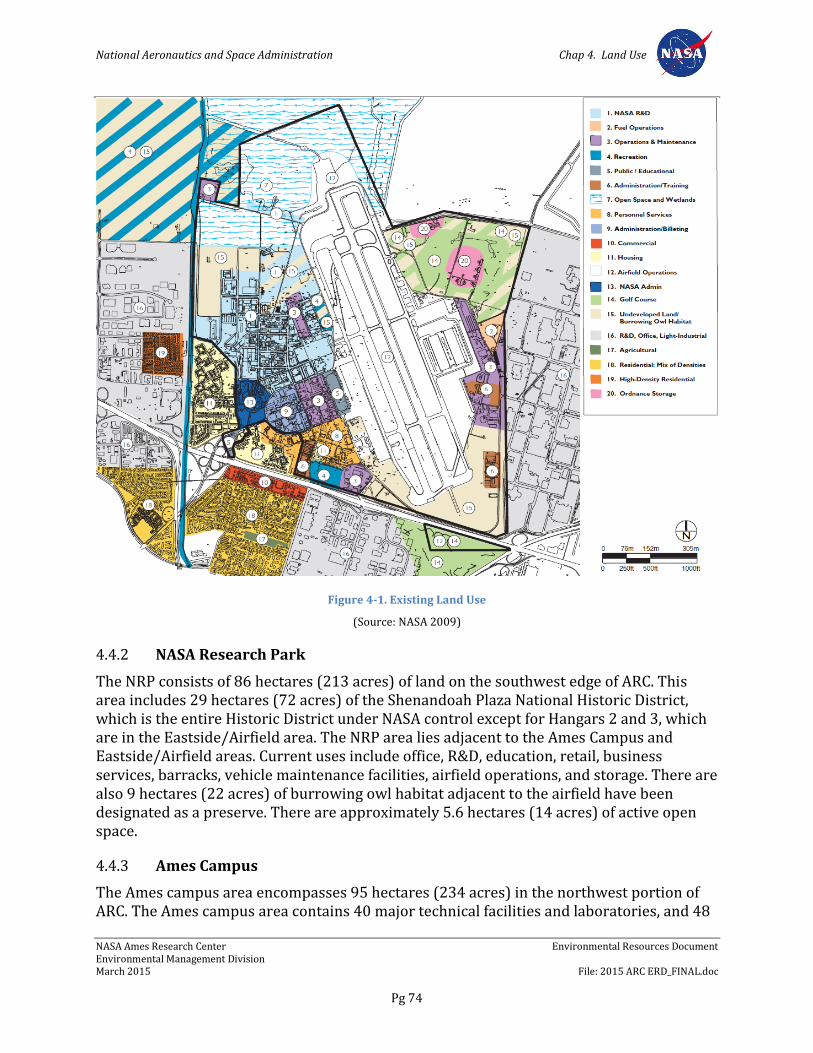
National Aeronautics and Space Administration Chap 4. Land Use
NASA Ames Research Center Environmental Resources Document Environmental Management Division March 2015 File: 2015 ARC ERD_FINAL.doc
Pg 74
Figure 4-1. Existing Land Use
(Source: NASA 2009)
4.4.2 NASA Research Park
The NRP consists of 86 hectares (213 acres) of land on the southwest edge of ARC. This area includes 29 hectares (72 acres) of the Shenandoah Plaza National Historic District, which is the entire Historic District under NASA control except for Hangars 2 and 3, which are in the Eastside/Airfield area. The NRP area lies adjacent to the Ames Campus and Eastside/Airfield areas. Current uses include office, R&D, education, retail, business services, barracks, vehicle maintenance facilities, airfield operations, and storage. There are also 9 hectares (22 acres) of burrowing owl habitat adjacent to the airfield have been designated as a preserve. There are approximately 5.6 hectares (14 acres) of active open space.
4.4.3 Ames Campus
The Ames campus area encompasses 95 hectares (234 acres) in the northwest portion of ARC. The Ames campus area contains 40 major technical facilities and laboratories, and 48
National Aeronautics and Space Administration Chap 4. Land Use
NASA Ames Research Center Environmental Resources Document Environmental Management Division March 2015 File: 2015 ARC ERD_FINAL.doc
Pg 75
other major supporting and administrative buildings and structures. Current programs of the Ames campus are directed toward research and development in exploration, life and space sciences, and information technology and aeronautics.
4.4.4 Eastside/Airfield
The Eastside/Airfield area consists of 385 hectares (952 acres) on the east side of ARC. The primary land use in the Eastside/Airfield area is the runway, which is currently utilized by CANG, ARC aircraft, and aircraft from other federal agencies, partners, and tenants. Hangars 2 and 3, which are part of the Shenandoah Plaza National Historic District, are in this area.
In recent years, most of the development activity in the Eastside/Airfield has involved construction of new facilities or consolidation of existing facilities on CANG’s property. CANG completed construction of its 70,000-square-foot hangar (Building 662) in 2002 as part of its Short Range Master Plan. In 2009, the National Guard Bureau prepared an EA and Finding of No Significant Impact to evaluate their “Proposed Long-Term Lease and Installation Development Plan for the 129th Rescue Wing,” under which several construction and demolition projects were needed to provide secure access, consolidate facilities, and ensure that existing facilities comply with Air National Guard space requirements (National Guard Bureau 2009). Several of the projects planned under the 2009 EA have been implemented or are currently under construction, including demolition of Buildings 664, 665, and 669, and construction of a new main entrance, para-rescue facility, training tower, and squadron operations building.
In October 2014, NASA entered into an Adaptive Reuse Lease with PV, to lease approximately 1,000 acres of land area in the Eastside/Airfield area and portions of the NRP area, which includes the following buildings and facilities: Hangar 1, Hangar 2, Hangar 3, Building 158 (Air Operations Building), MFA, and the Moffett Field Golf Course. The lease provides for PV’s use of Hangars 1, 2, and 3 for R&D while granting them limited use, operation, and maintenance of the airfield and golf course. Under the terms the lease, PV also has the right to construct a new 90,000-square foot educational facility, provided it does not interfere with the airfield and golf course operations, is consistent with the ARC’s Security Plan, and complies with applicable laws.
PV’s concept for these facilities prioritizes their rehabilitation and reuse in a manner consistent with their historic character and is anticipated to comply with the requirements of NEPA and the NADP EIS.
4.4.5 Bay View
The Bay View area is a 38-hectare (95-acre) site immediately north of the original ARC campus. Most of the land in the eastern portion of the planning area is comprised of undeveloped upland grassland supporting a few research facilities such as the OARF. On the western side of the planning area, approximately 42 acres of leased property in Bay View Parcels 1, 2, and 4 is currently under development for Google’s Bay View campus. The property is under lease to PV, a wholly-owned subsidiary of Google, pursuant to a 2008 Enhanced Use Lease between PV and NASA. Development of the Bay View area was evaluated in the NADP EIS, for which a ROD was signed in November 2002.

National Aeronautics and Space Administration Chap 4. Land Use
NASA Ames Research Center Environmental Resources Document Environmental Management Division March 2015 File: 2015 ARC ERD_FINAL.doc
Pg 76
4.4.6 Airfield Operations
Due to the nature of operations at the airfield, there are several areas that are designated as safety clearance zones based on the criteria established under FAA Regulation Part 77. These areas, shown in Figures 4-2, delineate areas on the ground that must be kept clear of structures or any other obstruction.
Figure 4-2. Minimum Operating Clearances Runway 32 Left and Right
(Source: NASA 2009)
MFA currently operates in accordance with these regulations, with the exception of Hangars 1, 2, and 3. Hangars 1 and 2 are considered to be “fundamental discrepancies” because they exceed the Transitional Surface slope (as described in the Federal Regulations section above), but because they predate existing federal regulations, and because they are part of the Shenandoah Plaza Historic District (see Chapter 7, Cultural Resources), NASA has no plans to correct these violations at the present time. ARC has received a temporary waiver from NASA Headquarters regarding these conditions. Hangar 1 is currently closed to address contamination associated with the Hangar 1 siding.
National Aeronautics and Space Administration Chap 4. Land Use
NASA Ames Research Center Environmental Resources Document Environmental Management Division March 2015 File: 2015 ARC ERD_FINAL.doc
Pg 77
As part of the MFA Lease, discussed above, PV is responsible for providing a qualified operator to manage the airfield. The lease includes also rights to a portion of the NASA’s annually allowable flights and responsibilities for rehabilitating the hangars.
4.4.7 Areas with Safety Clearance Zones
These areas include the following:
Outdoor Aerodynamic Research Facility. Aerodynamic testing of experimental aircraft is conducted on OARF’s suspended platform. OARF is surrounded by a 76 meter (250 foot) Primary Exclusion Zone, a 229 meter (750 foot) Primary Clearance Zone, and a 457 meter (1,500 foot) Secondary Safety Zone. When operational, activities within the Primary Exclusion Zone require safety clearance due to elevated noise levels and the potential for projectiles. The Primary Clearance Zone defines the area in which non-aerodynamic fragments from a damaged test vehicle would likely land. A 457 meter (1,500 foot) Secondary Safety Zone delineates the area within which aerodynamic fragments (i.e., parts of the aircraft itself) or complete test vehicles would likely land due to an accident. Although unlikely, projectiles may travel beyond these zone boundaries during an accident.
Low-Altitude Testing. NASA also performs low-altitude test flights and helicopter tests above the northern portion of the site (within the boundaries of ARC). These operations are occasional and carefully monitored.
Ordnance and Weapons Storage. Storage occurs near the northern perimeter on the northeast side of the runway. Due to the nature of explosives, stringent safety zones have been established around the ordnance bunkers in accordance with U.S. Air Force regulations. CANG and other resident agencies actively use the bunkers. CANG ensures full regulatory compliance. The need for secure ordnance and weapons storage areas has significantly increased in the Bay Area because of numerous base closures. Hence, this land use continues at ARC.
Magnetic Test Facility. Testing in this facility requires a magnetic field-free environment. The facility, however, does not generate magnetic fields itself and is not considered a safety threat.
Moffett Federal Airfield. NASA is responsible for managing the emergency services at MFA, including emergency/disaster preparedness. Operational responsibility for these services is the responsibility of the 129th Rescue Wing of CANG. The MFA Fire Chief oversees all aspects of fire protection, including crash, fire, rescue, and structural fire aspects of fire services.
4.4.8 Encroachment
Encroachment is the cumulative impact of pressures placed on NASA’s infrastructure, centers, facilities, and the surrounding communities and environmental controls resulting from: site specific development and urbanization; increasing regulatory requirements and community interests; competition for resources, such as air, land, water, energy, radio
National Aeronautics and Space Administration Chap 4. Land Use
NASA Ames Research Center Environmental Resources Document Environmental Management Division March 2015 File: 2015 ARC ERD_FINAL.doc
Pg 78
spectrum, and outer space; and rising costs of energy and other resources across the Agency. These pressures are a key risk facing NASA's institutional base and can constrain the Agency's ability to execute its mission effectively (NASA 2010).
Encroachment risks to ARC’s operations and mission include, but are not limited to:
New land uses that would interfere with airfield safety clearances established by federal regulations, would be adversely affected by the noise generated by the airfield or other operations, or both
Land area loss within ARC due to new development
Continued development on ARC’s borders
Cumulative pressures on drinking water supply, energy, and wastewater treatment
Changes in the severity of flooding or salt water intrusion
Spread of environmental contamination
Wildlife and habitat changes
4.5 Environmental Requirements
NASA has identified the following environmental policies that address ARC’s conformance with federal, state, and local land use plans and regulations.
4.5.1 NASA Procedural Directive 8500.1, NASA Environmental Management
Per NPD 8500.1, it is NASA policy to: maintain compliance with all applicable federal, state, and local environmental requirements; to incorporate environmental risk reduction and sustainable practices to the extent practicable throughout NASA’s programs, projects, and activities; and to consider environmental factors throughout the life cycle of programs, projects, and activities (as defined in NPD 7120.4, NASA Engineering and Program/Project Management Policy, and related documents), including planning, development, execution, and disposition activities. Examples of environmental factors include consideration of environmental impacts as required by the NEPA and NHPA; the proposed use of hazardous materials; the potential for waste generation; the need to acquire necessary permits, waivers, and authorizations; and the use of environmentally-preferable materials and processes wherever practicable.
4.5.2 NASA Procedural Requirements 8553.1, NASA Environmental Management System
NPR 8553.1 sets forth requirements for the NASA Environmental Management System (EMS), which functions primarily to: (1) incorporate people, procedures, and work practices into a formal structure to ensure that the important environmental impacts of the organization are identified and addressed; (2) promote continual improvement, including periodically evaluating environmental performance; (3) involve all members of the organization, as appropriate; and (4) actively involve senior management in support of the EMS.
National Aeronautics and Space Administration Chap 4. Land Use
NASA Ames Research Center Environmental Resources Document Environmental Management Division March 2015 File: 2015 ARC ERD_FINAL.doc
Pg 79
Agencywide, the EMS employs a standardized approach to managing environmental activities that allows for efficient, prioritized system execution, while at the same time helping to improve environmental performance and to maintain compliance with applicable environmental regulations and requirements. NASA’s EMS approach involves identifying all activities, products, and services under each NASA center’s control, and the environmental aspects associated with each centers’ continued engagement in those activities, products, and services. Once identified, priority environmental aspects are assigned a risk ranking (from 1 to 4, based on its severity and frequency of occurrence) and are evaluated on a continual basis as means of highlighting associated positive or negative impacts and setting objectives and targets to reduce environmental risk. Each center’s EMS also identifies methods for ensuring compliance by keeping abreast of environmental requirements. This includes requirements by law (EOs, federal regulations, state and local laws) and voluntary commitments made by the center or NASA.
4.5.3 Ames Procedural Requirements 8500.1, Ames Environmental Procedural Requirements
APR 8500.1 sets forth general procedural requirements to ensure compliance with applicable federal, state, and local environmental laws; regulations and EOs; and NASA policies and procedures. Organizational directors, division chiefs, branch chiefs, section heads, supervisors, managers, and CORs are responsible for planning, designing, constructing, managing, operating, and maintaining facilities in conformance with applicable regulatory directives, and should obtain environmental review from the Environmental Management Division early in project planning consistent with NASA's NEPA implementing procedures (NPR 8580.1 and EO 12114), NASA policies and procedures for programs and projects (NPR 7120), and NASA regulations related to environmental quality (14 CFR 1216). Program and project managers should coordinate with the Environmental Management Division in a timely manner to ensure that any new or modified programs, projects, and activities comply with regulatory requirements.
4.5.4 Ames Procedural Requirements 8553.1, Ames Environmental Management System
APR 8553.1 sets forth requirements for the Center-level EMS in accordance with NPR 8553.1B, NASA Environmental Management Systems. The ARC EMS also includes consideration of the findings of NASA Headquarters’ triennial (3-year) Environmental Functional Review and other external EMS audits, as required.
Under the ARC EMS, the Center conducts an annual risk analysis across Center activities to determine which of 16 environmental aspects are of high or medium priority. The Center then identifies objectives (goals) and targets and develops action plans known as Environmental Management Plans to reduce identified risks. Currently, the high- and medium-priority environmental aspects of Center business activities are Air Emissions, Hazardous Material Management, Water and Energy Conservation, and Other Sustainability Practices. Objectives associated with these high- and medium-priority environmental aspects include:
National Aeronautics and Space Administration Chap 4. Land Use
NASA Ames Research Center Environmental Resources Document Environmental Management Division March 2015 File: 2015 ARC ERD_FINAL.doc
Pg 80
Reducing air (including greenhouse gas [GHG]) emissions through energy efficiency
Improving hazardous material management
Improving energy and water efficiency
Providing for the integration of other sustainability practices into Center activities
4.5.5 Ames Policy Directive 8822.1, NASA Research Park Design Review Program
APD 8822.1 establishes specific policies, responsibilities, and procedures for the Design Review Program for all proposed projects within the NRP and Bay View areas. New development projects in the NRP and Bay View areas should be coordinated through the NRP Design Review process during conceptual design (before building design or prior to 50 percent completion of the schematic design phase) to ensure that they meet all applicable land use and design requirements. Completion of an Environmental Checklist in coordination with the Environmental Management Division is also required during Design Review, as it will determine if additional environmental studies or approvals will be required before proceeding with the project.
4.5.6 Ames Procedural Directive 8829.1, NASA Ames Construction Permits
APD 8829.1 establishes Ames-specific policies and responsibilities for construction activities at ARC. All construction work at ARC is reviewed in accordance with the Construction Permit Process (see APR 8829.1). Construction permits must be obtained prior to the commencement of the construction, modification, demolition, replacement, or new construction of any building, temporary structure, site utility, electrical or mechanical system, life safety alarm system, physical security system, or fire suppression system. The Environmental Management Division, for its part, reviews all preliminary plans submitted for construction permit approval. This ensures that all permitted work will be designed, performed, and constructed in accordance with applicable environmental requirements. For NRP projects, the project proponent must first engage in the the NRP Design Review process (described above) and obtain approval from the NRP Design Review Board before applying for a construction permit. These planning review and approval procedures ensure consistency with Ames Master Planning and compatibility with other planned work as well as project definition and readiness.
4.5.7 Ames Environmental Work Instructions
Ames’s EWIs, which replace the previous Ames Environmental Handbook (APR 8800.3), set forth requirements to ensure that programs, projects, and activities at ARC comply with applicable federal, state, and local laws; regulations and EOs; and NASA policies and procedures. Each EWI lists relevant regulatory authorities and documents, assigns individual and organizational responsibilities within ARC, and identifies specific requirements applicable to the work being performed.
EWIs relevant to land development at ARC and compliance with applicable land use plans and regulations include, but are not limited to:
National Aeronautics and Space Administration Chap 4. Land Use
NASA Ames Research Center Environmental Resources Document Environmental Management Division March 2015 File: 2015 ARC ERD_FINAL.doc
Pg 81
EWI 2-4, Wetlands and Flood Plains (Under review)
EWI 8, Restoration
EWI 12, Public Involvement
EWI 15, Wildlife (Under review)
EWI 16, Cultural Resources Management (Under review)
EWI 14, NEPA and Environmental Justice
EWI 18, Environmental Requirements for Construction Projects (Under review)
National Aeronautics and Space Administration Chap 5. Recreation
NASA Ames Research Center Environmental Resources Document Environmental Management Division March 2015 File: 2015 ARC ERD_FINAL.doc
Pg 82
Chapter 5. Recreation
5.1 Overview
This chapter summarizes regulatory and planning guidance relevant to recreation, and describes existing recreational facilities at ARC and in nearby communities. It also discusses relevant policies and measures that address potential recreational impacts of operations and future development at ARC. Information presented in this chapter was obtained from the November 2009 NASA ARC ERD (NASA 2009), NADP EIS (Design, Community & Environment 2002), local planning documents, and other sources.
5.2 Regulatory Background
5.2.1 Federal Regulations
5.2.1.1 Coastal Zone Management Act
The Coastal Zone Management Act (CZMA) was enacted in 1972 to regulate development affecting coastal waters and adjacent shorelines. The CZMA also applies to the inland belt that has “significant and direct impacts on coastal waters.” Under the CZMA, states are encouraged voluntarily to develop coastal zone management programs (CZMPs) to preserve and protect the unique features relevant to each coastal area. In many places, the effort to preserve and protect coastal resources includes providing for planned and managed recreational use.
The Office of Ocean and Coastal Resource Management of the National Oceanic and Atmospheric Administration approve CZMPs. All federal projects and projects that require a federal permit must be consistent with approved CZMPs. In California, local coastal programs developed under the California Coastal Act serve as each area’s CZMP.
For the Don Edwards San Francisco Bay National Wildlife Refuge, the South Bay Salt Pond Restoration Project (SBSPRP) has an approved EIS/Environmental Impact Report, which evaluated the impacts of the transfer of over 10,000 acres of salt evaporation ponds to tidal waters and wildlife habitat functions.
5.2.1.2 National Environmental Policy Act
NEPA requires federal agencies to include in their decision-making process appropriate and careful consideration of all environmental effects of a proposed action and of possible alternative actions. Measures to avoid or minimize the adverse effects of proposed actions and to restore and enhance environmental quality as much as possible must be developed and discussed where feasible.
National Aeronautics and Space Administration Chap 5. Recreation
NASA Ames Research Center Environmental Resources Document Environmental Management Division March 2015 File: 2015 ARC ERD_FINAL.doc
Pg 83
5.2.2 State Regulations
5.2.2.1 McAteer-Petris Act and San Francisco Bay Plan
The McAteer-Petris Act, passed by the State of California in 1965, established the BCDC as the state agency responsible for regulating development in and around San Francisco Bay (Bay) and mandated the planning effort that resulted in development of the San Francisco Bay Plan (Bay Plan). Shortly thereafter, the federal CZMA encouraged states to voluntarily develop CZMPs, as described above. Partly in response to these federal recommendations, the California Coastal Act of 1976 established the California Coastal Commission and recognized the BCDC as the state agency with primary responsibility for enforcing the state’s CZMP within the Bay Area.
The Bay Plan describes the values associated with the Bay and presents policies and planning maps to guide future uses of the bay and its shoreline. Under the Bay Plan, priorities for suitable uses of the shoreline include ports, water-related industry, airports, wildlife refuges, and water-related recreation. The Bay Plan also proposes adding land to the Bay wildlife refuge system; encourages public access via marinas, waterfront parks, and beaches; and requires the provision of maximum access along the waterfront and certain shorelines, except where public uses conflict with other significant uses, or where public use is inappropriate because of safety concerns.
BCDC is responsible for implementing the policies of the Bay Plan. All federal projects in the Bay Area’s shoreline regions are required to submit a consistency determination to BCDC and to demonstrate consistency with the Bay Plan and the appropriate Bay Plan maps. Moffett Field is an airport priority use area and it is recommended that the site be evaluated for use as a commercial airport if the site is ever declared surplus by the military. (The Bay Plan specifically states that it “does not advocate the closing of any military installation.”) The Bay Plan also recommends that the salt ponds adjacent to the north end of Moffett Field be reserved for possible airport expansion if and when these ponds are not needed for salt production.
5.2.3 Local Regulations
5.2.3.1 Bay Trail Plan
Senate Bill 100, enacted in 1987, directed the ABAG to develop a plan and identify an alignment for a trail envisioned as a “ring around the Bay.” The resulting Bay Trail Plan, adopted by ABAG in July 1989, includes a proposed alignment; a set of policies to guide the future selection, design, and implementation of specific routes; and strategies for financing and implementation. Since the adoption of the Bay Trail Plan, most of the jurisdictions along the Bay Trail alignment have passed resolutions in support of the Bay Trail and have incorporated the trail into their general plans. In 1990, the San Francisco Bay Trail Project was created as a nonprofit organization dedicated to planning, promoting, and advocating implementation of the Bay Trail. The San Francisco Bay Trail Project is administered by ABAG and is housed at ABAG’s offices in Oakland.
National Aeronautics and Space Administration Chap 5. Recreation
NASA Ames Research Center Environmental Resources Document Environmental Management Division March 2015 File: 2015 ARC ERD_FINAL.doc
Pg 84
5.2.3.2 City of Mountain View
5.2.3.2.1 Parks and Open Space Plan
The City of Mountain View regards its parks and other open spaces as some of its most important resources and has developed a Park and Open Space Plan to guide the long-term acquisition, development, and preservation of parkland. The Parks and Open Space Plan is a comprehensive review of open space needs for the City of Mountain View. In addition to offering a long-term vision to guide land use planning decisions, it also provides detailed evaluation of current needs in the city and prioritizes recommendations for the acquisition, improvement, and preservation of parks and open space based on the perceived need (City of Mountain View 2008).
5.2.3.2.2 City of Mountain View General Plan
The Parks, Open Space and Community Facilities Element of the Mountain View General Plan (City of Mountain View 2012) includes six key goals for open space and recreational facilities within the city, as summarized below.
Goal POS-1: An expanded and enhanced park and open space system.
Goal POS-2: Parks and public facilities equitably distributed throughout the community and accessible to residents and employees.
Goal POS-3: Open space areas with natural characteristics that are protected and sustained.
Goal POS-4: Parks and public facilities that are well designed and integrated with the surrounding neighborhood.
Goal POS-5: Cooperation between the City and local school districts to meet shared open space, recreation and education needs.
Goal POS-6: An integrated system of multi-use trails connecting to key local and regional destinations and amenities.
5.2.3.3 City of Sunnyvale
5.2.3.3.1 City of Sunnyvale General Plan
Like Mountain View, the City of Sunnyvale considers parklands an essential component of a desirable urban environment and is committed to maintaining and improving its system of parks and open space. The Land Use and Transportation Chapter of the Sunnyvale General Plan (City of Sunnyvale 2011) articulates two goals for open space in the city, as summarized below.
National Aeronautics and Space Administration Chap 5. Recreation
NASA Ames Research Center Environmental Resources Document Environmental Management Division March 2015 File: 2015 ARC ERD_FINAL.doc
Pg 85
Goal LT -8: Adequate and Balanced Open Space. Provide and maintain adequate and balanced open space and recreation facilities for the benefit of maintaining a healthy community based on community needs and the ability of the city to finance, construct, maintain and operate these facilities now and in the future.
Goal LT -9: Regional Approach to Open Space. A regional approach to providing and preserving open space and providing open space and recreational services, facilities and amenities for the broader community.
5.3 Regional Setting
This section describes offsite recreational facilities in the vicinity, with a focus on facilities that are close enough to ARC that they are likely to be used by ARC employees, residents, and visitors. Wescoat Army housing complex has been privatized and new housing has been constructed. This development includes recreation facilities and green belt area.
Shoreline at Mountain View Regional Park. Shoreline at Mountain View Regional Park is a 280-hectare (700-acre) regional recreation and wildlife area. It offers concert and event facilities, a network of hiking and biking trails, a restored Victorian home built by Henry Rengstorff in 1867, a championship golf course, a 20-hectare (50-acre) saltwater sailing lake, and a meadow area for picnics and play. It also includes natural areas that offer important habitat for wildlife and migratory birds.
San Vernon Park. San Vernon Park has an area of 0.8 hectare (2 acres) and includes a basketball court, playground, picnic area, and outdoor volleyball court.
Stevenson Park. Stevenson Park has an area of 5 hectares (12 acres) and offers a basketball court, playground, soccer/football field, picnic area, softball field, and tennis courts.
Whisman Park. Whisman Park has an area of 5 hectares (12 acres) and offers a basketball court, playground, soccer/football field, softball field, tennis courts, barbeque facilities, outdoor volleyball court, and access to hiking trails.
Baylands Preserve. Operated by the City of Palo Alto and bounded by Mountain View and East Palo Alto, the 785-hectare (1,940-acre) Baylands Preserve is the largest tract of undisturbed marshland in the Bay Area. It includes 24 kilometers (5 linear miles) of multiuse trails, the Lucy Evans Baylands Nature Interpretive Center, the Byxbee Park Hills Art Park, and picnic and barbecue facilities. Baylands Preserve is widely considered to offer some of the best bird-watching opportunities available in the Bay Area.
Sunnyvale Municipal Golf Course. The Sunnyvale Municipal Golf Course offers 18 holes and has an extent of about 80 hectares (200 acres), of which 15 hectares (35 acres) are part of ARC.
National Aeronautics and Space Administration Chap 5. Recreation
NASA Ames Research Center Environmental Resources Document Environmental Management Division March 2015 File: 2015 ARC ERD_FINAL.doc
Pg 86
Baylands Park. Baylands Park offers more than 30 hectares (70 acres) of developed parkland that includes play areas, picnic areas, and the Baylands Grove Amphitheater. It also provides connections to the Bay Trail. An additional 40 hectares (105 acres) of seasonal wetland habitat is protected as a wetlands preserve.
Stevens Creek Trail. Stevens Creek Trail is a heavily used feeder trail for the Bay Trail. It starts at Landels Park in Mountain View and follows Stevens Creek through urban residential neighborhoods and high-tech business parks to the Bay Trail. A portion of the Stevens Creek Trail follows the western edge of the ARC campus.
Stevens Creek Shoreline Nature Study Area. The Stevens Creek Shoreline Nature Study Area is a nature preserve operated by the Midpeninsula Regional Open Space District. This area is part of the NASA Ames Storm Water Retention Pond (SWRP) complex and is accessed via a pedestrian bridge from Shoreline at Mountain View Regional Park.
Bay Trail. The Bay Trail is planned as a multiuse recreational corridor offering 805 kilometers (500 continuous miles) of hiking and bicycling trails encircling San Francisco and San Pablo Bays (San Francisco Bay Trail Project 2014). Insofar as possible, proposed Bay Trail alignments incorporate BCDC’s public access trails, which were designed in accordance with the Bay Plan. To date, approximately 544 kilometers (338 miles) of the trail network have been completed, including segments at Baylands Park in Sunnyvale, Alviso Marina County Park in Alviso, and Shoreline at Mountain View Regional Park in Mountain View. In 2002, ARC and ABAG signed a Memorandum of Understanding (MOU) to plan a potential route and preferred alignment for an approximately two-mile segment of the Bay Trail along the northern perimeter of ARC (NASA 2002) (see Figure 5-1). ARC granted an easement to the USFWS to manage the “Moffett Gap” portion of the Bay Trail, and the trail was later constructed along a levee to the north of ARC. The trail was officially opened to the public in 2010. There are no plans to relocate this segment to ARC (Thompson 2014).
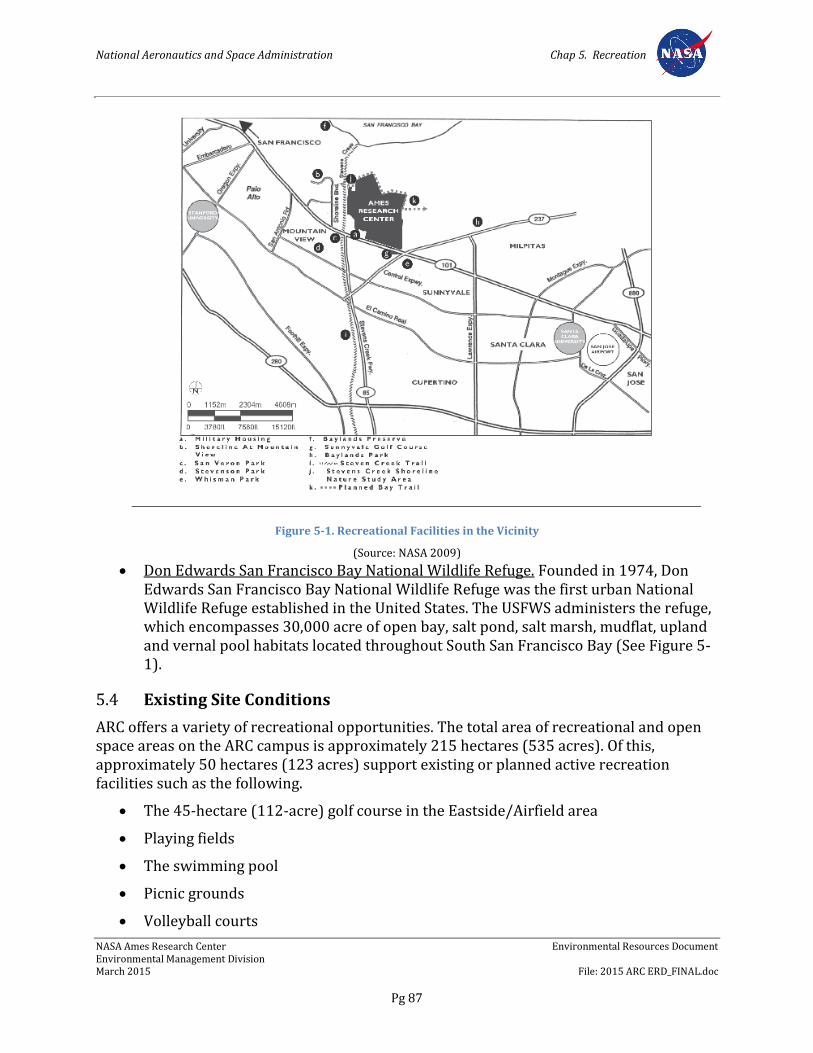
National Aeronautics and Space Administration Chap 5. Recreation
NASA Ames Research Center Environmental Resources Document Environmental Management Division March 2015 File: 2015 ARC ERD_FINAL.doc
Pg 87
Figure 5-1. Recreational Facilities in the Vicinity
(Source: NASA 2009) Don Edwards San Francisco Bay National Wildlife Refuge. Founded in 1974, Don
Edwards San Francisco Bay National Wildlife Refuge was the first urban National Wildlife Refuge established in the United States. The USFWS administers the refuge, which encompasses 30,000 acre of open bay, salt pond, salt marsh, mudflat, upland and vernal pool habitats located throughout South San Francisco Bay (See Figure 5-1).
5.4 Existing Site Conditions
ARC offers a variety of recreational opportunities. The total area of recreational and open space areas on the ARC campus is approximately 215 hectares (535 acres). Of this, approximately 50 hectares (123 acres) support existing or planned active recreation facilities such as the following.
The 45-hectare (112-acre) golf course in the Eastside/Airfield area
Playing fields
The swimming pool
Picnic grounds
Volleyball courts
National Aeronautics and Space Administration Chap 5. Recreation
NASA Ames Research Center Environmental Resources Document Environmental Management Division March 2015 File: 2015 ARC ERD_FINAL.doc
Pg 88
Informal recreation areas
Natural areas that are used for walking and trail running
The perimeter roads encircling the Bay View and North of Bay View areas are also used for walking and running. NASA’s Bicycle Commute Trail (also used by pedestrians) extends from the Stevens Creek Trail to the former Wright Avenue Gate (Gate 17).
5.5 Environmental Requirements
NASA has identified the following environmental policies and measures that address potential recreational impacts of operations and future development at ARC.
5.5.1 NASA Procedural Directive 8500.1, NASA Environmental Management
Per NPD 8500.1, it is NASA policy to: maintain compliance with all applicable federal, state, and local environmental requirements; to incorporate environmental risk reduction and sustainable practices to the extent practicable throughout NASA’s programs, projects, and activities; and to consider environmental factors throughout the life cycle of programs, projects, and activities (as defined in NPD 7120.4, NASA Engineering and Program/Project Management Policy, and related documents), including planning, development, execution, and disposition activities. Examples of environmental factors include consideration of environmental impacts as required by the NEPA and NHPA; the proposed use of hazardous materials; the potential for waste generation; the need to acquire necessary permits, waivers, and authorizations; and the use of environmentally-preferable materials and processes wherever practicable.
5.5.2 Ames Procedural Requirements 8500.1, Ames Environmental Procedural Requirements
APR 8500.1 sets forth general procedural requirements to ensure compliance with applicable federal, state, and local environmental laws; regulations and EOs; and NASA policies and procedures. Organizational directors, division chiefs, branch chiefs, section heads, supervisors, managers, and CORs are responsible for planning, designing, constructing, managing, operating, and maintaining facilities in conformance with applicable regulatory directives, and should obtain environmental review from the Environmental Management Division early in project planning consistent with NASA's NEPA implementing procedures (NPR 8580.1 and EO 12114), NASA policies and procedures for programs and projects (NPR 7120), and NASA regulations related to environmental quality (14 CFR 1216). Program and project managers should coordinate with the Environmental Management Division in a timely manner to ensure that any new or modified programs, projects, and activities comply with regulatory requirements.
5.5.3 Ames Environmental Work Instructions
Ames’s EWIs, which replace the previous Ames Environmental Handbook (APR 8800.3), set forth requirements to ensure that programs, projects, and activities at ARC comply with applicable federal, state, and local laws; regulations and EOs; and NASA policies and
National Aeronautics and Space Administration Chap 5. Recreation
NASA Ames Research Center Environmental Resources Document Environmental Management Division March 2015 File: 2015 ARC ERD_FINAL.doc
Pg 89
procedures. Each EWI lists relevant regulatory authorities and documents, assigns individual and organizational responsibilities within ARC, and identifies specific requirements applicable to the work being performed.
The following EWIs are relevant to operations and future development at ARC with the potential to impact recreational resources.
EWI, 2-4 Wetlands and Flood Plains (Under review)
EWI 12, Public Involvement
EWI 14, NEPA and Environmental Justice
EWI 18, Environmental Requirements for Construction Projects (Under review)
5.5.4 NASA Ames Development Plan Final Programmatic Environmental Impact Statement
Under Mitigated Alternative 5 in the NADP EIS, ARC has committed to the following design measures to ensure that implementation of the NADP does not adversely affect recreational resources.
Approximately 6.4 hectares (15.7 acres) of new park space would be added to the NRP area, as well as approximately 4.6 hectares (11.4 acres) of new active recreational space in the Bay View area and approximately 3.2 hectares (7.8 acres) in the Ames Campus area for a total of 14.1 hectares (34.9 acres).
Approximately 12 hectares (28 acres) of existing undeveloped land in the Bay View area would be developed, leaving a total of approximately 22.35 hectares (55.23 acres) of passive open space, which would function as wildlife habitat.
No additional active parkland would be lost under this alternative.
New residents and employees added under the NADP would generate a total demand for 10.2 hectares (25.3 acres) of new parkland.
A total of 14.1 hectares (34.9 acres) of new parkland would be added to ARC for a surplus of 3.9 hectares (9.6 acres).
The NADP EIS concludes that there would be no negative effects on the quality of any existing or proposed parks or open spaces as a result of implementing Mitigated Alternative 5, except for temporary noise impacts due to construction. Moreover, the EIS has determined that Mitigated Alternative 5 would include a surplus of recreational lands, so it would not add to any cumulative impact that might occur, and could help mitigate these cumulative impacts as the parkland in NRP and Bay View would be open to the community. As such, no additional measures are needed to address recreational impacts from ongoing NADP development.
National Aeronautics and Space Administration Chap 6. Aesthetics
NASA Ames Research Center Environmental Resources Document Environmental Management Division March 2015 File: 2015 ARC ERD_FINAL.doc
Pg 90
Chapter 6. Aesthetics
6.1 Overview
This chapter describes the visual character of ARC, the remaining areas of Moffett Field, the adjacent portions of the cities of Mountain View and Sunnyvale, and the views into and out of ARC. This chapter also includes a discussion of the regulatory framework applicable to visual resources and relevant plans, policies, practices, guidelines, and measures that address potential visual effects of operations and future development at ARC. The information presented in this chapter is based on the November 2009 NASA ARC ERD (NASA 2009), NADP EIS (Design, Community & Environment 2002), and other sources.
6.2 Regulatory Background
6.2.1 Federal Regulations
6.2.1.1 National Environmental Policy Act
NEPA requires federal agencies to include in their decision-making process appropriate and careful consideration of all environmental effects of a proposed action and of possible alternative actions. Measures to avoid or minimize the adverse effects of proposed actions and to restore and enhance environmental quality as much as possible must be developed and discussed where feasible.
6.2.2 Local Regulations
6.2.2.1 Santa Clara County Tree Preservation and Removal Ordinance
Santa Clara County’s Tree Preservation and Removal Ordinance (County Code Division C16) was adopted to establish and maintain tree cover, protect property values, preserve aesthetic resources, prevent erosion, counteract air pollution, provide wind protection, maintain climatic balance, provide habitat, and to protect community and historic assets. The ordinance protects all qualified trees on both public and private land. Any tree that qualifies as a protected tree may not be removed without having first obtained a permit unless it is irreversibly diseased or dead, or if it represents a hazard. In order to obtain a permit, the applicant must submit plans that include a plan to replant trees of similar types, including native trees where the protected tree to be removed is a native (Santa Clara County Ordinance No. NS-1203.107, §1, 2-11-97).
6.3 Regional Setting
ARC is located along the southwestern edge of the San Francisco Bay in the northern portion of Santa Clara County, California (Figure 6-1). The City of Mountain View borders the center to the south and west, and the City of Sunnyvale borders it to the south and east (Figure 1-2).
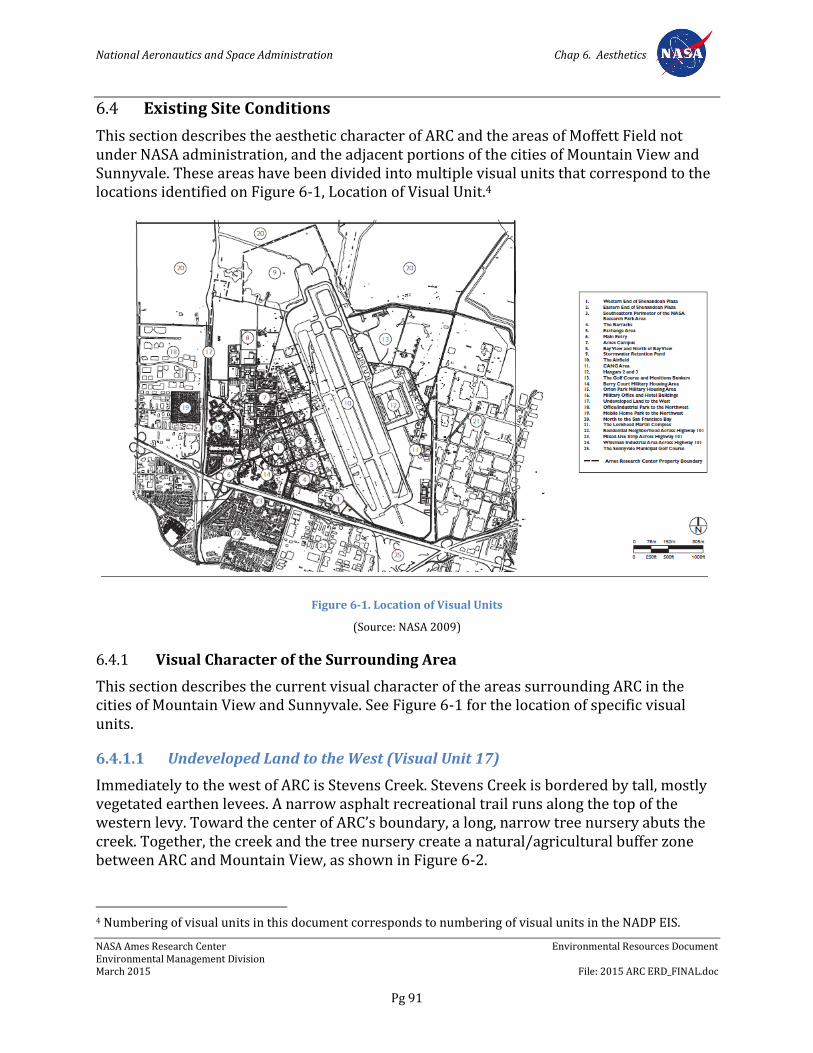
National Aeronautics and Space Administration Chap 6. Aesthetics
NASA Ames Research Center Environmental Resources Document Environmental Management Division March 2015 File: 2015 ARC ERD_FINAL.doc
Pg 91
6.4 Existing Site Conditions
This section describes the aesthetic character of ARC and the areas of Moffett Field not under NASA administration, and the adjacent portions of the cities of Mountain View and Sunnyvale. These areas have been divided into multiple visual units that correspond to the locations identified on Figure 6-1, Location of Visual Unit.4
Figure 6-1. Location of Visual Units
(Source: NASA 2009)
6.4.1 Visual Character of the Surrounding Area
This section describes the current visual character of the areas surrounding ARC in the cities of Mountain View and Sunnyvale. See Figure 6-1 for the location of specific visual units.
6.4.1.1 Undeveloped Land to the West (Visual Unit 17)
Immediately to the west of ARC is Stevens Creek. Stevens Creek is bordered by tall, mostly vegetated earthen levees. A narrow asphalt recreational trail runs along the top of the western levy. Toward the center of ARC’s boundary, a long, narrow tree nursery abuts the creek. Together, the creek and the tree nursery create a natural/agricultural buffer zone between ARC and Mountain View, as shown in Figure 6-2.
4 Numbering of visual units in this document corresponds to numbering of visual units in the NADP EIS.
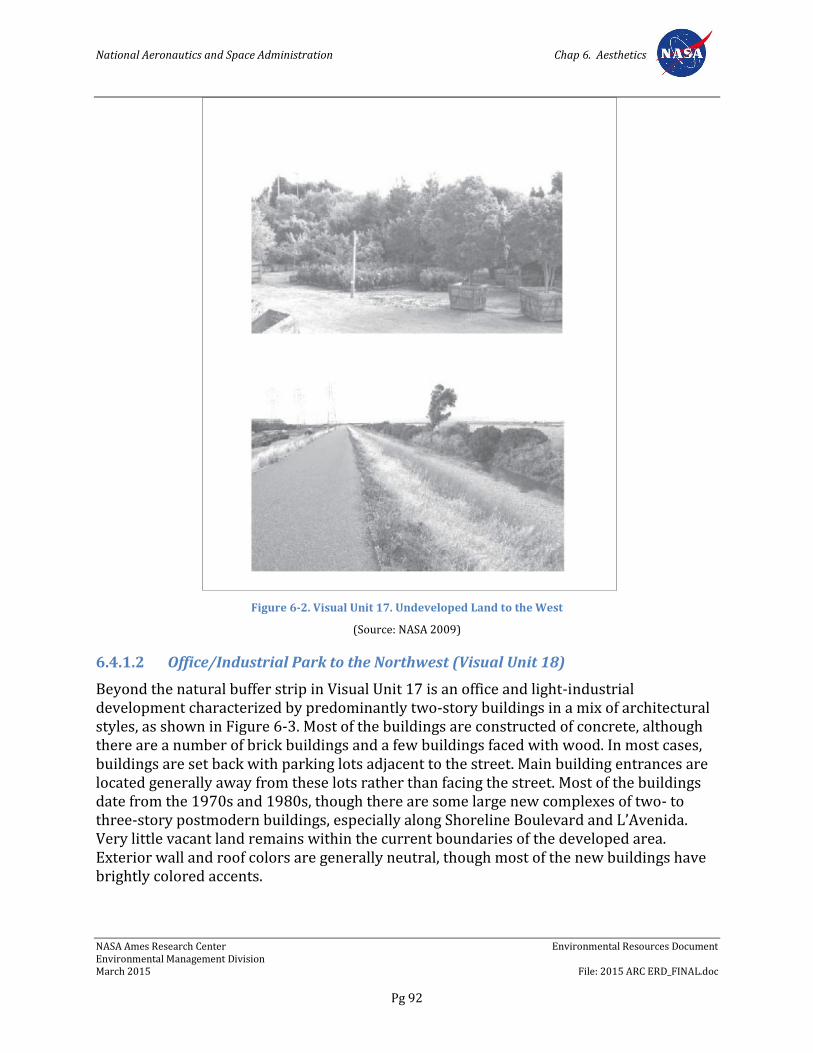
National Aeronautics and Space Administration Chap 6. Aesthetics
NASA Ames Research Center Environmental Resources Document Environmental Management Division March 2015 File: 2015 ARC ERD_FINAL.doc
Pg 92
Figure 6-2. Visual Unit 17. Undeveloped Land to the West
(Source: NASA 2009)
6.4.1.2 Office/Industrial Park to the Northwest (Visual Unit 18)
Beyond the natural buffer strip in Visual Unit 17 is an office and light-industrial development characterized by predominantly two-story buildings in a mix of architectural styles, as shown in Figure 6-3. Most of the buildings are constructed of concrete, although there are a number of brick buildings and a few buildings faced with wood. In most cases, buildings are set back with parking lots adjacent to the street. Main building entrances are located generally away from these lots rather than facing the street. Most of the buildings date from the 1970s and 1980s, though there are some large new complexes of two- to three-story postmodern buildings, especially along Shoreline Boulevard and L’Avenida. Very little vacant land remains within the current boundaries of the developed area. Exterior wall and roof colors are generally neutral, though most of the new buildings have brightly colored accents.
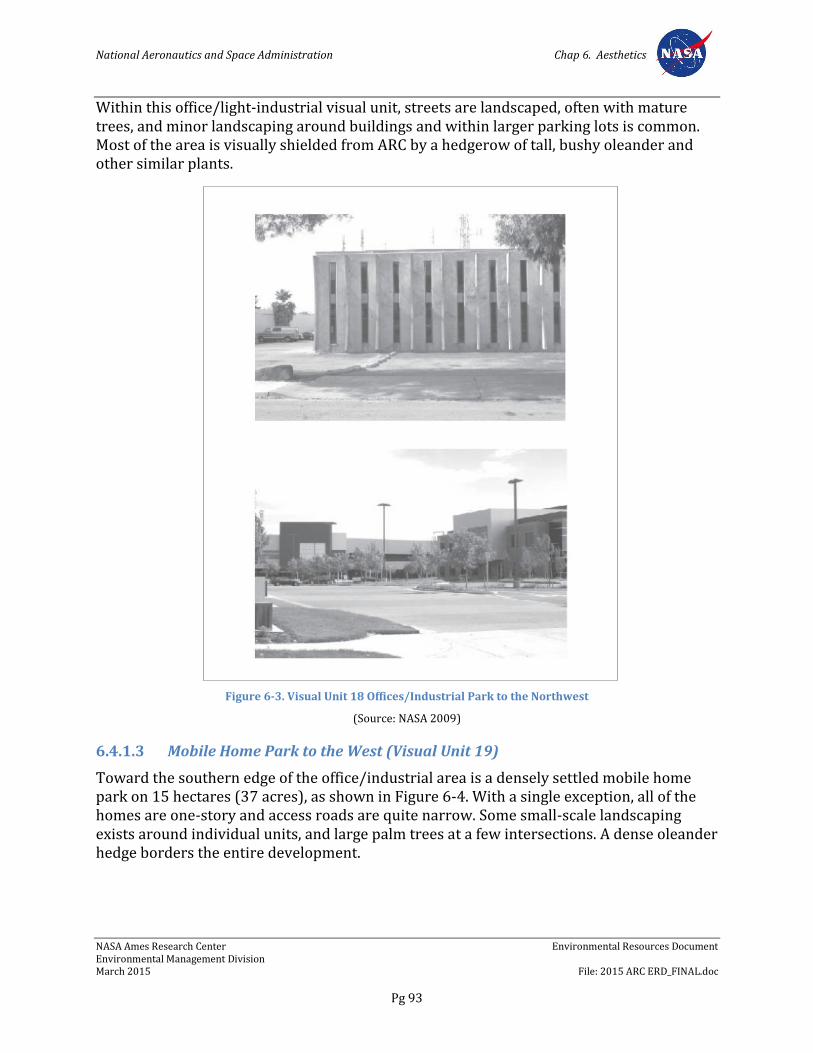
National Aeronautics and Space Administration Chap 6. Aesthetics
NASA Ames Research Center Environmental Resources Document Environmental Management Division March 2015 File: 2015 ARC ERD_FINAL.doc
Pg 93
Within this office/light-industrial visual unit, streets are landscaped, often with mature trees, and minor landscaping around buildings and within larger parking lots is common. Most of the area is visually shielded from ARC by a hedgerow of tall, bushy oleander and other similar plants.
Figure 6-3. Visual Unit 18 Offices/Industrial Park to the Northwest
(Source: NASA 2009)
6.4.1.3 Mobile Home Park to the West (Visual Unit 19)
Toward the southern edge of the office/industrial area is a densely settled mobile home park on 15 hectares (37 acres), as shown in Figure 6-4. With a single exception, all of the homes are one-story and access roads are quite narrow. Some small-scale landscaping exists around individual units, and large palm trees at a few intersections. A dense oleander hedge borders the entire development.
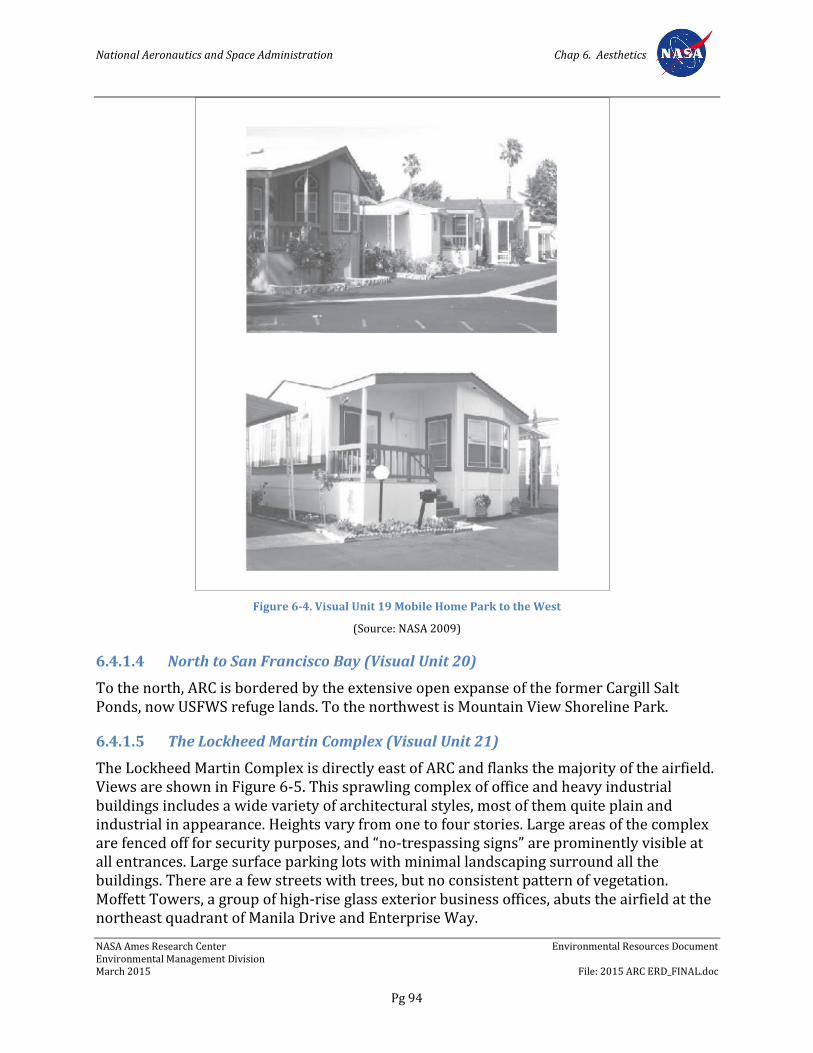
National Aeronautics and Space Administration Chap 6. Aesthetics
NASA Ames Research Center Environmental Resources Document Environmental Management Division March 2015 File: 2015 ARC ERD_FINAL.doc
Pg 94
Figure 6-4. Visual Unit 19 Mobile Home Park to the West
(Source: NASA 2009)
6.4.1.4 North to San Francisco Bay (Visual Unit 20)
To the north, ARC is bordered by the extensive open expanse of the former Cargill Salt Ponds, now USFWS refuge lands. To the northwest is Mountain View Shoreline Park.
6.4.1.5 The Lockheed Martin Complex (Visual Unit 21)
The Lockheed Martin Complex is directly east of ARC and flanks the majority of the airfield. Views are shown in Figure 6-5. This sprawling complex of office and heavy industrial buildings includes a wide variety of architectural styles, most of them quite plain and industrial in appearance. Heights vary from one to four stories. Large areas of the complex are fenced off for security purposes, and “no-trespassing signs” are prominently visible at all entrances. Large surface parking lots with minimal landscaping surround all the buildings. There are a few streets with trees, but no consistent pattern of vegetation. Moffett Towers, a group of high-rise glass exterior business offices, abuts the airfield at the northeast quadrant of Manila Drive and Enterprise Way.
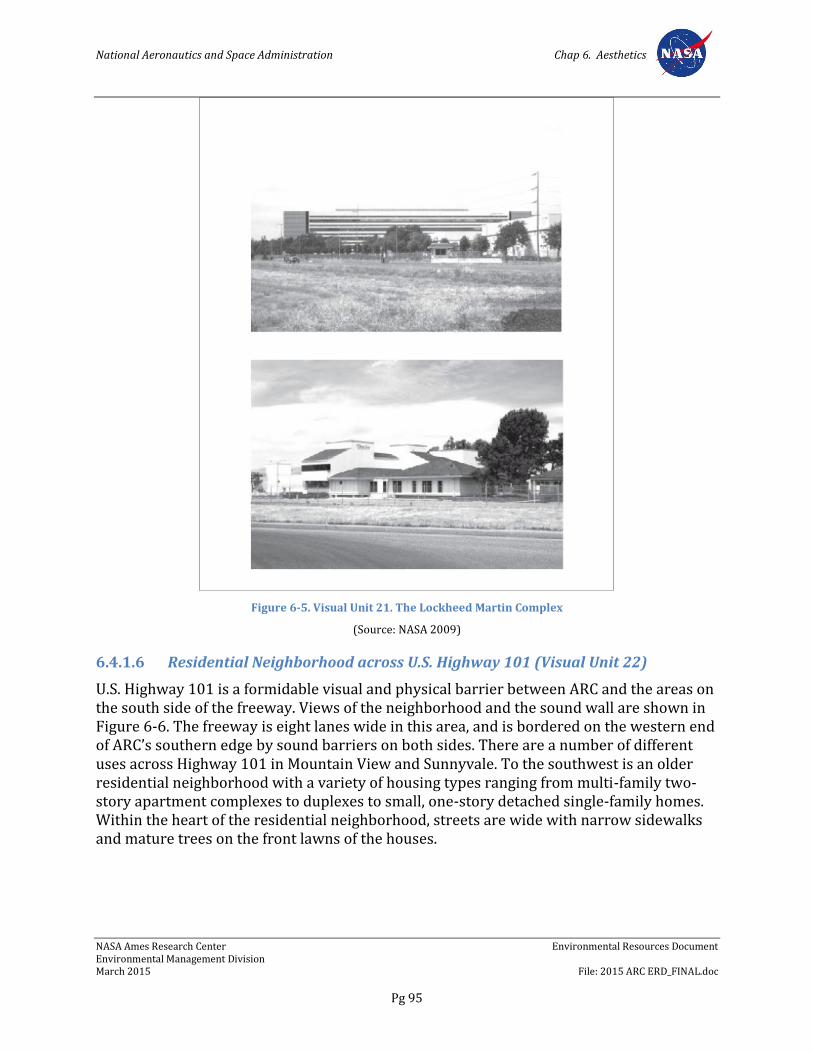
National Aeronautics and Space Administration Chap 6. Aesthetics
NASA Ames Research Center Environmental Resources Document Environmental Management Division March 2015 File: 2015 ARC ERD_FINAL.doc
Pg 95
Figure 6-5. Visual Unit 21. The Lockheed Martin Complex
(Source: NASA 2009)
6.4.1.6 Residential Neighborhood across U.S. Highway 101 (Visual Unit 22)
U.S. Highway 101 is a formidable visual and physical barrier between ARC and the areas on the south side of the freeway. Views of the neighborhood and the sound wall are shown in Figure 6-6. The freeway is eight lanes wide in this area, and is bordered on the western end of ARC’s southern edge by sound barriers on both sides. There are a number of different uses across Highway 101 in Mountain View and Sunnyvale. To the southwest is an older residential neighborhood with a variety of housing types ranging from multi-family two-story apartment complexes to duplexes to small, one-story detached single-family homes. Within the heart of the residential neighborhood, streets are wide with narrow sidewalks and mature trees on the front lawns of the houses.
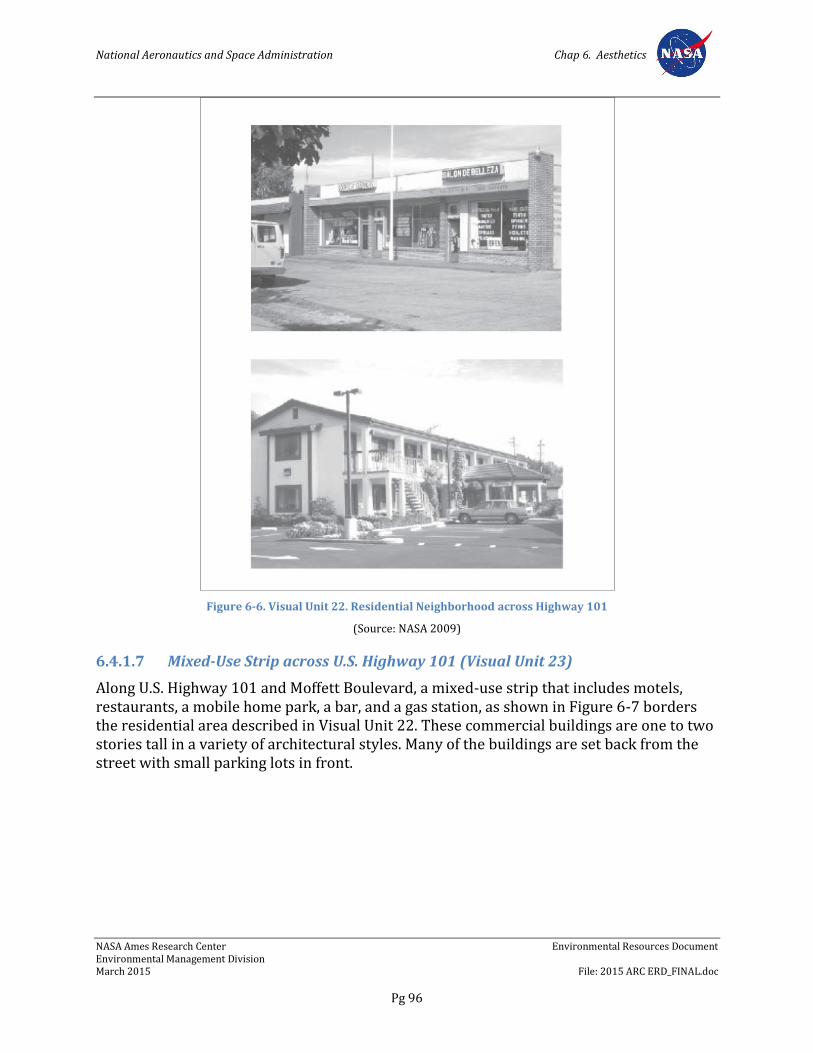
National Aeronautics and Space Administration Chap 6. Aesthetics
NASA Ames Research Center Environmental Resources Document Environmental Management Division March 2015 File: 2015 ARC ERD_FINAL.doc
Pg 96
Figure 6-6. Visual Unit 22. Residential Neighborhood across Highway 101
(Source: NASA 2009)
6.4.1.7 Mixed-Use Strip across U.S. Highway 101 (Visual Unit 23)
Along U.S. Highway 101 and Moffett Boulevard, a mixed-use strip that includes motels, restaurants, a mobile home park, a bar, and a gas station, as shown in Figure 6-7 borders the residential area described in Visual Unit 22. These commercial buildings are one to two stories tall in a variety of architectural styles. Many of the buildings are set back from the street with small parking lots in front.
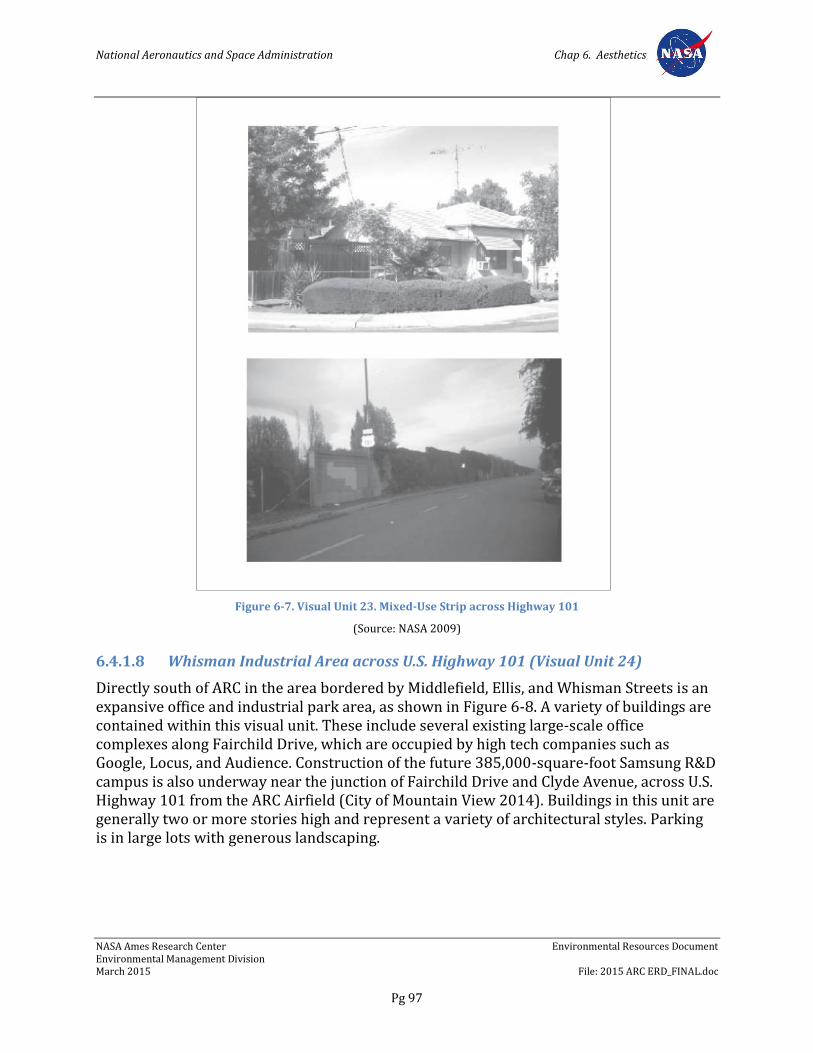
National Aeronautics and Space Administration Chap 6. Aesthetics
NASA Ames Research Center Environmental Resources Document Environmental Management Division March 2015 File: 2015 ARC ERD_FINAL.doc
Pg 97
Figure 6-7. Visual Unit 23. Mixed-Use Strip across Highway 101
(Source: NASA 2009)
6.4.1.8 Whisman Industrial Area across U.S. Highway 101 (Visual Unit 24)
Directly south of ARC in the area bordered by Middlefield, Ellis, and Whisman Streets is an expansive office and industrial park area, as shown in Figure 6-8. A variety of buildings are contained within this visual unit. These include several existing large-scale office complexes along Fairchild Drive, which are occupied by high tech companies such as Google, Locus, and Audience. Construction of the future 385,000-square-foot Samsung R&D campus is also underway near the junction of Fairchild Drive and Clyde Avenue, across U.S. Highway 101 from the ARC Airfield (City of Mountain View 2014). Buildings in this unit are generally two or more stories high and represent a variety of architectural styles. Parking is in large lots with generous landscaping.
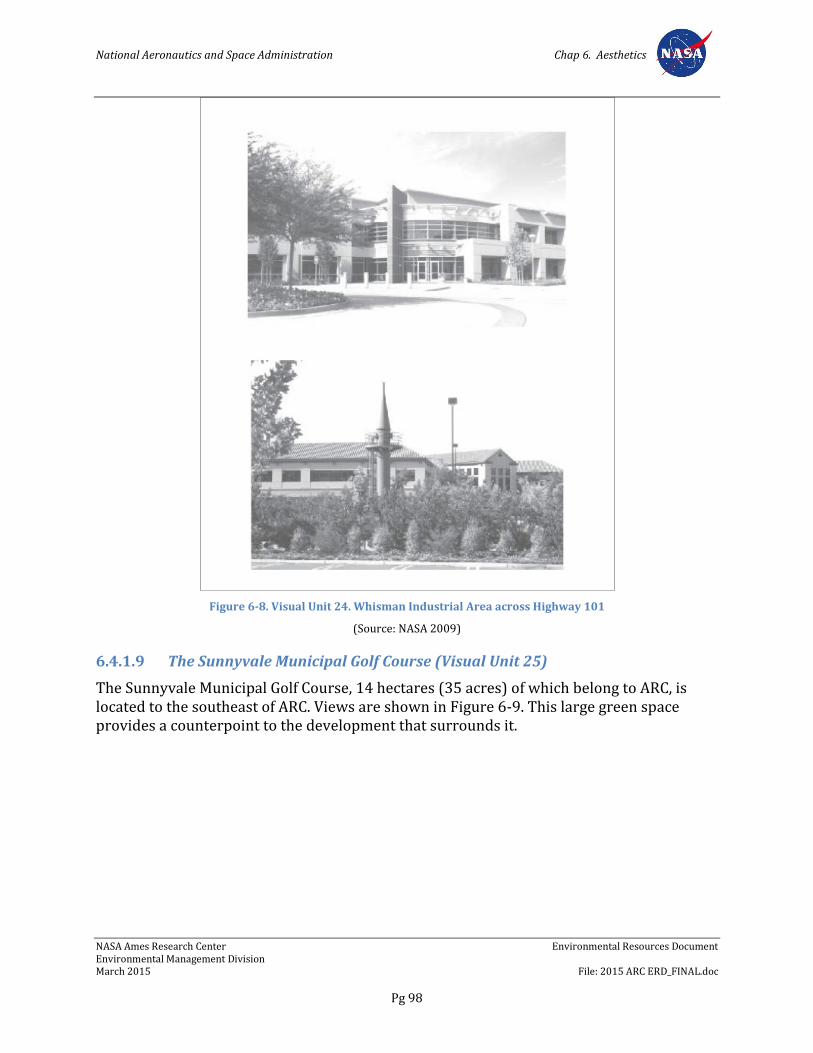
National Aeronautics and Space Administration Chap 6. Aesthetics
NASA Ames Research Center Environmental Resources Document Environmental Management Division March 2015 File: 2015 ARC ERD_FINAL.doc
Pg 98
Figure 6-8. Visual Unit 24. Whisman Industrial Area across Highway 101
(Source: NASA 2009)
6.4.1.9 The Sunnyvale Municipal Golf Course (Visual Unit 25)
The Sunnyvale Municipal Golf Course, 14 hectares (35 acres) of which belong to ARC, is located to the southeast of ARC. Views are shown in Figure 6-9. This large green space provides a counterpoint to the development that surrounds it.
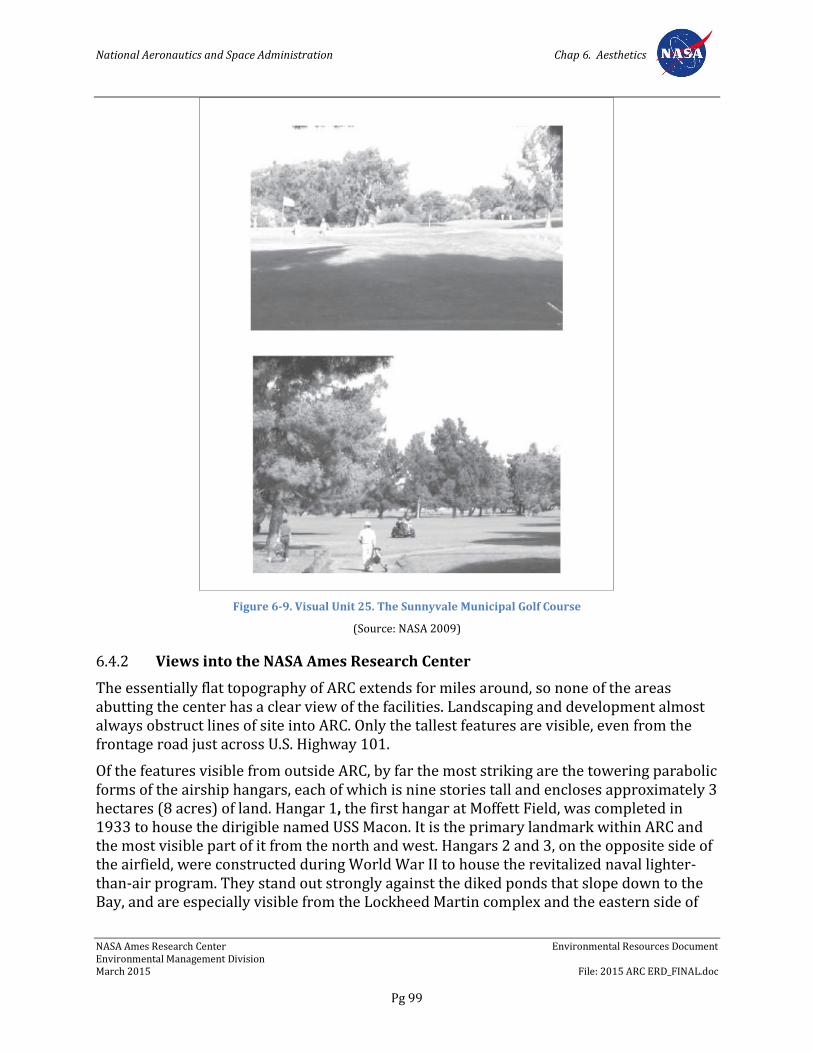
National Aeronautics and Space Administration Chap 6. Aesthetics
NASA Ames Research Center Environmental Resources Document Environmental Management Division March 2015 File: 2015 ARC ERD_FINAL.doc
Pg 99
Figure 6-9. Visual Unit 25. The Sunnyvale Municipal Golf Course
(Source: NASA 2009)
6.4.2 Views into the NASA Ames Research Center
The essentially flat topography of ARC extends for miles around, so none of the areas abutting the center has a clear view of the facilities. Landscaping and development almost always obstruct lines of site into ARC. Only the tallest features are visible, even from the frontage road just across U.S. Highway 101.
Of the features visible from outside ARC, by far the most striking are the towering parabolic forms of the airship hangars, each of which is nine stories tall and encloses approximately 3 hectares (8 acres) of land. Hangar 1, the first hangar at Moffett Field, was completed in 1933 to house the dirigible named USS Macon. It is the primary landmark within ARC and the most visible part of it from the north and west. Hangars 2 and 3, on the opposite side of the airfield, were constructed during World War II to house the revitalized naval lighter-than-air program. They stand out strongly against the diked ponds that slope down to the Bay, and are especially visible from the Lockheed Martin complex and the eastern side of
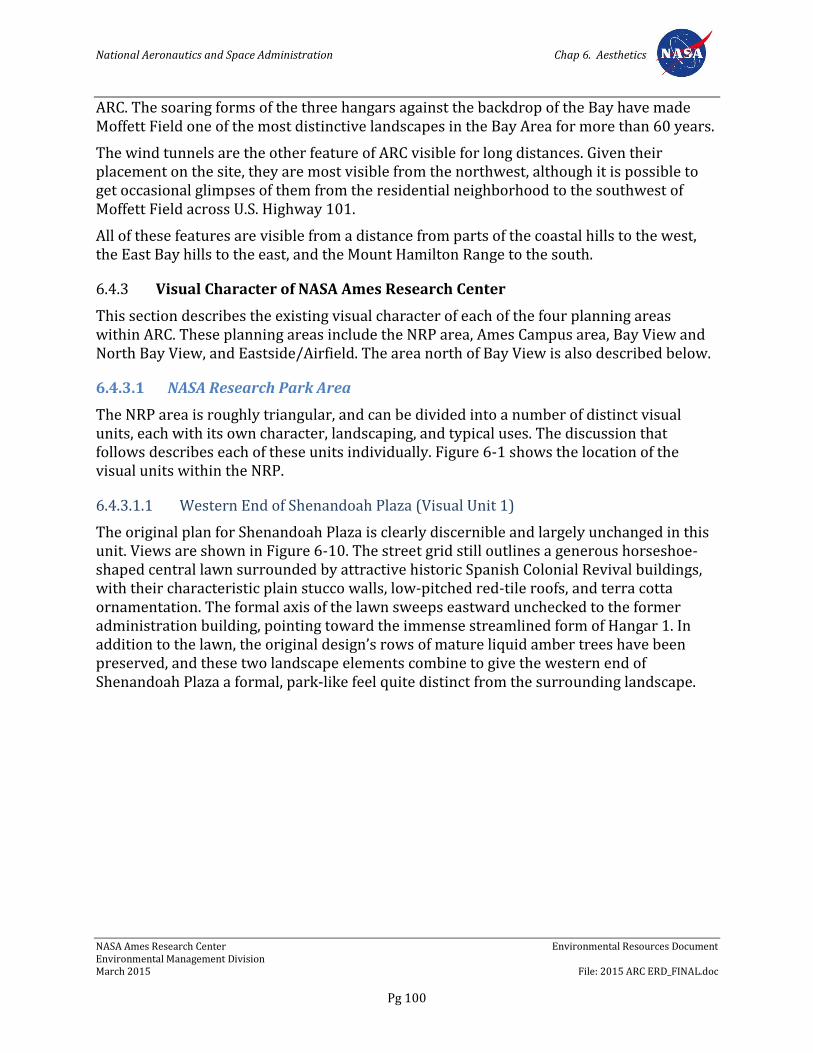
National Aeronautics and Space Administration Chap 6. Aesthetics
NASA Ames Research Center Environmental Resources Document Environmental Management Division March 2015 File: 2015 ARC ERD_FINAL.doc
Pg 100
ARC. The soaring forms of the three hangars against the backdrop of the Bay have made Moffett Field one of the most distinctive landscapes in the Bay Area for more than 60 years.
The wind tunnels are the other feature of ARC visible for long distances. Given their placement on the site, they are most visible from the northwest, although it is possible to get occasional glimpses of them from the residential neighborhood to the southwest of Moffett Field across U.S. Highway 101.
All of these features are visible from a distance from parts of the coastal hills to the west, the East Bay hills to the east, and the Mount Hamilton Range to the south.
6.4.3 Visual Character of NASA Ames Research Center
This section describes the existing visual character of each of the four planning areas within ARC. These planning areas include the NRP area, Ames Campus area, Bay View and North Bay View, and Eastside/Airfield. The area north of Bay View is also described below.
6.4.3.1 NASA Research Park Area
The NRP area is roughly triangular, and can be divided into a number of distinct visual units, each with its own character, landscaping, and typical uses. The discussion that follows describes each of these units individually. Figure 6-1 shows the location of the visual units within the NRP.
6.4.3.1.1 Western End of Shenandoah Plaza (Visual Unit 1)
The original plan for Shenandoah Plaza is clearly discernible and largely unchanged in this unit. Views are shown in Figure 6-10. The street grid still outlines a generous horseshoe-shaped central lawn surrounded by attractive historic Spanish Colonial Revival buildings, with their characteristic plain stucco walls, low-pitched red-tile roofs, and terra cotta ornamentation. The formal axis of the lawn sweeps eastward unchecked to the former administration building, pointing toward the immense streamlined form of Hangar 1. In addition to the lawn, the original design’s rows of mature liquid amber trees have been preserved, and these two landscape elements combine to give the western end of Shenandoah Plaza a formal, park-like feel quite distinct from the surrounding landscape.
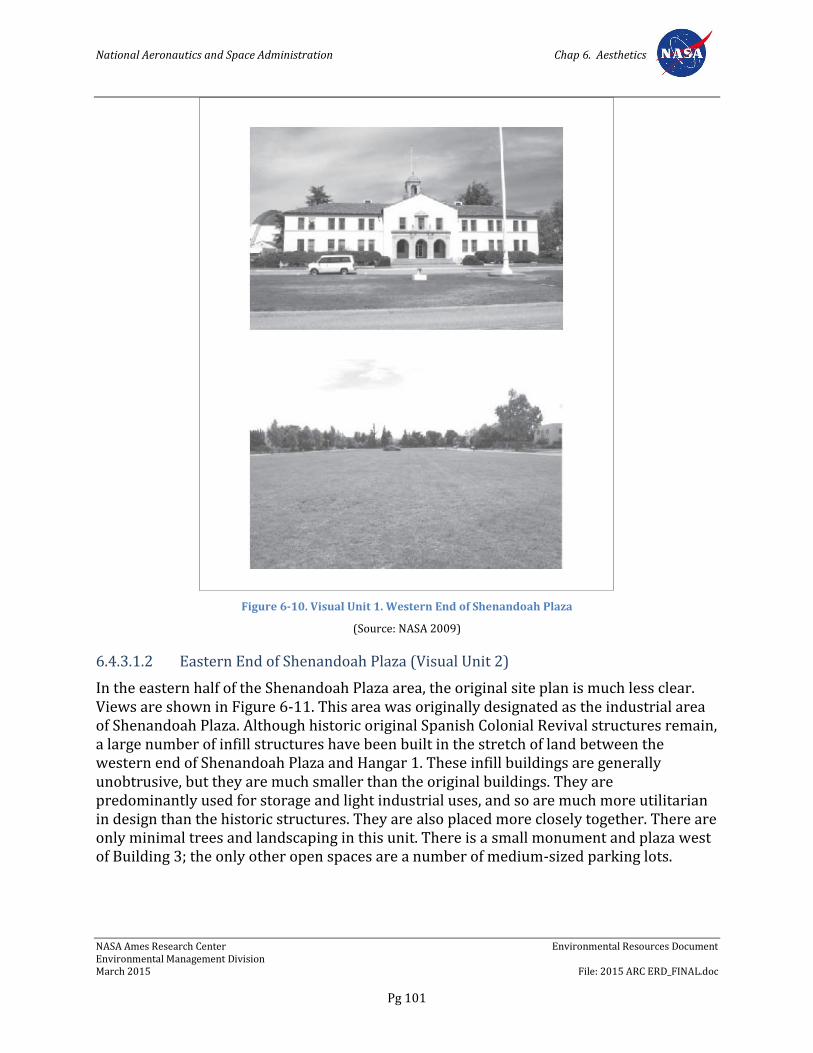
National Aeronautics and Space Administration Chap 6. Aesthetics
NASA Ames Research Center Environmental Resources Document Environmental Management Division March 2015 File: 2015 ARC ERD_FINAL.doc
Pg 101
Figure 6-10. Visual Unit 1. Western End of Shenandoah Plaza
(Source: NASA 2009)
6.4.3.1.2 Eastern End of Shenandoah Plaza (Visual Unit 2)
In the eastern half of the Shenandoah Plaza area, the original site plan is much less clear. Views are shown in Figure 6-11. This area was originally designated as the industrial area of Shenandoah Plaza. Although historic original Spanish Colonial Revival structures remain, a large number of infill structures have been built in the stretch of land between the western end of Shenandoah Plaza and Hangar 1. These infill buildings are generally unobtrusive, but they are much smaller than the original buildings. They are predominantly used for storage and light industrial uses, and so are much more utilitarian in design than the historic structures. They are also placed more closely together. There are only minimal trees and landscaping in this unit. There is a small monument and plaza west of Building 3; the only other open spaces are a number of medium-sized parking lots.
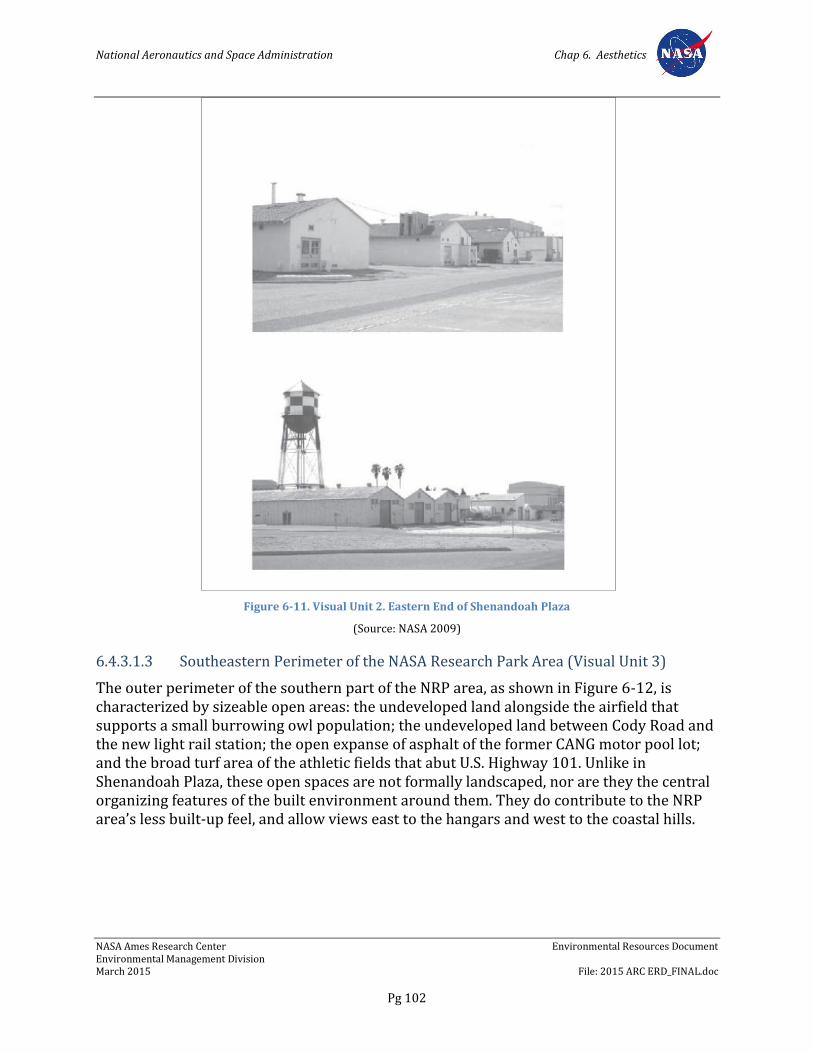
National Aeronautics and Space Administration Chap 6. Aesthetics
NASA Ames Research Center Environmental Resources Document Environmental Management Division March 2015 File: 2015 ARC ERD_FINAL.doc
Pg 102
Figure 6-11. Visual Unit 2. Eastern End of Shenandoah Plaza
(Source: NASA 2009)
6.4.3.1.3 Southeastern Perimeter of the NASA Research Park Area (Visual Unit 3)
The outer perimeter of the southern part of the NRP area, as shown in Figure 6-12, is characterized by sizeable open areas: the undeveloped land alongside the airfield that supports a small burrowing owl population; the undeveloped land between Cody Road and the new light rail station; the open expanse of asphalt of the former CANG motor pool lot; and the broad turf area of the athletic fields that abut U.S. Highway 101. Unlike in Shenandoah Plaza, these open spaces are not formally landscaped, nor are they the central organizing features of the built environment around them. They do contribute to the NRP area’s less built-up feel, and allow views east to the hangars and west to the coastal hills.
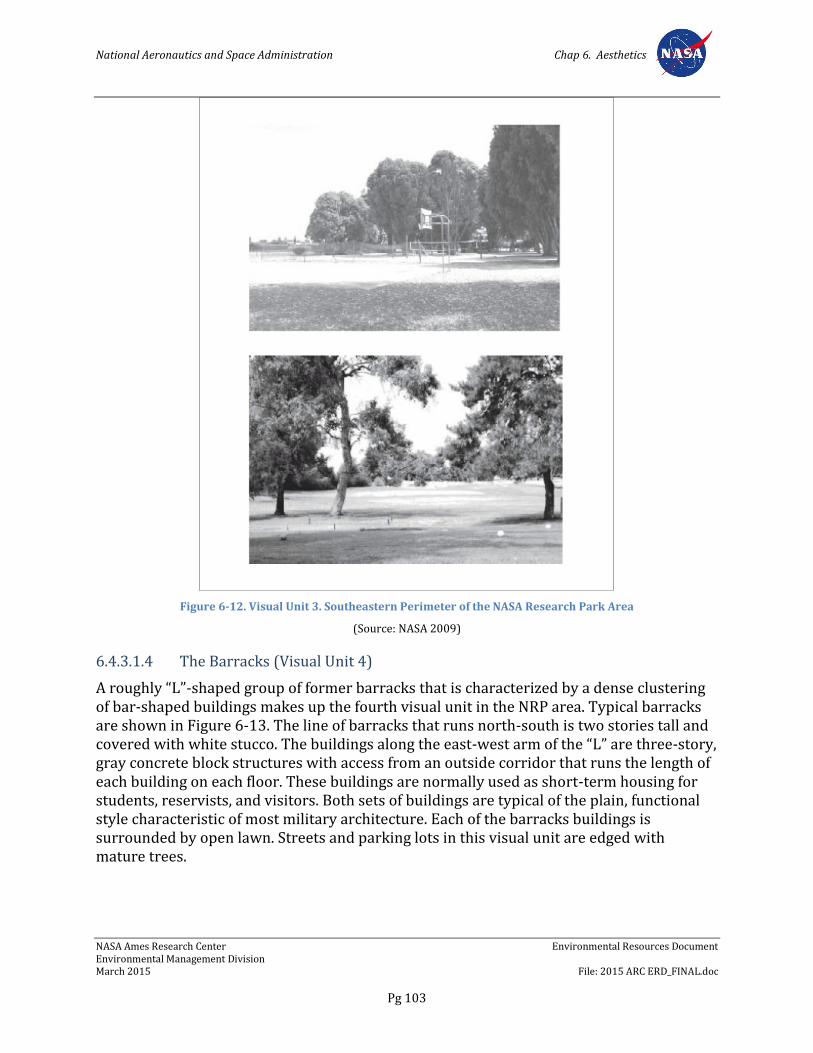
National Aeronautics and Space Administration Chap 6. Aesthetics
NASA Ames Research Center Environmental Resources Document Environmental Management Division March 2015 File: 2015 ARC ERD_FINAL.doc
Pg 103
Figure 6-12. Visual Unit 3. Southeastern Perimeter of the NASA Research Park Area
(Source: NASA 2009)
6.4.3.1.4 The Barracks (Visual Unit 4)
A roughly “L”-shaped group of former barracks that is characterized by a dense clustering of bar-shaped buildings makes up the fourth visual unit in the NRP area. Typical barracks are shown in Figure 6-13. The line of barracks that runs north-south is two stories tall and covered with white stucco. The buildings along the east-west arm of the “L” are three-story, gray concrete block structures with access from an outside corridor that runs the length of each building on each floor. These buildings are normally used as short-term housing for students, reservists, and visitors. Both sets of buildings are typical of the plain, functional style characteristic of most military architecture. Each of the barracks buildings is surrounded by open lawn. Streets and parking lots in this visual unit are edged with mature trees.
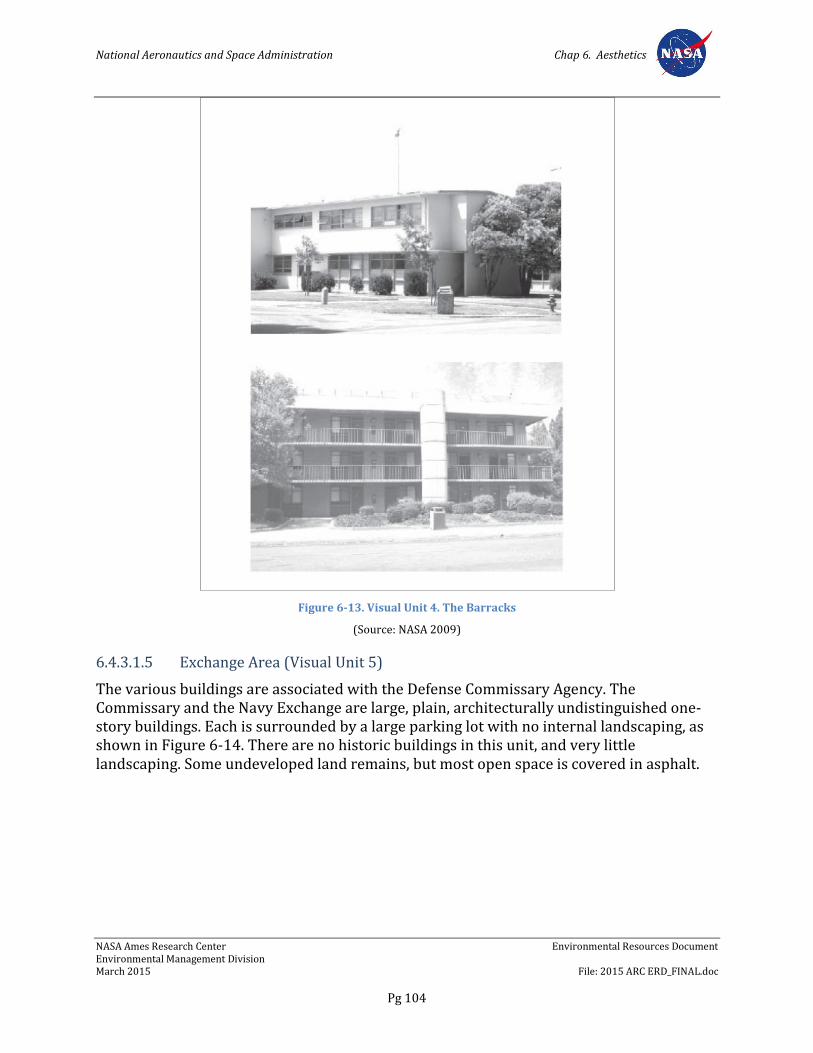
National Aeronautics and Space Administration Chap 6. Aesthetics
NASA Ames Research Center Environmental Resources Document Environmental Management Division March 2015 File: 2015 ARC ERD_FINAL.doc
Pg 104
Figure 6-13. Visual Unit 4. The Barracks
(Source: NASA 2009)
6.4.3.1.5 Exchange Area (Visual Unit 5)
The various buildings are associated with the Defense Commissary Agency. The Commissary and the Navy Exchange are large, plain, architecturally undistinguished one-story buildings. Each is surrounded by a large parking lot with no internal landscaping, as shown in Figure 6-14. There are no historic buildings in this unit, and very little landscaping. Some undeveloped land remains, but most open space is covered in asphalt.
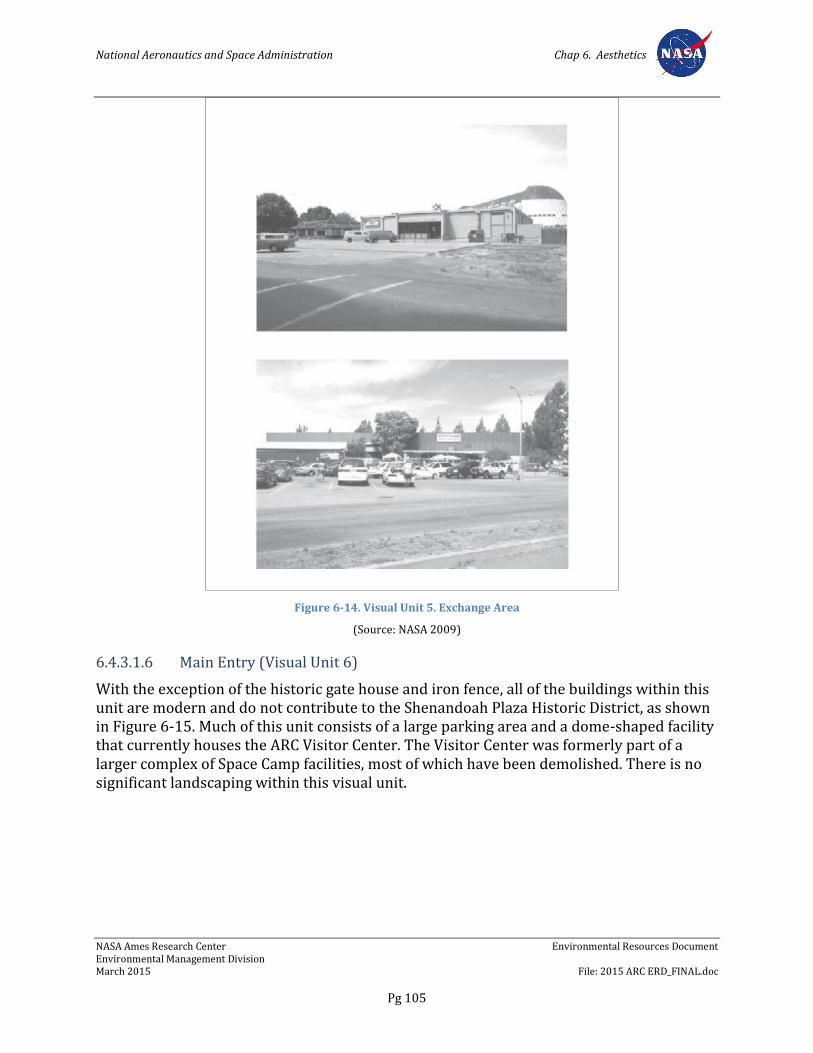
National Aeronautics and Space Administration Chap 6. Aesthetics
NASA Ames Research Center Environmental Resources Document Environmental Management Division March 2015 File: 2015 ARC ERD_FINAL.doc
Pg 105
Figure 6-14. Visual Unit 5. Exchange Area
(Source: NASA 2009)
6.4.3.1.6 Main Entry (Visual Unit 6)
With the exception of the historic gate house and iron fence, all of the buildings within this unit are modern and do not contribute to the Shenandoah Plaza Historic District, as shown in Figure 6-15. Much of this unit consists of a large parking area and a dome-shaped facility that currently houses the ARC Visitor Center. The Visitor Center was formerly part of a larger complex of Space Camp facilities, most of which have been demolished. There is no significant landscaping within this visual unit.
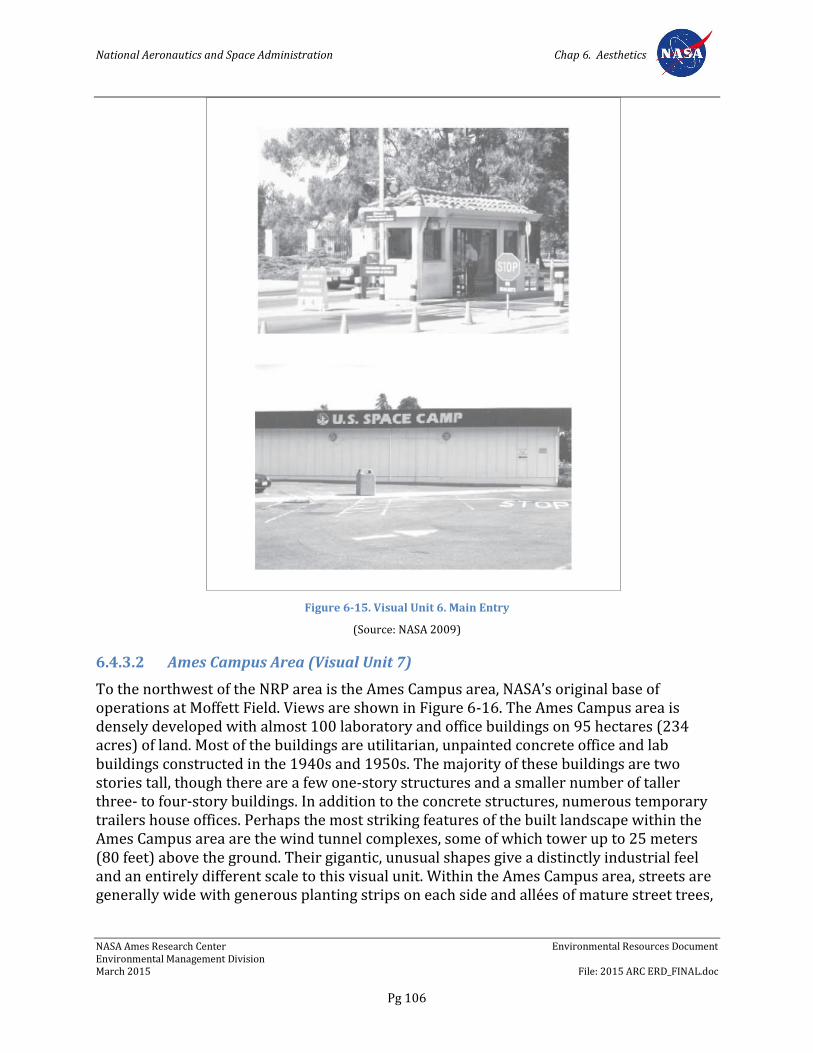
National Aeronautics and Space Administration Chap 6. Aesthetics
NASA Ames Research Center Environmental Resources Document Environmental Management Division March 2015 File: 2015 ARC ERD_FINAL.doc
Pg 106
Figure 6-15. Visual Unit 6. Main Entry
(Source: NASA 2009)
6.4.3.2 Ames Campus Area (Visual Unit 7)
To the northwest of the NRP area is the Ames Campus area, NASA’s original base of operations at Moffett Field. Views are shown in Figure 6-16. The Ames Campus area is densely developed with almost 100 laboratory and office buildings on 95 hectares (234 acres) of land. Most of the buildings are utilitarian, unpainted concrete office and lab buildings constructed in the 1940s and 1950s. The majority of these buildings are two stories tall, though there are a few one-story structures and a smaller number of taller three- to four-story buildings. In addition to the concrete structures, numerous temporary trailers house offices. Perhaps the most striking features of the built landscape within the Ames Campus area are the wind tunnel complexes, some of which tower up to 25 meters (80 feet) above the ground. Their gigantic, unusual shapes give a distinctly industrial feel and an entirely different scale to this visual unit. Within the Ames Campus area, streets are generally wide with generous planting strips on each side and allées of mature street trees,
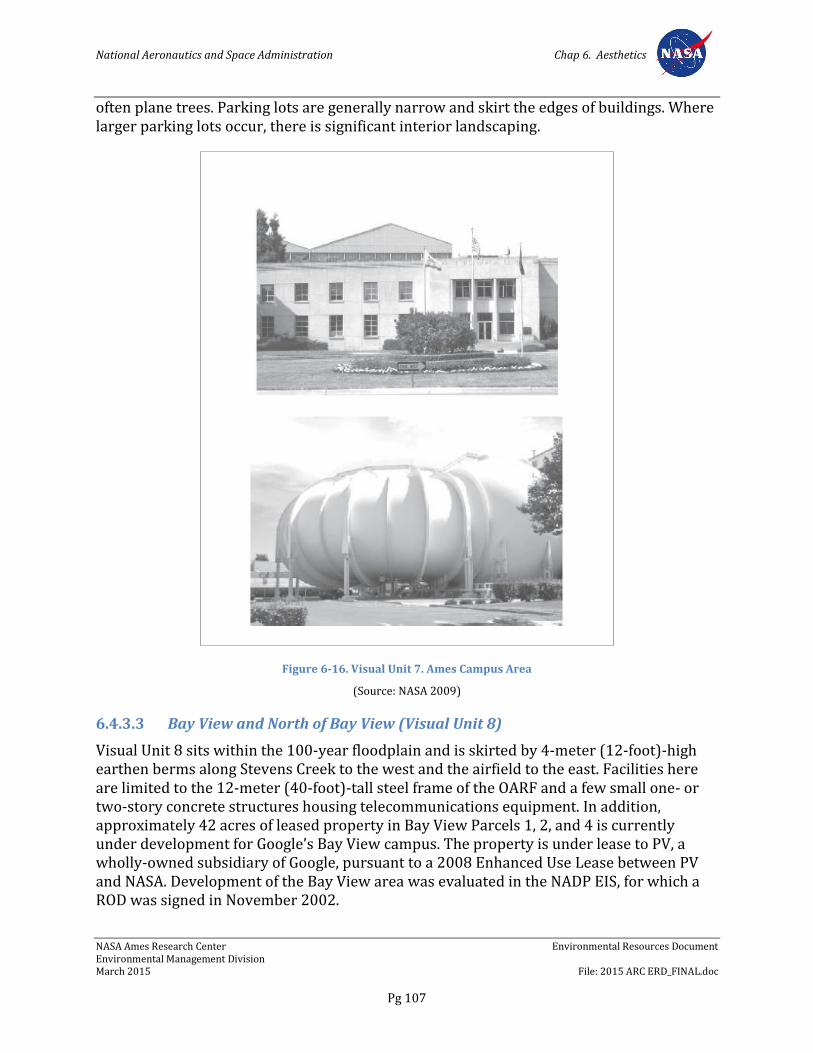
National Aeronautics and Space Administration Chap 6. Aesthetics
NASA Ames Research Center Environmental Resources Document Environmental Management Division March 2015 File: 2015 ARC ERD_FINAL.doc
Pg 107
often plane trees. Parking lots are generally narrow and skirt the edges of buildings. Where larger parking lots occur, there is significant interior landscaping.
Figure 6-16. Visual Unit 7. Ames Campus Area
(Source: NASA 2009)
6.4.3.3 Bay View and North of Bay View (Visual Unit 8)
Visual Unit 8 sits within the 100-year floodplain and is skirted by 4-meter (12-foot)-high earthen berms along Stevens Creek to the west and the airfield to the east. Facilities here are limited to the 12-meter (40-foot)-tall steel frame of the OARF and a few small one- or two-story concrete structures housing telecommunications equipment. In addition, approximately 42 acres of leased property in Bay View Parcels 1, 2, and 4 is currently under development for Google’s Bay View campus. The property is under lease to PV, a wholly-owned subsidiary of Google, pursuant to a 2008 Enhanced Use Lease between PV and NASA. Development of the Bay View area was evaluated in the NADP EIS, for which a ROD was signed in November 2002.
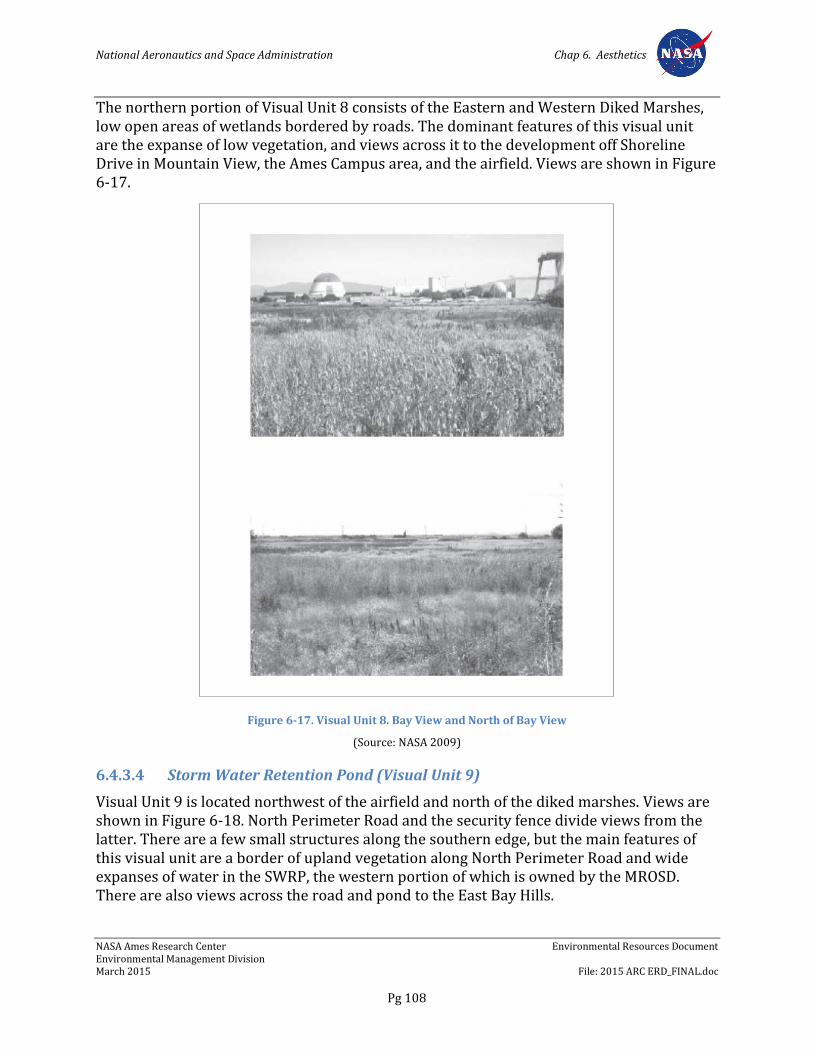
National Aeronautics and Space Administration Chap 6. Aesthetics
NASA Ames Research Center Environmental Resources Document Environmental Management Division March 2015 File: 2015 ARC ERD_FINAL.doc
Pg 108
The northern portion of Visual Unit 8 consists of the Eastern and Western Diked Marshes, low open areas of wetlands bordered by roads. The dominant features of this visual unit are the expanse of low vegetation, and views across it to the development off Shoreline Drive in Mountain View, the Ames Campus area, and the airfield. Views are shown in Figure 6-17.
Figure 6-17. Visual Unit 8. Bay View and North of Bay View
(Source: NASA 2009)
6.4.3.4 Storm Water Retention Pond (Visual Unit 9)
Visual Unit 9 is located northwest of the airfield and north of the diked marshes. Views are shown in Figure 6-18. North Perimeter Road and the security fence divide views from the latter. There are a few small structures along the southern edge, but the main features of this visual unit are a border of upland vegetation along North Perimeter Road and wide expanses of water in the SWRP, the western portion of which is owned by the MROSD. There are also views across the road and pond to the East Bay Hills.
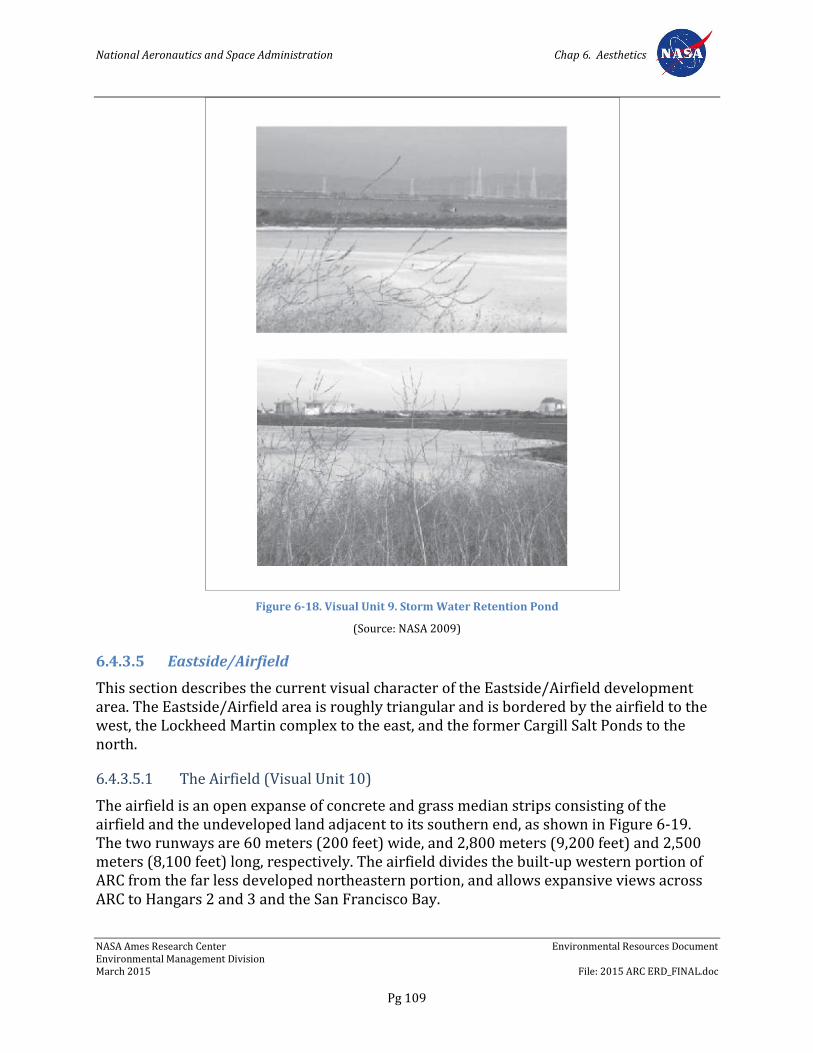
National Aeronautics and Space Administration Chap 6. Aesthetics
NASA Ames Research Center Environmental Resources Document Environmental Management Division March 2015 File: 2015 ARC ERD_FINAL.doc
Pg 109
Figure 6-18. Visual Unit 9. Storm Water Retention Pond
(Source: NASA 2009)
6.4.3.5 Eastside/Airfield
This section describes the current visual character of the Eastside/Airfield development area. The Eastside/Airfield area is roughly triangular and is bordered by the airfield to the west, the Lockheed Martin complex to the east, and the former Cargill Salt Ponds to the north.
6.4.3.5.1 The Airfield (Visual Unit 10)
The airfield is an open expanse of concrete and grass median strips consisting of the airfield and the undeveloped land adjacent to its southern end, as shown in Figure 6-19. The two runways are 60 meters (200 feet) wide, and 2,800 meters (9,200 feet) and 2,500 meters (8,100 feet) long, respectively. The airfield divides the built-up western portion of ARC from the far less developed northeastern portion, and allows expansive views across ARC to Hangars 2 and 3 and the San Francisco Bay.

National Aeronautics and Space Administration Chap 6. Aesthetics
NASA Ames Research Center Environmental Resources Document Environmental Management Division March 2015 File: 2015 ARC ERD_FINAL.doc
Pg 110
Figure 6-19. Visual Unit 10. The Airfield
(Source: NASA 2009)
6.4.3.5.2 California Air National Guard Area (Visual Unit 11)
The CANG area (shown in Figure 6-20) is roughly triangular in shape, with its two long sides delineated by Macon Road to the east and East Patrol Road to the northeast. The short, southern end of the triangle runs roughly parallel to the end of the runways. The area has buildings with adjacent land adequate for CANG to consolidate and construct mission essential facilities. Trees are numerous on the land, grass areas are sprinkled, medians have been landscaped, and land awaiting development has been left in its natural form. Open land is either airfield safety zones, identified for future facilities, burrowing owls, recreation, or restricted areas necessary to maintain security.
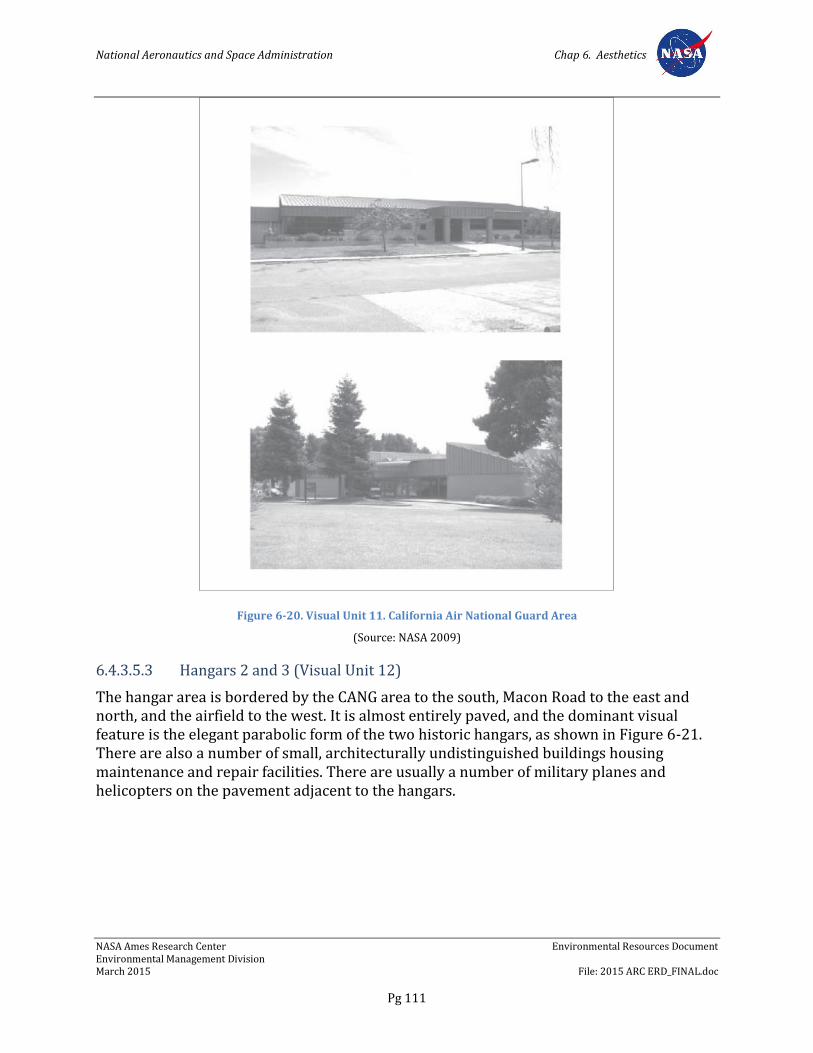
National Aeronautics and Space Administration Chap 6. Aesthetics
NASA Ames Research Center Environmental Resources Document Environmental Management Division March 2015 File: 2015 ARC ERD_FINAL.doc
Pg 111
Figure 6-20. Visual Unit 11. California Air National Guard Area
(Source: NASA 2009)
6.4.3.5.3 Hangars 2 and 3 (Visual Unit 12)
The hangar area is bordered by the CANG area to the south, Macon Road to the east and north, and the airfield to the west. It is almost entirely paved, and the dominant visual feature is the elegant parabolic form of the two historic hangars, as shown in Figure 6-21. There are also a number of small, architecturally undistinguished buildings housing maintenance and repair facilities. There are usually a number of military planes and helicopters on the pavement adjacent to the hangars.
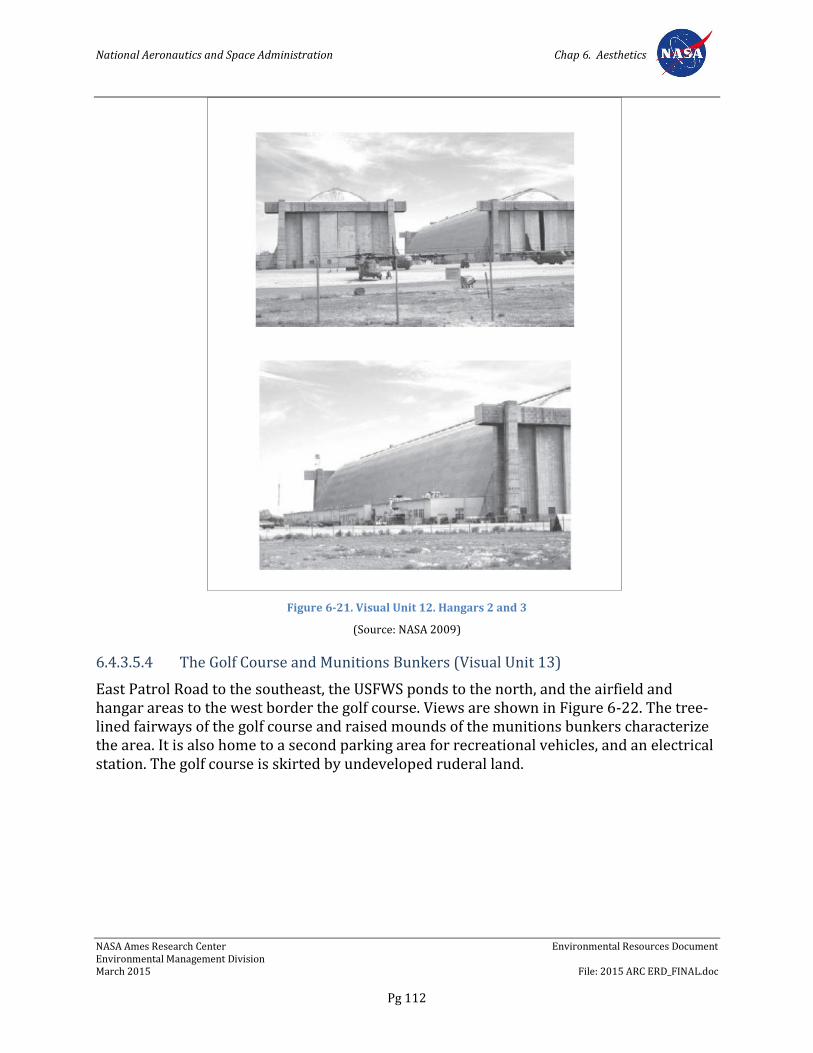
National Aeronautics and Space Administration Chap 6. Aesthetics
NASA Ames Research Center Environmental Resources Document Environmental Management Division March 2015 File: 2015 ARC ERD_FINAL.doc
Pg 112
Figure 6-21. Visual Unit 12. Hangars 2 and 3
(Source: NASA 2009)
6.4.3.5.4 The Golf Course and Munitions Bunkers (Visual Unit 13)
East Patrol Road to the southeast, the USFWS ponds to the north, and the airfield and hangar areas to the west border the golf course. Views are shown in Figure 6-22. The tree-lined fairways of the golf course and raised mounds of the munitions bunkers characterize the area. It is also home to a second parking area for recreational vehicles, and an electrical station. The golf course is skirted by undeveloped ruderal land.
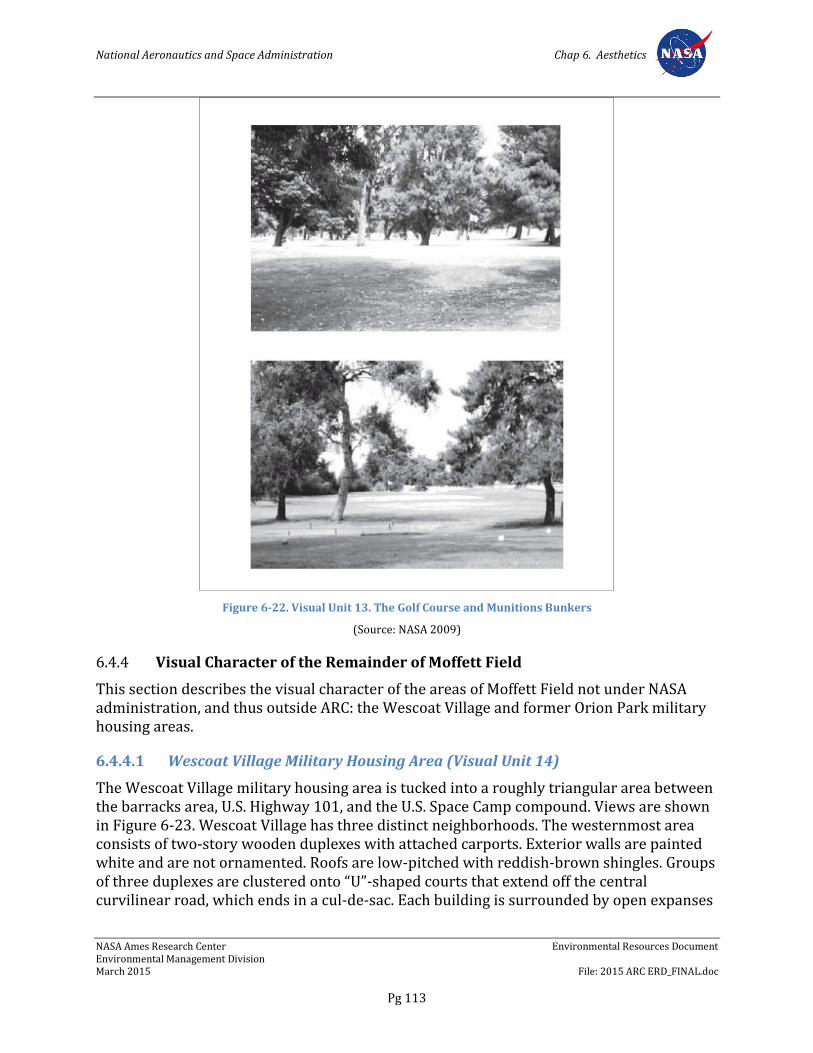
National Aeronautics and Space Administration Chap 6. Aesthetics
NASA Ames Research Center Environmental Resources Document Environmental Management Division March 2015 File: 2015 ARC ERD_FINAL.doc
Pg 113
Figure 6-22. Visual Unit 13. The Golf Course and Munitions Bunkers
(Source: NASA 2009)
6.4.4 Visual Character of the Remainder of Moffett Field
This section describes the visual character of the areas of Moffett Field not under NASA administration, and thus outside ARC: the Wescoat Village and former Orion Park military housing areas.
6.4.4.1 Wescoat Village Military Housing Area (Visual Unit 14)
The Wescoat Village military housing area is tucked into a roughly triangular area between the barracks area, U.S. Highway 101, and the U.S. Space Camp compound. Views are shown in Figure 6-23. Wescoat Village has three distinct neighborhoods. The westernmost area consists of two-story wooden duplexes with attached carports. Exterior walls are painted white and are not ornamented. Roofs are low-pitched with reddish-brown shingles. Groups of three duplexes are clustered onto “U”-shaped courts that extend off the central curvilinear road, which ends in a cul-de-sac. Each building is surrounded by open expanses
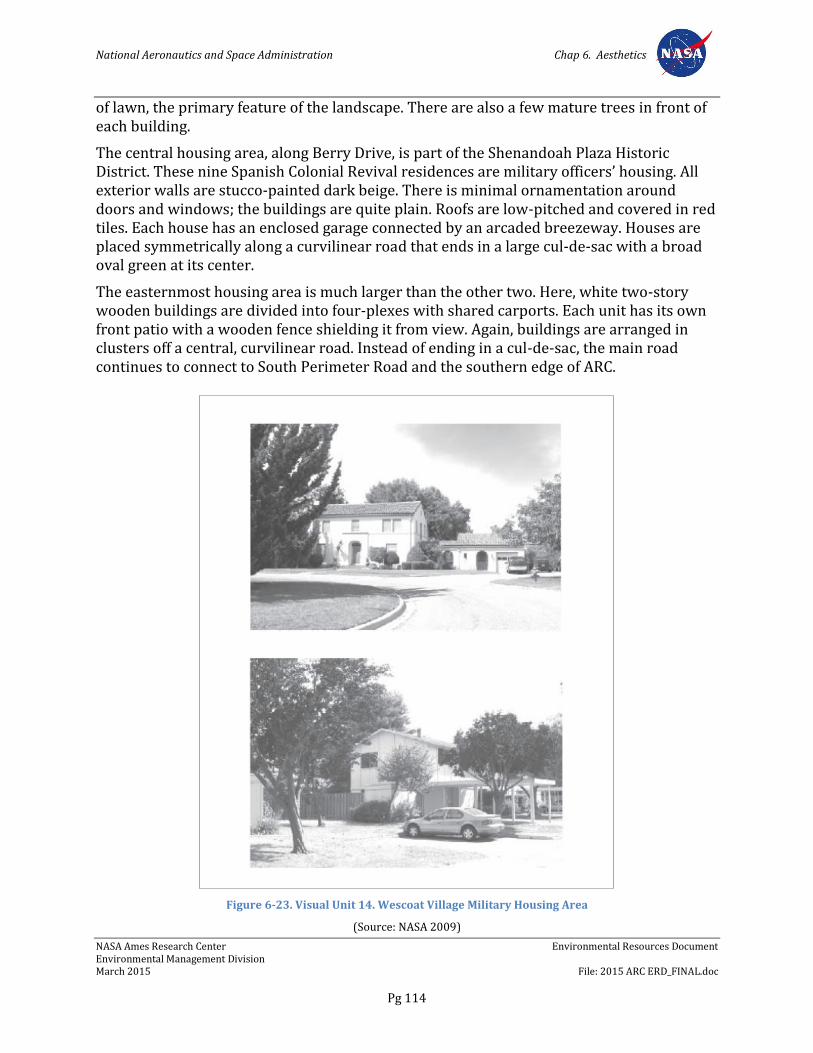
National Aeronautics and Space Administration Chap 6. Aesthetics
NASA Ames Research Center Environmental Resources Document Environmental Management Division March 2015 File: 2015 ARC ERD_FINAL.doc
Pg 114
of lawn, the primary feature of the landscape. There are also a few mature trees in front of each building.
The central housing area, along Berry Drive, is part of the Shenandoah Plaza Historic District. These nine Spanish Colonial Revival residences are military officers’ housing. All exterior walls are stucco-painted dark beige. There is minimal ornamentation around doors and windows; the buildings are quite plain. Roofs are low-pitched and covered in red tiles. Each house has an enclosed garage connected by an arcaded breezeway. Houses are placed symmetrically along a curvilinear road that ends in a large cul-de-sac with a broad oval green at its center.
The easternmost housing area is much larger than the other two. Here, white two-story wooden buildings are divided into four-plexes with shared carports. Each unit has its own front patio with a wooden fence shielding it from view. Again, buildings are arranged in clusters off a central, curvilinear road. Instead of ending in a cul-de-sac, the main road continues to connect to South Perimeter Road and the southern edge of ARC.
Figure 6-23. Visual Unit 14. Wescoat Village Military Housing Area
(Source: NASA 2009)
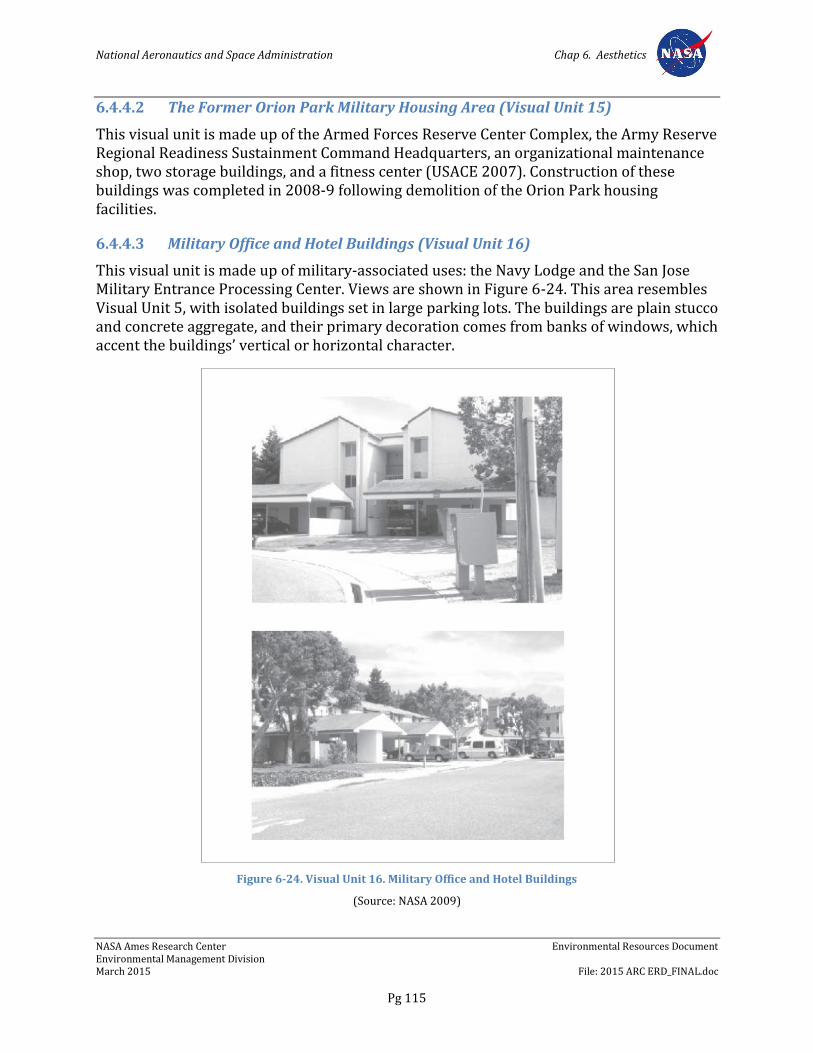
National Aeronautics and Space Administration Chap 6. Aesthetics
NASA Ames Research Center Environmental Resources Document Environmental Management Division March 2015 File: 2015 ARC ERD_FINAL.doc
Pg 115
6.4.4.2 The Former Orion Park Military Housing Area (Visual Unit 15)
This visual unit is made up of the Armed Forces Reserve Center Complex, the Army Reserve Regional Readiness Sustainment Command Headquarters, an organizational maintenance shop, two storage buildings, and a fitness center (USACE 2007). Construction of these buildings was completed in 2008-9 following demolition of the Orion Park housing facilities.
6.4.4.3 Military Office and Hotel Buildings (Visual Unit 16)
This visual unit is made up of military-associated uses: the Navy Lodge and the San Jose Military Entrance Processing Center. Views are shown in Figure 6-24. This area resembles Visual Unit 5, with isolated buildings set in large parking lots. The buildings are plain stucco and concrete aggregate, and their primary decoration comes from banks of windows, which accent the buildings’ vertical or horizontal character.
Figure 6-24. Visual Unit 16. Military Office and Hotel Buildings
(Source: NASA 2009)
National Aeronautics and Space Administration Chap 6. Aesthetics
NASA Ames Research Center Environmental Resources Document Environmental Management Division March 2015 File: 2015 ARC ERD_FINAL.doc
Pg 116
6.4.5 Protected Trees
To establish which trees at ARC qualify as protected trees under Santa Clara County’s Heritage Tree Ordinance, NASA surveyed the entire ARC during summer 2001. The Wescoat Village and former Orion Park military housing areas were not surveyed because they are not under NASA control. The survey identified trees in all of the planning areas except the Bay View area.
6.4.5.1 Ames Campus Area
In the Ames Campus area, protected trees are primarily located along streets or in planting strips in parking lots. Some areas house trees planted alongside existing buildings. Finally, there are a small number of protected trees clustered in the undeveloped area south of the administration building.
6.4.5.2 NASA Research Park Area
Within the NRP area, the location of protected trees is not as regular as in the Ames Campus area. Within the Shenandoah Plaza Historic District, there are comparatively few protected trees, which for the most part are clustered in open space areas or grouped near buildings. The only areas where trees line a roadway are along Clark Memorial Drive, the entrance road, and a small strip along South Akron Road in front of Building 20. In the remainder of the NRP area, protected trees primarily line the edges of roads and parking lots, or are clustered around buildings. There are a few open areas adjacent to the athletic fields along U.S. Highway 101 and next to the Navy Exchange, where trees are more loosely grouped.
6.4.5.3 Eastside/Airfield Area
In the Eastside/Airfield area, protected trees are limited to the golf course, and the southernmost of the areas currently occupied by CANG.
6.5 Environmental Requirements
NASA has identified the following environmental plans, policies, practices, guidelines, and measures that address potential visual effects of operations and future development at ARC.
6.5.1 NASA Procedural Directive 8500.1, NASA Environmental Management
Per NPD 8500.1, it is NASA policy to: maintain compliance with all applicable federal, state, and local environmental requirements; to incorporate environmental risk reduction and sustainable practices to the extent practicable throughout NASA’s programs, projects, and activities; and to consider environmental factors throughout the life cycle of programs, projects, and activities (as defined in NPD 7120.4, NASA Engineering and Program/Project Management Policy, and related documents), including planning, development, execution, and disposition activities. Examples of environmental factors include consideration of environmental impacts as required by the NEPA and NHPA; the proposed use of hazardous
National Aeronautics and Space Administration Chap 6. Aesthetics
NASA Ames Research Center Environmental Resources Document Environmental Management Division March 2015 File: 2015 ARC ERD_FINAL.doc
Pg 117
materials; the potential for waste generation; the need to acquire necessary permits, waivers, and authorizations; and the use of environmentally-preferable materials and processes wherever practicable.
6.5.2 Ames Procedural Requirements 8500.1, Ames Environmental Procedural Requirements
APR 8500.1 sets forth general procedural requirements to ensure compliance with applicable federal, state, and local environmental laws; regulations and EOs; and NASA policies and procedures. Organizational directors, division chiefs, branch chiefs, section heads, supervisors, managers, and CORs are responsible for planning, designing, constructing, managing, operating, and maintaining facilities in conformance with applicable regulatory directives, and should obtain environmental review from the Environmental Management Division early in project planning consistent with NASA's NEPA implementing procedures (NPR 8580.1A and EO 12114), NASA policies and procedures for programs and projects (NPR 7120), and NASA regulations related to environmental quality (14 CFR 1216). Program and project managers should coordinate with the Environmental Management Division in a timely manner to ensure that any new or modified programs, projects, and activities comply with regulatory requirements.
6.5.3 Ames Policy Directive 8822.1, NASA Research Park Design Review Program
APD 8822.1 establishes specific policies, responsibilities, and procedures for the Design Review Program for all proposed projects within the NRP and Bay View areas. As part of the Program, the Architecture and Planning Review addresses and implements the applicable land use and design measures included in the NRP and Bay View design guides (discussed below) and the NADP EIS. The Environmental Review, performed by the Environmental Management Division, also addresses all preliminary environmental issues, including aesthetic issues, as they relate to development under the NADP.
New development projects in the NRP and Bay View areas should be coordinated through the NRP Design Review process during conceptual design (before building design or prior to 50 percent completion of the schematic design phase) to ensure that they meet all applicable land use and design requirements. Completion of an Environmental Checklist in coordination with the Environmental Management Division is also required during Design Review, as it will determine if additional environmental studies or approvals will be required before proceeding with the project.
6.5.4 Ames Environmental Work Instructions
Ames’s EWIs, which replace the previous Ames Environmental Handbook (APR 8800.3), set forth requirements to ensure that programs, projects, and activities at ARC comply with applicable federal, state, and local laws; regulations and EOs; and NASA policies and procedures. Each EWI lists relevant regulatory authorities and documents, assigns individual and organizational responsibilities within ARC, and identifies specific requirements applicable to the work being performed.
National Aeronautics and Space Administration Chap 6. Aesthetics
NASA Ames Research Center Environmental Resources Document Environmental Management Division March 2015 File: 2015 ARC ERD_FINAL.doc
Pg 118
The following EWIs are relevant to operations and future development at ARC with the potential to impact aesthetic resources.
EWI 12, Public Involvement
EWI 14, NEPA and Environmental Justice
EWI 16, Cultural Resources Management (Under review)
EWI 18, Environmental Requirements for Construction Projects (Under review)
6.5.5 Ames Design Guides
Site and building design at ARC is guided by the NASA Research Park Design Guide (DMJMH+N and EDAW 2001) and Bay View Design Guide (NBBJ 2012). The purpose of these guides is to ensure that new buildings constructed under the NADP would stylistically complement the existing buildings in the Ames Campus and Eastside/Airfield. In addition to general planning concepts concerning open space, circulation, and infrastructure, both guides includes numerous design concepts. Currently, there are no design guidelines, height limits, and setback requirements for the Ames Campus and Eastside/Airfield areas.
6.5.6 Ames Landscaping Management Policies and Practices
NASA has established a number of landscaping management policies and practices as discussed in other resource chapters in this document and as summarized below.
Through its storm water pollution prevention and water pollution control programs for construction, demolition, and excavation projects, NASA ensures implementation of construction practices at ARC that minimize adverse water quality effects on natural habitats.
New landscaping at ARC is to be designed with native species, and any imported soil used for landscaping or erosion-control structures that contain hay or other dried plant material must be certified as weed-free.
NASA places restrictions on any construction equipment operating within 76 meters (250 feet) of jurisdictional wetlands or other sensitive habitats in the Bay View area to prevent the spread of invasive weeds. To minimize impacts on wetland habitats, construction is to be avoided in the jurisdictional wetlands along the northern boundary of the Bay View area and within 61 meters (200 feet) of these wetlands. Fill activities and other disturbances are to be minimized in jurisdictional wetlands elsewhere.
NASA ARC has an active mulching program that accepts landscape trimmings generated at ARC. The program dramatically reduces the volume of green waste material sent to landfills.
To reduce dependency on potable water, the Moffett Field Golf Course is currently using reclaimed water for irrigation. NASA also plans to use the Navy’s treated groundwater for irrigation in the NRP area to reduce demand for potable supply.
National Aeronautics and Space Administration Chap 6. Aesthetics
NASA Ames Research Center Environmental Resources Document Environmental Management Division March 2015 File: 2015 ARC ERD_FINAL.doc
Pg 119
Two native gardens have been established at ARC, one west of N-269 and the other north of N-235. Both gardens contain a large variety of native plants.
6.5.7 NASA Ames Development Plan Final Programmatic Environmental Impact Statement
The NADP EIS identifies the following mitigation measures to address potential visual impacts from build out of NADP Mitigated Alternative 5.
6.5.7.1 Mitigation Measure AES-1
NASA and its partners would develop design guidelines for the Bay View, Ames Campus and Eastside/Airfield areas in order to ensure that new buildings would stylistically complement the existing buildings in the Ames Campus and Eastside/Airfield. Design guidelines for the Bay View area would include setback requirements for Stevens Creek and Western Diked Marsh, and would ensure harmonious design.
6.5.7.2 Mitigation Measure AES-2
The visual effect of NRP Parcel 6 housing would be mitigated through a combination of landscaping, screening and overall design.
6.5.7.3 Mitigation Measure AES-3
In order to prevent the obstruction of key views of the hangars and the wind tunnels in Ames Research Center from the areas of Mountain View and Sunnyvale across Highway 101, buildings in the NRP area would be carefully sited to preserve view corridors through the new development, especially from the Whisman Street corridor.
6.5.7.4 Mitigation Measure AES-4
As the site plan for new development in the Bay View area was developed, NASA and its partners would design the new street layout to preserve view corridors through the new development to the North of Bay View area and the salt ponds.
6.5.7.5 Mitigation Measure AES-5
NASA and its partners would use height limits and site layout to preserve view corridors from the Stevens Creek Trail through new development in Bay View to the historic hangars and to the San Francisco Bay.
6.5.7.6 Mitigation Measure AES-6a
Where possible, NASA and its partners would carefully site any development so as to preserve the protected trees.
National Aeronautics and Space Administration Chap 6. Aesthetics
NASA Ames Research Center Environmental Resources Document Environmental Management Division March 2015 File: 2015 ARC ERD_FINAL.doc
Pg 120
6.5.7.7 Mitigation Measure AES-6b
Where it is not possible to preserve protected trees in place, NASA and its partners would develop a revegetation plan consistent with the requirements of the Santa Clara County Tree Preservation and Removal Ordinance.
National Aeronautics and Space Administration Chap 7. Cultural Resources
NASA Ames Research Center Environmental Resources Document Environmental Management Division March 2015 File: 2015 ARC ERD_FINAL.doc
Pg 121
Chapter 7. Cultural Resources
7.1 Overview
This chapter discusses the prehistoric and historic setting of the ARC facility and describes the archaeological and historic resources that remain on the site. This chapter also includes a discussion of the regulatory framework applicable to cultural resources and relevant plans, policies, guidelines, and measures that govern historic and archaeological resources at ARC. The information presented in this chapter is based on the November 2009 NASA ARC ERD (NASA 2009), NADP EIS (Design, Community & Environment 2002), historical survey reports, and other sources.
7.2 Regulatory Background
7.2.1 Federal Regulations
7.2.1.1 Section 106 of the National Historic Preservation Act of 1966
Section 106 of the NHPA, as amended (16 USC 470) and 36 CFR 800) require that projects receiving federal money, or those permitted or licensed by federal agencies, must take into account the effects of the undertaking on historic properties, consult with the State Historic Preservation Officer (SHPO) regarding those effects, and allow the Advisory Council on Historic Preservation an opportunity to comment on the undertaking. Regulations implementing Section 106 encourage that consultation be completed in parallel with the NEPA compliance process.
Section 106 defines a historic property or historic resource as “any prehistoric or historic district, site, building, structure, or object included on, or eligible for inclusion” on the National Register of Historic Places (NRHP).
7.2.1.2 Archaeological Resources Protection Act of 1979
The Archaeological Resources Protection Act of 1979 (ARPA) (16 USC 470; 43 CFR 7) requires federal land-owning agencies to issue ARPA permits to qualified individuals, institutions, or firms that conduct archaeological surveys within federal and Native American lands.
7.2.1.3 Native American Graves and Protection and Repatriation Act of 1990
The Native American Graves and Protection and Repatriation Act of 1990 (NAGPRA) (Title 25, USC, Section 3001 et seq.) requires federal agencies and federally funded projects to document Native American human remains and cultural items within their collections, notify Native American groups of these items, and provide an opportunity for repatriation of these materials. It also requires plans for dealing with potential future collections of Native American human remains and associated funerary objects, sacred objects, and objects of cultural patrimony discovered as a result of projects funded or overseen by the federal government.
National Aeronautics and Space Administration Chap 7. Cultural Resources
NASA Ames Research Center Environmental Resources Document Environmental Management Division March 2015 File: 2015 ARC ERD_FINAL.doc
Pg 122
7.2.1.4 National Environmental Policy Act
NEPA requires federal agencies to include in their decision-making process appropriate and careful consideration of all environmental effects of a proposed action and of possible alternative actions. Measures to avoid or minimize the adverse effects of proposed actions and to restore and enhance environmental quality as much as possible must be developed and discussed where feasible.
7.3 Regional Prehistoric and Historic Setting
7.3.1 Prehistoric Setting
Archaeological research suggests that the southern shore of the San Francisco Bay has been inhabited continuously for up to 4,000 years. At the time of European contact, the Costanoans (from the Spanish Costanos or “coastal people”), a group of hunting and gathering communities indigenous to central California inhabited the Santa Clara Valley. Linguistic analysis suggests that the Costanoans arrived in the San Francisco Bay region around A.D. 500. The term Costanoan as applied by anthropologists does not imply the existence of a politically unified entity, but rather refers to different groups of people who shared similar cultural traits and belonged to the same linguistic family. Descendants of the group that currently reside in the San Francisco Bay Area generally prefer the term “Ohlone.”
ARC lies within the Tamyen (Tamien) and Ramaytush areas of the Ohlone geographic range. Based on Spanish mission records and archaeological data, researchers have estimated a 1770 population of 1,000 to 1,200 individuals for this area. Within the Tamyen and Ramaytush areas, the population was further subdivided into tribelets. It is believed that the Posol-mi tribelet occupied the area comprising present-day ARC.
The place name Posol-mi is probably derived from Rancho Posolmi, the grant confirmed to Native American Lopez Indigo (alternatively Ynigo) in 1881. Ynigo occupied the land east of the City of Mountain View as early as 1834. Lopez Indigo and other Native Americans are known to have farmed the ARC property from at least 1834 through 1864.
Historic accounts from the 1770s to 1790s and archaeological data suggest that a number of tribelets may have had temporary camps within the vicinity of ARC. However, the Ohlone way of life seems to have disappeared by 1810 due to introduced diseases, declining birth rates, and the impact of the mission system. The Ohlone people transformed from hunters and gatherers into agricultural laborers (and in some cases, craft artisans). They lived at the missions and worked with former neighboring groups.
Although the area around ARC continued to be settled in the early part of the 19th century, the patterns of use changed. The economy began to focus on the growth of agricultural crops and the transportation of those crops to market through a series of landings and associated warehouses along the San Francisco Bay. The Native Americans from Mission Santa Clara were apparently involved in the hide and tallow trade that coursed up and down the Guadalupe River between 1820 and 1850. Individuals from the mission carried the products down to the embarcadero where they could be loaded onto ships. Later,
National Aeronautics and Space Administration Chap 7. Cultural Resources
NASA Ames Research Center Environmental Resources Document Environmental Management Division March 2015 File: 2015 ARC ERD_FINAL.doc
Pg 123
because of the secularization of the missions by Mexico in 1834, most of the aboriginal population gradually moved to ranchos to work as manual laborers.
7.3.2 Historic Setting
Spanish explorers in the late 1760s and 1770s were the first Europeans to traverse the Santa Clara Valley. The first party, that of Gaspar de Portola and Father Juan Crespi, arrived in the Alviso-San Jose area in the fall of 1769. Sergeant Jose Francisco Ortega of the Portola and Crespi party was sent to explore the eastern portion of the San Francisco Bay. The second Hispanic exploration party, that of Juan Bautista de Anza and Father Pedro Font, reached the lower Guadalupe River in early 1776. The favorable reports of Anza and Font led to the establishment of both Mission Santa Clara and the Pueblo San Jose de Guadalupe in 1777.
The Mexican revolt against Spain (1822) followed by the secularization of the missions (1834) significantly changed land ownership patterns in the Santa Clara Valley. Whereas the Spanish philosophy of government was directed toward the founding of presidios, missions, and secular towns, the Mexican policy stressed individual ownership of the land. During the Mexican Period, vast tracts of land, including former mission lands, were granted to individuals.
After 1875, horticulture became widespread due to successful crop experimentation and the expansion of markets via rail. The shift from livestock to horticulture permitted smaller parcels of land and generated a labor-intensive but profitable product. In the 1880s, after the development of the refrigerator railroad car, horticulture became Santa Clara Valley’s primary land use. Throughout this period, Santa Clara Valley’s population increased substantially.
During the first half of the 20th century, the Cities of Mountain View, Sunnyvale, Milpitas, and San Jose were isolated central services centers surrounded by farmsteads and acres of agricultural lands. This predominance of fruit production/processing held steady until after World War II. In the second half of the century, dense urban housing, commercial centers, and the electronics industry displaced Santa Clara Valley’s agrarian land use.
7.4 Existing Site Conditions
7.4.1 Archaeological Resources
A portion of ARC is situated on the west part of Rancho Posolmi (see discussion above). Several adobe dwellings were located in the ARC area, but they were destroyed long ago. According to previous historic documents, no structures were located at ARC during most of the second half of the 18th century.
According to a review of existing data, several recorded prehistoric archaeological resources are located throughout the ARC site. Most subsurface resources are on the southeast side of the site. These resources are associated with prehistoric dwellings ranging from small temporary encampments to large villages such as that identified as Posol-mi.
National Aeronautics and Space Administration Chap 7. Cultural Resources
NASA Ames Research Center Environmental Resources Document Environmental Management Division March 2015 File: 2015 ARC ERD_FINAL.doc
Pg 124
One recorded resource, CA-SC1-23, was located in a previously cultivated field on the western portion of ARC known as the Kitchen Midden Site. It was recorded in the early part of the 20th century and was supposedly still extant in the mid-1950s. Investigations conducted for NASA in the 1970s and 1980s, however, did not result in the location of this site. Therefore, in 1991, Basin Research Associates conducted a detailed surface survey and mechanically assisted subsurface testing program. Fifty-eight backhoe test units were excavated in a grid-like pattern in the project area. No artifacts associated with past site occupation were detected at or below the surface. Destruction by agricultural practices (that is, dispersion) is a likely cause of the site’s disappearance. The findings of Basin Research Associates were submitted to the SHPO, who concurred with the determination that the CA-SC1-23 site is no longer extant.
Although 10 other prehistoric or prehistoric/historic archaeological sites have been previously recorded within the boundaries of ARC (four are associated with Ynigo), these sites no longer exist.
In summary, no known, extant archeological resources at ARC qualify for inclusion on the NRHP. The integrity of all archaeological resources was apparently destroyed by past agricultural practices (for example, disking and tilling) or construction of the airfield.
7.4.2 Historic Resources
7.4.2.1 Shenandoah Plaza Historic District
On February 24, 1994, the Shenandoah Plaza Historic District was officially added to the NRHP. The buildings, landscapes, and objects included in the district are listed on the NRHP because of their association with the expanding coastal defense capabilities of the U.S. Navy and airship technology during the inter-war period between 1932 and 1945, and because of their distinctive site plan and Spanish Colonial Revival architecture.
The District consists of 97 buildings, structures, and objects, 58 of which contribute to its historic significance. The District’s significant buildings, structures, and objects that are under NASA’s jurisdiction are listed in Table 7-1. The rest are within Wescoat Village military housing area and are under the stewardship of the DOD. Non-contributing buildings within Shenandoah Plaza that are under NASA’s stewardship are listed in Table 7-2.
The “contributing” buildings and structures are representative of the development of the NAS Sunnyvale from the early 1930s through the early 1960s (NAS Sunnyvale was renamed NAS Moffett Field in 1942). Among the buildings in the Shenandoah Plaza Historic District, the Spanish Colonial Revival style dominates, with its neutral colors, red tile roofs, terracotta ornamentation, and almost residential proportions. Buildings are typically two stories tall, with low-pitched, slightly hipped rooflines. Exterior walls are consistently quite plain, except for a stringcourse around the entire perimeter of each building separating the first and second floors. Windows are simple rectangular shapes, vertically oriented, multi-paned, and double-hung. Flowery terracotta ornamentation defines the major front and back entrances, and often some of the most prominent windows.
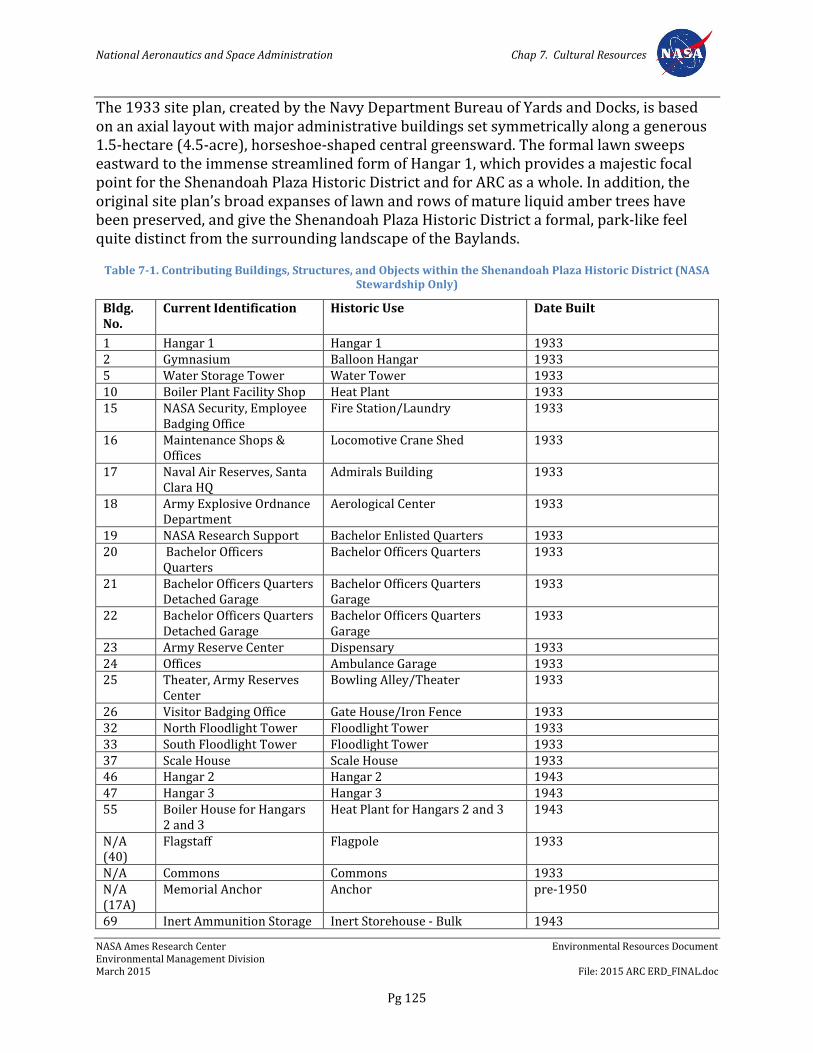
National Aeronautics and Space Administration Chap 7. Cultural Resources
NASA Ames Research Center Environmental Resources Document Environmental Management Division March 2015 File: 2015 ARC ERD_FINAL.doc
Pg 125
The 1933 site plan, created by the Navy Department Bureau of Yards and Docks, is based on an axial layout with major administrative buildings set symmetrically along a generous 1.5-hectare (4.5-acre), horseshoe-shaped central greensward. The formal lawn sweeps eastward to the immense streamlined form of Hangar 1, which provides a majestic focal point for the Shenandoah Plaza Historic District and for ARC as a whole. In addition, the original site plan’s broad expanses of lawn and rows of mature liquid amber trees have been preserved, and give the Shenandoah Plaza Historic District a formal, park-like feel quite distinct from the surrounding landscape of the Baylands.
Table 7-1. Contributing Buildings, Structures, and Objects within the Shenandoah Plaza Historic District (NASA Stewardship Only)
Bldg. No.
Current Identification Historic Use Date Built
1 Hangar 1 Hangar 1 1933 2 Gymnasium Balloon Hangar 1933 5 Water Storage Tower Water Tower 1933 10 Boiler Plant Facility Shop Heat Plant 1933 15 NASA Security, Employee
Badging Office Fire Station/Laundry 1933
16 Maintenance Shops & Offices
Locomotive Crane Shed 1933
17 Naval Air Reserves, Santa Clara HQ
Admirals Building 1933
18 Army Explosive Ordnance Department
Aerological Center 1933
19 NASA Research Support Bachelor Enlisted Quarters 1933 20 Bachelor Officers
Quarters Bachelor Officers Quarters 1933
21 Bachelor Officers Quarters Detached Garage
Bachelor Officers Quarters Garage
1933
22 Bachelor Officers Quarters Detached Garage
Bachelor Officers Quarters Garage
1933
23 Army Reserve Center Dispensary 1933 24 Offices Ambulance Garage 1933 25 Theater, Army Reserves
Center Bowling Alley/Theater 1933
26 Visitor Badging Office Gate House/Iron Fence 1933 32 North Floodlight Tower Floodlight Tower 1933 33 South Floodlight Tower Floodlight Tower 1933 37 Scale House Scale House 1933 46 Hangar 2 Hangar 2 1943 47 Hangar 3 Hangar 3 1943 55 Boiler House for Hangars
2 and 3 Heat Plant for Hangars 2 and 3 1943
N/A (40)
Flagstaff Flagpole 1933
N/A Commons Commons 1933 N/A (17A)
Memorial Anchor Anchor pre-1950
69 Inert Ammunition Storage Inert Storehouse - Bulk 1943
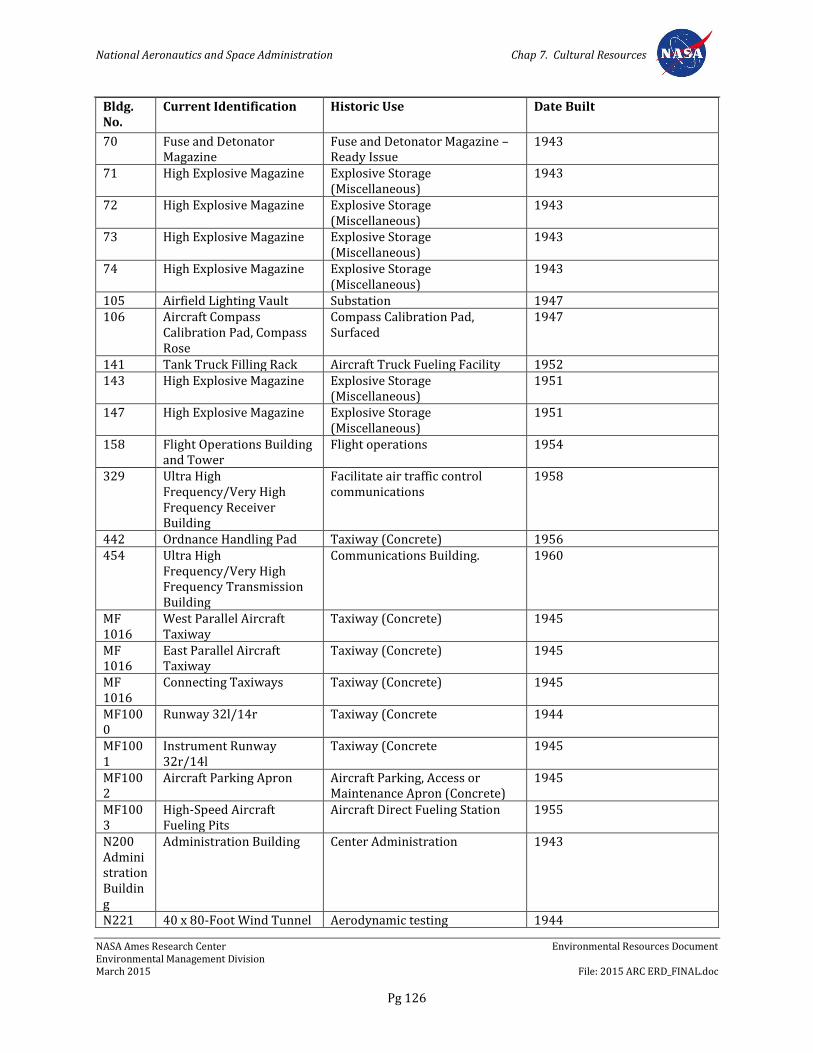
National Aeronautics and Space Administration Chap 7. Cultural Resources
NASA Ames Research Center Environmental Resources Document Environmental Management Division March 2015 File: 2015 ARC ERD_FINAL.doc
Pg 126
Bldg. No.
Current Identification Historic Use Date Built
70 Fuse and Detonator
Magazine Fuse and Detonator Magazine – Ready Issue
1943
71 High Explosive Magazine Explosive Storage (Miscellaneous)
1943
72 High Explosive Magazine Explosive Storage (Miscellaneous)
1943
73 High Explosive Magazine Explosive Storage (Miscellaneous)
1943
74 High Explosive Magazine Explosive Storage (Miscellaneous)
1943
105 Airfield Lighting Vault Substation 1947 106 Aircraft Compass
Calibration Pad, Compass Rose
Compass Calibration Pad, Surfaced
1947
141 Tank Truck Filling Rack Aircraft Truck Fueling Facility 1952 143 High Explosive Magazine Explosive Storage
(Miscellaneous) 1951
147 High Explosive Magazine Explosive Storage (Miscellaneous)
1951
158 Flight Operations Building and Tower
Flight operations 1954
329 Ultra High Frequency/Very High Frequency Receiver Building
Facilitate air traffic control communications
1958
442 Ordnance Handling Pad Taxiway (Concrete) 1956 454 Ultra High
Frequency/Very High Frequency Transmission Building
Communications Building. 1960
MF 1016
West Parallel Aircraft Taxiway
Taxiway (Concrete) 1945
MF 1016
East Parallel Aircraft Taxiway
Taxiway (Concrete) 1945
MF 1016
Connecting Taxiways Taxiway (Concrete) 1945
MF1000
Runway 32l/14r Taxiway (Concrete 1944
MF1001
Instrument Runway 32r/14l
Taxiway (Concrete 1945
MF1002
Aircraft Parking Apron Aircraft Parking, Access or Maintenance Apron (Concrete)
1945
MF1003
High-Speed Aircraft Fueling Pits
Aircraft Direct Fueling Station 1955
N200 Administration Building
Administration Building Center Administration 1943
N221 40 x 80-Foot Wind Tunnel Aerodynamic testing 1944
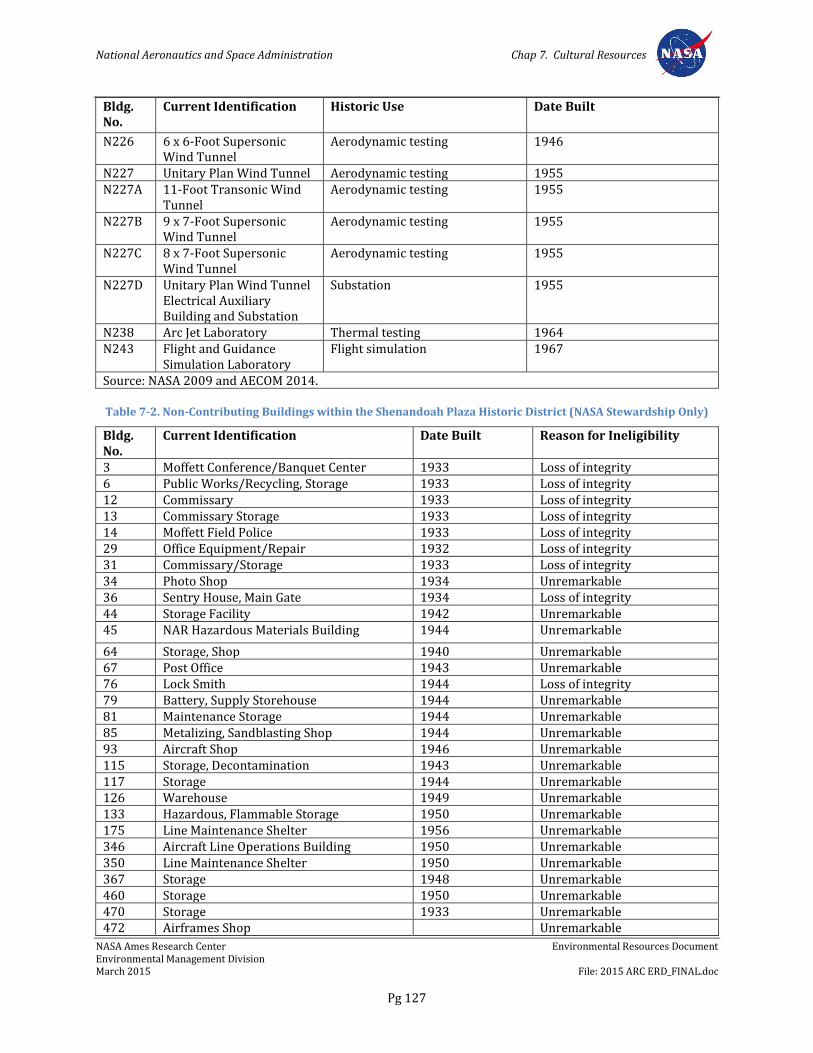
National Aeronautics and Space Administration Chap 7. Cultural Resources
NASA Ames Research Center Environmental Resources Document Environmental Management Division March 2015 File: 2015 ARC ERD_FINAL.doc
Pg 127
Bldg. No.
Current Identification Historic Use Date Built
N226 6 x 6-Foot Supersonic
Wind Tunnel Aerodynamic testing 1946
N227 Unitary Plan Wind Tunnel Aerodynamic testing 1955 N227A 11-Foot Transonic Wind
Tunnel Aerodynamic testing 1955
N227B 9 x 7-Foot Supersonic Wind Tunnel
Aerodynamic testing 1955
N227C 8 x 7-Foot Supersonic Wind Tunnel
Aerodynamic testing 1955
N227D Unitary Plan Wind Tunnel Electrical Auxiliary Building and Substation
Substation 1955
N238 Arc Jet Laboratory Thermal testing 1964 N243 Flight and Guidance
Simulation Laboratory Flight simulation 1967
Source: NASA 2009 and AECOM 2014.
Table 7-2. Non-Contributing Buildings within the Shenandoah Plaza Historic District (NASA Stewardship Only)
Bldg. No.
Current Identification Date Built Reason for Ineligibility
3 Moffett Conference/Banquet Center 1933 Loss of integrity 6 Public Works/Recycling, Storage 1933 Loss of integrity 12 Commissary 1933 Loss of integrity 13 Commissary Storage 1933 Loss of integrity 14 Moffett Field Police 1933 Loss of integrity 29 Office Equipment/Repair 1932 Loss of integrity 31 Commissary/Storage 1933 Loss of integrity 34 Photo Shop 1934 Unremarkable 36 Sentry House, Main Gate 1934 Loss of integrity 44 Storage Facility 1942 Unremarkable 45 NAR Hazardous Materials Building 1944 Unremarkable
64 Storage, Shop 1940 Unremarkable 67 Post Office 1943 Unremarkable 76 Lock Smith 1944 Loss of integrity 79 Battery, Supply Storehouse 1944 Unremarkable 81 Maintenance Storage 1944 Unremarkable 85 Metalizing, Sandblasting Shop 1944 Unremarkable 93 Aircraft Shop 1946 Unremarkable 115 Storage, Decontamination 1943 Unremarkable 117 Storage 1944 Unremarkable 126 Warehouse 1949 Unremarkable 133 Hazardous, Flammable Storage 1950 Unremarkable 175 Line Maintenance Shelter 1956 Unremarkable 346 Aircraft Line Operations Building 1950 Unremarkable 350 Line Maintenance Shelter 1950 Unremarkable 367 Storage 1948 Unremarkable 460 Storage 1950 Unremarkable 470 Storage 1933 Unremarkable 472 Airframes Shop Unremarkable
National Aeronautics and Space Administration Chap 7. Cultural Resources
NASA Ames Research Center Environmental Resources Document Environmental Management Division March 2015 File: 2015 ARC ERD_FINAL.doc
Pg 128
Bldg. No.
Current Identification Date Built Reason for Ineligibility
478 Standby Generator 1963 <50 Years Old 482 Painting & Washing Facility 1963 <50 Years Old 493 Swimming Pool, Officer Area 1963 <50 Years Old 498 Covered HazMat Storage Area 1965 <50 Years Old 499 Ground Support Equipment Shed 1966 <50 Years Old 501 Fire Station, AIB 1940 Loss of integrity 509 Exchange Shop 1968 <50 Years Old 510 NASA Maintenance Office 1967 <50 Years Old 527 Storage Shed 1968 <50 Years Old 539 Flight Line Storage 1972 <50 Years Old 540 Flight Line Storage 1972 <50 Years Old 542 Incinerator 1973 <50 Years Old 566 Plant Engineering Support Office 1979 <50 Years Old 567 Warehouse 1978 <50 Years Old 569 Air Force, Special Investigations 1978 <50 Years Old 570 Maintenance Storage 1978 <50 Years Old 941 Administration Office, Navy Exchange 1940 Loss of integrity 942 Navy Exchange, Crafts 1940 Loss of integrity Source: NASA 2009.
Of the historic buildings within the Shenandoah Plaza Historic District, the most striking are the Administration Building (Building 17), which sits at the head of Shenandoah Plaza, the Bachelor Officers Quarters (Building 20), and the original hangars, especially Hangar 1.
The almost 1,800-square meter (19,000 square foot) Administration Building, constructed in 1933, follows the typical architectural pattern of the original campus design: two stories high with stucco walls, red tile roofing, and terracotta ornamentation. It is the most prominently sited building within the original 1933 campus plan. Unlike the other buildings in the Shenandoah Plaza Historic District, the Administration Building’s primary entrance projects out from the main structure, with a triple round-arched entrance. The detailing around the major entrances and windows includes ornamental urns, pilasters, and floral sculpture that counterpoint the austere, shallow cruciform shape of the building. There is also a small, centered bell tower with flat arches on each of its faces, capped by a small red dome.
The Bachelor Officers Quarters (Building 20), constructed in 1933, is also a large two-story structure in the typical Spanish Colonial style of the Shenandoah Plaza Historic District buildings. It sits on the south side of the plaza where the central green widens outwards, facing the equally prominent but less architecturally impressive Bachelor Enlisted Quarters. The Bachelor Officers Quarters has more ornamentation than other buildings in the Shenandoah Plaza Historic District, and a very elegant entryway of three large round arches. A rear wing projects south from the building and abuts the original 1933 officer automobile storage structures, Buildings 22, and 21.
The most significant building in the Shenandoah Plaza Historic District, however, is Hangar 1, which was designed in the Streamline Moderne style to emulate the sleek, ultra-modern form of the airship it was built to house rather than the Spanish Colonial Revival
National Aeronautics and Space Administration Chap 7. Cultural Resources
NASA Ames Research Center Environmental Resources Document Environmental Management Division March 2015 File: 2015 ARC ERD_FINAL.doc
Pg 129
architecture of the rest of the original core of Moffett Field. The giant parabola of Hangar 1 towers 65 meters (211 feet) above the plaza. Constructed in 1932 through 1933, this one-story steel truss building is one of the largest non-internally supported buildings in the United States, enclosing 3 hectares (8 acres) of land. The smooth curve of its plate metal cladding is detailed on each side with bands of horizontally oriented windows set flush in the skin. Gigantic curving doors on tracks create the north and south ends of the buildings. Hangar 1 is historically significant because of its unique use, its beautifully executed Streamline Moderne design, its ingenious structural construction, and its size; it is still the dominant landmark in the southern San Francisco Bay Area. In addition to anchoring the Shenandoah Plaza Historic District, Hangar 1 has been designated a Naval Historical Landmark and a California Historic Civil Engineering Landmark by Section 57 of the American Society of Civil Engineering.
Hangar 1 was recently found to be a source of PCBs, as well as lead, asbestos, and zinc. Both NASA and the Navy undertook actions to address this contamination in 2003. As part of a subsequent action, which was completed by the Navy in June 2013, Hangar 1 has been stripped of its siding, man doors, roof, and windows, and the steel framing that remains has been covered in a special coating to provide a protective barrier over any remaining hazardous materials. For additional information on this subject, refer to Chapter 18, Hazardous Materials.
7.4.2.2 Ames Research Center Campus Historic Buildings
7.4.2.2.1 The Unitary Plan Wind Tunnel Complex
The Unitary Plan Wind Tunnel Complex (Building N-227) is the only building at ARC that is currently included on the NRHP. It was listed as a National Historic Landmark on the NRHP in 1985 because of its significant association with the development of the American space program. It has also been designated an International Historic Mechanical Engineering Landmark. The Unitary Plan Wind Tunnel Complex consists of three separate wind tunnels, each of which loops back to connect to the same central 193,880-megawatt (260,000-horsepower) engine. Covering 7,100 square meters (77,000 square feet), the three huge loops of metal conduit create one of the most striking architectural landmarks at ARC.
7.4.2.2.2 Other Elements
In 1995, ARC conducted a historical survey of 19 additional buildings that had been built in 1950 or earlier. Three of these buildings (N-200, N-221, and N-226) were determined to be eligible for inclusion on the NRHP. These buildings are associated with the advancement of aeronautics, science, and exploration during World War II and the post-war period (1940-1950). The findings of this survey were submitted in November 1995 to the California SHPO for review. The SHPO did not formally respond to the submittal, although ARC requested a formal response in December 1997. Historic buildings at ARC are listed in Table 7-3.

National Aeronautics and Space Administration Chap 7. Cultural Resources
NASA Ames Research Center Environmental Resources Document Environmental Management Division March 2015 File: 2015 ARC ERD_FINAL.doc
Pg 130
Table 7-3. Historic Buildings at the Ames Campus
Bldg. No. Current Identification Date Built N-200 Administration Building- (nominated) 1943 N-221 12- by 24-meter (40- by 80-foot) Wind Tunnel-
nominated 1944
N-226 2- by 2-meter (6- by 6-foot) Supersonic Wind Tunnel- nominated
1946
N-227 Unitary Plan Wind Tunnel 1954 Source: NASA 2009.
The Administration Building (N-200) was constructed in 1943 and dates back to the earliest years of the ARC. Its importance relative to the other structures at the ARC is signified by the greater degree of ornamental detail near the windows and entry, as well as its formal, symmetrical facade. As the Administration Building, it housed ARC’s management during its gradual transformation from an aeronautical laboratory emphasizing high-speed wind tunnel research to the diverse and sophisticated research campus of today.
The 12- by 24-meter (40- by 80-foot) Wind Tunnel (N-221) is the single most prominent landmark within the ARC campus area. This structure is the largest wind tunnel in the world. For almost 40 years, it was a closed-system tunnel. An expansion from 1979 to 1982 created an additional 24- by 37-meter (80- by 120-foot) test section with an open-intake air system. The wind tunnel was designed to test full-scale aircraft. It was used during the last year of World War II, and it served as the test site of the first U.S. aircraft with a jet engine, the Ryan XFR-1.
The 2- by 2-meter (6- by 6-foot) Supersonic Wind Tunnel (N-226) is the site of testing that led to significant advances in the fields of aerodynamics and space exploration by helping to solve the mysteries of flight beyond Mach 1. The supersonic wind tunnel included a feature that allowed a range of speeds from Mach 1.3 to 1.8, and 130-centimeter (50-inch) glass windows for researchers to observe the flow of supersonic air around the models in the tunnel.
7.4.2.3 Eastside/Airfield
In November 2013, NASA prepared a historic property survey report (HPSR) for the Airfield area of the ARC. The HPSR was prepared as part of ongoing consultation between NASA and the SHPO regarding the NHRP eligibility of the Airfield area of NASA ARC as a contributing feature of the NAS Sunnyvale Historic District. The HPSR provides NASA and its potential tenant(s) or lessees with baseline information on the physical features of the Airfield that should be treated in accordance with historic preservation standards. The HPSR includes a physical history of the Airfield and related features; a statement of significance and integrity evaluation; an inventory of contributing and character-defining features; and treatment recommendations for the Airfield. The HPSR supports NASA's compliance with Section 110 of the NHPA and with other laws and regulations related to cultural resources management (NASA 2014b).
National Aeronautics and Space Administration Chap 7. Cultural Resources
NASA Ames Research Center Environmental Resources Document Environmental Management Division March 2015 File: 2015 ARC ERD_FINAL.doc
Pg 131
7.4.3 Cold War Resources
In March 1999, an Inventory and Evaluation of Cold War Era Historical Resources of Moffett Federal Airfield and the NASA Crows Landing Flight Facility (formerly Naval Auxiliary Landing Field) was conducted. The survey concluded that, of the 148 buildings and structures evaluated, none were considered eligible for listing on the NRHP. Twenty of these buildings were used specifically to support the P-3 Orion anti-submarine warfare mission at Moffett Federal Airfield. Although the mission was considered of exceptional national significance within the Cold War context, the buildings themselves do not exhibit special architectural or engineering features that would give them exceptional significance as representatives of the Cold War P-3 mission. The remaining 128 buildings and structures are considered support buildings found at any installation and therefore are not considered significant (Cole 1999).
7.4.4 Space Shuttle Program Resources
Between August and October 2007, NASA conducted an assessment of eleven properties within ARC, including 10 buildings and a 36% Scale Orbiter Model (currently on display on the west side of the NFAC to determine their eligibility for listing in the NHRP in the context of the Space Shuttle Program. Of the properties surveyed, only N-238 (Arc Jet Laboratory) and N-243 (Flight and Guidance Simulation Laboratory) were determined to meet the general registration requirements for listing in the NHRP within the context of the Space Shuttle Program. N-238 was determined to be significant under Criterion A (Events) for the research and development of the Space Shuttle’s thermal protection systems. N-243 was determined to be significant under Criterion A (Events) for the VMS, which contributed to the training of the astronauts for the Space Shuttle Program. Both properties retain historic integrity and were determined to qualify for NRHP Criteria Consideration G: Properties that have Achieved Significance within the Past 50 Years. The remaining nine buildings and 36% Scale Orbiter Model did not meet the general registration requirements and were determined to be ineligible for listing in the NHRP in the context of the Space Shuttle Program (Page and Turnbull 2007).
7.5 Environmental Requirements
NASA is committed to the preservation and rehabilitation of existing cultural resources on the ARC site when feasible and practicable. Therefore, NASA has identified the following plans, policies, guidelines, and measures that ensure proper management of cultural resources at ARC in compliance with applicable federal, state, and local laws.
7.5.1 NASA Procedural Directive 8500.1, NASA Environmental Management
Per NPD 8500.1, it is NASA policy to: maintain compliance with all applicable federal, state, and local environmental requirements; to incorporate environmental risk reduction and sustainable practices to the extent practicable throughout NASA’s programs, projects, and activities; and to consider environmental factors throughout the life cycle of programs, projects, and activities (as defined in NPD 7120.4, NASA Engineering and Program/Project Management Policy, and related documents), including planning, development, execution,
National Aeronautics and Space Administration Chap 7. Cultural Resources
NASA Ames Research Center Environmental Resources Document Environmental Management Division March 2015 File: 2015 ARC ERD_FINAL.doc
Pg 132
and disposition activities. Examples of environmental factors include consideration of environmental impacts as required by the NEPA and NHPA; the proposed use of hazardous materials; the potential for waste generation; the need to acquire necessary permits, waivers, and authorizations; and the use of environmentally-preferable materials and processes wherever practicable.
7.5.2 Ames Procedural Requirements 8500.1, Ames Environmental Procedural Requirements
APR 8500.1 sets forth general procedural requirements to ensure compliance with applicable federal, state, and local environmental laws; regulations and EOs; and NASA policies and procedures. Organizational directors, division chiefs, branch chiefs, section heads, supervisors, managers, and CORs are responsible for planning, designing, constructing, managing, operating, and maintaining facilities in conformance with applicable regulatory directives, and should obtain environmental review from the Environmental Management Division early in project planning consistent with NASA's NEPA implementing procedures (NPR 8580.1 and EO 12114), NASA policies and procedures for programs and projects (NPR 7120), and NASA regulations related to environmental quality (14 CFR 1216). Program and project managers should coordinate with the Environmental Management Division in a timely manner to ensure that any new or modified programs, projects, and activities comply with regulatory requirements.
7.5.3 NASA Procedural Requirements 8510.1, NASA Cultural Resources Management
NPR 8510.1 implements applicable requirements for the Cultural Resources Management (CRM) Program under NPD 8500.1, NASA Environmental Management, described above. NASA's CRM Program is managed by the agency's Federal Preservation Officer, Environmental Management Division, and NASA Headquarters, and is implemented by the Center Historic Preservation Officer at NASA's 13 Centers and component facilities, including ARC. The agency-wide program provides the policy and procedures to ensure the preservation of cultural resources with significant ties to NASA’s mission, communities, and the history of the Nation. It also assigns key roles and responsibilities for establishing, assigning, and maintaining CRM Program requirements.
7.5.4 Ames Environmental Work Instructions
Ames’s EWIs, which replace the previous Ames Environmental Procedures and Guidelines (APR 8800.3), set forth requirements to ensure that programs, projects, and activities at ARC comply with applicable federal, state, and local laws; regulations and EOs; and NASA policies and procedures. Each EWI lists relevant regulatory authorities and documents, assigns individual and organizational responsibilities within ARC, and identifies specific requirements applicable to the work being performed.
The following EWIs are relevant to operations and future development at ARC with the potential to impact cultural resources.
EWI 12, Public Involvement
National Aeronautics and Space Administration Chap 7. Cultural Resources
NASA Ames Research Center Environmental Resources Document Environmental Management Division March 2015 File: 2015 ARC ERD_FINAL.doc
Pg 133
EWI 14, NEPA and Environmental Justice
EWI 16, Cultural Resources Management (Under review)
EWI 18, Environmental Requirements for Construction Projects (Under review)
7.5.5 NASA Ames Integrated Cultural Resources Management Plan
Per NPR 8510.1, an Integrated Cultural Resources Management Plan (ICRMP) has been prepared for ARC as an internal compliance and management tool that integrates the NASA Cultural Resources Management (CRM) Program with mission activities at ARC. The CRM Program is NASA’s historic preservation program established for the identification, evaluation, and protection of historic properties in compliance with the NHPA and its implementing regulations (36 CFR Part 800). The CRM Program provides the policy and procedures to ensure that each NASA center and component facility complies with all of the local, state, and federal laws and regulations related to cultural resources management, including NHPA, NEPA, NAGPRA, and ARPA.
For details on relevant measures, please see the ICRMP, found at http://historicproperties.arc.nasa.gov/icrmp.html.
7.5.6 NASA Ames Historic Resource Protection Plan
NASA has prepared a Historic Resources Protection Plan (HRPP) that establishes criteria and guidelines for the ongoing preservation and maintenance of historic resources within the Shenandoah Plaza Historic District. NASA’s HRPP sets out nine preservation management goals and policies for the Shenandoah Plaza Historic District. The HRPP also categorizes all properties within the district following a system of National Register Treatment Categories based on those developed by various branches of the DOD. NRHP eligibility has been determined for all Shenandoah Plaza buildings. Yet within this group, there is flexibility for determining treatment categories. Each of the four treatment categories proposes a particular level of preservation treatment suitable for the significance of the resources within it. The HRPP states that all undertakings that may affect the Shenandoah Plaza Historic District shall implement treatments as outlined in the plan.
Any future projects that involve the rehabilitation of contributing buildings within the Shenandoah Plaza Historic District would also follow the HRPP. Appropriate landscaping would be used to avoid impacts to historic buildings. The HRPP includes the guidelines for the rehabilitation of historic structures located at ARC. New additions would be located on secondary facades. Restoring facades that have been previously altered would be considered as an alternative.
The HRPP is included in Appendix G of the NADP EIS.
7.5.7 NASA Ames Historic Re-Use Guidelines
NASA has prepared design guidelines to assist NASA Ames professional staff, tenants, and their consultants in rehabilitating historic structures within Shenandoah Plaza. The
National Aeronautics and Space Administration Chap 7. Cultural Resources
NASA Ames Research Center Environmental Resources Document Environmental Management Division March 2015 File: 2015 ARC ERD_FINAL.doc
Pg 134
guidelines are intended to be a design aid in determining acceptable alterations, additions, and repairs for preserving the character of existing buildings. They are based upon The Secretary of the Interior’s Standards for Rehabilitation.
The guidelines set parameters for compatible designs including orientation, height, setback, materials, and style. The guidelines also indicate which areas must not be used as building sites. Any project undertaken within the vicinity of designated or potentially designated resources, structures, or districts would be subject to review by the SHPO through the Section 106 process. Any agreed-upon mitigation, such as plan modification and design harmony, would be undertaken.
7.5.8 NASA Ames Development Plan Final Programmatic Environmental Impact Statement
The NADP EIS identifies the following mitigation measures to address potential impacts to cultural resources from build out of NADP Mitigated Alternative 5.
7.5.8.1 Mitigation Measure CUL-1
In the event that human remains and/or cultural materials are found, all construction would cease within a 15-meter (50-foot) radius in order to proceed with the testing and mitigation measures required pursuant to Section 7050.5 of the Health and Safety Code and Section 5097.94 of the Public Resources Code of the State of California. The SHPO and the NASA Federal Preservation Officer would be contacted as soon as possible. Construction in the affected area would not resume until the regulations of the Advisory Council on Historic Preservation (36 CFR Part 800) have been satisfied.
7.5.8.2 Mitigation Measure CUL-2
In the event of the discovery of human remains, the project manager would notify the Santa Clara County Coroner. The coroner would make the determination as to whether the remains are Native American. If the coroner determines that the remains are not subject to his or her authority, s/he would notify the Native American Heritage Commission, who would attempt to identify the descendants of the deceased Native American. If no satisfactory agreement can be reached as to the disposition of the remains pursuant to state law, then the remains would be reinterred with items associated with the Native American burial on the property in a location not subject to further disturbance.
National Aeronautics and Space Administration Chap 8. Air Quality
NASA Ames Research Center Environmental Resources Document Environmental Management Division March 2015 File: 2015 ARC ERD_FINAL.doc
Pg 135
Chapter 8. Air Quality
8.1 Overview
This chapter describes the regional setting of ARC, including climatic and meteorological conditions, and summarizes measured air pollutant concentrations representative of existing project conditions. It also summarizes applicable federal, state, and local air quality regulations as well as relevant plans, policies, and measures that address air quality effects of operations and future development at ARC. Information presented in this chapter was obtained from the November 2009 NASA ARC ERD (NASA 2009), NADP EIS (Design, Community & Environment 2002), state and regional air quality management authorities, and other sources.
8.2 Regulatory Background
8.2.1 Federal and State Air Quality Standards
Both the federal government and the State of California have established ambient air quality standards for “criteria” pollutants (Table 8-1). These criteria pollutants now include carbon monoxide (CO), ozone (O3), nitrogen dioxide (NO2), particulate matter with a diameter less than 10 microns (PM10) and those with a diameter of 2.5 microns or less (PM2.5), sulfur dioxide (SO2), and lead (Pb). The air pollutants for which standards have been established are considered the most prevalent air pollutants known to be hazardous to human health. Besides the six criteria air pollutants described above, there is another group of substances found in ambient air referred to as toxic air contaminants. These contaminants (hydrogen sulfide (H2S), vinyl chloride (C2H3Cl), and sulfates (SO4)) tend to be localized and are found in relatively low concentrations in ambient air. However, they can result in adverse chronic health effects if exposure to low concentrations occurs for long periods. They are regulated at the local, state, and federal levels.
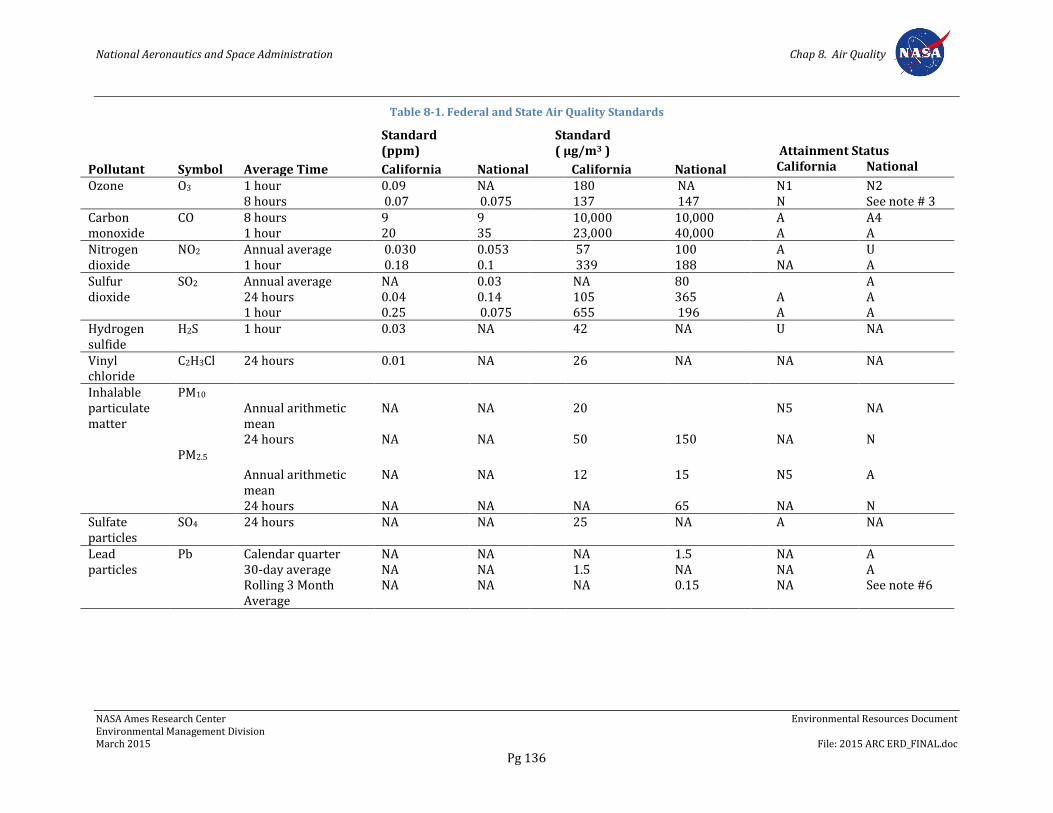
National Aeronautics and Space Administration Chap 8. Air Quality
NASA Ames Research Center Environmental Resources Document Environmental Management Division March 2015 File: 2015 ARC ERD_FINAL.doc
Pg 136
Table 8-1. Federal and State Air Quality Standards
Pollutant Symbol Average Time
Standard (ppm)
Standard ( µg/m3 ) Attainment Status
California National California National California National Ozone O3 1 hour 0.09 NA 180 NA N1 N2
8 hours 0.07 0.075 137 147 N See note # 3 Carbon monoxide
CO 8 hours 9 9 10,000 10,000 A A4 1 hour 20 35 23,000 40,000 A A
Nitrogen dioxide
NO2 Annual average 0.030 0.053 57 100 A U 1 hour 0.18 0.1 339 188 NA A
Sulfur dioxide
SO2 Annual average NA 0.03 NA 80 A 24 hours 0.04 0.14 105 365 A A 1 hour 0.25 0.075 655 196 A A
Hydrogen sulfide
H2S 1 hour 0.03 NA 42 NA U NA
Vinyl chloride
C2H3Cl 24 hours 0.01 NA 26 NA NA NA
Inhalable particulate matter
PM10 Annual arithmetic mean
NA NA 20 N5 NA
24 hours NA NA 50 150 NA N PM2.5
Annual arithmetic mean
NA NA 12 15 N5 A
24 hours NA NA NA 65 NA N Sulfate particles
SO4 24 hours NA NA 25 NA A NA
Lead particles
Pb Calendar quarter NA NA NA 1.5 NA A 30-day average NA NA 1.5 NA NA A
Rolling 3 Month Average
NA NA NA 0.15 NA See note #6

National Aeronautics and Space Administration Chap 8. Air Quality
NASA Ames Research Center Environmental Resources Document Environmental Management Division March 2015 File: 2015 ARC ERD_FINAL.doc
Pg 137
Pollutant Symbol Average Time
Standard (ppm)
Standard ( µg/m3 ) Attainment Status
California National California National California National Notes: All standards are based on measurements at 25ºC and 1 atmosphere pressure. National standards shown are the primary (health effects) standards. NA = not applicable. A = Attainment N = Nonattainment U = Unclassified μg/m3 = micrograms per cubic meter 1. The 8-hour CA ozone standard was approved by the Air Resources Board on April 28, 2005 and became effective on May 17, 2006.4. Final designations effective July 20, 2012. 2. Final designations effective July 20, 2012. 3. The national 1-hour ozone standard was revoked by U.S. EPA on June 15, 2005. 4. In April 1998, the Bay Area was redesignated to attainment for the national 8-hour carbon monoxide standard. 5. In June 2002, CARB established new annual standards for PM2.5 and PM10. 6. National lead standard, rolling 3-month average: final rule signed October 15, 2008. Final designations effective December 31, 2011. Sources: CARB 2013; BAAQMD 2014a.
National Aeronautics and Space Administration Chap 8. Air Quality
NASA Ames Research Center Environmental Resources Document Environmental Management Division March 2015 File: 2015 ARC ERD_FINAL.doc
Pg 138
8.2.2 Federal Regulations
8.2.2.1 Clean Air Act
The Clean Air Act of 1970 (CAA) was enacted by Congress to protect air quality in the United States. The CAA is implemented through air pollution laws administered and enforced by the U.S. Environmental Protection Agency (EPA). However the EPA has largely delegated the task of administering air pollution laws to the states.
The CAA also requires EPA to set National Ambient Air Quality Standards (NAAQS). These standards limit the concentrations of certain pollutants in the ambient air. The limits set for these pollutants, called criteria air pollutants, include both primary and secondary limits or standards. Primary standards were established to protect the public's health and secondary standards were established to prevent environmental and property damage. Currently, there are six criteria pollutants limited by NAAQS: CO, NO2, O3, PM, SO2, and Pb.
The EPA designates an area as being in “attainment” for a pollutant if its concentration in ambient air does not exceed the NAAQS for that pollutant over a certain time period. If an area does not meet one of the NAAQS over a 3-year period, the EPA designates it as a “nonattainment” area for that particular pollutant. EPA requires states with nonattainment areas to prepare and submit air quality plans showing how the standards will be met in the future or, if they cannot be met, how they can show progress toward meeting the standards. These air quality plans are referred to as state implementation plans (SIPs). Under severe cases, EPA may impose a federal plan.
8.2.2.1.1 General Conformity
Section 176(c) of the 1990 CAA Amendments outlines the “conformity” provisions for federal projects. Federal actions are required to conform to the requirements of a SIP, and must not jeopardize efforts for a region to achieve NAAQS. Section 176(c) assigns primary oversight responsibility for conformity assurance to the federal agency undertaking the project, not the EPA, state, or local agency. For there to be conformity, federally supported or funded activities must not: (1) cause or contribute to any new air quality standard violation, (2) increase the frequency or severity of any existing standard violation, or (3) delay the timely attainment of any standard, interim emission reduction, or other SIP milestone aimed at bringing the region into attainment.
In 1993, EPA issued conformity regulations (40 CFR Parts 51 and 93) that addressed transportation projects (Transportation Conformity) and conformity of all other non-transportation federal actions (General Conformity). The primary requirements of the Transportation Conformity rule are that implementation of transportation plans or programs cannot produce more emissions of pollutants than budgeted in the latest SIP.
The General Conformity regulations apply to a wide range of federal actions or approvals that would cause emissions of criteria air pollutants above specified levels to occur in locations designated as nonattainment or maintenance areas. Since the Bay Area is in nonattainment (nonclassified) for O3 and is a CO maintenance area, federal projects are subject to the General Conformity regulations if they generate emissions of O3 precursor
National Aeronautics and Space Administration Chap 8. Air Quality
NASA Ames Research Center Environmental Resources Document Environmental Management Division March 2015 File: 2015 ARC ERD_FINAL.doc
Pg 139
pollutants (volatile organic compounds [VOCs] and nitrogen oxide [NOx]) or CO in excess of approximately 91 tonnes (100 tons) per year, or if the emissions are more than 10% of the nonattainment or maintenance area's emission inventory for the pollutant of concern.
Projects that are subject to the General Conformity regulations are required to mitigate or fully offset the emissions caused by the action, including both direct and indirect (for example, traffic) emissions that the federal agency has some control over. BAAQMD adopted and incorporated the Transportation and General Conformity regulations into the SIP in 1994.
8.2.2.1.2 Title V
Title V of the 1990 CAA Amendments (sections 501-507) requires large industrial facilities to apply for federal operating permits. These permits list all of the federal CAA and state and local air quality requirements that apply to the facility, and describe the monitoring and recordkeeping requirements that are needed to ensure compliance. Under Title V, a major source is defined as a facility with actual or potential emissions that meet or exceed the major source threshold for its location. The major source threshold for any “air pollutant” is 100 tons/year. Major source thresholds for “hazardous air pollutants” (HAP) are 10 tons/year for a single HAP or 25 tons/year for any combination of HAP.
If a permitted facility can keep its potential to emit (the maximum physical and operational capacity of a source to emit any air pollutant) below Title V definition thresholds for a major source, it may apply for a Synthetic Minor Operating Permit (SMOP) through the local air quality management authority. A major source has actual or potential emissions that meet or exceed the major source threshold for their location. The EPA has authorized BAAQMD to issue Title V permits to facilities in the Bay Area.
8.2.2.2 National Environmental Policy Act
NEPA requires federal agencies to include in their decision-making process appropriate and careful consideration of all environmental effects of a proposed action and of possible alternative actions. Measures to avoid or minimize the adverse effects of proposed actions and to restore and enhance environmental quality as much as possible must be developed and discussed where feasible.
8.2.3 State Regulations
The California Clean Air Act (CCAA) of 1988, amended in 1992, outlines a program for areas in the state to attain the California Ambient Air Quality Standards (CAAQS) by the earliest practical date. The CCAA sets more stringent air quality standards for all of the pollutants covered under national standards. It also regulates levels of C2H3Cl, hydrogen sulfide, sulfates, and visibility-reducing particulates. If an area does not meet CAAQS, CARB designates the area as a nonattainment area. Based on the California standards, the Bay Area is a serious nonattainment area for O3 (since the area cannot forecast attainment of the state O3 standard in the foreseeable future). CARB requires regions that do not meet CAAQS for O3 to submit clean air plans that describe plans to attain the standard. The Bay
National Aeronautics and Space Administration Chap 8. Air Quality
NASA Ames Research Center Environmental Resources Document Environmental Management Division March 2015 File: 2015 ARC ERD_FINAL.doc
Pg 140
Area is also a state nonattainment area for PM10. The Bay Area has met CAAQS for all other air pollutants.
8.2.4 Local and Regional Regulations
The local air quality regulatory agency responsible for the San Francisco Bay Area Air Basin is BAAQMD. BAAQMD regulates stationary sources (with respect to federal, state, and local regulations), monitors regional air pollutant levels (including measurement of toxic air contaminants), develops air quality control strategies, and conducts public awareness programs. BAAQMD has also developed California Environmental Quality Act (CEQA) guidelines that establish significance thresholds and provide guidance for evaluating potential air quality impacts of projects and plans.
BAAQMD has prepared the Bay Area Clean Air Plan (CAP) to address the California Clean Air Act. This plan includes a comprehensive strategy to reduce emissions from stationary, area, and mobile sources, and attain the stricter state air quality standard mandated by the California Clean Air Act. CAP is designed as a multi-pollutant plan to protect public health and the climate. The 2010 CAP serves as the triennial updated to the Bay Area ozone plan for state air quality planning purposes. The primary objective of the 2010 CAP is to define control strategies that the BAAQMD and its partners will implement to: (1) reduce emissions and decrease ambient concentrations of harmful pollutants; (2) safeguard public health by reducing exposure to air pollutants that pose the greatest health risk, with an emphasis on protecting the communities most heavily impacted by air pollution; and (3) reduce GHG emissions to protect the climate (BAAQMD 2010a).
BAAQMD Regulation 2, Rule 6, Major Facility Review, gives BAAQMD the authority to issue permits to a major facility, defined as a facility with the “potential to emit" more than 100,000 tons per year of GHG and 100 tons per year of a regulated air pollutant. Major facilities that are willing to accept federally enforceable permit conditions that limit emissions to less than Title V thresholds can apply for SMOP.
In order to be eligible for a SMOP, a site must either have a maximum potential to emit that is less than each Title V emission threshold (less than 95 tons per year of NOx, CO, precursor organic compounds (POC), PM10, and SO2, less than 9 tons per year) of any HAP, and less than 23 tons per year of all HAPS combined) or must accept conditions limiting the site to less than these emissions thresholds (BAAQMD Regulation 2-6-423). In addition for a facility to be eligible for a SMOP for GHG emissions, the emission threshold is 90% of the Title V emission threshold, or 90,000 tons per year of carbon dioxide equivalent (CO2E) emissions, or must accept conditions limiting the site to less than these emissions thresholds (BAAQMD Regulation 2-6-423.2.2).
8.3 Regional Setting
ARC is a federal facility located on approximately 800 hectares (2,000 acres) of land between U.S. Highway 101 and the southwestern edge of the San Francisco Bay in the northern portion of Santa Clara County, California (Figures 1-1 and 1-2). The City of Mountain View borders it to the south and west, and the City of Sunnyvale to the south and east. ARC is about 56 kilometers (35 miles) south of San Francisco and 16 kilometers (10
National Aeronautics and Space Administration Chap 8. Air Quality
NASA Ames Research Center Environmental Resources Document Environmental Management Division March 2015 File: 2015 ARC ERD_FINAL.doc
Pg 141
miles) north of San Jose, in the heart of Silicon Valley. For planning purposes, ARC is divided into four subareas: the NASA Research Park, Eastside/Airfield, Bay View, and the Ames campus (Figure 1-3).
8.3.1 Regional Topography and Climate
ARC is located in the San Francisco Bay Area Air Basin, which includes the City of San Francisco, portions of Sonoma and Solano counties, and all of San Mateo, Santa Clara, Alameda, Contra Costa, Marin, and Napa counties.
The climate at ARC is characterized by warm, dry summers and cool, moist winters. The proximity of the San Francisco Bay and the Pacific Ocean has a moderating influence on the climate. The major synoptic feature controlling the area's climate is a large high-pressure system located in the eastern Pacific Ocean known as the Pacific High. The strength and position of the Pacific High varies seasonally. It is at its strongest when it is located off the West Coast of the United States during the summer. Large-scale atmospheric subsidence associated with the Pacific High produces an elevated temperature inversion along the West Coast. The base of this inversion is usually located from 300 to 1,000 meters (984 to 3,281 feet) above mean sea level, depending on the intensity of subsidence and the prevailing weather condition. Vertical mixing is often limited to the base of the inversion, trapping air pollutants in the lower atmosphere. Marine air trapped below the base of the inversion is often condensed into fog or stratus clouds by the cool Pacific Ocean. This condition is typical of the warmer months of the year, from roughly May through October. Stratus clouds usually form offshore and move into the Bay Area during the evening hours. As the land warms the following morning, the clouds often dissipate, except in areas immediately adjacent to the coast. The stratus then redevelops and moves inland late in the day. Otherwise, clear skies and dry conditions prevail during summer.
As winter approaches, the Pacific High becomes weaker and shifts south, allowing pressure systems associated with the polar jet stream to affect the region. Low-pressure systems produce periods of cloudiness, strong shifting winds, and precipitation. The number of days with precipitation can vary greatly from year to year, resulting in a wide range of annual precipitation totals. Precipitation is generally lowest along the coastline and bay, with the highest amounts occurring along south- and west-facing slopes. Annual precipitation totals for ARC ranged from about 150 to 790 millimeters (6 to 31 inches) during the 1945-1993 period of record, with an annual average of 343 millimeters (13.5 inches). About 90% of rainfall in the region occurs between November and April. High-pressure systems in winter can produce cool stagnant conditions. Radiation fog and haze are common during extended winter periods when high-pressure systems influence the weather.
The annual average high temperatures at ARC are 68° Fahrenheit (F)/20° Centigrade (C). Annual average low temperatures are 50°F/10°C. In July, the average high and low temperatures are 75°F and 57°F (25°C and 13°C), respectively, while in January the average high and low temperatures are 57°F and 42°F (13°C and 6°C). Extreme high and low temperatures recorded during the 48-year period of record were 105°F and 21°F (40°C and 6°C), respectively. Temperatures along the Bay Area are generally less extreme compared to inland locations due to the moderating effect of the Pacific Ocean. The proximity of the Eastern Pacific High and relatively lower pressure inland produces a
National Aeronautics and Space Administration Chap 8. Air Quality
NASA Ames Research Center Environmental Resources Document Environmental Management Division March 2015 File: 2015 ARC ERD_FINAL.doc
Pg 142
prevailing west to northwest sea breeze along the central and northern California coast for most of the year. As this wind is channeled through the Golden Gate Bridge and other gaps, it branches off to the northeast and southeast, following the general orientation of the San Francisco Bay. As a result, the wind prevails from the north to northwest in the South Bay region and ARC during daytime hours. Nocturnal winds and land breezes during the colder months of the year prevail from the south due to drainage out of the Santa Clara Valley.
During the fall and winter months, the Pacific High can combine with high pressure over the interior regions of the western United States (known as the Great Basin High) to produce extended periods of light winds and low-level temperature inversions. This condition frequently produces poor atmospheric mixing that results in degraded regional air quality. O3 standards traditionally are exceeded when this condition occurs during the warmer months of the year.
8.3.2 Regional Air Quality
BAAQMD monitors air pollutant levels continuously throughout the nine-county San Francisco Bay Area Air Basin. The air pollutants of greatest concern in the South Bay Area are ground-level O3 and PM10 because the San Francisco Bay region as a whole does not comply with air quality standards for either pollutant.
Prior to 1995, the San Francisco Bay Area Air Basin was classified by EPA as a “moderate nonattainment” area for O3 since some air pollutant monitors in the area routinely measure concentrations exceeding the national 1-hour O3 standard. In 1993, after 3 years of monitoring compliance with the 1-hour O3 standard, the Bay Area Air Quality Management District (BAAQMD) submitted the 1993 Ozone Maintenance Plan to EPA to request the redesignation of the region to an O3 maintenance area. The plan included measures to maintain the attainment of the O3 NAAQS.
In 1995, EPA granted the request and classified the Bay Area as a "maintenance" area after the region had not violated the O3 standard for 5 years (1990-1994). However, violations of the national 1-hour O3 standard occurred during the summers of 1995 and 1996. As a result, in 1997 EPA revoked the region's clean air status and designated the area as an "unclassified nonattainment" area for O3.
In response to the redesignation of the area to an O3 nonattainment area, the Bay Area co-lead agencies (BAAQMD, MTC, and ABAG) prepared and submitted the San Francisco Bay Area Ozone Attainment Plan, or Ozone SIP, to the California Air Resources Board (CARB). This plan, which was a revision to the 1993 Ozone Maintenance Plan, was submitted to EPA in 1999. The plan includes a compilation of existing and proposed plans and regulations that govern how the region complies with the federal CAA requirements. This plan was designed to show how the region would attain the federal O3 standard by the end of the 2000 O3 season (summer) and thereafter.
EPA defines attainment of the national 1-hour O3 standard as when the Bay Area does not record an exceedance of the O3 standard more than three times in one year for three consecutive years. The Bay Area continued to violate the O3 NAAQS in 1998; therefore, attainment of the standard was not possible before 2000. In March 2001, EPA formally announced that the region had not attained the 1-hour O3 standard and it would only
National Aeronautics and Space Administration Chap 8. Air Quality
NASA Ames Research Center Environmental Resources Document Environmental Management Division March 2015 File: 2015 ARC ERD_FINAL.doc
Pg 143
partially approve the plan. As a result, a new Ozone Attainment Plan was developed and submitted to CARB and EPA. This plan is required to demonstrate attainment of the 1-hour O3 standard by 2006. The BAAQMD, in cooperation with the Metropolitan Transportation Commission and ABAG, prepared the Bay Area 2005 Ozone Strategy Plan, which is replacing the 2001 Ozone Attainment Plan. The 2005 Ozone Strategy Plan addresses national and state air quality planning requirements.
The Bay Area 2001 Ozone Attainment Plan for the national 1-hour O3 standard included two commitments for further planning: (1) a commitment to conduct a mid-course review of progress toward attaining the national 1-hour O3 standard by December 2003 and (2) a commitment to provide a revised O3 attainment strategy to EPA by April 2004 (BAAQMD 2004).
In April 2004, EPA made a final finding that the Bay Area had attained the national 1-hour O3 standard. The EPA later transitioned from the national 1-hour standard to a new 8-hour standard, as the new standard was considered a more health protective standard. The 8-hour standard took effect in June 2004 and the 1-hour standard was revoked on June 15, 2005.
In May 27, 2008, EPA implemented a more stringent national 8-hour standard of 0.075 ppm. In April 30, 2012, the EPA designated the Bay Area being in nonattainment of the 2008 ozone 8-hour standard.
In 2010, the EPA established new 1-hour standards for sulfur dioxide and nitrogen dioxide. The 1-hour standard for SO2 is 0.075 ppm. The Bay Area is considered to be in attainment of the new 1-hour national standard for SO2. For nitrogen dioxide, the 1-hour national standard is 0.100 ppm. The Bay Area is unclassified for the 1-hour national standard for NO2.
As described above, the San Francisco Bay Area annually exceeds the CAAQS for 1-hour O3
and 24-hour average PM levels. Throughout the Bay Area, the new 8-hour O3 standard was exceeded from 3 to 8 days annually from 2009 to 2013. The number of days on an annual basis that exceeded the more stringent 1-hour state O3 standard at one or more stations in the Bay Area ranged from 3 to 11 days per year during the 5 years, 2009 to 2013 (BAAQMD 2014b). NAAQS for PM10 is not exceeded anywhere in the Bay Area, but the more stringent state standard is routinely exceeded in the Bay Area, as well as most other parts of the state. The Bay Area is in nonattainment for the NAAQS for PM2.5 for the national 24-hour standard of 35 µg/m3 and is also in nonattainment for the state’s annual mean standard of 12 µg/m3. No other air quality standards are exceeded in the Bay Area. As a result, the San Francisco Bay Area is considered nonattainment for ground-level O3 at both the state and federal levels, and nonattainment for PM10 at the state level only. The Bay Area currently complies with state and federal standards for CO, SO2, and Pb. For NO2, the Bay Area is in attainment with the state standards and the national 24-hour standard, but is unclassified for the national 1-hour standard.
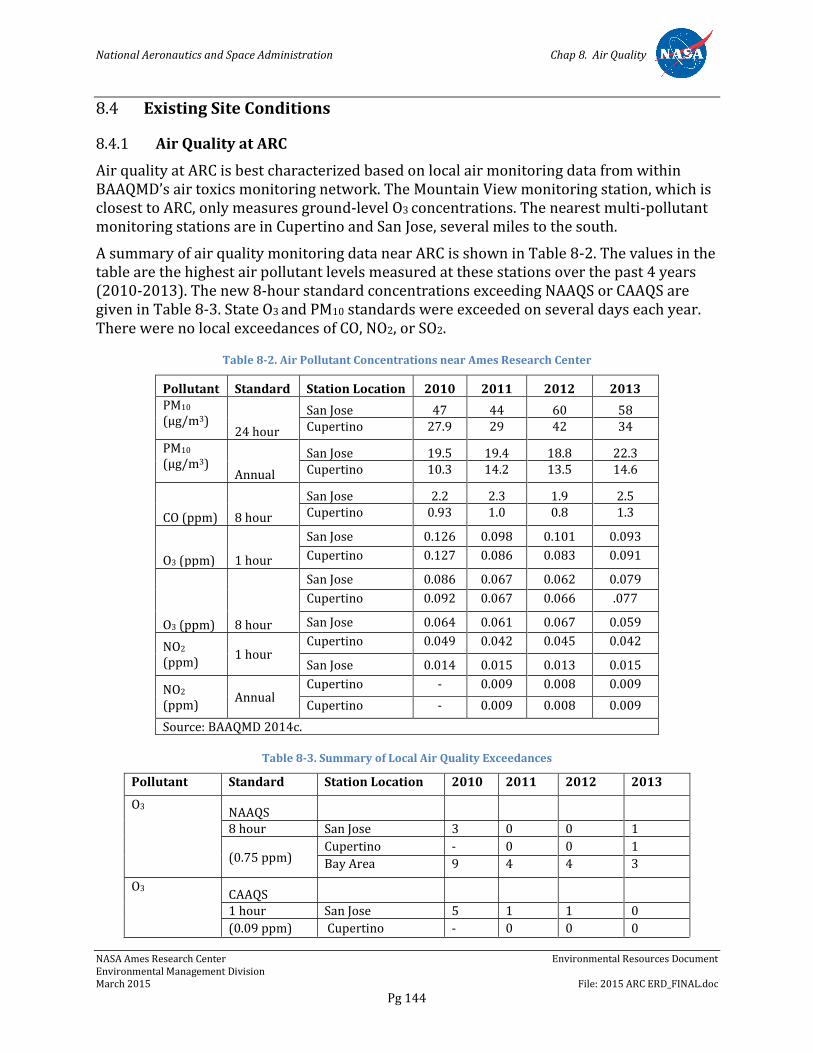
National Aeronautics and Space Administration Chap 8. Air Quality
NASA Ames Research Center Environmental Resources Document Environmental Management Division March 2015 File: 2015 ARC ERD_FINAL.doc
Pg 144
8.4 Existing Site Conditions
8.4.1 Air Quality at ARC
Air quality at ARC is best characterized based on local air monitoring data from within BAAQMD’s air toxics monitoring network. The Mountain View monitoring station, which is closest to ARC, only measures ground-level O3 concentrations. The nearest multi-pollutant monitoring stations are in Cupertino and San Jose, several miles to the south.
A summary of air quality monitoring data near ARC is shown in Table 8-2. The values in the table are the highest air pollutant levels measured at these stations over the past 4 years (2010-2013). The new 8-hour standard concentrations exceeding NAAQS or CAAQS are given in Table 8-3. State O3 and PM10 standards were exceeded on several days each year. There were no local exceedances of CO, NO2, or SO2.
Table 8-2. Air Pollutant Concentrations near Ames Research Center
Pollutant Standard Station Location 2010 2011 2012 2013 PM10 (µg/m3)
24 hour
San Jose 47 44 60 58 Cupertino 27.9 29 42 34
PM10 (µg/m3)
Annual
San Jose 19.5 19.4 18.8 22.3 Cupertino 10.3 14.2 13.5 14.6
CO (ppm) 8 hour
San Jose 2.2 2.3 1.9 2.5 Cupertino 0.93 1.0 0.8 1.3
O3 (ppm) 1 hour
San Jose 0.126 0.098 0.101 0.093
Cupertino 0.127 0.086 0.083 0.091
O3 (ppm) 8 hour
San Jose 0.086 0.067 0.062 0.079
Cupertino 0.092 0.067 0.066 .077
San Jose 0.064 0.061 0.067 0.059
NO2 (ppm)
1 hour Cupertino 0.049 0.042 0.045 0.042
San Jose 0.014 0.015 0.013 0.015
NO2 (ppm)
Annual Cupertino - 0.009 0.008 0.009
Cupertino - 0.009 0.008 0.009
Source: BAAQMD 2014c.
Table 8-3. Summary of Local Air Quality Exceedances
Pollutant Standard Station Location 2010 2011 2012 2013
O3 NAAQS 8 hour San Jose 3 0 0 1
(0.75 ppm) Cupertino - 0 0 1
Bay Area 9 4 4 3
O3 CAAQS 1 hour San Jose 5 1 1 0
(0.09 ppm) Cupertino - 0 0 0
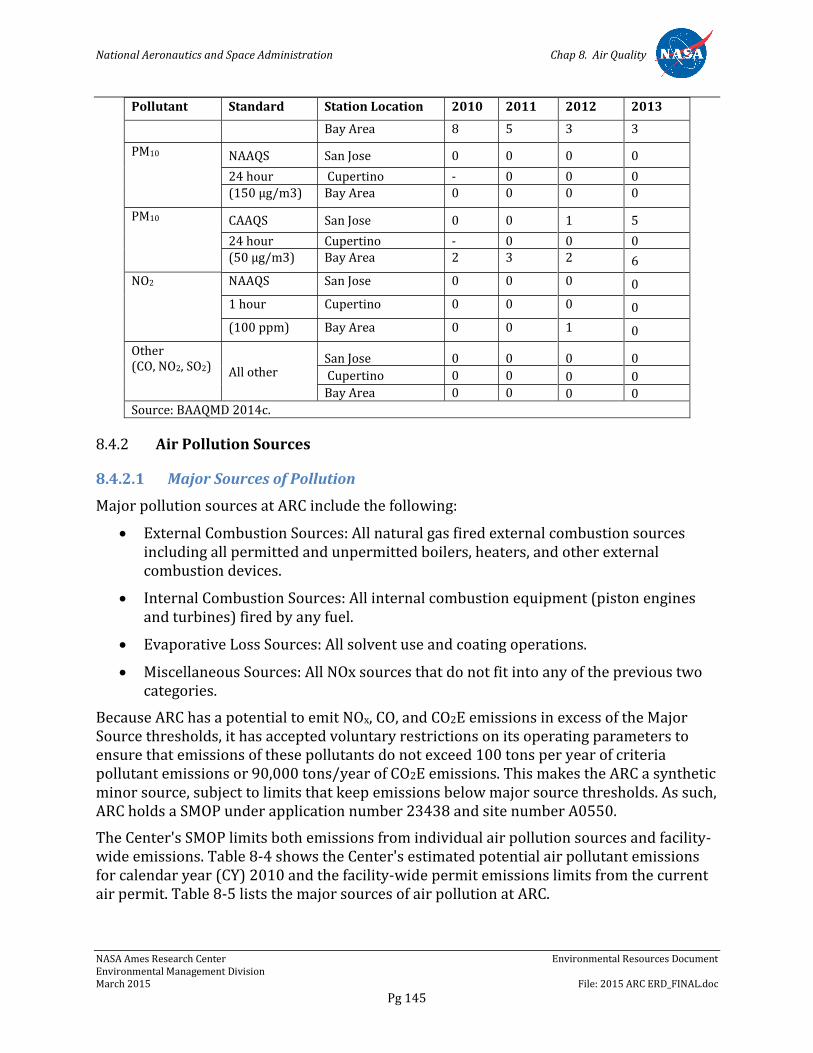
National Aeronautics and Space Administration Chap 8. Air Quality
NASA Ames Research Center Environmental Resources Document Environmental Management Division March 2015 File: 2015 ARC ERD_FINAL.doc
Pg 145
Pollutant Standard Station Location 2010 2011 2012 2013
Bay Area 8 5 3 3
PM10 NAAQS San Jose 0 0 0 0
24 hour Cupertino - 0 0 0
(150 µg/m3) Bay Area 0 0 0 0
PM10
CAAQS San Jose 0 0 1 5
24 hour Cupertino - 0 0 0 (50 µg/m3) Bay Area 2 3 2 6
NO2 NAAQS San Jose 0 0 0 0
1 hour Cupertino 0 0 0 0
(100 ppm) Bay Area 0 0 1 0
Other (CO, NO2, SO2) All other
San Jose 0 0 0 0
Cupertino 0 0 0 0 Bay Area 0 0 0 0
Source: BAAQMD 2014c.
8.4.2 Air Pollution Sources
8.4.2.1 Major Sources of Pollution
Major pollution sources at ARC include the following:
External Combustion Sources: All natural gas fired external combustion sources including all permitted and unpermitted boilers, heaters, and other external combustion devices.
Internal Combustion Sources: All internal combustion equipment (piston engines and turbines) fired by any fuel.
Evaporative Loss Sources: All solvent use and coating operations.
Miscellaneous Sources: All NOx sources that do not fit into any of the previous two categories.
Because ARC has a potential to emit NOx, CO, and CO2E emissions in excess of the Major Source thresholds, it has accepted voluntary restrictions on its operating parameters to ensure that emissions of these pollutants do not exceed 100 tons per year of criteria pollutant emissions or 90,000 tons/year of CO2E emissions. This makes the ARC a synthetic minor source, subject to limits that keep emissions below major source thresholds. As such, ARC holds a SMOP under application number 23438 and site number A0550.
The Center's SMOP limits both emissions from individual air pollution sources and facility-wide emissions. Table 8-4 shows the Center's estimated potential air pollutant emissions for calendar year (CY) 2010 and the facility-wide permit emissions limits from the current air permit. Table 8-5 lists the major sources of air pollution at ARC.
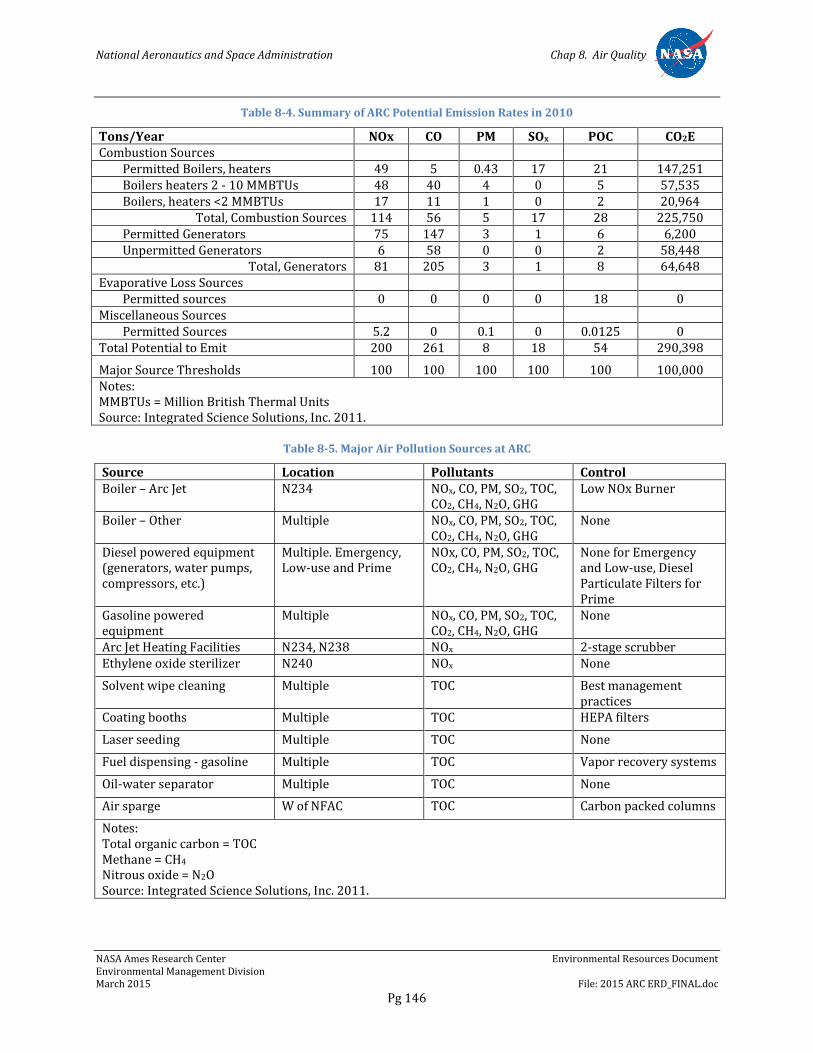
National Aeronautics and Space Administration Chap 8. Air Quality
NASA Ames Research Center Environmental Resources Document Environmental Management Division March 2015 File: 2015 ARC ERD_FINAL.doc
Pg 146
Table 8-4. Summary of ARC Potential Emission Rates in 2010
Tons/Year NOx CO PM SOx POC CO2E Combustion Sources
Permitted Boilers, heaters 49 5 0.43 17 21 147,251 Boilers heaters 2 - 10 MMBTUs 48 40 4 0 5 57,535 Boilers, heaters <2 MMBTUs 17 11 1 0 2 20,964
Total, Combustion Sources 114 56 5 17 28 225,750 Permitted Generators 75 147 3 1 6 6,200 Unpermitted Generators 6 58 0 0 2 58,448
Total, Generators 81 205 3 1 8 64,648 Evaporative Loss Sources
Permitted sources 0 0 0 0 18 0 Miscellaneous Sources
Permitted Sources 5.2 0 0.1 0 0.0125 0 Total Potential to Emit 200 261 8 18 54 290,398
Major Source Thresholds 100 100 100 100 100 100,000 Notes: MMBTUs = Million British Thermal Units Source: Integrated Science Solutions, Inc. 2011.
Table 8-5. Major Air Pollution Sources at ARC
Source Location Pollutants Control Boiler – Arc Jet N234 NOx, CO, PM, SO2, TOC,
CO2, CH4, N2O, GHG Low NOx Burner
Boiler – Other Multiple NOx, CO, PM, SO2, TOC, CO2, CH4, N2O, GHG
None
Diesel powered equipment (generators, water pumps, compressors, etc.)
Multiple. Emergency, Low-use and Prime
NOx, CO, PM, SO2, TOC, CO2, CH4, N2O, GHG
None for Emergency and Low-use, Diesel Particulate Filters for Prime
Gasoline powered equipment
Multiple NOx, CO, PM, SO2, TOC, CO2, CH4, N2O, GHG
None
Arc Jet Heating Facilities N234, N238 NOx 2-stage scrubber Ethylene oxide sterilizer N240 NOx None
Solvent wipe cleaning Multiple TOC Best management practices
Coating booths Multiple TOC HEPA filters
Laser seeding Multiple TOC None
Fuel dispensing - gasoline Multiple TOC Vapor recovery systems
Oil-water separator Multiple TOC None
Air sparge W of NFAC TOC Carbon packed columns
Notes: Total organic carbon = TOC Methane = CH4 Nitrous oxide = N2O Source: Integrated Science Solutions, Inc. 2011.
National Aeronautics and Space Administration Chap 8. Air Quality
NASA Ames Research Center Environmental Resources Document Environmental Management Division March 2015 File: 2015 ARC ERD_FINAL.doc
Pg 147
8.4.2.2 Indoor Air Vapor Intrusion
8.4.2.2.1 Background
The Naval Air Station (NAS) Moffett Field is a National Priorities List (NPL) site (EPA ID: CA2170090078) and part of the MEW Superfund Study Area which includes three separately listed NPL sites, including portions of the NAS Moffett Field NPL site.
Groundwater at the Middlefield-Ellis-Whisman (MEW) Superfund Study Area (MEW Site) has been contaminated with VOCs, primarily the solvent trichloroethene (TCE) (Figure 8-1). Portions of that groundwater have migrated northward through the subsurface onto former NAS Moffett Field where the contamination has mixed with U.S. Navy and NASA contaminant sources. The combined area of contamination is referred to as the “regional groundwater contamination plume.” Clean up of contaminated groundwater and soil associated with these sources is governed by the Fairchild, Intel, and Raytheon Sites, MEW Study Area, Mountain View, California, 1989 ROD (EPA 1989). For more details on the regional groundwater contamination plume, see Chapter 18, Hazardous Materials.
Based on the EPA’s updated understanding of the way chemicals can potentially migrate from the subsurface soil and groundwater to the indoor air, EPA requested the Potentially Responsible Parties (PRPs) for the MEW groundwater contamination – the MEW Companies, U.S. Navy, and NASA - to evaluate the potential vapor intrusion pathway into buildings overlying shallow TCE groundwater contamination at the MEW Site. From 2003 through 2008, the MEW Companies, NASA, U.S. Navy, and EPA collected over 3,000 air samples from 47 commercial buildings and 20 residences within the Vapor Intrusion Study Area.
In August 2010, the EPA amended the original 1989 MEW Site ROD, in accordance with CERCLA and the National Contingency Plan (NCP), to address health risks associated with long-term exposure to TCE and other MEW Site Chemicals of Concern (COCs) through the vapor intrusion (VI) pathway in current and future buildings overlying the MEW Site and to select a remedy to prevent exposure to levels exceeding the indoor air cleanup criteria for long-term exposure for residential and commercial buildings (EPA 2010). Human exposure to COCs via the VI pathway occurs when vapors of volatile chemicals in the groundwater and soil enter the building from below and accumulate in indoor air that is subsequently breathed.
EPA’s supplemental remedial investigation for the vapor intrusion pathway in the Vapor Intrusion Study Area, including portions of ARC, indicates that there are no immediate or short-term health concerns. All indoor air concentrations were below the screening criteria for acute and short-term health-based Minimal Risk Levels developed by the Agency for Toxic Substances Disease Registry. Therefore, EPA’s focus is whether TCE and other Site chemicals of potential concern in indoor air pose an unacceptable risk of chronic health effects from long-term exposure (30 years for residential exposure and 25 years for non-residential exposure).
Under CERCLA, the EPA is the lead regulatory agency responsible for directing the cleanup process for the MEW Site. At ARC, the Navy is the lead agency for the cleanup at NAS
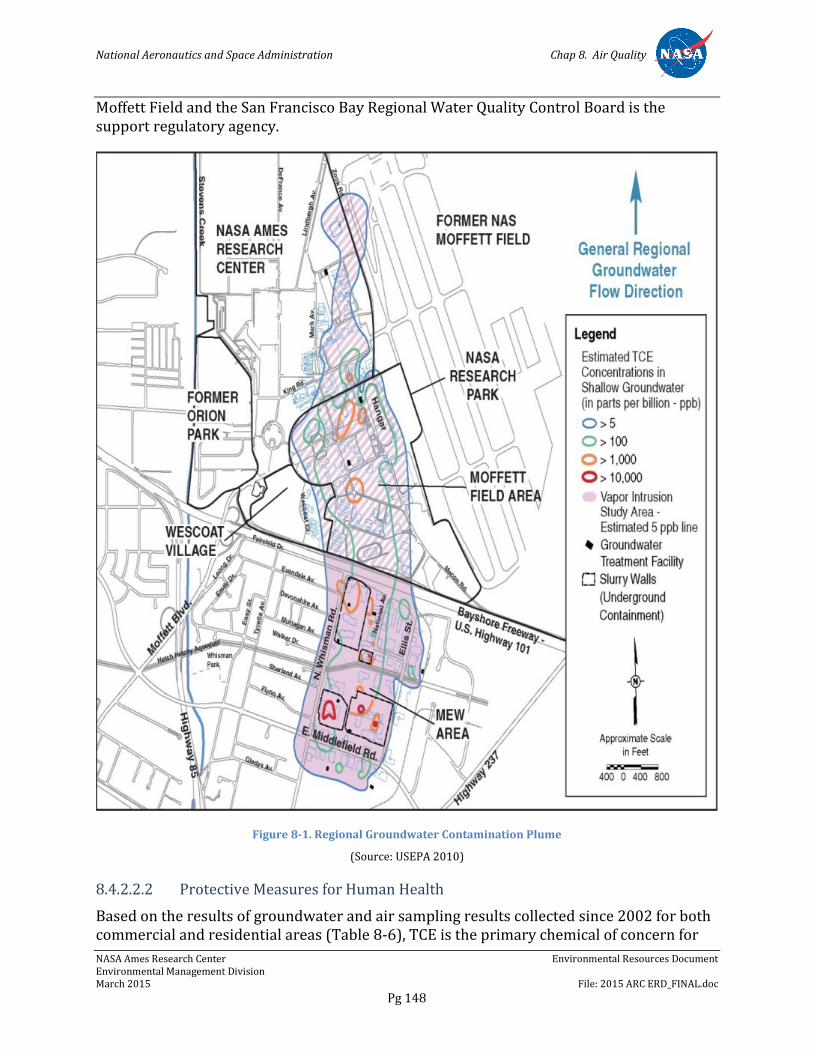
National Aeronautics and Space Administration Chap 8. Air Quality
NASA Ames Research Center Environmental Resources Document Environmental Management Division March 2015 File: 2015 ARC ERD_FINAL.doc
Pg 148
Moffett Field and the San Francisco Bay Regional Water Quality Control Board is the support regulatory agency.
Figure 8-1. Regional Groundwater Contamination Plume
(Source: USEPA 2010)
8.4.2.2.2 Protective Measures for Human Health
Based on the results of groundwater and air sampling results collected since 2002 for both commercial and residential areas (Table 8-6), TCE is the primary chemical of concern for
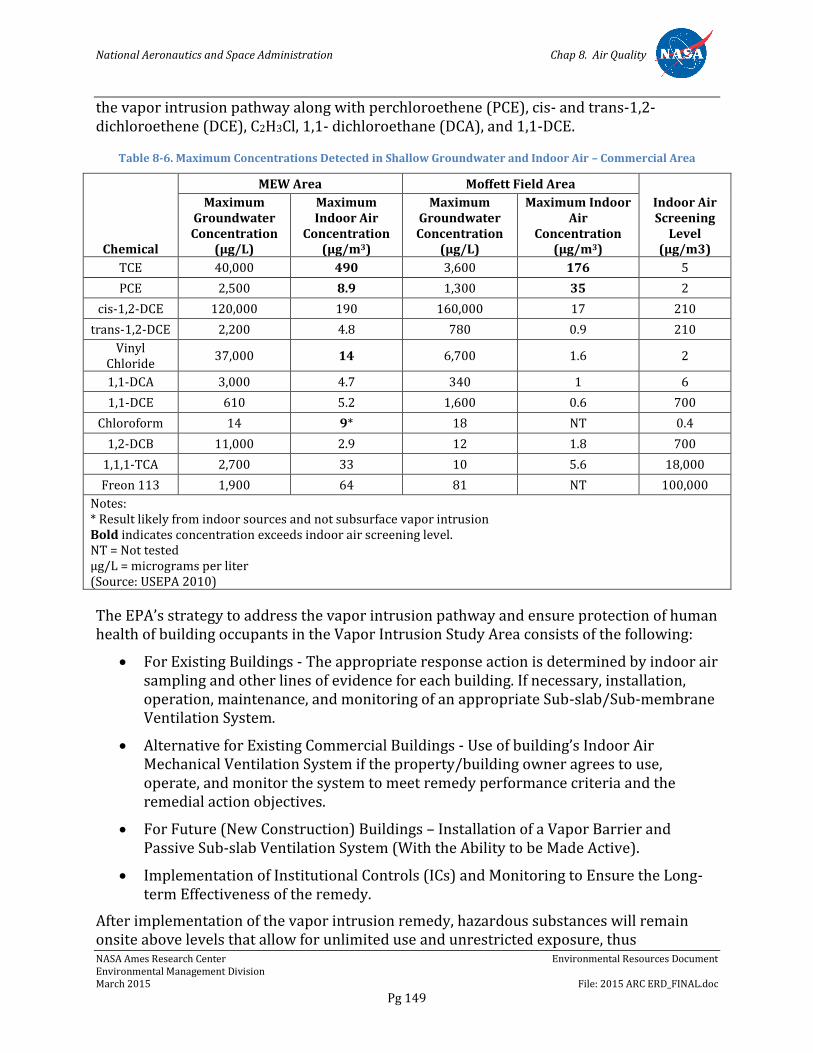
National Aeronautics and Space Administration Chap 8. Air Quality
NASA Ames Research Center Environmental Resources Document Environmental Management Division March 2015 File: 2015 ARC ERD_FINAL.doc
Pg 149
the vapor intrusion pathway along with perchloroethene (PCE), cis- and trans-1,2-dichloroethene (DCE), C2H3Cl, 1,1- dichloroethane (DCA), and 1,1-DCE.
Table 8-6. Maximum Concentrations Detected in Shallow Groundwater and Indoor Air – Commercial Area
Chemical
MEW Area Moffett Field Area
Indoor Air Screening
Level (μg/m3)
Maximum Groundwater Concentration
(μg/L)
Maximum Indoor Air
Concentration (μg/m3)
Maximum Groundwater Concentration
(μg/L)
Maximum Indoor Air
Concentration (μg/m3)
TCE 40,000 490 3,600 176 5
PCE 2,500 8.9 1,300 35 2
cis-1,2-DCE 120,000 190 160,000 17 210
trans-1,2-DCE 2,200 4.8 780 0.9 210
Vinyl Chloride
37,000 14 6,700 1.6 2
1,1-DCA 3,000 4.7 340 1 6
1,1-DCE 610 5.2 1,600 0.6 700
Chloroform 14 9* 18 NT 0.4
1,2-DCB 11,000 2.9 12 1.8 700
1,1,1-TCA 2,700 33 10 5.6 18,000
Freon 113 1,900 64 81 NT 100,000
Notes: * Result likely from indoor sources and not subsurface vapor intrusion Bold indicates concentration exceeds indoor air screening level. NT = Not tested μg/L = micrograms per liter (Source: USEPA 2010)
The EPA’s strategy to address the vapor intrusion pathway and ensure protection of human health of building occupants in the Vapor Intrusion Study Area consists of the following:
For Existing Buildings - The appropriate response action is determined by indoor air sampling and other lines of evidence for each building. If necessary, installation, operation, maintenance, and monitoring of an appropriate Sub-slab/Sub-membrane Ventilation System.
Alternative for Existing Commercial Buildings - Use of building’s Indoor Air Mechanical Ventilation System if the property/building owner agrees to use, operate, and monitor the system to meet remedy performance criteria and the remedial action objectives.
For Future (New Construction) Buildings – Installation of a Vapor Barrier and Passive Sub-slab Ventilation System (With the Ability to be Made Active).
Implementation of Institutional Controls (ICs) and Monitoring to Ensure the Long-term Effectiveness of the remedy.
After implementation of the vapor intrusion remedy, hazardous substances will remain onsite above levels that allow for unlimited use and unrestricted exposure, thus
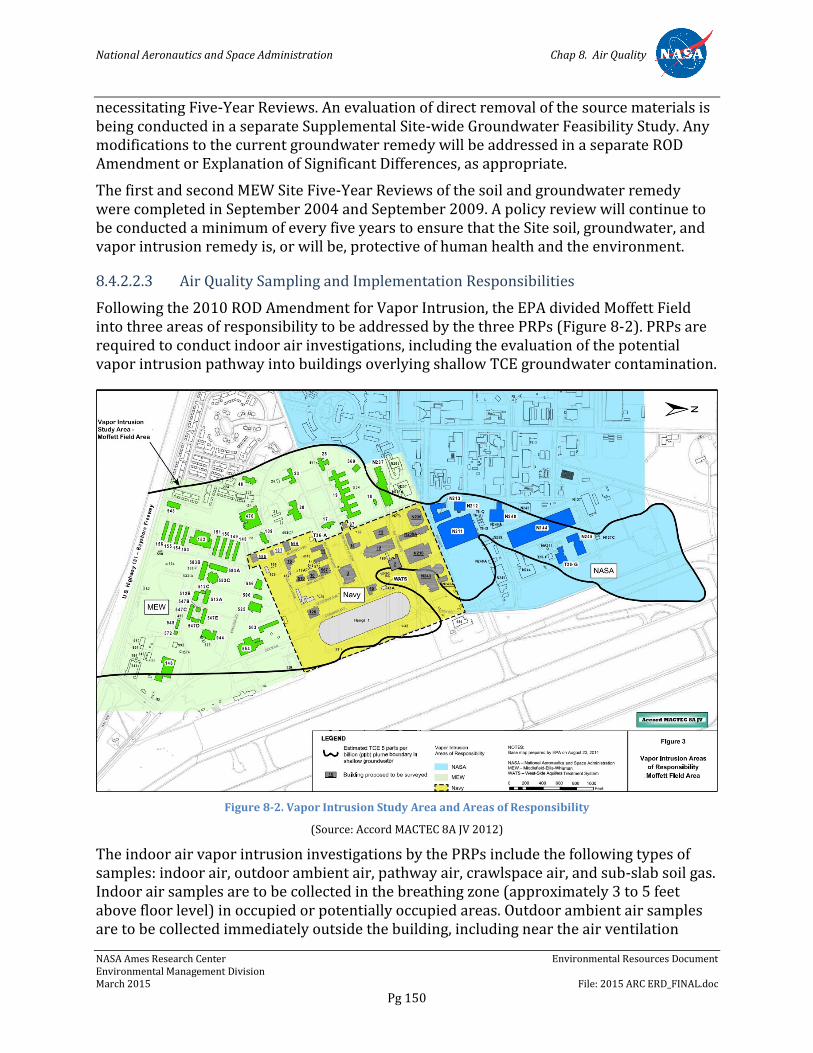
National Aeronautics and Space Administration Chap 8. Air Quality
NASA Ames Research Center Environmental Resources Document Environmental Management Division March 2015 File: 2015 ARC ERD_FINAL.doc
Pg 150
necessitating Five-Year Reviews. An evaluation of direct removal of the source materials is being conducted in a separate Supplemental Site-wide Groundwater Feasibility Study. Any modifications to the current groundwater remedy will be addressed in a separate ROD Amendment or Explanation of Significant Differences, as appropriate.
The first and second MEW Site Five-Year Reviews of the soil and groundwater remedy were completed in September 2004 and September 2009. A policy review will continue to be conducted a minimum of every five years to ensure that the Site soil, groundwater, and vapor intrusion remedy is, or will be, protective of human health and the environment.
8.4.2.2.3 Air Quality Sampling and Implementation Responsibilities
Following the 2010 ROD Amendment for Vapor Intrusion, the EPA divided Moffett Field into three areas of responsibility to be addressed by the three PRPs (Figure 8-2). PRPs are required to conduct indoor air investigations, including the evaluation of the potential vapor intrusion pathway into buildings overlying shallow TCE groundwater contamination.
Figure 8-2. Vapor Intrusion Study Area and Areas of Responsibility
(Source: Accord MACTEC 8A JV 2012)
The indoor air vapor intrusion investigations by the PRPs include the following types of samples: indoor air, outdoor ambient air, pathway air, crawlspace air, and sub-slab soil gas. Indoor air samples are to be collected in the breathing zone (approximately 3 to 5 feet above floor level) in occupied or potentially occupied areas. Outdoor ambient air samples are to be collected immediately outside the building, including near the air ventilation
National Aeronautics and Space Administration Chap 8. Air Quality
NASA Ames Research Center Environmental Resources Document Environmental Management Division March 2015 File: 2015 ARC ERD_FINAL.doc
Pg 151
system air intake, for comparison to indoor air to evaluate the potential contribution of VOCs from outdoor air to indoor air. Pathway samples are to be collected in areas where potential conduits (such as penetrations through slab, drains, utility lines or vaults) into the building are observed that might provide a direct route for VOC vapor migration into the building. Additionally, background outdoor air samples are to be collected at distances of 0.25 to 1.5 miles away from the Site to assess background levels of VOCs in the general area.
Indoor air results are then compared to (1) short-term health-based screening levels; (2) long-term health-based screening levels, and (3) outdoor ambient air. The EPA uses an interim long-term TCE indoor air screening level of 5.0 μg/m3 for commercial buildings and 1 μg/m3 for residential buildings.
Vapor intrusion is further assessed by using multiple line of evidence. The types of information to be used include building surveys, chemical use, operations, historical facility and property information, Site geology and hydrogeology, and subsurface and air sampling information and conditions (groundwater, soil gas, sub-slab soil gas, crawlspace, pathway samples), chemical ratios, and tracer compounds, to determine whether the indoor air concentrations are attributable to subsurface Site contamination and no other sources, such as consumer products or outdoor background air sources.
Where discrete mitigation measures (e.g., sealing conduits, enhanced mechanical ventilation, air purifiers, sub-slab vapor control systems) are implemented, indoor TCE concentrations are reduced to below the interim screening level. Increasing air exchange rates generally results in decreasing indoor air TCE concentrations. Vapor intrusion resulting in concentrations above interim long-term indoor air screening levels appears more likely in commercial buildings when ventilation systems are not providing sufficient air exchanges with outside air in all or part of a building.
The EPA has determined that buildings overlying elevated groundwater concentrations appear to have a greater likelihood of indoor air TCE concentrations exceeding the TCE screening level, but that actual indoor air concentrations are also dependent on other building factors such as air ventilation system operations, building configuration, and preferential pathways into the building.
On an ongoing basis, the PRPs conduct indoor air sampling and investigations in accordance with the provisions of the 2010 EPA ROD Amendment for VI. Building surveys are conducted to identify each building’s structural condition, observe the ventilation system layout and use by the building occupants, observe operational procedures in laboratory and maintenance areas, and gather information about building use schedules. Prior to conducting the surveys, information on basic HVAC systems and chemical use and storage are collected. Building survey results are used to select potential sampling locations within each building for the indoor air sampling work plan.
The 2010 ROD also provides a tiering system to determine the appropriate response action for each building within the Vapor Intrusion Study Area. The tiering system for existing buildings is based on indoor air sampling with or without engineering controls (ECs) in place, and other lines of evidence.

National Aeronautics and Space Administration Chap 8. Air Quality
NASA Ames Research Center Environmental Resources Document Environmental Management Division March 2015 File: 2015 ARC ERD_FINAL.doc
Pg 152
To determine the appropriate tier and corresponding response action for the nonresidential buildings within each area of responsibility, a vapor intrusion investigation is conducted consisting of indoor air sampling and background air sampling and analysis of COCs by EPA Method TO-15 SIM. Samples are collected in the breathing zone of work areas (office areas, meeting rooms, and high-traffic areas such as hallways), at potential vapor intrusion pathways (foundation cracks, expansion joints, crawl spaces, drains, and pipe inlets), and in ambient outdoor air. Grab samples are collected in elevator shafts (ventilation pathways between floors) with priority given to basement and first-floor work areas, followed by potential pathways, then second- through fourth-floor work areas.
Using the indoor air sampling results, the buildings are tiered to determine the need for a response action in accordance with EPA’s Response Action Tiering System, described in detail in the 2010 ROD Amendment. Indoor air quality for COCs is compared to the ROD Amendment cleanup levels and to ambient outdoor air with consideration of whether or not an air quality EC is in place and operating correctly.
The Moffett Field Area is primarily used for military housing, air operations, storage, educational facilities, research and development, office, and retail space. NASA’s redevelopment plans in the Moffett Field Area include demolition of all non-historic structures. Plans are underway to redevelop unimproved land at Moffett Field into sustainable research facilities including office, educational, recreational, and residential uses. Cleanup actions are being taken at the Site under the 1989 ROD to restore groundwater to its potential beneficial use, which is designated as drinking water. Note that the groundwater at the Site is not currently being used for drinking water or other domestic purposes.
The alternatives evaluated for the vapor intrusion pathway are:
Alternative 1: No Action
Alternative 2: Active Indoor Air Ventilation System, Monitoring, and ICs
Alternative 3: Passive Sub-slab Ventilation with Vapor Barrier (and Ability to Convert to Active), Monitoring, and ICs
Alternative 4: Active Sub-slab or Sub-membrane Ventilation, Monitoring, and ICs
ICs are non-engineered legal and administrative instruments that help to minimize the potential for human exposure to contamination and protect the integrity of an engineered remedy. There are four categories of ICs: government controls; proprietary controls; enforcement tools with IC components; and informational devices. Each of these types of ICs can be used, alone or in combination, to ensure the protectiveness of an engineered remedy. See the “Final Supplemental Feasibility Study for the Vapor Intrusion Pathway” (Haley & Aldrich, Inc. 2009) for more detailed information and an evaluation of each of the ICs considered.
For new development at NASA Research Park within the Moffett Field Area, the remedy will rely in part on management procedures already in place by ARC. ARC uses its March 2005 Environmental Issues Management Plan (EIMP) as a decision framework for the management of residual chemicals in soil and groundwater. The EIMP already includes
National Aeronautics and Space Administration Chap 8. Air Quality
NASA Ames Research Center Environmental Resources Document Environmental Management Division March 2015 File: 2015 ARC ERD_FINAL.doc
Pg 153
certain measures to be implemented in future development at NASA Research Park to address the vapor intrusion pathway. Specifically, the EIMP provides design requirements for new construction, risk management procedures for future subsurface activities, and procedures for long-term management of environmental conditions in the NASA Research Park area. Specifically with regard to vapor intrusion, the EIMP requires all future construction overlying 5 part per billion (ppb) of VOCs in the shallow groundwater to incorporate vapor intrusion mitigation either with a sub-slab ventilation system or an indoor air mechanical ventilation system that maintains positive pressure. Additionally, after mitigation measures are implemented, the EIMP requires ongoing monitoring of contaminants and remedial measures.
A portion of the Moffett Field Area is not within the NASA Research Park area, but is also owned by NASA. For those properties and all properties within the Moffett Field Area, sampling, operations, maintenance, and monitoring requirements should be, according to the 2010 VI ROD, incorporated into the appropriate Master Plan planning documents. Additionally, similar requirements to those in the EIMP should be adopted for new construction within the Moffett Field Area and for ongoing implementation and monitoring of the remedy.
8.4.3 Conformity Analysis
As noted above, Section 176(c) of the CAA Amendments requires federal agencies to ensure that their actions conform to applicable plans for achieving and maintaining the NAAQS. The primary oversight responsibility for assuring conformity is assigned to the federal agency.
Prior to publication of the final NADP EIS, NASA calculated the annual emissions associated with the build out and operations of the NADP to evaluate the need for a conformity analysis. The calculations indicated that the project-related emissions would exceed de minimis levels of CO for Alternatives 2 through 5 under 10-year build out plans. Thus, implementation of any of Alternatives, including Mitigated Alternative 5, required a SIP conformity determination for CO.
NASA subsequently drafted a conformity determination, which is included in Appendix D of the NADP EIS. The conformity determination found that the predicted CO concentrations associated with the development of the NADP would not cause or contribute to any new violation of the NAAQS for CO or increase the frequency or severity of any existing violation of the CO NAAQS. As such, NASA determined that implementation of Mitigated Alternative 5 would conform to the applicable SIP for CO.
8.5 Environmental Requirements
NASA has identified the following environmental plans, policies, and measures that address potential air quality effects of operations and future development at ARC.
8.5.1 NASA Procedural Directive 8500.1, NASA Environmental Management
Per NPD 8500.1, it is NASA policy to: maintain compliance with all applicable federal, state, and local environmental requirements; to incorporate environmental risk reduction and

National Aeronautics and Space Administration Chap 8. Air Quality
NASA Ames Research Center Environmental Resources Document Environmental Management Division March 2015 File: 2015 ARC ERD_FINAL.doc
Pg 154
sustainable practices to the extent practicable throughout NASA’s programs, projects, and activities; and to consider environmental factors throughout the life cycle of programs, projects, and activities (as defined in NPD 7120.4, NASA Engineering and Program/Project Management Policy, and related documents), including planning, development, execution, and disposition activities. Examples of environmental factors include consideration of environmental impacts as required by the NEPA and NHPA; the proposed use of hazardous materials; the potential for waste generation; the need to acquire necessary permits, waivers, and authorizations; and the use of environmentally-preferable materials and processes wherever practicable.
8.5.2 NASA Procedural Requirements 8553.1, NASA Environmental Management System
NPR 8553.1 sets forth requirements for the NASA EMS, which functions primarily to: (1) incorporate people, procedures, and work practices into a formal structure to ensure that the important environmental impacts of the organization are identified and addressed; (2) promote continual improvement, including periodically evaluating environmental performance; (3) involve all members of the organization, as appropriate; and (4) actively involve senior management in support of the EMS.
Agencywide, the EMS employs a standardized approach to managing environmental activities that allows for efficient, prioritized system execution, while at the same time helping to improve environmental performance and to maintain compliance with applicable environmental regulations and requirements. NASA’s EMS approach involves identifying all activities, products, and services under each NASA center’s control, and the environmental aspects associated with each centers’ continued engagement in those activities, products, and services. Once identified, priority environmental aspects are assigned a risk ranking (from 1 to 4, based on its severity and frequency of occurrence) and are evaluated on a continual basis as means of highlighting associated positive or negative impacts and setting objectives and targets to reduce environmental risk. Each center’s EMS also identifies methods for ensuring compliance by keeping abreast of environmental requirements. This includes requirements by law (EOs, federal regulations, state and local laws) and voluntary commitments made by the center or NASA.
8.5.3 Ames Procedural Requirements 8500.1, Ames Environmental Procedural Requirements
APR 8500.1 sets forth general procedural requirements to ensure compliance with applicable federal, state, and local environmental laws; regulations and EOs; and NASA policies and procedures. Organizational directors, division chiefs, branch chiefs, section heads, supervisors, managers, and CORs are responsible for planning, designing, constructing, managing, operating, and maintaining facilities in conformance with applicable regulatory directives, and should obtain environmental review from the Environmental Management Division early in project planning consistent with NASA's NEPA implementing procedures (NPR 8580.1 and EO 12114), NASA policies and procedures for programs and projects (NPR 7120), and NASA regulations related to environmental quality (14 CFR 1216). Program and project managers should coordinate
National Aeronautics and Space Administration Chap 8. Air Quality
NASA Ames Research Center Environmental Resources Document Environmental Management Division March 2015 File: 2015 ARC ERD_FINAL.doc
Pg 155
with the Environmental Management Division in a timely manner to ensure that any new or modified programs, projects, and activities comply with regulatory requirements.
8.5.4 Ames Procedural Requirements 8553.1, Ames Environmental Management System
APR 8553.1 sets forth requirements for the Center-level EMS in accordance with NPR 8553.1B, NASA Environmental Management Systems. The ARC EMS also includes consideration of the findings of NASA Headquarters’ triennial (3-year) Environmental Functional Review and other external EMS audits, as required.
Under the ARC EMS, the Center conducts an annual risk analysis across Center activities to determine which of 16 environmental aspects are of high or medium priority. The Center then identifies objectives (goals) and targets and develops action plans known as Environmental Management Plans to reduce identified risks. Currently, the high- and medium-priority environmental aspects of Center business activities are Air Emissions, Hazardous Material Management, Water and Energy Conservation, and Other Sustainability Practices. Objectives associated with these high- and medium-priority environmental aspects include:
Reducing air (including GHG) emissions through energy efficiency
Improving hazardous material management
Improving energy and water efficiency
Providing for the integration of other sustainability practices into Center activities
8.5.5 Ames Environmental Work Instructions
Ames’s EWIs, which replace the previous Ames Environmental Handbook (APR 8800.3), set forth requirements to ensure that programs, projects, and activities at ARC comply with applicable federal, state, and local laws; regulations and EOs; and NASA policies and procedures. Each EWI lists relevant regulatory authorities and documents, assigns individual and organizational responsibilities within ARC, and identifies specific requirements applicable to the work being performed.
The following EWIs are relevant to operations and future development at ARC with the potential to impact air quality.
EWI 1, Air
EWI 12, Public Involvement
EWI 14, NEPA and Environmental Justice
EWI 18, Environmental Requirements for Construction Projects (Under review)
8.5.6 NASA Ames Research Center Environmental Issues Management Plan
ARC’s EIMP contains numerous measures designed to be protective of human health due to potential exposure via vapor intrusion including methods to address VOC vapor intrusion into new construction and existing buildings, and reducing the potential for lateral
National Aeronautics and Space Administration Chap 8. Air Quality
NASA Ames Research Center Environmental Resources Document Environmental Management Division March 2015 File: 2015 ARC ERD_FINAL.doc
Pg 156
migration of VOCs in utility corridors. Please see the full text of the EIMP for more information.
8.5.7 Construction Emissions Mitigation Plan for NASA Ames Development Plan Projects
As required by NADP EIS Mitigation Measures AQ-7b and AQ-7b (see below), ARC maintains a CEMP to ensure that construction and operations under the NADP can generate no more than 91,000 kilograms (100 tons) each of ozone precursors per year. Additionally, activities under the NADP are constrained by air quality concerns associated with emissions of diesel particular matter, which the State of California lists as a toxic air contaminant based on its potential to increase the risk of cancer, premature death, and other health problems. The CEMP sets forth requirements for tracking anticipated construction, demolition, and new facility operation by NASA and its partners; lists possible emissions reduction strategies if emissions are projected to exceed de minimis levels in a given year; includes measure to control fugitive dust and equipment and vehicle emissions; and designates a CEMP/Disturbance Coordinator responsible for ensuring that measures included in the CEMP are implemented. The CEMP also includes an analysis addressing the feasibility of using reformulated or alternative diesel fuel to power contractor construction vehicles and/or equipment, updated biennially, as well as an analysis addressing the feasibility of using low emissions construction equipment, updated annually. As an added requirement, NASA also consults with the BAAQMD on an annual basis during project construction to determine if additional air quality mitigations to reduce the project’s air quality impact are warranted.
8.5.8 EPA’s 2010 Record of Decision Amendment for the Vapor Intrusion Pathway, Middlefield-Ellis-Whisman Superfund Study Area
The EPA’s strategy to address the vapor intrusion pathway and ensure protection of human health of building occupants in the Vapor Intrusion Study Area consists of the following:
For Existing Buildings - The appropriate response action is determined by indoor air sampling and other lines of evidence for each building. If necessary, installation, operation, maintenance, and monitoring of an appropriate Sub-slab/Sub-membrane Ventilation System.
Alternative for Existing Commercial Buildings - Use of building’s Indoor Air Mechanical Ventilation System if the property/building owner agrees to use, operate, and monitor the system to meet remedy performance criteria and the remedial action objectives.
For Future (New Construction) Buildings – Installation of a Vapor Barrier and Passive Sub-slab Ventilation System (With the Ability to be Made Active).
Implementation of ICs and Monitoring to Ensure the Long-term Effectiveness of the remedy.
Responsibility for implementation is determined according to the Areas of Responsibility (see Figure 8-2 of the “Indoor Vapor Intrusion” section in this chapter).
National Aeronautics and Space Administration Chap 8. Air Quality
NASA Ames Research Center Environmental Resources Document Environmental Management Division March 2015 File: 2015 ARC ERD_FINAL.doc
Pg 157
8.5.9 NASA Ames Development Plan Final Programmatic Environmental Impact Statement
The NADP FEIS identifies the following mitigation measures to address potential air quality impacts from build out of NADP Mitigated Alternative 5.
8.5.9.1.1 Mitigation Measure AQ-2
NASA and its partners would schedule construction to ensure that annual emissions of ozone precursors associated with project construction and operation do not exceed a cumulative total of 100 tons per year. This would apply over all years of project construction and operation or until an applicable State Implementation Plan that includes the project emissions is approved by EPA. Implementation of this mitigation is mandatory to comply with the Federal Clean Air Act.
8.5.9.1.2 Mitigation Measure AQ-3
Prior to the issuance of occupancy permits, operators of laboratories and disaster training facilities would be required to consult with the BAAQMD regarding possible permit requirements and emissions reduction equipment and to comply with BAAQMD’s requirements.
8.5.9.1.3 Mitigation Measure AQ-4
Long-term residential uses would be avoided at areas located over high concentration zones of the Regional Plume in accordance with the Human Health Risk Assessment (HHRA) and the Environmental Issues Management Plan (EIMP), unless construction mitigation measures are implemented to reduce the risk of vapor intrusion.
8.5.9.1.4 Mitigation Measure AQ-5
NASA would review all planned uses in light of the findings of the HHRA to ensure that planned uses would not create unacceptable public health risks. Proposed uses would be moved if unacceptable risks were found that could not be mitigated to an acceptable level.
8.5.9.1.5 Mitigation Measure AQ-6a
Measures to control dust generation would reduce the impact associated with PM10 to a level of less-than-significant. The following measures, including all control measures recommended by the BAAQMD, would be incorporated into construction contract specifications and enforced by NASA. These measures include the following provisions.
Use reclaimed water on all active construction areas at least twice daily and more often during windy periods. Watering is the single
National Aeronautics and Space Administration Chap 8. Air Quality
NASA Ames Research Center Environmental Resources Document Environmental Management Division March 2015 File: 2015 ARC ERD_FINAL.doc
Pg 158
most effective measure to control dust emissions from construction sites. Proper watering could reduce dust emissions by over 75%.
Cover all hauling trucks or maintain at least 0.6 meters (2 feet) of freeboard. Use dust-proof chutes as appropriate to load debris onto trucks during any demolition.
Pave, apply reclaimed water three times daily, or apply (non-toxic) soil stabilizers on all unpaved access roads, parking areas, and staging areas at construction sites.
Sweep daily (with water sweepers) all paved access roads, parking areas, and staging areas and sweep streets daily (with water sweepers) if visible soil material is deposited onto the adjacent roads.
Hydro seed or apply (non-toxic) soil stabilizers to inactive construction areas (previously graded areas that are inactive for 10 days or more).
Enclose, cover, water twice daily, or apply (non-toxic) soil binders to exposed stockpiles.
Limit traffic speeds on any unpaved roads to 25 kilometers per hour (15 mph).
Install sandbags or other erosion control measures to prevent silt runoff to public roadways.
Replant vegetation in disturbed areas as quickly as possible.
Install wheel washers for all exiting trucks, or wash off the tires or tracks of all trucks and equipment leaving the site.
If necessary, install windbreaks, or plant trees/vegetative windbreaks at the windward side(s) of construction areas.
Suspend excavation and grading activity when winds (instantaneous gusts) exceed 40 kilometers per hour (25 mph) and visible dust emission cannot be prevented from leaving the construction site(s).
Limit areas subject to disturbance during excavation, grading, and other construction activity at any one time.
Prior to disturbance (or removal) of materials suspected to contain asbestos, lead, or other toxic air contaminants, contact the BAAQMD.
NASA would designate an Environmental Coordinator responsible for ensuring that mitigation measures to reduce air quality impacts from
National Aeronautics and Space Administration Chap 8. Air Quality
NASA Ames Research Center Environmental Resources Document Environmental Management Division March 2015 File: 2015 ARC ERD_FINAL.doc
Pg 159
construction are properly implemented. This person would also be responsible for notifying adjacent land uses of construction activities and schedule.
8.5.9.1.6 Mitigation Measure AQ-6b
Measures to reduce emissions of nitrogen oxides and particulate matter from diesel fuel combustion during construction should be evaluated and implemented where reasonable and feasible. The following measures would reduce the impacts from construction fuel combustion.
Properly maintain construction equipment. This measure would reduce emissions of ROG, NOx, and PM10 by about 5%.
Evaluate the use of available alternative diesel fuels and, where reasonable and feasible, use alternative diesel fuels. The CARB has verified reductions of NOx by almost 15%, and particulate matter by almost 63%, from use of alternative diesel fuels. However, the use of these fuels may not be appropriate for all diesel equipment.
Reduce construction traffic trips through Transportation Demand Management (TDM) policies and implementation measures.
Reduce unnecessary idling of construction equipment and avoid staging equipment near or upwind from sensitive receptors such as on-site residences or daycare uses.
Where possible, use newer, cleaner burning diesel-fueled construction equipment. The Environmental Coordinator would prohibit the use of equipment that visibly produces substantially higher emissions than other typical equipment of similar size.
8.5.9.1.7 Mitigation Measure AQ-7a
NASA would install air pollution devices, for example, particulate traps and oxidation catalysts, on construction equipment to the greatest extent that is technically feasible.
8.5.9.1.8 Mitigation Measure AQ-7b
NASA and its partners would develop and implement a Construction Emissions Mitigation Plan (CEMP) to ensure that the project would comply with the Federal Clean Air Act and further reduce emissions. The plan would include measures and procedures, sufficiently defined to ensure a reduction of nitrogen oxides, PM10, and diesel particulate matter. The CEMP would be developed in consultation with EPA and BAAQMD. The CEMP would be evaluated by NASA and its partners on an annual basis to schedule
National Aeronautics and Space Administration Chap 8. Air Quality
NASA Ames Research Center Environmental Resources Document Environmental Management Division March 2015 File: 2015 ARC ERD_FINAL.doc
Pg 160
construction ensuring that emissions of ozone precursors associated with project construction and operation would not exceed 91 tonnes (100 tons) per year and update measures to include new rules or regulations. NASA and its partners would consult with the BAAQMD on an annual basis during project construction to determine if additional air quality mitigations to reduce the project’s air quality impact are warranted, and to take such additional air quality mitigation as is appropriate and reasonable, and in an expeditious manner. A CEMP coordinator, who would also act as a “Disturbance Coordinator,” would be responsible for ensuring that measures included in the CEMP are implemented. This would be done through field inspections, records review, and investigations of complaints. At a minimum, the CEMP would include the following measures to reduce emissions from construction activities:
Require that all equipment be properly maintained at all times.
All construction equipment working on site would be required to include maintenance records indicating that all equipment is tuned to engine manufacturer’s specifications in accordance with the time frame recommended by the manufacturer. All construction equipment would be prohibited from idling more than 5 minutes.
Tampering with equipment to increase horsepower would be strictly prohibited.
Include particulate traps, oxidation catalysts, and other suitable control devices on all construction equipment used at the site.
Diesel fuel having a sulfur content of 15 ppm or less, or other suitable alternative diesel fuel, would be used unless such fuel cannot be reasonably procured in the market area.
The CEMP would also ensure that construction-related trips are minimized through appropriate policies and implementation measures.
The CEMP would address the feasibility on a biannual basis of requiring the use of reformulated or alternative diesel fuels.
The CEMP Coordinator (or Environmental Coordinator) would prohibit the use of equipment that visibly produces substantially higher emissions than other typical equipment of similar size. The staging of three or more pieces of construction equipment near or just upwind from sensitive receptors such as residences or daycare uses would be prohibited.
National Aeronautics and Space Administration Chap 8. Air Quality
NASA Ames Research Center Environmental Resources Document Environmental Management Division March 2015 File: 2015 ARC ERD_FINAL.doc
Pg 161
8.5.9.1.9 Mitigation Measure AQ-7c
The CEMP would address the feasibility of requiring or encouraging the use of “cleaner” (lower emissions) construction equipment on an annual basis. For larger construction projects (projects greater than 9,290 square meters (100,000 square feet)), a percentage of the equipment would be required to be 1996 or newer. This would be determined as follows:
If equipment is leased by the Contractor, then the percentage of 1996 or newer equipment would be maximized so that the total cost of leasing equipment would not exceed 110% of the average available cost for leased equipment.
If equipment is owned by the Contractor, then the CEMP shall identify the minimum percentage of total horsepower for 1996 or newer equipment that should be used in construction. For the first year of construction, it shall be considered possible that 1996 or newer equipment shall makeup a minimum of 75% of the total horsepower, unless NASA and its partners can show the BAAQMD that it is not reasonable.
National Aeronautics and Space Administration Chap 9. Greenhouse Gas Emissions
NASA Ames Research Center Environmental Resources Document Environmental Management Division March 2015 File: 2015 ARC ERD_FINAL.doc
Pg 162
Chapter 9. Greenhouse Gas Emissions
9.1 Overview
This chapter describes the environmental and regulatory setting for GHG emissions. It also describes GHG emissions resulting from current operations at ARC. Relevant plans, policies, and strategies that ensure ARC’s continued successful operation in support of Agency-wide GHG reduction goals are also discussed. Information and data presented in the following sections was obtained from the EPA, state and regional air quality management authorities, and other sources.
9.2 Regulatory Background
9.2.1 Federal Regulations
9.2.1.1 Title 40 Code of Federal Regulations 98
On October 30, 2009, the USEPA published a rule for the mandatory reporting of GHGs from sources that in general emit 25,000 metric tons or more of carbon dioxide equivalent per year in the United States. Smaller sources and certain sectors such as the agricultural sector and land use changes are not included in the mandatory reporting. Implementation of 40 CFR Part 98 is referred to as the Greenhouse Gas Reporting Program (GHGRP) (USEPA 2013a).
9.2.1.2 Executive Order 13514
President Obama signed EO 13514 On October 5, 2009, setting sustainability goals for federal agencies. The EO makes reductions of GHG emissions a priority. It requires agencies to develop and update annually, a Strategic Sustainability Performance Plan (SSPP) which includes plans to reduce scope 1-3 GHG emissions.
Per EO 13514, “scope 1, 2, and 3” mean:
(i) scope 1: direct greenhouse gas emissions from sources that are owned or controlled by the Federal agency;
(ii) scope 2: direct greenhouse gas emissions resulting from the generation of electricity, heat, or steam purchased by a Federal agency; and
(iii) scope 3: greenhouse gas emissions from sources not owned or directly controlled by a Federal agency but related to agency activities such as vendor supply chains, delivery services, and employee travel and commuting;
National Aeronautics and Space Administration Chap 9. Greenhouse Gas Emissions
NASA Ames Research Center Environmental Resources Document Environmental Management Division March 2015 File: 2015 ARC ERD_FINAL.doc
Pg 163
9.2.1.3 Draft National Environmental Policy Act Guidance on Consideration of the Effects of Climate Change and Greenhouse Gas Emissions
In February 2010, the CEQ issued this draft guidance memorandum on the ways in which federal agencies can improve their consideration of the effects of GHG emissions and climate change in their evaluation of proposals for federal actions under NEPA. The draft guidance was intended to help explain how agencies of the federal government should analyze the environmental effects of GHG emissions and climate change when they describe the environmental effects of a proposed agency action in accordance with Section 102 of NEPA and the CEQ Regulations for Implementing the Procedural Provisions of NEPA (40 CFR parts 1500-1508).
On December 18, 2014, the CEQ issued a second draft guidance intended to provide further direction on how federal agencies should address the effects of GHG emissions and climate change under NEPA. The proposed guidance supersedes the earlier draft guidance issued by the CEQ in 2010.
9.2.2 State Regulations
9.2.2.1 California Global Warming Solutions Act (Assembly Bill 32)
In 2006 California approved AB 32, the California Global Warming Solutions Act of 2006, which requires California to reduce its GHG emissions to 1990 levels by 2020. AB 32 includes the major GHGs and groups of GHGs that are being emitted into the atmosphere. The gases include CO2, CH4, N2O, hydrofluorocarbons, perfluorocarbons, sulfur hexafluoride (SF6) and nitrogen trifluoride.
Under AB 32, CARB is required to develop a Scoping Plan with strategies to meet the GHG emission reduction goals. The first report was developed in 2008 and updated in 2014. The Scoping Plan has a range of GHG reduction actions which include direct regulations, alternative compliance mechanisms, monetary and non-monetary incentives, voluntary actions, market-based mechanisms, and an AB 32 program implementation fee regulation to fund the program (CARB 2013).
9.2.3 Local Regulations
9.2.3.1 Bay Area Air Quality Management District Greenhouse Gas Fee
On May 2008 the BAAQMD approved a new fee on GHG emissions from stationary sources that are subject to an Air District permit requirement. The GHG fee schedule applies to all permitted facilities with GHG emissions, there are no threshold for lesser amounts of GHG emissions. The approved GHG fee was 4.4 cents per metric ton of GHG emissions.
9.3 Regional Setting
The BAAQMD prepared a GHG source inventory report that estimates direct and indirect GHG emissions in the Bay Area for 2007, later updated in February 2010. The report states that in 2007 the GHG emissions for the Bay Area were 95.8 million metric tons (MT) of
National Aeronautics and Space Administration Chap 9. Greenhouse Gas Emissions
NASA Ames Research Center Environmental Resources Document Environmental Management Division March 2015 File: 2015 ARC ERD_FINAL.doc
Pg 164
(CO2E. The emissions estimate includes emissions from imported electricity, 7.1 million MTCO2E. The breakdown of the emissions per pollutant is shown in Table 9-1.
Table 9-1. Bay Area 2007 GHG Emissions by Pollutant
Pollutant Percentage CO2E (Million MT) CO2 91.6 87.8 CH4 2.6 2.5 NOx 1.6 1.5 HFC, PFC, SF6 4.1 4 Source: BAAQMD 2010b.
Table 9-2 shows the breakdown of the GHG emissions by sector. The largest sources of emissions were transportation and industrial/commercial use.
Table 9-2. Bay Area 2007 GHG Emissions by Sector
Sector Percentage CO2E (Million MT) Industrial/Commercial 36.4 34.86 Residential Fuel Usage 7.12 6.82 Electricity/Co-Generation 15.87 15.20 Off-Road Equipment 3.05 2.92 Transportation 36.41 34.87 Agriculture/Farming 1.16 1.11 Source: BAAQMD 2010b.
9.4 Existing Site Conditions
9.4.1 U.S. EPA Greenhouse Gas Mandatory Reporting Rule (40 CFR 98)
The EPA published 40 CFR part 98 in 2009 and has been revised several times since its publication. The rule is referred as the GHG Mandatory Reporting Rule. Applicability depends on the source categories present at each facility. For combustion facilities like NASA Ames, facilities need to report if the total GHG emissions from all stationary combustion sources are 25,000 MTCO2E or more.
NASA Ames’ GHG emissions from stationary combustion sources have not equal or exceeded the 25,000 MTCO2E threshold since the regulation was adopted. The majority of NASA Ames’ GHG combustion emissions are from boilers combusting natural gas.
9.4.2 EO 13514 Annual Greenhouse Gas Inventory Reporting
This EO requires reporting on progress toward GHG reduction goals on an agency-wide basis. NASA HQ uses the annual energy reporting through the Department of Energy’s (DOE’s) annual GHG and sustainability workbook to report on this EO at the agency level. There is no additional Center reporting required (Fischer 2014.).
9.4.3 Mandatory State Greenhouse Gas Emissions Reporting (Title 17, California Code of Regulations, Section 95100-95158)
On December 2007, CARB approved the Regulation for the Mandatory Reporting of Greenhouse Gas Emissions to comply with one of the requirements of AB 32 to adopt a GHG
National Aeronautics and Space Administration Chap 9. Greenhouse Gas Emissions
NASA Ames Research Center Environmental Resources Document Environmental Management Division March 2015 File: 2015 ARC ERD_FINAL.doc
Pg 165
reporting regulation. The Mandatory Reporting Regulation is applicable to industrial facilities, fuel suppliers and electricity importers.
The thresholds for GHG facility reporting depend on the source category present at each facility. Emissions need to be totaled across all applicable source categories at each facility. For facilities with stationary fuel combustion sources only, CARB initially set the threshold for reporting at 25,000 MTCO2E and required third party verification of emissions. On December 2010 CARB approved amendments to the reporting rule decreasing the reporting threshold to 10,000 MTCO2E. Facilities emitting 10,000 MTCO2E or more started reporting on June 1, 2013 for reporting 2012 GHG emissions. Facilities with emissions between 10,000 and 25,000 MTCO2E have the option to file an abbreviated report using simpler emission calculation methods and reports are not subject to third party verification.
ARC’s GHG emissions have been between 10,000 and 25,000 MTCO2E since the inception of CARB’s GHG mandatory reporting rule. In June 2013, NASA Ames became subject to the lowered 10,000 MTCO2E threshold and submitted its first annual GHG emissions abbreviated report.
ARC’s GHG emissions subject to CARB’s mandatory reporting for 2012 and 2013 were:
2012 NASA Ames GHG emissions: 18,205 MTCO2E
2013 NASA Ames GHG emissions: 18,364 MTCO2E
The GHG emissions were below 25,000 MTCO2E for both 2012 and 2013 and did not require third party verification.
9.5 Environmental Requirements
NASA has identified the following environmental plans, policies, and strategies that address the integration of Agency-wide GHG reduction goals with operations and future development at ARC.
9.5.1 NASA Procedural Directive 8500.1, NASA Environmental Management
Per NPD 8500.1, it is NASA policy to: maintain compliance with all applicable federal, state, and local environmental requirements; to incorporate environmental risk reduction and sustainable practices to the extent practicable throughout NASA’s programs, projects, and activities (including improvement of energy efficiency and reduction of energy consumption and greenhouse gas emissions, among other practices; and to consider environmental factors throughout the life cycle of programs, projects, and activities (as defined in NPD 7120.4, NASA Engineering and Program/Project Management Policy, and related documents), including planning, development, execution, and disposition activities. Examples of environmental factors include consideration of environmental impacts as required by the NEPA and NHPA; the proposed use of hazardous materials; the potential for waste generation; the need to acquire necessary permits, waivers, and authorizations; and the use of environmentally-preferable materials and processes wherever practicable.
National Aeronautics and Space Administration Chap 9. Greenhouse Gas Emissions
NASA Ames Research Center Environmental Resources Document Environmental Management Division March 2015 File: 2015 ARC ERD_FINAL.doc
Pg 166
9.5.2 NASA Procedural Requirements 8553.1, NASA Environmental Management System
NPR 8553.1 sets forth requirements for the NASA EMS, which functions primarily to: (1) incorporate people, procedures, and work practices into a formal structure to ensure that the important environmental impacts of the organization are identified and addressed; (2) promote continual improvement, including periodically evaluating environmental performance; (3) involve all members of the organization, as appropriate; and (4) actively involve senior management in support of the EMS.
Agencywide, the EMS employs a standardized approach to managing environmental activities that allows for efficient, prioritized system execution, while at the same time helping to improve environmental performance and to maintain compliance with applicable environmental regulations and requirements. NASA’s EMS approach involves identifying all activities, products, and services under each NASA center’s control, and the environmental aspects associated with each centers’ continued engagement in those activities, products, and services. Once identified, priority environmental aspects are assigned a risk ranking (from 1 to 4, based on its severity and frequency of occurrence) and are evaluated on a continual basis as means of highlighting associated positive or negative impacts and setting objectives and targets to reduce environmental risk. Each center’s EMS also identifies methods for ensuring compliance by keeping abreast of environmental requirements. This includes requirements by law (EOs, federal regulations, state and local laws) and voluntary commitments made by the center or NASA.
9.5.3 NASA 2014 Strategic Sustainability Performance Plan
In addition to outlining new requirements for GHG management and sustainable buildings and communities, to mention only a few of the requirements, EO 13514 (discussed above) requires NASA and all federal agencies to develop, implement, and annually update a SSPP.
Goal 1 of NASA’s SSPP is devoted to its GHG emission reduction targets and performance against those targets. NASA GHG emission reduction targets reflect: identified reductions in energy use and intensity; reduced use of fossil fuels and increased use of alternative fuels in fleet vehicles; increased application of green building technologies and sustainable design; and innovative energy technologies and funding strategies which promote conservation and renewable energy use.
Currently, NASA is on target to meet its GHG emission reduction targets in FY 2020 (NASA 2014c). In FY 2013, from baselines established for FY 2008, NASA reductions are as follows:
Scope 1 and 2 GHG emissions. Tracking with required energy reductions, NASA achieved 16.3% reductions versus an FY 2020 target of 18.3%.
Scope 3 GHG emissions. Including Scope 3 renewable energy project hosting credits, NASA achieved 17.9% reductions versus an FY 2020 target of 12.6%.
Along with other NASA centers, ARC reports its fuel and electricity use to NASA Headquarters annually to assist with performance tracking under the SSPP.
National Aeronautics and Space Administration Chap 9. Greenhouse Gas Emissions
NASA Ames Research Center Environmental Resources Document Environmental Management Division March 2015 File: 2015 ARC ERD_FINAL.doc
Pg 167
9.5.4 NASA’s NEPA Emission Estimation Tool
NASA has developed a methodology for estimating emissions of GHGs calculated using NASA’s NEPA Emission Estimation Tool (N2E2). For major federal actions at ARC, and other actions requiring an estimation of GHG emissions, analysis will include a calculation of emissions using the N2E2, where the tool does not duplicate efforts necessary to meet other federal, state, or local requirements.
9.5.5 Ames Procedural Requirements 8500.1, Ames Environmental Procedural Requirements
APR 8500.1 sets forth general procedural requirements to ensure compliance with applicable federal, state, and local environmental laws; regulations and EOs; and NASA policies and procedures. Organizational directors, division chiefs, branch chiefs, section heads, supervisors, managers, and CORs are responsible for planning, designing, constructing, managing, operating, and maintaining facilities in conformance with applicable regulatory directives, and should obtain environmental review from the Environmental Management Division early in project planning consistent with NASA's NEPA implementing procedures (NPR 8580.1 and EO 12114), NASA policies and procedures for programs and projects (NPR 7120), and NASA regulations related to environmental quality (14 CFR 1216). Program and project managers should coordinate with the Environmental Management Division in a timely manner to ensure that any new or modified programs, projects, and activities comply with regulatory requirements.
9.5.6 Ames Procedural Requirements 8553.1, Ames Environmental Management System
APR 8553.1 sets forth requirements for the Center-level EMS in accordance with NPR 8553.1B, NASA Environmental Management Systems, as described above. The ARC EMS also includes consideration of the findings of NASA Headquarters’ triennial (3-year) Environmental Functional Review and other external EMS audits, as required.
Under the ARC EMS, the Center conducts an annual risk analysis across Center activities to determine which of 16 environmental aspects are of high or medium priority. The Center then identifies objectives (goals) and targets and develops action plans known as Environmental Management Plans to reduce identified risks. Currently, the high- and medium-priority environmental aspects of Center business activities are Air Emissions, Hazardous Material Management, Water and Energy Conservation, and Other Sustainability Practices. Objectives associated with these medium- and high-priority environmental aspects include:
Reducing air (including GHG) emissions through energy efficiency
Improving hazardous material management
Improving energy and water efficiency
Providing for the integration of other sustainability practices into Center activities
National Aeronautics and Space Administration Chap 9. Greenhouse Gas Emissions
NASA Ames Research Center Environmental Resources Document Environmental Management Division March 2015 File: 2015 ARC ERD_FINAL.doc
Pg 168
9.5.7 Ames Environmental Work Instructions
Ames’s EWIs, which replace the previous Ames Environmental Handbook (APR 8800.3), set forth requirements to ensure that programs, projects, and activities at ARC comply with applicable federal, state, and local laws; regulations and EOs; and NASA policies and procedures. Each EWI lists relevant regulatory authorities and documents, assigns individual and organizational responsibilities within ARC, and identifies specific requirements applicable to the work being performed.
The following EWIs are relevant to operations and future development at ARC with the potential to generate GHGs.
EWI 1, Air
EWI 12, Public Involvement
EWI 14, NEPA and Environmental Justice
EWI 17 Pollution Prevention/Affirmative Procurement (P2/AP) (Under review)
EWI 18, Environmental Requirements for Construction Projects (Under review)
National Aeronautics and Space Administration Chap10. Climate Change
NASA Ames Research Center Environmental Resources Document Environmental Management Division March 2015 File: 2015 ARC ERD_FINAL.doc
Pg 169
Chapter 10. Climate Change
10.1 Overview
This chapter describes the historical climate observed at NASA ARC and compares it to future projections in climate as defined by the current state of knowledge of possible outcomes from continuing current trends in GHG emissions. In addition, it describes the regulatory mandate under which federal agencies, including NASA, are required to evaluate their climate change risks and vulnerabilities and to manage the local effects of climate change on their mission and operations. Possible risks to NASA Ames infrastructure, human capital, and natural ecosystems from projected changes in climate are also discussed.
This chapter was prepared by ARC’s Climate Adaptation Science Investigators (CASI) team for the purposes of this ERD and to inform ARC’s planners. Sources include many CASI-funded publications. Many thanks to Cristina Milesi for leading the development of this chapter, and the CASI members that contributed directly to its writing or whose work was drawn upon as sources: Cristina Milesi, Mariza Costa-Cabral, William Mills, Sujoy Roy, John Rath, Robert Coats, Norman Miller, Peter Bromirski, Max Loewenstein, Felicia Chiang, Nick Murphy, and James Podolske.
10.2 Regulatory Background
10.2.1 Federal Regulations
10.2.1.1 Executive Order 13514
In 2009, President Obama issued EO 13514, titled “Federal Leadership in Environmental, Energy, and Economic Performance,” that mandates that all federal agencies, including NASA centers, “evaluate agency climate-change risks and vulnerabilities to manage the effects of climate change on the agency's operations and mission in both the short and long-term.” In response to this mandate, NASA is integrating climate factors into its existing management plans. NASA has assembled a team of CASI scientists that work together with the operational stewards at each NASA Center to investigate and manage local climate risks. The emphasis of the CASI effort is on adaptation to climate change through science-informed planning at each of the NASA centers.
10.2.1.2 Executive Order 13653
EO 13653, “Preparing the United States for the Impacts of Climate Change,” was issued by President Obama on November 1, 2013 to supplement EO 13514 (discussed above). Whereas EO 13514 is primarily concerned with water conservation and climate change mitigation through energy conservations and reductions in GHG emissions, EO 13653 contains specific language, goals, and objectives to prepare the Nation for the impacts of climate change by undertaking actions to enhance climate preparedness and resilience.
EO 13653 requires federal agencies, including NASA, to engage in partnering with other agencies to develop and share timely data, information, and decision-support tools to assist
National Aeronautics and Space Administration Chap10. Climate Change
NASA Ames Research Center Environmental Resources Document Environmental Management Division March 2015 File: 2015 ARC ERD_FINAL.doc
Pg 170
with climate preparedness and resilience. Agencies are also required to modernize federal programs to support climate resilient investment and manage lands and waters for climate preparedness and resilience. Specific requirements for agency Adaptation Plans are described, as are requirements for establishment of a new Council on Climate Preparedness and Resilience and State, Local, and Tribal Leaders Task Force.
10.2.1.3 Draft National Environmental Policy Act Guidance on Consideration of the Effects of Climate Change and Greenhouse Gas Emissions
In February 2010, the CEQ issued a draft guidance memorandum on the ways in which Federal agencies can improve their consideration of the effects of GHG emissions and climate change in their evaluation of proposals for federal actions under NEPA. The draft guidance was intended to help explain how agencies of the federal government should analyze the environmental effects of GHG emissions and climate change when they describe the environmental effects of a proposed agency action in accordance with Section 102 of NEPA and the CEQ Regulations for Implementing the Procedural Provisions of NEPA (40 CFR parts 1500-1508).
On December 18, 2014, the CEQ issued a second draft guidance intended to provide further direction on how federal agencies should address the effects of GHG emissions and climate change under NEPA. The proposed guidance supersedes the earlier draft guidance issued by the CEQ in 2010.
10.3 Global and Regional Setting
10.3.1 Climate
Climate is the average and the statistical variability of the weather recorded at a location over a long period of time. Climate change refers to the long-term change in these statistical characteristics. With a progression that started with the industrial revolution, the climate over much of the Earth surface has been warming in response to the greenhouse effect of increased rates in fossil fuel burning, deforestation, and other anthropogenic changes. Air temperatures have increased across the San Francisco Bay Area, including Moffett Field (Cayan et al. 2012).
10.3.2 Sea Level Rise
Sea levels are rising globally as a consequence of global warming, though with large geographic variations. Global warming acts on sea levels through two main mechanisms. First by warming the oceans, which expand as the temperatures increase, and secondly by melting land ice (glaciers and ice sheets) and adding water to the oceans. Over the past decade the rate of ice loss has accelerated and now ice melting contributes to 80% of the total increase in sea level, up from about 50% in the previous decade, when melting was as important as thermal expansion (Benoit and Cazenave 2012).
The tidal gauge at the Golden Gate is the nation’s oldest continually operating tidal observation station, with a record starting in 1854. It has been observed that mean sea level at the Golden Gate tidal station has increased about 2.2 millimeters/year (or 2.2 centimeters/decade) from 1930 to present. Satellite measurements since 1993 from
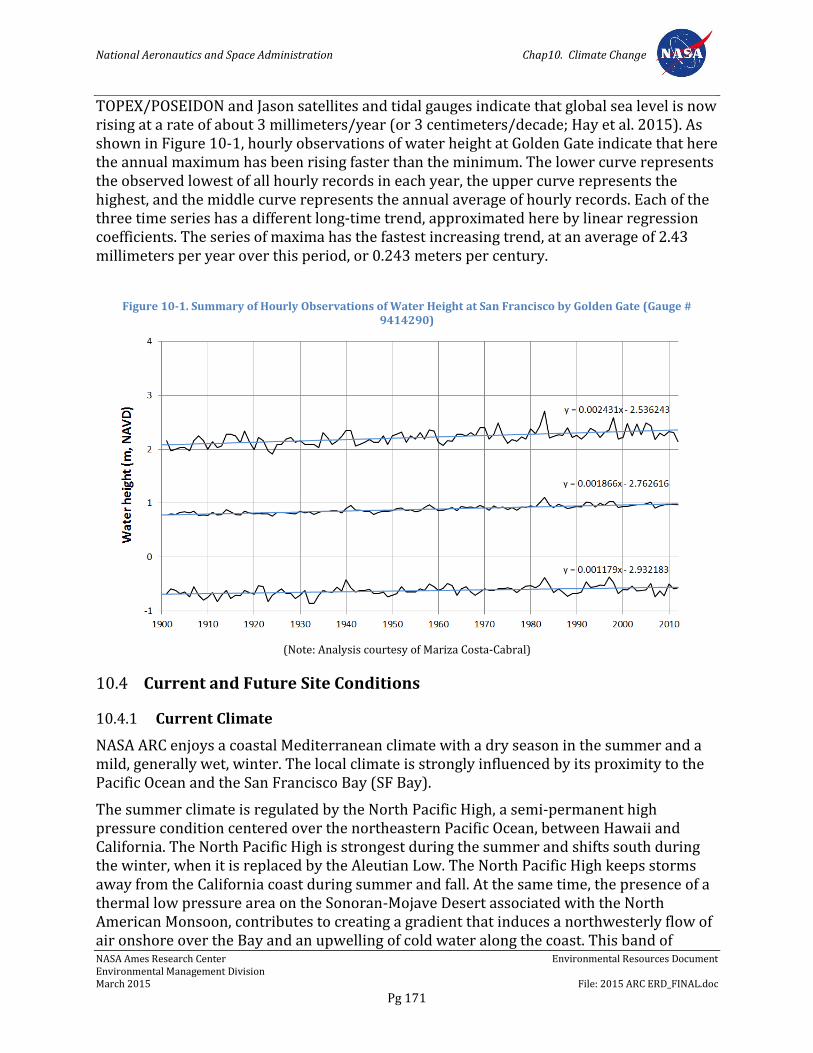
National Aeronautics and Space Administration Chap10. Climate Change
NASA Ames Research Center Environmental Resources Document Environmental Management Division March 2015 File: 2015 ARC ERD_FINAL.doc
Pg 171
TOPEX/POSEIDON and Jason satellites and tidal gauges indicate that global sea level is now rising at a rate of about 3 millimeters/year (or 3 centimeters/decade; Hay et al. 2015). As shown in Figure 10-1, hourly observations of water height at Golden Gate indicate that here the annual maximum has been rising faster than the minimum. The lower curve represents the observed lowest of all hourly records in each year, the upper curve represents the highest, and the middle curve represents the annual average of hourly records. Each of the three time series has a different long-time trend, approximated here by linear regression coefficients. The series of maxima has the fastest increasing trend, at an average of 2.43 millimeters per year over this period, or 0.243 meters per century.
Figure 10-1. Summary of Hourly Observations of Water Height at San Francisco by Golden Gate (Gauge # 9414290)
(Note: Analysis courtesy of Mariza Costa-Cabral)
10.4 Current and Future Site Conditions
10.4.1 Current Climate
NASA ARC enjoys a coastal Mediterranean climate with a dry season in the summer and a mild, generally wet, winter. The local climate is strongly influenced by its proximity to the Pacific Ocean and the San Francisco Bay (SF Bay).
The summer climate is regulated by the North Pacific High, a semi-permanent high pressure condition centered over the northeastern Pacific Ocean, between Hawaii and California. The North Pacific High is strongest during the summer and shifts south during the winter, when it is replaced by the Aleutian Low. The North Pacific High keeps storms away from the California coast during summer and fall. At the same time, the presence of a thermal low pressure area on the Sonoran-Mojave Desert associated with the North American Monsoon, contributes to creating a gradient that induces a northwesterly flow of air onshore over the Bay and an upwelling of cold water along the coast. This band of
San Francisco – historical hourly record
National Aeronautics and Space Administration Chap10. Climate Change
NASA Ames Research Center Environmental Resources Document Environmental Management Division March 2015 File: 2015 ARC ERD_FINAL.doc
Pg 172
colder waters along the coast, about 80 miles wide, is responsible for the high frequency of fog and stratus clouds met in the SF Bay area during the evening and morning hours of the summer. Fog and stratus clouds are the result of condensation of the westerly moist cool air as this flows over the band of cool waters along the coast. They form offshore and move into the Bay Area during the late afternoon hours. Generally the clouds dissipate the following late morning, as the land warms, except in areas immediately adjacent to the coast, creating sunny and clear conditions. Natural climate variability can produce changes in ocean circulation and sea surface temperatures that can cause large variations in coastal climate. For example, during El Niño years upwelling diminishes and sea surface temperatures increase along the coast.
The winter climate is influenced more often by the Aleutian Low, while the Pacific High weakens and shifts south. The Aleutian Low is a semi-permanent low pressure centered near the Aleutian Islands that induces the formation of strong cyclones steered by the Polar Jet winds. When the Jetstream moves south, low-pressure conditions over the California coast cause cloudiness and stormy conditions, often with heavy precipitation. Extreme precipitation events can alternatively be caused by atmospheric rivers, long narrow bands of warm moist air from the subtropics. Atmospheric rivers are responsible for 20-50% of the local annual precipitation. High-pressure systems in winter can produce cool stagnant conditions that lead to the formation of radiation fog and haze.
The San Francisco Bay, which borders the northern edge of the research facility, also exerts a strong microclimatic influence on NASA ARC. This influence establishes a steep gradient in temperatures, from the cooler and windier Northern portion of the facility, close to the Bay shores, to the warmer southern edge of the campus.
A record of daily temperature and precipitation for NASA ARC exists since 1945 from the Moffett Federal Airfield meteorological station (KNUQ, station identifier GHCND: USW00023244) showing that during the recent decades the climate at NASA ARC has become slightly warmer during the day. However, quantifying how much temperatures have increased at NASA ARC is difficult because of the limited length of the station record, discontinuities in the location of the weather station, and changes in microclimate induced by infrastructure development at the Center of the past decades. In spite of the warming, the climatic conditions at NASA ARC are still considered mild because of the ventilation provided by the proximity to the Bay.
10.4.2 Current Temperature Conditions
The average annual temperature recorded at NASA ARC for the 1981-2010 reference period (years 1994-1998 excluded because of incomplete data) is 15.7°C (60.3°F). Annual maximum temperature averages 20.7°C (69.3°F), while average annual minimum temperatures is 10.7°C (51.2°F). Yearly maximum annual temperatures are recorded in the summer, and the maximum recorded over the reference period was 36.8°C (98.2°F). On average, there are 6 days a year when maximum temperatures surpass 32°C (90°F). Yearly minimum annual temperatures are recorded in the winter and the record low during the reference period was -0.2°C (31.6°F). Over the 1981-2010 reference period temperatures have rarely been below freezing, less than one day a year on average.
National Aeronautics and Space Administration Chap10. Climate Change
NASA Ames Research Center Environmental Resources Document Environmental Management Division March 2015 File: 2015 ARC ERD_FINAL.doc
Pg 173
Temperatures from the Moffett Airfield meteorological record show a slight warming compared to the 1961-1990 reference period. In the 1961-1990 period the average annual temperature was 15.2°C (59.4°F). Annual maximum temperature averaged 20.0°C (68.1°F), while average annual minimum temperatures was 10.5°C (50.8°F). The maximum daily temperature recorded over the 1961-1990 period was 36°C (96.8°F). On average, there were 4 to 5 days a year when maximum temperatures surpassed 32°C (90°F). The minimum annual temperature for 1961-1990 was also -0.2°C (31.6°F), with 1.4 days of subfreezing temperatures a year.
The comparison of temperatures between the two reference periods shows a modest asymmetric warming over the past decades, with maximum temperatures rising faster than minimum temperatures. Most studies worldwide had the opposite finding, of minimum temperatures rising faster than maximum temperatures (IPCC 2007). Whether global warming was solely responsible for driving this slight warming at Moffett Field cannot be determined at this time. It should be noted that the meteorological station was moved to a new location on the airfield in 1996. Additionally, expansion of built-up area in the region may also have affected the record through an urban-induced climate change (the urban heat island effect). On the other hand, the amount of heat island effect from the extensive urbanization the South Bay has undergone during the past 50 years is expected to be higher than the small amount observed. This buffering of the temperature trend would be consistent with a coastal cooling effect observed at other stations of the SF Bay Area. This cooling effect has been attributed to an increase in sea breeze caused by a steepening of the temperature gradient between the air over the ocean and a warming inland region (Lebassi et al. 2009).
10.4.3 Current Precipitation
Most of the annual rainfall at ARC falls between the months of November and March, with peaks in December, January and February. During the 1981-2010 reference period average annual rainfall was 376 millimeters, but with large historical interannual variability, ranging from 157 millimeters (in 1953) to 798 millimeters (in 1998). The two rainiest years were those of the strongest El Niño conditions: 1983 (798 millimeters) and 1998 (778 millimeters). On average there are 68 wet days per year. No distinct changes in precipitation are observed with respect to the previous reference period (1961-1990), when total annual rainfall averaged 352 millimeters and interannual variability was similar. A greater difference in average annual precipitation can be observed when comparing the 1978-2014 period versus the 1948-1977. The break point of 1978 marks the shift in dominant sign of the Pacific Decadal Oscillation (PDO), a long-lived El Niño-like pattern of Pacific climate variability (Zhang et al. 1997). During 1948-1977, a period of predominantly negative sign of the PDO index (PDOI), mean annual precipitation recorded at Moffett Field was 339 millimeters. In the subsequent period 1978-2010, when the PDOI was predominantly positive, the recorded mean annual precipitation was higher, 376 millimeters. However, this difference is still small in light of the wide range of recorded annual values.
National Aeronautics and Space Administration Chap10. Climate Change
NASA Ames Research Center Environmental Resources Document Environmental Management Division March 2015 File: 2015 ARC ERD_FINAL.doc
Pg 174
10.4.4 Projected Climate Change
Climate projections represent a set of possible climate outcomes given a set of influential conditions. Since the Anthropocene (late 1800s to present), the main influence on changes in climate is the increasing rate in GHG emissions from fossil fuel burning. On a more regional scale, changes in climate can also be caused by natural processes in the climate system, such as changes in ocean circulation patterns. Examples of natural changes in the climate system that influence ARC are changes in ocean circulations that cause El Niño/La Niña conditions, acting on interannual variability, and the PDO, which acts on the time scale of two to three decades. Additional drivers for regional changes in climate are large-scale modifications in land cover that impact energy exchanges between the earth surface and the atmosphere, such as the expansion of irrigated agriculture over the Central Valley of California.
Likewise, the intensity and rate of future climate change will depend on rate of increase in GHG concentration in the atmosphere and how these increases will interact with natural influences on climate and other anthropogenic landscape transformations. To understand how the climate system reacts to perturbations in any of its components and project how it will evolve into the future, simulations from Global Circulation Models (GCM) under different scenarios of population growth and economic development are compared and compiled into ensemble means. The GCMs have a very coarse spatial resolution, with a grid-cell size on the order of 2.5° × 2.5° (approximately 275 × 275 square kilometers). To make the information from the GCM relevant at the local scale, statistical techniques are employed to downscale the results to a spatial resolution sufficient to incorporate the orographic complexity.
Here we analyze downscaled results from Coupled Model Intercomparison Project Phase 5 (CMIP5) GCM modeling results from the Intergovernmental Panel on Climate Change (5th Assessment Report (IPCC 2013) for the Representative Concentration Pathway (RCP) 8.5. RCP 8.5 assumes a business as usual of increasing GHG emissions throughout the 21st century. Daily CMIP5 GCM model results used here are downscaled to 1km spatial resolution by means of the Bias Correction Statistical Downscaling (BCSD) technique (Thrasher et al. 2013). Projected changes in temperature and precipitation are provided for three future 30-year periods centered on 2020, 2050 and 2080, respectively from a group of GCMs that best matched the observed record at Moffett Field Air Station (CCSM4, CESM1-BGC and MIROC5).
10.4.5 Projected Changes in Temperature
The temperatures at NASA ARC are overall expected to continue to rise over the coming decades. While on average the climate is expected to remain mild, heat stress is likely to increase as the asymmetric daytime warming trend will persist and the number of days above 32°C (90°F) will more than double by mid-century. Changes in minimum temperatures are expected to be more modest and will continue to have about one night of freezing temperatures per year. A summary of the baseline precipitation variables from the Moffett Airfield meteorological station (1980-2010 reference period) and projected changes in temperature from selected CMIP5 models under RCP 8.5 (high GHG emission scenario) are presented in Table 10-1.
National Aeronautics and Space Administration Chap10. Climate Change
NASA Ames Research Center Environmental Resources Document Environmental Management Division March 2015 File: 2015 ARC ERD_FINAL.doc
Pg 175
Table 10-1. Baseline Temperature Variables from the Moffett Airfield Meteorological Station and Projected Temperatures from downscaled CMIP5 models
Variable Baseline 2020s 2050s 2080s Average Temperature (°F) 60.3 +1 to 2 °F +2 to 3 °F +5 °F Max Temperature (°F) 69.3 +2 to 3 °F +4 to 5 °F +6 to 7.2 °F Min Temperature (°F) 51.2 No change +1 °F +3 to 4 °F Max Temperature above 90°F (days) 6 10 to 12 7 to 14 20 to 25 Min Temperature below 32°F (days) 1 1 to 5 0 to 6 1 Note: Analysis by Cristina Milesi.
10.4.6 Projected Changes in Precipitation
A summary of the baseline precipitation variables from the Moffett Airfield meteorological station (1980-2010 reference period) and projected changes in precipitation from selected CMIP5 models under RCP 8.5 (high GHG emission scenario) are presented in Table 10-2. Projected changes in precipitation remain uncertain. Overall little change in total annual precipitation is expected. The projections from the BCSD-downscaled models suggests modest increases in precipitation throughout the century, more likely in the 2020s and 2080s, while the 2050s may see a small decline in total annual rainfall. The seasonality of the rainfall is projected to remain unchanged, with about 80% of the annual rainfall continuing to fall between November and March throughout the century.
While little changes are predicted in terms of total annual precipitation, it is projected that the winter rainfall at NASA ARC will come from bigger storms in fewer days and the 100-year return period for extreme storm events will increase (Chiang et al. 2014), increasing the risk of floods at the center.
Since warmer daytime temperatures and thus enhanced evapotranspiration rates will accompany these modest changes in precipitation, drought stress in the region is also likely to increase.
Table 10-2. Baseline Precipitation Variables from the Moffett Airfield Meteorological Station and Projected Precipitation Variables from downscaled CMIP5 models
Variable Baseline 2020s 2050s 2080s Annual Precipitation (mm) 376 +5 to 11% -14 to +8% -7 to +36% Nov-March precipitation (%) 82 76 to 82 82 to 84 84% Wet Days 68 61-63 51-58 55-69 Note: Analysis by Cristina Milesi
10.4.7 Projected Sea Level Rise
At NASA ARC rates of change in local mean sea level and extreme tides need to be closely monitored even though major uncertainties exist with global and regional sea level rise projections. Knowles (2009), in a study that is widely used for planning purposes by the BCDC, estimated a rise of 0.4 meters (16 inches) by 2050 and 1.4 meters (55 inches) by 2100. More recently, the National Research Council (NRC 2012) published projections for California, Oregon and Washington, taking into account regional subsidence and uplift, as well as the contributions from thermal expansions of the oceans and melting of grounded glaciers and ice sheets. According to this study, sea level along much of the California coast south of Cape Mendocino will rise 5 to 30 centimeters (2 to 12 inches) by 2030, 13 to 61
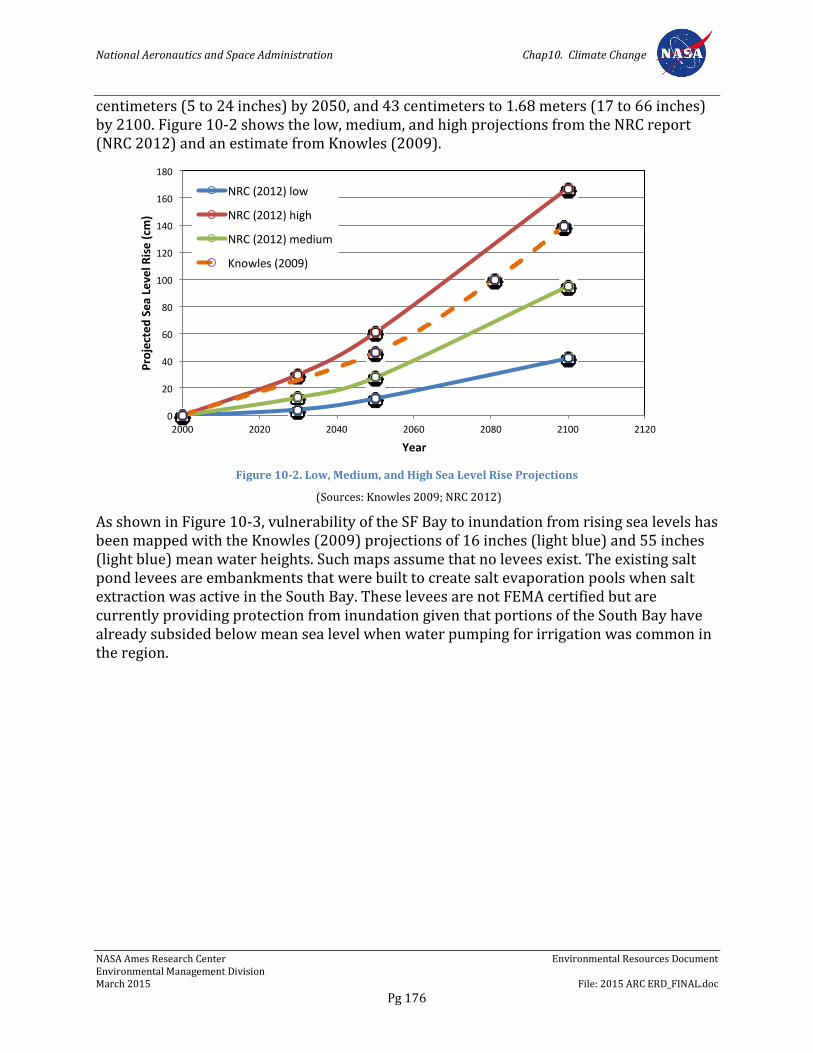
National Aeronautics and Space Administration Chap10. Climate Change
NASA Ames Research Center Environmental Resources Document Environmental Management Division March 2015 File: 2015 ARC ERD_FINAL.doc
Pg 176
centimeters (5 to 24 inches) by 2050, and 43 centimeters to 1.68 meters (17 to 66 inches) by 2100. Figure 10-2 shows the low, medium, and high projections from the NRC report (NRC 2012) and an estimate from Knowles (2009).
Figure 10-2. Low, Medium, and High Sea Level Rise Projections
(Sources: Knowles 2009; NRC 2012)
As shown in Figure 10-3, vulnerability of the SF Bay to inundation from rising sea levels has been mapped with the Knowles (2009) projections of 16 inches (light blue) and 55 inches (light blue) mean water heights. Such maps assume that no levees exist. The existing salt pond levees are embankments that were built to create salt evaporation pools when salt extraction was active in the South Bay. These levees are not FEMA certified but are currently providing protection from inundation given that portions of the South Bay have already subsided below mean sea level when water pumping for irrigation was common in the region.
0
20
40
60
80
100
120
140
160
180
2000 2020 2040 2060 2080 2100 2120
ProjectedSeaLevelR
ise(cm
)
Year
NRC(2012)low
NRC(2012)high
NRC(2012)medium
Knowles(2009)
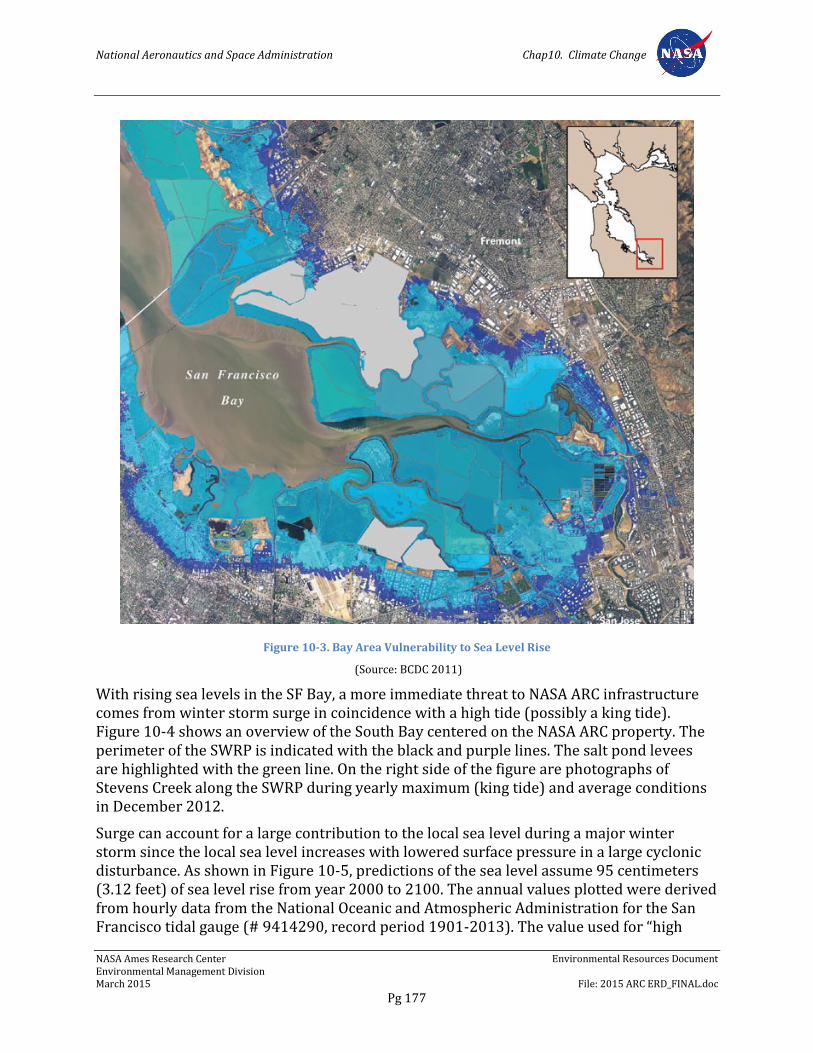
National Aeronautics and Space Administration Chap10. Climate Change
NASA Ames Research Center Environmental Resources Document Environmental Management Division March 2015 File: 2015 ARC ERD_FINAL.doc
Pg 177
Figure 10-3. Bay Area Vulnerability to Sea Level Rise
(Source: BCDC 2011)
With rising sea levels in the SF Bay, a more immediate threat to NASA ARC infrastructure comes from winter storm surge in coincidence with a high tide (possibly a king tide). Figure 10-4 shows an overview of the South Bay centered on the NASA ARC property. The perimeter of the SWRP is indicated with the black and purple lines. The salt pond levees are highlighted with the green line. On the right side of the figure are photographs of Stevens Creek along the SWRP during yearly maximum (king tide) and average conditions in December 2012.
Surge can account for a large contribution to the local sea level during a major winter storm since the local sea level increases with lowered surface pressure in a large cyclonic disturbance. As shown in Figure 10-5, predictions of the sea level assume 95 centimeters (3.12 feet) of sea level rise from year 2000 to 2100. The annual values plotted were derived from hourly data from the National Oceanic and Atmospheric Administration for the San Francisco tidal gauge (# 9414290, record period 1901-2013). The value used for “high
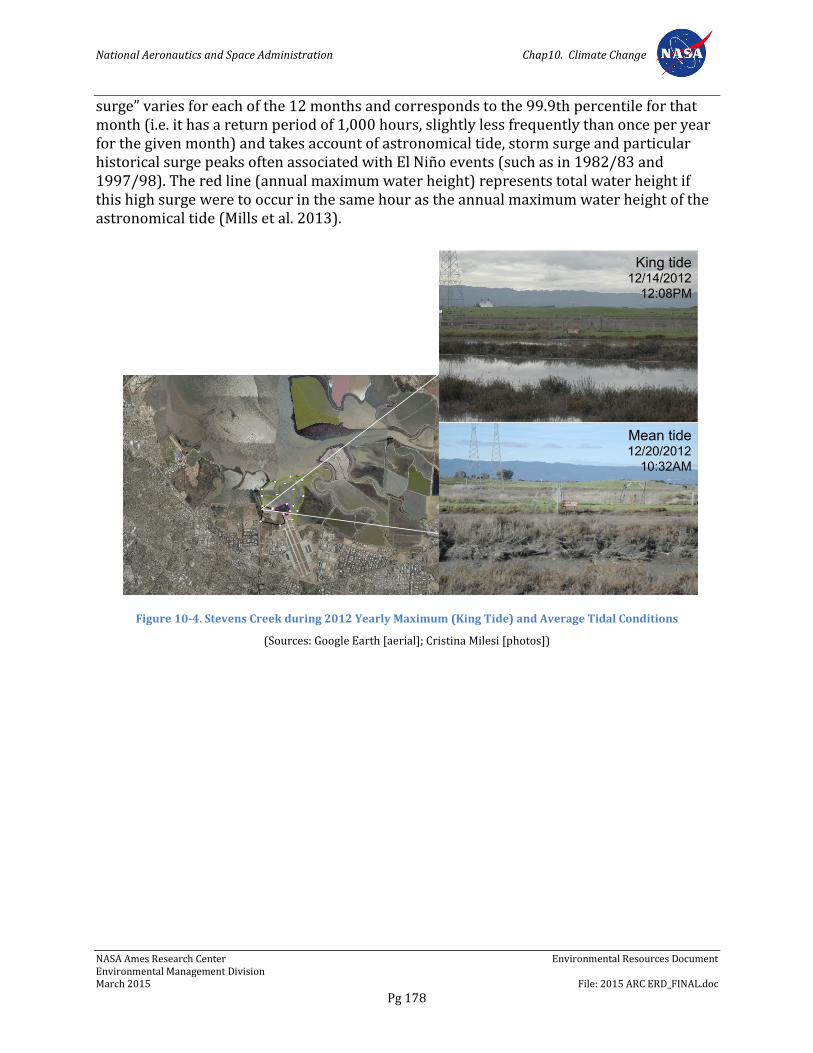
National Aeronautics and Space Administration Chap10. Climate Change
NASA Ames Research Center Environmental Resources Document Environmental Management Division March 2015 File: 2015 ARC ERD_FINAL.doc
Pg 178
surge” varies for each of the 12 months and corresponds to the 99.9th percentile for that month (i.e. it has a return period of 1,000 hours, slightly less frequently than once per year for the given month) and takes account of astronomical tide, storm surge and particular historical surge peaks often associated with El Niño events (such as in 1982/83 and 1997/98). The red line (annual maximum water height) represents total water height if this high surge were to occur in the same hour as the annual maximum water height of the astronomical tide (Mills et al. 2013).
Figure 10-4. Stevens Creek during 2012 Yearly Maximum (King Tide) and Average Tidal Conditions
(Sources: Google Earth [aerial]; Cristina Milesi [photos])
Mean tide 12/20/2012
10:32AM
King tide 12/14/2012
12:08PM
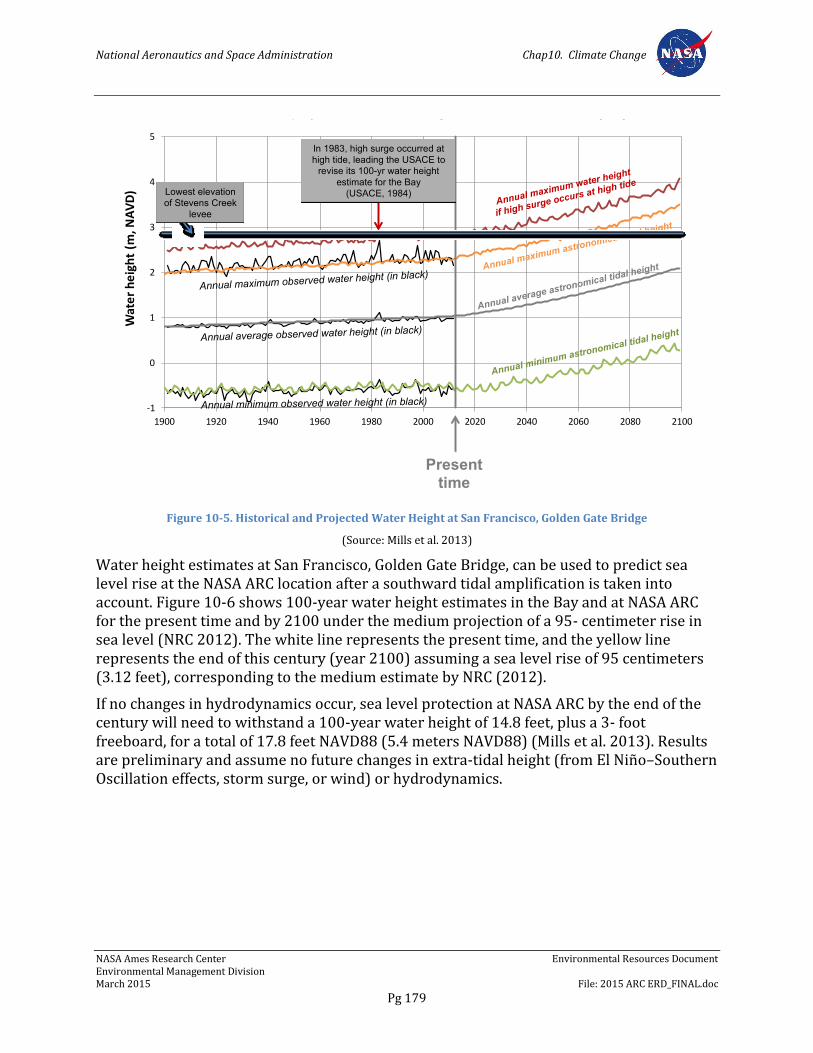
National Aeronautics and Space Administration Chap10. Climate Change
NASA Ames Research Center Environmental Resources Document Environmental Management Division March 2015 File: 2015 ARC ERD_FINAL.doc
Pg 179
Figure 10-5. Historical and Projected Water Height at San Francisco, Golden Gate Bridge
(Source: Mills et al. 2013)
Water height estimates at San Francisco, Golden Gate Bridge, can be used to predict sea level rise at the NASA ARC location after a southward tidal amplification is taken into account. Figure 10-6 shows 100-year water height estimates in the Bay and at NASA ARC for the present time and by 2100 under the medium projection of a 95- centimeter rise in sea level (NRC 2012). The white line represents the present time, and the yellow line represents the end of this century (year 2100) assuming a sea level rise of 95 centimeters (3.12 feet), corresponding to the medium estimate by NRC (2012).
If no changes in hydrodynamics occur, sea level protection at NASA ARC by the end of the century will need to withstand a 100-year water height of 14.8 feet, plus a 3- foot freeboard, for a total of 17.8 feet NAVD88 (5.4 meters NAVD88) (Mills et al. 2013). Results are preliminary and assume no future changes in extra-tidal height (from El Niño–Southern Oscillation effects, storm surge, or wind) or hydrodynamics.
-1
0
1
2
3
4
5
1900 1920 1940 1960 1980 2000 2020 2040 2060 2080 2100
Waterheight(m
,NAVD)
SanFrancisco
Present time
Annual minimum astronomical tidal height
Annual maximum astronomical tidal height
Annual average astronomical tidal height
Annual maximum water height
if high surge occurs at high tide
Annual maximum observed water height (in black)
Annual average observed water height (in black)
Annual minimum observed water height (in black)
In 1983, high surge occurred at
high tide, leading the USACE to
revise its 100-yr water height
estimate for the Bay
(USACE, 1984)
Historical and projected total water height at San Francisco tidal gauge
Lowest elevation
of Stevens Creek
levee

National Aeronautics and Space Administration Chap10. Climate Change
NASA Ames Research Center Environmental Resources Document Environmental Management Division March 2015 File: 2015 ARC ERD_FINAL.doc
Pg 180
Figure 10-6. Estimated Water Height at the San Francisco Bridge, and Three South Bay Locations, Including NASA ARC
(Source: NRC 2012)
10.4.8 Risks to NASA Ames
Changes in climate have the potential to impact NASA ARC by challenging operations and exposing infrastructure and employees to an increased frequency of hazards. Challenges from a changing climate may be the consequence of local climatic changes or to changes in the broader region with which NASA ARC has strong interdependencies (i.e., changes in precipitation in the Sierra Mountains may affect water availability locally).
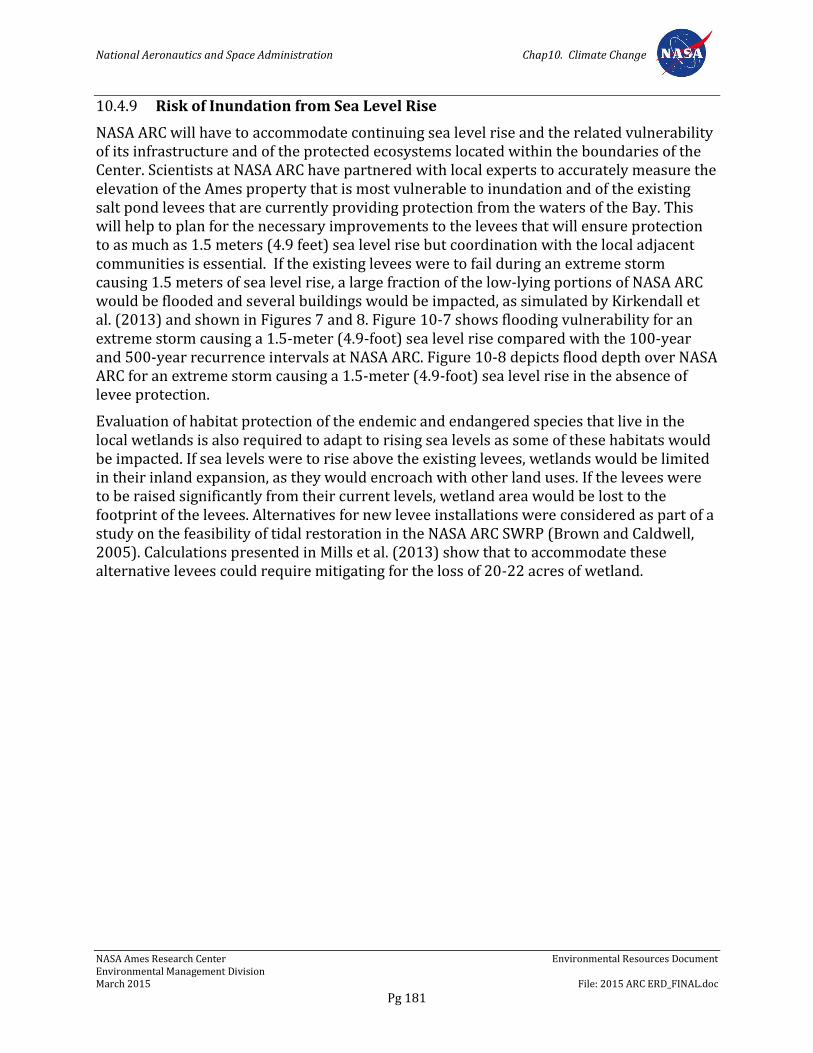
National Aeronautics and Space Administration Chap10. Climate Change
NASA Ames Research Center Environmental Resources Document Environmental Management Division March 2015 File: 2015 ARC ERD_FINAL.doc
Pg 181
10.4.9 Risk of Inundation from Sea Level Rise
NASA ARC will have to accommodate continuing sea level rise and the related vulnerability of its infrastructure and of the protected ecosystems located within the boundaries of the Center. Scientists at NASA ARC have partnered with local experts to accurately measure the elevation of the Ames property that is most vulnerable to inundation and of the existing salt pond levees that are currently providing protection from the waters of the Bay. This will help to plan for the necessary improvements to the levees that will ensure protection to as much as 1.5 meters (4.9 feet) sea level rise but coordination with the local adjacent communities is essential. If the existing levees were to fail during an extreme storm causing 1.5 meters of sea level rise, a large fraction of the low-lying portions of NASA ARC would be flooded and several buildings would be impacted, as simulated by Kirkendall et al. (2013) and shown in Figures 7 and 8. Figure 10-7 shows flooding vulnerability for an extreme storm causing a 1.5-meter (4.9-foot) sea level rise compared with the 100-year and 500-year recurrence intervals at NASA ARC. Figure 10-8 depicts flood depth over NASA ARC for an extreme storm causing a 1.5-meter (4.9-foot) sea level rise in the absence of levee protection.
Evaluation of habitat protection of the endemic and endangered species that live in the local wetlands is also required to adapt to rising sea levels as some of these habitats would be impacted. If sea levels were to rise above the existing levees, wetlands would be limited in their inland expansion, as they would encroach with other land uses. If the levees were to be raised significantly from their current levels, wetland area would be lost to the footprint of the levees. Alternatives for new levee installations were considered as part of a study on the feasibility of tidal restoration in the NASA ARC SWRP (Brown and Caldwell, 2005). Calculations presented in Mills et al. (2013) show that to accommodate these alternative levees could require mitigating for the loss of 20-22 acres of wetland.
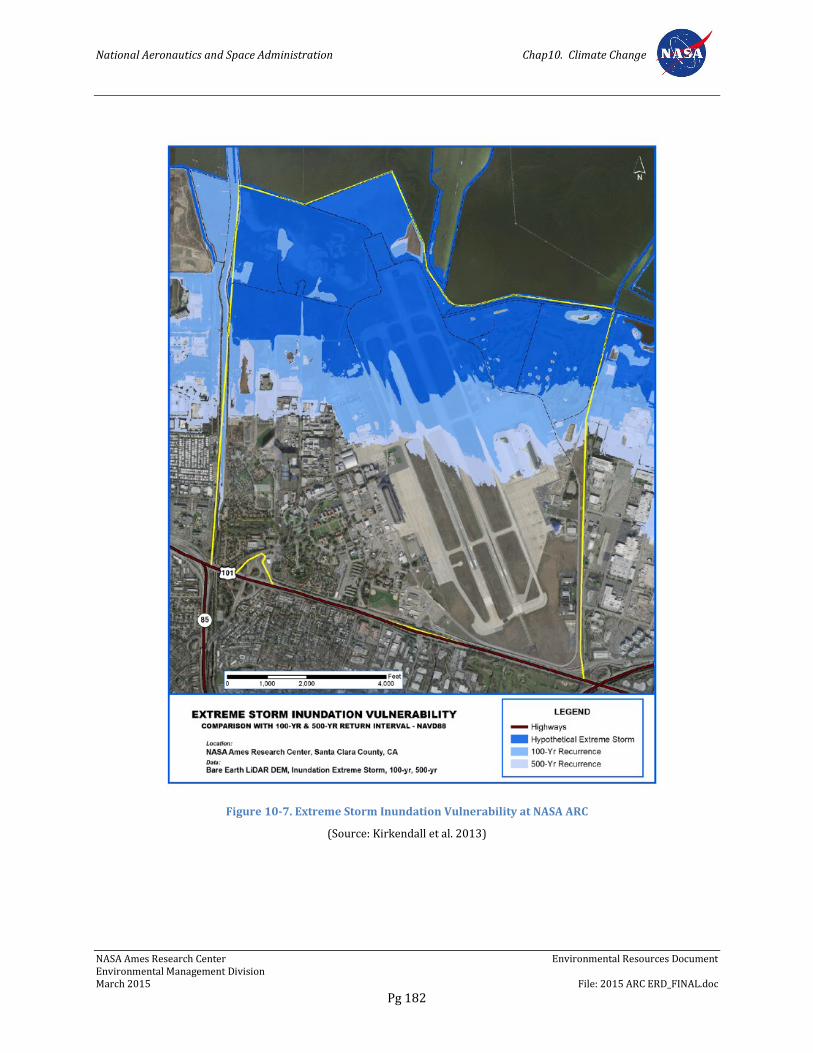
National Aeronautics and Space Administration Chap10. Climate Change
NASA Ames Research Center Environmental Resources Document Environmental Management Division March 2015 File: 2015 ARC ERD_FINAL.doc
Pg 182
Figure 10-7. Extreme Storm Inundation Vulnerability at NASA ARC
(Source: Kirkendall et al. 2013)
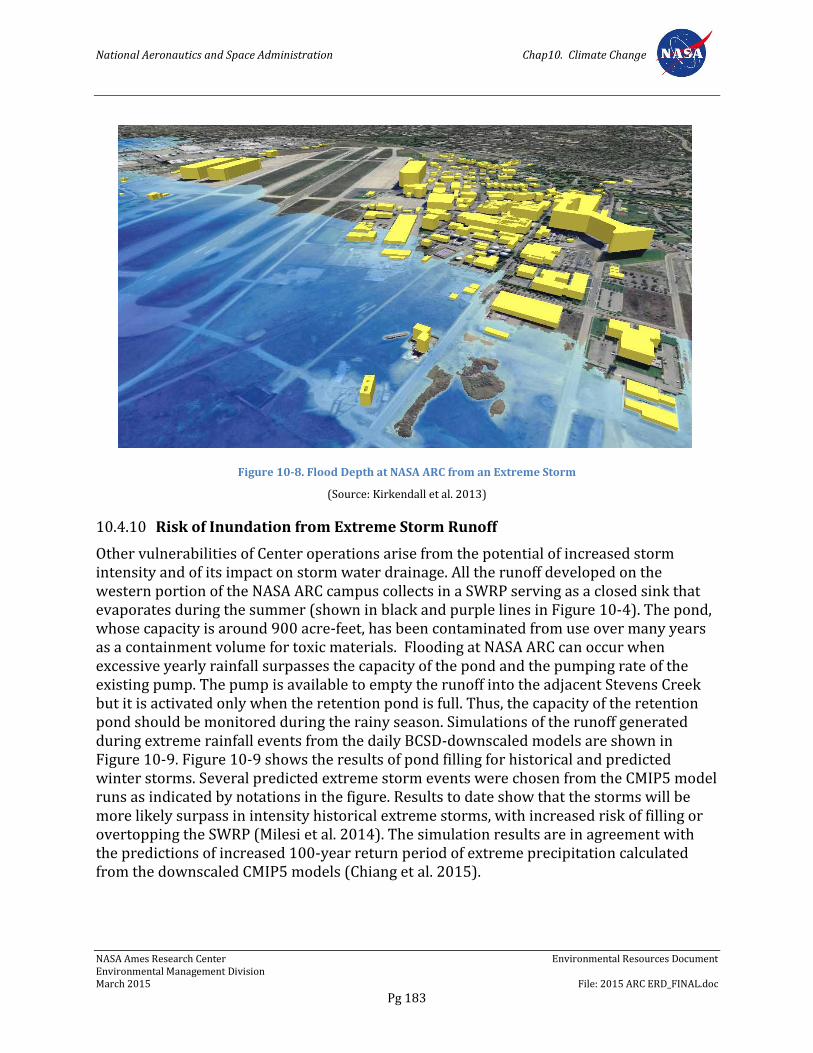
National Aeronautics and Space Administration Chap10. Climate Change
NASA Ames Research Center Environmental Resources Document Environmental Management Division March 2015 File: 2015 ARC ERD_FINAL.doc
Pg 183
Figure 10-8. Flood Depth at NASA ARC from an Extreme Storm
(Source: Kirkendall et al. 2013)
10.4.10 Risk of Inundation from Extreme Storm Runoff
Other vulnerabilities of Center operations arise from the potential of increased storm intensity and of its impact on storm water drainage. All the runoff developed on the western portion of the NASA ARC campus collects in a SWRP serving as a closed sink that evaporates during the summer (shown in black and purple lines in Figure 10-4). The pond, whose capacity is around 900 acre-feet, has been contaminated from use over many years as a containment volume for toxic materials. Flooding at NASA ARC can occur when excessive yearly rainfall surpasses the capacity of the pond and the pumping rate of the existing pump. The pump is available to empty the runoff into the adjacent Stevens Creek but it is activated only when the retention pond is full. Thus, the capacity of the retention pond should be monitored during the rainy season. Simulations of the runoff generated during extreme rainfall events from the daily BCSD-downscaled models are shown in Figure 10-9. Figure 10-9 shows the results of pond filling for historical and predicted winter storms. Several predicted extreme storm events were chosen from the CMIP5 model runs as indicated by notations in the figure. Results to date show that the storms will be more likely surpass in intensity historical extreme storms, with increased risk of filling or overtopping the SWRP (Milesi et al. 2014). The simulation results are in agreement with the predictions of increased 100-year return period of extreme precipitation calculated from the downscaled CMIP5 models (Chiang et al. 2015).
Use of Geomatic Techniques to Evaluate Flooding from the February, 1998
Extreme Storm and Sea Level Rise at NASA Ames Research Center
1. Abstract
The NASA Ames Research Center (ARC) campus, located on
the southern waterfront of South San Francisco Bay (Figure
1), is vulnerable to projected sea level rise (SLR) given its low
elevation. The campus is also vulnerable to flooding during intense
precipitation episodes, as was experienced in the February 1998
Extreme Storm which inundated ARC with over 7 cm of rain in a 24
hour period, with the previous two days having also delivered 3.5
cm of rain. The ARC campus and surrounding areas were severely
flooded leading to significant damage to the local infrastructure.
To assess the potential impact of future storm events to the ARC
campus, the February 1998 Extreme Storm was evaluated using
several remote sensing and geomatic techniques. Supervised
classification and change detection of multispectral Landsat 5
(TM) imagery from January 17 and February 18, 1998 (the closest
dates to the storm for which imagery is available) was performed,
to evaluate the extent of flooding after the storm. Both images were
recorded at low tide with water levels less than the mean lower
low water (MLLW) elevation when referenced to the Coyote Creek
tidal station datum. Significantly more area is classified as water
in the February image than in the January image. However, change
detection analysis underestimates total flood water coverage in
other areas due to the time difference between the heart of the
Extreme storm and the available Landsat scene image dates.
Ground classification of a publicly available Light Detection and
Ranging (LiDAR) point cloud was performed, and a high resolution
1-m digital elevation model (DEM) and 3D building feratures of the
ARC campus were generated to provide a topographic reference
for geospatial analysis. The LiDAR DEM was incorporated into
FEMA’s natural hazard risk assessment and loss estimation
software package Hazus-MH 2.1 to generate a flood depth grid.
This flood depth grid estimates the extent of flooding due to the
Extreme Storm at ARC and is compared to the Hazus generated
100-year and 500-year floodplains. The 3D building features
extracted from the LiDAR are combined with the flood depth grid to
analyze impact to infrastructure due to such a storm.
In addition to extreme rainstorm events, also sea level rise will
pose a significant risk of flooding to the ARC campus requiring
updates and maintenance of the protective levees. In the San
Francisco Bay area the mean sea-level is projected to rise in the
course of this century, with widely varying estimates (Figure 6). To
evaluate the potential impact of a 150 cm rise in mean sea level,
a second flood depth grid was generated using Hazus. This flood
depth grid estimates the potential impact of SLR on floodplain
extent and flood volume, and is compared to the Hazus generated
100-year and 500-year floodplains. The 3D building features
extracted from the LiDAR are combined with the flood depth grid to
analyze impact to infrastructure due to sea level rise.
2. The Extreme Storm of February 1998
Precipitation Characteristics
The February 1998 Extreme Storm inundated ARC with over 7 cm of rain in a
24 hour period, with the previous two days having also delivered 3.5 cm of rain
(Figure 2). The ARC campus and surrounding areas were severely flooded leading to
significant damage to the local infrastructure.
Whitney G. Kirkendall1,2, William B. Mills1, Sujoy Roy1
Mariza Costa-Cabral3, Christina Milesi4
1Tetra Tech, Inc., 2 URS, 3Northwest Hydraulic Consultants, 4NASA Ames Research Center
4. How Will Future Storms Affect NASA Ames
ReferencesBurroughs, Nicole (2010) Climate change impacts and adaptation strategies at NASA
Ames Research Center, ARC Seminar presented April 28, 2010.
FEMA Region III (2013) Coastal Analysis and Mapping Glossary & Acronyms, accessed
November 7, 2013, available online: http://www.r3coastal.com/Glossary--Acronyms.
Gao, Bo-Cai (1996) NDWI – A normalized difference water index for remote
sensing of vegetation liquid water from space. Remote Sensing of the Environment,
V58, 257–266.
Knowles, Noah (2009) Potential inundation due to rising sea levels in the San Francisco
Bay region. California Climate Change Center CEC-500-2009-023-D. 21 pp.
Lin, Meng-Lung et al. (2010) Quick spatial assessment of drought information derived
from MODIS imagery using amplitude analysis. World Academy of Science, Engineering
and Technology, V43.
National Research Council (NRC), Committee on Sea Level Rise in California,
Oregon and Washington (2012) Sea level rise for the coasts of California, Oregon
and Washington: Past, present and future. National Research Council. The National
Academies Press, Washington DC, 260 pp.
NOAA (2009) Significant Wave Height, accessed November 7, 2013, available online:
http://www.srh.noaa.gov/key/?n=marine_sigwave.
NOAA (2013) Tides & Currents, accessed November 24, 2013, available online:
http://tidesandcurrents.noaa.gov/datums.html?units=1&epoch=0&id=9414575&n
ame=Coyote+Creek&state=CA.
NH23C-1537
FIGURE 1: The location of NASA Ames Research Center.
FIGURE 6: SLR projections for San Francisco Bay. All four curves are concave upward and are well described by second-order polynomials. See the list of literature references. FIGURE 7a: Hazus flood depth grid for the hypothetical Extreme Storm with
40 cm of SLR. The flood extent is approximately equivalent to the current 100-year recurrence interval.
FIGURE 7b: Hazus flood depth grid for the hypothetical Extreme Storm with 150 cm of SLR. The floodplain extends beyond 100-year recurrence interval.
A C K N O W L E D G E M E N T: This material is based upon work supported by NASA under award number NNX12AG33G.
5. Outcomes
Utility of Methodology at Other Facilities
This semi-automated geomatic
evaluation of floodplain extent and
potential impact to infrastructure can
be applied at many facilities for planning
purposes. A higher resolution LiDAR-
based model (where LiDAR is available)
will result in a more accurate estimate of
potential economic losses and physical
damage, allowing stakeholders to plan
more effectively and maximize and
prioritize resources for the future.
The Hazus flood model can expand
beyond the coastal flood hazard to
riverine hazards, or a combination of
the two. These tools provide a way for
stakeholders and the public in general to
not only model and visualize the impact
of current flood potential at a particular
facility, or even at a particular building,
but also to have the ability to visualize
and analyze what might happen as
the sea level rises throughout the next
century and beyond.
SLR Background and Projections for Next 100 Years
SLR will pose a significant risk of flooding to the ARC campus. In the San Francisco
Bay area the mean sea-level (MSL) is projected to rise by 150 cm (Knowles, 2010)
in the maximum scenario for the year 2100 (Figure 6). A higher MSL will increase
the frequency, extent, and depth of flooding for a given storm event (Burroughs
and Iraci, 2010). In order to evaluate the potential impact of future Extreme Storms
while incorporating 150 cm of SLR, an additional suite of flood depth grids were
generated using Hazus. These flood depth grids estimate the potential impact of
SLR on floodplain extent and flood volume for a particular event.
Author Contact: [email protected] and [email protected]
3. Impact of the Storm on NASA Ames
Estimation of Flood Extent
High Resolution LiDAR DEM Generation
To evaluate the impact of the 1998 Extreme Storm on ARC, a publicly available
LiDAR point cloud from Santa Clara County (2006) was leveraged. High resolution
LiDAR digital elevation models (DEMs) are extremely valuable in evaluating
floodplain extent and projections of sea level rise. Whereas widely available DEMs
for the United States generally fall into the 3 to 30 meter horizontal resolution range
with RMSE as high as 2.44 meters, publicly available LiDAR point clouds may yield
DEMs with 1 meter or better post-spacing and vertical accuracies in the range of
10 to 50 centimeters or better.
The Santa Clara County LiDAR point cloud was cropped to the area of interest, tiled,
and then ground classified. The point spacing of the ground class was just less than
1 meter which supported a high resolution, natural neighbors, 1 meter DEM of ARC
and the surrounding areas for geospatial flood analysis.
Delineation of the 1998 Extreme Storm flood extent proved a challenge due to
the limited availability of data from the period of January 1998 to February 1998.
Landsat, however, provided two vital datasets for this purpose.
Landsat 5 Supervised Image Classification
The Landsat family of satellites provides a relatively high resolution (30 m)
multispectral toolset for detection of surficial features. The Landsat 5 Thematic
Mapper (TM) senses seven spectral bands of the electromagnetic spectrum. Band
7 (2.08–2.35um) and Band 4 (0.76–0.90um) exhibit strong absorption over water
features and may be used for delineation of the boundary between land and water.
Band 1 is useful for determining the boundary between bare earth (soils & rock)
from vegetation. Band combination 741 was used for delineation of the estimated
flood extent.
The 1998 Extreme Storm occurred from February 1st to February 8th. The
available cloud-free Landsat 5 imagery for this time period falls on January 17,
and February 18. Both images were recorded at low tide with water levels less
than the MLLW value when referenced to the Coyote Creek tidal station datum.
For each image date, the Landsat bands were made into a 741 composite image,
cropped to the ARC campus. Unsupervised classification was performed using
a maximum-likelihood algorithm. The training sets were revised, and supervised
classification was performed. The January 17th classified image was subtracted
from the February 18th classified image. This change detection analysis resulted
in significantly more area being classified as water in the February image than the
January image (Figure 4) in the area of the storm water retention ponds. However,
change detection analysis underestimates total flood water coverage over other
areas of the Moffett campus, and no flood water coverage was classified in these
images outside of this area. This is due to the nine day lag between the end of the
storm (February 8) and the available Landsat scene acquisition date (February 18).
Geo-Located Photographs
Burroughs (2010) presented three geo-located photographs showing significant
flooding just after the 1998 extreme storm. The photographs were taken at the
pump station that moves water from Moffett Channel into Lockheed Channel, the
ordnance bunkers, and Moffett Golf Course adjacent to ARC. The landward-most
photograph also corresponds to the highest elevation of the three locations, and
thus we can confirm visually that the flooding extended at least to between the 6’
and 7’ foot contour (NAVD 88) made from the high resolution LiDAR DEM.
NDMI
The Normalized Difference Moisture Index (NDMI), by Gao (1996) provides an
indicator of vegetation water content and was calculated for each of the January 17
and February 18 Landsat TM scenes.
NDMI = [Band 4 – Band 5] / [Band4 + Band 5]
NDMI values vary between -1 and 1 with negative values indicating lower water
content, and positive values indicating higher water content. The NDMI values for
each individual image were classified into either a low moisture (value less than
or equal to zero) or high moisture (value greater than zero) category. The January
image was then subtracted from the February image to determine the areas
of increased moisture between the two time epochs. The Moffett Golf Course
contains large areas of increased water content that developed between January
and February of 1998.
Based on these three datasets, the flood extent for the 1998 Extreme Storm is
estimated to be approximately the 7-ft contour.
Hazus Flood Modleing
Hazus Model of Flood Extent Associated with Hypothetical Inundation from the Bay
The LiDAR DEM described in Section 1 was incorporated into FEMA’s natural
hazard risk assessment and loss estimation software package Hazus-MH 2.1
to model a storm similar to the 1998 Extreme Storm in extent in a hypothetical
scenario in which levees currently protecting the NASA ARC property from flooding
were overtopped.
The three possible input parameters for the Hazus coastal flood model include
stillwater elevation (SWEL), wave setup, and significant wave height. The SWEL is
defined as the mean water level in the absence of waves (FEMA Region III, 2013).
The SWEL plus the wave setup is the coastal base flood elevation (BFE). The
significant wave height is the average height of the largest third of waves within
a given time (NOAA, 2009). For this study we modeled a floodplain only with the
stillwater elevation. The wave setup and significant wave height parameters were
set to zero.
We generated a flood depth grid for the hypothetical storm that would
approximately match the extent of the 1998 Extreme Storm (7 ft contour interval
NAVD88). This was achieved by setting the SWEL parameter of the Hazus coastal
flood model for the 10-yr return interval to 7 feet. The flood depth grid extent is
consistent with the water coverage shown in the Landsat change analysis, the geo-
located photographs, and the NDMI change analysis, so as expected, it partially
inundates the Moffett Golf Course, the pump station at the Moffet/Lockhead
channel intersect, the ordnance bunkers, several roads and other infrastructure.
However, the northern-most portion of the runway is also inundated. This would be
the case if inundation originated from the Bay (an assumption of Hazus). Though it
is anecdotely known that the northern portion of the runway was flooded during the
1998 extreme storm, the available datasets for this study did not show evidence to
prove or disprove this notion.
Hazus Model of 100- and 500- Year Floodplain
Figure 4 compares the floodplain of the hypothetical extreme storm to that of the
100-yr and 500-yr floodplains. In order to generate the floodplains for the 100-
yr and 500-yr return interval, we input a 100-yr stillwater elevation of 11.7 feet
NAVD88. This is the SWEL for the area of Coyote Creek at Guadalupe Slough
(Mariza Costa-Cabral, personal communication, October 21, 2013). The Hazus
coastal flood model calculated the 500-yr stillwater elevation to be 13.8 feet
NAVD88. The 100-yr floodplain extends over a third of the runway, and includes
the footprints of at least 20 structures. The 500-yr floodplain covers more than half
of the runway, and includes the footprints of at least 30 structures including the
Moffett Field hangars.
Sensitivity Analysis of Hazus to Levees in DEM
To determine the influence of the levees in the LiDAR DEM on the Hazus generated
flood depth grids, the levees in the area of interest were burned into the DEM at an
elevation of 15 ft NAVD88. The 100-yr floodplain was generated with this DEM, and
the results are shown in Figure 8. The levees clearly act as barriers to the influx of
water modeled by the 100-yr recurrence interval, thus all of the Hazus flood depth
grids generated for this study are not full levee failure scenarios.
This analysis also clearly demonstrates the value of the levee infrastructure. The
fact that the levee system did not fail during the 1998 extreme storm prevented
a much worse flood event. This analysis emphasizes the importance of investing
in the update and maintenance of this vital flood protection infrastructure, though
nationwide this will be an investment in the billions of dollars.
3D Model of ARC Campus
Feature extraction of buildings from the LiDAR DEM was performed using a custom
workflow to generate a high resolution 3D model of the ARC campus. When
combined with the flood depth grid, the 3D building features provide a unique way
to both visualize and analyze the impact to infrastructure due to an extreme storm,
flood, rise in sea level, or combination thereof.
FIGURE 4: Flooding vulnerability compared for an Extreme Storm compared with the 100-year and 500-year recurrence intervals.
FIGURE 5: Inundation vulnerability with hypothetical 15-ft high levees. The value of the levees is clearly shown as they completely prevent flooding of the ARC campus. If levees were to be breached during a storm event or due to sea-level rise, the extent of flood coverage would likely increase.
FIGURE 3: Flood coverage delineated from spectral image classification of Landsat TM scenes from January 17, 1998 and February 18, 1998. The February 18th image clearly shows increased water cover in the area of the storm water retention ponds after the Extreme Storm.
FIGURE 2: Daily precipitation (from midnight to midnight) obtained from the hourly precipitation record for Moffett Field.
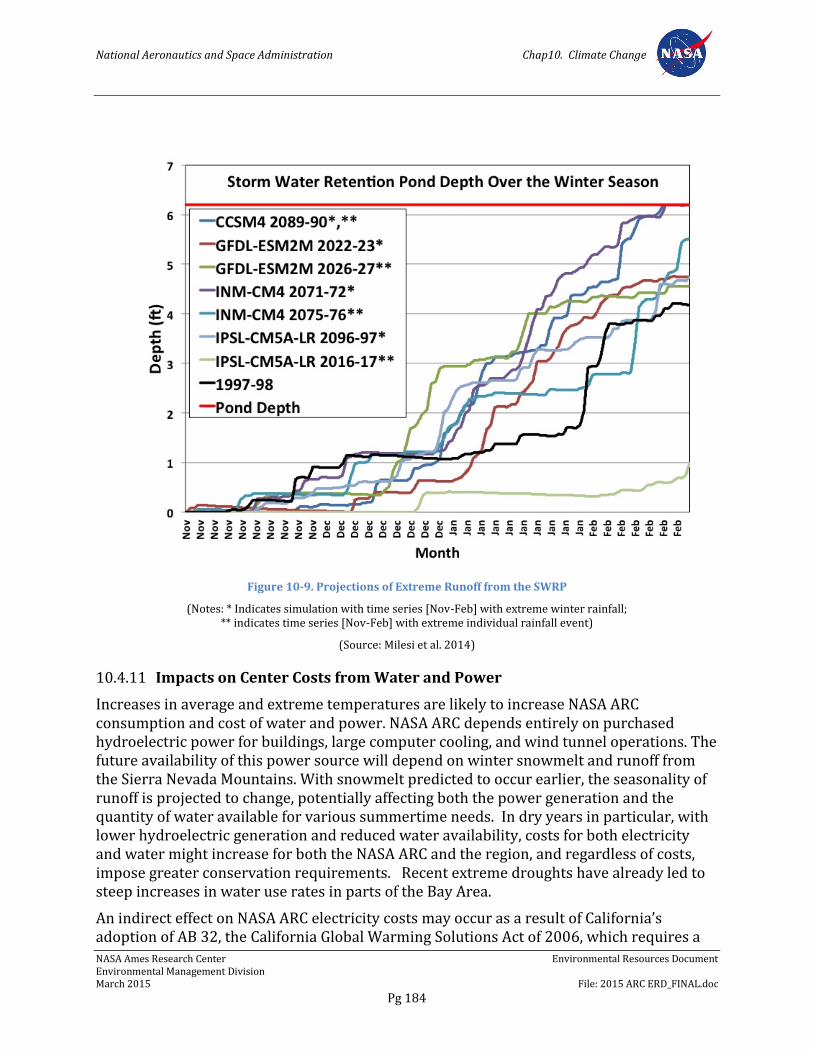
National Aeronautics and Space Administration Chap10. Climate Change
NASA Ames Research Center Environmental Resources Document Environmental Management Division March 2015 File: 2015 ARC ERD_FINAL.doc
Pg 184
Figure 10-9. Projections of Extreme Runoff from the SWRP
(Notes: * Indicates simulation with time series [Nov-Feb] with extreme winter rainfall; ** indicates time series [Nov-Feb] with extreme individual rainfall event)
(Source: Milesi et al. 2014)
10.4.11 Impacts on Center Costs from Water and Power
Increases in average and extreme temperatures are likely to increase NASA ARC consumption and cost of water and power. NASA ARC depends entirely on purchased hydroelectric power for buildings, large computer cooling, and wind tunnel operations. The future availability of this power source will depend on winter snowmelt and runoff from the Sierra Nevada Mountains. With snowmelt predicted to occur earlier, the seasonality of runoff is projected to change, potentially affecting both the power generation and the quantity of water available for various summertime needs. In dry years in particular, with lower hydroelectric generation and reduced water availability, costs for both electricity and water might increase for both the NASA ARC and the region, and regardless of costs, impose greater conservation requirements. Recent extreme droughts have already led to steep increases in water use rates in parts of the Bay Area.
An indirect effect on NASA ARC electricity costs may occur as a result of California’s adoption of AB 32, the California Global Warming Solutions Act of 2006, which requires a
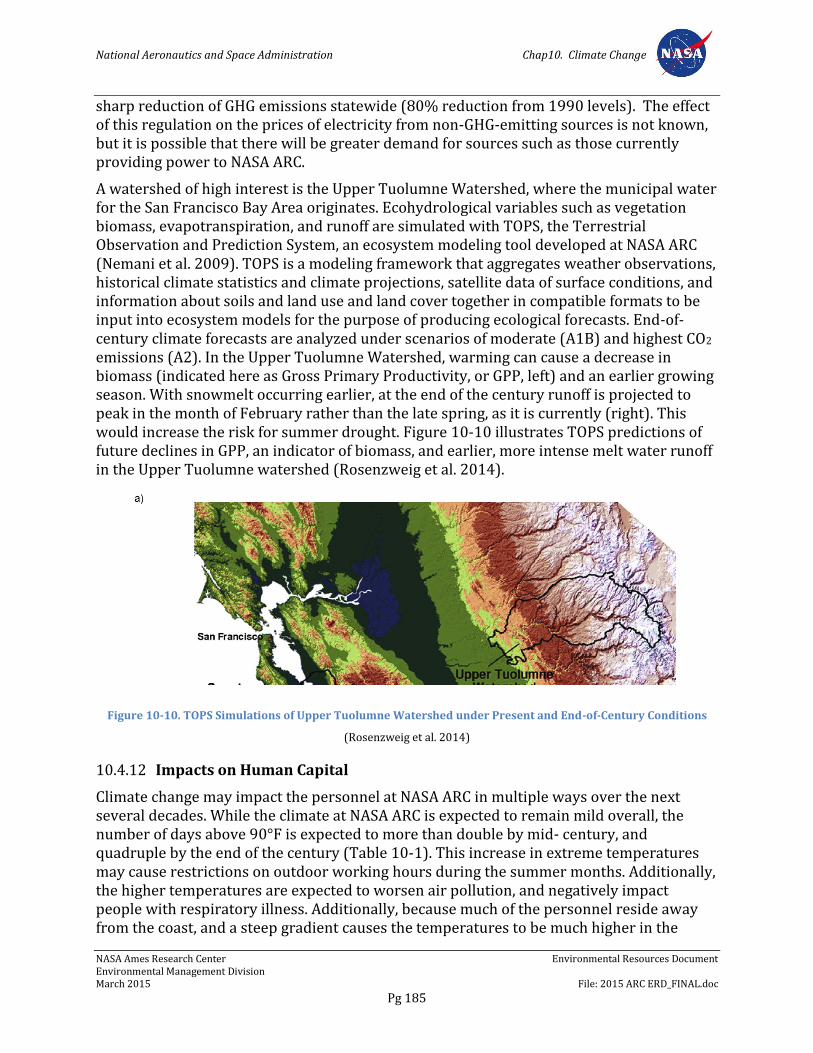
National Aeronautics and Space Administration Chap10. Climate Change
NASA Ames Research Center Environmental Resources Document Environmental Management Division March 2015 File: 2015 ARC ERD_FINAL.doc
Pg 185
sharp reduction of GHG emissions statewide (80% reduction from 1990 levels). The effect of this regulation on the prices of electricity from non-GHG-emitting sources is not known, but it is possible that there will be greater demand for sources such as those currently providing power to NASA ARC.
A watershed of high interest is the Upper Tuolumne Watershed, where the municipal water for the San Francisco Bay Area originates. Ecohydrological variables such as vegetation biomass, evapotranspiration, and runoff are simulated with TOPS, the Terrestrial Observation and Prediction System, an ecosystem modeling tool developed at NASA ARC (Nemani et al. 2009). TOPS is a modeling framework that aggregates weather observations, historical climate statistics and climate projections, satellite data of surface conditions, and information about soils and land use and land cover together in compatible formats to be input into ecosystem models for the purpose of producing ecological forecasts. End-of-century climate forecasts are analyzed under scenarios of moderate (A1B) and highest CO2 emissions (A2). In the Upper Tuolumne Watershed, warming can cause a decrease in biomass (indicated here as Gross Primary Productivity, or GPP, left) and an earlier growing season. With snowmelt occurring earlier, at the end of the century runoff is projected to peak in the month of February rather than the late spring, as it is currently (right). This would increase the risk for summer drought. Figure 10-10 illustrates TOPS predictions of future declines in GPP, an indicator of biomass, and earlier, more intense melt water runoff in the Upper Tuolumne watershed (Rosenzweig et al. 2014).
Figure 10-10. TOPS Simulations of Upper Tuolumne Watershed under Present and End-of-Century Conditions
(Rosenzweig et al. 2014)
10.4.12 Impacts on Human Capital
Climate change may impact the personnel at NASA ARC in multiple ways over the next several decades. While the climate at NASA ARC is expected to remain mild overall, the number of days above 90°F is expected to more than double by mid- century, and quadruple by the end of the century (Table 10-1). This increase in extreme temperatures may cause restrictions on outdoor working hours during the summer months. Additionally, the higher temperatures are expected to worsen air pollution, and negatively impact people with respiratory illness. Additionally, because much of the personnel reside away from the coast, and a steep gradient causes the temperatures to be much higher in the
National Aeronautics and Space Administration Chap10. Climate Change
NASA Ames Research Center Environmental Resources Document Environmental Management Division March 2015 File: 2015 ARC ERD_FINAL.doc
Pg 186
surrounding communities, the discomfort and health consequences of rising temperatures felt when the workforce is at home can impact work productivity.
Other impacts on human capital can be caused by interruptions in transportation caused by flooding during extreme storm events, from extremes of runoff, and/or storm surge. Just like extreme precipitation and sea level rise can cause flooding of portions of the Center, such events can also flood the highways and other roads in the South Bay and prevent personnel from reaching or leaving the Center.
Additional ways in which climate can impact the human capital should be considered and analyzed.
10.5 Environmental Requirements
NASA has identified the following environmental plans, policies, and strategies that address climate change risks to operations and future development at ARC.
10.5.1 NASA Procedural Directive 8500.1, NASA Environmental Management
Per NPD 8500.1, it is NASA policy to: maintain compliance with all applicable federal, state, and local environmental requirements; to incorporate environmental risk reduction and sustainable practices to the extent practicable throughout NASA’s programs, projects, and activities; and to consider environmental factors throughout the life cycle of programs, projects, and activities (as defined in NPD 7120.4, NASA Engineering and Program/Project Management Policy, and related documents), including planning, development, execution, and disposition activities. Examples of environmental factors include consideration of environmental impacts as required by the NEPA and NHPA; the proposed use of hazardous materials; the potential for waste generation; the need to acquire necessary permits, waivers, and authorizations; and the use of environmentally-preferable materials and processes wherever practicable.
NPR 8500.1, Section 1(b), includes the following applicable policies regarding climate change resilience.
(5) Apply NASA's scientific expertise and products so that we can incorporate climate information into our decision making and planning; create innovative, sustainable, and flexible solutions; and share best practices; in order to create climate-resilient NASA Centers.
10.5.2 NASA 2014 Strategic Sustainability Performance Plan
In addition to outlining new requirements for GHG management and sustainable buildings and communities, to mention only a few of the requirements, EO 13514 (discussed above) requires NASA and all federal agencies to develop, implement, and annually update a SSPP.
Goal 9 of NASA’s SSPP is devoted to strategies to ensure climate change resilience. As of September 30, 2013, ARC and other NASA centers are integrating climate factors into their existing management plans through the adaptation process. Additionally, NASA’s Master Planning Community of Practice and Senior/Center Sustainability Officers are discussing climate design and other climate adaptation policies at regularly scheduled meetings.
National Aeronautics and Space Administration Chap10. Climate Change
NASA Ames Research Center Environmental Resources Document Environmental Management Division March 2015 File: 2015 ARC ERD_FINAL.doc
Pg 187
Per the SSPP, planned future actions in support of Goal 9 include the continuation of NASA’s adaptation workshops to reinforce early progress and extend momentum towards a more climate-resilient Agency; continued contributions by NASA to national and international climate research efforts; and updates to CASI’s climate projections for NASA centers through incorporation of advanced climate models.
10.5.3 NASA 2014 Climate Risk Management Plan
In response to EO 13514 and 13653 (discussed above), which require federal agencies to develop Climate Adaptation Plans to evaluate their climate change risks and vulnerabilities and to manage the effects of climate change on each agency's operations and mission, NASA has developed a "Climate Risk Management Plan." The Plan, which is appended to the 2014 SSPP, describes NASA’s overall goal and strategy “to create climate-resilient NASA centers able to execute NASA’s mission.” The plan also identifies long- and short-term risks from climate change on NASA’s strategic objectives, roles, and responsibilities; opportunities and approaches for managing climate-related risks; trends and factors that may affect NASA’s climate risk identification and adaptation strategies; and governance processes and organizational resources within NASA that provide oversight of climate change-related issues.
As highlighted in the Plan, the following strategies are being implemented at ARC and other NASA centers to address local climate risks and preserve mission capabilities.
Ongoing investigations by CASI into local climate risks at ARC and other centers assists NASA with its goal of creating climate-resilient NASA centers and reducing risk to mission.
NASA has well-established communities of practice in the areas of master planning and climate change adaptation that are coordinated by NASA Headquarters and staffed by one or more individuals from each center or facility, including ARC.
The NEPA process at ARC and other centers enables NASA to incorporate climate risks into decision-making and planning, which further reduces NASA’s exposure to future climate-related risks.
The Center Sustainability Officer at ARC, as at other centers, is tasked with the role of assessing the Center’s vulnerabilities, identifying risks, and developing and implementing climate change adaptation strategies endorsed by Center or Headquarters leadership.
10.5.4 Ames Procedural Requirements 8500.1, Ames Environmental Procedural Requirements
APR 8500.1 sets forth general procedural requirements to ensure compliance with applicable federal, state, and local environmental laws; regulations and EOs; and NASA policies and procedures. Organizational directors, division chiefs, branch chiefs, section heads, supervisors, managers, and CORs are responsible for planning, designing, constructing, managing, operating, and maintaining facilities in conformance with applicable regulatory directives, and should obtain environmental review from the
National Aeronautics and Space Administration Chap10. Climate Change
NASA Ames Research Center Environmental Resources Document Environmental Management Division March 2015 File: 2015 ARC ERD_FINAL.doc
Pg 188
Environmental Management Division early in project planning consistent with NASA's NEPA implementing procedures (NPR 8580.1 and EO 12114), NASA policies and procedures for programs and projects (NPR 7120), and NASA regulations related to environmental quality (14 CFR 1216). Program and project managers should coordinate with the Environmental Management Division in a timely manner to ensure that any new or modified programs, projects, and activities comply with regulatory requirements.
10.5.5 Ames Environmental Work Instructions
Ames’s EWIs, which replace the previous Ames Environmental Handbook (APR 8800.3), set forth requirements to ensure that programs, projects, and activities at ARC comply with applicable federal, state, and local laws; regulations and EOs; and NASA policies and procedures. Each EWI lists relevant regulatory authorities and documents, assigns individual and organizational responsibilities within ARC, and identifies specific requirements applicable to the work being performed.
The following EWIs are relevant with respect to climate change risks to operations and future development at ARC.
EWI 12, Public Involvement
EWI 14, NEPA and Environmental Justice
EWI 18, Environmental Requirements for Construction Projects (Under review)
National Aeronautics and Space Administration Chap11. Geology, Seismicity, Soils, and Mineral Resources
NASA Ames Research Center Environmental Resources Document Environmental Management Division March 2015 File: 2015 ARC ERD_FINAL.doc
Pg 189
Chapter 11. Geology, Seismicity, Soils, and Mineral Resources
11.1 Overview
This chapter discusses the geologic and seismic setting of the ARC facility, describes the soils on the site, and provides an overview of mineral resources in the vicinity. It also summarizes the regulations applicable to geologic practice (including construction earthwork) at ARC, as well as relevant policies, measures, and best management practices (BMPs) that address potential onsite seismic and geologic hazards. Information in this chapter was obtained from the November 2009 NASA ARC ERD (NASA 2009), NADP EIS (Design, Community & Environment 2002), and other sources.
11.2 Regulatory Background
11.2.1 Federal Regulations
11.2.1.1 National Environmental Policy Act
NEPA requires federal agencies to include in their decision-making process appropriate and careful consideration of all environmental effects of a proposed action and of possible alternative actions. Measures to avoid or minimize the adverse effects of proposed actions and to restore and enhance environmental quality as much as possible must be developed and discussed where feasible.
11.2.2 State Regulations
11.2.2.1 Alquist-Priolo Earthquake Fault Zoning Act
California’s Alquist-Priolo Earthquake Fault Zoning Act (Public Resources Code Section 2621 et seq.), originally enacted in 1972 as the Alquist-Priolo Special Studies Zones Act and renamed in 1994, is intended to reduce the risk to life and property from surface fault rupture during earthquakes. The Alquist-Priolo Act prohibits the location of most types of structures intended for human occupancy across the traces of active faults and strictly regulates construction in the corridors along active faults (earthquake fault zones). It also defines criteria for identifying active faults, giving legal weight to terms such as active, and establishes a process for reviewing building proposals in and adjacent to Earthquake Fault Zones.
Under the Alquist-Priolo Act, faults are zoned, and construction along and across them is strictly regulated if they are “sufficiently active” and “well-defined.” A fault is considered sufficiently active if one or more of its segments or strands shows evidence of surface displacement during Holocene time (defined for purposes of the act as referring to approximately the past 11,000 years). A fault is considered well defined if its trace can be clearly identified by a trained geologist at the ground surface or in the shallow subsurface using standard professional techniques, criteria, and judgment.
National Aeronautics and Space Administration Chap11. Geology, Seismicity, Soils, and Mineral Resources
NASA Ames Research Center Environmental Resources Document Environmental Management Division March 2015 File: 2015 ARC ERD_FINAL.doc
Pg 190
11.2.2.2 Seismic Hazards Mapping Act
Like the Alquist-Priolo Act, the Seismic Hazards Mapping Act of 1990 (Public Resources Code Sections 2690-2699.6) is intended to reduce damage resulting from earthquakes. While the Alquist-Priolo Act focuses on surface fault rupture, the Seismic Hazards Mapping Act addresses other earthquake-related hazards, including strong groundshaking, liquefaction, and seismically-induced landslides. Its provisions are similar in concept to those of the Alquist-Priolo Act. The state is charged with identifying and mapping areas at risk of strong groundshaking, liquefaction, landslides, and other corollary hazards, and cities and counties are required to regulate development within mapped Seismic Hazard Zones.
Under the Seismic Hazards Mapping Act, permit review is the primary mechanism for local regulation of development. Specifically, cities and counties are prohibited from issuing development permits for sites within Seismic Hazard Zones until appropriate site-specific geologic and/or geotechnical investigations have been carried out and measures to reduce potential damage have been incorporated into the development plans.
11.2.2.3 Surface Mining and Reclamation Act
The principal legislation addressing mineral resources in California is the Surface Mining and Reclamation Act of 1975 (SMARA) (Public Resources Code Sections 2710–2719), which was enacted in response to land use conflicts between urban growth and essential mineral production. SMARA provides a comprehensive surface mining and reclamation policy to encourage the production and conservation of mineral resources while ensuring that adverse environmental effects of mining are prevented or minimized, that mined lands are reclaimed and residual hazards to public health and safety are eliminated, and that consideration is given to recreation, watershed, wildlife, aesthetic, and other related values.
SMARA provides for the evaluation of an area’s mineral resources using a system of Mineral Resource Zone (MRZ) classifications that reflect the known or inferred presence and significance of a given mineral resource. The MRZ classifications are based on available geologic information (including geologic mapping and other information on surface exposures, drilling records, and mine data) and on socioeconomic factors, such as market conditions and urban development patterns. The MRZ classifications are defined as follows:
MRZ-1: Areas where adequate information indicates that no significant mineral deposits are present, or where it is judged that little likelihood exists for their presence
MRZ-2: Areas where adequate information indicates that significant mineral deposits are present, or where it is judged that a high likelihood for their presence exists
MRZ-3: Areas containing mineral deposits, the significance of which cannot be evaluated from available data
MRZ-4: Areas where available information is inadequate for assignment into any other MRZ
National Aeronautics and Space Administration Chap11. Geology, Seismicity, Soils, and Mineral Resources
NASA Ames Research Center Environmental Resources Document Environmental Management Division March 2015 File: 2015 ARC ERD_FINAL.doc
Pg 191
SMARA governs the use and conservation of a wide variety of mineral resources. However, certain activities and resources are exempt from the provisions of SMARA, including excavation and grading conducted for farming, some types of construction, and recovery from flooding or other natural disaster. Solar extraction of salt and related minerals from sea and bay waters is also exempt from SMARA governance.
11.2.2.4 California Building Standards Code
The California Building Standards Code (CBSC) (Title 24, California Code of Regulations [CCR]) embodies the state’s minimum standards for structural design and construction. CBSC is based on the widely used Uniform Building Code (International Conference of Building Officials 1997), as modified for California conditions. Key modifications provide additional stringency for mitigation of seismic hazards through appropriate design and construction.
CBSC provides a comprehensive set of standards for all aspects of construction. Chapters in the code with particular relevance to geologic and geotechnical practice include those addressing excavation, grading, and fill placement; foundation investigations and foundation design; and seismic design/seismic hazard mitigation.
11.2.3 Local Regulations
11.2.3.1 Santa Clara County Mineral Resources Policies
The current Santa Clara County General Plan (County of Santa Clara 1994) contains a number of policies that recognize the importance of the county’s mineral resources and establish a planning framework to ensure that they remain available in the future. Several of the policies are countywide, as summarized below.
Countywide Resource Conservation Policy C-RC 44: Recognizes the need to ensure continued availability of mineral resources to meet long-term demand
Countywide Resource Conservation Policy C-RC 45b: Recognizes the need to preserve economically important mineral deposits (particularly construction aggregate) and access routes, with the aim of maintaining and supplying current and future demand
Countywide Resource Conservation Policy C-RC-46: Establishes the goal of protecting regionally significant mineral resource sites and access routes from incompatible land uses and development that would preclude or unnecessarily limit resource availability
Additional policies apply to the county’s unincorporated rural areas, as follows.
Rural Unincorporated Area Resource Conservation Policy R-RC 67: Establishes the goal of ensuring that local mineral resources are recognized for their importance to the local, regional, and state economies
National Aeronautics and Space Administration Chap11. Geology, Seismicity, Soils, and Mineral Resources
NASA Ames Research Center Environmental Resources Document Environmental Management Division March 2015 File: 2015 ARC ERD_FINAL.doc
Pg 192
Rural Unincorporated Area Resource Conservation Policy R-RC 70: Identifies the need to consider the importance of mineral resources to their market region as a whole when making land use decisions involving mineral resource areas of state or regional significance
Rural Unincorporated Area Resource Conservation Policy R-RC 71: Recognizes the need to identify additional mineral resource areas besides those that are currently designated by the State of California in order to augment diminishing supplies available from existing quarries
11.3 Regional Setting
11.3.1 Topography
The ARC site is located on nearly flat topography at the north end of the Santa Clara Valley, a gently sloping, northwest-trending depression bounded by the Santa Cruz Mountains to the west and south, and the Diablo Range to the east. About 15 miles wide at its northern end along the margin of San Francisco Bay, the valley narrows to a width of slightly more than 2 miles at its southern end. It is part of a regionally extensive topographic depression that includes San Francisco Bay, as well as the Petaluma, Sonoma, and Napa valleys to the north. Topography in the Santa Clara Valley, as in the rest of the Bay Area, is largely controlled by strands of the San Andreas Fault system.
Current elevations on the valley floor range from mean sea level (MSL) along the margin of San Francisco Bay to about 200 feet above sea level in the south near the intersection of State Route 82 and U.S. Highway 101 (US-101). Between 1932 and 1968, a large portion of the Santa Clara Valley experienced marked subsidence because of groundwater overdraft; subsidence rates in some areas approached 0.30 meter (1 foot) per year. In response, the SCVWD established a program in the late 1960s to create numerous surface reservoirs that would promote artificial recharge of aquifers. Combined with increased reliance on imported sources of supply and control of groundwater pumping rates, this program has been successful in raising the water table, and subsidence is no longer considered a serious problem.
11.3.2 Geology
Bedrock exposed in the Santa Cruz Mountains to the west of the Santa Clara Valley includes Mesozoic Franciscan Complex sandstone and marine sedimentary rocks of Miocene age. To the east, the core of the Diablo Range uplift is also composed of Franciscan Complex rocks (sandstone, chert, and ultramafic rocks) overlain by and faulted against Miocene marine and terrestrial sedimentary rocks. Low hills situated where the Santa Clara Valley narrows along US-101 consist of Franciscan chert, ultramafic rocks, and sandstone. Both the Santa Cruz Mountains and Diablo Range are flanked by extensive aprons of Quaternary alluvial fan deposits recording uplift and erosional dissection of the ranges.
The Santa Clara Valley formed as a down-dropped block between two major faults: the San Andreas Fault to the west and the Hayward Fault to the east. Sediments filling the valley depression include alluvial fan and fluvial deposits that interfinger to the north (toward
National Aeronautics and Space Administration Chap11. Geology, Seismicity, Soils, and Mineral Resources
NASA Ames Research Center Environmental Resources Document Environmental Management Division March 2015 File: 2015 ARC ERD_FINAL.doc
Pg 193
San Francisco Bay) with estuarine “bay mud” deposits. Surface geologic maps show alluvial fan deposits extending northeast approximately to US-101. North of US-101, finer-grained floodplain deposits predominate, with the Bay itself fringed by mud. To the south, the transition from finer-grained interfluvial deposits to coarser alluvial fan sediments is approximately coincident with a steepening of the present topographic slope near US-101.
The upper 75 meters (250 feet) of the valley fill comprises four separate stratigraphic units of Quaternary (Pleistocene and Holocene) age. They include “bay muds” (clay and silty clay units deposited in an estuarine setting in San Francisco Bay) and fluvial and alluvial units. Pleistocene units are typically partially consolidated, and Holocene units are unconsolidated. A marked unconformity separates the Upper Pleistocene units of the Santa Clara Valley from overlying Holocene strata. Complex interfingering relationships between estuarine bay muds and alluvial/fluvial facies likely record sea level fluctuations.
Bay muds are divided into older and younger subunits. Their “older bay mud” is as much as 45 meters (150 feet) thick and is further subdivided into lower and upper informal units. The lower unit consists of light gray silty clay and the upper unit is dominated by sand and gravel, but contains interbeds of clay, silty clay, and clayey sand. The older bay mud was primarily deposited in fluvial and alluvial fan settings. The “younger bay mud” ranges from 5 meters (15 feet) to 15 meters (50 feet) thick. It consists primarily of dark gray to dark brown organic clay containing minor peat and clayey sand and is interpreted as estuarine and marine deposits. Local sand lenses may represent stream deposits. Holocene alluvium consists of interbedded sand and gravel with lesser silt and clay. These strata are interpreted as recording fluvial and alluvial deposition.
11.3.3 Seismicity
The Santa Clara Valley is located in one of the most seismically active regions of the United States. Seismic activity in the area has occurred mostly along the San Andreas Fault, including the great San Francisco earthquake of 1906 and the Loma Prieta earthquake of 1989. At least 10 other earthquakes with magnitudes greater than 6.0 on the Richter scale have occurred in the Bay Area in the past 100 years. The maximum credible earthquake or design basis for the San Andreas Fault is magnitude 8.3. For the Hayward and Calaveras faults, the maximum credible earthquake is magnitude 7.5. There have been important quakes on other faults, notably the Hayward.
11.4 Existing Site Conditions
11.4.1 Topography
ARC is located approximately 1 mile south of the San Francisco Bay margin in an area that historically supported tidal salt marsh and mud flats. The former salt ponds are now part of the USFWS SBSPRP. Consistent with the historic loss of these habitats Bay-wide, the large area north and northeast of ARC is now diked and consists of evaporation ponds that were formerly used for commercial salt production. The northernmost portion of the ARC site is located within the 100-year tidal floodplain.
National Aeronautics and Space Administration Chap11. Geology, Seismicity, Soils, and Mineral Resources
NASA Ames Research Center Environmental Resources Document Environmental Management Division March 2015 File: 2015 ARC ERD_FINAL.doc
Pg 194
Topography at the ARC site is nearly flat. From north to south, the site rises at a slope generally less than 1%, ranging in elevation from approximately 0.6 meter (2 feet) below MSL near its northern boundary to approximately 10 meters (33 feet) above MSL in the south. Elevation change from east to west is minimal. The principal topographic features on the site are low levees constructed to protect roads and structures from Bay waters during high storm tides.
Between 1932 and 1969, the area that is now the ARC site experienced 1.5 to 2 meters (4.9 to 6 feet) of subsidence because of groundwater overdraft. As described in Regional Setting above, efforts to arrest subsidence through artificial groundwater recharge and improved stewardship have largely been successful. Fluctuation in groundwater levels during wet or dry years, which might previously have threatened buildings, is now unlikely to cause any structural damage. However, structures such as long utility lines and stormwater channels that are more sensitive to local subsidence are designed to minimize any problems.
11.4.2 Geology
Bedrock underlying the ARC site is believed to belong to the Franciscan Formation of late Jurassic age. Bedrock at the site is overlain by 460 meters (1,495 feet) or more of alluvium and bay muds of Pleistocene and Holocene age.
11.4.3 Seismicity
No faults recognized as active by the State of California or the current CBSC traverse the ARC site, and the ARC site is not within any Earthquake Fault Zone identified by the state pursuant to the Alquist-Priolo Earthquake Fault Zoning Act. Consequently, surface rupture is considered unlikely to affect the site. Nonetheless, because of its location, the site could experience strong groundshaking generated by earthquakes on any of several faults in the region (San Andreas, Hayward, and Calaveras).
11.4.4 Soils
Surface soils along the San Francisco Bay margin typically consist of silt and clay. The ARC site is located on soils assigned to Sunnyvale silty clay, Alviso clay, Bayshore clay loam, and Pacheco loam classification. However, soils at ARC have been substantially altered by land uses during the past 100 years. The majority of the site’s upland areas and portions of its wetlands now support artificial fill and/or impervious cover overlying native soils. Native soil is typically exposed only in the diked brackish marshes and open grasslands on the northwest portion of the site, and even in these areas some alterations related to land use have occurred. For instance, diking and draining have altered the surface and shallow groundwater hydrology of the sites and eliminated the natural tidal influence on soils. Nonetheless, as discussed in detail in Chapter 12, Vegetation and Wetlands, the soils remain saline and this salinity maintains salt marsh vegetation in areas that are now removed from tidal influence.
The following sections provide additional detail on Sunnyvale silty clay, Alviso clay, Bayshore clay loam, Pacheco loam, and artificial fill materials, as well as kitchen midden deposits that may be present in some areas.
National Aeronautics and Space Administration Chap11. Geology, Seismicity, Soils, and Mineral Resources
NASA Ames Research Center Environmental Resources Document Environmental Management Division March 2015 File: 2015 ARC ERD_FINAL.doc
Pg 195
11.4.4.1 Sunnyvale Silty Clay, Drained
About 70% of the ARC site is situated on Sunnyvale silty clay, drained, including the developed southern and central portions of the site. Sunnyvale silty clay typically forms in low-level positions on alluvial plains. The surface soil consists of 28 to 45 centimeters (11 to 18 inches) of moderately alkaline dark gray calcareous silty clay. The subsoil consists of 65 to 80 centimeters (26 to 32 inches) of light gray and gray strongly calcareous silty clay. The substratum is mottled light gray slightly calcareous silty clay alluvium. Sunnyvale silty clay is not included in the National Hydric Soil Series List; however, it exhibits hydric characteristics at ARC.
Sunnyvale silty clay has a water storage capacity of 23 to 25 centimeters (9 to 10 inches). Runoff rates are very slow and erosion is negligible. Permeability of the subsoil is slow, and ponding may occur in winter months.
Sunnyvale silty clay is highly expansive. The inherent fertility of this soil is high. However, the choice of plants is limited because the soil drains poorly and the soil textures are fine or very fine.
11.4.4.2 Alviso Clay
The north portion of the Eastside/Airfield area, which represents about 25% of the ARC site, is situated on Alviso clay. Alviso clay typically forms on tidal flats and may be subject to flooding at high tides, where it is not protected by levees. The surface soil consists of 15 to 25 centimeters (6 to 10 inches) of neutral to moderately alkaline dark gray clay. A layer of organic material is locally present in the upper few centimeters of the surface soil. The subsoil consists of 75 to 100 centimeters (30 to 40 inches) of moderately alkaline gray silty clay. The substratum is gray silty clay overlying layered basin sediments. Alviso clay is included on the National Hydric Soil Series List.
Alviso clay is very poorly drained and has a water storage capacity of 10 to 20 centimeters (4 to 8 inches). Runoff rates are very slow and erosion is negligible. The subsoil is slowly permeable, so ponding may occur. The water table is typically 0.3 to 1 meter (1 to 3 feet) below the ground surface.
Alviso clay is highly expansive. The inherent fertility of this soil is very low. The choice of plants is further limited by soil moisture, and by salinity and/or alkalinity.
11.4.4.3 Bayshore Clay Loam
The east edge and southwest corner of the ARC site, comprising about 3% of ARC’s total area, are situated on Bayshore clay loam. Bayshore clay loam typically forms in low-level positions on alluvial plains. The surface soil consists of 28 to 40 centimeters (11 to 16 inches) of dark gray calcareous clay loam, overlying subsoil consisting of 53 to 93 centimeters (21 to 37 inches) of light gray and white strongly calcareous clay loam. The substratum consists of light gray gravelly loam.
National Aeronautics and Space Administration Chap11. Geology, Seismicity, Soils, and Mineral Resources
NASA Ames Research Center Environmental Resources Document Environmental Management Division March 2015 File: 2015 ARC ERD_FINAL.doc
Pg 196
Bayshore clay loam is poorly drained and has a water storage capacity of 20 to 25 centimeters (8 to 10 inches). Runoff rates are very slow and erosion is negligible. The subsoil is moderately slowly permeable.
Bayshore clay loam is moderately expansive. The inherent fertility of this soil is very low. The choice of plants is further limited by soil moisture, and by salinity and/or alkalinity.
11.4.4.4 Pacheco Loam, Clay Substratum
The western portion of the Bay View area, along Stevens Creek, is situated on Pacheco loam, clay substratum. The area underlain by Pacheco loam represents about 3% of the ARC site. The surface soil consists of 35 to 45 centimeters (14 to 18 inches) of moderately alkaline grayish brown fine sandy loam, loam, and clay loam. The subsoil consists of 45 to 63 centimeters (18 to 25 inches) of moderately alkaline mottled light gray loam. The substratum is clay.
Pacheco loam is poorly drained and has a water storage capacity of 10 to 20 centimeters (4 to 8 inches). Runoff rates are very slow and erosion is negligible. The subsoil is slowly permeable, and the water table may be within 0.6 meter (2 feet) of the surface during and following the wet season.
Pacheco loam is moderately expansive. The inherent fertility of this soil is moderate. The choice of plants is limited by soil moisture.
11.4.4.5 Artificial Fill
Developed portions of the ARC site, including the golf course, levees, and areas where buildings are present, are underlain by artificial fill consisting of native soil mixed with gravel, concrete, asphalt, and other materials. Characteristics of the fill differ from site to site, depending on the native soil, added materials, and degree of compaction, which varies with land use. For instance, the golf course was constructed on fill that resembles Sunnyvale and Alviso clays. Fill underlying runway areas, roads, and levees consists of basin clays mixed with gravel and is substantially compacted. All fills for roads, buildings, airfields, and runways are engineered.
11.4.4.6 Kitchen Middens
There are two areas at Ames Research Center, one on the northern end of the Bay View area and one in the middle of the Eastside/Airfield area, where soils are classified as kitchen middens. Kitchen middens represent areas that were used as cooking or camping sites by Native Americans. The native soil material is typically dark gray, friable, calcareous loam or clay loam, mixed with ashes, charcoal, shell fragments, stones, and sparse bones or bone fragment.
Kitchen middens typically occur on nearly level to gently sloping topography, as at ARC. In most places, native soil underlies the middens at depths of 0.3 to 0.6 meter (1 to 2 feet).
Kitchen middens are well drained and have a water storage capacity of 20 to 25 centimeters (8 to 10 inches). Runoff rates are moderate and erosion is not usually a hazard.
National Aeronautics and Space Administration Chap11. Geology, Seismicity, Soils, and Mineral Resources
NASA Ames Research Center Environmental Resources Document Environmental Management Division March 2015 File: 2015 ARC ERD_FINAL.doc
Pg 197
However, permeability is slow and heavy rains can lead to localized ponding and/or flooding.
Fertility is moderate and the rooting zone is very deep. Elsewhere in the Santa Clara Valley, kitchen middens support irrigated row crops, prunes, apricots, walnuts, and pasture.
11.5 Environmental Requirements
The following section describes policies, measures, and BMPs adopted by NASA to minimize potential adverse effects from onsite seismic and geologic hazards.
11.5.1 NASA Procedural Directive 8500.1, NASA Environmental Management
Per NPD 8500.1, it is NASA policy to: maintain compliance with all applicable federal, state, and local environmental requirements; to incorporate environmental risk reduction and sustainable practices to the extent practicable throughout NASA’s programs, projects, and activities; and to consider environmental factors throughout the life cycle of programs, projects, and activities (as defined in NPD 7120.4, NASA Engineering and Program/Project Management Policy, and related documents), including planning, development, execution, and disposition activities. Examples of environmental factors include consideration of environmental impacts as required by the NEPA and NHPA; the proposed use of hazardous materials; the potential for waste generation; the need to acquire necessary permits, waivers, and authorizations; and the use of environmentally-preferable materials and processes wherever practicable.
11.5.2 Ames Procedural Requirements 8500.1, Ames Environmental Procedural Requirements
APR 8500.1 sets forth general procedural requirements to ensure compliance with applicable federal, state, and local environmental laws; regulations and EOs; and NASA policies and procedures. Organizational directors, division chiefs, branch chiefs, section heads, supervisors, managers, and CORs are responsible for planning, designing, constructing, managing, operating, and maintaining facilities in conformance with applicable regulatory directives, and should obtain environmental review from the Environmental Management Division early in project planning consistent with NASA's NEPA implementing procedures (NPR 8580.1 and EO 12114), NASA policies and procedures for programs and projects (NPR 7120), and NASA regulations related to environmental quality (14 CFR 1216). Program and project managers should coordinate with the Environmental Management Division in a timely manner to ensure that any new or modified programs, projects, and activities comply with regulatory requirements.
11.5.3 Ames Environmental Work Instructions
Ames’s EWIs, which replace the previous Ames Environmental Procedures and Guidelines (APR 8800.3), set forth requirements to ensure that programs, projects, and activities at ARC comply with applicable federal, state, and local laws; regulations and EOs; and NASA policies and procedures. Each EWI lists relevant regulatory authorities and documents,
National Aeronautics and Space Administration Chap11. Geology, Seismicity, Soils, and Mineral Resources
NASA Ames Research Center Environmental Resources Document Environmental Management Division March 2015 File: 2015 ARC ERD_FINAL.doc
Pg 198
assigns individual and organizational responsibilities within ARC, and identifies specific requirements applicable to the work being performed.
The following EWIs are relevant to operations and future development at ARC and effects related to seismic and geologic hazards.
EWI 12, Public Involvement
EWI 14, NEPA and Environmental Justice
EWI 18, Environmental Requirements for Construction Projects (Under review)
11.5.4 Measures for Seismic Safety
To the extent feasible, structures are sited and constructed to minimize the possibility of serious structural damage, human injury, and loss of life in earthquakes up to and including the design basis event. All new construction is required to meet the seismic requirements of the current CBSC. In addition, many older buildings on the site, such as Hangar 3 and Building N-210, have been or will be seismically upgraded. NASA has committed to ensuring that all future rehabilitation of historic structures within the Shenandoah Plaza Historic District follows the Guidelines for the Rehabilitation of Historic Structures developed by the Architectural Resources Group for NASA, and that all rehabilitation of historic buildings within the ARC site follows the Secretary of the Interior’s Guidelines for the Rehabilitation of Historic Structures in order to maximize seismic safety while minimizing effects on the integrity of any National Register-listed or eligible structure.
Hazards from seismically-induced settlement and liquefaction are evaluated for all new major structures. NASA Ames requires the preparation of a soils report for all new construction, and ensures that the recommendations of these studies are incorporated into building design and construction.
Certain pipelines crossing the site are very prone to damage from seismic activity. Disruption of the high-pressure air system that serves several buildings would pose a threat to safety. Damage to a utility or fuel line (for example, a break in a sewer or natural gas main) could be reasonably controlled by pipeline shutdown, prompt cleanup, and repair.
11.5.5 Soils Measures
Erosion prevention measures are implemented during all construction and grounds maintenance activities.
In addition, as discussed in Measures for Seismic Safety above, all new construction will include geotechnical analyses of proposed sites to determine the design and construction measures necessary to address the risk of structural damage from expansive and/or corrosive soils.
National Aeronautics and Space Administration Chap11. Geology, Seismicity, Soils, and Mineral Resources
NASA Ames Research Center Environmental Resources Document Environmental Management Division March 2015 File: 2015 ARC ERD_FINAL.doc
Pg 199
11.5.6 Stormwater Best Management Practices
Stormwater BMPs are implemented during all building, construction, and landscaping activities at ARC. This may include the planting and maintenance of vegetation, diversion of run-on and runoff, placement of sandbags, and silt screens or other sediment control devices. Any site where soils are exposed to water and wind and result in soil erosion5 and sedimentation6 problems.
Human activities can accelerate erosion by removing vegetation, compacting or disturbing the soil, changing natural drainage patterns and by covering the ground with impermeable surfaces (pavement, concrete, and buildings). When the land surface is developed or “hardened” in this manner, storm water cannot seep into or “infiltrate” the ground. As a result, larger amounts of water move more quickly across the site, which can carry more sediment and other pollutants to creeks and streams. Because the vegetation primarily consists of marshlands and grasslands, soil erosion prevention is not required in many areas of ARC. However, erosion prevention measures are considered during any construction and / or grounds maintenance activities.
Targeted constituents in these BMPs are:
Sediment
Heavy Metals
Toxic Materials
The requirements of these BMPs are the following:
Identify areas, which, due to topography, activities, or other factors, have a high potential for significant soil erosion, and identify structural, vegetative, and / or stabilization measures used to limit erosion
Retain as much vegetation (plants) onsite as possible
Minimize the time that soil is exposed. Water exposed areas to control dust
Prevent runoff from flowing across disturbed areas (divert the flow to vegetated areas)
Stabilize the disturbed soils as soon as possible by planting vegetation or hydroseeding
Slow down the runoff flowing across site (regrading, silt fences, planting)
Provide drainage ways for the increased runoff (use grassy swales rather than concrete drains)
Remove sediment from storm water run-off before it leaves the site
5 Erosion is a natural process in which soil and rock materials are loosened and removed.
6 Sedimentation occurs when soil particles are suspended in surface runoff or wind and are deposited in streams and other water bodies.
National Aeronautics and Space Administration Chap11. Geology, Seismicity, Soils, and Mineral Resources
NASA Ames Research Center Environmental Resources Document Environmental Management Division March 2015 File: 2015 ARC ERD_FINAL.doc
Pg 200
For large piles of soil where tarps or other covers are not feasible, place filtering media (e.g. straw bales, rocks, silt fences, etc.) around the base of each pile or at the storm drain inlet to remove these materials from rainwater run-off
11.5.7 NASA Ames Development Plan Final Programmatic Environmental Impact Statement
The NADP EIS identifies the following mitigation measures to address potential seismic and soil-related impacts from build out of NADP Mitigated Alternative 5.
11.5.7.1 Mitigation Measure GEO-1
All rehabilitation of historic structures within the Shenandoah Plaza Historic District would follow the Guidelines for the Rehabilitation of Historic Structures developed by the Architectural Resources Group for NASA and within the Ames Campus would follow the Secretary of the Interior Guidelines for the rehabilitation of Historic Structures in order to maximize seismic safety while minimizing effects on the integrity of any structure on or eligible for the National Register of Historic Places.
11.5.7.2 Mitigation Measure GEO-2
All new buildings at Ames Research Center would be designed to meet the current Uniform Building Code regulations for seismic safety.
11.5.7.3 Mitigation Measure GEO-3
All new construction would be designed based on geotechnical analyses of proposed sites to determine the structural measures necessary to counter the shrink-swell potential of the soil and the risk of structural damage from ground subsidence.
11.5.7.4 Mitigation Measure GEO-4
Prior to construction of individual facilities, NASA and its partners would conduct detailed geotechnical investigations of all proposed building sites, and would incorporate the engineering recommendations of these studies into building design and construction.
National Aeronautics and Space Administration Chap 12. Hydrology and Water Quality
NASA Ames Research Center Environmental Resources Document Environmental Management Division March 2015 File: 2015 ARC ERD_FINAL.doc
Pg 201
Chapter 12. Hydrology and Water Quality
12.1 Overview
This chapter describes water quality, including surface water drainage, stormwater management, groundwater hydrology, and surface and groundwater quality. Applicable regulations are discussed, as well relevant plans, policies, programs, measures, and BMPs adopted by NASA to protect surface water and groundwater quality at ARC. Information presented in this chapter was obtained from the November 2009 NASA ARC ERD (NASA 2009), NADP EIS (Design, Community & Environment 2002), local planning documents, and other sources.
12.2 Regulatory Background
12.2.1 Federal Regulations
12.2.1.1 Clean Water Act
The Clean Water Act (CWA) is the primary federal law that protects the quality of the nation’s surface waters, including lakes, rivers, and coastal wetlands. It operates on the principle that all discharges into the nation’s waters are unlawful unless specifically authorized by a permit; permit review is the CWA’s primary regulatory tool.
The sections of the CWA most relevant at ARC are Section 303 (Water Quality Standards and Implementation Plans) and Section 402 (National Pollutant Discharge Elimination System [NPDES]). The EPA has delegated its authority to implement and enforce the provisions of these sections to the individual states. In California, the nine Regional Water Quality Control Boards (RWQCBs) enforce the provisions under guidance from the State Water Resources Control Board (SWRCB). Additional information on the requirements imposed by CWA Sections 303, 401, and 402 is provided in Porter-Cologne.
12.2.1.2 Drinking Water Act
The Safe Drinking Water Act of 1974 (Public Law 93-523) is the principal federal law that protects the quality of the nation’s drinking water. It empowers EPA to set drinking water standards and to oversee the water providers (cities, water districts, and agencies) that actually implement those standards. It also includes provisions for the protection of surface waters and wetlands, in support of drinking water quality.
In California, EPA delegates some of its implementation authority to the SWRCB, Division of Drinking Water. The SWRCB administers a wide range of regulatory programs that include components aimed at drinking water quality and safety, such as:
Permitting for water well installation
Potable water supply monitoring requirements for public drinking water systems and new domestic wells
Regulations for septic and sewer systems
National Aeronautics and Space Administration Chap 12. Hydrology and Water Quality
NASA Ames Research Center Environmental Resources Document Environmental Management Division March 2015 File: 2015 ARC ERD_FINAL.doc
Pg 202
Regulations governing generation, handling, and discharge/disposal of hazardous materials and wastes
Regulations for USTs and solid waste disposal facilities
The following sections of the CFR contain key provisions of the Safe Drinking Water Act.
40 CFR, Part 141 (National Primary Drinking Water Regulations) and 40 CFR, Part 142 (National Primary Drinking Water Regulations Implementation): The National Primary Drinking Water Regulations are fundamental health-based standards for drinking water purity. They are enforced nationwide.
40 CFR, Part 143 (National Secondary Drinking Water Regulations) The National Secondary Drinking Water Regulations establish standards for drinking water contaminants that primarily affect aesthetic qualities such as taste, odor, and clarity, although they may have health implications at high concentrations. The secondary drinking water standards are not federally enforceable but are intended as guidelines that the states may adopt on a discretionary basis. California has elected to enforce these standards.
12.2.1.3 National Environmental Policy Act
NEPA requires federal agencies to include in their decision-making process appropriate and careful consideration of all environmental effects of a proposed action and of possible alternative actions. Measures to avoid or minimize the adverse effects of proposed actions and to restore and enhance environmental quality as much as possible must be developed and discussed where feasible.
12.2.2 State Regulations
12.2.2.1 Porter-Cologne Act and State Implementation of CWA Requirements
12.2.2.1.1 Overview
The Porter-Cologne Water Quality Control Act, passed in 1969, provides state-level requirements promulgated in the federal CWA. It established the SWRCB and divided the state into nine regions, each overseen by an RWQCB. The SWRCB is the primary state agency responsible for protecting the quality of the state’s surface and groundwater supplies, but much of its daily implementation authority is delegated to the nine RWQCBs. ARC is under the jurisdiction of the San Francisco Bay RWQCB.
Consistent with the federal CWA, the Porter-Cologne Act provides for the development and periodic review of water quality control plans (basin plans) that designate beneficial uses of California’s major rivers and groundwater basins and establish narrative and numerical water quality objectives for those waters. The purpose of water quality objectives is to protect designated beneficial uses for each basin’s waters. To ensure currency, basin plans must be updated every 3 years.
Basin plans are primarily implemented by using the NPDES permitting system to regulate waste discharges so that water quality objectives are met. Basin plans provide the technical
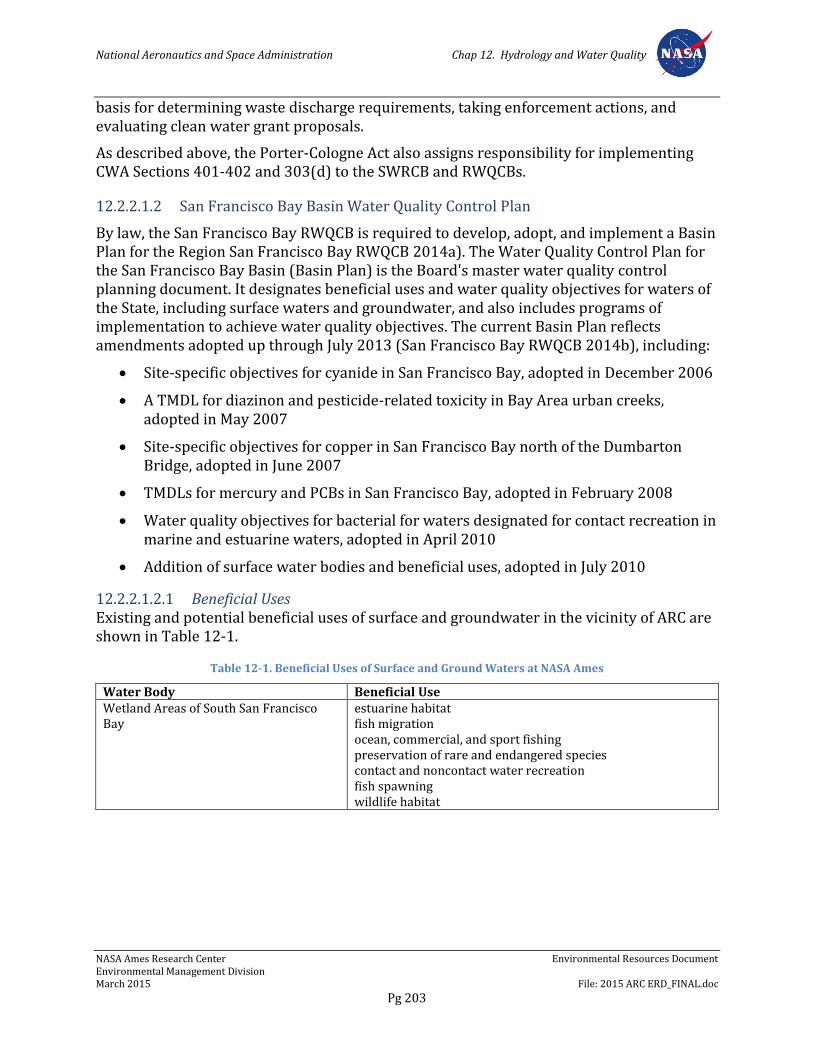
National Aeronautics and Space Administration Chap 12. Hydrology and Water Quality
NASA Ames Research Center Environmental Resources Document Environmental Management Division March 2015 File: 2015 ARC ERD_FINAL.doc
Pg 203
basis for determining waste discharge requirements, taking enforcement actions, and evaluating clean water grant proposals.
As described above, the Porter-Cologne Act also assigns responsibility for implementing CWA Sections 401-402 and 303(d) to the SWRCB and RWQCBs.
12.2.2.1.2 San Francisco Bay Basin Water Quality Control Plan
By law, the San Francisco Bay RWQCB is required to develop, adopt, and implement a Basin Plan for the Region San Francisco Bay RWQCB 2014a). The Water Quality Control Plan for the San Francisco Bay Basin (Basin Plan) is the Board's master water quality control planning document. It designates beneficial uses and water quality objectives for waters of the State, including surface waters and groundwater, and also includes programs of implementation to achieve water quality objectives. The current Basin Plan reflects amendments adopted up through July 2013 (San Francisco Bay RWQCB 2014b), including:
Site-specific objectives for cyanide in San Francisco Bay, adopted in December 2006
A TMDL for diazinon and pesticide-related toxicity in Bay Area urban creeks, adopted in May 2007
Site-specific objectives for copper in San Francisco Bay north of the Dumbarton Bridge, adopted in June 2007
TMDLs for mercury and PCBs in San Francisco Bay, adopted in February 2008
Water quality objectives for bacterial for waters designated for contact recreation in marine and estuarine waters, adopted in April 2010
Addition of surface water bodies and beneficial uses, adopted in July 2010
12.2.2.1.2.1 Beneficial Uses Existing and potential beneficial uses of surface and groundwater in the vicinity of ARC are shown in Table 12-1.
Table 12-1. Beneficial Uses of Surface and Ground Waters at NASA Ames
Water Body Beneficial Use Wetland Areas of South San Francisco Bay
estuarine habitat fish migration ocean, commercial, and sport fishing preservation of rare and endangered species contact and noncontact water recreation fish spawning wildlife habitat
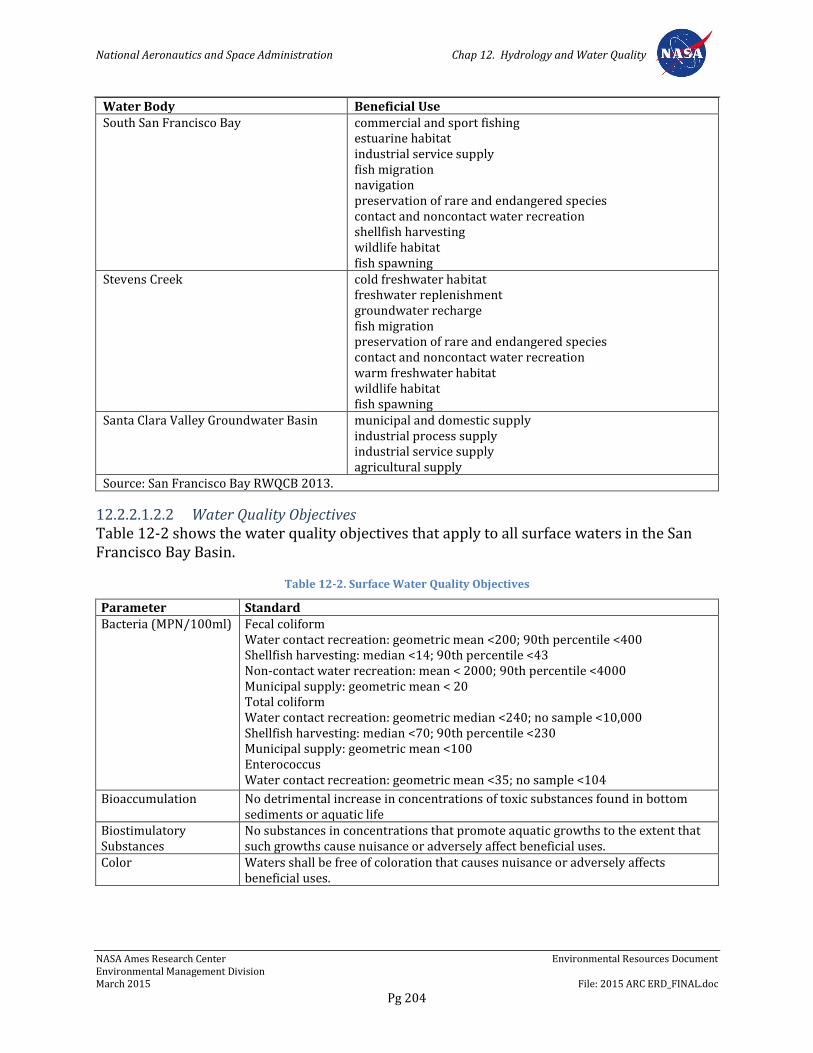
National Aeronautics and Space Administration Chap 12. Hydrology and Water Quality
NASA Ames Research Center Environmental Resources Document Environmental Management Division March 2015 File: 2015 ARC ERD_FINAL.doc
Pg 204
Water Body Beneficial Use South San Francisco Bay commercial and sport fishing
estuarine habitat industrial service supply fish migration navigation preservation of rare and endangered species contact and noncontact water recreation shellfish harvesting wildlife habitat fish spawning
Stevens Creek cold freshwater habitat freshwater replenishment groundwater recharge fish migration preservation of rare and endangered species contact and noncontact water recreation warm freshwater habitat wildlife habitat fish spawning
Santa Clara Valley Groundwater Basin municipal and domestic supply industrial process supply industrial service supply agricultural supply
Source: San Francisco Bay RWQCB 2013.
12.2.2.1.2.2 Water Quality Objectives Table 12-2 shows the water quality objectives that apply to all surface waters in the San Francisco Bay Basin.
Table 12-2. Surface Water Quality Objectives
Parameter Standard Bacteria (MPN/100ml)
Fecal coliform Water contact recreation: geometric mean <200; 90th percentile <400 Shellfish harvesting: median <14; 90th percentile <43 Non-contact water recreation: mean < 2000; 90th percentile <4000 Municipal supply: geometric mean < 20 Total coliform Water contact recreation: geometric median <240; no sample <10,000 Shellfish harvesting: median <70; 90th percentile <230 Municipal supply: geometric mean <100 Enterococcus Water contact recreation: geometric mean <35; no sample <104
Bioaccumulation No detrimental increase in concentrations of toxic substances found in bottom sediments or aquatic life
Biostimulatory Substances
No substances in concentrations that promote aquatic growths to the extent that such growths cause nuisance or adversely affect beneficial uses.
Color Waters shall be free of coloration that causes nuisance or adversely affects beneficial uses.
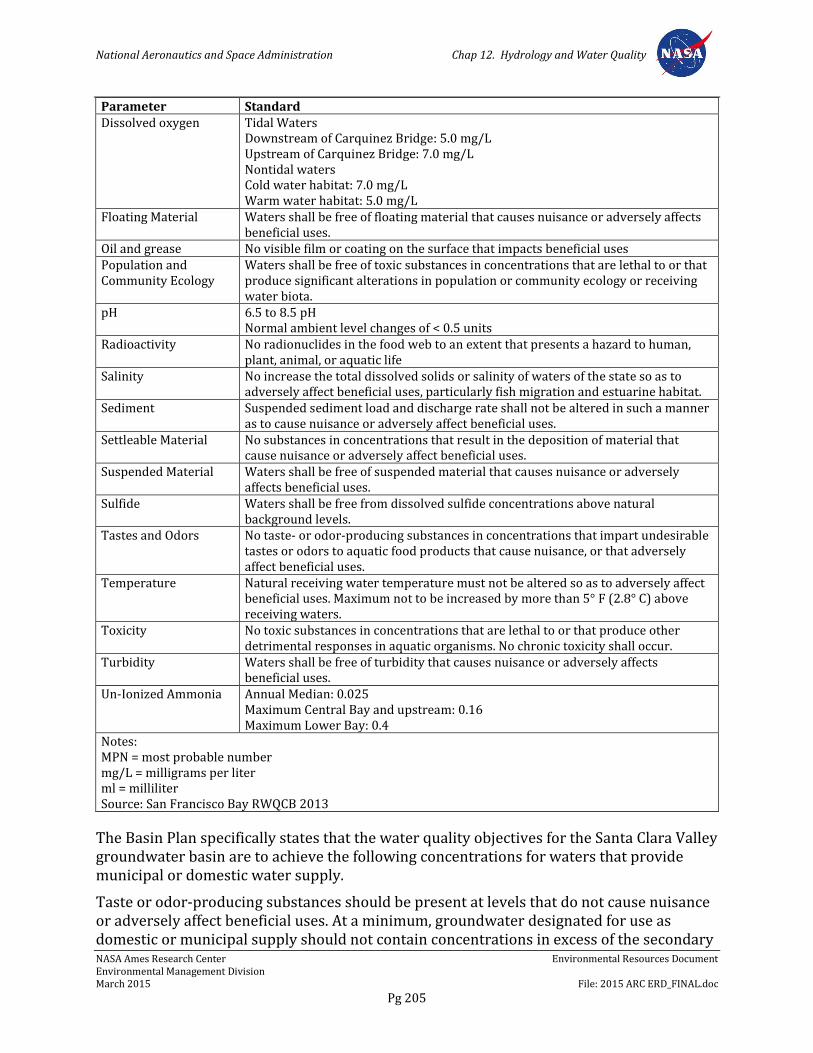
National Aeronautics and Space Administration Chap 12. Hydrology and Water Quality
NASA Ames Research Center Environmental Resources Document Environmental Management Division March 2015 File: 2015 ARC ERD_FINAL.doc
Pg 205
Parameter Standard Dissolved oxygen Tidal Waters
Downstream of Carquinez Bridge: 5.0 mg/L Upstream of Carquinez Bridge: 7.0 mg/L Nontidal waters Cold water habitat: 7.0 mg/L Warm water habitat: 5.0 mg/L
Floating Material Waters shall be free of floating material that causes nuisance or adversely affects beneficial uses.
Oil and grease No visible film or coating on the surface that impacts beneficial uses Population and Community Ecology
Waters shall be free of toxic substances in concentrations that are lethal to or that produce significant alterations in population or community ecology or receiving water biota.
pH 6.5 to 8.5 pH Normal ambient level changes of < 0.5 units
Radioactivity No radionuclides in the food web to an extent that presents a hazard to human, plant, animal, or aquatic life
Salinity No increase the total dissolved solids or salinity of waters of the state so as to adversely affect beneficial uses, particularly fish migration and estuarine habitat.
Sediment Suspended sediment load and discharge rate shall not be altered in such a manner as to cause nuisance or adversely affect beneficial uses.
Settleable Material No substances in concentrations that result in the deposition of material that cause nuisance or adversely affect beneficial uses.
Suspended Material Waters shall be free of suspended material that causes nuisance or adversely affects beneficial uses.
Sulfide Waters shall be free from dissolved sulfide concentrations above natural background levels.
Tastes and Odors No taste- or odor-producing substances in concentrations that impart undesirable tastes or odors to aquatic food products that cause nuisance, or that adversely affect beneficial uses.
Temperature Natural receiving water temperature must not be altered so as to adversely affect beneficial uses. Maximum not to be increased by more than 5° F (2.8° C) above receiving waters.
Toxicity No toxic substances in concentrations that are lethal to or that produce other detrimental responses in aquatic organisms. No chronic toxicity shall occur.
Turbidity Waters shall be free of turbidity that causes nuisance or adversely affects beneficial uses.
Un-Ionized Ammonia Annual Median: 0.025 Maximum Central Bay and upstream: 0.16 Maximum Lower Bay: 0.4
Notes: MPN = most probable number mg/L = milligrams per liter ml = milliliter Source: San Francisco Bay RWQCB 2013
The Basin Plan specifically states that the water quality objectives for the Santa Clara Valley groundwater basin are to achieve the following concentrations for waters that provide municipal or domestic water supply.
Taste or odor-producing substances should be present at levels that do not cause nuisance or adversely affect beneficial uses. At a minimum, groundwater designated for use as domestic or municipal supply should not contain concentrations in excess of the secondary
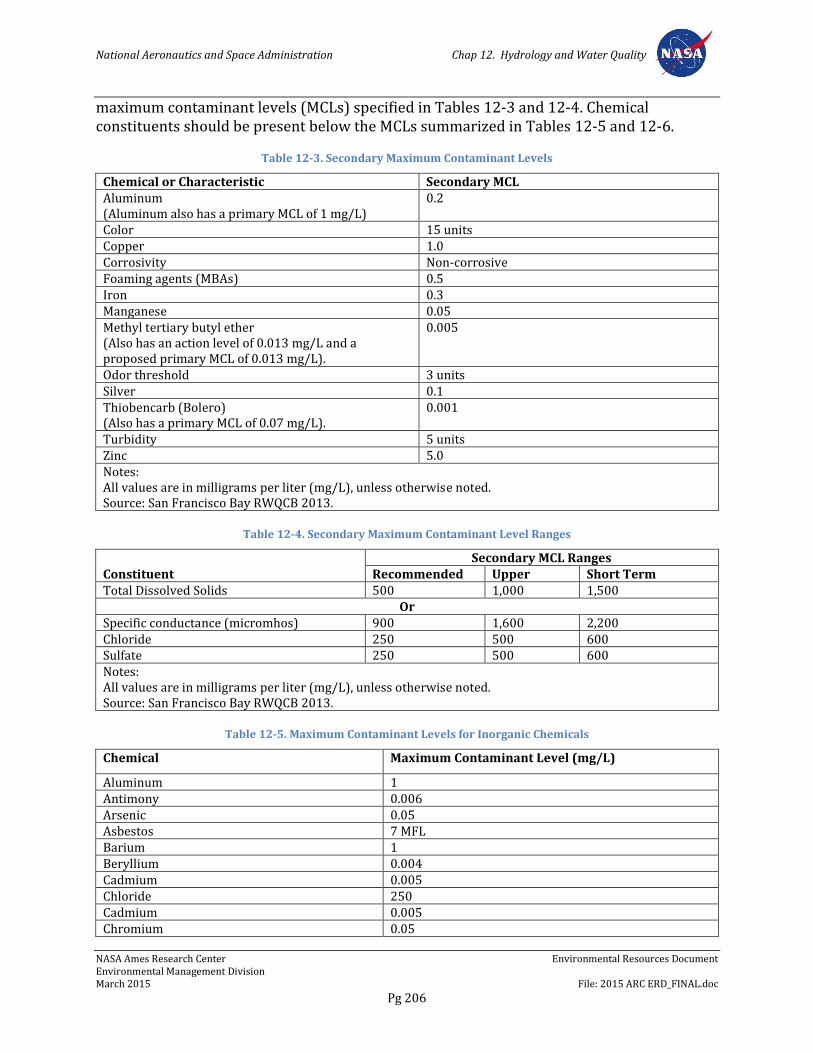
National Aeronautics and Space Administration Chap 12. Hydrology and Water Quality
NASA Ames Research Center Environmental Resources Document Environmental Management Division March 2015 File: 2015 ARC ERD_FINAL.doc
Pg 206
maximum contaminant levels (MCLs) specified in Tables 12-3 and 12-4. Chemical constituents should be present below the MCLs summarized in Tables 12-5 and 12-6.
Table 12-3. Secondary Maximum Contaminant Levels
Chemical or Characteristic Secondary MCL Aluminum (Aluminum also has a primary MCL of 1 mg/L)
0.2
Color 15 units Copper 1.0 Corrosivity Non-corrosive Foaming agents (MBAs) 0.5 Iron 0.3 Manganese 0.05 Methyl tertiary butyl ether (Also has an action level of 0.013 mg/L and a proposed primary MCL of 0.013 mg/L).
0.005
Odor threshold 3 units Silver 0.1 Thiobencarb (Bolero) (Also has a primary MCL of 0.07 mg/L).
0.001
Turbidity 5 units Zinc 5.0 Notes: All values are in milligrams per liter (mg/L), unless otherwise noted. Source: San Francisco Bay RWQCB 2013.
Table 12-4. Secondary Maximum Contaminant Level Ranges
Constituent Secondary MCL Ranges
Recommended Upper Short Term Total Dissolved Solids 500 1,000 1,500
Or Specific conductance (micromhos) 900 1,600 2,200 Chloride 250 500 600 Sulfate 250 500 600 Notes: All values are in milligrams per liter (mg/L), unless otherwise noted. Source: San Francisco Bay RWQCB 2013.
Table 12-5. Maximum Contaminant Levels for Inorganic Chemicals
Chemical Maximum Contaminant Level (mg/L)
Aluminum 1 Antimony 0.006 Arsenic 0.05 Asbestos 7 MFL Barium 1 Beryllium 0.004 Cadmium 0.005 Chloride 250 Cadmium 0.005 Chromium 0.05

National Aeronautics and Space Administration Chap 12. Hydrology and Water Quality
NASA Ames Research Center Environmental Resources Document Environmental Management Division March 2015 File: 2015 ARC ERD_FINAL.doc
Pg 207
Chemical Maximum Contaminant Level (mg/L)
Copper 1 Cyanide 0.15 Fluoride 0.6-1.7 Iron 0.3 Lead 0.05 Manganese 0.05 Mercury 0.002 Nickel 0.1 Nitrate (as NO3) 45 Nitrate + Nitrite (sum as nitrogen) 10 Nitrite (as nitrogen) 1 Selenium 0.05 Silver 0.1 Sulfate 250 Thallium 0.002 Zinc 5 Notes: mg/L = micrograms per liter. MFL = million fibers per liter; MCL for fibers exceeding 10 micrometers in length. Source: San Francisco Bay RWQCB 2013.
Table 12-6. Maximum Contaminant Levels for Organic Chemicals
Chemical Maximum Contaminant Level (mg/L) (a) Volatile Organic Chemicals Benzene 0.001 Carbon tetrachloride 0.0005 1,2-Dichlorobenzene 0.6 1,4-Dichlorobenzene 0.005 1,1-Dichloroethane 0.005 1,2-Dichloroethane 0.0005 1,1-Dichloroethylene 0.006 Cis-1,2-Dichloroethylene 0.006 Trans-1,2-Dichloroethylene 0.01 Dichloromethane 0.005 1,2-Dichloropropane 0.005 1,3-Dichloropropene 0.0005 Ethylbenzene 0.7 Monochlorobenzene 0.07 Styrene 0.1 1,1,2,2-Tetrachloroethane 0.0001 Tetrachloroethylene 0.005 Toluene 0.15 1,2,4-Trichlorobenzene 0.005 1,1,1-Trichloroethane 0.200 1,1,2-Trichloroethane 0.005 Trichloroethylene 0.005 Trichlorofluoromethane 0.15 1,1,2-Trichloro-1,2,2-Trifluoroethane 1.2 Vinyl Chloride 0.0005 Xylenes 1.750
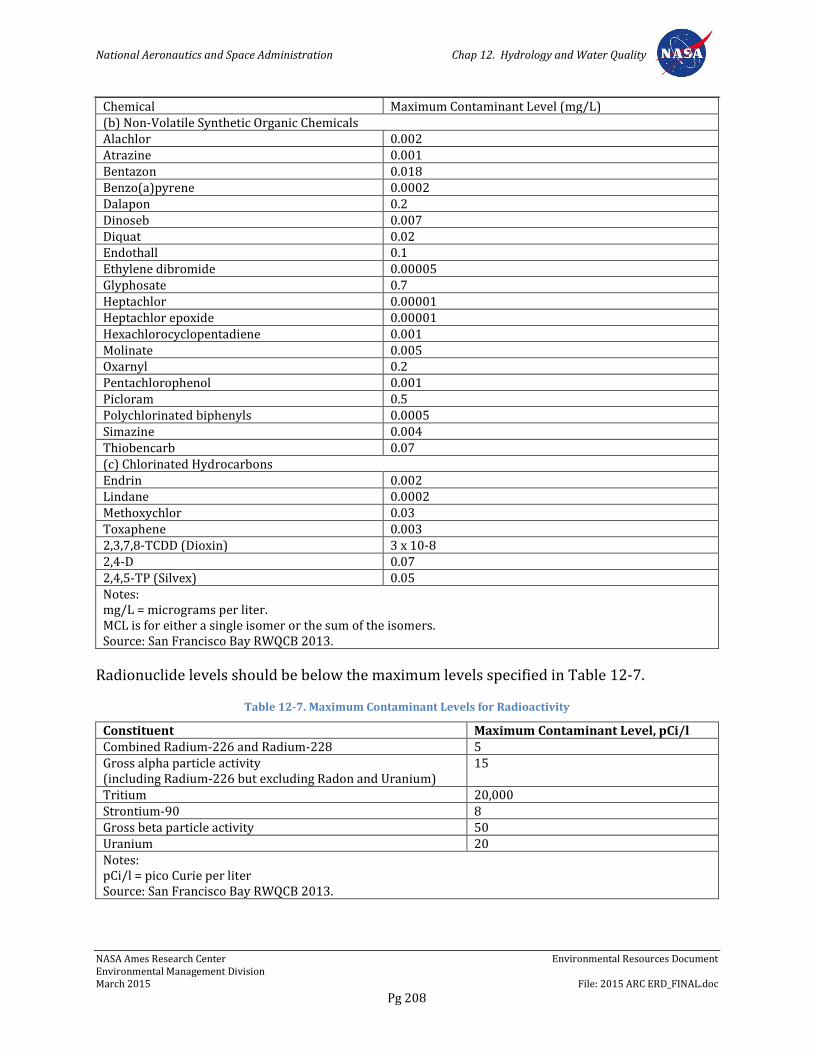
National Aeronautics and Space Administration Chap 12. Hydrology and Water Quality
NASA Ames Research Center Environmental Resources Document Environmental Management Division March 2015 File: 2015 ARC ERD_FINAL.doc
Pg 208
Chemical Maximum Contaminant Level (mg/L) (b) Non-Volatile Synthetic Organic Chemicals Alachlor 0.002 Atrazine 0.001 Bentazon 0.018 Benzo(a)pyrene 0.0002 Dalapon 0.2 Dinoseb 0.007 Diquat 0.02 Endothall 0.1 Ethylene dibromide 0.00005 Glyphosate 0.7 Heptachlor 0.00001 Heptachlor epoxide 0.00001 Hexachlorocyclopentadiene 0.001 Molinate 0.005 Oxarnyl 0.2 Pentachlorophenol 0.001 Picloram 0.5 Polychlorinated biphenyls 0.0005 Simazine 0.004 Thiobencarb 0.07 (c) Chlorinated Hydrocarbons Endrin 0.002 Lindane 0.0002 Methoxychlor 0.03 Toxaphene 0.003 2,3,7,8-TCDD (Dioxin) 3 x 10⁻⁸ 2,4-D 0.07 2,4,5-TP (Silvex) 0.05 Notes: mg/L = micrograms per liter. MCL is for either a single isomer or the sum of the isomers. Source: San Francisco Bay RWQCB 2013.
Radionuclide levels should be below the maximum levels specified in Table 12-7.
Table 12-7. Maximum Contaminant Levels for Radioactivity
Constituent Maximum Contaminant Level, pCi/l Combined Radium-226 and Radium-228 5 Gross alpha particle activity (including Radium-226 but excluding Radon and Uranium)
15
Tritium 20,000 Strontium-90 8 Gross beta particle activity 50 Uranium 20 Notes: pCi/l = pico Curie per liter Source: San Francisco Bay RWQCB 2013.
National Aeronautics and Space Administration Chap 12. Hydrology and Water Quality
NASA Ames Research Center Environmental Resources Document Environmental Management Division March 2015 File: 2015 ARC ERD_FINAL.doc
Pg 209
12.2.2.2 State Responsibility for CWA Section 303 - Total Maximum Daily Load Program
12.2.2.2.1 Overview
Section 303(d) of CWA established the total maximum daily load (TMDL) process to guide and ensure the application of state water quality standards. A TMDL represents the maximum amount or concentration of a given pollutant allowable in a given water body, based on the nature of the water body and its designated beneficial uses.
To identify water bodies in which TMDLs may be needed, SWRCB maintains a “Section 303(d) list” of water bodies in which water quality is impaired.7 The most urgent impairments are prioritized for development of TMDL programs, which establish a means of limiting pollutant input. The goal of a TMDL program is to reduce the concentration of a specific contaminant over a specified period. Once a TMDL program has been adopted by the local RWQCB, activities within the watershed that contains the impaired water body are prohibited from increasing the concentration of the contaminant(s) addressed in the TMDL.
12.2.2.2.2 Impaired Water Bodies At and Near NASA Ames
South San Francisco Bay and Stevens Creek are both identified as water quality-impaired on the current 303(d) list (SWRCB 2010). South San Francisco Bay is listed as impaired for chlordane, Dichlorodiphenyltrichloroethane (DDT), diazinon, dieldrin, dioxin compounds, invasive species, furan compounds, mercury, PCBs, and selenium. Stevens Creek is impaired for diazinon. South San Francisco Bay is on the monitoring list for impairment by trash. Stevens Creek is identified as water quality-impaired for diazinon, trash, temperature, and toxicity in 2010.
12.2.2.3 State Responsibility for CWA Section 402 - NPDES Program
12.2.2.3.1 Overview
CWA Section 402, enacted as an amendment to the original act in 1972, regulates discharges of pollutants from point sources to surface waters. It established the NPDES program, overseen by EPA and administered in California by the RWQCBs under the auspices of the SWRCB. Additional amendments to CWA in 1987 created a new subsection of the act (Section 402(p)) devoted to permitting for discharges of stormwater.
The NPDES program provides for two types of permits: general permits (those that cover a number of similar or related activities) and individual permits (those issued on a project-by-project basis). For example, all construction activities affecting more than 1 acre are regulated under the NPDES General Permit for Discharges of Storm Water Runoff associated with Construction Activity.
7 A stream, lake, or other water body is said to be impaired for a pollutant if established water quality standards for that water body are not met despite implementation of technology-based controls on point sources of pollutant input.
National Aeronautics and Space Administration Chap 12. Hydrology and Water Quality
NASA Ames Research Center Environmental Resources Document Environmental Management Division March 2015 File: 2015 ARC ERD_FINAL.doc
Pg 210
12.2.2.3.2 NASA Ames Stormwater Discharge Permit
Each year, ARC (including the airfield) submits a Storm Water Annual Report in accordance with its General Permit (No. CAS000001) for Discharges of Storm Water Associated with Industrial Activities. The Storm Water Annual Report includes information on monitoring observations and results, stormwater sampling results, annual inspection reporting, and the effectiveness of the Storm Water Pollution Prevention Plan (SWPPP). It also provides certification that the SWPPP is being implemented and complies with the requirements of the general permit.
The SWPPP was developed in accordance with good engineering practices to comply with federal Best Available Technology/Best Conventional Pollution Control Technology requirements and to meet the following specific objectives:
To identify and evaluate sources of pollutants associated with industrial activities that may affect the quality of stormwater discharges and authorized non-stormwater discharges from the facility
To identify and implement site-specific BMPs to reduce or eliminate pollutants associated with industrial activities in stormwater discharges and authorized non-stormwater discharges
The SWPPP is updated periodically to ensure it addresses all existing and new storm water concerns. It undergoes formal revision approximately every 5 years.
12.2.2.4 Drinking Water Standards
Title 22 of the CCR outlines drinking water standards in the State of California. MCLs for various contaminants are made enforceable regulatory standards under the federal Safe Drinking Water Act. MCL standards must be met by all public drinking water systems to which they apply. Primary MCLs can be found in 22 CCR Sections 64431-64444. Specific regulations for lead and copper are in 22 CCR Section 64670 et seq. Secondary MCLs that address the taste, odor, and appearance of drinking water are found in 22 CCR Section 64449.
Drinking water is also regulated pursuant to the Safe Drinking Water and Toxic Enforcement Act of 1986 (Proposition 65) (CCR Sections 12000–14000, California Health and Safety Code Sections 25249.5–25249.1365). Among other things, California’s Safe Drinking Water and Toxic Enforcement Act prohibits companies from knowingly discharging listed chemicals into sources of drinking water. Government agencies are exempt from its requirements; it does not apply to federal activities at ARC. Nonfederal resident agencies and other nonfederal users at ARC are not exempt.
12.2.2.5 Policy for Implementation of Toxics Standards for Inland Surface Waters, Enclosed Bays, and Estuaries of California
The state’s Policy for Implementation of Toxics Standards for Inland Surface Waters, Enclosed Bays, and Estuaries of California (SWRCB 2005) established new standards for a variety of toxic pollutants. The goal of this policy is to establish a standardized approach for permitting discharges of toxic pollutants to non-ocean surface waters in a manner that
National Aeronautics and Space Administration Chap 12. Hydrology and Water Quality
NASA Ames Research Center Environmental Resources Document Environmental Management Division March 2015 File: 2015 ARC ERD_FINAL.doc
Pg 211
promotes statewide consistency. Accordingly, the policy is a tool to be used in conjunction with watershed management approaches and, where appropriate, the development of TMDLs to ensure that water quality standards are met and beneficial uses are protected. It applies to discharges of toxic pollutants into California’s inland surface waters, enclosed bays, and estuaries subject to regulation under the Porter-Cologne Water Quality Control Act and CWA. Such regulation may occur through the issuance of NPDES permits, the issuance or waiver of waste discharge requirements, or other regulatory approaches.
The SIP establishes implementation provisions for priority pollutant criteria established by EPA through the National Toxics Rule and the California Toxics Rule, and for priority pollutant objectives established by the RWQCBs in their respective basin plans. It also sets forth monitoring requirements for 2,3,7,8-TCDD equivalents and chronic toxicity control provisions, as well as special provisions for certain types of discharges and factors that could affect the application of the SIP such as nonpoint source discharges, site-specific objectives, and categorical and case-by-case exceptions as granted by the SWRCB or applicable RWQCB.
12.2.2.6 Groundwater Management Act (Assembly Bill 3030)
California’s Groundwater Management Act (Water Code Sections 10750-10756) gives existing local agencies expanded authority over the management of groundwater resources in basins recognized by the Department of Water Resources. Its intent is to promote the voluntary development of groundwater management plans in order to ensure stable groundwater supplies for the future.
The act identifies the required technical components of a groundwater management plan. It also stipulates procedures for adopting a groundwater management plan, including passage of a formal resolution of intent to adopt a plan, and holding a public hearing on the proposed plan. The act also requires agencies to establish rules and regulations to implement an adopted plan, and empowers agencies to raise funds to pay for the facilities needed to manage the basin, such as extraction wells, conveyance infrastructure, recharge facilities, and testing and treatment facilities.
12.2.3 Local Regulations
12.2.3.1 Santa Clara County
12.2.3.1.1 Santa Clara Valley Urban Runoff Pollution Prevention Program
The Santa Clara Valley Urban Runoff Pollution Prevention Program was created by an association of 13 cities and towns in the Santa Clara Valley, together with Santa Clara County and the Santa Clara Valley Water District. Its mission is to assist in the protection of beneficial uses of receiving waters by preventing pollutants generated by activities in urban service areas from entering runoff, to the extent feasible. The member agencies share a common NPDES Permit for Discharge of Storm Water to South San Francisco Bay. As a condition of the permit, the agencies created an Urban Runoff Management Plan, which identifies the activities various city departments are required to undertake in order to comply with the federal and state requirements of the stormwater permit. The plan
National Aeronautics and Space Administration Chap 12. Hydrology and Water Quality
NASA Ames Research Center Environmental Resources Document Environmental Management Division March 2015 File: 2015 ARC ERD_FINAL.doc
Pg 212
includes regulatory, monitoring, and outreach measures, as well as measures designed to restore a natural flow hydrograph in urban streams.
12.2.3.1.2 Santa Clara County General Plan
Recognizing the importance of maintaining and improving the Santa Clara County’s water quality both to ensure continuing water supply and to preserve aquatic and wetland habitat, the County General Plan includes several strategies for water quality protection, such as reducing nonpoint source pollution; restoring wetlands, riparian areas, and other habitats that improve bay water quality; and implementing watershed management planning. Specific County policies relevant to water quality include (Santa Clara County 1994):
Adequate safeguards for water resources and habitats should be developed and enforced to avoid or minimize water pollution, including organic matter and wastes, pesticides and herbicides, effluent from municipal wastewater treatment plants, chemicals used in industrial and commercial activities and processes, industrial wastewater discharges, hazardous wastes, and nonpoint source pollution
Multi-jurisdictional, countywide programs and regulatory efforts to address water pollution problems should have the full support and participation of each jurisdiction within Santa Clara County, including federal agencies
The County has also prepared a riparian protection ordinance that would provide for the protection and enhancement of riparian habitat along designated streams in the County.
12.2.3.1.3 City of Mountain View
The Mountain View 2030 General Plan (City of Mountain View 2012) contains the following relevant goals and policies related to water quality.
Goal INC-8: An effective and innovative stormwater drainage system that protects properties from flooding and minimizes adverse environmental impacts from stormwater runoff.
Policy INC 8.1: Citywide stormwater system. Maintain the stormwater system in good condition.
Policy INC 8.2: National Pollutant Discharge Elimination System (NPDES) Permit. Comply with requirements in the Municipal Regional Stormwater NPDES Permit.
Policy INC 8.3: Cost-effective strategies. Encourage stormwater strategies that minimize additional City administrative and maintenance costs.
Policy INC 8.4: Runoff pollution prevention. Reduce the amount of stormwater runoff and stormwater pollution entering creeks, water channels and the San Francisco Bay through participation in the Santa Clara Valley Urban Runoff Pollution Prevention Program.
National Aeronautics and Space Administration Chap 12. Hydrology and Water Quality
NASA Ames Research Center Environmental Resources Document Environmental Management Division March 2015 File: 2015 ARC ERD_FINAL.doc
Pg 213
Policy INC 8.5: Site-specific stormwater treatment. Require post-construction stormwater treatment controls consistent with MRP requirements for both new development and redevelopment projects.
Policy INC 8.6: Green streets. Seek opportunities to develop green streets and sustainable streetscapes that minimize stormwater runoff, using techniques such as onstreet bio-swales, bio-retention, permeable pavement or other innovative approaches.
Policy INC 8.7: Stormwater quality. Improve the water quality of stormwater and reduce flow quantities.
12.2.3.1.4 City of Sunnyvale
The City of Sunnyvale General Plan (City of Sunnyvale, 2011a) contains the following relevant goals and policies in Chapter 6, Safety and Noise, and Chapter 7, Environmental Management, related to hydrology, water quality, and flooding.
Goal EM-10: Reduce runoff and pollutant discharge.
Policy EM-8.3: Ensure that stormwater control measures and Best Management Practices (BMPs) are implemented to reduce the discharge of pollutants in stormwater to the maximum extent practicable.
Goal SN-1: Acceptable levels of risk for natural and human-caused hazards.
Policy SN-1.3: Operate and maintain the storm drainage system at a level to minimize damages and ensure public safety.
The City of Sunnyvale Municipal Code includes requirements to manage water flows and improve the quality of stormwater runoff (Sunnyvale Municipal Code, Chapter 12.60). Requirements include:
BMPs for erosion control and stormwater management, such as soil/stock pile stabilization, for major projects to achieve measurable reduction in stormwater runoff and manage stormwater quality. Requirements for Low Impact Design, the goal of which is “to reduce runoff and mimic a site’s predevelopment hydrology by implementing specific practices to control sources of potential pollution and site design strategies to treat stormwater” design criteria for stormwater treatment measures based on the area of impervious surface present at a site
A requirement to develop site-specific stormwater management plans, including selection, implementation, and maintenance of stormwater BMPs
12.3 Regional setting
12.3.1 Climate and Precipitation
Like the rest of California’s central coast, the South Bay region experiences a Mediterranean-type climate characterized by mild, wet winters and warm, dry summers. Moderated by proximity to the San Francisco Bay and the ocean, temperatures are seldom

National Aeronautics and Space Administration Chap 12. Hydrology and Water Quality
NASA Ames Research Center Environmental Resources Document Environmental Management Division March 2015 File: 2015 ARC ERD_FINAL.doc
Pg 214
below freezing. Summer weather is dominated by sea breezes caused by differential heating between the interior valleys and the coast, while winter weather is dominated by storms from the northern Pacific Ocean that produce nearly all the annual rainfall.
Most precipitation in the region falls during the winter, when severe storms are frequent. During December, January, and February, the monthly precipitation is approximately 7 centimeters (2.7 inches), decreasing to 2.5 to 5 centimeters (1 to 2 inches) per month during the early spring. Less precipitation falls during the late spring and summer; from May through September, rainfall averages less than 1.25 centimeters (0.5 inch) per month. The average annual rainfall at ARC is approximately 35 centimeters (13.5 inches).
California experiences weather related to El Niño approximately every 3 to 7 years. An El Niño year results from changes in the distribution of heat and rainfall in the equatorial Pacific Ocean such that seawater warms and the region of thunderstorm activity moves eastward. Depending on the position of the jet stream in northern California, a strong El Niño is often associated with powerful Pacific storms and unusually wet winters in the state. El Niño storms generate high winds, producing record rainfall amounts, and can result in flooding throughout California. The most recent El Niño winter (1997-1998) was typical of this pattern, although according to Palo Alto City records, the 1997-1998 El Niño did not reach 100-year storm levels; the 30 inches that fell is typical of an 80-year storm.
12.3.2 Surface Water
12.3.2.1 Surface Water Drainage
Surface waters include rivers, streams, and lakes (collectively described as inland surface waters), estuarine waters, and coastal waters. There are three major surface water bodies in the vicinity of ARC: San Francisco Bay, Stevens Creek, and the Guadalupe Slough San Francisco Bay, located approximately 1.6 kilometers (1 mile) north of ARC, is the second-largest bay on the Pacific Coast, with a surface area of approximately 1,090 square kilometers (420 square miles) at mean high water. San Francisco Bay has approximately 445 kilometers (275 miles) of shoreline exclusive of islands, and is bordered by 335 square kilometers (130 square miles) of tidal flats and marshes. It receives surface water and groundwater inflow from the entire San Francisco Basin.
Surface waters of the County drain from the Santa Cruz Mountains in the west to the southern portion of the San Francisco Bay. Principal drainages of the western County are Stevens Creek, San Tomas Aquino Creek, and the Guadalupe River system.
Stevens Creek forms the western boundary of ARC and drains a watershed of 99.33 square kilometers (38.35 square miles). It is a perennial stream, although flow varies seasonally. Along with three other area streams, Stevens Creek receives stormwater discharge from the City of Mountain View storm drain system. Stevens Creek also received treated groundwater from the MEW and NASA sites. Stevens Creek discharges to San Francisco Bay.
Guadalupe Slough is located approximately 3.2 kilometers (2 miles) northeast of ARC and is fed by San Tomas Aquino Creek and the Moffett Channel. The Guadalupe Slough flows year-round, with seasonal variability.
National Aeronautics and Space Administration Chap 12. Hydrology and Water Quality
NASA Ames Research Center Environmental Resources Document Environmental Management Division March 2015 File: 2015 ARC ERD_FINAL.doc
Pg 215
12.3.3 Groundwater
ARC is within the Santa Clara Valley groundwater basin, the largest of 31 identified groundwater basins adjoining the San Francisco Bay. The basin contains 622 square kilometers (240 square miles) of principal aquifers and has a storage capacity of 3.7 trillion liters (3 million acre-feet) in the upper 300 meters (1,000 feet) of subsurface depth. Principal areas of recharge are located.
Groundwater in the Santa Clara Valley drains north toward San Francisco Bay. The main pumping zones are the confined aquifers located at depths of 60 meters (200 feet) or more in the interior portion of the basin, together with the forebay along the elevated edges of the basin. The estimated safe perennial yield of the basin is about 120 billion liters (100,000 acre-feet).
Historically, groundwater was a major supply of municipal, industrial, and agricultural water for the County. Beginning in the 1930s, however, serious overdrafts caused rapidly declining water tables, deteriorating water quality (in part as a result of salt-water intrusion), and marked ground subsidence in parts of the valley. To alleviate these problems, the Santa Clara Valley Water District constructed a series of surface reservoirs in the 1960s to promote artificial recharge of aquifers. Artificial recharge, combined with increased importation of water and control of production rates, allows the water table to rise during average or wetter-than-average years, and decline only slightly in drier-than-average years. Currently, groundwater provides about 50% of the County’s total water supply, and subsidence is no longer considered a serious problem.
12.3.4 Water Quality
Geologic processes and land use activities in upstream areas of the drainage basin influence the quality of surface waters. In a natural system, surface water quality depends primarily on the mineral composition of the rocks in the upper headwater areas of the stream. Farther downstream, water quality is influenced by the mineral composition of the materials over which water flows, and by contributions from tributaries. In urban or developed streams, water quality is also affected by input from various types of point and nonpoint pollutant sources.
Point source pollution is discharged from a discrete source, such as the outfall from a pipe. Many types of pollutants can occur in point source discharges, depending on the pollutant source. By contrast, nonpoint source pollution is derived from widespread sources or runoff over large areas of land, and has no single location of discharge. Nonpoint source pollutants can enter waterways through urban and/or agricultural runoff, groundwater discharge, and atmospheric deposition. Typical nonpoint source pollutants include inorganic chemicals (salts, metals, and biostimulatory nutrients, such as nitrogen and phosphorus), suspended solids, pesticides, bacteria, oil and grease, and contaminants such as heavy metals that accumulate on the ground surface.
The quality of groundwater stored in aquifers reflects the geology of the basin, the quality of recharge waters, and land uses. Groundwater typically contains an elevated level of minerals or salts, depending on the type of rock or sediment that forms the aquifer. In some cases, the concentrations of minerals or salts are too high for potable uses. Land use factors
National Aeronautics and Space Administration Chap 12. Hydrology and Water Quality
NASA Ames Research Center Environmental Resources Document Environmental Management Division March 2015 File: 2015 ARC ERD_FINAL.doc
Pg 216
that can influence groundwater quality include water withdrawals, artificial recharge, consumer waste landfills, underground chemical storage tanks, and various types of accidental chemical spills and releases. These land uses have the potential to contaminate the underground water supply, consequently preventing potable or other water use.
12.4 Existing Site Conditions
12.4.1 Surface Water at NASA Ames
12.4.1.1 Historic Surface Water Hydrology
ARC is located in the Stevens Creek watershed. Historically (prior to construction of ARC), surface drainage at the site flowed toward the creek and ultimately north toward San Francisco Bay. Tidal marsh historically covered a larger area, including a portion of the northern area of what is now ARC. Stevens Creek may have had a meandering channel that supported a marsh wetland corridor.
12.4.1.2 Present Surface Water Hydrology
The hydrologic network at ARC no longer flows directly to Stevens Creek and its native marshland areas. Historic surface flow pathways have been altered such that drainage channels function to control and remove stormwater runoff from developed areas, as opposed to the natural function that would allow flooding of adjacent lands. Runoff from impervious surfaces, such as paved lots and building roofs, is now collected and diverted to the SWRP and Northern Channel at the north end of the site.
The ARC drainage area consists of about 680 hectares (1,690 acres) and is served by two drainage systems (Figure 12-1). The first system, referred to as the western drainage system, encompasses approximately 275 hectares (680 acres) and serves the (NRP area, most of the Ames Campus area, Wesctoat Village military housing, and the Bay View area. The majority of this drainage discharges into the SWRP after passing through a sediment settling basin located within the southern portion of the Eastern Diked Marsh which flows into the SWRP. The Bay View area drainage flows directly into the Western Diked Marsh which discharges into the SWRP. The second drainage system, referred to as the eastern drainage system, encompasses approximately 410 hectares (1,010 acres). This system serves the southeast portion of the NRP area, the Ames Campus facilities next to the runway, the Eastside/Airfield area, and the CANG area. There is no direct connection between the eastern drainage system and the SWRP, and local flooding occurs in the northern part of the airfield during peak rainfall events due to lack of adequate drainage capacity. Storm drainpipe diameters at ARC range from 150 millimeters (6 inches) to 1,070 millimeters (42 inches). Both the western and eastern drainage systems receive input from Caltrans’ U.S. Highway 101 (US-101) right-of-way along the south edge of ARC.
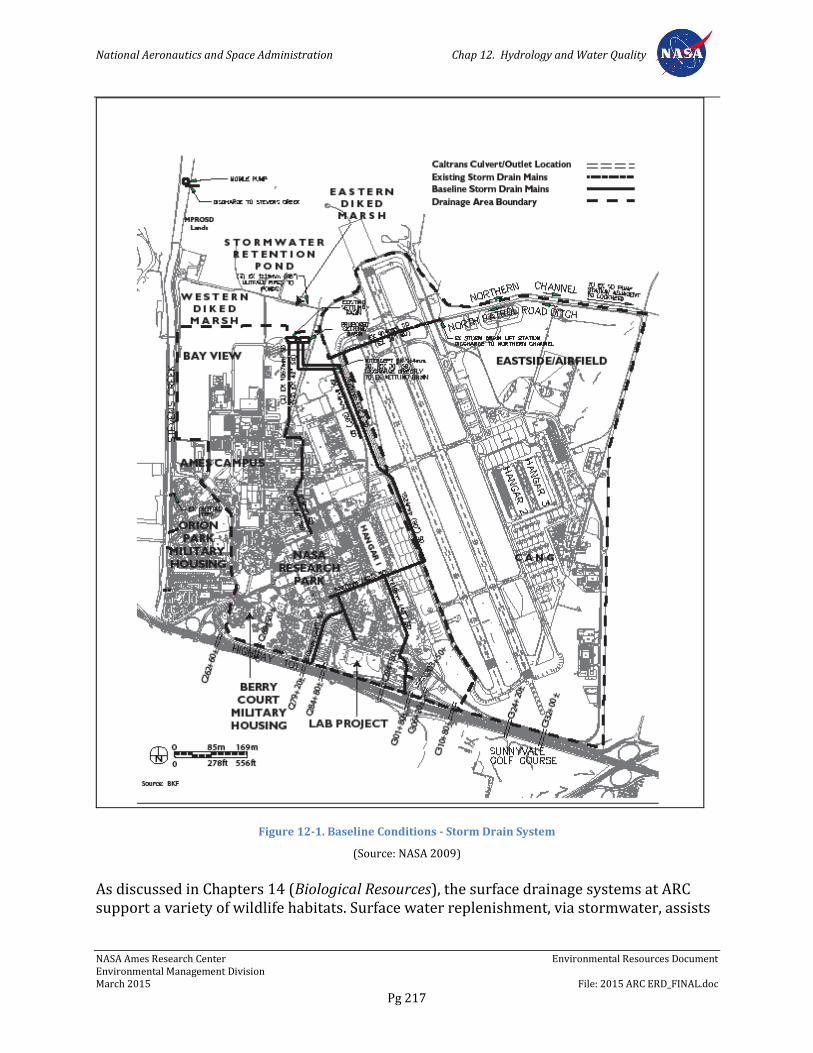
National Aeronautics and Space Administration Chap 12. Hydrology and Water Quality
NASA Ames Research Center Environmental Resources Document Environmental Management Division March 2015 File: 2015 ARC ERD_FINAL.doc
Pg 217
Figure 12-1. Baseline Conditions - Storm Drain System
(Source: NASA 2009)
As discussed in Chapters 14 (Biological Resources), the surface drainage systems at ARC support a variety of wildlife habitats. Surface water replenishment, via stormwater, assists
National Aeronautics and Space Administration Chap 12. Hydrology and Water Quality
NASA Ames Research Center Environmental Resources Document Environmental Management Division March 2015 File: 2015 ARC ERD_FINAL.doc
Pg 218
in maintaining the nearby wetlands and makes an important contribution to maintenance of ecological diversity in the South Bay and the San Francisco Bay Area.
The following sections describe the western and eastern drainage systems in additional detail.
12.4.1.2.1 Western Drainage System
The western drainage system begins in the Wescoat Village military housing area and NRP area. Eight drainage structures, which serve approximately 14 hectares (35 acres) of the US-101 right-of-way, discharge into the area that is drained by the western drainage system. Stormwater flows north, through Wescoat Village , the NRP area, and Shenandoah Plaza, toward a main junction on the boundary between Shenandoah Plaza and the Ames Campus area, at the intersection of McCord Avenue and Bushnell Road. Stormwater from a small portion of the former Orion Park military housing area flows east toward the same junction. This line passes through Orion Park, the Main Gate area, and the ARC area.
At the McCord Avenue/Bushnell Road junction, all lines discharge into a 910-millimeter (36-inch) main trunk line. From this point, stormwater flows north through the Ames Campus area. Several other storm drain lines in the ARC area discharge directly into this main line at various points.
At the border of the ARC and Bay View areas, the 910-millimeter (36-inch) main line discharges into two 1,070-millimeter (42-inch) pipes, which flow north through the Bay View area toward a settling basin located in the northeastern portion of Bay View. From the settling basin, stormwater is discharged into the Eastern Diked Marsh, located just north of Bay View. From the Eastern Diked Marsh, flow drains to the SWRP via three 1,220-millimeter (48-inch) culverts under North Perimeter Road.
The SWRP has no outfall. During most years, water is removed by evaporation only. In some years, when wet-season flow into the SWRP exceeds the pond’s storage capacity, temporary pumps are moved onto the SWRP’s western levee and excess water is pumped into Stevens Creek. The capacity of the temporary pumps is less than 0.30 cubic meters per second (10 cubic feet per second), which is much less than the peak runoff of 6.2 cubic meters per second (220 cubic feet per second) from the 2-year storm for the 275-hectare (680-acre) area that discharges into the SWRP. If runoff discharges to the SWRP at a rate exceeding the pumps’ capacity, water backs up, inundating the wetlands north of the Bay View area and causing localized flooding in Bay View.
Over the past 20 years, several storm drain studies have been completed, all of which agree that major renovation and rehabilitation of the western drainage system is needed. Some intermediate measures have been taken to protect specific buildings, but significant improvements to the underground system have not been made.
12.4.1.2.2 Eastern Drainage System
The eastern drainage system begins in the southern portion of the Ames Campus area and the southern CANG area. Two manholes in the runway infield contain 300-millimeter (12-inch) storm drain lines that receive local runoff, as well as flow delivered to the southern
National Aeronautics and Space Administration Chap 12. Hydrology and Water Quality
NASA Ames Research Center Environmental Resources Document Environmental Management Division March 2015 File: 2015 ARC ERD_FINAL.doc
Pg 219
airfield via two drainage structures that serve approximately 6 hectares (15 acres) of the US-101 right-of-way. The storm drainpipes beneath the airfield restrict and decelerate flow somewhat when they are more than one-quarter full, but this is considered a minor concern because the full-flow velocity is only about 0.61 meters per second (2 feet per second); the more important concern appears to be the potential for trash and debris to accumulate where flow is restricted.
Stormwater from the airfield and the CANG area travels north through several storm drain lines and by overland flow. A small concrete-lined channel that flows west toward the Moffett Field storm drain lift station at the northeast corner of the airfield collects overland runoff from the golf course. This channel is commonly referred to as North Patrol Road Ditch. It is separated from the Northern Channel, which flows east, by a levee. The levee was recently raised to prevent flow in the Northern Channel (downstream of the lift station) from discharging into the smaller channel and flowing back into the lift station.
The southeastern portion of the NRP also contributes to the eastern drainage system via a main line that flows north, near the westernmost portion of the airfield. Several smaller lines from the eastern Ames Campus area enter this line along Zook Road. Just south of North Warehouse Road, the main line reaches its ultimate size of 910 millimeters (36 inches), providing a flow capacity of about 1.1 cubic meters per second (40 cubic feet per second). This is sufficient to convey runoff from an 11-hectare (26-acre) drainage area during a 25-year storm event with no surface ponding. However, the line is presently draining a much larger area and localized flooding can result if rainfall is heavy.
Stormwater from the 910-millimeter (36-inch) main, the high-speed fueling area, and the North Patrol Road Ditch, along with shallow groundwater, discharge into the lift station at B-191. The lift station consists of two 15-kilowatt (20-horsepower) pumps and has a capacity of approximately 45,000 liters per minute (12,000 gallons per minute). From the lift station, water is pumped into the Northern Channel. In addition, two portable pumps, each with a capacity of 19,000 liters per minute (5,000 gallons per minute), are located at intermediate points along North Patrol Road Ditch and discharge directly into the Northern Channel. Therefore, the total peak discharge into the Northern Channel from the site is 83,000 liters per minute (22,000 gallons per minute) or 1.40 cubic meters per second (49 cubic feet per second).
The Northern Channel flows east off of the site to follow the northern boundary of the neighboring Lockheed Martin site. It connects to the easternmost Lockheed pond, adjacent to the Moffett Channel (Sunnyvale West Side Channel), through a 1,220-millimeter (48-inch) culvert. A pump station with three pumps lifts the water into the Moffett Channel where it flows by gravity to Guadalupe Slough and then into San Francisco Bay. This pump station serves an additional 267 hectares (660 acres) of land east of ARC and has a total capacity of 117,000 liters per minute (31,000 gallons per minute) or 1.95 cubic meters per second (69 cubic feet per second).
12.4.1.2.3 Flood Hazards
As identified above, some parts of the stormwater management system at ARC are in need of upgrades. During the El Niño storms of 1998, many basements at ARC flooded, and some
National Aeronautics and Space Administration Chap 12. Hydrology and Water Quality
NASA Ames Research Center Environmental Resources Document Environmental Management Division March 2015 File: 2015 ARC ERD_FINAL.doc
Pg 220
buildings had as much as 0.3 to 0.6 meters (1 to 2 feet) of water on the ground floor, including Buildings N-244, N-245, N-246, N-248, and Trailer 20. Structures constructed in the floodplain area in recent years have been built on raised building pads.
12.4.1.3 Surface Water Quality
12.4.1.3.1 Overview
Because ARC is at the bottom of the watershed, and since the majority of the Stevens Creek watershed supports urban land uses, surface waters flowing adjacent to ARC reflect water quality typical of urban or developed streams where various types of point- and nonpoint-source pollutants affect water quality.
Because surface water drainage at ARC has been substantially modified for stormwater management, water quality concerns in this area focus on maintaining compliance with a stormwater discharge permit, as opposed to protection of drinking water, although protection of natural habitat is also addressed. Monitoring the quality of stormwater at ARC is also important to track movement of contaminants and contaminated groundwater.
The ARC Environmental Management Division administers a quarterly storm drainage monitoring program. Low levels of organic compounds have been detected in effluent stormwater, but these are not considered significant. Relatively little runoff from the western portion of ARC is discharged into the San Francisco Bay, and water quality is typically within the regulated acceptable range.
In December 1992, the 930-square meter (10,000-square foot) concrete Stormwater Settling Basin (SWSB) was built northeast of the OARF at ARC. The purpose of the basin is to remove oil, grease, and particulate matter before runoff is discharged to the diked stormwater retention ponds south of the USFWS ponds. NASA removes sediment from the settling basin annually and tests for VOCs and metals to ensure appropriate disposal.
No recent water quality data are available for Stevens Creek. However, because the creek is downstream of urbanized areas, contaminants typical of urban runoff pollutants are likely to be present. RWQCB water quality monitoring for common urban contaminants at 12 locations on Stevens Creek was conducted during 2002 and 2003. Also, continuous (15-min interval) monitoring of temperature, pH, dissolve organics, and conductivity was conducted at four stations in 2002 and 2003.
12.4.1.3.2 Site-Wide Ecological Assessment
For a better understanding of the potential ecological risks associated with chemicals at ARC, the U.S. Navy conducted a Site-Wide Ecological Assessment (SWEA) from 1993 until 1997. As part of this effort, samples of soil, sediment, surface water, air (soil vapor), and organismal tissue were collected for chemical analyses to characterize the exposure risk to various ecological receptors. The Phase I SWEA provided conceptual site models, including a description of habitats, a qualitative evaluation of chemical sources and potential exposure pathways, and an overview of potential plant and animal receptors. The Phase II SWEA presented a quantitative and qualitative ecological risk assessment and provided information to support risk management decisions. Hydrocarbons (quantified as total

National Aeronautics and Space Administration Chap 12. Hydrology and Water Quality
NASA Ames Research Center Environmental Resources Document Environmental Management Division March 2015 File: 2015 ARC ERD_FINAL.doc
Pg 221
petroleum hydrocarbons, diesel, motor oil, and “other heavy components”) were detected in the samples collected at drainage channels and ditches, including the Eastern Diked Marsh and the SWRP (Site 25).
12.4.2 Groundwater at NASA Ames
12.4.2.1 Description of Aquifers
Several aquifers separated by less permeable clay and silt layers are present in the subsurface at ARC. They are divided into two sequences (a shallower unconfined or semi-confined sequence and a deeper confined sequence) separated by a laterally extensive clay layer. The upper aquifer sequence consists of the “A” and “B” aquifers; the lower aquifer sequence consists of the “C” and “Deep” aquifers.
12.4.2.1.1 “A” Aquifer
The “A” aquifer is located between the depths of 1.5 and 20 meters (5 and 65 feet) below ground surface (bgs) and is divided into two zones by a discontinuous low-permeability horizon (aquitard). The A1 aquifer zone extends from a depth of 1.5 to 9 meters (5 to 30 feet) bgs and the A2 aquifer zone8 from 10 to 20 meters (35 to 65 feet) bgs. The “A” aquifer consists of alluvial channel deposits with the channel axes oriented approximately north-south. The degree of channel continuity has not been determined.
12.4.2.1.2 “B” Aquifer
The “B” aquifer is located between the depths of 21 and 37 meters (70 and 120 feet) bgs and is separated from the “A” aquifer by the A/B aquitard, a locally continuous clay layer that ranges in thickness from 1.5 meters (5 feet) on the west side of ARC to 6 meters (20 feet) on the east side. The depth to the top of the A/B aquitard ranges from 15 meters (50 feet) bgs on the east side of ARC to 21 meters (70 feet) bgs on the west side. Because fewer wells penetrate the “B” aquifer, its stratigraphy is less well understood than that of the “A” aquifer. However, it is generally divided into the B2 and B3 aquifers.
12.4.2.1.3 “C” Aquifer
The “C” aquifer is a confined aquifer located between the depths of 47 and 76 meters (155 and 250 feet) bgs. The “C” aquifer is effectively isolated from the upper aquifers by a 6- to 12-meter (20- to 40-foot)-thick laterally continuous clay layer (the B/C aquitard), which extends from a depth of approximately 37 to 47 meters (120 to 155 feet) bgs. Few wells have penetrated the “C” aquifer, and data to characterize it are limited. However, it is known to consist of relatively thin sand and gravel units interbedded with silts and clays.
12.4.2.2 Groundwater Flow
Groundwater in both the “A” and “B” aquifers flows in a north-northeasterly direction toward San Francisco Bay, with a horizontal hydraulic gradient of about 0.003 to 0.007 meters per meter (0.01 to 0.02 feet per foot). The hydraulic conductivity of the “A” aquifer 8 South of U.S. 101, the A2 aquifer is known as the B1 aquifer zone.
National Aeronautics and Space Administration Chap 12. Hydrology and Water Quality
NASA Ames Research Center Environmental Resources Document Environmental Management Division March 2015 File: 2015 ARC ERD_FINAL.doc
Pg 222
ranges from 2 to 73 meters per day (6 to 240 feet per day). The hydraulic conductivity of the “B” aquifer is lower, at 0.1 to 11 meters per day (0.35 to 36 feet per day). The expected long-term yield from the upper aquifers ranges between 0 and 76 liters (20 gallons) per minute.
The vertical gradient between the “A” and “B” aquifers varies due to differences in confining conditions over individual sand and gravel units, but generally ranges from 0.2 to 0.4 meters (0.50 to 1.1 feet) in the upward direction.
Groundwater in the “C” aquifer also flows north-northeasterly toward San Francisco Bay, but the horizontal hydraulic gradient is substantially less steep than in the “A” and “B” aquifers, averaging about 0.0005 meters per meter (0.001 feet per foot).
The vertical gradient between the “C” aquifer and overlying units is strongly upward, commonly exceeding 5.5 meters (18 feet).
12.4.2.3 Groundwater Use
Groundwater in the “A” and “B” aquifers (upper aquifer zones) is not currently used for domestic, municipal, or industrial water supply at ARC, with the exception of a small amount of treated groundwater that is used by the ARC Jet facility cooling towers. The northern portions of the upper aquifers are generally not considered suitable as sources of drinking water because they contain naturally high levels of dissolved solids and other inorganic content. The upper aquifers are also unattractive for use as agricultural supply because of their elevated concentrations of inorganic constituents and salinity and their limited productivity. Water from the upper aquifers may be used for industrial service and industrial process supply, although low yields present a major limitation and many uses are precluded by elevated salt concentrations. This is unlikely to change in the future, in part because other sources of supply are available for industrial uses at ARC. In addition, fresh groundwater in the upper aquifers currently serves to reduce land subsidence and inhibit the intrusion of salt water into the aquifer system, so it is important to avoid repeating the historic pattern of overuse. Water from the “A” aquifer also provides surface water replenishment that assists in maintaining wildlife habitat in nearby wetlands.
Historically, groundwater from the “C” aquifer was used for drinking and agricultural purposes at ARC. The wells associated with these uses were drilled to depths of as much as 305 meters (1,000 feet) bgs. They are no longer in use for supply. Most have been closed, but a few are still used for water quality monitoring. An additional well near Building N-267 that originally provided agricultural supply is no longer in use. Use of the “C” aquifer is currently restricted to preventing land subsidence and saltwater intrusion. Similar concerns will likely dominate both near-term and future use of water from this aquifer.
12.4.2.4 Groundwater Quality and Groundwater Remediation Efforts
Since the early 1980s, numerous investigations have been conducted at and around ARC to evaluate soil and groundwater contamination in the area. Activities at the MEW Superfund site, which originates in neighboring Mountain View, the Navy, and ARC, have all contributed to an area of groundwater contamination collectively referred to as the regional plume (Figure 12-2). Additional localized contamination is a legacy of early Navy
National Aeronautics and Space Administration Chap 12. Hydrology and Water Quality
NASA Ames Research Center Environmental Resources Document Environmental Management Division March 2015 File: 2015 ARC ERD_FINAL.doc
Pg 223
activities at what is now ARC. The following sections provide additional details on subsurface contamination as it affects groundwater, and past and current groundwater remediation efforts at ARC. A more detailed description of hazardous materials at the ARC site can be found in Chapter 18, Hazardous Materials.
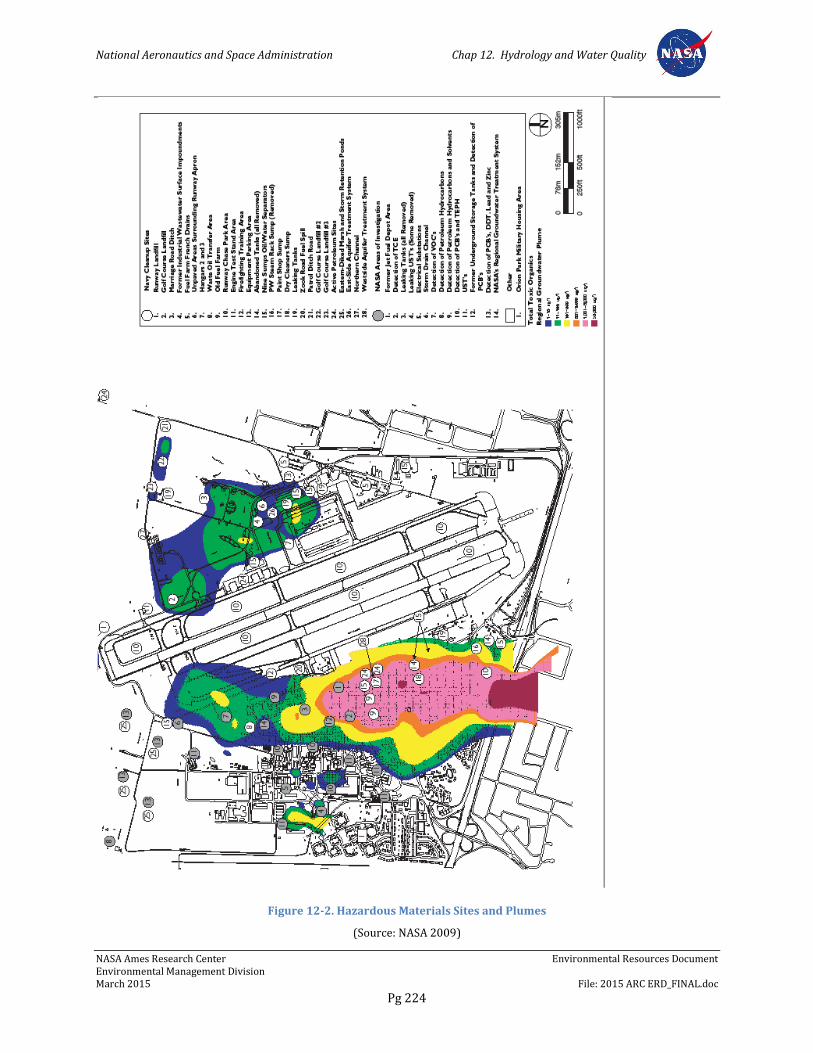
National Aeronautics and Space Administration Chap 12. Hydrology and Water Quality
NASA Ames Research Center Environmental Resources Document Environmental Management Division March 2015 File: 2015 ARC ERD_FINAL.doc
Pg 224
Figure 12-2. Hazardous Materials Sites and Plumes
(Source: NASA 2009)
National Aeronautics and Space Administration Chap 12. Hydrology and Water Quality
NASA Ames Research Center Environmental Resources Document Environmental Management Division March 2015 File: 2015 ARC ERD_FINAL.doc
Pg 225
12.5 Environmental Requirements
The following section describes plans, policies, programs, measures, and BMPs adopted by NASA to protect surface water (including stormwater) and groundwater quality at ARC.
12.5.1 NASA Procedural Directive 8500.1, NASA Environmental Management
Per NPD 8500.1, it is NASA policy to: maintain compliance with all applicable federal, state, and local environmental requirements; to incorporate environmental risk reduction and sustainable practices to the extent practicable throughout NASA’s programs, projects, and activities; and to consider environmental factors throughout the life cycle of programs, projects, and activities (as defined in NPD 7120.4, NASA Engineering and Program/Project Management Policy, and related documents), including planning, development, execution, and disposition activities. Examples of environmental factors include consideration of environmental impacts as required by the NEPA and NHPA; the proposed use of hazardous materials; the potential for waste generation; the need to acquire necessary permits, waivers, and authorizations; and the use of environmentally-preferable materials and processes wherever practicable.
12.5.2 NASA Procedural Requirements 8553.1, NASA Environmental Management System
NPR 8553.1 sets forth requirements for the NASA EMS, which functions primarily to: (1) incorporate people, procedures, and work practices into a formal structure to ensure that the important environmental impacts of the organization are identified and addressed; (2) promote continual improvement, including periodically evaluating environmental performance; (3) involve all members of the organization, as appropriate; and (4) actively involve senior management in support of the EMS.
Agencywide, the EMS employs a standardized approach to managing environmental activities that allows for efficient, prioritized system execution, while at the same time helping to improve environmental performance and to maintain compliance with applicable environmental regulations and requirements. NASA’s EMS approach involves identifying all activities, products, and services under each NASA center’s control, and the environmental aspects associated with each centers’ continued engagement in those activities, products, and services. Once identified, priority environmental aspects are assigned a risk ranking (from 1 to 4, based on its severity and frequency of occurrence) and are evaluated on a continual basis as means of highlighting associated positive or negative impacts and setting objectives and targets to reduce environmental risk. Each center’s EMS also identifies methods for ensuring compliance by keeping abreast of environmental requirements. This includes requirements by law (EOs, federal regulations, state and local laws) and voluntary commitments made by the center or NASA.
12.5.3 Ames Procedural requirements 8500.1, Ames Environmental Procedural Requirements
APR 8500.1 sets forth general procedural requirements to ensure compliance with applicable federal, state, and local environmental laws; regulations and EOs; and NASA
National Aeronautics and Space Administration Chap 12. Hydrology and Water Quality
NASA Ames Research Center Environmental Resources Document Environmental Management Division March 2015 File: 2015 ARC ERD_FINAL.doc
Pg 226
policies and procedures. Organizational directors, division chiefs, branch chiefs, section heads, supervisors, managers, and CORs are responsible for planning, designing, constructing, managing, operating, and maintaining facilities in conformance with applicable regulatory directives, and should obtain environmental review from the Environmental Management Division early in project planning consistent with NASA's NEPA implementing procedures (NPR 8580.1 and EO 12114), NASA policies and procedures for programs and projects (NPR 7120), and NASA regulations related to environmental quality (14 CFR 1216). Program and project managers should coordinate with the Environmental Management Division in a timely manner to ensure that any new or modified programs, projects, and activities comply with regulatory requirements.
12.5.4 Ames Procedural Requirements 8553.1, Ames Environmental Management System
APR 8553.1 sets forth requirements for the Center-level EMS in accordance with NPR 8553.1B, NASA Environmental Management Systems. The ARC EMS also includes consideration of the findings of NASA Headquarters’ triennial (3-year) Environmental Functional Review and other external EMS audits, as required.
Under the ARC EMS, the Center conducts an annual risk analysis across Center activities to determine which of 16 environmental aspects are of high or medium priority. The Center then identifies objectives (goals) and targets and develops action plans known as Environmental Management Plans to reduce identified risks. Currently, the high- and medium-priority environmental aspects of Center business activities are Air Emissions, Hazardous Material Management, Water and Energy Conservation, and Other Sustainability Practices. Objectives associated with these high- and medium-priority environmental aspects include:
Reducing air (including GHG) emissions through energy efficiency
Improving hazardous material management
Improving energy and water efficiency
Providing for the integration of other sustainability practices into Center activities
12.5.5 Ames Environmental Work Instructions
Ames’s EWIs, which replace the previous Ames Environmental Handbook (APR 8800.3), set forth requirements to ensure that programs, projects, and activities at ARC comply with applicable federal, state, and local laws; regulations and EOs; and NASA policies and procedures. Each EWI lists relevant regulatory authorities and documents, assigns individual and organizational responsibilities within ARC, and identifies specific requirements applicable to the work being performed.
The following EWIs are relevant to operations and future development at ARC with the potential to impact water resources.
EWI 2.1, Drinking Water Management
EWI 2.2, Industrial Waste Water
National Aeronautics and Space Administration Chap 12. Hydrology and Water Quality
NASA Ames Research Center Environmental Resources Document Environmental Management Division March 2015 File: 2015 ARC ERD_FINAL.doc
Pg 227
EWI 2.3, Storm Water
EWI 2-4, Wetlands and Flood Plains (Under revision)
EWI 3, Tanks
EWI 3-1, Aboveground Storage Tanks
EWI 3-2, Underground Storage Tanks
EWI 3-3, SPCC Plan
EWI 8, Restoration
EWI 9, Emergency Response
EWI 12, Public Involvement
EWI 14, NEPA and Environmental Justice
EWI 18, Environmental Requirements for Construction Projects (Under review)
12.5.6 Spill Prevention, Control, and Countermeasures Plan
The current Spill Prevention, Control, and Countermeasures Plan (SPCC) was prepared to identify aboveground storage of petroleum products, standard operating procedures, and detailed emergency response and mitigation actions in the event of a spill. Its specific purposes include:
Establish procedures, methods, equipment, and other requirements to prevent the discharge of oil from non-transportation related onshore facilities into or upon navigable waters of the United States and adjoining shorelines
Evaluate existing containment and diversionary structures constructed to control spill occurrences
Recommend operational changes and facility modifications to minimize the probability of a spill event
Discuss responsibilities for record keeping, inspections, personnel training, and notifications relative to plan implementation
The current Spill Prevention, Control, and Countermeasures Plan has been reviewed in May 2013. The plan is required to be revised approximately every five years.
12.5.7 Storm Water Pollution Prevention Program
ARC’s SWPPP has two major objectives: (1) to identify the sources of pollutants that affect the quality of stormwater discharges and authorized non-stormwater discharges from the facility, and (2) to describe and ensure the implementation of BMPs to reduce or eliminate pollutants in stormwater discharges and authorized non-stormwater discharges. The program includes the following general BMPs. These practices apply to all industrial and maintenance activities on ARC and have been shown to be effective in preventing pollution.
Training and supervision
National Aeronautics and Space Administration Chap 12. Hydrology and Water Quality
NASA Ames Research Center Environmental Resources Document Environmental Management Division March 2015 File: 2015 ARC ERD_FINAL.doc
Pg 228
Process and equipment modification
Raw material and product substitution or elimination
Proper construction, demolition, and excavation activities
Hazardous waste storage and handling
Spill prevention and response
Material handling and storage, including outdoor process equipment operations
Loss prevention and good housekeeping
Closed-loop recycling of industrial process water
As part of its Annual Report for Storm Water Discharges Associated with Industrial Activities, NASA conducts sampling and inspections to verify the effectiveness of the BMPs. Activities include:
Stormwater sampling conducted at 12 locations on the site, including the two discharge locations, at least twice a year during the wet season (October through May)
Visual observations conducted during the wet and dry seasons at the 12 sampling locations to identify any unusual characteristics in the stormwater discharge
Documenting quarterly visual observations of non-stormwater discharges, if applicable
Conducting an Annual Comprehensive Site Compliance Evaluation for all potential pollutant sources and areas of industrial activity, as identified in the SWPPP
12.5.8 Measures to Minimize Impacts on Groundwater
Although any operation that involves the use of hazardous materials and/or produces hazardous waste has the potential to impact groundwater quality, most operations at ARC are unlikely to affect the quality of the groundwater or impair any of its current or potential beneficial uses, in part because of measures incorporated into ongoing operations at the site. For example, all liquid hazardous materials are stored in secure containers with a secondary containment of 110% of the containers capacity which is in accordance with the County Hazardous Materials Storage Ordinance. (There is a more detailed description of this ordinance in Chapter 18, Hazardous Materials). Nonetheless, two program areas have a greater potential to result in groundwater contamination: activities that support aircraft operations, and fuel storage in underground tanks.
In 1992, approximately 9,500 liters (2,500 gallons) of jet fuel were accidentally released during the defueling of a C-130 aircraft. In 1996 and 1997, two additional accidental releases that occurred during fuel transfer activities at the Defense Fuel Supply Point resulted in a total of approximately 3,200 liters (850 gallons) of jet fuel being spilled onto exposed soils. These spills were remediated and NASA has since taken steps to reduce this type of mishap, including establishing written standard operating procedures for fuel transfer activities. However, the potential remains that similar releases may occur in the
National Aeronautics and Space Administration Chap 12. Hydrology and Water Quality
NASA Ames Research Center Environmental Resources Document Environmental Management Division March 2015 File: 2015 ARC ERD_FINAL.doc
Pg 229
future. Accordingly, NASA has developed emergency response capabilities to mitigate future releases, minimizing the potential impact on groundwater. No major spills occurred during the years 2012 and 2013.
12.5.9 Best Management Practices for Construction, Demolition, and Excavation Operations
Construction, demolition, and excavation projects generate a great deal of dust, debris, waste materials, and wastewaters that, when improperly managed, can result in prohibited discharges to the storm drainage system. Various construction projects occur at ARC throughout the year. A SWPPP is required in all construction contractor specifications. Furthermore, the California Storm Water Best Management Practice Handbook for Construction Activity is made available to construction contractors working at ARC. Targeted constituents are sediment, heavy metals, toxic materials, floatable materials, oil and grease, petroleum products, and contaminated groundwater.
The following BMPs are applicable to all construction, demolition, and excavation activities at ARC that could potentially release pollutants to the storm water. Requirements of these BMPs are:
Each job site should be managed in such a manner to avoid discharges of prohibited substances to the storm drain system
Routine inspection of job site should be performed to ensure that construction, demolition, and excavation materials (liquid or solid) are not entering the storm drain system
Keep the job site tidy and clean up debris regularly
Placement of cleaning equipment or tools over catch basins is prohibited
Storm drain catch basins should be covered to prevent pollutants and sediments from entering the storm drain system
Special precautions should be employed if rain is forecasted or if water is applied. These precautions should include, but are not limited to:
Increased monitoring frequency for storm drains and rectifying ongoing releases or identifying and preventing any possible release
Reduction in activities that cause material to encounter rainwater
Following all construction, demolition, and excavation activities; the job site should be swept to remove debris and residue. Catch basins should be vacuumed or cleaned to remove sediment and debris
National Aeronautics and Space Administration Chap 12. Hydrology and Water Quality
NASA Ames Research Center Environmental Resources Document Environmental Management Division March 2015 File: 2015 ARC ERD_FINAL.doc
Pg 230
Construction, demolition, and excavation materials (gravel, sand, lumber, cement, chemicals, contaminated equipment, etc.) should be stored under a roof or structure or covered with a tarp or plastic visqueen. Covered items should be secured with ropes, sandbags, or bricks to prevent or minimize contact with rainwater. For large piles of soil or other construction materials where tarps or other covers are not feasible, placement of filtering media (for example, straw bales, rocks, and silt fences) around the base of each pile or at the storm drain inlet is required to remove these materials from rainwater runoff. Do not store items near catch basins
Wet concrete and concrete cutting waters should be conducted to prevent discharge to the storm drains. Blocking or plugging drains in the vicinity may be warranted. This can be done in a number of ways, such as placing weighted plastic visqueen over drains or using sandbags or spill control absorbent socks
Residual concrete and concrete/asphalt cutting effluent from equipment and machinery should not be discharged to the storm drain. Estimate the amount of wastewater that will be generated and arrange to have a storage container (tank) available. Properly dispose of wastewater off site
Outdoor concrete work should be postponed if rain is forecasted unless precautions are taken to prevent discharge of wet concrete and other construction debris to the storm drain
During paint scraping operations, use impermeable ground cloths, such as plastic sheeting, to collect dust, and paint chips
Use impermeable ground cloths while painting. Place in-use paint buckets in a pan or over plastic sheeting to ensure that accidental spills are not discharged to the storm drain
Mixing of paint should take place indoors or in a place that is not exposed rain or wind
At the end of the workday, store paint buckets and other equipment away from contact with stormwater in a secured, secondarily contained area
Treat a paint spill as a chemical spill. Capture the material before it flows to the storm drain. Clean it up promptly. Report the event to ARC’s Environmental Management Division, Code JQ , at 650-604- 0237, or call 911 for large spills
Outdoor sandblasting should comply with the following:
Tarpaulins or ground cloths should be placed beneath the work area to capture the blasting medium and particles from the surface being cleaned
Consider curtailing sandblasting on a windy day or, if rain is forecast, to minimize the amount of area that will require clean up and to avoid sand waste from being washed into the storm drain
Vacuum the work area when job is complete
National Aeronautics and Space Administration Chap 12. Hydrology and Water Quality
NASA Ames Research Center Environmental Resources Document Environmental Management Division March 2015 File: 2015 ARC ERD_FINAL.doc
Pg 231
If sandblasting paint containing lead, cadmium, or other toxic contaminants, comply with the following:
Obtain approval from ARC’s Environmental Management Division at 650-604-0237and the Occupational Safely, Health, and Medical Services Office at 650-604-5602
Follow measures outlined in “Outdoor Sandblasting” listed above
Perform air monitoring is required
Follow Occupational Safety and Health Administration(OSHA) regulations for worker safety
For broken lines that contain substances other than potable water, the operator shall immediately notify the ARC’s Environmental Management Division and initiate the following actions immediately:
Berm the area to prevent runoff to the storm drain
Immediately block off adjacent storm drain catch basins
12.5.10 Good Housekeeping Best Management Practices
Good housekeeping BMPs are designed to maintain a clean and orderly work environment. Often the most effective first step toward preventing pollution in stormwater from industrial sites simply involves using good common sense to improve the facility’s basic housekeeping methods. Poor housekeeping can result in more waste being generated than necessary and an increased potential for stormwater contamination. A clean and orderly work area reduces the possibility of accidental spills caused by mishandling of chemicals and equipment, thereby reducing safety hazards. Well-maintained material and chemical storage areas should minimize discharges of materials/pollutants that could contaminate stormwater. Simple procedures can be used to promote good housekeeping, including improved operation and maintenance of industrial machinery and processes, material storage practices, material inventory controls, routine and regular clean-up schedules, maintaining well organized work areas, and educational programs.
ARC’s policy is that managers, including line supervisors, are responsible for ensuring that personnel are educated in proper environmental hazards management, including stormwater pollution prevention. These BMPs are applicable to all industrial activities at ARC.
Targeted constituents of these BMPs are sediments, nutrients, floatable materials, oxygen-demanding substances, heavy metals, toxic materials, and oil and grease.
Requirements of the Good Housekeeping BMPs are as follows:
Conduct formal monthly inspections of all buildings and surrounding areas to ensure the following:
Outside areas are cleaned and organized
Drips, leaks, or evidence of such, from equipment or pipes are contained
National Aeronautics and Space Administration Chap 12. Hydrology and Water Quality
NASA Ames Research Center Environmental Resources Document Environmental Management Division March 2015 File: 2015 ARC ERD_FINAL.doc
Pg 232
Adequate space exists in work areas to minimize spill potential
Garbage is removed regularly
Walkways and passageways are easily accessible
Walkways and passageways are free of materials that could be spilled
Evidence is noted of dust from painting, sanding, or other industrial activities
Cleanup procedures for spilled materials exist
An inspection log should be maintained in order to feed other environmental reporting requirements at ARC. Moreover, a formal annual inspection of ARC is conducted by the Environmental Management Division to verify industrial activities in the SWPPP and identify new activities and BMPs.
Conduct an annual inventory of chemical substances, including hazardous materials and pollutants present on site. This inventory shall meet the requirements of the Santa Clara County Hazardous Materials Storage Ordinance inventory of chemicals and toxic substances
Maintain a current file of all Material Safety Data Sheet (MSDS) for chemicals and toxic substances
Label chemical containers in accordance with OSHA, EPA, U.S. Department of Transportation, and other applicable federal, state, and local requirements
Maintain dry and clean floors and ground surfaces by using brooms, shovels, vacuum cleaners, and cleaning machines
Regularly pickup and dispose of garbage, debris, and waste material
Make sure equipment is working properly
Routinely inspect for leaks or conditions that could lead to discharges of chemicals or contact of stormwater with raw materials, intermediate materials, waste materials, or products
Ensure that all employees understand spill cleanup procedures.
Improper storage can result in the release of materials and chemicals that can cause stormwater runoff pollution. Proper storage techniques include:
Providing adequate aisle space to facilitate material transfer and easy access for inspections
Storing containers, drums, and bags away from direct traffic routes to prevent accidental improper weight distribution of containers
Stacking containers according to manufacturer’s instructions to avoid damaging the containers from improper weight distribution
Storing containers on pallets or similar devices to prevent container corrosion, which can result from moisture on the ground
National Aeronautics and Space Administration Chap 12. Hydrology and Water Quality
NASA Ames Research Center Environmental Resources Document Environmental Management Division March 2015 File: 2015 ARC ERD_FINAL.doc
Pg 233
Maintain an up-to-date inventory of all materials (hazardous and non-hazardous). This inventory will reduce additional material costs caused by overstocking. Inventorying also enables the tracking of materials stored and handled on site and identifies which materials and activities pose the most risk to the environment
During inventory of hazardous materials, clearly mark those that require special handling, storage, use, and disposal considerations
Keep the work site clean and orderly. Remove debris in a timely fashion. Sweep the area
Cover materials of particular concern, such as hazardous materials or sand piles that must remain outdoors, particularly during the rainy, season
Educate employees who are doing the work
Inform onsite contractors of ARC policy. Include appropriate provisions in their contract to ensure proper housekeeping and disposal practices are implemented
Make sure that nearby storm drains are well marked to minimize the chance of inadvertent disposal of residual paints and other liquids
Do not dump waste liquids down the storm drain
Advise concrete truck drivers to not wash their truck over the storm drain
Placement of cleaning equipment or tools over catch basins is prohibited
12.5.11 Best Management Practices for Material Handling and Storage
Material handling and storage BMPs include procedures to minimize the potential for spills and leaks and to minimize exposure of significant materials to stormwater and authorized non-stormwater discharges. Accidental releases of materials from underground liquid storage tanks, aboveground storage tanks, drums, containers, and dumpsters present the potential for contaminated stormwaters with many different pollutants. Materials spilled, leaked, or released from storage containers and dumpsters may accumulate in soils or on the surfaces where they may be transported by stormwater runoff. Currently, hazardous materials are stored outdoors at ARC in secondarily contained and roofed chemical storage facilities or lockers. Standard Operating Procedures prohibit materials from contacting stormwater runoff in the event of an accident or spill.
These BMPs also address the loading and unloading of materials, which usually takes place outside at the NASA Ames Supply Support Facility at N-255, and the CANG Facilities 681 and 682. Loading or unloading of materials occurs in two ways: materials in containers or direct liquid transfer. Materials leaked, spilled, or lost during loading/unloading may collect in the soil or on other surfaces and be carried away by runoff or when the area is cleaned. Rainfall may wash pollutants from machinery used to unload or move materials. The loading or unloading may involve rail or truck transfer.
Targeted constituents of these BMPs include floatable materials, oxygen demanding substances, heavy metals, toxic materials, and oil and grease.
National Aeronautics and Space Administration Chap 12. Hydrology and Water Quality
NASA Ames Research Center Environmental Resources Document Environmental Management Division March 2015 File: 2015 ARC ERD_FINAL.doc
Pg 234
These BMPs are applicable to all industrial activities at ARC, in particular those areas where containers storing liquid materials are located outside of buildings. It should be noted that the storage of reactive, ignitable, or flammable liquids must comply with the California Health and Safety Code, the Santa Clara County Hazardous Materials Storage Ordinance, and the local fire code.
Requirements of the Material Handling and Storage BMPs are as follows:
Prevent or reduce the discharge of pollutants to stormwater from outdoor container storage areas by storing hazardous substances in chemical storage lockers or facilities, installing safeguards against accidental releases, providing secondary containment, conducting weekly inspections of hazardous waste, monthly inspections of hazardous materials, and training employees in standard operating procedures and small spill cleanup techniques
Protect materials from rainfall, runoff, and wind dispersal by implementing controls such as:
Store materials indoors or in a chemical storage locker
Cover the storage area with a roof
Minimize storm water run-on by enclosing the area or providing a berm
Storage of oil and hazardous materials must meet specific federal, state, and local standards, including:
A Spill Prevention Control and Countermeasure Plan (SPCC)
Secondary containment, integrity, and leak detection monitoring
Emergency preparedness plans
Operator must be trained in proper storage
All hazardous materials storage areas must be inspected monthly; hazardous waste accumulation areas must be inspected weekly. Hazardous materials and hazardous waste inspections must be documented. Documentation must be kept on file for a period of five years. Inspections must include the following questions:
Are all materials correctly segregated?
Are hazardous materials/waste storage areas clearly identified, describing hazard class(es) of materials in storage?
Are all containers (and secondary containment, if needed) labeled to identify the material/waste hazard?
Is the secondary containment free of liquid or debris?
Are all containers in good condition?
Are Material Safety Data Sheets available for all hazardous materials in inventory?
Hazardous materials shall be properly stored:
National Aeronautics and Space Administration Chap 12. Hydrology and Water Quality
NASA Ames Research Center Environmental Resources Document Environmental Management Division March 2015 File: 2015 ARC ERD_FINAL.doc
Pg 235
Hazardous materials should be placed in a designated area
The designated storage area should be covered with a roof
Designated areas should be paved, free of cracks and gaps, and liquid tight in order to contain leaks and spills
Liquid materials should be secondarily contained to hold 10% of the volume of all the containers or 110% of the volume of the largest container, whichever is greater
Drums stored in an area where unauthorized persons may gain access must be secured to prevent accidental spillage, pilferage, or any unauthorized use
Employees trained in emergency spill cleanup procedures should be present where dangerous waste, liquid chemicals, or other wastes are loaded or unloaded
Using engineering safe guards and thus reducing accidental releases of pollutants can prevent operator errors. Safeguards include:
Overflow protection devices on tank systems to warn the operator to automatically shut down transfer pumps when the tank reaches full capacity
Protective guards (bollards) around tanks and aboveground piping to prevent vehicle or forklift damage
Clearly tagging or labeling all valves to reduce human error
Weekly inspections of tanks should be conducted to include:
A check for external corrosion and structural failure
A check for spills and overfills due to operator error
A check for failure of piping system (pipes, pumps, flanges, coupling, hoses, and valves)
A check for leaks or spills during pumping of liquids or gases from truck or railcar to a storage facility or vice versa
Visual inspection of new tank or container installation, loose fittings, loose valves, poor welding, and improper or poorly fitted gaskets
Inspection of tank foundations, connections, coatings, tank walls, and exposed piping system. Look for corrosion, leaks, cracks, scratches, and other physical damage that may weaken the tank or container system
Proper use of pesticides and fertilizers will reduce the risk of loss to storm water. In addition:
Pesticide applicators must be licensed with the California Department of Pesticide Regulation and county agricultural commissioners
No person shall pollute water supplies or waterways while loading, mixing, or applying pesticides on ARC property
National Aeronautics and Space Administration Chap 12. Hydrology and Water Quality
NASA Ames Research Center Environmental Resources Document Environmental Management Division March 2015 File: 2015 ARC ERD_FINAL.doc
Pg 236
No person shall transport, handle, store, load, apply, or dispose of any pesticide, container, or apparatus in such a manner as to pollute water supplies or waterways, or cause damage or injury to land, humans, plants, or animals
Pesticides/fertilizers should not be applied during the wet season as they may be carried from the site by the next storm
Avoid over-watering not only to conserve water but to avoid the discharge of water that may have become contaminated with nutrients and pesticides
Store pesticides and application equipment in a responsible manner
Properly dispose of the used containers
Stormwater from parking lots may contain undesirable concentrations of oil, grease, suspended particulates, and metals such as copper, lead, cadmium, and zinc, as well as the petroleum byproducts of engine combustion. Deposition of air particulates, generated by the facility or by adjacent industries, may contribute significant amounts of pollutants. Therefore, the following maintenance operations shall occur:
Sweeping of main streets shall be conducted monthly and sweeping of parking lots shall be conducted quarterly. Sweeping should be conducted with a vacuum sweeper, rather than a mechanical brush sweeping device, which is not as effective at removing the fine particulates
Cleaning of catch basins and building laterals shall be conducted annually. Maintain painted stencils that mark storm drain inlets “No Dumping! Flows to Bay.” This stencil will minimize inadvertent dumping of liquid wastes;
Debris shall be disposed of off center at an approved landfill site
Prevent or reduce the discharge of pollutants to stormwater from outdoor loading/unloading of materials through implementation of the following:
When materials are received, they shall remain in the travel path only for a time reasonably necessary to transport the materials but no longer than 24 hours
Use a written operations plan that describes procedures for loading and/or unloading
Have an emergency spill cleanup plan readily available
Employees trained in spill containment and cleanup should be present during the loading/unloading
Establish depots of cleanup materials next to or near each loading/unloading area and train employees in their use
Park delivery vehicles so that spills or leaks can be contained
Cover the loading/unloading docks to reduce exposure of materials to rain
National Aeronautics and Space Administration Chap 12. Hydrology and Water Quality
NASA Ames Research Center Environmental Resources Document Environmental Management Division March 2015 File: 2015 ARC ERD_FINAL.doc
Pg 237
12.5.11.1 Best Management Practices for Outdoor Process Equipment Operations and Maintenance
Outdoor equipment includes rooftop cooling towers or air conditioners, rooftop air vents for industrial equipment, outdoor air compressors, and other service equipment. Indoor wet processes include areas where leaks or discharges may discharge to outdoor areas, and material transfer areas, such as loading areas, where forklifts or trucks may carry pollutants outdoors on their tires. Ordinary precautions, such as those below, may suffice for smaller equipment.
Targeted constituents of these BMPs include oil and grease, heavy metals, and antifreeze.
These BMPs are applicable to all areas with outside process equipment at ARC. Requirements are as follows:
Inspect equipment on a regular basis for leaks malfunctions, staining on and around the equipment, and other evidence of leaks and discharges
Assign the inspector the responsibility of reporting a spill
Develop a routine for taking actions on reporting, cleaning up the spill, and repairing the leak to prevent future spills
If absorbent material is used on a spill, sweep and dispose of material in a timely manner
Place equipment on an impermeable surface or install a drip pan beneath potential leak points
Construct a simple roof to minimize the amount of rainwater that contacts the equipment and install a berm to prevent runon and runoff
Air compressors and other equipment produce small quantities of automatic blowdown water, which commonly contains lubricating oil or other potential pollutants. Blowdown water may not be discharged to any impermeable outside areas or to the storm drain system. Blowdown water must be discharged to the sanitary sewer or to a permeable area (for example, landscaping area)
Electrical equipment should be managed to:
Take care in tapping oil-containing equipment. Avoid drips and leaks whenever possible
Place an absorbent pad with the impervious lining side down under electrical equipment prior to tapping. The absorbent material will retain small drips with impervious backing in limiting leakage
Properly dispose of oil-contaminated materials. Any PCB-contaminated absorbent materials must be bagged, labeled, and disposed of in accordance with 40 CFR 761
For all PCB-containing electrical equipment, follow NASA Ames Procedures for PCB Management. If you have any questions regarding the PCB Program, call the NASA Environmental Management Division at 650-604-0237.
National Aeronautics and Space Administration Chap 12. Hydrology and Water Quality
NASA Ames Research Center Environmental Resources Document Environmental Management Division March 2015 File: 2015 ARC ERD_FINAL.doc
Pg 238
12.5.11.2 Best Management Practices for Spill Response and Prevention
Spill response and prevention BMPs include spill cleanup procedures and necessary cleanup equipment based upon the quantities and locations of significant materials that may spill or leak. Spills and leaks together are one of the largest industrial sources of stormwater pollutants, and in most cases are avoidable. The most common causes of unintentional releases and spills include:
Lack of awareness regarding proper hazardous materials handling procedures
External corrosion and structural failure of storage containers
Improper equipment or facility installation
Spills and overfills due to operator error
Failure of piping systems (pipes, pumps, couplings, hoses, and valves)
Leaks during pumping of liquids or gases from trucks to a storage facility and vice-versa
Establishing standard operating procedures, such as safety and spill prevention procedures, along with proper employee training can reduce these accidental releases. Avoiding spills and leaks is preferable to cleaning them up after they occur, not only from an environmental standpoint, but also because spills cause increased operating costs and lower productivity.
Targeted constituents of these BMPs include floatable materials, heavy metals, toxic materials, and oil and grease.
These BMPs are applicable to all industrial activities at ARC. Requirements for implementation are as follows:
Hazardous materials are segregated according to hazard class, stored in secondary containment to prevent accidental release, labeled according to the container’s contents and the material’s hazard, and accurately inventoried for reporting to the NASA Environmental Management Division, and to federal, state, and local regulatory agencies
Hazardous materials storage areas are equipped with emergency spill response equipment appropriate to the types of materials in use and storage
The hazardous materials storage areas are inspected monthly to ensure storage requirements are being satisfied
It is the responsibility of managers and supervisors at ARC to ensure employee training in these areas:
Safe handling of hazardous materials in the employee’s work place, including spill response, segregation, and secondary containment
Proper disposal of hazardous waste, including sewer discharge prohibitions, pickup procedures, and Emergency Response and First Responder Training
National Aeronautics and Space Administration Chap 12. Hydrology and Water Quality
NASA Ames Research Center Environmental Resources Document Environmental Management Division March 2015 File: 2015 ARC ERD_FINAL.doc
Pg 239
Building Emergency Action Plans are available at each building and include a Hazardous Substance Plan. The Hazardous Substance Plan details the chemical inventory of the building, hazardous substance spill procedure, and hazardous chemicals training.
The NASA Ames Site Contingency Plan is the guideline for emergency response to incidents involving hazardous waste and/or hazardous waste constituents. The emergency coordination and notification for incidents involving hazardous waste shall be in accordance with federal, state, and local statutory and regulatory requirements. Contact the Environmental Management Division at 650-604-0237 for additional information.
In the event of a spill near a storm drain: block, dike, divert, and/or cover the storm drain to prevent a release from entering the stormwater system.
In the event of a spill that cannot be cleaned up by two people within 0.5 hour with cleanup materials available on the scene, call Ames Dispatch at 911 or 650-604-5555 immediately.
12.5.11.3 Waste Handling and Recycling Best Management Practice
Waste handling and recycling BMPs include the procedures or processes to handle, store, or dispose of waste or recyclable materials. Hazardous waste is accumulated at NASA Ames Facility N-265, and NRP Building 950. The containment structure at the accumulation areas prohibits materials from contacting stormwater runoff. Rainwater captured within the containment structures is pumped to portable holding tanks and the water is determined to be hazardous or non-hazardous. The water is either discharged to the sanitary sewer system or managed as a hazardous waste, as determined from the characterization.
Targeted constituents of these BMPs include heavy metals, toxic materials, floatable materials, oxygen demanding substances, and oil and grease.
These BMPs are applicable to all industrial activities at ARC and require the following measures.
Prevent or reduce the discharge of pollutants to stormwater from outdoor container storage areas by storing hazardous waste in chemical storage lockers or facilities, installing safeguards against accidental releases, providing secondary containment, conducting weekly inspections, and training employees in standard operating procedures and small spill cleanup techniques
Protect materials from rainfall, runoff, and wind dispersal by implementing controls such as:
Store materials indoors or in a chemical storage locker;
Cover the storage area with a roof; and
Minimize stormwater runon by enclosing the area or providing a berm.
Storage of waste oil and hazardous materials must meet specific federal, state, and local standards, including:
National Aeronautics and Space Administration Chap 12. Hydrology and Water Quality
NASA Ames Research Center Environmental Resources Document Environmental Management Division March 2015 File: 2015 ARC ERD_FINAL.doc
Pg 240
A SPCC
Secondary containment, integrity, and leak-detection monitoring
Emergency preparedness plans
Waste materials and recyclables are segregated according to hazard class, stored in secondary containment to prevent accidental release, labeled according to the container’s contents and the material’s hazard, and accurately inventoried for reporting to the NASA Environmental Management Division and to federal, state, and local regulatory agencies
Waste materials and recyclables storage areas are equipped with emergency spill response equipment appropriate to the types of materials
The waste materials and storage areas are inspected weekly to ensure that storage requirements are being satisfied. Hazardous waste inspections must be documented. Documentation must be kept on file for a period of five years. Inspections must include the following questions:
Are all materials correctly segregated?
Are hazardous waste storage areas clearly identified, describing hazard class(es) of materials in storage?
Are all containers (and secondary containment, if needed) labeled to identify the waste material and hazard class?
Are all containers intact and in good condition?
It is the responsibility of managers and supervisors at ARC to ensure employee training in these areas:
Safe handling of hazardous wastes in the employee’s work place, including spill response, segregation, and secondary containment
Proper disposal of hazardous waste, including sewer discharge prohibitions and pickup procedures
Emergency Response and First Responder training
Building Emergency Action Plans are available at each building and include a Hazardous Substance Plan. The Hazardous Substance Plan details the chemical inventory of the building, hazardous substance spill procedure, and hazardous chemicals training.
The NASA-Ames Research Center Site Contingency Plan is the guideline for emergency response to incidents involving hazardous waste and/or hazardous waste constituents. The emergency coordination and notification for incidents involving hazardous waste shall be in accordance with federal, state, and local statutory and regulatory requirements. Contact the NASA Environmental Management Division, Code JQ, at 605-604- 0237.
National Aeronautics and Space Administration Chap 12. Hydrology and Water Quality
NASA Ames Research Center Environmental Resources Document Environmental Management Division March 2015 File: 2015 ARC ERD_FINAL.doc
Pg 241
12.5.12 NASA Ames Development Plan Final Programmatic Environmental Impact Statement
The NADP EIS identifies the following mitigation measures to address potential hydrology and water quality impacts from build out of NADP Mitigated Alternative 5.
12.5.12.1 Mitigation Measure HAZ-1
NASA's development partners would work with the Remediation Project Manager within the Office of Environmental Services during site planning and would implement the guidelines and recommendations in the Environmental Issues Management Plan (EIMP) to ensure that none of the proposed construction, demolition, and infrastructure improvement projects would expose personnel to unacceptable levels of contaminated soil or groundwater. Where the Remediation Project Manager determined that there would be a possible risk of exposure to people or clean soil or groundwater, the proposed design would be altered to prevent such exposure if feasible. If it were not feasible to avoid exposure, protective measures would be undertaken to minimize the risk of exposure as described in the EIMP.
12.5.12.2 Mitigation Measure BIO-18
Potentially contaminated runoff would be managed using stormwater BMPs. Swales would be constructed adjacent to wetlands in upland areas to intercept and filter any runoff before it reaches the wetland. Construction of swales would be permitted within the 61-meter (200-foot) buffer zone around wetlands, but not within the wetlands themselves.
12.5.12.3 Mitigation Measure BIO-19
To minimize impacts on wetlands, construction would be avoided in the jurisdictional wetlands along the northern boundary of the Bay View area and within 61 meters (200 feet) of these wetlands. Fill activities and other disturbances would be minimized in jurisdictional wetlands elsewhere.
National Aeronautics and Space Administration Chap 13. Prime and Unique Farmlands
NASA Ames Research Center Environmental Resources Document Environmental Management Division March 2015 File: 2015 ARC ERD_FINAL.doc
Pg 242
Chapter 13. Prime and Unique Farmlands
13.1 Overview
This chapter discusses the regulatory framework relevant to farmland protection in the vicinity of ARC. It also discusses agricultural zoning and land use designations applicable to ARC and the surrounding region. The information presented in this chapter was drawn from the November 2009 NASA ARC ERD (NASA 2009), local planning documents, and Important Farmland mapping data for Santa Clara County.
13.2 Regulatory Background
13.2.1 Federal Regulations
13.2.1.1 Farmland Protection Policy Act
The Farmland Protection Policy Act (FPPA) requires federal agencies to consider how farmland may be affected by their activities or responsibilities that involve 1) financing or assisting construction of improvement projects or 2) acquiring, managing, or disposing of federal land and facilities. To comply with the provisions of the FPPA, the lead federal agency must consult with the Natural Resources Conservation Service (NRCS) and complete a Land Evaluation and Site Assessment (LESA) for each affected site or area. The federal lead agency is responsible for coordinating completion of the Farmland Conversion Impact Rating Form (Form AD-1006) with the NRCS as part of the LESA process.
13.2.1.2 Farmland Mapping and Monitoring Program
The state’s Farmland Mapping and Monitoring Program (FMMP), part of the California Department of Conservation’s (DOC’s) Division of Land Conservation, is responsible for mapping and monitoring Important Farmlands for most of the state’s agricultural areas. These maps are updated every two years based on information that FMMP receives from local agencies. The Important Farmland mapping system defines four categories of farmlands based on various characteristics including physical and chemical features, current use, and irrigation water supplies. These categories are Prime Farmland, Unique Farmland, Farmland of Statewide Importance, and Farmland of Local Importance.
13.2.1.3 National Environmental Policy Act
NEPA requires federal agencies to include in their decision-making process appropriate and careful consideration of all environmental effects of a proposed action and of possible alternative actions. Measures to avoid or minimize the adverse effects of proposed actions and to restore and enhance environmental quality as much as possible must be developed and discussed where feasible.
National Aeronautics and Space Administration Chap 13. Prime and Unique Farmlands
NASA Ames Research Center Environmental Resources Document Environmental Management Division March 2015 File: 2015 ARC ERD_FINAL.doc
Pg 243
13.2.2 Local Regulations
13.2.2.1 City of Mountain View Zoning
Lands zoned for agricultural uses border ARC to the west and south within the City of Mountain View. Regulations pertaining to zoned Agriculture districts are included in the City of Mountain View Zoning Ordinance, Chapter 36, Article III, Division 1. Applicable regulations include permitted, accessory, and conditional uses; height regulations; area lot width and yard requirements; and other requirements.
ARC is not subject to the City’s zoning regulations because it is a federal facility; however, it does cooperate with the City on matters of mutual concern and attempts to meet the City’s guidelines and standards whenever possible.
13.3 Regional Setting
Despite its rich agricultural history, the area surrounding ARC underwent a rapid transformation in the decades following World War II and has since evolved into a center of industry and innovation. The largely urban landscape that exists today contains a diverse mix of residential, commercial, industrial, public, institutional, and open space uses (see Chapter 4, Land Use). Only a few isolated parcels on ARC’s borders in Mountain View are zoned for agricultural uses (City of Mountain View 2013a), although none of these contain active farmland. These include:
A linear strip of land on the west side of Stevens Creek that conforms to a PG&E transmission line right-of-way
An undeveloped parcel at the southwest quadrant of Highway 101 and Moffett Boulevard
A vacant parcel at the northeast quadrant of Highway 101 and Ellis Street that is subdivided by VTA’s Winchester-Mountain View Light Rail Line
According to the DOC’s Santa Clara County Important Farmland 2010 Map (DOC 2011), none of this land, or any other land on ARC’s borders, is designated by the state as Important Farmland (i.e. Prime Farmland, Unique Farmland, Farmland of Statewide Importance, or Farmland of Local Importance).
13.4 Existing Site Conditions
Agricultural crops were historically cultivated at ARC in the Bay View and Eastside/Airfield areas; however, these activities were discontinued by the early 1990s and have not resumed since. Currently, no land at ARC is zoned for agricultural uses (Santa Clara County 1994; City of Mountain View 2013a; City of Sunnyvale 2011a).
13.5 Environmental Requirements
There is currently no Important Farmland at ARC, or any such land on ARC’s borders; therefore, no measures are needed to address the potential conversion of farmland due to future development activities at ARC.
National Aeronautics and Space Administration Chap 14. Wetlands and Floodplains
NASA Ames Research Center Environmental Resources Document Environmental Management Division March 2015 File: 2015 ARC ERD_FINAL.doc
Pg 244
Chapter 14. Wetlands and Floodplains
14.1 Overview
This chapter provides information about wetlands and floodplains at ARC. Applicable regulations are discussed, as well as relevant policies and measures that minimize harm to lives and property, and that preserve the natural and beneficial values of wetlands and floodplains. The information presented in this chapter was drawn from the November 2009 NASA ARC ERD (NASA 2009), NADP EIS (Design, Community & Environment 2002), Storm Water Retention Pond Tidal Restoration Feasibility Study (Brown and Caldwell et al. 2005), current flood hazard data for the area, and other sources.
14.2 Regulatory Background
14.2.1 Federal Regulations
14.2.1.1 Clean Water Act
The CWA is an amendment to the Federal Water Pollution Control Act of 1972, which outlined the basic structure for regulating discharges of pollutants to waters of the United States. Several sections of this act pertain to regulating impacts to wetlands. Section 401 (Water Quality Certification) specifies requirements for permit review, particularly at the state level. The discharge of dredged or fill material into waters of the United States is subject to permitting under Section 404 (Discharge of Dredged and Fill Materials into Waters of the United States). The Corps and the EPA administer the CWA.
14.2.1.2 Section 401: Water Quality Certification
Section 401 of the federal CWA gives individual states the authority to issue, waive, or deny certification that a proposed activity is in conformance with state water quality standards. Under CWA Section 401, applicants for a federal license or permit to conduct activities that may result in the discharge of a pollutant into waters of the United States must obtain certification from the applicable state RQWCB in which the discharge would originate. Therefore, all projects that have a federal component and may affect state water quality (including projects that require federal agency approval, such as issuance of a Section 404 permit) must also comply with CWA Section 401. The ARC site is under the jurisdiction of the San Francisco Bay RWQCB.
14.2.1.3 Section 404: Discharge of Dredged and Fill Materials into Waters of the United States
The Corps and EPA regulate the placement of fill and dredged materials into waters of the United States under CWA Section 404. Waters of the United States include lakes, rivers, streams, and their tributaries, as well as wetlands. Wetlands are defined for regulatory purposes as areas “inundated or saturated by surface or ground water at a frequency and duration sufficient to support, and that under normal circumstances do support, a prevalence of vegetation typically adapted for life in saturated soil conditions.” Applicants
National Aeronautics and Space Administration Chap 14. Wetlands and Floodplains
NASA Ames Research Center Environmental Resources Document Environmental Management Division March 2015 File: 2015 ARC ERD_FINAL.doc
Pg 245
must obtain a permit from the Corps for all discharges of dredged or fill material into waters of the United States, including adjacent wetlands, before proceeding with a proposed activity.
The Corps may either issue individual permits on a case-by-case basis or general permits at a program level. General permits are pre-authorized, and are issued to cover similar activities that are expected to cause only minimal adverse environmental effects. Nationwide permits are a type of general permit issued to cover particular fill activities. Nationwide permits have a set of conditions that must be met for the permits to apply to a particular project, as well as specific conditions that apply to each nationwide permit.
Compliance with CWA Section 404 requires compliance with several other environmental laws and regulations. The Corps cannot issue an individual permit or verify the use of a general permit until the requirements of the NEPA, the Endangered Species Act (ESA), and the NHPA have been met. In addition, the Corps cannot issue or verify any permit until a water quality certification or a waiver of certification has been issued pursuant to CWA Section 401.
14.2.1.4 National Environmental Policy Act
NEPA requires federal agencies to include in their decision-making process appropriate and careful consideration of all environmental effects of a proposed action and of possible alternative actions. Measures to avoid or minimize the adverse effects of proposed actions and to restore and enhance environmental quality as much as possible must be developed and discussed where feasible.
14.2.1.5 Federal Flood Insurance Program
Alarmed by the increasing costs of disaster relief, Congress passed the National Flood Insurance Act in 1968 and the Flood Disaster Protection Act in 1973. The intent of these acts was to reduce the need for large publicly funded flood control structures and decrease disaster relief costs by restricting development on floodplains.
The Federal Emergency Management Agency (FEMA) administers the National Flood Insurance Program (NFIP) to provide subsidized flood insurance to communities that comply with FEMA regulations limiting development on floodplains. FEMA issues Flood Insurance Rate Maps (FIRMs) delineating flood hazard zones for communities participating in the NFIP.
14.2.1.6 Executive Order 11990 – Protection of wetlands
EO 11990 directs federal agencies to minimize the destruction, loss, and degradation of wetlands, and to preserve and enhance the natural and beneficial values of wetland communities. Agencies must avoid undertaking or providing assistance for new construction located in wetlands unless they determine that: (1) there is no practical alternative to such construction and (2) the proposed action includes all practical measures to minimize harm to wetlands that may result from such use. Agencies must also provide opportunity for early public review of any plans or proposals for new construction in wetlands. For major NASA actions significantly affecting the quality of the human
National Aeronautics and Space Administration Chap 14. Wetlands and Floodplains
NASA Ames Research Center Environmental Resources Document Environmental Management Division March 2015 File: 2015 ARC ERD_FINAL.doc
Pg 246
environment, an analysis and determination of wetland impacts will be included in any statement prepared under Section 102(2)(C) of NEPA. EO 11990 is codified for NASA in 14 CFR 1216.205 and incorporated into the NASA Management Directives System.
14.2.1.7 Executive Order 11988 – Floodplain Management
EO 11988 requires federal agencies to take action to minimize occupancy and modification of the floodplain. Specifically, EO 11988 prohibits federal agencies from funding construction in the 100-year floodplain unless there are no practicable alternatives. The 100-year or base floodplain designates the area that is predicted to flood during a 100-year storm, which has a 1 percent chance of occurring in any given year. For critical actions9, federal agencies must avoid modifying the base or 500-year floodplain. The 500-year floodplain designates the area with a 0.2 percent chance of flooding in any given year.
EO 11988 requires that federal agencies provide early public notice and evaluation of actions that may impact the floodplain, and provide opportunities for public input if no practicable alternative to floodplain development exists. For major NASA actions significantly affecting the quality of the human environment, a floodplain evaluation will be included in any statement prepared under Section 102(2)(C) of NEPA. EO 11988 is codified for NASA in 14 CFR 1216.205 and incorporated into the NASA Management Directives System.
14.2.1.8 Title 14 Code of Federal Regulations 1216.205 - Procedures for Evaluating NASA Actions Impacting Floodplains and Wetlands
As set forth in 14 CFR 1216.205, NASA must avoid taking any action in a floodplain unless there are no practicable alternatives. Upon considering a proposed action in the base floodplain (or 500-year floodplain for critical actions), the proposed action and alternatives must be comparatively evaluated taking into account the identified impacts, the steps necessary to minimize these impacts, and opportunities to restore and preserve floodplain values. If there is no practicable alternative to locating a proposed action in the floodplain, statement of funding and public explanation must be provided to all those who have received the early public notice. If there are no or only minor challenges to the proposed development, the action may then proceed through the normal NASA approval process. If significant issues arise during the 15- to 30-day public review process, a re-evaluation of the proposal and alternatives must be repeated.
Evaluations of floodplain impacts must be made at the earliest stage of advance planning, such as during facilities master plan development. Once approved, construction of facilities in the floodplain area must be in accordance with the standards and criteria of the NFIP and wherever practicable, structures should be elevated above the applicable flood level.
9 Per 44 CFR §9.4, Floodplain Management and Protection of Wetlands, A “Critical Action means an action for which even a slight chance of flooding is too great.” Roughly stated, a critical action includes any activity or project that creates, maintains, or extends the life of a facility that may use or store hazardous materials, provide emergency services, store irreplaceable documents or files, house or shelter mobility impaired individuals, or generate or store water, power, or gas for general use.
National Aeronautics and Space Administration Chap 14. Wetlands and Floodplains
NASA Ames Research Center Environmental Resources Document Environmental Management Division March 2015 File: 2015 ARC ERD_FINAL.doc
Pg 247
For actions affecting wetlands or floodplains, applicable NEPA procedures shall be used to provide the opportunity for early public review of the proposed action. A notice of intent to prepare an EIS may be used to satisfy the requirement for NASA to publish a notice of proposed action in a wetland or floodplain.
14.2.1.9 Congressional Authorizations for the South San Francisco Bay Shoreline Study
Section 142 of the Water Resources Development Act (WRDA) of 1976 authorized the Corps to investigate, among other things, the feasibility of providing protection against tidal and fluvial flooding along the San Francisco Bay shoreline. Following the Corps’ completion of the initial San Francisco Bay Shoreline Study for San Mateo, Alameda, and Santa Clara Counties, the U.S. House of Representatives’ Committee on Transportation and Infrastructure authorized the Corps in 2002 to perform a reconnaissance phase study, in accordance with Section 905(b) of the 1986 WRDA, to determine if there was federal interest in a cost shared feasibility phase study of the South San Francisco Bay shoreline (USACE 2004). The Corps completed the study and published a Section 905(b) analysis report in 2004 recommending that the Shoreline Study proceed into the feasibility phase. Congress then authorized the Corps, under Section 4027 of the 2007 WRDA, to conduct a feasibility study in cooperation with the SCVWD and California State Coastal Conservancy for flood damage reduction along the South San Francisco Bay Shoreline, restoration of the South San Francisco salt ponds, and other related purposes (HDR Engineering, Inc. 2014). This congressionally authorized study, currently in progress, is called the South San Francisco Bay Shoreline Study.
14.2.2 State Regulations
Fish and Game Code 1602 – Lake and Streambed Alteration Permits
The California Department of Fish and Wildlife (CDFW) has jurisdiction over ephemeral intermittent, and perennial waterways, including ephemeral streams, desert washes, and watercourses with a subsurface flow. It may also apply to work undertaken within natural lakes, manmade reservoirs, or the floodplain of a body of water. Under Section 1602, CDFW must be notified of any activity that substantially diverts or obstructs a waterway; changes or uses material from the bed, channel, or bank of a waterway; or deposits or disposes of debris, waste, or other material containing ground pavement where it may pass into any waterway. Notification to CDFW (through a Lake or Streambed Alteration Agreement) is required prior to the start of construction. The Agreement includes reasonable conditions necessary to protect sensitive fish and wildlife resources and, as applicable, must comply with CEQA.
14.2.3 Local Regulations
14.2.3.1 Santa Clara County
Existing County policies require that development in flood hazard areas: (a) not be located in a floodway or areas of highest risk; or (b) if located in hazard areas, to be designed, elevated and/or constructed to withstand or mitigate the risk of flooding. At a minimum,
National Aeronautics and Space Administration Chap 14. Wetlands and Floodplains
NASA Ames Research Center Environmental Resources Document Environmental Management Division March 2015 File: 2015 ARC ERD_FINAL.doc
Pg 248
new development must be placed to ensure that the finish floor elevation of the first story is above the 100-year flood level, which may require padding up the building location or by elevated building design measures. These requirements are implemented through the building permit process according to regulations contained in the County Floodplain Management Ordinance, Title C, Division C12, Chapter VII, of the Santa Clara County Ordinance Code.
14.2.3.2 City of Mountain View
Mountain View’s Drainage and Flood Control Ordinance, as codified in the Mountain View City Code, Chap. 8, Article IX, were established to reduce hazards associated with development on parcels at risk for flooding. All properties in flood hazard zones must comply with this ordinance. Areas at ARC to which these provisions could apply10 include portions of the Bay View area, the Eastern and Western Diked Marshes, and the SWRP.
14.2.3.3 City of Sunnyvale
Sunnyvale enforces specific building code requirements in flood prone areas to minimize potential property damage from flooding. Specific requirements for development in these areas, as set forth in the Buildings and Construction Ordinance, Title 16 of the Sunnyvale Municipal Code, include minimum foundation pad heights above the projected flood depth as specified on the applicable FIRM.
14.3 Regional Setting
ARC is located in northern Santa Clara County at the southern end of the San Francisco Bay. U.S. Highway 101, adjacent to the southern boundary of the ARC, provides primary transportation access to the facility. ARC is part of the metropolitan Bay Area; San Francisco is located 65 kilometers (40 miles) to the northwest, and San Jose is located 16 kilometers (10 miles) to the southeast. The cities of Mountain View and Sunnyvale are adjacent to ARC, across U.S. Highway 101. The USFWS owns the salt ponds and marshes north of Moffett Field, which were previously used for salt production by Cargill Salt Company. North of the USFWS property is the San Francisco Bay, approximately 1.6 kilometers (1 mile) to the north of Moffett Field. Stevens Creek forms the western boundary of ARC and discharges to San Francisco Bay. Along with three other area streams, Stevens Creek receives stormwater discharge from the City of Mountain View storm drain system, as well as treated groundwater from the MEW and NASA sites. There is also a limited connection between ARC and Guadalupe Slough via gates and pumps located to the northeast of Moffett Field, which discharge to the Northern Channel and Moffett Channel.
The Corps, together with the SCVWD and CSCC, is currently developing the South San Francisco Bay Shoreline Study to identify and recommend flood risk management and ecosystem restoration projects along South San Francisco Bay for federal funding. The study is being conducted through several “Interim Feasibility Studies,” the first of which is an investigation of flood protection for all Santa Clara County Baylands, from Palo Alto
10 To the extent that these areas are within the City of Mountain View limits. Most of ARC is in unincorporated Santa Clara County.
National Aeronautics and Space Administration Chap 14. Wetlands and Floodplains
NASA Ames Research Center Environmental Resources Document Environmental Management Division March 2015 File: 2015 ARC ERD_FINAL.doc
Pg 249
through Alviso to Southern Santa Clara County, in addition to the restoration of former salt production ponds within the Alviso Pond complex and adjacent properties such as areas around ARC (HDR Engineering, Inc. 2014). The scope of the current phase of the Shoreline Study is focusing on the most flood-prone section of the Santa Clara County shoreline: the area between Alviso Slough and Coyote Creek, which includes the Alviso community and the San Jose/Santa Clara Water Pollution Control Plant (South San Francisco Bay Shoreline Study 2014). The Corps is in the process of developing a draft feasibility study and EIS on project alternatives for the Alviso area.
A separate but related project, the SBSPRP, is a collaborative effort among federal, state, and local agencies working with scientists and the public to develop a programmatic plan for habitat restoration, flood management, and wildlife-oriented public access within the approximately 15,100 acres of former Cargill Inc. salt ponds in South San Francisco Bay acquired in 2003 (EDAW et al. 2007). With an initial goal to restore 7,500 acres to tidal marsh, the SBSPRP has to date achieved approximately 41% of that goal, with over 3,040 acres of former salt ponds restored to tidal flow. The Project has also enhanced a total of 477 acres of pond habitat for wildlife use toward a Project goal of 1,600 acres and has created 2.9 miles of public access trails along with interpretive signage and a new viewing platform at Pond A16 in Alviso (South Bay Salt Pond Restoration Project 2013).
Although the SBSPRP is separate from the Shoreline Study, it has similar objectives, shares the same geographic scope, and includes complementary restoration and flood management components; consequently, the planning and management of these two projects is being closely integrated.
14.4 Existing Site Conditions
14.4.1 Wetlands
A total of 51 acres of waters of the United States, including 42.4 acres of seasonal wetland and 8.6 acres of other waters of the United States were formally delineated at ARC in 2000 based on the Corps’ 1987 Wetlands Delineation Manual (Environmental Laboratory 1987). Waters of the U.S. were identified in the Bay View area, the Eastside/Airfield area (excluding the golf course), and the area immediately north of the Bay View area (North of Bay View area). Results of the wetland delineation were verified by the Corps in May 2001 and are incorporated by reference in the 2002 NADP PEIS.
The wetland delineation identified the wetlands located within the Bay View planning area and the Eastern and Western Diked Marshes in the North of Bay View area as seasonal wetlands. Specifically, two principle types of wetlands, as classified by the USFWS (Cowardin et al. 1979), were identified in these areas: PEMCh (Palustrine, emergent, seasonally flooded, diked) and PEMYKh (Palustrine, emergent, saturated, semipermanent; seasonal, artificially flooded, diked).
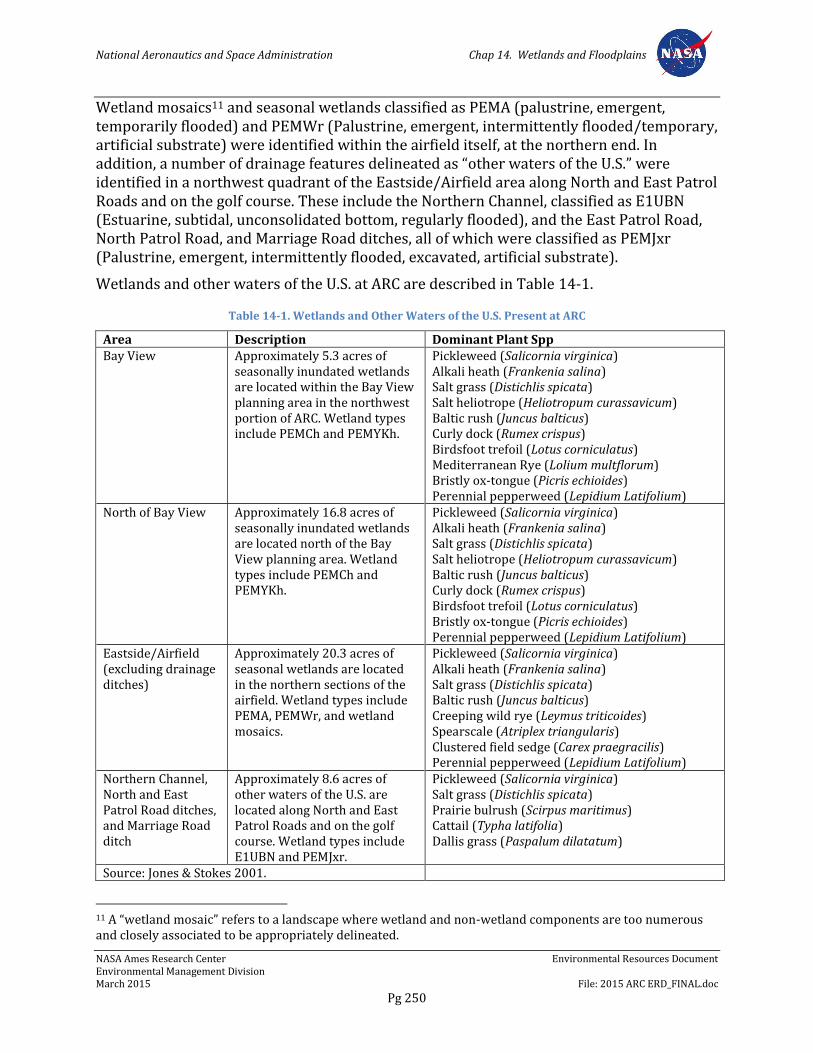
National Aeronautics and Space Administration Chap 14. Wetlands and Floodplains
NASA Ames Research Center Environmental Resources Document Environmental Management Division March 2015 File: 2015 ARC ERD_FINAL.doc
Pg 250
Wetland mosaics11 and seasonal wetlands classified as PEMA (palustrine, emergent, temporarily flooded) and PEMWr (Palustrine, emergent, intermittently flooded/temporary, artificial substrate) were identified within the airfield itself, at the northern end. In addition, a number of drainage features delineated as “other waters of the U.S.” were identified in a northwest quadrant of the Eastside/Airfield area along North and East Patrol Roads and on the golf course. These include the Northern Channel, classified as E1UBN (Estuarine, subtidal, unconsolidated bottom, regularly flooded), and the East Patrol Road, North Patrol Road, and Marriage Road ditches, all of which were classified as PEMJxr (Palustrine, emergent, intermittently flooded, excavated, artificial substrate).
Wetlands and other waters of the U.S. at ARC are described in Table 14-1.
Table 14-1. Wetlands and Other Waters of the U.S. Present at ARC
Area Description Dominant Plant Spp Bay View Approximately 5.3 acres of
seasonally inundated wetlands are located within the Bay View planning area in the northwest portion of ARC. Wetland types include PEMCh and PEMYKh.
Pickleweed (Salicornia virginica) Alkali heath (Frankenia salina) Salt grass (Distichlis spicata) Salt heliotrope (Heliotropum curassavicum) Baltic rush (Juncus balticus) Curly dock (Rumex crispus) Birdsfoot trefoil (Lotus corniculatus) Mediterranean Rye (Lolium multflorum) Bristly ox-tongue (Picris echioides) Perennial pepperweed (Lepidium Latifolium)
North of Bay View Approximately 16.8 acres of seasonally inundated wetlands are located north of the Bay View planning area. Wetland types include PEMCh and PEMYKh.
Pickleweed (Salicornia virginica) Alkali heath (Frankenia salina) Salt grass (Distichlis spicata) Salt heliotrope (Heliotropum curassavicum) Baltic rush (Juncus balticus) Curly dock (Rumex crispus) Birdsfoot trefoil (Lotus corniculatus) Bristly ox-tongue (Picris echioides) Perennial pepperweed (Lepidium Latifolium)
Eastside/Airfield (excluding drainage ditches)
Approximately 20.3 acres of seasonal wetlands are located in the northern sections of the airfield. Wetland types include PEMA, PEMWr, and wetland mosaics.
Pickleweed (Salicornia virginica) Alkali heath (Frankenia salina) Salt grass (Distichlis spicata) Baltic rush (Juncus balticus) Creeping wild rye (Leymus triticoides) Spearscale (Atriplex triangularis) Clustered field sedge (Carex praegracilis) Perennial pepperweed (Lepidium Latifolium)
Northern Channel, North and East Patrol Road ditches, and Marriage Road ditch
Approximately 8.6 acres of other waters of the U.S. are located along North and East Patrol Roads and on the golf course. Wetland types include E1UBN and PEMJxr.
Pickleweed (Salicornia virginica) Salt grass (Distichlis spicata) Prairie bulrush (Scirpus maritimus) Cattail (Typha latifolia) Dallis grass (Paspalum dilatatum)
Source: Jones & Stokes 2001.
11 A “wetland mosaic” refers to a landscape where wetland and non-wetland components are too numerous and closely associated to be appropriately delineated.
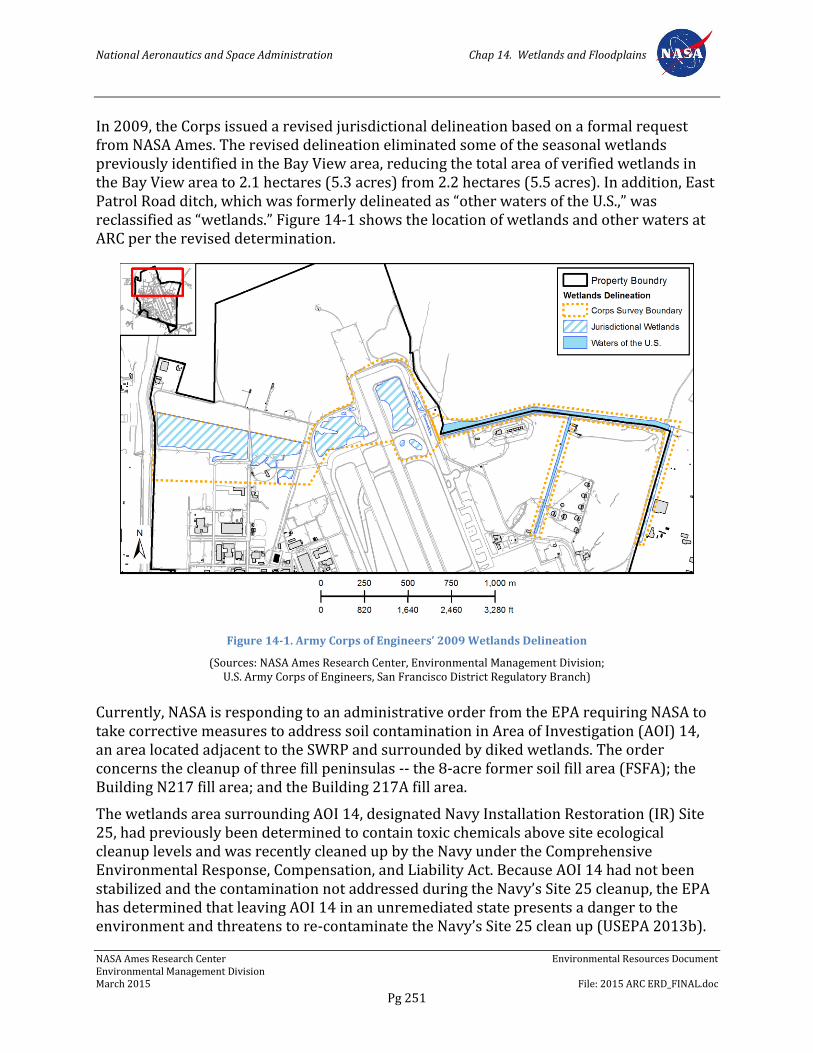
National Aeronautics and Space Administration Chap 14. Wetlands and Floodplains
NASA Ames Research Center Environmental Resources Document Environmental Management Division March 2015 File: 2015 ARC ERD_FINAL.doc
Pg 251
In 2009, the Corps issued a revised jurisdictional delineation based on a formal request from NASA Ames. The revised delineation eliminated some of the seasonal wetlands previously identified in the Bay View area, reducing the total area of verified wetlands in the Bay View area to 2.1 hectares (5.3 acres) from 2.2 hectares (5.5 acres). In addition, East Patrol Road ditch, which was formerly delineated as “other waters of the U.S.,” was reclassified as “wetlands.” Figure 14-1 shows the location of wetlands and other waters at ARC per the revised determination.
Figure 14-1. Army Corps of Engineers’ 2009 Wetlands Delineation
(Sources: NASA Ames Research Center, Environmental Management Division; U.S. Army Corps of Engineers, San Francisco District Regulatory Branch)
Currently, NASA is responding to an administrative order from the EPA requiring NASA to take corrective measures to address soil contamination in Area of Investigation (AOI) 14, an area located adjacent to the SWRP and surrounded by diked wetlands. The order concerns the cleanup of three fill peninsulas -- the 8-acre former soil fill area (FSFA); the Building N217 fill area; and the Building 217A fill area.
The wetlands area surrounding AOI 14, designated Navy Installation Restoration (IR) Site 25, had previously been determined to contain toxic chemicals above site ecological cleanup levels and was recently cleaned up by the Navy under the Comprehensive Environmental Response, Compensation, and Liability Act. Because AOI 14 had not been stabilized and the contamination not addressed during the Navy’s Site 25 cleanup, the EPA has determined that leaving AOI 14 in an unremediated state presents a danger to the environment and threatens to re-contaminate the Navy’s Site 25 clean up (USEPA 2013b).
National Aeronautics and Space Administration Chap 14. Wetlands and Floodplains
NASA Ames Research Center Environmental Resources Document Environmental Management Division March 2015 File: 2015 ARC ERD_FINAL.doc
Pg 252
The required corrective measures for AOI 14 are considered necessary due to the presence of chemicals of concern, primarily, PCB, DDT, lead, and zinc, in excess of NASA’s site-specific soil action levels. To address the contamination and protect the surrounding wetlands, NASA developed an Interim Corrective Action Measures Work Plan and installed a temporary silt fence around the northern portion of the FSFA in coordination with the USFWS, the Corps, and the RWQCB. Final corrective measures for AOI 14 have not been determined.
ARC is not engaged in a wetlands banking program.
14.4.2 Floodplains
Historically, flooding at ARC, primarily in the northern portions of the site, has originated from two sources: San Francisco Bay and Stevens Creek. Improvements to the bay-side levees surrounding the former Cargill salt ponds in San Francisco Bay and subsequent flood control improvements to Stevens Creek have provided greater protection from flooding in recent years but have not removed the risk entirely. In addition, the stormwater drainage and retention systems at ARC lack the capacity to handle high water volumes and have on occasion caused general and localized flooding in certain areas of the Center during peak rainfall events (see additional information on flood hazards in Chapter 11, Hydrology and Water Quality).
Much of the Bay View area and parts of the Ames Campus area are located within the 100-year and 500-year floodplain boundaries as delineated on FIRMs produced by FEMA (Figure 14–2). Geographic areas within floodplains are further divided into one or more flood zones, which FEMA uses to assign levels of flood risk for flood management and insurance purposes. At ARC, areas located in the 100-year floodplain are considered at high risk for flooding and thus are assigned to Zone AE, while areas in the 500-year floodplain, which are at minimal to moderate risk of flooding, are assigned to Zone X (hatched). The northern Eastside/Airfield area, the NRP area, and the majority of the Ames Campus area south of Hunsaker Road, which FEMA has not studied, have possible but undetermined flood hazards; consequently, all of these areas are designated as Zone D. FEMA flood hazard zones present at ARC are described in Table 14-2.
Table 14-2. FEMA Flood Hazard Zones Present at ARC
Zone Definition AE (Stippled) Areas subject to inundation by the 1-percent-annual-chance flood event. Because
detailed hydraulic analyses have not been performed, no Base Flood Elevations (BFEs) or flood depths are shown.
X (Hatched) Moderate risk areas within the 0.2-percent-annual-chance floodplain, areas of 1-percent-annual-chance flooding where average depths are less than 1 foot, areas of 1-percent-annual-chance flooding where the contributing drainage area is less than 1 square mile, and areas protected from the 1-percent-annual-chance flood by a levee. No BFEs or base flood depths are shown within these zones. (Zone X (hatched) is used on new and revised maps in place of Zone B.)
D Unstudied areas where flood hazards are undetermined, but flooding is possible. No mandatory flood insurance purchase requirements apply, but coverage is available in participating communities.
Source: FEMA 2014a.
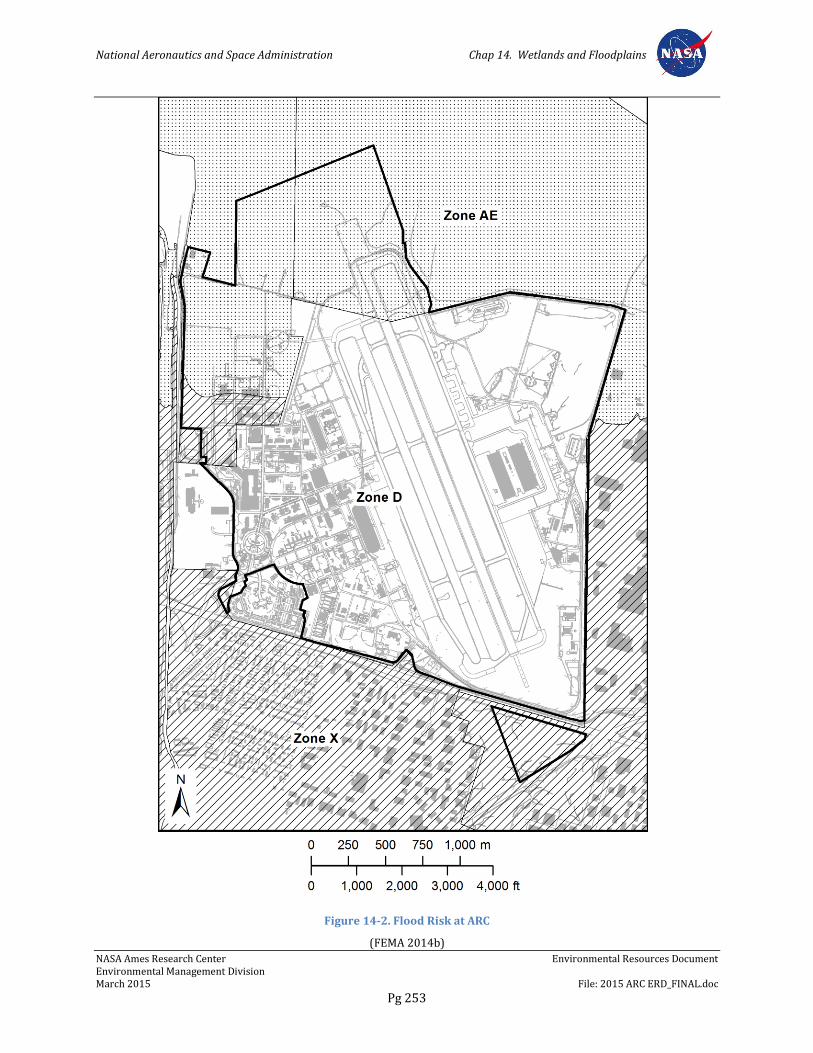
National Aeronautics and Space Administration Chap 14. Wetlands and Floodplains
NASA Ames Research Center Environmental Resources Document Environmental Management Division March 2015 File: 2015 ARC ERD_FINAL.doc
Pg 253
Figure 14-2. Flood Risk at ARC
(FEMA 2014b)
National Aeronautics and Space Administration Chap 14. Wetlands and Floodplains
NASA Ames Research Center Environmental Resources Document Environmental Management Division March 2015 File: 2015 ARC ERD_FINAL.doc
Pg 254
Google’s 1.2 million-square-foot Bay View campus is currently under construction in the Bay View area of ARC, much of it within the 100-year floodplain. To mitigate for future flood risk associated with the development of new housing in the Bay View area, fill was placed in Bay View Parcels 1, 2, and 4, effectively raising the existing site elevations in those areas above the 100-year flood level of 11+ feet above grade (based on the North American Vertical Datum of 1988 [NAVD88]). The minimum entry floor level for occupiable buildings on the Bay View campus is anticipated to be at 12+ feet above grade, or 1 foot above the base floodplain, which is consistent with the design assumptions presented in the floodplain analysis in Chapter 6 of the NADP EIS. The analysis determined that the addition of fill above the 100-year tide elevation “would not cause changes in tidal water levels at other locations and would not have a cumulative impact.” Additionally, the current design of the Bay View campus incorporates many of the stormwater management practices proposed in the EIS to reduce the impact of stormwater runoff on the floodplain, including green roofs, bioswales, and stormwater detention basins.
No other development activities are currently located in, or proposed for, floodplains at ARC.
14.5 Environmental Requirements
NASA has identified the following environmental policies and measures that are designed to minimize harm to lives and property, and preserve the natural and beneficial values of wetlands and floodplains.
14.5.1 NASA Procedural Directive 8500.1, NASA Environmental Management
Per NPD 8500.1, it is NASA policy to: maintain compliance with all applicable federal, state, and local environmental requirements; to incorporate environmental risk reduction and sustainable practices to the extent practicable throughout NASA’s programs, projects, and activities; and to consider environmental factors throughout the life cycle of programs, projects, and activities (as defined in NPD 7120.4, NASA Engineering and Program/Project Management Policy, and related documents), including planning, development, execution, and disposition activities. Examples of environmental factors include consideration of environmental impacts as required by the NEPA and NHPA; the proposed use of hazardous materials; the potential for waste generation; the need to acquire necessary permits, waivers, and authorizations; and the use of environmentally-preferable materials and processes wherever practicable.
14.5.2 Ames Procedural Requirements 8500.1, Ames Environmental Procedural Requirements
APR 8500.1 sets forth general procedural requirements to ensure compliance with applicable federal, state, and local environmental laws; regulations and EOs; and NASA policies and procedures. Organizational directors, division chiefs, branch chiefs, section heads, supervisors, managers, and CORs are responsible for planning, designing, constructing, managing, operating, and maintaining facilities in conformance with applicable regulatory directives, and should obtain environmental review from the Environmental Management Division early in project planning consistent with NASA's
National Aeronautics and Space Administration Chap 14. Wetlands and Floodplains
NASA Ames Research Center Environmental Resources Document Environmental Management Division March 2015 File: 2015 ARC ERD_FINAL.doc
Pg 255
NEPA implementing procedures (NPR 8580.1 and EO 12114), NASA policies and procedures for programs and projects (NPR 7120), and NASA regulations related to environmental quality (14 CFR 1216). Program and project managers should coordinate with the Environmental Management Division in a timely manner to ensure that any new or modified programs, projects, and activities comply with regulatory requirements.
14.5.3 Ames Environmental Work Instructions
Ames’s EWIs, which replace the previous Ames Environmental Handbook (APR 8800.3), set forth requirements to ensure that programs, projects, and activities at ARC comply with applicable federal, state, and local laws; regulations and EOs; and NASA policies and procedures. Each EWI lists relevant regulatory authorities and documents, assigns individual and organizational responsibilities within ARC, and identifies specific requirements applicable to the work being performed.
The following EWIs are relevant to operations and future development at ARC with the potential to impact wetlands and floodplains.
EWI 2-4, Wetlands and Flood Plains (Under review)
EWI 12, Public Involvement
EWI 14, NEPA and Environmental Justice
EWI 18, Environmental Requirements for Construction Projects (Under review)
14.5.4 NASA Ames Development Plan Final Programmatic Environmental Impact Statement
The NADP EIS identifies the following mitigation measures to address impacts to wetlands from build out of NADP Mitigated Alternative 5.
14.5.4.1 Mitigation Measure BIO-3
Landscaping would be designed with native species (with the possible exception of lawn areas). Invasive plants would not be used in any landscaping. Any imported soil used for landscaping must be certified as weed-free. Similarly, any erosion-control structures that contain hay or other dried plant material (e.g., hay bales) must be certified as weed-free. Any construction equipment operating within 76 meters (250 feet) of jurisdictional wetlands or other sensitive habitats in the Bay View area would be washed with reclaimed water prior to use in this area to remove potential weed seeds. The construction zone would be surveyed periodically by a qualified botanist, so that any infestations of invasive species that establish within the construction zone of the Bay View area can be eradicated before the plants can flower and set seed. Project proponents must obtain all applicable permits and approvals for discharges of dredged or fill material into waters of the United States, including wetlands, before proceeding with a proposed action.

National Aeronautics and Space Administration Chap 14. Wetlands and Floodplains
NASA Ames Research Center Environmental Resources Document Environmental Management Division March 2015 File: 2015 ARC ERD_FINAL.doc
Pg 256
14.5.4.2 Mitigation Measure BIO-18
Potentially contaminated runoff would be managed using stormwater BMPs. Swales would be constructed adjacent to wetlands in upland areas to intercept and filter any runoff before it reaches the wetland. Construction of swales would be permitted within the 61-meter (200-foot) buffer zone around wetlands, but not within the wetlands themselves.
14.5.4.3 Mitigation Measure BIO-19
To minimize impacts on wetlands, construction would be avoided in the jurisdictional wetlands along the northern boundary of the Bay View area and within 61 meters (200 feet) of these wetlands. Fill activities and other disturbances would be minimized in jurisdictional wetlands elsewhere.
National Aeronautics and Space Administration Chap 15. Biological Resources
NASA Ames Research Center Environmental Resources Document Environmental Management Division March 2015 File: 2015 ARC ERD_FINAL.doc
Pg 257
Chapter 15. Biological Resources
15.1 Overview
This chapter provides information about biological resources at ARC, including the types and distribution of habitat, wildlife, vegetation, and special-status species. Applicable regulations are discussed, as are relevant plans, programs, policies, and measures that are designed to preserve and protect special-status wildlife and their habitats at ARC. The information presented in this chapter was drawn from the November 2009 NASA ARC ERD (NASA 2009), NADP EIS (Design, Community & Environment 2002), and the results of biological studies that have been previously conducted at ARC.
15.2 Regulatory Background
15.2.1 Federal Regulations
15.2.1.1 Endangered Species Act
The federal ESA protects fish and wildlife species that are listed as threatened or endangered, and their habitats. “Endangered” species, subspecies, or distinct population segments are those that are in danger of extinction through all or a significant portion of their range, and “threatened” species, subspecies, or distinct population segments are likely to become endangered in the near future. The USFWS administers ESA.
15.2.1.1.1 Section 7
Section 7 of ESA requires federal agencies to ensure that their actions do not jeopardize the continued existence of a listed fish, wildlife, or plant species, or destroy or adversely modify that species’ critical habitat, as defined and designated by federal regulations. federally listed species that are known to occur at the facility include California brown pelican (Pelecanus occidentalis), California clapper rail (Rallus longirostris obsoletus), California least tern (Sterna antillarum browni), western snowy plover (Charadrius alexandrinus mvosus), and salt marsh harvest mouse (Reithrodontomys raviventris).
15.2.1.1.2 Section 9
Section 9 of ESA prohibits the take of any fish or wildlife species listed as endangered under the act, and also prohibits removing, digging up, cutting, maliciously damaging, or destroying federally listed plants on sites under federal jurisdiction. As defined by ESA, “take” means “to harass, harm, pursue, hunt, shoot, wound, kill, trap, capture, or collect, or to attempt to engage in any such conduct.” “Harm” is defined as “any act that kills or injures the species, including significant habitat modification.” Take of threatened species is also prohibited unless otherwise authorized by federal regulations
15.2.1.2 Migratory Bird Treaty Act
The federal Migratory Bird Treaty Act (MBTA), administered by the USFWS, implements a series of treaties between the United States, Mexico, and Canada that provide for the
National Aeronautics and Space Administration Chap 15. Biological Resources
NASA Ames Research Center Environmental Resources Document Environmental Management Division March 2015 File: 2015 ARC ERD_FINAL.doc
Pg 258
international protection of migratory birds. The law contains no requirement to prove intent to violate any of its provisions. Wording in the act makes it clear that most actions that result in “taking” or possession (permanent or temporary) of a protected species can be a violation of the act. In the MBTA, the word “take” is defined as meaning “pursue, hunt, shoot, wound, kill, trap, capture, or collect, or attempt to pursue, hunt, shoot, wound, kill, trap, capture, or collect.” The provisions of the MBTA are nearly absolute, “except as permitted by regulations.” Examples of permitted actions that do not violate the law are the possession of a hunting license to pursue specific game birds, legitimate research activities, display in zoological gardens, bird-banding, and similar activities.
15.2.1.3 Bald and Golden Eagle Protection Act
Protection of the bald eagle (Haliaeetus leucocephalus) began in 1940 with the passage of the Eagle Protection Act. The Eagle Protection Act was later amended to include the golden eagle (Aquila chrysaetos) and was renamed. The Bald and Golden Eagle Protection Act makes it unlawful to import, export, take, sell, purchase, or barter any bald eagle or golden eagle, their parts, products, nests, or eggs. Take includes pursuing, shooting, poisoning, wounding, killing, capturing, trapping, collecting, molesting, or disturbing. The USFWS for may grant exceptions for scientific or exhibition use, or for traditional and cultural use by Native Americans. However, no permits may be issued for import, export, or commercial activities involving eagles.
15.2.1.4 National Environmental Policy Act
NEPA requires federal agencies to include in their decision-making process appropriate and careful consideration of all environmental effects of a proposed action and of possible alternative actions. Measures to avoid or minimize the adverse effects of proposed actions and to restore and enhance environmental quality as much as possible must be developed and discussed where feasible.
15.2.2 State Laws
The most relevant state laws regulating biological resources are the California Endangered Species Act and the California Fish and Game Code, each of which is described below.
15.2.2.1 California Endangered Species Act
The California Endangered Species Act (CESA) protects wildlife and plants listed as threatened and endangered by the California Fish and Game Commission. CDFW administers the act. The act requires state agencies to conserve threatened and endangered species (Section 2055), and thus restricts all persons from taking listed species except under certain circumstances. The act defines “take” as any action or attempt to “hunt, pursue, catch, capture, or kill.” The CDFW may authorize take under Section 2081 agreements, except for designated “fully protected species.” The requirements for an application for an incidental take permit under the CESA are described in Section 2081 of the California Fish and Game Code and in final adopted regulations for implementing Sections 2080 and 2081.
National Aeronautics and Space Administration Chap 15. Biological Resources
NASA Ames Research Center Environmental Resources Document Environmental Management Division March 2015 File: 2015 ARC ERD_FINAL.doc
Pg 259
15.2.2.2 California Fish and Game Code
The California Fish and Game Code provides protection from take for a variety of species. Section 5050 lists protected amphibians and reptiles, eggs and nests of all birds are protected under Section 3503, nesting birds (including raptors and passerines) under Sections 3503.5 and 3513, birds of prey under Section 3503.5, and fully protected birds under Section 3511. All birds that occur naturally in California and are not resident game birds, migratory game birds, or fully protected birds are considered non-game birds and are protected under Section 3800. Mammals are protected under Section 4700. Hawks, falcons, and owls that occur at ARC are thus protected under Section 3503.5 and non-game birds under Section 3800. In addition, several bird species listed under Section 3511, including golden eagles and white-tailed kites, occur or have the potential to occur in ARC. Specific measures to avoid take of western burrowing owl (Athene cunicularia hypogea), a protected bird of prey, are incorporated into the Western Burrowing Owl Habitat Management Plan (BOHMP) written into the 2002 NADP EIS.
15.2.2.3 California Native Plant Protection Act
The California Native Plant Protection Act of 1977 (CNPPA) prohibits importation of rare and endangered plants into California, take of rare and endangered plants, and sale of rare and endangered plants. CESA defers to the CNPPA, which ensures that state-listed plant species are protected when state agencies are involved in projects subject to the CEQA. In this case, plants listed as rare under the CNPPA are not protected under CESA but rather under CEQA.
The following kinds of activities are exempt from the California Native Plant Protection Act:
Agricultural operations
Fire control measures
Timber harvest operations
Mining assessment work
Removal of plants by private landowners on private land for construction of canals, ditches, buildings, roads, or other rights-of-way
Removal of plants for performance of a public service by a public agency or a publicly or privately-owned public utility
While CEQA does not apply directly to federal agencies, ARC does consider the impacts on state-listed species during NEPA analyses. CEQA does apply to state agencies located at ARC.
15.2.3 Local Regulations
15.2.3.1 Santa Clara County Heritage Tree Ordinance
The Santa Clara County Heritage Tree Ordinance is designed to protect trees in order to provide aesthetic beauty, economic vitality, and environmental stability for county lands. Protected trees generally include:
National Aeronautics and Space Administration Chap 15. Biological Resources
NASA Ames Research Center Environmental Resources Document Environmental Management Division March 2015 File: 2015 ARC ERD_FINAL.doc
Pg 260
Trees that are 95.8 centimeters (37.7 inches) or more in circumference (30 centimeters [12 inches] in diameter) at 137 centimeters (4.5 feet) above ground
Multiple trunk trees with a total of 192 centimeters (75.4 inches) in circumference (61 centimeters [24 inches] in diameter of all trunks within the following areas of the county:
Parcels zoned “hillside” that are 3 acres or less
Parcels within a “-d” (Design Review) combining zoning district
Parcels within the Los Gatos Specific Plan Area
Any heritage tree, as defined by the Tree Preservation Ordinance
Any tree required to be planted as a replacement for an unlawfully removed tree
Any tree required to be planted or retained by the conditions of approval for any use permit, building site approval, grading permit, architectural and site approval, design review, special permit, or subdivision
Any tree that meets the minimum measurements and occurs on any property owned or leased by the County of Santa Clara
Any tree, regardless of size, within road rights-of-way and easements of the county, whether within or outside of the unincorporated territory of the county
The ordinance requires that project proponents take into account the location of all heritage trees on a property when new building or outdoor space is planned. Development plans must preserve and minimize disturbance to as many trees as possible. Heritage trees can only be removed if approved by the county. The removal of any heritage trees must be mitigated by planting replacement trees at a ratio determined by the Santa Clara County Planning Department.
15.3 Regional Setting
ARC is in northern Santa Clara County at the southern end of the San Francisco Bay. U.S. Highway 101, adjacent to the southern boundary of the facility, provides primary transportation access to the facility. Ames is part of the metropolitan Bay Area; San Francisco is located 65 kilometers (40 miles) to the northwest and San Jose is located 16 kilometers (10 miles) to the southeast. The cities of Mountain View and Sunnyvale are adjacent to Ames, across U.S. Highway 101. The USFWS owns the salt ponds and marshes north of Moffett Field previously used for salt production by Cargill Salt Company. North of the USFWS Service property is the San Francisco Bay, approximately 1.6 kilometer (1 mile) to the north of Moffett Field. Stevens Creek forms the western boundary of ARC and discharges to San Francisco Bay. Along with three other area streams, Stevens Creek receives stormwater discharge from the City of Mountain View storm drain system, as well as treated groundwater from the MEW and NASA sites. There is also a limited connection between ARC and Guadalupe Slough via gates and pumps located to the northeast of Moffett Field, which discharge to the Northern Channel and Moffett Channel.
National Aeronautics and Space Administration Chap 15. Biological Resources
NASA Ames Research Center Environmental Resources Document Environmental Management Division March 2015 File: 2015 ARC ERD_FINAL.doc
Pg 261
15.4 Existing Site Conditions
The following sections discuss existing biological resources at ARC. Sections are organized geographically. The first three sections discuss resources in the (NRP and Ames Campus, the Bay View area, and the Eastside/Airfield area, respectively. A fourth section summarizes resources immediately north of the Bay View area, adjacent to but outside of the area, referred to herein as the North of Bay View area.
Vertebrate animal life at ARC largely consists of migratory and wintering birds, visiting birds from the nearby bay front and open water habitats, and several resident species of birds and small mammals. There are four federally-listed (Endangered or Threatened) species that either forage and/or breed at Ames. They are Ridgway’s rail, California least tern, western snowy plover, and salt marsh harvest mouse.
Species listed as Federally Endangered or Threatened are fully protected under the provisions of ESA. Unlike threatened and endangered species, Federal Candidate Species and Federal Species of Special Concern are not afforded any legal protection under ESA but typically receive special attention from federal and state agencies during the environmental review process. Species listed on the state level include State Endangered, California Fully Protected, and California Species of Special Concern. All state and federal special-status species potentially found at ARC are summarized in Table 15-1 and are discussed in detail below.
Table 15-2 lists special-status plant species that occur or may occur in the Ames Research Center area. Based on research and analysis conducted during preparation of the NADP EIS, there are no designated critical habitat areas within or near the ARC. All of the existing habitat areas in the vicinity have been extensively disturbed by agriculture and development over the past two centuries.
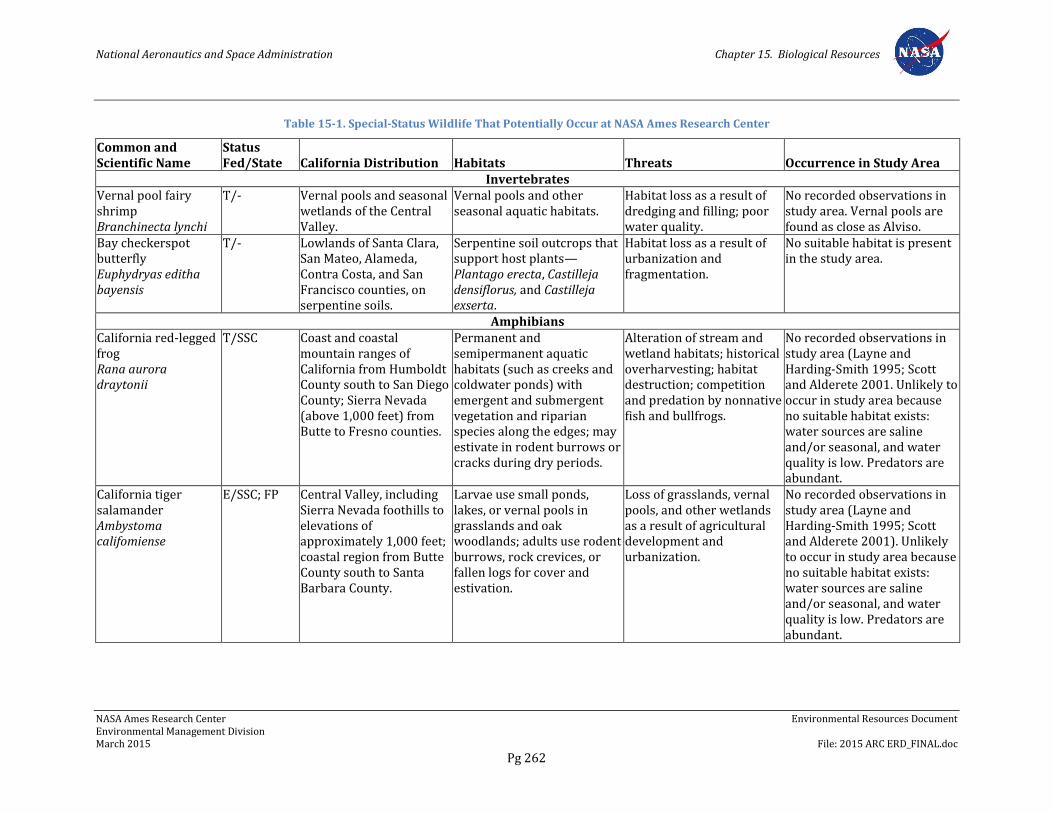
National Aeronautics and Space Administration Chapter 15. Biological Resources
NASA Ames Research Center Environmental Resources Document Environmental Management Division March 2015 File: 2015 ARC ERD_FINAL.doc
Pg 262
Table 15-1. Special-Status Wildlife That Potentially Occur at NASA Ames Research Center
Common and Scientific Name
Status Fed/State California Distribution Habitats Threats Occurrence in Study Area
Invertebrates Vernal pool fairy shrimp Branchinecta lynchi
T/- Vernal pools and seasonal wetlands of the Central Valley.
Vernal pools and other seasonal aquatic habitats.
Habitat loss as a result of dredging and filling; poor water quality.
No recorded observations in study area. Vernal pools are found as close as Alviso.
Bay checkerspot butterfly Euphydryas editha bayensis
T/- Lowlands of Santa Clara, San Mateo, Alameda, Contra Costa, and San Francisco counties, on serpentine soils.
Serpentine soil outcrops that support host plants—Plantago erecta, Castilleja densiflorus, and Castilleja exserta.
Habitat loss as a result of urbanization and fragmentation.
No suitable habitat is present in the study area.
Amphibians California red-legged frog Rana aurora draytonii
T/SSC Coast and coastal mountain ranges of California from Humboldt County south to San Diego County; Sierra Nevada (above 1,000 feet) from Butte to Fresno counties.
Permanent and semipermanent aquatic habitats (such as creeks and coldwater ponds) with emergent and submergent vegetation and riparian species along the edges; may estivate in rodent burrows or cracks during dry periods.
Alteration of stream and wetland habitats; historical overharvesting; habitat destruction; competition and predation by nonnative fish and bullfrogs.
No recorded observations in study area (Layne and Harding-Smith 1995; Scott and Alderete 2001. Unlikely to occur in study area because no suitable habitat exists: water sources are saline and/or seasonal, and water quality is low. Predators are abundant.
California tiger salamander Ambystoma califomiense
E/SSC; FP Central Valley, including Sierra Nevada foothills to elevations of approximately 1,000 feet; coastal region from Butte County south to Santa Barbara County.
Larvae use small ponds, lakes, or vernal pools in grasslands and oak woodlands; adults use rodent burrows, rock crevices, or fallen logs for cover and estivation.
Loss of grasslands, vernal pools, and other wetlands as a result of agricultural development and urbanization.
No recorded observations in study area (Layne and Harding-Smith 1995; Scott and Alderete 2001). Unlikely to occur in study area because no suitable habitat exists: water sources are saline and/or seasonal, and water quality is low. Predators are abundant.
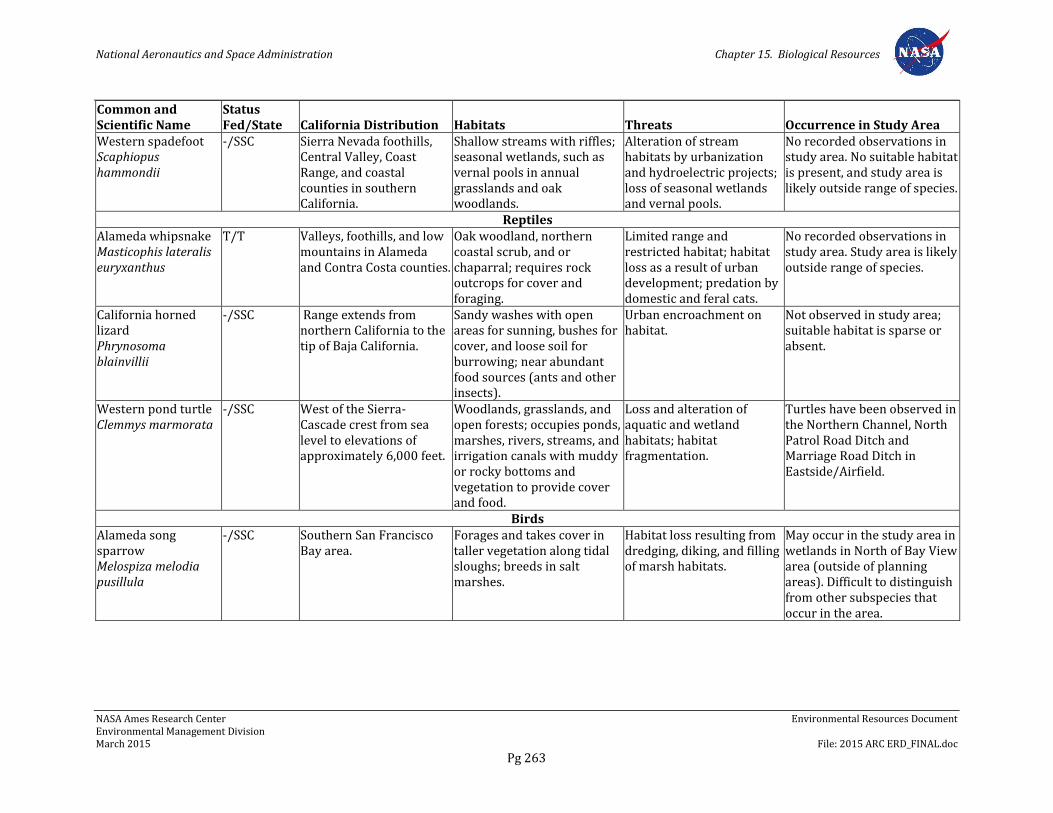
National Aeronautics and Space Administration Chapter 15. Biological Resources
NASA Ames Research Center Environmental Resources Document Environmental Management Division March 2015 File: 2015 ARC ERD_FINAL.doc
Pg 263
Common and Scientific Name
Status Fed/State California Distribution Habitats Threats Occurrence in Study Area
Western spadefoot Scaphiopus hammondii
-/SSC Sierra Nevada foothills, Central Valley, Coast Range, and coastal counties in southern California.
Shallow streams with riffles; seasonal wetlands, such as vernal pools in annual grasslands and oak woodlands.
Alteration of stream habitats by urbanization and hydroelectric projects; loss of seasonal wetlands and vernal pools.
No recorded observations in study area. No suitable habitat is present, and study area is likely outside range of species.
Reptiles Alameda whipsnake Masticophis lateralis euryxanthus
T/T Valleys, foothills, and low mountains in Alameda and Contra Costa counties.
Oak woodland, northern coastal scrub, and or chaparral; requires rock outcrops for cover and foraging.
Limited range and restricted habitat; habitat loss as a result of urban development; predation by domestic and feral cats.
No recorded observations in study area. Study area is likely outside range of species.
California horned lizard Phrynosoma blainvillii
-/SSC Range extends from northern California to the tip of Baja California.
Sandy washes with open areas for sunning, bushes for cover, and loose soil for burrowing; near abundant food sources (ants and other insects).
Urban encroachment on habitat.
Not observed in study area; suitable habitat is sparse or absent.
Western pond turtle Clemmys marmorata
-/SSC West of the Sierra-Cascade crest from sea level to elevations of approximately 6,000 feet.
Woodlands, grasslands, and open forests; occupies ponds, marshes, rivers, streams, and irrigation canals with muddy or rocky bottoms and vegetation to provide cover and food.
Loss and alteration of aquatic and wetland habitats; habitat fragmentation.
Turtles have been observed in the Northern Channel, North Patrol Road Ditch and Marriage Road Ditch in Eastside/Airfield.
Birds Alameda song sparrow Melospiza melodia pusillula
-/SSC Southern San Francisco Bay area.
Forages and takes cover in taller vegetation along tidal sloughs; breeds in salt marshes.
Habitat loss resulting from dredging, diking, and filling of marsh habitats.
May occur in the study area in wetlands in North of Bay View area (outside of planning areas). Difficult to distinguish from other subspecies that occur in the area.
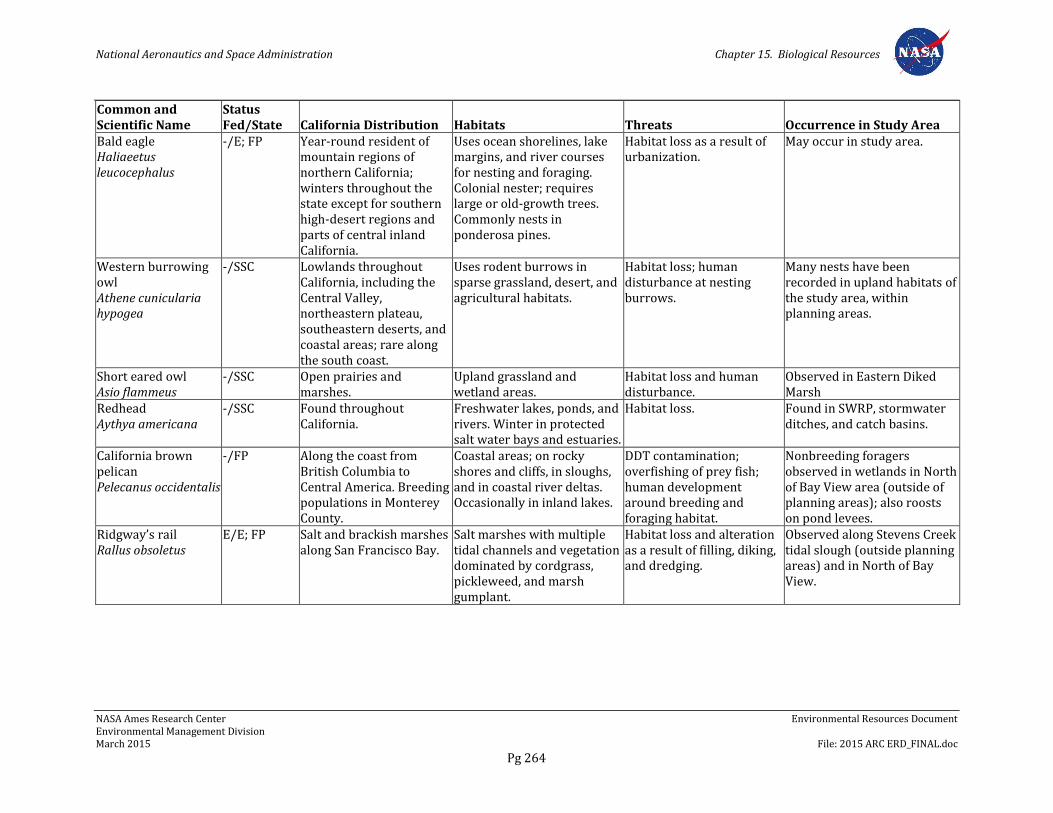
National Aeronautics and Space Administration Chapter 15. Biological Resources
NASA Ames Research Center Environmental Resources Document Environmental Management Division March 2015 File: 2015 ARC ERD_FINAL.doc
Pg 264
Common and Scientific Name
Status Fed/State California Distribution Habitats Threats Occurrence in Study Area
Bald eagle Haliaeetus leucocephalus
-/E; FP Year-round resident of mountain regions of northern California; winters throughout the state except for southern high-desert regions and parts of central inland California.
Uses ocean shorelines, lake margins, and river courses for nesting and foraging. Colonial nester; requires large or old-growth trees. Commonly nests in ponderosa pines.
Habitat loss as a result of urbanization.
May occur in study area.
Western burrowing owl Athene cunicularia hypogea
-/SSC Lowlands throughout California, including the Central Valley, northeastern plateau, southeastern deserts, and coastal areas; rare along the south coast.
Uses rodent burrows in sparse grassland, desert, and agricultural habitats.
Habitat loss; human disturbance at nesting burrows.
Many nests have been recorded in upland habitats of the study area, within planning areas.
Short eared owl Asio flammeus
-/SSC
Open prairies and marshes.
Upland grassland and wetland areas.
Habitat loss and human disturbance.
Observed in Eastern Diked Marsh
Redhead Aythya americana
-/SSC Found throughout California.
Freshwater lakes, ponds, and rivers. Winter in protected salt water bays and estuaries.
Habitat loss. Found in SWRP, stormwater ditches, and catch basins.
California brown pelican Pelecanus occidentalis
-/FP Along the coast from British Columbia to Central America. Breeding populations in Monterey County.
Coastal areas; on rocky shores and cliffs, in sloughs, and in coastal river deltas. Occasionally in inland lakes.
DDT contamination; overfishing of prey fish; human development around breeding and foraging habitat.
Nonbreeding foragers observed in wetlands in North of Bay View area (outside of planning areas); also roosts on pond levees.
Ridgway’s rail Rallus obsoletus
E/E; FP Salt and brackish marshes along San Francisco Bay.
Salt marshes with multiple tidal channels and vegetation dominated by cordgrass, pickleweed, and marsh gumplant.
Habitat loss and alteration as a result of filling, diking, and dredging.
Observed along Stevens Creek tidal slough (outside planning areas) and in North of Bay View.
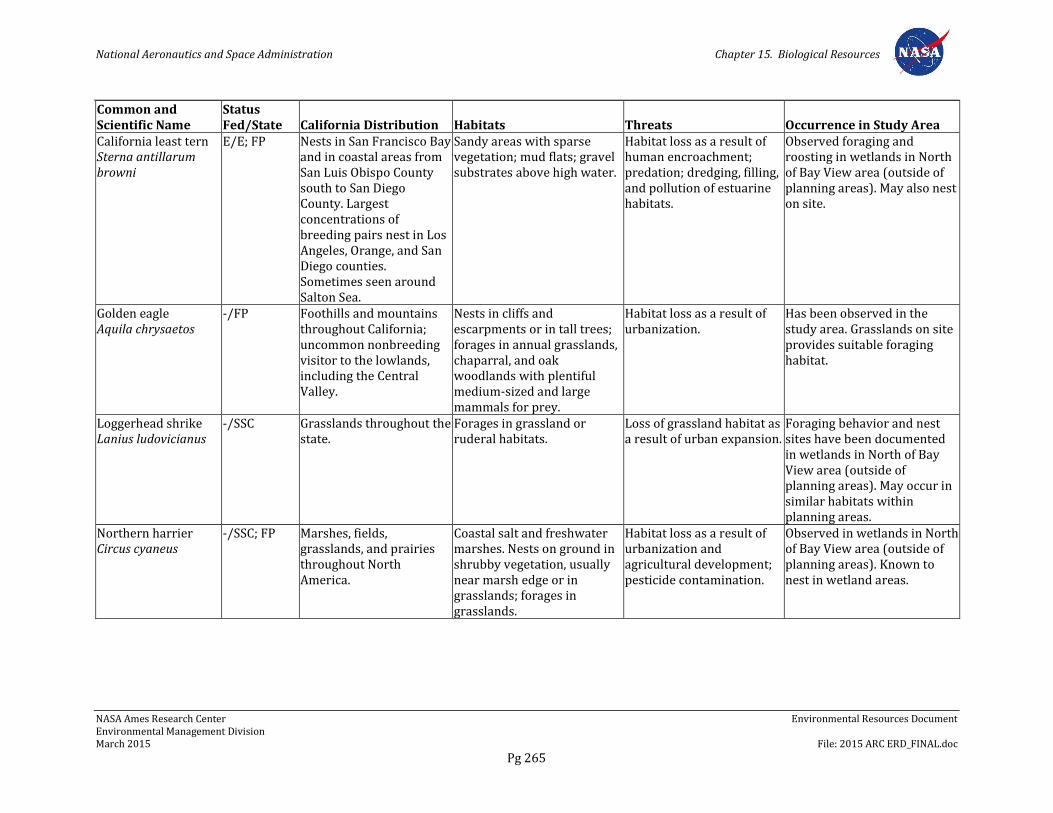
National Aeronautics and Space Administration Chapter 15. Biological Resources
NASA Ames Research Center Environmental Resources Document Environmental Management Division March 2015 File: 2015 ARC ERD_FINAL.doc
Pg 265
Common and Scientific Name
Status Fed/State California Distribution Habitats Threats Occurrence in Study Area
California least tern Sterna antillarum browni
E/E; FP Nests in San Francisco Bay and in coastal areas from San Luis Obispo County south to San Diego County. Largest concentrations of breeding pairs nest in Los Angeles, Orange, and San Diego counties. Sometimes seen around Salton Sea.
Sandy areas with sparse vegetation; mud flats; gravel substrates above high water.
Habitat loss as a result of human encroachment; predation; dredging, filling, and pollution of estuarine habitats.
Observed foraging and roosting in wetlands in North of Bay View area (outside of planning areas). May also nest on site.
Golden eagle Aquila chrysaetos
-/FP Foothills and mountains throughout California; uncommon nonbreeding visitor to the lowlands, including the Central Valley.
Nests in cliffs and escarpments or in tall trees; forages in annual grasslands, chaparral, and oak woodlands with plentiful medium-sized and large mammals for prey.
Habitat loss as a result of urbanization.
Has been observed in the study area. Grasslands on site provides suitable foraging habitat.
Loggerhead shrike Lanius ludovicianus
-/SSC Grasslands throughout the state.
Forages in grassland or ruderal habitats.
Loss of grassland habitat as a result of urban expansion.
Foraging behavior and nest sites have been documented in wetlands in North of Bay View area (outside of planning areas). May occur in similar habitats within planning areas.
Northern harrier Circus cyaneus
-/SSC; FP Marshes, fields, grasslands, and prairies throughout North America.
Coastal salt and freshwater marshes. Nests on ground in shrubby vegetation, usually near marsh edge or in grasslands; forages in grasslands.
Habitat loss as a result of urbanization and agricultural development; pesticide contamination.
Observed in wetlands in North of Bay View area (outside of planning areas). Known to nest in wetland areas.
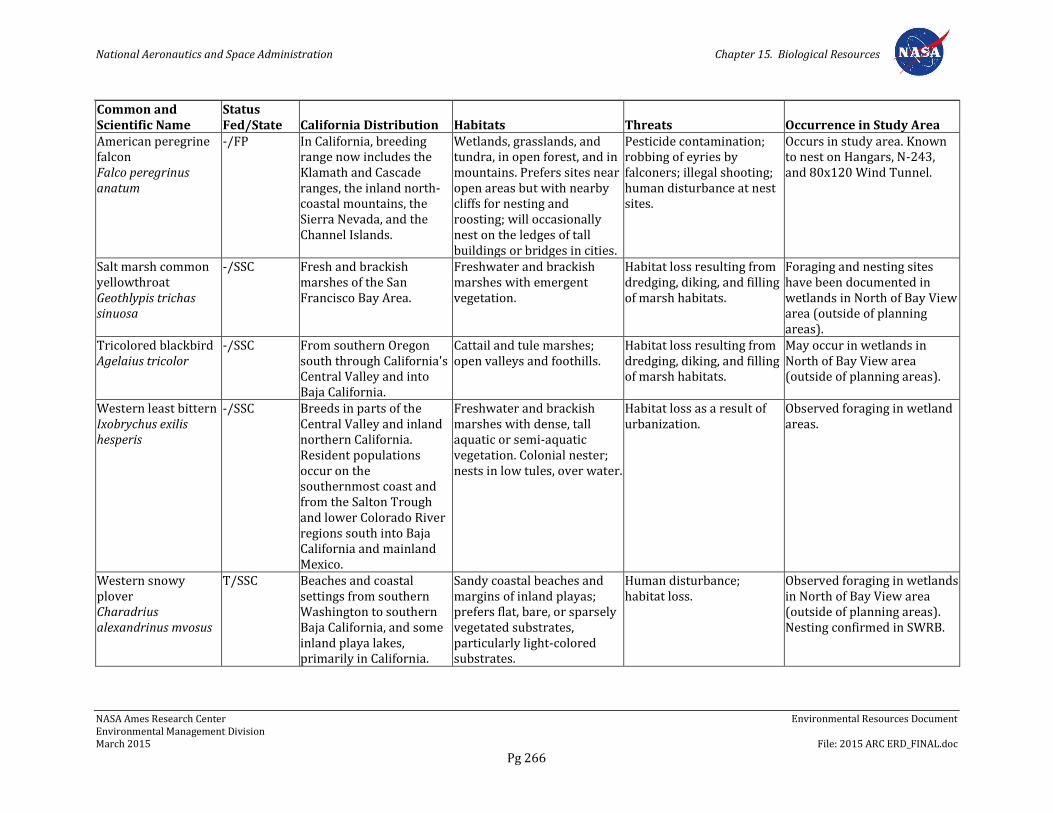
National Aeronautics and Space Administration Chapter 15. Biological Resources
NASA Ames Research Center Environmental Resources Document Environmental Management Division March 2015 File: 2015 ARC ERD_FINAL.doc
Pg 266
Common and Scientific Name
Status Fed/State California Distribution Habitats Threats Occurrence in Study Area
American peregrine falcon Falco peregrinus anatum
-/FP In California, breeding range now includes the Klamath and Cascade ranges, the inland north-coastal mountains, the Sierra Nevada, and the Channel Islands.
Wetlands, grasslands, and tundra, in open forest, and in mountains. Prefers sites near open areas but with nearby cliffs for nesting and roosting; will occasionally nest on the ledges of tall buildings or bridges in cities.
Pesticide contamination; robbing of eyries by falconers; illegal shooting; human disturbance at nest sites.
Occurs in study area. Known to nest on Hangars, N-243, and 80x120 Wind Tunnel.
Salt marsh common yellowthroat Geothlypis trichas sinuosa
-/SSC Fresh and brackish marshes of the San Francisco Bay Area.
Freshwater and brackish marshes with emergent vegetation.
Habitat loss resulting from dredging, diking, and filling of marsh habitats.
Foraging and nesting sites have been documented in wetlands in North of Bay View area (outside of planning areas).
Tricolored blackbird Agelaius tricolor
-/SSC From southern Oregon south through California's Central Valley and into Baja California.
Cattail and tule marshes; open valleys and foothills.
Habitat loss resulting from dredging, diking, and filling of marsh habitats.
May occur in wetlands in North of Bay View area (outside of planning areas).
Western least bittern Ixobrychus exilis hesperis
-/SSC Breeds in parts of the Central Valley and inland northern California. Resident populations occur on the southernmost coast and from the Salton Trough and lower Colorado River regions south into Baja California and mainland Mexico.
Freshwater and brackish marshes with dense, tall aquatic or semi-aquatic vegetation. Colonial nester; nests in low tules, over water.
Habitat loss as a result of urbanization.
Observed foraging in wetland areas.
Western snowy plover Charadrius alexandrinus mvosus
T/SSC Beaches and coastal settings from southern Washington to southern Baja California, and some inland playa lakes, primarily in California.
Sandy coastal beaches and margins of inland playas; prefers flat, bare, or sparsely vegetated substrates, particularly light-colored substrates.
Human disturbance; habitat loss.
Observed foraging in wetlands in North of Bay View area (outside of planning areas). Nesting confirmed in SWRB.
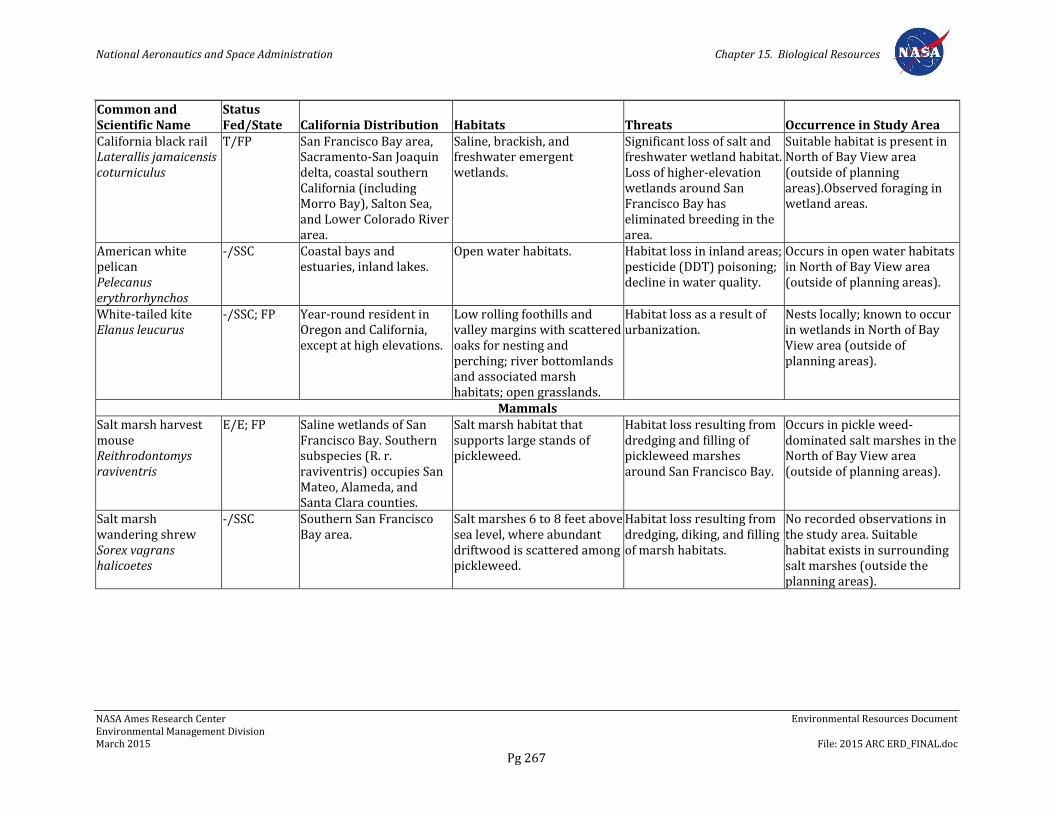
National Aeronautics and Space Administration Chapter 15. Biological Resources
NASA Ames Research Center Environmental Resources Document Environmental Management Division March 2015 File: 2015 ARC ERD_FINAL.doc
Pg 267
Common and Scientific Name
Status Fed/State California Distribution Habitats Threats Occurrence in Study Area
California black rail Laterallis jamaicensis coturniculus
T/FP San Francisco Bay area, Sacramento-San Joaquin delta, coastal southern California (including Morro Bay), Salton Sea, and Lower Colorado River area.
Saline, brackish, and freshwater emergent wetlands.
Significant loss of salt and freshwater wetland habitat. Loss of higher-elevation wetlands around San Francisco Bay has eliminated breeding in the area.
Suitable habitat is present in North of Bay View area (outside of planning areas).Observed foraging in wetland areas.
American white pelican Pelecanus erythrorhynchos
-/SSC Coastal bays and estuaries, inland lakes.
Open water habitats. Habitat loss in inland areas; pesticide (DDT) poisoning; decline in water quality.
Occurs in open water habitats in North of Bay View area (outside of planning areas).
White-tailed kite Elanus leucurus
-/SSC; FP Year-round resident in Oregon and California, except at high elevations.
Low rolling foothills and valley margins with scattered oaks for nesting and perching; river bottomlands and associated marsh habitats; open grasslands.
Habitat loss as a result of urbanization.
Nests locally; known to occur in wetlands in North of Bay View area (outside of planning areas).
Mammals Salt marsh harvest mouse Reithrodontomys raviventris
E/E; FP Saline wetlands of San Francisco Bay. Southern subspecies (R. r. raviventris) occupies San Mateo, Alameda, and Santa Clara counties.
Salt marsh habitat that supports large stands of pickleweed.
Habitat loss resulting from dredging and filling of pickleweed marshes around San Francisco Bay.
Occurs in pickle weed-dominated salt marshes in the North of Bay View area (outside of planning areas).
Salt marsh wandering shrew Sorex vagrans halicoetes
-/SSC Southern San Francisco Bay area.
Salt marshes 6 to 8 feet above sea level, where abundant driftwood is scattered among pickleweed.
Habitat loss resulting from dredging, diking, and filling of marsh habitats.
No recorded observations in the study area. Suitable habitat exists in surrounding salt marshes (outside the planning areas).
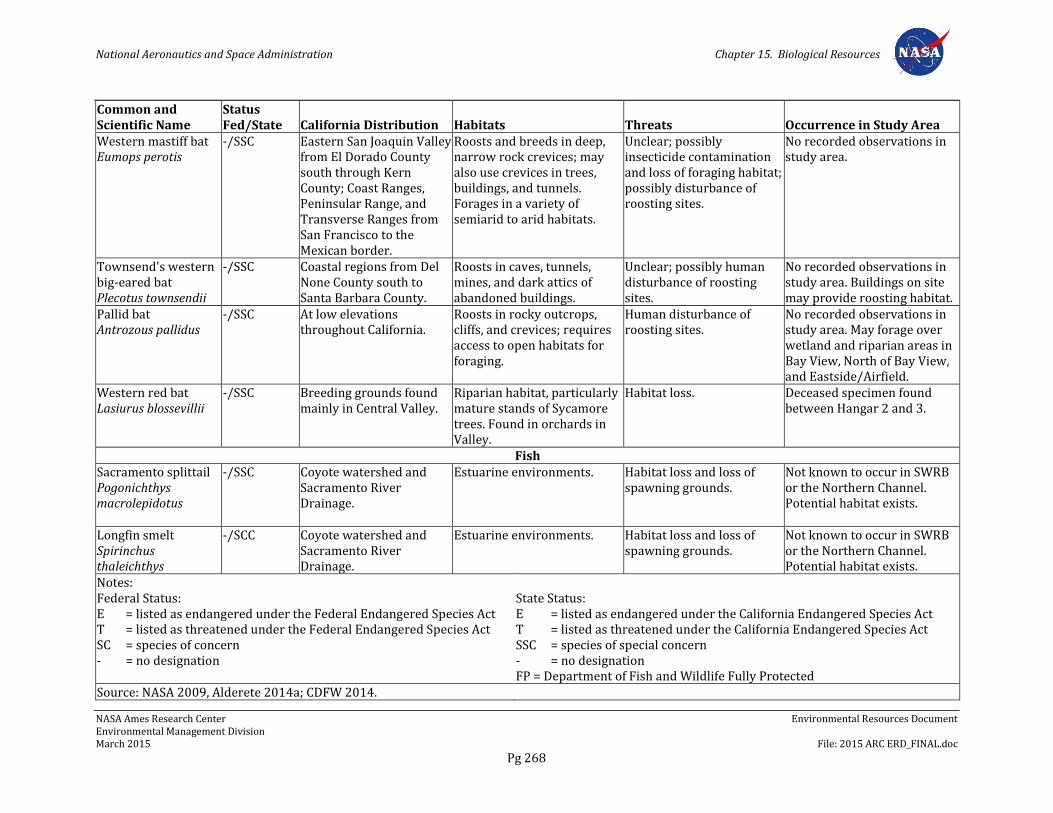
National Aeronautics and Space Administration Chapter 15. Biological Resources
NASA Ames Research Center Environmental Resources Document Environmental Management Division March 2015 File: 2015 ARC ERD_FINAL.doc
Pg 268
Common and Scientific Name
Status Fed/State California Distribution Habitats Threats Occurrence in Study Area
Western mastiff bat Eumops perotis
-/SSC Eastern San Joaquin Valley from El Dorado County south through Kern County; Coast Ranges, Peninsular Range, and Transverse Ranges from San Francisco to the Mexican border.
Roosts and breeds in deep, narrow rock crevices; may also use crevices in trees, buildings, and tunnels. Forages in a variety of semiarid to arid habitats.
Unclear; possibly insecticide contamination and loss of foraging habitat; possibly disturbance of roosting sites.
No recorded observations in study area.
Townsend's western big-eared bat Plecotus townsendii
-/SSC Coastal regions from Del None County south to Santa Barbara County.
Roosts in caves, tunnels, mines, and dark attics of abandoned buildings.
Unclear; possibly human disturbance of roosting sites.
No recorded observations in study area. Buildings on site may provide roosting habitat.
Pallid bat Antrozous pallidus
-/SSC At low elevations throughout California.
Roosts in rocky outcrops, cliffs, and crevices; requires access to open habitats for foraging.
Human disturbance of roosting sites.
No recorded observations in study area. May forage over wetland and riparian areas in Bay View, North of Bay View, and Eastside/Airfield.
Western red bat Lasiurus blossevillii
-/SSC Breeding grounds found mainly in Central Valley.
Riparian habitat, particularly mature stands of Sycamore trees. Found in orchards in Valley.
Habitat loss. Deceased specimen found between Hangar 2 and 3.
Fish Sacramento splittail Pogonichthys macrolepidotus
-/SSC
Coyote watershed and Sacramento River Drainage.
Estuarine environments.
Habitat loss and loss of spawning grounds.
Not known to occur in SWRB or the Northern Channel. Potential habitat exists.
Longfin smelt Spirinchus thaleichthys
-/SCC Coyote watershed and Sacramento River Drainage.
Estuarine environments. Habitat loss and loss of spawning grounds.
Not known to occur in SWRB or the Northern Channel. Potential habitat exists.
Notes: Federal Status: E = listed as endangered under the Federal Endangered Species Act T = listed as threatened under the Federal Endangered Species Act SC = species of concern - = no designation
State Status: E = listed as endangered under the California Endangered Species Act T = listed as threatened under the California Endangered Species Act SSC = species of special concern - = no designation FP = Department of Fish and Wildlife Fully Protected
Source: NASA 2009, Alderete 2014a; CDFW 2014.
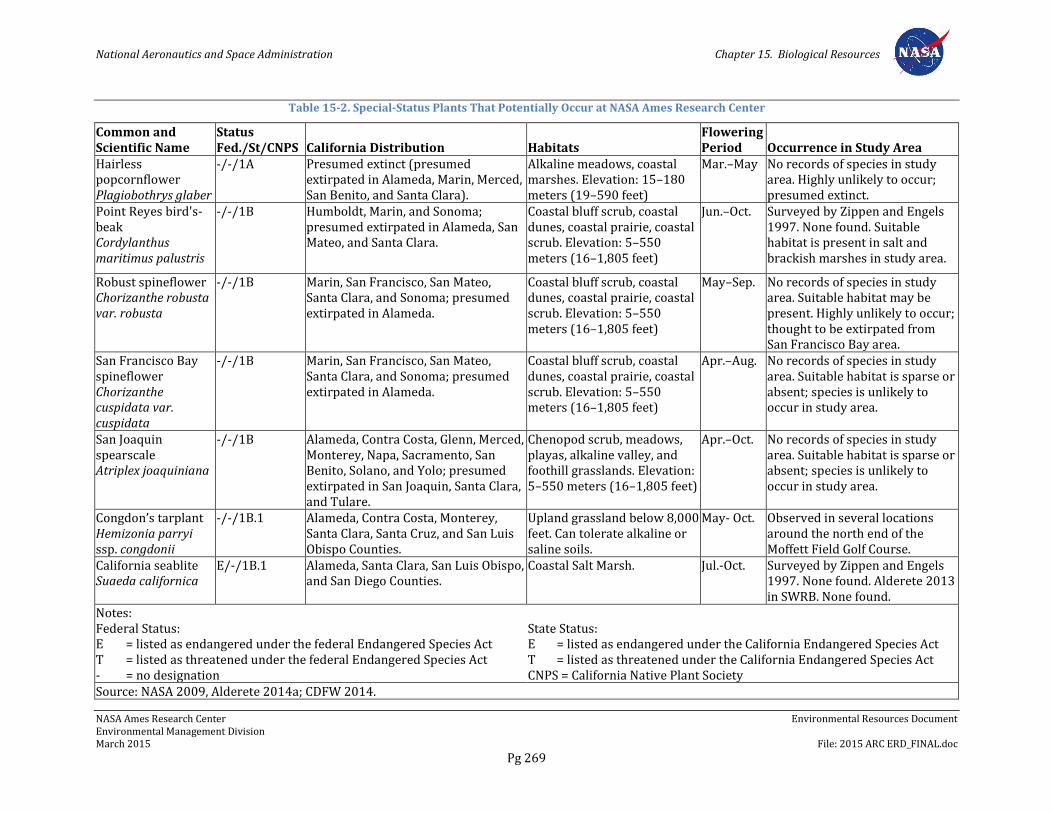
National Aeronautics and Space Administration Chapter 15. Biological Resources
NASA Ames Research Center Environmental Resources Document Environmental Management Division March 2015 File: 2015 ARC ERD_FINAL.doc
Pg 269
Table 15-2. Special-Status Plants That Potentially Occur at NASA Ames Research Center
Common and Scientific Name
Status Fed./St/CNPS California Distribution Habitats
Flowering Period Occurrence in Study Area
Hairless popcornflower Plagiobothrys glaber
-/-/1A Presumed extinct (presumed extirpated in Alameda, Marin, Merced, San Benito, and Santa Clara).
Alkaline meadows, coastal marshes. Elevation: 15–180 meters (19–590 feet)
Mar.–May No records of species in study area. Highly unlikely to occur; presumed extinct.
Point Reyes bird's-beak Cordylanthus maritimus palustris
-/-/1B Humboldt, Marin, and Sonoma; presumed extirpated in Alameda, San Mateo, and Santa Clara.
Coastal bluff scrub, coastal dunes, coastal prairie, coastal scrub. Elevation: 5–550 meters (16–1,805 feet)
Jun.–Oct. Surveyed by Zippen and Engels 1997. None found. Suitable habitat is present in salt and brackish marshes in study area.
Robust spineflower Chorizanthe robusta var. robusta
-/-/1B Marin, San Francisco, San Mateo, Santa Clara, and Sonoma; presumed extirpated in Alameda.
Coastal bluff scrub, coastal dunes, coastal prairie, coastal scrub. Elevation: 5–550 meters (16–1,805 feet)
May–Sep. No records of species in study area. Suitable habitat may be present. Highly unlikely to occur; thought to be extirpated from San Francisco Bay area.
San Francisco Bay spineflower Chorizanthe cuspidata var. cuspidata
-/-/1B Marin, San Francisco, San Mateo, Santa Clara, and Sonoma; presumed extirpated in Alameda.
Coastal bluff scrub, coastal dunes, coastal prairie, coastal scrub. Elevation: 5–550 meters (16–1,805 feet)
Apr.–Aug. No records of species in study area. Suitable habitat is sparse or absent; species is unlikely to occur in study area.
San Joaquin spearscale Atriplex joaquiniana
-/-/1B Alameda, Contra Costa, Glenn, Merced, Monterey, Napa, Sacramento, San Benito, Solano, and Yolo; presumed extirpated in San Joaquin, Santa Clara, and Tulare.
Chenopod scrub, meadows, playas, alkaline valley, and foothill grasslands. Elevation: 5–550 meters (16–1,805 feet)
Apr.–Oct. No records of species in study area. Suitable habitat is sparse or absent; species is unlikely to occur in study area.
Congdon’s tarplant Hemizonia parryi ssp. congdonii
-/-/1B.1
Alameda, Contra Costa, Monterey, Santa Clara, Santa Cruz, and San Luis Obispo Counties.
Upland grassland below 8,000 feet. Can tolerate alkaline or saline soils.
May- Oct. Observed in several locations around the north end of the Moffett Field Golf Course.
California seablite Suaeda californica
E/-/1B.1 Alameda, Santa Clara, San Luis Obispo, and San Diego Counties.
Coastal Salt Marsh. Jul.-Oct. Surveyed by Zippen and Engels 1997. None found. Alderete 2013 in SWRB. None found.
Notes: Federal Status: E = listed as endangered under the federal Endangered Species Act T = listed as threatened under the federal Endangered Species Act - = no designation
State Status: E = listed as endangered under the California Endangered Species Act T = listed as threatened under the California Endangered Species Act CNPS = California Native Plant Society
Source: NASA 2009, Alderete 2014a; CDFW 2014.
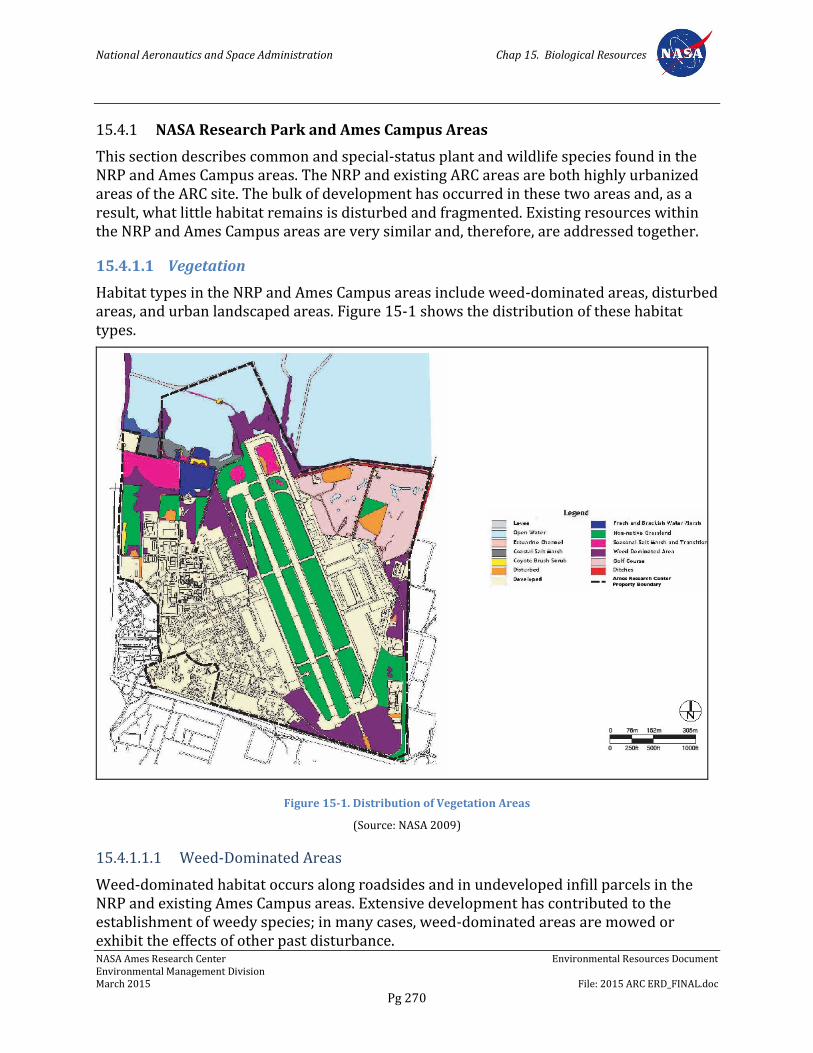
National Aeronautics and Space Administration Chap 15. Biological Resources
NASA Ames Research Center Environmental Resources Document Environmental Management Division March 2015 File: 2015 ARC ERD_FINAL.doc
Pg 270
15.4.1 NASA Research Park and Ames Campus Areas
This section describes common and special-status plant and wildlife species found in the NRP and Ames Campus areas. The NRP and existing ARC areas are both highly urbanized areas of the ARC site. The bulk of development has occurred in these two areas and, as a result, what little habitat remains is disturbed and fragmented. Existing resources within the NRP and Ames Campus areas are very similar and, therefore, are addressed together.
15.4.1.1 Vegetation
Habitat types in the NRP and Ames Campus areas include weed-dominated areas, disturbed areas, and urban landscaped areas. Figure 15-1 shows the distribution of these habitat types.
Figure 15-1. Distribution of Vegetation Areas
(Source: NASA 2009)
15.4.1.1.1 Weed-Dominated Areas
Weed-dominated habitat occurs along roadsides and in undeveloped infill parcels in the NRP and existing Ames Campus areas. Extensive development has contributed to the establishment of weedy species; in many cases, weed-dominated areas are mowed or exhibit the effects of other past disturbance.
National Aeronautics and Space Administration Chap 15. Biological Resources
NASA Ames Research Center Environmental Resources Document Environmental Management Division March 2015 File: 2015 ARC ERD_FINAL.doc
Pg 271
This habitat type is generally dominated by nonnative annual herbs, primarily bristly ox-tongue (Picris echiodes), scattered geranium (Geranium dissectum), and nonnative annual grasses (Avena spp., Polypogon monspeliensis, Hordeum spp., and Vulpia spp.). These sites may also support invasive exotic weeds that crowd out native species and create a monoculture habitat with little value to wildlife. The dominant species in this habitat may alternate between nonnative grasses and weedy herbs, depending on the season, amount of rainfall, and maintenance activities (for example, mowing).
15.4.1.1.2 Disturbed Areas
Disturbed areas are common in the undeveloped regions between buildings and along roadsides in NRP and Ames Campus areas. Disturbed areas may exhibit altered topography resulting from past or present fill or excavation and are commonly covered with debris. These areas are significantly altered from their original habitat type. In many cases, they are almost bare or are dominated by ruderal species. Weedy species that may be found in this habitat type include the invasive exotic perennial pepperweed (Lepidium latifolium).
15.4.1.1.3 Urban Landscaped Areas
Urban landscaping includes ornamental trees, shrubs, and turf grasses that were intentionally planted around the buildings in the NRP area and the Ames Campus. Most species are nonnative and require irrigation and regular maintenance. Species planted in these areas include lawn grasses, juniper (Juniperus spp.), cypress (Cypressus spp.), and domestic roses (Rosa spp.). In 2007 and 2008, native gardens were established at the Center. Located west of N-269, and to the north of N-235, these gardens include a vast array of native plants.
15.4.1.1.4 Special-Status Plants
No special-status plants are known or expected to occur in the NRP or Ames Campus planning areas because of their highly urbanized nature.
15.4.1.2 Wildlife
15.4.1.2.1 Common Wildlife
Common species of wildlife found in these areas consist of species that are adaptable to human presence and disturbance, such as skunks (Mephitis mephitis), raccoons (Procyon lotor), and opossums (Didelphis virginiana). Also common are feral cats (Felis catus), which substantially disturb natural wildlife communities by predation. Small mammals, such as California ground squirrels (Spermophilus beecheyi), western harvest mice (Reithrodontomys megalotis), deer mice (Peromyscus maniculatus), California vole (Microtus californicus), and house mice (Mus musculus), are abundant and provide a significant prey base for these predators. Ornamental trees and shrubs create habitat for common bird species, such as European starling (Sturnus vulgaris), mourning dove (Zenaida macroura), Brewer’s blackbird (Euphagus cyanocephalus), sparrow (Zonotrichia spp.), and house finch (Carpodacus mexicanus).
National Aeronautics and Space Administration Chap 15. Biological Resources
NASA Ames Research Center Environmental Resources Document Environmental Management Division March 2015 File: 2015 ARC ERD_FINAL.doc
Pg 272
15.4.1.2.2 Special-Status Wildlife
15.4.1.2.2.1 Western Burrowing Owl Because of the highly urbanized nature of these areas, only one special-status animal, the western burrowing owl, is known or expected to occur in the NRP and Ames Campus areas.
Burrowing owls have been listed as a California Species of Concern since 1978, so direct impacts to either the birds or their nests are prohibited. In addition, the California Fish and Game Code prohibits the take, possession, or destruction of birds, their nests, or their eggs. Burrowing owls are also listed as a Federal Species of Concern.
Burrowing owls are small brown and white mottled owls with bright lemon-yellow eyes and long, unfeathered legs. They are approximately 18 to 25 centimeters (7 to 10 inches) tall, and weigh on average 3 to 4 ounces (150 grams). They range from Mexico to Canada. Of all of the 171 species of owls worldwide, the burrowing owl is the only one that nests underground.
Burrowing owls usually move into burrows that other animals have abandoned rather than digging their own, and thus usually live within colonies of small burrowing animals. In Northern California, burrowing owls live primarily in ground squirrel colonies. They not only use burrows that ground squirrels have abandoned as nests, but also depend on the squirrels to graze down the vegetation around burrows to short grass or even dirt, which is the owl’s preferred habitat.
Typical burrowing owl habitat is open, dry, sparsely vegetated terrain. The availability of burrows is the most critical element. Owls’ choice of burrows is affected by several key factors, such as the percentage of vegetative cover and the height of vegetation surrounding the burrow mouth, soil texture, and the presence of perches suitable for keeping watch for predators. At ARC, the typical vegetation height around burrows is 6.9 centimeters (2.7 inches) and the typical area of vegetative cover is 57%, as opposed to 26 centimeters (10.4 inches) and 85% in areas where no owls are found.
Historically, burrowing owls were found in natural areas of open prairie or open shrub-steppe habitat. Human population growth and land use changes have destroyed much of their original habitat, however, so burrowing owls now commonly nest in the perimeters of agricultural fields, irrigation ditches, fallow fields, open fields prepared for development, airports, golf courses, military bases, and parks. They have become quite tolerant of human presence as long as suitable nesting and foraging habitat exist.
Some burrowing owls are migratory, while others live in roughly the same area year round. Whether they migrate out or just move a small distance, burrowing owls often return to the same or nearby nest burrows each spring to breed. Once owls have chosen a nest burrow, they are loath to leave it, which can make it very difficult to relocate them. All of the relocation attempts that have been studied have had low success rates.
Burrowing owls are active during both day and night. By day, they stand by their nest burrow guarding against predators. At night they do most of their feeding. They prey primarily on large insects and small rodents. Burrowing owls forage in ruderal, manicured, or natural grasslands. While they do most of their foraging within 91 meters (300 feet) of
National Aeronautics and Space Administration Chap 15. Biological Resources
NASA Ames Research Center Environmental Resources Document Environmental Management Division March 2015 File: 2015 ARC ERD_FINAL.doc
Pg 273
their burrows, recent research also indicates that owls may forage as far as 4.8 kilometers (3 miles) from their burrows in the evening.
Burrowing owls are themselves prey for a number of aerial and ground species, including hawks, falcons, coyotes, snakes, skunks, raccoons, feral cats, and loose dogs. The major unnatural causes of death for owls include effects from pesticides, predation by nonnative and feral animals, destruction of nests by surface disturbances (such as grading), and collisions with cars since owls generally fly low to the ground.
Currently, the western burrowing owl is declining throughout much of its western North American range. It is endangered in Minnesota, Iowa, and throughout its range in Canada. It is a Species of Concern in six states, including California. The extensive destruction of prairie dogs and ground squirrels (whose colonies it usually shares), the use of pesticides and herbicides, and the conversion of grasslands to agricultural and urban uses have all contributed to the burrowing owl’s declining numbers.
The burrowing owl was once a relatively common grassland bird in California. Although owls still occur in much of their pre-1940s range in California, the species no longer breeds in Marin, San Francisco, Santa Cruz, Napa, coastal San Luis Obispo, or Ventura counties. Only one to two breeding pairs exist in each of Sonoma, Santa Barbara, Orange, coastal Monterey, and San Mateo counties.
The South San Francisco Bay region, which includes Santa Clara and Alameda counties, lost a substantial portion of its owl population during the explosive development of the 1980s, and numbers are still declining. The region currently supports a population of approximately 120 breeding pairs of burrowing owls. ARC supports one of the largest subpopulations, with roughly 25 breeding pairs. The relatively large size of ARC’s burrowing owl population makes it an anchor for the entire region. The survival of this population may thus be critical to the long-term persistence of burrowing owls in the region.
Burrowing owls have thrived at ARC for four main reasons. First, ARC’s federal ownership has largely protected the land from the rampant development that has destroyed much of the owl habitat in the rest of Santa Clara County. A second reason is that ARC is closed to the public, preventing much human disturbance of owl burrows and foraging areas. Thirdly, short grass habitat has been maintained as part of standard maintenance procedures. Finally, ground squirrels are not controlled throughout much of ARC, which leaves burrowing owls their essential habitat requirements, ground squirrels and their burrows.
15.4.2 Bay View Area
This section describes common and special-status wildlife species in the Bay View area. The Bay View area is less developed than other parts of ARC and, as a result, it supports more native habitat types. However, despite its more natural appearance, the Bay View area has been subject to disturbance, resulting in the development of nonnative grasslands and weed-dominated areas. For example, areas that now support coyote brush scrub and non-native grassland habitats were previously under dryland cultivation and were affected
National Aeronautics and Space Administration Chap 15. Biological Resources
NASA Ames Research Center Environmental Resources Document Environmental Management Division March 2015 File: 2015 ARC ERD_FINAL.doc
Pg 274
by farming practices, including disking and plowing, until the 1980s. These areas were further disturbed during the recent clearing of Parcels 1, 2, and 4 for Google’s Bay View campus, currently under development. The 42-acre property is under lease to PV, a wholly-owned subsidiary of Google, pursuant to a 2008 Enhanced Use Lease between PV and NASA. Development of the Bay View area was evaluated in the NADP EIS, for which a ROD was signed in November 2002.
15.4.2.1 Vegetation
Habitats in the Bay View area include seasonal salt marsh and transition, coyote brush scrub, nonnative grassland, weed-dominated areas, disturbed areas, and urban landscaped areas. Figure 15-1 shows the distribution of these habitat types.
15.4.2.1.1 Seasonal Salt Marsh and Transition
Seasonal salt marsh is found in the wetlands north of the Bay View area and along the border between these wetlands and the Bay View area. Only a very small extent of seasonal salt marsh and transitional habitat is actually within the Bay View area (approximately 2.1 hectares [5.3 acres]).
Seasonal salt marsh occurs on the uppermost edges of coastal salt marsh habitats and includes vegetation that is transitional between the salt marsh and adjacent uplands or structural elements (roads, levees, and dikes). At lower elevations, seasonal salt marsh is dominated by pickleweed (Salicornia virginica), alkali heath (Frankenia salina), and salt grass (Distichlis spicata). Black mustard (Brassica nigra) and Australian saltbush (Atriplex semibaccata) are present along berms and in other elevated areas. In some areas, perennial pepperweed may exceed 50% cover. Its presence indicates the displacement of native plant species and reduction in habitat value for wildlife.
15.4.2.1.2 Coyote Brush Scrub
At the ARC, areas of coyote brush scrub include regions that have been disturbed in the past or have been subjected to repeated disturbances over time. In the Bay View area, this habitat type occurs on the western boundary of the ARC, along West Perimeter Road.
In coastal areas, coyote brush (Baccharis pilularis) is often one of the first native shrub species to colonize disturbed upland areas and sometimes forms dense stands. Dense stands of coyote brush are categorized as coyote brush scrub. The overstory of coyote brush scrub is dominated by coyote brush. The species composition of the herbaceous plants in the understory is similar to that of adjacent habitats (nonnative grassland or weed-dominated areas). At the ARC, other shrub and tree species were also observed in some stands of coyote brush scrub, including the native elderberry (Sambucus mexicana) and nonnative ornamental olive (Olea spp.) and acacia (Acacia spp.).
15.4.2.1.3 Nonnative Grassland
A large portion of the Bay View area along the west boundary of the ARC (West Perimeter Road) is nonnative grassland habitat. Areas classified as non-native grasslands are dominated by nonnative grasses, including annual Mediterranean grasses such as
National Aeronautics and Space Administration Chap 15. Biological Resources
NASA Ames Research Center Environmental Resources Document Environmental Management Division March 2015 File: 2015 ARC ERD_FINAL.doc
Pg 275
Mediterranean rye (Lolium multiflorum), wild oats (Avena spp.), bromes (Bromus spp.), and rattail fescue (Vulpia myuros). Another common species, creeping red fescue (Festuca rubra), is a nonnative perennial grass. Non-native herbaceous species contribute less than 20% of vegetation cover in nonnative grasslands; they include bristly ox-tongue, birdfoot trefoil (Lotus corniculatus), field bindweed (Convolvulus arvensis), and milk thistle (Silybum marianum).
15.4.2.1.4 Weed-Dominated Areas
The Bay View area supports weedy habitats similar to those in the NRP and existing ARC Campus areas. Weed-dominated habitat in the Bay View area occurs along roadsides and in open spaces between development sites. It may also occur as patches enclosed by other habitat types. Some weed-dominated habitats in the Bay View area include areas where moist soil supports an increased diversity of nonnative weedy species. In some locations, large stands of invasive exotic species such as kikuyu grass (Pennisetum clandestinum), periwinkle (Vinca major), and perennial pepperweed are present. Kikuyu grass is abundant on berms, roadsides adjacent to coastal salt marsh, and freshwater and brackish marsh habitats. Figure 15-1 shows the location of a large stand of periwinkle. The presence of these species is notable because they are all highly invasive and have the potential to displace vegetation that is more desirable. If not controlled, these invasive species will continue to spread into surrounding habitats.
15.4.2.1.5 Other Habitat Types
Other habitat types are sparsely represented in the Bay View area. Because there has been little development in the area, currently disturbed areas are limited to Bay View Parcels 1, 2, 4 (discussed above) and the perimeters of existing buildings in this area.
15.4.2.1.6 Special-Status Plants
No special-status plants are known or expected to occur in the Bay View area because of its highly urbanized nature.
15.4.2.2 Wildlife
15.4.2.2.1 Common Wildlife
The Bay View area supports a variety of wildlife. Common and dominant species include many birds that use coyote brush scrub, nonnative grassland, and the willows in the wetter areas. These species include song sparrow (Melospiza melodia), white-crowned sparrow (Zonotrichia leucophrys), golden-crowned sparrow (Zonotrichia atriacapilla), lesser goldfinch (Carduelis psaltria), American goldfinch (Carduelis tristis), Brewer’s blackbird, western meadowlark (Sturnella neglecta), marsh wren (Cistothorus palustris), Bewick’s wren (Thryomanes bewickii), and house finch. Raccoons, opossums, and skunks are common mammals in this area. Non-native red foxes (Vulpes vulpes) and feral cats are also frequently seen. Small mammals supply an abundant prey base; they include burrowing species, such as pocket gophers (Thomomys bottae), and larger lagomorphs, such as black-tailed hares (Lepus californicus).
National Aeronautics and Space Administration Chap 15. Biological Resources
NASA Ames Research Center Environmental Resources Document Environmental Management Division March 2015 File: 2015 ARC ERD_FINAL.doc
Pg 276
Because of the Bay View area’s proximity to wetland and open water habitats, and the intermittent presence of a small extent of open water within the Bay View area, migratory waterfowl are common.
15.4.2.2.2 Special-Status Wildlife
The following special-status animal species have been observed in the Bay View area.
15.4.2.2.2.1 Salt Marsh Common Yellowthroat The salt marsh common yellowthroat (Geothlypis trichas sinuosa) is a California Species of Special Concern. It is a small warbler that resides in the marshes of the San Francisco Bay area. During the breeding season (March to late July), it can be found in marshes from Sonoma, Napa, Solano, and Marin counties south to Santa Clara County. This species uses both wetland and upland vegetation for foraging and nesting. Salt marsh common yellowthroats are commonduring the breeding season at ARC.
15.4.2.2.2.2 Loggerhead Shrike The loggerhead shrike (Lanius ludovicianus) is a state and federal Species of Special Concern. It is a common resident and winter visitor in lowlands and foothills throughout California, and prefers open habitats offering scattered shrubs, trees, posts, fences, utility lines, or other perches. Loggerhead shrikes are commonly observed in the Bay View area in the upland habitats adjacent to the freshwater and brackish marshes.
15.4.2.2.2.3 White-Tailed Kite White-tailed kites (Elanus leucurus) are fully protected under Section 3511 of the California Fish and Game Code. This species is a year-round resident of low rolling foothills and valley margins throughout California, and often forages for birds and small mammals in open grassland and marsh habitats. White-tailed kites are common at ARC. Individuals of the species have been observed in courtship behavior and nests have been found in the Storm Water Retention Pond and the Western Diked Marsh.
15.4.2.2.2.4 Western Burrowing Owl Burrowing owls are uncommon in the Bay View area, but can be found in Shoreline Regional Park to the west of ARC.
15.4.2.2.2.5 Northern Harrier Northern harriers (Circus cyaneus) are fully protected under Section 3511 of the California Fish and Game Code. They are large raptors that occupy coastal salt and freshwater marshes. Northern harriers often forage in grasslands and fields that surround the marsh north of the Bay View area, and they are seen regularly in the Bay View area.
15.4.2.2.2.6 Golden Eagle The golden eagle is a California Species of Special Concern and is protected under the federal Migratory Bird Treaty Act and the Bald and Golden Eagle Protection Act. The golden eagle feeds mainly on rabbits and on California ground squirrels. Pairs typically nest on cliffs or in trees, preferably near grasslands where prey is available. Golden eagles have
National Aeronautics and Space Administration Chap 15. Biological Resources
NASA Ames Research Center Environmental Resources Document Environmental Management Division March 2015 File: 2015 ARC ERD_FINAL.doc
Pg 277
been observed in the Bay View area, and foraging habitat is available in the area’s nonnative grasslands and weed-dominated habitats.
15.4.2.2.3 American Peregrine Falcon
The American peregrine falcon (Falco peregrinus anatum) is state-listed as endangered. Peregrine falcons nest on ledges in tall vertical cliffs and other rocky outcrops secure from predators. The species forages on a variety of birds and small mammals in both terrestrial and wetland habitats. Suitable foraging habitat exists throughout the annual grasslands and weed-dominated portions of ARC. Peregrine falcons have nested at various locations at Ames for a number of years.
15.4.3 Eastside/Airfield
This section describes common and special-status wildlife species found in the Eastside/Airfield area. The airfield and its accompanying hangars and support buildings occupy the majority of the Eastside/Airfield area. Other land uses in the area include office buildings and the golf course. The golf course provides irrigated, grassy, open habitat for small mammals and the predators that prey on them. Both California ground squirrels and burrowing owls are numerous. The golf course also encompasses permanent ponds and stormwater runoff ditches that are supplied with brackish water, providing habitat for a large population of western pond turtles.
15.4.3.1 Vegetation
Habitats in the Eastside/Airfield area include estuarine channel, seasonal wetland, seasonal salt marsh, nonnative grassland, weed-dominated areas, disturbed areas, and a golf course.
15.4.3.1.1 Estuarine Channel
The northern channel is a storm drain channel that contains shallow water habitats that exhibit estuarine characteristics. USFWS ponds to the north may influence adjacent tidal wetlands. The channel runs along the northern boundary of the Eastside/Airfield area and is separated from the North Patrol Road by an armored chain link fence and the East Patrol Road Ditch. The northern channel’s saltwater influx is contributed by the San Francisco Bay, and becomes seasonally diluted by freshwater runoff that enters the channel. The channel’s shore supports emergent hydrophytic vegetation that provides habitat for a variety of waterbirds, including salt marsh common yellowthroat (Geothlypis trichas sinuosa) and common moorhen (Gallinula chloropus). The channel also supports several fish and invertebrate species, including bay shrimp, crab and mosquito fish and longjaw mudsucker (Gallinula chloropus). Freshwater gastropod shells have been found in the channel, suggesting that the winter influx of fresh water supports populations of snails.
15.4.3.1.2 Seasonal Wetland
The seasonal wetlands in the Eastside/Airfield area are located on the airfield itself and in several ditches on and adjacent to the golf course. Because of their low elevation and proximity to salt water, these wetlands may be slightly brackish or alkaline. Vegetation in
National Aeronautics and Space Administration Chap 15. Biological Resources
NASA Ames Research Center Environmental Resources Document Environmental Management Division March 2015 File: 2015 ARC ERD_FINAL.doc
Pg 278
this habitat type is a mosaic of large patches of Baltic rush (Juncus balticus), creeping wild rye (Leymus triticoides), and cattails (Typha spp.). Other species include spearscale (Atriplex triangularis), salt grass, clustered field sedge (Carex praegracilis), and nonnative perennial pepperweed.
15.4.3.1.3 Seasonal Salt Marsh
In the Eastside/Airfield area, seasonal salt marsh habitats occur in constructed ditches. The ditches are located along East Patrol Road and North Patrol Road adjacent to the golf course. They represent a unique habitat because their steep banks and the long-term availability of water support the development of several narrow, linear vegetation zones adjacent to one another.
The ditch along North Patrol Road has steep banks, and wetland vegetation is limited to the lower portions of the banks, immediately above the water line. The dominant plant species in the wetland portions of the North Patrol Road ditch include pickleweed, salt grass, and prairie bulrush (Scirpus maritimus). Adjacent uplands support the nonnative herbaceous species birdfoot trefoil and yellow sweet clover (Melilotus inducus) and the nonnative grasses rattail fescue and Mediterranean canary grass (Phalaris minor). Cattails and bulrushes (Scirpus spp.) form patches of emergent vegetation.
The ditch along the East Patrol Road is slightly wider and has more gently sloping banks than the North Patrol Road ditch. During the field surveys in August and September 2000, surface water was present only in a ponded area at the northern end of the ditch. The East Patrol Road ditch supports much less vegetation than the North Patrol Road ditch, and it is dominated by nonnative dallis grass (Paspalum dilatum) and litter, with a few stands of prairie bulrush.
15.4.3.1.4 Other Habitat Types
Nonnative grasslands, weed-dominated areas, and disturbed areas are also present in the Eastside/Airfield area. They occur between developed parcels, along roads, and in open fields.
15.4.3.1.5 Golf Course
The golf course provides irrigated, grassy, open habitat for small mammals and the predators that prey on them. Both California ground squirrels and western burrowing owls are numerous. The golf course also encompasses permanent ponds and stormwater runoff ditches that are supplied with brackish water.
15.4.3.1.6 Special-Status Plants
In Fall of 2013, Congdon's tarplant (Hemizonia parryi ssp. congdonii) was observed in several locations on the north side of the golf course and later confirmed by a local biologist. Two distinct patches were found: a western patch that disappeared during the 2014 growing season and a much larger eastern patch that continues to persist. NASA’s wildlife biologist has put temporary fencing around the patches to protect them during the seeding phase but allows the patches to be mowed short along roadsides after flowering.
National Aeronautics and Space Administration Chap 15. Biological Resources
NASA Ames Research Center Environmental Resources Document Environmental Management Division March 2015 File: 2015 ARC ERD_FINAL.doc
Pg 279
The biologist is currently working with NASA Grounds Maintenance to protect this species where it is found (Alderete 2014b).
15.4.3.2 Wildlife
15.4.3.2.1 Common Wildlife
Common and dominant wildlife species that occur in the Eastside/Airfield area are similar to those found in the NRP and Ames Campus areas. In addition, the migratory waterfowl present in the most of the Bay View area utilize the seasonal wetlands in the northern portion of the airfield when enough rain falls to fill them. The prey base of small mammals (particularly California ground squirrels) in the Eastside/Airfield is large, and many raptors have been seen hunting here, including the peregrine falcon, golden eagle, and white-tailed kite.
15.4.3.2.2 Special-Status Wildlife
The following special-status animal species occur or may occur in the Eastside/Airfield area.
15.4.3.2.2.1 Western Burrowing Owl Because of the large population of California ground squirrels, burrowing owls are common in the Eastside/Airfield area and on the Lockheed Martin property to the east of ARC.
15.4.3.2.2.2 Western Pond Turtle The western pond turtle (Clemmys marmorata) is a California Species of Special Concern. Pond turtles are found in quiet waters of lowland and foothill ponds, streams, marshes, and reservoirs. They require upland habitat for breeding. A pond turtle may travel long distances upslope from a permanent or nearly permanent water source to lay its eggs in grassland or scrub habitat. Turtles have been observed in the Northern Channel and Marriage Road Ditch in Eastside/Airfield. ARC has developed a habitat management plan to protect the western pond turtle population (Jones & Stokes 2004).
15.4.3.2.2.3 California Red-Legged Frog The California red-legged frog is federally listed as Threatened and is a California Species of Special Concern. The species requires permanent or semi-permanent aquatic habitats with emergent and submergent vegetation. Red-legged frog surveys were conducted in 1994 (Layne and Harding-Smith 1995) and 2001 (Scott and Alderete 2001), but no frogs or larvae have been detected.
Suitable habitat for the California red-legged frog may occur in ponds and ditches on the golf course. However, salinity levels in these ponds are normally within the lethal range for developing red-legged frog embryos and larvae. Because of the lack of suitable habitat and the presence of predators, California red-legged frogs are considered very unlikely to occur in the Eastside/Airfield area.
National Aeronautics and Space Administration Chap 15. Biological Resources
NASA Ames Research Center Environmental Resources Document Environmental Management Division March 2015 File: 2015 ARC ERD_FINAL.doc
Pg 280
15.4.3.2.2.4 California Tiger Salamander The California tiger salamander is a candidate for federal listing and is a California Species of Special Concern. Tiger salamanders are terrestrial and spend most of their time underground in small-mammal burrows, emerging only for brief periods to breed. Breeding is known to occur in temporary pools and may occur in more permanent bodies of water.
The salinity tolerance of the California tiger salamander is unknown, but may be similar to that of the California red-legged frog. California tiger salamander surveys have been conducted, but no individuals have been observed. Because of the lack of suitable habitat and the presence of predators, California tiger salamanders are considered very unlikely to occur in the Eastside/Airfield area.
15.4.4 North of Bay View Area
Immediately north of the Bay View area is a tract of high-quality wetland habitat that is rich in vegetation and wildlife. This region, referred to as the North of Bay View area, is within ARC jurisdiction, but has been excluded from future development because of the special-status species it supports or may support, and because of the presence of jurisdictional wetlands.
The North of Bay View wetland area contains the most diverse and least disturbed habitats at ARC, including coastal salt marsh, seasonal salt marsh and transition, freshwater and brackish marshes, coyote brush scrub, unvegetated areas (including open water), and disturbed areas. Habitat suitable for many special-status plants and wildlife occur or may occur in the North of Bay View area. Surveys have been conducted for delta tule pea (Lathyrus jepsonii var. jepsonii), hairless popcornflower (Plagiobothrys glaber), Point Reyes bird’s-beak (Cordylanthus maritimus ssp. palustris), and California sea-blite (Suaeda californica). To date, none of these species has been observed.
In addition, habitat suitable for many special-status wildlife species occurs or may occur in the North of Bay View area. Surveys have documented the presence of many special-status wildlife species, including: salt marsh harvest mouse, California brown pelican, Ridgway’s rail (Rallus obsoletus), California least tern, western burrowing owl, golden eagle, loggerhead shrike, northern harrier, peregrine falcon, salt marsh common yellowthroat, western snowy plover, and white-tailed kite. Special-status species that have not been recorded, but for which suitable habitat is present, include Alameda song sparrow (Melospiza melodia pusillula), tricolored blackbird (Agelaius tricolor), western least bittern (Ixobrychus exilis hesperis), salt marsh wandering shrew (Sorex vagrans haliocoetes), and bald eagle.
15.5 Environmental Requirements
NASA has identified the following plans, programs, policies, and measures that are designed to protect special-status wildlife species and their habitats at ARC.
National Aeronautics and Space Administration Chap 15. Biological Resources
NASA Ames Research Center Environmental Resources Document Environmental Management Division March 2015 File: 2015 ARC ERD_FINAL.doc
Pg 281
15.5.1 NASA Procedural Directive 8500.1, NASA Environmental Management
Per NPD 8500.1, it is NASA policy to: maintain compliance with all applicable federal, state, and local environmental requirements; to incorporate environmental risk reduction and sustainable practices to the extent practicable throughout NASA’s programs, projects, and activities; and to consider environmental factors throughout the life cycle of programs, projects, and activities (as defined in NPD 7120.4, NASA Engineering and Program/Project Management Policy, and related documents), including planning, development, execution, and disposition activities. Examples of environmental factors include consideration of environmental impacts as required by the NEPA and NHPA; the proposed use of hazardous materials; the potential for waste generation; the need to acquire necessary permits, waivers, and authorizations; and the use of environmentally-preferable materials and processes wherever practicable.
15.5.2 Ames Procedural Requirements 8500.1, Ames Environmental Procedural Requirements
APR 8500.1 sets forth general procedural requirements to ensure compliance with applicable federal, state, and local environmental laws; regulations and EOs; and NASA policies and procedures. Organizational directors, division chiefs, branch chiefs, section heads, supervisors, managers, and CORs are responsible for planning, designing, constructing, managing, operating, and maintaining facilities in conformance with applicable regulatory directives, and should obtain environmental review from the Environmental Management Division early in project planning consistent with NASA's NEPA implementing procedures (NPR 8580.1 and EO 12114), NASA policies and procedures for programs and projects (NPR 7120), and NASA regulations related to environmental quality (14 CFR 1216). Program and project managers should coordinate with the Environmental Management Division in a timely manner to ensure that any new or modified programs, projects, and activities comply with regulatory requirements.
15.5.3 Ames Environmental Work Instructions
Ames’s EWIs, which replace the previous Ames Environmental Handbook (APR 8800.3), set forth requirements to ensure that programs, projects, and activities at ARC comply with applicable federal, state, and local laws; regulations and EOs; and NASA policies and procedures. Each EWI lists relevant regulatory authorities and documents, assigns individual and organizational responsibilities within ARC, and identifies specific requirements applicable to the work being performed.
The following EWIs are relevant to operations and future development at ARC with the potential to impact biological resources.
EWI 2-4, Wetlands and Flood Plains (Under review)
EWI 12, Public Involvement
EWI 14, NEPA and Environmental Justice
EWI 15, Wildlife (Under review)
National Aeronautics and Space Administration Chap 15. Biological Resources
NASA Ames Research Center Environmental Resources Document Environmental Management Division March 2015 File: 2015 ARC ERD_FINAL.doc
Pg 282
EWI 18, Environmental Requirements for Construction Projects (Under review)
15.5.4 Burrowing Owl Habitat Management Plan
To protect the burrowing owl population at ARC, a BOHMP) was prepared in 1999 by Dr. Lynne Trulio, a burrowing owl expert, and incorporated into the 2002 NADP EIS. This report presents management techniques for protecting owls and owl habitat, relocating predators, and minimizing the impact of any new projects ARC’s owl population.
The BOHMP describes potential impacts from the proposed NADP development Alternatives analyzed in the NADP EIS, and lays out measures to avoid or mitigate them. The key provision of the BOHMP is the creation of burrowing owl preserves. The alternatives vary somewhat in the size of the preserves they set aside for burrowing owls. In the BOHMP, Dr. Trulio and NASA staff selected a 9-hectare (22-acre) area in NRP, a 3-hectare (8-acre) site in the Ames Campus area, a 10-hectare (24-acre) area in Eastside/Airfield, and an 11-hectare (27-acre) area in Bay View. Together, the four preserves set aside approximately 33 hectares (81 acres) for burrowing owl nesting and foraging. According to the BOHMP, NASA would avoid most of the potentially significant long-term impacts on burrowing owl nesting habitat by establishing these preserves and steering development away from them.
Because impacts on burrowing owls could still result from implementation of the NADP, the BOHMP includes mitigation measures to address these impacts, which are described in more detail in Section 4.9 of this EIS. The mitigation measures are designed to address loss of burrows during construction, loss of habitat due to new development, disturbance of existing burrows, increased vehicle collisions, control of ground squirrels, decreased prey base, and increased predation. Taken together, the avoidance mitigation measures described in Section 4.9 are expected to achieve long-term protection of the existing burrowing owl colony at the Center given the proposed level of development under the NADP.
The BOHMP is included in Appendix F of the NADP EIS.
15.5.5 Other Plans
Other plans that are applicable to the management of common and special-status wildlife at ARC include, but are not limited to, the following:
Western Pond Turtle Habitat Management Plan
Wildlife Management Plan for Ammunition Bunkers
Wildlife Management Plan for Chase Park
Electrical Substation Wildlife Management Plan
Ground Squirrel Action Plans
Ground Squirrel Control Plans
Airfield Wildlife Control Safety Plan
National Aeronautics and Space Administration Chap 15. Biological Resources
NASA Ames Research Center Environmental Resources Document Environmental Management Division March 2015 File: 2015 ARC ERD_FINAL.doc
Pg 283
Wildlife Hazard Management Plan (JO-7)
15.5.6 Predator Management Program
In the mid-1990's USFWS adopted a Predator Management Program to help recover the Federally Endangered Ridgeway's rail from small mammalian predators. Non-native red fox was recently introduced to the Bay Area, and was having a large impact on the ground nesting birds. NASA Ames Research Center has a large area of Coastal Salt Marsh habitat on the northern end of the runways, and is adjacent to high quality rail breeding grounds in the Steven's Creek drainage. NASA adopted the trapping program to be in line with federal guidelines to protect the endangered species found on property including salt marsh harvest mouse, snowy plover, and least tern. In 2003, a study was conducted in the SWRP to determine what predator species were found hunting in Coastal Salt Marsh and what kind of impact they were having (Meckstroth and Miles 2003). It was found that most of the nests during the breeding season in the SWRP were predated and that skunks were the most abundant predator. USDA Wildlife Services routinely surveys and traps small mammalian predators at Ames to reduce the predation pressure on these species.
15.5.7 NASA Ames Development Plan Final Programmatic Environmental Impact Statement
The NADP EIS identifies the following mitigation measures to address impacts to special-status wildlife from build out of NADP Mitigated Alternative 5.
15.5.7.1 Mitigation Measure BIO-1
To minimize the potential for injury or death caused by construction vehicles to western burrowing owls or migratory birds in all four planning areas, and to salt marsh harvest mice in the Bay View area, the following components would be implemented:
As much as possible, construction traffic would not be routed on roads adjacent to habitats where these special-status species occur and would be prohibited from using roads when habitat considerations require it.
Occupied or potential habitat for these species near established routes would be marked as off-limits to construction vehicles.
In the Bay View area, if construction vehicles must travel on roads within approximately 30 meters (100 feet) of occupied or potential habitat, drift fencing would be erected to prevent salt marsh harvest mice from crossing these roads. The drift fencing would be placed so that harvest mice retain access to adjacent upland habitats for use as refuge during high water events.
All drivers of construction vehicles would be informed of the established vehicle routes and made aware of the importance of
National Aeronautics and Space Administration Chap 15. Biological Resources
NASA Ames Research Center Environmental Resources Document Environmental Management Division March 2015 File: 2015 ARC ERD_FINAL.doc
Pg 284
avoiding occupied and potential habitat for western burrowing owls and salt marsh harvest mice.
Construction activities would not be allowed to disturb nesting migratory birds.
15.5.7.2 Mitigation Measure BIO-3
Landscaping would be designed with native species (with the possible exception of lawn areas). Invasive plants would not be used in any landscaping. Any imported soil used for landscaping must be certified as weed-free. Similarly, any erosion-control structures that contain hay or other dried plant material (for example, hay bales) must be certified as weed-free. Any construction equipment operating within 76 meters (250 feet) of jurisdictional wetlands or other sensitive habitats in the Bay View area would be washed with reclaimed water prior to use in this area to remove potential weed seeds. The construction zone would be surveyed periodically by a qualified botanist so that any infestations of invasive species that establish within the construction zone of the Bay View area can be eradicated before the plants can flower and set seed.
15.5.7.3 Mitigation Measure BIO-4a
NASA and its partners would institute the following programs and policies to limit increases in predator populations:
Prohibit employees from feeding wildlife, including cats
Institute and enforce a no pets policy in new housing or offices
Install trash containers that cannot be opened by predator species
Augment the existing nonnative predator control program, which includes humane trapping and removal of feral cats and other nonnative predators
Conduct a public education program about the impacts caused by nonnative predators and the need to refrain from feeding feral cats and other wildlife
A regular construction cleanup crew would be designated to ensure that construction debris and trash do not attract predators or scavengers
National Aeronautics and Space Administration Chap 15. Biological Resources
NASA Ames Research Center Environmental Resources Document Environmental Management Division March 2015 File: 2015 ARC ERD_FINAL.doc
Pg 285
15.5.7.4 Mitigation Measure BIO-4b
Design north and east fences bordering Bay View housing to eliminate movement of potential predators from the housing area to sensitive wildlife areas. The design would include:
Burying the bottom portion of the fence at least 46 centimeters (18 inches) below ground level
Making the fencing grid size small enough to prevent rats from passing through
Placing roll wire along the top of the fencing to eliminate predators climbing over the fence and to deter avian predators from perching
15.5.7.5 Mitigation Measure BIO-5
To avoid impacts to roosting bats, a qualified wildlife biologist would conduct a preconstruction survey of buildings to be demolished or renovated in accordance with recommendations of the California Department of Fish and Game. If special-status roosting bats are found, the California Department of Fish and Game is to be consulted. An avoidance or mitigation plan would be developed and implemented. Avoidance measures could include construction outside of hibernation and maternal roosting periods (winter), excluding bats from the buildings after they have left the roost to forage at night by closing entrances, and the construction of bat boxes to accommodate displaced bats. If bat boxes were used, NASA would monitor their success.
15.5.7.6 Mitigation Measure BIO-6
NASA and its partners would use trash receptors that are animal resistant, and would maintain a regular garbage disposal schedule.
15.5.7.7 Mitigation Measure BIO-7
NASA is conducting a lighting study to determine baseline levels. When feasible, nighttime lighting would be excluded in new development adjacent to high-quality wildlife habitat in the North of Bay View area. The Bay View housing would not be allowed to cause a net increase in lighting in the areas north or east of Bay View. The impacts of necessary lighting would be minimized by using low-glare light sources for example, low-pressure sodium lighting) mounted on short poles and directed away from native habitats. In addition, light amplification to nearby sensitive areas would be eliminated through directional lighting with baffles, non-reflective tinting on windows, and other mechanisms.
National Aeronautics and Space Administration Chap 15. Biological Resources
NASA Ames Research Center Environmental Resources Document Environmental Management Division March 2015 File: 2015 ARC ERD_FINAL.doc
Pg 286
15.5.7.8 Mitigation Measure AES-6a
Where possible, NASA and its partners would carefully site any development so as to preserve the protected trees.
15.5.7.9 Mitigation Measure AES-6b
Where it is not possible to preserve protected trees in place, NASA and its partners would develop a revegetation plan consistent with the requirements of the Santa Clara County Tree Preservation and Removal Ordinance.
National Aeronautics and Space Administration Chap 16. Transportation and Circulation
NASA Ames Research Center Environmental Resources Document Environmental Management Division March 2015 File: 2015 ARC ERD_FINAL.doc
Pg 287
Chapter 16. Transportation and Circulation
16.1 Overview
This chapter describes the existing transportation characteristics of the ARC and the surrounding area. It also summarizes regulations applicable to the local and regional transportation systems as well as relevant plans, programs, policies, and measures that address potential transportation and traffic effects of operations and future development at ARC. Information presented in this chapter was obtained from the November 2009 NASA ARC ERD (NASA 2009), NADP EIS (Design, Community & Environment 2002), and the standards and guidelines of the California Department of Transportation (Caltrans), the City of Mountain View, the City of Sunnyvale, and the Santa Clara Valley Transportation Authority (VTA).
16.2 Regulatory Background
16.2.1 Federal Regulations
16.2.1.1 NASA’s Site Circulation Standards
Roadways within ARC are under the governance of NASA. Previous publications by the Federal Highway Administration and the Federal Transit Administration indicated that operations of all transportation facilities are typically designed and maintained based on standard engineering practice and may adhere to local standards. However, the federal government does not employ its own specific standards for intersection operation or other modes that would be used to identify significant environmental impacts. To determine the environmental impacts of its actions, NASA uses the criteria of the local, county, and state jurisdictions.
16.2.1.2 National Environmental Policy Act
NEPA requires federal agencies to include in their decision-making process appropriate and careful consideration of all environmental effects of a proposed action and of possible alternative actions. Measures to avoid or minimize the adverse effects of proposed actions and to restore and enhance environmental quality as much as possible must be developed and discussed where feasible.
16.2.2 State Regulations
Caltrans has jurisdiction over all state routes (SRs), including interstate freeways, U.S. highways, and state highways. Caltrans strives to maintain a target level of service (LOS) at the transition between LOS C and LOS D on state highway facilities. In cases where this level of service is not feasible, the lead agency should consult with Caltrans to establish an appropriate LOS threshold. If an existing state highway facility is operating worse than the
National Aeronautics and Space Administration Chap 16. Transportation and Circulation
NASA Ames Research Center Environmental Resources Document Environmental Management Division March 2015 File: 2015 ARC ERD_FINAL.doc
Pg 288
appropriate target LOS, the existing Measures of Effectiveness should be maintained12 (Caltrans 2002).
Any modifications to facilities within the Caltrans right-of-way must be approved by the State. Although impacts to freeway segments are identified as part of the transportation impact analysis process established by VTA, Caltrans can request additional information to determine anticipated impacts to state facilities. Caltrans has an Environmental Review Section to address new developments in local jurisdictions.
16.2.3 Local Regulations
16.2.3.1 Santa Clara County
VTA both maintains roadways and expressway facilities in unincorporated areas of Santa Clara County and serves as the County’s congestion management agency. The Congestion Management Program (CMP), which VTA oversees, monitors operations of all freeways and selected expressways and regional arterials through a biennial count program and determines the need for deficiency plans to reduce overall congestion.
VTA has also established uniform methods and guidelines for evaluating the transportation impacts of land use decisions on CMP facilities. All of the cities and towns within Santa Clara County have adopted the same transportation impact analysis methodology and significance criteria except for selected areas that are governed by special policies (North San Jose and the Evergreen area in San Jose). This common set of methods and guidelines allows each CMP member agency to understand the impacts of development in adjacent jurisdictions. By projecting against significant impacts to CMP facilities, VTA can better anticipate the effect of land use changes and improve the planning process for the overall regional transportation system. Impacts to CMP facilities must be addressed as part of the environmental review process just as the policies of affected local jurisdictions must be used to determine impact significance. The CMP facilities in the study area includeUS-101, SR 237, SR 85, and Central Expressway. The county strives to maintain an LOS D standard for roadway operations and follows the CMP criteria for regional facilities (VTA 2012).
16.2.3.2 City of Mountain View
The Mobility Element of the City of Mountain View General Plan states specific goals, policies, and actions designed to maintain acceptable traffic operations and reduce congestion, and includes plans for future bicycle facilities and walkways. Improved circulation is expected to be provided through enhancement of transit, bicycle, and pedestrian modes, as well as the use of aggressive Transportation Demand Management measures to reduce single-occupant vehicle trips (City of Mountain View 2012). The City has adopted LOS D as the minimum overall performance standard for City‐controlled roadways.
12 Caltrans consider LOS by itself to be an inadequate measure of effectiveness (MOE) for describing traffic operational conditions. For intersection operations, the accepted MOEs used by Caltrans include flow, average control delay, queue, and volume/capacity ratio. For freeway and ramp operations, flow, speed, and travel/time delay are the accepted MOEs in addition to LOS.
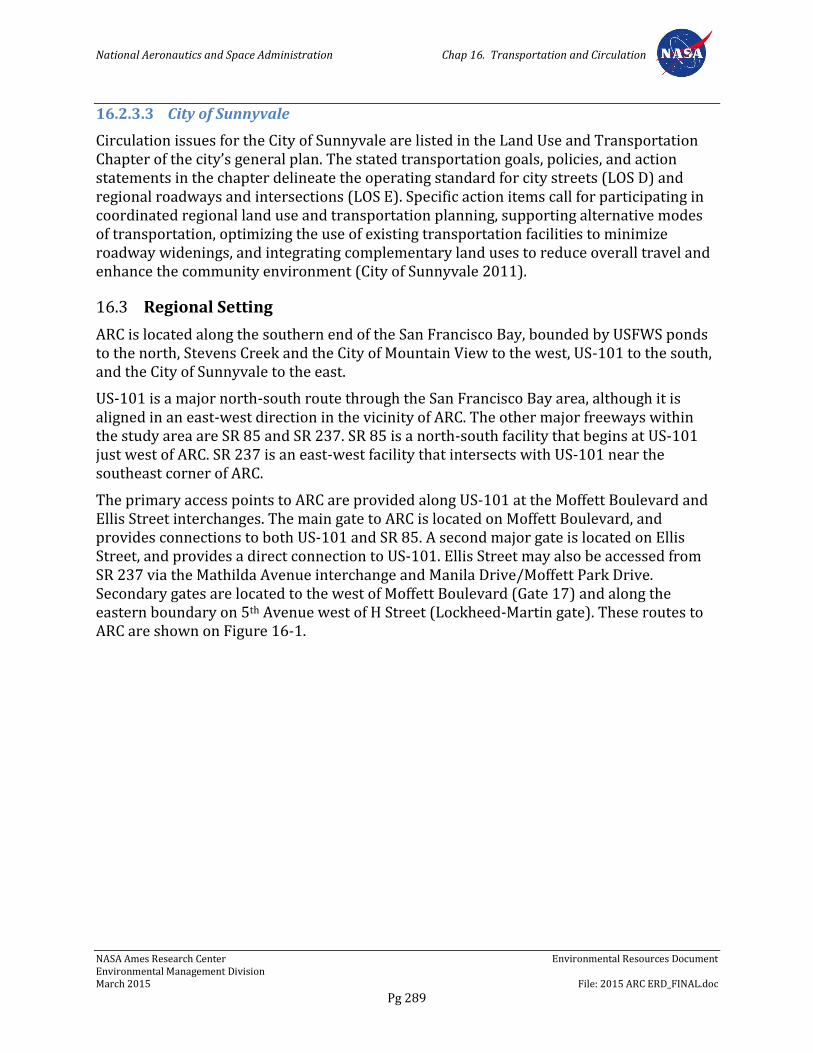
National Aeronautics and Space Administration Chap 16. Transportation and Circulation
NASA Ames Research Center Environmental Resources Document Environmental Management Division March 2015 File: 2015 ARC ERD_FINAL.doc
Pg 289
16.2.3.3 City of Sunnyvale
Circulation issues for the City of Sunnyvale are listed in the Land Use and Transportation Chapter of the city’s general plan. The stated transportation goals, policies, and action statements in the chapter delineate the operating standard for city streets (LOS D) and regional roadways and intersections (LOS E). Specific action items call for participating in coordinated regional land use and transportation planning, supporting alternative modes of transportation, optimizing the use of existing transportation facilities to minimize roadway widenings, and integrating complementary land uses to reduce overall travel and enhance the community environment (City of Sunnyvale 2011).
16.3 Regional Setting
ARC is located along the southern end of the San Francisco Bay, bounded by USFWS ponds to the north, Stevens Creek and the City of Mountain View to the west, US-101 to the south, and the City of Sunnyvale to the east.
US-101 is a major north-south route through the San Francisco Bay area, although it is aligned in an east-west direction in the vicinity of ARC. The other major freeways within the study area are SR 85 and SR 237. SR 85 is a north-south facility that begins at US-101 just west of ARC. SR 237 is an east-west facility that intersects with US-101 near the southeast corner of ARC.
The primary access points to ARC are provided along US-101 at the Moffett Boulevard and Ellis Street interchanges. The main gate to ARC is located on Moffett Boulevard, and provides connections to both US-101 and SR 85. A second major gate is located on Ellis Street, and provides a direct connection to US-101. Ellis Street may also be accessed from SR 237 via the Mathilda Avenue interchange and Manila Drive/Moffett Park Drive. Secondary gates are located to the west of Moffett Boulevard (Gate 17) and along the eastern boundary on 5th Avenue west of H Street (Lockheed-Martin gate). These routes to ARC are shown on Figure 16-1.
National Aeronautics and Space Administration Chap 16. Transportation and Circulation
NASA Ames Research Center Environmental Resources Document Environmental Management Division March 2015 File: 2015 ARC ERD_FINAL.doc
Pg 290
Figure 16-1. Primary Access Points
(Source: NASA 2009)
16.4 Existing Conditions
16.4.1 Regional Roadway Network
The major regional roadways that are most significant for ARC are summarized below.
16.4.1.1 U.S. Highway 101
US-101 is a major north-south route in California extending from Los Angeles past the Oregon state line. To the north, US-101 provides connections to San Francisco and cities throughout San Mateo County. To the south, it provides connections to Santa Clara and San Jose. Near ARC, US-101 has four lanes in each direction, with inside lanes designated as High Occupancy Vehicle (HOV) lanes during the peak commute periods on weekdays. There is also a US-101 and SR 85 connector, which includes new ramps and HOV lanes for Shoreline Blvd, Old Middlefield Road and access for US-101 and SR 85.
National Aeronautics and Space Administration Chap 16. Transportation and Circulation
NASA Ames Research Center Environmental Resources Document Environmental Management Division March 2015 File: 2015 ARC ERD_FINAL.doc
Pg 291
16.4.1.2 State Route 85
SR 85 is a circumferential freeway that originates at US-101 near ARC and goes south then east to rejoin US-101 in south San Jose. From ARC, SR 85 provides connections to Sunnyvale, Cupertino, and southern San Jose. For most of its length, SR 85 is a six-lane facility, with the inside lanes designated as HOV lanes during the peak commute periods. Ramps to and from SR 85 are provided on Moffett Boulevard southeast of US-101.
16.4.1.3 State Route 237
SR 237 is aligned to the southeast of ARC, running between SR 85 and Interstate 680(I-680) with connections to US-101 and Interstate 880 (I-880). On the key segment between US-101 and I-880, SR 237 is primarily a six-lane freeway, with the inside lanes designated as HOV lanes during the peak commute periods. It provides access to ARC from Milpitas to the east, as well as from East Bay further north up I-880 andI-680. Access from ARC to SR 237 is typically provided via US-101 from either the Ellis Street or Moffett Boulevard interchanges, although direct access is provided via Manila Drive/Moffett Park Drive and the SR 237/Mathilda Avenue interchange.
16.4.1.4 Moffett Boulevard
Moffett Boulevard is a four-lane arterial that serves as the primary connector into ARC. Regional access to ARC from Moffett Boulevard is provided via interchanges with both US-101 and SR 85 (to and from the south only).
16.4.1.5 Ellis Street
Ellis Street is four-lane arterial running between the South/Ellis Gate at ARC and Middlefield in Mountain View. Between Middlefield and the interchange with US-101, Ellis Street includes marked bicycle lanes in each direction.
16.4.1.6 Manila Drive/Moffett Park Drive
This two-lane roadway runs between Ellis Street and Mathilda Avenue along the edge of ARC. It runs mostly parallel to US-101. It provides access to the new light rail transit station and a connection between ARC and the SR 237/Mathilda interchange.
16.4.1.7 H Street
H Street is a two-lane roadway extending between Manila Drive and 3rd Avenue east of the airfield. This street crosses the VTA light rail line.
16.4.1.8 5th Avenue
5th Avenue is a two-lane roadway linking Macon Road within the airfield to Borregas Drive east of Mathilda Avenue. A security gate is located at the west end of the street. This street also crosses the VTA light rail line at Mathilda Avenue.
National Aeronautics and Space Administration Chap 16. Transportation and Circulation
NASA Ames Research Center Environmental Resources Document Environmental Management Division March 2015 File: 2015 ARC ERD_FINAL.doc
Pg 292
16.4.1.9 Mathilda Avenue
Mathilda Avenue is a multi-lane arterial southeast of ARC with interchanges at both US-101 and SR 237. In conjunction with Manila/Moffett Park Drive, Mathilda Avenue offers an alternative route for accessing these two freeways.
16.4.1.10 Middlefield Road
This two- to four-lane arterial extends through the study area roughly parallel to US-101. Middlefield Road intersects with both Ellis Street and Moffett Boulevard. Through the study area, Middlefield Road has two lanes in each direction.
16.4.1.11 Central Expressway
Central Expressway is a four-lane limited access arterial extending from southeast of Charleston Road in the City of Palo Alto to De La Cruz Boulevard in the City of Santa Clara. It provides a local alternate to US-101 and includes an at-grade intersection at Moffett Boulevard, as well as grade-separated interchanges at SR 85 (to and from the north only) and Middlefield Road.
16.4.2 Level of Service
LOS is a qualitative measure for stating the operating quality of a roadway facility, ranging from LOS A (free-flow conditions) to LOS F (congested conditions). Methodologies used to evaluate traffic LOS for regional roadways and intersections are described in the Traffic Level of Service Analysis Guidelines produced by VTA (VTA 2003). VTA administers the Santa Clara County’s CMP and monitors the impact of land use decisions by the member jurisdictions. The methodology for evaluating intersection and freeway performance is described below.
The method for evaluating an intersection’s operation is based on the average stopped vehicular delay. The average delay for signalized intersections is correlated to an LOS designation as shown in Table 16-1.
Table 16-1. Signalized Intersection Criteria
Level of Service Average Delay Per Vehicle (Seconds)
A delay ≤ 10.0 B+ B B-
10.0 < delay ≤ 12.0 12.0 < delay ≤ 18.0 18.0 < delay ≤ 20.0
C+ C C-
20.0 < delay ≤ 23.0 23.0 < delay ≤ 32.0 32.0 < delay ≤ 35.0
D+ D D-
35.0 < delay ≤ 39.0 39.0 < delay ≤ 51.0 51.0 < delay ≤ 55.0
E+ E E-
55.0 < delay ≤ 60.0 60.0 < delay ≤ 75.0 75.0 < delay ≤ 80.0

National Aeronautics and Space Administration Chap 16. Transportation and Circulation
NASA Ames Research Center Environmental Resources Document Environmental Management Division March 2015 File: 2015 ARC ERD_FINAL.doc
Pg 293
Level of Service Average Delay Per Vehicle (Seconds)
F delay > 80.0 Source: VTA 2003.
Operations of unsignalized intersections are calculated using the procedures outlined in the current Highway Capacity Manual. The LOS rating is based on the average control delay for each minor street movement measured in seconds per vehicle. For all-way stop control intersections, LOS is defined for the intersection as a whole based on a weighted average control delay. Only the worst-case delay is used to identify LOS for two-way stop-controlled intersections (that is, stop signs on the minor street approaches). Table 16-2 presents the range of control delay that corresponds to each LOS designation.
Table 16-2. Level of Service Criteria for Unsignalized Intersections
Level of Service Average Control Delay per Vehicle (Seconds) A ≤ 10 B 10.1 to 15.0 C 15.1 to 25.0 D 25.1 to 35.0 E 35.1 to 50.0 F > 50 Source: Transportation Research Board 2000.
The method for evaluating freeway operations is based on density expressed as passenger cars per mile per lane. The LOS criteria for freeway operations are shown in Table 16-3.
Table 16-3. Freeway Level of Service Criteria
Level of Service Density (vehicles per mile per lane) Travel Speed (MPH) A ≤ 11 60 – 65 B 11 < density ≤ 18 57 – 60 C 18 < density ≤ 26 54 – 57 D 26 < density ≤ 46 46 – 54 E 46 < density ≤ 58 35 – 46 F > 58 < 35 Source: VTA 2003.
Roadway system deficiencies and impacts are defined as occurring where the calculated LOS falls below the acceptable level of performance. VTA has established LOS E as the standard for signalized intersections on CMP facilities. In general, both Mountain View and Sunnyvale consider LOS D to be the minimum acceptable level of peak-hour operation for signalized intersections on non-CMP routes. Neither VTA nor the cities have established a minimum LOS standard for stop sign-controlled intersections. However, typical practice in these jurisdictions has been to accept LOS E operation for a particular movement or shared approach, but to investigate the possibility of signalization in cases where LOS F operations occur or are projected. Caltrans warrant criteria in the Highway Capacity Manual are used to help identify the need for signalization, especially in cases where vehicles on the minor street approaches are expected to experience extensive delay.
National Aeronautics and Space Administration Chap 16. Transportation and Circulation
NASA Ames Research Center Environmental Resources Document Environmental Management Division March 2015 File: 2015 ARC ERD_FINAL.doc
Pg 294
Both the cities of Mountain View and Sunnyvale have established LOS D to be the LOS standard for local roadways, and LOS E for regional roadways. Santa Clara County has also established LOS D as the standard for roadways in unincorporated areas and expressway facilities. In addition, Caltrans has a target level of service LOS at the transition between LOS C and LOS D on all SRs, including Interstate 280, US-101, SR 85, and SR 237.13
16.4.2.1 Intersection Level of Service
Based on the VTA’s 2012 CMP Monitoring and Conformance Report (VTA 2012), most intersections in the vicinity of ARC currently operate at an acceptable LOS in conformance with local standards. Only two CMP study intersection in the neighboring jurisdictions, the El Camino Real/Grant Road intersection in Mountain View and the Lawrence Expressway/ Arques Avenue in Sunnyvale, currently operate at a deficient level (LOS E); however, neither of these intersections is in located close proximity to ARC. While traffic operations near ARC generally perform at an acceptable level, it should be noted that several locations operate at worse LOS based due to special circumstances. For example, at the Moffett Boulevard-Castro Street/Central Expressway intersection, crossing gates closing the south leg of the intersection to accommodate Caltrain passenger rail operations periodically disrupt normal traffic signal cycle operations. This activity increases delay for some movements and worsens overall LOS. It can take several cycles or more for operations to return to normal until the next train requires lowering of the crossing arms.
16.4.2.2 Freeway Level of Service
Several of the freeway segments near ARC operate at LOS F during one or both peak periods, including SR 85, SR 237, and US-101 (VTA 2012). These results illustrate the high level of existing congestion on the area’s freeway system, particularly northbound on US-101.
16.4.2.3 Internal Roadway Segment Level of Service
With the closure of Moffett Field as a military base, most roadways within ARC carry relatively low volumes of traffic. There are currently no capacity or delay problems at any of the key internal intersections.
16.4.3 Bicycle and Pedestrian Facilities
Currently, there are bicycle facilities at two locations within ARC. To the north, there are marked bicycle lanes on Wright Avenue between the Moffett Extension and Hunsaker Road. To the south, a separate bicycle path was recently constructed adjacent to Macon Road between Ellis Street and the Lockheed Gate. Throughout the remainder of ARC, the low traffic volumes and the availability of sidewalks and shoulders result in a reasonable environment for cyclists.
13 The transition between C and D corresponds on freeways to a volume to capacity ratio of 0.71 and a maximum freeway flow rate would be is 1,680 vehicles per hour per lane, as specified by Caltrans’ “Guide for the Preparation of Traffic Impact Studies” (Caltrans 2002).
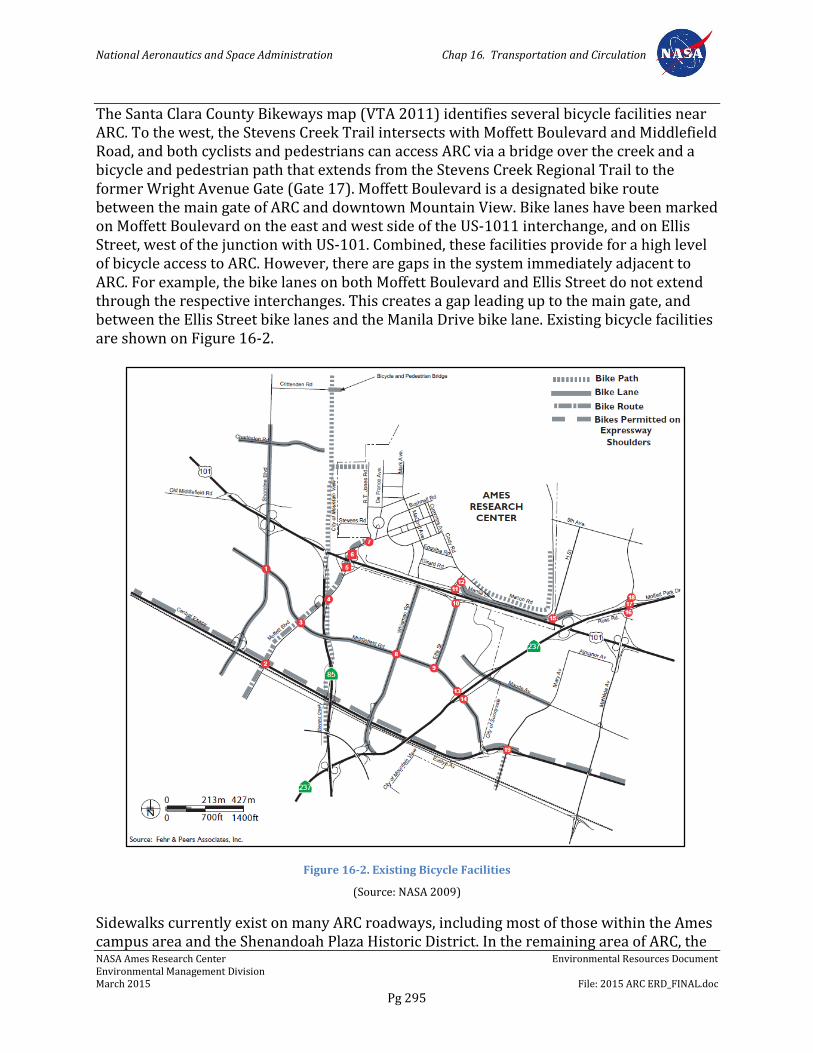
National Aeronautics and Space Administration Chap 16. Transportation and Circulation
NASA Ames Research Center Environmental Resources Document Environmental Management Division March 2015 File: 2015 ARC ERD_FINAL.doc
Pg 295
The Santa Clara County Bikeways map (VTA 2011) identifies several bicycle facilities near ARC. To the west, the Stevens Creek Trail intersects with Moffett Boulevard and Middlefield Road, and both cyclists and pedestrians can access ARC via a bridge over the creek and a bicycle and pedestrian path that extends from the Stevens Creek Regional Trail to the former Wright Avenue Gate (Gate 17). Moffett Boulevard is a designated bike route between the main gate of ARC and downtown Mountain View. Bike lanes have been marked on Moffett Boulevard on the east and west side of the US-1011 interchange, and on Ellis Street, west of the junction with US-101. Combined, these facilities provide for a high level of bicycle access to ARC. However, there are gaps in the system immediately adjacent to ARC. For example, the bike lanes on both Moffett Boulevard and Ellis Street do not extend through the respective interchanges. This creates a gap leading up to the main gate, and between the Ellis Street bike lanes and the Manila Drive bike lane. Existing bicycle facilities are shown on Figure 16-2.
Figure 16-2. Existing Bicycle Facilities
(Source: NASA 2009)
Sidewalks currently exist on many ARC roadways, including most of those within the Ames campus area and the Shenandoah Plaza Historic District. In the remaining area of ARC, the
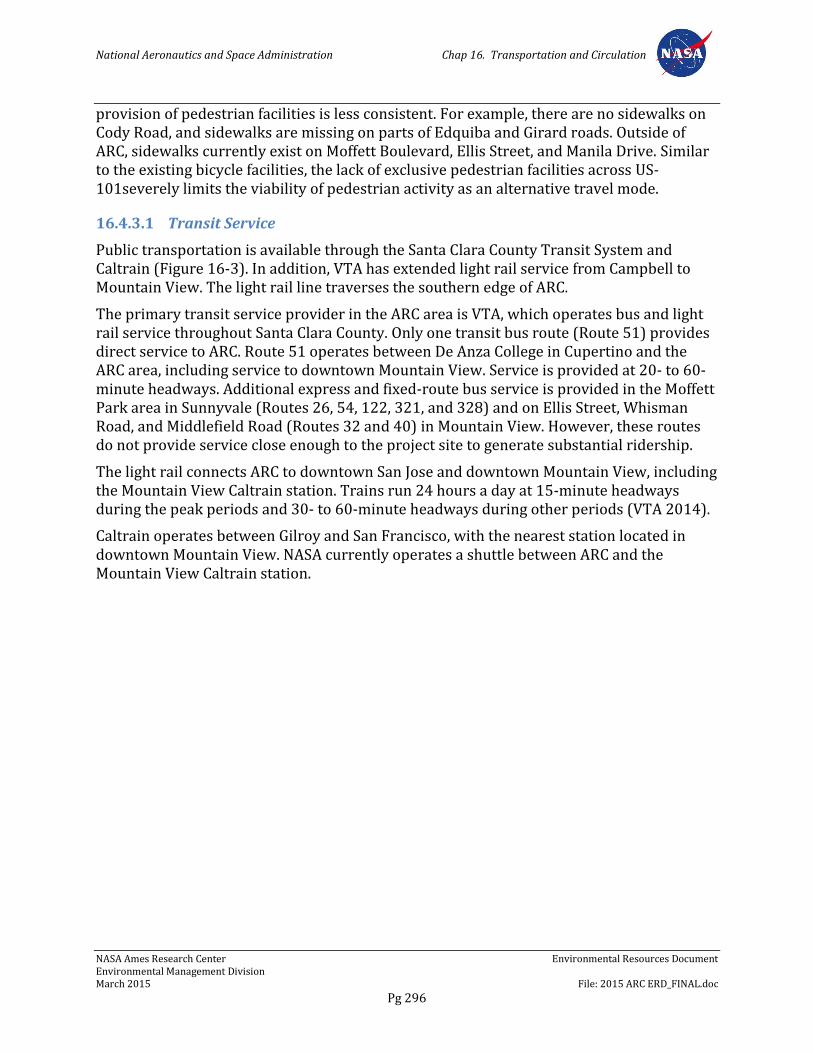
National Aeronautics and Space Administration Chap 16. Transportation and Circulation
NASA Ames Research Center Environmental Resources Document Environmental Management Division March 2015 File: 2015 ARC ERD_FINAL.doc
Pg 296
provision of pedestrian facilities is less consistent. For example, there are no sidewalks on Cody Road, and sidewalks are missing on parts of Edquiba and Girard roads. Outside of ARC, sidewalks currently exist on Moffett Boulevard, Ellis Street, and Manila Drive. Similar to the existing bicycle facilities, the lack of exclusive pedestrian facilities across US-101severely limits the viability of pedestrian activity as an alternative travel mode.
16.4.3.1 Transit Service
Public transportation is available through the Santa Clara County Transit System and Caltrain (Figure 16-3). In addition, VTA has extended light rail service from Campbell to Mountain View. The light rail line traverses the southern edge of ARC.
The primary transit service provider in the ARC area is VTA, which operates bus and light rail service throughout Santa Clara County. Only one transit bus route (Route 51) provides direct service to ARC. Route 51 operates between De Anza College in Cupertino and the ARC area, including service to downtown Mountain View. Service is provided at 20- to 60-minute headways. Additional express and fixed-route bus service is provided in the Moffett Park area in Sunnyvale (Routes 26, 54, 122, 321, and 328) and on Ellis Street, Whisman Road, and Middlefield Road (Routes 32 and 40) in Mountain View. However, these routes do not provide service close enough to the project site to generate substantial ridership.
The light rail connects ARC to downtown San Jose and downtown Mountain View, including the Mountain View Caltrain station. Trains run 24 hours a day at 15-minute headways during the peak periods and 30- to 60-minute headways during other periods (VTA 2014).
Caltrain operates between Gilroy and San Francisco, with the nearest station located in downtown Mountain View. NASA currently operates a shuttle between ARC and the Mountain View Caltrain station.
National Aeronautics and Space Administration Chap 16. Transportation and Circulation
NASA Ames Research Center Environmental Resources Document Environmental Management Division March 2015 File: 2015 ARC ERD_FINAL.doc
Pg 297
Figure 16-3. Existing Transit Service
(Source: NASA 2009)
16.4.4 Parking
Parking is currently accommodated at a number of lots and on-street locations throughout ARC. An inventory conducted in February and March 1999 identified more than 10,000 parking stalls or spaces within the entire ARC complex. Parking lots in the existing interior portion of ARC are relatively small and scattered and tend to be centralized near highly populated buildings. Parking also occurs on the internal road system at the facility and on adjacent areas. Visitor parking for about 50 cars and one bus is provided next to the visitor center, along Moffett Boulevard next to Building 943.
Overall, a concentration of people working in certain areas has caused a demand for parking spaces that often exceeds supply. Overflow parking must be utilized in these areas. This results in parking congestion, particularly during periodic conferences. Although the parking situation is inconvenient at times, it does not constitute a serious environmental problem.
16.5 Environmental Requirements
NASA has identified the following environmental plans, programs, policies, and measures that address potential transportation and traffic effects of operations and future development at ARC.
National Aeronautics and Space Administration Chap 16. Transportation and Circulation
NASA Ames Research Center Environmental Resources Document Environmental Management Division March 2015 File: 2015 ARC ERD_FINAL.doc
Pg 298
16.5.1 NASA Procedural Directive 8500.1, NASA Environmental Management
Per NPD 8500.1, it is NASA policy to: maintain compliance with all applicable federal, state, and local environmental requirements; to incorporate environmental risk reduction and sustainable practices to the extent practicable throughout NASA’s programs, projects, and activities; and to consider environmental factors throughout the life cycle of programs, projects, and activities (as defined in NPD 7120.4, NASA Engineering and Program/Project Management Policy, and related documents), including planning, development, execution, and disposition activities. Examples of environmental factors include consideration of environmental impacts as required by the NEPA and NHPA; the proposed use of hazardous materials; the potential for waste generation; the need to acquire necessary permits, waivers, and authorizations; and the use of environmentally-preferable materials and processes wherever practicable.
16.5.2 NASA Procedural Requirements 8553.1, NASA Environmental Management System
NPR 8553.1 sets forth requirements for the NASA EMS, which functions primarily to: (1) incorporate people, procedures, and work practices into a formal structure to ensure that the important environmental impacts of the organization are identified and addressed; (2) promote continual improvement, including periodically evaluating environmental performance; (3) involve all members of the organization, as appropriate; and (4) actively involve senior management in support of the EMS.
Agencywide, the EMS employs a standardized approach to managing environmental activities that allows for efficient, prioritized system execution, while at the same time helping to improve environmental performance and to maintain compliance with applicable environmental regulations and requirements. NASA’s EMS approach involves identifying all activities, products, and services under each NASA center’s control, and the environmental aspects associated with each centers’ continued engagement in those activities, products, and services. Once identified, priority environmental aspects are assigned a risk ranking (from 1 to 4, based on its severity and frequency of occurrence) and are evaluated on a continual basis as means of highlighting associated positive or negative impacts and setting objectives and targets to reduce environmental risk. Each center’s EMS also identifies methods for ensuring compliance by keeping abreast of environmental requirements. This includes requirements by law (EOs, federal regulations, state and local laws) and voluntary commitments made by the center or NASA.
16.5.3 Ames Procedural Requirements 8500.1, Ames Environmental Procedural Requirements
APR 8500.1 sets forth general procedural requirements to ensure compliance with applicable federal, state, and local environmental laws; regulations and EOs; and NASA policies and procedures. Organizational directors, division chiefs, branch chiefs, section heads, supervisors, managers, and CORs are responsible for planning, designing, constructing, managing, operating, and maintaining facilities in conformance with applicable regulatory directives, and should obtain environmental review from the
National Aeronautics and Space Administration Chap 16. Transportation and Circulation
NASA Ames Research Center Environmental Resources Document Environmental Management Division March 2015 File: 2015 ARC ERD_FINAL.doc
Pg 299
Environmental Management Division early in project planning consistent with NASA's NEPA implementing procedures (NPR 8580.1 and EO 12114), NASA policies and procedures for programs and projects (NPR 7120), and NASA regulations related to environmental quality (14 CFR 1216). Program and project managers should coordinate with the Environmental Management Division in a timely manner to ensure that any new or modified programs, projects, and activities comply with regulatory requirements.
16.5.4 Ames Procedural Requirements 8553.1, Ames Environmental Management System
APR 8553.1 sets forth requirements for the Center-level EMS in accordance with NPR 8553.1B, NASA Environmental Management Systems. The ARC EMS also includes consideration of the findings of NASA Headquarters’ triennial (3-year) Environmental Functional Review and other external EMS audits, as required.
Under the ARC EMS, the Center conducts an annual risk analysis across Center activities to determine which of 16 environmental aspects are of high or medium priority. The Center then identifies objectives (goals) and targets and develops action plans known as Environmental Management Plans to reduce identified risks. Currently, the high- and medium-priority environmental aspects of Center business activities are Air Emissions, Hazardous Material Management, Water and Energy Conservation, and Other Sustainability Practices. Objectives associated with these high- and medium-priority environmental aspects include:
Reducing air (including GHG) emissions through energy efficiency
Improving hazardous material management
Improving energy and water efficiency
Providing for the integration of other sustainability practices into Center activities
16.5.5 Ames Environmental Work Instructions
Ames’s EWIs, which replace the previous Ames Environmental Handbook (APR 8800.3), set forth requirements to ensure that programs, projects, and activities at ARC comply with applicable federal, state, and local laws; regulations and EOs; and NASA policies and procedures. Each EWI lists relevant regulatory authorities and documents, assigns individual and organizational responsibilities within ARC, and identifies specific requirements applicable to the work being performed.
The following EWIs are relevant to operations and future development at ARC with the potential to impact traffic and transportation.
EWI 12, Public Involvement
EWI 14, NEPA and Environmental Justice
EWI 18, Environmental Requirements for Construction Projects (Under review)
National Aeronautics and Space Administration Chap 16. Transportation and Circulation
NASA Ames Research Center Environmental Resources Document Environmental Management Division March 2015 File: 2015 ARC ERD_FINAL.doc
Pg 300
16.5.6 ARC Transportation Demand Management Programs
NASA has established a number of TDM or similar programs for employees that help reduce the number of automobiles trips generated by the existing uses in the Ames Campus and NASA Research Park areas. Such programs are governed by a variety of federal environmental statutes, regulations, and EOs, which require federal agencies to address transportation issues with the goal of eliminating environmentally wasteful or harmful practices, increasing energy efficiency, and reducing GHG emissions (see Chapter 2, Existing Facilities, Operations, and Their Impacts).
16.5.6.1 Ames Commute Alternatives Program
ARC actively supports automobile trip reduction through the Ames Commute Alternatives Program (ACAP). Through the ACAP, ARC provides information on ridesharing, mass transit, and telecommuting; promotes participation in Bike-to-Work and Spare-the-Air events; and operates a shuttle bus that runs to and from the Mountain View Caltrain station and Bayshore VTA light rail station during morning and afternoon commute hours.
Overall, NASA’s existing programs for the NASA-controlled portion of ARC results in an estimated 21% reduction in the number of single-occupant vehicle trips generated by the ARC personnel relative to the typical number of single-occupant trips that would otherwise be expected from a similar number of employees in Santa Clara County. For further details on the ACAP, refer to the discussion in Chapter 20, Sustainability.
16.5.6.2 NASA Research Park and Bay View Transportation Demand Management Plan
Under the NADP, NASA has developed an aggressive TDM plan that governs all NRP partners, lessees, and tenants in the NRP and Bay View areas. The plan includes TDM strategies designed to achieve the greatest, reasonable level of vehicle trip reduction, such as parking fees, site-wide EcoPass, a robust shuttle service combined, marketing, guaranteed ride home, and on-site housing.
The goal of the TDM plan for the NRP and Bay View areas is to achieve an Average Vehicle Ridership (AVR) of 1.72 at project build-out. A 1.72 AVR means that for every 100 employees/students coming to the site, 58 vehicles are utilized for transportation (100/58 = 1.72).
Based on the projected numbers of off-site employees, students, and visitors that would be generated by NADP projects, it was estimated that this non-resident population could achieve a 22 percent trip reduction under the TDM plan. In addition, with the provision of onsite housing under the NADP, it was estimated that there would be an additional reduction in project-generated vehicle trips of 10 % or more, since onsite residents would be expected to work or attend classes within the NRP. As designed, the TDM Plan for the NADP and Bay View Areas includes four phases to ensure that the programs are implemented in a manner that is supported by the level of development on site. The NRP and Bay View TDM Plan’s phasing requirements are based upon the total number of employees working at proposed NADP sites plus CUP EA sites. Upon commencement of
National Aeronautics and Space Administration Chap 16. Transportation and Circulation
NASA Ames Research Center Environmental Resources Document Environmental Management Division March 2015 File: 2015 ARC ERD_FINAL.doc
Pg 301
Phase 1, the plan relies on the formation of a Transportation Management Agency, or TMA, composed of dues-paying NRP and Bay View partners, lessees, and tenants as the means for running the site-wide TDM programs, managing the parking supply, and providing support to employers for any employer-specific programs.
The NRP and Bay View TDM Plan is included in Appendix B of the NADP EIS.
16.5.7 NASA Ames Development Plan Final Programmatic Environmental Impact Statement (NADP EIS)
The NADP EIS identifies the following mitigation measures to address potential transportation and traffic impacts from build out of NADP Mitigated Alternative 5.
16.5.7.1 Mitigation Measure CIR-1
As part of the NADP, NASA and its partners shall implement an aggressive Transportation Demand Management (TDM) program designed to reduce trip generation by a total of at least 22 percent. TDM measures are phased as described in Appendix B of the FPEIS. Each phase specifies an Average Vehicle Ridership (AVR) goal. NASA will not proceed to the next phase of development until the AVR goal of the previous phase is achieved. In addition, on-site housing will be constructed to reduce vehicle trip generation to external streets and freeways by internalizing trips to onsite employment centers and amenities.
To completely mitigate the highway impacts of the proposed project under any of the development alternatives, each highway segment would have to be widened to provide an additional travel lane in at least one direction or other capacity improvements would have to be made. In many cases, widening is infeasible due to right-of-way constraints and the proximity of existing building structures and development. Immediately adjacent to the project site, for example, Highway 101 could not be widened because of the proximity of Manila Drive and the VTA light rail line. In addition, large-scale freeway widening projects are beyond the scope of a single project and could only garner a relatively small fair-share contribution towards the improvement. Therefore, despite the substantial trip reductions from implementation of the TDM program, the increase in vehicle trips and congestion on the highway system associated with implementation of the NADP would be a significant, unavoidable impact. NASA will work with VTA and Caltrans to consider other mitigations.
16.5.7.2 Mitigation Measure CIR-3
Intersection of Moffett Boulevard/Clark Memorial Drive/R.T. Jones Road. Development under the NADP would include the following improvements to achieve acceptable operations and minimize queuing at this intersection:
National Aeronautics and Space Administration Chap 16. Transportation and Circulation
NASA Ames Research Center Environmental Resources Document Environmental Management Division March 2015 File: 2015 ARC ERD_FINAL.doc
Pg 302
Installation of a traffic signal.
Provision of the following lane configurations:
Northbound (from Space Camp/base housing): one left - turn lane, one shared lane through/right turn lane.
Southbound (from Bay View): one left-turn lane, one through lane, and one "free" right-turn lane (i.e., the right-turn movement would not be controlled by the signal and would require a third westbound receiving lane on Moffett Boulevard).
Westbound (from Clark Memorial Drive): one left-turn lane, two through lanes, and one right-turn lane.
Eastbound (from Highway 101): two left-turn lanes, one through lane, and one shared through/right turn lane.
This measure would provide LOS C or D operations or better during all periods under all alternatives.
16.5.7.3 Mitigation Measure CIR-6
Development under the NADP would modify the Ellis Street underpass to better accommodate bicyclists. Two options are proposed.
One option would be to shift all of the vehicle travel lanes to the north by 4 to 5 meters (12 to 15 feet). Currently, two travel lanes are provided in each direction between three sets of concrete piers. By moving the westbound lane to the north side of the northernmost piers and shifting the other lanes accordingly, additional width could be provided to accommodate bicycle lanes. The northern abutment would have to be rebuilt with a retaining wall similar to the design that was implemented to accommodate the light rail tracks. If this option were implemented, bike lanes would be at least 1.5 meters (5 feet) wide, and adequate signage and lighting would be provided. Figure 4.3-6 illustrates this measure. The feasibility of this improvement would have to be evaluated by a structural engineer and by Caltrans since the intersection configurations at the two adjacent ramp intersections would have to be modified.
Another option would be modify the intersection to provide reversible 2.4-meter (8-foot) lanes that would allow for two lanes of car traffic and one lane of eastbound bike traffic in the morning and only one lane of car traffic and one lane for bikes in a westbound direction. In the afternoon/evening, the extra lane would provide westbound traffic flows.
National Aeronautics and Space Administration Chap 16. Transportation and Circulation
NASA Ames Research Center Environmental Resources Document Environmental Management Division March 2015 File: 2015 ARC ERD_FINAL.doc
Pg 303
Again, adequate signage and lighting would be provided. Implementation of this mitigation measure would reduce the potential impact on bicyclist safety to less-than-significant levels. If this improvement is determined to be infeasible and no alternative is found, then the impact would remain significant and unavoidable.
16.5.7.4 Mitigation Measure CIR-7
Improvements to facilities within Caltrans right-of-way associated with the development proposed under the NADP shall adhere to the conditions and requirements of Caltrans statewide NPDES Permit CAS #000003, Order #99-06-DWQ and NPDES General Permit CAS #000002, Order #99-08-DWQ, and shall incorporate Treatment Best Management Practices described in Section 4.4 of the Storm Water Management Plan which implements the statewide NPDES permit, as such requirements specifically apply to the proposed improvements. In general, this would include the preparation and implementation of a Storm Water Pollution Prevention Plan and Best Management Practices for construction and post-construction conditions for each such project.
National Aeronautics and Space Administration Chap 17. Public Services, Utilities, and Energy
NASA Ames Research Center Environmental Resources Document Environmental Management Division March 2015 File: 2015 ARC ERD_FINAL.doc
Pg 304
Chapter 17. Public Services, Utilities, and Energy
17.1 Overview
This chapter describes public and emergency services at ARC, including security and emergency services, schools, water supply, sanitary sewer service, solid waste and wastewater disposal, and energy supply. It also summarizes applicable federal, state, and local regulations applicable to public and emergency services, as well relevant policies, practices, and measures that address potential effects on such services as a result of operations and future development at ARC. Information presented in this chapter was obtained from the November 2009 NASA ARC ERD (NASA 2009), NADP EIS (Design, Community & Environment 2002), and other sources.
17.2 Regulatory Background
17.2.1 Federal Requirements
17.2.1.1 Federal Guidelines for Energy Consumption
The National Energy Conservation Policy Act of 1978 (NECPA), the Energy Policy Act of 2005 (EPAct 2005), the Energy Independence and Security Act of 2007, EO 13423 (Strengthening Federal Environmental, Energy, and Transportation Management), and EO 13514 (Federal Leadership in Environmental, Energy, and Economic Performance) require all federal agencies, including NASA, to implement specific energy resource management goals. These goals include reduction from fiscal year 2003, including a 3% annual reduction in energy use intensity and a 30% reduction by the end of fiscal year 2015. They also require at least half of all renewable energy required comes from sources developed after Jan. 1, 1999.
Other goals outlined in NECPA and EOs 13423 and 13514 include:
Metering all federal buildings
Requiring all federal buildings to meet performance standards
Minimizing reliance on petroleum through development and use of alternative energy sources
Procuring renewable energy and energy-efficient goods and products
Participating in demand-side management services
Using outreach programs to promote vehicle fuel efficiency
Requiring dual fuel vehicles to use alternate fuel capability
Achieving a 10% reduction in fuel consumption in federal vehicles by 1995
NASA goals related to these, and progress in meeting these goals are summarized in the NASA SSPP.
National Aeronautics and Space Administration Chap 17. Public Services, Utilities, and Energy
NASA Ames Research Center Environmental Resources Document Environmental Management Division March 2015 File: 2015 ARC ERD_FINAL.doc
Pg 305
17.2.1.2 National Environmental Policy Act
NEPA requires federal agencies to include in their decision-making process appropriate and careful consideration of all environmental effects of a proposed action and of possible alternative actions. Measures to avoid or minimize the adverse effects of proposed actions and to restore and enhance environmental quality as much as possible must be developed and discussed where feasible.
17.3 Regional Setting
A variety services and utilities are needed to meet both the basic and operational needs of ARC, ARC personnel, and Wescoat Village residents. These include services and infrastructure for electricity, natural gas, water, and telecommunications; solid waste disposal and recycling; childcare and educational services; and an array of security and emergency services. While some of these services are unique to ARC, many extend from broader regional distribution networks such as those that provide drinking water, recycled water, stormwater drainage, wastewater treatment and disposal, and gas and electricity services to ARC, the cities of Mountain View and Sunnyvale, and places beyond. ARC is also served by regional waste hauling and recycling services and community-based services such as schools.
17.4 Existing Site Conditions
17.4.1 Security and Emergency Services
17.4.1.1 Security
ARC, with exception of the NRP and other leased areas, is a closed federal facility. Public access to the campus is restricted. The site can be entered through several secured points. Visitors to the NRP are required to show a California driver’s license at the main gate. Visitors to the Ames Campus or Eastside Airfield are required to enter through the visitor pass and identification facility (Building 26), where they must sign in and are issued a temporary identification badge. This badge and a picture ID are required to enter through the Ames Campus gates or the Eastside Airfield Gate. ARC employees and contractors are also required to wear identification badges with photographs. The campus is regularly patrolled by NASA Ames’ armed security force.
17.4.1.2 Emergency Services
In case of an emergency, NASA’s Emergency Control Center Duty Office performs dispatch services. The following sections describe the services available to respond to emergencies at ARC.
17.4.1.2.1 Disaster Assistance and Response Team
ARC’s volunteer DART is available to respond to catastrophic emergencies (for example, earthquakes or other center-wide emergencies).
National Aeronautics and Space Administration Chap 17. Public Services, Utilities, and Energy
NASA Ames Research Center Environmental Resources Document Environmental Management Division March 2015 File: 2015 ARC ERD_FINAL.doc
Pg 306
17.4.1.2.2 Hazardous Materials Response
ARC has a 24-hour Emergency Spill Response Team responsible for cleanup of hazardous materials spills and releases. The Ames Fire Department provides this response capability, which is activated by calls to 911 from any onsite telephone line.
17.4.1.2.3 Health Care
A health unit for ARC staff and other personnel on the site is located in Building N-215. The health unit is staffed by a physician and two nurses and offers first aid, emergency medical services, and referral services. Medical emergencies can also be handled by the Moffett Field Fire Department (MFFD), which has firefighters trained as emergency medical technicians. In addition, the Duty Office can call the Santa Clara County Paramedics, if necessary.
17.4.1.2.4 Police Protection
The NASA/ARC Protective Services Office, Security Services Branch, oversees Law enforcement at ARC under NASA’s Federal Law Enforcement Authority pursuant to the Space Act (42 USC 2456 and 2456a). Currently, NASA contracts with a private company to provide police protection services.
17.4.1.2.5 Fire Protection
NASA provides fire protection services at ARC through contracted services. The fire department’s personnel are housed in an onsite building. Most buildings at ARC are equipped with fire detection devices, some of which are connected to the central dispatch facility.
The MFFD is also available to provide fire protection services in an emergency. In addition, ARC participates in the Santa Clara County Fire Mutual Aid Service and has a cooperative response agreement with all the city fire departments in Santa Clara County. Because of its proximity to ARC, the Mountain View Fire Department would be the first department contacted if additional fire response was needed. If Mountain View could not respond, the CANG dispatcher would then contact the City of Sunnyvale Fire Department, which is the next closest to ARC. If Sunnyvale were also unable to respond, the CANG dispatcher would continue to contact Santa Clara city departments until assistance was found.
When a fire department acts under the Santa Clara County Fire Mutual Aid Agreement, the standard procedure is to provide two fire engines, one truck, and one chief officer. The maximum amount of support available to NASA for a serious emergency would be 22 fire engines with four firefighters each, seven trucks, and seven chief officers. The only situation where NASA would be without substantial backup support would be if another event or combination of events occurred that affected all cities in Santa Clara County.
17.4.2 Schools
There is no permanent housing at ARC and therefore no demand for school services. Children who live in Wescoat Village, which is located in a portion of Moffett Field not
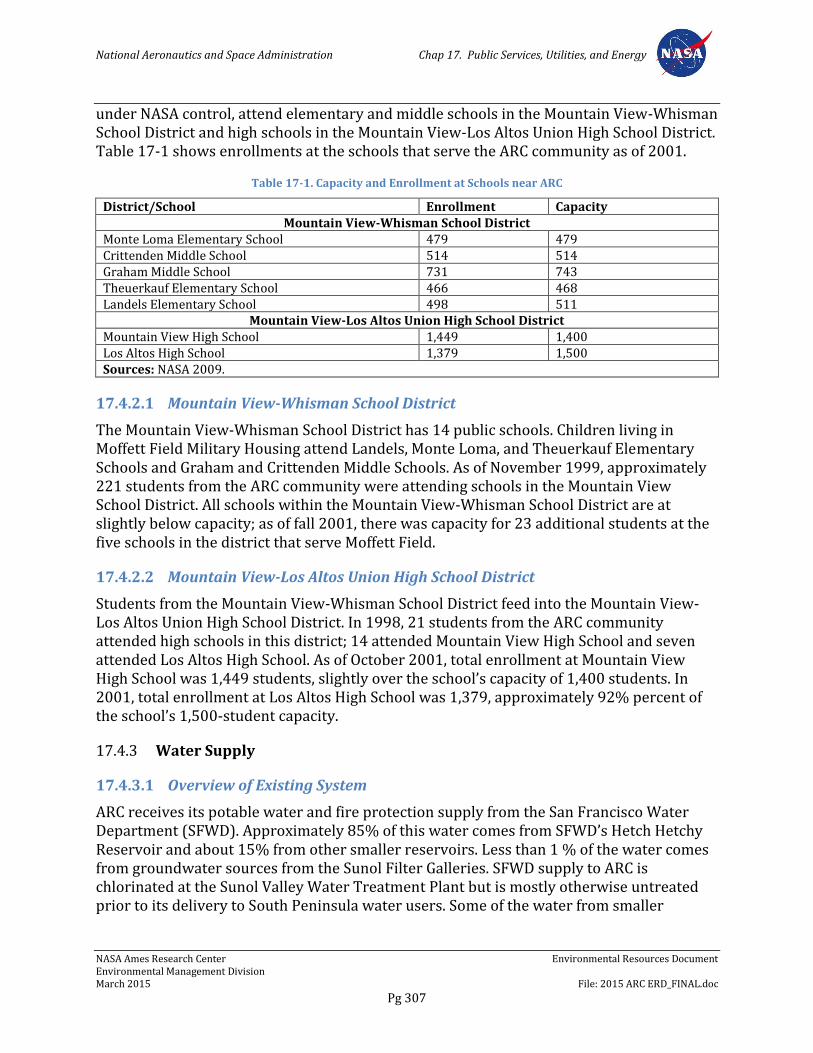
National Aeronautics and Space Administration Chap 17. Public Services, Utilities, and Energy
NASA Ames Research Center Environmental Resources Document Environmental Management Division March 2015 File: 2015 ARC ERD_FINAL.doc
Pg 307
under NASA control, attend elementary and middle schools in the Mountain View-Whisman School District and high schools in the Mountain View-Los Altos Union High School District. Table 17-1 shows enrollments at the schools that serve the ARC community as of 2001.
Table 17-1. Capacity and Enrollment at Schools near ARC
District/School Enrollment Capacity Mountain View-Whisman School District
Monte Loma Elementary School 479 479 Crittenden Middle School 514 514 Graham Middle School 731 743 Theuerkauf Elementary School 466 468 Landels Elementary School 498 511
Mountain View-Los Altos Union High School District Mountain View High School 1,449 1,400 Los Altos High School 1,379 1,500 Sources: NASA 2009.
17.4.2.1 Mountain View-Whisman School District
The Mountain View-Whisman School District has 14 public schools. Children living in Moffett Field Military Housing attend Landels, Monte Loma, and Theuerkauf Elementary Schools and Graham and Crittenden Middle Schools. As of November 1999, approximately 221 students from the ARC community were attending schools in the Mountain View School District. All schools within the Mountain View-Whisman School District are at slightly below capacity; as of fall 2001, there was capacity for 23 additional students at the five schools in the district that serve Moffett Field.
17.4.2.2 Mountain View-Los Altos Union High School District
Students from the Mountain View-Whisman School District feed into the Mountain View-Los Altos Union High School District. In 1998, 21 students from the ARC community attended high schools in this district; 14 attended Mountain View High School and seven attended Los Altos High School. As of October 2001, total enrollment at Mountain View High School was 1,449 students, slightly over the school’s capacity of 1,400 students. In 2001, total enrollment at Los Altos High School was 1,379, approximately 92% percent of the school’s 1,500-student capacity.
17.4.3 Water Supply
17.4.3.1 Overview of Existing System
ARC receives its potable water and fire protection supply from the San Francisco Water Department (SFWD). Approximately 85% of this water comes from SFWD’s Hetch Hetchy Reservoir and about 15% from other smaller reservoirs. Less than 1 % of the water comes from groundwater sources from the Sunol Filter Galleries. SFWD supply to ARC is chlorinated at the Sunol Valley Water Treatment Plant but is mostly otherwise untreated prior to its delivery to South Peninsula water users. Some of the water from smaller
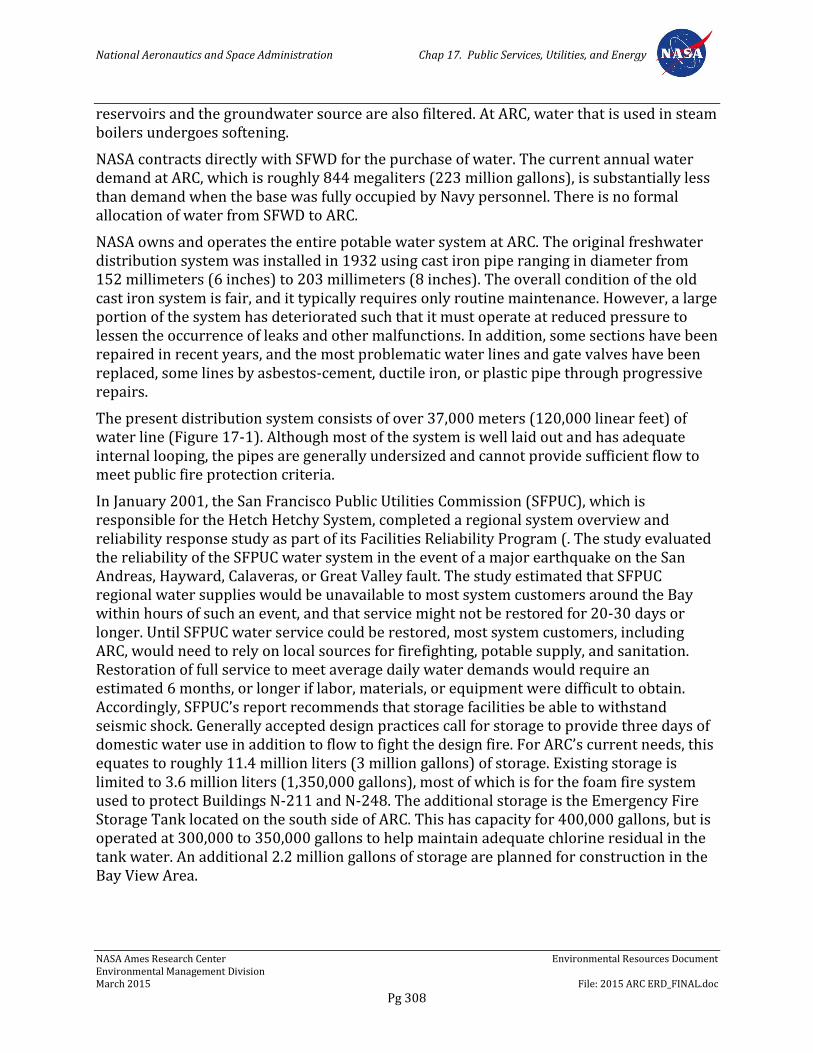
National Aeronautics and Space Administration Chap 17. Public Services, Utilities, and Energy
NASA Ames Research Center Environmental Resources Document Environmental Management Division March 2015 File: 2015 ARC ERD_FINAL.doc
Pg 308
reservoirs and the groundwater source are also filtered. At ARC, water that is used in steam boilers undergoes softening.
NASA contracts directly with SFWD for the purchase of water. The current annual water demand at ARC, which is roughly 844 megaliters (223 million gallons), is substantially less than demand when the base was fully occupied by Navy personnel. There is no formal allocation of water from SFWD to ARC.
NASA owns and operates the entire potable water system at ARC. The original freshwater distribution system was installed in 1932 using cast iron pipe ranging in diameter from 152 millimeters (6 inches) to 203 millimeters (8 inches). The overall condition of the old cast iron system is fair, and it typically requires only routine maintenance. However, a large portion of the system has deteriorated such that it must operate at reduced pressure to lessen the occurrence of leaks and other malfunctions. In addition, some sections have been repaired in recent years, and the most problematic water lines and gate valves have been replaced, some lines by asbestos-cement, ductile iron, or plastic pipe through progressive repairs.
The present distribution system consists of over 37,000 meters (120,000 linear feet) of water line (Figure 17-1). Although most of the system is well laid out and has adequate internal looping, the pipes are generally undersized and cannot provide sufficient flow to meet public fire protection criteria.
In January 2001, the San Francisco Public Utilities Commission (SFPUC), which is responsible for the Hetch Hetchy System, completed a regional system overview and reliability response study as part of its Facilities Reliability Program (. The study evaluated the reliability of the SFPUC water system in the event of a major earthquake on the San Andreas, Hayward, Calaveras, or Great Valley fault. The study estimated that SFPUC regional water supplies would be unavailable to most system customers around the Bay within hours of such an event, and that service might not be restored for 20-30 days or longer. Until SFPUC water service could be restored, most system customers, including ARC, would need to rely on local sources for firefighting, potable supply, and sanitation. Restoration of full service to meet average daily water demands would require an estimated 6 months, or longer if labor, materials, or equipment were difficult to obtain. Accordingly, SFPUC’s report recommends that storage facilities be able to withstand seismic shock. Generally accepted design practices call for storage to provide three days of domestic water use in addition to flow to fight the design fire. For ARC’s current needs, this equates to roughly 11.4 million liters (3 million gallons) of storage. Existing storage is limited to 3.6 million liters (1,350,000 gallons), most of which is for the foam fire system used to protect Buildings N-211 and N-248. The additional storage is the Emergency Fire Storage Tank located on the south side of ARC. This has capacity for 400,000 gallons, but is operated at 300,000 to 350,000 gallons to help maintain adequate chlorine residual in the tank water. An additional 2.2 million gallons of storage are planned for construction in the Bay View Area.
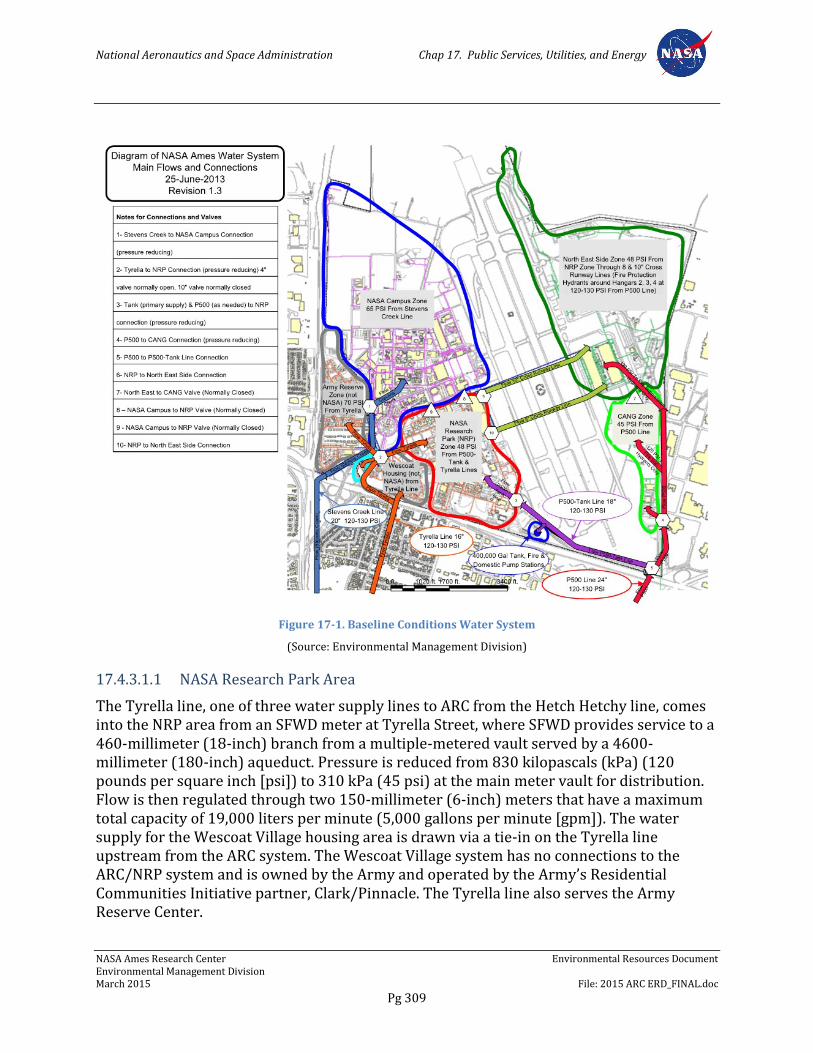
National Aeronautics and Space Administration Chap 17. Public Services, Utilities, and Energy
NASA Ames Research Center Environmental Resources Document Environmental Management Division March 2015 File: 2015 ARC ERD_FINAL.doc
Pg 309
Figure 17-1. Baseline Conditions Water System
(Source: Environmental Management Division)
17.4.3.1.1 NASA Research Park Area
The Tyrella line, one of three water supply lines to ARC from the Hetch Hetchy line, comes into the NRP area from an SFWD meter at Tyrella Street, where SFWD provides service to a 460-millimeter (18-inch) branch from a multiple-metered vault served by a 4600-millimeter (180-inch) aqueduct. Pressure is reduced from 830 kilopascals (kPa) (120 pounds per square inch [psi]) to 310 kPa (45 psi) at the main meter vault for distribution. Flow is then regulated through two 150-millimeter (6-inch) meters that have a maximum total capacity of 19,000 liters per minute (5,000 gallons per minute [gpm]). The water supply for the Wescoat Village housing area is drawn via a tie-in on the Tyrella line upstream from the ARC system. The Wescoat Village system has no connections to the ARC/NRP system and is owned by the Army and operated by the Army’s Residential Communities Initiative partner, Clark/Pinnacle. The Tyrella line also serves the Army Reserve Center.
National Aeronautics and Space Administration Chap 17. Public Services, Utilities, and Energy
NASA Ames Research Center Environmental Resources Document Environmental Management Division March 2015 File: 2015 ARC ERD_FINAL.doc
Pg 310
After the addition of the 1.5-megaliter (400,000-gallon) potable water storage tank at the southwest corner of the airfield, the NRP is also fed through a new connection from this water storage tank.
The water distribution system in the NRP area is in worse condition than that serving the other parts of ARC. To minimize leaks and localized failures in this part of the system, the operating pressure in this area has been reduced to 331 kPa (48 psi), requiring that inter-ties to other parts of the ARC campus be closed off, as discussed in more detail below. Nonetheless, ongoing maintenance and repair has kept the NRP system operational and has eliminated the most serious deficiencies. The main line that runs along South Akron Road was replaced with 300-millimeter (12-inch) ductile iron pipe (1999). A parallel line located in North Akron Road was also replaced with a 250 mm (10-inch) PVC pipe. This has increased the overall capacity of the system substantially, but the operating pressure is still limited by the weaker portion of the system.
The NRP water system is connected to both the Ames campus area and Eastside/Airfield water systems. The Ames campus water system connects to the NRP system via two 200-millimeter (8-inch) valves located along Bushnell Street at McCord and Cummins Avenues. To avoid damage to the NRP system because of the Ames campus system’s higher operating pressure, the valves are normally closed. The Eastside/Airfield water system connects to the NRP system via two lines that cross under the runway. One line is 200 millimeters (8 inches) in diameter and the other is 250 millimeters (10 inches). The valves on these lines are located in the middle of the runway infield, and were normally kept closed because of the large difference in operating pressure between the two systems; however, rebalancing the systems has resulted in thee valves being open with the northern section of the Eastside/ airfield being fed through these lines.
Fire flow is provided through the potable water distribution system. Hydrants are flushed annually and flow checks are performed every five years. Fire hydrants are also periodically used to irrigate landscaped areas. The fire capacity design for ARC is not based on the largest building size because the larger buildings have sprinkler systems. Instead, the ARC fire marshal has set the minimum fire capacity for new systems at 5,700 liters per minute (1,500 gpm) at 140 kPa (20 psi) residual as required by the Uniform Fire Code. The April 2000 fire hydrant report shows a range of flows, with many hydrants providing less than 3,800 liters per minute (1,000 gpm) and the lowest providing less than 2,300 liters per minute (600 gpm).
An unused 740,000-liter (200,000-gallon) elevated tank is located within the NRP area east of Shenandoah Plaza. The tank presently may contain a small amount of stagnant water, and there is some concern that this water could leak into the main system and contaminate potable supply. This has been cited as an issue by the Division of Drinking Water, SWRCB. The tank could not be brought back into service without being drained, cleaned, and seismically retrofitted. A pump station would also have to be installed adjacent to the tank both to fill the tank and to boost the pressure of water drawn from the tank to supply the distribution system. At present, there is no plan to restore the tank to service.
An Emergency Fire Storage Tank has been built in the NRP area south of the Ellis Street gate. This is fed by a tie-in of the P-500 Hetch Hetchy tie-in on the south-east side of the
National Aeronautics and Space Administration Chap 17. Public Services, Utilities, and Energy
NASA Ames Research Center Environmental Resources Document Environmental Management Division March 2015 File: 2015 ARC ERD_FINAL.doc
Pg 311
installation. This tank has a capacity of 400,000 gallons and is operated at 300,000 to 350,000 gallons, dependent on season to minimize loss of chlorine residual. This tank services the NRP area and the northern section of the Eastside/ airfield.
17.4.3.1.2 Ames Campus and Bay View Areas
The Stevens Creek Line is the western most line that serves ARC. It parallels Stevens Creek south of US-101. North of US-101 it heads northeast until it heads north again along R. T. Jones Road until it reaches a pressure reducing station before entering the main Ames Campus to the east. It is this line that is being extended as a part of the Bay View project to provide water to Ames Campus and Bay View through the two new 1.1 million gallon tanks to be built. The Stevens Creek Line is a 510-millimeter (20-inch) asbestos cement pipe and its pressure is reduced to an operating pressure of 410 - 450 kPa (60 - 65 psi) currently serving the Ames campus area.
Fire flow is provided through the potable water distribution system, with a hydrant maintenance program similar to that employed in the NRP area. The fire protection capacity of the Ames campus system is greater than that of the NRP system because of the better condition of the pipes, which enables higher operating pressures. The Ames campus system is fed from a single source with no open connections to the NRP area or the Eastside/Airfield loop. The Ames campus water system is connected to the NRP system by two 200-millimeter (8-inch) valves that are normally closed to protect the NRP system. These closed valves limit the redundancy of the fire protection system.
Two storage tanks located near the ARC wind tunnels have a combined capacity of approximately 3.6 megaliters (950,000 gallons). The larger tank (2.8 megaliters or 750,000 gallons) is situated at grade and provides water for the foam fire protection system that protects Buildings N-211 and N-248. The smaller tank (0.8 mega-liters or 200,000 gallons) is elevated and is kept partially filled because of seismic safety concerns. Two 1.1 million gallon tanks are planned for construction in the Bay View area.
17.4.3.1.3 Eastside/Airfield Area
The P-500 Line is the eastern most line entering ARC. The Eastside/Airfield area is served by a 610-millimeter (24-inch) feed from SFWD’s 4,600-millimeter (180-inch) aqueduct (Hetch Hetchy Line) near the intersection of US-101 and SR-237. The feed enters ARC east of the runway and runs parallel to Macon Road. The pressure in the feed is maintained at the aqueduct’s 830-kPa (120-psi) operating pressure, and there are no pressure-reducing stations in the main loop within the Eastside/Airfield area. Substantially higher water pressure is required in this area to support fire protection at Hangars 2 and 3 east of the runways, where a minimum fire flow of 38,000 liters per minute (10,000 gpm) is needed.
The Eastside/Airfield distribution system contains lines ranging from 200 millimeters (8 inches) to 250 millimeters (10 inches) in diameter with several smaller-diameter dead ends. The only significant looping in this system is found surrounding the hangars. The Eastside/Airfield water system is connected to the NRP system via one 200-millimeter (8-inch) line and one 250-millimeter (10-inch) line, as discussed above.
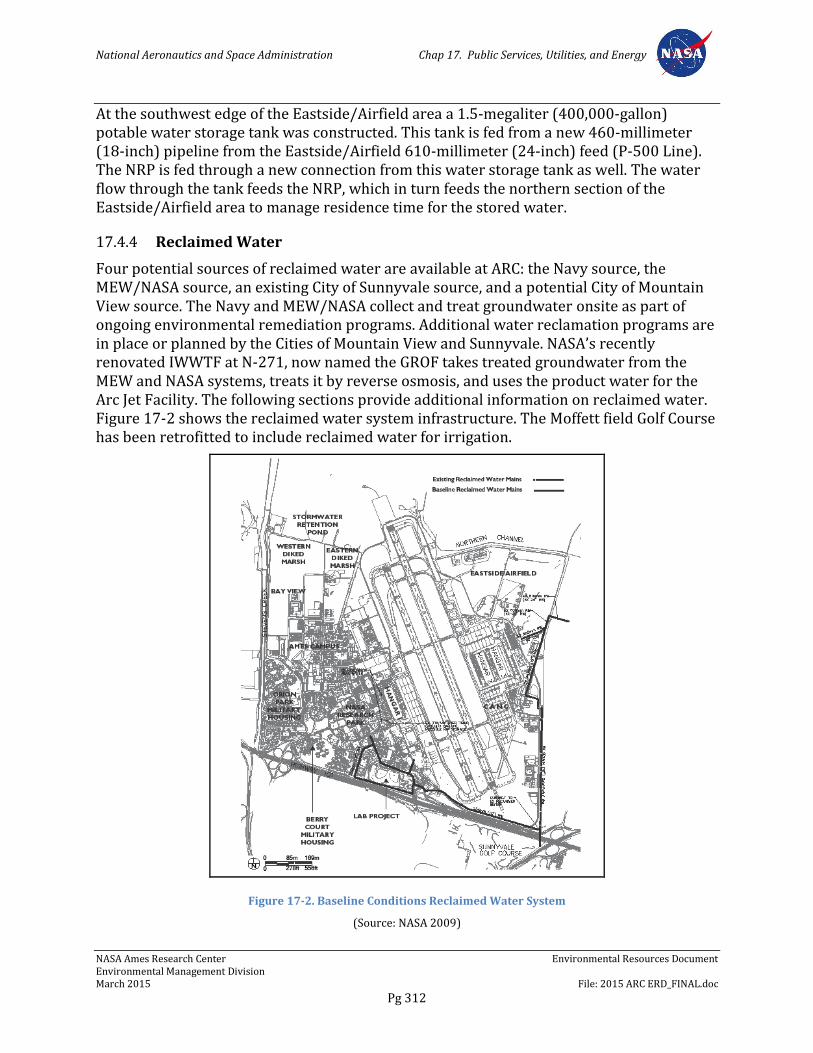
National Aeronautics and Space Administration Chap 17. Public Services, Utilities, and Energy
NASA Ames Research Center Environmental Resources Document Environmental Management Division March 2015 File: 2015 ARC ERD_FINAL.doc
Pg 312
At the southwest edge of the Eastside/Airfield area a 1.5-megaliter (400,000-gallon) potable water storage tank was constructed. This tank is fed from a new 460-millimeter (18-inch) pipeline from the Eastside/Airfield 610-millimeter (24-inch) feed (P-500 Line). The NRP is fed through a new connection from this water storage tank as well. The water flow through the tank feeds the NRP, which in turn feeds the northern section of the Eastside/Airfield area to manage residence time for the stored water.
17.4.4 Reclaimed Water
Four potential sources of reclaimed water are available at ARC: the Navy source, the MEW/NASA source, an existing City of Sunnyvale source, and a potential City of Mountain View source. The Navy and MEW/NASA collect and treat groundwater onsite as part of ongoing environmental remediation programs. Additional water reclamation programs are in place or planned by the Cities of Mountain View and Sunnyvale. NASA’s recently renovated IWWTF at N-271, now named the GROF takes treated groundwater from the MEW and NASA systems, treats it by reverse osmosis, and uses the product water for the Arc Jet Facility. The following sections provide additional information on reclaimed water. Figure 17-2 shows the reclaimed water system infrastructure. The Moffett field Golf Course has been retrofitted to include reclaimed water for irrigation.
Figure 17-2. Baseline Conditions Reclaimed Water System
(Source: NASA 2009)
National Aeronautics and Space Administration Chap 17. Public Services, Utilities, and Energy
NASA Ames Research Center Environmental Resources Document Environmental Management Division March 2015 File: 2015 ARC ERD_FINAL.doc
Pg 313
17.4.4.1 Navy Treated Groundwater
The Navy treats groundwater on site as part of an ongoing environmental remediation program. It is extracted from aquifers that are contaminated with trichloroethylene, perchloroethylene, and fuel (see additional discussion in Chapter 10, Hydrology and Water Quality, and Chapter 17, Hazardous Materials). The treated water meets current NPDES discharge standards. It is planned to use this water for irrigation in the NRP area to reduce demand for potable supply.
17.4.4.2 Middlefield-Ellis-Whisman Reclaimed Water
The MEW companies are conducting groundwater remediation under EPA supervision. The MEW reclaimed water is collected and treated on site as part of an ongoing environmental remediation program. It is collected from the same aquifer as the Navy reclaimed water but from a separate allocated area, the MEW treatment area is primarily contaminated with TCE and PCE (see additional discussion in Chapter 10, Hydrology and Water Quality and Chapter 17, Hazardous Materials). The treated water meets current NPDES discharge standards. NASA further treats some of this water at N-271 and then reuses it in the ARC Jet boiler to reduce demand for potable supply.
17.4.4.3 Sunnyvale Reclaimed Water
The Eastside/Airfield area is currently served by a 610-millimeter (24-inch) feed from the City of Sunnyvale’s reclaimed water system, which enters ARC at the Lockheed Gate north of First Avenue. The line “Ts” and is reduced to 510 millimeters (20 inches) to continue south along East Patrol Road. The main line is reduced again to 460 millimeters (18 inches) where a 200-millimeter (8-inch) service line Ts off toward the Airfield Substation (Building 591). The main line is further reduced to 410 millimeters (16 inches) as it parallels Macon Road. The line leaves ARC at the southeast corner of the site, near the intersection of US-101 and SR-237.
The City of Sunnyvale has indicated that there may be adequate supply available to serve all of ARC with reclaimed water. This water is suitable for use as irrigation water, and is used for irrigation at the Moffett Field Golf Course.
17.4.4.4 Mountain View Reclaimed Water
The City of Mountain View does not have reclaimed water available at ARC at this time. However, Mountain View is encouraging the use of reclaimed water for new projects within its service area and has joined with the Palo Alto Regional Water Quality Control Plant to apply for federal funding to construct a reclaimed water line between the treatment plant and ARC. This source could be available to serve future phases of development at ARC.
17.4.4.5 Treatment of Reclaimed Water for Industrial Use
NASA has recently renovated the IWWTF to create the GROF to further treat treated groundwater. The water produced by the GROF is used as makeup water in the boiler for the Arc Jet. The GROF provides 38.2 million liters (10.1 million gallons) of makeup water
National Aeronautics and Space Administration Chap 17. Public Services, Utilities, and Energy
NASA Ames Research Center Environmental Resources Document Environmental Management Division March 2015 File: 2015 ARC ERD_FINAL.doc
Pg 314
per year to the Arc Jet boiler, which will reduce by that amount demand for SFWD potable water.
17.4.5 Sanitary Sewer Service
Installation of the sewer system at what is now ARC began in the 1930s, and the oldest portions of the existing system date from this period. The majority of the pipe is vitrified clay and is in need of either rehabilitation or replacement.
ARC’s sanitary sewer infrastructure includes approximately 27,700 meters (90,900 linear feet) of collection lines in two separate systems (Figure 17-3). One system serves the NRP area, including Shenandoah Plaza; the Eastside/Airfield area; the CANG area; and the southern and eastern portions of the Ames Campus and Wescoat Village. This system discharges into the City of Sunnyvale sewer system and is referred to as the eastern sanitary sewer system. The other system serves the Army Reserve property, the remainder of the Ames campus, and the Bay View area. This system discharges into the City of Mountain View sewer system and is referred to as the western sanitary sewer system. The following sections provide additional detail on the eastern and western sanitary sewer systems.
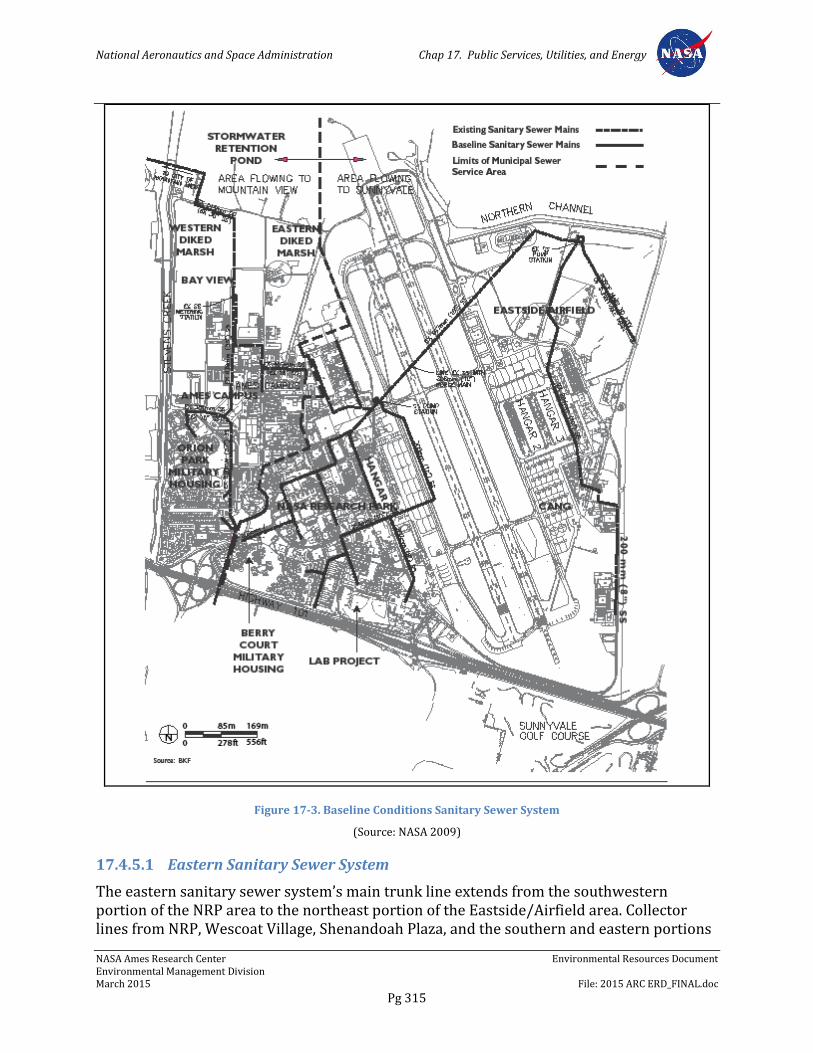
National Aeronautics and Space Administration Chap 17. Public Services, Utilities, and Energy
NASA Ames Research Center Environmental Resources Document Environmental Management Division March 2015 File: 2015 ARC ERD_FINAL.doc
Pg 315
Figure 17-3. Baseline Conditions Sanitary Sewer System
(Source: NASA 2009)
17.4.5.1 Eastern Sanitary Sewer System
The eastern sanitary sewer system’s main trunk line extends from the southwestern portion of the NRP area to the northeast portion of the Eastside/Airfield area. Collector lines from NRP, Wescoat Village, Shenandoah Plaza, and the southern and eastern portions
National Aeronautics and Space Administration Chap 17. Public Services, Utilities, and Energy
NASA Ames Research Center Environmental Resources Document Environmental Management Division March 2015 File: 2015 ARC ERD_FINAL.doc
Pg 316
of the Ames campus feed into this trunk line. The Eastside/Airfield and CANG areas discharge directly into the existing pump station.
From Wescoat Village and NRP, three main lines flow north through Shenandoah Plaza toward the main trunk line. Several smaller lines flow south and east toward the main trunk line from the southern and eastern portion of the Ames campus.
The main trunk line flows northeast beneath the existing airfield. It has a diameter of 460 millimeters (18 inches) and a capacity of 7,600 liters per minute (2,000 gpm). Currently, the peak wet-weather flow through this line is estimated at 4,160 liters per minute (1,100 gpm). Video logging of the sewer pipe conducted in 1995 showed that the line was in good condition at that time. Two manholes within the runway infield contain 300-millimeter (12-inch) storm drain lines. These lines are sound, and the potential for cross- contamination appears to be minimal.
From the airfield, the main sewer line continues northeast to a pump station located in the northeastern portion of the Eastside/Airfield area. Although still functional, the pump station is nearing the end of its useful life and will eventually be replaced rather than refurbished because its design is outdated. The pump station has a capacity of 7,600 liters per minute (2,000 gpm), and receives a peak wet-weather flow of approximately 4,900 liters per minute (1,320 gpm). From the pump station, sewage is conveyed east through a 250-millimeter (10-inch) force main to an offsite gravity main that continues on to the Sunnyvale Water Pollution Control Plant (SWPCP), located about 3 kilometers (2 miles) east of the ARC campus. The force main and gravity line that convey effluent from the pump station to the SWPCP are reported to be in good condition.
The SWPCP has the capacity to treat 112 megaliters per day (29.5 million gallons per day [MGD]). It currently receives about 62.5 megaliters (16.5 MGD), and the City of Sunnyvale has no plans to expand it.
NASA’s contract with the SWPCP is based on effluent quantity and content. Currently NASA Ames is classified as a Significant Industrial User (SIU), subject to the Local Limits for Wastewater. Due to the large volume of wastewater being discharged from the facility, the City has designated NASA Ames as a SIU, because of the potential to violate the Local Limits and adversely affect the POTW’s operation. To ensure that applicable discharge standards are met, the quantity of flow is monitored and SWPCP takes monthly samples at the outflow to monitor effluent content. Samples are tested for pH and heavy metals, including cadmium, chromium, lead, arsenic, and selenium.
17.4.5.2 Western Sanitary Sewer System
The western sanitary sewer system’s main trunk line enters ARC immediately east of the Moffett Boulevard interchange as a 690-millimeter (27-inch) line running under US-101. The line extends from the freeway, north along RT Jones Road and Parson’s Avenue through ARC to a location north of the North Perimeter Road, where it leaves the site. This gravity line is operated by the City of Mountain View and is referred to as the East Trunk in their documents. The Mountain View East Trunk originally served a large industrial complex south of US-101, which discharged a large volume of sewage. Since then, recent
National Aeronautics and Space Administration Chap 17. Public Services, Utilities, and Energy
NASA Ames Research Center Environmental Resources Document Environmental Management Division March 2015 File: 2015 ARC ERD_FINAL.doc
Pg 317
high-tech development has replaced the large industrial sites, and sewage flow at the point where the line enters ARC has decreased.
The East Trunk collects wastewater from an area south of US-101 before entering ARC, where it receives unmetered domestic flow from the Army Reserve property and metered industrial flow from the Ames campus area. Ames campus flow enters the line at a metering station north of Building N255. The collection system within the Ames Campus consists of lines with diameters ranging from 200 millimeters (8 inches) to 460 millimeters (18 inches). The metering station discharges to a 760-millimeter (30-inch) main, which in turn transitions to a 910-millimeter (36-inch) main as the line continues north and connects to the City of Mountain View sanitary sewer system.
The East Trunk collects wastewater from the Army Reserve and metered industrial flow from the Ames campus area. Ames campus flow enters the line at a metering station north of Building N-255. The collection system within the Ames campus consists of lines with diameters ranging from 200 millimeters (8 inches) to 460 millimeters (18 inches). The metering station discharges to a 760-millimeter (30-inch) main, which in turn transitions to a 910-millimeter (36-inch) main as the line continues north and connects to the City of Mountain View sanitary sewer system.
The East Trunk flows to a lift station located near the Mountain View Golf Course. The lift station is already at its design capacity of 40 megaliters per day (10 MGD), and wet-weather flows exceed the station capacity two or three times a year. When that occurs, the Supervisory Control and Data Acquisition sensing system automatically shuts down the pumps and closes a slide gate in the lift station. This is referred to as bypass mode. Under bypass mode operations, sewage flows by gravity to the Palo Alto Regional Water Quality Control Plant. The City of Mountain View is required to notify ARC when this occurs, because flow can back up into the East Trunk line at least as far as the metering station. The City prepared a study of the lift station that recommended continuing to utilize bypass mode and expanding the downstream pipe rather than expanding the station’s capacity.
The Mountain View sewer system conveys flow to the Palo Alto Regional Water Quality Control Plant, which is jointly owned by the Cities of Palo Alto, Mountain View, and Los Altos and is operated by the City of Palo Alto. Mountain View currently has approximately 38% ownership and is entitled to 38% of the plant’s capacity of approximately 144 megaliters per day (38 MGD) of dry-weather flow and 303 megaliters per day (80 MGD) of peak wet-weather flow. Current peak wet-weather flow into the plant is 227 megaliters per day (60 MGD). Mountain View’s allocation of plant capacity is thus 55 megaliters per day (14.4 MGD) dry-weather flow and 114 megaliters per day (30 MGD) peak wet-weather flow, of which it currently uses approximately 37 megaliters per day (9.8 MGD) dry-weather flow and 83 megaliters per day (22 MGD) peak wet-weather flow.
Since 1993, ARC has had a separate permit with the Palo Alto Regional Water Quality Control Plant that provides for treatment of up to 1.14 megaliters per day (0.3 MGD) peak flow. Current dry-weather flow is approximately 0.4 megaliters per day (0.11 MGD). Wet-weather flow readings are unreliable, indicating a much higher peak flow than actually occurs, because the flow meter is inundated during large rainfall events; however, existing wet-weather flow is probably almost 2.3 megaliters per day (0.6 MGD).
National Aeronautics and Space Administration Chap 17. Public Services, Utilities, and Energy
NASA Ames Research Center Environmental Resources Document Environmental Management Division March 2015 File: 2015 ARC ERD_FINAL.doc
Pg 318
Under the waste water permit with Palo Alto ARC is under obligation to continue to work toward finding an environmental discharge for the reverse osmosis concentrate from the GROF, as Palo Alto would prefer not to take this waste.
17.4.6 Solid Waste Disposal
NASA contracts for solid waste disposal and recycling at ARC. ARC has no active landfill, so solid waste is taken to the Newby Island Landfill in San Jose. Newby Island has a total capacity of 38.8 million cubic meters (50.8 million cubic yards). As of 2006, it had a remaining capacity of 12 million cubic meters (18.3 million cubic yards) and was expected to reach capacity in 2025, its anticipated closure date (CalRecycle 2014a). The City of San Jose is currently reviewing an application from Newby Island to revise their operating permit. If approved, the revised permit would increase the capacity of the landfill by approx. 15.1 million cubic yards and extend the estimated closure date until January 2041 (CalRecycle 2014b).
In 2013, approximately 760 tonnes (838 tons) of non-construction solid waste were generated at ARC. As discussed in Chapter 19, Sustainability, recycling and composting programs have been implemented at ARC with the goal of reducing offsite waste disposal at landfills by 50%. Approximately 1,293 tonnes (1,425 tons) of the total solid waste generated at ARC were recycled on- or offsite in 2013, including 328 tonnes (361 tons) of green waste mulched onsite. The 2013 data reflect a 69% diversion rate for non-construction and demolition waste.
17.4.7 Energy
17.4.7.1 Electrical Service
NASA buys electrical power to serve ARC from two sources, the U.S. Department of Energy’s Western Area Power Administration (WAPA) and PG&E.
WAPA is contracted to provide NASA with firm power up to 80 megawatts (MW), which represents approximately 80% of the energy consumed at ARC. If this demand is exceeded, NASA buys the balance from PG&E, up to a maximum combined peak demand of 240 MW. NASA’s agreement with PG&E is based on a real-time pricing rate schedule; the real-time price of power varies every hour as a function of overall system demand, which allows NASA to control its energy costs by scheduling high-demand testing during non-peak periods when electricity is less costly. Because of this arrangement, NASA is able to obtain power below the commercial rate for electricity.
Energy usage by resident agencies at ARC is managed by the resident agencies without NASA oversight. Since most of the resident agencies are federal agencies, however, they abide by the same energy regulations as NASA.
ARC’s electrical distribution system is shown in Figure 17-4.
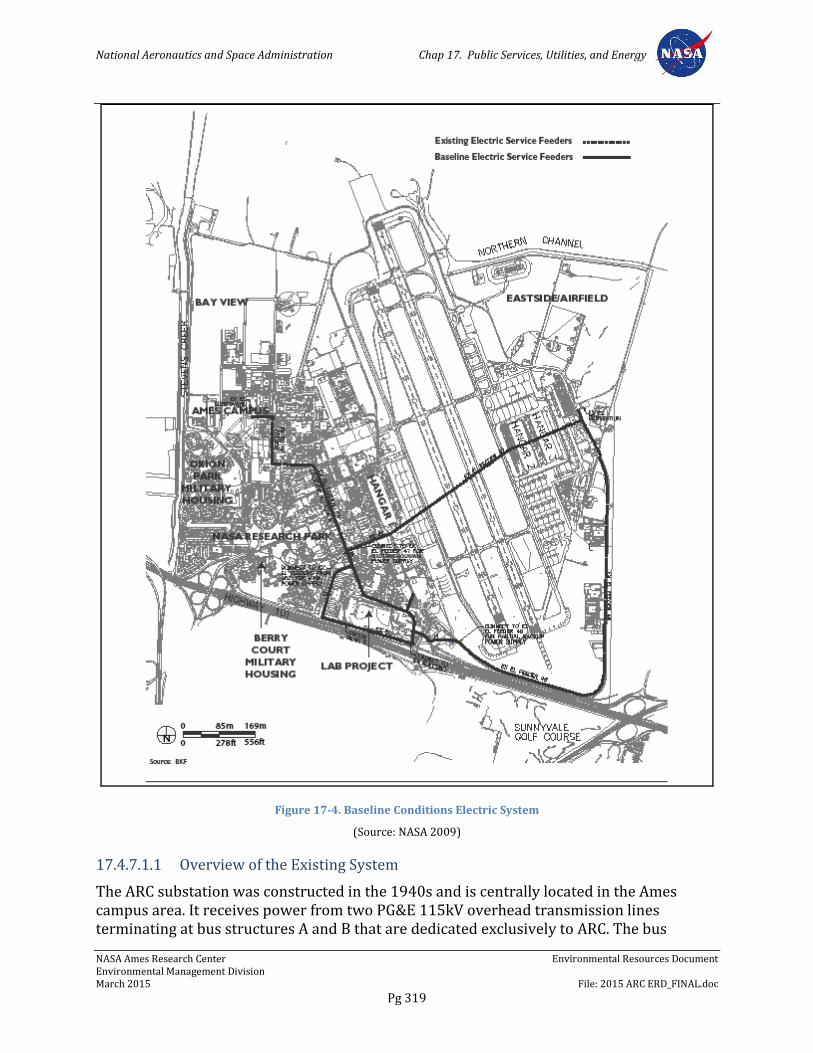
National Aeronautics and Space Administration Chap 17. Public Services, Utilities, and Energy
NASA Ames Research Center Environmental Resources Document Environmental Management Division March 2015 File: 2015 ARC ERD_FINAL.doc
Pg 319
Figure 17-4. Baseline Conditions Electric System
(Source: NASA 2009)
17.4.7.1.1 Overview of the Existing System
The ARC substation was constructed in the 1940s and is centrally located in the Ames campus area. It receives power from two PG&E 115kV overhead transmission lines terminating at bus structures A and B that are dedicated exclusively to ARC. The bus
National Aeronautics and Space Administration Chap 17. Public Services, Utilities, and Energy
NASA Ames Research Center Environmental Resources Document Environmental Management Division March 2015 File: 2015 ARC ERD_FINAL.doc
Pg 320
structures serve as the main distribution point to 17 outdoor transformers that step down from 115kV to various secondary voltages (13.8kV to ARC, 12kV to the NRP area, and 6.9kV and other special voltages specific to lab testing). The 17 outdoor substation-type transformers have a total rating capacity of approximately 650 megavolt amperes (MVA). Of this total, substation-type transformers, dedicated to serve specific lab buildings and their large motor loads, provide 600 MVA (92%). The remaining 50 MVA provides typical electrical service for lighting, HVAC, and other such functions at buildings throughout the Ames campus. In addition to serving the Ames campus, the ARC substation provides emergency backup 12kV power to the switchgear located in the NRP area (Switchgear C) via Feeder 19, which has an estimated capacity of 6.5 MVA and runs through Shenandoah Plaza along McCord Avenue.
NASA’s contract with WAPA limits the maximum rate of delivery to the ARC substation to 80 MW at a power factor of >0.95. Full utilization of the existing buildings served by the ARC substation would create a demand of nearly 36 MW for general (non-lab) applications. However, reduced occupancy and the implementation of energy conservation measures have dropped the demand to about 20 MW.
A second electrical substation was constructed in the early 1980s and is located in the Eastside/Airfield area, northeast of the hangars. The Airfield substation receives power from a single PG&E 115kV overhead transmission line that also provides power to the Lockheed property to the east. This 115kV line terminates at a 115-12kV substation at a dead-end structure and one 115kV oil circuit breaker that serves two step-down transformers, each rated at 7.5/9.9 MVA. The secondary sides (12kV) of both transformers terminate at a main breaker rated at 15kV, 500 MVA, 1200 amperes. The two mains, one tie, and seven feeder breakers are housed in an outdoor walk-in enclosure designated Switchgear A. The total transformer capacity is approximately 20 MVA.
This substation was originally dedicated to serve the Naval Air Station, which included the airfield; the NRP area, including the Shenandoah Plaza Historic District; and military housing to the south and west of ARC. At present, in addition to serving the Eastside/Airfield area, this substation provides power to Switchgear C through Feeder 47 (estimated capacity 6.7 MVA), which crosses the runways near the hangars, and Feeder 48 (estimated capacity 5.2 MVA), which runs south from the substation along Macon Road, around the southern end of the runways, and west to Switchgear C. If maintenance is necessary on any of the 115kV equipment, power must be cut to all facilities served by this substation.
NASA’s contract with WAPA limits the maximum rate of delivery to the Eastside/Airfield substation to 5,009 kW at a power factor of 1.0, which translates to 5.01 MVA. Full utilization of the existing buildings served by the Airfield substation could create a demand of as much as 5 MW. Existing demand is about 3.5 MW.
17.4.7.1.2 NASA Research Park Area
Three major 12-kV incoming feeders serve Switchgear C, which is located in the NRP area at the northwest corner of the intersection of Bailey Road and South Perimeter Road. Switchgear C was installed in the mid-1980s and is in relatively good condition. Due to the
National Aeronautics and Space Administration Chap 17. Public Services, Utilities, and Energy
NASA Ames Research Center Environmental Resources Document Environmental Management Division March 2015 File: 2015 ARC ERD_FINAL.doc
Pg 321
feeder sizes, operation requires both Feeders 47 and 48 to be energized at Switchgear C in order to provide 11.2 MVA of load capacity. Feeder 19 is a backup and can only provide power to Switchgear C if the other two feeders’ circuit breakers are locked out and in the open position.
The existing underground electrical distribution system in the NRP area consists of a mixture of terra cotta conduits (maximum size 89 millimeters or 3.5 inches), transite conduits, and PVC conduits (maximum size 127 millimeters or 5 inches, with the majority at 100 millimeters or 4 inches). Most new construction uses PVC conduits. Upgrading to a larger cable size in existing conduits is limited to the existing diameter size of the conduit. From a safety standpoint, many of the manholes are overcrowded with cables and are too small to accommodate the existing cabling system. In addition, the 12-kV system is incompatible with the 13.8-kV system in ARC, discussed below. In general, performing any maintenance on the distribution feeders in the NRP area interrupts service to many buildings because the existing distribution feeders are radial-feed.
Switchgear C provides power to the Army Reserve property and Wescoat Village military housing area, the runway lighting, and an antiquated low-voltage system that serves about 25 buildings in the NRP area. Voltage for this system is stepped down from 12 to 2.4kV at Switchgear E, located at the corner of Wescoat Road and McCord Avenue. Most of the transformers, switchgears, cables, and related components that make up the 2.4-kV system are reaching or have exceeded their life expectancy. Many of the 2.4-kV system feeders incorporate paper-insulated lead cables; lead is considered a hazardous material and must be handled and disposed in accordance with EPA regulations. In some cases, oil fuse cutouts or switches and cable-link boxes are still in service; these are also considered a safety hazard by today’s standards. It had long been the intention of the Navy and NASA to phase out the 2.4-kV system. In 1992, NASA completed a construction project that installed eleven 15-kV pad-mounted distribution switches throughout the site. These distribution switches will be the points of connection for the existing building transformers when the 2.4-kV system is upgraded.
17.4.7.1.3 Ames Campus and Bay View Areas
The distribution system for the Ames campus area operates at 13.8kV and 7.2kV, and consists of an underground duct-bank system made up of cables, conduits, and manhole vaults. More than 100 distribution-type transformers located in or near buildings step the distribution voltage down to utilization level (480/277 V, 208/120 V). Distribution transformers include oil and dry types.
The ARC substation equipment and distribution system is more than 40 years old; the typical service life for medium- and high-voltage equipment is 20-30 years, and the cost to maintain this system will increase steadily as the system ages. The Electric Power Office was formed in the late 1990s in order to improve safety and prevent catastrophic failures of aging electrical infrastructure. Recent improvements to the system include replacing antiquated 115-kV oil circuit breakers, replacing transformer T-44 and repairing transformers T-45 and T-46, and replacing the power monitoring system. In addition, a program of maintenance and regularly scheduled replacement has been instituted for the
National Aeronautics and Space Administration Chap 17. Public Services, Utilities, and Energy
NASA Ames Research Center Environmental Resources Document Environmental Management Division March 2015 File: 2015 ARC ERD_FINAL.doc
Pg 322
protective relays on high- and medium-voltage systems. As of 2004, almost all of the 115-kV protective relays have been replaced with modern microprocessor components, with the remainder of the systems slated for replacement as needed. Additional planned improvements include replacing the recently retrofitted 15-kV-class air circuit breakers (SF6); 70% of the remaining lead cable; all building service transformers, primary switchgear, and secondary switchboards; and all underground distribution switches in manholes with aboveground distribution switches. The 7.2-kV distribution system will also be converted to 13.8kV. Once these improvements are complete, the only major remaining deficiency in the ARC campus area will be the underground duct-bank system, which is undersized and in poor condition.
A new dedicated 3 MW line for the N-258 has been installed, along with stand by generators.
17.4.7.1.4 Eastside/Airfield
The distribution system for the Eastside/Airfield area operates primarily at 12kV, with some remaining 2.4-kV portions. Switchgears B and D are located on Feeder 47 near the hangars and provide power to the buildings in this area. A 12-kV distribution system extends south, eventually running parallel to Feeder 48 along Macon Road, and provides power to the CANG facilities.
17.4.7.2 Natural Gas, Fuel Oil, and Propane
Space heating at ARC relies on natural gas. Fuel oil was used in the past, but all fuel tanks for space heating boilers were removed in the 1980s to reduce potential sources of subsurface contamination. Propane was used until the late 1980s but is no longer in use; the onsite propane facility was deactivated in 1990.
17.4.7.2.1 Overview of the Existing Natural Gas System
Natural gas supply for ARC is purchased directly from the producers through the Defense Energy Support Center. NASA pays PG&E a transmission fee to convey natural gas from the producers to the ARC campus via PG&E infrastructure. The main PG&E piping is considered a high-pressure natural gas piping system.
Natural gas is delivered to ARC via two main service lines (Figure 17-5).
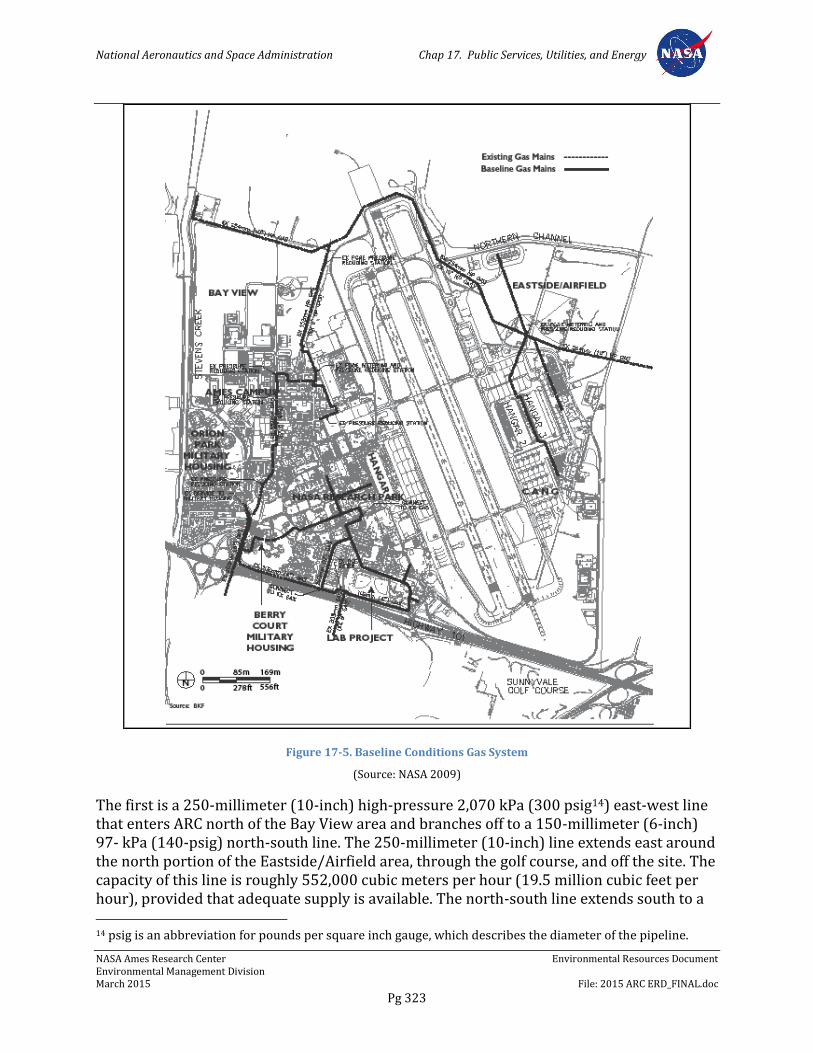
National Aeronautics and Space Administration Chap 17. Public Services, Utilities, and Energy
NASA Ames Research Center Environmental Resources Document Environmental Management Division March 2015 File: 2015 ARC ERD_FINAL.doc
Pg 323
Figure 17-5. Baseline Conditions Gas System
(Source: NASA 2009)
The first is a 250-millimeter (10-inch) high-pressure 2,070 kPa (300 psig14) east-west line that enters ARC north of the Bay View area and branches off to a 150-millimeter (6-inch) 97- kPa (140-psig) north-south line. The 250-millimeter (10-inch) line extends east around the north portion of the Eastside/Airfield area, through the golf course, and off the site. The capacity of this line is roughly 552,000 cubic meters per hour (19.5 million cubic feet per hour), provided that adequate supply is available. The north-south line extends south to a 14 psig is an abbreviation for pounds per square inch gauge, which describes the diameter of the pipeline.
National Aeronautics and Space Administration Chap 17. Public Services, Utilities, and Energy
NASA Ames Research Center Environmental Resources Document Environmental Management Division March 2015 File: 2015 ARC ERD_FINAL.doc
Pg 324
PG&E pressure-reducing station near the intersection of Lindbergh Avenue and North Perimeter Road, where pressure is lowered from 2,070 kPa (300 psig) to 970 kPa (140 psig). The line then continues south through the Bay View area to another PG&E pressure-reducing and metering station in the Ames campus area. From the Ames campus area, the line extends through the Wescoat Village military housing area, exiting ARC under US-101.
A second service line enters ARC via a separate crossing under US-101. The metering station (G-27) for this service is located at the northwest corner of Bailey Road and South Perimeter Road, and it serves the NRP area and Wescoat Village military housing.
A third line crosses under US-101 and onto Front Street. It serves the Army Reserve property, which is not part of ARC.
The following sections provide additional detail on natural gas service in each of the four planning areas.
17.4.7.2.2 NASA Research Park Area
The natural gas distribution system in the NRP area is considered a medium-pressure system. The NRP area receives natural gas supply through a 100-millimeter (4-inch) steel pipe that has a capacity of roughly 150,000 cubic meters per hour (5.3 million cubic feet per hour), provided that adequate supply is available. The incoming nominal pressure to the metering station at Bailey Road and South Perimeter Road is 450 kPa (65 psig), which is reduced to a nominal pressure of 117 kPa (17 psig) at the downstream portion of the metering station. From the metering station, natural gas is supplied to various buildings via a network of distribution pipelines.
The NRP area’s natural gas distribution system appears to be in fair condition. Some of the existing steel pipes, primarily in the area west of Bailey Road, have been replaced with polyethylene pipes due to corrosion and gas leakage problems. Pipe corrosion resulted from the effects of a shallow water table on aging pipes. Gas valves found to be inoperable also posed a leakage hazard and have been replaced. Other valves are planned for replacement in the future.
The main natural gas meters in the NRP area appear to be in good condition. Some buildings in the area have sub-meters, which also appear to be in good condition. Other buildings have pressure regulators without gas meters on the supply piping.
The primary use of natural gas in the NRP area is for space heating in offices, lodging shops, and training centers. Additional gas consumers include cooking equipment, water heaters, and a boiler plant, which provides heat to most of the Shenandoah Plaza buildings.
17.4.7.2.3 Ames Campus and Bay View Areas
The Ames campus and Bay View areas receive natural gas through a 200-millimeter (8-inch) steel pipe, which is reduced to 150-millimeter (6-inch) and 100-millimeter (4-inch) steel piping loops elsewhere in the area.
The Ames campus/Bay View natural gas distribution system is considered a medium-pressure system. As described above, PG&E has a pressure-reducing station near the
National Aeronautics and Space Administration Chap 17. Public Services, Utilities, and Energy
NASA Ames Research Center Environmental Resources Document Environmental Management Division March 2015 File: 2015 ARC ERD_FINAL.doc
Pg 325
intersection of Lindbergh Avenue and North Perimeter Road, where the nominal pressure is reduced from the 2,070 kPa (300 psig) carried by the main line to 970 kPa (140 psig). The main pressure-reducing station in this area, located at the intersection of Mark Avenue and Hunsaker Avenue, reduces the nominal pressure from 970 kPa (140 psig) to 410 kPa (60 psig) and then to 140 kPa (20 psig) at the downstream portion of the metering station. Several other stations regulate the pressure down further to operating pressures in the range of 48-100 kPa (7-15 psig).
The natural gas distribution system in the Ames campus and Bay View areas appear to be in fair condition. Ongoing maintenance has kept the system in good working order. Some of the existing steel pipes have been replaced with polyethylene pipes because of corrosion and gas leakage. Gas valves have been removed and replaced, and some pipes have been abandoned and rerouted.
In the Ames campus and Bay View areas, natural gas is primarily used to heat offices and research facilities and to power domestic water heaters. It also powers a boiler plant in one of the research facilities.
17.4.7.2.4 Eastside/Airfield Area
The Eastside/Airfield area receives natural gas through PG&E’s 250-millimeter (10-inch) trunk line, which crosses beneath the north end of the airfield. As discussed above, the pressure in the main line is 2,070 kPa (300 psig). A branch line with a capacity of about 221,000 cubic meters (7.8 million cubic feet) per hour extends from the main line to a pressure-reducing station where the pressure is reduced to 970 kPa (140 psig). After metering, the pressure is further reduced from 410 kPa (60 psig) at the downstream portion of the station. Several other pressure-reducing stations regulate the pressure down further to operating pressures in the range of 48-100 kPa) 7-15 psig).
The primary use of natural gas in the Eastside/Airfield area is space heating and domestic hot water.
17.4.7.3 Alternative Energy Sources
NASA has considered using solar water heating, buying energy from renewable energy sources, and buying electric vehicles. Currently, photovoltaiac arrays are positioned on buildings N232, N235 and N245, and ARC is meeting requirements to purchase renewable energy. Electric carts have been extensively utilized on site.
17.5 Environmental Requirements
NASA has identified the following environmental policies, practices, and measures that address potential effects on public and emergency services as a result of operations and future development at ARC.
17.5.1 NASA Procedural Directive 8500.1, NASA Environmental Management
Per NPD 8500.1, it is NASA policy to: maintain compliance with all applicable federal, state, and local environmental requirements; to incorporate environmental risk reduction and
National Aeronautics and Space Administration Chap 17. Public Services, Utilities, and Energy
NASA Ames Research Center Environmental Resources Document Environmental Management Division March 2015 File: 2015 ARC ERD_FINAL.doc
Pg 326
sustainable practices to the extent practicable throughout NASA’s programs, projects, and activities; and to consider environmental factors throughout the life cycle of programs, projects, and activities (as defined in NPD 7120.4, NASA Engineering and Program/Project Management Policy, and related documents), including planning, development, execution, and disposition activities. Examples of environmental factors include consideration of environmental impacts as required by the NEPA and NHPA; the proposed use of hazardous materials; the potential for waste generation; the need to acquire necessary permits, waivers, and authorizations; and the use of environmentally-preferable materials and processes wherever practicable.
17.5.2 NASA Procedural Requirements 8553.1, NASA Environmental Management System
NPR 8553.1 sets forth requirements for the NASA EMS, which functions primarily to: (1) incorporate people, procedures, and work practices into a formal structure to ensure that the important environmental impacts of the organization are identified and addressed; (2) promote continual improvement, including periodically evaluating environmental performance; (3) involve all members of the organization, as appropriate; and (4) actively involve senior management in support of the EMS.
Agencywide, the EMS employs a standardized approach to managing environmental activities that allows for efficient, prioritized system execution, while at the same time helping to improve environmental performance and to maintain compliance with applicable environmental regulations and requirements. NASA’s EMS approach involves identifying all activities, products, and services under each NASA center’s control, and the environmental aspects associated with each centers’ continued engagement in those activities, products, and services. Once identified, priority environmental aspects are assigned a risk ranking (from 1 to 4, based on its severity and frequency of occurrence) and are evaluated on a continual basis as means of highlighting associated positive or negative impacts and setting objectives and targets to reduce environmental risk. Each center’s EMS also identifies methods for ensuring compliance by keeping abreast of environmental requirements. This includes requirements by law (EOs, federal regulations, state and local laws) and voluntary commitments made by the center or NASA.
17.5.3 Ames Procedural Requirements 8500.1, Ames Environmental Procedural Requirements
APR 8500.1 sets forth general procedural requirements to ensure compliance with applicable federal, state, and local environmental laws; regulations and EOs; and NASA policies and procedures. Organizational directors, division chiefs, branch chiefs, section heads, supervisors, managers, and CORs are responsible for planning, designing, constructing, managing, operating, and maintaining facilities in conformance with applicable regulatory directives, and should obtain environmental review from the Environmental Management Division early in project planning consistent with NASA's NEPA implementing procedures (NPR 8580.1 and EO 12114), NASA policies and procedures for programs and projects (NPR 7120), and NASA regulations related to environmental quality (14 CFR 1216). Program and project managers should coordinate
National Aeronautics and Space Administration Chap 17. Public Services, Utilities, and Energy
NASA Ames Research Center Environmental Resources Document Environmental Management Division March 2015 File: 2015 ARC ERD_FINAL.doc
Pg 327
with the Environmental Management Division in a timely manner to ensure that any new or modified programs, projects, and activities comply with regulatory requirements.
17.5.4 Ames Procedural Requirements 8553.1, Ames Environmental Management System
APR 8553.1 sets forth requirements for the Center-level EMS in accordance with NPR 8553.1B, NASA Environmental Management Systems. The ARC EMS also includes consideration of the findings of NASA Headquarters’ triennial (3-year) Environmental Functional Review and other external EMS audits, as required.
Under the ARC EMS, the Center conducts an annual risk analysis across Center activities to determine which of 16 environmental aspects are of high or medium priority. The Center then identifies objectives (goals) and targets and develops action plans known as Environmental Management Plans to reduce identified risks. Currently, the high- and medium-priority environmental aspects of Center business activities are Air Emissions, Hazardous Material Management, Water and Energy Conservation, and Other Sustainability Practices. Objectives associated with these high- and medium-priority environmental aspects include:
Reducing air (including GHG) emissions through energy efficiency
Improving hazardous material management
Improving energy and water efficiency
Providing for the integration of other sustainability practices into Center activities
17.5.5 Ames Environmental Work Instructions
Ames’s EWIs, which replace the previous Ames Environmental Handbook (APR 8800.3), set forth requirements to ensure that programs, projects, and activities at ARC comply with applicable federal, state, and local laws; regulations and EOs; and NASA policies and procedures. Each EWI lists relevant regulatory authorities and documents, assigns individual and organizational responsibilities within ARC, and identifies specific requirements applicable to the work being performed.
The following EWIs are relevant to operations and future development at ARC with the potential to impact public and emergency services.
EWI 2-1, Drinking Water Management
EWI 2-2, Industrial Waste Water
EWI 4, Solid Waste and Recycling
EWI 2.3, Storm Water
EWI 12, Public Involvement
EWI 14, NEPA and Environmental Justice
EWI 18, Environmental Requirements for Construction Projects (Under review)
National Aeronautics and Space Administration Chap 17. Public Services, Utilities, and Energy
NASA Ames Research Center Environmental Resources Document Environmental Management Division March 2015 File: 2015 ARC ERD_FINAL.doc
Pg 328
17.5.6 NASA Ames Energy Conservation Policies and Practices
ARC has designated Plant Engineering as responsible for implementing an Energy Conservation Plan. Within the directorate, the Plant Engineering Branch is responsible for managing the program and reporting to NASA Headquarters. The Plant Engineering Branch also has the authority to require that some types of projects include energy conservation measures such as energy-efficient lighting, as appropriate.
Below are examples of current operations and maintenance practices at ARC that promote energy conservation.
All space-heating boilers have been replaced with water heaters to improve energy efficiency and minimize harmful exhaust emissions.
Most outdoor lighting has been retrofitted with more efficient light sources such as light-emitting diode or inductive fluorescent.
All chilled water plants and heat exchangers are tested and cleaned annually to remove scale15 build-up.
Existing heating and cooling systems are reviewed and replaced as appropriate with increasingly efficient systems. Replacement equipment is required to meet the State’s Title 24 energy standards. Smaller units are specified where new building load calculations warrant, and multiple smaller cooling units have replaced large single plants in some cases. These smaller units are doing a better job of matching the cooling load, thus increasing energy efficiency.
Roof replacements are designed to meet Title 24 insulation standards, and roof materials are designed to protect the insulation from moisture damage.
ARC has funded many energy conservation measures with a large Utility Energy Savings Contract, general funds and Construction of Facilities funds. Examples include installation of energy-efficient lighting and replacement of HVAC equipment with newer, more efficient, non-chlorofluorocarbon units.
17.5.7 NASA Ames Development Plan Final Programmatic Environmental Impact Statement
The NADP EIS identified the following mitigation measures to address potential impacts to public services from build out of NADP Mitigated Alternative 5.
17.5.7.1 Mitigation Measure INFRA-1
NASA would cooperate with the City of Sunnyvale in determining the cumulative impact of existing and proposed development on the sanitary sewer conveyance system between Ames Research Center and the SWPCP.
15 Scale is a coating or encrustation formed inside boilers and pipes after extensive use. It forms because of dissolved mineral substances precipitating out of solution, and can lessen conveyance capacity of pipes and interfere with heat transfer in boiler systems, wasting energy.
National Aeronautics and Space Administration Chap 17. Public Services, Utilities, and Energy
NASA Ames Research Center Environmental Resources Document Environmental Management Division March 2015 File: 2015 ARC ERD_FINAL.doc
Pg 329
NASA and its partners would contribute their fair share toward construction of conveyance pipes and supporting infrastructure which are determined to be necessary to mitigate the cumulative impact of existing and proposed development. NASA’s fair share will be based on its pro rata share of the total flow of all existing and proposed development contributing to either the existing sewer conveyance system between ARC and SWPCP or the new system designed to replace or augment the existing system.
17.5.7.2 Mitigation Measure INFRA-2
NASA will cooperate with the City of Mountain View in determining the cumulative impact of existing and proposed development on the sanitary sewer conveyance system between Ames Research Center and the PARWQCP. New conveyance piping would be installed between the area served by the existing lift station at the Mountain View Golf Course and the Palo Alto Regional Water Quality Control Plant (PARWQCP), with sufficient capacity to accommodate the total expected flow. This would require the installation of roughly 5486 meters (18000 lineal feet) of pipe. NASA will contribute its fair share toward construction of the conveyance pipes and supporting infrastructure that are determined to be regional to mitigate the cumulative impact of existing and proposed development. NASA’s fair share will be based on its pro rata share of the total flow of all existing and proposed development contributing to the new sewer conveyance system between ARC and PARWQCP.
17.5.7.3 Mitigation Measure INFRA-2
The 1993 agreement between the PARWQCP and Ames Research Center would be amended to address the capacity issues. NASA would also enter into an agreement with the city of MV that stipulates the amount of flow NASA would be permitted in the MV conveyance system.
17.5.7.4 Mitigation Measure SOCIO-3
NASA and the Mountain View-Los Altos Union High School District will negotiate an agreement whereby in any given year, should the Mountain View-Los Altos Union High School District’s per student operating revenues decrease below a pre-determined baseline as a direct result of enrollment generated by the NADP, NASA or its partners will compensate the District for the shortfall associated with these students. The baseline would be set to the District’s per student operating revenues in the year prior to when students residing at ARC first begin attending classes in the District, and would be adjusted for cost of living and inflationary changes over time.
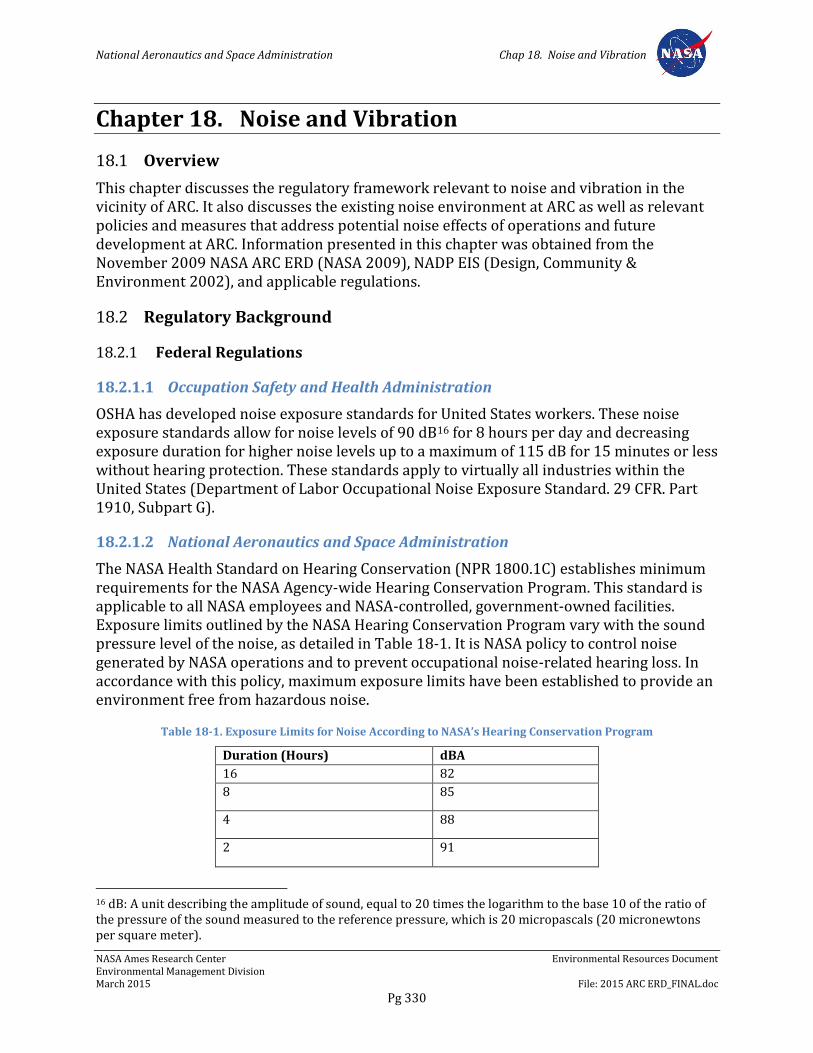
National Aeronautics and Space Administration Chap 18. Noise and Vibration
NASA Ames Research Center Environmental Resources Document Environmental Management Division March 2015 File: 2015 ARC ERD_FINAL.doc
Pg 330
Chapter 18. Noise and Vibration
18.1 Overview
This chapter discusses the regulatory framework relevant to noise and vibration in the vicinity of ARC. It also discusses the existing noise environment at ARC as well as relevant policies and measures that address potential noise effects of operations and future development at ARC. Information presented in this chapter was obtained from the November 2009 NASA ARC ERD (NASA 2009), NADP EIS (Design, Community & Environment 2002), and applicable regulations.
18.2 Regulatory Background
18.2.1 Federal Regulations
18.2.1.1 Occupation Safety and Health Administration
OSHA has developed noise exposure standards for United States workers. These noise exposure standards allow for noise levels of 90 dB16 for 8 hours per day and decreasing exposure duration for higher noise levels up to a maximum of 115 dB for 15 minutes or less without hearing protection. These standards apply to virtually all industries within the United States (Department of Labor Occupational Noise Exposure Standard. 29 CFR. Part 1910, Subpart G).
18.2.1.2 National Aeronautics and Space Administration
The NASA Health Standard on Hearing Conservation (NPR 1800.1C) establishes minimum requirements for the NASA Agency-wide Hearing Conservation Program. This standard is applicable to all NASA employees and NASA-controlled, government-owned facilities. Exposure limits outlined by the NASA Hearing Conservation Program vary with the sound pressure level of the noise, as detailed in Table 18-1. It is NASA policy to control noise generated by NASA operations and to prevent occupational noise-related hearing loss. In accordance with this policy, maximum exposure limits have been established to provide an environment free from hazardous noise.
Table 18-1. Exposure Limits for Noise According to NASA’s Hearing Conservation Program
Duration (Hours) dBA 16 82
8 85
4 88
2 91
16 dB: A unit describing the amplitude of sound, equal to 20 times the logarithm to the base 10 of the ratio of the pressure of the sound measured to the reference pressure, which is 20 micropascals (20 micronewtons per square meter).

National Aeronautics and Space Administration Chap 18. Noise and Vibration
NASA Ames Research Center Environmental Resources Document Environmental Management Division March 2015 File: 2015 ARC ERD_FINAL.doc
Pg 331
Duration (Hours) dBA 1 94
0.5 97
0.25 100
0.125 103
Source: NPR 1800.1C, Table 1
The Hearing Conservation Program establishes a noise hazard area as any work area with a noise level of 85 dBA17 or greater. Thus, NASA's program is 3 dB more stringent than OSHA’s. Earmuffs or earplugs are to be provided to attenuate employee noise exposure to a level above 85 dBA. A combination of both earmuffs and earplugs are to be required where noise levels equal or exceed 97 dBA.
18.2.1.3 U.S. Department of Housing and Urban Development
The U.S. Department of Housing and Urban Development (HUD) relies on noise exposure criteria to evaluate the acceptability of sites for housing assistance. Typically, outdoor Ldn18 or CNEL19 below 65 dB is considered acceptable to HUD for residential land uses. HUD does not detail noise criteria for land uses other than residential. For comparison, Table 18-2 lists HUD’s noise exposure criteria and those of other federal, state, and local agencies, as discussed in the remainder of this section.
18.2.1.4 Federal Aviation Administration
According to the FAA, Ldn or CNEL below 65 dB is considered acceptable for residential land use, and Ldn values below 70 dB are normally acceptable for commercial land use. Commercial land use is conditionally acceptable between 70 dB and 80 dB, while industrial land use in areas below Ldn values of 85 dB is normally acceptable. Open space use is to occur in areas below 75 dB.
18.2.1.5 U.S. Army
The U.S. Army’s noise thresholds are based on guidelines established by the Federal Interagency Committee on Urban Noise with the goal of protecting public health and welfare with regard to noise. The Interagency guidelines describe the 65 Ldn contour as the threshold of significant impact for residential land uses and a variety of noise-sensitive
17 dBA: An A-weighted system of noise measurement, in which the decibel values of sounds at very high or very low frequencies are reduced to correct for the frequency response of the human ear, compared with unweighted decibels (dB), in which no correction is made for audio frequency.
18 Ldn: The average A-weighted noise level during a 24-hour day, obtained after addition of 10 decibels to levels measured in the night between 10:00 p.m. and 7:00 a.m.
19 CNEL: The average A-weighted noise level during a 24-hour day, obtained after addition of 5 decibels in the evening from 7:00 p.m. to 10:00 p.m. and after addition of 10 decibels to CNEL levels measured in the night between 10:00 p.m. and 7:00 a.m.
National Aeronautics and Space Administration Chap 18. Noise and Vibration
NASA Ames Research Center Environmental Resources Document Environmental Management Division March 2015 File: 2015 ARC ERD_FINAL.doc
Pg 332
institutions such as hospitals, nursing homes, schools, auditoriums, and outdoor music shells. For noise exposure between Ldn 65-70 dB, the guidelines call for building codes to require at least 25 dB outdoor-to-indoor noise level reduction (NLR); between Ldn 70-75 dB, the guidelines call for at least 30 dB NLR.
18.2.1.6 National Environmental Policy Act
NEPA requires federal agencies to include in their decision-making process appropriate and careful consideration of all environmental effects of a proposed action and of possible alternative actions. Measures to avoid or minimize the adverse effects of proposed actions and to restore and enhance environmental quality as much as possible must be developed and discussed where feasible.
18.2.2 State Regulations
18.2.2.1 California Office of Planning and Research
In 1990, the California Governor's Office of Planning and Research published guidelines to aid California municipalities in preparing their general plans. This document uses the CNEL and Ldn noise descriptors interchangeably to relate land use compatibility for community noise environments.
The most commonly used noise exposure measure for environmental noise is Ldn. This is a night-penalized average used for most noise and land use compatibility criteria. The day-night average sound level is obtained after the addition of 10 dB to noise levels measured in the night between 10:00 p.m. and 7:00 a.m. In California, an alternative measure is the CNEL, which is similar to Ldn except a 5 dB penalty is added during the evening hours of 7:00 p.m. to 10:00 p.m. Because Ldn and CNEL nearly always render results within 1 dB, they can generally be compared in land use compatibility analyses.
The California State Planning Guidelines (Figure 18-1) show Ldn or CNEL values below 60 dB to be acceptable for residential land use, and values below 70 dB as acceptable for commercial land use. Industrial land use in areas below Ldn values of 75 dB is also acceptable. Open space use is acceptable in areas below 70 dB, depending upon the specific nature of the space; for example, playgrounds are acceptable up to 70 dB and golf courses are acceptable up to 75 dB.
18.2.2.2 California Division of Aeronautics
The California Division of Aeronautics (CDA) relies on the noise criteria contained in Article 3, Chapter 4, Part 1, Division 9, Public Utilities Code (Regulation of Airports), which governs the operation of aircraft and aircraft engines at the State’s airports. The CDA sets Ldn 65 dB as its official noise limit for residential land use; however, this this only applies to aircraft noise at state facilities and not at ARC. NASA attempts, whenever possible, to meet local guidelines and standards and considers them as advisory in nature.
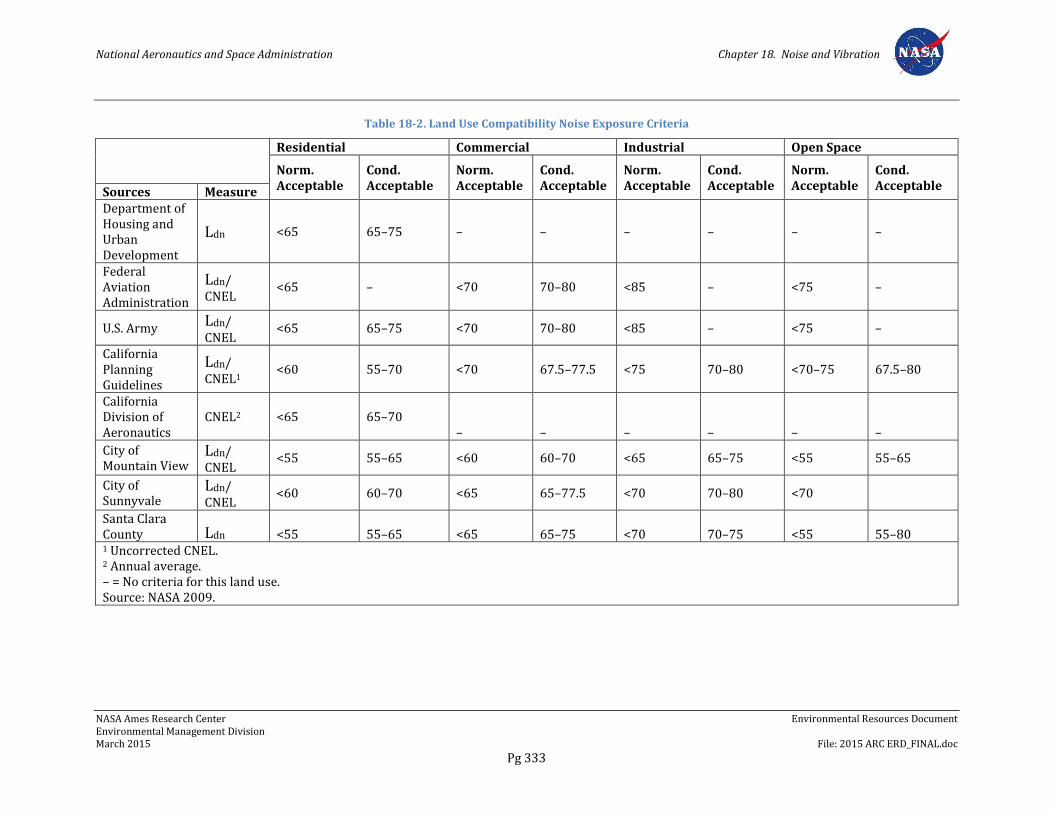
National Aeronautics and Space Administration Chapter 18. Noise and Vibration
NASA Ames Research Center Environmental Resources Document Environmental Management Division March 2015 File: 2015 ARC ERD_FINAL.doc
Pg 333
Table 18-2. Land Use Compatibility Noise Exposure Criteria
Residential Commercial Industrial Open Space
Norm. Acceptable
Cond. Acceptable
Norm. Acceptable
Cond. Acceptable
Norm. Acceptable
Cond. Acceptable
Norm. Acceptable
Cond. Acceptable Sources Measure
Department of Housing and Urban Development
Ldn <65 65–75 – – – – – –
Federal Aviation Administration
Ldn/ CNEL
<65 – <70 70–80 <85 – <75 –
U.S. Army Ldn/ CNEL
<65 65–75 <70 70–80 <85 – <75 –
California Planning Guidelines
Ldn/ CNEL1
<60 55–70 <70 67.5–77.5 <75 70–80 <70–75 67.5–80
California Division of Aeronautics
CNEL2 <65 65–70 – – – – – –
City of Mountain View
Ldn/ CNEL
<55 55–65 <60 60–70 <65 65–75 <55 55–65
City of Sunnyvale
Ldn/ CNEL
<60 60–70 <65 65–77.5 <70 70–80 <70
Santa Clara County Ldn <55 55–65 <65 65–75 <70 70–75 <55 55–80 1 Uncorrected CNEL. 2 Annual average. – = No criteria for this land use. Source: NASA 2009.
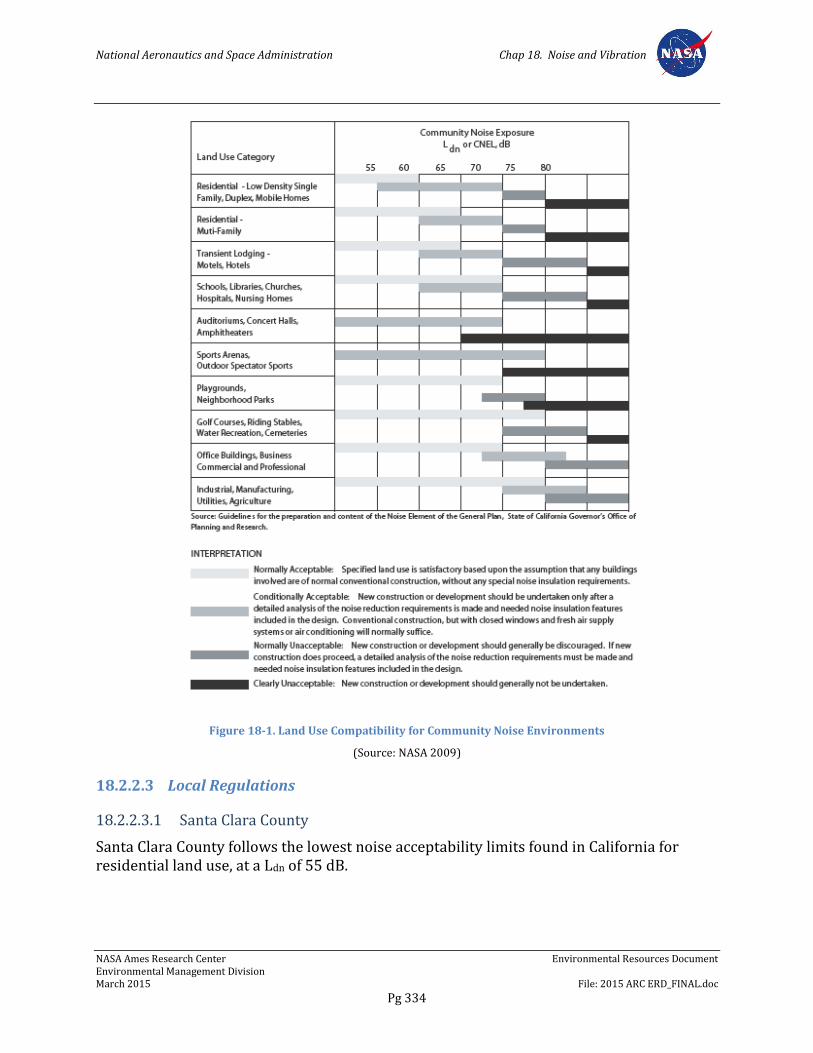
National Aeronautics and Space Administration Chap 18. Noise and Vibration
NASA Ames Research Center Environmental Resources Document Environmental Management Division March 2015 File: 2015 ARC ERD_FINAL.doc
Pg 334
Figure 18-1. Land Use Compatibility for Community Noise Environments
(Source: NASA 2009)
18.2.2.3 Local Regulations
18.2.2.3.1 Santa Clara County
Santa Clara County follows the lowest noise acceptability limits found in California for residential land use, at a Ldn of 55 dB.
National Aeronautics and Space Administration Chap 18. Noise and Vibration
NASA Ames Research Center Environmental Resources Document Environmental Management Division March 2015 File: 2015 ARC ERD_FINAL.doc
Pg 335
18.2.2.3.2 City of Mountain View
The City of Mountain View has one of the strictest residential noise standards of any municipality in California for residential land use. A Ldn below 55 dB is specified for new construction, although many residences throughout the city are already exposed to more severe noise environments. The commercial and industrial land use criteria are 60 dB.
In addition to the noise exposure criteria in the Mountain View Noise Element, a noise ordinance is also referenced in the Noise Element and applied by the city. It specifies a 55 dB maximum noise level from stationary emitters in the City of Mountain View when measured at residential property lines during the daytime and 50 dB during the nighttime (10:00 p.m. to 7:00 a.m.).
18.2.2.3.3 City of Sunnyvale
The Sunnyvale criteria follow the state guidelines rather closely, the only exception being open space use, which is to occur in areas below a Ldn of 70 dB. The authors of the Sunnyvale Noise Supplement indicated that Ldn should be interpreted as the yearly average throughout their document.
18.3 Regional Setting
This ERD encompasses the entire ARC, a federal facility located on approximately 800 hectares (2,000 acres) of land between U.S. Highway 101 and the southwestern edge of the San Francisco Bay in the northern portion of Santa Clara County, California. The City of Mountain View borders it to the south and west, and the City of Sunnyvale to the south and east. ARC is about 56 kilometers (35 miles) south of San Francisco and 16 kilometers (10 miles) north of San Jose, in the heart of Silicon Valley. Figure 1-1 shows the regional context of the site and Figure 1-2 shows the local context. For planning purposes, ARC is divided into four subareas: the NASA Research Park, Eastside Airfield, Bay View, and the Ames campus (Figure 1-3).
The closest residential land use is the DOD housing at Wescoat Village, located south of the NRP area. The other land uses directly adjacent to the site are office, industrial, and open space. In addition, within approximately 610 meters (2,000 feet) is Santiago Villa, an existing mobile home facility. The next nearest residential land uses are on the south side of U.S. Highway 101. The most sensitive land uses are the residential uses. Office use is the next most sensitive land use, and the least sensitive land uses are commercial/industrial uses.
18.4 Existing Site Conditions
This section describes the existing noise environment at ARC. Noises generated by ARC and Moffett Field have historically been a source of complaints from surrounding areas. Noise produced by many of the wind tunnels and aircraft operations generate complaints from residents off site. Figures showing noise contours described in this section all occur at the end of this section.
National Aeronautics and Space Administration Chap 18. Noise and Vibration
NASA Ames Research Center Environmental Resources Document Environmental Management Division March 2015 File: 2015 ARC ERD_FINAL.doc
Pg 336
18.4.1 Wind Tunnels
Among NASA’s wind tunnels, the primary noise generators include: 40- by 80-Foot Wind Tunnel. The 40- by 80-Foot Wind Tunnel is a closed-circuit
wind tunnel. A typical test day can consist of one or two shifts, day or night. Each test shift averages approximately 4 hours, with the wind tunnel running. Current noise exposure levels from this facility are presented in Figure 18-2.
80- by 120-Foot Wind Tunnel. The 80- by 120-Foot Wind Tunnel is a non-return wind tunnel that shares the same drive system as the 40- by 80-Foot Wind Tunnel. Because both facilities use the same drive system, only one can be operated at a time. Figure 18-3 shows the current noise exposure levels for the 80- by 120-Foot Wind Tunnel.
Unitary Plan Wind Tunnels. The Unitary Plan Wind Tunnel complex consists of three wind tunnels, the 11-foot, the 9- by 7-foot, and the 8- by 7-foot. Only one of these tunnels can be used at a time. At present, only the 11-foot tunnel is regularly used. The 9- by 7-foot Supersonic Wind Tunnel and the 8- by 7-foot Supersonic Wind Tunnel are currently not in operation. Noise levels were measured during operation of the 11-foot Transonic Wind Tunnel in October 2000. Measured noise levels ranged from 80 to 85 dBA along Wagner Lane at distances of 15 to 20 meters (50 to 75 feet) west of the facility. Noise levels along Mark Avenue between Wagner Lane and Boyd Road typically range from 75 to 79 dBA. Noise levels were measured inside the lobby of Building N-234 on Boyd Road directly east of the wind tunnel. The measured noise level was 48 dBA and the operating tunnel was barely audible. Noise levels along DeFrance Avenue were measured at several locations north of the facility and typically ranged from 65 to 70 dBA. Figure 18-4 shows the current noise exposure levels for the complex.
12-Foot Pressure Wind Tunnel. The 12-foot Pressure Wind Tunnel also generates noise. Noise levels measured for NASA worker exposure evaluations provide some data for the tunnel. The measured noise levels are 90 dBA at 61 meters (200 feet) from the tunnel at Bushnell Street and 80 to 90 dBA at the cooling towers located north, south, east, and west of the facility. Figure 18-5 shows the noise exposure contours for the 12-foot Pressure Wind Tunnel. (This wind tunnel is not currently in operation.)
18.4.2 Arc Jets
The arc jet facility is used to perform high temperature materials tests. Noise levels were measured during operation of the arc jets in June 2001. Measured noise levels reached 80 dBA at a distance of 50 meters (146 feet) north of the facility, 78 dBA at a distance of 75 meters (246 feet) to the east of the cooling towers, and 75 dBA along Boyd Road south of the facility. Figure 18-6 shows the noise exposure levels for the arc jets facility.
National Aeronautics and Space Administration Chap 18. Noise and Vibration
NASA Ames Research Center Environmental Resources Document Environmental Management Division March 2015 File: 2015 ARC ERD_FINAL.doc
Pg 337
18.4.3 Airfield Operations, Traffic, and Other Existing Noise Sources
In addition to the wind tunnels, the OARF, and arc jets, there are several other noise sources at and beyond the ARC that affect the four planning areas and the surrounding community, most notably airfield operations and traffic noise from local highways.
ARC is home to a variety of government-related aircraft. Noise from MFA was evaluated for the period from 1999 to 2010. Noise exposure contours were determined in terms of CNEL. Figure 18-7 shows noise contours from NASA baseline aircraft operations.
Ambient traffic noise measurements were made during the preparation of the NADP EIS at four locations within ARC. Figure 18-8 shows the locations of the noise measurements. Noise levels were measured adjacent to U.S. Highway 101 at an exposed location along South Perimeter Road (S1), in a location protected by a sound wall at Wescoat Court (S2), and at a distance from the highway near Building N-547C on Girardi Road (S3) to determine how noise levels decrease over distance. The final measurement was conducted at the intersection of Cody Road and Severyns Avenue (S4). The data gathered during these measurements is summarized in Table 18-3. The existing Ldn noise exposure contours resulting from traffic are shown in Figure 18-9.
18.4.4 Composite Noise Exposure Contours
Composite noise exposure contours of existing noise conditions at ARC are presented in Figure 18-10. These contours were developed using the following information:
Moffett Field airstrip CNEL Noise Exposure, 1999
Noise measurement along U.S. Highway 101
Noise measurement of the Unitary Plan Wind Tunnel
NASA Ames Aerodynamic Testing Project EIS
Noise measurement of the arc jets
Thus, Figure 18-11 represents a composite of noise contours from all of these noise sources.
Table 18-3. Ambient Traffic Noise Levels
Location Leq1 L(10)2 L(50)3 L(90)4 Dominant Noise Source
S1: Recreation Fields south of Dailey Road; microphone 5 feet above grade
74 76 73 72 U.S. Highway 101 traffic
S2: Wescoat Court; 50 feet from the property line; microphone 5 feet above grade
68 69 67 66 U.S. Highway 101 traffic
S3: Building N-547C; microphone 5 feet above grade
56 57 55 54 U.S. Highway 101 traffic
National Aeronautics and Space Administration Chap 18. Noise and Vibration
NASA Ames Research Center Environmental Resources Document Environmental Management Division March 2015 File: 2015 ARC ERD_FINAL.doc
Pg 338
Location Leq1 L(10)2 L(50)3 L(90)4 Dominant Noise Source
S4: Cody Road at Severyns Road; microphone 5 feet above grade
53 57 50 49 U.S. Highway 101 traffic
Notes: 1 Leq: The average A-weighted noise level during the measurement period. 2 L(10): The A-weighted noise levels that are exceeded 10% of the time during the measurement period. 3 L(50): The A-weighted noise levels that are exceeded 50% of the time during the measurement period. 4 L(90): The A-weighted noise levels that are exceeded 90% of the time during the measurement period. Source: NASA 2009.
18.4.5 Outdoor Aerodynamic Research Facility
The OARF is located in the Bay View area and is used to obtain a wide range of hover and acoustic data on full-scale or small-scale aircraft and other aerospace components. High noise-generating projects, such as powered model tests, run an average of 2 hours per day when the facility is in operation. Other tests have been administered at the facility for up to 7 hours per day.
The experimental physics branch of ARC tested hybrid rocket fuel motors at the OARF. NASA staff measured rocket fuel test noise levels in September 2001. The orientation for the rocket test rig and measured noise levels are shown on Figure 18-11. The measured noise levels reflect the effects of orienting the facility to mitigate potential noise impacts. The noise levels are generated for very short time intervals, approximately 10 to 20 seconds.
18.5 Environmental Requirements
NASA has identified the following environmental policies and measures that address potential noise effects of operations and future development at ARC.
18.5.1 NASA Procedural Directive 8500.1, NASA Environmental Management
Per NPD 8500.1, it is NASA policy to: maintain compliance with all applicable federal, state, and local environmental requirements; to incorporate environmental risk reduction and sustainable practices to the extent practicable throughout NASA’s programs, projects, and activities; and to consider environmental factors throughout the life cycle of programs, projects, and activities (as defined in NPD 7120.4, NASA Engineering and Program/Project Management Policy, and related documents), including planning, development, execution, and disposition activities. Examples of environmental factors include consideration of environmental impacts as required by the NEPA and NHPA; the proposed use of hazardous materials; the potential for waste generation; the need to acquire necessary permits, waivers, and authorizations; and the use of environmentally-preferable materials and processes wherever practicable.

National Aeronautics and Space Administration Chap 18. Noise and Vibration
NASA Ames Research Center Environmental Resources Document Environmental Management Division March 2015 File: 2015 ARC ERD_FINAL.doc
Pg 339
18.5.2 Ames Procedural Requirements 8500.1, Ames Environmental Procedural Requirements
APR 8500.1 sets forth general procedural requirements to ensure compliance with applicable federal, state, and local environmental laws; regulations and EOs; and NASA policies and procedures. Organizational directors, division chiefs, branch chiefs, section heads, supervisors, managers, and CORs are responsible for planning, designing, constructing, managing, operating, and maintaining facilities in conformance with applicable regulatory directives, and should obtain environmental review from the Environmental Management Division early in project planning consistent with NASA's NEPA implementing procedures (NPR 8580.1 and EO 12114), NASA policies and procedures for programs and projects (NPR 7120), and NASA regulations related to environmental quality (14 CFR 1216). Program and project managers should coordinate with the Environmental Management Division in a timely manner to ensure that any new or modified programs, projects, and activities comply with regulatory requirements.
18.5.3 Ames Procedural Requirements 8715.1, Ames Health and Safety Procedural Requirements
APR 8715.1 establishes the procedural requirements for complying with the NASA Agency-wide Hearing Conservation Program. It includes a description of organizational and individual responsibilities at ARC for complying with program requirements, as well as NASA’s allowable noise exposure limits, which are generally applied as an eight-hour exposure limit of 85 dBA. For exposures of shorter or longer durations, the exposure limit may be adjusted accordingly. Hearing Conservation Program elements are required to be implemented at the Action Level; that is, whenever employee noise exposures equal or exceed an eight-hour time-weighted average of 82 dBA for 30 days per year, or 85 dBA for one day. Hearing Conservation Program elements include exposure monitoring, audiometric testing, medical monitoring, and training.
18.5.4 Ames Environmental Work Instructions
Ames’s EWIs, which replace the previous Ames Environmental Handbook (APR 8800.3), set forth requirements to ensure that programs, projects, and activities at ARC comply with applicable federal, state, and local laws; regulations and EOs; and NASA policies and procedures. Each EWI lists relevant regulatory authorities and documents, assigns individual and organizational responsibilities within ARC, and identifies specific requirements applicable to the work being performed.
The following EWIs are relevant to potential noise effects of operations and future development at ARC.
EWI 12, Public Involvement
EWI 14, NEPA and Environmental Justice
EWI 18, Environmental Requirements for Construction Projects (Under review)
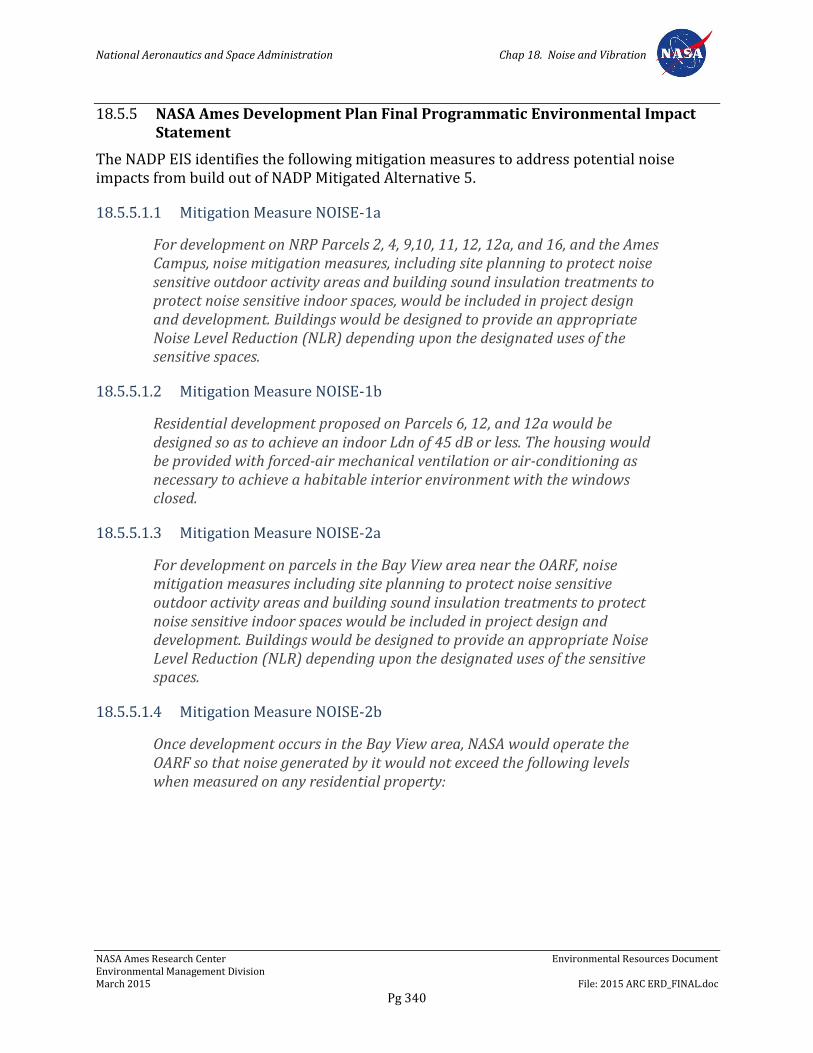
National Aeronautics and Space Administration Chap 18. Noise and Vibration
NASA Ames Research Center Environmental Resources Document Environmental Management Division March 2015 File: 2015 ARC ERD_FINAL.doc
Pg 340
18.5.5 NASA Ames Development Plan Final Programmatic Environmental Impact Statement
The NADP EIS identifies the following mitigation measures to address potential noise impacts from build out of NADP Mitigated Alternative 5.
18.5.5.1.1 Mitigation Measure NOISE-1a
For development on NRP Parcels 2, 4, 9,10, 11, 12, 12a, and 16, and the Ames Campus, noise mitigation measures, including site planning to protect noise sensitive outdoor activity areas and building sound insulation treatments to protect noise sensitive indoor spaces, would be included in project design and development. Buildings would be designed to provide an appropriate Noise Level Reduction (NLR) depending upon the designated uses of the sensitive spaces.
18.5.5.1.2 Mitigation Measure NOISE-1b
Residential development proposed on Parcels 6, 12, and 12a would be designed so as to achieve an indoor Ldn of 45 dB or less. The housing would be provided with forced-air mechanical ventilation or air-conditioning as necessary to achieve a habitable interior environment with the windows closed.
18.5.5.1.3 Mitigation Measure NOISE-2a
For development on parcels in the Bay View area near the OARF, noise mitigation measures including site planning to protect noise sensitive outdoor activity areas and building sound insulation treatments to protect noise sensitive indoor spaces would be included in project design and development. Buildings would be designed to provide an appropriate Noise Level Reduction (NLR) depending upon the designated uses of the sensitive spaces.
18.5.5.1.4 Mitigation Measure NOISE-2b
Once development occurs in the Bay View area, NASA would operate the OARF so that noise generated by it would not exceed the following levels when measured on any residential property:
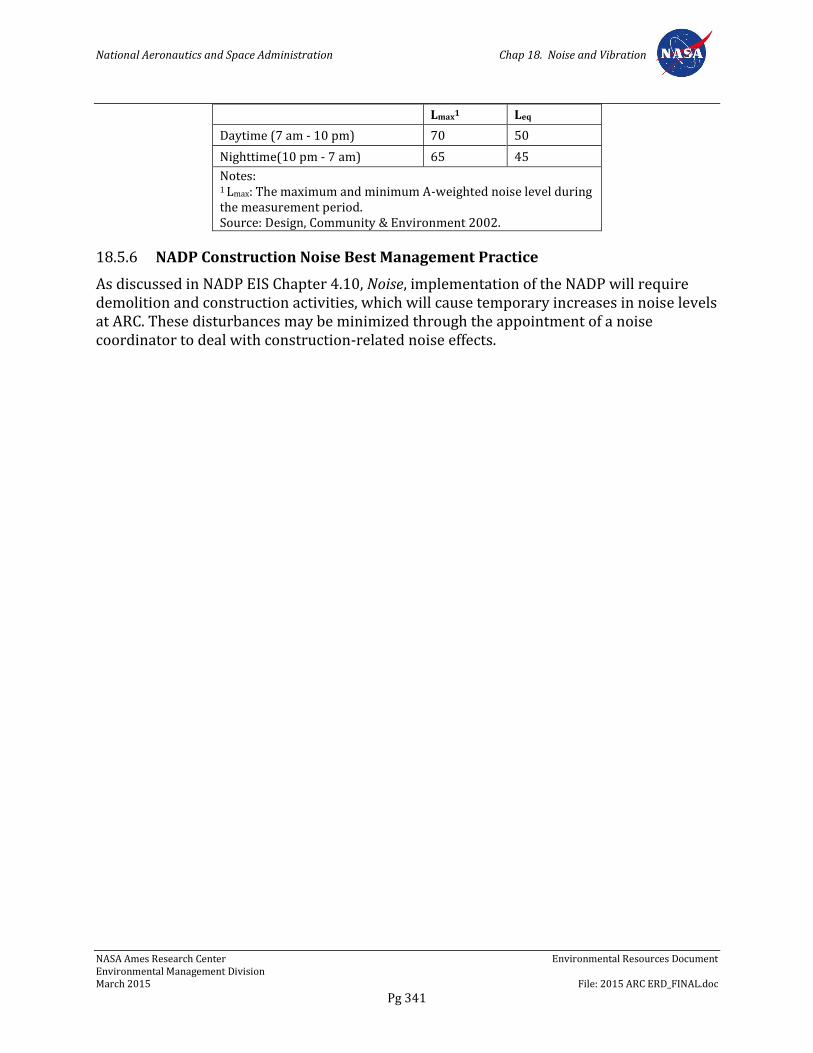
National Aeronautics and Space Administration Chap 18. Noise and Vibration
NASA Ames Research Center Environmental Resources Document Environmental Management Division March 2015 File: 2015 ARC ERD_FINAL.doc
Pg 341
Lmax1 Leq
Daytime (7 am - 10 pm) 70 50
Nighttime(10 pm - 7 am) 65 45
Notes: 1 Lmax: The maximum and minimum A-weighted noise level during the measurement period. Source: Design, Community & Environment 2002.
18.5.6 NADP Construction Noise Best Management Practice
As discussed in NADP EIS Chapter 4.10, Noise, implementation of the NADP will require demolition and construction activities, which will cause temporary increases in noise levels at ARC. These disturbances may be minimized through the appointment of a noise coordinator to deal with construction-related noise effects.
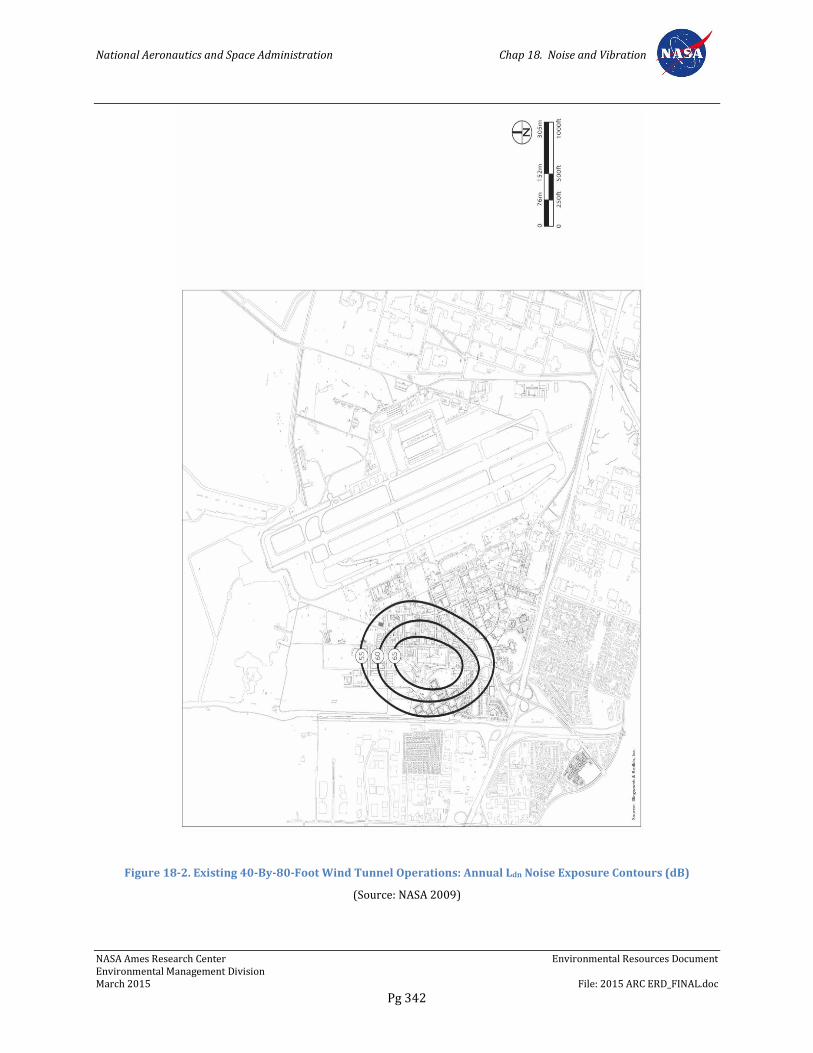
National Aeronautics and Space Administration Chap 18. Noise and Vibration
NASA Ames Research Center Environmental Resources Document Environmental Management Division March 2015 File: 2015 ARC ERD_FINAL.doc
Pg 342
Figure 18-2. Existing 40-By-80-Foot Wind Tunnel Operations: Annual Ldn Noise Exposure Contours (dB)
(Source: NASA 2009)
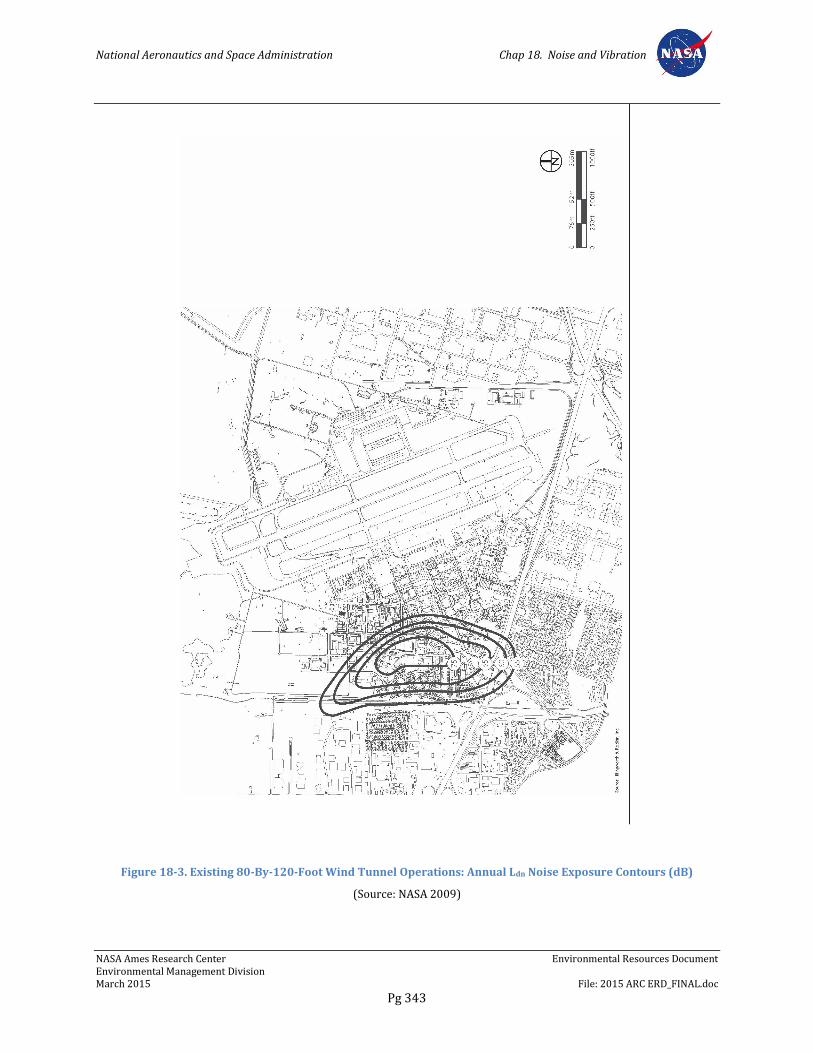
National Aeronautics and Space Administration Chap 18. Noise and Vibration
NASA Ames Research Center Environmental Resources Document Environmental Management Division March 2015 File: 2015 ARC ERD_FINAL.doc
Pg 343
Figure 18-3. Existing 80-By-120-Foot Wind Tunnel Operations: Annual Ldn Noise Exposure Contours (dB)
(Source: NASA 2009)
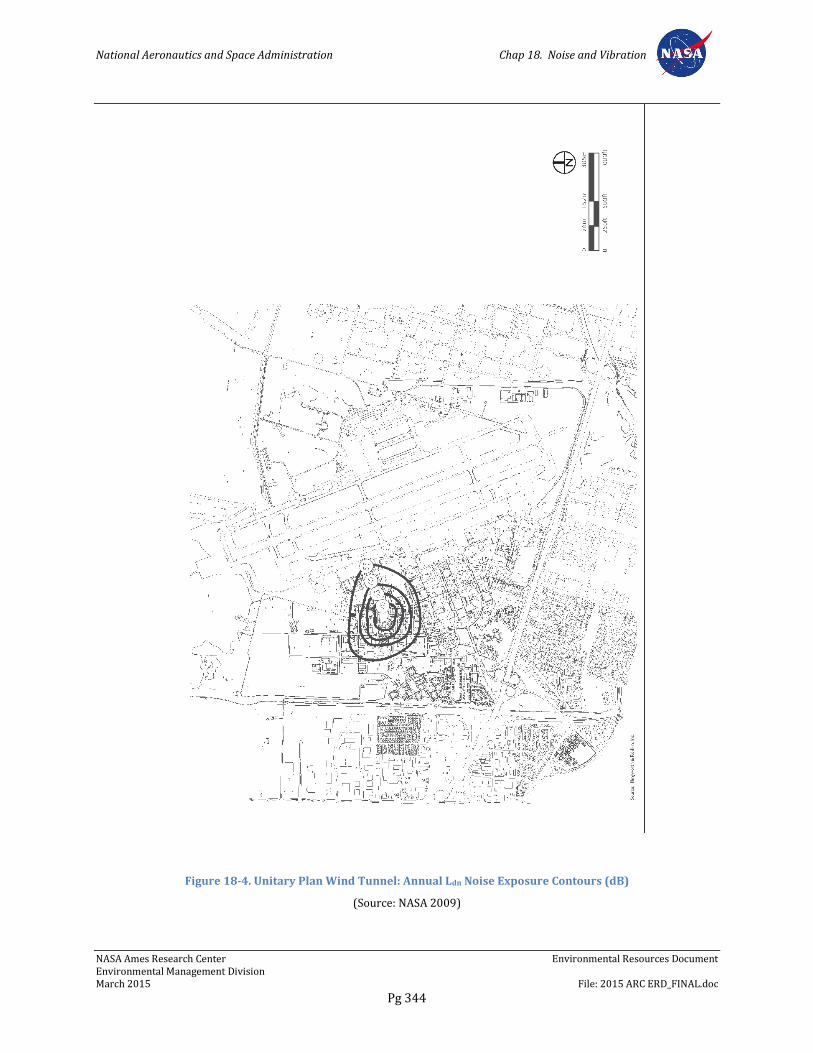
National Aeronautics and Space Administration Chap 18. Noise and Vibration
NASA Ames Research Center Environmental Resources Document Environmental Management Division March 2015 File: 2015 ARC ERD_FINAL.doc
Pg 344
Figure 18-4. Unitary Plan Wind Tunnel: Annual Ldn Noise Exposure Contours (dB)
(Source: NASA 2009)
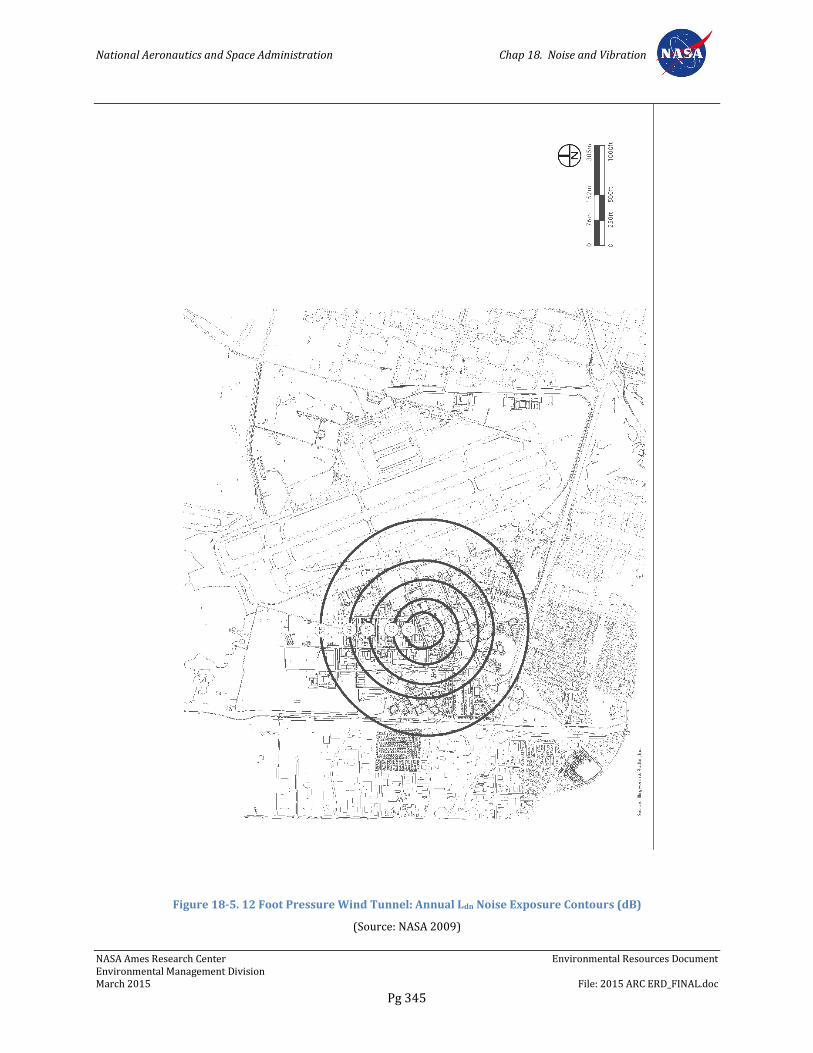
National Aeronautics and Space Administration Chap 18. Noise and Vibration
NASA Ames Research Center Environmental Resources Document Environmental Management Division March 2015 File: 2015 ARC ERD_FINAL.doc
Pg 345
Figure 18-5. 12 Foot Pressure Wind Tunnel: Annual Ldn Noise Exposure Contours (dB)
(Source: NASA 2009)
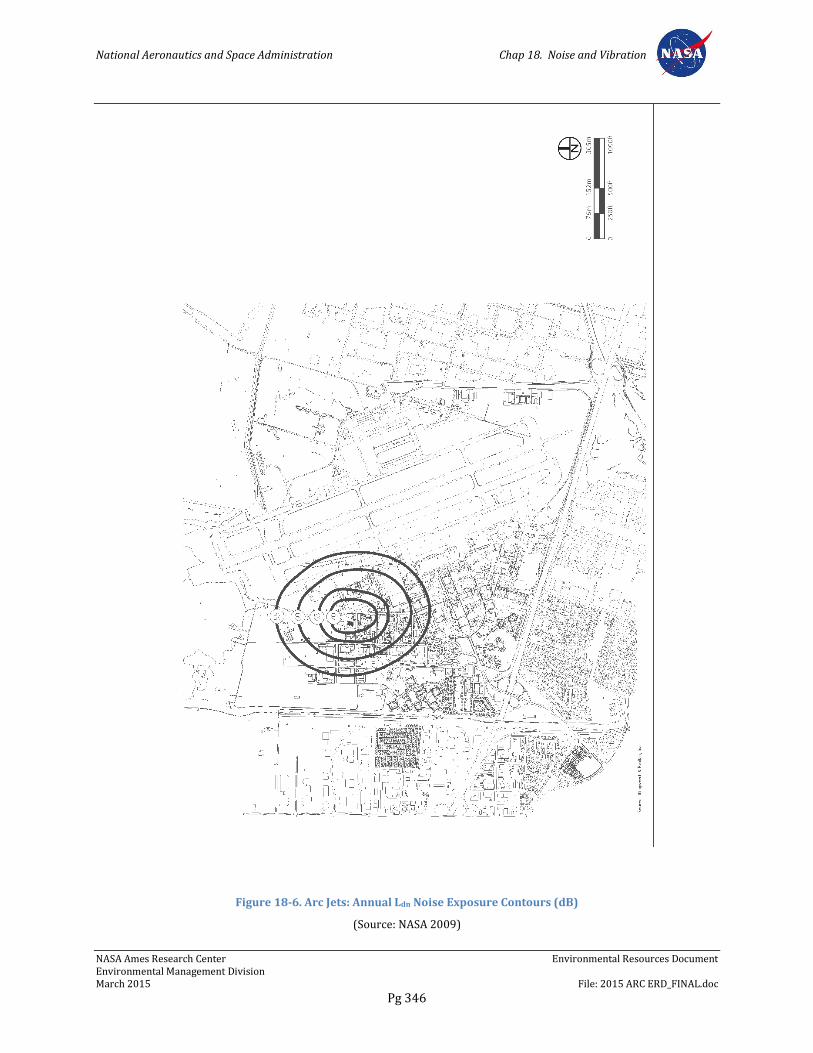
National Aeronautics and Space Administration Chap 18. Noise and Vibration
NASA Ames Research Center Environmental Resources Document Environmental Management Division March 2015 File: 2015 ARC ERD_FINAL.doc
Pg 346
Figure 18-6. Arc Jets: Annual Ldn Noise Exposure Contours (dB)
(Source: NASA 2009)
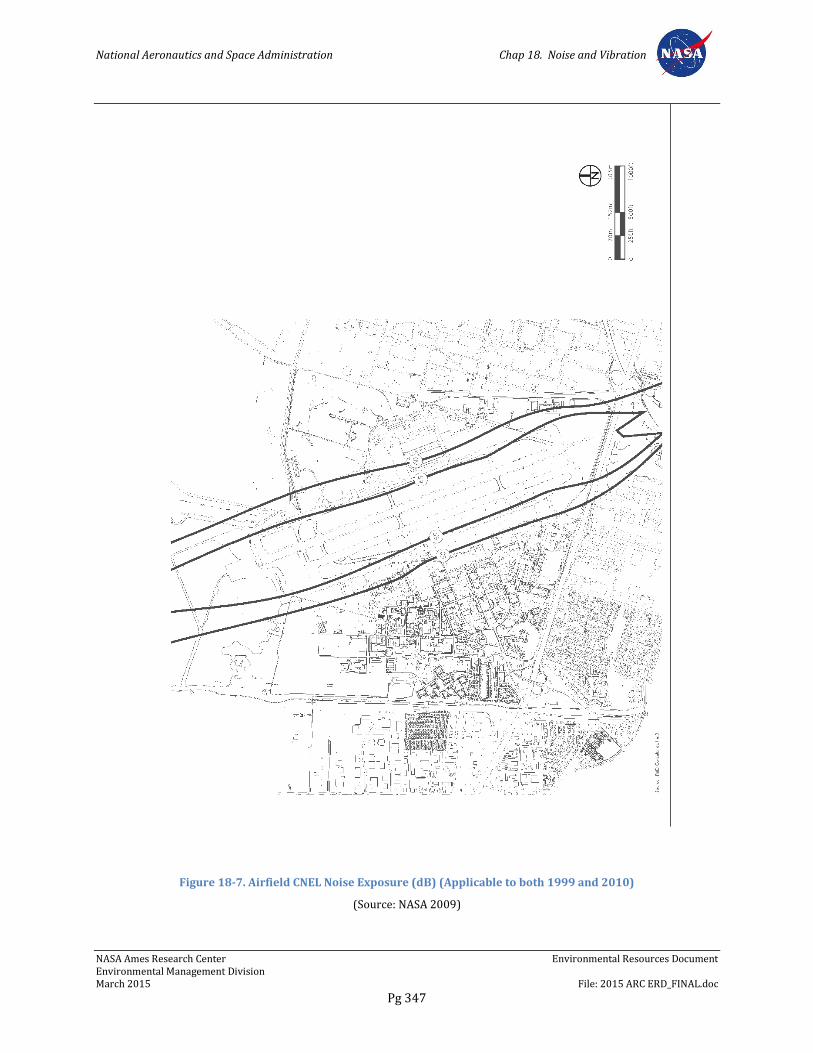
National Aeronautics and Space Administration Chap 18. Noise and Vibration
NASA Ames Research Center Environmental Resources Document Environmental Management Division March 2015 File: 2015 ARC ERD_FINAL.doc
Pg 347
Figure 18-7. Airfield CNEL Noise Exposure (dB) (Applicable to both 1999 and 2010)
(Source: NASA 2009)
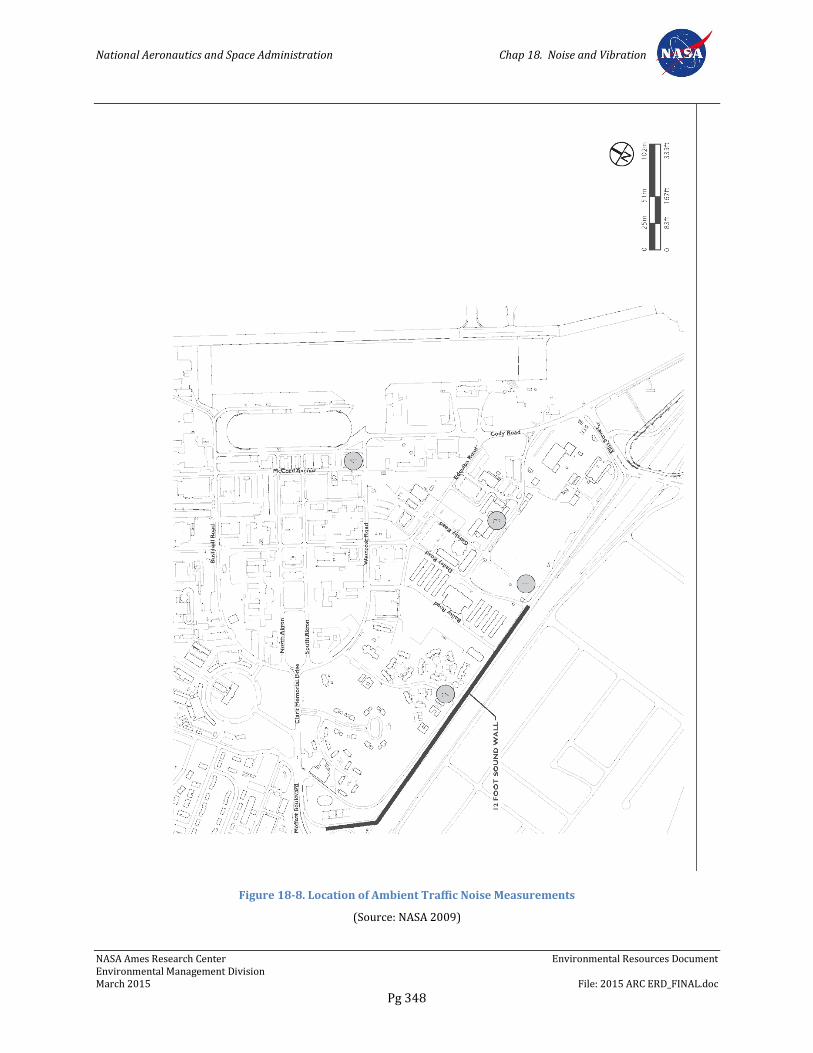
National Aeronautics and Space Administration Chap 18. Noise and Vibration
NASA Ames Research Center Environmental Resources Document Environmental Management Division March 2015 File: 2015 ARC ERD_FINAL.doc
Pg 348
Figure 18-8. Location of Ambient Traffic Noise Measurements
(Source: NASA 2009)
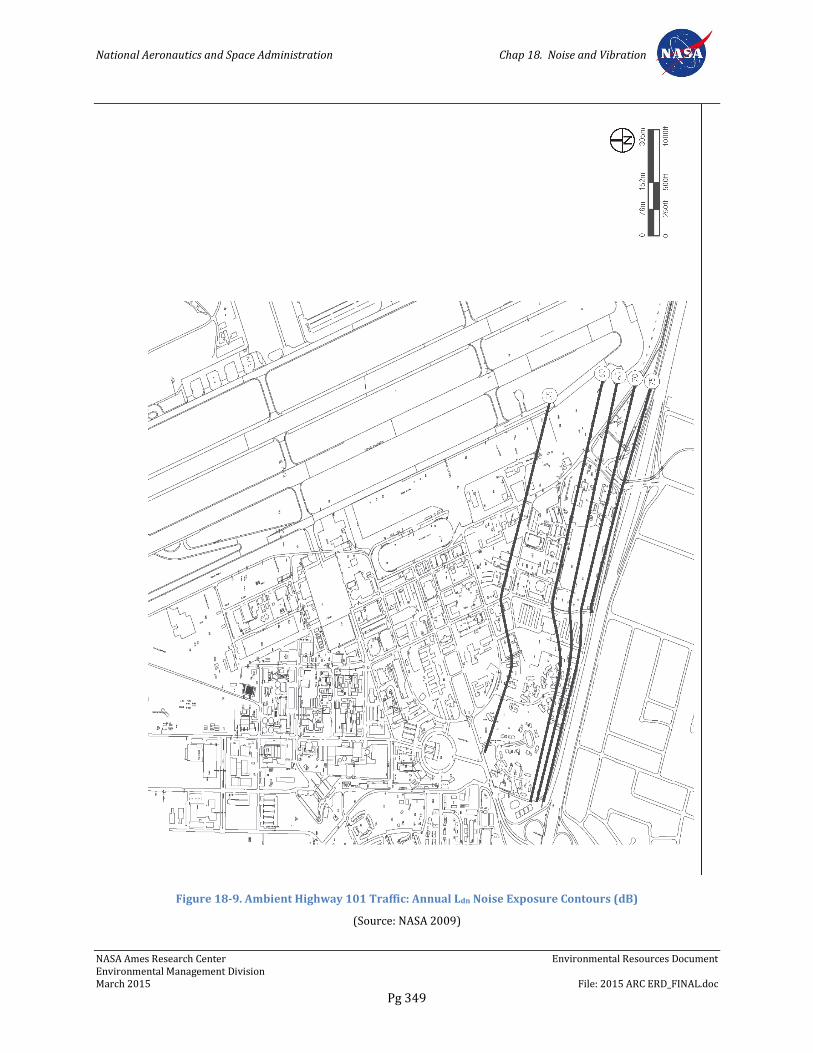
National Aeronautics and Space Administration Chap 18. Noise and Vibration
NASA Ames Research Center Environmental Resources Document Environmental Management Division March 2015 File: 2015 ARC ERD_FINAL.doc
Pg 349
Figure 18-9. Ambient Highway 101 Traffic: Annual Ldn Noise Exposure Contours (dB)
(Source: NASA 2009)
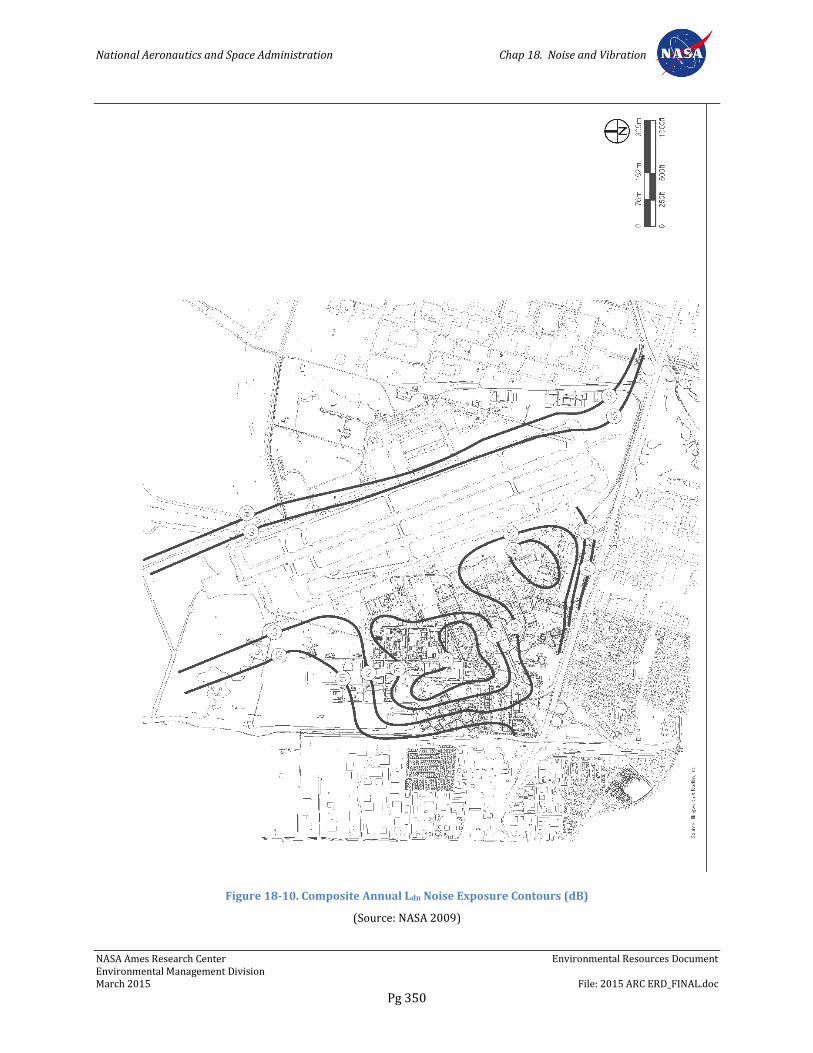
National Aeronautics and Space Administration Chap 18. Noise and Vibration
NASA Ames Research Center Environmental Resources Document Environmental Management Division March 2015 File: 2015 ARC ERD_FINAL.doc
Pg 350
Figure 18-10. Composite Annual Ldn Noise Exposure Contours (dB)
(Source: NASA 2009)
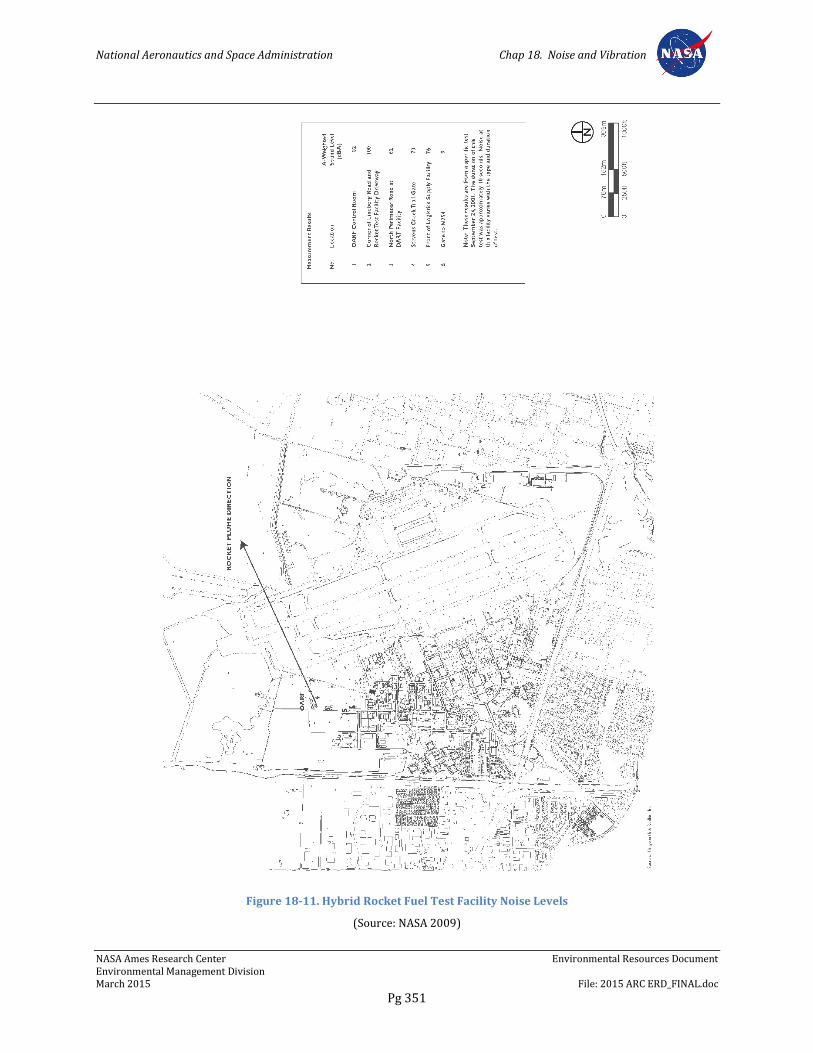
National Aeronautics and Space Administration Chap 18. Noise and Vibration
NASA Ames Research Center Environmental Resources Document Environmental Management Division March 2015 File: 2015 ARC ERD_FINAL.doc
Pg 351
Figure 18-11. Hybrid Rocket Fuel Test Facility Noise Levels
(Source: NASA 2009)
National Aeronautics and Space Administration Chap 19. Hazardous Materials and Site Contamination
NASA Ames Research Center Environmental Resources Document Environmental Management Division March 2015 File: 2015 ARC ERD_FINAL.doc
Pg 352
Chapter 19. Hazardous Materials and Site Contamination
19.1 Overview
This chapter describes the use and management of chemical, radioactive and other materials broadly categorized as hazardous materials20. Applicable regulations and NASA’s pollution prevention practices are also discussed. Information regarding hazardous materials was obtained from the November 2009 NASA ARC ERD (NASA 2009), NAPD EIS (Design, Community & Environment 2002), internal documents, and other sources.
19.2 Regulatory Background
19.2.1 Federal Regulations
19.2.1.1 Resource Conservation and Recovery Act
The Resource Conservation and Recovery Act (RCRA), including the Federal Hazardous and Solid Waste Amendments, is the primary law governing disposal of solid and hazardous waste. RCRA established three distinct, yet interrelated, programs:
• The solid waste program, under RCRA Subtitle D, which encourages states to develop comprehensive plans to manage nonhazardous industrial solid waste and municipal solid waste, sets criteria for municipal solid waste landfills and other solid waste disposal facilities, and prohibits the open dumping of solid waste.
• The hazardous waste program, under RCRA Subtitle C, which establishes a system for controlling hazardous waste from the time it is generated until its ultimate disposal.
• The underground storage tank (UST) program, under RCRA Subtitle I, which regulates underground storage tanks containing hazardous substances and petroleum products.
RCRA focuses only on active and future facilities and does not address abandoned or historical sites, which are managed under the Comprehensive Environmental Response, Compensation, and Liability Act (CERCLA).
19.2.1.2 Comprehensive Environmental Response, Compensation, and Liability Act
CERCLA, commonly known as Superfund, was enacted by Congress in 1980. This law created a tax on the chemical and petroleum industries and provided broad federal authority to respond directly to releases or threatened releases of hazardous substances that may endanger public health or the environment. CERCLA:
20 Hazardous materials, as defined by the California Department of Toxic Substances Control (DTSC), are any materials that, because of their quantity, concentration, physical, or chemical characteristics, pose a significant present or potential hazard to human health and safety or to the environment if released into the workplace or the environment. Extremely or acutely hazardous materials are materials that may cause rapid death, permanent injury, or persistent harm to the environment.
National Aeronautics and Space Administration Chap 19. Hazardous Materials and Site Contamination
NASA Ames Research Center Environmental Resources Document Environmental Management Division March 2015 File: 2015 ARC ERD_FINAL.doc
Pg 353
• Established prohibitions and requirements concerning closed and abandoned hazardous waste sites;
• Provided for liability of entities responsible for releases of hazardous waste at these sites; and
• Established a trust fund to provide for cleanup when no responsible party could be identified.
CERCLA authorizes two kinds of response actions:
• Short-term removals, where actions may be taken to address releases or threatened releases requiring prompt response, and
• Long-term remedial response actions that permanently and significantly reduce the dangers associated with releases or threats of releases of hazardous substances that are serious, but not immediately life threatening. These actions can be conducted only at sites listed on EPA's National Priorities List (NPL).
CERCLA also enabled revision of the National Contingency Plan (NCP), which provides the guidelines and procedures for responding to releases and threatened releases of hazardous substances, pollutants or contaminants. The NCP also established the NPL. CERCLA was amended by the Superfund Amendments and Reauthorization Act (SARA) in 1986.
19.2.1.3 Toxic Substances Control Act
PCBs are regulated under the Emergency Planning and Community Right-to-Know Act (EPCRA) (40 CFR 350-372); PCB Manufacturing, Processing, Distribution in Commerce and Use Prohibitions (40 CFR 761); Toxic Substances Control Act (PL-94-469); and EOs (12088, 12580, and 12856).
19.2.1.4 National Environmental Policy Act
NEPA requires federal agencies to include in their decision-making process appropriate and careful consideration of all environmental effects of a proposed action and of possible alternative actions. Measures to avoid or minimize the adverse effects of proposed actions and to restore and enhance environmental quality as much as possible must be developed and discussed where feasible.
19.2.2 State Regulations
California regulations are equal to or more stringent than federal regulations. EPA has granted the State primary oversight responsibility to administer and enforce hazardous waste management programs. State regulations require planning and management to ensure that hazardous wastes are handled, stored, and disposed of properly to reduce risks to human health and the environment. State regulatory requirements are found in the California Health and Safety Code, and CCR, Titles 22 and 26. California’s hazardous materials regulations include the California Hazardous Waste Requirements (22 CCR 66261–66268, 67426–66429, and 67780).
National Aeronautics and Space Administration Chap 19. Hazardous Materials and Site Contamination
NASA Ames Research Center Environmental Resources Document Environmental Management Division March 2015 File: 2015 ARC ERD_FINAL.doc
Pg 354
19.2.2.1 Hazardous Materials Release Response Plans and Inventory Act of 1985
The Hazardous Materials Release Response Plans and Inventory Act, also known as the Business Plan Act, requires businesses using hazardous materials to prepare a hazardous materials business plan that describes their facilities, inventories, emergency response plans, and training programs. Hazardous materials are defined as raw or unused materials that are part of a process or manufacturing step. They are not considered hazardous waste. Health concerns pertaining to the release of hazardous materials, however, are similar to those relating to hazardous waste.
19.2.2.2 Hazardous Waste Control Act
The Hazardous Waste Control Act created the state hazardous waste management program, which is similar to, but more stringent than, the federal Resource Conservation and Recovery Act program. The act is implemented by regulations contained in 26 CCR, which describes the following required aspects for the proper management of hazardous waste:
Identification and classification
Generation and transport
Design and permitting of recycling, treatment, storage, and disposal facilities
Treatment standards
Operation of facilities and staff training
Closure of facilities and liability requirements
These regulations list more than 800 materials that may be hazardous and establish criteria for their identification, packaging, and disposal. Under the Hazardous Waste Control Act and 26 CCR, the generator of hazardous waste must complete a manifest that accompanies the waste from the generator to the transporter to the ultimate disposal location. Copies of the manifest must be filed with the DTSC.
19.2.2.3 Emergency Services Act
Under the Emergency Services Act, the state developed an emergency response plan to coordinate emergency services provided by federal, state, and local agencies. Rapid response to incidents involving hazardous materials or hazardous waste is an important part of the plan, which is administered by the California Office of Emergency Services. The office coordinates the responses of other agencies, including the EPA, California Highway Patrol, RWQCBs, air quality management districts, and county disaster response offices.
19.2.2.4 California Occupational Safety and Health Administration Standards
Workers potentially exposed to hazardous material, hazardous waste or contaminated media are subject to monitoring and personal safety equipment requirements established in California Occupational Safety and Health Administration (Cal/OSHA) regulations (Title 8).Title 8 specifically addresses airborne contaminants and controls pertaining to asbestos and lead exposure during construction activities. The primary intent of the Title 8
National Aeronautics and Space Administration Chap 19. Hazardous Materials and Site Contamination
NASA Ames Research Center Environmental Resources Document Environmental Management Division March 2015 File: 2015 ARC ERD_FINAL.doc
Pg 355
requirements is to protect workers, but compliance with some of these regulations would also reduce potential hazards to non-construction workers and project area occupants because required site monitoring, reporting and other controls would be in place.
Workers who are in direct contact with soil or groundwater containing hazardous levels of constituents would perform all activities in accordance with a hazardous operations site-specific health and safety plan (HSP), as outlined in Cal/OSHA standards. An HSP is not required for workers such as heavy equipment operators, carpenters, painters, or other construction workers who would not be performing investigation or remediation activities where direct contact with materials containing hazardous levels of constituents could occur. However, elements of an HSP protect those workers who may be adjacent to cleanup activities by establishing engineering controls, monitoring, and security measures to prevent unauthorized entry to cleanup sites and to reduce hazards outside the investigation/cleanup area.
In addition to an HSP, Cal/OSHA requires that sites on the NPL must have a risk management plan (RMP) that is reviewed and approved by the RWQCB and administered by the responsible party. The RMP identifies specific measures to reduce potential risks to human and ecological populations during construction of the proposed project for each site or group of sites to be developed. The RWQCB follows EPA guidelines for risk management.
EPA, RWQCB, and DTSC guidelines define potential health risks associated with chemical exposure as excess lifetime cancer risk and non-cancer toxicity. Excess lifetime cancer risk is estimated from exposure concentrations, exposure duration and risk/potency factors. The calculated cancer risk approximates the probability of an individual developing cancer over the course of a lifetime due to exposure to a cumulative dose of a potential carcinogen.
Unlike cancer risk estimates, the measure used to describe the potential for non-carcinogenic toxic effects to occur is expressed in terms of a hazard index (HI), which is calculated as the ratio of the predicted acute or chronic exposure (dose) of a non-carcinogenic substance to that chemical’s toxicity threshold, often referred to as the reference dose. The HI assumes that there is a level of exposure below which it is unlikely, even for sensitive populations, to experience adverse health effects. Because there are inherent uncertainties and assumptions used in the modeling, the final calculated risk values are viewed as conservative estimates of exposure risk.
19.2.3 Local Regulations
The Santa Clara County Department of Environmental Health regulates hazardous material storage and use at ARC. The regulatory requirements are specified in the Hazardous Materials Storage Ordinance (County of Santa Clara, March 17, 2003) and the Toxic Gas Storage Ordinance (County of Santa Clara).
All hazardous material storage areas are permitted by the County of Santa Clara based on the individual facility, the maximum quantity of the material stored, and by its hazard class. Typical hazard classes found at ARC are compressed gases, flammable liquids and solids, oxidizers, organic peroxides, poisons, corrosives, and other regulated materials. The permits are compared with current inventories annually to ensure that the appropriate permits are maintained for each facility at ARC.
National Aeronautics and Space Administration Chap 19. Hazardous Materials and Site Contamination
NASA Ames Research Center Environmental Resources Document Environmental Management Division March 2015 File: 2015 ARC ERD_FINAL.doc
Pg 356
19.2.4 Other Laws, Regulations, and Programs
Various laws, regulations, EOs, and other requirements are applicable to hazardous materials management, including:
Safe Drinking Water and Toxic Enforcement Act of 1986 (Proposition 65), which requires labeling of substances known or suspected by the State of California to cause cancer
California Government Code Section 65962.5, which requires the Office of Permit Assistance to compile a list of possible contaminated sites in the State of California
Comprehensive Environmental Response, Compensation, and Liability Information System
National Priorities List for Uncontrolled Hazardous Waste Sites
Emergency Planning and Community-Right-to-Know Act of 1986 (Public Law 99-499)
Superfund Amendments and Reauthorization Act, Title III, Sections 312 and 313
Pollution Prevention Act of 1990 (42 USC 13101 et seq.)
Resource Conservation and Recovery Act of 1976, as amended by the Hazardous and Solid Waste Amendments of 1984 (42 USC 6002)
Presidential Executive Order 12969, Federal Acquisition and Community Right-To-Know Presidential Executive Order 13423 Strengthening Federal Environmental, Energy, and Transportation Management
Presidential Executive Order 13514, Federal Leadership in Environmental, Energy, and Economic Performance
Hazardous Waste Source Reduction and Management Review Act of 1989 (Senate Bill 14), CCR Title 22, Sections 67100.4, 67100.5
NASA Procedural Requirements 8530.1A Affirmative Procurement Program and Plan for Environmentally Preferable Products.
19.3 Regional Setting
A plume of contaminated groundwater flows northward beneath ARC toward the San Francisco Bay. At present, the plume underlies a total of 130 hectares (320 acres) of ARC, most of which is within the NRP area. The main contaminants in the plume are volatile organic compounds (VOCs), among them TCE, 1,1,1-TCE, cis- and trans- 1,2 DCE, 1,1-DCE, 1,1-DCE, dichlorobenzene, chloroform, Freon 113, phenol, and C2H3Cl. The first two are the most commonly found.
The Regional Plume stems from two main sources: an EPA-designated Superfund site outside of ARC at the MEW site across U.S. Highway 101, and contamination from operations at Moffett Field during the Navy’s administration of the base.
National Aeronautics and Space Administration Chap 19. Hazardous Materials and Site Contamination
NASA Ames Research Center Environmental Resources Document Environmental Management Division March 2015 File: 2015 ARC ERD_FINAL.doc
Pg 357
Another solvent-contaminated groundwater plume exists in the former Orion Park military housing area immediately adjacent to ARC and has migrated onto the west portion of ARC. The regulatory agencies have not identified the responsible parties for the plume. ARC is voluntarily operating an air sparging and soil vapor extraction system located on the western ARC boundary to mitigate this plume (see Figure 19-1, Extent of Regional Plume and Orion Park Plume).
19.4 Existing Site Conditions
ARC’s core businesses are astrobiology, nanotechnology, information technology, aviation systems, airspace operations, research and development, and related support operations. Resident agencies conduct a variety of activities, including research and development, airfield operations, administrative, and military support operations. As such, routine operations require the use of numerous types and quantities of hazardous materials, resulting in the generation of hazardous and nonhazardous wastes at ARC.
ARC, including tenants and resident agencies, uses a wide variety of hazardous materials for research and operations. At any given time, there may be more than 5,000 hazardous substances in the laboratories, shops, and other facilities within the Ames Campus area, producing a comparable number of types of hazardous waste. The quantities from laboratories are often small: ounces or grams of particular substances; quantities from shops and other operations may be greater than 55 gallons.
Both ARC, tenants, and resident agencies are responsible for regulatory compliance at the site. Tenant and resident agency organizations are responsible for obtaining hazardous materials permits required for their operations and preparing emergency response plans and procedures. These organizations are required to comply with the same regulations as ARC. The PCB and radiation safety programs are managed collectively over the entire ARC site.
In addition, NASA is dedicated to sustaining an effective environmental protection culture. A significant aspect of that culture is pollution prevention. NASA’s pollution prevention strategy is to eliminate or reduce the use of hazardous substances, to reuse or recycle hazardous materials, to dispose of hazardous materials and hazardous waste in an environmentally safe manner, to buy recycled products, and to recycle.
19.4.1 Restoration Sites
Hazardous materials consisting of solvents, metals, PCBs and petroleum products have been released to the environment on Former NAS Moffett Field and ARC (Site) from operations conducted by the US Navy and NASA. In addition, groundwater contaminated with solvents (MEW Regional Plume) has migrated onto NAS Moffett Field and ARC. The sources of this contaminated groundwater are responsible parties (MEW Companies) located south of NAS Moffett Field. A second solvent-contaminated groundwater plume is located immediately west of ARC and has migrated onto ARC. The responsible parties for the western plume have not been identified by the EPA or the State.
The NAS Moffett Field Superfund site was listed on the NPL in July 1987 (52 Fed. Reg. 27620), and the Navy has been addressing contamination pursuant to the Navy’s 1990
National Aeronautics and Space Administration Chap 19. Hazardous Materials and Site Contamination
NASA Ames Research Center Environmental Resources Document Environmental Management Division March 2015 File: 2015 ARC ERD_FINAL.doc
Pg 358
Moffett Federal Facility Agreement (FFA), as amended in 1994. The 1990 FFA requires the Navy to conduct remedial investigations and feasibility studies, conduct removal actions, and select and implement remedial actions to protect human health and the environment at NAS Moffett Field. Similarly, the MEW Companies have been addressing contamination from the MEW Superfund Site that reaches onto the Moffett Field pursuant to the 1991 Unilateral Administrative Order (UAO) and 1992 Consent Decree (CD), both as amended.
In 1994, a majority portion of NAS Moffett Field, with the exception of the Wescoat, Orion Park, and Shenandoah housing, is subject to a MOU that established roles for conduct of environmental restoration and ongoing environmental compliance at NAS Moffett Field.
As the current land owner of NAS Moffett Field, NASA has a combined role at the Site. NASA must address its own sources of contamination while also implementing Land Use Controls (LUCs) that ensure the protectiveness of other parties’ response actions at the Site, including the CERCLA response actions at NAS Moffett Field being conducted by Navy and by the MEW Companies.
In the early 1990s, ARC implemented the Center-Wide Sampling and Analysis Program (CWSAP), to evaluate potential soil and groundwater issues at NASA Ames. The CWSAP identified ten (10) Areas of Investigation (AOIs) at ARC. Seven (7) additional AOIs have been designated since that time when new information has been identified indicating the need for further investigation and possible remediation. The 1994 CWSAP and subsequent evaluations identified areas of potential soil and groundwater contamination from any source. The designated AOIs, shown on Figure 19-2, encompass broad areas containing potential NASA and/or non-NASA sources of contamination requiring further investigation.
Certain cleanup areas at NAS Moffett Field have been designated as “Sites” or “Operable Units,” or “OUs,” under the Navy Moffett FFA which require the Navy to implement investigations and response actions at Moffett, as shown on Figure 19-2. Some Navy-designated Sites include NASA AOIs. Certain of these Sites require ongoing ICs to ensure protectiveness.
The MEW Regional Plume constitutes a Superfund Cleanup at the Site that requires ongoing investigation, remediation, and implementation of ICs to ensure protectiveness. The MEW Regional Plume includes both NASA AOIs and a Navy OUs, as shown on Figure 19-2.
NASA Ames has executed a FFA with US EPA Region IX and the State of California. The general purposes of this FFA are to:
Ensure that the environmental impacts associated with NASA’s past and present activities at the Site are thoroughly investigated and appropriate remedial action taken as necessary to protect the public health, welfare and the environment;
Establish a procedural framework and schedule for developing, implementing and monitoring appropriate response actions at the portions of the Moffett Field Site where NASA was a source of contamination, in accordance with CERCLA, as amended by SARA, the NCP, Superfund Guidance and policy, RCRA, RCRA Guidance and policy, and applicable state law;
National Aeronautics and Space Administration Chap 19. Hazardous Materials and Site Contamination
NASA Ames Research Center Environmental Resources Document Environmental Management Division March 2015 File: 2015 ARC ERD_FINAL.doc
Pg 359
Ensure that response actions taken by the Navy and by the MEW Companies on the Site currently owned by NASA that require implementation of LUCs in order to be fully protective of human health and the environment are completed through landowner implementation of those associated LUCs, and
Facilitate cooperation, exchange of information and participation of the Parties in such actions.
The current areas undergoing investigation or restoration by the Navy, NASA and other responsible parties on NAS Moffett Field and ARC are shown on Figures 19-1-19-3 and are described below.
19.4.1.1 Areas of NASA ARC Responsibility
Area of Investigation (AOI) 14: AOI 14 consists of three peninsulas, the twelve-acre Former Soils Fill Area (FSFA), Building N217 Fill Area, and Building N217A Fill Area, within the northern SWRP that serves as actual and potential habitat for several ecological receptors. ARC deposited fill within AOI 14 that contained PCBs, DDT, lead, chromium, cadmium and zinc.
AOIs 3, 7, and 9: AOIs 3, 7, and 9 were broad areas identified for investigation of potential ARC and Navy source areas to groundwater contamination that contribute to the MEW Regional Plume. This groundwater contamination is primarily VOCs. In accordance with EPA’s 1989 MEW Study Area ROD, the MEW Companies, the Navy, and NASA have been operating groundwater extraction and treatment systems to address and control various portions of the MEW Regional Plume. These activities are conducted by the Navy under the 1990 Moffett FFA with the Navy and under a UAO and CD with the MEW Companies. To date, NASA Ames has been implementing the remedy in its designated area of responsibility pursuant to a separate agreement with the MEW Companies.
AOI 3 includes a number of formerly independent AOIs, specifically (1) AOI 1 - Former N-211 Jet Fuel Depot; (2) AOI 2 - N239, N239A, N210, N243 and N243A Area; (3) AOI 3 – USTs in N248A, N248B, and N259 Area; (4) AOI 3 East - N248, N248C and N248D Areas; and (5) AOI 12 – the N211 Hangar Area. Any remediation of these areas would be addressed in accordance with EPA’s 1989 MEW Study Area ROD. NASA Ames has entered into a separate agreement with the MEW Companies concerning allocation of work for AOI 3 under which NASA Ames is conducting the remediation of petroleum compounds and the MEW Companies are conducting remediation of the VOCs. No wells are specifically associated with these areas at this time.
AOI 7 includes Navy Site 8 North and ARCs’ Vertical Takeoff and Landing Pad. Historic documents indicate that solvents and oils were released from drums stored by the Navy at Site 8. Previous actions included the removal of both contaminated soil (excavation and disposal) and groundwater (excavation pit dewatering, treatment and discharge) by ARC. In 2000, ARC installed two extraction wells (NASA-3A and NASA-4A) in the shallow A Aquifer at AOI 7 for treatment of Navy Site 8 VOC releases within the MEW Regional Plume.
AOI 9 was originally identified by NASA Ames for further investigation of potential sources contributing to the MEW Regional Plume. No NASA Ames or other sources have been
National Aeronautics and Space Administration Chap 19. Hazardous Materials and Site Contamination
NASA Ames Research Center Environmental Resources Document Environmental Management Division March 2015 File: 2015 ARC ERD_FINAL.doc
Pg 360
identified in the area of AOI 9, however NASA Ames has agreed to take responsibility for Regional Plume activities in this area under its agreements with the MEW Companies. NASA Ames remedy operation and data reporting feed into Navy and MEW Companies monitoring reports on the MEW Regional Plume. Groundwater contamination was found to be elevated in this area, and, in 2000, NASA Ames installed two extraction wells (NASA-1A and NASA-4A) in the shallow A Aquifer downgradient of Building N240. NASA-2A (AOI 7) and NASA-4A (AOI 9) were shutdown in 2009 due to low performance and have not been returned to service or replaced.
Vapor Intrusion: EPA amended the 1989 ROD to select a vapor intrusion remedy for the MEW Superfund Site in its August 16, 2010 ROD Amendment for the Vapor Intrusion Pathway (2010 MEW ROD Amendment). The 2010 MEW ROD Amendment addresses the potential long-term exposure risks from TCE and VOCs through the vapor intrusion pathway. Vapor intrusion is an exposure pathway from the shallow subsurface contamination that is currently being addressed by actions under the MEW Superfund Site’s 1989 ROD.
The primary source of vapor intrusion into buildings within the MEW Superfund Site is TCE contamination in the shallow groundwater; accordingly, the Vapor Intrusion Study Area is generally defined as the area where TCE concentrations in shallow groundwater are greater than 5 g/L, or ppb. In September 2011, EPA worked with the MEW Companies, NASA Ames, and the Navy to develop the Statement of Work (SOW) for the Vapor Intrusion Remedy Remedial Design and Remedial Action (September 2011 SOW). All work required pursuant to this September 2011 SOW is referred to herein as Vapor Intrusion Work.
Pursuant to an agreement among NASA Ames, Navy, and the MEW Companies, each entity is responsible for implementing the Vapor Intrusion Remedy in a designated area, as depicted on the map attached as Figure 19-3. Pursuant to an agreement between the MEW Companies and NASA, ARC is responsible for implementing the Vapor Intrusion Work within the Vapor Intrusion Study Area – Moffett Field Area in the area designated as the “NASA Vapor Intrusion Area.” The MEW Companies and the Navy are responsible for conducting the Vapor Intrusion Work in other designated areas under their respective enforcement instruments.
AOI 6: The Lindbergh Avenue Storm Drainage Channel/Ditch (“Ditch”) was an approximate 2000 foot-long open, concrete-lined channel located along Lindbergh Avenue in the northeastern portion of NASA Ames that collected runoff from McCord Road, King Road, Severyns Road, the aircraft ramp and western portion of NAS Moffett Field, including the area surrounding Hangar 1. The channel was closed in 1993 with the replacement of a new storm drain system that drains stormwater from NASA Ames and the western areas of NAS Moffett Field to the SWSB located within the Eastern Diked Marsh in the northwestern portion of NASA Ames. Contaminants of concern associated with the former ditch were PCBs (Aroclors 1254, 1260, 1262 and 1268), lead and petroleum constituents. NASA Ames conducted investigation and remediation at AOI 6 in 1994-1996, 2000 and 2001. In 1994, the concrete liner was removed and the entire length of the ditch south of the diversion box was over-excavated to a depth of approximately 3.5 feet. In 2000, additional soil samples were collected along the entire length of the former ditch, and in 2001, additional soil north of the
National Aeronautics and Space Administration Chap 19. Hazardous Materials and Site Contamination
NASA Ames Research Center Environmental Resources Document Environmental Management Division March 2015 File: 2015 ARC ERD_FINAL.doc
Pg 361
diversion box exceeding the then-existing petroleum, lead and PCB cleanup levels for NASA Ames and Navy IR Site 25 was removed. Upon completion of the 2001 excavation, the entire ditch was backfilled with imported soil to match the surrounding topographic conditions. A completion report describing NASA’s activities at AOI 6 will be submitted to document the cleanup actions taken at AOI 6 to date and determining whether future action is necessary.
Storm Water Settling Basin: The SWSB is a concrete basin approximately 100 feet long and 75 feet wide that receives all of the stormwater drainage from NASA Ames. The SWSB is located within the boundaries of Navy Site 25 Eastern Diked Marsh and the outfall from the SWSB enters the Eastern Diked Marsh. The primary contaminants in the sediment from the SWSB are PCBs, DDT, lead, and zinc. NASA Ames conducts annual sampling and maintenance of the settling basin and settling basin outfall area and provides the data to the Navy. These annual reports should be provided to EPA and the State. These areas will be further assessed to determine whether potential NASA Ames sources are impacting Navy Site 25.
Hangar 1: Hangar 1, Navy Moffett Site 29, was constructed by the Navy in 1932 to house the giant airship U.S.S. Macon. The hangar’s floor space covers 8 acres, and it stands 200 feet high. The building materials and paint used to construct Hangar 1 contain PCBs, asbestos, lead and zinc. Contaminants in these materials moved into the environment around the hangar and, ultimately, reached AOI 6 and Navy Site 25 through the storm drain system. In 2003, the Navy completed a time-critical removal action that coated the exterior of Hangar 1 to seal the materials on the building surface. In July 2008, the Navy issued an Engineering Evaluation/Cost Analysis recommending removal of the Hangar 1 siding and coating the structural steel frame, and in January 2009, the Navy signed an Action Memorandum documenting selection of this recommended alternative. The Navy has removed the Hangar siding, coated the steel frame, and has finalized the After Action Completion Report and Long-Term Management Plan addressing long-term maintenance and LUCs. A Final ROD to finalize the Hangar response actions is currently being developed by the Navy. Although this is a Navy OU, and NASA is not a source of contamination at Hangar 1, NASA Ames has agreed to take over operation and maintenance of the following specific elements of Hangar 1: (1) walkway to the beacon, (2) clam shell door hinge pins, (3) thirty-six trucks supporting the doors, (4) the four door gear drive motors, and (5) the hangar’s electrical vaults (with the exception of electrical vault five). NASA will document and perform remedy operation and maintenance of these elements, as well as any operation and maintenance elements that NASA agrees to implement, in a NASA-specific long-term management plan for Hangar 1. The Navy remains responsible for the operation and maintenance for all other portions of the Hangar 1 remedy, including maintenance of the coating on the structural steel frame. As land owner, NASA is responsible for LUCs associated with the Navy’s ROD for Hangar 1.
19.4.1.2 Areas Subject to NASA Land Use Controls
Navy Installation Restoration (IR) Sites 1 and 2: Navy IR Sites 1 and 2 are former landfills located in the northern portion of NAS Moffett Field and make up Navy OU1. The Site 2 Landfill is now referred to as the Site 2 Former Landfill, because the waste material was removed and transferred to Site 1 as part of remedy implementation and Site 2 was
National Aeronautics and Space Administration Chap 19. Hazardous Materials and Site Contamination
NASA Ames Research Center Environmental Resources Document Environmental Management Division March 2015 File: 2015 ARC ERD_FINAL.doc
Pg 362
closed with No Further Action status in 2003. In 1997, the Navy and regulatory agencies signed the OU1 ROD. The Navy installed a multi-layer landfill cap at Site 1 in November 1998. Long-term maintenance of the cap and landfill gas and groundwater monitoring at Site 1 began in 1999 to ensure that the landfill was not emitting unacceptable levels of gas and that contaminants were not leaching into the groundwater or the San Francisco Bay. The OU1 ROD also listed the ICs that needed to be implemented for the Site. Two Five-Year Reviews for OU1 have been completed (2002 and 2007), each concluding that the remedy continues to be protective of human health and the environment in the short term, but noting that for long-term protectiveness, ICs needed to be implemented.
Navy IR Site 22: The Site 22 landfill covers 11 acres. The Navy operated the landfill from approximately 1950 to 1967, primarily for domestic waste disposal. The landfill waste is buried a minimum of 3 feet below the ground surface. By 1973, the Site 22 landfill had been converted into holes 3, 6 and 7 of the Moffett Field Golf Course. Between 1994 and 1999, the Navy conducted an RI of the soil and groundwater and characterized the type and extent of contaminants throughout Site 22. Site 22 soil and groundwater contain VOCs, semi-volatile organic compounds, and pesticides. Groundwater monitoring is being conducted by the Navy to ensure that contaminants are not migrating away from Site 22. In June 2002, the Navy issued a ROD signed by EPA and the Regional Water Board selecting use of a biotic barrier as the Site 22 remedy in order to prevent animal access to the landfill and listing the Site 22 ICs. The biotic barrier was completed in August 2003. Regular maintenance and long-term monitoring of groundwater and landfill gas is ongoing at Site 22 by the Navy, as required under the September 2003 Post-Construction Operations, Maintenance, and Monitoring Plan. The Navy completed a Five-Year Review for the Site 22 Landfill in 2008 which concluded that the remedy continues to be protective of human health and the environment in the short term, but noting that for long-term protectiveness, ICs needed to be implemented.
Hangar 1: The Navy addressed long-term maintenance of the Hangar 1 Removal Action in the June 2013 Hangar 1 Final Long-Term Management Plan, which referenced ICs to be selected in the Final ROD for the Hangar. The Navy is developing a Final ROD for the Hangar which includes LUCs for the Navy Hangar 1 response actions.
Vapor Intrusion Remedy: EPA’s 2010 ROD Amendment for Vapor Intrusion includes the use of ICs to ensure the ongoing implementation of the Vapor Intrusion remedy. These ICs include preventing interference with the current implementation of the Vapor Intrusion remedy, ensuring ongoing implementation of the remedy in future development, and providing information to building occupants about the remedy being implemented. With regard to all areas of the Site currently owned by NASA that are part of the MEW Vapor Intrusion Study Area, the Vapor Intrusion Work for NASA includes implementation of those ICs.
19.4.1.3 NASA Areas of Investigation within the Ames Campus
AOI 4 consists of the courtyard area within the NFAC (40- by 80-Foot and 80- by 120-Foot wind tunnels). Several of the underground storage tanks leaked, and all have been removed. Soil and groundwater has been impacted by Jet Fuel and gasoline contaminants. ARC is implementing groundwater monitoring under a voluntary agreement with the DTSC.
National Aeronautics and Space Administration Chap 19. Hazardous Materials and Site Contamination
NASA Ames Research Center Environmental Resources Document Environmental Management Division March 2015 File: 2015 ARC ERD_FINAL.doc
Pg 363
AOI 5 includes two electrical substations (Buildings N-225 and N-225A), a drum storage area, and one underground storage tank located in the western portion of the Ames Campus. The drum storage area was closed in the mid-1980s, and the tank was removed in 1990. The electrical substations remain. Analyses of soil and groundwater samples from within AOI 5 have detected petroleum hydrocarbons, PCBs, and VOCs. The oversight agency for AOI 5 is DTSC.
AOI 8 is referred to as the Navarro farms area and includes Building N-267 and a bioremediation pad located at the northwest corner of ARC. Excavation of petroleum-impacted soil was completed and the site was closed by the DTSC.
AOI 10 includes three electrical substations not included in other AOIs. Transformer oil containing PCBs was used historically in many transformers. Excavation of PCB-contaminated soils at the Building N-221C Substation was completed and AOI 10 was closed by the DTSC.
AOI 11 includes 14 existing or former underground storage tanks at nine sites not located in other AOIs. . All of the three former single-wall tanks at the Building N-251 motor pool were replaced with two double-wall tanks and the remaining tanks were removed. Contamination remains at Tank Sites 7 and U-14. New Tanks 25 and 26 (Motor Pool) are still in use. The remaining tank sites are now clean. The oversight agency for AOI 11 is DTSC.
AOI 13 is contained within Navy IR Site 25.
AOI 15 consists of the NASA Fuel Line, which was clean closed under oversight of Santa Clara County.
Orion Park Plume is a solvent-contaminated groundwater plume exists in the former Orion Park military housing area immediately adjacent to the west of ARC and has migrated onto the west portion of ARC. The regulatory agencies have not identified the responsible parties for the plume. ARC is voluntarily operating an air sparging and soil vapor extraction system located on the western ARC boundary to mitigate this plume.
19.4.1.4 Navy Installation Restoration Program Sites
Navy IR Site 1: The IR Site 1 landfill is described above, and is currently in long-term monitoring and maintenance by the Navy.
Navy IR Site 2: The Site 2 golf course landfill is described above and was closed.
Navy IR Site 3: The site consists of a ditch along the eastern side of Marriage Road approximately 6 feet below grade. Storm drains located in and near Hangars 2 and 3 discharged detergents, hydraulic fluids, oils, fuels, solvents, detergents, paint, and paint stripper into this ditch, parts of which are lined with concrete. Based on site investigations the Navy, EPA, DTSC, and RWQCB signed a No-Action ROD for site soil. The low levels of solvent contamination in the aquifer below the site are being addressed under Navy IR Site 26.
Navy IR Site 4 consists of a former, unlined industrial wastewater holding pond that received approximately 15 million gallons of wastewater from airfield operations,
National Aeronautics and Space Administration Chap 19. Hazardous Materials and Site Contamination
NASA Ames Research Center Environmental Resources Document Environmental Management Division March 2015 File: 2015 ARC ERD_FINAL.doc
Pg 364
including aircraft washing and equipment maintenance. It was removed, closed, and replaced by new ponds in the late 1970s. No unacceptable risks to human health were identified for soil and a No-Action ROD was signed in 1994 for soil. Solvent contamination in the shallow aquifer below the site is being addressed under IR Site 26.
Navy IR Site 5 is the main fuel facility for Moffett Field. The fuel farm is divided into two parts: Site 5 north and south. Originally, the fuel farm consisted of 10 underground bulk storage tanks and four aboveground storage tanks. Six of the underground tanks were removed in 1995 from Site 5 south. The remaining eight tanks, four underground and four aboveground, are located in Site 5 north. These tanks are planned for removal and closure by the Defense Logistics Agency. There is soil and groundwater contamination at both locations, with the heaviest contamination in Site 5 north. The Navy is currently studying the site as part of its petroleum sites evaluation and closure program to determine what remediation will be needed. There is no remediation effort currently underway at Site 5.
Navy IR Site 6 is an area just north of Hangars 2 and 3 where it is believed that liquid wastes from aircraft maintenance, including paint, paint stripper, oil, fuel, and solvents, may have been released before it was paved in 1979. The Navy reports that No Further Action (NFA) was approved by the regulatory agencies for site soil and that solvent contamination in the shallow aquifer below the site is being addressed under Navy IR Site 26.
Navy IR Site 7 comprises the paved/unpaved areas surrounding and including Hangars 2 and 3.Unpaved areas in the corners of each of the hangars were used to dispose of liquid wastes from aircraft maintenance, including solvents, fuel, paint, paint stripper, and hydraulic fluid. In addition, a power plant in the northeastern corner of Hangar 3 may have released solvents on unpaved areas around the hangar. The Navy reports that NFA was approved by the regulatory agencies for site soil and that solvent contamination in the shallow aquifer below the site is being addressed under Navy IR Site 26.
Navy IR Site 8 is a former chemical storage and oil transfer area located in the northeastern portion of ARC. From the 1940s through 1981, this area had a 19,000-liter (5,000-gallon) waste oil tank and sump, which reportedly also received transformer oils (possibly containing PCBs) and solvents. Oil spilled during transfer contaminated some soils on the site. The tank and sump were removed in 1981, and NASA remediated contaminated soils in the northern portion of Site 8 through excavation and offsite disposal in 1994. The Navy states that Site 8 is closed.
Navy IR Site 9 consists of an old fuel farm and NEX Service Station and includes two former groups of underground fuel tanks and their associated piping. Fuel leakage from the tanks and pipes contaminated both subsurface soils and groundwater. Groundwater contamination from Site 9 mixed with the solvents in the MEW Regional Plume, and is being remediated by the Navy’s Westside Aquifer Treatment System (WATS). The Navy determined that the soil contamination met the RWQCB’s requirements for low-risk closure, and no further work on the soil is planned by the Navy.
Navy IR Site 10 is known as the Chase Park and runway areas. Groundwater is contaminated with VOCs believed to be from the MEW Regional Plume and is being addressed under Navy IR Site 28.
National Aeronautics and Space Administration Chap 19. Hazardous Materials and Site Contamination
NASA Ames Research Center Environmental Resources Document Environmental Management Division March 2015 File: 2015 ARC ERD_FINAL.doc
Pg 365
Navy IR Site 11 is an area near the northeastern end of the runway that was used to test aircraft engines. The site is covered with a concrete and asphalt pad, but a small drainage depression likely carried spilled hydraulic fluid, waste oil, and fuel to the southern edge of the pad. The Navy reports that NFA was approved by the regulatory agencies for site soil and that solvent contamination in the shallow aquifer below the site is being addressed under Navy IR Site 26.
Navy IR Site 12 is the former fire-fighting training area north of Hangar 1 on the west side of the runway. Jet fuels spilled during training have contaminated subsurface soils. Most of the contaminated soil (5,500 cubic yards), was removed in 1993. Because Zook Road and the west parallel taxiway border the site, it was not possible to remove all of the contaminated soil. The Navy evaluated the remaining contamination at Site 12 and found that it was not a threat to human or ecological receptors. The Navy reports that the site is closed and no further work is planned.
Navy IR Site 13 is a paved area east of Hangars 2 and 3 that is used as a parking lot. A surface drainage ditch received industrial wastewater from equipment washing, leaks, and spills. The drainage ditch flows to the main storm sewer. The Navy reports that NFA was approved by the regulatory agencies for site soil and that solvent contamination in the shallow aquifer below the site is being addressed under Navy IR Site 26.
Navy IR Site 14 North includes two former underground tanks located near the former dry cleaning building (Building 88) just south of Hangar 1. Free product and extensive groundwater contamination (up to 150 feet below ground surface) from solvents (PCE, TCE) have been documented. The Navy is currently evaluating treatment options and is preparing a work plan for pilot study of in-situ chemical oxidation for source treatment. Also see description for Site 18.
Navy IR Site 14 South is the former CANG motor pool. There is both soil and groundwater contamination from two underground tanks and associated piping, which have been removed. Originally, a groundwater pump-and-treat system was used to remediate the site. Low permeability soils limited flow rates, however, so this approach was abandoned. Then a remediation system involving recirculating and treating the groundwater in place was operated. Currently, the Navy is allowing the site to attenuate naturally, although benzene levels in the groundwater still exceed the cleanup level.
Navy IR Site 15 includes nine sumps, one oil/water separator, and an underground storage tank which have been removed. The Navy reports that Site 15 is closed.
Navy IR Site 16 consisted of two catch basins that drained a concrete wash pad to an underground oil/water separator. They were removed, and no contamination was found. The Navy reports that Site 15 is closed.
Navy IR Site 17 is the sump for the paint shop, which received wastes including oil and latex-based paints, thinners, toluene, and turpentine. The sump and surrounding contaminated soils were removed in 1991. No contamination remains at the site and the Navy reports that Site 17 is closed.
Navy IR Site 18 is the sump on the northern (down gradient) side of the former dry cleaning building (Building 88). The sump was removed, and no contamination from it was
National Aeronautics and Space Administration Chap 19. Hazardous Materials and Site Contamination
NASA Ames Research Center Environmental Resources Document Environmental Management Division March 2015 File: 2015 ARC ERD_FINAL.doc
Pg 366
found. However, the dry cleaning building, foundation, and underground piping were demolished and removed along with approximately 300 cubic meters (400 cubic yards) of soils contaminated with cleaning solvents. See above description for Site 14 North.
Navy IR Site 19 includes four underground storage tanks that have been removed. One of the tanks is believed to be a source of the solvent contamination in the groundwater in the Eastside/Airfield area. Groundwater treatment is being addressed under Navy IR Site 26.
Navy IR Site 20 is an area north of Hangar 1 adjacent to the airfield where off-specification fuels were stored in aboveground tanks removed in 1982. Fuels spilled from these tanks accumulated in low areas near the taxiways, runways and Zook Road. Soil and groundwater are contaminated with low levels of petroleum products. The Navy has determined that Site 20 meets the criteria for low-risk closure, and states that the site is closed.
Navy IR Site 21 is a surface drainage ditch on the northern edge of the Eastside/Airfield area that carries some of the stormwater flow from the eastern side of ARC. Reportedly, waste fluids, including transmission fluid, hydraulic fluid, and motor oil, were dumped here. The Navy reports that this site is closed.
Navy IR Site 22 is described above, and is currently in long-term monitoring and maintenance by the Navy.
Navy IR Site 23 is a former, 2-acre landfill approximately located immediately south of the northern weapons bunker area. There is no record of the source of the landfilled material, but construction and landscaping materials such as concrete, asphalt, grass clippings, and mulch have been observed at the site. Aluminum airplane parts and electronic equipment were also observed. There is no evidence of any hazardous materials, and the Navy states that the site is closed.
Navy IR Site 24 includes the fuel pits in Hangar 1, the high-speed fuel facility on the east side of the base, and the fuel wharf. No petroleum contamination was found at the Hangar 1 fuel pits, though there are solvents in the underlying groundwater. Minor amounts of contamination were found at the fuel wharf and the high-speed fuel facility. The Navy states that the site is closed.
Navy IR Site 25 includes the Eastern Diked Marsh and northern SWRP. The Navy completed sediment removal to address ecologic risk from PCBs, pesticides, and metals. The Navy reports that the site is closed and is currently completing pickleweed restoration in the pond area.
Navy IR Site 26: Site 26 consists of two distinct chlorinated VOC groundwater plumes located east of the NAS Moffett Field runways, in the area of Hangar 3, that impact the upper portion of the A aquifer. In 1996, the Navy and regulatory agencies signed the OU 5 ROD for the Site 26 remedy. In 1999, the Navy began operation of the East-side Aquifer Treatment System (EATS). The remedy for the southern plume required extraction and treatment until contaminant levels meet drinking-water (MCLs, groundwater monitoring, and implementation of ICs to prevent human exposure to, or ingestion of, contaminated groundwater. The remedy for the northern plume only requires groundwater monitoring. In 2003, the Navy proposed to replace the existing remedy with biostimulation/bioaugmentation, monitored natural attenuation, and new ICs, and a draft
National Aeronautics and Space Administration Chap 19. Hazardous Materials and Site Contamination
NASA Ames Research Center Environmental Resources Document Environmental Management Division March 2015 File: 2015 ARC ERD_FINAL.doc
Pg 367
ROD amendment was approved in 2014. EATS was turned off in 2003. Two Five-Year Reviews for Site 26 have been completed (2005 and 2010), each concluding that the existing remedy continues to be protective of human health and the environment in the short term, but noting that ICs need to be implemented in order to reach long-term protectiveness.
Navy IR Site 27 includes the Northern Channel, North Patrol Road Ditch, and Marriage Road Ditch. The principal contaminant is PCBs. The Navy completed excavation of contaminated sediments and reports that the site is closed.
Navy IR Site 28 consists of the WATS for remediating the Navy’s area of responsibility within the MEW Regional Plume.
Navy IR Site 29 is Hanger 1 and is described above.
19.4.1.5 Other Potential Sources of Hazardous Materials
This section summarizes known information regarding storage tanks, lead-based paint, asbestos, PCBs, spent abrasive materials, radon, mold, medical/biohazardous waste, and pesticides at ARC.
19.4.1.5.1 Storage Tanks
Several hundred underground storage tanks have been present at ARC; most of them have been removed. The removed tanks are in various stages of the closure and/or remedial investigation process. Many of the aboveground storage tanks, sumps, and oil/water separators were also removed. Tanks that were still needed and in compliance were kept, while others were replaced with double-wall tanks.
19.4.1.5.2 Lead-Based Paint
Many of the buildings at ARC have been surveyed for lead-based paint. Because lead-based paint was in common use before 1978, it is assumed that the majority of the buildings at ARC contain it. Sampling has also found lead contamination in the soils surrounding some of the buildings that had lead-based exterior paint.
19.4.1.5.3 Asbestos
As with lead-based paint, most of the buildings at ARC have been tested for asbestos-containing materials (ACMs). ACMs were in common use into the 1970s and were found in almost all of the buildings tested. Common ACMs at ARC include pipe lagging, floor and ceiling tile, sheetrock, waterlines, and gasket material.
19.4.1.5.4 Polychlorinated Biphenyls
There is a substantial amount of documentation of the presence of PCBs at ARC, including a base-wide inventory conducted by the Navy prior to handover, and quarterly inspections still being carried out by the NASA Environmental Management Division in compliance with 40 CFR 761. Known items containing PCBs include capacitors, regulators, oil fuse
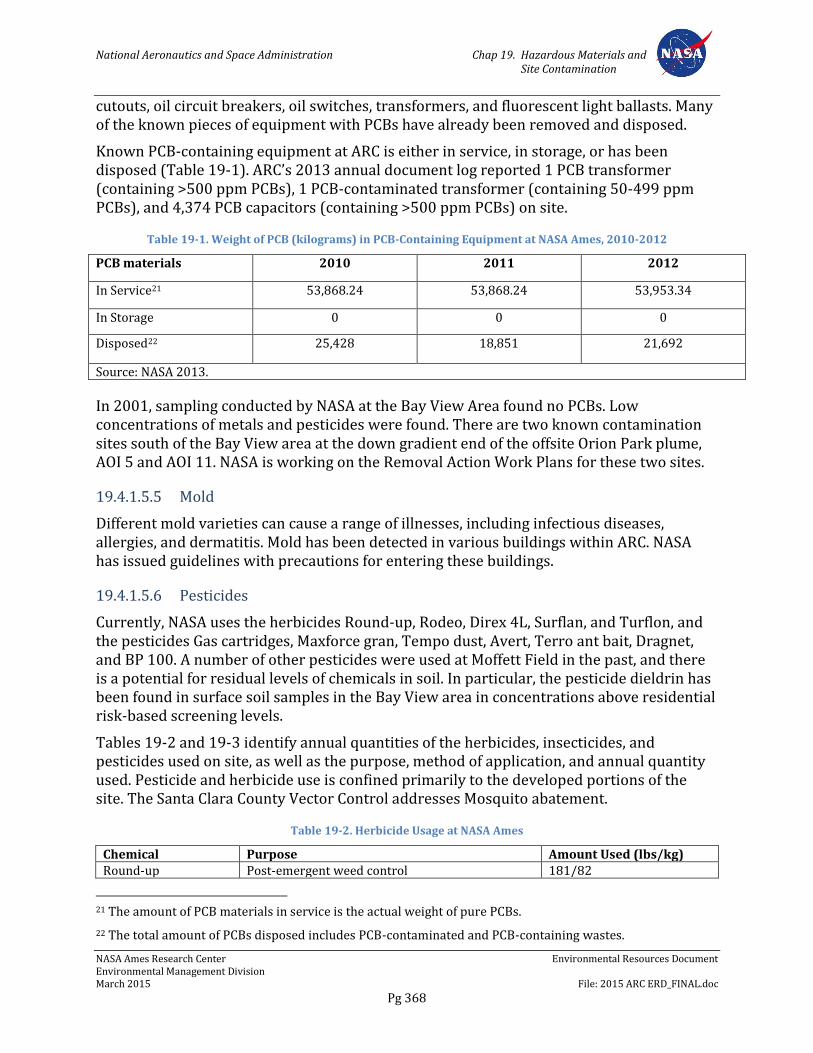
National Aeronautics and Space Administration Chap 19. Hazardous Materials and Site Contamination
NASA Ames Research Center Environmental Resources Document Environmental Management Division March 2015 File: 2015 ARC ERD_FINAL.doc
Pg 368
cutouts, oil circuit breakers, oil switches, transformers, and fluorescent light ballasts. Many of the known pieces of equipment with PCBs have already been removed and disposed.
Known PCB-containing equipment at ARC is either in service, in storage, or has been disposed (Table 19-1). ARC’s 2013 annual document log reported 1 PCB transformer (containing >500 ppm PCBs), 1 PCB-contaminated transformer (containing 50-499 ppm PCBs), and 4,374 PCB capacitors (containing >500 ppm PCBs) on site.
Table 19-1. Weight of PCB (kilograms) in PCB-Containing Equipment at NASA Ames, 2010-2012
PCB materials 2010 2011 2012
In Service21 53,868.24 53,868.24 53,953.34
In Storage 0 0 0
Disposed22 25,428 18,851 21,692
Source: NASA 2013.
In 2001, sampling conducted by NASA at the Bay View Area found no PCBs. Low concentrations of metals and pesticides were found. There are two known contamination sites south of the Bay View area at the down gradient end of the offsite Orion Park plume, AOI 5 and AOI 11. NASA is working on the Removal Action Work Plans for these two sites.
19.4.1.5.5 Mold
Different mold varieties can cause a range of illnesses, including infectious diseases, allergies, and dermatitis. Mold has been detected in various buildings within ARC. NASA has issued guidelines with precautions for entering these buildings.
19.4.1.5.6 Pesticides
Currently, NASA uses the herbicides Round-up, Rodeo, Direx 4L, Surflan, and Turflon, and the pesticides Gas cartridges, Maxforce gran, Tempo dust, Avert, Terro ant bait, Dragnet, and BP 100. A number of other pesticides were used at Moffett Field in the past, and there is a potential for residual levels of chemicals in soil. In particular, the pesticide dieldrin has been found in surface soil samples in the Bay View area in concentrations above residential risk-based screening levels.
Tables 19-2 and 19-3 identify annual quantities of the herbicides, insecticides, and pesticides used on site, as well as the purpose, method of application, and annual quantity used. Pesticide and herbicide use is confined primarily to the developed portions of the site. The Santa Clara County Vector Control addresses Mosquito abatement.
Table 19-2. Herbicide Usage at NASA Ames
Chemical Purpose Amount Used (lbs/kg) Round-up Post-emergent weed control 181/82
21 The amount of PCB materials in service is the actual weight of pure PCBs.
22 The total amount of PCBs disposed includes PCB-contaminated and PCB-containing wastes.
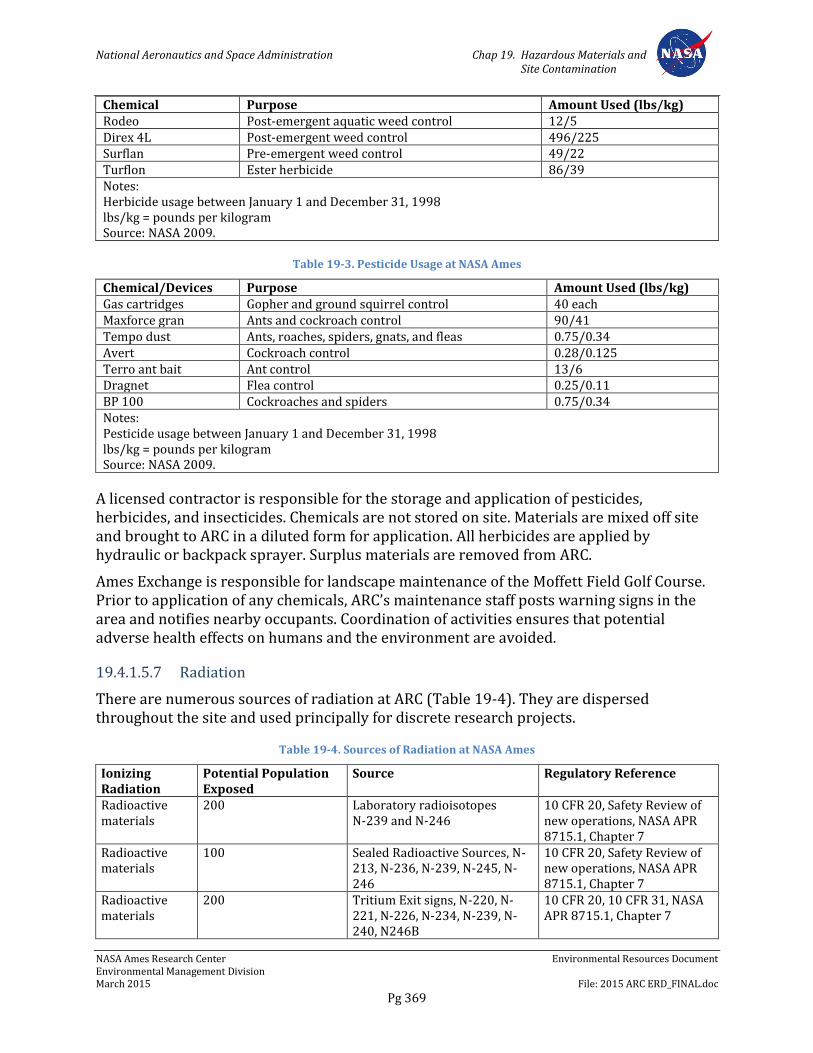
National Aeronautics and Space Administration Chap 19. Hazardous Materials and Site Contamination
NASA Ames Research Center Environmental Resources Document Environmental Management Division March 2015 File: 2015 ARC ERD_FINAL.doc
Pg 369
Chemical Purpose Amount Used (lbs/kg) Rodeo Post-emergent aquatic weed control 12/5 Direx 4L Post-emergent weed control 496/225 Surflan Pre-emergent weed control 49/22 Turflon Ester herbicide 86/39 Notes: Herbicide usage between January 1 and December 31, 1998 lbs/kg = pounds per kilogram Source: NASA 2009.
Table 19-3. Pesticide Usage at NASA Ames
Chemical/Devices Purpose Amount Used (lbs/kg) Gas cartridges Gopher and ground squirrel control 40 each Maxforce gran Ants and cockroach control 90/41 Tempo dust Ants, roaches, spiders, gnats, and fleas 0.75/0.34 Avert Cockroach control 0.28/0.125 Terro ant bait Ant control 13/6 Dragnet Flea control 0.25/0.11 BP 100 Cockroaches and spiders 0.75/0.34 Notes: Pesticide usage between January 1 and December 31, 1998 lbs/kg = pounds per kilogram Source: NASA 2009.
A licensed contractor is responsible for the storage and application of pesticides, herbicides, and insecticides. Chemicals are not stored on site. Materials are mixed off site and brought to ARC in a diluted form for application. All herbicides are applied by hydraulic or backpack sprayer. Surplus materials are removed from ARC.
Ames Exchange is responsible for landscape maintenance of the Moffett Field Golf Course. Prior to application of any chemicals, ARC’s maintenance staff posts warning signs in the area and notifies nearby occupants. Coordination of activities ensures that potential adverse health effects on humans and the environment are avoided.
19.4.1.5.7 Radiation
There are numerous sources of radiation at ARC (Table 19-4). They are dispersed throughout the site and used principally for discrete research projects.
Table 19-4. Sources of Radiation at NASA Ames
Ionizing Radiation
Potential Population Exposed
Source Regulatory Reference
Radioactive materials
200 Laboratory radioisotopes N-239 and N-246
10 CFR 20, Safety Review of new operations, NASA APR 8715.1, Chapter 7
Radioactive materials
100 Sealed Radioactive Sources, N-213, N-236, N-239, N-245, N-246
10 CFR 20, Safety Review of new operations, NASA APR 8715.1, Chapter 7
Radioactive materials
200 Tritium Exit signs, N-220, N-221, N-226, N-234, N-239, N-240, N246B
10 CFR 20, 10 CFR 31, NASA APR 8715.1, Chapter 7

National Aeronautics and Space Administration Chap 19. Hazardous Materials and Site Contamination
NASA Ames Research Center Environmental Resources Document Environmental Management Division March 2015 File: 2015 ARC ERD_FINAL.doc
Pg 370
Ionizing Radiation
Potential Population Exposed
Source Regulatory Reference
Radioactive materials
100 Industrial Radiographies (Iridium 192) centerwide
10 CFR 34, Safety review of new operations, NASA APR 8715.1, Chapter 7
Radioactive materials
5 Moisture density gauge (cesium/americium) N-246, and centerwide
10 CFR 20, 10 CFR 30, Safety review of new operations, NASA APR 8715.1, Chapter 7
Radiation machines
40 X-ray machines, Electron microscopes Buildings N-230, N-234, N-236, N-237, N-239, N-240, N-242, N-244, and N-255
CCR Title 17, Safety review of new operations
Radar 20 Radar transmitters/Receivers centerwide
ANSI/IEEE C95.1, NCRP Report #86, Safety review of new operations, NASA APR 8715.1, Chapter 8
Microwaves 50 Microwave transmitters, research use of microwave energy, centerwide
ANSI/IEEE C95.1, NCRP Report #86,Safety review of new operations, NASA APR 8715.1, Chapter 8
Incoherent UV 40 UV lamps, N-223, N-229, N-239, N-240, N-245,
ACGIH BEI & TLV, Safety review of new operations, NASA APR 8715.1, Chapter 8
Coherent Infrared, UV, and visible spectrum
250 Lasers (total of about 100) at various fixed and temporary locations throughout center
ANSI Z136.1, Safety review of new operations, NASA APR 8715.1, Chapter 8
Source: NASA 2009; Packard 2014.
Sources of ionizing radiation at the site include numerous sealed and unsealed sources of radioactive materials in laboratory use, a moisture density gauge, radiation detection equipment calibrator, a gamma irradiation device, and a variety of X-ray-generating machines used mostly for research purposes. The primary radioactive isotopes used at ARC in laboratory experiments are carbon-14, Phosphorous-32, Iodine-125, Sulfur-35, and tritium (Hydrogen-3). Low to high activity sealed sources of Cesium-137, Strontium/Yttrium-90, and Americium-241 are used for various laboratory research and animal/sample irradiation. Large industrial sources of iridium are brought on site by offsite contractors and used for industrial radiography. The quantities of radionuclide in use generally are expressed in microcuries or millicuries.
Sources of nonionizing radiation at the site include lasers, microwave, radio frequency transmitters, and UV radiation (UV lamps) used for research and routine uses. Much of the research use includes Class 3B and Class 4 lasers. The lasers are used in laboratories, wind tunnels, on the runways, and on experimental aircraft. Microwave and radar units are used primarily by the Ames communications group in Code IO and for some research purposes including ground penetrating radar, solid waste water recovery processing. A small group of researchers is investigating the biological and physical properties of UV radiation. There are numerous sources at ARC of Extremely Low Frequency and Ultra Low Frequency radiation, which have not been shown to be harmful. The Non-Ionizing Radiation Safety
National Aeronautics and Space Administration Chap 19. Hazardous Materials and Site Contamination
NASA Ames Research Center Environmental Resources Document Environmental Management Division March 2015 File: 2015 ARC ERD_FINAL.doc
Pg 371
Committee and the Radiation Safety Committee provide oversight for the safe use of these radiation sources. Radioactive waste is stored in a decay-in-storage facility licensed by the Nuclear Regulatory Commission (NRC). A commercial radioactive waste broker removes radioactive waste materials not maintained for decay or containing RCRA-controlled materials from the site to be disposed of off-site at licensed facilities.
19.4.1.5.8 Other Potential Sources
Some medical or bio-hazardous waste has been and is generated within ARC. At present, very small quantities of medical and bio-hazardous wastes are generated in three locations at the center due to research activities and the operation of the center’s Health Unit. There are a few locations, such as the wind tunnels, where uncontrolled blasting could have occurred at ARC. Testing has not found any radon levels above the EPA’s action levels.
19.4.1.6 Adjacent Off-Site Contamination
During the investigation and monitoring activities for NASA AOIs 4 and 11, low levels of TCE were discovered in the groundwater in Orion Park. In order to locate the source of TCE, NASA conducted several investigations. A review of well data and subsurface geology indicates that the TCE is coming from the offsite housing area, and then flowing beneath the western portion of the Ames Campus. The U.S. Navy is planning to continue with the investigation of Orion Park in order to determine the source of the TCE. NASA is also conducting further investigation of the area to better define subsurface conditions with the goal of implementing some control measures to prevent further migration of TCE onto the Ames Campus and to prevent its migration beneath Bay View. Potential hazardous materials contamination may also exist in the nearby Mountain View industrial area, where some hazardous materials users operate.
19.5 Environmental Requirements
NASA has identified the following environmental policies, practices, and measures that address potential hazardous materials effects of operations and future development at ARC.
19.5.1 NASA Procedural Directive 8500.1, NASA Environmental Management
Per NPD 8500.1, it is NASA policy to: maintain compliance with all applicable federal, state, and local environmental requirements; to incorporate environmental risk reduction and sustainable practices to the extent practicable throughout NASA’s programs, projects, and activities; and to consider environmental factors throughout the life cycle of programs, projects, and activities (as defined in NPD 7120.4, NASA Engineering and Program/Project Management Policy, and related documents), including planning, development, execution, and disposition activities. Examples of environmental factors include consideration of environmental impacts as required by the NEPA and NHPA; the proposed use of hazardous materials; the potential for waste generation; the need to acquire necessary permits, waivers, and authorizations; and the use of environmentally-preferable materials and processes wherever practicable.
National Aeronautics and Space Administration Chap 19. Hazardous Materials and Site Contamination
NASA Ames Research Center Environmental Resources Document Environmental Management Division March 2015 File: 2015 ARC ERD_FINAL.doc
Pg 372
19.5.2 NASA Procedural Requirements 8553.1, NASA Environmental Management System
NPR 8553.1 sets forth requirements for the NASA EMS, which functions primarily to: (1) incorporate people, procedures, and work practices into a formal structure to ensure that the important environmental impacts of the organization are identified and addressed; (2) promote continual improvement, including periodically evaluating environmental performance; (3) involve all members of the organization, as appropriate; and (4) actively involve senior management in support of the EMS.
Agencywide, the EMS employs a standardized approach to managing environmental activities that allows for efficient, prioritized system execution, while at the same time helping to improve environmental performance and to maintain compliance with applicable environmental regulations and requirements. NASA’s EMS approach involves identifying all activities, products, and services under each NASA center’s control, and the environmental aspects associated with each centers’ continued engagement in those activities, products, and services. Once identified, priority environmental aspects are assigned a risk ranking (from 1 to 4, based on its severity and frequency of occurrence) and are evaluated on a continual basis as means of highlighting associated positive or negative impacts and setting objectives and targets to reduce environmental risk. Each center’s EMS also identifies methods for ensuring compliance by keeping abreast of environmental requirements. This includes requirements by law (EOs, federal regulations, state and local laws) and voluntary commitments made by the center or NASA.
19.5.3 Ames Procedural Requirements 8500.1, Ames Environmental Procedural Requirements
APR 8500.1 sets forth general procedural requirements to ensure compliance with applicable federal, state, and local environmental laws; regulations and EOs; and NASA policies and procedures. Organizational directors, division chiefs, branch chiefs, section heads, supervisors, managers, and CORs are responsible for planning, designing, constructing, managing, operating, and maintaining facilities in conformance with applicable regulatory directives, and should obtain environmental review from the Environmental Management Division early in project planning consistent with NASA's NEPA implementing procedures (NPR 8580.1 and EO 12114), NASA policies and procedures for programs and projects (NPR 7120), and NASA regulations related to environmental quality (14 CFR 1216). Program and project managers should coordinate with the Environmental Management Division in a timely manner to ensure that any new or modified programs, projects, and activities comply with regulatory requirements.
19.5.4 Ames Procedural Requirements 8553.1, Ames Environmental Management System
APR 8553.1 sets forth requirements for the Center-level EMS in accordance with NPR 8553.1B, NASA Environmental Management Systems. The ARC EMS also includes consideration of the findings of NASA Headquarters’ triennial (3-year) Environmental Functional Review and other external EMS audits, as required.
National Aeronautics and Space Administration Chap 19. Hazardous Materials and Site Contamination
NASA Ames Research Center Environmental Resources Document Environmental Management Division March 2015 File: 2015 ARC ERD_FINAL.doc
Pg 373
Under the ARC EMS, the Center conducts an annual risk analysis across Center activities to determine which of 16 environmental aspects are of high or medium priority. The Center then identifies objectives (goals) and targets and develops action plans known as Environmental Management Plans to reduce identified risks. Currently, the high- and medium-priority environmental aspects of Center business activities are Air Emissions, Hazardous Material Management, Water and Energy Conservation, and Other Sustainability Practices. Objectives associated with these high- and medium-priority environmental aspects include:
Reducing air (including GHG) emissions through energy efficiency
Improving hazardous material management
Improving energy and water efficiency
Providing for the integration of other sustainability practices into Center activities
19.5.5 Ames Environmental Work Instructions
Ames’s EWIs, which replace the previous Ames Environmental Handbook (APR 8800.3), set forth requirements to ensure that programs, projects, and activities at ARC comply with applicable federal, state, and local laws; regulations and EOs; and NASA policies and procedures. Each EWI lists relevant regulatory authorities and documents, assigns individual and organizational responsibilities within ARC, and identifies specific requirements applicable to the work being performed.
The following EWIs are relevant to potential hazardous materials effects from operations and future development at ARC.
EWI 3-1, Aboveground Storage Tanks (AST)
EWI 3-2, Underground Storage Tanks (UST)
EWI 3-3, SPCC Plan
EWI 4, Solid Waste and Recycling
EWI 5, Chemical Management
EWI 5-1, Hazardous Materials
EWI 5-2, Hazardous Waste Management
EWI 5-3, Toxic Gas Management
EWI 5-4, Medical Waste
EWI 5-5, PCBs
EWI 6, Emergency Preparedness and Community Right-to-Know
EWI 6-1, BEAP Program
EWI 7, Closure Plan I
EWI 8, Restoration
National Aeronautics and Space Administration Chap 19. Hazardous Materials and Site Contamination
NASA Ames Research Center Environmental Resources Document Environmental Management Division March 2015 File: 2015 ARC ERD_FINAL.doc
Pg 374
EWI 9, Emergency Response
EWI 10, Environmental Training (Under review)
EWI 11, Instrument Calibration (Under review)
EWI 12, Public Involvement
EWI 14, NEPA and Environmental Justice
EWI 17, Pollution Prevention/Affirmative Procurement (Under review)
EWI 18, Environmental Requirements for Construction Projects (Under review)
19.5.6 Hazardous Materials and Wastes
A number of protocols are in place throughout ARC to control the hazards associated with hazardous substances and to minimize the risks of exposure or spills. NPRs and ARC’s EWIs ensure that the center meets all federal, state, and local hazardous materials and hazardous waste regulations. The Hazardous Waste Minimization Plan prescribes actions that will reduce ARC’s hazardous waste output.
Container management rules intend to decrease the impacts of hazardous materials. Container management general rules include:
Limit storage to a 1-week supply, if feasible
Return containers to storage location daily
Keep containers tightly closed when not in use
Do not remove or deface manufacturers' labels
Label all containers to meet Hazard Communication or Lab Standard requirements
Store corrosives below shoulder height
Store poisons separately in a controlled area
Store flammable liquids (> 10 gallons) in vented cabinets
Store refrigerated flammables in a “desparked” refrigerator
Segregate chemically incompatible materials
Observe special rules for flammable and toxic gases
Secondary containment for stored liquids and liquids in use
As discussed above, all hazardous material storage areas at ARC must comply with the Santa Clara County Hazardous Materials Storage Ordinance and Toxic Gas Storage Ordinance by obtaining and keeping current the appropriate permits (e.g. hazardous materials storage permits, toxic gas storage permits, temporary fuel tank permits, etc.). Detailed procedures for managing hazardous materials are found in EWI 5-1, Hazardous Materials Management. In addition, NASA implements internal policies and procedures to prevent accidental releases of toxic gas by users. The quantities of toxic gases stored on site
National Aeronautics and Space Administration Chap 19. Hazardous Materials and Site Contamination
NASA Ames Research Center Environmental Resources Document Environmental Management Division March 2015 File: 2015 ARC ERD_FINAL.doc
Pg 375
are limited and monitored quarterly to minimize impacts from an accidental release of toxic gas at ARC.
NASA’s Hazardous Materials Management Program identifies sources of information on hazardous materials. The plan includes avenues for employees to choose the least hazardous material, minimize quantities of hazardous materials used, minimize the sources of hazardous waste, plan for appropriate storage, and plan for controls (including engineering (ventilation, and sensors), administrative (procedures), and personal protective equipment).
Various hazardous materials are used at ARC in research projects and day-to-day operations. It is a requirement for all ARC employees who handle hazardous waste to be trained in hazardous waste management, release response, and environmental essentials. Hazardous materials users are required to prepare accurate hazardous materials inventory statements (HMIS). Each HMIS includes the location, type, and amount of hazardous materials and associated hazards. ARC prepares a Center-wide HMIS annually; the centerwide HMIS is submitted to Santa Clara County’s Hazardous Materials Compliance Division.
Each hazardous materials storage area is inspected regularly to ensure that all containers are in good condition and that secondary containment systems are free of liquid. Discrepancies are promptly corrected. ARC has implemented procedures for managing hazardous materials. These procedures are found in EWI 5-1, Hazardous Materials Management. All civil servants, contractor employees, and resident agency personnel at ARC who use, store, or manage hazardous materials are required to follow these procedures.
Toxic gases are used in various research projects and in day-to-day operations. These gases are typically contained in small lecture bottles and cylinders and must be stored in appropriate cabinets and controlled areas.
To minimize potential community impacts, a policy was implemented at ARC in spring 1997 that limits the quantity of toxic gas that can normally be used or stored on site. Toxic gas users that may require larger quantities would be required to prepare an offsite consequence analysis, in accordance with EPA and other applicable protocols, to determine the potential for impacting nearby communities during a worst-case release of toxic gas. ARC monitors the amount of toxic gas kept on site by completing quarterly inventories that document the type, location, and amount of toxic gas on site.
The Radiation Safety Committee supervises and monitors all activities at ARC that might involve radiation hazards. The Ames’ Radiation Safety Committee is composed of the Radiation Safety Officer and members of the ARC scientific community experienced in the handling and safeguarding of radiation sources and radioactive materials. The Ionizing Radiation Committee authorizes use, prepares hazard analyses, establishes safety practices, and approves facilities in which radiation sources will be used, and generally supervises and monitors all ARC activities in which radiation hazards may be a factor.
The Radiation Safety Officer, appointed by Ames’ Director with the concurrence of the NRC, works with the Ames’ Occupational Safety, Health, and Medical Services Office performing
National Aeronautics and Space Administration Chap 19. Hazardous Materials and Site Contamination
NASA Ames Research Center Environmental Resources Document Environmental Management Division March 2015 File: 2015 ARC ERD_FINAL.doc
Pg 376
day-to-day radiation safety oversight. Radiation Safety Officer activities include training, maintaining controls of radioactive materials possession, experimental design, operation of ionizing radiation sources, administration of the NRC license audit, and measurement of all radionuclide-producing electronic emission devices. All ionizing radiation sources greater than NRC defined “generally licensed materials” are licensed or registered, depending on their use.
The Non-Ionizing Radiation Safety Committee oversees the use of nonionizing sources of radiation at the site. The Non-Ionizing Radiation Safety Committee is composed of the Laser Safety Officer and members of the ARC scientific community having experience in the handling and controls of nonionizing sources of radiation. The Non-Ionizing Radiation Safety Committee authorizes use, prepares hazard analyses, establishes safety practices, and approves facilities in which nonionizing radiation sources will be used, and generally supervises and monitors all ARC activities in which laser hazards may be a factor.
The Laser Safety Officer, appointed by the ARC Director, works with the Ames’ Occupational Safety, Health, and Medical Services Office performing day-to-day laser safety oversight. Laser Safety Officer activities include training, evaluations of new laser projects, assistance in experimental design, checks for proper operation, internal audits, and operations safety procedures.
The Hazardous Substance Reporting Protocols set procedures for reporting hazardous substances to outside regulatory agencies, which is done by the NASA Ames Environmental Management Division. Other personnel report hazardous substance inventory to the NASA Ames Environmental Management Division, and report hazardous substance spills to the NASA Ames Dispatch Office, which activates the spill response system.
The Hazardous Waste Disposal Procedures at ARC require that all hazardous wastes be transported to secure, ventilated packaging areas, from which they are packaged and transported to state and federally authorized treatment or disposal sites.
The PCBs Removal and Controlling Access Policy is stated in the EWI 5-1, Hazardous Materials Management. PCB management requirements at ARC include quarterly inspections, training, reporting and recordkeeping, spill cleanup and reporting, safe storage, transportation, and disposal. ARC implements ongoing efforts to remove PCB-containing equipment and light ballasts per regulatory compliance and through the replacement of obsolete items.
The Radioactive Waste Disposal Procedures require that all radioactive wastes be stored in N-246 Room 190 which is a separate concrete building outside the main N-246 building. Approximately every 6 months, a licensed contractor removes the packaged waste from the site and takes it to authorized disposal sites within the United States. NASA is authorized to hold radioactive material with a physical half-life of less than 120 days for decay-in-storage before disposal. ARC is licensed by NRC to possess and use radioactive materials. The Radioactive Materials License, 04-07845-04, is administered under supervision of the Ames Radiation Safety Committee.
Chapter 7 of the Ames Health and Safety Manual, APR 8715.1; Titles 10, 21, and 49 of the CFR; and Title 17 of the CCR provide the controls and procedures used to regulate ionizing
National Aeronautics and Space Administration Chap 19. Hazardous Materials and Site Contamination
NASA Ames Research Center Environmental Resources Document Environmental Management Division March 2015 File: 2015 ARC ERD_FINAL.doc
Pg 377
sources of radiation. Chapter 8 of the Ames Health and Safety Manual, ANSI Z136.1, ANSI/IEEE C95.1, and 29 CFR (Occupational Safety and Health Administration section) provide the controls and procedures used to regulate nonionizing sources of radiation.
NASA has also developed a strategic plan to guide its facilities in compliance with EO 12969, Federal Acquisition and Community Right-To-Know. The EO, adopted August 3, 1993, sets out to ensure federal facility compliance with the chemical reporting requirements of the Emergency Planning and Community-Right-to-Know Act of 1986 (42 USC Sections 11001–11050) and the requirements of the Pollution Prevention Act of 1990 (42 USC Sections 13101–13109).
19.5.7 Pollution Prevention
ARC is in the process of implementing NASA’s Environmental Excellence for the 21st Century strategy, which includes a pollution prevention plan consistent with the requirements of relevant federal and state regulations and laws. Pollution prevention refers to technology or operational changes that reduce the amount and/or toxicity of hazardous materials used and waste generated. Examples of pollution prevention practices include source reduction (through product substitution and source control), employee and management training in environmental best management practices, product redesign and process modification, reuse and recycling of materials, and treatment/disposal of wastes.
ARC has reduced solid and hazardous waste production, minimized impacts to the environment, and controlled air emissions through a variety of methods and technologies. In addition, ARC has routinely implemented recycling and educational programs to reach the ARC community and bring environmental issues to the forefront. In accordance with EOs 13514 and 13423, ARC’s goal is to increase waste prevention, recycling, and the purchase and use of recycled content and environmentally preferable products and services. The following are some of the pollution prevention programs and activities that are currently being implemented at ARC. ARC implements NASA’s pollution prevention strategy by:
Operating the Ames Chemical Exchange (ACE)
Maintaining accurate and up-to-date Building Emergency Action Plans and SPCC plans and ensuring that facility activities comply with the procedures within these plans
Reviewing and revising standard construction specifications to incorporate pollution prevention measures into all phases of a project and inspecting major construction projects to ensure compliance
Supporting and continually improving facility-wide recycling efforts
Promoting employee awareness of environmental programs through training and active information dissemination
Reducing the use and storage of hazardous materials through materials substitutions and more efficient procurement strategies
Promoting affirmative procurement of recycled goods and services
National Aeronautics and Space Administration Chap 19. Hazardous Materials and Site Contamination
NASA Ames Research Center Environmental Resources Document Environmental Management Division March 2015 File: 2015 ARC ERD_FINAL.doc
Pg 378
Identifying measures to reduce major hazardous waste streams
19.5.7.1 Mulching
All landscaping green waste is made into mulch in an area south of OARF for future landscaping use. A mulching program began in 1996 at ARC. At its inception, the program consisted of gathering yard waste from the Moffett Field Golf Course and composting it into green material active compost. During 1997, the program was extensively modified to include all landscape trimmings generated at ARC, and a limited amount of shredded paper. In addition, during scheduled periods, such as Pollution Prevention Week, employees are educated in the composting process and a composting open house is held at the mulching facility. This program has several benefits. It dramatically reduces the volume of material sent to landfills, saves money spent on landscape maintenance by reducing the purchase of soil amendments, and provides an educational opportunity for the ARC community.
19.5.7.2 Recycling and Source Reduction
ARC has implemented a single stream recycling program. Recycled materials included white paper, mixed paper, cardboard, plastics, toner cartridges, various types of batteries, fluorescent lamps, certain solvents, waste oil, oil filters, scrap metal, tires, computers, construction and demolition waste, empty drums, and plastic, glass, and glass containers. The motor pool currently recycles coolant, oil filters, and oils, and uses recycled oil. In addition, retread tires are used when possible. To minimize the amount of waste generated, ARC is dedicated to recycling used materials when possible. Reporting the quantities of recycled material is required for the following purposes:
EPA biennial reporting for hazardous waste generators
Annual Recycling and Sustainable Acquisition Report
Annual recycling update questionnaire submitted to NASA headquarters
Tracking progress toward established solid waste recycling goals
Tracking progress toward hazardous waste minimization goals
Tracking progress toward pollution prevention goals
19.5.7.3 Electronic Waste Recycling
NASA-owned computers and equipment that are surplus are managed by the Property Disposal Office, Code JSL. Ames computers that are turned in to the property disposal officer are staged in the N-255 warehouse for the required screening period. During this screening period, anyone at Ames or any other federal or state agency can claim the computer for internal government use. Equipment that is not donated or reutilized is sent to an approved processing facility for materials recovery within North America. The Ames Environmental Management Division, Code JQ, audits and approves the facility to ensure that the equipment is handled properly and that no e-waste is exported to overseas scrap markets, either directly or through recycling brokers.
National Aeronautics and Space Administration Chap 19. Hazardous Materials and Site Contamination
NASA Ames Research Center Environmental Resources Document Environmental Management Division March 2015 File: 2015 ARC ERD_FINAL.doc
Pg 379
19.5.7.4 Affirmative Procurement
ARC continues to promote affirmative procurement and uses recycled products whenever possible as the default items procured through Stores Stock, in accordance with RCRA Comprehensive Procurement Guidelines and EO 13514. The following practices are incorporated into all ARC activities and operations to promote cost-effective source reduction and to enhance recycling.
Recycled Products Purchasing - When purchasing/ordering items designated by EPA as being available with recycled content, all ARC employees and contractors shall purchase those items composed of the highest percentage of recovered materials practicable consistent with product performance requirements, quality, and safety.
Recycled Paper Use - All employees shall order and use printing and writing paper made from recycled materials instead of products made from virgin materials. Printing and writing paper ordered shall contain at least 100% recycled fibers (paper meeting the 50% recycled content requirement is currently available from onsite Stores Stock).
Double-Sided Photocopies - Reports, memos, and other paper documents shall be photocopied in double-sided format when possible.
Electronic Communication - Employees shall transfer documents electronically when possible.
Energy Conservation - All employees shall turn off lighting, printers, and other equipment when not in use and prior to leaving for the day, when feasible.
Reusable Products - All employees shall order and use non-disposable products or products that promote reuse (for example, ballpoint pens with replaceable ink cartridges and rechargeable batteries).
19.5.7.5 Energy
ARC reduces energy use whenever possible through a combination of alternative source of energy projects, relamping initiatives, Center-wide e-mails, and use of the Energy Saving Program Contract. New facilities and equipment shall include specifications for conserving water and energy. Examples include energy-saving lighting devices and golf course uses recycle water.
19.5.7.6 Chemicals and Ozone-Depleting Substances
Unused chemicals that are in good and stable condition are reused on site through the ACE program. The ACE is a chemical redistribution program that promotes the use of surplus chemicals. By using ACE, individuals and organizations save money by eliminating the purchase of new chemicals and reducing or eliminating disposal costs of surplus chemicals.
It is the responsibility of chemical purchasers to check the ACE inventory for product availability prior to purchasing new chemicals. This can be done with the assistance of the Ames Hazardous Materials Specialist. Every attempt is made to provide the ARC
National Aeronautics and Space Administration Chap 19. Hazardous Materials and Site Contamination
NASA Ames Research Center Environmental Resources Document Environmental Management Division March 2015 File: 2015 ARC ERD_FINAL.doc
Pg 380
community with alternatives to the purchase of new chemicals. All chemicals on site are tracked through a HMIS to ensure safety and possible source reduction.
An ozone-depleting substance (ODS) is a chemical substance, usually consisting of some combination of chlorine, fluorine, or bromine plus carbon, such as chlorofluorocarbons (CFCs) and hydrochlorofluorocarbons (HCFCs) that has been shown to destroy stratospheric ozone (The Border Center 2014). These substances are commonly found in aerosol products, foams, and fire extinguishers, and are used as refrigerants and in air-conditioning and cooling equipment.
ODS are regulated under the Title VI of the CAA and are divided into two classes:
Class I includes the fully halogenated CFCs, halons, and the ODSs that are the most threatening to the ozone layer.
Class II compounds include HCFCs, which are known or can be reasonably anticipated to have harmful effects on the stratospheric ozone layer.
ODS at ARC are reduced and eliminated whenever possible through process modifications and chemical substitutions. ARC continues to manage its stockpile of halon, a fire extinguishing agent used in aircraft and space vehicle firefighting, while looking for non-ODS alternatives. Additionally, Ames collects old refrigerators and air-conditioning units prior to disposal and drains any CFC- or HCFC-containing refrigerants (NASA 2011b).
19.5.7.7 Toxic Release Inventory
As a federal facility, Ames complies with section 301 through 313 of the EPCRA, which sets forth requirements for Toxic Release Inventory (TRI) reporting. TRI reporting is only triggered when a facility exceeds one or more of the three activity thresholds for manufacturing, processing, and otherwise use. Threshold calculations are based on cumulative quantities of each TRI chemical manufactured, processed or otherwise used over the reporting year. Ames quantifies the amount of each TRI chemical and chemical category involved in each of these three activities and compares the amounts to the thresholds. The TRI Chemical list includes over 650 listed TRI chemicals and compounds. Ames has 156 TRI chemicals and 23 compounds known to be used or present on site. None of these chemicals or compounds met reporting thresholds for the most recent reporting year (2012) (ERT 2013).
The estimated mass of the top 10 TRI chemicals and compounds ranged from 2-47% of the mass thresholds for reporting after relevant exemptions are taken. Among these chemicals and compounds, polycyclic aromatic compounds, lead, lead compounds, mercury and mercury compounds are listed persistent, bioaccumulative, and toxic (PBT) chemicals. PBT chemicals have lower activity thresholds for reporting than other chemicals.
19.5.7.8 Integrated Pest and Vegetative Management
The impact of pesticide use on biotic resources on site is minimal because ARC applies Integrated Pest Management (IPM) and Integrated Vegetation Management (IVM), which are complementary programs that employ methods designed to reduce impacts to the environment.
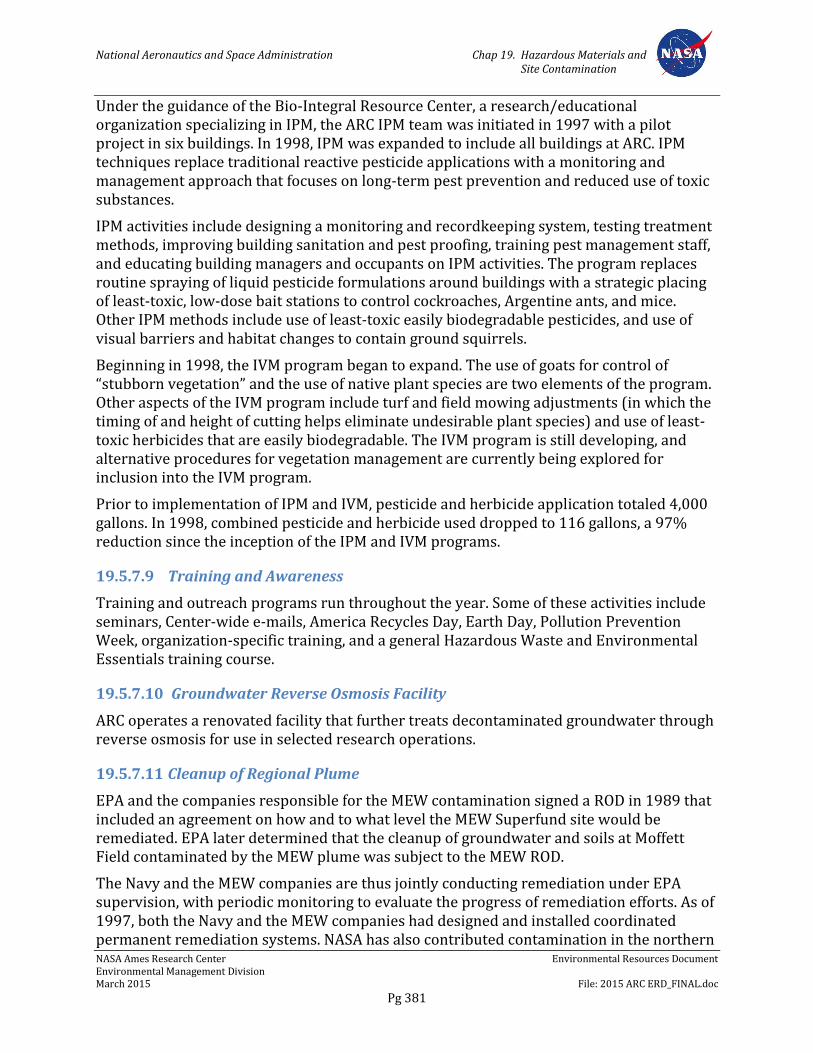
National Aeronautics and Space Administration Chap 19. Hazardous Materials and Site Contamination
NASA Ames Research Center Environmental Resources Document Environmental Management Division March 2015 File: 2015 ARC ERD_FINAL.doc
Pg 381
Under the guidance of the Bio-Integral Resource Center, a research/educational organization specializing in IPM, the ARC IPM team was initiated in 1997 with a pilot project in six buildings. In 1998, IPM was expanded to include all buildings at ARC. IPM techniques replace traditional reactive pesticide applications with a monitoring and management approach that focuses on long-term pest prevention and reduced use of toxic substances.
IPM activities include designing a monitoring and recordkeeping system, testing treatment methods, improving building sanitation and pest proofing, training pest management staff, and educating building managers and occupants on IPM activities. The program replaces routine spraying of liquid pesticide formulations around buildings with a strategic placing of least-toxic, low-dose bait stations to control cockroaches, Argentine ants, and mice. Other IPM methods include use of least-toxic easily biodegradable pesticides, and use of visual barriers and habitat changes to contain ground squirrels.
Beginning in 1998, the IVM program began to expand. The use of goats for control of “stubborn vegetation” and the use of native plant species are two elements of the program. Other aspects of the IVM program include turf and field mowing adjustments (in which the timing of and height of cutting helps eliminate undesirable plant species) and use of least-toxic herbicides that are easily biodegradable. The IVM program is still developing, and alternative procedures for vegetation management are currently being explored for inclusion into the IVM program.
Prior to implementation of IPM and IVM, pesticide and herbicide application totaled 4,000 gallons. In 1998, combined pesticide and herbicide used dropped to 116 gallons, a 97% reduction since the inception of the IPM and IVM programs.
19.5.7.9 Training and Awareness
Training and outreach programs run throughout the year. Some of these activities include seminars, Center-wide e-mails, America Recycles Day, Earth Day, Pollution Prevention Week, organization-specific training, and a general Hazardous Waste and Environmental Essentials training course.
19.5.7.10 Groundwater Reverse Osmosis Facility
ARC operates a renovated facility that further treats decontaminated groundwater through reverse osmosis for use in selected research operations.
19.5.7.11 Cleanup of Regional Plume
EPA and the companies responsible for the MEW contamination signed a ROD in 1989 that included an agreement on how and to what level the MEW Superfund site would be remediated. EPA later determined that the cleanup of groundwater and soils at Moffett Field contaminated by the MEW plume was subject to the MEW ROD.
The Navy and the MEW companies are thus jointly conducting remediation under EPA supervision, with periodic monitoring to evaluate the progress of remediation efforts. As of 1997, both the Navy and the MEW companies had designed and installed coordinated permanent remediation systems. NASA has also contributed contamination in the northern
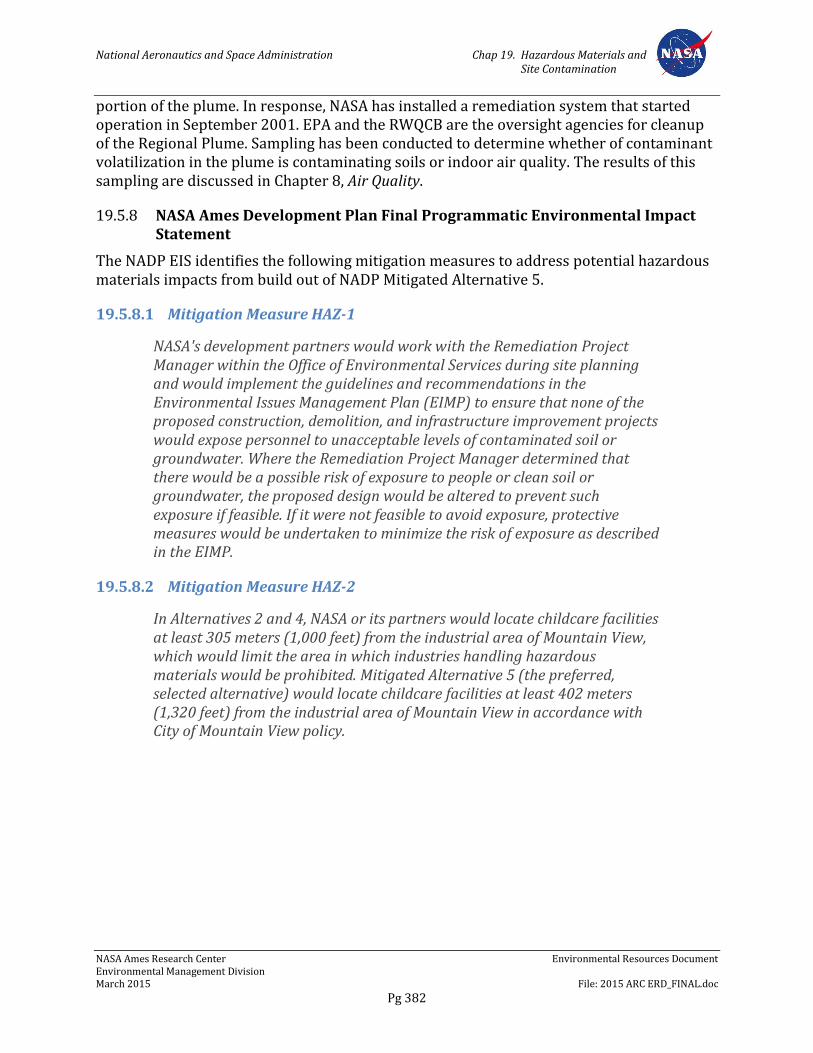
National Aeronautics and Space Administration Chap 19. Hazardous Materials and Site Contamination
NASA Ames Research Center Environmental Resources Document Environmental Management Division March 2015 File: 2015 ARC ERD_FINAL.doc
Pg 382
portion of the plume. In response, NASA has installed a remediation system that started operation in September 2001. EPA and the RWQCB are the oversight agencies for cleanup of the Regional Plume. Sampling has been conducted to determine whether of contaminant volatilization in the plume is contaminating soils or indoor air quality. The results of this sampling are discussed in Chapter 8, Air Quality.
19.5.8 NASA Ames Development Plan Final Programmatic Environmental Impact Statement
The NADP EIS identifies the following mitigation measures to address potential hazardous materials impacts from build out of NADP Mitigated Alternative 5.
19.5.8.1 Mitigation Measure HAZ-1
NASA's development partners would work with the Remediation Project Manager within the Office of Environmental Services during site planning and would implement the guidelines and recommendations in the Environmental Issues Management Plan (EIMP) to ensure that none of the proposed construction, demolition, and infrastructure improvement projects would expose personnel to unacceptable levels of contaminated soil or groundwater. Where the Remediation Project Manager determined that there would be a possible risk of exposure to people or clean soil or groundwater, the proposed design would be altered to prevent such exposure if feasible. If it were not feasible to avoid exposure, protective measures would be undertaken to minimize the risk of exposure as described in the EIMP.
19.5.8.2 Mitigation Measure HAZ-2
In Alternatives 2 and 4, NASA or its partners would locate childcare facilities at least 305 meters (1,000 feet) from the industrial area of Mountain View, which would limit the area in which industries handling hazardous materials would be prohibited. Mitigated Alternative 5 (the preferred, selected alternative) would locate childcare facilities at least 402 meters (1,320 feet) from the industrial area of Mountain View in accordance with City of Mountain View policy.
National Aeronautics and Space Administration Chap 19. Hazardous Materials and Site Contamination
NASA Ames Research Center Environmental Resources Document Environmental Management Division March 2015 File: 2015 ARC ERD_FINAL.doc
Pg 383
Figure 19-1. Extent of Regional Plume (right) and Orion Park Plume (left)
(Source: ERT 2014a).
National Aeronautics and Space Administration Chapter 19. Hazardous Materials and Site Contamination
NASA Ames Research Center Environmental Resources Document Environmental Management Division March 2015 File: 2015 ARC ERD_FINAL.doc
Pg 384
Figure 19-2. Restoration Sites
(Source: ChaduxTt JV 2010)
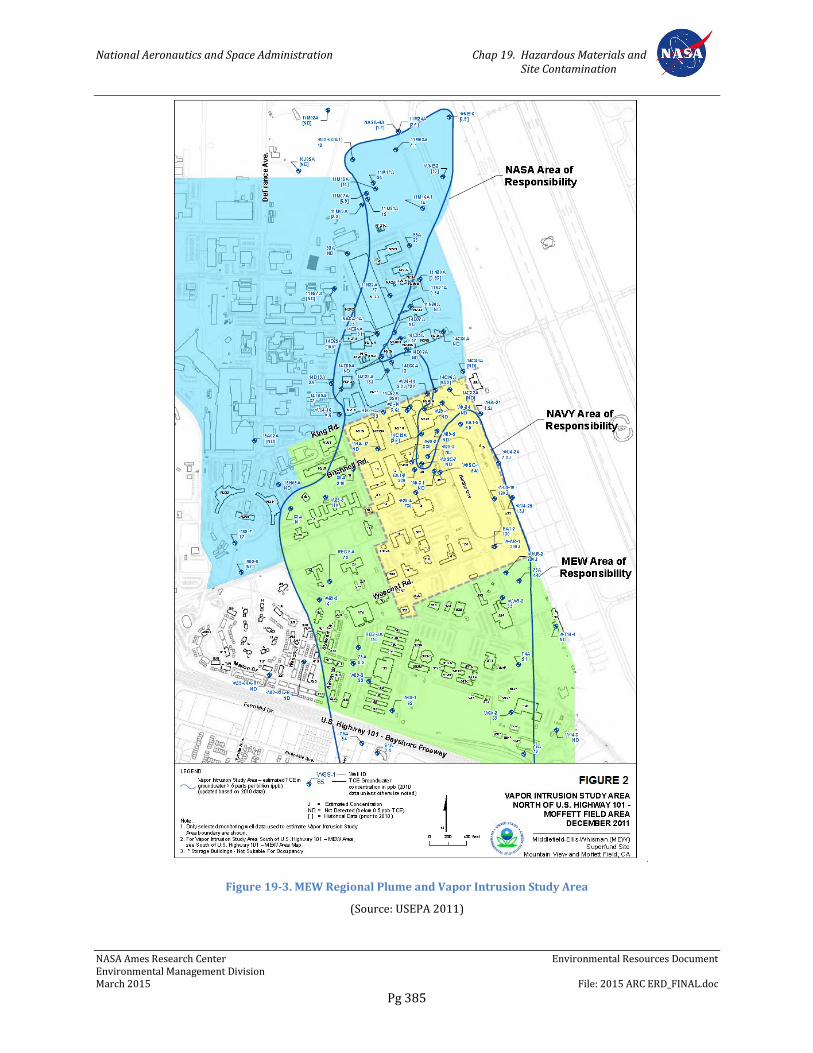
National Aeronautics and Space Administration Chap 19. Hazardous Materials and Site Contamination
NASA Ames Research Center Environmental Resources Document Environmental Management Division March 2015 File: 2015 ARC ERD_FINAL.doc
Pg 385
.
Figure 19-3. MEW Regional Plume and Vapor Intrusion Study Area
(Source: USEPA 2011)
National Aeronautics and Space Administration Chap 20. Environmental Justice
NASA Ames Research Center Environmental Resources Document Environmental Management Division March 2015 File: 2015 ARC ERD_FINAL.doc
Pg 386
Chapter 20. Environmental Justice
20.1 Overview
This chapter describes existing environmental justice and socioeconomic conditions in the areas surrounding ARC. It also summarizes the regulations applicable to environmental justice as well as relevant plans, policies, practices, and measures that address potential environmental justice impacts of operations and future development at ARC. Information and data presented in this chapter was obtained from the November 2009 NASA ARC ERD (NASA 2009), NADP EIS (Design, Community & Environment 2002), 2010 U.S. Census, and other sources.
20.2 Regulatory Background
20.2.1 Federal Regulations
20.2.1.1 Executive Order 12898, Federal Actions to Address Environmental Justice in Minority Populations and Low-Income Populations
On February 11, 1994, the President of the United States issued an EO on federal actions to address environmental justice in minority populations and low-income populations (EO 12898). The order is designed to focus federal attention on the environmental and human health conditions in minority and low-income communities with the goal of achieving environmental justice. (Environmental justice is the principle that low-income and minority populations should not disproportionately bear the burden of environmental hazards.) The order directs federal agencies to:
Develop strategies that promote non-discrimination in federal programs that substantially affect human health and the environment
Provide minority communities and low-income communities access to public information on matters relating to their health or the environment
Provide these communities an opportunity to participate in matters relating to their health or the environment
20.2.1.2 National Environmental Policy Act
NEPA and NASA’s Environmental Justice Implementation Plans (EJIPs) (described in Section 20.5.4) are NASA’s primary mechanisms for implementing the EO. When appropriate, EAs and EISs will be used to evaluate potential environmental effects (including human health, economic, and social) of ARC’s activities on minority communities and low-income communities.
20.3 Regional Setting
Information regarding minority populations and low-income populations was gathered from the 16 census tracts located along Highway 101 within 5 kilometers (3.1 miles) of ARC. These tracts include single- and multi-family homes and mobile home parks within
National Aeronautics and Space Administration Chap 20. Environmental Justice
NASA Ames Research Center Environmental Resources Document Environmental Management Division March 2015 File: 2015 ARC ERD_FINAL.doc
Pg 387
the cities of Mountain View and Sunnyvale, as well as the Wescoat Village and former Orion Park military housing areas.
20.3.1 Minority Populations
For the purposes of this environmental justice analysis, minority populations in the vicinity of ARC were identified in accordance with the definitions provided by the CEQ in its publication Environmental Justice; Guidance under the National Environmental Policy Act (CEQ 1997). These definitions are as follows:
Minority—Minority means a person who is: American Indian or Alaska Native; Asian; Native Hawaiian or other Pacific Islander; black or African American; Hispanic or Latino; some other race; or two or more races.
Minority population—Minority populations are identified where either: (a) the minority population of the affected area exceeds 50% or (b) the minority population percentage of the affected area is meaningfully greater than the minority population percentage in the general population. The CEQ guidance also states that a minority population exists “if there is more than one minority group present and the minority percentage, as calculated by aggregating all minority persons, meets one of the above-stated thresholds.
For analysis purposes, a minority population is identified as follows:
The minority population in the study area is equal to or greater than 50%; or
The minority population in the study area is 10 or more percentage points higher than that of the comparable population (city or county, depending on location)
According to the 2010 census data, several census tracts in the study area contain minority populations exceeding 50 percent of the total population. This includes tracts that have proportionally higher percentages of Asian residents (5048.02, 5048.03, 5087.04, and 5091. 02) and Hispanic/Latino residents (tracts 5046.02 and 5090) relative to the total population. In addition, a number of census tracts in the study area contain a single minority group that comprises less than 50% of the total population but is 10 or more percentage points higher than the group’s average in the comparative population. Tracts 5048.02, 5048.03, 5048.06, 5087.04, 5089, 5090, 5091.08, and 5093.04 in Sunnyvale have Hispanic/Latino populations ranging from 29.3 to 49.8%, which is higher than the city as a whole (18.9%). Tract 5108.01 in Palo Alto also contains a meaningfully greater percentage of Asian residents (44.0%) relative to the city (27.0%), and tract 5047, which is largely in unincorporated Santa Clara County, has a higher percentage of Black or African American residents (13.8%) than the County as a whole (2.4%).
In all, 14 of 16 census tracts in the study area either contain individual or combined minority groups that exceed 50 percent of the total population for the affected area or have a meaningfully greater percentage of minorities in comparison to the general population. These tracts are as follows: 5046.02, 5047, 5048.02, 5048.03, 5048.06, 5087.04, 5089, 5090, 5091.02, 5091.08, 5092.01, 5092.02, 5093.04, and 5108.01.
National Aeronautics and Space Administration Chap 20. Environmental Justice
NASA Ames Research Center Environmental Resources Document Environmental Management Division March 2015 File: 2015 ARC ERD_FINAL.doc
Pg 388
Table 20-1 provides a breakdown, by race and ethnicity, of county, city, and tract populations. Table 20-2 characterizes the study area minority population and the other comparative populations.
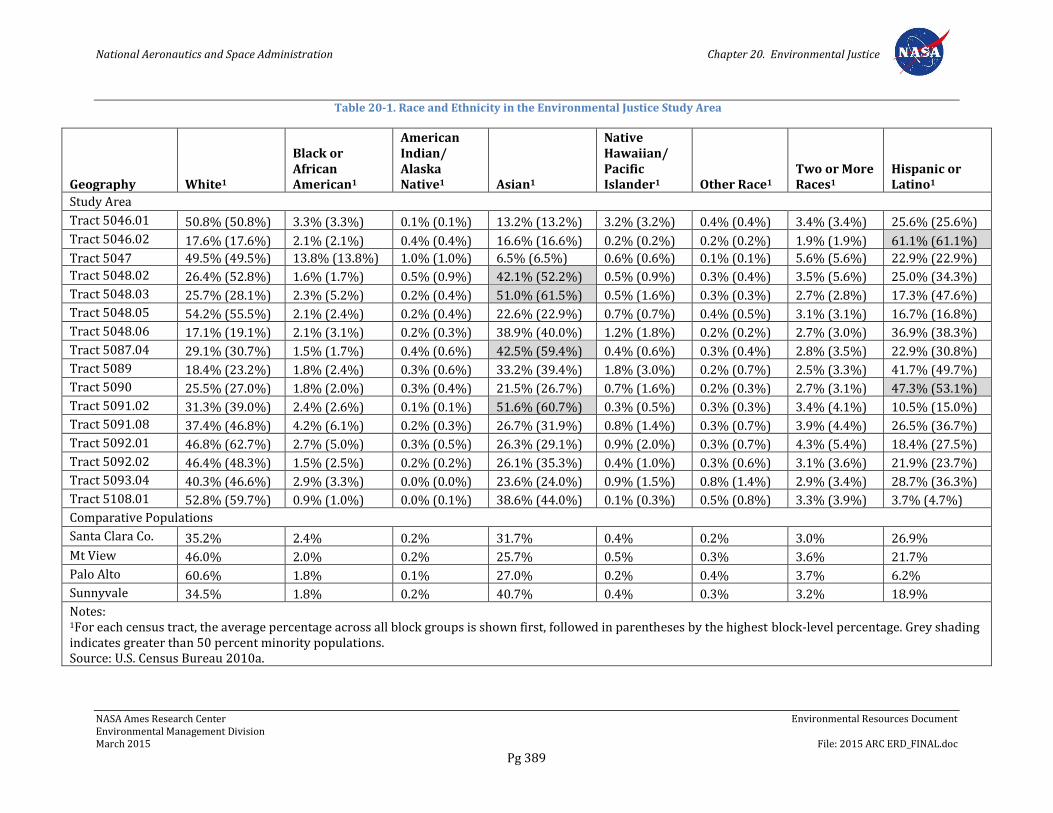
National Aeronautics and Space Administration Chapter 20. Environmental Justice
NASA Ames Research Center Environmental Resources Document Environmental Management Division March 2015 File: 2015 ARC ERD_FINAL.doc
Pg 389
Table 20-1. Race and Ethnicity in the Environmental Justice Study Area
Geography White1
Black or African American1
American Indian/ Alaska Native1 Asian1
Native Hawaiian/ Pacific Islander1 Other Race1
Two or More Races1
Hispanic or Latino1
Study Area
Tract 5046.01 50.8% (50.8%) 3.3% (3.3%) 0.1% (0.1%) 13.2% (13.2%) 3.2% (3.2%) 0.4% (0.4%) 3.4% (3.4%) 25.6% (25.6%)
Tract 5046.02 17.6% (17.6%) 2.1% (2.1%) 0.4% (0.4%) 16.6% (16.6%) 0.2% (0.2%) 0.2% (0.2%) 1.9% (1.9%) 61.1% (61.1%)
Tract 5047 49.5% (49.5%) 13.8% (13.8%) 1.0% (1.0%) 6.5% (6.5%) 0.6% (0.6%) 0.1% (0.1%) 5.6% (5.6%) 22.9% (22.9%)
Tract 5048.02 26.4% (52.8%) 1.6% (1.7%) 0.5% (0.9%) 42.1% (52.2%) 0.5% (0.9%) 0.3% (0.4%) 3.5% (5.6%) 25.0% (34.3%)
Tract 5048.03 25.7% (28.1%) 2.3% (5.2%) 0.2% (0.4%) 51.0% (61.5%) 0.5% (1.6%) 0.3% (0.3%) 2.7% (2.8%) 17.3% (47.6%)
Tract 5048.05 54.2% (55.5%) 2.1% (2.4%) 0.2% (0.4%) 22.6% (22.9%) 0.7% (0.7%) 0.4% (0.5%) 3.1% (3.1%) 16.7% (16.8%)
Tract 5048.06 17.1% (19.1%) 2.1% (3.1%) 0.2% (0.3%) 38.9% (40.0%) 1.2% (1.8%) 0.2% (0.2%) 2.7% (3.0%) 36.9% (38.3%)
Tract 5087.04 29.1% (30.7%) 1.5% (1.7%) 0.4% (0.6%) 42.5% (59.4%) 0.4% (0.6%) 0.3% (0.4%) 2.8% (3.5%) 22.9% (30.8%)
Tract 5089 18.4% (23.2%) 1.8% (2.4%) 0.3% (0.6%) 33.2% (39.4%) 1.8% (3.0%) 0.2% (0.7%) 2.5% (3.3%) 41.7% (49.7%)
Tract 5090 25.5% (27.0%) 1.8% (2.0%) 0.3% (0.4%) 21.5% (26.7%) 0.7% (1.6%) 0.2% (0.3%) 2.7% (3.1%) 47.3% (53.1%)
Tract 5091.02 31.3% (39.0%) 2.4% (2.6%) 0.1% (0.1%) 51.6% (60.7%) 0.3% (0.5%) 0.3% (0.3%) 3.4% (4.1%) 10.5% (15.0%)
Tract 5091.08 37.4% (46.8%) 4.2% (6.1%) 0.2% (0.3%) 26.7% (31.9%) 0.8% (1.4%) 0.3% (0.7%) 3.9% (4.4%) 26.5% (36.7%)
Tract 5092.01 46.8% (62.7%) 2.7% (5.0%) 0.3% (0.5%) 26.3% (29.1%) 0.9% (2.0%) 0.3% (0.7%) 4.3% (5.4%) 18.4% (27.5%)
Tract 5092.02 46.4% (48.3%) 1.5% (2.5%) 0.2% (0.2%) 26.1% (35.3%) 0.4% (1.0%) 0.3% (0.6%) 3.1% (3.6%) 21.9% (23.7%)
Tract 5093.04 40.3% (46.6%) 2.9% (3.3%) 0.0% (0.0%) 23.6% (24.0%) 0.9% (1.5%) 0.8% (1.4%) 2.9% (3.4%) 28.7% (36.3%)
Tract 5108.01 52.8% (59.7%) 0.9% (1.0%) 0.0% (0.1%) 38.6% (44.0%) 0.1% (0.3%) 0.5% (0.8%) 3.3% (3.9%) 3.7% (4.7%)
Comparative Populations
Santa Clara Co. 35.2% 2.4% 0.2% 31.7% 0.4% 0.2% 3.0% 26.9%
Mt View 46.0% 2.0% 0.2% 25.7% 0.5% 0.3% 3.6% 21.7%
Palo Alto 60.6% 1.8% 0.1% 27.0% 0.2% 0.4% 3.7% 6.2%
Sunnyvale 34.5% 1.8% 0.2% 40.7% 0.4% 0.3% 3.2% 18.9%
Notes: 1For each census tract, the average percentage across all block groups is shown first, followed in parentheses by the highest block-level percentage. Grey shading indicates greater than 50 percent minority populations. Source: U.S. Census Bureau 2010a.
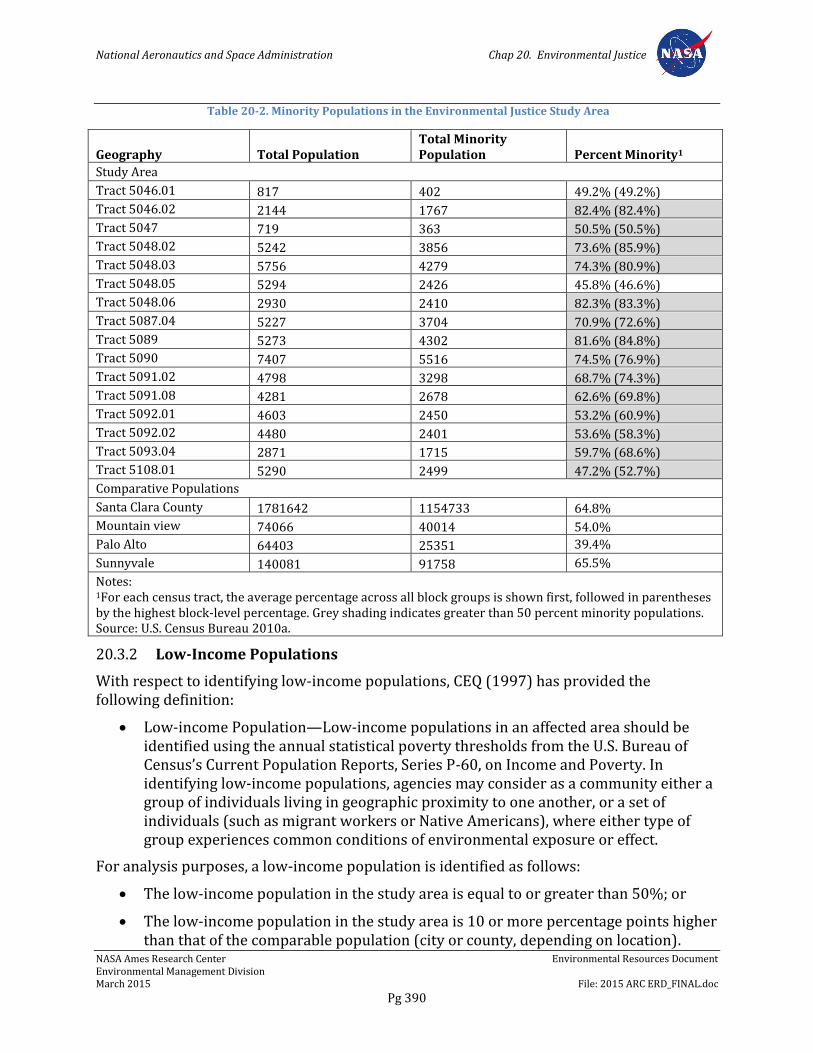
National Aeronautics and Space Administration Chap 20. Environmental Justice
NASA Ames Research Center Environmental Resources Document Environmental Management Division March 2015 File: 2015 ARC ERD_FINAL.doc
Pg 390
Table 20-2. Minority Populations in the Environmental Justice Study Area
20.3.2 Low-Income Populations
With respect to identifying low-income populations, CEQ (1997) has provided the following definition:
Low-income Population—Low-income populations in an affected area should be identified using the annual statistical poverty thresholds from the U.S. Bureau of Census’s Current Population Reports, Series P-60, on Income and Poverty. In identifying low-income populations, agencies may consider as a community either a group of individuals living in geographic proximity to one another, or a set of individuals (such as migrant workers or Native Americans), where either type of group experiences common conditions of environmental exposure or effect.
For analysis purposes, a low-income population is identified as follows:
The low-income population in the study area is equal to or greater than 50%; or
The low-income population in the study area is 10 or more percentage points higher than that of the comparable population (city or county, depending on location).
Geography Total Population Total Minority Population
Percent Minority1
Study Area
Tract 5046.01 817 402 49.2% (49.2%)
Tract 5046.02 2144 1767 82.4% (82.4%)
Tract 5047 719 363 50.5% (50.5%)
Tract 5048.02 5242 3856 73.6% (85.9%)
Tract 5048.03 5756 4279 74.3% (80.9%)
Tract 5048.05 5294 2426 45.8% (46.6%)
Tract 5048.06 2930 2410 82.3% (83.3%)
Tract 5087.04 5227 3704 70.9% (72.6%)
Tract 5089 5273 4302 81.6% (84.8%)
Tract 5090 7407 5516 74.5% (76.9%)
Tract 5091.02 4798 3298 68.7% (74.3%)
Tract 5091.08 4281 2678 62.6% (69.8%)
Tract 5092.01 4603 2450 53.2% (60.9%)
Tract 5092.02 4480 2401 53.6% (58.3%)
Tract 5093.04 2871 1715 59.7% (68.6%)
Tract 5108.01 5290 2499 47.2% (52.7%)
Comparative Populations
Santa Clara County 1781642 1154733 64.8%
Mountain view 74066 40014 54.0%
Palo Alto 64403 25351 39.4%
Sunnyvale 140081 91758 65.5%
Notes: 1For each census tract, the average percentage across all block groups is shown first, followed in parentheses by the highest block-level percentage. Grey shading indicates greater than 50 percent minority populations. Source: U.S. Census Bureau 2010a.
National Aeronautics and Space Administration Chap 20. Environmental Justice
NASA Ames Research Center Environmental Resources Document Environmental Management Division March 2015 File: 2015 ARC ERD_FINAL.doc
Pg 391
The Census Bureau’s Current Population Reports referred to in the above guidance present data on income and poverty at the national level. Subnational data on income and poverty, which was historically collected during the national decennial census, is now collected annually by the Census Bureau under its American Community Survey (ACS) program. As such, census tract data from the 2006−2010 ACS 5-Year Estimates (U.S. Census Bureau 2010b) were used to identify low-income populations in this analysis.
Poverty status, as defined by the U.S. Census, is determined by comparing a family or household’s income with the poverty thresholds appropriate for its size. The Poverty Guidelines issued by the U.S. Department of Health and Human Services (HHS) are based on simplifications of the U.S. Census Bureau’s detailed matrix of poverty thresholds and are updated annually using Consumer Price Index data. The guidelines vary by family/household size, with one set of figures for the 48 contiguous states, one set for Alaska, and one set for Hawaii.
For the year 2010 (HHS 2010), the national poverty thresholds for the 48 contiguous states were as follows:
Family of 1: $10,830 Family of 5: $25,790
Family of 2: $14,570 Family of 6: $29,530
Family of 3: $18,310 Family of 7: $33,270
Family of 4: $22,050 Family of 8: $37,010
Guidance from the EPA (1998) on incorporating environmental justice concerns in NEPA compliance analyses also suggests using other state and regional low-income poverty definitions as appropriate. Therefore, to account for the higher cost of living in the Bay Area, a higher threshold is considered appropriate for the identification of low-income populations within the study area. For the purpose of this analysis, low-income people are those with an annual household income that falls at or below a threshold that is 1.25 times the HHS 2010 Poverty Guidelines.
For households in the study area where the average household size is between 2 and 3 people, 1.25 times the poverty threshold for three people is ~$23,000; for households with between 3 and 4 people, the poverty threshold adjusts to ~$27,500. Based on the thresholds, households with incomes ranging from less than $10,000 to $29,999 (the range presented in the ACS 2010 5-year dataset) were tabulated to the block level for each census tract and for all comparative populations to obtain a low-income percentage.
None of the census tracts within the study area have low-income populations that exceed 50% of the total population; however, a number of tracts contain low income populations that are 10 or more percentage points higher than the low-income average in the comparative population. Tracts 5046.02, 5048.02, 5048.03, 5087.04, 5090, and 5091.02, all in Sunnyvale, have low-income populations ranging from 22.2 to 33.1%, which is higher than the city average (11.2%). As such, they would be considered low income.
Table 20-3 provides the total number and percent of low-income households within the study area and the other comparative populations.
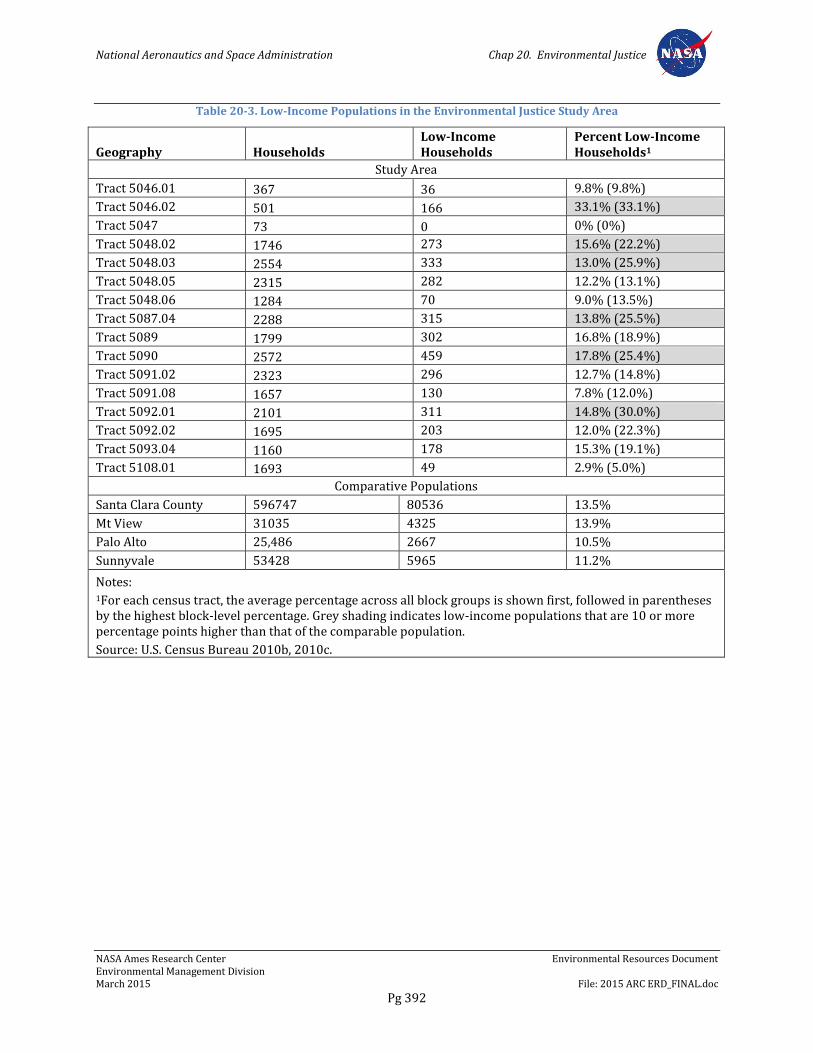
National Aeronautics and Space Administration Chap 20. Environmental Justice
NASA Ames Research Center Environmental Resources Document Environmental Management Division March 2015 File: 2015 ARC ERD_FINAL.doc
Pg 392
Table 20-3. Low-Income Populations in the Environmental Justice Study Area
Geography Households
Low-Income Households
Percent Low-Income Households1
Study Area
Tract 5046.01 367 36 9.8% (9.8%)
Tract 5046.02 501 166 33.1% (33.1%)
Tract 5047 73 0 0% (0%)
Tract 5048.02 1746 273 15.6% (22.2%)
Tract 5048.03 2554 333 13.0% (25.9%)
Tract 5048.05 2315 282 12.2% (13.1%)
Tract 5048.06 1284 70 9.0% (13.5%)
Tract 5087.04 2288 315 13.8% (25.5%)
Tract 5089 1799 302 16.8% (18.9%)
Tract 5090 2572 459 17.8% (25.4%)
Tract 5091.02 2323 296 12.7% (14.8%)
Tract 5091.08 1657 130 7.8% (12.0%)
Tract 5092.01 2101 311 14.8% (30.0%)
Tract 5092.02 1695 203 12.0% (22.3%)
Tract 5093.04 1160 178 15.3% (19.1%)
Tract 5108.01 1693 49 2.9% (5.0%)
Comparative Populations
Santa Clara County 596747 80536 13.5%
Mt View 31035 4325 13.9%
Palo Alto 25,486 2667 10.5%
Sunnyvale 53428 5965 11.2%
Notes: 1For each census tract, the average percentage across all block groups is shown first, followed in parentheses by the highest block-level percentage. Grey shading indicates low-income populations that are 10 or more percentage points higher than that of the comparable population.
Source: U.S. Census Bureau 2010b, 2010c.
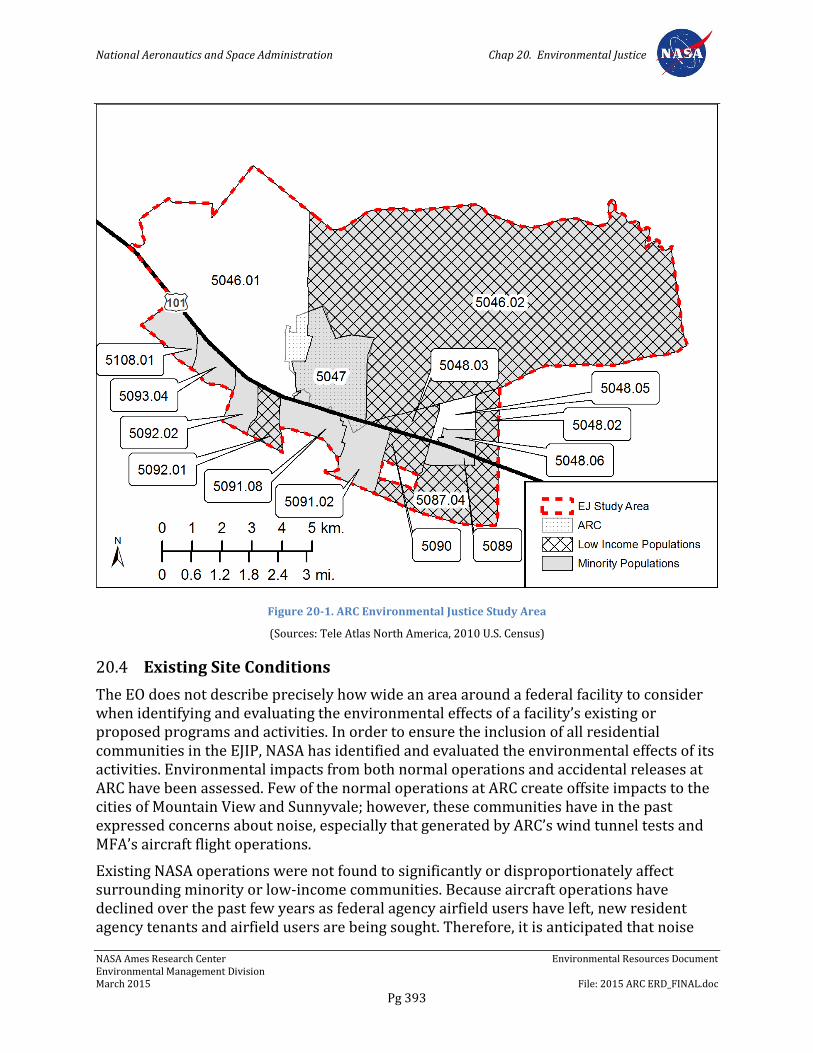
National Aeronautics and Space Administration Chap 20. Environmental Justice
NASA Ames Research Center Environmental Resources Document Environmental Management Division March 2015 File: 2015 ARC ERD_FINAL.doc
Pg 393
Figure 20-1. ARC Environmental Justice Study Area
(Sources: Tele Atlas North America, 2010 U.S. Census)
20.4 Existing Site Conditions
The EO does not describe precisely how wide an area around a federal facility to consider when identifying and evaluating the environmental effects of a facility’s existing or proposed programs and activities. In order to ensure the inclusion of all residential communities in the EJIP, NASA has identified and evaluated the environmental effects of its activities. Environmental impacts from both normal operations and accidental releases at ARC have been assessed. Few of the normal operations at ARC create offsite impacts to the cities of Mountain View and Sunnyvale; however, these communities have in the past expressed concerns about noise, especially that generated by ARC’s wind tunnel tests and MFA’s aircraft flight operations.
Existing NASA operations were not found to significantly or disproportionately affect surrounding minority or low-income communities. Because aircraft operations have declined over the past few years as federal agency airfield users have left, new resident agency tenants and airfield users are being sought. Therefore, it is anticipated that noise
National Aeronautics and Space Administration Chap 20. Environmental Justice
NASA Ames Research Center Environmental Resources Document Environmental Management Division March 2015 File: 2015 ARC ERD_FINAL.doc
Pg 394
will continue to be a long-term concern, although noise from Ames does not disproportionately impact minority or low-income communities.
Hazardous materials releases were evaluated and measures were implemented to reduce or eliminate the risk and impacts of accidental toxic gas releases. The quantity of toxic gases in storage is limited to volumes that would not generate offsite effects. Furthermore, the use of toxic gases is restricted to properly designed cabinets equipped with continuous monitoring devices, alarms, and abatement equipment.
20.5 Environmental Requirements
NASA has identified the following environmental plans, policies, practices, and measures that address potential environmental justice impacts of operations and future development at ARC.
20.5.1 NASA Procedural Directive 8500.1, NASA Environmental Management
Per NPD 8500.1, it is NASA policy to: maintain compliance with all applicable federal, state, and local environmental requirements; to incorporate environmental risk reduction and sustainable practices to the extent practicable throughout NASA’s programs, projects, and activities; and to consider environmental factors throughout the life cycle of programs, projects, and activities (as defined in NPD 7120.4, NASA Engineering and Program/Project Management Policy, and related documents), including planning, development, execution, and disposition activities. Examples of environmental factors include consideration of environmental impacts as required by the NEPA and NHPA; the proposed use of hazardous materials; the potential for waste generation; the need to acquire necessary permits, waivers, and authorizations; and the use of environmentally-preferable materials and processes wherever practicable.
20.5.2 Ames Procedural Requirements 8500.1, Ames Environmental Procedural Requirements
APR 8500.1 sets forth general procedural requirements to ensure compliance with applicable federal, state, and local environmental laws; regulations and EOs; and NASA policies and procedures. Organizational directors, division chiefs, branch chiefs, section heads, supervisors, managers, and CORs are responsible for planning, designing, constructing, managing, operating, and maintaining facilities in conformance with applicable regulatory directives, and should obtain environmental review from the Environmental Management Division early in project planning consistent with NASA's NEPA implementing procedures (NPR 8580.1 and EO 12114), NASA policies and procedures for programs and projects (NPR 7120), and NASA regulations related to environmental quality (14 CFR 1216). Program and project managers should coordinate with the Environmental Management Division in a timely manner to ensure that any new or modified programs, projects, and activities comply with regulatory requirements.
National Aeronautics and Space Administration Chap 20. Environmental Justice
NASA Ames Research Center Environmental Resources Document Environmental Management Division March 2015 File: 2015 ARC ERD_FINAL.doc
Pg 395
20.5.3 Ames Environmental Work Instructions
Ames’s EWIs, which replace the previous Ames Environmental Handbook (APR 8800.3), set forth requirements to ensure that programs, projects, and activities at ARC comply with applicable federal, state, and local laws; regulations and EOs; and NASA policies and procedures. Each EWI lists relevant regulatory authorities and documents, assigns individual and organizational responsibilities within ARC, and identifies specific requirements applicable to the work being performed.
The following EWIs are relevant to potential environmental justice impacts of operations and future development at ARC.
EWI 12, Public Involvement
EWI 14, NEPA and Environmental Justice
EWI 18, Environmental Requirements for Construction Projects (Under review)
20.5.4 NASA Ames Environmental Justice Implementation Plan
In 1995, NASA published an agency-wide Environmental Justice Strategy, pursuant to Section 2-2 of EO 12898. The purpose of this strategy is to ensure the integration of environmental justice into NASA’s activities, programs, and policies through the development and implementation of location-specific EJIPs.
NASA ARC (as well as other NASA centers) developed its own EJIP and adapted its NEPA process to ensure that environmental justice concerns are addressed in each environmental assessment and environmental impact statement, as appropriate. According to the EO, evaluation of potential environmental justice impacts should be based on socioeconomic information to the extent possible, identifying minority populations and/or low-income populations that may be adversely affected. This information can then be used to determine whether any of the neighboring minority and low-income populations could be experiencing disproportionately high and adverse environmental effects as the result of ARC’s programs, policies, or activities. If disproportionately high and adverse human health and environmental effects on minority communities or low-income communities are identified, the EJIP advocates that prudent measures be developed for eliminating or mitigating these effects, to the extent practicable.
20.5.5 NASA Ames Public Participation Program
Pursuant to Section 3-302 of EO 12898, subpart (b), NASA must inform the public when programs, policies, or activities regarding environmental justice concerns arise. At a minimum, NASA holds public meetings at times and in places that are convenient to the public to provide information and solicit comments from the community if proposed actions may impact local communities. NASA also develops public documents on environmental issues and publishes public meeting notices in local English language and non-English language newspapers. NASA also places all environmental documents in two local libraries so that they are easily accessible to the public. NASA maintains up-to-date
National Aeronautics and Space Administration Chap 20. Environmental Justice
NASA Ames Research Center Environmental Resources Document Environmental Management Division March 2015 File: 2015 ARC ERD_FINAL.doc
Pg 396
mailing lists of interested stakeholders to whom they send periodic updates to ensure full awareness of ARC’s operations and potential impacts.
20.5.6 NASA Ames Supporting Policies and Practices
NASA has developed a number of policies and practices by which to minimize regional environmental justice impacts from ARC operations and increase stakeholders’ involvement in activities. Some of these are:
Pollution Prevention/Waste Minimization
Hazardous Materials Management
Hazardous Waste Management
Industrial Wastewater Management
Medical Waste Management
Environmental Training
Air Pollution Control
Polychlorinated Biphenyls Management
Storage Tank Management
Hazardous Materials Closure Plans
Storm Water Management
SPCC and Facility Response Plan
Emergency Planning and Community Right-To-Know
Emergency Response
Community Relations and Public Participation
Environmental Justice
NEPA
Toxic Gas Management Procedures
20.5.7 NASA Ames Development Plan Final Programmatic Environmental Impact Statement
The NADP EIS identifies the following mitigation measure to address potential socioeconomic impacts from build out of NADP Mitigated Alternative 5.
20.5.7.1 Mitigation Measure SOCIO-1d
NASA would require at least 10 percent of the on-site housing to be affordable to low income households.
National Aeronautics and Space Administration Chap 21. Sustainability
NASA Ames Research Center Environmental Resources Document Environmental Management Division March 2015 File: 2015 ARC ERD_FINAL.doc
Pg 397
Chapter 21. Sustainability
21.1 Overview
This chapter describes existing strategies and practices related to sustainability at ARC. It also summarizes the regulations applicable to environmental, energy, and transportation management. Information and data presented in this chapter was obtained from the 2009 NASA ARC ERD (NASA 2009) and other sources.
21.2 Regulatory Background
21.2.1 Federal Regulations
42 USC 6901, Resource Conservation and Recovery Act
42 USC 8251 et. seq., Federal Energy Management
42 USC 13101–13109, Pollution Prevention Act of 1990
Executive Order 13423, Strengthening Federal Environmental, Energy, and Transportation Management
Executive Order 13514, Federal Leadership in Environmental, Energy, and Economic Performance
Executive Order 13150, Federal Workforce Transportation
Presidential Memorandum on Environmentally and Economically Beneficial Landscape Practices on Federal Landscaped Grounds
40 CFR Part 247, Comprehensive Procurement Guidelines
10 CFR Part 435, Energy Conservation Voluntary Performance Standards for New Buildings; Mandatory for Federal Buildings
U. S. Energy Policy Act of 1992
21.2.2 State Regulations
California Code of Regulations Title 13, Air Resources Board
California Code of Regulations Title 22, Environmental Health
California Code of Regulations Title 23, Waters
California Code of Regulations Title 24 Part 6, California's Energy Efficiency Standards for Residential and Nonresidential Buildings
California Health and Safety Code
21.2.3 NASA Policy and Procedures
NPD 8500.1C, NASA Environmental Management

National Aeronautics and Space Administration Chap 21. Sustainability
NASA Ames Research Center Environmental Resources Document Environmental Management Division March 2015 File: 2015 ARC ERD_FINAL.doc
Pg 398
APD 8500.1, Ames Environmental Policy
APR 8500.1, Ames Environmental Procedural Requirements
NASA Strategic Sustainability Performance Plan
21.3 Current Sustainability Strategies and Practices
21.3.1 Facilities Sustainability
To promote sustainable development23, there is a body of practical advice on how to plan, design, construct, operate, and maintain buildings to balance facility lifecycle24 cost, environmental impact, and occupant health, safety, security, and productivity.
The essential elements of sustainability include:
Energy and resource efficiency, including water conservation
Site selection to minimize impacts to the environment (e.g., through transportation)
Optimization of energy, environmental, and lifecycle costs associated with construction, operation, and decommissioning of facilities
Use of sustainable materials (that is, reused, recycled, recyclable, nontoxic, low-embodied energy content, renewable, long lifecycle, resource efficient, harvested on a sustained yield basis, and least polluting)
Emphasis on durability and efficiency of materials and equipment
A healthy environment, including indoor air quality
Features in support of enhanced worker productivity
Design for personnel safety and security
Design for decommissioning and disposal
A philosophy that defines facility operational objectives, then tests and verifies that all building systems and components have been properly installed and perform to the level intended (that is, building commissioning)
21.3.2 Meet LEED Standards
The LEED Green Building Rating System® developed by the USGBC, evaluates a building's design, construction, operation and maintenance over its lifecycle for environmentally responsible elements and efficient use of resources. The system provides a recognized standard for building sustainability by designating levels of green building certification as certified silver, gold, or platinum. Development at ARC should strive for the highest
23 Sustainable development, as it relates to “green buildings” or “environmentally responsible facilities,” refers to structures and designs that cause no net environmental burden or deficit.
24 Lifecycle of a product includes procurement of the original raw materials, processing, manufacturing, transportation, use, reuse, and recycling or disposal.
National Aeronautics and Space Administration Chap 21. Sustainability
NASA Ames Research Center Environmental Resources Document Environmental Management Division March 2015 File: 2015 ARC ERD_FINAL.doc
Pg 399
possible LEED rating in building design, and must meet at least the minimum elements required to achieve LEED Silver certification.
21.3.3 Use Resources Efficiently and Purchase Environmentally Preferable25 Products
Elements that promote efficient resource use and environmental purchasing include:
Encourage purchasing of products that create less waste
Choose products that are durable, repairable, and recyclable
Avoid over packaging
Encourage purchase of goods made from recycled materials
Discourage purchase of environmentally-damaging or polluting materials, such as tropical hardwood, peat, formaldehyde-based laminates, PVC, or ozone-depleting substances
Support and promote projects and enterprises for the repair and reuse of furniture, clothes, and other goods
Encourage people to use hiring/lending services, such as libraries, tool hire, and car hire, in preference to buying new goods
Address the impact of the building industry on resource use and waste by specifying reused materials in construction contracts and planning policies, and encouraging adaptable and durable building designs
21.3.4 Design for the Environment
Products designed for the protection of the environment are available. Such products are made from renewable resources26 harvested in a sustainable manner, fabricated with recyclability goals, and produced using energy efficiently. Make purchases that favor sustainability. Buy items that are designed for the environment.
21.3.5 Sustainable Development
Sustainable development projects differ from typical construction projects because a multidisciplinary design and construction team is formed early in the process. This team cooperatively plans and integrates the project’s functional and operational requirements to achieve of specific environmental and economic goals. Members of the team could include planners, architects, engineers, construction quality assurance specialists, contractors, building occupants, and environmental and energy managers. An outline of the principal stages and essential concerns for each stage follows.
25 Environmentally Preferable means products or services with limited or no impact on human health and the environment as compared with other products and services that serve the same purpose.
26 Renewable Resource is a resource such as energy, water, or a raw material, which is consumed at a rate that does not exceed its ability to naturally replenish or regenerate itself.
National Aeronautics and Space Administration Chap 21. Sustainability
NASA Ames Research Center Environmental Resources Document Environmental Management Division March 2015 File: 2015 ARC ERD_FINAL.doc
Pg 400
21.3.5.1 Planning
Project concepts, goals, sustainability, and budgets are established. This is where the project team should begin considering and incorporating sustainable development practices. Federal acquisition regulations require contractor selection criteria to include specialized experience and technical competence in the type of work required, including, where appropriate, experience in energy conservation, pollution prevention, waste reduction, and the use of recycled materials.
21.3.5.2 Requirements Analysis
Information is gathered in preparation for design. The project team should review operations and maintenance requirements. Review of environmental impact studies, pollution prevention plans, energy use, budgets, and site surveys create a foundation that helps ensure an optimal design for human and natural environments.
21.3.5.3 Project Definition
For most projects, a conceptual design is created during a collaborative, multidisciplinary work session during which the project design, plan, and major systems are defined. Since these decisions set the direction for the design, they largely determine the team’s ultimate success in meeting the project’s design-for-environment goals.
21.3.5.4 Contract Document Development
Construction plans and specifications are developed at this stage. Useful tools at this stage are checklists of sustainable development actions related to site work, water quality and conservation, energy efficiency, building material selection, and waste management.
21.3.5.5 Construction
Installation practices that maintain good air quality, water quality, conservation of natural resources, and waste reduction are high priorities during construction of sustainable facilities. Contractors should be educated about these priorities and their role in achieving them. Quality assurance evaluators play an essential role in ensuring that sustainable design provisions in contract documents are translated into finished projects.
21.3.5.6 Occupancy, Operations and Maintenance
A sustainable facility cannot fulfill its environmental and economic potential without the cooperation of knowledgeable occupants and maintainers. If personnel are educated about sustainability and have been involved throughout the process, the transition will be increasingly smooth and the project team’s sustainability goals closer to realization.
21.3.5.7 Post-Occupancy Evaluation
Facility managers, in cooperation with environmental engineers can perform evaluations to measure the facility’s water and energy consumption, indoor air quality, and waste generation. Maintenance requirements and operational costs should also be considered.
National Aeronautics and Space Administration Chap 21. Sustainability
NASA Ames Research Center Environmental Resources Document Environmental Management Division March 2015 File: 2015 ARC ERD_FINAL.doc
Pg 401
This performance data measures the sustainability of construction and establishes a benchmark for future projects.
21.3.5.8 Facility Reuse
Existing facilities are thoroughly evaluated before deciding whether to reuse or demolish.
21.3.6 Education and Training
Sustainability-focused education and training work toward developing high levels of awareness of sustainability among ARC employees to provide a workforce well prepared for delivering quality, environmentally sustainable services and products.
21.3.7 Walk, Bike, or Take Public Transportation
The ACAP assists civil servants, contractors, and visitors in choosing transportation other than single-occupant vehicles. General acceptance of transportation alternatives to the single-occupant vehicle would reduce air, soil, water pollution, traffic congestion, and vehicle accident deaths. Through ACAP, ARC has information on car and vanpool, mass transit, and telecommuting. Past and current ACAP activities include:
ARC employees have participated in and won the North Bayshore Bike toWork Challenge. “Bike to Work” is a community-wide celebration and public education effort that provides incentives for people to commute by bicycle. Biking is an inexpensive, healthy, and fun way to alleviate gridlock and reduce air pollution. Ames continues to have good participation in each Bike to Work Day and throughout the year.
The NASA shuttle service is provided by ACAP in compliance with the BAAQMD’s former trip reduction law, Regulation 13. This law required employers to provide commute incentives to reduce traffic congestion and air pollution. The shuttle transports commuters to and from the Mountain View Caltrain Station and the VTA light rail in the morning and afternoon. Shuttle service is available to ARC civil service and contractor employees only. All shuttles are wheelchair accessible and have bicycle accommodations. A NASA badge is required to board the bus.
“Spare the Air Tonight” starts in mid-November and extends through the end of January. This program targets the reduction of carbon monoxide and particulate matter that can reach unhealthy concentrations on cold nights with little air movement. Every winter, the BAAQMD asks Bay Area residents to cooperate to improve air quality on days when pollution threatens to reach unhealthy levels. When a Spare-the-Air-Tonight advisory is issued, residents are requested to avoid driving and refrain from lighting fireplaces and woodstoves (unless the stove or fireplace, containing an insert, is a clean-burning EPA-certified model).
The BAAQMD donates Santa Clara County bus or CalTrain tickets to anyone not already using public transportation. The tickets are good for any day announced as a spare-the-air day. This provides an opportunity for people unfamiliar with public transit to experience the benefits of stress-free commuting.
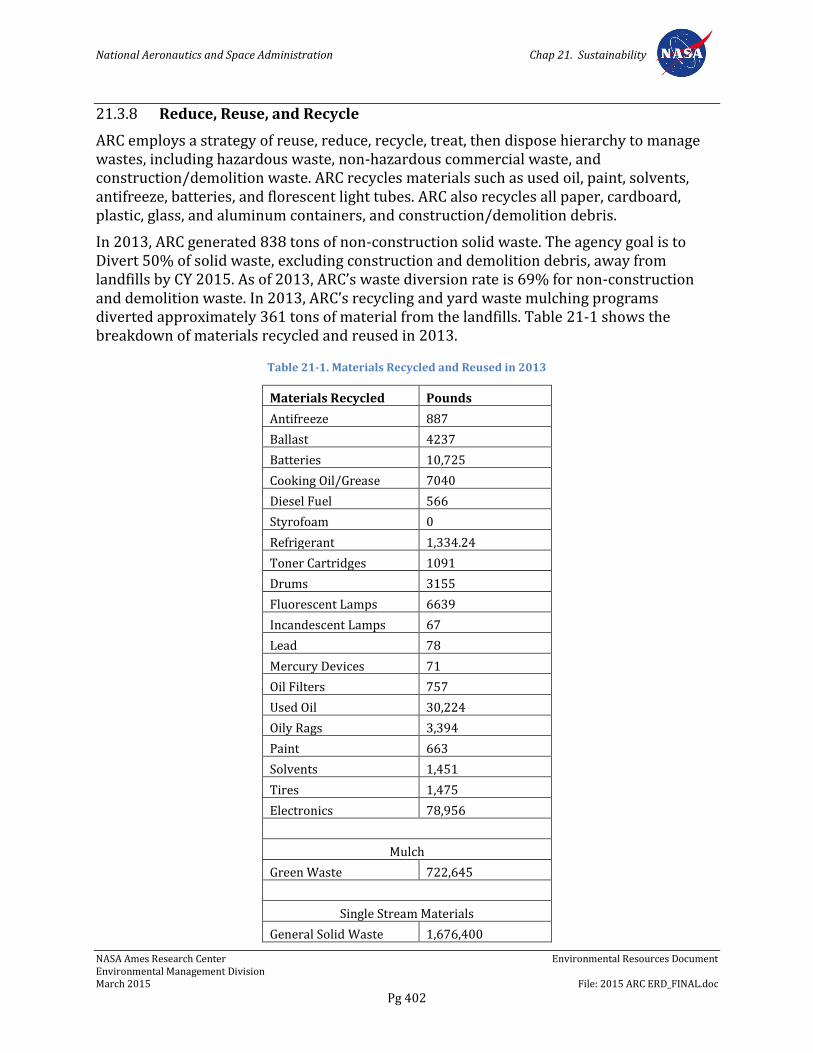
National Aeronautics and Space Administration Chap 21. Sustainability
NASA Ames Research Center Environmental Resources Document Environmental Management Division March 2015 File: 2015 ARC ERD_FINAL.doc
Pg 402
21.3.8 Reduce, Reuse, and Recycle
ARC employs a strategy of reuse, reduce, recycle, treat, then dispose hierarchy to manage wastes, including hazardous waste, non-hazardous commercial waste, and construction/demolition waste. ARC recycles materials such as used oil, paint, solvents, antifreeze, batteries, and florescent light tubes. ARC also recycles all paper, cardboard, plastic, glass, and aluminum containers, and construction/demolition debris.
In 2013, ARC generated 838 tons of non-construction solid waste. The agency goal is to Divert 50% of solid waste, excluding construction and demolition debris, away from landfills by CY 2015. As of 2013, ARC’s waste diversion rate is 69% for non-construction and demolition waste. In 2013, ARC’s recycling and yard waste mulching programs diverted approximately 361 tons of material from the landfills. Table 21-1 shows the breakdown of materials recycled and reused in 2013.
Table 21-1. Materials Recycled and Reused in 2013
Materials Recycled Pounds
Antifreeze 887
Ballast 4237
Batteries 10,725
Cooking Oil/Grease 7040
Diesel Fuel 566
Styrofoam 0
Refrigerant 1,334.24
Toner Cartridges 1091
Drums 3155
Fluorescent Lamps 6639
Incandescent Lamps 67
Lead 78
Mercury Devices 71
Oil Filters 757
Used Oil 30,224
Oily Rags 3,394
Paint 663
Solvents 1,451
Tires 1,475
Electronics 78,956
Mulch
Green Waste 722,645
Single Stream Materials
General Solid Waste 1,676,400
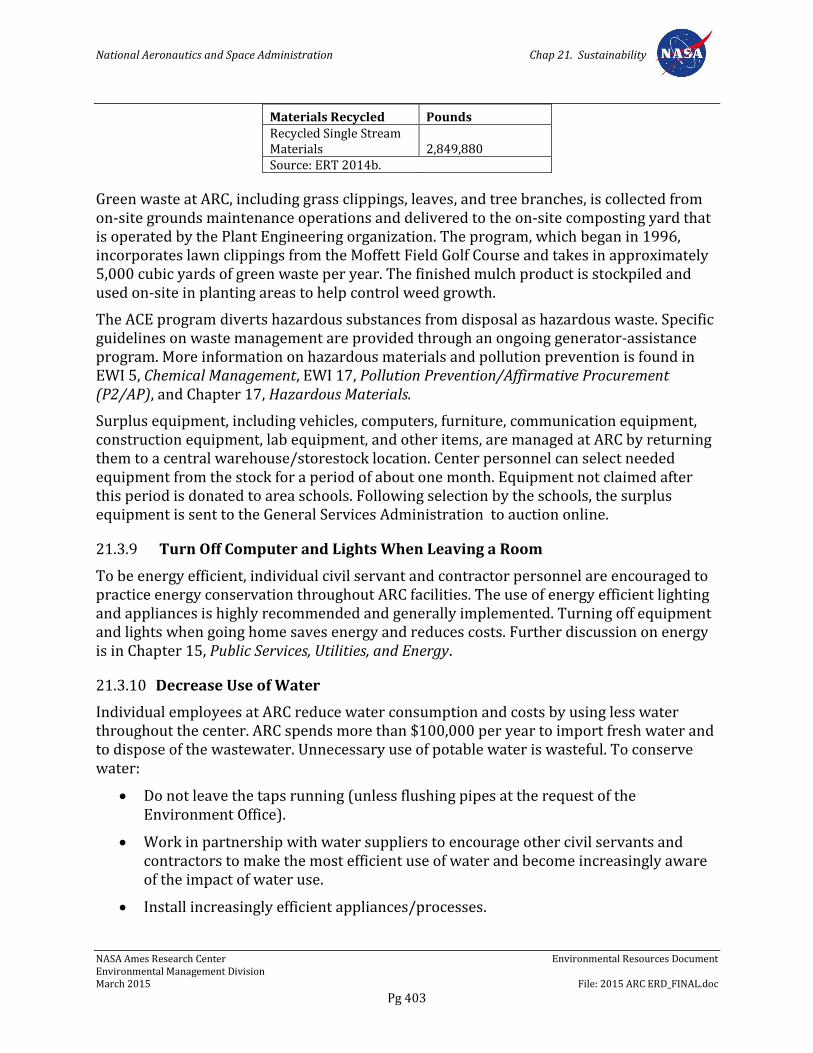
National Aeronautics and Space Administration Chap 21. Sustainability
NASA Ames Research Center Environmental Resources Document Environmental Management Division March 2015 File: 2015 ARC ERD_FINAL.doc
Pg 403
Materials Recycled Pounds Recycled Single Stream Materials 2,849,880 Source: ERT 2014b.
Green waste at ARC, including grass clippings, leaves, and tree branches, is collected from on-site grounds maintenance operations and delivered to the on-site composting yard that is operated by the Plant Engineering organization. The program, which began in 1996, incorporates lawn clippings from the Moffett Field Golf Course and takes in approximately 5,000 cubic yards of green waste per year. The finished mulch product is stockpiled and used on-site in planting areas to help control weed growth.
The ACE program diverts hazardous substances from disposal as hazardous waste. Specific guidelines on waste management are provided through an ongoing generator-assistance program. More information on hazardous materials and pollution prevention is found in EWI 5, Chemical Management, EWI 17, Pollution Prevention/Affirmative Procurement (P2/AP), and Chapter 17, Hazardous Materials.
Surplus equipment, including vehicles, computers, furniture, communication equipment, construction equipment, lab equipment, and other items, are managed at ARC by returning them to a central warehouse/storestock location. Center personnel can select needed equipment from the stock for a period of about one month. Equipment not claimed after this period is donated to area schools. Following selection by the schools, the surplus equipment is sent to the General Services Administration to auction online.
21.3.9 Turn Off Computer and Lights When Leaving a Room
To be energy efficient, individual civil servant and contractor personnel are encouraged to practice energy conservation throughout ARC facilities. The use of energy efficient lighting and appliances is highly recommended and generally implemented. Turning off equipment and lights when going home saves energy and reduces costs. Further discussion on energy is in Chapter 15, Public Services, Utilities, and Energy.
21.3.10 Decrease Use of Water
Individual employees at ARC reduce water consumption and costs by using less water throughout the center. ARC spends more than $100,000 per year to import fresh water and to dispose of the wastewater. Unnecessary use of potable water is wasteful. To conserve water:
Do not leave the taps running (unless flushing pipes at the request of the Environment Office).
Work in partnership with water suppliers to encourage other civil servants and contractors to make the most efficient use of water and become increasingly aware of the impact of water use.
Install increasingly efficient appliances/processes.
National Aeronautics and Space Administration Chap 21. Sustainability
NASA Ames Research Center Environmental Resources Document Environmental Management Division March 2015 File: 2015 ARC ERD_FINAL.doc
Pg 404
21.3.11 Decrease Use of Paper
ARC has copy machines capable of two-sided copying. ARC also purchases paper with a 100 percent post-consumer recycled content. Employees are encouraged to make double-sided photocopies and to always use two sides of paper before disposing of paper in recycling bins. ARC also encourages the use of email and electronic files instead of creating excess paper copies and paper file systems.
21.3.12 Other Tips for Reducing Environmental Impact
Use of coffee mugs instead of Styrofoam or other disposable cups is encouraged. Make sure the vehicles are tuned up, and avoid any leaks or adverse emissions from vehicles.
21.3.13 Sustainability at ARC
Accepting the concept that sustainability is the integration of ecological, economic, and cultural concerns, individual and community activities should be conducted in a sustainable manner. It is ARC policy to:
Have sustainability indicators to evaluate how well ARC activities are conducted to meet desired goals
Plan for sustainability using objective and subjective information, including hard data and perception of trends
Minimize environmental impacts on the neighboring community and create a healthy environment for workers, visitors, and neighbors
Communicate and disseminate the concepts in this and other chapters of this document to ARC employees
Maximize the reuse of resources, use resources efficiently, and minimize the consumption of raw material resources (energy, water, land, and materials) from construction to the end of facilities’ useful lives
Seek renewable energy sources as opposed to using fossil fuels. Design facilities for long-term durability, flexibility, and eventual reuse. Protect and restore the natural environment
Move beyond traditional quality criteria involving schedules and budgets and move toward sustainability by including conservation of resources, promotion of a healthy workplace, and avoidance of environmental degradation
Rent equipment that is only used occasionally and purchase remanufactured office equipment
Purchase concentrates and products with minimal packaging and reclaim reusable parts from old equipment
Send meeting minutes via email or post minutes on a server
Provide and use recycling bins, post waste reduction signs to remind personnel to recycle, and buy recyclable paper byproducts whenever possible
National Aeronautics and Space Administration Chap 22. Land Use Controls
NASA Ames Research Center Environmental Resources Document Environmental Management Division March 2015 File: 2015 ARC ERD_FINAL.doc
Pg 405
Chapter 22. Land Use Controls
22.1 Overview
This chapter describes existing agreements and controls to address contamination at ARC. It also summarizes applicable regulations. Information and data presented in this chapter was obtained from the 2009 NASA ARC ERD (Design, Community & Environment 2002) and other sources.
22.2 Regulatory Background
LUCs are engineered controls or non-engineered instruments undertaken to reduce environmental or health risk. ICs, a subset of LUCs, are non-engineered instruments, such as administrative or legal controls (e.g., deed restrictions, building or excavation permits, well drilling prohibitions or easements), that are imposed on properties to prevent exposure to contaminants or protect the integrity of response actions.
Although treatment and engineering controls are primarily used in response actions, LUCs are often important components of response action implementation. The NCP emphasizes that ICs are meant to supplement engineering controls and that ICs will rarely be the sole remedy at a site. LUCs can be implemented when contamination is first discovered, when remedies are ongoing, and when residual contamination does not allow for unrestricted use after completion of response actions.
NASA ARC has responsibility for LUCs from two main requirements:
Response actions undertaken by NASA for NASA sources of contamination (NCP, CERCLA, and NASA ARC’s FFA), and
Response actions undertaken by Responsible Parties (Navy and MEW Companies) on NASA ARC property that require implementation of LUCs to be fully protective of human health and the environment are completed through NASA ARC implementation of those associated LUCs (NASA ARC FFA). Such LUCs are documented in the Parties’ response action RODs that are approved by EPA, Region 9, and the RWQCB.
In addition to specific LUCs that are established for response actions at individual sites, as property owner, NASA’s general LUC responsibilities for NASA and other Responsible Parties’ response actions include:
Providing for reasonable site access for response action implementation and regulatory agency oversight,
Preventing alteration of, interference with or damage to response action systems by NASA, NASA contractors or tenants, and
Incorporating LUC requirements in NASA land planning documents, contracts, leases, agreements, and deed covenants.
National Aeronautics and Space Administration Chap 22. Land Use Controls
NASA Ames Research Center Environmental Resources Document Environmental Management Division March 2015 File: 2015 ARC ERD_FINAL.doc
Pg 406
22.3 Current Agreements and Land Use Controls
22.3.1 1992 Memorandum of Understanding between Department of the Navy and NASA regarding Moffett Field, California
The 1992 MOU provides that the Navy retains complete responsibility for compliance with all terms and provisions of the Navy’s 1989 FFA and all other environmental restoration or remediation requirements and regulations arising from its activities on Former NAS Moffett Field, whether from Navy or Navy contractor sources. Further, the Navy is responsible for contamination that migrates onto or from Former NAS Moffett Field, regardless of the source and regardless of whether identified in the Navy’s FFA. NASA is not a party to the Navy’s 1989 FFA. In addition, the Navy retains complete responsibility for all environmental requirements and regulations associated with the activities of the Navy associated with Former NAS Moffett Field.
NASA’s institutional control responsibilities under the 1992 MOU consist of the following:
NASA is responsible for any contamination resulting from NASA activities.
NASA shall ensure that the Navy, DOD, EPA, and the State of California have unobstructed access to known or suspected areas of contamination or response action areas.
NASA and its contractors and tenants shall not engage in any activity or construct any obstacles that would hinder or prevent the Navy from implementing its response action responsibilities.
NASA and its contractors and tenants shall give notice to the Navy prior to any construction on or adjacent to areas of known or suspected contamination.
22.3.2 2008 Memorandum of Agreement between Navy and NASA for Installation Restoration Site 22 Landfill, Former NAS Moffett Field, California
The 2008 Memorandum of Agreement (MOA) establishes roles and responsibilities of the Navy and NASA for monitoring and ICs pursuant to the 2002 ROD for Navy IR Site 22 landfill. The approved remedy for Site 22 consists of a biotic barrier cap to prevent burrowing animals from disturbing subsurface contamination, management of surface water flows across the site, groundwater and landfill gas monitoring, and ICs to prevent excavation of waste.
NASA’s ICs responsibilities are:
Include land use and access restrictions in NASA’s land use planning documents and materials related to NASA’s facility master planning process.
Incorporate the terms and conditions of the MOA into APRs.
Allow Navy, Navy contractors, and regulatory agencies reasonable access to the site.
Protect the structural aspects of the landfill cap (biotic barrier).
National Aeronautics and Space Administration Chap 22. Land Use Controls
NASA Ames Research Center Environmental Resources Document Environmental Management Division March 2015 File: 2015 ARC ERD_FINAL.doc
Pg 407
Maintain vegetation, topsoil layer, irrigation system and drainage components encompassed within or adjacent to the Site 22 landfill boundary to ensure NASA operations do not impact the remedy.
Prohibit alterations to the drainage patterns or modifications of surface contours.
Prohibit extraction of groundwater from the site.
Prohibit residential land use.
Maintain and keep Building 191 pumping station in operation.
Obtain prior written approval from the Navy before conducting any subsurface excavation, digging, drilling, or any other disturbance of the Site 22 surface.
Conduct at least quarterly monitoring or visual inspections of the site to ensure compliance with and proper maintenance of the ICs.
Require regulatory approval for consideration of alternative land uses.
Identify parties responsible for ongoing operations, maintenance and monitoring activities for the site.
Provide periodic updates (such as annual reports) to EPA regarding implementation, monitoring, and efficacy of the ICs.
Require all current and prospective tenants, contractors, and subcontractors to comply with the terms of the MOA and provide any necessary training. Incorporate requirements into contracts and subcontracts as necessary.
Incorporate the ICs into all current prospective lease agreements for parcels including or adjacent to the site.
Include a restrictive deed covenant with ICs in place for transfer of the property to a non-federal entity.
Transfer by NASA of the property to another federal agency will require such agency to enter into an interagency agreement with the Navy agreeing to assume NASA’s responsibilities under the MOA.
Restrictive covenants and/or interagency agreements shall include requirement for Navy review and written approval prior to any proposed construction activities, improvements, or alterations to property that may impact the Site 22 landfill remedy.
22.3.3 1999 Memorandum of Agreement between Navy and NASA Regarding Institutional Controls at Operable Units One and Five, Moffett Field, California:
The 1999 MOA documents the major points of agreement that NASA will use in implementing the ICs required in the Navy RODs for Navy OUs 1 and 5.
NASA’s institutional control responsibilities under the MOA are:
National Aeronautics and Space Administration Chap 22. Land Use Controls
NASA Ames Research Center Environmental Resources Document Environmental Management Division March 2015 File: 2015 ARC ERD_FINAL.doc
Pg 408
NASA will not undertake any activities that would compromise the integrity of the landfill cap at Site 1. Navy will conduct any required ongoing maintenance needed to maintain the integrity of the landfill cap.
NASA will maintain the Building 191 pump station and drain/subdrain system associated with Site 1 and Site 5 as long as NASA either owns the property or maintains operational control of the sites.
NASA will note the necessity of these restrictions and actions in NASA’s land use planning documents (Master Plan) and real property records.
If NASA conveys the property, NASA will notify subsequent landowners of these requirements by appropriate notices and land use restrictions.
22.3.4 2010 Middlefield-Ellis-Whisman Record of Decision Amendment for the Vapor Intrusion Pathway
The 2010 MEW ROD Amendment addresses potential long-term exposure risk from VOCs through the vapor intrusion pathway associated with the Regional Groundwater Plume. Vapor intrusion is an exposure pathway from shallow subsurface contamination that is being addressed by actions under the MEW Superfund Site’s 1989 ROD and Amendments. The MEW companies, Navy, and NASA have designated areas of responsibility at NASA Ames for the vapor intrusion pathway.
The 2010 MEW ROD Amendment includes ICs to ensure ongoing implementation of the vapor intrusion remedy. As property owner, NASA’s institutional control responsibilities are:
Prevent interference with the current implementation of the vapor intrusion remedy,
Ensure ongoing implementation of the remedy in future development, and
Provide information to building occupants about the remedy being implemented.
22.3.5 2014 Navy Installation Restoration Site 26 Record of Decision Amendment
The Navy IR Site 26 ROD Amendment remedy consists of:
Active groundwater treatment by biostimulation/bioaugmentation injection,
Groundwater monitoring, and
Implementation of ICs.
NASA is the responsible party for implementing, maintaining, reporting on, and enforcing ICs for Navy Site 26 until cleanup standards have been met in groundwater underlying the site. ICs identified for NASA implementation are:
Prohibit use of and access to groundwater (except for treatment and dewatering) until cleanup levels are met.
National Aeronautics and Space Administration Chap 22. Land Use Controls
NASA Ames Research Center Environmental Resources Document Environmental Management Division March 2015 File: 2015 ARC ERD_FINAL.doc
Pg 409
Protect and maintain the integrity of the remedial action, including monitoring systems.
Notify and require property owners and developers that any new building or construction planned over the groundwater plume be designed and constructed in a manner that will mitigate potential unacceptable health risk from vapor intrusion, or evaluate and demonstrate that there is not potential unacceptable vapor intrusion risk prior to construction. All vapor intrusion risk evaluations will require written approval by the regulatory agencies.
National Aeronautics and Space Administration Chap 23. References
NASA Ames Research Center Environmental Resources Document Environmental Management Division March 2015 File: 2015 ARC ERD_FINAL.doc
Pg 410
Chapter 23. References
Accord MACTEC 8A JV. 2012. Final Work Plan for Vapor Intrusion Sampling, Former Naval Air Station, Moffett Field, California. San Diego, CA: Accord MACTEC 8A JV.
AECOM. 2014. Integrated Cultural Resources Management Plan, NASA Ames Research Center. Moffett Field, CA: NASA Ames Research Center.
Alderete, C. 2014a. Data attached to e-mail from Wildlife Biologist, NASA Ames Research Center, to Andrew Martin, NASA Ames Research Center Environmental Compliance Specialist, April 30, 2014. Data and e-mail in Martin’s possession.
______. 2014b. Data attached to e-mail from Wildlife Biologist, NASA Ames Research Center, to Andrew Martin, NASA Ames Research Center Environmental Compliance Specialist, January 7, 2015. Data and e-mail in Martin’s possession.
Association of Bay Area Governments (ABAG). 2009. Projections 2009. Oakland, CA. ABAG.
______. 2013. Plan Bay Area Projections 2013. Oakland, CA. ABAG.
Bay Area Air Quality Management District (BAAQMD). 2010a. Bay Area 2010 Clean Air Plan. San Francisco, CA: BAAQMD. http://www.baaqmd.gov/Divisions/Communications-and-Outreach/Air-Quality-in-the-Bay-Area/Air-Quality-Summaries.aspx
______. 2010b. Source Inventory of Bay Area Greenhouse Gas Emissions. San Francisco, CA: BAAQMD. http://www.baaqmd.gov/~/media/Files/Planning%20and%20Research/Emission%20Inventory/regionalinventory2007_2_10.ashx?la=en
______. 2014a. Annual Bay Area Air Quality Summaries. Last modified April 7, 2014. http://www.baaqmd.gov/Divisions/Communications-and-Outreach/Air-Quality-in-the-Bay-Area/Air-Quality-Summaries.aspx
______. 2014b. Air Quality and Attainment Status. Accessed on September 24, 2014.http://hank.baaqmd.gov/pln/air_quality/ambient_air_quality.htm#twelve
______. 2014c. Spare the Air: Ozone Box Scores. Accessed on September 24, 2014. http://sparetheair.org/Stay-Informed/Ozone/Ozone-Box-Scores.aspx
The Border Center. 2014. “Ozone Depleting Substances, Refrigeration, Etc.” Environmental Import and Export Issues. Accessed March 3, 2014. http://bordercenter.org/chem/ozonedepleting.htm
Brown and Caldwell, PWA, H. T. Harvey & Associates, and GAIA Consulting Inc. 2005. Moffett Field Storm Water Retention Pond Tidal Restoration Feasibility Study. Moffett Field, CA: NASA Ames Research Center.
California Air Resources Board (CARB). 2013. Ambient Air Quality Standards (AAQS). Last modified July 2, 2013. http://www.arb.ca.gov/research/aaqs/aaqs.htm
National Aeronautics and Space Administration Chap 23. References
NASA Ames Research Center Environmental Resources Document Environmental Management Division March 2015 File: 2015 ARC ERD_FINAL.doc
Pg 411
______. 2014. AB 32 Scoping Plan. Last updated June 23, 2014. http://www.arb.ca.gov/cc/scopingplan/scopingplan.htm
California Department of Conservation (DOC). 2011. Santa Clara County Important Farmland 2010. Map published June 2011. Sacramento, Ca: DOC, Division of Land Resource Protection.
California Department of Fish and Wildlife (CDFW). California Natural Diversity Database. Accessed April 28, 2014. https://www.dfg.ca.gov/biogeodata/cnddb/
California Department of Transportation (Caltrans). 2002. Guide for the Preparation of Traffic Impact Studies. Sacramento, CA: Caltrans.
CalRecycle .2014a. Facility/Site Summary Details: Newby Island Sanitary Landfill (43-AN-0003). Accessed November 21, 2014. http://www.calrecycle.ca.gov/SWFacilities/Directory/43-AN-0003/Detail
______. 2014b. Public Notice: Newby Island Sanitary Landfill –San Jose. Accessed November 21, 2014. http://www.calrecycle.ca.gov/Actions/PublicNoticeDetail.aspx?id=1379&aiid=1253
Hay, Carling C., Eric Morrow, Robert E. Kopp, and Jerry X. Mitrovica. 2015. “Probabilistic Reanalysis of Twentieth-Century Sea-Level Rise.” Nature 517 (7535): 481–84.
Cayan, Dan R., Mary Tyree, and Sam Iacobellis. 2012. Climate Change Scenarios for the San Francisco Region. California Energy Commission. Publication number: CEC5002012042.
ChaduxTt Joint Venture (ChaduxTt JV). 2010. Final Five-Year Review Report Installation Restoration Sites 1, 22, 26, and 28 Former Naval Air Station Moffett Field, Moffett Field, California. San Diego, CA: Department of the Navy, Base Realignment and Closure Program Management Office West. http://yosemite.epa.gov/R9/SFUND/R9SFDOCW.NSF/688299b284b16e92882574260073faef/59f9c657f7f0a0f4882576d3006a96bd/$FILE/1.0%20to%2011.0.pdf
Chiang, Felicia, Cristina Milesi, Mariza Costa-Cabral, John Rath, Weile Wang, and James Podolske. "Precipitation in the SF Bay Area: Comparing Downscaling Methods' Skill in Representing Extreme Precipitation.” In Hindcast Accuracy and Differences in Projections. Presentation at the American Geophysical Union Fall Meeting, San Francisco, CA, Dec. 19, 2014.
Cowardin, L. M., V. Carter, F. C. Golet, E. T. LaRoe. 1979. Classification of Wetlands and Deepwater Habitats of the United States. U.S. Department of the Interior, Fish and Wildlife Service, Washington, D.C. Jamestown, ND: Northern Prairie Wildlife Research Center. http://www.npwrc.usgs.gov/resource/wetlands/classwet/index.htm (Version 04DEC1998)
National Aeronautics and Space Administration Chap 23. References
NASA Ames Research Center Environmental Resources Document Environmental Management Division March 2015 File: 2015 ARC ERD_FINAL.doc
Pg 412
City of Mountain View. 2008. Parks and Open Space Plan. Mountain View, CA: City of Mountain View. http://www.mountainview.gov/civicax/filebank/blobdload.aspx?BlobID=7998
______. 2012. Mountain View 2030 General Plan. Mountain View, CA: City of Mountain View Community Development Department. http://www.mountainview.gov/civicax/filebank/blobdload.aspx?blobid=10702
______. 2013a. Zoning Map. Last updated May 2013. http://www.mountainview.gov/civicax/filebank/blobdload.aspx?BlobID=10990
______. 2013b. Marketing of the 6.69-Acre Moffett Gateway Site Located at 750 Moffett Boulevard (APN 153-19-007). Staff Report, November 12, 2013. Mountain View, CA: City of Mountain View. http://laserfiche.mountainview.gov/WebLink/0/doc/67897/Electronic.aspx
______. 2014a. North Bayshore Precise Plan. Public Draft, July 2014. Mountain View, CA: City of Mountain View. http://www.mountainview.gov/depts/comdev/planning/activeprojects/northbayshore_.asp
______. 2014b. Current Project List. Accessed November 6, 2014. http://www.mountainview.gov/depts/comdev/planning/activeprojects/list.asp
City of Sunnyvale 2011a. Sunnyvale General Plan. Sunnyvale, CA: City of Sunnyvale. http://ecityhall.sunnyvale.ca.gov/cd/GeneralPlan.pdf
______. 2011b. Onizuka Air Force Station Local Redevelopment Authority Amended Redevelopment Plan. Sunnyvale, CA: City of Sunnyvale Community Development Department. http://sunnyvale.ca.gov/Portals/0/Sunnyvale/CDD/Onizuka/Approved%20Redevelopment%20Plan%20Amendment%2012-13-11.pdf
______. 2013. City of Sunnyvale Moffett Park Specific Plan. Updated 2013. Sunnyvale, CA: City of Sunnyvale. http://sunnyvale.ca.gov/Portals/0/Sunnyvale/CDD/Non-Residential/Moffett%20Park%20Specific%20Plan%20-%202013AmendmentFINAL-FOR%20WEB.pdf
______. 2014a. City of Sunnyvale Zoning Map. Last updated June 2014. http://sunnyvale.ca.gov/Portals/0/Sunnyvale/CDD/Maps/Zoning%20North%20of%20101%20for%20web.pdf
______. 2014b. Development Updates. Sunnyvale, CA: City of Sunnyvale Community Development Department. http://sunnyvale.ca.gov/Departments/CommunityDevelopment/CurrentProjectsandHearings/DevelopmentUpdates.aspx
National Aeronautics and Space Administration Chap 23. References
NASA Ames Research Center Environmental Resources Document Environmental Management Division March 2015 File: 2015 ARC ERD_FINAL.doc
Pg 413
Cole, Alexandra C. 1999. Final Inventory and Evaluation of Cold War Era Historical Resources. Santa Barbara, CA: SAIC.
Council on Environmental Quality (CEQ). 1997. Council on Environmental Quality Environmental Justice Guidance under the National Environmental Policy Act. Washington, D.C.: CEQ.
Dataquick. 2014. Dataquick Prospect FinderFarm. Accessed July 7, 2014. http://www.dataquick.com.
Design, Community & Environment. 2002. NASA Ames Development Plan Final Programmatic Environmental Impact Statement. Berkeley, CA: Design, Community & Environment.
DMJMH+N and EDAW. 2001. NASA Research Park Design Guide. San Francisco, CA: DMJMH+N and EDAW.
Earth Resources Technology (ERT). 2013. CY 2012 Emergency Planning and Community Right-to-Know Act Toxic Release Inventory Threshold Determination Report. Moffett Field, CA: NASA Ames Research Center, Environmental Management Division.
______. 2014a. 2013 Annual Progress Report, NASA Ames Groundwater Treatment System. Moffett Field, CA: NASA Ames Research Center, Environmental Management Division.
______. 2014b. NASA Environmental Tracking System [Computer file]. Version updated February 10, 2014. Moffett Field, CA: NASA Ames Research Center.
EDAW, Williams and Associates, Ltd., H.T. Harvey and Associates, Brown and Caldwell, and Geomatrix. 2007. South Bay Salt Pond Restoration Project Final Environmental Impact Statement/Report. Submitted to U.S. Fish and Wildlife Service and California Department of Fish and Game.
Environmental Laboratory. 1987. U.S. Army Corps of Engineers Wetlands Delineation Manual. Technical Report Y-87-1. Vicksburg, MS: U.S. Army Waterways Experiment Station.
Federal Emergency Management Agency (FEMA). 2014a. Flood Zones. Last updated July 24, 2014. https://www.fema.gov/floodplain-management/flood-zones
______. 2014b. NHFL Inventory Table, 06085C-NFHL, Santa Clara County, California. Last updated March 14, 2014. http://www.floodmaps.fema.gov/NFHL/status.shtml
Fischer, Holger. 2014. E-mail from Staff Engineer, NASA Headquarters, to John Scarboro, NASA Ames Research Center Senior Environmental Management Engineer, July 22, 2014. E-mail in Scarboro’s possession.
Haley & Aldrich, Inc, 2009. Final Supplemental Feasibility Study for the Vapor Intrusion Pathway Middlefield-Ellis-Whisman Study Area, Mountain View and Moffett Field,
National Aeronautics and Space Administration Chap 23. References
NASA Ames Research Center Environmental Resources Document Environmental Management Division March 2015 File: 2015 ARC ERD_FINAL.doc
Pg 414
California. San Jose, CA: Haley & Aldrich, Inc. http://yosemite.epa.gov/R9/SFUND/R9SFDOCW.NSF/3dc283e6c5d6056f88257426007417a2/a7c0b37c456f502e882575f5006bba80/$FILE/36083676.pdf/FS%20Report%20-%20Final.pdf
HDR Engineering, Inc. 2014. Shoreline Phase I Study, Draft Integrated Interim Feasibility Study and Environmental Impact Statement/Report. Sacramento, CA: HDR Engineering, Inc. http://www.spn.usace.army.mil/Portals/68/docs/FOIA%20Hot%20Topic%20Docs/SSF%20Bay%20Shoreline%20Study/0_Main_Report_Shoreline.pdf
Integrated Science Solutions. 2011. Synthetic Minor Operating Permit Application, National Aeronautics and Space Administration, Ames Research Center, Moffett Field, CA. Moffett Field, CA: NASA Ames Research Center.
International Conference of Building Officials. 1997. Uniform Building Code, Volume I. Whittier, CA: International Conference of Building Officials.
Intergovernmental Panel on Climate Change (IPCC). 2007. Climate Change 2007: The Physical Science Basis. Working Group I Contribution to the Fourth Assessment Report of the Intergovernmental Panel on Climate Change [Solomon, S., D. Qin, M. Manning, Z. Chen, M. Marquis, K.B. Averyt, M. Tignor, and H.L. Miller (eds.)]. Cambridge, United Kingdom and New York, NY, USA: Cambridge University Press,
______. 2013. Climate Change 2013: The Physical Science Basis. Contribution of Working Group I to the Fifth Assessment Report of the Intergovernmental Panel on Climate Change [Stocker, T.F., D. Qin, G.-K. Plattner, M. Tignor, S.K. Allen, J. Boschung, A. Nauels, Y. Xia, V. Bex and P.M. Midgley (eds.)]. Cambridge, United Kingdom and New York, NY, USA: Cambridge University Press.
Jones & Stokes. 2001. Delineation of Waters of the United States for Moffett Field, California. San Jose, CA: Jones & Stokes.
______. 2004. Western Pond Turtle Habitat Management Plan. Prepared for NASA Ames Research Center. San Jose, CA: Jones & Stokes.
Kirkendall, Whitney G., William B. Mills, Sujoy B. Roy, Mariza Costa-Cabral, and Cristina Milesi. 2013. “Use of Geomatic Techniques to Evaluate Flooding from the February, 1998 Extreme Storm and Sea Level Rise at NASA Ames Research Center.” Abstract #NH23C-1537. American Geophysical Union 2013 Fall Meeting, Dec. 7-13, San Francisco, CA.
Knowles, Noah. 2009. “Potential Inundation Due to Rising Sea Levels in the San Francisco Bay Region.” PIER Research Report. Publication number: CEC-500-2009-023-F.
Layne, V.L., and E.K. Harding-Smith. 1995. Sensitive Species Surveys at Moffett Field, 1994. Unpublished report.
National Aeronautics and Space Administration Chap 23. References
NASA Ames Research Center Environmental Resources Document Environmental Management Division March 2015 File: 2015 ARC ERD_FINAL.doc
Pg 415
Lebassi, Bereket, Jorge Gonzalez, Drazen Fabris, Edwin Maurer, Norman Miller, Cristina Milesi, Paul Switzer, and Robert Bornstein. 2009. "Observed 1970-2005 Cooling of Summer Daytime Temperatures in Coastal California." Journal of Climate 22 (13): 3558-3573.
Lopez, Courtney. 2014. E-mail from NASA Research Park Administrative Assistant, NASA Ames Research Center, to Hugo Hoffman, NASA Ames Research Center NEPA Manager and Natural Resources Manager, December 18, 2014. E-mail in Hoffman’s possession.
Meckstroth, A.M. and A.K. Miles. 2003. Predation of Nesting Waterbirds in an Urban Environment, NASA Ames Research Station, Moffett Field, California. Davis, CA: United States Department of the Interior, Western Ecological Research Center, USGS Field Station.
Meyssignac, Benoit, and Anny Cazenave. 2012. “Sea level: A Review of Present-Day and Recent-Past Changes and Variability.” Journal of Geodynamics 58: 96-109.
Metropolitan Transportation Commission (MTC). 2001. Commuter Forecasts for the San Francisco Bay Area, 1990-2020. Oakland California: MTC.
Metropolitan Transportation Commission (MTC) and Association of Bay Area Governments (ABAG). 2013. MTC Travel Model. Accessed December 8, 2014. http://analytics.mtc.ca.gov/foswiki/Main/TravelModel
Milesi, Cristina, Mariza Costa-Cabral, John Rath, Felicia Chiang, William B. Mills, Sujoy B. Roy, Bridget Thrasher, Weile Wang, Max Loewenstein, and James Podolske. 2014."Comparison of Downscaled CMIP5 Precipitation Datasets for Projecting Changes in Extreme Precipitation in the San Francisco Bay Area." Presentation at the Biennial Bay-Delta Science Conference, Sacramento, CA, Oct. 28-30, 2014.
National Aeronautics and Space Administration (NASA). 2002. NASA, Association Of Bay Area Governments Step Out On Bay Trail. NASA press release 02-14AR, February 5, 2002. Moffett Field, CA: NASA Ames Research Center.
______. 2008. Ames Research Center Mission Statement. Last updated August 11, 2008. http://www.nasa.gov/centers/ames/about/missionstatement.html
______. 2009. Environmental Resources Document, NASA Ames Research Center. Moffett Field, CA: NASA Ames Research Center.
______. 2010. Center Operational Assurance, Environmental Management Division. Last modified September 29, 2010. http://www.nasa.gov/offices/emd/home/coa.html
______. 2011a. 2011 NASA Strategic Plan. Washington, D.C: NASA. http://www.nasa.gov/pdf/516579main_NASA2011StrategicPlan.pdf.
______. 2011b. 2011 Environmental Sustainability Report. Moffett Field, CA: NASA Ames Research Center. http://environment.arc.nasa.gov/sustain/doc/ESR-2011-Final2.pdf
National Aeronautics and Space Administration Chap 23. References
NASA Ames Research Center Environmental Resources Document Environmental Management Division March 2015 File: 2015 ARC ERD_FINAL.doc
Pg 416
______. 2013 Polychlorinated Biphenyls Annual Document Log. Moffett Field, CA: NASA Ames Research Center, Environmental Management Division.
______. 2014a. Real Property Report [Computer file]. Accessed July 17, 2014. Moffett, Field, CA: NASA Ames Research Center.
______. 2014b. Airfield, Summary of the Historic Property Survey Report for the Airfield at NASA Ames Research Center, Moffett Field, California. Last updated November 2014. http://historicproperties.arc.nasa.gov/airfield.html
______. 2014c. Strategic Sustainability Performance Plan. Accessed December 16, 2014. http://www.nasa.gov/sites/default/files/files/NASA_2014_SSPP_final.pdf
NASA Research Park Office. 2014. Data attached to e-mail from NASA Research Park Office, NASA Ames Research Center, to Hugo Hoffman, NASA Ames Research Center NEPA Manager and Natural Resources Manager, April 22, 2014. Data and e-mail in Hoffman’s possession.
National Guard Bureau. 2009. Proposed Long‐Term Lease and Installation Development Plan for the 129th Rescue Wing, California Air National Guard. Arlington, VA: National Guard Bureau.
National Research Council (NRC). 2012. Sea-Level Rise for the Coasts of California, Oregon, and Washington: Past, Present, and Future. Washington, D.C.: National Academies Press.
NBBJ. 2012. Bay View Design Guide. San Francisco, CA: NBBJ.
Nemani, Ramakrishna, Hirofumi Hashimoto, Petr Votava, Forrest Melton, Weile Wang, Andrew Michaelis, Linda Mutch, Cristina Milesi, Sam Hiatt, and Michael White. 2009. "Monitoring and Forecasting Ecosystem Dynamics Using the Terrestrial Observation and Prediction System (TOPS)." Remote Sensing of Environment 113 (7): 1497-1509.
Packard, Eric. 2014. Data attached to e-mail from Assistant Radiation/Laser/Nonionizing Radiation Safety Officer, NASA Ames Research Center, to Hugo Hoffman, NASA Ames Research Center NEPA Manager and Natural Resources Manager, April 2, 2014. Data and e-mail in Hoffman’s possession.
Page & Turnbull. 2007 Evaluation of Historic Resources Associated with the Space Shuttle Program at Ames Research Center. San Francisco, CA: Page & Turnbull.
The Planning Collaborative, Inc. 1980. Stevens Creek: A Plan of Opportunities (Comprehensive Use and Management Guidelines). San Francisco, CA: Planning Collaborative Inc.
RealFacts. 2014. Market Overview, Santa Clara and selected zips 94002-94588. Novato, California: RealFacts.
National Aeronautics and Space Administration Chap 23. References
NASA Ames Research Center Environmental Resources Document Environmental Management Division March 2015 File: 2015 ARC ERD_FINAL.doc
Pg 417
Rosenzweig, Cynthia, Radley M. Horton, Daniel A. Bader, Molly E. Brown, Russell DeYoung, Olga Dominguez, Merrilee Fellows, Lawrence Friedl, William Graham, Carlton Hall, Sam Higuchi, Laura Iraci, Gary Jedlovec, Jack Kaye, Max Loewenstein, Thomas Mace, Cristina Milesi, William Patzert, Paul W. Stackhouse Jr., and Kim Toufectis. 2014. "Enhancing Climate Resilience at NASA Centers: A Collaboration between Science and Stewardship." Bulletin of the American Meteorological Society 95 (9): 1351-1363.
San Francisco Bay Conservation and Development Commission (BCDC). 2011. Living with a Rising Bay: Climate Change Impacts on San Francisco Bay and Adaptation Strategies. San Francisco, CA: BCDC. http://www.bcdc.ca.gov/BPA/LivingWithRisingBay.pdf
San Francisco Bay Trail Project. 2014. About Us. Accessed November 11, 2014. http://www.baytrail.org/aboutus.html
Santa Clara County. 1994. Santa Clara County General Plan 1995-2010. San Jose, CA: Santa Clara County Planning Office. http://www.sccgov.org/sites/planning/PlansPrograms/GeneralPlan/Pages/GP.aspx
______. 2010. County of Santa Clara Housing Element Update 2009-2014. San Jose, CA: Santa Clara County Planning Office. http://www.sccgov.org/sites/planning/PlansPrograms/GeneralPlan/Housing/Pages/HousingElement.aspx
______. 2012. Santa Clara County Zoning Atlas. Last updated July 2012. http://www.sccgov.org/sites/planning/GIS/Zoning/Documents/zoning_atlas.pdf
Selby, Diane. 2014. E-mail from Chief, Resources Management Division, NASA Ames Research Center, to David Shiver, NASA Ames Research Center Real Estate Advisor, July 22, 2014. E-mail in Shiver’s possession.
San Francisco Bay Regional Water Quality Control Board (San Francisco Bay RWQCB). 2013. San Francisco Bay Basin (Region 2) Water Quality Control Plan (Basin Plan). San Francisco, CA: San Francisco Bay RWQCB. http://www.waterboards.ca.gov/sanfranciscobay/basin_planning.shtml
______. 2014a. Total Maximum Daily Loads (TMDLs) and the 303(d) List of Impaired Water Bodies. Accessed November 10, 2014. http://www.waterboards.ca.gov/sanfranciscobay/water_issues/programs/TMDLs/
______. 2014b. Adopted Basin Plan Amendments. Accessed November 10, 2014. http://www.waterboards.ca.gov/sanfranciscobay/water_issues/programs/planningtmdls/amendments/bpa_table.shtml
Santa Clara Valley Transportation Authority (VTA). 2003. Traffic Level of Service Analysis Guidelines. San Jose, CA: VTA. http://www.vta.org/sfc/servlet.shepherd/document/download/069A0000001ELtYIAW
National Aeronautics and Space Administration Chap 23. References
NASA Ames Research Center Environmental Resources Document Environmental Management Division March 2015 File: 2015 ARC ERD_FINAL.doc
Pg 418
______. 2011. Santa Clara Valley Bikeways Map. San Jose, CA: VTA. http://www.vta.org/projects-and-programs/planning/bikes-bikeways-map-effective-april-2011
______. 2012. 2012 Monitoring & Conformance Report. San Jose, CA: VTA. http://www.vta.org/sfc/servlet.shepherd/version/download/068A0000001QIe1
______. 2014. Schedules, 902 Mountain View to Winchester. Last updated July 8, 2013. http://www.vta.org/routes/rt902
Scott, N.J. and C.S. Alderete. 2001. Amphibian Survey of Moffett Field, Santa Clara County, California, with Focus on the California Red-Legged Frog (Rana Aurora Draytonii) and the California Tiger Salamander (Ambystoma Californiense). Moffett, CA: NASA Ames Research Center.
South Bay Salt Pond Restoration Project. 2013. Track Our Progress. Accessed November 11, 2014. http://www.southbayrestoration.org/track-our-progress/
South San Francisco Bay Shoreline Study .2014. About the San Francisco Bay Shoreline Study. Accessed November 17, 2014. http://www.southbayshoreline.org/about.html
State of California Employment Development Department (EDD). 2014. Employment by Industry Data. Accessed December 8, 2014. http://www.calmis.ca.gov/file/indhist/santchaw.xls
State Water Resources Control Board (SWRCB). 2005. Policy for Implementation of Toxics Standards for Inland Surface Waters, Enclosed Bays, and Estuaries of California. Sacramento, CA: SWRCB, California Environmental Protection Agency. http://www.swrcb.ca.gov/water_issues/programs/state_implementation_policy/docs/final.pdf
______. 2010. Impaired Water Bodies, 2010 Integrated Report (Clean Water Act Section 303(d) List/305(b) Report) - Statewide. Last updated August 5, 2013. http://www.waterboards.ca.gov/water_issues/programs/tmdl/integrated2010.shtml
Thompson, Laura. 2014. Phone communication from Bay Trail Project Manager, Association of Bay Area Governments, to Andrew Martin, NASA Ames Research Center Environmental Compliance Specialist, November 11, 2014. Notes in Martin’s possession.
Thrasher, Bridget, Jun Xiong, Weile Wang, Forrest Melton, Andrew Michaelis, and Ramakrishna Nemani. 2013. "Downscaled Climate Projections Suitable for Resource Management." Eos, Transactions American Geophysical Union 94 (37): 321-323.
Transportation Research Board. 2000. 2000 Highway Capacity Manual. Washington, D.C.: National Research Council.
National Aeronautics and Space Administration Chap 23. References
NASA Ames Research Center Environmental Resources Document Environmental Management Division March 2015 File: 2015 ARC ERD_FINAL.doc
Pg 419
U.S. Army Corps of Engineers (USACE). 2004. South San Francisco Bay Shoreline Project, Section 905(b) (WRDA 86) Analysis. San Francisco, CA: USACE. http://www.southbayrestoration.org/pdf_files/USACE%20SSFBS%20905(b)%20-%20Sept%202004.PDF
______. 2007. Environmental Assessment for the Construction and Operation of an Armed Forces Reserve Center Complex at Moffett Field, California. Mobile, AL: USACE. http://www.hqda.army.mil/ACSIM/brac/sites%5CCA%5CMoffett_Field_AFRC%5CMoffettFieldCA%20EA.pdf
U.S. Census Bureau. 2010a. American FactFinder, P5, Hispanic or Latino Origin by Race, Universe: Total Population, 2010 Census Summary File 1. Accessed October 21, 2014. http://factfinder.census.gov/faces/tableservices/jsf/pages/productview.xhtml?pid=DEC_10_SF1_P5&prodType=table
______. 2010b. American FactFinder, QT-P11, Households and Families: 2010, 2010 Census Summary File 2. Accessed October 21, 2014. http://factfinder.census.gov/faces/tableservices/jsf/pages/productview.xhtml?pid=DEC_10_SF2_QTP11&prodType=table
______. 2010c. American Community Survey, 2006-2010 ACS 5-Year Estimates, Table B19001, Household Income in the Past 12 Months (In 2010 Inflation-Adjusted Dollars). Accessed October 21, 2014. http://www.census.gov/acs/www/data_documentation/summary_file/
______. n.d. American FactFinder. Accessed December 8, 2014. http://factfinder2.census.gov/faces/nav/jsf/pages/index.xhtml
U.S. Department of Health and Human Services (HHS). 2010. The HHS Poverty Guidelines for the Remainder of 2010 (August 2010). Accessed October 21, 2014. http://aspe.hhs.gov/poverty/10poverty.shtml
U.S. Environmental Protection Agency (USEPA). 1998. Final Guidance for Incorporating Environmental Justice Concerns in EPA’s NEPA Compliance Analyses. Washington, D.C.: USEPA.
______. 1989. Record of Decision, Fairchild, Intel, and Raytheon Sites, Middlefield-Ellis-Whisman Study Area, Mountain View, California. San Francisco, CA: U.S. Environmental Protection Agency, Region 9.
______. 2010. Record of Decision Amendment for the Vapor Intrusion Pathway, Middlefield-Ellis-Whisman (MEW) Superfund Study Area. San Francisco, CA: U.S. Environmental Protection Agency, Region 9.
______. 2011. Vapor Intrusion Study Area North of U.S. 101- Moffett Field Area, December 2011. San Francisco, CA: USEPA, Region 9. http://yosemite.epa.gov/r9/sfund/r9sfdocw.nsf/3dc283e6c5d6056f88257426007417a2/db2161db14b4b41d88257968006b0191!OpenDocument
National Aeronautics and Space Administration Chap 23. References
NASA Ames Research Center Environmental Resources Document Environmental Management Division March 2015 File: 2015 ARC ERD_FINAL.doc
Pg 420
______. 2013a. Greenhouse Gases Reporting Program Implementation. Accessed December 14, 2014 http://www.epa.gov/ghgreporting/documents/pdf/2009/FactSheet.pdf
______. 2013b. Unilateral Administrative Order, U.S. EPA Docket No. RCRA-7003-09-2013-0002, Former Soils Fill Area, NASA Ames Research Center, Moffett Field, California. San Francisco, CA: USEPA, Region 9.
Zhang, Yuan, John M. Wallace, and David S. Battisti. 1997. "ENSO-like Interdecadal Variability: 1900-93." Journal of Climate 10 (5): 1004-1020.
Zippin, D.B. and T.M. Engels. 1997. Directed Rare Plant Surveys for California Sea-Blite and Point Reyes Bird’s Beak at NASA Ames Research Center and Moffett Federal Airfield, CA, 1997. Moffett Field, CA: NASA Ames Research Center.
Related Documents