ENVIRONMENTAL REPORTING AND TRANSPORT – THE CASE OF A PUBLIC TRANSPORT COMPANY Otto Andersen ∗ Western Norway Research Institute Abstract This article discusses corporate environmental reporting in the field of transport. In addition to addressing this issue in general, the article includes empirical material from a case transport company. The process of preparing the year 2000 environmental report for the company is described. The environmental report includes actions for improving the environmental performance of the company, and indicators for monitoring of the progress from year to year. This is based in separate studies of the employee’s company travels, daily travel to work, and the purchasing of energy. The company is using societal accounting to show its responsibility as an important societal actor, improving the stakeholder dialogue and providing knowledge at the political level. Introduction This is the second of two articles describing the work carried out by Western Norway Research Institute in connection with the environmental reporting from the public transport ∗ Correspondence to: Otto Andersen, Environment Research Group, Western Norway Research Institute, PO Box 163, N-6851 Sogndal, Norway. E-mail: [email protected]

Welcome message from author
This document is posted to help you gain knowledge. Please leave a comment to let me know what you think about it! Share it to your friends and learn new things together.
Transcript

ENVIRONMENTAL REPORTING AND TRANSPORT – THE CASE OF A PUBLIC TRANSPORT COMPANY
Otto Andersen∗
Western Norway Research Institute
Abstract
This article discusses corporate environmental reporting in the field of transport. In addition
to addressing this issue in general, the article includes empirical material from a case transport
company. The process of preparing the year 2000 environmental report for the company is
described. The environmental report includes actions for improving the environmental
performance of the company, and indicators for monitoring of the progress from year to year.
This is based in separate studies of the employee’s company travels, daily travel to work, and
the purchasing of energy. The company is using societal accounting to show its responsibility
as an important societal actor, improving the stakeholder dialogue and providing knowledge
at the political level.
Introduction
This is the second of two articles describing the work carried out by Western Norway
Research Institute in connection with the environmental reporting from the public transport
∗ Correspondence to: Otto Andersen, Environment Research Group, Western Norway Research Institute, PO Box 163, N-6851 Sogndal, Norway. E-mail: [email protected]

company Oslo Sporveier. This article comprises work connected to the environmental report
and the societal accounting from the company, while the first article describes scenarios for
the transport development in Oslo (Andersen, 2003).
The publishing of environmental reports has become an important way for companies to
communicate environmental issues with the stakeholders. A substantial amount of research
has been carried out in the field of corporate environmental reporting since the first
environmental reports were issued more than a decade ago (e.g. Azzone et al., 1996; Kolk,
1999; Kolk et al., 2001). Legislative requirements in many countries (e.g. the Netherlands,
Sweden and Norway) for disclosure of environmental issues have contributed to the increased
attention on corporate environmental reporting. In addition, a stronger societal demand for
corporate transparency on environmental issues has emerged both from primary and
secondary stakeholders1.
Transport is a major consumer of energy and an important source of emissions of greenhouse
gases. Transport activities are in addition an important source of the most serious local and
regional environmental problems2. The problems are particularly detrimental in cities. To take
a look at how well transport is included in corporate environmental reports thus becomes
important. Historically the environmental reporting has focused on the production activities of
the corporations. Process-energy, material use and emissions connected to the production
processes and the production facilities have historically been well accounted for in the 1 The differentiation between primary and secondary stakeholders is based on the definitions by Clarkson (1995). A primary shareholder group is “one without whose continuing participation the corporation cannot survive as a going concern”, whereas secondary stakeholders are “those who influence or affect, or are influenced or affected by, the corporation, but are not engaged in transactions with the corporation and are not essential for its survival”. According to such a classification, primary stakeholders are investors, employees, customers, suppliers, governments and communities. Secondary stakeholders include media and activist groups. 2 The list of local and regional environmental problems from transport is extensive, and includes the emissions of a large number of substances with serious environmental and health effects (nitrogen oxides, particles, sulphur oxides, volatile organic compounds and others), noise, land-use demands, building corrosion and death/disabilities from traffic accidents.
environmental reports. It is however not that common to include transport activities in the
reporting. A recent study of environmental reporting in Denmark indicates that no more than a
quarter of the companies include transport in their environmental reports (Holgaard and
Remmen, 2001).
There are in addition many different ways to include transport in corporate environmental
reporting. At least four types of transport connected to the activities of companies can be
identified:
1. The movement of goods to and from a production facility. This includes the transport
of raw materials into the production facilities and the distribution of finished products
to the customers. For a transport company that has transport services as its main
product, the amount of transport provided through the services is commonly included
in the reporting. For public transport companies this encompass the person transport
work of the basic transport services provided (bus, tram, metro etc.).
2. The internal transport in the company. This type of transport encompasses the person-
and goods-transport within a unit and between the different 0units of the company.
This is usually carried out by the company’s own vehicles, but can also be performed
by contracting companies.
3. Business travels. The travels made by the employees to meetings, seminars and
conferences are also a type of transport work that is generated by a company’s
activities. This type of transport is taking place within the company’s working hours

and the travels often last for several days. Even so, this transport is not commonly
included in corporate environmental reports.
4. Travels to work. The daily travels of the company’s employees between home and the
work place are even less common to include in corporate environmental reports.
However, a company that provides public transport services is particularly exposed to
criticism or pressure from stakeholders if the employees are not using public transport.
The reporting of employee’s travels to work is in addition particularly relevant for a
company providing environmentally friendly transport. This is reflected in the
environmental report from the case company Oslo Sporveier.
Since transport is a major consumer of energy, it is logical that energy use has a central
position in the environmental reports from companies providing transport. Both the type and
amounts of energy used are important from an environmental point of view. For companies
that consume large amounts of energy in their operations, the choice of energy type and
quality are important for environmental reasons. It is important for these companies to be able
to document the amount of purchased energy coming from renewable sources of energy. The
mission of greenhouse gases is tightly coupled to the combustion of fossil energy. Disclosing
data on emissions of CO2 and other greenhouse gases are essential elements in company
environmental reports.
Corporate environmental reports are used to communicate relevant environmental issues to
the stakeholders. For companies that provide public transport services, important primary
stakeholder groups are the public and communities. In addition, the public transport system is
important for the functioning and development of urban areas. Public transport companies
thus have important societal functions. As important societal actors public transport
companies have a societal responsibility. The publishing of an environmental report is one
way by which the company can demonstrate this responsibility. The company can show how
the environmental effects of the company’s services compare with other ways of providing
the service. The company can do this by disclosing its societal account. This is done in the
environmental report for Oslo Sporveier for the year 2000. It is not common to include
societal accounting in corporate environmental reports. But for a company that serves an
important societal function, which is the case for Oslo Sporveier, it is logical to do so. The
societal accounting can have the function of providing knowledge at the political level, by
analysing the impact of various transport forms in the city. The societal accounting can thus
complement an important function of the scenarios prepared by the company for the
development of transport between 1996 and 2016 in Oslo (Andersen, 2003).
The process of preparing the environmental report for Oslo Sporveier has consisted of a long-
term collaboration between the company and the researchers at Western Norway Research
Institute. It started with the preparation of scenarios for the development of transport,
continued with the compilation of material for the 2000 environmental report including the
societal accounting, and continues on with annual environmental reporting.
The environmental report project
The company Oslo Sporveier is the largest public transport provider in Oslo, a city with
approximately half a million people. The size of the public transport provided by the company
is illustrated by the key figures for year 2000 in Table 1.
In addition to the three transport means metro, tram and bus, the company also provides train
and boat services through contracts with companies operating these transport means. Of the
three main transport means provided by the company, the metro lines transports most people,
while the bus route network is the most extensive in terms of number of routs and total length.
The area of coverage is the mainly within Oslo, but some lines also extend outside the city
borders.
The composition of the vehicle fleet is shown in Table 2. In addition to the vehicles providing
the transport services (shown in Table 2), the company also operates a fleet of additional
vehicles for use in service and maintenance of material, infrastructure and company buildings.
Since the company’s main activity is to provide transport services, the environmental effects
of the transport was chosen as the superior focus in the environmental report. The report
comprises all the basic transport systems, metro, tram and bus in which the company provides
services. But due to the superior transport focus, other forms of transport are also included.
These encompass company travels and the daily employee travel to and from work.
The project, which consisted of preparing the environmental report for Oslo Sporveier, can be
considered as a case in itself, for the collaboration between a research institute and a public
transport company. It has been part of a long-term collaboration between Oslo Sporveier and
Western Norway Research Institute. The project was organised through a steering group and a
project group in Oslo Sporveier. The steering group had the superior responsibility for the
project, while the project group was responsible for the operational aspects of carrying out the
project. The steering group consisted of the company-wide upper management and functioned
to motivate the employees to commit time and effort to the project. The project group

consisted of middle management from the operational units of the company. The following
units were represented: metro, trams, buses, property, service, economy, purchasing,
marketing, HSE (health, safety and environment), planning, and traffic management.
The preparation of the environmental report was a process based on a high degree of
employee participation. The members of the project group collaborated closely with the
researchers from Western Norway Research Institute, and made substantial efforts in
assembling the necessary data material on the activities of the company. The employees
participated in the identification of the critical areas and the formulation of actions for
improving the environmental performance of the company.
In this article the empirical material in five main areas connected to the Oslo Sporveier
environmental report for the year 2000 is presented: 1) The company’s main operations, 2)
Business travel, 3) Travels to work, 4) Purchasing and 5) Societal accounting.
Main company operations
The environmental impacts of the main operations of Oslo Sporveier were analysed in terms
of energy use and emissions of CO2, NOx, PM10 and PM2.5. Both energy in the form of
electricity and the mobile and stationary combustion of fuels were included. The various types
of energy use in the main operations of the company are shown in Table 3.
The largest energy-consuming operation is the metro lines, which used close to 71 GWh of
electricity, which is 35% of the total energy use of the company in 2000. The fuel for the
buses also constitute a large part (27%) of the company’s total energy use, while the energy
for the buildings is the third largest (20%) form of energy use in the company.
Due to the large energy use in the operation of the main services provided by the company, as
series of actions to reduce the energy use has been identified Feil! Finner ikke
referansekilden..
The main source of CO2, NOx, PM10 and PM2.5 -emissions from the company’s main
operations are shown in Table 4.
The combustion of fuel in the buses is the largest source of all three emission components. In
total for the year 2000 the use of diesel to run the buses caused emission of 14 272 tonnes of
CO2, 141 tonnes of NOx and almost 13 tonnes of PM10, of which close to 10 tonnes are PM2.5.
In reducing the emissions from the main operations the company has implemented several
actions and measures (Feil! Finner ikke referansekilden.).
Business travel
The transport in the form of business journeys made by the employees of Oslo Sporveier to
conferences, meetings, seminars etc. was analysed in detail. The sources of data material for
this analysis were two internal reporting systems used by the employees to claim
reimbursement for this type of travel activity. The first consisted of forms used to claim
reimbursement for travel by public transport or rental car, while the second consisted of forms
used to report private car usage on the business journeys. All the forms in these two categories
in the company, processed in the year 2000, were used in this analysis. This consisted of a
total of 334 journeys by air, rail, train bus or ferry to destinations outside Oslo and Akershus.
The results of the analysis of the company journeys indicated that in the year 2000 accounted
for a total energy use of 535 MWh, the emissions of 356 tonnes of CO2, 713 kg NOx and 40
kg PM10.
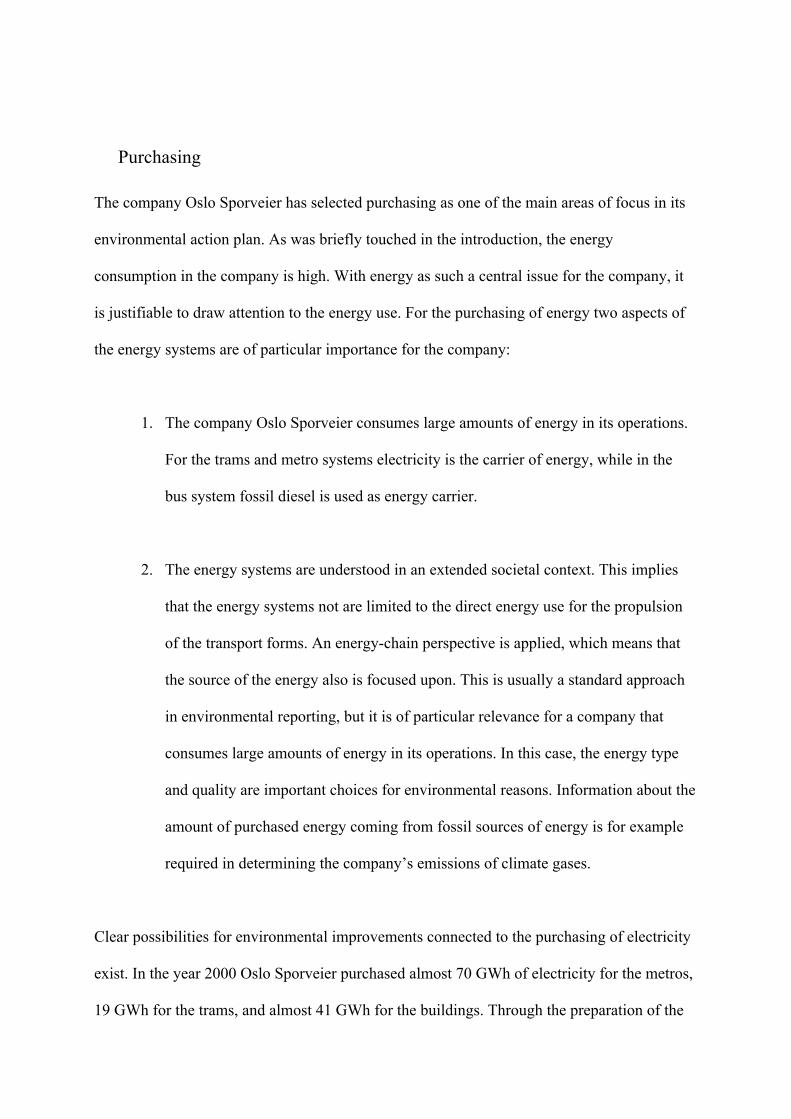
In Figure 1 the distribution of the distance travelled with the various transport forms used on
the business journeys is shown. Of the accumulated distance of 810 000 kilometres, air travel
constituted 83%, private car 10%, and train, bus and ferry each 2-3%. Air travel accounted for
338 tonnes or 97% of the total CO2 –emissions from the company journeys. This corresponds
to as much as two percent of the total CO2 –emissions from the company operations shown in
Table 4. It is therefore important for the company to reduce the air travel. Private car also
accounts for a much larger part of the emissions than rail and bus. These are superior
justifications for implemented company actions (Box 3) aiming at reducing all unnecessary
air travel and private car use.
Restrictions on unnecessary business travel and travel by air and private cars are proposed and
implemented in various ways through the environmental action plan in the company.
Indicators have also been established for measuring the changes in this form of employee
travel. They are shown in Box 4.
Travels to work
Due to the fact that the daily travels of the company’s employees between home and the work
place are not common to include in corporate environmental reports, but are particularly
relevant for a company providing environmentally friendly transport, it is devoted relatively
large space to this type of transport in this article. The work travels performed by the
employees of Oslo Sporveier were analysed through a relatively extensive study where 796 of
the employees were interviewed on nine of the largest work locations in the company. The
total number of employees at the time of the study was 2323. By taking into consideration the
amount of part-time employment, answers were obtained from 38% of the total number of
man-years in the company, which is the respondent rate in the study.
The interviews were carried out by employees of the company in collaboration with the
researches from Western Norway Research Institute. A combination of e-mail and personal
interviews was used. Employees with access to personal computer answered a questionnaire
distributed by e-mail, while the others were interviewed in-person. Answers were obtained
regarding the travel to work on the actual day the questionnaires were sent out and the
interviews carried out. The “today’s travel” approach used was chosen to reduce the potential
source of errors from the employees having to remember their travel far back in time. The
disadvantage with this approach is however that the chosen day of the interviews could be an
atypical day for various reasons. No such reasons was however identified, except for the fact
that the day chosen in November is in a season when the use of bicycling/walking is relatively
low. The question of how the bicycling/walking on the day of the interview deviated from the
annual average was not answered with this methodological approach. Questions were asked
about transport mode, distance travelled, and for the use of private cars, also the number of
people in the car during the journey.

The results of the study indicated that the work travel by the employees accounted for an
energy use of 11.9 GWh corresponding to 6% of the company’s total energy use in year 2000.
This is a relatively high number, as the company is a major consumer of energy through the
trams, metro and bus services. Emissions of CO2 from the work travel amounted to as much
as 2 963 tonnes, corresponding to 17% of the company’s total CO2 –emissions. The NOx –
emissions amounted to 8.1 tonnes, or 5% of the company total. Approx. 1.6 tonnes of PM10,
corresponding to 13% of the total from the company operations was emitted. The reason why
the percentage is so much higher for CO2, NOx and PM10 than for energy is that there is a
much higher fraction of energy use in the form of fossil fuels in the work travel than in the
total company energy use. A major part of the total company energy use is in the form of
electricity for the trams and metro systems.
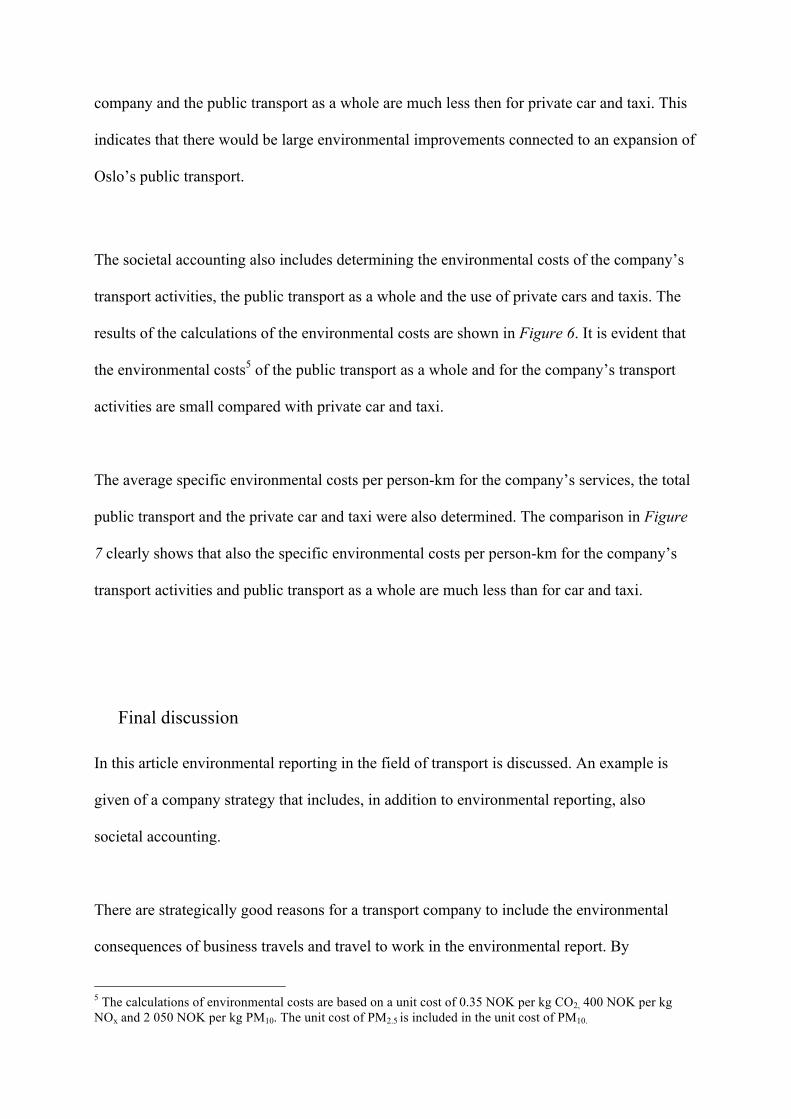
The result of the study also showed that 428 of the 796 of the work journeys (54% of total)
were carried out by private car, while in 324 of the journeys (41% of total) public transport
were used for the major (longest) segment of the work journey (Figure 2).
Two additional studies of work travel in Oslo and Akershus County have found private car
shares ranging from 58% to 53% (Andersen, 2001). The share of private car use of 54% found
in the study of employee work travel in Oslo Sporveier thus indicates a similar private car
share as work travel in general in Oslo city and Akershus County. However, as relatively
large parts of the company are centrally located in Oslo and with good access to public
transport it is reason to expect that the share of private car usage was lower. This share of
private car use should however be considered in light of the employees’ home relative to the
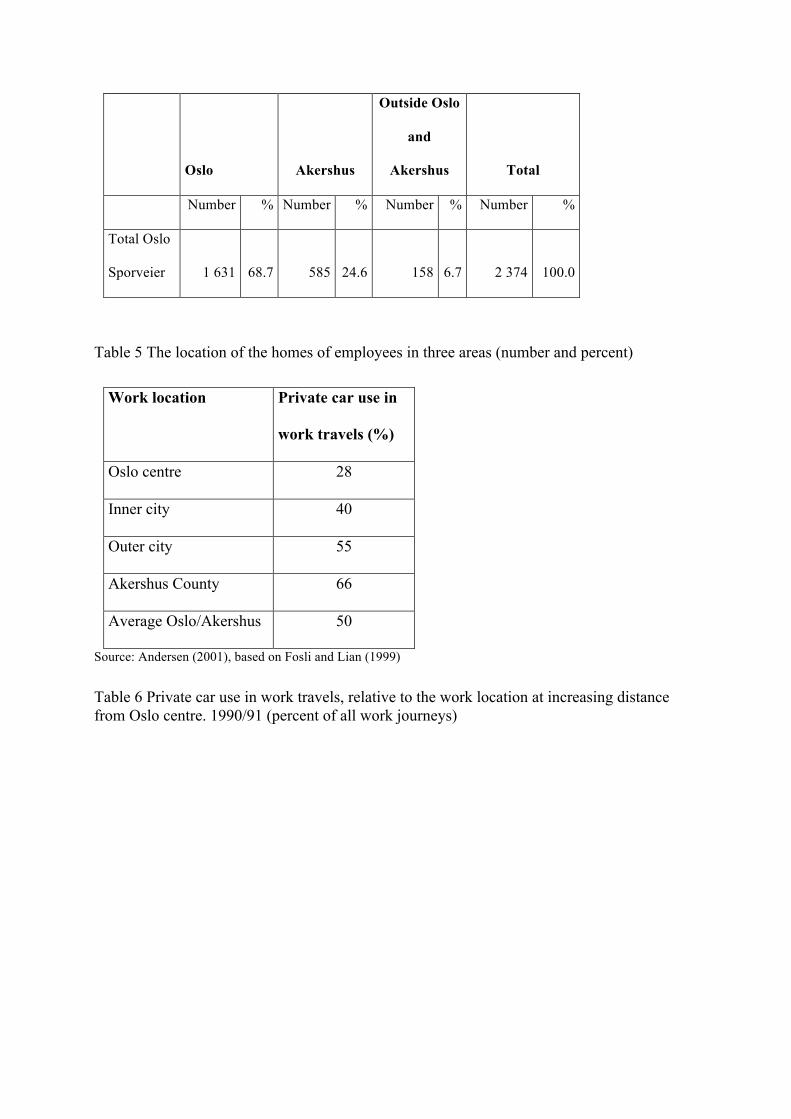
work place location. In Table 5 the location of the employees’ homes in three areas is shown:

1) Oslo, 2) Akershus County and 3) Outside Oslo and Akershus County. Close to 69% of the
employees live within Oslo city’s borders, with relatively good access to public transport.
This supports the expectation of a lower share of private cars than the findings in the study
indicate.
Analyses of data from an earlier study of travel behaviour for Oslo/Akershus (1990/91)
showed the share of private car use relative to the work location at increasing distance from
Oslo centre (Andersen, 2001). The results are shown in Table 6 and Figure 3.
As seen in Table 6 the share of private car is relatively low when the work location is Oslo
centre. At locations further away there is a substantial but still gradual increase up to the
outermost zone: Akershus. In the inner city the share of private car is still substantially below
the average of approx. 50%, while it is barely above in the outer city. It is not until a location
in Akershus that the share of private car is substantially higher than the average and higher
than what referred to above in the other studies of Oslo/Akershus (average 53-58%).
In Figure 3 a strong increase in the share of private car out to about 6 km from the Oslo centre
is evident. The use of private car is there somewhat higher than the average for
Oslo/Akershus. When the work location is gradually farther away from the city the increase in
private car share is more moderate. When the distance from the centre is about 25 km the
private car share is above 70%.
The study of work travel among the employees in Oslo Sporveier found that at the company
locations with the lowest private car use the share of private car is about as would be expected
relative to the average for Oslo/Akershus. The basis for the relatively high share of private car
for the company as a whole is primarily the high shares (77-86%) of private car usage at three
units. The shares of private car usage at these three units are above what one would expect
from their location with relatively good accessibility with public transport and situated at
node-points in the public transport route network. This is an additional indication that there
would be reason to believe that lower shares of private car is possible, facilitated by actions
working in that direction at all company units.
The average occupancy rate of the private car journeys in the study of employee work travel
in Oslo Sporveier was found to be 1.18 persons per car. This is the same as the occupancy rate
on weekdays in Oslo in the morning rush found in a separate study (Andersen, 2001). An
average private car occupancy rate of 1.1 for work travel has previously been found in
Oslo/Akershus. The Norwegian national average occupancy rate for work travel in 1998 was
also about 1.1 (ibid.). The occupancy rate for work travel in Oslo Sporveier is thus somewhat
higher than the average both nationally and for Oslo and Akershus. The possible difference is
however small. The occupancy rate found in the study of work travels in Oslo Sporveier is not
high enough to rule out the possibilities that company actions could have an effect on
increasing the occupancy rate.
Oslo Sporveier has established several actions connected to the employee’s work travel (Box
5). The first group of actions is aiming at stimulating the employees to use public transport
instead of private car. First of all, the employees can travel free on the transport means
operated by Oslo Sporveier within the Oslo city border. In addition, the company is operating
a system of employee transport, consisting of buses picking up and delivering employees. The
superior justification for this system is to make it easier to get to and from work for
employees with work hours extending into the night, when the public transport services are
not operating. The company has also made an objective to establish a new overall parking
policy. A superior goal is to increase the restrictions on accessibility of parking space. These
restrictions apply to employees who are not dependent on private car use to and from work.
In spite of the system with free travel on public transport within the borders of Oslo, and the
system of special buses picking up and delivering employees at their homes, the study of the
work travel among the employees found a relatively high private car use. On the other hand,
the use of public transport – about 40 percent – is substantially higher than the average for
Oslo/Akershus. The use of metro is more than twice as high. Seen this way, it is apparent that
the stimulating actions, such as the system of free travel, have an effect. The problem
however is that they do not appear to result in a lower private car use, but first of all a lower
walking/bicycle use. The average in Oslo/Akershus for walking/bicycle use is 18-20 percent,
while it was found to be as low as 5 percent in Oslo Sporveier3.
The second group of actions connected to the employee’s work travel consists of actions
aiming at stimulating to increased bicycling/walking. As a part of its environmental action
plan the company is working towards increasing the bicycling use by implementing
information and facilitating actions for making the use of bicycle a more preferred transport
choice. These actions are anchored in the company’s HSE work. In addition, an objective of
carrying out annually surveys of employee’s work travel is established, for the purpose of
monitoring the use of various transport modes.
The company has established a set of indicators for the measuring of changes in the
employee’s work travel from year to year. The indicators are shown in Box 6.
3 See previous comment regarding potential error in bicycling/walking rate.
Purchasing
The company Oslo Sporveier has selected purchasing as one of the main areas of focus in its
environmental action plan. As was briefly touched in the introduction, the energy
consumption in the company is high. With energy as such a central issue for the company, it
is justifiable to draw attention to the energy use. For the purchasing of energy two aspects of
the energy systems are of particular importance for the company:
1. The company Oslo Sporveier consumes large amounts of energy in its operations.
For the trams and metro systems electricity is the carrier of energy, while in the
bus system fossil diesel is used as energy carrier.
2. The energy systems are understood in an extended societal context. This implies
that the energy systems not are limited to the direct energy use for the propulsion
of the transport forms. An energy-chain perspective is applied, which means that
the source of the energy also is focused upon. This is usually a standard approach
in environmental reporting, but it is of particular relevance for a company that
consumes large amounts of energy in its operations. In this case, the energy type
and quality are important choices for environmental reasons. Information about the
amount of purchased energy coming from fossil sources of energy is for example
required in determining the company’s emissions of climate gases.
Clear possibilities for environmental improvements connected to the purchasing of electricity
exist. In the year 2000 Oslo Sporveier purchased almost 70 GWh of electricity for the metros,
19 GWh for the trams, and almost 41 GWh for the buildings. Through the preparation of the

environmental report for the year 2000 a discussion was started if the company should start to
apply environmental criteria to the purchasing of electricity. For the years 2001/2002, the
company action plan specifies that the possibilities for purchasing of environmentally labelled
electricity will be investigated, both for the propulsion energy and energy for the buildings.
There are many different criteria for environmentally labelling of electricity. Criteria for green
electricity according to the Swedish “Bra miljøval” (“Good environmental choice”) label
guarantee that only the energy sources hydropower, bio energy and wind energy are utilised.
The main issue here is to exclude the electricity from coal fired or nuclear power stations. The
exclusion of fossil fuel- or nuclear generated electricity implies that the electricity comes from
renewable energy sources only, and as such can be considered CO2 neutral. A decision to
switch to only using green electricity can thereby contribute to a reduction in the CO2
emissions from the company activities4.
Also for the purchasing of new equipment the company will start to apply environmental
criteria. For the upgrading and purchasing of new electrified transport equipment (trams and
metro) are increased energy-efficiency and reduction in noise important factors that are taken
into consideration. For the purchasing of new buses is in addition company criteria
established for the reduction in exhaust emissions.
Environmental criteria are also established for the choice of suppliers. These include criteria
regarding the supplier’s environmental policy, environmental report and environmental
management system. Indicators expressing the percentage of purchases where the supplies
fulfil the criteria are also established. Also for the choice of products, indicators expressing
4 Since basically all electricity produced in Norway is from hydroelectric power, the CO2 -reduction is based on the assumption that there is a net import of electricity to Norway. This was the case in the years 1997 (3.4% import), 1998 (3.1% import), 1999 (2.9% import), and 2001 (3.0% import). In the year 2000 the situation was however quite different with a net export of 13,3% (Statistics Norway, 2002).

the environmental aspects are starting to be applied. Both life-cycle costs and environmental
issues such as eco-labelling, content of recycled material and content of hazardous chemicals
are included in the indicators.
The societal accounting
As a way of showing its responsibility as an important societal actor, the company Oslo
Sporveier has chosen to disclose its societal account. Through the societal account, the
company is demonstrating how the environmental consequences of the company’s transport
activities compare with other parts of Oslo’s person transport system. The company thus uses
the societal accounting to communicate important environmental issues to the stakeholders.
The environmental indicators used in the societal accounting for Oslo Sporveier include direct
energy use, emissions of CO2, NOx and PM10 and PM2.5. Data for the indicators in the year
2000 was obtained for the company’s activities. In addition, data was obtained from the other
public transport companies operating in Oslo, to determine the environmental consequences
of the total public transport in Oslo. The data for the private cars and taxis in Oslo were
obtained by using official statistics of this transport work and applying average factors for
energy use and emissions connected to this transport in Oslo. The results of these calculations
are shown in Figure 4. From the figure it is evident that the environmental consequences in
terms of emissions and energy use for both the public transport as a whole, and for the
company’s transport activities, are small compared with private car and taxi.
Also the average specific energy use and emissions per person-km for the company’s
activities, the total public transport and private car and taxi were determined. The comparison
in Figure 5 clearly shows that the average specific emissions and energy use for both the
company and the public transport as a whole are much less then for private car and taxi. This
indicates that there would be large environmental improvements connected to an expansion of
Oslo’s public transport.
The societal accounting also includes determining the environmental costs of the company’s
transport activities, the public transport as a whole and the use of private cars and taxis. The
results of the calculations of the environmental costs are shown in Figure 6. It is evident that
the environmental costs5 of the public transport as a whole and for the company’s transport
activities are small compared with private car and taxi.
The average specific environmental costs per person-km for the company’s services, the total
public transport and the private car and taxi were also determined. The comparison in Figure
7 clearly shows that also the specific environmental costs per person-km for the company’s
transport activities and public transport as a whole are much less than for car and taxi.
Final discussion
In this article environmental reporting in the field of transport is discussed. An example is
given of a company strategy that includes, in addition to environmental reporting, also
societal accounting.
There are strategically good reasons for a transport company to include the environmental
consequences of business travels and travel to work in the environmental report. By
5 The calculations of environmental costs are based on a unit cost of 0.35 NOK per kg CO2, 400 NOK per kg NOx and 2 050 NOK per kg PM10. The unit cost of PM2.5 is included in the unit cost of PM10.

disclosing these types of information the company is improving its transparency. This is
important for a good stakeholder dialogue. Even for a company that has transport as its main
product can these types of activities cause major environmental impacts, adding to the
impacts of the main operations of the company. This is shown for the case of Oslo Sporveier,
where the company’s total CO2-emissions increase by 20% and the PM10 -emissions by 13%
when the employee’s company travel and daily travel to work are included.
It is not strategically wise for a public transport company to accept that a large number of its
employees use private car to work. This problem is amplified if the occupancy rate of the car
use is low. If this is the case the company will easily be subjected to stakeholder critique. The
reporting of developments in employee’s travels to work is thus strategically advantageous for
a company providing environmentally friendly transport.
The case of Oslo Sporveier also shows how an environmental strategy for a company can
include specific requirements to the purchasing of energy and materials. It is a logical
environmental strategy for a company that purchases large amounts of energy, to apply
specific environmental criteria to the type of energy being purchased. Failure to consider the
environmental life-cycle, for example of the electricity being purchased, can result in
omission of major impacts of the company’s activities.
In this article an example is given of how societal accounting can be used in connection with
environmental reporting. Through the societal accounting a company can show the
environmental consequences of the company’s services in relation to other ways of providing
the service. Applied to transport services, the societal accounting for Oslo Sporveier is an
example of how the environmental consequences of the company’s products (services)

compare with the total public transport and the private car usage. The results of the societal
accounting for Oslo Sporveier clearly indicates that there would be large environmental
improvements connected to an increased share of public transport usage, as is also a key
element of the company strategy. The societal accounting thus gives important knowledge at
the political level regarding the development of a city. In that way it serves the function of
supplementing and correcting the scenarios.
It is possible to picture the flow of knowledge through the company strategy and the political
level with a “loop”. The scenarios provide important knowledge to the political level
regarding transport development. The societal accounting corrects and supplements the
scenarios. With the help of the societal accounting, the environmental report is thus “lifted”
up annually to a political level. This is of high value for a company with important societal
functions. The “looping” of knowledge back to the scenarios contributes to change the
framework conditions for the company, expressed through the environmental report. A
connection between political strategies and the company strategy is thus established.
References
Andersen O. 1998. Svevestøv fra persontransport i Oslo. En beregning av
mengder og kostnader. (Particles from person transport in Oslo. A
calculation of amounts and costs). Vf-Rapport 14/98. Western Norway
Research Institute: Sogndal, Norway. (In Norwegian).
Andersen O. 2001. Arbeidsreisene for ansatte i AS Oslo Sporveier (The work
Travels of the Employees of AS Oslo Sporveier). Vf-Notat 9/01, Western
Norway Research Institute: Sogndal. (In Norwegian).

Andersen O. 2003. Transport Scenarios in a Company Strategy. Business
Strategy and the Environment. (Submitted).
Azzone G., Manzini R., Noci G. 1996. Evolutionary Trends in Environmental
Reporting. In Industry and the Environment: Practical Applications of
Environmental Management Approaches in Business. Ulhøy, JP and Madsen H
(eds). The Corporate Technology and Environment Management Research
Group, The Aarhus School of Business: Aarhus.
Clarkson MBE. 1995. A stakeholder framework for analysing and evaluation corporate
social performance. Academy of Management Review. 20 (1) 92-117.
Holgaard JE., Remmen A. 2001. Transport på vej ind i virksomhedernes miljøarbejde?
(Is transport becoming part of enterprise environmental work?). Transport- og
Luftkvalitetskontoret, Miljøstyrelsen / Aalborg University. (In Danish, with
English summary).
Høyer KG., Holden E., Lundli HE., Aall C. 1998. Sustainable Transport and Mobility.
Theories, Principles and Examples in a Norwegian Context. Vf-Rapport 12/98.
Western Norway Research Institute: Sogndal, Norway.
Kolk A. 1999. Evaluating Corporate Environmental Reporting. Business Strategy and
the Environment. 8:225-237.
Kolk A., Walhain S., van de Wateringen S. 2001. Environmental Reporting by the
Fortune Global 250: Exploring the Influence of Nationality and Sector. Business
Strategy and the Environment. 10:15-28.
Lundli HE., Andersen O., Høyer KG. 1998. Transportscenarier for Oslo. 1996-2016.
Konsekvenser for areal, tidsbruk og utslipp av CO2, NOx og svevestøv.

(Transport scenarios for Oslo. 1996-2016. Consequences for land use, time use
and emission of CO2, NOx and particles). VF-rapport 13/98. Western Norway
Research Institute: Sogndal, Norway. (In Norwegian).
Statistics Norway. 2002. Elektisitetsstatistikk. (Electricity statistics).
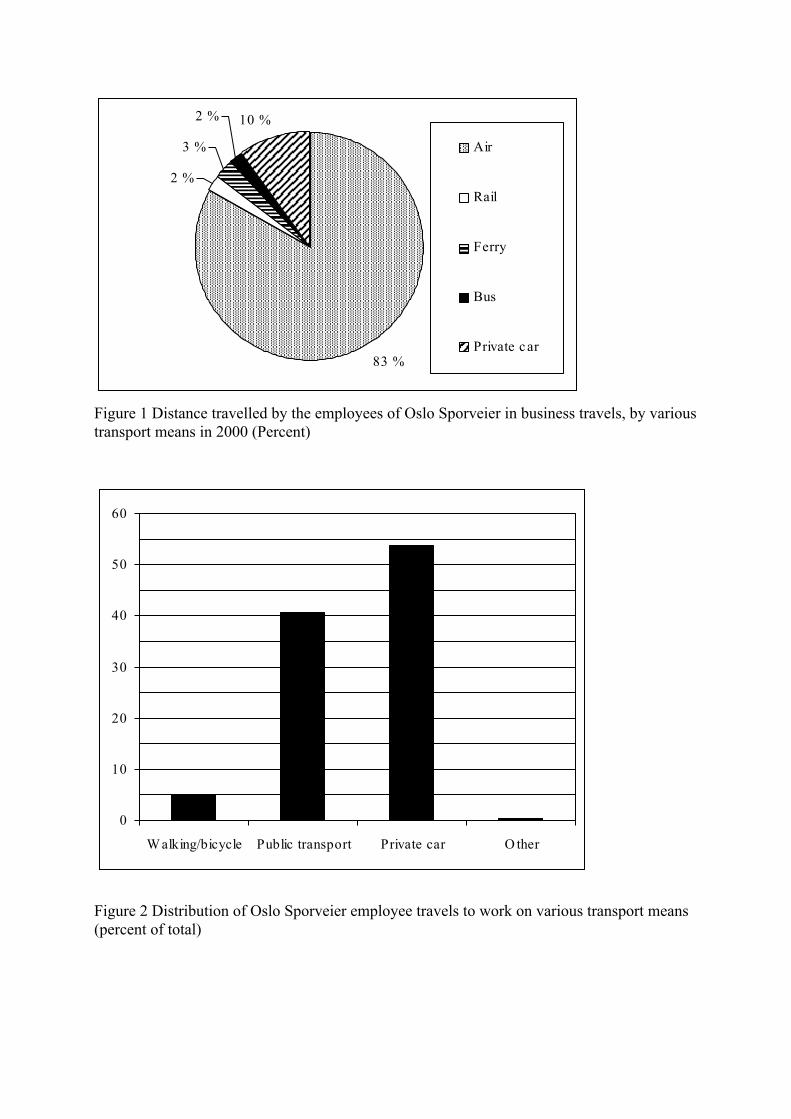
Figure 1 Distance travelled by the employees of Oslo Sporveier in business travels, by various transport means in 2000 (Percent)
Figure 2 Distribution of Oslo Sporveier employee travels to work on various transport means (percent of total)
83 %
2 %
3 %
2 % 10 %
Air
Rail
Ferry
Bus
Private car
0
10
20
30
40
50
60
W alking/bicycle Public transport Private car O ther

Source: Andersen (2001), based on Fosli and Lian (1999)
Figure 3 Private car usage in travels to work as a function of the distance from the work location to Oslo centre. 1990/91 (Percent of all work journeys)
Figure 4 Energy use and emissions from Oslo’s total person transport (Energy in GWh, CO2 in kilo-tonnes, other emissions in tonnes)
0
10
20
30
40
50
60
70
80
0 3 6 9 12 15 18 21 24 27 30
Distance from Oslo centre (km)
0
500
1 000
1 500
2 000
2 500
3 000
3 500
4 000
Energy CO2 NOx PM10 PM2.5
Oslo Sporveier
All public transport
Private car + taxi
CO2 NOx PM10 PM2.5

Figure 5 Specific energy use and emission per person-km for Oslo’s person transport (Energy in kWh/pkm, CO2 in kg/pkm, other emissions in g/pkm)
Figure 6 Total environmental costs of Oslo’s person transport (million NOK)
0
0.2
0.4
0.6
0.8
1
Energy CO2 NOx PM10 PM2.5
Oslo Sporveier
All public transport
Private car + taxi
0
500
1 000
1 500
2 000
2 500
3 000
O slo Sporveier All public transport Private car + taxi
CO2 NOx PM10 PM2.5

Figure 7 Average environmental costs of person transport in Oslo per person-km (NOK)
0
0,1
0,2
0,3
0,4
0,5
0,6
0,7
0,8
O slo Sporveier All public transport Private car + taxi

Company
segment
Number of
person-
journeys
(millions)
Number of
person-
kilometres
(millions)
Number
of lines
Total length
of lines
(kilometres)
Metro 68 405 5 119
Tram 35 86 11 153
Bus 54 231 62 1 387
Table 1 Key figures for Oslo Sporveier in the year 2000
Vehicle type Numbers
Metro train cars 207
Tram cars 73
Buses 303
Table 2 Vehicle fleet operated by Oslo Sporveier

Type of energy use Amount of energy used
(MWh) %
Electricity for metro lines 70 940 35.3
Electricity for tram lines 19 074 9.5
Electricity for buildings 40 840 20.3
Electricity for trains 5 576 2.8
Fuel oil for buildings 5 036 2.5
Fuel for buses 53 278 26.5
Fuel for boats 3 000 1.5
Additional vehicles (service etc.) 3 307 1.6
Total 201 051 100.0
Table 3 Energy use of main company operations in the year 2000
Source of
emissions
CO2
(tonnes)
%
NOx
(kilogram)
%
PM10
(kilogram)
%
PM2.5
(kilogram)
%
Buses 14 272 83.1 141 415 85.6 11 570 90.7 8 999 91.3
Buildings
(fuel oil)
1 230
7.2 1 172 0.7 64 0.5 45 0.5
Boats 800 4.7 17 600 10.7 466 3.7 363 3.7
Additional
vehicles
880
5.1 5 010 3.0 651 5.1 451 4.6
Total 17 182 100 165 197 100 12 751 100 9 858 100
Table 4 CO2, NOx, PM10 and PM2.5 - emissions from the company’s main operations
Oslo
Akershus
Outside Oslo
and
Akershus Total
Number % Number % Number % Number %
Total Oslo
Sporveier 1 631 68.7 585 24.6 158 6.7 2 374
100.0
Table 5 The location of the homes of employees in three areas (number and percent)
Work location Private car use in
work travels (%)
Oslo centre 28
Inner city 40
Outer city 55
Akershus County 66
Average Oslo/Akershus 50
Source: Andersen (2001), based on Fosli and Lian (1999)
Table 6 Private car use in work travels, relative to the work location at increasing distance from Oslo centre. 1990/91 (percent of all work journeys)
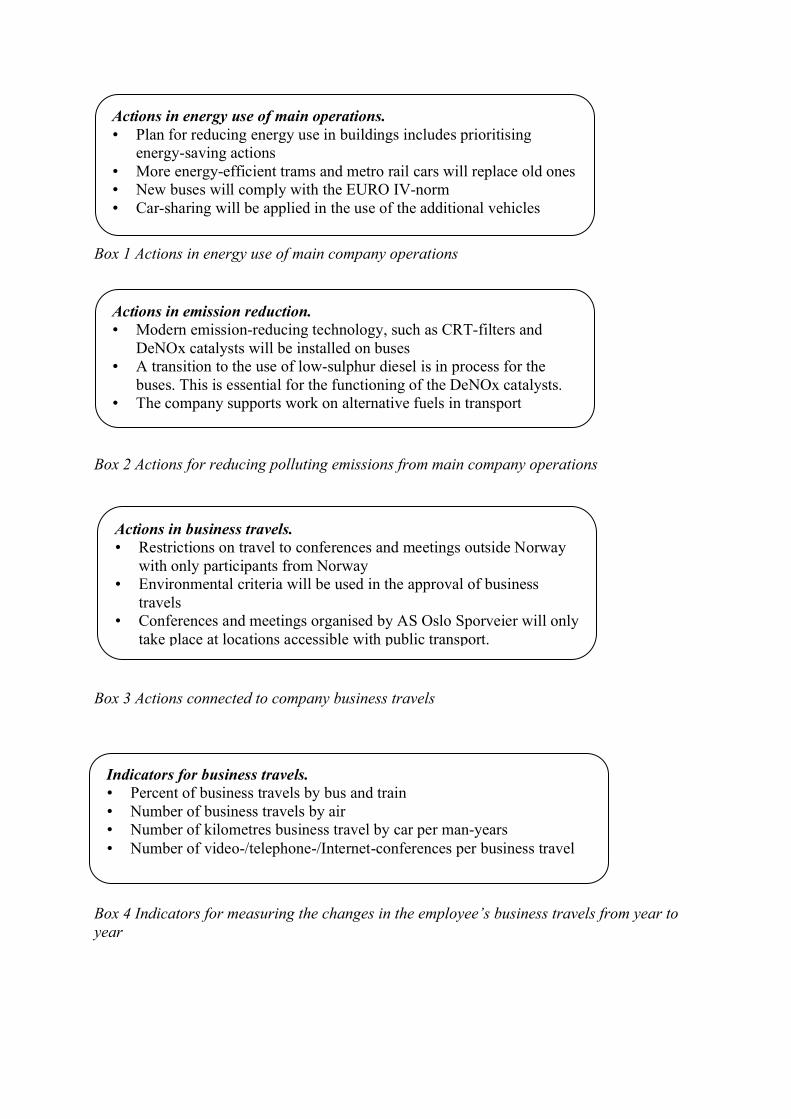
Box 1 Actions in energy use of main company operations
Box 2 Actions for reducing polluting emissions from main company operations
Box 3 Actions connected to company business travels
Box 4 Indicators for measuring the changes in the employee’s business travels from year to year
Actions in energy use of main operations. • Plan for reducing energy use in buildings includes prioritising
energy-saving actions • More energy-efficient trams and metro rail cars will replace old ones • New buses will comply with the EURO IV-norm • Car-sharing will be applied in the use of the additional vehicles
Actions in emission reduction. • Modern emission-reducing technology, such as CRT-filters and
DeNOx catalysts will be installed on buses • A transition to the use of low-sulphur diesel is in process for the
buses. This is essential for the functioning of the DeNOx catalysts. • The company supports work on alternative fuels in transport
Actions in business travels. • Restrictions on travel to conferences and meetings outside Norway
with only participants from Norway • Environmental criteria will be used in the approval of business
travels • Conferences and meetings organised by AS Oslo Sporveier will only
take place at locations accessible with public transport. • Annual survey of business travels
Indicators for business travels. • Percent of business travels by bus and train • Number of business travels by air • Number of kilometres business travel by car per man-years • Number of video-/telephone-/Internet-conferences per business travel
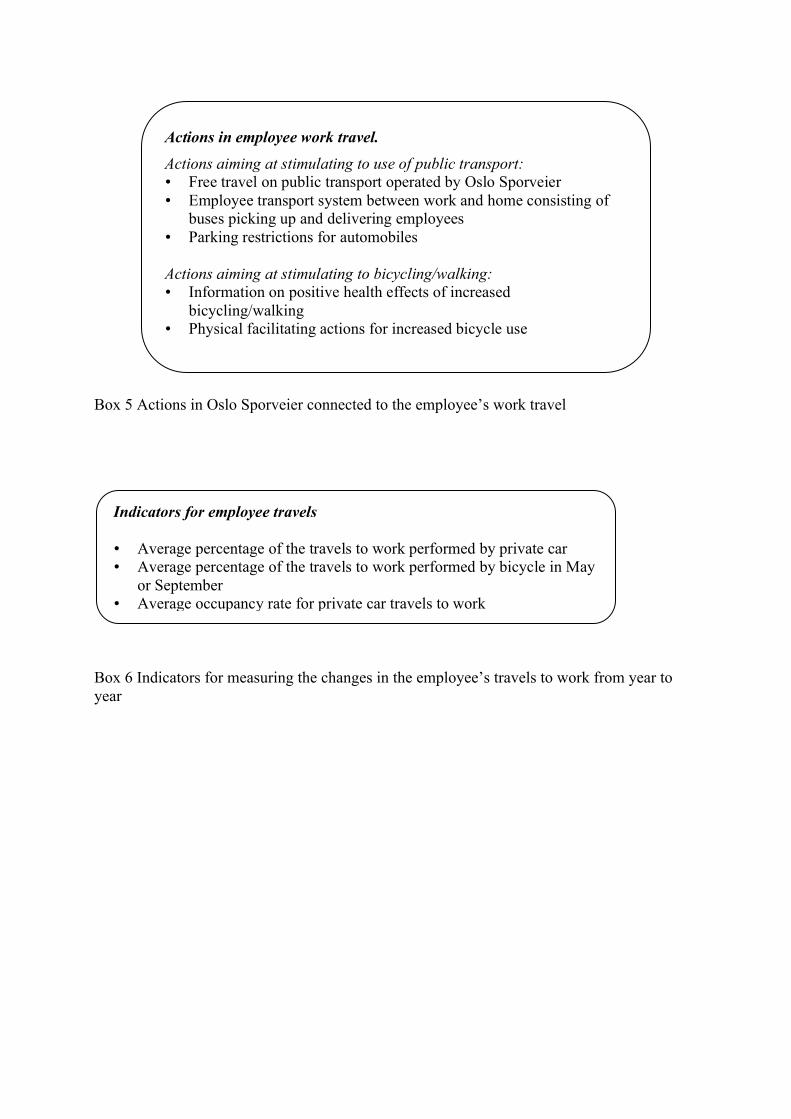
Box 5 Actions in Oslo Sporveier connected to the employee’s work travel
Box 6 Indicators for measuring the changes in the employee’s travels to work from year to year
Actions in employee work travel.
Actions aiming at stimulating to use of public transport: • Free travel on public transport operated by Oslo Sporveier • Employee transport system between work and home consisting of
buses picking up and delivering employees • Parking restrictions for automobiles Actions aiming at stimulating to bicycling/walking: • Information on positive health effects of increased
bicycling/walking • Physical facilitating actions for increased bicycle use
Indicators for employee travels • Average percentage of the travels to work performed by private car • Average percentage of the travels to work performed by bicycle in May
or September • Average occupancy rate for private car travels to work
Related Documents