Page 1 of 229 United States Office of Chemical Safety and Environmental Protection Agency Pollution Prevention Draft Risk Evaluation for Trichloroethylene Supplemental Information File: Environmental Releases and Occupational Exposure Assessment CASRN: 79-01-6 February 2020 PEER REVIEW DRAFT. DO NOT CITE OR QUOTE

Welcome message from author
This document is posted to help you gain knowledge. Please leave a comment to let me know what you think about it! Share it to your friends and learn new things together.
Transcript

Page 1 of 229
United States Office of Chemical Safety and
Environmental Protection Agency Pollution Prevention
Draft Risk Evaluation for
Trichloroethylene
Supplemental Information File:
Environmental Releases and Occupational Exposure Assessment
CASRN: 79-01-6
February 2020
PEER REVIEW DRAFT. DO NOT CITE OR QUOTE
PEER REVIEW DRAFT. DO NOT CITE OR QUOTE
Page 2 of 229
TABLE OF CONTENTS
ABBREVIATIONS ..................................................................................................................................14
EXECUTIVE SUMMARY .....................................................................................................................17
1 INTRODUCTION ............................................................................................................................19
1.1 Overview .....................................................................................................................................19
1.2 Scope ...........................................................................................................................................19
1.3 Components of the Occupational Exposure and Environmental Release Assessment ...............27
1.4 General Approach and Methodology for Occupational Exposures and Environmental Releases
27
Estimates of Number of Facilities ......................................................................................... 27
Process Description ............................................................................................................... 28
Worker Activities ................................................................................................................... 28
Number of Workers and Occupational Non-Users ................................................................ 28
Inhalation Exposure Assessment Approach and Methodology ............................................. 29
1.4.5.1 General Approach ........................................................................................................... 29
1.4.5.2 Approach for this Risk Evaluation ................................................................................. 30
Dermal Exposure Assessment Approach ............................................................................... 33
Water Release Sources .......................................................................................................... 33
Water Release Assessment Approach and Methodology ...................................................... 33
2 ENGINEERING ASSESSMENT ....................................................................................................34
2.1 Manufacturing .............................................................................................................................34
Facility Estimates ................................................................................................................... 34
Process Description ............................................................................................................... 35
Exposure Assessment ............................................................................................................ 36
2.1.3.1 Worker Activities ........................................................................................................... 36
2.1.3.2 Number of Potentially Exposed Workers ....................................................................... 36
2.1.3.3 Occupational Exposure Results ...................................................................................... 37
Water Release Assessment .................................................................................................... 38
2.1.4.1 Water Release Sources ................................................................................................... 38
2.1.4.2 Water Release Assessment Results ................................................................................ 38
2.2 Processing as a Reactant .............................................................................................................43
Facility Estimates ................................................................................................................... 43
Process Description ............................................................................................................... 43
Exposure Assessment ............................................................................................................ 44
2.2.3.1 Worker Activities ........................................................................................................... 44
2.2.3.2 Number of Potentially Exposed Workers ....................................................................... 44
2.2.3.3 Occupational Exposure Results ...................................................................................... 45
Water Release Assessment .................................................................................................... 46
2.2.4.1 Water Release Sources ................................................................................................... 46
2.2.4.2 Water Release Assessment Results ................................................................................ 46
2.3 Formulation of Aerosol and Non-Aerosol Products ...................................................................47
Facility Estimates ................................................................................................................... 47
Process Description ............................................................................................................... 48
PEER REVIEW DRAFT. DO NOT CITE OR QUOTE
Page 3 of 229
Exposure Assessment ............................................................................................................ 48
2.3.3.1 Worker Activities ........................................................................................................... 48
2.3.3.2 Number of Potentially Exposed Workers ....................................................................... 49
2.3.3.3 Occupational Exposure Results ...................................................................................... 49
Water Release Assessment .................................................................................................... 50
2.3.4.1 Water Release Sources ................................................................................................... 50
2.3.4.2 Water Environmental Release Assessment Results ....................................................... 50
2.4 Repackaging ................................................................................................................................50
Facility Estimates ................................................................................................................... 50
Process Description ............................................................................................................... 51
Exposure Assessment ............................................................................................................ 51
2.4.3.1 Worker Activities ........................................................................................................... 51
2.4.3.2 Number of Potentially Exposed Workers ....................................................................... 52
2.4.3.3 Occupational Exposure Results ...................................................................................... 52
Water Release Assessment .................................................................................................... 53
2.4.4.1 Water Release Sources ................................................................................................... 53
2.4.4.2 Water Environmental Release Assessment Results ....................................................... 53
2.5 Batch Open Top Vapor Degreasing ............................................................................................54
Facility Estimates ................................................................................................................... 54
Process Description ............................................................................................................... 55
Exposure Assessment ............................................................................................................ 57
2.5.3.1 Worker Activities ........................................................................................................... 57
2.5.3.2 Number of Potentially Exposed Workers ....................................................................... 57
2.5.3.3 Occupational Exposure Results ...................................................................................... 63
2.5.3.3.1 Inhalation Exposure Assessment Results Using Monitoring Data ......................... 63
2.5.3.3.2 Inhalation Exposure Assessment Results Using Modeling ..................................... 64
Water Release Assessment .................................................................................................... 66
2.5.4.1 Water Release Sources ................................................................................................... 66
2.5.4.2 Water Release Assessment Results ................................................................................ 66
2.6 Batch Closed-Loop Vapor Degreasing .......................................................................................70
Facility Estimates ................................................................................................................... 70
Process Description ............................................................................................................... 70
Exposure Assessment ............................................................................................................ 72
2.6.3.1 Worker Activities ........................................................................................................... 72
2.6.3.2 Number of Potentially Exposed Workers ....................................................................... 72
2.6.3.3 Occupational Exposure Results ...................................................................................... 73
Water Release Assessment .................................................................................................... 73
2.6.4.1 Water Release Sources ................................................................................................... 73
2.6.4.2 Water Release Assessment Results ................................................................................ 74
2.7 Conveyorized Vapor Degreasing ................................................................................................74
Facility Estimates ................................................................................................................... 74
Process Description ............................................................................................................... 74
Exposure Assessment ............................................................................................................ 79
2.7.3.1 Worker Activities ........................................................................................................... 79
2.7.3.2 Number of Potentially Exposed Workers ....................................................................... 79
2.7.3.3 Occupational Exposure Results ...................................................................................... 80

PEER REVIEW DRAFT. DO NOT CITE OR QUOTE
Page 4 of 229
2.7.3.3.1 Inhalation Exposure Assessment Results Using Monitoring Data ......................... 80
2.7.3.3.2 Inhalation Exposure Assessment Results Using Modeling ..................................... 81
Water Release Assessment .................................................................................................... 83
2.7.4.1 Water Release Sources ................................................................................................... 83
2.7.4.2 Water Release Assessment Results ................................................................................ 83
2.8 Web Vapor Degreasing ...............................................................................................................84
Facility Estimates ................................................................................................................... 84
Process Description ............................................................................................................... 84
Exposure Assessment ............................................................................................................ 84
2.8.3.1 Worker Activities ........................................................................................................... 85
2.8.3.2 Number of Potentially Exposed Workers ....................................................................... 85
2.8.3.3 Occupational Exposure Results ...................................................................................... 85
Water Release Assessment .................................................................................................... 87
2.8.4.1 Water Release Sources ................................................................................................... 87
2.8.4.2 Water Release Assessment Results ................................................................................ 87
2.9 Cold Cleaning ..............................................................................................................................88
Estimates of Number of Facilities ......................................................................................... 88
Process Description ............................................................................................................... 88
Exposure Assessment ............................................................................................................ 89
2.9.3.1 Worker Activities ........................................................................................................... 89
2.9.3.2 Number of Potentially Exposed Workers ....................................................................... 89
2.9.3.3 Occupational Exposure Results ...................................................................................... 90
Water Release Assessment .................................................................................................... 92
2.9.4.1 Water Release Sources ................................................................................................... 92
2.9.4.2 Water Release Assessment Results ................................................................................ 93
2.10 Aerosol Applications: Spray Degreasing/Cleaning, Automotive Brake and Parts Cleaners,
Penetrating Lubricants, and Mold Releases ...........................................................................................93
Facility Estimates ................................................................................................................... 93
Process Description ............................................................................................................... 94
Exposure Assessment ............................................................................................................ 95
2.10.3.1 Worker Activities ........................................................................................................... 95
2.10.3.2 Number of Potentially Exposed Workers ....................................................................... 95
2.10.3.3 Occupational Exposure Results ...................................................................................... 96
Water Release Assessment .................................................................................................... 98
2.11 Metalworking Fluids ...................................................................................................................98
Facility Estimates ................................................................................................................... 98
Process Description ............................................................................................................... 98
Exposure Assessment ............................................................................................................ 99
2.11.3.1 Worker Activities ........................................................................................................... 99
2.11.3.2 Number of Potentially Exposed Workers ....................................................................... 99
2.11.3.3 Occupational Exposure Results .................................................................................... 100
2.11.3.3.1 Inhalation Exposure Assessment Results Using Monitoring Data ..................... 100
2.11.3.3.2 Inhalation Exposure Assessment Results Using Modeling................................. 101
Water Release Assessment .................................................................................................. 102
2.11.4.1 Water Release Sources ................................................................................................. 102
PEER REVIEW DRAFT. DO NOT CITE OR QUOTE
Page 5 of 229
2.11.4.2 Water Release Assessment Results .............................................................................. 102
2.12 Adhesives, Sealants, Paints, and Coatings ................................................................................102
Facility Estimates ................................................................................................................. 102
Process Description ............................................................................................................. 103
Exposure Assessment .......................................................................................................... 103
2.12.3.1 Worker Activities ......................................................................................................... 103
2.12.3.2 Number of Potentially Exposed Workers ..................................................................... 103
2.12.3.3 Occupational Exposure Results .................................................................................... 105
Water Release Assessment .................................................................................................. 106
2.12.4.1 Water Release Sources ................................................................................................. 107
2.12.4.2 Water Environmental Release Assessment Results ..................................................... 107
2.13 Other Industrial Uses .................................................................................................................111
Estimates of Number of Facilities ....................................................................................... 111
Process Description ............................................................................................................. 111
Exposure Assessment .......................................................................................................... 111
2.13.3.1 Worker Activities ......................................................................................................... 111
2.13.3.2 Number of Potentially Exposed Workers ..................................................................... 112
2.13.3.3 Occupational Exposure Results .................................................................................... 113
Water Release Assessment .................................................................................................. 114
2.13.4.1 Water Release Sources ................................................................................................. 114
2.13.4.2 Water Release Assessment Results .............................................................................. 114
2.14 Spot Cleaning, Wipe Cleaning and Carpet Cleaning ................................................................116
Facility Estimates ................................................................................................................. 116
Process Description ............................................................................................................. 116
2.14.2.1 Spot Cleaning ............................................................................................................... 116
2.14.2.2 Carpet Cleaning ............................................................................................................ 116
2.14.2.3 Wipe Cleaning .............................................................................................................. 117
Exposure Assessment .......................................................................................................... 117
2.14.3.1 Worker Activities ......................................................................................................... 117
2.14.3.2 Number of Potentially Exposed Workers ..................................................................... 117
2.14.3.3 Occupational Exposure Results .................................................................................... 118
2.14.3.3.1 Inhalation Exposure Assessment Results Using Monitoring Data ..................... 118
2.14.3.3.2 Inhalation Exposure Assessment Results Using Modeling................................. 119
Water Release Assessment .................................................................................................. 120
2.14.4.1 Water Release Sources ................................................................................................. 120
2.14.4.2 Water Release Assessment Results .............................................................................. 120
2.15 Industrial Processing Aid ..........................................................................................................121
Facility Estimates ................................................................................................................. 121
Process Description ............................................................................................................. 122
Exposure Assessment .......................................................................................................... 122
2.15.3.1 Worker Activities ......................................................................................................... 122
2.15.3.2 Number of Potentially Exposed Workers ..................................................................... 123
2.15.3.3 Occupational Exposure Results .................................................................................... 124
Water Release Assessment .................................................................................................. 125
2.15.4.1 Water Release Sources ................................................................................................. 125
2.15.4.2 Water Release Assessment Results .............................................................................. 125

PEER REVIEW DRAFT. DO NOT CITE OR QUOTE
Page 6 of 229
2.16 Commercial Printing and Copying ............................................................................................125
Facility Estimates ................................................................................................................. 126
Process Description ............................................................................................................. 126
Exposure Assessment .......................................................................................................... 127
2.16.3.1 Worker Activities ......................................................................................................... 127
2.16.3.2 Number of Potentially Exposed Workers ..................................................................... 127
2.16.3.3 Occupational Exposure Results .................................................................................... 127
Water Release Assessment .................................................................................................. 128
2.16.4.1 Water Release Sources ................................................................................................. 128
2.16.4.2 Water Release Assessment Results .............................................................................. 128
2.17 Other Commercial Uses ............................................................................................................129
Estimates of Number of Facilities ....................................................................................... 129
Process Description ............................................................................................................. 129
Exposure Assessment .......................................................................................................... 129
2.17.3.1 Worker Activities ......................................................................................................... 129
2.17.3.2 Number of Potentially Exposed Workers ..................................................................... 129
2.17.3.3 Occupational Exposure Results .................................................................................... 130
Water Release Assessment .................................................................................................. 130
2.17.4.1 Water Release Sources ................................................................................................. 130
2.17.4.2 Water Release Assessment Results .............................................................................. 130
2.18 Process Solvent Recycling and Worker Handling of Wastes ...................................................131
Facility Estimates ................................................................................................................. 131
Process Description ............................................................................................................. 131
Exposure Assessment .......................................................................................................... 135
2.18.3.1 Worker Activities ......................................................................................................... 136
2.18.3.2 Number of Potentially Exposed Workers ..................................................................... 136
2.18.3.3 Occupational Exposure Results .................................................................................... 137
Water Release Assessment .................................................................................................. 137
2.18.4.1 Water Release Sources ................................................................................................. 137
2.18.4.2 Water Release Assessment Results .............................................................................. 137
2.19 Dermal Exposure Assessment ...................................................................................................138
3 DISCUSSION OF UNCERTAINTIES AND LIMITATIONS...................................................145
3.1 Variability..................................................................................................................................145
3.2 Uncertainties and Limitations ...................................................................................................145
Number of Workers ............................................................................................................. 145
Analysis of Exposure Monitoring Data ............................................................................... 146
Near-Field/Far-Field Model Framework ............................................................................. 147
3.2.3.1 Vapor Degreasing and Cold Cleaning Models ............................................................. 147
3.2.3.2 Brake Servicing Model ................................................................................................. 148
3.2.3.3 Spot Cleaning Model .................................................................................................... 148
Modeled Dermal Exposures ................................................................................................ 149
REFERENCES .......................................................................................................................................150
Appendix A Approach for Estimating Number of Workers and Occupational Non-Users ....... 160

PEER REVIEW DRAFT. DO NOT CITE OR QUOTE
Page 7 of 229
Appendix B Equations for Calculating Acute and Chronic (Non-Cancer and Cancer) Inhalation
Exposures 166
Appendix C Sample Calculations for Calculating Acute and Chronic (Non-Cancer and Cancer)
Inhalation Exposures ............................................................................................................................ 171
Appendix D Approach for Estimating Water Releases from Manufacturing Sites Using Effluent
Guidelines 173
Appendix E Vapor Degreasing and Cold Cleaning Near-Field/Far-Field Inhalation Exposure
Models Approach and Parameters ...................................................................................................... 176
E.2.1 Far-Field Volume ..................................................................................................................186
E.2.2 Air Exchange Rate ................................................................................................................186
E.2.3 Near-Field Indoor Air Speed ................................................................................................186
E.2.4 Near-Field Volume ...............................................................................................................187
E.2.5 Exposure Duration ................................................................................................................187
E.2.6 Averaging Time ....................................................................................................................187
E.2.7 Vapor Generation Rate .........................................................................................................187
E.2.8 Operating Hours ....................................................................................................................190
Appendix F Brake Servicing Near-Field/Far-Field Inhalation Exposure Model Approach and
Parameters 192
F.2.1 Far-Field Volume ..................................................................................................................201
F.2.2 Air Exchange Rate ................................................................................................................201
F.2.3 Near-Field Indoor Air Speed ................................................................................................201
F.2.4 Near-Field Volume ...............................................................................................................202
F.2.5 Application Time ..................................................................................................................202
F.2.6 Averaging Time ....................................................................................................................202
F.2.7 Trichloroethylene Weight Fraction .......................................................................................202
F.2.8 Volume of Degreaser Used per Brake Job ...........................................................................203
F.2.9 Number of Applications per Brake Job ................................................................................203
F.2.10 Amount of Trichloroethylene Used per Application ............................................................204
F.2.11 Operating Hours per Week ...................................................................................................204
F.2.12 Number of Brake Jobs per Work Shift .................................................................................204
Appendix G Spot Cleaning Near-Field/Far-Field Inhalation Exposure Model Approach and
Parameters 205
G.2.1 Far-Field Volume ..................................................................................................................213
G.2.2 Near-Field Volume ...............................................................................................................213
PEER REVIEW DRAFT. DO NOT CITE OR QUOTE
Page 8 of 229
G.2.3 Air Exchange Rate ................................................................................................................213
G.2.4 Near-Field Indoor Wind Speed .............................................................................................213
G.2.5 Averaging Time ....................................................................................................................214
G.2.6 Use Rate ................................................................................................................................214
G.2.7 Vapor Generation Rate .........................................................................................................214
G.2.8 Operating Hours ....................................................................................................................214
G.2.9 Operating Days .....................................................................................................................215
G.2.10 Fractional Number of Operating Days that a Worker Works ...............................................215
Appendix H Dermal Exposure Assessment Method ....................................................................... 216
H.1.1 Modification of EPA/OPPT Models .....................................................................................216
H.2.1 Small Doses (Case 1: M0 ≤ Msat) ..........................................................................................217
H.2.2 Large Doses (Case 2: M0 > Msat) ..........................................................................................218
PEER REVIEW DRAFT. DO NOT CITE OR QUOTE
Page 9 of 229
LIST OF TABLES
Table 1-1. Crosswalk of Subcategories of Use Listed in the Problem Formulation Document to
Conditions of Use Assessed in the Risk Evaluation ......................................................... 21
Table 1-2. Assigned Protection Factors for Respirators in OSHA Standard 29 CFR § 1910.134 .. 32
Table 2-1. List of Assessed TCE Manufacturing Sites ............................................................................. 34
Table 2-2. Estimated Number of Workers Potentially Exposed to Trichloroethylene During
Manufacturing ................................................................................................................... 37
Table 2-3. Summary of Worker Inhalation Exposure Monitoring Data from TCE Manufacturing ......... 38
Table 2-4. Summary of OCPSF Effluent Limitations for Trichloroethylene ........................................... 39
Table 2-5. Reported Water Releases of Trichloroethylene from Manufacturing Sites Reporting to 2016
TRI .................................................................................................................................... 41
Table 2-6. Estimated Water Releases of Trichloroethylene from Manufacturing Sites Not Reporting to
2016 TRI ........................................................................................................................... 41
Table 2-7. List of Assessed Sites Using TCE as a Reactant/Intermediate ................................................ 43
Table 2-8. Estimated Number of Workers Potentially Exposed to TCE During Processing as a Reactant
........................................................................................................................................... 45
Table 2-9. Summary of Worker Inhalation Exposure Surrogate Monitoring Data from TCE Use as a
Reactant............................................................................................................................. 46
Table 2-10. Water Release Estimates for Sites Using TCE as a Reactant ................................................ 46
Table 2-11. List of Assessed Sites Using TCE in Formulation Products ................................................. 47
Table 2-12. Estimated Number of Workers Potentially Exposed to Trichloroethylene During Use in in
the Formulation of Aerosol and Non-Aerosol Products ................................................... 49
Table 2-13. Summary of Worker Inhalation Exposure Monitoring Data for Unloading TCE During
Formulation of Aerosol and Non-Aerosol Products ......................................................... 50
Table 2-14. Estimated Number of Workers Potentially Exposed to Trichloroethylene During
Repackaging ...................................................................................................................... 52
Table 2-15. Summary of Worker Inhalation Exposure Monitoring Data for Unloading/Loading TCE
from Bulk Containers ........................................................................................................ 53
Table 2-16. Reported Water Releases of Trichloroethylene from Sites Repackaging TCE ..................... 54
Table 2-17. Crosswalk of Open-Top Vapor Degreasing SIC Codes in DMR to NAICS Codes .............. 58
Table 2-18. Estimated Number of Workers Potentially Exposed to Trichlorethylene During Use in
Open-Top Vapor Degreasing ............................................................................................ 60
Table 2-19. Summary of Worker Inhalation Exposure Monitoring Data for Batch Open-Top Vapor
Degreasing ........................................................................................................................ 64
Table 2-20. Summary of Exposure Modeling Results for TCE Degreasing in OTVDs ................... 66
Table 2-21. Reported Water Releases of Trichloroethylene from Sites Using TCE in Open-Top Vapor
Degreasing ........................................................................................................................ 67
Table 2-22. Estimated Number of Workers Potentially Exposed to Trichloroethylene During Use in
Closed-Loop Vapor Degreasing ....................................................................................... 72
Table 2-23. Summary of Worker Inhalation Exposure Monitoring Data for Batch Closed-Loop Vapor
Degreasing ........................................................................................................................ 73
Table 2-24. Estimated Number of Workers Potentially Exposed to Trichloroethylene During Use in
Conveyorized Vapor Degreasing ...................................................................................... 79

PEER REVIEW DRAFT. DO NOT CITE OR QUOTE
Page 10 of 229
Table 2-25. Summary of Worker Inhalation Exposure Monitoring Data for Conveyorized Vapor
Degreasing ....................................................................................................................... 80
Table 2-26. Summary of Exposure Modeling Results for TCE Degreasing in Conveyorized
Degreasers ........................................................................................................................ 83
Table 2-27. Summary of Exposure Modeling Results for TCE Degreasing in Web Degreasers ..... 87
Table 2-28. Estimated Number of Workers Potentially Exposed to Trichloroethylene During Use in Cold
Cleaning ............................................................................................................................ 89
Table 2-29. Summary of Exposure Modeling Results for Use of Trichloroethylene in Cold Cleaning... 92
Table 2-30. NAICS Codes for Aerosol Degreasing and Lubricants ......................................................... 93
Table 2-31. Estimated Number of Workers Potentially Exposed to Trichloroethylene During Use
of Aerosol Degreasers and Aerosol Lubricants ............................................................ 96
Table 2-32. Summary of Worker and Occupational Non-User Inhalation Exposure Modeling Results for
Aerosol Degreasing ........................................................................................................... 98
Table 2-33. Summary of Worker Inhalation Exposure Monitoring Data for TCE Use in Metalworking
Fluids............................................................................................................................... 100
Table 2-34. ESD Exposure Estimates for Metalworking Fluids Based on Monitoring Data ................. 101
Table 2-35. Summary of Exposure Results for Use of TCE in Metalworking Fluids Based on ESD
Estimates ......................................................................................................................... 102
Table 2-36. Estimated Number of Workers Potentially Exposed to Trichloroethylene During Use of
Adhesives and Coatings .................................................................................................. 104
Table 2-37. Summary of Worker Inhalation Exposure Monitoring Data for Adhesives/Paints/Coatings
......................................................................................................................................... 106
Table 2-38. Reported Water Releases of Trichloroethylene from Sites Using TCE in Adhesives,
Sealants, Paints and Coatings ......................................................................................... 107
Table 2-39. Crosswalk of Other Industrial Use SIC Codes in DMR to NAICS Codes .......................... 112
Table 2-40. Estimated Number of Workers Potentially Exposed to Trichloroethylene During Other
Industrial Uses ................................................................................................................ 113
Table 2-41 Summary of Occupational Exposure Surrogate Monitoring Data for Unloading TCE
During Other Industrial Uses ...................................................................................... 114
Table 2-42. Reported Water Releases of Trichloroethylene from Other Industrial Uses ....................... 115
Table 2-43. Estimated Number of Workers Potentially Exposed to Trichloroethylene During Spot, Wipe,
and Carpet Cleaning ........................................................................................................ 117
Table 2-44. Summary of Worker Inhalation Exposure Monitoring Data for Spot Cleaning Using
TCE ................................................................................................................................ 118
Table 2-45. Summary of Exposure Modeling Results for Spot Cleaning Using TCE .................... 120
Table 2-46. Reported Water Releases of Trichloroethylene from Sites Using TCE Spot Cleaning ...... 121
Table 2-47. Summary of NAICS Codes and Descriptions of TRI and DMR Sites Reporting TCE
Used as A Processing Aid ............................................................................................. 121
Table 2-48. Estimated Number of Workers Potentially Exposed to Trichloroethylene During Use as an
Industrial Processing Aid ................................................................................................ 123
Table 2-49. Summary of Exposure Monitoring Data for Use as a Processing Aid ......................... 124
Table 2-50. Reported Water Releases of Trichloroethylene from Industrial Processing Aid Sites Using
TCE ................................................................................................................................. 125
Table 2-51. Summary of Worker Inhalation Exposure Monitoring Data for High Speed Printing Presses
......................................................................................................................................... 128
PEER REVIEW DRAFT. DO NOT CITE OR QUOTE
Page 11 of 229
Table 2-52. Reported Water Releases of Trichloroethylene from Commercial Printing and Copying .. 128
Table 2-53. Crosswalk of Other Industrial Use SIC Codes in DMR to NAICS Codes .......................... 129
Table 2-54. Reported Water Releases of Trichloroethylene from Other Commercial Uses in the 2016
DMR ............................................................................................................................... 130
Table 2-55. Estimated Number of Workers Potentially Exposed to Trichloroethylene During
Recycling/Waste Handling ............................................................................................. 137
Table 2-56. Estimated Water Releases of Trichloroethylene from Disposal/Recycling of TCE.... 137
Table 2-57. Glove Protection Factors for Different Dermal Protection Strategies ................................. 140
Table 2-58. Estimated Dermal Absorbed Dose (mg/day) for Workers in All Conditions of Use .......... 143
LIST OF FIGURES
Figure 2-1. Use of Vapor Degreasing in a Variety of Industries .............................................................. 55
Figure 2-2. Open Top Vapor Degreaser ................................................................................................... 56
Figure 2-3. Open Top Vapor Degreaser with Enclosure .......................................................................... 57
Figure 2-4. Schematic of the Open-Top Vapor Degreasing Near-Field/Far-Field Inhalation Exposure
Model ................................................................................................................................ 65
Figure 2-5. Closed-loop/Vacuum Vapor Degreaser ................................................................................. 71
Figure 2-6. Monorail Conveyorized Vapor Degreasing System (U.S. EPA, 1977) ................................. 75
Figure 2-7. Cross-Rod Conveyorized Vapor Degreasing System (U.S. EPA, 1977) ............................... 76
Figure 2-8. Vibra Conveyorized Vapor Degreasing System (U.S. EPA, 1977) ....................................... 77
Figure 2-9. Ferris Wheel Conveyorized Vapor Degreasing System (U.S. EPA, 1977) ........................... 78
Figure 2-10. Belt/Strip Conveyorized Vapor Degreasing System (U.S. EPA, 1977) .............................. 78
Figure 2-11. Belt/Strip Conveyorized Vapor Degreasing Schematic of the Conveyorized Degreasing
Near-Field/Far-Field Inhalation Exposure Model ............................................................ 82
Figure 2-12. Continuous Web Vapor Degreasing System ........................................................................ 84
Figure 2-13. Schematic of the Web Degreasing Near-Field/Far-Field Inhalation Exposure Model ........ 86
Figure 2-14. Typical Batch-Loaded, Maintenance Cold Cleaner (U.S. EPA, 1981) ................................ 88
Figure 2-15. Schematic of the Cold Cleaning Near-Field/Far-Field Inhalation Exposure Model ............ 91
Figure 2-16. Overview of Aerosol Degreasing ......................................................................................... 95
Figure 2-17. Schematic of the Near-Field/Far-Field Model for Aerosol Degreasing............................... 97
Figure 2-18. Exposure Scenario for Spot Cleaning Process ................................................................... 116
Figure 2-19. Schematic of the Near-Field/Far-Field Model for Spot Cleaning ...................................... 119
Figure 2-20. Typical Waste Disposal Process ........................................................................................ 132
Figure 2-21.Typical Industrial Incineration Process ............................................................................... 134
Figure 2-22. General Process Flow Diagram for Solvent Recovery Processes (U.S. EPA, 1980)......... 135
LIST OF APPENDIX TABLES
Table A-1. SOCs with Worker and ONU Designations for All Conditions of Use Except Dry Cleaning
......................................................................................................................................... 161
Table A-2. SOCs with Worker and ONU Designations for Dry Cleaning Facilities ............................. 161
Table A-4. Estimated Number of Potentially Exposed Workers and ONUs under NAICS 812320 ...... 163
Table B-1. Parameter Values for Calculating Inhalation Exposure Estimates ....................................... 167
Table B-2. Overview of Average Worker Tenure from U.S. Census SIPP (Age Group 50+) ............... 169
PEER REVIEW DRAFT. DO NOT CITE OR QUOTE
Page 12 of 229
Table B-3. Median Years of Tenure with Current Employer by Age Group ......................................... 170
Table D-1. Summary of OCPSF Effluent Guidelines for Trichloroethylene ......................................... 173
Table D-2. Default Parameters for Estimating Water Releases of Trichloroethylene from Manufacturing
Sites ................................................................................................................................. 174
Table D-3. Summary of Facility Trichloroethylene Production Volumes and Wastewater Flow Rates 175
Table E-1. Summary of Parameter Values and Distributions Used in the Open-Top Vapor Degreasing
Near-Field/Far-Field Inhalation Exposure Model .......................................................... 182
Table E-2. Summary of Parameter Values and Distributions Used in the Conveyorized Degreasing Near-
Field/Far-Field Inhalation Exposure Model.................................................................... 183
Table E-3. Summary of Parameter Values and Distributions Used in the Web Degreasing Near-
Field/Far-Field Inhalation Exposure Model.................................................................... 184
Table E-4. Summary of Parameter Values and Distributions Used in the Cold Cleaning Near-Field/Far-
Field Inhalation Exposure Model .................................................................................... 185
Table E-5. Summary of Trichloroethylene Vapor Degreasing and Cold Cleaning Data from the 2014
NEI .................................................................................................................................. 187
Table E-6. Distribution of Trichloroethylene Open-Top Vapor Degreasing Unit Emissions ................ 188
Table E-7. Distribution of Trichloroethylene Conveyorized Degreasing Unit Emissions ..................... 189
Table E-8. Distribution of Trichloroethylene Web Degreasing Unit Emissions .................................... 190
Table E-9. Distribution of Trichloroethylene Cold Cleaning Unit Emissions ........................................ 190
Table E-10. Distribution of Trichloroethylene Open-Top Vapor Degreasing Operating Hours ............ 190
Table E-11. Distribution of Trichloroethylene Conveyorized Degreasing Operating Hours ................. 190
Table E-12. Distribution of Trichloroethylene Web Degreasing Operating Hours ................................ 191
Table E-13. Distribution of Trichloroethylene Cold Cleaning Operating Hours ................................... 191
Table F-1. Summary of Parameter Values and Distributions Used in the Brake Servicing Near-Field/Far-
Field Inhalation Exposure Model .................................................................................... 198
Table F-2. Summary of Trichloroethylene-Based Aerosol Degreaser Formulations ..................... 203
Table G-1. Summary of Parameter Values and Distributions Used in the Spot Cleaning Near-Field/Far-
Field Inhalation Exposure Model .................................................................................... 210
Table G-2. Composite Distribution of Dry Cleaning Facility Floor Areas ............................................ 213
Table H-1. Estimated Fraction Evaporated and Absorbed (fabs) using Equation H-8 ........................... 219
LIST OF APPENDIX FIGURES
Figure A-1. Graphical Example for the Approach for Estimating Number of Workers and
Occupational Non-Users ............................................................................................... 165
Figure E-1. The Near-Field/Far-Field Model as Applied to the Open-Top Vapor Degreasing Near-
Field/Far-Field Inhalation Exposure Model and the Cold Cleaning Near-Field/Far-Field
Inhalation Exposure Model ............................................................................................. 177
Figure E-2. The Near-Field/Far-Field Model as Applied to the Conveyorized Degreasing Near-
Field/Far-Field Inhalation Exposure Model.................................................................... 178
Figure E-3. The Near-Field/Far-Field Model as Applied to the Web Degreasing Near-Field/Far-Field
Inhalation Exposure Model ............................................................................................. 178
Figure F-1. The Near-Field/Far-Field Model as Applied to the Brake Servicing Near-Field/Far-Field
Inhalation Exposure Model ............................................................................................. 193
PEER REVIEW DRAFT. DO NOT CITE OR QUOTE
Page 13 of 229
Figure G-1. The Near-Field/Far-Field Model as Applied to the Spot Cleaning Near-Field/Far-Field
Inhalation Exposure Model ............................................................................................. 206
PEER REVIEW DRAFT. DO NOT CITE OR QUOTE
Page 14 of 229
ABBREVIATIONS
ɛ0 Vacuum Permittivity
AF Assessment Factor
AQS Air Quality System
ATCM Airborne Toxic Control Measure
ATSDR Agency for Toxic Substances and Disease Registries
BAF Bioaccumulation Factor
BCF Bioconcentration Factor
BLS Bureau of Labor Statistics
CAA Clean Air Act
CARB California Air Resources Board
CASRN Chemical Abstracts Service Registry Number
CBI Confidential Business Information
CCR California Code of Regulations
CDR Chemical Data Reporting
CEHD Chemical Exposure Health Data
CERCLA Comprehensive Environmental Response, Compensation, and Liability Act
CFC Chlorofluorocarbon
CFR Code of Federal Regulations
ChV Chronic Value (MATC)
CNS Central Nervous System
COC Concentration of Concern
COU Conditions of Use
CPCat Chemical and Product Categories
CWA Clean Water Act
CYP2E1 Cytochrome P450 2E1
DMR Discharge Monitoring Report
EC50 Effect concentration at which 50% of test organisms exhibit an effect
ECHA European Chemicals Agency
EDC Ethylene Dichloride
EG Effluent Guidelines
EPA Environmental Protection Agency
EPCRA Emergency Planning and Community Right-to-Know Act
ESD Emission Scenario Document
FDA Food and Drug Administration
FFDCA Federal Food, Drug, and Cosmetic Act
FIFRA Federal Insecticide, Fungicide, and Rodenticide Act
FR Federal Register
GACT Generally Available Control Technology
GST Glutathione-S-transferase
HAP Hazardous Air Pollutant
HCFC Hydrochlorofluorocarbon
HCl Hydrochloric Acid
HEC Human Equivalent Concentration
HFC Hydrofluorocarbon
HHE Health Hazard Evaluation

PEER REVIEW DRAFT. DO NOT CITE OR QUOTE
Page 15 of 229
HPV High Production Volume
ICIS-NPDES Integrated Compliance Information System-National Pollutant Discharge Elimination
System
IMIS Integrated Management Information System
ISOR Initial Statement of Reasons
IRIS Integrated Risk Information System
Koc Soil Organic Carbon-Water Partitioning Coefficient
Kow Octanol/Water Partition Coefficient
LC50 Lethal Concentration at which 50% of test organisms die
LOEC Lowest-observable-effect Concentration
MATC Maximum Acceptable Toxicant Concentration
MCL Maximum Contaminant Level
MCLG Maximum Contaminant Level Goal
MSDS Material Safety Data Sheet
NAICS North American Industry Classification System
NATA National Scale Air-Toxics Assessment
NCEA National Center for Environmental Assessment
NCP National Contingency Plan
NEI National Emissions Inventory
NESHAP National Emission Standards for Hazardous Air Pollutants
NHANES National Health and Nutrition Examination Survey - CDC
NICNAS National Industrial Chemicals Notification and Assessment Scheme
NIH National Institute of Health
NIOSH National Institute for Occupational Safety and Health
NOEC No-observable-effect Concentration
NPDWR National Primary Drinking Water Regulation
NRC National Research Council
NTP National Toxicology Program
OCSPP Office of Chemical Safety and Pollution Prevention
OECD Organization for Economic Co-operation and Development
OES Occupational Exposure Scenario
ONU Occupational Non-User
OPPT Office of Pollution Prevention and Toxics
OSHA Occupational Safety and Health Administration
OST Office of Science and Technology
OW Office of Water
PECO Population, Exposure, Comparator, and Outcome
PEL Permissible Exposure Limit
PESS Potentially Exposed or Susceptible Subpopulations
POD Point of Departure
POTW Publicly Owned Treatment Works
QC Quality Control
QSAR Quantitative Structure Activity Relationship
RCRA Resource Conservation and Recovery Act
REACH Registration, Evaluation, Authorisation and Restriction of Chemicals
SDS Safety Data Sheet
PEER REVIEW DRAFT. DO NOT CITE OR QUOTE
Page 16 of 229
SDWA Safe Drinking Water Act
SIDS Screening Information Dataset
SOC Standard Occupational Classification
SNUN Significant New Use Notice
SNUR Significant New Use Rule
STORET STOrage and RETrieval
TCE Trichloroethylene
TRI Toxics Release Inventory
TSCA Toxic Substances Control Act
TWA Time Weighted Average
TSDF Treatment, Storage, and Disposal Facility
U.S. United States
UV Ultraviolet
USGS United States Geological Survey
VOC Volatile Organic Compound
PEER REVIEW DRAFT. DO NOT CITE OR QUOTE
Page 17 of 229
EXECUTIVE SUMMARY
The Toxic Substances Control Act, TSCA § 6(b)(4) requires the United States Environmental Protection
Agency (U.S. EPA) to establish a risk evaluation process. In performing risk evaluations for existing
chemicals, EPA is directed to “determine whether a chemical substance presents an unreasonable risk of
injury to health or the environment, without consideration of costs or other non-risk factors, including an
unreasonable risk to a potentially exposed or susceptible subpopulation identified as relevant to the risk
evaluation by the Administrator under the conditions of use.” In December of 2016, EPA published a list
of 10 chemical substances that are the subject of the Agency’s initial chemical risk evaluations (81 FR
91927), as required by TSCA § 6(b)(2)(A). Trichloroethylene (TCE) was one of these chemicals.
TCE is a colorless volatile liquid with a mildly sweet odor that is used primarily as a manufacturing aid,
a reactant or intermediate, a spot and wipe cleaning solvent, a vapor degreasing solvent, and aerosol
degreasing solvent and is subject to federal and state regulations and reporting requirements (U.S. EPA,
2014b). TCE is a Toxics Release Inventory (TRI)-reportable substance effective January 1, 1987.
Focus of this Risk Evaluation
During scoping and problem formulation, EPA considered all known TSCA uses for TCE. TCE has
been manufactured and imported in the U.S. in large volumes with the most recently available data from
the 2016 Chemical Data Reporting (CDR) indicating approximately 172 million pounds were either
manufactured or imported in the U.S. in 2015. The largest use of TCE, accounting for 84% of
consumption, is as a reactant/intermediate in manufacturing. The second largest use of TCE, an
estimated 15% of consumption, is as a degreasing solvent for vapor degreasing machines and aerosol
degreasing products (e.g., brake cleaners) that are used to clean contaminated metal parts or other
fabricated materials. The remaining volume is attributed to other uses such as spot cleaners, adhesives,
sealants, and coatings, and as an additive in metalworking fluids (U.S. EPA, 2014b).
Exposures to workers, consumers, general populations, and ecological species may occur from
industrial, commercial, and consumer uses of TCE and releases to air, water or land. Workers and
occupational non-users may be exposed to TCE during conditions of use such as manufacturing,
processing, distribution, repackaging, spot and wipe cleaning, degreasing, recycling and disposal, and
other miscellaneous uses of TCE. Consumers and bystanders may also be exposed to TCE via inhalation
of TCE that volatizes during use of consumer products or dermal contact with products containing TCE.
Exposures to the general population and ecological species may occur from releases related to the
manufacture, processing, distribution, and use of TCE.
Risk Evaluation Approach
EPA evaluated acute and chronic exposures to workers and occupational non-users in association with
TCE conditions of use. EPA used inhalation monitoring data from literature sources where reasonably
available and exposure models where monitoring data were not reasonably available or were deemed
insufficient for capturing actual exposure within the OES. EPA also used modeling approaches to
estimate dermal exposures. EPA evaluated releases to water from the conditions of use assessed in this
risk evaluation. EPA used release data from literature sources where reasonably available and used
modeling approaches where release data were not available.
Uncertainties of this Risk Evaluation
There are a number of uncertainties associated with the monitoring and modeling approaches used to
PEER REVIEW DRAFT. DO NOT CITE OR QUOTE
Page 18 of 229
assess TCE exposures and releases. For example, the sites used to collect exposure monitoring and
release data were not selected randomly, and the data reported therein may not be representative of all
sites pertaining to the exposure and release scenarios. Further, of necessity, modeling approaches
employed knowledge-based assumptions that may not apply to all use scenarios. Because site-specific
differences in use practices and engineering controls exist, but are largely unknown, this represents
another source of variability that EPA could not quantify in the assessment.
Human and Ecological Populations Considered in this Risk Evaluation
EPA assessed risks from acute and chronic TCE exposure to workers (those directly handling TCE) and
occupational non-users (workers not directly involved with the use of TCE) for the uses outlined under
Focus of this Risk Evaluation. EPA assumed that workers and occupational non-users would be
individuals of both sexes (age 16 years and older, including pregnant workers) based upon occupational
work permits, although exposures to younger workers in occupational settings cannot be ruled out. An
objective of the monitored and modeled inhalation data was to provide separate exposure level estimates
for workers and occupational non-users.
EPA assessed releases to water to estimate exposures to aquatic species. The water release estimates
developed by EPA are used to estimate the presence of TCE in the environment and biota and evaluate
the environmental hazards. The release estimates were used to model exposure to aquatic species where
environmental monitoring data were not reasonably available.

PEER REVIEW DRAFT. DO NOT CITE OR QUOTE
Page 19 of 229
1 INTRODUCTION
1.1 Overview TSCA § 6(b)(4) requires the United States Environmental Protection Agency (U.S. EPA) to establish a
risk evaluation process. In performing risk evaluations for existing chemicals, EPA is directed to
“determine whether a chemical substance presents an unreasonable risk of injury to health or the
environment, without consideration of costs or other non-risk factors, including an unreasonable risk to a
potentially exposed or susceptible subpopulation identified as relevant to the risk evaluation by the
Administrator under the conditions of use.” In December of 2016, EPA published a list of 10 chemical
substances that are the subject of the Agency’s initial chemical risk evaluations (81 FR 91927), as
required by TSCA § 6(b)(2)(A). Trichloroethylene (TCE) was one of these chemicals.
TCE, also known as Ethylene trichloride; 1,1,2-Trichloroethylene; Trichloroethene; acetylene
trichloride; Ethinyl trichloride, trichloroethene, and TRI, is a colorless volatile liquid with a mildly
sweet odor that is used primarily as a reactant or intermediate, and as a vapor and aerosol degreasing
solvent and is subject to federal and state regulations and reporting requirements. TCE is a TRI-
reportable substance effective January 1, 1987.
1.2 Scope Workplace exposures and releases to water have been assessed for the following industrial1 and
commercial2 conditions of use of TCE:
1. Manufacturing;
2. Processing as a Reactant;
3. Formulation of Aerosol and Non-Aerosol Products;
4. Repackaging;
5. Batch Open-Top Vapor Degreasing;
6. Batch Closed-Loop Vapor Degreasing;
7. Conveyorized Vapor Degreasing;
8. Web Vapor Degreasing;
9. Cold Cleaning;
10. Aerosol Applications: Spray Degreasing/Cleaning, Automotive Brake and Parts Cleaners,
Penetrating Lubricants, and Mold Releases;
11. Metalworking Fluids;
12. Adhesives, Sealants, Paints, and Coatings (Industrial and Commercial);
13. Other Industrial Uses (such as functional fluids);
14. Spot Cleaning, Wipe Cleaning and Carpet Cleaning;
15. Industrial Processing Aid;
16. Commercial Printing and Copying;
17. Other Commercial Uses; and
1 Industrial means a site at which one or more chemical substances or mixtures are manufactured (including imported) or
processed. 2 Commercial means the processing or use at a site of a chemical substance or a mixture containing a chemical substance
(including as part of an article) in a commercial enterprise providing saleable goods or services.
PEER REVIEW DRAFT. DO NOT CITE OR QUOTE
Page 20 of 229
18. Process Solvent Recycling and Worker Handling of Wastes.
For work place exposures, EPA considered exposures to both workers who directly handle TCE and
occupational non-users (ONUs) who do not directly handle TCE but may be exposed to vapors or mists
that enter their breathing zone while working in locations in close proximity to where TCE is being
used.
For purposes of this report, “releases to water” include both direct discharges to surface water and
indirect discharges to publicly-owned treatment works (POTW) or non-POTW wastewater treatment
(WWT) (TSDF - treatment, storage, and disposal facility for example). It should be noted that for
purposes of risk evaluation, discharges to POTW and non-POTW WWT are not evaluated the same as
discharges to surface water. EPA considers removal efficiencies of POTWs and WWT plants and
environmental fate and transport properties when evaluating risks from indirect discharges. The purpose
of this report is only to quantify direct and indirect discharges; therefore, these factors are not discussed.
The details on how these factors were considered when determining risk are described in the Risk
Evaluation for Trichloroethylene (U.S. EPA, 2019h).
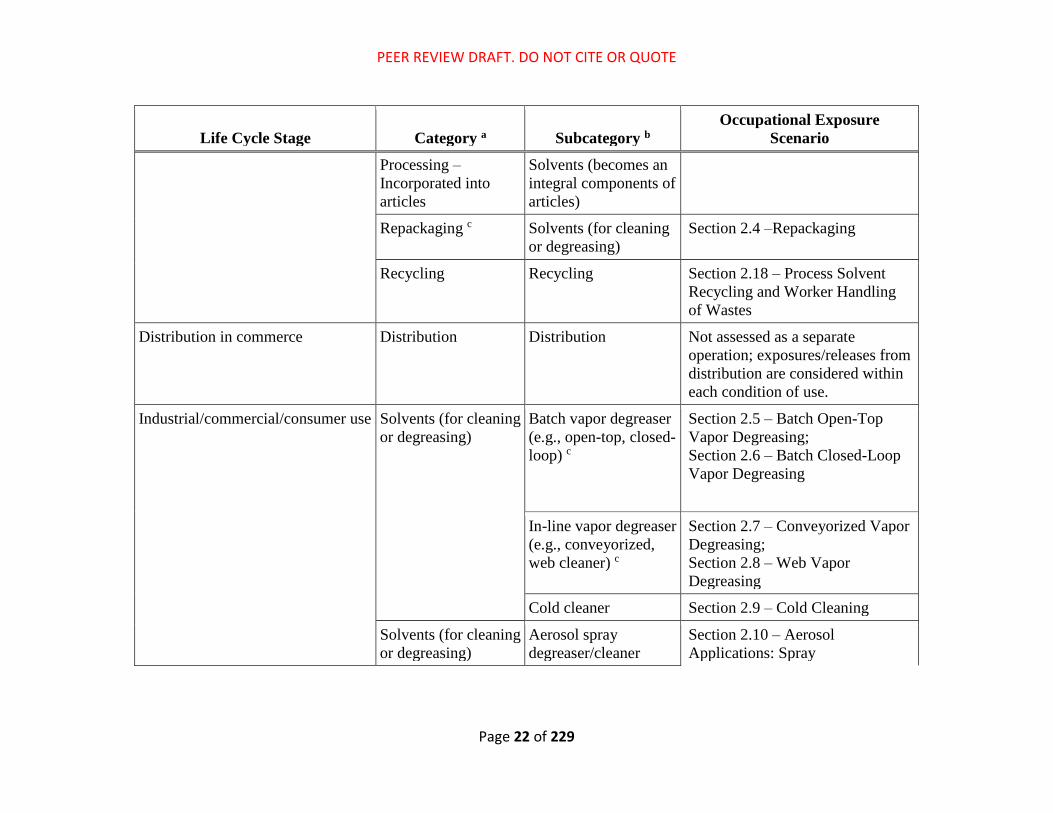
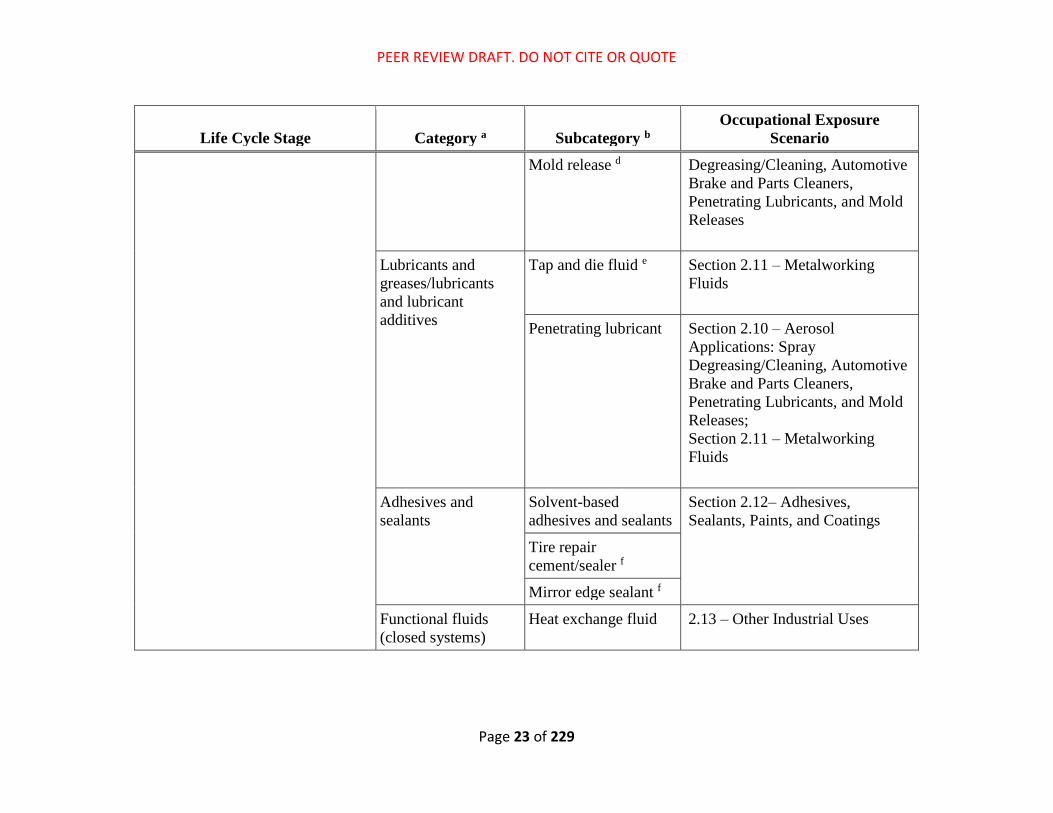
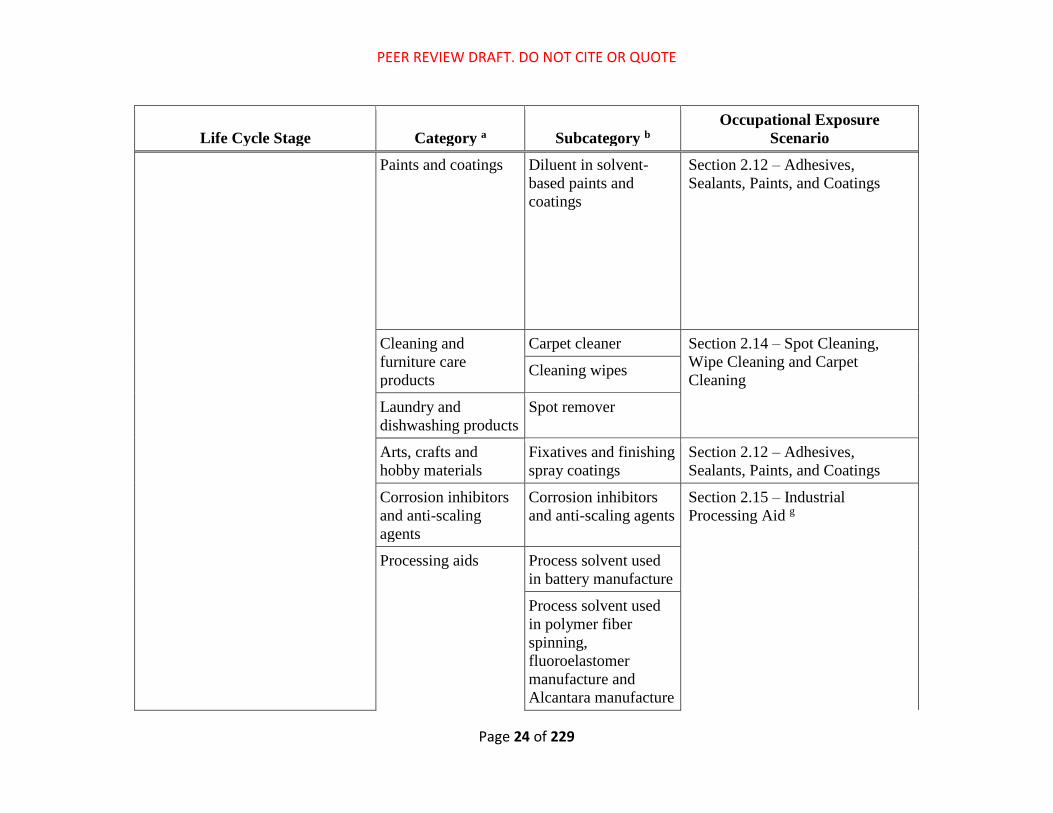
The assessed conditions of use were described in Table 2-3 of the Problem Formulation of the Risk
Evaluation for Trichloroethylene (Problem Formulation Document) (U.S. EPA, 2018c); however, due to
expected similarities in both processes and exposures/releases several of the subcategories of use (based
on CDR) in Table 2-3 were grouped and assessed together during the risk evaluation process. The
conditions of use as described in (U.S. EPA, 2018c) were evaluated for occupational scenarios based on
corresponding occupational exposure scenarios (OES). A crosswalk of the conditions of use in Table 2-3
to the occupational exposure scenarios assessed in this report is provided in Table 1-1.

PEER REVIEW DRAFT. DO NOT CITE OR QUOTE
Page 21 of 229
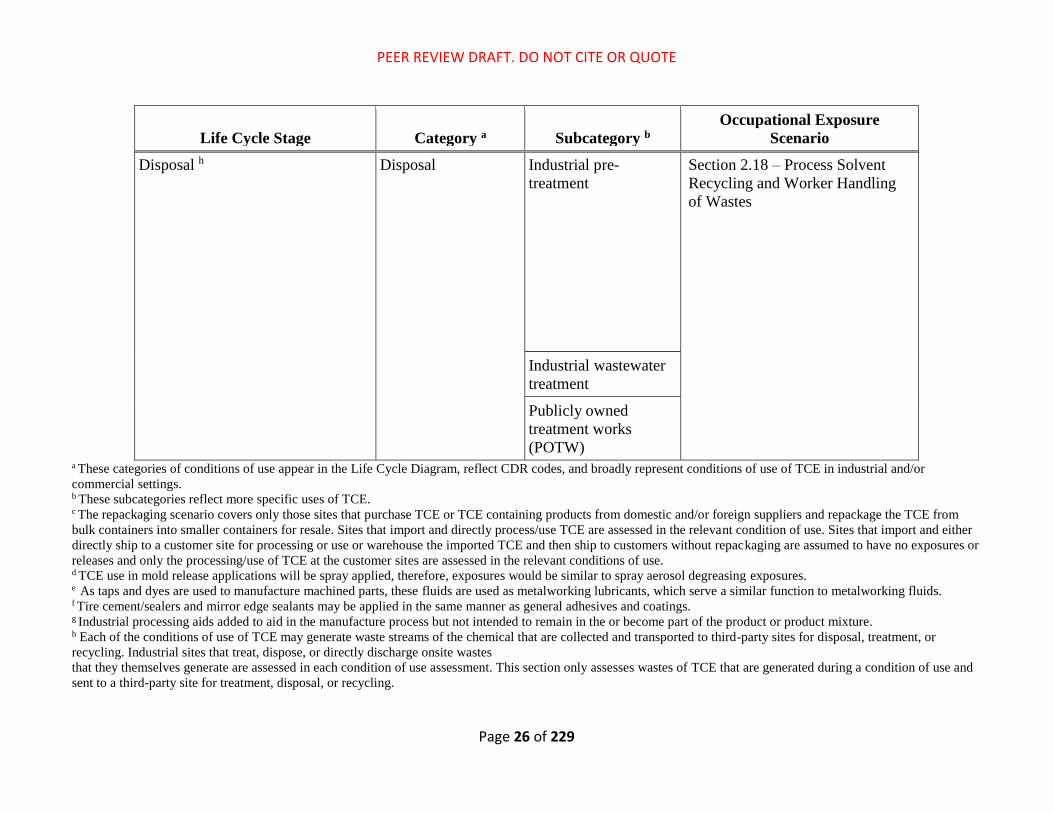
Table 1-1. Crosswalk of Subcategories of Use Listed in the Problem Formulation Document to Occupational Exposure Scenarios
Assessed in the Risk Evaluation
Life Cycle Stage Category a Subcategory b
Occupational Exposure
Scenario
Manufacture Domestic
manufacture
Domestic manufacture Section 2.1 – Manufacturing
Import Import Section 2.4 –Repackaging c
Processing Processing as a
reactant/
intermediate
Intermediate in
industrial gas
manufacturing (e.g.,
manufacture of
fluorinated gases used
as refrigerants, foam
blowing agents and
solvents)
Section 2.2 – Processing as a
Reactant
Processing -
Incorporation into
formulation, mixture
or reaction product
Solvents (for cleaning
or degreasing)
Section 2.3 – Formulation of
Aerosol and Non-Aerosol
Products;
Adhesives and sealant
chemicals
Solvents (which
become part of
product formulation or
mixture) (e.g.,
lubricants and greases,
paints and coatings,
other uses)
PEER REVIEW DRAFT. DO NOT CITE OR QUOTE
Page 22 of 229
Life Cycle Stage Category a Subcategory b
Occupational Exposure
Scenario
Processing –
Incorporated into
articles
Solvents (becomes an
integral components of
articles)
Repackaging c Solvents (for cleaning
or degreasing)
Section 2.4 –Repackaging
Recycling Recycling Section 2.18 – Process Solvent
Recycling and Worker Handling
of Wastes
Distribution in commerce Distribution Distribution Not assessed as a separate
operation; exposures/releases from
distribution are considered within
each condition of use.
Industrial/commercial/consumer use Solvents (for cleaning
or degreasing)
Batch vapor degreaser
(e.g., open-top, closed-
loop) c
Section 2.5 – Batch Open-Top
Vapor Degreasing;
Section 2.6 – Batch Closed-Loop
Vapor Degreasing
In-line vapor degreaser
(e.g., conveyorized,
web cleaner) c
Section 2.7 – Conveyorized Vapor
Degreasing;
Section 2.8 – Web Vapor
Degreasing
Cold cleaner Section 2.9 – Cold Cleaning
Solvents (for cleaning
or degreasing)
Aerosol spray
degreaser/cleaner
Section 2.10 – Aerosol
Applications: Spray
PEER REVIEW DRAFT. DO NOT CITE OR QUOTE
Page 23 of 229
Life Cycle Stage Category a Subcategory b
Occupational Exposure
Scenario
Mold release d Degreasing/Cleaning, Automotive
Brake and Parts Cleaners,
Penetrating Lubricants, and Mold
Releases
Lubricants and
greases/lubricants
and lubricant
additives
Tap and die fluid e Section 2.11 – Metalworking
Fluids
Penetrating lubricant Section 2.10 – Aerosol
Applications: Spray
Degreasing/Cleaning, Automotive
Brake and Parts Cleaners,
Penetrating Lubricants, and Mold
Releases;
Section 2.11 – Metalworking
Fluids
Adhesives and
sealants
Solvent-based
adhesives and sealants
Section 2.12– Adhesives,
Sealants, Paints, and Coatings
Tire repair
cement/sealer f
Mirror edge sealant f
Functional fluids
(closed systems)
Heat exchange fluid 2.13 – Other Industrial Uses
PEER REVIEW DRAFT. DO NOT CITE OR QUOTE
Page 24 of 229
Life Cycle Stage Category a Subcategory b
Occupational Exposure
Scenario
Paints and coatings Diluent in solvent-
based paints and
coatings
Section 2.12 – Adhesives,
Sealants, Paints, and Coatings
Cleaning and
furniture care
products
Carpet cleaner Section 2.14 – Spot Cleaning,
Wipe Cleaning and Carpet
Cleaning
Cleaning wipes
Laundry and
dishwashing products
Spot remover
Arts, crafts and
hobby materials
Fixatives and finishing
spray coatings
Section 2.12 – Adhesives,
Sealants, Paints, and Coatings
Corrosion inhibitors
and anti-scaling
agents
Corrosion inhibitors
and anti-scaling agents
Section 2.15 – Industrial
Processing Aid g
Processing aids Process solvent used
in battery manufacture
Process solvent used
in polymer fiber
spinning,
fluoroelastomer
manufacture and
Alcantara manufacture

PEER REVIEW DRAFT. DO NOT CITE OR QUOTE
Page 25 of 229
Life Cycle Stage Category a Subcategory b
Occupational Exposure
Scenario
Extraction solvent
used in caprolactam
manufacture
Precipitant used in
beta-cyclodextrin
manufacture
Ink, toner and
colorant products
Toner aid Section 2.16 –Commercial
Printing and Copying
Automotive care
products
Brake and parts
cleaner
Section 2.10– Aerosol
Applications: Spray
Degreasing/Cleaning, Automotive
Brake and Parts Cleaners,
Penetrating Lubricants, and Mold
Releases
Apparel and footwear
care products
Shoe polish Section 2.17 – Other Commercial
Uses
Other uses Hoof polishes
Pepper spray
Lace wig and hair
extension glues
Gun scrubber
Other miscellaneous
industrial, commercial
and consumer uses
PEER REVIEW DRAFT. DO NOT CITE OR QUOTE
Page 26 of 229
Life Cycle Stage Category a Subcategory b
Occupational Exposure
Scenario
Disposal h Disposal
Industrial pre-
treatment
Section 2.18 – Process Solvent
Recycling and Worker Handling
of Wastes
Industrial wastewater
treatment
Publicly owned
treatment works
(POTW) a These categories of conditions of use appear in the Life Cycle Diagram, reflect CDR codes, and broadly represent conditions of use of TCE in industrial and/or
commercial settings. b These subcategories reflect more specific uses of TCE. c The repackaging scenario covers only those sites that purchase TCE or TCE containing products from domestic and/or foreign suppliers and repackage the TCE from
bulk containers into smaller containers for resale. Sites that import and directly process/use TCE are assessed in the relevant condition of use. Sites that import and either
directly ship to a customer site for processing or use or warehouse the imported TCE and then ship to customers without repackaging are assumed to have no exposures or
releases and only the processing/use of TCE at the customer sites are assessed in the relevant conditions of use. d TCE use in mold release applications will be spray applied, therefore, exposures would be similar to spray aerosol degreasing exposures. e As taps and dyes are used to manufacture machined parts, these fluids are used as metalworking lubricants, which serve a similar function to metalworking fluids.
f Tire cement/sealers and mirror edge sealants may be applied in the same manner as general adhesives and coatings. g Industrial processing aids added to aid in the manufacture process but not intended to remain in the or become part of the product or product mixture. h Each of the conditions of use of TCE may generate waste streams of the chemical that are collected and transported to third-party sites for disposal, treatment, or
recycling. Industrial sites that treat, dispose, or directly discharge onsite wastes that they themselves generate are assessed in each condition of use assessment. This section only assesses wastes of TCE that are generated during a condition of use and
sent to a third-party site for treatment, disposal, or recycling.

PEER REVIEW DRAFT. DO NOT CITE OR QUOTE
Page 27 of 229
1.3 Components of the Occupational Exposure and Environmental Release
Assessment The occupational exposure and environmental release assessment of each OES comprises the following
components:
• Facility Estimates: An estimate of the number of sites that use TCE for the given OES.
• Process Description: A description of the OES, including the role of the chemical in the use;
process vessels, equipment, and tools used during the OES.
• Worker Activities: A descriptions of the worker activities, including an assessment for potential
points of worker and occupational non-user (ONU) exposure.
• Number of Workers and Occupational Non-Users: An estimate of the number of workers and
occupational non-users potentially exposed to the chemical for the given OES.
• Occupational Inhalation Exposure Results: Central tendency and high-end estimates of
inhalation exposure to workers and occupational non-users. See Section 1.4.5 for a discussion of
EPA’s statistical analysis approach for assessing inhalation exposure.
• Water Release Sources: A description of each of the potential sources of water releases in the
process for the given OES.
• Water Release Assessment Results: Estimates of chemical released into water (surface water,
POTW, or non-POTW WWT).
In addition to the above components for each OES, a separate dermal exposure section is included that
provides estimates of the dermal exposures for all the assessed conditions of use.
1.4 General Approach and Methodology for Occupational Exposures and
Environmental Releases
Estimates of Number of Facilities
Where available, EPA used 2016 CDR (U.S. EPA, 2017a), 2016 TRI (U.S. EPA, 2017c), 2016
Discharge Monitoring Report (DMR) (U.S. EPA, 2016a) and 2014 National Emissions Inventory (NEI)
(U.S. EPA, 2018a) data to provide a basis to estimate the number of sites using TCE within an OES.
Generally, information for reporting sites in CDR and NEI was sufficient to accurately characterize each
reporting site’s OES. However, information for determining the OES for reporting sites in TRI and
DMR is typically more limited.
In TRI, sites submitting a Form R indicate whether they perform a variety of activities related to the
chemical including, but not limited to: produce the chemical; import the chemical; use the chemical as a
reactant; use the chemical as a chemical processing aid; and ancillary or other use. In TRI, sites
submitting Form A are not required to designate an activity. For both Form R and Form A, TRI sites are
also required to report the primary North American Industry Classification System (NAICS) code for
their site. For each TRI site, EPA used the reported primary NAICS code and activity indicators to
determine the OES at the site. For instances where EPA could not definitively determine the OES
because: 1) the report NAICS codes could include multiple conditions of use; 2) the site report multiple
activities; and/or 3) the site did not report activities due to submitting a Form A, EPA had to make an
assumption on the OES to avoid double counting the site. For these sites, EPA supplemented the NAICS
PEER REVIEW DRAFT. DO NOT CITE OR QUOTE
Page 28 of 229
code and activity information with the following information to determine a “most likely” or “primary”
OES:
1. Information on known uses of the chemical and market data identifying the most prevalent
conditions of use of the chemical.
2. Information obtained from public comments and/or industry meetings with EPA that provided
specific information on the site.
In DMR, the only information reported on OES is each site’s Standard Industrial Classification (SIC)
code. EPA could not determine each reporting site’s OES based on SIC code alone; therefore, EPA
supplemented the SIC code information with the same supplementary information used for the TRI sites
(market data, public comments, and industry meetings).
Where the number of sites could not be determined using CDR/TRI/DMR/NEI or where
CDR/TRI/DMR/NEI data were determined to insufficiently capture the number of sites within an OES,
EPA supplemented the available data with U.S. economic data using the following method:
1. Identify the North American Industry Classification System (NAICS) codes for the industry
sectors associated with these uses.
2. Estimate total number of sites using the U.S. Census’ Statistics of US Businesses (SUSB) (U.S.
Census Bureau, 2015) data on total establishments by 6-digit NAICS.
3. Use market penetration data to estimate the percentage of establishments likely to be using TCE
instead of other chemicals.
4. Combine the data generated in Steps 1 through 3 to produce an estimate of the number of sites
using TCE in each 6-digit NAICS code, and sum across all applicable NAICS codes for the OES
to arrive at a total estimate of the number of sites within the OES.
Process Description
EPA performed a literature search to find descriptions of processes involved in each OES. Where
process descriptions were unclear or not reasonably available, EPA referenced relevant Emission
Scenario Documents (ESD) or Generic Scenarios (GS). Process descriptions for each OES can be found
in Section 2.
Worker Activities
EPA performed a literature search to identify worker activities that could potentially result in
occupational exposures. Where worker activities were unclear or not reasonably available, EPA
referenced relevant ESD’s or GS’s. Worker activities for each OES can be found in Section 2.
Number of Workers and Occupational Non-Users
Where available, EPA used CDR data to provide a basis to estimate the number of workers and ONUs.
EPA supplemented the CDR data with U.S. economic data using the following method:
1. Identify the North American Industry Classification System (NAICS) codes for the industry
sectors associated with these uses.
2. Estimate total employment by industry/occupation combination using the Bureau of Labor
Statistics’ Occupational Employment Statistics data (BLS Data).

PEER REVIEW DRAFT. DO NOT CITE OR QUOTE
Page 29 of 229
3. Refine the BLS Data estimates where they are not sufficiently granular by using the U.S.
Census’ Statistics of US Businesses (SUSB) (U.S. Census Bureau, 2015) data on total
employment by 6-digit NAICS.
4. Use market penetration data to estimate the percentage of employees likely to be using TCE
instead of other chemicals.
5. Where market penetration data are not reasonably available, use the estimated workers/ONUs
per site in the 6-digit NAICS code and multiply by the number of sites estimated from CDR,
TRI, DMR or NEI. In DMR data, sites report Standard Industrial Classification (SIC) codes
rather than NAICS codes; therefore, EPA mapped each reported SIC code to a NAICS code for
use in this analysis.
6. Combine the data generated in Steps 1 through 5 to produce an estimate of the number of
employees using TCE in each industry/occupation combination, and sum these to arrive at a total
estimate of the number of employees with exposure within the OES.
Appendix A summarizes the methods EPA used to estimate the number of workers potentially
exposed to TCE for each OES.
Inhalation Exposure Assessment Approach and Methodology
1.4.5.1 General Approach
EPA provided occupational exposure results representative of central tendency conditions and high-end
conditions. A central tendency is assumed to be representative of occupational exposures in the center of
the distribution for a given OES. For risk evaluation, EPA used the 50th percentile (median), mean
(arithmetic or geometric), mode, or midpoint values of a distribution as representative of the central
tendency scenario. EPA’s preference is to provide the 50th percentile of the distribution. However, if the
full distribution is not known, EPA may assume that the mean, mode, or midpoint of the distribution
represents the central tendency depending on the statistics available for the distribution.
A high-end is assumed to be representative of occupational exposures that occur at probabilities above
the 90th percentile but below the exposure of the individual with the highest exposure (U.S. EPA, 1992).
For risk evaluation, EPA provided high-end results at the 95th percentile. If the 95th percentile is not
available, EPA used a different percentile greater than or equal to the 90th percentile but less than or
equal to the 99.9th percentile, depending on the statistics available for the distribution. If the full
distribution is not known and the preferred statistics are not available, EPA estimated a maximum or
bounding estimate in lieu of the high-end.
For occupational exposures, EPA used measured or estimated air concentrations to calculate exposure
concentration metrics required for risk assessment, such as average daily concentration (ADC) and
lifetime average daily concentration (LADC). These calculations require additional parameter inputs,
such as years of exposure, exposure duration and frequency, and lifetime years. EPA estimated exposure
concentrations from monitoring data, modeling, or occupational exposure limits.
For the final exposure result metrics, each of the input parameters (e.g., air concentrations, working
years, exposure frequency, lifetime years) may be a point estimate (i.e., a single descriptor or statistic,
such as central tendency or high-end) or a full distribution. EPA considered three general approaches for
estimating the final exposure result metrics:
PEER REVIEW DRAFT. DO NOT CITE OR QUOTE
Page 30 of 229
• Deterministic calculations: EPA used combinations of point estimates of each parameter to
estimate a central tendency and high-end for each final exposure metric result. EPA documented
the method and rationale for selecting parametric combinations to be representative of central
tendency and high-end in Appendix B.
• Probabilistic (stochastic) calculations: EPA used Monte Carlo simulations using the full
distribution of each parameter to calculate a full distribution of the final exposure metric results
and selecting the 50th and 95th percentiles of this resulting distribution as the central tendency and
high-end, respectively.
• Combination of deterministic and probabilistic calculations: EPA had full distributions for some
parameters but point estimates of the remaining parameters. For example, EPA used Monte
Carlo modeling to estimate exposure concentrations, but only had point estimates of exposure
duration and frequency, and lifetime years. In this case, EPA documented the approach and
rationale for combining point estimates with distribution results for estimating central tendency
and high-end results in Appendix B.
EPA follows the following hierarchy in selecting data and approaches for assessing inhalation
exposures:
1. Monitoring data:
a. Personal and directly applicable
b. Area and directly applicable
c. Personal and potentially applicable or similar
d. Area and potentially applicable or similar
2. Modeling approaches:
a. Surrogate monitoring data
b. Fundamental modeling approaches
c. Statistical regression modeling approaches
3. Occupational exposure limits:
a. Company-specific OELs (for site-specific exposure assessments, e.g., there is only one
manufacturer who provides to EPA their internal OEL but does not provide monitoring data)
b. OSHA PEL
c. Voluntary limits (ACGIH TLV, NIOSH REL, Occupational Alliance for Risk Science
(OARS) workplace environmental exposure level (WEEL) [formerly by AIHA])
EPA assessed TCE occupational exposure of the following two receptor categories: male or female
workers who are ≥16 years or older; and, female workers of reproductive age (≥16 years to less than 50
years).
1.4.5.2 Approach for this Risk Evaluation
EPA reviewed workplace inhalation monitoring data collected by government agencies such as OSHA
and NIOSH, monitoring data found in published literature (i.e., personal exposure monitoring data and
area monitoring data), and monitoring data submitted via public comments. Studies were evaluated
using the evaluation strategies laid out in the Application of Systematic Review in TSCA Risk
Evaluations (U.S. EPA, 2018b).
PEER REVIEW DRAFT. DO NOT CITE OR QUOTE
Page 31 of 229
Exposures are calculated from the datasets provided in the sources depending on the size of the dataset.
For datasets with six or more data points, central tendency and high-end exposures were estimated using
the 50th percentile and 95th percentile. For datasets with three to five data points, central tendency
exposure was calculated using the 50th percentile and the maximum was presented as the high-end
exposure estimate. For datasets with two data points, the midpoint was presented as a midpoint value
and the higher of the two values was presented as a higher value. Finally, data sets with only one data
point presented the value as a what-if exposure. For datasets including exposure data that were reported
as below the limit of detection (LOD), EPA estimated the exposure concentrations for these data,
following EPA’s Guidelines for Statistical Analysis of Occupational Exposure Data (U.S. EPA, 1994)
which recommends using the 𝐿𝑂𝐷
√2 if the geometric standard deviation of the data is less than 3.0 and
𝐿𝑂𝐷
2
if the geometric standard deviation is 3.0 or greater. Specific details related to each OES can be found in
Section 2. For each OES, these values were used to calculate acute and chronic (non-cancer and cancer)
exposures. Equations and sample calculations for chronic exposures can be found in Appendix B and
Appendix C, respectively.
EPA used exposure monitoring data or exposure models to estimate inhalation exposures for all
conditions of use. Specific details related to the use of monitoring data for each OES can be found in
Section 2. Descriptions of the development and parameters used in the exposure models used for this
assessment can be found in Appendix D through Appendix G.
Consideration of Engineering Controls and Personal Protective Equipment
OSHA and NIOSH recommend employers utilize the hierarchy of controls to address hazardous
exposures in the workplace. The hierarchy of controls strategy outlines, in descending order of priority,
the use of elimination, substitution, engineering controls, administrative controls, and lastly personal
protective equipment (PPE). The hierarchy of controls prioritizes the most effective measures first which
is to eliminate or substitute the harmful chemical (e.g., use a different process, substitute with a less
hazardous material), thereby preventing or reducing exposure potential. Following elimination and
substitution, the hierarchy recommends engineering controls to isolate employees from the hazard,
followed by administrative controls, or changes in work practices to reduce exposure potential (e.g.,
source enclosure, local exhaust ventilation systems). Administrative controls are policies and procedures
instituted and overseen by the employer to protect worker exposures. As the last means of control, the
use of personal protective equipment (e.g., respirators, gloves) is recommended, when the other control
measures cannot reduce workplace exposure to an acceptable level.
Respiratory Protection
OSHA’s Respiratory Protection Standard (29 CFR § 1910.134) requires employers in certain industries
to address workplace hazards by implementing engineering control measures and, if these are not
feasible, provide respirators that are applicable and suitable for the purpose intended. Respirator
selection provisions are provided in § 1910.134(d) and require that appropriate respirators are selected
based on the respiratory hazard(s) to which the worker will be exposed and workplace and user factors
that affect respirator performance and reliability. Assigned protection factors (APFs) are provided in
Table 1 under § 1910.134(d)(3)(i)(A) (see below in Table 2-61) and refer to the level of respiratory
protection that a respirator or class of respirators is expected to provide to employees when the employer
implements a continuing, effective respiratory protection program.
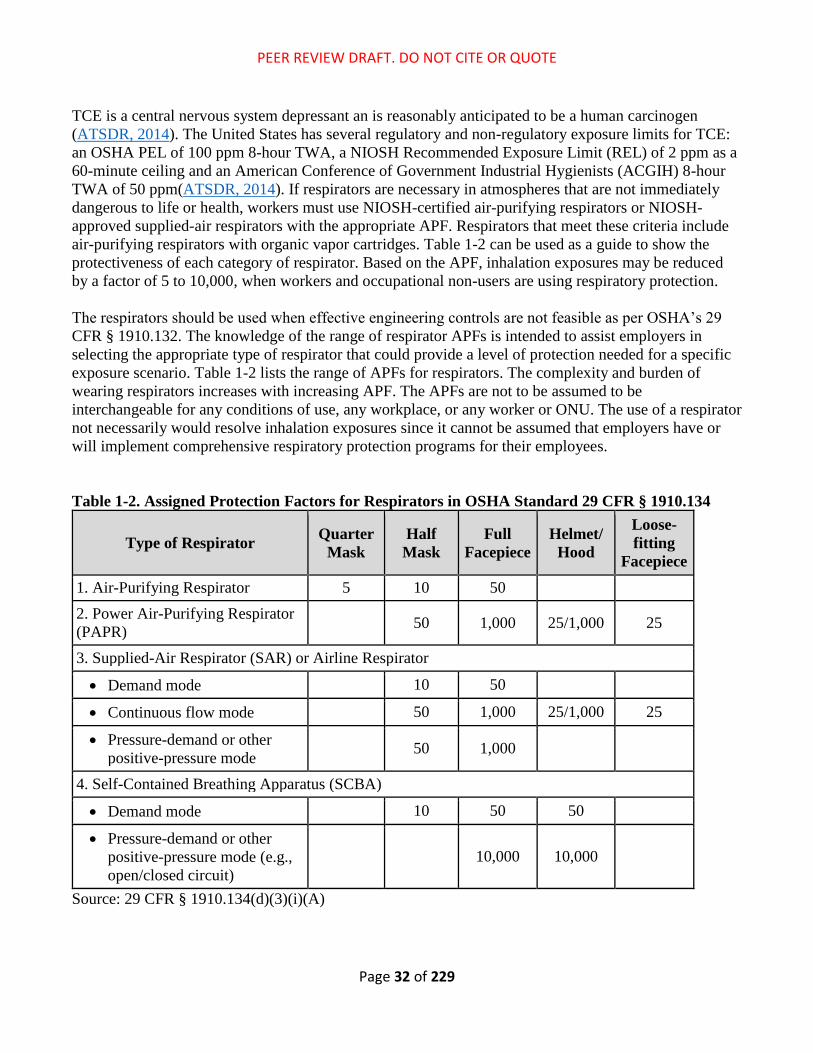
PEER REVIEW DRAFT. DO NOT CITE OR QUOTE
Page 32 of 229
TCE is a central nervous system depressant an is reasonably anticipated to be a human carcinogen
(ATSDR, 2014). The United States has several regulatory and non-regulatory exposure limits for TCE:
an OSHA PEL of 100 ppm 8-hour TWA, a NIOSH Recommended Exposure Limit (REL) of 2 ppm as a
60-minute ceiling and an American Conference of Government Industrial Hygienists (ACGIH) 8-hour
TWA of 50 ppm(ATSDR, 2014). If respirators are necessary in atmospheres that are not immediately
dangerous to life or health, workers must use NIOSH-certified air-purifying respirators or NIOSH-
approved supplied-air respirators with the appropriate APF. Respirators that meet these criteria include
air-purifying respirators with organic vapor cartridges. Table 1-2 can be used as a guide to show the
protectiveness of each category of respirator. Based on the APF, inhalation exposures may be reduced
by a factor of 5 to 10,000, when workers and occupational non-users are using respiratory protection.
The respirators should be used when effective engineering controls are not feasible as per OSHA’s 29
CFR § 1910.132. The knowledge of the range of respirator APFs is intended to assist employers in
selecting the appropriate type of respirator that could provide a level of protection needed for a specific
exposure scenario. Table 1-2 lists the range of APFs for respirators. The complexity and burden of
wearing respirators increases with increasing APF. The APFs are not to be assumed to be
interchangeable for any conditions of use, any workplace, or any worker or ONU. The use of a respirator
not necessarily would resolve inhalation exposures since it cannot be assumed that employers have or
will implement comprehensive respiratory protection programs for their employees.
Table 1-2. Assigned Protection Factors for Respirators in OSHA Standard 29 CFR § 1910.134
Type of Respirator Quarter
Mask
Half
Mask
Full
Facepiece
Helmet/
Hood
Loose-
fitting
Facepiece
1. Air-Purifying Respirator 5 10 50
2. Power Air-Purifying Respirator
(PAPR) 50 1,000 25/1,000 25
3. Supplied-Air Respirator (SAR) or Airline Respirator
• Demand mode 10 50
• Continuous flow mode 50 1,000 25/1,000 25
• Pressure-demand or other
positive-pressure mode 50 1,000
4. Self-Contained Breathing Apparatus (SCBA)
• Demand mode 10 50 50
• Pressure-demand or other
positive-pressure mode (e.g.,
open/closed circuit)
10,000 10,000
Source: 29 CFR § 1910.134(d)(3)(i)(A)
PEER REVIEW DRAFT. DO NOT CITE OR QUOTE
Page 33 of 229
Dermal Exposure Assessment Approach
Dermal exposure data was not readily available for the conditions of use in the assessment. Because
TCE is a volatile liquid that readily evaporates from the skin, EPA estimated dermal exposures using the
Dermal Exposure to Volatile Liquids Model. This model determines a dermal potential dose rate based
on an assumed amount of liquid on skin during one contact event per day and the steady-state fractional
absorption for TCE based on a theoretical framework provided by Kasting (Kasting and Miller, 2006).
The amount of liquid on the skin is adjusted by the weight fraction of TCE in the liquid to which the
worker is exposed. Specific details of the dermal exposure assessment can be found in Section 2.19 and
equations and sample calculations for estimate dermal exposures can be found in Appendix H.
Water Release Sources
EPA performed a literature search to identify process operations that could potentially result in direct or
indirect discharges to water for each OES. Where release sources were unclear or not reasonably
available, EPA referenced relevant ESD’s or GS’s. Water release sources for each OES can be found in
Section 2.
Water Release Assessment Approach and Methodology
Where available, EPA used 2016 TRI (U.S. EPA, 2017c) and 2016 DMR (U.S. EPA, 2016a) data to
provide a basis for estimating releases. Facilities are only required to report to TRI if the facility has 10
or more full-time employees, is included in an applicable NAICS code, and manufactures, processes, or
uses the chemical in quantities greater than a certain threshold (25,000 pounds for manufacturers and
processors of TCE and 10,000 pounds for users of TCE). Due to these limitations, some sites that
manufacture, process, or use TCE may not report to TRI and are therefore not included in these datasets.
For the 2016 DMR (U.S. EPA, 2016a), EPA used the Water Pollutant Loading Tool within EPA’s
Enforcement and Compliance History Online (ECHO) to query all TCE point source water discharges in
2016. DMR data are submitted by National Pollutant Discharge Elimination System (NPDES) permit
holders to states or directly to the EPA according to the monitoring requirements of the facility’s permit.
States are only required to load major discharger data into DMR and may or may not load minor
discharger data. The definition of major vs. minor discharger is set by each state and could be based on
discharge volume or facility size. Due to these limitations, some sites that discharge TCE may not be
included in the DMR dataset.
Where releases are expected but TRI and DMR data were not available or where EPA determined TRI
and DMR data did not sufficiently represent releases of TCE to water for an OES, releases were
estimated using data from literature, relevant ESD’s or GS’s, existing EPA models (e.g., EPA Water
Saturation Loss Model), and/or relevant Effluent Limitation Guidelines (ELG). ELG are national
regulatory standards set forth by EPA for wastewater discharges to surface water and municipal sewage
treatment plants. Specific details related to the use of release data or models for each OES can be found
in Section 2.
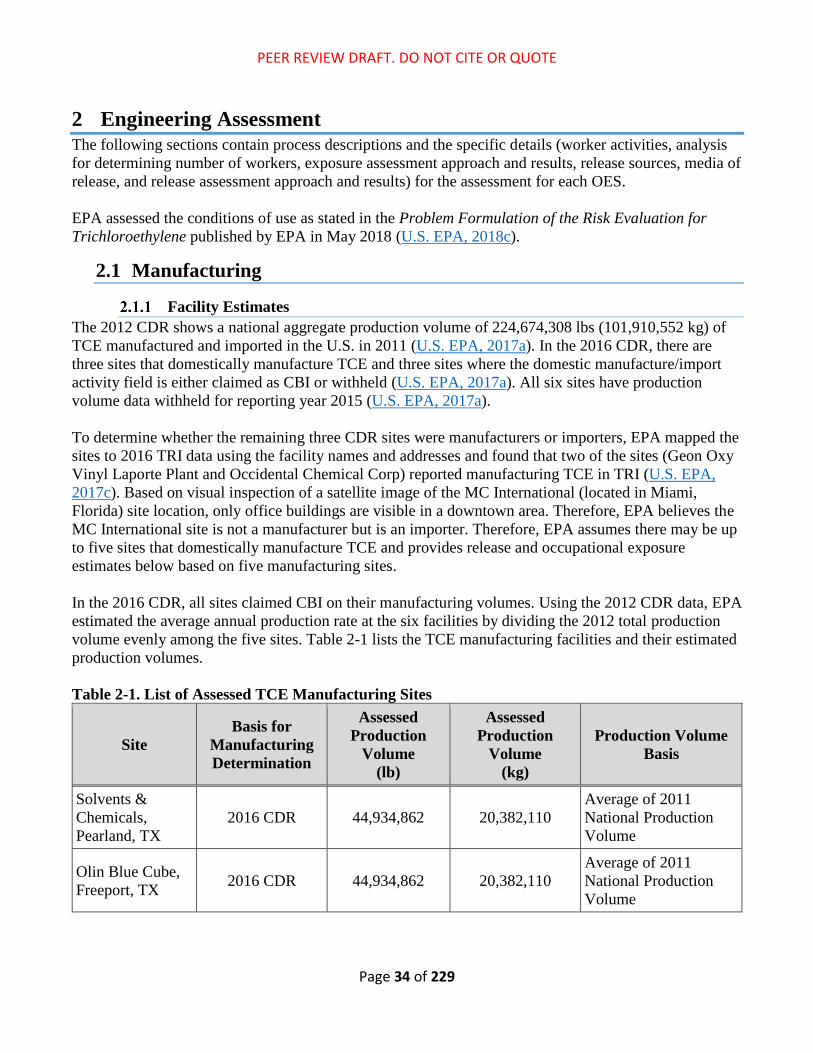
PEER REVIEW DRAFT. DO NOT CITE OR QUOTE
Page 34 of 229
2 Engineering Assessment
The following sections contain process descriptions and the specific details (worker activities, analysis
for determining number of workers, exposure assessment approach and results, release sources, media of
release, and release assessment approach and results) for the assessment for each OES.
EPA assessed the conditions of use as stated in the Problem Formulation of the Risk Evaluation for
Trichloroethylene published by EPA in May 2018 (U.S. EPA, 2018c).
2.1 Manufacturing
Facility Estimates
The 2012 CDR shows a national aggregate production volume of 224,674,308 lbs (101,910,552 kg) of
TCE manufactured and imported in the U.S. in 2011 (U.S. EPA, 2017a). In the 2016 CDR, there are
three sites that domestically manufacture TCE and three sites where the domestic manufacture/import
activity field is either claimed as CBI or withheld (U.S. EPA, 2017a). All six sites have production
volume data withheld for reporting year 2015 (U.S. EPA, 2017a).
To determine whether the remaining three CDR sites were manufacturers or importers, EPA mapped the
sites to 2016 TRI data using the facility names and addresses and found that two of the sites (Geon Oxy
Vinyl Laporte Plant and Occidental Chemical Corp) reported manufacturing TCE in TRI (U.S. EPA,
2017c). Based on visual inspection of a satellite image of the MC International (located in Miami,
Florida) site location, only office buildings are visible in a downtown area. Therefore, EPA believes the
MC International site is not a manufacturer but is an importer. Therefore, EPA assumes there may be up
to five sites that domestically manufacture TCE and provides release and occupational exposure
estimates below based on five manufacturing sites.
In the 2016 CDR, all sites claimed CBI on their manufacturing volumes. Using the 2012 CDR data, EPA
estimated the average annual production rate at the six facilities by dividing the 2012 total production
volume evenly among the five sites. Table 2-1 lists the TCE manufacturing facilities and their estimated
production volumes.
Table 2-1. List of Assessed TCE Manufacturing Sites
Site
Basis for
Manufacturing
Determination
Assessed
Production
Volume
(lb)
Assessed
Production
Volume
(kg)
Production Volume
Basis
Solvents &
Chemicals,
Pearland, TX
2016 CDR 44,934,862 20,382,110
Average of 2011
National Production
Volume
Olin Blue Cube,
Freeport, TX 2016 CDR 44,934,862 20,382,110
Average of 2011
National Production
Volume

PEER REVIEW DRAFT. DO NOT CITE OR QUOTE
Page 35 of 229
Site
Basis for
Manufacturing
Determination
Assessed
Production
Volume
(lb)
Assessed
Production
Volume
(kg)
Production Volume
Basis
Axiall
Corporation dba
Eagle US 2 LLC,
Westlake, LAa
2016 CDR 44,934,862 20,382,110
Average of 2011
National Production
Volume
Geon Oxy Vinyl
Laporte Plant,
Laporte, TX
2016 TRI 44,934,862 20,382,110
Average of 2011
National Production
Volume
Occidental
Chemical Corp
Wichita,
Wichita, KS
2016 TRI 44,934,862 20,382,110
Average of 2011
National Production
Volume
a Axiall was purchased by Westlake Chemical in 2016. The site at 1300 PPG Drive Westlake, LA dba Eagle US 2 LLC.
Process Description
Trichloroethylene (TCE) is currently produced domestically by either direct chlorination or
oxychlorination of ethylene dichloride (EDC) or other chlorinated ethanes. TCE can be produced
separately or as a coproduct of perchloroethylene by varying raw material ratios. TCE was once
manufactured predominantly by the chlorination of acetylene. The acetylene-based process consists of
two steps. First acetylene is chlorinated to 1,1,2,2-tetrachloroethane. The product is then
dehydrohalogenated to trichloroethylene at 96 to 100 °C in aqueous bases such as Ca(OH)2 (GmbH,
1940), or by thermal cracking over a catalyst such as barium chloride on activated carbon or silica or
aluminum gels (Elkin, 1969). However, because of the high cost of acetylene, EDC chlorination became
the preferred method for producing TCE (Most, 1989).
Chlorination of EDC – The chlorination of EDC involves a non-catalytic reaction of chlorine and EDC
or other C2 chlorinated hydrocarbons to form perchloroethylene and TCE as co-products and
hydrochloric acid (HCl) as a byproduct (ATSDR, 2014; Snedecor et al., 2004; U.S. EPA, 1985).
Following reaction, the product undergoes quenching, HCl separation, neutralization, drying, and
distillation (U.S. EPA, 1985). This process is advantageous at facilities that have a feedstock source of
mixed C2 chlorinated hydrocarbons from other processes and an outlet for the HCl byproduct (Snedecor
et al., 2004). The following illustrates the reaction to form TCE from EDC and chlorine.
ClCH2CH2Cl + 2 Cl2 → ClCH=CCl2 + 3 HCl
Oxychlorination of C2 chlorinated hydrocarbons – The oxychlorination of C2 chlorinated
hydrocarbons involves the reaction of either chlorine or HCl and oxygen with EDC in the presence of a
catalyst to produce perchloroethylene and TCE as co-products (ATSDR, 2014; Snedecor et al., 2004).
An example reaction using HCl and oxygen to produce TCE is given below.
ClCH2CH2Cl +HCl + O2→ ClCH=CCl2 + 2 H2O

PEER REVIEW DRAFT. DO NOT CITE OR QUOTE
Page 36 of 229
Following reaction, the product undergoes HCl separation, drying, distillation, neutralization with
ammonia, and a final drying step (U.S. EPA, 1985). The advantage of this process is that no byproduct
HCl is produced and can be combined with other processes as a net HCl consumer (ATSDR, 2014;
Snedecor et al., 2004).
In both processes the product ratio of TCE to perchloroethylene is controlled by adjusting the reactant
ratios (Snedecor et al., 2004).
Exposure Assessment
The following sections detail EPA’s occupational exposure assessment for manufacturing of TCE.
2.1.3.1 Worker Activities
During manufacturing, workers are potentially exposed while connecting and disconnecting hoses and
transfer lines to containers and packaging to be loaded with TCE product (e.g., railcars, tank trucks,
totes, drums, bottles) and intermediate storage vessels (e.g., storage tanks, pressure vessels). Workers
near loading racks and container filling stations are potentially exposed to fugitive emissions from
equipment leaks and displaced vapor as containers are filled. These activities are potential sources of
worker exposure through dermal contact with liquid and inhalation of vapors.
ONUs include employees that work at the site where TCE is manufactured, but they do not directly
handle the chemical and are therefore expected to have lower inhalation exposures and are not expected
to have dermal exposures. ONUs for manufacturing include supervisors, managers, and tradesmen that
may be in the manufacturing area but do not perform tasks that result in the same level of exposures as
manufacturing workers.
2.1.3.2 Number of Potentially Exposed Workers
EPA estimated the number of workers and occupational non-users (ONUs) potentially exposed to TCE
at manufacturing sites using 2016 CDR data (where available), BLS Data (U.S. BLS, 2016), and the
U.S. Census’ SUSB (U.S. Census Bureau, 2015). The method for estimating number of workers from
the BLS’ Occupational Employment Statistics data and U.S. Census’ SUSB data is detailed in Section
1.4.3. These estimates were derived using industry- and occupation-specific employment data from the
BLS and U.S. Census.
2016 CDR data for number of workers are available for three manufacturing sites. Of the three sites, one
site reported at least 100 but fewer than 500 workers, one site reported at least 50 but fewer than 100
workers, and one site reported at least 25 but fewer than 50 workers (U.S. EPA, 2017a). For the other
three manufacturing sites, the number of workers in CDR is either claimed as CBI or withheld (U.S.
EPA, 2017a).
EPA identified the NAICS code 325199, All Other Basic Organic Chemical Manufacturing, as the code
expected to include sites manufacturing TCE. Based on 2016 data from the BLS for this NAICS code
and related SOC codes, there are an average of 39 workers and 19 ONUs per site, or a total of 58
potentially exposed workers and ONUs, for sites under this NAICS code (U.S. BLS, 2016). This is
consistent with the one site reporting 50 to 100 workers and only slightly higher than the one site
reporting 25 to 50 workers.
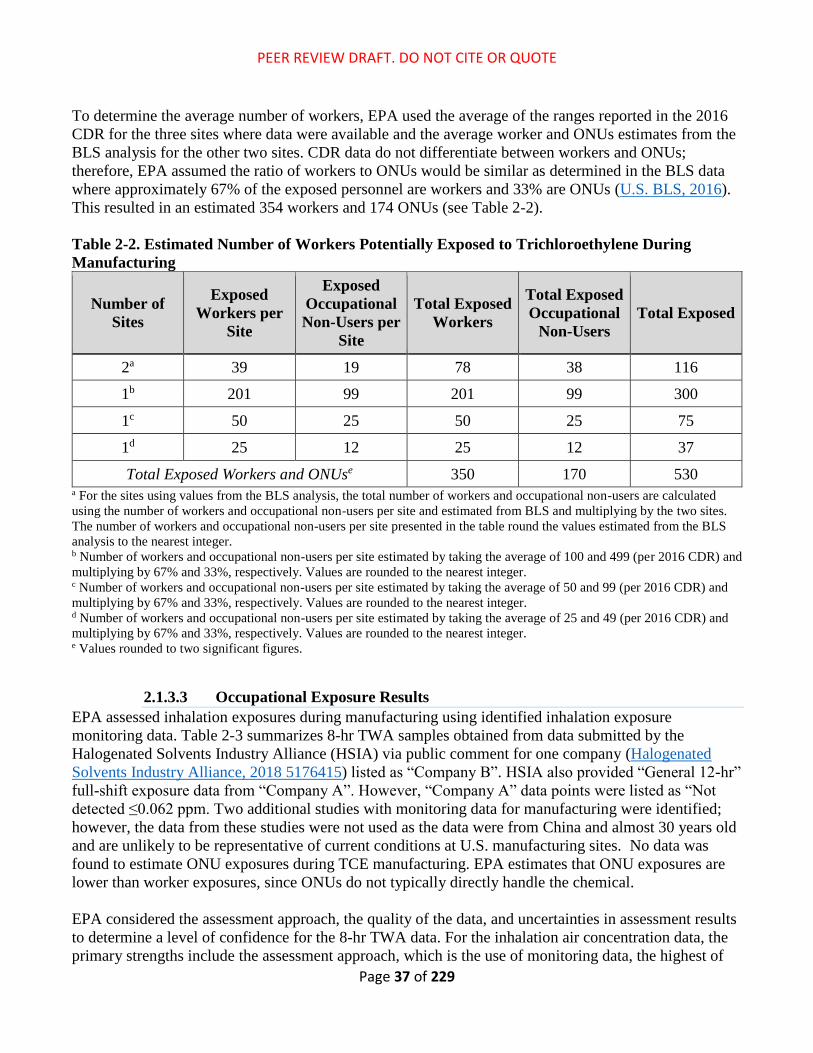
PEER REVIEW DRAFT. DO NOT CITE OR QUOTE
Page 37 of 229
To determine the average number of workers, EPA used the average of the ranges reported in the 2016
CDR for the three sites where data were available and the average worker and ONUs estimates from the
BLS analysis for the other two sites. CDR data do not differentiate between workers and ONUs;
therefore, EPA assumed the ratio of workers to ONUs would be similar as determined in the BLS data
where approximately 67% of the exposed personnel are workers and 33% are ONUs (U.S. BLS, 2016).
This resulted in an estimated 354 workers and 174 ONUs (see Table 2-2).
Table 2-2. Estimated Number of Workers Potentially Exposed to Trichloroethylene During
Manufacturing
Number of
Sites
Exposed
Workers per
Site
Exposed
Occupational
Non-Users per
Site
Total Exposed
Workers
Total Exposed
Occupational
Non-Users
Total Exposed
2a 39 19 78 38 116
1b 201 99 201 99 300
1c 50 25 50 25 75
1d 25 12 25 12 37
Total Exposed Workers and ONUse 350 170 530 a For the sites using values from the BLS analysis, the total number of workers and occupational non-users are calculated
using the number of workers and occupational non-users per site and estimated from BLS and multiplying by the two sites.
The number of workers and occupational non-users per site presented in the table round the values estimated from the BLS
analysis to the nearest integer. b Number of workers and occupational non-users per site estimated by taking the average of 100 and 499 (per 2016 CDR) and
multiplying by 67% and 33%, respectively. Values are rounded to the nearest integer. c Number of workers and occupational non-users per site estimated by taking the average of 50 and 99 (per 2016 CDR) and
multiplying by 67% and 33%, respectively. Values are rounded to the nearest integer. d Number of workers and occupational non-users per site estimated by taking the average of 25 and 49 (per 2016 CDR) and
multiplying by 67% and 33%, respectively. Values are rounded to the nearest integer. e Values rounded to two significant figures.
2.1.3.3 Occupational Exposure Results
EPA assessed inhalation exposures during manufacturing using identified inhalation exposure
monitoring data. Table 2-3 summarizes 8-hr TWA samples obtained from data submitted by the
Halogenated Solvents Industry Alliance (HSIA) via public comment for one company (Halogenated
Solvents Industry Alliance, 2018 5176415) listed as “Company B”. HSIA also provided “General 12-hr”
full-shift exposure data from “Company A”. However, “Company A” data points were listed as “Not
detected ≤0.062 ppm. Two additional studies with monitoring data for manufacturing were identified;
however, the data from these studies were not used as the data were from China and almost 30 years old
and are unlikely to be representative of current conditions at U.S. manufacturing sites. No data was
found to estimate ONU exposures during TCE manufacturing. EPA estimates that ONU exposures are
lower than worker exposures, since ONUs do not typically directly handle the chemical.
EPA considered the assessment approach, the quality of the data, and uncertainties in assessment results
to determine a level of confidence for the 8-hr TWA data. For the inhalation air concentration data, the
primary strengths include the assessment approach, which is the use of monitoring data, the highest of

PEER REVIEW DRAFT. DO NOT CITE OR QUOTE
Page 38 of 229
the inhalation approach hierarchy. These monitoring data include 16 data points from 1 source, and the
data quality ratings from systematic review for these data were high. The primary limitations of these
data include the uncertainty of the representativeness of these data toward the true distribution of
inhalation concentrations for the industries and sites covered by this scenario. Based on these strengths
and limitations of the inhalation air concentration data, the overall confidence for these 8-hr TWA data
in this scenario is medium to high.
Table 2-3. Summary of Worker Inhalation Exposure Monitoring Data from TCE Manufacturing
Scenario 8-hr TWA
(ppm)
AC
(ppm)
ADC
(ppm)
LADC
(ppm)
Numbe
r of
Data
Points
Confidence
Rating of Air
Concentration
Data
High-End 2.59 0.86 0.59 0.30
16 High Central
Tendency 0.38 0.13 0.09 0.03
AC = Acute Concentration; ADC = Average Daily Concentration; and LADC = Lifetime Average Daily Concentration.
Equations and parameters for calculation of the AC, ADC, and LADC are described in Appendix B.
Source: (Halogenated Solvents Industry Alliance, 2018 5176415)
Water Release Assessment
The following sections detail EPA’s water release assessment for manufacturing of TCE.
2.1.4.1 Water Release Sources
In general, potential sources of water releases in the chemical industry may include the following:
equipment cleaning operations, aqueous wastes from scrubbers/decanters, reaction water, process water
from washing intermediate products, and trace water settled in storage tanks (OECD, 2019). Based on
the process for manufacturing TCE, EPA expects the sources of water releases to be from aqueous
wastes from decanters used to separate catalyst fines, caustic neutralizer column, and caustic scrubbers;
and water removed from the TCE product in drying columns (Most, 1989). Additional water releases
may occur if a site uses water to clean process equipment; however, EPA does not expect this to be a
primary source of water releases from manufacturing sites as equipment cleaning is not expected to
occur daily and manufacturers would likely use an organic solvent to clean process equipment.
2.1.4.2 Water Release Assessment Results
Of the five manufacturing sites assessed, three reported in the 2016 TRI (one of these three sites
reported zero water releases to TRI). Additionally, one of these sites also reported to 2016 DMR. For the
sites that reported water releases, EPA assessed water releases as reported in the 2016 TRI and 2016
DMR. For the remaining two sites, EPA assessed water releases at the maximum daily and maximum
average monthly concentrations allowed under the Organic Chemicals, Plastics and Synthetic Fibers
(OCPSF) Effluent Guidelines (EG) and Standards (40 C.F.R. Part 414) (U.S. EPA, 2019g). The OCPSF
EG applies to facilities classified under the following SIC codes:
• 2821—Plastic Materials, Synthetic Resins, and Nonvulcanizable Elastomers;
• 2823—Cellulosic Man-Made Fibers;
• 2865—Cyclic Crudes and Intermediates, Dyes, and Organic Pigments; and
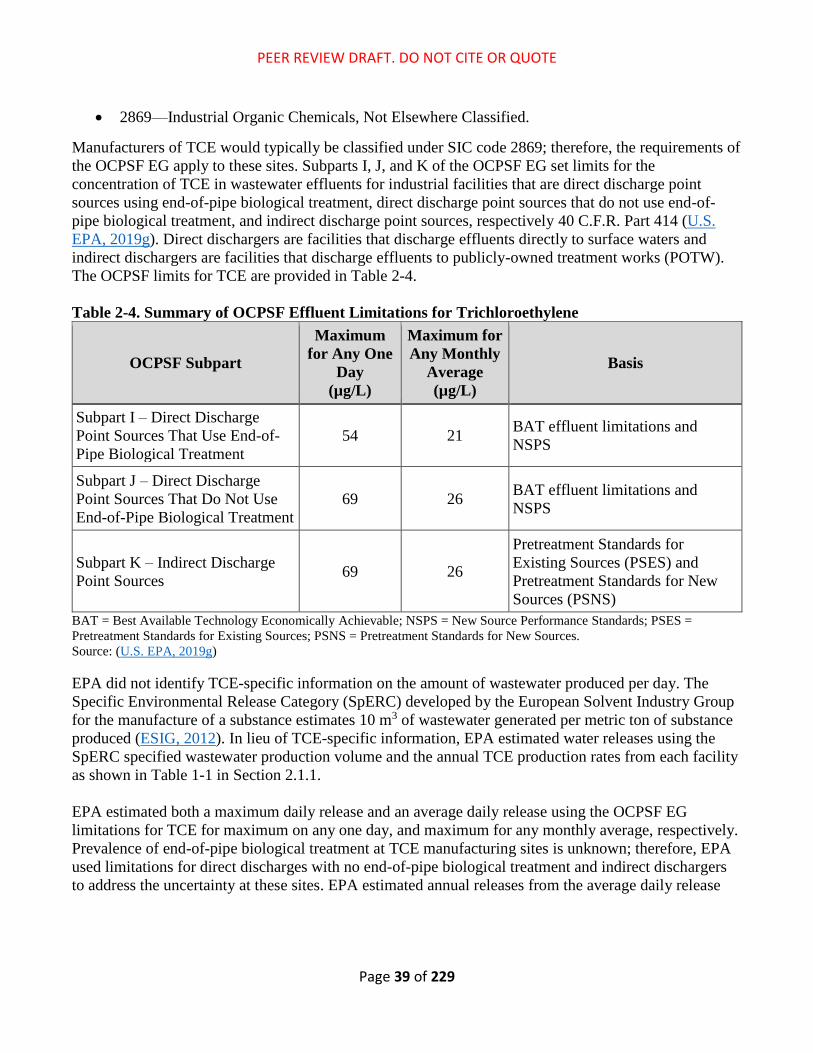
PEER REVIEW DRAFT. DO NOT CITE OR QUOTE
Page 39 of 229
• 2869—Industrial Organic Chemicals, Not Elsewhere Classified.
Manufacturers of TCE would typically be classified under SIC code 2869; therefore, the requirements of
the OCPSF EG apply to these sites. Subparts I, J, and K of the OCPSF EG set limits for the
concentration of TCE in wastewater effluents for industrial facilities that are direct discharge point
sources using end-of-pipe biological treatment, direct discharge point sources that do not use end-of-
pipe biological treatment, and indirect discharge point sources, respectively 40 C.F.R. Part 414 (U.S.
EPA, 2019g). Direct dischargers are facilities that discharge effluents directly to surface waters and
indirect dischargers are facilities that discharge effluents to publicly-owned treatment works (POTW).
The OCPSF limits for TCE are provided in Table 2-4.
Table 2-4. Summary of OCPSF Effluent Limitations for Trichloroethylene
OCPSF Subpart
Maximum
for Any One
Day
(µg/L)
Maximum for
Any Monthly
Average
(µg/L)
Basis
Subpart I – Direct Discharge
Point Sources That Use End-of-
Pipe Biological Treatment
54 21 BAT effluent limitations and
NSPS
Subpart J – Direct Discharge
Point Sources That Do Not Use
End-of-Pipe Biological Treatment
69 26 BAT effluent limitations and
NSPS
Subpart K – Indirect Discharge
Point Sources 69 26
Pretreatment Standards for
Existing Sources (PSES) and
Pretreatment Standards for New
Sources (PSNS)
BAT = Best Available Technology Economically Achievable; NSPS = New Source Performance Standards; PSES =
Pretreatment Standards for Existing Sources; PSNS = Pretreatment Standards for New Sources.
Source: (U.S. EPA, 2019g)
EPA did not identify TCE-specific information on the amount of wastewater produced per day. The
Specific Environmental Release Category (SpERC) developed by the European Solvent Industry Group
for the manufacture of a substance estimates 10 m3 of wastewater generated per metric ton of substance
produced (ESIG, 2012). In lieu of TCE-specific information, EPA estimated water releases using the
SpERC specified wastewater production volume and the annual TCE production rates from each facility
as shown in Table 1-1 in Section 2.1.1.
EPA estimated both a maximum daily release and an average daily release using the OCPSF EG
limitations for TCE for maximum on any one day, and maximum for any monthly average, respectively.
Prevalence of end-of-pipe biological treatment at TCE manufacturing sites is unknown; therefore, EPA
used limitations for direct discharges with no end-of-pipe biological treatment and indirect dischargers
to address the uncertainty at these sites. EPA estimated annual releases from the average daily release

PEER REVIEW DRAFT. DO NOT CITE OR QUOTE
Page 40 of 229
and assuming 350 days/yr of operation3. Details of the approach and example calculations for estimating
water release using the OCPSF EG limitations are provided in Appendix D.
Table 2-5 summarizes water releases from the manufacturing process for sites reporting to TRI and
Table 2-6 summarizes water releases from sites not reporting to TRI. The estimated total annual release
across all sites is 60.5 – 453.6 kg/yr discharged to surface water or POTWs.
3 Due to large throughput, manufacturing sites are assumed to operate seven days per week and 50 weeks per year with two
weeks per year for shutdown activities.
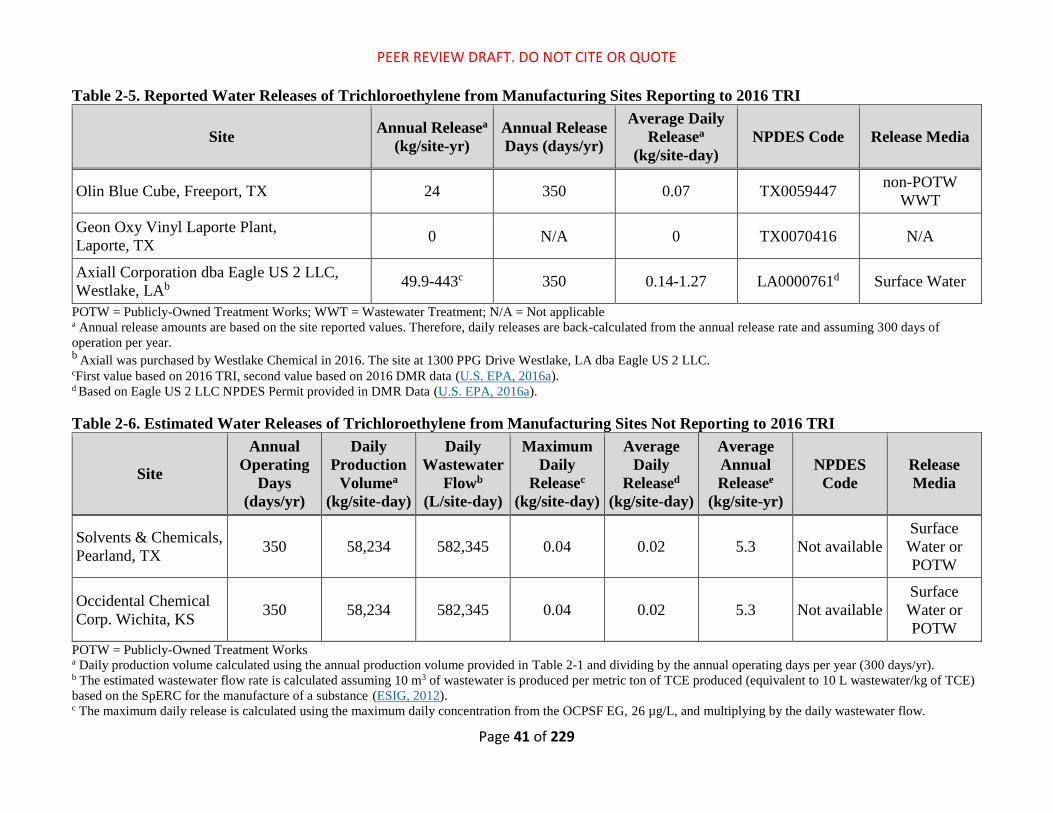
PEER REVIEW DRAFT. DO NOT CITE OR QUOTE
Page 41 of 229
Table 2-5. Reported Water Releases of Trichloroethylene from Manufacturing Sites Reporting to 2016 TRI
Site Annual Releasea
(kg/site-yr)
Annual Release
Days (days/yr)
Average Daily
Releasea
(kg/site-day)
NPDES Code Release Media
Olin Blue Cube, Freeport, TX 24 350 0.07 TX0059447 non-POTW
WWT
Geon Oxy Vinyl Laporte Plant,
Laporte, TX 0 N/A 0 TX0070416 N/A
Axiall Corporation dba Eagle US 2 LLC,
Westlake, LAb 49.9-443c 350 0.14-1.27 LA0000761d Surface Water
POTW = Publicly-Owned Treatment Works; WWT = Wastewater Treatment; N/A = Not applicable a Annual release amounts are based on the site reported values. Therefore, daily releases are back-calculated from the annual release rate and assuming 300 days of
operation per year. b
Axiall was purchased by Westlake Chemical in 2016. The site at 1300 PPG Drive Westlake, LA dba Eagle US 2 LLC. cFirst value based on 2016 TRI, second value based on 2016 DMR data (U.S. EPA, 2016a).
d Based on Eagle US 2 LLC NPDES Permit provided in DMR Data (U.S. EPA, 2016a).
Table 2-6. Estimated Water Releases of Trichloroethylene from Manufacturing Sites Not Reporting to 2016 TRI
Site
Annual
Operating
Days
(days/yr)
Daily
Production
Volumea
(kg/site-day)
Daily
Wastewater
Flowb
(L/site-day)
Maximum
Daily
Releasec
(kg/site-day)
Average
Daily
Released
(kg/site-day)
Average
Annual
Releasee
(kg/site-yr)
NPDES
Code
Release
Media
Solvents & Chemicals,
Pearland, TX 350 58,234 582,345 0.04 0.02 5.3 Not available
Surface
Water or
POTW
Occidental Chemical
Corp. Wichita, KS 350 58,234 582,345 0.04 0.02 5.3 Not available
Surface
Water or
POTW
POTW = Publicly-Owned Treatment Works a Daily production volume calculated using the annual production volume provided in Table 2-1 and dividing by the annual operating days per year (300 days/yr). b The estimated wastewater flow rate is calculated assuming 10 m3 of wastewater is produced per metric ton of TCE produced (equivalent to 10 L wastewater/kg of TCE)
based on the SpERC for the manufacture of a substance (ESIG, 2012). c The maximum daily release is calculated using the maximum daily concentration from the OCPSF EG, 26 µg/L, and multiplying by the daily wastewater flow.
PEER REVIEW DRAFT. DO NOT CITE OR QUOTE
Page 42 of 229
d The average daily release is calculated using the maximum monthly average concentration from the OCPSF EG, 69 µg/L, and multiplying by the daily wastewater flow. e The average annual release is calculated as the maximum monthly average concentration multiplied by the daily wastewater production, and 350 operating days/year.
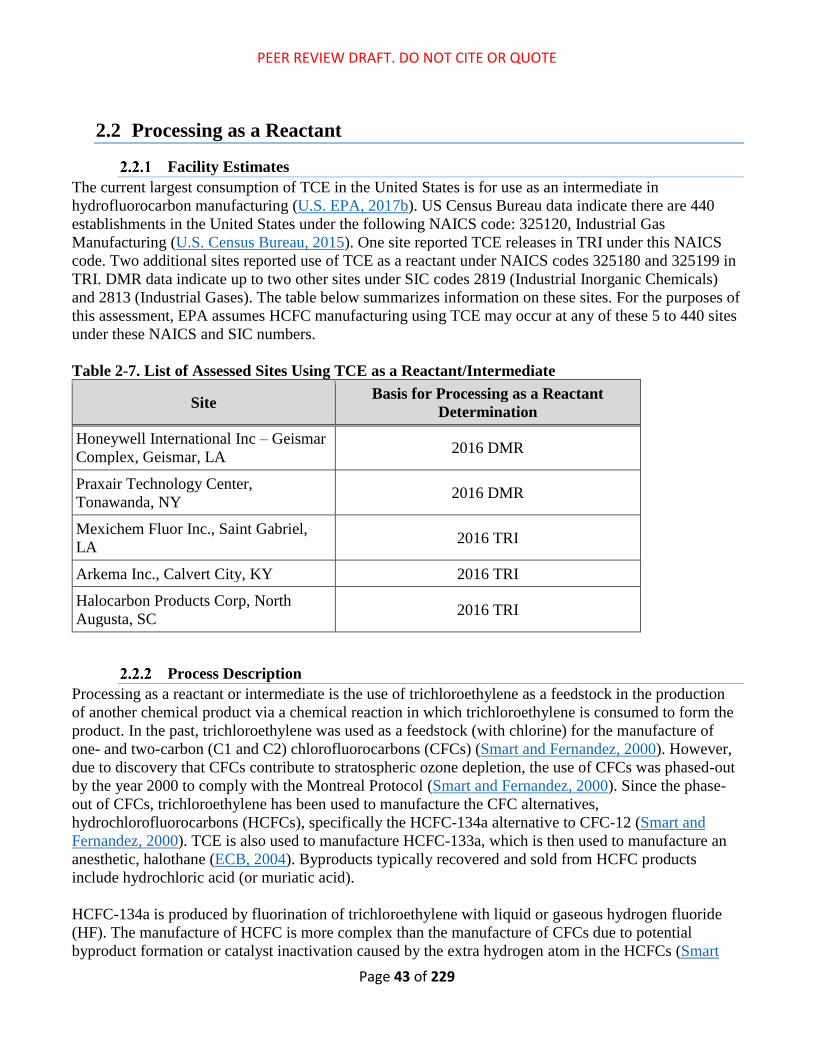
PEER REVIEW DRAFT. DO NOT CITE OR QUOTE
Page 43 of 229
2.2 Processing as a Reactant
Facility Estimates
The current largest consumption of TCE in the United States is for use as an intermediate in
hydrofluorocarbon manufacturing (U.S. EPA, 2017b). US Census Bureau data indicate there are 440
establishments in the United States under the following NAICS code: 325120, Industrial Gas
Manufacturing (U.S. Census Bureau, 2015). One site reported TCE releases in TRI under this NAICS
code. Two additional sites reported use of TCE as a reactant under NAICS codes 325180 and 325199 in
TRI. DMR data indicate up to two other sites under SIC codes 2819 (Industrial Inorganic Chemicals)
and 2813 (Industrial Gases). The table below summarizes information on these sites. For the purposes of
this assessment, EPA assumes HCFC manufacturing using TCE may occur at any of these 5 to 440 sites
under these NAICS and SIC numbers.
Table 2-7. List of Assessed Sites Using TCE as a Reactant/Intermediate
Site Basis for Processing as a Reactant
Determination
Honeywell International Inc – Geismar
Complex, Geismar, LA 2016 DMR
Praxair Technology Center,
Tonawanda, NY 2016 DMR
Mexichem Fluor Inc., Saint Gabriel,
LA 2016 TRI
Arkema Inc., Calvert City, KY 2016 TRI
Halocarbon Products Corp, North
Augusta, SC 2016 TRI
Process Description
Processing as a reactant or intermediate is the use of trichloroethylene as a feedstock in the production
of another chemical product via a chemical reaction in which trichloroethylene is consumed to form the
product. In the past, trichloroethylene was used as a feedstock (with chlorine) for the manufacture of
one- and two-carbon (C1 and C2) chlorofluorocarbons (CFCs) (Smart and Fernandez, 2000). However,
due to discovery that CFCs contribute to stratospheric ozone depletion, the use of CFCs was phased-out
by the year 2000 to comply with the Montreal Protocol (Smart and Fernandez, 2000). Since the phase-
out of CFCs, trichloroethylene has been used to manufacture the CFC alternatives,
hydrochlorofluorocarbons (HCFCs), specifically the HCFC-134a alternative to CFC-12 (Smart and
Fernandez, 2000). TCE is also used to manufacture HCFC-133a, which is then used to manufacture an
anesthetic, halothane (ECB, 2004). Byproducts typically recovered and sold from HCFC products
include hydrochloric acid (or muriatic acid).
HCFC-134a is produced by fluorination of trichloroethylene with liquid or gaseous hydrogen fluoride
(HF). The manufacture of HCFC is more complex than the manufacture of CFCs due to potential
byproduct formation or catalyst inactivation caused by the extra hydrogen atom in the HCFCs (Smart

PEER REVIEW DRAFT. DO NOT CITE OR QUOTE
Page 44 of 229
and Fernandez, 2000). Therefore, the process involved in the manufacture of HCFCs requires additional
reaction and distillation steps as compared to the CFC manufacturing process (Smart and Fernandez,
2000).
Exposure Assessment
The following sections detail EPA’s occupational exposure assessment for the processing of TCE as a
reactant.
2.2.3.1 Worker Activities
During processing TCE as a reactant, workers are potentially exposed while connecting and
disconnecting hoses and transfer lines to containers and packaging to be unloaded (e.g., railcars, tank
trucks, totes) and intermediate storage vessels (e.g., storage tanks, pressure vessels). Workers near
loading racks and container filling stations are potentially exposed to fugitive emissions from equipment
leaks and displaced vapor as containers are filled. These activities are potential sources of worker
exposure through dermal contact with liquid and inhalation of vapors. TCE exposures from the process
are not expected as these reactions occur in closed systems (Arkema Inc., 2018).
ONUs include employees that work at the site where TCE is reacted, but they do not directly handle the
chemical and are therefore expected to have lower inhalation exposures and are not expected to have
dermal exposures. ONUs for processing as a reactant include supervisors, managers, and tradesmen that
may be in the same area as exposure sources but do not perform tasks that result in the same level of
exposures as workers.
2.2.3.2 Number of Potentially Exposed Workers
EPA estimated the number of workers and occupational non-users potentially exposed to TCE at sites
processing TCE as a reactant using 2016 TRI data (where available), BLS Data (U.S. BLS, 2016) and
the U.S. Census’ SUSB (U.S. Census Bureau, 2015). The method for estimating number of workers
from the BLS Occupational Employment Statistics data and U.S. Census’ SUSB data is detailed in
Section 1.4.4. These estimates were derived using industry- and occupation-specific employment data
from the BLS and U.S. Census. Upon review of 2016 TRI and DMR data, EPA found 5 sites reported
using TCE as a reactant (U.S. EPA, 2017c) and (U.S. EPA, 2016a). Based on BLS data for the NAICS
code 325120, Industrial Gas Manufacturing, there are 440 facilities (see number of facility discussion in
Section 2.2.1.
EPA determined the number of workers using the related SOC codes from BLS analysis that are
associated with the primary NAICS codes listed in TRI. Two of the submissions in TRI and DMR
identified the primary NAICS code to be 325120, Industrial Gas Manufacturing. For NAICS code
325120, there are an average of 14 workers and 7 ONUs per site, or a total of 21 potentially exposed
workers and ONUs (U.S. BLS, 2016).
To determine the high-end total number of workers and ONUs, EPA used the high-end number of
facilities based on US Census Bureau data for NAICS code: 325120, Industrial Gas Manufacturing (U.S.
Census Bureau, 2015) (440 sites) and information from BLS to obtain the number of workers and ONUs
per site. This resulted in an estimated 6,100 workers and 2,900 ONUs (see Table 2-8. ) at 440 sites.
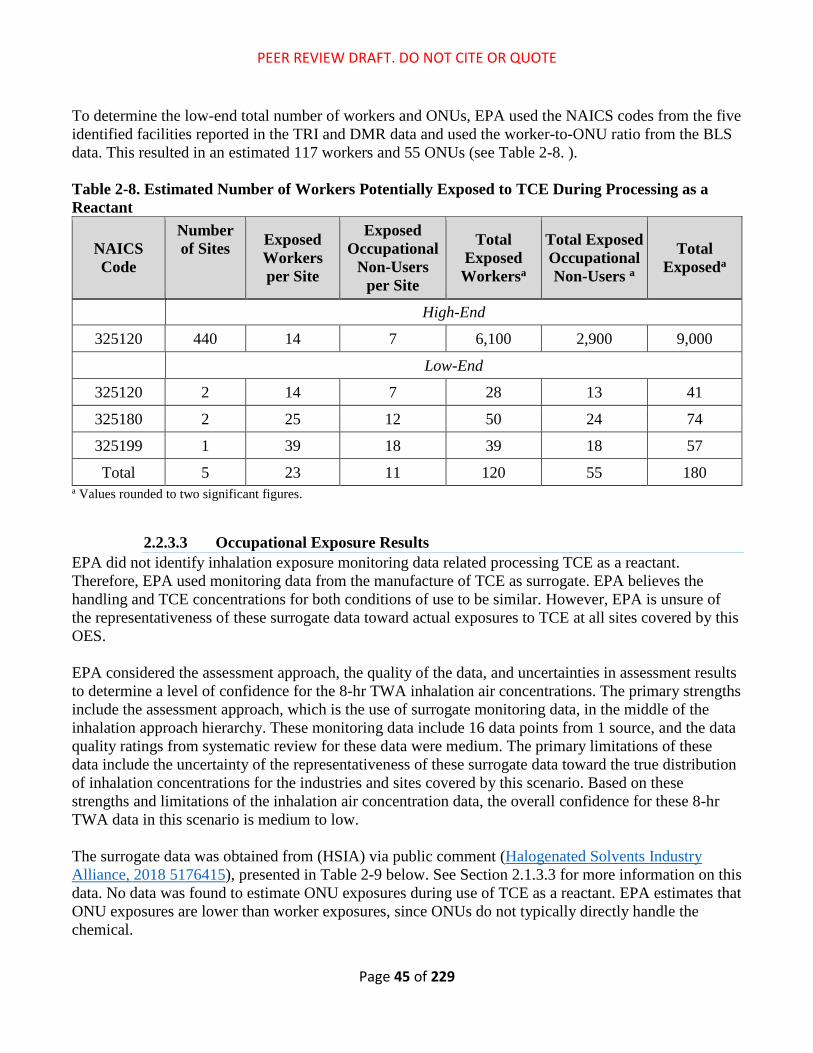
PEER REVIEW DRAFT. DO NOT CITE OR QUOTE
Page 45 of 229
To determine the low-end total number of workers and ONUs, EPA used the NAICS codes from the five
identified facilities reported in the TRI and DMR data and used the worker-to-ONU ratio from the BLS
data. This resulted in an estimated 117 workers and 55 ONUs (see Table 2-8. ).
Table 2-8. Estimated Number of Workers Potentially Exposed to TCE During Processing as a
Reactant
NAICS
Code
Number
of Sites Exposed
Workers
per Site
Exposed
Occupational
Non-Users
per Site
Total
Exposed
Workersa
Total Exposed
Occupational
Non-Users a
Total
Exposeda
High-End
325120 440 14 7 6,100 2,900 9,000
Low-End
325120 2 14 7 28 13 41
325180 2 25 12 50 24 74
325199 1 39 18 39 18 57
Total 5 23 11 120 55 180 a Values rounded to two significant figures.
2.2.3.3 Occupational Exposure Results
EPA did not identify inhalation exposure monitoring data related processing TCE as a reactant.
Therefore, EPA used monitoring data from the manufacture of TCE as surrogate. EPA believes the
handling and TCE concentrations for both conditions of use to be similar. However, EPA is unsure of
the representativeness of these surrogate data toward actual exposures to TCE at all sites covered by this
OES.
EPA considered the assessment approach, the quality of the data, and uncertainties in assessment results
to determine a level of confidence for the 8-hr TWA inhalation air concentrations. The primary strengths
include the assessment approach, which is the use of surrogate monitoring data, in the middle of the
inhalation approach hierarchy. These monitoring data include 16 data points from 1 source, and the data
quality ratings from systematic review for these data were medium. The primary limitations of these
data include the uncertainty of the representativeness of these surrogate data toward the true distribution
of inhalation concentrations for the industries and sites covered by this scenario. Based on these
strengths and limitations of the inhalation air concentration data, the overall confidence for these 8-hr
TWA data in this scenario is medium to low.
The surrogate data was obtained from (HSIA) via public comment (Halogenated Solvents Industry
Alliance, 2018 5176415), presented in Table 2-9 below. See Section 2.1.3.3 for more information on this
data. No data was found to estimate ONU exposures during use of TCE as a reactant. EPA estimates that
ONU exposures are lower than worker exposures, since ONUs do not typically directly handle the
chemical.
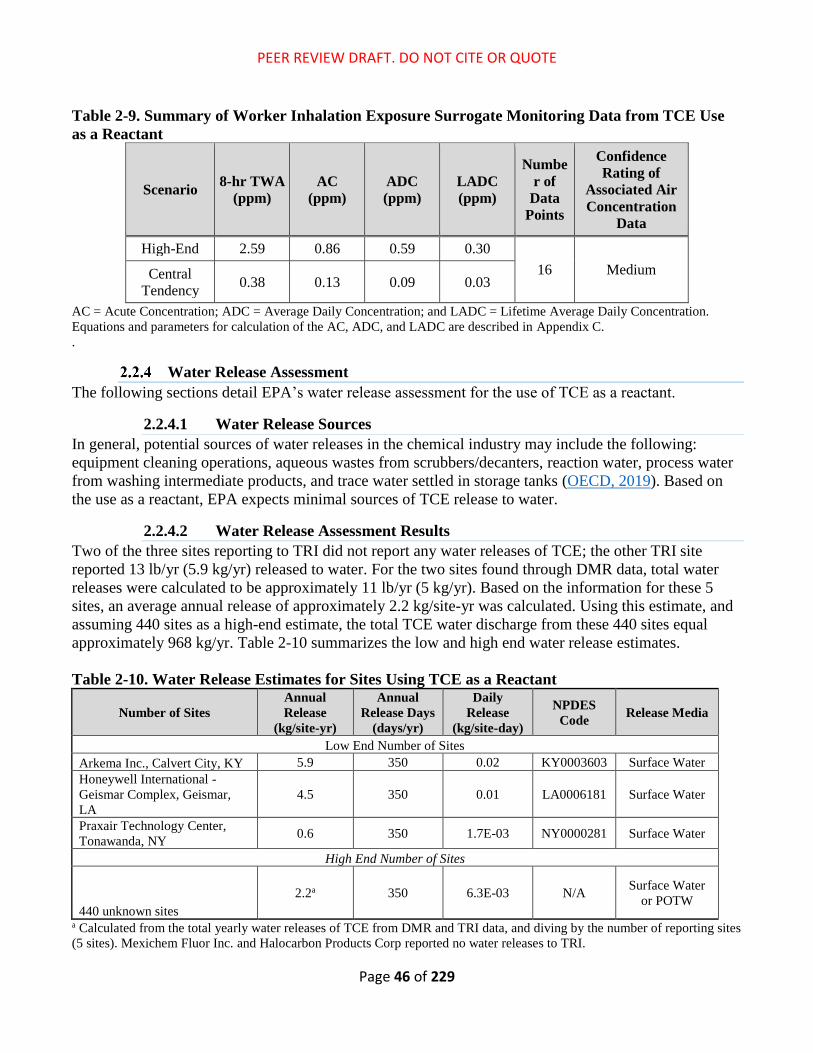
PEER REVIEW DRAFT. DO NOT CITE OR QUOTE
Page 46 of 229
Table 2-9. Summary of Worker Inhalation Exposure Surrogate Monitoring Data from TCE Use
as a Reactant
Scenario 8-hr TWA
(ppm)
AC
(ppm)
ADC
(ppm)
LADC
(ppm)
Numbe
r of
Data
Points
Confidence
Rating of
Associated Air
Concentration
Data
High-End 2.59 0.86 0.59 0.30
16 Medium Central
Tendency 0.38 0.13 0.09 0.03
AC = Acute Concentration; ADC = Average Daily Concentration; and LADC = Lifetime Average Daily Concentration.
Equations and parameters for calculation of the AC, ADC, and LADC are described in Appendix C.
.
Water Release Assessment
The following sections detail EPA’s water release assessment for the use of TCE as a reactant.
2.2.4.1 Water Release Sources
In general, potential sources of water releases in the chemical industry may include the following:
equipment cleaning operations, aqueous wastes from scrubbers/decanters, reaction water, process water
from washing intermediate products, and trace water settled in storage tanks (OECD, 2019). Based on
the use as a reactant, EPA expects minimal sources of TCE release to water.
2.2.4.2 Water Release Assessment Results
Two of the three sites reporting to TRI did not report any water releases of TCE; the other TRI site
reported 13 lb/yr (5.9 kg/yr) released to water. For the two sites found through DMR data, total water
releases were calculated to be approximately 11 lb/yr (5 kg/yr). Based on the information for these 5
sites, an average annual release of approximately 2.2 kg/site-yr was calculated. Using this estimate, and
assuming 440 sites as a high-end estimate, the total TCE water discharge from these 440 sites equal
approximately 968 kg/yr. Table 2-10 summarizes the low and high end water release estimates.
Table 2-10. Water Release Estimates for Sites Using TCE as a Reactant
Number of Sites
Annual
Release
(kg/site-yr)
Annual
Release Days
(days/yr)
Daily
Release
(kg/site-day)
NPDES
Code Release Media
Low End Number of Sites
Arkema Inc., Calvert City, KY 5.9 350 0.02 KY0003603 Surface Water
Honeywell International -
Geismar Complex, Geismar,
LA
4.5 350 0.01 LA0006181 Surface Water
Praxair Technology Center,
Tonawanda, NY 0.6 350 1.7E-03 NY0000281 Surface Water
High End Number of Sites
440 unknown sites
2.2a 350 6.3E-03 N/A Surface Water
or POTW
a Calculated from the total yearly water releases of TCE from DMR and TRI data, and diving by the number of reporting sites
(5 sites). Mexichem Fluor Inc. and Halocarbon Products Corp reported no water releases to TRI.
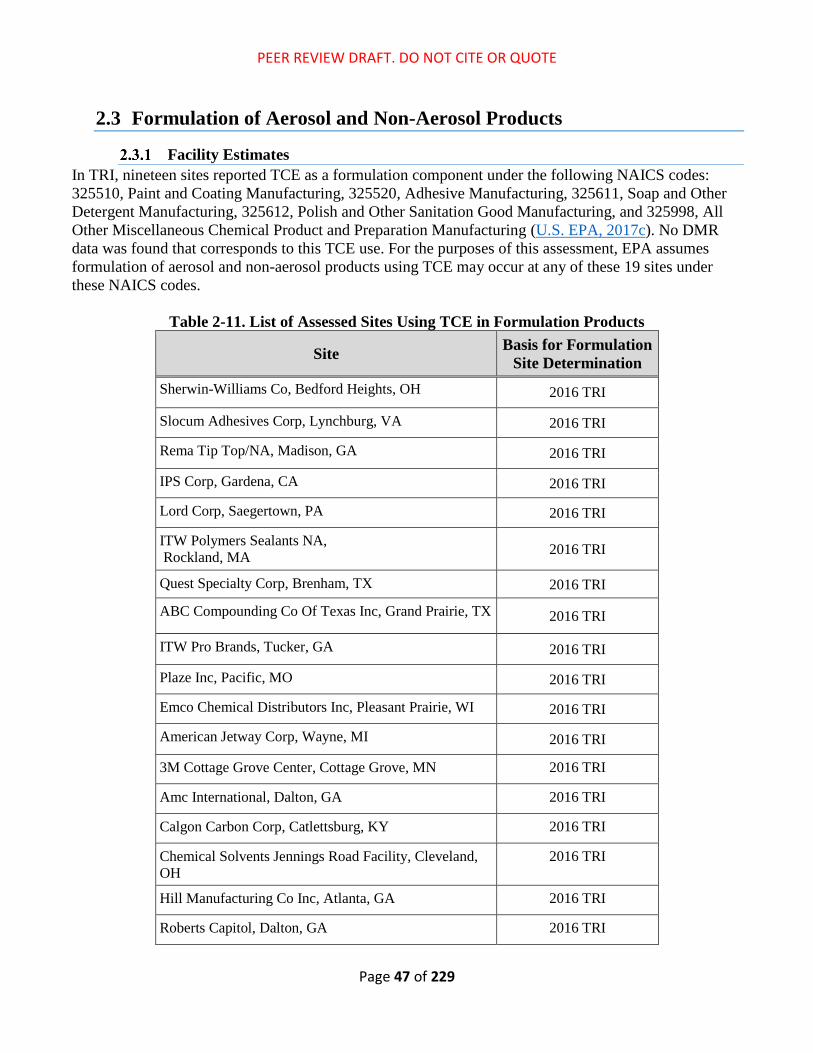
PEER REVIEW DRAFT. DO NOT CITE OR QUOTE
Page 47 of 229
2.3 Formulation of Aerosol and Non-Aerosol Products
Facility Estimates
In TRI, nineteen sites reported TCE as a formulation component under the following NAICS codes:
325510, Paint and Coating Manufacturing, 325520, Adhesive Manufacturing, 325611, Soap and Other
Detergent Manufacturing, 325612, Polish and Other Sanitation Good Manufacturing, and 325998, All
Other Miscellaneous Chemical Product and Preparation Manufacturing (U.S. EPA, 2017c). No DMR
data was found that corresponds to this TCE use. For the purposes of this assessment, EPA assumes
formulation of aerosol and non-aerosol products using TCE may occur at any of these 19 sites under
these NAICS codes.
Table 2-11. List of Assessed Sites Using TCE in Formulation Products
Site Basis for Formulation
Site Determination
Sherwin-Williams Co, Bedford Heights, OH 2016 TRI
Slocum Adhesives Corp, Lynchburg, VA 2016 TRI
Rema Tip Top/NA, Madison, GA 2016 TRI
IPS Corp, Gardena, CA 2016 TRI
Lord Corp, Saegertown, PA 2016 TRI
ITW Polymers Sealants NA,
Rockland, MA 2016 TRI
Quest Specialty Corp, Brenham, TX 2016 TRI
ABC Compounding Co Of Texas Inc, Grand Prairie, TX 2016 TRI
ITW Pro Brands, Tucker, GA 2016 TRI
Plaze Inc, Pacific, MO 2016 TRI
Emco Chemical Distributors Inc, Pleasant Prairie, WI 2016 TRI
American Jetway Corp, Wayne, MI 2016 TRI
3M Cottage Grove Center, Cottage Grove, MN 2016 TRI
Amc International, Dalton, GA 2016 TRI
Calgon Carbon Corp, Catlettsburg, KY 2016 TRI
Chemical Solvents Jennings Road Facility, Cleveland,
OH
2016 TRI
Hill Manufacturing Co Inc, Atlanta, GA 2016 TRI
Roberts Capitol, Dalton, GA 2016 TRI
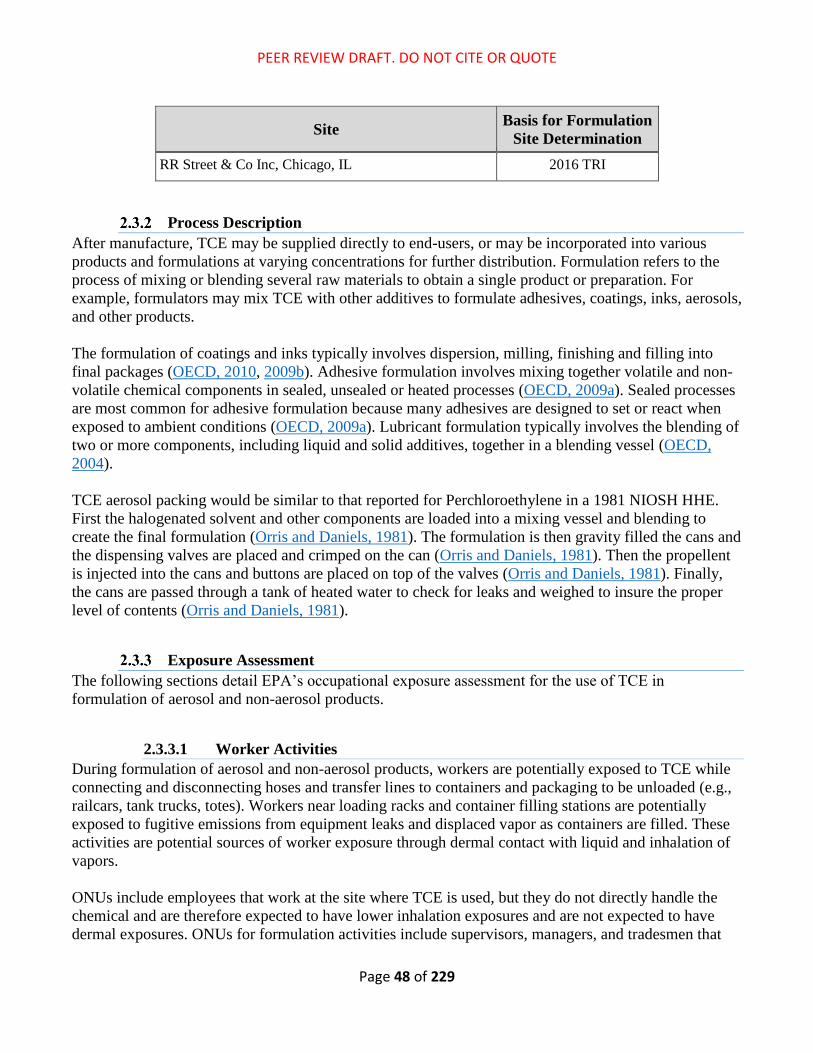
PEER REVIEW DRAFT. DO NOT CITE OR QUOTE
Page 48 of 229
Site Basis for Formulation
Site Determination
RR Street & Co Inc, Chicago, IL 2016 TRI
Process Description
After manufacture, TCE may be supplied directly to end-users, or may be incorporated into various
products and formulations at varying concentrations for further distribution. Formulation refers to the
process of mixing or blending several raw materials to obtain a single product or preparation. For
example, formulators may mix TCE with other additives to formulate adhesives, coatings, inks, aerosols,
and other products.
The formulation of coatings and inks typically involves dispersion, milling, finishing and filling into
final packages (OECD, 2010, 2009b). Adhesive formulation involves mixing together volatile and non-
volatile chemical components in sealed, unsealed or heated processes (OECD, 2009a). Sealed processes
are most common for adhesive formulation because many adhesives are designed to set or react when
exposed to ambient conditions (OECD, 2009a). Lubricant formulation typically involves the blending of
two or more components, including liquid and solid additives, together in a blending vessel (OECD,
2004).
TCE aerosol packing would be similar to that reported for Perchloroethylene in a 1981 NIOSH HHE.
First the halogenated solvent and other components are loaded into a mixing vessel and blending to
create the final formulation (Orris and Daniels, 1981). The formulation is then gravity filled the cans and
the dispensing valves are placed and crimped on the can (Orris and Daniels, 1981). Then the propellent
is injected into the cans and buttons are placed on top of the valves (Orris and Daniels, 1981). Finally,
the cans are passed through a tank of heated water to check for leaks and weighed to insure the proper
level of contents (Orris and Daniels, 1981).
Exposure Assessment
The following sections detail EPA’s occupational exposure assessment for the use of TCE in
formulation of aerosol and non-aerosol products.
2.3.3.1 Worker Activities
During formulation of aerosol and non-aerosol products, workers are potentially exposed to TCE while
connecting and disconnecting hoses and transfer lines to containers and packaging to be unloaded (e.g.,
railcars, tank trucks, totes). Workers near loading racks and container filling stations are potentially
exposed to fugitive emissions from equipment leaks and displaced vapor as containers are filled. These
activities are potential sources of worker exposure through dermal contact with liquid and inhalation of
vapors.
ONUs include employees that work at the site where TCE is used, but they do not directly handle the
chemical and are therefore expected to have lower inhalation exposures and are not expected to have
dermal exposures. ONUs for formulation activities include supervisors, managers, and tradesmen that
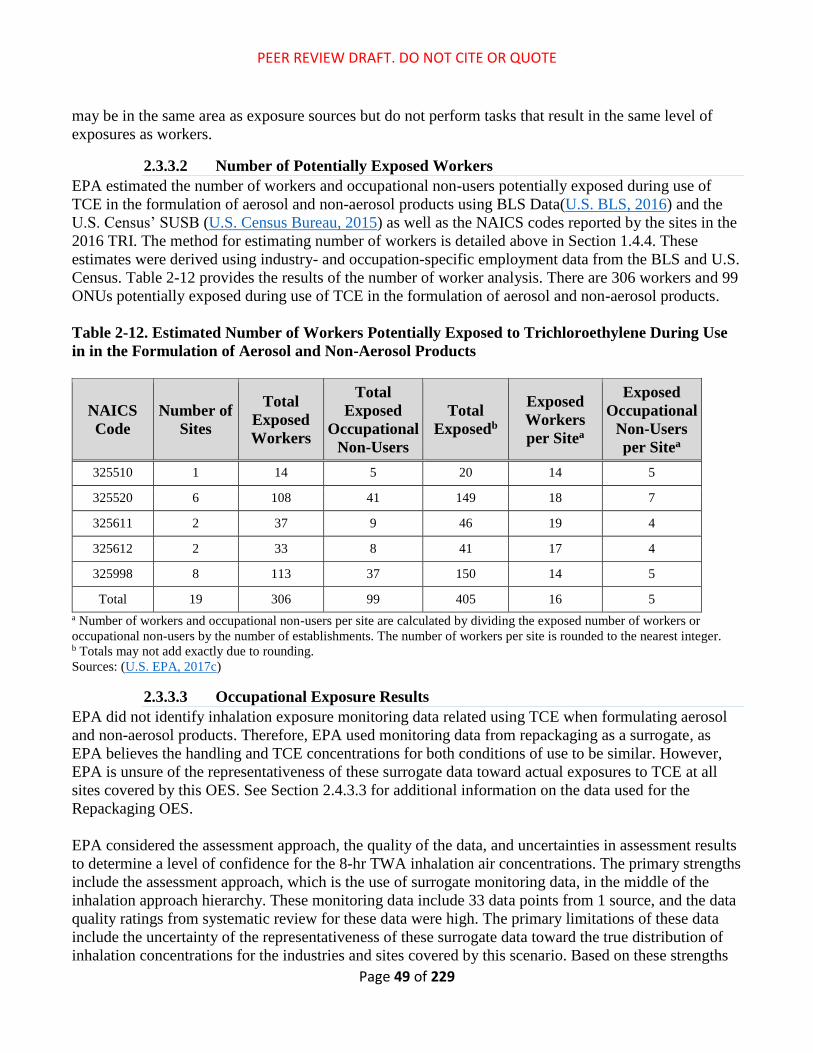
PEER REVIEW DRAFT. DO NOT CITE OR QUOTE
Page 49 of 229
may be in the same area as exposure sources but do not perform tasks that result in the same level of
exposures as workers.
2.3.3.2 Number of Potentially Exposed Workers
EPA estimated the number of workers and occupational non-users potentially exposed during use of
TCE in the formulation of aerosol and non-aerosol products using BLS Data(U.S. BLS, 2016) and the
U.S. Census’ SUSB (U.S. Census Bureau, 2015) as well as the NAICS codes reported by the sites in the
2016 TRI. The method for estimating number of workers is detailed above in Section 1.4.4. These
estimates were derived using industry- and occupation-specific employment data from the BLS and U.S.
Census. Table 2-12 provides the results of the number of worker analysis. There are 306 workers and 99
ONUs potentially exposed during use of TCE in the formulation of aerosol and non-aerosol products.
Table 2-12. Estimated Number of Workers Potentially Exposed to Trichloroethylene During Use
in in the Formulation of Aerosol and Non-Aerosol Products
NAICS
Code
Number of
Sites
Total
Exposed
Workers
Total
Exposed
Occupational
Non-Users
Total
Exposedb
Exposed
Workers
per Sitea
Exposed
Occupational
Non-Users
per Sitea
325510 1 14 5 20 14 5
325520 6 108 41 149 18 7
325611 2 37 9 46 19 4
325612 2 33 8 41 17 4
325998 8 113 37 150 14 5
Total 19 306 99 405 16 5
a Number of workers and occupational non-users per site are calculated by dividing the exposed number of workers or
occupational non-users by the number of establishments. The number of workers per site is rounded to the nearest integer. b Totals may not add exactly due to rounding. Sources: (U.S. EPA, 2017c)
2.3.3.3 Occupational Exposure Results
EPA did not identify inhalation exposure monitoring data related using TCE when formulating aerosol
and non-aerosol products. Therefore, EPA used monitoring data from repackaging as a surrogate, as
EPA believes the handling and TCE concentrations for both conditions of use to be similar. However,
EPA is unsure of the representativeness of these surrogate data toward actual exposures to TCE at all
sites covered by this OES. See Section 2.4.3.3 for additional information on the data used for the
Repackaging OES.
EPA considered the assessment approach, the quality of the data, and uncertainties in assessment results
to determine a level of confidence for the 8-hr TWA inhalation air concentrations. The primary strengths
include the assessment approach, which is the use of surrogate monitoring data, in the middle of the
inhalation approach hierarchy. These monitoring data include 33 data points from 1 source, and the data
quality ratings from systematic review for these data were high. The primary limitations of these data
include the uncertainty of the representativeness of these surrogate data toward the true distribution of
inhalation concentrations for the industries and sites covered by this scenario. Based on these strengths
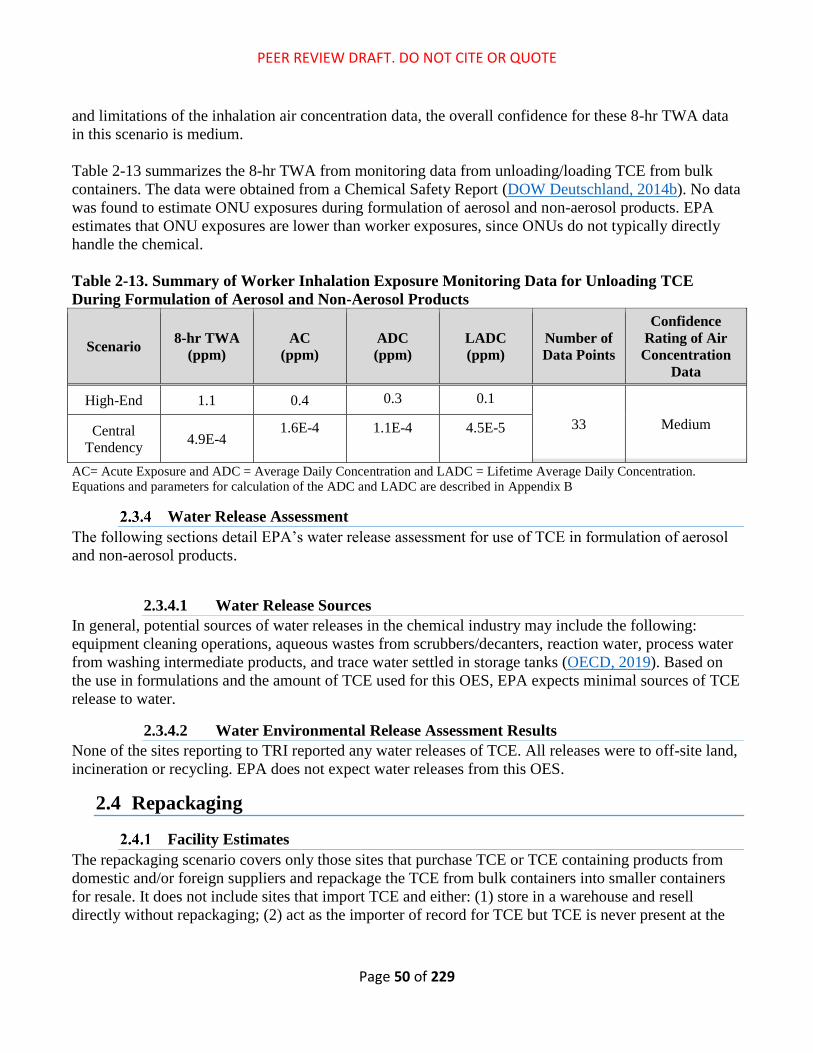
PEER REVIEW DRAFT. DO NOT CITE OR QUOTE
Page 50 of 229
and limitations of the inhalation air concentration data, the overall confidence for these 8-hr TWA data
in this scenario is medium.
Table 2-13 summarizes the 8-hr TWA from monitoring data from unloading/loading TCE from bulk
containers. The data were obtained from a Chemical Safety Report (DOW Deutschland, 2014b). No data
was found to estimate ONU exposures during formulation of aerosol and non-aerosol products. EPA
estimates that ONU exposures are lower than worker exposures, since ONUs do not typically directly
handle the chemical.
Table 2-13. Summary of Worker Inhalation Exposure Monitoring Data for Unloading TCE
During Formulation of Aerosol and Non-Aerosol Products
Scenario 8-hr TWA
(ppm)
AC
(ppm)
ADC
(ppm)
LADC
(ppm)
Number of
Data Points
Confidence
Rating of Air
Concentration
Data
High-End 1.1 0.4 0.3 0.1
33 Medium Central
Tendency 4.9E-4
1.6E-4 1.1E-4 4.5E-5
AC= Acute Exposure and ADC = Average Daily Concentration and LADC = Lifetime Average Daily Concentration.
Equations and parameters for calculation of the ADC and LADC are described in Appendix B
Water Release Assessment
The following sections detail EPA’s water release assessment for use of TCE in formulation of aerosol
and non-aerosol products.
2.3.4.1 Water Release Sources
In general, potential sources of water releases in the chemical industry may include the following:
equipment cleaning operations, aqueous wastes from scrubbers/decanters, reaction water, process water
from washing intermediate products, and trace water settled in storage tanks (OECD, 2019). Based on
the use in formulations and the amount of TCE used for this OES, EPA expects minimal sources of TCE
release to water.
2.3.4.2 Water Environmental Release Assessment Results
None of the sites reporting to TRI reported any water releases of TCE. All releases were to off-site land,
incineration or recycling. EPA does not expect water releases from this OES.
2.4 Repackaging
Facility Estimates
The repackaging scenario covers only those sites that purchase TCE or TCE containing products from
domestic and/or foreign suppliers and repackage the TCE from bulk containers into smaller containers
for resale. It does not include sites that import TCE and either: (1) store in a warehouse and resell
directly without repackaging; (2) act as the importer of record for TCE but TCE is never present at the

PEER REVIEW DRAFT. DO NOT CITE OR QUOTE
Page 51 of 229
site4; or (3) import the chemical and process or use the chemical directly at the site. In case #1, there is
little or negligible opportunity for exposures or releases as the containers are never opened. In cases #2,
the potential for exposure and release is at the site receiving TCE, not the “import” site and
exposures/releases at the site receiving TCE are assessed in the relevant OES based on the use for TCE
at the site. Similarly, for case #3, the potential for exposure and release at these sites are evaluated in the
relevant OES depending on the use for TCE at the site.
To determine the number of sites that may repackage TCE, EPA considered 2016 TRI data, and 2016
DMR data. In the 2016 TRI, 17 facilities report under the NAICS code 424690, Other Chemical and
Allied Products Merchant Wholesalers. To address the uncertainty at these sites, EPA assumes that these
sites may perform repackaging activities of TCE. Note: CDR data was not used in this case as none of
the manufacturing sites provided non-CBI information on downstream repackaging sites.
In the 2016 DMR data, there are three sites that report under the SIC code 4226, Special Warehousing
and Storage (NAICS code equivalent: 493110); and one site that reports under the SIC code 5169,
Chemical and Allied Products (NAICS code equivalent: 424690). One site reported to DMR using SIC
code 4953,Refuse Systems (NAICS code equivalent: 562920) but the company website indicates the
facility is a terminal storage facility. EPA assumes the primary OES at these sites is repackaging.
Therefore, EPA assesses a total of 22 sites (17+3+1+1 = 22 sites) for the repackaging of TCE.
Process Description
In general, commodity chemicals are imported into the United States in bulk via water, air, land, and
intermodal shipments (Tomer and Kane, 2015). These shipments take the form of oceangoing chemical
tankers, railcars, tank trucks, and intermodal tank containers. Chemicals shipped in bulk containers may
be repackaged into smaller containers for resale, such as drums or bottles. Domestically manufactured
commodity chemicals may be shipped within the United States in liquid cargo barges, railcars, tank
trucks, tank containers, intermediate bulk containers (IBCs)/totes, and drums. Both imported and
domestically manufactured commodity chemicals may be repackaged by wholesalers for resale; for
example, repackaging bulk packaging into drums or bottles.
The exact shipping and packaging methods specific to TCE are not known. For this risk evaluation, EPA
assesses the repackaging of TCE from bulk packaging to drums and bottles at wholesale repackaging
sites.
Exposure Assessment
The following sections detail EPA’s occupational exposure assessment for repackaging TCE.
2.4.3.1 Worker Activities
During repackaging, workers are potentially exposed while connecting and disconnecting hoses and
transfer lines to containers and packaging to be unloaded (e.g., railcars, tank trucks, totes), intermediate
storage vessels (e.g., storage tanks, pressure vessels), and final packaging containers (e.g., drums,
bottles). Workers near loading racks and container filling stations are potentially exposed to fugitive
4 In CDR, the reporting site is the importer of record which may be a corporate site or other entity that facilitates the import
of the chemical but never actually receives the chemical. Rather, the chemical is shipped directly to the site processing or
using the chemical.
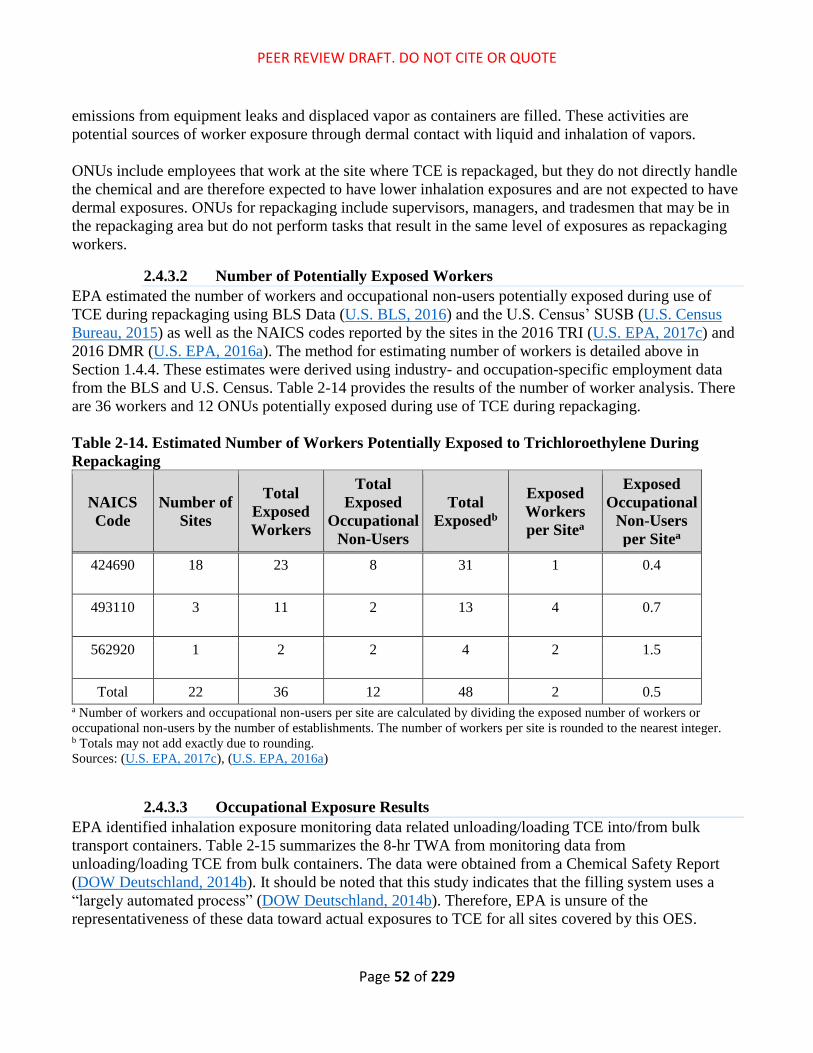
PEER REVIEW DRAFT. DO NOT CITE OR QUOTE
Page 52 of 229
emissions from equipment leaks and displaced vapor as containers are filled. These activities are
potential sources of worker exposure through dermal contact with liquid and inhalation of vapors.
ONUs include employees that work at the site where TCE is repackaged, but they do not directly handle
the chemical and are therefore expected to have lower inhalation exposures and are not expected to have
dermal exposures. ONUs for repackaging include supervisors, managers, and tradesmen that may be in
the repackaging area but do not perform tasks that result in the same level of exposures as repackaging
workers.
2.4.3.2 Number of Potentially Exposed Workers
EPA estimated the number of workers and occupational non-users potentially exposed during use of
TCE during repackaging using BLS Data (U.S. BLS, 2016) and the U.S. Census’ SUSB (U.S. Census
Bureau, 2015) as well as the NAICS codes reported by the sites in the 2016 TRI (U.S. EPA, 2017c) and
2016 DMR (U.S. EPA, 2016a). The method for estimating number of workers is detailed above in
Section 1.4.4. These estimates were derived using industry- and occupation-specific employment data
from the BLS and U.S. Census. Table 2-14 provides the results of the number of worker analysis. There
are 36 workers and 12 ONUs potentially exposed during use of TCE during repackaging.
Table 2-14. Estimated Number of Workers Potentially Exposed to Trichloroethylene During
Repackaging
NAICS
Code
Number of
Sites
Total
Exposed
Workers
Total
Exposed
Occupational
Non-Users
Total
Exposedb
Exposed
Workers
per Sitea
Exposed
Occupational
Non-Users
per Sitea
424690 18 23 8 31 1 0.4
493110 3 11 2 13 4 0.7
562920 1 2 2 4 2 1.5
Total 22 36 12 48 2 0.5 a Number of workers and occupational non-users per site are calculated by dividing the exposed number of workers or
occupational non-users by the number of establishments. The number of workers per site is rounded to the nearest integer. b Totals may not add exactly due to rounding. Sources: (U.S. EPA, 2017c), (U.S. EPA, 2016a)
2.4.3.3 Occupational Exposure Results
EPA identified inhalation exposure monitoring data related unloading/loading TCE into/from bulk
transport containers. Table 2-15 summarizes the 8-hr TWA from monitoring data from
unloading/loading TCE from bulk containers. The data were obtained from a Chemical Safety Report
(DOW Deutschland, 2014b). It should be noted that this study indicates that the filling system uses a
“largely automated process” (DOW Deutschland, 2014b). Therefore, EPA is unsure of the
representativeness of these data toward actual exposures to TCE for all sites covered by this OES.
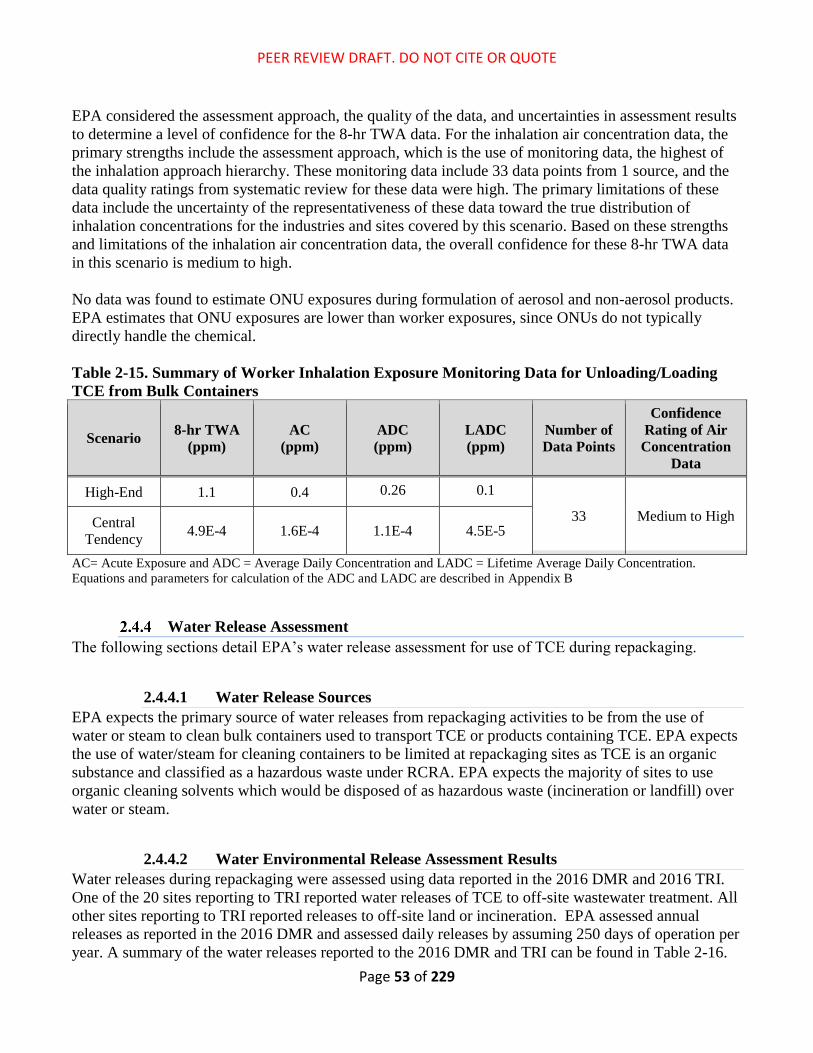
PEER REVIEW DRAFT. DO NOT CITE OR QUOTE
Page 53 of 229
EPA considered the assessment approach, the quality of the data, and uncertainties in assessment results
to determine a level of confidence for the 8-hr TWA data. For the inhalation air concentration data, the
primary strengths include the assessment approach, which is the use of monitoring data, the highest of
the inhalation approach hierarchy. These monitoring data include 33 data points from 1 source, and the
data quality ratings from systematic review for these data were high. The primary limitations of these
data include the uncertainty of the representativeness of these data toward the true distribution of
inhalation concentrations for the industries and sites covered by this scenario. Based on these strengths
and limitations of the inhalation air concentration data, the overall confidence for these 8-hr TWA data
in this scenario is medium to high.
No data was found to estimate ONU exposures during formulation of aerosol and non-aerosol products.
EPA estimates that ONU exposures are lower than worker exposures, since ONUs do not typically
directly handle the chemical.
Table 2-15. Summary of Worker Inhalation Exposure Monitoring Data for Unloading/Loading
TCE from Bulk Containers
Scenario 8-hr TWA
(ppm)
AC
(ppm)
ADC
(ppm)
LADC
(ppm)
Number of
Data Points
Confidence
Rating of Air
Concentration
Data
High-End 1.1 0.4 0.26 0.1
33 Medium to High Central
Tendency 4.9E-4 1.6E-4 1.1E-4 4.5E-5
AC= Acute Exposure and ADC = Average Daily Concentration and LADC = Lifetime Average Daily Concentration.
Equations and parameters for calculation of the ADC and LADC are described in Appendix B
Water Release Assessment
The following sections detail EPA’s water release assessment for use of TCE during repackaging.
2.4.4.1 Water Release Sources
EPA expects the primary source of water releases from repackaging activities to be from the use of
water or steam to clean bulk containers used to transport TCE or products containing TCE. EPA expects
the use of water/steam for cleaning containers to be limited at repackaging sites as TCE is an organic
substance and classified as a hazardous waste under RCRA. EPA expects the majority of sites to use
organic cleaning solvents which would be disposed of as hazardous waste (incineration or landfill) over
water or steam.
2.4.4.2 Water Environmental Release Assessment Results
Water releases during repackaging were assessed using data reported in the 2016 DMR and 2016 TRI.
One of the 20 sites reporting to TRI reported water releases of TCE to off-site wastewater treatment. All
other sites reporting to TRI reported releases to off-site land or incineration. EPA assessed annual
releases as reported in the 2016 DMR and assessed daily releases by assuming 250 days of operation per
year. A summary of the water releases reported to the 2016 DMR and TRI can be found in Table 2-16.
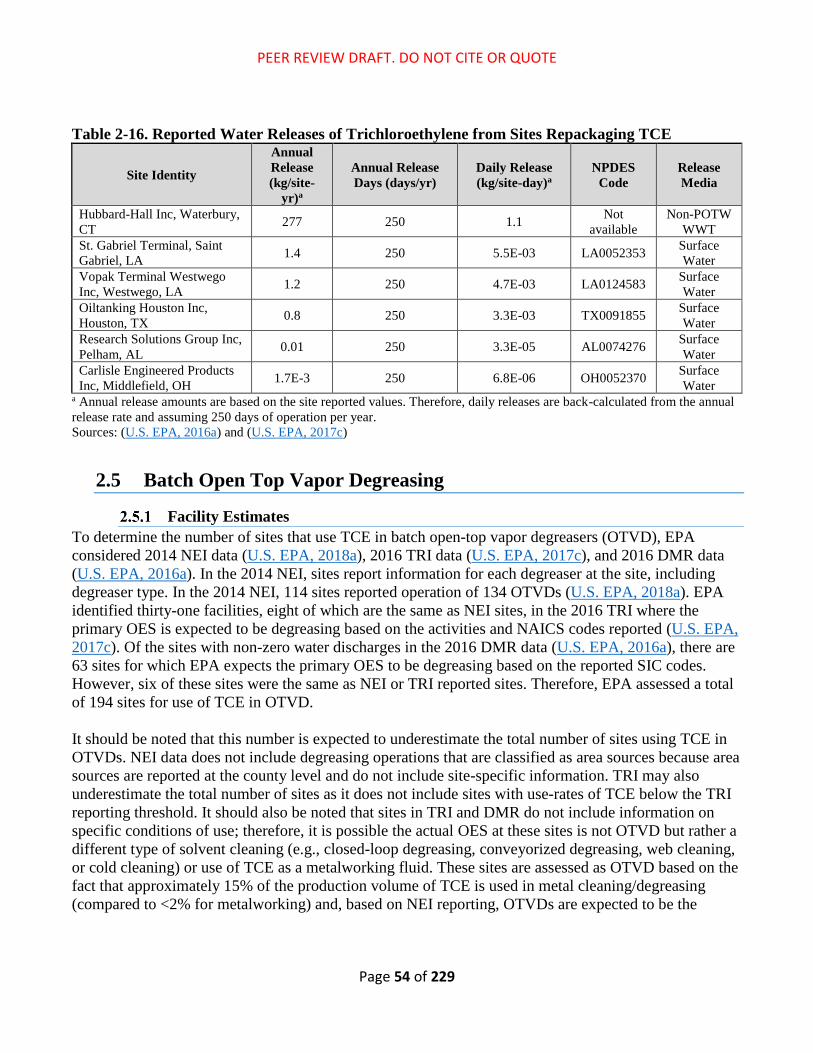
PEER REVIEW DRAFT. DO NOT CITE OR QUOTE
Page 54 of 229
Table 2-16. Reported Water Releases of Trichloroethylene from Sites Repackaging TCE
Site Identity
Annual
Release
(kg/site-
yr)a
Annual Release
Days (days/yr)
Daily Release
(kg/site-day)a
NPDES
Code
Release
Media
Hubbard-Hall Inc, Waterbury,
CT 277 250 1.1
Not
available
Non-POTW
WWT
St. Gabriel Terminal, Saint
Gabriel, LA 1.4 250 5.5E-03 LA0052353
Surface
Water
Vopak Terminal Westwego
Inc, Westwego, LA 1.2 250 4.7E-03 LA0124583
Surface
Water
Oiltanking Houston Inc,
Houston, TX 0.8 250 3.3E-03 TX0091855
Surface
Water
Research Solutions Group Inc,
Pelham, AL 0.01 250 3.3E-05 AL0074276
Surface
Water
Carlisle Engineered Products
Inc, Middlefield, OH 1.7E-3 250 6.8E-06 OH0052370
Surface
Water a Annual release amounts are based on the site reported values. Therefore, daily releases are back-calculated from the annual
release rate and assuming 250 days of operation per year.
Sources: (U.S. EPA, 2016a) and (U.S. EPA, 2017c)
2.5 Batch Open Top Vapor Degreasing
Facility Estimates
To determine the number of sites that use TCE in batch open-top vapor degreasers (OTVD), EPA
considered 2014 NEI data (U.S. EPA, 2018a), 2016 TRI data (U.S. EPA, 2017c), and 2016 DMR data
(U.S. EPA, 2016a). In the 2014 NEI, sites report information for each degreaser at the site, including
degreaser type. In the 2014 NEI, 114 sites reported operation of 134 OTVDs (U.S. EPA, 2018a). EPA
identified thirty-one facilities, eight of which are the same as NEI sites, in the 2016 TRI where the
primary OES is expected to be degreasing based on the activities and NAICS codes reported (U.S. EPA,
2017c). Of the sites with non-zero water discharges in the 2016 DMR data (U.S. EPA, 2016a), there are
63 sites for which EPA expects the primary OES to be degreasing based on the reported SIC codes.
However, six of these sites were the same as NEI or TRI reported sites. Therefore, EPA assessed a total
of 194 sites for use of TCE in OTVD.
It should be noted that this number is expected to underestimate the total number of sites using TCE in
OTVDs. NEI data does not include degreasing operations that are classified as area sources because area
sources are reported at the county level and do not include site-specific information. TRI may also
underestimate the total number of sites as it does not include sites with use-rates of TCE below the TRI
reporting threshold. It should also be noted that sites in TRI and DMR do not include information on
specific conditions of use; therefore, it is possible the actual OES at these sites is not OTVD but rather a
different type of solvent cleaning (e.g., closed-loop degreasing, conveyorized degreasing, web cleaning,
or cold cleaning) or use of TCE as a metalworking fluid. These sites are assessed as OTVD based on the
fact that approximately 15% of the production volume of TCE is used in metal cleaning/degreasing
(compared to <2% for metalworking) and, based on NEI reporting, OTVDs are expected to be the
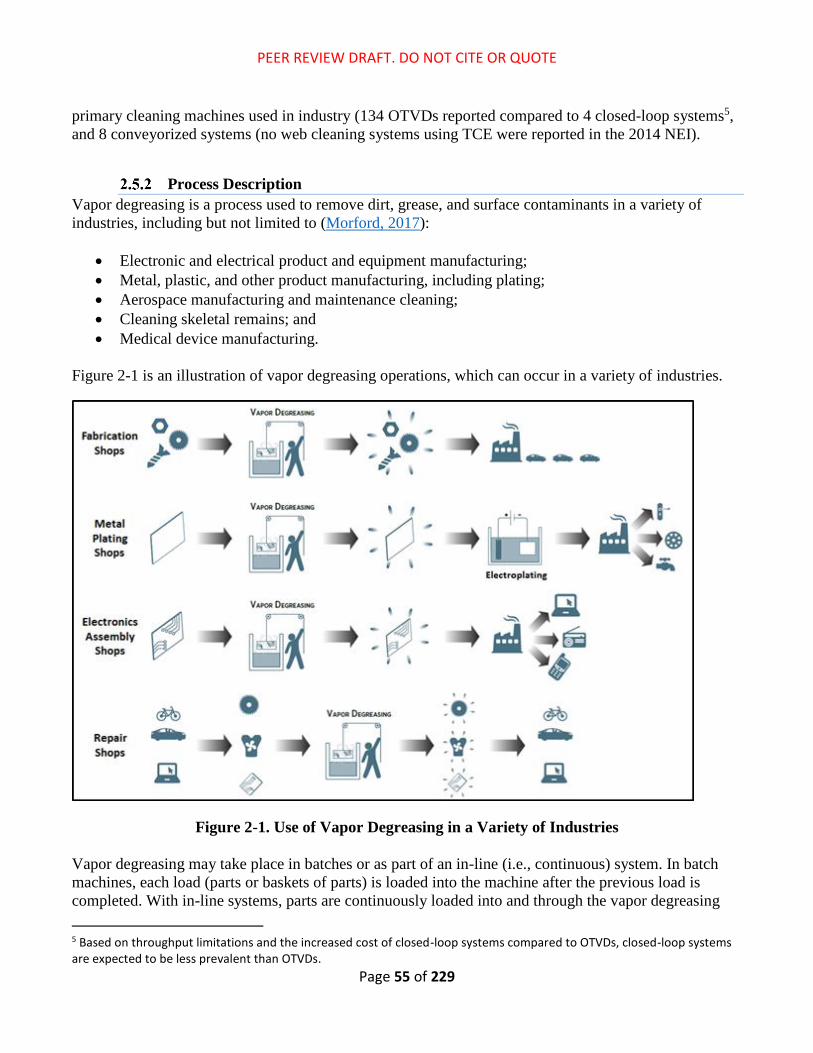
PEER REVIEW DRAFT. DO NOT CITE OR QUOTE
Page 55 of 229
primary cleaning machines used in industry (134 OTVDs reported compared to 4 closed-loop systems5,
and 8 conveyorized systems (no web cleaning systems using TCE were reported in the 2014 NEI).
Process Description
Vapor degreasing is a process used to remove dirt, grease, and surface contaminants in a variety of
industries, including but not limited to (Morford, 2017):
• Electronic and electrical product and equipment manufacturing;
• Metal, plastic, and other product manufacturing, including plating;
• Aerospace manufacturing and maintenance cleaning;
• Cleaning skeletal remains; and
• Medical device manufacturing.
Figure 2-1 is an illustration of vapor degreasing operations, which can occur in a variety of industries.
Figure 2-1. Use of Vapor Degreasing in a Variety of Industries
Vapor degreasing may take place in batches or as part of an in-line (i.e., continuous) system. In batch
machines, each load (parts or baskets of parts) is loaded into the machine after the previous load is
completed. With in-line systems, parts are continuously loaded into and through the vapor degreasing
5 Based on throughput limitations and the increased cost of closed-loop systems compared to OTVDs, closed-loop systems are expected to be less prevalent than OTVDs.

PEER REVIEW DRAFT. DO NOT CITE OR QUOTE
Page 56 of 229
equipment as well as the subsequent drying steps. Vapor degreasing equipment can generally be
categorized into one of the three categories: (1) batch vapor degreasers, (2) conveyorized vapor
degreasers and (3) web vapor degreasers.
In batch open-top vapor degreasers (OTVDs), a vapor cleaning zone is created by heating the liquid
solvent in the OTVD causing it to volatilize. Workers manually load or unload fabricated parts directly
into or out of the vapor cleaning zone. The tank usually has chillers along the side of the tank to prevent
losses of the solvent to the air. However, these chillers are not able to eliminate emissions, and
throughout the degreasing process significant air emissions of the solvent can occur. These air emissions
can cause issues with both worker health and safety as well as environmental issues. Additionally, the
cost of replacing solvent lost to emissions can be expensive (NEWMOA, 2001). Figure 2-2 illustrates a
standard OTVD.
Figure 2-2. Open Top Vapor Degreaser
OTVDs with enclosures operate the same as standard OTVDs except that the OTVD is enclosed on all
sides during degreasing. The enclosure is opened and closed to add or remove parts to/from the machine,
and solvent is exposed to the air when the cover is open. Enclosed OTVDs may be vented directly to the
atmosphere or first vented to an external carbon filter and then to the atmosphere (ICF Consulting,
2004). Figure 2-3 illustrates an OTVD with an enclosure. The dotted lines in Figure 2-3represent the
optional carbon filter that may or may not be used with an enclosed OTVD.

PEER REVIEW DRAFT. DO NOT CITE OR QUOTE
Page 57 of 229
Figure 2-3. Open Top Vapor Degreaser with Enclosure
Exposure Assessment
The following sections detail EPA’s occupational exposure assessment for batch open-top vapor
degreasing.
2.5.3.1 Worker Activities
When operating OTVD, workers manually load or unload fabricated parts directly into or out of the
vapor cleaning zone. Worker exposure can occur from solvent dragout or vapor displacement when the
substrates enter or exit the equipment, respectively (Kanegsberg and Kanegsberg, 2011). The amount of
time a worker spends at the degreaser can vary depending on the number of workloads needed to be
cleaned. Reports from NIOSH at three sites using OTVDs found degreaser operators may spend 0.5 to 2
hours per day at the degreaser (NIOSH, 2002a, b, d).
Worker exposure is also possible while charging new solvent or disposing spent solvent. The frequency
of solvent charging can vary greatly from site-to-site and is dependent on the type, size, and amount of
parts cleaned in the degreaser. NIOSH investigations found that one site added a 55-gallon drum of new
solvent to the degreaser unit every one to two weeks; another site added one 55-gallon drum per month;
and another site added two 55-gallon drums per month to its large degreaser and three 55 gallon drums
per year to its small degreaser (NIOSH, 2002a, b, d).
2.5.3.2 Number of Potentially Exposed Workers
EPA estimated the number of workers and occupational non-users potentially exposed during use of
TCE in OTVDs using BLS Data (U.S. BLS, 2016) and the U.S. Census’ SUSB (U.S. Census Bureau,
2015) as well as the primary NAICS code reported by each site in the 2014 NEI, 2016 TRI, or 2016
DMR. The method for estimating number of workers is detailed above in Section 1.4.4. These estimates
were derived using industry- and occupation-specific employment data from the BLS and U.S. Census.
The employment data from the U.S. Census SUSB and the Bureau of Labor Statistics’ Occupational

PEER REVIEW DRAFT. DO NOT CITE OR QUOTE
Page 58 of 229
Employment Statistics data are based on NAICS code; therefore, SIC codes reported in the 2016 DMR
had to be mapped to a NAICS code to estimate the number of workers. A crosswalk of the SIC codes to
the NAICS codes used in the analysis are provided in Table 2-17. In the 2016 DMR there were nine sites
that did not report a SIC code. Also, another thirteen sites where relevant Bureau of Labor Statistics
Occupational Employment Statistics data could not be found for the corresponding NAICS codes; for
these twenty-two sites, EPA referenced the 2017 Emission Scenario Document (ESD) on the Use of
Vapor Degreasers to estimate the number of workers and ONUs (OECD, 2017).
Table 2-17. Crosswalk of Open-Top Vapor Degreasing SIC Codes in DMR to NAICS Codes
SIC Code Corresponding NAICS Code
2821 – Plastics Materials, Synthetic Resins, and
Nonvulcanizable Elastomers
325211 – Plastics Material and Resin Manufacturing
2822 – Synthetic Rubber (Vulcanizable Elastomers) 325212 – Synthetic Rubber Manufacturing
3053 – Gaskets; Packing and Sealing Devices 339991 – Gasket, Packing, and Sealing Device
Manufacturing
3069 - Fabricated Rubber Products, Not Elsewhere
Classified
326199 - All Other Plastics Product Manufacturing
3312 – Steel Works, Blast Furnaces (Including Coke
Ovens), and Rolling Mills
331110 – Iron and Steel Mills and Ferroalloy
Manufacturing
3398 – Metal Heat Treating 332811 – Metal Heat Treating
3423- Hand and Edge Tools, Except Machine Tools
and Handsaws
332216 - Saw Blade and Handtool Manufacturing
3462 - Iron and Steel Forgings 332111 – Iron and Steel Forging
3471 - Electroplating, Plating, Polishing, Anodizing,
and Coloring
332813 - Electroplating, Plating, Polishing, Anodizing,
and Coloring
3483 - Ammunition, Except for Small Arms 332993 - Ammunition (except Small Arms)
Manufacturing
3489 – Ordnance and Accessories, Not Elsewhere
Classified
332994 – Small Arms, Ordnance, and Ordnance
Accessories Manufacturing
3492 - Fluid Power Valves and Hose Fittings 332912 - Fluid Power Valve and Hose Fitting
Manufacturing
3499 - Fabricated Metal Products, Not Elsewhere
Classified
332919 - Other Metal Valve and Pipe Fitting
Manufacturing
3511 - Steam, Gas, and Hydraulic Turbines, and
Turbine Generator Set Units
333611 - Turbine and Turbine Generator Set Units
Manufacturing
3537 – Industrial Trucks, Tractors, Trailers, and
Stackers
333924 – Industrial Truck, Tractor, Trailer, and Stacker
Machinery Manufacturing
3545 - Cutting Tools, Machine Tool Accessories, and
Machinists' Precision Measuring Devices
332216 - Saw Blade and Handtool Manufacturing
3546 - Power-Driven Handtools 333991 - Power-Driven Handtool Manufacturing
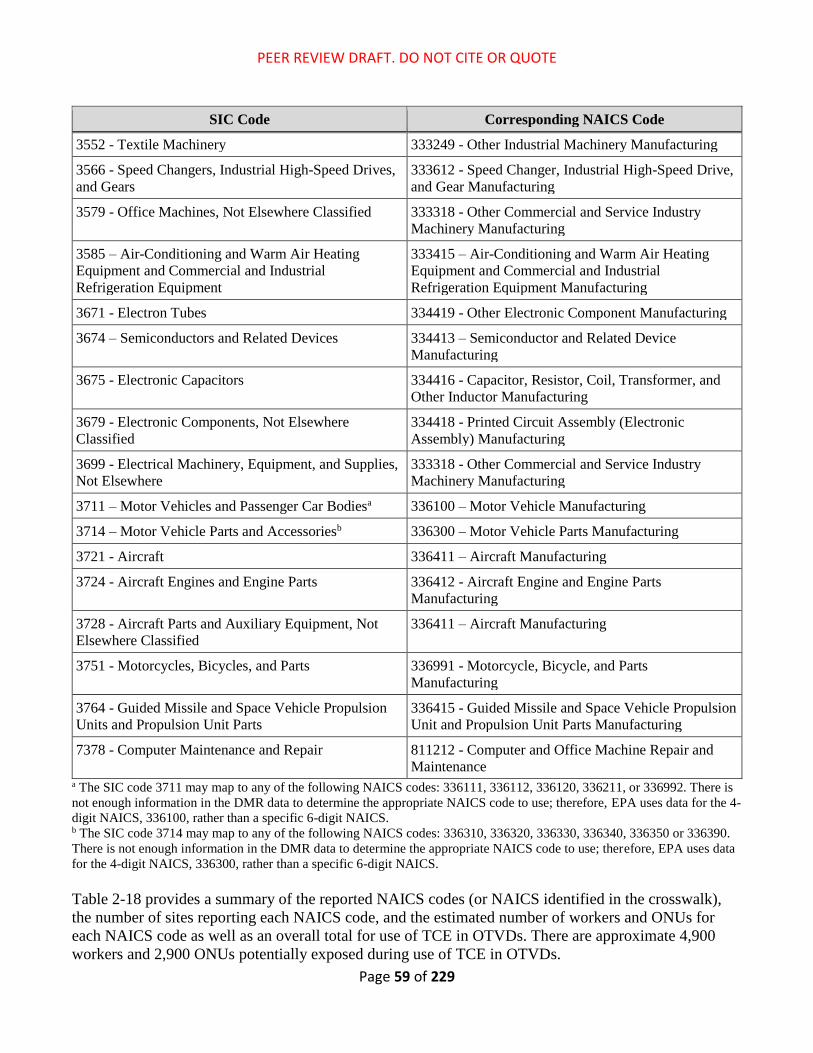
PEER REVIEW DRAFT. DO NOT CITE OR QUOTE
Page 59 of 229
SIC Code Corresponding NAICS Code
3552 - Textile Machinery 333249 - Other Industrial Machinery Manufacturing
3566 - Speed Changers, Industrial High-Speed Drives,
and Gears
333612 - Speed Changer, Industrial High-Speed Drive,
and Gear Manufacturing
3579 - Office Machines, Not Elsewhere Classified 333318 - Other Commercial and Service Industry
Machinery Manufacturing
3585 – Air-Conditioning and Warm Air Heating
Equipment and Commercial and Industrial
Refrigeration Equipment
333415 – Air-Conditioning and Warm Air Heating
Equipment and Commercial and Industrial
Refrigeration Equipment Manufacturing
3671 - Electron Tubes 334419 - Other Electronic Component Manufacturing
3674 – Semiconductors and Related Devices 334413 – Semiconductor and Related Device
Manufacturing
3675 - Electronic Capacitors 334416 - Capacitor, Resistor, Coil, Transformer, and
Other Inductor Manufacturing
3679 - Electronic Components, Not Elsewhere
Classified
334418 - Printed Circuit Assembly (Electronic
Assembly) Manufacturing
3699 - Electrical Machinery, Equipment, and Supplies,
Not Elsewhere
333318 - Other Commercial and Service Industry
Machinery Manufacturing
3711 – Motor Vehicles and Passenger Car Bodiesa 336100 – Motor Vehicle Manufacturing
3714 – Motor Vehicle Parts and Accessoriesb 336300 – Motor Vehicle Parts Manufacturing
3721 - Aircraft 336411 – Aircraft Manufacturing
3724 - Aircraft Engines and Engine Parts 336412 - Aircraft Engine and Engine Parts
Manufacturing
3728 - Aircraft Parts and Auxiliary Equipment, Not
Elsewhere Classified
336411 – Aircraft Manufacturing
3751 - Motorcycles, Bicycles, and Parts 336991 - Motorcycle, Bicycle, and Parts
Manufacturing
3764 - Guided Missile and Space Vehicle Propulsion
Units and Propulsion Unit Parts
336415 - Guided Missile and Space Vehicle Propulsion
Unit and Propulsion Unit Parts Manufacturing
7378 - Computer Maintenance and Repair 811212 - Computer and Office Machine Repair and
Maintenance a The SIC code 3711 may map to any of the following NAICS codes: 336111, 336112, 336120, 336211, or 336992. There is
not enough information in the DMR data to determine the appropriate NAICS code to use; therefore, EPA uses data for the 4-
digit NAICS, 336100, rather than a specific 6-digit NAICS. b The SIC code 3714 may map to any of the following NAICS codes: 336310, 336320, 336330, 336340, 336350 or 336390.
There is not enough information in the DMR data to determine the appropriate NAICS code to use; therefore, EPA uses data
for the 4-digit NAICS, 336300, rather than a specific 6-digit NAICS.
Table 2-18 provides a summary of the reported NAICS codes (or NAICS identified in the crosswalk),
the number of sites reporting each NAICS code, and the estimated number of workers and ONUs for
each NAICS code as well as an overall total for use of TCE in OTVDs. There are approximate 4,900
workers and 2,900 ONUs potentially exposed during use of TCE in OTVDs.

PEER REVIEW DRAFT. DO NOT CITE OR QUOTE
Page 60 of 229
Table 2-18. Estimated Number of Workers Potentially Exposed to Trichlorethylene During Use in
Open-Top Vapor Degreasing
NAICS
Code
Number of Sites
Reporting the
NAICS Code
Total
Exposed
Workers
Total
Exposed
Occupational
Non-Users
Total
Exposed
Exposed
Workers
per Site
Exposed
Occupational
Non-Users per
Site
314999 1 2 5 7 2 5
323111 1 2 1 3 2 1
325211 3 82 36 119 27 12
325220 1 47 21 68 47 21
325998 1 14 5 19 14 5
326199 1 18 5 23 18 5
326200 3 125 20 145 42 7
331210 8 308 76 384 39 9
331222 1 23 6 29 23 6
331491 2 41 13 55 21 7
332111 2 26 9 35 13 5
332119 10 81 29 110 8 3
332215 2 16 6 22 8 3
332216 3 21 8 29 7 3
332613 1 13 3 17 13 3
332618 2 18 5 22 9 2
332721 8 31 16 47 4 2
332722 3 18 10 28 6 3
332811 5 49 11 61 10 2
332812 9 65 15 80 7 2

PEER REVIEW DRAFT. DO NOT CITE OR QUOTE
Page 61 of 229
NAICS
Code
Number of Sites
Reporting the
NAICS Code
Total
Exposed
Workers
Total
Exposed
Occupational
Non-Users
Total
Exposed
Exposed
Workers
per Site
Exposed
Occupational
Non-Users per
Site
332813 22 174 40 214 8 2
332912 4 111 43 154 28 11
332913 2 37 14 51 19 7
332919 2 36 14 50 18 7
332991 1 39 15 54 39 15
332993 1 63 24 87 63 24
332994 5 56 22 77 11 4
332999 3 17 6 23 6 2
333200 2 17 13 29 8 6
333300 3 41 19 61 14 6
333413 1 21 6 26 21 6
333415 4 173 47 220 43 12
333515 1 4 3 8 4 3
333612 2 37 20 56 18 10
333900 2 26 13 38 13 6
334416 2 44 39 83 22 20
334417 1 41 37 78 41 37
334418 1 28 25 54 28 25
334419 2 39 35 75 20 18
334512 1 9 10 19 9 10
334513 1 11 11 22 11 11
334515 1 9 10 19 9 10
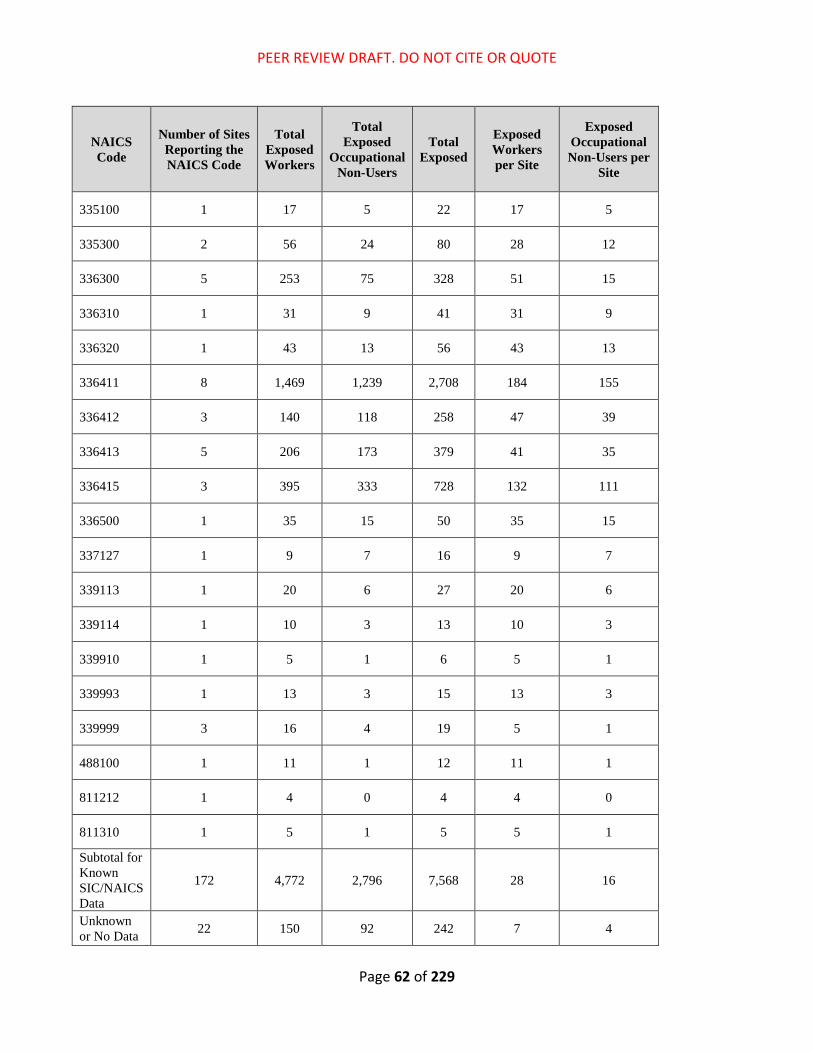
PEER REVIEW DRAFT. DO NOT CITE OR QUOTE
Page 62 of 229
NAICS
Code
Number of Sites
Reporting the
NAICS Code
Total
Exposed
Workers
Total
Exposed
Occupational
Non-Users
Total
Exposed
Exposed
Workers
per Site
Exposed
Occupational
Non-Users per
Site
335100 1 17 5 22 17 5
335300 2 56 24 80 28 12
336300 5 253 75 328 51 15
336310 1 31 9 41 31 9
336320 1 43 13 56 43 13
336411 8 1,469 1,239 2,708 184 155
336412 3 140 118 258 47 39
336413 5 206 173 379 41 35
336415 3 395 333 728 132 111
336500 1 35 15 50 35 15
337127 1 9 7 16 9 7
339113 1 20 6 27 20 6
339114 1 10 3 13 10 3
339910 1 5 1 6 5 1
339993 1 13 3 15 13 3
339999 3 16 4 19 5 1
488100 1 11 1 12 11 1
811212 1 4 0 4 4 0
811310 1 5 1 5 5 1
Subtotal for
Known
SIC/NAICS
Data
172 4,772 2,796 7,568 28 16
Unknown
or No Data 22 150 92 242 7 4
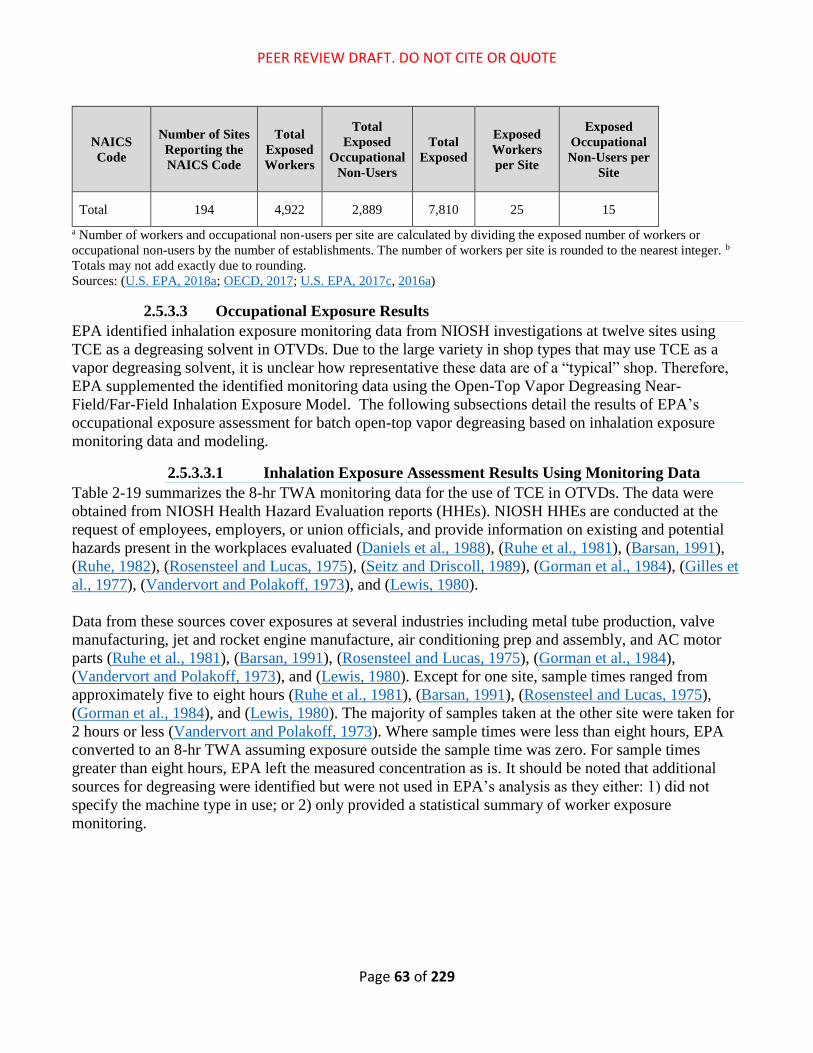
PEER REVIEW DRAFT. DO NOT CITE OR QUOTE
Page 63 of 229
NAICS
Code
Number of Sites
Reporting the
NAICS Code
Total
Exposed
Workers
Total
Exposed
Occupational
Non-Users
Total
Exposed
Exposed
Workers
per Site
Exposed
Occupational
Non-Users per
Site
Total 194 4,922 2,889 7,810 25 15
a Number of workers and occupational non-users per site are calculated by dividing the exposed number of workers or
occupational non-users by the number of establishments. The number of workers per site is rounded to the nearest integer. b
Totals may not add exactly due to rounding. Sources: (U.S. EPA, 2018a; OECD, 2017; U.S. EPA, 2017c, 2016a)
2.5.3.3 Occupational Exposure Results
EPA identified inhalation exposure monitoring data from NIOSH investigations at twelve sites using
TCE as a degreasing solvent in OTVDs. Due to the large variety in shop types that may use TCE as a
vapor degreasing solvent, it is unclear how representative these data are of a “typical” shop. Therefore,
EPA supplemented the identified monitoring data using the Open-Top Vapor Degreasing Near-
Field/Far-Field Inhalation Exposure Model. The following subsections detail the results of EPA’s
occupational exposure assessment for batch open-top vapor degreasing based on inhalation exposure
monitoring data and modeling.
2.5.3.3.1 Inhalation Exposure Assessment Results Using Monitoring Data
Table 2-19 summarizes the 8-hr TWA monitoring data for the use of TCE in OTVDs. The data were
obtained from NIOSH Health Hazard Evaluation reports (HHEs). NIOSH HHEs are conducted at the
request of employees, employers, or union officials, and provide information on existing and potential
hazards present in the workplaces evaluated (Daniels et al., 1988), (Ruhe et al., 1981), (Barsan, 1991),
(Ruhe, 1982), (Rosensteel and Lucas, 1975), (Seitz and Driscoll, 1989), (Gorman et al., 1984), (Gilles et
al., 1977), (Vandervort and Polakoff, 1973), and (Lewis, 1980).
Data from these sources cover exposures at several industries including metal tube production, valve
manufacturing, jet and rocket engine manufacture, air conditioning prep and assembly, and AC motor
parts (Ruhe et al., 1981), (Barsan, 1991), (Rosensteel and Lucas, 1975), (Gorman et al., 1984),
(Vandervort and Polakoff, 1973), and (Lewis, 1980). Except for one site, sample times ranged from
approximately five to eight hours (Ruhe et al., 1981), (Barsan, 1991), (Rosensteel and Lucas, 1975),
(Gorman et al., 1984), and (Lewis, 1980). The majority of samples taken at the other site were taken for
2 hours or less (Vandervort and Polakoff, 1973). Where sample times were less than eight hours, EPA
converted to an 8-hr TWA assuming exposure outside the sample time was zero. For sample times
greater than eight hours, EPA left the measured concentration as is. It should be noted that additional
sources for degreasing were identified but were not used in EPA’s analysis as they either: 1) did not
specify the machine type in use; or 2) only provided a statistical summary of worker exposure
monitoring.
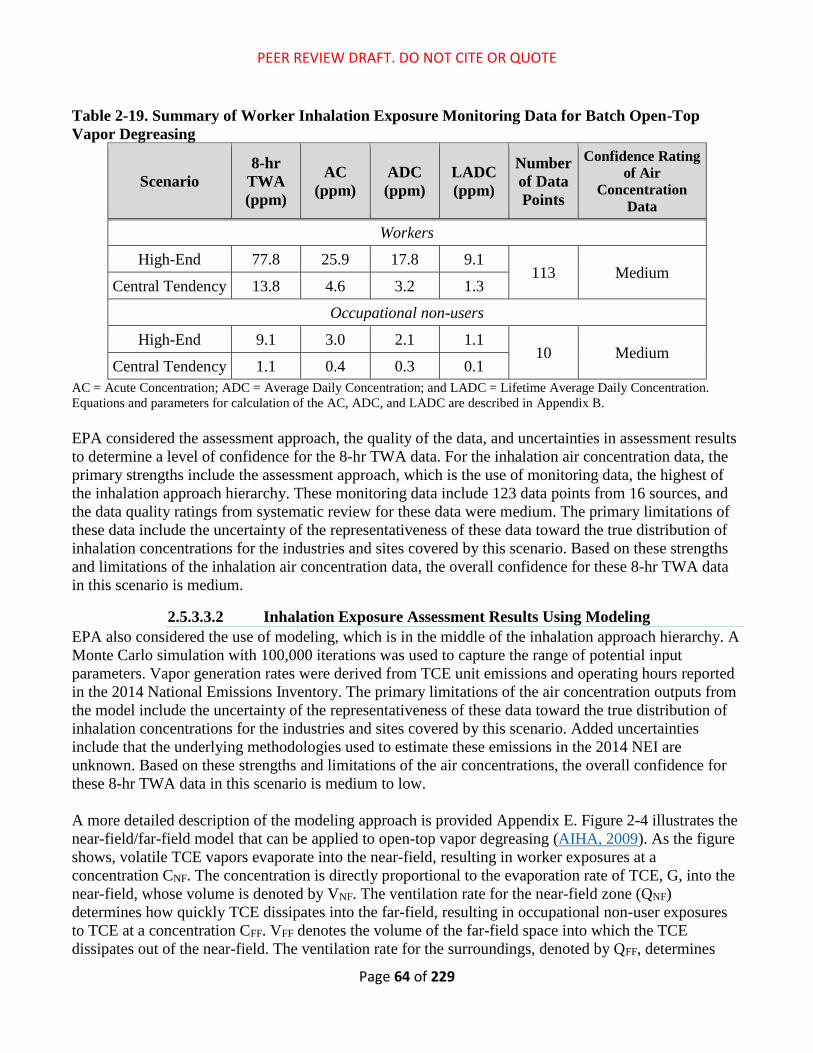
PEER REVIEW DRAFT. DO NOT CITE OR QUOTE
Page 64 of 229
Table 2-19. Summary of Worker Inhalation Exposure Monitoring Data for Batch Open-Top
Vapor Degreasing
Scenario
8-hr
TWA
(ppm)
AC
(ppm)
ADC
(ppm)
LADC
(ppm)
Number
of Data
Points
Confidence Rating
of Air
Concentration
Data
Workers
High-End 77.8 25.9 17.8 9.1 113 Medium
Central Tendency 13.8 4.6 3.2 1.3
Occupational non-users
High-End 9.1 3.0 2.1 1.1 10 Medium
Central Tendency 1.1 0.4 0.3 0.1
AC = Acute Concentration; ADC = Average Daily Concentration; and LADC = Lifetime Average Daily Concentration.
Equations and parameters for calculation of the AC, ADC, and LADC are described in Appendix B.
EPA considered the assessment approach, the quality of the data, and uncertainties in assessment results
to determine a level of confidence for the 8-hr TWA data. For the inhalation air concentration data, the
primary strengths include the assessment approach, which is the use of monitoring data, the highest of
the inhalation approach hierarchy. These monitoring data include 123 data points from 16 sources, and
the data quality ratings from systematic review for these data were medium. The primary limitations of
these data include the uncertainty of the representativeness of these data toward the true distribution of
inhalation concentrations for the industries and sites covered by this scenario. Based on these strengths
and limitations of the inhalation air concentration data, the overall confidence for these 8-hr TWA data
in this scenario is medium.
2.5.3.3.2 Inhalation Exposure Assessment Results Using Modeling
EPA also considered the use of modeling, which is in the middle of the inhalation approach hierarchy. A
Monte Carlo simulation with 100,000 iterations was used to capture the range of potential input
parameters. Vapor generation rates were derived from TCE unit emissions and operating hours reported
in the 2014 National Emissions Inventory. The primary limitations of the air concentration outputs from
the model include the uncertainty of the representativeness of these data toward the true distribution of
inhalation concentrations for the industries and sites covered by this scenario. Added uncertainties
include that the underlying methodologies used to estimate these emissions in the 2014 NEI are
unknown. Based on these strengths and limitations of the air concentrations, the overall confidence for
these 8-hr TWA data in this scenario is medium to low.
A more detailed description of the modeling approach is provided Appendix E. Figure 2-4 illustrates the
near-field/far-field model that can be applied to open-top vapor degreasing (AIHA, 2009). As the figure
shows, volatile TCE vapors evaporate into the near-field, resulting in worker exposures at a
concentration CNF. The concentration is directly proportional to the evaporation rate of TCE, G, into the
near-field, whose volume is denoted by VNF. The ventilation rate for the near-field zone (QNF)
determines how quickly TCE dissipates into the far-field, resulting in occupational non-user exposures
to TCE at a concentration CFF. VFF denotes the volume of the far-field space into which the TCE
dissipates out of the near-field. The ventilation rate for the surroundings, denoted by QFF, determines

PEER REVIEW DRAFT. DO NOT CITE OR QUOTE
Page 65 of 229
how quickly TCE dissipates out of the surrounding space and into the outside air. Appendix E outlines
the equations uses for this model.
Figure 2-4. Schematic of the Open-Top Vapor Degreasing Near-Field/Far-Field Inhalation
Exposure Model
Appendix E presents the model parameters, parameter distributions, and assumptions for the TCE Open-
Top Vapor Degreasing Near-Field/Far-Field Inhalation Exposure Model. To estimate the TCE vapor
generation rate, the model developed a distribution from the reported annual emission rates and annual
operating times reported in the 2014 NEI. NEI records where the annual operating time was not reported
were excluded from the distribution.
Batch degreasers are assumed to operate between two and 24 hours per day, based on NEI data on the
reported operating hours for OTVD using TCE. EPA performed a Monte Carlo simulation with 100,000
iterations and the Latin Hypercube sampling method in @Risk to calculate 8-hour TWA near-field and
far-field exposure concentrations. Near-field exposure represents exposure concentrations for workers
who directly operate the vapor degreasing equipment, whereas far-field exposure represents exposure
concentrations for occupational non-users (i.e., workers in the surrounding area who do not handle the
degreasing equipment). The modeled 8-hr TWA results and the values in Appendix B are used to
calculate 24-hr AC, ADC, and LADC.
Table 2-20 presents a statistical summary of the exposure modeling results. Estimates of AC, ADC and
LADC for use in assessing risk were made using the approach and equations described in Appendix B.
These exposure estimates represent modeled exposures for the workers and occupational non-users. For
workers, the 50th percentile exposure is 34.8 ppm 8-hr TWA, with a 95th percentile of 388 ppm 8-hr
TWA.

PEER REVIEW DRAFT. DO NOT CITE OR QUOTE
Page 66 of 229
Both of these values are an order of magnitude higher than identified in the monitoring data. This may
be due to the limited number of sites from which the monitoring data were taken whereas the model is
meant to capture a broader range of scenarios. It is also uncertain of the underlying methodologies used
to estimate emissions in the 2014 NEI data.
Table 2-20. Summary of Exposure Modeling Results for TCE Degreasing in OTVDs
Percentile
8-hr TWA
(ppm)
ACa
(ppm)
ADC
(ppm)
LADC
(ppm)
Confidence Rating of Air
Concentration Data
Workers (Near-field)
High-End 388 129.3 88.5 35.3
N/A – Modeled Data Central
Tendency 34.8 79.0 8.0 3.0
Occupational non-users (Far-Field)
High-End 237 79.0 54.0 21.1
N/A – Modeled Data Central
Tendency 18.1 6.0 4.1 1.5
AC = Acute Concentration; ADC = Average Daily Concentration; and LADC = Lifetime Average Daily Concentration.
Equations and parameters for calculation of the AC, ADC, and LADC are described in Appendix B. a Acute exposures calculated as a 24-hr TWA.
Water Release Assessment
The following sections detail EPA’s water release assessment for use of TCE in OTVDs.
2.5.4.1 Water Release Sources
The primary source of water releases from OTVDs is wastewater from the water separator. Water in the
OTVD may come from two sources: 1) Moisture in the atmosphere that condenses into the solvent when
exposed to the condensation coils on the OTVD; and/or 2) steam used to regenerate carbon adsorbers
used to control solvent emissions on OTVDs with enclosures (Durkee, 2014; Kanegsberg and
Kanegsberg, 2011; NIOSH, 2002a, b, c, d). The water is removed in a gravity separator and sent for
disposal (NIOSH, 2002a, b, c, d). The current disposal practices of the wastewater are unknown;
however, a 1982 EPA (Gilbert et al., 1982) report estimated 20% of water releases from metal cleaning
(including batch systems, conveyorized systems, and vapor and cold systems) were direct discharges to
surface water and 80% of water releases were discharged indirectly to a POTW.
2.5.4.2 Water Release Assessment Results
Water releases for OTVDs were assessed using data reported in the 2016 TRI and 2016 DMR. As noted
in 2.5.1, due to limited information in these reporting programs, these sites may in fact not operate
OTVDs, but may operate other solvent cleaning machines or perform metalworking activities. They are
included in the OTVD assessment as EPA expects OTVDs to be the most likely OES. EPA assessed
annual releases as reported in the 2016 TRI or 2016 DMR and assessed daily releases by assuming 260
days of operation per year, as recommended in the 2017 ESD on Use of Vapor Degreasers, and
averaging the annual releases over the operating days. A summary of the water releases reported to the
2016 TRI and DMR can be found in Table 2-21.
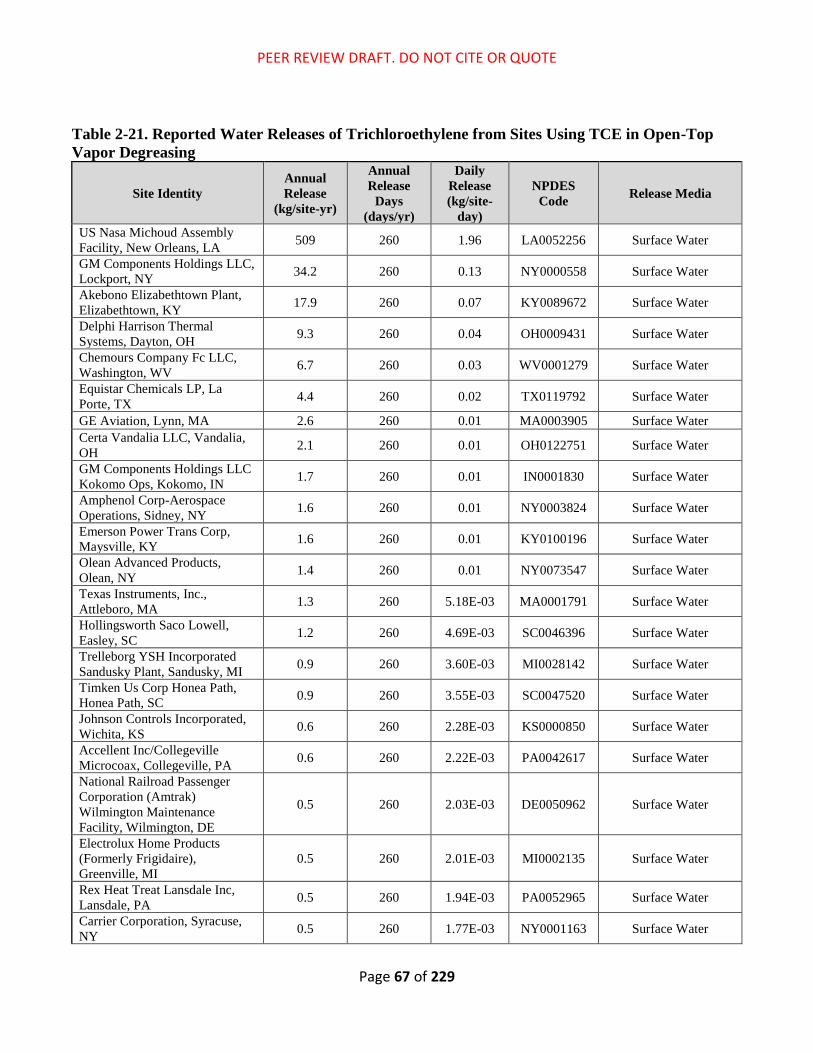
PEER REVIEW DRAFT. DO NOT CITE OR QUOTE
Page 67 of 229
Table 2-21. Reported Water Releases of Trichloroethylene from Sites Using TCE in Open-Top
Vapor Degreasing
Site Identity
Annual
Release
(kg/site-yr)
Annual
Release
Days
(days/yr)
Daily
Release
(kg/site-
day)
NPDES
Code Release Media
US Nasa Michoud Assembly
Facility, New Orleans, LA 509 260 1.96 LA0052256 Surface Water
GM Components Holdings LLC,
Lockport, NY 34.2 260 0.13 NY0000558 Surface Water
Akebono Elizabethtown Plant,
Elizabethtown, KY 17.9 260 0.07 KY0089672 Surface Water
Delphi Harrison Thermal
Systems, Dayton, OH 9.3 260 0.04 OH0009431 Surface Water
Chemours Company Fc LLC,
Washington, WV 6.7 260 0.03 WV0001279 Surface Water
Equistar Chemicals LP, La
Porte, TX 4.4 260 0.02 TX0119792 Surface Water
GE Aviation, Lynn, MA 2.6 260 0.01 MA0003905 Surface Water
Certa Vandalia LLC, Vandalia,
OH 2.1 260 0.01 OH0122751 Surface Water
GM Components Holdings LLC
Kokomo Ops, Kokomo, IN 1.7 260 0.01 IN0001830 Surface Water
Amphenol Corp-Aerospace
Operations, Sidney, NY 1.6 260 0.01 NY0003824 Surface Water
Emerson Power Trans Corp,
Maysville, KY 1.6 260 0.01 KY0100196 Surface Water
Olean Advanced Products,
Olean, NY 1.4 260 0.01 NY0073547 Surface Water
Texas Instruments, Inc.,
Attleboro, MA 1.3 260 5.18E-03 MA0001791 Surface Water
Hollingsworth Saco Lowell,
Easley, SC 1.2 260 4.69E-03 SC0046396 Surface Water
Trelleborg YSH Incorporated
Sandusky Plant, Sandusky, MI 0.9 260 3.60E-03 MI0028142 Surface Water
Timken Us Corp Honea Path,
Honea Path, SC 0.9 260 3.55E-03 SC0047520 Surface Water
Johnson Controls Incorporated,
Wichita, KS 0.6 260 2.28E-03 KS0000850 Surface Water
Accellent Inc/Collegeville
Microcoax, Collegeville, PA 0.6 260 2.22E-03 PA0042617 Surface Water
National Railroad Passenger
Corporation (Amtrak)
Wilmington Maintenance
Facility, Wilmington, DE
0.5 260 2.03E-03 DE0050962 Surface Water
Electrolux Home Products
(Formerly Frigidaire),
Greenville, MI
0.5 260 2.01E-03 MI0002135 Surface Water
Rex Heat Treat Lansdale Inc,
Lansdale, PA 0.5 260 1.94E-03 PA0052965 Surface Water
Carrier Corporation, Syracuse,
NY 0.5 260 1.77E-03 NY0001163 Surface Water
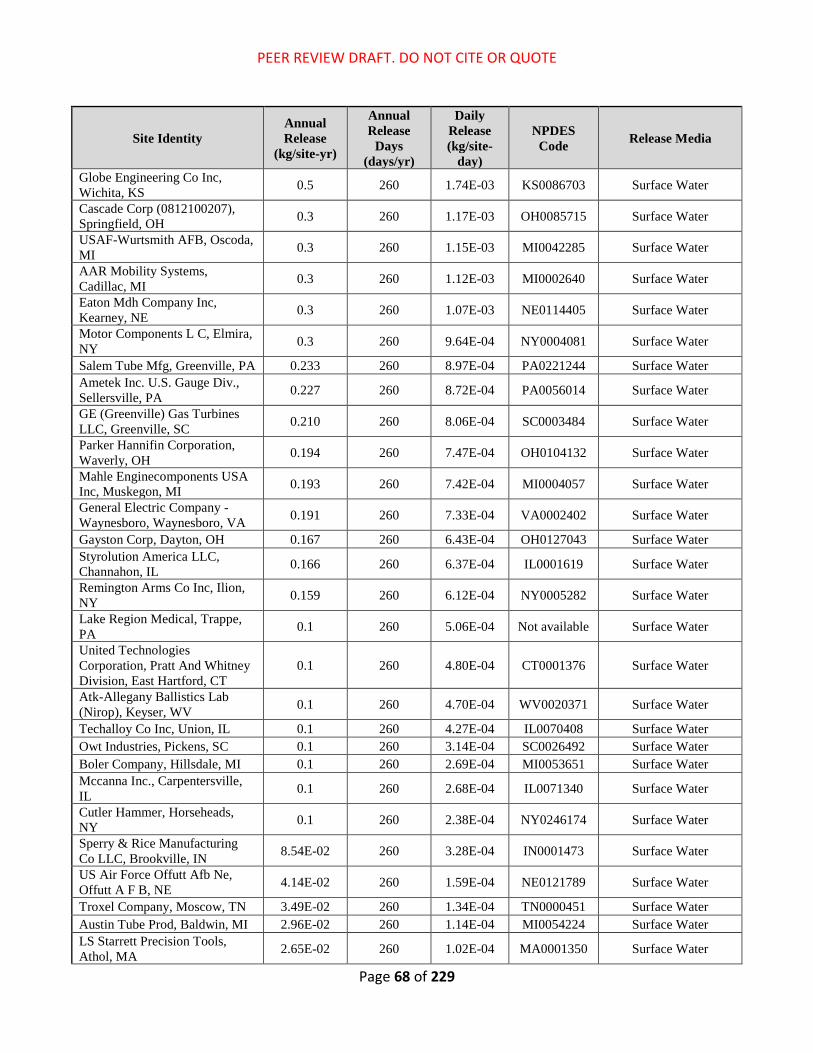
PEER REVIEW DRAFT. DO NOT CITE OR QUOTE
Page 68 of 229
Site Identity
Annual
Release
(kg/site-yr)
Annual
Release
Days
(days/yr)
Daily
Release
(kg/site-
day)
NPDES
Code Release Media
Globe Engineering Co Inc,
Wichita, KS 0.5 260 1.74E-03 KS0086703 Surface Water
Cascade Corp (0812100207),
Springfield, OH 0.3 260 1.17E-03 OH0085715 Surface Water
USAF-Wurtsmith AFB, Oscoda,
MI 0.3 260 1.15E-03 MI0042285 Surface Water
AAR Mobility Systems,
Cadillac, MI 0.3 260 1.12E-03 MI0002640 Surface Water
Eaton Mdh Company Inc,
Kearney, NE 0.3 260 1.07E-03 NE0114405 Surface Water
Motor Components L C, Elmira,
NY 0.3 260 9.64E-04 NY0004081 Surface Water
Salem Tube Mfg, Greenville, PA 0.233 260 8.97E-04 PA0221244 Surface Water
Ametek Inc. U.S. Gauge Div.,
Sellersville, PA 0.227 260 8.72E-04 PA0056014 Surface Water
GE (Greenville) Gas Turbines
LLC, Greenville, SC 0.210 260 8.06E-04 SC0003484 Surface Water
Parker Hannifin Corporation,
Waverly, OH 0.194 260 7.47E-04 OH0104132 Surface Water
Mahle Enginecomponents USA
Inc, Muskegon, MI 0.193 260 7.42E-04 MI0004057 Surface Water
General Electric Company -
Waynesboro, Waynesboro, VA 0.191 260 7.33E-04 VA0002402 Surface Water
Gayston Corp, Dayton, OH 0.167 260 6.43E-04 OH0127043 Surface Water
Styrolution America LLC,
Channahon, IL 0.166 260 6.37E-04 IL0001619 Surface Water
Remington Arms Co Inc, Ilion,
NY 0.159 260 6.12E-04 NY0005282 Surface Water
Lake Region Medical, Trappe,
PA 0.1 260 5.06E-04 Not available Surface Water
United Technologies
Corporation, Pratt And Whitney
Division, East Hartford, CT
0.1 260 4.80E-04 CT0001376 Surface Water
Atk-Allegany Ballistics Lab
(Nirop), Keyser, WV 0.1 260 4.70E-04 WV0020371 Surface Water
Techalloy Co Inc, Union, IL 0.1 260 4.27E-04 IL0070408 Surface Water
Owt Industries, Pickens, SC 0.1 260 3.14E-04 SC0026492 Surface Water
Boler Company, Hillsdale, MI 0.1 260 2.69E-04 MI0053651 Surface Water
Mccanna Inc., Carpentersville,
IL 0.1 260 2.68E-04 IL0071340 Surface Water
Cutler Hammer, Horseheads,
NY 0.1 260 2.38E-04 NY0246174 Surface Water
Sperry & Rice Manufacturing
Co LLC, Brookville, IN 8.54E-02 260 3.28E-04 IN0001473 Surface Water
US Air Force Offutt Afb Ne,
Offutt A F B, NE 4.14E-02 260 1.59E-04 NE0121789 Surface Water
Troxel Company, Moscow, TN 3.49E-02 260 1.34E-04 TN0000451 Surface Water
Austin Tube Prod, Baldwin, MI 2.96E-02 260 1.14E-04 MI0054224 Surface Water
LS Starrett Precision Tools,
Athol, MA 2.65E-02 260 1.02E-04 MA0001350 Surface Water

PEER REVIEW DRAFT. DO NOT CITE OR QUOTE
Page 69 of 229
Site Identity
Annual
Release
(kg/site-yr)
Annual
Release
Days
(days/yr)
Daily
Release
(kg/site-
day)
NPDES
Code Release Media
Avx Corp, Raleigh, NC 2.30E-02 260 8.83E-05 NC0089494 Surface Water
Handy & Harman Tube Co/East
Norriton, Norristown, PA 1.61E-02 260 6.17E-05 PA0011436 Surface Water
Indian Head Division, Naval
Surface Warfare Center, Indian
Head, MD
1.08E-02 260 4.16E-05 MD0003158 Surface Water
General Dynamics Ordnance
Tactical Systems, Red Lion, PA 6.34E-03 260 2.44E-05 PA0043672 Surface Water
Trane Residential Solutions -
Fort Smith, Fort Smith, AR 3.46E-03 260 1.33E-05 AR0052477 Surface Water
Lexmark International Inc.,
Lexington, KY 3.23E-03 260 1.24E-05 KY0097624 Surface Water
Alliant Techsystems Operations
LLC, Elkton, MD 3.02E-03 260 1.16E-05 MD0000078 Surface Water
Daikin Applied America, Inc.
(Formally Mcquay
International), Scottsboro, AL
2.15E-03 260 8.26E-06 AL0069701 Surface Water
Beechcraft Corporation,
Wichita, KS 2.04E-03 260 7.86E-06 KS0000183 Surface Water
Federal-Mogul Corp, Scottsville,
KY 1.50E-03 260 5.78E-06 KY0106585 Surface Water
Cessna Aircraft Co (Pawnee
Facility), Wichita, KS 1.36E-03 260 5.24E-06 KS0000647 Surface Water
N.G.I, Parkersburg, WV 3.43E-04 260 1.32E-06 WV0003204 Surface Water
Hyster-Yale Group, Inc,
Sulligent, AL 2.35E-04 260 9.03E-07 AL0069787 Surface Water
Hitachi Electronic Devices
(USA), Inc., Greenville, SC 6.58E-05 260 2.53E-07 SC0048411 Surface Water
WWT = Wastewater Treatment a Annual release amounts are based on the site reported values. Therefore, daily releases are back-calculated from the annual
release rate and assuming 260 days of operation per year.
Sources: 2016 TRI (U.S. EPA, 2017c); 2016 DMR (U.S. EPA, 2016a)
As discussed in Section 2.5.1, data from TRI and DMR may not represent the entirety of sites using
TCE in OTVDs. EPA did not identify other data sources to estimate water releases from sites not
reporting to TRI or DMR. However, sites operating degreasers are regulated by the following national
ELGs:
• Electroplating Point Source Category Subparts A, B, D, E, F, G, and H (U.S. EPA, 2019d)6;
• Iron and Steel Manufacturing Point Source Category Subpart J (U.S. EPA, 2019e);
• Metal Finishing Point Source Category Subpart A (U.S. EPA, 2019f)7;
• Coil Coating Point Source Category Subpart D (U.S. EPA, 2019b);
6 The Electroplating ELG applies only to sites that discharge to POTW (indirect discharge) that were in operation before July 15, 1983. Processes that began operating after July 15, 1983 and direct dischargers are subject to the Metal Finishing ELG (40 C.F.R Part 433). 7 The Metal Finishing ELG do not apply when wastewater discharges from metal finishing operations are already regulated by the Iron and Steel, Coil Coating, Aluminum Forming, or Electrical and Electronic Components ELGs.

PEER REVIEW DRAFT. DO NOT CITE OR QUOTE
Page 70 of 229
• Aluminum Forming Point Source Category Subparts A, B, C, D, E, and F (U.S. EPA, 2019a);
and
• Electrical and Electronic Components Point Source Category Subparts A and B (U.S. EPA,
2019c).
All above ELGs set discharges limits based on the total toxic organics (TTO) concentration in the
wastewater stream and not a specific TCE limit. TTO is the summation of the concentrations for a
specified list of pollutants which may be different for each promulgated ELG and includes TCE for the
above referenced ELGs. Therefore, the concentration of TCE in the effluent is expected to be less than
the TTO limit.
The operation of the water separator via gravity separation is such that the maximum concentration of
TCE leaving the OTVD is equal to the solubility of TCE in water, 1,280 mg/L (Durkee, 2014). In cases
where this concentration exceeds the limit set by the applicable ELGs, EPA expects sites will perform
some form of wastewater treatment for the effluent stream leaving the OTVD to ensure compliance with
the ELG prior to discharge. EPA did not identify information on the amount of wastewater generated
from OTVDs to estimate releases from sites not reporting to TRI or DMR.
2.6 Batch Closed-Loop Vapor Degreasing
Facility Estimates
To determine the number of sites that use TCE in batch closed-loop vapor degreasers, EPA considered
2014 NEI data (U.S. EPA, 2018a), 2016 TRI data (U.S. EPA, 2017c), and 2016 DMR data (U.S. EPA,
2016a). Sites in TRI and DMR do not differentiate between degreaser types and therefore are included
in the OTVD assessment and are not considered again here. In the 2014 NEI, four closed-system vapor
degreasers were reported in operation at four sites (a single closed-loop vapor degreaser per site) (U.S.
EPA, 2018a). Therefore, EPA assesses four sites for closed-loop degreasing. It should be noted that this
number is expected to underestimate the total number of sites using TCE in closed-loop degreasers as
closed-loop degreasers are not required to report to NEI. Additionally, NEI data does not include
degreasing operations that are classified as area sources because area sources are reported at the county
level and do not include site-specific information.
Process Description
In closed-loop degreasers, parts are placed into a basket, which is then placed into an airtight work
chamber. The door is closed, and solvent vapors are sprayed onto the parts. Solvent can also be
introduced to the parts as a liquid spray or liquid immersion. When cleaning is complete, vapors are
exhausted from the chamber and circulated over a cooling coil where the vapors are condensed and
recovered. The parts are dried by forced hot air. Air is circulated through the chamber and residual
solvent vapors are captured by carbon adsorption. The door is opened when the residual solvent vapor
concentration has reached a specified level (Kanegsberg and Kanegsberg, 2011). Figure 2-5 illustrates a
standard closed-loop vapor degreasing system.
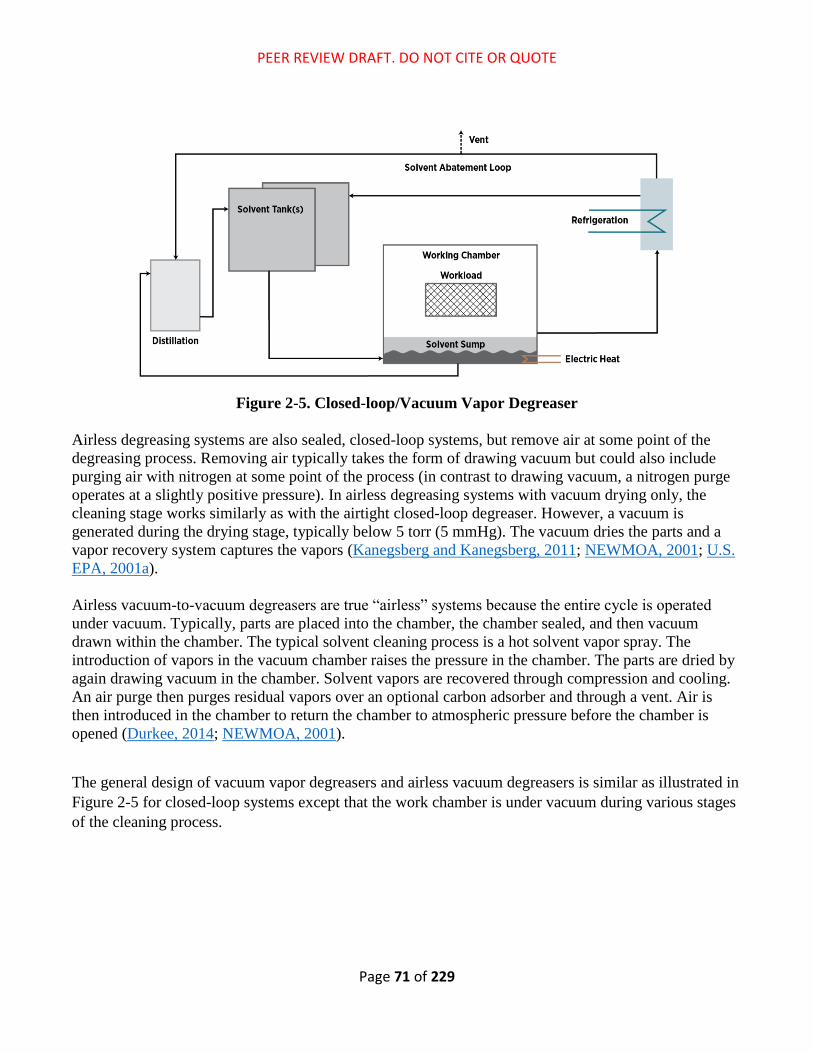
PEER REVIEW DRAFT. DO NOT CITE OR QUOTE
Page 71 of 229
Figure 2-5. Closed-loop/Vacuum Vapor Degreaser
Airless degreasing systems are also sealed, closed-loop systems, but remove air at some point of the
degreasing process. Removing air typically takes the form of drawing vacuum but could also include
purging air with nitrogen at some point of the process (in contrast to drawing vacuum, a nitrogen purge
operates at a slightly positive pressure). In airless degreasing systems with vacuum drying only, the
cleaning stage works similarly as with the airtight closed-loop degreaser. However, a vacuum is
generated during the drying stage, typically below 5 torr (5 mmHg). The vacuum dries the parts and a
vapor recovery system captures the vapors (Kanegsberg and Kanegsberg, 2011; NEWMOA, 2001; U.S.
EPA, 2001a).
Airless vacuum-to-vacuum degreasers are true “airless” systems because the entire cycle is operated
under vacuum. Typically, parts are placed into the chamber, the chamber sealed, and then vacuum
drawn within the chamber. The typical solvent cleaning process is a hot solvent vapor spray. The
introduction of vapors in the vacuum chamber raises the pressure in the chamber. The parts are dried by
again drawing vacuum in the chamber. Solvent vapors are recovered through compression and cooling.
An air purge then purges residual vapors over an optional carbon adsorber and through a vent. Air is
then introduced in the chamber to return the chamber to atmospheric pressure before the chamber is
opened (Durkee, 2014; NEWMOA, 2001).
The general design of vacuum vapor degreasers and airless vacuum degreasers is similar as illustrated in
Figure 2-5 for closed-loop systems except that the work chamber is under vacuum during various stages
of the cleaning process.
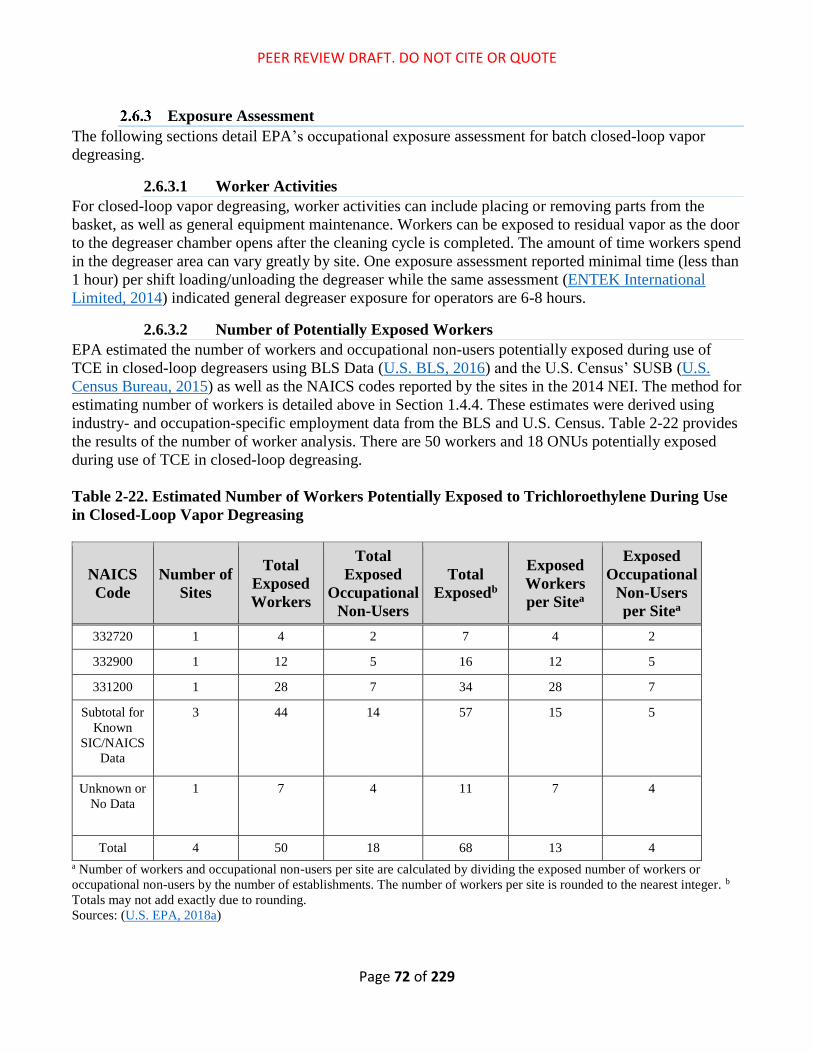
PEER REVIEW DRAFT. DO NOT CITE OR QUOTE
Page 72 of 229
Exposure Assessment
The following sections detail EPA’s occupational exposure assessment for batch closed-loop vapor
degreasing.
2.6.3.1 Worker Activities
For closed-loop vapor degreasing, worker activities can include placing or removing parts from the
basket, as well as general equipment maintenance. Workers can be exposed to residual vapor as the door
to the degreaser chamber opens after the cleaning cycle is completed. The amount of time workers spend
in the degreaser area can vary greatly by site. One exposure assessment reported minimal time (less than
1 hour) per shift loading/unloading the degreaser while the same assessment (ENTEK International
Limited, 2014) indicated general degreaser exposure for operators are 6-8 hours.
2.6.3.2 Number of Potentially Exposed Workers
EPA estimated the number of workers and occupational non-users potentially exposed during use of
TCE in closed-loop degreasers using BLS Data (U.S. BLS, 2016) and the U.S. Census’ SUSB (U.S.
Census Bureau, 2015) as well as the NAICS codes reported by the sites in the 2014 NEI. The method for
estimating number of workers is detailed above in Section 1.4.4. These estimates were derived using
industry- and occupation-specific employment data from the BLS and U.S. Census. Table 2-22 provides
the results of the number of worker analysis. There are 50 workers and 18 ONUs potentially exposed
during use of TCE in closed-loop degreasing.
Table 2-22. Estimated Number of Workers Potentially Exposed to Trichloroethylene During Use
in Closed-Loop Vapor Degreasing
NAICS
Code
Number of
Sites
Total
Exposed
Workers
Total
Exposed
Occupational
Non-Users
Total
Exposedb
Exposed
Workers
per Sitea
Exposed
Occupational
Non-Users
per Sitea
332720 1 4 2 7 4 2
332900 1 12 5 16 12 5
331200 1 28 7 34 28 7
Subtotal for
Known
SIC/NAICS
Data
3 44 14 57 15 5
Unknown or
No Data
1 7 4 11 7 4
Total 4 50 18 68 13 4
a Number of workers and occupational non-users per site are calculated by dividing the exposed number of workers or
occupational non-users by the number of establishments. The number of workers per site is rounded to the nearest integer. b
Totals may not add exactly due to rounding. Sources: (U.S. EPA, 2018a)
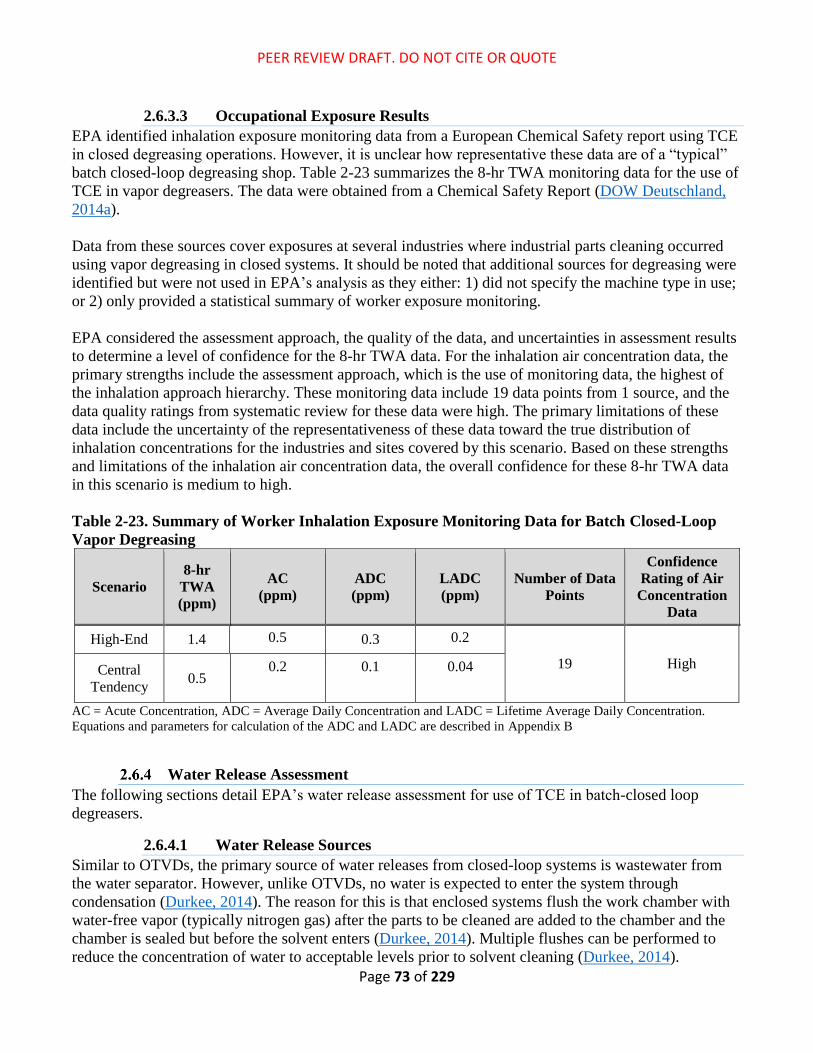
PEER REVIEW DRAFT. DO NOT CITE OR QUOTE
Page 73 of 229
2.6.3.3 Occupational Exposure Results
EPA identified inhalation exposure monitoring data from a European Chemical Safety report using TCE
in closed degreasing operations. However, it is unclear how representative these data are of a “typical”
batch closed-loop degreasing shop. Table 2-23 summarizes the 8-hr TWA monitoring data for the use of
TCE in vapor degreasers. The data were obtained from a Chemical Safety Report (DOW Deutschland,
2014a).
Data from these sources cover exposures at several industries where industrial parts cleaning occurred
using vapor degreasing in closed systems. It should be noted that additional sources for degreasing were
identified but were not used in EPA’s analysis as they either: 1) did not specify the machine type in use;
or 2) only provided a statistical summary of worker exposure monitoring.
EPA considered the assessment approach, the quality of the data, and uncertainties in assessment results
to determine a level of confidence for the 8-hr TWA data. For the inhalation air concentration data, the
primary strengths include the assessment approach, which is the use of monitoring data, the highest of
the inhalation approach hierarchy. These monitoring data include 19 data points from 1 source, and the
data quality ratings from systematic review for these data were high. The primary limitations of these
data include the uncertainty of the representativeness of these data toward the true distribution of
inhalation concentrations for the industries and sites covered by this scenario. Based on these strengths
and limitations of the inhalation air concentration data, the overall confidence for these 8-hr TWA data
in this scenario is medium to high.
Table 2-23. Summary of Worker Inhalation Exposure Monitoring Data for Batch Closed-Loop
Vapor Degreasing
Scenario
8-hr
TWA
(ppm)
AC
(ppm)
ADC
(ppm)
LADC
(ppm)
Number of Data
Points
Confidence
Rating of Air
Concentration
Data
High-End 1.4 0.5 0.3 0.2
19 High Central
Tendency 0.5
0.2 0.1 0.04
AC = Acute Concentration, ADC = Average Daily Concentration and LADC = Lifetime Average Daily Concentration.
Equations and parameters for calculation of the ADC and LADC are described in Appendix B
Water Release Assessment
The following sections detail EPA’s water release assessment for use of TCE in batch-closed loop
degreasers.
2.6.4.1 Water Release Sources
Similar to OTVDs, the primary source of water releases from closed-loop systems is wastewater from
the water separator. However, unlike OTVDs, no water is expected to enter the system through
condensation (Durkee, 2014). The reason for this is that enclosed systems flush the work chamber with
water-free vapor (typically nitrogen gas) after the parts to be cleaned are added to the chamber and the
chamber is sealed but before the solvent enters (Durkee, 2014). Multiple flushes can be performed to
reduce the concentration of water to acceptable levels prior to solvent cleaning (Durkee, 2014).
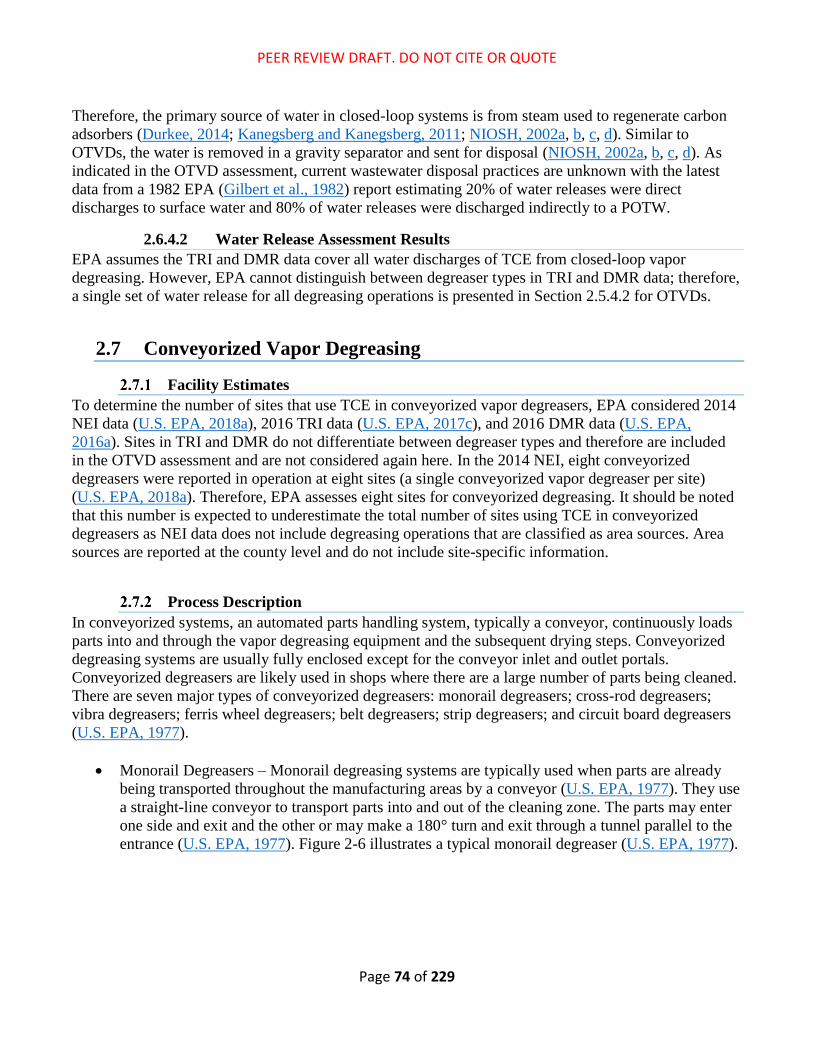
PEER REVIEW DRAFT. DO NOT CITE OR QUOTE
Page 74 of 229
Therefore, the primary source of water in closed-loop systems is from steam used to regenerate carbon
adsorbers (Durkee, 2014; Kanegsberg and Kanegsberg, 2011; NIOSH, 2002a, b, c, d). Similar to
OTVDs, the water is removed in a gravity separator and sent for disposal (NIOSH, 2002a, b, c, d). As
indicated in the OTVD assessment, current wastewater disposal practices are unknown with the latest
data from a 1982 EPA (Gilbert et al., 1982) report estimating 20% of water releases were direct
discharges to surface water and 80% of water releases were discharged indirectly to a POTW.
2.6.4.2 Water Release Assessment Results
EPA assumes the TRI and DMR data cover all water discharges of TCE from closed-loop vapor
degreasing. However, EPA cannot distinguish between degreaser types in TRI and DMR data; therefore,
a single set of water release for all degreasing operations is presented in Section 2.5.4.2 for OTVDs.
2.7 Conveyorized Vapor Degreasing
Facility Estimates
To determine the number of sites that use TCE in conveyorized vapor degreasers, EPA considered 2014
NEI data (U.S. EPA, 2018a), 2016 TRI data (U.S. EPA, 2017c), and 2016 DMR data (U.S. EPA,
2016a). Sites in TRI and DMR do not differentiate between degreaser types and therefore are included
in the OTVD assessment and are not considered again here. In the 2014 NEI, eight conveyorized
degreasers were reported in operation at eight sites (a single conveyorized vapor degreaser per site)
(U.S. EPA, 2018a). Therefore, EPA assesses eight sites for conveyorized degreasing. It should be noted
that this number is expected to underestimate the total number of sites using TCE in conveyorized
degreasers as NEI data does not include degreasing operations that are classified as area sources. Area
sources are reported at the county level and do not include site-specific information.
Process Description
In conveyorized systems, an automated parts handling system, typically a conveyor, continuously loads
parts into and through the vapor degreasing equipment and the subsequent drying steps. Conveyorized
degreasing systems are usually fully enclosed except for the conveyor inlet and outlet portals.
Conveyorized degreasers are likely used in shops where there are a large number of parts being cleaned.
There are seven major types of conveyorized degreasers: monorail degreasers; cross-rod degreasers;
vibra degreasers; ferris wheel degreasers; belt degreasers; strip degreasers; and circuit board degreasers
(U.S. EPA, 1977).
• Monorail Degreasers – Monorail degreasing systems are typically used when parts are already
being transported throughout the manufacturing areas by a conveyor (U.S. EPA, 1977). They use
a straight-line conveyor to transport parts into and out of the cleaning zone. The parts may enter
one side and exit and the other or may make a 180° turn and exit through a tunnel parallel to the
entrance (U.S. EPA, 1977). Figure 2-6 illustrates a typical monorail degreaser (U.S. EPA, 1977).

PEER REVIEW DRAFT. DO NOT CITE OR QUOTE
Page 75 of 229
Figure 2-6. Monorail Conveyorized Vapor Degreasing System (U.S. EPA, 1977)
• Cross-rod Degreasers – Cross-rod degreasing systems utilize two parallel chains connected by a
rod that support the parts throughout the cleaning process. The parts are usually loaded into
perforated baskets or cylinders and then transported through the machine by the chain support
system. The baskets and cylinders are typically manually loaded and unloaded (U.S. EPA, 1977).
Cylinders are used for small parts or parts that need enhanced solvent drainage because of
crevices and cavities. The cylinders allow the parts to be tumbled during cleaning and drying and
thus increase cleaning and drying efficiency. Figure 2-7 illustrates a typical cross-rod degreaser
(U.S. EPA, 1977).
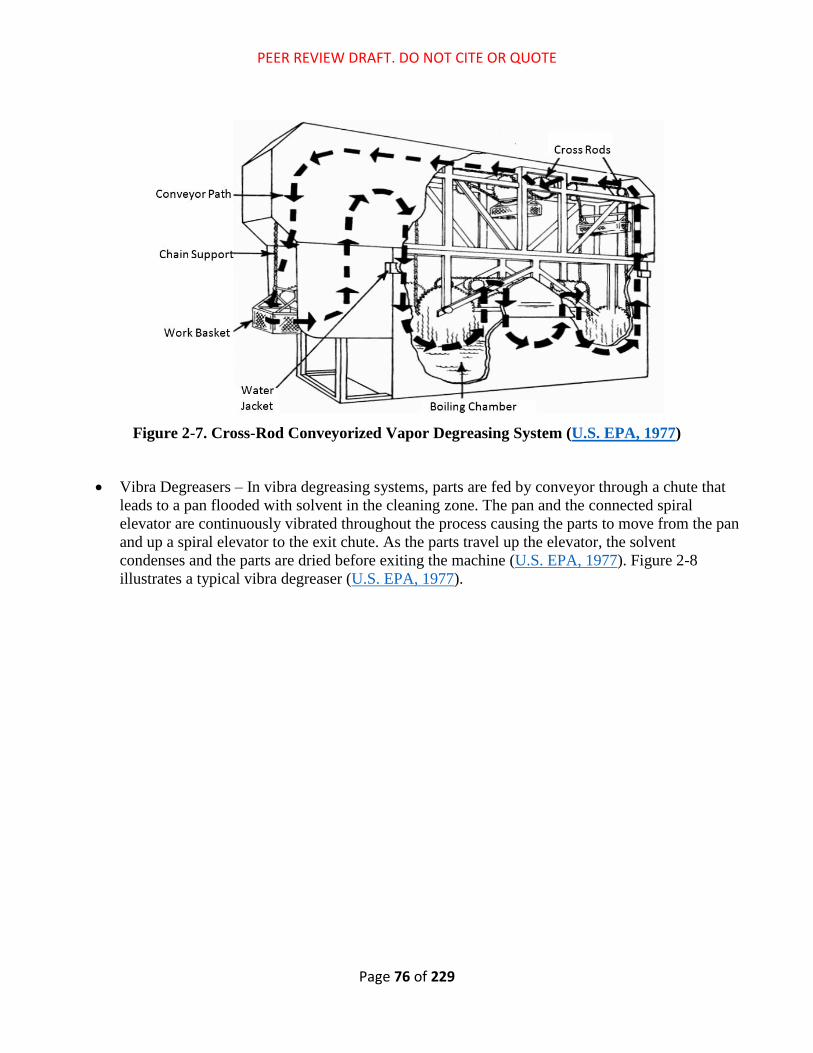
PEER REVIEW DRAFT. DO NOT CITE OR QUOTE
Page 76 of 229
Figure 2-7. Cross-Rod Conveyorized Vapor Degreasing System (U.S. EPA, 1977)
• Vibra Degreasers – In vibra degreasing systems, parts are fed by conveyor through a chute that
leads to a pan flooded with solvent in the cleaning zone. The pan and the connected spiral
elevator are continuously vibrated throughout the process causing the parts to move from the pan
and up a spiral elevator to the exit chute. As the parts travel up the elevator, the solvent
condenses and the parts are dried before exiting the machine (U.S. EPA, 1977). Figure 2-8
illustrates a typical vibra degreaser (U.S. EPA, 1977).
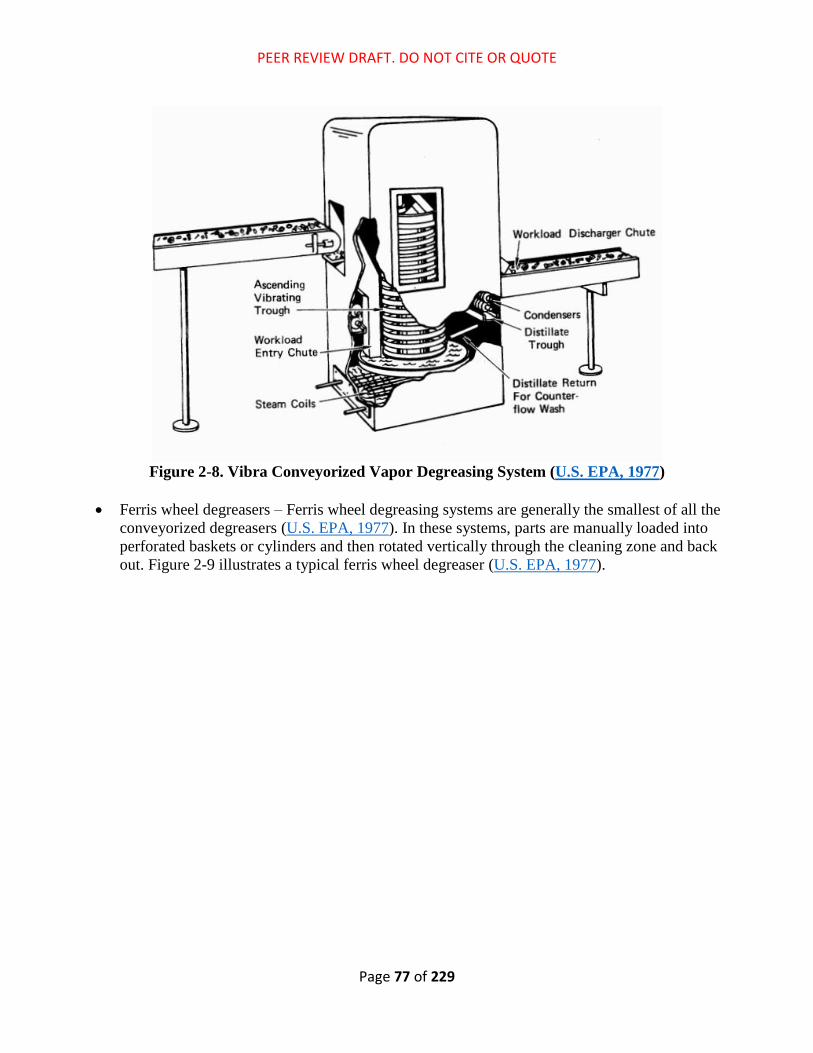
PEER REVIEW DRAFT. DO NOT CITE OR QUOTE
Page 77 of 229
Figure 2-8. Vibra Conveyorized Vapor Degreasing System (U.S. EPA, 1977)
• Ferris wheel degreasers – Ferris wheel degreasing systems are generally the smallest of all the
conveyorized degreasers (U.S. EPA, 1977). In these systems, parts are manually loaded into
perforated baskets or cylinders and then rotated vertically through the cleaning zone and back
out. Figure 2-9 illustrates a typical ferris wheel degreaser (U.S. EPA, 1977).
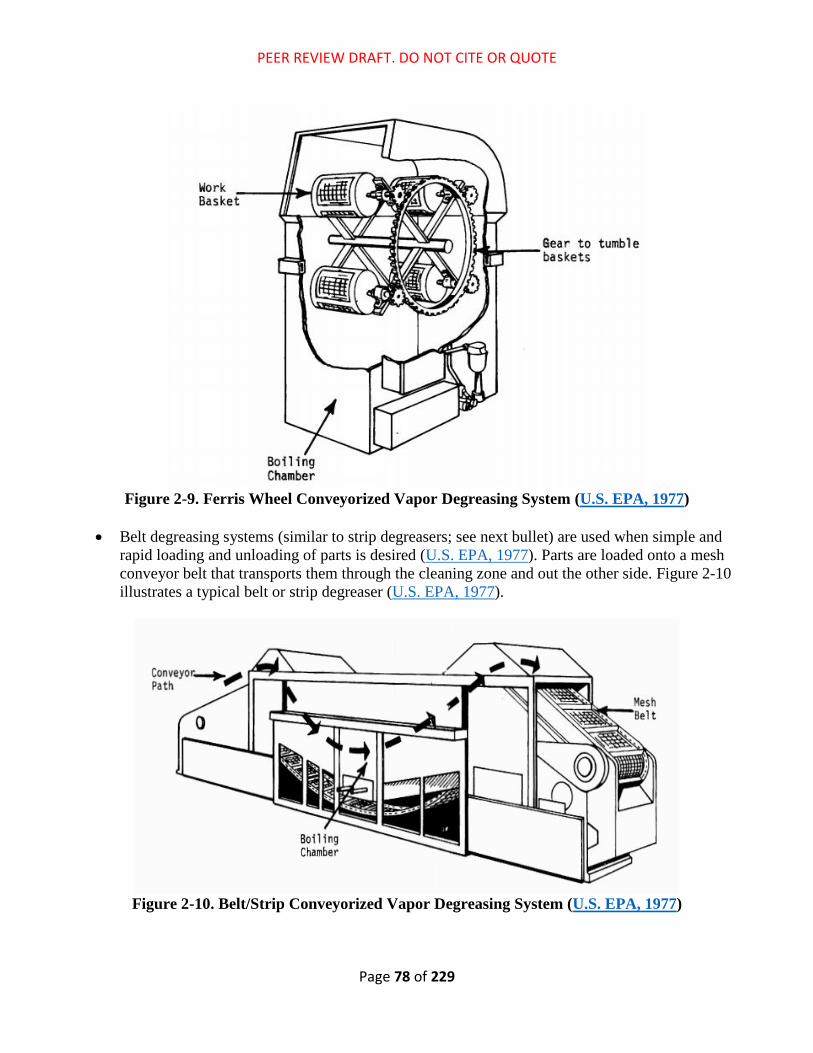
PEER REVIEW DRAFT. DO NOT CITE OR QUOTE
Page 78 of 229
Figure 2-9. Ferris Wheel Conveyorized Vapor Degreasing System (U.S. EPA, 1977)
• Belt degreasing systems (similar to strip degreasers; see next bullet) are used when simple and
rapid loading and unloading of parts is desired (U.S. EPA, 1977). Parts are loaded onto a mesh
conveyor belt that transports them through the cleaning zone and out the other side. Figure 2-10
illustrates a typical belt or strip degreaser (U.S. EPA, 1977).
Figure 2-10. Belt/Strip Conveyorized Vapor Degreasing System (U.S. EPA, 1977)
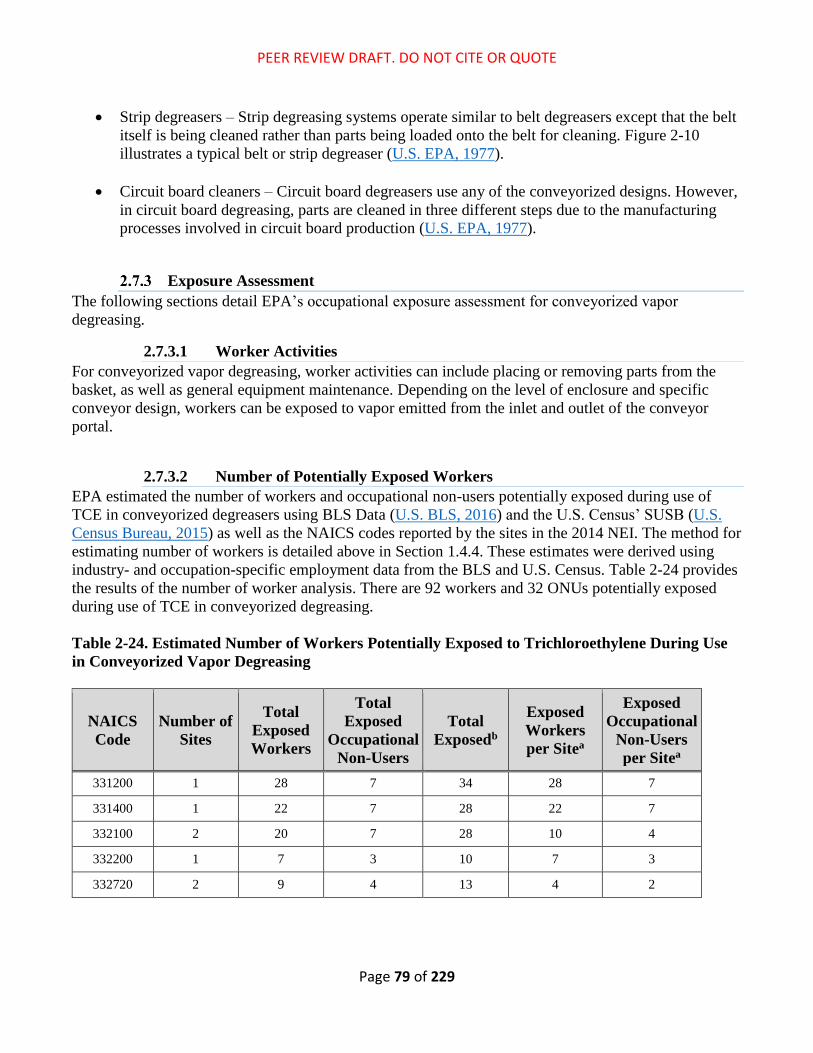
PEER REVIEW DRAFT. DO NOT CITE OR QUOTE
Page 79 of 229
• Strip degreasers – Strip degreasing systems operate similar to belt degreasers except that the belt
itself is being cleaned rather than parts being loaded onto the belt for cleaning. Figure 2-10
illustrates a typical belt or strip degreaser (U.S. EPA, 1977).
• Circuit board cleaners – Circuit board degreasers use any of the conveyorized designs. However,
in circuit board degreasing, parts are cleaned in three different steps due to the manufacturing
processes involved in circuit board production (U.S. EPA, 1977).
Exposure Assessment
The following sections detail EPA’s occupational exposure assessment for conveyorized vapor
degreasing.
2.7.3.1 Worker Activities
For conveyorized vapor degreasing, worker activities can include placing or removing parts from the
basket, as well as general equipment maintenance. Depending on the level of enclosure and specific
conveyor design, workers can be exposed to vapor emitted from the inlet and outlet of the conveyor
portal.
2.7.3.2 Number of Potentially Exposed Workers
EPA estimated the number of workers and occupational non-users potentially exposed during use of
TCE in conveyorized degreasers using BLS Data (U.S. BLS, 2016) and the U.S. Census’ SUSB (U.S.
Census Bureau, 2015) as well as the NAICS codes reported by the sites in the 2014 NEI. The method for
estimating number of workers is detailed above in Section 1.4.4. These estimates were derived using
industry- and occupation-specific employment data from the BLS and U.S. Census. Table 2-24 provides
the results of the number of worker analysis. There are 92 workers and 32 ONUs potentially exposed
during use of TCE in conveyorized degreasing.
Table 2-24. Estimated Number of Workers Potentially Exposed to Trichloroethylene During Use
in Conveyorized Vapor Degreasing
NAICS
Code
Number of
Sites
Total
Exposed
Workers
Total
Exposed
Occupational
Non-Users
Total
Exposedb
Exposed
Workers
per Sitea
Exposed
Occupational
Non-Users
per Sitea
331200 1 28 7 34 28 7
331400 1 22 7 28 22 7
332100 2 20 7 28 10 4
332200 1 7 3 10 7 3
332720 2 9 4 13 4 2
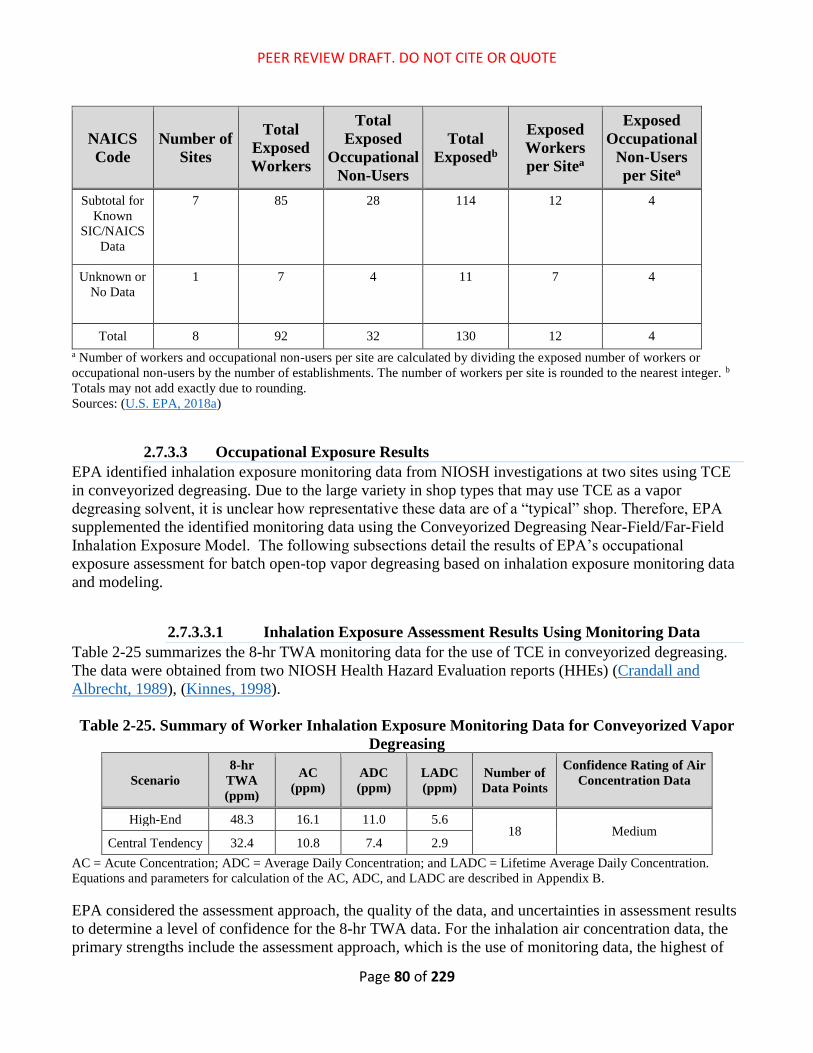
PEER REVIEW DRAFT. DO NOT CITE OR QUOTE
Page 80 of 229
NAICS
Code
Number of
Sites
Total
Exposed
Workers
Total
Exposed
Occupational
Non-Users
Total
Exposedb
Exposed
Workers
per Sitea
Exposed
Occupational
Non-Users
per Sitea
Subtotal for
Known
SIC/NAICS
Data
7 85 28 114 12 4
Unknown or
No Data
1 7 4 11 7 4
Total 8 92 32 130 12 4
a Number of workers and occupational non-users per site are calculated by dividing the exposed number of workers or
occupational non-users by the number of establishments. The number of workers per site is rounded to the nearest integer. b
Totals may not add exactly due to rounding. Sources: (U.S. EPA, 2018a)
2.7.3.3 Occupational Exposure Results
EPA identified inhalation exposure monitoring data from NIOSH investigations at two sites using TCE
in conveyorized degreasing. Due to the large variety in shop types that may use TCE as a vapor
degreasing solvent, it is unclear how representative these data are of a “typical” shop. Therefore, EPA
supplemented the identified monitoring data using the Conveyorized Degreasing Near-Field/Far-Field
Inhalation Exposure Model. The following subsections detail the results of EPA’s occupational
exposure assessment for batch open-top vapor degreasing based on inhalation exposure monitoring data
and modeling.
2.7.3.3.1 Inhalation Exposure Assessment Results Using Monitoring Data
Table 2-25 summarizes the 8-hr TWA monitoring data for the use of TCE in conveyorized degreasing.
The data were obtained from two NIOSH Health Hazard Evaluation reports (HHEs) (Crandall and
Albrecht, 1989), (Kinnes, 1998).
Table 2-25. Summary of Worker Inhalation Exposure Monitoring Data for Conveyorized Vapor
Degreasing
Scenario
8-hr
TWA
(ppm)
AC
(ppm)
ADC
(ppm)
LADC
(ppm)
Number of
Data Points
Confidence Rating of Air
Concentration Data
High-End 48.3 16.1 11.0 5.6 18 Medium
Central Tendency 32.4 10.8 7.4 2.9
AC = Acute Concentration; ADC = Average Daily Concentration; and LADC = Lifetime Average Daily Concentration.
Equations and parameters for calculation of the AC, ADC, and LADC are described in Appendix B.
EPA considered the assessment approach, the quality of the data, and uncertainties in assessment results
to determine a level of confidence for the 8-hr TWA data. For the inhalation air concentration data, the
primary strengths include the assessment approach, which is the use of monitoring data, the highest of

PEER REVIEW DRAFT. DO NOT CITE OR QUOTE
Page 81 of 229
the inhalation approach hierarchy. These monitoring data include 18 data points from 2 sources, and the
data quality ratings from systematic review for these data were medium. The primary limitations of
these data include the uncertainty of the representativeness of these data toward the true distribution of
inhalation concentrations for the industries and sites covered by this scenario. Based on these strengths
and limitations of the inhalation air concentration data, the overall confidence for these 8-hr TWA data
in this scenario is medium to low.
2.7.3.3.2 Inhalation Exposure Assessment Results Using Modeling
EPA also considered the use of modeling, which is in the middle of the inhalation approach hierarchy. A
Monte Carlo simulation with 100,000 iterations was used to capture the range of potential input
parameters. Vapor generation rates were derived from TCE unit emissions and operating hours reported
in the 2014 National Emissions Inventory. The primary limitations of the air concentration outputs from
the model include the uncertainty of the representativeness of these data toward the true distribution of
inhalation concentrations for the industries and sites covered by this scenario. Added uncertainties
include that emissions data in the 2014 NEI were only found for three total units, and the underlying
methodologies used to estimate these emissions are unknown. Based on these strengths and limitations
of the air concentrations, the overall confidence for these 8-hr TWA data in this scenario is medium to
low.
A more detailed description of the modeling approach is provided Appendix E. Figure 2-11 illustrates
the near-field/far-field model that can be applied to conveyorized vapor degreasing. As the figure shows,
TCE vapors evaporate into the near-field (at evaporation rate G), resulting in near-field exposures to
workers at a concentration CNF. The concentration is directly proportional to the evaporation rate of
TCE, G, into the near-field, whose volume is denoted by VNF. The ventilation rate for the near-field zone
(QNF) determines how quickly TCE dissipates into the far-field (i.e., the facility space surrounding the
near-field), resulting in occupational bystander exposures to TCE at a concentration CFF. VFF denotes the
volume of the far-field space into which the TCE dissipates out of the near-field. The ventilation rate for
the surroundings, denoted by QFF, determines how quickly TCE dissipates out of the surrounding space
and into the outdoor air. Appendix E outlines the equations uses for this model.
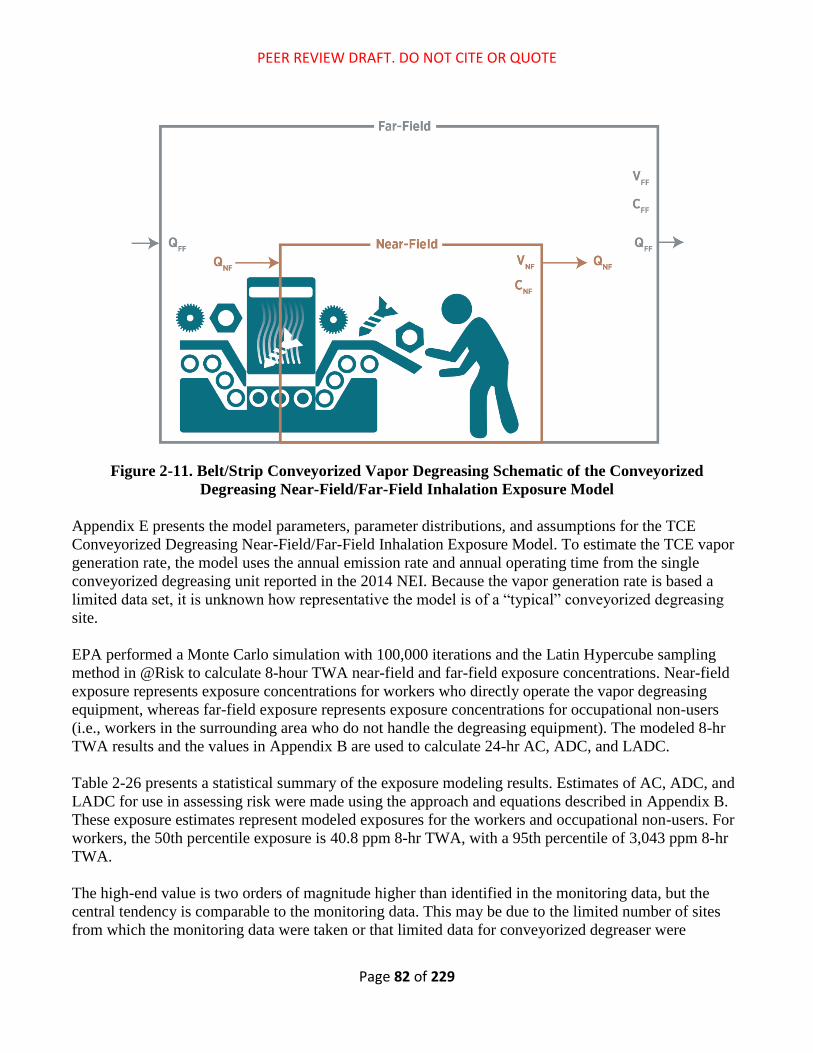
PEER REVIEW DRAFT. DO NOT CITE OR QUOTE
Page 82 of 229
Figure 2-11. Belt/Strip Conveyorized Vapor Degreasing Schematic of the Conveyorized
Degreasing Near-Field/Far-Field Inhalation Exposure Model
Appendix E presents the model parameters, parameter distributions, and assumptions for the TCE
Conveyorized Degreasing Near-Field/Far-Field Inhalation Exposure Model. To estimate the TCE vapor
generation rate, the model uses the annual emission rate and annual operating time from the single
conveyorized degreasing unit reported in the 2014 NEI. Because the vapor generation rate is based a
limited data set, it is unknown how representative the model is of a “typical” conveyorized degreasing
site.
EPA performed a Monte Carlo simulation with 100,000 iterations and the Latin Hypercube sampling
method in @Risk to calculate 8-hour TWA near-field and far-field exposure concentrations. Near-field
exposure represents exposure concentrations for workers who directly operate the vapor degreasing
equipment, whereas far-field exposure represents exposure concentrations for occupational non-users
(i.e., workers in the surrounding area who do not handle the degreasing equipment). The modeled 8-hr
TWA results and the values in Appendix B are used to calculate 24-hr AC, ADC, and LADC.
Table 2-26 presents a statistical summary of the exposure modeling results. Estimates of AC, ADC, and
LADC for use in assessing risk were made using the approach and equations described in Appendix B.
These exposure estimates represent modeled exposures for the workers and occupational non-users. For
workers, the 50th percentile exposure is 40.8 ppm 8-hr TWA, with a 95th percentile of 3,043 ppm 8-hr
TWA.
The high-end value is two orders of magnitude higher than identified in the monitoring data, but the
central tendency is comparable to the monitoring data. This may be due to the limited number of sites
from which the monitoring data were taken or that limited data for conveyorized degreaser were

PEER REVIEW DRAFT. DO NOT CITE OR QUOTE
Page 83 of 229
reported to the 2014 NEI data (data were only found for three total units). It is also uncertain of the
underlying methodologies used to estimate emissions in the 2014 NEI data.
Table 2-26. Summary of Exposure Modeling Results for TCE Degreasing in Conveyorized
Degreasers
Scenario 8-hr TWA
(ppm)
ACa
(ppm)
ADC
(ppm)
LADC
(ppm)
Data Quality Rating
of Associated Air
Concentration Data
Workers (Near-field)
High-End 3,043 1,014.4 694.8 275.2
N/A – Modeled Data Central
Tendency 40.8
13.6 9.3 5.3
Occupational non-users (Far-Field)
High-End 1,878 626 428.8 168.3
N/A – Modeled Data Central
Tendency 23.3
7.8 5.3 3.6
AC = Acute Concentration; ADC = Average Daily Concentration; and LADC = Lifetime Average Daily Concentration.
Equations and parameters for calculation of the AC, ADC, and LADC are described in Appendix B. a Acute exposures calculated as a 24-hr TWA.
Water Release Assessment
The following sections detail EPA’s water release assessment for use of TCE in batch-conveyorized
vapor degreasers.
2.7.4.1 Water Release Sources
Similar to OTVDs, the primary source of water releases from conveyorized systems is expected to be
from wastewater from the water separator with the primary sources of water being: 1) Moisture in the
atmosphere that condenses into the solvent when exposed to the condensation coils on the system;
and/or 2) steam used to regenerate carbon adsorbers used to control solvent emissions (Durkee, 2014;
Kanegsberg and Kanegsberg, 2011; NIOSH, 2002a, b, c, d). The current disposal practices of the
wastewater are unknown; however, a 1982 EPA (Gilbert et al., 1982) report estimated 20% of water
releases from metal cleaning (including batch systems, conveyorized systems, and vapor and cold
systems) were direct discharges to surface water and 80% of water releases were discharged indirectly to
a POTW.
2.7.4.2 Water Release Assessment Results
EPA assumes the TRI and DMR data cover all water discharges of TCE from conveyorized degreasing.
However, EPA cannot distinguish between degreaser types in TRI and DMR data; therefore, a single set
of water release for all degreasing operations is presented in Section 2.5.4 for OTVDs.

PEER REVIEW DRAFT. DO NOT CITE OR QUOTE
Page 84 of 229
2.8 Web Vapor Degreasing
Facility Estimates
To determine the number of sites that use TCE in web vapor degreasers, EPA considered 2014 NEI data,
2016 TRI data, and 2016 DMR data. Sites in TRI and DMR do not differentiate between degreaser types
and therefore are included in the OTVD assessment and are not considered again here. In the 2014 NEI,
no web degreasers were reported in operation (U.S. EPA, 2018a). Although the use of TCE was not
reported in web degreasing in 2014 NEI, the use of TCE in web degreasing could still be a reasonably
foreseeable OES, as NEI data does not include degreasing operations that are classified as area sources.
Area sources are reported at the county level and do not include site-specific information. Therefore,
EPA used (U.S. EPA, 2011) data for web degreasing. In the (U.S. EPA, 2011), one web degreasing site
was reported. Therefore, EPA assesses one site for web degreasing.
Process Description
Continuous web cleaning machines are a subset of conveyorized degreasers but differ in that they are
specifically designed for cleaning parts that are coiled or on spools such as films, wires and metal strips
(Kanegsberg and Kanegsberg, 2011; U.S. EPA, 2006). In continuous web degreasers, parts are uncoiled
and loaded onto rollers that transport the parts through the cleaning and drying zones at speeds greater
than 11 feet per minute (U.S. EPA, 2006). The parts are then recoiled or cut after exiting the cleaning
machine (Kanegsberg and Kanegsberg, 2011; U.S. EPA, 2006). Figure 2-12 illustrates a typical
continuous web cleaning machine.
Figure 2-12. Continuous Web Vapor Degreasing System
Exposure Assessment
PEER REVIEW DRAFT. DO NOT CITE OR QUOTE
Page 85 of 229
2.8.3.1 Worker Activities
For web vapor degreasing, worker activities are expected to be similar to other degreasing uses and can
include placing or removing parts from the degreasing machine, as well as general equipment
maintenance. Depending on the level of enclosure and specific design, workers can be exposed to vapor
emitted from the inlet and outlet of the conveyor portal.
2.8.3.2 Number of Potentially Exposed Workers
EPA does not have data to estimate the total workers and ONUs exposed to TCE from web degreasing
as this information was not available in BLS Data (U.S. BLS, 2016) and the U.S. Census’ SUSB (U.S.
Census Bureau, 2015). Refer to Section 2.5 for general information on vapor degreasing.
2.8.3.3 Occupational Exposure Results
EPA did not identify inhalation exposure monitoring data related to the use of TCE in web degreasing.
Therefore, EPA used the Near-Field/Far-Field Model to estimate exposures to workers and ONUs. The
following details the results of EPA’s occupational exposure assessment for use in web degreasers based
on inhalation exposure modeling.
A more detailed description of the modeling approach is provided Appendix E. Figure 2-13 illustrates
the near-field/far-field model that can be applied to web degreasing. As the figure shows, TCE vapors
evaporate into the near-field (at evaporation rate G), resulting in near-field exposures to workers at a
concentration CNF. The concentration is directly proportional to the evaporation rate of TCE, G, into the
near-field, whose volume is denoted by VNF. The ventilation rate for the near-field zone (QNF)
determines how quickly TCE dissipates into the far-field (i.e., the facility space surrounding the near-
field), resulting in occupational bystander exposures to TCE at a concentration CFF. VFF denotes the
volume of the far-field space into which the TCE dissipates out of the near-field. The ventilation rate for
the surroundings, denoted by QFF, determines how quickly TCE dissipates out of the surrounding space
and into the outdoor air. Appendix E outlines the equations uses for this model.
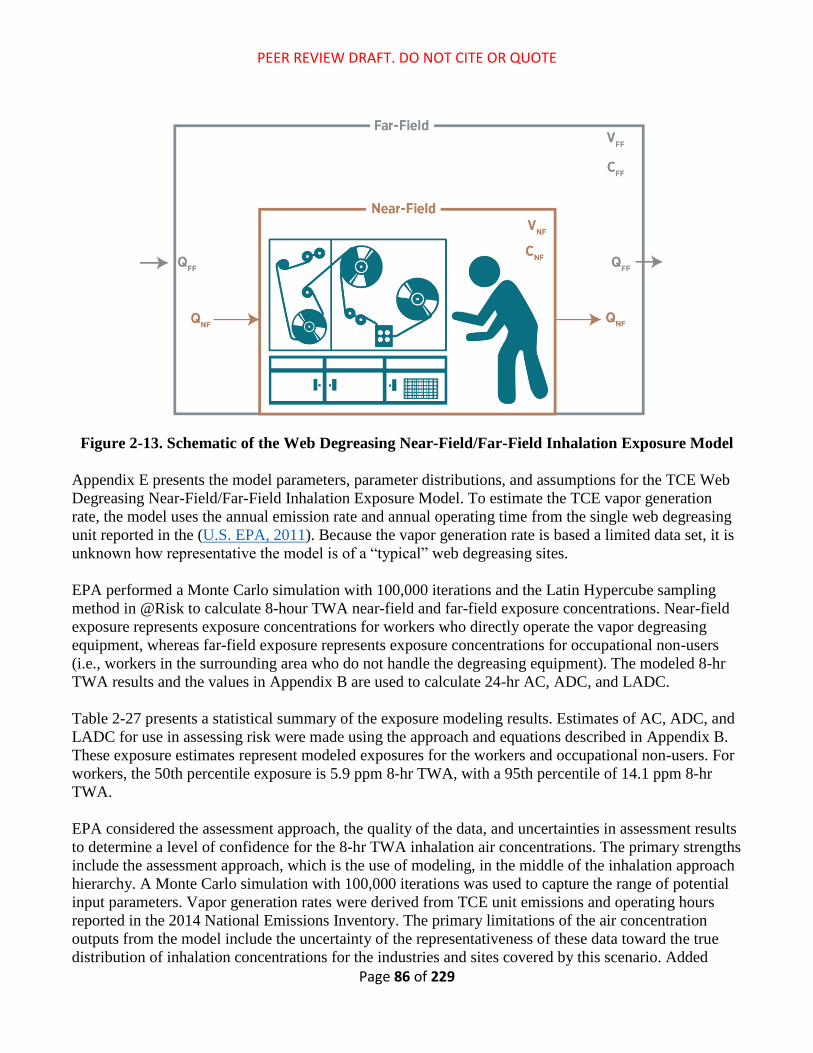
PEER REVIEW DRAFT. DO NOT CITE OR QUOTE
Page 86 of 229
Figure 2-13. Schematic of the Web Degreasing Near-Field/Far-Field Inhalation Exposure Model
Appendix E presents the model parameters, parameter distributions, and assumptions for the TCE Web
Degreasing Near-Field/Far-Field Inhalation Exposure Model. To estimate the TCE vapor generation
rate, the model uses the annual emission rate and annual operating time from the single web degreasing
unit reported in the (U.S. EPA, 2011). Because the vapor generation rate is based a limited data set, it is
unknown how representative the model is of a “typical” web degreasing sites.
EPA performed a Monte Carlo simulation with 100,000 iterations and the Latin Hypercube sampling
method in @Risk to calculate 8-hour TWA near-field and far-field exposure concentrations. Near-field
exposure represents exposure concentrations for workers who directly operate the vapor degreasing
equipment, whereas far-field exposure represents exposure concentrations for occupational non-users
(i.e., workers in the surrounding area who do not handle the degreasing equipment). The modeled 8-hr
TWA results and the values in Appendix B are used to calculate 24-hr AC, ADC, and LADC.
Table 2-27 presents a statistical summary of the exposure modeling results. Estimates of AC, ADC, and
LADC for use in assessing risk were made using the approach and equations described in Appendix B.
These exposure estimates represent modeled exposures for the workers and occupational non-users. For
workers, the 50th percentile exposure is 5.9 ppm 8-hr TWA, with a 95th percentile of 14.1 ppm 8-hr
TWA.
EPA considered the assessment approach, the quality of the data, and uncertainties in assessment results
to determine a level of confidence for the 8-hr TWA inhalation air concentrations. The primary strengths
include the assessment approach, which is the use of modeling, in the middle of the inhalation approach
hierarchy. A Monte Carlo simulation with 100,000 iterations was used to capture the range of potential
input parameters. Vapor generation rates were derived from TCE unit emissions and operating hours
reported in the 2014 National Emissions Inventory. The primary limitations of the air concentration
outputs from the model include the uncertainty of the representativeness of these data toward the true
distribution of inhalation concentrations for the industries and sites covered by this scenario. Added

PEER REVIEW DRAFT. DO NOT CITE OR QUOTE
Page 87 of 229
uncertainties include that emissions data in the 2011 NEI were only found for one unit, and the
underlying methodologies used to estimate the emission is unknown. Based on these strengths and
limitations of the air concentrations, the overall confidence for these 8-hr TWA data in this scenario is
medium to low.
Table 2-27. Summary of Exposure Modeling Results for TCE Degreasing in Web Degreasers
Scenario 8-hr TWA
(ppm)
ACa
(ppm)
ADC
(ppm)
LADC
(ppm)
Confidence Rating
of Air
Concentration
Data
Workers (Near-field)
High-End 14.1 4.7 3.2 1.4
N/A – Modeled Data Central
Tendency 5.9
2.0 1.4 0.5
Occupational non-users (Far-Field)
High-End 9.6 3.2 2.2 0.9
N/A – Modeled Data Central
Tendency 3.1
1.0 0.7 0.3
AC = Acute Concentration; ADC = Average Daily Concentration; and LADC = Lifetime Average Daily Concentration.
Equations and parameters for calculation of the AC, ADC, and LADC are described in Appendix B. a Acute exposures calculated as a 24-hr TWA.
Water Release Assessment
The following sections detail EPA’s water release assessment for use of TCE in web degreasers.
2.8.4.1 Water Release Sources
Similar to OTVDs, the primary source of water releases from web systems is expected to be from
wastewater from the water separator with the primary sources of water being: 1) Moisture in the
atmosphere that condenses into the solvent when exposed to the condensation coils on the system;
and/or 2) steam used to regenerate carbon adsorbers used to control solvent emissions (Durkee, 2014;
Kanegsberg and Kanegsberg, 2011; NIOSH, 2002a, b, c, d). The current disposal practices of the
wastewater are unknown; however, a 1982 EPA (Gilbert et al., 1982) report estimated 20% of water
releases from metal cleaning (including batch systems, conveyorized systems, and vapor and cold
systems) were direct discharges to surface water and 80% of water releases were discharged indirectly to
a POTW.
2.8.4.2 Water Release Assessment Results
EPA assumes the TRI and DMR data cover all water discharges of TCE from web vapor degreasing.
However, EPA cannot distinguish between degreaser types in TRI and DMR data; therefore, a single set
of water release for all degreasing operations is presented in Section 2.5.4.2 for OTVDs.
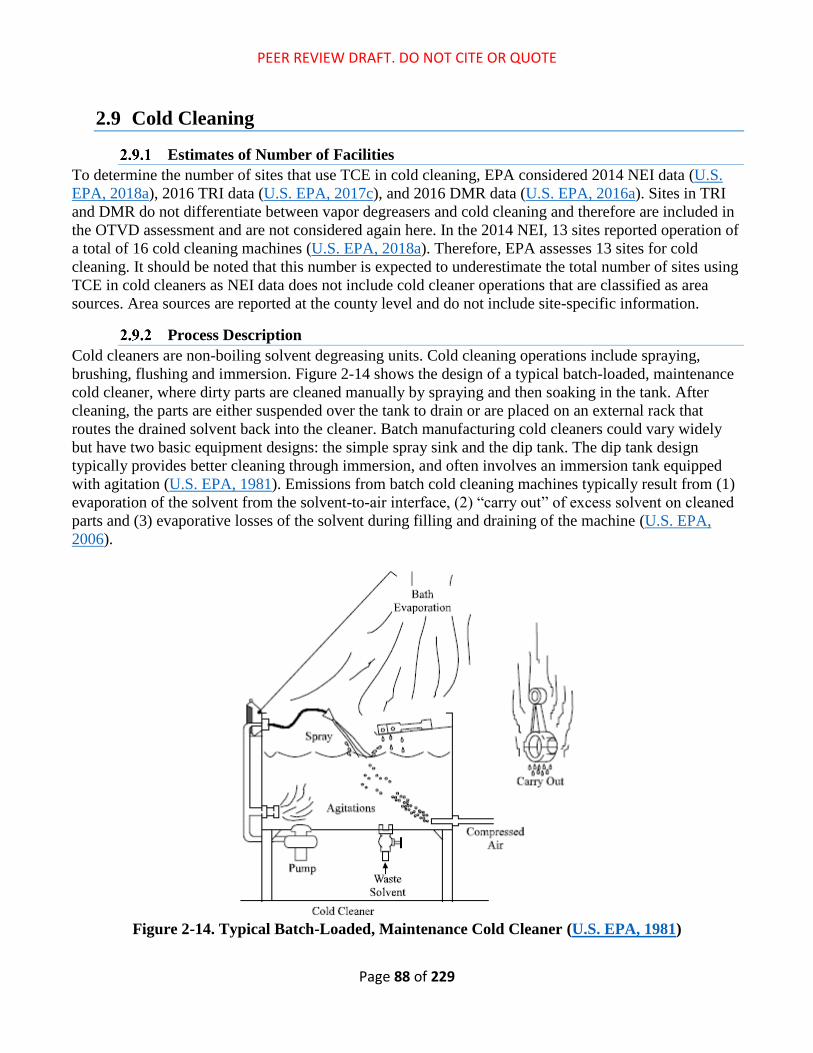
PEER REVIEW DRAFT. DO NOT CITE OR QUOTE
Page 88 of 229
2.9 Cold Cleaning
Estimates of Number of Facilities
To determine the number of sites that use TCE in cold cleaning, EPA considered 2014 NEI data (U.S.
EPA, 2018a), 2016 TRI data (U.S. EPA, 2017c), and 2016 DMR data (U.S. EPA, 2016a). Sites in TRI
and DMR do not differentiate between vapor degreasers and cold cleaning and therefore are included in
the OTVD assessment and are not considered again here. In the 2014 NEI, 13 sites reported operation of
a total of 16 cold cleaning machines (U.S. EPA, 2018a). Therefore, EPA assesses 13 sites for cold
cleaning. It should be noted that this number is expected to underestimate the total number of sites using
TCE in cold cleaners as NEI data does not include cold cleaner operations that are classified as area
sources. Area sources are reported at the county level and do not include site-specific information.
Process Description
Cold cleaners are non-boiling solvent degreasing units. Cold cleaning operations include spraying,
brushing, flushing and immersion. Figure 2-14 shows the design of a typical batch-loaded, maintenance
cold cleaner, where dirty parts are cleaned manually by spraying and then soaking in the tank. After
cleaning, the parts are either suspended over the tank to drain or are placed on an external rack that
routes the drained solvent back into the cleaner. Batch manufacturing cold cleaners could vary widely
but have two basic equipment designs: the simple spray sink and the dip tank. The dip tank design
typically provides better cleaning through immersion, and often involves an immersion tank equipped
with agitation (U.S. EPA, 1981). Emissions from batch cold cleaning machines typically result from (1)
evaporation of the solvent from the solvent-to-air interface, (2) “carry out” of excess solvent on cleaned
parts and (3) evaporative losses of the solvent during filling and draining of the machine (U.S. EPA,
2006).
Figure 2-14. Typical Batch-Loaded, Maintenance Cold Cleaner (U.S. EPA, 1981)
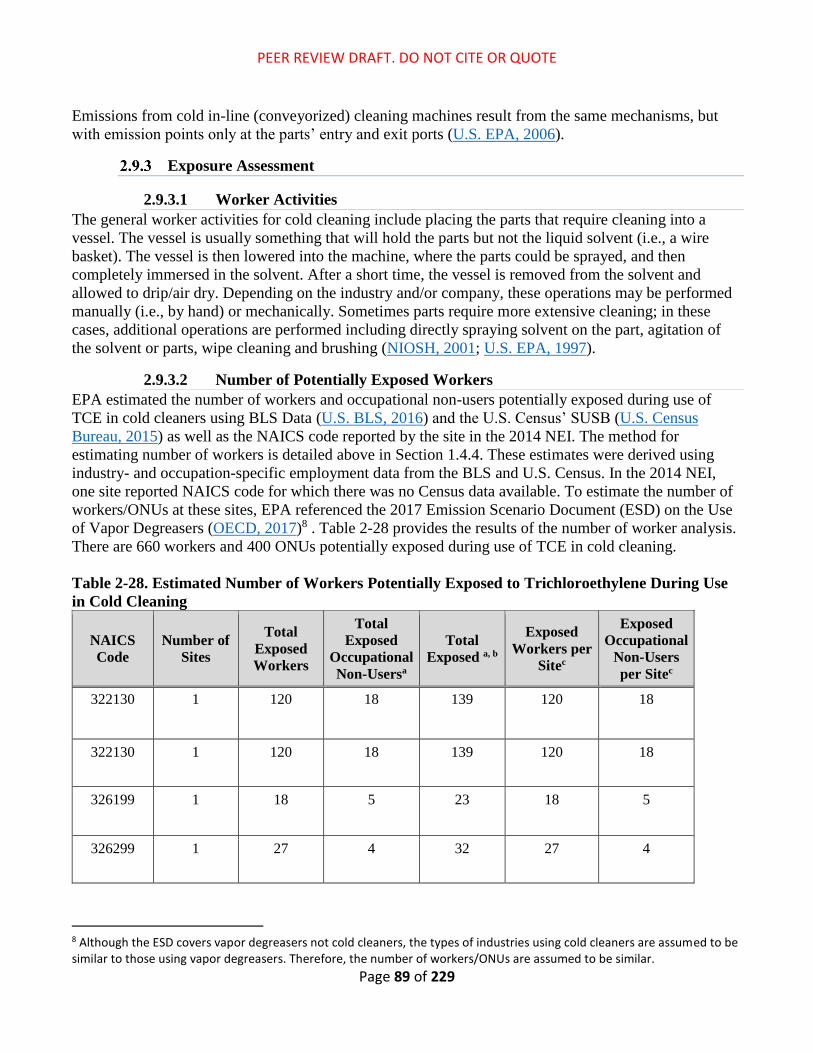
PEER REVIEW DRAFT. DO NOT CITE OR QUOTE
Page 89 of 229
Emissions from cold in-line (conveyorized) cleaning machines result from the same mechanisms, but
with emission points only at the parts’ entry and exit ports (U.S. EPA, 2006).
Exposure Assessment
2.9.3.1 Worker Activities
The general worker activities for cold cleaning include placing the parts that require cleaning into a
vessel. The vessel is usually something that will hold the parts but not the liquid solvent (i.e., a wire
basket). The vessel is then lowered into the machine, where the parts could be sprayed, and then
completely immersed in the solvent. After a short time, the vessel is removed from the solvent and
allowed to drip/air dry. Depending on the industry and/or company, these operations may be performed
manually (i.e., by hand) or mechanically. Sometimes parts require more extensive cleaning; in these
cases, additional operations are performed including directly spraying solvent on the part, agitation of
the solvent or parts, wipe cleaning and brushing (NIOSH, 2001; U.S. EPA, 1997).
2.9.3.2 Number of Potentially Exposed Workers
EPA estimated the number of workers and occupational non-users potentially exposed during use of
TCE in cold cleaners using BLS Data (U.S. BLS, 2016) and the U.S. Census’ SUSB (U.S. Census
Bureau, 2015) as well as the NAICS code reported by the site in the 2014 NEI. The method for
estimating number of workers is detailed above in Section 1.4.4. These estimates were derived using
industry- and occupation-specific employment data from the BLS and U.S. Census. In the 2014 NEI,
one site reported NAICS code for which there was no Census data available. To estimate the number of
workers/ONUs at these sites, EPA referenced the 2017 Emission Scenario Document (ESD) on the Use
of Vapor Degreasers (OECD, 2017)8 . Table 2-28 provides the results of the number of worker analysis.
There are 660 workers and 400 ONUs potentially exposed during use of TCE in cold cleaning.
Table 2-28. Estimated Number of Workers Potentially Exposed to Trichloroethylene During Use
in Cold Cleaning
NAICS
Code
Number of
Sites
Total
Exposed
Workers
Total
Exposed
Occupational
Non-Usersa
Total
Exposed a, b
Exposed
Workers per
Sitec
Exposed
Occupational
Non-Users
per Sitec
322130 1 120 18 139 120 18
322130 1 120 18 139 120 18
326199 1 18 5 23 18 5
326299 1 27 4 32 27 4
8 Although the ESD covers vapor degreasers not cold cleaners, the types of industries using cold cleaners are assumed to be similar to those using vapor degreasers. Therefore, the number of workers/ONUs are assumed to be similar.

PEER REVIEW DRAFT. DO NOT CITE OR QUOTE
Page 90 of 229
NAICS
Code
Number of
Sites
Total
Exposed
Workers
Total
Exposed
Occupational
Non-Usersa
Total
Exposed a, b
Exposed
Workers per
Sitec
Exposed
Occupational
Non-Users
per Sitec
332813 3 24 5 29 8 2
335921 1 20 7 28 20 7
335991 1 21 8 29 21 8
335999 1 13 5 18 13 5
336411 2 367 310 677 184 155
336413 1 41 35 76 41 35
Subtotal for
Known
SIC/NAICS
Data
12 653 398 1,051 54 33
Unknown
or No Data
1 7 4 11 7 4
Total 13 660 400 1,100 51 31 a Values rounded to two significant figures. b Totals may not add exactly due to rounding. c Number of workers and occupational non-users per site are calculated by dividing the exposed number of workers or
occupational non-users by the number of establishments. The number of workers per site is rounded to the nearest integer. Sources: (U.S. EPA, 2018a; OECD, 2017)
2.9.3.3 Occupational Exposure Results
EPA did not identify inhalation exposure monitoring data for the Cold Cleaning OES. Therefore, EPA
used the Cold Cleaning Near-Field/Far-Field Inhalation Exposure Model to estimate exposures to
workers and ONUs. The following details the results of EPA’s occupational exposure assessment for
cold cleaning based on modeling.
A more detailed description of the modeling approach is provided Appendix E. Figure 2-15 illustrates
the near-field/far-field model that can be applied to cold cleaning. As the figure shows, TCE vapors
evaporate into the near-field (at evaporation rate G), resulting in near-field exposures to workers at a
concentration CNF. The concentration is directly proportional to the evaporation rate of TCE, G, into the
near-field, whose volume is denoted by VNF. The ventilation rate for the near-field zone (QNF)
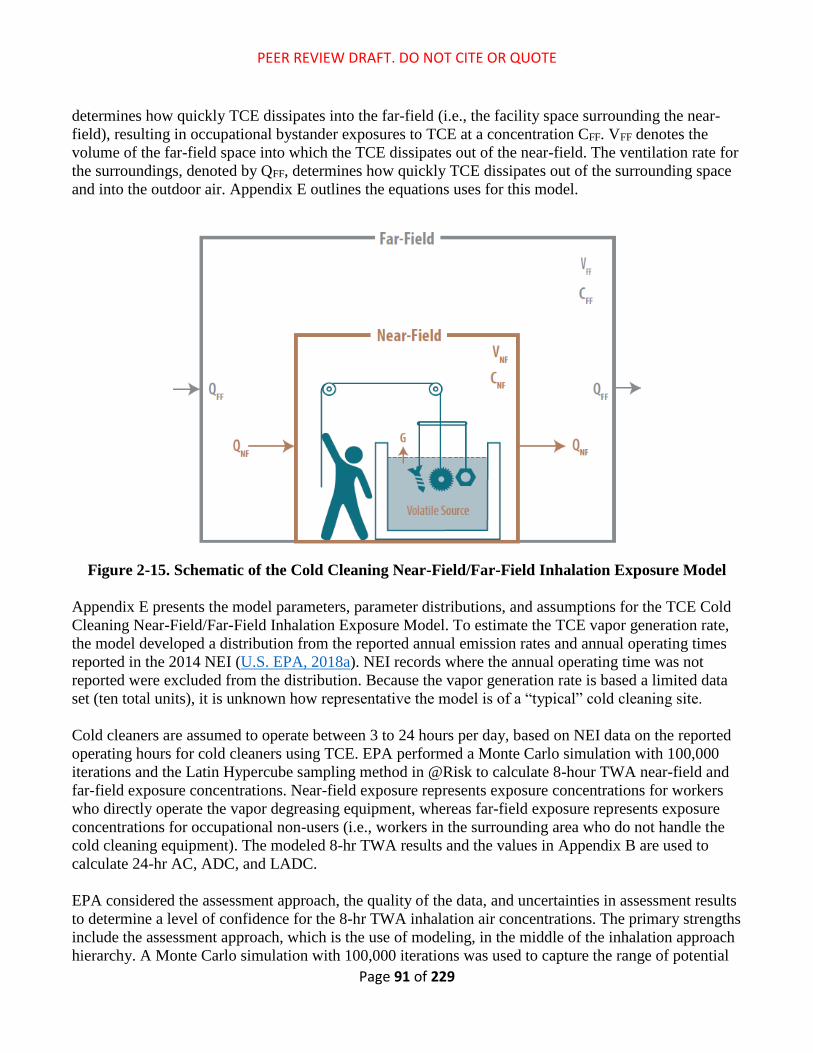
PEER REVIEW DRAFT. DO NOT CITE OR QUOTE
Page 91 of 229
determines how quickly TCE dissipates into the far-field (i.e., the facility space surrounding the near-
field), resulting in occupational bystander exposures to TCE at a concentration CFF. VFF denotes the
volume of the far-field space into which the TCE dissipates out of the near-field. The ventilation rate for
the surroundings, denoted by QFF, determines how quickly TCE dissipates out of the surrounding space
and into the outdoor air. Appendix E outlines the equations uses for this model.
Figure 2-15. Schematic of the Cold Cleaning Near-Field/Far-Field Inhalation Exposure Model
Appendix E presents the model parameters, parameter distributions, and assumptions for the TCE Cold
Cleaning Near-Field/Far-Field Inhalation Exposure Model. To estimate the TCE vapor generation rate,
the model developed a distribution from the reported annual emission rates and annual operating times
reported in the 2014 NEI (U.S. EPA, 2018a). NEI records where the annual operating time was not
reported were excluded from the distribution. Because the vapor generation rate is based a limited data
set (ten total units), it is unknown how representative the model is of a “typical” cold cleaning site.
Cold cleaners are assumed to operate between 3 to 24 hours per day, based on NEI data on the reported
operating hours for cold cleaners using TCE. EPA performed a Monte Carlo simulation with 100,000
iterations and the Latin Hypercube sampling method in @Risk to calculate 8-hour TWA near-field and
far-field exposure concentrations. Near-field exposure represents exposure concentrations for workers
who directly operate the vapor degreasing equipment, whereas far-field exposure represents exposure
concentrations for occupational non-users (i.e., workers in the surrounding area who do not handle the
cold cleaning equipment). The modeled 8-hr TWA results and the values in Appendix B are used to
calculate 24-hr AC, ADC, and LADC.
EPA considered the assessment approach, the quality of the data, and uncertainties in assessment results
to determine a level of confidence for the 8-hr TWA inhalation air concentrations. The primary strengths
include the assessment approach, which is the use of modeling, in the middle of the inhalation approach
hierarchy. A Monte Carlo simulation with 100,000 iterations was used to capture the range of potential

PEER REVIEW DRAFT. DO NOT CITE OR QUOTE
Page 92 of 229
input parameters. Vapor generation rates were derived from TCE unit emissions and operating hours
reported in the 2014 National Emissions Inventory. The primary limitations of the air concentration
outputs from the model include the uncertainty of the representativeness of these data toward the true
distribution of inhalation concentrations for the industries and sites covered by this scenario. Added
uncertainties include that emissions data in the 2014 NEI were only found for ten total units, and the
underlying methodologies used to estimate these emissions are unknown. Based on these strengths and
limitations of the air concentrations, the overall confidence for these 8-hr TWA data in this scenario is
medium to low.
Table 2-29 presents a statistical summary of the exposure modeling results. Estimates of AC, ADC, and
LADC for use in assessing risk were made using the approach and equations described in Appendix B.
These exposure estimates represent modeled exposures for the workers and occupational non-users. For
workers, the 50th percentile exposure is 3.33 ppm 8-hr TWA, with a 95th percentile of 57.2 ppm 8-hr
TWA.
Table 2-29. Summary of Exposure Modeling Results for Use of Trichloroethylene in Cold
Cleaning
Scenario 8-hr TWA
(ppm)
AC
(ppm)
ADC
(ppm)
LADC
(ppm)
Confidence
Rating of Air
Concentration
Data
Workers (Near-field)
High-End 57.2 19.1 13.1 5.2 N/A – Modeled
Data Central
Tendency 3.33 1.11 0.8 0.3
Occupational non-users (Far-Field)
High-End 34.7 11.6 7.9 3.1 N/A – Modeled
Data Central
Tendency 1.8 0.6 0.4 0.2
AC = Acute Concentration; ADC = Average Daily Concentration; and LADC = Lifetime Average Daily Concentration.
Equations and parameters for calculation of the AC, ADC, and LADC are described in Appendix B.
Water Release Assessment
2.9.4.1 Water Release Sources
Similar to OTVDs, the primary source of water releases from cold cleaners is expected to be from
wastewater from the water separator with the primary source of water expected to be from moisture in
the atmosphere that condenses into the solvent. Water may also enter vapor degreasers via steam used to
regenerate carbon adsorbers; however, it is unclear if carbon adsorbers would be used in conjunction
with cold cleaning equipment. The current disposal practices of the wastewater are unknown; however, a
1982 EPA (Gilbert et al., 1982) report estimated 20% of water releases from metal cleaning (including
batch systems, conveyorized systems, and vapor and cold systems) were direct discharges to surface
water and 80% of water releases were discharged indirectly to a POTW.
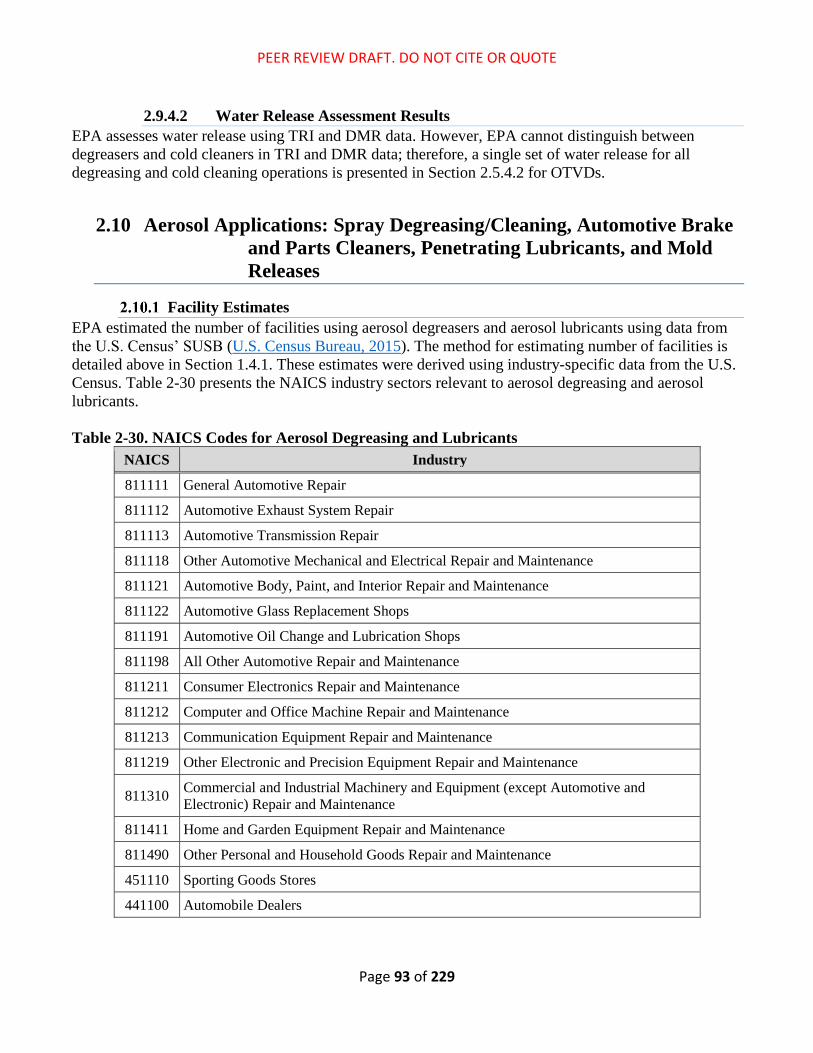
PEER REVIEW DRAFT. DO NOT CITE OR QUOTE
Page 93 of 229
2.9.4.2 Water Release Assessment Results
EPA assesses water release using TRI and DMR data. However, EPA cannot distinguish between
degreasers and cold cleaners in TRI and DMR data; therefore, a single set of water release for all
degreasing and cold cleaning operations is presented in Section 2.5.4.2 for OTVDs.
2.10 Aerosol Applications: Spray Degreasing/Cleaning, Automotive Brake
and Parts Cleaners, Penetrating Lubricants, and Mold
Releases
Facility Estimates
EPA estimated the number of facilities using aerosol degreasers and aerosol lubricants using data from
the U.S. Census’ SUSB (U.S. Census Bureau, 2015). The method for estimating number of facilities is
detailed above in Section 1.4.1. These estimates were derived using industry-specific data from the U.S.
Census. Table 2-30 presents the NAICS industry sectors relevant to aerosol degreasing and aerosol
lubricants.
Table 2-30. NAICS Codes for Aerosol Degreasing and Lubricants
NAICS Industry
811111 General Automotive Repair
811112 Automotive Exhaust System Repair
811113 Automotive Transmission Repair
811118 Other Automotive Mechanical and Electrical Repair and Maintenance
811121 Automotive Body, Paint, and Interior Repair and Maintenance
811122 Automotive Glass Replacement Shops
811191 Automotive Oil Change and Lubrication Shops
811198 All Other Automotive Repair and Maintenance
811211 Consumer Electronics Repair and Maintenance
811212 Computer and Office Machine Repair and Maintenance
811213 Communication Equipment Repair and Maintenance
811219 Other Electronic and Precision Equipment Repair and Maintenance
811310 Commercial and Industrial Machinery and Equipment (except Automotive and
Electronic) Repair and Maintenance
811411 Home and Garden Equipment Repair and Maintenance
811490 Other Personal and Household Goods Repair and Maintenance
451110 Sporting Goods Stores
441100 Automobile Dealers
PEER REVIEW DRAFT. DO NOT CITE OR QUOTE
Page 94 of 229
There are 256,850 establishments among the industry sectors expected to use aerosol degreasers and/or
aerosol lubricants (citation for SUSB). In 1997, the California Air Resources Board (CARB) conducted
a survey of automotive maintenance and repair facilities and estimated approximately 11,700 to 27,900
lb/yr of TCE was used in brake servicing (approximately 90% to 96% in aerosol products), while
approximately 11,900 to 30,000 lb/yr of TCE was used in brake and non-brake uses (approximately 91%
to 95% in aerosol products) in California (CARB, 2000). Also based on CARB’s survey, approximately
73% of automotive maintenance and repair facilities use brake cleaning products to perform brake jobs,
and approximately 38% of these facilities use brake cleaning products containing chlorinated chemicals
(CARB, 2000). Furthermore, approximately 5% to 6% of facilities that use chlorinated products reported
using TCE-based products. Approximately 36% of facilities that use chlorinated products reported using
methylene chloride-based products. OSHA's final rule on methylene chloride became effective on
October 22, 1998, which is after the date of CARB’s survey. Therefore, it is possible the TCE market
share increased to account for declining methylene chloride usage in response to OSHA’s rule.
These data only relate to aerosol brake cleaning products used in the automotive repair industry;
however, aerosol degreasing and penetrating lubricants may also be used in electronics repair, industrial
equipment repair, home and garden equipment repair, or other similar industries. Market penetration
data for these industries were not identified; therefore, in lieu of other information, EPA assumes a
similar market penetration as for brake cleaning products.
EPA estimates the average market penetration for TCE aerosol degreasers, brake and parts cleaners, and
penetrating lubricants as the high-end value calculated from CARB data, or 6% of facilities that use
chlorinated-based products that use TCE, multiplied by the 38% of facilities that use brake cleaning
products that use chlorinated-based products, multiplied by the 73% of facilities that use brake cleaning
products, or 1.7% (6% x 38% x 73% = 1.7%) (CARB, 2000). This results in approximately 4,366
establishments using aerosol products containing TCE. The number of establishments using TCE-based
aerosol solvents may have increased since 1997 if the use of methylene chloride decreased in response
to OSHA’s 1998 rule.
Process Description
EPA’s Preliminary Information on Manufacturing, Processing, Distribution, Use, and Disposal for TCE
(U.S. EPA, 2017b) identified 16 aerosol-based degreasing products containing TCE. These products
include degreasers for applications such as brake cleaning, mold cleaning, and other metal product
cleaning. The weight percent of TCE in these products range from 40% to 100%. Additional aerosol
products include film cleaners, coil cleaners, and various lubricants. The weight percent of TCE in these
products ranges from 40% to 100% (with most products containing greater than 90% TCE). EPA
expects significant overlap in the industry sectors that use aerosol-based products; therefore, these uses
are combined.
Aerosol degreasing is a process that uses an aerosolized solvent spray, typically applied from a
pressurized can, to remove residual contaminants from fabricated parts. A propellant is used to
aerosolize the formulation, allowing it to be sprayed onto substrates. Similarly, aerosol lubricant
products use an aerosolized spray to help free frozen parts by dissolving rust and leave behind a residue
to protect surfaces against rust and corrosion. Based on the safety data sheets for the identified products,
TCE-based aerosol products generally use carbon dioxide and liquified petroleum gas (LPG) (i.e.,
propane and butane) as the propellant.

PEER REVIEW DRAFT. DO NOT CITE OR QUOTE
Page 95 of 229
Exposure Assessment
The following sections detail EPA’s occupational exposure assessment for aerosol degreasing and
aerosol lubricants.
2.10.3.1 Worker Activities
Figure 2-16 illustrates the typical process of using aerosol degreasing to clean components in
commercial settings. One example of a commercial setting with aerosol degreasing operations is repair
shops, where service items are cleaned to remove any contaminants that would otherwise compromise
the service item’s operation. Internal components may be cleaned in place or removed from the service
item, cleaned, and then re-installed once dry (U.S. EPA, 2014a).
Figure 2-16. Overview of Aerosol Degreasing
Workers at these facilities are expected to be exposed through dermal contact with and inhalation of
mists during application of the aerosol product to the service item. ONUs include employees that work
at the facility but do not directly apply the aerosol product to the service item and are therefore expected
to have lower inhalation exposures and are not expected to have dermal exposures. EPA believes
workers would not typically utilize respiratory protection during aerosol degreasing activities.
2.10.3.2 Number of Potentially Exposed Workers
EPA estimated the number of workers and occupational non-users potentially exposed to aerosol
degreasers and aerosol lubricants containing TCE using BLS Data (U.S. BLS, 2016) and the U.S.
Census’ SUSB (U.S. Census Bureau, 2015). The method for estimating number of workers is detailed
above in Section 1.4.4. These estimates were derived using industry- and occupation-specific
employment data from the BLS and U.S. Census.
Based on the market penetration of 1.7% and data from the BLS and U.S. Census, there are
approximately 14,200 workers and 1,690 occupational non-users potentially exposed to TCE as an
aerosol degreasing solvent or aerosol lubricant (see Table 2-31) (CARB, 2000), (U.S. BLS, 2016), (U.S.
Census Bureau, 2015).

PEER REVIEW DRAFT. DO NOT CITE OR QUOTE
Page 96 of 229
Table 2-31. Estimated Number of Workers Potentially Exposed to Trichloroethylene During Use
of Aerosol Degreasers and Aerosol Lubricants
Number of
Sites
Exposed
Workers per
Sitea
Exposed
Occupational
Non-Users per
Sitea
Total Exposed
Workersb
Total Exposed
Occupational
Non-Usersb
Total Exposedc
4,366 3 0.4 14,200 1,690 15,900 a Number of workers and occupational non-users per site are calculated by dividing the exposed number of workers or
occupational non-users by the number of establishments. The number of workers per site is rounded to the nearest integer.
The number of occupational non-users per site is shown as 0.4, as it rounds up to one. b Values rounded to two significant figures. c Totals may not add exactly due to rounding.
2.10.3.3 Occupational Exposure Results
EPA did not identify inhalation exposure monitoring data related to the use of TCE in aerosol
degreasers. Therefore, EPA estimated inhalation exposures using the Brake Servicing Near-field/Far-
field Exposure Model. EPA used the brake servicing model as a representative scenario for this OES as
there was ample data describing the brake servicing use and it is a significant use of TCE-based aerosol
products. The following details the results of EPA’s occupational exposure assessment for aerosol
degreasing and aerosol lubricants based on modeling.
EPA considered the assessment approach, the quality of the data, and uncertainties in assessment results
to determine a level of confidence for the 8-hr TWA inhalation air concentrations. The primary strengths
include the assessment approach, which is the use of modeling, in the middle of the inhalation approach
hierarchy. A Monte Carlo simulation with 100,000 iterations was used to capture the range of potential
input parameters. Various model parameters were derived from a CARB brake service study and TCE
concentration data 16 products representative of the OES. The primary limitations of the air
concentration outputs from the model include the uncertainty of the representativeness of these data
toward the true distribution of inhalation concentrations for the industries and sites covered by this
scenario. Based on these strengths and limitations of the air concentrations, the overall confidence for
these 8-hr TWA data in this scenario is medium.
A more detailed description of the modeling approach is provided in Appendix E. Figure 2-17 illustrates
the near-field/far-field for the aerosol degreasing scenario. As the figure shows, TCE in aerosolized
droplets immediately volatilizes into the near-field, resulting in worker exposures at a concentration CNF.
The concentration is directly proportional to the amount of aerosol degreaser applied by the worker, who
is standing in the near-field-zone (i.e., the working zone). The volume of this zone is denoted by VNF.
The ventilation rate for the near-field zone (QNF) determines how quickly TCE dissipates into the far-
field (i.e., the facility space surrounding the near-field), resulting in occupational non-user exposures to
TCE at a concentration CFF. VFF denotes the volume of the far-field space into which the TCE dissipates
out of the near-field. The ventilation rate for the surroundings, denoted by QFF, determines how quickly
TCE dissipates out of the surrounding space and into the outside air.
In this scenario, TCE mists enter the near-field in non-steady “bursts,” where each burst results in a
sudden rise in the near-field concentration, followed by a more gradual rise in the far-field
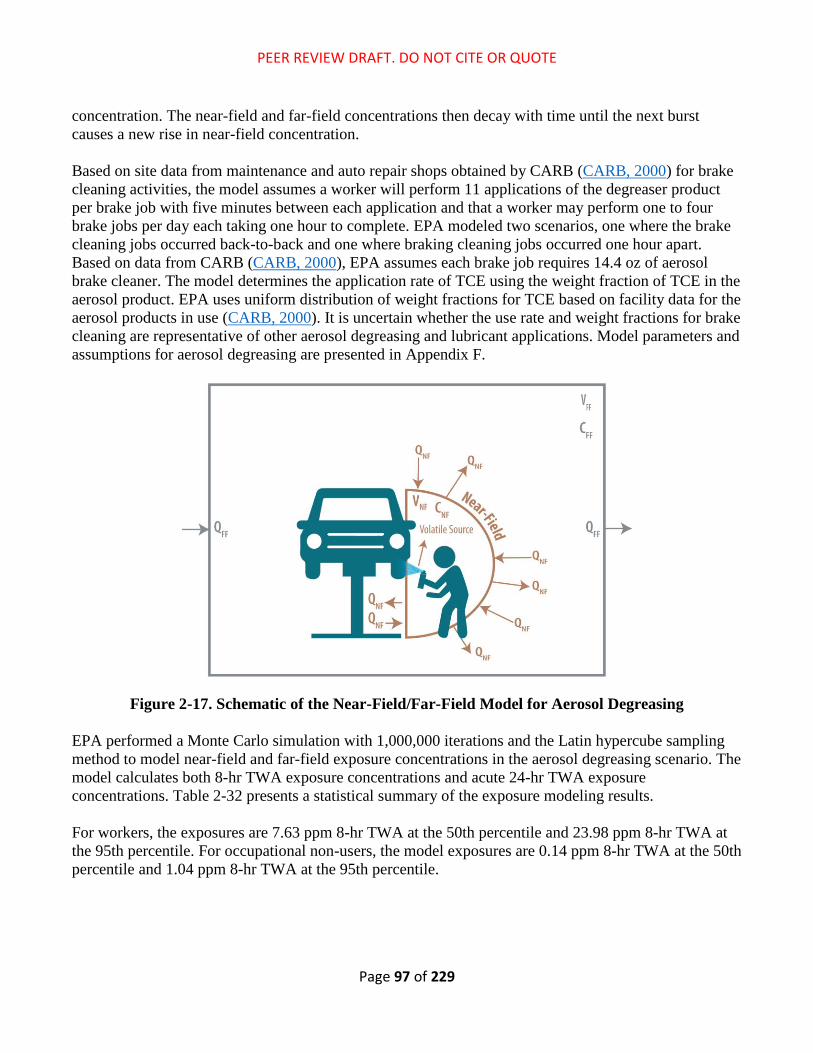
PEER REVIEW DRAFT. DO NOT CITE OR QUOTE
Page 97 of 229
concentration. The near-field and far-field concentrations then decay with time until the next burst
causes a new rise in near-field concentration.
Based on site data from maintenance and auto repair shops obtained by CARB (CARB, 2000) for brake
cleaning activities, the model assumes a worker will perform 11 applications of the degreaser product
per brake job with five minutes between each application and that a worker may perform one to four
brake jobs per day each taking one hour to complete. EPA modeled two scenarios, one where the brake
cleaning jobs occurred back-to-back and one where braking cleaning jobs occurred one hour apart.
Based on data from CARB (CARB, 2000), EPA assumes each brake job requires 14.4 oz of aerosol
brake cleaner. The model determines the application rate of TCE using the weight fraction of TCE in the
aerosol product. EPA uses uniform distribution of weight fractions for TCE based on facility data for the
aerosol products in use (CARB, 2000). It is uncertain whether the use rate and weight fractions for brake
cleaning are representative of other aerosol degreasing and lubricant applications. Model parameters and
assumptions for aerosol degreasing are presented in Appendix F.
Figure 2-17. Schematic of the Near-Field/Far-Field Model for Aerosol Degreasing
EPA performed a Monte Carlo simulation with 1,000,000 iterations and the Latin hypercube sampling
method to model near-field and far-field exposure concentrations in the aerosol degreasing scenario. The
model calculates both 8-hr TWA exposure concentrations and acute 24-hr TWA exposure
concentrations. Table 2-32 presents a statistical summary of the exposure modeling results.
For workers, the exposures are 7.63 ppm 8-hr TWA at the 50th percentile and 23.98 ppm 8-hr TWA at
the 95th percentile. For occupational non-users, the model exposures are 0.14 ppm 8-hr TWA at the 50th
percentile and 1.04 ppm 8-hr TWA at the 95th percentile.
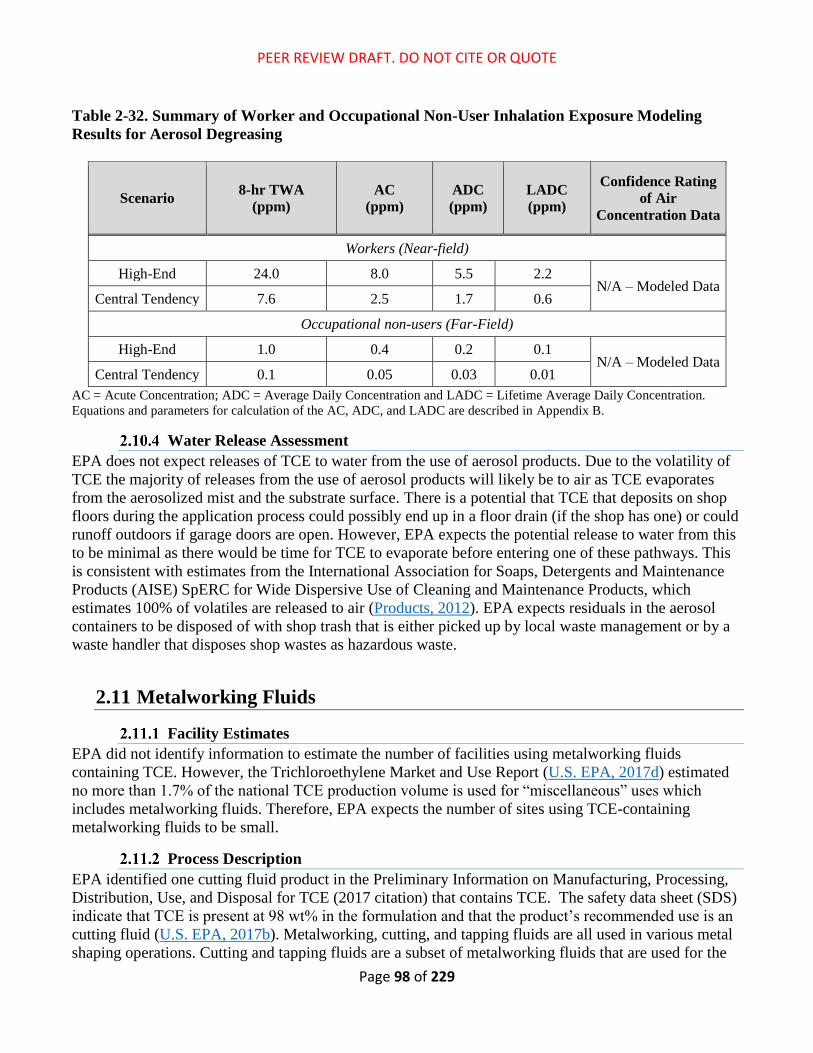
PEER REVIEW DRAFT. DO NOT CITE OR QUOTE
Page 98 of 229
Table 2-32. Summary of Worker and Occupational Non-User Inhalation Exposure Modeling
Results for Aerosol Degreasing
Scenario 8-hr TWA
(ppm)
AC
(ppm)
ADC
(ppm)
LADC
(ppm)
Confidence Rating
of Air
Concentration Data
Workers (Near-field)
High-End 24.0 8.0 5.5 2.2 N/A – Modeled Data
Central Tendency 7.6 2.5 1.7 0.6
Occupational non-users (Far-Field)
High-End 1.0 0.4 0.2 0.1 N/A – Modeled Data
Central Tendency 0.1 0.05 0.03 0.01
AC = Acute Concentration; ADC = Average Daily Concentration and LADC = Lifetime Average Daily Concentration.
Equations and parameters for calculation of the AC, ADC, and LADC are described in Appendix B.
Water Release Assessment
EPA does not expect releases of TCE to water from the use of aerosol products. Due to the volatility of
TCE the majority of releases from the use of aerosol products will likely be to air as TCE evaporates
from the aerosolized mist and the substrate surface. There is a potential that TCE that deposits on shop
floors during the application process could possibly end up in a floor drain (if the shop has one) or could
runoff outdoors if garage doors are open. However, EPA expects the potential release to water from this
to be minimal as there would be time for TCE to evaporate before entering one of these pathways. This
is consistent with estimates from the International Association for Soaps, Detergents and Maintenance
Products (AISE) SpERC for Wide Dispersive Use of Cleaning and Maintenance Products, which
estimates 100% of volatiles are released to air (Products, 2012). EPA expects residuals in the aerosol
containers to be disposed of with shop trash that is either picked up by local waste management or by a
waste handler that disposes shop wastes as hazardous waste.
2.11 Metalworking Fluids
Facility Estimates
EPA did not identify information to estimate the number of facilities using metalworking fluids
containing TCE. However, the Trichloroethylene Market and Use Report (U.S. EPA, 2017d) estimated
no more than 1.7% of the national TCE production volume is used for “miscellaneous” uses which
includes metalworking fluids. Therefore, EPA expects the number of sites using TCE-containing
metalworking fluids to be small.
Process Description
EPA identified one cutting fluid product in the Preliminary Information on Manufacturing, Processing,
Distribution, Use, and Disposal for TCE (2017 citation) that contains TCE. The safety data sheet (SDS)
indicate that TCE is present at 98 wt% in the formulation and that the product’s recommended use is an
cutting fluid (U.S. EPA, 2017b). Metalworking, cutting, and tapping fluids are all used in various metal
shaping operations. Cutting and tapping fluids are a subset of metalworking fluids that are used for the

PEER REVIEW DRAFT. DO NOT CITE OR QUOTE
Page 99 of 229
machining of internal and external threads using cutting tools like taps and thread-mills (OECD, 2011b).
While some cutting and tapping fluids may be used by consumers in a DIY setting, there is no indication
that this product is marketed solely to consumers, therefore, EPA assesses the industrial use of
metalworking fluids in the metal products and machinery (MP&M) industry. In general, industrial metal
shaping operations include machining, grinding, deformation, blasting, and other operations and may
use different types of metalworking fluids to provide cooling and lubrication and to assist in metal
shaping and protect the part being shaped from oxidation (OECD, 2011b).
The OECD ESD on the Use of Metalworking Fluids (OECD, 2011b) provides a generic process
description of the industrial use of both water-based and straight oil metalworking fluids in the MP&M
industry. Based on the recommended use of “oil-based cutting and tapping fluid” listed in the SDS (U.S.
EPA, 2017b), EPA assesses as a straight oil. Metalworking fluids are typically received in containers
ranging from 5-gallon pails to bulk containers (OECD, 2011b). Straight oils are transferred directly into
the trough of the metalworking machine without dilution (OECD, 2011b). The metalworking fluids are
pumped from the trough and usually sprayed directly on the part during metal shaping (OECD, 2011b).
The fluid stays on the part and may drip dry before being rinsed or wiped clean. Any remaining
metalworking fluid is usually removed during a cleaning or degreasing operation (OECD, 2011b).
Exposure Assessment
The following sections detail EPA’s occupational exposure assessment for using metalworking
fluids containing TCE.
2.11.3.1 Worker Activities
Workers are expected to unload the metalworking fluid from containers; clean containers; dilute water-
based metalworking fluids; transfer fluids to the trough; performing metal shaping operations; rinse,
wipe, and/or transfer the completed part; change filters; transfer spent fluids; and clean equipment
(OECD, 2011b).
ONUs include employees that work at the site where TCE is used in an industrial setting as a
metalworking fluid, but they typically do not directly handle the chemical and are therefore expected to
have lower exposures. ONUs for metalworking fluids include supervisors, managers, and tradesmen that
may be in the processing area but do not perform tasks that result in the same level of exposures as
machinists.
Since TCE has a high vapor pressure (73.46 mmHg at 25°C), workers may be exposed to TCE when
handling liquid metalworking fluid, such as unloading, transferring, and disposing spent metalworking
fluids and cleaning machines and troughs. The greatest source of potential exposure is during metal
shaping operations. The high machine speeds can generate airborne mists of the metalworking fluids to
which workers can be exposed. Additionally, the high vapor pressure of TCE may lead to its evaporation
from the airborne mist droplets, potentially creating a fog of vapor and mist.
2.11.3.2 Number of Potentially Exposed Workers
The ESD on the Use of Metalworking Fluids cites a NIOSH study of 79 small machine shops, which
observed an average of 46 machinists per site (OECD, 2011b). The ESD also cites an EPA effluent limit
guideline development for the MP&M industry, which estimated a single shift supervisor per shift, who

PEER REVIEW DRAFT. DO NOT CITE OR QUOTE
Page 100 of 229
may perform tasks such as transferring and diluting neat metalworking fluids, disposing spent
metalworking fluids, and cleaning the machines and troughs (OECD, 2011b).
Since the machinists perform the metal shaping operations, during which metalworking fluid mists are
generated, EPA assesses the machinists as workers, as they have the highest potential exposure. EPA
assessed the single shift supervisor per site as an ONU, as this employee is not expected to have as high
an exposure as the machinists. Assuming two shifts per day (hence two shift supervisors per day), EPA
assesses 46 workers and two ONUs per site (OECD, 2011b). Although, per the ESD, it is possible the
shift supervisors may perform some tasks that may lead to direct handling of the metalworking fluid,
EPA assesses these shift supervisors as ONUs as their exposures are expected to be less than the
machinist exposures and EPA is assessing the machinists as workers, which yields a high worker-to-
ONU ratio of 23-to-1. The number of establishments that use TCE-based metalworking fluids is
unknown; therefore, EPA does not have data to estimate the total workers and ONUs exposed to TCE
from use of metalworking fluids.
2.11.3.3 Occupational Exposure Results
EPA identified inhalation exposure monitoring data from OSHA facility inspections (OSHA, 2017) at
two sites using TCE in metalworking fluids. Due to small sample sizes, it is unclear how representative
these data are of “typical” MWF use. Therefore, EPA supplemented the identified monitoring data with
an assessment of inhalation exposures using the ESD on the Use of Metalworking Fluids (OECD,
2011b). The following subsections detail the results of EPA’s occupational exposure assessment for
TCE use in MWFs based on inhalation exposure monitoring data and modeling.
2.11.3.3.1 Inhalation Exposure Assessment Results Using Monitoring Data
Table 2-33 summarizes the 8-hr TWA monitoring data for the use of TCE in MWFs. No data was found
to estimate ONU exposures from use in metalworking fluids. Data from this source covers exposures at
a facility that produces various electrical resistors (Gilles and Philbin, 1976). The data were provided as
full-shift TWAs.
Table 2-33. Summary of Worker Inhalation Exposure Monitoring Data for TCE Use in
Metalworking Fluids
Scenario
8-hr
TWA
(ppm)
AC
(ppm)
ADC
(ppm)
LADC
(ppm)
Number
of Data
Points
Confidence Rating of
Air Concentration
Data
High-End 75.4 25.1 17.2 8.8
3 High Central
Tendency 69.7 23.2 15.9 6.3
AC = Acute Concentration; ADC = Average Daily Concentration; and LADC = Lifetime Average Daily Concentration.
Equations and parameters for calculation of the AC, ADC, and LADC are described in Appendix B.
EPA considered the assessment approach, the quality of the data, and uncertainties in assessment results
to determine a level of confidence for the 8-hr TWA inhalation air concentrations. The primary strengths
include the assessment approach, which is the use of monitoring data, the highest of the inhalation
approach hierarchy. These monitoring data include 3 data points from 1 source, and the data quality
ratings from systematic review for these data were high. The primary limitations of these data include
limited dataset (3 data points from 1 site), and the uncertainty of the representativeness of these data
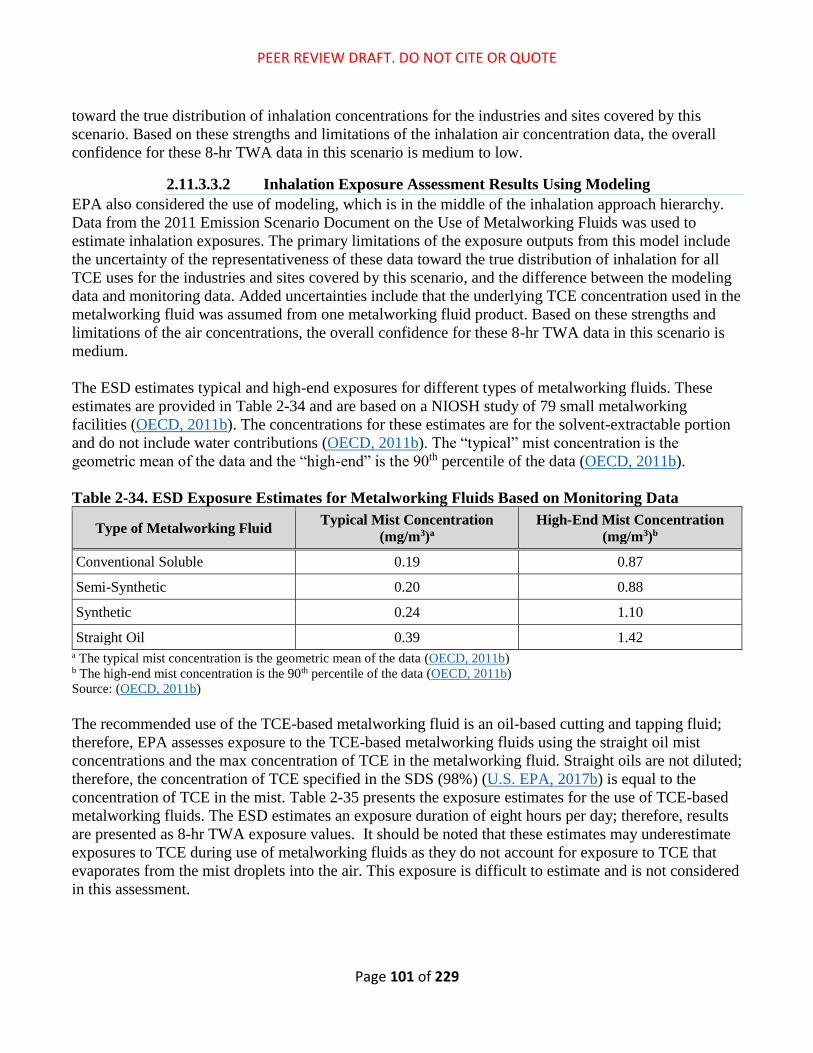
PEER REVIEW DRAFT. DO NOT CITE OR QUOTE
Page 101 of 229
toward the true distribution of inhalation concentrations for the industries and sites covered by this
scenario. Based on these strengths and limitations of the inhalation air concentration data, the overall
confidence for these 8-hr TWA data in this scenario is medium to low.
2.11.3.3.2 Inhalation Exposure Assessment Results Using Modeling
EPA also considered the use of modeling, which is in the middle of the inhalation approach hierarchy.
Data from the 2011 Emission Scenario Document on the Use of Metalworking Fluids was used to
estimate inhalation exposures. The primary limitations of the exposure outputs from this model include
the uncertainty of the representativeness of these data toward the true distribution of inhalation for all
TCE uses for the industries and sites covered by this scenario, and the difference between the modeling
data and monitoring data. Added uncertainties include that the underlying TCE concentration used in the
metalworking fluid was assumed from one metalworking fluid product. Based on these strengths and
limitations of the air concentrations, the overall confidence for these 8-hr TWA data in this scenario is
medium.
The ESD estimates typical and high-end exposures for different types of metalworking fluids. These
estimates are provided in Table 2-34 and are based on a NIOSH study of 79 small metalworking
facilities (OECD, 2011b). The concentrations for these estimates are for the solvent-extractable portion
and do not include water contributions (OECD, 2011b). The “typical” mist concentration is the
geometric mean of the data and the “high-end” is the 90th percentile of the data (OECD, 2011b).
Table 2-34. ESD Exposure Estimates for Metalworking Fluids Based on Monitoring Data
Type of Metalworking Fluid Typical Mist Concentration
(mg/m3)a
High-End Mist Concentration
(mg/m3)b
Conventional Soluble 0.19 0.87
Semi-Synthetic 0.20 0.88
Synthetic 0.24 1.10
Straight Oil 0.39 1.42 a The typical mist concentration is the geometric mean of the data (OECD, 2011b) b The high-end mist concentration is the 90th percentile of the data (OECD, 2011b)
Source: (OECD, 2011b)
The recommended use of the TCE-based metalworking fluid is an oil-based cutting and tapping fluid;
therefore, EPA assesses exposure to the TCE-based metalworking fluids using the straight oil mist
concentrations and the max concentration of TCE in the metalworking fluid. Straight oils are not diluted;
therefore, the concentration of TCE specified in the SDS (98%) (U.S. EPA, 2017b) is equal to the
concentration of TCE in the mist. Table 2-35 presents the exposure estimates for the use of TCE-based
metalworking fluids. The ESD estimates an exposure duration of eight hours per day; therefore, results
are presented as 8-hr TWA exposure values. It should be noted that these estimates may underestimate
exposures to TCE during use of metalworking fluids as they do not account for exposure to TCE that
evaporates from the mist droplets into the air. This exposure is difficult to estimate and is not considered
in this assessment.
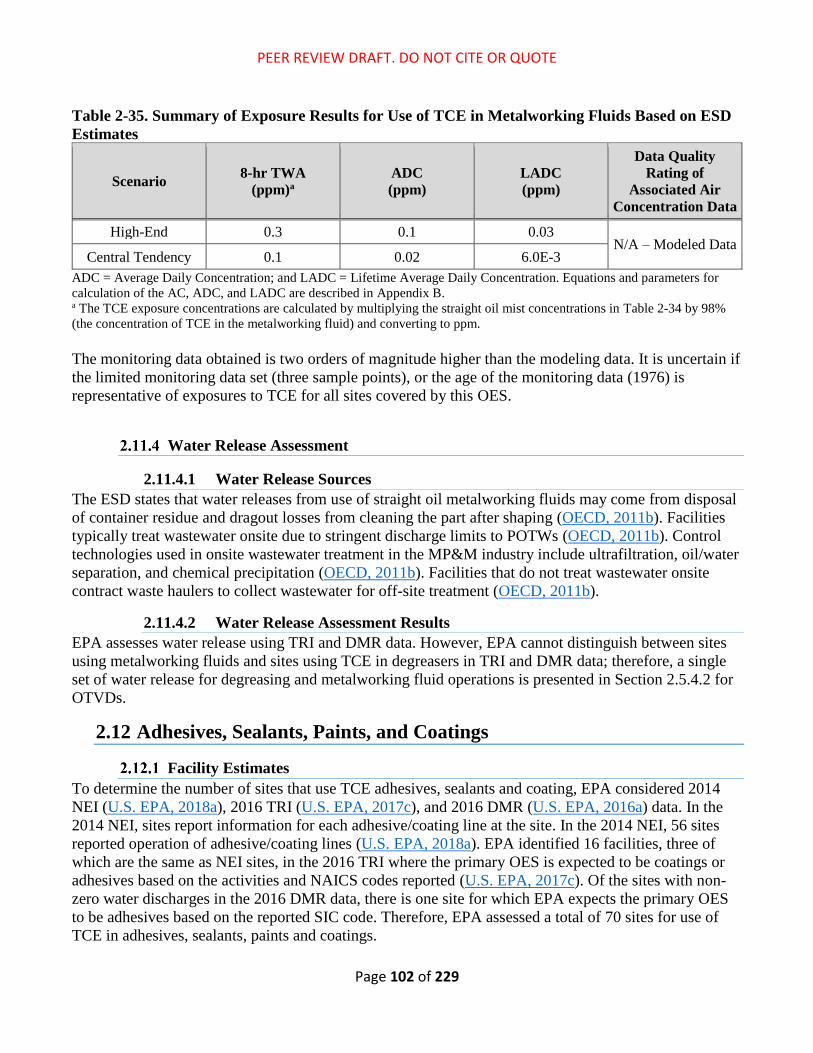
PEER REVIEW DRAFT. DO NOT CITE OR QUOTE
Page 102 of 229
Table 2-35. Summary of Exposure Results for Use of TCE in Metalworking Fluids Based on ESD
Estimates
Scenario 8-hr TWA
(ppm)a
ADC
(ppm)
LADC
(ppm)
Data Quality
Rating of
Associated Air
Concentration Data
High-End 0.3 0.1 0.03 N/A – Modeled Data
Central Tendency 0.1 0.02 6.0E-3
ADC = Average Daily Concentration; and LADC = Lifetime Average Daily Concentration. Equations and parameters for
calculation of the AC, ADC, and LADC are described in Appendix B. a The TCE exposure concentrations are calculated by multiplying the straight oil mist concentrations in Table 2-34 by 98%
(the concentration of TCE in the metalworking fluid) and converting to ppm.
The monitoring data obtained is two orders of magnitude higher than the modeling data. It is uncertain if
the limited monitoring data set (three sample points), or the age of the monitoring data (1976) is
representative of exposures to TCE for all sites covered by this OES.
Water Release Assessment
2.11.4.1 Water Release Sources
The ESD states that water releases from use of straight oil metalworking fluids may come from disposal
of container residue and dragout losses from cleaning the part after shaping (OECD, 2011b). Facilities
typically treat wastewater onsite due to stringent discharge limits to POTWs (OECD, 2011b). Control
technologies used in onsite wastewater treatment in the MP&M industry include ultrafiltration, oil/water
separation, and chemical precipitation (OECD, 2011b). Facilities that do not treat wastewater onsite
contract waste haulers to collect wastewater for off-site treatment (OECD, 2011b).
2.11.4.2 Water Release Assessment Results
EPA assesses water release using TRI and DMR data. However, EPA cannot distinguish between sites
using metalworking fluids and sites using TCE in degreasers in TRI and DMR data; therefore, a single
set of water release for degreasing and metalworking fluid operations is presented in Section 2.5.4.2 for
OTVDs.
2.12 Adhesives, Sealants, Paints, and Coatings
Facility Estimates
To determine the number of sites that use TCE adhesives, sealants and coating, EPA considered 2014
NEI (U.S. EPA, 2018a), 2016 TRI (U.S. EPA, 2017c), and 2016 DMR (U.S. EPA, 2016a) data. In the
2014 NEI, sites report information for each adhesive/coating line at the site. In the 2014 NEI, 56 sites
reported operation of adhesive/coating lines (U.S. EPA, 2018a). EPA identified 16 facilities, three of
which are the same as NEI sites, in the 2016 TRI where the primary OES is expected to be coatings or
adhesives based on the activities and NAICS codes reported (U.S. EPA, 2017c). Of the sites with non-
zero water discharges in the 2016 DMR data, there is one site for which EPA expects the primary OES
to be adhesives based on the reported SIC code. Therefore, EPA assessed a total of 70 sites for use of
TCE in adhesives, sealants, paints and coatings.
PEER REVIEW DRAFT. DO NOT CITE OR QUOTE
Page 103 of 229
Process Description
Based on products identified in Preliminary Information on Manufacturing, Processing, Distribution,
Use, and Disposal: Trichlorethylene (U.S. EPA, 2017b) and 2016 CDR reporting (U.S. EPA, 2017a),
TCE may be used in various adhesive, sealant, coating, paint, and paint stripper products for industrial,
commercial and consumer applications. Based on reporting in the 2014 NEI typical application methods
may include spray, roll, and dip applications (U.S. EPA, 2018a). In the 2014 NEI (U.S. EPA, 2018a)
there are instances where the application method is not specified; therefore, other applications methods
(e.g., curtain, syringe/bead, roller/brush, electrodeposition/electrocoating, and autodeposition) may also
be used for these products.
The general process for adhesives and coatings include unloading liquid adhesives or coatings from
containers into the coating reservoir/application equipment, then applying the adhesive or coating to a
flat or three-dimensional substrate (OECD, 2015, 2009b). For adhesives substrates are then joined and
allowed to cure with the volatile solvent (in this case TCE) evaporating during the curing stage (OECD,
2015). For solvent-based coatings, after application the substrates typically undergo a drying stage in
which the solvent evaporates from the coating (OECD, 2009b).
Exposure Assessment
The following sections detail EPA’s occupational exposure assessment for using adhesives and coatings
containing TCE.
2.12.3.1 Worker Activities
Worker activities may include unloading adhesive or coating products from containers into application
equipment, and, where used, manual application of the adhesive or coatings (e.g., use of spray guns or
brushes to apply product to substrate) (OECD, 2015). Workers may be exposed to TCE during the
application process if mists are generated such as during spray and roll applications (OECD, 2015).
Workers may also be exposed to TCE vapors that evaporate from the adhesive or coating as it is applied
or during the drying/curing process (OECD, 2015). EPA expects ONUs may be exposed to mists or
vapors that enter their breathing zone during routine work in areas where coating applications are
occurring.
2.12.3.2 Number of Potentially Exposed Workers
EPA estimated the number of workers and occupational non-users potentially exposed during use of
TCE in adhesives/coatings using BLS Data (U.S. BLS, 2016) and the U.S. Census’ SUSB (U.S. Census
Bureau, 2015) as well as the NAICS codes reported by the sites in the 2016 TRI (U.S. EPA, 2017c) and
2014 NEI (U.S. EPA, 2018a). The one site reporting to 2016 DMR used SIC code 3053 (Gaskets,
Packing and Sealing Development), which corresponds to a NAICS code 339991 (Gasket, Packing, and
Sealing Device Manufacturing). The method for estimating number of workers is detailed above in
Section 1.4.4. These estimates were derived using industry- and occupation-specific employment data
from the BLS and U.S. Census. Table 2-36 provides the results of the number of worker analysis. There
are 43 workers and 19 ONUs potentially exposed per site during use of TCE in adhesives and coatings.

PEER REVIEW DRAFT. DO NOT CITE OR QUOTE
Page 104 of 229
Table 2-36. Estimated Number of Workers Potentially Exposed to Trichloroethylene During Use
of Adhesives and Coatings
NAICS Code Number of
Sites
Total
Exposed
Workers
Total
Exposed
Occupational
Non-Users
Total
Exposedb
Exposed
Workers per
Sitea
Exposed
Occupational
Non-Users
per Sitea
313320 1 9 4 13 9 4
326150 1 15 4 19 15 4
326211 2 449 72 522 225 36
326212 4 39 6 46 10 2
326220 2 85 14 99 43 7
332321 3 53 14 67 18 5
332812 2 14 3 18 7 2
332813 9 71 16 87 8 2
332994 2 22 9 31 11 4
332999 2 11 4 16 6 2
333515 1 4 3 8 4 3
334417 1 41 37 78 41 37
335931 1 25 9 33 25 9
336211 3 100 13 113 33 4
336360 1 74 22 96 74 22
336390 5 225 67 292 45 13
336411 3 551 465 1,016 184 155
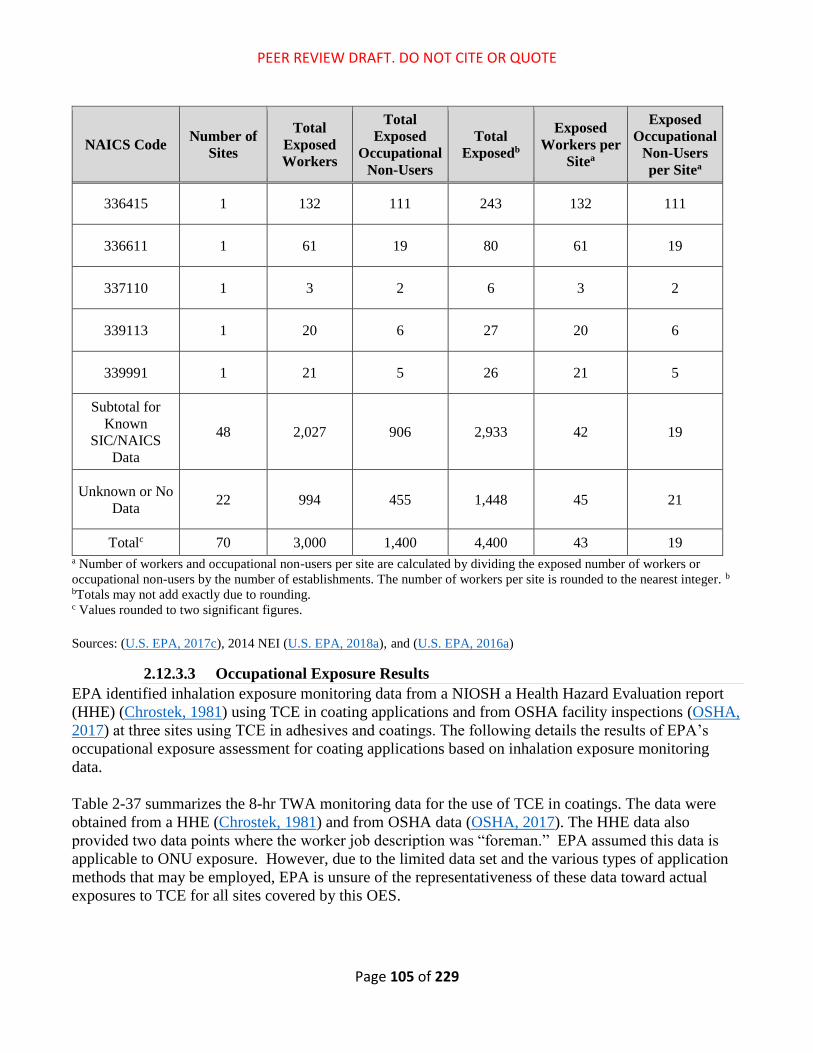
PEER REVIEW DRAFT. DO NOT CITE OR QUOTE
Page 105 of 229
NAICS Code Number of
Sites
Total
Exposed
Workers
Total
Exposed
Occupational
Non-Users
Total
Exposedb
Exposed
Workers per
Sitea
Exposed
Occupational
Non-Users
per Sitea
336415 1 132 111 243 132 111
336611 1 61 19 80 61 19
337110 1 3 2 6 3 2
339113 1 20 6 27 20 6
339991 1 21 5 26 21 5
Subtotal for
Known
SIC/NAICS
Data
48 2,027 906 2,933 42 19
Unknown or No
Data 22 994 455 1,448 45 21
Totalc 70 3,000 1,400 4,400 43 19 a Number of workers and occupational non-users per site are calculated by dividing the exposed number of workers or
occupational non-users by the number of establishments. The number of workers per site is rounded to the nearest integer. b bTotals may not add exactly due to rounding. c Values rounded to two significant figures.
Sources: (U.S. EPA, 2017c), 2014 NEI (U.S. EPA, 2018a), and (U.S. EPA, 2016a)
2.12.3.3 Occupational Exposure Results
EPA identified inhalation exposure monitoring data from a NIOSH a Health Hazard Evaluation report
(HHE) (Chrostek, 1981) using TCE in coating applications and from OSHA facility inspections (OSHA,
2017) at three sites using TCE in adhesives and coatings. The following details the results of EPA’s
occupational exposure assessment for coating applications based on inhalation exposure monitoring
data.
Table 2-37 summarizes the 8-hr TWA monitoring data for the use of TCE in coatings. The data were
obtained from a HHE (Chrostek, 1981) and from OSHA data (OSHA, 2017). The HHE data also
provided two data points where the worker job description was “foreman.” EPA assumed this data is
applicable to ONU exposure. However, due to the limited data set and the various types of application
methods that may be employed, EPA is unsure of the representativeness of these data toward actual
exposures to TCE for all sites covered by this OES.

PEER REVIEW DRAFT. DO NOT CITE OR QUOTE
Page 106 of 229
Table 2-37. Summary of Worker Inhalation Exposure Monitoring Data for
Adhesives/Paints/Coatings
Scenario 8-hr TWA
(ppm)
AC
(ppm)
ADC
(ppm)
LADC
(ppm)
Number
of Data
Points
Confidence
Rating of Air
Concentration
Data
Workers
High-End 39.5 13.2 9.0 4.6
22 Medium Central
Tendency 4.6 1.6 1.1 0.4
Occupational non-users
High-End 1.0 0.3 0.2 0.1
2 Medium Central
Tendency 0.9 0.3 0.2 0.1
AC = Acute Concentration, ADC = Average Daily Concentration and LADC = Lifetime Average Daily Concentration.
Equations and parameters for calculation of the ADC and LADC are described in Appendix B
EPA considered the assessment approach, the quality of the data, and uncertainties in assessment results
to determine a level of confidence for the 8-hr TWA data. For the inhalation air concentration data, the
primary strengths include the assessment approach, which is the use of monitoring data, the highest of
the inhalation approach hierarchy. These monitoring data include 22 data points from 2 sources, and the
data quality ratings from systematic review for these data were medium to high. The primary limitations
of these data include the uncertainty of the representativeness of these data toward the true distribution
of inhalation concentrations for the industries and sites covered by this scenario. Based on these
strengths and limitations of the inhalation air concentration data, the overall confidence for these 8-hr
TWA data in this scenario is medium to low.
For the ONU inhalation air concentration data, the primary strengths include the assessment approach,
which is the use of monitoring data, the highest of the inhalation approach hierarchy. These monitoring
data include 2 data points from 1 source, and the data quality ratings from systematic review for the data
point was high. The primary limitations of this data is the limited dataset (two data points from 1 site),
and the uncertainty of the representativeness of this data toward the true distribution of inhalation
concentrations for the industries and sites covered by this scenario. Based on these strengths and
limitations of the inhalation air concentration data, the overall confidence for these 8-hr TWA data in
this scenario is medium to low.
EPA did not find data to provide inhalation exposure estimates for commercial adhesive, sealant, paint
and coating applications. Therefore, EPA uses the industrial data discussed above as surrogate for
commercial coatings, as EPA believes the activities and exposures will be similar between industrial and
commercial sites covered by this OES.
Water Release Assessment
The following sections detail EPA’s water release assessment for use of TCE in adhesives, sealants, and
paints/coatings.
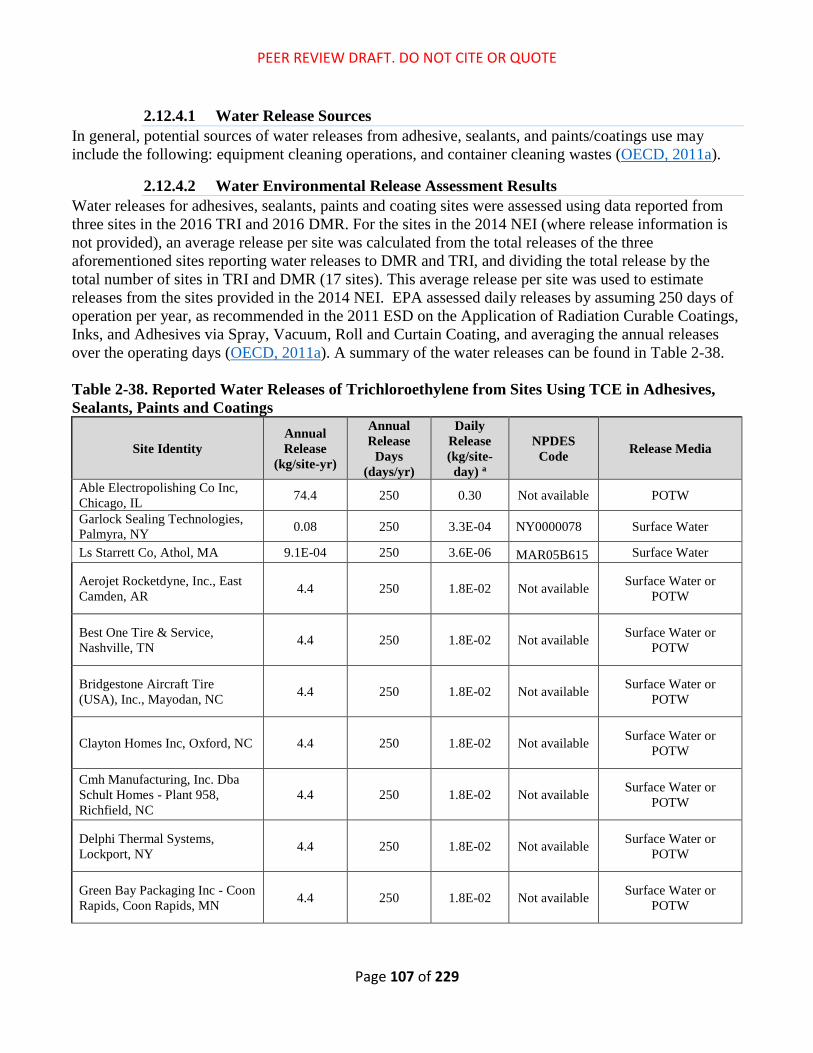
PEER REVIEW DRAFT. DO NOT CITE OR QUOTE
Page 107 of 229
2.12.4.1 Water Release Sources
In general, potential sources of water releases from adhesive, sealants, and paints/coatings use may
include the following: equipment cleaning operations, and container cleaning wastes (OECD, 2011a).
2.12.4.2 Water Environmental Release Assessment Results
Water releases for adhesives, sealants, paints and coating sites were assessed using data reported from
three sites in the 2016 TRI and 2016 DMR. For the sites in the 2014 NEI (where release information is
not provided), an average release per site was calculated from the total releases of the three
aforementioned sites reporting water releases to DMR and TRI, and dividing the total release by the
total number of sites in TRI and DMR (17 sites). This average release per site was used to estimate
releases from the sites provided in the 2014 NEI. EPA assessed daily releases by assuming 250 days of
operation per year, as recommended in the 2011 ESD on the Application of Radiation Curable Coatings,
Inks, and Adhesives via Spray, Vacuum, Roll and Curtain Coating, and averaging the annual releases
over the operating days (OECD, 2011a). A summary of the water releases can be found in Table 2-38.
Table 2-38. Reported Water Releases of Trichloroethylene from Sites Using TCE in Adhesives,
Sealants, Paints and Coatings
Site Identity
Annual
Release
(kg/site-yr)
Annual
Release
Days
(days/yr)
Daily
Release
(kg/site-
day) a
NPDES
Code Release Media
Able Electropolishing Co Inc,
Chicago, IL 74.4 250 0.30 Not available POTW
Garlock Sealing Technologies,
Palmyra, NY 0.08 250 3.3E-04 NY0000078 Surface Water
Ls Starrett Co, Athol, MA 9.1E-04 250 3.6E-06 MAR05B615 Surface Water
Aerojet Rocketdyne, Inc., East
Camden, AR 4.4 250 1.8E-02 Not available
Surface Water or
POTW
Best One Tire & Service,
Nashville, TN 4.4 250 1.8E-02 Not available
Surface Water or
POTW
Bridgestone Aircraft Tire
(USA), Inc., Mayodan, NC 4.4 250 1.8E-02 Not available
Surface Water or
POTW
Clayton Homes Inc, Oxford, NC 4.4 250 1.8E-02 Not available Surface Water or
POTW
Cmh Manufacturing, Inc. Dba
Schult Homes - Plant 958,
Richfield, NC
4.4 250 1.8E-02 Not available Surface Water or
POTW
Delphi Thermal Systems,
Lockport, NY 4.4 250 1.8E-02 Not available
Surface Water or
POTW
Green Bay Packaging Inc - Coon
Rapids, Coon Rapids, MN 4.4 250 1.8E-02 Not available
Surface Water or
POTW
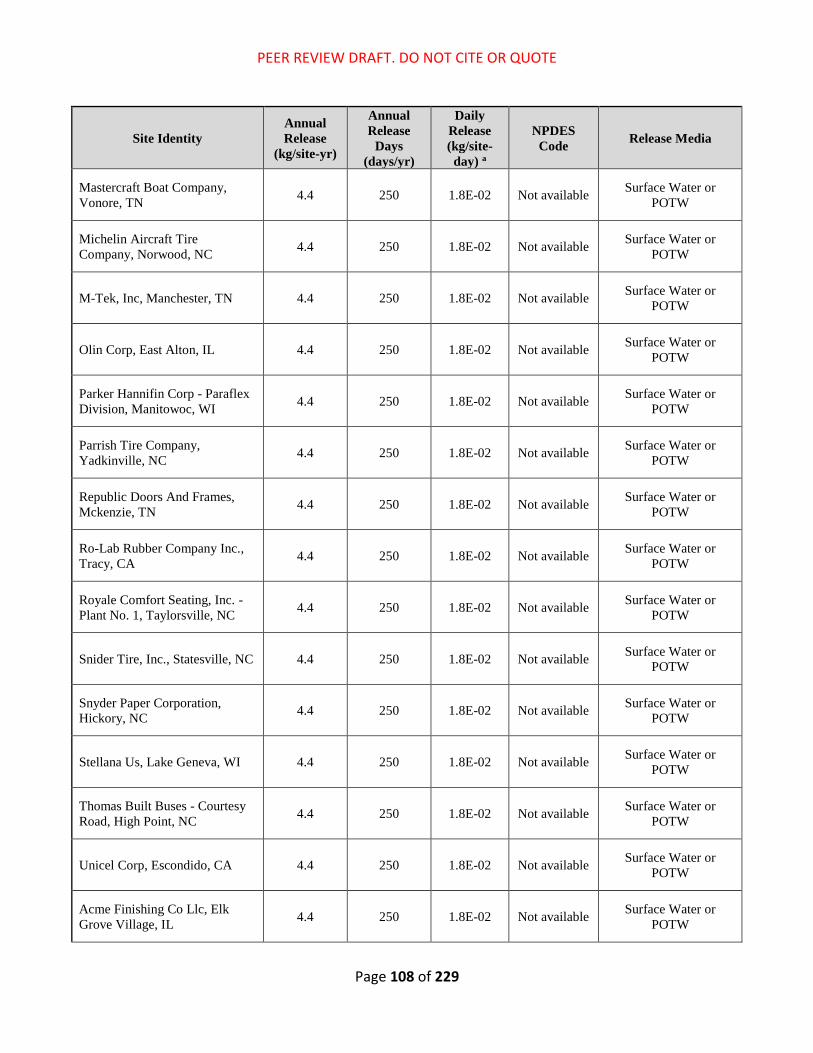
PEER REVIEW DRAFT. DO NOT CITE OR QUOTE
Page 108 of 229
Site Identity
Annual
Release
(kg/site-yr)
Annual
Release
Days
(days/yr)
Daily
Release
(kg/site-
day) a
NPDES
Code Release Media
Mastercraft Boat Company,
Vonore, TN 4.4 250 1.8E-02 Not available
Surface Water or
POTW
Michelin Aircraft Tire
Company, Norwood, NC 4.4 250 1.8E-02 Not available
Surface Water or
POTW
M-Tek, Inc, Manchester, TN 4.4 250 1.8E-02 Not available Surface Water or
POTW
Olin Corp, East Alton, IL 4.4 250 1.8E-02 Not available Surface Water or
POTW
Parker Hannifin Corp - Paraflex
Division, Manitowoc, WI 4.4 250 1.8E-02 Not available
Surface Water or
POTW
Parrish Tire Company,
Yadkinville, NC 4.4 250 1.8E-02 Not available
Surface Water or
POTW
Republic Doors And Frames,
Mckenzie, TN 4.4 250 1.8E-02 Not available
Surface Water or
POTW
Ro-Lab Rubber Company Inc.,
Tracy, CA 4.4 250 1.8E-02 Not available
Surface Water or
POTW
Royale Comfort Seating, Inc. -
Plant No. 1, Taylorsville, NC 4.4 250 1.8E-02 Not available
Surface Water or
POTW
Snider Tire, Inc., Statesville, NC 4.4 250 1.8E-02 Not available Surface Water or
POTW
Snyder Paper Corporation,
Hickory, NC 4.4 250 1.8E-02 Not available
Surface Water or
POTW
Stellana Us, Lake Geneva, WI 4.4 250 1.8E-02 Not available Surface Water or
POTW
Thomas Built Buses - Courtesy
Road, High Point, NC 4.4 250 1.8E-02 Not available
Surface Water or
POTW
Unicel Corp, Escondido, CA 4.4 250 1.8E-02 Not available Surface Water or
POTW
Acme Finishing Co Llc, Elk
Grove Village, IL 4.4 250 1.8E-02 Not available
Surface Water or
POTW

PEER REVIEW DRAFT. DO NOT CITE OR QUOTE
Page 109 of 229
Site Identity
Annual
Release
(kg/site-yr)
Annual
Release
Days
(days/yr)
Daily
Release
(kg/site-
day) a
NPDES
Code Release Media
Aerojet Rocketdyne, Inc.,
Rancho Cordova, CA 4.4 250 1.8E-02 Not available
Surface Water or
POTW
Allegheny Cnty Airport
Auth/Pgh Intl Airport,
Pittsburgh, PA
4.4 250 1.8E-02 Not available Surface Water or
POTW
Amphenol Corp - Aerospace
Operations, Sidney, NY 4.4 250 1.8E-02 Not available
Surface Water or
POTW
Aprotech Powertrain, Asheville,
NC 4.4 250 1.8E-02 Not available
Surface Water or
POTW
Clayton Homes Inc, Oxford, NC 4.4 250 1.8E-02 Not available Surface Water or
POTW
Coating & Converting Tech
Corp/Adhesive Coatings,
Philadelphia, PA
4.4 250 1.8E-02 Not available Surface Water or
POTW
Corpus Christi Army Depot,
Corpus Christi, TX 4.4 250 1.8E-02 Not available
Surface Water or
POTW
Electronic Data Systems Camp
Pendleton, Camp Pendleton, CA 4.4 250 1.8E-02 Not available
Surface Water or
POTW
Florida Production Engineering,
Inc., Ormond Beach, FL 4.4 250 1.8E-02 Not available
Surface Water or
POTW
Goodrich Corporation,
Jacksonville, FL 4.4 250 1.8E-02 Not available
Surface Water or
POTW
Kasai North America Inc,
Madison Plant, Madison, MS 4.4 250 1.8E-02 Not available
Surface Water or
POTW
Kirtland Air Force Base,
Albuquerque, NM 4.4 250 1.8E-02 Not available
Surface Water or
POTW
Marvin Windows & Doors,
Warroad, MN 4.4 250 1.8E-02 Not available
Surface Water or
POTW
Mcneilus Truck &
Manufacturing Inc, Dodge
Center, MN
4.4 250 1.8E-02 Not available Surface Water or
POTW
Metal Finishing Co. - Wichita (S
Mclean Blvd), Wichita, KS 4.4 250 1.8E-02 Not available
Surface Water or
POTW
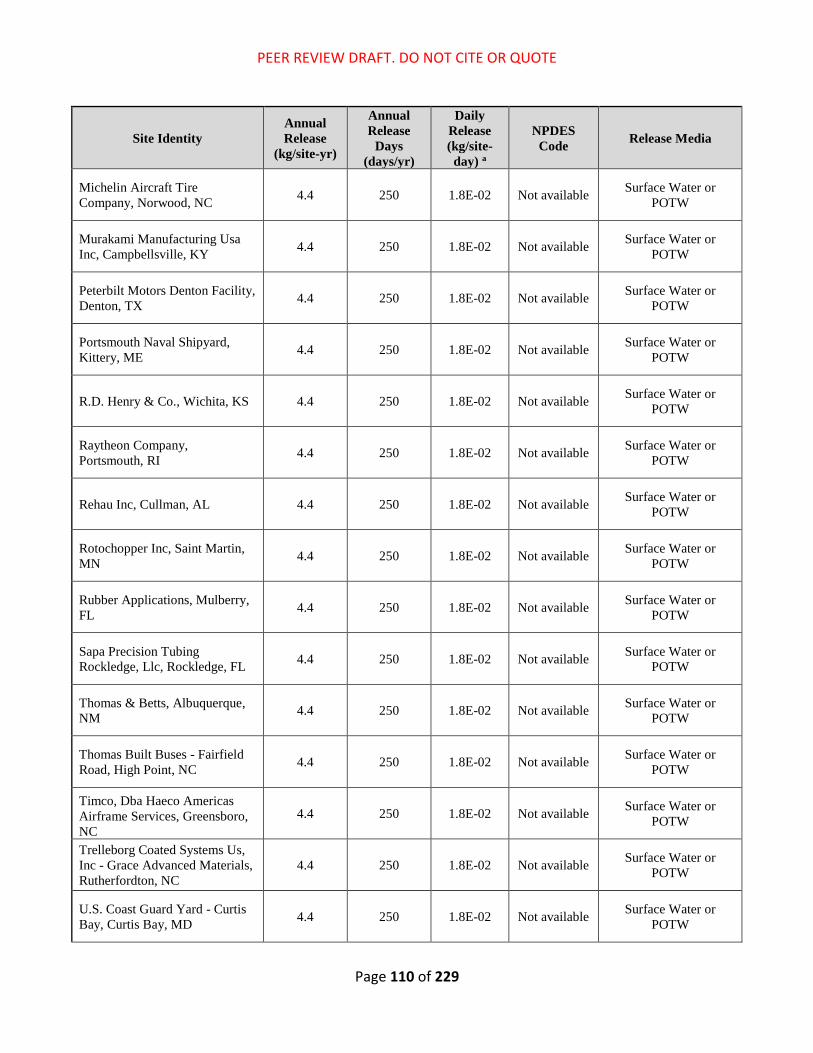
PEER REVIEW DRAFT. DO NOT CITE OR QUOTE
Page 110 of 229
Site Identity
Annual
Release
(kg/site-yr)
Annual
Release
Days
(days/yr)
Daily
Release
(kg/site-
day) a
NPDES
Code Release Media
Michelin Aircraft Tire
Company, Norwood, NC 4.4 250 1.8E-02 Not available
Surface Water or
POTW
Murakami Manufacturing Usa
Inc, Campbellsville, KY 4.4 250 1.8E-02 Not available
Surface Water or
POTW
Peterbilt Motors Denton Facility,
Denton, TX 4.4 250 1.8E-02 Not available
Surface Water or
POTW
Portsmouth Naval Shipyard,
Kittery, ME 4.4 250 1.8E-02 Not available
Surface Water or
POTW
R.D. Henry & Co., Wichita, KS 4.4 250 1.8E-02 Not available Surface Water or
POTW
Raytheon Company,
Portsmouth, RI 4.4 250 1.8E-02 Not available
Surface Water or
POTW
Rehau Inc, Cullman, AL 4.4 250 1.8E-02 Not available Surface Water or
POTW
Rotochopper Inc, Saint Martin,
MN 4.4 250 1.8E-02 Not available
Surface Water or
POTW
Rubber Applications, Mulberry,
FL 4.4 250 1.8E-02 Not available
Surface Water or
POTW
Sapa Precision Tubing
Rockledge, Llc, Rockledge, FL 4.4 250 1.8E-02 Not available
Surface Water or
POTW
Thomas & Betts, Albuquerque,
NM 4.4 250 1.8E-02 Not available
Surface Water or
POTW
Thomas Built Buses - Fairfield
Road, High Point, NC 4.4 250 1.8E-02 Not available
Surface Water or
POTW
Timco, Dba Haeco Americas
Airframe Services, Greensboro,
NC
4.4 250 1.8E-02 Not available Surface Water or
POTW
Trelleborg Coated Systems Us,
Inc - Grace Advanced Materials,
Rutherfordton, NC
4.4 250 1.8E-02 Not available Surface Water or
POTW
U.S. Coast Guard Yard - Curtis
Bay, Curtis Bay, MD 4.4 250 1.8E-02 Not available
Surface Water or
POTW
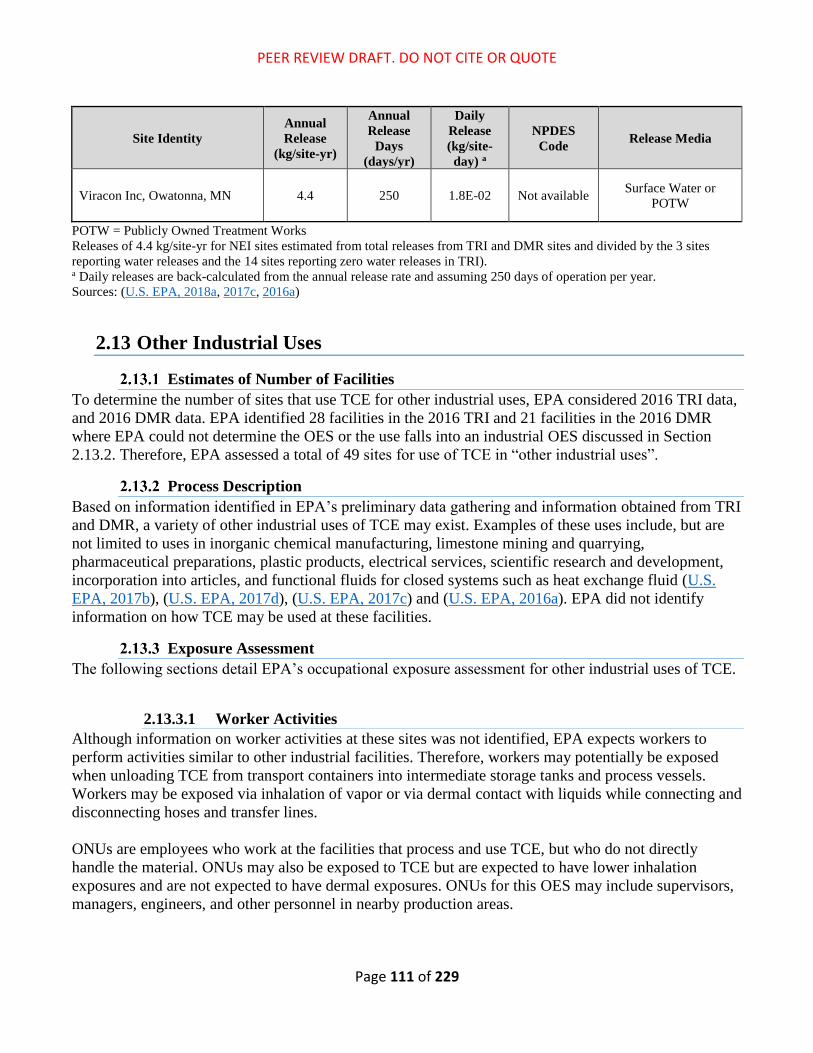
PEER REVIEW DRAFT. DO NOT CITE OR QUOTE
Page 111 of 229
Site Identity
Annual
Release
(kg/site-yr)
Annual
Release
Days
(days/yr)
Daily
Release
(kg/site-
day) a
NPDES
Code Release Media
Viracon Inc, Owatonna, MN 4.4 250 1.8E-02 Not available Surface Water or
POTW
POTW = Publicly Owned Treatment Works
Releases of 4.4 kg/site-yr for NEI sites estimated from total releases from TRI and DMR sites and divided by the 3 sites
reporting water releases and the 14 sites reporting zero water releases in TRI). a Daily releases are back-calculated from the annual release rate and assuming 250 days of operation per year.
Sources: (U.S. EPA, 2018a, 2017c, 2016a)
2.13 Other Industrial Uses
Estimates of Number of Facilities
To determine the number of sites that use TCE for other industrial uses, EPA considered 2016 TRI data,
and 2016 DMR data. EPA identified 28 facilities in the 2016 TRI and 21 facilities in the 2016 DMR
where EPA could not determine the OES or the use falls into an industrial OES discussed in Section
2.13.2. Therefore, EPA assessed a total of 49 sites for use of TCE in “other industrial uses”.
Process Description
Based on information identified in EPA’s preliminary data gathering and information obtained from TRI
and DMR, a variety of other industrial uses of TCE may exist. Examples of these uses include, but are
not limited to uses in inorganic chemical manufacturing, limestone mining and quarrying,
pharmaceutical preparations, plastic products, electrical services, scientific research and development,
incorporation into articles, and functional fluids for closed systems such as heat exchange fluid (U.S.
EPA, 2017b), (U.S. EPA, 2017d), (U.S. EPA, 2017c) and (U.S. EPA, 2016a). EPA did not identify
information on how TCE may be used at these facilities.
Exposure Assessment
The following sections detail EPA’s occupational exposure assessment for other industrial uses of TCE.
2.13.3.1 Worker Activities
Although information on worker activities at these sites was not identified, EPA expects workers to
perform activities similar to other industrial facilities. Therefore, workers may potentially be exposed
when unloading TCE from transport containers into intermediate storage tanks and process vessels.
Workers may be exposed via inhalation of vapor or via dermal contact with liquids while connecting and
disconnecting hoses and transfer lines.
ONUs are employees who work at the facilities that process and use TCE, but who do not directly
handle the material. ONUs may also be exposed to TCE but are expected to have lower inhalation
exposures and are not expected to have dermal exposures. ONUs for this OES may include supervisors,
managers, engineers, and other personnel in nearby production areas.

PEER REVIEW DRAFT. DO NOT CITE OR QUOTE
Page 112 of 229
2.13.3.2 Number of Potentially Exposed Workers
Table 2-39 summarizes SIC codes (and the corresponding NAICS codes) reported by the sites in the
2016 DMR (U.S. EPA, 2016a).
Table 2-39. Crosswalk of Other Industrial Use SIC Codes in DMR to NAICS Codes
SIC Code Corresponding NAICS Code
1422– Crushed and Broken Limestone 212312 - Crushed and Broken Limestone Mining and Quarrying
2812 – Alkalies and Chlorine 325180 – Other Basic Inorganic Chemical Manufacturing
2819 – Industrial Inorganic Chemicals,
NEC
325180 – Other Basic Inorganic Chemical Manufacturing
2834 – Pharmaceutical Preparations 325412 - Pharmaceutical Preparation Manufacturing
2869 – Industrial Organic Chemicals,
NEC
325199 – All Other Basic Inorganic Chemical Manufacturing
3089 – Plastic Products, NECa 326100 – Plastics Products Manufacturing
4911 – Electrical Servicesb 221100 – Electric Power Generation, Transmission and Distribution
9661 – Space Research and Technology 927110 - Space Research and Technology
9711 – National Security 928110 – National Security
3229 - Pressed & Blown Glass and
Glassware
327212 – Other Pressed and Blown Glass and Glassware
Manufacturing
3069 – Fabricated Rubber Products,
NEC
326299 – All Other Rubber Product Manufacturing
1799 – Special Trade Contractorsc 230000 - Construction
9999 – Nonclassifiable Establishments No NAICS listed in the crosswalk a The SIC code 3089 may map to any of the following NAICS codes: 326121, 326122, 326199, 336612, 337215, or 339113.
There is not enough information in the DMR data to determine the appropriate NAICS for each site; therefore, EPA uses data
for the 4-digit NAICS, 326100, rather than a specific 6-digit NAICS. b The SIC code 4911 may map to any of the following NAICS codes: 221111, 221112, 221113, 221114, 221115, 221116,
221117, 221118, 221121, or 221122. There is not enough information in the DMR data to determine the appropriate NAICS
for each site; therefore, EPA uses data for the 4-digit NAICS, 221100, rather than a specific 6-digit NAICS. c The SIC code 1799 may map to any of the following NAICS codes: 236220, 237990, 238150, 238190, 238290, 238310,
238320, 238350, 238390, 238910, 561790, 562910. There is not enough information in the DMR data to determine the
appropriate NAICS for each site; therefore, EPA uses data for the 2-digit NAICS, 230000, rather than a specific 6-digit
NAICS.
EPA estimated the number of workers and occupational non-users potentially exposed during use of
TCE in Other Industrial Uses using BLS Data (U.S. BLS, 2016) and the U.S. Census’ SUSB (U.S.
Census Bureau, 2015) as well as the SIC/NAICS codes reported by the sites in the 2016 TRI (U.S. EPA,
2017c) and 2016 DMR (U.S. EPA, 2016a).
Table 2-40 provides a summary of the reported NAICS codes (or NAICS identified in the crosswalk),
the number of sites reporting each NAICS code, and the estimated number of workers and ONUs for
each NAICS code as well as an overall total for other industrial uses. There are approximately 2,300
workers and 1,000 ONUs potentially exposed during other industrial uses.
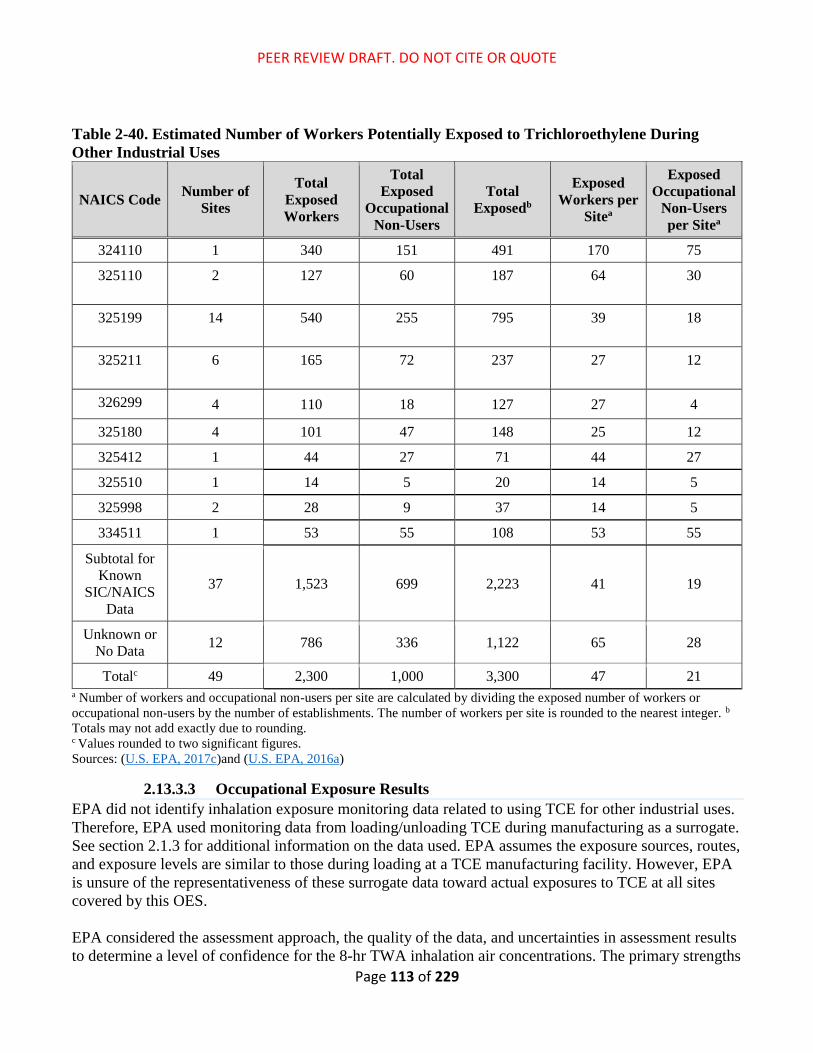
PEER REVIEW DRAFT. DO NOT CITE OR QUOTE
Page 113 of 229
Table 2-40. Estimated Number of Workers Potentially Exposed to Trichloroethylene During
Other Industrial Uses
NAICS Code Number of
Sites
Total
Exposed
Workers
Total
Exposed
Occupational
Non-Users
Total
Exposedb
Exposed
Workers per
Sitea
Exposed
Occupational
Non-Users
per Sitea
324110 1 340 151 491 170 75
325110 2 127 60 187 64 30
325199 14 540 255 795 39 18
325211 6 165 72 237 27 12
326299 4 110 18 127 27 4
325180 4 101 47 148 25 12
325412 1 44 27 71 44 27
325510 1 14 5 20 14 5
325998 2 28 9 37 14 5
334511 1 53 55 108 53 55
Subtotal for
Known
SIC/NAICS
Data
37 1,523 699 2,223 41 19
Unknown or
No Data 12 786 336 1,122 65 28
Totalc 49 2,300 1,000 3,300 47 21 a Number of workers and occupational non-users per site are calculated by dividing the exposed number of workers or
occupational non-users by the number of establishments. The number of workers per site is rounded to the nearest integer. b
Totals may not add exactly due to rounding. c Values rounded to two significant figures. Sources: (U.S. EPA, 2017c)and (U.S. EPA, 2016a)
2.13.3.3 Occupational Exposure Results
EPA did not identify inhalation exposure monitoring data related to using TCE for other industrial uses.
Therefore, EPA used monitoring data from loading/unloading TCE during manufacturing as a surrogate.
See section 2.1.3 for additional information on the data used. EPA assumes the exposure sources, routes,
and exposure levels are similar to those during loading at a TCE manufacturing facility. However, EPA
is unsure of the representativeness of these surrogate data toward actual exposures to TCE at all sites
covered by this OES.
EPA considered the assessment approach, the quality of the data, and uncertainties in assessment results
to determine a level of confidence for the 8-hr TWA inhalation air concentrations. The primary strengths

PEER REVIEW DRAFT. DO NOT CITE OR QUOTE
Page 114 of 229
include the assessment approach, which is the use of surrogate monitoring data, in the middle of the
inhalation approach hierarchy. These monitoring data include 16 data points from 1 source, and the data
quality ratings from systematic review for these data were medium. The primary limitations of these
data include the uncertainty of the representativeness of these surrogate data toward the true distribution
of inhalation concentrations for the industries and sites covered by this scenario. Based on these
strengths and limitations of the inhalation air concentration data, the overall confidence for these 8-hr
TWA data in this scenario is medium.
Table 2-41 summarizes the 8-hr TWA from monitoring data from TCE manufacturing. The data were
obtained from obtained from data submitted by the Halogenated Solvents Industry Alliance (HSIA) via
public comment for one company (Halogenated Solvents Industry Alliance, 2018 5176415). No data
was found to estimate ONU exposures during other industrial uses of TCE. EPA estimates that ONU
exposures are lower than worker exposures, since ONUs do not typically directly handle the chemical.
Table 2-41 Summary of Occupational Exposure Surrogate Monitoring Data for Unloading TCE
During Other Industrial Uses
Scenario
8-hr
TWA
(ppm)
AC
(ppm)
ADC
(ppm)
LADC
(ppm)
Number of Data
Points Confidence Rating of Air
Concentration Data
High-End 2.6 0.9 0.6 0.3
16 Medium Central
Tendency
0.4 0.1 0.1 0.03
AC = Acute Concentration; ADC = Average Daily Concentration; and LADC = Lifetime Average Daily Concentration.
Equations and parameters for calculation of the AC, ADC, and LADC are described in Appendix B
Water Release Assessment
The following sections detail EPA’s water release assessment for other industrial uses of TCE.
2.13.4.1 Water Release Sources
Specifics of the processes and potential sources of release for other industrial uses are unknown.
However, general potential sources of water releases in the chemical industry may include the
following: equipment cleaning operations, aqueous wastes from scrubbers/decanters, reaction water,
process water from washing intermediate products, and trace water settled in storage tanks (OECD,
2019).
2.13.4.2 Water Release Assessment Results
EPA assessed water releases using the annual discharge values reported to the 2016 TRI and the 2016
DMR by the 49 sites using TCE in other industrial uses. In the 2016 TRI, all 28 reported zero discharge
to water. In the 2016 DMR, twenty-one sites reported a direct discharge to surface water (indirect
discharges not reported in DMR data).
To estimate the daily release, EPA assumed a default of 250 days/yr of operation and averaged the
annual release over the operating days. Table 2-42 summarizes the water releases from the 2016 TRI
and DMR for sites with non-zero discharges.
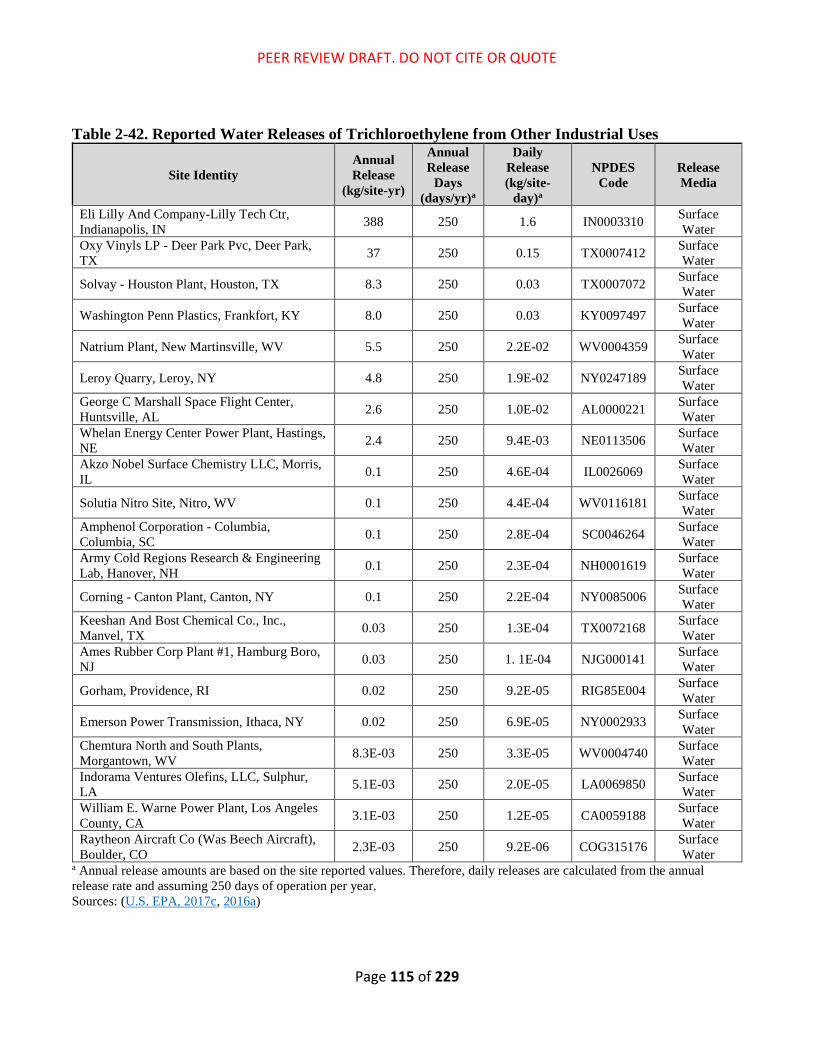
PEER REVIEW DRAFT. DO NOT CITE OR QUOTE
Page 115 of 229
Table 2-42. Reported Water Releases of Trichloroethylene from Other Industrial Uses
Site Identity
Annual
Release
(kg/site-yr)
Annual
Release
Days
(days/yr)a
Daily
Release
(kg/site-
day)a
NPDES
Code
Release
Media
Eli Lilly And Company-Lilly Tech Ctr,
Indianapolis, IN 388 250 1.6 IN0003310
Surface
Water
Oxy Vinyls LP - Deer Park Pvc, Deer Park,
TX 37 250 0.15 TX0007412
Surface
Water
Solvay - Houston Plant, Houston, TX 8.3 250 0.03 TX0007072 Surface
Water
Washington Penn Plastics, Frankfort, KY 8.0 250 0.03 KY0097497 Surface
Water
Natrium Plant, New Martinsville, WV 5.5 250 2.2E-02 WV0004359 Surface
Water
Leroy Quarry, Leroy, NY 4.8 250 1.9E-02 NY0247189 Surface
Water
George C Marshall Space Flight Center,
Huntsville, AL 2.6 250 1.0E-02 AL0000221
Surface
Water
Whelan Energy Center Power Plant, Hastings,
NE 2.4 250 9.4E-03 NE0113506
Surface
Water
Akzo Nobel Surface Chemistry LLC, Morris,
IL 0.1 250 4.6E-04 IL0026069
Surface
Water
Solutia Nitro Site, Nitro, WV 0.1 250 4.4E-04 WV0116181 Surface
Water
Amphenol Corporation - Columbia,
Columbia, SC 0.1 250 2.8E-04 SC0046264
Surface
Water
Army Cold Regions Research & Engineering
Lab, Hanover, NH 0.1 250 2.3E-04 NH0001619
Surface
Water
Corning - Canton Plant, Canton, NY 0.1 250 2.2E-04 NY0085006 Surface
Water
Keeshan And Bost Chemical Co., Inc.,
Manvel, TX 0.03 250 1.3E-04 TX0072168
Surface
Water
Ames Rubber Corp Plant #1, Hamburg Boro,
NJ 0.03 250 1. 1E-04 NJG000141
Surface
Water
Gorham, Providence, RI 0.02 250 9.2E-05 RIG85E004 Surface
Water
Emerson Power Transmission, Ithaca, NY 0.02 250 6.9E-05 NY0002933 Surface
Water
Chemtura North and South Plants,
Morgantown, WV 8.3E-03 250 3.3E-05 WV0004740
Surface
Water
Indorama Ventures Olefins, LLC, Sulphur,
LA 5.1E-03 250 2.0E-05 LA0069850
Surface
Water
William E. Warne Power Plant, Los Angeles
County, CA 3.1E-03 250 1.2E-05 CA0059188
Surface
Water
Raytheon Aircraft Co (Was Beech Aircraft),
Boulder, CO 2.3E-03 250 9.2E-06 COG315176
Surface
Water a Annual release amounts are based on the site reported values. Therefore, daily releases are calculated from the annual
release rate and assuming 250 days of operation per year.
Sources: (U.S. EPA, 2017c, 2016a)

PEER REVIEW DRAFT. DO NOT CITE OR QUOTE
Page 116 of 229
2.14 Spot Cleaning, Wipe Cleaning and Carpet Cleaning
Facility Estimates
There are 34,650 establishments in the United States under NAICS 812300, Dry Cleaning and Laundry
Services and 21,370 establishments in the United States under NAICS 812320, Dry Cleaning and
Laundry Services (except coin-operated) (U.S. Census Bureau, 2015). There are 7,728 establishments in
the United States under NAICS 561740, Cleaning and Furniture Care Products (U.S. Census Bureau,
2015). For the purposes of this assessment, EPA assumes spot cleaning, wipe cleaning, and carpet
cleaning using TCE may occur at all 63,748 sites under these NAICS numbers.
Process Description
The following sections outline how TCE is used to spot clean garments and carpets, was well as use as a
wipe cleaner.
2.14.2.1 Spot Cleaning
On receiving a garment, dry cleaners inspect for stains or spots they can remove as much as possible
before cleaning the garment in a dry cleaning machine. As Figure 2-18 shows, spot cleaning occurs on a
spotting board and can involve the use of a spotting agent containing TCE. The spotting agent can be
applied from squeeze bottles, hand-held spray bottles, or even from spray guns connected to pressurized
tanks. Once applied, the dry cleaner may come into further contact with the TCE if using a brush,
spatula, pressurized air or steam, or their fingers to scrape or flush away the stain (NIOSH, 1997) and
(Young, 2012).
Figure 2-18. Exposure Scenario for Spot Cleaning Process
As TCE is only used as a spot cleaner at dry cleaning facilities, EPA does not assess a dry cleaning
scenario. Therefore, this scenario represents dry cleaners where spot cleaning is the only source of TCE
exposure. The extent of such uses is likely limited, several TCE-free spot cleaner formulations are
available.
2.14.2.2 Carpet Cleaning
The process of carpet cleaning using TCE is similar to that discussed for Spot Cleaning above (Section
2.8.2.1). Carpets are inspected for stains, then the spotting agent can be applied from squeeze bottles,
hand-held spray bottles, or even from spray guns connected to pressurized tanks. Once applied, the
cleaner may come into further contact with the TCE if using a brush, spatula, pressurized air or steam, or
their fingers to scrape or flush away the stain(Young, 2012; NIOSH, 1997).
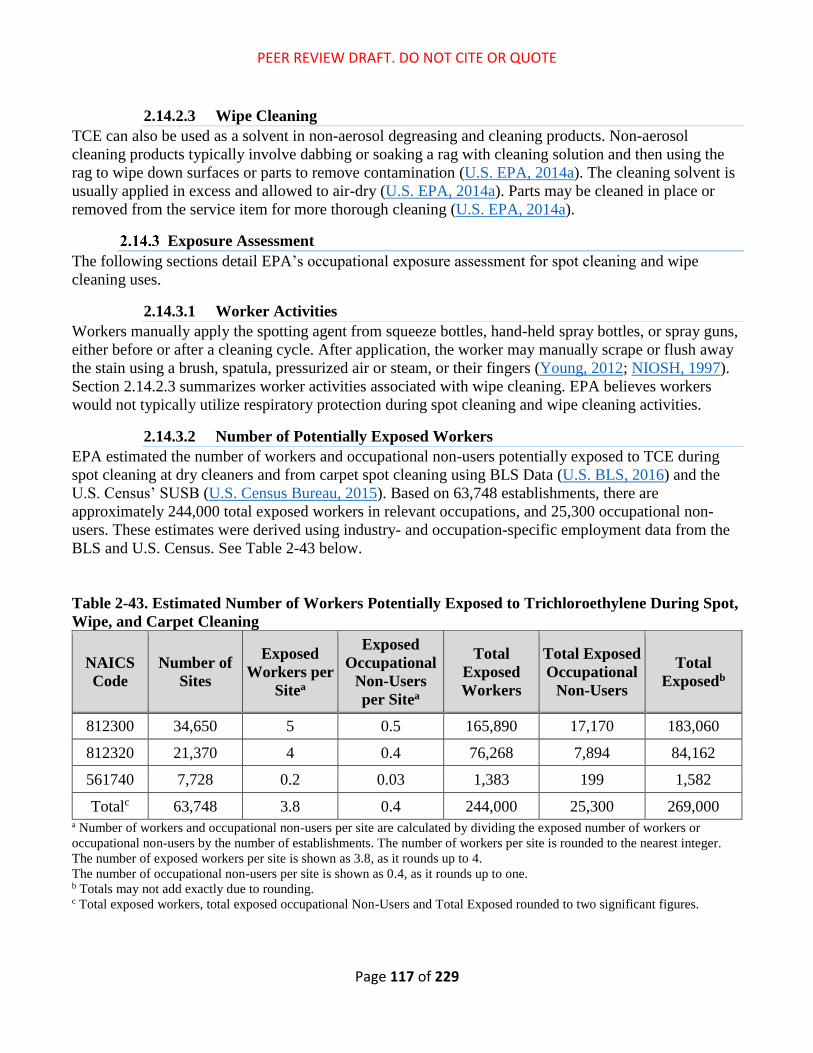
PEER REVIEW DRAFT. DO NOT CITE OR QUOTE
Page 117 of 229
2.14.2.3 Wipe Cleaning
TCE can also be used as a solvent in non-aerosol degreasing and cleaning products. Non-aerosol
cleaning products typically involve dabbing or soaking a rag with cleaning solution and then using the
rag to wipe down surfaces or parts to remove contamination (U.S. EPA, 2014a). The cleaning solvent is
usually applied in excess and allowed to air-dry (U.S. EPA, 2014a). Parts may be cleaned in place or
removed from the service item for more thorough cleaning (U.S. EPA, 2014a).
Exposure Assessment
The following sections detail EPA’s occupational exposure assessment for spot cleaning and wipe
cleaning uses.
2.14.3.1 Worker Activities
Workers manually apply the spotting agent from squeeze bottles, hand-held spray bottles, or spray guns,
either before or after a cleaning cycle. After application, the worker may manually scrape or flush away
the stain using a brush, spatula, pressurized air or steam, or their fingers (Young, 2012; NIOSH, 1997).
Section 2.14.2.3 summarizes worker activities associated with wipe cleaning. EPA believes workers
would not typically utilize respiratory protection during spot cleaning and wipe cleaning activities.
2.14.3.2 Number of Potentially Exposed Workers
EPA estimated the number of workers and occupational non-users potentially exposed to TCE during
spot cleaning at dry cleaners and from carpet spot cleaning using BLS Data (U.S. BLS, 2016) and the
U.S. Census’ SUSB (U.S. Census Bureau, 2015). Based on 63,748 establishments, there are
approximately 244,000 total exposed workers in relevant occupations, and 25,300 occupational non-
users. These estimates were derived using industry- and occupation-specific employment data from the
BLS and U.S. Census. See Table 2-43 below.
Table 2-43. Estimated Number of Workers Potentially Exposed to Trichloroethylene During Spot,
Wipe, and Carpet Cleaning
NAICS
Code
Number of
Sites
Exposed
Workers per
Sitea
Exposed
Occupational
Non-Users
per Sitea
Total
Exposed
Workers
Total Exposed
Occupational
Non-Users
Total
Exposedb
812300 34,650 5 0.5 165,890 17,170 183,060
812320 21,370 4 0.4 76,268 7,894 84,162
561740 7,728 0.2 0.03 1,383 199 1,582
Totalc 63,748 3.8 0.4 244,000 25,300 269,000 a Number of workers and occupational non-users per site are calculated by dividing the exposed number of workers or
occupational non-users by the number of establishments. The number of workers per site is rounded to the nearest integer.
The number of exposed workers per site is shown as 3.8, as it rounds up to 4.
The number of occupational non-users per site is shown as 0.4, as it rounds up to one. b Totals may not add exactly due to rounding. c Total exposed workers, total exposed occupational Non-Users and Total Exposed rounded to two significant figures.
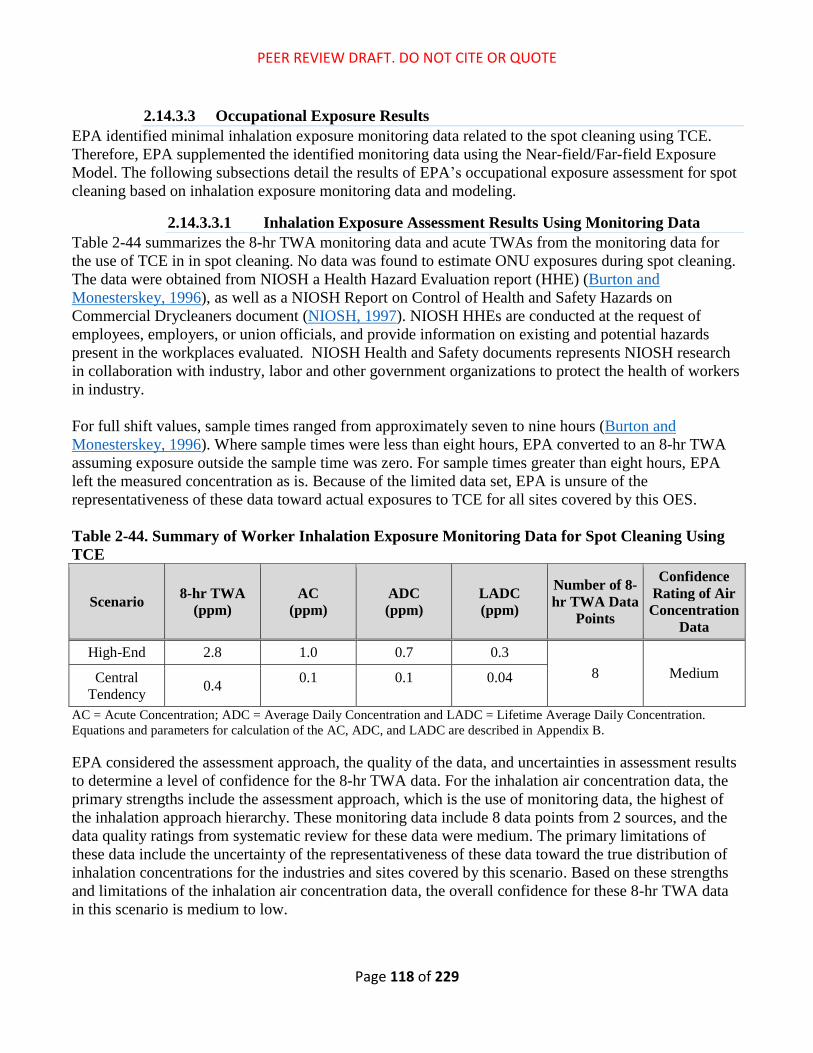
PEER REVIEW DRAFT. DO NOT CITE OR QUOTE
Page 118 of 229
2.14.3.3 Occupational Exposure Results
EPA identified minimal inhalation exposure monitoring data related to the spot cleaning using TCE.
Therefore, EPA supplemented the identified monitoring data using the Near-field/Far-field Exposure
Model. The following subsections detail the results of EPA’s occupational exposure assessment for spot
cleaning based on inhalation exposure monitoring data and modeling.
2.14.3.3.1 Inhalation Exposure Assessment Results Using Monitoring Data
Table 2-44 summarizes the 8-hr TWA monitoring data and acute TWAs from the monitoring data for
the use of TCE in in spot cleaning. No data was found to estimate ONU exposures during spot cleaning.
The data were obtained from NIOSH a Health Hazard Evaluation report (HHE) (Burton and
Monesterskey, 1996), as well as a NIOSH Report on Control of Health and Safety Hazards on
Commercial Drycleaners document (NIOSH, 1997). NIOSH HHEs are conducted at the request of
employees, employers, or union officials, and provide information on existing and potential hazards
present in the workplaces evaluated. NIOSH Health and Safety documents represents NIOSH research
in collaboration with industry, labor and other government organizations to protect the health of workers
in industry.
For full shift values, sample times ranged from approximately seven to nine hours (Burton and
Monesterskey, 1996). Where sample times were less than eight hours, EPA converted to an 8-hr TWA
assuming exposure outside the sample time was zero. For sample times greater than eight hours, EPA
left the measured concentration as is. Because of the limited data set, EPA is unsure of the
representativeness of these data toward actual exposures to TCE for all sites covered by this OES.
Table 2-44. Summary of Worker Inhalation Exposure Monitoring Data for Spot Cleaning Using
TCE
Scenario 8-hr TWA
(ppm)
AC
(ppm)
ADC
(ppm)
LADC
(ppm)
Number of 8-
hr TWA Data
Points
Confidence
Rating of Air
Concentration
Data
High-End 2.8 1.0 0.7 0.3
8 Medium Central
Tendency 0.4
0.1 0.1 0.04
AC = Acute Concentration; ADC = Average Daily Concentration and LADC = Lifetime Average Daily Concentration.
Equations and parameters for calculation of the AC, ADC, and LADC are described in Appendix B.
EPA considered the assessment approach, the quality of the data, and uncertainties in assessment results
to determine a level of confidence for the 8-hr TWA data. For the inhalation air concentration data, the
primary strengths include the assessment approach, which is the use of monitoring data, the highest of
the inhalation approach hierarchy. These monitoring data include 8 data points from 2 sources, and the
data quality ratings from systematic review for these data were medium. The primary limitations of
these data include the uncertainty of the representativeness of these data toward the true distribution of
inhalation concentrations for the industries and sites covered by this scenario. Based on these strengths
and limitations of the inhalation air concentration data, the overall confidence for these 8-hr TWA data
in this scenario is medium to low.
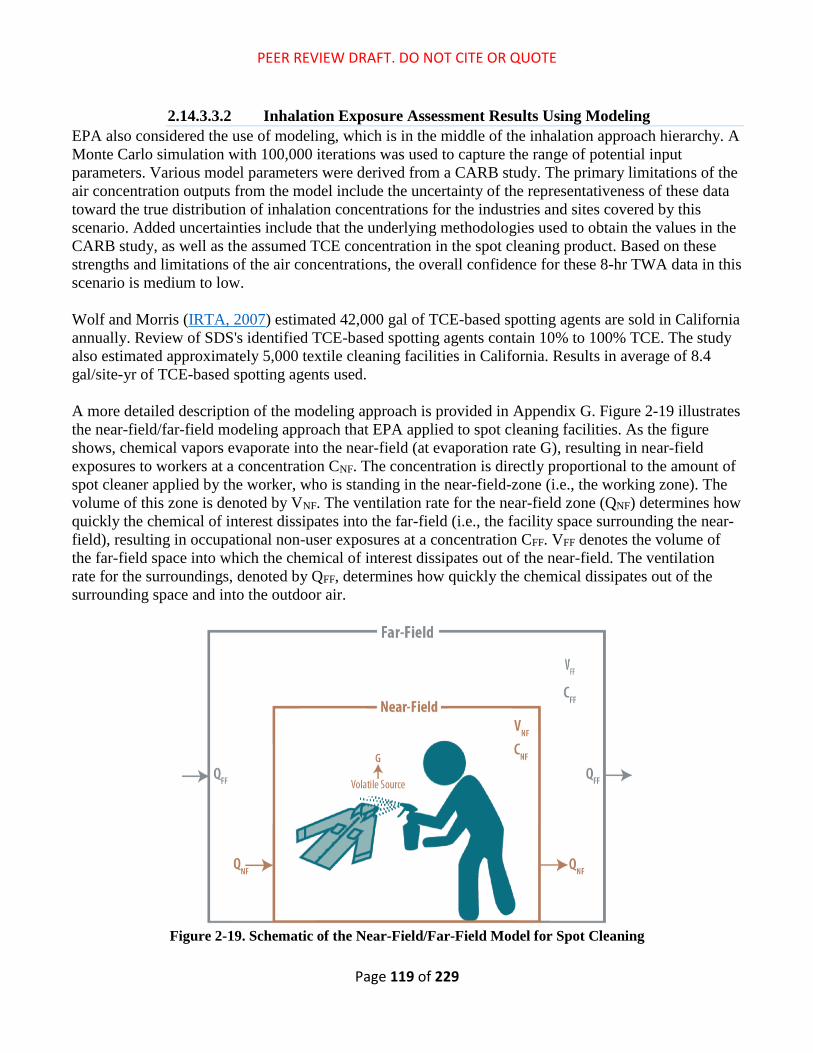
PEER REVIEW DRAFT. DO NOT CITE OR QUOTE
Page 119 of 229
2.14.3.3.2 Inhalation Exposure Assessment Results Using Modeling
EPA also considered the use of modeling, which is in the middle of the inhalation approach hierarchy. A
Monte Carlo simulation with 100,000 iterations was used to capture the range of potential input
parameters. Various model parameters were derived from a CARB study. The primary limitations of the
air concentration outputs from the model include the uncertainty of the representativeness of these data
toward the true distribution of inhalation concentrations for the industries and sites covered by this
scenario. Added uncertainties include that the underlying methodologies used to obtain the values in the
CARB study, as well as the assumed TCE concentration in the spot cleaning product. Based on these
strengths and limitations of the air concentrations, the overall confidence for these 8-hr TWA data in this
scenario is medium to low.
Wolf and Morris (IRTA, 2007) estimated 42,000 gal of TCE-based spotting agents are sold in California
annually. Review of SDS's identified TCE-based spotting agents contain 10% to 100% TCE. The study
also estimated approximately 5,000 textile cleaning facilities in California. Results in average of 8.4
gal/site-yr of TCE-based spotting agents used.
A more detailed description of the modeling approach is provided in Appendix G. Figure 2-19 illustrates
the near-field/far-field modeling approach that EPA applied to spot cleaning facilities. As the figure
shows, chemical vapors evaporate into the near-field (at evaporation rate G), resulting in near-field
exposures to workers at a concentration CNF. The concentration is directly proportional to the amount of
spot cleaner applied by the worker, who is standing in the near-field-zone (i.e., the working zone). The
volume of this zone is denoted by VNF. The ventilation rate for the near-field zone (QNF) determines how
quickly the chemical of interest dissipates into the far-field (i.e., the facility space surrounding the near-
field), resulting in occupational non-user exposures at a concentration CFF. VFF denotes the volume of
the far-field space into which the chemical of interest dissipates out of the near-field. The ventilation
rate for the surroundings, denoted by QFF, determines how quickly the chemical dissipates out of the
surrounding space and into the outdoor air.
Figure 2-19. Schematic of the Near-Field/Far-Field Model for Spot Cleaning
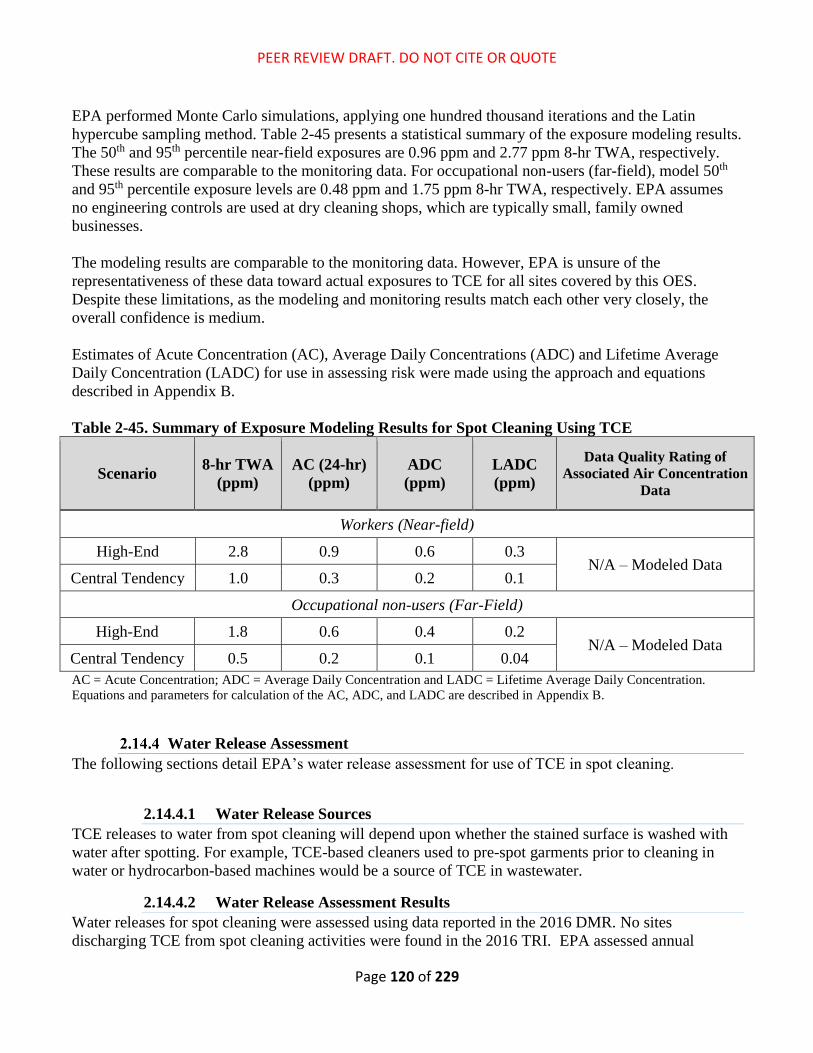
PEER REVIEW DRAFT. DO NOT CITE OR QUOTE
Page 120 of 229
EPA performed Monte Carlo simulations, applying one hundred thousand iterations and the Latin
hypercube sampling method. Table 2-45 presents a statistical summary of the exposure modeling results.
The 50th and 95th percentile near-field exposures are 0.96 ppm and 2.77 ppm 8-hr TWA, respectively.
These results are comparable to the monitoring data. For occupational non-users (far-field), model 50th
and 95th percentile exposure levels are 0.48 ppm and 1.75 ppm 8-hr TWA, respectively. EPA assumes
no engineering controls are used at dry cleaning shops, which are typically small, family owned
businesses.
The modeling results are comparable to the monitoring data. However, EPA is unsure of the
representativeness of these data toward actual exposures to TCE for all sites covered by this OES.
Despite these limitations, as the modeling and monitoring results match each other very closely, the
overall confidence is medium.
Estimates of Acute Concentration (AC), Average Daily Concentrations (ADC) and Lifetime Average
Daily Concentration (LADC) for use in assessing risk were made using the approach and equations
described in Appendix B.
Table 2-45. Summary of Exposure Modeling Results for Spot Cleaning Using TCE
Scenario 8-hr TWA
(ppm)
AC (24-hr)
(ppm)
ADC
(ppm)
LADC
(ppm)
Data Quality Rating of
Associated Air Concentration
Data
Workers (Near-field)
High-End 2.8 0.9 0.6 0.3 N/A – Modeled Data
Central Tendency 1.0 0.3 0.2 0.1
Occupational non-users (Far-Field)
High-End 1.8 0.6 0.4 0.2 N/A – Modeled Data
Central Tendency 0.5 0.2 0.1 0.04
AC = Acute Concentration; ADC = Average Daily Concentration and LADC = Lifetime Average Daily Concentration.
Equations and parameters for calculation of the AC, ADC, and LADC are described in Appendix B.
Water Release Assessment
The following sections detail EPA’s water release assessment for use of TCE in spot cleaning.
2.14.4.1 Water Release Sources
TCE releases to water from spot cleaning will depend upon whether the stained surface is washed with
water after spotting. For example, TCE-based cleaners used to pre-spot garments prior to cleaning in
water or hydrocarbon-based machines would be a source of TCE in wastewater.
2.14.4.2 Water Release Assessment Results
Water releases for spot cleaning were assessed using data reported in the 2016 DMR. No sites
discharging TCE from spot cleaning activities were found in the 2016 TRI. EPA assessed annual
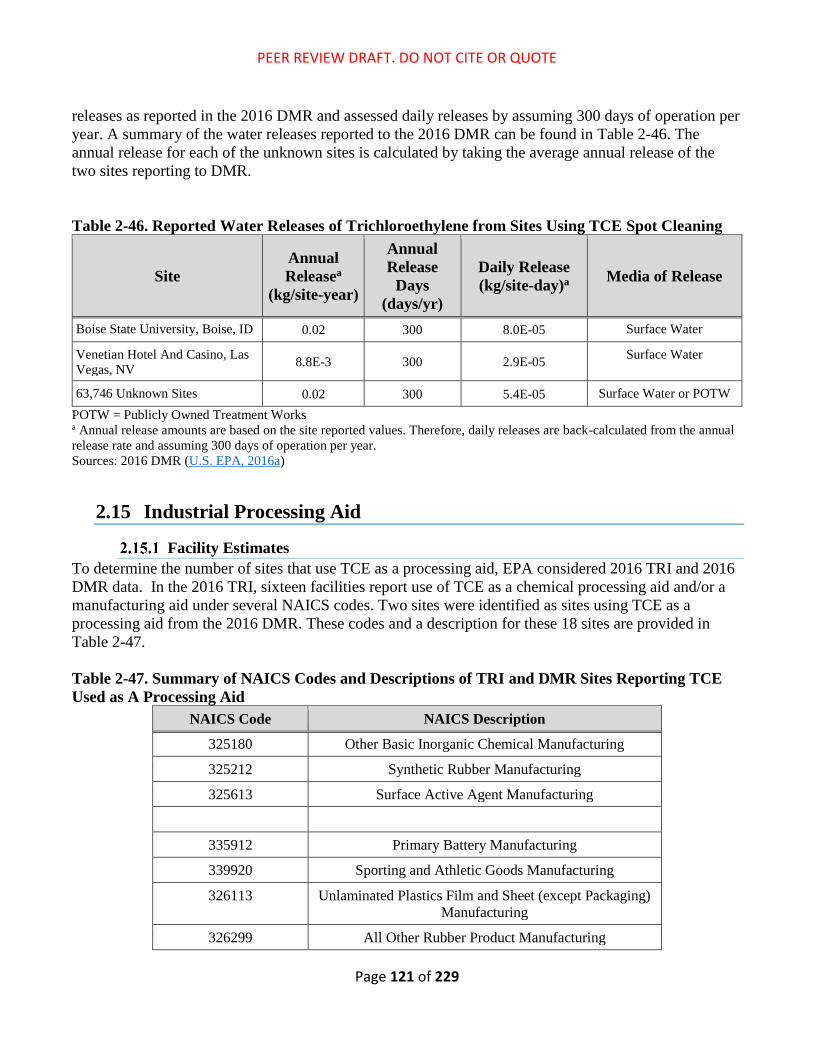
PEER REVIEW DRAFT. DO NOT CITE OR QUOTE
Page 121 of 229
releases as reported in the 2016 DMR and assessed daily releases by assuming 300 days of operation per
year. A summary of the water releases reported to the 2016 DMR can be found in Table 2-46. The
annual release for each of the unknown sites is calculated by taking the average annual release of the
two sites reporting to DMR.
Table 2-46. Reported Water Releases of Trichloroethylene from Sites Using TCE Spot Cleaning
Site
Annual
Releasea
(kg/site-year)
Annual
Release
Days
(days/yr)
Daily Release
(kg/site-day)a Media of Release
Boise State University, Boise, ID 0.02 300 8.0E-05 Surface Water
Venetian Hotel And Casino, Las
Vegas, NV 8.8E-3 300 2.9E-05
Surface Water
63,746 Unknown Sites 0.02 300 5.4E-05 Surface Water or POTW
POTW = Publicly Owned Treatment Works a Annual release amounts are based on the site reported values. Therefore, daily releases are back-calculated from the annual
release rate and assuming 300 days of operation per year.
Sources: 2016 DMR (U.S. EPA, 2016a)
2.15 Industrial Processing Aid
Facility Estimates
To determine the number of sites that use TCE as a processing aid, EPA considered 2016 TRI and 2016
DMR data. In the 2016 TRI, sixteen facilities report use of TCE as a chemical processing aid and/or a
manufacturing aid under several NAICS codes. Two sites were identified as sites using TCE as a
processing aid from the 2016 DMR. These codes and a description for these 18 sites are provided in
Table 2-47.
Table 2-47. Summary of NAICS Codes and Descriptions of TRI and DMR Sites Reporting TCE
Used as A Processing Aid
NAICS Code NAICS Description
325180 Other Basic Inorganic Chemical Manufacturing
325212 Synthetic Rubber Manufacturing
325613 Surface Active Agent Manufacturing
335912 Primary Battery Manufacturing
339920 Sporting and Athletic Goods Manufacturing
326113 Unlaminated Plastics Film and Sheet (except Packaging)
Manufacturing
326299 All Other Rubber Product Manufacturing

PEER REVIEW DRAFT. DO NOT CITE OR QUOTE
Page 122 of 229
NAICS Code NAICS Description
332721 Precision Turned Product Manufacturing
332811 Metal Heat Treating
332812 Metal Coating, Engraving (except Jewelry and
Silverware), and Allied Services to Manufacturers
335991 Carbon and Graphite Product Manufacturing
336413 Other Aircraft Parts and Auxiliary Equipment
Manufacturing
EPA assumes that all 18 sites use TCE as an industrial processing aid.
Process Description
According to the TRI Reporting Forms and Instructions (RFI) Guidance Document, a processing aid is a
“chemical that is added to a reaction mixture to aid in the manufacture or synthesis of another chemical
substance but is not intended to remain in or become part of the product or product mixture is otherwise
used as a chemical processing aid. Examples of such chemicals include, but are not limited to, process
solvents, catalysts, inhibitors, initiators, reaction terminators, and solution buffers” (U.S. EPA, 2018d).
Additionally, processing aids are intended to improve the processing characteristics or the operation of
process equipment, but not intended to affect the function of a substance or article created (U.S. EPA,
2016b).
One processing aid use of TCE is in the manufacturing of photographic and x-ray films, plastics
manufacturing and ink processing (Halogenated Solvents Industry Alliance, 2017 5176417). According
to public comments from the Saft America, Inc. (Saft America, 2017), TCE is used in research and
development, occasionally battery production. Dow states TCE is used as a solvent in waterless drying
and finishing operations (Dow Chemical, 2014). Other specific processing aid uses of TCE were not
identified; however, EPA expects use as a process solvent to be amongst the major processing aid uses.
Exposure Assessment
The following sections detail EPA’s occupational exposure assessment for the use of TCE as a
processing aid.
2.15.3.1 Worker Activities
During the use of TCE as a processing aid, workers are potentially exposed to TCE while connecting
and disconnecting hoses and transfer lines to containers and packaging to be unloaded (e.g., railcars,
tank trucks, totes). Workers near loading racks and container filling stations are potentially exposed to
fugitive emissions from equipment leaks and displaced vapor as containers are filled. These activities
are potential sources of worker exposure through dermal contact with liquid and inhalation of vapors.
ONUs include employees that work at the site where TCE is used, but they do not directly handle the
chemical and are therefore expected to have lower inhalation exposures and are not expected to have
dermal exposures. ONUs for formulation activities include supervisors, managers, and tradesmen that
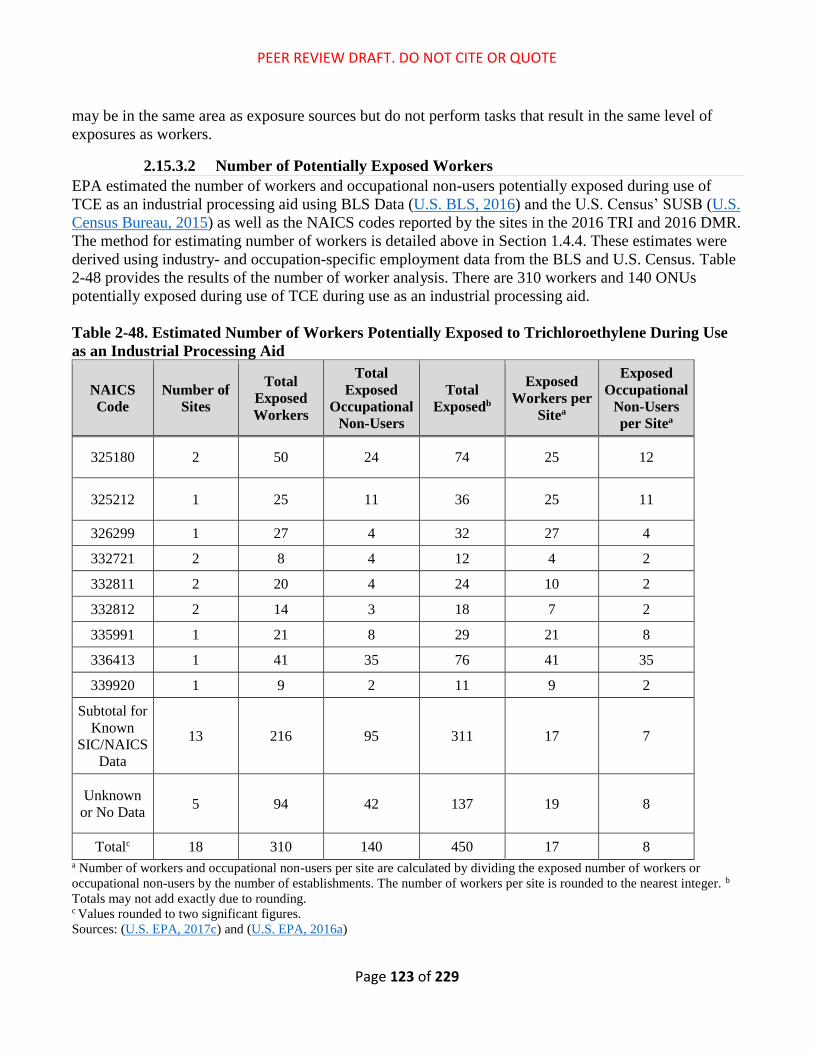
PEER REVIEW DRAFT. DO NOT CITE OR QUOTE
Page 123 of 229
may be in the same area as exposure sources but do not perform tasks that result in the same level of
exposures as workers.
2.15.3.2 Number of Potentially Exposed Workers
EPA estimated the number of workers and occupational non-users potentially exposed during use of
TCE as an industrial processing aid using BLS Data (U.S. BLS, 2016) and the U.S. Census’ SUSB (U.S.
Census Bureau, 2015) as well as the NAICS codes reported by the sites in the 2016 TRI and 2016 DMR.
The method for estimating number of workers is detailed above in Section 1.4.4. These estimates were
derived using industry- and occupation-specific employment data from the BLS and U.S. Census. Table
2-48 provides the results of the number of worker analysis. There are 310 workers and 140 ONUs
potentially exposed during use of TCE during use as an industrial processing aid.
Table 2-48. Estimated Number of Workers Potentially Exposed to Trichloroethylene During Use
as an Industrial Processing Aid
NAICS
Code
Number of
Sites
Total
Exposed
Workers
Total
Exposed
Occupational
Non-Users
Total
Exposedb
Exposed
Workers per
Sitea
Exposed
Occupational
Non-Users
per Sitea
325180 2 50 24 74 25 12
325212 1 25 11 36 25 11
326299 1 27 4 32 27 4
332721 2 8 4 12 4 2
332811 2 20 4 24 10 2
332812 2 14 3 18 7 2
335991 1 21 8 29 21 8
336413 1 41 35 76 41 35
339920 1 9 2 11 9 2
Subtotal for
Known
SIC/NAICS
Data
13 216 95 311 17 7
Unknown
or No Data 5 94 42 137 19 8
Totalc 18 310 140 450 17 8 a Number of workers and occupational non-users per site are calculated by dividing the exposed number of workers or
occupational non-users by the number of establishments. The number of workers per site is rounded to the nearest integer. b
Totals may not add exactly due to rounding. c Values rounded to two significant figures. Sources: (U.S. EPA, 2017c) and (U.S. EPA, 2016a)
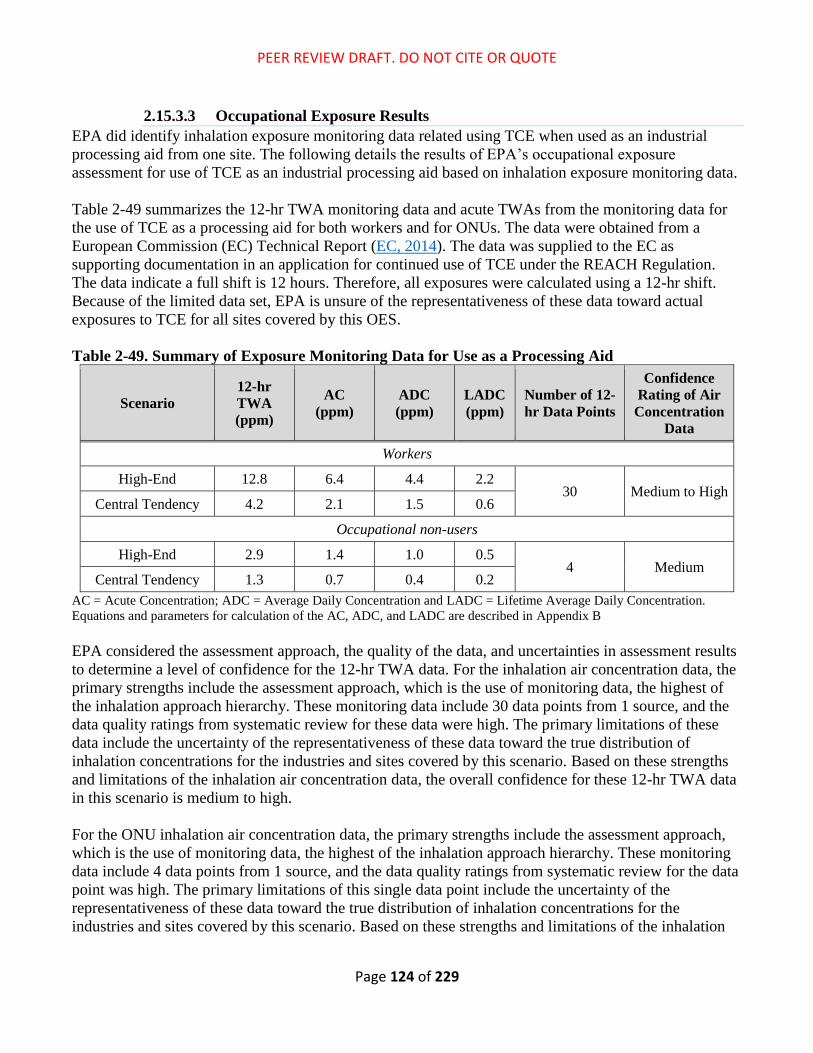
PEER REVIEW DRAFT. DO NOT CITE OR QUOTE
Page 124 of 229
2.15.3.3 Occupational Exposure Results
EPA did identify inhalation exposure monitoring data related using TCE when used as an industrial
processing aid from one site. The following details the results of EPA’s occupational exposure
assessment for use of TCE as an industrial processing aid based on inhalation exposure monitoring data.
Table 2-49 summarizes the 12-hr TWA monitoring data and acute TWAs from the monitoring data for
the use of TCE as a processing aid for both workers and for ONUs. The data were obtained from a
European Commission (EC) Technical Report (EC, 2014). The data was supplied to the EC as
supporting documentation in an application for continued use of TCE under the REACH Regulation.
The data indicate a full shift is 12 hours. Therefore, all exposures were calculated using a 12-hr shift.
Because of the limited data set, EPA is unsure of the representativeness of these data toward actual
exposures to TCE for all sites covered by this OES.
Table 2-49. Summary of Exposure Monitoring Data for Use as a Processing Aid
Scenario
12-hr
TWA
(ppm)
AC
(ppm)
ADC
(ppm)
LADC
(ppm)
Number of 12-
hr Data Points
Confidence
Rating of Air
Concentration
Data
Workers
High-End 12.8 6.4 4.4 2.2 30 Medium to High
Central Tendency 4.2 2.1 1.5 0.6
Occupational non-users
High-End 2.9 1.4 1.0 0.5 4 Medium
Central Tendency 1.3 0.7 0.4 0.2
AC = Acute Concentration; ADC = Average Daily Concentration and LADC = Lifetime Average Daily Concentration.
Equations and parameters for calculation of the AC, ADC, and LADC are described in Appendix B
EPA considered the assessment approach, the quality of the data, and uncertainties in assessment results
to determine a level of confidence for the 12-hr TWA data. For the inhalation air concentration data, the
primary strengths include the assessment approach, which is the use of monitoring data, the highest of
the inhalation approach hierarchy. These monitoring data include 30 data points from 1 source, and the
data quality ratings from systematic review for these data were high. The primary limitations of these
data include the uncertainty of the representativeness of these data toward the true distribution of
inhalation concentrations for the industries and sites covered by this scenario. Based on these strengths
and limitations of the inhalation air concentration data, the overall confidence for these 12-hr TWA data
in this scenario is medium to high.
For the ONU inhalation air concentration data, the primary strengths include the assessment approach,
which is the use of monitoring data, the highest of the inhalation approach hierarchy. These monitoring
data include 4 data points from 1 source, and the data quality ratings from systematic review for the data
point was high. The primary limitations of this single data point include the uncertainty of the
representativeness of these data toward the true distribution of inhalation concentrations for the
industries and sites covered by this scenario. Based on these strengths and limitations of the inhalation

PEER REVIEW DRAFT. DO NOT CITE OR QUOTE
Page 125 of 229
air concentration data, the overall confidence for these 12-hr TWA data in this scenario is medium to
low.
Water Release Assessment
The following sections detail EPA’s water release assessment for use of TCE as an industrial processing
aid.
2.15.4.1 Water Release Sources
In general, potential sources of water releases in the chemical industry may include the following:
equipment cleaning operations, aqueous wastes from scrubbers/decanters, reaction water, process water
from washing intermediate products, and trace water settled in storage tanks (OECD, 2019). Based on
the use as a processing aid and the amount of TCE used for this OES, EPA expects minimal sources of
TCE release to water.
2.15.4.2 Water Release Assessment Results
Water releases during use as a processing aid were assessed using data reported in the 2016 TRI as well
as 2016 DMR. Four of the 16 sites reporting to TRI provided water releases. The remaining 12 sites
reported all releases were to off-site land, incineration or recycling. EPA assessed annual releases as
reported in the 2016 TRI and assessed daily releases by assuming 300 days of operation per year. A
summary of the water releases reported to the 2016 DMR and 2016 TRI can be found in Table 2-50.
Table 2-50. Reported Water Releases of Trichloroethylene from Industrial Processing Aid Sites
Using TCE
Site Identity
Annual
Release
(kg/site-yr)a
Annual
Release
Days
(days/yr)
Daily Release
(kg/site-day)a
NPDES
Code
Release
Media
Entek International LLC, Lebanon, OR 113 300 0.4 Not
available POTW
Occidental Chemical Corp Niagara
Plant, Niagara Falls, NY 5.8 300 0.02 NY0003336
Surface
Water
National Electrical Carbon Products Dba
Morgan Adv Materials, Fostoria, OH 2.3 300 7. 6E-03
Not
available POTW
Daramic LLC, Corydon, IN 2.3 300 0.01 Not
available
Surface
Water
PPG Industries Inc Barberton,
Barberton, OH 1.4 300 4.5E-3 OH0123897 POTW
Stepan Co Millsdale Road, Elwood, IL 0.2 300 5.5E-04 IL0002453 Surface
Water a Annual release amounts are based on the site reported values. Therefore, daily releases are back-calculated from the annual
release rate and assuming 300 days of operation per year.
POTW = Publicly Owned Treatment Works
Sources: (U.S. EPA, 2017c, 2016a)
2.16 Commercial Printing and Copying
PEER REVIEW DRAFT. DO NOT CITE OR QUOTE
Page 126 of 229
Facility Estimates
There are 25,688 establishments in the United States under the following NAICS codes: 323111,
Commercial Printing (except Screen and Books); 323113, Commercial Screen Printing; 323117, Books
Printing; and 323120, Support Activities for Printing (U.S. Census Bureau, 2015). However, the
systematic literature review of uses of and exposure to TCE (Bakke et al., 2007) indicate TCE use in
printing was rare by the 1970s. The TCE Market and Use Report indicates approximately 1.7% of the
TCE manufactured/imported into the U.S. is for uses considered “other uses,” which would include all
other uses other than as a chemical intermediate or as a degreaser (U.S. EPA, 2017d). Also, there is no
information on the market share of TCE for this OES. Therefore, there is not enough information to
quantify the number of facilities using TCE in commercial printing and copying.
Process Description
The Scoping Document for Emission Scenario Document on Manufacture and Use of Printing
Inks(OECD, 2010) provides general process descriptions and worker activities for industrial commercial
printing/copying uses.
Printing processes can be sheet-fed or web-fed. Web presses are used for larger printing
runs and print images onto a continuous roll (web) of paper. After printing, the web is cut to a
preferred size. Sheet-fed presses print on individual sheets of paper or other substrate. Most
commercial printing is done on sheet-fed presses while long runs for newspapers, magazines,
and books are usually printed on web-fed. There is an additional distinction between web-fed
printing processes. Non-heat-set printing refers to continuous processes without the application
of heat. In heat-set web printing a continuous roll of paper or other substrate material is printed
with the application of heat. Several types of printing processes include:
• Lithography – this process is based on the principle that oil and water are not miscible. The image
area on the printing plates is photochemically treated to absorb an oil-based ink in the image areas
and to absorb only water in the non-image areas. At the printing facility, the ink paste is unloaded
from a container into an ink tank on the printing machine. The machine is set in motion and ink is
transferred first to the ink rollers, then to the printing cylinder, then to the intermediate blanket
roll, and finally to the paper. The blanket imparts the image to the substrate. Lithography presses
may be sheet-fed, non-heat-set-fed, or heat-set-fed. Web-fed lithography is used in the production
of articles such as periodicals, newspapers, advertising, and books.
• Gravure - is a printing process in which the image is etched or engraved below the surface of a
plate or cylinder. The printing image consists of millions of minute cells etched or engraved into
copper cylinders or plates plated with chrome. Gravure processes using cylinders are referred to
as rotogravure. Engraving cylinders is a relatively complex and expensive task. As a result,
rotogravure is typically used for long printing jobs where engraving new printing images is not
frequently required.
• Flexography - is an example of relief printing where the image area is raised relative to the non-
image area. The inks must be very fluid to print properly and include both water-borne and
solvent-borne systems. Flexographic printing can be sheet or web-fed. The major uses of
flexographic printing are for flexible and rigid packaging, newspapers, magazines, and
directories, and consumer paper products such as paper towels and tissues.
• Letterpress - uses a relief printing plate or cylinder like flexography. The plates differ from
flexographic plates because they use a raised metal image. Viscous inks similar to lithographic
PEER REVIEW DRAFT. DO NOT CITE OR QUOTE
Page 127 of 229
inks are used. Sheet-fed, heat-set web, and non-heat-set web presses are currently used.
Letterpress is used to print newspapers, magazines, books, stationary, and advertising.
• Digital Printing - refers to any printing completed via digital files. It is not limited by short runs
and is capable of incorporating data directly for compact database and printing to a digital press
not using traditional methods of film or printing plates.
• Screen Printing - ink is transferred to the substrate through a porous screen marked with a stencil.
Screen printing inks include ultra-violet cure, water-borne, solvent-borne, and plastisol. Plastisol
is mainly used in textile printing. Both sheet-fed and web-fed presses are used. Depending on the
substrate printed, it can be dried after each color application or, for absorbent substrates, after all
colors have been printed. Solvent- and water-borne inks are dried in hot air or infrared drying
ovens. Screen printing is used for short print runs of artistic images, especially on objects that
cannot be printed by other means, such as signs, displays, electronics, wall paper, greeting cards,
ceramics, decals, banners, and textiles.
Exposure Assessment
The following sections detail EPA’s occupational exposure assessment for the use of TCE in
commercial printing and copying.
2.16.3.1 Worker Activities
The worker activity, use pattern, and associated exposure will vary depending on the type of
printing/copying employed. However, in general, workers may be exposed to mists generated during the
ink application process.
2.16.3.2 Number of Potentially Exposed Workers
The HHE (Finely and Page, 2005) summarized 44 workers potentially exposed and 74 ONUs at one site.
The Scoping Document for Emission Scenario Document on Manufacture and Use of Printing Inks
(OECD, 2010) provides the estimated number of workers per site to vary from 16 to 43 based on the
type of printing involved. Further, the scenario estimates an industry average of 18 workers per site.
However, without an estimate for the number of sites using TCE in printing, there is not enough data to
quantify the total number of exposed workers or ONUs for this OES.
2.16.3.3 Occupational Exposure Results
EPA identified inhalation exposure monitoring data from a NIOSH a Health Hazard Evaluation report
(HHE) (Finely and Page, 2005) using TCE in high speed printing presses. The following details the
results of EPA’s occupational exposure assessment for printing applications based on inhalation
exposure monitoring data. Table 2-51 summarizes the 8-hr TWA monitoring data for the use of TCE in
printing. The data were obtained from a HHE (Finely and Page, 2005).
EPA considered the assessment approach, the quality of the data, and uncertainties in assessment results
to determine a level of confidence for the 8-hr TWA data. For the inhalation air concentration data, the
primary strengths include the assessment approach, which is the use of monitoring data, the highest of
the inhalation approach hierarchy. These monitoring data include 20 data points from 1 source, and the
data quality ratings from systematic review for these data were medium. The primary limitations of
these data include a limited dataset, and the uncertainty of the representativeness of these data toward
the true distribution of inhalation concentrations for the industries and sites covered by this scenario.

PEER REVIEW DRAFT. DO NOT CITE OR QUOTE
Page 128 of 229
Based on these strengths and limitations of the inhalation air concentration data, the overall confidence
for these 8-hr TWA data in this scenario is medium to low.
Table 2-51. Summary of Worker Inhalation Exposure Monitoring Data for High Speed Printing
Presses
Scenario 8-hr TWA
(ppm)
AC
(ppm) ADC
(ppm)
LADC
(ppm)
Number of
Data Points
Confidence Rating of
Air Concentration
Data
High-End 2.1 0.7 0.5 0.2
20 Medium Central
Tendency 0.1
0.03 0.02 8.0E-3
AC = Acute Concentration, ADC = Average Daily Concentration and LADC = Lifetime Average Daily Concentration.
Equations and parameters for calculation of the ADC and LADC are described in Appendix B.
No monitoring data were reasonably available to estimate ONU exposures. EPA estimates that ONU
exposures are lower than worker exposures, since ONUs do not typically directly handle the chemical.
Water Release Assessment
The following sections detail EPA’s water release assessment for use of TCE in commercial printing
and copying.
2.16.4.1 Water Release Sources
A potential source of water releases from Printing/copying use would come from clean-out of printing
equipment if the ink is water-based (OECD, 2010). Based on the use in printing/copying and the amount
of TCE used for this OES, EPA expects minimal sources of TCE release to water.
2.16.4.2 Water Release Assessment Results
Water releases during use in printing and copying were assessed using data reported in the 2016 DMR.
One site provided water releases. EPA assessed annual releases as reported in the 2016 DMR and
assessed daily releases by assuming 250 days of operation per year. A summary of the water releases
reported to the 2016 DMR can be found in Table 2-52.
Table 2-52. Reported Water Releases of Trichloroethylene from Commercial Printing and
Copying
Site Identity
Annual
Release
(kg/site-yr)a
Annual
Release
Days
(days/yr)
Daily Release
(kg/site-day)a
NPDES
Code
Release
Media
Printing and Pub Sys Div, Weatherford,
OK 0.05 250 2.0E-4 OK0041785
Surface
Water a Annual release amounts are based on the site reported values. Therefore, daily releases are back-calculated from the annual
release rate and assuming 250 days of operation per year.
As only one site was identified with water releases for this OES, EPA acknowledges this site does not
represent the entirety of commercial printing and copying sites using TCE. However, data was not
reasonably available to estimate water releases from additional sites. Based on EPA models, releases
PEER REVIEW DRAFT. DO NOT CITE OR QUOTE
Page 129 of 229
from containers may be up to: 1) 0.3% to 0.6% for small containers (<20 gal) or drums that are emptied
via pouring; or 2) 2.5% to 3% for drums emptied via pumping; however, not all sites are expected to
dispose of container residues to water. Additional water release sources of TCE at these sites may exist
and will vary depending on the use rate of the TCE-based products.
2.17 Other Commercial Uses
Estimates of Number of Facilities
EPA did not identify information to estimate the number of sites using TCE for other commercial uses.
EPA did identify nine facilities in the 2016 DMR where EPA could not determine the OES or the use
falls into a commercial use discussed in Section 2.17.2. However, due to the large variety of TCE-based
products and uses of TCE, these nine sites are not expected to represent the entirety of sites using TCE
in other commercial applications.
Process Description
Based on information identified in EPA’s preliminary data gathering and information obtained from
public comments, a variety of other commercial uses of TCE may exist. Examples of these uses include,
but are not limited to, mold cleaning, release, and protectant products, shoe polish, hoof polish, pepper
spray, lace wig and hair extension glue, gun scrubber, and operation of nonresidential buildings. For
many of these uses TCE is expected to act similar to a cleaning solvent used to remove dirt or other
contaminates from substrates (e.g., mold cleaning, release and protectant products, shoe polish, hoof
polish, and gun scrubber). However, TCE utilizes its adhesive properties when used as a component of
lace wig and hair extension glue.
Exposure Assessment
The following sections detail EPA’s occupational exposure assessment for other commercial uses of
TCE.
2.17.3.1 Worker Activities
The worker activity, use pattern, and associated exposure will vary for each OES. For polishes and gun
scrubbers, EPA expects workers may be exposed to TCE vapors that evaporate from the application
material (rag, brush, etc.) or the substrate surface during use. For lace wig and hair extension glue,
workers may be exposed to TCE that evaporates from the application process or through absorption into
the skin upon application of the lace wig or hair extensions.
2.17.3.2 Number of Potentially Exposed Workers
Table 2-53 summarizes SIC codes (and the corresponding NAICS codes) reported by the sites in the
2016 DMR (U.S. EPA, 2016a). EPA has not identified information on the number of sites and
potentially exposed workers associated with these uses. The use of TCE for these conditions of use is
expected to be minimal.
Table 2-53. Crosswalk of Other Industrial Use SIC Codes in DMR to NAICS Codes
SIC Code Corresponding NAICS Code
6512 – Operation of Nonresidential
Buildings
531120 - Lessors of Nonresidential Buildings (except
Miniwarehouses)
9999 – Nonclassifiable Establishments No NAICS listed in the crosswalk
PEER REVIEW DRAFT. DO NOT CITE OR QUOTE
Page 130 of 229
SIC Code Corresponding NAICS Code
1799 – Special Trade Contractors,
NECa
230000 - Construction
1794 – Excavation Work 238910 – Site Preparation Contractors a The SIC code 1799 may map to any of the following NAICS codes: 236220, 237990, 238150, 238190, 238290, 238310,
238320, 238350, 238390, 238910, 561790, 562910. There is not enough information in the DMR data to determine the
appropriate NAICS for each site; therefore, EPA uses data for the 2-digit NAICS, 230000, rather than a specific 6-digit
NAICS.
EPA does not have data to estimate the total workers and ONUs exposed to TCE from other commercial
uses as this information was not available in BLS Data (U.S. BLS, 2016) and the U.S. Census’ SUSB
(U.S. Census Bureau, 2015).
2.17.3.3 Occupational Exposure Results
EPA did not identify any inhalation exposure monitoring data related to TCE use in other commercial
uses. See Section 2.14.3 for the assessment of worker exposure during spot cleaning activities. EPA
assumes the exposure sources, routes, and exposure levels are similar to those for spot cleaners.
Water Release Assessment
The following sections detail EPA’s water release assessment for other commercial uses of TCE.
2.17.4.1 Water Release Sources
Specifics of the processes and potential sources of release for these uses are unknown. Based on the
volatility of TCE, EPA expects the majority of TCE used for these applications to evaporate and be
released to air. EPA expects residuals in containers to be disposed of with general site trash that is either
picked up by local waste management or by a waste handler that disposes wastes as hazardous waste.
2.17.4.2 Water Release Assessment Results
Table 2-54 summarizes non-zero water releases from sites using TCE in other commercial uses reported
in the 2016 DMR. To estimate the daily release for the sites in Table 2-54, EPA assumed a default of
250 days/yr of operation and averaged the annual release over the operating days. These data are not
expected to capture the entirety of water releases from these uses; however, EPA does not have
information to estimate water releases from sites not reporting to DMR.
Table 2-54. Reported Water Releases of Trichloroethylene from Other Commercial Uses in the
2016 DMR
Site Identity
Annual
Release
(kg/site-
yr)
Annual
Release
Days
(days/yr)
Daily
Release
(kg/site-
day)
NPDES
Code
Release
Media
Corning Hospital, Corning, NY 3.2 250 0.013 NY0246701 Surface
Water
Water Street Commercial Bldg, Dayton, OH 0.7 250 2.8E-03 OH0141496 Surface
Water
Union Station North Wing Office Building, Denver, CO 1.0E-01 250 4.0E-04 COG315293 Surface
Water
PEER REVIEW DRAFT. DO NOT CITE OR QUOTE
Page 131 of 229
Confluence Park Apartments, Denver, CO 7.1E-02 250 2.8E-04 COG315339 Surface
Water
Park Place Mixed Use Development, Annapolis, MD 6.7E-02 250 2.7E-04 MD0068861 Surface
Water
Tree Top Inc Wenatchee Plant, Wenatchee, WA 9.0E-03 250 3.6E-05 WA0051527 Surface
Water
Wynkoop Denver LLCP St, Denver, CO 7.8E-03 250 3.1E-05 COG603115 Surface
Water
Greer Family LLC, South Burlington, VT 1.3E-03 250 5.0E-06 VT0001376 Surface
Water
John Marshall III Site, Mclean, VA 4.7E-04 250 1.9E-06 VA0090093 Surface
Water a Annual release amounts are based on the site reported values. Therefore, daily releases are calculated from the annual
release rate and assuming 250 days of operation per year.
Sources: (U.S. EPA, 2016a)
2.18 Process Solvent Recycling and Worker Handling of Wastes
Facility Estimates
To determine the number of sites that recycle/dispose of TCE, EPA considered 2016 TRI data, and 2016
DMR data. Based on the activities and NAICS codes reported in the 2016 TRI, EPA identified 28
facilities where the primary OES is expected to be disposal or recycling of TCE-containing wastes (U.S.
EPA, 2017c). Two sites were identified for this OES in the 2016 DMR data. Based on the TRI and DMR
data, EPA assesses a total of 30 sites for the disposal/recycling of TCE.
Process Description
Each of the conditions of use of TCE may generate waste streams of the chemical that are collected and
transported to third-party sites for disposal, treatment, or recycling. Industrial sites that treat or dispose
onsite wastes that they themselves generate are assessed in each OES assessment in Sections 2.1 through
2.17. Similarly, point source discharges of TCE to surface water are assessed in each OES assessment in
Sections 2.1 through 2.17 (point source discharges are exempt as solid wastes under RCRA).Wastes of
TCE that are generated during an OES and sent to a third-party site for treatment, disposal, or recycling
may include the following:
• Wastewater: TCE may be contained in wastewater discharged to POTW or other, non-public
treatment works for treatment. Industrial wastewater containing TCE discharged to a POTW may
be subject to EPA or authorized NPDES state pretreatment programs. The assessment of
wastewater discharges to POTWs and non-public treatment works of TCE is included in each of
the OES assessments in Sections 2.1 through 2.17.
• Solid Wastes: Solid wastes are defined under RCRA as any material that is discarded by being:
abandoned; inherently waste-like; a discarded military munition; or recycled in certain ways
(certain instances of the generation and legitimate reclamation of secondary materials are
exempted as solid wastes under RCRA). Solid wastes may subsequently meet RCRA’s definition
of hazardous waste by either being listed as a waste at 40 CFR §§ 261.30 to 261.35 or by
meeting waste-like characteristics as defined at 40 CFR §§ 261.20 to 261.24. Solid wastes that
are hazardous wastes are regulated under the more stringent requirements of Subtitle C of
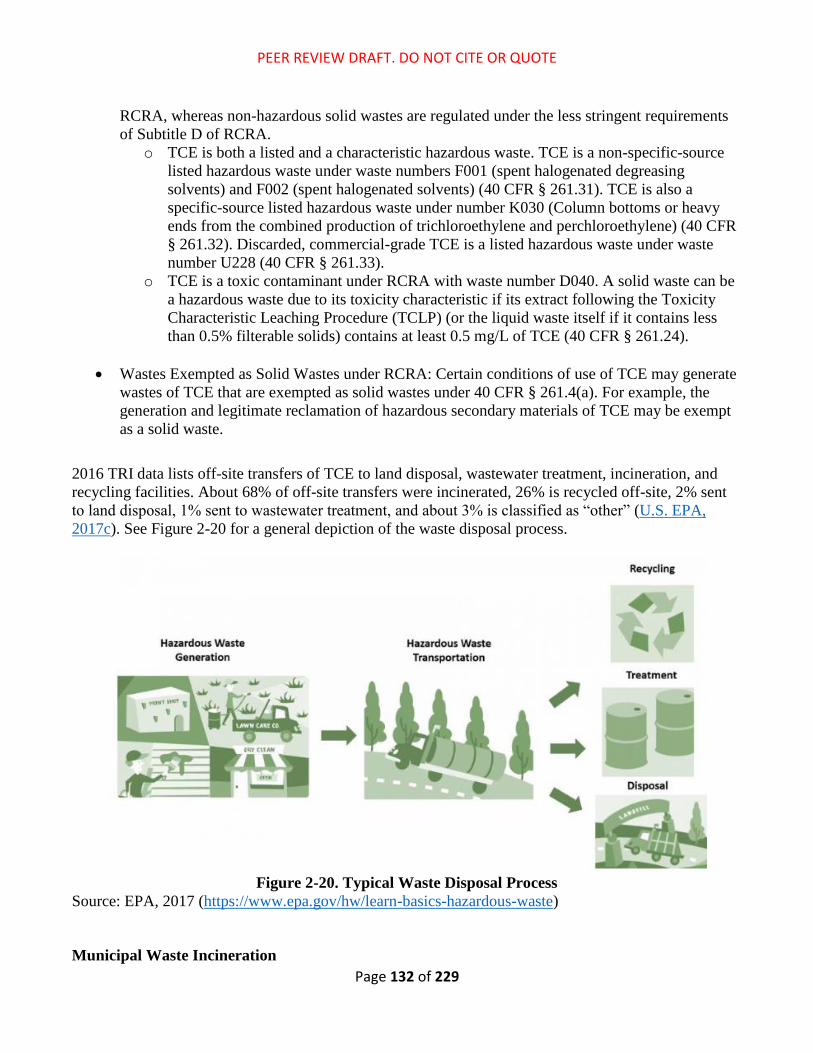
PEER REVIEW DRAFT. DO NOT CITE OR QUOTE
Page 132 of 229
RCRA, whereas non-hazardous solid wastes are regulated under the less stringent requirements
of Subtitle D of RCRA.
o TCE is both a listed and a characteristic hazardous waste. TCE is a non-specific-source
listed hazardous waste under waste numbers F001 (spent halogenated degreasing
solvents) and F002 (spent halogenated solvents) (40 CFR § 261.31). TCE is also a
specific-source listed hazardous waste under number K030 (Column bottoms or heavy
ends from the combined production of trichloroethylene and perchloroethylene) (40 CFR
§ 261.32). Discarded, commercial-grade TCE is a listed hazardous waste under waste
number U228 (40 CFR § 261.33).
o TCE is a toxic contaminant under RCRA with waste number D040. A solid waste can be
a hazardous waste due to its toxicity characteristic if its extract following the Toxicity
Characteristic Leaching Procedure (TCLP) (or the liquid waste itself if it contains less
than 0.5% filterable solids) contains at least 0.5 mg/L of TCE (40 CFR § 261.24).
• Wastes Exempted as Solid Wastes under RCRA: Certain conditions of use of TCE may generate
wastes of TCE that are exempted as solid wastes under 40 CFR § 261.4(a). For example, the
generation and legitimate reclamation of hazardous secondary materials of TCE may be exempt
as a solid waste.
2016 TRI data lists off-site transfers of TCE to land disposal, wastewater treatment, incineration, and
recycling facilities. About 68% of off-site transfers were incinerated, 26% is recycled off-site, 2% sent
to land disposal, 1% sent to wastewater treatment, and about 3% is classified as “other” (U.S. EPA,
2017c). See Figure 2-20 for a general depiction of the waste disposal process.
Figure 2-20. Typical Waste Disposal Process
Source: EPA, 2017 (https://www.epa.gov/hw/learn-basics-hazardous-waste)
Municipal Waste Incineration
PEER REVIEW DRAFT. DO NOT CITE OR QUOTE
Page 133 of 229
Municipal waste combustors (MWCs) that recover energy are generally located at large facilities
comprising an enclosed tipping floor and a deep waste storage pit. Typical large MWCs may range in
capacity from 250 to over 1,000 tons per day. At facilities of this scale, waste materials are not generally
handled directly by workers. Trucks may dump the waste directly into the pit, or waste may be tipped to
the floor and later pushed into the pit by a worker operating a front-end loader. A large grapple from an
overhead crane is used to grab waste from the pit and drop it into a hopper, where hydraulic rams feed
the material continuously into the combustion unit at a controlled rate. The crane operator also uses the
grapple to mix the waste within the pit, in order to provide a fuel consistent in composition and heating
value, and to pick out hazardous or problematic waste.
Facilities burning refuse-derived fuel (RDF) conduct on-site sorting, shredding, and inspection of the
waste prior to incineration to recover recyclables and remove hazardous waste or other unwanted
materials. Sorting is usually an automated process that uses mechanical separation methods, such as
trommel screens, disk screens, and magnetic separators. Once processed, the waste material may be
transferred to a storage pit, or it may be conveyed directly to the hopper for combustion.
Tipping floor operations may generate dust. Air from the enclosed tipping floor, however, is
continuously drawn into the combustion unit via one or more forced air fans to serve as the primary
combustion air and minimize odors. Dust and lint present in the air is typically captured in filters or
other cleaning devices in order to prevent the clogging of steam coils, which are used to heat the
combustion air and help dry higher-moisture inputs.9
Hazardous Waste Incineration
Commercial scale hazardous waste incinerators are generally two-chamber units, a rotary kiln followed
by an afterburner, that accept both solid and liquid waste. Liquid wastes are pumped through pipes and
are fed to the unit through nozzles that atomize the liquid for optimal combustion. Solids may be fed to
the kiln as loose solids gravity fed to a hopper, or in drums or containers using a conveyor.10,11
Incoming hazardous waste is usually received by truck or rail, and an inspection is required for all waste
received. Receiving areas for liquid waste generally consist of a docking area, pumphouse, and some
kind of storage facilities. For solids, conveyor devices are typically used to transport incoming waste
(See Figure 2-21).
Smaller scale units that burn municipal solid waste or hazardous waste (such as infectious and hazardous
waste incinerators at hospitals) may require more direct handling of the materials by facility personnel.
Units that are batch-loaded require the waste to be placed on the grate prior to operation and may
involve manually dumping waste from a container or shoveling waste from a container onto the grate.
9 J.B. Kitto, Eds., Steam: Its Generation and Use, 40th Edition, Babcock and Wilcox/American Boiler Manufacturers Association, 1992. 10 Environmental Technology Council’s Hazardous Waste Resource Center; http://www.etc.org/advanced-technologies/high-temperature-incineration.aspx 11 Incineration Services; Heritage; https://www.heritage-enviro.com/services/incineration/
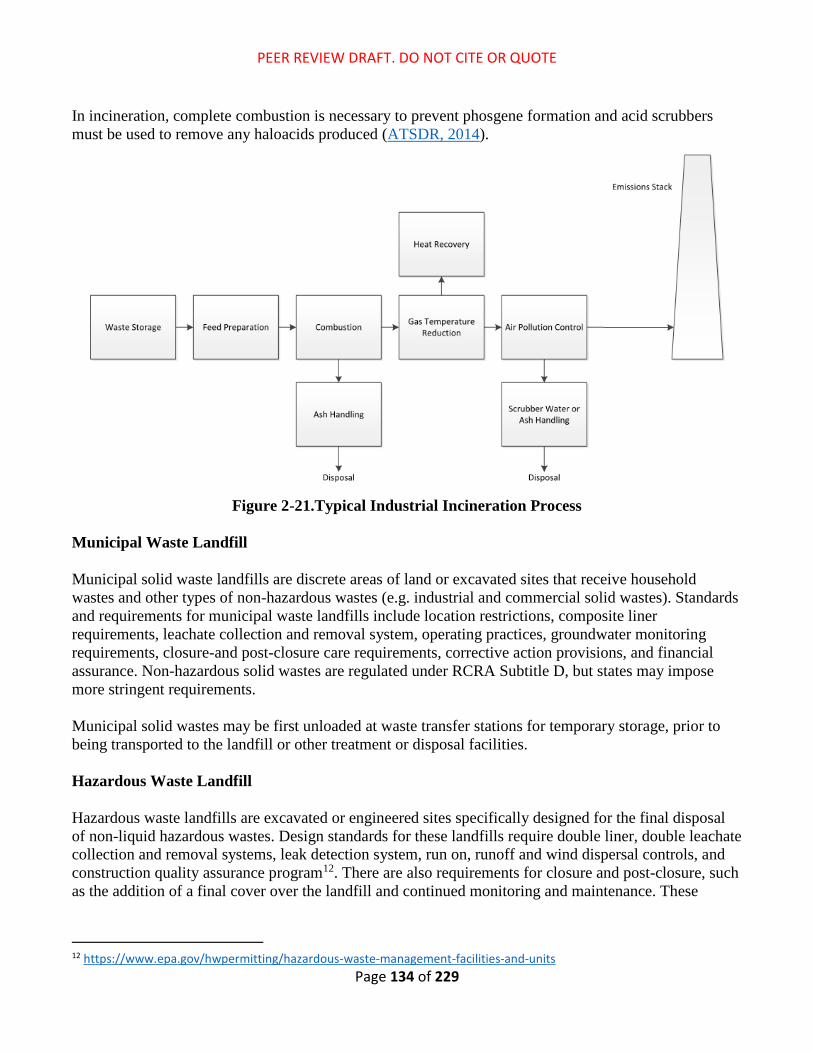
PEER REVIEW DRAFT. DO NOT CITE OR QUOTE
Page 134 of 229
In incineration, complete combustion is necessary to prevent phosgene formation and acid scrubbers
must be used to remove any haloacids produced (ATSDR, 2014).
Figure 2-21.Typical Industrial Incineration Process
Municipal Waste Landfill
Municipal solid waste landfills are discrete areas of land or excavated sites that receive household
wastes and other types of non-hazardous wastes (e.g. industrial and commercial solid wastes). Standards
and requirements for municipal waste landfills include location restrictions, composite liner
requirements, leachate collection and removal system, operating practices, groundwater monitoring
requirements, closure-and post-closure care requirements, corrective action provisions, and financial
assurance. Non-hazardous solid wastes are regulated under RCRA Subtitle D, but states may impose
more stringent requirements.
Municipal solid wastes may be first unloaded at waste transfer stations for temporary storage, prior to
being transported to the landfill or other treatment or disposal facilities.
Hazardous Waste Landfill
Hazardous waste landfills are excavated or engineered sites specifically designed for the final disposal
of non-liquid hazardous wastes. Design standards for these landfills require double liner, double leachate
collection and removal systems, leak detection system, run on, runoff and wind dispersal controls, and
construction quality assurance program12. There are also requirements for closure and post-closure, such
as the addition of a final cover over the landfill and continued monitoring and maintenance. These
12 https://www.epa.gov/hwpermitting/hazardous-waste-management-facilities-and-units
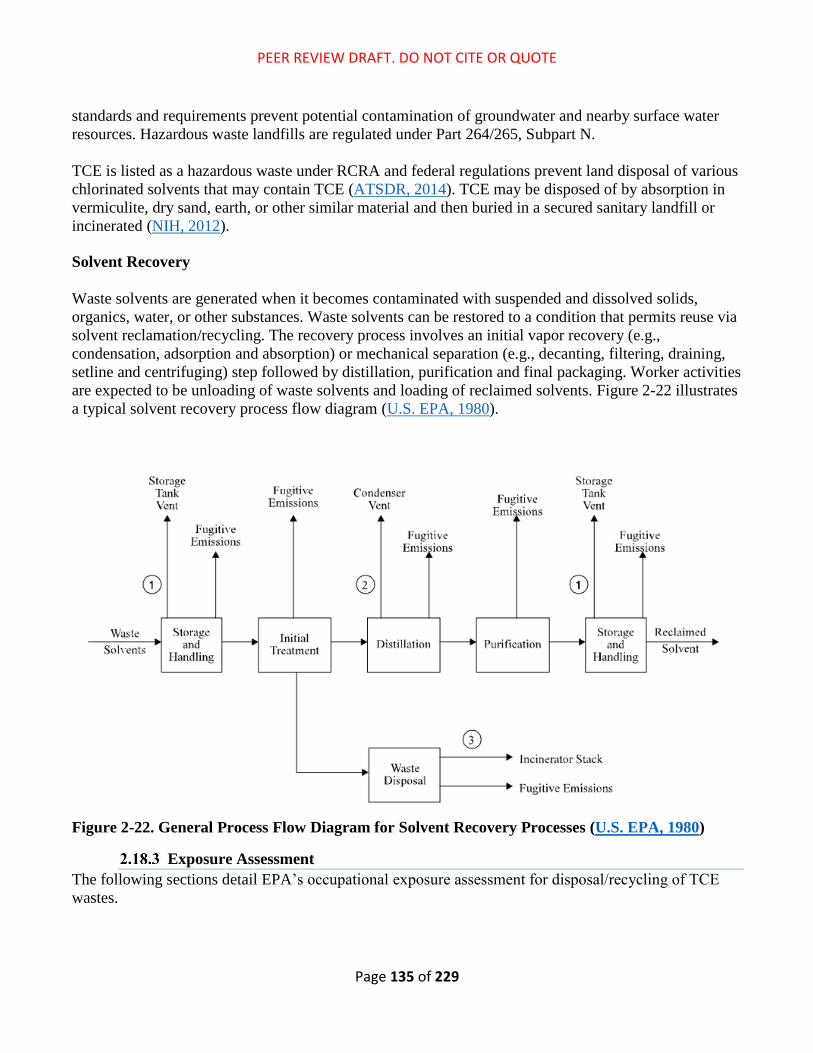
PEER REVIEW DRAFT. DO NOT CITE OR QUOTE
Page 135 of 229
standards and requirements prevent potential contamination of groundwater and nearby surface water
resources. Hazardous waste landfills are regulated under Part 264/265, Subpart N.
TCE is listed as a hazardous waste under RCRA and federal regulations prevent land disposal of various
chlorinated solvents that may contain TCE (ATSDR, 2014). TCE may be disposed of by absorption in
vermiculite, dry sand, earth, or other similar material and then buried in a secured sanitary landfill or
incinerated (NIH, 2012).
Solvent Recovery
Waste solvents are generated when it becomes contaminated with suspended and dissolved solids,
organics, water, or other substances. Waste solvents can be restored to a condition that permits reuse via
solvent reclamation/recycling. The recovery process involves an initial vapor recovery (e.g.,
condensation, adsorption and absorption) or mechanical separation (e.g., decanting, filtering, draining,
setline and centrifuging) step followed by distillation, purification and final packaging. Worker activities
are expected to be unloading of waste solvents and loading of reclaimed solvents. Figure 2-22 illustrates
a typical solvent recovery process flow diagram (U.S. EPA, 1980).
Figure 2-22. General Process Flow Diagram for Solvent Recovery Processes (U.S. EPA, 1980)
Exposure Assessment
The following sections detail EPA’s occupational exposure assessment for disposal/recycling of TCE
wastes.
PEER REVIEW DRAFT. DO NOT CITE OR QUOTE
Page 136 of 229
2.18.3.1 Worker Activities
At waste disposal sites, workers are potentially exposed via inhalation of TCE vapor. Depending on the
concentration of TCE in the waste stream, the route and level of exposure may be similar to that
associated with container unloading activities. See Section 2.4.3 for the assessment of worker exposure
from chemical unloading activities.
Municipal Waste Incineration
At municipal waste incineration facilities, there may be one or more technicians present on the tipping
floor to oversee operations, direct trucks, inspect incoming waste, or perform other tasks as warranted by
individual facility practices. These workers may wear protective gear such as gloves, safety glasses, or
dust masks. Specific worker protocols are largely up to individual companies, although state or local
regulations may require certain worker safety standards be met. Federal operator training requirements
pertain more to the operation of the regulated combustion unit rather than operator health and safety.
Workers are potentially exposed via inhalation to vapors while working on the tipping floor. Potentially-
exposed workers include workers stationed on the tipping floor, including front-end loader and crane
operators, as well as truck drivers. The potential for dermal exposures is minimized by the use of trucks
and cranes to handle the wastes.
Hazardous Waste Incineration
More information is needed to determine the potential for worker exposures during hazardous waste
incineration and any requirements for personal protective equipment. There is likely a greater potential
for worker exposures for smaller scale incinerators that involve more direct handling of the wastes.
Municipal and Hazardous Waste Landfill
At landfills, typical worker activities may include operating refuse vehicles to weigh and unload the
waste materials, operating bulldozers to spread and compact wastes, and monitoring, inspecting, and
surveying and landfill site13.
2.18.3.2 Number of Potentially Exposed Workers
EPA estimated the number of workers and occupational non-users potentially exposed during use of
TCE during recycling and waste handling using BLS Data (U.S. BLS, 2016) and the U.S. Census’
SUSB (U.S. Census Bureau, 2015) as well as the NAICS codes reported by the sites in the 2016 TRI
(U.S. EPA, 2017c) . There were two discernable recycling and waste handling sites in the 2016 DMR
data (U.S. EPA, 2016a). These sites did not report a relevant SIC/NAICS code,but based on research of
the site and/or company, both were determined to be Recycling/Waste Handling sites. To estimate the
number of workers, both sites were grouped under NAICS code 562211. The method for estimating
number of workers is detailed above in Section 1.4.4. These estimates were derived using industry- and
occupation-specific employment data from the BLS and U.S. Census. Table 2-55 provides the results of
the number of worker analysis. There are approximately 380 workers and 140 ONUs potentially
exposed during use of TCE during recycling/waste disposal.
13 http://www.calrecycle.ca.gov/SWfacilities/landfills/needfor/Operations.htm
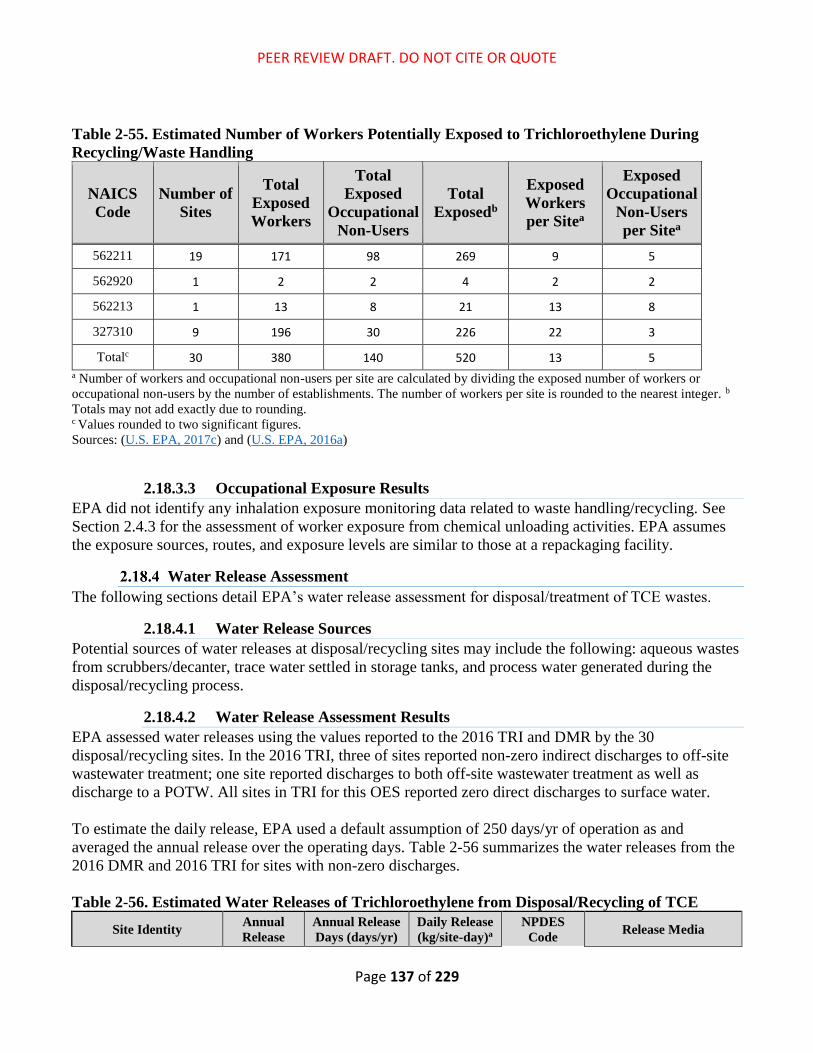
PEER REVIEW DRAFT. DO NOT CITE OR QUOTE
Page 137 of 229
Table 2-55. Estimated Number of Workers Potentially Exposed to Trichloroethylene During
Recycling/Waste Handling
NAICS
Code
Number of
Sites
Total
Exposed
Workers
Total
Exposed
Occupational
Non-Users
Total
Exposedb
Exposed
Workers
per Sitea
Exposed
Occupational
Non-Users
per Sitea
562211 19 171 98 269 9 5
562920 1 2 2 4 2 2
562213 1 13 8 21 13 8
327310 9 196 30 226 22 3
Totalc 30 380 140 520 13 5
a Number of workers and occupational non-users per site are calculated by dividing the exposed number of workers or
occupational non-users by the number of establishments. The number of workers per site is rounded to the nearest integer. b
Totals may not add exactly due to rounding. c Values rounded to two significant figures. Sources: (U.S. EPA, 2017c) and (U.S. EPA, 2016a)
2.18.3.3 Occupational Exposure Results
EPA did not identify any inhalation exposure monitoring data related to waste handling/recycling. See
Section 2.4.3 for the assessment of worker exposure from chemical unloading activities. EPA assumes
the exposure sources, routes, and exposure levels are similar to those at a repackaging facility.
Water Release Assessment
The following sections detail EPA’s water release assessment for disposal/treatment of TCE wastes.
2.18.4.1 Water Release Sources
Potential sources of water releases at disposal/recycling sites may include the following: aqueous wastes
from scrubbers/decanter, trace water settled in storage tanks, and process water generated during the
disposal/recycling process.
2.18.4.2 Water Release Assessment Results
EPA assessed water releases using the values reported to the 2016 TRI and DMR by the 30
disposal/recycling sites. In the 2016 TRI, three of sites reported non-zero indirect discharges to off-site
wastewater treatment; one site reported discharges to both off-site wastewater treatment as well as
discharge to a POTW. All sites in TRI for this OES reported zero direct discharges to surface water.
To estimate the daily release, EPA used a default assumption of 250 days/yr of operation as and
averaged the annual release over the operating days. Table 2-56 summarizes the water releases from the
2016 DMR and 2016 TRI for sites with non-zero discharges.
Table 2-56. Estimated Water Releases of Trichloroethylene from Disposal/Recycling of TCE
Site Identity Annual
Release
Annual Release
Days (days/yr)
Daily Release
(kg/site-day)a
NPDES
Code Release Media

PEER REVIEW DRAFT. DO NOT CITE OR QUOTE
Page 138 of 229
(kg/site-
yr)a
Veolia Es Technical
Solutions LLC,
Middlesex, NJ
6035 250 24.1 Not
available
POTW WWT (0.02%)
and Non-POTW WWT
(99.98%)
Clean Harbors Deer Park
LLC, La Porte, TX 87.1 250 0.3 TX0005941 Non-POTW WWT
Clean Harbors El Dorado
LLC, El Dorado, AR 9.1 250 0.04 AR0037800 Non-POTW WWT
Clean Water Of New
York Inc, Staten Island,
NY
0.9 250 3.8E-03 NY0200484 Surface Water
Reserve Environmental
Services, Ashtabula, OH 3.9E-04 250 1.6E-06 OH0098540 Surface Water
POTW = Publicly-Owned Treatment Works; WWT = Wastewater Treatment a Annual release amounts are based on the site reported values. Therefore, daily releases are back-calculated from the annual
release rate and assuming 250 days of operation per year.
Sources: (U.S. EPA, 2017c) and (U.S. EPA, 2016a)
2.19 Dermal Exposure Assessment EPA estimated workers’ dermal exposure to TCE for the industrial and commercial use scenarios
considering evaporation of liquid from the surface of the hands and conditions of use with and without
gloves. The OSHA recommends employers utilize the hierarchy of controls for reducing or removing
hazardous exposures. The most effective controls are elimination, substitution, or engineering controls.
Gloves are the last course of worker protection in the hierarchy of controls and should only be
considered when process design and engineering controls cannot reduce workplace exposure to an
acceptable level.
Vapor absorption during dermal exposure requires that TCE be capable of achieving a sufficient
concentration in the media at the temperature and atmospheric pressure of the scenario under
evaluation to provide a significant driving force for skin penetration. Because TCE is a volatile liquid (VP
= 73.46 mmHg and 25℃), the dermal absorption of TCE depends on the type and duration of exposure.
Where exposure is not occluded, only a fraction of TCE that comes into contact with the skin will be
absorbed as the chemical readily evaporates from the skin. Dermal exposure may be significant in cases of
occluded exposure, repeated contacts, or dermal immersion. For example, work activities with a high degree
of splash potential may result in TCE liquids trapped inside the gloves, inhibiting the evaporation of TCE
and increasing the exposure duration. See Appendix E for more information about occlusion and the
incorporation of gloves in the dermal exposure assessment. EPA collected and reviewed reasonably
available SDSs (Safety Data Sheets) to inform the evaluation of gloves used with TCE in liquid and
aerosol form at varying concentrations.
Trichloroethylene in liquid form at 99-100% concentration is expected to be used in both industrial and
commercial settings. For industrial scenarios using this form of TCE, the following Conditions of Use
are expected; Manufacture of TCE, Processing as a Reactant, Industrial Processing Aid, Formulation of
Aerosol and Non Aerosol Products, Repackaging, Process Solvent Recycling, Batch Open Top Vapor
Degreasing, Batch Closed-Loop Vapor Degreasing, Conveyorized Vapor Degreasing, and Web Vapor
Degreasing. For trichlorethylene in liquid form at 99-100% concentration an SDS from Mallinckrodt
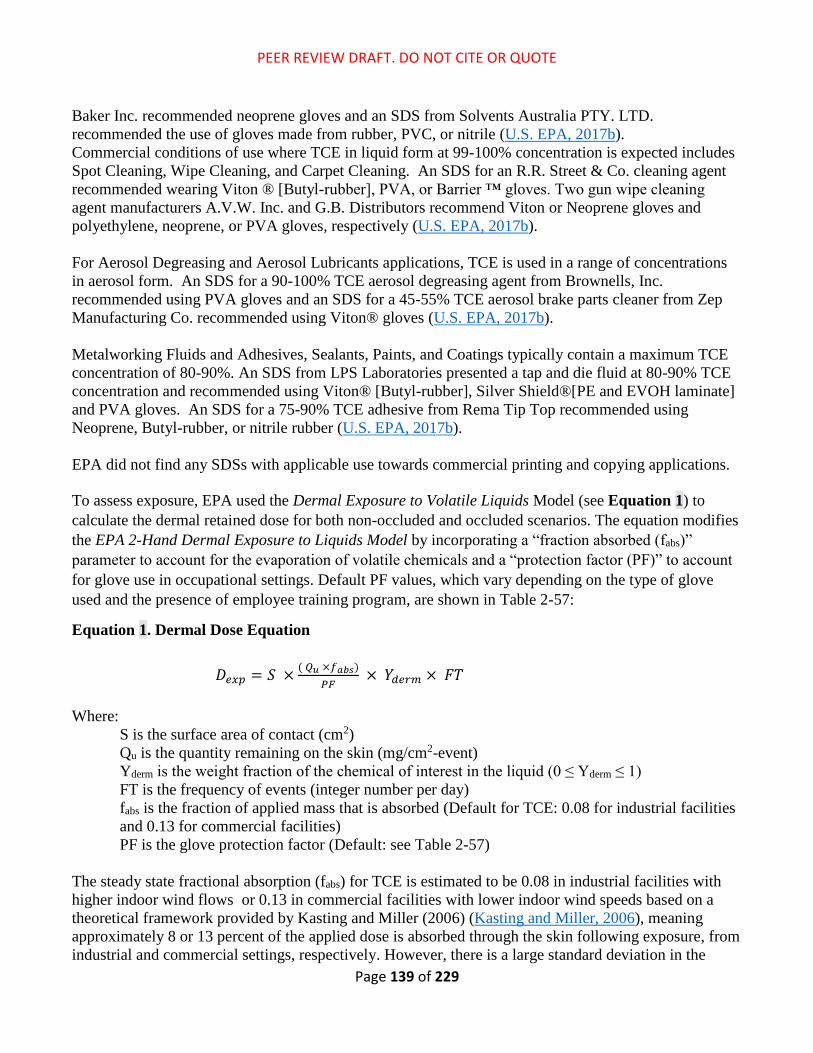
PEER REVIEW DRAFT. DO NOT CITE OR QUOTE
Page 139 of 229
Baker Inc. recommended neoprene gloves and an SDS from Solvents Australia PTY. LTD.
recommended the use of gloves made from rubber, PVC, or nitrile (U.S. EPA, 2017b).
Commercial conditions of use where TCE in liquid form at 99-100% concentration is expected includes
Spot Cleaning, Wipe Cleaning, and Carpet Cleaning. An SDS for an R.R. Street & Co. cleaning agent
recommended wearing Viton ® [Butyl-rubber], PVA, or Barrier ™ gloves. Two gun wipe cleaning
agent manufacturers A.V.W. Inc. and G.B. Distributors recommend Viton or Neoprene gloves and
polyethylene, neoprene, or PVA gloves, respectively (U.S. EPA, 2017b).
For Aerosol Degreasing and Aerosol Lubricants applications, TCE is used in a range of concentrations
in aerosol form. An SDS for a 90-100% TCE aerosol degreasing agent from Brownells, Inc.
recommended using PVA gloves and an SDS for a 45-55% TCE aerosol brake parts cleaner from Zep
Manufacturing Co. recommended using Viton® gloves (U.S. EPA, 2017b).
Metalworking Fluids and Adhesives, Sealants, Paints, and Coatings typically contain a maximum TCE
concentration of 80-90%. An SDS from LPS Laboratories presented a tap and die fluid at 80-90% TCE
concentration and recommended using Viton® [Butyl-rubber], Silver Shield®[PE and EVOH laminate]
and PVA gloves. An SDS for a 75-90% TCE adhesive from Rema Tip Top recommended using
Neoprene, Butyl-rubber, or nitrile rubber (U.S. EPA, 2017b).
EPA did not find any SDSs with applicable use towards commercial printing and copying applications.
To assess exposure, EPA used the Dermal Exposure to Volatile Liquids Model (see Equation 1) to
calculate the dermal retained dose for both non-occluded and occluded scenarios. The equation modifies
the EPA 2-Hand Dermal Exposure to Liquids Model by incorporating a “fraction absorbed (fabs)”
parameter to account for the evaporation of volatile chemicals and a “protection factor (PF)” to account
for glove use in occupational settings. Default PF values, which vary depending on the type of glove
used and the presence of employee training program, are shown in Table 2-57:
Equation 1. Dermal Dose Equation
𝐷𝑒𝑥𝑝 = 𝑆 ×( 𝑄𝑢 ×𝑓𝑎𝑏𝑠)
𝑃𝐹 × 𝑌𝑑𝑒𝑟𝑚 × 𝐹𝑇
Where:
S is the surface area of contact (cm2)
Qu is the quantity remaining on the skin (mg/cm2-event)
Yderm is the weight fraction of the chemical of interest in the liquid (0 ≤ Yderm ≤ 1)
FT is the frequency of events (integer number per day)
fabs is the fraction of applied mass that is absorbed (Default for TCE: 0.08 for industrial facilities
and 0.13 for commercial facilities)
PF is the glove protection factor (Default: see Table 2-57)
The steady state fractional absorption (fabs) for TCE is estimated to be 0.08 in industrial facilities with
higher indoor wind flows or 0.13 in commercial facilities with lower indoor wind speeds based on a
theoretical framework provided by Kasting and Miller (2006) (Kasting and Miller, 2006), meaning
approximately 8 or 13 percent of the applied dose is absorbed through the skin following exposure, from
industrial and commercial settings, respectively. However, there is a large standard deviation in the

PEER REVIEW DRAFT. DO NOT CITE OR QUOTE
Page 140 of 229
experimental measurement, which is indicative of the difficulty in spreading a small, rapidly evaporating
dose of TCE evenly over the skin surface.
Table 2-57. Glove Protection Factors for Different Dermal Protection Strategies
Dermal Protection Characteristics Setting Protection
Factor, PF
a. No gloves used, or any glove / gauntlet without permeation data
and without employee training Industrial and
Commercial
Uses
1
b. Gloves with available permeation data indicating that the
material of construction offers good protection for the substance 5
c. Chemically resistant gloves (i.e., as b above) with “basic”
employee training 10
d. Chemically resistant gloves in combination with specific
activity training (e.g., procedure for glove removal and disposal)
for tasks where dermal exposure can be expected to occur
Industrial
Uses Only 20
Table 2-58 presents the estimated dermal retained dose for workers in various exposure scenarios. The
dose estimates assume one exposure event (applied dose) per work day and that approximately eight to
thirteen percent14 of the applied dose is absorbed through the skin. Table 2-58 also includes estimated
dermal retained dose for occluded scenarios for conditions of use where EPA determined occlusion was
reasonably expected to occur. Occluded scenarios are generally expected where workers are expected to
come into contact with bulk liquid TCE during use in open systems (e.g., during solvent changeout in
vapor degreasing) and not expected in closed-type systems (e.g., during connection/ disconnection of
hoses used in loading of bulk containers in manufacturing). See discussion on occlusion in Appendix
H.7 for further description of these scenarios. The exposure estimates are provided for each OES, where
the conditions of use are “binned” based on the maximum possible exposure concentration (Yderm), the
likely level of exposure, and potential for occlusion. The exposure concentration is determined based on
EPA’s review of currently available products and formulations containing TCE. For example, EPA
found that TCE concentration in degreasing formulations such as C-60 Solvent Degreaser can be as high
as 100 percent.
To streamline the dermal exposure assessment, the conditions of use were grouped based on
characteristics known to effect dermal exposure such as the maximum weight fraction of TCE could be
present in that OES, open or closed system use of TCE, and large or small-scale use. Four different
groups or “bins” were created to group conditions of use based on this analysis.
• Bin 1 covers industrial uses that generally occur in closed systems. For these uses, dermal
exposure is likely limited to chemical loading/unloading activities (e.g. connecting hoses) and
taking quality control samples. EPA assesses the following glove use scenarios for Bin 1
conditions of use:
14 The absorbed fraction (fabs) is a function of indoor air speed, which differs for industrial and commercial settings.
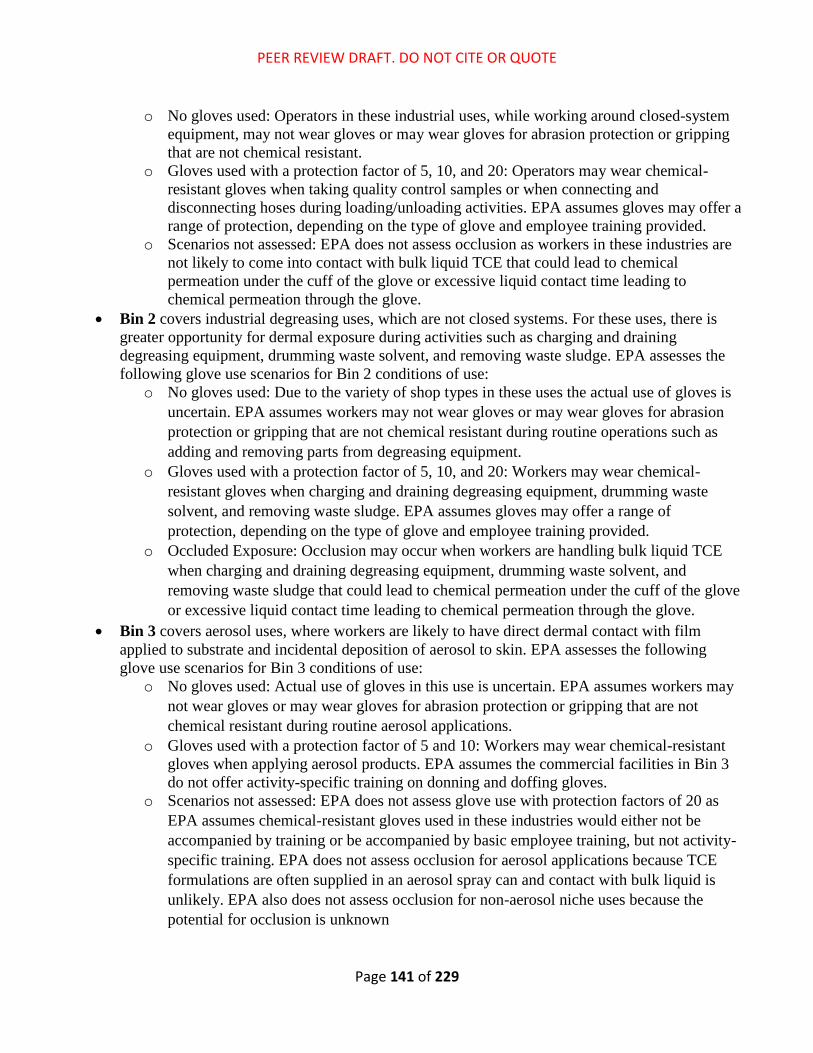
PEER REVIEW DRAFT. DO NOT CITE OR QUOTE
Page 141 of 229
o No gloves used: Operators in these industrial uses, while working around closed-system
equipment, may not wear gloves or may wear gloves for abrasion protection or gripping
that are not chemical resistant.
o Gloves used with a protection factor of 5, 10, and 20: Operators may wear chemical-
resistant gloves when taking quality control samples or when connecting and
disconnecting hoses during loading/unloading activities. EPA assumes gloves may offer a
range of protection, depending on the type of glove and employee training provided.
o Scenarios not assessed: EPA does not assess occlusion as workers in these industries are
not likely to come into contact with bulk liquid TCE that could lead to chemical
permeation under the cuff of the glove or excessive liquid contact time leading to
chemical permeation through the glove.
• Bin 2 covers industrial degreasing uses, which are not closed systems. For these uses, there is
greater opportunity for dermal exposure during activities such as charging and draining
degreasing equipment, drumming waste solvent, and removing waste sludge. EPA assesses the
following glove use scenarios for Bin 2 conditions of use:
o No gloves used: Due to the variety of shop types in these uses the actual use of gloves is
uncertain. EPA assumes workers may not wear gloves or may wear gloves for abrasion
protection or gripping that are not chemical resistant during routine operations such as
adding and removing parts from degreasing equipment.
o Gloves used with a protection factor of 5, 10, and 20: Workers may wear chemical-
resistant gloves when charging and draining degreasing equipment, drumming waste
solvent, and removing waste sludge. EPA assumes gloves may offer a range of
protection, depending on the type of glove and employee training provided.
o Occluded Exposure: Occlusion may occur when workers are handling bulk liquid TCE
when charging and draining degreasing equipment, drumming waste solvent, and
removing waste sludge that could lead to chemical permeation under the cuff of the glove
or excessive liquid contact time leading to chemical permeation through the glove.
• Bin 3 covers aerosol uses, where workers are likely to have direct dermal contact with film
applied to substrate and incidental deposition of aerosol to skin. EPA assesses the following
glove use scenarios for Bin 3 conditions of use:
o No gloves used: Actual use of gloves in this use is uncertain. EPA assumes workers may
not wear gloves or may wear gloves for abrasion protection or gripping that are not
chemical resistant during routine aerosol applications.
o Gloves used with a protection factor of 5 and 10: Workers may wear chemical-resistant
gloves when applying aerosol products. EPA assumes the commercial facilities in Bin 3
do not offer activity-specific training on donning and doffing gloves.
o Scenarios not assessed: EPA does not assess glove use with protection factors of 20 as
EPA assumes chemical-resistant gloves used in these industries would either not be
accompanied by training or be accompanied by basic employee training, but not activity-
specific training. EPA does not assess occlusion for aerosol applications because TCE
formulations are often supplied in an aerosol spray can and contact with bulk liquid is
unlikely. EPA also does not assess occlusion for non-aerosol niche uses because the
potential for occlusion is unknown
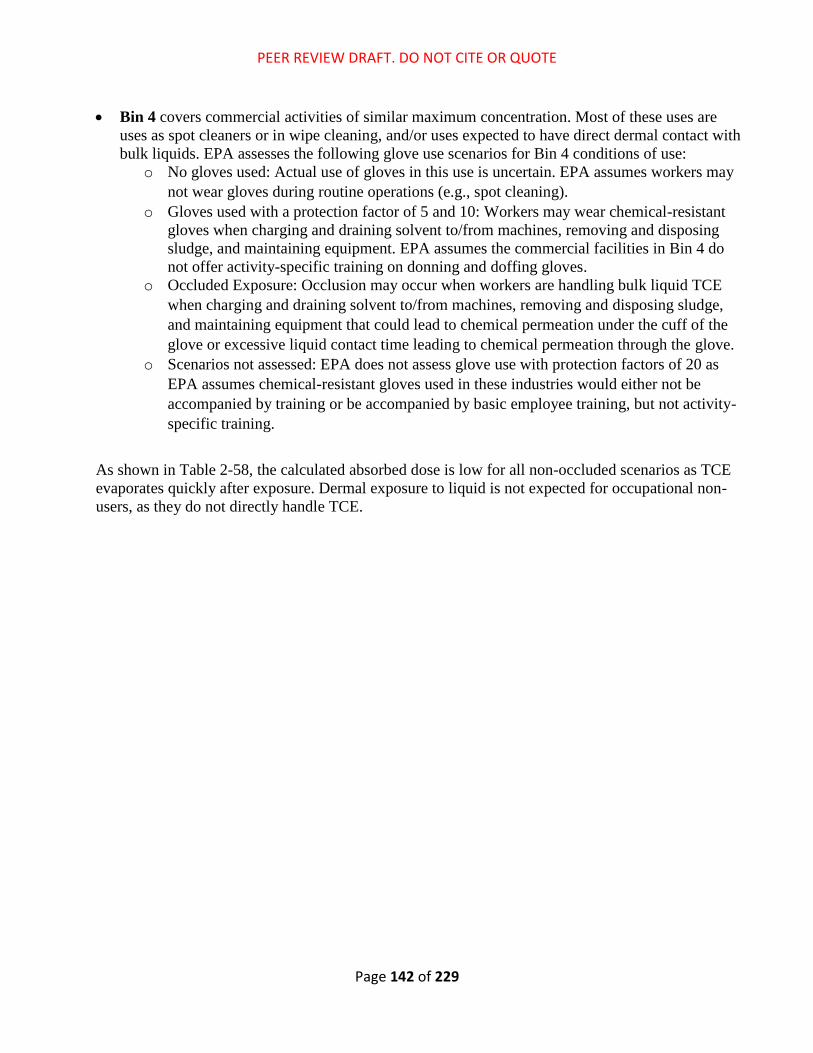
PEER REVIEW DRAFT. DO NOT CITE OR QUOTE
Page 142 of 229
• Bin 4 covers commercial activities of similar maximum concentration. Most of these uses are
uses as spot cleaners or in wipe cleaning, and/or uses expected to have direct dermal contact with
bulk liquids. EPA assesses the following glove use scenarios for Bin 4 conditions of use:
o No gloves used: Actual use of gloves in this use is uncertain. EPA assumes workers may
not wear gloves during routine operations (e.g., spot cleaning).
o Gloves used with a protection factor of 5 and 10: Workers may wear chemical-resistant
gloves when charging and draining solvent to/from machines, removing and disposing
sludge, and maintaining equipment. EPA assumes the commercial facilities in Bin 4 do
not offer activity-specific training on donning and doffing gloves.
o Occluded Exposure: Occlusion may occur when workers are handling bulk liquid TCE
when charging and draining solvent to/from machines, removing and disposing sludge,
and maintaining equipment that could lead to chemical permeation under the cuff of the
glove or excessive liquid contact time leading to chemical permeation through the glove.
o Scenarios not assessed: EPA does not assess glove use with protection factors of 20 as
EPA assumes chemical-resistant gloves used in these industries would either not be
accompanied by training or be accompanied by basic employee training, but not activity-
specific training.
As shown in Table 2-58, the calculated absorbed dose is low for all non-occluded scenarios as TCE
evaporates quickly after exposure. Dermal exposure to liquid is not expected for occupational non-
users, as they do not directly handle TCE.
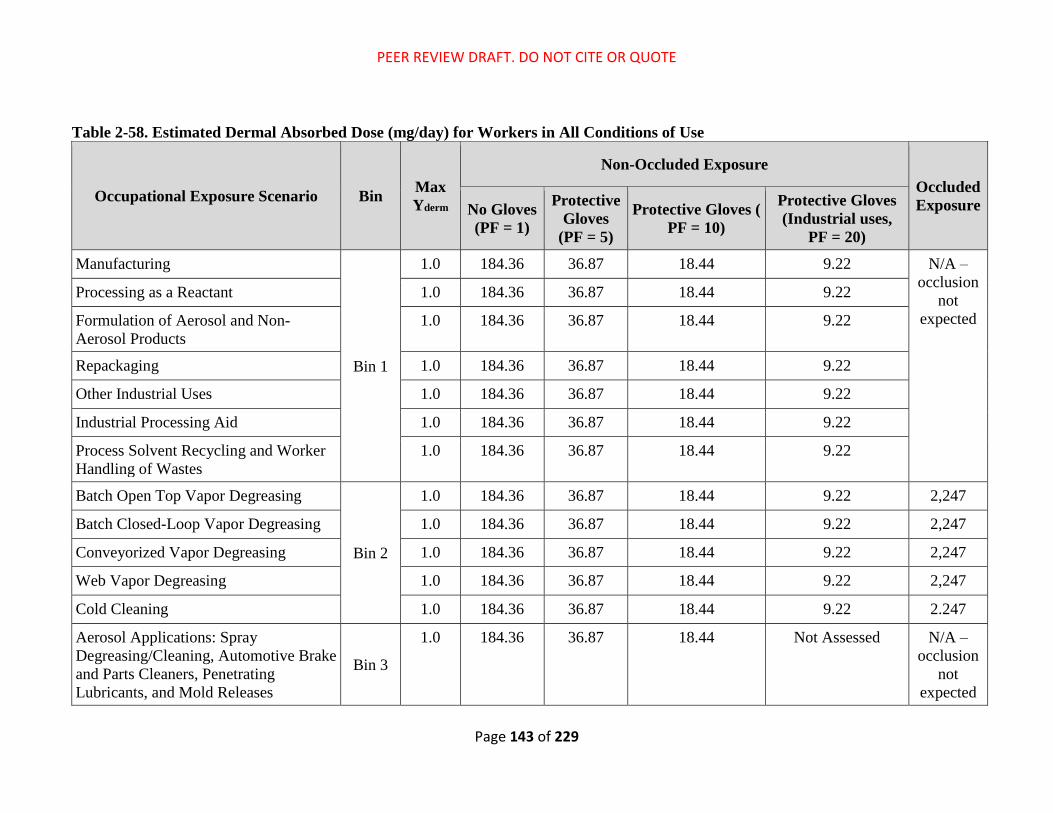
PEER REVIEW DRAFT. DO NOT CITE OR QUOTE
Page 143 of 229
Table 2-58. Estimated Dermal Absorbed Dose (mg/day) for Workers in All Conditions of Use
Occupational Exposure Scenario Bin Max
Yderm
Non-Occluded Exposure
Occluded
Exposure No Gloves
(PF = 1)
Protective
Gloves
(PF = 5)
Protective Gloves (
PF = 10)
Protective Gloves
(Industrial uses,
PF = 20)
Manufacturing
Bin 1
1.0 184.36 36.87 18.44 9.22 N/A –
occlusion
not
expected
Processing as a Reactant 1.0 184.36 36.87 18.44 9.22
Formulation of Aerosol and Non-
Aerosol Products
1.0 184.36 36.87 18.44 9.22
Repackaging 1.0 184.36 36.87 18.44 9.22
Other Industrial Uses 1.0 184.36 36.87 18.44 9.22
Industrial Processing Aid 1.0 184.36 36.87 18.44 9.22
Process Solvent Recycling and Worker
Handling of Wastes
1.0 184.36 36.87 18.44 9.22
Batch Open Top Vapor Degreasing
Bin 2
1.0 184.36 36.87 18.44 9.22 2,247
Batch Closed-Loop Vapor Degreasing 1.0 184.36 36.87 18.44 9.22 2,247
Conveyorized Vapor Degreasing 1.0 184.36 36.87 18.44 9.22 2,247
Web Vapor Degreasing 1.0 184.36 36.87 18.44 9.22 2,247
Cold Cleaning 1.0 184.36 36.87 18.44 9.22 2.247
Aerosol Applications: Spray
Degreasing/Cleaning, Automotive Brake
and Parts Cleaners, Penetrating
Lubricants, and Mold Releases
Bin 3
1.0 184.36 36.87 18.44 Not Assessed
N/A –
occlusion
not
expected

PEER REVIEW DRAFT. DO NOT CITE OR QUOTE
144
Occupational Exposure Scenario Bin Max
Yderm
Non-Occluded Exposure
Occluded
Exposure No Gloves
(PF = 1)
Protective
Gloves
(PF = 5)
Protective Gloves (
PF = 10)
Protective Gloves
(Industrial uses,
PF = 20)
Adhesives, Sealants, Paints, and
Coatings (Industrial)
0.9 165.92 33.18 16.59
Adhesives, Sealants, Paints, and
Coatings (Commercial)
0.9 260.50 52.10 26.05
Metalworking Fluids
Bin 4
0.8 147.49 29.50 14.75 Not Assessed
1,798
Spot Cleaning 1.0 289.44 57.89 28.94 2,247
Wipe Cleaning 1.0 289.44 57.89 28.94 2,247
Carpet Cleaning 1.0 289.44 57.89 28.94 2,247
Commercial Printing and Copying 0.35 101.30 20.26 10.13 786
Other Commercial Uses 1.0 289.44 57.89 28.94 2,247

PEER REVIEW DRAFT. DO NOT CITE OR QUOTE
Page 145 of 229
3 Discussion of Uncertainties and Limitations
3.1 Variability EPA addressed variability in models by identifying key model parameters to apply a statistical
distribution that mathematically defines the parameter’s variability. EPA defined statistical
distributions for parameters using documented statistical variations where reasonably available.
3.2 Uncertainties and Limitations Uncertainty is “the lack of knowledge about specific variables, parameters, models, or other
factors” and can be described qualitatively or quantitatively (U.S. EPA, 2001b). The following
sections discuss uncertainties in each of the assessed conditions of use scenarios.
Number of Workers
There are a number of uncertainties surrounding the estimated number of workers potentially
exposed to TCE, as outlined below. Most are unlikely to result in a systematic underestimate or
overestimate, but could result in an inaccurate estimate.
CDR data are used to estimate the number of workers associated with manufacturing. There are
inherent limitations to the use of CDR data as they are reported by manufacturers and importers
of TCE. Manufacturers and importers are only required to report if they manufactured or
imported TCE in excess of 25,000 pounds at a single site during any calendar; as such, CDR may
not capture all sites and workers associated with any given chemical.
There are also uncertainties with BLS data, which are used to estimate the number of workers for
the remaining conditions of use. First, BLS Data employment data for each industry/occupation
combination are only available at the 3-, 4-, or 5-digit NAICS level, rather than the full 6-digit
NAICS level. This lack of granularity could result in an overestimate of the number of exposed
workers if some 6-digit NAICS are included in the less granular BLS estimates but are not, in
reality, likely to use TCE for the assessed applications. EPA addressed this issue by refining the
OES estimates using total employment data from the U.S. Census’ SUSB. However, this
approach assumes that the distribution of occupation types (SOC codes) in each 6-digit NAICS is
equal to the distribution of occupation types at the parent 5-digit NAICS level. If the distribution
of workers in occupations with TCE exposure differs from the overall distribution of workers in
each NAICS, then this approach will result in inaccuracy.
Second, EPA’s judgments about which industries (represented by NAICS codes) and
occupations (represented by SOC codes) are associated with the uses assessed in this report are
based on EPA’s understanding of how TCE is used in each industry. Designations of which
industries and occupations have potential exposures is nevertheless subjective, and some
industries/occupations with few exposures might erroneously be included, or some
industries/occupations with exposures might erroneously be excluded. This would result in
inaccuracy but would be unlikely to systematically either overestimate or underestimate the
count of exposed workers.

PEER REVIEW DRAFT. DO NOT CITE OR QUOTE
Page 146 of 229
Analysis of Exposure Monitoring Data
This report uses existing worker exposure monitoring data to assess exposure to TCE during
several conditions of use. To analyze the exposure data, EPA categorized each PBZ data point as
either “worker” or “occupational non-user”. The categorizations are based on descriptions of
worker job activity as provided in literature and EPA’s judgment. In general, samples for
employees that are expected to have the highest exposure from direct handling of TCE are
categorized as “worker” and samples for employees that are expected to have the lower exposure
and do not directly handle TCE are categorized as “occupational non-user”.
Exposures for occupational non-users can vary substantially. Most data sources do not
sufficiently describe the proximity of these employees to the TCE exposure source. As such,
exposure levels for the “occupational non-user” category will have high variability depending on
the specific work activity performed. It is possible that some employees categorized as
“occupational non-user” have exposures similar to those in the “worker” category depending on
their specific work activity pattern. Also, there is uncertainty in the ONU risk estimates since in
some instances the data or modeling used worker exposure estimates where no data or models
were reasonably available for ONU exposure estimates.
Some data sources may be inherently biased. For example, bias may be present if exposure
monitoring was conducted to address concerns regarding adverse human health effects reported
following exposures during use. Similarly, OSHA CEHD are obtained from OSHA inspections,
which may be the result of worker complaints, and may provide exposure results that may
generally exceed the industry average.
Some scenarios have limited exposure monitoring data in literature, if any. Where there are few
data points reasonably available, it is unlikely the results will be representative of worker
exposure across the industry. In cases where there was no exposure monitoring data, EPA may
have used monitoring data from similar conditions of use as surrogate. While these conditions of
use have similar worker activities contributing to exposures, it is unknown that the results will be
fully representative of worker exposure across different conditions of use.
Where sufficient data were reasonably available, the 95th and 50th percentile exposure
concentrations were calculated using reasonably available data. The 95th percentile exposure
concentration is intended to represent a high-end exposure level, while the 50th percentile
exposure concentration represents typical exposure level. The underlying distribution of the data,
and the representativeness of the data, are not known. Where discrete data was not reasonably
available, EPA used reported statistics (i.e., median, mean, 90th percentile, etc.). Since EPA
could not verify these values, there is an added level of uncertainty.
EPA calculated ADC and LADC values assuming workers and ONUs are regularly exposed
during their entire working lifetime, which likely results in an overestimate. Individuals may
change jobs during the course of their career such that they are no longer exposed to TCE, and
that actual ADC and LADC values become lower than the estimates presented.

PEER REVIEW DRAFT. DO NOT CITE OR QUOTE
Page 147 of 229
Near-Field/Far-Field Model Framework
The near-field/far-field approach is used as a framework to model inhalation exposure for many
conditions of use. The following describe uncertainties and simplifying assumptions generally
associated with this modeling approach:
• There is some degree of uncertainty associated with each model input parameter. In
general, the model inputs were determined based on review of reasonably available
literature. Where the distribution of the input parameter is known, a distribution is
assigned to capture uncertainty in the Monte Carlo analysis. Where the distribution is
unknown, a uniform distribution is often used. The use of a uniform distribution will
capture the low-end and high-end values but may not accurately reflect actual distribution
of the input parameters.
• The model assumes the near-field and far-field are well mixed, such that each zone can
be approximated by a single, average concentration.
• All emissions from the facility are assumed to enter the near-field. This assumption will
overestimate exposures and risks in facilities where some emissions do not enter the
airspaces relevant to worker exposure modeling.
• The exposure models estimate airborne concentrations. Exposures are calculated by
assuming workers spend the entire activity duration in their respective exposure zones
(i.e., the worker in the near-field and the occupational non-user in the far-field). Since
vapor degreasing and cold cleaning involve automated processes, a worker may actually
walk away from the near-field during part of the process and return when it is time to
unload the degreaser. As such, assuming the worker is exposed at the near-field
concentration for the entire activity duration may overestimate exposure.
• For certain TCE applications (e.g. vapor degreasing and cold cleaning), TCE vapor is
assumed to emit continuously while the equipment operates (i.e. constant vapor
generation rate). Actual vapor generation rate may vary with time. However, small time
variability in vapor generation is unlikely to have a large impact in the exposure estimates
as exposures are calculated as a time-weighted average.
• The exposure models represent model workplace settings for each TCE OES. The models
have not been regressed or fitted with monitoring data.
Each subsequent section below discusses uncertainties associated with the individual model.
3.2.3.1 Vapor Degreasing and Cold Cleaning Models
The OTVD, conveyorized vapor degreasing, and cold cleaning assessments use a near-field/far-
field approach to model worker exposure. In addition to the uncertainties described above, the
vapor degreasing and cold cleaning models have the following uncertainties:
• To estimate vapor generation rate for each equipment type, EPA used a distribution of the
emission rates reported in the 2014 NEI for each degreasing/cold cleaning equipment
type. NEI only contains information on major sources not area sources. Therefore, the
emission rate distribution used in modeling may not be representative of degreasing/cold
cleaning equipment emission rates at area sources.
PEER REVIEW DRAFT. DO NOT CITE OR QUOTE
Page 148 of 229
• The emission rate for conveyorized vapor degreasing is based on equipment at eight sites.
It is uncertain how representative these data are of a “typical” site.
• EPA assumes workers and occupational non-users remove themselves from the
contaminated near- and far-field zones at the conclusion of the task, such that they are no
longer exposed to any residual TCE in air.
3.2.3.2 Brake Servicing Model
The aerosol degreasing assessment also uses a near-field/far-field approach to model worker
exposure. Specific uncertainties associated with the aerosol degreasing scenario are presented
below:
• The model references a CARB study (CARB, 2000) on brake servicing to estimate use
rate and application frequency of the degreasing product. The brake servicing scenario
may not be representative of the use rates for other aerosol degreasing applications
involving TCE.
• The TCE Use Dossier (U.S. EPA, 2017b) presented 16 different aerosol degreasing
formulations containing TCE. For each Monte Carlo iteration, the model determines the
TCE concentration in product by selecting one of 16 possible formulations, assuming the
distribution for each formulation is equal to that found in a survey of brake cleaning
shops in California. It is uncertain if this distribution is representative of other geographic
locations within the U.S.
• Some of the aerosol formulations presented in the TCE Use Dossier (U.S. EPA, 2017b)
were provided as ranges. For each Monte Carlo iteration the model selects a TCE
concentration within the range of concentrations using a uniform distribution. In reality,
the TCE concentration in the formulation may be more consistent than the range
provided.
3.2.3.3 Spot Cleaning Model
The multi-zone spot cleaning model also uses a near-field/far-field approach. Specific
uncertainties associated with the spot cleaning scenario are presented below:
• The model assumes a use rate based on estimates of the amount of TCE-based spot
cleaner sold in California and the number of textile cleaning facilities in California
(IRTA, 2007). It is uncertain if this distribution is representative of other geographic
locations in the U.S.
• The model assumes a facility floor area based on data from (CARB, 2006) and King
County (Whittaker and Johanson, 2011). It is unknown how representative the area is of
“typical” spot cleaning facilities. Therefore, these assumptions may result in an
overestimate or underestimate of worker exposure during spot cleaning.
• Many of the model input parameters were obtained from (Von Grote et al., 2003), which
is a German study. Aspects of the U.S. spot cleaning facilities may differ from German
facilities. However, it is not known whether the use of German data will under- or over-
estimate exposure.

PEER REVIEW DRAFT. DO NOT CITE OR QUOTE
Page 149 of 229
Modeled Dermal Exposures
The Dermal Exposure to Volatile Liquids Model is used to estimate dermal exposure to TCE in
occupational settings. The model assumes a fixed fractional absorption of the applied dose;
however, fractional absorption may be dependent on skin loading conditions. The model also
assumes a single exposure event per day based on existing framework of the EPA/OPPT 2-Hand
Dermal Exposure to Liquids Model and does not address variability in exposure duration and
frequency.
PEER REVIEW DRAFT. DO NOT CITE OR QUOTE
Page 150 of 229
REFERENCES
AIHAAIHA (American Industrial Hygiene Association). (2009). Mathematical models for
estimating occupational exposure to chemicals. In CB Keil; CE Simmons; TR Anthony
(Eds.), (2nd ed.). Fairfax, VA: AIHA Press.
Arkema Inc.Arkema Inc. (2018). Arkema Inc. comments to inform EPAs rulemaking on problem
formulations for the risk evaluations to be conducted under the Toxic Substances Control
Act, and general guiding principles to apply systematic review in TSCA risk evaluations.
(EPA-HQ-OPPT-2016-0737-0109). Washington, D.C.
https://www.regulations.gov/document?D=EPA-HQ-OPPT-2016-0737-0109
ATSDRATSDR (Agency for Toxic Substances and Disease Registry). (2014). Toxicological
profile for tetrachloroethylene (Draft for public comment). Atlanta, GA: US Department
of Health and Human Services, Public Health Service.
http://www.atsdr.cdc.gov/ToxProfiles/tp.asp?id=265&tid=48
Bakke, B; Stewart, P; Waters, M.Bakke, B; Stewart, P; Waters, M. (2007). Uses of and exposure
to trichloroethylene in U.S. industry: A systematic literature review [Review]. J Occup
Environ Hyg 4: 375-390. http://dx.doi.org/10.1080/15459620701301763
Baldwin, PE; Maynard, AD.Baldwin, PE; Maynard, AD. (1998). A survey of wind speed in
indoor workplaces. Ann Occup Hyg 42: 303-313. http://dx.doi.org/10.1016/S0003-
4878(98)00031-3
Barsan, ME.Barsan, ME. (1991). Health hazard evaluation report no. HETA 90-344-2159, A.W.
Cash Valve Manufacturing Corporation, Decatur, Illinois. (HETA 90-344-2159).
Cincinnati, OH: National Institute for Occupational Safety and Health.
Burton, NC; Monesterskey, J.Burton, NC; Monesterskey, J. (1996). Health hazard evaluation
report no. HETA 96-0135-2612, Eagle Knitting Mills, Inc., Shawano, Wisconsin. (HETA
96-0135-2612). Cincinnati, OH: National Institute for Occupational Safety and Health.
CARBCARB (California Air Resources Board). (2000). Initial statement of reasons for the
proposed airborne toxic control measure for emissions of chlorinated toxic air
contaminants from automotive maintenance and repair activities.
CARB.CARB. (2006). California Dry Cleaning Industry Technical Assessment Report.
Stationary Source Division, Emissions Assessment Branch.
https://www.arb.ca.gov/toxics/dryclean/finaldrycleantechreport.pdf
Cherrie, JW; Semple, S; Brouwer, D.Cherrie, JW; Semple, S; Brouwer, D. (2004). Gloves and
Dermal Exposure to Chemicals: Proposals for Evaluating Workplace Effectiveness. Ann
Occup Hyg 48: 607-615. http://dx.doi.org/10.1093/annhyg/meh060
Chrostek, WJ, : Levine, M. S.Chrostek, WJ, : Levine, M. S. (1981). Health hazard evaluation
report no. HHE 30-153-881, Palmer Industrial Coatings Incorp., Williamsport,
Pennsylvania. (HHE 30-153-881). Cincinnati, OH: National Institute for Occupational
Safety and Health.
Crandall, MS; Albrecht, WN.Crandall, MS; Albrecht, WN. (1989). Health Hazard Evaluation
Report No. HETA-86-380-1957, York International Corporation, Madisonville,
Kentucky (pp. 86-380). (NIOSH/00189611). Crandall, MS; Albrecht, WN.
Dancik, Y; Bigliardi, PL; Bigliardi-Qi, M, ei.Dancik, Y; Bigliardi, PL; Bigliardi-Qi, M, ei.
(2015). What happens in the skin? Integrating skin permeation kinetics into studies of
developmental and reproductive toxicity following topical exposure. Reprod Toxicol 58:
252-281. http://dx.doi.org/10.1016/j.reprotox.2015.10.001
PEER REVIEW DRAFT. DO NOT CITE OR QUOTE
Page 151 of 229
Daniels, WJ; Orris, P; Kramkowski, R; Almaguer, D.Daniels, WJ; Orris, P; Kramkowski, R;
Almaguer, D. (1988). Health Hazard Evaluation Report No. HETA-86-121-1923,
Modern Plating Corporation, Freeport, Illinois (pp. 86-121). (NIOSH/00184446).
Daniels, WJ; Orris, P; Kramkowski, R; Almaguer, D.
Demou, E; Hellweg, S; Wilson, MP; Hammond, SK; Mckone, TE.Demou, E; Hellweg, S;
Wilson, MP; Hammond, SK; Mckone, TE. (2009). Evaluating indoor exposure modeling
alternatives for LCA: A case study in the vehicle repair industry. Environ Sci Technol 43:
5804-5810. http://dx.doi.org/10.1021/es803551y
Dow ChemicalDow Chemical (Dow Chemical Company). (2014). Product safety assessment:
Trichloroethylene.
DOW Deutschland.DOW Deutschland. (2014a). Chemical safety report: Use of trichloroethylene
in industrial parts cleaning by vapour degreasing in closed systems where specific
requirements (system of use-parameters) exist. Ispra, Italy: European Commission Joint
Research Centre, Institute for Health and Consumer Protection, European Chemicals
Bureau.
http://ec.europa.eu/DocsRoom/documents/14369/attachments/1/translations/en/renditions
/native
DOW Deutschland.DOW Deutschland. (2014b). Chemical safety report: Use of
trichloroethylene in packaging. Ispra, Italy: European Commission Joint Research Centre,
Institute for Health and Consumer Protection, European Chemicals Bureau.
http://ec.europa.eu/DocsRoom/documents/14371/attachments/1/translations/en/renditions
/native
Durkee, J.Durkee, J. (2014). Cleaning with solvents: Methods and machinery. In Cleaning with
solvents: Methods and machinery. Oxford, UK: Elsevier Inc.
https://www.sciencedirect.com/book/9780323225205/cleaning-with-solvents-methods-
and-machinery
ECEC (European Commission). (2014). Exposure scenario: Use: Trichloroethylene as an
extraction solvent for removal of process oil and formation of the porous structure in
polyethylene based separators used in lead-acid batteries. Ispra, Italy: European
Commission Joint Research Centre, Institute for Health and Consumer Protection,
European Chemicals Bureau.
http://ec.europa.eu/DocsRoom/documents/12344/attachments/1/translations/en/renditions
/native
ECBECB (European Chemicals Bureau). (2004). European Union risk assessment report:
Trichloroethylene (pp. 1-348). (EUR 21057 EN). European Commission.
https://echa.europa.eu/documents/10162/83f0c99f-f687-4cdf-a64b-514f1e26fdc0
Elkin, LM.Elkin, LM. (1969). Process Economics Program, Chlorinated Solvents, Report No.
48. In Kirk-Othmer Encyclopedia of Chemical Technology. Menlo Park, CA: Stanford
Research Institute.
ENTEK International Limited.ENTEK International Limited. (2014). Analysis of alternatives:
Use of trichloroethylene as an extraction solvent for removal of process oil and formation
of the porous structure in polyethylene based separators used in lead-acid batteries.
Helsinki, Finland: European Chemicals Agency.
https://echa.europa.eu/documents/10162/9a728963-e57f-48de-b977-7d05462c43e9
PEER REVIEW DRAFT. DO NOT CITE OR QUOTE
Page 152 of 229
ESIG.ESIG. (2012). SPERC fact sheet: Manufacture of substance - industrial (solvent-borne).
Brussels, Belgium: European Solvents Industry Group (ESIG).
https://www.esig.org/reach-ges/environment/
FH, F.FH, F. (2012). Dermal Absorption of Finite doses of Volatile Compounds. J Pharm Sci
101: 2616-2619. http://dx.doi.org/10.1080/15287394
Finely, M; Page, E.Finely, M; Page, E. (2005). Health hazard evaluation report no. HETA 2003-
0203-2952, Wallace Computer Services, Clinton, Illinois. (HETA 2003-0203-2952).
Cincinnati, OH: National Institute for Occupational Safety and Health.
Frasch, HF; Bunge, AL.Frasch, HF; Bunge, AL. (2015). The transient dermal exposure II: post-
exposure absorption and evaporation of volatile compounds. J Pharm Sci 104: 1499-
1507. http://dx.doi.org/10.1002/jps.24334
Frasch, HF; Dotson, GS; Barbero, AM.Frasch, HF; Dotson, GS; Barbero, AM. (2011). In vitro
human epidermal penetration of 1-bromopropane. J Toxicol Environ Health A 74: 1249-
1260. http://dx.doi.org/10.1080/15287394.2011.595666
Garrod, AN; Phillips, AM; Pemberton, JA.Garrod, AN; Phillips, AM; Pemberton, JA. (2001).
Potential exposure of hands inside protective glovesa summary of data from non-
agricultural pesticide surveys. Ann Occup Hyg 45: 55-60.
http://dx.doi.org/10.1016/S0003-4878(00)00013-2
Gilbert, D; Goyer, M; Lyman, W; Magil, G; Walker, P; Wallace, D; Wechsler, A; Yee, J.Gilbert,
D; Goyer, M; Lyman, W; Magil, G; Walker, P; Wallace, D; Wechsler, A; Yee, J. (1982).
An exposure and risk assessment for tetrachloroethylene. (EPA-440/4-85-015).
Washington, DC: U.S. Environmental Protection Agency, Office of Water Regulations
and Standards. http://nepis.epa.gov/Exe/ZyPURL.cgi?Dockey=2000LLOH.txt
Gilles, D; Anania, TL; Ilka, R.Gilles, D; Anania, TL; Ilka, R. (1977). Health hazard evaluation
report no. HHE 77-12-418, Airtex Products, Fairfield, Illinois. (HHE 77-12-418).
Cincinnati, OH: National Institute for Occupational Safety and Health.
Gilles, D; Philbin, E.Gilles, D; Philbin, E. (1976). Health hazard evaluation report no. HHE 76-
61-337, TRW Incorporated, Philadelphia, Pennsylvania. (HHE 76-61-337). Cincinnati,
OH: National Institute for Occupational Safety and Health.
GmbH, WC.GmbH, WC. (1940). German Patent 901,774. In Kirk-Othmer Encyclopedia of
Chemical Technology. Wacker Chemie GmbH.
Golsteijn, L; Huizer, D; Hauck, M; van Zelm, R; Huijbregts, MA.Golsteijn, L; Huizer, D;
Hauck, M; van Zelm, R; Huijbregts, MA. (2014). Including exposure variability in the
life cycle impact assessment of indoor chemical emissions: the case of metal degreasing.
Environ Int 71: 36-45. http://dx.doi.org/10.1016/j.envint.2014.06.003
Gorman, R; Rinsky, R; Stein, G; Anderson, K.Gorman, R; Rinsky, R; Stein, G; Anderson, K.
(1984). Health hazard evaluation report no. HETA 82-075-1545, Pratt & Whitney
Aircraft, West Palm Beach, Florida. (HETA 82-075-1545). Cincinnati, OH: National
Institute for Occupational Safety and Health.
Halogenated Solvents Industry Alliance, I.Halogenated Solvents Industry Alliance, I. (2017).
RE: Docket no. EPA-HQ-2016-0737. (EPA-HQ-OPPT-2016-0737-0027). Washington,
D.C. https://www.regulations.gov/document?D=EPA-HQ-OPPT-2016-0737-0027
Halogenated Solvents Industry Alliance, I.Halogenated Solvents Industry Alliance, I. (2018). Re:
Docket no. EPA-HQ-OPPT-2016-0737. (EPA-HQ-OPPT-2016-0737-0103). Washington,
D.C. https://www.regulations.gov/document?D=EPA-HQ-OPPT-2016-0737-0103
PEER REVIEW DRAFT. DO NOT CITE OR QUOTE
Page 153 of 229
Hellweg, S; Demou, E; Bruzzi, R; Meijer, A; Rosenbaum, RK; Huijbregts, MA; Mckone,
TE.Hellweg, S; Demou, E; Bruzzi, R; Meijer, A; Rosenbaum, RK; Huijbregts, MA;
Mckone, TE. (2009). Integrating human indoor air pollutant exposure within Life Cycle
Impact Assessment [Review]. Environ Sci Technol 43: 1670-1679.
http://dx.doi.org/10.1021/es8018176
ICF Consulting.ICF Consulting. (2004). The U.S. solvent cleaning industry and the transition to
non ozone depleting substances. https://www.epa.gov/sites/production/files/2014-
11/documents/epasolventmarketreport.pdf
IRTAIRTA (Institute for Research and Technical Assistance). (2007). Spotting chemicals:
Alternatives to perchloroethylene and trichloroethylene in the textile cleaning industry.
Prepared for: Cal/EPAs Department of Toxic Substances Control and U.S. Environmental
Protection Agency Region IX.
http://www.irta.us/reports/DTSC%20Spotting%20Chemical%20for%20Web.pdf
Kanegsberg, B; Kanegsberg, E.Kanegsberg, B; Kanegsberg, E. (2011). Handbook for critical
cleaning, cleaning agents and systems (2nd ed.). Boca Raton, FL: CRC Press.
Kasting, BG; Miller, MA.Kasting, BG; Miller, MA. (2006). Kinetics of finite dose absorption
through skin 2: Volatile compounds. J Pharm Sci 95: 268-280.
http://dx.doi.org/10.1002/jps.20497
Kinnes, GM.Kinnes, GM. (1998). Health hazard evaluation report no. HETA 97-0214-2689,
Dorma Door Controls, Inc., Reamstown Pennsylvania. (HETA 97-0214-2689).
Cincinnati, OH: National Institute for Occupational Safety and Health.
Klein, P; Kurz, J.Klein, P; Kurz, J. (1994). [Reduction of Solvent Concentrations in
Surroundings of Dry-Cleaning Shops]. Bonningheim, Germany: Hohenstein
Physiological lnstitute on Clothing.
Lewis, FA.Lewis, FA. (1980). Health hazard evaluation report no. HHE 80-87-708, Harowe
Servo Contorls Inc., West Chester, Pennsylvania. (HHE 80-87-708). Cincinnati, OH:
National Institute for Occupational Safety and Health.
Marquart, H; Franken, R; Goede, H; Fransman, W; Schinkel, J.Marquart, H; Franken, R; Goede,
H; Fransman, W; Schinkel, J. (2017). Validation of the dermal exposure model in
ECETOC TRA. Annals of Work Exposures and Health 61: 854-871.
http://dx.doi.org/10.1093/annweh/wxx059
Morford, RG.Morford, RG. (2017). Comment submitted by Richard G. Morford, General
Counsel, Enviro Tech International, Inc. Available online at
https://www.regulations.gov/document?D=EPA-HQ-OPPT-2016-0741-0016
Morris, M; Wolf, K.Morris, M; Wolf, K. (2005). Evaluation of New and Emerging Technologies
for Textile Cleaning. Institute for Research and Technical Assistance (IRTA).
http://wsppn.org/pdf/irta/Emerging_Technologies_Textile_%20Clea.pdf
Most, CC.Most, CC. (1989). Locating and estimating air emissions from sources of
perchloroethylene and trichloroethylene. (EPA-450/2-89-013). Research Triangle Park,
NC: U.S. EPA. https://www3.epa.gov/ttn/chief/le/perc.pdf
NEWMOANEWMOA (Northeast Waste Management Officials' Association). (2001). Pollution
prevention technology profile - Closed loop vapor degreasing. Boston, MA.
http://www.newmoa.org/prevention/p2tech/ProfileVaporDegreasing.pdf
NIH.NIH. (2012). Hazardous Substances Data Bank (HSDB): Trichloroethylene. Bethesda, MD:
U.S. Department of Health & Human Services, National Institutes of Health, U.S.
National Library of Medicine. https://toxnet.nlm.nih.gov/newtoxnet/hsdb.htm

PEER REVIEW DRAFT. DO NOT CITE OR QUOTE
Page 154 of 229
NIOSHNIOSH (National Institute for Occupational Safety and Health). (1997). Control of health
and safety hazards in commercial drycleaners: chemical exposures, fire hazards, and
ergonomic risk factors. In Education and Information Division. (DHHS (NIOSH)
Publication Number 97-150). Atlanta, GA. http://www.cdc.gov/niosh/docs/97-150/
NIOSHNIOSH (National Institute for Occupational Safety and Health). (2001). Evaluation of
Solvent Exposures from the Degreaser. Trilthic Inc., IN. In Hazard Evaluation Technical
Assisstance Branch. (HETA 2000-0233-2845). NIOSH Publishing Office: National
Institute of Occupational Safety and Health.
http://www.cdc.gov/niosh/hhe/reports/pdfs/2000-0233-2845.pdf
NIOSH.NIOSH. (2002a). In-depth survey report: control of perchloroethylene (PCE) in vapor
degreasing operations, site #1. (EPHB 256-19b). Cincinnati, Ohio: National Institute for
Occupational Safety and Health (NIOSH).
NIOSHNIOSH (National Institute for Occupational Safety and Health). (2002b). In-depth survey
report: Control of perchloroethylene (PCE) in vapor degreasing operations, site #2.
(EPHB 256-16b). CDC. https://www.cdc.gov/niosh/surveyreports/pdfs/256-16b.pdf
NIOSH.NIOSH. (2002c). In-depth survey report: control of perchloroethylene (PCE) in vapor
degreasing operations, site #4. (EPHB 256-18b). Cincinnati, Ohio: National Institute for
Occupational Safety and Health (NIOSH).
NIOSHNIOSH (National Institute for Occupational Safety and Health). (2002d). In-depth survey
report: Control of perchloroethylene exposure (PCE) in vapor degreasing operations, site
#3. (EPHB 256-17b). CDC. https://www.cdc.gov/niosh/surveyreports/pdfs/ECTB-256-
17b.pdf
OECDOECD (Organisation for Economic Co-operation and Development). (2004). Emission
scenario document on lubricants and lubricant additives. In OECD Series On Emission
Scenario Documents. (JT00174617). Paris, France.
http://www.olis.oecd.org/olis/2004doc.nsf/LinkTo/env-jm-mono(2004)21
OECDOECD (Organisation for Economic Co-operation and Development). (2009a). Emission
scenario document on adhesive formulation. (JT03263583). Paris, France.
OECDOECD (Organisation for Economic Co-operation and Development). (2009b). Emission
scenario documents on coating industry (paints, lacquers and varnishes). (JT03267833).
Paris, France.
OECDOECD (Organisation for Economic Co-operation and Development). (2010). Scoping
Document for Emission Scenario Document on Manufacturing and Use of Printing Inks.
OECD Environmental Health and Safety Publications.
OECDOECD (Organisation for Economic Co-operation and Development). (2011a). EMISSION
SCENARIO DOCUMENT ON RADIATION CURABLE COATING, INKS AND
ADHESIVES. In Series on Emission Scenario Documents No 27. Paris: OECD
Environmental Health and Safety Publications. http://www.oecd-
ilibrary.org/docserver/download/9714111e.pdf?expires=1497031939&id=id&accname=g
uest&checksum=C794B2987D98D1D145225EAF9B482280
OECDOECD (Organisation for Economic Co-operation and Development). (2011b). Emission
scenario document on the use of metalworking fluids. In OECD Environmental health
and safety publications Series on emission scenario documents Emission scenario
document on coating and application via spray painting in the automotive refinishing
industry Number 11. (JT03304938). Organization for Economic Cooperation and
Development.
PEER REVIEW DRAFT. DO NOT CITE OR QUOTE
Page 155 of 229
OECDOECD (Organisation for Economic Co-operation and Development). (2015). Emission
scenario document on use of adhesives. (Number 34). Paris, France.
http://www.oecd.org/officialdocuments/publicdisplaydocumentpdf/?cote=ENV/JM/MON
O(2015)4&doclanguage=en
OECD.OECD. (2017). Draft ESD on Vapor Degreasing - Internal EPA document. Organization
for Economic Co-operation and Development (OECD).
OECD.OECD. (2019). Emission scenario documents. Available online at
http://www.oecd.org/env/ehs/risk-assessment/emissionscenariodocuments.htm (accessed
August 29, 2019).
Orris, P; Daniels, W.Orris, P; Daniels, W. (1981). Health Hazard Evaluation Report 80-201-816:
Peterson/Puritan Company. (HE 80-201-816). NIOSH.
https://www.cdc.gov/niosh/hhe/reports/pdfs/80-201-
816.pdf?id=10.26616/NIOSHHHE80201816
OSHAOSHA (Occupational Safety & Health Administration). (2017). Chemical Exposure
Health Data (CEHD) provided by OSHA to EPA. U.S. Occupational Safety and Health
Administration.
Products, IAfSDaM.Products, IAfSDaM. (2012). AISE SPERC fact sheet - wide dispersive use
of cleaning and maintenance products. International Association for Soaps Detergents
and Maintenance Products. https://www.aise.eu/our-activities/regulatory-
context/reach/environmental-exposure-assessment.aspx
Rosensteel, RE; Lucas, JB.Rosensteel, RE; Lucas, JB. (1975). Health hazard evaluation report
no. HHE 74-28-212, Westinghouse Air Brake Company, Wilmerding, Pennsyvlania.
(HHE 74-28-212). Cincinnati, OH: National Institute for Occupational Safety and Health.
Ruhe, RL.Ruhe, RL. (1982). Health hazard evaluation report no. HETA 82-040-119, Synthes
Ltd. (USA), Monument, Colorado. (HETA 82-040-119). Cincinnati, OH: National
Institute for Occupational Safety and Health.
Ruhe, RL; Watanabe, A; Stein, G.Ruhe, RL; Watanabe, A; Stein, G. (1981). Health hazard
evaluation report no. HHE 80-49-808, Superior Tube Company, Collegeville,
Pennsylvania. (HHE 80-49-808). Cincinnati, OH: National Institute for Occupational
Safety and Health. https://www.cdc.gov/niosh/hhe/reports/pdfs/80-49-808.pdf
Saft America, I.Saft America, I. (2017). Memorandum: Trichoroethylene, Docket ID number
EPA-HQ-OPPT-2016-0737. (EPA-HQ-OPPT-2016-0737-0007). Washington, D.C.
https://www.regulations.gov/document?D=EPA-HQ-OPPT-2016-0737-0007
SCGSCG (Scientific Consulting Group, Inc.). (2013). Final peer review comments for the OPPT
trichloroethylene (TCE) draft risk assessment. Available online at
https://www.epa.gov/sites/production/files/2017-
06/documents/tce_consolidated_peer_review_comments_september_5_2013.pdf
Seitz, T; Driscoll, R.Seitz, T; Driscoll, R. (1989). Health hazard evaluation report no. HETA 88-
082-1971, Jostens Incorporated, Princeton, Illinois. (HETA 88-082-1971). Cincinnati,
OH: National Institute for Occupational Safety and Health.
https://www.cdc.gov/niosh/hhe/reports/pdfs/1988-0082-1971.pdf
Smart, BE; Fernandez, RE.Smart, BE; Fernandez, RE. (2000). Fluorinated aliphatic compounds
[Encyclopedia]. In Kirk-Othmer encyclopedia of chemical technology. Hoboken, NJ:
John Wiley and Sons, Inc. http://dx.doi.org/10.1002/0471238961.0612211519130118.a01
Snedecor, G; Hickman, JC; Mertens, JA.Snedecor, G; Hickman, JC; Mertens, JA. (2004).
Chloroethylenes and chloroethanes.

PEER REVIEW DRAFT. DO NOT CITE OR QUOTE
Page 156 of 229
Tomer, A; Kane, J.Tomer, A; Kane, J. (2015). The great port mismatch. U.S. goods trade and
international transportation. The Global Cities Initiative. A joint project of Brookings and
JPMorgon Chase. https://www.brookings.edu/wp-
content/uploads/2015/06/brgkssrvygcifreightnetworks.pdf
U.S. BLSU.S. BLS (U.S. Bureau of Labor Statistics). (2014). Employee Tenure News Release.
Available online at http://www.bls.gov/news.release/archives/tenure_09182014.htm
U.S. BLSU.S. BLS (U.S. Bureau of Labor Statistics). (2016). May 2016 Occupational
Employment and Wage Estimates: National Industry-Specific Estimates. Available
online at http://www.bls.gov/oes/tables.htm
U.S. Census Bureau.U.S. Census Bureau. (2013). Census 2012 Detailed Industry Code List
[Database]. Retrieved from https://www.census.gov/topics/employment/industry-
occupation/guidance/code-lists.html
U.S. Census Bureau.U.S. Census Bureau. (2015). Statistics of U.S. Businesses (SUSB).
https://www.census.gov/data/tables/2015/econ/susb/2015-susb-annual.html
U.S. Census Bureau.U.S. Census Bureau. (2019). Survey of Income and Program Participation:
SIPP introduction and history. Washington, DC. https://www.census.gov/programs-
surveys/sipp/about/sipp-introduction-history.html
U.S. EPAU.S. EPA (U.S. Environmental Protection Agency). (1977). Control of volatile organic
emissions from solvent metal cleaning [EPA Report]. (EPA-450/2-77-022). Research
Triangle Park, NC: U.S. Environmental Protection Agency, Office of Air and Waste
Management, Office of Air Quality Planning and Standards.
U.S. EPAU.S. EPA (U.S. Environmental Protection Agency). (1980). Chapter 4.7: Waste
Solvent Reclamation. In AP-42 Compilation of air pollutant emission factors (5th ed.).
Research Triangle Park, NC: Office of Air and Radiation, Office of Air Quality and
Planning Standards. https://www3.epa.gov/ttn/chief/ap42/ch04/index.html
U.S. EPAU.S. EPA (U.S. Environmental Protection Agency). (1981). AP-42. Compilation of air
pollutant emission factors. Chapter 4.6: Solvent degreasing. Washington, DC.
http://www3.epa.gov/ttn/chief/ap42/ch04/final/c4s06.pdf
U.S. EPAU.S. EPA (U.S. Environmental Protection Agency). (1985). Occupational exposure and
environmental release assessment of tetrachloroethylene. Office of Pesticides and Toxic
Substances.
U.S. EPAU.S. EPA (U.S. Environmental Protection Agency). (1992). Guidelines for exposure
assessment. Federal Register 57(104):22888-22938 [EPA Report]. In Guidelines for
exposure assessment. (EPA/600/Z-92/001). Washington, DC.
http://cfpub.epa.gov/ncea/cfm/recordisplay.cfm?deid=15263
U.S. EPA.U.S. EPA. (1994). Guidelines for Statistical Analysis of Occupational Exposure Data:
Final. United States Environmental Protection Agency :: U.S. EPA.
U.S. EPAU.S. EPA (U.S. Environmental Protection Agency). (1997). Solvent Cleaning. Volume
III, Chapter 6. pp. 6.2.1. Washington, DC.
http://www3.epa.gov/ttnchie1/eiip/techreport/volume03/iii06fin.pdf
U.S. EPAU.S. EPA (U.S. Environmental Protection Agency). (2001a). Guide to industrial
assessments for pollution prevention and energy efficiency [EPA Report]. (EPA/625/R-
99/003). Cincinnati, OH: Office of Research and Development, National Risk
Management Research Laboratory, Center for Environmental Research Information.
U.S. EPAU.S. EPA (U.S. Environmental Protection Agency). (2001b). Risk assessment guidance
for superfund: Volume III - Part A, Process for conducting probabilistic risk assessment

PEER REVIEW DRAFT. DO NOT CITE OR QUOTE
Page 157 of 229
[EPA Report]. (EPA 540-R-02-002). Washington, DC: U.S. Environmental Protection
Agency, Office of Emergency and Remedial Response.
U.S. EPAU.S. EPA (U.S. Environmental Protection Agency). (2006). Risk assessment for the
halogenated solvent cleaning source category [EPA Report]. (EPA Contract No. 68-D-
01-052). Research Triangle Park, NC: U.S. Environmental Protection Agency, Office of
Air Quality Planning and Standards. https://www.regulations.gov/document?D=EPA-
HQ-OAR-2002-0009-0022
U.S. EPAU.S. EPA (U.S. Environmental Protection Agency). (2011). The 2011 National
Emissions Inventory. Retrieved from https://www.epa.gov/air-emissions-
inventories/2011-national-emissions-inventory-nei-data
U.S. EPAU.S. EPA (U.S. Environmental Protection Agency). (2013). ChemSTEER user guide -
Chemical screening tool for exposures and environmental releases. Washington, D.C.
https://www.epa.gov/sites/production/files/2015-05/documents/user_guide.pdf
U.S. EPAU.S. EPA (U.S. Environmental Protection Agency). (2014a). Degreasing with TCE in
commercial facilities: Protecting workers [EPA Report]. Washington, DC: U.S.
Environmental Protection Agency, Office of Pollution Prevention and Toxics.
U.S. EPAU.S. EPA (U.S. Environmental Protection Agency). (2014b). TSCA work plan
chemical risk assessment. Trichloroethylene: Degreasing, spot cleaning and arts & crafts
uses. (740-R1-4002). Washington, DC: Environmental Protection Agency, Office of
Chemical Safety and Pollution Prevention.
http://www2.epa.gov/sites/production/files/2015-
09/documents/tce_opptworkplanchemra_final_062414.pdf
U.S. EPAU.S. EPA (U.S. Environmental Protection Agency). (2016a). EPA Discharge
Monitoring Report Data. Retrieved from https://cfpub.epa.gov/dmr/
U.S. EPAU.S. EPA (U.S. Environmental Protection Agency). (2016b). Instructions for reporting
2016 TSCA chemical data reporting. (EPA/600/R-09/052F). Washington, DC: U.S.
Environmental Protection Agency, Office of Pollution Prevention and Toxics.
https://www.epa.gov/chemical-data-reporting/instructions-reporting-2016-tsca-chemical-
data-reporting
U.S. EPAU.S. EPA (U.S. Environmental Protection Agency). (2017a). Chemical data reporting
under the Toxic Substances Control Act. Available online at
https://www.epa.gov/chemical-data-reporting (accessed August 29, 2017).
U.S. EPAU.S. EPA (U.S. Environmental Protection Agency). (2017b). Preliminary information
on manufacturing, processing, distribution, use, and disposal: Trichloroethylene
[Comment]. (EPA-HQ-OPPT-2016-0737-003). Washington, DC: Office of Chemical
Safety and Pollution Prevention. https://www.regulations.gov/document?D=EPA-HQ-
OPPT-2016-0737-0003
U.S. EPAU.S. EPA (U.S. Environmental Protection Agency). (2017c). Toxics Release Inventory
(TRI), reporting year 2016. Retrieved from https://www.epa.gov/toxics-release-
inventory-tri-program/tri-data-and-tools
U.S. EPAU.S. EPA (U.S. Environmental Protection Agency). (2017d). Trichloroethylene market
and use report. Washington, DC: U.S. Environmental Protection Agency, Office of
Chemical Safety and Pollution Prevention, Chemistry, Economics, and Sustainable
Strategies Division. https://www.epa.gov/sites/production/files/2016-
05/documents/instructions_for_reporting_2016_tsca_cdr_13may2016.pdf
http://www2.epa.gov/sites/production/files/2015-09/documents/tce_opptworkplanchemra_final_062414.pdf
http://www2.epa.gov/sites/production/files/2015-09/documents/tce_opptworkplanchemra_final_062414.pdf
https://www.epa.gov/chemical-data-reporting/instructions-reporting-2016-tsca-chemical-data-reporting
PEER REVIEW DRAFT. DO NOT CITE OR QUOTE
Page 158 of 229
U.S. EPAU.S. EPA (U.S. Environmental Protection Agency). (2018a). 2014 National Emissions
Inventory Report. https://www.epa.gov/air-emissions-inventories/2014-national-
emissions-inventory-nei-data
U.S. EPAU.S. EPA (U.S. Environmental Protection Agency). (2018b). Application of systematic
review in TSCA risk evaluations. (740-P1-8001). Washington, DC: U.S. Environmental
Protection Agency, Office of Chemical Safety and Pollution Prevention.
https://www.epa.gov/sites/production/files/2018-
06/documents/final_application_of_sr_in_tsca_05-31-18.pdf
U.S. EPAU.S. EPA (U.S. Environmental Protection Agency). (2018c). Problem formulation of
the risk evaluation for trichloroethylene. (EPA-740-R1-7014). Washington, DC: Office of
Chemical Safety and Pollution Prevention, United States Environmental Protection
Agency. https://www.epa.gov/sites/production/files/2018-
06/documents/tce_problem_formulation_05-31-31.pdf
U.S. EPAU.S. EPA (U.S. Environmental Protection Agency). (2018d). TRI Reporting Forms and
Instructions (RFI) Guidance Document.
https://ofmpub.epa.gov/apex/guideme_ext/f?p=guideme_ext:41:0::NO:::
U.S. EPAU.S. EPA (U.S. Environmental Protection Agency). (2019a). Aluminum forming point
source category. (40 CFR Part 467). Washington, D.C. https://www.ecfr.gov/cgi-bin/text-
idx?SID=117c2452100f178f42f8141c0887e5f4&mc=true&node=pt40.32.467&rgn=div5
U.S. EPAU.S. EPA (U.S. Environmental Protection Agency). (2019b). Coil coating point source
category. (40 CFR Part 465). Washington, D.C. https://www.ecfr.gov/cgi-bin/text-
idx?SID=117c2452100f178f42f8141c0887e5f4&mc=true&node=pt40.32.465&rgn=div5
U.S. EPAU.S. EPA (U.S. Environmental Protection Agency). (2019c). Electrical and electronic
components point source category. (40 CFR Part 469). Washington, D.C.
https://www.ecfr.gov/cgi-bin/text-
idx?SID=117c2452100f178f42f8141c0887e5f4&mc=true&node=pt40.32.469&rgn=div5
U.S. EPAU.S. EPA (U.S. Environmental Protection Agency). (2019d). Electroplating Point
Source Category. (40 CFR Part 413). Washington, D.C. https://www.ecfr.gov/cgi-
bin/text-
idx?SID=5c5a19d4dd729db1e53fb9ca47e16706&mc=true&node=pt40.31.413&rgn=div
5
U.S. EPAU.S. EPA (U.S. Environmental Protection Agency). (2019e). Iron and steel
manufacturing point source category. (40 CFR Part 420). Washington, D.C.
https://www.ecfr.gov/cgi-bin/text-
idx?SID=5c5a19d4dd729db1e53fb9ca47e16706&mc=true&node=pt40.31.420&rgn=div
5
U.S. EPAU.S. EPA (U.S. Environmental Protection Agency). (2019f). Metal finishing point
source company. (40 CFR Part 433). Washington, D.C. https://www.ecfr.gov/cgi-
bin/text-
idx?SID=117c2452100f178f42f8141c0887e5f4&mc=true&node=pt40.32.433&rgn=div5
U.S. EPAU.S. EPA (U.S. Environmental Protection Agency). (2019g). Organic chemicals,
plastics, and synthetic fibers. (40 CFR Part 414). Washington, D.C.
https://www.ecfr.gov/cgi-bin/text-
idx?SID=5c5a19d4dd729db1e53fb9ca47e16706&mc=true&node=pt40.31.414&rgn=div
5

PEER REVIEW DRAFT. DO NOT CITE OR QUOTE
Page 159 of 229
U.S. EPAU.S. EPA (U.S. Environmental Protection Agency). (2019h). Risk evaluation for
trichloroethylene. Washington, D.C.
Vandervort, R; Polakoff, PL.Vandervort, R; Polakoff, PL. (1973). Health hazard evaluation
report no. HHE 72-84-31, Dunham-Bush, Incroprated, West Hartford, Connecticut, Part
2. (HHE 72-84-31). Cincinnati, OH: National Institute for Occupational Safety and
Health.
von Grote, J; Hürlimann, C; Scheringer, M; Hungerbühler, K.von Grote, J; Hürlimann, C;
Scheringer, M; Hungerbühler, K. (2006). Assessing occupational exposure to
perchloroethylene in dry cleaning. J Occup Environ Hyg 3: 606-619.
http://dx.doi.org/10.1080/15459620600912173
Von Grote, J; Hurlimann, JC; Scheringer, M; Hungerbuhler, K.Von Grote, J; Hurlimann, JC;
Scheringer, M; Hungerbuhler, K. (2003). Reduction of Occupational Exposure to
Perchloroethylene and Trichloroethylene in Metal Degreasing over the Last 30 years:
Influence of Technology Innovation and Legislation. J Expo Anal Environ Epidemiol 13:
325-340. http://dx.doi.org/10.1038/sj.jea.7500288
Whittaker, SG; Johanson, CA.Whittaker, SG; Johanson, CA. (2011). A profile of the dry
cleaning industry in King County, Washington: Final report. (LHWMP 0048). Seattle,
WA: Local Hazardous Waste Management Program in King County.
http://www.hazwastehelp.org/publications/publications_detail.aspx?DocID=Oh73%2fQil
g9Q%3d
Young, ML.Young, ML. (2012). Pre-spotting step toward better cleaning. Available online at
https://americandrycleaner.com/articles/pre-spotting-step-toward-better-cleaning
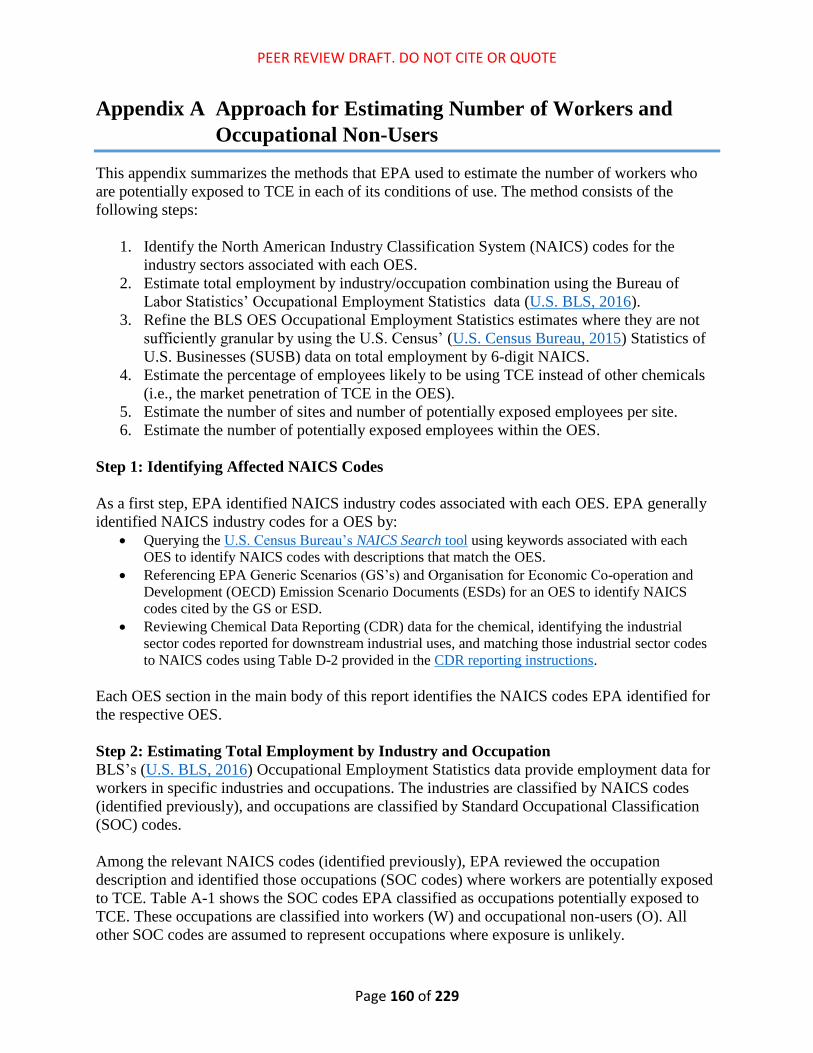
PEER REVIEW DRAFT. DO NOT CITE OR QUOTE
Page 160 of 229
Appendix A Approach for Estimating Number of Workers and
Occupational Non-Users
This appendix summarizes the methods that EPA used to estimate the number of workers who
are potentially exposed to TCE in each of its conditions of use. The method consists of the
following steps:
1. Identify the North American Industry Classification System (NAICS) codes for the
industry sectors associated with each OES.
2. Estimate total employment by industry/occupation combination using the Bureau of
Labor Statistics’ Occupational Employment Statistics data (U.S. BLS, 2016).
3. Refine the BLS OES Occupational Employment Statistics estimates where they are not
sufficiently granular by using the U.S. Census’ (U.S. Census Bureau, 2015) Statistics of
U.S. Businesses (SUSB) data on total employment by 6-digit NAICS.
4. Estimate the percentage of employees likely to be using TCE instead of other chemicals
(i.e., the market penetration of TCE in the OES).
5. Estimate the number of sites and number of potentially exposed employees per site.
6. Estimate the number of potentially exposed employees within the OES.
Step 1: Identifying Affected NAICS Codes
As a first step, EPA identified NAICS industry codes associated with each OES. EPA generally
identified NAICS industry codes for a OES by:
• Querying the U.S. Census Bureau’s NAICS Search tool using keywords associated with each
OES to identify NAICS codes with descriptions that match the OES.
• Referencing EPA Generic Scenarios (GS’s) and Organisation for Economic Co-operation and
Development (OECD) Emission Scenario Documents (ESDs) for an OES to identify NAICS
codes cited by the GS or ESD.
• Reviewing Chemical Data Reporting (CDR) data for the chemical, identifying the industrial
sector codes reported for downstream industrial uses, and matching those industrial sector codes
to NAICS codes using Table D-2 provided in the CDR reporting instructions.
Each OES section in the main body of this report identifies the NAICS codes EPA identified for
the respective OES.
Step 2: Estimating Total Employment by Industry and Occupation
BLS’s (U.S. BLS, 2016) Occupational Employment Statistics data provide employment data for
workers in specific industries and occupations. The industries are classified by NAICS codes
(identified previously), and occupations are classified by Standard Occupational Classification
(SOC) codes.
Among the relevant NAICS codes (identified previously), EPA reviewed the occupation
description and identified those occupations (SOC codes) where workers are potentially exposed
to TCE. Table A-1 shows the SOC codes EPA classified as occupations potentially exposed to
TCE. These occupations are classified into workers (W) and occupational non-users (O). All
other SOC codes are assumed to represent occupations where exposure is unlikely.
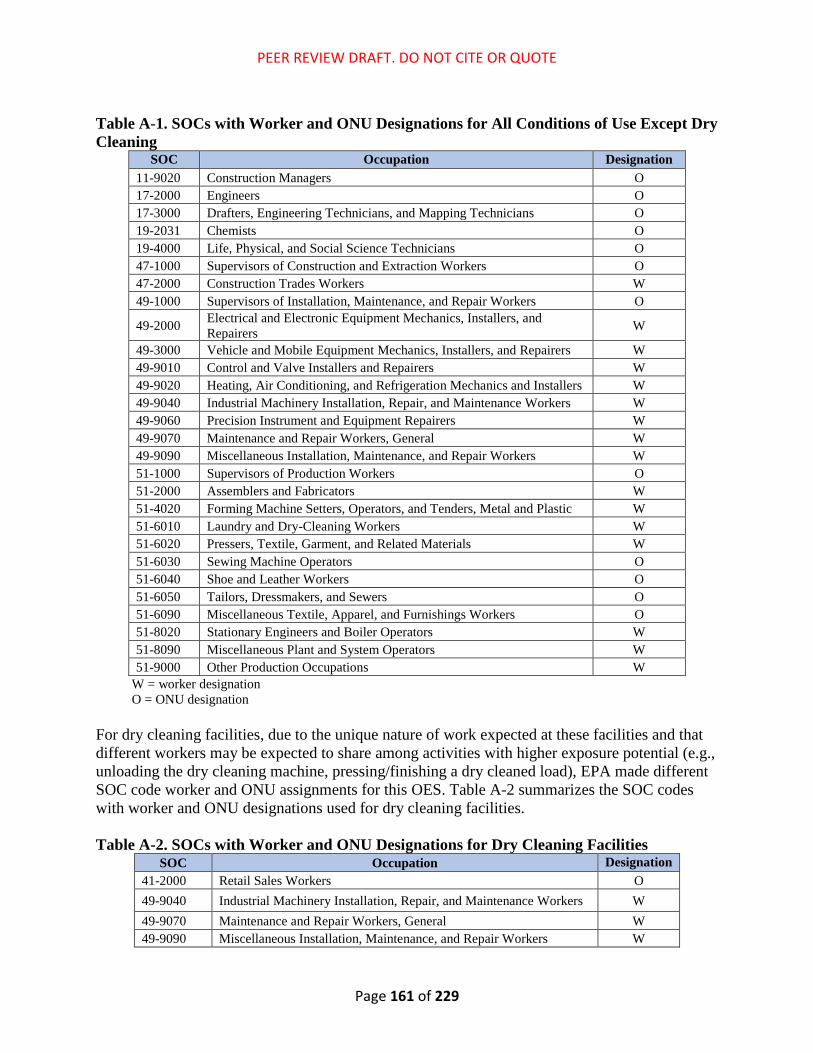
PEER REVIEW DRAFT. DO NOT CITE OR QUOTE
Page 161 of 229
Table A-1. SOCs with Worker and ONU Designations for All Conditions of Use Except Dry
Cleaning SOC Occupation Designation
11-9020 Construction Managers O
17-2000 Engineers O
17-3000 Drafters, Engineering Technicians, and Mapping Technicians O
19-2031 Chemists O
19-4000 Life, Physical, and Social Science Technicians O
47-1000 Supervisors of Construction and Extraction Workers O
47-2000 Construction Trades Workers W
49-1000 Supervisors of Installation, Maintenance, and Repair Workers O
49-2000 Electrical and Electronic Equipment Mechanics, Installers, and
Repairers W
49-3000 Vehicle and Mobile Equipment Mechanics, Installers, and Repairers W
49-9010 Control and Valve Installers and Repairers W
49-9020 Heating, Air Conditioning, and Refrigeration Mechanics and Installers W
49-9040 Industrial Machinery Installation, Repair, and Maintenance Workers W
49-9060 Precision Instrument and Equipment Repairers W
49-9070 Maintenance and Repair Workers, General W
49-9090 Miscellaneous Installation, Maintenance, and Repair Workers W
51-1000 Supervisors of Production Workers O
51-2000 Assemblers and Fabricators W
51-4020 Forming Machine Setters, Operators, and Tenders, Metal and Plastic W
51-6010 Laundry and Dry-Cleaning Workers W
51-6020 Pressers, Textile, Garment, and Related Materials W
51-6030 Sewing Machine Operators O
51-6040 Shoe and Leather Workers O
51-6050 Tailors, Dressmakers, and Sewers O
51-6090 Miscellaneous Textile, Apparel, and Furnishings Workers O
51-8020 Stationary Engineers and Boiler Operators W
51-8090 Miscellaneous Plant and System Operators W
51-9000 Other Production Occupations W
W = worker designation
O = ONU designation
For dry cleaning facilities, due to the unique nature of work expected at these facilities and that
different workers may be expected to share among activities with higher exposure potential (e.g.,
unloading the dry cleaning machine, pressing/finishing a dry cleaned load), EPA made different
SOC code worker and ONU assignments for this OES. Table A-2 summarizes the SOC codes
with worker and ONU designations used for dry cleaning facilities.
Table A-2. SOCs with Worker and ONU Designations for Dry Cleaning Facilities SOC Occupation Designation
41-2000 Retail Sales Workers O
49-9040 Industrial Machinery Installation, Repair, and Maintenance Workers W
49-9070 Maintenance and Repair Workers, General W
49-9090 Miscellaneous Installation, Maintenance, and Repair Workers W
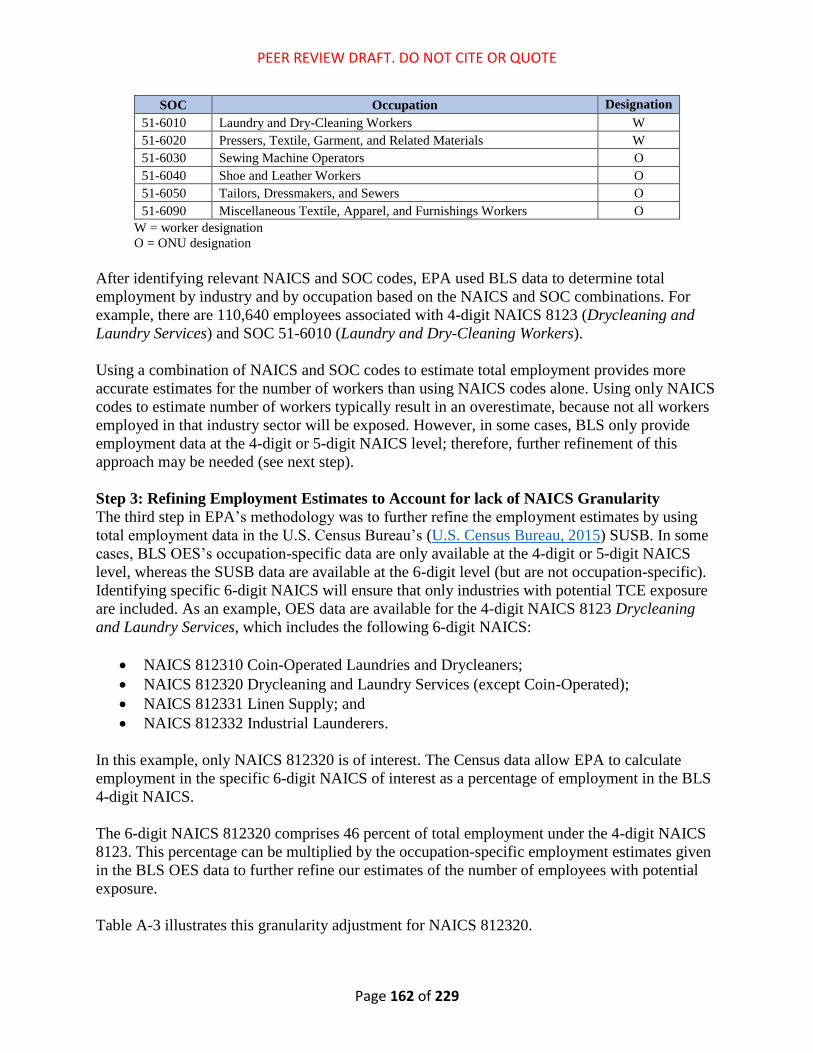
PEER REVIEW DRAFT. DO NOT CITE OR QUOTE
Page 162 of 229
SOC Occupation Designation
51-6010 Laundry and Dry-Cleaning Workers W
51-6020 Pressers, Textile, Garment, and Related Materials W
51-6030 Sewing Machine Operators O
51-6040 Shoe and Leather Workers O
51-6050 Tailors, Dressmakers, and Sewers O
51-6090 Miscellaneous Textile, Apparel, and Furnishings Workers O
W = worker designation
O = ONU designation
After identifying relevant NAICS and SOC codes, EPA used BLS data to determine total
employment by industry and by occupation based on the NAICS and SOC combinations. For
example, there are 110,640 employees associated with 4-digit NAICS 8123 (Drycleaning and
Laundry Services) and SOC 51-6010 (Laundry and Dry-Cleaning Workers).
Using a combination of NAICS and SOC codes to estimate total employment provides more
accurate estimates for the number of workers than using NAICS codes alone. Using only NAICS
codes to estimate number of workers typically result in an overestimate, because not all workers
employed in that industry sector will be exposed. However, in some cases, BLS only provide
employment data at the 4-digit or 5-digit NAICS level; therefore, further refinement of this
approach may be needed (see next step).
Step 3: Refining Employment Estimates to Account for lack of NAICS Granularity
The third step in EPA’s methodology was to further refine the employment estimates by using
total employment data in the U.S. Census Bureau’s (U.S. Census Bureau, 2015) SUSB. In some
cases, BLS OES’s occupation-specific data are only available at the 4-digit or 5-digit NAICS
level, whereas the SUSB data are available at the 6-digit level (but are not occupation-specific).
Identifying specific 6-digit NAICS will ensure that only industries with potential TCE exposure
are included. As an example, OES data are available for the 4-digit NAICS 8123 Drycleaning
and Laundry Services, which includes the following 6-digit NAICS:
• NAICS 812310 Coin-Operated Laundries and Drycleaners;
• NAICS 812320 Drycleaning and Laundry Services (except Coin-Operated);
• NAICS 812331 Linen Supply; and
• NAICS 812332 Industrial Launderers.
In this example, only NAICS 812320 is of interest. The Census data allow EPA to calculate
employment in the specific 6-digit NAICS of interest as a percentage of employment in the BLS
4-digit NAICS.
The 6-digit NAICS 812320 comprises 46 percent of total employment under the 4-digit NAICS
8123. This percentage can be multiplied by the occupation-specific employment estimates given
in the BLS OES data to further refine our estimates of the number of employees with potential
exposure.
Table A-3 illustrates this granularity adjustment for NAICS 812320.
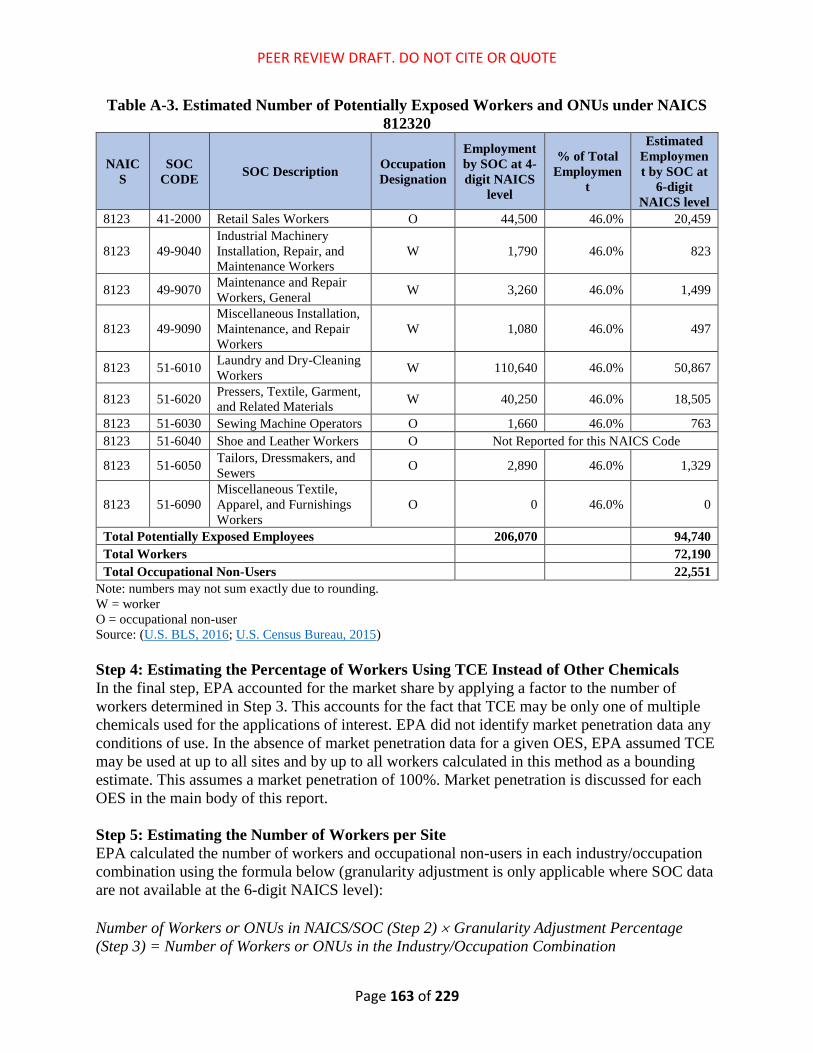
PEER REVIEW DRAFT. DO NOT CITE OR QUOTE
Page 163 of 229
Table A-3. Estimated Number of Potentially Exposed Workers and ONUs under NAICS
812320
NAIC
S
SOC
CODE SOC Description
Occupation
Designation
Employment
by SOC at 4-
digit NAICS
level
% of Total
Employmen
t
Estimated
Employmen
t by SOC at
6-digit
NAICS level
8123 41-2000 Retail Sales Workers O 44,500 46.0% 20,459
8123 49-9040
Industrial Machinery
Installation, Repair, and
Maintenance Workers
W 1,790 46.0% 823
8123 49-9070 Maintenance and Repair
Workers, General W 3,260 46.0% 1,499
8123 49-9090
Miscellaneous Installation,
Maintenance, and Repair
Workers
W 1,080 46.0% 497
8123 51-6010 Laundry and Dry-Cleaning
Workers W 110,640 46.0% 50,867
8123 51-6020 Pressers, Textile, Garment,
and Related Materials W 40,250 46.0% 18,505
8123 51-6030 Sewing Machine Operators O 1,660 46.0% 763
8123 51-6040 Shoe and Leather Workers O Not Reported for this NAICS Code
8123 51-6050 Tailors, Dressmakers, and
Sewers O 2,890 46.0% 1,329
8123 51-6090
Miscellaneous Textile,
Apparel, and Furnishings
Workers
O 0 46.0% 0
Total Potentially Exposed Employees 206,070 94,740
Total Workers 72,190
Total Occupational Non-Users 22,551
Note: numbers may not sum exactly due to rounding.
W = worker
O = occupational non-user
Source: (U.S. BLS, 2016; U.S. Census Bureau, 2015)
Step 4: Estimating the Percentage of Workers Using TCE Instead of Other Chemicals
In the final step, EPA accounted for the market share by applying a factor to the number of
workers determined in Step 3. This accounts for the fact that TCE may be only one of multiple
chemicals used for the applications of interest. EPA did not identify market penetration data any
conditions of use. In the absence of market penetration data for a given OES, EPA assumed TCE
may be used at up to all sites and by up to all workers calculated in this method as a bounding
estimate. This assumes a market penetration of 100%. Market penetration is discussed for each
OES in the main body of this report.
Step 5: Estimating the Number of Workers per Site
EPA calculated the number of workers and occupational non-users in each industry/occupation
combination using the formula below (granularity adjustment is only applicable where SOC data
are not available at the 6-digit NAICS level):
Number of Workers or ONUs in NAICS/SOC (Step 2) Granularity Adjustment Percentage
(Step 3) = Number of Workers or ONUs in the Industry/Occupation Combination
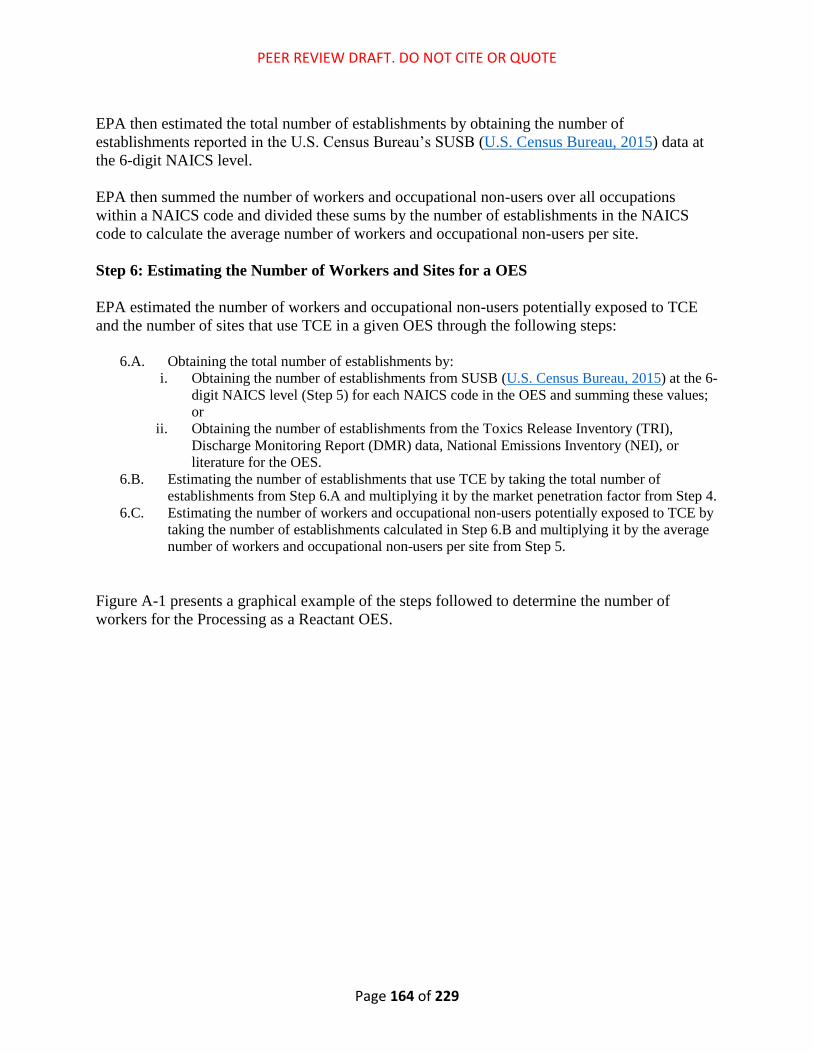
PEER REVIEW DRAFT. DO NOT CITE OR QUOTE
Page 164 of 229
EPA then estimated the total number of establishments by obtaining the number of
establishments reported in the U.S. Census Bureau’s SUSB (U.S. Census Bureau, 2015) data at
the 6-digit NAICS level.
EPA then summed the number of workers and occupational non-users over all occupations
within a NAICS code and divided these sums by the number of establishments in the NAICS
code to calculate the average number of workers and occupational non-users per site.
Step 6: Estimating the Number of Workers and Sites for a OES
EPA estimated the number of workers and occupational non-users potentially exposed to TCE
and the number of sites that use TCE in a given OES through the following steps:
6.A. Obtaining the total number of establishments by:
i. Obtaining the number of establishments from SUSB (U.S. Census Bureau, 2015) at the 6-
digit NAICS level (Step 5) for each NAICS code in the OES and summing these values;
or
ii. Obtaining the number of establishments from the Toxics Release Inventory (TRI),
Discharge Monitoring Report (DMR) data, National Emissions Inventory (NEI), or
literature for the OES.
6.B. Estimating the number of establishments that use TCE by taking the total number of
establishments from Step 6.A and multiplying it by the market penetration factor from Step 4.
6.C. Estimating the number of workers and occupational non-users potentially exposed to TCE by
taking the number of establishments calculated in Step 6.B and multiplying it by the average
number of workers and occupational non-users per site from Step 5.
Figure A-1 presents a graphical example of the steps followed to determine the number of
workers for the Processing as a Reactant OES.

PEER REVIEW DRAFT. DO NOT CITE OR QUOTE
Page 165 of 229
Figure A-1. Graphical Example for the Approach for Estimating Number of Workers and
Occupational Non-Users

PEER REVIEW DRAFT. DO NOT CITE OR QUOTE
Page 166 of 229
Appendix B Equations for Calculating Acute and Chronic (Non-
Cancer and Cancer) Inhalation Exposures
This report assesses TCE exposures to workers in occupational settings, presented as 8-hr time
weighted average (TWA). The 8-hr TWA exposures are then used to calculate acute exposure
(AC), average daily concentration (ADC) for chronic, non-cancer risks, and lifetime average
daily concentration (LADC) for chronic, cancer risks.
Acute workplace exposures are assumed to be equal to the contaminant concentration in air (8-hr
TWA), per Equation B-1.
Equation B-1
𝐴𝐶 =𝐶 × 𝐸𝐷
𝐴𝑇𝑎𝑐𝑢𝑡𝑒
Where:
AC = acute exposure concentration
C = contaminant concentration in air (TWA)
ED = exposure duration (hr/day)
ATacute = acute averaging time (hr)
ADC and LADC are used to estimate workplace exposures for non-cancer and cancer risks,
respectively. These exposures are estimated as follows:
Equation B-2
ADC or LADC =C × ED × EF × WY
AT or ATc
Equation B-3
AT = WY × 365day
yr× 24
hr
day
Equation B-4
ATC = LT × 365day
yr× 24
hr
day
Where:
ADC = Average daily concentration used for chronic non-cancer risk calculations
LADC = Lifetime average daily concentration used for chronic cancer risk calculations
ED = Exposure duration (hr/day)
EF = Exposure frequency (day/yr)
WY = Working years per lifetime (yr)
AT = Averaging time (hr) for chronic, non-cancer risk
ATC = Averaging time (hr) for cancer risk
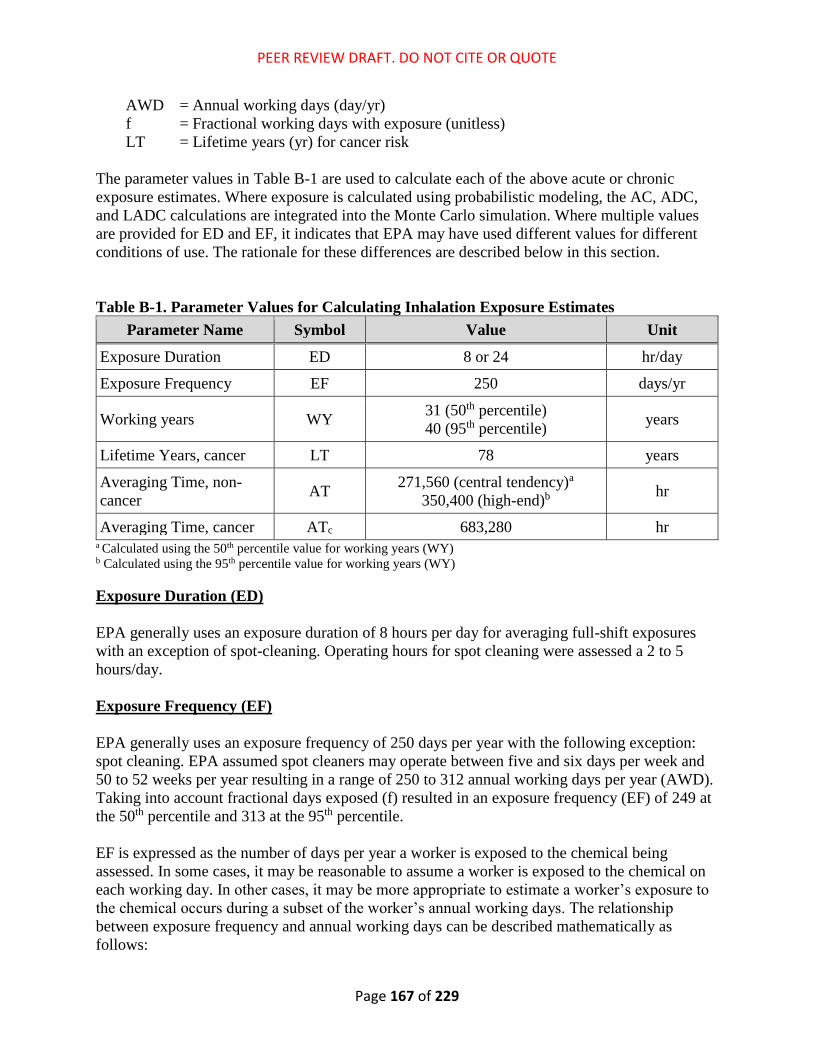
PEER REVIEW DRAFT. DO NOT CITE OR QUOTE
Page 167 of 229
AWD = Annual working days (day/yr)
f = Fractional working days with exposure (unitless)
LT = Lifetime years (yr) for cancer risk
The parameter values in Table B-1 are used to calculate each of the above acute or chronic
exposure estimates. Where exposure is calculated using probabilistic modeling, the AC, ADC,
and LADC calculations are integrated into the Monte Carlo simulation. Where multiple values
are provided for ED and EF, it indicates that EPA may have used different values for different
conditions of use. The rationale for these differences are described below in this section.
Table B-1. Parameter Values for Calculating Inhalation Exposure Estimates
Parameter Name Symbol Value Unit
Exposure Duration ED 8 or 24 hr/day
Exposure Frequency EF 250 days/yr
Working years WY 31 (50th percentile)
40 (95th percentile) years
Lifetime Years, cancer LT 78 years
Averaging Time, non-
cancer AT
271,560 (central tendency)a
350,400 (high-end)b hr
Averaging Time, cancer ATc 683,280 hr a Calculated using the 50th percentile value for working years (WY) b Calculated using the 95th percentile value for working years (WY)
Exposure Duration (ED)
EPA generally uses an exposure duration of 8 hours per day for averaging full-shift exposures
with an exception of spot-cleaning. Operating hours for spot cleaning were assessed a 2 to 5
hours/day.
Exposure Frequency (EF)
EPA generally uses an exposure frequency of 250 days per year with the following exception:
spot cleaning. EPA assumed spot cleaners may operate between five and six days per week and
50 to 52 weeks per year resulting in a range of 250 to 312 annual working days per year (AWD).
Taking into account fractional days exposed (f) resulted in an exposure frequency (EF) of 249 at
the 50th percentile and 313 at the 95th percentile.
EF is expressed as the number of days per year a worker is exposed to the chemical being
assessed. In some cases, it may be reasonable to assume a worker is exposed to the chemical on
each working day. In other cases, it may be more appropriate to estimate a worker’s exposure to
the chemical occurs during a subset of the worker’s annual working days. The relationship
between exposure frequency and annual working days can be described mathematically as
follows:
PEER REVIEW DRAFT. DO NOT CITE OR QUOTE
Page 168 of 229
Equation B-5
𝐸𝐹 = 𝑓 × 𝐴𝑊𝐷
Where:
EF = exposure frequency, the number of days per year a worker is exposed to the
chemical (day/yr)
f = fractional number of annual working days during which a worker is exposed to
the chemical (unitless)
AWD = annual working days, the number of days per year a worker works (day/yr)
BLS (2016) provides data on the total number of hours worked and total number of employees
by each industry NAICS code. These data are available from the 3- to 6-digit NAICS level
(where 3-digit NAICS are less granular and 6-digit NAICS are the most granular). Dividing the
total, annual hours worked by the number of employees yields the average number of hours
worked per employee per year for each NAICS.
EPA has identified approximately 140 NAICS codes applicable to the multiple conditions of use
for the ten chemicals undergoing risk evaluation. For each NAICS code of interest, EPA looked
up the average hours worked per employee per year at the most granular NAICS level available
(i.e., 4-digit, 5-digit, or 6-digit). EPA converted the working hours per employee to working days
per year per employee assuming employees work an average of eight hours per day. The average
number of days per year worked, or AWD, ranges from 169 to 282 days per year, with a 50th
percentile value of 250 days per year. EPA repeated this analysis for all NAICS codes at the 4-
digit level. The average AWD for all 4-digit NAICS codes ranges from 111 to 282 days per year,
with a 50th percentile value of 228 days per year. 250 days per year is approximately the 75th
percentile. In the absence of industry- and TCE-specific data, EPA assumes the parameter f is
equal to one for all conditions of use.
Working Years (WY)
EPA has developed a triangular distribution for working years. EPA has defined the parameters
of the triangular distribution as follows:
• Minimum value: BLS CPS tenure data with current employer as a low-end estimate of
the number of lifetime working years: 10.4 years;
• Mode value: The 50th percentile tenure data with all employers from SIPP as a mode
value for the number of lifetime working years: 36 years; and
• Maximum value: The maximum average tenure data with all employers from SIPP as a
high-end estimate on the number of lifetime working years: 44 years.
This triangular distribution has a 50th percentile value of 31 years and a 95th percentile value of
40 years. EPA uses these values for central tendency and high-end ADC and LADC calculations,
respectively.
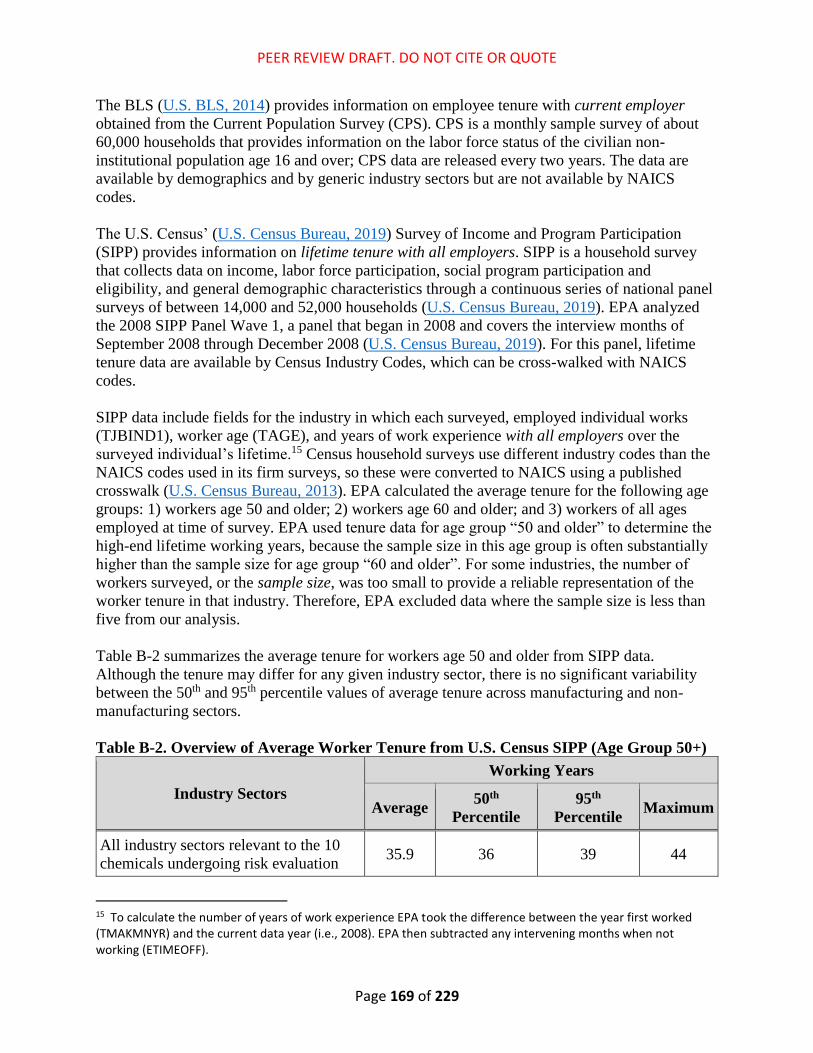
PEER REVIEW DRAFT. DO NOT CITE OR QUOTE
Page 169 of 229
The BLS (U.S. BLS, 2014) provides information on employee tenure with current employer
obtained from the Current Population Survey (CPS). CPS is a monthly sample survey of about
60,000 households that provides information on the labor force status of the civilian non-
institutional population age 16 and over; CPS data are released every two years. The data are
available by demographics and by generic industry sectors but are not available by NAICS
codes.
The U.S. Census’ (U.S. Census Bureau, 2019) Survey of Income and Program Participation
(SIPP) provides information on lifetime tenure with all employers. SIPP is a household survey
that collects data on income, labor force participation, social program participation and
eligibility, and general demographic characteristics through a continuous series of national panel
surveys of between 14,000 and 52,000 households (U.S. Census Bureau, 2019). EPA analyzed
the 2008 SIPP Panel Wave 1, a panel that began in 2008 and covers the interview months of
September 2008 through December 2008 (U.S. Census Bureau, 2019). For this panel, lifetime
tenure data are available by Census Industry Codes, which can be cross-walked with NAICS
codes.
SIPP data include fields for the industry in which each surveyed, employed individual works
(TJBIND1), worker age (TAGE), and years of work experience with all employers over the
surveyed individual’s lifetime.15 Census household surveys use different industry codes than the
NAICS codes used in its firm surveys, so these were converted to NAICS using a published
crosswalk (U.S. Census Bureau, 2013). EPA calculated the average tenure for the following age
groups: 1) workers age 50 and older; 2) workers age 60 and older; and 3) workers of all ages
employed at time of survey. EPA used tenure data for age group “50 and older” to determine the
high-end lifetime working years, because the sample size in this age group is often substantially
higher than the sample size for age group “60 and older”. For some industries, the number of
workers surveyed, or the sample size, was too small to provide a reliable representation of the
worker tenure in that industry. Therefore, EPA excluded data where the sample size is less than
five from our analysis.
Table B-2 summarizes the average tenure for workers age 50 and older from SIPP data.
Although the tenure may differ for any given industry sector, there is no significant variability
between the 50th and 95th percentile values of average tenure across manufacturing and non-
manufacturing sectors.
Table B-2. Overview of Average Worker Tenure from U.S. Census SIPP (Age Group 50+)
Industry Sectors
Working Years
Average 50th
Percentile
95th
Percentile Maximum
All industry sectors relevant to the 10
chemicals undergoing risk evaluation 35.9 36 39 44
15 To calculate the number of years of work experience EPA took the difference between the year first worked (TMAKMNYR) and the current data year (i.e., 2008). EPA then subtracted any intervening months when not working (ETIMEOFF).

PEER REVIEW DRAFT. DO NOT CITE OR QUOTE
Page 170 of 229
Industry Sectors
Working Years
Average 50th
Percentile
95th
Percentile Maximum
Manufacturing sectors (NAICS 31-33) 35.7 36 39 40
Non-manufacturing sectors (NAICS 42-
81) 36.1 36 39 44
Source: Census Bureau, 2016a.
Note: Industries where sample size is less than five are excluded from this analysis.
BLS CPS data provides the median years of tenure that wage and salary workers had been with
their current employer. Table B-3 presents CPS data for all demographics (men and women) by
age group from 2008 to 2012. To estimate the low-end value on number of working years, EPA
uses the most recent (2014) CPS data for workers age 55 to 64 years, which indicates a median
tenure of 10.4 years with their current employer. The use of this low-end value represents a
scenario where workers are only exposed to the chemical of interest for a portion of their lifetime
working years, as they may change jobs or move from one industry to another throughout their
career.
Table B-3. Median Years of Tenure with Current Employer by Age Group
Age January 2008 January 2010 January 2012 January 2014
16 years and
over 4.1 4.4 4.6 4.6
16 to 17 years 0.7 0.7 0.7 0.7
18 to 19 years 0.8 1.0 0.8 0.8
20 to 24 years 1.3 1.5 1.3 1.3
25 years and
over 5.1 5.2 5.4 5.5
25 to 34 years 2.7 3.1 3.2 3.0
35 to 44 years 4.9 5.1 5.3 5.2
45 to 54 years 7.6 7.8 7.8 7.9
55 to 64 years 9.9 10.0 10.3 10.4
65 years and
over 10.2 9.9 10.3 10.3
Source: (U.S. BLS, 2014).
Lifetime Years (LT)
EPA assumes a lifetime of 78 years for all worker demographics.

PEER REVIEW DRAFT. DO NOT CITE OR QUOTE
Page 171 of 229
Appendix C Sample Calculations for Calculating Acute and
Chronic (Non-Cancer and Cancer) Inhalation
Exposures
Sample calculations for high-end and central tendency acute and chronic exposure
concentrations for one setting, Manufacturing, are demonstrated below. The explanation of the
equations and parameters used is provided in Appendix B. The final values will have two
significant figures since they are based on values from modeling.
Example High-End AC, ADC, and LADC
Calculate ACHE:
𝐴𝐶𝐻𝐸 =𝐶𝐻𝐸 × 𝐸𝐷
𝐴𝑇𝑎𝑐𝑢𝑡𝑒
𝐴𝐶𝐻𝐸 =2.6 𝑝𝑝𝑚 × 8 ℎ𝑟/𝑑𝑎𝑦
24 ℎ𝑟/𝑑𝑎𝑦= 0.87 𝑝𝑝𝑚
Calculate ADCHE:
𝑨𝑫𝑪𝑯𝑬 =𝑪𝑯𝑬 × 𝑬𝑫 × 𝑬𝑭 × 𝑬𝑾𝒀
𝑨𝑻
𝑨𝑫𝑪𝑯𝑬 =𝟐. 𝟔 𝒑𝒑𝒎 × 𝟖
𝒉𝒓𝒅𝒂𝒚
× 𝟐𝟓𝟎𝒅𝒂𝒚𝒔𝒚𝒆𝒂𝒓 × 𝟒𝟎 𝒚𝒆𝒂𝒓𝒔
(𝟒𝟎 𝒚𝒆𝒂𝒓𝒔 × 𝟑𝟔𝟓𝒅𝒂𝒚𝒔𝒚𝒆𝒂𝒓 × 𝟐𝟒
𝒉𝒐𝒖𝒓𝒔𝒅𝒂𝒚
)= 𝟎. 𝟓𝟗 𝒑𝒑𝒎
Calculate LADCHE:
𝑳𝑨𝑫𝑪𝑯𝑬 =𝑪𝑯𝑬 × 𝑬𝑫 × 𝑬𝑭 × 𝑬𝑾𝒀
𝑨𝑻𝑳𝑨𝑫𝑪
𝑳𝑨𝑫𝑪𝑯𝑬 =𝟐. 𝟔 𝒑𝒑𝒎 × 𝟖
𝒉𝒓𝒅𝒂𝒚
× 𝟐𝟓𝟎𝒅𝒂𝒚𝒔𝒚𝒆𝒂𝒓 × 𝟒𝟎 𝒚𝒆𝒂𝒓𝒔
(𝟕𝟖 𝒚𝒆𝒂𝒓𝒔 × 𝟑𝟔𝟓𝒅𝒂𝒚𝒔𝒚𝒆𝒂𝒓 × 𝟐𝟒
𝒉𝒐𝒖𝒓𝒔𝒅𝒂𝒚
)= 𝟎. 𝟑𝟎 𝒑𝒑𝒎
Example Central Tendency AEC, ADC, and LADC
Calculate ACCT:

PEER REVIEW DRAFT. DO NOT CITE OR QUOTE
Page 172 of 229
𝐴𝐶𝐶𝑇 =𝐶𝐶𝑇 × 𝐸𝐷
𝐴𝑇𝑎𝑐𝑢𝑡𝑒
𝐴𝐶𝐶𝑇 =0.03 𝑝𝑝𝑚 × 8 ℎ𝑟/𝑑𝑎𝑦
24 ℎ𝑟/𝑑𝑎𝑦= 0.01 𝑝𝑝𝑚
Calculate ADCCT:
𝐴𝐷𝐶𝐶𝑇 =𝐶𝐶𝑇 × 𝐸𝐷 × 𝐸𝐹 × 𝑊𝑌
𝐴𝑇
𝐴𝐷𝐶𝐶𝑇 =0.03 𝑝𝑝𝑚 × 8
ℎ𝑟𝑑𝑎𝑦
× 250𝑑𝑎𝑦𝑠𝑦𝑒𝑎𝑟 × 31 𝑦𝑒𝑎𝑟𝑠
31 𝑦𝑒𝑎𝑟𝑠 × 365𝑑𝑎𝑦𝑠
𝑦𝑟× 24
ℎ𝑟𝑑𝑎𝑦
= 0.01 𝑝𝑝𝑚
Calculate LADCCT:
𝐿𝐴𝐷𝐶𝐶𝑇 =𝐶𝐶𝑇 × 𝐸𝐷 × 𝐸𝐹 × 𝑊𝑌
𝐴𝑇𝑐
𝑳𝑨𝑫𝑪𝑪𝑻 =𝟎. 𝟎𝟑 𝒑𝒑𝒎 × 𝟖
𝒉𝒓𝒅𝒂𝒚
× 𝟐𝟓𝟎𝒅𝒂𝒚𝒔𝒚𝒆𝒂𝒓 × 𝟑𝟏 𝒚𝒆𝒂𝒓𝒔
𝟕𝟖 𝒚𝒆𝒂𝒓𝒔 × 𝟑𝟔𝟓𝒅𝒂𝒚𝒔𝒚𝒆𝒂𝒓 × 𝟐𝟒 𝒉𝒓/𝒅𝒂𝒚
= 𝟐. 𝟖 × 𝟏𝟎−𝟑 𝒑𝒑𝒎

PEER REVIEW DRAFT. DO NOT CITE OR QUOTE
Page 173 of 229
Appendix D Approach for Estimating Water Releases from
Manufacturing Sites Using Effluent Guidelines
This appendix presents a methodology for estimating water releases of TCE from manufacturing sites
using effluent guidelines (EGs). This method uses the maximum daily and maximum average monthly
concentrations allowed under the Organic Chemicals, Plastics and Synthetic Fibers (OCPSF) Effluent
Guidelines and Standards (U.S. EPA, 2019g). EGs are national regulatory standards set forth by EPA for
wastewater discharges to surface water and municipal sewage treatment plants. The OCPSF EG applies
to facilities classified under the following SIC codes:
• 2821—Plastic Materials, Synthetic Resins, and Nonvulcanizable Elastomers;
• 2823—Cellulosic Man-Made Fibers;
• 2865—Cyclic Crudes and Intermediates, Dyes, and Organic Pigments; and
• 2869—Industrial Organic Chemicals, Not Elsewhere Classified.
Manufacturers of TCE would typically be classified under SIC code 2869; therefore, the requirements of
the OCPSF EG are assumed to apply to manufacturing sites. Subparts I, J, and K of the OCPSF EG set
limits for the concentration of TCE in wastewater effluent for industrial facilities that are direct
discharge point sources using end-of-pipe biological treatment, direct discharge point sources that do not
use end-of-pipe biological treatment, and indirect discharge point sources, respectively (U.S. EPA,
2019g). Direct dischargers are facilities that discharge effluent directly to surface waters and indirect
dischargers are facilities that discharge effluent to publicly-owned treatment works (POTW). The
OCPSF limits for TCE in each of the Subparts are provided in Table D-1.
Table D-1. Summary of OCPSF Effluent Guidelines for Trichloroethylene
OCPSF Subpart
Maximum
for Any
One Day
(µg/L)
Maximum
for Any
Monthly
Average
(µg/L)
Basis
Subpart I – Direct Discharge Point Sources That
Use End-of-Pipe Biological Treatment 54 21
BAT effluent limitations
and NSPS
Subpart J – Direct Discharge Point Sources That
Do Not Use End-of-Pipe Biological Treatment 69 26
BAT effluent limitations
and NSPS
Subpart K – Indirect Discharge Point Sources 69 26
Pretreatment Standards
for Existing Sources
(PSES) and
Pretreatment Standards
for New Sources
(PSNS)
BAT = Best Available Technology Economically Achievable; NSPS = New Source Performance Standards; PSES =
Pretreatment Standards for Existing Sources; PSNS = Pretreatment Standards for New Sources.
Source: (U.S. EPA, 2019g)
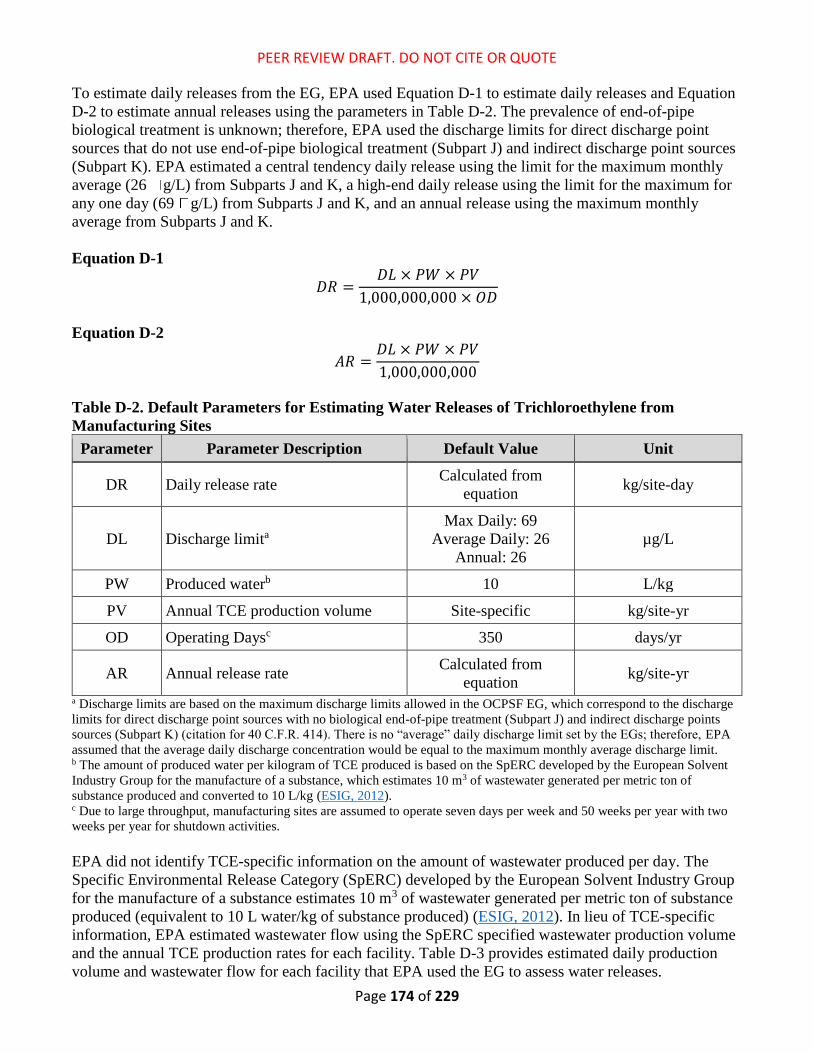
PEER REVIEW DRAFT. DO NOT CITE OR QUOTE
Page 174 of 229
To estimate daily releases from the EG, EPA used Equation D-1 to estimate daily releases and Equation
D-2 to estimate annual releases using the parameters in Table D-2. The prevalence of end-of-pipe
biological treatment is unknown; therefore, EPA used the discharge limits for direct discharge point
sources that do not use end-of-pipe biological treatment (Subpart J) and indirect discharge point sources
(Subpart K). EPA estimated a central tendency daily release using the limit for the maximum monthly
average (26 g/L) from Subparts J and K, a high-end daily release using the limit for the maximum for
any one day (69 g/L) from Subparts J and K, and an annual release using the maximum monthly
average from Subparts J and K.
Equation D-1
𝐷𝑅 =𝐷𝐿 × 𝑃𝑊 × 𝑃𝑉
1,000,000,000 × 𝑂𝐷
Equation D-2
𝐴𝑅 =𝐷𝐿 × 𝑃𝑊 × 𝑃𝑉
1,000,000,000
Table D-2. Default Parameters for Estimating Water Releases of Trichloroethylene from
Manufacturing Sites
Parameter Parameter Description Default Value Unit
DR Daily release rate Calculated from
equation kg/site-day
DL Discharge limita
Max Daily: 69
Average Daily: 26
Annual: 26
µg/L
PW Produced waterb 10 L/kg
PV Annual TCE production volume Site-specific kg/site-yr
OD Operating Daysc 350 days/yr
AR Annual release rate Calculated from
equation kg/site-yr
a Discharge limits are based on the maximum discharge limits allowed in the OCPSF EG, which correspond to the discharge
limits for direct discharge point sources with no biological end-of-pipe treatment (Subpart J) and indirect discharge points
sources (Subpart K) (citation for 40 C.F.R. 414). There is no “average” daily discharge limit set by the EGs; therefore, EPA
assumed that the average daily discharge concentration would be equal to the maximum monthly average discharge limit. b The amount of produced water per kilogram of TCE produced is based on the SpERC developed by the European Solvent
Industry Group for the manufacture of a substance, which estimates 10 m3 of wastewater generated per metric ton of
substance produced and converted to 10 L/kg (ESIG, 2012). c Due to large throughput, manufacturing sites are assumed to operate seven days per week and 50 weeks per year with two
weeks per year for shutdown activities.
EPA did not identify TCE-specific information on the amount of wastewater produced per day. The
Specific Environmental Release Category (SpERC) developed by the European Solvent Industry Group
for the manufacture of a substance estimates 10 m3 of wastewater generated per metric ton of substance
produced (equivalent to 10 L water/kg of substance produced) (ESIG, 2012). In lieu of TCE-specific
information, EPA estimated wastewater flow using the SpERC specified wastewater production volume
and the annual TCE production rates for each facility. Table D-3 provides estimated daily production
volume and wastewater flow for each facility that EPA used the EG to assess water releases.

PEER REVIEW DRAFT. DO NOT CITE OR QUOTE
Page 175 of 229
Table D-3. Summary of Facility Trichloroethylene Production Volumes and Wastewater Flow
Rates
Site
Annual Production
Volume
(kg/site-yr)
Annual
Operating Days
(days/yr)
Daily Production
Volume
(kg/site-day)
Daily
Wastewater Flow
(L/site-day)
Solvents &
Chemicals,
Pearland, TXa
20,382,094 350 58,234 582,345
Occidental
Chemical Corp.
Wichata, KSa
20,382,094 350 58,234 582,345
a The 2015 annual production volumes in the 2016 CDR for these sites was either claimed as CBI or withheld. EPA estimate
the production volume by subtracting known site production volumes from the national production volume and averaging the
result over all the sites with CBI or withheld production volumes and converting from pounds to kilograms. b Annual production volume for this site is based on the 2015 production volume reported in the 2016 CDR and converting
from pounds to kilograms.
EPA estimated both a maximum daily release and an average daily release using the OCPSF EG limits
for TCE for maximum on any one day and maximum for any monthly average, respectively. Prevalence
of end-of-pipe biological treatment at TCE manufacturing sites is unknown; therefore, EPA used limits
for direct discharges with no end-of-pipe biological treatment and indirect dischargers as conservative.
EPA estimated annual releases from the average daily release and assuming 350 days/yr of operation.
Example max daily, average daily, and annual water release calculations for TCE at manufacturing sites
based on the estimated production volume for Solvents & Chemicals (44,934,862 lbs/yr or 20,382,094
kg/yr)16:
𝑀𝑎𝑥 𝐷𝑅 =69
𝜇𝑔𝐿 × 10
𝐿𝑘𝑔
× 20,382,094𝑘𝑔𝑦𝑟
1,000,000,000𝜇𝑔𝑘𝑔
× 350𝑑𝑎𝑦𝑠
𝑦𝑟
= 0.04𝑘𝑔
𝑑𝑎𝑦
𝐴𝑣𝑒𝑟𝑎𝑔𝑒 𝐷𝑅 =26
𝜇𝑔𝐿 × 10
𝐿𝑘𝑔
× 20,382,094𝑘𝑔𝑦𝑟
1,000,000,000𝜇𝑔𝑘𝑔
× 350𝑑𝑎𝑦𝑠
𝑦𝑟
= 0.015 𝑘𝑔
𝑑𝑎𝑦
𝐴𝑅 =26
𝜇𝑔𝐿 × 10
𝐿𝑘𝑔
× 20,382,094𝑘𝑔𝑦𝑟
1,000,000,000𝜇𝑔𝑘𝑔
= 5.3𝑘𝑔
𝑦𝑟
16 This estimated production volume is equal to the estimated production volume assessed for all manufacturing sites.

PEER REVIEW DRAFT. DO NOT CITE OR QUOTE
Page 176 of 229
Appendix E Vapor Degreasing and Cold Cleaning Near-Field/Far-Field
Inhalation Exposure Models Approach and Parameters
This appendix presents the modeling approach and model equations used in the following models:
• Open-Top Vapor Degreasing Near-Field/Far-Field Inhalation Exposure Model;
• Conveyorized Degreasing Near-Field/Far-Field Inhalation Exposure Model;
• Web Degreasing Near-Field/Far-Field Inhalation Exposure Model; and
• Cold Cleaning Near-Field/Far-Field Inhalation Exposure Model.
The models were developed through review of the literature and consideration of existing EPA/OPPT
exposure models. These models use a near-field/far-field approach (AIHA, 2009), where a vapor
generation source located inside the near-field diffuses into the surrounding environment. Workers are
assumed to be exposed to TCE vapor concentrations in the near-field, while occupational non-users are
exposed at concentrations in the far-field.
The model uses the following parameters to estimate exposure concentrations in the near-field and far-
field:
• Far-field size;
• Near-field size;
• Air exchange rate;
• Indoor air speed;
• Exposure duration;
• Vapor generation rate; and
• Operating hours per day.
An individual model input parameter could either have a discrete value or a distribution of values. EPA
assigned statistical distributions based on reasonably available literature data. A Monte Carlo simulation
(a type of stochastic simulation) was conducted to capture variability in the model input parameters. The
simulation was conducted using the Latin hypercube sampling method in @Risk Industrial Edition,
Version 7.0.0. The Latin hypercube sampling method is a statistical method for generating a sample of
possible values from a multi-dimensional distribution. Latin hypercube sampling is a stratified method,
meaning it guarantees that its generated samples are representative of the probability density function
(variability) defined in the model. EPA performed the model at 100,000 iterations to capture the range of
possible input values (i.e., including values with low probability of occurrence).
Model results from the Monte Carlo simulation are presented as 95th and 50th percentile values. The
statistics were calculated directly in @Risk. The 95th percentile value was selected to represent high-end
exposure level, whereas the 50th percentile value was selected to represent typical exposure level. The
following subsections detail the model design equations and parameters for vapor degreasing and cold
cleaning models.
Model Design Equations Figure E-1. The Near-Field/Far-Field Model as Applied to the Open-Top Vapor Degreasing Near-
Field/Far-Field Inhalation Exposure Model and the Cold Cleaning Near-Field/Far-Field Inhalation
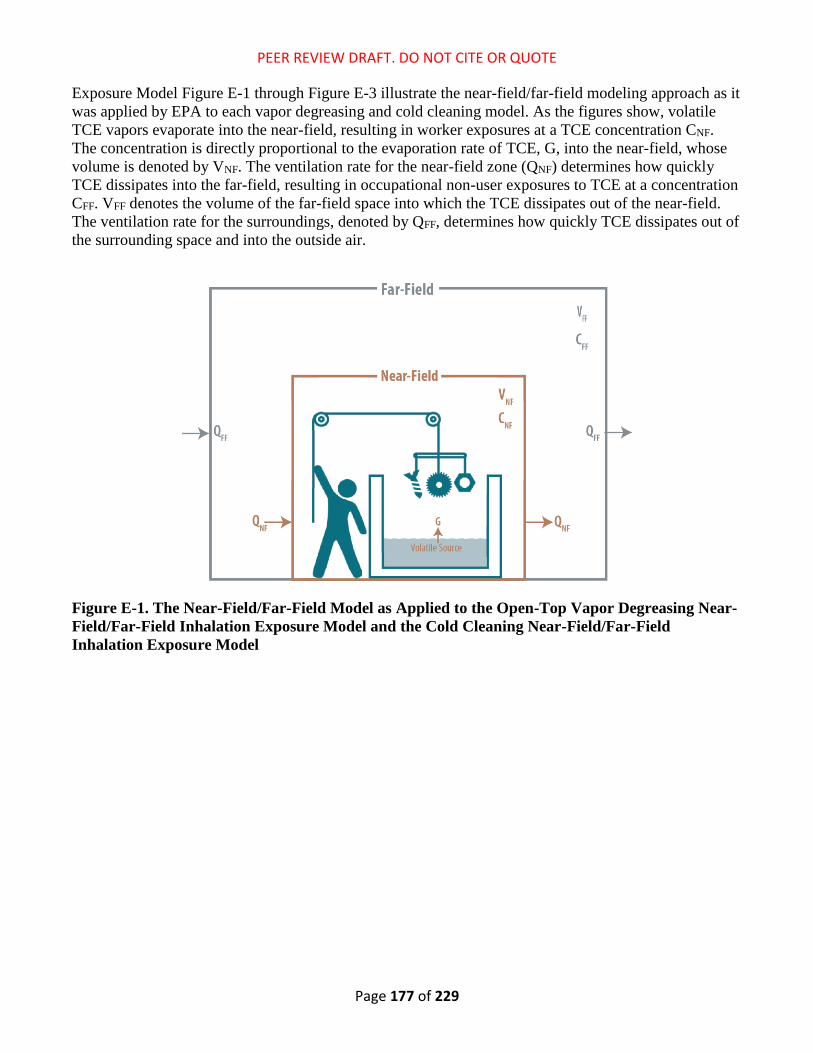
PEER REVIEW DRAFT. DO NOT CITE OR QUOTE
Page 177 of 229
Exposure Model Figure E-1 through Figure E-3 illustrate the near-field/far-field modeling approach as it
was applied by EPA to each vapor degreasing and cold cleaning model. As the figures show, volatile
TCE vapors evaporate into the near-field, resulting in worker exposures at a TCE concentration CNF.
The concentration is directly proportional to the evaporation rate of TCE, G, into the near-field, whose
volume is denoted by VNF. The ventilation rate for the near-field zone (QNF) determines how quickly
TCE dissipates into the far-field, resulting in occupational non-user exposures to TCE at a concentration
CFF. VFF denotes the volume of the far-field space into which the TCE dissipates out of the near-field.
The ventilation rate for the surroundings, denoted by QFF, determines how quickly TCE dissipates out of
the surrounding space and into the outside air.
Figure E-1. The Near-Field/Far-Field Model as Applied to the Open-Top Vapor Degreasing Near-
Field/Far-Field Inhalation Exposure Model and the Cold Cleaning Near-Field/Far-Field
Inhalation Exposure Model
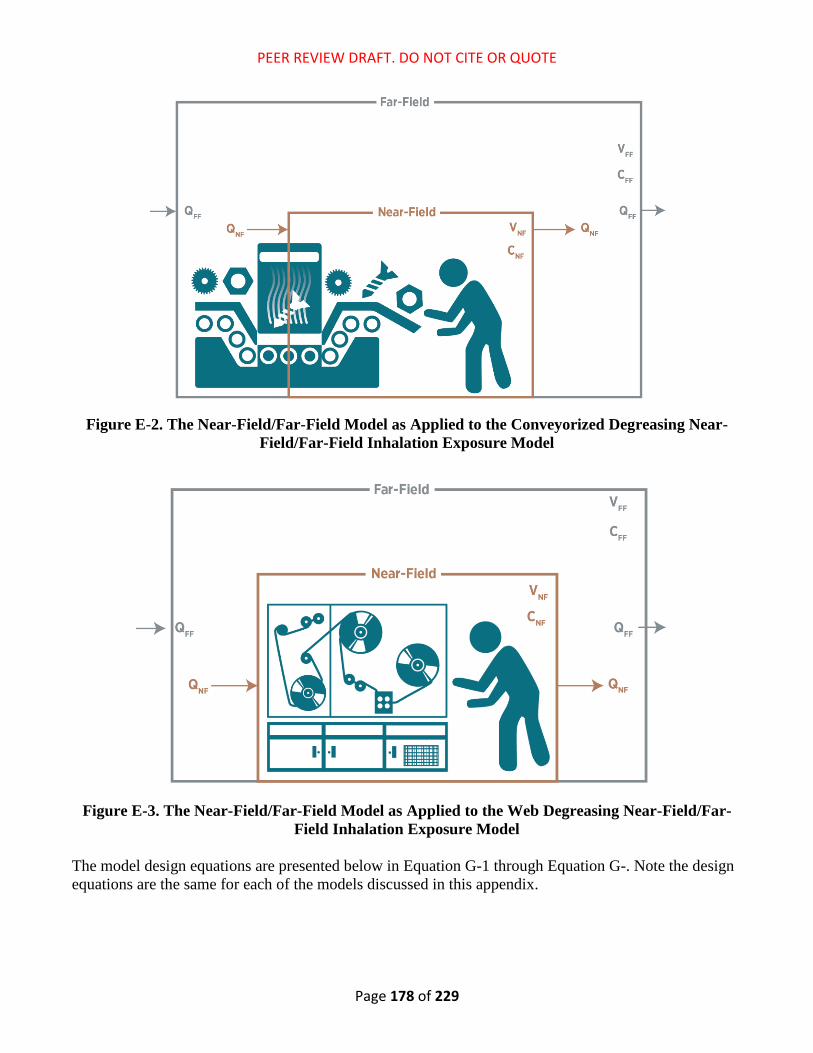
PEER REVIEW DRAFT. DO NOT CITE OR QUOTE
Page 178 of 229
Figure E-2. The Near-Field/Far-Field Model as Applied to the Conveyorized Degreasing Near-
Field/Far-Field Inhalation Exposure Model
Figure E-3. The Near-Field/Far-Field Model as Applied to the Web Degreasing Near-Field/Far-
Field Inhalation Exposure Model
The model design equations are presented below in Equation G-1 through Equation G-. Note the design
equations are the same for each of the models discussed in this appendix.

PEER REVIEW DRAFT. DO NOT CITE OR QUOTE
Page 179 of 229
Near-Field Mass Balance
Equation E-3
𝑉𝑁𝐹
𝑑𝐶𝑁𝐹
𝑑𝑡= 𝐶𝐹𝐹𝑄𝑁𝐹 − 𝐶𝑁𝐹𝑄𝑁𝐹 + 𝐺
Far-Field Mass Balance
Equation E-4
𝑉𝐹𝐹
𝑑𝐶𝐹𝐹
𝑑𝑡= 𝐶𝑁𝐹𝑄𝑁𝐹 − 𝐶𝐹𝐹𝑄𝑁𝐹 − 𝐶𝐹𝐹𝑄𝐹𝐹
Where:
VNF = near‐field volume;
VFF = far‐field volume;
QNF = near‐field ventilation rate;
QFF = far‐field ventilation rate;
CNF = average near‐field concentration;
CFF = average far‐field concentration;
G = average vapor generation rate; and
t = elapsed time.
Both of the previous equations can be solved for the time-varying concentrations in the near-field and
far-field as follows (AIHA, 2009):
Equation E-5
𝐶𝑁𝐹 = 𝐺(𝑘1 + 𝑘2𝑒𝜆1𝑡 − 𝑘3𝑒𝜆2𝑡)
Equation E-6
𝐶𝐹𝐹 = 𝐺 (1
𝑄𝐹𝐹+ 𝑘4𝑒𝜆1𝑡 − 𝑘5𝑒𝜆2𝑡)
Where:
Equation E-7
𝑘1 =1
(𝑄𝑁𝐹
𝑄𝑁𝐹 + 𝑄𝐹𝐹) 𝑄𝐹𝐹
Equation E-8
𝑘2 =𝑄𝑁𝐹𝑄𝐹𝐹 + 𝜆2𝑉𝑁𝐹(𝑄𝑁𝐹 + 𝑄𝐹𝐹)
𝑄𝑁𝐹𝑄𝐹𝐹𝑉𝑁𝐹(𝜆1 − 𝜆2)
Equation E-9
𝑘3 =𝑄𝑁𝐹𝑄𝐹𝐹 + 𝜆1𝑉𝑁𝐹(𝑄𝑁𝐹 + 𝑄𝐹𝐹)
𝑄𝑁𝐹𝑄𝐹𝐹𝑉𝑁𝐹(𝜆1 − 𝜆2)
Equation E-10
𝑘4 = (𝜆1𝑉𝑁𝐹 + 𝑄𝑁𝐹
𝑄𝑁𝐹) 𝑘2
Equation E-11
𝑘5 = (𝜆2𝑉𝑁𝐹 + 𝑄𝑁𝐹
𝑄𝑁𝐹) 𝑘3
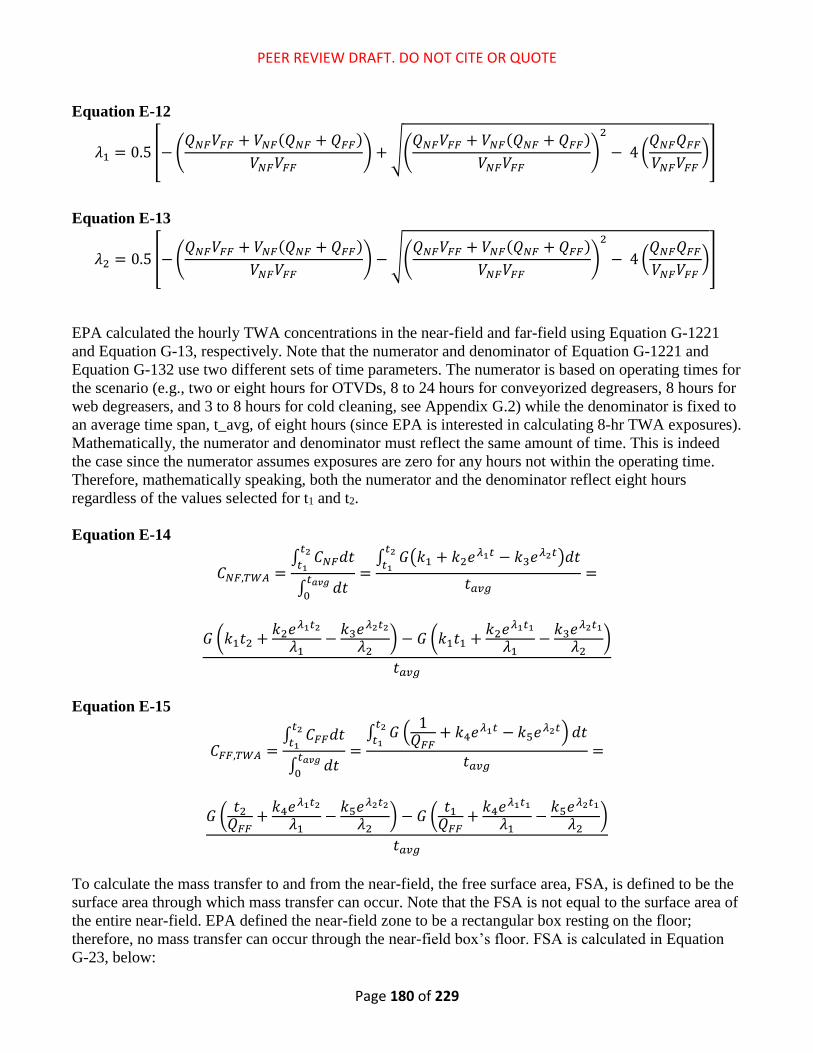
PEER REVIEW DRAFT. DO NOT CITE OR QUOTE
Page 180 of 229
Equation E-12
𝜆1 = 0.5 [− (𝑄𝑁𝐹𝑉𝐹𝐹 + 𝑉𝑁𝐹(𝑄𝑁𝐹 + 𝑄𝐹𝐹)
𝑉𝑁𝐹𝑉𝐹𝐹) + √(
𝑄𝑁𝐹𝑉𝐹𝐹 + 𝑉𝑁𝐹(𝑄𝑁𝐹 + 𝑄𝐹𝐹)
𝑉𝑁𝐹𝑉𝐹𝐹)
2
− 4 (𝑄𝑁𝐹𝑄𝐹𝐹
𝑉𝑁𝐹𝑉𝐹𝐹)]
Equation E-13
𝜆2 = 0.5 [− (𝑄𝑁𝐹𝑉𝐹𝐹 + 𝑉𝑁𝐹(𝑄𝑁𝐹 + 𝑄𝐹𝐹)
𝑉𝑁𝐹𝑉𝐹𝐹) − √(
𝑄𝑁𝐹𝑉𝐹𝐹 + 𝑉𝑁𝐹(𝑄𝑁𝐹 + 𝑄𝐹𝐹)
𝑉𝑁𝐹𝑉𝐹𝐹)
2
− 4 (𝑄𝑁𝐹𝑄𝐹𝐹
𝑉𝑁𝐹𝑉𝐹𝐹)]
EPA calculated the hourly TWA concentrations in the near-field and far-field using Equation G-1221
and Equation G-13, respectively. Note that the numerator and denominator of Equation G-1221 and
Equation G-132 use two different sets of time parameters. The numerator is based on operating times for
the scenario (e.g., two or eight hours for OTVDs, 8 to 24 hours for conveyorized degreasers, 8 hours for
web degreasers, and 3 to 8 hours for cold cleaning, see Appendix G.2) while the denominator is fixed to
an average time span, t_avg, of eight hours (since EPA is interested in calculating 8-hr TWA exposures).
Mathematically, the numerator and denominator must reflect the same amount of time. This is indeed
the case since the numerator assumes exposures are zero for any hours not within the operating time.
Therefore, mathematically speaking, both the numerator and the denominator reflect eight hours
regardless of the values selected for t1 and t2.
Equation E-14
𝐶𝑁𝐹,𝑇𝑊𝐴 =∫ 𝐶𝑁𝐹𝑑𝑡
𝑡2
𝑡1
∫ 𝑑𝑡𝑡𝑎𝑣𝑔
0
=∫ 𝐺(𝑘1 + 𝑘2𝑒𝜆1𝑡 − 𝑘3𝑒𝜆2𝑡)𝑑𝑡
𝑡2
𝑡1
𝑡𝑎𝑣𝑔=
𝐺 (𝑘1𝑡2 +𝑘2𝑒𝜆1𝑡2
𝜆1−
𝑘3𝑒𝜆2𝑡2
𝜆2) − 𝐺 (𝑘1𝑡1 +
𝑘2𝑒𝜆1𝑡1
𝜆1−
𝑘3𝑒𝜆2𝑡1
𝜆2)
𝑡𝑎𝑣𝑔
Equation E-15
𝐶𝐹𝐹,𝑇𝑊𝐴 =∫ 𝐶𝐹𝐹𝑑𝑡
𝑡2
𝑡1
∫ 𝑑𝑡𝑡𝑎𝑣𝑔
0
=∫ 𝐺 (
1𝑄𝐹𝐹
+ 𝑘4𝑒𝜆1𝑡 − 𝑘5𝑒𝜆2𝑡) 𝑑𝑡𝑡2
𝑡1
𝑡𝑎𝑣𝑔=
𝐺 (𝑡2
𝑄𝐹𝐹+
𝑘4𝑒𝜆1𝑡2
𝜆1−
𝑘5𝑒𝜆2𝑡2
𝜆2) − 𝐺 (
𝑡1
𝑄𝐹𝐹+
𝑘4𝑒𝜆1𝑡1
𝜆1−
𝑘5𝑒𝜆2𝑡1
𝜆2)
𝑡𝑎𝑣𝑔
To calculate the mass transfer to and from the near-field, the free surface area, FSA, is defined to be the
surface area through which mass transfer can occur. Note that the FSA is not equal to the surface area of
the entire near-field. EPA defined the near-field zone to be a rectangular box resting on the floor;
therefore, no mass transfer can occur through the near-field box’s floor. FSA is calculated in Equation
G-23, below:
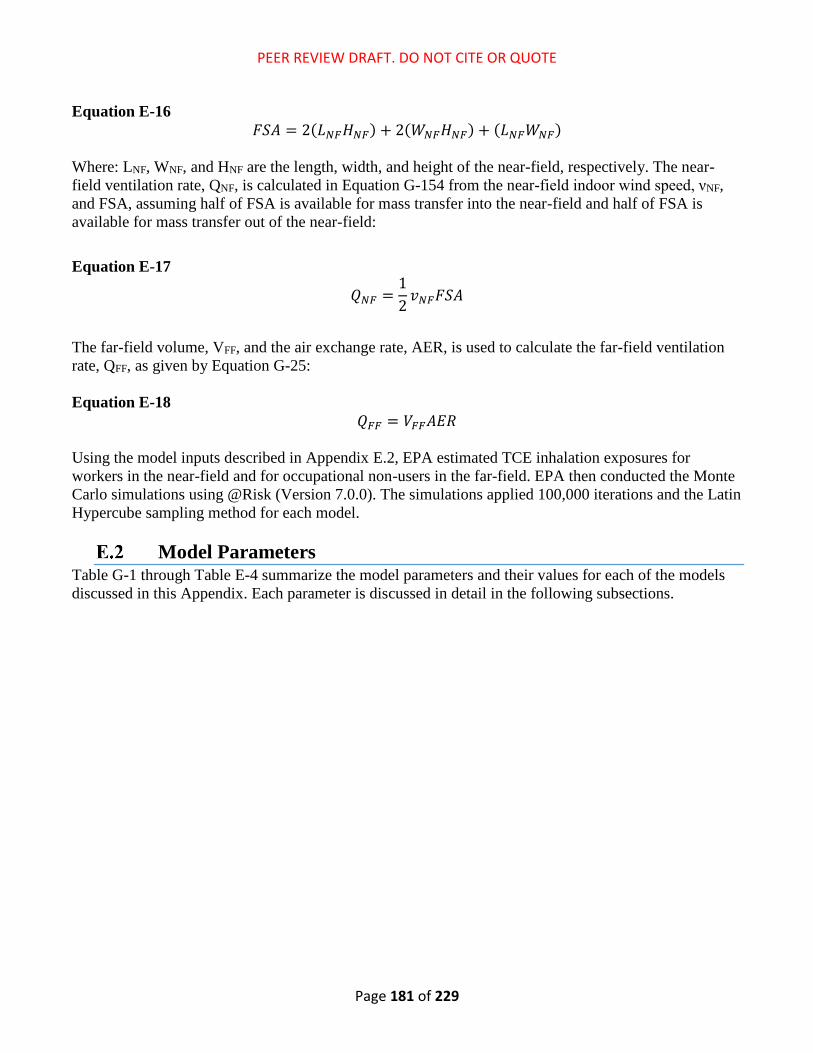
PEER REVIEW DRAFT. DO NOT CITE OR QUOTE
Page 181 of 229
Equation E-16
𝐹𝑆𝐴 = 2(𝐿𝑁𝐹𝐻𝑁𝐹) + 2(𝑊𝑁𝐹𝐻𝑁𝐹) + (𝐿𝑁𝐹𝑊𝑁𝐹)
Where: LNF, WNF, and HNF are the length, width, and height of the near-field, respectively. The near-
field ventilation rate, QNF, is calculated in Equation G-154 from the near-field indoor wind speed, νNF,
and FSA, assuming half of FSA is available for mass transfer into the near-field and half of FSA is
available for mass transfer out of the near-field:
Equation E-17
𝑄𝑁𝐹 =1
2𝑣𝑁𝐹𝐹𝑆𝐴
The far-field volume, VFF, and the air exchange rate, AER, is used to calculate the far-field ventilation
rate, QFF, as given by Equation G-25:
Equation E-18
𝑄𝐹𝐹 = 𝑉𝐹𝐹𝐴𝐸𝑅
Using the model inputs described in Appendix E.2, EPA estimated TCE inhalation exposures for
workers in the near-field and for occupational non-users in the far-field. EPA then conducted the Monte
Carlo simulations using @Risk (Version 7.0.0). The simulations applied 100,000 iterations and the Latin
Hypercube sampling method for each model.
Model Parameters Table G-1 through Table E-4 summarize the model parameters and their values for each of the models
discussed in this Appendix. Each parameter is discussed in detail in the following subsections.

PEER REVIEW DRAFT. DO NOT CITE OR QUOTE
Page 182 of 229
Table E-1. Summary of Parameter Values and Distributions Used in the Open-Top Vapor Degreasing Near-Field/Far-Field
Inhalation Exposure Model
Input
Parameter Symbol Unit
Deterministic Values Uncertainty Analysis Distribution Parameters Comments
Value Basis Lower
Bound
Upper
Bound Mode
Distribution
Type
Far-field
volume VFF ft3 10,594 Midpoint 10,594 70,629 17,657 Triangular See Section E.2.1
Air
exchange
rate
AER hr-1 2 Mode 2 20 3.5 Triangular See Section E.2.2
Near-field
indoor wind
speed
vNF ft/hr 1,181
50th
percentile 154 23,882 — —
See Section E.2.3
cm/s 10 50th
percentile 1.3 202.2 — —
Near-field
length LNF ft 10 — — — —
Constant
Value
See Section E.2.4 Near-field
width WNF ft 10 — — — —
Constant
Value
Near-field
height HNF ft 6 — — — —
Constant
Value
Starting
time t1 hr 0 — — — —
Constant
Value Constant.
Exposure
Duration t2 hr 8 — 2 8 — -- See Section E.2.5
Averaging
Time tavg hr 8 — — — —
Constant
Value See Section E.2.6
Vapor
generation
rate
G mg/hr 2.34E+07 Average 4.54E+02 4.67E+07 — Discrete
See Section E.2.7 lb/hr 51.50 Average 0.001 103.00 — Discrete
Operating
hours per
day
OH hr/day 8 — — Discrete See Section E.2.8

PEER REVIEW DRAFT. DO NOT CITE OR QUOTE
Page 183 of 229
Table E-2. Summary of Parameter Values and Distributions Used in the Conveyorized Degreasing Near-Field/Far-Field Inhalation
Exposure Model
Input
Parameter Symbol Unit
Deterministic Values Uncertainty Analysis Distribution Parameters
Comments Value Basis
Lower
Bound
Upper
Bound Mode
Distribution
Type
Far-field
volume VFF ft3 10,594 Midpoint 10,594 70,629 17,657 Triangular See Section E.2.1
Air
exchange
rate
AER hr-1 2 Mode 2 20 3.5 Triangular See Section E.2.2
Near-field
indoor
wind speed
vNF ft/hr 1,181
50th
percentile 154 23,882 — — See Section E.2.3
cm/s 10 50th
percentile 1.3 202.2 — —
Near-field
length LNF ft 10 — — — —
Constant
Value
See Section E.2.4 Near-field
width WNF ft 10 — — — —
Constant
Value
Near-field
height HNF ft 6 — — — —
Constant
Value
Starting
time t1 hr 0 — — — —
Constant
Value Constant.
Exposure
Duration t2 hr 24 — 24 8 —
Constant
Value See Section E.2.5
Averaging
Time tavg hr 8 — — — —
Constant
Value See Section E.2.6
Vapor
generation
rate
G mg/hr 1.6E+07 Average 3.63E+05 3.29E+07 — Discrete See Section E.2.7
Operating
hours per
day
OH hr/day 24 — — — — Constant See Section E.2.8
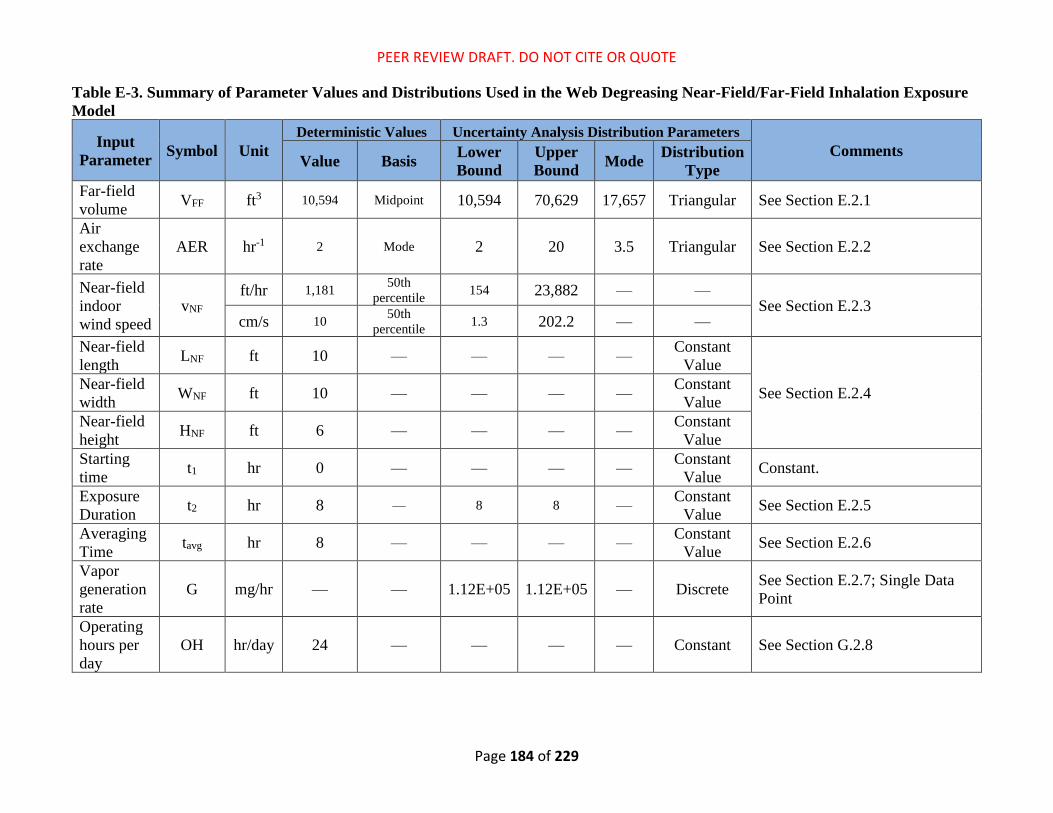
PEER REVIEW DRAFT. DO NOT CITE OR QUOTE
Page 184 of 229
Table E-3. Summary of Parameter Values and Distributions Used in the Web Degreasing Near-Field/Far-Field Inhalation Exposure
Model
Input
Parameter Symbol Unit
Deterministic Values Uncertainty Analysis Distribution Parameters
Comments Value Basis
Lower
Bound
Upper
Bound Mode
Distribution
Type
Far-field
volume VFF ft3 10,594 Midpoint 10,594 70,629 17,657 Triangular See Section E.2.1
Air
exchange
rate
AER hr-1 2 Mode 2 20 3.5 Triangular See Section E.2.2
Near-field
indoor
wind speed
vNF ft/hr 1,181
50th
percentile 154 23,882 — —
See Section E.2.3 cm/s 10
50th
percentile 1.3 202.2 — —
Near-field
length LNF ft 10 — — — —
Constant
Value
See Section E.2.4 Near-field
width WNF ft 10 — — — —
Constant
Value
Near-field
height HNF ft 6 — — — —
Constant
Value
Starting
time t1 hr 0 — — — —
Constant
Value Constant.
Exposure
Duration t2 hr 8 — 8 8 —
Constant
Value See Section E.2.5
Averaging
Time tavg hr 8 — — — —
Constant
Value See Section E.2.6
Vapor
generation
rate
G mg/hr — — 1.12E+05 1.12E+05 — Discrete See Section E.2.7; Single Data
Point
Operating
hours per
day
OH hr/day 24 — — — — Constant See Section G.2.8
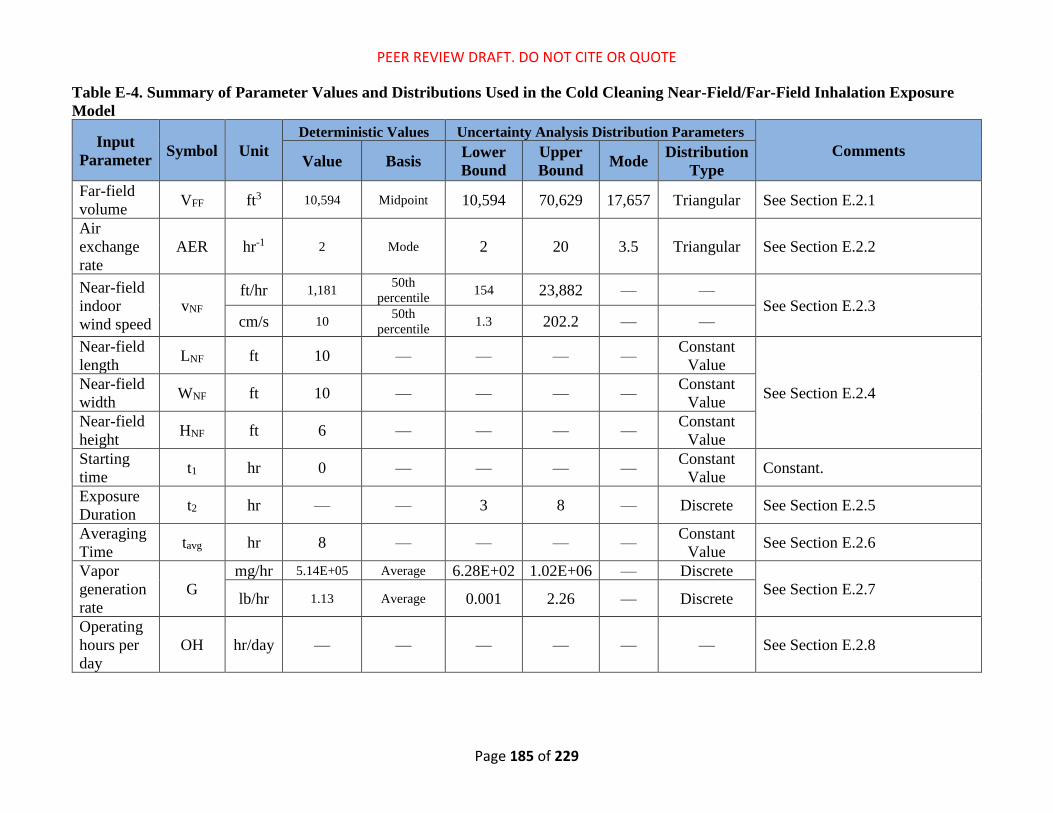
PEER REVIEW DRAFT. DO NOT CITE OR QUOTE
Page 185 of 229
Table E-4. Summary of Parameter Values and Distributions Used in the Cold Cleaning Near-Field/Far-Field Inhalation Exposure
Model
Input
Parameter Symbol Unit
Deterministic Values Uncertainty Analysis Distribution Parameters
Comments Value Basis
Lower
Bound
Upper
Bound Mode
Distribution
Type
Far-field
volume VFF ft3 10,594 Midpoint 10,594 70,629 17,657 Triangular See Section E.2.1
Air
exchange
rate
AER hr-1 2 Mode 2 20 3.5 Triangular See Section E.2.2
Near-field
indoor
wind speed
vNF ft/hr 1,181
50th
percentile 154 23,882 — —
See Section E.2.3 cm/s 10
50th
percentile 1.3 202.2 — —
Near-field
length LNF ft 10 — — — —
Constant
Value
See Section E.2.4 Near-field
width WNF ft 10 — — — —
Constant
Value
Near-field
height HNF ft 6 — — — —
Constant
Value
Starting
time t1 hr 0 — — — —
Constant
Value Constant.
Exposure
Duration t2 hr — — 3 8 — Discrete See Section E.2.5
Averaging
Time tavg hr 8 — — — —
Constant
Value See Section E.2.6
Vapor
generation
rate
G
mg/hr 5.14E+05 Average 6.28E+02 1.02E+06 — Discrete
See Section E.2.7 lb/hr 1.13 Average 0.001 2.26 — Discrete
Operating
hours per
day
OH hr/day — — — — — — See Section E.2.8
PEER REVIEW DRAFT. DO NOT CITE OR QUOTE
Page 186 of 229
E.2.1 Far-Field Volume
EPA used the same far-field volume distribution for each of the models discussed. The far-field volume
is based on information obtained from (Von Grote et al., 2003) that indicated volumes at German metal
degreasing facilities can vary from 300 to several thousand cubic meters. They noted that smaller
volumes are more typical and assumed 400 and 600 m3 (14,126 and 21,189 ft3) in their exposure models
(Von Grote et al., 2003). These are the highest and lowest values EPA identified in the literature;
therefore, EPA assumes a triangular distribution bound from 300 m3 (10,594 ft3) to 2,000 m3 (70,629 ft3)
with a mode of 500 m3 (the midpoint of 400 and 600 m3) (17,657 ft3).
E.2.2 Air Exchange Rate
EPA used the same air exchange rate distribution for each of the models discussed. The air exchange
rate is based on data from (Hellweg et al., 2009) and information received from a peer reviewer during
the development of the 2014 TSCA Work Plan Chemical Risk Assessment Trichloroethylene:
Degreasing, Spot Cleaning and Arts & Crafts Uses (SCG, 2013). (Hellweg et al., 2009) reported that
average air exchange rates for occupational settings using mechanical ventilation systems vary from 3 to
20 hr-1. The risk assessment peer reviewer comments indicated that values around 2 to 5 hr-1 are likely
(SCG, 2013), in agreement with the low end reported by (Hellweg et al., 2009). Therefore, EPA used a
triangular distribution with the mode equal to 3.5 hr-1, the midpoint of the range provided by the risk
assessment peer reviewer (3.5 is the midpoint of the range 2 to 5 hr-1), with a minimum of 2 hr-1, per the
risk assessment peer reviewer (SCG, 2013) and a maximum of 20 hr-1 per (Hellweg et al., 2009).
E.2.3 Near-Field Indoor Air Speed
(Baldwin and Maynard, 1998) measured indoor air speeds across a variety of occupational settings in the
United Kingdom. Fifty-five work areas were surveyed across a variety of workplaces.
EPA analyzed the air speed data from (Baldwin and Maynard, 1998) and categorized the air speed
surveys into settings representative of industrial facilities and representative of commercial facilities.
EPA fit separate distributions for these industrial and commercial settings and used the industrial
distribution for facilities performing vapor degreasing and/or cold cleaning.
EPA fit a lognormal distribution for both data sets as consistent with the authors observations that the air
speed measurements within a surveyed location were lognormally distributed and the population of the
mean air speeds among all surveys were lognormally distributed. Since lognormal distributions are
bound by zero and positive infinity, EPA truncated the distribution at the largest observed value among
all of the survey mean air speeds from (Baldwin and Maynard, 1998).
EPA fit the air speed surveys representative of industrial facilities to a lognormal distribution with the
following parameter values: mean of 22.414 cm/s and standard deviation of 19.958 cm/s. In the model,
the lognormal distribution is truncated at a maximum allowed value of 202.2 cm/s (largest surveyed
mean air speed observed in (Baldwin and Maynard, 1998) to prevent the model from sampling values
that approach infinity or are otherwise unrealistically large.
(Baldwin and Maynard, 1998) only presented the mean air speed of each survey. The authors did not
present the individual measurements within each survey. Therefore, these distributions represent a
distribution of mean air speeds and not a distribution of spatially variable air speeds within a single
workplace setting. However, a mean air speed (averaged over a work area) is the required input for the
model.

PEER REVIEW DRAFT. DO NOT CITE OR QUOTE
Page 187 of 229
E.2.4 Near-Field Volume
EPA assumed a near-field of constant dimensions of 10 ft x 10 ft x 6 ft resulting in a total volume of 600
ft3.
E.2.5 Exposure Duration
EPA assumed the maximum exposure duration for each model is equal to the entire work-shift (eight
hours). Therefore, if the degreaser/cold cleaning machine operating time was greater than eight hours,
then exposure duration was set equal to eight hours. If the operating time was less than eight hours, then
exposure duration was set equal to the degreaser/cold cleaning machine operating time (see Appendix
E.2.8 for discussion of operating hours).
E.2.6 Averaging Time
EPA was interested in estimating 8-hr TWAs for use in risk calculations; therefore, a constant averaging
time of eight hours was used for each of the models.
E.2.7 Vapor Generation Rate
For the vapor generation rate from each machine type (OTVD, conveyorized and cold), EPA used a
discrete distribution based on the annual unit emission rates reported in the (U.S. EPA, 2018a). No web
degreasers were reported in the 2014 NEI, therefore, (U.S. EPA, 2011) data was used for web
degreasers. Annual unit emission rates were converted to hourly unit emission rates by dividing the
annual reported emissions by the reported annual operating hours (see Appendix E.2.8). Reported annual
emissions in NEI without accompanying reported annual operating hours were not included in the
analysis. Emission rates reported as zero were also excluded as it is unclear if this is before or after
vapor controls used by the site and if the vapor controls used would control emissions into the work area
(thus reducing exposure) or only control emissions to the environment (which would not affect worker
exposures). Table E-5 summarizes the data in the 2014 NEI.
Table E-5. Summary of Trichloroethylene Vapor Degreasing and Cold Cleaning Data from the
2014 NEI
Unit Type Total Units Units with Zero
Emissions
Units without
Accompanying
Operating Hours
Units Used
in
Analysisa
Open-Top Vapor Degreasers 149 29 62 76
Conveyorized Degreasers 8 0 5 3
Web Degreasersb 1 0 0 1
Cold Cleaning Machines 17 1 6 10
a – Some units with zero emissions also did not include accompanying operating hours; therefore, subtracting the units with
zero emissions and the units without operating hours from the total units does not equal the units in the analysis due to double
counting.
b – No web degreasers reported in the 2014 NEI. One web degreaser reported in the (U.S. EPA, 2011) was used in this
analysis.
Source: (U.S. EPA, 2018a, 2011)
Table E-6 through Table E-9 summarize the distribution of hourly unit emissions for each machine type
calculated from the annual emission in the 2014 NEI.
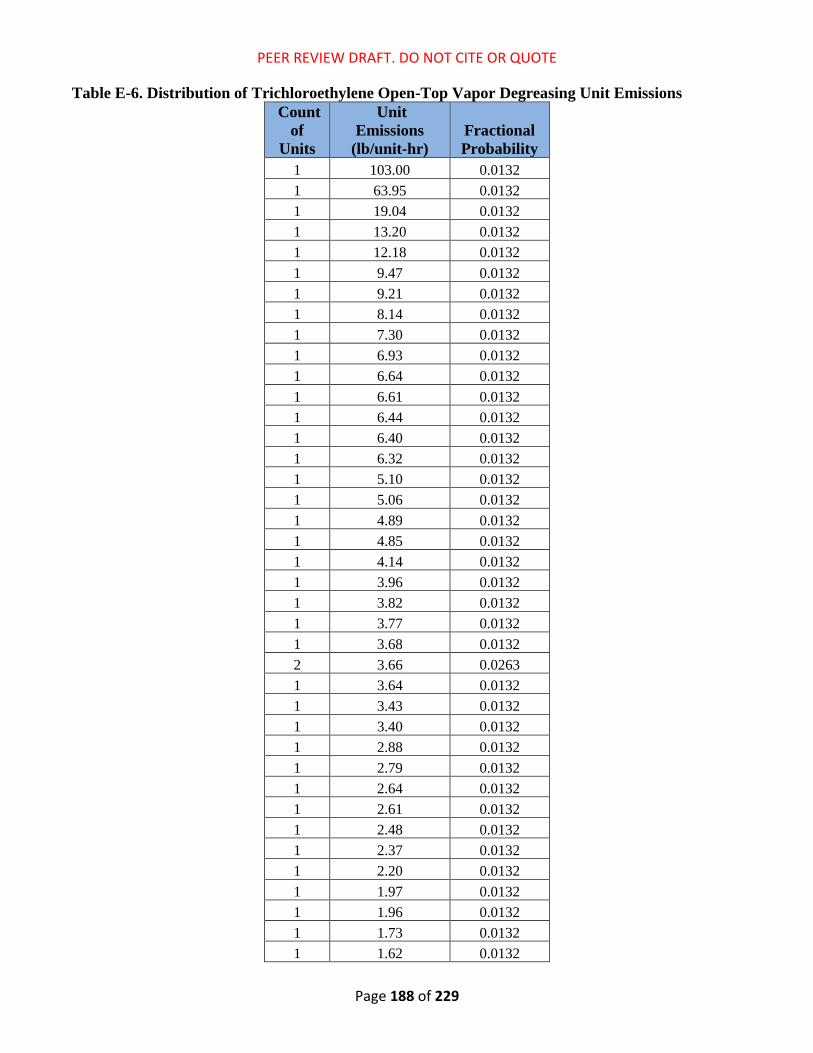
PEER REVIEW DRAFT. DO NOT CITE OR QUOTE
Page 188 of 229
Table E-6. Distribution of Trichloroethylene Open-Top Vapor Degreasing Unit Emissions
Count
of
Units
Unit
Emissions
(lb/unit-hr)
Fractional
Probability
1 103.00 0.0132
1 63.95 0.0132
1 19.04 0.0132
1 13.20 0.0132
1 12.18 0.0132
1 9.47 0.0132
1 9.21 0.0132
1 8.14 0.0132
1 7.30 0.0132
1 6.93 0.0132
1 6.64 0.0132
1 6.61 0.0132
1 6.44 0.0132
1 6.40 0.0132
1 6.32 0.0132
1 5.10 0.0132
1 5.06 0.0132
1 4.89 0.0132
1 4.85 0.0132
1 4.14 0.0132
1 3.96 0.0132
1 3.82 0.0132
1 3.77 0.0132
1 3.68 0.0132
2 3.66 0.0263
1 3.64 0.0132
1 3.43 0.0132
1 3.40 0.0132
1 2.88 0.0132
1 2.79 0.0132
1 2.64 0.0132
1 2.61 0.0132
1 2.48 0.0132
1 2.37 0.0132
1 2.20 0.0132
1 1.97 0.0132
1 1.96 0.0132
1 1.73 0.0132
1 1.62 0.0132

PEER REVIEW DRAFT. DO NOT CITE OR QUOTE
Page 189 of 229
Count
of
Units
Unit
Emissions
(lb/unit-hr)
Fractional
Probability
1 1.59 0.0132
1 1.44 0.0132
1 1.33 0.0132
1 1.22 0.0132
1 1.09 0.0132
2 0.93 0.0263
1 0.90 0.0132
2 0.84 0.0263
1 0.83 0.0132
1 0.79 0.0132
3 0.79 0.0395
1 0.70 0.0132
1 0.62 0.0132
1 0.60 0.0132
1 0.43 0.0132
1 0.42 0.0132
1 0.39 0.0132
1 0.38 0.0132
1 0.38 0.0132
1 0.35 0.0132
1 0.23 0.0132
1 0.18 0.0132
1 0.15 0.0132
1 0.15 0.0132
1 0.14 0.0132
1 0.11 0.0132
1 0.10 0.0132
2 0.10 0.0263
1 0.07 0.0132
1 0.03 0.0132
1 0.001 0.0132
Table E-7. Distribution of Trichloroethylene Conveyorized Degreasing Unit Emissions
Count
of Units
Unit
Emissions
(lb/unit-hr)
Fractional
Probability
1 72.48 0.3333
1 1.51 0.3333
1 0.80 0.3333
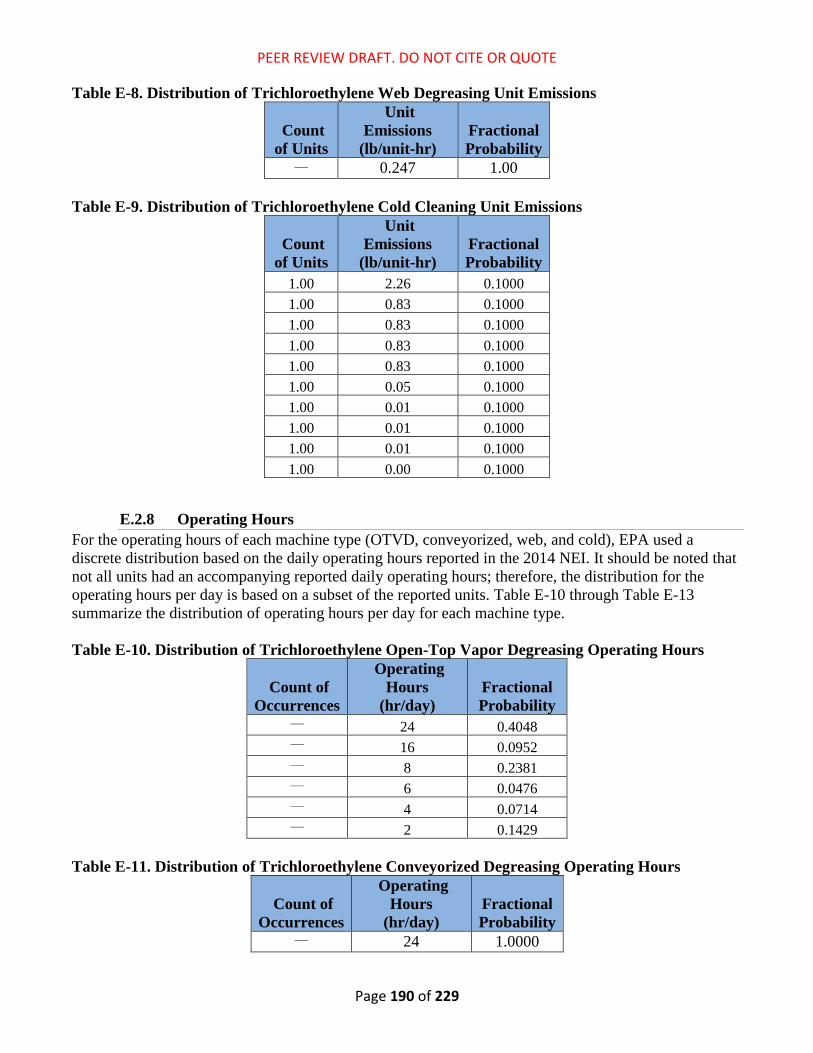
PEER REVIEW DRAFT. DO NOT CITE OR QUOTE
Page 190 of 229
Table E-8. Distribution of Trichloroethylene Web Degreasing Unit Emissions
Count
of Units
Unit
Emissions
(lb/unit-hr)
Fractional
Probability — 0.247 1.00
Table E-9. Distribution of Trichloroethylene Cold Cleaning Unit Emissions
Count
of Units
Unit
Emissions
(lb/unit-hr)
Fractional
Probability
1.00 2.26 0.1000
1.00 0.83 0.1000
1.00 0.83 0.1000
1.00 0.83 0.1000
1.00 0.83 0.1000
1.00 0.05 0.1000
1.00 0.01 0.1000
1.00 0.01 0.1000
1.00 0.01 0.1000
1.00 0.00 0.1000
E.2.8 Operating Hours
For the operating hours of each machine type (OTVD, conveyorized, web, and cold), EPA used a
discrete distribution based on the daily operating hours reported in the 2014 NEI. It should be noted that
not all units had an accompanying reported daily operating hours; therefore, the distribution for the
operating hours per day is based on a subset of the reported units. Table E-10 through Table E-13
summarize the distribution of operating hours per day for each machine type.
Table E-10. Distribution of Trichloroethylene Open-Top Vapor Degreasing Operating Hours
Count of
Occurrences
Operating
Hours
(hr/day)
Fractional
Probability — 24 0.4048 — 16 0.0952 — 8 0.2381 — 6 0.0476 — 4 0.0714 — 2 0.1429
Table E-11. Distribution of Trichloroethylene Conveyorized Degreasing Operating Hours
Count of
Occurrences
Operating
Hours
(hr/day)
Fractional
Probability — 24 1.0000
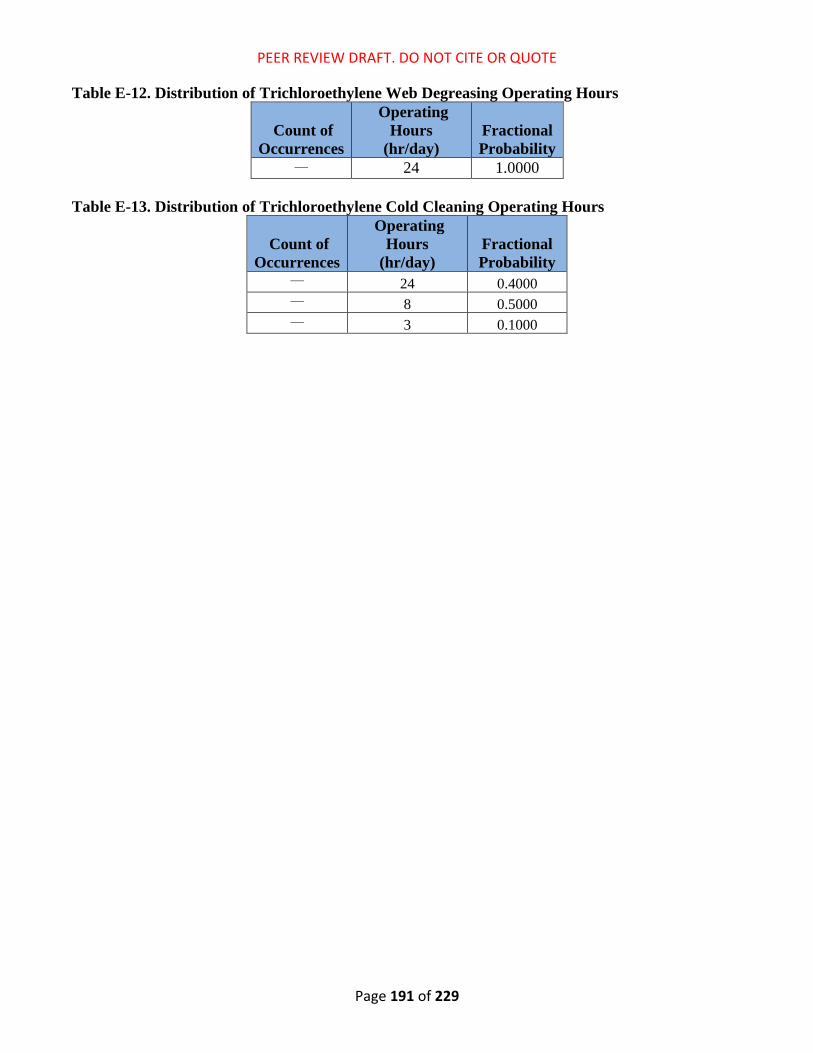
PEER REVIEW DRAFT. DO NOT CITE OR QUOTE
Page 191 of 229
Table E-12. Distribution of Trichloroethylene Web Degreasing Operating Hours
Count of
Occurrences
Operating
Hours
(hr/day)
Fractional
Probability — 24 1.0000
Table E-13. Distribution of Trichloroethylene Cold Cleaning Operating Hours
Count of
Occurrences
Operating
Hours
(hr/day)
Fractional
Probability — 24 0.4000 — 8 0.5000 — 3 0.1000
PEER REVIEW DRAFT. DO NOT CITE OR QUOTE
Page 192 of 229
Appendix F Brake Servicing Near-Field/Far-Field Inhalation Exposure
Model Approach and Parameters
This appendix presents the modeling approach and model equations used in the Brake Servicing Near-
Field/Far-Field Inhalation Exposure Model. The model was developed through review of the literature
and consideration of existing EPA exposure models. This model uses a near-field/far-field approach
(AIHA, 2009), where an aerosol application located inside the near-field generates a mist of droplets,
and indoor air movements lead to the convection of the droplets between the near-field and far-field.
Workers are assumed to be exposed to TCE droplet concentrations in the near-field, while occupational
non-users are exposed at concentrations in the far-field.
The model uses the following parameters to estimate exposure concentrations in the near-field and far-
field:
• Far-field size;
• Near-field size;
• Air exchange rate;
• Indoor air speed;
• Concentration of TCE in the aerosol formulation;
• Amount of degreaser used per brake job;
• Number of degreaser applications per brake job;
• Time duration of brake job;
• Operating hours per week; and
• Number of jobs per work shift.
An individual model input parameter could either have a discrete value or a distribution of values. EPA
assigned statistical distributions based on reasonably available literature data. A Monte Carlo simulation
(a type of stochastic simulation) was conducted to capture variability in the model input parameters. The
simulation was conducted using the Latin hypercube sampling method in @Risk Industrial Edition,
Version 7.0.0. The Latin hypercube sampling method is a statistical method for generating a sample of
possible values from a multi-dimensional distribution. Latin hypercube sampling is a stratified method,
meaning it guarantees that its generated samples are representative of the probability density function
(variability) defined in the model. EPA performed the model at 100,000 iterations to capture the range of
possible input values (i.e., including values with low probability of occurrence).
Model results from the Monte Carlo simulation are presented as 95th and 50th percentile values. The
statistics were calculated directly in @Risk. The 95th percentile value was selected to represent high-end
exposure level, whereas the 50th percentile value was selected to represent central tendency exposure
level. The following subsections detail the model design equations and parameters for the brake
servicing model.
Model Design Equations In brake servicing, the vehicle is raised on an automobile lift to a comfortable working height to allow
the worker (mechanic) to remove the wheel and access the brake system. Brake servicing can include
inspections, adjustments, brake pad replacements, and rotor resurfacing. These service types often
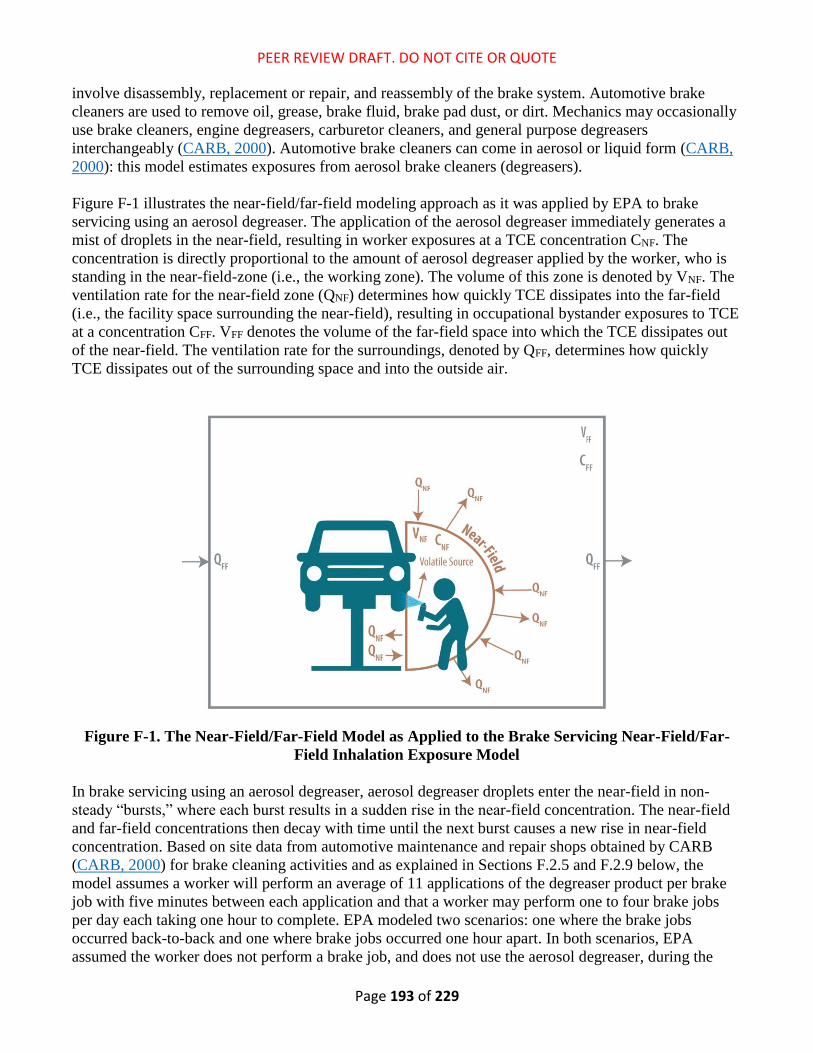
PEER REVIEW DRAFT. DO NOT CITE OR QUOTE
Page 193 of 229
involve disassembly, replacement or repair, and reassembly of the brake system. Automotive brake
cleaners are used to remove oil, grease, brake fluid, brake pad dust, or dirt. Mechanics may occasionally
use brake cleaners, engine degreasers, carburetor cleaners, and general purpose degreasers
interchangeably (CARB, 2000). Automotive brake cleaners can come in aerosol or liquid form (CARB,
2000): this model estimates exposures from aerosol brake cleaners (degreasers).
Figure F-1 illustrates the near-field/far-field modeling approach as it was applied by EPA to brake
servicing using an aerosol degreaser. The application of the aerosol degreaser immediately generates a
mist of droplets in the near-field, resulting in worker exposures at a TCE concentration CNF. The
concentration is directly proportional to the amount of aerosol degreaser applied by the worker, who is
standing in the near-field-zone (i.e., the working zone). The volume of this zone is denoted by VNF. The
ventilation rate for the near-field zone (QNF) determines how quickly TCE dissipates into the far-field
(i.e., the facility space surrounding the near-field), resulting in occupational bystander exposures to TCE
at a concentration CFF. VFF denotes the volume of the far-field space into which the TCE dissipates out
of the near-field. The ventilation rate for the surroundings, denoted by QFF, determines how quickly
TCE dissipates out of the surrounding space and into the outside air.
Figure F-1. The Near-Field/Far-Field Model as Applied to the Brake Servicing Near-Field/Far-
Field Inhalation Exposure Model
In brake servicing using an aerosol degreaser, aerosol degreaser droplets enter the near-field in non-
steady “bursts,” where each burst results in a sudden rise in the near-field concentration. The near-field
and far-field concentrations then decay with time until the next burst causes a new rise in near-field
concentration. Based on site data from automotive maintenance and repair shops obtained by CARB
(CARB, 2000) for brake cleaning activities and as explained in Sections F.2.5 and F.2.9 below, the
model assumes a worker will perform an average of 11 applications of the degreaser product per brake
job with five minutes between each application and that a worker may perform one to four brake jobs
per day each taking one hour to complete. EPA modeled two scenarios: one where the brake jobs
occurred back-to-back and one where brake jobs occurred one hour apart. In both scenarios, EPA
assumed the worker does not perform a brake job, and does not use the aerosol degreaser, during the

PEER REVIEW DRAFT. DO NOT CITE OR QUOTE
Page 194 of 229
first hour of the day.
EPA denoted the top of each five-minute period for each hour of the day (e.g., 8:00 am, 8:05 am, 8:10
am, etc.) as tm,n. Here, m has the values of 0, 1, 2, 3, 4, 5, 6, and 7 to indicate the top of each hour of the
day (e.g., 8 am, 9 am, etc.) and n has the values of 0, 1, 2, 3, 4, 5, 6, 7, 8, 9, 10, and 11 to indicate the top
of each five-minute period within the hour. No aerosol degreaser is used, and no exposures occur, during
the first hour of the day, t0,0 to t0,11 (e.g., 8 am to 9 am). Then, in both scenarios, the worker begins the
first brake job during the second hour, t1,0 (e.g., 9 am to 10 am). The worker applies the aerosol
degreaser at the top of the second 5-minute period and each subsequent 5-minute period during the hour-
long brake job (e.g., 9:05 am, 9:10 am,…9:55 am). In the first scenario, the brake jobs are performed
back-to-back, if performing more than one brake job on the given day. Therefore, the second brake job
begins at the top of the third hour (e.g., 10 am), and the worker applies the aerosol degreaser at the top
of the second 5-minute period and each subsequent 5-minute period (e.g., 10:05 am, 10:10 am,…10:55
am). In the second scenario, the brake jobs are performed every other hour, if performing more than one
brake job on the given day. Therefore, the second brake job begins at the top of the fourth hour (e.g., 11
am), and the worker applies the aerosol degreaser at the top of the second 5-minute period and each
subsequent 5-minute period (e.g., 11:05 am, 11:10 am,…11:55 am).
In the first scenario, after the worker performs the last brake job, the workers and occupational non-users
(ONUs) continue to be exposed as the airborne concentrations decay during the final three to six hours
until the end of the day (e.g., 4 pm). In the second scenario, after the worker performs each brake job,
the workers and ONUs continue to be exposed as the airborne concentrations decay during the time in
which no brake jobs are occurring and then again when the next brake job is initiated. In both scenarios,
the workers and ONUs are no longer exposed once they leave work.
Based on data from CARB (CARB, 2000), EPA assumes each brake job requires one 14.4-oz can of
aerosol brake cleaner as described in further detail below. The model determines the application rate of
TCE using the weight fraction of TCE in the aerosol product. EPA uses a uniform distribution of weight
fractions for TCE based on facility data for the aerosol products in use (CARB, 2000).
The model design equations are presented below in Equation F-1 through Equation F-21.
Near-Field Mass Balance
Equation F-1
𝑉𝑁𝐹
𝑑𝐶𝑁𝐹
𝑑𝑡= 𝐶𝐹𝐹𝑄𝑁𝐹 − 𝐶𝑁𝐹𝑄𝑁𝐹
Far-Field Mass Balance
Equation F-2
𝑉𝐹𝐹
𝑑𝐶𝐹𝐹
𝑑𝑡= 𝐶𝑁𝐹𝑄𝑁𝐹 − 𝐶𝐹𝐹𝑄𝑁𝐹 − 𝐶𝐹𝐹𝑄𝐹𝐹
Where:
VNF = near‐field volume;
VFF = far‐field volume;
QNF = near‐field ventilation rate;
QFF = far‐field ventilation rate;
CNF = average near‐field concentration;
CFF = average far‐field concentration; and
t = elapsed time.
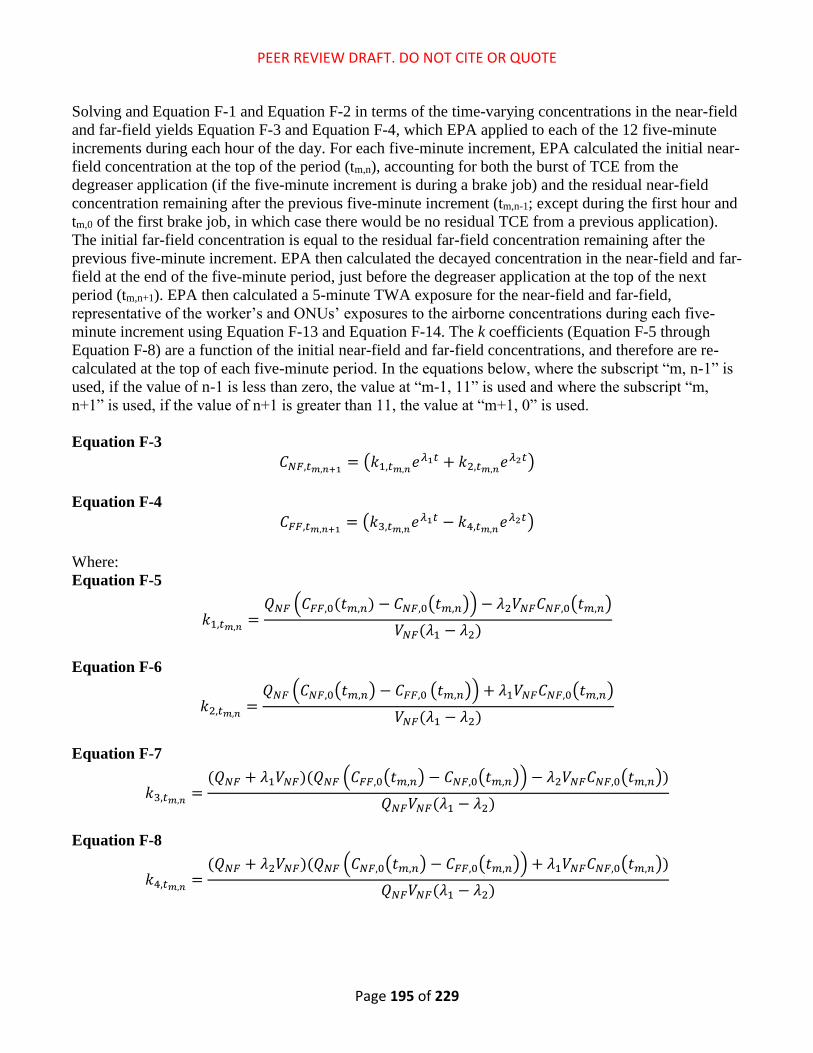
PEER REVIEW DRAFT. DO NOT CITE OR QUOTE
Page 195 of 229
Solving and Equation F-1 and Equation F-2 in terms of the time-varying concentrations in the near-field
and far-field yields Equation F-3 and Equation F-4, which EPA applied to each of the 12 five-minute
increments during each hour of the day. For each five-minute increment, EPA calculated the initial near-
field concentration at the top of the period (tm,n), accounting for both the burst of TCE from the
degreaser application (if the five-minute increment is during a brake job) and the residual near-field
concentration remaining after the previous five-minute increment (tm,n-1; except during the first hour and
tm,0 of the first brake job, in which case there would be no residual TCE from a previous application).
The initial far-field concentration is equal to the residual far-field concentration remaining after the
previous five-minute increment. EPA then calculated the decayed concentration in the near-field and far-
field at the end of the five-minute period, just before the degreaser application at the top of the next
period (tm,n+1). EPA then calculated a 5-minute TWA exposure for the near-field and far-field,
representative of the worker’s and ONUs’ exposures to the airborne concentrations during each five-
minute increment using Equation F-13 and Equation F-14. The k coefficients (Equation F-5 through
Equation F-8) are a function of the initial near-field and far-field concentrations, and therefore are re-
calculated at the top of each five-minute period. In the equations below, where the subscript “m, n-1” is
used, if the value of n-1 is less than zero, the value at “m-1, 11” is used and where the subscript “m,
n+1” is used, if the value of n+1 is greater than 11, the value at “m+1, 0” is used.
Equation F-3
𝐶𝑁𝐹,𝑡𝑚,𝑛+1= (𝑘1,𝑡𝑚,𝑛
𝑒𝜆1𝑡 + 𝑘2,𝑡𝑚,𝑛𝑒𝜆2𝑡)
Equation F-4
𝐶𝐹𝐹,𝑡𝑚,𝑛+1= (𝑘3,𝑡𝑚,𝑛
𝑒𝜆1𝑡 − 𝑘4,𝑡𝑚,𝑛𝑒𝜆2𝑡)
Where:
Equation F-5
𝑘1,𝑡𝑚,𝑛=
𝑄𝑁𝐹 (𝐶𝐹𝐹,0(𝑡𝑚,𝑛) − 𝐶𝑁𝐹,0(𝑡𝑚,𝑛)) − 𝜆2𝑉𝑁𝐹𝐶𝑁𝐹,0(𝑡𝑚,𝑛)
𝑉𝑁𝐹(𝜆1 − 𝜆2)
Equation F-6
𝑘2,𝑡𝑚,𝑛=
𝑄𝑁𝐹 (𝐶𝑁𝐹,0(𝑡𝑚,𝑛) − 𝐶𝐹𝐹,0 (𝑡𝑚,𝑛)) + 𝜆1𝑉𝑁𝐹𝐶𝑁𝐹,0(𝑡𝑚,𝑛)
𝑉𝑁𝐹(𝜆1 − 𝜆2)
Equation F-7
𝑘3,𝑡𝑚,𝑛=
(𝑄𝑁𝐹 + 𝜆1𝑉𝑁𝐹)(𝑄𝑁𝐹 (𝐶𝐹𝐹,0(𝑡𝑚,𝑛) − 𝐶𝑁𝐹,0(𝑡𝑚,𝑛)) − 𝜆2𝑉𝑁𝐹𝐶𝑁𝐹,0(𝑡𝑚,𝑛))
𝑄𝑁𝐹𝑉𝑁𝐹(𝜆1 − 𝜆2)
Equation F-8
𝑘4,𝑡𝑚,𝑛=
(𝑄𝑁𝐹 + 𝜆2𝑉𝑁𝐹)(𝑄𝑁𝐹 (𝐶𝑁𝐹,0(𝑡𝑚,𝑛) − 𝐶𝐹𝐹,0(𝑡𝑚,𝑛)) + 𝜆1𝑉𝑁𝐹𝐶𝑁𝐹,0(𝑡𝑚,𝑛))
𝑄𝑁𝐹𝑉𝑁𝐹(𝜆1 − 𝜆2)
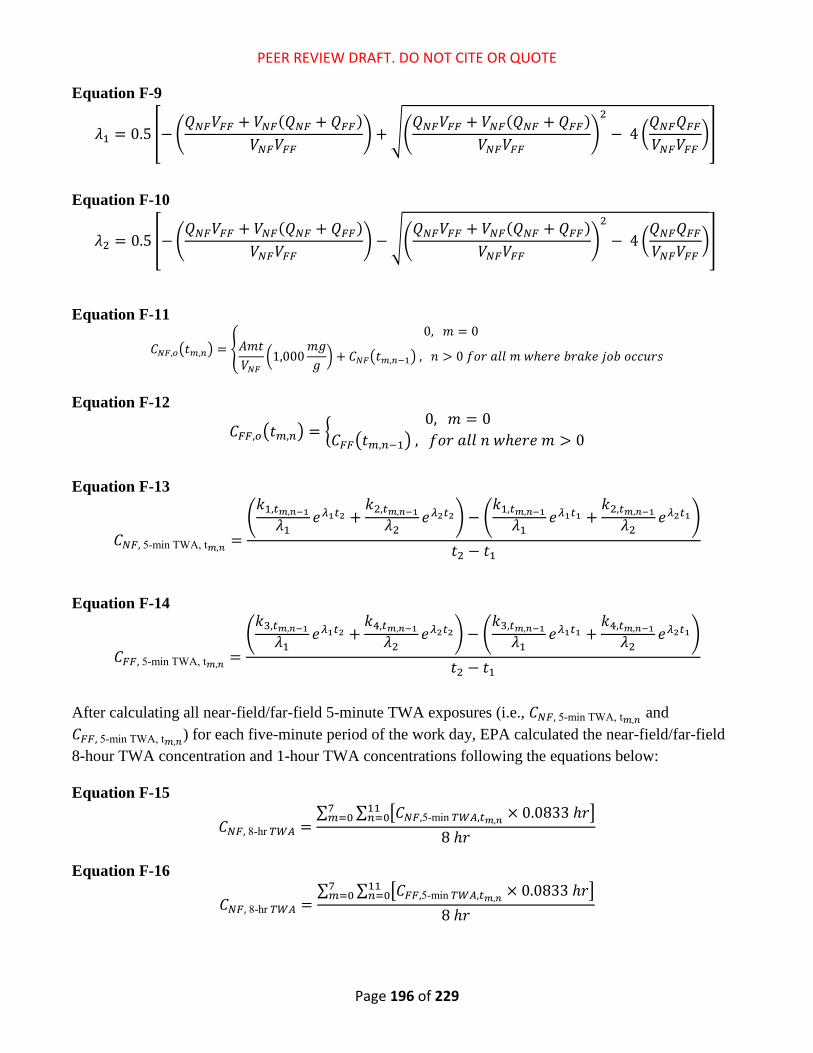
PEER REVIEW DRAFT. DO NOT CITE OR QUOTE
Page 196 of 229
Equation F-9
𝜆1 = 0.5 [− (𝑄𝑁𝐹𝑉𝐹𝐹 + 𝑉𝑁𝐹(𝑄𝑁𝐹 + 𝑄𝐹𝐹)
𝑉𝑁𝐹𝑉𝐹𝐹) + √(
𝑄𝑁𝐹𝑉𝐹𝐹 + 𝑉𝑁𝐹(𝑄𝑁𝐹 + 𝑄𝐹𝐹)
𝑉𝑁𝐹𝑉𝐹𝐹)
2
− 4 (𝑄𝑁𝐹𝑄𝐹𝐹
𝑉𝑁𝐹𝑉𝐹𝐹)]
Equation F-10
𝜆2 = 0.5 [− (𝑄𝑁𝐹𝑉𝐹𝐹 + 𝑉𝑁𝐹(𝑄𝑁𝐹 + 𝑄𝐹𝐹)
𝑉𝑁𝐹𝑉𝐹𝐹) − √(
𝑄𝑁𝐹𝑉𝐹𝐹 + 𝑉𝑁𝐹(𝑄𝑁𝐹 + 𝑄𝐹𝐹)
𝑉𝑁𝐹𝑉𝐹𝐹)
2
− 4 (𝑄𝑁𝐹𝑄𝐹𝐹
𝑉𝑁𝐹𝑉𝐹𝐹)]
Equation F-11
𝐶𝑁𝐹,𝑜(𝑡𝑚,𝑛) = {
0, 𝑚 = 0𝐴𝑚𝑡
𝑉𝑁𝐹
(1,000𝑚𝑔
𝑔) + 𝐶𝑁𝐹(𝑡𝑚,𝑛−1) , 𝑛 > 0 𝑓𝑜𝑟 𝑎𝑙𝑙 𝑚 𝑤ℎ𝑒𝑟𝑒 𝑏𝑟𝑎𝑘𝑒 𝑗𝑜𝑏 𝑜𝑐𝑐𝑢𝑟𝑠
Equation F-12
𝐶𝐹𝐹,𝑜(𝑡𝑚,𝑛) = {0, 𝑚 = 0
𝐶𝐹𝐹(𝑡𝑚,𝑛−1) , 𝑓𝑜𝑟 𝑎𝑙𝑙 𝑛 𝑤ℎ𝑒𝑟𝑒 𝑚 > 0
Equation F-13
𝐶𝑁𝐹, 5-min TWA, t𝑚,𝑛=
(𝑘1,𝑡𝑚,𝑛−1
𝜆1𝑒𝜆1𝑡2 +
𝑘2,𝑡𝑚,𝑛−1
𝜆2𝑒𝜆2𝑡2) − (
𝑘1,𝑡𝑚,𝑛−1
𝜆1𝑒𝜆1𝑡1 +
𝑘2,𝑡𝑚,𝑛−1
𝜆2𝑒𝜆2𝑡1)
𝑡2 − 𝑡1
Equation F-14
𝐶𝐹𝐹, 5-min TWA, t𝑚,𝑛=
(𝑘3,𝑡𝑚,𝑛−1
𝜆1𝑒𝜆1𝑡2 +
𝑘4,𝑡𝑚,𝑛−1
𝜆2𝑒𝜆2𝑡2) − (
𝑘3,𝑡𝑚,𝑛−1
𝜆1𝑒𝜆1𝑡1 +
𝑘4,𝑡𝑚,𝑛−1
𝜆2𝑒𝜆2𝑡1)
𝑡2 − 𝑡1
After calculating all near-field/far-field 5-minute TWA exposures (i.e., 𝐶𝑁𝐹, 5-min TWA, t𝑚,𝑛 and
𝐶𝐹𝐹, 5-min TWA, t𝑚,𝑛) for each five-minute period of the work day, EPA calculated the near-field/far-field
8-hour TWA concentration and 1-hour TWA concentrations following the equations below:
Equation F-15
𝐶𝑁𝐹, 8-hr 𝑇𝑊𝐴 =∑ ∑ [𝐶𝑁𝐹,5-min 𝑇𝑊𝐴,𝑡𝑚,𝑛
× 0.0833 ℎ𝑟]11𝑛=0
7𝑚=0
8 ℎ𝑟
Equation F-16
𝐶𝑁𝐹, 8-hr 𝑇𝑊𝐴 =∑ ∑ [𝐶𝐹𝐹,5-min 𝑇𝑊𝐴,𝑡𝑚,𝑛
× 0.0833 ℎ𝑟]11𝑛=0
7𝑚=0
8 ℎ𝑟
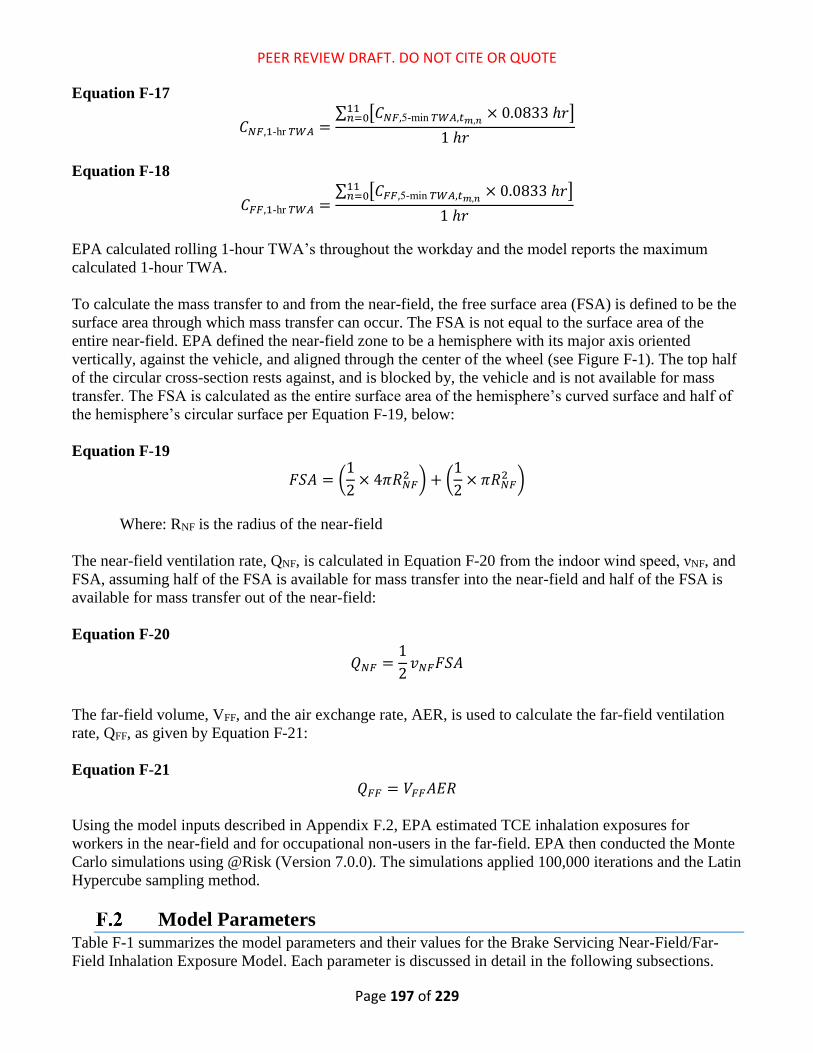
PEER REVIEW DRAFT. DO NOT CITE OR QUOTE
Page 197 of 229
Equation F-17
𝐶𝑁𝐹,1-hr 𝑇𝑊𝐴 =∑ [𝐶𝑁𝐹,5-min 𝑇𝑊𝐴,𝑡𝑚,𝑛
× 0.0833 ℎ𝑟]11𝑛=0
1 ℎ𝑟
Equation F-18
𝐶𝐹𝐹,1-hr 𝑇𝑊𝐴 =∑ [𝐶𝐹𝐹,5-min 𝑇𝑊𝐴,𝑡𝑚,𝑛
× 0.0833 ℎ𝑟]11𝑛=0
1 ℎ𝑟
EPA calculated rolling 1-hour TWA’s throughout the workday and the model reports the maximum
calculated 1-hour TWA.
To calculate the mass transfer to and from the near-field, the free surface area (FSA) is defined to be the
surface area through which mass transfer can occur. The FSA is not equal to the surface area of the
entire near-field. EPA defined the near-field zone to be a hemisphere with its major axis oriented
vertically, against the vehicle, and aligned through the center of the wheel (see Figure F-1). The top half
of the circular cross-section rests against, and is blocked by, the vehicle and is not available for mass
transfer. The FSA is calculated as the entire surface area of the hemisphere’s curved surface and half of
the hemisphere’s circular surface per Equation F-19, below:
Equation F-19
𝐹𝑆𝐴 = (1
2× 4𝜋𝑅𝑁𝐹
2 ) + (1
2× 𝜋𝑅𝑁𝐹
2 )
Where: RNF is the radius of the near-field
The near-field ventilation rate, QNF, is calculated in Equation F-20 from the indoor wind speed, νNF, and
FSA, assuming half of the FSA is available for mass transfer into the near-field and half of the FSA is
available for mass transfer out of the near-field:
Equation F-20
𝑄𝑁𝐹 =1
2𝑣𝑁𝐹𝐹𝑆𝐴
The far-field volume, VFF, and the air exchange rate, AER, is used to calculate the far-field ventilation
rate, QFF, as given by Equation F-21:
Equation F-21
𝑄𝐹𝐹 = 𝑉𝐹𝐹𝐴𝐸𝑅
Using the model inputs described in Appendix F.2, EPA estimated TCE inhalation exposures for
workers in the near-field and for occupational non-users in the far-field. EPA then conducted the Monte
Carlo simulations using @Risk (Version 7.0.0). The simulations applied 100,000 iterations and the Latin
Hypercube sampling method.
Model Parameters Table F-1 summarizes the model parameters and their values for the Brake Servicing Near-Field/Far-
Field Inhalation Exposure Model. Each parameter is discussed in detail in the following subsections.

PEER REVIEW DRAFT. DO NOT CITE OR QUOTE
Page 198 of 229
Table F-1. Summary of Parameter Values and Distributions Used in the Brake Servicing Near-Field/Far-Field Inhalation Exposure
Model
Input
Parameter Symbol Unit
Constant Model
Parameter Values Variable Model Parameter Values
Comments
Value Basis Lower
Bound
Upper
Bound Mode
Distributio
n Type
Far-field volume VFF m3 — — 206 70,679 3,769 Triangular
Distribution based on data
collected by CARB (CARB,
2000).
Air exchange
rate AER hr-1 — — 1 20 3.5 Triangular
(Demou et al., 2009) identifies
typical AERs of 1 hr-1 and 3 to 20
hr-1 for occupational settings
without and with mechanical
ventilation systems, respectively.
(Hellweg et al., 2009) identifies
average AERs for occupational
settings utilizing mechanical
ventilation systems to be between
3 and 20 hr-1. (Golsteijn et al.,
2014) indicates a characteristic
AER of 4 hr-1. Peer reviewers of
EPA’s 2013 TCE draft risk
assessment commented that
values around 2 to 5 hr-1 may be
more likely (SCG, 2013), in
agreement with (Golsteijn et al.,
2014). A triangular distribution is
used with the mode equal to the
midpoint of the range provided by
the peer reviewer (3.5 is the
midpoint of the range 2 to 5 hr-1).
Near-field indoor
wind speed vNF
ft/hr — — 0 23,882 — Lognormal Lognormal distribution fit to
commercial-type workplace data
from (Baldwin and Maynard,
1998). cm/s — — 0 202.2 — Lognormal
Near-field radius RNF m 1.5 — — — — Constant
Value Constant.
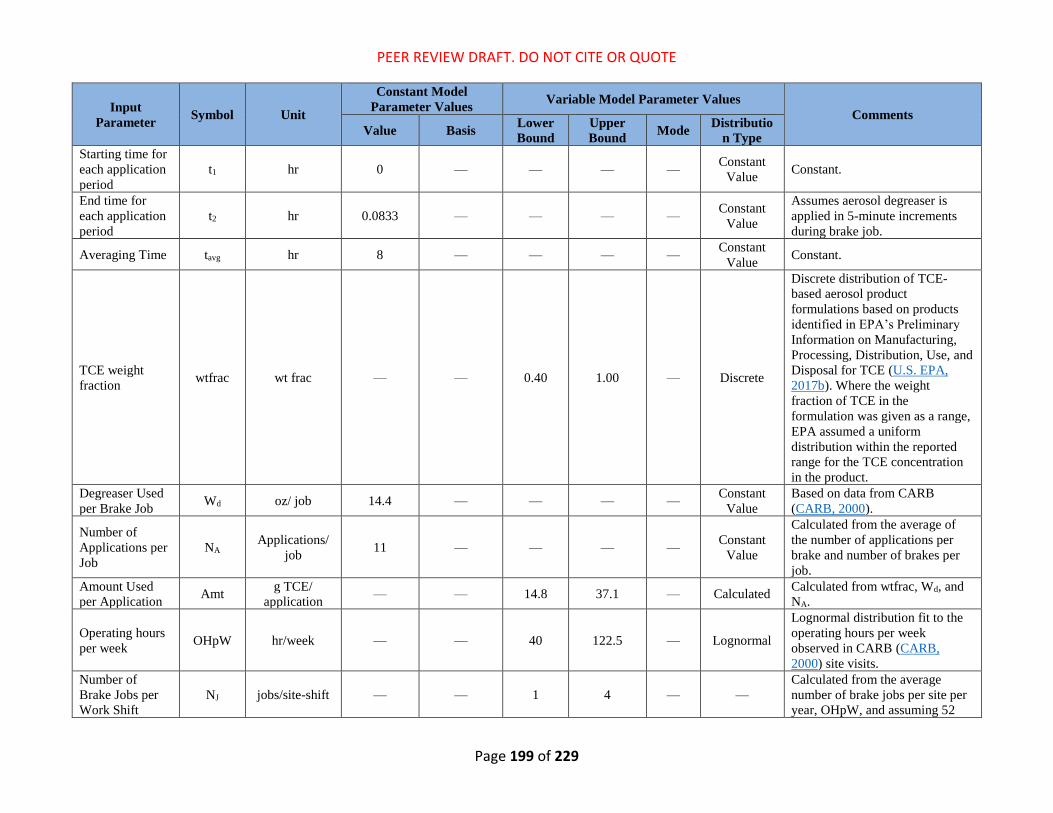
PEER REVIEW DRAFT. DO NOT CITE OR QUOTE
Page 199 of 229
Input
Parameter Symbol Unit
Constant Model
Parameter Values Variable Model Parameter Values
Comments
Value Basis Lower
Bound
Upper
Bound Mode
Distributio
n Type
Starting time for
each application
period
t1 hr 0 — — — — Constant
Value Constant.
End time for
each application
period
t2 hr 0.0833 — — — — Constant
Value
Assumes aerosol degreaser is
applied in 5-minute increments
during brake job.
Averaging Time tavg hr 8 — — — — Constant
Value Constant.
TCE weight
fraction wtfrac wt frac — — 0.40 1.00 — Discrete
Discrete distribution of TCE-
based aerosol product
formulations based on products
identified in EPA’s Preliminary
Information on Manufacturing,
Processing, Distribution, Use, and
Disposal for TCE (U.S. EPA,
2017b). Where the weight
fraction of TCE in the
formulation was given as a range,
EPA assumed a uniform
distribution within the reported
range for the TCE concentration
in the product.
Degreaser Used
per Brake Job Wd oz/ job 14.4 — — — —
Constant
Value
Based on data from CARB
(CARB, 2000).
Number of
Applications per
Job
NA Applications/
job 11 — — — —
Constant
Value
Calculated from the average of
the number of applications per
brake and number of brakes per
job.
Amount Used
per Application Amt
g TCE/
application — — 14.8 37.1 — Calculated
Calculated from wtfrac, Wd, and
NA.
Operating hours
per week OHpW hr/week — — 40 122.5 — Lognormal
Lognormal distribution fit to the
operating hours per week
observed in CARB (CARB,
2000) site visits.
Number of
Brake Jobs per
Work Shift
NJ jobs/site-shift — — 1 4 — —
Calculated from the average
number of brake jobs per site per
year, OHpW, and assuming 52

PEER REVIEW DRAFT. DO NOT CITE OR QUOTE
Page 200 of 229
Input
Parameter Symbol Unit
Constant Model
Parameter Values Variable Model Parameter Values
Comments
Value Basis Lower
Bound
Upper
Bound Mode
Distributio
n Type
operating weeks per year and 8
hours per work shift.
PEER REVIEW DRAFT. DO NOT CITE OR QUOTE
Page 201 of 229
F.2.1 Far-Field Volume
The far-field volume is based on information obtained from (CARB, 2000) from site visits of 137
automotive maintenance and repair shops in California. (CARB, 2000) indicated that shop volumes at
the visited sites ranged from 200 to 70,679 m3 with an average shop volume of 3,769 m3. Based on this
data EPA assumed a triangular distribution bound from 200 m3 to 70,679 m3 with a mode of 3,769 m3
(the average of the data from (CARB, 2000).
CARB measured the physical dimensions of the portion of the facility where brake service work was
performed at the visited facilities. CARB did not consider other areas of the facility, such as customer
waiting areas and adjacent storage rooms, if they were separated by a normally closed door. If the door
was normally open, then CARB did consider those areas as part of the measured portion where brake
servicing emissions could occur (CARB, 2000). CARB’s methodology for measuring the physical
dimensions of the visited facilities provides the appropriate physical dimensions needed to represent the
far-field volume in EPA’s model. Therefore, CARB’s reported facility volume data are appropriate for
EPA’s modeling purposes.
F.2.2 Air Exchange Rate
The air exchange rate (AER) is based on data from (Demou et al., 2009), (Hellweg et al., 2009),
(Golsteijn et al., 2014), and information received from a peer reviewer during the development of the
2014 TSCA Work Plan Chemical Risk Assessment Trichloroethylene: Degreasing, Spot Cleaning and
Arts & Crafts Uses (SCG, 2013). (Demou et al., 2009) identifies typical AERs of 1 hr-1 and 3 to 20 hr-1
for occupational settings without and with mechanical ventilation systems, respectively. Similarly,
(Hellweg et al., 2009) identifies average AERs for occupational settings using mechanical ventilation
systems to vary from 3 to 20 hr-1. (Golsteijn et al., 2014) indicates a characteristic AER of 4 hr-1. The
risk assessment peer reviewer comments indicated that values around 2 to 5 hr-1 are likely (SCG, 2013),
in agreement with (Golsteijn et al., 2014) and the low end reported by (Demou et al., 2009) and
(Hellweg et al., 2009). Therefore, EPA used a triangular distribution with the mode equal to 3.5 hr-1, the
midpoint of the range provided by the risk assessment peer reviewer (3.5 is the midpoint of the range 2
to 5 hr-1), with a minimum of 1 hr-1, per (Demou et al., 2009) and a maximum of 20 hr-1 per (Demou et
al., 2009) and (Hellweg et al., 2009).
F.2.3 Near-Field Indoor Air Speed
(Baldwin and Maynard, 1998) measured indoor air speeds across a variety of occupational settings in the
United Kingdom. Fifty-five work areas were surveyed across a variety of workplaces.
EPA analyzed the air speed data from (Baldwin and Maynard, 1998) and categorized the air speed
surveys into settings representative of industrial facilities and representative of commercial facilities.
EPA fit separate distributions for these industrial and commercial settings and used the commercial
distribution for facilities performing aerosol degreasing or other aerosol applications.
EPA fit a lognormal distribution for both data sets as consistent with the authors observations that the air
speed measurements within a surveyed location were lognormally distributed and the population of the
mean air speeds among all surveys were lognormally distributed. Since lognormal distributions are
bound by zero and positive infinity, EPA truncated the distribution at the largest observed value among
all of the survey mean air speeds from (Baldwin and Maynard, 1998).
EPA fit the air speed surveys representative of commercial facilities to a lognormal distribution with the
following parameter values: mean of 10.853 cm/s and standard deviation of 7.883 cm/s. In the model,

PEER REVIEW DRAFT. DO NOT CITE OR QUOTE
Page 202 of 229
the lognormal distribution is truncated at a maximum allowed value of 202.2 cm/s (largest surveyed
mean air speed observed in (Baldwin and Maynard, 1998) to prevent the model from sampling values
that approach infinity or are otherwise unrealistically large.
(Baldwin and Maynard, 1998) only presented the mean air speed of each survey. The authors did not
present the individual measurements within each survey. Therefore, these distributions represent a
distribution of mean air speeds and not a distribution of spatially-variable air speeds within a single
workplace setting. However, a mean air speed (averaged over a work area) is the required input for the
model.
F.2.4 Near-Field Volume
EPA defined the near-field zone to be a hemisphere with its major axis oriented vertically, against the
vehicle, and aligned through the center of the wheel (see Figure F-1). The near-field volume is
calculated per Equation F-22. EPA defined a near-field radius (RNF) of 1.5 meters, approximately 4.9
feet, as an estimate of the working height of the wheel, as measured from the floor to the center of the
wheel.
Equation F-22
𝑉𝑁𝐹 =1
2×
4
3𝜋𝑅𝑁𝐹
3
F.2.5 Application Time
EPA assumed an average of 11 brake cleaner applications per brake job (see Section F.2.9). CARB
observed, from their site visits, that the visited facilities did not perform more than one brake job in any
given hour (CARB, 2000). Therefore, EPA assumed a brake job takes one hour to perform. Using an
assumed average of 11 brake cleaner applications per brake job and one hour to perform a brake job,
EPA calculates an average brake cleaner application frequency of once every five minutes (0.0833 hr).
EPA models an average brake job of having no brake cleaner application during its first five minutes
and then one brake cleaner application per each subsequent 5-minute period during the one-hour brake
job.
F.2.6 Averaging Time
EPA was interested in estimating 8-hr TWAs for use in risk calculations; therefore, a constant averaging
time of eight hours was used.
F.2.7 Trichloroethylene Weight Fraction
EPA reviewed the Preliminary Information on Manufacturing, Processing, Distribution, Use, and
Disposal: Trichloroethylene report (U.S. EPA, 2017b) for aerosol degreasers that contain TCE. EPA
(2017) identifies 16 aerosol degreaser products that overall range in TCE content from 40 to 100 weight
percent. The identified aerosol degreasers include a brake cleaner as well as general purpose degreasers,
machine cleaners, electronic/electrical parts cleaners, and a mold cleaner. EPA includes all of these
aerosol degreasers in the estimation of TCE content as: 1) automotive maintenance and repair facilities
may use different degreaser products interchangeably as observed by (CARB, 2000); and 2) EPA uses
this brake servicing model as an exposure scenario representative of all commercial-type aerosol
degreaser applications.
EPA used a discrete distribution to model the TCE weight fraction based on the number of occurrences
of each product type. In some instances, the concentration of TCE was reported as a range. For these
product types, EPA used a uniform distribution to model the TCE weight fraction within the product

PEER REVIEW DRAFT. DO NOT CITE OR QUOTE
Page 203 of 229
type. Table F-2 provides a summary of the reported TCE content reported in the safety data sheets
identified in (U.S. EPA, 2017b), the number of occurrences of each product type, and the fractional
probability of each product type.
Table F-2. Summary of Trichloroethylene-Based Aerosol Degreaser Formulations
Name of Aerosol
Degreaser Product
Identified in (U.S. EPA,
2017b)
Trichloroethylene
Weight Percent
Number of
Occurrences
Fractional
Probability
C-60 Solvent Degreaser 90-100% 1 0.063
Fusing Machine Cleaner 40-60% 1 0.063
Solvent Degreaser > 90% 1 0.063
Electro Blast 90-100% 1 0.063
Electro Solv 90-100% 1 0.063
Pro Tools NF Solvent
Degreaser 60-100% 1 0.063
Aerosolve II >90% 1 0.063
Power Solv II 90-100% 1 0.063
Zep 45 40-50% 1 0.063
Super Solv 90-100% 1 0.063
Parts Cleaner 45-55% 1 0.063
Electronic Contact Cleaner &
Protectant - Aerosol 97% 1 0.063
Flash Free Electrical Degreaser 98% 1 0.063
Chlorinated Brake & Parts
Cleaner – Aerosol 98% 1 0.063
MR 351 - Mold Cleaner 69% 1 0.063
C-60 Solvent [TCE Cleaner]
Degreaser 90-100% 1 0.063
Total 16 1.000
F.2.8 Volume of Degreaser Used per Brake Job
(CARB, 2000) assumed that brake jobs require 14.4 oz of aerosol product. EPA did not identify other
information to estimate the volume of aerosol product per job; therefore, EPA used a constant volume of
14.4 oz per brake job based on (CARB, 2000).
F.2.9 Number of Applications per Brake Job
Workers typically apply the brake cleaner before, during, and after brake disassembly. Workers may
also apply the brake cleaner after brake reassembly as a final cleaning process (CARB, 2000).
Therefore, EPA assumed a worker applies a brake cleaner three or four times per wheel. Since a brake
job can be performed on either one axle or two axles (CARB, 2000), EPA assumed a brake job may
involve either two or four wheels. Therefore, the number of brake cleaner (aerosol degreaser)
applications per brake job can range from six (3 applications/brake x 2 brakes) to 16 (4
applications/brake x 4 brakes). EPA assumed a constant number of applications per brake job based on
the midpoint of this range of 11 applications per brake job.
PEER REVIEW DRAFT. DO NOT CITE OR QUOTE
Page 204 of 229
F.2.10 Amount of Trichloroethylene Used per Application
EPA calculated the amount of Trichloroethylene used per application using Equation F-23. The
calculated mass of Trichloroethylene used per application ranges from 14.8 to 37.1 grams.
Equation F-23
𝐴𝑚𝑡 =𝑊𝑑 × 𝑤𝑡𝑓𝑟𝑎𝑐 × 28.3495
𝑔𝑜𝑧
𝑁𝐴
Where:
Amt = Amount of TCE used per application (g/application);
Wd = Weight of degreaser used per brake job (oz/job);
Wtfrac = Weight fraction of TCE in aerosol degreaser (unitless); and
NA = Number of degreaser applications per brake job (applications/job).
F.2.11 Operating Hours per Week
(CARB, 2000) collected weekly operating hour data for 54 automotive maintenance and repair facilities.
The surveyed facilities included service stations (fuel retail stations), general automotive shops, car
dealerships, brake repair shops, and vehicle fleet maintenance facilities. The weekly operating hours of
the surveyed facilities ranged from 40 to 122.5 hr/week. EPA fit a lognormal distribution to the surveyed
weekly operating hour data. The resulting lognormal distribution has a mean of 16.943 and standard
deviation of 13.813, which set the shape of the lognormal distribution. EPA shifted the distribution to
the right such that its minimum value is 40 hr/week and set a truncation of 122.5 hr/week (the truncation
is set as 82.5 hr/week relative to the left shift of 40 hr/week).
F.2.12 Number of Brake Jobs per Work Shift
(CARB, 2000) visited 137 automotive maintenance and repair shops and collected data on the number of
brake jobs performed annually at each facility. CARB calculated an average of 936 brake jobs
performed per facility per year. EPA calculated the number of brake jobs per work shift using the
average number of jobs per site per year, the operating hours per week, and assuming 52 weeks of
operation per year and eight hours per work shift using Equation F-24 and rounding to the nearest
integer. The calculated number of brake jobs per work shift ranges from one to four.
Equation F-24
𝑁𝐽 =936
𝑗𝑜𝑏𝑠site-year
× 8ℎ𝑜𝑢𝑟𝑠𝑠ℎ𝑖𝑓𝑡
52𝑤𝑒𝑒𝑘𝑠
𝑦𝑟 × 𝑂𝐻𝑝𝑊
Where:
NJ = Number of brake jobs per work shift (jobs/site-shift); and
OHpW = Operating hours per week (hr/week).

PEER REVIEW DRAFT. DO NOT CITE OR QUOTE
Page 205 of 229
Appendix G Spot Cleaning Near-Field/Far-Field Inhalation Exposure
Model Approach and Parameters
This appendix presents the modeling approach and model equations used in the Spot Cleaning Near-
Field/Far-Field Inhalation Exposure Model. The model was developed through review of relevant
literature and consideration of existing EPA/OPPT exposure models. The model uses a near-field/far-
field approach (AIHA, 2009), where a vapor generation source located inside the near-field leads to the
evaporation of vapors into the near-field, and indoor air movements lead to the convection of vapors
between the near-field and far-field. Workers are assumed to be exposed to TCE vapor concentrations in
the near-field, while occupational non-users are exposed at concentrations in the far-field.
The model uses the following parameters to estimate exposure concentrations in the near-field and far-
field:
• Far-field size;
• Near-field size;
• Air exchange rate;
• Indoor air speed;
• Spot cleaner use rate;
• Vapor generation rate;
• Weight fraction of TCE in the spot cleaner; and
• Operating hours per day.
An individual model input parameter could either have a discrete value or a distribution of values.
EPA/OPPT assigned statistical distributions based on reasonably available literature data. A Monte
Carlo simulation (a type of stochastic simulation) was conducted to capture variability in the model
input parameters. The simulation was conducted using the Latin hypercube sampling method in @Risk
Industrial Edition, Version 7.0.0. The Latin hypercube sampling method is a statistical method for
generating a sample of possible values from a multi-dimensional distribution. Latin hypercube sampling
is a stratified method, meaning it guarantees that its generated samples are representative of the
probability density function (variability) defined in the model. EPA/OPPT performed the model at
100,000 iterations to capture the range of possible input values (i.e., including values with low
probability of occurrence).
Model results from the Monte Carlo simulation are presented as 95th and 50th percentile values. The
statistics were calculated directly in @Risk. The 95th percentile value was selected to represent a high-
end exposure, whereas the 50th percentile value was selected to represent a central tendency exposure
level. The following subsections detail the model design equations and parameters for the spot cleaning
model.
Model Design Equations Figure G-1 illustrates the near-field/far-field modeling approach as it was applied by EPA/OPPT to spot
cleaning facilities. As the figure shows, TCE vapors evaporate into the near-field (at evaporation rate G),
resulting in near-field exposures to workers at a concentration CNF. The concentration is directly
proportional to the amount of spot cleaner applied by the worker, who is standing in the near-field-zone
(i.e., the working zone). The volume of this zone is denoted by VNF. The ventilation rate for the near-
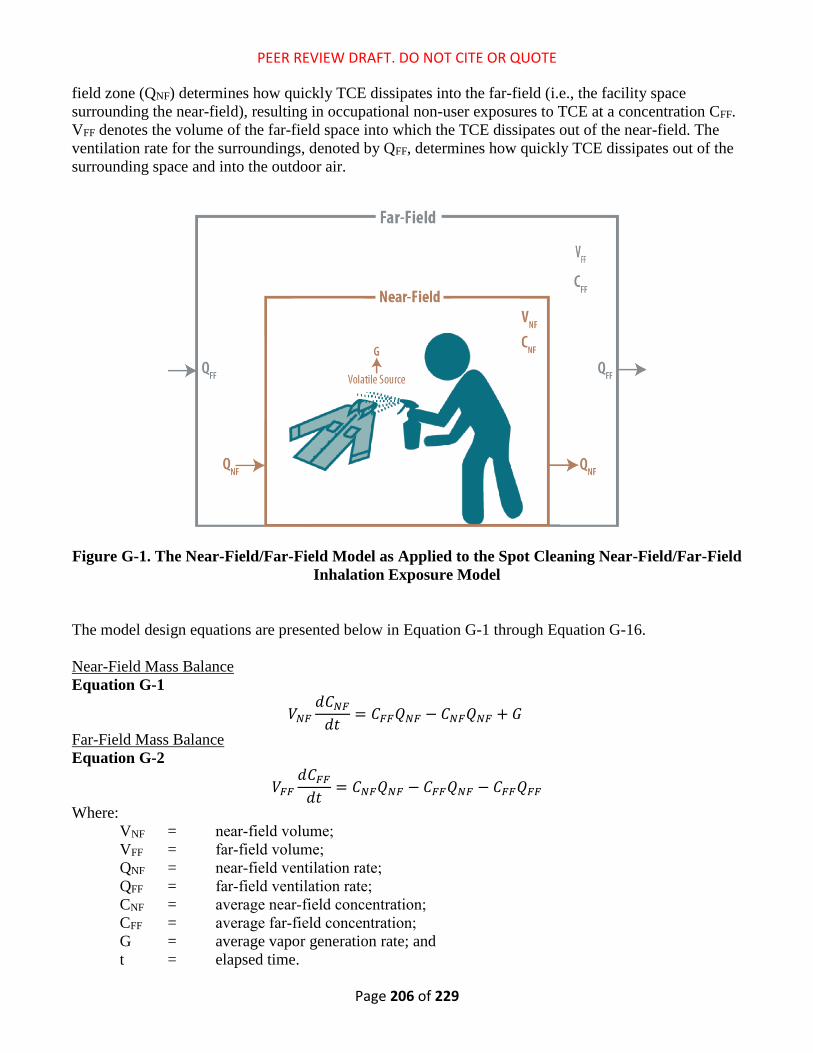
PEER REVIEW DRAFT. DO NOT CITE OR QUOTE
Page 206 of 229
field zone (QNF) determines how quickly TCE dissipates into the far-field (i.e., the facility space
surrounding the near-field), resulting in occupational non-user exposures to TCE at a concentration CFF.
VFF denotes the volume of the far-field space into which the TCE dissipates out of the near-field. The
ventilation rate for the surroundings, denoted by QFF, determines how quickly TCE dissipates out of the
surrounding space and into the outdoor air.
Figure G-1. The Near-Field/Far-Field Model as Applied to the Spot Cleaning Near-Field/Far-Field
Inhalation Exposure Model
The model design equations are presented below in Equation G-1 through Equation G-16.
Near-Field Mass Balance
Equation G-1
𝑉𝑁𝐹
𝑑𝐶𝑁𝐹
𝑑𝑡= 𝐶𝐹𝐹𝑄𝑁𝐹 − 𝐶𝑁𝐹𝑄𝑁𝐹 + 𝐺
Far-Field Mass Balance
Equation G-2
𝑉𝐹𝐹
𝑑𝐶𝐹𝐹
𝑑𝑡= 𝐶𝑁𝐹𝑄𝑁𝐹 − 𝐶𝐹𝐹𝑄𝑁𝐹 − 𝐶𝐹𝐹𝑄𝐹𝐹
Where:
VNF = near‐field volume;
VFF = far‐field volume;
QNF = near‐field ventilation rate;
QFF = far‐field ventilation rate;
CNF = average near‐field concentration;
CFF = average far‐field concentration;
G = average vapor generation rate; and
t = elapsed time.
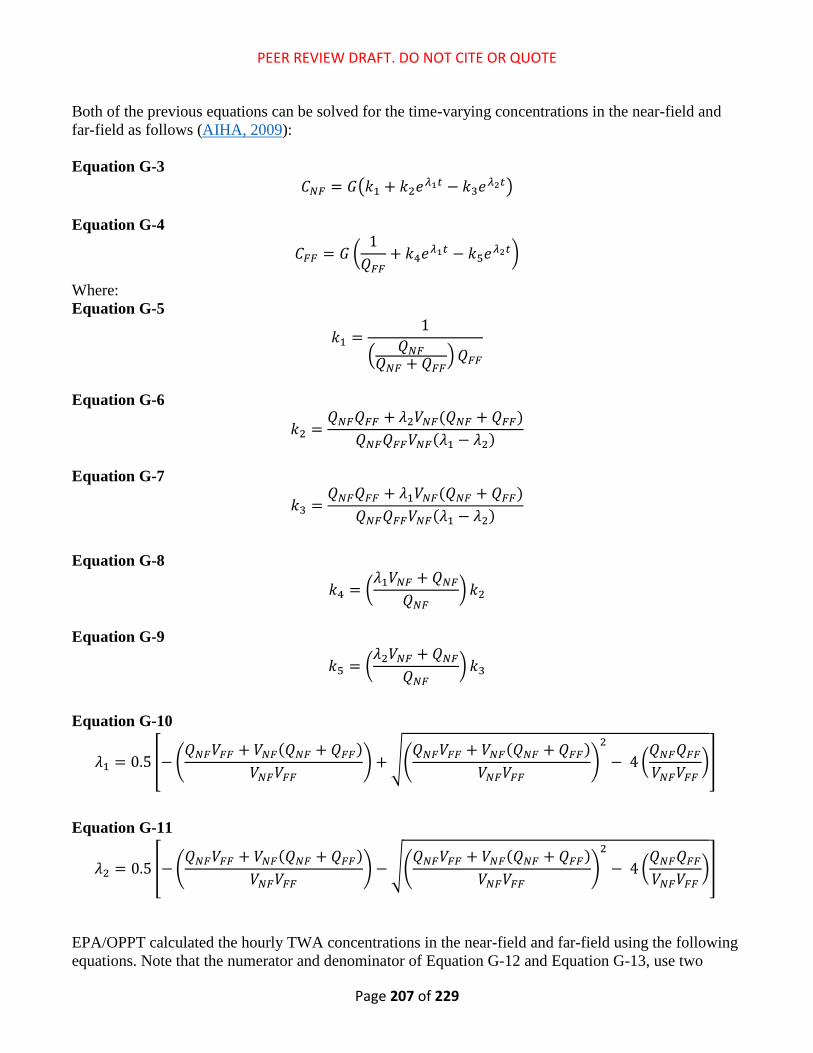
PEER REVIEW DRAFT. DO NOT CITE OR QUOTE
Page 207 of 229
Both of the previous equations can be solved for the time-varying concentrations in the near-field and
far-field as follows (AIHA, 2009):
Equation G-3
𝐶𝑁𝐹 = 𝐺(𝑘1 + 𝑘2𝑒𝜆1𝑡 − 𝑘3𝑒𝜆2𝑡)
Equation G-4
𝐶𝐹𝐹 = 𝐺 (1
𝑄𝐹𝐹+ 𝑘4𝑒𝜆1𝑡 − 𝑘5𝑒𝜆2𝑡)
Where:
Equation G-5
𝑘1 =1
(𝑄𝑁𝐹
𝑄𝑁𝐹 + 𝑄𝐹𝐹) 𝑄𝐹𝐹
Equation G-6
𝑘2 =𝑄𝑁𝐹𝑄𝐹𝐹 + 𝜆2𝑉𝑁𝐹(𝑄𝑁𝐹 + 𝑄𝐹𝐹)
𝑄𝑁𝐹𝑄𝐹𝐹𝑉𝑁𝐹(𝜆1 − 𝜆2)
Equation G-7
𝑘3 =𝑄𝑁𝐹𝑄𝐹𝐹 + 𝜆1𝑉𝑁𝐹(𝑄𝑁𝐹 + 𝑄𝐹𝐹)
𝑄𝑁𝐹𝑄𝐹𝐹𝑉𝑁𝐹(𝜆1 − 𝜆2)
Equation G-8
𝑘4 = (𝜆1𝑉𝑁𝐹 + 𝑄𝑁𝐹
𝑄𝑁𝐹) 𝑘2
Equation G-9
𝑘5 = (𝜆2𝑉𝑁𝐹 + 𝑄𝑁𝐹
𝑄𝑁𝐹) 𝑘3
Equation G-10
𝜆1 = 0.5 [− (𝑄𝑁𝐹𝑉𝐹𝐹 + 𝑉𝑁𝐹(𝑄𝑁𝐹 + 𝑄𝐹𝐹)
𝑉𝑁𝐹𝑉𝐹𝐹) + √(
𝑄𝑁𝐹𝑉𝐹𝐹 + 𝑉𝑁𝐹(𝑄𝑁𝐹 + 𝑄𝐹𝐹)
𝑉𝑁𝐹𝑉𝐹𝐹)
2
− 4 (𝑄𝑁𝐹𝑄𝐹𝐹
𝑉𝑁𝐹𝑉𝐹𝐹)]
Equation G-11
𝜆2 = 0.5 [− (𝑄𝑁𝐹𝑉𝐹𝐹 + 𝑉𝑁𝐹(𝑄𝑁𝐹 + 𝑄𝐹𝐹)
𝑉𝑁𝐹𝑉𝐹𝐹) − √(
𝑄𝑁𝐹𝑉𝐹𝐹 + 𝑉𝑁𝐹(𝑄𝑁𝐹 + 𝑄𝐹𝐹)
𝑉𝑁𝐹𝑉𝐹𝐹)
2
− 4 (𝑄𝑁𝐹𝑄𝐹𝐹
𝑉𝑁𝐹𝑉𝐹𝐹)]
EPA/OPPT calculated the hourly TWA concentrations in the near-field and far-field using the following
equations. Note that the numerator and denominator of Equation G-12 and Equation G-13, use two
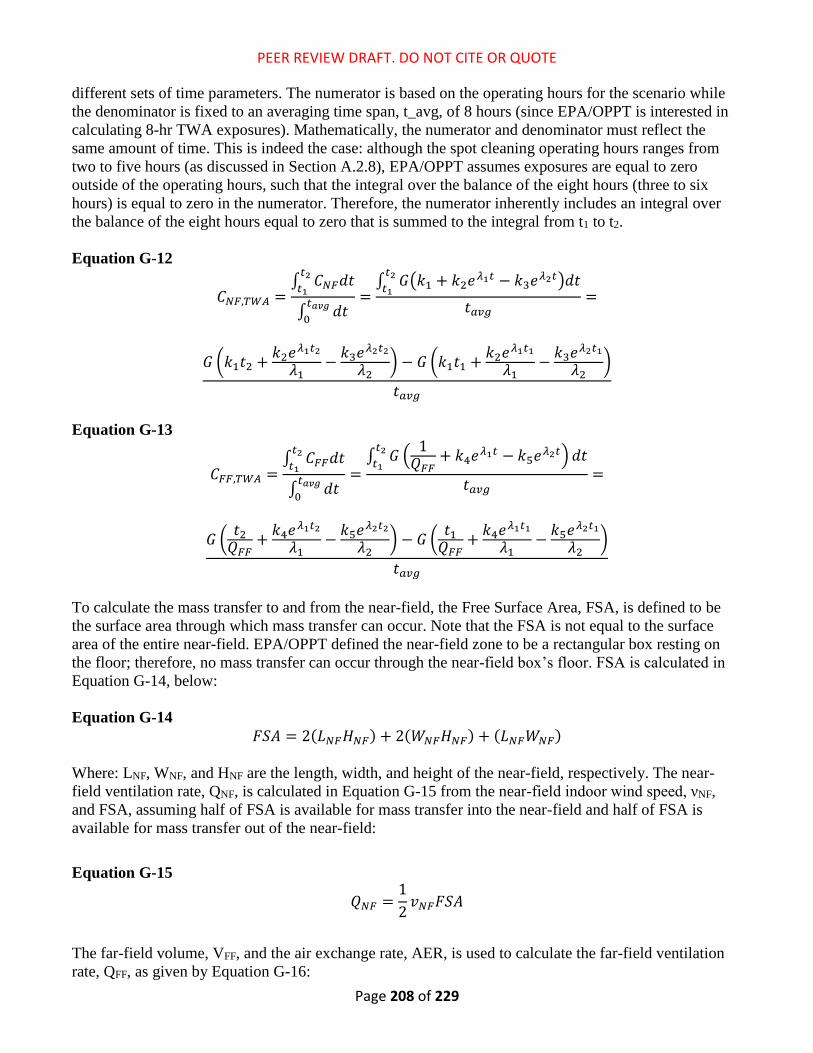
PEER REVIEW DRAFT. DO NOT CITE OR QUOTE
Page 208 of 229
different sets of time parameters. The numerator is based on the operating hours for the scenario while
the denominator is fixed to an averaging time span, t_avg, of 8 hours (since EPA/OPPT is interested in
calculating 8-hr TWA exposures). Mathematically, the numerator and denominator must reflect the
same amount of time. This is indeed the case: although the spot cleaning operating hours ranges from
two to five hours (as discussed in Section A.2.8), EPA/OPPT assumes exposures are equal to zero
outside of the operating hours, such that the integral over the balance of the eight hours (three to six
hours) is equal to zero in the numerator. Therefore, the numerator inherently includes an integral over
the balance of the eight hours equal to zero that is summed to the integral from t1 to t2.
Equation G-12
𝐶𝑁𝐹,𝑇𝑊𝐴 =∫ 𝐶𝑁𝐹𝑑𝑡
𝑡2
𝑡1
∫ 𝑑𝑡𝑡𝑎𝑣𝑔
0
=∫ 𝐺(𝑘1 + 𝑘2𝑒𝜆1𝑡 − 𝑘3𝑒𝜆2𝑡)𝑑𝑡
𝑡2
𝑡1
𝑡𝑎𝑣𝑔=
𝐺 (𝑘1𝑡2 +𝑘2𝑒𝜆1𝑡2
𝜆1−
𝑘3𝑒𝜆2𝑡2
𝜆2) − 𝐺 (𝑘1𝑡1 +
𝑘2𝑒𝜆1𝑡1
𝜆1−
𝑘3𝑒𝜆2𝑡1
𝜆2)
𝑡𝑎𝑣𝑔
Equation G-13
𝐶𝐹𝐹,𝑇𝑊𝐴 =∫ 𝐶𝐹𝐹𝑑𝑡
𝑡2
𝑡1
∫ 𝑑𝑡𝑡𝑎𝑣𝑔
0
=∫ 𝐺 (
1𝑄𝐹𝐹
+ 𝑘4𝑒𝜆1𝑡 − 𝑘5𝑒𝜆2𝑡) 𝑑𝑡𝑡2
𝑡1
𝑡𝑎𝑣𝑔=
𝐺 (𝑡2
𝑄𝐹𝐹+
𝑘4𝑒𝜆1𝑡2
𝜆1−
𝑘5𝑒𝜆2𝑡2
𝜆2) − 𝐺 (
𝑡1
𝑄𝐹𝐹+
𝑘4𝑒𝜆1𝑡1
𝜆1−
𝑘5𝑒𝜆2𝑡1
𝜆2)
𝑡𝑎𝑣𝑔
To calculate the mass transfer to and from the near-field, the Free Surface Area, FSA, is defined to be
the surface area through which mass transfer can occur. Note that the FSA is not equal to the surface
area of the entire near-field. EPA/OPPT defined the near-field zone to be a rectangular box resting on
the floor; therefore, no mass transfer can occur through the near-field box’s floor. FSA is calculated in
Equation G-14, below:
Equation G-14
𝐹𝑆𝐴 = 2(𝐿𝑁𝐹𝐻𝑁𝐹) + 2(𝑊𝑁𝐹𝐻𝑁𝐹) + (𝐿𝑁𝐹𝑊𝑁𝐹)
Where: LNF, WNF, and HNF are the length, width, and height of the near-field, respectively. The near-
field ventilation rate, QNF, is calculated in Equation G-15 from the near-field indoor wind speed, νNF,
and FSA, assuming half of FSA is available for mass transfer into the near-field and half of FSA is
available for mass transfer out of the near-field:
Equation G-15
𝑄𝑁𝐹 =1
2𝑣𝑁𝐹𝐹𝑆𝐴
The far-field volume, VFF, and the air exchange rate, AER, is used to calculate the far-field ventilation
rate, QFF, as given by Equation G-16:
PEER REVIEW DRAFT. DO NOT CITE OR QUOTE
Page 209 of 229
Equation G-16
𝑄𝐹𝐹 = 𝑉𝐹𝐹𝐴𝐸𝑅
Using the model inputs in Table H-1, EPA/OPPT estimated TCE inhalation exposures for workers in the
near-field and for occupational bystanders in the far-field. EPA/OPPT then conducted the Monte Carlo
simulations using @Risk (Version 7.0.0). The simulations applied 100,000 iterations and the Latin
hypercube sampling method.
Model Parameters Table G-1 summarizes the model parameters and their values for the Spot Cleaning Near-Field/Far-Field
Exposure Model. Each parameter is discussed in detail in the following subsections.
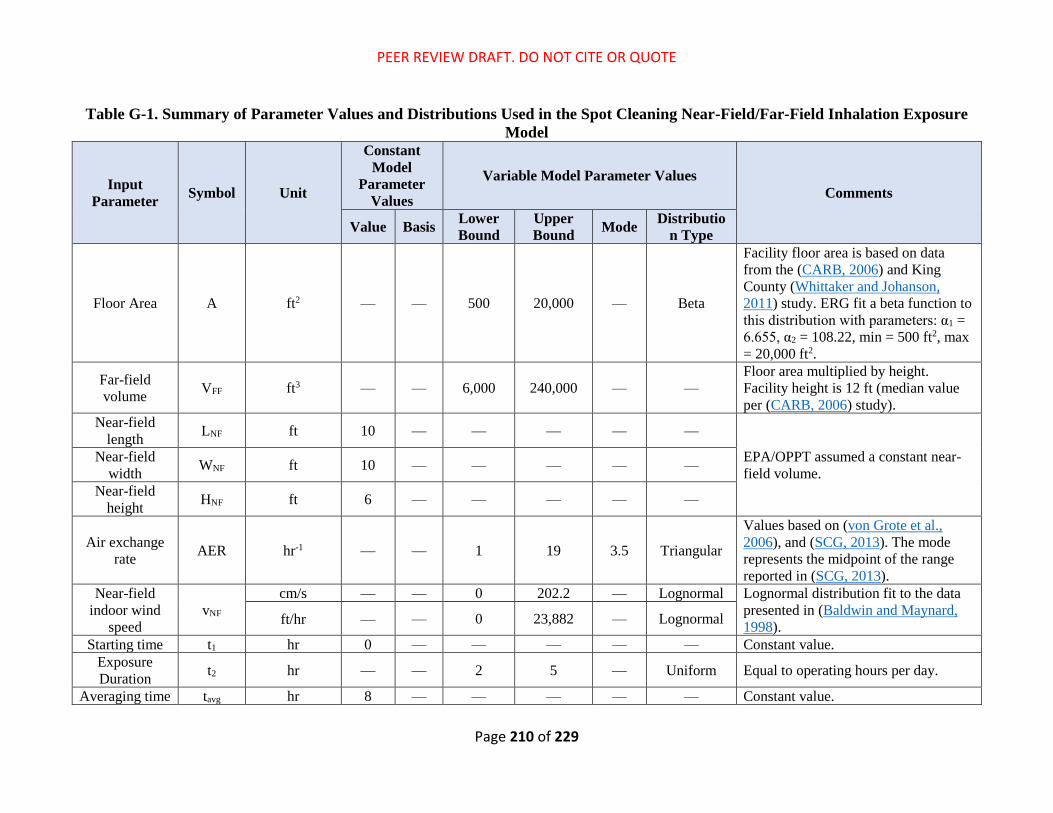
PEER REVIEW DRAFT. DO NOT CITE OR QUOTE
Page 210 of 229
Table G-1. Summary of Parameter Values and Distributions Used in the Spot Cleaning Near-Field/Far-Field Inhalation Exposure
Model
Input
Parameter Symbol Unit
Constant
Model
Parameter
Values
Variable Model Parameter Values
Comments
Value Basis Lower
Bound
Upper
Bound Mode
Distributio
n Type
Floor Area A ft2 — — 500 20,000 — Beta
Facility floor area is based on data
from the (CARB, 2006) and King
County (Whittaker and Johanson,
2011) study. ERG fit a beta function to
this distribution with parameters: α1 =
6.655, α2 = 108.22, min = 500 ft2, max
= 20,000 ft2.
Far-field
volume VFF ft3 — — 6,000 240,000 — —
Floor area multiplied by height.
Facility height is 12 ft (median value
per (CARB, 2006) study).
Near-field
length LNF ft 10 — — — — —
EPA/OPPT assumed a constant near-
field volume.
Near-field
width WNF ft 10 — — — — —
Near-field
height HNF ft 6 — — — — —
Air exchange
rate AER hr-1 — — 1 19 3.5 Triangular
Values based on (von Grote et al.,
2006), and (SCG, 2013). The mode
represents the midpoint of the range
reported in (SCG, 2013).
Near-field
indoor wind
speed
vNF
cm/s — — 0 202.2 — Lognormal Lognormal distribution fit to the data
presented in (Baldwin and Maynard,
1998). ft/hr — — 0 23,882 — Lognormal
Starting time t1 hr 0 — — — — — Constant value.
Exposure
Duration t2 hr — — 2 5 — Uniform Equal to operating hours per day.
Averaging time tavg hr 8 — — — — — Constant value.
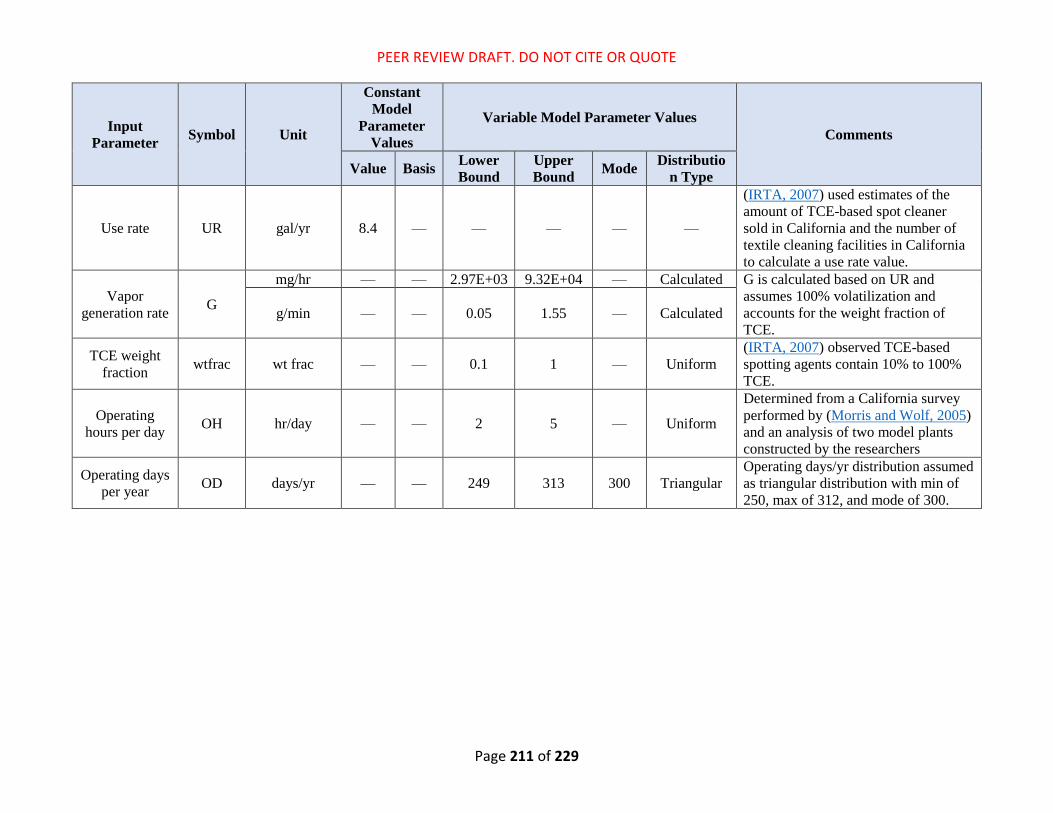
PEER REVIEW DRAFT. DO NOT CITE OR QUOTE
Page 211 of 229
Input
Parameter Symbol Unit
Constant
Model
Parameter
Values
Variable Model Parameter Values
Comments
Value Basis Lower
Bound
Upper
Bound Mode
Distributio
n Type
Use rate UR gal/yr 8.4 — — — — —
(IRTA, 2007) used estimates of the
amount of TCE-based spot cleaner
sold in California and the number of
textile cleaning facilities in California
to calculate a use rate value.
Vapor
generation rate G
mg/hr — — 2.97E+03 9.32E+04 — Calculated G is calculated based on UR and
assumes 100% volatilization and
accounts for the weight fraction of
TCE. g/min — — 0.05 1.55 — Calculated
TCE weight
fraction wtfrac wt frac — — 0.1 1 — Uniform
(IRTA, 2007) observed TCE-based
spotting agents contain 10% to 100%
TCE.
Operating
hours per day OH hr/day — — 2 5 — Uniform
Determined from a California survey
performed by (Morris and Wolf, 2005)
and an analysis of two model plants
constructed by the researchers
Operating days
per year OD days/yr — — 249 313 300 Triangular
Operating days/yr distribution assumed
as triangular distribution with min of
250, max of 312, and mode of 300.

PEER REVIEW DRAFT. DO NOT CITE OR QUOTE
Page 212 of 229
Input
Parameter Symbol Unit
Constant
Model
Parameter
Values
Variable Model Parameter Values
Comments
Value Basis Lower
Bound
Upper
Bound Mode
Distributio
n Type
Fractional
number of
operating days
that a worker
works
f Dimensionles
s 1 — 0.8 1.0 — Uniform
In BLS/Census data, the weighted
average worked hours per year and per
worker in the dry cleaning sector is
approximately 1,600 (i.e., 200 day/yr
at 8 hr/day).
The BLS/Census data weighted
average of 200 day/yr falls outside the
triangular distribution of operating
days and to account for lower exposure
frequencies and part-time workers,
EPA/OPPT defines f as a uniform
distribution ranging from 0.8 to 1.0.
The 0.8 value was derived from the
observation that the weighted average
of 200 day/yr worked (from
BLS/Census) is 80% of the standard
assumption that a full-time worker
works 250 day/yr. The maximum of
1.0 is appropriate as dry cleaners may
be family owned and operated and
some workers may work as much as
every operating day.

PEER REVIEW DRAFT. DO NOT CITE OR QUOTE
Page 213 of 229
G.2.1 Far-Field Volume
EPA/OPPT calculated the far-field volume by setting a distribution for the facility floor area and
multiplying the floor area by a facility height of 12 ft (median value per (CARB, 2006) study) as
discussed in more detail below.
The 2006 CARB California Dry Cleaning Industry Technical Assessment Report (CARB, 2006) and the
Local Hazardous Waste Management Program in King County A Profile of the Dry Cleaning Industry in
King County, Washington (Whittaker and Johanson, 2011) provide survey data on dry cleaning facility
floor area. The CARB (2006) study also provides survey data on facility height. Using survey results
from both studies, EPA/OPPT composed the following distribution of floor area. To calculate facility
volume, EPA/OPPT used the median facility height from the CARB (2006) study. The facility height
distribution in the CARB (2006) study has a low level of variability, so the median height value of 12 ft
presents a simple but reasonable approach to calculate facility volume combined with the floor area
distribution.
Table G-2. Composite Distribution of Dry Cleaning Facility Floor Areas
Floor Area
Value (ft2)
Percentile
(as
fraction) Source
20,000 1 King County
3,000 0.96 King County
2,000 0.84 King County
1,600 0.5 CARB 2006
1,100 0.1 CARB 2006
500 0 CARB 2006
EPA/OPPT fit a beta function to this distribution with parameters: α1 = 6.655, α2 = 108.22, min = 500
ft2, max = 20,000 ft2.
G.2.2 Near-Field Volume
EPA/OPPT assumed a near-field of constant dimensions of 10 ft wide by 10 ft long by 6 ft high
resulting in a total volume of 600 ft3.
G.2.3 Air Exchange Rate
(von Grote et al., 2006) indicated typical air exchange rates (AERs) of 5 to 19 hr-1 for dry cleaning
facilities in Germany. (Klein and Kurz, 1994) indicated AERs of 1 to 19 hr-1, with a mean of 8 hr-1 for
dry cleaning facilities in Germany. During the 2013 peer review of EPA/OPPT’s 2013 draft risk
assessment of TCE, a peer reviewer indicated that air exchange rate values around 2 to 5 hr-1 are likely
(SCG, 2013), in agreement with the low end of the ranges reported by von Grote et al. and (Klein and
Kurz, 1994). A triangular distribution is used with the mode equal to the midpoint of the range provided
by the peer reviewer (3.5 is the midpoint of the range 2 to 5 hr-1).
G.2.4 Near-Field Indoor Wind Speed
(Baldwin and Maynard, 1998) measured indoor air speeds across a variety of occupational settings in the
United Kingdom. Fifty-five work areas were surveyed across a variety of workplaces.
EPA/OPPT analyzed the air speed data from Baldwin and Maynard (1998) and categorizing the air
PEER REVIEW DRAFT. DO NOT CITE OR QUOTE
Page 214 of 229
speed surveys into settings representative of industrial facilities and representative of commercial
facilities. EPA/OPPT fit separate distributions for these industrial and commercial settings and used the
commercial distribution for dry cleaners (including other textile cleaning facilities that conduct spot
cleaning).
EPA/OPPT fit a lognormal distribution for both data sets as consistent with the authors observations that
the air speed measurements within a surveyed location were lognormally distributed and the population
of the mean air speeds among all surveys were lognormally distributed. Since lognormal distributions
are bound by zero and positive infinity, EPA/OPPT truncated the distribution at the largest observed
value among all of the survey mean air speeds from Baldwin and Maynard (1998).
The air speed surveys representative of commercial facilities were fit to a lognormal distribution with
the following parameter values: mean of 10.853 cm/s and standard deviation of 7.883 cm/s. In the
model, the lognormal distribution is truncated at a maximum allowed value of 202.2 cm/s (largest
surveyed mean air speed observed in Baldwin and Maynard (1998)) to prevent the model from sampling
values that approach infinity or are otherwise unrealistically large.
Baldwin and Maynard (1998) only presented the mean air speed of each survey. The authors did not
present the individual measurements within each survey. Therefore, these distributions represent a
distribution of mean air speeds and not a distribution of spatially-variable air speeds within a single
workplace setting. However, a mean air speed (averaged over a work area) is the required input for the
model.
G.2.5 Averaging Time
EPA/OPPT is interested in estimating 8-hr TWAs for use in risk calculations; therefore, a constant
averaging time of eight hours was used.
G.2.6 Use Rate
EPA/OPPT used a top-down approach to estimate use rate based on the volume of TCE-based spotting
agent sold in California and the number of textile cleaning facilities in California.
(IRTA, 2007) estimated 42,000 gal of TCE-based spotting agents are sold in California annually and
there are approximately 5,000 textile cleaning facilities in California. This results in an average use rate
of 8.4 gal/site-year of TCE-based spotting agents.
The study authors’ review of safety data sheets identified TCE-based spotting agents contain 10% to
100% TCE.
G.2.7 Vapor Generation Rate
EPA/OPPT set the vapor generation rate for spot cleaning (G) equal to the use rate of TCE with
appropriate unit conversions. EPA/OPPT multiplied the spotting agent use rate by the weight fraction of
TCE (which ranges from 0.1 to 1) and assumed all TCE applied to the garment evaporates. EPA used a
density of 1.46 g/cm3 (U.S. EPA, 2018c). To calculate an hourly vapor generation rate, EPA/OPPT
divided the annual use rate by the number of operating days and the number of operating hours selected
from their respective distributions for each iteration.
G.2.8 Operating Hours
(Morris and Wolf, 2005) surveyed dry cleaners in California, including their spotting labor. The authors
developed two model plants: a small PERC dry cleaner that cleans 40,000 lb of clothes annually; and a

PEER REVIEW DRAFT. DO NOT CITE OR QUOTE
Page 215 of 229
large PERC dry cleaner that cleans 100,000 lb of clothes annually. The authors modeled the small dry
cleaner with a spotting labor of 2.46 hr/day and the large dry cleaner with a spotting labor of 5 hr/day.
EPA/OPPT models a uniform distribution of spotting labor varying from 2 to 5 hr/day.
G.2.9 Operating Days
EPA modeled the operating days per year using a triangular distribution from 250 to 312 days per year
with a mode of 300 days per year17. The low-end operating days per year is based on the assumption that
at a minimum the dry cleaner operates five days per week and 50 weeks per year. The mode of 300 days
per year is based on an assumption that most dry cleaners will operate six days per week and 50 weeks
per year. The high-end value is based on the assumption that the dry cleaner would operate at most six
days per week and 52 weeks per year, assuming the dry cleaner is open year-round.
G.2.10 Fractional Number of Operating Days that a Worker Works
To account for lower exposure frequencies and part-time workers, EPA/OPPT defines a fractional days
of exposure as a uniform distribution ranging from 0.8 to 1.0. EPA expects a worker’s annual working
days may be less than the operating days based on BLS/Census data that showed the weighted average
worked hours per year and per worker in the dry cleaning sector is approximately 1,600 (i.e., 200 day/yr
at 8 hr/day) which falls outside the range of operating days per year used in the model (250 to 312
day/yr with mode of 300 day/yr).
The low end of the range, 0.8, was derived from the observation that the weighted average of 200 day/yr
worked (from BLS/Census) is 80% of the standard assumption that a full-time worker works 250 day/yr.
The maximum of 1.0 is appropriate as dry cleaners may be family owned and operated and some
workers may work as much as every operating day. EPA defines the exposure frequency as the number
of operating days (250 to 312 day/yr) multiplied by the fractional days of exposure (0.8 to 1.0).
17 For modeling purposes, the minimum value was set to 249 days per year and the maximum to 313 days per year; however, these values have a probability of zero; therefore, the true range is from 250 to 312 days per year.
PEER REVIEW DRAFT. DO NOT CITE OR QUOTE
Page 216 of 229
Appendix H Dermal Exposure Assessment Method
This method was developed through review of relevant literature and consideration of existing exposure
models, such as EPA/OPPT models and the European Centre for Ecotoxicology and Toxicology of
Chemicals Targeted Risk Assessment (ECETOC TRA).
Incorporating the Effects of Evaporation
H.1.1 Modification of EPA/OPPT Models
Current EPA/OPPT dermal models do not incorporate the evaporation of material from the dermis. The
dermal potential dose rate, Dexp (mg/day), is calculated as (U.S. EPA, 2013):
Equation H-1
𝑫𝒆𝒙𝒑 = 𝑺 × 𝑸𝒖 × 𝒀𝒅𝒆𝒓𝒎 × 𝑭𝑻
Where:
S is the surface area of contact (cm2)
Qu is the quantity remaining on the skin (mg/cm2-event)
Yderm is the weight fraction of the chemical of interest in the liquid (0 ≤ Yderm ≤ 1)
FT is the frequency of events (integer number per day).
Here Qu does not represent the quantity remaining after evaporation, but represents the quantity
remaining after the bulk liquid has fallen from the hand that cannot be removed by wiping the skin (e.g.,
the film that remains on the skin).
One way to account for evaporation of a volatile solvent would be to add a multiplicative factor to the
EPA/OPPT model to represent the proportion of chemical that remains on the skin after evaporation, fabs
(0 ≤ fabs ≤ 1):
Equation H-2
𝑫𝒆𝒙𝒑 = 𝑺 × ( 𝑸𝒖 × 𝒇𝒂𝒃𝒔) × 𝒀𝒅𝒆𝒓𝒎 × 𝑭𝑻
This approach simply removes the evaporated mass from the calculation of dermal uptake. Evaporation
is not instantaneous, but the EPA/OPPT model already has a simplified representation of the kinetics of
dermal uptake.
Calculation of fabs
(Kasting and Miller, 2006) developed a diffusion model to describe the absorption of volatile
compounds applied to the skin. As of part of the model, Kasting and Miller define a ratio of the liquid
evaporation to absorption, . They derive the following definition of (which is dimensionless) at
steady-state:
PEER REVIEW DRAFT. DO NOT CITE OR QUOTE
Page 217 of 229
Equation H-3
𝝌 = 𝟑. 𝟒 × 𝟏𝟎−𝟑𝒖𝟎.𝟕𝟖𝑷𝒗𝒑𝑴𝑾𝟑.𝟒
𝑲𝒐𝒄𝒕𝟎.𝟕𝟔𝑺𝑾
Where:
u is the air velocity (m/s)
Koct is the octanol:water partition coefficient
MW is the molecular weight
SW is the water solubility (g/cm3)
Pvp is the vapor pressure (torr)
Chemicals for which >> 1 will largely evaporate from the skin surface, while chemicals for which
<< 1 will be largely absorbed; = 1 represents a balance between evaporation and absorption. Equation
H-3 is applicable to chemicals having a log octanol/water partition coefficient less than or equal to three
(log Kow ≤ 3)18. The equations that describe the fraction of the initial mass that is absorbed (or
evaporated) are rather complex (Equations 20 and 21 of (Kasting and Miller, 2006) but can be solved.
H.2.1 Small Doses (Case 1: M0 ≤ Msat)
In the small dose scenario, the initial dose (M0) is less than that required to saturate the upper layers of
the stratum corneum (M0 ≤ Msat), and the chemical is assumed to evaporate from the skin surface at a
rate proportional to its local concentration.
For this scenario, (FH, 2012) calculated the fraction of applied mass that is absorbed, based on the
infinite limit of time (i.e. infinite amount of time available for absorption after exposure):
Equation H-4
𝑓𝑎𝑏𝑠 =𝑚𝑎𝑏𝑠(∞)
𝑀0=
2 + 𝑓𝜒
2 + 2𝜒
Where:
mabs is the mass absorbed
M0 is the initial mass applied
f is the relative depth of penetration in the stratum corneum (f = 0.1 can be assumed)
is as previously defined
Note the simple algebraic solution in Equation H-4 provides a theoretical framework for the total mass
that is systemically absorbed after exposure to a small finite dose (mass/area) of chemical, which
depends on the relative rates of evaporation, permeation, and the initial load. At “infinite time”, the
applied dose is either absorbed or evaporated (FH, 2012). The finite dose is a good model for splash-
type exposure in the workplace (Frasch and Bunge, 2015).
The fraction of the applied mass that evaporates is simply the complement of that absorbed:
18 For simplification, (Kasting and Miller, 2006) does not consider the resistance of viable tissue layers underlying the stratum corneum, and the analysis is applicable to hydrophilic-to-moderately lipophilic chemicals. For small molecules, this limitation is equivalent to restricting the analysis to compounds where Log Kow ≤ 3.

PEER REVIEW DRAFT. DO NOT CITE OR QUOTE
Page 218 of 229
Equation H-5
𝑚𝑒𝑣𝑎𝑝(∞)
𝑀0= 1 − 𝑓𝑎𝑏𝑠 =
2𝜒 − 𝑓𝜒
2 + 2𝜒
Where:
mevap is the mass evaporated
The fraction absorbed can also be represented as a function of dimensionless time τ (Dt/h2), as shown in
Equation H-6:
Equation H-6
𝒇𝒂𝒃𝒔 =𝒎𝒂𝒃𝒔
𝑴𝟎= 𝟐 ∑
𝟏
𝝀𝒏
∞
𝒏=𝟏
(𝟏 − 𝒆−𝝀𝒏𝟐𝝉) (
𝝌𝟐 + 𝝀𝒏𝟐
𝝌𝟐 + 𝝀𝒏𝟐 + 𝝌
) ∙ (𝒄𝒐𝒔(𝟏 − 𝒇) 𝝀𝒏 − 𝒄𝒐𝒔𝝀𝒏
𝒇 ∙ 𝝀𝒏)
where the eigenvalues 𝜆𝑛 are the positive roots of the equation:
Equation H-7
𝝀𝒏 ∙ 𝐜𝐨𝐭 (𝝀𝒏) + 𝝌 = 𝟎
Equation H-6 and Equation H-7 must be solved analytically. It should be noted that the dimensionless
time τ is not a representation of exposure duration for a work activity; rather, it represents the amount of
time available for absorption after the initial exposure dose is applied. Since most dermal risk
assessments are typically more concerned with the quantity absorbed, rather than the time course of
absorption, the simple algebraic solution is recommended over the analytical solution.
H.2.2 Large Doses (Case 2: M0 > Msat)
For large doses (M0 > Msat), the chemical saturates the upper layers of the stratum corneum, and any
remaining amount forms a residual layer (or pool) on top of the skin. The pool acts as a reservoir to
replenish the top layers of the membrane as the chemical permeates into the lower layer. In this case,
absorption and evaporation approach steady-state values as the dose is increased, similar to an infinite
dose scenario.
The steady-state fraction absorbed can be approximated by Equation H-8:
Equation H-8
𝑓𝑎𝑏𝑠(∞) = 1
𝜒 + 1
Table H-1 presents the estimated absorbed fraction calculated using the steady-state approximation for
large doses (Equation H-8) for TCE.

PEER REVIEW DRAFT. DO NOT CITE OR QUOTE
Page 219 of 229
Table H-1. Estimated Fraction Evaporated and Absorbed (fabs) using Equation H-8
Chemical Name Trichloroethylene
CASRN 79-01-6
Molecular Formula C2HCl3
Molecular Weight (g/mol) 131.39
PVP (torr) 73.46
Universal gas constant, R
(L*atm/K*mol) 0.0821
Temperature, T (K) 303
Log Kow 2.42
Koct 263.0
Sw (g/L) 1.28
Sw (µg/cm3) 1280
u (m/s)a 0.1674
Evaporative Flux, χ 11.19
Fraction Evaporated 0.92
Fraction Absorbed 0.08
u (m/s)a 0.0878
Evaporative Flux, χ 6.76
Fraction Evaporated 0.87
Fraction Absorbed 0.13 a EPA used air speeds from (Baldwin and Maynard, 1998): the 50th percentile of industrial occupational environments of
16.74 cm/s is used for industrial settings and the 50th percentile of commercial occupational environments of 8.78 cm/s is
used for commercial settings.
Comparison of fabs to FRabs in the Consumer Exposure Model (CEM)
The Dermal Dose from Product Applied to Skin, Fraction Absorbed Model (P_DER2a) within CEM
Version 2.1.6 also uses a fraction absorbed parameter to estimate dermal dose. In this model, a fraction
absorbed parameter (FRabs) is applied to a potential dose (i.e., amount of chemical retained on the skin)
to estimate the amount of chemical that penetrates the skin. P_DER2a references (Frasch and Bunge,
2015) to estimate the fraction absorbed using a simple algebraic approximation at infinite time following
a transient exposure:
Equation H-9
𝐹𝑅𝑎𝑏𝑠 = 3 + 𝜒 [1 − exp (−𝑎1
𝑡𝑒𝑥𝑝
𝑡𝑙𝑎𝑔)]
3(1 + 𝜒)
Where:
𝜒 is the ratio of the evaporation rate from the stratum corneum (SC) surface to the dermal
absorption rate through the SC (unitless, see Equation 90 of CEM)
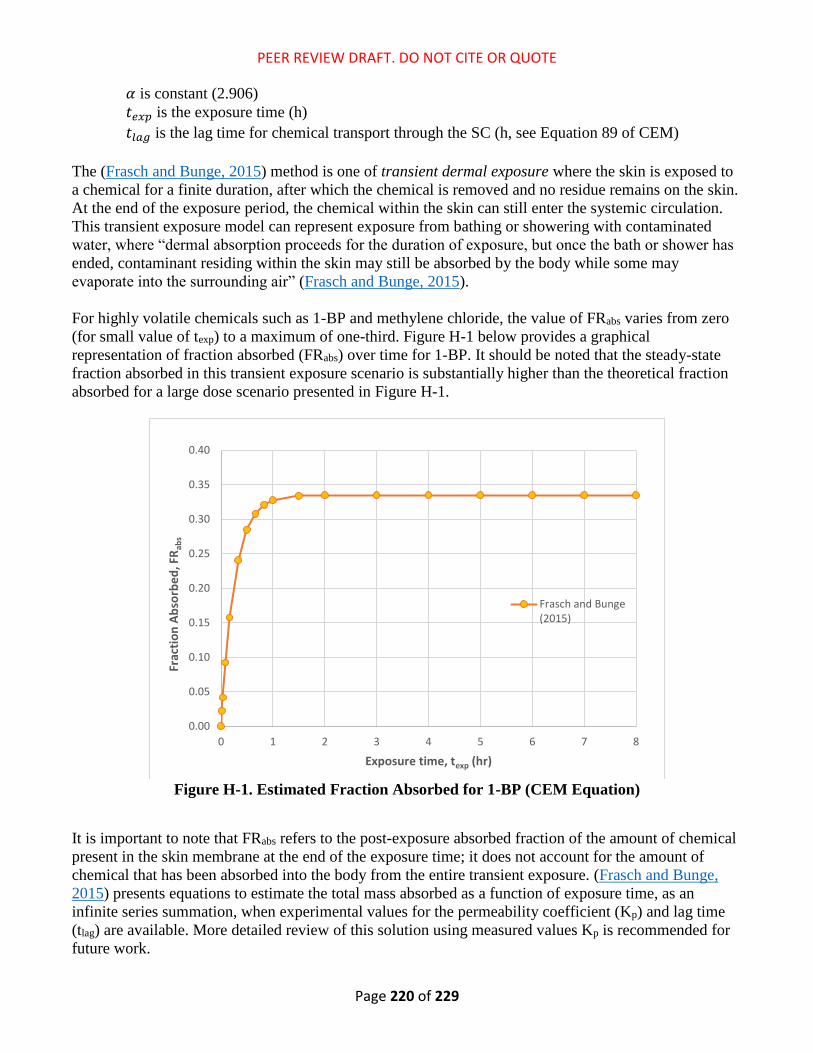
PEER REVIEW DRAFT. DO NOT CITE OR QUOTE
Page 220 of 229
𝛼 is constant (2.906)
𝑡𝑒𝑥𝑝 is the exposure time (h)
𝑡𝑙𝑎𝑔 is the lag time for chemical transport through the SC (h, see Equation 89 of CEM)
The (Frasch and Bunge, 2015) method is one of transient dermal exposure where the skin is exposed to
a chemical for a finite duration, after which the chemical is removed and no residue remains on the skin.
At the end of the exposure period, the chemical within the skin can still enter the systemic circulation.
This transient exposure model can represent exposure from bathing or showering with contaminated
water, where “dermal absorption proceeds for the duration of exposure, but once the bath or shower has
ended, contaminant residing within the skin may still be absorbed by the body while some may
evaporate into the surrounding air” (Frasch and Bunge, 2015).
For highly volatile chemicals such as 1-BP and methylene chloride, the value of FRabs varies from zero
(for small value of texp) to a maximum of one-third. Figure H-1 below provides a graphical
representation of fraction absorbed (FRabs) over time for 1-BP. It should be noted that the steady-state
fraction absorbed in this transient exposure scenario is substantially higher than the theoretical fraction
absorbed for a large dose scenario presented in Figure H-1.
Figure H-1. Estimated Fraction Absorbed for 1-BP (CEM Equation)
It is important to note that FRabs refers to the post-exposure absorbed fraction of the amount of chemical
present in the skin membrane at the end of the exposure time; it does not account for the amount of
chemical that has been absorbed into the body from the entire transient exposure. (Frasch and Bunge,
2015) presents equations to estimate the total mass absorbed as a function of exposure time, as an
infinite series summation, when experimental values for the permeability coefficient (Kp) and lag time
(tlag) are available. More detailed review of this solution using measured values Kp is recommended for
future work.
0.00
0.05
0.10
0.15
0.20
0.25
0.30
0.35
0.40
0 1 2 3 4 5 6 7 8
Frac
tio
n A
bso
rbe
d, F
Rab
s
Exposure time, texp (hr)
Frasch and Bunge(2015)

PEER REVIEW DRAFT. DO NOT CITE OR QUOTE
Page 221 of 229
Comparison of fabs to Experimental Values for 1-BP
Sections H.2 and H.3 present theoretical frameworks for estimating the fraction of volatile chemical
absorbed in finite dose, infinite dose, and transient exposure scenarios. It is unclear whether these
frameworks have been validated against measured data for the specific chemicals of current OPPT
interest. Where reasonably available, experimental studies and actual measurements of absorbed dose
are preferred over theoretical calculations.
In a 2011 study, Frasch et al. tested dermal absorption characteristics of 1-BP. For the finite dose
scenario, (Frasch et al., 2011) determined that unoccluded exposure resulted in less than 0.2 percent of
applied 1-BP dose penetrated the skin – a value substantially lower than the theoretical ~6 percent
absorbed estimated using Equation H-8. While this discrepancy is unexplained, the 2011 Frasch et al.
study recognized the large standard deviation of certain experimental results, and the difficulty of
spreading a small, rapidly evaporating dose of 1-BP evenly over the skin surface. (Frasch et al., 2011)
also raised the possibility that 1-BP may dehydrate the stratum corneum, thereby decreasing the skin
permeability after initial exposure.
Potential for Occlusion Occlusion refers to skin covered directly or indirectly by impermeable films or substances. Chemical
protective gloves are one of the most widely used forms of PPE intended to prevent skin exposure
to chemicals. Gloves can prevent the evaporation of volatile chemicals from the skin, resulting in
occlusion. Chemicals trapped in the glove may be broadly distributed over the skin (increasing S in
Equation H-1), or if not distributed within the glove, the chemical mass concentration on the skin at the
site of contamination may be maintained for prolonged periods of time (increasing Qu in Equation H-1).
Conceptually, occlusion is similar to the “infinite dose” study design used in in vitro and ex vivo dermal
penetration studies, in which the dermis is exposed to a large, continuous reservoir of chemical.
The protective measures could produce negative events due to the nature of occlusion, which
often causes stratum corneum hyper-hydration and reduces the protective barrier properties of the skin.
Many gloves do not resist the penetration of low molecular weight chemicals: those chemicals may enter
the glove and become trapped on the skin under occlusion for many hours. Breakthrough times for
glove materials are often underestimates of the true breakthrough times, because the measurements do
not take into account increased temperature and flexing of the material during use, which is not
accounted for in tests to determine breakthrough times. Occlusion by gloves raises skin temperature and
hydration leading to a reduction in its natural barrier properties. The impact of occlusion on dermal
uptake is complex: continuous contact with the chemical may degrade skin tissues, increasing the rate of
uptake, but continuous contact may also saturate the skin, slowing uptake (Dancik et al., 2015). Wearing
gloves which are internally contaminated can lead to increased systemic absorption due to increased area
of contact and reduced skin barrier properties, and repeated skin contact with chemicals can give higher
than expected exposure if evaporation of the carrier occurs and the concentration in contact with the skin
increases. These phenomena are dependent upon the chemical, the vehicle and environmental
conditions. It is probably not feasible to incorporate these sources of variability in a screening-level
population model of dermal exposure without chemical-specific studies.
Existing EPA/OPPT dermal models (Equation H-1) could theoretically be modified to account for the
increased surface area and/or increased chemical mass in the glove. This could be achieved through a
multiplicative variable (such as used in Equation H-2 to account for evaporative loss) or a change in the
default values of S and/or Qu. It may be reasonable to assume that the surface area of hand in contact
with the chemical, S, is the area of the whole hand owing to the distribution of chemical within the
PEER REVIEW DRAFT. DO NOT CITE OR QUOTE
Page 222 of 229
glove. Since Qu reflects the film that remains on the skin (and cannot be wiped off), a larger value
should be used to reflect that the liquid volume is trapped in the glove, rather than falling from the hand.
Alternatively, the product S Qu (cm2 mg/cm2-event) could be replaced by a single variable
representing the mass of chemical that deposits inside the glove per event, M (mg/event):
Equation H-10
𝐷𝑒𝑥𝑝 = 𝑀 × 𝑌𝑑𝑒𝑟𝑚 × 𝐹𝑇
(Garrod et al., 2001) surveyed contamination by involatile components of non-agricultural pesticide
products inside gloves across different job tasks and found that protective gloves were nearly always
contaminated inside. While the study does not describe the exact mechanism in which the contamination
occurs (e.g. via the cuff, permeation, or penetration through imperfections in glove materials), it
quantified inner glove exposure as “amount of product per unit time”, with a median value of 1.36 mg
product per minute, a 75th percentile value of 4.21 mg/min, and a 95th percentile value of 71.9 mg/min. It
is possible to use these values to calculate the value of M, i.e. mass of chemical that deposits inside the
glove, if the work activity duration is known.
Assuming an activity duration of one hour, the 50th and 95th percentile values translate to 81.6 mg and
4,314 mg of inner glove exposure. While these values may be used as default for M in Equation H-10,
EPA notes the significant difference between the 50th and 95th percentile deposition, with the 95th
percentile value being two times more conservative than the defaults for the EPA/OPPT 2-Hand Dermal
Exposure Model (where the product S Qu is 2,247 mg/event) that assumes that the air within open
areas of the building is well-mixed at the breathing level zone of the occupied space; environmental
conditions are maintained at 50% relative humidity and 23ºC (73ºF); there are no additional sources of
these pollutants; and there are no sinks or potential re-emitting sources within the space for these
pollutants. The assumption is also made that the emissions are not interacting with any pre-existing air
pollutants, since the chamber tests are done under clean conditions, which is not the case in the real
environment. Given the significant variability in inner glove exposure and lack of information on the
specific mechanism in which the inner glove contamination occurs, EPA addresses the occlusion
scenario in combination with other glove contamination and permeation factors through the use of a
protection factor, as described in the next section.
EPA does not expect occlusion scenarios to be a reasonable occurrence for all conditions of use.
Specifically, occlusion is not expected at sites using chemicals in closed systems where the only
potential of dermal exposure is during the connecting/disconnecting of hoses used for unloading/loading
of bulk containers (e.g., tank trucks or rail cars) or while collecting quality control samples including
manufacturing sites, repackaging sites, sites processing the chemical as a reactant, formulation sites, and
other similar industrial sites. Occlusion is also not expected to occur at highly controlled sites, such as
electronics and pharmaceuticals manufacturing sites, where, due to purity requirements, the use of
engineering controls is expected to limit potential dermal exposures. EPA also does not expect occlusion
at sites where contact with bulk liquid chemical is not expected such as aerosol degreasing sites where
workers are only expected to handle the aerosol cans containing the chemical and not the actual bulk
liquid chemical.
EPA expects occlusion to be a reasonable occurrence at sites where workers may come in contact with
bulk liquid chemical and handle the chemical in open systems. This includes conditions of use such as
vapor degreasing, cold cleaning, and dry cleaning where workers are expected to handle bulk chemical
during cleanout of spent solvent and addition of fresh solvent to equipment. Similarly, occlusion may
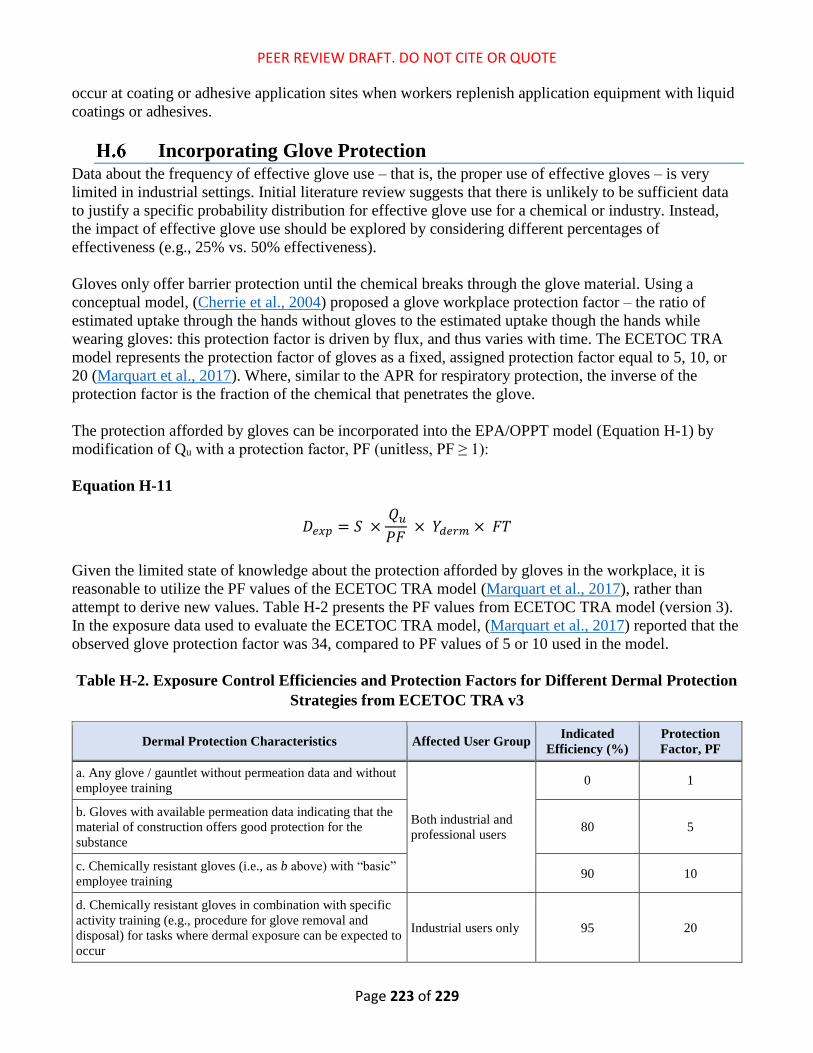
PEER REVIEW DRAFT. DO NOT CITE OR QUOTE
Page 223 of 229
occur at coating or adhesive application sites when workers replenish application equipment with liquid
coatings or adhesives.
Incorporating Glove Protection Data about the frequency of effective glove use – that is, the proper use of effective gloves – is very
limited in industrial settings. Initial literature review suggests that there is unlikely to be sufficient data
to justify a specific probability distribution for effective glove use for a chemical or industry. Instead,
the impact of effective glove use should be explored by considering different percentages of
effectiveness (e.g., 25% vs. 50% effectiveness).
Gloves only offer barrier protection until the chemical breaks through the glove material. Using a
conceptual model, (Cherrie et al., 2004) proposed a glove workplace protection factor – the ratio of
estimated uptake through the hands without gloves to the estimated uptake though the hands while
wearing gloves: this protection factor is driven by flux, and thus varies with time. The ECETOC TRA
model represents the protection factor of gloves as a fixed, assigned protection factor equal to 5, 10, or
20 (Marquart et al., 2017). Where, similar to the APR for respiratory protection, the inverse of the
protection factor is the fraction of the chemical that penetrates the glove.
The protection afforded by gloves can be incorporated into the EPA/OPPT model (Equation H-1) by
modification of Qu with a protection factor, PF (unitless, PF ≥ 1):
Equation H-11
𝐷𝑒𝑥𝑝 = 𝑆 × 𝑄𝑢
𝑃𝐹 × 𝑌𝑑𝑒𝑟𝑚 × 𝐹𝑇
Given the limited state of knowledge about the protection afforded by gloves in the workplace, it is
reasonable to utilize the PF values of the ECETOC TRA model (Marquart et al., 2017), rather than
attempt to derive new values. Table H-2 presents the PF values from ECETOC TRA model (version 3).
In the exposure data used to evaluate the ECETOC TRA model, (Marquart et al., 2017) reported that the
observed glove protection factor was 34, compared to PF values of 5 or 10 used in the model.
Table H-2. Exposure Control Efficiencies and Protection Factors for Different Dermal Protection
Strategies from ECETOC TRA v3
Dermal Protection Characteristics Affected User Group Indicated
Efficiency (%)
Protection
Factor, PF
a. Any glove / gauntlet without permeation data and without
employee training
Both industrial and
professional users
0 1
b. Gloves with available permeation data indicating that the
material of construction offers good protection for the
substance
80 5
c. Chemically resistant gloves (i.e., as b above) with “basic”
employee training 90 10
d. Chemically resistant gloves in combination with specific
activity training (e.g., procedure for glove removal and
disposal) for tasks where dermal exposure can be expected to
occur
Industrial users only 95 20
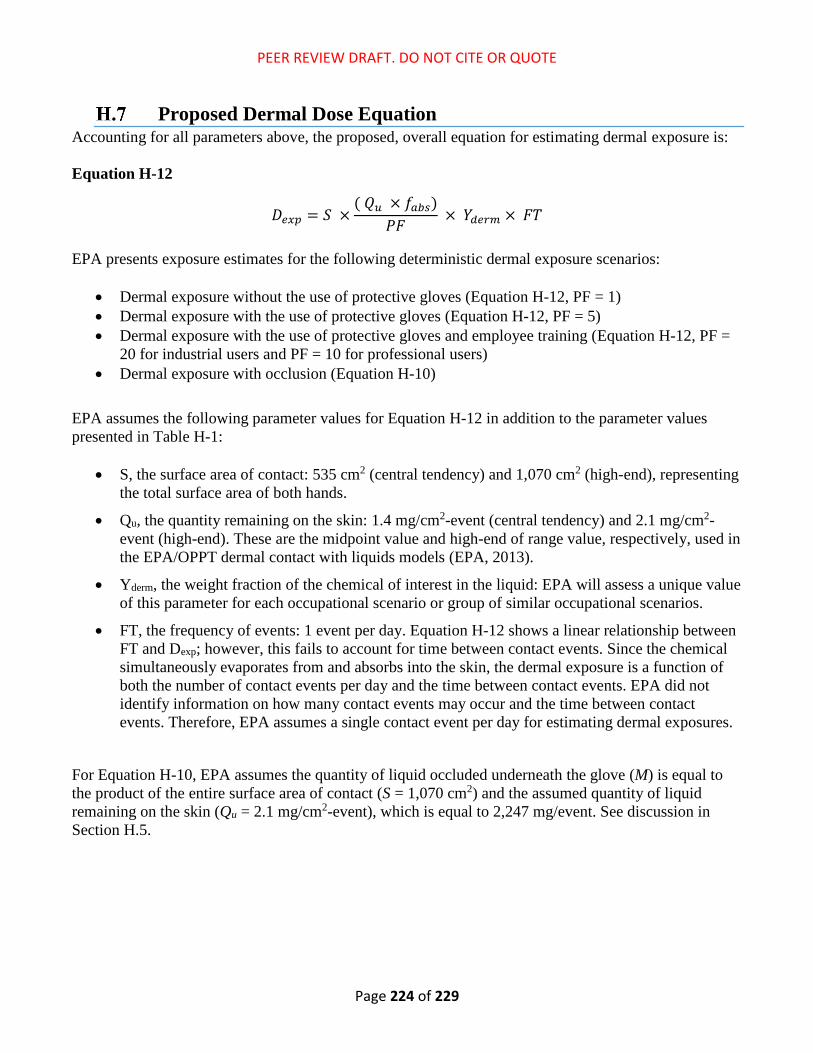
PEER REVIEW DRAFT. DO NOT CITE OR QUOTE
Page 224 of 229
Proposed Dermal Dose Equation Accounting for all parameters above, the proposed, overall equation for estimating dermal exposure is:
Equation H-12
𝐷𝑒𝑥𝑝 = 𝑆 ×( 𝑄𝑢 × 𝑓𝑎𝑏𝑠)
𝑃𝐹 × 𝑌𝑑𝑒𝑟𝑚 × 𝐹𝑇
EPA presents exposure estimates for the following deterministic dermal exposure scenarios:
• Dermal exposure without the use of protective gloves (Equation H-12, PF = 1)
• Dermal exposure with the use of protective gloves (Equation H-12, PF = 5)
• Dermal exposure with the use of protective gloves and employee training (Equation H-12, PF =
20 for industrial users and PF = 10 for professional users)
• Dermal exposure with occlusion (Equation H-10)
EPA assumes the following parameter values for Equation H-12 in addition to the parameter values
presented in Table H-1:
• S, the surface area of contact: 535 cm2 (central tendency) and 1,070 cm2 (high-end), representing
the total surface area of both hands.
• Qu, the quantity remaining on the skin: 1.4 mg/cm2-event (central tendency) and 2.1 mg/cm2-
event (high-end). These are the midpoint value and high-end of range value, respectively, used in
the EPA/OPPT dermal contact with liquids models (EPA, 2013).
• Yderm, the weight fraction of the chemical of interest in the liquid: EPA will assess a unique value
of this parameter for each occupational scenario or group of similar occupational scenarios.
• FT, the frequency of events: 1 event per day. Equation H-12 shows a linear relationship between
FT and Dexp; however, this fails to account for time between contact events. Since the chemical
simultaneously evaporates from and absorbs into the skin, the dermal exposure is a function of
both the number of contact events per day and the time between contact events. EPA did not
identify information on how many contact events may occur and the time between contact
events. Therefore, EPA assumes a single contact event per day for estimating dermal exposures.
For Equation H-10, EPA assumes the quantity of liquid occluded underneath the glove (M) is equal to
the product of the entire surface area of contact (S = 1,070 cm2) and the assumed quantity of liquid
remaining on the skin (Qu = 2.1 mg/cm2-event), which is equal to 2,247 mg/event. See discussion in
Section H.5.
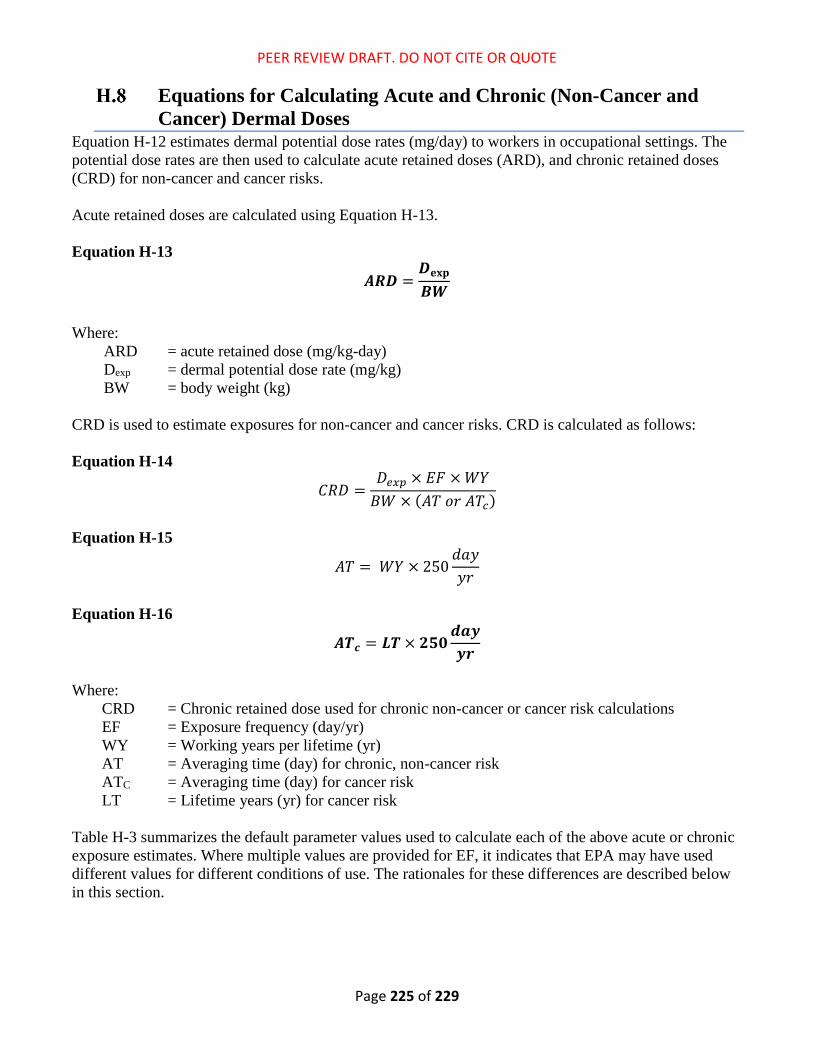
PEER REVIEW DRAFT. DO NOT CITE OR QUOTE
Page 225 of 229
Equations for Calculating Acute and Chronic (Non-Cancer and
Cancer) Dermal Doses Equation H-12 estimates dermal potential dose rates (mg/day) to workers in occupational settings. The
potential dose rates are then used to calculate acute retained doses (ARD), and chronic retained doses
(CRD) for non-cancer and cancer risks.
Acute retained doses are calculated using Equation H-13.
Equation H-13
𝑨𝑹𝑫 =𝑫𝐞𝐱𝐩
𝑩𝑾
Where:
ARD = acute retained dose (mg/kg-day)
Dexp = dermal potential dose rate (mg/kg)
BW = body weight (kg)
CRD is used to estimate exposures for non-cancer and cancer risks. CRD is calculated as follows:
Equation H-14
𝐶𝑅𝐷 =𝐷𝑒𝑥𝑝 × 𝐸𝐹 × 𝑊𝑌
𝐵𝑊 × (𝐴𝑇 𝑜𝑟 𝐴𝑇𝑐)
Equation H-15
𝐴𝑇 = 𝑊𝑌 × 250𝑑𝑎𝑦
𝑦𝑟
Equation H-16
𝑨𝑻𝒄 = 𝑳𝑻 × 𝟐𝟓𝟎𝒅𝒂𝒚
𝒚𝒓
Where:
CRD = Chronic retained dose used for chronic non-cancer or cancer risk calculations
EF = Exposure frequency (day/yr)
WY = Working years per lifetime (yr)
AT = Averaging time (day) for chronic, non-cancer risk
ATC = Averaging time (day) for cancer risk
LT = Lifetime years (yr) for cancer risk
Table H-3 summarizes the default parameter values used to calculate each of the above acute or chronic
exposure estimates. Where multiple values are provided for EF, it indicates that EPA may have used
different values for different conditions of use. The rationales for these differences are described below
in this section.

PEER REVIEW DRAFT. DO NOT CITE OR QUOTE
Page 226 of 229
Table_H-3
Parameter Name Symbol Value Unit
Exposure Frequency EF 250 days/yr
Working years WY 31 (50th percentile)
40 (95th percentile) years
Lifetime Years, cancer LT 78 years
Body Weight BW
80 (Average Adult Worker)
72.4 (Females of Reproductive Age)
kg
Averaging Time, non-
cancer AT
11,315 (central tendency)a
14,600 (high-end)b day
Averaging Time, cancer ATc 28,470 day a Calculated using the 50th percentile value for working years (WY) b Calculated using the 95th percentile value for working years (WY)
Exposure Frequency (EF)
EPA generally uses an exposure frequency of 250 days per year with two notable exceptions: dry
cleaning and DoD uses. EPA assumed dry cleaners may operate between five and six days per week and
50 to 52 weeks per year resulting in a range of 250 to 312 annual working days per year (AWD). Taking
into account fractional days exposed (f) resulted in an exposure frequency (EF) of 258 at the 50th
percentile and 293 at the 95th percentile. For the two DoD uses, information was provided indicating
process frequencies of two to three times per week (oil analysis) and two to three times per month (water
pipe repair). EPA used the maximum frequency for high-end estimates and the midpoint frequency for
central tendency estimates. For the oil analysis use this resulted in 125 days/yr at the central tendency
and 150 days/yr at the high-end. For the water pipe repair, this resulted in 30 days/yr at the central
tendency and 36 days/yr at the high-end.
EF is expressed as the number of days per year a worker is exposed to the chemical being assessed. In
some cases, it may be reasonable to assume a worker is exposed to the chemical on each working day. In
other cases, it may be more appropriate to estimate a worker’s exposure to the chemical occurs during a
subset of the worker’s annual working days. The relationship between exposure frequency and annual
working days can be described mathematically as follows:
Equation H-17
𝐸𝐹 = 𝑓 × 𝐴𝑊𝐷
Where:
EF = exposure frequency, the number of days per year a worker is exposed to the chemical
(day/yr)
f = fractional number of annual working days during which a worker is exposed to the
chemical (unitless)
AWD = annual working days, the number of days per year a worker works (day/yr)
BLS (2016) provides data on the total number of hours worked and total number of employees by each

PEER REVIEW DRAFT. DO NOT CITE OR QUOTE
Page 227 of 229
industry NAICS code. These data are available from the 3- to 6-digit NAICS level (where 3-digit
NAICS are less granular and 6-digit NAICS are the most granular). Dividing the total, annual hours
worked by the number of employees yields the average number of hours worked per employee per year
for each NAICS.
EPA has identified approximately 140 NAICS codes applicable to the multiple conditions of use for the
ten chemicals undergoing risk evaluation. For each NAICS code of interest, EPA looked up the average
hours worked per employee per year at the most granular NAICS level available (i.e., 4-digit, 5-digit, or
6-digit). EPA converted the working hours per employee to working days per year per employee
assuming employees work an average of eight hours per day. The average number of days per year
worked, or AWD, ranges from 169 to 282 days per year, with a 50th percentile value of 250 days per
year. EPA repeated this analysis for all NAICS codes at the 4-digit level. The average AWD for all 4-
digit NAICS codes ranges from 111 to 282 days per year, with a 50th percentile value of 228 days per
year. 250 days per year is approximately the 75th percentile. In the absence of industry- and PCE-
specific data, EPA assumes the parameter f is equal to one for all conditions of use except dry cleaning.
Dry cleaning used a uniform distribution from 0.8 to 1 for f. The 0.8 value was derived from the
observation that the weighted average of 200 day/yr worked (from BLS/Census) is 80% of the standard
assumption that a full-time worker works 250 day/yr. The maximum of 1 is appropriate as dry cleaners
may be family owned and operated and some workers may work as much as every operating day.
Working Years (WY)
EPA has developed a triangular distribution for working years. EPA has defined the parameters of the
triangular distribution as follows:
• Minimum value: BLS CPS tenure data with current employer as a low-end estimate of the
number of lifetime working years: 10.4 years;
• Mode value: The 50th percentile tenure data with all employers from SIPP as a mode value for
the number of lifetime working years: 36 years; and
• Maximum value: The maximum average tenure data with all employers from SIPP as a high-end
estimate on the number of lifetime working years: 44 years.
This triangular distribution has a 50th percentile value of 31 years and a 95th percentile value of 40 years.
EPA uses these values for central tendency and high-end ADC and LADC calculations, respectively.
The BLS (2014b) provides information on employee tenure with current employer obtained from the
Current Population Survey (CPS). CPS is a monthly sample survey of about 60,000 households that
provides information on the labor force status of the civilian non-institutional population age 16 and
over; CPS data are released every two years. The data are available by demographics and by generic
industry sectors but are not available by NAICS codes.
The U.S. Census’ (2016a) Survey of Income and Program Participation (SIPP) provides information on
lifetime tenure with all employers. SIPP is a household survey that collects data on income, labor force
participation, social program participation and eligibility, and general demographic characteristics
through a continuous series of national panel surveys of between 14,000 and 52,000 households
(Census, 2016b). EPA analyzed the 2008 SIPP Panel Wave 1, a panel that began in 2008 and covers the
interview months of September 2008 through December 2008 (Census, 2016a-b). For this panel, lifetime
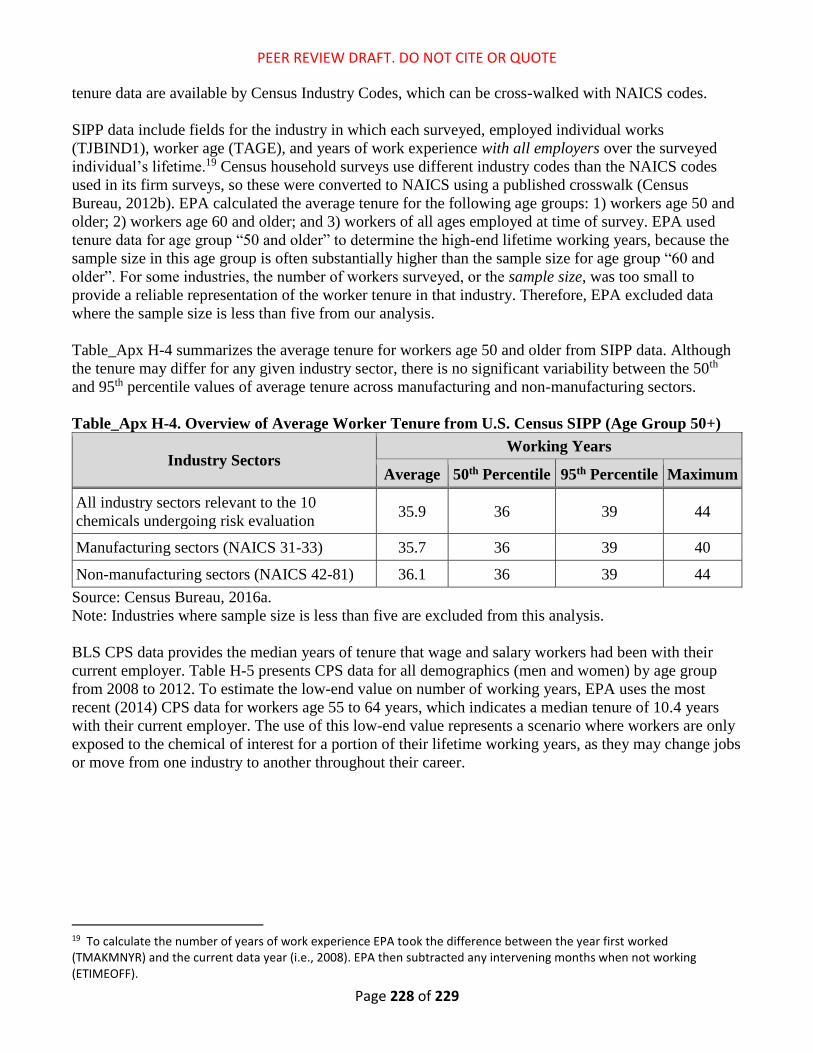
PEER REVIEW DRAFT. DO NOT CITE OR QUOTE
Page 228 of 229
tenure data are available by Census Industry Codes, which can be cross-walked with NAICS codes.
SIPP data include fields for the industry in which each surveyed, employed individual works
(TJBIND1), worker age (TAGE), and years of work experience with all employers over the surveyed
individual’s lifetime.19 Census household surveys use different industry codes than the NAICS codes
used in its firm surveys, so these were converted to NAICS using a published crosswalk (Census
Bureau, 2012b). EPA calculated the average tenure for the following age groups: 1) workers age 50 and
older; 2) workers age 60 and older; and 3) workers of all ages employed at time of survey. EPA used
tenure data for age group “50 and older” to determine the high-end lifetime working years, because the
sample size in this age group is often substantially higher than the sample size for age group “60 and
older”. For some industries, the number of workers surveyed, or the sample size, was too small to
provide a reliable representation of the worker tenure in that industry. Therefore, EPA excluded data
where the sample size is less than five from our analysis.
Table_Apx H-4 summarizes the average tenure for workers age 50 and older from SIPP data. Although
the tenure may differ for any given industry sector, there is no significant variability between the 50th
and 95th percentile values of average tenure across manufacturing and non-manufacturing sectors.
Table_Apx H-4. Overview of Average Worker Tenure from U.S. Census SIPP (Age Group 50+)
Industry Sectors Working Years
Average 50th Percentile 95th Percentile Maximum
All industry sectors relevant to the 10
chemicals undergoing risk evaluation 35.9 36 39 44
Manufacturing sectors (NAICS 31-33) 35.7 36 39 40
Non-manufacturing sectors (NAICS 42-81) 36.1 36 39 44
Source: Census Bureau, 2016a.
Note: Industries where sample size is less than five are excluded from this analysis.
BLS CPS data provides the median years of tenure that wage and salary workers had been with their
current employer. Table H-5 presents CPS data for all demographics (men and women) by age group
from 2008 to 2012. To estimate the low-end value on number of working years, EPA uses the most
recent (2014) CPS data for workers age 55 to 64 years, which indicates a median tenure of 10.4 years
with their current employer. The use of this low-end value represents a scenario where workers are only
exposed to the chemical of interest for a portion of their lifetime working years, as they may change jobs
or move from one industry to another throughout their career.
19 To calculate the number of years of work experience EPA took the difference between the year first worked (TMAKMNYR) and the current data year (i.e., 2008). EPA then subtracted any intervening months when not working (ETIMEOFF).
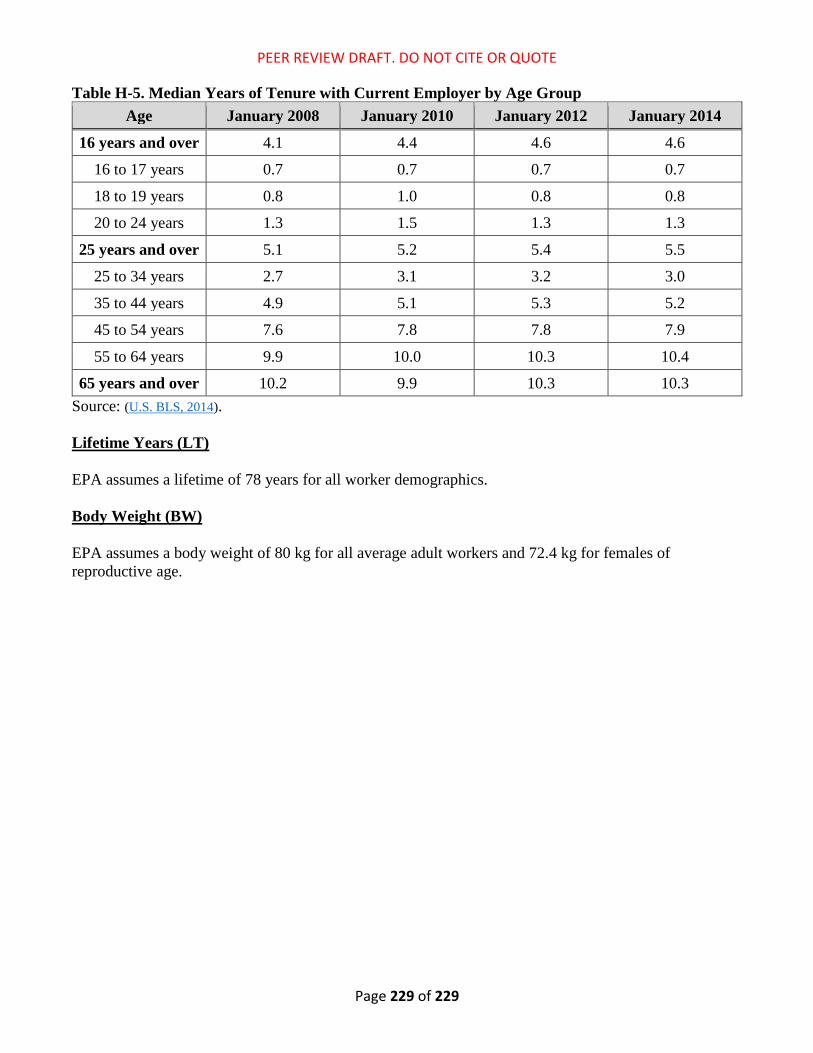
PEER REVIEW DRAFT. DO NOT CITE OR QUOTE
Page 229 of 229
Table H-5. Median Years of Tenure with Current Employer by Age Group
Age January 2008 January 2010 January 2012 January 2014
16 years and over 4.1 4.4 4.6 4.6
16 to 17 years 0.7 0.7 0.7 0.7
18 to 19 years 0.8 1.0 0.8 0.8
20 to 24 years 1.3 1.5 1.3 1.3
25 years and over 5.1 5.2 5.4 5.5
25 to 34 years 2.7 3.1 3.2 3.0
35 to 44 years 4.9 5.1 5.3 5.2
45 to 54 years 7.6 7.8 7.8 7.9
55 to 64 years 9.9 10.0 10.3 10.4
65 years and over 10.2 9.9 10.3 10.3
Source: (U.S. BLS, 2014).
Lifetime Years (LT)
EPA assumes a lifetime of 78 years for all worker demographics.
Body Weight (BW)
EPA assumes a body weight of 80 kg for all average adult workers and 72.4 kg for females of
reproductive age.
Related Documents


