Welcome message from author
This document is posted to help you gain knowledge. Please leave a comment to let me know what you think about it! Share it to your friends and learn new things together.
Transcript

Environmental Policies, Product Market Regulation and
Innovation in Renewable Energy
Lionel Nesta∗ Francesco Vona† Francesco Nicolli‡
Abstract
We investigate the effectiveness of policies in favor of innovation in renew-able energy under different levels of competition. Using information regardingrenewable energy policies, product market regulation and high-quality greenpatents for OECD countries since the late 1970s, we develop a pre-sample meancount-data econometric specification that also accounts for the endogeneity ofpolicies. We find that renewable energy policies are significantly more effectivein fostering green innovation in countries with deregulated energy markets. Wealso find that public support for renewable energy is crucial only in the genera-tion of high-quality green patents, whereas competition enhances the generationof green patents irrespective of their quality.
Keywords: renewable energy technology; patents; environmental policies; prod-uct market regulation; policy complementarity.
JEL classification: Q55, Q58, Q42, Q48, O34
1 Introduction
Innovation is commonly regarded as the most effective response to sustaining currentstandards of living while overcoming serious environmental concerns. In the case ofenergy, increasing resource scarcity calls for the rapid development of new energysources and, in particular, of renewable energy. As of today, renewable energy cannotcompete with fossil fuel in terms of production costs but impressive technologicalprogress has paved the way for promising alternatives, such as biomass, solar andwind energy sources 1. Nations, too, have developed areas of specialization in specifictypes of renewable energy sources, such as Denmark in wind technologies, Swedenand Germany in bioenergy, Germany and Spain in solar energy, and Norway andAustria in hydropower.
In addressing the issue of how to foster environmental innovation, the theoreticalliterature stresses the importance of policy interventions targeted at both knowledgeand environmental externalities (Fischer & Newell 2008, Acemoglu et al. 2012, Poppet al. 2009). Along these lines, a vast empirical literature has assessed the extent to
∗SciencesPo, OFCE-DRIC, [email protected]†Corresponding author, SciencesPo, OFCE-DRIC, [email protected]‡University of Ferrara, [email protected] example, in the most favored geographical locations, wind has proved to be almost as
competitive as other forms of electricity generation, whereas solar energy still costs significantlymore than fossil fuel energy sources (see e.g. Pan & Khler 2007, Nemet 2006, IEA 2004).
1
which environmental policies and/or energy prices are able to spur environmentalinnovations (Popp 2002, Johnstone et al. 2010). Another line of research in the fieldof energy economics investigates the effect of market liberalization on the propen-sity to innovate of electric utilities and specialized suppliers of electrical equipment(Jamasb & Pollitt 2008, Sanyal & Ghosh 2012). While both competition and poli-cies in support of innovation are key drivers of energy technologies (Newell 2011),the interplay of these two factors has yet to be assessed in a rigorous empiricalframework.
Our aim is to fill this gap by investigating the effectiveness of policies that en-courage innovation in renewable energy under different levels of competition. Ourtheoretical background is the recent reappraisal of the debate about the relationshipbetween innovation and competition in Schumpeterian growth models (Aghion et al.2001, 2005). These models have questioned the standard argument that oligopolis-tic markets enhance innovation via two arguments: first, lowering barriers to entryyields greater incentives for incumbents to invest in innovation to escape new entrantcompetition; second, fostering entry is tantamount to supporting the introductionof new inventions into the market. This should be particularly so for renewableenergy technologies that involve decentralized energy generation and a smaller scaleof production.
More generally, the positive effect of lowering barriers of entry for innovation islikely to prevail in those sectors in which innovation may be radical and competencedestroying, as in the case of centralized energy production. Several studies documentthe political opposition of large utilities to renewable energy policies and to the keyrole of new players for renewable energy innovation2. The internal resistance of theelectricity sector against radical innovation also depends on the cognitive “lock-in”of incumbents that lack the appropriate skills to develop these technologies. In thiscontext, the external stimulus of market liberalization, particularly in the form offree access to the grid for independent power producers, might be essential to fosterrenewable energy innovation (Makard & Truffer 2006).
Our paper is the first to carry out a cross-country analysis that empirically as-sesses the complementarity between targeted industrial policies and competition inenergy production3. We developed a unique dataset that contains cross-country in-formation on renewable energy policies (REPs), product market regulation (PMR)and high-quality renewable energy patents, i.e., where priority is claimed in severalcountries. In fact, one should expect such complementarities to arise because pro-duction of energy is generally more expensive with green technologies; thus, publicsubsidies are essential to spur demand for renewable energy and to make marketentry attractive for new players. It follows that a combination of public policies andproduct market deregulation is likely to bring about a positive effect on innovation.In particular, one should expect policies to be significantly more effective in liber-alized markets because public subsidies attract private R&D investments and may
2See, e.g., Neuhoff (2005), Jacobsson & Bergek (2004), Hadjilambrinos (2000), Nilsson et al.(2004) and Lauber & Mez (2004). For cross-country econometric analyses on the effect of theenergy lobby on energy intensity, see Fredriksson et al. (2004) and, on renewable energy policies,see Nicolli & Vona (2012).
3The contribution of Aghion et al. (2012), addressing similar matters, is both more general inthat it pertains to all sectors and more specific because it concentrates on manufacturing firms inChina.
2
trigger a race for leadership in the emerging market for clean energy.Another distinct feature of our contribution is the econometric specification,
which, to our knowledge, is the first to combine three econometric issues into acount-data setting. First, we make use of a dynamic empirical setup that accountsexplicitly for the fact that innovation tends to occur in technological domains inwhich firms have previously developed skills and competencies. Second, we accountfor unobserved country heterogeneity by means of the pre-sample mean Poissonmodel with linear feedback suggested by Blundell et al. (2002). The initial con-ditions, built upon pre-sample information about the dependent variable, are themost convenient way to account for unobserved individual effects, particularly whenvariables of interest are highly persistent. We choose this model because we have along string of pre-sample observations for our dependent variable, a key requirementto reduce the bias in the estimated coefficients. Finally, we use the GMM estimatorbecause it provides a flexible mechanism to address the issue of endogeneity for bothenvironmental policies and the index of market competition.
Our main findings are the following. First and foremost, we find that REPs aresignificantly more effective in fostering green innovation in countries with deregu-lated energy markets. The effect is sizeable; REPs are twice as effective in dereg-ulated energy markets with respect to the average level of regulation in developedcountries. Second, energy market deregulation has a positive effect on innovation.This effect is primarily driven by the entry barrier component of the PMR indexand becomes weaker when the main variables of interest are instrumented. Third,both public policies and their interaction with PMR have a much larger effect onhigh-quality triadic patents than on generic ones. Finally, our analysis allows us toreassess the role of other determinants of renewable energy technologies that havebeen the focus of the existing empirical literature (see e.g. Popp 2002, Johnstoneet al. 2010). We conclude that public R&D expenditures play a key role only forhigh-quality triadic patents, whereas energy prices are not as important as previouslythought when controlling for REPs and PMR.
The remainder of the paper is organized as follows. Section 2 discusses thetheoretical underpinnings on which our empirical strategy is based in detail. Thefirst part of Section 3 provides details on the methodology used to build our datasetand our main policy indicators, while the second part describes the econometricmatters at hand. Section 4 presents the baseline results. Sections 5 and 6 are allrobustness checks, the former controlling for the endogeneity of the policy variables,and the latter accounting for patent quality. Section 7 quantifies the marginal effectof the policy variables. Section 8 concludes.
2 Factors affecting renewable energy innovations
The relationship between innovation and competition has been recently reconsid-ered in Schumpeterian growth models (see e.g. Aghion et al. 2001, 2005). Thisnew class of models incorporates both the classical Schumpeterian effect, in whichcompetition reduces innovative rents and therefore R&D investments, and an es-caping competition effect. The latter effect holds that the threat of entry of newfirms induces incumbents to increase R&D investments to preserve or enhance theirmarket shares. The theory suggests that the effect of competition on innovation is
3
crucially mediated by initial sectoral characteristics. In particular, a positive effectof competition on innovation prevails in sectors initially characterized by low levelsof competition. In the case of energy industries, both the electricity and the gassector are naturally characterized by a low level of competition at the onset of theliberalization process; therefore, the escaping competition effect is expected to pre-vail. Nonetheless, country-level studies, mostly limited to the US and the UK, foundthat R&D expenditures and patent activities declined after market reforms4. It isworth noting, however, that this evidence neither applies directly to cross-countrycomparisons nor seems robust for patent-based analyses, particularly for renewableenergy patents(Jamasb & Pollitt 2011).
The literature on innovation regimes provides a slightly different rationale tosupport the positive effect of competition on radical innovations. Winter (1984)distinguishes between an entrepreneurial innovation regime, in which entry spursinnovation, and a routinized regime, characterized by R&D investments of largefirms aimed at improving existing technologies5. In a similar vein, Klepper (1996)explains an industry’s life cycle in terms of returns on R&D investments, whereproduct innovation is more beneficial to smaller and younger firms, while processinnovation yields greater returns for large firms. As a result, during their life cycle,firms modify the type of innovative activities undertaken, gradually shifting towardsroutinized process R&D activities. As a whole, the positive effect of competition oninnovation is expected to strongly dominate in the context of radically innovativetechnologies and emergent markets.
Renewable energy innovation seems to fit the conditions highlighted in the liter-ature on innovation regimes well. Such innovation is in fact radical and competencedestroying for the centralized paradigm of energy production (David & Wright 2006,Lehtonen & Nye 2009). While production of energy from more promising renew-able sources is mainly decentralized in small and medium sized units, the skills ofincumbents are tied to large scale plants using coal, nuclear materials or gas as pri-mary energy inputs. Thus, there is substantial evidence showing the sustained entryof new firms producing clean energy or with new electric equipment, such as windturbines, even before the liberalization process began6. These new firms are consid-ered key players for innovation in the electricity sector (Jacobsson & Bergek 2004,Sanyal & Cohen 2009). Thus, we expect the effect of deregulation to be positive oninnovation in renewable energy (Makard & Truffer 2006).
From an empirical viewpoint, past contributions have previously assessed theeffect of liberalization on innovation. Sanyal & Ghosh (2012) show that greater com-petition in wholesale markets can increase the fraction of innovative rents that areobtained by specialized upstream suppliers, as long as many non-utility generationactors enter the wholesale market. These new actors (such as farmers, small com-
4See for the US Dooley (1998), Sanyal (2007), Nemet & Kammen (2007), Sanyal & Cohen (2009),Sanyal & Ghosh (2012) and for the UK Jamasb & Pollitt (2008). Similarly, the negative effectsof deregulation on energy R&D were found for electric utilities worldwide by Sterlacchini (2012),Salies (2010).
5Empirical evidence that small firms tend to undertake more radical innovation or in generalrespond to different innovative inputs can be found in Akcigit & Kerr (2010), Scherer (1984), Acs& Audretsch (1988), among others. In particular, Acs & Audretsch (1988) found that lower marketconcentration increases innovation by small firms by a factor of 2
6See, e.g., Jacobsson & Johnson (2000), Jacobsson & Bergek (2004), Nilsson et al. (2004), Lauber& Mez (2004), Hadjilambrinos (2000), Makard & Truffer (2006).
4
munities, municipalities and households) are generally specialized in decentralizedenergy production, such as combined generation, local heating systems and renew-able sources. In Denmark, for instance, most wind turbines are owned by house-holds, municipalities and small communities, whereas utility-owned wind capacityaccounted for only 15% of the total installed wind capacity in 1990 (Hadjilambrinos2000).
Deregulation of the energy markets has often been designed to favor these smallproducers. In the US for example, the approval of the Public Utility RegulatoryPolicies Act (PURPA) mandates that public utilities purchase energy from small-scale power producers, essentially non-utility generators producing from renewablesources (Loiter & Norberg-Bohm 1999). The entry of non-utility generators withtheir associated positive effect on innovation is therefore expected to be significantlystronger for renewable energy technologies.
With the exception of R&D subsidies, the primary goal of renewable energypolicy is to generate a certain volume of demand for clean energy (Popp et al.2009). The positive demand shock is expected to stimulate innovation, particularlywhen the entry of new players is facilitated. Aghion et al. (2012) address the issueof complementarity between market competition and industrial policies along thelines of Schumpeterian growth models. Policies targeted at sectors with highertechnological potential have a larger effect on firm innovative efforts, provided thatthere is a low degree of collusion in the sector. Similarly, electric utilities in amonopolistic position are likely to respond to targeted REPs with relatively lowinnovative efforts because profit levels for these firms are marginally affected byrenewable energy innovation. Public policies will be successful when new playersdeveloping new technologies enter the market, instead of incumbents complyingwith regulations using existing solutions. In other words, success in public supportalso depends on low entry barriers to the market.
Our paper is also related to a vast empirical literature on environmental innova-tion that analyzes the inducement effect of policy and energy prices (Jaffe & Palmer1997, Newell et al. 1999, Popp 2002). Although past studies have tested the effect ofpolicy on innovation using patent data7, only a few studies have incorporated someform of path dependency into their empirical specification. Popp (2002) investigatesthe effect of technology-specific knowledge stocks, energy prices and public R&D onrenewable and energy-efficient USPTO patents. Aghion et al. (2011) also includetechnology-specific knowledge stocks to test the directed technical change hypothesisof Acemoglu et al. (2012) for the auto industry by using firm-level data. Differentlyfrom these works, we account for path dependency by including linear feedback onthe dependent variable to disentangle the short- and long-run effects of our variablesof interest.
Finally, our paper is complementary to Johnstone et al. (2010), who showsthat targeted policies in OECD countries have had a positive and significant effecton patent applications for renewable technologies. In particular, guaranteed priceschemes and investment incentives have played a major role in the early phase ofthe technology life cycle, whereas, for relatively more mature technologies, quantity-based instruments seem more suitable. However, their emphasis is on the heteroge-
7See, e.g.,Lanjouw & Mody (1996), Brunnermeier & Cohen (2003), Popp (2002, 2006a), John-stone et al. (2010), Verdolini & Galeotti (2011).
5
neous effects of different policies, while our paper tests the policy complementarityhypothesis, including dynamic feedbacks and accounting for endogeneity in policies.
3 Empirical Protocol
3.1 Data
Our database combines several sources, gathering patent data to measure innovationusing policy and regulatory variables found in various data sources. The set ofexplanatory variables used in this paper is almost identical to the one used by theclosely related paper of Johnstone et al. (2010); we add the PMR index and buildan aggregate policy index that may be instrumented.
Dependent Variable. We measure innovation by means of patent statistics.Patent counts provide readily accessible and exhaustive information on both thenature of the invention and the applicant. We use the PATSTAT database, whichaccounts for more than 70 million patents worldwide, covers 84 different patent of-fices, and spans over a long time period. PATSTAT provides codified informationon the legal authorities issuing the patent document to the name of the inventor,its nationality, the priority dates and the assignee being granted ownership of theinvention.
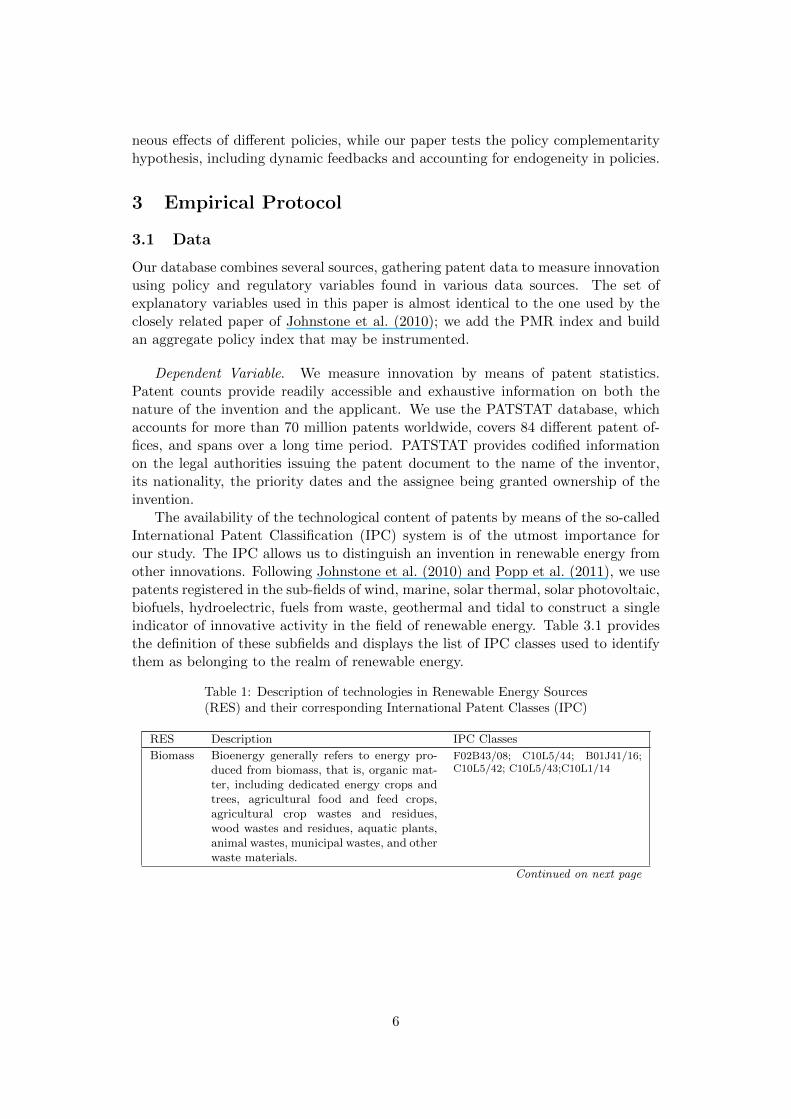
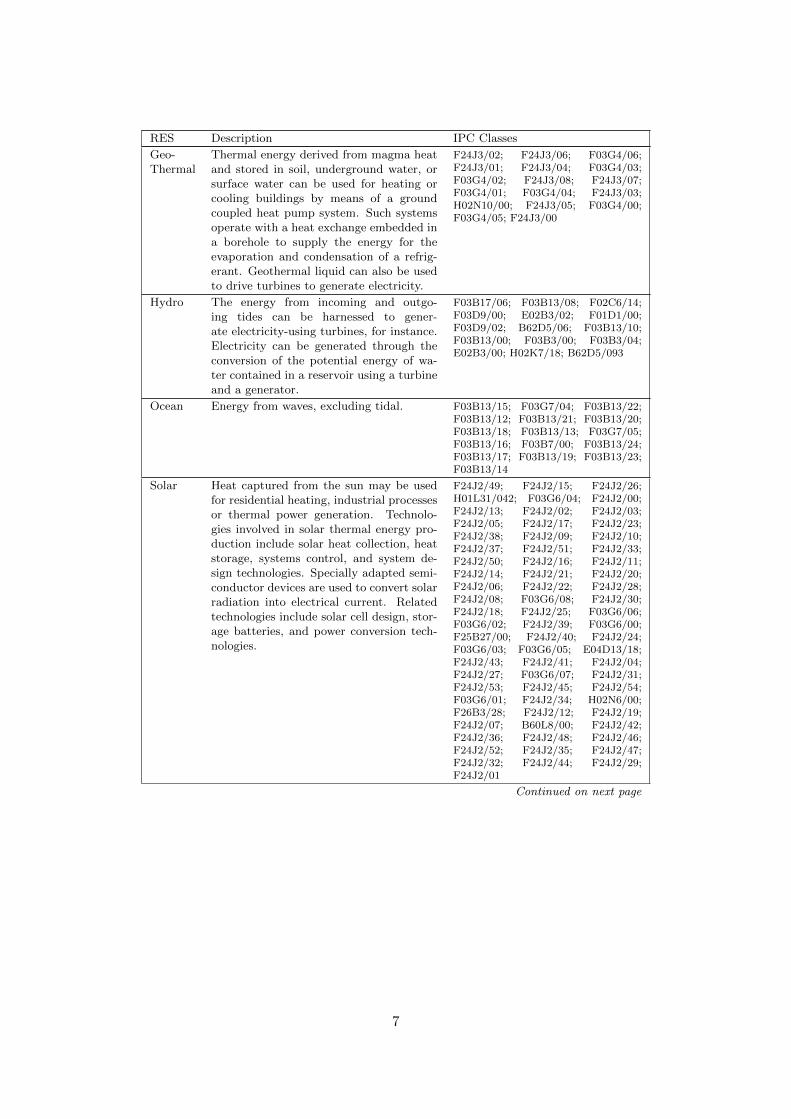
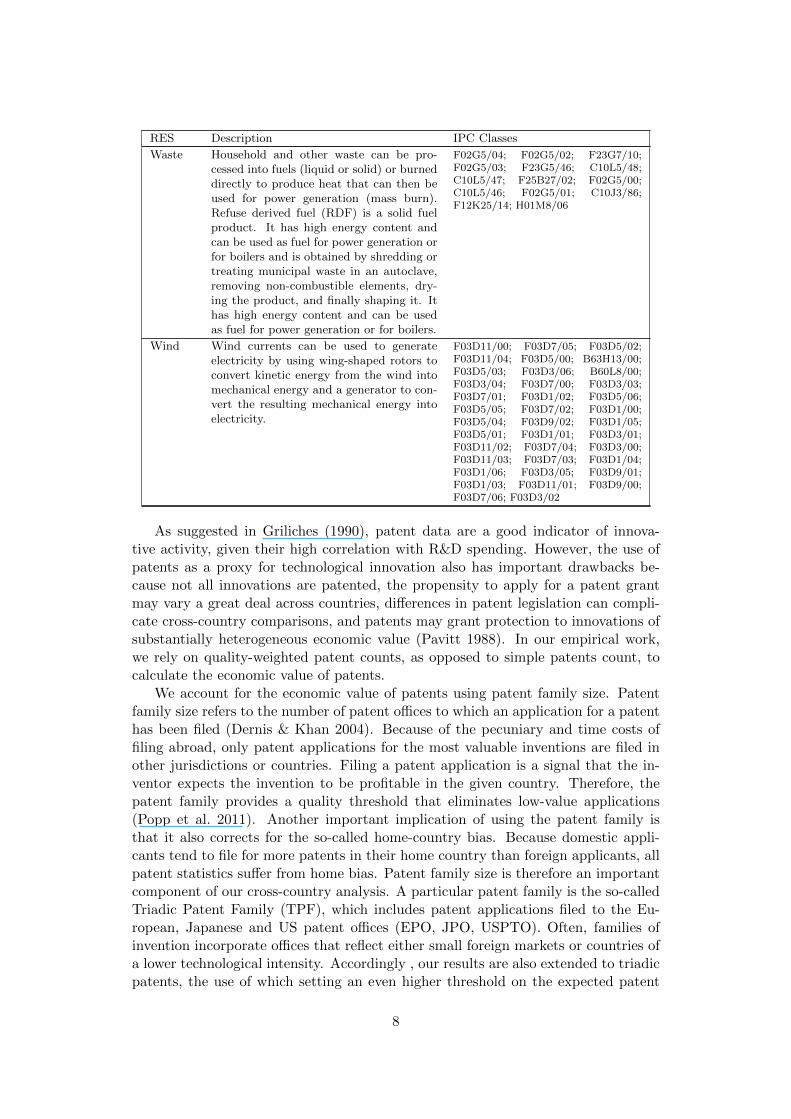
The availability of the technological content of patents by means of the so-calledInternational Patent Classification (IPC) system is of the utmost importance forour study. The IPC allows us to distinguish an invention in renewable energy fromother innovations. Following Johnstone et al. (2010) and Popp et al. (2011), we usepatents registered in the sub-fields of wind, marine, solar thermal, solar photovoltaic,biofuels, hydroelectric, fuels from waste, geothermal and tidal to construct a singleindicator of innovative activity in the field of renewable energy. Table 3.1 providesthe definition of these subfields and displays the list of IPC classes used to identifythem as belonging to the realm of renewable energy.
Table 1: Description of technologies in Renewable Energy Sources(RES) and their corresponding International Patent Classes (IPC)
RES Description IPC Classes
Biomass Bioenergy generally refers to energy pro-duced from biomass, that is, organic mat-ter, including dedicated energy crops andtrees, agricultural food and feed crops,agricultural crop wastes and residues,wood wastes and residues, aquatic plants,animal wastes, municipal wastes, and otherwaste materials.
F02B43/08; C10L5/44; B01J41/16;C10L5/42; C10L5/43;C10L1/14
Continued on next page
6
RES Description IPC Classes
Geo-Thermal
Thermal energy derived from magma heatand stored in soil, underground water, orsurface water can be used for heating orcooling buildings by means of a groundcoupled heat pump system. Such systemsoperate with a heat exchange embedded ina borehole to supply the energy for theevaporation and condensation of a refrig-erant. Geothermal liquid can also be usedto drive turbines to generate electricity.
F24J3/02; F24J3/06; F03G4/06;F24J3/01; F24J3/04; F03G4/03;F03G4/02; F24J3/08; F24J3/07;F03G4/01; F03G4/04; F24J3/03;H02N10/00; F24J3/05; F03G4/00;F03G4/05; F24J3/00
Hydro The energy from incoming and outgo-ing tides can be harnessed to gener-ate electricity-using turbines, for instance.Electricity can be generated through theconversion of the potential energy of wa-ter contained in a reservoir using a turbineand a generator.
F03B17/06; F03B13/08; F02C6/14;F03D9/00; E02B3/02; F01D1/00;F03D9/02; B62D5/06; F03B13/10;F03B13/00; F03B3/00; F03B3/04;E02B3/00; H02K7/18; B62D5/093
Ocean Energy from waves, excluding tidal. F03B13/15; F03G7/04; F03B13/22;F03B13/12; F03B13/21; F03B13/20;F03B13/18; F03B13/13; F03G7/05;F03B13/16; F03B7/00; F03B13/24;F03B13/17; F03B13/19; F03B13/23;F03B13/14
Solar Heat captured from the sun may be usedfor residential heating, industrial processesor thermal power generation. Technolo-gies involved in solar thermal energy pro-duction include solar heat collection, heatstorage, systems control, and system de-sign technologies. Specially adapted semi-conductor devices are used to convert solarradiation into electrical current. Relatedtechnologies include solar cell design, stor-age batteries, and power conversion tech-nologies.
F24J2/49; F24J2/15; F24J2/26;H01L31/042; F03G6/04; F24J2/00;F24J2/13; F24J2/02; F24J2/03;F24J2/05; F24J2/17; F24J2/23;F24J2/38; F24J2/09; F24J2/10;F24J2/37; F24J2/51; F24J2/33;F24J2/50; F24J2/16; F24J2/11;F24J2/14; F24J2/21; F24J2/20;F24J2/06; F24J2/22; F24J2/28;F24J2/08; F03G6/08; F24J2/30;F24J2/18; F24J2/25; F03G6/06;F03G6/02; F24J2/39; F03G6/00;F25B27/00; F24J2/40; F24J2/24;F03G6/03; F03G6/05; E04D13/18;F24J2/43; F24J2/41; F24J2/04;F24J2/27; F03G6/07; F24J2/31;F24J2/53; F24J2/45; F24J2/54;F03G6/01; F24J2/34; H02N6/00;F26B3/28; F24J2/12; F24J2/19;F24J2/07; B60L8/00; F24J2/42;F24J2/36; F24J2/48; F24J2/46;F24J2/52; F24J2/35; F24J2/47;F24J2/32; F24J2/44; F24J2/29;F24J2/01
Continued on next page
7
RES Description IPC Classes
Waste Household and other waste can be pro-cessed into fuels (liquid or solid) or burneddirectly to produce heat that can then beused for power generation (mass burn).Refuse derived fuel (RDF) is a solid fuelproduct. It has high energy content andcan be used as fuel for power generation orfor boilers and is obtained by shredding ortreating municipal waste in an autoclave,removing non-combustible elements, dry-ing the product, and finally shaping it. Ithas high energy content and can be usedas fuel for power generation or for boilers.
F02G5/04; F02G5/02; F23G7/10;F02G5/03; F23G5/46; C10L5/48;C10L5/47; F25B27/02; F02G5/00;C10L5/46; F02G5/01; C10J3/86;F12K25/14; H01M8/06
Wind Wind currents can be used to generateelectricity by using wing-shaped rotors toconvert kinetic energy from the wind intomechanical energy and a generator to con-vert the resulting mechanical energy intoelectricity.
F03D11/00; F03D7/05; F03D5/02;F03D11/04; F03D5/00; B63H13/00;F03D5/03; F03D3/06; B60L8/00;F03D3/04; F03D7/00; F03D3/03;F03D7/01; F03D1/02; F03D5/06;F03D5/05; F03D7/02; F03D1/00;F03D5/04; F03D9/02; F03D1/05;F03D5/01; F03D1/01; F03D3/01;F03D11/02; F03D7/04; F03D3/00;F03D11/03; F03D7/03; F03D1/04;F03D1/06; F03D3/05; F03D9/01;F03D1/03; F03D11/01; F03D9/00;F03D7/06; F03D3/02
As suggested in Griliches (1990), patent data are a good indicator of innova-tive activity, given their high correlation with R&D spending. However, the use ofpatents as a proxy for technological innovation also has important drawbacks be-cause not all innovations are patented, the propensity to apply for a patent grantmay vary a great deal across countries, differences in patent legislation can compli-cate cross-country comparisons, and patents may grant protection to innovations ofsubstantially heterogeneous economic value (Pavitt 1988). In our empirical work,we rely on quality-weighted patent counts, as opposed to simple patents count, tocalculate the economic value of patents.
We account for the economic value of patents using patent family size. Patentfamily size refers to the number of patent offices to which an application for a patenthas been filed (Dernis & Khan 2004). Because of the pecuniary and time costs offiling abroad, only patent applications for the most valuable inventions are filed inother jurisdictions or countries. Filing a patent application is a signal that the in-ventor expects the invention to be profitable in the given country. Therefore, thepatent family provides a quality threshold that eliminates low-value applications(Popp et al. 2011). Another important implication of using the patent family isthat it also corrects for the so-called home-country bias. Because domestic appli-cants tend to file for more patents in their home country than foreign applicants, allpatent statistics suffer from home bias. Patent family size is therefore an importantcomponent of our cross-country analysis. A particular patent family is the so-calledTriadic Patent Family (TPF), which includes patent applications filed to the Eu-ropean, Japanese and US patent offices (EPO, JPO, USPTO). Often, families ofinvention incorporate offices that reflect either small foreign markets or countries ofa lower technological intensity. Accordingly , our results are also extended to triadicpatents, the use of which setting an even higher threshold on the expected patent
8
020
040
060
080
0
1975 1980 1985 1990 1995 2000 2005 2010
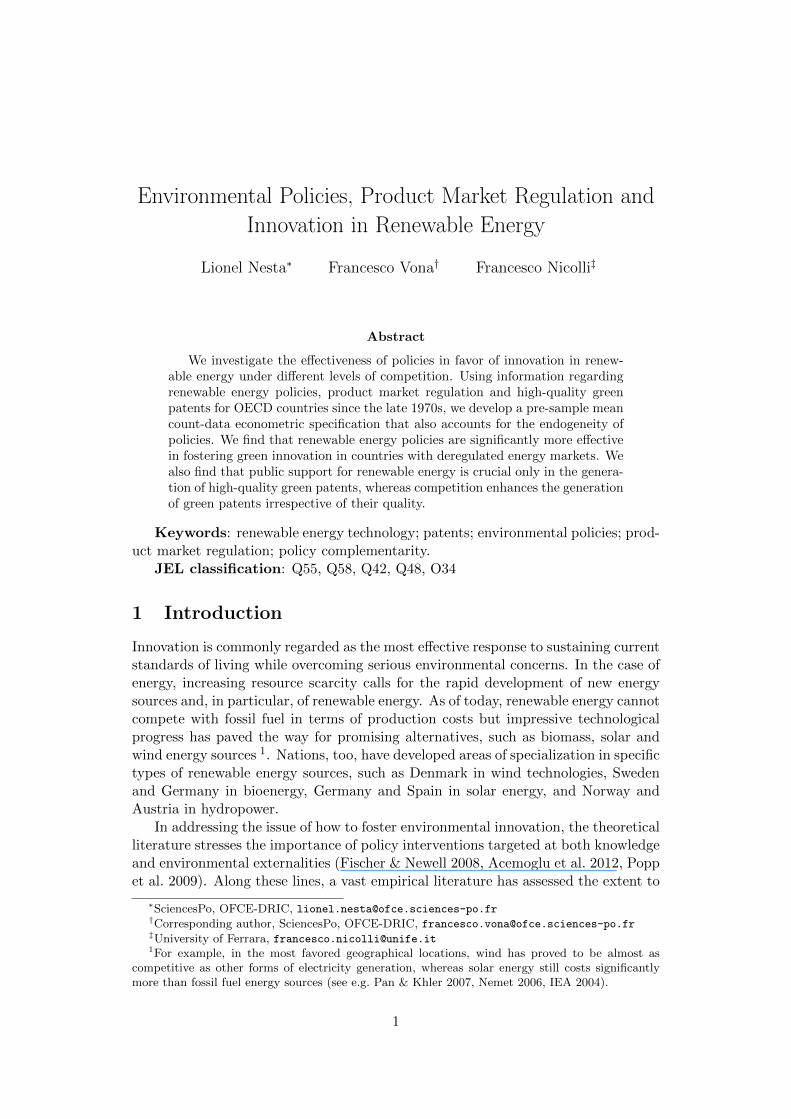
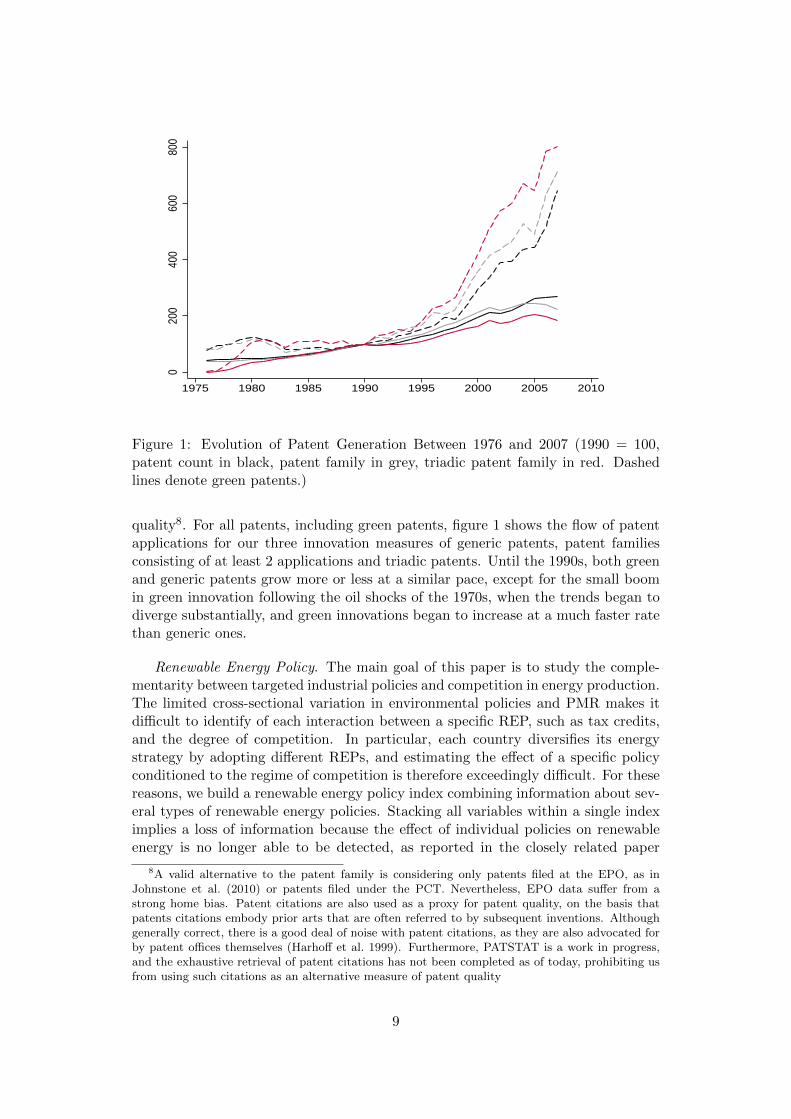
Figure 1: Evolution of Patent Generation Between 1976 and 2007 (1990 = 100,patent count in black, patent family in grey, triadic patent family in red. Dashedlines denote green patents.)
quality8. For all patents, including green patents, figure 1 shows the flow of patentapplications for our three innovation measures of generic patents, patent familiesconsisting of at least 2 applications and triadic patents. Until the 1990s, both greenand generic patents grow more or less at a similar pace, except for the small boomin green innovation following the oil shocks of the 1970s, when the trends began todiverge substantially, and green innovations began to increase at a much faster ratethan generic ones.
Renewable Energy Policy. The main goal of this paper is to study the comple-mentarity between targeted industrial policies and competition in energy production.The limited cross-sectional variation in environmental policies and PMR makes itdifficult to identify of each interaction between a specific REP, such as tax credits,and the degree of competition. In particular, each country diversifies its energystrategy by adopting different REPs, and estimating the effect of a specific policyconditioned to the regime of competition is therefore exceedingly difficult. For thesereasons, we build a renewable energy policy index combining information about sev-eral types of renewable energy policies. Stacking all variables within a single indeximplies a loss of information because the effect of individual policies on renewableenergy is no longer able to be detected, as reported in the closely related paper
8A valid alternative to the patent family is considering only patents filed at the EPO, as inJohnstone et al. (2010) or patents filed under the PCT. Nevertheless, EPO data suffer from astrong home bias. Patent citations are also used as a proxy for patent quality, on the basis thatpatents citations embody prior arts that are often referred to by subsequent inventions. Althoughgenerally correct, there is a good deal of noise with patent citations, as they are also advocated forby patent offices themselves (Harhoff et al. 1999). Furthermore, PATSTAT is a work in progress,and the exhaustive retrieval of patent citations has not been completed as of today, prohibiting usfrom using such citations as an alternative measure of patent quality
9
of Johnstone et al. (2010). Yet an aggregate policy index allows us to address therather unexplored issue of endogeneity in the estimation of the effect of REPs oninnovation.
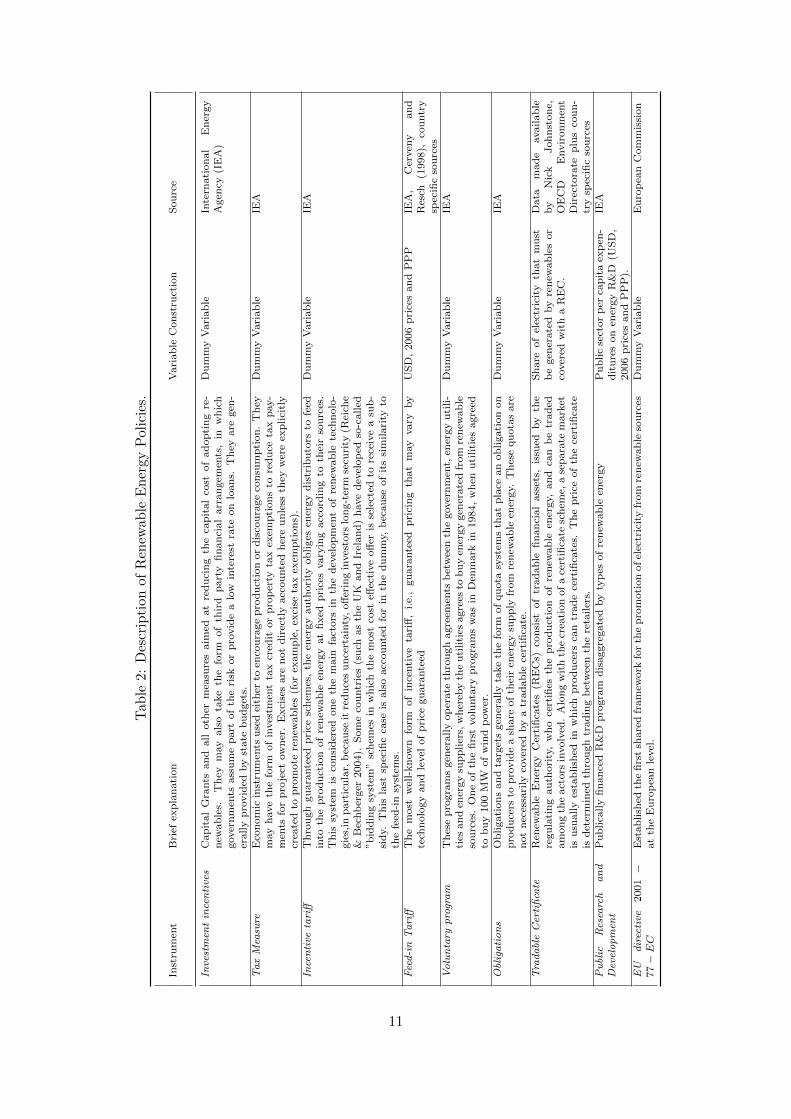
The REP index is based on the exploitation of a comprehensive dataset madeavailable by the International Energy Agency (IEA 2004), which contains detailedcountry fact sheets and provides information on the year of adoption of selectedREPs for most OECD countries (Johnstone et al. 2010), see Table 2 for a detaileddescription. We then build a single policy index that varies across years and countriesas described below.
First, we create a series of dummy variables reflecting the adoption of a set ofthe following legal supports for renewable energy: (i) the introduction of investmentincentives; (ii)economic instruments used to encourage production or discourageconsumption (usually called tax measures); (iii) the adoption of incentive tariff sys-tems, such as feed-in tariffs or bidding schemes; (iv) the establishment of voluntaryprograms or agreements among the actors involved in the energy sector; (v) legis-lation that makes it compulsory for producers to produce a share of their energysupply from renewable energy (which is not covered by a tradable certificate); (vi)the presence of tradable Renewable Energy Certificates (REC) systems; and (vii)the implementation of a publically financed R&D program. The policy index is thesum of all implemented policies expressed as dummies. Similar examples of envi-ronmental policy indices based on a synthesis of diverse policy performances can befound in Dasgupta et al. (2001) and Esty & Porter (2005). An indicator based onadoption dummies appears to reflect the overall scope of the government’s supportof renewable energy closely.
Our policy index screens out information held in continuous policy variables,such as public renewable R&D expenditures, feed-in tariff schemes and RECs9. Torecover information on the intensity of public commitment to renewable energy, weconsider the variables. For public R&D expenditures, we insert its per capita valuein all regressions separately. For the latter two policies (feed-in tariff schemes andRECs), we analyze their individual effects in particular econometric specificationsinstead. However, looking at the intensity of these two policies remains somewhatmisleading. On the one hand, RECs have been implemented since the early 2000s,and they have hardly been changed since then. On the other hand, the intensity offeed-in tariff schemes have been subject to downward adjustments, particularly inearly adopting countries, such as Denmark and Germany.
Product Market Regulation. We characterize product market regulation (PMR)using the time-varying sector specific index developed at the OECD10. For each
9Information on the former is available in the joint IEA-OECD dataset, and the main referencesfor feed-in tariffs are two reports drawn up by the IEA (2004), Cerveny & Resch (1998) and severalcountry-specific sources. The variable constructed by Johnstone et al. (2010) measures the strin-gency of REC targets, which reflects the share of electricity that must be generated by renewablesor covered with an REC. Using aggregation methods that allow the exploitation of both continuousand 0-1 policy signals, such as Principal Component Analysis, do not change the presented results.For details on the possible methodologies that can be used to aggregate this heterogeneous set ofpolicies and on the common determinants of indices derived from different aggregation methods,see Nicolli & Vona (2012).
10The data sources include the privatization Barometer of the Fondazione Enrico Mattei, the In-tegrated Data Base of the World Trade Organization and interviews with civil servants in particular
10
Tab
le2:
Des
crip
tion
ofR
enew
able
En
ergy
Pol
icie
s.
Inst
rum
ent
Bri
efex
pla
nati
on
Vari
ab
leC
on
stru
ctio
nS
ou
rce
Inve
stm
ent
ince
nti
ves
Cap
ital
Gra
nts
an
dall
oth
erm
easu
res
aim
edat
red
uci
ng
the
cap
ital
cost
of
ad
op
tin
gre
-n
ewab
les.
Th
eym
ay
als
ota
ke
the
form
of
thir
dp
art
yfi
nan
cial
arr
an
gem
ents
,in
wh
ich
gover
nm
ents
ass
um
ep
art
of
the
risk
or
pro
vid
ea
low
inte
rest
rate
on
loan
s.T
hey
are
gen
-er
ally
pro
vid
edby
state
bu
dget
s.
Du
mm
yV
ari
ab
leIn
tern
ati
on
al
En
ergy
Agen
cy(I
EA
)
Ta
xM
easu
reE
con
om
icin
stru
men
tsu
sed
eith
erto
enco
ura
ge
pro
du
ctio
nor
dis
cou
rage
con
sum
pti
on
.T
hey
may
have
the
form
of
inves
tmen
tta
xcr
edit
or
pro
per
tyta
xex
emp
tion
sto
red
uce
tax
pay-
men
tsfo
rp
roje
ctow
ner
.E
xci
ses
are
not
dir
ectl
yacc
ou
nte
dh
ere
un
less
they
wer
eex
plici
tly
crea
ted
top
rom
ote
ren
ewab
les
(for
exam
ple
,ex
cise
tax
exem
pti
on
s).
Du
mm
yV
ari
ab
leIE
A
Ince
nti
veta
riff
Th
rou
gh
gu
ara
nte
edp
rice
sch
emes
,th
een
ergy
au
thori
tyob
liges
ener
gy
dis
trib
uto
rsto
feed
into
the
pro
du
ctio
nof
ren
ewab
leen
ergy
at
fixed
pri
ces
vary
ing
acc
ord
ing
toth
eir
sou
rces
.T
his
syst
emis
con
sid
ered
on
eth
em
ain
fact
ors
inth
ed
evel
op
men
tof
ren
ewab
lete
chn
olo
-gie
s,in
part
icu
lar,
bec
au
seit
red
uce
su
nce
rtain
ty,off
erin
gin
ves
tors
lon
g-t
erm
secu
rity
(Rei
che
&B
echb
erger
2004).
Som
eco
untr
ies
(su
chas
the
UK
an
dIr
elan
d)
have
dev
elop
edso
-called
”b
idd
ing
syst
em”
sch
emes
inw
hic
hth
em
ost
cost
effec
tive
off
eris
sele
cted
tore
ceiv
ea
sub
-si
dy.
Th
isla
stsp
ecifi
cca
seis
als
oacc
ou
nte
dfo
rin
the
du
mm
y,b
ecau
seof
its
sim
ilari
tyto
the
feed
-in
syst
ems.
Du
mm
yV
ari
ab
leIE
A
Fee
d-i
nT
ari
ffT
he
most
wel
l-kn
ow
nfo
rmof
ince
nti
ve
tari
ff,
i.e.
,gu
ara
nte
edp
rici
ng
that
may
vary
by
tech
nolo
gy
an
dle
vel
of
pri
cegu
ara
nte
edU
SD
,2006
pri
ces
an
dP
PP
IEA
,C
erven
yan
dR
esch
(1998),
cou
ntr
ysp
ecifi
cso
urc
esV
olu
nta
ryp
rogr
am
Th
ese
pro
gra
ms
gen
erally
op
erate
thro
ugh
agre
emen
tsb
etw
een
the
gover
nm
ent,
ener
gy
uti
li-
ties
an
den
ergy
sup
plier
s,w
her
eby
the
uti
liti
esagre
esto
bu
yen
ergy
gen
erate
dfr
om
ren
ewab
leso
urc
es.
On
eof
the
firs
tvolu
nta
ryp
rogra
ms
was
inD
enm
ark
in1984,
wh
enu
tili
ties
agre
edto
bu
y100
MW
of
win
dp
ow
er.
Du
mm
yV
ari
ab
leIE
A
Obl
iga
tio
ns
Ob
ligati
on
san
dta
rget
sgen
erally
take
the
form
of
qu
ota
syst
ems
that
pla
cean
ob
ligati
on
on
pro
du
cers
top
rovid
ea
share
of
thei
ren
ergy
sup
ply
from
ren
ewab
leen
ergy.
Th
ese
qu
ota
sare
not
nec
essa
rily
cover
edby
atr
ad
ab
lece
rtifi
cate
.
Du
mm
yV
ari
ab
leIE
A
Tra
da
ble
Cer
tifi
cate
Ren
ewab
leE
ner
gy
Cer
tifi
cate
s(R
EC
s)co
nsi
stof
trad
ab
lefi
nan
cial
ass
ets,
issu
edby
the
regu
lati
ng
au
thori
ty,
wh
oce
rtifi
esth
ep
rod
uct
ion
of
ren
ewab
leen
ergy,
an
dca
nb
etr
ad
edam
on
gth
eact
ors
involv
ed.
Alo
ng
wit
hth
ecr
eati
on
of
ace
rtifi
cate
sch
eme,
ase
para
tem
ark
etis
usu
ally
esta
blish
edin
wh
ich
pro
du
cers
can
trad
ece
rtifi
cate
s.T
he
pri
ceof
the
cert
ifica
teis
det
erm
ined
thro
ugh
trad
ing
bet
wee
nth
ere
tail
ers.
Sh
are
of
elec
tric
ity
that
mu
stb
egen
erate
dby
ren
ewab
les
or
cover
edw
ith
aR
EC
.
Data
mad
eavailab
leby
Nic
kJoh
nst
on
e,O
EC
DE
nvir
on
men
tD
irec
tora
tep
lus
cou
n-
try
spec
ific
sou
rces
Pu
blic
Res
earc
ha
nd
Dev
elo
pm
ent
Pu
blica
lly
fin
an
ced
R&
Dp
rogra
md
isaggre
gate
dby
typ
esof
renew
ab
leen
ergy
Pu
blic
sect
or
per
cap
ita
exp
en-
dit
ure
son
ener
gy
R&
D(U
SD
,2006
pri
ces
an
dP
PP
).
IEA
EU
dir
ecti
ve2001−
77−EC
Est
ab
lish
edth
efi
rst
share
dfr
am
ework
for
the
pro
moti
on
ofel
ectr
icit
yfr
om
ren
ewab
leso
urc
esat
the
Eu
rop
ean
level
.D
um
my
Vari
ab
leE
uro
pea
nC
om
mis
sion
11
sector, the index combines information on barriers to entrepreneurship and admin-istrative regulation (such as licenses and permits, administrative burdens, and legalbarriers), state control (such as price control and ownership), and barriers to tradeand foreign direct investment (such as tariffs and ownership barriers)11.
The sectors of interest in the field of renewable energy are electricity (ISIC 4010)and gas (ISIC 4020). The PMR index for electricity and gas essentially combinesdifferent sub-indices ranging from 0 to 6, where high values indicate a high levelof regulation and therefore a low level of competition. The first is ownership thatassumes five values: private (0), mostly private (1.5), mixed (3), mostly public (4.5)and public (6). The second is an index of entry barriers that combine information onthird party access to the grid (regulated (0), negotiated (3), no access (6)) and thepower of minimum consumers size to freely choose their supplier (from no threshold(0) to no choice (6)). The third component is vertical integration ranging fromunbundling (0) to full integration (6). In the main analysis, we used a single index,weighting the electricity and gas indices by 0.75 and 0.25, respectively. Using thesimple PMR index for electricity does not alter the results.
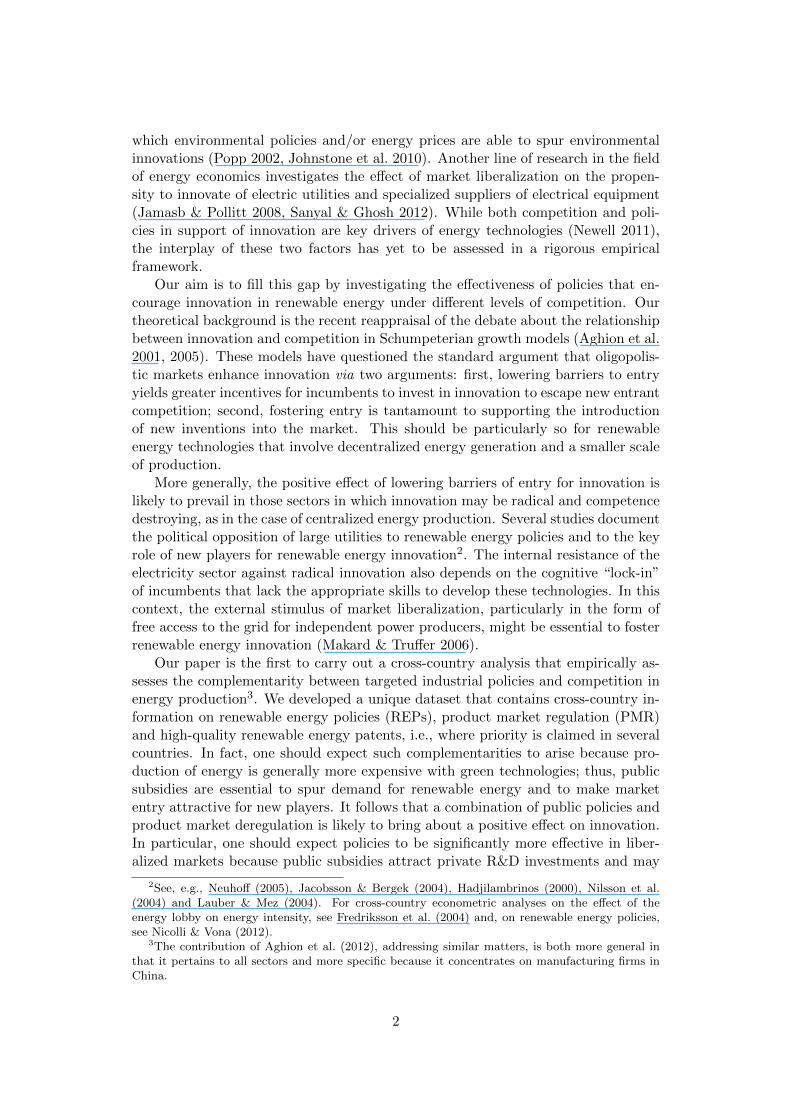
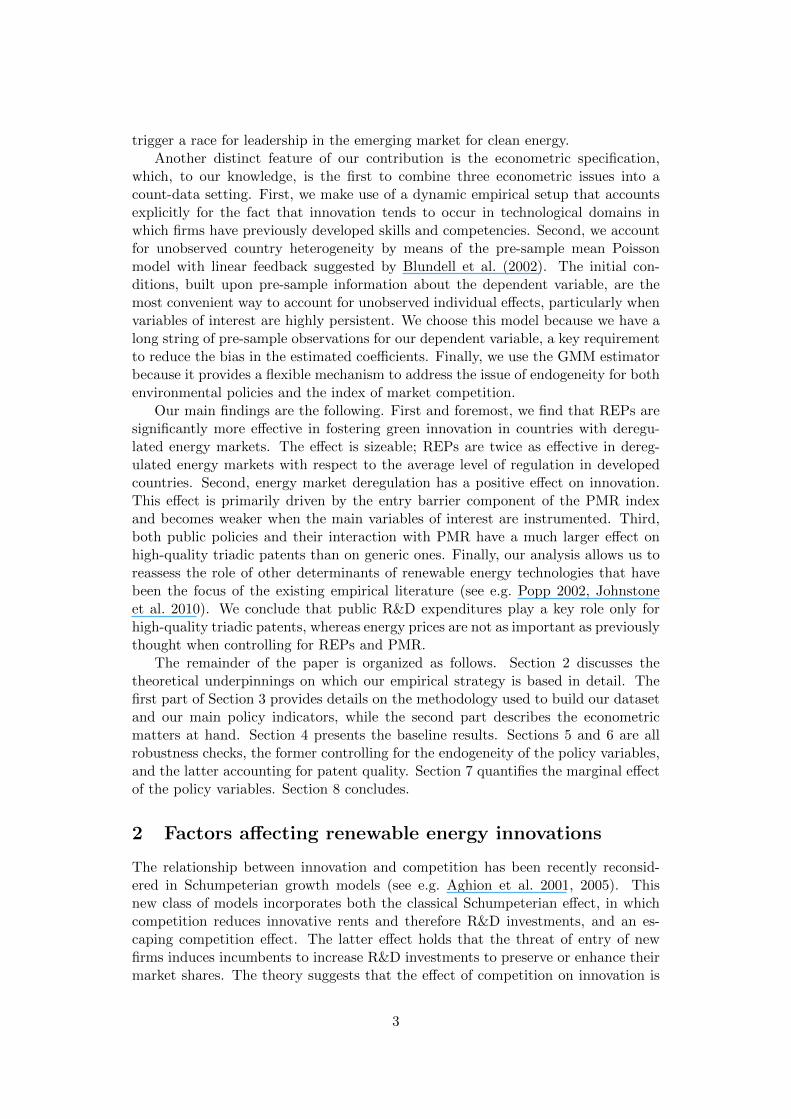
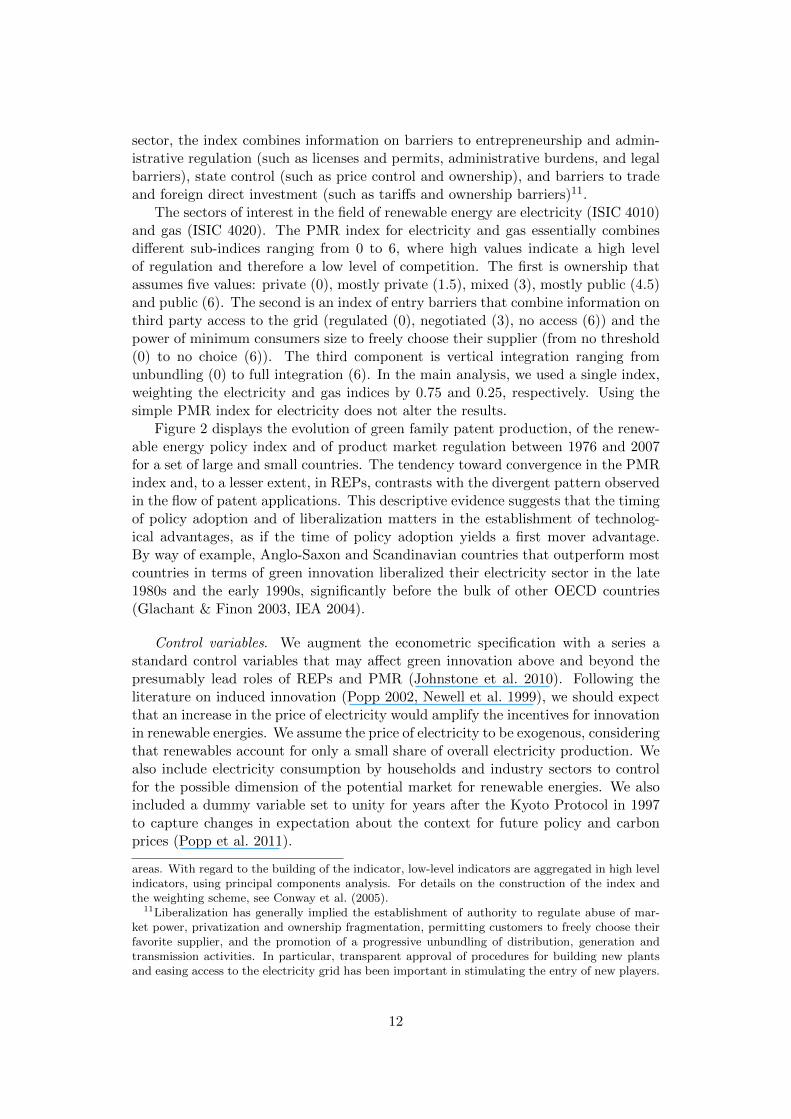
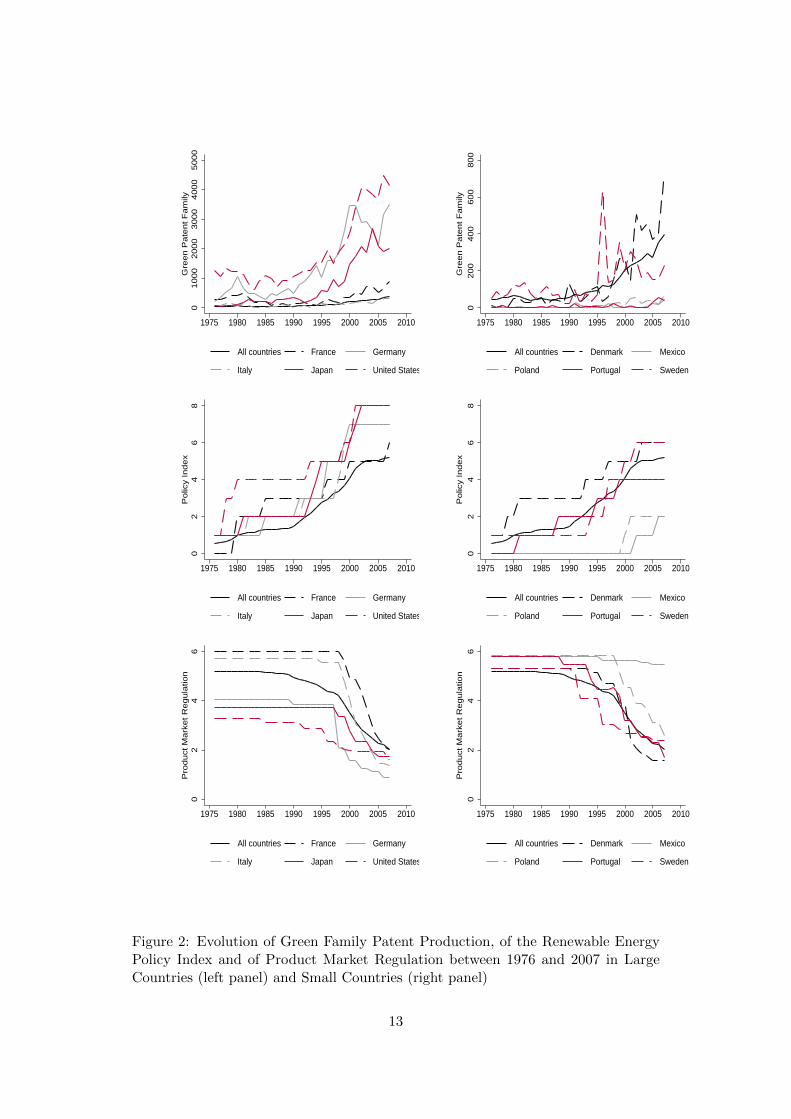
Figure 2 displays the evolution of green family patent production, of the renew-able energy policy index and of product market regulation between 1976 and 2007for a set of large and small countries. The tendency toward convergence in the PMRindex and, to a lesser extent, in REPs, contrasts with the divergent pattern observedin the flow of patent applications. This descriptive evidence suggests that the timingof policy adoption and of liberalization matters in the establishment of technolog-ical advantages, as if the time of policy adoption yields a first mover advantage.By way of example, Anglo-Saxon and Scandinavian countries that outperform mostcountries in terms of green innovation liberalized their electricity sector in the late1980s and the early 1990s, significantly before the bulk of other OECD countries(Glachant & Finon 2003, IEA 2004).
Control variables. We augment the econometric specification with a series astandard control variables that may affect green innovation above and beyond thepresumably lead roles of REPs and PMR (Johnstone et al. 2010). Following theliterature on induced innovation (Popp 2002, Newell et al. 1999), we should expectthat an increase in the price of electricity would amplify the incentives for innovationin renewable energies. We assume the price of electricity to be exogenous, consideringthat renewables account for only a small share of overall electricity production. Wealso include electricity consumption by households and industry sectors to controlfor the possible dimension of the potential market for renewable energies. We alsoincluded a dummy variable set to unity for years after the Kyoto Protocol in 1997to capture changes in expectation about the context for future policy and carbonprices (Popp et al. 2011).
areas. With regard to the building of the indicator, low-level indicators are aggregated in high levelindicators, using principal components analysis. For details on the construction of the index andthe weighting scheme, see Conway et al. (2005).
11Liberalization has generally implied the establishment of authority to regulate abuse of mar-ket power, privatization and ownership fragmentation, permitting customers to freely choose theirfavorite supplier, and the promotion of a progressive unbundling of distribution, generation andtransmission activities. In particular, transparent approval of procedures for building new plantsand easing access to the electricity grid has been important in stimulating the entry of new players.
12
01
00
02
00
03
00
04
00
05
00
0G
ree
n P
ate
nt
Fa
mily
1975 1980 1985 1990 1995 2000 2005 2010
All countries France Germany
Italy Japan United States
02
00
40
06
00
80
0G
ree
n P
ate
nt
Fa
mily
1975 1980 1985 1990 1995 2000 2005 2010
All countries Denmark Mexico
Poland Portugal Sweden
02
46
8P
olic
y In
de
x
1975 1980 1985 1990 1995 2000 2005 2010
All countries France Germany
Italy Japan United States
02
46
8P
olic
y In
de
x
1975 1980 1985 1990 1995 2000 2005 2010
All countries Denmark Mexico
Poland Portugal Sweden
02
46
Pro
du
ct M
ark
et
Re
gu
latio
n
1975 1980 1985 1990 1995 2000 2005 2010
All countries France Germany
Italy Japan United States
02
46
Pro
du
ct M
ark
et
Re
gu
latio
n
1975 1980 1985 1990 1995 2000 2005 2010
All countries Denmark Mexico
Poland Portugal Sweden
Figure 2: Evolution of Green Family Patent Production, of the Renewable EnergyPolicy Index and of Product Market Regulation between 1976 and 2007 in LargeCountries (left panel) and Small Countries (right panel)
13
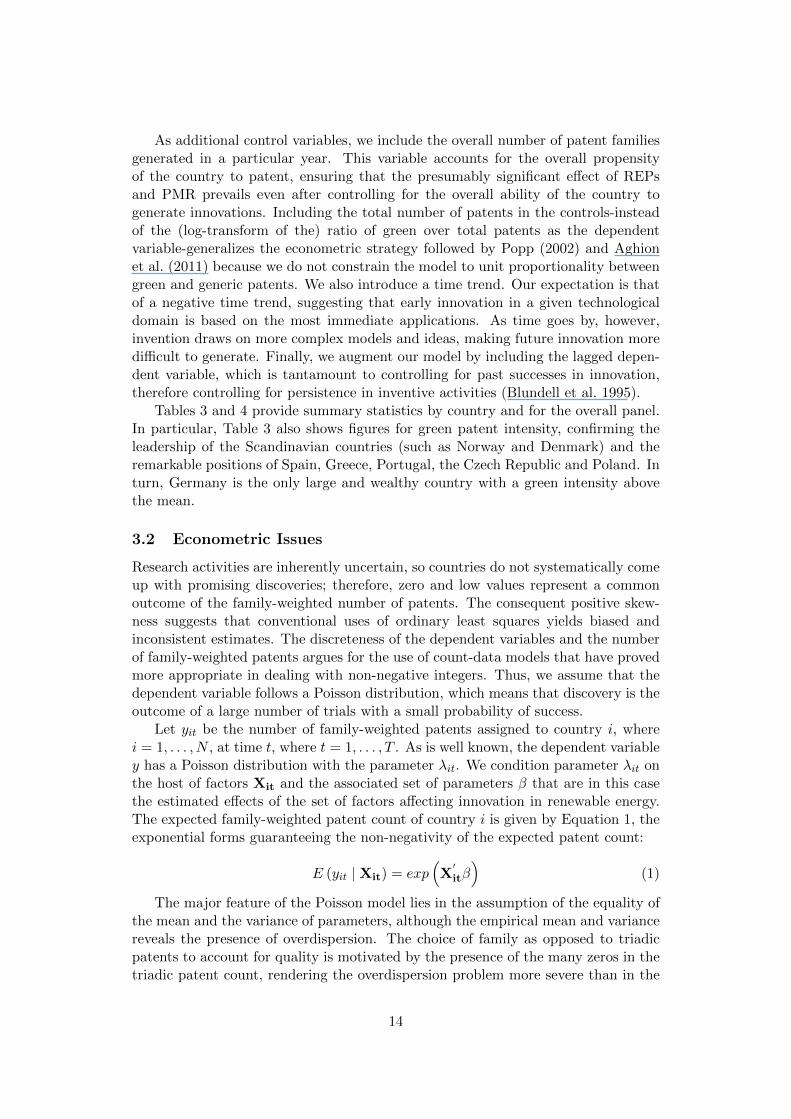
As additional control variables, we include the overall number of patent familiesgenerated in a particular year. This variable accounts for the overall propensityof the country to patent, ensuring that the presumably significant effect of REPsand PMR prevails even after controlling for the overall ability of the country togenerate innovations. Including the total number of patents in the controls-insteadof the (log-transform of the) ratio of green over total patents as the dependentvariable-generalizes the econometric strategy followed by Popp (2002) and Aghionet al. (2011) because we do not constrain the model to unit proportionality betweengreen and generic patents. We also introduce a time trend. Our expectation is thatof a negative time trend, suggesting that early innovation in a given technologicaldomain is based on the most immediate applications. As time goes by, however,invention draws on more complex models and ideas, making future innovation moredifficult to generate. Finally, we augment our model by including the lagged depen-dent variable, which is tantamount to controlling for past successes in innovation,therefore controlling for persistence in inventive activities (Blundell et al. 1995).
Tables 3 and 4 provide summary statistics by country and for the overall panel.In particular, Table 3 also shows figures for green patent intensity, confirming theleadership of the Scandinavian countries (such as Norway and Denmark) and theremarkable positions of Spain, Greece, Portugal, the Czech Republic and Poland. Inturn, Germany is the only large and wealthy country with a green intensity abovethe mean.
3.2 Econometric Issues
Research activities are inherently uncertain, so countries do not systematically comeup with promising discoveries; therefore, zero and low values represent a commonoutcome of the family-weighted number of patents. The consequent positive skew-ness suggests that conventional uses of ordinary least squares yields biased andinconsistent estimates. The discreteness of the dependent variables and the numberof family-weighted patents argues for the use of count-data models that have provedmore appropriate in dealing with non-negative integers. Thus, we assume that thedependent variable follows a Poisson distribution, which means that discovery is theoutcome of a large number of trials with a small probability of success.
Let yit be the number of family-weighted patents assigned to country i, wherei = 1, . . . , N , at time t, where t = 1, . . . , T . As is well known, the dependent variabley has a Poisson distribution with the parameter λit. We condition parameter λit onthe host of factors Xit and the associated set of parameters β that are in this casethe estimated effects of the set of factors affecting innovation in renewable energy.The expected family-weighted patent count of country i is given by Equation 1, theexponential forms guaranteeing the non-negativity of the expected patent count:
E (yit | Xit) = exp(X′itβ)
(1)
The major feature of the Poisson model lies in the assumption of the equality ofthe mean and the variance of parameters, although the empirical mean and variancereveals the presence of overdispersion. The choice of family as opposed to triadicpatents to account for quality is motivated by the presence of the many zeros in thetriadic patent count, rendering the overdispersion problem more severe than in the
14
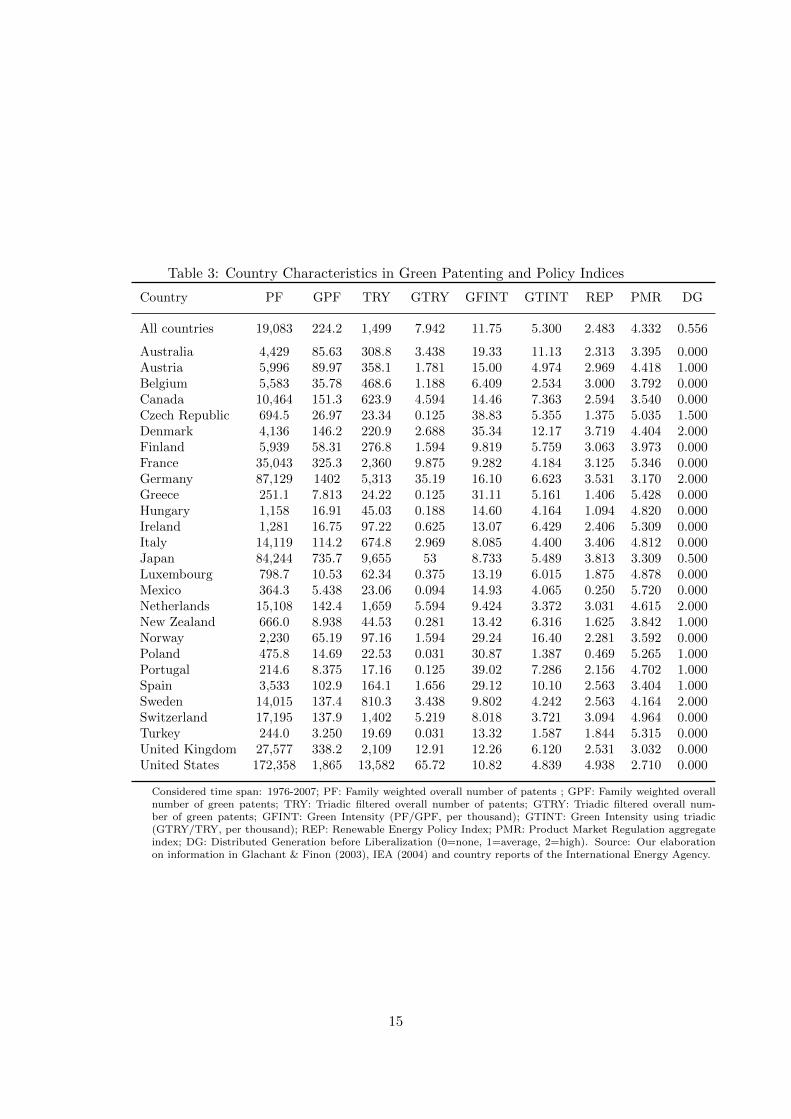
Table 3: Country Characteristics in Green Patenting and Policy Indices
Country PF GPF TRY GTRY GFINT GTINT REP PMR DG
All countries 19,083 224.2 1,499 7.942 11.75 5.300 2.483 4.332 0.556
Australia 4,429 85.63 308.8 3.438 19.33 11.13 2.313 3.395 0.000Austria 5,996 89.97 358.1 1.781 15.00 4.974 2.969 4.418 1.000Belgium 5,583 35.78 468.6 1.188 6.409 2.534 3.000 3.792 0.000Canada 10,464 151.3 623.9 4.594 14.46 7.363 2.594 3.540 0.000Czech Republic 694.5 26.97 23.34 0.125 38.83 5.355 1.375 5.035 1.500Denmark 4,136 146.2 220.9 2.688 35.34 12.17 3.719 4.404 2.000Finland 5,939 58.31 276.8 1.594 9.819 5.759 3.063 3.973 0.000France 35,043 325.3 2,360 9.875 9.282 4.184 3.125 5.346 0.000Germany 87,129 1402 5,313 35.19 16.10 6.623 3.531 3.170 2.000Greece 251.1 7.813 24.22 0.125 31.11 5.161 1.406 5.428 0.000Hungary 1,158 16.91 45.03 0.188 14.60 4.164 1.094 4.820 0.000Ireland 1,281 16.75 97.22 0.625 13.07 6.429 2.406 5.309 0.000Italy 14,119 114.2 674.8 2.969 8.085 4.400 3.406 4.812 0.000Japan 84,244 735.7 9,655 53 8.733 5.489 3.813 3.309 0.500Luxembourg 798.7 10.53 62.34 0.375 13.19 6.015 1.875 4.878 0.000Mexico 364.3 5.438 23.06 0.094 14.93 4.065 0.250 5.720 0.000Netherlands 15,108 142.4 1,659 5.594 9.424 3.372 3.031 4.615 2.000New Zealand 666.0 8.938 44.53 0.281 13.42 6.316 1.625 3.842 1.000Norway 2,230 65.19 97.16 1.594 29.24 16.40 2.281 3.592 0.000Poland 475.8 14.69 22.53 0.031 30.87 1.387 0.469 5.265 1.000Portugal 214.6 8.375 17.16 0.125 39.02 7.286 2.156 4.702 1.000Spain 3,533 102.9 164.1 1.656 29.12 10.10 2.563 3.404 1.000Sweden 14,015 137.4 810.3 3.438 9.802 4.242 2.563 4.164 2.000Switzerland 17,195 137.9 1,402 5.219 8.018 3.721 3.094 4.964 0.000Turkey 244.0 3.250 19.69 0.031 13.32 1.587 1.844 5.315 0.000United Kingdom 27,577 338.2 2,109 12.91 12.26 6.120 2.531 3.032 0.000United States 172,358 1,865 13,582 65.72 10.82 4.839 4.938 2.710 0.000
Considered time span: 1976-2007; PF: Family weighted overall number of patents ; GPF: Family weighted overallnumber of green patents; TRY: Triadic filtered overall number of patents; GTRY: Triadic filtered overall num-ber of green patents; GFINT: Green Intensity (PF/GPF, per thousand); GTINT: Green Intensity using triadic(GTRY/TRY, per thousand); REP: Renewable Energy Policy Index; PMR: Product Market Regulation aggregateindex; DG: Distributed Generation before Liberalization (0=none, 1=average, 2=high). Source: Our elaborationon information in Glachant & Finon (2003), IEA (2004) and country reports of the International Energy Agency.
15
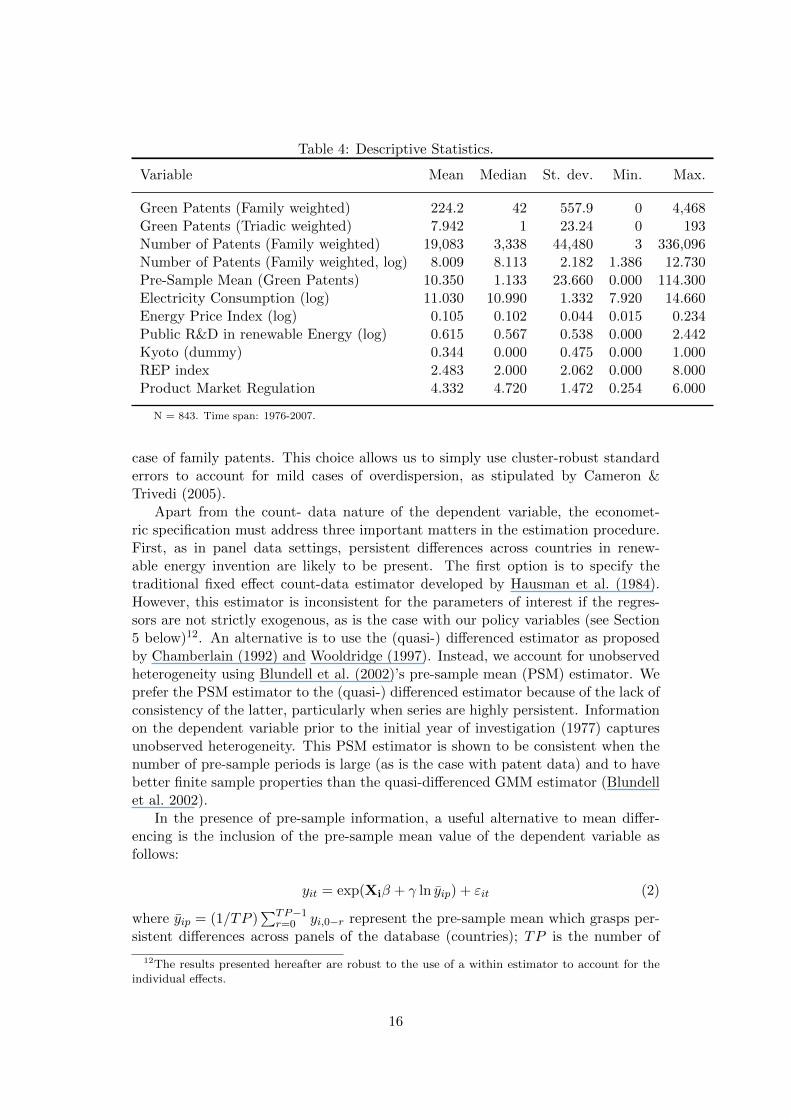
Table 4: Descriptive Statistics.
Variable Mean Median St. dev. Min. Max.
Green Patents (Family weighted) 224.2 42 557.9 0 4,468Green Patents (Triadic weighted) 7.942 1 23.24 0 193Number of Patents (Family weighted) 19,083 3,338 44,480 3 336,096Number of Patents (Family weighted, log) 8.009 8.113 2.182 1.386 12.730Pre-Sample Mean (Green Patents) 10.350 1.133 23.660 0.000 114.300Electricity Consumption (log) 11.030 10.990 1.332 7.920 14.660Energy Price Index (log) 0.105 0.102 0.044 0.015 0.234Public R&D in renewable Energy (log) 0.615 0.567 0.538 0.000 2.442Kyoto (dummy) 0.344 0.000 0.475 0.000 1.000REP index 2.483 2.000 2.062 0.000 8.000Product Market Regulation 4.332 4.720 1.472 0.254 6.000
N = 843. Time span: 1976-2007.
case of family patents. This choice allows us to simply use cluster-robust standarderrors to account for mild cases of overdispersion, as stipulated by Cameron &Trivedi (2005).
Apart from the count- data nature of the dependent variable, the economet-ric specification must address three important matters in the estimation procedure.First, as in panel data settings, persistent differences across countries in renew-able energy invention are likely to be present. The first option is to specify thetraditional fixed effect count-data estimator developed by Hausman et al. (1984).However, this estimator is inconsistent for the parameters of interest if the regres-sors are not strictly exogenous, as is the case with our policy variables (see Section5 below)12. An alternative is to use the (quasi-) differenced estimator as proposedby Chamberlain (1992) and Wooldridge (1997). Instead, we account for unobservedheterogeneity using Blundell et al. (2002)’s pre-sample mean (PSM) estimator. Weprefer the PSM estimator to the (quasi-) differenced estimator because of the lack ofconsistency of the latter, particularly when series are highly persistent. Informationon the dependent variable prior to the initial year of investigation (1977) capturesunobserved heterogeneity. This PSM estimator is shown to be consistent when thenumber of pre-sample periods is large (as is the case with patent data) and to havebetter finite sample properties than the quasi-differenced GMM estimator (Blundellet al. 2002).
In the presence of pre-sample information, a useful alternative to mean differ-encing is the inclusion of the pre-sample mean value of the dependent variable asfollows:
yit = exp(Xiβ + γ ln yip) + εit (2)
where yip = (1/TP )∑TP−1
r=0 yi,0−r represent the pre-sample mean which grasps per-sistent differences across panels of the database (countries); TP is the number of
12The results presented hereafter are robust to the use of a within estimator to account for theindividual effects.
16
pre-sample observations.Second, we introduce dynamics by inserting a linear feedback as in Blundell et al.
(2002):
yit = ρyit−1 + exp(Xiβ + γ ln yip) + εit (3)
The purpose of imposing a linear feedback, as opposed to an exponential feed-back, is that it eliminates the possibility of an explosive series. Thus, imposing alinear feedback model is akin to imposing a lower bound to the expected patentcount set to ρyit−1, because exp(Xiβ + γ ln yip) is always positive. Note that theinclusion of the lagged dependent variable allows us to account for lags between theset of covariates and the dependent variable without imposing a lag structure.
The last issue concerns the well-known endogeneity of policies for three reasons.The first reason is the mutual reinforcement effect initially recognized by Downingand White (1986), who posited that, if innovation in environmental technologiesfollows the implementation of an effective policy support, progress in the generationof renewable energy will, in turn, provide support for that policy. Second, the effectof a given policy is likely to be heterogeneous, implying that unobservable factorsaffect both the policy and the propensity to patents; thus, an omitted variablebias plagues the estimated policy-innovation relationship. Third, renewable energypolicies are measured with a substantial error. For most policies, particularly theones in place since the 1970s and 1980s, the lack of detailed information allows onlyfor policy dummies, which at best are only rough proxies.
We will therefore estimate Model 3 using the generalized method of moments.Relying on a GMM estimator allows for use of instruments as follows:
1
N
N∑i=1
T∑t=1
Zit (yit − ρyit−1 − exp(Xitβ + γ ln yip)) = 0 (4)
where we define exclusion restrictions in the case of endogeneity of the regressors
as Zit =(1, Xit,yip,Pit−τ , IVit−τ
), Xit is the adapted set of variables, which are
considered exogenous, Pit−τ are our various measures of policy indices (REP andPMR), and IV are instruments that serve as additional moment restrictions, whichare typically out-of-sample instruments that will be discussed in later parts of thepaper.
4 Baseline Results
Table 5 displays the results of regressions in which we sequentially introduce ourvariables of interest in the specification. In Model 1, the linear feedback and thefamily weighted number of patents capture a significant share of the variance of thedependent variable. The country-specific initial conditions (Pre-Sample Mean) andenergy prices have the expected sign and are near significance. In turn, public R&Din renewable energy has no particular effect on the dependent variable. Model 2introduces the Kyoto dummy with our Renewable Energy Policy index. Both arepositive and significant, validating the idea that public authorities are essential toguide the direction of invention. Innovation in renewable energy is greater in coun-tries in which there is substantial public support for it. Not surprisingly, estimated
17
elasticities decrease in Model 2; the effects of the linear feedback and of the numberof generic patents decline well below unity, while the time trend becomes negative13.These results suggest the presence of a technological frontier that becomes moredifficult to move forward as the knowledge stock increases.
From the above, we can conclude that policies fostering demand for clean energymatter more than mere public R&D expenditures, which highlights the leading roleof demand and learning effects, as opposed to a pure technology push (Fischer &Newell 2008). These results are consistent with those of Popp (2002), who foundthat public R&D expenditures have an unstable and often insignificant effect ongreen patents. Section 6 below addresses this issue in more detail.
Model 3 shows that PMR, the index for product market competition, has anegative and significant effect on the generation of green patents, implying thatinvention in renewable energy occurs in more competitive markets14. Past literaturehas produced results that are both consistent and at odds with our findings. Onthe one hand, Jamasb & Pollitt (2008) (resp., Sanyal & Ghosh 2012) find thatliberalization in the energy market in the UK (resp., in the US) has had a negativeeffect on overall energy patents. On the other hand, Blundell et al. (1995) (resp.,Griffith et al. 2010) estimate a positive effect on generic innovation in the UK (resp.,for a group of EU countries), particularly in sectors characterized by low initiallevels of competition. These discrepancies may reveal systematic differences in theway liberalization has been implemented in these countries, or they may show theresults of differences in measurements and econometric specification. Importantly,the inclusion of PMR leaves the parameter estimate of the Policy Index unaffected.This result suggests that regulations in product markets and policies in support ofrenewable energy are significantly distinct instruments that are available to policymakers.
Model 4 displays the key specification where we include an interaction termbetween PMR and the Policy Index. The negative sign and statistical significance ofthe interaction term is expected theoretically. These findings reveal that renewableenergy policies are more effective in more competitive markets, validating the policycomplementarity hypothesis. Table 3 shows that the policy mix displayed by theUS seems the most appropriate, scoring highest in the REP index and achieving thelowest score in PMR, implying a policy mix of substantial support for renewableenergy innovation in a broadly deregulated market. More mitigated policy mixescan be found in France and, to a lesser extent, Denmark, where substantial publicsupport in favor of renewable energy may be made less efficient by the lack ofcompetition in their respective energy markets. These remarks should not concealwithin-country variations that would exhibit an increase in public support with anincrease in competition in energy markets for both countries.
Model 5 offers an alternative way of testing our policy complementarity hypoth-esis that allows for nonlinearity in the interaction effect. In particular, we allow thepolicy index REP to interact with each tercile of the PMR index to see whetherincrements in policy effectiveness are best achieved with mild or full liberalization.
13This latter result is consistent with the idea that invention becomes harder as time goes by.For example, renewable energies are characterized by decreasing returns associated with the limitednumber of appropriate geographical locations (Fischer & Newell 2008).
14The inclusion of PMR squared does not provide evidence in favor of a non-linear effect of PMR.
18
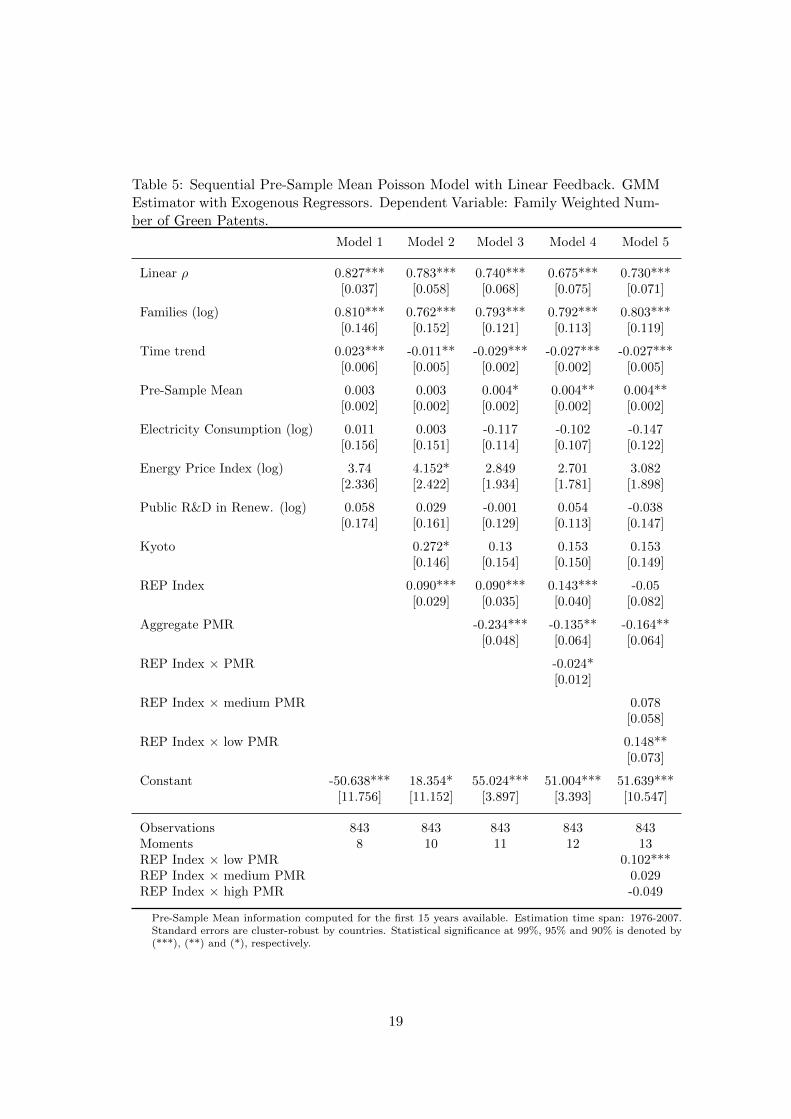
Table 5: Sequential Pre-Sample Mean Poisson Model with Linear Feedback. GMMEstimator with Exogenous Regressors. Dependent Variable: Family Weighted Num-ber of Green Patents.
Model 1 Model 2 Model 3 Model 4 Model 5
Linear ρ 0.827*** 0.783*** 0.740*** 0.675*** 0.730***[0.037] [0.058] [0.068] [0.075] [0.071]
Families (log) 0.810*** 0.762*** 0.793*** 0.792*** 0.803***[0.146] [0.152] [0.121] [0.113] [0.119]
Time trend 0.023*** -0.011** -0.029*** -0.027*** -0.027***[0.006] [0.005] [0.002] [0.002] [0.005]
Pre-Sample Mean 0.003 0.003 0.004* 0.004** 0.004**[0.002] [0.002] [0.002] [0.002] [0.002]
Electricity Consumption (log) 0.011 0.003 -0.117 -0.102 -0.147[0.156] [0.151] [0.114] [0.107] [0.122]
Energy Price Index (log) 3.74 4.152* 2.849 2.701 3.082[2.336] [2.422] [1.934] [1.781] [1.898]
Public R&D in Renew. (log) 0.058 0.029 -0.001 0.054 -0.038[0.174] [0.161] [0.129] [0.113] [0.147]
Kyoto 0.272* 0.13 0.153 0.153[0.146] [0.154] [0.150] [0.149]
REP Index 0.090*** 0.090*** 0.143*** -0.05[0.029] [0.035] [0.040] [0.082]
Aggregate PMR -0.234*** -0.135** -0.164**[0.048] [0.064] [0.064]
REP Index × PMR -0.024*[0.012]
REP Index × medium PMR 0.078[0.058]
REP Index × low PMR 0.148**[0.073]
Constant -50.638*** 18.354* 55.024*** 51.004*** 51.639***[11.756] [11.152] [3.897] [3.393] [10.547]
Observations 843 843 843 843 843Moments 8 10 11 12 13REP Index × low PMR 0.102***REP Index × medium PMR 0.029REP Index × high PMR -0.049
Pre-Sample Mean information computed for the first 15 years available. Estimation time span: 1976-2007.Standard errors are cluster-robust by countries. Statistical significance at 99%, 95% and 90% is denoted by(***), (**) and (*), respectively.
19
The results show that extensive liberalization of the energy market allows for theentire benefit of REPs to be reaped. In systems with mildly deregulated energy mar-kets, the REP index is almost significant. Conversely, REPs show no inducementeffects in heavily regulated energy systems. This result has important implicationsfor evaluating the welfare effect of REPs. In heavily regulated energy sectors, moreambitious REPs produce welfare gains only if the positive effect of installed cleanenergy and of the associated reduction of greenhouse gas emissions more than offsetthe null effect in term of innovation.
In theory, the above results may stem from the particular way of measuring thepolicy and the PMR indicators. With regards to the REP indicator, an element ofconcern is the use of dummies for all policies with the exception of public R&D percapita. Because we have reliable cross-country information on a continuous scalefor feed-in tariffs and RECs, we include these policies in Model 6 and display theresults in Table 6. This exercise does not affect our main results on policy comple-mentarity and on the effect of PMR. In turn, the new policies, particularly RECs,do not display statistically significant effects. This result may stem from the lackof variance in these variables. In most countries, RECs were adopted in 2000 asa national policy that complied with the Kyoto Protocol. In the same vein, theeffect of feed-in tariffs is most likely weakened because they have been gradually ad-justed downward in countries experiencing substantial technological improvements.Overall, policy signals appear more appropriate than policy intensities in capturingcountry commitments toward renewable energy over the long time span considered.
The PMR index is the combination of entry barriers, vertical integration andpublic ownership. Understanding which of these three components has the greater ef-fect on innovation has relevant implications for the design of energy markets. Model7 presents a specification with the PMR split into its three components. The mainobservation is that the aggregate effect of PMR seems largely driven by barriersto entry and, to a lesser extent, by the percentage of public ownership in energyutilities. The lack of significant effect for vertical integration implies that easingbarriers to entry is enough to stimulate clean innovations even in markets withlarge, vertically integrated firms. This result is also explained by the fact that localdistribution networks are owned by small companies in countries such as Denmark,and municipalities have favored the transition to clean energy (Ropenus & Skytte2005). Finally, we check the robustness of these results by adding the PMR-REPinteraction in a model with PMR split into its components. This specification ispresented in Model 8 and confirms the policy complementarity hypothesis. No-tably, entry barriers remain the only component of the PMR index that maintainsa statistically significant effect.
In Model 9 of Table 6, we jointly consider the interactions between PMR, theREP index and R&D subsidies. The estimate of the interaction term between publicR &D and the PMR is of the expected sign and highly significant. In particular,public R&D positively influences green innovation when its capacity to attract pri-vate investment is magnified by the increase in market competition. Note that theinclusion of this interaction term drives the effect of the REP index to insignificance.Although significant, the interaction of deregulation with public R&D is not robustacross alternative specifications. In the remainder of the paper, we therefore empha-size the complementarity between REPs and PMR rather than with public R&D in
20
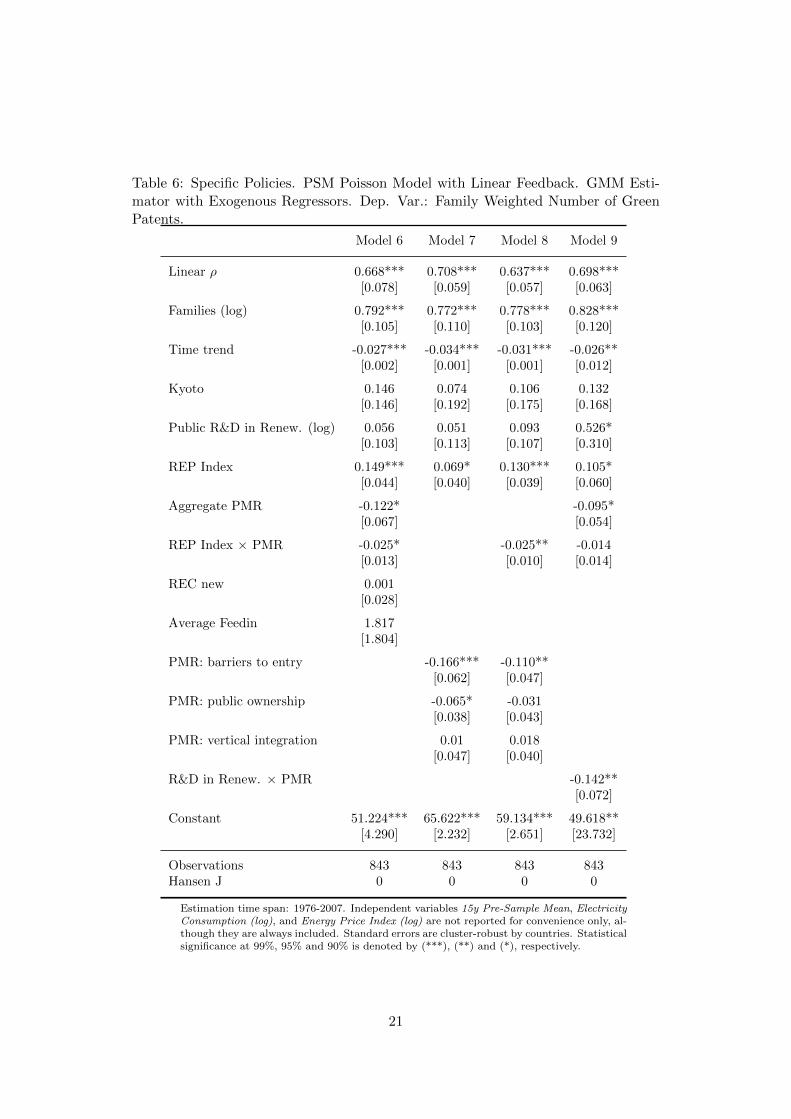
Table 6: Specific Policies. PSM Poisson Model with Linear Feedback. GMM Esti-mator with Exogenous Regressors. Dep. Var.: Family Weighted Number of GreenPatents.
Model 6 Model 7 Model 8 Model 9
Linear ρ 0.668*** 0.708*** 0.637*** 0.698***[0.078] [0.059] [0.057] [0.063]
Families (log) 0.792*** 0.772*** 0.778*** 0.828***[0.105] [0.110] [0.103] [0.120]
Time trend -0.027*** -0.034*** -0.031*** -0.026**[0.002] [0.001] [0.001] [0.012]
Kyoto 0.146 0.074 0.106 0.132[0.146] [0.192] [0.175] [0.168]
Public R&D in Renew. (log) 0.056 0.051 0.093 0.526*[0.103] [0.113] [0.107] [0.310]
REP Index 0.149*** 0.069* 0.130*** 0.105*[0.044] [0.040] [0.039] [0.060]
Aggregate PMR -0.122* -0.095*[0.067] [0.054]
REP Index × PMR -0.025* -0.025** -0.014[0.013] [0.010] [0.014]
REC new 0.001[0.028]
Average Feedin 1.817[1.804]
PMR: barriers to entry -0.166*** -0.110**[0.062] [0.047]
PMR: public ownership -0.065* -0.031[0.038] [0.043]
PMR: vertical integration 0.01 0.018[0.047] [0.040]
R&D in Renew. × PMR -0.142**[0.072]
Constant 51.224*** 65.622*** 59.134*** 49.618**[4.290] [2.232] [2.651] [23.732]
Observations 843 843 843 843Hansen J 0 0 0 0
Estimation time span: 1976-2007. Independent variables 15y Pre-Sample Mean, ElectricityConsumption (log), and Energy Price Index (log) are not reported for convenience only, al-though they are always included. Standard errors are cluster-robust by countries. Statisticalsignificance at 99%, 95% and 90% is denoted by (***), (**) and (*), respectively.
21
renewable energy.
5 Endogeneity
Endogeneity is a key issue in the estimation of the effects of the REP and PMRindices because both reverse causality and omitted variables can induce a bias inthe estimated coefficients. Further complicating the estimation of their joint effect isa mutual reinforcement effect between them, which amplifies the sources of reversecausality, as discussed by Downing & White (1986). Historic successful innovationsin clean energy reinforce the lobbying power of innovating firms toward policy mak-ers. In turn, current policies may have a positive influence on future innovation15.
In general, the recent liberalization of energy markets should have reduced theincumbents’ lobbying capacity, favoring the adoption of ambitious policies and fa-cilitating the emergence of new players in renewable energy innovation. The closeinterplay between competition and innovation policies points to the existence of alatent factor affecting both the liberalization process and the adoption of REPs.Moreover, because of the strong persistence of our two policy indicators, the timingof reforms is of paramount importance in establishing comparative advantages inrenewable energy technologies. Accordingly, we chose an instrument that jointlyinfluences the two policy indicators and, in particular, their time of adoption.
Our strategy is to use both within-sample and out-of-sample instruments. First,our time-series cross-country database fits perfectly with the use of lags in the policyvariables. We therefore use one- and two-year lags as instruments for future levels inthe REP index, in the PMR and in their interaction. Second, we included a series ofout-of-sample instruments, which serve as predictors of policy implementation. Inthe vector of out-of-sample instruments, we include a proxy (TENSYS) accountingfor the time length for which a country has had consolidated and durable demo-cratic institutions. This information is provided by the 2010 version of the WorldBank Database on Political Institutions (for details see, Beck et al. 2001). In fact,a growing literature shows that democratic countries tend to approve stricter en-vironmental policies and to foster product market liberalizations (Congleton 1992,Murdoch & Sandler 1997, Fredriksson et al. 2005, Neumayer 2002, Pitlik 2007, Pit-liks & Wirth 2003, Chang & Berdief 2011). With respect to younger democracies,our conjecture is that durable democracies ensure a longer time horizon for decisionmaking and should be more responsive to citizens’ preferences as a result of environ-mental activists and NGOs exerting a positive influence on environmental policies(Fredriksson et al. 2005, List & Sturm 2006).
To capture complementary aspects that may affect agents’ expectations aboutpolitical decisions, we use two additional variables provided by the World Bank thatmeasure the length of time the government has been in office (YRSOFF), and thetime the government will remain in office before the next election (YRCURNT). Indemocracies, the duration of the chief executive may advocate a government thatis successful in meeting citizens’ interests or may be an index of political strength
15Note that the positive feedback mechanism may become negative because existing lobbies in theenergy sector and large utility generators are likely to exacerbate failures in given policies and/orgreen innovation output by postulating a reduction in the support for renewable energy (Jacobsson& Johnson 2000, Nilsson et al. 2004, Lauber & Mez 2004, Nicolli & Vona 2012).
22
and perpetuation of existing elites, e.g., Chang & Berdief (2011), Levy-Yeyati et al.(2010), Grossman & Noh (1990). For the energy sector in OECD countries, wherethere is a certain degree of policy homogeneity, a long-term democracy, along withthe presence of a more stable governments, may influence the speed of both liberal-ization and environmental policy adoption. Lastly, the robustness of our choice ofinstruments is tested by using a different set of out-of-sample instruments: per capitaincome and a proxy for a ‘pre-sample’ share of energy from distributed generation.The use of the first variable is motivated by the robust evidence that ambitious envi-ronmental policies tend to be adopted in more developed countries (Dasgupta et al.2001, Esty & Porter 2005, Nicolli & Vona 2012). The second instrument is a proxyfor initial know-how in decentralized energy production16. Appendix A displays theresults of the regression between the policy variables and the set of instruments.
Table 7 shows estimates of the pre-sample mean estimator with endogenousregressors using alternative vectors of instruments. First, all sets of exclusion re-strictions pass the Hansen test on exogeneity of the instruments, particularly forthe set of political instruments (Models 12 and 13). Second, as in Popp (2002), theeffect of R&D per capita is greatly underestimated without properly accounting forendogeneity. Depending on the specification, the effect of public R&D per capita isinflated by a factor of 2. In turn, the effects of all remaining variables are of similarsize of those obtained in the model with exogenous (or pre-determined) regressors.
Regarding the main variables of interest, both the effects of PMR and of theREP index maintain the identical sign, but their effects decrease. The decrease inthe estimated coefficient is particularly impressive for PMR, making it insignificantin most specifications. In turn, the magnitude of the estimation bias for the REPindex is negligible across specifications, ranging from 6% to 15% of the original effect.The synergetic effect is amplified by 20 to 37%. A final point must be stressed in thecomparison with the case of exogenous regressors. Accounting for endogeneity leadsto a slight but relevant change in the interpretation of the results. While in Models4 and 5, REPs seem effective only in liberalized markets, liberalization of the energymarket here appears to have a positive effect on clean innovation, particularly whencombined with ambitious policies.
6 Quality of Inventions
The use of patent families, as opposed to patent counts, aims to address the qualityof invention when simply calculating numbers of patents. The intuition is thatan economically valuable invention should benefit from intellectual property rightsacross several legal authorities, whereas a local, small-scale invention should focuson the local market only. However, the use of patent families does not control forthe quality of patent offices. Imagine an invention being granted by, for example,10 legal authorities, none of which cover a large market. How would that comparewith an invention being granted in the three largest markets worldwide, which arethe US, the European and the Japanese markets? Therefore, an even more stringent
16In the late 1980s, energy generation was essentially centralized when liberalization started.However, Nordic and central European countries were previously committed to dispersed ownershipstructures with a significant share of energy produced in local heating systems or as a by-productof farm and industry activities (Glachant & Finon (2003)).
23
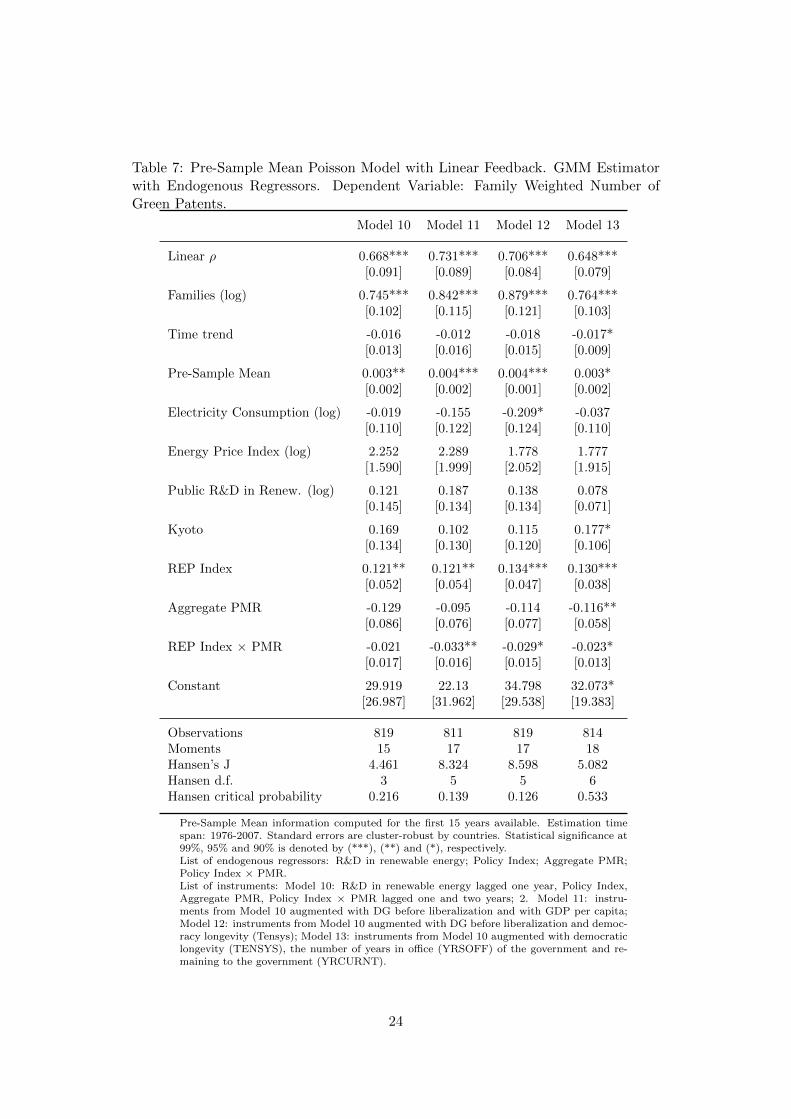
Table 7: Pre-Sample Mean Poisson Model with Linear Feedback. GMM Estimatorwith Endogenous Regressors. Dependent Variable: Family Weighted Number ofGreen Patents.
Model 10 Model 11 Model 12 Model 13
Linear ρ 0.668*** 0.731*** 0.706*** 0.648***[0.091] [0.089] [0.084] [0.079]
Families (log) 0.745*** 0.842*** 0.879*** 0.764***[0.102] [0.115] [0.121] [0.103]
Time trend -0.016 -0.012 -0.018 -0.017*[0.013] [0.016] [0.015] [0.009]
Pre-Sample Mean 0.003** 0.004*** 0.004*** 0.003*[0.002] [0.002] [0.001] [0.002]
Electricity Consumption (log) -0.019 -0.155 -0.209* -0.037[0.110] [0.122] [0.124] [0.110]
Energy Price Index (log) 2.252 2.289 1.778 1.777[1.590] [1.999] [2.052] [1.915]
Public R&D in Renew. (log) 0.121 0.187 0.138 0.078[0.145] [0.134] [0.134] [0.071]
Kyoto 0.169 0.102 0.115 0.177*[0.134] [0.130] [0.120] [0.106]
REP Index 0.121** 0.121** 0.134*** 0.130***[0.052] [0.054] [0.047] [0.038]
Aggregate PMR -0.129 -0.095 -0.114 -0.116**[0.086] [0.076] [0.077] [0.058]
REP Index × PMR -0.021 -0.033** -0.029* -0.023*[0.017] [0.016] [0.015] [0.013]
Constant 29.919 22.13 34.798 32.073*[26.987] [31.962] [29.538] [19.383]
Observations 819 811 819 814Moments 15 17 17 18Hansen’s J 4.461 8.324 8.598 5.082Hansen d.f. 3 5 5 6Hansen critical probability 0.216 0.139 0.126 0.533
Pre-Sample Mean information computed for the first 15 years available. Estimation timespan: 1976-2007. Standard errors are cluster-robust by countries. Statistical significance at99%, 95% and 90% is denoted by (***), (**) and (*), respectively.List of endogenous regressors: R&D in renewable energy; Policy Index; Aggregate PMR;Policy Index × PMR.List of instruments: Model 10: R&D in renewable energy lagged one year, Policy Index,Aggregate PMR, Policy Index × PMR lagged one and two years; 2. Model 11: instru-ments from Model 10 augmented with DG before liberalization and with GDP per capita;Model 12: instruments from Model 10 augmented with DG before liberalization and democ-racy longevity (Tensys); Model 13: instruments from Model 10 augmented with democraticlongevity (TENSYS), the number of years in office (YRSOFF) of the government and re-maining to the government (YRCURNT).
24
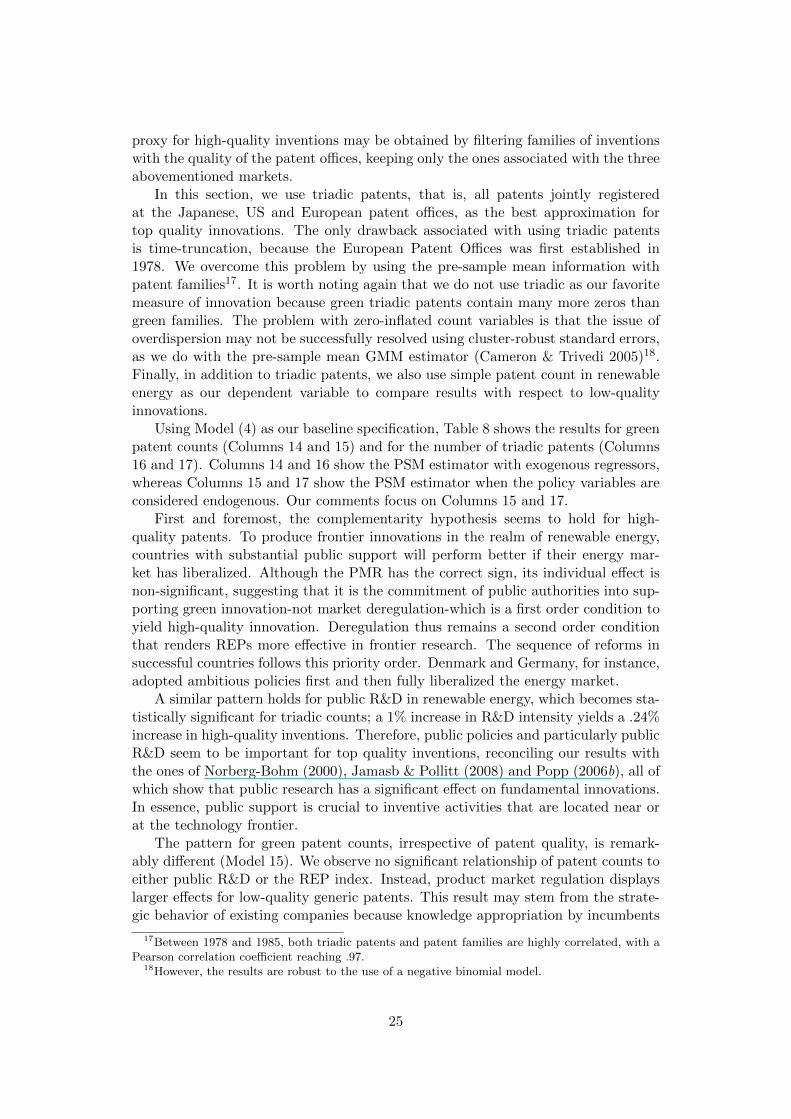
proxy for high-quality inventions may be obtained by filtering families of inventionswith the quality of the patent offices, keeping only the ones associated with the threeabovementioned markets.
In this section, we use triadic patents, that is, all patents jointly registeredat the Japanese, US and European patent offices, as the best approximation fortop quality innovations. The only drawback associated with using triadic patentsis time-truncation, because the European Patent Offices was first established in1978. We overcome this problem by using the pre-sample mean information withpatent families17. It is worth noting again that we do not use triadic as our favoritemeasure of innovation because green triadic patents contain many more zeros thangreen families. The problem with zero-inflated count variables is that the issue ofoverdispersion may not be successfully resolved using cluster-robust standard errors,as we do with the pre-sample mean GMM estimator (Cameron & Trivedi 2005)18.Finally, in addition to triadic patents, we also use simple patent count in renewableenergy as our dependent variable to compare results with respect to low-qualityinnovations.
Using Model (4) as our baseline specification, Table 8 shows the results for greenpatent counts (Columns 14 and 15) and for the number of triadic patents (Columns16 and 17). Columns 14 and 16 show the PSM estimator with exogenous regressors,whereas Columns 15 and 17 show the PSM estimator when the policy variables areconsidered endogenous. Our comments focus on Columns 15 and 17.
First and foremost, the complementarity hypothesis seems to hold for high-quality patents. To produce frontier innovations in the realm of renewable energy,countries with substantial public support will perform better if their energy mar-ket has liberalized. Although the PMR has the correct sign, its individual effect isnon-significant, suggesting that it is the commitment of public authorities into sup-porting green innovation-not market deregulation-which is a first order condition toyield high-quality innovation. Deregulation thus remains a second order conditionthat renders REPs more effective in frontier research. The sequence of reforms insuccessful countries follows this priority order. Denmark and Germany, for instance,adopted ambitious policies first and then fully liberalized the energy market.
A similar pattern holds for public R&D in renewable energy, which becomes sta-tistically significant for triadic counts; a 1% increase in R&D intensity yields a .24%increase in high-quality inventions. Therefore, public policies and particularly publicR&D seem to be important for top quality inventions, reconciling our results withthe ones of Norberg-Bohm (2000), Jamasb & Pollitt (2008) and Popp (2006b), all ofwhich show that public research has a significant effect on fundamental innovations.In essence, public support is crucial to inventive activities that are located near orat the technology frontier.
The pattern for green patent counts, irrespective of patent quality, is remark-ably different (Model 15). We observe no significant relationship of patent counts toeither public R&D or the REP index. Instead, product market regulation displayslarger effects for low-quality generic patents. This result may stem from the strate-gic behavior of existing companies because knowledge appropriation by incumbents
17Between 1978 and 1985, both triadic patents and patent families are highly correlated, with aPearson correlation coefficient reaching .97.
18However, the results are robust to the use of a negative binomial model.
25
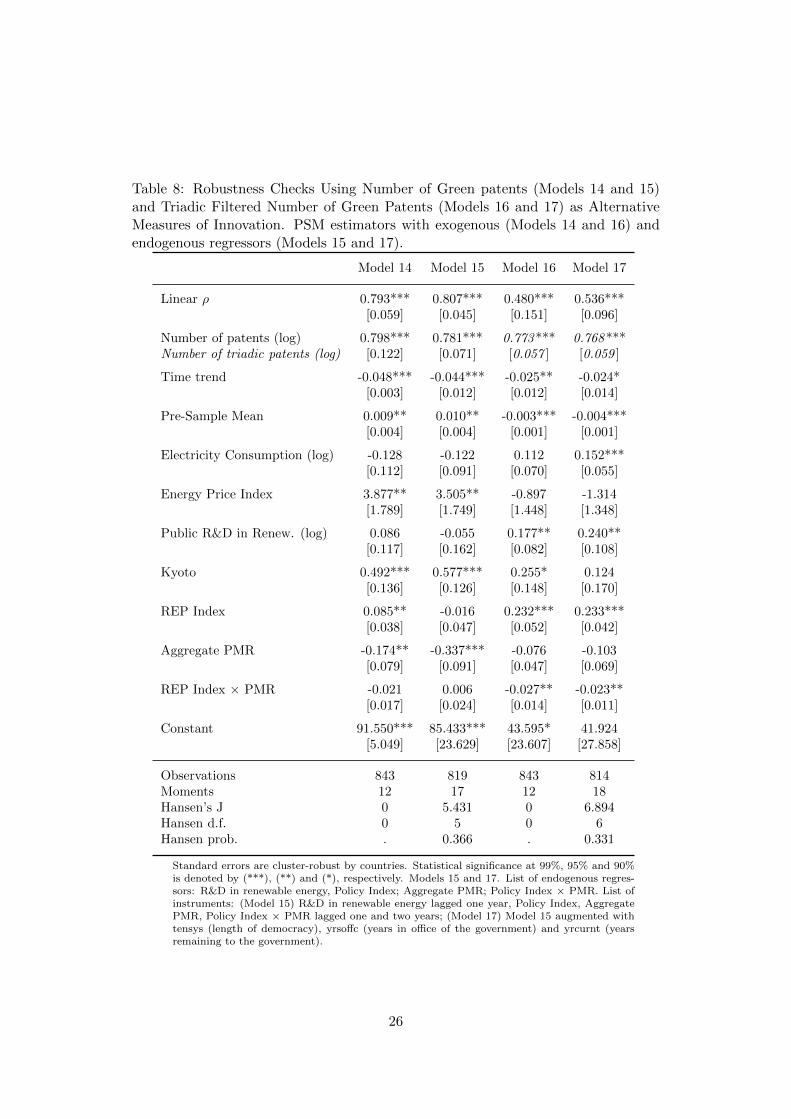
Table 8: Robustness Checks Using Number of Green patents (Models 14 and 15)and Triadic Filtered Number of Green Patents (Models 16 and 17) as AlternativeMeasures of Innovation. PSM estimators with exogenous (Models 14 and 16) andendogenous regressors (Models 15 and 17).
Model 14 Model 15 Model 16 Model 17
Linear ρ 0.793*** 0.807*** 0.480*** 0.536***[0.059] [0.045] [0.151] [0.096]
Number of patents (log) 0.798*** 0.781*** 0.773*** 0.768***Number of triadic patents (log) [0.122] [0.071] [0.057 ] [0.059 ]
Time trend -0.048*** -0.044*** -0.025** -0.024*[0.003] [0.012] [0.012] [0.014]
Pre-Sample Mean 0.009** 0.010** -0.003*** -0.004***[0.004] [0.004] [0.001] [0.001]
Electricity Consumption (log) -0.128 -0.122 0.112 0.152***[0.112] [0.091] [0.070] [0.055]
Energy Price Index 3.877** 3.505** -0.897 -1.314[1.789] [1.749] [1.448] [1.348]
Public R&D in Renew. (log) 0.086 -0.055 0.177** 0.240**[0.117] [0.162] [0.082] [0.108]
Kyoto 0.492*** 0.577*** 0.255* 0.124[0.136] [0.126] [0.148] [0.170]
REP Index 0.085** -0.016 0.232*** 0.233***[0.038] [0.047] [0.052] [0.042]
Aggregate PMR -0.174** -0.337*** -0.076 -0.103[0.079] [0.091] [0.047] [0.069]
REP Index × PMR -0.021 0.006 -0.027** -0.023**[0.017] [0.024] [0.014] [0.011]
Constant 91.550*** 85.433*** 43.595* 41.924[5.049] [23.629] [23.607] [27.858]
Observations 843 819 843 814Moments 12 17 12 18Hansen’s J 0 5.431 0 6.894Hansen d.f. 0 5 0 6Hansen prob. . 0.366 . 0.331
Standard errors are cluster-robust by countries. Statistical significance at 99%, 95% and 90%is denoted by (***), (**) and (*), respectively. Models 15 and 17. List of endogenous regres-sors: R&D in renewable energy, Policy Index; Aggregate PMR; Policy Index × PMR. List ofinstruments: (Model 15) R&D in renewable energy lagged one year, Policy Index, AggregatePMR, Policy Index × PMR lagged one and two years; (Model 17) Model 15 augmented withtensys (length of democracy), yrsoffc (years in office of the government) and yrcurnt (yearsremaining to the government).
26
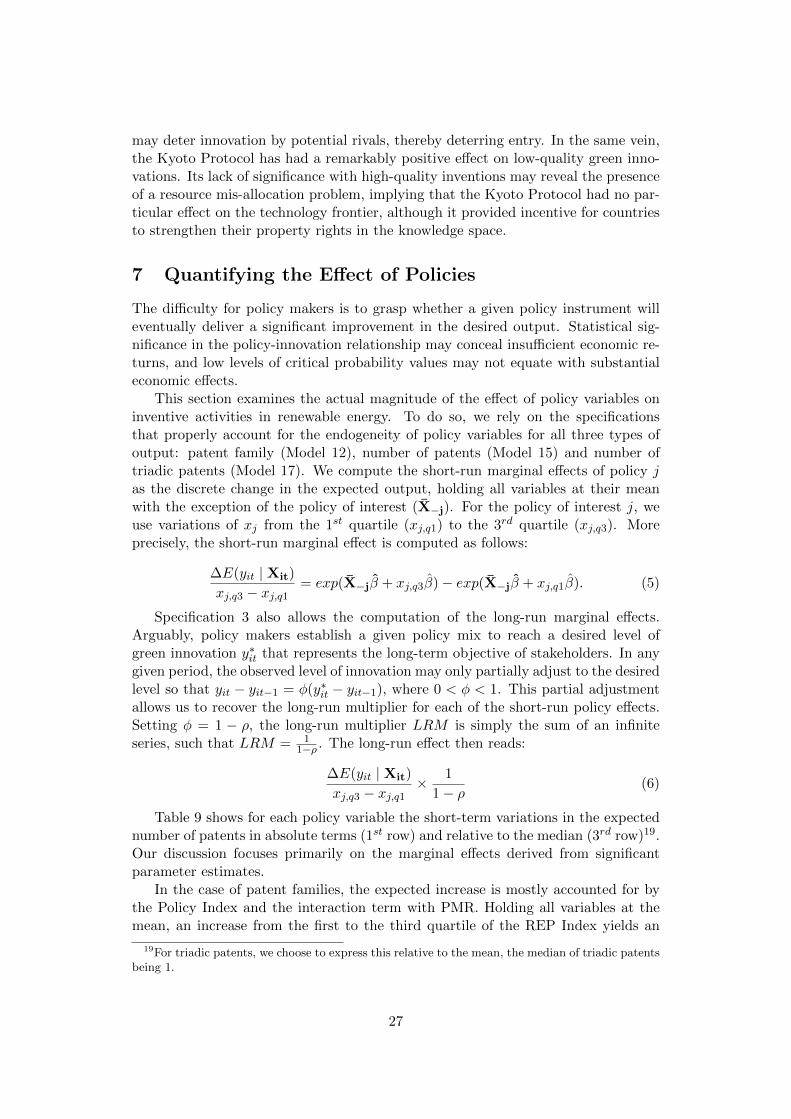
may deter innovation by potential rivals, thereby deterring entry. In the same vein,the Kyoto Protocol has had a remarkably positive effect on low-quality green inno-vations. Its lack of significance with high-quality inventions may reveal the presenceof a resource mis-allocation problem, implying that the Kyoto Protocol had no par-ticular effect on the technology frontier, although it provided incentive for countriesto strengthen their property rights in the knowledge space.
7 Quantifying the Effect of Policies
The difficulty for policy makers is to grasp whether a given policy instrument willeventually deliver a significant improvement in the desired output. Statistical sig-nificance in the policy-innovation relationship may conceal insufficient economic re-turns, and low levels of critical probability values may not equate with substantialeconomic effects.
This section examines the actual magnitude of the effect of policy variables oninventive activities in renewable energy. To do so, we rely on the specificationsthat properly account for the endogeneity of policy variables for all three types ofoutput: patent family (Model 12), number of patents (Model 15) and number oftriadic patents (Model 17). We compute the short-run marginal effects of policy jas the discrete change in the expected output, holding all variables at their meanwith the exception of the policy of interest (X−j). For the policy of interest j, weuse variations of xj from the 1st quartile (xj,q1) to the 3rd quartile (xj,q3). Moreprecisely, the short-run marginal effect is computed as follows:
∆E(yit | Xit)
xj,q3 − xj,q1= exp(X−jβ + xj,q3β)− exp(X−jβ + xj,q1β). (5)
Specification 3 also allows the computation of the long-run marginal effects.Arguably, policy makers establish a given policy mix to reach a desired level ofgreen innovation y∗it that represents the long-term objective of stakeholders. In anygiven period, the observed level of innovation may only partially adjust to the desiredlevel so that yit − yit−1 = φ(y∗it − yit−1), where 0 < φ < 1. This partial adjustmentallows us to recover the long-run multiplier for each of the short-run policy effects.Setting φ = 1 − ρ, the long-run multiplier LRM is simply the sum of an infiniteseries, such that LRM = 1
1−ρ . The long-run effect then reads:
∆E(yit | Xit)
xj,q3 − xj,q1× 1
1− ρ(6)
Table 9 shows for each policy variable the short-term variations in the expectednumber of patents in absolute terms (1st row) and relative to the median (3rd row)19.Our discussion focuses primarily on the marginal effects derived from significantparameter estimates.
In the case of patent families, the expected increase is mostly accounted for bythe Policy Index and the interaction term with PMR. Holding all variables at themean, an increase from the first to the third quartile of the REP Index yields an
19For triadic patents, we choose to express this relative to the mean, the median of triadic patentsbeing 1.
27
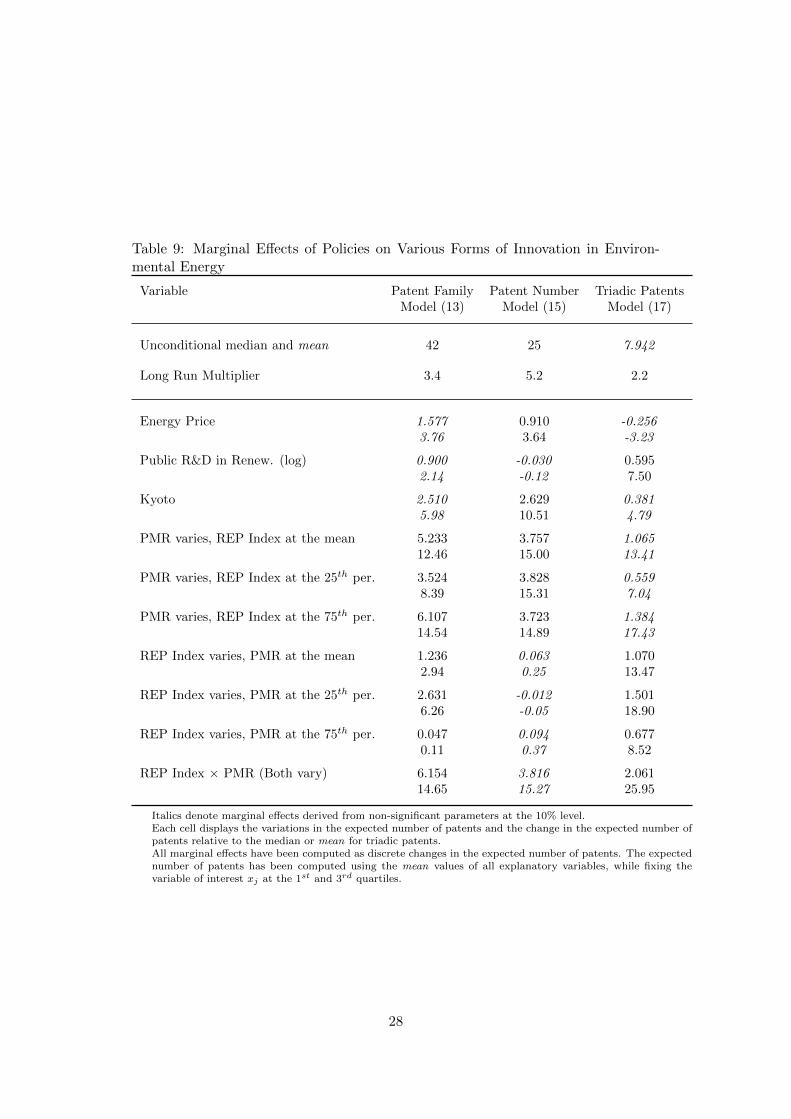
Table 9: Marginal Effects of Policies on Various Forms of Innovation in Environ-mental Energy
Variable Patent Family Patent Number Triadic PatentsModel (13) Model (15) Model (17)
Unconditional median and mean 42 25 7.942
Long Run Multiplier 3.4 5.2 2.2
Energy Price 1.577 0.910 -0.2563.76 3.64 -3.23
Public R&D in Renew. (log) 0.900 -0.030 0.5952.14 -0.12 7.50
Kyoto 2.510 2.629 0.3815.98 10.51 4.79
PMR varies, REP Index at the mean 5.233 3.757 1.06512.46 15.00 13.41
PMR varies, REP Index at the 25th per. 3.524 3.828 0.5598.39 15.31 7.04
PMR varies, REP Index at the 75th per. 6.107 3.723 1.38414.54 14.89 17.43
REP Index varies, PMR at the mean 1.236 0.063 1.0702.94 0.25 13.47
REP Index varies, PMR at the 25th per. 2.631 -0.012 1.5016.26 -0.05 18.90
REP Index varies, PMR at the 75th per. 0.047 0.094 0.6770.11 0.37 8.52
REP Index × PMR (Both vary) 6.154 3.816 2.06114.65 15.27 25.95
Italics denote marginal effects derived from non-significant parameters at the 10% level.Each cell displays the variations in the expected number of patents and the change in the expected number ofpatents relative to the median or mean for triadic patents.All marginal effects have been computed as discrete changes in the expected number of patents. The expectednumber of patents has been computed using the mean values of all explanatory variables, while fixing thevariable of interest xj at the 1st and 3rd quartiles.
28
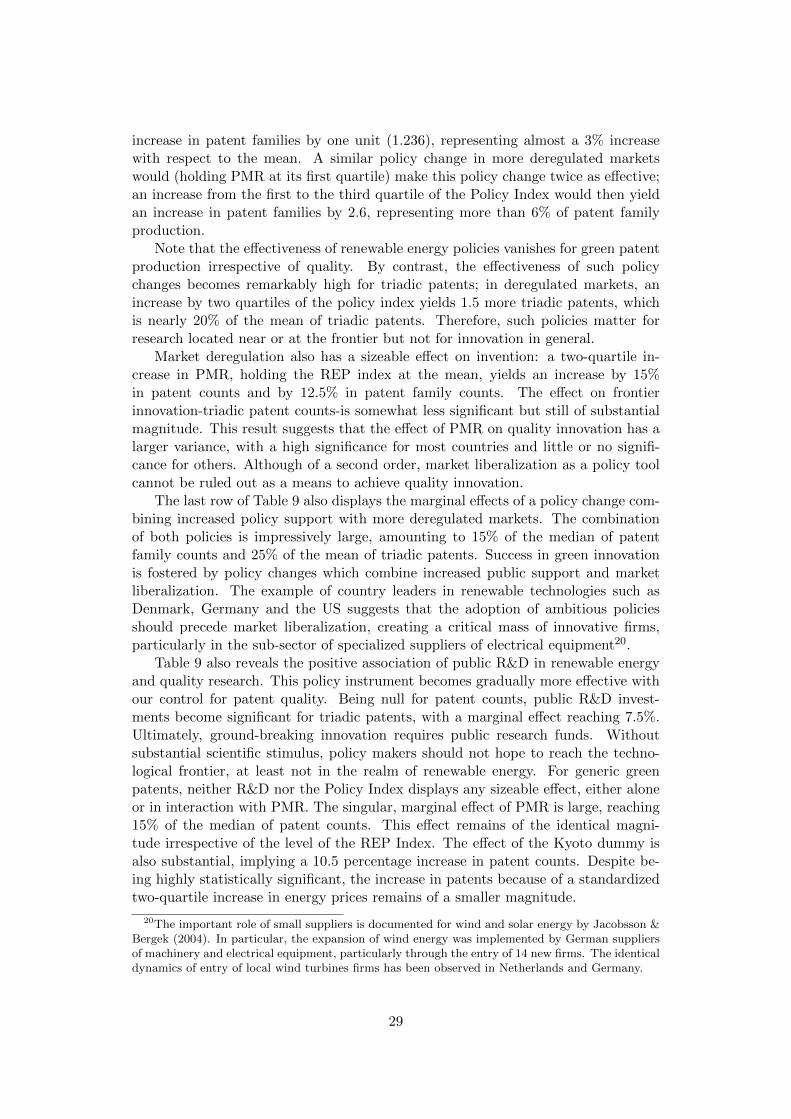
increase in patent families by one unit (1.236), representing almost a 3% increasewith respect to the mean. A similar policy change in more deregulated marketswould (holding PMR at its first quartile) make this policy change twice as effective;an increase from the first to the third quartile of the Policy Index would then yieldan increase in patent families by 2.6, representing more than 6% of patent familyproduction.
Note that the effectiveness of renewable energy policies vanishes for green patentproduction irrespective of quality. By contrast, the effectiveness of such policychanges becomes remarkably high for triadic patents; in deregulated markets, anincrease by two quartiles of the policy index yields 1.5 more triadic patents, whichis nearly 20% of the mean of triadic patents. Therefore, such policies matter forresearch located near or at the frontier but not for innovation in general.
Market deregulation also has a sizeable effect on invention: a two-quartile in-crease in PMR, holding the REP index at the mean, yields an increase by 15%in patent counts and by 12.5% in patent family counts. The effect on frontierinnovation-triadic patent counts-is somewhat less significant but still of substantialmagnitude. This result suggests that the effect of PMR on quality innovation has alarger variance, with a high significance for most countries and little or no signifi-cance for others. Although of a second order, market liberalization as a policy toolcannot be ruled out as a means to achieve quality innovation.
The last row of Table 9 also displays the marginal effects of a policy change com-bining increased policy support with more deregulated markets. The combinationof both policies is impressively large, amounting to 15% of the median of patentfamily counts and 25% of the mean of triadic patents. Success in green innovationis fostered by policy changes which combine increased public support and marketliberalization. The example of country leaders in renewable technologies such asDenmark, Germany and the US suggests that the adoption of ambitious policiesshould precede market liberalization, creating a critical mass of innovative firms,particularly in the sub-sector of specialized suppliers of electrical equipment20.
Table 9 also reveals the positive association of public R&D in renewable energyand quality research. This policy instrument becomes gradually more effective withour control for patent quality. Being null for patent counts, public R&D invest-ments become significant for triadic patents, with a marginal effect reaching 7.5%.Ultimately, ground-breaking innovation requires public research funds. Withoutsubstantial scientific stimulus, policy makers should not hope to reach the techno-logical frontier, at least not in the realm of renewable energy. For generic greenpatents, neither R&D nor the Policy Index displays any sizeable effect, either aloneor in interaction with PMR. The singular, marginal effect of PMR is large, reaching15% of the median of patent counts. This effect remains of the identical magni-tude irrespective of the level of the REP Index. The effect of the Kyoto dummy isalso substantial, implying a 10.5 percentage increase in patent counts. Despite be-ing highly statistically significant, the increase in patents because of a standardizedtwo-quartile increase in energy prices remains of a smaller magnitude.
20The important role of small suppliers is documented for wind and solar energy by Jacobsson &Bergek (2004). In particular, the expansion of wind energy was implemented by German suppliersof machinery and electrical equipment, particularly through the entry of 14 new firms. The identicaldynamics of entry of local wind turbines firms has been observed in Netherlands and Germany.
29
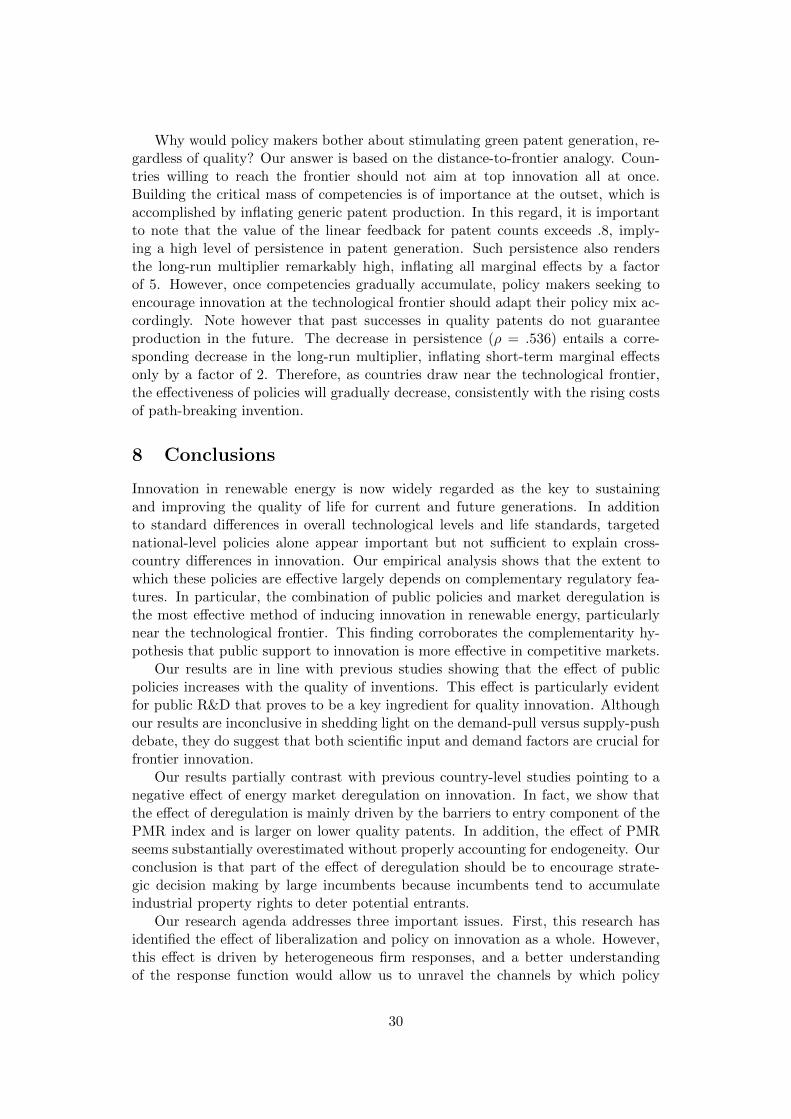
Why would policy makers bother about stimulating green patent generation, re-gardless of quality? Our answer is based on the distance-to-frontier analogy. Coun-tries willing to reach the frontier should not aim at top innovation all at once.Building the critical mass of competencies is of importance at the outset, which isaccomplished by inflating generic patent production. In this regard, it is importantto note that the value of the linear feedback for patent counts exceeds .8, imply-ing a high level of persistence in patent generation. Such persistence also rendersthe long-run multiplier remarkably high, inflating all marginal effects by a factorof 5. However, once competencies gradually accumulate, policy makers seeking toencourage innovation at the technological frontier should adapt their policy mix ac-cordingly. Note however that past successes in quality patents do not guaranteeproduction in the future. The decrease in persistence (ρ = .536) entails a corre-sponding decrease in the long-run multiplier, inflating short-term marginal effectsonly by a factor of 2. Therefore, as countries draw near the technological frontier,the effectiveness of policies will gradually decrease, consistently with the rising costsof path-breaking invention.
8 Conclusions
Innovation in renewable energy is now widely regarded as the key to sustainingand improving the quality of life for current and future generations. In additionto standard differences in overall technological levels and life standards, targetednational-level policies alone appear important but not sufficient to explain cross-country differences in innovation. Our empirical analysis shows that the extent towhich these policies are effective largely depends on complementary regulatory fea-tures. In particular, the combination of public policies and market deregulation isthe most effective method of inducing innovation in renewable energy, particularlynear the technological frontier. This finding corroborates the complementarity hy-pothesis that public support to innovation is more effective in competitive markets.
Our results are in line with previous studies showing that the effect of publicpolicies increases with the quality of inventions. This effect is particularly evidentfor public R&D that proves to be a key ingredient for quality innovation. Althoughour results are inconclusive in shedding light on the demand-pull versus supply-pushdebate, they do suggest that both scientific input and demand factors are crucial forfrontier innovation.
Our results partially contrast with previous country-level studies pointing to anegative effect of energy market deregulation on innovation. In fact, we show thatthe effect of deregulation is mainly driven by the barriers to entry component of thePMR index and is larger on lower quality patents. In addition, the effect of PMRseems substantially overestimated without properly accounting for endogeneity. Ourconclusion is that part of the effect of deregulation should be to encourage strate-gic decision making by large incumbents because incumbents tend to accumulateindustrial property rights to deter potential entrants.
Our research agenda addresses three important issues. First, this research hasidentified the effect of liberalization and policy on innovation as a whole. However,this effect is driven by heterogeneous firm responses, and a better understandingof the response function would allow us to unravel the channels by which policy
30

changes translate into overall country performance. Second, our dynamic specifica-tion can be enriched to test the directed technical change hypothesis put forwardby Acemoglu et al. (2012). In particular, we could empirically test whether theeffect of energy market deregulation and public policy adoption will be able to re-vert previous patterns of green versus conventional patent production. Third, theEU integration of energy markets may have had unintended consequences on greeninnovation insofar as integration may select out small players, reinforcing the powerof incumbents. EU incumbents are more likely to lobby for policies that are less con-ductive to innovation, i.e., RECs rather than feed-in tariffs (Jacobsson et al. 2009).These concerns could be rigorously tested using firm-level data for EU countrieswithin the appropriate time frame.
31
References
Acemoglu, D., Aghion, P., Bursztyn, L. & Hemous, D. (2012), ‘The environmentand directed technical change’, American Economic Review 102, 131–66.
Acs, Z. & Audretsch, D. (1988), ‘Innovation in large and small firms: An empiricalanalysis’, American Economic Review 78, 678–90.
Aghion, P., Bloom, N., Blundell, R., Griffith, R. & Howitt, P. (2005), ‘Competi-tion and innovation: an inverted U relationship’, Quarterly Journal of Economics120, 701–28.
Aghion, P., Dechezlepretre, A., Hemous, D., Martin, R. & Reenen, J. V. (2011),‘Carbon taxes, path dependency and directed technical change: evidence fromthe auto industry’, mimeo Harvard Universtity .
Aghion, P., Dewatripont, M., Du, L., Harrison, A. & Legros, P. (2012), Industrialpolicy and competition, NBER working paper, National Bureau of Economic Re-search, Inc. 18048, NBER.
Aghion, P., Harris, C., Howitt, P. & Vickers, J. (2001), ‘Competition, imitation andgrowth with step-by-step innovation’, Review of Economic Studies 68, 467–92.
Akcigit, U. & Kerr, W. (2010), Growth through heterogeneous innovations, NBERworking paper, National Bureau of Economic Research, Inc. 16443, NBER.
Beck, T., Clarke, G., Groff, A., Keefer, P. & Walsh, P. (2001), ‘New tools in com-parative political economy: The database of political institutions’, World BankEconomic Review 15, 165–76.
Blundell, R., Griffith, R. & van Reenen, J. (1995), ‘Dynamic count data models oftechnological innovation’, Economic Journal 105, 333–44.
Blundell, R., Griffith, R. & Windmeijer, F. (2002), ‘Individual effects and dynamicsin count data models’, Journal of Econometrics 108, 113–131.
Brunnermeier, S. & Cohen, M. (2003), ‘Determinants of environmental innovationin US manufacturing industries’, Journal of Environmental Economics and Man-agement 45(2), 278–293.
Cameron, C. & Trivedi, P., eds (2005), Microeconometrics: Methods and Applica-tions, Cambridge University Press, Cambridge MA.
Cerveny, M. & Resch, G. (1998), Feed-in tariffs and regulations concerning renewableenergy electricity generation in European countries, Technical report, Energiever-wertungsagentur (E.V.A), Wien.
Chamberlain, G. (1992), ‘Comment: Sequential moment restrictions in panel data’,Journal of Business and Economic Statistics 10(1), 20–26.
Chang, C. & Berdief, A. (2011), ‘The political economy of energy regulation inOECD countries’, Energy Policy 33, 816–25.
32
Congleton, R. (1992), ‘Political institutions and pollution control’, Review of Eco-nomics and Statistics 74, 412–21.
Conway, P., Janod, V. & Nicoletti, G. (2005), Product market regulation in OECDcountries: 1998 to 2003, OECD Economics Department Working Papers 419,OECD Publishing.
Dasgupta, S., Mody, A., Roy, S. & Wheeler, D. (2001), ‘Environmental regulationand development: A cross-country empirical analysis’, Oxford Development Stud-ies 29(2), 173–187.
David, P. & Wright, G. (2006), General purpose technologies and productivitysurges: Historical reflections on the future of the ICT revolution, in P. David& M. Thomas, eds, ‘The Economic Future in Historical Perspective’, Oxford Uni-versity Press for the British Academy.
Dernis, H. & Khan, M. (2004), Triadic patent families methodology, OECD Science,Technology and Industry Working Papers 2004/2, OECD Publishing.
Dooley, J. (1998), ‘Unintended consequences: energy R&D in a deregulated energymarket’, Energy Policy 26(7), 547 – 555.
Downing, P. & White, L. (1986), ‘Innovation in pollution control’, Journal of Envi-ronmental Economics and Management 13(1), 18 – 29.
Esty, D. & Porter, M. (2005), National environmental performance: An empiricalanalysis of policy results and determinants, Faculty Scholarship Series 430, YaleLaw School.
Fischer, C. & Newell, R. (2008), ‘Environmental and technology policies for climatemitigation’, Journal of Environmental Economics and Management 55(2), 142–162.
Fredriksson, P., Neumayer, E., Damania, R. & Gates, S. (2005), ‘Environmental-ism, democracy, and pollution control’, Journal of Environmental Economics andManagement 49, 343–65.
Fredriksson, P., Vollebergh, H. & Dijkgraaf, E. (2004), ‘Corruption and energy effi-ciency in OECD countries: theory and evidence’, Journal of Environmental Eco-nomics and Management 47, 207–231.
Glachant, J.-M. & Finon, D., eds (2003), Competition in European electricity mar-kets: a cross-country comparison, Edward Elgar, London.
Griffith, R., Harrison, R. & Simpson, H. (2010), ‘Product market reform and inno-vation in the EU’, Scandinavian Journal of economics 112, 389–415.
Griliches, Z. (1990), ‘Patent statistics as economic indicators: A survey’, Journal ofEconomic Literature 28(4), 1661–1707.
Grossman, H. & Noh, S. (1990), ‘A theory of kleptocracy with probabilistic survivaland reputation’, Economics & Politics 2, 157–71.
33
Hadjilambrinos, C. (2000), ‘Understanding technology choice in electricity indus-tries: a comparative study of France and Denmark’, Energy Policy 28(15), 1111– 1126.
Harhoff, D., Narin, F., Scherer, F. & Vopel, K. (1999), ‘Citation frequency and thevalue of patented inventions’, The Review of Economics and Statistics 81(3), pp.511–515.
Hausman, J., Hall, B. H. & Griliches, Z. (1984), ‘Econometric models for count datawith an application to the patents-r&d relationship’, Econometrica 52(4), 909–938.
IEA (2004), Renewable energymarket and policy trends in IEA countries, Technicalreport, International Energy Agency, Paris.
Jacobsson, S. & Bergek, A. (2004), ‘Transforming the energy sector: the evolution oftechnological systems in renewable energy technology’, Industrial and CorporateChange 13, 815–849.
Jacobsson, S., Bergek, A., Finon, D., Lauber, V., Mitchell, C., Toke, D. & Ver-bruggen, A. (2009), ‘EU renewable energy support policy: Faith or facts?’, EnergyPolicy 37, 2143–46.
Jacobsson, S. & Johnson, A. (2000), ‘The diffusion of renewable energy technology:an analytical framework and key issues for research’, Energy Policy 28, 625 – 640.
Jaffe, A. & Palmer, K. (1997), ‘Environmental regulation and innovation: A paneldata study’, The Review of Economics and Statistics 79(4), 610–619.
Jamasb, T. & Pollitt, M. (2008), ‘Deregulation R&D in network industries: the caseof the electricity industry’, Reaserach Policy 37, 995–1008.
Jamasb, T. & Pollitt, M. (2011), ‘Electricity sector liberalisation and innovation: ananalysis of the UK’s patenting activities’, Research Policy 40, 309–324.
Johnstone, N., Hai, I. & Popp, D. (2010), ‘Renewable energy policies and technolog-ical innovation: Evidence based on patent counts’, Environmental and ResourceEconomics 45, 133–155.
Klepper, S. (1996), ‘Entry, exit, growth, and innovation over the product life cycle’,American Economic Review 86(3), 562–583.
Lanjouw, J. & Mody, A. (1996), ‘Innovation and the international diffusion of envi-ronmentally responsive technology’, Research Policy 25(4), 549–571.
Lauber, V. & Mez, L. (2004), ‘Three decades of renewable electricity policies inGermany’, Energy & Environment 15, 599–623.
Lehtonen, M. & Nye, S. (2009), ‘History of electricity network control and dis-tributed generation in the UK and Western Denmark’, Energy Policy 37(6), 2338– 2345.
34
Levy-Yeyati, E., Sturzenegger, F. & Reggio, I. (2010), ‘On the endogeneity of ex-change rate regimes’, European Economic Review 54, 659–77.
List, J. & Sturm, D. (2006), ‘How elections matter: Theory and evidence fromenvironmental policy’, The Quarterly Journal of Economics 121(4), 1249–1281.
Loiter, J. & Norberg-Bohm, V. (1999), ‘Technology policy and renewable energy:public roles in the development of new energy technologies’, Energy Policy 27, 85– 97.
Makard, J. & Truffer, B. (2006), ‘Innovation process in large technical systems:market liberalization as a driver of radical change?’, Research Policy 35, 609–25.
Murdoch, J. & Sandler, T. (1997), ‘The voluntary provision of a pure public good:The case of reduced CFC emissions and the montreal protocol’, Journal of PublicEconomics 63(3), 331–349.
Nemet, G. (2006), ‘Beyond the learning curve: factors influencing cost reductions inphotovoltaics’, Energy Policy 34(17), 3218 – 3232.
Nemet, G. & Kammen, D. (2007), ‘US energy research and development: declin-ing investment, increasing need, and the feasibility of expansion’, Energy Policy35, 746755.
Neuhoff, K. (2005), ‘Large-scale deployment of renewables for electricity generation’,Oxford Review of Economic Policy 21(1), 88–110.
Neumayer, E. (2002), ‘Do democracies exhibit stronger international environmentalcommitment? a cross-country analysis’, Journal of Peace Research 39(2), 139–164.
Newell, R. (2011), The Energy Innovation System: A Historical Perspective, Vol.Accelerating Energy Innovation: Insights from Multiple Sectors, University ofChicago Press for the National Bureau of Economic Research, Chicago, chapter 2,pp. 25 – 47.
Newell, R., Jaffe, A. & Stavins, R. (1999), ‘The induced innovation hypothesisand energy-saving technological change’, The Quarterly Journal of Economics114(3), 941–975.
Nicolli, F. & Vona, F. (2012), The evolution of renewable energy policy in OECDcountries: aggregate indicators and determinants, Nota di Lavoro 51, FEEM,Fondazione Enrico Mattei.
Nilsson, L., Johansson, B., Astrand, K., Ericsson, K., Svenningsson, P., Brjesson,P. & Neij, L. (2004), ‘Seeing the wood for the trees: 25 years of renewable energypolicy in Sweden’, Energy for Sustainable Development 8, 67–81.
Norberg-Bohm, V. (2000), ‘Creating incentives for environmentally enhancing tech-nological change: Lessons from 30 years of US energy technology policy’, Techno-logical Forecasting and Social Change 65(2), 125–148.
35
Pan, H. & Khler, J. (2007), ‘Technological change in energy systems: Learningcurves, logistic curves and input-output coefficients’, Ecological Economics 63, 49– 758.
Pavitt, K. (1988), Uses and abuses of patent statistics, in A. van Raan, ed., ‘Hand-book of Quantitative Studies of Science and Technologies’, Elsevier Science Pub-blisher.
Pitlik, H. (2007), ‘A race to liberalization? diffusion of economic policy reformamong OECD economies’, Public Choice 132(1), 159–178.
Pitliks, H. & Wirth, S. (2003), ‘Do crises promote the extent of economic liberaliza-tion? An empirical test’, European Journal of Political Economy 19(3), 565–581.
Popp, D. (2002), ‘Induced innovation and energy prices’, American Economic Review92(1), 160–180.
Popp, D. (2006a), ‘International innovation and diffusion of air pollution controltechnologies: the effects of NOX and SO2 regulation in the US, Japan, and Ger-many’, Journal of Environmental Economics and Management 51(1), 46–71.
Popp, D. (2006b), ‘They don’t invent them like they used to: an examination ofenergy patent citations over time’, Economic of Innovation and New Technology15, 753–76.
Popp, D., Hai, I. & Medhi, N. (2011), ‘Technology and the diffusion of renewableenergy’, Energy Economics 33(4), 648 – 662.
Popp, D., Newell, R. & Jaffe, A. (2009), Energy, the environment, and technologicalchange, NBER Working Papers 14832, National Bureau of Economic Research,Inc.
Reiche, D. & Bechberger, M. (2004), ‘Policy differences in the promotion of renew-able energies in the EU member states’, Energy Policy 32(7), 843–849.
Ropenus, S. & Skytte, K. (2005), Regulatory review and barriers for the electricitysupply system for distributed generation in EU-15, International conference onfuture power systems.
Salies, E. (2010), A test of the Schumpeterian hypothesis in a panel of Europeanelectric utilities, Vol. Innovation, Economic Growth and the Firm: Theory andEvidence of Industrial Dynamics, Edward Elgar, Cheltenham, UK, pp. 102–136.
Sanyal, P. (2007), ‘The effect of deregulation on environmental research by electricutilities’, Journal of Regulatory Economics 31, 335–53.
Sanyal, P. & Cohen, L. (2009), ‘Powering progress: Restructuring, competition andR&D in the US electric utility industry’, The Energy Journal 30, 41–80.
Sanyal, P. & Ghosh, S. (2012), ‘Product market competition and upstream innova-tion: Theory and evidence from the US electricity market deregulation’, Reviewof Economics and Statistics forthcoming.
36
Scherer, F. (1984), Innovation and Growth: Schumpeterian Perspectives, MIT PressCambridge.
Sterlacchini, A. (2012), ‘Energy R&D in private and state-owned utilities: an anal-ysis of the major world electric companies’, Energy Policy 41, 494–506.
Verdolini, E. & Galeotti, M. (2011), ‘At home and abroad: An empirical analy-sis of innovation and diffusion in energy technologies’, Journal of EnvironmentalEconomics and Management 61(2), 119–134.
Winter, S. (1984), ‘Schumpeterian competition in alternative technological regimes’,Journal of Economic Behavior & Organization 28, 287–320.
Wooldridge, J. M. (1997), ‘Multiplicative panel data models without the strict exo-geneity assumption’, Econometric Theory 13(5), 667–678.
Acknowledgements
We are indebted to Alessandro Sapio and Elena Verdolini for useful comments anddiscussions. We wish to thank the seminar participants at the SKEMA-OFCE Work-shop on Economic Growth in Sophia-Antipolis (France), the Fondazione Enrico Mat-tei in Milan, the Institute of Innovation and Knowledge Management in Valencia,the Institute of Environmental Science and Technology in Barcelona, the conferenceentitled ‘Innovation, Economic Change and Policies: An out of equilibrium perspec-tive’ in Rome, the European Conference of the International Association for EnergyEconomics in Venice and the V th Atlantic Workshop on Energy and EnvironmentalEconomics in A Toxa (Galicia), especially Philippe Aghion, Ufuk Akcigit, ValentinaBosetti, Diego Comin, Davide Consoli, Enrica De Cian, Pedro Linares, VincenzoLombardo, Pietro Peretto, Mario Pianta, Francesca Sanna-Randaccio, FrancescoSaraceno, David Soskice, Massimo Tavoni and Jeroen van den Bergh. We are alsoindebted to Giuseppe Nicoletti for providing us the data on Product Market Regula-tion by sector. One of us wishes to thank the Fondazione Enrico Mattei for hostinghim during the writing of this paper. Usual disclaimer applies.
37
Appendix A. On the Quality of Instruments
Table I reports the results of the first-stage estimates using alternative vectors ofinstruments.
The results corroborate our expectations showing that the consolidation of democ-racy, i.e., variable timedem., is an excellent predictor of both policy variables, ex-plaining 23% and 18% of the variance of the REP and PMR indexes, respectively.
Income per capita and the DG share are good explanatory variables for bothPMR and REP index. Therefore, although less convincingly exogenous than theduration of the political system, they represent appropriate alternative instrumentsto test the robustness of our main results. Lastly, contrary to our expectations, thetime the government has been in office and the time that it will remain in officehave both the identical negative effect on environmental policies and the identicalpositive effect on PMR.
38
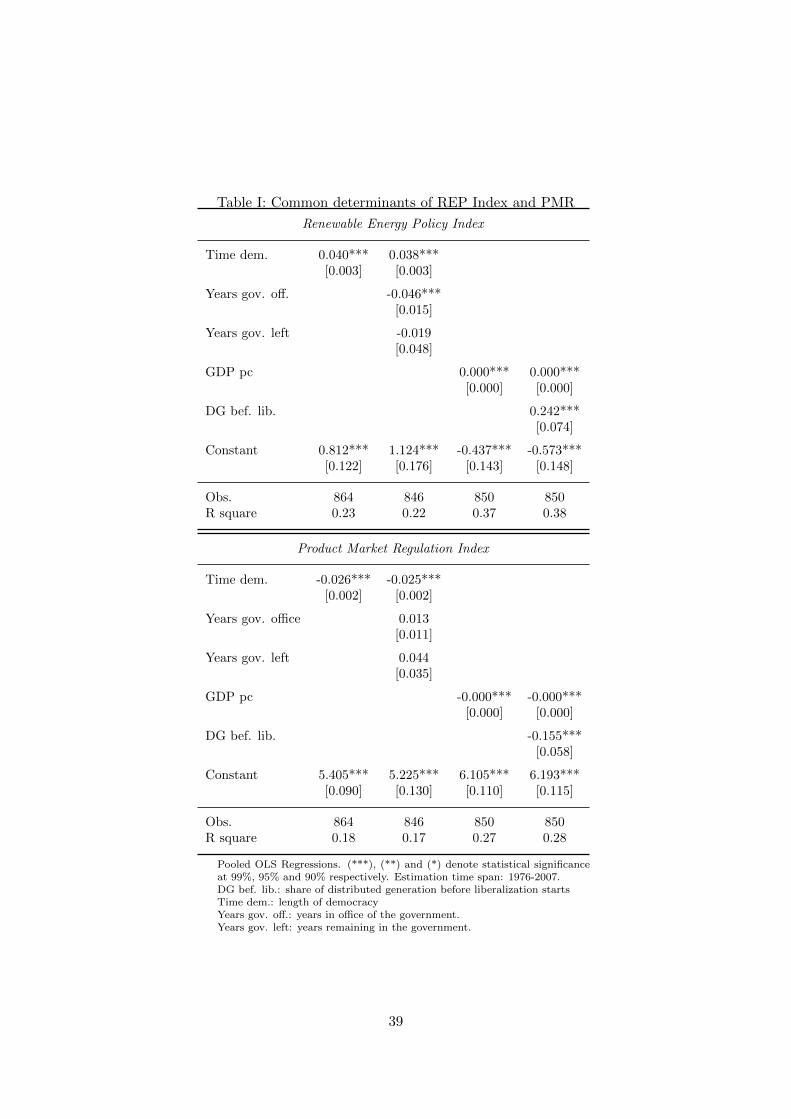
Table I: Common determinants of REP Index and PMR
Renewable Energy Policy Index
Time dem. 0.040*** 0.038***[0.003] [0.003]
Years gov. off. -0.046***[0.015]
Years gov. left -0.019[0.048]
GDP pc 0.000*** 0.000***[0.000] [0.000]
DG bef. lib. 0.242***[0.074]
Constant 0.812*** 1.124*** -0.437*** -0.573***[0.122] [0.176] [0.143] [0.148]
Obs. 864 846 850 850R square 0.23 0.22 0.37 0.38
Product Market Regulation Index
Time dem. -0.026*** -0.025***[0.002] [0.002]
Years gov. office 0.013[0.011]
Years gov. left 0.044[0.035]
GDP pc -0.000*** -0.000***[0.000] [0.000]
DG bef. lib. -0.155***[0.058]
Constant 5.405*** 5.225*** 6.105*** 6.193***[0.090] [0.130] [0.110] [0.115]
Obs. 864 846 850 850R square 0.18 0.17 0.27 0.28
Pooled OLS Regressions. (***), (**) and (*) denote statistical significanceat 99%, 95% and 90% respectively. Estimation time span: 1976-2007.DG bef. lib.: share of distributed generation before liberalization startsTime dem.: length of democracyYears gov. off.: years in office of the government.Years gov. left: years remaining in the government.
39
Related Documents