
Welcome message from author
This document is posted to help you gain knowledge. Please leave a comment to let me know what you think about it! Share it to your friends and learn new things together.
Transcript


Environmental Monitoring for Cleanrooms and
Controlled Environments
DK2965_C000a.indd 1 10/03/2006 2:55:31 PM

DRUGS AND THE PHARMACEUTICAL SCIENCESA Series of Textbooks and Monographs
Executive EditorJames SwarbrickPharmaceuTech, Inc.
Pinehurst, North Carolina
Advisory Board
Larry L. AugsburgerUniversity of Maryland
Baltimore, Maryland
Jennifer B. DressmanJohann Wolfgang Goethe University
Frankfurt, Germany
Jeffrey A. HughesUniversity of Florida College of
PharmacyGainesville, Florida
Trevor M. JonesThe Association of the
British Pharmaceutical IndustryLondon, United Kingdom
Vincent H. L. LeeUniversity of Southern California
Los Angeles, California
Jerome P. SkellyAlexandria, Virginia
Geoffrey T. TuckerUniversity of Sheffield
Royal Hallamshire HospitalSheffield, United Kingdom
Harry G. BrittainCenter for Pharmaceutical PhysicsMilford, New Jersey
Anthony J. HickeyUniversity of North Carolina School ofPharmacyChapel Hill, North Carolina
Ajaz HussainSandozPrinceton, New Jersey
Stephen G. SchulmanUniversity of FloridaGainesville, Florida
Elizabeth M. ToppUniversity of Kansas School ofPharmacyLawrence, Kansas
Peter YorkUniversity of Bradford School ofPharmacyBradford, United Kingdom
DK2965_C000a.indd 2 10/03/2006 2:55:31 PM

1. Pharmacokinetics, Milo Gibaldi and Donald Perrier
2. Good Manufacturing Practices for Pharmaceuticals: A Plan for TotalQuality Control, Sidney H. Willig, Murray M. Tuckerman, and William S. Hitchings IV
3. Microencapsulation, edited by J. R. Nixon
4. Drug Metabolism: Chemical and Biochemical Aspects, Bernard Testa and Peter Jenner
5. New Drugs: Discovery and Development, edited by Alan A. Rubin
6. Sustained and Controlled Release Drug Delivery Systems, edited byJoseph R. Robinson
7. Modern Pharmaceutics, edited by Gilbert S. Banker and Christopher T. Rhodes
8. Prescription Drugs in Short Supply: Case Histories, Michael A. Schwartz
9. Activated Charcoal: Antidotal and Other Medical Uses, David O. Cooney
10. Concepts in Drug Metabolism (in two parts), edited by Peter Jenner and Bernard Testa
11. Pharmaceutical Analysis: Modern Methods (in two parts), edited by James W. Munson
12. Techniques of Solubilization of Drugs, edited by Samuel H. Yalkowsky
13. Orphan Drugs, edited by Fred E. Karch
14. Novel Drug Delivery Systems: Fundamentals, Developmental Concepts,Biomedical Assessments, Yie W. Chien
15. Pharmacokinetics: Second Edition, Revised and Expanded, Milo Gibaldiand Donald Perrier
16. Good Manufacturing Practices for Pharmaceuticals: A Plan for TotalQuality Control, Second Edition, Revised and Expanded, Sidney H. Willig,Murray M. Tuckerman, and William S. Hitchings IV
17. Formulation of Veterinary Dosage Forms, edited by Jack Blodinger
18. Dermatological Formulations: Percutaneous Absorption, Brian W. Barry
19. The Clinical Research Process in the Pharmaceutical Industry, edited byGary M. Matoren
20. Microencapsulation and Related Drug Processes, Patrick B. Deasy
21. Drugs and Nutrients: The Interactive Effects, edited by Daphne A. Roe and T. Colin Campbell
22. Biotechnology of Industrial Antibiotics, Erick J. Vandamme
23. Pharmaceutical Process Validation, edited by Bernard T. Loftus and Robert A. Nash
24. Anticancer and Interferon Agents: Synthesis and Properties, edited by Raphael M. Ottenbrite and George B. Butler
25. Pharmaceutical Statistics: Practical and Clinical Applications,Sanford Bolton
DK2965_C000a.indd 3 10/03/2006 2:55:31 PM

26. Drug Dynamics for Analytical, Clinical, and Biological Chemists, Benjamin J. Gudzinowicz, Burrows T. Younkin, Jr., and Michael J. Gudzinowicz
27. Modern Analysis of Antibiotics, edited by Adjoran Aszalos
28. Solubility and Related Properties, Kenneth C. James
29. Controlled Drug Delivery: Fundamentals and Applications, Second Edition, Revised and Expanded, edited by Joseph R. Robinson and Vincent H. Lee
30. New Drug Approval Process: Clinical and Regulatory Management,edited by Richard A. Guarino
31. Transdermal Controlled Systemic Medications, edited by Yie W. Chien
32. Drug Delivery Devices: Fundamentals and Applications, edited by Praveen Tyle
33. Pharmacokinetics: Regulatory • Industrial • Academic Perspectives,edited by Peter G. Welling and Francis L. S. Tse
34. Clinical Drug Trials and Tribulations, edited by Allen E. Cato
35. Transdermal Drug Delivery: Developmental Issues and ResearchInitiatives, edited by Jonathan Hadgraft and Richard H. Guy
36. Aqueous Polymeric Coatings for Pharmaceutical Dosage Forms,edited by James W. McGinity
37. Pharmaceutical Pelletization Technology, edited by Isaac Ghebre-Sellassie
38. Good Laboratory Practice Regulations, edited by Allen F. Hirsch
39. Nasal Systemic Drug Delivery, Yie W. Chien, Kenneth S. E. Su, and Shyi-Feu Chang
40. Modern Pharmaceutics: Second Edition, Revised and Expanded,edited by Gilbert S. Banker and Christopher T. Rhodes
41. Specialized Drug Delivery Systems: Manufacturing and ProductionTechnology, edited by Praveen Tyle
42. Topical Drug Delivery Formulations, edited by David W. Osborne and Anton H. Amann
43. Drug Stability: Principles and Practices, Jens T. Carstensen
44. Pharmaceutical Statistics: Practical and Clinical Applications, Second Edition, Revised and Expanded, Sanford Bolton
45. Biodegradable Polymers as Drug Delivery Systems, edited by Mark Chasin and Robert Langer
46. Preclinical Drug Disposition: A Laboratory Handbook, Francis L. S. Tseand James J. Jaffe
47. HPLC in the Pharmaceutical Industry, edited by Godwin W. Fong and Stanley K. Lam
48. Pharmaceutical Bioequivalence, edited by Peter G. Welling, Francis L. S. Tse, and Shrikant V. Dinghe
49. Pharmaceutical Dissolution Testing, Umesh V. Banakar
50. Novel Drug Delivery Systems: Second Edition, Revised and Expanded,Yie W. Chien
DK2965_C000a.indd 4 10/03/2006 2:55:31 PM

51. Managing the Clinical Drug Development Process, David M. Cocchettoand Ronald V. Nardi
52. Good Manufacturing Practices for Pharmaceuticals: A Plan for TotalQuality Control, Third Edition, edited by Sidney H. Willig and James R. Stoker
53. Prodrugs: Topical and Ocular Drug Delivery, edited by Kenneth B. Sloan
54. Pharmaceutical Inhalation Aerosol Technology, edited by Anthony J. Hickey
55. Radiopharmaceuticals: Chemistry and Pharmacology, edited by Adrian D. Nunn
56. New Drug Approval Process: Second Edition, Revised and Expanded,edited by Richard A. Guarino
57. Pharmaceutical Process Validation: Second Edition, Revised and Expanded, edited by Ira R. Berry and Robert A. Nash
58. Ophthalmic Drug Delivery Systems, edited by Ashim K. Mitra
59. Pharmaceutical Skin Penetration Enhancement, edited by Kenneth A. Walters and Jonathan Hadgraft
60. Colonic Drug Absorption and Metabolism, edited by Peter R. Bieck
61. Pharmaceutical Particulate Carriers: Therapeutic Applications, edited byAlain Rolland
62. Drug Permeation Enhancement: Theory and Applications, edited by Dean S. Hsieh
63. Glycopeptide Antibiotics, edited by Ramakrishnan Nagarajan
64. Achieving Sterility in Medical and Pharmaceutical Products, Nigel A. Halls
65. Multiparticulate Oral Drug Delivery, edited by Isaac Ghebre-Sellassie
66. Colloidal Drug Delivery Systems, edited by Jörg Kreuter
67. Pharmacokinetics: Regulatory • Industrial • Academic Perspectives,Second Edition, edited by Peter G. Welling and Francis L. S. Tse
68. Drug Stability: Principles and Practices, Second Edition, Revised and Expanded, Jens T. Carstensen
69. Good Laboratory Practice Regulations: Second Edition, Revised and Expanded, edited by Sandy Weinberg
70. Physical Characterization of Pharmaceutical Solids, edited by Harry G. Brittain
71. Pharmaceutical Powder Compaction Technology, edited by Göran Alderborn and Christer Nyström
72. Modern Pharmaceutics: Third Edition, Revised and Expanded, edited byGilbert S. Banker and Christopher T. Rhodes
73. Microencapsulation: Methods and Industrial Applications, edited by Simon Benita
74. Oral Mucosal Drug Delivery, edited by Michael J. Rathbone
75. Clinical Research in Pharmaceutical Development, edited by Barry Bleidt and Michael Montagne
DK2965_C000a.indd 5 10/03/2006 2:55:32 PM

76. The Drug Development Process: Increasing Efficiency and CostEffectiveness, edited by Peter G. Welling, Louis Lasagna, and Umesh V. Banakar
77. Microparticulate Systems for the Delivery of Proteins and Vaccines, edited by Smadar Cohen and Howard Bernstein
78. Good Manufacturing Practices for Pharmaceuticals: A Plan for TotalQuality Control, Fourth Edition, Revised and Expanded, Sidney H. Willigand James R. Stoker
79. Aqueous Polymeric Coatings for Pharmaceutical Dosage Forms:Second Edition, Revised and Expanded, edited by James W. McGinity
80. Pharmaceutical Statistics: Practical and Clinical Applications, Third Edition, Sanford Bolton
81. Handbook of Pharmaceutical Granulation Technology, edited by Dilip M. Parikh
82. Biotechnology of Antibiotics: Second Edition, Revised and Expanded,edited by William R. Strohl
83. Mechanisms of Transdermal Drug Delivery, edited by Russell O. Potts and Richard H. Guy
84. Pharmaceutical Enzymes, edited by Albert Lauwers and Simon Scharpé
85. Development of Biopharmaceutical Parenteral Dosage Forms, edited byJohn A. Bontempo
86. Pharmaceutical Project Management, edited by Tony Kennedy
87. Drug Products for Clinical Trials: An International Guide to Formulation •Production • Quality Control, edited by Donald C. Monkhouse and Christopher T. Rhodes
88. Development and Formulation of Veterinary Dosage Forms:Second Edition, Revised and Expanded, edited by Gregory E. Hardee and J. Desmond Baggot
89. Receptor-Based Drug Design, edited by Paul Leff
90. Automation and Validation of Information in Pharmaceutical Processing, edited by Joseph F. deSpautz
91. Dermal Absorption and Toxicity Assessment, edited by Michael S. Roberts and Kenneth A. Walters
92. Pharmaceutical Experimental Design, Gareth A. Lewis, Didier Mathieu, and Roger Phan-Tan-Luu
93. Preparing for FDA Pre-Approval Inspections, edited by Martin D. Hynes III
94. Pharmaceutical Excipients: Characterization by IR, Raman, and NMRSpectroscopy, David E. Bugay and W. Paul Findlay
95. Polymorphism in Pharmaceutical Solids, edited by Harry G. Brittain
96. Freeze-Drying/Lyophilization of Pharmaceutical and Biological Products,edited by Louis Rey and Joan C. May
97. Percutaneous Absorption: Drugs–Cosmetics–Mechanisms–Methodology,Third Edition, Revised and Expanded, edited by Robert L. Bronaugh and Howard I. Maibach
DK2965_C000a.indd 6 10/03/2006 2:55:32 PM

98. Bioadhesive Drug Delivery Systems: Fundamentals, Novel Approaches,and Development, edited by Edith Mathiowitz, Donald E. Chickering III,and Claus-Michael Lehr
99. Protein Formulation and Delivery, edited by Eugene J. McNally
100. New Drug Approval Process: Third Edition, The Global Challenge,edited by Richard A. Guarino
101. Peptide and Protein Drug Analysis, edited by Ronald E. Reid
102. Transport Processes in Pharmaceutical Systems, edited by Gordon L. Amidon, Ping I. Lee, and Elizabeth M. Topp
103. Excipient Toxicity and Safety, edited by Myra L. Weiner and Lois A. Kotkoskie
104. The Clinical Audit in Pharmaceutical Development, edited by Michael R. Hamrell
105. Pharmaceutical Emulsions and Suspensions, edited by Francoise Nielloud and Gilberte Marti-Mestres
106. Oral Drug Absorption: Prediction and Assessment, edited by Jennifer B. Dressman and Hans Lennernäs
107. Drug Stability: Principles and Practices, Third Edition, Revised and Expanded, edited by Jens T. Carstensen and C. T. Rhodes
108. Containment in the Pharmaceutical Industry, edited by James P. Wood
109. Good Manufacturing Practices for Pharmaceuticals: A Plan for TotalQuality Control from Manufacturer to Consumer, Fifth Edition, Revised and Expanded, Sidney H. Willig
110. Advanced Pharmaceutical Solids, Jens T. Carstensen
111. Endotoxins: Pyrogens, LAL Testing, and Depyrogenation, Second Edition, Revised and Expanded, Kevin L. Williams
112. Pharmaceutical Process Engineering, Anthony J. Hickey and David Ganderton
113. Pharmacogenomics, edited by Werner Kalow, Urs A. Meyer and Rachel F. Tyndale
114. Handbook of Drug Screening, edited by Ramakrishna Seethala and Prabhavathi B. Fernandes
115. Drug Targeting Technology: Physical • Chemical • Biological Methods,edited by Hans Schreier
116. Drug–Drug Interactions, edited by A. David Rodrigues
117. Handbook of Pharmaceutical Analysis, edited by Lena Ohannesian and Anthony J. Streeter
118. Pharmaceutical Process Scale-Up, edited by Michael Levin
119. Dermatological and Transdermal Formulations, edited by Kenneth A. Walters
120. Clinical Drug Trials and Tribulations: Second Edition, Revised and Expanded, edited by Allen Cato, Lynda Sutton, and Allen Cato III
DK2965_C000a.indd 7 10/03/2006 2:55:32 PM

121. Modern Pharmaceutics: Fourth Edition, Revised and Expanded, edited byGilbert S. Banker and Christopher T. Rhodes
122. Surfactants and Polymers in Drug Delivery, Martin Malmsten
123. Transdermal Drug Delivery: Second Edition, Revised and Expanded,edited by Richard H. Guy and Jonathan Hadgraft
124. Good Laboratory Practice Regulations: Second Edition, Revised and Expanded, edited by Sandy Weinberg
125. Parenteral Quality Control: Sterility, Pyrogen, Particulate, and PackageIntegrity Testing: Third Edition, Revised and Expanded, Michael J. Akers,Daniel S. Larrimore, and Dana Morton Guazzo
126. Modified-Release Drug Delivery Technology, edited by Michael J. Rathbone, Jonathan Hadgraft, and Michael S. Roberts
127. Simulation for Designing Clinical Trials: A Pharmacokinetic-Pharmacodynamic Modeling Perspective, edited by Hui C. Kimko and Stephen B. Duffull
128. Affinity Capillary Electrophoresis in Pharmaceutics and Biopharmaceutics, edited by Reinhard H. H. Neubert and Hans-Hermann Rüttinger
129. Pharmaceutical Process Validation: An International Third Edition, Revised and Expanded, edited by Robert A. Nash and Alfred H. Wachter
130. Ophthalmic Drug Delivery Systems: Second Edition, Revisedand Expanded, edited by Ashim K. Mitra
131. Pharmaceutical Gene Delivery Systems, edited by Alain Rolland and Sean M. Sullivan
132. Biomarkers in Clinical Drug Development, edited by John C. Bloom and Robert A. Dean
133. Pharmaceutical Extrusion Technology, edited by Isaac Ghebre-Sellassieand Charles Martin
134. Pharmaceutical Inhalation Aerosol Technology: Second Edition, Revised and Expanded, edited by Anthony J. Hickey
135. Pharmaceutical Statistics: Practical and Clinical Applications, Fourth Edition, Sanford Bolton and Charles Bon
136. Compliance Handbook for Pharmaceuticals, Medical Devices, and Biologics, edited by Carmen Medina
137. Freeze-Drying/Lyophilization of Pharmaceutical and Biological Products:Second Edition, Revised and Expanded, edited by Louis Rey and Joan C. May
138. Supercritical Fluid Technology for Drug Product Development, edited byPeter York, Uday B. Kompella, and Boris Y. Shekunov
139. New Drug Approval Process: Fourth Edition, Accelerating Global Registrations, edited by Richard A. Guarino
140. Microbial Contamination Control in Parenteral Manufacturing, edited byKevin L. Williams
141. New Drug Development: Regulatory Paradigms for Clinical Pharmacologyand Biopharmaceutics, edited by Chandrahas G. Sahajwalla
DK2965_C000a.indd 8 10/03/2006 2:55:32 PM

142. Microbial Contamination Control in the Pharmaceutical Industry, edited byLuis Jimenez
143. Generic Drug Product Development: Solid Oral Dosage Forms, edited byLeon Shargel and Izzy Kanfer
144. Introduction to the Pharmaceutical Regulatory Process, edited by Ira R. Berry
145. Drug Delivery to the Oral Cavity: Molecules to Market, edited by Tapash K. Ghosh and William R. Pfister
146. Good Design Practices for GMP Pharmaceutical Facilities, edited byAndrew Signore and Terry Jacobs
147. Drug Products for Clinical Trials, Second Edition, edited by DonaldMonkhouse, Charles Carney, and Jim Clark
148. Polymeric Drug Delivery Systems, edited by Glen S. Kwon
149. Injectable Dispersed Systems: Formulation, Processing, and Performance, edited by Diane J. Burgess
150. Laboratory Auditing for Quality and Regulatory Compliance,Donald Singer, Raluca-Ioana Stefan, and Jacobus van Staden
151. Active Pharmaceutical Ingredients: Development, Manufacturing, and Regulation, edited by Stanley Nusim
152. Preclinical Drug Development, edited by Mark C. Rogge and David R. Taft
153. Pharmaceutical Stress Testing: Predicting Drug Degradation, edited bySteven W. Baertschi
154. Handbook of Pharmaceutical Granulation Technology: Second Edition, edited by Dilip M. Parikh
155. Percutaneous Absorption: Drugs–Cosmetics–Mechanisms–Methodology,Fourth Edition, edited by Robert L. Bronaugh and Howard I. Maibach
156. Pharmacogenomics: Second Edition, edited by Werner Kalow, Urs A. Meyer and Rachel F. Tyndale
157. Pharmaceutical Process Scale-Up, Second Edition, edited by Michael Levin
158. Microencapsulation: Methods and Industrial Applications, Second Edition, edited by Simon Benita
159. Nanoparticle Technology for Drug Delivery, edited by Ram B. Gupta and Uday B. Kompella
160. Spectroscopy of Pharmaceutical Solids, edited by Harry G. Brittain
161. Dose Optimization in Drug Development, edited by Rajesh Krishna
162. Herbal Supplements-Drug Interactions: Scientific and RegulatoryPerspectives, edited by Y. W. Francis Lam, Shiew-Mei Huang, and Stephen D. Hall
163. Pharmaceutical Photostability and Stabilization Technology, edited byJoseph T. Piechocki and Karl Thoma
164. Environmental Monitoring for Cleanrooms and Controlled Environments,edited by Anne Marie Dixon
DK2965_C000a.indd 9 10/03/2006 2:55:32 PM

DK2965_C000a.indd 10 10/03/2006 2:55:32 PM

Environmental Monitoringfor Cleanrooms and
Controlled Environments
edited by
Anne Marie DixonCleanroom Management Associates, Inc.
Carson City, Nevada, U.S.A.
New York London
DK2965_C000a.indd 11 10/03/2006 2:55:33 PM

Informa Healthcare USA, Inc.270 Madison AvenueNew York, NY 10016
© 2007 by Informa Healthcare USA, Inc. Informa Healthcare is an Informa business
No claim to original U.S. Government worksPrinted in the United States of America on acid‑free paper10 9 8 7 6 5 4 3 2 1
International Standard Book Number‑10: 0‑8247‑2359‑7 (Hardcover)International Standard Book Number‑13: 978‑0‑8247‑2359‑0 (Hardcover)
This book contains information obtained from authentic and highly regarded sources. Reprinted material is quoted with permission, and sources are indicated. A wide variety of references are listed. Reasonable efforts have been made to publish reliable data and information, but the author and the publisher cannot assume responsibility for the validity of all materials or for the consequences of their use.
No part of this book may be reprinted, reproduced, transmitted, or utilized in any form by any electronic, mechanical, or other means, now known or hereafter invented, including photocopying, microfilming, and recording, or in any information storage or retrieval system, without written permission from the publishers.
For permission to photocopy or use material electronically from this work, please access www.copyright.com (http://www.copyright.com/) or contact the Copyright Clearance Center, Inc. (CCC) 222 Rosewood Drive, Danvers, MA 01923, 978‑750‑8400. CCC is a not‑for‑profit organization that provides licenses and registration for a variety of users. For organizations that have been granted a photocopy license by the CCC, a separate system of payment has been arranged.
Trademark Notice: Product or corporate names may be trademarks or registered trademarks, and are used only for identification and explanation without intent to infringe.
Visit the Informa Web site atwww.informa.com
and the Informa Healthcare Web site atwww.informahealthcare.com
DK2965_C000a.indd 12 10/03/2006 2:55:33 PM

forewordForeword
As with many aspects of scientific endeavor, the passage of time often providesdeeper knowledge, greater clarity, and understanding. Take for example the dis-covery of microbes, or germs, as the causative agent for infection. Louis Pasteurdemonstrated that the fermentation process was caused by the growth of micro-organisms and that the growth of microorganisms in nutrient broths was not aresult of spontaneous generation. With his experiments, he managed to convincemost of Europe that the germ theory of disease, also called the pathogenic theoryof medicine as the cause of many infectious diseases, was true. This clearer under-standing of the cause of disease opened new doors for innovation in hygienicpractices and the development of antibiotics. The passage of time, to some extent,has done this for the subject of environmental monitoring.
In the past two decades, technological advances have taken active air samplingfrom a cumbersome activity with relatively primitive equipment in a cleanroomenvironment to a simple process with self-contained, easily sanitized samplingdevices. Particle monitoring that required operators to remain stationary during afilling process and document counts manually have been replaced with sophisti-cated remote-sensing devices that can record, analyze, and maintain data withlittle to no human intervention. The understanding of how, where, when, and whyto sample and analyze data has also improved.
Conversely, our advanced communication technology has resulted in thepromulgation of reams of available information. Attempting to remain currentwith this potential deluge has presented challenges to those responsible for envi-ronmental monitoring programs. Regulatory guidance documents have becomemore numerous and, although efforts at harmonization continue, are not consis-tent. As a result, there is more information available to digest, but there is not aconcomitant, automatic level of understanding to go with it.
The lack of a clear understanding of the purpose of an environmental moni-toring program and its relationship to the release of a sterile pharmaceuticalproduct can end up as a very costly error and waste of good product, or, moreseriously, pose a potential health risk to the patient. Within the framework of riskmanagement, environmental monitoring is considered a very important mitigationmeasure for manufacturers of sterile products. Thus, having a firm foundationalunderstanding of this important program is essential to an overall sterility assur-ance program.
This guide is an invaluable resource for helping to provide the clarity ofunderstanding of key aspects of environmental monitoring. There is a significantbody of available information related to this topic. This book focuses on presentingclear, simple, practical information in an easy-to-read format. The first section of thebook encompasses the basics of how particles and microbes behave in a cleanroom.Understanding this behavior is vital in establishing a meaningful and effectiveenvironmental monitoring program. Helping wend the way through the expanding
iii

guidance documents, it provides clear information on the new InternationalStandards Organization standards and their application as another key buildingblock for the environmental monitoring program. Chapters on particle, viable air,and surface monitoring provide considerations for equipment selection, theiroperation, maintenance, data generation, and, most importantly, data analysis andmanagement. Monitoring of water and related endotoxin are also included.
Regulatory agencies around the globe have expectations for any product pur-ported to be sterile. The sterility testing that is required is one of the mostimportant for the release of product, and while the sterility test has its limitations,false positives can result in the unnecessary rejection of product; hence, it is criticalto understand the essential requirements for this test. Associated with this are theexpectations for final drug products produced utilizing aseptic processing. Asepticprocessing simulations, or media fills, though seemingly simple procedures,require clear understanding in order to construct and conduct ones that willaddress all the requirements to provide the data that supports the ongoingacceptability of the process. In essence, aseptic processing and its associatedcontrols replace terminal sterilization of products. In this book, the reader will findchapters that address each of these in clear and concise terms.
It has been my privilege to work with Anne Marie Dixon for nearly twodecades. Her depth of knowledge of environmental monitoring, as well as thebroader topic of cleanroom standards, is nothing short of inspirational. With thisbook, she has brought together a group of experts who have created a deep, prac-tical, and easily understandable reservoir of information that should provide theuser with the knowledge needed to utilize environmental monitoring in the mannerit was intended—as an ongoing indicator of environmental and process control.This book provides that deeper knowledge, greater clarity, and understanding ofthe subject.
Nanette LondereeFormerly of Bayer,
Pharmaceutical Division,Biological Products,
Berkeley, California, U.S.A.
iv Foreword

prefacePreface
Contamination, which causes product defects, is a measurable process variable.It is defined today as any material, substance, or energy that adversely affectsa product or process. The science of contamination control is a multidisciplinarytechnology drawing on chemistry, physics, material science, microbiology, and otherfields. One of the critical technologies in this field is environmental monitoring.
Environmental monitoring is a tool that provides meaningful information onthe quality of a process, processing environment, and final product. An adequateprogram will aid the user of cleanrooms and controlled environments to identifyand eliminate potential sources of contamination. Parts 211 and 600 of Title 21 ofthe Code of Federal Regulations include general requirements for environmentalcontrol of pharmaceutical and biological processes. However, bulk manufacturingand medical device industries must also monitor their processes and environments.
Many guidance documents are often open to interpretation. In addition,there are scattered industry standards, technical reports, International StandardsOrganization standards, and other documents that offer some assistance.
This book was developed to assist the user by providing information on theentire subject of environmental monitoring and the interpretation of this data as atool in the field of contamination control. An environmental monitoring programgenerally includes the monitoring of air (both viable and nonviable), surfaces, water,alert and action levels, trending, and procedures for responding to excursions.This book also includes information on certification/requalification and the newInternational Standards Organization standards. Chapter 1 presents backgroundinformation on how aerosols perform in cleanrooms or controlled environments.
Written procedures exist in today’s manufacturing facilities, addressing suchareas as frequency of sampling, location of sample, time of sampling, conditions,duration, sample size, and techniques. The interpretation of the results is key incontrolling contamination. Several chapters address the data presentation, trending,and investigations and how they can provide a valuable tool in reducing risk toproduct, process, and patient.
Cleanrooms and controlled environments do not operate themselves. Theymust be maintained, supported, controlled, and carefully monitored. The clean-room is a tool that is used to eliminate variables by providing a stable and safebackground environment for our products. An environmental monitoring programcan become a valuable tool to assist both quality and manufacturing departmentsin reducing the risk to product and processes.
Anne Marie Dixon
v


Contents
Foreword Nanette Londeree . . . . iiiPreface . . . . vContributors . . . . xi
1. The Behavior of Particles in Cleanrooms . . . . . . . . . . . . . . . . . 1David S. Ensor and Karin K. FoardeIntroduction . . . . 3Physical Properties of Particles . . . . 5Sources of Particles in Cleanrooms . . . . 7Particle Mechanics . . . . 10Filtration . . . . 16Air Sampling in Cleanrooms . . . . 18Cleanroom Dynamics . . . . 21Summary . . . . 24References . . . . 25
2. The Application of the New International StandardsOrganization Cleanroom Standards . . . . . . . . . . . . . . . . . . . . 29Richard A. Matthews
The International Standards . . . . 31Guidelines . . . . 31Working Groups . . . . 32Documents and Their Titles . . . . 33ISO Project Stages and Associated Documents . . . . 33Specific Information on Each Standard . . . . 33Summary . . . . 41Reference . . . . 41
3. Cleanroom Certification and Particulate Testing . . . . . . . . . . . 43David Brande
Introduction . . . . 45High-Efficiency Particulate Air Filters . . . . 45Pharmaceutical Introduction . . . . 46
vii

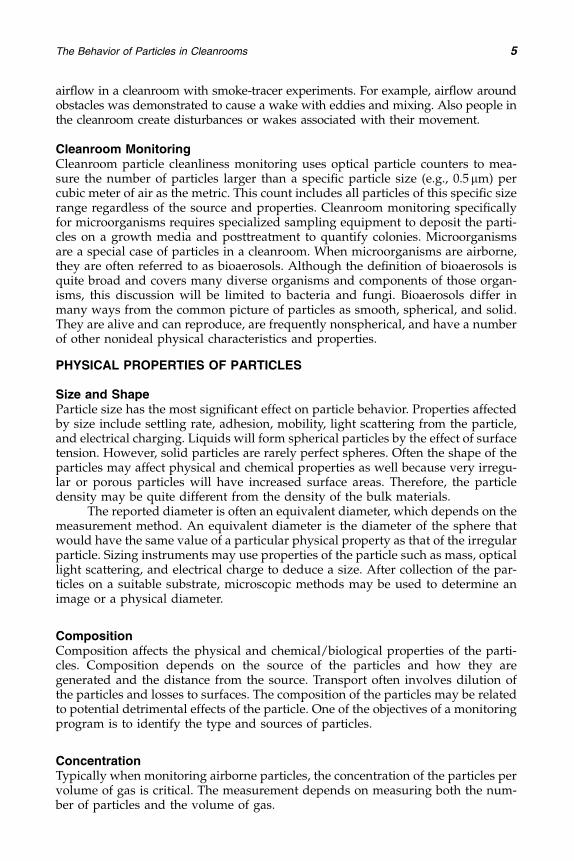
Air Volumes . . . . 47Practical Application . . . . 49Airflow Patterns . . . . 50Practical Application . . . . 50Pressure . . . . 51Filter Integrity . . . . 52Practical Application . . . . 53Bleedthrough . . . . 56Room Classification . . . . 56Practical Application . . . . 58Conclusion . . . . 60
4. Monitoring of Airborne Viable Particles . . . . . . . . . . . . . . . . . 61Bengt Ljungqvist and Berit Reinmuller
Introduction . . . . 63Sampling Efficiency . . . . 63Biological Efficiency . . . . 65Air Sampling . . . . 65Points to Consider . . . . 67Summary . . . . 68References . . . . 70
5. Microbial Surface Monitoring . . . . . . . . . . . . . . . . . . . . . . . . . 71Scott Sutton
Introduction . . . . 73Types of Monitoring Methods . . . . 77Efficacy of Methods . . . . 81Accuracy/Precision of Methods . . . . 85The Role of Microbial Identification . . . . 86The Potential of Rapid Microbiology . . . . 87Conclusions . . . . 88References . . . . 89
6. Process Simulations (Media Fills) . . . . . . . . . . . . . . . . . . . . . . 93Anne Marie Dixon
Background . . . . 95Contamination Sources . . . . 96The Process of Devising, Executing, and
Assessing Media Fills . . . . 97Case Study . . . . 109Summary . . . . 109Conclusions . . . . 110
viii Contents

Further Reading . . . . 111References . . . . 111
7. Water Monitoring . . . . . . . . . . . . . . . . . . . . . . . . . . . . . . . . . 113Anne Marie Dixon and Karen Zink McCullough
Introduction . . . . 115Standards . . . . 115Validation . . . . 115Sampling . . . . 117Routine Monitoring . . . . 119Investigations . . . . 120Incoming Water . . . . 122Pretreatment . . . . 123Water Generation . . . . 123Water Distribution . . . . 123Sample Procurement . . . . 125Sample Testing . . . . 126Further Reading . . . . 127References . . . . 127
8. Bacterial Endotoxin Testing . . . . . . . . . . . . . . . . . . . . . . . . . . 129Karen Zink McCullough
Introduction . . . . 131The Quality System . . . . 133Risk . . . . 134Hazard and CCP Analysis . . . . 135Applying the Principles of Risk Management to the
Control of Endotoxin Contaminationin Parenterals . . . . 137
Peeling the Artichoke: Determination of CCPsin the Laboratory Performance of theBET Assay . . . . 156
Summary . . . . 173Abbreviations and Acronyms . . . . 175Glossary . . . . 176References . . . . 177
9. Fault Tree Analysis of the United StatesPharmacopeia Sterility Test . . . . . . . . . . . . . . . . . . . . . . . . . . 181Karen Zink McCullough and Audra Zakzeski
Introduction . . . . 183Risk . . . . 184
Contents ix

The Sterility Test Failure Case Study . . . . 185Test Method . . . . 187Organism Indentification . . . . 193Materials Transport . . . . 196Equipment . . . . 198Environment . . . . 200Technique . . . . 208The Checklist . . . . 210References . . . . 214Appendix 1: The Sterility Test—Big Moving Parts . . . . 215Appendix 2: The Statistics of Endotoxin and
Sterility Testing . . . . 221
Index . . . . 225
x Contents

Contributors
David Brande NNE-US, Inc., Clayton, North Carolina, U.S.A.
Anne Marie Dixon Cleanroom Management Associates, Inc., Carson City,Nevada, U.S.A.
David S. Ensor Center for Aerosol Technology, RTI International,Research Triangle Park, North Carolina, U.S.A.
Karin K. Foarde Microbial and Molecular Biology, RTI International,Research Triangle Park, North Carolina, U.S.A.
Bengt Ljungqvist Building Services Engineering, KTH, Stockholm, Sweden
Richard A. Matthews Filtration Technology, Inc., Greensboro,North Carolina, U.S.A.
Karen Zink McCullough Whitehouse Station, New Jersey, U.S.A.
Berit Reinmuller Building Services Engineering, KTH, Stockholm, Sweden
Scott Sutton Vectech Pharmaceutical Consultants, Farmington Hills,Michigan, U.S.A.
Audra Zakzeski Carson City, Nevada, U.S.A.
xi


CHAPTER
1 The Behavior of Particles in Cleanrooms
David S. Ensor and Karin K. Foarde
& IntroductionBackgroundCleanroom AirflowCleanroom Monitoring
& Physical Properties of ParticlesSize and ShapeCompositionConcentrationParticle Size DistributionsInert Particle FormationBiological Particles
& Sources of Particles in CleanroomsResuspensionNebulizationThermal ProcessesPeopleProcesses in RoomsOutside AirBiocontaminants
& Particle MechanicsSteady Motion of Particles in Fluid—Stokes LawParticle DiffusionInertial Effects (Unsteady Flow Conditions)Other External Forces
& FiltrationFilter Materials
& Air Sampling in CleanroomsSampling via Nozzles or InletsSample Transport Through Tubes
& Cleanroom DynamicsOperational StatesParticle Bursts/TransportEffect of ActivitySurface Deposition
& Summary& References
1


1 The Behavior of Particles in Cleanrooms
David S. Ensor
Center for Aerosol Technology, RTI International, Research Triangle Park,North Carolina, U.S.A.
Karin K. FoardeMicrobial and Molecular Biology, RTI International, Research Triangle Park,North Carolina, U.S.A.
INTRODUCTION
BackgroundThe specification and design of cleanroom environmental monitoring programsshould consider behavior of particles with respect to sources, transport, and fate.Although a cleanroom represents a controlled environment with unidirectionalflow and highly filtered air, the location of particle sources within the room, equip-ment, and personnel may influence the transport of particles and may affect criticalprocessing locations.
Monitoring programs to quantify particle concentration need to recognizepotential particle size-dependent sampling and measurement biases. Gravitationalsettling rates and particle inertia depend on the particle diameter, shape, and spe-cific gravity. Sedimentation or gravitational settling may affect the location andconcentration of particles in the cleanroom. Sampling particles may have particlesize-dependent errors from entry of particles from the cleanroom air to samplinginlets from inertia. Settling of particles in sampling tubing and inertial depositionon tubing bends in the sampler may also cause particle size-dependent biases ofthe sample.
Cleanroom AirflowCleanrooms may be configured in many different ways depending on the intendedpurpose. The performance of the cleanroom depends on the type of airflow design(turbulent or unidirectional flow), location of air inlets and return, and size andlocation of processing equipment. The diagram of a unidirectional flow cleanroomoperation in Figure 1A illustrates a simple layout with ceiling filters and sidereturns. Clean air from the inlet filters displaces and removes contaminating par-ticles from the work area. Sources of particles in the cleanroom include potentialpathways through leaks around the filters, direct penetration through the filters,the processes, reentrainment from surfaces, and shedding from operators.
ISO 14644-4 (1) contains minimum requirements for design and construction.Airborne cleanliness standards and monitoring are covered by ISO 14644-1 and -2(2,3). Biocontamination requirements are in ISO 14698-1 and -2 (4,5). A cleanroommay be evaluated under three possible conditions or states: as-built, at-rest, andoperational. The as-built state describes a functioning cleanroom without processequipment. The at-rest state includes process equipment without activity. Theoperational state describes the situation of full production activity. Particles in a
3

working cleanroom may follow complex paths in the presence of operating equip-ment and personnel.
Some insights can be gained from airflow-modeling results. An exampleof airflow modeling developed by Yamamoto et al. (6,7) is shown in Figure 1B.The model used a two-dimensional Navier–Stokes solution to the equations of flow.Particles generally follow the streamlines of airflow. However, sufficiently large par-ticles may settle by gravity or have sufficient mass or inertia to deviate from theairflow when the air changes direction. In Figure 1B, the flow streamlines are shownfor the case of a full-filtered ceiling with wall side returns. The air is shown flowingaround an obstacle such as a solid table or process equipment. At the edges of theobstacle in this particular example, recirculation zones form. Recirculation of airmay cause transport of particles from the floor to the top of the work surface.Although a cleanroom maybe designed to provide unidirectional airflow, the pres-ence of and operation of processing equipment and people in a working facilitycan change the character of the airflow. Fitzner (8) demonstrated the complexity of
FIGURE 1 (A) Diagram of a unidirectional flow cleanroom illustrating relative location of inlets,returns, and airflow. Air-conditioning, fans, and dampers have not been shown for clarity. (B)Computation of cleanroom airflow streamlines. Formation of an eddy at the corner of the workarea.
4 Ensor and Foarde
airflow in a cleanroom with smoke-tracer experiments. For example, airflow aroundobstacles was demonstrated to cause a wake with eddies and mixing. Also people inthe cleanroom create disturbances or wakes associated with their movement.
Cleanroom MonitoringCleanroom particle cleanliness monitoring uses optical particle counters to mea-sure the number of particles larger than a specific particle size (e.g., 0.5 mm) percubic meter of air as the metric. This count includes all particles of this specific sizerange regardless of the source and properties. Cleanroom monitoring specificallyfor microorganisms requires specialized sampling equipment to deposit the parti-cles on a growth media and posttreatment to quantify colonies. Microorganismsare a special case of particles in a cleanroom. When microorganisms are airborne,they are often referred to as bioaerosols. Although the definition of bioaerosols isquite broad and covers many diverse organisms and components of those organ-isms, this discussion will be limited to bacteria and fungi. Bioaerosols differ inmany ways from the common picture of particles as smooth, spherical, and solid.They are alive and can reproduce, are frequently nonspherical, and have a numberof other nonideal physical characteristics and properties.
PHYSICAL PROPERTIES OF PARTICLES
Size and ShapeParticle size has the most significant effect on particle behavior. Properties affectedby size include settling rate, adhesion, mobility, light scattering from the particle,and electrical charging. Liquids will form spherical particles by the effect of surfacetension. However, solid particles are rarely perfect spheres. Often the shape of theparticles may affect physical and chemical properties as well because very irregu-lar or porous particles will have increased surface areas. Therefore, the particledensity may be quite different from the density of the bulk materials.
The reported diameter is often an equivalent diameter, which depends on themeasurement method. An equivalent diameter is the diameter of the sphere thatwould have the same value of a particular physical property as that of the irregularparticle. Sizing instruments may use properties of the particle such as mass, opticallight scattering, and electrical charge to deduce a size. After collection of the par-ticles on a suitable substrate, microscopic methods may be used to determine animage or a physical diameter.
CompositionComposition affects the physical and chemical/biological properties of the parti-cles. Composition depends on the source of the particles and how they aregenerated and the distance from the source. Transport often involves dilution ofthe particles and losses to surfaces. The composition of the particles may be relatedto potential detrimental effects of the particle. One of the objectives of a monitoringprogram is to identify the type and sources of particles.
ConcentrationTypically when monitoring airborne particles, the concentration of the particles pervolume of gas is critical. The measurement depends on measuring both the num-ber of particles and the volume of gas.
The Behavior of Particles in Cleanrooms 5

Particle Size DistributionsAirborne particles are rarely found as a single-particle size. Even a group of onetype of microorganism will exhibit a distribution in size because of natural varia-bility. Sometimes, organisms or particles may be clumped creating larger particlesfrom the formation process or Brownian coagulation while airborne. By necessity,the results need to be treated statistically. In the cumulative format, the particle sizedistribution is plotted as the numbers of particles ‘‘larger than or equal to’’ a spe-cific diameter or the cumulative numbers of particle ‘‘smaller than or equal to’’ aspecific diameter. The ‘‘larger than or equal to’’ cumulative curves are used inthe cleanroom industry to define cleanliness standards (2). This convention waslikely motivated by limitations in instrumentation. It is a reasonable assumptionthat particles larger than a specific diameter will be detected by an optical particlecounter. The particles smaller than a specific lower limit cannot be detectedbecause of resolution limitations of the instrument. Often particle size distributionsare fitted with mathematical models to better understand behavior. The straightline used in cleanroom standards in logarithmic coordinates is an example of apower law distribution:
NðdpÞ ¼ d�np ð1Þ
where N(dp) is the cumulative number distribution as a function of particle diam-eter, dp the particle diameter, and n a statistically determined slope of the sizedistribution.
Size distributions are characterized with moments, mean, mode, and stan-dard deviations. Often logarithmic distributions are used to characterize theobserved sizes. For more information, please refer to Ensor (9) and Hinds (10).For scientific work, often the size increment is normalized with a log incrementto cause the area under the curve in log–log plot to relate to a parameter of interest.
Inert Particle FormationThe formation processes determine both the composition and the size. Mechanicalprocesses such as abrasion, crushing, and grinding are normally responsible forparticles larger than 1 mm. These larger particles may be introduced into the airimmediately upon formation or introduced by resuspension from the floor or othersurfaces. Particles smaller than 1mm normally are formed by gas-phase chemicalreactions or the condensation of vapor. Particles may be formed from spray dro-plets as dissolved solids evaporate leaving residue; the size of the particledepends on the concentration of the material in the liquid.
Biological ParticlesBioaerosols as a group vary markedly in size or shape. Examples of shapes of com-mon bacteria are shown in Figure 2. Microbiological textbooks traditionally givesize data for microorganisms. Generally, the physical size was determined micro-scopically by observing the organism suspended in fluid. This, however, providesonly general guidance as to the properties of a bioaerosol because the bioaerosolmay not be a suspension of single particles. Rather the bioaerosol may be a suspen-sion of microbiological particles attached to various kinds of environmental particles.These environmental particles might include dust, sputum, skin cells, etc. Therefore,the physical dimensions of microorganisms are applicable only to situations verysimilar to those for which the measurements were made. The aerodynamic diameters
6 Ensor and Foarde

of bioaerosols must be directly measured. Sampling instruments are designed to col-lect a size range representative of the bioaerosols of interest (Table 1).
Particle properties, in addition to size and shape, may be important, althoughlittle or no data specific to microorganisms are available. For instance, the surfacetexture of particles may be important to their likelihood of becoming airborne. Theirregular surface of a mold spore may affect its likelihood of adhering to a smoothsurface. Particle density has an impact on both aerodynamics and retention on sur-faces. The surrounding environment may be important. Bacteria and some fungalspores are known to change size and shape as relative humidity changes. Thesechanges affect bioaerosol behavior.
SOURCES OF PARTICLES IN CLEANROOMS
Particle sources in the room are most likely due to local generation in the roomor penetration of contaminated air from the outside through the filters. Even
TABLE 1 Representative Properties of Some Common Environmental Organisms
Organism Type Size and shape Comments
Bacillus subtilis Gram-positive bacteria 0.7–0.8�2–3mm rodswith an ellipsoidalspore �0.7–0.8�1–1.5mm
Spore-forming bacteriathat is ubiquitous innature
Staphylococcusepidermidis
Gram-positive bacteria 0.5–1.5mm spheres Vegetative bacteriawhich inhabits thehuman skin andrespiratory tract
Penicilliumchrysogenum
Fungus (mold) 3–4mm�2.8–3.8mm,subglobose toellipsoidal becomingglobose
Found in air-conditioning systemswhere patients weresuffering fromallergic disease,food products
Cladosporiumsphaerosper-mum
Fungus (mold) Ellipsoidal to lemon-shaped, 3–4� 7mmin diameter; someramoconidia (33�3–5mm)
Found in contaminatedbuilding material,plants, soil
FIGURE 2 Cell shapes and arrangements for common bacterial forms. (A)–(E) Cocci [(A) sta-phylococci, (B) streptococci, (C) diplococci, (D) coccobacilli, (E) micrococci]; (G)–(J) rods [(G)enterobacteria, (H) bacilli, (I) coryneforms, (J) fusobacteria]; (F) and (K) coiled rods (spirochetes).
The Behavior of Particles in Cleanrooms 7

high-efficiency particulate air (HEPA) and ultra low penetrating air filters allow avery small fraction of particles to pass through the filter. There is always possibilityof pinhole leaks in the filter, and leaks in the filter seals have not been detected andrepaired. Also cleanrooms normally operate at positive pressures to prevent inleakage of contaminated air from the outside. If, for some reason, the cleanroomoperates at negative pressures, leaks in the room envelope can introduce particlesinto the facility. The sources of particles in electronic cleanrooms were found to beevenly divided between personnel and process (11). It has also been reported thatpersonnel contributes 35% of the contaminants (12). ISO 14644-5 (13) describes theminimum requirements for operations during manufacturing to control particleswithin selected limits.
ResuspensionResuspension is, in a general sense, any process causing release of particles from asurface. The release may be caused by physical rubbing or contact with the surface,movement or flexing of the surface, vibration of the object, or the movement of gasat sufficient velocity above the surface. The detailed resuspension mechanisms arenot well understood. Dynamic resuspension theory has been developed to explaindetachment of inert particles from surfaces. It has been hypothesized that a popu-lation of particles have a distribution of adhesion forces with respect to theparticular surface (14). In practice, when a high-velocity gas jet is used to removeparticles, particle concentrations have been observed to follow an inverse timerelationship t�1 with respect to the observed downstream concentration (15). Inaddition, the resuspension is dependent on the velocity of flow to exert a forceon the particles and the turbulence of flow. It has been hypothesized that resuspen-sion may be explained in terms of the airflow exerting lift on the particle inaddition to simple drag to dislodge the particles from the surface (16).
The air movement caused by walking will resuspend the particles because ofthe lateral airflow along the floor caused by the motion of the shoe. Although therehave been limited cleanroom studies isolating this form of contamination (17), thismechanism has been shown to be important in indoor air-quality studies (18).
NebulizationNebulization is the formation of droplets from liquids. Whenever liquids splash orgas bubbles through a liquid, opportunities exist for generation of the particles. Ifdroplets become airborne, the liquid will evaporate leaving an airborne solid resi-due. The sizes of the particles are a function of the droplet diameters and theconcentration of nonvolatile residue in the liquid (11).
Thermal ProcessesParticles are also formed from heating volatile material with subsequent cooling.This formation process applies to process heaters and electrical equipment (9).Although these sources are not important from a viability standpoint, the particleswould contribute to the total burden of the cleanroom (11).
PeoplePeople are a significant source of particles in the cleanroom. The source particlesmay be found in expelled breath and shedding of particles from the skin. Masksare used to reduce the concentration of expelled breath particles. The role of
8 Ensor and Foarde

cleanroom garments is to reduce the shedding of particles from people into thecleanroom. Reduction of people-generated particles, such as controlling the useof makeup, is well established. Garments are used to reduce the emissions inthe room. Two parameters of interest are: particles released from the fabric andparticles penetrating the fabric (19).
IEST RP-3 (20) describes the ‘‘body box method’’ to determine the penetrationof particles through the fabric of a garment. The body box is about the size of aphone booth. Clean air is introduced into the top of the chamber, and particle sam-pling is conducted to measure emissions. The second method in RP-3 is the HelmkeDrum test method where the garments are tumbled in a drum, and the particlesreleased from the garment are measured with an optical particle counter. Recently,the particle size distribution of particles released from garments with the HelmkeDrum test method was analyzed (21) and found to have a power law size distri-bution with a slope of -1 [Equation. (1)]. In addition, the method was statisticallytested (22) and found to have acceptable repeatability and reproductively.
Processes in RoomsIEST RP-26 (23) describes methods to measure particle emissions from equipment.These include a chamber and a tunnel method (24). The chamber method involvesplacing the device into a low leak rate chamber. Either in the chamber or connectedthrough a duct is a blower HEPA filter combination to allow cleaning of the air andthen measuring the rate of concentration build up after the flow to the filter isstopped. The duct method uses a test duct through which clean air from a fanHEPA combination flows past the device under test. The concentration of particlesemitted from the device is determined by sampling the air upstream and down-stream of the device. Particle emissions are reported in units of source strength,number of particle released/time, to allow application to various conditions.
Outside AirAlthough cleanroom air is highly filtered, some of the particles are from the ambi-ent outdoor environment. Viner (25) has showed that the cleanrooms tended tohave a similar concentration versus time pattern as outside air with a much lowerconcentration under conditions of limited use. This is believed to result from thevery small fraction of ambient particles penetrating the high-efficiency filters pro-tecting the cleanroom.
BiocontaminantsBiocontaminants may become airborne in a number of ways. They may originateand become airborne outdoors and enter a building in infiltrating or make upair, be transported in from outside as a deposit and be dispersed inside, or orig-inate and become dispersed from either inside spaces or within the ventilationsystem. Whatever their source, airborne biocontaminants must first becomeentrained in the air and then be transported. Little systematic research (specificto indoor airborne biocontaminant generation) has been conducted, but thegeneral conditions that contribute to dispersal are known from concentrationmeasurements and aerosol studies. The method of generation (initial dispersal)can be expected to affect the particle size and concentration.
The overall process of airborne biocontamination includes the launching step,in which biological particles are dislodged from a surface (or released by the micro-
The Behavior of Particles in Cleanrooms 9

biological organism) and injected into the air close to that surface; and the entrain-ment step, in which the now airborne biological particle is entrained in a turbulenteddy or series of eddies and carried into the mixed breathing air. Dispersed parti-cles may settle and redeposit or become entrained in the mixed air stream andfollow the air currents in the occupied space.
For fungi, the main natural method of dispersal is through the air. Many ofthe spore dispersal methods are quite complicated. They may be either active orpassive and dry or moisture-requiring mechanisms. The minimum air speedrequired to remove spores from the mycelia is reported to vary from 0.4 to2.0 m/s flow velocity. The level of turbulence and the surface velocity were notreported. A number of different spore-release mechanisms have been identified.In addition, the fungal response to falling or rising relative humidities is liberationof spores in some cases (26,27).
Some fungal spores are released as chain-like shapes, and portions of thechains could become reentrained by airflow. The rough surfaces of some other fun-gal spores may reduce adhesion and make them more easily resuspended.Adhesion of collected particles is significantly increased if the surface is wet withliquid such as oil or water or if a condensed interstitial water film has formed underhigh-humidity conditions. Extrapolating from studies of particle adhesion (28),dispersion and resuspension should be reduced by high relative humidities.
Fungal or other bioaerosols that naturally exist outdoors may enter a clean-room duct system with incoming outdoor air or become established in a sectionof the duct that becomes wet or is for some reason at high humidity. If growing,fungal spores can enter the air stream. Airborne organisms that do becomeentrained can be transported throughout the building in the ventilation system.Bioaerosol transport through a ventilation system is similar to that of other parti-cles having the same aerodynamic diameter. It is primarily dependent on theparticle size and the system design (velocity, duct diameter, bends, etc.). A numberof forces may lead to particle deposition. Large particles are likely to settle to thebottom of a duct at low-flow regions. Deposition in corners and on flow obstacles isgenerally caused by inertial effects (impaction). Based on theoretical analysis andexperimental studies, micrometer-sized particles are probably deposited on ductwalls by impaction from turbulent eddies, whereas submicrometer-sized particlesare probably deposited on duct walls by Brownian diffusion. Expressions for aero-sol transport efficiency through ducts have been developed. The calculations areapproximate, but have been used widely to compute sampling line losses andare known to give reasonable results in many cases. For these reasons, resus-pension from duct surfaces requires a disturbance of some kind (mechanicalshock, flow surges, or turbulent air burst), and the intensity of the disturbanceaffects both the concentration and the particle size of the resuspended aerosol.
PARTICLE MECHANICS
Steady Motion of Particles in Fluid—Stokes LawAs suggested earlier in the description of airflow in a cleanroom, there are caseswhen the particles have motion relative to the surrounding air. Understanding thismotion is important for sampling of aerosols. The particle drag force in viscousflow is given by Stokes law:
FD ¼ 3pgVdp ð2Þ
10 Ensor and Foarde

where FD is the drag force on the particle, g the viscosity, V the particle velocity,and dp the particle diameter (Fig. 3).
There are several assumptions underlying this equation: the fluid is incom-pressible, the particle is not near a wall, motion is constant, particle is a rigidsphere, and the fluid velocity at the surface of the particle is zero. The differencebetween the gravitational force and the drag force yields the sedimentation velo-city. This is shown by:
FD ¼ Fg ¼ mg ð3Þ
3pgVdp ¼ðqp � qgÞpd3
pg
6
VTS ¼qpd2
pg
18g
ð4Þ
where Fg is the force of gravity, m the mass of the particle, qg the gas density, qp theparticle density, g the gravitational constant (980 cm/s/s), and VTS the terminalsedimentation velocity (cm/s).
As mentioned above, one way to characterize irregular or nonspherical par-ticles is to use the equivalent diameter concept. The settling velocity equation (4)has been used to determine an equivalent particle diameter. However, particlediameter, particle density, and shape are often unknown for a given observed set-tling velocity. The following particle diameters are defined (10):
VTS ¼qpd2
eg
18gv¼ qbd2
sg
18g¼ q0d2
ag
18gð5Þ
where de is the equivalent volume diameter, the diameter of a sphere having thesame volume as the irregular particle; v the dynamic shape factor, ds Stokes diameter,the diameter of the sphere that has the same density and settling velocity as theirregular particle; and da the aerodynamic diameter, i.e., the diameter of the unit den-sity (qp¼ 1 g/cm3) sphere that has the same settling velocity as the irregular particle.
FIGURE 3 Force balance on a particle illus-trating that the difference in drag and anexternal force such as gravity yields a netvelocity.
The Behavior of Particles in Cleanrooms 11

Aerodynamic diameter is a widely used descriptor of particles for whichinstruments using the inertial separation can be accurate. The aerodynamic diam-eter is also quite useful to describe processes which depend on particle inertia suchas inhalation health effects, high-velocity filtration, impaction, cyclones, etc.
There are three observations with respect to Figure 4. (i) Particles larger thanabout 5mm settle rapidly from the air and suspensions are unstable. (ii) Particlessmaller than about 1mm have vary small settling velocities and can be quite stable.(iii) Finally, the curve has a slight concave curvature due to deviation from theStokes d2
p relationship for small particles. One of the assumptions of Stokes lawis the velocity of the fluid at the surface of the particle surface is zero. However,as the size of the particles approach molecular dimensions, this assumptionbecomes less valid. In effect, the particles ‘‘slip’’ past the gas molecules to a greaterextent than predicted than just with the Stokes law. Cunningham developed thefirst slip correction factors (10). The slip correction factor is given by:
Cc ¼ 1þ kdp
�2:514þ 0:800 exp
��0:55
dp
k
��ð6Þ
where k is the mean free path of the gas molecules.In Figure 5, the slip correction is shown for standard conditions. The correc-
tion Equation (6) is semiempirical based on data taken over a range of particles andenvironmental conditions.
Particle DiffusionBrownian motion is the movement of particles from collisions with surroundingmolecules observed by Robert Brown in water suspensions of pollen. For particlesless than 0.1mm in diameter, diffusion caused by Brownian motion may be animportant factor in predicting their behavior (10). Brownian motion will in effectmove particles from regions of high concentration to low concentration. Particlediffusion is an important mechanism for the collection of Sub-0.1 mm particles in
FIGURE 4 Particle settling velo-city as a function of particlediameter. The particles are spheri-cal with a particle density¼1 g/cm3 in still air.
12 Ensor and Foarde

air flowing through filters and tubes. The diffusion coefficient for aerosol particlesis given by the Stokes–Einstein equation:
D ¼ kTCc
3pgdpð7Þ
where D is the diffusion coefficient and k Boltzmann’s constant.Figure 6 shows the inverse relationship of the diffusion coefficient with par-
ticle diameter in Equation (7).
FIGURE 5 Slip correction as a function of particle diameter. The particles are assumed to be spherical.
FIGURE 6 The diffusion coefficient as a function of particle diameter. The lower size limit of0.00037mm represents the diameter of an ‘‘air molecule.’’
The Behavior of Particles in Cleanrooms 13

Inertial Effects (Unsteady Flow Conditions)Particles of sufficient size will exhibit inertial effects, which cause a deviation fromairflow streamlines. Example of this occurs when particles are accelerated in a noz-zle and the air jet directed at a surface as shown in Figure 7. Impactors are oftenused to capture particles by directing against a collection surface for subsequentanalysis (29). Impactors are often used with media for bioaerosol sampling (30)with appropriate corrections (31). These are often called sieve or silt samplers, exam-ples are Anderson sampler and slit to agar samplers. In general, the greater the jetvelocity, the smaller the particle that can be collected. However, the jet velocity is lim-ited by sonic velocity. Also high-velocity jets may blow-off of the particles from thecollection surface. Therefore, for most conventional impactors, the limit for particlecollection is about 0.3mm. Impactors have been developed using very small jet dia-meters and low pressure to allow collection of particles smaller than 0.1mm (32).
The efficiency of an impactor depends on the Stokes number. The Stokesnumber is defined as:
Stk ¼ qpd2pUCc=9gDj ð8Þ
where qp is the density of the particle, dp the particle diameter, U the velocitythrough the jet, Cc the Cunningham correction factor, n the viscosity of gas, andDj the diameter of hole forming the jet.
The collecting efficiency can be computed with fluid dynamic simulations ofan impactor (32). In practice, the impactor is calibrated to obtain the appropriatecollection efficiencies.
In Figure 8, impactor collection efficiency is shown for various collection sur-faces. Theory assumes that a particle touching the surface of the substrate iscaptured. In practice, particles may bounce or can be resuspended from the sur-face. In the extremes are an oiled surface and bare surfaces. Fiber filter matshave used as collection substrates to reduce particle bounce. As seen in the figure,the efficiency of a filter mat is midway between the bare and the oiled surfaces. Forsome regions of Stokes number, the collection substrate may act like a filter of theair flowing parallel along the collection surface. Usually bounce is not a problemfor microorganism sampling because the agar is fairly sticky and the jet velocity
FIGURE 7 Illustration of an impactor showing the position of nozzle and impaction surface.Abbreviation: W is the width of the acceleration nozzle, T is the depth of the nozzle, S is the distancefrom the nozzle to the impaction plate. Source: From Ref. 32.
14 Ensor and Foarde

is low to prevent damage to the organism. Other problems include overloadingwith particles or excessive sampling times, which will dry the media.
Other External ForcesUnder some circumstances, a suspended particle may be moved appreciably byexternal gradients such as light, heat, and electrical charge.
ElectricalParticles usually have an electrical charge resulting from a wide range of mechanismsduring formation and transport. Charged particles will follow Coulombs law and willbe attracted to other particles and surfaces of opposite charge and will be repelled byidentical polarity. Naturally occurring particles typically will be charged (34).
ThermalDark spots near the wall near an old-fashioned radiator for interior heating is acommon example. Particles move from high temperatures to low temperatures(along the temperature gradient). The effect is strongly dependent on particlediameter with the greatest effect found for the smallest particles (35).
LightNormally under normal ambient light illumination and ambient atmospheric pres-sures found in a cleanroom, the effects of light on particles are insignificant.However, under conditions of either/or high intensities such as that generated by alaser or low pressure, light forces can be significant. There are two mechanisms: thelight heats the particle and the thermal gradient causes motion either in the direction
FIGURE 8 Effect of collectionsurface on impactor cutoffcurve. Source: From Ref. 33.Reprinted with permission ofthe University Press of Florida.Abbreviation: PSL, polystyrenelatex.
The Behavior of Particles in Cleanrooms 15

of the light or away depending on the refractive index of the particle or in some casesthe momentum from photons can cause motions away from the light (36).
FILTRATION
Air filtration is vital to the central purpose of cleanroom to create an environmentwith acceptably low particle contamination. The heating, ventilation, and airconditioning system contains general ventilation and high-efficiency filters. Thecleanroom itself typically uses ceiling HEPA filters. Small filters may also used in sam-plers to collect air samples of particles.
Filter MaterialsA wide variety of filters are available. Filters are designed to remove particles withthe least pressure drop. Filters have been made from various kinds of polymers,glass fibers, porous membranes, fibrillated polymeric films, and porous metals.A fibrous filter medium used for HEPA filtration is shown in Figure 9.
The goal in selecting filters is to maintain the highest flow rate, lowest pres-sure drop, and lowest particle penetration. The penetration is the outletconcentration divided by the inlet concentration. The efficiency of a filter is definedin terms of the fractional penetration of particles:
Efficiencyð%Þ ¼ ð1� penetrationÞ � 100 ð9ÞFractional penetration is the ratio of the outlet concentration divided by the
inlet concentration at a range of particle of varying sizes.Fibrous filters collect particles primarily by the following mechanisms: inter-
ception, inertial impaction, diffusion, and electrostatic attraction as illustrated inFigure 10. Detailed filtration theory and the importance of the collection mechan-isms have been reviewed (37,38).
FIGURE 9 Micrograph of typical HEPA fibrous filter media (2000x). Source: From Dr. Howard J.Walls.
16 Ensor and Foarde

Interception occurs when a particle comes into contact and sticks to the fiberwhile following the airflow streamline. This mechanism depends on the ratio of theparticle diameter to the fiber diameter and is effective for particles larger than1 mm. The physical parameters of importance include particle diameter, fiberdiameter, filter packing density, and depth.
Collection by diffusion is effective for particles smaller than 0.1 mm. This col-lection mechanism results from the random Brownian motion driving the particlesto the fiber. It is dependent on the ratio of the particle diffusion coefficient to the airvelocity through the filter. The physical parameters of importance are particlediameter, fiber diameter, air velocity, filter packing density, and depth.
Inertial deposition occurs when a particle deviates from the flow streamlinefrom its inertia as the air flows around the fiber and contacts the fiber. This mechanismis most effective on particles larger than a few tenths of a micron because it utilizes theinertia of the particle and works best in systems with high air velocities. The physicalproperties of importance include particle mass, air velocity, and fiber diameter, particlephase that may affect particle bounce, filter packing density, and depth.
Electrostatic attraction occurs when the particle and/or fiber has an electro-static charge. Electrostatic particle collection mechanisms are important for threeapplications: (i) Active electrostatic systems use corona charging of the particlesand/or use an electric field on a filter mat. A number of different electrostaticallyaugmented systems have been available for at least 50 years (39). (ii) Tribogenera-tion by the passage of air over dielectric fibers. (iii) Permanently electrostaticallycharged fibers. The Hansen filter for respirators developed in the 1930s used tri-boelectrically charged resin in wool filters (40). Modern permanent electrostaticfilters use polymer fibers that have been processed with corona discharge or fibril-lated sheets of electret material to provide a permanent charge on the fibers. Thesefilters have enhanced efficiency until the charges are covered or shielded by parti-cles (41). The physical parameters of importance include particle charge, fibercharge, particle mass, air velocity, filter packing density, and depth.
In Figure 11, particles larger than 0.1mm are collected predominately by inter-ception. For low-efficiency filters with high face velocities, impaction may be
FIGURE 10 Illustration of the mechanisms responsible for particle collection in fibrous filters.
The Behavior of Particles in Cleanrooms 17

significant. Collection by diffusion is predominant below 0.1 mm. The most pen-etrating particle diameter is at the point in the filtration curve where thediffusion and interception mechanisms are least effective. The most penetratingparticle diameter depends on the face velocity, porosity, and fiber diameter. Theparticle penetration of the filter tends to increase and the most penetrating diam-eter tends to be reduced because the shorter residence time in the media reducesthe effectiveness of diffusion. Typically the most penetrating diameter is from 0.1to 0.5mm depending on the type of filter. High-efficiency filters are normally testedat the most penetrating particle diameter (43–45). As microorganisms of interesthave larger diameters than the most penetrating particle diameter, the penetrationof microorganisms is lower than the penetration of the most penetrating diame-ter (46). The filtration efficiency and the pressure drop will increase with time asthe filter collects particles (47).
AIR SAMPLING IN CLEANROOMS
Air sampling in cleanrooms is an essential activity. Understanding the physicalproperties of particles, their sources, and their behavior is key to developing agood, effective sampling program. Knowing where to sample in a cleanroom canprevent many problems by identifying problems early.
Sampling via Nozzles or InletsThe sampling of the air from a cleanroom involves aspirating air from ambient airthrough a nozzle. Ideally, the particles in the air would enter the sample nozzle
FIGURE 11 Particle size–dependent fractional penetration for cleanroom filters. Source: From Ref.42. Abbreviations: DOS, dioctylsebacate; HeV, Hollingsworth and Vose.
18 Ensor and Foarde

without separation of particle by size from inertial effects or deposition of the par-ticles inside the nozzle or tubing. The preferred sampling approach is to match theflow velocity in the inlet with the velocity in the ambient air. The effect of mis-matched air velocity in affecting particle concentration is shown in Figure 12.Sample biases tend to be caused by inertial effects found in larger particles. Theinstrument may under sample the large particles if the velocity in the inlet is muchlarger than the surrounding air. In this case, small particles from an area ofapproaching air larger than the area of the nozzle are drawn into the sample. Ifthe air velocity at the inlet is less than the surrounding air, the larger particleswould be enriched. The effective area of the nozzle for fine particles is smaller thanthe area of the nozzle, whereas the larger particles because of their inertia will continueon their preestablished trajectories enriching the sample. The entry of particle into asampling tube is dependent on several parameters. These include (i) airflow velocity(and turbulence) in the surrounding air, (ii) size and flow velocity of the samplinginlet, and (iii) the angle of the sampling nozzle with respect to the airflow direction.For example, if the particles are sampled by a nozzle at right angles to the directionof airflow, the large particles would be thrown away from the nozzle by the changein airflow direction.
In Figure 13, the concentration changes, with ambient flow velocity Uo andsample flow velocity U ratio as a parameter, are shown as a function of the squareroot of the stokes number (49). The relative angle h of the nozzle to the ambient airflow direction; perfect alignment occurs when h is zero. The square root of theStokes number is proportional to particle size. Therefore, for very small particles
FIGURE 12 Illustration of isokineticsampling flow. Source: From Ref. 48.
The Behavior of Particles in Cleanrooms 19

the air velocities are unimportant. However, when the square root of the Stokesnumber is larger than 1, the velocity ratio can be quite important.
Sample Transport Through TubesAfter entry into the sampling tube, the particles are transported through the tubingto the sampler. Mechanisms affecting the particles are the same as described above:(i) gravitational sedimentation (ii), inertial deposition in elbows (iii), turbulentdeposition (iv), loss by diffusion, and possibly (v) electrostatic deposition onsurfaces. To reduce deposition from electrostatic effects, conducting tubingmaterial should be used. From a practical standpoint, tubing as short as possibleshould be used. Also, large radius bends with radius of curvature four times thetubing diameter should be used if bends are needed. Also expansions and contrac-tions of the tubing diameter or in fittings should be avoided. The flow velocity isalso important affecting residence time in the tube important for gravitational sedi-mentation, velocity in the turns, and turbulence. Turbulence in the tubing isdetermined by computation of the Reynolds number:
Re ¼DUqg
lð10Þ
where D is the tubing diameter. When Re is less than 2000, the flow is laminar.When Re is greater than 4000, the flow is turbulent.
Typically, flow rates are selected to produce sufficient velocity for turbulentflow but low enough to minimize deposition in bends. In Figure 14, transportefficiency (the fraction of particles penetrating the tube) shows the effects of tubinglength for laminar and turbulent flows.
The transport efficiency is shown in Figure 14 as a function of aerodynamicparticle diameter with tubing length and Reynolds number as parameters. Theseresults were computed using Deposition 4.0 developed by McFarland (50). Themost important parameter is the particle diameter. The next most important is
FIGURE 13 Concentration ration versus the square root of Stokes number for several values ofvelocity ration, h ¼ 0, based on Durham and Lundgren empirical results. Source: From Refs. 10 and 49.
20 Ensor and Foarde

the tubing length. Turbulence enhances deposition for particles larger than 10 mmas shown by comparing the deposition in Figure 14A and B.
CLEANROOM DYNAMICS
Operational StatesAs described earlier, cleanroom conditions can be described by its operationalstates: (i) as-built, (ii) standby, and (iii) operational. The particles in the cleanroomwill depend on these states. For example, in the operational state the effects of per-sonnel and process equipment will become significant.
FIGURE 14 Tubing length. (A) Penetration of particles through a circular tube 12.7 mm (1/2 in) indiameter with tubing length as a parameter in laminar flow. The flow rate was 10 lpm and theRe¼ 275. (B) Penetration of particles through a circular tube 6.35 mm (1/4 in) in diameter withtubing length as a parameter in turbulent flow. The flow rate was 30 lpm and the Re¼5000.
The Behavior of Particles in Cleanrooms 21

Particle Bursts/TransportIt has been observed (25) that long-term measurements in operational cleanroomyield steady particle concentrations with occasional short, random, relatively highconcentration of particles or ‘‘particle bursts.’’ These busts of particles have beenrelated to specific processes.
Effect of ActivityThe measurement of particle size distribution over a wide range of particle diam-eter and integrated over particle bursts during operational states is difficult toperform. Ensor et al. (51) described the use of an array of condensation nucleicounters with diffusion batteries to limit the particles to a specific size range. Dif-fusion batteries contain a series of screens selected so that the small particles arecollected and the larger particles pass through the device. Six condensation nucleicounters and two optical counters were used. The sampling array can be used todirectly obtain the ‘‘larger than or equal to’’ cumulative particle size distributioncurves used in cleanroom standards. The at-rest cumulative ‘‘larger than or equalto’’ specific particle diameter curve in Figure 15A shows the source of the particlesare particles from outside penetrating the air filters in the 0.1–0.3mm particle sizerange. During the work day, when the cleanroom is in operation, both very smalland large particles are introduced into the air as indicated by the straight curve inFigure 15B . It was observed that particle counts in a cleanroom rise during periodsof activity in the cleanroom.
During the at-rest or inactive state, the size distribution in the cleanroom isdefined by the filter particle size-dependent efficiency. If the filter penetrationcurve as presented in Figure 11 is converted to a cumulative curve, the particle sizedistribution curve observed at rest in Figure 15A will be predicted. The implicationis that in the cleanroom studied the size distribution during nights without activitythat the particles results mainly from atmospheric ambient air particles that are notcollected by the filter. Because of the low penetration or high particle collection, theconcentration within the cleanroom is orders of magnitudes lower than the outsideair. When the room is active, both large and small particles are introduced into thecleanroom from internal sources as shown in Figure 15B. The sources of particlesdescribed earlier could all influence the particle concentrations. As this was anelectronic cleanroom, it is expected that the fine particles less than 0.5 mm werecaused by thermal generation by the furnaces or wafer coating operations. The lar-ger particles greater than 0.5mm were likely caused by emissions from personnel orresuspension from the floors (52–54).
Surface DepositionDeposition of particles to surfaces in the cleanroom is important for two reasons:critical work surfaces may be contaminated by particles deposited from the airand particles may be monitored with witness plates or exposed slides. However,particle deposition is particle size-dependent. This means that sampling surfaceseither by wipe sampling or witness plates will have a bias due to the differencesin deposition velocity.
Deposition velocity ¼ Concentrationð#=m3Þfluxð#=m2=secÞ ð11Þ
22 Ensor and Foarde

Ideally deposition velocity in the above equation is measured by measuring the con-centration above the surface while measuring the flux or the number of particle perunit area. In the large particle limit, the deposition velocity equals to the sedimentationvelocity. However, as the particle diameter is reduced, other forces, such as turbulence,electrical forces, Brownian diffusion, and phoretic forces from temperature gradients,become important and will affect deposition velocity (55–58). Brownian diffusionincreases the deposition of submicron particles in a manner similar to that describedearlier for filtration and deposition in tubing. Computations of deposition velocities ina unidirectional flow cleanroom are shown in Figure 16 (54). The deposition velocityis a combination of settling velocity as shown in Figure 4 and diffusion following thetrend in Figure 6. The higher the deposition velocity, the more likely the particle will bedeposited on the surface. The minimum in the particle deposition curve means thatparticles in the 0.1–1mm range are relatively stable in the air. These theoretical curvesfor deposition are reasonably predictive of actual deposition rates (59).
FIGURE 15 (A) Cleanroom particle size distribution during an at-rest state measured at night whileno operators were present. (B) Cleanroom particle size distribution during an operational state mea-sured during a normal workday. Source: From Ref. 51.
The Behavior of Particles in Cleanrooms 23

SUMMARY
The behavior of particles in cleanrooms starts with sources of the particles and trans-port within the cleanroom. The sources may be from outside the cleanroom,processes or equipment within the cleanroom, and personnel operating the clean-room. As an approximation, the particles will follow the air flowing in thecleanroom. However, particles may deviate from the bulk airflow from gravitationalsedimentation, inertial effects if the air suddenly changes direction, Browniandiffusion, and other outside forces such as electrostatics, thermal, and light.
Solid particles are rarely perfect spheres. Often equivalent diameters ratherthan physical diameter are used to describe the particle. The equivalent particlediameter often results from the method of measurement. The particle size is theprimary variable in determining particle behavior.
The mechanisms of particle generation include resuspension, spraying ofliquids, combustion, or thermal processes.
There may be significant biases when sampling aerosols. For example, theentry of particles depends on the relative velocity within the nozzle and the ambi-ent air and orientation of the tube to the airflow velocity. If the sample nozzle is notaligned with the direction of airflow, the size distribution may be enriched ordepleted in large particles, and deposition within the nozzle may be increased. Par-ticles may also be lost in tubing by gravitational settling and deposition on bends.
In an operating cleanroom, the particle size distribution depends on the levelof activity.
FIGURE 16 Particle deposition onto a 125-mm round horizontal surface in a unidirectional flowcleanroom. Source: From Ref. 55.
24 Ensor and Foarde

REFERENCES
1. ISO 14644-4. Cleanrooms and Associated Controlled Environments—Part 4:Design, Construction and Startup.
2. ISO 14644-1. Cleanrooms and Associated Controlled Environments—Part 1:Classification of Air Cleanliness.
3. ISO 14644-2. Cleanrooms and Associated Controlled Environments—Part 2: Speci-fications for Testing and Monitoring to Prove Continued Compliance with ISO14644-1.
4. ISO 14698-1. Cleanrooms and Associated Controlled Environments—Part 1: Bio-contamination Control, General Principles and Methods.
5. ISO 14698-2. Cleanrooms and Associated Controlled Environments—Part 2: Bio-contamination Control, Evaluation, and Interpretation of Biocontamination Data.
6. Yamamoto T, Donovan RP, Ensor DS. Model study for optimization of cleanroomairflows. J Environ Sci 1988; 31(6):24–29.
7. Yamamoto T. Airflow modeling and particle control by vertical laminar flow. In:Donovan RP, ed. Particle Control for Semiconductor Manufacturing. New York:Marcel Dekker, 1990:301–323.
8. Fitzner K. Particle movement in cleanrooms with laminar flow. In: Proceedings ofthe Ninth ICCCS, Los Angeles, 1988:657–662.
9. Ensor DS. Particle size distributions. In: Donovan RP, ed. Particle Control for Semi-conductor Manufacturing. New York: Marcel Dekker, 1990:27–45.
10. Hinds WC. Aerosol Technology. New York: Wiley, 1982.11. Sem GJ. The dynamics of aerosols in cleanroom environments: implication for
monitoring and control of airborne particles and their sources. In: Donovan RP,ed. Particle Control for Semiconductor Manufacturing. New York: Marcel Dekker,1990:143–157.
12. Dixon AM. Guidelines for cleanroom management and discipline. In: Tolliver DL,ed. Handbook of Contamination Control in Microelectronics. Park Ridge: NoyesPublications, 1988:136–152.
13. ISO 14644-5. Cleanrooms and Associated Controlled Environments—Part 5: Opera-tions.
14. Reeks MW, Hall D. Deposition and resuspension of gas-borne particles in recircu-lating turbulent flows. J Fluids Eng 1988; 110:165–171.
15. Jurcik B, Wang H-C. The modeling of particle resuspension in turbulent flow. JAerosol Sci 1991; 22(suppl 1):S149–S152.
16. Ziskind G, Fichman M, Gutfinger C. Resuspension of particles from surfaces toturbulent flows—review and analysis. J Aerosol Sci. 1995; 26:613–644.
17. Lake E, Watanabe N, Goto H, Kitano M. The effect of sedimentary particles onfloors in non-unidirectional airflow cleanrooms. In: Proceedings of Institute ofEnvironmental Sciences and Technology, Phoenix, 1998:581–587.
18. Foarde K, Berry M. A comparison of biocontaminant levels associated with hardvs. carpet floors in nonproblem schools: results of a year long study. J Expo AnalEnviron Epidemiol Macher JM 2004; 14(suppl 1):S41–S48.
19. Whyte W, Bailey PV. Particle dispersion in relation to clothing. J Environ Sci 1989;32(2):43–49.
20. IEST RP-CC 003.3. Garment system considerations for cleanrooms and other con-trolled environments. Institute of Environmental Science and Technology, RollingMeadows, 2003.
21. Ensor DS, Elion JM, Eudy J. The size distribution of particles released by garmentsduring Helmke drum tests. J Inst Environ Sci Technol 2001; 44(4):24–27.
The Behavior of Particles in Cleanrooms 25

22. Elion JM, Ensor DS, Berndt C, et al. Improving the repeatability and reproduci-bility of the Helmke drum test method. J Inst Environ Sci Technol 2001;44(4):28–32.
23. IEST RP-CC 0026. Cleanroom Operations. Rolling Meadows: Institute of Environ-mental Science and Technology, 2004.
24. Donovan RP, Locke BR, Ensor DS. Test method for measuring aerosol particleemission rates from cleanroom equipment. Microcontamination 1987; 5(10):36–39, 60–63.
25. Viner AS. Predicted and measured cleanroom contamination. In: Donovan RP, ed.Particle Control for Semiconductor Manufacturing. New York: Marcel Dekker,1990:129–141.
26. Lacey J. The aerobiology of conidial fungi. In: Gary TC, Bryce K, eds. Biology ofConidial Fungi. New York: Academic Press, 1981:373–416.
27. Foarde KK, VanOsdell DW, Ensor DS. Entrainment and transport of bioaerosols forventilation ducts. In: Proceedings of ICCCS 14th International Symposium on Con-tamination Control. Phoenix, April 26–May 1, 1998:459–465.
28. Zimon AD. Adhesion of Dust and Powder. New York: Plenum Press, 1980.29. Lodge JP, Chan TL, eds. Cascade Impactor. Akron: American Industrial Hygiene
Association, 1986.30. Macher J, ed. Bioaerosols: Assessment and Control. American Conference of
Governmental Industrial Hygienists. Cincinnati, 1999.31. Macher JM. Positive-hole correction of multiple-jet impactors for collecting viable
microorganisms. Am Indus Hygiene Assoc J 1989; 50:561–568.32. Marple VA, Rubow KL, Olson BA. Inertial, gravitational, centrifugal, and thermal
collection techniques. In: Willeke K, Baron P, eds. Aerosol Measurement. NewYork: Van Nostrand Reinhold, 1993:206–232.
33. Marple VA, Willeke K. Inertial impactors. In: Lundren DA, Harris FS, Marlow WH,Lippmann M, Clark WE, Durham MD, eds. Aerosol Measurement. Gainesville:University of Florida Press, 1979:90–107.
34. Donovan RP. Particle deposition data: room air ionization as a control method. In:Donovan RP, ed. Particle Control for Semiconductor Manufacturing. New York:Marcel Dekker, 1990:325–340.
35. Nazaroff WW, Cass GR. Mass-transport aspects of pollutant removal at indoor sur-faces. Environ Int 1989; 15:567–584.
36. Preining O. Photophoresis. In: Davies CN, ed. Aerosol Science. New York: Aca-demic Press, 1966:111–135.
37. Kirsch AA, Stechkina IB. The theory of aerosol filtration with fibrous filters. In:Shaw DT, ed. Fundamentals of Aerosol Science. New York: Wiley, 1978:165–256.
38. Ensor DS, Donovan RP. Aerosol filtration technology. In: Tolliver DL, ed. Hand-book of Contamination Control in Microelectronics. Park Ridge: NoyesPublications, 1988:1–63.
39. Donovan RP, VanOsdell DW. Electrical enhancement of fabric filtration. In: Cher-emisinoff NP, ed. Encyclopedia of Fluid Flow. Houston: Gulf Publishing Co.,1986:1331–1359.
40. Davies CN. Air Filtration. New York: Academic Press, 1973.41. Romay FT, Liu BYH, Chae S-J. Experimental study of electrostatic capture mecha-
nism in commercial electret filters. Aerosol Sci Technol 1998; 28:224–234.42. Dhaniyala S, Liu BYH. Investigations of particle penetration in fibrous filters. J Inst
Environ Sci Technol 1999; 42(1):32–40.43. IEST RP-CC 001.3. HEPA and ULPA filters. Rolling Meadows: Institute of Environ-
mental Science and Technology, 1993.
26 Ensor and Foarde

44. IEST RP-CC 002.2. Unidirectional flow clean air devices. Rolling Meadows: Insti-tute of Environmental Science and Technology, 1999.
45. IEST RP-CC 007.1. Testing ULPA Filters. Rolling Meadows: Institute of Environ-mental Science and Technology, 1992.
46. Decker HM, Buchanan LM, Hall LB, Goddard KR. Air filtration of microbial par-ticles. Am J Public Health 1962; 53:1982–1988.
47. Thomas D, Contal P, Renaudin V, Penicot P, Leclere D, Vendel J. Modelling pres-sure drop in HEPA filters during dynamic filtration. J Aerosol Sci 1999; 30:235–246.
48. Brockmann JE. Sampling and transport of aerosols. In: Willeke K, Baron PA, eds.Aerosol Measurement. New York: Van Nostrand Reinhold, 1993:77–111.
49. Durham MD, Lundgren DH. Evaluation of aerosol aspiration efficiency as a func-tion of Stokes number, velocity ration, and nozzle angle. J Aerosol Sci 1980; 11:179–188.
50. McFarland AR. Deposition Version 4.0. College Station, TX: Aerosol TechnologyLaboratory, Department of Mechanical Engineering, Texas A&M University.
51. Ensor DS, Viner AS, Johnson EW, Donovan EW, Keady PB, Weyrauch KJ. Measure-ment of ultrafine aerosol particle size distributions at low concentrations byparallel arrays of a diffusion battery and a condensation nucleus counter in series.J Aerosol Sci 1989; 20(4):471–475.
52. Ensor DS, Donovan RP, Locke BR. Particle size distributions in cleanrooms. JEnviron Sci 1987; 30(6):44–49.
53. Donovan RP, Locke BR, Ensor DS, Osburn CM. The case for incorporating conden-sation nuclei counters into a standard for air quality. Microcontamination 1984;8:(12), 39–44.
54. Liu BYH, Lee JW, Pui DYH, Ahn KH, Gilbert SL. Performance of a laboratorycleanroom. J Environ Sci 1998; 30(5):22–25.
55. Liu BYH, Ahn K. Particle deposition on semiconductor wafers. Aerosol Sci Technol1987; 6(3):215–224.
56. Nazaroff WW, Cass GR. Particle deposition from a natural convection flow onto avertical isothermal flat plate. J Aerosol Sci 1987; 18:445–455.
57. Fissan HJ, Turner JR. Electrostatic effects in particle deposition onto product sur-faces. In: Proceedings of the ICCCS, Los Angeles, 1988:400–404.
58. Turner JR, Liguras DK, Fissan HJ. Cleanroom applications of particle depositionfrom stagnation flow: electrostatics effects. J Aerosol Sci 1989; 20(4):403–417.
59. Wu JJ, Miller RJ, Cooper DW, Flynn JF, Delson DJ. Deposition of submicron aerosolparticles during integrated circuit manufacturing: experiments. J Environ Sci 1989;27(1):27–45.
The Behavior of Particles in Cleanrooms 27


CHAPTER
2 The Application of the NewInternational Standards OrganizationCleanroom Standards
Richard A. Matthews
& The International Standards& Guidelines& Working Groups& Documents and Their Titles& ISO Project Stages and Associated Documents& Specific Information on Each Standard
ISO 14644-1 Classification of Air Cleanliness (18 Pages)ISO 14644-2—Specifications for Testing and Monitoring to Prove
Continued Compliance with ISO 14644-1 (7 Pages)ISO 14644-3 Test Methods (62 Pages)ISO 14644-4—Design, Construction, and Startup (51 Pages)ISO 14644-5 Operations (44 Pages)ISO 14644-6—Vocabulary (21 Pages)ISO 14644-7—Separative Devices (Clean Air Hoods, Glove Boxes,
Isolators, and Mini Environments) (52 Pages)ISO 14644-8—Classification of Airborne Molecular
Contamination (22 Pages)ISO 14698-1 (32 Pages) and ISO 14698-2 (11 Pages)
Biocontamination Control& Summary& Reference
29


2 The Application of the NewInternational Standards OrganizationCleanroom Standards
Richard A. Matthews
Filtration Technology, Inc., Greensboro, North Carolina, U.S.A.
THE INTERNATIONAL STANDARDS
In 1992, at the instigation of the Institute of Environmental Sciences andTechnology (IEST), the American National Standards Institute (ANSI) petitioned theInternational Standards Organization (ISO) to create a new technical committee,‘‘Clean Rooms and Associated Controlled Environments.’’ This new technical com-mittee, ISO/TC 209, was formally established in May, 1993. The importance of thisendeavor is underscored by the fact that currently there are over 50,000 cleanroomsworldwide, with an annual economic impact in excess of $1 trillion.
The ANSI is responsible for participation in those technical areas of workwhere the United States’ interests have dictated support. ANSI then looks to a non-profit organization that develops standards in a particular technology area todetermine the United States’ position in a similar international standardizationactivity. The IEST is the body of choice for the activity of ISO/TC 209.
The mission of this technical committee is to develop a series of internationalstandards for cleanrooms and associated controlled environments, encompassingstandardization of equipment, facilities, and operational methods. ISO/TC 209defines procedural limits, operational limits, and testing procedures to achievedesired attributes to minimize contamination.
Topics of interest are nonviable particles, viable particles, surface clean-liness, airflow patterns and velocities, room infiltration leakage, personnelprocedures, personnel clothing, equipment preparation, and other topics relatedto optimizing cleanroom operations. Currently there are 19 voting members,designated as ‘‘P’’ members, 20 nonvoting ‘‘O’’ members, and 5 formal liaisongroups (Table 1).
GUIDELINES
These are the general guidelines established for ISO/TC 209 operations:
1. Do not define cleanrooms by user-specific applications.2. Do nothing that causes a major economic impact to a specific nation.3. Do not classify cleanrooms by microbial limits.4. Standardize criteria for cleanrooms and related environments.5. Eliminate trade barriers.6. Consensus vote for all final drafts.7. Recognize that ISO standards are not mandatory.
31

WORKING GROUPS
In accordance with ISO procedures, all work is performed in working groups. Eachvoting member country can send two delegates to each group. Currently, there arenine working groups. The governorship of each working group is assigned to avoting nation (Table 2).
TABLE 1 ISO/TC 209 Member Nations and Liaison Groups
‘‘P’’ Voting nations ‘‘O’’ Observer nations
Australia ArgentinaBelgium BarbadosBrazil BulgariaChina CubaDenmark Czech RepublicFinland EgyptFrance HungaryGermany IndiaItaly IrelandJapan JamaicaRepublic of Korea MalaysiaNetherlands MexicoNorway PhilippinesPortugal PolandRussian Federation Saudi ArabiaSweden Serbia and MontenegroSwitzerland South AfricaUnited Kingdom ThailandUnited States Turkey, UkraineLiaison groups
International Confederation of Contamination ControlSocieties
ISO/TC 146 (Air quality)ISO/TC 198 (Sterilization of health-care products)ISO/TC 229 (Nanotechnology)CEN/TC 243 (Cleanroom technology)
TABLE 2 ISO/TC 209 Working Groups
Number Title Convenor nation
1 Classes of air cleanliness United Kingdom2 Biocontamination United Kingdom3 Test methods Japan4 Design and construction Germany5 Operations United States6 Vocabulary Switzerland7 Separative devices United States8 Molecular contamination United Kingdom9 Clean surfaces Switzerland
32 Matthews

DOCUMENTS AND THEIR TITLES
14644-1 Classification of Air Cleanliness14644-2 Specifications for Testing and Monitoring to
Prove Continued Compliance with ISO 14644-114644-3 Test Methods14644-4 Design and Construction14644-5 Cleanroom Operations14644-6 Vocabulary14644-7 Separative Devices14644-8 Molecular Contamination14698-1 Biocontamination—General Principles14698-2 Biocontamination—Evaluation and
Interpretation of Biocontamination Data
ISO PROJECT STAGES AND ASSOCIATED DOCUMENTS
Project stage Name Abbreviation Comment
Preliminary stage Preliminary WorkItem
PWI First definition of work to beaccomplished
Proposal stageactivity
New Work ItemProposal
NP Time-specific activity (mustcomplete working draftwithin 6 months of NP)
Preparatory stage Working Drafts WD Time-specific activity (mustcomplete CD within 12months of NP)
Committee stage Committee Drafts CD Requires comment bynational standards bodieswithin 3 to 6 months
Inquiry stage DraftInternationalStandard
DIS Requires comment and voteby national standardsbodies and P memberswithin 5 months
Approval stage Final DraftInternationalStandard
FDIS Incorporates changes fromDIS and formal P membervote within 2 months
Publication stage InternationalStandard
ISO Automatic publication within2 months of FDIS vote
SPECIFIC INFORMATION ON EACH STANDARD
ISO 14644-1 Classification of Air Cleanliness (18 Pages)The scope of this standard published in 1999 covers the classification of air cleanli-ness in cleanrooms and associated controlled environments exclusively in terms ofconcentration of airborne particles (Table 3).
Only particle populations having cumulative distributions based on thresh-old (lower limits) sizes ranging from 0.1 to 5.0mm are considered for classificationpurposes. This standard is divided into the mandatory section called the normative
Application of New ISO Cleanroom Standards 33

and annexes, of which some are normative and others informative. Within the nor-mative sections are the mandatory criteria. These include:
& Classes of air cleanliness& Mathematical method for determining air cleanliness classification& Determination of air cleanliness classification using a discrete particle
counter (DPC)& Statistical treatment of particle concentration data& You must specify and report:
1. ISO Class2. Occupancy state3. Particle size or sizes
The particle classification of air in a cleanroom or a clean zone is defined inone or more of these occupancy states—‘‘as built,’’ ‘‘at rest,’’ or ‘‘operational.’’
& ‘‘As built’’ is a condition where the installation is complete, with all the servicesconnected and functioning, but contains no production equipment, materials,or personnel.
& ‘‘At rest’’ is a condition where the installation is complete with the equipmentinstalled but personnel are not present.
& ‘‘Operational’’ is a condition where the installation is functioning, equipment isrunning, and personnel are present.
The airborne classification is based upon the maximum permitted concen-tration of particles for each particle size. This is based on the following formula:
Cn ¼ 10N � ð0:1Þ2:08
D
where Cn is the maximum permitted concentration in particles per cubic meterof air of airborne particles that are equal to or larger than the consideredparticle size. N is the ISO classification number, which shall not exceed a valueof 9. (Intermediate ISO classifications may be specified with 0.1, the smallest per-mitted increment of N.) D is the considered particle size in micrometers. 0.1 is aconstant with the dimension of micrometers. Annex D provides examples of classi-fication calculations.
TABLE 3 Selected Airborne Particulate Cleanliness Classes for Cleanrooms
ISO Classificationnumber
Maximum concentration limits (particles/m3 of air)
�0.1mm �0.2mm �0.3mm �0.5 mm �1 mm �5.0mm
ISO Class 1 10 2ISO Class 2 100 24 10 4ISO Class 3 1000 237 102 35 8ISO Class 4 10,000 2370 1020 352 83ISO Class 5 100,000 23,700 10,200 3520 832 29ISO Class 6 1,000,000 237,000 102,000 35,200 8320 293ISO Class 7 352,000 83,200 2930ISO Class 8 3,520,000 832,000 29,300ISO Class 9 35,200,000 8,320,000 293,000
34 Matthews

However, provisions are made to quantify particles smaller than 0.1mm.These are called ultrafine particles and may be quantified with a U descriptor. Con-versely, particles larger than 5.0mm are called macroparticles and may be quantifiedwith an M descriptor. U and M descriptors are not used in classification of aircleanliness, but they may be used for defining acceptable and/or measurable levelsof nonclassified air cleanliness. Found in Annex B is the determination of particlecleanliness classifications using a discrete-particle counting, light- scattering instru-ment. To derive the minimum number of sampling points, the equation is
NL ¼ffiffiffiffiAp
where NL is the minimum number of sampling locations. A is the area of the clean-room in square meters.
For example, a cleanroom measuring 30 ft� 40 ft has an area of 1200 squarefeet. This converts to 111.5 m2. The square root of 111.5 is 10.56 rounded to 11 sam-pling locations.
Annex B does allow for the establishment of a single sample location. Toallow for one sample, you must sample a sufficient volume of air such that a mini-mum of 20 particles would be detected if the particle concentration for the largestparticle size were at the class limit. If only one sampling location is to be sampled, aminimum of three sample volumes at that location must be taken.
For sample locations greater than 1 and less than 10, the 95% upper confi-dence level must be calculated and details for this are in Annex B. This Annexalso allows for averaging when the number of sample locations is 10 or greater.
The sampling procedure for the DPC in Annex B states that the probe mustbe positioned directly into the airflow that is being sampled. The interpretations ofthe results are to assure that the classification requirement has been met. However,if noncompliance is caused by a single nonrandom outlier value with less than 10sample locations, this value may be called an outlier and this outlier may beexcluded from the calculation provided that:
1. The calculation is repeated2. At least three measurement values remain3. No more than one measurement is excluded4. The suspect cause is documented
Of course, the value must be still within the classification level.
ISO 14644-2—Specifications for Testing and Monitoring to ProveContinued Compliance with ISO 14644-1 (7 Pages)This part of the ISO 14644 series published in 2000 specifies requirements forperiodic testing of a cleanroom or clean zone to prove continued compliance withISO 14644-1 for the designated classification of airborne particulate cleanliness.The common term of ‘‘recertification’’ has been replaced by ‘‘requalification,’’which is defined as the execution of a test sequence specified for the installationto demonstrate compliance with ISO 14644-1 according to the classification ofthe installation including the verification of selected pretest conditions. The typeof routine monitoring for particulates will dictate the maximum time intervalbetween requalifications. As an example, classifications of cleanrooms lower thanor equal to ISO Class 5 have a maximum time interval of six months. ISO classifica-tions greater than ISO Class 5 will have a maximum time interval of 12 months.
Application of New ISO Cleanroom Standards 35

However, where the installation is equipped with instrumentation for continuousor frequent monitoring of airborne particle concentration and air pressure differen-tial, the time factor may be extended provided the results of continuous or frequentmonitoring remain within the specified limits. Continuous monitoring is definedas updating that occurs constantly. Frequent monitoring is updating that occursat specified intervals not to exceed 60 minutes during operations. Air flow volumeor velocity and air pressure differential are also required tests for requalification.The maximum time interval for these is 12 months (Table 4).
In addition to the normative tests, there are also some optional tests that areindicated in Annex A and these include installed filter leakage, airflow visualiza-tion, recovery, and containment leakage.
ISO 14644-3 Test Methods (62 Pages)This standard published in 2005 specifies the test methods for characterizing theperformance of cleanrooms and clean zones. ISO 14644-3 places emphasis onthe 13 recommended tests used to characterize cleanrooms and clean zones:
1. Airborne particle count for classification2. Airborne particle count for ultrafine particles3. Airborne particle count for macroparticles4. Airflow5. Air pressure difference6. Installed filter system leakage7. Airflow direction and visualization8. Temperature9. Humidity
10. Electrostatic and ion generator11. Particle deposition12. Recovery13. Containment leakage
As identified in ISO 14644-1 and ISO 14644-2, some of these tests are man-datory but most are voluntary. The key controlling factor in the quality level ofany cleanroom is the owner’s requirements and what measurements are neces-sary to achieve that level of performance. The overall emphasis of these tests isperformance. ISO 14644-3 does not specifically address measurements on productor processes in cleanrooms. Rather, it covers the cleanroom performance character-istics that lead to the ability to measure product and process quality levels asdesired by the owner.
Of the 13 recommended cleanroom qualification tests, the choice of whichtests are to be applied to a particular cleanroom is per agreement between thebuyer and seller. There are three major annexes in this ISO standard.
TABLE 4 Schedule of Testing to Demonstrate Compliance
Test parameter Maximum time interval (months) Test procedure
Class of air cleanliness� ISO Class 5 6 Annex B in ISO 14644-1:1999> ISO Class 5 12 Annex B in ISO 14644-1:1999
Airflow volume or velocity 12 ISO 14644-3:2005, clause B.4Air pressure difference 12 ISO 14644-3:2005, clause B.5
36 Matthews

Annex A is by far the most user friendly as it lists all the recommended testsand provides a means of defining the sequence in which the tests are to be utilizedin classifying and qualifying a cleanroom or clean zone.
Annex B details the individual test methods so there can be no misunder-standing between the customer and the supplier, i.e., buyer and seller. Over 60%of the pages of ISO 14644-3 are contained in Annex B. Each test method is carefullydescribed. How the test it to be conducted, any test limitations, and how the testdata is reported are presented in this standard.
Annex C of ISO 14644-3 lists the instrumentation that will be used by the 13recommended tests. The performance parameters for each instrument are given,including the sensitivity limits, measuring range, acceptable error, response time,calibration interval, counting efficiency, and data display. For example, particlecounting can be accomplished by utilizing a DPC, a condensation nucleus counter,a cascade impactor, a time of flight particle instrument, or a piezobalance impactor.
It is important to have clearly defined test methods and metrology when thesignificant investment value of a cleanroom project must rest on very specific ref-eree performance criteria. ISO 14644-3 provides these referee test methods, therebyproviding stability and global uniformity to the base performance criteria forworld-class cleanrooms and clean zones.
ISO 14644-4—Design, Construction, and Startup (51 Pages)This part of ISO 14644 published in 2001 specifies the requirements for the design andconstruction of a cleanroom installation but does not prescribe specific technologicalor contractual means to meet these requirements. Construction guidance is provided,including the requirements for startup and qualification. Basic elements of design andconstruction needed to insure continued satisfactory operation are identified throughthe consideration of relevant aspects of operation and maintenance.
This ISO standard details items that will be needed for planning and design,construction and startup, testing and approval, and documentation. Eight annexesare included in this document.
These annexes describe in detail the basic concepts for designing clean space.For example, what is this space to be used for, what is the proper layout for equip-ment and personnel access, what type of contamination and choice of constructionmaterials must be considered, how do you handle the environmental parameters,and what is the airflow pattern?
Annex H provides an excellent checklist to assist the user in communicatingwith the designer on the requirements for the process, equipment, external factors,systems, and other issues that influence the cost, scheduling, and basic design of acleanroom and other controlled environments. A careful following of the guidanceterms spelled out in Annex H is a must for anyone designing, building, or operat-ing clean space.
ISO 14644-5 Operations (44 Pages)This standard published in 2004 specifies the basic requirements for operating acleanroom. The standard is divided into six important key elements:
& Operational systems& Cleanroom clothing& Personnel
Application of New ISO Cleanroom Standards 37

& Stationary equipment& Materials and portable equipment& Cleanroom cleaning.
The operational system requirements address the procedures, protocols, andrisk factors used to identify the various contamination concerns. System require-ments, including documentation and training, are also covered.
The second section discusses cleanroom clothing. The elements include thefabric, laundry, frequency of change, packaging of garments, garment inspection,and other special considerations such as electrostatic discharge, chemical, andmicrobial fabric concerns and issues.
The third section on personnel addresses storage of personal items, jewelry,and cosmetics, as well as personnel training, behavior, and hygiene.
Stationary equipment must include the installation, maintenance, and preven-tive maintenance of such equipment. Discussion on cleaning and decontaminationof the equipment, as well as admittance to its location for usage, is included.
Materials and portable equipment speak to the appropriate level of cleanli-ness in reference to the process and products. Proper entry procedures andprotocols for bringing items into the cleanroom and removing items such as fin-ished product and waste items from the cleanroom are covered here.
The section on cleanroom cleaning is extensive. This section specifies themethods and procedures, training, schedules, and contamination checks used toensure that cleanliness has been achieved and the cleanroom controlled environ-ment is maintained at the level for which it was designed.
The six annexes to this ISO standard expound on the normative section ingreat detail and list actual procedures and examples for each one of these sections.Included in the annexes are a gowning procedure, specific information on training,equipment repair procedures, and detailed cleaning procedures.
ISO 14644-6—Vocabulary (21 Pages)The scope of this standard to be published in 2007 is to define those terms thatrequire more specific description than is found in normal dictionary sources. ISO14644-6 is the repository of all of the common terms and definitions used in allthe other ISO 14644 and ISO 14698 documents pertaining to cleanrooms and asso-ciated controlled environments. It is an alphabetical database of terms applicable tothis new family of ISO cleanroom standards. These definitions have been harmo-nized to allow for uniformity of meaning across these new cleanroom standards.
ISO 14644-7—Separative Devices (Clean Air Hoods, Glove Boxes,Isolators, and Mini Environments) (52 Pages)This standard published in 2004 covers clean areas that are usually stand-aloneand self-sufficient by design. Their other primary criterion is that they are notdesigned for internal occupancy by personnel, i.e., they are people-free enclosures.
Interestingly, most of the new science in this family of ISO cleanroom stan-dards is in this particular document.
Picture if you will all the information in the other nine cleanroom standardshaving to be placed into the confined spaces of a smaller controlled clean environ-ment. This is what is classified as a separative device. Examples are clean benches,isolators, glove boxes, and mini environments.
38 Matthews

They usually enclose a small research or manufacturing process that not onlyprotects this process from the personnel directly involved but also protects thesepersonnel from the process.
In addition to the confined controlled environment space, there are specificcriteria for access devices, transfer devices, leak testing, and special air- and gas-handling systems.
There is a very effective Annex A, which provides a separation continuumconcept along with a representative table of eight separation continuum devicesdefined in general terms. This provides an excellent guidance for determiningdesign, construction, and operational requirements.
ISO 14644-8—Classification of Airborne MolecularContamination (22 Pages)This particular standard published in 2006 establishes a rating system for deter-mining airborne molecular contamination in cleanrooms. It provides a system toclassify the type of contaminant, the amount of contaminant, and the methodsby which it was collected and analyzed. The contaminant categories are acid, base,biotoxic, condensable, corrosive, dopant, organic, oxidant, and specific individualsubstances where appropriate.
Sources of molecular contamination are described, such as outdoor air, con-struction materials, process chemicals, process tooling, and personnel. Four typicalcollection methods are cited along with eight sampling methods.
There are 17 offline analytical methods cited along with 9 online methods.There is a wide variety of choice of collection and analysis to determine the amountand type of airborne molecular contamination. All of this information is thenplaced into a classification system as follows:
ISO-AMC Class N(x)
N is the ISO-AMC class, which is the logarithmic concentration, expressed in g/m3
within a range of 0 to 12. N¼ log10[concentration in g/m3]; x is the contaminatecategory.
For example, ISO-AMC Class-6 (NH3) expresses an airborne concentration of10�6 g/m3 of ammonia. 10�6 is 1 mg/m3 or 1000 ng/m3. These ISO-AMC classes arelisted in Table 5.
Annex D of this document provides the specific requirements for measuringand classifying airborne molecular contamination in Separative Devices (ISO 14644-7).
With this knowledge of concentration, cleanroom operators can make valuejudgments on levels of airborne molecular contamination that is or is not accept-able for quality purposes. A baseline quality level can be established andutilized as an on-going monitoring tool. Anyone concerned with airborne molecu-lar contamination should be using ISO 14644-8 as a baseline quality standard.A companion document on surface molecular contamination is in developmentand should be published by 2008.
ISO 14698-1 (32 Pages) and ISO 14698-2 (11 Pages)Biocontamination ControlISO-14698-1 published in 2003 describes the principles and the basic metrologyfor a formal system to assess and control biocontamination in cleanrooms.
Application of New ISO Cleanroom Standards 39

As international trade in hygiene-sensitive products increases, there is a strongrequirement for stable and safe products, particularly in the health-care field.Achieving this stability and safety requires the control of biocontamination inthe design, specifications, operation, and controls of cleanrooms and associatedcontrolled environments.
ISO 14698-1 provides guidance principles for establishing and maintaining aformal system to assess biocontamination controls in these special environments. Itis important to have a formal system that can assess and control factors that willaffect the microbiological quality of a product or process. There are a number offormalized systems to achieve this, such as hazard analysis critical control points,fault tree analysis, failure mode and effect analysis, and others. ISO 14698-1 isconcerned only with a formal system to address microbiological hazards in clean-rooms. Such a system must have the means of identifying the potential hazard,determine the resilient likelihood of occurrence, designate risk zones, establishmeasures of prevention or control, establish control limits, establish monitoringand observation schedules, establish corrective action, establish training pro-grams, and provide proper documentation. It is the user’s responsibility todevelop, initiate, implement, and document a formal system for biocontaminationcontrol—one that enables detection of adverse conditions in a timely fashion.Certain regulatory authorities will have significant impact on this responsibility.Target, alert, and action levels must be determined for any given risk zone. Suchlevels will determine the required remediation effect. All these factors impactproduct quality.
A biocontamination sampling program must be established for cleanroomair, walls, floors, ceilings, process equipment, raw materials, processed liquidsand gases, furniture, storage containers, personnel attire, and protective clothing.Sampling frequency site locations, sample identification, culturing methods, andevaluation criteria must be included. This formal system becomes a key part ofthe validation process for a cleanroom or associated controlled environment.
ISO 14698-1 also provides detailed guidance on how to measure airbornebiocontamination, how to validate air samplers, and how to measure bioconta-mination of surfaces, liquids, and textiles used in cleanrooms. It also providesguidance for validating laundry processes and how to provide proper personnel
TABLE 5 ISO-AMC Classes
ISO-AMC classConcentration
(g/m3) Concentration (mg/m)3 Concentration (ng/m3)
0 100 106 (1,000,000) 109 (1,000,000,000)�1 10�1 105 (100,000) 108 (100,000,000)�2 10�2 104 (10,000) 107 (10,000,000)�3 10�3 103 (1000) 106 (1,000,000)�4 10�4 102 (100) 105 (100,000)�5 10�5 101 (10) 104 (10,000)�6 10�6 100 (1) 103 (1000)�7 10�7 10�1 (0.1) 102 (100)�8 10�8 10�2 (0.01) 101 (10)�9 10�9 10�3 (0.001) 100 (1)�10 10�10 10�4 (0.0001) 10�1 (0.1)�11 10�11 10�5 (0.00001) 10�2 (0.01)�12 10�12 10�6 (0.000001) 10�3 (0.001)
40 Matthews

training. ISO 14698-1 has a companion document ISO 14698-2, which providesguidance on the evaluation and interpretation of biocontamination data.
The scope of ISO 14698-2 published in 2003 gives guidance on basic princi-ples and metrology requirements of all microbiological data evaluation obtainedfrom sampling for viable particles in specified risk zones in cleanrooms. Determin-ing the presence and significance of biocontamination is a multistep task. Samplingtechniques, time factors, culturing techniques, and analysis methods (qualitative orquantitative) have to be carefully planned. Target, alert, and action levels have tobe determined for each risk zone based on the initial biocontamination data, collec-tion, and evaluation plan. Each enumeration technique must be validated,considering the viable particles involved. Good data and evaluation documenta-tion is necessary to determine trend analysis and the quality of risk zones. Allthe specification results require verification. ISO 14698-2 provides the guidancefor answering all these concerns.
SUMMARY
The 10 ISO documents outlined above represent Phase One of the work if ISO/TC 209. They provide a strong baseline of ISO standards for cleanrooms and asso-ciated controlled environments used in the research and manufacture of qualityproducts. This is particularly applicable to those products that cannot beadequately manufactured in a nonclean environment.
These 10 ISO documents are living standards. By ISO rules, they have to bereviewed every five years. All ISO nations are asked to review each document,offer comments, and indicate the continuing use of the document. Commentsreceived are given to ISO/TC 209 for acceptance or rejection and the particularstandards is either left as is, modified, or terminated as appropriate.
This five-year review process is part of Phase Two of the work of ISO/TC 209.In addition, new work has been started on surface particulate contamination andsurface molecular contamination to establish methods of measurement, analysis,and classification.
Phase Two also allows for ISO/TC 209 to stay abreast of changing cleanroomtechnology and industry needs. ISO/TC 209 now has formal liaison with the newlyformed ISO/TC 229 on nanotechnology. The future of expanding needs for clean-rooms and associated controlled environments is upon us.
Copies of the ISO 14644 and ISO 14698 standards can be obtained from theInstitute of Environmental Sciences and Technology (1).
REFERENCE
1. www.IEST.org.
Application of New ISO Cleanroom Standards 41


CHAPTER
3 Cleanroom Certification and Particulate Testing
David Brande
& Introduction& High-Efficiency Particulate Air Filters& Pharmaceutical Introduction& Air Volumes& Practical Application& Airflow Patterns& Practical Application& Pressure& Filter Integrity& Practical Application& Bleedthrough& Room Classification& Practical Application& Conclusion
43


3 Cleanroom Certification and Particulate Testing
David Brande
NNE-US, Inc., Clayton, North Carolina, U.S.A.
INTRODUCTION
To begin, let us get a clear definition of what we will be discussing in this chapter—do you have a ‘‘clean room,’’ or do you have a ‘‘cleanroom?’’ Of course as we knowfrom growing up, when it is separated into two different words—clean androom—that is what your mother always wanted to have. As one word, it laysthe foundation of our current desire for a controlled environment in which weare trying to minimize detriment caused by particulate, either viable or nonviable.
In this chapter, we are going to discuss cleanroom certification in the pharma-ceutical, bio-pharma, and Medical Device industry as an Food and DrugAdministration (FDA)-regulated controlled environment and to the practicalityof providing that service in the context of current requirements and proceduresboth nationally and internationally.
Now by definition, and this is out of IEST-RP-CC006.3, a cleanroom is ‘‘a roomin which the air supply, air distribution, filtration of the air supply, materials of con-struction, and operating procedures are regulated to control particle concentration sothat an appropriate air cleanliness class, as defined in ISO14644-1, 1999 can be met.’’
HIGH-EFFICIENCY PARTICULATE AIR FILTERS
When talking about certifying the effectiveness of controlled environment areas,consider the membrane that actually creates this environment that we desire forthe production of our quality products. That membrane is what we refer to ashigh-efficiency particulate air (HEPA) filtration. The standard filter that is mostcommon is a 2-ft. by 4-ft. (2� 4) ceiling-mounted filter that filters the incomingsupply air. These filters are supplied by a large number of manufacturers world-wide, some have been around for 50 years or more, and others are newer to theindustry, but the supply of filters is very prominent within the industry.
We cannot talk about HEPA filters without first understanding a little bitabout their history which goes all the way back to the World War I gas and chemi-cal warfare. Of course, the urgency of the moment was to try to guard againstlong-term damage or even death of the individuals fighting in the war. It wasnot until World War II that we discovered that a mixture of asbestos and cellulosecombined would make quite a good filtering device. This discovery came with thecapture of a German gas mask in which the filtering mechanism was from a com-pany by the name of Drager. Of course, the information was top secret throughoutWorld War II and as part of our American history, the ‘‘new’’ filter technology wasused in what is now known as the top secret research of the Manhattan project. Thework that was being done on the development of the nuclear bomb resulted in aneed for a level of filtration that only a HEPA filter could provide. Later thegovernmental group known as the Manhattan project morphed into the Atomic
45

Energy Commission of the United States and today HEPA filters are a prominentfixture in nuclear containment.
That early association with the U.S. military, resulted in what we refer to asMilitary Specifications (MIL-SPECS) associated with a type media that we useknown as MIL-SPEC F-15079B and then of course, the MIL-SPEC for testing of fil-ter media is 282. Even after World War II, these MIL-SPECS were still classified andonly the U.S. government used them, but in the 1950s that information was declas-sified and four companies began producing HEPA filters for the government andsubsequently for general consumption.
It was this beginning that set up the use almost immediately of what we nowrefer to as microelectronics industry’s need for the use of HEPA filters. The militarywas already using the filters for the assembly of mechanical devices that were uti-lized in missiles and airplanes. As things became more and more miniaturized anddust particles were more and more critical, of course, it was just natural that micro-electronics was the first to start utilizing HEPA filters in a production environment.
What I would like to do now is go back and talk briefly about each of the testsneeded to qualify a cleanroom and some of the problems that you will run into try-ing to actually perform the tests and considerations that need to be taken intoaccount in reporting the data.
PHARMACEUTICAL INTRODUCTION
It was after microelectronics that pharmaceutical began using the HEPA filters forprimary supply filtration and then shortly followed by medical device and thenfood processing. Of course, other industries that are coming along such as the auto-mobile painting industry are using HEPA filters also. Even so, all have roots in theAtomic Energy Commission from World War II.
The HEPA filter utilizes three collection mechanisms of physics that allowthem to collect most of the particulate matter, hence their original nomenclatureof the ‘‘absolute filter.’’ Those mechanisms are impaction, interception, and dif-fusion. There are other mechanisms, but these are the primary forces of ourHEPA filter. In the beginning, we were interested in a particle size of one-halfmicron (0.50mm), the smallest that could be measured with some degree of confi-dence and this particle size became the basis for the English-based cleanroomclassification system. Therefore, Class 100 (or Class 10,000) meant there could beas many as 100 (or 10,000) half-micron particles per cubic foot of air.
We will address this more later on in this chapter as we speak directly aboutroom classification. To give you kind of a context of what the particle sizes we seekto collect with the HEPA filter, the average human hair is about 100 microns wide;therefore, something that is one-half of a micron is roughly one-200th of the widthof a human hair.
Of course, the overall efficiency is what we are interested in when we talkabout these filters and 0.3 mm became the particle size that we thought was goingto be the most difficult to capture. We are talking about research that was donethrough the 1950s and 1960s and so most of the American standards still refer toefficiency ratings at 0.3mm with dioctyl phthalate (DOP). This was actually a theor-etical calculation and with the advance of both science and equipment, we havesince determined that 0.3mm is not the most difficult particle size to collect, butrather a particle size somewhat smaller. Therefore, 0.3 mm is not necessarily the bestmeasurement for the true efficiency of a filter, something to be covered later.
46 Brande

At this point, let us talk about why we would want to certify a cleanroom, afterall the filters are tested at the factory. First, we have got to verify conformance withthe design and the procurement specifications. In other words, have we gotten whatwe paid for? Also, you have to check for proper handling and installation, validatethat the filtration’s system’s performance is what was required, and make sure thatcompliance with any regulatory pressures, say from the FDA. Then, of course, weneed to satisfy any kind of quality control or yield issues or meet any InternationalStandards Organization (ISO) requirements that we are working with.
What are the minimal requirements? The specific standard you are using isgoing to have anywhere from 13 to 15 different tests that are being offered for test-ing different parameters of the cleanroom’s performance. Many of these tests areindustry-specific; in other words, not everyone is interested in accomplishing theend result of say a vibration test, something very critical to microelectronics orMedical Device industries but not so critical to the bio-pharma industry. The sameapplies to tests like, say room-parallelism, meaning that the air is remains parallelwhile moving through the room. Again, critical in microelectronics not so critical inbio-pharma or Medical Device industries because the rooms are primarilydesigned with side wall returns.
So I propose to you if a room can be shown to successfully provide four dif-ferent methods of particulate control, then the room is certified. This qualificationwill require four tests under normal conditions. If you have an ISO 5 or cleaner,then we have one additional test that we would recommend. I would like to dis-cuss what it is that we are trying to prove when we perform these four tests.
First Postulate:Show that if particulate does enter the controlled environment, the particulate will be
disposed of in a timely and efficient manner.
For the higher classifications, we utilize room air exchange rates, the result ofmeasuring the volume of air provided to the room and then taking into account thecubic volume of the room. Then if certifying an ISO 5 or cleaner, there will be aneed for airflow visualization to demonstrate exactly what is happening withthe air flow through the room.
AIR VOLUMES
Now when it comes to measuring the room air exchange rates and documentingthe airflow visualization, the tests are fairly easily done. You are going to deter-mine the actual supply volume coming into the room and there may be someuniformity requirements. Some clients like to have uniformity between the filters,if there are multiple filters in a room. And then, of course, you add all of those sup-plies to get a total volume of the room. I recommend that these measurements bemade with a flow hood (Fig. 1) when possible, which collects all of the air exitingfrom a filter and sends it through a fixed measuring device, called a tube array. Themeasuring of all of the air volume is more accurate than any other method.
When you cannot use a hood, most of the manufacturers who have the elec-tronic micromanometers also have what they call a tube array (Fig. 2) that can be
Cleanroom Certification and Particulate Testing 47

utilized to read velocity pressure directly on the filter face, which then automat-ically converted to velocity, which can later be converted to volume manually.Ultimately, volume is what we want to have.
Next on the list is using a thermal anemometer (Fig. 3) to read velocity.Whenever you use any device other than the flow hood device, you will lose somelevel of accuracy and consistency in being able to depict what is the true volume ofthe filter.
Finally, a device that was once popular and is again having some resurgenceinto popularity is the vane anemometer. The vane anemometer (Fig. 4) helps todampen some of the fluctuations both in direction and speed that are taking placein the filters, as a result of the newly designed filters we now have in the market-place with a high degree of variation in filter face velocity.
Once you collect all the volumes, either by direct measurement or conver-sion, simply divide it into the room volume and multiply it by 60 and you willhave what your room air exchange rates are per hour.
Room volume
Supply volume� 60 ¼ air changes=hour
FIGURE 2 Proper use of tube array todetermine filter face velocity.
FIGURE 1 Proper application of a flowhood to determine filter volume.
48 Brande
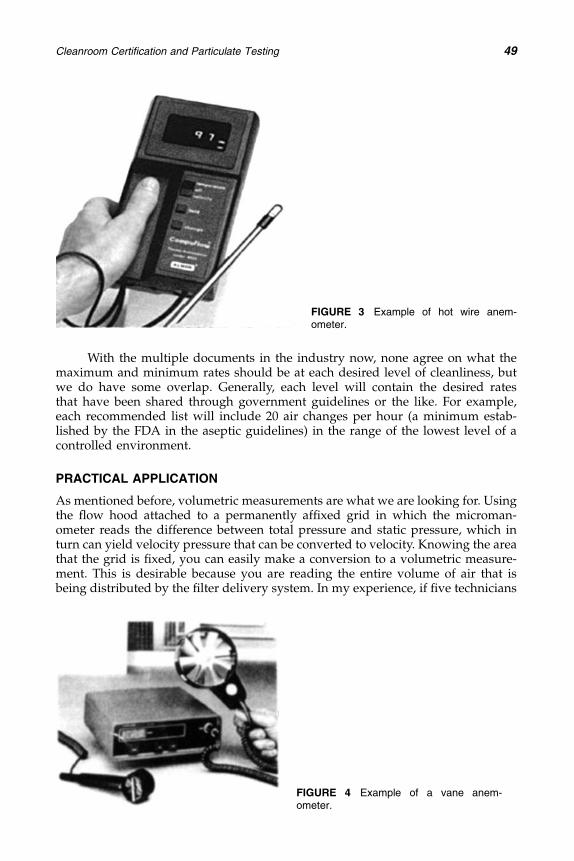
With the multiple documents in the industry now, none agree on what themaximum and minimum rates should be at each desired level of cleanliness, butwe do have some overlap. Generally, each level will contain the desired ratesthat have been shared through government guidelines or the like. For example,each recommended list will include 20 air changes per hour (a minimum estab-lished by the FDA in the aseptic guidelines) in the range of the lowest level of acontrolled environment.
PRACTICAL APPLICATION
As mentioned before, volumetric measurements are what we are looking for. Usingthe flow hood attached to a permanently affixed grid in which the microman-ometer reads the difference between total pressure and static pressure, which inturn can yield velocity pressure that can be converted to velocity. Knowing the areathat the grid is fixed, you can easily make a conversion to a volumetric measure-ment. This is desirable because you are reading the entire volume of air that isbeing distributed by the filter delivery system. In my experience, if five technicians
FIGURE 4 Example of a vane anem-ometer.
FIGURE 3 Example of hot wire anem-ometer.
Cleanroom Certification and Particulate Testing 49

read the same filter, they are going to come back with numbers that are very closeto each other resulting in the desirability of measuring volumetrically.
When you need to read in velocities, the tube array would be desired as partof the micromanometer set. Again if five people to make the same measurement,the variation is going to be a little bit wider because of how each one places the tubearray on the filter screen or how many readings they take as the others that measuredthe velocities. Introduce more variability; get greater variability in the results!
With an anemometer, the variability extrapolates itself even greater becauseyou are only measuring a very small area of the filter. You may take eight readingsin which all eight readings accumulatively represent less than 2 in. of filter face,due to the size of the probe inlet. But then we are going to multiply that to be rep-resentative of the almost 1000 in.2 that a 2� 4 filter face makes up, if there is anerror or if there is variability, once you extrapolate it to such large numbers, itbecomes a significant number that needs to be taken into account.
Whereas reading volumes, there is a better understanding of exactly what isbeing delivered. There is no better way to sample a population (measure the vol-ume of air) than to measure the entire population, without statistically sampling(as in velocities).
When determining the room air exchange rates, normally the user is lookingfor an even threshold number like a minimum of 20 air changes or a minimum of60 air changes. So when making measurements of the room, do not takeinto account any fixtures if the room air exchange rates are not close to being attheir threshold.
For example, in looking for a minimum of 20 taking into account width,length, and height of the room, you have 27 air changes per hour. You are not inter-ested in whether that there is cabinetry in the room. On the other hand, if a roommeasured at say 19 air changes per hour, then you may want to go in and take outthe volume that a permanent tank or any other permanent fixtures such as cabi-netry or pylons that actually take up volume of the room. By taking those intoaccount, you get a truer reading of room air exchange rates.
AIRFLOW PATTERNS
In an ISO 5 cleanroom, after the room air exchange rates are established, the usermay require some form of airflow visualization, sometimes referred to as ‘‘smokepattern testing’’ or ‘‘airflow pattern testing.’’ Airflow visualization is a moredescriptive test. ‘‘Smoke’’ infers a more destructive test than it actually is andthe reference to ‘‘pattern’’ clearly indicates a condition that is not always present.Airflow visualization has become very popular primarily because of its definitivecharacterization in that the test truly ‘‘shows’’ what is happening inside a roomand the visualization will lead to a lot of understanding of what is happening interms of particulate control and of course how the process equipment can affectthe flow of air through the work area.
PRACTICAL APPLICATION
This test is highly subjective; as a result, a lot of people have different ideas about howto produce it. The aerosol used must be physically capable of showing you what ishappening with the airflow movement. For example, a carbon-dioxide-generatedplume using dry ice is extremely colder than the surrounding ambient air. Naturally,
50 Brande

the plume will drop just like the cold air that falls into the room once a freezer door isopened. You will have the same effect if you try and use this in a traditional controlledenvironment. Also, an additional drawback to dry ice is the short plume created thatproves to be difficult to capture on film past a couple of feet.
Many certifiers, including myself, have had good results using a theatricalfog generator that has a mixture of glycol. However, this fluid does leave a residuethat may require a cleaning validation and product and equipment compatibilitytesting. After the airflow visualization test using an appropriate aerosol, cleaningis recommended. In situations where aseptic cleanliness was paramount, an alter-native is a hydrosonic humidifiers supplied with water for injection. However, thistype of generated plume is very difficult to videotape unlike the theatrical fog,which has a very long trail. A major drawback in using theatrical fog is that itwill set off a fire alarm system, so you do need to be aware that the fire alarmsneed to be shut down, with permission of the safety department and the local fireMarshall.
You can do an individual plume as simple as an individual holding the gen-erator and holding the delivery tube as they walk through an area. By modifying adelivery system, with several holes, multiple plumes will allow you to cover 3, 4, 6,8 ft. at one time. The method utilized should always provide the user with docu-mented results in VHS videotape or DVD of your cleanroom or process. One ofthe things that may be very useful is an Apple program called iMovie and iDVD(there are comparable programs for the PC). In the field, a white board can be usedfor filming and specific clip information. This documentation will assist the user inthe compilation of the video.
Second Postulate:The second postulate was that we must demonstrate that no particulate will enter the
controlled environment as a result of construction. Of course, we do that by performingroom pressure differential.
PRESSURE
We can qualify through pressure differentials the ability to keep particulate eitherin or out depending on what is required. Room pressurization as a test is probablythe simplest and easiest of the tests to accomplish in the sense that it is literally thedifference in pressure across a doorway between two different rooms and moreimportantly two different classifications.
A production area can be either positive or negative depending on what isbeing produced. If you are producing a vaccine, you most likely have the roomunder negative pressure and if you are producing insulin or a Medical device,you have it under positive pressure. Yet you have all these inlets and outletsand doorways and mouse holes for the product to migrate through. We can mea-sure through pressure differentials the ability to keep particulate either in or outdepending on the desire. Remember that the first requirement is to verify the capa-bility that the production area can maintain specified a room pressure differentialbetween the cleanroom and the surrounding areas.
Pressure differentials can be measured by a variety of different pieces of equip-ment. Also, ideally you need to do this test after the completion of the airflow-relatedtests such as airflow volume and velocities. Before measuring pressures, you need to
Cleanroom Certification and Particulate Testing 51

make sure that the room is operating at its proper airflows and any adjustments havebeen made.
The most popular piece of equipment is the modern day electronic microman-ometer. You can also use the traditional incline manometer, which has been used foryears and even a mechanical differential pressure gage can be utilized to read pres-sures. The equipment is easy to utilize and easy to set up. Measurements in theUnited States are predominantly done in inches of water gage, but we are seeingmore and more of the requirement for measurements in pascals, which is theEuropean measurement that can convert to millimeters instead of inches.
The FDA has given us guidelines, starting in 1987, stating that they wouldlike for this pressure to be 0.05 in. of water gage. Currently, the FDA has clarifiedthat goal in the current guidelines of September 2004 in that the pressure differen-tial between classes needs to be 0.05 in. of water gage. Sometimes within an area ofproduction, you will have similar rooms operating and often times those pressureswill be less than 0.05, but you need to remember that if there is a classificationchange, we need to make sure that it is 0.05. If you are within a classification, youneed to have the cleanest area more positive than the less clean (or the reverse ifyour goal is to maintain negative pressure) and the most positive area to be thecenter of what they refer to as the pressure bulls eye with pressures cascading out-ward. So if you have a similar area, say of ISO 5, you need to have at least a 0.03and often companies use air locks to achieve these pressure differentials betweenareas inside the same classification.
Third postulate:You need to establish that no particulate can enter the controlled environment through the
supply air system.
In order to prove this, you will need to perform the in-place integrity test andto do that you would utilize photometers and an oil aerosol such as polyalpha ole-fin (PAO). Photometers along with an oil aerosol will yield the best test results as tothe integrity of the installed filers.
FILTER INTEGRITY
Integrity testing is the most physical and the most difficult to perform of all thetests recommended. Just the sheer task of scanning every square inch of filter facefor integrity and document any bypass of the system itself is very labor-intensive.The difficulty in acquiring a significant upstream challenge to the system to ensurethat the test is valid can also prove difficult. This is one of the several reasonswhy the FDA has insisted in the past on using an oil-based aerosol challenge tosecure the integrity of the filters. If you start deviating from a photometric mea-sured oil-based aerosol challenge, you add additional factors that can effect thereported outcome and the validity of the work.
First, why would you want to test a HEPA filter once onsite and installed(in situ) when they have already been tested and certified by the factory of the man-ufacturer? There are actually many reasons for testing after installation. First, andprobably most important, the factory actually grades the filter with an efficiency test.The simplest definition of an efficiency test would be to measure the particulateupstream of the filter and then measure the particulate downstream of the filter, that
52 Brande
fractional component of those two numbers gives us the overall efficiency of the filterin percent, such as 99.97% efficient at collecting 0.3mm particles.
From the more practical side, there can be shipping damage as a result of justthe physical movement of the filters in trucks across the country also the removalof those filters by inexperienced people from the trucks to the loading docks andthen on into the production areas for installation, by either trained or untrainedinstallation personnel and also whether they were properly installed into the filterhousings. Many new construction areas hire individuals installing the filtershad never seen HEPA filters before given the task of instillation, needless to say,a recipe for a potentially undesirable outcome. Remember that the HEPA filter isonly one component of the entire system that is used to establish particulate con-trol over the production area.
Let me return to the grading system for a moment, which can be very critical inunderstanding the purchase of the correct filter for the application at hand. Over theyears, industry has added different grades of filters because applications have chan-ged in both use and advancement in technology. For a long period, only grade levelsof A, B, C, D, E, and F. The first three, A, B, and C, were both MIL-STD manufacturedand tested. (Institute of Environmental Sciences—IEST RP-001.) These grades offilters were primarily used in the pharmaceutical industry, in particular, C, due tothe two additional test methods associated with the classification before the filterleft the factory. To explain the classification further, a grade A filter meant that thefilter has been tested with an oil aerosol at rated flow. A grade B filter meant thatthe filter is also tested at 20% of rated flow, with an oil aerosol. A grade C filtermeant that the filter has then been hand-scanned by an individual, sometimesby robotics, with a form of oil aerosol that is used in the field. Why is thisso important? You can have a hole in a filter and pass total penetration but therequirement in the bio/pharmaceutical industry is no filter with holes and no leaksgreater than 0.01%. For this reason, C filters are very popular in bio-pharma, becausethe factory testing of scanning the filter is very similar to what will be done on siteafter installation.
The filter grade F, originally intended primarily for microelectronics, was thefirst deviation from MIL-SPEC and came about after we discovered more aboutthe actual efficiency of the filters in terms of something smaller of 0.3 microns was themost difficult to collect. These filters are ultra-low particulate air (ULPA) filters.
All these filter grades can be found in the Institute of Environmental Sciencesand Technologies (IEST), recommended practice (RP), for contamination control(CC001) currently at revision 1.4. The newest revision has included more filtergrades to the sequence and now has grades G, H, I, J, and K added. Remember thatfilter grades A, B, and C are produced and tested to MIL-SPEC standards, whereasthe grade F filter production and test requirements come from another recom-mended practice, IEST RP CC007 ULPA filters.
PRACTICAL APPLICATION
Now let us discuss these individual tests and how we would perform them in thefield different from the factory. Aerosol generation, hot DOP versus cold DOP,pretty much sums up the difference between the factory testing and what is donein the field. Hot DOP is an MIL-SPEC requirement involving a large and expensivepiece of equipment in the factory that can create a monodisbursed aerosol of 0.3mmwhich what we historically wanted to test at, thinking that that was the most
Cleanroom Certification and Particulate Testing 53

difficult particle to collect. In the field, cold DOP generation of a polydispersed oilaerosol is used because that is what technology has provided.
We can generate a cold oil aerosol through the use of Laskin nozzles (Fig. 5)for small pieces of equipment up to a few thousand cubic feet per minute (cfm).When the requirement is for larger pieces of equipment, i.e., air handlers up toabout 50,000 cfm, thermal generators are used. Thermal generators (Fig. 6) areoften confused with hot DOP generation but they are only hot in the sense thatthe equipment operates at high temperature (760�F) but the distribution of theaerosol is still considered polydisbursed and currently a little bit smaller than0.3mm. So the factory is set up to test the filters C type much like we test themin the field with a polydisbursed aerosol and using Laskin nozzles. In field testing,an in-place integrity test requires a full media scan (Fig. 7). It also includes thejoints, the frames, the ceiling itself in which the filter housing has been place. Ofcourse, the gaskets and any other seals that may be associated with separating that
0.200 cm
1.59 cm(0.625 in.)
(0.002 in.) diameter
AA
0.95 cm(0.275 in.)
0.105 cm (0.055 in.)
Length variableto burtinstallation
SECTION AA
0.335 cm(0.166 in.)
0.95 cm(0.275 in.)
Brass plugsilver braze
0.04 cm
0.475 cm (0.167 in.)
Silver braze
FIGURE 5 Design specifications fora Laskin nozzle.
54 Brande

room from the outside environment. To do that, we have to be prepared to run asuccessful challenge, in the field, with enough aerosol upstream that we can beconfident that the filters are leak-free.
In the past, one customer had an area where discrete particle counters hadbeen used to scan the HEPA filters in a production facility for seven years. After test-ing with photometers and oil aerosol, it was determined that the filters were riddledwith leaks and some as big as 80% with light fixtures that leaked greater than 20%.Remember that any leak greater than 0.01% needs to be repaired. It was obvious thatthese large leaks had been overlooked or missed on prior certifications, supportingthe fact that the scanning method was improperly applied. The point that I want tomake is that is not the test method (integrity testing using discrete particle counters)that is not good, but rather it is a very difficult and very complex for untrained peopleto utilize and perform in the field, for a multitude of reasons. Normally discrete par-ticle counter scanning has to be performed at a much slower rate than the traditionaloil-based aerosol with photometry. Again, the differences between these two tests aresomething that you need to keep in mind when ordering one over the other test.
FIGURE 6 An example of a thermalgenerator.
FIGURE 7 Proper scanning of a HEPAfilter with a photometer.
Cleanroom Certification and Particulate Testing 55

BLEEDTHROUGH
Currently in the industry, there has been a shift in the manufacture of high-efficiency filters and no longer is the heavy grade MIL-SPEC filters (99.99%efficient at 0.3mm) readily available. Again, this is why we now have filter gradesA to K to allow for this large variation in how filters can be made.
If you order an old-style filter, 99.99% efficient at 0.3mm, the filter will in fact beefficient at that level, but for any particulate smaller than 0.3mm, efficiency coulddrop off quickly for that filter. Regarding the test methodology that we have beenusing for the past 40 years, we have recently discovered that we have been testingfilters in the field at a particle smaller than 0.3mm, more or less in the 0.25–0.27mm size. The result is significant mass leakage through the filter media intothe production area and this is a phenomenon that has been around for since theearly 1990s called bleedthrough. Everyone needs to be aware when ordering filtersespecially in a pharmaceutical application where you are currently restricted to thetest methodology of oil-based aerosol with photometric test equipment, that we aregoing to end up testing with this smaller particle and you must understand that thisis not the equivalent filter that we were using say ten or twelve years ago, when yourfacility was built. So in the process of reordering, you should consider this issue ofbleedthrough most likely. When reordering and told ‘‘that filter designation has beenchanged to . . . ’’ beware! You will have bleedthrough.
With a Laskin nozzle generator, you will not have the bleedthrough issue.This phenomenon is only associated with thermal generators of all makes andmodels, those generators that are designed to be utilized in air handlers 3000to 50,000 cfm. This is addressed in IEST RP CC0034, a RP for testing HEPA andULPA filters.
Once you have completed the integrity testing of an area, you need to docu-ment any leaks that have been found in any of the filters in the area of theproduction area that you were testing. Some will do this simply by listing the filtersby their filter numbers. However, some will go as far as to place a rendering of thefilter on paper, where the approximate location of the leak is documented. Bydoing this in terms of a room or multiple rooms and showing the approximatelocations, you are able to reduce the amount of paperwork that you have to handle.
Fourth Postulate:In conclusion, you must show that the controlled environment can produce and maintain
the desired room classification.
From inception, certain rooms were set up to be designated levels of particulatecontrol with room classifications according to the ISO 14644-1 Air cleanliness classes.These levels of cleanliness are determined for each room based on an accepted stat-istical method of collecting particle counts for each classification. Room classificationdiffers dramatically from monitoring in that the former is an issue of design and con-struction and the latter is related to the production of the final product.
ROOM CLASSIFICATION
When collecting data for the room classification, one of the things that you have gotto take into account is that there are three stated levels of activity for a cleanroomthat it can be tested at, but in the pharmaceutical applications only two of the three
56 Brande

are used. In microelectronics, we have an ‘‘as-built’’ state, which tests just theroom, clear of any equipment, and personnel. Bio-pharma does not use this firstlevel of testing because there really no difference between as-built and as-rest ina bio-pharma application because no adjustments can be made to the floor. MedicalDevice may wish to use the ‘‘as-built’’ state, but it is not mandatory. The next levelof activity use is called ‘‘at-rest’’ which means that all the equipment has beeninstalled, but no personnel are present. In some applications, this activity level isoften referred to as ‘‘static conditions.’’ The final level of classification is ‘‘oper-ational’’ and allows for testing to be performed while both equipment andpersonnel are present and working. This final stage of testing is often referred toas ‘‘dynamic conditions’’ in some applications.
Federal Standard 209 was the standard for room classification that weutilized for many years, but currently ISO 14644 part 1 is the recognized inter-national standard. To begin a room certification, you first need to establishthe number of locations (NL ¼
ffiffiffiffiAp
; NL ¼ Number of locations rounded up tonext and A ¼ area in square meters) and then lay out those locations in a gridwithin the room to give a systematic and representative chance for every area ofthe room to pass or fail.
If there are less than 10 locations for the area being tested, there are proce-dures provided for in the ISO standard to do a statistical analysis and create anupper confidence level (UCL) of 95%. When laying out your test grid take intoaccount the room shape and of course the critical process areas that are presentin the area.
Remember that you always test a specific particle size when classifying aroom. Therefore, an area is classified to a particular size of particle such as an areais ISO Class X at X.X microns and larger (e.g., ISO Class 5 at 0.5 mm and larger orISO 7 at 5.0 mm and larger).
Let us discuss the actual room classification or the taking of discrete particlecounts within an area to classify the particulate level in that area. As I mentionedbefore, Federal Standard 209 was the first document written to discuss how youwould actually take these particle counts to classify an area, and was written in theearly 1960s. One of the FS209 versions, FS209B, stayed around a long time, publishedin the early 1970s, the version was replaced in 1987 with version FS209C. That versionquickly became FS209D due to some technical issues and once again, in short order,we ended up with our final version of the standard, which was Federal Standard 209E.
FS209E was both metric and English, in that we still utilized the customaryclassifications of Class 100, Class 10,000, and Class 100,000 but there were also met-ric equivalents for those standards and they were listed as SI. For instance, an SI 3.5was Class 100, 5.5 was Class 10,000, and 6.5 were a Class 100,000. FS209E was verypopular and often used throughout the world. With the publishing of the ISO14644-1, the United States was obligated to sunset the Federal Standard 209 whichwas successfully done in November 2001. Since the sun setting of Federal Stan-dard, there is only one standard for classification and that is ISO 14644-1, aninternational standard which lists classified areas from ISO 1 measuring 0.1 sizeparticles through ISO 9 allowing up to 1 million 0.5 particles per cubic foot. Froma practical standpoint, even though there is 81 classification levels in the ISOdocument, in other words a person could be certified to 5.4 or 5.6, bio-pharma doesnot utilize the in between classifications. Instead, bio-pharma, will use thetraditional ISO Classes 5, 6, 7, and 8, which is the English equivalent of Classes100, 1000, 10,000, and 100,000 in that order.
Cleanroom Certification and Particulate Testing 57

Even though the new ISO standard is only metric and there is no mention ofcubic feet, we still cannot get away from the fact that almost all the particle count-ers used throughout the world today, still measure in one cubic foot or as they arereported now 28.3 cubic liters per minute. This is still remains the basis of makingall of our measurements. We still make our measurements on one cubic foot butnow we extrapolate that measurement to quantify a cubic meter. Some manufac-tures have begun producing what they refer to as ‘‘high volume’’ samplers thatsample either at 2 cfm or 50 L/min.
Some users within the United States are still having some difficulty in under-standing an ISO 5 versus an ISO 7 area. In the last few years, since the FederalStandard has been sunsetted, often times we will include in our reporting ‘‘U.S.customary Class 100’’ or ‘‘U.S. customary Class 10,000’’ to describe an area thatis ISO Class 5 or ISO Class 7 area. Much like the Federal Standard 209B whichremained in the nomenclature long after it was replaced, I am quite sure we willstill see the nomenclature for stating the number of 0.5 particles allowed per cubicfoot will still be utilized into the near future as away to refer to classified areas, butwithin the ISO standard, it is very explicit about the proper nomenclature
PRACTICAL APPLICATION
One of the big differences in converting from the Federal Standard 209E and theISO 14644-1 standard is in the statistical analysis of determining locations.In the old Federal Standard, we used to take into account the classificationlevel you were attempting to classify at. For example, to determine thenumber of sample locations you would first take the square root of the desiredclassification level to determine the amount of square foot area that each countwould represent.
Therefore, in a Class 100,000 area or as we now know an ISO 8, each countwould represent 316 ft.2 Even in a very large room, you only had to takecounts at few locations to classify the area. In contrast, if you were testing a criticalarea, such as Class 100, each count would represent approximately 10 ft.2 and a lotmore counts were needed. With the statistical analysis currently under the ISO, thedetermination was made there was not the need for that level of stratification.Whether it is an ISO 4 or an ISO 8, the number of count locations is based onthe square root of the area in meters to be classified. In other words, it does notmatter what the classification level, the number of locations are always going tobe the same, if the area remains the same.
So now how does that effect the transition between those of us who havebeen testing by Federal Standard 209 for all these years trying to transition intothe ISO. First, it means that in your critical Class 100 areas, you are going to takeless counts than you have been. The Class 1000 and the Class 10,000 not that dif-ferent, in that the number of locations will still come out within a digit or so ofwhat they were. In the Class 100,000 areas where you have been taking less counts,you are going to end up taking considerably more counts in those areas. You willfind this the biggest difference between the old FS209 standard and the new ISOinternational standard.
The statistical analysis of the data that are collected still remains almostunchanged although there is currently some debate about whether or not the cur-rent statistical analysis that we are using currently is sufficient and will be subjectof debate. Especially in the upcoming year or so as we are reevaluating the ISO
58 Brande

14644-1 because the standard has reached its five-year anniversary date and there-fore is subject to an obligatory reevaluation and restructuring if agreed among thevoting nations.
When calculating the number of particle count locations, the square rootingof the room area will always give an number to some decimal point. In both the oldand the new standards, a fractional number is automatically raised to the nextwhole integer. If the calculation results in a number such as 3.89, then you mustround up to four locations. And if you come up with 3.01, you are still going togo to four as the number of locations.
The easiest thing to do because most rooms are rectangular or square is toalways go for an even number to be evenly spaced within the area. For example,if you had a room that required seven counts and it was either square or rectangu-lar, we would probably go ahead and do eight counts in that area so that we couldevenly distribute the locations throughout the room. If the room has an odd shapeto it, then it could be accepting of an odd number of counts, if you have a littlealcove off to the side that would warrant an additional location. I cannot say itstrong enough, when in doubt—always take more locations than you need if thereis anything question. If you do not, when you return to the office and do final cal-culations and find out that the answer was not 3.89 but it was actually 4.03 thenyou are one location short because you rounded it up to 4, should have beenrounded to 5 and you are going to have to go back and take one more count inthe area. There is never a penalty for additional counts that are being taken.
When taking the counts, the biggest problem is that the sampling tube is notproperly cleaned prior to testing. Even though the technician may run the zerocount filter, the tube itself by just sitting in the case or sitting in the truck has accu-mulated particles in it. Most often, a failure occurs with the first counts of the day,traditionally one of the two situations are the resultant cause. Either when startingup the first location of the day and we are pulling in these large particles andnumerous particles that have been lying in the tube or after going from an areaof high classification, say an ISO 8 to an ISO 5 area and the tube is loaded up withthe particles that have collected on the inner sides of the tube. Therefore, the clean-ing of the tubes is definitely a requirement and being aware of that and shakingthem because they are going through the zero count filters to make sure that thetube is being cleared of particles. The particle counting probe must always beorientated into the airflow. You can put the zero count filter on your sampling tubeand shake the tube and you know that no particles are coming through the zerocount filter but you will still register particles that are all coming out of the tubingthat is being used for collection. Generally, during certification, only one sampleper location is taken.
In terms of the locations, just as with the old Federal Standard and of coursewith the new ISO 14644-1 statistics, that when you have a minimum number oflocations, in other words less than 10, you need to be aware that there is additionalUCL that needs to be determined, such as the 95% UCL.
Now if you are only doing one location, you are okay, you just have to threecounts in the one location. Of course, it would be an area smaller than 1 m2 toaccomplish that. So it would be more like a closet or a small piece of productionequipment. Anywhere between two and nine locations, there is a systematicaccounting to reach the 95% UCL that will have to be done for each location.
For routine monitoring, the sample locations will be selected by reviewingthe certification data and also by performing a risk analysis of the critical points
Cleanroom Certification and Particulate Testing 59

for the process and product. Routine monitoring should combine room as well asprocess and product locations.
CONCLUSION
These five tests that we have just discussed a little bit are five tests that are centeredaround the HEPA filtration system itself, the membrane that separates the pro-duction area from any uncontrolled environment be it the warehouse or theoffice area.
There is another series of tests that we refer to as optional and this particulargroup of optional tests which are airflow parallelism test, the enclosure integrity orinduction leak test, the recovery test, and the particle fallout count test are all teststhat involve air movement and particle migration. There are five tests, which areboth environmental and worker-comfort oriented. Listed they would be lightinglevel, noise level, temperature, and moisture test and finally vibration testing(Institute of Environmental Sciences—IEST RP 006 and ISO 14644-3—Cleanroomsand Associated Controlled Environments: Test Methods).
60 Brande

CHAPTER
4 Monitoring of Airborne Viable Particles
Bengt Ljungqvist and Berit Reinmuller
& Introduction& Sampling Efficiency
Physical EfficiencyBiological Efficiency
& Air SamplingGeneralActive SamplingPassive Sampling
& Points to Consider& Summary& References
61


4 Monitoring of Airborne Viable Particles
Bengt Ljungqvist and Berit Reinmuller
Building Services Engineering, KTH, Stockholm, Sweden
INTRODUCTION
Monitoring of airborne viable particles could be considered as a specific form of aero-sol measurement. The term ‘‘aerosol’’ means an assembly of liquid or solid particlesin a gaseous medium (e.g., air) stabile enough to enable observation and measure-ment. Generally, the size of aerosol particles is in the range 0.001 to 100mm (1).
Particle size, shape, and density determine the behavior of the particle in air.A commonly used term in aerosol science and technology is the aerodynamicdiameter, which is the diameter of a unit-density sphere (1 g/cm3) having the samevalue of physical properties as the irregularly shaped particle being studied. Thisparticle diameter is in the literature also called equivalent diameter. Reference tothe aerodynamic equivalent diameter of a particle is useful for describing settlingand inertial behavior. Large particles, e.g., skin flakes, might have an inertial beha-vior similar to that of a particle with smaller aerodynamic diameter. The motion ofa particle is of concern for impaction sampling devices (e.g., slit-to-agar samplers,sieve samplers, cascade samplers, and centrifugal samplers) and for settling plates.
SAMPLING EFFICIENCY
Physical EfficiencyThe physical sampling efficiency of an aerosol sampler is influenced by inlet orextraction efficiency and by separation efficiency:
& Inlet or extraction efficiency is a function of the inlet design of the sampler andits ability to collect particles from the air in a representative way and transportthe particles to the impaction nozzle or the filter.
& Separation efficiency is the ability of the sampling device to separate and col-lect particles of different sizes from the air stream by impaction onto thecollection medium or into the filter medium.
The physical sampling efficiency is the same whether the particles consist ofsingle microorganisms, carry microorganisms, or are nonviable (inanimate). Thephysical sampling efficiency is based on the physical characteristics of the sam-pling device such as airflow, orifice shape, and orifice size. The d50 (cutoff size)describes the aerodynamic equivalent particle diameter removed by 50% from theair stream and impacted. The d50-value can, according to Hinds (2) and Nevalainenet al. (3), be calculated as follows:
d50 ¼
ffiffiffiffiffiffiffiffiffiffiffiffiffiffiffiffiffiffiffiffiffi9gDhStk50
qUC
sð1Þ
63

where g is the viscosity of air [g/(cm�s)], Dh the hydraulic diameter of the air inlet noz-zle (cm), Stk50 the Stokes number that gives 50% collection efficiency (nondimensional),q the particle density (g/cm3), U the impact velocity (cm/s), and C the Cunninghamcorrection factor used for particles smaller than 1mm (nondimensional).
Impactor collection data are usually given in terms of an aerodynamic d50
(q¼ 1 g/cm3) and the results of impactor measurements expressed in terms ofaerodynamic diameter. The Cunningham correction factor could, for particle sizesdiscussed here, mostly be chosen as 1. For smaller particles and more accurate esti-mations, see Ref. (2). It could be mentioned that such a correction for particles withdiameters of 1 and 0.5mm, a reduction will occur with 8% and 14%, respectively.The Stk50 number is often chosen to 0.24 to 0.25 for inlet nozzles (2,3).
Most impaction sampling devices have sharp cutoff characteristics, meaningthat almost all particles larger than that of d50 are collected.
However, it is not yet common for manufacturers of microbiological sam-plers to present the d50 of their equipment. Eq. (1) can be simplified usingconstant factors for air viscosity, particle density, and correction factor. Theexpression for d50 (in mm) will approximately become:
d50 �ffiffiffiffiffiffiffiffiffiffiffi40Dh
U
rð2Þ
where Dh is the hydraulic diameter of the air inlet nozzle (mm) and U the impactvelocity (m/s).
For a round opening, the hydraulic diameter Dh is the hole diameter. For arectangular long slit (length much larger than the width), the hydraulic diameterwill approximately be twice the slit width.
Examples1. Calculate d50 for an impaction sampler with a sampling air volume flow of
100 L/min and a lid with 200 holes of diameter of 1 mm. The ratio betweenthe airflow and the total hole area gives the impaction velocity of 10.6 m/s.With aid of eq. (2), the value of d50 will be estimated as 1.94 mm.
2. An impaction sampler with a sampling air volume flow of 50 L/min and a rec-tangular inlet slit 1 mm wide and 25 mm long has an impaction velocity of33.3 m/s. The calculated d50 will, with the aid of eq. (2), be 1.55 mm.
Information of the d50-value is an important factor when selecting the appro-priate equipment for a cleanroom. However, the user should be aware that in acontrolled environment with cleanroom dressed operators as main contaminationsource, the aerodynamic equivalent size of viable particles usually are smaller thanin a typical operating theater. A study by Ljungqvist and Reinmuller (4) of the gen-eration of viable particles from cleanroom dressed operators reported the viableparticle size distribution according to results from the Andersen1 6-stage sampler(cascade sampler). The results shown as percentage of airborne aerobic colonyforming units (CFUs) separated by the Andersen 6-stage sampler are illustratedin Figure 1.
Figure 1 shows that approximately one-third of the viable aerobic particlesrecovered are smaller than 2.1mm according to the size distribution from Andersen6-stage air sampler.
64 Ljungqvist and Reinmu€ller

Biological EfficiencyThe biological sampling efficiency, mostly below the physical sampling efficiency, isthe ability to maintain the viability of the microorganisms during separation and col-lection in combination with the ability of the collection medium to support growth.
Guidance on the evaluation of biological efficiency is presented in the ISO14698–1 (5) in the informative Annex B. The method described is based on amethod by Clark et al. (6) and cannot be carried out in a common microbiologicallaboratory. The test should preferably be performed in an independent test labora-tory. The results of the tests are expected to be provided by the manufacturer of theair sampler.
The method makes use of airborne particles of different sizes containingspores of Bacillus subtilis var. niger NCTC 10073 which survives the sampling con-ditions. To obtain the concentration of spores in the test chamber, a membrane filteris used. The concentration obtained from the test sampler is compared with theconcentration from the membrane filter over five sizes between 0.8 and 15mm.For each test, at least 10 experiments should be carried out. The efficiency of thetested sampler is calculated using the following equation:
Efficiency of samplerð%Þ ¼ test sampler count
total count (from membrane sampler)� 100
ð3Þ
Measuring the biological efficiency with microorganism typically found inthe cleanroom is suggested as a better method by Whyte (7). Whyte also pointsout the importance of testing the air sampler including the tube extension if tubeextensions are used.
AIR SAMPLING
GeneralEvaluation of environmental bioburden through the collection, recovery, andgrowth of airborne microorganisms is carried out using suitable sampling deviceson a routine basis according to a defined sampling plan. One of the most commonmethods for clean zone bioburden evaluation is active air sampling.
FIGURE 1 Viable aerodynamic particlesize distribution in percent of airborneaerobic CFUs, measured with an Ander-sen 6-stage sampler (cascade sampler),during evaluation studies of operatorsdressed in new modern cleanroom cloth-ing systems. Abbreviation: CFU, colonyforming units. Source: From Ref. 4.
Monitoring of Airborne Viable Particles 65
There are three main methods for collecting particles that are used for micro-biological tests: impaction, filtration, and sedimentation. Impaction and filtrationmethods are considered active sampling techniques and require the collection ofa known air volume. Sedimentation is the passive collection of airborne viable con-tamination by ‘‘fall out’’ or settling into an open Petri dish.
The purpose of the active sampling procedure is to separate particles fromthe air at a representative location without affecting the viability of the micro-organisms, and without altering the airflow pattern in the sampling region.
The selection of the most appropriate sampling device for a particular appli-cation depends upon the following factors:
& Physical characteristics of the sampling equipment,& The type of viable particles to be sampled (single spores or cells that are carried
by nonviable particles),& The equivalent size of particles to be collected,& The sensitivity of the viable particles to the sampling procedure,& The expected concentration of CFUs in the environment,& The ability to detect low levels of CFUs in a reliable way,& The time and duration of the sampling, and& The sampling location.
Furthermore, sampling in an aseptic environment requires that it is possible tosterilize or disinfect the sampling device and that the media, including the contain-ers (plates or strips), are sterile. Aseptic skill in handling of the equipment isrequired. During operation of the sampler, particles equal to and larger than 0.5mmshould not be generated. Aerodynamic design of the device might be needed whensampling is performed within the critical zone. The relevance of a sampling locationcan be evaluated with the method for limitation of risks (LR method) described byLjungqvist and Reinmuller (8). When using devices that create air wakes or turbu-lence, care must be taken especially, but not only, within the critical zone (9,10).
Active SamplingThere are several methods and devices available for the active collection of air-borne viable particles. The purpose of the sampling should guide the selectionof a particular method, material, and device. Airborne viable particulate samplingdevices have been compared in several published studies (11–17).
ISO 14698–1 (5) considers air samplers that collect viable particulates bydirect impact of particles on nutrient media and filtration samplers that collect par-ticles on special filters suitable for active sampling in clean zones with a lowbiocontamination. The impaction velocity should be high enough to separate par-ticles down to approximately 1mm and low enough to avoid mechanical damage ofthe cells. For cleanrooms applications, 1 m3 should be sampled in a reasonable timewithout drying the collection medium.
ImpactionImpaction is the most commonly used technique for active air sampling. Impactionsamplers increase the velocity of airborne particles by means of a hole, slit, or by afan blade in the sampling head during the sampling. The stream of air is blown ordrawn toward the surface of the collecting medium at high velocity. Because ofinertia, the particles cannot follow the deflected air at the surface without being
66 Ljungqvist and Reinmu€ller

thrown against the surface and being caught on it (7,18). The cutoff size value d50
describes the aerodynamic size of impacting particles provided that the distancebetween the nozzle outlet and the collecting surface is suitably short. This distanceshould be greater than the hydraulic diameter of the nozzle opening. The uppervalue of this distance is not well known but it must be ensured that the air jethas not dissipated before impinging upon the plate. To produce a desirable sharpcutoff, the Reynolds number in the nozzle throat should be between 500 and 3000(2,18). The collecting surface may consist of different sticky, solid materials such asagar media. The impaction principle is applied in different ways in slit-to-agarsamplers, sieve samplers, and centrifugal samplers, each sampler with its ownphysical characteristics.
FiltrationFiltration constitutes a separation of particles on a filter. Membrane or depth-typefilters can be used for microbiological air sampling. Particles penetrate into thefilter and are retained and bound therein. The filter-bed material may be of awater-soluble substance that can be dissolved before culturing. With filtrationmethods, the risk of desiccation of the bacterial cells retained by the filter is ofspecial concern. According to Jensen et al. (19), filtration is probably not a suitablemethod for evaluating the levels of vegetative cells due to its desiccating effects.
Passive SamplingParticle sedimentation is the oldest collection technique. Passive microbial air sam-pling with settling plates (gravitational sedimentation sampling) is often used and isconsidered to give an estimate of the risk of contamination (20). The Annex 1 to theGuide to Good Manufacturing Practice for Medicinal Products (21) requires long-timemonitoring of air in the grade A area [equivalent to the Food and Drug Administration(FDA) ‘‘critical area’’] with settling plates in addition to the active sampling.
Settle PlatesThe use of settling plates offers, because they are easy to handle and allowexposure times up to four hours, offers advantages over the more cumbersomeactive air sampling devices. The settling of particles onto the exposed plate is affec-ted by local air movements, exposure time, and the particle settling velocity.
POINTS TO CONSIDER
It is generally accepted that the estimation of the concentration of airborne CFUscan be affected by the choice of sampler, agar volume of collection containers,and the sampling method. Available sampling devices have characteristics thatmake them more or less suitable for use in a specific environment, or for a specifictype of sampling.
Different strategies for environmental monitoring might be applied for differentprocessing conditions. Qualification of cleanrooms, routine monitoring, or troubleshooting each requires a specific approach. The use of risk analysis systems duringassessment of microbiological hazards in cleanrooms is a recommendation (5).
The monitoring program should have a scientifically based sampling plan,which considers sampling methods and devices, locations, and frequencies. Therationale for each sampling location should be clear. In addition, control levels
Monitoring of Airborne Viable Particles 67

should be established along with the actions to be taken when results exceed thesepreset levels. If a great number of manual interventions are required during manu-facturing operations, the importance of the environmental monitoring programincreases.
The locations for air sampling should be determined during the commission-ing/qualification and start-up of a cleanroom or controlled environment.Considerations should be given to the proximity to the product and whether airmight be in contact with a product. It may be prudent to identify indicator sites,which are near but not in contact with the product. Locations with intensive per-sonnel movement or high population of staff should be considered as critical areasfor monitoring.
An environmental control program should refer to validated methods, andthe devices used for active air sampling should be characterized and calibrated.
Once the appropriate media and sampling volume have been selected withregard to regulatory requirements, specific contamination risks to the process,and the design of the sampler, the incubation time and temperature can be chosen.Incubation time and temperature may vary depending upon the predominanttypes of microflora or upon the selected media. The incubation time should be longenough to ensure the growth of recovered microorganisms. By experience, threedays at 30�C to 35�C are a minimum for mesophilic bacteria. Fungi might requiretwo to four additional days of incubation at room temperature in daylight. Thesterility of the media and its container is critical. Media sterilization processes mustbe validated and the media must be tested for sterility and for growth promotionprior to or concurrent with its use.
Microbial monitoring need not always identify all microbial contaminantspresent in controlled environments. However, routine monitoring should provideenough information so that adequate remedial actions can be taken if contami-nation levels exceed control levels. In order that decisions can be maderegarding corrective actions, identification of isolates to the genus or in some casesspecies level is required for tracing a contamination. The methods used for identi-fication of isolates should be validated with known microorganisms as well as withthe most common isolates from the environment being monitored. Control organ-isms used to validate microbial identification methods should be traceable torecognized type culture collections, such as American Type Culture Collection.Subcultures taken from type culture stocks should not be more than five serial pas-sages from the master stock to ensure purity and identity.
SUMMARY
To interpret the results from viable air sampling, the user should understand thedynamics of sampling and collection of viable particles on the collection medium.Results of 0 CFU/m3 in manned cleanrooms could indicate that the sampling pro-cess, sampling location or the collection media, incubation time, and temperaturehave not been optimized.
It is important to be aware of the limitations of each sampling method.Results achieved with one method must not be compared with results fromanother method without careful investigation. To improve the evaluation of con-trolled environments based on achieved results, the air sampler used has to bespecified. An air sampler must be selected based on a careful evaluation of thesampler’s characteristics, the sampling conditions, and sampling requirements.
68 Ljungqvist and Reinmu€ller

Systematic, purposeful, and economic microbiological monitoring of air-borne contaminants is the goal. The rational of each sampling location should beclear. When necessary, a sampling location should be evaluated with regard toits response to detect nonaccepted interventions in critical zones.
Trending should be performed with regard to the concentration of CFUs, fre-quency of detected growth, and to the identified species within the totalenvironmental monitoring for the respective area. Microbiological results fromair, surfaces, people, and results from continuous particle monitoring should beevaluated together.
The microbiological contamination in air varies highly with the activity in thesampling region and the sampling time usually is relatively short; the active sam-pling techniques give only limited information about the concentration of viableparticles in the cleanroom at a specified time and no indications of conditionsbefore or after sampling.
Particle monitoring cannot be considered a substitute for microbial monitor-ing, as it does not provide adequate information regarding the presence of viableparticles. However, continuous monitoring of airborne particles provides infor-mation regarding total airborne particle levels during specific work activities,and the length of clean up periods within the clean environment. When this infor-mation is combined with the results from the routine monitoring of airborne viableparticles in the cleanroom, a relationship might be established between the numberof total airborne particles equal to and larger than 0.5 mm per volume unit of airand the number of airborne CFUs per volume unit of air. This relation is probablysimilar for cleanrooms with a high degree of uniformity regarding processes andnumber of people present.
A real-time measurement technique using particle counters provides the abil-ity to immediately detect changes in the cleanroom. Current good manufacturingpractice (GMP) asks for periodic or continuous monitoring at representative loca-tions to be carried out during dynamic manufacturing conditions. The resultsshould be evaluated promptly to detect deviations from normally observed levels.Increased concentrations indicate increased activity in the cleanroom and shouldbe noted by the microbiologist evaluating the air samples from the same time. Par-ticle monitoring is a valuable tool for the systematic evaluation of changes,whether those changes reduce or increase process risks.
To base the risk assessment on environmental monitoring data requires anunderstanding of the process, the cleanroom, and environmental microbiology.To know what and when deviations imply hazardous conditions and a risk tothe products requires both technological and microbiological experiences.
Monitoring of Airborne Viable Particles 69

REFERENCES
1. Willeke K, Baron PA, eds. Aerosol Measurement: Principles, Techniques andApplications. New York: Van Nostrand Reinhold, 1993.
2. Hinds WC. Aerosol Technology. 2nd ed. New York: Wiley, 1999.3. Nevalainen A, Willeke K, Liebhaber F, Pastuszka J, Burge H, Henningson E. Bioaer-
osol sampling. In: Willeke K, Baron PA, eds. Aerosol Measurement: Principles,Techniques and Applications. New York: Van Nostrand Reinhold, 1993:471–492.
4. Ljungqvist B, Reinmuller B. Cleanroom Clothing Systems, People as a Contami-nation Source. Bethesda, MD; PDA/River Grove, IL: DHI Publishing LLC, 2004.
5. ISO 14698–1. Cleanrooms and associated controlled environments—Biocontamina-tion control—Part 1: General Principles and Methods. Geneva: InternationalOrganization for Standards, 2003.
6. Clark S, Lach V, Lidwell OM. The performance of the Biotest RCS centrifugal airsampler. J Hosp Infect 1981; 2:181–186.
7. Whyte W. Collection efficiency of microbial methods used to monitor cleanrooms.Eur J Parenter Pharmaceut Sci 2005; 10(2):43–50.
8. Ljungqvist B, Reinmuller B. Hazard analyses of airborne contamination in clean-rooms—application of a method for limitation of risks. PDA J Pharmaceut SciTechnol 1995; 49:239–243.
9. Ljungqvist B, Reinmuller B. Some aspects on the use of the biotest RCS air samplerin unidirectional air flow testing. J Parenter Sci Technol 1991; 45(4):177–180.
10. Ljungqvist B, Reinmuller B. The Biotest RCS air sampler in unidirectional flow. JPharm Sci Technol 1994; 48(1):41–44.
11. Vogt KH. Quantitative Keimzahlbestimmung in der Raumluft—Zwei Gerate undMethoden im Vergleich. In: Krankenhaus-Hygiene þ Infektionsverhutung. Heidel-berg: Verlag fur Medicin Dr. Ewald Fischer GmbH, 1990; 12:34–37.
12. Hecker W, Meier R. Bestimmung der Luftkeimzahl im Produktionsbereich mitneurem Geraten. Pharm Ind 1991; 53(5):496–503.
13. Benbough JE, Bennett AM, Parks SR. Determination of the collection efficiency of amicrobial air sampler. J Appl Bacteriol 1993; 74:170–173.
14. Willeke K, Grinshpun SA, Donnelly J, et al. Physical and biological sampling efficien-cies of bioaerosol samplers. In: Indoor Air’93. Proceedings of the Sixth InternationalConference on Indoor Air Quality and Climate, Helsinki, Vol. 4, 1993:131–136.
15. Griffiths WD, DeCosemo GAL. The assessment of bioaerosols: a critical review. JAerosol Sci 1994; 25(8):1425–1458.
16. Henningson EW, Ahlberg MS. Evaluation of microbiological aerosol samplers: areview. J Aerosol Sci 1994; 25:1459–1492.
17. Ljungqvist B, Reinmuller B. Active sampling of airborne viable particles in con-trolled environments: a comparative study of common instruments. Eur JParenter Sci 1998; 3(3):59–62.
18. Marple VA, Rubow KL, Olson BA. Inertial, gravitational, centrifugal and thermal col-lection techniques. In: Willeke K, Baron PA, eds. Aerosol Measurement: Principles,Techniques and Applications. New York: Van Nostrand Reinhold, 1993:206–232.
19. Jensen PA, Todd WF, Davis GN, Scarpino PV. Evaluation of eight bioaerosol sam-plers challenged with aerosols of free bacteria. Am Ind Hyg Assoc J 1992;53(10):660–667.
20. Whyte W. Sterility assurance and models for assessing airborne bacterial contami-nation. J Parenter Sci Technol 1986; 40(5):188–197.
21. EU GMP European Commission. The Rules Governing Medicinal Products in theEuropean Community. Vol. IV. Guide to Good Manufacturing Practice, incl. Annex1, Manufacture of Sterile Medicinal Products. 1997 revised 2003.
70 Ljungqvist and Reinmu€ller

CHAPTER
5 Microbial Surface Monitoring
Scott Sutton
& IntroductionRegulatory RequirementsPersonnelBarrier IsolatorsDemonstration Cleaning/Disinfection EfficacySample SitesTrending and ControlAssistance in Investigation
& Types of Monitoring MethodsRODAC PlatesSwabSurface RinseOther Sampling Methods
& Efficacy of MethodsNature of Microorganisms on a SurfaceValidation by Repetitive RecoveryLinear Regression MethodValidation Using Inoculated Product
& Accuracy/Precision of MethodsCountable Range of CFU on a PlateIs a Qualitative Evaluation Useful?
& The Role of Microbial Identification& The Potential of Rapid Microbiology& Conclusions& References
71


5 Microbial Surface Monitoring
Scott Sutton
Vectech Pharmaceutical Consultants, Farmington Hills, Michigan, U.S.A.
INTRODUCTION
The accurate and consistent microbial monitoring of controlled rooms as a measureof quality control is an important measure in the manufacture of sterile and non-sterile pharmaceutical products. While it is a direct measure of the bioburden inthe environment immediately surrounding the product manufacture, it cannotbe overinterpreted as a measure of finished product quality (1), but rather a mea-sure of the state of control of the facility and operations. Other chapters in this bookdeal with the importance of air-monitoring techniques; it is the purpose of thischapter to present the methods for microbial monitoring of surfaces. From theoutset, we have to note that the link between surface sampling results, viable airmonitoring, and personnel monitoring is a basic assumption of the industry, onethat has never been demonstrated (2,3). In fact, recent data designed to test thisassumption call its validity into question (4).
In addition to the methods themselves, we will discuss the means to deter-mine the sampling efficiency of the methods. Determination of the samplingefficiency of the method is a required parameter of method validation. Anothercritical parameter for both the validation and the performance of the test is thedetermination of the uncertainty of the method used. Finally, we will briefly exam-ine some potential alternatives to traditional microbiological methods in this area,as there are large advantages to the manufacture available from reducing thetimelines for product manufacture and release.
Regulatory RequirementsAlthough directed specifically at aseptic processing, the Food and Drug Administra-tion (FDA) guide to aseptic processing (5) describes the importance for environmentalmonitoring for all manufacturing conditions:
In aseptic processing, one of the most important laboratory controls is theenvironmental-monitoring program. This program provides meaningfulinformation on the quality of the aseptic processing environment (e.g., whena given batch is being manufactured) as well as environmental trends of ancil-lary clean areas. Environmental monitoring should promptly identifypotential routes of contamination, allowing for implementation of correctionsbefore product contamination occurs (211.42 and 211.113).Evaluating the quality of air and surfaces in the cleanroom environment shouldstart with a well-defined written program and scientifically sound methods.The monitoring program should cover all production shifts and include air,floors, walls, and equipment surfaces, including the critical surfaces that comein contact with the product, container, and closures. Written procedures shouldinclude a list of locations to be sampled. Sample timing, frequency, and locationshould be carefully selected based upon their relationship to the operation
73

performed. Samples should be taken throughout the classified areas of theaseptic processing facility (e.g., aseptic corridors, gowning rooms) using scien-tifically sound sampling procedures. Sample sizes should be sufficient tooptimize detection of environmental contaminants at levels that might beexpected in a given clean area.
There are then two overriding concerns in monitoring; that the monitoringprovide meaningful information on product quality, and that the sampling meth-ods be scientifically sound. We will examine the subject of surface-monitoringprocedures from these two perspectives in this chapter.
Overall, there can be little controversy over the advisability of conductingmicrobial assays as part of the control tests on the manufacturing process (6).A major concern in sterile product manufacture is the absence of microorganisms.However, there is legitimate concern that the current regulatory climateencourages the distressing trend to overinterpret the microbiology data and applythe testing methods inappropriately (5,7).
PersonnelMonitoring of personnel in the aseptic environment is an important factor in bothdemonstrating adequate control and maintaining documentation of that complianceon the part of the operators. The largest source of contamination in a cleanroom isthe personnel working there (8), therefore containment of that contamination by theaseptic gowns is of paramount importance to prevent shedding of particulate contami-nation into the air and to prevent contamination of material through touch. Personnelmonitoring provides documentation as to the state of control of the operators.
A second major advantage of this monitoring is that it is also an excellentmechanism to constantly remind the operators of the importance of microbial con-cerns. Many companies place pass/fail criteria on personnel monitoring results,and an employee’s access to the aseptic core can be revoked for exceeding theacceptance criteria for this monitoring.
Barrier IsolatorsWhile there is room for a reasonable debate on the utility of environmental monitor-ing inside a barrier isolator unit, there is clear regulatory expectation that thismonitoring will occur. Appendix 1 of the FDA aseptic processing guide (4) explicitlystates ‘‘an appropriate environmental-monitoring program should be establishedthat routinely ensures acceptable microbiological quality of air, surfaces, and gloves(or half-suits) as well as particle levels, within the isolator.’’
The Pharmaceutical Inspection Convention and Pharmaceutical InspectionCo-operation Scheme (PIC/S) Guidance document on isolators (9) provides someexcellent cautionary notes on this topic:
9.5.7.2 Microbiological monitoring should take into account the special require-ments for sensitivity of testing in isolators subjected to a sporicidal process andavoid compromising operations. The interpretation of results of environmentalmonitoring should be based on the premise that the detection of any microbio-logical contamination probably indicates a failure of the system.9.5.7.2.1 Media fills and sterility testing should be carried out as normal foraseptic processing.9.5.7.2.2 Environmental monitoring within the isolator should not interfere withzone protection, and in process controls should not carry any risk for production.
74 Sutton

9.5.7.2.3 The use of settle plates, contact plates, swabs and the presence ofsampling points for active air samplers or particle counters may add riskto the system subjected to a sporicidal process. Some of the ways that thismay be addressed include the following:
& Sampling at the end of production.& Sampling at potentially worst case positions, e.g., in an exhaust.& Using multiple wrapped irradiated plates and swabs etc. may reduce the
risk of introducing contamination into the system, but there have beeninstances when the supplier has made changes or mistakes and compro-mised processes. The fertility of irradiated media should be given specialattention. Testing the supplier’s formula at extremes of the irradiation treat-ment using local isolates as well as standard cultures should be considered.The effect of exposure of wrapped plates, etc. to the sporicidal processshould be examined in case of loss of fertility due to penetration of the agent.
& A significant risk to the interpretation of results is the accidental infectionof plates etc. by subsequent handling, so incubation in sealed sterile passout bags may be necessary. Another risk to the interpretation of results isthe presence of a colony that developed prior to irradiation.
& Built in sampling systems should be gassed or otherwise assured to befree from contamination and not compromise operations, special arrange-ments of filters and/or valves may be used.
& Quantitative results are not as relevant as in conventional clean roomsbecause the detection of any contamination probably indicates somethinghas failed. Conventional sampling may be replaced by ’in house’ devicesknown to be sterile, such as settling pots full of media or transport fluid.Large areas of the gloves and isolator surfaces may be swabbed and theswab incubated in sterile broth.
Demonstration Cleaning/Disinfection EfficacySurface monitoring is vital as a component in the demonstration of adequate clean-ing/disinfection program (10–12). The best evidence a facility can have of theappropriate selection of disinfectants, procedures, and application is the continueddocumentation of surface monitoring results that are under control. Although theconcern of microorganisms developing resistance to biocides and overrunningthe facility is not scientifically supportable (13), different species of bacteria canand do display different sensitivities to biocidal agents. A major problem in thisregard is the presence of spore-forming microorganisms that can survive biocideapplication designed to destroy vegetative microorganisms. Exclusive use of adisinfectant may result in the accumulation of spore-forming microorganisms.Continued monitoring of the facility surfaces, with identification of the organismsseen, can be extremely useful in determining when a sporicidal agent should beused in addition to (or in place of) the standard cleaning regimen (14).
Sample SitesThe sample sites must be chosen with care in any aspect of the environmental-monitoring program, surface sites are no exception. Prior to choosing the sites toinclude in a validation protocol, a thorough study of the facility, the work flow,and the product contact and product exposure areas should be made. The sitesfor the validation study are chosen to ‘‘overtest’’ the area. Once the data have beencollected for a number of weeks, the sites can be evaluated for their proximity to
Microbial Surface Monitoring 75

open product (and so potential for product contamination) and for the frequencyand degree of contamination seen. This consideration is important to provide assensitive a measure as possible for the state of facility control (15).
Trending and ControlOne of the major advantages to collecting data over a period of time is the ability totrend and analyze the data from a historical perspective. This trending is certainlyexpected from regulatory agencies (4) and is recommended by United States Phar-macopeia (USP) (16). While the traditional method of setting alert and action levelsis to determine specific plate counts of interest, this method is not supportablegiven the limitations of the measurement method.
The traditional method of setting alert and action levels is by the observanceof specific levels. Levels that are in the literature are presented in Table 1(surface),Table 2 (gowns), and Table 3 (gloves) (17). While these levels are recognized byregulatory agencies, they may not be appropriate for a specific location and situ-ation. It is strongly recommended to conduct periodic reviews of the historicaldata for all environmental-monitoring data and evaluate the trends, not limitingyour evaluation to the arbitrary levels found in regulatory guidance (4).
Another philosophy on setting levels is that you should use the historicaldata to determine reasonable levels for your facility. This is complicated by the factthat most control charts are based on data following a normal distribution, whilemicrobiological data follow a Poisson distribution (18,19). However, these datacan be evaluated using different methods (20,21).
An alternate trending method that is gaining acceptance is to determine a fre-quency model that provides useful indication of the facility’s state of control. In
TABLE 1 Levels Provided in Common References—Surface Viables (Except Floors)
Regional standard Class (limit) Class (limit) Class (limit)
USP < 1116> M3.5 (3 CFU/contactplate)
M5.5 (5 CFU/contact plate) M6.5 (not stated)
EU; at rest, static A and B (not stated) C (not stated) D (not stated)EU; operational,
dynamicA (<1 CFU/contact plate) C (25 CFU/contact plate) D (50 CFU/contact
plate)EU; operational,
dynamicB (5 CFU/contact plate) C (25 CFU/contact plate) D (50 CFU/contact
plate)
Abbreviations: CFU, colony-forming units; USP, United States Pharmacopeia; EU, European Union.
TABLE 2 Levels Provided in Common References—Personnel Gowns
Regional standard Class (limit) Class (limit) Class (limit)
USP < 1116> M3.5 (5 CFU/contactplate)
M5.5 (20 CFU/contactplate)
M6.5 (not stated)
EU; at rest, static A and B (not stated) C (not stated) D (not stated)EU; operational,
dynamicA (<1 CFU/contact plate) C (25 CFU/contact plate) D (50 CFU/contact plate)
EU; operational,dynamic
B (5 CFU/contact plate) C (25 CFU/contact plate) D (50 CFU/contact plate)
Abbreviations: CFU, colony-forming units; USP, United States Pharmacopeia; EU, European Union.
76 Sutton
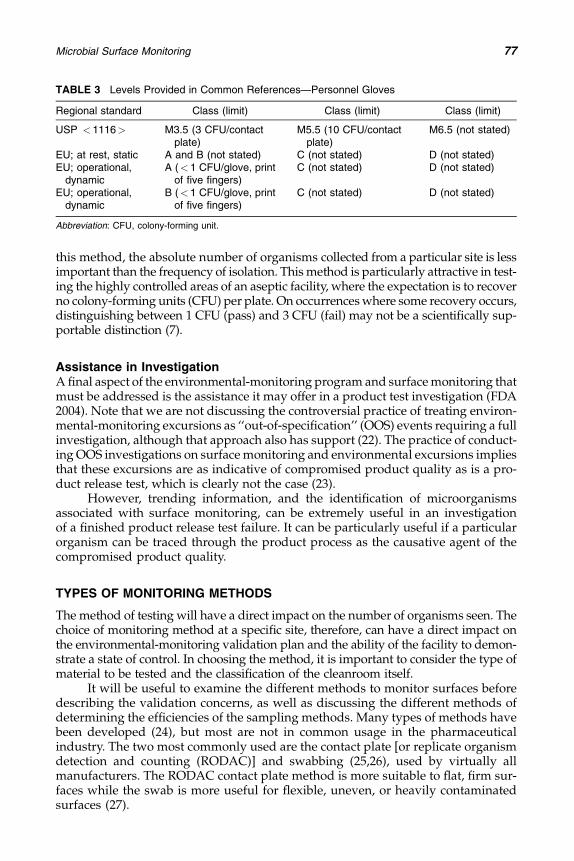
this method, the absolute number of organisms collected from a particular site is lessimportant than the frequency of isolation. This method is particularly attractive in test-ing the highly controlled areas of an aseptic facility, where the expectation is to recoverno colony-forming units (CFU) per plate. On occurrences where some recovery occurs,distinguishing between 1 CFU (pass) and 3 CFU (fail) may not be a scientifically sup-portable distinction (7).
Assistance in InvestigationA final aspect of the environmental-monitoring program and surface monitoring thatmust be addressed is the assistance it may offer in a product test investigation (FDA2004). Note that we are not discussing the controversial practice of treating environ-mental-monitoring excursions as ‘‘out-of-specification’’ (OOS) events requiring a fullinvestigation, although that approach also has support (22). The practice of conduct-ing OOS investigations on surface monitoring and environmental excursions impliesthat these excursions are as indicative of compromised product quality as is a pro-duct release test, which is clearly not the case (23).
However, trending information, and the identification of microorganismsassociated with surface monitoring, can be extremely useful in an investigationof a finished product release test failure. It can be particularly useful if a particularorganism can be traced through the product process as the causative agent of thecompromised product quality.
TYPES OF MONITORING METHODS
The method of testing will have a direct impact on the number of organisms seen. Thechoice of monitoring method at a specific site, therefore, can have a direct impact onthe environmental-monitoring validation plan and the ability of the facility to demon-strate a state of control. In choosing the method, it is important to consider the type ofmaterial to be tested and the classification of the cleanroom itself.
It will be useful to examine the different methods to monitor surfaces beforedescribing the validation concerns, as well as discussing the different methods ofdetermining the efficiencies of the sampling methods. Many types of methods havebeen developed (24), but most are not in common usage in the pharmaceuticalindustry. The two most commonly used are the contact plate [or replicate organismdetection and counting (RODAC)] and swabbing (25,26), used by virtually allmanufacturers. The RODAC contact plate method is more suitable to flat, firm sur-faces while the swab is more useful for flexible, uneven, or heavily contaminatedsurfaces (27).
TABLE 3 Levels Provided in Common References—Personnel Gloves
Regional standard Class (limit) Class (limit) Class (limit)
USP <1116> M3.5 (3 CFU/contactplate)
M5.5 (10 CFU/contactplate)
M6.5 (not stated)
EU; at rest, static A and B (not stated) C (not stated) D (not stated)EU; operational,
dynamicA (<1 CFU/glove, print
of five fingers)C (not stated) D (not stated)
EU; operational,dynamic
B (<1 CFU/glove, printof five fingers)
C (not stated) D (not stated)
Abbreviation: CFU, colony-forming unit.
Microbial Surface Monitoring 77

RODAC PlatesThe RODAC plate was first described by Hall and Hartnett (28) as a means ofdirect sampling for surface contamination. It has become widely accepted due toits ease of use and wide applicability. The method employs small Petri dishes (sur-face area of approximately 25 cm2), overfilled with nutrient agar. The surfacetension of the molten nutrient agar holds the liquid in place, projecting beyondthe upper edge of the dish as the agar sets (29). The contact plate is then usedby pressing it against the flat surface to be tested. Organisms on the surface ofthe equipment will be lifted off and remain adherent to the agar. The RODAC plateis then covered and incubated, with the CFU/plate reported (30).
This method is used not only for sampling of flat surfaces of equipment butalso for personnel. A variant on this method is the touch plate where personnel willplace their fingertips on the surface of an agar plate to get an estimate of the num-ber of microorganisms on the tips.
There are several limitations to this method (31). The most obvious is theneed for a flat surface as the agar projecting above the dish must come into contactwith the surface being tested. A second limitation is that this method is very sensi-tive to residual disinfectant that may be on the surface and transferred, althoughthis limitation can be overcome by incorporation of neutralizing agents into thenutrient agar (32,33).
Other limitations of the method are common for any of the enumerationmethods. To derive numbers, we are forced to use the measurement of CFU asdetermined by growth in or on agar. The number of CFUs has a lower limit ofquantification, normally recognized to be at 25 CFU/plate (34). At the otherextreme, the linear range of CFU/plate is considered to be around 250 CFU for astandard sized plate (35). The smaller size of the Petri dish implies a smaller range(i.e., a lower upper limit to the countable number of colonies on the plate). Finally,as this method involves direct contact between the nutrient agar and the surfacebeing tested, media residue remaining on the surface must be removed.
SwabSwabs can be used in those situations where the use of contact plate is impractical,i.e., to test irregular surfaces. A moistened swab (typically cotton, Dacron, or cal-cium alginate) is used to scrub the surface after which the microorganisms areresuspended in a buffer and plated (or filtered, then plated) for recovery and deter-mination of CFU (36). This method is somewhat operator dependent (37), but canserve well in those situations where the RODAC plate cannot be used.
The swab material type can have an effect on the recovery. Rose et al. (38)evaluated four swab materials for the recovery of Bacillus anthracis spores fromsteel coupons and found that premoistened (rather than dry) macrofoam and cot-ton swabs had far better recovery of the artificially inoculated steel coupons thandid polyester or rayon swabs. Care must always be taken in interpreting thesestudies, of course, as the recovery efficiencies are heavily influenced by the methodused and data from challenge studies may not reflect data generated from nat-urally contaminated surfaces. Another common material type, calcium alginate,also can be useful as the entire sampling material can be brought into solutionso that the microorganisms could be recovered by filtration.
The swab method has a large number of manipulations in comparison to theRODAC method. After sampling and transport to the lab, microorganisms from
78 Sutton

the swab are resuspended, filtered, the filter is placed on a nutrient agar surface,and then the sample in incubated for growth. This process calls for strict adherenceto aseptic technique by the operator to avoid accidental contamination.
Another consideration when evaluating recovery methods is the potential forthe choice of method to influence the type of organisms recovered. For example, theswab technique might recover a different range of bacteria than the RODAC. Lemmenet al. (39) conducted an in-use evaluation of the two methods in the hospital environ-ment. Over a period of 22 months, the two methods were used side-by-side inhospital rooms. They found gram-positive cocci more often than gram-negativebacteria overall, and found that RODAC plates gave higher recoveries of the gram-positive organisms. The swab technique was more effective at recovering gram-nega-tive rods than was the RODAC method. All results were statistically significant.
Surface RinseIn general terms, the surface rinse method involves vigorously agitating sterileliquid over the surface to be tested, then recovering the liquid, filtering the recov-ered liquid, laying the membrane filter on a nutrient agar plate, and thenincubating for growth. One application for this technology is to sample the interiorof large equipment.
It would be very difficult to get a technician to the interior of some sterileequipment to conduct surface sampling for microbial contamination. However,the technician could introduce sterile water into that space, agitate, and thenrecover the test solution for further evaluation. This method allows sampling inareas that would be impossible by other means. However, it also involves a largenumber of physical manipulations, any one of which could introduce contami-nation into the sample leading to erroneous results. Great care in aseptictechnique is necessary to successfully employ this technique.
Other Sampling MethodsThere are many other types of methods described in the literature from the food,clinical, and applied microbiology literature. Few have acceptance in the pharma-ceutical industry due to concerns over contamination of cleanrooms and the needfor strict aseptic handling. Several of these methods are described here.
Flexible FilmsThe concept behind the commercially available flexible film sampling devices isthat they try to retain the positive attributes of the RODAC plate, while allowingsome sampling of modestly irregular surfaces. The nutrient agar is placed on aflexible foil backing, allowing sampling of curved surfaces. After sampling, theagar is incubated and the colonies counted as for the contact plate.
Agar SausageThe basic method involves creating nutrient agar cylinders—the original authormade them in artificial sausage casings, hence the name (40). The end of the ‘‘saus-age’’ is cut off to make a smooth surface, then the smooth end placed on the surfaceto be sampled. The sample is then cut off, placed in a sterile Petri dish, and the newlyexposed end can be used for another sampling event. Periodically sausage ends canbe cut off to check for sterility. The disadvantages associated with manipulations ofthis type are obvious.
Microbial Surface Monitoring 79

Direct Agar OverlayThis method was developed to provide a means for comparison of commonly usedrecovery methods (41). In principle, a circle is drawn on a tile of the nonporous sur-face to be tested using a wax pencil (the authors used the bottom of a Petri dish tomake a circle approximately 4.0 in.2). Nutrient agar is poured into the circle andallowed to solidify. The agar is then covered with a Petri dish cover (containing apiece of moistened filter paper to retard drying) and incubated in a high-humidityincubator at 35�C overnight. The agar is then flooded with a dye (2,3,5-triphenyl2H-tetrazolium chloride was used) until the colonies turned deep red. The tile wasthen dried for 10 to 15 minutes at 65�C to 70�C. The colonies were then counted underslight magnification. This method is obviously not suitable for use in a cleanroom,but might find application as a control study on method qualification investigations.
Membrane Filter SamplingNitrocellulose membrane filters have been suggested as a sampling device for sur-face sampling (42). This method has been evaluated in comparison with RODACplate sampling and found to compare favorably (43). The basic technique is to takea sterile nitrocellulose membrane, place it in contact with the surface to be tested(for approximately 30 sec) and then place it on the surface of a nutrient agar plateor pad soaked in nutrient medium (sample side up). The colonies are directly readfrom the surface of the membrane following incubation.
The study of Poletti et al. (43) was extensively controlled for sampling variabilityby design and used a glass surface contaminated by 24-hour exposure to air in an ani-mal facility. Multiple samples were taken from different locations on the glass by eachmethod, and the resultant counts were compared statistically. In this study, the nitro-cellulose filter sampling method was more effective than RODAC plates.
An earlier study on the use of membrane filters provided some interestingobservations on nominal pore size effects (44). The authors were concerned withthe sampling of burn sites for clinical evaluation, and so were looking to recoveryfrom moist samples. They artificially inoculated two test materials: the bottom ofPetri dishes and bovine skeletal muscle. The inoculum was laboratory-preparedbacterial suspensions, sampled within five minutes. Using this method, the mem-brane filter technique was effective, with the 5mm membrane giving better resultsthan the 0.45, 1.2, or 3mm pore rated membranes. Unfortunately, the authors of thisstudy did not indicate the membrane material type.
Foam Sampling DeviceThe BisKit is a single-use device that allows the sampling of a 1 m2 area at a singletime. The kit contains a resuspension buffer that is forced through the foam aftersampling and is then collected for membrane filtration and determination of thecolony numbers on the membrane surface. Due to the large sample size, a greatdeal greater sensitivity is possible. However, this large sample size also reducesthe number of sites where the technique may be used and increases the residueissues. In addition, the kit, while commercially available, comes at a high costper test. However, this kit has been shown to be very efficient at recovery of sporesartificially seeded onto common building material (45).
Spray/SuspensionClark (46) described a spray method for the rinsing of microbes off the surface of awall. The method used a spray gun with a dedicated cup and collection device.
80 Sutton

The sterile water, sprayed on the wall and collected, was then evaluated for viablecells by membrane filtration. The requirements for sterile change parts (sprayer,cup, collection device) has hindered acceptance of this method.
A similar concept is the collection cylinder. In this method, a hollow cylinderof known circumference is placed on a horizontal, smooth surface. Sampling bufferis added to the cylinder, filling it part way. The liquid is then agitated, and thenremoved to a sterile collection tube by pipette. The liquid is filtered and the mem-brane places on nutrient agar for microbial recovery. This method has beendescribed for the evaluation of skin microbes (47).
These methods suffer from excessive manipulations, the requirement for asignificant number of different sterile consumables, and significant residue onthe sample surface after testing. In addition, they are limited to very small numbersof different surface types (the Clark apparatus to smooth walls, the cylinder tosmooth horizontal surfaces).
Agar SlidesThe agar slide is a variant of the contact plate that has been used in the food indus-try. One of the most popular commercial varieties is the Hygcult TPC dipslide. Theslide comes prepackaged in a screw-cap tube, with the solid agar support attachedto the cap at a hinge. The sample is taken by holding the cap and pressing the agarflat onto the surface to be tested.
Salo et al. (48) reported on a 12-laboratory collaborative study using stainlesssteel coupons and artificially inoculated laboratory strains. They allowed drying ofthe challenge suspensions for five minutes (at which time they report standingliquid on the coupon remained) and then tested the dipslide, RODAC plating, andswabbing. The dipslide performed as well as the contact plate and swabbing.
EFFICACY OF METHODS
The validation of sampling methods requires some estimation of the samplingefficiency of the method on the materials found in your facility. To qualify or vali-date the method, there must be some way to estimate the numbers of organismsremoved as a percentage of the total microorganisms (49).
ISO EN 1175–1996 (50) provides three criteria for validation of microbialrecovery:
1. Assessment of the adequacy of the technique used to remove micro-organismsfrom the product, if such removal is part of the technique; and
2. assessment of the adequacy of the technique used to enumerate removedmicroorganisms, including microbiological counting techniques and cultureconditions; and
3. assessment of the recovery efficiency of the method used in order that the cor-rection factor can be calculated.
Although the specific guidance document addresses bioburden of medicaldevices, the philosophy captured in first and second points is valid for all studies ofthis type. ISO 11737–1 extends this consideration to the production process (51). Thevalidation also needs to take into account the particular strengths and weaknessesof the method being validated and determine the appropriateness of that measure.These concerns are equally applicable to surface-monitoring studies. A good reviewof the different methods and validation concerns is provided by Favero et al. (52).
Microbial Surface Monitoring 81

The choice of method to conduct the microbial monitoring will affect the vali-dation design, as will the choice of which method to use to analyze the data.However, before making these decisions it is important to at least briefly examinethe nature of organisms on a surface.
Nature of Microorganisms on a SurfaceMicrobial surface contamination may come from several sources. In highly con-trolled areas, the main source of microbial load will be from the operators, andcan be assumed to be associated with skin flakes. However, in sampling from therest of the facility, there can be many different types of adherence mechanisms hold-ing the endogenous bioburden to the cleanroom surfaces (53). These mechanismscan include electrostatic mechanisms, metabolic mechanisms mediated initiallyby the pili of the cell, then by production of an extracellular glycocalyx, or a varietyof other means. The association of microorganisms with a solid matrix is rarelyone of the bacteria laying there, a factor that complicates validation studies.
A second factor that complicates these studies is the difficulty of getting areproducible inoculum on the surface. A common approach is to grow a challengeorganism inoculum in the lab, then lay the bacterial suspension of the material tobe tested. If the material is allowed to dry, the cells become desiccated and die(54,55), usually at unpredictable levels. One way around this issue is to test the sur-face before it is completely dry, but it is unclear if this method is addressing theability of the method to sample from the surface or the ability of the method tosample cells in suspension. A second way around the problem of desiccation isto use microbial spores, which are naturally resistant to death by desiccation. Thisapproach, however, is divorced from the actual conditions to be tested as it onlymeasures the ability of the method to recover spores laid across the surface. A finalmethod is to naturally contaminate the material, and then repeatedly sample thesame location. Eventually no more bacteria will be recovered and it is assumed thatafter repeated sampling to extinction, all microorganisms on the surface wererecovered. These examine the validation methods in detail.
Validation by Repetitive RecoveryISO 111737–1 (51) describes a method of repetitive recovery to validate the sam-pling method. The principle of this method is that the method of samplingshould be repeated on the same location until there is no more recovery. Recoveryefficiency is determined in this method by dividing the initial recovery by the sumof all CFU recovered.
This assumes that the material has a bioburden, that cells are not dying off asthe sampling is occurring, that no further contamination of the site is occurring,that you have sampled sufficiently to exhaust the bioburden, and that all biobur-den is removed. It has the advantage of using native bioburden in a normalstate of adherence rather than artificially inoculated organisms. Annex B of thisISO 111737–1 describes the method in detail.
Linear Regression MethodWhyte (56) presented a linear regression method that is very similar to the methodoutlined above. Rather than calculating the recovery efficiency using only the twodata points (initial and total recovery), this method uses all the numbers generated.This method provides a much more accurate estimate, but suffers from the samerequirements as the method described above for repetitive recovery, with the
82 Sutton

additional assumption that all microorganisms on the surface adhere with the sametenacity through the sampling events (the use of linear regression assumes linearity).
First of all, the CFU/sampling event is converted to the log10 value (the datatransformation converts the numbers to approximate a normal distribution)(Table 4). Then linear regression analysis is performed of the sample number (inde-pendent variable) and the log10 CFU obtained (dependent variable). The samplingefficiency is determined from the liner regression equation of Y ¼ mX þ C, where mis the slope of the line and is equal to log10(1 � sampling efficiency).
An example is given here: Data from a RODAC sampling experiment (Fig. 1)Linear regression:a
y ¼ �0:1398x þ 2:4089 with a correlation coefficient R2 ¼ 0:9158
Analysis:
Slope ¼ m ¼ �0:1398 ¼ log10ð1� sampling efficiencyÞ:Sampling efficiency ¼ 1� 10m ¼ 1� 0:27523 ¼ 0:27523 ¼ 27%:
In comparison, the previous method gives a recovery efficiency of
Recovery ¼ 200
868¼ 0:230415 ¼ 23%:
This method was also used by Yamayoshi et al. (57) to demonstrate the use ofswabbing as a microbial recovery method in areas of very high contamination. Theauthors argued that in their hands, the measured rate of removal was almost constantamong all the materials tested, and so proposed a single number for all swabbingefficiency calculations. It should be noted that this single efficiency number has not beenverified by others and that it is recommended that all monitoring studies be validated.
FIGURE 1 Example data for replicate organism detection and counting recovery efficiency.Abbreviation: CFU, colony-forming unit.
a Note that the dependent variable in this analysis is (n�1), not n itself.
Microbial Surface Monitoring 83

Another treatment of this method can be found in the article by Eginton (58)who used this linear regression method to analyze removal of microorganismsfrom artificially inoculated tiles. They found significant differences in efficienciesdepending on organism tested and tile material.
Through this method, typical recovery efficiencies for contact plates andswabs are commonly found in the range of 15% to 35% when using naturally con-taminated material. The major disadvantage to this method is the challengeinherent in creating contaminated surfaces to test. The method of contaminationthat will yield representative bioburden on the surface is difficult to standardize.
Validation Using Inoculated ProductAnnex B of ISO 11737–1 discusses a second method to validate microbial recovery.In this method, a challenge organism is used to inoculate the surface with a knownnumber of microorganisms (spores of Bacillus subtilis var. niger are recommendedfor convenience and resistance to desiccation). The number of organisms removedwith one sample is divided by the number inoculated (taking into considerationthe surface area sampled) to provide the recovery efficiency.
The use of inoculated material is also recommended by the Parenteral DrugAssociation. Technical Report #21 entitled ‘‘Bioburden Recovery Validation’’ exam-ines both medical device and surface-monitoring methods (59). The use of severalartificial inocula is recommended, including bacterial vegetative cells and spores,yeast, and mold. Although mention is made in the technical report of the problemof inocula desiccation, no acceptance criteria are recommended.
The absence of commonly recognized acceptance criteria for these studieshas led some laboratories to extreme situations. USP chapter < 1227> (35) recom-mends a recovery efficiency of not less than 70% for microbial recovery studies‘‘when the intent is to demonstrate neutralization of antimicrobial properties.’’The design of this study of antimicrobial neutralization is to take the challengeinoculum, split it into parallel treatment groups, and then treat one with peptoneand the other with the product to be tested. The degree of control the technicianhas over inoculum levels in this design far exceeds that of surface inoculationand recovery after drying. However, the difference in study design has not pre-vented labs from attempting to apply acceptance criteria of not less than 70% tocoupon recovery studies. This is a misapplication of the information found inUSP < 1227> and practitioners are urged to avoid making this mistake.
TABLE 4
Sample number (n) n � 1 Count log10 count
1 0 200 2.301032 1 130 2.1139433 2 150 2.1760914 3 134 2.1271055 4 89 1.949396 5 50 1.698977 6 60 1.7781518 7 30 1.4771219 8 15 1.17609110 9 10 1
84 Sutton

The validation of recovery efficiency using challenge organisms on a couponis the most convenient and is widely used. However, it is also the least desirablediscussed due to its lack of correlation with the basic nature of the contaminatedsurfaces seen in the actual sampling event.
ACCURACY/PRECISION OF METHODS
One aspect of microbiological assays that is frequently overlooked is the relationshipbetween the method capabilities and the expected results. This is a particular prob-lem in surface sampling issues for environmental monitoring. While it is extremelytempting to think that we can measure the level of microbial contamination in allareas of the production facility, there are some areas where the observed level of con-tamination is so low as to fall into the range of ‘‘noise’’ in microbial assays. This doesnot, however, obviate the need to test in these areas, but we do need to take intoaccount the limitations of our methods when interpreting the data (60). The measure-ment of the uncertainty in microbiological methods has found its way into the ISOregulations for competency of testing laboratories, which are expected to establishand define the uncertainty of their methods and include this estimate in their reports(61). The units and methods to be used for this estimate are the subject of some dis-cussion (62), as microbiological data offer some challenges to the statistician (63).Microbiological data do not fit a normal distribution and statistics commonly usedto create process monitoring controls are not appropriate to this application.
Regulations require, and prudence dictates, measuring the degree ofmicrobial contamination on surfaces in controlled environments, especially thosesurfaces near open product. However, our methods do not allow for accuratemeasurement at these levels. This situation has created confusion in the mindsof many and has led to a regulatory environment that is not scientifically support-able (64). Let us look at this issue in detail.
Countable Range of CFU on a PlateThis discussion has to start with a consideration of the number of countable colon-ies on a plate. The lower limit of quantification is set by the nature of the counts,which follow a Poisson distribution (65). The significance of this is that the error ofthe counts is equal to the square root of the mean. In other words, the relationshipbetween the average estimate of the CFU and the percentage error of the estimatesincreases dramatically once the CFU/plate drops below 20 (Fig. 2) (7,35). Clearly,any reasonable definition of assay accuracy and precision would require a mini-mum of 20 CFU/plate for a quantitative assay.
The upper limit of quantification on a plate is a bit more involved. USP< 1227> gives a general upper limit of 250, but also notes that this is based on theorganism’s growth characteristics and the surface area of the agar. For example,the currently accepted range of 25 to 250 was ‘‘validated’’ for counting Escherichiacoli from dairy samples (35), replacing the previously ‘‘validated’’ range of 30 to300 for the identical application (66). Although demonstrated as appropriate onlyfor E. coli from dairy samples, this number has gained wide acceptance for mostbacterial colony count applications. However, no one would try to employ thatrange of CFU on a plate for an assay involving Aspergillus niger, which formslarge colonies, or for bacterial species which form larger colonies. Likewise, onecannot claim the same upper limit if the surface area of the plate (or membranefilter) is small, as this will encourage occlusion of the colonies, leading to an
Microbial Surface Monitoring 85

underestimation of CFU. The USP chapter < 1227> provides a method to deter-mine the upper limit of the counts for a variety of situations.
Here we see a problem—comparing our ability to accurately count CFU andthe guidance (Tables 1–3), we have only qualitative measures for the highest con-trolled rooms. Although the regulations recommend counts less than 10 CFU/platein several instances, the methods available to us cannot accurately determine thosenumbers (7,67–70).
Is a Qualitative Evaluation Useful?The regulatory levels suggested for surface monitoring in the more highly controlledrooms are qualitative at best. Is this really a problem? The first aspect to consider isthat the relationship between surface contamination (especially at these levels) andproduct quality is an assumption. It is a reasonable assumption, so reasonable in factthat several attempts have been made to incorporate this measure into risk assess-ment models (71–73), but it is an assumption. There are no definitive studies thathave shown product contamination as a consequence of a particular level of back-ground microbial load. However, the risk assessment models proposed to date arethemselves qualitative in nature, and the imprecision of the microbiological datais not a handicap to their application.
The recognition of the qualitative nature of the data may also encouragenew ways of looking at the trending of the information. Several companies havemoved away from the arbitrary and inaccurate method of setting alert and actionlevels by the apparent number of CFU recovered, and have moved to settingalert and action levels based on the frequency of the event in a given period oftime (74).
THE ROLE OF MICROBIAL IDENTIFICATION
An understanding of the microbial flora in the manufacturing facility over time iscritical. If nothing else, it serves as a means to evaluate the effectiveness of the
FIGURE 2 Percent error as a function of the estimated CFU per plate. Abbreviation: CFU, colony-forming units.
86 Sutton

cleaning protocol for the facility. However, there are a range of identification tech-nologies available to the quality control (QC) microbiology laboratory, and not allapplications require the most elaborate methods.
In general, microbial identification methods can be grouped into two cate-gories (75,76):
1. Phenotypic: identification based on the phenotype of the microorganism. Thesecan include standard biochemical methods, the analysis of carbohydrate utili-zation patterns, and the composition of fatty acid in the microbial cell.
2. Genotypic: identification based on the genotype, or genetic makeup of the cell.These can include DNA fingerprinting by ribotyping, polymerized chain reac-tion (PCR), or DNA sequencing.
A strong case can be made that phenotypic identification systems are morethan adequate for standard trending purposes, although the FDA aseptic proces-sing guidance encourages the use of genotypic methods (75). A real concern isthe well-established observation that different identification systems may not pro-vide identical microbial data (77,78). Therefore, performing an investigation with acontaminant identified with one system (perhaps a genotypic system) and includ-ing data from a different system is not a valid approach.
A good compromise for many companies is to use phenotypic methods forstandard activities, as these are the methods most familiar to the QC microbiologylab. The individual plates are retained until batch release, and then discarded. Ifneeded for an investigation prior to batch release, the retained plates are availablefor the microbiology laboratory to reidentify the isolates found in the manufactur-ing facility using the same identification system used for the rest of theinvestigation.
The identification of the organisms recovered from surfaces and personnelshould be identified, at least to the genus level. This information should beincluded in the environmental-monitoring database and trended along with therest of the data. As noted above, the isolates (usually as single colony isolate cul-tures) should be retained at least until the release of the batch is finalized to beavailable in case of an investigation.
THE POTENTIAL OF RAPID MICROBIOLOGY
The best avenue to real-time release of product is through shortening the timerequired for microbiological testing (79). This, of course, includes in-process controltests such as surface-monitoring assays. The U.S. FDA has recently issued a guid-ance document describing the topic of ‘‘process analytical technology,’’ designedto encourage the use of in-process controls to increase product quality throughadvances in technology (80). This approach has encouraged some very thoughtfulevaluations. Korczynski developed an integrated approach to product quality in awell-reasoned and comprehensive review (81). He argued that PAT is one of severalquality initiatives [including Hazard Analysis Critical Control Points (HACCP), con-current validation, and parametric release] with the potential to dramaticallyimprove the final product quality through control of the process. This approach,he argued, could result in greatly reducing the number of number of release tests,although it could not remove the need for sterility testing at present.
Several authors have recently described the potential for rapid microbiologi-cal methods in in-process testing. Moldenhauer (82), Cundell (83), Sutton (84), and
Microbial Surface Monitoring 87

Miller (85) provide overviews of the regulatory approaches and validation con-cerns associated with the implementation of the different methods, but it shouldalso be noted here that most of the methods used for surface monitoring are notgenerally part of a regulatory submission. The test methods for surface monitoring(RODAC and swabs) can be adapted for a rapid test (86) and would provide realadvantages to the company in terms of immediate feedback on the state of controlof the facility. Among these are ATP bioluminescence (87), autofluorescence (88),flow cytometry (89), solid-phase cytometry (90), PCR (45,91), and others.
There are many opportunities for the use of rapid microbiological methods inthe monitoring of solid surfaces as well as other applications in the environmental-monitoring program. These have the potential to dramatically decrease the amountof time required for results to be reported, and potential increase the usefulness ofthe data. The interested reader is referred to the review articles referenced abovefor more information on these methods.
CONCLUSIONS
Surface monitoring is a critical component to the demonstration of the state of con-trol of the manufacturing environment, but it cannot be linked to finished productquality at the present time. There are several different methods used to monitorsurfaces, each of them has its own particular strengths and weaknesses.
The validation or qualification of surface-monitoring methods is confoundedby technical difficulties. One common method is to inoculate the surface with a con-trolled inoculum and calculate recovery from the inoculum level. This suffers fromissues with desiccation and the concern that this results in an artificial situation.A second method utilizes natural bioburden with repetitive sampling. This methodof validation can be analyzed either by linear regression or by total recovery.
The data in itself is a concern, as frequently regulatory documents recommendlevels below the ability of the methods to accurately measure. Suggestions are pro-vided on how to design alert and action levels that reflect this limitation.
The reliance on standard microbiological methods ensures that the in-processsurface-monitoring data will not be available for several days. The use of rapid micro-biological alternative methods can be justified as process improvements, allowingclose to real-time microbiological control data on the manufacturing process.
88 Sutton

REFERENCES
1. Agalloco J et al. Aseptic processing: a review of current industry practice. PharmTechnol Oct 2004; 126–150.
2. Akers JE. Environmental monitoring and control: proposed standards, currentpractices. PDA J Pharm Sci Technol 1997; 51:36–47.
3. Hertroys R et al. Moving towards a (microbiological) environmental monitoringprogram that can be used to release aseptically produced pharmaceuticals: ahypothesis, a practical programme and some results. PDA J Pharm Sci Technol1997; 51:52–59.
4. Lindsay J. Experience in Media Fills at PDA TRI, Poster Presentation at PDASpring 2002 Meeting, 2002.
5. FDA. Guidance for industry: sterile drug products produced by aseptic proces-sing—current good manufacturing practice, 2004.
6. Cundell AM. Microbial testing in support of aseptic processing. Pharm Technol2004; 28(6):58–66.
7. Hussong D, Madsen RE. Analysis of environmental microbiology data from clean-room samples. Pharm Technol 2004 (Aseptic Proc Issue):10–15.
8. Hyde WA. Origin of bacteria in the clean room and their growth requirements.PDA J Pharm Sci Technol 1998; 52(4):154–158.
9. PIC/S. PI 014-1: Recommendation on isolators used for aseptic processing andsterility testing, 2002.
10. PIC/S. PI-006-2: Recommendations on validation master plan, installation andoperational qualification, non-sterile process validation, cleaning validation, 2004.
11. Tidswell E. Risk-based approaches facilitate expedient validations for control ofmicroorganisms during equipment cleaning and hold. Am Pharm Rev 2005;8:28–33.
12. LeBlanc DA. Equipment cleaning validation: microbial control issues. J ValidationTechnol 2002; 8:40–46.
13. Sutton SVW. Disinfectant rotation—a microbiologist’s view. Control Environ 2005;8(7):9–14.
14. Sartain EK. Designing a cleanroom disinfectant program to meet productionrequirements and regulatory expectations. A2C2 2004; 7(12):21–24.
15. PDA. PDA Tech Report #13: fundamentals of a microbiological environmentalmonitoring program. PDA J Parenter Sci Technol 1990; 44:S3–S16.
16. USP < 1116> . Microbiological control and monitoring environments used for themanufacture of healthcare products. Pharm Forum 2005; 31(2):524–549.
17. PDA. Tech Report #13 (Revised): fundamentals of an environmental monitoringprogram. PDA J Pharm Sci Technol 2001; 55:1–36.
18. Cowell ND, Morisetti MD. Microbiological techniques—some statistical aspects. JSci Food Agric 1969; 20:573–579.
19. Stearman RL. Statistical concepts in microbiology. Bacteriol Rev 1955; 19:160–215.20. Cundell A et al. Statistical analysis of environmental monitoring data: does a worst
case time for monitoring clean rooms exist? PDA J Pharm Sci Technol 1998;52(6):326–330.
21. Wilson J. Setting alert/action limits for environmental monitoring programs. PDAJ Pharm Sci Technol 1997; 51:161–162.
22. Westney R. Strategies for managing environmental monitoring investigations. AmPharm Rev 2005; 8(4):18–31.
23. Akers JE, Agalloco JP. Recent inspectional trends: are regulatory requirements forsterite products becoming scientifically undoable or impractical? PDAJ pharm SciTechnol 2002; 56(4):179–182.
Microbial Surface Monitoring 89

24. Baldock JD. Microbiological monitoring of the food plant: methods to assess bac-terial contamination on surfaces. J Milk Food Technol 1974; 37(7):1974.
25. PDA. PDA Tech Report #24: current practices in the validation of aseptic proces-sing—1996. PDA J Pharm Sci Technol 1997; 51(2).
26. PDA. PDA Tech Report #36: Current practices in the validation of aseptic proces-sing—2001. PDA J Pharm Sci Technol 2002; 56(3).
27. Niskanen A, Pohja MS. Comparative studies on the sampling and investigation ofmicrobial contamination of surfaces by the contact plate and swab methods. J ApplBacteriol 1977; 42:53–63.
28. Hall LB, Hartnett MJ. Measurement of the bacterial contamination on surfaces.Pub Health Report 1964; 79:1021–1024.
29. Bruch M. Improved method for pouring RODAC plates. Appl Microbiol 1968;16(9):1427–1428.
30. Rohde PA. A new culture plate: its applications. PDA Bull Parent Drug Assoc 1963;17(1):11–13.
31. Keenan KM et al. Some statistical problems in the standardization of a method forsampling surfaces for microbiological contamination. Hosp Lab Serv 1965; 2:208–215.
32. Dey BP. Comparison of Dey and Engley (D/E) neutralizing medium to letheenmedium and standard methods medium for recovery of Staphylococcus aureus fromsanitized surfaces. J Ind Microbiol 1995; 14:21–25.
33. Schiemann DA. Evaluation of neutralizers in RODAC media for microbial recov-ery from disinfected floors. J Environ Health 1976; 38(6):401–404.
34. Tomasiewicz DM et al. The most suitable number of colonies on plates for count-ing. J Food Prot 1980; 43(4):282–286.
35. USP < 1227> . Validation of microbial recovery from pharmacopeial articles. In:USP 29 United States Pharmacopeial Convention, Washington, DC, 2006:3053–3055.
36. Speck ML, Black LA. Effectiveness of cotton-swab methods in bacteriologicalexamination of paper ice cream containers. Food Res 1937; 2:559–566.
37. Richard J. Observations on the value of a swab technique for determining the bac-teriological state of milking equipment surfaces. J Appl Bacteriol 1980; 49:19–27.
38. Rose L et al. Swab materials and Bacillus anthracis spore recovery from nonporoussurfaces. Emerg Infect Dis 2004; 10(6):1023–1029.
39. Lemmen S et al. Comparison of two sampling methods for the detection of gram-positive and gram-negative bacteria in the environment: moistened swabs versusRODAC plates. Int J Hyg Environ Health 2001; 203:245–248.
40. Cate L. A note on a simple and rapid method of bacteriological sampling by meansof agar sausages. J Appl Bacteriol 1965; 28(2):221–223.
41. Angelotti R, Foter MJ. A direct surface agar plate laboratory method for quantitativelydetecting bacterial contamination on nonporous surfaces. Am J Public Health Sep1957; 170–174.
42. Pitzurra M et al. A new method to study the microbial contamination of surfaces.Hyg Med 1997; 22:77–92.
43. Poletti L et al. Comparative efficiency of nitrocellulose membranes versus RODACplates in microbial sampling on surfaces. J Hosp Infect 1999; 41:195–201.
44. Craythorn J et al. Membrane filter contact technique for bacteriological sampling ofmoist surfaces. J Clin Microbiol 1980; 12(2):250–255.
45. Buttner MP et al. Evaluation of the Biological Sampling Kit (BiSKit) for large-areasurface sampling. Appl Environ Microbiol 2004; 70(12):7040–7045.
46. Clark DS. Method of estimating the bacterial population on surfaces. Can J Micro-biol 1965; 11:407–413.
90 Sutton

47. Williamson P et al. A new method for the quantitative investigation of cutaneousbacteria. J Invest Derm 1965; 45(6):498–503.
48. Salo S et al. Validation of the microbiological methods hygicult dipslide, contactplate, and swabbing in surface hygiene control: a nordic collaborative study. JAOAC Int 2000; 83(6):1357–1365.
49. Moldenhauer J. Surface monitoring. In: Moldenhauer J, ed. Environmental Moni-toring: A Comprehensive Handbook. River Grove: DHI Publishers, 2005:339–356.
50. ISO. EN 1174–1 Sterilization of medical devices—estimation of the population ofmicro organisms on product—Part I, 1996.
51. ISO. ISO 11737–1 Sterilization of medical devices—microbiological methods—Part1: Estimation of population of microorganisms on products, 1995.
52. Favero MS et al. Microbiological sampling of surfaces. J Appl Bacteriol 1968;31:336–343.
53. Bakker DP et al. Bacterial strains isolated from different niches can exhibit differ-ent patterns of adhesion to substrata. Appl Environ Microbiol 2004; 70(6):3758–3760.
54. Douglas J. Recovery of known numbers of micro-organisms from surfaces byswabbing. Lab Pract 1968; 17(12):1336–1337.
55. Potts M. Desiccation tolerance of prokaryotes. Microbiol Rev 1994; 58(4):755–805.56. Whyte W. Methods for calculating the efficiency of bacterial surface sampling tech-
niques. J Hosp Infect 1989; 13:33–41.57. Yamayoshi T et al. Surface sampling using a single swab method. J Hosp Infect
1984; 5:386–390.58. Eginton PJ. Quantification of the ease of removal of bacteria from surfaces. J Indust
Microbiol 1995; 15:305–310.59. PDA. PDA Technical Report #21: Bioburden recovery validation. PDA J Parent Sci
Technol 1990; 44(6):324–331.60. Akers J, Moore C. The need for pragmatism. A2C2 Jan 1998; 23–30.61. ISO. ISO/IEC 17025 General requirements for the competence of testing and cali-
bration laboratories, 1999.62. Forster LI. Measurement uncertainty in microbiology. J AOAC Int 2003; 86:1089–
1094.63. Ilstrup D. Statistical methods in microbiology. Clin Microbiol Rev 1990; 3:219–226.64. Akers JE. Science based aseptic processing. PDA J Pharm Sci Technol 2002;
56(6):283–290.65. Eisenhart C, Perry W. Statistical methods and control in bacteriology. Bacteriol Rev
1943; 7:57–137.66. Breed R, Dotterrer WD. The number of colonies allowable on satisfactory agar
plates. J Bacteriol 1916; 1:321–331.67. Wilson J. Environmental monitoring: misconceptions and misapplications. PDA
J Pharm Sci Technol 2001; 55:185–190.68. Akers JE, Agalloco J. Environmental monitoring: myths and misapplications. PDA
J Pharm Sci Technol 2001; 55:176–184.69. Akers JE, Agalloco JP. Aseptic processing, elephants, blind men and sterility. PDA
J Pharm Sci Technol 2002; 56:231–234.70. Hussong D, Mello R. Alternative microbiology methods and pharmaceutical qual-
ity control. Am Pharm Rev 2006; 9(1):62–68.71. Eaton T. Microbial risk assessment for aseptically prepared products. Am Pharm
Rev 2005; 8:46–51.72. Eaton T. Microbial risk assessments for pharmaceutical products. Cleanroom
Monitor S2C2 2005; 52:1–12.
Microbial Surface Monitoring 91

73. Akers J, Agalloco J. Risk analysis for aseptic processing: the Akers–Agallocomethod. Pharm Technol 2005; 29:74–88.
74. Caputo RA, Huffman A. Environmental monitoring: data trending using a fre-quency model. PDA J Pharm Sci Technol 2004; 58:254–260.
75. Sutton SVW, Cundell AM. Microbial identification in the pharmaceutical industry.Pharm Forum 2004; 30(5):1884–1894.
76. Cundell AM. Microbial identification strategies in the pharmaceutical industry.PDA J Pharm Sci Technol 2006; 60(2):111–123.
77. Tang Y et al. Comparison of phenotypic and genotypic techniques for identification ofunusual aerobic pathogenic gram-negative bacilli. J Clin Microbiol 1998; 36(12):3674–3679.
78. Stager CE, Davis JR. Automated systems for identification of microorganisms. ClinMicrobiol Rev 1992; 5(3):302–327.
79. Singer DC, Cundell AM. The role of rapid microbiological methods within the pro-cess analytical technology initiative. Pharm Forum 2003; 29(6):2109–2113.
80. FDA. Guidance for industry: Process analytical technology—a framework forinnovative pharmaceutical development, manufacturing, and quality assurance,2004.
81. Korczynski MS. The integration of process analytical technologies, concurrentvalidation, and parametric release programs in aseptic processing. PDA J PharmSci Technol 2004; 58(4):181–191.
82. Moldenhauer J. An overview of rapid microbiology methods. Pharm Form QualityJun/Jul 2004; 61–64.
83. Cundell AM. Opportunities for rapid microbial methods. Eur Pharm Rev 2006;1:64–70.
84. Sutton SVW. Validation of alternative microbiology methods for product testing:Quantitative and qualitative assays. Pharm Technol 2005; 29(4):118–122.
85. Miller MJ. Rapid Microbiological methods and FDA’s initiatives for pharmaceuti-cal cGMP’s for the 21st century, PAT and sterile drug products produced by asepticprocessing. Am Pharm Rev 2005; 8(1):104–107.
86. Sutton SV. Opportunities for the pharmaceutical industry. In: Miller M, ed. Encyc-lopedia of Rapid Microbiological Methods. Vol. 1. Washington, DC: DHIPublications, 2005:123–156.
87. Buttner M et al. Enhanced detection of surface-associated bacteria in indoor envir-onments by quantitative PCR. Appl Environ Microbiol 2001; 67(6):2564–2570.
88. Bolotin C. Instantaneous microbial detection. Control Environ 2005; 8(12):10–15.89. Veal DA et al. Florescence staining and flow cytometry for monitoring microbial
cells. J Immunol Meth 2000; 243:191–210.90. Brailsford M. Making the switch to real-time microbiological process control.
Manuf Chem 1997; 35–36.91. Nadkarni M. Determination of bacterial load by real-time PCR using a broad-
range (universal) probe and primers set. Microbiology 2002; 148:257–266.
92 Sutton

CHAPTER
6 Process Simulations (Media Fills)
Anne Marie Dixon
& Background& Contamination Sources
PeopleEquipmentRoom EnvironmentEnvironmental Monitoring
& The Process of Devising, Executing, andAssessing Media Fills
Establishment of a ProgramProtocol PreparationProcess ParametersAcceptance CriteriaInterpretation of Results and Acceptance CriteriaFailure Investigation and Corrective ActionInvalidation of a Media Fill
& Case Study& Summary& Conclusions& Further Reading& References
93


6 Process Simulations (Media Fills)
Anne Marie Dixon
Cleanroom Management Associates, Inc., Carson City, Nevada, U.S.A.
BACKGROUND
Sterile pharmaceuticals are either by aseptic processing techniques or by terminal ster-ilization methods. In aseptic processing, the drug product, container, and enclosure arepresterilized and the filling operations are performed in high quality environments,traditionally called cleanrooms. Aseptic processing can provide products with a highdegree of sterility assurance when they are carried out under stringent aseptic proces-sing conditions with well-defined standards. In the 1960s and 1970s, the asepticprocessing methods, even when performed under optimal conditions, could only bevalidated to ensure that the contamination rate is no greater than one contaminatedunit per thousand (10�3) filled. Today, processing technologies have emerged andare capable of minimizing or eliminating human intervention with proper techniques,proper gowning, effective sanitization of surfaces, and sterile materials.
The word ‘‘validation’’ first appeared in print in the 1978 revision to the cur-rent good manufacturing practices regulations (cGMPs) (1). Section 211.113(‘‘Control of Microbiological Contamination’’) of the cGMP requires the establish-ment of, and adherence to, ‘‘appropriate written procedures designed to preventmicrobial contamination of drug products purporting to be sterile. Such proce-dures must include validation of any sterilization process’’ (2).
In 1987, Food and Drug Administration (FDA) published a guideline thataddressed acceptable practices and procedures for the preparation of drug prod-ucts by aseptic processing according to the cGMP regulations (3). Validation wasdefined in this document as ‘‘ . . . establishing documented evidence which pro-vides a high degree of assurance that a specific process will consistently produceproduct meeting its predetermined specifications and quality attributed’’ (3).
Two issues must be considered in the validation of any aseptic process. First,the drug substance itself and all the necessary components for formulation and fill-ing need to be processed using procedures and equipment that have beenvalidated to assure sterility. Second, the aseptic assembly process, i.e., the fillingoperation, needs to be validated separately to demonstrate that the process ofassembly does not compromise the sterility of individual components and finishedproduct. One of the most difficult and important tasks in pharmaceutical pro-duction is that of an aseptic process validation. The requirement for validationforced the industry to begin thinking carefully about how to formally qualify facili-ties and institute appropriate controls for aseptic processing.
‘‘The aseptic process simulation is widely used for the validation of asepticprocessing. The test substitutes sterile microbiological growth medium for sterileproducts and so is referred to as media fill’’ (4). During a media fill, the exposureto operators, mechanics, samplers, interventions, components, and the fillingenvironment (air cleanliness) all affect the nutrient sterile medium’s chances ofbecoming contaminated. If growth is observed in a media fill, it is assumed that
95
the process is not in control, and that there is a chance that routine production isincapable of producing a sterile drug product.
FDA’s ‘‘Aseptic Processing Guideline’’ in 1987 describes a media fill as ‘‘an’’acceptable method of validating aseptic manufacturing, not as ‘‘the only’’ accept-able method. However, by the 1990s, both the FDA and the EU GMPs includedrequirements for media fills in support of aseptic processes. Because of the sensi-tivity of the microbiological growth medium to overt contamination, media fills arenow the generally accepted approach for validating the adequacy of protectionfrom microbial contamination afforded by the aseptic filling process as well asfor identifying potential weaknesses in the operation that might contribute to con-tamination of the drug product.
In addition to demonstrating that the aseptic fill/finish process is capable ofproducing a sterile drug product, process simulations are used to qualify or certifyaseptic processing personnel (including operators, mechanics, and samplers), vali-date a new facility, validate significant changes to a filling record, and validate newfilling line equipment. Each of these aspects of the media fill is now an expectationof current GMPs.
CONTAMINATION SOURCES
PeopleCleanroom environments containing people are never sterile. Maintaining safe prod-uct conditions throughout the processing is extremely important. It is recognizedthroughout the industry that the final product testing is inadequate to totally assurethe sterility of any aseptically filled product (5). Microbial contamination for sterileproducts manufactured by aseptic process is mainly caused by human intervention.Cleanroom operators generate millions of particles with every movement. Everyemployee who enters an aseptic area must have successfully completed trainingand qualifications in gowning, cleanroom disciplines, basic microbiology, and aseptictechniques prior to entrance. Particles can and do migrate through the cleanroomapparel. Complete barrier gowning is required—full hood, coverall, facemask, pro-tective goggles, gloves, and boots. If a garment does not seal at the neck or aroundthe eye area, or is oversized, particulates from the head and sleeve will vent intothe cleanroom environment above the working level because of the bellows effect.
Personnel-associated product contamination may occur by direct or indirectroutes. Touching a sterile instrument with a nonsterile gloved hand, for example,can result in direct contamination. In contrast, an indirect contamination is causedby poor adherence to procedures intended to minimize contamination load anddispersal throughout the cleanroom. For example, personnel can create turbulenceby rapid movements, increasing the chance of indirect contamination. Poor gown-ing techniques, failure to follow written procedures, and failure to minimize thefrequency of entrances and exits could also establish the potential for indirectcontamination risk.
The quality of filling under aseptic conditions will vary with the training,experience, motivation, and operational familiarity of each operator to the machine,equipment, cleanroom, and the fatigue of the operator. In general, a media fillshould simulate the worst-case conditions that might exist during normal opera-tions. It should challenge the operators to the same extent that would be expectedduring the lengthiest, most complex production run.
96 Dixon

There is a minimum requirement to involve individuals in at least one pro-cess simulation (operators, mechanics, and quality assurance personnel) on anannual basis. However, in order to maintain their aseptic awareness and validationstatus, it makes good sense to incorporate as many people as possible in each pro-cess simulation trial.
EquipmentUnvalidated sterilization/depyrogenation/sanitization cycles for product contactequipment or components (vials/stoppers) can result in a lack of assurance sterilityor an endotoxin contamination event. Likewise, inadequate cleaning of product contactsurfaces prior to sterilization could result in product carryover and crosscontamination.
Room EnvironmentProper cleanroom conditions are demonstrated by the proper qualification of heat-ing, ventilation and air conditioning (HVAC) systems, utility systems (includingwater), cleaning and sanitization procedures, proper gowning procedures, and lim-iting access only to trained/qualified people.
Patched, poor, or uncertified high-efficiency particulate air (HEPA) filters,inadequate air change rates, loss of pressurization, and lack of procedures to comeback into production after a loss of pressurization can adversely affect the asepticmanufacturing environment.
All utilities that come into contact with sterile components or sterile productmust be designed to provide assurance of sterility. Water for injection (WFI) systemsmust undergo a stringent qualification process to demonstrate that they are capableof consistently delivering high quality water. Gasses, particularly those that come intocontact with product as overlays or vessel purges, must be filtered at the point of use (6).
All cleanroom surfaces including walls, ceilings, benches, floors, doors, phones,intercoms, vents, and filling equipment must be cleaned and sanitized using validatedprocedures. Validation of cleaning and sanitization includes choice of sanitizers, test-ing of sanitizers to demonstrate efficacy both in vitro and in situ, testing of productcontact surfaces for residuals, rotation of disinfectants/sanitizers as needed, the clean-ing method itself (mops, wipes), and the proper training of cleaning personnel.
Environmental MonitoringEnvironmental monitoring, if not performed correctly, can be a source of contami-nation. Training must include demonstration of aseptic technique, the ability tocompletely remove any contact plate residuals, an understanding of laminarity,and how to perform monitoring without disturbing operators or equipment.
A poorly conceived environmental monitoring program can be detrimental to anaseptic process in that inappropriate sampling locations and frequencies or lack of dataanalysis will result in a failure to recognize adverse trends in the environmental quality.
THE PROCESS OF DEVISING, EXECUTING, ANDASSESSING MEDIA FILLS
Establishment of a ProgramThe first step in establishing a media fill program is the drafting of a broad policy,a document that may be in the form of a memo, master plan, policy statement,standard operating procedure, or validation protocol. This policy document shoulddefine the purpose of the program, a risk analysis, the frequency of routine
Process Simulations (Media Fills) 97

revalidation, and nonroutine reasons for revalidation. A crossfunctional groupthat includes manufacturing, validation, and quality should draft the document.The roles and responsibilities of each function or group such as the microbiologist,engineers, the quality experts, operational staff, and management should bedefined.
A media fill program should incorporate the contamination risk factors thatoccur on a production line and accurately assess the state of process control. Therisks to be included are:
& People& Equipment& Components& Facility and utilities
A recommended media fill program incorporates the contamination risk fac-tors that occur on a production line and accurately assesses the state of processcontrol. Media fill studies should simulate aseptic manufacturing process opera-tions as closely as possible, incorporating a worst-case approach. The media fillprogram should address the applicable issues as such:
1. Equipment
& Factors associated with the longest permitted run on the processing line& Number and type of normal interventions, e.g., maintenance, stoppages,
and equipment adjustments& Line speed and configuration& Lyophilization where applicable& Aseptic assembly of equipment (e.g., startup)
2. Personnel
& Number of personnel and their activities& Shift changes, breaks, and gown changes& Operator fatigue
3. Operations
& Number of aseptic additions& Number and type of aseptic equipment disconnect and connections& Aseptic sample of collection& Manual weight checks& Container closure system& Specific provisions for aseptic processing-related standard operating
procedures
Media fills should never be used to justify an unacceptable practice. A solidmedia fill program is the key to acceptable manufacturing success and it can beassured by good planning and operational staff input.
Protocol PreparationThe detailed planning is the second step of this program and it should include theidentification of the risk variables in defining the worst case. Once the process hasbeen clearly defined, the media fill or appropriate standard operating procedure orvalidation protocol can be written. A protocol in the form of a batch record must
98 Dixon

be prepared for each run on each line. This document should include, but is notlimited to, the following:
& Identification of the process (lyo, aseptic fill in preparation for TS, powder fill,liquid fill)
& Identification of the room& Identification of the filling line and equipment& Type of container/closure to be used& Line speed& Number of units to be filled& Number and type of interventions& Number of personnel to participate& Type of media to be used& Volume of medium to be filled into the containers& Incubator identification and incubation time and temperature& Environmental monitoring& Copy of the batch record to be used& Acceptance criteria for the test& Description of documentation record for the final report& Box or tray number of positive units& Growth support testing requirements and result& Rationale for worst-case ‘‘parameters’’ chosen& Summation of the data from the batch record environmental monitoring
samples based upon this information, a conclusion is formulated regardingthe acceptability of the manufacturing process and the facility
& Aseptic set up and assembly of sterile equipment
All personnel who enter the aseptic processing area, including techniciansand maintenance personnel, should participate in a media fill at least once per yearas part of the operator qualification process.
Process Parameters
Production Batch Size/Media FillThe duration and size of the fill must be reflective of the actual product being man-ufactured. The duration of the run should be sufficient to ensure that the necessarynumber of units and activities are included. A minimum number of 5000 filled con-tainers are specified in the FDA aseptic product manufacturing guidelines on 30September 2004. A generally accepted media fill size is from 5000 to 10,000 units.A hold time for the bulk media should be established for each media fill. Initially,the hold time should mimic the production hold times.
The speed and a line configuration of the filling process are parameters thatare highly dependent on the individual line being challenged. In many situations,the ‘‘worst case’’ is the speed that provides for the greatest exposure of media toenvironmental conditions, i.e., the slowest speed and the largest vial neck opening.However, many production lines that fill very small vials at fast speeds can createthe greatest number of jammed containers, misfilled product, or manual inter-ventions. It is advisable to use a risk assessment to determine the most criticalparameters.
Using ‘‘industry standard definitions’’ of worst-case scenarios is not a sub-stitute for a thorough understanding of the process being validated. After an
Process Simulations (Media Fills) 99

evaluation of the process and the batch parameters, the fill protocol must representthe most difficult manufacturing period.
A media filled batch record must be prepared. Media filled documents aremost useful as process validation and training exercises when the document isidentical as close as possible to the actual manufacturing batch. The batch recorddocumenting production conditions and simulated activity should be preparedfor each media filled line. The same vigilance that is used for routine productionmust be observed in both media fill and routine production runs. One additionto the batch record that has proved to be a useful tool is a typical table that listswhere real or simulated line jams are cleared, spills cleared, or rejected vials areremoved from the line. This table will reflect that a given action is supported bythe media fill and can also serve as a reminder to the operators what interventionsneed to be performed.
When the aseptic filling process is performed manually or the practice of anyother extensive manual manipulations, the duration of the process simulationshould generally be no less than the length of the actual manufacturing processto best simulate contamination risks as posed by the operator. For operations withproduction sizes under 5000, the number of media vials should be equal to themaximum batch size made on a processing line. For very small batch sizes, whichare common in clinical practices and in some biological practices, the volumeshould be equal to that of the production or the clinical trial run. This is to simulatea day’s worth of filling.
InterventionsIt is expected that a predetermined list of all permitted interventions be maintainedand incorporated into the process simulation on a periodic basis. Typical interventionsshould be performed during each process simulation. Atypical intervention shouldbe performed at least once per year. Process simulation tests must include allnormal activities that occur during an aseptic filling process in order to substantiatethe acceptability of those practices and routine operation. Routine interventionsinclude:
& Aseptic assembly of the equipment& Bulk connection and startup of the line& Initial weight and/or volume checks& Periodic weight and/or volume checks& Addition of components& Operator breaks& Product sampling& Filter integrity testing& Environmental monitoring& Any other activity that is part of a normal operational process
It is possible that a nonplanned intervention may be necessary to correct forcontainer breakage and fluid leakage jams which may occur during the processsimulation. In addition to these, the following are examples of nonroutine activities:
& Stopper jam& Broken containers& Product spills& Adjustments of fill head assemblies
100 Dixon

& Equipment change-out& Removal of components& Any other malfunction that could require a manual adjustment
The interventions should be reviewed and discussed in detail in order todetermine those that must be included in each media fill. Operators should betrained in the execution of these interventions (7). Proper documentation isrequired for all interventions in the batch record. The documentation shouldinclude the time the event occurred and the identification of the event.
Large Batch SizeFor these types of processes where high-speed fillers are commonplace, a mini-mum of 5000 units should be filled in order to accommodate the number ofinterventions normally used in production. There are a number of ways to accom-plish this in order to achieve all the interventions and show both the stress of thecleanroom and the fatigue of the operator. In order to simulate specific time dura-tion, it should be ensured that media units are filled at the beginning, middle, andend of a specific time duration. Media should also be filled to simulate change-outof personnel at break times. Consider the following example:
1. Fill 3000 units with medium, switch to sterile WFI for an extended period oftime; fill an additional 3000 units with medium. Alternate WFI with mediumover the course of the day in order to show the stress of the fill line as wellas the stress of the operator. (Note of caution: it is difficult to reconcile the totalmedia quantity, as residual in the line will cross into the WFI units. These unitswill also require incubation. However, if the growth medium gets diluted outto the point where it is not a factor, and the diluted media is not validated forgrowth promotion, it may be difficult to determine if there is a failure or aninvalid growth occurrence.)
2. Fill 3000 with medium, run glass and stoppers without any liquid being addedfor an extended period of time, and then fill an additional 3000 units of mediumthroughout the day. There is a current concern that switching from medium toWFI will allow for bleed-over into the vials. Because the vials are now deluded,should the vials be incubated? What would the results mean? How these vialsare to be handled? Therefore, it is the opinion of the author that running the linebetween media vials, without any liquid, does simulate the fill line being run,the stress of the cleanroom, and potential stress of the operator.
Filling SpeedIn general, a fill speed, used for any container, should be set at the low end of thefilling range for the size container. If a higher speed results in the potential forgreater interventions, then the speed should be considered when selecting processsimulation test parameters in the validation protocol.
The duration of the run should be sufficient to cover all manipulations thatare normally performed in actual manufacturing. The number of test units shouldreflect the worst-case exposure time at filling rates that are equivalent to or slowerthan actual production filling speeds.
Lyophilized Filled ProductMost lyophilized products are aseptically filled solutions that are transferred to asterile lyophilization chamber after filling. It is an industry practice to simulate
Process Simulations (Media Fills) 101

lyophilization as part of the media or process simulation protocol. Containers arefilled with medium and stoppers are partially inserted into the necks. The contain-ers are manually or robotically transported and loaded into the lyophilizer. A fullor partial vacuum is drawn on the chamber at ambient temperature and main-tained for the duration of a normal lyophilization process. The chamber is thenvented and the stoppers are seated within the chamber. The stoppered units areremoved from the aseptic area and sealed and transported for incubation. Theadvantage of this type of simulation is that the medium is not frozen. Therefore,there are fewer concerns with regard to microbial survival.
However, this type of process has some disadvantages. The amount of timerequired to perform the entire lyophilization cycle is extensive. The vacuum mustnot be so low as to permit the medium and the container to boil out.
A compromise should be considered. There is the ability to do a simulatedload with a shortened time. These containers are filled and stoppers are partiallyinserted into the necks. The units are manually or robotically loaded into the lyo-philizer, partial vacuum is drawn, and is held for a predetermined time. Thechamber is then vented and the stoppers are seated within the chamber. Theseunits are returned for aseptic processing area, sealed, and transported for incu-bation. The disadvantage of this is that the shortened time exposure may notsimulate the actual lyophilization process duration adequately and the potentialrisk of contamination during the normal process cycle time.
Anaerobic ConditionsManufacturers that fill a number of aerobically processed products are advisedto perform a periodic process simulation using appropriate anaerobicmedium, e.g., alternate fluid thioglycollate without agar. The use of an inertgas and anaerobic medium (e.g., alternate fluid thioglycollate medium) wouldbe appropriate when the presence of anaerobic organisms has been confirmedeither during the environmental monitoring or more likely during sterility pro-duct testing.
In addition to using the thioglycollate medium, manufacturers are alsoadvised to perform an aerobic fill using a growth medium such as soybean caseindigest, with a compressed air overlay. This will simulate the turbulence in the pro-duct container and allow for environmental data for aerobic organisms.
Regardless of the fill type, one should address anaerobes during media fills—especially facultative anaerobes from personnel.
Media Growth PromotionIn general, a microbial growth medium such as soybean casein digest mediumshould be used. This media selected should be demonstrated to promote growthof United States Pharmacopoeia (USP) < 71> indicated organisms as well as rep-resentative isolates identified from environmental monitoring, personalmonitoring, and positive sterility test results.
Positive control units should be inoculated with a less than 100 colony-form-ing units challenge and incubated. For those instances in which growth promotiontesting fails, the origin of any contamination found during the simulation shouldbe nevertheless investigated and the media fill should be promptly repeated.Growth promotion of media in the units is most meaningful if they are performedat the same time as the possible contamination of an aseptically filled product, i.e.,
102 Dixon

a randomly selected unit in parallel with the incubation of the media fill. It isrecommended to perform a growth promotion at the beginning and at the end(i.e., incubated vials) to demonstrate that the incubation conditions were not det-rimental to the growth of organisms.
Growth promotion at the end of the incubation may not detect any interac-tion between the contaminants and the containers that may mask grossinhibition. Testing of the final media may prove useful if the media fillhas failed. However, if the residual media fails and the media fill passes, theresults of the media fill must stand. The inability of incubated units to demon-strate growth on the growth promotion does not invalidate the run. However,there needs to be an investigation. If the growth promotion is a type of‘‘system suitability,’’ it is important to understand what this type of failure wouldindicate.
Environmental ConditionsThese are controversial factors in media fill scenarios. While operations staffacknowledges that environmental conditions may have a significant impact onsterility assurance, cleanroom managers are rightfully against including any inten-tional falsification of environmental control.
The best middle ground may be to conduct media fills during times thatreflect full range of environmental variation, such as before and after maintenanceshutdowns as well as mid-production times, seasonal variation that effecthumidity, or stressing the cleanability of the cleanroom.
It should be stated that altering the operational conditions of a cleanroom out-side the basis of design could have a significant impact on the cleanroom, HVACsystem, and HEPA filtration systems. Generally, if a product fill would be aborted,then a media fill is also aborted.
Filled VolumeThis volume should be sufficient to assess potential microbial contaminationand to ensure the complete contact of all sterile surfaces inside the containerwhen inverted.
Regardless of the actual fill volume selected, the process simulation testshould include a fill weight adjustment using methods identical to those employedduring production.
IncubationThe conditions suitable for recovery of bioburden and environmental monitoringisolates should be not less than 14 days at a temperature between 20�C and 35�C.The temperature chosen should be based upon the ability to recover micro-organisms normally found environmentally or in the product bioburden.
Many firms prefer a two-temperature incubation schedule to incubate at 20�Cto 25�C for a minimum of seven days followed by incubation at a higher temperaturerange, which is not to exceed 35�C for a total minimum incubation time of 14 days.
It is a generally accepted practice that prior to incubation, the containers areinverted or otherwise manipulated to ensure that all the surfaces, including theinternal surface of the closure, are thoroughly wetted by the media. These contain-ers should not be completely filled with media in order to provide sufficientoxygen for the growth of obligate aerobes.
Process Simulations (Media Fills) 103
The concept of process simulation is to assess the potential contamination inunits that are representative of normal production cycles. The requirement to incu-bate and include the evaluation of procedurally excluded units, those used forprocess testing or interventions (when the removal of such units is reproducibleand clearly documented in the routine production), does not assess the potentialof the production for nonsterile units. The inclusion of procedurally excluded unitspresents an artificially stringent measure of the capability of an aseptic process.However, removing units that under normal filling would not be removed istotally unacceptable. There must be a control mechanism for exclusion and a fullaccountability of these units.
Many firms perform an inspection of units leaving the filling area for broken,noticeably cracked, or without stoppers or crimps. All such units, if discarded,must be recorded with a description of the fault.
Reconciliation requirements for process simulation units should be equivalentto the requirement for a production size run. A 100% reconciliation accountability ofall units filled should be the target.
Two reconciliations must be performed prior to incubation. The first reconcil-iation is of the total number of units filled. Generally, there are three categoriesof containers:
1. Group I: marketable product and vials with cosmetic defects from post fillinspection operations
2. Group II: intervention—units removed3. Group III: defects—cracks, no stoppers, leaks
All containers in Group I must be incubated. No containers can be discarded.The second reconciliation is for the media. Accountability must be performed
for the total bulk media. As an example, assume 1000 L of media has been pre-pared, then:
1000L�total volume
�600L�filled
�375L�residual in the bulk tank
�5L�surge tank residual
�20L�lines, filters, assemblies, waste, purge
¼ TOTALLY RECONCILED BULK
Generally, these two reconciliations are included in the batch record.
Acceptance CriteriaEquipment failures, environmental excursions, and staff shortages can have a dra-matic impact on the media fill, just as they do on routine production. It is essentialthat all staff members be trained to report deviations from the plan so a decisionmay be made immediately to keep or discard the vials.
104 Dixon

The definition of an accepted media fill is one of the most critical variationsbetween regulatory agencies. The FDA guidance document on 30 September 2004specifies that growth in a single vial must be thoroughly investigated and willresult in failure for small fill quantities. ISO guidelines are more lenient relyingon the statistical analysis of 0.1% contamination with a 95% confidence level. How-ever, the expectation is no contamination regardless of the lot size. A researcharticle (8) indicated that the existing criteria, such as ‘‘less than 0.1%,’’ ‘‘less than0.05%,’’ and less than two positives, are not appropriate to assure the integrityof processes and sometimes lead to erroneous results.
However, persistent low levels of contaminated vials should be taken asan indication of a manufacturing problem, even if the media fill passed formalacceptance criteria. Any positive unit indicates a potential problem regardless ofthe run size. All positives of media and environmental should be identifiedto genus and species. These identified positives should be compared to previousenvironmental and personnel isolates. All positives should result in a thorough,documented, investigation. If the positives are indicative of an unacceptablepractice, e.g., a particular type of intervention, the procedure must be analyzed,and SOPs must be written and implemented after proper training. It is advisablethat water fill training be performed prior to the rerun of a media fill to ensure thatthe practices are acceptable.
Consecutive acceptable media fill simulations are required to initially validatea new process. After the initial testing, regular validation is required. In the UnitedStates, a media fill must be repeated at six-month intervals. Other regulatory juris-dictions require a minimum of four media fills per year. Specific requirements foreach jurisdiction should be also reviewed periodically.
Generally, three consecutive successful process simulation tests are per-formed when qualifying a new facility or filling line or validating a process.Prior to the release of a new facility, filling line, or process for production use,acceptable results from these consecutive tests should be achieved to demonstrate thereproducibility of the process. It is current industry standard that mediafills are performed on each aseptic filling line twice a year. Additional tests can beperformed to evaluate changes in procedures, practices, cleanroom equipment con-figurations, changes in HVAC conditions, installation of new HEPA filters, etc.
A question commonly asked is what is the magic of three batches in avalidation program. The number three is used because it could be said that oneis equal to an event, two equals coincidence and three is equal to science. Three isa rough optimum for capturing variability at an acceptable cost. Therefore, themagic number three is a reasonable approach to demonstrate reproducibility ofany line.
During the fill, the quality department should be the primary observinggroup. In addition, videotaping has become widely accepted as a method of review(in the case of any failures) and training.
All personnel must be gown plated on exit. At a minimum, gloves and fore-arms must be tested. Any positive results must be identified and investigated.
Interpretation of Results and Acceptance CriteriaDespite the number of units filled during a process simulation test, or the number ofpositives allowed, the ultimate goal for the number of positives in any process simu-lation is zero! A sterile product is, after all, one that contains no viable organisms.
Process Simulations (Media Fills) 105

The following criteria should be used to establish appropriate process simu-lation test limits and acceptance criteria:
& The test methodology must simulate the process as closely as possible. Devia-tions from the established processes must be justified.
& The rationale for choosing the methodology and limits must be justified anddocumented.
& Test methodology should be sensitive enough to confirm a low process simula-tion test contamination rate and the selection limit must be routinelyachievable.
& Any positive unit indicates a potential problem regardless of run size. All posi-tives should be identified and should result in a thorough and documentedinvestigation.
In the ‘‘Guidance for Industry FDA Sterile Drug Products Produced by Asep-tic Processing’’ on 30 September 2004 the following interpretation of test results isindicated.
& One filling fewer than 5000 units: no contamination should be detected.& One filling from 5000 to 10,000 units: one contaminate in a unit should
result in an investigation, including consideration of a repeat media fill.Two contaminated units are considered cause for revalidation followinginvestigation.
& When filling more than 10,000 units: one contaminated unit should result in aninvestigation. Two contaminated units are considered cause for revalidationfollowing investigation.
& For any size, intermittent incidents of microbial contamination in media filledlines can be indicative of a persistent low-level contamination problem thatshould be investigated. Accordingly, reoccurring incidents of contaminatedunits in media fills for an individual line, regardless of acceptance criteria,would be a signal of an adverse trend on the aseptic processing line that shouldlead to problem identification, correction, and revalidation.
Failure Investigation and Corrective ActionA contaminated container should be carefully examined for any breach in theintegrity of the container system. Damaged containers should not be consideredan evaluation (acceptance) of an aseptic processing capability of the process. How-ever, a vial that is broken during incubation should be addressed.
All positives from integral containers should be identified to at leastgenus and species whenever possible. A comprehensive consistent sampling andidentification scheme is crucial in the investigation and determination of the con-tamination source. This is the same practice that is performed for all ISO 5 andsterility testing suites.
Identify the contaminant and compare the result to the database of the organ-isms most recently identified. Processing records should be reviewed. Criticalsystems should be reviewed and documented for changes. Calibration recordsshould be checked. All HEPA filters in the filling area should be inspected anddecertified if warranted. Personnel involved in the fill should be assessed to assurethe proper training was provided. Validation and change control records should bereviewed for any procedure or process changes.
106 Dixon

Tur
bid
Via
l
Env
ironm
ent
Bul
k
Per
sonn
elE
quip
men
t
EM
dat
a (a
ir, s
urf
aces
) Tra
inin
g
Vid
eo o
f p
roce
ss s
imu
latio
n(o
per
ato
r b
ehav
ior)
Inte
rven
tion
s
EM
dat
a (p
erso
nn
el)
Cle
anro
om
co
nd
itio
ns
(hea
t, h
um
idity
, air
chan
ges
)
Fo
rmu
latio
n/f
illin
geq
uip
men
tst
erili
zatio
n/s
aniti
zatio
n
Bu
lk s
teril
ityB
ulk
ho
ld t
ime
valid
ated
?
Inte
rvie
w Q
A o
bse
rver
s
To
o m
any
peo
ple
in t
he
roo
m?
San
itiza
tion
re
cord
s
Raw
mat
eria
l bio
bu
rden
in s
pec
/in t
ren
d?
Via
l/sto
pp
er s
teril
izat
ion
Via
l Exa
min
atio
n
Def
ectiv
e?
Con
trols
Med
ia s
teril
ity
Med
ia g
row
thpr
om
otio
n
Cra
cks?
Imp
rop
erly
sea
ted
clo
sure
s?
Org
anis
m r
eco
vere
dan
d id
entif
ied
?
Org
anis
m m
atch
an
y re
cove
red
fro
m p
erso
nn
el
or
envi
ron
men
t?
Inte
rvie
w
op
erat
ors
FIG
UR
E1
Afishbone
analy
sis
show
ing
undesired
event
and
the
underlyin
gfa
ult
events
.A
bbre
via
tion:
EM
,environm
ent
monitoring.
Process Simulations (Media Fills) 107

A full risk analysis should be performed. A media failure signals an under-lying weakness of the system or the process. In the context of GMP, a risk analysisfocuses on what a failure means to the patient and, secondarily, to the particularmanufacturing process and elements within the quality system.
The risk of contamination to an aseptic process by airborne contaminantsentered through the air handling system to the facility is minimal. This is made evi-dent by the fact that the data generated by the environmental monitoring programgenerally show zero microbial contaminants in an ISO Class 5 cleanroom or betterand very low particulate (nonviable) contaminants. Any excursion should beinvestigated and documented; however, a variance is not an automatic invalidationof a process simulation test.
The major source, however, of contamination in the cleanroom is widelyaccepted to be the personnel that are present. Use of a cleanroom does not guaran-tee sterility nor prevent contamination caused by poor operator aseptic techniques,poor gowning practices, and lack of training. This contamination, however, is non-random in nature and must be strongly correlated with human activity.
A fishbone analysis shows an undesired event and then determines theunderlying fault events that could contribute to it (Fig. 1). The final investigationreport should contain the following:
& A summary of the occurrence& All systems investigated, not just the systems tied to the failure& A conclusion as to the cause and supporting documentation& Potential effect on previous batches since last media fill& Corrective action& Outcome of additional process simulation tests if they were performed& Appropriate signatures
This investigation needs to be completed in a timely fashion. It may be neces-sary to issue an interim report (9).
Three consecutive successful process simulations are required to qualify anew or significantly revised change aseptic line or area. If there has been a failureon any process simulation without an assignable cause, one process simulation isrequired for requalification of an aseptic processing line.
Invalidation of a Media FillA media fill can only be invalidated for reasons that would absolutely result in thediscard of a product batch. These conditions must be filled out explicitly andthe written justification for the media fill discard and the decision should be madeon the day of execution.
Under what conditions may a process simulation be invalidated?
& Failure of growth promotion of media, provided there are no positive units inthe process simulation.
& Failure of physical conditions in the aseptic processing area (power outage,pressurization loss, HEPA filter failure).
& Failure of operators to follow proper procedures not permitted in normal pro-duction which would lead to the discontinuation of a batch and rejection of allvials filled to that point.
108 Dixon

Process simulation can be aborted for any reason when according to the pro-cedure would lead to the discontinuation of a production batch. However, cleardocumentation of the event that caused the discontinuation should be performedand maintained. Process simulations can be invalidated for any or all of theabove reasons.
CASE STUDY
In a paper presented by John Lindsey at the 2004 PDA Sitek Summit 8–20 March 2004,Orlando, Florida entitled ‘‘Media Fill Challenges,’’ case studies were presented ofwork that was done during the PDA aseptic processing course. The case studies indi-cated that the line had been contaminated and yet the media fill results in some caseshad passed.
During Dr. Lindsey’s case studies, filling line, the cleanroom, filling equip-ment, stoppable, sterile alcohol, and crimper, among others, were contaminated.The results of this study showed that in many of the cases, the media fills havepassed, even though items had been severely compromised.
Five conclusions established at the summit that need to be considered are thefollowing:
1. The level of environmental contamination can influence the sterility assuranceof the product.
2. Good aseptic technique can reduce the risk to the product contamination evenin the presence of a contaminated environment.
3. Personnel are the main vectors of contamination in an aseptically filling facility,unless a contaminated aerosol is created.
4. A contaminated media fill unit is a major event in modern cleanrooms withbasic design, including HEPA filtered air, and a knowledge of good aseptic tech-niques of positive filled media vial or product filled vial should never occur.
5. Any positive filled unit, regardless of the number of vials, should be investi-gated thoroughly and if a reasonable, assignable cause is not determined,the results should be considered a failure.
SUMMARY
The primary purpose for a media fill program is to demonstrate the capabilityof the aseptic process to produce a sterile product. The regulatory requirements,the detailed planning and execution, and the careful documentation are all designedto support this single goal.
Media fills will also provide an important opportunity to train, certify, andmaintain certification of employees working in product manufacture. This in turnsupports the sterility assurance of the product but is an important enough second-ary goal to stand alone.
Training of employees supports not only the specific process being simulatedbut also the enhancement of the individual’s aseptic technique skills overall.Together these two goals are mandated by the regulatory authorities to complywith current good manufacturing practices.
FDA has focused attention on media fill programs as part of a riskbased approach that places more scrutiny in areas of higher risk to the patient
Process Simulations (Media Fills) 109

population. FDA requires that media fill simulations be designed to represent theactual manufacturing practices and process, and concentrate on factors that aremost likely to result in failure, including ‘‘worst-case scenarios.’’
CONCLUSIONS
& Media fills are a necessary part of validation of aseptic processing and ongoingroutine monitoring.
& Microbial contamination of sterile products manufactured by aseptic proces-sing is mainly caused by human interventions.
& Regardless of the number of positives recovered from a media fill, it is the dutyof manufacturers to investigate the origin of microbial contamination to ensurethat both the aseptic manufacturing environment and the product are notat risk.
Media fills in practical numbers have the capability only of detecting con-tamination which is related to events which may compromise asepsis and not ofestimating the underlying contamination rate of the process operating under stoch-astic control (10).
110 Dixon

FURTHER READING
ISO 13408-1. Aseptic Processing of health care products-Part 1: General Requirements,First Edition, 1998-08-01.
PDA. Current practices in the validation of aseptic processing. Technical ReportNumber 36, 2001.
REFERENCES
1. FDA. Current good manufacturing practices for finished pharmaceuticals. FederalRegister 43, 29 September 1978:45077.
2. Code of Federal Regulations 21 CFR Part 211.113(b).3. FDA. Guideline on sterile drug products produced by aseptic processing, 1987.4. Roganti F, Boeh RJ. Design of an aseptic process simulation. Pharm Technol
September 2004, Page 76–84 .5. Parenteral Drug Association. Validation of a septic filling for solution drug pro-
ducts. Technical Monograph Number 2, Philadelphia, Pennsylvania, 1980.6. High purity water systems.7. Agalloco J. Managing aseptic interventions. Pharm Technol March 2005, page
56–66.8. Kawamura K, Abe H. A novel approach to the statistical evaluation of media fill
tests by the difference from no contamination data. PDA Journal, Vol 58, No. 6,November-December 2004:309–320.
9. PDA Technical Report Number 22. Process simulation testing for aseptically filledproducts, 1996 Supplement; 50(S1).
10. Halls NA. Practicalities of setting acceptance criteria for media fill trials. PDA J2000 May–June ; Lyon 54(3):247–251.
Process Simulations (Media Fills) 111


CHAPTER
7 Water Monitoring
Anne Marie Dixon and Karen Zink McCullough
& Introduction& Standards& Validation& Sampling
Sample Vessel& Routine Monitoring& Investigations& Incoming Water& Pretreatment& Water Generation& Water Distribution& Sample Procurement& Sample Testing& Further Reading& References
113


7 Water Monitoring
Anne Marie Dixon
Cleanroom Management Associates, Inc., Carson City, Nevada, U.S.A.
Karen Zink McCulloughWhitehouse Station, New Jersey, U.S.A.
INTRODUCTION
Water is ubiquitous in the pharmaceutical industry. It is used as a support component[clean in place (CIP), presterilization preparation of vials and stoppers] as well as amajor raw material in formulations. Microorganisms may be isolated from the puri-fication, storage, and distribution portions of any water system. If water is used in thefinal product, these microorganisms or their byproducts may create a significantpatient risk. Control of a water system is established through careful validationand the setting of specifications [temperature, total organic carbon (TOC), conduc-tivity, flow rater, microbial load, endotoxin] that govern the routine operation ofthe system. Once validated, control of the system is demonstrated by careful and reg-ular monitoring of the physical parameters of the system (volume, temperature, etc.)as well as the quality attributes of the water that is produced.
STANDARDS
Water quality specifications for a number of types of water used in the pharmaceu-tical industry are defined by the U.S. Pharmacopeia (USP) and other internationalorganizations. The standards listed in the ‘‘Official Monographs/Water’’ of theUSP are enforceable by the U.S. Food and Drug Administration (FDA). The FDAdefines good manufacturing practices for the healthcare industry (pharmaceuticals,biologicals, and medical device) for the production and use of pharmaceuticalwaters including regulation of the facilities that house water production systems.FDA has published a document entitled ‘‘Guide to Inspections of High-Purity WaterSystems.’’ This document, while intended to be used as a guide for FDA investiga-tors, provides information for industry on the agency’s expectations for the designand operation of systems that produce pharmaceutical grade water.
To meet regulatory concerns is to demonstrate control over the process. Thisis accomplished by proper specifications for design, validation, operation, andmonitoring. In addition, testing procedures, operating and maintenance protocolsand procedures, and accurate record keeping are all important components of theoverall process established to consistently produce quality compendial water.
VALIDATION
Validation will ensure that the systems meet the required quality standards. Validationof a water system includes the installation qualification (IQ), operational qualification(OQ), and performance qualification (PQ).
115

The purpose of the IQ is to identify each piece of equipment in or componentof the system to determine that the installation is as per approved specifications.The IQ must demonstrate the following:
& The system was designed and built according to specifications.& The equipment performance is within specifications and is the system that was
tested by the manufacturer.& All components are properly installed and the utilities are consistent with the
equipment requirements.& The operators have been properly trained in the correct operation of the
equipment.& The equipment and monitoring instrumentation are as per the specifications.& The system is housed under the proper environmental conditions.
The IQ documentation package should include a description of the systemand full detailed drawings. The process and instrumentation diagram (P&ID) isa key document. It must be a clear, concise, and accurate reflection of the as-builtcondition. The P&ID is used during the IQ to check the equipment installation and‘‘walk down’’ the pipe routing. The P&ID is also the source of sample port number-ing and locations that are tested throughout the PQ and beyond.
After the equipment and piping have been verified, installed, and oper-ational, the initial phase of testing can begin, generally in the OQ portion of thevalidation. The objective of the OQ is to ensure that the tested system perfor-mances are consistent with the process for which it was intended. Therefore,during the OQ, the equipment, cycles, and programs must be tested to prove thatthe system functions according to specifications.
Initial sanitization is critical, as is the continued sanitization of a loop. Ifthe loop is kept hot, routine sanitization can follow standard practice but ambientloops or drops downstream of a heat exchanger can be a challenge. Challengesto maintaining water systems at points of use include the ability to sanitize thesampling ports, ease of sample taking, proximity to a drain for adequate flush,and dead legs.
FDA is very concerned that the microbiological and chemical samples aretaken in the same manner (e.g., through hoses) as the system is used. So, there needsto be considerable control over the sterilization and changing of hoses along withprocedural constraints on their use (e.g., draining, not touching the floor, etc.).All users of the water system including manufacturing operators and water sam-plers must be trained on the same standard operating procedure (SOP) for waterprocurement to assure that procurement practices are consistent and appropriateto the intended use of the water produced by the system.
The PQ is designed to demonstrate that the water system will consistentlyproduce quality water over an extended period of time—usually no less thanone year. During the course of that year, any seasonal variations in the quality ofthe feed water and operating parameters could affect the quality of the water.For example, in the spring, especially in the northeast portion of the United States,increases in Gram-negative organisms have been observed. Any water systemmust be designed to operate under anticipated extremes. Therefore, the ‘‘whole’’system from pretreatment to deionization to distillation to distribution must per-form to specifications in production conditions at all times. The final part of thevalidation is the compilation of the data into a final report.
116 Dixon and McCullough

During the initial month or 90 days of the PQ, samples are taken daily fromall points on the loop and are tested for quality attributes (TOC, conductivity,endotoxin, microbial load). As experience is gained with the system and confi-dence in the system’s ability to consistently produce quality water is built,sampling may be reduced incrementally, but must be representative of all seg-ments of the system. Ultimately, a routine monitoring plan will emerge from theanalysis of PQ data. Minimally, routine monitoring should assure that each loopand the holding tanks are sampled once a day and that each port on the loop issampled at least once a week. The reduction in sampling is justified if the PQ datahave demonstrated stability in the quality of the water in the loop and have alsodemonstrated that each of the ports consistently operated properly (i.e., no leaks,no mechanical problems with valves, no dead legs, sufficient flushing). Once the‘‘hardware’’ of the system (piping and ports) have been qualified as operatingproperly and consistently, one might assume that water sampled from any porton the recirculation loop is representative of the quality of the water in the loop.The requirement to do each port once a week is to monitor the port, especiallyif there are changes to the configuration or tubing or something else external tothe actual quality of the water post-still.
SAMPLING
Once in operation, control is monitored by the periodic taking of samples and test-ing the samples against the specifications set during validation. Monitoringactually serves three purposes:
1. In the absence of excursions, data gathered from monitoring demonstrate sta-bility of the system.
2. Sudden increases in one or more of the system specifications (e.g., increase inendotoxin or microbial load) may be indicative of an acute problem such asfailure of reverse osmosis (RO) membranes.
3. Long-term gradual increases in detected levels or numbers of excursions in oneor more of the system specifications could signal a chronic problem such as theestablishment of a biofilm.
The key to any qualification or monitoring activity is the integrity of the sam-ples. In-line testing by calibrated instrumentation eliminates the need for ‘‘grab’’samples and provides assurance that sample integrity is maintained and dataare accurate. However, when analysts have to take samples, and when samplingsometimes occurs in uncontrolled or nonsterile support areas for aseptic proces-sing, sample integrity is easily breached. Therefore, a few simple but veryimportant precautions are required.
Sample VesselSample vessels must be prepared in a manner that suits their use:
& Samples taken for microbial limits (bioburden) analysis must be sterile. If con-tainers are prepared in-house, their sterilization either in the autoclave or in adry heat oven must be validated.
& Vessels used for specimens undergoing endotoxin analysis must be free ofinterferences such as detectable endotoxin and inhibitory leachables. If thesecontainers are prepared in-house they must be subject to a validated dry heat
Water Monitoring 117

depyrogenation cycle (autoclaving is not a method for the depyrogenation ofglass or plastic containers.) If vessels are purchased as disposable, sterile,and ‘‘pyrogen-free,’’ USP < 85> requires that they be prescreened for thepresence of interferences—residual endotoxin on surfaces and/or inhibitorysubstances that could be leached from plastics (1). Plastics are suitable for sam-pling if they have been shown to be noninterfering with the test. As a generalrule, polypropylene should not be used to draw samples for endotoxin testingas inhibitors from the plastic surface have been detected and reported in theliterature (2,3). If a certificate of analysis is accepted for residual endotoxinor inhibitory substances in sample containers, it must be verified as acceptableeither by ‘‘in-house’’ confirmation or by a directed vendor audit.
& Containers used for obtaining samples for TOC analysis must be scrupulouslycleaned of organic residues and must have a tight fitting lid.
Samples for microbial limits, endotoxin, or TOC testing are easily contami-nated and must be taken very carefully to avoid extrinsic contamination. In anonsterile area or uncontrolled area, the sampler must take care not to touch theinside of the container or lid and must not expose the inside of the lid or containerto dirty surfaces (e.g., do not lay the lid down on a dirty surface, do not touch theend of the drop to the inside of the container or the lid). Water must be allowed toflow freely, and it is collected from the stream, being careful not to touch the insideof the container to the outside of the sampling port. Care must be taken to avoidusing alcohol to clean the end of a drop prior to taking a TOC sample, as residualdisinfectant could contaminate the sample.
FDA’s ‘‘Guide to the Inspection of High-Purity Water Systems’’ requires thatat any point of use sampling reflect how the water is to be drawn during manufac-ture (4). For example, if water for manufacturing is routinely drawn through steriletubing, the monitoring sample must be drawn through the very same tubing. Caremust be taken by both manufacturing and sampling personnel to reduce the possi-bility of contamination from tubing by:
& Letting the tubing drain freely when not in use so as not to provide ‘‘puddles’’of standing water inside of the tubing for microorganisms to grow.
& Keeping the outlet end of the tubing from touching the floor or hands.
If contamination of the tubing during manufacturing or sampling is suspected,the tubing should be discarded and a new piece of sterile tubing should be installed.Tubing should be changed regularly depending on the quality attributes andintended use of the product. Clearly, sterility and asepsis are more important forparenterals than for nonsterile active pharmaceutical ingredients (APIs).
It is important to design the system in a manner that provides for unob-structed access to all sampling ports. Ports that are behind or under formulationvessels, in closets, or are situated 9 ft above the ground are difficult to sample,and their placement only increases the risk of contamination upon sampling theirplacement may but also pose a significant safety risk to the operator.
Prior to taking the sample, a volume of water is flushed to waste. The totalvolume of this flush or the total time of the flush must be validated. The purposeof the flush is to eliminate any potential contaminants from the inside of the sam-ple port. The flush is an important step in any sample taking, but is especiallyimportant in an ambient system where any length of a deadleg is a potential sitefor the seeding of a biofilm.
118 Dixon and McCullough

Sample volume for microbiological analysis should be reflective of theexpected quality of the water and the type of analysis to be performed. Waterfor injection has a microbial limit of 10 CFU/100 mL. Because of the expectedlow numbers, a sample size of less than 100 mL is unacceptable for water for injec-tion (WFI) or for any sterile water. Potable water used as feed for furtherpurification or nonsterile purified water used in the formulation of nonparenteralpreparations will have microorganisms, so a sample size of 10, 1, or even 1 mL of a1:10 dilution of the sample may be appropriate depending on the expectedmicrobial load. The real concern for WFI is endotoxin. WFI can pass the limulusamebocyte lysate (LAL) endotoxin test yet fail microbial limits; conversely, WFIcan fail the LAL endotoxin test yet pass microbial limits. It is therefore importantto monitor the WFI system for both endotoxin in microorganisms.
Once the sample is taken, it must be transported back to the analysis labo-ratory in a method that will not compromise its integrity. Samples for TOC musthave little or no headspace, samples for endotoxin and microbial limits must havecaps firmly screwed on or snapped on. Once in the laboratory, analysis shouldcommence as quickly as possible—usually within four hours of drawing the sam-ple. Maximum time and optimum temperature for storage of samples not testedimmediately must be validated, but samples for microbial limits and endotoxinshould be refrigerated to slow any microbial growth. Freezing of samples formicrobial limits testing or endotoxin testing is not advised unless validated.
ROUTINE MONITORING
A pharmaceutical system is dynamic and thus requires ongoing microbiologicalmonitoring. After the initial validation, the three elements of a microbiological moni-toring program for a water system are:
1. Representative sampling2. Investigative testing3. Analyzing the resulting data
Trending is an effective way to analyze data from a dynamic water system.The results of the trend analysis become the driving force for determining the bestapproach to ongoing sample testing. For example, seasonal differences in feedwater might be reflected in an upward trend for microbial counts the pretreatmentsystem. This increasing trend will likely have two immediate effects: (i) it precipi-tates discussion on increasing the frequency maintenance and regeneration of thepretreatment system during certain times of the year and (ii) it will provide a focusfor the investigation of a distillation or distribution failure. Monitoring accom-plished by trend analysis can provide a continuous quality improvement processfor water system control.
The microbiological quality attributes of a water system are measured byquantitative (total microbial and endotoxin) and qualitative methods (speciesidentification, and presence or absence of coliform). The data must be reviewedin respect to the validation process specifications.
From a microbiological standpoint, any count is a potentially significant count.Given that bacteria would rather grow on a substrate than be suspended, the totalnumber of bacteria that inhabit a system, particularly an ambient system, can begrossly underestimated by counting only planktonic (suspended) bacteria. Addition-ally, the testing technique can also underestimate the number of bacteria that truly
Water Monitoring 119

inhabit the system. Today, high-purity water is generally tested using low nutrientmedia to mimic the conditions under which these organisms grow. The detectionof gram-negative bacteria in the system could be a foreshadowing of endotoxinproblems.
All microbiological test methods must be validated. Data comparability overtime will largely depend on the stability and robustness of the test method. Aschanges to the method may introduce additional variability in the test data, anymodification should be thoughtfully considered and carefully validated.
Classical microbial monitoring, however, does not provide for real-time data.Depending on the test method and medium used, incubation times will extend up tofive days. The bacterial endotoxins test provides accurate data in an hour or less thatcan be used as a monitoring tool or can be used as a ‘‘go/no go’’ decision on a tankfull of formulation water. Rapid methods for the enumeration of live bacteria arecurrently available. These tests provide useable data, generally within four hoursof taking the sample. Though not yet utilized as in-line monitoring systems, theuse of these rapid methods is a giant step in the application of technology to theconcept of continuous monitoring or process analytical technology (PAT).
To develop an effective microbiological monitoring plan, the intendedpurpose must be defined. The monitoring program must allow for the demon-stration of:
& The quality of the water as used& The evaluation of the system stability over time (ongoing system evaluation
through trend analysis)& Compliance
The quality plan for the water system must provide for the development ofsampling and testing protocols that will provide data to support the monitoringplan. The continuous evaluation and re-evaluation of the number of different sitesto sample and of the frequency of sampling at each site are dependent on theresults of the trending.
Careful data organization and analysis including an assessment both of theseverity of each individual excursion and its possible association with a develop-ing system or trend will help to identify an appropriate and effective correctiveaction in the event of a microbiological excursion. The sampling plan must beflexible and dynamic enough to respond to evolving patterns and trends. Thefollowing conditions might influence the sampling plan:
& Change in sanitization methodology or frequency& Changes in sanitization effectiveness& Regeneration frequency of deionization beds& Effectiveness of microbial retentive filters& Detection of still leakage or malfunction& Detection of equipment failures
INVESTIGATIONS
The failure of a water system to meet any specification is a serious business andcompliance concern. Failures in the system during the PQ of the system are ofparticular concern because any anomalies in the design or functioning of the sys-tem should have been detected and corrected in the execution of the design
120 Dixon and McCullough

qualification (DQ), IQ, and OQ of the system. By the time PQ is executed, thesystem, whether generating purified water, water for injection, or of a site-specificwater quality, should be working optimally.
Failure modes based on quality attributes and specifications for the water gen-erated by pharmaceutical systems include chemical problems (TOC, conductivity),biological problems (microbial load, endotoxin), or nonviable particulates. Inabilityto validate and maintain the efficient cleaning of the system can lead to increasedlevels of any of these attributes.
Each excursion must be investigated to determine the root cause. Arguably, afailure during qualification is more critical than a routine failure, as this is thetime when the system has to ‘‘prove’’ its ability to produce water of consistentlyhigh quality.
Because of the importance of any failure, and particularly the importance ofrepeated failures or patterns of excursions, a thorough investigation is warranted.Sometimes, even the most robust investigation will not reveal any obvious rootcause. However, even though a root cause might be difficult to identify, it doesnot relieve a firm of the responsibility of performing an unbiased, scientific, andtimely investigation into any water system failure.
At a very high level, the investigation must start with the identification of allof the possible failure routes or modes that could have contributed to the excur-sion. Even if a member of the investigation team feels strongly that he or shecan identify the root cause without an investigation, it is important that all possi-bilities be either eliminated or elevated by performing an objective analysis.
A tool such as a fishbone diagram makes the start of the investigation easyand allows the investigation team to systematically work through the problem.A good place to start the investigation is to map out the system using the ‘‘as-built’’drawings and walk through the component parts to identify all of the critical con-trol points where the failure could have been introduced. At the ‘‘head’’ of the fishis the description of the failure (e.g., endotoxin, TOC, conductivity, microbial limit).The ‘‘bones’’ of the fish identify all of the possible routes to that failure. In this case,
FIGURE 1 Fishbone diagram of investigation.
Water Monitoring 121

incoming water quality, pretreatment, water generation, water distribution, waterprocurement, and water testing have all been identified as possible causes of thefailure (Fig. 1).
INCOMING WATER
The quality of the incoming water is critical to the choice of treatment processesand controls required to create consistently high-quality water for manufacturingpurposes. Water quality can be seasonal, with higher microbial counts and higherendotoxin often showing up in warmer weather. Testing of incoming water is animportant part of the control of a water system, but an understanding of the watersource and any treatment of the water at the source are also important. Forexample, a firm will want to get certificates of analysis for the water from a munici-pal water provider so that (i) there is an understanding of what happens to thewater between the source and the plant and (ii) there is an understanding of what
FIGURE 2 Water plant with holding tank.
122 Dixon and McCullough

needs to be incorporated into the in-house treatment system to mitigate fluctua-tions in municipal water quality.
PRETREATMENT
The pretreatment is a very important but often overlooked part of the water sys-tem. Mathematical models of water systems indicate that the quality of theincoming water, the efficiency of each of the pretreatment steps, and the frequencyof cleaning/regeneration of mixed media and charcoal as well as deionized (water)(DI) beds are vital to the production of consistently good quality water.
& Look at the quality of the incoming potable water—has it changed over time?City water does change—is your problem associated with a change?
& Look for loading in pretreatment filtration systems including charcoal filters anddeionization beds. Microorganisms can set up house in these systems and pro-duce not only more organisms, but also in the case of Gram-negativeorganisms, colonized pretreatment components can be endotoxin factories.
& Look at maintenance records for charcoal filters and deionization beds—wereregeneration events missed? Have regeneration methods been validated? Hasthe regeneration interval been validated? Are regeneration events spaced toofar apart?
& If a UV light is part of pretreatment, is it functioning properly? Testing pre- andpost-UV exposure should be done as part of the qualification of the systemand at specified intervals.
& If RO is part of the pretreatment process, it must be validated for its intended use.
WATER GENERATION
Given the mechanism of distillation, a properly functioning still should consist-ently generate WFI—i.e., water that is sterile and has an endotoxin contentunder 0.25 EU/mL. Still efficiency must be validated during OQ and monitoredclosely for a year during PQ. Care must be taken during normal operation thatthe efficiency of the still is not exceeded due to poor pretreatment. Failures poststill should initiate investigation on validation of the still as well as the qualityof the water upstream to study the possibility of still overloading.
If water for manufacturing is generated using only RO rather than by distil-lation, particular care must be taken to examine the process flow for the following:
& RO membranes must be in series, to provide a ‘‘safety net’’ in the case that onemembrane is damaged or exhibits microbial grow through.
& As with the still, the efficiency of the RO membrane series and the system’s pre-ventive maintenance requirements including sanitization and/or membranereplacement intervals must be identified and validated during qualification.
WATER DISTRIBUTION
The distribution system, consisting of the holding tank for the generated water, thepiping, and the sample/use ports, is perhaps the must vulnerable in the entire gen-eration/distribution/use cycle.
In general, to keep the possibility of bacterial contamination and growth at aminimum, distribution systems must be engineered to keep the water circulating.Dead legs, which provide an environment for the accumulation of noncirculating
Water Monitoring 123

water and the growth of bacteria, are to be avoided. Sample and use ports must beaccessible and sanitary. Piping must be constructed free of rough welds, which canact as a home for bacteria and a starting point for rouging in the system. Samplingvalves including gaskets must be made of inert materials that are resistant to corrosionand degradation by the constant exposure to deionized water and/or the port saniti-zation method. Physical conditions that provide a place for bacterial growth areunacceptable in any type of purified water system.
FIGURE 3 WFI storage tank and control panels.
124 Dixon and McCullough

The system’s holding tank for water immediately downstream of the still is aplace where contamination will lead to the fouling of the entire system. Maintenanceof the tank in a sanitized state is essential. Proper venting and the use of sterile ventfilters on the tank will greatly reduce the possibility of the introduction of bacteria intothe headspace of the tank when water is drawn for distribution. If air or an inert gas isused as an overlay for the tank water, its must be validated such that it will not con-tribute either viable or nonviable particulates to the water; essentially, the overlaymust meet the classification of the area into which it is introduced or the substancefor which it is used as an overlay (Aseptic Processing Guideline, 2004). Because waterin a circulating system is returned to the tank, an understanding of the quality of thewater returned and the effect of its reintroduction on the overall quality of the wateralready in the tank must be understood during the qualification phase of the system.
Because of the nature of bacteria to grow on solid substrates, biofilms are ofparticular concern in cold or ambient systems as well as downstream of any heatexchanger unit on a hot system. Sanitization of the system, whether hot or cold,must be validated. Sanitizing agent(s), time and temperature of exposure andthe sanitization interval of the piping, sampling ports, use ports, and the holdingtank are all enormously important to maintaining the quality of a pharmaceuticalwater system. Any lack of validation, lack of preventive maintenance that will keepthe system in a validated state, or departure from the validated conditions is likelyto be a root cause for a water failure.
Some ambient systems are particularly vulnerable to microbial contamination,RO or other filtration methods that operate at ambient temperature and are sus-ceptible to contamination and microbial growth, which compromises the entiredownstream distribution system.
SAMPLE PROCUREMENT
Water procurement procedures, particularly the analyst’s water sampling tech-nique and equipment used to take a failed sample, are almost always the first ofmany areas called into question. While this is understandable because it is the‘‘easiest’’ to explain, it is important to recognize that the laboratory is only oneof many root causes and should be one of many paths that are studied duringthe course of the investigation.
If documented evidence can be produced that implicates either the sampleror the equipment, then the sample result may be legitimately voided, corrective/preventive action identified, and a new sample taken. Examples of these kindsof acute errors are an acknowledgement by the sampler that the sample could havebeen compromised due to lack of aseptic technique, leaving the sampling vesselsopen for more time than necessary, not flushing the port for the validated amountof time, and inappropriate sterilization/depyrogenation of the sampling vessels. Iftrend analysis suggests a more chronic problem, e.g., a lot of purchased vesselsthat are nonsterile, a majority of the excursions assigned to one sampler, an unva-lidated test method, or a sampling vessel whose chemical properties inhibitthe proper testing of the sample, then the action taken become more preventivethan corrective:
& Examine the training courses and records of the analysts involved.& If a single sampler seems to have more excursions than others, go out and
observe the analyst’s technique.
Water Monitoring 125

& Go out and walk the system—are the ports in question particularly difficult toaccess? Does port configuration require that the sampler sacrifice aseptic tech-nique for safety? Are the ports dripping or do they appear to be compromised?
& Examine sampling materials—is there a particular lot or manufacturer ofsampling vessel that is implicated?
The implications of ‘‘false’’positive due to a sampling error is huge, as theintegrity of the system is in doubt unless and until a sampling or testing errorcan be conclusively identified.
SAMPLE TESTING
A firm needs to assure itself that the integrity of a sample is not compromisedbetween the time it is taken and the time it is tested. In terms of the chain of cus-tody of the sample:
& How was the sample transported?& Who transported it? Is this a different person than the analyst who drew the
sample?& Where and under what conditions was the sample stored prior to testing?& Have those storage conditions been validated?& Could the integrity of the sample have been compromised by something phy-
sical (e.g., loose top on the sampling vessel, labeling mix ups)?
The laboratory investigation must proceed past the procurement and trans-port/storage issues and look carefully at the practices of the laboratory and thelaboratory analysts:
& Is the test method validated?& Did the procedure used in failed test depart from the validated test method?& Was the analyst properly trained and qualified?& Was the test equipment appropriately prepared (e.g., sterile materials for bio-
burden testing, depyrogenated materials for endotoxin testing, and cleanvessels for TOC and nonviable particulates)?
& If the testing was performed under a controlled environmental condition, is thereevidence that the environment met the requirements necessary for testing?
All of the items of the failure investigation as defined above, when identifiedand reviewed, will lead to a completed study with an accurate root cause and cor-rective actions or preventive actions, or both.
As stated at the beginning of this chapter, water is a critical utility. Attentionmust be paid to every detail in the design, installation, operations, and prevent-ative maintenance of a system.
126 Dixon and McCullough

FURTHER READING
FDA Guide to Inspections of High-Purity Water Systems.United States Pharmacopeia 29h1231i. ‘‘Water for Pharmaceutical Purposes’’. The
United States Pharmacopeial Convention, Rockville, Maryland, 2006.U.S. EPA 40CFR141.21 Total Coliform Rule.
REFERENCES
1. United States Pharmacopeia 29(85), ‘‘Bacterial Endotoxin Test’’. The United StatesPharmacopeial Convention, Rockville, Maryland, 2006.
2. Associates of Cape Cod. The problems with plastics. LAL Update 1988; 6(3):1–3.3. Roslansky PF, Dawson ME, Novitsky TJ. Plastics, endotoxins, and the limulus ame-
bocyte lysate test. J Parent Sci Technol 1991; 45(2):83–87.4. Food and Drug Administration. Guide to inspections of high purity water systems,
1993. http://www.fda.gov/ora/inspect ref/igs/high.html.
Water Monitoring 127


CHAPTER
8 Bacterial Endotoxin Testing
Karen Zink McCullough
& Introduction& The Quality System& Risk& Hazard and CCP Analysis
Principle 1: Conduct a Hazard AnalysisPrinciple 2: Identify CCPPrinciple 3: Assign Limits for Each CCPPrinciple 4: Verify Monitoring and Testing of LimitsPrinciple 5: Verify Corrective ActionsPrinciple 6: Verify Operational Procedures for CCPsPrinciple 7: Verify that Records of Each CCP Are Documented
& Applying the Principles of Risk Management to the Control ofEndotoxin Contamination in Parenterals
HACCP Principle 1: Identify the HazardHACCP Principle 2: Identify CCPsHACCP Principle 3: Assigning Endotoxin LimitsHACCP Principle 4: Verify Monitoring and Testing of LimitsHACCP Principle 5: Verify Corrective and Preventive ActionsHACCP Principle 6: Verify Operational ProceduresHACCP Principle 7: Verification of Documentation
& Peeling the Artichoke: Determination of CCPs in theLaboratory Performance of the BET Assay
Bacterial Endotoxins Test MethodologiesThe Testing Sequence
& Summary& Abbreviations and Acronyms& Glossary& References
129


8 Bacterial Endotoxin Testing
Karen Zink McCullough
Whitehouse Station, New Jersey, U.S.A.
INTRODUCTION
Why is a chapter on the bacterial endotoxin test (BET) included in a book onenvironmental monitoring? Because endotoxins, which are potent pyrogens, orfever causing agents, are by-products of viable and/or nonviable contaminationof parenteral products by Gram-negative microorganisms. If we define a drug pro-duct’s ‘‘environment’’ as the combination of raw materials or active pharmaceuticalingredients (APIs) and their related processing environments, drug product manu-facturing steps and their related environments, and laboratory testing and itsrelated environment, we can demonstrate that major sources of Gram-negativecontamination in the parenteral industry are environmental and include but maynot be limited to the following:
& Acute and chronic problems with water systems and distribution loops& Raw materials and APIs, especially those obtained from natural sources& Nonvalidated cleaning and/or storage of manufacturing equipment& Nonvalidated hold times for nonsterile product formulations& Nonvalidated depyrogenation procedures& By-products of fermentations& Shedding of microorganisms by operators, and& The technique, equipment, and reagents used in the performance of the
test itself
The control of endotoxin in parenterals is not accomplished through end-product testing, but is assured through careful system and process validation,value-added process control and thorough operator training. A validated test sys-tem and properly qualified analysts and an understanding of the benefits andlimitations of the test method are essential to an accurate test result.
There was no evaluation or report of evaluation of the process from a pyrogen/endotoxin aspect. —FDA 483 citation
The risks of not monitoring a drug product’s environment to both patientwelfare and a firm’s ‘‘bottom line’’ are clear. As with the sterility test, a final endo-toxin determination based solely on a retrospective analysis of a statisticallyinsignificant number of units at the end-product testing stage could result in therelease of product that is contaminated. The risk to the patient is a potentiallysevere febrile reaction or even death. The risk to the firm is a recall and possiblelegal and compliance actions. Conversely, a ‘‘false positive’’ result on a finishedproduct test due to nonvalidated or improperly validated test methods, uncon-trolled test conditions, or unqualified analysts could cause firm to reject a batchof product that is well within specification and would pose no risk to the patient.
131

Carefully conceived validation and process control rooted in a risk-based modelmakes sense in the following:
& Reducing the risk of hazards to the patient& Reducing the risk of product liability& Reducing the risk of compliance actions against the drug product manufacturer& Reducing the risk of potentially unnecessary financial losses to the firm due to
false positive results& Reducing time and money spent on non value-added validation studies& Reducing the level of monitoring to a minimum but efficient and valuable level
In ‘‘Pharmaceutical current Good Manufacturing Practices (cGMPs) for the21st Century,’’ the Food and Drug Administration (FDA) has acknowledged thatthe increasing complexity in both the numbers and the types of parenteral pro-ducts being manufactured and the globalization of the pharmaceutical industryhave made the concept of ‘‘one size fits all’’ Good Manufacturing Practice(GMP) regulation inefficient and cumbersome (1,2). In that publication and sub-sequent updates, it is clear that the compliance focus is shifting away from aplethora of ‘‘GMP-isms’’ toward the concept of a Quality System, where firms takeinto account the intended use of the product, its specific formulation and proces-sing steps, and its identified quality attributes. The implications of this initiativeon the future of parenteral manufacturing are enormous. The days of blindly fol-lowing a set of externally imposed rules and regulations will be replaced by arequirement to understand products and processes so that an internally determ-ined and customized set of rules based on universally accepted best practicescan be applied. FDA will require justification, articulation, implementation, andmonitoring of these internal rules with an eye toward reassessment during the pro-duct life cycle and modification of testing and control as necessary.
This chapter will focus on the utilization of risk management in the appli-cation of cGMP/Quality System to the use of the BET as a tool for the proactive,detection, monitoring and control of endotoxins in drug-product manufacturing.For those readers who are new to endotoxin and endotoxin testing, the conceptspresented in this chapter are based on the following facts and assumptions asdescribed in the law (21 CFR), the science of endotoxin and its detection, andthe compliance requirements for the utilization of the BET to detect endotoxin(3–6). Historical and technical explanations of these facts and assumptions maybe found in the section ‘‘Peeling the Artichoke: Determination of critical controlpoints (CCPs) in the Laboratory Performance of the BET Assay,’’ as well as in anumber of referenced texts.
1. The Law—GMPs and the Quality System Regulation (7–10):
& 21 CFR 211.167(a): ‘‘For each batch of drug product purporting to be sterileand/or pyrogen free, there shall be appropriate laboratory testing to deter-mine conformance to such requirements.’’
& 21 CFR 211.100(a): ‘‘There shall be written procedures for production andprocess control designed to assure that the drug products have the ident-ity, strength, quality and purity they purport or are represented topossess.’’
& 21 CFR 820.70(a): ‘‘Each manufacturer shall develop, conduct, control andmonitor production processes to ensure that a device conforms to itsspecifications.’’
132 McCullough

& 21 CFR 820.70(e): ‘‘Each manufacturer shall establish and maintain proce-dures to prevent contamination of equipment or product that couldreasonably be expected to have an adverse effect on product quality.’’
2. The Science of pyrogen, endotoxin, and the BET (11,12):
& Pyrogens, by definition, are fever-causing substances.& Endotoxins are a specific class of very potent pyrogens. Endotoxins are a
structural component of the outer cell membrane of Gram-negative bacteria.& If administered in sufficient quantities, patients can suffer a number of
adverse effects from the intravenous injection of endotoxin. Excessivedoses of endotoxin can be lethal.
& Endotoxin is a serious hazard in the pharmaceutical industry, as it isubiquitous, is potent, and is difficult to remove.
& Endotoxin is not retained by sterilizing filters, nor is it consistentlyreduced or eliminated by moist heat (autoclaving) or irradiation(c, e-beaming) sterilization methods (13,14).
& Endotoxin is remarkably heat-stable, requiring high heat for long periodsof time for depyrogenation (13–15).
& Lipopolysaccharide is purified endotoxin.& An endotoxin unit (EU) is a unit of measure of an endotoxin’s biological
activity, and not weight or mass.& The BET is a highly specific and sensitive way to detect, monitor, and quan-
titate endotoxins in any raw material, in process sample or drug product.
3. Compendial and Compliance Definitions and Requirements (3–6):
& As of 2001, the JP, the EP, and the USP have published a ‘‘harmonized’’BET. While some of the details of the test methods or language mightdiffer among the three documents, they are philosophically aligned.
& An endotoxin limit is a calculation of the maximum level of endotoxin thatcan be safely administered in a dose of drug product without causing afever in the patient. The endotoxin limit is based on the ‘‘threshold pyro-genic dose of endotoxin’’ determined experimentally in rabbits andconfirmed in humans that is defined as 5 EU/kg (16,17). The formula forthe endotoxin limit is K/M where K¼ the threshold pyrogenic limit of5 EU/kg and M¼dose/kg of patient weight/hr (18).
& Validation of the BET (also known as ‘‘inhibition/enhancement’’) isrequired for all materials under test (4–6,19,20). Test method validationof the BET requires the quantitative recovery of a known addedamount of endotoxin (endotoxin ‘‘spike’’) to undiluted or diluted drugproduct, in process sample or raw material/excipient sample to demon-strate lack of test interference by the substance. Inhibition interferencecould result in a ‘‘false negative’’ test, and true enhancement interference(much more rare than inhibition) could result in a ‘‘false positive’’ test.
THE QUALITY SYSTEM
The Quality System, as defined in 21CFR 820, is the GMP regulation for the medi-cal device industry (7). At the core of the Quality System is the recognitionand clear articulation that control in manufacturing is a series of integrated andinterdependent processes. The Quality System Regulation requires that each
Bacteria Endotoxins Testing 133

manufacturer establish and maintain a system of control over product and processthat is appropriate for the quality attributes, product specifications and intendeduse of the final product.
The Quality System is comprised of seven essential and interdependentsubsystems including management controls, facility and equipment controls,material controls, records/documents/change control controls, production andprocess controls including sterilization process controls, design controls, and cor-rective and preventive action (CAPA) (10,21). The purpose of the Quality Systemis to infuse quality, safety, and effectiveness into a product throughout its life cycle,starting with development and evolving as experience and data are gatheredthrough routine manufacturing (22). At the core of the Quality System is theemphasis on solving quality problems through identification of CCPs, feedback,and analysis of data rather than a reliance on the pass/fail test results for finishedproduct that dominate a traditional ‘‘quality control (QC)’’ model.
RISK
In ‘‘Pharmaceutical GMPs for the 21st Century,’’ FDA has identified the concept of‘‘risk management’’ as a convenient and appropriate tool for the application andimplementation of the Quality System concept to parenteral manufacturing(1,2,23). The concept of risk is not a new one to FDA or other regulatory and indus-try trade organizations, but is new to the manufacture of small volume parenterals(SVPs) and large volume parenterals (LVPs) and biologics.
& 21CFR820: ‘‘Quality System Regulation’’ as applied to the manufacture of par-enteral and nonparenteral medical devices requires a risk analysis asappropriate during device design validation [21 CFR 820.30 (g)].
& ‘‘Hazard Analysis and Critical Control Point Principles and ApplicationGuidelines,’’ published in 1997 by FDA, defines the principles of risk analysisas applied to processing in the food industry (24).
& ‘‘The European Parliament and the Council of the European Union’’ have pub-lished a directive on the manufacture of in vitro diagnostic (IVD) products (25).Annex 1 of this directive defines risk management as an essential requirementin the manufacture of IVD products.
& ISO 14971: ‘‘Medical Devices—Application of Risk Management to MedicalDevices,’’ describes a ‘‘framework within which experience, insight, and judg-ment are applied systematically to manage risks’’ (26).
& The European Diagnostic Manufacturers Association published a documententitled, ‘‘Risk Analysis of In vitro Diagnostic Medical Devices,’’ which remindsreaders that, ‘‘Acceptability cannot be generalized by means of a standard.Therefore, the manufacturer is obliged to consider the possible risks of the spe-cific device during the development process in light of its intended use(s) andalso taking account of potential manufacturer’s liability’’ (27).
The basic tenent of risk management is that when one manages ‘‘risk’’ (theestimation of the possible occurrence of an identified hazard or hazardous con-dition), one understands, anticipates, and works to minimize the potentialimpact of a product failure, or hazard to the patient and to the manufacturer.A good risk-management program contains all of the components of a goodQuality System from fundamental policies and task-specific procedures to changecontrol to process validation and control to laboratory testing to release. For the
134 McCullough

process example in this chapter, the hazard is ‘‘endotoxin contamination,’’ the fail-ure mode is endotoxin in excess of the calculated or assigned endotoxin limit, andthe implication of product failure to the patient is a potential severe adverse reac-tion (fever) or even death.
In order to understand, anticipate and minimize risk, one performs a ‘‘riskanalysis’’ of product and process to identify critical steps in a process that, ifuncontrolled, undetected, or incorrectly measured, could result in a product failureor patient hazard. Risk analysis, ideally, is based on a combination of empiricaldata, scientifically based assumptions, manufacturing experience, and compliancerequirements. At the highest level in our example, once we calculate the endotoxinlimit for the final product, we will be analyzing the drug-product environment forthose places where endotoxin contamination might enter the system and where, bydesign, endotoxin is removed from the system. We define these steps or elementsof the process as CCPs.
Ideally, risk analysis is undertaken by a cross-functional team of experts dur-ing the development phase of the drug-product life cycle, and is updatedperiodically to reflect any process improvements, formulation changes, equipmentchanges, etc. The risk team for endotoxin might consist of representatives from thefollowing departments who understand the science and control of endotoxin:manufacturing, Quality Assurance (QA), engineering, maintenance, validation,QC microbiology (or QC chemistry if the BET is performed in an analytical labora-tory), regulatory/compliance and development. Input from all team members willprovide a comprehensive analysis of all aspects of the process including utilities,facilities, equipment, manufacturing steps, environment, and laboratory testing.Starting the analysis early in the product life cycle provides an opportunity to col-lect data for the exercise of setting appropriate limits for identified CCPs. However,risk analysis is also an extremely valuable exercise for the objective analysis of anexisting process.
Setting limits for identified intermediate CCPs will provide the drug ordevice manufacturer with a significant measure of ‘‘risk control,’’ in that the vali-dation and routine monitoring schemes can be designed from the beginning tocontrol endotoxin contamination and assure its removal where appropriate.Ultimately, the ability to assure the consistently high quality of the product isdependent on the firm’s recognition of the importance of risk management, itscommitment to periodically reassess risk, and its willingness make appropriateprocessing, control, and testing adjustments.
HAZARD AND CCP ANALYSIS
There are many published methods for risk analysis (22,24,26,28–30). While thechoice of method and documentation is up to the user, comparison of all publishedmethods for risk analysis indicates that even though approaches (example ‘‘top-down’’ vs. ‘‘bottom-up’’), lexicons, charts, and diagrams may be different, theyall rely on similar critical thinking processes (Table 1).
One method of applying the logic of risk management to parenteral manufac-turing is through a method that FDA requires in the food industry called HazardAnalysis and Critical Control Point (HACCP) study (24). HACCP is a process-oriented approach to risk analysis, which focuses on prevention or reduction ofrisk through the proactive identification of critical points in the system (steps,
Bacteria Endotoxins Testing 135

equipment, facilities, ingredients, methods, etc.), setting limits relative to the iden-tified hazard, monitoring those limits, identifying possible CAPAs before anexcursion happens, and documenting the entire program. There are seven basicprinciples to HACCP and they are as follows:
Principle 1: Conduct a Hazard AnalysisA hazard is defined as any condition that results in an adverse consequence thatis detrimental to the product or to the patient. In HACCP, each part of the
TABLE 1 Comparison of Three Different Methods of Risk Analysis
Objective HACCP (22,24) ISO 14971 (26) FMEA (30)
Preparatory Assemble a team,define a charter,and developan HACCP Plan
Establish a riskmanagement plan
Identifying FMEAelements
Define the problemrelative to theintended use orpurpose of theproduct and stateddesirable or requiredquality characteristics
Principle 1: Conduct ahazard analysis
Risk analysis: Intendeduse/purpose;identification (ID) ofquality charac-teristics; IDof known orforseeable hazards;estimation of riskfor each hazard
Identify functions(intended purpose ofthe product); identifypotential failuremodes (categories offailure); define theeffects or potentialdownstreamconsequences offailure mode
Establish criticalpriorities relative tothe intended use orfinal specifications
Principle 2: Determinecritical control points
Risk evaluation:Prioritization of risks
Quantify the severity ofthe effects; quantifythe occurrence of thefailure; calculatecriticality (severity�occurrence)
Define limits for eachcritical step
Principle 3: Establishcritical limits
Risk control: Optionanalysis;implementationof risk controlmeasures
Define current designor process controls
Define monitoringparameters andconsequences ofexcursion
Principle 4: Establishmonitoringprocedures
Risk control:Implementationof risk controlmeasures
Determine and validate(if necessary)detection methods formonitoring
Validation, update asnecessary accordingto change control
Principle 5: Establishcorrective actions
Risk control:Verification ofefficacy of the riskcontrol measures.Overall residualrisk evaluation,post productioninformation
Reducing risk—revisitand provide feedbackaccording to thecontrols andmonitoring instituted
Principle 6: Establishverificationprocedures
Documentation Principle 7: establishrecord keeping
Risk management file Document the studyand actions taken
Abbreviations: HACCP, Hazard Analysis and Critical Control Point; ISO, International Standards Organization;FMEA, failure mode and effect analysis; ID, identification.
136 McCullough

manufacturing process is evaluated to determine whether a particular hazardcould result if the step is not controlled. Hazards can be biological (e.g., lack ofassurance of sterility for parenterals, objectionable organisms in nonsterileproducts, endotoxin contamination in excess of the defined limit for parenterals),physical (e.g., nonviable particulate contamination, cracked vials, unseated stop-pers), or chemical (e.g., subpotent or super potent drug product).
Principle 2: Identify CCPNot every action or step, piece of equipment, facility, or utility within a process iscritical for each identified hazard. Risk analysis provides a mechanism to scientifi-cally and objectively differentiate points in the process that carry little risk frompoints that carry considerable risk, and to prioritize these points relative to theidentified hazard. Identification of CCPs early in product development identifiesa minimum number of important points for initial process validation studiesand for routine monitoring, resulting in value-added and efficient process control.
Principle 3: Assign Limits for Each CCPEach CCP must have an assigned limit that is relevant, accurate, scientificallysound, attainable, and verifiable.
Principle 4: Verify Monitoring and Testing of LimitsOnce limits have been assigned, equipment used to take those measurements mustbe qualified and calibrated, and test methods must be validated.
Principle 5: Verify Corrective ActionsHaving a comprehensive process analysis provides the team with the opportunityto anticipate and identify the types of hazard-specific excursions that could happenduring routine manufacture, and prospectively analyze each excursion type withregard to its risk to the product and patient. Reasons for excursions can be identi-fied and categorized via a failure mode effect analysis (28) or a similar logic. TheHACCP team can then consider and document the types of CAPA that wouldbe appropriate for possible identified failures.
Principle 6: Verify Operational Procedures for CCPsThis step includes writing standard operating procedures (SOPs) and appropriatedocumentation to identify frequency of routine monitoring, responsibility for datagathering,/analysis/reporting, provisions or out of specification (OOS) investi-gation, training, preventive maintenance and calibration schemes for equipment.
Principle 7: Verify that Records of Each CCP Are DocumentedProcess control requires complete and controlled documentation, both for routinerelease purposes and for diagnostic purposes in the event of a CCP excursion.
APPLYING THE PRINCIPLES OF RISK MANAGEMENT TO THECONTROL OF ENDOTOXIN CONTAMINATIONIN PARENTERALS
Recognizing that cGMPs and the Quality System Regulations are based on theprinciple of process control, how can a firm utilize the principles of risk analysis
Bacteria Endotoxins Testing 137

to selectively, efficiently, and effectively examine processes and products to under-stand, anticipate, and minimize the possibility of endotoxin contamination?
Risk management through analysis requires that the entire manufacturingprocess be objectively examined to identify CCPs. Risk analysis is like peelingan artichoke. Depending on the process or product, risk analyses occur either sim-ultaneously or sequentially on a number of different levels. At the highest levels,the facility, utilities, and systems [e.g., water for injection (WFI), heating, venti-lation, and air conditioning (HVAC), cleaning validation and sanitization] areanalyzed for the particular hazard, and are validated and monitored accordingto respective control and CCPs.a Once facilities and utilities are analyzed and vali-dated, the risk team can move to the next layer of analysis: the process itself.
On a very high level, one might define CCPs as places in the process whereendotoxin can either be added to or eliminated from the system. This can be adaunting task, especially with a complex process, so looking at smaller piece partsmakes the analysis process more manageable. In order to study process control, itis most helpful to create a graphic representation the manufacturing process.A map of a simple, generic process is outlined in Figure 1. This process will bethe example and reference point for the remainder of this section. For ease of analy-sis, the process has been divided into five distinct segments:
1. Raw materials: Raw materials/APIs are received into the laboratory for testingagainst raw-material specifications for disposition by QA.
2. Formulation/compounding: Raw materials and API are formulated in WFI.3. Filtration: The formulated product is subjected to sterile filtration and then to
ultrafiltration immediately prior to filling.4. Filling: The sterile formulated product is aseptically filled into sterile/
depyrogenated vials and stoppered with sterile/depyrogenated closures.5. End-product testing: The drug product is tested to finished-product specifica-
tions for disposition by QA.
FIGURE 1 Generic process sequence. Abbreviations: CIP, clean in place; WFI, water for injection;API, active pharmaceutical ingredient; COA, certificate of analysis.
a The WFI system, which is a critical system for the control of endotoxin, is discussed indetail in Chapter 7.
138 McCullough

For the example, we will make the following assumptions:
& All utilities and systems such as WFI, clean in place (CIP), sterilize in place(SIP), HVAC and cleaning/sanitization have been validated.
& The dose of the example drug product is 1 mL/person and is administered inone single intramuscular (IM) injection/day. This drug has not been approvedfor use in children.
& The API is chemically synthesized in our facility.& The active ingredient has a low molecular weight relative to endotoxin aggre-
gates.& Site audits have not yet been performed for all raw material suppliers.& Preliminary testing has been performed on a limited number of supplier’s pre-
shipment samples of raw materials.& The formulation of the example drug is described in Table 2.
The seven principles of HACCP can applied to the process outlined inFigure 1 as follows:
HACCP Principle 1: Identify the HazardFor the current discussion, ‘‘endotoxin contamination’’ has been defined as thehazard. Gone untested, undetected, or incorrectly measured, endotoxin contami-nation can cause serious complications or even the death of a patient receivingadulterated drug product
HACCP Principle 2: Identify CCPsEach segment of the generic process will be examined objectively for the presenceof CCPs. Determination of CCPs must be scientific and unbiased. The consistentuse of a decision tree, such as the one outlined in Figure 2, is suggested
Taking each of the five process segments separately, we can use the decisiontree to identify CCPs.
Process Segment 1: Raw Materials
‘‘ . . . there was no report that discussed the purity and endotoxin content of rawmaterials.’’ (FDA 483 citation)
Raw materials come from many sources. Looking across the spectrum ofraw materials used in parenteral manufacturing, one might expect that materials
TABLE 2 Formulation of Generic Exemplar Product
Component Concentration
NaCl 9 (mg/mL)Dextrose 150 (mg/mL)Synthesized active pharmaceutical
ingredients (drug substance)75 (mg/mL)
Water for injection 1 mL
Bacteria Endotoxins Testing 139

FIG
UR
E2
Decis
ion
tree
for
the
identifi
cation
of
CC
Ps.
Abbre
via
tion:
CC
P,
criticalcontr
olpoin
ts.
Sourc
e:
Fro
mR
efs
.29
and
31.
140 McCullough

isolated from natural sources are likely to contain endotoxin because Gram-negative bacteria are ubiquitous in nature. Components such as sugars and activeingredients such as heparin (extracted and purified from pigs and cows) or activeingredients isolated and purified from fermentations utilizing an Escherichia colihost are likely to contain endotoxin (32). Conversely, inorganic salts, strongacids/bases or chemically synthesized materials are less likely to contain endotoxinbecause the nature of the manufacturing processes are such that they are less subjectto contamination by Gram-negative bacteria. Is it acceptable for components of par-enteral formulations to contain endotoxin? Yes. The BET cannot measure ‘‘0’’endotoxin; so material can technically never be labeled as ‘‘endotoxin-free’’ or ‘‘pyro-gen-free.’’ However, the cumulative level of endotoxin in the particular formulationcontributed by individual formulation materials, processing steps, and fill compo-nents (vials and stoppers) may not exceed the calculated endotoxin limit for thefinal drug product. Therefore, without reasonable process control, there is a very realrisk that endotoxin in the final product may exceed its calculated endotoxin limit.
Are raw materials CCPs? Raw materials are clearly control points, but theircriticality in terms of the potential for endotoxin contamination is dependent onthe origin and processing of the raw material and the concentration of the materialin the final drug product. The decision tree in Figure 2 was used to document andjustify analyses for two common raw materials—dextrose and sodium chloride.Dextrose is derived from corn, and is therefore likely to have some backgroundlevel of endotoxin. Sodium chloride is an inorganic salt, and as such is less likelyto contain endotoxin. Preliminary testing of a number of lots in the laboratoryshould be performed to confirm any assumptions.
Question 1: Does this step (in this case, this raw material) involve a hazard orsignificant risk or severity to warrant its control? For dextrose, preliminary testingin the QC laboratory as well as examination of endotoxin test results at our sup-plier might well reveal that there is considerable lot-to-lot variability in the levelof endotoxin in the material. So, the answer for dextrose would be ‘‘yes,’’ andwe would continue to question no. 2. For sodium chloride, its origin, our vendoraudit, the vendor testing, and our preliminary testing might indicate that we findlow levels of endotoxin (or perhaps no detectable endotoxin), and that because ofthe processing of sodium chloride there is no lot-to-lot variability. The answer toquestion no. 1 for sodium chloride would be ‘‘no,’’ and sodium chloride wouldnot be considered to be a critical raw material.
TABLE 3 Decision Tree: Process Segment 1—Raw Materials
Raw material
Question Sodium chloride Dextrose
1. Does this step involve a hazardor significant risk or severity towarrant its control?
NO (not a CCP) YES—dextrose is derived from anatural source
2. Does a preventive measure forthe hazard exist at this step?
NA YES—vendor qualification and a CoAwill minimize the potential for highlevels of endotoxin
3. Is control at this step necessaryto prevent, eliminate, or reducethe hazard?
YES—testing of each lot will confirmthat endotoxin is below theacceptable limit (CCP)
Abbreviation: CCP, critical control point.
Bacteria Endotoxins Testing 141

Question 2: Does a preventive measure for the hazard exist at this step? Fordextrose, the vendor qualification and initial confirmation of the vendor’s certifi-cate of analysis, and the level of dextrose in the finished drug product mightprovide a level of comfort for the laboratory to accept the CoA in lieu of testingeach lot received. So, we will answer ‘‘yes’’ to question no. 2, as we have identifiedthe vendor’s processing and testing as a preventive measure.
Question 3a: Is control at this step necessary to prevent, eliminate, orreduce the hazard to the patient? In our case, dextrose is a huge formulationcomponent, and we might feel more comfortable including a QC endotoxintest for each lot received. Our answer to 3a is ‘‘yes,’’ so we have now identifieddextrose as a CCP.
Another raw material of note is the API. The FDA has repeatedly cited com-panies for not having endotoxin limits for APIs, indicating that FDA considers theactive ingredient to be a critical control point.
The specification for the active drug substance . . . does not include a microbial contentor bacterial endotoxin limit, and the drug substance is not qualified by the vendorfrom a microbial or bacterial endotoxin perspective. (FDA 483 citation)
Process Segment 2: FormulationThe formulation segment of the process can be subjected to the same decision-mak-ing CCP analysis that was used for the raw materials. I have chosen the ‘‘hold’’step to illustrate the decision process.
Some batches without established bulk holding times have been held for an extendedperiod of time without bioburden or LAL data to support the time. There was no bio-burden or endotoxin testing conducted during validation. (FDA 483 citation)
For our product, raw materials are not sterile and allowing an unpreserved,nonsterile formulation to sit for any appreciable period of time increases the prob-ability of bacterial growth. If any of the bioburden bacteria happen to be Gramnegative, this hold step also increases the probability of endotoxin generation.Therefore, because of the variability of numbers and types of microorganisms inthe raw materials, the hold step is a CCP even after validation and should be mon-itored on a routine basis for endotoxin.
If the hold step is on a sterile, formulated product the CCP decision may bevery different. Once sterile and held in a sterile container, the bulk should remain
TABLE 4 Decision Tree for Process Segment 2—Formulation
Question Hold time
1. Does this step involve a hazard orsignificant risk or severity to warrantits control?
YES—the holding of a nonsterile, formulated drug productcould result in bacterial growth. If the growth includesGram-negative bacteria, the endotoxin levels in theproduct will increase during the hold time
2. Does a preventive measure for thehazard exist at this step?
YES—validation has confirmed appropriate hold times andtemperatures
3. Is control at this step necessary toprevent, eliminate, or reduce thehazard?
YES—if raw materials come in with Gram-negativebioburden or if times and temperatures are not followed,the material could become contaminated with endotoxinthat will exceed the depyrogenating ability of ourdownstream processing
142 McCullough

sterile. By definition, there are no live Gram-negative bacteria in that solution, sothe possibility of proliferation and adding endotoxin during hold time should benon-existent. However, endotoxin testing is an important component of the holdtime validation study, to confirm that the combination of vessel, hold time, andhold temperature is not a significant factor.
Process Segment 3: FiltrationOur process specifies two filtrations prior to filling. The first is a filtration through a0.22mm filter (sterilizing filter) and the second, immediately prior to filling, isthrough an ultrafilter (UF), which is intended as a final depyrogenation step. Aswith any depyrogenating step, the efficiency of the UF in removing endotoxinmust be demonstrated (Table 5).
Review of endotoxin reduction validation studies revealed no control was conductedto determine the amount of endotoxin that can be recovered after seeding the tankwith pyrogens. (FDA 483 citation)
The sterilizing filter has no effect on endotoxin. Although the filter is vali-dated for the retention of live and dead bacteria or even larger cell parts, theendotoxin molecule or aggregate is sufficiently small that it will pass through a0.22 mm filter. Therefore, the sterilizing filter would be a CCP for a different hazard(bioburden or lack of assurance of sterility), but it is not a CCP for the identifiedendotoxin hazard.
The UF, if sized correctly, will remove endotoxin. UFs are ‘‘rated’’ by themolecular weight of molecules that are retained by the membrane. If the producthas a sufficiently low molecular weight as compared to endotoxin, which,depending on aggregation state has a molecular weight of 20,000 to 1,000,000Da, one can use ultrafiltration to separate endotoxin from formulated product(11–14,33,34). For our example, the UF was deliberately placed in the process aftersterile filtration and before filling as a mechanism for depyrogenation. As adepyrogenating device, and as the ultimate step in our process designed speci-fically for endotoxin removal, the ultrafiltration step is defined as a CCP.
TABLE 5 Decision Tree: Process Segment—Filtration
Filtration step
Question Sterile filtration Ultrafiltration
I. Does this step involve ahazard or significant risk orseverity to warrant itscontrol?
NO. While the sterile filtrationmight help with the eliminationof live Gram-negative bacteria,it will not filter out freeendotoxin (not a CCP)
YES—the intent of this step isto remove endotoxin
2. Does a preventive measurefor the hazard exist at thisstep?
NA Yes—ultrafiltration has beenvalidated
3. Is control at this stepnecessary to prevent,eliminate, or reduce thehazard?
NA YES—routine monitoring at thisstep is important to thecontrol of endotoxin in thefinal product (CCP)
Abbreviation: CCP, critical control point.
Bacteria Endotoxins Testing 143

Process Segment 4: FillingThe filling step takes place in a Class 100 (ISO 5) area. Filling needles and fillinglines are sterilized. Vials and stoppers are depyrogenated. Although there aremany steps in the filling process, we will concentrate on two steps: the depyro-genation of components and the actual filling of the vials (Table 6).
The firm has not validated the cycle used to depyrogenate vials to ensure properendotoxin reduction of test vials. (FDA 483 citation)
The washing process used by the firm for rubber closure components has not beenvalidated for the reduction of endotoxins. (FDA 483 citation)
Incoming ComponentsIncoming components are not defined in our decision tree as a CCP. As with rawmaterials, the only way to reduce or eliminate endotoxin at this point is to screena preshipment sample for endotoxin and reject the lot if the level of endotoxin isfound to be in excess of a predetermined limit. Current glass production processes,shrink–wrap packaging, and validated shipping reduce the likelihood of significantcontamination, even in nonsterile components. In the case of glass, stoppers, andother components, a subsequent, validated depyrogenation step in the process priorto filling must, by definition, reduce endotoxin by at least three logs to an acceptablelevel (35). Therefore, while monitoring of incoming components may be usefulduring validation to determine a baseline for incoming component cleanliness, andwhile a number of lots might be tested at some interval (perhaps annually) to confirmthat endotoxin levels on incoming components are stable and low, we might defineincoming components as a control point, rather than a CCP.
TABLE 6 Decision Tree: Process Segment 4—Filling
Filtration step
Question Incoming components Depyrogenation Filling
1. Does this stepinvolve a hazard orsignificant risk orseverity to warrant itscontrol?
NO—processing andpackaging ofcomponents controlendotoxin andpreliminary testingconfirms low, if any,endotoxin is detected(not a CCP)
YES—if not properlyvalidated and if notproperly run on aroutine basis,components may notbe depyrogenated
NO—history ofenvironmentalmonitoring (includingpersonnel monitor-ing) does notindicatecontamination byGram-negativebacteria (not a CCP)
2. Does a preventivemeasure for thehazard exist at thisstep?
NA YES—depyrogenationprocesses have beenvalidated
NA
3. Is control at this stepnecessary toprevent, eliminate, orreduce the hazard?
NA YES—continuedexamination ofcharts/readouts ofdepyrogenationprocedures must beincluded in the batchrecord reviewprocess (CCP)
NA
Abbreviation: CCP, critical control point.
144 McCullough

DepyrogenationDepyrogenation processes for vials and stoppers are validated to eliminate orreduce endotoxin to clinically insignificant levels. Per USP, validation of a depyr-ogenation process requires that at least a three-log reduction be demonstratedfrom a starting point of at least 1000 recoverable EUs (15,35). Heat-stable compo-nents such as glass vials and ampoules and metal instruments are generallydepyrogenated by dry heat, while heat-labile components such as rubber stoppersare depyrogenated by long rinsing cycles in WFI. As a terminal depyrogenationstep, the depyrogenation process (baking of vials or rinsing of stoppers) is aCCP (see section ‘‘Peeling the Artichoke: Determination of CCPs in the LaboratoryPerformance of the BET Assay’’ for additional discussion of depyrogenation.).
FillingThe environment is critical to maintaining asepsis during filling. To the extent thatcontrol of the environment including air, water, and surfaces eliminates or reducesthe probability of introduction and proliferation of any microorganism into theenvironment, it also controls Gram-negatives, and ultimately the potential forendotoxin contamination. Although endotoxin in the air is measured insome environments (e.g., fiber and fabric mills), air in an aseptic area is not routinelymonitored for the presence of endotoxin. The possible presence of endotoxin in aclassified area is extrapolated from the types and numbers of viable organismsrecovered viable air and surface monitoring in the core. Any organism isolatedfrom a Class 100 (ISO 5, EU Grade A/B) environment should be identified to genusand species (23); so the laboratory would be alerted immediately to an outbreak ofGram-negatives in the core.
Fortunately, gram-negative organisms are rarely isolated from a Class 100aseptic environment. This history suggests that the risk of endotoxin contaminationin drug products from normal flora found in aseptic areas is minimal. One estimatefor the amount of endotoxin in one E. coli cell is 2.9� 10�4 pg/cell (12). Assumingthat the potency of the endotoxin is 10 EU/ng (a common potency for E. coliendotoxin), and that the sensitivity of the test system is 0.0625 EU/mL (a commongel clot sensitivity), it would take approximately 21,500 cells/mL to elicit a gel clotpositive response. This logic suggests that while environmental control is a CCPfor microbial contamination in general, the likelihood of a positive endotoxin resultfrom the environment without a huge and obvious excursion of Gram-negativeorganisms is minimal. Therefore, we can justifiably call routine environmental con-trol a CCP for asepsis, but a control point for endotoxin.
Although relatively rare, the isolation of a Gram-negative organism in the coreis both an out-of-trend excursion and a potential endotoxin generator; so Gramnegatives should be treated as objectionable, and their source investigated. Waterin the aseptic core, nonvalidated storage of wet components, nonvalidated SIP, orCIP or equipment, and ineffective sanitation/sterilization should be consideredwhen investigating the presence of Gram-negative bacteria in the core or an OOSBET test result. Contact plates from gowning qualification and personnel monitor-ing must be examined for the presence of Gram-negative bacteria. Operators mustundergo training in personal hygiene and aseptic technique to guard against con-tamination of sterilized/depyrogenated product and components. Operators whoshow evidence of Gram-negative bacteria either on the gowning qualification orroutine personnel monitoring samples, or operators who are ill must be reassignedto tasks outside of the core until investigation and/or retraining is completed.
Bacteria Endotoxins Testing 145

Process Segment 5: Finished Product TestingThe final step in our generic process is finished-product testing. As with sterility, thestate called ‘‘free of detectable endotoxin’’ cannot be assured through finishedproduct testing—it is assured through careful process validation and value-addedmonitoring for routine process control. If a process is validated and is in control,the result of the finished-product testing should be a foregone conclusion.
The FDA Guideline for Limulus Amebocyte Lysate (LAL) testing of finishedproducts requires that a minimum of three units, representing the beginning,middle, and end of the fill be tested for endotoxin. For medical devices, the minimumnumber of units selected for testing is dependent on the lot size (6). The harmonizedpharmacopeial chapters are silent on the issue of sampling.
Although the number of test units is statistically insignificant, the results of fin-ished product testing are extremely important. An OOS result on any one of theindividual units or on the pool of the units culled at random from across the fillingrun can cause the entire batch to be rejected unless contamination during testing, abreach of the test protocol that could have resulted in a false positive, operator error,contaminated test equipment, or the use of inappropriate reagents can be unequivo-cally demonstrated and documented (36). As with the sterility test, it is imperative inBET testing that the assay be kept as clean as possible to avoid the possibility of a falsepositive. Qualified analysts who can demonstrate good aseptic technique, equipmentthat is clean and free of detectable endotoxin, a validated test method and qualified/calibrated assay equipment are all vital prerequisites to a valid BET test (Table 7).
Thus, the performance of test itself, including the reagents, the equipment,the method, and the analyst is a critical control step in any process employing theBET. For a more detailed analysis of test methodology, see section ‘‘Peelingthe Artichoke: Determination of CCPs in the Laboratory Performance of theBET Assay.’’
Many segments in our generic process could require additional, more task-specific risk analyses. For example, the following task-specific processes shouldbe further examined for the presence of CCPs for the endotoxin hazard:
& The synthesis or fermentation process for our API& Any depyrogenation step (section ‘‘Peeling the Artichoke: Determination
of CCPs in the Laboratory Performance of the BET Assay’’)& The testing process itself (section ‘‘Peeling the Artichoke: Determination of
CCPs in the Laboratory Performance of the BET Assay’’)
TABLE 7 Decision Tree: Process Segment 5—Testing
Question Finished product testing
1. Does this step involve a hazard orsignificant risk or severity to warrantits control?
YES—there is a significant risk of a false result if thebacterial endotoxins test is not validated or if it isimproperly performed
2. Does a preventive measure for thehazard exist at this step?
YES—analyst qualification, reagent confirmation of labelclaim (or standard curve linearity), product validation,and routine system suitability all provide assurance thatthe test is performing correctly
3. Is control at this step necessary toprevent, eliminate, or reduce thehazard?
YES—the test and its accessories must be continuallycontrolled to assure a valid test result (CCP)
Abbreviation: CCP, critical control point.
146 McCullough

& Complex formulations& Labor-intensive or equipment-intensive manufacturing steps
Control points and CCPs for our generic process as identified in HACCPPrinciple 2 are summarized in Table 8.
HACCP Principle 3: Assigning Endotoxin LimitsOnce CCPs have been identified, scientifically sound and attainable endotoxin lim-its must be assigned. Initially, action limits are calculated and assigned for the drugproduct and to all critical materials and processing steps. As process experience isgained, action limits may be modified and alert limits may be set based on histori-cal data and process capability, recognizing possible seasonal fluctuations in theendotoxin content of incoming city water and raw materials.
Endotoxins were not evaluated during validation and there was not data to justifyestablished endotoxin specifications. (FDA 483 citation)
The calculated endotoxin limit for a drug product is the maximum allowablelevel of endotoxin for a product with a specific formula and an identified maximumdose per kilogram patient weight, route of administration length of administration.For endotoxin testing, compendial limits exist for drug products and WFI, but notfor raw materials, individual APIs, and formulation excipients (18,20). In order toassign limits to items for which no published limit exists, we must start with the cal-culated limit for the finished drug product and work backward to ‘‘distribute’’ theallowable endotoxin among the various formulation components. Any assumptionsthat are made during this exercise must be clearly stated, explained, and justified.
Calculating Endotoxin Limits for Small-Volume Parenteral Drug ProductsThe endotoxin limit for a SVP drug product is defined on the basis of dose, and iscalculated using the following formula:
Endotoxin limit ¼ K
M
where K is the threshold human pyrogenic dose (5.0 EU/kg for any route of admin-istration other than intrathecal, 0.2 EU/kg for those drug products administered
TABLE 8 Summary of Control and Critical Control Points for the Process Outlined in Figure 1
Identified control point Manufacturing segment
Uncontrolled points Sterile filtration FiltrationControl points Sodium chloride Raw materials
Incoming components FillingFilling environment Filling
Critical control points Active pharmaceutical ingredient Raw materialsDextrose Raw materialsHolding of formulated product FormulationUltrafiltration FiltrationDepyrogenation FillingDrug-product testing Laboratory testing
Bacteria Endotoxins Testing 147

intrathecally), M is the maximum recommended human dose of product/kg ofbody weight administered in a single one-hour period.
For our example, the dose of the product is 1 mL/person, and our drug isadministered in a single IM injection (assumptions and Table 2). We assume thatthe average person weighs 70 kg (3,6,37). Therefore, the total allowable endotoxinper person would be the following:
70 kg=person� 5EU=kg ¼ 350 EU=person
The endotoxin limit for our product is calculated as follows:
Limit ¼ K
M¼ 5:0 EU=kg
1:0 mL=70 kg¼ 350 EU=mL
Therefore, the maximum level of endotoxin ‘‘available’’ to us for distributionamong all components in the formulation, including stoppers and vials, is 350EU/mL (Fig. 3).
The endotoxin limit specification for a drug product may not exceed this cal-culated value, but a firm may choose to assign a lower, more stringent endotoxinlimit for the product. This lower limit provides manufacturers with a ‘‘safety factor’’and can be justified given the follows:
& The patient could be on multiple therapies, each of which can potentially contributeendotoxin. We tend to think of the endotoxin limit in terms of only one therapy perpatient, but we must realize that the 5 EU/kg limit is really the sum of all endotoxinsources. Thus, it is in the patient’s best interest that the detectable endotoxin in anyone-drug product be well below the allowable limit.
& The BET has a considerable error (see section ‘‘Segment 5: Data Analysis andInterpretation’’).
Often, firms choose half or quarter of the calculated endotoxin limit as theirin-house specification for a well-characterized product and process. Althoughmanufacturing a product with very low endotoxin is clearly in the patient’sinterest, there are some cautionary notes on the practice of assigning ‘‘safety fac-tor’’ in-house endotoxin limits.
& If the in-house final product specification is lower than the calculated or com-pendial limit, a product may not be released if it fails the in-house specificationbut passes the compendial or calculated specification. Therefore, if the in-houselimit is set too low, product may be rejected unnecessarily.
& In-house limits that are different than calculated limits must be set relative tothe documented manufacturing history of the product (process capability)rather than an arbitrary or common level. Setting endotoxin limits without
FIGURE 3 Assigning limits relative to process flow: drug product. Abbreviations: EU, endotoxinunit; UF, ultrafilter.
148 McCullough
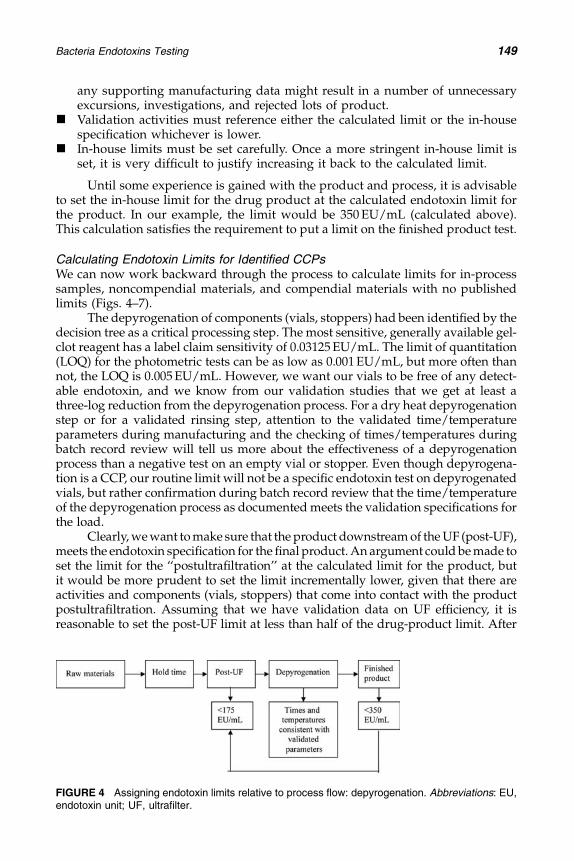
any supporting manufacturing data might result in a number of unnecessaryexcursions, investigations, and rejected lots of product.
& Validation activities must reference either the calculated limit or the in-housespecification whichever is lower.
& In-house limits must be set carefully. Once a more stringent in-house limit isset, it is very difficult to justify increasing it back to the calculated limit.
Until some experience is gained with the product and process, it is advisableto set the in-house limit for the drug product at the calculated endotoxin limit forthe product. In our example, the limit would be 350 EU/mL (calculated above).This calculation satisfies the requirement to put a limit on the finished product test.
Calculating Endotoxin Limits for Identified CCPsWe can now work backward through the process to calculate limits for in-processsamples, noncompendial materials, and compendial materials with no publishedlimits (Figs. 4–7).
The depyrogenation of components (vials, stoppers) had been identified by thedecision tree as a critical processing step. The most sensitive, generally available gel-clot reagent has a label claim sensitivity of 0.03125 EU/mL. The limit of quantitation(LOQ) for the photometric tests can be as low as 0.001 EU/mL, but more often thannot, the LOQ is 0.005 EU/mL. However, we want our vials to be free of any detect-able endotoxin, and we know from our validation studies that we get at least athree-log reduction from the depyrogenation process. For a dry heat depyrogenationstep or for a validated rinsing step, attention to the validated time/temperatureparameters during manufacturing and the checking of times/temperatures duringbatch record review will tell us more about the effectiveness of a depyrogenationprocess than a negative test on an empty vial or stopper. Even though depyrogena-tion is a CCP, our routine limit will not be a specific endotoxin test on depyrogenatedvials, but rather confirmation during batch record review that the time/temperatureof the depyrogenation process as documented meets the validation specifications forthe load.
Clearly, we want to make sure that the product downstream of the UF (post-UF),meets the endotoxin specification for the final product. An argument could be made toset the limit for the ‘‘postultrafiltration’’ at the calculated limit for the product, butit would be more prudent to set the limit incrementally lower, given that there areactivities and components (vials, stoppers) that come into contact with the productpostultrafiltration. Assuming that we have validation data on UF efficiency, it isreasonable to set the post-UF limit at less than half of the drug-product limit. After
FIGURE 4 Assigning endotoxin limits relative to process flow: depyrogenation. Abbreviations: EU,endotoxin unit; UF, ultrafilter.
Bacteria Endotoxins Testing 149

collecting sufficient historical data on this step, we may choose to tighten the limit toalign with process capability. Setting this limit lower than the drug-productlimit should help assure that the drug product, in the absence of testing error or overtcontamination event in filling, will always meet the specification.
If we work back through the process one more step, we can assign an endo-toxin limit to the formulated bulk posthold and upstream of the ultrafiltration(preaseptic filtration and pre-UF). This hold is on nonsterile, formulated bulk,which poses some unique considerations. The limit that we assign must dependon the following:
& The history of the endotoxin levels and bioburden levels in the formulated bulkupstream of the sterilizing filter (e.g., are Gram-negatives normally isolatedfrom the prefiltration bulk bioburden samples?),
& The efficiency of the UF to remove endotoxin, which is demonstrated duringthe validation of the process, and
& Validation data from the hold time studies.
In the absence of historical data, but recognizing the validated ability of theUF to provide a three-log reduction in endotoxin, we could justifiably set a limitfor the unfiltered bulk that is an order of magnitude higher than the downstreamlimit. Therefore, we might allow no more than 1750 EU/mL upstream of theUF. Again, once we gain experience with quantitative and qualitative bioburdenand endotoxin in the formulated product at the end of the holding time, wecould easily adjust this limit. A second check on this CCP is at the batch record
FIGURE 5 Assigning endotoxin limits relative to process flow: post-UF. Abbreviations: EU, endo-toxin unit; UF, ultrafilter.
FIGURE 6 Assigning endotoxin limits relative to process flow ultrafiltration. Abbreviations: EU,endotoxin unit; UF, ultrafilter.
150 McCullough

review stage, where the reviewer will confirm that the actual hold time did notexceed the validated limit. However, assuming that a validated three-log reductionin product stream endotoxin has been validated for the UF, we should detect lessthan 1.7 EU/mL downstream of the UF—two orders of magnitude lower thanspecified, and providing an additional safety factor for our drug product.
Assigning limits to noncompendial items such as raw materials and excipi-ents can be complicated. The simple formulation for our drug product is outlinedin Table 2. As there is the possibility of further contamination during filling, we willwork backwards from the post-UF sample limit of < 175 EU/mL rather than thedrug product limit of < 350 EU/mL to assign limits to individual components.
There are a number of thought processes that might be used in order todistribute the allowable endotoxin of 175 EU/mL:
Method 1: We have four components in our formulation. If we assume thateach component of the formulation is allowed to contribute 25% of the allowableendotoxin load, our calculated endotoxin limits, corrected for component concen-tration in the final drug product, would be as in Table 9. There are a number oftroubling issues with this scenario:
& Our allowable limit for WFI far exceeds the compendial limit of not more than0.25 EU/mL.
& Dextrose, the raw material that is likely to contribute the most endotoxin to ourformulation, is allowed the least amount of endotoxin per unit weight.
& Sodium chloride, a raw material that is not likely to contribute significantendotoxin to our final product, is given a limit that is an order of magnitudehigher than the either the API or the dextrose.
Method 2: We can assign an endotoxin limitb to all of the ingredients equallyper unit of weight. If we add up all of the ingredients, we have 234 mg of dry ingre-dients in the formulation. If we assume that the contribution of the WFI isnegligible relative to the limit we have set or the product (the WFI compendiallimit of not more than 0.25 EU/mL relative to our assigned limit of 175 EU/mL),we can equally divide our 175 EU among the 234 mg in the formulation:
175 EU=mL
234 mg=mL¼ 0:74 EU=mg
By this method, each milligram of material in the formulation, regardless oforigin, would be allowed to contribute 0.74 EU. Although these numbers seem tobe more reasonable than the limits calculated in method 1, there is still a problemwith this method in that we have assigned the same limit to the raw material that is
b When rounding endotoxin limits, it is prudent to round all calculated endotoxin limitsdown to the more conservative number.
FIGURE 7 Assigning endotoxin limits relative to process flow: raw materials. Abbreviations: EU,endotoxin unit; UF, ultrafilter.
Bacteria Endotoxins Testing 151

most likely to contribute endotoxin (dextrose) as to the raw material that is leastlikely to contribute endotoxin (sodium chloride or our synthesized API).
Method 3: We can assign endotoxin limits based on the percentage of thematerial in the final formulation, assuming that the WFI contribution is negligible,for our example (Table 10).
Working through the calculation, we find that if we assign an endotoxin limitfor each component based on percentage in the final formulation and then adjustfor the concentrations of each component, we get the same result as in Method 2,and we are left with the same concerns as for Method 2.
Method 4: We can allocate endotoxin based on the source of the raw material.For this method, we will need to clearly articulate and document our assumptions:
& Contribution by WFI is negligible at below 0.25 EU/mL.& Dextrose is the only component in the formulation from a natural source; so it
can be assumed that it will be the most variable in endotoxin content and themost likely to contribute endotoxin to the final product. Preliminary testing hasconfirmed that endotoxin in incoming dextrose is quite variable. In theexample, we have allowed the dextrose to contribute 90% of the total allowableendotoxin in the formulation.
& Sodium chloride is an inorganic salt and is not likely to contribute largeamounts of endotoxin to our product. Preliminary testing of a number of lotsof sodium chloride has confirmed that endotoxin levels are consistently low. Inthe example, we limit sodium chloride to 1% of the total allowable endotoxin.
& The API is the product of a chemical synthesis and as such, has a low prob-ability of contributing endotoxin contamination relative to the dextrose. Wehave allowed it to contribute 9% of the drug product limit.
Given these assumptions, we might assign endotoxin limits that are some-what arbitrary, but are based on a logic that is supported by preliminary testingdata (Table 11).
Using this method, we have shifted the bulk of the allowable endotoxin(90%) to the component that is most likely to contribute endotoxin—the dextrose.
TABLE 9 Calculation of Endotoxin Limits for Formulation Components: Method 1
Component EU/mLConcentration
(mg/mL)Calculated
endotoxin level
NaCl 43.75 9 4.86 EU/mgDextrose 43.75 150 0.291 EU/mgActive pharmaceutical ingredient 43.75 75 0.583 EU/mgWater for injection 43.75 1 mL 43.75 EU/mL
Abbreviation: EU, endotoxin unit.
TABLE 10 Calculation of Endotoxin Limits for Formulation Components: Method 3
ComponentConcentration
(mg/mL)Percentage of
formulation EU/mL EU/mg
NaCl 9 38 6.65 0.74Dextrose 150 64 112 0.74Active pharmaceutical ingredient 75 32 56 0.74
Abbreviation: EU, endotoxin unit.
152 McCullough

By this method, we have allowed the dextrose to contribute about 50% moreendotoxin than any of the other three methods for assigning limits to raw materials(above), and we have allowed the dextrose to contribute endotoxin at a level that isat least five times higher than any other formulation componentc.
Out of the four methods, Method 4 provides the most flexibility in assigningendotoxin limits to the components of any given formulation. However, we cannot cre-ate a circumstance where the same raw material could have different endotoxin limitsdepending on the formulation in which it is used. To standardize limits and make lab-oratory testing easier, we need to choose the most stringent of the endotoxin limits thathavebeencalculatedforanyrawmaterialacrossthecompany’sproductline.Anexamplein Table 12 illustrates endotoxin limits for three different fictitious formulations.
For example, sodium chloride is used in all three of the formulations, but themost stringent limit is 0.001 EU/mg that has been assigned for Formulation B. If wemake this limit our company specification for NaCl, we will be assured that the rawmaterial will also meet the requirements for Formulations A and C. The company-wide, rounded down specifications for these raw materials in Table 12 would be:
& Dextrose: 1.0 EU/mg& NaCl: 0.001 EU/mg& Sodium phosphate monobasic: 0.03 EU/mg& Mannitol: 0.5 EU/mg.
Tabulating and choosing endotoxin limits in this way accomplishes two things:
& It makes laboratory testing more efficient in that all lots of raw material,regardless of the final formulation, are tested against a single specification.
TABLE 11 Calculation of Endotoxin Limits for Formulation Components: Method 4
ComponentAssigned percentage
total EU EU/mLConcentration
(mg/mL) EU/mg
NaCl 1 1.75 9 0.19Dextrose 90 157.5 150 1.05Active pharmaceutical ingredient 9 15.75 75 0.21
Abbreviation: EU, endotoxin unit.
c If the formulation contained multiple components from natural sources or if the API were theproduct of fermentation, we might think differently and distribute our endotoxin using a dif-ferent set of assumptions that are more appropriate to the formulation. The only requirementof method 4 is that assumptions are clearly articulated, justified, and documented.
TABLE 12 Choosing Endotoxin Limits
Material
Formulation
Formulation A: EU/mg(our example, Table 2 )
FormulationB: EU/mg
FormulationC: EU/mg
NaCl 1.75 0.001 0.4Dextrose 1.05 2.0 N/ASodium phosphate monobasic N/A 0.35 0.03Mannitol N/A N/A 0.53
Abbreviations: EU, endotoxin unit; N/A, not applicable.
Bacteria Endotoxins Testing 153

& Because the most stringent formulation is chosen for the specification, the firmcan be assured that no raw material will contribute endotoxin to a formulationin excess of its allowable limit
In summary, controls and limits can be assigned to identified CCPs as in Table 13.
HACCP Principle 4: Verify Monitoring andTesting of LimitsHACCP Principle 4 requires that limits are valid and that the test methods andequipment used to measure endotoxin are also validated/qualified. For any CCPrequiring a BET, the test method would be validated according to the harmonizedpharmacopeia and the FDA Guideline (3–6). Any valid BET assay requires the fol-lowing prerequisite tests:
& Analysts must be qualified (6).& The lysate reagent label claim or standard curve linearity must be verified (3–6).& If a secondary endotoxin standard [control standard endotoxin (CSE)] is used
for the assay, it must be compared and standardized against the primary endo-toxin standard [reference standard endotoxin (RSE)] for every uniquecombination of CSE lot/lysate lot used in the laboratory (6).
& The consumable equipment must be shown to be free of interference anddetectable endotoxin (3–5).
TABLE 13 Summary of Control and Critical Control Points for the Process Outlined in Figure 1
Identified criticalcontrol point
Manufacturingsegment
Sample to betested or
document tobe examined Limit Responsibility
Dextrose Raw materials Dextrose <1.0 EU/mg Quality controltesting
Active pharma-ceuticalingredient
Raw materials Active pharma-ceuticalingredient
<0.2 EU/mg Quality controltesting
Holding offormulatedproduct
Posthold/preultrafilter
<1750 EU/mL Quality controltesting
Batch record Hold time not toexceedspecified limits
Manufacturing;quality assurancebatch recordreview
Ultrafiltration Filtration Postultrafilter <175 EU/mL Quality controltesting
Depyrogenation Filling Batch record Conformance tovalidatedtime/temperature
Manufacturing;quality assurancebatch recordreviews
Drug producttesting
Laboratory Filled vials <350 EU/mL Quality controltesting
Abbreviation: EU, endotoxin unit.
154 McCullough

& Laboratory equipment used in the performance of the BET including pipettors,depyrogenation ovens, incubating devices, mixers, and photometric readersmust be calibrated/qualified/validated as appropriate. Software used in thecalculation, tabulation, and trending of endotoxin test data must be validatedand must be 21 CFR Part 11 compliant (Table 14).
HACCP Principle 5: Verify Corrective and Preventive ActionsPrior to implementing a HACCP plan, possible failure scenarios should be antici-pated and identified so that appropriate CAPAs can be defined ahead of time andimplemented quickly if needed. This exercise serves two purposes: (i) It providesthe opportunity for objective analysis of possible failure without the stress of apending investigation and (ii) it provides the opportunity for the definition ofunbiased and scientifically supported CAPAs that can be uniformly applied toall similar excursions going forward.
For example, the vial depyrogenation process, which has been identified as aCCP, might fail to meet the time/temperature parameters determined in the vali-dation study and required by the batch record. Possible reasons and associatedCAPAs for this failure might include those shown in Table 15.
HACCP Principle 6: Verify Operational ProceduresOnce process validation is complete, implementation of routine testing requiresthat the proper infrastructure is in place. Training of new operators and analysts
TABLE 14 Hazard and Critical Control Point Analysis Principle 4: Verification of Monitoring andTesting for Endotoxina
Identified criticalcontrol point
LaboratorySOPs
Equipment/systemsto be qualified
Validation protocolsand reports
Dextrose, activepharmaceuticalingredient
Testing SOP Testing equipmentb BET test methodfor the raw material
Holding offormulatedproduct
Testing equipment BET test method for theprocess intermediate
Ultrafiltration Testing SOP UF removal efficiency BET test method for theprocess intermediate
Testing equipment UF endotoxin removalefficiency
Depyrogenation Preparation anduse of endotoxinindicators fordepyrogenationstudies
Depyrogenation oven(heat stable items)
Depyrogenation parametersfor identified load patterns(time/temperature)Washing machine
(heat labile items)Testing equipment
Drug producttesting
Testing SOP Testing equipment BET test method for thedrug product
aOver and above the prerequisite testing described above.bTesting equipment includes pipettes, tubes, pipettors, heat blocks/water baths for gel clot testing; pipettes, tubes,pipettors, plates, plate/tube reader, and data analysis software for photometric tests.Abbreviations: SOP, standard operating procedure; CIP, clean in place; BET, bacterial endotoxins; UF, ultrafilter;SIP, sterilize in place.
Bacteria Endotoxins Testing 155

and retraining of veteran employees should be consistent, repeated at definedintervals, and well documented. Validation, calibration and qualification philoso-phies, and strategies should be clearly articulated in master plans that referenceappropriate in-house specifications as well as regulatory, compliance, andindustry-consensus documents. Strategies and methods should be harmonizedwhere possible among laboratories, processing areas, and manufacturing sites sothat data from similar or identical processes are comparable. Equipment must berequalified and recalibrated according to manufacturer’s instructions and/or adefined calibration schedule. For example:
& Depyrogenation ovens should always be requalified upon the introduction of anovel load pattern, but must be requalified at least annually.
& Changes to processes may require revalidation as determined by change control.& Control may also require BET revalidation of raw materials as part of the quali-
fication of a second supplier.
HACCP Principle 7: Verification of DocumentationThe following documents are necessary components of a complete drug productbatch record or device history record. These documents must reflect routine moni-toring for all CCPs.
& Comprehensive, complete, reviewed, and signed batch records includingmanufacturing processes and QC testing
& Change control for processes, facilities, testing, or software& Approved variances or deviations for manufacturing or testing& Approved investigations for excursions and product OOS results
PEELING THE ARTICHOKE: DETERMINATION OF CCPs IN THELABORATORY PERFORMANCE OF THE BET ASSAY
Laboratory testing has been identified by the decision tree as a CCP (Table 7). We can‘‘peel the artichoke’’ and examine the sequence of events in the laboratory testing
TABLE 15 Analysis of a Possible Depyrogenation Failurea
Failure mode Potential effectsPotential causes
of failure Detection methodRecommended
action
Incomplete cycle(failure to meettime/tempera-ture requirements
Inefficientdepyrogenationcould resultin vialscontaminatedwith endotoxin,and thereforedrug productcontaminatedwith endotoxin
Power failure Alarm, buildingmanagementsystem, or chartrecorder
Provide back-uppower todepyrogenationequipment
Equipment failure(timer, tempera-ture controller,chart recorder) Chart recorder/
BMS recordreview
Increasedattention to orfrequency ofpreventivemaintenance,calibration
Operator failure toset proper time/temperatureparameters
Chart recorder/BMS recordreview
Retraining
aAfter failure modes and effects analysis.Source: From Ref. 30.Abbreviation: BMS, building management system.
156 McCullough

segment using much the same thought process as we looked at the sequence ofsteps in the generic aseptic manufacturing process (above). How do we definecontrol points and CCPs in the test procedure? The new hazard for laboratorytesting is ‘‘false test results.’’ The task is to identify those steps in the testing processthat can be primarily responsible for the generation of ‘‘false’’ results—either falsepositives (a significant compliance and financial issue for the company) orfalse negatives (a significant safety hazard to the patient and a compliance as wellas legal issue for the firm).
Bacterial Endotoxins Test MethodologiesThree technologies are described in the pharmacopeia for use in the performanceof the BET. All three use a reagent that is formulated from the blood of the horse-shoe crab. The reagent is called LAL. Limulus is the genus name of the North-American horseshoe crab, Limulus polyphemus; Amebocyte is the name of the circu-lating blood cells of the horseshoe crab; and Lysate describes the disruption of theamebocytes, which is a step in the preparation of the reagent. Lysate can also bemade from the blood of the Asian horseshoe crab, Tachepleyus tridentatus. Thislysate is called TAL. For a more complete and detailed discussion of BET reagentsand methodologies, see Ref. 11.
The Gel Clot TestIn nature, the horseshoe crab’s blood clots as part of an immune response tothe presence of endotoxin. The gel-clot test is an in vitro test based on the in vivoreaction of the blood of the horseshoe crab with endotoxin. The presence of endo-toxin, through a cascade of reactions, results in the cleaving of the coagulogenmolecule (the clotting protein) to create a peptide called coagulin. The more theendotoxin at the beginning of the cascade, the more the coagulin at the end. Ifenough coagulin molecules are generated, they form a matrix that is visuallyobserved as a clot. The sensitivity of the gel-clot reagent defines the limit of detectionof the test system. Thus, if a reagent is labeled with a sensitivity of 0.0625 EU/mL,it means that the reagent will clot in the presence of 0.0625 EU/mL or more ofendotoxin in a noninterfering test solution.
The gel-clot test is binary. If, upon 180� inversion, the clot remains at the bot-tom of the tube, the test is positive. Any other reaction is scored as a negative. Twotypes of gel-clot tests are described in the pharmacopeia: the limits test and theassay. The limits test is a qualitative test, where a single dilution of the test sampleis assayed, and the result is reported as ‘‘<k EU/mL’’ or ‘‘�k EU/mL’’ where k isthe confirmed label claim sensitivity of the reagent. For example, if a WFI sampleis tested using lysate where k¼ 0.125 EU/mL, and the result is observed andscored as negative, the endotoxin level in the sample is reported as less than0.125 EU/mL. If the sample induces a gel, the sample is scored as positive, andthe result is reported as 0.125 EU/mL or above. If a sample must be dilutedfor the test, the result is reported as < (k)(dilution factor) mL or �(k)(dilutionfactor mL).
The assay is a more quantitative gel-clot test. For the assay, the test sample isdiluted, and each dilution is tested using the gel-clot method. The last tube in thedilution series that scores positive and is followed by a negative response is calledthe endpoint dilution. Endotoxin content in a gel-clot assay is calculated andreported as equal to the (endpoint dilution factor) (k). For example, if the endpointin a dilution series of city water is 1:250 and k is equal to 0.125 EU/mL, the result
Bacteria Endotoxins Testing 157

is calculated and reported as:
Endotoxin level ¼ ðendpoint dilution factorÞðkÞ¼ ð250Þð0:125 EU=mLÞ¼ 31:25 EU=mL
Photometric TestsAlthough the gel-clot test is capable of producing a quantitative result, the assay islabor-intensive and time-consuming. The photometric tests are based on the workperformed by Drs. Jack Levin and Frederick Bang who, in 1968, reported on thekinetics of the reaction between lysate and endotoxin. Levin and Bang (38) lookedat the kinetics of the lysate reaction by measuring the optical density (i.e., accu-mulation of coagulin) over time after the addition of endotoxin. Figure 8 is arepresentation of the kinetic reactions of a series of endotoxin standards.
They made two important observations: (i) that the higher the endotoxin con-centration, the shorter the ‘‘lag’’ time (i.e., the part at the initiation of the reactionwhere no observable change in optical density takes place), and (ii) the higher theendotoxin concentration, the faster the rate of the reaction, once initiated. Theseobservations form the foundation of the two basic photometric methods: the end-point and the kinetic assays. In the photometric assays, endotoxin standardsprepared in LAL reagent water (LRW) are used to construct the standard curve.
Two of the photometric assays use a synthetic substrate as a substitute for thecoagulogen molecule. A chromophore is coupled to the substrate so that inthe absence of an activated clotting enzyme, the solution containing thesubstrate–chromophore complex is clear. When the clotting enzyme is activatedby endotoxin, the chromophore is cleared from the substrate. The cleaved chromo-phore is yellow. As with coagulin, the rate of formation of yellow color isproportional to the level of activated clotting enzyme, which in turn is proportionalto the level of endotoxin that is present in the system.
Endpoint chromogenic assay: In the endpoint chromogenic assay, the LAL reac-tion is stopped at a point in time (dotted line, Fig. 9A) by the addition of acetic acid,which freezes the color formation. Software prepares a standard curve of the inten-sity of the yellow color as a function of the endotoxin concentration. The result is alinear standard curve with a positive slope (a direct relationship between color
FIGURE 8 Kinetics of the limulusamebocyte lysate (LAL) reaction.Source: From Ref. 38. Abbrevi-ation: OD, optical density.
158 McCullough

intensity and endotoxin concentration), and a range of about one log (Fig. 9A). Theyellow color formed in unknowns is similarly ‘‘frozen,’’ and the endotoxin content isdetermined by interpolation from the standard curve (dotted line, Figure 9b).
Kinetic assay: The major limitation of the endpoint chromogenic assay is thatthe standard curve range is limited to about one log. One may look at the same setof endotoxin standards and ask a different question: How long does it take for eachstandard to reach a targeted optical density? The dotted line in Figure 10A repre-sents the ‘‘onset’’ or ‘‘reaction’’ optical density. The assay measures the time that ittakes for each standard and sample to reach the onset OD. The standard curve isconstructed by plotting the log of the onset time as a function of the log of theendotoxin concentration (Fig. 10B). Data transformation is necessary to constructa linear standard curve. The relationship between onset time and endotoxin concen-tration is an inverse one. ‘‘Lower’’ endotoxin concentrations take a ‘‘longer’’ time toreach the onset OD.
The Testing SequenceFollowing the logic stream used for the analysis of the manufacturing process, thetesting sequence can be divided into four testing segments: initial QC, validation,routine testing, data analysis, and interpretation (Fig. 11). We can identify test
FIGURE 9 Endpoint chromogenic assay (A) and standard curve (B). Abbreviation: OD, opticaldensity.
FIGURE 10 Kinetic assay (A) and standard curve (B). Abbreviation: OD, optical density.
Bacteria Endotoxins Testing 159

controls or prerequisites in each of these segments, which will help us understandthe criticality of the assay. To simplify this analysis, let us make the followingassumptions:
& Training and appropriate SOPs are critical to any operation, and by definitionare CCPs. For the example, let us assume that SOPs are in place and traininghas been successfully completed.
& All equipment has been properly qualified and documented.
Segment 1: Test ConditionsThe segment defined as ‘‘test conditions’’ is a catch-all to describe the basicenvironment for performing the test (Fig. 12). Two major areas are examined in thiscategory, although more might be defined in a particular laboratory setting. Theconditions that have been chosen for this example that could adversely affectthe test and result in false results are analyst technique, and test area cleanlinessclassification (i.e., Class 100, Class 10,000, etc.).
TechniqueAny BET is technique dependent. Literature and logic tell us that it takes a largenumber of Gram-negative organisms to cause a false positive in an LAL test. Whilethese large numbers are not generally contributed solely by the room air, theycould potentially be contributed by poor aseptic technique during the testing ofsmall volume samples. For example, touching the ‘‘working end’’ of the pipette,getting fingers inside the reaction tubes, and poor pipetting technique, whichcould result in endotoxin carryover, can result in a false positive result. Any posi-tive is considered to be a de facto product failure unless it can be proven anddocumented that the result is the product of poor technique (36). Likewise,improper dilution of a drug product that interferes with the test could result ina false negative. Improper ‘‘spiking’’ of positive controls could result in a voidedtest. Unless someone is watching the operator at all times, poor technique is
FIGURE 12 Test conditions.
FIGURE 11 Generic bacterial endotoxins testing sequence.
160 McCullough

difficult to prove, meaning that false positive tests often, if not regularly, result inunnecessary product rejection. Thus, proper technique certainly reduces the pos-sibility of a false result, and therefore it is a ‘‘critical control factor’’ in theperformance of the BET.
Room Air ClassificationIt takes a large number of Gram-negative bacteria from the air to cause a falseresult in a BET. Sample preparation may be performed in a laminar flow hoodas added protection against contamination, but because the test is incubateduncovered out on the bench, the use of laminar flow hood is not a necessary pre-caution, particularly if the analyst is skilled in aseptic technique. There is onenotable exception, however. If the sample is potentially toxic or harmful to the ana-lyst, it should be prepared in a biosafety cabinet (BSC) and under conditions thatprotect the person. A clean and tidy laboratory environment consistent with 21CFR 211, ‘‘cGMP for Finished Pharmaceuticals’’ and 21 CFR 58, ‘‘Good LaboratoryPractices for nonclinical laboratory studies’’ is all that is needed to run the BET(7,9). Therefore, the room’s cleanliness classification (i.e., Class 100, Class 10,000)is not a critical control factor.
Segment 2: Initial Quality ControlThe initial QC segment of the process identifies all the prerequisites necessaryprior to running a valid routine test. In total, these activities demonstrate thatthe laboratory, including analysts, reagents, environment, equipment, and testmethods are ‘‘in control.’’ ‘‘All of the requirements of initial QC are listed in eitherthe harmonized pharmacopeial chapters, the lysate manufacturer’s productinserts, or the 1987 FDA Guideline. Therefore they are, by default, CCPs in theperformance of the BET’’ (Lysate manufacturers’ product inserts) (3–6). Prerequi-sites are shown in Figure 13.
Lysate Label Claim/Linearity VerificationThe sensitivity of each lot of lysate reagent is initially determined by the manufac-turer and is then confirmed and certified by FDA’s Center for Biologics Evaluationand Research (CBER) before release for sale (3–6). The 1987 FDA Guideline and allof the current pharmacopeia state that the sensitivity of each new lot of lysatereagent that is received in the laboratory must be confirmed by the laboratorybefore use. The idea is not to reassign sensitivity to the reagent, but rather to
FIGURE 13 Prerequisites (initial quality control) to the bacterial endotoxins test.
Bacteria Endotoxins Testing 161

demonstrate that the testing laboratory can replicate the result obtained both by thelysate manufacturer and by the CBER.
For gel clot, an endotoxin standard is diluted in LAL reagent water (LRW) to‘‘bracket’’ the label claim sensitivity of the reagent. Bracket means diluting the endo-toxin standard to concentrations equal to 2k, k, 1
2k, and 14k, where k is the label claim
sensitivity of the reagent. These four endotoxin dilutions are tested in quadruplicate,and the endpoints (i.e., last positive test result followed by a negative result) for eachof the four replicate series is determined. Because the dilution series is geometric ratherthan arithmetic, the determined lysate sensitivity is calculated using a geometric mean:
GM = antilogR log10 endpoint
f
� �
where f is the number of replicates.Table 16 is an example of a gel clot label claim verification study. In this case,
k is 0.125 EU/mL. The geometric mean for this example is calculated as follows:
GM ¼ antilog�0:903þ�1:204þ�1:204þ�0:903
4
� �
¼ antilogð�1:0535Þ ¼ 0:088 EU=mL
The lysate label claim sensitivity is confirmed if the geometric mean of the replicateendpoints is equal to the label claim� one twofold dilution (i.e., within the windowof 2k to 1
2k). In the example, the determined label claim is 0.088 EU/mL, which iswithin the window of 2k (0.25 EU/mL) to 1
2k (0.0626 EU/mL), which confirms themanufacturer’s label claim sensitivity of 0.125 EU/mL. Once confirmed, the labelclaim sensitivity of 0.125 EU/mL, not the determined sensitivity of 0.088 EU/mL,is used for all gel-clot calculations going forward.
Lysates formulated for photometric testing do not have a label claim sensitivity.The sensitivity of the test system, meaning the lowest endotoxin concentration in themaximum recommended standard curve range, is determined by the lysate manu-facturer. For any given assay, the test sensitivity (k) is set by the user, and is equal tothe value of the lowest point on the laboratory’s referenced standard curve, whichmight be a subset of the manufacturer’s maximum recommended range. To accepta new lot of lysate into the laboratory, the analyst must create a standard curve con-sisting of at least three points. Most photometric tests suggest a 10-fold dilutionsseries, though the lysate manufacturer might suggest a twofold series (check thelysate manufacturer’s product insert for recommended standard curve parameters).
TABLE 16 Example of a Gel Clot Label Claim Verification Study
Endotoxin concentration
Replicate2k
(0.25 EU/mL)k (0.125EU/mL)
12k (0.0625
EU/mL)
14k(0.03125
EU/mL)Endpoint(EU/mL)
Logendpoint
1 þ þ – – 0.125 –0.0932 þ – – – 0.0625 –1.2043 þ – – – 0.0625 –1.2044 þ þ – – 0.125 –0.093
Abbreviation: EU, endotoxin unit.
162 McCullough

In order to accept the lot of lysate, the absolute value of the correlation coefficient, ormeasure of linearity that is calculated from a linear regression analysis of theobserved data points, must be greater than or equal to 0.980.
Analyst QualificationAnalyst training is required by the 1987 FDA Guideline, by 21 CFR 211 and by 21CFR 820 (6–8). Although not specifically required in the harmonized pharmaco-peia, the BET analyst qualification exercise, as described in the 1987 FDAGuideline, should be viewed as the culmination of analyst training (6). The essen-tial question in analyst qualification is, ‘‘Can each analyst get the same result (labelclaim for a gel clot test or linearity for a photometric test) as both the lysate manu-facturer and the FDA have gotten?’’ The method for analyst qualification isidentical to lysate label claim verification (above).
Endotoxin StandardizationThe primary endotoxin standard (RSE) is the endotoxin that lysate manufacturersuse to establish label claim (gel clot) or standard curve characteristics (photometric)for each lot of lysate they produce. User laboratories can obtain the consumer ver-sion of this standard from USP, but it is expensive and has a relatively short shelf lifeonce reconstituted. Most laboratories opt for using a secondary standard for routinetesting called the CSE, obtained from the lysate manufacturer, because it is muchless costly and has a longer expiration after reconstitution than the RSE. However,because all of the reagents in the BET are biological in nature, standardization of thepotency of the CSE relative to the RSE must be performed for each unique combi-nation of lysate lot/CSE lot in use in the laboratory. In a busy laboratory, this canbe quite time consuming and expensive. FDA has historically accepted a certificate ofanalysis (CoA) obtained from the lysate vendor defining the potency of the CSE inEU/ng for each unique combination of lysate lot/endotoxin lot. It is recommendedthat the CoA be accepted only after a successful vendor qualification audit (6).
Equipment QualificationEquipment qualification is a basic component of control in any testing laboratory(3–5,7). For the BET, equipment to be qualified and/or calibrated includes, butmay not be limited to, pipettors, heat blocks, water baths, timers, depyrogenationovens, plate and tube readers, and instrument-specific software. Depyrogenationovens must have validated time and temperature control specifications for each loadpattern the laboratory uses. Heat blocks and water baths used for the incubation ofgel clot tests must have current temperature maps to qualify them for use. In additionto heat mapping of the incubating chamber(s), the optics and data transmission forplate and tube readers must be qualified. Software that is used with plate/tube read-ers for calculation, analysis, and reporting of data must be compliant with 21 CFRPart 11 (10).
Testing of Consumables for Interference with the TestMany laboratories use plastic consumables in the performance of the BET. Theseconsumables (tubes, pipettes, pipette tips) are received as sterile, but may ormay not be free of BET test interference. A label of ‘‘pyrogen free’’ on a consumableis not the same as a lot-specific CoA that reports calculated data obtained from avalidated test method. The harmonized BET chapter in the USP, EP, and JP requiresthat these consumable plastics be tested before use for test interference: essentiallyleachable inhibitory substances and contaminating surface endotoxin (3–5).
Bacteria Endotoxins Testing 163

Depyrogenated borosilicate glass is the ‘‘gold standard’’ for the BET. The use ofdisposable plastic is allowed, but there are cautions. Polystyrene has been shown tobe the most benign of the plastics with regard to BET test interference (39,40). Poly-proplyene plastic can interfere with the performance of the test, and should beavoided for sample collection and preparation (39,40). An exception to the poly-propylene rule is the use of disposable pipette tips for mechanical pipettors. Thesetips likely do not cause interference because of the short sample exposure time duringtesting. They should, however, be tested as any other plastic consumable and releasedprior to use.
There is no published method for the determination of BET interference inplastic consumables. The industry practice, however, is to utilize the same pro-cedure described for the BET testing of medical devices in the United StatesPharmacopeia (37). In this method, the product contact surfaces of the test itemsare exposed to LRW that has been preheated to 37�C. Items are allowed to sit orrecirculate (for the examination of fluid pathways) for one hour at controlled roomtemperature. The soaking water (sometimes called rinse or eluate) is assayed forBET test interference exactly the same way that drug product or a dilution of drugproduct is tested for interference (below). Demonstration of the lack of test inter-ference (either inhibition or the presence of endogenous endotoxin in thesample) will release the lot of consumables for use in the laboratory.
DepyrogenationThere are two parts to a successful depyrogenation validation study. The first isthe physical identification of ‘‘cold spots’’ in the empty chamber and in each loadpattern. The second is the demonstration that the chosen time and temperaturecombination will eliminate endotoxin that is placed in an appropriate pattern tocover all parts of the chamber in a test unit as well as at the cold spots. The rulesfor depyrogenation are set out in the USP in Chapter < 1211> , ‘‘Sterilization andSterility Assurance of Compendial Articles’’ (35). Recognizing that endotoxinadsorbs to glass and other surfaces (39,41), the depyrogenation study begins withthe demonstration of the recovery of at least 1000 EUs from the surface to be pro-cessed. Endotoxin adsorption to surfaces will vary depending on the endotoxinformulation, the endotoxin concentration, the method of fixing endotoxin to thesurface, and the recovery method (15,42–44). Aside from the requirement torecover at least 1000 EU/article, there are no rules governing initial concentration,fixing of endotoxin to the surface of the test article, or methods for recovery ofendotoxin from the test article, so the laboratory must be able to demonstrate dur-ing validation that their spike and recovery methods are valid. A successfuldepyrogenation requires the demonstration of at least a three-log reduction inendotoxin from the recoverable levels. Log reduction is calculated as follows:
Log reduction ¼ log10 recoverable endotoxin� log10 residual endotoxin
(preprocessing) (postproccessing)
Example: If testing demonstrates that recoverable endotoxin ¼ 5000 EU/unitand residual endotoxin in each test unit is < 0.03125 EU/unit, the log reductionwould be:
& Log reduction > log10 5000 EU � log10 0.03125 EU& Log reduction > 5 �(�1.5)
164 McCullough

& Log reduction > 6.5& Note: Log reduction > 6.5 because the residual endotoxin is < 0.03125 EU/unit.
Segment 3: ValidationAs with the initial QC elements, validation is a requirement of all compendia,lysate manufacturer’s product inserts, and the 1987 FDA Guideline, and is there-fore a CCP in the preparation for routine use of the BET as a release test orroutine monitoring tool. A complete validation study is expected for any sampleunder test, not just for the release of finished drug product.
Validation is the demonstration that the sample under test or a dilution ofthat sample does not interfere (i.e., neither inhibits nor enhances) with the resultsof the BET assay. The literature cites many instances of test interference (45,46).Dilution of the product in LRW is the easiest and most convenient way to over-come interference. It makes sense, however, that there be a limit to the allowabledilution so that the limit of detection in the test method is not exceeded. Thatdilution limit is known as the maximum valid dilution (MVD), and is calculatedusing the formula:
MVD = (endotoxin limit)(concentration of the product)
k
where the endotoxin limit¼ K/M, the concentration of the product is equal to the con-centration of the active ingredient for those products administered on a weight/kgbasis, and equal to 1 for those products administered on a volume/kg basis,k ¼ the test sensitivity, meaning the confirmed label claim sensitivity for gel clot tests,or the lowest point on the referenced standard curve for photometric tests.
In the MVD equation, the endotoxin limit is a constant. As the product con-centration increases, so does the MVD. As the test sensitivity increases (i.e., k getslower), the MVD increases. The MVD is a dilution factor.
There are two very important system test parameters that need to be met for theBET assay to run optimally (47). The first is pH. It must be demonstrated that the pHof the mixture of sample (or sample dilution) and lysate falls within the optimumrange that is specified by the lysate manufacturer. Because the lysate is processedfrom horseshoe crab blood, it is naturally buffered to some extent, but the final buffer-ing capacity of the reagent depends on the individual lysate manufacturer’s productformulation. If the pH of the mixture of lysate and sample falls outside the range, theproduct may be adjusted using NaOH, HCl, or tris buffers shown to be free of detect-able endotoxin, or the sample may be diluted in LRW to reduce the effects of productconcentration on pH. The second important test parameter is divalent cations.Divalent cations are important to the lysate reaction, and are added to the lysate dur-ing reagent formulation. Those drug products that are chelate (e.g., heparin, citrate ordrugs containing EDTA) will lower the divalent ion concentration available for thereaction and may result in an inhibitory response. Adding cations back to the reactionor diluting the product in LRW to reduce the chelating capacity of the test sample areremedies for this interference problem.
Validation requires that the drug product, or dilution of drug product, notexceed the calculated MVD be ‘‘spiked’’ with endotoxin, and that the endotoxinbe quantitatively recovered. For gel clot two parallel series of endotoxin dilutionsare compared. One series uses LRW as the diluent and acts as the control series.The second series uses drug product diluted to the proposed final test concen-tration, as the diluent for endotoxin. The geometric mean calculation for the two
Bacteria Endotoxins Testing 165

separate endotoxin dilution series (endotoxin diluted in LRW and endotoxindiluted in product or proposed test concentration of product) must both confirmk � 1 twofold dilution. For photometric tests, drug product or a dilution of drugproduct not to exceed the calculated MVD must be spiked at a level equal to themidpoint of the standard curve, and the recovery of the endotoxin spike mustbe within the range of 50% to 200% of the nominal value (see section ‘‘Segment5: Data Analysis and Interpretation’’). Regardless of method, recovery conditionsmust be met for three lots of drug product. If the test method changes, for examplefrom gel clot to kinetic chromogenic, a new validation must be run on three lots ofproduct. The reason for running a new validation is that the interference profiles ofmany drug products will change depending on the test method (46).
Segment 4: Routine TestingOnce all of the prerequisites described above in segments 1–3 have been met, thelaboratory is ready to test material for release.
System Suitability ControlSystem suitability control testing is an essential component of a routine BET testingscheme. Properly performed and interpreted system suitability controls help toassure that individual test results are valid. The consequence of inappropriateresults on the system suitability is the invalidation of all tests that reference thosecontrols. System suitability controls include:
& Negative control: The negative control, which is the testing of LRW, assures thatthe system components (reagents, tubes, technique) do not contribute endo-toxin contamination to the test. A valid test requires that the negative controlin a gel clot test does not gel and in a photometric test, it does not react.
& Positive product control (PPC): A PPC is required for each sample under test. ThePPC for a gel clot test is the sample diluted to the test concentration and ‘‘spiked’’with endotoxin to a level of 2k. Avalid gel clot PPC requires that all tubes contain-ing spiked product gel. For photometric testing, the PPC is the sample diluted tothe test concentration ‘‘spiked’’ with endotoxin at a level equal to the midpoint ofthe standard curve. Avalid photometric PPC requires that endotoxin be recoveredwithin the range of 50% to 200% of the nominal spike value.
& Standard series: The 1987 FDA Guideline requires that a standard series (2k, k,12k, and 1
4k) be run at least once a day for each combination of lysate lot/endo-toxin lot used in the day’s testing. That requirement was dropped in thecurrent harmonized compendial chapters for the limits test. In the harmonizedmethod, a 2k endotoxin/LRW control is required for each group of limits test
FIGURE 14 Laboratory testing.
166 McCullough

samples. The harmonized chapter, however, requires that a standard series berun concurrently with each gel clot assay performed. As in the label claim veri-fication assay, the geometric mean of the standard series must confirm k � 1twofold dilution. The standard series for a photometric test is the stan-dard curve. The current harmonized photometric method requires that astandard curve be run for every plate or set of tubes containing test samples.A valid standard curve requires at least three points, and the absolute valueof the correlation coefficient, which is a measure of linearity determined fromlinear regression analysis of those points, must be � 0.980 (3–6).
SamplingSampling is not addressed in the harmonized compendia chapters. The only refer-ence to sampling for the BET is found in the 1987 Guideline, which, for drugproducts, requires that at least three samples be taken to represent the beginning,middle, and end of the filling run. Samples may be pooled for testing or may be testedindividually. For medical devices, suggested sampling is based on the lot size (6).
DocumentationDocumentation is important for any laboratory test, including the BET. Not only is itgood practice to document the specific reagents and materials used to generate anyone test result, but these data are important to the investigation of any OOS result ortracking/trending of invalid test results. Depending on the software, much of thefollowing data will be entered into the computer prior to running a photometric test.For gel clot, the data should be kept on controlled laboratory test sheets or laboratorynotebooks. Minimally, records should be kept to track the following:
& Reagents used for a particular test, including lot numbers, reconstitution dates,and expiration dates for the lysate, the endotoxin, the LRW, and any otherreagents (e.g., buffers, dispersing agents) that might be used in the perfor-mance of the test
& Tag numbers for equipment& Temperature in the incubating device at the beginning and the end of the gel
clot test& Time in/time out for gel clot testing& Sample identification and lot number for the material under test& The endotoxin limit, MVD, and test dilution for the sample under test& Number of samples and whether they are pooled or tested individually& All raw data results of system suitability testing& A calculation of the amount of endotoxin measured in the test sample (see sec-
tion ‘‘Segment 5: Data Analysis and Interpretation’’)& A final declaration of the status of the test once data are reviewed and compared
to product specifications. The declaration should be a choice among the follow-ing: meets specification; does not meet specification; invalid; needs investigation.
InvestigationThe laboratory must have a provision for investigation in the event of a test failure.An OOS on the BET is a de facto sample failure unless the result can be unequivo-cally shown to be due to a documented laboratory error. The investigation may bedivided into two parts. The first is a review of all of the laboratory data includingsystem suitability, calibration/qualification status, and/or maintenance record ofthe equipment used in the performance of the test, the history of the lots of reagents
Bacteria Endotoxins Testing 167

used, and analyst interview. The purpose of this part of the investigation is to deter-mine if the OOS was due to a testing error. Some examples of invalid tests:
& Nonconforming system suitability results& A depyrogenation cycle for the reaction tubes (gel clot) or sample preparation
materials (tubes, spatulas, etc.) that did not meet time/temperature specifications& The observation, at the end of the test period, that the volume of liquid in the
well or tube is inappropriate (i.e., visibly too high or too low)& Analyst testing history—Has this analyst had more than his/her share of OOS
and/or invalid test results? Is retraining necessary?
The second part of the investigation is a full inquiry into the manufacture ofthe drug product. Referencing back to the process HACCP and the correspondingCCPs with regard to the endotoxin hazard provides the basis for this part of theinvestigation. This portion of the investigation should include (but should notnecessarily be limited to):
1. Results of CCP raw material and in-process testing relative to establishedendotoxin limits
2. Results of WFI testing3. Results of CIP/SIP4. Examination of the depyrogenation processes for sampling and manufacturing
equipment5. Examination of the any product stream depyrogenation steps6. Examination of environmental monitoring results for the presence of gram-
negative bacteria in the manufacturing area7. Examination of batch records to identify other hazard excursions or processing
interventions that might be related to the endotoxin OOS8. Trending of data over the last three, six, and 12 months relative to:
& Sample type—Has this sample type had relatively more OOS/invalid testresults than others? Has there been a process change that could warrantadditional validation testing? Has endotoxin in this sample type been trendingupward (or downward), even if it has not exceeded established action limits?
& Manufacturing personnel—Have the same personnel been involved inprevious BET OOS results? If so, should they be retrained?
& Manufacturing equipment—Examine the maintenance record of labora-tory and manufacturing equipment. Might there be a problem withequipment that could contribute to the problem?
Segment 5: Data Analysis and Interpretation
End-Product TestingThe focus of the testing laboratory is to keep control over the test conditions andmethods to assure that results are accurate, precise, and consistent. Accuracyand precision are measures of experimental error. Consistency is inter/intra-ana-lyst or inter/intralaboratory reproducibility. Misinterpretation or miscalculationof data can lead to false results—both false positive and false negative. To thatend, the data analysis and interpretation are CCPs.
Precision is a measure of the reproducibility of measurements with a data set.In a gel clot, confirmation of label claim limits imprecision because a valid testrequires that the geometric mean of the standard series confirm the label claim� 1
168 McCullough

twofold dilution. To analytical chemists, a � 1 twofold dilution is a huge error—itallows for a maximum error of 100%! But remember, this is a biological assay, notan analytical assay. In photometric tests, the coefficient of variation for replicatesample aliquots is the measure of precision.
Accuracy is a measure of how close a data point or calculated value is to areference value—a theoretical value, a known value, or a hypothetical value. Labelclaim in gel clot requires that the analyst confirm an external value—the label claimthat was initially assigned by the lysate manufacturer, confirmed by CBER, andultimately confirmed by the testing laboratory. In kinetics, there is no requirementto ‘‘match’’ any standard curve parameter to a value supplied by the manufacturer.Is this a problem? Consider the following kinetic test. The thin solid line in Figure 15represents a linear kinetic standard curve. The dashed line represents the onsettime and interpolated value of an unknown (x). If we acknowledge that the sampleonset time is independent of the standard curve to which it is compared, we cansee that the same sample onset time, when interpolated from another standardcurve (thick line), will give us a very different result (y), in this case an underesti-mation of endotoxin content which, depending on the endotoxin limit for theproduct, may be a false negative result. Likewise, if the sample onset time is inter-polated from the thick dotted line, we might get an overestimation of endotoxin inthe sample (z), which, depending on the endotoxin limit for the product may be afalse positive result.
In this case, the standard curves that resulted in an overestimation (‘‘z’’) orunderestimation (‘‘y’’) both met the linearity requirement and had the same slopeas the first standard curve, but the y-intercept was different. Therefore, the differ-ences among the interpolated values ‘‘x,’’ ‘‘y,’’ and ‘‘z’’ are not differences in onsettimes or endotoxin levels, but they are artifacts of uncontrolled standard curves.What could cause a change in the y-intercept? The inappropriate dilution of stan-dards. Weak standards will overestimate endotoxin. Strong standards willunderestimate endotoxin.
Two other standard curve parameters that could affect the calculation ofendotoxin levels in unknowns are linearity and slope.
FIGURE 15 The effect of y-intercepton endotoxin determination.
Bacteria Endotoxins Testing 169

The standard curves for endotoxin assays are often bowed. This nonlinearityis a function of the nature of the assay, as well as the range of the standard curve(wider range standard curves tend to be less linear). Figure 16 shows two curves:a ‘‘bowed’’ curve that could well be the curve that results from the observed pointsand a linear curve, the curve that might be determined from the linear regressionanalysis of the observed points; ‘‘x’’ is the level of endotoxin interpolated fromthe standard curve; ‘‘y’’ is the endotoxin level that would be expected relative to theobserved points. The greater the bow, the greater the inaccuracy of the interpolatedvalue (48–50). Nonlinearity can be addressed by (i) limiting the range of the standardcurve and/or (ii) using a polynomial regression rather than a linear regression curveanalysis tool.d
The third parameter in photometric testing than can result in ‘‘false’’ or inac-curate results is slope. Figure 17 shows two standard curves that both meet thelinearity requirement and that share the same y-intercept. However, they differin slope. A number of standard-curve related issues are illustrated in Figure 17.
& The onset time for sample ‘‘a’’ is greater than the bottom point on the thinline standard curve, meaning that the sample has less than k endotoxin (k ¼the bottom point on the standard curve). For example, if the standard curvewere 5.0 EU/mL - 0.05 EU/mL (k), the sample onset time, as interpolated fromthe thin line standard curve, would be recorded as < 0.05 EU/mL. However,if the same onset time were used to interpolate and calculate an endotoxinresult from the thick standard curve, there would be detectable endotoxin inthe sample. If this were a water sample, the result could be pass or fail depend-ing on a firm’s WFI limit the referenced standard curve.
& Likewise, the onset time for sample ‘‘b’’ indicates that again, the endotoxincontent could be significantly different depending on the referenced stan-dard curve.
FIGURE 16 The effect of linearityon endotoxin determination.
d The use of polynomial regression is approved by the FDA on a lysate manufacturer-by-manufacturer basis. Contact your lysate manufacturer for details.
170 McCullough

FIGURE 17 The effect of slope onendotoxin determination.
FIGURE 18 LAL Testing Laboratory. Source: Courtesy of Associates of Cape Cod, Inc.
Bacteria Endotoxins Testing 171

Accuracy in endotoxin determination in the photometric test is a function ofthe accuracy of the standard curve. Laboratories must be cognizant of the effectsthat standard curves parameters (y-intercept, slope, linearity) can have on testresults, and must work toward limiting the allowable divergence in these param-eters from day to day between analysts and between instruments.
Tracking and TrendingTracking and trending of OOS results and the accompanying investigation reportsand CAPAs is routine in the parenteral industry. However, laboratories often forgetto track/trend laboratory errors and take the time to deduce the reasons for invalidtest results. For example, Table 17 is a listing of all of the invalid kinetic testingresults from a fictional laboratory.
Looking at the data chronologically, one can see that there were many pro-blems in 2003, but trends, patterns, but the possible or probable root causes arenot obvious. If the table were sorted first by problem and then by analyst, a verydifferent pattern emerges (Table 18).
A number of patterns are now obvious. Clearly, attention to these trends andthe immediate implementation of appropriate preventive actions will reduce therisk of invalid and/or ‘‘false’’ results in the future.
& All of the ‘‘hot wells’’ (presumed random endotoxin contamination in micro-well plates) were attributed to CC. Is this really a ‘‘hot well’’ problem, or isit an analyst problem?
& BA was responsible for 5/7 or 71% of the invalid spike recoveries. Does heneed retraining?
TABLE 17 Invalid Test Results for 2003
Date Problem Lysate lot Analyst Product Correlation
12/31/2003 Invalid spike XYZ123 BA WFI port 2 0.9911/14/2003 OOS XYZ123 KS Holding tank 0.9982/11/2003 Void curve XYZ123 BA N/A 0.9792/13/2003 Hot well XYZ123 CC NSA 0.9992/21/2003 Invalid spike XYZ123 BA Lipid emulsion 0.9953/16/2003 OOS XYZ123 CC Ampicillin 0.9993/31/2003 Invalid spike XYZ123 BA NSA 0.9864/4/2003 Negative cont XYZ123 MG NaCl 0.9964/30/2003 Hot well XYZ123 CC WFI port 2 0.9995/8/2003 OOS XYZ123 BA Holding tank 0.9975/28/2003 Invalid spike ABC234 BA Ringer’s 0.9936/7/2003 Invalid spike ABC234 MG Lipid emulsion 0.9996/13/2003 Hot well ABC234 CC Recrystallized 0.9867/4/2003 OOS ABC234 MG Holding tank 0.9998/29/2003 Missed well ABC234 KS Ampicillin 0.9949/2/2003 Void curve ABC234 BA Ringer’s 0.9769/12/2003 Negative cont ABC234 KS WFI port 2 0.99810/6/2003 Hot well ABC234 CC NaCl 0.99910/30/2003 Invalid spike ABC234 BA Holding tank 0.99111/4/2003 Invalid spike ABC234 CC Lipid emulsion 1.00011/24/2003 OOS ABC234 KS Holding tank 0.99812/14/2003 Negative cont ABC234 MG NSA 0.99712/30/2003 Void curve ABC234 BA NaCl 0.975
Abbreviations: OOS, out of specification; WFI, water for injection.
172 McCullough

& Looking more closely at the invalid spike recoveries, 3/7 or roughly 43% of theinvalid spike recoveries were with lipid emulsion. These three invalid spikeswere obtained by three different analysts. Could this trend indicate a problemwith interference in the assay? Was there a change in a process step or rawmaterial that could correlate with the issues with lipid emulsion spikerecovery?
& MG was responsible for 66% of the negative control problems. Does he needretraining?
& Sixty percent of the OOS results were on WFI holding tank samples. Is there alarger problem with the holding tank? Did these OOS results occur aftershutdowns? After cleanings? What about products made on those days? Whatdid the loop samples look like on those days? Is there a problem with access tothe holding tank port that could cause a sampling error and result in endotoxincontamination?
& BA as responsible for 100% of the voided curves, which were the result of non-linearity. Remember, BA was also responsible for 71% of the invalid spikerecoveries (above). Do we have a problem with BA?
SUMMARY
This chapter has demonstrated the application of HACCP as one method of riskanalysis to apply the bacterial endotoxin test as a tool for process control. Onceour assumptions and ‘‘knowns’’ were clearly delineated, HACCP helped to objec-tively identify and differentiate CCPs in the process. The exercise forced us to think
TABLE 18 Invalid Test Results for 2003 Sorted by Problem and Analyst
Date Problem Lysate lot Analyst Product Correlation
2/13/2003 Hot well XYZ123 CC NSA 0.9994/30/2003 Hot well XYZ123 CC WFI port 2 0.9996/13/2003 Hot well ABC234 CC Recrystallized 0.98610/6/2003 Hot well ABC234 CC NaCl 0.99912/31/2003 Invalid spike XYZ123 BA WFI port 2 0.9912/21/2003 Invalid spike XYZ123 BA Lipid emulsion 0.9953/31/2003 Invalid spike XYZ123 BA NSA 0.9865/28/2003 Invalid spike ABC234 BA Ringer’s 0.99310/30/2003 Invalid spike ABC234 BA Holding tank 0.99111/4/2003 Invalid spike ABC234 CC Lipid emulsion 1.0006/7/2003 Invalid spike ABC234 MG Lipid emulsion 0.9998/29/2003 Missed well ABC234 KS Ampicillin 0.9949/12/2003 Negative cont ABC234 KS WFI port 2 0.9984/4/2003 Negative cont XYZ123 MG NaCl 0.99612/14/2003 Negative cont ABC234 MG NSA 0.9975/8/2003 OOS XYZ123 BA Holding tank 0.9973/16/2003 OOS XYZ123 CC Ampicillin 0.9991/14/2003 OOS XYZ123 KS Holding tank 0.99811/24/2003 OOS ABC234 KS Holding tank 0.9987/4/2003 OOS ABC234 MG Holding tank 0.9992/11/2003 Void curve XYZ123 BA N/A 0.9799/2/2003 Void curve ABC234 BA Ringer’s 0.97612/30/2003 Void curve ABC234 BA NaCl 0.975
Abbreviations: OOS, out of specification; WFI, water for injection.
Bacteria Endotoxins Testing 173

carefully about every step in the manufacturing process. Perhaps not unexpectedly,HACCP indicated that the laboratory testing of the product is just as critical,arguably more critical, than the processing itself in determining the fate of adrug product.
The identification of these points through HACCP is an invaluable asset inthe analysis of product and process throughout the product life cycle. In develop-ment, the analysis will help to identify potential processing inconsistencies. Duringtechnology transfer and validation, the analysis helps to identify a minimal butvaluable number of significant focus points. For routine testing, HACCP forcedus to think carefully and assign scientifically sound and attainable endotoxin limitsto CCPs.
174 McCullough

ABBREVIATIONS AND ACRONYMS
API Active pharmaceutical ingredientBET Bacterial endotoxins testCAPA Corrective action/preventive actionCBER Center for biologics evaluation and researchCCP Critical control pointCFR Code of federal regulationsCIP Clean in placecGMP Current good manufacturing practicesCoA Certificate of analysisCP Control pointEP European PharmacopeiaEU Endotoxin unitGMP Good Manufacturing PracticesHACCP Hazard and critical control point analysisHVAC Heating, ventilation and air conditioningIM IntramuscularIV IntravenousIVD In vitro diagnosticISO International Organization for StandardizationJP Japanese PharmacopeiaLAL Limulus amebocyte lysateLOQ Limit of quantitationLPS LipopolysaccharideLRW LAL reagent waterLVP Large volume parenteralMVD Maximum valid dilutionOOS Out of specificationOOT Out of trendPDA Parenteral drug associationPPC Positive product controlQA Quality assuranceQC Quality controlQSR Quality system regulationRODAC Replicate organism detection and counting (plates)SIP Sterilize in placeSVP Small volume parenteralUSP U.S. PharmacopeiaWFI Water for injection
Bacteria Endotoxins Testing 175

GLOSSARY
Bracket A term used to describe the series of endotoxin dilutionsused in gel clot testing. Bracketing means preparingendotoxin dilutions equal to 2k, k, 1
2k and 14k where k is
equal to the label claim sensitivity of a gel clot reagentCorrelation coefficient A measure of linearity that is calculated from the linear
regression of a set of observed points. A correlationcoefficient of j1.0j means that the observed pointsstatistically fall directly on the regression line
Endotoxin A potent class of pyrogens isolated from the outer cellmembrane of gram-negative bacteria
Endotoxin limit The maximum allowable level of endotoxin for a product witha specific formula and an identified maximum dose
Endpoint For the gel clot test, the endpoint is the last positive that isfollowed by a negative in a series of endotoxin dilutions
Failure mode A design failure in which a system, subsystem, process orpart fails to meet its intended purpose or function (30)
Good manufacturingpractice
Defined in 21 CFR 211, good manufacturing practices (GMP)describe accepted and expected principles and practicesfor the manufacture of parenteral drug products
Hazard Any condition that results in an adverse consequence that isdetrimental to the product, the end user, or themanufacturer
Lambda (k) The BET test sensitivity defined as the confirmed label claimsensitivity for gel clot and the lowest point on thereferenced standard curve for photometric methods
Limulus amebocytelysate (LAL) reagentwater (LRW)
LAL reagent water is water containing no detectableendotoxin in the LAL test system. LRW is used for the BETnegative control
Lipopolysaccharide The chemical description of purified endotoxinPyrogen A fever-causing substanceQuality system Defined in 21 CFR 820, the Quality System is the current
GMP for medical devicesRisk The estimation of the possible occurrence of an identified
hazard or hazardous conditionRisk analysis Examination of a combination of empirical data, scientifically
based assumptions, manufacturing experience andcompliance requirements to determine risk
Risk control Proactive measures taken to restrict the possibility of risk in amanufacturing operation
Risk management The process of understanding, anticipating, and minimizingthe potential impact of a product failure or hazard to theproduct, the end user, or the manufacturer
Spike The addition of a known amount of endotoxin to a test articleUltrafiltration A filtration process whereby molecules are excluded based
on their molecular weight. Ultrafilters are rated on the basisof molecular weight exclusion limits, and their effectivenessas depyrogenating filters is due to their action as size-discriminating screens (12)
176 McCullough

REFERENCES
1. United States Food and Drug Administration. Pharmaceutical cGMPs for the 21stCentury: A Risk Based Approach 2002 at http://www.fda.gov/od/guidance/gmp.html.
2. United States Food and Drug Administration. Pharmaceutical cGMPs for the 21stCentury: A Risk Based Approach: Second Progress Report and ImplementationPlan 2002 at http://www.fda.gov.cdergmp21stcenturysummary.htm.
3. United States Pharmacopeia. ‘‘Bacterial Endotoxin Test’’ 2004a; 27:85.4. European Pharmacopeia. Chapter 2,6,14, ‘‘Bacterial Endotoxins’’, 2002.5. Japanese Pharmacopeia. ‘‘Bacterial Endotoxins Test’’. Chap. 6, 2001.6. United States Food and Drug Administration. Guideline on Validation of the
Limulus Amebocyte Lysate Test as an Enroduct Endotoxin Test for Human andAnimal Parenteral Drugs, Biological Products, and Medical Devices, 1987 athttp://www.fda.gov/cder/guidance/old005fn.pdf.
7. Code of Federal Regulations. Current Good Manufacturing Practices for FinishedPharmaceuticals.Title 21, Part 211. 2003a.
8. Code of Federal Regulations. Electronic Records; Electronic Signatures. Title 21,Part 11. 2003b.
9. Code of Federal Regulations. Good Laboratory Practice for Nonclinical LaboratoryStudies Title 21, Part 58. 2003c.
10. Code of Federal Regulations. Quality System Regulation Title 21, Part 820. 2003d.11. Williams KL. Endotoxins: Pyrogens, LAL Testing and Depyrogenation. 2nd ed.
New York: Marcel Dekker, 2001.12. Pearson FC. Pyrogens: Endotoxins, LAL Testing and Depyrogenation. New York:
Marcel Dekker inc, 1985:32.13. Parenteral Drug Association. Technical Monograph #7. Depyrogenation, 1985.14. Weary M, Pearson F III. A manufacturer’s guide to depyrogenation. BioPharm
1988; 1[4]:22–29.15. LAL Users’ Group. Preparation and use of endotoxin indicators for depyrogena-
tion process studies. J Parent Sci Tech 1989; 43(3):109–112.16. Dabbah R, Ferry E Jr, Gunther DA, et al. Pyrogenicity of E. coli 055:B5 endotoxin by
the USP rabbit test–a HIMA collaborative study. J Parenter Drug Assoc 1980;34(3):212–216.
17. Hochstein HD, Fitzgerald EA, McMahon FG, Vargas R. Properties of US Standardendotoxin (E) in human male volunteers. J Endotoxin Res 1994; 1:52–56.
18. Weary M. Understanding and setting endotoxin limits. J Parent Sci Tech 1990;44(1):16.
19. United States Pharmacopeia 29, < 85> . Bacterial Endotoxin Test 2006.20. McCullough KZ. Process control: in process and raw material testing using LAL.
Pharma Technol 1988:40.21. United States Food and Drug Administration. Guide to Inspection of Quality Sys-
tems, 1999 at http://www.fda.gov/ora/inspect_ref/igs/qsit/qsitguide.htm.22. United States Food and Drug Administration. Quality System Manual, 1997b at
http://www.fda.gov/cdrh/qsr.23. United States Food-Drug Administration. Guidance for Industry Sterile Drugs Pro-
duced by Aseptic Processing Current Good Manufacturing Practice 2004.24. United States Food and Drug Administration. Hazard Analysis and Critical
Control Point Principles and Application Guidelines, 1997a at http://www.cfsan.fda.gov/~comm/nacmcfp.html.
Bacteria Endotoxins Testing 177

25. European Parliament and the Council of the European Union. 1998. Directive 98/79/EC of the European Parliament and of the Council of 27 October 1998 on invitro diagnostic medical devices.
26. International Organization for Standardization (ISO). International Standard14971, ‘‘Application of the concepts of risk management to medical devices’’, 2000.
27. European Diagnostic Manufacturer’s Organization. Risk Analysis of In Vitro Diag-nostic Medical Devices, 1998.
28. American Society for Quality. The Certified Quality Auditor’s HACCP Handbook.Milwaukee, Wisconsin: ASQ Quality Press, 2002.
29. Corlett DA. HACCP User’s Manual. Gaithersburg, Maryland: Aspen PublishersInc, 1998.
30. Stamatis DH. Failure Mode and Effect Analysis: FMEA from theory to execution.2nd ed. Milwaukee, Wisconsin: ASQ Quality Press, 2003.
31. NACMCF. 1992. Hazard analysis and Critical Control Point Principles and Appli-cation Guidelines. National Advisory Committee on Microbiological Criteria forFoods.
32. McCullough KZ, John TS. Microbial attributes of active pharmaceutical ingredi-ents. In: Ira Berry, Daniel Harpaz, ed. Validating Active PharmaceuticalIngredients. Denver, Colorado: IHS Health Group, 2001.
33. Sweadner KJ, Forte M, Nelson LL. Filtration removal of endotoxin (pyrogens) insolution in different states of aggregation. Appl Env Microbiol 1992; 34:382–395.
34. Abramson D, Butler LD, Chrai S. Depyrogenation of a parenteral solution by ultra-filtration. J Parent Sci Tech 1981; 35:3–7.
35. United States Pharmacopeia "Sterilization and sterility assurance of compendialarticles’’ 2004c; 27:1211.
36. United States Food and Drug Administration. Guidance for Industry: Investigat-ing Out of Specification (OOS) Test Results for Pharmaceutical Production 1998at http://www.fda.gov/cder/guidance1212dft.pdf.
37. United States Pharmacopeia. ‘‘Transfusion and Infusion Assemblies and SimilarMedical Devices’’ 2004b; 27:161.
38. Levin J, Bang F. Clottable protein in Limulus: Its localization and kinetics of itscoagulation by endotoxin. Thromb Diath Haemorrh 1968; 19:186–197.
39. Roslansky PF, Dawson ME, Novitsky TG. Plastics, endotoxins, and the limulusamebocyte lysate test. J Parent Sci Tech 1991; 45:83–87.
40. Novitsky TJ. 1988. The Problems with Plastics In, LAL update Vol 6, No. 3.41. Roslansky PF, Dawson ME, Novitsky TJ. Problems with plastic test tubes. J Cell
Biol 1990; 3:308.42. Novitsky TJ, Schmidengenback J, Remillard JF. Factors affecting recovery of endo-
toxin adsorbed to container surfaces. J Parent Sci Tech 1986; 40(6).43. Jensch UE, Gail L, Klaoehn M. Fixing and removing of bacterial endotoxin from
glass surfaces for validation of dry heat sterilization. In: Detection of BacterialEndotoxins with the Limulus Amebocyte Lysate Test. New York: Alan R Liss, 1987.
44. Ludwig JD, Avis KV. Validation of a heating cell for precisely controlled studies onthe thermal destruction of endotoxin in glass. J Parent Sci Tech 1986; 42(1).
45. Twohy CW, Duran AP, Munson TE. Endotoxin contamination of parenteral drugsand radiopharmaceuticals as determined by the limulus amebocyte lysate method.J Parent Sci Tech 1984; 38:190–201.
46. McCullough KZ, Cynthia W. Variability in the LAL test: comparison of three kin-etic methods for the testing of pharmaceutical products. J Parent Sci Tech 1992;44:69–72.
47. Cooper JF. Resolving LAL test interferences. J Parent Sci Tech 1990; 44(1):13–15.
178 McCullough

48. Associates of Cape Cod. LAL Update 1998; 16(4). http://www.acciusa.com/pdf/updat1298.pdf.
49. Charles River Endosafe. LAL Times, 2000. http://www.criver.com/endosafe/techdocsendo_pdf/LAL_Times_Sept2000.pdf.
50. Cambrex Biosciences. Win CL Software, 2004. http://www.cambrex.com/Con-tent/Documents/Bioscience/Automated%LAL%20Software.pdf.
51. European Commission. EC Guide to Good Manufacturing Practice. Revision toAnnex 1. Manufacture of Sterile Medicinal Products, 2003.
52. United States of America, Plantiff vs Barr Laboratories, Inc et al, Dependants. CivicAction 92-1744.
Bacteria Endotoxins Testing 179


CHAPTER
9 Fault Tree Analysis of the United StatesPharmacopeia Sterility Test
Karen Zink McCullough and Audra Zakzeski
& Introduction& Risk& The Sterility Test Failure Case Study
Root Cause Determination via Fault Tree AnalysisThe Investigation
& Test MethodTest Method ValidationSystem SuitabilityNegative ControlMedia Suitability AnalysisMedia SterilityGrowth Promotion Test of Aerobes, Anaerobes, and FungiMedia Storage
& Organism IdentificationValidation of Organism Identification Methodology
& Materials TransportThe Sterility Test SampleTesting SuppliesMaterials Storage
& Equipment& Environment
Establishing ControlProcedure
& TechniqueTraining, Education, and Observation
& The Checklist& References& Appendix 1: The Sterility Test—Big Moving Parts
MethodologyEnvironmentEquipmentMedia and Diluting FluidsValidation
& Appendix 2: The Statistics of Endotoxin and Sterility TestingCase 1: Sterility TestingCase 2: Endotoxin Testing
181


9 Fault Tree Analysis of the United StatesPharmacopeia Sterility Test
Karen Zink McCullough
Whitehouse Station, New Jersey, U.S.A.
Audra ZakzeskiCarson City, Nevada, U.S.A.
INTRODUCTION
A ‘‘necessary evil’’ is something that one does not like to do, or perhaps does notunderstand the need to do, but which one realizes must be done. Sterility testingfalls into this category. It must be done because the Code of Federal Regulations(CFR) requires that a sterility test be performed on each lot of product labeled‘‘sterile’’ (21 CFR 211.167(a); 21 CFR 610.12). Unfortunately, given the statisticallimitations of the current test method, the result of a sterility test really gives little,if any, indication about the sterility of a batch (Appendix 1) (1,2).
Statistical evaluations indicate . . . if a 10,000-unit lot with a 0.1 percent contaminationlevel was sterility tested using 20 units, there is a 98 percent chance that the batchwould pass the test (1).
Given these statistics, it is reasonable to assert that sterility is assured throughcareful process validation and control, not through end product testing.
A positive result on a sterility test presents the manufacturer with a quandary—was the test contaminated by the analyst during test execution or was it randomly con-taminated at any number of critical steps during manufacture or is there a systemicproblem that could have caused the failure? A failed sterility test is considered byFood and Drug Administration and by United States Pharmacopeia (USP) to be‘‘guilty until proven innocent’’ and the assumption is that the contamination tookplace at some point during manufacture unless and until it can be proven conclusivelythat the failure was caused by a deficiency in the laboratory (1,3,4). 21 CFR 211.165(f)states, ‘‘Drug products failing to meet established standards or specifications and anyother relevant quality control criteria shall be rejected.’’ Thus, any failed sterility testcarries significant financial and compliance implications for the drug manufacturer.
As sterility is a quality attribute of parenteral products, a failure is, by defi-nition, out-of-specification (OOS) result and is subject to extensive investigation,regardless of the lot’s ultimate disposition (5,6). The investigation must be unbiased,scientifically sound, and timely. It must not only look for the cause of the failed testin question, but also should use the failure as a starting point for looking for adversetrends or patterns in laboratory test results, environmental monitoring data, manu-facturing batch records, facility-monitoring data such as temperature and humidity,and validated systems such as water for injection (WFI). The investigation must besupported by the collection of ‘‘objective evidence,’’ and should include any correc-tive action or preventive action (CAPA) that becomes evident as a result of theanalysis (1,3,4,6–8).
183

Practically speaking, an investigation into a failed sterility test is more of a pre-ventive exercise than a corrective one. It is extraordinarily difficult to justify theinvalidation of a failed sterility test. If your only purpose in performing an investi-gation into laboratory testing is to invalidate a failed test, you will likely bedisappointed in your efforts. However, the investigation process can be a most pro-ductive one if it leads to a better understanding of both the manufacturing and thesterility test processes and identifies activities, situations, equipment, or processesthat can be improved upon in order to prevent another OOS from happening.
RISK
In the best of all worlds, a manufacturer will perform a risk analysis during devel-opments scale up and transfer of the product for routine manufacture. Thisrisk analysis is a cross-functional effort with representation from development,manufacturing/operations, quality, engineering, and facilities to identify criticalprocessing points relative to identified product hazards or failure modes. For thepurposes of this chapter, our failure is a nonsterile product. The risk analysis canbe performed using any number of published models including hazard analysisand critical control point (HACCP), failure modes and effects analysis (FMEA), orfault tree analysis (FTA) to identify process critical control points or faults that couldbe root causes of a an identified failure (9–12). The utility of performing a prospec-tive risk analysis is clear.
& Critical points in the manufacture and testing of the product relative to anyidentified hazard or failure mode can be objectively identified for the purpo-ses of process validation, process control/monitoring, and test methoddevelopment.
& Limits for both validation and routine monitoring can be set for all identifiedcritical points.
& Validation and routine documentation requirements for monitoring of criticalpoints can be identified.
& Provisions for trending of data from critical monitoring points can be described.& The prospective risk analysis provides a consensus-driven, consistent,
unbiased, and scientifically based roadmap for an investigation in the eventof a test failure.
Risk analysis does not only applied to manufacturing processes. The micro-biology laboratory should perform a risk analysis on critical methods such assterility testing in order to prospectively identify and proactively correct or controlpotential problems that could result in an OOS sterility test result.
This chapter takes a critical look at sterility test methodology from the per-spective of a failure. We have chosen FTA as our tool, although any risk analysistool can be adapted for this purpose. Throughout this chapter, we describe thetypes of objective evidence that might be collected in support of the investigationand CAPAs that might be proposed if the evidence suggests a deficiency. Ourexamples are only illustrative, as the required or desired objective evidence andCAPAs will vary with the product, the process, the facility, etc. As a cautionarynote, we focus here on the laboratory portion of the investigation. As a sterilityfailure can have more than one identified root cause, a complete investigation con-tains rigorous analyses of all possible root causes in the lab, manufacturing, andfacilities. For those who are unfamiliar with sterility test, Appendix 1 provides
184 McCullough and Zakzeski

a discussion of the basic components of the test procedure and test interpretation.(Appendix 2 provides some insight into the statistical basis and limitations of thecurrent test method as described in USP 29 (4).)
THE STERILITY TEST FAILURE CASE STUDY
Root Cause Determination via Fault Tree AnalysisWith the observation of an OOS result, we are obligated by 21 CFR 211.192, legalprecedent, FDA, and our own standard operating procedures (SOPs) to determinethe root cause(s) of any sterility test failure (1,5,6). Root cause analysis will help usto identify the who, what, where, when, why, and how of a failure and in the pro-cess will provide clues for generating CAPAs that will address deficiencies with aneye toward preventing similar failures from happening in the future (13). How dowe approach and document our thought process through to the identification of aroot cause of the failure?
The investigation is optimally driven by quality assurance (QA). Why QA?Since they neither manufacture nor test the product, they have no ‘‘stake’’ in the out-come of the investigation other than to assure that it is objective, scientific, and timely.Recognizing that there may be more than one root cause for the failure and given thegoal to provide an unbiased and scientific analysis of the failure, the investigationteam should be cross-functional, and should require participation by affected depart-ments including manufacturing/operations, quality control/testing, engineering,and facilities (6).
We have chosen a method called ‘‘fault tree analysis’’ or FTA for our exam-ple. FTA is a ‘‘top-down,’’ deductive, qualitative approach to failure analysis (12).The ‘‘language’’ of FTA, as adapted for our purposes, is simple. The sterility failureis the top event. We look to analyze the failure through the identification of increas-ingly more specific intermediate events that could potentially contribute to thefailure. Each intermediate event could have additional contributing input events.The relationship between input and output events is described by a gate. For ourexample, we will rely on the ‘‘OR’’ gate described in Table 1. In the end, we identifya series of basic events as potential root causes of the failure. This collection of basicevents is our unbiased set of possible root cause events that we will use to steer theinvestigation. The complete graphic representation of possible faults for the iden-tified failure will serve to highlight the interrelationships between departments,procedures, and events when prospectively analyzing a process or retrospectivelyinvestigating a failure.
TABLE 1 Symbols Used in Fault Tree Analysis
Symbol Meaning
An intermediate event—an event that occurs because of one or more causes activethrough logic gates
a An ‘‘OR’’ gate—the output from this gate occurs if at least one of the inputs occurs
a A ‘‘basic event’’—identifies a basic initiating fault with no further development (i.e.,‘‘end of the line’’ for that particular branch of our analysis)
Fault Tree Analysis of the United States Pharmacopeia Sterility Test 185

The three basic symbols that we are using and their meanings are describedbelow and in Ref. (12):
The InvestigationAt a very high level, there are three basic sources of error that could have resultedin a sterility OOS: either there was a problem with the analysis itself (laboratory-related), and/or there was an isolated and potentially identifiable error associatedonly with the manufacturing of the batch in question (operator or nonprocess-related error), and/or there was a batch-independent chronic problem with aprocess, procedure, or system (process-related error) (5). Supporting any OOSinvestigation is the collection and analysis of ‘‘objective evidence,’’ which is docu-mentation that will become part of the investigation record and must be used in thejustification for excluding or implicating any basic event as a possible root cause ofthe failure.
Preliminary AnalysisTo support the formal investigation, it is prudent to take time to look at the sterilityfailure in the context of the history of testing, the product tested, any changes to theproduct or process, and the type of organism that has been identified (Table 2). Thisinitial examination of historic trends is not the complete investigation, but it providesa perspective for the investigation that could provide some clues for specific ques-tions to ask and additional data to gather and analyze in the performance of theremainder of the inquiry?
In the end, the failure could be the result of a combination of laboratory, pro-cess, and nonprocess-related errors. In the event of multiple root causedeterminations, process and nonprocess-related errors ‘‘trump’’ laboratory errors,and the batch must be rejected.
The Fault TreeThe beginning of the fault tree might look like Figure 1. The top event is the ster-ility test failure. The three big intermediate categories that could contribute to thefailure are laboratory errors, nonprocess-related batch-specific isolated errors, andbatch-independent or systemic process-related errors. We will work through thepossibility of laboratory error (Fig. 1), but a complete investigation would workthrough all three error categories.
Laboratory ErrorIf we consider the laboratory as a potential source of error, we must ask the ques-tions, ‘‘What behaviors, conditions, or procedures in the testing laboratory couldresult in an inadvertent contamination event and nonproduct-related growth ina sterility test?’’ and ‘‘What was different or unique about this particular testand its supporting functions that could have contributed to the OOS?’’
We have identified six major categories of possible causes, faults, or clues thatcould help us to determine if our failure is laboratory-related: (i) test method, (ii)organism identification (ID), (iii) transport of materials used in the performance ofthe test, (iv) equipment used in the performance of the test, (v) the environmentin the sterility test suite, and (vi) the analyst’s technique in the performance ofthe test. We consistently use the ‘‘or’’ gate symbol in our graphic, because theremay ultimately be more than one intermediate event or root cause (Fig. 2).
186 McCullough and Zakzeski

TEST METHOD
A valid sterility test method requires considerable supporting work and documen-tation (4). We can identify two broad classes of supporting data: test methodvalidation and routine system suitability tests (Fig. 3).
TABLE 2 Preliminary Analysis: Looking at Historical Trends
Trends in . . . . . . could indicate
Sterility OOS by product type (e.g.,lyophilized, terminally sterilized,aseptically manufactured)
Process error (terminal sterilization cycle needsrevalidation, transfer of filled vials from filling machine tothe lyophilizer is not monitored)
Sterility OOS by a specific product Process error (manufacturing process)Sterility OOS by analyst Laboratory error (difficulty in test method)Sterility OOS by season Process error (facility issue)
Nonprocess error (e.g., seasonally high bioburden in rawmaterials)
Laboratory error (poor control of environment)Sterility OOS correlated with trends or
spikes in manufacturingenvironmental monitoring
Process error (chronic facility control problem)Nonprocess error (spikes in EM could indicate acute
nonprocess problem involving facilities or people)Sterility OOS correlated with trends or
spikes in testing suite environmentalmonitoring
Laboratory error (failure to control the testing environment)
Sterility OOS correlated with ‘‘people’’organisms
Nonprocess error (poor hygiene, poor aseptic technique,poor cleanroom etiquette)
Process error (poor cleaning regimen)Laboratory error (poor aseptic technique on the part of the
analyst)Sterility OOS correlated with
‘‘environmental’’ organismsProcess error (poor cleaning regimen, poor sterilization
regimen, poor facility control)Sterility OOS correlated with time of
the day that the test is performedLaboratory error (could be associated with lack of
control of temperature and humidity in the test area;could be associated with fatigue on the part of theanalyst)
Sterility OOS correlated with change in process, rawmaterial supplier
Process error (poor validation, poor vendorqualification)
Sterility OOS correlated withmanufacturing shift
Nonprocess error (potentially personnel-related)
Abbreviations: OOS, out-of-specification; EM, environmental monitoring.
FIGURE 1
Fault Tree Analysis of the United States Pharmacopeia Sterility Test 187

Test Method ValidationThe validation of the test method answers the question, ‘‘Is there any interferencein the test system that would prevent the growth of microorganisms?’’ Quitehonestly, the risk in not performing a validation of the sterility test method is afalse-negative result (due to undetected test inhibition), not a false-positive(14,15). But, as GMP requires that all test methods be validated, it is an importantbasic premise of any investigation to demonstrate the validity of a test method. Aswith any analytical method, the sterility test should not be performed in theabsence of a validation study.
Objective evidence:
& A properly executed and documented validation study must be filed for eachproduct that is subject to sterility testing to assure that the test performs asexpected.
& A check of the testing SOP and an interview with the analyst may reveal thatthe validated test method was not followed. If this is the case, there is the possi-bility that an extra step was added or a step was deleted that could havecaused an inadvertent contamination event.
Corrective action (or) preventive action:
& If no test method validation exists, one must be performed before routine pro-duct testing can resume.
& If the validated test method was not followed, retraining is in order.& If the SOP does not align with the validated test method, then it must be
revised to bring it into alignment with laboratory practice. The rule of thumbis to ‘‘do what you say, and say what you do.’’
FIGURE 2
FIGURE 3
188 McCullough and Zakzeski

& If the analyst experienced problems with the test method, an optimizationstudy may be in order to examine the ruggedness of the sterility test methodfor that product.
System Suitability‘‘System suitability’’ is the collection of controls that applies to an individual ster-
ility test. We might identify two components of a sterility test system suitabilitycontrol set: the negative control and the media suitability analyses (Fig. 4).
Negative ControlThe negative control is a sterility test without a sample. Its purpose is to examinethe degree of control over the aggregate of the test conditions, including the ana-lyst’s technique at the time of the test. As there is no sample involved, the rate ofpositives observed on the negative control provides a measure of the laboratory’sor the analyst’s inherent rate of ‘‘false-positives.’’ False-positives have identifiablecauses: lack of assurance of the sterility of the media, lack of assurance of the ster-ility of the equipment, an uncontrolled environment, and poor analyst techniqueare all possible causes of growth in a negative control. Therefore, when lookingat an individual sterility test positive, it is important to examine the test resultsfor the associated negative control to help determine if a systemic laboratory error(e.g., media or equipment processing, cleaning) or an analyst error (e.g., poor asep-tic technique) might have occurred.
Objective evidence:
& The test record for the lot in question will document the result of the negativecontrol. Growth in this control indicates that some component of the systemwas out of control on the day of the test. If so, further investigation needs tobe performed to determine out where a systemic or incidental error mighthave occurred.
& The test record and personnel-monitoring records could indicate that the prob-lem was associated with the analyst’s technique. Identification of a ‘‘people’’organism in the negative control such as Staphylococcus epidermidis could sup-port the theory that there was a possible break in aseptic technique on thepart of the analyst.
& The media suitability analysis record would confirm the sterility of the dilutingfluid as well as the other media used in the performance of the test. If, for
FIGURE 4
Fault Tree Analysis of the United States Pharmacopeia Sterility Test 189

example, the diluting fluid were not sterile, one would expect the negative con-trol as well as most, if not all of the test samples that utilized that lot of dilutingfluid to be positive, and to be positive with common organisms. If the analystexhibits poor aseptic technique, one would expect that some number of his/hertests as well as some number of his/her negative controls over time would bepositive, and would most likely be positive with an organism usually associ-ated with people, e.g., Staphylococcus or Propionibacterium.
& The environmental testing record will indicate the numbers and types of micro-organisms isolated from the test area and will provide a measure of the controlof the environment on the day of the test. High counts could suggest that eitherthere was an intervention without sufficient cleaning (e.g., repair) or that thecleaning was ineffective and that a poorly controlled environment could havebeen, in part, responsible for growth in the negative control.
& The autoclave charts will indicate if the validated times and temperatures weremet for the sterilization of equipment used in the performance of the test.
& The cleaning log will indicate if and when the area was cleaned prior to the testand who did the cleaning.
Corrective action (or) preventive action:
& If investigation into the history of the analyst’s test results indicates that he/shehas had an unusually high number of negative controls exhibiting growth inthe past, then a retraining could be in order. As a note, the total number ofnegative controls that exhibit growth across all analysts in the laboratory usinga membrane filtration (MF) manifold method under laminar flow in a clean-room should not exceed 0.5% (16). Clearly, it would be expected that the useof isolators or closed testing systems would drive the acceptable number offalse-positives much lower (Appendix 2).
& Evidence of improperly sterilized media or equipment will invalidate all test-ing during that session. All media or equipment associated with the impropersterilization run must be removed from use.
& A poor testing environment indicates a lack of control in the test area. Forexample, nonconforming counts under laminar flow hoods (LAFs) and biosaf-ety cabinets could signal that maintenance and/or cleaning is in order.
Media Suitability AnalysisThe USP chapter on sterility testing has a section entitled, ‘‘Suitability Tests’’ (4).These tests refer to the examination of each lot of bacteriological growth mediumand diluting fluid used in the performance of the sterility test to assure that (i) itis sterile, (ii) it supports growth, and (iii) it has been stored properly. Not meetingthe requirements of any of the suitability tests could compromise the validity of thesterility test (Fig. 5).
Media SterilityEach lot of bacteriological growth medium, sterility test diluent, and environmen-tal monitoring media, whether commercially prepared and purchased or preparedin-house, must undergo a preincubation to demonstrate that the lot is sterile. USPrequires that a portion of each lot (unopened containers) of media used in the ster-ility test be incubated for 14 days to demonstrate sterility. Some laboratoriespreincubate the entire lot and some laboratories incubate a randomly selected
190 McCullough and Zakzeski

and statistically valid subset of the lot. The acceptance criterion for media sterilityis that none of the incubated units exhibits growth in the 14-day period of the test.If growth is observed in this portion of the media suitability tests, the lot ofmedium should be rejected and must not be used in any testing.
Growth during preuse testing of a lot of purchased media indicates prep-aration or sterilization problems at the vendor, packaging integrity problems, ortransport problems. Transport has two components with respect to purchasedmedia. The first is transport chain between the manufacturer/distributor/customer.The second is transport within the lab from an unclassified space to a classifiedspace or between spaces of ‘‘dirtier’’ to ‘‘cleaner’’ room classifications. A positive ona lot of medium made in-house could indicate bioburden/organism resistance pro-blems in the dehydrated media, sterilization problems including autoclave cyclevalidation, storage problems, or transport problems.
Objective evidence:
& Records of the sterility portion of the media suitability test for this lot ofmedium used in a sterility test including sterility media, diluting fluid, andsolid media used for environmental monitoring must be complete and avail-able for inspection.
& Media preparation documents, sterilization charts, and storage conditions(incubator charts) must be examined carefully in the event of a positive onmedia prepared in-house.
& In addition, examine the history of the media testing for past instances of positiveresults. Look for trends in positive results that may be related to types of media,manufacturer of the media (if purchased), manufacturer and lot number of themedia powder, and sterilization records of the medium (if prepared in-house).
Corrective action (or) preventive action:
& If media are purchased, an investigation into the lack of assurance of sterility,including a directed audit of the media manufacturer should be one outcomeof a media positive. If a directed audit is called for, examine the manufacturer’sprocesses and documentation including validation for the media preparation,packaging, sterilization, testing, storage, and transport.
& For media prepared in-house, if deficiencies are found in preparation, sterilization,or storage, it must be determined if there was an acute problem (e.g., someone setthe autoclave on the wrong cycle) or if there is a chronic problem (e.g., the auto-clave cycle is inappropriate). Single instances of media failures would suggest theformer; multiple instances of media failures would suggest the latter.
FIGURE 5
Fault Tree Analysis of the United States Pharmacopeia Sterility Test 191

& Any excursion from expected results should automatically require the quaran-tine of any remaining media until the results of a laboratory investigation intothe deviation are analyzed, the root cause of the excursion is identified, andappropriate CAPAs are implemented.
Growth Promotion Test of Aerobes, Anaerobes, and FungiThe second part of the USP media suitability test is meant to demonstrate that eachlot of medium will support the growth of low numbers (<100 CFU) of indicatormicroorganisms that are identified in a USP panel of suggested organisms. Thepanel is the same panel recommended for the validation of the sterility test andincludes a spectrum of organisms covering aerobes and anaerobes, Gram-positiveand Gram-negative, spore formers and nonspore formers, bacteria and fungi, andyeast and mold. Inclusion of an environmental isolate that is not part of the USPpanel is expected by some regulators to represent organisms that might be selectedby conditions in the particular manufacturing environment. For example, it isappropriate to use an organism isolated from a beta-lactam manufacturing facilityfor test method validation and media testing because this organism is likely resis-tant to beta-lactam antibiotics.
Objective evidence:
& Records of the growth-promotion suitability test must be available. Recordsshould minimally include the date of manufacture, test date, expiration date,the types and numbers organisms (confirmed using either pour plate or MFmethods) used to test each type of medium, the number of passages fromthe primary culture, incubation times and temperatures, confirmation thatgrowth occurred as appropriate with the required time, and analyst initials.
& If a supplier qualification study including a vendor audit and a product vali-dation study has determined that a certificate of analysis from the mediavendor attesting to the sterility and growth promotion of the media is accept-able, then a certificate should be on file for each lot of media or diluting fluidused in the performance or surveillance of the test. Certificates of analysisshould not be accepted from the media manufacturer until proper vendorqualification and certificate verification testing has been performed and docu-mented. Media are critical to a valid sterility test, so the vendor should berecertified on a regular basis.
Corrective action (or) preventive action:
& Any excursion from expected results should automatically require the quaran-tine of any remaining media until the results of a laboratory investigation intothe deviation are analyzed, the root cause of the excursion is identified, andappropriate CAPAs are implemented. Growth-promotion testing may deviatefrom the expected outcome for a number of reasons including but not limitedto overdiluted or low-viability inoculum and dry plates.
Media StorageThe stability of any growth medium, whether purchased or prepared in-house,must be determined through validation to determine an appropriate expiration date.If a certificate of analysis for expiration date is accepted, it must be confirmed in theuser laboratory. The medium must not be used if it is beyond its expiration date.
192 McCullough and Zakzeski

The real risk of using expired media in a sterility test is not a false-positive, but afalse-negative due to the potential for ‘‘old’’ media not to support growth. Expir-ation dating is an indicator of media robustness and must be examined for acomplete investigation into overall laboratory control.
Objective evidence:
& Media suitability test records and/or certificates of analysis must be examinedfor evidence of expiration dating and for matching of expiration dates to test-ing dates.
Corrective action (or) preventive action:
& Dispose of any media that is beyond its expiration date.
In the end, look back at the media preparation and testing records to see if thelots of media used in the OOS test had been used elsewhere, and examine thosetesting records for excursions or nonconformities. Patterns of excursions mightindicate that a particular lot or manufacturer of media is problematic, and mayrequire destruction of remaining units of the medium, an audit of the manufac-turer, or the validation of a second supplier (Fig. 6).
ORGANISM IDENTIFICATION
Organisms isolated from any positive sterility test as well as any Class 100 (GradeA/B, ISO 5) environment, both the manufacturing and testing environments,should be identified to genus and species (1,17). There are two reasons for this:
& The manufacturer needs to know and understand the normal flora of both themanufacturing and testing areas. Knowing the flora assists in sanitizer effective-ness studies and cleaning validation studies. Normal flora are an importantsource of environmental isolates to use for method validation and media testing.
FIGURE 6
Fault Tree Analysis of the United States Pharmacopeia Sterility Test 193

& Matching recovered organisms from manufacturing or testing environmentswith isolates recovered in the sterility test will help to answer the question,‘‘Was the OOS isolate also recovered from the manufacturing area, the manu-facturing operators, the sterility test area, or the sterility analyst?’’
When looking at the process of organism ID, one might examine two differ-ent aspects of the identification process that could affect investigation outcome, thevalidation of the identification method, and the likelihood of possible sources ofthe identified organism (Fig. 7).
Validation of Organism Identification MethodologyIdentification can take place on pure cultures of isolates using a number of differ-ent methods including nucleic acid ‘‘fingerprint’’ analysis and biochemical reactionprofile (17). In any method, the identification of an isolate is determined by com-paring the profile from an individual analysis to profiles contained in a broaddatabase of known and previously identified organisms. The result is a mathemat-ical probability associated with a match of the unknown to an organism profile thatis contained in the database. However, databases may be built on information fromnonmanufacturing sources. For example, some databases may be built from infor-mation gathered on clinical rather than manufacturing isolates. It is important toknow and understand the source of the system’s database.
Any identification method used in the laboratory must be fully validated. Aswith any piece of analytical equipment, an ID system must have a documentedinstallation qualification (IQ), operational qualification (OQ), and performancequalification (PQ). As part of the qualification process, a panel of known organ-isms, as suggested by manufacturer, must be consistently and correctly identified.
Objective evidence:
& Executed and signed IQ, OQ, and PQ must be on file for an automated system;method validation for a manual system.
Corrective action (or) preventive action:
& If a system or database is deemed inappropriate for the task, a second systemmust be qualified.
& If the system has not been qualified, all the identifications from that systemare questionable. The instrument should be taken out of service and properlyvalidated.
FIGURE 7
194 McCullough and Zakzeski

Organism IdentificationOnce validated, the real likelihood of any identification test result must be carefullyexamined by the testing laboratory. For example, if the identification system suggeststhat the organism isolated from your sterility OOS is Yersinia (aka Pasturella) pestis, youshould have a healthy dose of skepticism, as Yersinia pestis is the organism responsiblefor the plague in sixteenth century Europe. Although anything is possible, it is highlyunlikely that this organism is the reason for your twenty-first century sterility OOS.Likewise, a saltwater marine microorganism might find its way into a facility that islocated near the beach but is unlikely to be found in a Midwest manufacturing facility.When reviewing the ID of an isolate, think carefully about the foundation of the refer-enced database (e.g., clinical vs. industrial or environmental) and the likelihood of theisolation that organism from your manufacturing or testing environment. If you haveany concerns, run the isolate through a second, validated system.
Once you are comfortable with the identification of the organism, you can use itas a clue for the rest of the investigation. For example, the recovery of Propionibacteriumacnes from the OOS would suggest that the source of the contamination is a person orpeople. The investigation could focus on the people as a likely source of the contami-nation by looking at (i) organisms recovered from surfaces where analysts routinelytouch (e.g., handles, intercoms), (ii) ‘‘touch or finger plates’’ that are taken routinelyupon exit from the test area, and (iii) any analyst gown monitoring that might takeplace upon exit from the sterility test suite. Identification of Pseudomonas species mightsuggest that the source of the contamination was water, and the investigation couldfocus on potential leaks, quality of the WFI used in cleaning and manufacture, etc.Identification of Pseudomonas species as a contaminant in the product is also a clueto look for endotoxin contamination in the product and intermediates, as endotoxinis a byproduct of the growth and reproduction of Gram-negative species. If the sameorganism is isolated from the sample, the manufacturing environments analysts, thetesting environment and manufacturing operators, the batch should be rejectedunless typing using advanced nucleic acid techniques definitively eliminates manu-facturing as a source of contamination (1,2,17).
Objective evidence:
& Identification documentation including a ‘‘reality check’’ of the probability ofthe isolate as identified is required. Questions to be asked include: ‘‘Is thisorganism part of the normal flora of this geographic area?’’ ‘‘Has this organismbeen identified in this facility before—could it possibly be part of the normalflora of the manufacturing or testing areas?’’ ‘‘Could people, materials, orequipment have brought this organism into the facility?’’
& The laboratory’s trending and database of organisms recovered in the manu-facturing and testing areas will help determine the likelihood of theidentification and at least circumstantial evidence as to its origin.
& Sorting OOS test results by organism or by recovery date will determine if theisolation of the organism is seasonal or if there is a correlation between organ-ism recovered and a specific product, or a specific analyst.
Corrective action (or) preventive action:
& If the identification is unlikely, check the purity of the culture. Maybe you areidentifying the wrong organism. If you are convinced that the identification isimprobable, try and identify the organism on another system to confirm the ID.
Fault Tree Analysis of the United States Pharmacopeia Sterility Test 195

& If trending indicates that the problem is seasonal, then validation of a changein sanitizer or cleaning regimen might be in order. For example, if Bacillusthuringiensis is used by the municipality in the summer for mosquito controland it is recovered seasonally in the cleanroom, then sanitizers used in thesummer must demonstrate effectiveness against this organism (Fig. 8).
MATERIALS TRANSPORT
By ‘‘materials,’’ we mean those materials, other than liquid media and sterility test-ing equipment, that are transported into and out of the sterility test suite for thepurposes of testing. Where possible, the preferred method of materials transportinto any cleanroom is via a double-door sterilizer. However, some supplies usedin the performance of the sterility test are not heat stable, and therefore requirea documented and validated procedure for entry into the cleanroom. Two cate-gories of materials immediately come to mind: the test sample itself and anymaterials that are wrapped multiple times for the purposes of clean transport(e.g., contact plates for microbiological monitoring of the sterility test suite) (Fig. 9).
The Sterility Test SampleOne very common cause of a sterility test failure is the sample itself—not the samplematerial, but the outside of the sample container. It only makes sense that if one istaking precautions to keep the sterility test suite as clean as possible, then the out-sides of any containers, including the sterility test sample, must be properly and
FIGURE 9
FIGURE 8
196 McCullough and Zakzeski

completely sanitized prior to transport into the test area. ‘‘Dunking’’ sealed vials orampoules in 0.5% hypochlorite or another sporocide prior to transport into the suiteis one method that is commonly used, but validation must include data to prove thatsanitizer does not leak into the vials during submission. If vials come from the fillingline with the plastic flip caps on them, remove the flip seals prior to sanitization.Unless validated, one cannot be certain that the sanitizer will effectively reach underthe flip cap. If samples are taken in jars or plastic containers, a suitable ‘‘wipe down’’procedure using an appropriate sanitizer will have to be validated.
Objective evidence:
& A validation study of the sanitization method for bringing the samples into thearea is required. Validation must include the effectiveness of the sanitizationprocedure against organisms commonly found in the environment.
& An analyst interview will indicate if proper transport procedures were followed.
Corrective action (or) preventive action:
& If a validated transport method does not exist, assure that one is developed.Ineffective sanitization of the sample is a common source of contamination thatcould ultimately find its way into a sterility test.
Testing SuppliesDepending on the set-up of the suite, other materials such as the heat labile parts of airsamplers, the pumps used during the test, or prepared solid media used for environ-mental monitoring need to be transported into the test area. Prepared, purchasedmedia are generally double- or triple-wrapped, meaning that the outermost wrappingis not sterile, but the inner wrappings are sterile. Wrappings should be removed anddiscarded as entry into the cleanroom progresses. Whatever the sequence, the methodneeds to be clearly documented in an SOP and validated. If a piece of equipment can-not be submerged or presterilized, a sequential ‘‘wipe down’’ procedure for exposedsurfaces should be clearly documented. Under no circumstances should cardboard orlaboratory papers be brought into a cleanroom. These articles are loaded with micro-organisms and can be a significant source of contamination. If paper and writingimplements are needed in the cleanroom, suitable autoclavable materials should bepreapproved and the sterilization cycle validated before use.
Objective evidence:
& SOPs and executed validation protocols for material transport, including sam-ple preparation, should be examined.
& An analyst interview should be performed to see if anything was different on theday of the test (e.g., new lot of isopropyl alcohol (IPA), change in packaging onprepared media, use of a replacement pump or air sampler that had been storedin a warehouse, lack of following the established and validated SOP, etc.).
Corrective action (or) preventive action:
& If a validated transport method does not exist, one must be proposed and exe-cuted.
& Validation for transport may need reexamination if it is determined that thereare logistical obstacles to good practice.
& If materials were brought into the suite improperly, any remaining materialsshould be removed from the area, reprocessed if possible, and the analysis retrived.
Fault Tree Analysis of the United States Pharmacopeia Sterility Test 197

Materials StoragePart of material handling is the storage of the supplies and equipment once in thecleanroom. Short-term storage of media and other supplies in a cleanroom orisolator is fine provided that the environment is stable and the conditions (lengthof storage, temperature, humidity, and expiration date) have been determined andvalidated. Once asepsis is broken (e.g., shutdown, power failure, temperature orhumidity excursion), any remaining test materials should be removed from thearea and discarded or resanitized prior to bringing them back into the test area.
Objective evidence:
& Work orders, room temperature/humidity charts, records of differential pres-sures, and entry logs are all types of evidence that should be examined toassure that the materials used in the performance of the test had not been sub-jected to a break in asepsis.
Corrective action (or) preventive action:
& If asepsis had been broken or if it is unsure whether or not asepsis had beenbroken, the room must be emptied of all materials, and the materials mustbe discarded, resterilized, or resanitized before restocking the suite prior toresuming testing. If SOPs do not exist that outline procedures that need to betaken if asepsis is broken, they need to be written or revised so that excursionsare handled consistently and properly (Fig. 10).
EQUIPMENT
All equipment used in the performance of the sterility test must be prepared and usedwith the focus on eliminating the possibility of contamination during the test (Fig. 11).
& Where possible, all equipment, including cleaning supplies, manifolds,punches, and forceps, should enter the cleanroom via a ‘‘pass through’’ sterili-zer. Sterilization load patterns and cycles must be documented, validated andmonitored.
FIGURE 10
198 McCullough and Zakzeski

& Laminar flow hoods used in the performance of the test must be certified asClass 100 and subject to the same preventive maintenance and recertificationprocedures as any LFH unit used in manufacturing.
& Sanitization of the surfaces in the sterility test hood must be validated. Periodicbreakdown and thorough cleaning of the hood must be validated anddocumented.
& Air samplers used to monitor the air for viables and nonviables during thecourse of the test must be calibrated and maintained in the same mannerand on the same schedule as units used to monitor manufacturing. All air sam-pler parts must be subject to a validated sterilization or sanitization regimen.
& Manifolds and pumps used in the sterility test must be included in a detailed anddocumented preventive maintenance program. Any mechanical pipettors used inthe performance of the test must be calibrated, and disposable tips must be sterile.
& Incubators must be qualified (IQ, OQ, and PQ). Qualification includes tempera-ture uniformity studies. Incubators should be cleaned on a regular basis and thecleaning should be documented in the cleaning and use log for the equipment.
& Chart recorders for incubators must be subject to validation and regular calibration.
Objective evidence:
& Calibration and maintenance records must be checked to assure that all equipmentused in the performance of the failed test were in good repair and in calibration.Equipment failure or unmonitored wear and tear are potential causes of a sterilitytest failure. For example, test failures linked to a common filtration manifold couldsuggest that improper sterilization of the manifold is a potential root cause ofthe failure.
& Sterilization records for equipment, cleaning supplies, and media for the OOStest in question must be checked to assure that the sterilization parameterswere consistent with the validated cycles. Shortened cycles or lower tempera-tures could result in nonsterile equipment.
Corrective action (or) preventive action:
& Validated sterilization cycles must be developed if they do not exist. Cycles andloads must be revalidated regularly.
& Calibration and preventive maintenance SOPs and records must be detailedand must be available for inspection (Fig. 12).
FIGURE 11
Fault Tree Analysis of the United States Pharmacopeia Sterility Test 199
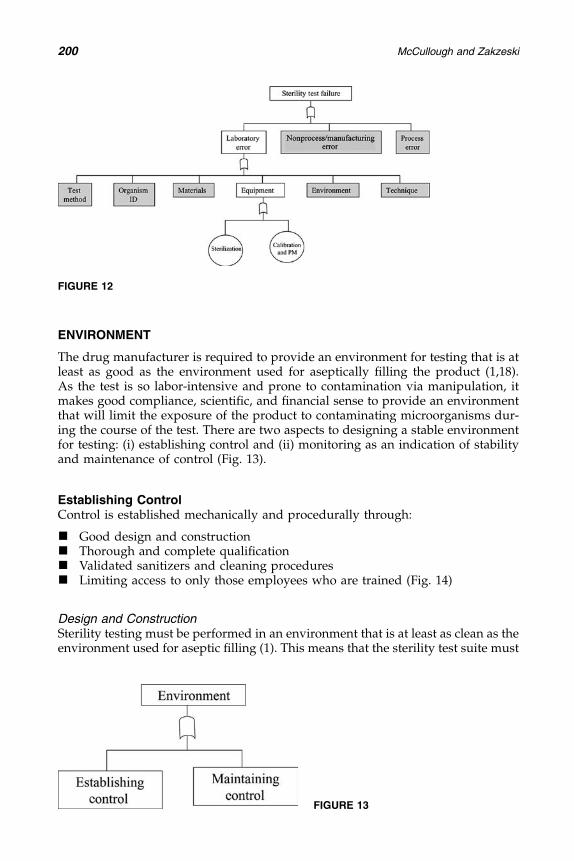
ENVIRONMENT
The drug manufacturer is required to provide an environment for testing that is atleast as good as the environment used for aseptically filling the product (1,18).As the test is so labor-intensive and prone to contamination via manipulation, itmakes good compliance, scientific, and financial sense to provide an environmentthat will limit the exposure of the product to contaminating microorganisms dur-ing the course of the test. There are two aspects to designing a stable environmentfor testing: (i) establishing control and (ii) monitoring as an indication of stabilityand maintenance of control (Fig. 13).
Establishing ControlControl is established mechanically and procedurally through:
& Good design and construction& Thorough and complete qualification& Validated sanitizers and cleaning procedures& Limiting access to only those employees who are trained (Fig. 14)
Design and ConstructionSterility testing must be performed in an environment that is at least as clean as theenvironment used for aseptic filling (1). This means that the sterility test suite must
FIGURE 12
FIGURE 13
200 McCullough and Zakzeski

incorporate the same design elements (air velocity, air changes, differential pres-sures, unidirectional airflow, temperature, humidity, and surface finishes) as anaseptic filling suite.
Objective evidence:
& The Basis of Design documents will describe the design of the cleanroom.& Records of work orders are an indicator of good design and construction as
well as an indicator of the stability of the testing suite. Repeating problemsdocumented in work orders may indicate design or construction problems.
& Temperature, humidity, and differential pressure records may suggest trendsor patterns that are indicators of environmental instability of the area. Recur-ring or chronic excursions in any of these areas may be an indicator of poordesign and/or construction.
Corrective action (or) preventive action:
& A poorly designed and poorly maintained sterility test suite is an OOS sterilitytest waiting to happen. Every effort must be made to design and maintain anenvironment that will minimize the possibility of extrinsic test contamination.If the testing area is poorly designed, consideration should be given to shuttingthe area down, redesigning the suite to at least filling suite specifications, andrequalifying it accordingly.
QualificationJust as an aseptic filling suite, the sterility test suite must be fully qualified, includ-ing a properly executed and documented IQ and OQ, and a PQ. For isolators,initial qualification includes an IQ, an OQ, and a PQ as described by the manufac-turer and as outlined in USP (19). Qualification serves a number of purposes,among them confirmation of the direction and velocity of the airflow, differentialpressure between contiguous rooms, determination of a nonviable particulatecount consistent with EU, ISO, or USP standards, identification of a ‘‘baseline’’microbiological flora in the area, the effectiveness of cleaning, and the ability tochoose appropriate sampling sites based on microbial recovery patterns.
Objective evidence:
& Validation documents will describe the qualification specifications and accept-ance criteria for the sterility test area and/or isolator. For a sterility testingsuite, the validation parameters and acceptance criteria must be equal to or bet-ter than the filling suite.
FIGURE 14
Fault Tree Analysis of the United States Pharmacopeia Sterility Test 201

Corrective action (or) preventive action:
& If it is found that the suite was not qualified, the room must be shut down, andproperly qualified in order to bring it back into compliance.
CleaningThere are two aspects to cleaning control: the initial selection of appropriate andeffective sanitizers and validation of the cleaning procedure (Fig. 15).
Sanitizer EffectivenessSanitizers must be chosen for their effectiveness against a known panel of organ-isms, as well as organisms isolated from the manufacturing and testingenvironments (1). The effectiveness of rotation of sanitizers is a matter of some dis-cussion among those in the industry, but whatever sanitization regimen is used itmust be validated to be effective on a spectrum of microorganisms including moldand bacterial spores across all seasons of the year. Validation includes in vitroexperiments such as the Association of Official Agricultural Chemists Use DilutionTest (20) and a determination that contaminating microorganisms will be removedeffectively from all surfaces and finishes during cleaning. These studies must ulti-mately define sanitizer concentration, contact time, cleaning frequency, the sterilityof the sanitizer or process by which sanitizers are rendered sterile, and effectiverinsing processes for the elimination of sanitizer residuals (21,22).
Objective evidence:
& Examination of sanitizer effectiveness validation data and comparison withisolates from the environment and failed sterility test will determine if the sani-tizers used are effective against the organisms that are recovered from the area.
& Examination of microbiological monitoring data from the area after cleaningand prior to testing may suggest that sanitizers and/or cleaning techniquesare ineffective. Upward trends in microbiological monitoring data that canbe associated with a change in cleaning solutions, tools, regimen, or crewsmay suggest a problem.
Corrective action (or) preventive action:
& Trending high microbial counts could warrant a number of additional actionsincluding conducting sanitizer effectiveness studies on environmental isolates,retraining of cleaning crew, and reexamination of preparation of sanitizers, andsterilization of cleaning equipment.
FIGURE 15
202 McCullough and Zakzeski

Cleaning ValidationA successful cleaning validation requires attention to three important functions.The first is sanitizer effectiveness (above). The second is the definition of propercleaning technique and the third is training in proper cleaning. The technique musttake into account equipment, chemical nature of the sanitizer, sanitizer concen-tration, contact time, and cleaning sequence methodology (top to bottom of theroom and far side of the room to the door) (Fig. 16).
Cleaning validation is often incorporated into the PQ of the cleanroom.Cleaning validation has two parts: demonstration of the stability of the environ-ment under static conditions, and the continued ability of the cleaning regimento maintain stability of the environment under dynamic conditions. Instability inthe environment under PQ may suggest problems with the cleaning validationprotocol, the sanitizer effectiveness, the frequency of cleaning, equipment, or clean-ing methods.
Objective evidence:
& Cleaning logs will tell you who cleaned, when he/she/they cleaned, and howlong it took to clean the area.
& Autoclave logs and charts will tell you what equipment and solutions (includ-ing water) were sterilized for cleaning. Note: concentrated sanitizers, if notreceived as sterile, should be filter-sterilized prior to use.
& Training records of cleaners will tell you if the cleaning crew is trained in themost recent SOP.
Corrective action (or) preventive action:
& Incomplete records such as entry logs, cleaning logs, and autoclave chart anno-tation will require retraining in proper documentation.
& Improper sterilization of equipment will require revalidation of sterilization runs.& If cleaning sessions are considerably shorter or longer than expected, retraining
may be in order. Short cleaning sessions may suggest an incomplete cleaningsession. Long cleaning sessions may suggest that a problem was encounteredduring the session.
& If training records suggest that cleaners are new to the job, or have not been toa cleaning refresher course, it could be time to schedule one.
ProcedureEstablishing and maintaining control of cleanrooms is supported by a level of pro-cedural control (Fig. 17).
FIGURE 16
Fault Tree Analysis of the United States Pharmacopeia Sterility Test 203

AccessAccess to sterility test areas must be limited to those who have specific training intheir assigned cleanroom tasks. Only trained cleaners should have access to thearea for cleaning. Only trained sterility test analysts should have access to the areaduring testing. Everyone with access to the suite, including mechanics and engi-neers, must be trained in gowning, GMPs, basic microbiology, and cleanroometiquette. Visitors who have a specific purpose such as repair in the area mustbe accompanied at all times through gowning and completion of their task.Unscheduled visits to the cleanroom by anyone other than analysts or cleanersshould be followed by a thorough cleaning. A break in asepsis for the purposesof repair must be followed by the same multiple cleaning regimen that would beused in the aseptic manufacturing area.
Objective evidence:
& Entry logs must be checked for unauthorized access to sterility testing areasprior to the session where the OOS result occurred.
& Cleaning logs must be checked to assure that any unusual access (e.g., repair)was followed by a thorough cleaning.
& Cleaning logs must also be checked to assure that the area was sanitized priorto testing, either earlier in the day or the evening before. Unauthorized orunscheduled activity without cleaning may have caused a break in asepsis,which could have contributed to the OOS. The environmental-monitoring pro-file will indicate whether or not a break in asepsis has occurred.
Corrective action (or) preventive action:
& If examination of entry and cleaning logs indicate that there was unusualactivity in the area that was not followed by an extensive cleaning, the areamust be shut down and resanitized.
GMP TrainingA rigorous training program is the cornerstone of a well-controlled area (Fig. 18) (23).
Cleanroom EtiquetteAll people working in a cleanroom must understand that behavior affects cleanli-ness. Even when gowned, people shed particles and microorganisms. Requiringthat jewelry and make up be removed before entering the area controlling move-ments once in the area and attention to frequent disinfection of hands are butthree components of good cleanroom behavior.
FIGURE 17
204 McCullough and Zakzeski

GowningAll people entering the sterility test suite (analysts, cleaners, mechanics) must beproperly gowned for work in aseptic areas. However, work at an isolator requiresno special gowning. Proper gowning requires extensive training and certification.
EducationAs part of GMP training, all cleanroom personnel, including sterility test analysts,should learn the basic principles of microbiology. They should know where organ-isms come from, how they are transported to and deposited in the cleanroom, howmicrobiological contamination is detected, and how it is prevented (1).
Objective evidence:
& Training records will indicate deficiencies in training and/or a need for recer-tification.
& Personnel monitoring data for anyone entering the area will indicate anyupward trends in counts of all people entering the area.
& Records of periodic observation of the sterility test analyst by supervisorystaff may reveal behaviors or techniques that could result in a break inasepsis.
Corrective action (or) preventive action:
& Upward trends in personnel monitoring will require retraining.& Observed behaviors that could result in contamination of the sterility test will
require retraining (Fig. 19).
FIGURE 19
FIGURE 18
Fault Tree Analysis of the United States Pharmacopeia Sterility Test 205

Maintaining Control
Preventive MaintenanceA significant factor in the maintenance of the cleanroom is the preventive mainte-nance of the HVAC system. As with the manufacturing area, high-efficiencyparticulate air (HEPA) filters in the sterility test cleanroom must be qualified uponinstallation and recertified periodically and the air flow and differential pressurebetween rooms must be balanced.
Objective evidence:
& Equipment log books or electronic preventive maintenance logs and equip-ment stickers must be checked to assure that calibration and preventivemaintenance is current.
Corrective action (or) preventive action:
& If any equipment is found to be out of calibration or is found to be beyond itsscheduled preventive maintenance, it should be taken out of service until thecalibration or service is performed.
& If equipment (e.g., the LFH, the autoclave, the HEPA filters) is found to be outof calibration or beyond its preventive maintenance timepoint, check previoustesting back to the piece’s last calibration or preventive maintenance to look forpatterns or trends in nonconforming results that used that piece of equipment(Fig. 20).
Environmental MonitoringOnce control is established through proper specifications, design, qualification,and procedure, control is maintained through careful and thoughtful environmen-tal monitoring (14,18). Temperature, humidity, and differential pressure must bemonitored continuously. An increase in temperature and/or humidity may changeconditions sufficiently to support bacterial and mold growth. In addition, anincrease in temperature and/or humidity makes conditions uncomfortable forthe analyst, perhaps increasing perspiration inside the sterile gown. Increasing per-spiration increases the possibility of contamination. The sterility test suite must beunder positive pressure relative to the adjacent rooms. A change in differentialpressure and at the extreme, a change from positive to negative pressure, couldallow organisms in the air from adjacent less clean areas to stream into the testingarea (Fig. 21).
FIGURE 20
206 McCullough and Zakzeski

Monitoring of air for viable and nonviable particulates as well as monitoringof surfaces for evidence of viables is expected (1). Just as in an aseptic processingarea, there are six kinds of monitoring that must take place:
1. The surfaces are monitored with contact plates after cleaning but prior to test-ing as a check on the effectiveness of the routine cleaning. The ability of theneutralizers contained in the contact plates to inactivate residual sanitizersmust be validated. If neutralizers do not successfully inactivate the sanitizer,counts that are observed in routine monitoring may be falsely depressed. Ifinactivation is unsuccessful, changes to the cleaning regimen, the sanitizers,and/or the neutralizers may be in order.
2. Monitoring surfaces after testing will provide data on the ‘‘cleanliness’’ of thetesting operation.
3. Monitoring of the air for viables and nonviables before the test will provide anindication of the stability of the test environment.
4. Monitoring the air for viables and nonviables during the test provides infor-mation on the ‘‘cleanliness’’ of the immediate testing environment.
5. Monitoring the air for nonviable particulates is a check on alignment with USPand ISO nonviable particle requirements for classified cleanrooms.
6. A major source of contamination both in manufacturing and in testing is theoperator. We have ‘‘one shot’’ at a sterility test, and it is important to demon-strate that the analyst can keep the test clean. One method of monitoring theanalyst is through personnel monitoring, i.e., the use of contact plates to lookfor microbial contamination on the hands and on the gown.
The process for choosing monitoring sites and frequencies in the sterility testsuite should mirror the process used for manufacturing. At a minimum, the suite
FIGURE 21
Fault Tree Analysis of the United States Pharmacopeia Sterility Test 207

needs to be monitored on each testing day and each testing session during the day,and the analyst needs to be monitored at the close of each testing session.
High counts in the testing suite and a genus/species match between organ-isms recovered in the failed test and in the test area may provide support for theinvalidation of the sterility test (1,17). However, the justification cannot be made inthe absence of data from manufacturing areas and operators. For example, ifan organism is found on the sterility test analyst, in the sterility test area, and inthe aseptic core (not even the specific rooms where manufacture or filling of thelot in question took place), one cannot rule out the possibility that the contami-nation came from the manufacturing area.
Objective evidence:
& Records of temperature, humidity, and differential pressure should be avail-able in the laboratory. Charts from recorders should be changed, reviewed,and signed by trained analysts who will be able to immediately spot excur-sions. If temperature, humidity, and pressure are monitored through anelectronic building maintenance system (BMS), records should be checkedfor the frequency and extent of excursions with an eye toward looking for pat-terns or trends that could adversely affect the environment.
& Environmental-monitoring records consisting of viable and nonviable air data,viable surface data, and personnel monitoring must be examined. In additionto data from the date and session in question, monitoring data from before andafter the OOS date need to be examined for trends or patterns in quantitative orqualitative recovery of organisms or nonviable counts.
& Personnel monitoring records will indicate whether the analyst exceeded limitson the day of the test, and what types of organisms were recovered. Theseidentified organisms must be compared to the OOS recovered organism.
& Preventive maintenance records for the area must be checked to see if unusualactivity was evident in the room that might have resulted in a contamination event.
Corrective action (or) preventive action:
& An upward trend in environmental monitoring data (viable and/or nonviable)suggests that the area is out of control. Looking at cleaning, work orders, entrylogs, certification reports, etc. may provide clues as to the types of preventiveand corrective actions that need to occur. Some of these actions may be as sim-ple as a filter replacement or limiting access, while others, like correcting poortechnique or cleanroom behavior, might take considerably more thought andeffort (Fig. 21).
TECHNIQUE
Sterility, by definition, is an absolute. We are required to make and test sterile productsin an aseptic environment, which is very clean, but because it is inhabited by people, itis not sterile. In spite of all of our efforts to control environmental conditions of the testthrough design, construction, sanitization, gowning, and HEPA-filtered air, the out-come of the sterility test is remarkably dependent on the analyst’s aseptic technique(Fig. 22).
In theory, there should never be a sterility test positive on a terminallysterilized (TS) product. A positive indicates one of the two things: an inadequatelysterilized product or contamination during testing. Assuming a validated sterilization
208 McCullough and Zakzeski

cycle and no deviations in the manufacture of the product, the most likely reasonfor a positive on a TS product is the analyst. Having said that, the investigation intoa TS-positive must be as complete, scientific, and unbiased to provide objective evi-dence to justify any thoughts of invalidation of the test result.
Training, Education, and ObservationThe appropriate level of education and extensive training is essential to a good out-come in a sterility test. If analysts are not trained microbiologists, they shouldundergo training to learn and understand what microorganisms are, where theycome from, how they find their way into the product, how to keep them out of a ster-ility test, and the compliance and financial consequences of a sterility test failure.
Manipulation of the test apparatus is difficult, and this manipulation, evenwith gloved hands working under a Class 100 LFH, can be a source of contami-nation. Given the difficulties, analysts should practice preparing the sample andusing the apparatus first in the laboratory on a bench without worrying aboutasepsis. The next step is to learning work within the restricted space of a laminarflow good. Finally, gowning adds yet another restriction in movement, so practi-cing in the laboratory, under an LFH, while gowned is the final step beforepracticing in the cleanroom.
Analysts should demonstrate on terminally sterilized and noninterferingmaterials (e.g., WFI or microbiological growth medium in vials) that they can pre-pare the test sample, keep it sterile, and come out with an uncontaminated test.Once they demonstrate proficiency out of the cleanroom, then they must demon-strate proficiency in the cleanroom environment. All sterility test analysts,including the most seasoned veteran, should be observed periodically to detectbreaks in acceptable aseptic technique or indications of poor cleanroom behavior.
Analysts should be trained to document all deviations to a test protocol andto terminate the procedure for all tests with clear deviations in technique that couldresult in a false-positive (e.g., dropping a filter, inadvertently touching a test criticalsurface). Attention to changes in facility, environment, test method, or techniquecould all be indicators of potential problems that, if corrected, could prevent a sterilityOOS (1).
Objective Evidence:
& Job descriptions will outline the education and experience expected of asterility test analyst.
FIGURE 22
Fault Tree Analysis of the United States Pharmacopeia Sterility Test 209

& Analyst training records will indicate the extent of training and/or experiencethat the analyst has had.
& Records of past OOS and false-positive results sorted by analyst will provideanalyst-specific data on possible problems with technique.
& Observation records of sterility analysts provide a continuing check on tech-nique.
Corrective action (or) preventive action:
& There should be no hesitation on retraining for an analyst whose performance,even if not proven conclusively, suggests a problem.
& Depending on the trends/patterns in OOS data, adjustments could be made inthe testing regimen. For example, if more OOS results are found toward theend of the day, every effort should be made to schedule sterility tests earlyin the day when analysts are fresh and alert. If analyst technique is threatenedbecause of logistics in the testing area, an analysis of furniture placement, ergo-nomics, and supply storage could be examined. The idea is to make testing aseasy and convenient for the analyst as possible to avoid confusion and clutterand disruption in the test area (Fig. 23).
THE CHECKLIST
By going through the preliminary work and then drilling down the fault treethrough intermediate events and identifying basic events of the that could havecontributed to the failure, we can create a checklist that might be used toobjectively guide an investigation into a sterility test positive. The data provided inthe checklist must be interpreted by the laboratory manager, and a narrative mustbe provided explaining if a problem was noted in the lab and if so, was the problemsuch that it could be a candidate for invalidating the sterility test result. Thelaboratory data will be considered along with the data gathered from the investi-gation of the manufacturing environment and process as well as all of the trendhistories to determine if, in fact, the documented laboratory problem was theonly identified root cause of the positive and the test can be justifiably invalidated(Table 3 & 4).
FIGURE 23
210 McCullough and Zakzeski

TABLE 3 Checklist for Investigation of a Sterility Test Positive
Item Evidence ConformsDoes notconform
Comments—comment
is requiredfor any pointthat ‘‘does
not conform’’
ProductWhat is the history of OOS
with this product?Microbiology laboratory
testing and trendingrecords
Has there been a recentchange history for thisproduct (process,formulation, change inraw material supplier)?
Change control records
Were the appropriatenumber of samplestested?
Test record
Were samples preparedand transported into thesuite in the usual andappropriate manner?
Test record, analystinterview
AnalystWhat is the history of OOS
for this analyst?Microbiology laboratory
testing and trendingrecords
When was the last OOS forthis analyst?
Microbiology laboratorytesting and trendingrecords
Is there a correlationbetween positives for thisproduct and this analyst?
Microbiology laboratorytesting and trendingrecords
What is the history of false-positives (growth on thenegative control) for thisanalyst?
Microbiology laboratorytesting and trendingrecords
Test methodIs this test method valid? Validation recordsWas the test method
followed?Test record, analyst
interviewWere there any problems
noted with preparing thesample?
Test record, analystinterview
Were there any problemsnoted performing thistest?
Test record, analystinterview
Did the negative controlexhibit growth?
Test record
MediaWere all media used in the
performance of the testor in the surveillance ofthe test sterile?
Media preparation andtesting records
(Continued )
Fault Tree Analysis of the United States Pharmacopeia Sterility Test 211

TABLE 3 Checklist for Investigation of a Sterility Test Positive (Continued )
Item Evidence ConformsDoes notconform
Comments—comment
is requiredfor any pointthat ‘‘does
not conform’’
Did all of the media used inthe performance of thetest or in the surveillanceof the test supportgrowth?
Media preparation andtesting records
Were all media used in theperformance of the testor in the surveillance ofthe test within theirexpiration period?
Media preparation andtesting records
Have there been previousproblems with these lotsof media?
Media preparation andtesting records
Organism identificationIs the identification method
validated?Validation records
Has this organism beenisolated from this productbefore?
Microbiology laboratorytesting and trendingrecords
Was this organism isolatedfrom the sterility test areaon or around thistest date?
Environmentalmonitoring records(sterility test area)
Was this organism isolatedfrom the manufacturingarea on or around themanufacturingdates?
Environmentalmonitoring records(manufacturing area)
Was this organism isolatedfrom the analyst whoperformed the sterilitytest?
Personnel monitoringrecords
FacilitiesWas there an interruption
in power during the test?Facilities
Differential pressure OK? Differential pressuremonitoring
HEPA filters certified? FacilitiesUnscheduled maintenance
required?Work orders, entry log
Cleaning performed asrequired?
Entry log, autoclavecharts
EnvironmentViable air counts on the
day of the test OK?Environmental
monitoring records
(Continued )
212 McCullough and Zakzeski

TABLE 4 Narrative: Acronyms and Definitions of Microbiological Terms
Aerobe Organisms that require oxygen to surviveAnaerobe Organisms that can only grow in the absence of oxygenCFU Colony-forming unitsFacultative anaerobe Can grow in the absence or presence of oxygenGram-positive and
gram-negativeorganisms
Organisms are divided into two broad categories based on their reactionin a differential staining technique called the Gram stain; differentiationis based on the ability to take up and retain a stain or counterstain basedon the organism’s cell wall composition
Spore (bacterial) Sometimes called an endospore, a spore is an ovoid body formed in thevegetative cells of some gram-positive bacilli that are resistant to heat,drying, freezing, deleterious chemicals, and radiation
Spore (fungal) Sometimes called conidia, fungal spores form singly or in clusters at theend of the hyphae found on some colonies; individual spores canseparate from the fungal colony, and can be carried to a new site where,if conditions are optimum, it can germinate to form a new mold colony
Source: From Ref. 24.
TABLE 3 Narrative: Acronyms and Definitions of Microbiological Terms (Continued )
Item Evidence ConformsDoes notconform
Comments—comment
is requiredfor any pointthat ‘‘does
not conform’’
Viable air counts for atleast a month before andsince the test. Anyupward trends?
Environmentalmonitoring records
Viable surface counts onthe day of the test OK?
Environmentalmonitoring records
Viable surface counts for atleast a month before andsince the test—anyupward trends?
Environmentalmonitoring records
Organism(s) isolated fromthe testing environmentthe same as isolatedfrom the product?
Environmentalmonitoring records
Nonviable counts OK? Environmentalmonitoring records
Temperature and humidityOK?
Chart recorders, BMS
Has the operator beenproperly trained?
Training records
Has the operator’stechnique been observedlately?
Training records
Abbreviations: OOS, out-of-specification; EM, environmental monitoring.
Fault Tree Analysis of the United States Pharmacopeia Sterility Test 213

REFERENCES
1. U.S. Department of Health and Human Services, Food and Drug Administration,Center for Drug Evaluation and Research (CDER), Center for Biologics Evaluationand Research (CBER), Office of Regulatory Affairs (ORA). Guidance for IndustrySterile Drug Products Produced by Aseptic Processing—Current Good Manufac-turing Practice, 2004. http://www.fda.gov/cder/guidance/1874dft.doc.
2. Cundell AM. Microbial testing in support of aseptic processing. Pharmaceut Tech-nol 2004; 56.
3. U.S. Department of Health and Human Services, Food and Drug Administration.Human Drug CGMP Notes, 1999.
4. United States Pharmacopeia 29, 2006 < 71> Sterility Test.5. United States of America, Plantiff 15 Barr Laboratories Inc, et al, Defendants Civic
Action 92–1744.6. US Department of Health and Human services. Guidance for Industry Investiga-
tions out of Specification (OOS) list Results for pharmaceutical Production, 1998.7. Avallone HL. Sterility retesting. J Parenter Sci Technol 1986; 40(2):56–57.8. Lee J. Investigating sterility test failures. Pharmaceut Technol 1990; 14(2):38–43.9. U.S. Food and Drug Administration. 1997. Hazard Analysis and Critical Control
Point Principles and Application Guidelines.10. Stamatis, D. H. Failure Mode and Effect Analysis: FMEA from Theory to
execution. Chapter 2: FMEA: A General Overview. ASQ Quality Press, 1993: 21–81.11. McDermott, Robine E, Mikulak RE, Beauregard MR. The Basics of FMEA.
Productivity Inc., Portland: Oregon, 1996: 27–45.12. Vesely WE, Goldberg FF, Roberts NH, Haasl DF. Fault Tree Handbook. Washing-
ton, DC: U.S. Government Printing Office, 1981.13. Rooney JJ, Vanden Heuvel LN. Root cause analysis for beginners. Qual Progr
2004; 45.14. United States Pharmacopeia 29. < 1227> , Validation of Microbial Recovery from
Pharmacopeial Articles, 2006.15. United States Pharmacopeia 29. < 1116> , Microbiological evaluation of clean
rooms and other controlled environments, 2006.16. U.S. Department of Health Human Services, Food and Drug Administration.
Aseptic Processing Guideline, 1987.17. Sutton SVW, Cundell AM. Microbial Identification in the Pharmaceutical Industry.
Stinumi to the Revision Process, United States Pharmacopeial Convention 1884–1894, 2004.
18. Deschenes P. Viable environmental microbiological monitoring: microbiology ofsterilization processes. In: Frederick JC, Agalloco JP, eds. Validation of Pharmaceu-tical Processes. 2nd ed. New York: Marcel Dekker, 1999.
19. United States Pharmacopeia 29. < 1208> , Sterility Testing—Validation of IsolatorSystems, 2006.
20. AOAC Official Methods of Analysis. 17th ed., Chapter 6. Disinfectants. AOACInternational, 2000 Washington DC.
21. Denney VF, Kopis EM, Marsik FJ. Elements for a successful disinfection programin the pharmaceutical environment. J Parenter Sci Technol 1999; 53(3)115–124.
22. Kaiser H, Klein D, Kopis E, LeBlanc D, McDonnell G, Tirey JF. Interaction ofdisinfectant residues on cleanroom substrates. J Parenter Sci Technol 1999;53(4).
23. Dixon, AM. Training Cleanroom Personnel. J Parenter Sci Technol 1991; 45(6).24. Davis BD, Dulbecco R, Eisen HN, Ginsberg HS, Barry Wood W. Microbiology. New
York: Harper & Row, 1967.
214 McCullough and Zakzeski

25. Sandle T. Environmental Monitoring in a Sterility Testing Isolator, 2003. http://www.pharmig.org.uk/pages/articles/envmon.html.
26. Millipore Corporation. Steritest2 User Guide, 2004. http://www.millipore.com/userguides.nsf/docs/p36200.
27. Friedman R, Mahoney SC. Risk factors in aseptic processing. Am Pharmaceut Rev2003.
28. Leahy TJ, Roche KL, Christopher MR. Microbiology of sterilization processes. In:Carleton FJ, Agalloco JP, eds. Validation of Pharmaceutical Processes, 2nd ed.New York: Marcel Dekker, 1999.
29. International Standards Organization ISO 14644-1 ‘‘Cleanrooms and AssociatedControlled Environment. Part 1: Classification of Air Cleanliness.
APPENDIX 1: THE STERILITY TEST—BIG MOVING PARTS
USP General Chapter 71, ‘‘Sterility Tests,’’ provides the parenteral industry with clearguidelines on how to perform the sterility test and how to interpret the results (4). ThisUSP chapter, recently harmonized philosophically with the European Pharmacopeiaand the Japanese Pharmacopeia, divides the sterility test into its component parts.
Methodology
Membrane FiltrationThe method of choice for the sterility test is the membrane filtration (MF) method. Forthis method, the analyst aseptically pools the contents of a prescribed number of contain-ers in a volume of sterile diluting fluid. The number of units tested is taken randomly torepresent the beginning, middle, and end of the batch as well as any significant interven-tions that happened during the course of the fill. The number of containers and thequantity of material to be tested depends on the amount of material/unit and the num-ber of filled units in the batch as described in Tables 5 and 6 USP < 71> (4).
Once the contents of the individual test units and pooled and dissolved (inthe case of solids), the sample is passed through a filter with a pore size not great-er than 0.45 m. After the sample has passed through the filter, it is rinsed withadditional volumes of diluting fluid to rid the filter of any interfering substances(refer to ‘‘Validation’’). After the final rinse, the filter is cut into two parts. Onepart of the cut filter is added to Soybean-Casein digest (SCD) medium and incu-bated for 14 days at 22.5 � 2.5�C to provide an optimum environment for thegrowth of aerobic bacteria, molds, and fungi. The other part of the filter is addedto fluid thioglycollate medium (FTM) and is incubated for 14 days at 32.5 � 2.5�C
TABLE 5 Probability of a Positive Sterility Test as Function of Contamination Rate
Contamination rateProbability of finding at least one contaminated
vial in a 20 unit sample (%)
1/1000 1.91/500 3.91/200 9.51/100 18.21/50 331/25 55.71/10 87.8
Fault Tree Analysis of the United States Pharmacopeia Sterility Test 215

to provide an optimum environment for the growth of obligate and facultativeanaerobes, as well as many aerobic microorganisms. Tubes are examined period-ically during this 14-day incubation period and at the end of incubation by atrained analyst to look for increasing turbidity, which is evidence of microbialgrowth. If no growth is observed over the 14-day incubation period, the sample,and by extension, the lot of product under test complies with the test for sterility.If growth is observed in either medium, the sample, and by extension, lot of pro-duct does not meet the requirements of the sterility test and the entire lot issubject to quarantine, investigation, and perhaps rejection.
Negative ControlThe analyst prepares the negative control by performing the entire test processincluding filtration, rinses, filter cutting, and incubation in the absence of a testsample. This control is usually performed before the rest of the test samples areprepared and filtered to assure that conditions are optimum for a negative test,i.e., the analyst is ‘‘fresh,’’ the testing equipment is untouched and has not beenexposed to the test material, and the testing bench is impeccably clean. Negativecontrols are incubated and examined for the presence of growth along with theassociated test articles. As no sample is involved, growth in the negative controlindicates clearly that something or a combination of things in the laboratory, eitherthe analyst, the equipment, the environment, and/or the media, could have beenresponsible for the contamination. Examining the number of positive responseson this control over time provides an indication of the inherent ‘‘false-positive’’rate of the sterility test in the laboratory and provides a benchmark against whichlaboratory and testing control is measured.
EnvironmentGiven the potential financial implications of a positive result, every effort must betaken to limit the risk of contamination during the course of the sterility test. Onepossible source of contamination is the testing environment.
Facilities—The Sterility Test SuiteMany companies perform sterility tests in a ‘‘sterility testing suite.’’ The suite is aseries of rooms, with appropriate gowning facilities, that mimics the productionfacility in its design, construction, preventive maintenance, and environmentalmonitoring surveillance program.
The testing laboratory environment should employ facilities and controlscomparable to those used for filling and closing operations. Poor or deficient ster-ility test facilities or controls can result in a high rate of test failures (1).
What does this mean? In the case of a sterility test suite, this means:
& The sterility suite is subject to the same design elements (e.g., air velocity, airchanges, differential pressures, unidirectional air flow) as the filling suite.
& The sterility suite must meet ISO 5 requirements for the immediate testingenvironment (LAF, biosafety cabinet) and at least ISO 7 for the space immedi-ately adjacent to the testing environment.
& The sterility suite is subject to the same IQ, OQ, and PQ acceptance criteria as isthe filling suite.
& The sterility suite is subject to the same maintenance procedures (e.g., periodicfilter certification and air balancing) as the filling suite.
216 McCullough and Zakzeski

& Hoods or biosafety cabinets used in the suite are subject to the same qualifi-cation and maintenance procedures as the hoods used in manufacturing.
& The sterility suite is subject to the same sanitization procedures (i.e., choice androtation of validated sanitizers, cleaning method, and cleaning frequency) asthe filling suite.
& The sterility suite is subject to the same type of restricted access as the fillingsuite.Analysts working in the sterility suite are subject to the same gowningtraining and qualification/requalification requirements as operators workingin the filling suite.
& The sterility suite must be monitored (viable and nonviable air and viable sur-face) with the same intensity and frequency as the filling suite (15). SOPs mustexist for the identification of monitoring sites and frequencies in the sterilitytest suite. Alert and action limits, comparable to those used in manufacturing,must be documented (1,18).
& Analysts working in the sterility suite are subject to the same intensive GMPtraining and personnel monitoring as operators working in the aseptic manufac-turing areas.
Sterility Testing IsolatorsAs an alternative to a sterility test suite, firms may choose to perform sterility testingin an isolator. An isolator is a carefully controlled, self-contained microenvironment.Isolators can be constructed from a number of different materials includingflexible plastics, rigid–plastic, glass, or stainless steel. Air is supplied through HEPAfilters, but unlike sterility suites, there is no requirement for air velocity or airexchange rate. The isolator is positive to the surrounding environment, so smallleaks or pinholes in the unit, while a concern, should not allow contamination toenter. Pressure gauges monitor the pressure differential between the isolator andthe surrounding environment. The interior of the isolator must meet ISO 5 con-ditions at rest, but there are no USP specifications for operational isolators. Theunit and transfer modules must be capable of withstanding sterilization and theymust be monitored (19,25). The isolator is subject to a number of extensive qualifi-cation procedures including integrity checks, sterilization cycle verification (i.e.,type, concentration, and distribution of sterilant), sterilization frequency, cleaningqualification (remember, cleaning and sanitizing are two different events), anddemonstration that when exposed to sterilant, the materials stored within the iso-lator are not compromised. The transfer of materials into and out of the isolatormust be validated.
When using an isolator for sterility testing, the analyst does not handle materi-als or samples directly. Instead, the equipment and materials used in the sterility testare housed inside the isolator, and the analyst performs the test using gloved handsthat are part of a half-suit. As neither the operator nor the laboratory environmentcontacts testing equipment or samples, it is expected that the use of a validated iso-lator will reduce or eliminate extrinsic contamination of the sterility test.
Equipment
Membrane Filtration Manifold—‘‘Open’’ SystemA sterility test manifold is a reusable stainless steel support for a number of cov-ered and sterilizable filter funnels. The assembled manifold is sterilized using avalidated moist heat sterilization cycle, and is placed directly under the LFH
Fault Tree Analysis of the United States Pharmacopeia Sterility Test 217
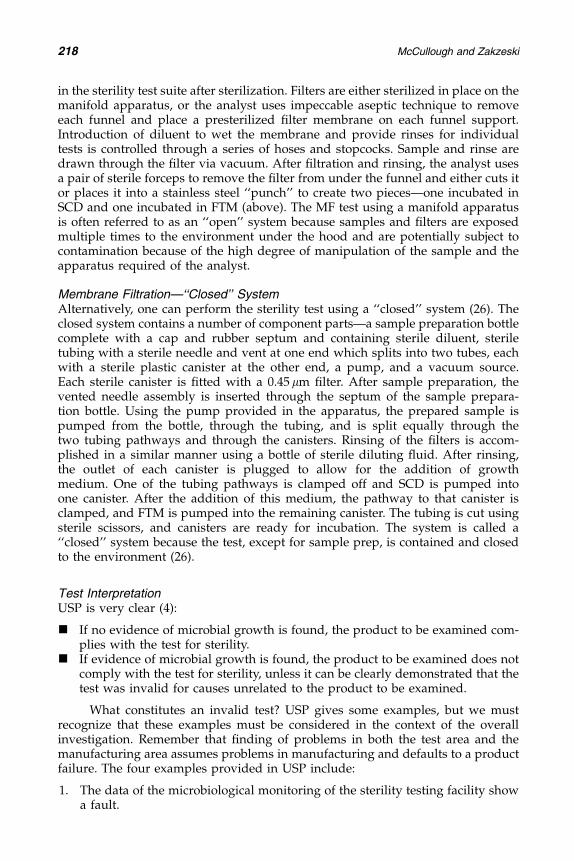
in the sterility test suite after sterilization. Filters are either sterilized in place on themanifold apparatus, or the analyst uses impeccable aseptic technique to removeeach funnel and place a presterilized filter membrane on each funnel support.Introduction of diluent to wet the membrane and provide rinses for individualtests is controlled through a series of hoses and stopcocks. Sample and rinse aredrawn through the filter via vacuum. After filtration and rinsing, the analyst usesa pair of sterile forceps to remove the filter from under the funnel and either cuts itor places it into a stainless steel ‘‘punch’’ to create two pieces—one incubated inSCD and one incubated in FTM (above). The MF test using a manifold apparatusis often referred to as an ‘‘open’’ system because samples and filters are exposedmultiple times to the environment under the hood and are potentially subject tocontamination because of the high degree of manipulation of the sample and theapparatus required of the analyst.
Membrane Filtration—‘‘Closed’’ SystemAlternatively, one can perform the sterility test using a ‘‘closed’’ system (26). Theclosed system contains a number of component parts—a sample preparation bottlecomplete with a cap and rubber septum and containing sterile diluent, steriletubing with a sterile needle and vent at one end which splits into two tubes, eachwith a sterile plastic canister at the other end, a pump, and a vacuum source.Each sterile canister is fitted with a 0.45 lm filter. After sample preparation, thevented needle assembly is inserted through the septum of the sample prepara-tion bottle. Using the pump provided in the apparatus, the prepared sample ispumped from the bottle, through the tubing, and is split equally through thetwo tubing pathways and through the canisters. Rinsing of the filters is accom-plished in a similar manner using a bottle of sterile diluting fluid. After rinsing,the outlet of each canister is plugged to allow for the addition of growthmedium. One of the tubing pathways is clamped off and SCD is pumped intoone canister. After the addition of this medium, the pathway to that canister isclamped, and FTM is pumped into the remaining canister. The tubing is cut usingsterile scissors, and canisters are ready for incubation. The system is called a‘‘closed’’ system because the test, except for sample prep, is contained and closedto the environment (26).
Test InterpretationUSP is very clear (4):
& If no evidence of microbial growth is found, the product to be examined com-plies with the test for sterility.
& If evidence of microbial growth is found, the product to be examined does notcomply with the test for sterility, unless it can be clearly demonstrated that thetest was invalid for causes unrelated to the product to be examined.
What constitutes an invalid test? USP gives some examples, but we mustrecognize that these examples must be considered in the context of the overallinvestigation. Remember that finding of problems in both the test area and themanufacturing area assumes problems in manufacturing and defaults to a productfailure. The four examples provided in USP include:
1. The data of the microbiological monitoring of the sterility testing facility showa fault.
218 McCullough and Zakzeski

This statement means that there is a clear and documented problem with theenvironment (as measured by microbiological monitoring) in the sterility test facilityand there is no observed problem with the environment in the manufacturingarea during either the manufacturing or the filling of the product. If there is amicrobiological problem (including personnel monitoring) in both places, or if thereis a problem with the sterility environment and there was any other condition duringmanufacture that could affect the environment (e.g., temperature or humidity spikeduring manufacturing or the same organism found in a different part of the asepticmanufacturing facility), then the documented problem in the lab cannot stand on itsown and cannot be considered sufficient to justify invalidation of the test.
2. A review of the testing procedure used during the test in question reveals afault.
This means that there is a documented problem with the test itself. However,if there was an obvious issue during the performance of the test, the procedureshould have been stopped at that point, documented, and the tubes/canistersnever should have been incubated. However, if a cap comes loose and falls off dur-ing the reading of the tubes containing the filters or if the tubing disconnects fromthe sterility canister and a positive is observed subsequent to that event, the testmay be a candidate for invalidation provided that there are no problems associatedwith manufacturing.
3. Microbial growth is found in the negative controls.
A finding of growth in the negative control is indicative of a break in aseptictechnique or a problem with the equipment or media. It might be reasonableto invalidate all tests referencing a nonconforming negative but one cannot pickand choose. For example, if S. epidermidis is found in the negative control and isalso found in the SCD medium of one sample tested during that same session,how can you ‘‘clearly demonstrate’’ that the organism in both tubes came fromthe sterility operator? To make things more complicated, if S. epidermidiswas found on one of the manufacturing operators, how can you ‘‘clearly demon-strate’’ that the S. epidermidis found in the test sample was the result of acontamination event by the sterility operator and not a contamination event bythe manufacturing operator?
4. After determination of the identity of the microorganisms isolated from thetest, the growth of this species (or these species) may be ascribed unequivo-cally to faults with respect to the material and/or the technique used inconducting the sterility test procedure.
The key word here is ‘‘unequivocally’’—that is a huge burden of proof.Nucleic acid analyses may permit you to distinguish types among the same genusand species of organisms isolated from the manufacturing and testing suites (1,17).Anything less than nucleic acid analyses is unequivocal and cannot be used to dis-tinguish origin differences between isolates of the same genus and species.
If an extensive investigation of the OOS looking for process, nonprocess, andlaboratory errors concludes that the test was unequivocally contaminated inthe laboratory and can be justifiably invalidated, the USP says that the new testshould use the same sample size as the original test. However, USP does notallow for another invalidation should the repeat test be positive. A positive teston a postinvalidation sample ‘‘does not comply with the test for sterility.’’
Fault Tree Analysis of the United States Pharmacopeia Sterility Test 219

Invalidating a test on a closed system where operator exposure to the test isminimized, or in an isolator, where operator intervention should be eliminated,is even more difficult than invalidating a test performed using an open system ina sterility test suite. In either of these two cases, the only rationale for invalidating atest is a documented failure in the system (e.g., loss of real pressure in the isolatoror leak in the canister).
Media and Diluting FluidsFor the sterility test, the USP outlines specific procedures that a laboratory shoulduse to demonstrate that each lot of medium, including the SCD, the FTM, and thediluting fluid used in the performance of the test meets the requirements forgrowth promotion and sterility (4). Validation in the form of the media sterility testand the growth promotion test will demonstrate the media’s ability to supportgrowth uniformly throughout the assigned expiration period. For media preparedin-house, this study must be performed for each type, presentation (e.g., plate size),and volume of medium (e.g., 10 mL of medium/tube, 100 mL of medium/tube).For media that is purchased, the assigned expiration dates of at least lots of mediashould be confirmed through the sterility and growth promotion tests as part of theinitial vendor qualification studies. Sterility of the media along with its ability of tosupport growth is essential attributes of any microbiological medium.
ValidationThe USP sterility test presumes that if contamination were to happen duringmanufacturing, and if a contaminated unit were to be sampled and tested, thenthe result of the test would be positive (i.e., growth of that organism would beobserved during the 14-day incubation period).
The ‘‘Validation Test’’ described in USP< 71>(4) requires that the analystperform the sterility test in the manner described in the chapter (preferably MF),but instructs the analyst to add not more than 100 colony-forming units (CFU)of one of the indicator panel of organisms to the final rinse of the filtration processfor the test article. Note that the organisms are added to the final rinse, not to thetest article itself. The indicator panel represents a spectrum of organisms thatmight be found in a sterility test including organisms isolated from humans as wellas from the environment and includes mold, yeast, Gram-positive andGram-negative bacteria, aerobe, anaerobe, and facultative anaerobe. A parallel testwithout the test article, but using the same number of organisms is performed as apositive control. Test material + organism is incubated along with the positive con-trol for not more than five days. After the incubation period, both the test and thepositive control are visually observed, and the growth is compared. If the growthin the tube containing the test article is visually comparable to the positive control,the product possesses no antimicrobial activity relative to that organism, and thetest may proceed. If growth observed in the presence of the product is visually lessthan the positive control, the product possesses some level of antimicrobial activityand the test method must be reevaluated to identify the cause of the interference.The method must be modified to eliminate or neutralize the antimicrobial activity.Interference may be eliminated by chemical inactivation (e.g., the use of penicilli-nase to inactivate penicillins and cephalosporins), the addition of a neutralizersuch as Tween to the diluting fluid, and/or increasing the volumes and numbersof rinses to physically eliminate interfering substances that might remain on the
220 McCullough and Zakzeski

membrane after filtration. For each sterile product, raw material, or intermediateunder test, the validation test is repeated for each of the panel of indicator organ-isms. Many regulators expect that an environmental isolate or an organism isolatedfrom a prior sterility OOS will be added to the panel of organisms used in the vali-dation. Why use so many organisms for the validation? In addition to representinga number of different categories and sources of microorganisms, this variety ofmicroorganisms represents a spectrum of sensitivities to common antimicrobialand sanitizing agents. For example, Bacillus subtilis spores could survive in thepresence of residual ethanol, whereas Pseudomonas aeruginosa vegetative cellswould be much more susceptible to the antimicrobial activity of ethanol. Organ-isms isolated from a cephalosporin-manufacturing environment is representativeof organisms that are resistant to the effects of the antibiotic.
The USP sterility test does not require that a product be ‘‘spiked’’ with micro-organisms and that those microorganisms be quantitatively or qualitativelyrecovered. Rather, the indicator organism, in low numbers, is added to the finalrinse of the test. Therefore, the validation does not answer the question of recover-ing organisms that might contaminate the product during manufacture or filling,but rather it demonstrates that the test method, in particular, the inactivation orremoval of any potentially inhibitory substances that might remain on the filtersurface, will not present conditions where organisms are prevented from growing.This is perhaps a small distinction, but a very important one.
APPENDIX 2: THE STATISTICS OF ENDOTOXIN ANDSTERILITY TESTING
The sterility test and the bacterial endotoxin test, regardless of the result, provideextremely limited information on the presence or absence of contaminated units ina batch of a parenteral product. Sterility and absence of detectable endotoxin areassured, not through end-product testing, but through the careful execution of a se-ries of well conceived and executed validation studies and value-added monitoringactivities to demonstrate that the processes, including equipment, process stream,filling, environment, people, and appropriate test methods, are capable of consist-ently producing a product that is sterile and free of detectable endotoxin.
Case #1: Sterility TestingIf the result of a validated USP sterility test is negative, what can one say about thesterility of the batch? Let us assume we demonstrate via process simulation (mediafill) studies that our inherent contamination rate is less than 1 in 1000 vials, and wetake the prescribed 20 vials for our sterility test. A negative test result using a vali-dated test method suggests that, to the limit of detection of the test, there were nocontaminated vials in the 20 that we chose for our test sample. If our fill size wereonly 20 vials, we could reasonably conclude that our batch is sterile—however, wewould have no product to sell. What does a negative sterility test mean when thebatch size is much larger than the sample size—say 50,000 units?
As the total population of 50,000 units is much larger than our sample size,we need to approximate the probability of finding a contaminated vial using a sta-tistical technique called binomial distribution. In order to use this technique, fourrequirements need to be met:
Fault Tree Analysis of the United States Pharmacopeia Sterility Test 221

1. The experiment consists of n identical trials, where n is set in advance. For oursterility test, each sample vial is an identical trial, and the number of vialstaken (20) is set by our SOP.
2. Each outcome can be categorized as either a success or a failure. For a sterilitytest, the contamination status of each vial is either sterile/negative (success) orcontaminated/positive (failure).
3. The trials are independent—one trial does not affect the outcome of the other.In our test, each vial, although ultimately pooled for the purposes of the test,represents an independent trial, whereas the contamination status of the con-tents of one vial has no effect on the contamination status of another vial.
4. The probability of success must be constant from one test to the next. In ourcase, we have measured our inherent contamination rate as less than 1 in1000 vials, so unless something in manufacturing changes, contamination rateshould be consistent from process to process.
We are interested in knowing the probability of getting one or more contami-nated vials in our sample. In statistical terms, the probability of getting at leastone contaminated vial is the same as one minus the probability of getting no posi-tively contaminated vials.
PðX � 1Þ ¼ 1� PðX ¼ 0Þ
To find the probability that no vial is contaminated, we use the formula:
Pðx ¼ 0Þ ¼ ð1� pÞn
where p is the probability of a contaminated vial (< 1:1000) and n the number ofunits in our sample.
Calculating out, the probability of testing a contaminated vial is less than
1� ð1� pnÞ ¼ 1� ð1� 0:001Þ20 ¼ 1� ð0:999Þ20 ¼ 1� 0:980189
or
� 1:9 % chance of getting a positive test
In other words, given the conditions of the test described above, we have a98% chance of passing the test!
This calculation tells us that there is less than a 2% chance of our finding acontaminated vial, given a batch size of 50,000, a sample size of 20, and an inherentcontamination rate of less than 1 in 1000 units. Knowing that, one might ask thequestion, ‘‘How contaminated does the lot need to be in order for me to fail a ster-ility test assuming a batch size of 50,000 and a sample size of 20?’’ Table 5 providesthe answer.
The statistics tells us that the contamination rate would have to be remark-ably high result to in a 50% probability of failing the test. So, a positive on avalidated USP sterility test would indicate either that the batch is highly contami-nated (which should have an obvious root cause in a properly validated andcontrolled manufacturing process) or the test was inadvertently contaminated bythe analyst. Which of the two scenarios will provide a root cause? Only anunbiased and scientific investigation will fulfill GMP requirements for an appro-priate dispositions.
222 McCullough and Zakzeski

Case #2: Endotoxin TestingThe bacterial endotoxin test provides us with another mathematical challenge. Thelogic process for looking at the usefulness of an end-product endotoxin test is thesame as for a sterility test, but some of the assumptions change.
1. Instead of 20 units/sample, the bacterial endotoxins test (BET) for a parenteraldrug product usually requires only three samples, one each from thebeginning, middle, and end of the run. So, our n is 3. Medical devices usuallytest 10 samples.
2. As with sterility, the outcome of the test is either a success or a failure. Suc-cess in the case of BET is endotoxin below the calculated or assignedendotoxin limit (pass). Failure is the detection of endotoxin in excess of thelimit.
3. As with sterility, each unit represents an individual outcome, even though thecontents of the vials might be pooled for our study.
4. We run into a problem when we try to assign a contamination rate for endo-toxin, as there is no endotoxin analog to a process simulation/media fill.Unlike sterility testing, endotoxin testing is not visual in that we do not seea contamination event as turbidity in an incubated vial. To determine endo-toxin contamination across the run, one would have to test everyvial. Unlike sterility, endotoxin contamination is not an absolute. We cannotmeasure zero endotoxin, and in fact, we are allowed to have endotoxin inour product, but the measured level of endotoxin cannot exceed the calculatedor assigned endotoxin limit.
If, for the sake of discussion that the endotoxin contamination rate approxi-mates the microorganism contamination rate, then a 50,000 unit batch, assuming a1 in 1000 contamination rate and a sample size of 30 calculates as follows:
Pðx ¼ 0Þ ¼ ð1� pÞn
1� ð1� pnÞ ¼ 1� ð1� 0:001Þ3 ¼ 1� ð0:999Þ3 ¼ 1� 0:997
or
� 0:3 % chance of getting a positive test
In other words, given the conditions of the test described above (a samplesize of 3, a batch size of 50,000, and a contamination rate of > 1 in 1000 units),we have a 99.7% chance of passing the test! Again, with such a low sample sizerelative to the batch size, finished product endotoxin testing tells us very littleabout the level of endotoxin in the batch of product. Monitoring the process usinga risk analysis method such as HACCP (Chapter 8) will provide our company withmuch better endotoxin control than end product testing alone.
Fault Tree Analysis of the United States Pharmacopeia Sterility Test 223


Index
Aerobic particles, viable, 64Aerosol(s)
definition of, 63generation, 53measurement, 63monodisbursed, 47oil, 52
polydispersed, 54sampling of, 9
Agar slides, 81Air
cleanliness, classification of, 33filtration, 16sampling, 65
active, 57, 60in cleanrooms, 18–19
velocity, 16, 17, 18, 201Airborne particles
biological, 6, 10classification, 32concentration, 36count, 36levels, total, 61viable, monitoring of, 55
Airflowdirection and visualization, 36patterns, 31, 50
and velocities, 36Airflow visualization test,
50–51American Type Culture
Collection, 68Andersen 6-stage sampler, 64Aseptic environment,
monitoring of personnel in, 64Aseptic filling process, 100Aseptic processing
environment, quality of, 74methods, 83
[Aseptic processing]validation of, 95, 110technique, 79, 96, 125, 146
Bacillus subtilis var. niger, 65, 84Bacterial endotoxins, generic, 141Bacterial endotoxins test (BET), 111,
112, 125critical control points (CCPs) in, 132data analysis and interpretation, 168laboratory performance of, 137plastic consumables in, 163sampling for, 167testing sequence, 160validation of, 133
Bioaerosols, 6Bioburden recovery validation, 74Biological sampling efficiency, 57
definition of, 65evaluation of, 65
BisKit, 80Body box method, 9Borosilicate glass, depyrogenated, 164Brownian coagulation, 6Brownian diffusion, 10, 24
Calcium alginate, 78Cleanroom
air sampling in, 18–21airflow streamlines, 4applications, 27behavior, 204, 208certification, 43, 45, 47classification, 35, 46clothing, 37, 38
modern, 65conditions, 20, 97
225

[Cleanroom]definition of, 34disciplines, 96duct system, 10dynamics, 18environmental monitoring
programs, 3environments, 73, 96, 209equipment configurations, 105etiquette, 187, 204industry, 6installation, 37microbiological hazards in, 67modern, 96operations, 22
optimizing, 27operators, 39, 96personnel, 205risk zones in, 41surfaces, 82, 97technology, 31, 41world-class, 37
Clean zones, 36definition of, 34
Condensation nuclei counters, 22Contamination
bacterial, 123indirect, 96low particle, 16molecular, 33, 39, 41rate, microorganism, 215risk factors, 98sources of, 64, 70, 96, 195, 207
Control standard endotoxin (CSE), 154Critical control points (CCPs), 132Cross contamination, 97Cunningham correction factor, 64
Dacron1, 78Deionization beds, 123Depyrogenation, 133, 143, 164, 168, 178
dry heat cycle, 117ovens, 155–156
Dextroseas CCP, 121endotoxin content in, 123
Dioctyl phthalate (DOP), 46hot versus cold, 53
Drug manufacture, parenteral
[Drug manufacture, parenteral]hazard and CCP analysis
(HACCP), 135quality system concepts, 134raw materials, 115
Drug productadulterated, 139dilution of, 164–166limulus amebocyte lysate (LAL)
testing of, 119small-volume parenteral, endotoxin
limit for, 147sterile, production of, 96
Electrostatic particle collectionmechanisms, 17
Endotoxinadsorption, 164aggregates, 139in air, 145analysis, 117assays, 170bacterial, 157concentration, 158–159, 164contamination, 135, 137–139, 145,
166, 178, 195control of, 135, 137random, 172rate, 215
control, 216detectable, 117, 141, 146, 165, 170dilution series, 158endogenous, 164factories, 123formulation, 164generation, 142hazard, 143, 146, 168levels, reported, 118limits
bacterial, 120calculated, 147, 148, 151choosing, 153in-house, 148specification, 120
recoverable, 164reduction, 144residual, 118, 164secondary, 154sources, 148
226 Index

[Endotoxin]standardization, 163test data, 155
Environmentbioburden in, 73contamination, and sterility
assurance, 109control, 103, 145testing, 187, 190, 193, 195, 202
Environmental monitoring, 67, 91,97, 102, 131, 197, 208
media, 190methods, types of, 77programs, 3, 68, 108results, 157samples, 99validation plan, 77
Fault tree analysis (FTA), 184Fiber filter
mats, 14mechanisms, 16
Filterbleedthrough, 56charcoal, 123delivery system, 49efficiency, 16fibrous, 16grades of, 53Hansen, for respirators, 17heavy grade MIL-SPEC, 56high-efficiency, 9, 16, 17, 56integrity, 56
testing, 88materials, 16–18media, 56
MIL-SPEC, for testing of, 46membrane
nitrocellulose, 80sampling, 80
zero count, 59Filter funnels, sterilizable, 217Filtration, 67Foam sampling device, 80Fungi, incubation time for, 68
Gel clot test, 157–158Glycocalyx, extracellular, 82
Good manufacturing practice(GMP), and quality systemregulation, 132
Gram-negative bacteria, 79, 120,141, 144
Gram-positive cocci, 79Growth medium, bacteriological, 190Growth promotion tests, 192‘‘Guide to Inspections of
High-Purity WaterSystems’’, 115, 118
Hansen filter, for respirators, 17Hazard and CCP analysis (HACCP)
in parenteral drug manufacturing, 135principles of, 136, 139, 147
High-efficiency particulate air (HEPA)filters, 97
ceiling, 16collection mechanism of, 46failure, 108fibrous media, 16and microelectronics, 46
House water productionsystems, 115
Hydrosonic humidifiers, 51Hygcult TPC dipslide, 81
Impactor cutoff curves, 15Impactors
efficiency of, 14for particle capture, 14
Incubation, 103Inert particle formation, 6International Standards Organization
(ISO), 3114644-1, classification of air
cleanliness, 3514644-2, specifications for testing and
monitoring, 3514644-3, test methods, 3614644-4, design, construction, and
startup, 3714644-5, operations, 3714644-6, vocabulary, 3814644-7, separative devices, 3814644-8, classification of airborne
molecular contamination, 39
Index 227

[International Standards Organization(ISO)]
cleanroom standards, 38nonviable particle requirements, 207
ISO 5 cleanroom, 50ISO-AMC classes, 39, 40
Label claim sensitivity, 149, 157, 162Laboratory
equipment, 155errors, 186, 187
systemic, 189test results, 183testing, 169
Laskin nozzle, and bleedthrough, 56Limulus amebocyte lysate,
kinetics of, 159Limulus polyphemus, 157
Mediafill
acceptance criteria for, 74factors affecting, 103invalidation of, 108program, 97, 108under anaerobic conditions, 102validation protocol, 98
filling speed, 101growth promotion, failure
of, 102simulation, by lyophilization, 102sterility, 108, 190sterilization processes, 68suitability tests, 190–191vials, batch sizes of, 100
Medical device industry, GMPregulation for, 133
Microbialidentification methods, 87monitoring, 68
of surfaces, 73recovery, 81
Microelectronics, HEPAfilters and, 46
Microorganism(s)contaminating, 200, 202saltwater marine, 195
[Microorganism(s)]sampling, 14spore-forming, 75
Molecular contamination, surface, 41
Navier-Stokes solution, twodimensional, 4
Nebulization, 8
Optical particle counters, 5Organism identification methodology,
validation of, 194
Particlebiological, 6bursts/transport, 22composition, 5
detrimental effects of, 5concentration, 5count locations, calculation of, 59density, 5, 11deposition velocity, 22, 23diameter, 11
aerodynamic, 20and diffusion coefficient, 13
diffusion coefficient, 17dust, 46emissions, from equipment, 9environmental, 7fallout count test, 60inertia, 3light, effects of, 15mechanics, 10migration, 60monitoring, continuous, 68nonviable, 31, 66properties, 7
air velocity, 17density, filter packing, 17fiber diameter, 17physical, 5
sedimentation, 67velocity, 23and particle diameter, 11
shape, 11size, effect on behavior, 5surface deposition of, 22, 23
228 Index

[Particle]suspended, 14ultrafine, 35viable, 31, 41, 68, 70
sensitivity of, 66Particle collection
by diffusion, 17by interception, 17methods for, 66
Particle counters, 58optical, 5
Petri dishes, 78, 80Pharmaceutical ingredient,
active, 138, 178Photometric tests, 158Piezobalance impactor, 37Plume
carbon-dioxide-generated, 50versus theatrical fog, 51
Polyalpha olefin, 52Potable water, 119Propionibacterium acnes, 195
Reference standard endotoxin(RSE), 154
Replicate organism detection andcounting (RODAC) contact plate
method, 77nutrient agar in, 78
Resuspension, definition of, 8Reverse osmosis (RO)
membranes, 117Reynolds number, 20, 67Room
air exchange, 47rate, measurement of, 47
classification, 56Federal Standard, 57formula, for number of locations, 57
infiltration leakage, 31
Samplerssieve or silt, 14silt-to-agar, 63
Sampling, 117active, in clean zones, 66device, selection of, 66efficiency, 63
[Sampling]determination, and validation, 73physical, 63, 65
method validation, by repetitiverecovery, 82
plastics for, 118ports, 118vessels, manufacture of, 126
Sanitizers, 97, 197, 202change in, 158
Settling plates, 67Smoke pattern testing, 50Smoke-tracer experiments, 5Sodium chloride, endotoxin
content in, 120Soybean-casein digest (SCD)
medium, 219Spores, fungal, 7, 10Sporicidal process, 75Staphylococcus epidermidis, 189Sterility
assurance, 70, 97, 103, 137, 191failure, 184–186problems, 191
Sterility test, 131, 188–192, 207–209, 219analyst, 205, 209area, 194, 201, 203and bacterial endotoxin test, 223fault tree analysis, 184growth promotion, 192hazard analysis and critical control
point (HACCP) of, 184isolators, 217media suitability analysis, 189membrane filtration (MF) in, 190microbiological monitoring of, 196organism identification, 193out-of-specification (OOS), 183risk analysis of, 184sample, 196standard operating procedures
(SOPs), 185suite, 186, 196, 204, 207, 220system suitability, 189
Stokes-Einstein equation, 13Stokes law, 10, 12Stokes number, 14Surface contamination, molecular, 41Surface-monitoring assays, 87–88Surface-monitoring studies, 81
Index 229

Suspensions, 81Swabs
Bacillus anthracis spores, recovery, 78types of, 78
Tachepleyus tridentatus, 157Thermal generators, 56Thioglycollate medium, 102Tube array, 47
U.S. Pharmacopeia (USP)‘‘Official Monographs/Water’’, 115sterility test, 183
Validation, definition of, 95Vane anemometer, 48Ventilation system, 10
Waterdistribution, 113generation, 122incoming, 122
testing of, 122for injection (WFI), 138, 183quality specifications, 115sampling technique, 125system
control of, 95dynamic, 119monitoring program
for, 119pretreatment of, 123purified, 124validation of, 115
Yersinia pestis, 195
230 Index

Related Documents


