Pima County Department of Environmental Quality Tucson, Arizona Clean Air Act Permit Page 1 of 13 Environmental Justice Analysis El Paso Natural Gas Company – Vail Compressor Station Proposed PSD Air Quality Permit #425 June 2020 Project Description Pima County Department of Environmental Quality (PDEQ), is proposing to issue a Prevention of Significant Deterioration (PSD) permit under section 165 of the Clean Air Act (CAA) that would authorize the major modification to the existing major source operating as the El Paso Natural Gas Company (EPNG) – Vail Compressor Station in accordance with the CAA PSD requirements. El Paso Natural Gas Company (EPNG), a Kinder Morgan Company, provides natural gas transportation services for natural gas suppliers and end users throughout the southwestern United States and owns and operates a large pipeline network. The Vail Compressor Station provides natural gas compression to the pipeline network. Its purpose is to compress natural gas to meet the pressure and volume demands of the customer. Compression is accomplished by three (3) natural gas fired General Electric (GE) Frame III turbines that drive the compressor units. The facility is permitted to operate 24 hours per day and 365 days per year. Primary electric power at the Vail station is purchased power. EPNG proposes modifications to the existing piping at the Vail Compressor Station. Specifically, the modifications include adding gas cooling equipment (e.g., piping, valves, fans) and gas recycling to allow for operational flexibility. Gas cooling is required to preserve the pipe's anti-corrosion coating. The fans will be operated on purchased power and do not require an additional emission source to operate. Installation of gas cooling equipment has the potential to increase fugitive emissions from additional compressor station piping components. The applicant has also requested an operating limitation for the turbines that will allow only two of the three turbines to operate simultaneously at any time except during periods of switching and routine maintenance, once the project is completed. EPNG also proposes to add a natural gas-fired emergency generator to provide power to the gas cooling fans in an emergency when line power is not available. Operation of the emergency generator will be limited to routine maintenance and testing and emergency events. EPNG is not proposing any physical change or change to the method of operation to the turbines, or the other emission sources, as part of this application. Furthermore, EPNG is not proposing any alternate operating scenarios as part of this piping modification project. The proposed piping modification project constitutes a major modification for certain pollutants under the preconstruction PSD permitting regulations and requires a significant revision under the Title V / Class I operating permit regulations.

Welcome message from author
This document is posted to help you gain knowledge. Please leave a comment to let me know what you think about it! Share it to your friends and learn new things together.
Transcript

Pima County Department of Environmental Quality Tucson, Arizona Clean Air Act Permit
Page 1 of 13
Environmental Justice Analysis El Paso Natural Gas Company – Vail Compressor Station Proposed PSD Air Quality Permit #425 June 2020 Project Description Pima County Department of Environmental Quality (PDEQ), is proposing to issue a Prevention of Significant Deterioration (PSD) permit under section 165 of the Clean Air Act (CAA) that would authorize the major modification to the existing major source operating as the El Paso Natural Gas Company (EPNG) – Vail Compressor Station in accordance with the CAA PSD requirements. El Paso Natural Gas Company (EPNG), a Kinder Morgan Company, provides natural gas transportation services for natural gas suppliers and end users throughout the southwestern United States and owns and operates a large pipeline network. The Vail Compressor Station provides natural gas compression to the pipeline network. Its purpose is to compress natural gas to meet the pressure and volume demands of the customer. Compression is accomplished by three (3) natural gas fired General Electric (GE) Frame III turbines that drive the compressor units. The facility is permitted to operate 24 hours per day and 365 days per year. Primary electric power at the Vail station is purchased power. EPNG proposes modifications to the existing piping at the Vail Compressor Station. Specifically, the modifications include adding gas cooling equipment (e.g., piping, valves, fans) and gas recycling to allow for operational flexibility. Gas cooling is required to preserve the pipe's anti-corrosion coating. The fans will be operated on purchased power and do not require an additional emission source to operate. Installation of gas cooling equipment has the potential to increase fugitive emissions from additional compressor station piping components. The applicant has also requested an operating limitation for the turbines that will allow only two of the three turbines to operate simultaneously at any time except during periods of switching and routine maintenance, once the project is completed. EPNG also proposes to add a natural gas-fired emergency generator to provide power to the gas cooling fans in an emergency when line power is not available. Operation of the emergency generator will be limited to routine maintenance and testing and emergency events. EPNG is not proposing any physical change or change to the method of operation to the turbines, or the other emission sources, as part of this application. Furthermore, EPNG is not proposing any alternate operating scenarios as part of this piping modification project. The proposed piping modification project constitutes a major modification for certain pollutants under the preconstruction PSD permitting regulations and requires a significant revision under the Title V / Class I operating permit regulations.

Page 2 of 13
Background for the Environmental Justice Analysis for the Project Executive Order 12898, entitled “Federal Actions To Address Environmental Justice in Minority Populations and Low-Income Populations,” states in relevant part that “each Federal agency shall make achieving environmental justice part of its mission by identifying and addressing, as appropriate, disproportionately high and adverse human health or environmental effects of its programs, policies, and activities on minority populations and low-income populations.” Section 1-101 of Exec. Order 12898, Vol. 59 Fed Reg 32, (Feb. 16, 1994). Based on this Executive Order, the EPA’s Environmental Appeals Board (EAB) has held that environmental justice issues must be considered in connection with the issuance of federal Clean Air Act (CAA) Prevention of Significant Deterioration (PSD) permits issued by EPA Regional Offices and states acting under delegations of Federal authority. EPA Regional Offices and their delegates in the states have for several years incorporated environmental justice considerations into their review of applications for PSD permits under 40 CFR 52.21. The EAB reinforced the importance of completing an environmental justice analysis. PDEQ determined that there may be minority or low-income populations potentially affected by the proposed action on the EPNG Significant Permit Revision - Piping Modification Project - permit application, and determined that it would be appropriate to prepare an Environmental Justice Analysis for this action, which is provided below. Regulatory Framework for the PDEQ’s PSD Permitting Decision for the Project The PSD program is a preconstruction review and permitting program applicable to certain new major stationary sources and major modifications at existing major stationary sources. The specific requirements under the PSD program applicable to stationary sources where PDEQ is the permitting authority are in the Code of Federal Regulations 40 CFR 52.21. The PSD program applies to any regulated NSR pollutant (as defined in 40 CFR 52.21). The EPNG Piping Modification Project would be a major modification to an existing major source that is in an area designated as attainment for all NAAQS. The applicability of the PSD program to a stationary source must be determined in advance of construction or modification and is pollutant-specific. The primary criterion is whether a proposed project is sufficiently large (in terms of its emissions) to be a major stationary source or major modification. If the potential emissions from the project meet or exceed the levels that are considered a major stationary source or a major modification, a PSD permit must be issued before construction of the project and will cover all regulated NSR pollutants emitted in significant amounts (as defined in 40 CFR 52.21). PDEQ has determined that a PSD permit is required for the EPNG Piping Modification Project because it potentially can cause a net emissions increase in Nitrogen Oxide (NOX) and Carbon Monoxide (CO). See Table 1.

Page 3 of 13
Table 1 Summary of the Site-Wide Potential to Emit Emissions
Annual Emissions (tpy)
PSD Review Required? 1 Pollutant
Baseline Actual Emissions
(BAE)
Projected Actual Emissions (PAE)
Net Emissions Increase (NEI)
PSD Significant Emission Rate
(SER)
NOx 4.98 238 232.65 40 Yes CO 1.35 117 116.04 100 Yes
VOC - 2.78 2.78 40 No SO2 0.02 1.55 1.53 40 No PM - 3.10 3.10 25 No
PM10 - 3.10 3.10 15 No PM2.5 - 3.10 3.10 10 No CO2e 2 1,310.0 54,299 52,989 75,000 No
1 Ozone PSD Review is required if NOx OR VOC exceed their respective SER 2 GHG (CO2e) SER according to 40 CFR 51.166(b)(48)
Local Area and Demographics Local Area The EPNG Vail Compressor Station is located on private land in Township 16 South, Range 15 East, Section 4, Pima County, Arizona. Geographic coordinates for the center of the EPNG Vail Compressor Station are approximately 32.066701 degrees latitude, -110.810146 degrees longitude (Figure 1-1). Tucson has an estimated population of 553,871, up slightly from 520,000 at the 2010 census. The Tucson metropolitan area is larger with an estimated population of 1,062,220. Tucson is the second-most populous city in Arizona after Phoenix. Tucson has a population density of 2,327 people per square mile. Tucson has a strong temporary population, which grows and recedes seasonally. Much of the city's economy is centered on the University of Arizona, which is the city's second largest employer, as well as tourism, with over 3.5 million people visiting the city each year. Along with vacationers, there are a large number of winter residents (snowbirds) who come for the mild winters. Many own second homes in the area1.
1 See http://worldpopulationreview.com/us-cities/tuscon-population/

Page 4 of 13
Figure 1-1 Ariel View of the EPNG Project Location at Vail Compressor Station

Page 5 of 13
Demographics The EPA's screening and demographic evaluation for potential environmental justice concerns focused on the primary populations that are expected to see air quality impacts from the Project above current baseline levels of air pollutants. As noted above, however, all air quality impacts of the Project have been demonstrated to be below the applicable health-based NAAQS. The identified “Impact Area” for purposes of this Environmental Justice Analysis encompasses approximately 78 square miles and includes a population of 31,497. The Impact Area includes a 5 mile radial area of the proposed project. To help formulate a plan for the outreach activities related to the Project, PDEQ reviewed the matrics for Pima County, the State of Arizona, and the United States. See Table 2 below. Table 2: Average Demographic Information for Proposed Project Location and Surrounding Areas
City/Area Population
2010 Census
Percent Minority
Percent Low
Income Population
Percent Linguistically
Isolated
Percent w/o
High School
Diploma
Percent under Age 5
Percent Over
64
Impact Area 30,051 44% 22% 1% 12% 6% 11% City of Tucson 520,116 55% 45% 56% 14% 6% 15%
Pima County 1,007,038 47% 39% 4% 12% 6% 18%
Arizona 6,641,928 44% 37% 4% 13% 6% 16% United States 308,758,105 39% 33% 4% 13% 6% 15%
Demographic information was obtained through the EPA’s EJSCREEN mapping tool: Environmental Justice Screening and Mapping Tool: https://ejscreen.epa.gov/mapper and the United States Census Bureau: https://www.census.gov/ Minority and Low Income Populations – The Impact Area is below the City of Tucson, County, State and U.S. averages for percent minority populations. The percentage of low income populations in the Impact Area and the City of Tucson are slightly lower compared with the County, State, and U.S. averages. Linguistic Isolation – Linguistic isolation limits a household’s capacity for civic engagement in the regulatory process.2 Within the impact area, 1% of the population are identified in linguistic isolation, this is well below the percentage in the City of Tucson. Arizona is equal to the national average and that of Pima County at 4%. Of those linguistically isolated, Spanish is the language predominantly spoken. Education levels – Education level is another factor that may influence susceptibility and vulnerability to air pollution. Limited formal education is a barrier to employment, health care and social resources, and can increase the risk of poverty, stress, and impacts from environmental stressors. The Impact Area is below the City of Tucson and is slightly below the State and equal to the County averages with respect to this factor.
2 A linguistically isolated household is defined by the U.S. Census Bureau as a household in which no member 14 years old
and over (1) speaks only English or (2) speaks a non-English language and speaks English "very well.” In other words, all members 14 years old and over have at least some difficulty with English.

Page 6 of 13
Environmental Public Health Data – The Center for Disease Control and Prevention (CDC) provides environmental health data for Pima County that is available here: https://ephtracking.cdc.gov/InfoByLocation/ In general, the demographic information provided in the CDC database for Pima County is consistent with the demographic information provided above. The database also provides other information such as asthma rates, population proximity to highways, access to parks, extreme heat days, number of high ozone days, and smoking rates. However, much of this data is not provided in a comparable format. We note that the CDC information does indicate that Pima County has current adult asthma rates higher than the national average, 9.4% versus 7.0%, respectively, as of 2016. As such, we looked at the most recent national and state asthma prevalence rates data from the Centers for Disease Control and Prevention, which indicated the 2018 asthma rate was 10.0% in Arizona as compared to a national rate of 7.7%3. Air Quality in Pima County and Potential Project Impacts Pima County is designated as attainment or unclassifiable for PM10, PM2.5, NO2, CO, SO2 and lead NAAQS, however this region is very close to non-attainment of the EPA ground level ozone. Impact of the Project’s Emissions PDEQ’s environmental justice analysis focuses on the potential effects on minority and low-income and other populations from emissions that may affect the NAAQS that are applicable in the Project’s PSD permit application. For this Project, we have reviewed impacts on the NAAQS for NO2 and CO (1-hr and 8-hr average). See referenced Air Quality Dispersion Modeling Report in footnote 4 of this page. Pima County has determined from the modeling results for the Project that the Project would not cause or contribute to a violation of the applicable health based NAAQS for any of the pollutants regulated under the PSD permit.4 The modelling report considered impacts assessed using Appendix W of the Guideline on Air Quality Models (Revised), Air Dispersion Modeling Guidelines for Arizona Air Quality Permits and Federal Land Managers’ Air Quality Related Values Workgroup (FLAG) Phase I Report – Revised and Interagency Workgroup on Air Quality Modeling Phase 2 Summary Report. The U.S. EPA American Meteorological Society / Environmental Protection Agency Regulatory Model (AERMOD) model includes a state-of-the-science downwash algorithm and utilizes AERMET, a meteorological data preprocessor that utilizes current planetary boundary layer theory to calculate the dispersion coefficients. The most current version of the AERMOD model (version 19191) was used in conducting the modeling analysis. The National Park Service (NPS) Air Resources Division has also reviewed the air quality modelling analysis and has concluded that the methodology, data used, and the results are correct and follows the EPA Guidelines on Air Quality Models.
3 See https://www.cdc.gov/asthma/most_recent_national_asthma_data.htm 4 See page 3-1 Air Quality Dispersion Modeling Report in Support of the Application for a Prevention of Significant
Deterioration (PSD) Authorization and Significant Revision to Class I Air Quality Permit for Vail compressor Station.

Page 7 of 13
The results of the analysis demonstrate that the project will not cause or contribute to a violation of any applicable NAAQS. The full impact analysis also considered post-project facility-wide emissions (i.e., not just the project sources) as well as off-site NOX emissions inventory within 50 km of the facility, as detailed in Section 8.3.2 of the modelling report and summarized in the following Tables 3-5. Table 3: Full Impact Analysis – NAAQS Results
The NAAQS are health-based standards and are designed to protect public health with an adequate margin of safety, including sensitive subpopulations. Considering the modeled results for the Project in light of the health-based nature of the applicable NAAQS, PDEQ has determined that the projected emissions of these pollutants from the Project will not result in disproportionately high and adverse human health or environmental effects on any population, including minority populations and low-income populations. Table 4: Full Impact Analysis – PSD Increment Results

Page 8 of 13
Table 5: Full Impact Analysis – Significant Monitoring Concentrations & Results
Outreach Activities for Pima County’s Proposed PSD Permit Decision PDEQ is undertaking various actions to provide public participation opportunities to the local community for its proposed PSD permit decision for the El Paso Natural Gas - Vail Compressor Station – Piping Modification Project. On February 10, 2021 a 30-day public comment period for this proposed PSD permit decision will begin. On March 9, 2021, PDEQ will host a virtual public information (open house) meeting to provide interested community members the opportunity to learn about the Project and the PDEQ’s permitting process and to informally discuss the potential air quality impacts of the Project. In light of the linguistically isolated Spanish-speaking population in the local community, English-Spanish translation services will be made available at the meeting. Please visit the following PDEQ website link for more details: https://webcms.pima.gov/cms/One.aspx?portalId=169&pageId=529798. PDEQ is issuing its public notice for the proposed PSD permit in both English and Spanish. Both versions of the notice are being provided to the public through PDEQ website, as well as being provided directly to those on our distribution list for those who have requested to be notified. All accompanying permit documents are also available for review by appointment at the PDEQ office located: 33 N Stone Ave, Suite 700, Tucson, Arizona, 85737 (call 520-724-7341 to make an appointment). We have also scheduled a virtual public hearing on March 16, 2021 to take formal oral and written comments on the Project. Please visit the PDEQ website above for more details. The 30-day public comment period for this proposed PSD permit decision will end on March 29, 2021.

Page 9 of 13
Attachment A
Analysis

Page 10 of 13
EJ Project
The EPA developed an environmental justice integrative geographic information system, or GIS, mapping and screening tool called, “EJSCREEN” (http://www2.epa.gov/ejscreen). EJSCREEEN is based on nationally accredited and validated data from the US Census Bureau’s American Community Survey 2008-2012 that allows one to combine environmental and demographic indicators to generate specific maps or reports. For this report, EJSCREEN was utilized to identify potential environmental justice individuals and communities that surround the spatial location of interest (EPNG; 10200 South Rita Road, Tucson, AZ 85747). The potential environmental justice individuals and communities of interest include: individuals below the poverty level, the minority population, and Spanish-speaking individuals.
Figure 1: EJSCREEN Demographic Population Map in the Project Area
Source: https://ejscreen.epa.gov/mapper/
Figure 1 represents the EJSCREEN People of Color Population Index map near the spatial location of interest (EPNG; 10200 South Rita Road, Tucson, AZ 85747). EJSCREEN lists the People of Color Population Index by reporting the percent of individuals by block group. Block groups are statistical divisions of census tracts that are used to present data and control block numbering. A block group consists of clusters of blocks within the same census tract that have the same first digit of their four-digit census number. As the number of People of Color individuals’ increase in a specific block area, the shade of color becomes darker, which represents a higher population of People of Color individuals in that specific area. These color coded census blocks call attention to certain locations with higher populations of color and allow for a more accurate depiction of the true population around the spatial location of interest.

Page 11 of 13
Figure 2: EJSCREEN Spanish Speaking Individuals Map in the Project Area
Source: https://ejscreen.epa.gov/mapper/
Figure 2 represents the EJ Non English Speaking Individuals map near the spatial location of interest (EPNG; 10200 South Rita Road, Tucson, AZ 85747). EJSCREEN lists the Non English Speaking Individuals by reporting the number of Non English speaking individuals by tract. Tracts are small, relatively permanent statistical subdivisions of a country delineated by local participants as part of the U.S. Census Bureau’s Participant Statistical Areas Program. As the number of Non English speaking individuals’ increase in a specific tract, the shade of color becomes darker, which represents a higher population of Non English speaking individuals in that specific area. These color coded tract areas call attention to certain locations with higher Non English speaking individuals and allow for a more accurate depiction of the true population around the spatial location of interest.

Page 12 of 13
Figure 3: EJSCREEN Low Income Population (National Percentiles) Map in the Project Area
Source: https://ejscreen.epa.gov/mapper/
Figure 3 represents the EJ Households of Low Income Population map near the spatial location of interest (EPNG; 10200 South Rita Road, Tucson, AZ 85747). EJSCREEN lists the percentage where households income is less than or equal to twice the federal “poverty level” by block groups. As the number of households below poverty level increases, the shade of color becomes darker, which represents a higher population in households below poverty level in that specific area. These color coded block groups call attention to certain locations of households below poverty level that surround the spatial location of interest. The color coded map allows for more accurate depiction of the surrounding households’ income levels, which illustrates a clearer picture of the socioeconomic status of households that surround the spatial location of interest.

Page 13 of 13
Attachment B
Environmental Justice

State
Percentile
EPA Region
Percentile
USA
Percentile
1/3
Selected Variables
EJ Index for PM2.5
EJ Index for Ozone
EJ Index for NATA* Diesel PM
EJ Index for Wastewater Discharge Indicator
EJ Indexes
This report shows the values for environmental and demographic indicators and EJSCREEN indexes. It shows environmental and demographic raw data (e.g., the estimated concentration of ozone in the air), and also shows what percentile each raw data value represents. These percentiles provide perspective on how the selected block group or buffer area compares to the entire state, EPA region, or nation. For example, if a given location is at the 95th percentile nationwide, this means that only 5 percent of the US population has a higher block group value than the average person in the location being analyzed. The years for which the data are available, and the methods used, vary across these indicators. Important caveats and uncertainties apply to this screening-level information, so it is essential to understand the limitations on appropriate interpretations and applications of these indicators. Please see EJSCREEN documentation for discussion of these issues before using reports.
EJ Index for NATA* Air Toxics Cancer Risk
EJ Index for NATA* Respiratory Hazard Index
EJ Index for Traffic Proximity and Volume
EJ Index for Lead Paint Indicator
EJ Index for Superfund Proximity
EJ Index for RMP Proximity
EJ Index for Hazardous Waste Proximity
EJSCREEN Report (Version )
37
39
35
36
37
32
64
87
37
20
35
21
24
19
24
23
25
44
83
28
14
22
39
44
37
45
39
35
63
91
46
28
39
5 miles Ring Centered at 32.066701,-110.810146, ARIZONA, EPA Region 9
Approximate Population: 31,497
EPNG Vail Compressor Station (The study area contains 1 blockgroup(s) with zero population.)
July 14, 2020
Input Area (sq. miles): 78.53
2019

2/3
EJSCREEN Report (Version )
Superfund NPLHazardous Waste Treatment, Storage, and Disposal Facilities (TSDF)
Sites reporting to EPA
5 miles Ring Centered at 32.066701,-110.810146, ARIZONA, EPA Region 9
Approximate Population: 31,497
EPNG Vail Compressor Station (The study area contains 1 blockgroup(s) with zero population.)
July 14, 2020
Input Area (sq. miles): 78.53
2019
01

EJSCREEN Report (Version )
Value State
Avg.
%ile in
State
EPA
Region
Avg.
%ile in
EPA
Region
USA
Avg.
%ile in
USA
3/3
RMP Proximity (facility count/km distance)Hazardous Waste Proximity (facility count/km distance)Wastewater Discharge Indicator (toxicity-weighted concentration/m distance)
Demographic Index
Population over 64 years of age
Minority PopulationLow Income PopulationLinguistically Isolated PopulationPopulation With Less Than High School EducationPopulation Under 5 years of age
Demographic Indicators
EJSCREEN is a screening tool for pre-decisional use only. It can help identify areas that may warrant additional consideration, analysis, or outreach. It does not provide a basis for decision-making, but it may help identify potential areas of EJ concern. Users should keep in mind that screening tools are subject to substantial uncertainty in their demographic and environmental data, particularly when looking at small geographic areas. Important caveats and uncertainties apply to this screening-level information, so it is essential to understand the limitations on appropriate interpretations and applications of these indicators. Please see EJSCREEN documentation for discussion of these issues before using reports. This screening tool does not provide data on every environmental impact and demographic factor that may be relevant to a particular location. EJSCREEN outputs should be supplemented with additional information and local knowledge before taking any action to address potential EJ concerns.
For additional information, see: www.epa.gov/environmentaljustice
Selected Variables
Environmental Indicators
Particulate Matter (PM 2.5 in µg/m3)Ozone (ppb)NATA* Diesel PM (µg/m3)NATA* Cancer Risk (lifetime risk per million)NATA* Respiratory Hazard IndexTraffic Proximity and Volume (daily traffic count/distance to road)Lead Paint Indicator (% Pre-1960 Housing)Superfund Proximity (site count/km distance)
* The National-Scale Air Toxics Assessment (NATA) is EPA's ongoing, comprehensive evaluation of air toxics in the United States. EPA developed the NATA to prioritize air toxics, emission sources, and locations of interest for further study. It is important to remember that NATA provides broad estimates of health risks over geographic areas of the country, not definitive risks to specific individuals or locations. More information on the NATA analysis can be found at: https://www.epa.gov/national-air-toxics-assessment.
Demographic Indicators
5 miles Ring Centered at 32.066701,-110.810146, ARIZONA, EPA Region 9
Approximate Population: 31,497
EPNG Vail Compressor Station (The study area contains 1 blockgroup(s) with zero population.)
July 14, 2020
Input Area (sq. miles): 78.53
2019
48.6
6.27
0.149
0.0041
0.34
0.33
0.098
0.0058
160
0.27
21
31%
44%
11%
6%
12%
1%
22%
50.8
7.11
0.549
1.9
0.74
0.64
0.08
0.088
480
0.54
38
41%
44%
37%
4%
13%
6%
16%
47%
59%
34%
8%
17%
6%
14%
36%
39%
33%
4%
13%
6%
15%
48.9
9.21
0.479
31
2.9
0.99
0.15
0.24
1700
0.53
35
43
8.3
0.479
14
4
0.74
0.13
0.28
750
0.44
32
29
22
16
72
59
58
80
40
43
7
6
42
56
32
41
58
51
50
27
32
36
22
50
53
47
51
62
36
48
60
56
37
47
9
<50th
74
28
42
62
18
22
<50th
<50th
87
9
<50th
74
45
51
65
11
43
<50th
<50th

Population by Race Number Percent
Population by Sex Number Percent
Population by Age Number Percent
Households by Tenure Number Percent
Owner Occupied
Renter Occupied
Data Note: Detail may not sum to totals due to rounding. Hispanic population can be of any race. Source: U.S. Census Bureau, Census 2010 Summary File 1.
Total
Population Reporting Two or More Races
Pacific Islander
Other Race Alone
Male
Female
Two or More Races Alone
Non-Hispanic Asian Alone
Age 18+
Age 65+
Age 0-17
Age 0-4
Population Density (per sq. mile) Minority Population
% Minority
Summary
Population
Some Other Race
White
Black
Pacific Islander Alone
White Alone
Black Alone
American Indian Alone
Total Hispanic Population
Total Non-Hispanic Population
American Indian
Asian
Census 2010
EJSCREEN Census 2010 Summary Report
Population Reporting One Race
Total
Households Housing Units Land Area (sq. miles)
% Land Area Water Area (sq. miles)
% Water Area
Location:Ring (buffer):
Description:
1/1
User-specified point center at 32.066701, -110.810146
5-miles radius
EPNG Vail Compressor Station
30,051
378
12,207
41%
8,592
9,692
79.46
100%
0.00
0%
30,051
28,680 95%
22,765 76%
2,159 7%
462 2%
875 3%
102 0%
2,318 8%
1,371 5%
8,234 27%
21,817 73%
17,844 59%
2,020 7%
333 1%
820 3%
91 0%
52 0%658 2%
17,236 57%
12,815 43%
2,070 7%
7,721 26%
22,330 74%
2,841 9%
8,592
7,255 84%
1,337 16%

ACS EstimatesPercent MOE (±)
Population by Race
Population Density (per sq. mile)
EJSCREEN ACS Summary Report
Summary of ACS Estimates
Population
Population Reporting One Race
Minority Population
% Minority
Households
Housing Units
Housing Units Built Before 1950
Per Capita Income
Land Area (sq. miles) (Source: SF1)
% Land Area
Water Area (sq. miles) (Source: SF1)
% Water Area
Total
White
Black
American Indian
Asian
Population by Sex
Population by Age
American Indian Alone
Asian
Pacific Islander
Some Other Race
Population Reporting Two or More Races
Total Hispanic Population
Total Non-Hispanic Population
White Alone
Black Alone
Non-Hispanic Asian Alone
Pacific Islander Alone
Other Race Alone
Two or More Races Alone
Male
Female
Age 0-4
Age 0-17
Age 18+
Age 65+
Data Note: Detail may not sum to totals due to rounding. Hispanic population can be of any race. N/A means not available. Source: U.S. Census Bureau, American Community Survey (ACS) .
1/3
Location:Ring (buffer):
Description:
User-specified point center at 32.066701, -110.810146
5-miles radius
EPNG Vail Compressor Station
2013 - 2017
2013 - 2017
31,497
397
13,768
44%
8,852
9,632
17
23,493
79.43
100%
0.00
0%
31,497 619
29,850 95% 1,621
23,042 73% 6512,187 7% 302
516 2% 128
636 2% 117
94 0% 69
3,375 11% 3541,647 5% 3699,590 30% 596
21,907
17,730 56% 467
2,018 6% 302
271 1% 95
595 2%
82 0%
116
69
79 0% 99
100%
1,133 4% 193
18,521 59% 432
12,976 41% 383
2,000 6% 1807,123 23% 327
24,374 77% 575
3,493 11% 283
July 15, 2020
2013 - 2017

ACS EstimatesPercent MOE (±)
Population 25+ by Educational Attainment
2+3+4Speak English "less than very well"
Non-English at Home1+2+3+4
High School Graduate
Some College, No Degree
Associate Degree
Population Age 5+ Years by Ability to Speak English Total
Speak only English
1Speak English "very well"2Speak English "well"3Speak English "not well"4Speak English "not at all"
3+4Speak English "less than well"
Bachelor's Degree or more
Total
Less than 9th Grade
9th - 12th Grade, No Diploma
Occupied Housing Units by Tenure
$50,000 - $75,000
$75,000 +
Total
Owner Occupied
Households by Household Income
Household Income Base
< $15,000
$15,000 - $25,000
$25,000 - $50,000
EJSCREEN ACS Summary Report
2/3
Linguistically Isolated Households* Total
Speak SpanishSpeak Other Indo-European LanguagesSpeak Asian-Pacific Island LanguagesSpeak Other Languages
Location:Ring (buffer):
Description:
In Labor Force Civilian Unemployed in Labor Force Not In Labor Force
Renter Occupied
Employed Population Age 16+ Years Total
Data Note: Datail may not sum to totals due to rounding. Hispanic population can be of any race.
N/A means not available. Source: U.S. Census Bureau, American Community Survey (ACS) *Households in which no one 14 and over speaks English "very well" or speaks English only.
User-specified point center at 32.066701, -110.810146
5-miles radius
EPNG Vail Compressor Station
2013 - 2017
July 15, 2020
21,396 100% 382
815 4% 1281,838 9% 200
4,711 22% 300
8,816 41% 337
2,375 11% 163
5,215 24% 224
29,497 100% 582
23,092 78% 477
6,405 22% 486
5,102 17% 351
653 2% 200
377 1% 159
273 1% 128
650 2% 204
1,303 4% 285
89 100% 90
55 62% 8013 14% 27
21 24% 25
0 0% 17
8,852 100% 173
361 4% 74587 7% 162
1,818 21% 176
1,743 20% 1854,342 49% 192
8,852 100% 173
6,919 78% 184
1,933 22% 151
25,123 100% 509
12,433 49% 328649 3% 111
12,690 51% 375

ACS EstimatesPercent MOE (±)
English
Spanish
French
French Creole
Italian
Portuguese
German
Yiddish
Other West Germanic
Scandinavian
Greek
Russian
Polish
Serbo-Croatian
Other Slavic
Armenian
Persian
Gujarathi
Hindi
Urdu
Other Indic
Other Indo-European
Chinese
Japanese
Korean
Mon-Khmer, Cambodian
Hmong
Thai
Laotian
Vietnamese
Other Asian
Tagalog
Other Pacific Island
Navajo
Other Native American
Hungarian
Arabic
Hebrew
African
Other and non-specified
Total Non-English
.
Data Note: Detail may not sum to totals due to rounding. Hispanic popultion can be of any race. N/A means not available. Source: U.S. Census Bureau, American Community Survey (ACS)*Population by Language Spoken at Home is available at the census tract summary level and up.
Population by Language Spoken at Home* Total (persons age 5 and above)
EJSCREEN ACS Summary Report
3/3
Location:Ring (buffer):
Description:
User-specified point center at 32.066701, -110.810146
5-miles radius
EPNG Vail Compressor Station
2013 - 2017
July 15, 2020
2013 - 2017
30,714 100% 477
24,637 80% 5074,841 16% 277
94 0% 89N/A N/A N/AN/A N/A N/AN/A N/A N/A123 0% 76N/A N/A N/AN/A N/A N/AN/A N/A N/AN/A N/A N/AN/A N/A N/AN/A N/A N/AN/A N/A N/AN/A N/A N/AN/A N/A N/AN/A N/A N/AN/A N/A N/AN/A N/A N/AN/A N/A N/AN/A N/A N/A
9649
N/A22
N/AN/AN/AN/A69
193 1%
68
102 0%
31
N/A N/A
N/A
25 0%
N/A
N/A N/A
N/A
N/A N/A
N/A
N/A N/A
23
N/A N/A
N/A
84 0%
N/A
259 1%
95
71 0%
696
N/A N/AN/A N/AN/A N/AN/A N/A12 0%
N/A N/AN/A N/A217 1%
6,077 20%

Save as PDF
Selected Variables Percentile in State Percentile in EPA Region Percentile in USAEJ Indexes
EJ Index for Particulate Matter (PM 2.5) 66 50 71EJ Index for Ozone 66 54 74EJ Index for NATA* Diesel PM 76 69 82EJ Index for NATA* Air Toxics Cancer Risk 68 56 75EJ Index for NATA* Respiratory Hazard Index 69 57 76EJ Index for Traffic Proximity and Volume 82 58 81EJ Index for Lead Paint Indicator 82 64 77EJ Index for Superfund Proximity 80 68 83EJ Index for RMP Proximity 76 58 76EJ Index for Hazardous Waste Proximity 83 60 80EJ Index for Wastewater Discharge Indicator 94 91 96
EJ Index for the Selected Area Compared to All People's Blockgroups in the State/Region/US
EJ Indexes
PM 2.5Ozone
NATA Diesel PM
NATA Cancer Risk
NATA Respiratory HI
Traffic Proximity
Lead Paint Indicator
Superfund Proximity
RMP Proximity
Hazardous Waste Proximity
Wastewater Discharge Indicator
Perc
entil
e
0
25
50
75
100
State Percentile Regional Percentile National PercentileThis report shows the values for environmental and demographic indicators and EJSCREEN indexes. It shows environmental and demographic raw data (e.g., the estimated concentration of ozone in theair), and also shows what percentile each raw data value represents. These percentiles provide perspective on how the selected block group or buffer area compares to the entire state, EPA region, ornation. For example, if a given location is at the 95th percentile nationwide, this means that only 5 percent of the US population has a higher block group value than the average person in the location beinganalyzed. The years for which the data are available, and the methods used, vary across these indicators. Important caveats and uncertainties apply to this screening-level information, so it is essential tounderstand the limitations on appropriate interpretations and applications of these indicators. Please see EJSCREEN documentation for discussion of these issues before using reports.
EJSCREEN Report (Version 2019)the User Specified AreaARIZONA, EPA Region 9
Approximate Population: 623,009Input Area (sq. miles): 375.60
(The study area contains 3 blockgroup(s) with zero population.)

Sites reporting to EPASuperfund NPL 0Hazardous Waste Treatment, Storage, and Disposal Facilities (TSDF) 14
Selected Variables Value State EPA Region USAAvg. %tile Avg. %tile Avg. %tile
Environmental IndicatorsParticulate Matter (PM 2.5 in µg/m ) 6.4 7.11 26 9.21 10 8.3 11Ozone (ppb) 48.3 50.8 24 48.9 45 43 86NATA* Diesel PM (µg/m ) 0.654 0.549 59 0.479 70-80th 0.479 70-80thNATA* Air Toxics Cancer Risk (risk per MM) 35 38 23 35 <50th 32 60-70thNATA* Respiratory Hazard Index 0.49 0.54 27 0.53 <50th 0.44 60-70thTraffic Proximity and Volume (daily traffic count/distance to road) 470 480 74 1700 41 750 67Lead Paint Indicator (% pre-1960s housing) 0.2 0.088 85 0.24 57 0.28 52Superfund Proximity (site count/km distance) 0.083 0.08 74 0.15 56 0.13 60RMP Proximity (facility count/km distance) 0.29 0.64 55 0.99 39 0.74 48Hazardous Waste Proximity (facility count/km distance) 0.8 0.74 74 2.9 41 4 60Wastewater Discharge Indicator (toxicity-weighted concentration/m distance) 0.25 1.9 86 31 85 14 92
Demographic IndicatorsDemographic Index 48% 41% 66 47% 53 36% 71Minority Population 51% 44% 64 59% 40 39% 67Low Income Population 45% 37% 64 34% 69 33% 72Linguistically Isolated Population 5% 4% 71 8% 49 4% 73Population with Less Than High School Education 14% 13% 62 17% 53 13% 64Population under Age 5 6% 6% 47 6% 48 6% 52Population over Age 64 15% 16% 65 14% 67 15% 59
*The National-Scale Air Toxics Assessment (NATA) is EPA's ongoing, comprehensive evaluation of air toxics in the United States. EPA developed the NATA to prioritize air toxics, emission sources, andlocations of interest for further study. It is important to remember that NATA provides broad estimates of health risks over geographic areas of the country, not definitive risks to specific individuals orlocations. More information on the NATA analysis can be found at: https://www.epa.gov/national-air-toxics-assessment.
3
3

For additional information, see: www.epa.gov/environmentaljustice (http://www.epa.gov/environmentaljustice)
EJSCREEN is a screening tool for pre-decisional use only. It can help identify areas that may warrant additional consideration, analysis, or outreach. It does not provide a basis for decision-making, but itmay help identify potential areas of EJ concern. Users should keep in mind that screening tools are subject to substantial uncertainty in their demographic and environmental data, particularly when lookingat small geographic areas. Important caveats and uncertainties apply to this screening-level information, so it is essential to understand the limitations on appropriate interpretations and applications of theseindicators. Please see EJSCREEN documentation for discussion of these issues before using reports. This screening tool does not provide data on every environmental impact and demographic factor thatmay be relevant to a particular location. EJSCREEN outputs should be supplemented with additional information and local knowledge before taking any action to address potential EJ concerns.
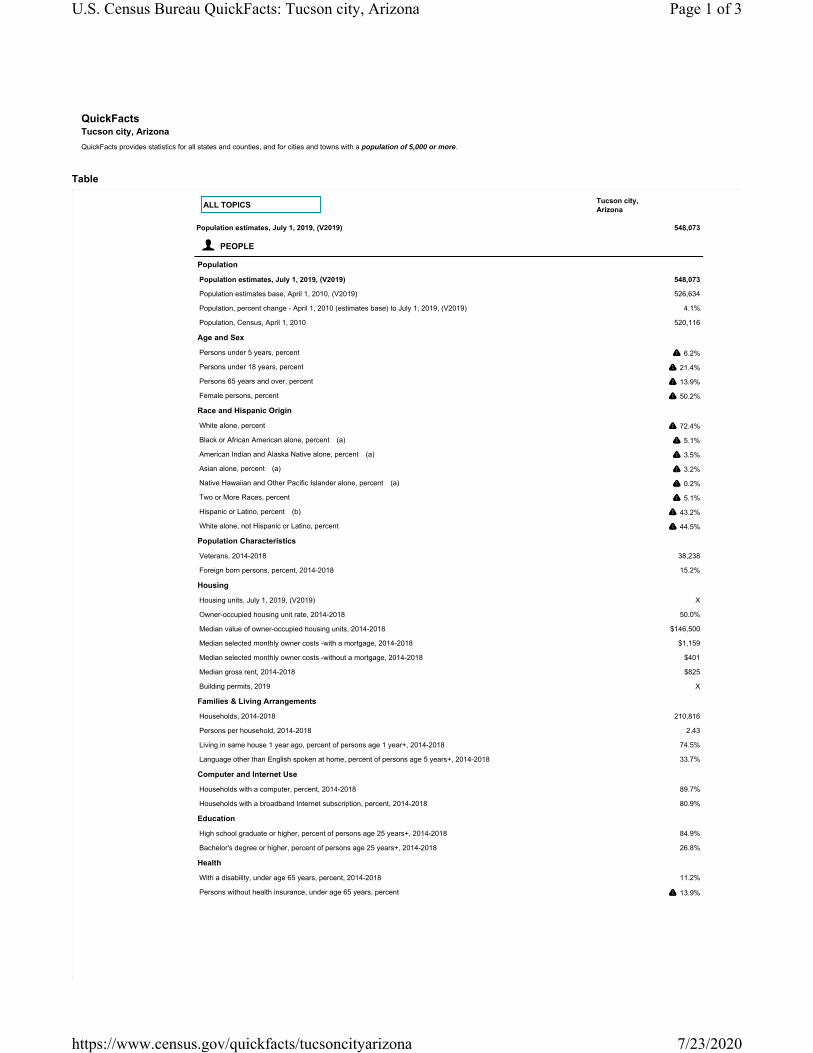
QuickFactsTucson city, ArizonaQuickFacts provides statistics for all states and counties, and for cities and towns with a population of 5,000 or more.
Table
ALL TOPICS
Population estimates, July 1, 2019, (V2019) 548,073
PEOPLE
Population
Population estimates, July 1, 2019, (V2019) 548,073
Population estimates base, April 1, 2010, (V2019) 526,634
Population, percent change - April 1, 2010 (estimates base) to July 1, 2019, (V2019) 4.1%
Population, Census, April 1, 2010 520,116
Age and Sex
Persons under 5 years, percent 6.2%
Persons under 18 years, percent 21.4%
Persons 65 years and over, percent 13.9%
Female persons, percent 50.2%
Race and Hispanic Origin
White alone, percent 72.4%
Black or African American alone, percent (a) 5.1%
American Indian and Alaska Native alone, percent (a) 3.5%
Asian alone, percent (a) 3.2%
Native Hawaiian and Other Pacific Islander alone, percent (a) 0.2%
Two or More Races, percent 5.1%
Hispanic or Latino, percent (b) 43.2%
White alone, not Hispanic or Latino, percent 44.5%
Population Characteristics
Veterans, 2014-2018 38,238
Foreign born persons, percent, 2014-2018 15.2%
Housing
Housing units, July 1, 2019, (V2019) X
Owner-occupied housing unit rate, 2014-2018 50.0%
Median value of owner-occupied housing units, 2014-2018 $146,500
Median selected monthly owner costs -with a mortgage, 2014-2018 $1,159
Median selected monthly owner costs -without a mortgage, 2014-2018 $401
Median gross rent, 2014-2018 $825
Building permits, 2019 X
Families & Living Arrangements
Households, 2014-2018 210,816
Persons per household, 2014-2018 2.43
Living in same house 1 year ago, percent of persons age 1 year+, 2014-2018 74.5%
Language other than English spoken at home, percent of persons age 5 years+, 2014-2018 33.7%
Computer and Internet Use
Households with a computer, percent, 2014-2018 89.7%
Households with a broadband Internet subscription, percent, 2014-2018 80.9%
Education
High school graduate or higher, percent of persons age 25 years+, 2014-2018 84.9%
Bachelor's degree or higher, percent of persons age 25 years+, 2014-2018 26.8%
Health
With a disability, under age 65 years, percent, 2014-2018 11.2%
Persons without health insurance, under age 65 years, percent 13.9%
Tucson city, Arizona
Page 1 of 3U.S. Census Bureau QuickFacts: Tucson city, Arizona
7/23/2020https://www.census.gov/quickfacts/tucsoncityarizona

Economy
In civilian labor force, total, percent of population age 16 years+, 2014-2018 60.6%
In civilian labor force, female, percent of population age 16 years+, 2014-2018 57.6%
Total accommodation and food services sales, 2012 ($1,000) (c) 1,235,423
Total health care and social assistance receipts/revenue, 2012 ($1,000) (c) 5,046,758
Total manufacturers shipments, 2012 ($1,000) (c) 1,551,529
Total merchant wholesaler sales, 2012 ($1,000) (c) 2,221,824
Total retail sales, 2012 ($1,000) (c) 7,878,160
Total retail sales per capita, 2012 (c) $15,026
Transportation
Mean travel time to work (minutes), workers age 16 years+, 2014-2018 22.4
Income & Poverty
Median household income (in 2018 dollars), 2014-2018 $41,625
Per capita income in past 12 months (in 2018 dollars), 2014-2018 $22,645
Persons in poverty, percent 23.4%
BUSINESSES
Businesses
Total employer establishments, 2018 X
Total employment, 2018 X
Total annual payroll, 2018 ($1,000) X
Total employment, percent change, 2017-2018 X
Total nonemployer establishments, 2018 X
All firms, 2012 41,619
Men-owned firms, 2012 19,879
Women-owned firms, 2012 16,106
Minority-owned firms, 2012 15,342
Nonminority-owned firms, 2012 24,162
Veteran-owned firms, 2012 3,667
Nonveteran-owned firms, 2012 35,470
GEOGRAPHY
Geography
Population per square mile, 2010 2,294.2
Land area in square miles, 2010 226.71
FIPS Code 0477000
Page 2 of 3U.S. Census Bureau QuickFacts: Tucson city, Arizona
7/23/2020https://www.census.gov/quickfacts/tucsoncityarizona

About datasets used in this table
Value Notes
Estimates are not comparable to other geographic levels due to methodology differences that may exist between different data sources.
Some estimates presented here come from sample data, and thus have sampling errors that may render some apparent differences between geographies statistically indistinguishable. Click the Quick Info icrow in TABLE view to learn about sampling error.
The vintage year (e.g., V2019) refers to the final year of the series (2010 thru 2019). Different vintage years of estimates are not comparable.
Fact Notes(a) Includes persons reporting only one race(b) Hispanics may be of any race, so also are included in applicable race categories(c) Economic Census - Puerto Rico data are not comparable to U.S. Economic Census data
Value Flags- Either no or too few sample observations were available to compute an estimate, or a ratio of medians cannot be calculated because one or both of the median estimates falls in the lowest or open ended distribution.D Suppressed to avoid disclosure of confidential informationF Fewer than 25 firmsFN Footnote on this item in place of dataN Data for this geographic area cannot be displayed because the number of sample cases is too small.NA Not availableS Suppressed; does not meet publication standardsX Not applicableZ Value greater than zero but less than half unit of measure shown
QuickFacts data are derived from: Population Estimates, American Community Survey, Census of Population and Housing, Current Population Survey, Small Area Health Insurance Estimates, Small Area IncoEstimates, State and County Housing Unit Estimates, County Business Patterns, Nonemployer Statistics, Economic Census, Survey of Business Owners, Building Permits.
CONNECT WITH US
ABOUT USHelp for Survey ParticipantsFAQsDirector's CornerRegional OfficesHistoryResearchScientific IntegrityCensus CareersBusiness OpportunitiesCongressional and IntergovernmentalContact Us
FIND DATAQuickFactsExplore Census Data2020 Census2010 CensusEconomic CensusInteractive MapsTraining & WorkshopsData ToolsDevelopersPublications
BUSINESS & ECONOMYHelp With Your FormsEconomic IndicatorsEconomic CensusE-StatsInternational TradeExport CodesNAICSGovernmentsLongitudinal Employer-Household Dynamics (LEHD)Survey of Business Owners
PEOPLE & HOUSEHOLDS2020 Census2010 CensusAmerican Community SurveyIncomePovertyPopulation EstimatesPopulation ProjectionsHealth InsuranceHousingInternationalGenealogy
SPECIAL TOPICSAdvisors, Centers and Research ProgramsStatistics in SchoolsTribal Resources (AIAN)Emergency PreparednessSpecial Census ProgramData Linkage InfrastructureFraudulent Activity & ScamsUSA.gov
NEWSROOMNews ReleasesRelease ScheduleFacts for FeaturesStats for StoriesBlogs
Accessibility | Information Quality | FOIA | Data Protection and Privacy Policy | U.S. Department of Commerce
Page 3 of 3U.S. Census Bureau QuickFacts: Tucson city, Arizona
7/23/2020https://www.census.gov/quickfacts/tucsoncityarizona

State
Percentile
EPA Region
Percentile
USA
Percentile
1/3
Selected Variables
EJ Index for PM2.5
EJ Index for Ozone
EJ Index for NATA* Diesel PM
EJ Index for Wastewater Discharge Indicator
EJ Indexes
This report shows the values for environmental and demographic indicators and EJSCREEN indexes. It shows environmental and demographic raw data (e.g., the estimated concentration of ozone in the air), and also shows what percentile each raw data value represents. These percentiles provide perspective on how the selected block group or buffer area compares to the entire state, EPA region, or nation. For example, if a given location is at the 95th percentile nationwide, this means that only 5 percent of the US population has a higher block group value than the average person in the location being analyzed. The years for which the data are available, and the methods used, vary across these indicators. Important caveats and uncertainties apply to this screening-level information, so it is essential to understand the limitations on appropriate interpretations and applications of these indicators. Please see EJSCREEN documentation for discussion of these issues before using reports.
EJ Index for NATA* Air Toxics Cancer Risk
EJ Index for NATA* Respiratory Hazard Index
EJ Index for Traffic Proximity and Volume
EJ Index for Lead Paint Indicator
EJ Index for Superfund Proximity
EJ Index for RMP Proximity
EJ Index for Hazardous Waste Proximity
EJSCREEN Report (Version )
61
71
58
60
61
77
78
92
80
70
76
47
60
45
43
48
53
60
89
56
52
62
69
76
67
65
70
77
74
95
77
72
79
the User Specified Area, ARIZONA, EPA Region 9
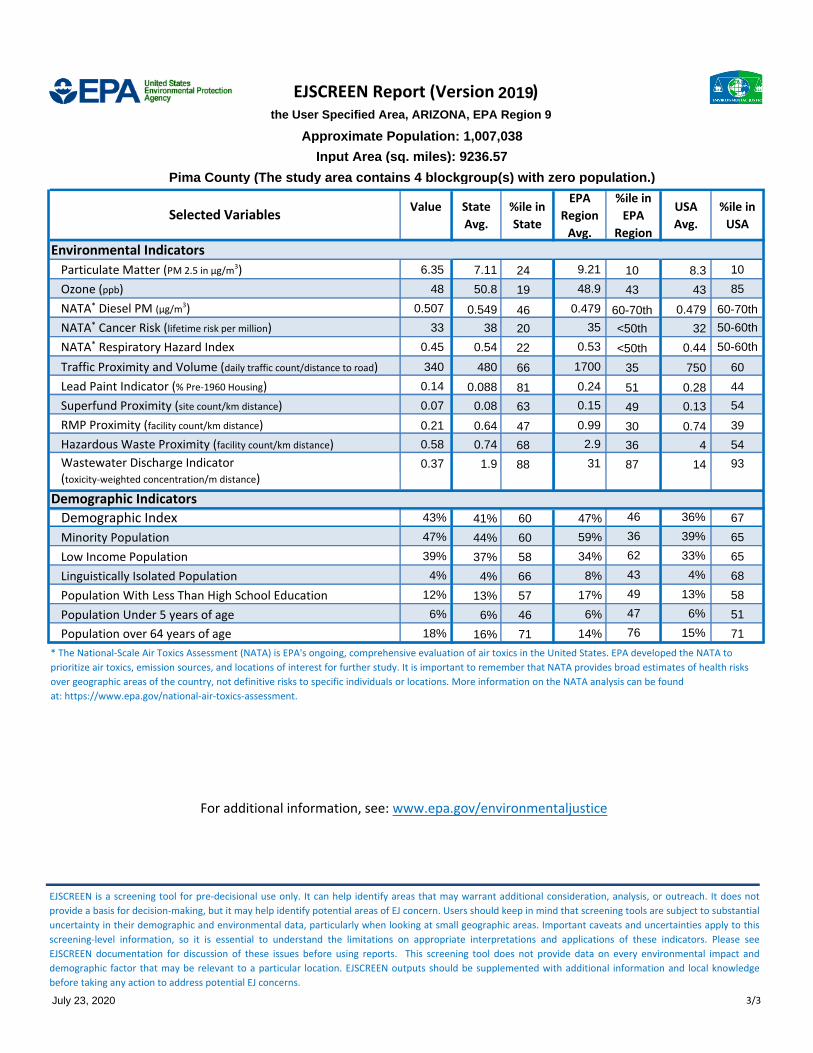
Approximate Population: 1,007,038
Pima County (The study area contains 4 blockgroup(s) with zero population.)
July 23, 2020
Input Area (sq. miles): 9236.57
2019

2/3
EJSCREEN Report (Version )
Superfund NPLHazardous Waste Treatment, Storage, and Disposal Facilities (TSDF)
Sites reporting to EPA
the User Specified Area, ARIZONA, EPA Region 9
Approximate Population: 1,007,038
Pima County (The study area contains 4 blockgroup(s) with zero population.)
July 23, 2020
Input Area (sq. miles): 9236.57
2019
122
EJSCREEN Report (Version )
Value State
Avg.
%ile in
State
EPA
Region
Avg.
%ile in
EPA
Region
USA
Avg.
%ile in
USA
3/3
RMP Proximity (facility count/km distance)Hazardous Waste Proximity (facility count/km distance)Wastewater Discharge Indicator (toxicity-weighted concentration/m distance)
Demographic Index
Population over 64 years of age
Minority PopulationLow Income PopulationLinguistically Isolated PopulationPopulation With Less Than High School EducationPopulation Under 5 years of age
Demographic Indicators
EJSCREEN is a screening tool for pre-decisional use only. It can help identify areas that may warrant additional consideration, analysis, or outreach. It does not provide a basis for decision-making, but it may help identify potential areas of EJ concern. Users should keep in mind that screening tools are subject to substantial uncertainty in their demographic and environmental data, particularly when looking at small geographic areas. Important caveats and uncertainties apply to this screening-level information, so it is essential to understand the limitations on appropriate interpretations and applications of these indicators. Please see EJSCREEN documentation for discussion of these issues before using reports. This screening tool does not provide data on every environmental impact and demographic factor that may be relevant to a particular location. EJSCREEN outputs should be supplemented with additional information and local knowledge before taking any action to address potential EJ concerns.
For additional information, see: www.epa.gov/environmentaljustice
Selected Variables
Environmental Indicators
Particulate Matter (PM 2.5 in µg/m3)Ozone (ppb)NATA* Diesel PM (µg/m3)NATA* Cancer Risk (lifetime risk per million)NATA* Respiratory Hazard IndexTraffic Proximity and Volume (daily traffic count/distance to road)Lead Paint Indicator (% Pre-1960 Housing)Superfund Proximity (site count/km distance)
* The National-Scale Air Toxics Assessment (NATA) is EPA's ongoing, comprehensive evaluation of air toxics in the United States. EPA developed the NATA to prioritize air toxics, emission sources, and locations of interest for further study. It is important to remember that NATA provides broad estimates of health risks over geographic areas of the country, not definitive risks to specific individuals or locations. More information on the NATA analysis can be found at: https://www.epa.gov/national-air-toxics-assessment.
Demographic Indicators
the User Specified Area, ARIZONA, EPA Region 9
Approximate Population: 1,007,038
Pima County (The study area contains 4 blockgroup(s) with zero population.)
July 23, 2020
Input Area (sq. miles): 9236.57
2019
48
6.35
0.507
0.37
0.58
0.21
0.07
0.14
340
0.45
33
43%
47%
18%
6%
12%
4%
39%
50.8
7.11
0.549
1.9
0.74
0.64
0.08
0.088
480
0.54
38
41%
44%
37%
4%
13%
6%
16%
47%
59%
34%
8%
17%
6%
14%
36%
39%
33%
4%
13%
6%
15%
48.9
9.21
0.479
31
2.9
0.99
0.15
0.24
1700
0.53
35
43
8.3
0.479
14
4
0.74
0.13
0.28
750
0.44
32
19
24
46
88
68
47
63
81
66
22
20
60
60
58
66
57
46
71
46
36
62
43
49
47
76
67
65
65
68
58
51
71
43
10
60-70th
87
36
30
49
51
35
<50th
<50th
85
10
60-70th
93
54
39
54
44
60
50-60th
50-60th


Related Documents