| 1 Environmental Goods & Services: Case for Wind Energy Environmental Goods & Services: Case for Wind Energy WTO Workshop on Environmental Goods and Services 23rd September, 2009 || Geneva Chintan Shah, Suzlon Energy Limited WTO Workshop on Environmental Goods and Services 23rd September, 2009 || Geneva Chintan Shah, Suzlon Energy Limited

Welcome message from author
This document is posted to help you gain knowledge. Please leave a comment to let me know what you think about it! Share it to your friends and learn new things together.
Transcript
| 1
Environmental Goods & Services: Case for Wind EnergyEnvironmental Goods & Services: Case for Wind Energy
WTO Workshop on Environmental Goods and Services
23rd September, 2009 || Geneva
Chintan Shah, Suzlon Energy Limited
WTO Workshop on Environmental Goods and Services
23rd September, 2009 || Geneva
Chintan Shah, Suzlon Energy Limited
| 2
Disclaimer
•This presentation and the accompanying slides (the “Presentation”), which have been prepared by Suzlon Energy Limited (the “Company”), have been prepared solely for information purposes and do not constitute any offer, recommendation or invitation to purchase or subscribe for any securities, and shall not form the basis or be relied on in connection with any contract or binding commitment whatsoever. No offering of securities of the Company will be made except by means of a statutory offering document containing detailed information about the Company.•This Presentation has been prepared by the Company based on information and data which the Company considers reliable, but the Company makes no representation or warranty, express or implied, whatsoever, and no reliance shall be placed on, the truth, accuracy, completeness, fairness and reasonableness of the contents of this Presentation. This Presentation may not be all inclusive and may not contain all of the information that you may consider material. Any liability in respect of the contents of, or any omission from, this Presentation is expressly excluded.•Certain matters discussed in this Presentation may contain statements regarding the Company’s market opportunity and business prospects that are individually and collectively forward-looking statements. Such forward-looking statements are not guarantees of future performance and are subject to known and unknown risks, uncertainties and assumptions that are difficult to predict. These risks and uncertainties include, but are not limited to, the performance of the Indian economy and of the economies of various international markets, the performance of the wind power industry in India and world-wide, competition, the company’s ability to successfully implement its strategy, the Company’s future levels of growth and expansion, technological implementation, changes and advancements, changes in revenue, income or cash flows, the Company’s market preferences and its exposure to market risks, as well as other risks. The Company’s actual results, levels of activity, performance or achievements could differ materially and adversely from results expressed in or implied by this Presentation. The Company assumes no obligation to update any forward-looking information contained in this Presentation. Any forward-looking statements and projections made by third parties included in this Presentation are not adopted by the Company and the Company is not responsible for such third party statements and projections.•No offering of the Company’s securities will be registered under the U.S. Securities Act of 1933, as amended (the “Securities Act”). Accordingly, unless an exemption from registration under theSecurities Act is available, the Company’s securities may not be offered, sold, resold, delivered or distributed, directly or indirectly, into the United States or to, or for the account or benefit of, any U.S. Person (as defined in regulation S under the Securities Act). •The distribution of this document in certain jurisdictions may be restricted by law and persons into whose possession this presentation comes should inform themselves about and observe any such restrictions.
| 3
Structure of the Presentation
• The Contexto Market Overview for Environmental Goods & Services
o Increasing Focus on Renewable Energy Technologies Today
o Leading Edge for Wind Energy
o Global Footprint : CY 2008
o Policy Support for Wind : USA & Europe
o Policy Support for Wind : India & China
• The Suzlon Groupo About Suzlon
o Suzlon’s Foot Print : Exports From India
• Country Wise Profile : Tariff & Non Tariff Barrierso Brazil
o Australia & USA
o Turkey
o Other Countries
• Learnings and the Way Forward
| 4
The ContextThe Context
| 5
Market Overview for Environmental Goods & Services
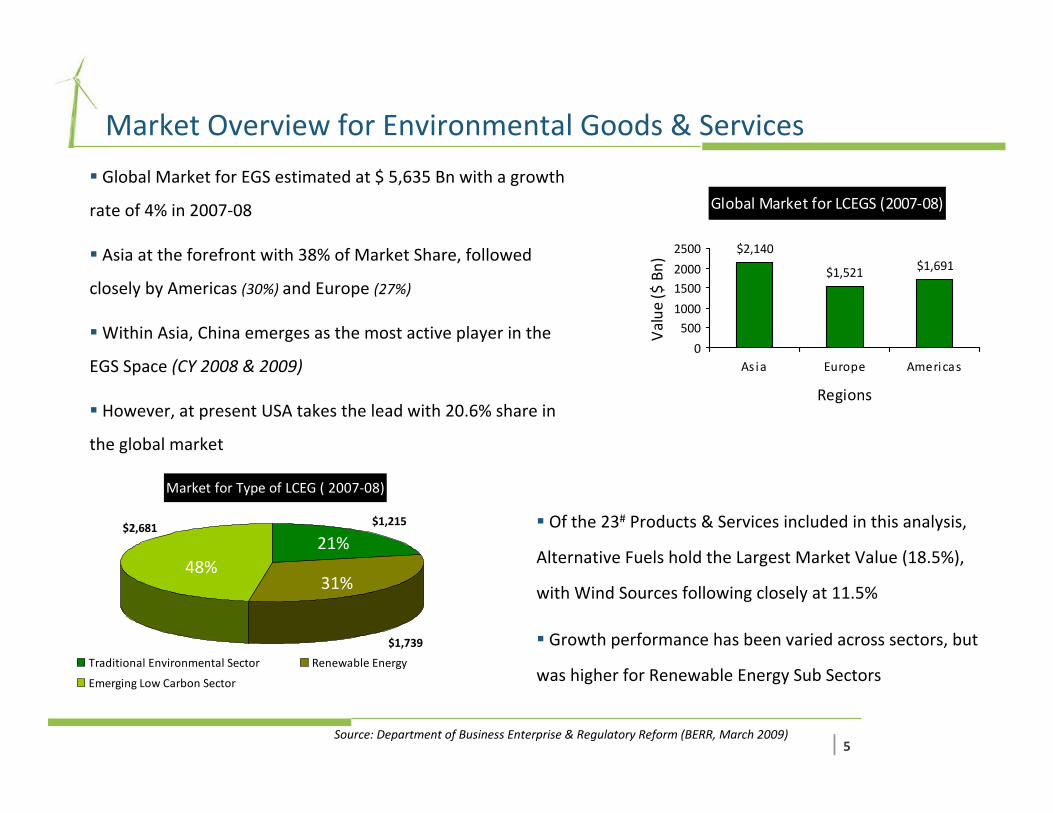
Global Market for EGS estimated at $ 5,635 Bn with a growth
rate of 4% in 2007‐08
Asia at the forefront with 38% of Market Share, followed
closely by Americas (30%) and Europe (27%)
Within Asia, China emerges as the most active player in the
EGS Space (CY 2008 & 2009)
However, at present USA takes the lead with 20.6% share in
the global market
Global Market for LCEGS (2007‐08)
$2,140
$1,521 $1,691
0
5001000
15002000
2500
As ia Europe Americas
Regions
Value
($ Bn)
48%21%
31%
Source: Department of Business Enterprise & Regulatory Reform (BERR, March 2009)
Of the 23# Products & Services included in this analysis,
Alternative Fuels hold the Largest Market Value (18.5%),
with Wind Sources following closely at 11.5%
Growth performance has been varied across sectors, but
was higher for Renewable Energy Sub Sectors
Market for Type of LCEG ( 2007‐08)
$1,215
$1,739
$2,681
Traditional Environmental Sector Renewable Energy
Emerging Low Carbon Sector
48%31%
21%
| 6
Increasing Focus on Renewable Energy Technologies Today
Definition of What Constitutes these goods is important – Finished Products may not be beneficial to the
Developing World Economy
o Finished Goods ~ Solar Modules, Wind Turbine Generators, Small Hydro Generators
o Intermediate Goods ~ Solar Cells, Silicon Ingots, Gear Box, Associated electronics et al
This definition is expected to change over time due to High Obsolescence in RE Goods
o High Levels of R&D lead to Betterment and Upgrade of Technology Employed
o Definition should be Dynamic so as to accommodate for Latest Technology Trends
Wind and Solar Sources of Renewable Energy ~ Drivers for Renewable Energy in the future
o Traditional Sources such as Small Hydro and Biomass would witness slower growth trends
o Upcoming Technologies like Wind and Solar are envisaged to be Front‐runners in the future
Source: Suzlon Internal
| 7
Leading Edge for Wind Energy
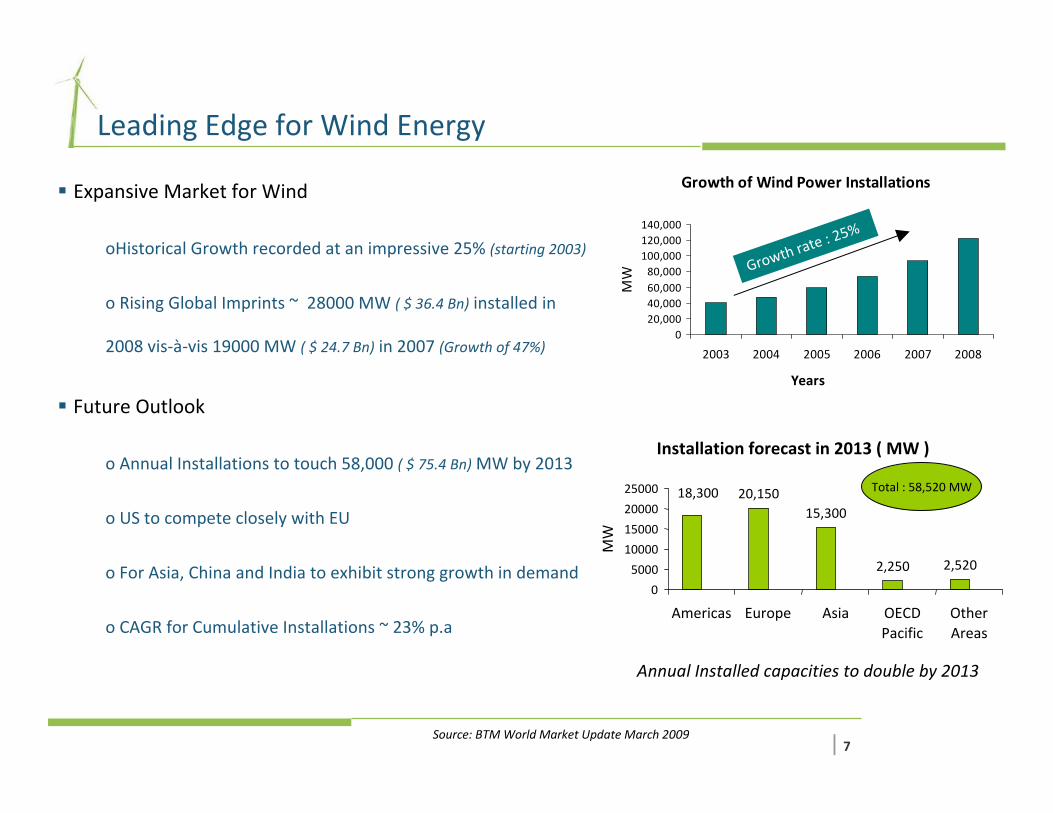
Expansive Market for Wind
oHistorical Growth recorded at an impressive 25% (starting 2003)
o Rising Global Imprints ~ 28000 MW ( $ 36.4 Bn) installed in
2008 vis‐à‐vis 19000 MW ( $ 24.7 Bn) in 2007 (Growth of 47%)
Future Outlook
o Annual Installations to touch 58,000 ( $ 75.4 Bn)MW by 2013
o US to compete closely with EU
o For Asia, China and India to exhibit strong growth in demand
o CAGR for Cumulative Installations ~ 23% p.a
Growth of Wind Power Installations
020,00040,00060,00080,000
100,000120,000140,000
2003 2004 2005 2006 2007 2008
Years
MW Grow
th rate : 2
5%
Annual Installed capacities to double by 2013
Source: BTM World Market Update March 2009
Total : 58,520 MW
Installation forecast in 2013 ( MW )
20,15015,300
2,250 2,520
18,300
0
5000
10000
15000
20000
25000
Americas Europe Asia OECDPacific
OtherAreas
MW
| 8
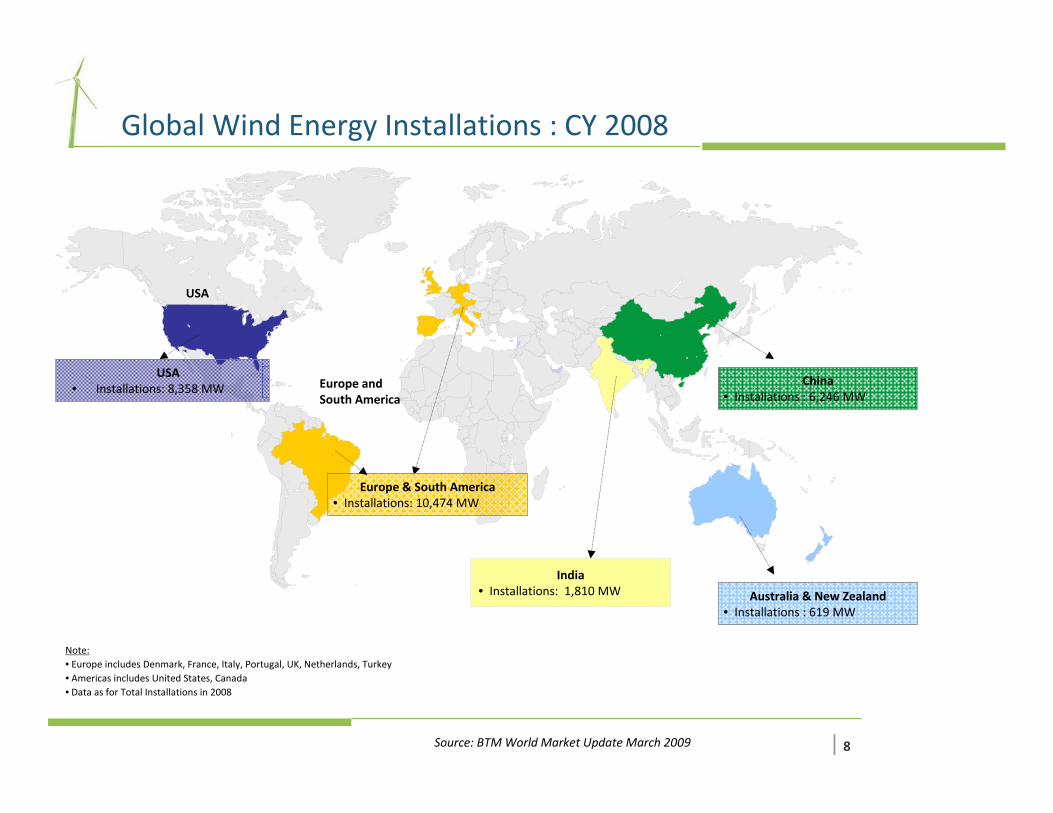
USA • Installations: 8,358 MW
Europe & South America• Installations: 10,474 MW
Note: • Europe includes Denmark, France, Italy, Portugal, UK, Netherlands, Turkey • Americas includes United States, Canada• Data as for Total Installations in 2008
Australia & New Zealand• Installations : 619 MW
India• Installations: 1,810 MW
USA
Europe and South America
Global Wind Energy Installations : CY 2008
China• Installations : 6,246 MW
Source: BTM World Market Update March 2009
| 9
United S
tates
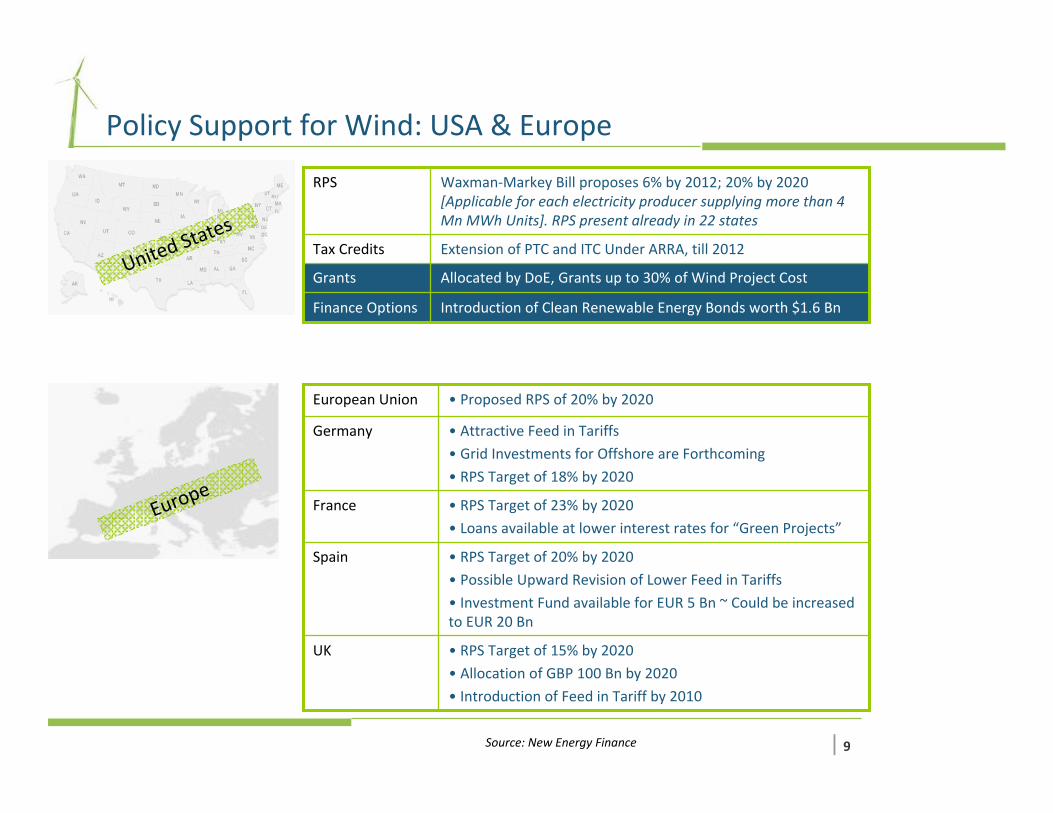
Policy Support for Wind: USA & Europe
Introduction of Clean Renewable Energy Bonds worth $1.6 BnFinance Options
Allocated by DoE, Grants up to 30% of Wind Project Cost Grants
Extension of PTC and ITC Under ARRA, till 2012Tax Credits
Waxman‐Markey Bill proposes 6% by 2012; 20% by 2020 [Applicable for each electricity producer supplying more than 4 Mn MWh Units]. RPS present already in 22 states
RPS
Europe
• Proposed RPS of 20% by 2020European Union
• RPS Target of 15% by 2020
• Allocation of GBP 100 Bn by 2020
• Introduction of Feed in Tariff by 2010
UK
• RPS Target of 20% by 2020
• Possible Upward Revision of Lower Feed in Tariffs
• Investment Fund available for EUR 5 Bn ~ Could be increased to EUR 20 Bn
Spain
• RPS Target of 23% by 2020
• Loans available at lower interest rates for “Green Projects”
France
• Attractive Feed in Tariffs
• Grid Investments for Offshore are Forthcoming
• RPS Target of 18% by 2020
Germany
Source: New Energy Finance
| 10
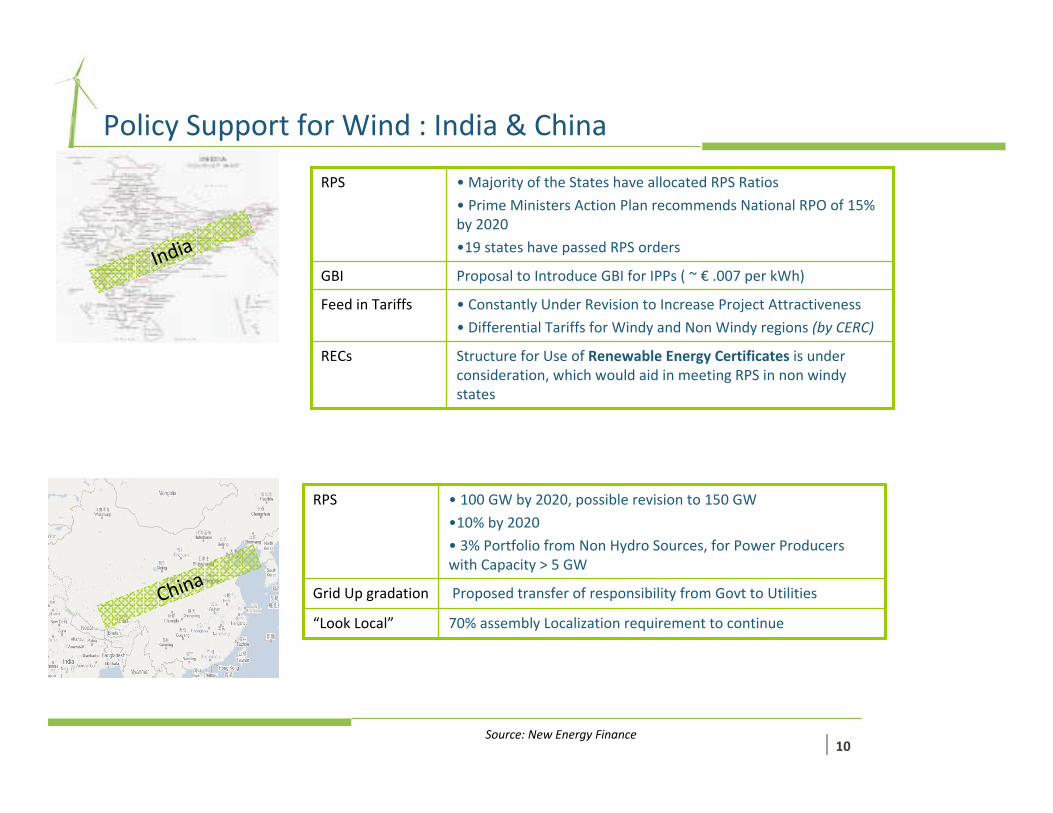
India
Structure for Use of Renewable Energy Certificates is under consideration, which would aid in meeting RPS in non windy states
RECs
• Constantly Under Revision to Increase Project Attractiveness
• Differential Tariffs for Windy and Non Windy regions (by CERC)
Feed in Tariffs
Proposal to Introduce GBI for IPPs ( ~ € .007 per kWh)GBI
• Majority of the States have allocated RPS Ratios
• Prime Ministers Action Plan recommends National RPO of 15% by 2020
•19 states have passed RPS orders
RPS
70% assembly Localization requirement to continue“Look Local”
Proposed transfer of responsibility from Govt to UtilitiesGrid Up gradation
• 100 GW by 2020, possible revision to 150 GW
•10% by 2020
• 3% Portfolio from Non Hydro Sources, for Power Producers with Capacity > 5 GW
RPS
Policy Support for Wind : India & China
China
Source: New Energy Finance
| 11
SUZLON GroupSUZLON Group
| 12
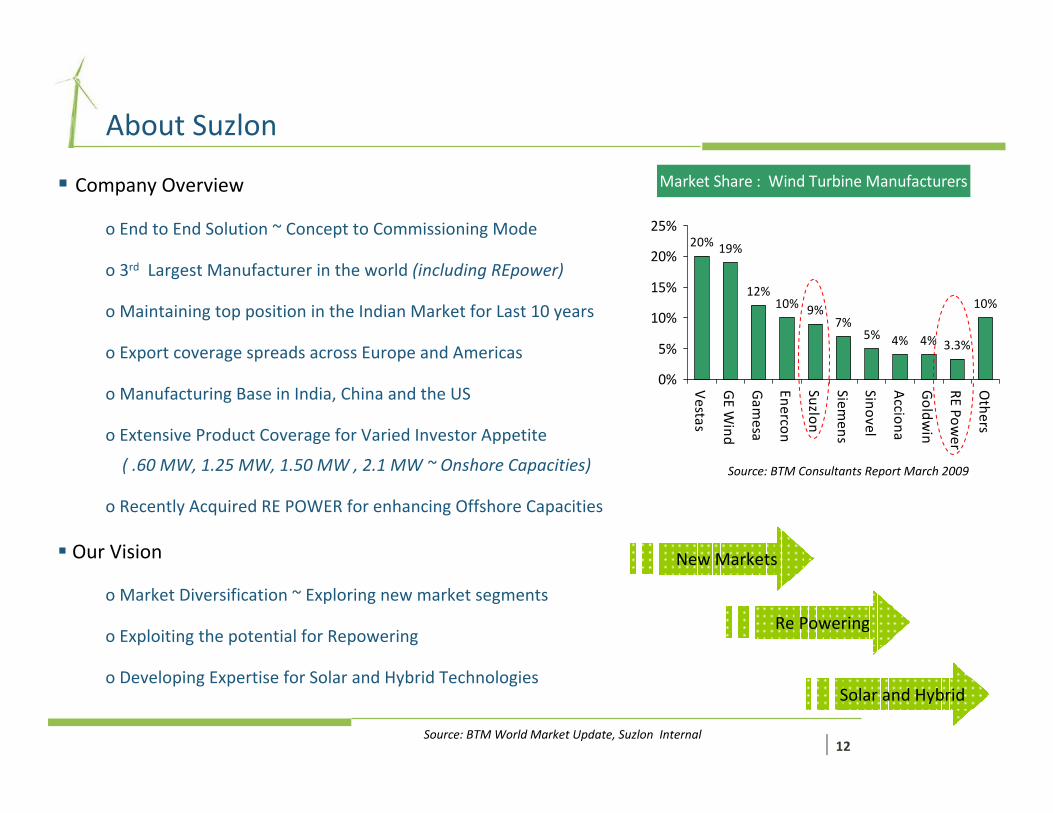
About Suzlon
Market Share : Wind Turbine Manufacturers
20% 19%
12%10% 9%
7%5% 4% 4% 3.3%
10%
0%
5%
10%
15%
20%
25%
Vestas
GE W
ind
Gam
esa
Enercon
Suzlon
Siemens
Sinovel
Acciona
Goldw
in
RE Power
Others
Source: BTM Consultants Report March 2009
Company Overview
o End to End Solution ~ Concept to Commissioning Mode
o 3rd Largest Manufacturer in the world (including REpower)
o Maintaining top position in the Indian Market for Last 10 years
o Export coverage spreads across Europe and Americas
o Manufacturing Base in India, China and the US
o Extensive Product Coverage for Varied Investor Appetite
( .60 MW, 1.25 MW, 1.50 MW , 2.1 MW ~ Onshore Capacities)
o Recently Acquired RE POWER for enhancing Offshore Capacities
Our Vision
o Market Diversification ~ Exploring new market segments
o Exploiting the potential for Repowering
o Developing Expertise for Solar and Hybrid Technologies
New Markets
Solar and Hybrid
Re Powering
Source: BTM World Market Update, Suzlon Internal
| 13
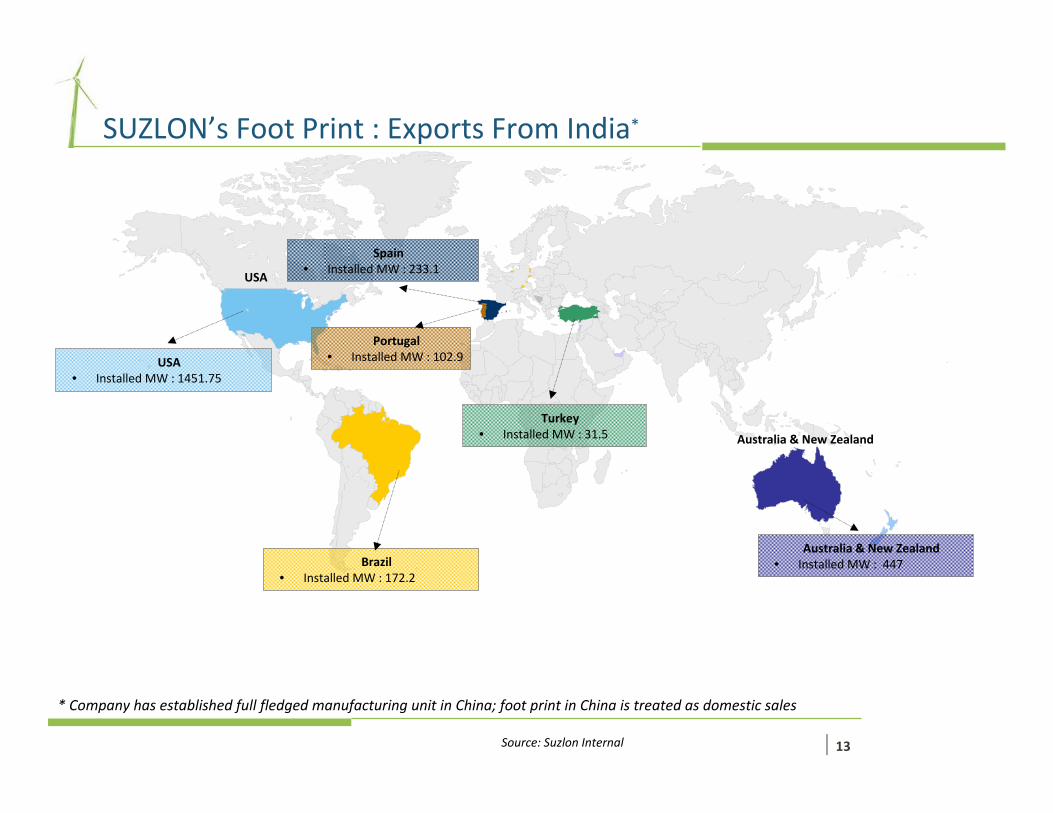
SUZLON’s Foot Print : Exports From India*
USA • Installed MW : 1451.75
USA
Australia & New Zealand • Installed MW : 447
Australia & New Zealand
Brazil • Installed MW : 172.2
Turkey• Installed MW : 31.5
Spain• Installed MW : 233.1
Portugal• Installed MW : 102.9
Source: Suzlon Internal
* Company has established full fledged manufacturing unit in China; foot print in China is treated as domestic sales
| 14
Country Wise Profile: Tariff & Non Tariff Barriers
Country Wise Profile: Tariff & Non Tariff Barriers
| 15
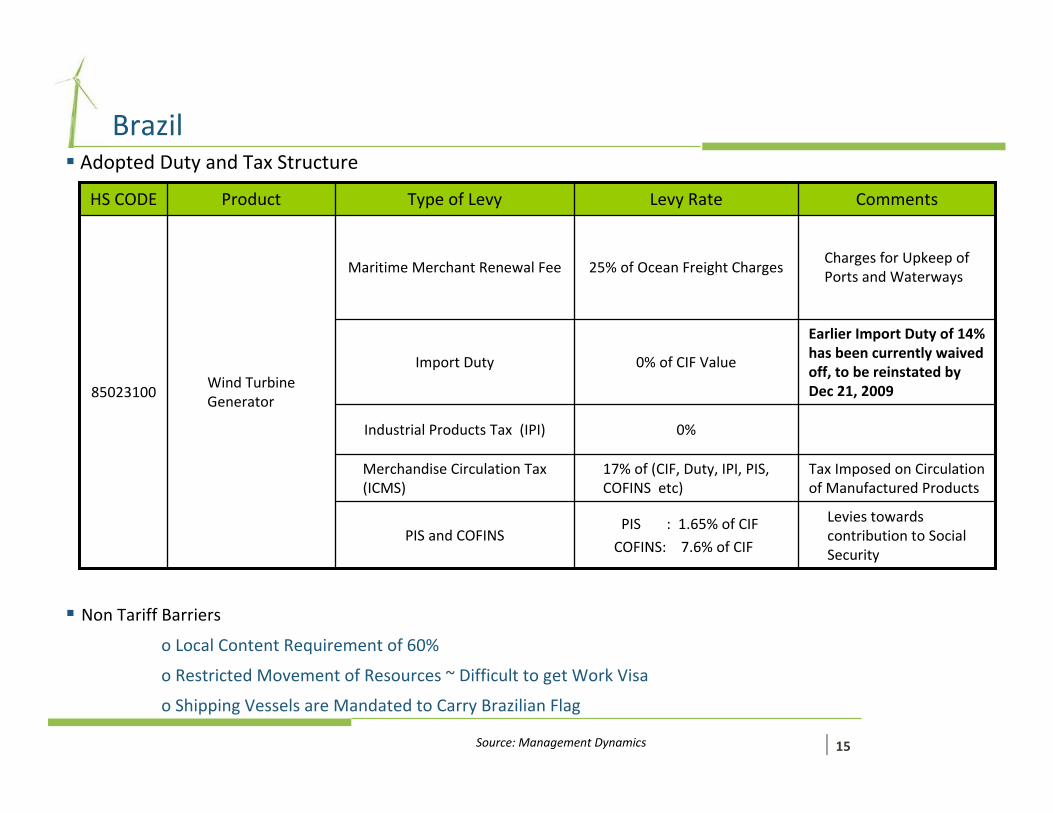
BrazilAdopted Duty and Tax Structure
Levies towards contribution to Social Security
PIS : 1.65% of CIF
COFINS: 7.6% of CIF PIS and COFINS
Tax Imposed on Circulation of Manufactured Products
17% of (CIF, Duty, IPI, PIS, COFINS etc)
Merchandise Circulation Tax (ICMS)
0%
0% of CIF Value
25% of Ocean Freight Charges
Levy Rate
Industrial Products Tax (IPI)
Earlier Import Duty of 14% has been currently waived off, to be reinstated by Dec 21, 2009
Import Duty
Charges for Upkeep of Ports and Waterways
Maritime Merchant Renewal Fee
Wind Turbine Generator
85023100
CommentsType of LevyProductHS CODE
Non Tariff Barriers
o Local Content Requirement of 60%
o Restricted Movement of Resources ~ Difficult to get Work Visa
o Shipping Vessels are Mandated to Carry Brazilian Flag
Source: Management Dynamics
| 16
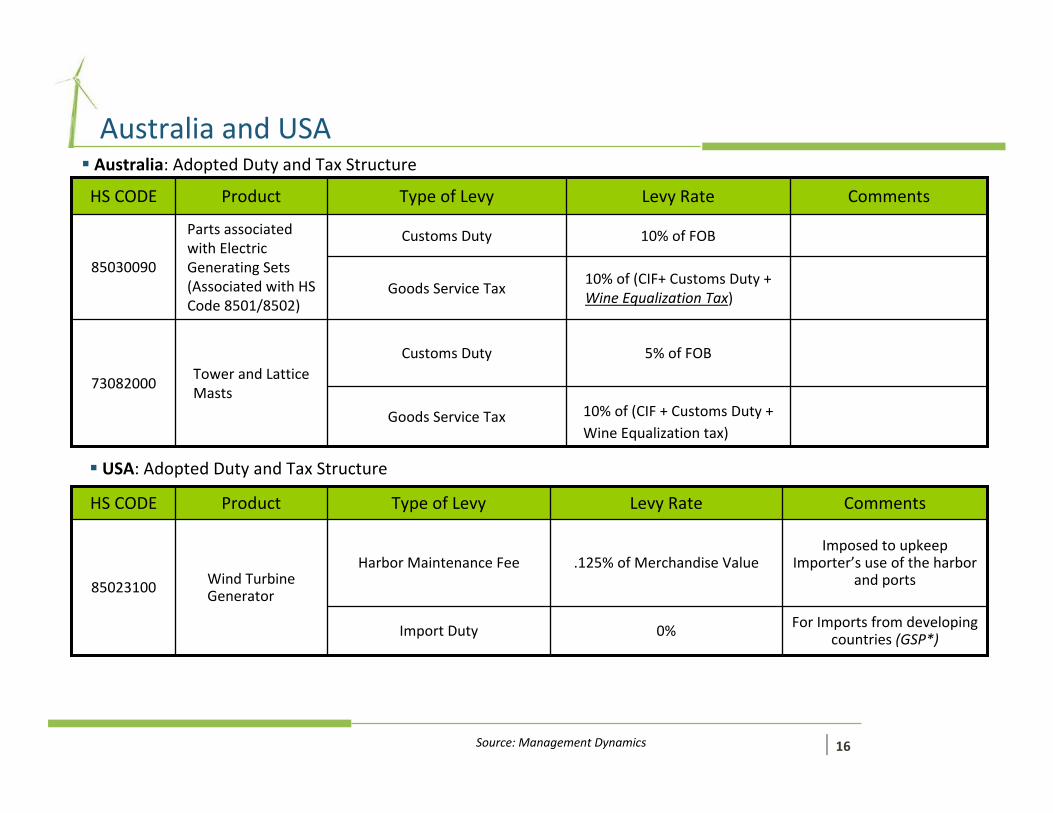
Australia and USA
10% of (CIF + Customs Duty +Wine Equalization tax)
Goods Service Tax
5% of FOBCustoms DutyTower and Lattice Masts
73082000
10% of (CIF+ Customs Duty + Wine Equalization Tax)
10% of FOB
Levy Rate
Goods Service Tax
Customs DutyParts associated with Electric Generating Sets (Associated with HS Code 8501/8502)
85030090
CommentsType of LevyProductHS CODE
Source: Management Dynamics
Australia: Adopted Duty and Tax Structure
USA: Adopted Duty and Tax Structure
0%
.125% of Merchandise Value
Levy Rate
For Imports from developing countries (GSP*)Import Duty
Imposed to upkeep Importer’s use of the harbor
and portsHarbor Maintenance Fee
Wind Turbine Generator85023100
CommentsType of LevyProductHS CODE
| 17
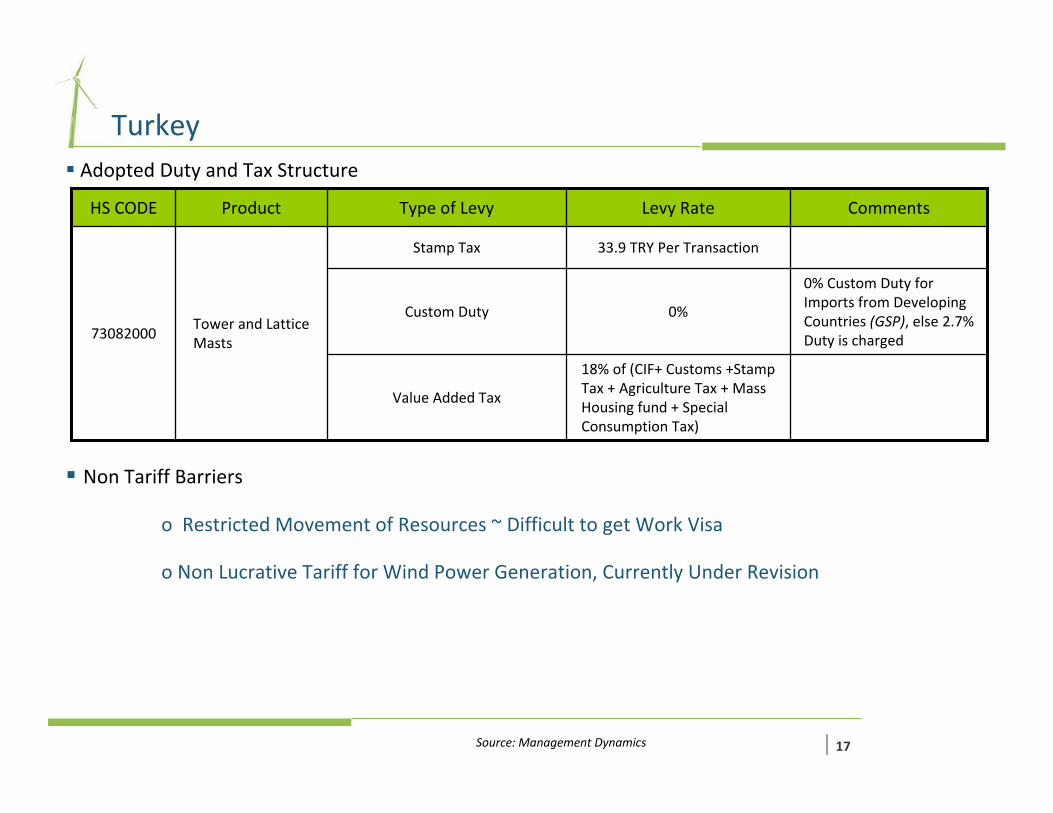
TurkeyAdopted Duty and Tax Structure
Non Tariff Barriers
o Restricted Movement of Resources ~ Difficult to get Work Visa
o Non Lucrative Tariff for Wind Power Generation, Currently Under Revision
18% of (CIF+ Customs +Stamp Tax + Agriculture Tax + Mass Housing fund + Special Consumption Tax)
0%
33.9 TRY Per Transaction
Levy Rate
Value Added Tax
0% Custom Duty for Imports from Developing Countries (GSP), else 2.7% Duty is charged
Custom Duty
Stamp Tax
Tower and Lattice Masts
73082000
CommentsType of LevyProductHS CODE
Source: Management Dynamics
| 18
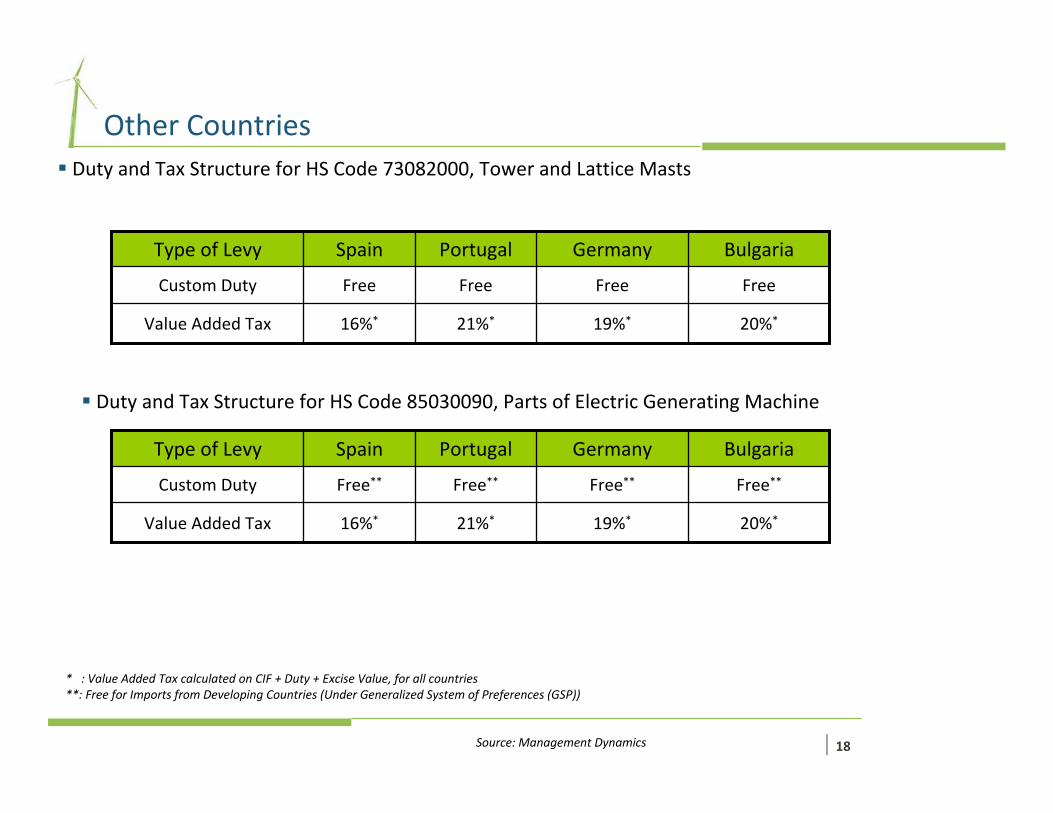
Other CountriesDuty and Tax Structure for HS Code 73082000, Tower and Lattice Masts
Source: Management Dynamics
20%*19%*21%*16%*Value Added Tax
Free
Germany
FreeFreeFreeCustom Duty
BulgariaPortugalSpainType of Levy
Duty and Tax Structure for HS Code 85030090, Parts of Electric Generating Machine
20%*19%*21%*16%*Value Added Tax
Free**
Germany
Free**Free**Free**Custom Duty
BulgariaPortugalSpainType of Levy
* : Value Added Tax calculated on CIF + Duty + Excise Value, for all countries**: Free for Imports from Developing Countries (Under Generalized System of Preferences (GSP))
| 19
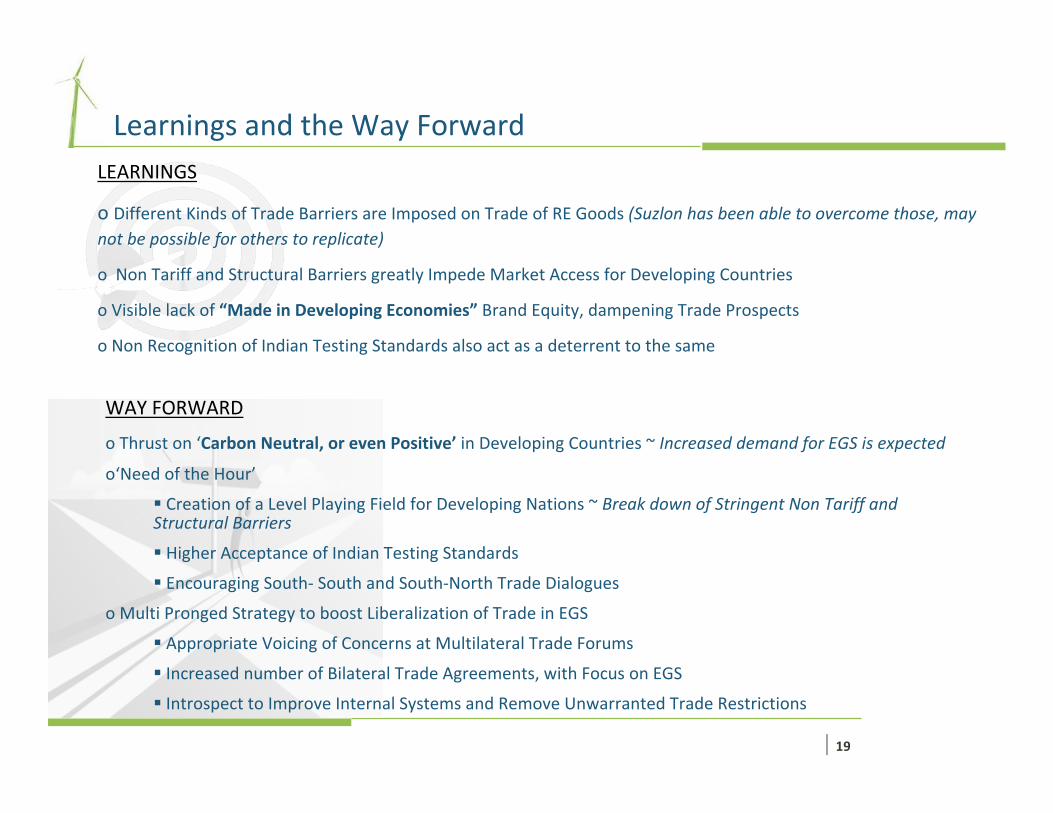
Learnings and the Way ForwardLEARNINGS
o Different Kinds of Trade Barriers are Imposed on Trade of RE Goods (Suzlon has been able to overcome those, may not be possible for others to replicate)
o Non Tariff and Structural Barriers greatly Impede Market Access for Developing Countries
o Visible lack of “Made in Developing Economies” Brand Equity, dampening Trade Prospects
o Non Recognition of Indian Testing Standards also act as a deterrent to the same
WAY FORWARD
o Thrust on ‘Carbon Neutral, or even Positive’ in Developing Countries ~ Increased demand for EGS is expected
o‘Need of the Hour’
Creation of a Level Playing Field for Developing Nations ~ Break down of Stringent Non Tariff and Structural Barriers
Higher Acceptance of Indian Testing Standards
Encouraging South‐ South and South‐North Trade Dialogues
o Multi Pronged Strategy to boost Liberalization of Trade in EGS
Appropriate Voicing of Concerns at Multilateral Trade Forums
Increased number of Bilateral Trade Agreements, with Focus on EGS
Introspect to Improve Internal Systems and Remove Unwarranted Trade Restrictions
| 20
Thank YouThank You
For further Information Chintan ShahHead – Strategic Business Development SUZLON Energy Limited Ground Floor, Godrej Millennium Bldg 9, Koregaon Park Road Pune – 411 001 India Phone : +91.20.401.22505;22000Email: [email protected]
Related Documents