Environmental Effects • Understanding fire history – P- Burn Objectives • Effects on soil • Effects on water • Introduction to effects on air quality Shep Zedaker Virginia Tech

Environmental Effects
Jan 02, 2016
Environmental Effects. Understanding fire history – P-Burn Objectives Effects on soil Effects on water Introduction to effects on air quality. Shep Zedaker Virginia Tech. Our Forest Has Changed!. Fire History. Pre- Homo sapiens Fire History The “Native” American Period - PowerPoint PPT Presentation
Welcome message from author
This document is posted to help you gain knowledge. Please leave a comment to let me know what you think about it! Share it to your friends and learn new things together.
Transcript

Environmental Effects
• Understanding fire history – P-Burn Objectives
• Effects on soil• Effects on water• Introduction to effects on air quality
Shep ZedakerVirginia Tech
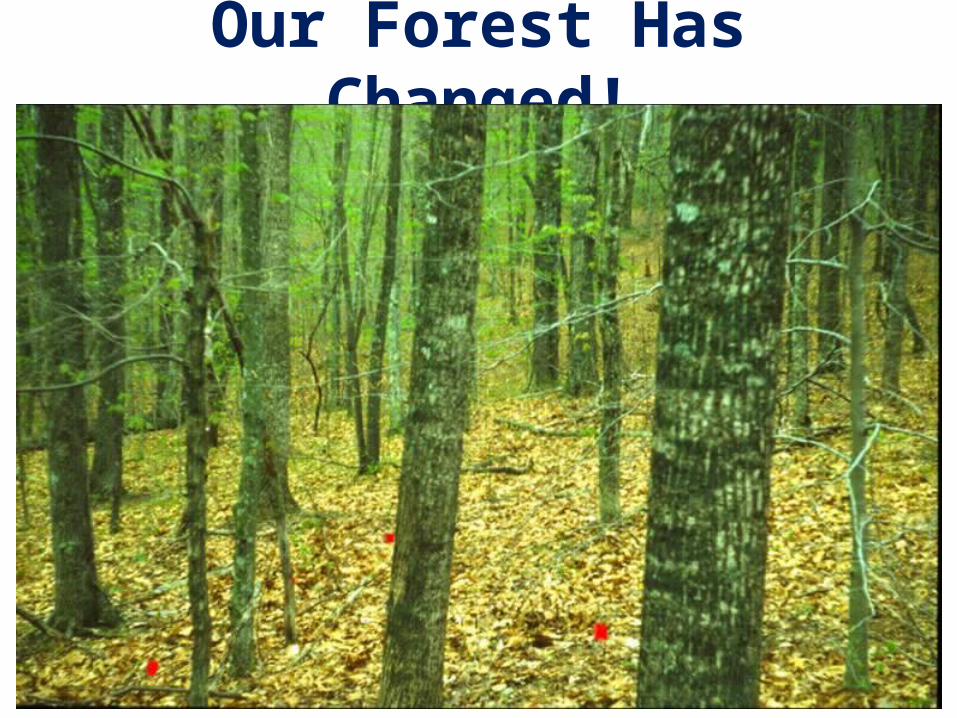
Our Forest Has Changed!
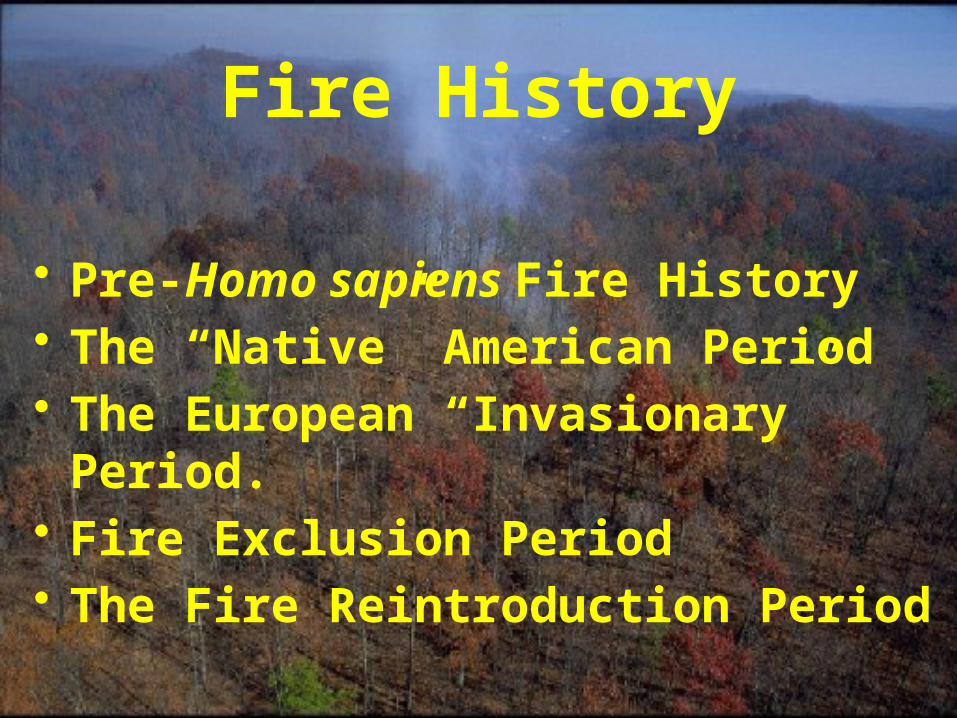
Fire History
• Pre-Homo sapiens Fire History• The “Native” American Period• The European “Invasionary” Period.• Fire Exclusion Period• The Fire Reintroduction Period
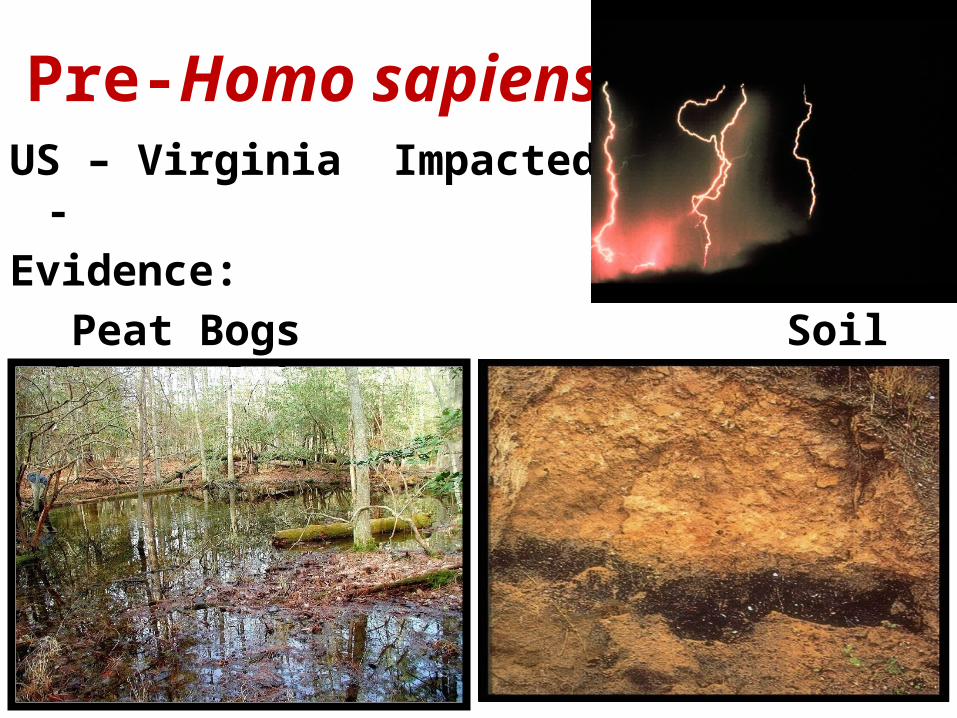
Pre-Homo sapiensUS – Virginia Impacted by: -
Evidence:
Peat Bogs Soil Charcoal Layers
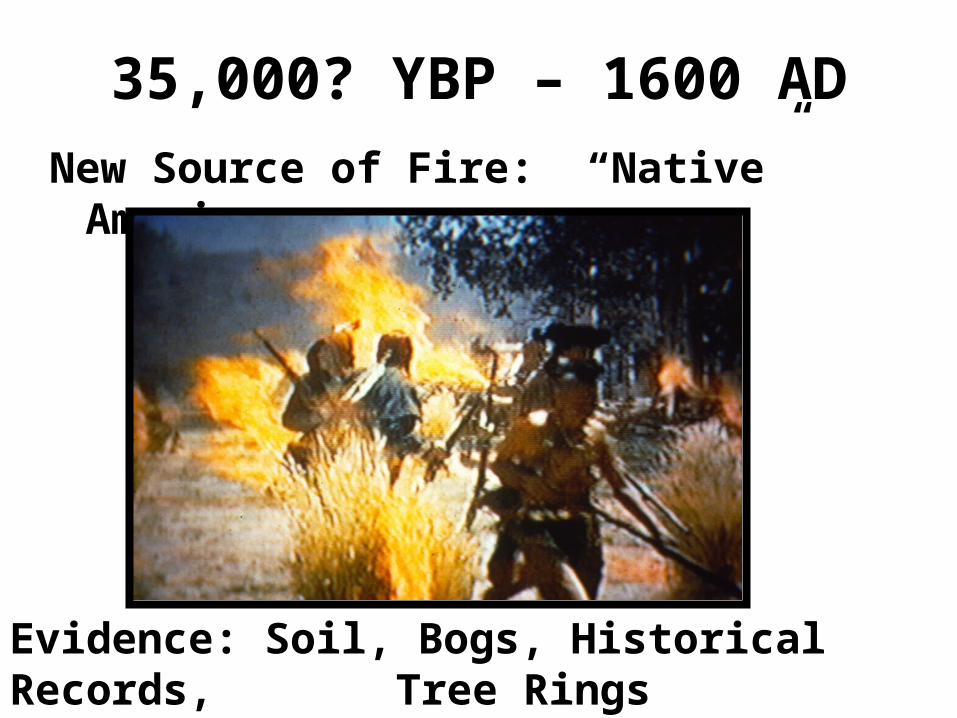
35,000? YBP – 1600 AD
New Source of Fire: “Native” Americans
Evidence: Soil, Bogs, Historical Records, Tree Rings
George Percy (1607)
Two days after first sighting the coast of Virginia in 1607, the Jamestown colonists noticed “…great smokes of fire…” rising from deep in the woods. “We marched to these smokes,” recalled George Percy, “and found that the savages had been burning down the grass as, we thought, either to make their plantation there or else to give signs to bring their forces together, and so to give us battle.”
Wood (1634)
“There is no underwood saving in swamps and low grounds that are wet…for it being the custome of the Indians to burne the wood in November…it consumes all the underwood and rubbish…there is scarce a bush or bramble or any cumbersome underwood to bee seene”
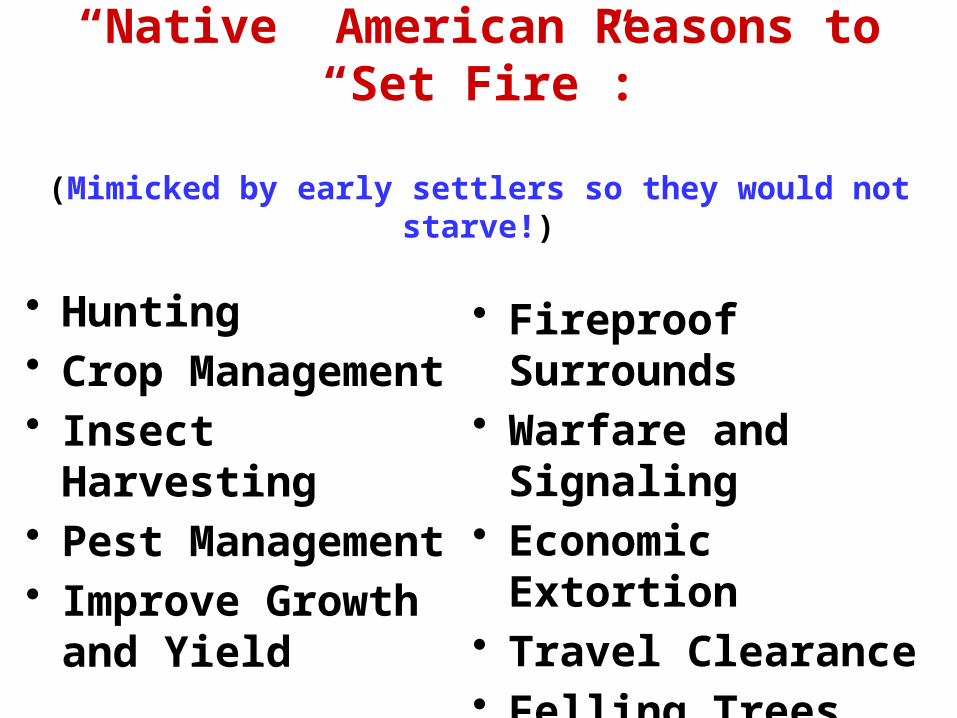
“Native” American Reasons to “Set Fire”:
(Mimicked by early settlers so they would not starve!)
• Hunting• Crop Management• Insect Harvesting• Pest Management• Improve Growth
and Yield
• Fireproof Surrounds• Warfare and
Signaling• Economic Extortion• Travel Clearance• Felling Trees• Riparian Area
Management

Impact of Native American Burning?Estimates of N. Am. population levels before 1500: 10 and 12 million(Fagan 2000, Ramenovsky 1987, Williams 1992).
Estimates of cleared land needed to support each person;
2-3 to 30-40 ac(Williams 1992).
Educated Calculation/Guess -Assume half the population was part of the eastern woodland culture,
each person needed 10 burned acres: 55 million acres cleared by rotational burning …
An area equal to the size of Virginia and North Carolina combined which must be burned every 2-4 years.
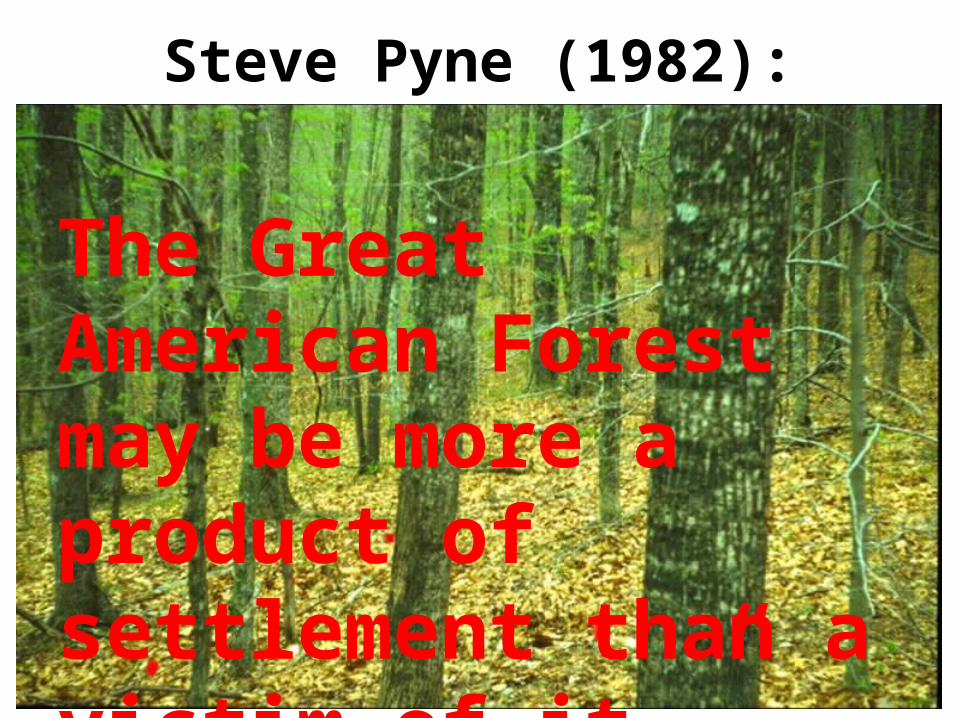
Steve Pyne (1982):
“The modification of the American continent by fire at the hands of Asian immigrants was the result of repeated, controlled, surface burns on a cycle of one to three years, broken by occasional holocausts from escape fires and periodic conflagrations during times of drought.”

Steve Pyne (1982):“Even under ideal circumstances, accidents occurred: signal fires escaped and campfires spread, with the result that valuable range was untimely scorched, buffalo driven away, and villages threatened. So extensive were the cumulative effects of these modifications that it may be said that the general consequence of the Indian occupation of the New World was to replace forested land with grassland or savannah, or, where the forest persisted, to open it up and free it from underbrush. Conversely, almost wherever the European went, forests followed.
Steve Pyne (1982):
The Great American Forest may be more a product of settlement than a victim of it.”
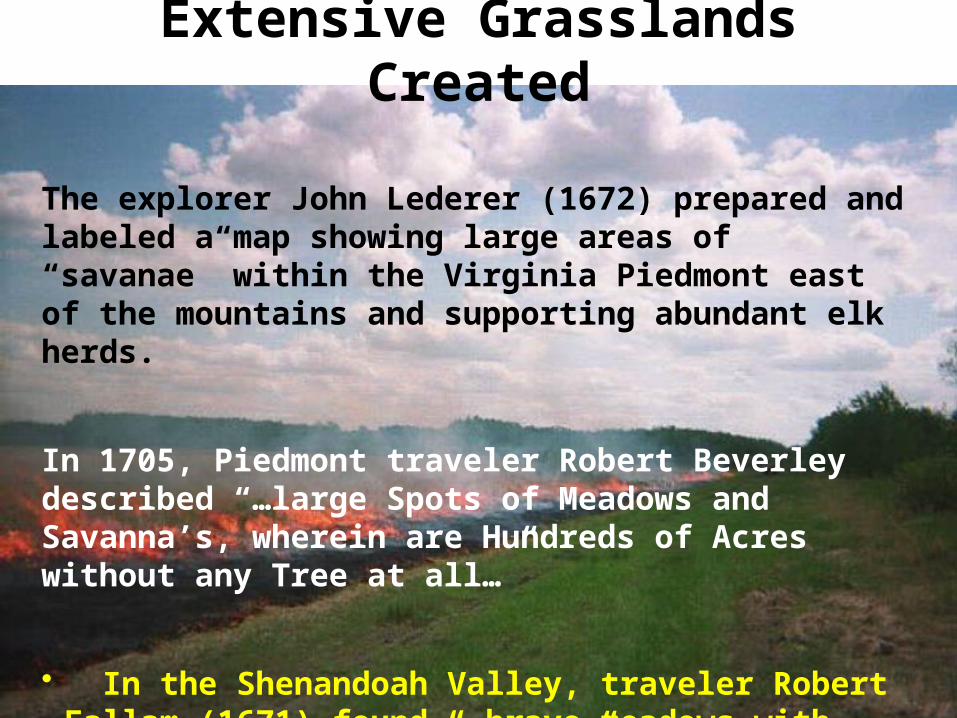
Extensive Grasslands Created
The explorer John Lederer (1672) prepared and labeled a map showing large areas of “savanae” within the Virginia Piedmont east of the mountains and supporting abundant elk herds.
In 1705, Piedmont traveler Robert Beverley described “…large Spots of Meadows and Savanna’s, wherein are Hundreds of Acres without any Tree at all…”
• In the Shenandoah Valley, traveler Robert Fallam (1671) found “…brave meadows with grass about a man’s height.” John Fontaine (1716) reported finding “the feeting of elks and buffaloes, and their beds” – sure signs of grasslands.

“Native’s” Burning Differed from “Nature’s”:
Seasonality of Burning: Seasons extended beyond times of potential lightening starts
Frequency of Burning: Much higher frequency of fire starts
Intensity of Burning: Decreased variation, mostly low intensity
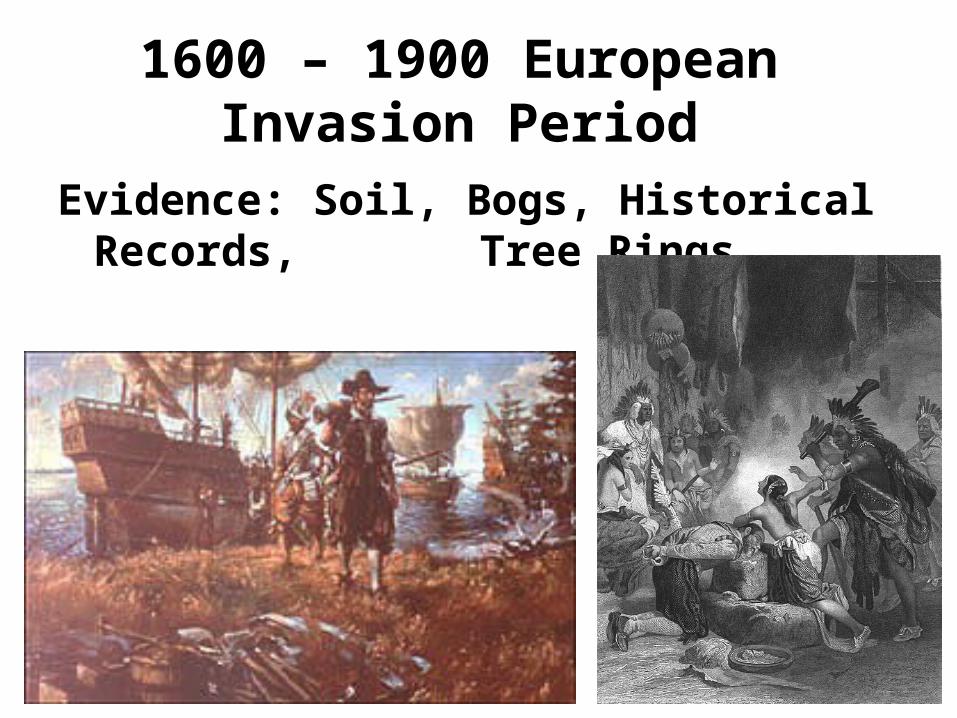
1600 – 1900 European Invasion Period
Evidence: Soil, Bogs, Historical Records, Tree Rings
Hammond (1880)
“The early settlers in this region were stock raisers and kept up the Indian practice of burning off the woods during the winter.”
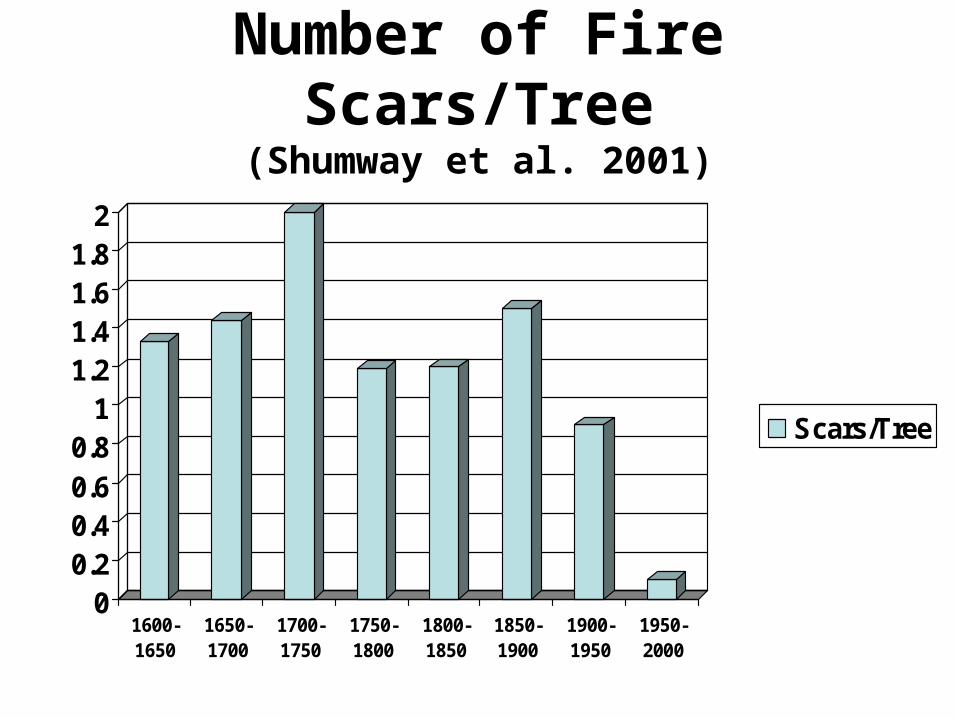
Number of Fire Scars/Tree(Shumway et al. 2001)
00.20.40.60.8
11.21.41.61.8
2
1600-1650
1650-1700
1700-1750
1750-1800
1800-1850
1850-1900
1900-1950
1950-2000
Scars/Tree

Hough (1882)
• Land Survey of Pennsylvania and Virginia in 1800’s
• 2-14% of all land burned annually• Average fire return frequency = 11 years• Area of Penn. + Va. = 54 million acres• Annual burn area in just these two states
= 4.8 million acres• Average area burned in whole US today
~5.5 million acres
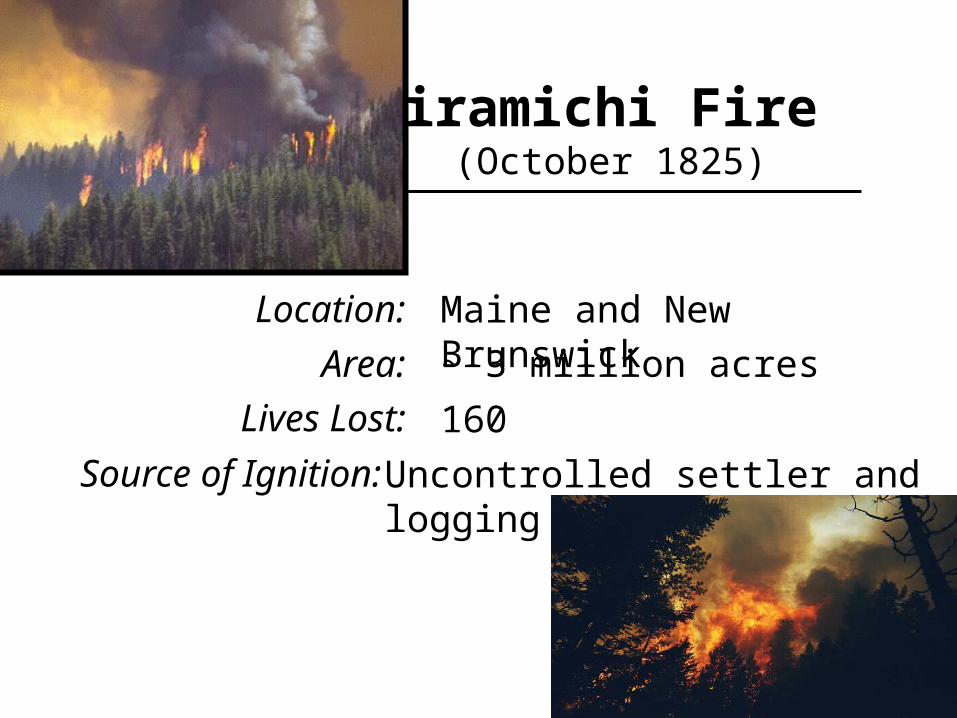
Miramichi Fire(October 1825)
Location: Maine and New Brunswick
~ 3 million acres
160
Uncontrolled settler and logging fires
Area:
Lives Lost:
Source of Ignition:
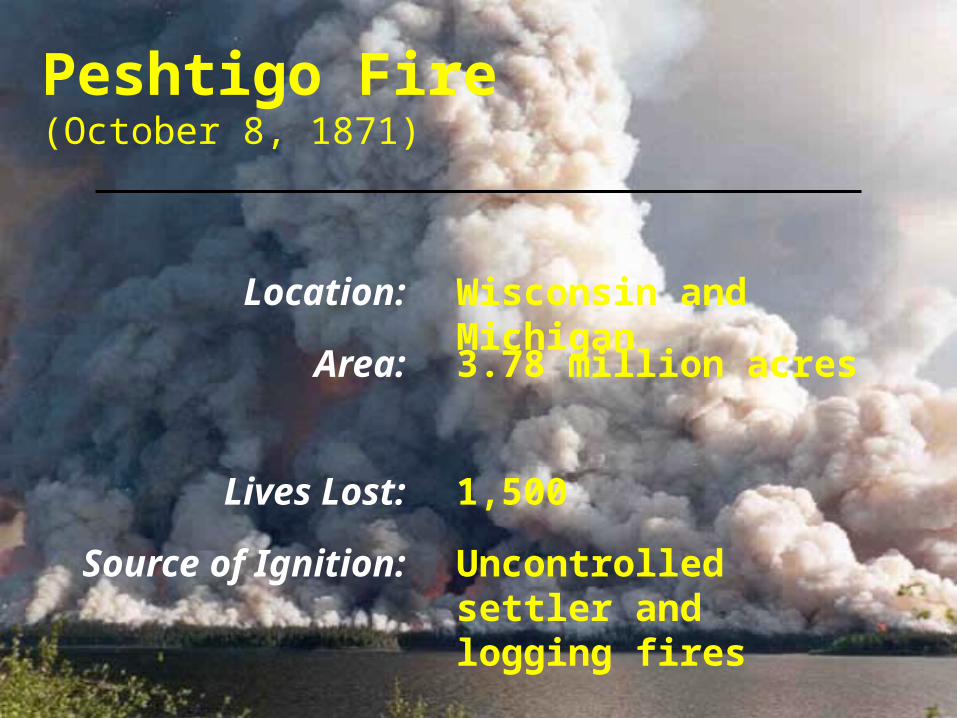
Peshtigo Fire (October 8, 1871)
Location: Wisconsin and Michigan
3.78 million acres
1,500
Uncontrolled settler and logging fires
Area:
Lives Lost:
Source of Ignition:

The “BIG BLOWUP”August 20-21, 1910
Location: Idaho and Montana
~ 3 Million Acres
85
Various uncontrolled settler, railroad and logging fires
Area:
Lives Lost:
Source of Ignition:
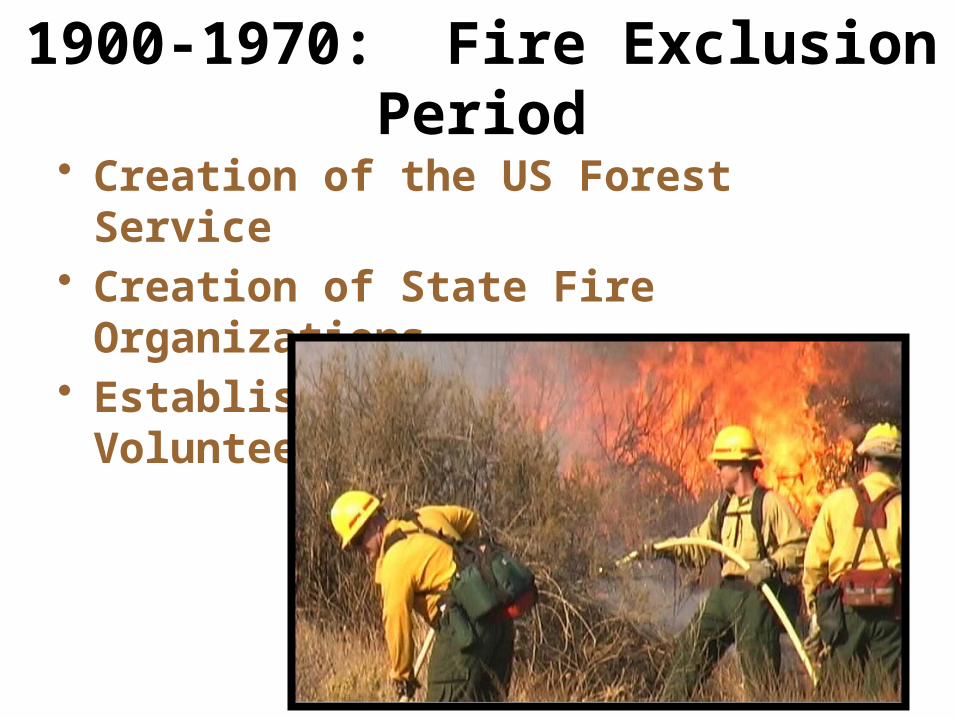
1900-1970: Fire Exclusion Period
• Creation of the US Forest Service• Creation of State Fire Organizations• Establishment of Rural Volunteer Fire
Stations
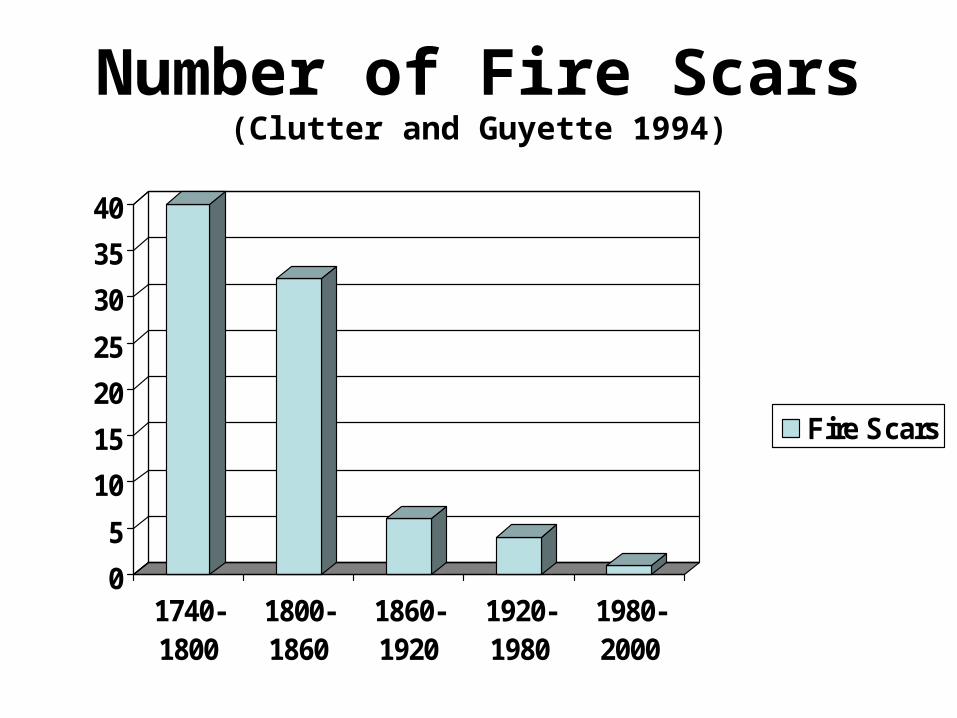
Number of Fire Scars(Clutter and Guyette 1994)
0
5
10
15
20
25
30
35
40
1740-1800
1800-1860
1860-1920
1920-1980
1980-2000
Fire Scars
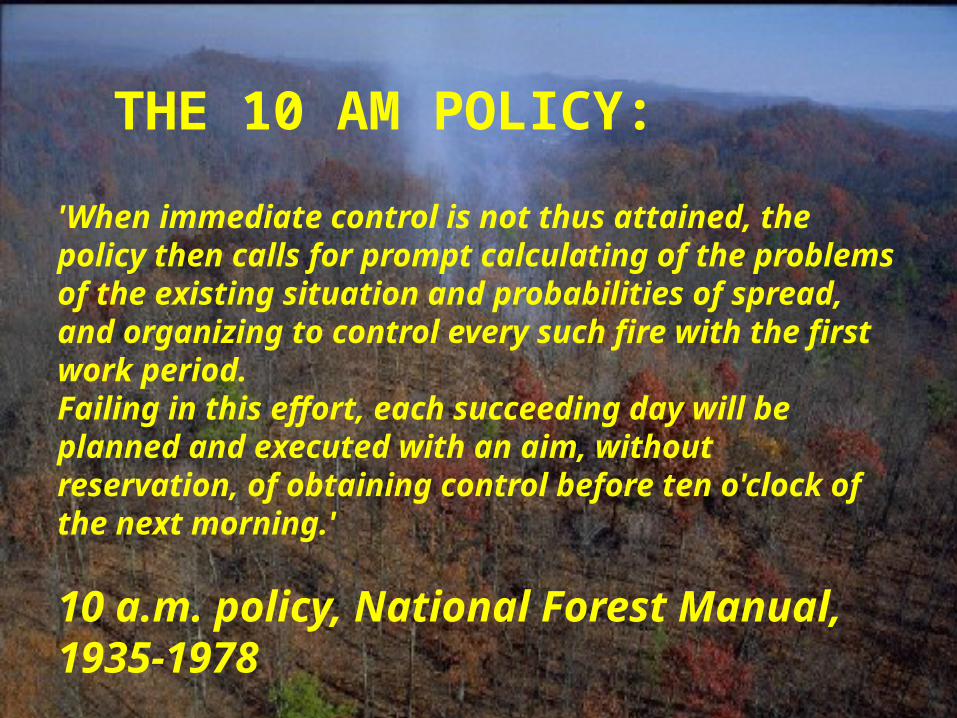
'When immediate control is not thus attained, the policy then calls for prompt calculating of the problems of the existing situation and probabilities of spread, and organizing to control every such fire with the first work period. Failing in this effort, each succeeding day will be planned and executed with an aim, without reservation, of obtaining control before ten o'clock of the next morning.'
10 a.m. policy, National Forest Manual, 1935-1978
THE 10 AM POLICY:
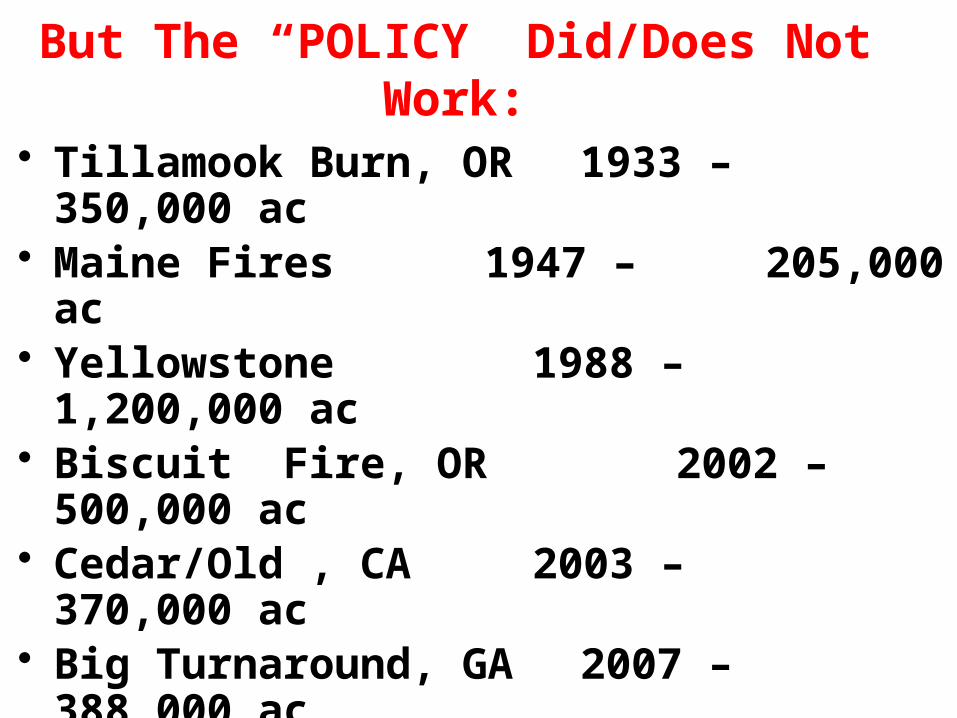
But The “POLICY” Did/Does Not Work:
• Tillamook Burn, OR 1933 – 350,000 ac• Maine Fires 1947 – 205,000 ac• Yellowstone 1988 – 1,200,000 ac• Biscuit Fire, OR 2002 – 500,000 ac• Cedar/Old , CA 2003 – 370,000 ac• Big Turnaround, GA 2007 – 388,000 ac• Long Butte, ID 2010 - 306,000 ac• Rock House, TX 2011 – 314,000 ac
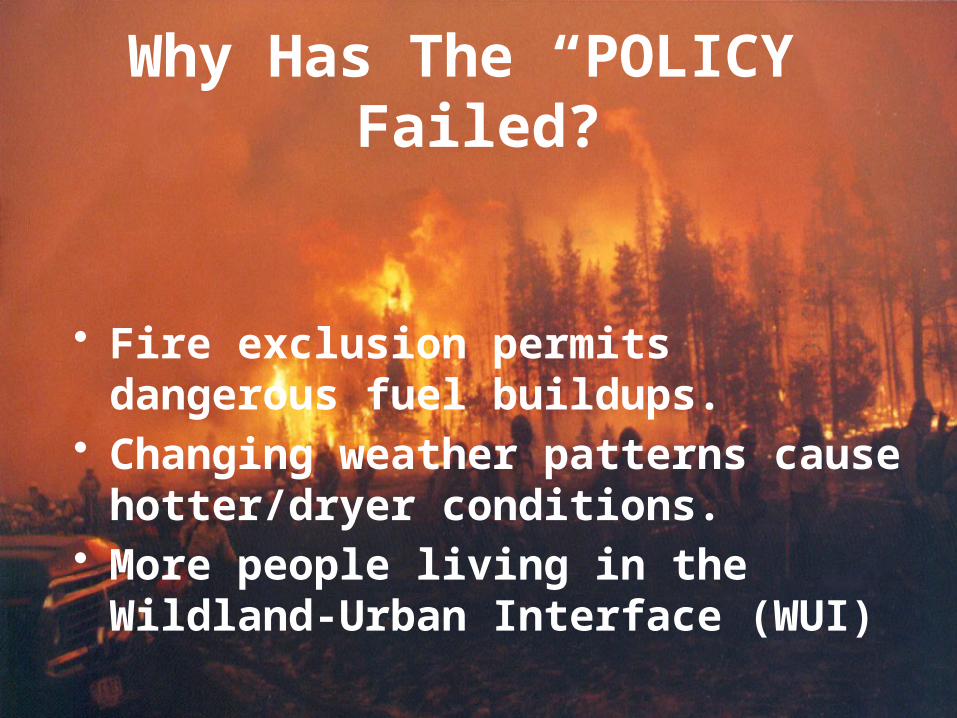
Why Has The “POLICY” Failed?
• Fire exclusion permits dangerous fuel buildups.
• Changing weather patterns cause hotter/dryer conditions.
• More people living in the Wildland-Urban Interface (WUI)

1970-Present: Fire Reintroduction• 1963 – USDI Park Service Rept.
Acknowledges Fire’s Role In Maintaining Some Ecosystems
• 1968 – First Park Service WFU and Rx Burns
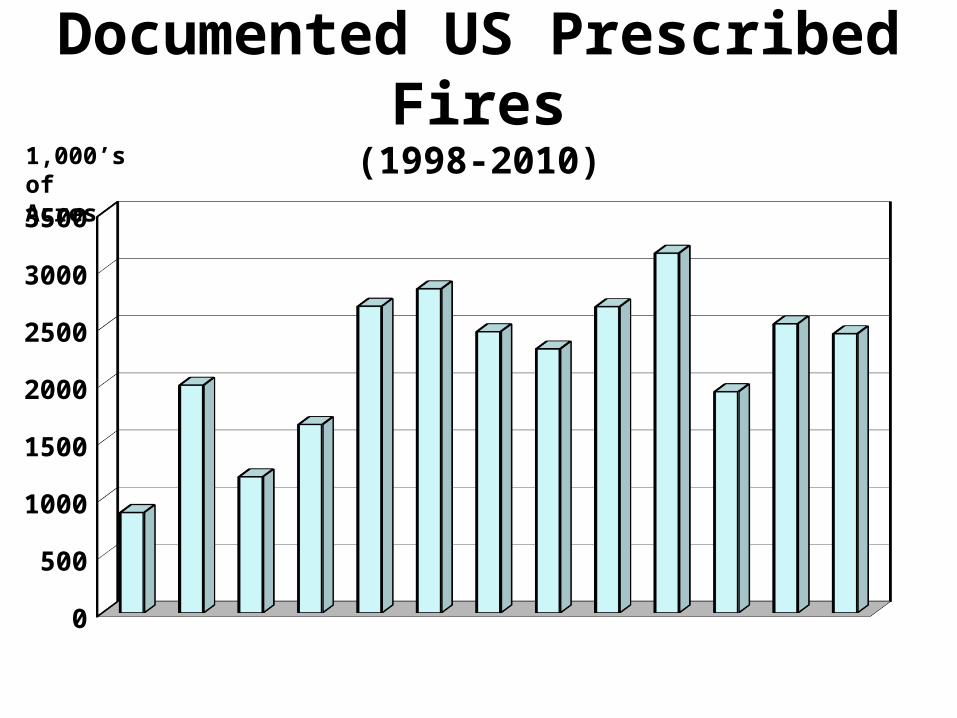
Documented US Prescribed Fires(1998-2010)
1998
1999
2000
2001
2002
2003
2004
2005
2006
2007
2008
2009
2010
0
500
1000
1500
2000
2500
3000
3500
1,000’s of Acres
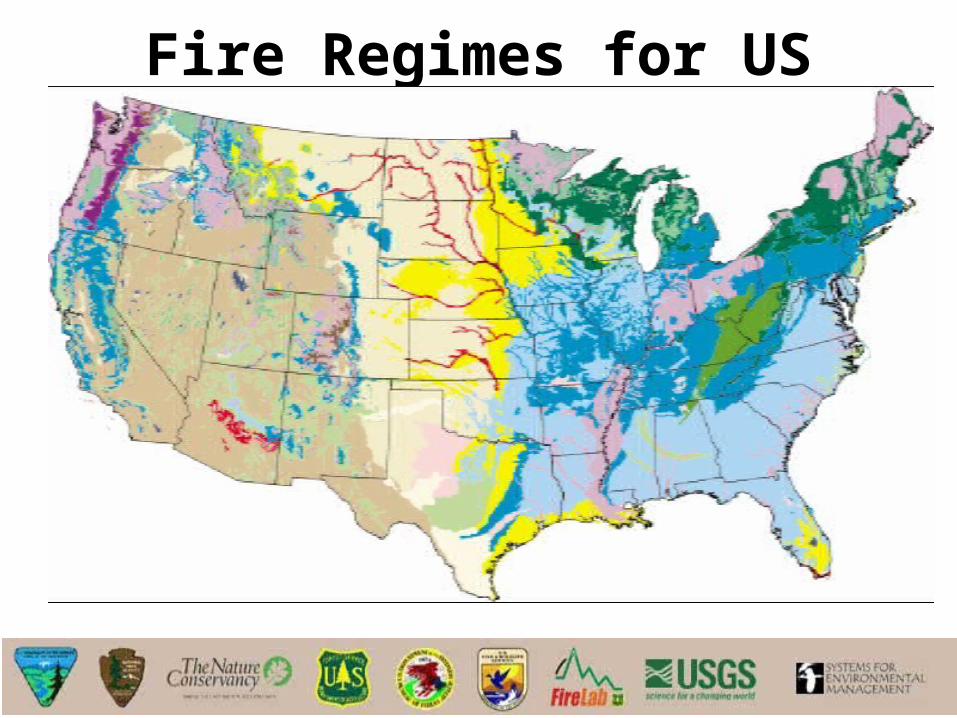
Fire Regimes for US

Fire Regimes:• I – 0-35 year frequency and low severity (mostly
surface fires) to mixed severity
• II – 0-35 year frequency and high severity (stand replacement)
• III – 35-200+ year frequency and mixed severity
• IV – 35-200+ year frequency and high severity
• V – 200+ year frequency and high severity
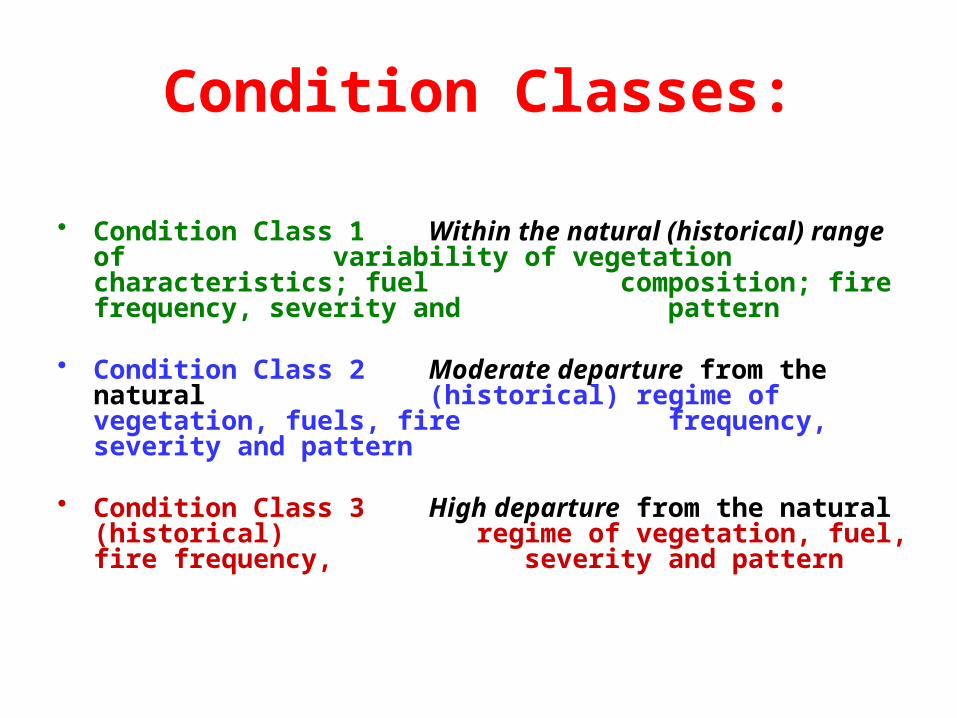
Condition Classes:
• Condition Class 1 Within the natural (historical) range of variability of vegetation
characteristics; fuel composition; fire frequency, severity and pattern
• Condition Class 2 Moderate departure from the natural (historical) regime of vegetation,
fuels, fire frequency, severity and pattern
• Condition Class 3 High departure from the natural (historical) regime of vegetation, fuel, fire frequency, severity and pattern
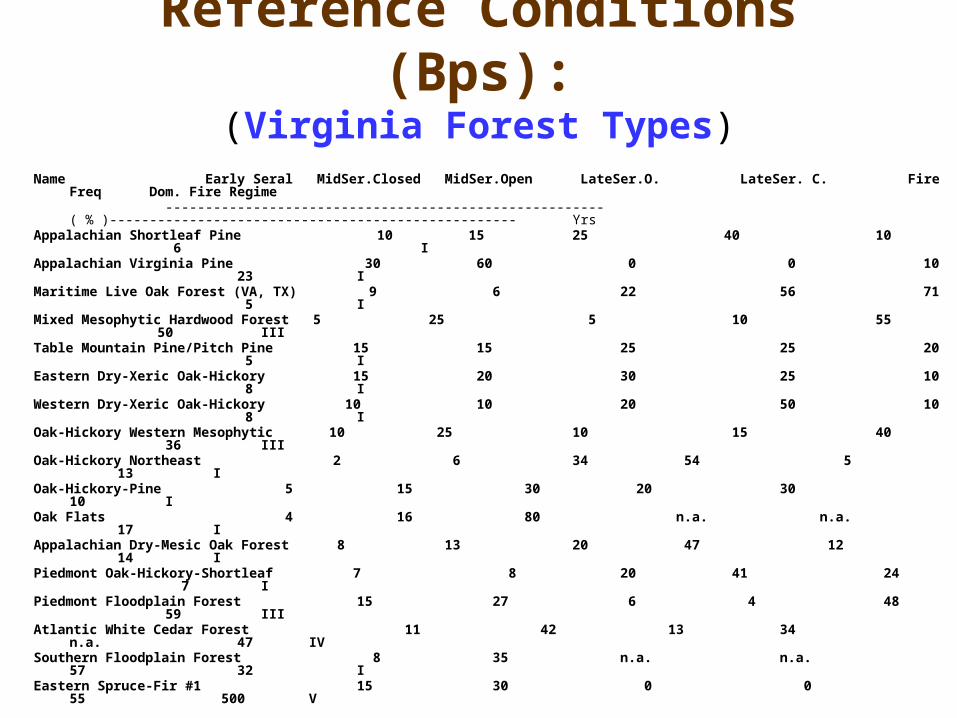
Reference Conditions (Bps):(Virginia Forest Types)
Name Early Seral MidSer.Closed MidSer.Open LateSer.O. LateSer. C. Fire Freq Dom. Fire Regime
-------------------------------------------------------( % )--------------------------------------------------- YrsAppalachian Shortleaf Pine 10 15 25 40 10 6 I
Appalachian Virginia Pine 30 60 0 0 10 23 I
Maritime Live Oak Forest (VA, TX) 9 6 22 56 71 5 I
Mixed Mesophytic Hardwood Forest 5 25 5 10 55 50 III
Table Mountain Pine/Pitch Pine 15 15 25 25 20 5 I
Eastern Dry-Xeric Oak-Hickory 15 20 30 25 10 8 I
Western Dry-Xeric Oak-Hickory 10 10 20 50 10 8 I
Oak-Hickory Western Mesophytic 10 25 10 15 40 36 III
Oak-Hickory Northeast 2 6 34 54 5 13 I
Oak-Hickory-Pine 5 15 30 20 30 10 I
Oak Flats 4 16 80 n.a. n.a. 17 I
Appalachian Dry-Mesic Oak Forest 8 13 20 47 12 14 I
Piedmont Oak-Hickory-Shortleaf 7 8 20 41 24 7 I
Piedmont Floodplain Forest 15 27 6 4 48 59 III
Atlantic White Cedar Forest 11 42 13 34 n.a. 47 IV
Southern Floodplain Forest 8 35 n.a. n.a. 57 32 I
Eastern Spruce-Fir #1 15 30 0 0 55 500 V
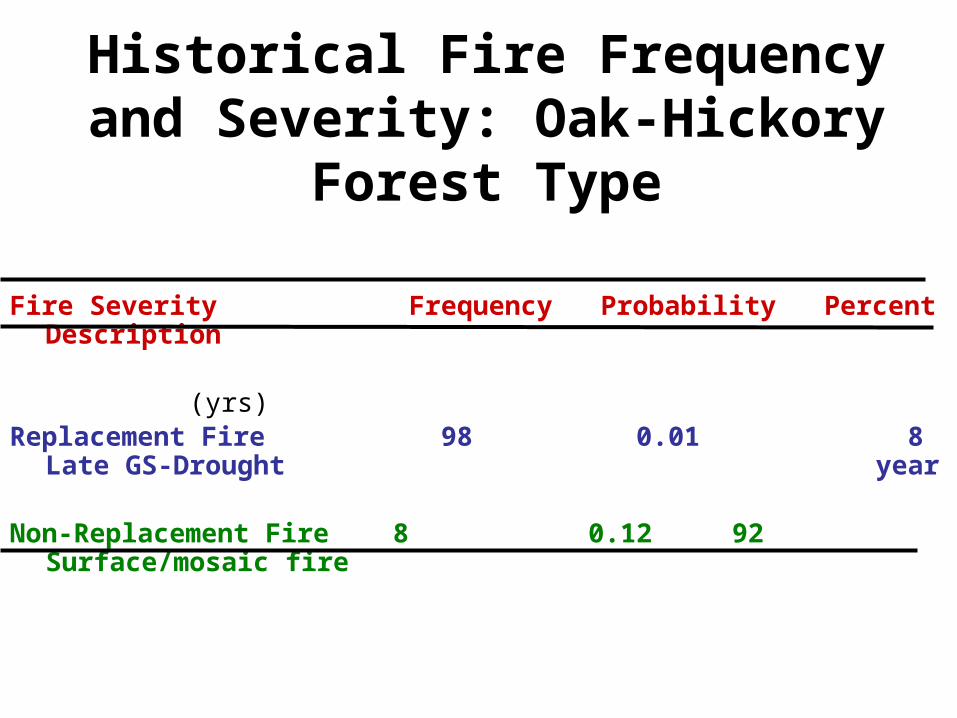
Historical Fire Frequency and Severity: Oak-Hickory Forest
Type
Fire Severity Frequency Probability Percent Description
(yrs)Replacement Fire 98 0.01 8 Late GS-Drought
year
Non-Replacement Fire 8 0.12 92 Surface/mosaic fire

Effects of Burning On Plant and Animal Communities
• Dependent on Fire: 1. Intensity2. Location3. Timing
4. Frequency
• High Intensity/Frequency: Simplifying• Low Intensity/Frequency:
Diversifying• Fire Exclusion: Simplifying
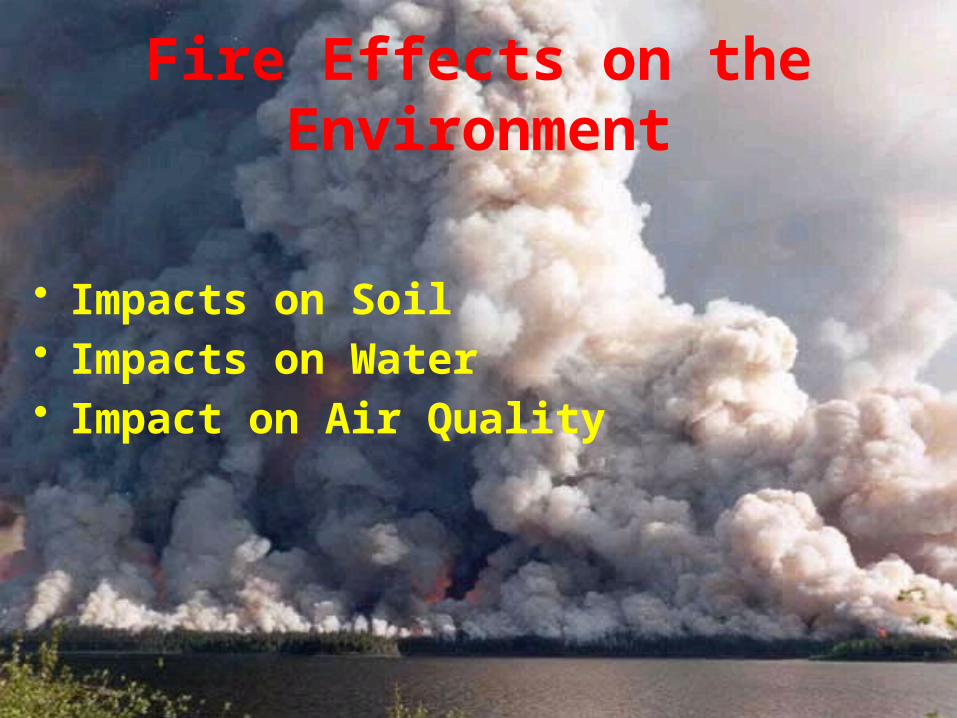
Fire Effects on the Environment
• Impacts on Soil• Impacts on Water• Impact on Air Quality
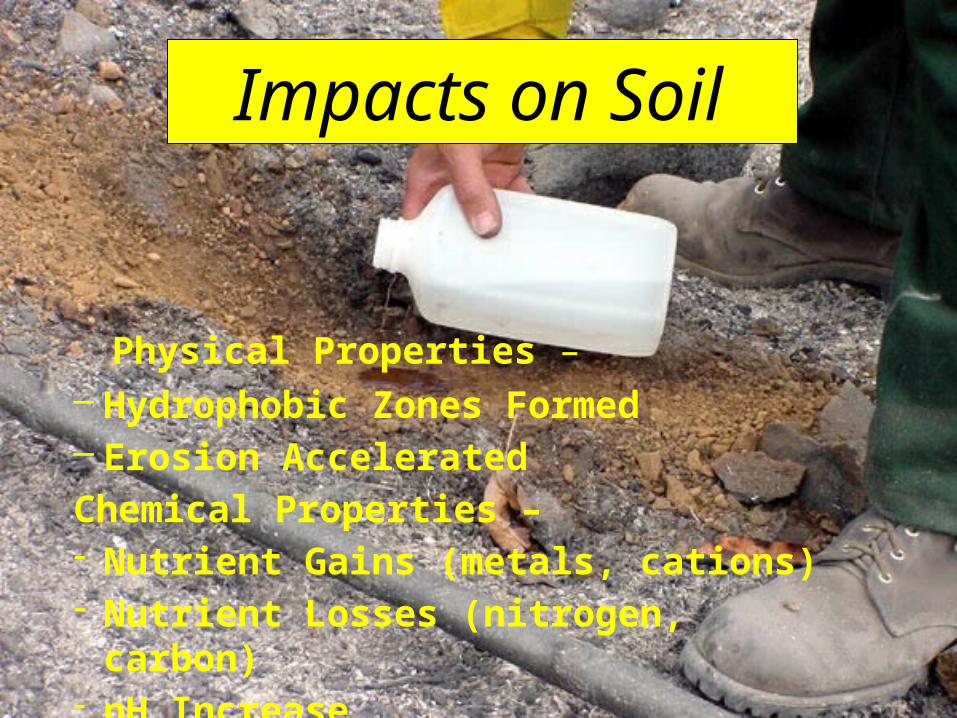
Impacts on Soil
Physical Properties – – Hydrophobic Zones Formed– Erosion Accelerated
Chemical Properties –- Nutrient Gains (metals, cations)- Nutrient Losses (nitrogen, carbon)- pH Increase
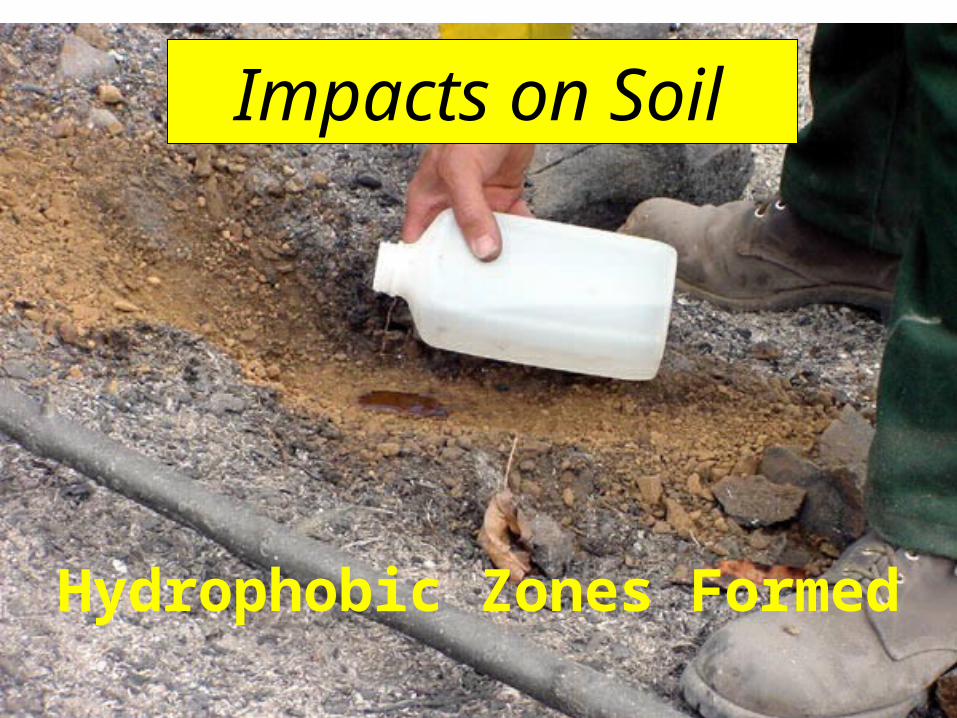
Impacts on Soil
Hydrophobic Zones Formed

Erosion
• Natural process - Intact Forest (0.05 to 0.10 tons/acre/year)
• Accelerated process - Agricultural Lands (3 to 15 tons/acre/year)
Fire Effects - Somewhere in between for most, but can be much more.

Erosion increases when. . .
• Slopes are steep and long.
• Forest floor is removed (soil is exposed).
• Soil Erodibility of the soil is high.
• Rainfall/runoff events are in intense
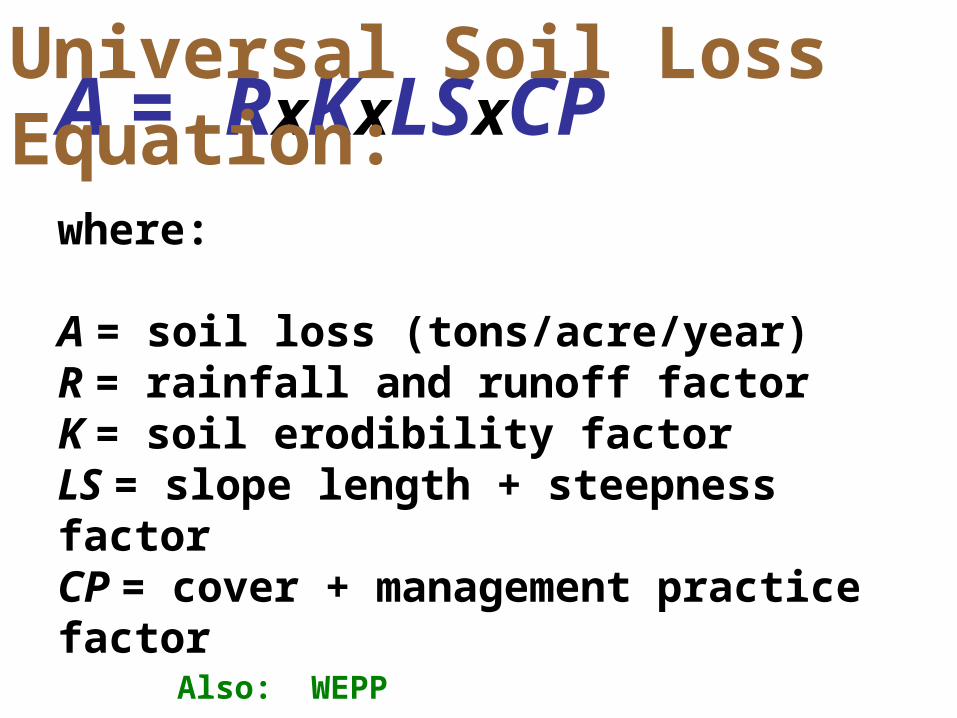
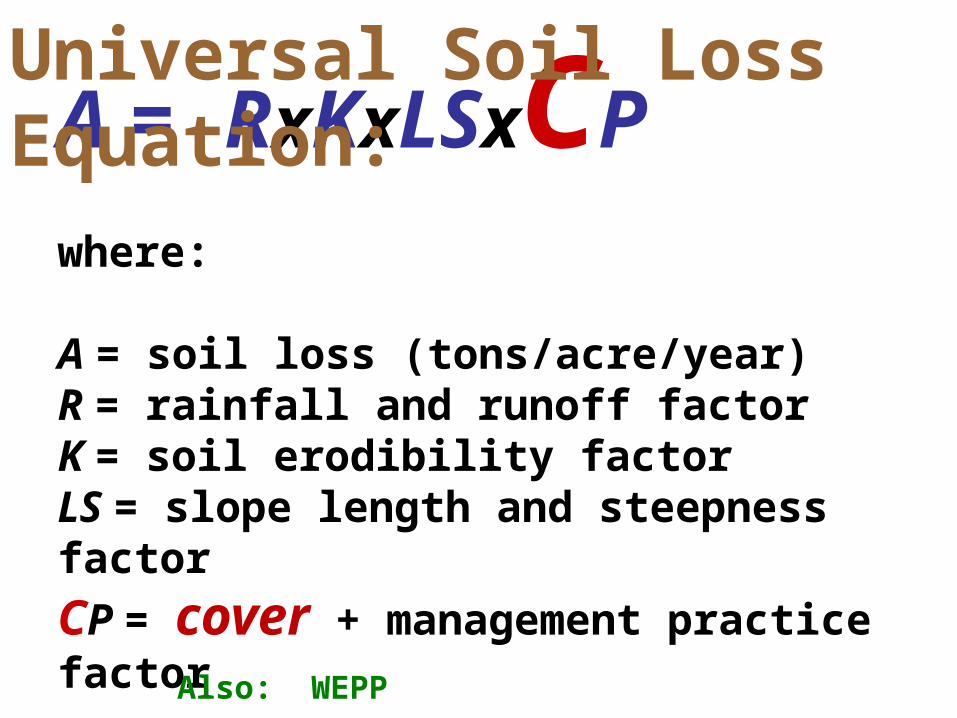
A = RxKxLSxCP where:
A = soil loss (tons/acre/year)R = rainfall and runoff factor K = soil erodibility factorLS = slope length + steepness factorCP = cover + management practice factor
Universal Soil Loss Equation:
Also: WEPP

Florida = 350 t/ac/yrNevada = 20 t/ac/yrVirginia = 150-300 t/ac/yr
R = Rainfall index – The Effect of Rain Type – Units =Tons/ac/year
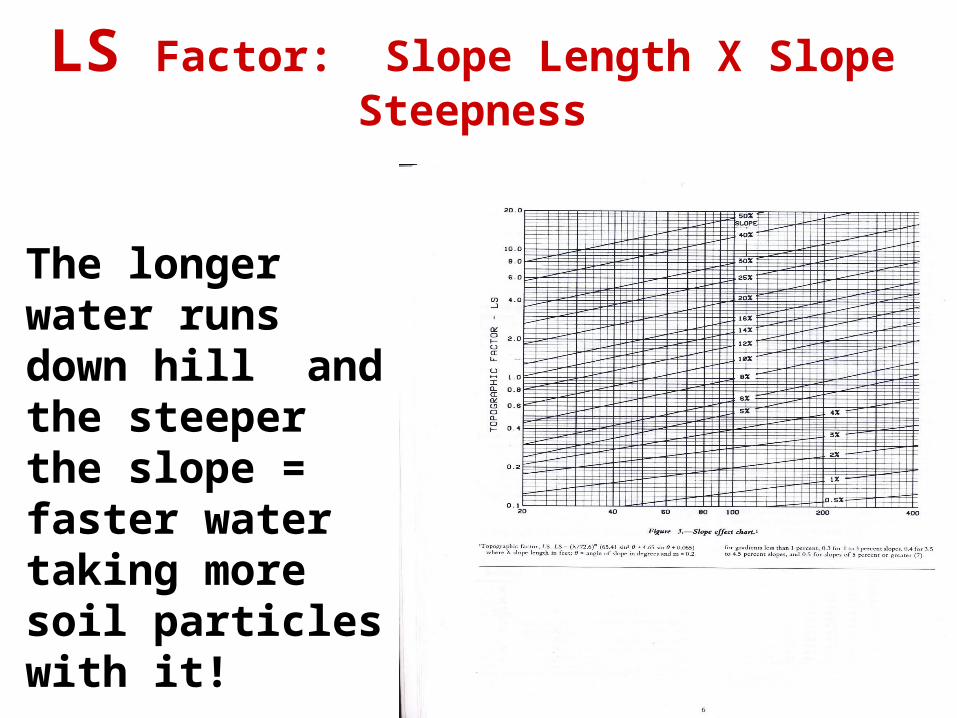
The longer water runs down hill and the steeper the slope = faster water taking more soil particles with it!
LS Factor: Slope Length X Slope Steepness
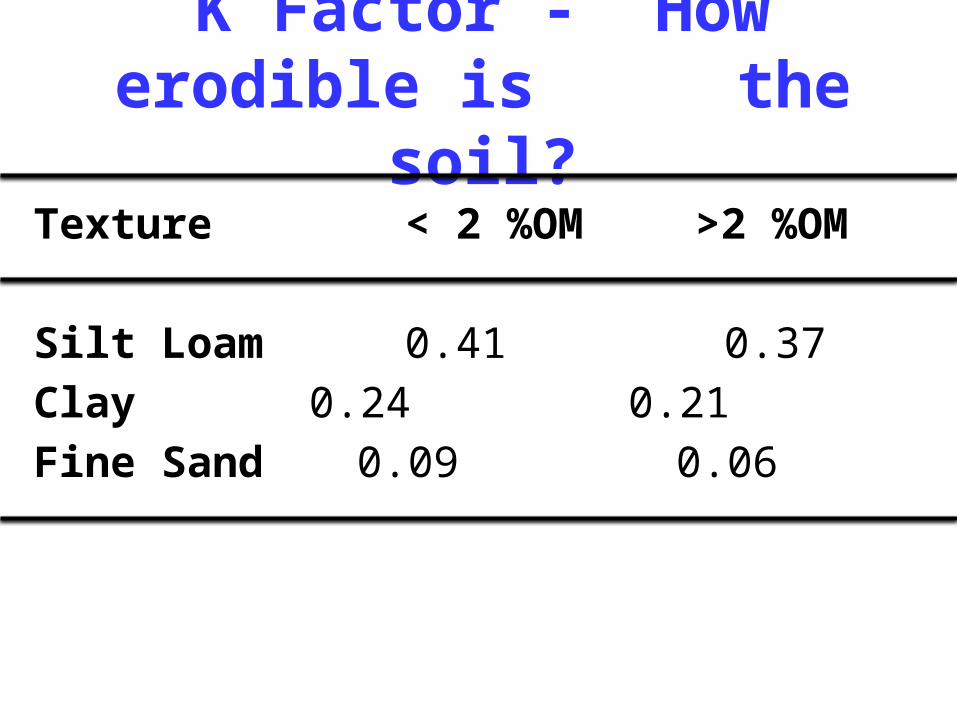
K Factor - How erodible is the soil?
Texture < 2 %OM >2 %OM
Silt Loam 0.41 0.37
Clay 0.24 0.21
Fine Sand 0.09 0.06
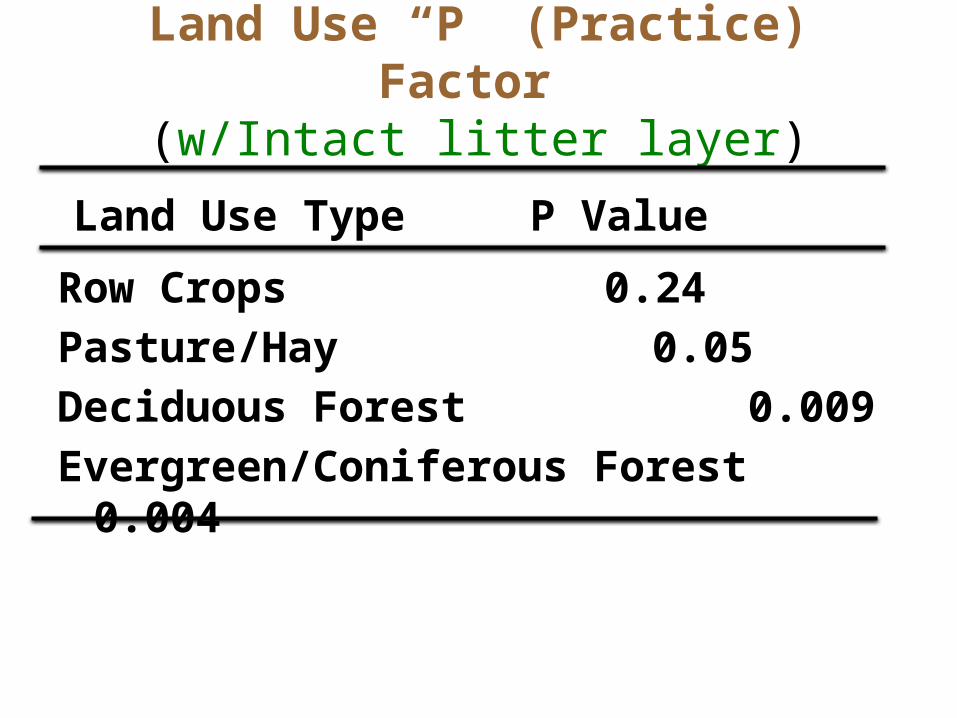
Land Use “P” (Practice) Factor (w/Intact litter layer)
Row Crops 0.24
Pasture/Hay 0.05
Deciduous Forest 0.009
Evergreen/Coniferous Forest 0.004
Land Use Type P Value

USLE “C” (cover) Factor
Cover Percent Ground Cover
Type 01 20 40 60 80 100
Grass 0.45 .20 .10 .040 .013 .003
Forbs 0.45 .24 .15 .090 .043 .011
A = RxKxLSxCP
where:
A = soil loss (tons/acre/year)R = rainfall and runoff factor K = soil erodibility factorLS = slope length and steepness factor
CP = cover + management practice factor
Universal Soil Loss Equation:
Also: WEPP
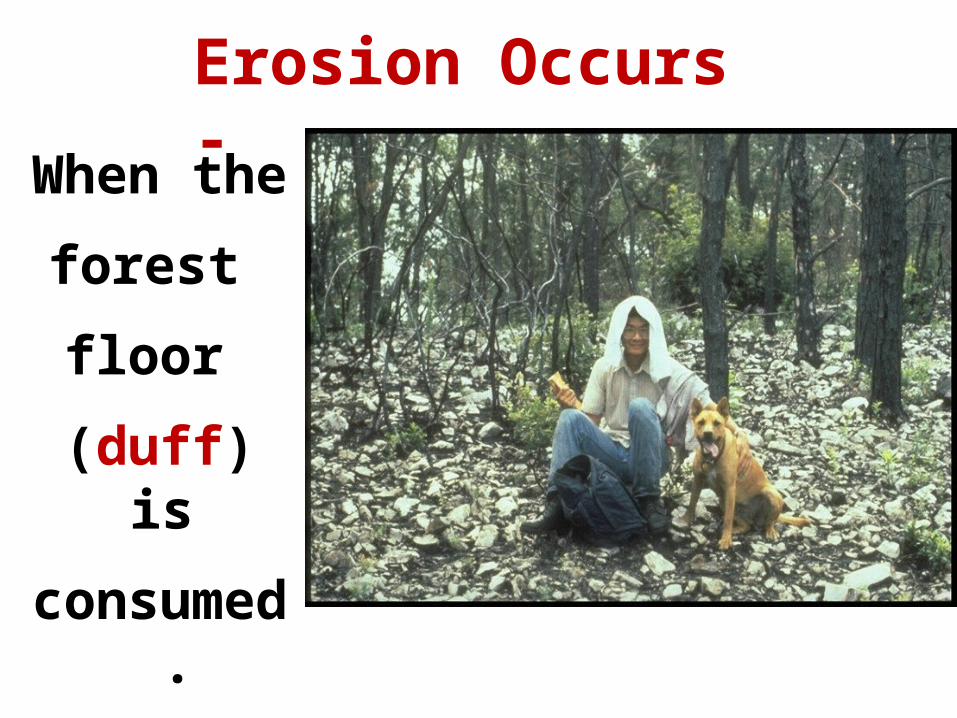
When the
forest
floor
(duff) is
consumed.
Erosion Occurs -
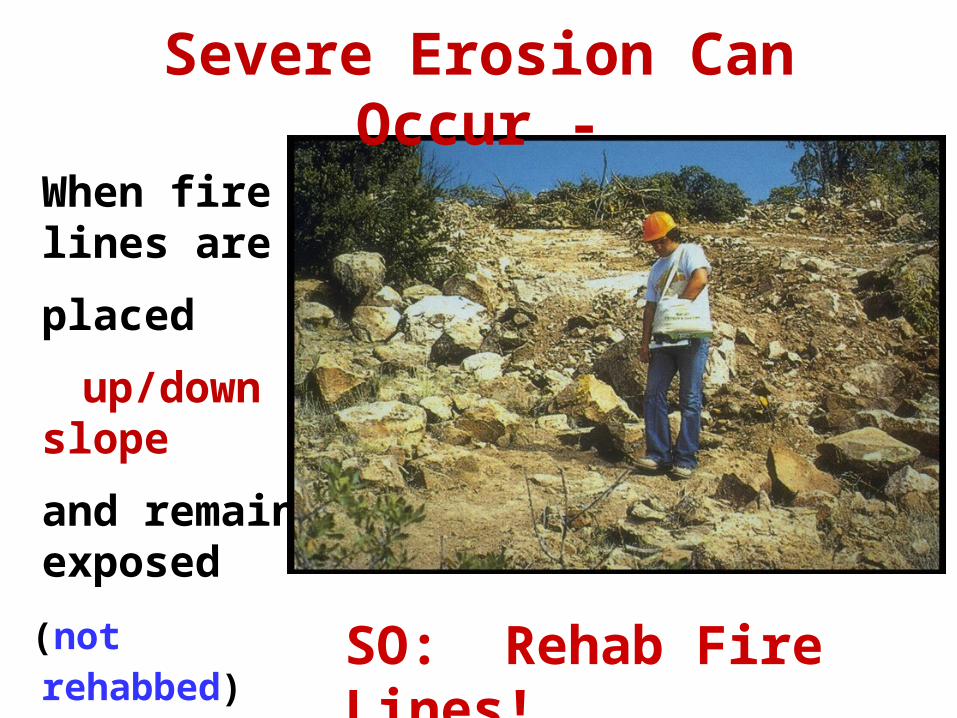
When fire lines are
placed
up/down slope
and remain exposed
(not rehabbed) SO: Rehab Fire Lines!
Severe Erosion Can Occur -
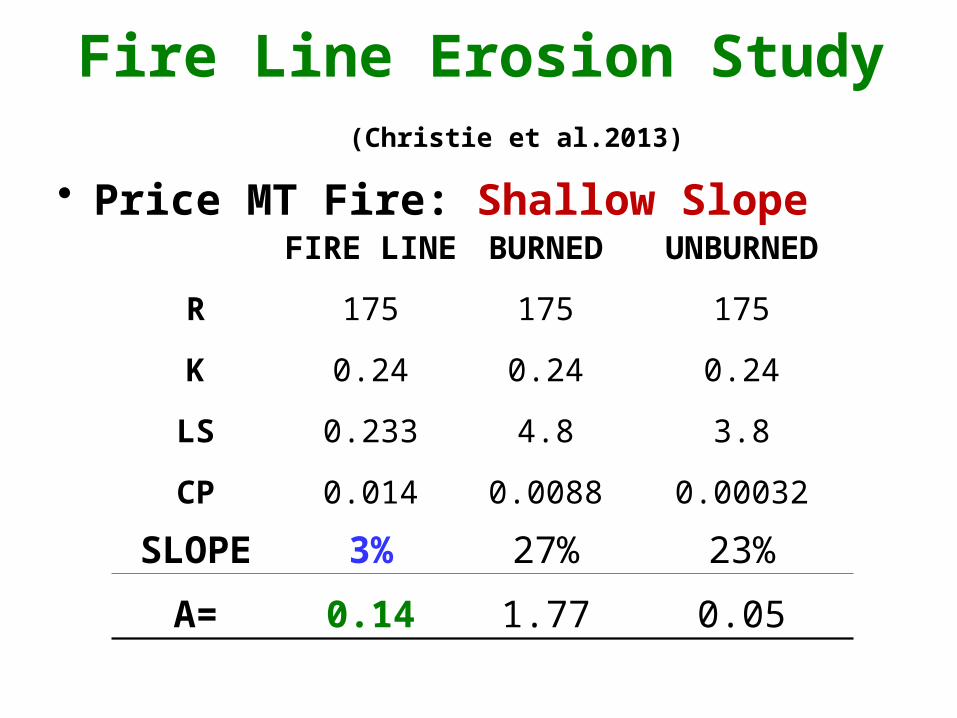
Fire Line Erosion Study (Christie et al.2013)
• Price MT Fire: Shallow SlopeFIRE LINE BURNED UNBURNED
R 175 175 175
K 0.24 0.24 0.24
LS 0.233 4.8 3.8
CP 0.014 0.0088 0.00032
SLOPE 3% 27% 23%
A= 0.14 1.77 0.05
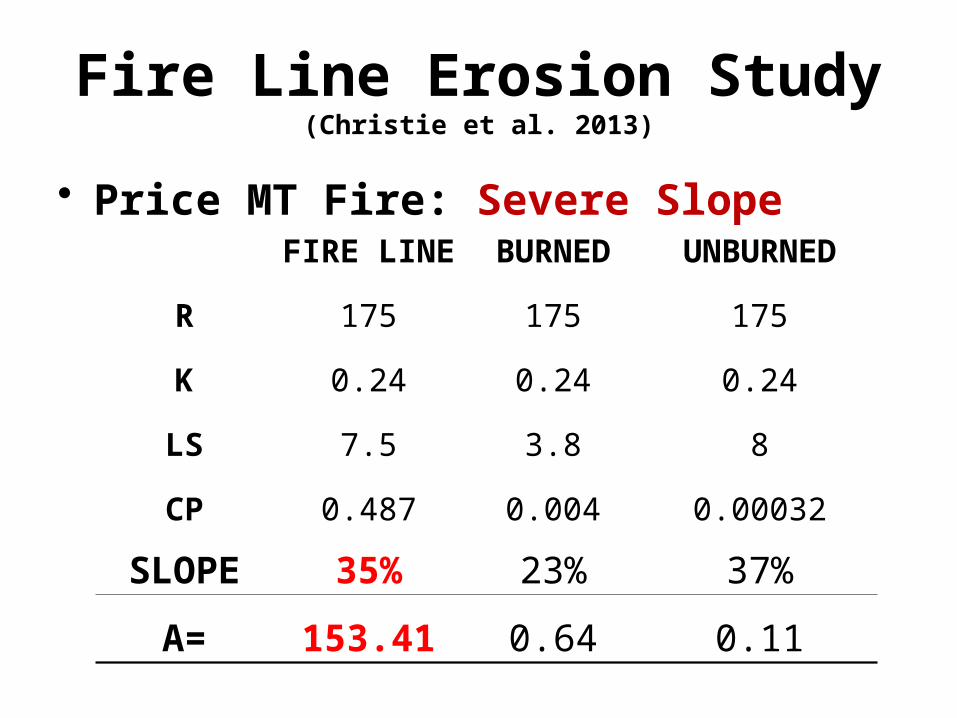
Fire Line Erosion Study(Christie et al. 2013)
• Price MT Fire: Severe SlopeFIRE LINE BURNED UNBURNED
R 175 175 175
K 0.24 0.24 0.24
LS 7.5 3.8 8
CP 0.487 0.004 0.00032
SLOPE 35% 23% 37%
A= 153.41 0.64 0.11

Fire can have a Major Effect on Nutrient Cycling
N, C - are volatilized (LOSS - to the atmosphere)
Metals - Cations - released from (P, K, Ca, Mg) Organic Matter
(GAINS – to soil)

Effects of Wildfire on Surface Soil in Table Mt./Pitch Pine
Shenandoah National Park, VA
N CFire Severity Level pH -------kg/ha--------
High 4.5 200 9,400
Low 4.4 288 13,200
Unburned 4.3 306 14,500
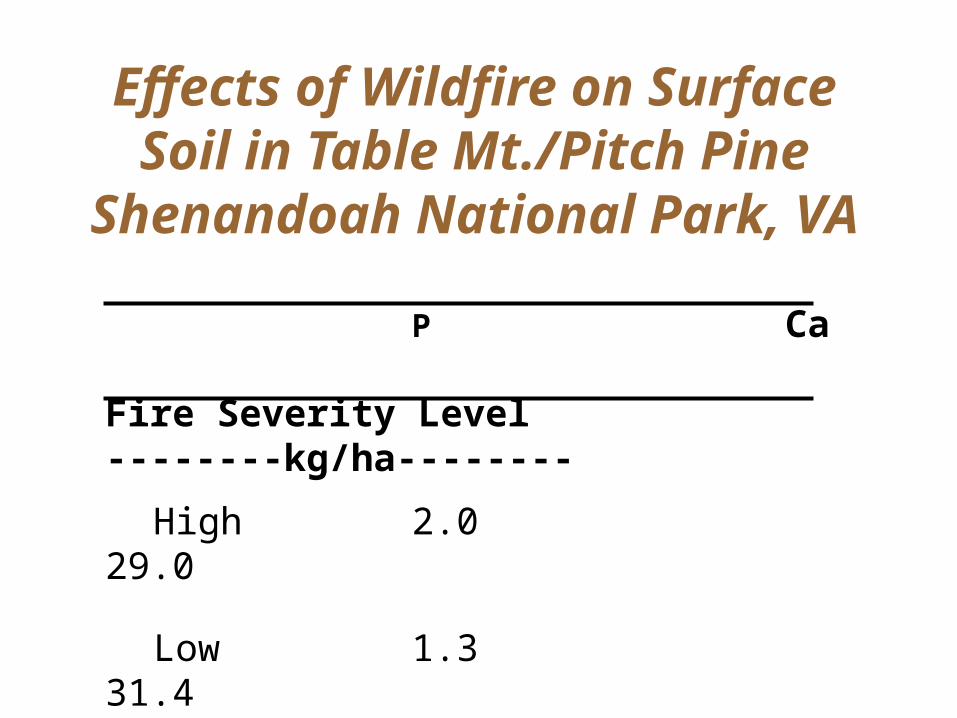
Effects of Wildfire on Surface Soil in Table Mt./Pitch Pine
Shenandoah National Park, VA
P CaFire Severity Level --------kg/ha--------
High 2.0 29.0
Low 1.3 31.4
Unburned 0.3 11.3

Losses of N following fire are often
off-set by increased rates of N2-fixation
by legumes.

pH
Availability

Table 2.4— Soil surface conditions after fire effects on infiltration, runoff and
erosion.
Soil surfacecondition Infiltration Runoff Erosion
Litter charred High Low LowLitter consumed Medium Medium MediumBare soil (duff gone) Low High HighWater repellent layers Very low Very high Severe
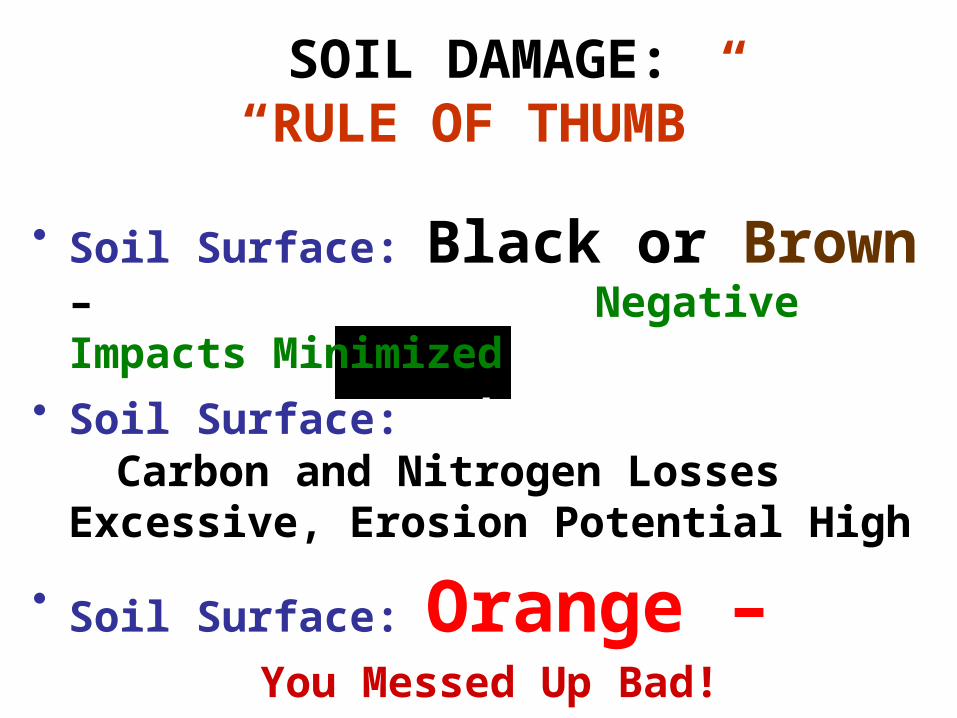
SOIL DAMAGE:“RULE OF THUMB”
• Soil Surface: Black or Brown – Negative Impacts Minimized
• Soil Surface: White -Carbon and Nitrogen Losses
Excessive, Erosion Potential High
• Soil Surface: Orange –You Messed Up Bad!

Impacts on Water
• Sedimentation• Eutrophication• pH Increase• Dissolved Oxygen Decrease
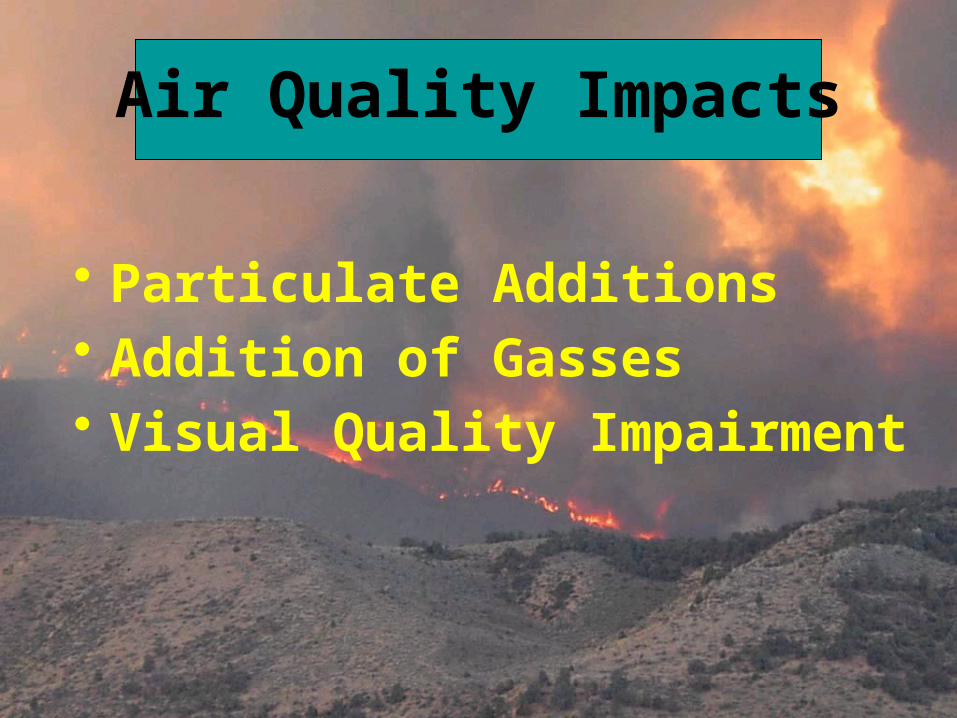
Air Quality Impacts
• Particulate Additions• Addition of Gasses• Visual Quality Impairment

BOTTOM LINE……The Effects of Wildfire Vs. Prescribed Fire
• Prescribed fire – Less intense, less variable
• Wildfire – Can be more/less intense, but generally is more
• Repeated, low-intensity, prescribed burns have been shown
to have little, long-term,
effect on soil N or C
Related Documents