Endo and Eltahir Malar J (2016) 15:578 DOI 10.1186/s12936-016-1633-7 RESEARCH Environmental determinants of malaria transmission in African villages Noriko Endo * and Elfatih A. B. Eltahir Abstract Background: Malaria transmission is complex, involving a range of hydroclimatological, biological, and environmen- tal processes. The high degree of non-linearity in these processes makes it difficult to predict and intervene against malaria. This study seeks both to define a minimal number of malaria transmission determinants, and to provide a theoretical basis for sustainable environmental manipulation to prevent malaria transmission. Methods: Using a field-tested mechanistic malaria model, HYDREMATS, a theoretical study was conducted under hypothetical conditions. Simulations were conducted with a range of hydroclimatological and environmental condi- tions: temperature (t), length of wet season (T wet ), storm inter-arrival time (T int ), persistence of vector breeding pools (T on ), and distribution of houses from breeding pools and from each other (X dist and Y dist , respectively). Based on the theoretical study, a malaria time scale, T o , and a predictive theory of malaria transmission were introduced. The per- formance of the predictive theory was compared against the observational malaria transmission data in West Africa. Population density was used to estimate the scale that describes the spatial distribution of houses. Results: The predictive theory shows a universality in malaria endemic conditions when plotted using two newly- introduced dimension-less parameters. The projected malaria transmission potential compared well with the obser- vation data, and the apparent differences were discussed. The results illustrate the importance of spatial aspects in malaria transmission. Conclusions: The predictive theory is useful in measuring malaria transmission potential, and it can also provide guidelines on how to plan the layout of human habitats in order to prevent endemic malaria. Malaria-resistant vil- lages can be designed by locating houses further than critical distances away from breeding pools or by removing pools within a critical distance from houses; the critical distance is described in the context of local climatology and hydrology. Keywords: Malaria transmission, Hydrology, Spatial impact, Characteristic time scale © The Author(s) 2016. This article is distributed under the terms of the Creative Commons Attribution 4.0 International License (http://creativecommons.org/licenses/by/4.0/), which permits unrestricted use, distribution, and reproduction in any medium, provided you give appropriate credit to the original author(s) and the source, provide a link to the Creative Commons license, and indicate if changes were made. The Creative Commons Public Domain Dedication waiver (http://creativecommons.org/ publicdomain/zero/1.0/) applies to the data made available in this article, unless otherwise stated. Background e transmission dynamics of malaria are complex. Cli- matological, hydrological, and biological factors interact non-linearly at various stages of the transmission cycle and shape malaria transmission dynamics. Another key element of malaria transmission dynamics is environ- mental factors. e large dimension and non-linearity of those factors make it difficult to predict and intervene against malaria. Malaria can be sustainably prevented through envi- ronmental modification approaches. Climatological, hydrological, and biological factors are hardly controlla- ble; malaria treatment interventions require continuous effort to attenuate or avoid the impact of those factors. Environmental factors, on the other hand, can be manip- ulated; well-designed planning of environmental con- ditions could work as a long-term malaria prevention approach. Facing the low momentum in the public health arena of malaria control, due to fatigue of donors, spread of drug-resistance, fragile health infrastructures etc., pre- vention approaches, as opposed to treatment approaches, Open Access Malaria Journal *Correspondence: [email protected] Ralph M. Parsons Laboratory, Department of Civil and Environmental Engineering, Massachusetts Institute of Technology, Cambridge, MA 02139, USA

Welcome message from author
This document is posted to help you gain knowledge. Please leave a comment to let me know what you think about it! Share it to your friends and learn new things together.
Transcript

Endo and Eltahir Malar J (2016) 15:578 DOI 10.1186/s12936-016-1633-7
RESEARCH
Environmental determinants of malaria transmission in African villagesNoriko Endo* and Elfatih A. B. Eltahir
Abstract
Background: Malaria transmission is complex, involving a range of hydroclimatological, biological, and environmen-tal processes. The high degree of non-linearity in these processes makes it difficult to predict and intervene against malaria. This study seeks both to define a minimal number of malaria transmission determinants, and to provide a theoretical basis for sustainable environmental manipulation to prevent malaria transmission.
Methods: Using a field-tested mechanistic malaria model, HYDREMATS, a theoretical study was conducted under hypothetical conditions. Simulations were conducted with a range of hydroclimatological and environmental condi-tions: temperature (t), length of wet season (Twet), storm inter-arrival time (Tint), persistence of vector breeding pools (Ton), and distribution of houses from breeding pools and from each other (Xdist and Ydist, respectively). Based on the theoretical study, a malaria time scale, To, and a predictive theory of malaria transmission were introduced. The per-formance of the predictive theory was compared against the observational malaria transmission data in West Africa. Population density was used to estimate the scale that describes the spatial distribution of houses.
Results: The predictive theory shows a universality in malaria endemic conditions when plotted using two newly-introduced dimension-less parameters. The projected malaria transmission potential compared well with the obser-vation data, and the apparent differences were discussed. The results illustrate the importance of spatial aspects in malaria transmission.
Conclusions: The predictive theory is useful in measuring malaria transmission potential, and it can also provide guidelines on how to plan the layout of human habitats in order to prevent endemic malaria. Malaria-resistant vil-lages can be designed by locating houses further than critical distances away from breeding pools or by removing pools within a critical distance from houses; the critical distance is described in the context of local climatology and hydrology.
Keywords: Malaria transmission, Hydrology, Spatial impact, Characteristic time scale
© The Author(s) 2016. This article is distributed under the terms of the Creative Commons Attribution 4.0 International License (http://creativecommons.org/licenses/by/4.0/), which permits unrestricted use, distribution, and reproduction in any medium, provided you give appropriate credit to the original author(s) and the source, provide a link to the Creative Commons license, and indicate if changes were made. The Creative Commons Public Domain Dedication waiver (http://creativecommons.org/publicdomain/zero/1.0/) applies to the data made available in this article, unless otherwise stated.
BackgroundThe transmission dynamics of malaria are complex. Cli-matological, hydrological, and biological factors interact non-linearly at various stages of the transmission cycle and shape malaria transmission dynamics. Another key element of malaria transmission dynamics is environ-mental factors. The large dimension and non-linearity of those factors make it difficult to predict and intervene against malaria.
Malaria can be sustainably prevented through envi-ronmental modification approaches. Climatological, hydrological, and biological factors are hardly controlla-ble; malaria treatment interventions require continuous effort to attenuate or avoid the impact of those factors. Environmental factors, on the other hand, can be manip-ulated; well-designed planning of environmental con-ditions could work as a long-term malaria prevention approach. Facing the low momentum in the public health arena of malaria control, due to fatigue of donors, spread of drug-resistance, fragile health infrastructures etc., pre-vention approaches, as opposed to treatment approaches,
Open Access
Malaria Journal
*Correspondence: [email protected] Ralph M. Parsons Laboratory, Department of Civil and Environmental Engineering, Massachusetts Institute of Technology, Cambridge, MA 02139, USA
Page 2 of 11Endo and Eltahir Malar J (2016) 15:578
could be more sustainable and cost-effective in fighting malaria.
Planning of house locations relative to vector breeding sites and removal of pools near houses could be effec-tive malaria prevention techniques. The importance of the relative distributions of houses and pools has been reported both in simulation studies [1, 2] and in obser-vational studies [3–6], spelling out the large risk of con-tracting malaria when houses are located near vector breeding pools. The threshold distance for high malaria transmission risk is reported to be some hundreds of meters [3, 4, 6]. This paper will demonstrate that the threshold distance to prevent malaria is not universal, but significantly influenced by climatology, hydrology, and biology of local vectors, and that those factors inter-act in a complex manner. Planning of malaria-resistant village, thus, may not be straightforward.
This study seeks both to reduce the dimension of malaria transmission determinants, and to aid environ-mental manipulation to prevent malaria. The objective of this paper is to provide a tool to analyse malaria trans-mission potential at various environments, including different house distribution conditions. The analyses are conduct for conditions where mosquito populations are limited primarily by water availability, such as the fringe of Sahel. Based on theoretical studies with a wide range of forcings and parameters, a predictive theory of malaria transmission potential will be presented. The theory will then be tested for West Africa. In testing the theory, the impact of house distribution is emphasized.
MethodsMalaria transmission simulation modelThis study was conducted using a mechanistic malaria transmission model, HYDREMATS—HYDRology, Ento-mology, and MAlaria Transmission Simulator. HYDRE-MATS is an agent-based model calibrated for relatively dry regions in West Africa [7–9]. HYDREMATS fea-tures the explicit representation of the location and the persistence of vector breeding pools, and the location of human houses. The spatial and temporal settings of the simulations are explained below.
Spatial settings of simulation domainSimulations were conducted under hypothetical settings. The spatial setup was a 1000 by 1500 m domain, having at the center a 20 m-wide breeding pool expanding lon-gitudinally (Fig. 1a). The pool appears and disappears depending on the hydrological setting assumed, which is described in the following section. Houses are located at Xdist m away from the pool transversely at both sides of the pool, and Ydist m away from each other longitudinally.
Temporal settings of poolsThe temporal settings employed are described in Fig. 1b. This study assumed that a year has a clear wet season for Twet days and a dry season for the rest of the year. Pools appear intermittently at an interval of Tint days during a rainy season of Twet days. Tint represents the storm inter-arrival time. Out of Tint days, pools persist for Ton days, gradually decreasing the probability of mosquitoes laying eggs and imposing persistence-dependent larval mortal-ity, representing progressive disappearance of pools. Each experiment was run for the simulation period of four years, repeating the temporal setting described above.
A certain minimum number of mosquitoes were allowed to exist throughout simulations in order to seed mosquito population dynamics for the first and the subse-quent rainy seasons after long dry periods. The parameter values used in the simulations are summarized in Table 1.
Basic reproduction rate, RoThe evaluation of the malaria transmission poten-tial under specified conditions was based on the basic reproduction rate (Ro), which is defined as the number of infections expected to be generated by a single infec-tious person in a totally susceptible population. The mechanistic structure of HYDREMATS is most suitable for estimating Ro under dynamic conditions; conven-tional Ross-MacDonald formula [10] assumes static con-ditions. Ro values for a given condition were estimated in HYDREMATS to follow the exact definition of Ro. HYDREMATS can simulate the status of each human, as well as each mosquito, and track infections (which human infects which mosquito, and which mosquito infects which human; hence it can calculate how many people were infected from an infectious person). In this way, HYDREMATS can calculate Ro for any dynamic environmental conditions and mosquito populations.
Long-term average of Ro (hereafter R̂o) was calculated as follows, where malaria endemics was defined as R̂o ≥ 1 .
where Ninf is the number of infectious people simu-lated over the simulation period of four years, and Ri
o is the number of infections generated from the i-th infec-tious person, assuming the population is susceptible. Because the calculation of Ro requires the assumption of fully susceptible population, any dual infection was counted towards Ri
o. The number of simulated malaria cases originated from the i-th infectious person, thus, dif-fers from Ri
o. Note that Ninf increases with time and that Rio is dictated by the time-varying vector population and
R̂o =
Ninf∑
i=1
Rio/Ninf ,

Page 3 of 11Endo and Eltahir Malar J (2016) 15:578
environmental conditions. R̂o can also be defined as the average of Ri
o values.
Time scale for stable malaria transmission, ToThis study introduces a new malaria time scale, To. To (t) is defined as the length of the rainy season required
to reach R̂o = 1 under the condition of permanent water body (hereafter hydrologically-saturated condition) at a given temperature t and a given spatial condition (Fig. 1c). The hydrologically-saturated condition assumes a persistent pool (i.e., Twet = ∞, Ton = ∞ and Ton/Tint = 1) that is created at the beginning of the simulation
20mXdist
1500m
non-absorbing boundary
1000m
housepoolYdis
t
grid size:10m x 10m
<Spatial setup>
<Temporal setup: hypothetical condition>
<Temporal setup: hydrolorogically-saturated condition>
a
b
c <Temporal setup: hydrolorogically-saturated condition>
Fig. 1 Spatial and temporal setup of the model. a Spatial setting in the simulations. Simulations were conducted under a 1000 m × 1500 m domain with 10 m × 10 m grids. A 20 m-width pool appears at the center of the domain. Houses are located Xdist away from the pool, and Ydist away from each other. b Temporal setting: hypothetical condition. The hypothetical condition used in this study defines a clear wet and dry season in a year. During a wet season (Twet), pools are created at every storm inter-arrival time (Tint), and persist for Ton days. Simulations were conducted for 4 years repeating the specified hypothetical hydrological conditions. c Temporal setting: hydrologically- saturated condition. The hydrologically saturated condition defines the condition where Twet = ∞ and Ton/Tint = 1. The persistent pool is assumed to be created at time zero. Under this condition, the time required to reach R̂o = 1 is defined as To
Page 4 of 11Endo and Eltahir Malar J (2016) 15:578
period. To is thus not a function of hydrological vari-ables: Twet, Tint, Ton. Under this condition, R̂o = 1 keeps rising until the system becomes stable. The stability point may or may not exceed R̂o = 1. If the system stabilizes at R̂o < 1, To was defined as infinite. To may or may not exceed 1 year.
With tlrv, tad, and tpara being temperatures that influence larval development time, adult life span, and parasite development time, respectively, To (t) was defined as
where this study assumes t = tlrv = tad = tpara. One can also define tlrv as water temperature, and tad and tpara as air temperature. In this study, water and air temperatures were assumed to be equal.
In order to analyse the contributions of larval develop-ment time, adult life span, and parasite development time at different temperatures, Tlrv
o (t),Tado (t),T
parao (t) were
introduced:
where tref is a reference temperature set at 27 °C.
Two dimensionless parametersTwo dimensionless parameters are introduced: D1 = Twet/To and D2 = Ton/Tint.
D1 measures the relative length of the wet season, Twet, compared to the malaria time scale, To. Relatively small D1 indicates a wet season that is too short to create the critical size of mosquito population that may sustain malaria transmission.
D2 describes the variability in hydrologic conditions determining the intermittency of pools. It indicates the proportion of time that pools exist during a rainy sea-son, and also the deviation between the condition dur-ing a rainy season and under the hydrologically-saturated condition. D2 nears one when pools are persistent, and
To(t) = To(tlrv, tad, tpara),
Tlrvo (t) = To(t, tref, tref),
Tado (t) = To(tref, t, tref),
Tparao (t) = To(tref, tref, t),
zero when pools are short-lasting. As D2 reaches one, the condition becomes closer to the hydrologically-saturated condition (D2 = 1 deviates slightly from the hydrologi-cally-saturated condition, where Ton = ∞, because finite Ton values impose gradual reduction in oviposition prob-ability and the additional larval mortality).
West Africa as a testing siteThe results of the theoretical work were tested against observational data over West Africa. West Africa was selected as a testing site for the following three reasons. First, the largest burden of malaria is in Africa (e.g., 90% of deaths), of which sub-Saharan West Africa experi-ences disproportionately high mortality and morbidity [11]. Second, West Africa features strong North–South gradients in temperature and rainfall, resulting in a range of climate conditions and malaria vulnerability [9, 12, 13] (Additional file 1). Finally, detailed hydrological data are available for West Africa from Yamana’s study [9]. HYDREMATS has been calibrated successfully in pre-vious studies [7–9] over the semi-arid climate in West Africa.
Estimation of model parameters for West AfricaHydroclimatological data and population data were used to estimate the dimensionless parameters, D1 and D2, which were then applied to estimate malaria trans-mission potential. Hydroclimatological data used were monthly temperature and rainfall data from 2001 to 2010 from CRU TS 3.21 [14]. Population density (PD) data were obtained from Gridded Population of the World, Version 3 (GPWv3) for the year 2000 [15].
The parameters used for estimating D1 and D2 are summarized in Table 2. D1 was obtained using Twet and To. Twet is the length of the rainy season. In the obser-vational data, a rainy season was defined as the period from when annual cumulative rainfall exceeds 10% until when it reaches 95%. This definition works well for West Africa because this region experiences just one distinct rainy season per year (Additional file 2). In estimating the malaria time scale, To, information on temperature, Xdist,
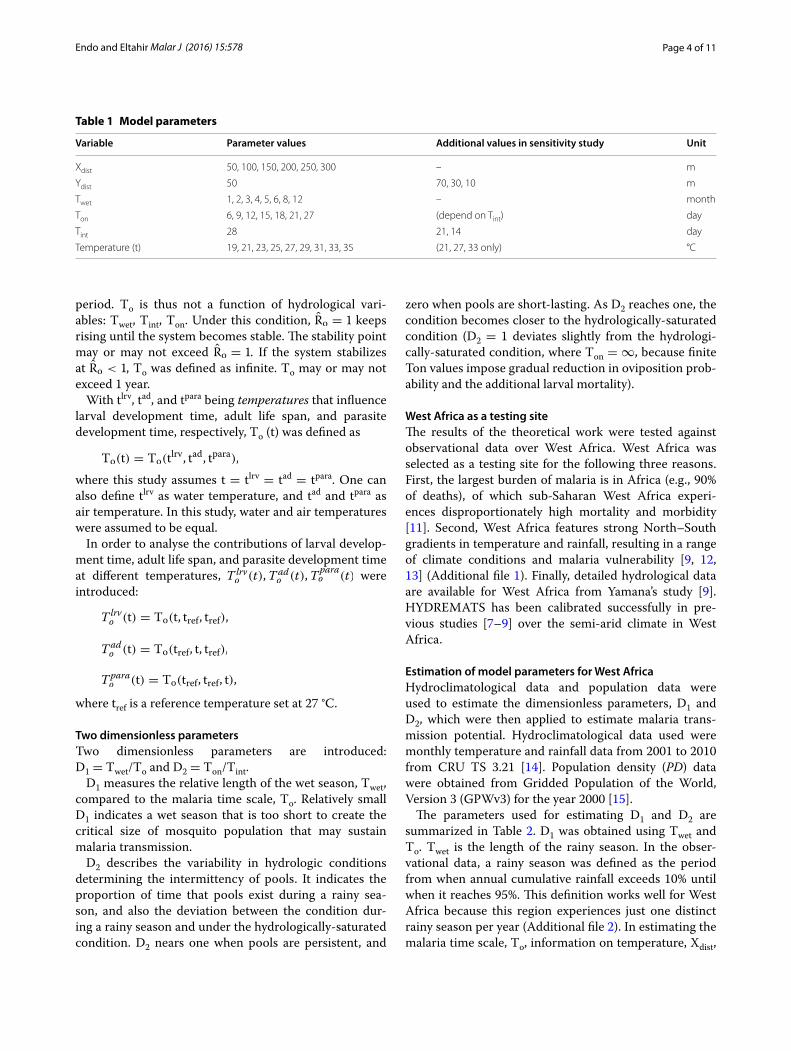
Table 1 Model parameters
Variable Parameter values Additional values in sensitivity study Unit
Xdist 50, 100, 150, 200, 250, 300 – m
Ydist 50 70, 30, 10 m
Twet 1, 2, 3, 4, 5, 6, 8, 12 – month
Ton 6, 9, 12, 15, 18, 21, 27 (depend on Tint) day
Tint 28 21, 14 day
Temperature (t) 19, 21, 23, 25, 27, 29, 31, 33, 35 (21, 27, 33 only) °C
Page 5 of 11Endo and Eltahir Malar J (2016) 15:578
and Ydist are required. The temperature used was the average temperature over the rainy season, because this is the major period when mosquito population dynamics and malaria transmission occur.
Estimation of Xdist and Ydist is not easy, because houses do not line up as assumed in the hypothetical setting in this study. For simplicity, Ydist was set at a fixed value of 50 m. Xdist was estimated by comparing the observational PD (Additional file 3) and the PD implied from Xdist (PDimp(Xdist)). The implied relationship between PDimp and Xdist was derived assuming the following: (a) five people live in a house, (b) household density of a village is 1/X2
dist (per m2), and (c) a fraction (1/α) of an area is pop-ulated by villages; PDimp = 5 × X−2
dist × α−1 × 10⁻⁶ (per km2). α was set at 15, so that the distribution of PD values can be captured more accurately within the Xdist values used in this study. Using the observational PD, Xdist was inferred (Additional file 3):
D2 is the proportion of pool persistence (Ton) to the storm inter-arrival time (Tint). In obtaining D2, instead of estimating Ton and Tint separately, the values of Ton/Tint were estimated. Although pool persistence was simulated explicitly for West Africa in Yamana’s study [9], deter-mining representative Ton values is challenging because natural climate forcing is neither regular nor periodic, and because Ton values vary significantly for each storm event. However, the total of Ton over the rainy season, Ttoton , can be obtained easily without any need to dif-
ferentiate storm events. The total of Tint over the rainy
Xdist =
50 if PD ≥ PDimp(Xdist = 50)
100 if PD ≥ PDimp(100) and PD < PDimp(50)
150 if PD ≥ PDimp(150) and PD < PDimp(100)
200 if PD ≥ PDimp(200) and PD < PDimp(150)
250 if PD ≥ PDimp(250) and PD < PDimp(200)
300 if PD ≥ PDimp(300)
season, on the other hand, equals Twet (Fig. 1b). Thus, in the hypothetical simulation setting, the proportion of Ttot
on to Twet equals the proportion of Ton to Tint (i.e., Ttoton/Twet = Ton/Tint). Moreover, although Ttot
on data are available only for the twelve sites used in Yamana’s study [9], a strong correlation between Ttot
on/Twet and annual-rainfall/Twet was found (Additional file 4). Ttot
on/Twet was found to scale empirically with annual-rainfall/Twet, with a factor of proportionality equal to 0.14.
Thus, D2 can be estimated from a globally available rainfall data set. The empirical equation relating D2 and rainfall data reads:
Although information on Ton and Tint is not usually available separately, Yamana’s study [9] provides reliable estimates for Ton/Tint or D2.
ResultsTimescale for stable malaria transmissionA time scale for malaria transmission, To, was intro-duced. To was defined as the time that Twet is required to last to reach R̂o = 1 under the hydrologically-saturated condition. In other words, if a static water body exists for To days of a year, annual Ro would reach the critical value of one, and malaria transmission is stable. To is thus inde-pendent of hydrological factors, Twet, Ton and Tint, but is dependent on temperature and spatial factors, Xdist and Ydist. To was obtained for each environmental condition, i.e. for different combinations of temperature, Xdist, and Ydist, by running simulations under the hydrologically-saturated condition.
The contour lines of To are shown in Fig. 2a on the plane of temperature and Xdist fixing Ydist at 50 m (results for different Ydist can be found in Additional file 5). Smaller To indicates higher malaria potential, which is always the case for smaller Xdist values. Above critical val-ues of Xdist, R̂o never reaches one, and hence To can be assumed as infinite. The condition with To = ∞ means that malaria cannot be sustained under this environmen-tal setup even with the existence of a permanent water body.
Responses of To to Xdist and temperature are non-linear, whose behaviours can be understood by looking at governing biological factors. Figure 2b illustrates the three important biological characteristic times: larval development time (blue), adult life span (red), and para-site development time in mosquito midgut (a.k.a. extrin-sic incubation period, EIP) (green). Larval development time spans mosquitoes’ aquatic life from eggs, to larvae, to pupae, and to adult emergence. In this model, the lar-val development time follows the Depinay’s equation [16], and the adult life span follows Martens’ equation
D2 = Ton/Tint = Ttoton/Twet = annual-rainfall/Twet × 0.14
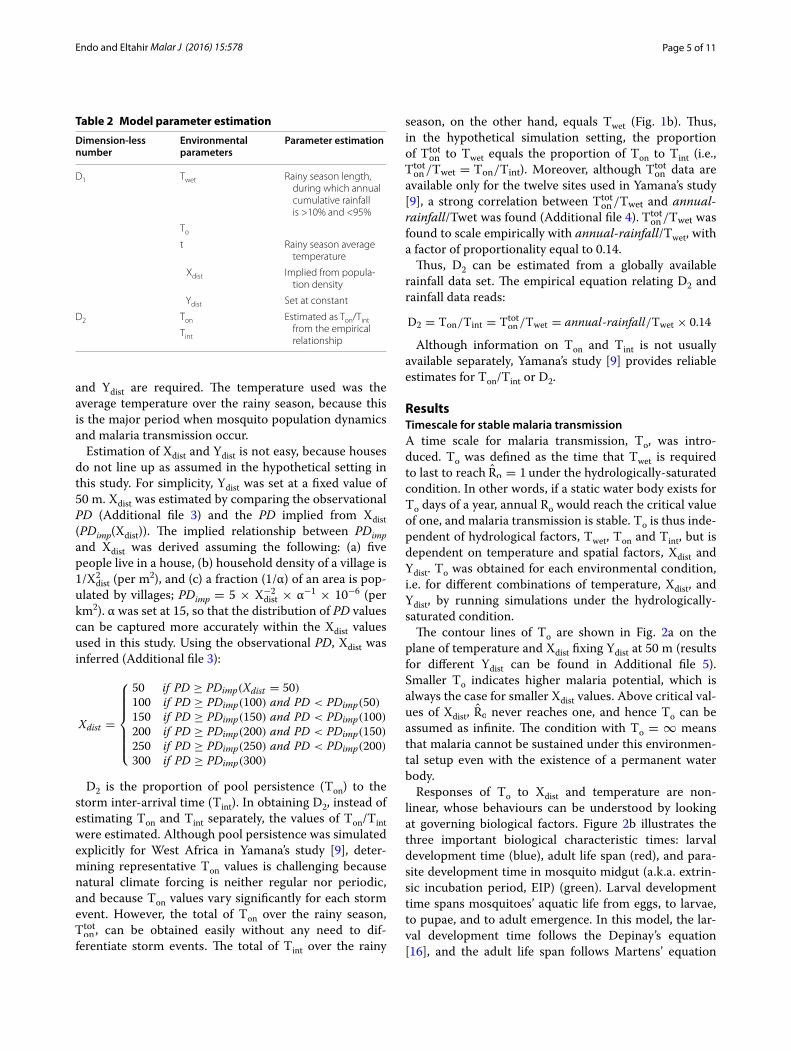
Table 2 Model parameter estimation
Dimension-less number
Environmental parameters
Parameter estimation
D1 Twet Rainy season length, during which annual cumulative rainfall is >10% and <95%
To
t Rainy season average temperature
Xdist Implied from popula-tion density
Ydist Set at constant
D2 Ton Estimated as Ton/Tint from the empirical relationship
Tint

Page 6 of 11Endo and Eltahir Malar J (2016) 15:578
[17]. The EIP is calculated using Detinova’s equation [18]. Because these biological time scales do not translate lin-early to malaria transmission potential, the behaviour of To differs from that of these timescales. In addition, the importance of these biological factors varies not just with temperature, as often asserted in the literature, but also with spatial collocation of pools and houses (Fig. 2c, d).
The contributions of larval development time, adult life span, and EIP were expressed in line with To, as Tlrv
o , Tado , and Tpara
o , respectively (for definition, see caption of Fig. 2 and “Methods” section). At small Xdist, malaria transmission is limited by EIP (Fig. 2c); even though infected mosquitoes find hosts, they are not often infec-tious yet. This effect is stronger at colder temperatures,
50
75
100
150
200
300400
Xdi
st [m
]
19 23 27 31 3550
100
150
200
250
300
oTemperature [ C]
To = Inf
19 23 27 31 350
5
10
15
20
25
30
Bio
logi
cal c
hara
cter
istic
tim
e [d
ay]
Larval dev. timeAdult life spanParasite dev. time
oTemperature [ C]
19 23 27 31 350
50
100
150
200
[day
]
ToTolarvae
Toadult
Toparasite
oTemperature [ C]19 23 27 31 350
50
100
150
200[d
ay]
ToTolarvae
Toadult
Toparasite
oTemperature [ C]
a
c
b
d
Fig. 2 Malaria time scale and contributing biological factors. a Contour lines of malaria time scale, To. Contour lines of To were drawn at intervals of 25 days from To = 50 to 100, of 50 days from To = 100 to 200, and of 100 days beyond that. Beyond the blue line, To become infinite, where the system stabilises at R̂o < 1. Ydist was set constant at 50 m. b Characteristic biological time scale. Average larval development time (aquatic stage life time from eggs to adult emergence) (blue), adult life span (red), and parasite development time (EIP) (green) are shown as a function of temperature. c To and contributing biological factors at Xdist = 100 m. To (black), Tlrvo (blue), Tado (red), and Tparao (green) are shown. Ydist was set at 50 m. d To and con-tributing biological factors at Xdist = 200 m. To (black), Tlrvo (blue), Tado (red), and Tparao (green) are shown. Ydist was set at 50 m. To (t) = To (tlrv, tad, tpara), where t = tlrv = tad = tpara. Tlrvo = To(t, tref, tref), which is a function of only tlrv. Tado = To(tref, t, tref), which is a function of only tad. Tparao = To(tref, tref, t)
, which is a function of only tpara. tlrv, tad, and tpara are temperatures that affects aquatic stage development, adult longevity, and parasite develop-ment, respectively. tref is a reference temperature set at 27 °C
Page 7 of 11Endo and Eltahir Malar J (2016) 15:578
when EIP is large. At large Xdist, mosquito life span is the main limiting factor for malaria transmission (Fig. 2d). Mosquitoes have to fly at least Xdist, between houses and pools, three times within their life time to transmit malaria. This limitation is especially strong when mos-quitoes’ life span is short at high temperature.
Universality in malaria endemic conditions in dimension-less spaceThe conditions for R̂o = 1 were mapped in a dimension-less space constructed by D1 = Twet/To and D2 = To/Tint.
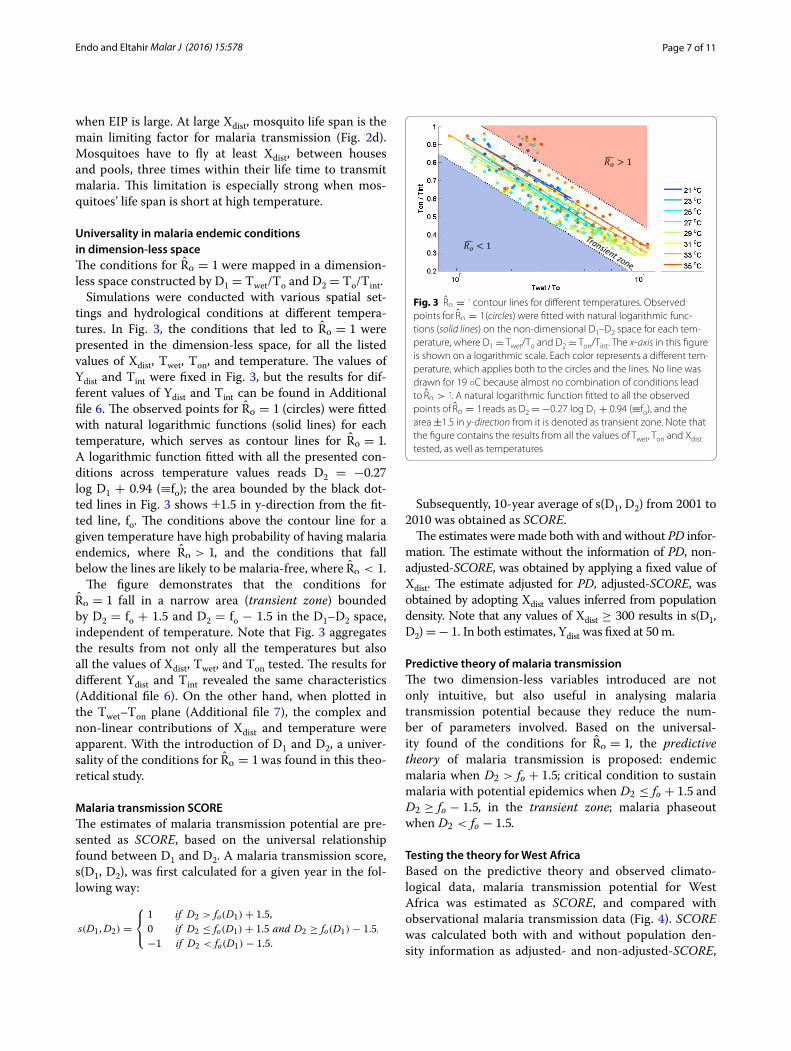
Simulations were conducted with various spatial set-tings and hydrological conditions at different tempera-tures. In Fig. 3, the conditions that led to R̂o = 1 were presented in the dimension-less space, for all the listed values of Xdist, Twet, Ton, and temperature. The values of Ydist and Tint were fixed in Fig. 3, but the results for dif-ferent values of Ydist and Tint can be found in Additional file 6. The observed points for R̂o = 1 (circles) were fitted with natural logarithmic functions (solid lines) for each temperature, which serves as contour lines for R̂o = 1. A logarithmic function fitted with all the presented con-ditions across temperature values reads D2 = −0.27 log D1 + 0.94 (≡fo); the area bounded by the black dot-ted lines in Fig. 3 shows ±1.5 in y-direction from the fit-ted line, fo. The conditions above the contour line for a given temperature have high probability of having malaria endemics, where R̂o > 1, and the conditions that fall below the lines are likely to be malaria-free, where R̂o < 1 .
The figure demonstrates that the conditions for R̂o = 1 fall in a narrow area (transient zone) bounded by D2 = fo + 1.5 and D2 = fo − 1.5 in the D1–D2 space, independent of temperature. Note that Fig. 3 aggregates the results from not only all the temperatures but also all the values of Xdist, Twet, and Ton tested. The results for different Ydist and Tint revealed the same characteristics (Additional file 6). On the other hand, when plotted in the Twet–Ton plane (Additional file 7), the complex and non-linear contributions of Xdist and temperature were apparent. With the introduction of D1 and D2, a univer-sality of the conditions for R̂o = 1 was found in this theo-retical study.
Malaria transmission SCOREThe estimates of malaria transmission potential are pre-sented as SCORE, based on the universal relationship found between D1 and D2. A malaria transmission score, s(D1, D2), was first calculated for a given year in the fol-lowing way:
s(D1,D2) =
1 if D2 > fo(D1)+ 1.5,
0 if D2 ≤ fo(D1)+ 1.5 and D2 ≥ fo(D1)− 1.5,
−1 if D2 < fo(D1)− 1.5.
Subsequently, 10-year average of s(D1, D2) from 2001 to 2010 was obtained as SCORE.
The estimates were made both with and without PD infor-mation. The estimate without the information of PD, non-adjusted-SCORE, was obtained by applying a fixed value of Xdist. The estimate adjusted for PD, adjusted-SCORE, was obtained by adopting Xdist values inferred from population density. Note that any values of Xdist ≥ 300 results in s(D1, D2) = − 1. In both estimates, Ydist was fixed at 50 m.
Predictive theory of malaria transmissionThe two dimension-less variables introduced are not only intuitive, but also useful in analysing malaria transmission potential because they reduce the num-ber of parameters involved. Based on the universal-ity found of the conditions for R̂o = 1, the predictive theory of malaria transmission is proposed: endemic malaria when D2 > fo + 1.5; critical condition to sustain malaria with potential epidemics when D2 ≤ fo + 1.5 and D2 ≥ fo − 1.5, in the transient zone; malaria phaseout when D2 < fo − 1.5.
Testing the theory for West AfricaBased on the predictive theory and observed climato-logical data, malaria transmission potential for West Africa was estimated as SCORE, and compared with observational malaria transmission data (Fig. 4). SCORE was calculated both with and without population den-sity information as adjusted- and non-adjusted-SCORE,
Fig. 3 R̂o = 1 contour lines for different temperatures. Observed points for R̂o = 1 (circles) were fitted with natural logarithmic func-tions (solid lines) on the non-dimensional D1–D2 space for each tem-perature, where D1 = Twet/To and D2 = Ton/Tint. The x-axis in this figure is shown on a logarithmic scale. Each color represents a different tem-perature, which applies both to the circles and the lines. No line was drawn for 19 ◦C because almost no combination of conditions lead to R̂o > 1. A natural logarithmic function fitted to all the observed points of R̂o = 1 reads as D2 = −0.27 log D1 + 0.94 (≡fo), and the area ±1.5 in y-direction from it is denoted as transient zone. Note that the figure contains the results from all the values of Twet, Ton and Xdist tested, as well as temperatures
Page 8 of 11Endo and Eltahir Malar J (2016) 15:578
respectively. In the adjusted-SCORE, population density data were used to extract spatial information; higher pop-ulation density was associated with smaller Xdist. In the non-adjusted-SCORE, fixed values of Xdist were applied.
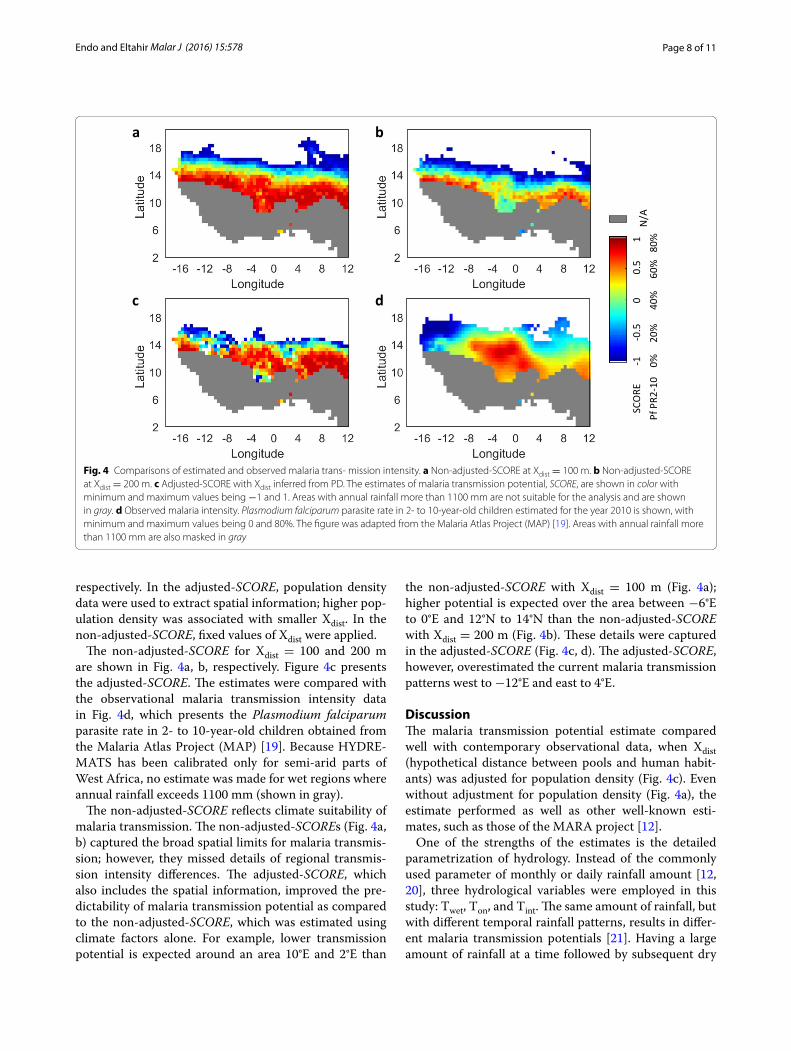
The non-adjusted-SCORE for Xdist = 100 and 200 m are shown in Fig. 4a, b, respectively. Figure 4c presents the adjusted-SCORE. The estimates were compared with the observational malaria transmission intensity data in Fig. 4d, which presents the Plasmodium falciparum parasite rate in 2- to 10-year-old children obtained from the Malaria Atlas Project (MAP) [19]. Because HYDRE-MATS has been calibrated only for semi-arid parts of West Africa, no estimate was made for wet regions where annual rainfall exceeds 1100 mm (shown in gray).
The non-adjusted-SCORE reflects climate suitability of malaria transmission. The non-adjusted-SCOREs (Fig. 4a, b) captured the broad spatial limits for malaria transmis-sion; however, they missed details of regional transmis-sion intensity differences. The adjusted-SCORE, which also includes the spatial information, improved the pre-dictability of malaria transmission potential as compared to the non-adjusted-SCORE, which was estimated using climate factors alone. For example, lower transmission potential is expected around an area 10°E and 2°E than
the non-adjusted-SCORE with Xdist = 100 m (Fig. 4a); higher potential is expected over the area between −6°E to 0°E and 12°N to 14°N than the non-adjusted-SCORE with Xdist = 200 m (Fig. 4b). These details were captured in the adjusted-SCORE (Fig. 4c, d). The adjusted-SCORE, however, overestimated the current malaria transmission patterns west to −12°E and east to 4°E.
DiscussionThe malaria transmission potential estimate compared well with contemporary observational data, when Xdist (hypothetical distance between pools and human habit-ants) was adjusted for population density (Fig. 4c). Even without adjustment for population density (Fig. 4a), the estimate performed as well as other well-known esti-mates, such as those of the MARA project [12].
One of the strengths of the estimates is the detailed parametrization of hydrology. Instead of the commonly used parameter of monthly or daily rainfall amount [12, 20], three hydrological variables were employed in this study: Twet, Ton, and Tint. The same amount of rainfall, but with different temporal rainfall patterns, results in differ-ent malaria transmission potentials [21]. Having a large amount of rainfall at a time followed by subsequent dry
SCO
RE
-1
-0.5
0
0.5
1 N
/A
Pf P
R2-1
0 0%
40
%
60%
80
%
20%
a
d c
b
Fig. 4 Comparisons of estimated and observed malaria trans- mission intensity. a Non-adjusted-SCORE at Xdist = 100 m. b Non-adjusted-SCORE at Xdist = 200 m. c Adjusted-SCORE with Xdist inferred from PD. The estimates of malaria transmission potential, SCORE, are shown in color with minimum and maximum values being −1 and 1. Areas with annual rainfall more than 1100 mm are not suitable for the analysis and are shown in gray. d Observed malaria intensity. Plasmodium falciparum parasite rate in 2- to 10-year-old children estimated for the year 2010 is shown, with minimum and maximum values being 0 and 80%. The figure was adapted from the Malaria Atlas Project (MAP) [19]. Areas with annual rainfall more than 1100 mm are also masked in gray
Page 9 of 11Endo and Eltahir Malar J (2016) 15:578
days is different from having continuous but low intensity rainfall for many days. Pool persistence, Ton, and storm inter-arrival time, Tint, account for both rainfall amount and temporal patterns. The information of Ton is rarely available from either ground observations or satellite data sets; however, a previous study [9] made it possible to estimate Ton/Tint through the association of the annual rainfall and Twet. In reality, pools persist over a range of period. Ton represents the average behaviour of pools for a given hydrological condition. Some pools disappear quicker, decreasing the total area of breeding pools. The effect of such heterogeneous pool persistence was implic-itly modeled through imposing declining probability of mosquitoes laying eggs and persistence-dependent larval mortality.
The length of the rainy season, Twet, is also an impor-tant determinant of malaria transmission, because it takes a certain time for mosquitoes to increase their pop-ulations. The effect of the rainy season length, however, is often demonstrated only implicitly, both in statistical models and in computational models. In the MARA pro-ject, Craig et al. [12] argued that malaria transmission requires 3 and 5 months of rain at relatively warm and cold regions of Africa, respectively. The MARA project, however, did not use the rainy season length itself as a model parameter, but used the 3 or 5 months as given “time windows” for calculation. The Malaria Early Warn-ing System (MEWS) is an improved version of MARA [22], and it outputs the number of months in a year dur-ing which climate conditions are suitable for malaria transmission. This notion is similar to Twet; yet the importance of Twet is better understood in comparison to To. The close description of hydrological conditions pro-vides the predictive theory with an advantage over other malaria transmission models.
The consideration of the spatial effect made the esti-mate even more accurate. This study employed the hypothetical spatial setup, and the conceptual relation-ship between the house-to-pool distance and population density. The hypothetical setting is relevant to villages near water-resources reservoirs, having a long shoreline as a vector breeding pool. In reality, the distribution of houses and pools varies significantly from place to place, and hence the hypothetical setup is not valid for many locations. However, the relationship between the house-to-pool distance and population density is based on an implied relationship and should represent the character-istic relationship of regions on a large scale.
The testing of the predictive theory produced a good malaria estimate over West Africa; however, it also has noteworthy shortcomings. First of all, although the inclu-sion of population density data improved the quality of the estimation of malaria transmission potential, the
effect of population density on malaria transmission is not straightforward. This analysis assumed that having a large population density is associated with a denser house network, and so a small distance between houses and pools, resulting in large transmission potential. A large population density, on the other hand, may be linked to economic development and to enhanced malaria con-trols, especially when an analysis is conducted at a village scale [23, 24]. The former effect appears to be stronger than the latter at the scale of the analysis, given that the spatial patterns of malaria transmission intensity were more closely reproduced by positively associating the malaria risk and population density. However, the latter effect, the negative association between the malaria risk and population density, could be dominating in some parts of the region.
Second, the estimate did not account for past and cur-rent levels of malaria interventions and human immunity, which may explain the overestimated malaria transmis-sion levels west to −12°E and east to 4°E (Fig. 4c, d) in this study. In Senegal, located around −16°E to −12°E, malaria parasite rate dropped significantly (by around 30%) between 2000 and 2015 due to extensive malaria control programmes [25, 26]. Around 4°E to 12°E and 12°N to 14°N is Southern Niger, where Hausa-Fulani peo-ple live. The overestimation around this region may be accounted for by the unique low-susceptibility to malaria of the Hausa-Fulani people [27]. In this sense, this esti-mate addressed the climatic and environmental suit-ability for malaria transmission in the absence of human controls. The estimate of actual malaria transmission intensity is useful; however, the climatic and environ-mental suitability for malaria transmission is also vital information for malaria control programmes.
To is a biological time scale introduced in this study, which is associated with the time needed to reach R̂o = 1 under the assumption of the hydrologically-saturated condition. The calculation of To depends on temperature and spatial settings of houses and pools but is independ-ent of hydrological conditions, i.e., Twet, Ton, and Tint.
Malaria transmission is complex, requiring many fac-tors to be considered. The introduction of To, together with the two dimension-less variables, D1 = Twet/To and D2 = Ton/Tint disclosed a universality in the condi-tions for stable malaria transmission. D1 and D2 not only reduce the number of malaria transmission determi-nants, but are also intuitive. Readers should, however, be aware that the values of To were obtained for relatively dry regions in West Africa. For other regions with more or less competent vectors, or with other limiting factors in play, the values of To should be evaluated accordingly.
The application of To and the predictive theory is not limited to the estimation of malaria transmission
Page 10 of 11Endo and Eltahir Malar J (2016) 15:578
potential; it also offers guidelines regarding the mini-mum distances that houses and pools should be apart to prevent malaria, as shown in the following examples. Firstly, To helps in defining the house-to-pool distances needed to prevent malaria transmissions around per-manent water bodies, such as water-resources reser-voirs. To prevent malaria near a permanent water body, where the condition compares with the hydrologically-saturated condition, To should be infinite. To can be rendered infinite by locating houses away from pools by a certain distance, whose value depends on temperature (Fig. 2). Secondly, malaria-preventive distances between houses and pools can also be inferred for other general conditions from the predictive theory and the To–Xdist relationship [from climatological data, Ton/Tint can be estimated as described in this paper’s “Methods” sec-tion. By using the Ton/Tint with the predictive theory (Fig. 3), Twet/To associated with Ro = 1 can be found. As Twet can be obtained from climatological data, To can be calculated. Finally, applying the To–Xdist relationship (Fig. 2a) for a given temperature, an Xdist value leading to the Ro = 1 condition can be found]. Malaria-resistant villages would require that houses should be located fur-ther than the critical distances, or that pools should be removed within the critical distances from houses.
The critical distances to prevent malaria found in this study also provide guidance for resource allocation. When relocation of settlements or removal of pools is not feasible, conventional interventions, such as distri-bution of bednets, remain primary malaria control strat-egy. The critical distances presented in this study shows the distance from pools within which such intervention should be prioritized. This study provides a useful guid-ance for estimating malaria transmission potential, and for designing malaria resistant villages by controlling house-to-pool distances. Ro values and critical distances suggested in this study should not be taken as abso-lute values that fit every condition, but they should be adjusted depending on the details of the local environ-ment. In particular, malaria transmission potential and critical malaria-preventive distances depend on the dis-tribution of houses and the initial number of mosquitoes in the beginning of the rainy seasons. The impact of dif-ferent house distribution could be a future research topic. The sensitivity to the initial mosquito population is not the focus of this study; how and how many mosquitoes emerge after a long dry period are the questions yet to be clarified. At the limit of no mosquitoes surviving after a long dry season, the potential for malaria transmis-sion would not exist even under the wettest hydrologic condition. The appearance of mosquito population after a long dry period can be explained either by aestivation or migration [28], and imposing the minimum mosquito
population in HYDREMARS conceptually agree with the aestivation hypothesis.
ConclusionIn fighting malaria, the use of medicine and bed-nets are effective approaches that can be deployed in malaria-endemic regions. Here, this study emphasizes alterna-tive preventive measures and suggested that effective environmental planning may offer a more sustainable approach that addresses the root cause of the problem. In order to reduce the dimension of malaria transmission determinants, and to aid environmental manipulation for malaria prevention, the predictive theory was developed and tested against observations.
The predictive theory, constructed with the two dimen-sionless parameters, is useful in measuring malaria trans-mission potential. The two dimensionless parameters contain information of many hydroclimatological and environmental factors. The comparison between the malaria estimate from the predictive theory and the obser-vational data illustrated the importance of the spatial col-location of vector breeding pools and human habitats.
The predictive theory can provide guidelines on how to plan the layout of human habitats in order to prevent endemic malaria. Malaria-resistant villages can be designed by locating houses further than critical distances away from breeding pools or by removing pools within a critical dis-tance from houses; the critical distance is described in the context of local climatology and hydrology.
AbbreviationsHYDREMATS: hydrology, entomology, and malaria transmission simulator; Ro: basic reproduction rate; R̂o: long-term average of Ro calculated in HYDRE-MATS. R̂o =
(
∑Ninfi=1 R
io
)
/Ninf ; Rio: the number of infections generated from the i-th infectious person, assuming that the population is fully susceptible; Ninf: the number of infectious people simulated over the simulation period of four years; Xdist: distance between vector breeding pools and human habitats (horizontal distance) (m); Ydist: distance between human habitats (longitudinal distance) (m); Twet: length of the rainy season (days); Tint: storm inter-arrival time (days); Ton: pool persistence (days); To: malaria time scale. The length of the rainy season required to reach R̂o = 1 under the hydrologically-saturated condition at a given temperature and a given spatial condition.
Additional files
Additional file 1. Malaria intensity and hydroclimatological conditions in West Africa.
Additional file 2. Cumulative rainfall and Twet for twelve sites in West Africa.
Additional file 3. Population density and inferred Xdist in West Africa.
Additional file 4. Comparison between Tontot /Twet and annual-rainfall/Twet.
Additional file 5. Contour lines of To at different Ydist values.
Additional file 6. Conditions for R̂o = 1 and the sensitivity to Xdist, Ydist and Tint.
Additional file 7. R̂o = 1 contour lines on the plane of Ton and Twet.

Page 11 of 11Endo and Eltahir Malar J (2016) 15:578
To(t) = To(tlrv, tad, tpara), where this study assumes t = tlrv = tad = tpara (days); t: temperature (°C); tlrv: temperature that influences aquatic-stage development (°C); tad: temperature that influences adult life span (°C); tpara: temperature that influences parasite development (°C); tref: reference temperature set at 27 (°C); T lrvo (t): T lrvo (t) = To(t, tref , tref ); T ado (t): T ado (t) = To(tref , t, tref ); T
parao (t)
: T parao (t) = To(tref , tref , t); D1: dimensionless parameter. D1 = Twet/To; D2: dimensionless parameter. D2 = Ton/Tint; PD: population density (per km2); PDimp: implied population density (per km2). PDimp = 5 × X−2
dist × α−1 × 10⁻⁶, with α being set at 15; s(D1, D2): malaria transmission score calculated for a year; SCORE: malaria transmission estimate. Ten-year average of s(D1, D2) from 2001 to 2010; EIP: extrinsic incubation period.
Authors’ contributionsNE and EABE conceived and designed the study. EABE supervised the research. NE performed the computational experiments, and wrote the manu-script. NE and EABE edited and approved the final manuscript. All authors read and approved the final manuscript.
AcknowledgementsThis work was supported by the U.S. National Science Foundation and by the Cooperative Agreement between the Masdar Institute of Science and Tech-nology (Masdar Institute), Abu Dhabi, UAE and the Massachusetts Institute of Technology (MIT), Cambridge, MA, USA.
Competing interestsThe authors declare that they have no competing interests.
Availability of data and materialsAll the data used in this study are available upon request.
FundingThis work was funded by the U.S. National Science Foundation grant EAR-0946280 and by the Cooperative Agreement between the Masdar Institute of Science and Technology (Masdar Institute), Abu Dhabi, UAE and the Mas-sachusetts Institute of Technology (MIT), Cambridge, MA, USA Reference 02/MI/MI/CP/11/07633/GEN/G/00.
Received: 6 September 2016 Accepted: 23 November 2016
References 1. Gu W, Regens JL, Beier JC, Novak RJ. Source reduction of mosquito larval
habitats has unexpected consequences on malaria transmission. Proc Natl Acad Sci USA. 2006;103:17560–3.
2. Bomblies A. Agent-based modeling of malaria vectors: the importance of spatial simulation. Parasit Vectors. 2014;7:308.
3. Minakawa N, Seda P, Yan G. Influence of host and larval habitat distribu-tion on the abundance of African malaria vectors in Western Kenya. Am J Trop Med Hyg. 2002;67:32–8.
4. van der Hoek W, Konradsen F, Amerasinghe PH, Perera D, Piyaratne M, Amerasinghe FP. Towards a risk map of malaria for Sri Lanka: the impor-tance of house location relative to vector breeding sites. Int J Epidemiol. 2003;32:280–5.
5. Cano J, Descalzo MA, Moreno M, Chen Z, Nzambo S, Bobuakasi L, et al. Spatial variability in the density, distribution and vectorial capacity of anopheline species in a high transmission village (Equatorial Guinea). Malar J. 2006;5:21.
6. Zhou G, Munga S, Minakawa N, Githeko AK, Yan G. Spatial relationship between adult malaria vector abundance and environmental factors in Western Kenya highlands. Am J Trop Med Hyg. 2007;77:29–35.
7. Bomblies A, Duchemin JB, Eltahir EAB. Hydrology of malaria: model development and application to a Sahelian village. Water Resour Res. 2008;44:W12445. doi:10.1029/2008WR006917.
8. Bomblies A, Duchemin JB, Eltahir EAB. A mechanistic approach for accu-rate simulation of village scale malaria transmission. Malar J. 2009;8:223.
9. Yamana TK, Bomblies A, Eltahir EAB. Climate change unlikely to increase malaria burden in West Africa. Nat Clim Chang. 2016;6:1009–13.
10. Macdonald G. The measurement of malaria transmission. Proc R Soc Med. 1955;48:295–302.
11. WHO. World malaria report 2015. Geneva: World Health Organization; 2015.
12. Craig M, Le Sueur D, Snow B. A climate-based distribution model of malaria transmission in sub-Saharan Africa. Parasitol Today. 1999;15:105–11.
13. Kleinschmidt I, Omumbo J, Briet O, Van De Giesen N, Sogoba N, Mensah NK, et al. An empirical malaria distribution map for West Africa. Trop Med Int Health. 2001;6:779–86.
14. Mitchell TD, Jones PD. An improved method of constructing a database of monthly climate observations and associated high-resolution grids. Int J Climatol. 2005;25:693–712.
15. Columbia University. Gridded Population of the World Version 3 (GPWv3). 2005.
16. Depinay JMO, Mbogo CM, Killeen G, Knols B, Beier J, Carlson J, et al. A simulation model of African Anopheles ecology and population dynam-ics for the analysis of malaria transmission. Malar J. 2004;3:29.
17. Martens P, Gellert GA. Health and climate change: modelling the impacts of global warming and ozone depletion. Nature. 1998;393:176.
18. Detinova TS. Age-grouping methods in Diptera of medical importance with special reference to some vectors of malaria. Monograph Ser World Health Organ. 1962;47:13–191.
19. Hay SI, Guerra CA, Gething PW, Patil A, Tatem AJ, Noor AM, et al. A world malaria map: Plasmodium falciparum endemicity in 2007. PLoS Med. 2009;6:0286–302.
20. Ermert V, Fink AH, Jones AE, Morse AP. Development of a new version of the Liverpool Malaria Model. I. Refining the parameter settings and mathematical formulation of basic processes based on a literature review. Malar J. 2011;10:35.
21. Bomblies A. Modeling the role of rainfall patterns in seasonal malaria transmission. Clim Change. 2012;112:673–85.
22. Grover-Kopec EK, Blumenthal MB, Ceccato P, Dinku T, Omumbo JA, Con-nor SJ. Web-based climate information resources for malaria control in Africa. Malar J. 2006;5:38.
23. Hay SI, Guerra CA, Tatem AJ, Atkinson PM, Snow RW. Urbanization, malaria transmission and disease burden in Africa. Nat Rev Microbiol. 2005;3:81–90.
24. Tatem AJ, Guerra CA, Kabaria CW, Noor AM, Hay SI. Human population, urban settlement patterns and their impact on Plasmodium falciparum malaria endemicity. Malar J. 2008;7:218.
25. Roll back malaria: focus on senegal. Progress & impact series, Number 4. Technical report, Geneva: World Health Organization; 2010.
26. Bhatt S, Weiss DJ, Cameron E, Bisanzio D, Mappin B, Dalrymple U, et al. The effect of malaria control on Plasmodium falciparum in Africa between 2000 and 2015. Nature. 2015;526:207–11.
27. Torcia MG, Santarlasci V, Cosmi L, Clemente A, Maggi L, Mangano VD, et al. Functional deficit of T regulatory cells in Fulani, an ethnic group with low susceptibility to Plasmodium falciparum malaria. Proc Natl Acad Sci USA. 2008;105:646–51.
28. Lehmann T, Dao A, Yaro AS, Adamou A, Kassogue Y, Diallo M, et al. Aesti-vation of the African malaria mosquito, Anopheles gambiae in the Sahel. Am J Trop Med Hyg. 2010;83:601–6.
Related Documents