MARINE ECOLOGY PROGRESS SERIES Mar Ecol Prog Ser Vol. 464: 153–165, 2012 doi: 10.3354/meps09822 Published September 19 INTRODUCTION Animal body size has an important influence on many physiological and ecological traits (Atkinson & Hirst 2007, Seibel 2007, Rosa et al. 2009), community growth and abundance (Blackburn & Gaston 1999, White et al. 2007) and ecosystem-scale energy flux and storage (Peters 1986). As a result, considerable effort has been devoted to the study of spatial pat- terns in body size, especially across large environ- mental gradients, to understand the organization of ecological communities. Bergmann (1847) was the first to propose a biogeographic ‘rule’ stating that smaller endotherms should, in general, abound in warmer areas, while larger-bodied species would inhabit colder climates. Underlying this hypothesis was the idea that a reduced surface to volume ratio at larger sizes facilitates greater heat conservation, allowing a lower mass-specific metabolic rate, whereas larger ratios in smaller individuals facilitate heat loss. In the same context, but for ectothermic animals, a ‘temperature-size rule’ was postulated (Atkinson 1994), which argues that at lower temperatures (higher latitudes), ectotherms generally exhibit lower growth rates and delayed maturation but also grow to a larger body size. At higher temperatures, they tend to grow faster and mature at smaller sizes, but their adult body size is reduced. Although both © Inter-Research 2012 · www.int-res.com *Email: [email protected] Environmental determinants of latitudinal size-trends in cephalopods Rui Rosa 1, *, Liliana Gonzalez 2 , Heidi M. Dierssen 3 , Brad A. Seibel 4 1 Laboratório Marítimo da Guia, Centro de Oceanografia, Faculdade de Ciências da Universidade de Lisboa, Av. Nossa Senhora do Cabo, 939, 2750-374 Cascais, Portugal 2 Department of Computer Science and Statistics, University of Rhode Island, 9 Greenhouse Road, Kingston, Rhode Island 02881, USA 3 Department of Marine Sciences, University of Connecticut, 1080 Shennecossett Road, Groton, Connecticut 06340-6048, USA 4 Department of Biological Sciences, University of Rhode Island, 100 Flagg Road, Kingston, Rhode Island 02881, USA ABSTRACT: Understanding patterns of body size variation is a fundamental goal in ecology, but although well studied in the terrestrial biota, little is known about broad-scale latitudinal trends of body size in marine fauna and much less about the factors that drive them. We conducted a com- prehensive survey of interspecific body size patterns in coastal cephalopod mollusks, covering both hemispheres in the western and eastern Atlantic. We investigated the relationship between body size and thermal energy, resource and habitat availability and depth ranges. Both latitude and depth range had a significant effect on maximum body size in each of the major cephalopod groups (cuttlefishes, squids and octopuses). We observed significant negative associations between sea surface temperature (SST) and body size. No consistent relationships between body size and either net primary productivity (NPP), habitat extent (shelf area) or environmental varia- tion (range of SST and NPP) were found. Thus, temperature seemed to play the most important role in structuring the distribution of cephalopod body size along the continental shelves of the Atlantic Ocean, and resource availability, seasonality or competition only played a limited role in determining latitudinal body size patterns. KEY WORDS: Body size · Ectotherms · Cephalopods · Thermal energy · Resource availability · Latitude · Temperature-size rule Resale or republication not permitted without written consent of the publisher

Welcome message from author
This document is posted to help you gain knowledge. Please leave a comment to let me know what you think about it! Share it to your friends and learn new things together.
Transcript
MARINE ECOLOGY PROGRESS SERIESMar Ecol Prog Ser
Vol. 464: 153–165, 2012doi: 10.3354/meps09822
Published September 19
INTRODUCTION
Animal body size has an important influence onmany physiological and ecological traits (Atkinson &Hirst 2007, Seibel 2007, Rosa et al. 2009), communitygrowth and abundance (Blackburn & Gaston 1999,White et al. 2007) and ecosystem-scale energy fluxand storage (Peters 1986). As a result, considerableeffort has been devoted to the study of spatial pat-terns in body size, especially across large environ-mental gradients, to understand the organization ofecological communities. Bergmann (1847) was thefirst to propose a biogeographic ‘rule’ stating thatsmaller endotherms should, in general, abound inwarmer areas, while larger-bodied species would
inhabit colder climates. Underlying this hypothesiswas the idea that a reduced surface to volume ratio atlarger sizes facilitates greater heat conservation,allowing a lower mass-specific metabolic rate,whereas larger ratios in smaller individuals facilitateheat loss.
In the same context, but for ectothermic animals, a‘temperature-size rule’ was postulated (Atkinson1994), which argues that at lower temperatures(higher latitudes), ectotherms generally exhibit lowergrowth rates and delayed maturation but also growto a larger body size. At higher temperatures, theytend to grow faster and mature at smaller sizes, buttheir adult body size is reduced. Although both
© Inter-Research 2012 · www.int-res.com*Email: [email protected]
Environmental determinants of latitudinal size-trends in cephalopods
Rui Rosa1,*, Liliana Gonzalez2, Heidi M. Dierssen3, Brad A. Seibel4
1Laboratório Marítimo da Guia, Centro de Oceanografia, Faculdade de Ciências da Universidade de Lisboa, Av. Nossa Senhora do Cabo, 939, 2750-374 Cascais, Portugal
2Department of Computer Science and Statistics, University of Rhode Island, 9 Greenhouse Road, Kingston, Rhode Island 02881, USA
3Department of Marine Sciences, University of Connecticut, 1080 Shennecossett Road, Groton, Connecticut 06340-6048, USA4Department of Biological Sciences, University of Rhode Island, 100 Flagg Road, Kingston, Rhode Island 02881, USA
ABSTRACT: Understanding patterns of body size variation is a fundamental goal in ecology, butalthough well studied in the terrestrial biota, little is known about broad-scale latitudinal trends ofbody size in marine fauna and much less about the factors that drive them. We conducted a com-prehensive survey of interspecific body size patterns in coastal cephalopod mollusks, coveringboth hemispheres in the western and eastern Atlantic. We investigated the relationship betweenbody size and thermal energy, resource and habitat availability and depth ranges. Both latitudeand depth range had a significant effect on maximum body size in each of the major cephalopodgroups (cuttlefishes, squids and octopuses). We observed significant negative associationsbetween sea surface temperature (SST) and body size. No consistent relationships between bodysize and either net primary productivity (NPP), habitat extent (shelf area) or environmental varia-tion (range of SST and NPP) were found. Thus, temperature seemed to play the most importantrole in structuring the distribution of cephalopod body size along the continental shelves of theAtlantic Ocean, and resource availability, seasonality or competition only played a limited role indetermining latitudinal body size patterns.
KEY WORDS: Body size · Ectotherms · Cephalopods · Thermal energy · Resource availability ·Latitude · Temperature-size rule
Resale or republication not permitted without written consent of the publisher
Mar Ecol Prog Ser 464: 153–165, 2012
hypotheses suggest that ambient energy (tempera-ture) is the best environmental explanatory variablefor the latitudinal-size trends, both lack a convincingmechanistic explanation. The resource availability(primary productivity) hypothesis assumes that bodymass must be maintained by a sufficient food supplyand predicts greater body sizes in more productiveareas (Rosenzweig 1968). However, it is worth notingthat cephalopods are voracious carnivores with manydifferent feeding strategies that enable them to feedopportunistically on a wide range of prey (Rosa et al.2004), and their growth seems to be primarily limitedby predation rather than food shortages (Wood &O’Dor 2000).
Some also argue that species adopt smaller bodysizes in more equatorial areas because of increasedinter- and intra-specific competition for resources(McNab 1971, Ashton et al. 2000). Because the feed-ing, behavior and reproduction of neritic cuttlefish,octopuses and squids are closely associated withseabed characteristics, one may argue that the largercontinental shelves near the poles (i.e. greater habi-tat availability) could affect cephalopod body sizevariation by reducing competition. Moreover, varia-tion in oxygen availability has been suggested toexplain polar gigantism (Chapelle & Peck 1999) andsize increase in the deep sea (McClain & Rex 2001,but also see Spicer & Gaston 1999 for a rebuttal ofthis idea). Seasonality (or fasting endurance) has alsobeen advocated to explain latitudinal size clines inboth endo- and ectotherms, with large-bodied spe-cies being favored in colder and more variable envi-ronments because they can store more energyreserves (namely fat) to enhance survival during sea-sonal shortages of resources (Lindsey 1966, Boyce1979). In marine systems, some argue that coastalanimals tend to be bigger than deeper living counter-parts (see the ‘size-structure hypothesis’ by Thiel1975, 1979). Yet, the generality of this phenomenon isnot convincing because body size has been reportedto decrease, increase or show no association withdepth (see reviews by Gage & Tyler 1991, Rex & Etter1998).
Although body size has been well studied in terres-trial biota, large-scale marine surveys of body sizehave been conducted only for fish (Lindsey 1966,Macpherson & Duarte 1994), amphipods (Poulin &Hamilton 1995, Chapelle & Peck 1999), gastropods(Frank 1975, Olabarria & Thurston 2003) and bivalvemollusks (Roy & Martien 2001). Only 2 of these stud-ies have covered both hemispheres (Poulin & Hamil-ton 1995, Chapelle & Peck 1999). In fact, while bathy-metric variations in body size have been fairly well
documented (Rex & Etter 1998, Rex et al. 1999, 2006,McClain & Rex 2001, McClain 2004, McClain et al.2006), very little is known about broad-scale latitudi-nal trends in body size in marine fauna, and muchless about the factors that drive them.
Here, we provide a comprehensive survey of large-scale interspecific body size patterns for cephalopodmollusks along the continental shelves on both sidesof the Atlantic. Furthermore, we investigate the rela-tionship between latitudinal size trends and sea sur-face temperature (SST, an indicator of energy avail-ability), net primary productivity (NPP, an indicatorof resource availability), SST and NPP range (a proxyof seasonality) and shelf area (habitat availability, asa surrogate for competition), with depth ranges takeninto account.
METHODS
Species data
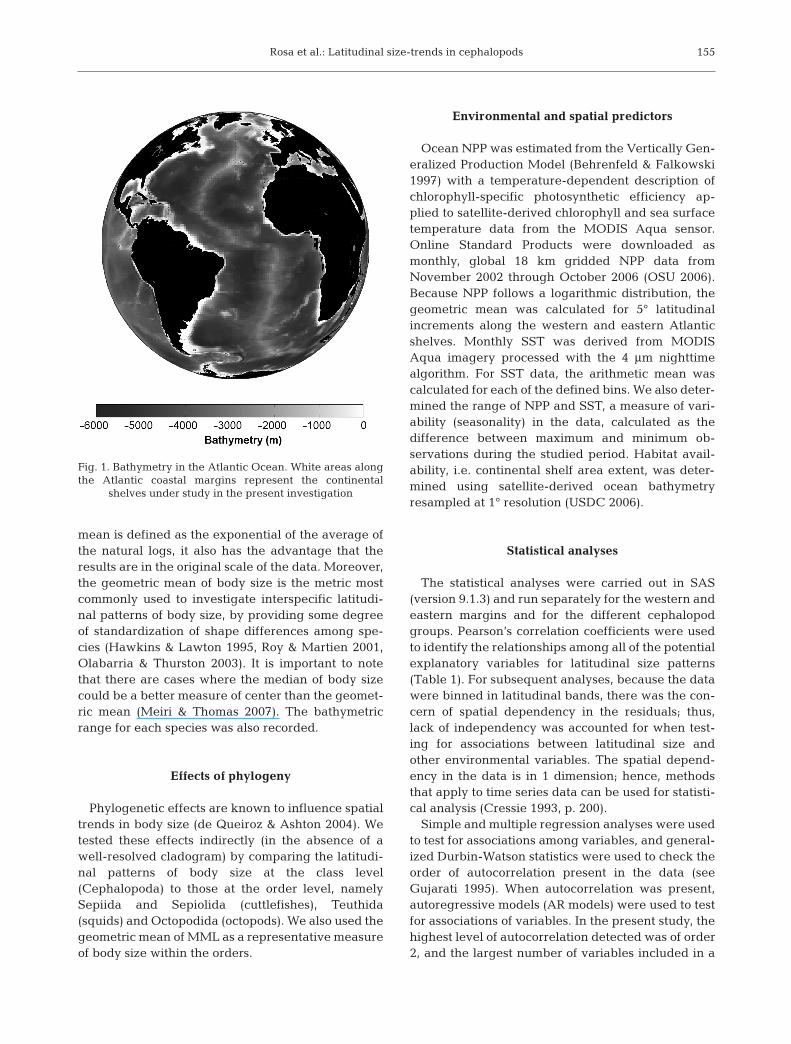
After the assemblage of a species diversity data-base of cephalopods in the continental shelves (Rosaet al. 2008a), here, we present the latitudinal rangesand body sizes of coastal cephalopod fauna, i.e. spe-cies that are associated with, but not restricted to,continental shelves and depths shallower than 200 min the Atlantic Ocean (Fig. 1). The body size databasewas constructed based on a comprehensive search ofprimary literature (e.g. Voss et al. 1998, Jereb &Roper 2005), regional faunal compilations (e.g. Rosa& Sousa Reis 2004) and expedition reports. Further-more, an additional search was carried out in severaljournals that publish papers on the taxonomy andbiogeography of cephalopod species (see Appendix 1for more details). To examine the relationshipbetween body size and latitude, we divided the west-ern and eastern Atlantic corridors into 5° latitudinalbins. Existing information on cephalopod biogeogra-phy did not permit finer resolution. We used the geo-metric mean of maximum length as a measure of size(here as maximum mantle length, MML). Although itis not the most common measure used to define lati-tudinal size patterns, MML is the most common stan-dard measure (and sometimes the only available) forcephalopod species. The body size variable for eachof the assemblages in each of the latitudinal bins hadmaximum skewness of 2.18 on the eastern side and1.89 on the western side. The geometric mean is auseful measure of center when the distribution of thelog-transformed original variable is made more sym-metrical (Dallal 2007), and because the geometric
154
Rosa et al.: Latitudinal size-trends in cephalopods 155
mean is defined as the exponential of the average ofthe natural logs, it also has the advantage that theresults are in the original scale of the data. Moreover,the geometric mean of body size is the metric mostcommonly used to investigate interspecific latitudi-nal patterns of body size, by providing some degreeof standardization of shape differences among spe-cies (Hawkins & Lawton 1995, Roy & Martien 2001,Olabarria & Thurston 2003). It is important to notethat there are cases where the median of body sizecould be a better measure of center than the geomet-ric mean (Meiri & Thomas 2007). The bathymetricrange for each species was also recorded.
Effects of phylogeny
Phylogenetic effects are known to influence spatialtrends in body size (de Queiroz & Ashton 2004). Wetested these effects indirectly (in the absence of awell-resolved cladogram) by comparing the latitudi-nal patterns of body size at the class level(Cephalopoda) to those at the order level, namelySepiida and Sepiolida (cuttlefishes), Teuthida(squids) and Octopodida (octopods). We also used thegeometric mean of MML as a representative measureof body size within the orders.
Environmental and spatial predictors
Ocean NPP was estimated from the Vertically Gen-eralized Production Model (Behrenfeld & Falkowski1997) with a temperature-dependent description ofchlorophyll-specific photosynthetic efficiency ap -plied to satellite-derived chlorophyll and sea surfacetemperature data from the MODIS Aqua sensor.Online Standard Products were downloaded asmonthly, global 18 km gridded NPP data fromNovember 2002 through October 2006 (OSU 2006).Because NPP follows a logarithmic distribution, thegeometric mean was calculated for 5° latitudinalincrements along the western and eastern Atlanticshelves. Monthly SST was derived from MODISAqua imagery processed with the 4 μm nighttimealgorithm. For SST data, the arithmetic mean wascalculated for each of the defined bins. We also deter-mined the range of NPP and SST, a measure of vari-ability (seasonality) in the data, calculated as the difference between maximum and minimum ob -servations during the studied period. Habitat avail-ability, i.e. continental shelf area extent, was deter-mined using satellite-derived ocean bathymetryresampled at 1° resolution (USDC 2006).
Statistical analyses
The statistical analyses were carried out in SAS(version 9.1.3) and run separately for the western andeastern margins and for the different cephalopodgroups. Pearson’s correlation coefficients were usedto identify the relationships among all of the potentialexplanatory variables for latitudinal size patterns(Table 1). For subsequent analyses, because the datawere binned in latitudinal bands, there was the con-cern of spatial dependency in the residuals; thus,lack of independency was accounted for when test-ing for associations between latitudinal size andother environmental variables. The spatial depend-ency in the data is in 1 dimension; hence, methodsthat apply to time series data can be used for statisti-cal analysis (Cressie 1993, p. 200).
Simple and multiple regression analyses were usedto test for associations among variables, and general-ized Durbin-Watson statistics were used to check theorder of autocorrelation present in the data (seeGujarati 1995). When autocorrelation was present,autoregressive models (AR models) were used to testfor associations of variables. In the present study, thehighest level of autocorrelation detected was of order2, and the largest number of variables included in a
Fig. 1. Bathymetry in the Atlantic Ocean. White areas alongthe Atlantic coastal margins represent the continental
shelves under study in the present investigation
Mar Ecol Prog Ser 464: 153–165, 2012
model was 2. Thus, a multiple regression model with2 independent variables and second order autore-gressive errors is defined as follows:
yl = β0 + β1 x1l + β2 x2l + εl (1)
εl = ρ1 εl−1 + ρ2 εl−2 + al (2)
where yl and xil for i =1,2 are the observations of theresponse (size) and predictor variables (i.e. sea sur-face temperature, depth, etc.) respectively, at lati-tude l, εl is the error term in the model at latitude l, al
is a normally and independently distributed (0, σ2a)
random variable, and ρi with i = 1, 2 is the autocorre-lation parameter or order 1 and 2 respectively. Thismodel can easily be converted to a simple regressionmodel by making β2 = 0 and to have an autoregres-sive error of order 1 by setting ρ2 = 0. If no autocorre-lation is present in the model, then ρi = 0 for i = 1, 2.
The AUTOREG procedure in SAS was used for theanalyses, and the method of maximum likelihoodwas chosen over the Yule-Walker approach as themethod of estimation because some of the data con-tained missing values (SAS 2008). Also, the estimatesof standard errors calculated with the maximum like-lihood method take into account the joint estimationof the regression parameters and AR componentsand may give more accurate standard errors than theYule-Walker method. The goodness of fit statisticsreported are the total-R2 and the Akaike’s informa-tion criterion (AIC):
R2tot = 1 − [SSE�SSTotal] (3)
where SSTotal is defined as the corrected sum ofsquares total for the response variable, and SSE is thefinal error sum of squares. AIC is defined as follows:
AIC = −2ln(L) + 2k (4)
where L is the value of the likelihood function evalu-ated at the parameter estimates, and k is the numberof estimated parameters.
RESULTS
Latitude and body size
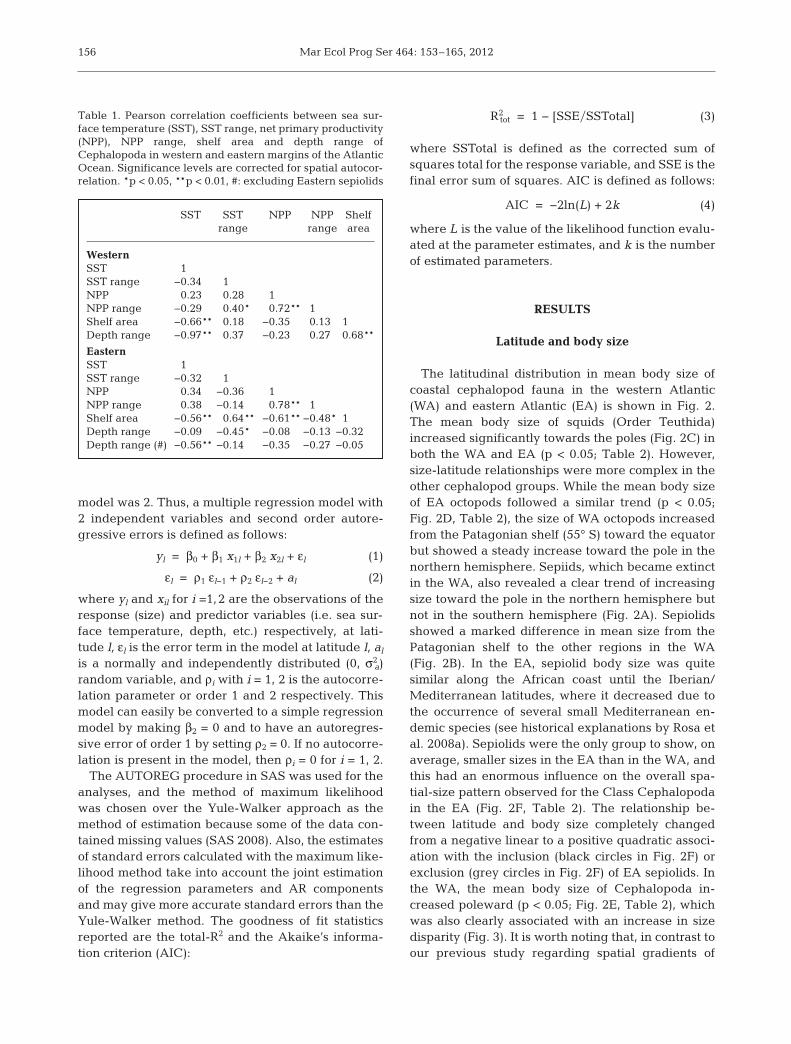
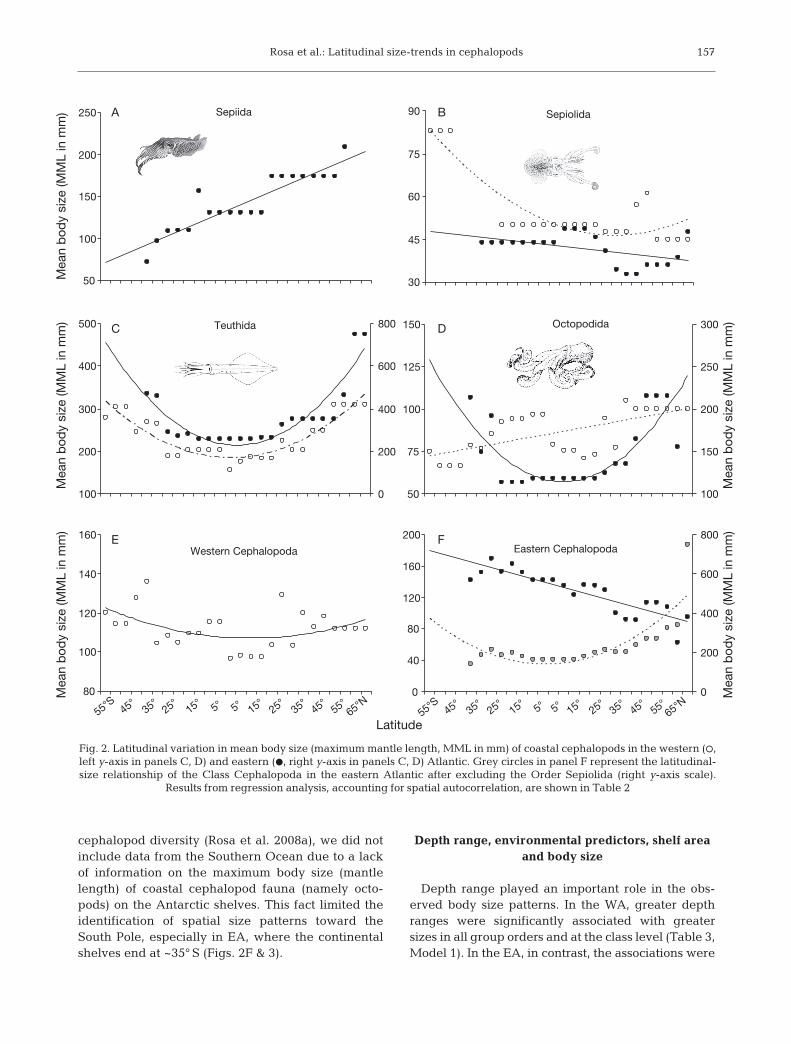
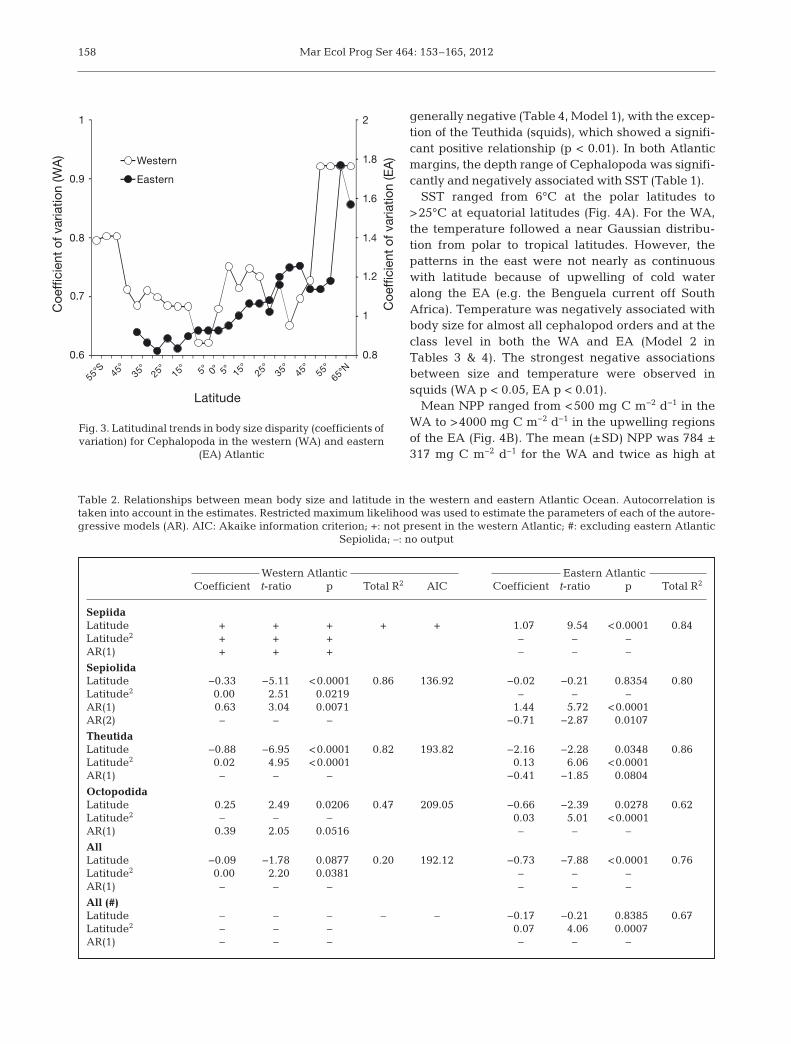
The latitudinal distribution in mean body size ofcoastal cephalopod fauna in the western Atlantic(WA) and eastern Atlantic (EA) is shown in Fig. 2.The mean body size of squids (Order Teuthida)increased significantly towards the poles (Fig. 2C) inboth the WA and EA (p < 0.05; Table 2). However,size-latitude relationships were more complex in theother cephalopod groups. While the mean body sizeof EA octopods followed a similar trend (p < 0.05;Fig. 2D, Table 2), the size of WA octopods increasedfrom the Patagonian shelf (55° S) toward the equatorbut showed a steady in crease toward the pole in thenorthern hemisphere. Sepiids, which became extinctin the WA, also revealed a clear trend of increasingsize toward the pole in the northern hemisphere butnot in the southern hemisphere (Fig. 2A). Sepiolidsshowed a marked difference in mean size from thePatagonian shelf to the other regions in the WA(Fig. 2B). In the EA, sepiolid body size was quite similar along the African coast until the Iberian/Mediterranean latitudes, where it decreased due tothe occurrence of several small Mediterranean en -demic species (see historical explanations by Rosa etal. 2008a). Sepiolids were the only group to show, onaverage, smaller sizes in the EA than in the WA, andthis had an enormous influence on the overall spa-tial-size pattern observed for the Class Cephalo podain the EA (Fig. 2F, Table 2). The relationship be -tween latitude and body size completely changedfrom a negative linear to a positive quadratic associ-ation with the inclusion (black circles in Fig. 2F) orexclusion (grey circles in Fig. 2F) of EA sepiolids. Inthe WA, the mean body size of Cephalopoda in -creased poleward (p < 0.05; Fig. 2E, Table 2), whichwas also clearly associated with an increase in sizedisparity (Fig. 3). It is worth noting that, in contrast toour previous study regarding spatial gradients of
156
SST SST NPP NPP Shelfrange range area
WesternSST 1SST range −0.34 1NPP 0.23 0.28 1NPP range −0.29 0.40* 0.72** 1Shelf area −0.66** 0.18 −0.35 0.13 1Depth range −0.97** 0.37 −0.23 0.27 0.68**
EasternSST 1SST range −0.32 1NPP 0.34 −0.36 1NPP range 0.38 −0.14 0.78** 1Shelf area −0.56** 0.64** −0.61** −0.48* 1Depth range −0.09 −0.45* −0.08 −0.13 −0.32Depth range (#) −0.56** −0.14 −0.35 −0.27 −0.05
Table 1. Pearson correlation coefficients between sea sur-face temperature (SST), SST range, net primary productivity(NPP), NPP range, shelf area and depth range ofCephalopoda in western and eastern margins of the AtlanticOcean. Significance levels are corrected for spatial autocor-relation. *p < 0.05, **p < 0.01, #: excluding Eastern sepiolids
Rosa et al.: Latitudinal size-trends in cephalopods
cephalopod diversity (Rosa et al. 2008a), we did notinclude data from the Southern Ocean due to a lackof information on the maximum body size (mantlelength) of coastal cephalopod fauna (namely octo -pods) on the Antarctic shelves. This fact limited theidentification of spatial size patterns toward theSouth Pole, especially in EA, where the continentalshelves end at ~35° S (Figs. 2F & 3).
Depth range, environmental predictors, shelf areaand body size
Depth range played an important role in the obs -erved body size patterns. In the WA, greater depthranges were significantly associated with greatersizes in all group orders and at the class level (Table 3,Model 1). In the EA, in contrast, the associations were
157
Sepiolida
30
45
60
75
90Sepiida
50
100
150
200
250 A B
C D
E F
Teuthida
100
200
300
400
500
Mea
n b
ody
size
(MM
L in
mm
)
0
200
400
600
800 Octopodida
50
75
100
125
150
100
150
200
250
300
Mea
n b
ody
size
(MM
L in
mm
)
Mea
n b
ody
size
(MM
L in
mm
)M
ean
bod
y si
ze (M
ML
in m
m)
Mea
n b
ody
size
(MM
L in
mm
)
Western Cephalopoda
80
100
120
140
160
55°S 45°35°
25°15° 5° 5° 15°
25°35°
45°55°
65°N
Eastern Cephalopoda
0
40
80
120
160
200
55°S 45°35°
25°15° 5° 5° 15°
25°35°
45°55°
65°N
Latitude
0
200
400
600
800
Fig. 2. Latitudinal variation in mean body size (maximum mantle length, MML in mm) of coastal cephalopods in the western (s,left y-axis in panels C, D) and eastern (d, right y-axis in panels C, D) Atlantic. Grey circles in panel F represent the latitudinal-size relationship of the Class Cephalopoda in the eastern Atlantic after excluding the Order Sepiolida (right y-axis scale).
Results from regression analysis, accounting for spatial autocorrelation, are shown in Table 2
Mar Ecol Prog Ser 464: 153–165, 2012
generally negative (Table 4, Model 1), with the excep-tion of the Teuthida (squids), which showed a signifi-cant positive relationship (p < 0.01). In both At lanticmargins, the depth range of Cephalo poda was signifi-cantly and negatively associated with SST (Table 1).
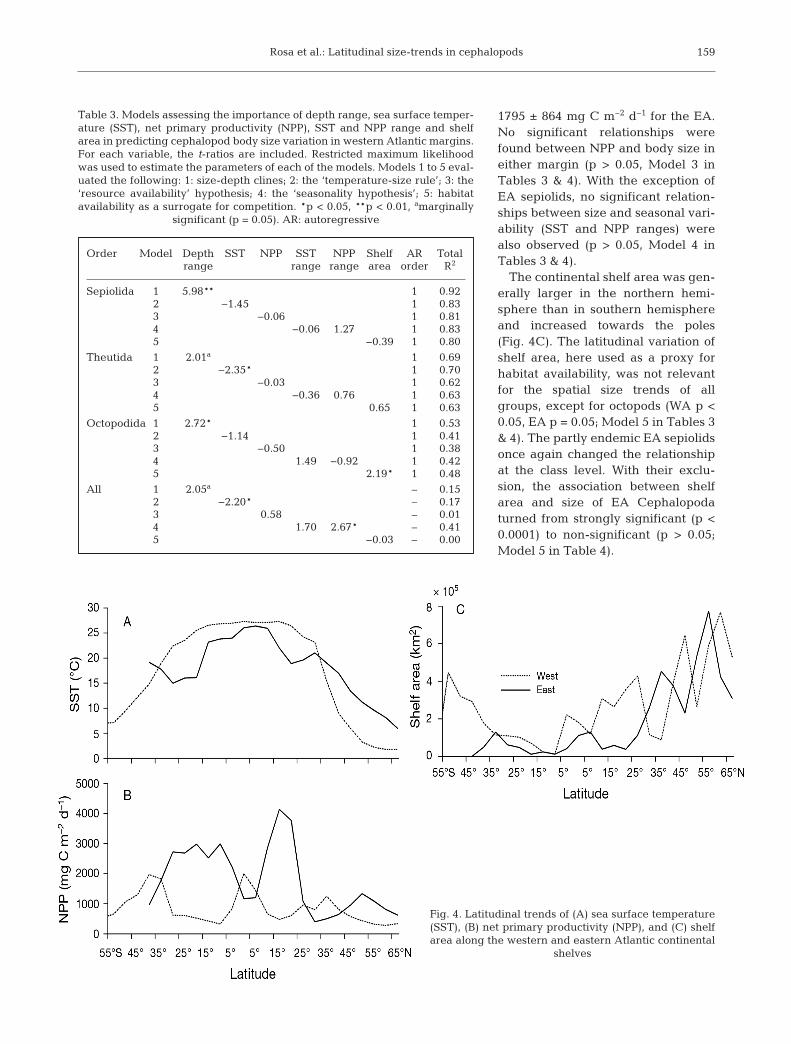
SST ranged from 6°C at the polar latitudes to>25°C at equatorial latitudes (Fig. 4A). For the WA,the temperature followed a near Gaussian distribu-tion from polar to tropical latitudes. However, thepatterns in the east were not nearly as continuouswith latitude because of upwelling of cold wateralong the EA (e.g. the Benguela current off SouthAfrica). Temperature was negatively associated withbody size for almost all cephalopod orders and at theclass level in both the WA and EA (Model 2 inTables 3 & 4). The strongest negative associationsbetween size and temperature were observed insquids (WA p < 0.05, EA p < 0.01).
Mean NPP ranged from <500 mg C m−2 d−1 in theWA to >4000 mg C m−2 d−1 in the upwelling regionsof the EA (Fig. 4B). The mean (±SD) NPP was 784 ±317 mg C m−2 d−1 for the WA and twice as high at
158
0.8
1
1.2
1.4
1.6
1.8
2
0.6
0.7
0.8
0.9
1
Coe
ffic
ient
of v
aria
tion
(EA
)
Coe
ffic
ient
of v
aria
tion
(WA
) Western
Eastern
Latitude
55°S
45° 35° 25° 15° 5° 0° 5° 15° 25° 35° 45° 55°65°
N
Fig. 3. Latitudinal trends in body size disparity (coefficients ofvariation) for Cephalopoda in the western (WA) and eastern
(EA) Atlantic
Western Atlantic Eastern Atlantic Coefficient t-ratio p Total R2 AIC Coefficient t-ratio p Total R2
Sepiida Latitude + + + + + 1.07 9.54 <0.0001 0.84Latitude2 + + + – – – AR(1) + + + – – –
Sepiolida Latitude −0.33 −5.11 <0.0001 0.86 136.92 −0.02 −0.21 0.8354 0.80Latitude2 0.00 2.51 0.0219 – – – AR(1) 0.63 3.04 0.0071 1.44 5.72 <0.0001 AR(2) – – – −0.71 −2.87 0.0107
Theutida Latitude −0.88 −6.95 <0.0001 0.82 193.82 −2.16 −2.28 0.0348 0.86Latitude2 0.02 4.95 <0.0001 0.13 6.06 <0.0001 AR(1) – – – −0.41 −1.85 0.0804
Octopodida Latitude 0.25 2.49 0.0206 0.47 209.05 −0.66 −2.39 0.0278 0.62Latitude2 – – – 0.03 5.01 <0.0001 AR(1) 0.39 2.05 0.0516 – – –
All Latitude −0.09 −1.78 0.0877 0.20 192.12 −0.73 −7.88 <0.0001 0.76Latitude2 0.00 2.20 0.0381 – – – AR(1) – – – – – –
All (#) Latitude – – – – – −0.17 −0.21 0.8385 0.67Latitude2 – – – 0.07 4.06 0.0007 AR(1) – – – – – –
Table 2. Relationships between mean body size and latitude in the western and eastern Atlantic Ocean. Autocorrelation istaken into account in the estimates. Restricted maximum likelihood was used to estimate the parameters of each of the autore-gressive models (AR). AIC: Akaike information criterion; +: not present in the western Atlantic; #: excluding eastern Atlantic
Sepiolida; –: no output
Rosa et al.: Latitudinal size-trends in cephalopods
1795 ± 864 mg C m−2 d−1 for the EA.No significant relationships werefound be tween NPP and body size ineither margin (p > 0.05, Model 3 inTables 3 & 4). With the exception ofEA sepiolids, no significant relation-ships be tween size and seasonal vari-ability (SST and NPP ranges) werealso ob served (p > 0.05, Model 4 inTables 3 & 4).
The continental shelf area was gen-erally larger in the northern hemi-sphere than in southern hemisphereand increased towards the poles(Fig. 4C). The latitudinal variation ofshelf area, here used as a proxy forhabitat availability, was not relevantfor the spatial size trends of allgroups, except for octopods (WA p <0.05, EA p = 0.05; Model 5 in Tables 3& 4). The partly endemic EA sepiolidsonce again changed the relationshipat the class level. With their exclu-sion, the association between shelfarea and size of EA Cephalopodaturned from strongly significant (p <0.0001) to non-significant (p > 0.05;Model 5 in Table 4).
159
Order Model Depth SST NPP SST NPP Shelf AR Total range range range area order R2
Sepiolida 1 5.98** 1 0.92 2 −1.45 1 0.83 3 −0.06 1 0.81 4 −0.06 1.27 1 0.83 5 −0.39 1 0.80
Theutida 1 2.01a 1 0.69 2 −2.35* 1 0.70 3 −0.03 1 0.62 4 −0.36 0.76 1 0.63 5 0.65 1 0.63
Octopodida 1 2.72* 1 0.53 2 −1.14 1 0.41 3 −0.50 1 0.38 4 1.49 −0.92 1 0.42 5 2.19* 1 0.48
All 1 2.05a – 0.15 2 −2.20* – 0.17 3 0.58 – 0.01 4 1.70 2.67* – 0.41 5 −0.03 – 0.00
Table 3. Models assessing the importance of depth range, sea surface temper-ature (SST), net primary productivity (NPP), SST and NPP range and shelfarea in predicting cephalopod body size variation in western Atlantic margins.For each variable, the t-ratios are included. Restricted maximum likelihoodwas used to estimate the parameters of each of the models. Models 1 to 5 eval-uated the following: 1: size-depth clines; 2: the ‘temperature-size rule’; 3: the‘resource availability’ hypothesis; 4: the ‘seasonality hypothesis’; 5: habitatavailability as a surrogate for competition. *p < 0.05, **p < 0.01, amarginally
significant (p = 0.05). AR: autoregressive
Fig. 4. Latitudinal trends of (A) sea surface temperature(SST), (B) net primary productivity (NPP), and (C) shelfarea along the western and eastern Atlantic continental
shelves
Mar Ecol Prog Ser 464: 153–165, 2012160
DISCUSSION
Effect of latitude and depth on body size
Previous studies have found a strong positive linkbetween latitude and body size in shallow-living gas-tropods (Frank 1975), amphipods (Poulin & Hamilton1995) and fish (Macpherson & Duarte 1994).However, latitude explained very little of the varianceof body size in deep-sea gastropods (Olabarria &Thurston 2003) or shallow-living bivalves (Roy &Martien 2001). Here, we show that latitude has a significant effect on the mean body size of coastalcephalopods (Fig. 2, Table 2). A size increase towardthe poles was supported at the class level (Cephalo -
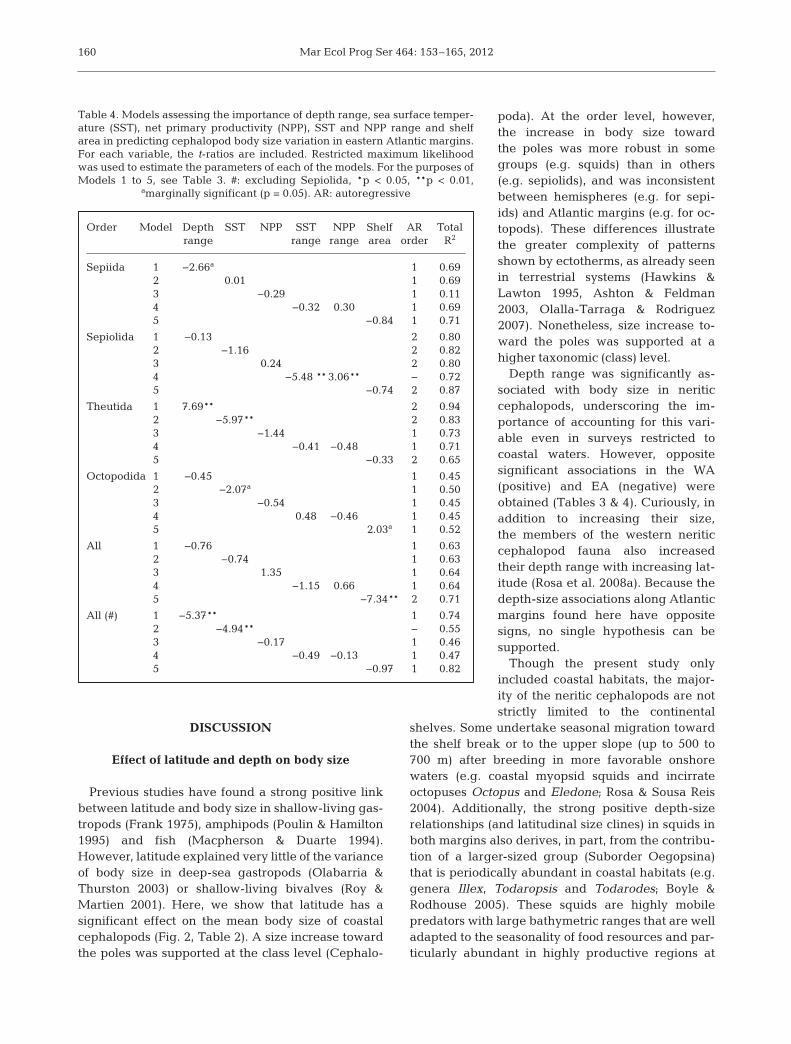
poda). At the order level, however,the increase in body size towardthe poles was more robust in somegroups (e.g. squids) than in others(e.g. sepiolids), and was inconsistentbetween hemispheres (e.g. for sepi -ids) and Atlantic margins (e.g. for oc-topods). These differences illustratethe greater complexity of patternsshown by ectotherms, as already seenin terrestrial systems (Hawkins &Lawton 1995, Ashton & Feldman2003, Olalla-Tarraga & Rodriguez2007). Nonetheless, size increase to-ward the poles was supported at ahigher taxonomic (class) level.
Depth range was significantly as -sociated with body size in neriticcephalo pods, underscoring the im -portance of accounting for this vari-able even in surveys restricted tocoastal waters. However, oppositesignificant associations in the WA(positive) and EA (negative) wereobtained (Tables 3 & 4). Curiously, inaddition to increasing their size,the members of the western neriticcephalopod fauna also increasedtheir depth range with increasing lat-itude (Rosa et al. 2008a). Because thedepth-size associations along Atlanticmargins found here have oppositesigns, no single hypothesis can besupported.
Though the present study onlyincluded coastal habitats, the major-ity of the neritic cephalopods are notstrictly limited to the continental
shelves. Some undertake seasonal migration towardthe shelf break or to the upper slope (up to 500 to700 m) after breeding in more favorable onshorewaters (e.g. coastal myopsid squids and incirrateoctopuses Octopus and Eledone; Rosa & Sousa Reis2004). Additionally, the strong positive depth-sizerelationships (and latitudinal size clines) in squids inboth margins also derives, in part, from the contribu-tion of a larger-sized group (Suborder Oegopsina)that is periodically abundant in coastal habitats (e.g.genera Illex, Todaropsis and Todarodes; Boyle &Rodhouse 2005). These squids are highly mobilepredators with large bathymetric ranges that are welladapted to the seasonality of food resources and par-ticularly abundant in highly productive regions at
Order Model Depth SST NPP SST NPP Shelf AR Total range range range area order R2
Sepiida 1 −2.66a 1 0.69 2 0.01 1 0.69 3 −0.29 1 0.11 4 −0.32 0.30 1 0.69 5 −0.84 1 0.71
Sepiolida 1 −0.13 2 0.80 2 −1.16 2 0.82 3 0.24 2 0.80 4 −5.48 **3.06** − 0.72 5 −0.74 2 0.87
Theutida 1 7.69** 2 0.94 2 −5.97** 2 0.83 3 −1.44 1 0.73 4 −0.41 −0.48 1 0.71 5 −0.33 2 0.65
Octopodida 1 −0.45 1 0.45 2 −2.07a 1 0.50 3 −0.54 1 0.45 4 0.48 −0.46 1 0.45 5 2.03a 1 0.52
All 1 −0.76 1 0.63 2 −0.74 1 0.63 3 1.35 1 0.64 4 −1.15 0.66 1 0.64 5 −7.34** 2 0.71
All (#) 1 −5.37** 1 0.74 2 −4.94** − 0.55 3 −0.17 1 0.46 4 −0.49 −0.13 1 0.47 5 −0.97 1 0.82
Table 4. Models assessing the importance of depth range, sea surface temper-ature (SST), net primary productivity (NPP), SST and NPP range and shelfarea in predicting cephalopod body size variation in eastern Atlantic margins.For each variable, the t-ratios are included. Restricted maximum likelihoodwas used to estimate the parameters of each of the models. For the purposes ofModels 1 to 5, see Table 3. #: excluding Sepiolida, *p < 0.05, **p < 0.01,
amarginally significant (p = 0.05). AR: autoregressive
Rosa et al.: Latitudinal size-trends in cephalopods 161
central (temperate) latitudes (Rosa et al. 2008b).Therefore, in addition to environmental forcing andphysiological constraints (discussed below), the size-depth-latitude relationships also reflect fundamentalaspects of cephalopod feeding ecologies and life his-tories.
Relating thermal energy and resource and habitatavailability with body size
Although the climate-based heat conservation hy -pothesis (see ‘Introduction’) may be plausible forendotherms (thermoregulators), it does not explainlatitudinal-size relationships in marine ectotherms(thermoconformers), such as cephalopods. Theprevalence of negative associations between temper-ature and body size in cephalopods (Tables 3 & 4)seems to support the concept of the ‘temperature-size rule’ (Atkinson 1994), i.e. at lower temperatures,cephalopods exhibit lower growth rates and delayedmaturation but also grow to a larger body size. Forinstance, the giant octopus Enteroctopus dofleinilives at average temperatures of 10°C in the NEPacific Ocean, achieves maturity at 10 to 15 kg(~1020 d of age), grows to more than 5 m length(>50 kg) and has a life span of 4 to 5 yr (Hartwick1983). In contrast, the pigmy octopus Octopus joubinifrom WA tropical shallow waters (average lifetimetemperatures of 25°C) matures in 182 d (to a finalweight of 30 g) and attains a maximum total lengthof 15 cm (Hanlon 1983). Outside the neritic province,the 2 most striking examples of cold-associatedgigantism are the 2 largest invertebrates of theoceans, namely the colossal Mesonychoteuthishamiltoni and giant squids Architeuthis sp. Knowl-edge of the biology and ecology of those organisms isscarce (Pereira et al. 2005, Rosa & Seibel 2010a). Thefirst is known to be a reclusive inhabitant of the cir-cumpolar Antarctic region that can weigh >500 kg(Rosa & Seibel 2010a), while the second is a wide-spread large oceanic predator (up to 16 m of totallength) that, presumably, lives at mesopelagic depths(in temperatures of~10 to 13°C) and has a life span ofseveral years (Landman et al. 2004). Although manysmall-sized counterexamples in polar/deep-sea habi-tats can be identified (e.g. small octopus Bathypoly-pus arcticus in North WA), the greater disparity ofsizes in these cold environments seems unequivocal.This evidence is also supported by the generalincrease in size disparity (coefficients of variation)toward the poles shown in the present survey (Fig. 3).Other inter-specific studies also point out that larger
size at maturity in cephalopods is a result of longerlife spans (Van Heukelem 1976, Forsythe 1984, Wood& O’Dor 2000) rather than faster growth rates (Calow1987).
The ‘temperature-size rule’ was only tested in sin-gle populations of a single species (in a controlledenvironment), and therefore it assumes that all popu-lations of a single species have the same reactionnorm (i.e. no genetic differences between size atmaturity and rearing temperature; see Belk & Hous-ton 2002, p. 807). Genetic divergence has been associated with latitudinal clines in body size (Par-tridge & Coyne,1997, Gockel et al. 2001, de Jong &Bochdanovits 2003); however, phenotypic plasticityseems to be a major contributor. Plasticity may beassociated with thermal effects on growth and differ-entiation, namely on the size of cells (Partridge etal. 1994, Van Voorhies 1996), number of cells (Jameset al. 1997, Noach et al. 1997) or both (Zwaan et al.2000) and at supra-cellular levels (e.g. organs;Nijhout 2003). These temperature-induced sizechanges can be interpreted as an integrated adaptivesuite of acclimatory responses at all levels of organi-zation to maintain aerobic scope and regulate oxy-gen supply (Pörtner 2002) as well as adjustments(Hochachka & Somero 2002).
Some advocate that size decrease at lower (tropi-cal) latitudes may be a strategy to mitigate oxygenlimitation (i.e. small size may reduce maintenancecosts that are otherwise elevated by temperature),which may also be exacerbated by the reduction inoxygen solubility with increasing temperature(Chapelle & Peck 1999, Woods 1999). Althoughgrowth is initially faster at higher temperatures, itmay slow down at a smaller size due to insufficientresource (oxygen) acquisition (Atkinson & Sibly1997). Reduced adult size at increased temperatureand lower oxygen levels has also been observed interrestrial ectotherms (Frazier et al. 2001). However,there is no evidence that the generally smaller size oftropical cephalopods is related to oxygen limitation.In fact, shallow-living cephalopods are not generallyoxygen limited (especially octopuses and cuttlefish,but even squids) because they can regulate their oxy-gen consumption rate to ~50% saturation. A goodexample is the jumbo squid Dosidicus gigas, a largejet-propelled predator (up to 50 kg of total weight)that lives in the eastern tropical Pacific, where tem-perature and oxygen are already found near theextremes in the oceans. It displays metabolic ratesamong the highest found in the oceans (Rosa &Seibel 2008) and undergoes diel vertical migrationsinto the mesopelagic oxygen minimum zones. Inter-
Mar Ecol Prog Ser 464: 153–165, 2012
estingly, D. gigas circumvents oxygen limitation inthe deep and hypoxic water (during the daytime) viametabolic suppression (Rosa & Seibel 2010b).
Increased primary productivity has also beenshown to have a positive effect on body size (Aava2001) and is considered as a potential explanation ofBergmann’s rule in terrestrial habitats (Rosenzweig1968). At a given temperature, growth rates and sizeat maturity increase as food or resource availabilityincreases (Atkinson & Sibly 1997). In the presentstudy, the differences in resource availability (asNPP) did not explain much of the variation of meanbody size (Tables 3 & 4). Seasonality (or fastingendurance) has also been advocated to explain latitu-dinal size clines (see ‘Introduction’), but we did notfind any evidence to support this hypothesis becauseenvironmental seasonality (as indicated by the rangein SST and NPP) did not explain much of the varianceof cephalopod size.
Because the feeding, behavior and reproduction ofneritic cuttlefish, octopuses and squids are closelyassociated with seabed characteristics, larger conti-nental shelves (greater habitat availability) couldalso explain body size variation by reducing compe-tition. Reduced competition near the poles, wherethe continental shelves are wider, may also permitgreater body sizes. This hypothesis seems to findsome support among the order Octopodida, whichcuriously is the group more closely associated withthe seabed. However, there is no direct evidence thatcompetition for resources is a major driver of thegrowth and population dynamics of cephalopods.
Cephalopods are voracious carnivores with manydifferent feeding strategies (including cannibalism)that enable them to feed opportunistically on a widerange of prey (e.g. Table 1 in Rosa et al. 2004), and,as already pointed out, many cephalopods alsoevolved migratory behaviors to exploit the seasonal-ity of food resources. Thus, the growth of cephalo -pods in the wild seems to be primarily limited by pre-dation rather than food shortages (Wood & O’Dor2000). Predation is more likely to limit the growth ofcephalopods because consumption by marine mam-mals, sea birds and fish is widespread, with somefeeding exclusively on cephalopods (e.g. some elas-mobranchs; Boyle & Rodhouse 2005). Yet, for the pre-dation hypothesis to explain the present latitudinalsize trends, the predation intensity for most cephalo-pod species must be positively correlated with lati-tude, which cannot be tested because relevant dataare not available.
In conclusion, temperature seemed to play the mostimportant role in structuring the distribution of
cephalopod body size along the continental shelvesof the Atlantic Ocean. Our findings show only a lim-ited role of resource availability, seasonality or com-petition in determining latitudinal body size patterns.
Acknowledgements. The Portuguese Foundation for Sci-ence and Technology (FCT) supported this study throughthe project PTDC/BIA-BEC/103266/2008 to R.R. Theauthors also acknowledge Oregon State University, NASAand the Ocean Biology Processing Group (Code 614.2) at theGoddard Space Flight Center for the production and distri-bution of the ocean color data.
LITERATURE CITED
Aava B (2001) Primary productivity can affect mammalianbody size frequency distributions. Oikos 93:205−213
Ashton KG, Feldman CR (2003) Bergmann’s rule in nona-vian reptiles: turtles follow it, lizards and snakes reverseit. Evolution 57:1151−1163
Ashton KG, Tracy MC, De Queiroz A (2000) Is Bergmann’srule valid for mammals? Am Nat 156:390−415
Atkinson D (1994) Temperature and organism size—a bio-logical law for ectotherms? Adv Ecol Res 25:1−58
Atkinson D, Hirst AG (2007) Life histories and body size. In:Hildrew A, Rafaelli D, Edmonds-Brown R (eds) Bodysize: the structure and function of aquatic ecosystems.Cambridge University Press, Cambridge, p 33−54
Atkinson D, Sibly RM (1997) Why are organisms usually big-ger in colder environments? Making sense of a life his-tory puzzle. Trends Ecol Evol 12:235−239
Behrenfeld MJ, Falkowski PG (1997) Photosynthetic ratesderived from satellite-based chlorophyll concentration.Limnol Oceanogr 42:1−20
Belk MC, Houston DD (2002) Bergmann’s rule in ecto-therms: a test using freshwater fishes. Am Nat 160:803–808
Bergmann C (1847) Ueber die Verhältnisse der Wärme -ökonomie der Thiere zu ihrer Grösse (Concerning therelationship of heat conservation of animals to their size).Göttinger Studien 3:595−708
Blackburn TM, Gaston KJ (1999) The relationship betweenanimal abundance and body size: a review of the mech-anisms. Adv Ecol Res 28:181−210
Boyce MS (1979) Seasonality and patterns of natural selec-tion for life histories. Am Nat 114:569−583
Boyle P, Rodhouse P (2005) Cephalopods: ecology and fish-eries. Blackwell Publishing, Oxford
Calow P (1987) Fact and theory: an overview. In: Boyle PR(ed) Cephalopod life cycles: comparative reviews, Vol 2.Academic Press, London, p 351−366
Chapelle G, Peck LS (1999) Polar gigantism dictated by oxy-gen availability. Nature 399:114−115
Cressie NAC (1993) Statistics for spatial data, revised edn.Wiley, New York, NY
Dallal G (2007) The handbook of statistical practice. www.tufts.edu/~gdallal/LHSP.HTM
de Jong G, Bochdanovits Z (2003) Latitudinal clines inDrosophila melanogaster: body size, allozyme frequen-cies, inversion frequencies, and the insulin-signallingpathway. J Genet 82:207−223
de Queiroz A, Ashton KG (2004) The phylogeny of a species-level tendency: Species heritability and possible deep
162

Rosa et al.: Latitudinal size-trends in cephalopods
origins of Bergmann’s rule in tetrapods. Evolution 58:1674−1684
Forsythe JW (1984) Octopus joubini (Mollusca: Cephalo -poda): a detailed study of growth through the full lifecycle in a closed seawater system. J Zool 202: 393−417
Frank PW (1975) Latitudinal variation in the life history fea-tures of the black turban snail Tegula funebralis (Proso-branchia: Trochidae). Mar Biol 31:181–192
Frazier MR, Woods HA, Harrison JF (2001) Interactiveeffects of rearing temperature and oxygen on the devel-opment of Drosophila melanogaster. Physiol BiochemZool 74:641−650
Gage JD, Tyler PA (1991) Deep-sea biology: a natural his-tory of organisms at the deep-sea floor. Cambridge University Press, Cambridge
Gockel J, Kennington WJ, Hoffmann A, Goldstein DB, Par-tridge L (2001) Nonclinality of molecular variation impli-cates selection in maintaining a morphological cline ofDrosophila melanogaster. Genetics 158:319−323
Gujarati DN (1995) Basic econometrics, 3rd edn. McGraw-Hill, New York, NY
Hanlon RT (1983) Octopus joubini. In: Boyle PR (ed)Cephalopod life cycles: species accounts, Vol 1. Aca-demic Press, London, p 293−310
Hartwick B (1983) Octopus dofleini. In: Boyle PR (ed)Cephalopod life cycles: species accounts, Vol 1. Aca-demic Press, London, p 277−292
Hawkins BA, Lawton JH (1995) Latitudinal gradients in but-terfly body sizes: is there a general pattern? Oecologia102:31−33
Hochachka PW, Somero GN (2002) Biochemical adaptation:mechanisms and process in physiological evolution.Oxford University Press, Oxford
James AC, Azevedo RBR, Partridge L (1997) Genetic andenvironmental responses to temperature of Drosophilamelanogaster from a latitudinal cline. Genetics 146:881−890
Jereb P, Roper CFE (2005) Cephalopods of the world: anannotated and illustrated catalogue of cephalopod spe-cies known to date, No. 4, Vol 1. FAO species cataloguefor fishery purposes, FAO, Rome
Landman NH, Coshran JK, Cerrato R, Mak J, Roper CFE, LuCC (2004) Habitat and age of the giant squid (Archi-teuthis sanctipauli) inferred from isotopic analyses. MarBiol 144:685−691
Lindsey CC (1966) Body sizes of poikilotherm vertebrates atdifferent latitudes. Evolution 20:456−465
Macpherson E, Duarte CM (1994) Patterns in species rich-ness, size, and latitudinal range of East Atlantic fishes.Ecography 17:242−248
McClain CR (2004) Connecting species richness, abun-dance and body size in deep-sea gastropods. Glob Ecol Biogeogr 13:327−334
McClain CR, Rex MA (2001) The relationship between dis-solved oxygen concentration and maximum size in deep-sea turrid gastropods: an application of quantile regres-sion. Mar Biol 139:681−685
McClain CR, Boyer AG, Rosenberg G (2006) The island ruleand the evolution of body size in the deep sea. J Biogeogr33:1578−1584
McNab TA (1971) On the ecological significance ofBergmann’s rule. Ecology 52:845−854
Meiri S, Thomas GH (2007) The geography of body size —challenges of the interspecific approach. Global Ecol Biogeogr 116:689–693
Nijhout HF (2003) The control of body size in insects. DevBiol 161:1–9
Noach EJ, De Jong G, Scharloo W (1997) Phenotypic plasti-city of wings in selection lines of Drosophila melano -gaster. Heredity 79:1−9
Olabarria C, Thurston MH (2003) Latitudinal and bathymet-ric trends in body size of the deep-sea gastropodTroschelia berniciensis (King). Mar Biol 143:723−730
Olalla-Tarraga MA, Rodriguez MA (2007) Energy and inter-specific body size patterns of amphibian faunas inEurope and North America: anurans follow Bergmann’srule, urodeles its converse. Glob Ecol Biogeogr 16:606−617
OSU (2006) Ocean productivity. Oregon State University,http://web.science.oregonstate.edu/ocean.productivity/
Partridge L, Coyne JA (1997) Bergmann’s rule in ecto-therms: is it adaptive? Evolution 51:632−635
Partridge L, Barrie B, Fowler K, French V (1994) Evolutionand development of body size and cell size in Drosophilamelanogaster in response to temperature. Evolution48:1269−1276
Pereira J, Rosa R, Moreno A, Henriques M, Sendao J, BorgesTC (2005) First recorded specimen of the giant squidArchiteuthis sp. in Portugal. J Mar Biol Assoc UK 85:175−176
Peters RH (1986) The ecological implications of body size.Cambridge Studies in Ecology Series, Cambridge Uni-versity Press, Cambridge
Pörtner HO (2002) Climate variation and the physiologicalbasis of temperature dependent biogeography: systemicto molecular hierarchy of thermal tolerance in animals.Comp Biochem Physiol A 132:739−761
Poulin R, Hamilton WJ (1995) Ecological determinants ofbody size and clutch size in amphipods: a comparativeapproach. Funct Ecol 9:364−370
Rex MA, Etter RJ (1998) Bathymetric patterns of body size:implications for deep-sea biodiversity. Deep-Sea Res II45: 103−127
Rex MA, Etter RJ, Clain AJ, Hill MS (1999) Bathymetric pat-terns of body size in deep-sea gastropods. Evolution 53:1298−1301
Rex MA, Etter RJ, Morris JS, Crouse J and others (2006)Global bathymetric patterns of standing stock and bodysize in the deep-sea benthos. Mar Ecol Prog Ser 317:1−8
Rosa R, Seibel BA (2008) Synergistic effects of climate-related variables suggest future physiological impair-ment in a top oceanic predator. Proc Natl Acad Sci USA105: 20776−20780
Rosa R, Seibel BA (2010a) Slow pace of life of the Antarcticcolossal squid. J Mar Biol Assoc UK 90:1375−1378
Rosa R, Seibel BA (2010b) Metabolic physiology of the Hum-boldt squid, Dosidicus gigas: implications for verticalmigration in a pronounced oxygen minimum zone. ProgOceanogr 86:72−80
Rosa R, Sousa Reis C (2004) Cephalopods of the Portuguesecoast. Prémio do Mar- Rei D. Carlos. Câmara Municipalde Cascais, Cascais (in Portuguese)
Rosa R, Marques AM, Nunes ML, Bandarra N, Reis CS(2004) Spatial-temporal changes in dimethyl acetal(octadecanal) levels of Octopus vulgaris (Mollusca,Cephalopoda): relation to feeding ecology. Sci Mar 68:227−236
Rosa R, Dierssen HM, Gonzalez L, Seibel BA (2008a) Eco-logical biogeography of cephalopod mollusks in theAtlantic Ocean: historical and contemporary causes of
163

Mar Ecol Prog Ser 464: 153–165, 2012
coastal diversity patterns. Glob Ecol Biogeogr 17:600−610
Rosa R, Dierssen HM, Gonzalez L, Seibel BA (2008b) Large-scale diversity patterns of cephalopods in the Atlanticopen ocean and deep-sea. Ecology 89:3449−3461
Rosa R, Trueblood L, Seibel BA (2009) Ecophysiological influ-ence on scaling of aerobic and anaerobic metabolism ofoceanic gonatid squids. Physiol Biochem Zool 82:419−429
Rosenzweig ML (1968) The strategy of body size in mam-malian carnivores. Am Midl Nat 80:299−315
Roy K, Martien KK (2001) Latitudinal distribution of bodysize in north-eastern Pacific marine bivalves. J Biogeogr28:485−493
SAS (2008) SAS/ETS, 9.1.3 user’s guide. http:// support. sas.com/documentation/onlinedoc/91pdf/index_913. html
Seibel BA (2007) On the depth and scale of metabolic ratevariation: scaling of oxygen consumption rates and enzy-matic activity in the Class Cephalopoda (Mollusca).J Exp Biol 210:1−11
Spicer JI, Gaston KJ (1999) Amphipod gigantism dictated byoxygen availability? Ecol Lett 2:397−401
Thiel H (1975) The size structure of the deep-sea benthos.Int Rev Gesamten Hydrobiol 60:576−606
Thiel H (1979) Structural aspects of the deep-sea benthos.Ambio Spec Rep 6:25−31
USDC (2006) 2-minute gridded global relief data
(ETOPO2v2), US Department of Commerce, NationalOceanic and Atmospheric Administration, National Geo-physical Data Center. www.ngdc.noaa.gov/mgg/fliers/06mgg01.html
Van Heukelem WF (1976) Growth, bioenergetics and life-span of Octopus cyanea and Octopus maya. PhD thesis,University of Hawaii, Honolulu, HI
Van Voorhies WA (1996) Bergmann size clines: a simpleexplanation for their occurrence in ectotherms. Evolution50: 1259−1264
Voss NA, Vecchione M, Toll RB, Sweeney MJ (1998) Sys-tematics and biogeography of cephalopods. SmithsonContrib Zool 586:1−276
White EP, Ernest SKM, Kerkhoff AJ, Enquist BJ (2007) Rela-tionships between body size and abundance in ecology.Trends Ecol Evol 22:323−330
Wood JB, O’Dor RK (2000) Do larger cephalopods livelonger? Effects of temperature and phylogeny on inter-specific comparisons of age and size at maturity. Mar Biol136: 91−99
Woods HA (1999) Egg-mass size and cell size: effects of tem-perature on oxygen distribution. Am Zool 39:244−252
Zwaan BJ, Azevedo RBR, James AC, van ’t Lande J, Par-tridge L (2000) Cellular basis of wing size variation inDrosophila melanogaster: a comparison of latitudinalclines on two continents. Heredity 84:338−347
164
0
5
10
15
20
25
30
Ner
itic
spec
ies
richn
ess
Sepiolida
Myopsina
Oegopsina
Octopoda
0
5
10
15
20
25
30
55°S
50° 45° 40° 35° 30° 25° 20° 15° 10° 5° 0° 5° 10° 15° 20° 25° 30° 35° 40° 45° 50° 55° 60° 65°70°
N
Latitude
Sepiida
SepiolidaMyopsinaOegopsinaOctopoda
Western
Eastern
Fig. A1. Number of species per bin in both Atlantic margins (Western: from 55° S to 70° N, Eastern: from 35° S to 70° N). These diversity data were first presented and discussed by Rosa et al. (2008a)
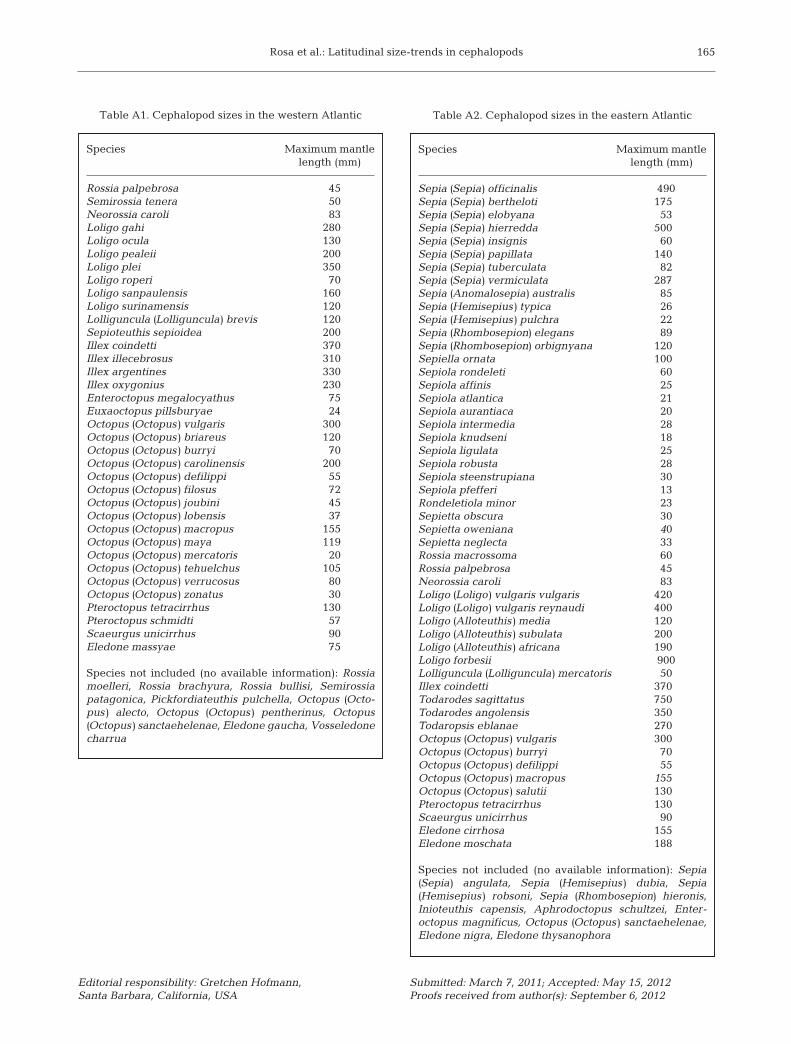
Appendix 1. Diversity (Fig. A1) and body size (maximum mantle length, MML, Tables A1 & A2) in coastal cephalopods of the Atlantic Ocean
Rosa et al.: Latitudinal size-trends in cephalopods 165
Species Maximum mantle length (mm)
Rossia palpebrosa 45Semirossia tenera 50Neorossia caroli 83Loligo gahi 280Loligo ocula 130Loligo pealeii 200Loligo plei 350Loligo roperi 70Loligo sanpaulensis 160Loligo surinamensis 120Lolliguncula (Lolliguncula) brevis 120Sepioteuthis sepioidea 200Illex coindetti 370Illex illecebrosus 310Illex argentines 330Illex oxygonius 230Enteroctopus megalocyathus 75Euxaoctopus pillsburyae 24Octopus (Octopus) vulgaris 300Octopus (Octopus) briareus 120Octopus (Octopus) burryi 70Octopus (Octopus) carolinensis 200Octopus (Octopus) defilippi 55Octopus (Octopus) filosus 72Octopus (Octopus) joubini 45Octopus (Octopus) lobensis 37Octopus (Octopus) macropus 155Octopus (Octopus) maya 119Octopus (Octopus) mercatoris 20Octopus (Octopus) tehuelchus 105Octopus (Octopus) verrucosus 80Octopus (Octopus) zonatus 30Pteroctopus tetracirrhus 130Pteroctopus schmidti 57Scaeurgus unicirrhus 90Eledone massyae 75
Species not included (no available information): Rossiamoelleri, Rossia brachyura, Rossia bullisi, Semirossiapatagonica, Pickfordiateuthis pulchella, Octopus (Octo-pus) alecto, Octopus (Octopus) pentherinus, Octopus(Octopus) sanctaehelenae, Eledone gaucha, Vosseledonecharrua
Table A1. Cephalopod sizes in the western Atlantic
Species Maximum mantle length (mm)
Sepia (Sepia) officinalis 490Sepia (Sepia) bertheloti 175 Sepia (Sepia) elobyana 53 Sepia (Sepia) hierredda 500 Sepia (Sepia) insignis 60 Sepia (Sepia) papillata 140 Sepia (Sepia) tuberculata 82 Sepia (Sepia) vermiculata 287 Sepia (Anomalosepia) australis 85 Sepia (Hemisepius) typica 26 Sepia (Hemisepius) pulchra 22 Sepia (Rhombosepion) elegans 89 Sepia (Rhombosepion) orbignyana 120 Sepiella ornata 100 Sepiola rondeleti 60 Sepiola affinis 25 Sepiola atlantica 21 Sepiola aurantiaca 20 Sepiola intermedia 28 Sepiola knudseni 18 Sepiola ligulata 25 Sepiola robusta 28 Sepiola steenstrupiana 30 Sepiola pfefferi 13 Rondeletiola minor 23 Sepietta obscura 30 Sepietta oweniana 40 Sepietta neglecta 33 Rossia macrossoma 60 Rossia palpebrosa 45 Neorossia caroli 83 Loligo (Loligo) vulgaris vulgaris 420 Loligo (Loligo) vulgaris reynaudi 400 Loligo (Alloteuthis) media 120 Loligo (Alloteuthis) subulata 200 Loligo (Alloteuthis) africana 190 Loligo forbesii 900Lolliguncula (Lolliguncula) mercatoris 50 Illex coindetti 370 Todarodes sagittatus 750 Todarodes angolensis 350 Todaropsis eblanae 270 Octopus (Octopus) vulgaris 300 Octopus (Octopus) burryi 70 Octopus (Octopus) defilippi 55 Octopus (Octopus) macropus 155 Octopus (Octopus) salutii 130 Pteroctopus tetracirrhus 130 Scaeurgus unicirrhus 90 Eledone cirrhosa 155 Eledone moschata 188
Species not included (no available information): Sepia(Sepia) angulata, Sepia (Hemisepius) dubia, Sepia(Hemi sepius) robsoni, Sepia (Rhombosepion) hieronis,Inioteuthis capensis, Aphrodoctopus schultzei, Enter -octopus magnificus, Octopus (Octopus) sanctaehelenae,Eledone nigra, Eledone thysanophora
Table A2. Cephalopod sizes in the eastern Atlantic
Editorial responsibility: Gretchen Hofmann,Santa Barbara, California, USA
Submitted: March 7, 2011; Accepted: May 15, 2012Proofs received from author(s): September 6, 2012
Related Documents