1529-6466/02/0050-0007$05.00 DOI:10.2138/rmg.2002.50.7 7 Environmental Chemistry of Beryllium J. Veselý 1 , S.A. Norton 2 , P. Skřivan 3 , V. Majer 1 , P. Krám 1 , T. Navrátil 3 , J.M. Kaste 4 1 Czech Geological Survey, Klárov 3, Prague 1, 118 21, C.R. 2 Dept. Geological Sciences, University of Maine, Orono, Maine 04469 3 Geological Institute, AS C. R., Rozvojová 135, Prague 6, C.R. 4 Dept. Earth Sciencs, Dartmouth College, Hanover, New Hampshire 03755 INTRODUCTION Beryllium is a rare but widely distributed element. As a consequence of rapid developments in the capabilities to determine low concentrations of Be in inorganic solids, tissue, air, and water, it is now possible to characterize the distribution of Be in various environmental compartments, to describe the fluxes among these compartments, and to determine the controls on these fluxes. Increased human activity, including land disturbance, metallurgical processes, the burning of fossil fuels (with associated air pollution, including Be, and related terrestrial acidification), has generally increased the flow of Be through ecosystems. This fact was recognized several decades ago (e.g., Kubizňáková 1983). The distribution and redistribution of Be nuclides are important to understand because of Be toxicity to fauna (including humans) and possibly to flora. The radioisotopes ( 7 Be and 10 Be) are used to understand environmental and geologic processes. Because of the very different half lives ( 7 Be = 53 days; 10 Be = 1.5 million years), Be nuclides have been used to study earth-surface processes as short as diurnal variation (EL-Hussein et al. 2001) to exposure age-dating (Braucher et al. 2000) and erosional processes (Small et al. 1999). Consequently, we review the literature from the perspective of the interaction of geologic materials, aqueous solutions, and biota, at or near Earth´s surface. This chapter is organized parallel to the hydrologic pathways from the atmosphere, through ecosystems, to estuaries. We focus on the environmental chemistry of the stable nuclide 9 Be, whereas Kaste et al. (this volume) focus on the cosmogenic isotope 7 Be and Morris et al. and Bierman et al. focus on 10 Be. Effects of point-source pollution on the immediate environment, such as in the vicinity of smelters, are not discussed except where the effects may be transmitted regionally by the atmos- phere or surface water. BERYLLIUM IN THE ATMOSPHERE The atmospheric flux of 9 Be (henceforth Be) is derived primarily from industrial emissions (particularly from coal combustion, Moore 1991), eolian dust, and metallurgical processes in the space and weapons industry (Zorn et al. 1988). Oil and natural gas have significantly lower concentrations of Be than coal. Most coals contain 0 to 100 mg Be kg -1 (Wedepohl 1969) although Fishbein (1984) reported coals with Be as high as 1000 mg Be kg -1 . The accumulation of Be in coal results from the affinity of Be for organic matter before and during accumulation, as well as metasomatism of the coal precursors by groundwater. The mean concentration of Be in coal ash ranges from 0.7 mg kg -1 to 2000 mg kg -1 in coals from the North Bohemian Basin (Bouška 1981). Emission factors for coal combustion range from 1 to 5.8% of the total Be, substantially lower than for Cd or Pb, 50 to 90% of which are in flue gases (Bezačínský et al. 1984; Šebestová et al. 1996). Emissions factors for Be are substantially lower for coal that has higher ash concentration (Dubanský et al. 1990). Be may be mobilized from ash and slag, especially by acidic

Welcome message from author
This document is posted to help you gain knowledge. Please leave a comment to let me know what you think about it! Share it to your friends and learn new things together.
Transcript
1529-6466/02/0050-0007$05.00 DOI:10.2138/rmg.2002.50.7
7 Environmental Chemistry of Beryllium J. Veselý1, S.A. Norton2, P. Skřivan3, V. Majer1,
P. Krám1, T. Navrátil3, J.M. Kaste4
1 Czech Geological Survey, Klárov 3, Prague 1, 118 21, C.R. 2 Dept. Geological Sciences, University of Maine, Orono, Maine 04469
3 Geological Institute, AS C. R., Rozvojová 135, Prague 6, C.R. 4 Dept. Earth Sciencs, Dartmouth College, Hanover, New Hampshire 03755
INTRODUCTION Beryllium is a rare but widely distributed element. As a consequence of rapid
developments in the capabilities to determine low concentrations of Be in inorganic solids, tissue, air, and water, it is now possible to characterize the distribution of Be in various environmental compartments, to describe the fluxes among these compartments, and to determine the controls on these fluxes. Increased human activity, including land disturbance, metallurgical processes, the burning of fossil fuels (with associated air pollution, including Be, and related terrestrial acidification), has generally increased the flow of Be through ecosystems. This fact was recognized several decades ago (e.g., Kubizňáková 1983). The distribution and redistribution of Be nuclides are important to understand because of Be toxicity to fauna (including humans) and possibly to flora. The radioisotopes (7Be and 10Be) are used to understand environmental and geologic processes. Because of the very different half lives (7Be = 53 days; 10Be = 1.5 million years), Be nuclides have been used to study earth-surface processes as short as diurnal variation (EL-Hussein et al. 2001) to exposure age-dating (Braucher et al. 2000) and erosional processes (Small et al. 1999). Consequently, we review the literature from the perspective of the interaction of geologic materials, aqueous solutions, and biota, at or near Earth´s surface. This chapter is organized parallel to the hydrologic pathways from the atmosphere, through ecosystems, to estuaries. We focus on the environmental chemistry of the stable nuclide 9Be, whereas Kaste et al. (this volume) focus on the cosmogenic isotope 7Be and Morris et al. and Bierman et al. focus on 10Be. Effects of point-source pollution on the immediate environment, such as in the vicinity of smelters, are not discussed except where the effects may be transmitted regionally by the atmos- phere or surface water.
BERYLLIUM IN THE ATMOSPHERE The atmospheric flux of 9Be (henceforth Be) is derived primarily from industrial
emissions (particularly from coal combustion, Moore 1991), eolian dust, and metallurgical processes in the space and weapons industry (Zorn et al. 1988). Oil and natural gas have significantly lower concentrations of Be than coal. Most coals contain 0 to 100 mg Be kg-1 (Wedepohl 1969) although Fishbein (1984) reported coals with Be as high as 1000 mg Be kg-1. The accumulation of Be in coal results from the affinity of Be for organic matter before and during accumulation, as well as metasomatism of the coal precursors by groundwater.
The mean concentration of Be in coal ash ranges from 0.7 mg kg-1 to 2000 mg kg-1 in coals from the North Bohemian Basin (Bouška 1981). Emission factors for coal combustion range from 1 to 5.8% of the total Be, substantially lower than for Cd or Pb, 50 to 90% of which are in flue gases (Bezačínský et al. 1984; Šebestová et al. 1996). Emissions factors for Be are substantially lower for coal that has higher ash concentration (Dubanský et al. 1990). Be may be mobilized from ash and slag, especially by acidic
292 Chapter 7: Veselý, Norton, Skřivan, Majer, Krám, Navrátil & Kaste
water. For example, 2.6 mg Be L-1 occurs in pond waste-water at pH 2.5 in the Czech Republic (Kubizňáková 1987). Acidic water releases Be best from fine-grained ash, whereas the coarse-grained fraction is strongly attacked by alkaline solutions (Kubizňáková 1987). Concentrations up to 29 mg Be kg-1 occur in industrial particles (e.g., from iron production, Seth and Pandey 1985).
Kubizňáková (1987) estimated annual emissions of Be in Europe to be 30 tons yr-1; Pacyna (1990) suggested 50 tons yr-1. For 1980 in the U.S.A., coal consumption was approximately 500 × 106 tons (Husar 1986). With an assumed average of 10 mg Be kg-1 (Phillips, 1973) and an emission factor of 5%, Be emissions in the United States would have been approximately 250 tons yr-1. Bezačínský et al. (1984) found that atmospheric deposition of Be during 1980 was three times higher per unit area in the former Czechoslovakia than in the United States. Yamagata (1981) reported that background concentrations of Be in Japan’s ambient air ranged from 0.04 to 0.261 ng m-3. Thorat et al. (2001) reported mean Be in air at the perimeter of a Be processing plant to be about 0.5 ng m-3, also well below recommended levels for industrial and ambient air quality. Thorat et al. attributed the values to mobilized dust, based on Be/Fe ratios in the suspended particulate material. However, air in industrial environments may have much higher Be values. For example, Nakamura et al. (1983) found up to 6.6 μg m-3, with a mean of 0.21 μg m-3 inside a Cu-Be casting factory.
Paleolimnological studies of remote lakes in upper New York State indicate that atmospheric deposition of Be started increasing in eastern North America about 1910 (Heath et al. 1988), twenty years later than in central Europe (see below). Such changes in atmospheric burden may explain the higher Be concentrations in the North Atlantic versus the Pacific Ocean. On the other hand, major input of Be to the surface waters of the South Atlantic may be from the partial dissolution of eolian dusts, with the proportional dissolution being about seven times that of Al (Measures et al. 1996).
BERYLLIUM IN PRECIPITATION Beryllium concentration in precipitation reflects regional atmospheric emissions
from coal combustion in power plants (Bezačínský 1980; Kubizňáková 1987). Solid atmospheric particles of soil dust and anthropogenically emitted 9Be, as well as cosmogenic 7Be and 10Be, are transported to the Earth’s surface mostly via wet precipitation (Baskaran 1995; Gaffney et al. 1994). The residence time of Be in the atmosphere can be inferred from 7Be radioisotope data (Kaste et al., this volume). 7Beryllium forms primarily in the stratosphere (residence time of 10Be, attached to particles, is about 14 months) and has an estimated residence time in the lower troposphere of 10.3 to 48 days (Baeza et al. 1996; Ďurana et al. 1996). The value for the stable lithospheric isotope 9Be should be shorter, because it is injected into the troposphere (with the coal fly ash and terrigenous dust) on coarser particles. The residence time of 9Be may be about nine days, the same as atmospheric water. The depositional flux of Be is related to the distance from and strength of emission sources.
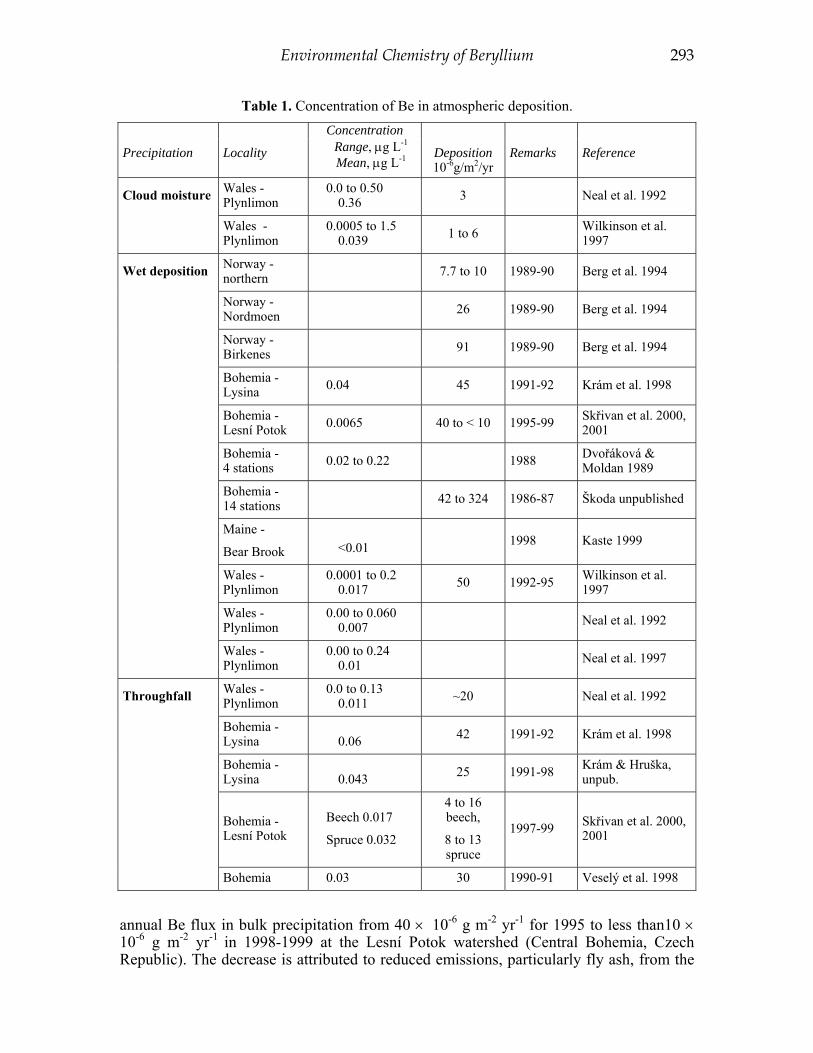
Volume-weighted concentrations of Be in bulk precipitation range from 0.007 μg L-1 in Wales to 0.22 μg Be L-1 in the most polluted area of the Czech Republic during 1985 to 1989 (Table 1). Concentrations of Be are much higher in cloud moisture (Neal et al. 1992). They reported a mean value of 0.36 μg L-1 for mist in an upland catchment in Wales. Atmospheric fluxes of Be in regions not under the influence of point sources of pollution range from <10 × 10-6 g m-2 yr-1 to approximately 50 × 10-6 g m-2 yr-1. Values reflect the importance of the wash-out effect of the wet precipitation, the amount of precipitation, and the impact of local and regional anthropogenic emission point sources of 9Be into the atmosphere. Skřivan et al. (2000) documented a steady decrease of the
Environmental Chemistry of Beryllium 293
Table 1. Concentration of Be in atmospheric deposition.
Precipitation
Locality
Concentration
Deposition 10-6g/m2/yr
Remarks
Reference Range, μg L-1
Mean, μg L-1
Cloud moisture Wales -Plynlimon
0.0 to 0.50 0.36 3 Neal et al. 1992
Wales -Plynlimon
0.0005 to 1.5 0.039 1 to 6 Wilkinson et al.
1997
Wet deposition Norway -northern 7.7 to 10 1989-90 Berg et al. 1994
Norway - Nordmoen 26 1989-90 Berg et al. 1994
Norway -Birkenes 91 1989-90 Berg et al. 1994
Bohemia - Lysina 0.04 45 1991-92 Krám et al. 1998
Bohemia -Lesní Potok 0.0065 40 to < 10 1995-99 Skřivan et al. 2000,
2001
Bohemia - 4 stations 0.02 to 0.22 1988 Dvořáková &
Moldan 1989
Bohemia - 14 stations 42 to 324 1986-87 Škoda unpublished
Maine -
Bear Brook
<0.01 1998 Kaste 1999
Wales -Plynlimon
0.0001 to 0.2 0.017 50 1992-95 Wilkinson et al.
1997
Wales - Plynlimon
0.00 to 0.060 0.007 Neal et al. 1992
Wales - Plynlimon
0.00 to 0.24 0.01 Neal et al. 1997
Throughfall Wales -Plynlimon
0.0 to 0.13 0.011 ~20 Neal et al. 1992
Bohemia -Lysina
0.06 42 1991-92 Krám et al. 1998
Bohemia - Lysina
0.043 25 1991-98 Krám & Hruška,
unpub.
Bohemia -Lesní Potok
Beech 0.017
Spruce 0.032
4 to 16 beech,
8 to 13 spruce
1997-99 Skřivan et al. 2000, 2001
Bohemia 0.03 30 1990-91 Veselý et al. 1998
annual Be flux in bulk precipitation from 40 × 10-6 g m-2 yr-1 for 1995 to less than10 × 10-6 g m-2 yr-1 in 1998-1999 at the Lesní Potok watershed (Central Bohemia, Czech Republic). The decrease is attributed to reduced emissions, particularly fly ash, from the
294 Chapter 7: Veselý, Norton, Skřivan, Majer, Krám, Navrátil & Kaste
Bohemian coal-burning power plants.
BERYLLIUM IN THROUGHFALL Throughfall is net precipitation that interacts with a forest canopy. Interactions of the
atmosphere and wet deposition with the canopy alter the chemistry of water reaching the forest floor (the organic-rich layer typically overlying mineral soil) and generally reduce the volume. Modification is caused by (1) evaporation/sublimation of water/snow/ice from foliar surfaces, (2) wash-off of solids, liquids, and gases deposited from the atmosphere in either dry or wet form, (3) leaching or ion exchange of leaf metabolite compounds, (4) adsorption of compounds, and (5) active uptake of nutrients from precipitation. The concentration of most chemical substances in water below the canopy (throughfall) exceeds that in the bulk precipitation. The increase depends on the intensity of interaction between the aqueous phase and foliage, and on the leaf area index of the forest canopy (Robson et al. 1994; Kostelník et al. 1989). Kaste et al. (this volume) demonstrate strong adsorption of 7Be by foliage. Skřivan et al. (2000) indicate that significant Be is taken up from soil solutions and incorporated into foliage, providing a possible source of Be to throughfall leaching. However, throughfall fluxes are not substantially different from bulk precipitation.
The Be concentration in throughfall and total flux of Be to the forest floor are poorly documented. Neal et al. (1992) reported the volume-weighted mean concentration of Be in throughfall and stemflow was 1.5 and 3 times higher than in rain, respectively, in mid-Wales. Beryllium in mist was five times higher than in rain. Total Be deposition on the moorland and forested area was about 20 × 10-6 g m-2 yr-1. Fluxes of Be in throughfall in beech (Fagus sylvatica L.) and Norway spruce (Picea abies) forest in the Lesní Potok watershed (Central Bohemia) (Table 1) were comparable. However, Skřivan et al. (2000) documented for 1999 that the flux of Be to the forest floor was dominated by litterfall (averaging 177 × 10-6 g m-2 yr-1 and 136 × 10-6 g m-2 yr-1, for beech and Norway spruce, respectively). These net fluxes are too high, compared to the Be fluxes in throughfall and in precipitation, to be attributed solely to dry deposition of Be to foliage and woody tissue. Total deposition of Be (wet plus dry) may be up to two times higher than is reported due to Be in particulate matter that is not normally included in analytical determinations (Rose 1990). Veselý (1990) showed that the concentration of dissolved Be in precipitation substantially increased after chemical digestion of precipitation samples in a microwave oven. These results suggest that particulate matter with low solubility contributed to the total Be flux in precipitation.
BERYLLIUM IN FLORA AND FAUNA Some forms of aqueous Be are toxic. Ezawa et al. (1999) described the inhibitory
effect of Be on the activity of alkaline phosphatase. They examined arbuscules of the mycorrhizal fungus Glomus etunicatum, which affect sugar metabolism. Mathur et al. (1994) observed that Be was associated with significant depletion of alkaline phosphatase, elevation of acid phosphatase activities in liver, and increased concentration of Be in blood and other soft organs. A series of experiments in the 1970s (e.g., Slonim 1973; Slonim and Slonim 1973) demonstrated that acute toxicity of Be to freshwater organisms is strongly decreased by increased water hardness (Ca + Mg), presumably because of the formation of non-toxic complexes between Be and HCO3
- or other ligands. Extrapolation of their findings to soft water suggests that toxicity may occur at concentrations of Be > 5 μg L-1. Jagoe et al. (1993) demonstrated that aqueous Be at 10 μg L-1 creates the same symptoms on fish gill surfaces as 50 μg Al L-1. Formation of complexes with SO4 and CO3 apparently eliminates toxicity of Be concentrations as high
Environmental Chemistry of Beryllium 295
as 10 mg L-1. Beryllium toxicity in soft water is comparable with that of Cd, but in water with high concentrations of Ca and Mg it is one to two orders of magnitude less toxic (Moore 1991).
Plants normally contain <1 mg Be kg-1 ashed weight (Meehan and Smythe 1967). Maňkovská (1995) found Be in wide concentration (0.0001 to 0.464 mg Be kg-1 dry weight (dw), mean 0.030) in 2-year old spruce needles from Slovakia. Only a slight enrichment of Be in the phytomass of bulk feeds (0.005 to 0.28 mg kg-1) and cereal grains (0.005 to 0.019 mg kg-1 dw) occurred in the severely polluted north-Bohemian region. The (Be in soil)/(Be in plant) concentration ratio was 0.004 to 0.01 for feeds crops and about 0.0015 for cereal grain, generally lower than transfer factors obtained in the laboratory, where Be was added to soils in soluble forms (Nĕmeček et al. 1994). The Be concentrations in rice and vegetables affected by wastewater were 13 and 1.8 to 6.2 times those of the controls (Long et al. 1989). The Be concentrations in potato and barley samples, collected in Germany, were 0.8 to 7 μg kg-1 dw with an average concentration of 2 to 3 μg Be kg-1 (Grote et al. 1996). Sajwan et al. (1996) assessed the effects of soil clay concentration on uptake of Be by soybeans. The most toxic effects of soluble Be occurred in soils low in clay; plant biomass was reduced by as much as 90%, as Be concentration in the tissues reached 226 mg kg-1 dw. Liming of soils (increasing the pH) resulted in lowered concentrations of Be in plant tissue.
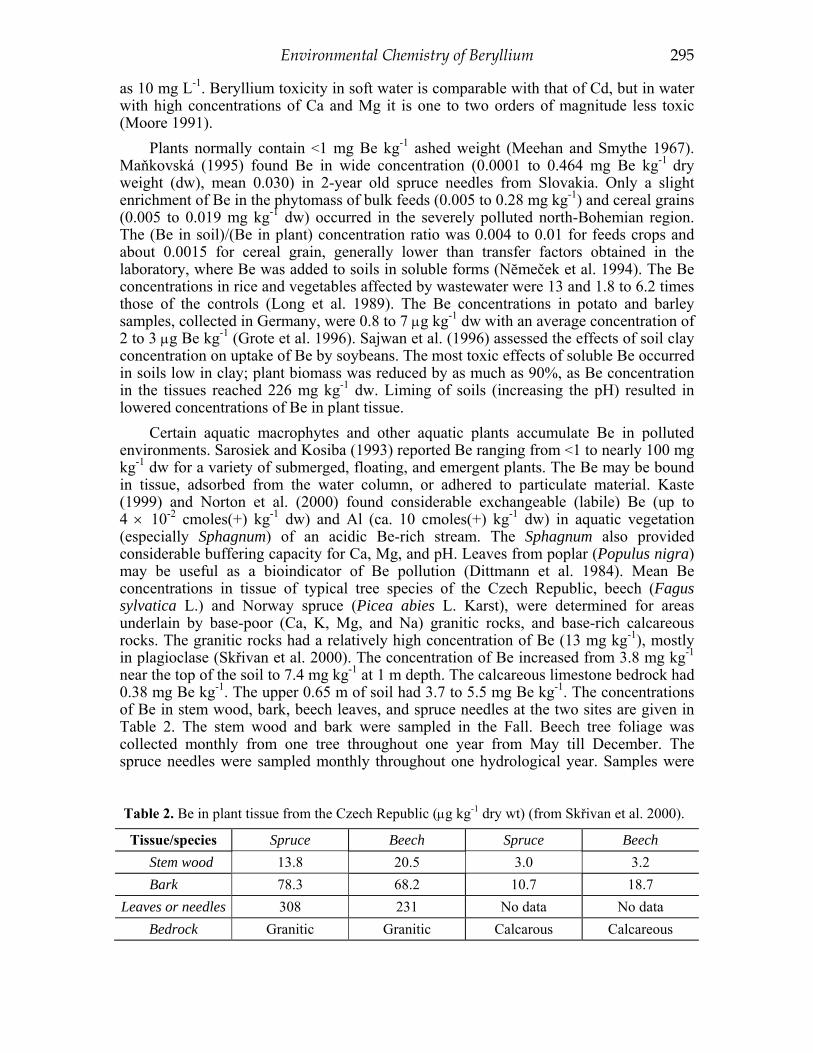
Certain aquatic macrophytes and other aquatic plants accumulate Be in polluted environments. Sarosiek and Kosiba (1993) reported Be ranging from <1 to nearly 100 mg kg-1 dw for a variety of submerged, floating, and emergent plants. The Be may be bound in tissue, adsorbed from the water column, or adhered to particulate material. Kaste (1999) and Norton et al. (2000) found considerable exchangeable (labile) Be (up to 4 × 10⁻² cmoles(+) kg-1 dw) and Al (ca. 10 cmoles(+) kg-1 dw) in aquatic vegetation (especially Sphagnum) of an acidic Be-rich stream. The Sphagnum also provided considerable buffering capacity for Ca, Mg, and pH. Leaves from poplar (Populus nigra) may be useful as a bioindicator of Be pollution (Dittmann et al. 1984). Mean Be concentrations in tissue of typical tree species of the Czech Republic, beech (Fagus sylvatica L.) and Norway spruce (Picea abies L. Karst), were determined for areas underlain by base-poor (Ca, K, Mg, and Na) granitic rocks, and base-rich calcareous rocks. The granitic rocks had a relatively high concentration of Be (13 mg kg-1), mostly in plagioclase (Skřivan et al. 2000). The concentration of Be increased from 3.8 mg kg-1 near the top of the soil to 7.4 mg kg-1 at 1 m depth. The calcareous limestone bedrock had 0.38 mg Be kg-1. The upper 0.65 m of soil had 3.7 to 5.5 mg Be kg-1. The concentrations of Be in stem wood, bark, beech leaves, and spruce needles at the two sites are given in Table 2. The stem wood and bark were sampled in the Fall. Beech tree foliage was collected monthly from one tree throughout one year from May till December. The spruce needles were sampled monthly throughout one hydrological year. Samples were
Table 2. Be in plant tissue from the Czech Republic (μg kg-1 dry wt) (from Skřivan et al. 2000).
Tissue/species Spruce Beech Spruce Beech Stem wood 13.8 20.5 3.0 3.2 Bark 78.3 68.2 10.7 18.7
Leaves or needles 308 231 No data No data Bedrock Granitic Granitic Calcarous Calcareous
296 Chapter 7: Veselý, Norton, Skřivan, Majer, Krám, Navrátil & Kaste
dried in a flow box at room temperature, acid digested (HNO3) and analyzed by ICP-MS. (Skřivan and Samek, unpublished). The large differences between the Be concentration in tree components at the two localities are probably caused by different availability of Be because of different soil pH.
BERYLLIUM IN SOIL The average upper continental crust abundance of Be is 3.1 mg kg-1, about twice that
of the lower continental crust (Wedepohl 1995). Granitic rocks, shales, and sandstone and limestones typically have between 2.5 and 5, 2 and 5, and <0.2 to 4 mg Be kg-1, respectively (Wedepohl 1969; Grigor´yev 1984). Clay sediments generally contain more Be than sandy sediment. Enrichment of Be occurs in manganese nodules of the Pacific Ocean (Merrill et al. 1960) and in limonitic concretions of near-shore sediments (Hirst 1962). Average Be concentration in metamorphic pelitic rocks is about 3.5 mg kg-1, ranging from 0.5 to 8 mg Be kg-1. The concentration of Be in granites may exceed 10 mg kg-1 (Macháček et al. 1966; London and Evensen, this volume). In some granitic pegmatites in Maine and New Hampshire, U.S.A., Be concentrations may locally exceed 10,000 mg kg-1 (Barton and Goldsmith 1968; Burr 1931). In these Be-rich terranes, the Be occurs predominantly in the mineral beryl (Be3Al2Si6O18); however, six other beryllium minerals are known to occur in the pegmatites (Burr 1931). Many of the Be-rich pegmatite occurrences in the northeastern U.S.A. are associated with the granitic bodies (Barton and Goldsmith, 1968). Some minerals with non-essential Be have high Be concentrations, for example, zinnwaldite and fluorite: 50 to 80 mg kg-1; topaz: 50 mg kg-1 (Dubanský et al., 1990). Shilin and Tsareva (1957) reported a Be concen- tration of 860 mg kg-1 for lepidolite (see also Grew, this volume).
Total Be in soil ranges from 0.1 to 300 mg kg-1, with the world average near 6 mg kg-1 (Drury et al. 1978). Shacklette (1984) reported <1 mg Be kg-1 to 15 mg Be kg-1 in soils from about 1,500 localities throughout the U.S.A. Anderson et al. (1990) observed Be in the range 0.3 to 30.5 mg kg-1 in Piedmont and Coastal Plain soils (southeastern U.S.A.), with a tendency to increase with soil depth. Chen et al. (1999) reported on 417 acidic soils (pHH2O = 5.04±0.97) from Florida that ranged from 0.01 to 5.92 mg Be kg-1. Soils in the Lost River Valley, Alaska contain from <1 to 300 mg Be kg-1, and average about 60 mg kg-1 (Sainsbury et al. 1986). Total and acid-soluble concentrations (2M HNO3) of Be were investigated in agricultural soils (Ap horizon) of the north-Bohemian region which has experienced high atmospheric pollution (Podlešáková and Němeček 1994). There the average total Be concentration ranged from 2.1 to 5.2 mg kg-1. Acid soluble Be ranged from 0.53 to 0.98 mg kg-1 (22 to 27% of total Be). The degree of soil pollution reflected the isolines of fly ash deposition. Dudka and Markert (1992) reported a geometric mean of 0.71 mg Be kg-1 for 130 soil samples distributed across Poland. Concentrations in the range 0.46 to 4.7 mg Be kg-1 occurred at the Nevada Nuclear Weapons Test Site, U.S.A., where Be may have been used in past operations (Patton 1992).
Data regarding the distribution and mobility of Be in soils are limited. Inorganic and organic ligand anions may increase, decrease or have no effect on the sorption of metals (including Be) in soils (Naidu et al. 1998). Important controls are pH, organic matter, and hydrous oxides (particularly of Al, Fe, and Mn). Anderson et al. (1990) determined exchangeable Be (5 g of soil and 25 mL of 1M NH4Cl) to be from <0.9 to 20 μg kg-1, comprising 0.0003 to 0.0083% of CEC in southeastern U.S.A. soils. Exchangeable Be was weakly negatively correlated with soil depth, whereas total Be increased with depth. Exchangeable Be and Al were unrelated. Kaste (1999) and Pellerin et al. (1999) found exchangeable Be forming 0.003 to 0.35% and 0.001 to 0.01% of CEC in spodic soils of
Environmental Chemistry of Beryllium 297
Halfmile (granite bedrock) and Bear Brook (quartzite and metapelitic bedrock) watersheds in Maine. Exchangeable Be in the forest floor increased nearly 300% on a transect of 17 m from well-drained upland soil to poorly drained riparian soil. Exchangeable Al followed a similar trend, but Ca was the opposite, decreasing towards the riparian zone. The increased Al and Be concentrations occur where the soils have a higher pH because of mixing of emerging groundwater and degassing of CO2 in the riparian zones. Concentrations of exchangeable Be were markedly different in the podzolic brown earths and peaty gley at Lysina watershed, in the Czech Republic (Krám and Kaste, unpublished). Podzolic brown earths had lower concentrations of exchangeable Be in the forest floor (O horizons; 36 μg kg-1 versus 163 μg kg-1) and in the mineral soil (E+B horizons; 27 μg kg-1 versus 77 μg kg-1) than in the peaty gley in the riparian zone of the stream. In the podzolic brown earths of the upper 40 cm of the mineral soil (E and B horizons), exchangeable Be was 5.9 mg m-2 versus 0.5 mg m-2 in the forest floor, which was 7 cm thick. Zajíc (unpublished) compared total and extrac-table Be in two soil profiles. Soils over Be-rich granite (15 mg Be kg-1) had 3.8 to 7.3 mg Be kg-1, 3 to 17% of which was extractable (0.5 g of soil with 100 mL 0.1 M HNO3). The soil developed on limestone (0.38 mg Be kg-1) had 0.38 to 5 mg Be kg-1, 19 to 25% of which was extractable.
Óvári et al. (2001) determined the speciation of Be in soil material (0-20 cm) from Hungarian sites polluted by atmospheric deposition. They found that 15 to 50% of the total Be could be extracted by sequential extraction of exchangeable, acid soluble, easily reducible, moderately reducible, and oxidizable fractions. Total Be ranged from 0.17 to 0.60 mg kg-1.
Beryllium is released from the Al-rich layers in the soil during acidification (Neal et al. 1992). Profiles of concentrations of Be in two acid-sensitive soils of forested regions receiving different loading of acid deposition suggested the depletion of Be in humic and upper mineral soils in more acidified areas (Veselý 1987; Gooddy et al. 1995; Veselý and Majer 1996). Kaste (1999) found that Be mobilization from an artificially acidified catchment in Maine, U.S.A. was twice that of the adjacent reference watershed.
CHEMICAL WEATHERING Beryllium occurs in trace amounts in silicate minerals such as feldspar, biotite, and
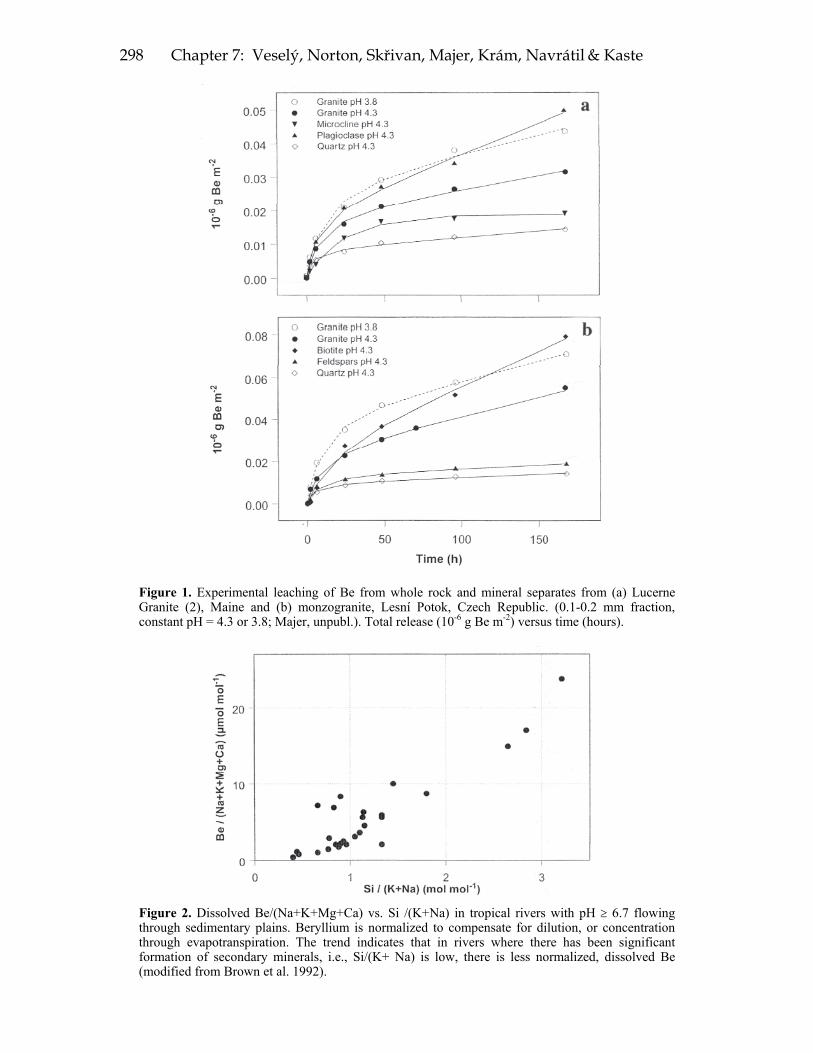
muscovite, most commonly substituting for Si and Al in tetrahedral positions. Chemical weathering of Be-bearing silicate minerals involves a set of incongruent reactions followed by the interactions of their hydrolysis products. Laboratory studies of Be release rates from granites from Maine and Bohemia (Fig. 1) and their individual minerals (0.1-0.2 mm fraction) at constant pH (4.3 and 3.8) indicate that release of Be increases as follows:
quartz < (microcline + plagioclase) < bulk granite < plagioclase < biotite Release rates increase with increasing Be concentration in the mineral and with decreasing pH. Rate of total Be weathering ranged from 0.07 to 3.2 × 10⁻⁶ g m-2 yr-1. The amount of Be leached from biotite and feldspars was comparable, in spite of substantially lower amount of biotite (5 to 10%), compared with the more abundant feldspar (about 60% of the granite) (Majer et al. unpublished). Plagioclase contained up to 20 mg Be kg-1, exceeding microcline (up to 4 mg kg-1). The fluoride (F-) concentration of biotite may be crucial to the high release rate of Be during weathering (Minařík et al. 1997), possibly because of complexation of Be with F- in soil leachate. In older soils where biotite has been preferentially weathered, release rates of Be by primary weathering should decrease as other factors determine the export from catchments.
298 Chapter 7: Veselý, Norton, Skřivan, Majer, Krám, Navrátil & Kaste
Figure 1. Experimental leaching of Be from whole rock and mineral separates from (a) Lucerne Granite (2), Maine and (b) monzogranite, Lesní Potok, Czech Republic. (0.1-0.2 mm fraction, constant pH = 4.3 or 3.8; Majer, unpubl.). Total release (10-6 g Be m-2) versus time (hours).
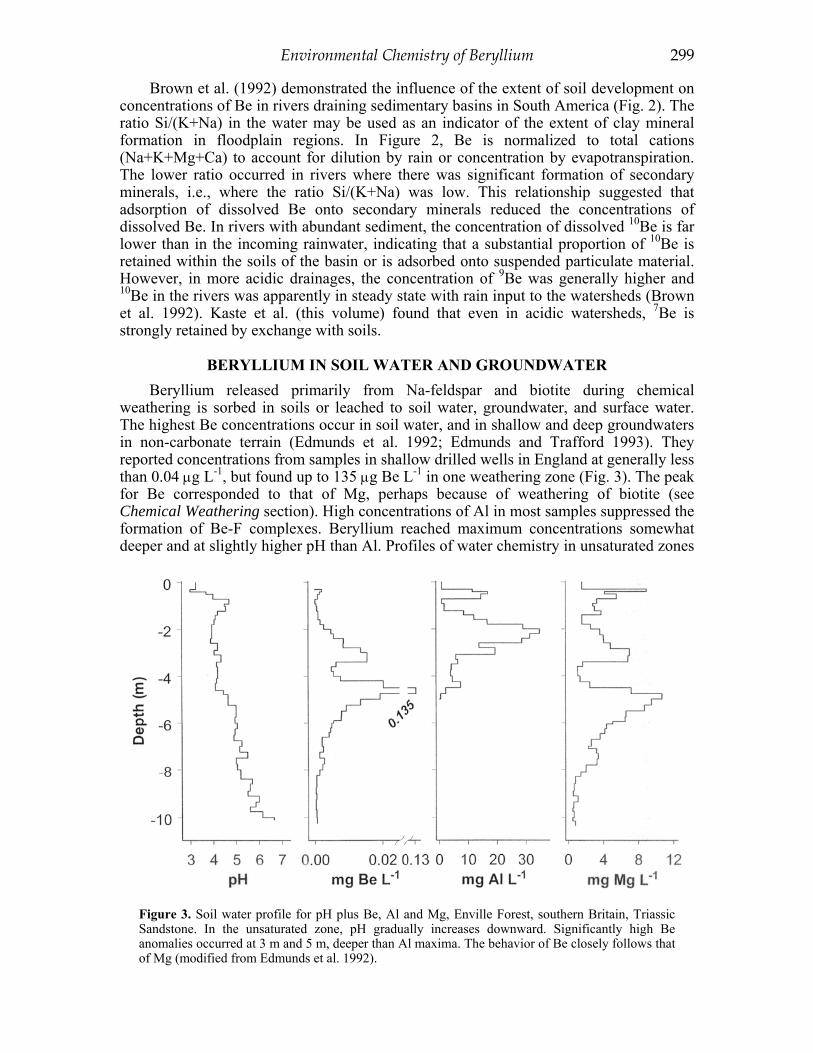
Figure 2. Dissolved Be/(Na+K+Mg+Ca) vs. Si /(K+Na) in tropical rivers with pH ≥ 6.7 flowing through sedimentary plains. Beryllium is normalized to compensate for dilution, or concentration through evapotranspiration. The trend indicates that in rivers where there has been significant formation of secondary minerals, i.e., Si/(K+ Na) is low, there is less normalized, dissolved Be (modified from Brown et al. 1992).
Environmental Chemistry of Beryllium 299
Brown et al. (1992) demonstrated the influence of the extent of soil development on concentrations of Be in rivers draining sedimentary basins in South America (Fig. 2). The ratio Si/(K+Na) in the water may be used as an indicator of the extent of clay mineral formation in floodplain regions. In Figure 2, Be is normalized to total cations (Na+K+Mg+Ca) to account for dilution by rain or concentration by evapotranspiration. The lower ratio occurred in rivers where there was significant formation of secondary minerals, i.e., where the ratio Si/(K+Na) was low. This relationship suggested that adsorption of dissolved Be onto secondary minerals reduced the concentrations of dissolved Be. In rivers with abundant sediment, the concentration of dissolved 10Be is far lower than in the incoming rainwater, indicating that a substantial proportion of 10Be is retained within the soils of the basin or is adsorbed onto suspended particulate material. However, in more acidic drainages, the concentration of 9Be was generally higher and 10Be in the rivers was apparently in steady state with rain input to the watersheds (Brown et al. 1992). Kaste et al. (this volume) found that even in acidic watersheds, 7Be is strongly retained by exchange with soils.
BERYLLIUM IN SOIL WATER AND GROUNDWATER Beryllium released primarily from Na-feldspar and biotite during chemical
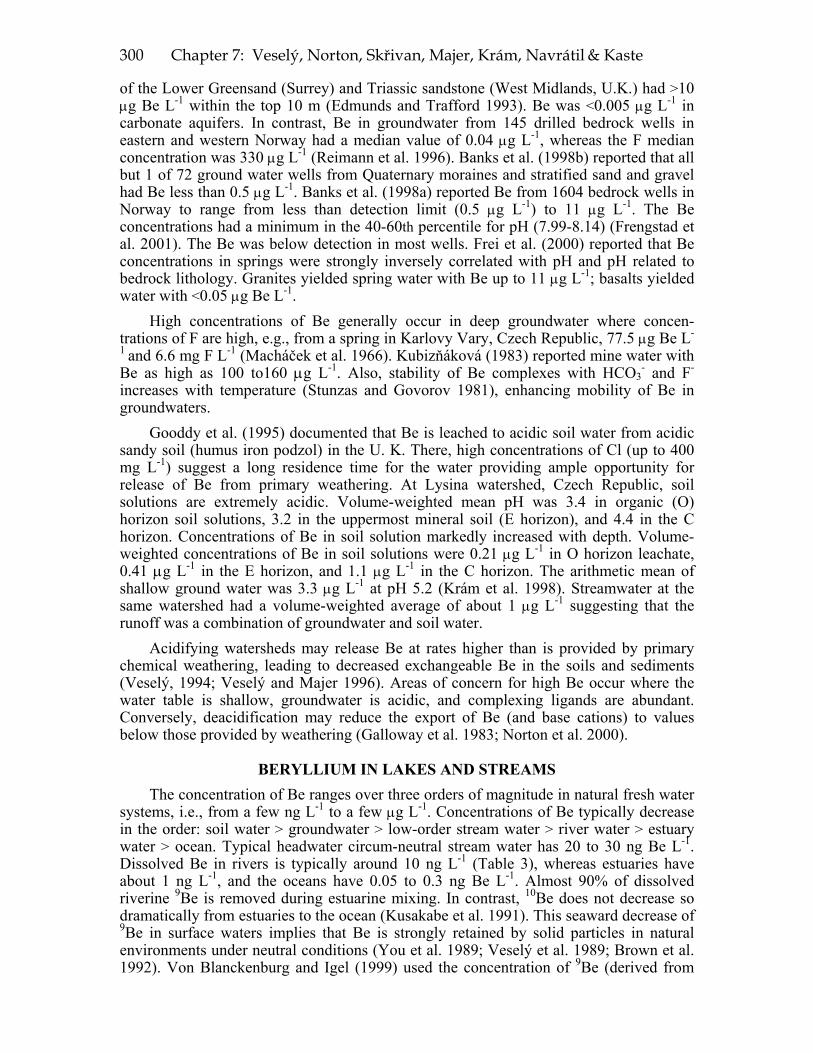
weathering is sorbed in soils or leached to soil water, groundwater, and surface water. The highest Be concentrations occur in soil water, and in shallow and deep groundwaters in non-carbonate terrain (Edmunds et al. 1992; Edmunds and Trafford 1993). They reported concentrations from samples in shallow drilled wells in England at generally less than 0.04 μg L-1, but found up to 135 μg Be L-1 in one weathering zone (Fig. 3). The peak for Be corresponded to that of Mg, perhaps because of weathering of biotite (see Chemical Weathering section). High concentrations of Al in most samples suppressed the formation of Be-F complexes. Beryllium reached maximum concentrations somewhat deeper and at slightly higher pH than Al. Profiles of water chemistry in unsaturated zones
Figure 3. Soil water profile for pH plus Be, Al and Mg, Enville Forest, southern Britain, Triassic Sandstone. In the unsaturated zone, pH gradually increases downward. Significantly high Be anomalies occurred at 3 m and 5 m, deeper than Al maxima. The behavior of Be closely follows that of Mg (modified from Edmunds et al. 1992).
300 Chapter 7: Veselý, Norton, Skřivan, Majer, Krám, Navrátil & Kaste
of the Lower Greensand (Surrey) and Triassic sandstone (West Midlands, U.K.) had >10 μg Be L-1 within the top 10 m (Edmunds and Trafford 1993). Be was <0.005 μg L-1 in carbonate aquifers. In contrast, Be in groundwater from 145 drilled bedrock wells in eastern and western Norway had a median value of 0.04 μg L-1, whereas the F median concentration was 330 μg L-1 (Reimann et al. 1996). Banks et al. (1998b) reported that all but 1 of 72 ground water wells from Quaternary moraines and stratified sand and gravel had Be less than 0.5 μg L-1. Banks et al. (1998a) reported Be from 1604 bedrock wells in Norway to range from less than detection limit (0.5 μg L-1) to 11 μg L-1. The Be concentrations had a minimum in the 40-60th percentile for pH (7.99-8.14) (Frengstad et al. 2001). The Be was below detection in most wells. Frei et al. (2000) reported that Be concentrations in springs were strongly inversely correlated with pH and pH related to bedrock lithology. Granites yielded spring water with Be up to 11 μg L-1; basalts yielded water with <0.05 μg Be L-1.
High concentrations of Be generally occur in deep groundwater where concen-trations of F are high, e.g., from a spring in Karlovy Vary, Czech Republic, 77.5 μg Be L-1 and 6.6 mg F L-1 (Macháček et al. 1966). Kubizňáková (1983) reported mine water with Be as high as 100 to160 μg L-1. Also, stability of Be complexes with HCO3
- and F-
increases with temperature (Stunzas and Govorov 1981), enhancing mobility of Be in groundwaters.
Gooddy et al. (1995) documented that Be is leached to acidic soil water from acidic sandy soil (humus iron podzol) in the U. K. There, high concentrations of Cl (up to 400 mg L-1) suggest a long residence time for the water providing ample opportunity for release of Be from primary weathering. At Lysina watershed, Czech Republic, soil solutions are extremely acidic. Volume-weighted mean pH was 3.4 in organic (O) horizon soil solutions, 3.2 in the uppermost mineral soil (E horizon), and 4.4 in the C horizon. Concentrations of Be in soil solution markedly increased with depth. Volume-weighted concentrations of Be in soil solutions were 0.21 μg L-1 in O horizon leachate, 0.41 μg L-1 in the E horizon, and 1.1 μg L-1 in the C horizon. The arithmetic mean of shallow ground water was 3.3 μg L-1 at pH 5.2 (Krám et al. 1998). Streamwater at the same watershed had a volume-weighted average of about 1 μg L-1 suggesting that the runoff was a combination of groundwater and soil water.
Acidifying watersheds may release Be at rates higher than is provided by primary chemical weathering, leading to decreased exchangeable Be in the soils and sediments (Veselý, 1994; Veselý and Majer 1996). Areas of concern for high Be occur where the water table is shallow, groundwater is acidic, and complexing ligands are abundant. Conversely, deacidification may reduce the export of Be (and base cations) to values below those provided by weathering (Galloway et al. 1983; Norton et al. 2000).
BERYLLIUM IN LAKES AND STREAMS The concentration of Be ranges over three orders of magnitude in natural fresh water
systems, i.e., from a few ng L-1 to a few μg L-1. Concentrations of Be typically decrease in the order: soil water > groundwater > low-order stream water > river water > estuary water > ocean. Typical headwater circum-neutral stream water has 20 to 30 ng Be L-1. Dissolved Be in rivers is typically around 10 ng L-1 (Table 3), whereas estuaries have about 1 ng L-1, and the oceans have 0.05 to 0.3 ng Be L-1. Almost 90% of dissolved riverine 9Be is removed during estuarine mixing. In contrast, 10Be does not decrease so dramatically from estuaries to the ocean (Kusakabe et al. 1991). This seaward decrease of 9Be in surface waters implies that Be is strongly retained by solid particles in natural environments under neutral conditions (You et al. 1989; Veselý et al. 1989; Brown et al. 1992). Von Blanckenburg and Igel (1999) used the concentration of 9Be (derived from
Environmental Chemistry of Beryllium 301
the continents) and 10Be (derived largely from direct precipitation) to draw inferences about lateral mixing and advection within ocean basins.
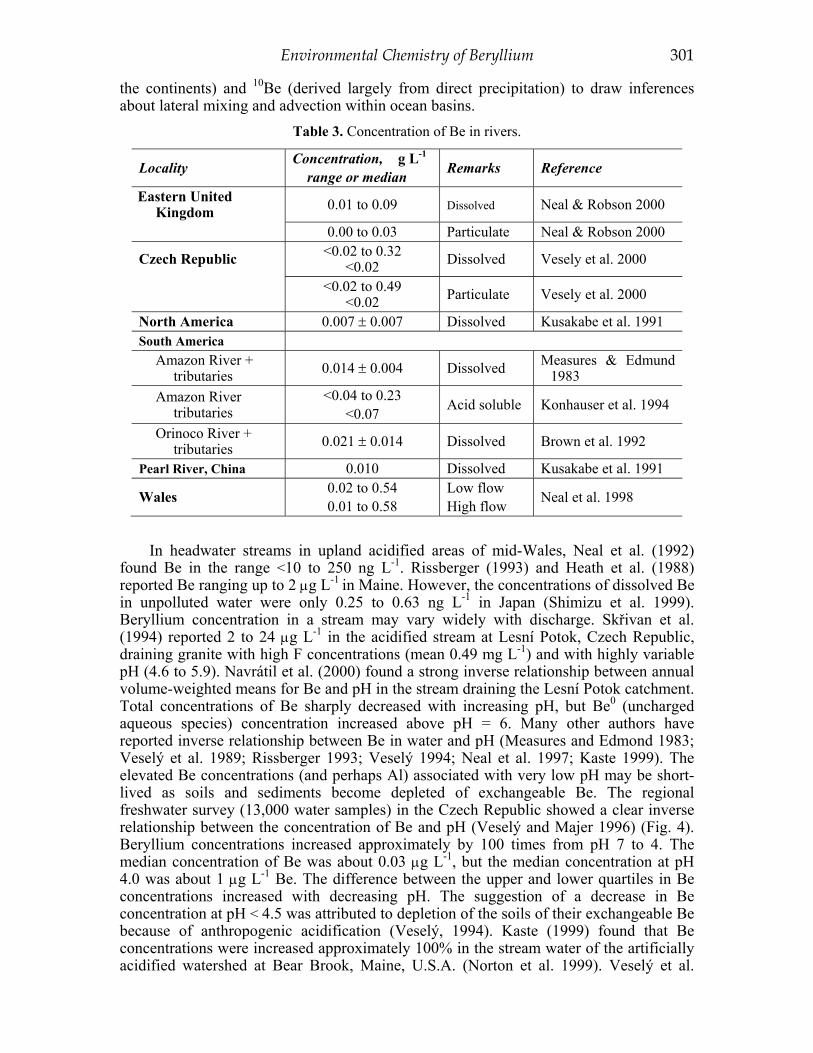
Table 3. Concentration of Be in rivers.
Locality Concentration, �g L-1 range or median
Remarks Reference
Eastern United Kingdom 0.01 to 0.09 Dissolved Neal & Robson 2000
0.00 to 0.03 Particulate Neal & Robson 2000
Czech Republic <0.02 to 0.32 <0.02 Dissolved Vesely et al. 2000
<0.02 to 0.49 <0.02 Particulate Vesely et al. 2000
North America 0.007 ± 0.007 Dissolved Kusakabe et al. 1991 South America
Amazon River + tributaries 0.014 ± 0.004 Dissolved Measures & Edmund
1983 Amazon River
tributaries <0.04 to 0.23
<0.07 Acid soluble Konhauser et al. 1994
Orinoco River + tributaries 0.021 ± 0.014 Dissolved Brown et al. 1992
Pearl River, China 0.010 Dissolved Kusakabe et al. 1991
Wales 0.02 to 0.54 0.01 to 0.58
Low flow High flow Neal et al. 1998
In headwater streams in upland acidified areas of mid-Wales, Neal et al. (1992)
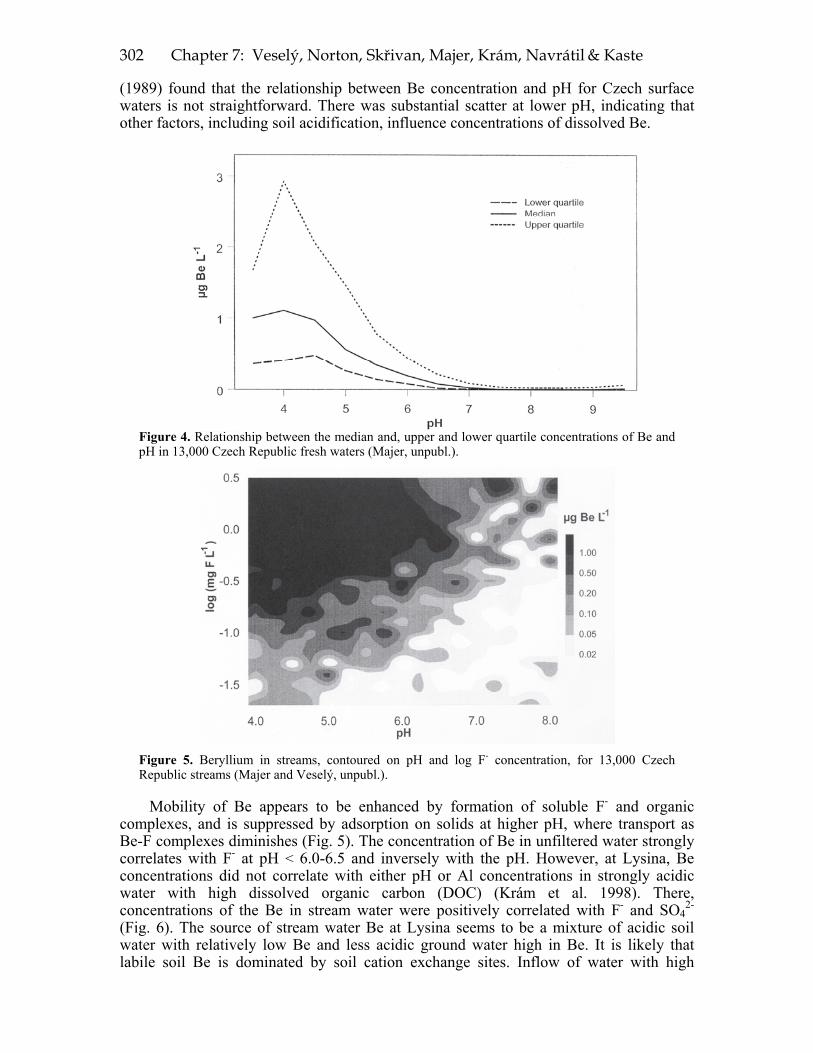
found Be in the range <10 to 250 ng L-1. Rissberger (1993) and Heath et al. (1988) reported Be ranging up to 2 μg L-1 in Maine. However, the concentrations of dissolved Be in unpolluted water were only 0.25 to 0.63 ng L-1 in Japan (Shimizu et al. 1999). Beryllium concentration in a stream may vary widely with discharge. Skřivan et al. (1994) reported 2 to 24 μg L-1 in the acidified stream at Lesní Potok, Czech Republic, draining granite with high F concentrations (mean 0.49 mg L-1) and with highly variable pH (4.6 to 5.9). Navrátil et al. (2000) found a strong inverse relationship between annual volume-weighted means for Be and pH in the stream draining the Lesní Potok catchment. Total concentrations of Be sharply decreased with increasing pH, but Be0 (uncharged aqueous species) concentration increased above pH = 6. Many other authors have reported inverse relationship between Be in water and pH (Measures and Edmond 1983; Veselý et al. 1989; Rissberger 1993; Veselý 1994; Neal et al. 1997; Kaste 1999). The elevated Be concentrations (and perhaps Al) associated with very low pH may be short-lived as soils and sediments become depleted of exchangeable Be. The regional freshwater survey (13,000 water samples) in the Czech Republic showed a clear inverse relationship between the concentration of Be and pH (Veselý and Majer 1996) (Fig. 4). Beryllium concentrations increased approximately by 100 times from pH 7 to 4. The median concentration of Be was about 0.03 μg L-1, but the median concentration at pH 4.0 was about 1 μg L-1 Be. The difference between the upper and lower quartiles in Be concentrations increased with decreasing pH. The suggestion of a decrease in Be concentration at pH < 4.5 was attributed to depletion of the soils of their exchangeable Be because of anthropogenic acidification (Veselý, 1994). Kaste (1999) found that Be concentrations were increased approximately 100% in the stream water of the artificially acidified watershed at Bear Brook, Maine, U.S.A. (Norton et al. 1999). Veselý et al.
302 Chapter 7: Veselý, Norton, Skřivan, Majer, Krám, Navrátil & Kaste
(1989) found that the relationship between Be concentration and pH for Czech surface waters is not straightforward. There was substantial scatter at lower pH, indicating that other factors, including soil acidification, influence concentrations of dissolved Be.
Figure 4. Relationship between the median and, upper and lower quartile concentrations of Be and pH in 13,000 Czech Republic fresh waters (Majer, unpubl.).
Figure 5. Beryllium in streams, contoured on pH and log F- concentration, for 13,000 Czech Republic streams (Majer and Veselý, unpubl.).
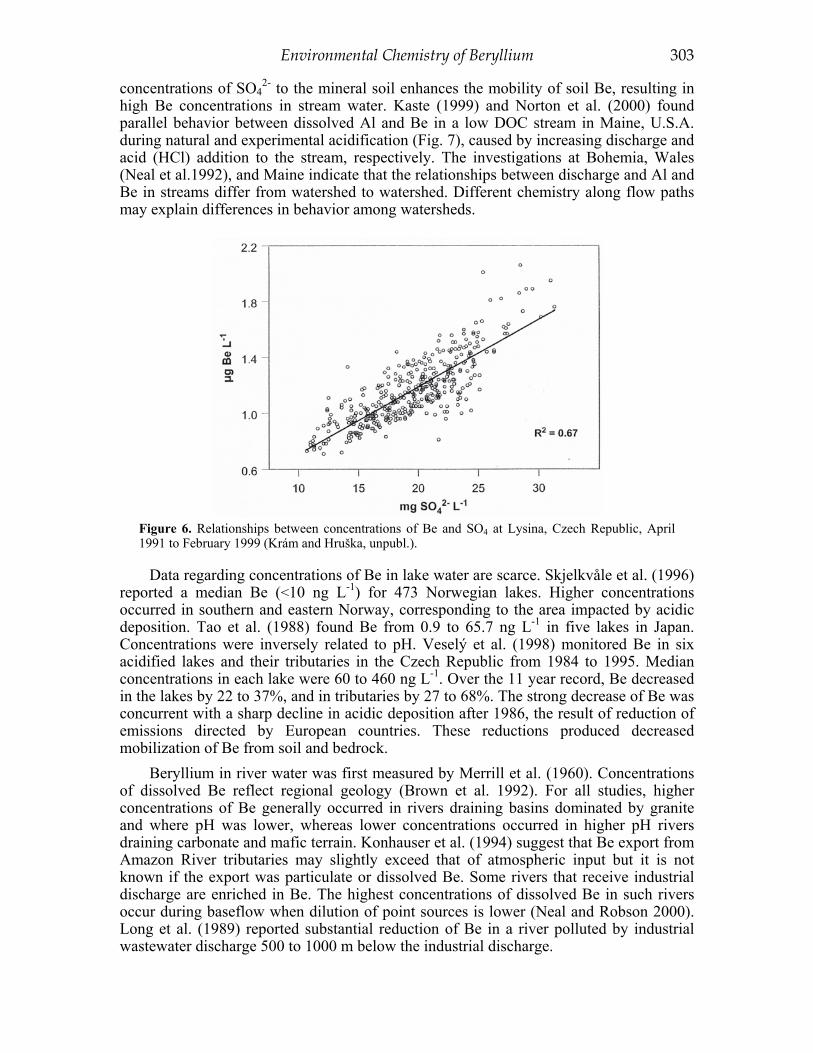
Mobility of Be appears to be enhanced by formation of soluble F- and organic complexes, and is suppressed by adsorption on solids at higher pH, where transport as Be-F complexes diminishes (Fig. 5). The concentration of Be in unfiltered water strongly correlates with F- at pH < 6.0-6.5 and inversely with the pH. However, at Lysina, Be concentrations did not correlate with either pH or Al concentrations in strongly acidic water with high dissolved organic carbon (DOC) (Krám et al. 1998). There, concentrations of the Be in stream water were positively correlated with F- and SO4
2- (Fig. 6). The source of stream water Be at Lysina seems to be a mixture of acidic soil water with relatively low Be and less acidic ground water high in Be. It is likely that labile soil Be is dominated by soil cation exchange sites. Inflow of water with high
Environmental Chemistry of Beryllium 303
concentrations of SO42- to the mineral soil enhances the mobility of soil Be, resulting in
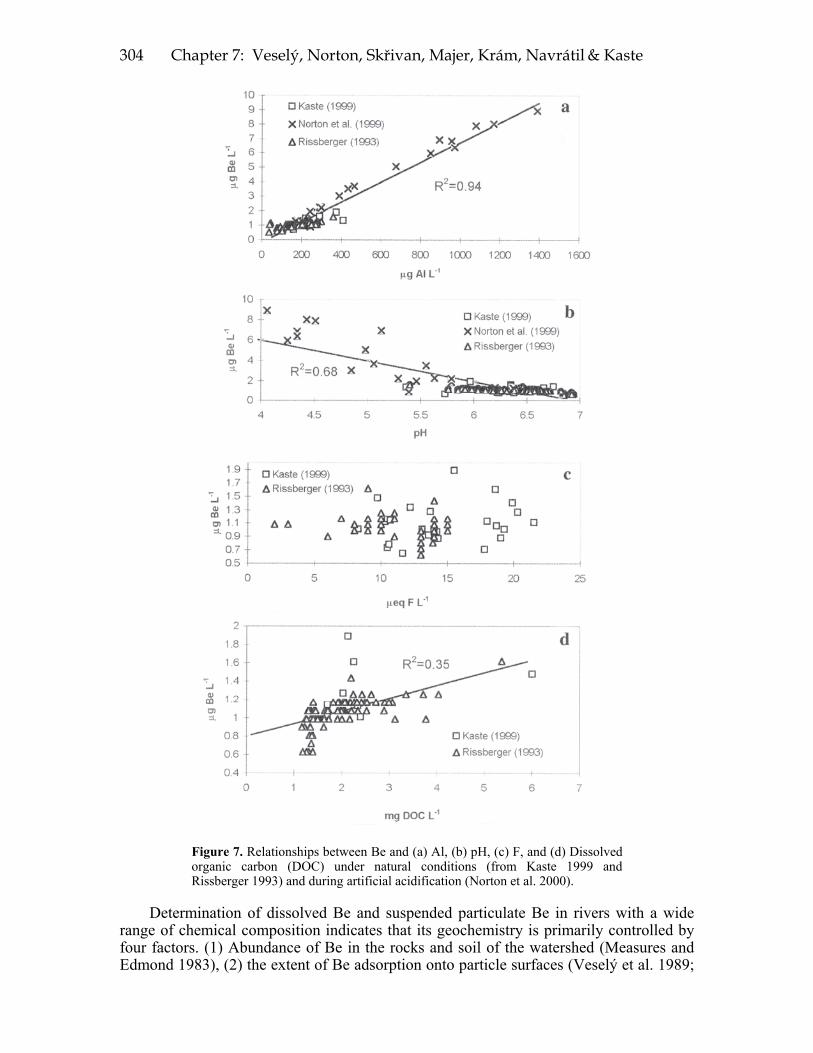
high Be concentrations in stream water. Kaste (1999) and Norton et al. (2000) found parallel behavior between dissolved Al and Be in a low DOC stream in Maine, U.S.A. during natural and experimental acidification (Fig. 7), caused by increasing discharge and acid (HCl) addition to the stream, respectively. The investigations at Bohemia, Wales (Neal et al.1992), and Maine indicate that the relationships between discharge and Al and Be in streams differ from watershed to watershed. Different chemistry along flow paths may explain differences in behavior among watersheds.
Figure 6. Relationships between concentrations of Be and SO4 at Lysina, Czech Republic, April 1991 to February 1999 (Krám and Hruška, unpubl.).
Data regarding concentrations of Be in lake water are scarce. Skjelkvåle et al. (1996) reported a median Be (<10 ng L-1) for 473 Norwegian lakes. Higher concentrations occurred in southern and eastern Norway, corresponding to the area impacted by acidic deposition. Tao et al. (1988) found Be from 0.9 to 65.7 ng L-1 in five lakes in Japan. Concentrations were inversely related to pH. Veselý et al. (1998) monitored Be in six acidified lakes and their tributaries in the Czech Republic from 1984 to 1995. Median concentrations in each lake were 60 to 460 ng L-1. Over the 11 year record, Be decreased in the lakes by 22 to 37%, and in tributaries by 27 to 68%. The strong decrease of Be was concurrent with a sharp decline in acidic deposition after 1986, the result of reduction of emissions directed by European countries. These reductions produced decreased mobilization of Be from soil and bedrock.
Beryllium in river water was first measured by Merrill et al. (1960). Concentrations of dissolved Be reflect regional geology (Brown et al. 1992). For all studies, higher concentrations of Be generally occurred in rivers draining basins dominated by granite and where pH was lower, whereas lower concentrations occurred in higher pH rivers draining carbonate and mafic terrain. Konhauser et al. (1994) suggest that Be export from Amazon River tributaries may slightly exceed that of atmospheric input but it is not known if the export was particulate or dissolved Be. Some rivers that receive industrial discharge are enriched in Be. The highest concentrations of dissolved Be in such rivers occur during baseflow when dilution of point sources is lower (Neal and Robson 2000). Long et al. (1989) reported substantial reduction of Be in a river polluted by industrial wastewater discharge 500 to 1000 m below the industrial discharge.
304 Chapter 7: Veselý, Norton, Skřivan, Majer, Krám, Navrátil & Kaste
Figure 7. Relationships between Be and (a) Al, (b) pH, (c) F, and (d) Dissolved organic carbon (DOC) under natural conditions (from Kaste 1999 and Rissberger 1993) and during artificial acidification (Norton et al. 2000).
Determination of dissolved Be and suspended particulate Be in rivers with a wide range of chemical composition indicates that its geochemistry is primarily controlled by four factors. (1) Abundance of Be in the rocks and soil of the watershed (Measures and Edmond 1983), (2) the extent of Be adsorption onto particle surfaces (Veselý et al. 1989;
Environmental Chemistry of Beryllium 305
Brown et al. 1992), (3) discharge (Neal et al. 1997), and (4) water chemistry. Partitioning between solid and aqueous phases in soil-, ground-, and surface water systems is affected by the abundance of organic matter and secondary minerals because Be is strongly adsorbed. Beryllium distribution in acidic waters which have had little interaction with fluvial sediments is dominated by the composition of the rocks and soil of the drainage basin, whereas Be in neutral to alkaline rivers in contact with sediment is inversely related to the degree of mineral alteration (Brown et al. 1992).
Beryllium concentrations in the western North Atlantic Ocean surface water (between 33° and 42°N) are about five times those in the surface Pacific (Measures and Edmond 1983; Ku et al. 1990). There is a systematic increase in the ratio 10Be/9Be [(atom/(atom)] × 107 along the advective flow lines of the surface North Atlantic (0.4) → deep North Atlantic (0.6) → circumpolar (1.0) → deep Pacific (1.2) → surface Pacific (1.3). This distribution pattern and contrasting North Atlantic-Pacific chemistry may be explained by a strong fluvial and continental/anthropogenic dust input of 9Be to the North Atlantic (analogous to Pb) and an ocean-wide more or less uniform fluvial and atmospheric input of cosmogenically produced 10Be (Ku et al. 1990).
SPECIATION OF BERYLLIUM IN WATER Speciation of Be in water is important because toxicity varies according to aqueous
speciation and mobility is largely controlled by the formation of various Be-complexes and adsorption-desorption phenomena. Equilibrium constants for various inorganic complexes have been compiled by many authors (e.g., Smith and Martell 1976; Högfeldt 1982; Rai et al. 1984). Consistent equilibrium constants may be incorporated into various chemical equilibrium models such as MINEQL+ (Schecher and McAvoy 1998). The quantitatively most important species in soft waters are Be-F and Be-OH complexes. Equilibrium constants in the Be-F-H2O system were redetermined by Anttila et al. (1991):
Be2+ + F- = BeF+log K = 5.21 Be2+ + 2F- = BeF2
0(aq)log K = 9.57 The binding constants for the ternary complexes
Be3(OH)3 3+ + F- = Be3(OH)3F2+log K = 4.48
Be3(OH)3F2+ + F- = Be3(OH)3F2 +log K = 3.51
are about one tenth of the corresponding stepwise constants for the formation of BeF+ and BeF2
0(aq). High concentrations of Al in waters (e.g., shallow groundwaters, Edmunds and
Trafford 1993) greatly suppress the formation of BeF+ complex ions due to formation of stronger Al-F complexes and depletion of free F- ions. Formation of Be-F complexes is most favored between pH 4.2 and 5.0 (Veselý et al. 1989). In waters with high total F-, BeF+ and BeF2
0(aq) may dominate up to pH ∼ 6.0 (Fig. 8). At pH < 4, Be occurs
dominantly as free uncomplexed ions (Be2+). At progressively higher pH, the Be becomes progressively hydroxylated, analagous to Al. Coordination chemistry of Be with organic ligands is reviewed by Schmidbaur (2001). He emphasizes that Be interacts with carboxylic and hydrocarboxylic acids and polyols. Binding to fulvic acids, among the strongest naturally occurring organic ligands, occurs above pH 6. Conditional stability constants for the complexation of Be with fulvic acids (log K = 5.9 to 6.5) at pH 6 to 7 (Esteves da Silva et al. 1996) are high, even larger than for the Cu(II) system. Log K for the Be-organic complex decreased with decreasing pH at pH < 6, and is slightly lower at pH 7 than at pH 6. The common trend is probably a result both of the acid-base properties of the ligand structures and of the Be hydrolysis. Some of the binding sites are protonated and unavailable for the complexation reactions. Beryllium strongly associates with soil
306 Chapter 7: Veselý, Norton, Skřivan, Majer, Krám, Navrátil & Kaste
fulvic acid, forming soluble complexes in soil water, but they decrease in relative abundance with lower pH. The relative significance of this association when compared to adsorption by inorganic (e.g., FeO(OH)) or organic (humic matter) solid phases in soils has not been estimated because no information on adsorption is available (Esteves da Silva et al. 1996). However, Be quantitatively co-precipitates with Fe(OH)3 at pH 8 to 13 (Novikov et al. 1977) and Be in unfiltered waters with pH 7.8 to 8.8 correlates with Fe concentration (Veselý et al. 1989).
Veselý et al. (1989) studied the speciation of total Be (particulate, colloidal, and dissolved) in fresh waters. Aqueous speciation of Be is most directly affected by forming soluble complexes with F- (Fig. 5) and dissolved organic matter. Rissberger (1993) and Kaste (1999) found that Be concentrations in a headwater stream in Maine related directly to discharge, the concentrations of dissolved organic carbon, and total F, and inversely to pH. Be export in the stream was partly as Be adsorbed on suspended particulate matter, dominantly Al(OH)3. The percentage of total Be exported in this form decreased with decreasing pH. The adsorption of Be onto Al(OH)3 occurs during degassing of CO2 from Al-saturated groundwater emerging to surface water. The degassing raises pH and precipitates Al(OH)3, which adsorbs the Be in the emerging groundwater (Norton and Henrik-sen 1983; Norton et al. 1992, 2000).
Beryllium is transported mostly in soluble form in acidic waters. As water is neutralized, dissolved Be becomes bound to the suspended particular matter, particu- larly organic matter, Al(OH)3, and FeO(OH), in acid-soluble forms. In circum-neutral fresh waters (e.g., rivers) most Be migrates as suspended (non-labile) alumino-silicate minerals. Analyzing ashed suspended solids from 169 principal rivers and lakes in Japan, Teraoka and Kobayashi (1980) found Be distribution divided across Japan. Beryllium is markedly lower in the eastern half. Concentrations of Be were positively correlated with Al and Ti. Also, total exchangeable Be (dissolved + hydroxylamine-leachable) particulate phase was primarily dependent on the concentration of suspended particles. The residual Be constitutes a large proportion of the particulate Be but a relatively small fraction of the particulate 10Be (Brown et al. 1992).
PARTITION (DISTRIBUTION) COEFFICIENTS OF BERYLLIUM BETWEEN WATER AND PARTICULATE MATTER
Adsorption-desorption processes strongly affect Be mobility in soil and leaching to surface or groundwater. Increasing soil pH leads to a rapid increase in net negative surface charge (Naidu et al. 1998) causing enhanced affinity for metal ions, i.e., an increase in cation exchange capacity. Changes in ambient solution chemistry can marked-ly influence the concentrations and nature of the Be species in soil water and fresh water and, consequently, their transport through the soil and into surface water.
Beryllium is strongly bound to solids under neutral conditions in natural systems. In waters of pH about 7.5, practically all Be occurs in/on suspended matter. The partitioning of Be between solid and water phases is characterized by its partition (distribution) coefficient Kd
Be, where KdBe = CS/CL , CS = the concentration of Be on solids (mg kg-1),
and CL = the concentration of Be in water (mg L-1). The KdBe (L kg-1) increases by 104
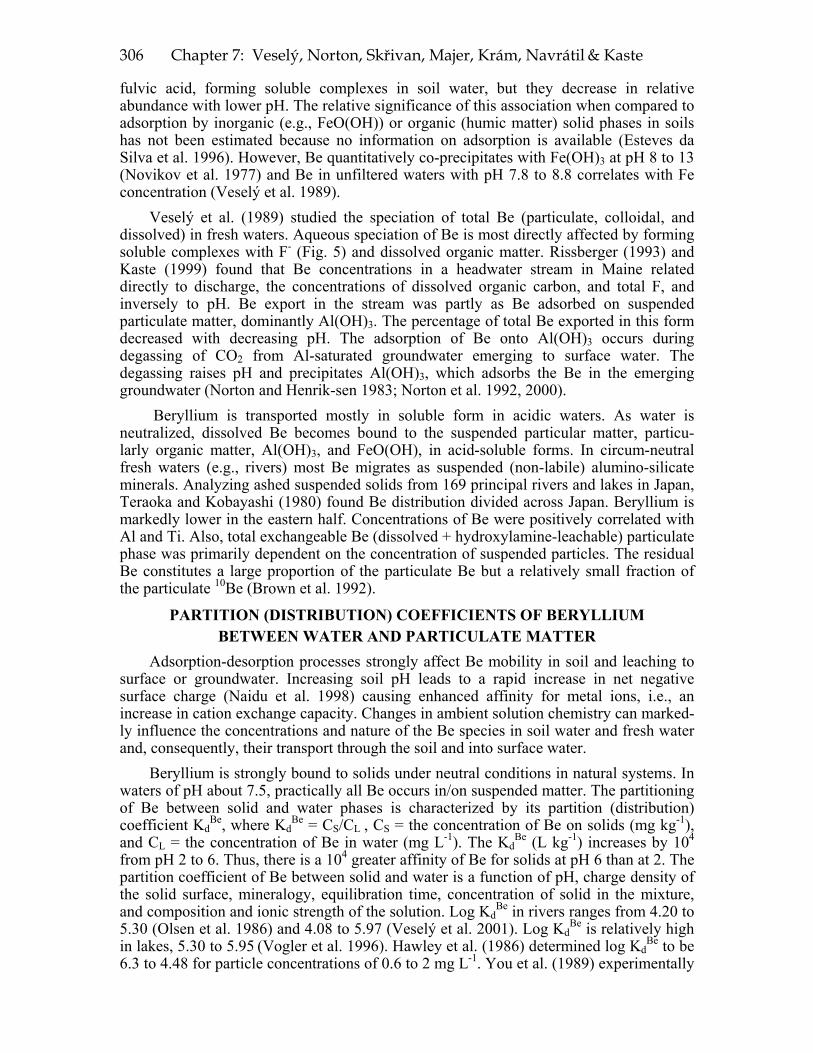
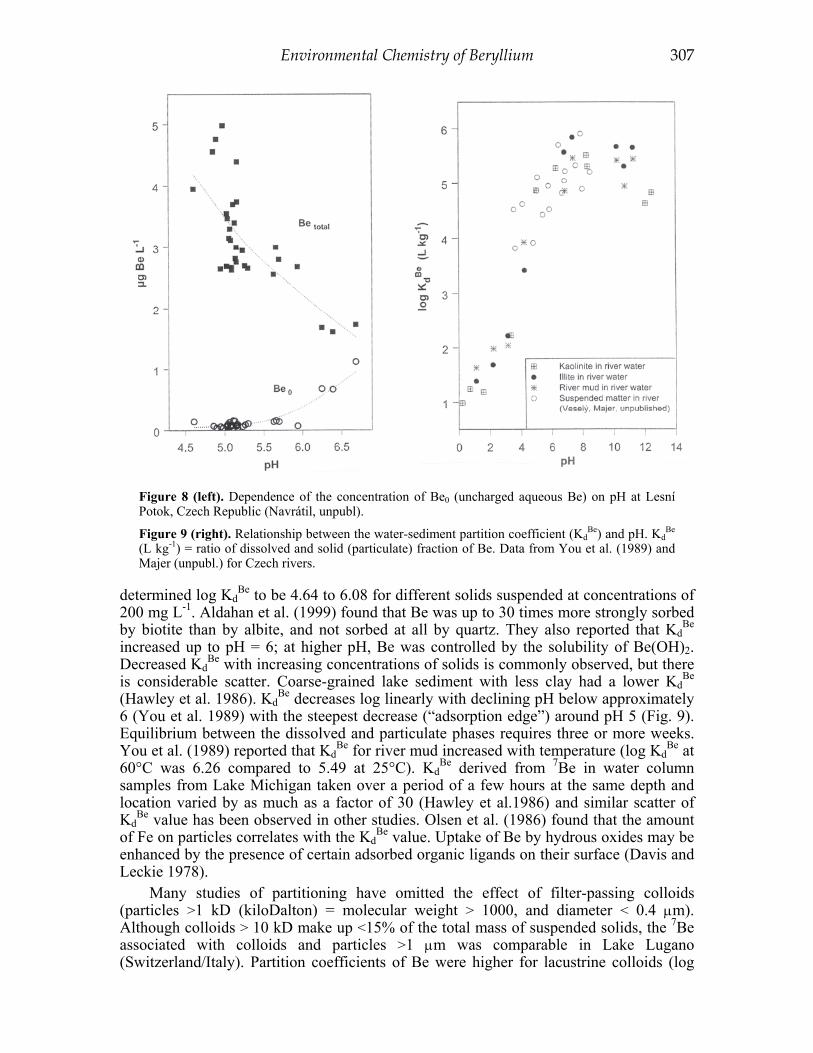
from pH 2 to 6. Thus, there is a 104 greater affinity of Be for solids at pH 6 than at 2. The partition coefficient of Be between solid and water is a function of pH, charge density of the solid surface, mineralogy, equilibration time, concentration of solid in the mixture, and composition and ionic strength of the solution. Log Kd
Be in rivers ranges from 4.20 to 5.30 (Olsen et al. 1986) and 4.08 to 5.97 (Veselý et al. 2001). Log Kd
Be is relatively high in lakes, 5.30 to 5.95 (Vogler et al. 1996). Hawley et al. (1986) determined log Kd
Be to be 6.3 to 4.48 for particle concentrations of 0.6 to 2 mg L-1. You et al. (1989) experimentally
Environmental Chemistry of Beryllium 307
Figure 8 (left). Dependence of the concentration of Be0 (uncharged aqueous Be) on pH at Lesní Potok, Czech Republic (Navrátil, unpubl).
Figure 9 (right). Relationship between the water-sediment partition coefficient (KdBe) and pH. Kd
Be (L kg-1) = ratio of dissolved and solid (particulate) fraction of Be. Data from You et al. (1989) and Majer (unpubl.) for Czech rivers.
determined log KdBe to be 4.64 to 6.08 for different solids suspended at concentrations of
200 mg L-1. Aldahan et al. (1999) found that Be was up to 30 times more strongly sorbed by biotite than by albite, and not sorbed at all by quartz. They also reported that Kd
Be increased up to pH = 6; at higher pH, Be was controlled by the solubility of Be(OH)2. Decreased Kd
Be with increasing concentrations of solids is commonly observed, but there is considerable scatter. Coarse-grained lake sediment with less clay had a lower Kd
Be (Hawley et al. 1986). Kd
Be decreases log linearly with declining pH below approximately 6 (You et al. 1989) with the steepest decrease (“adsorption edge”) around pH 5 (Fig. 9). Equilibrium between the dissolved and particulate phases requires three or more weeks. You et al. (1989) reported that Kd
Be for river mud increased with temperature (log KdBe at
60°C was 6.26 compared to 5.49 at 25°C). KdBe derived from 7Be in water column
samples from Lake Michigan taken over a period of a few hours at the same depth and location varied by as much as a factor of 30 (Hawley et al.1986) and similar scatter of Kd
Be value has been observed in other studies. Olsen et al. (1986) found that the amount of Fe on particles correlates with the Kd
Be value. Uptake of Be by hydrous oxides may be enhanced by the presence of certain adsorbed organic ligands on their surface (Davis and Leckie 1978).
Many studies of partitioning have omitted the effect of filter-passing colloids (particles >1 kD (kiloDalton) = molecular weight > 1000, and diameter < 0.4 μm). Although colloids > 10 kD make up <15% of the total mass of suspended solids, the 7Be associated with colloids and particles >1 μm was comparable in Lake Lugano (Switzerland/Italy). Partition coefficients of Be were higher for lacustrine colloids (log
308 Chapter 7: Veselý, Norton, Skřivan, Majer, Krám, Navrátil & Kaste
KdBe ∼ 6) than for particles >1 μm (log Kd
Be = 4 to 5) (Steinmann et al. 1999). The residence time of Be in the colloidal phase in water is typically higher than residence time in the particulate phase but one tenth the residence time for the truly dissolved Be. The rate-limiting step for scavenging was the adsorption of dissolved Be onto colloids. The coagulation rate of colloids <10 kD may be the limiting step in Be sedimentation from lake surface water. Coagulation rates ranged between 0.06 to 0.46 d-1, corres-ponding to a residence time for 7Be in the colloidal fraction of 2.2 to 16.3 days. The highest coagulation rates occurred after an algal bloom in spring (Steinmann et al. 1999).
BERYLLIUM IN SEDIMENT 7Be and 10Be, cosmogenic radionuclides with half lives of 53 days and 1.5 million
years, respectively (see Kaste et al., this volume), are used to study sedimentation processes. 7Be was used for determination of (1) rates of metal scavenging from lake surface waters (Steinmann et al. 1999), (2) sedimentation rates, and (3) recovery of the most recent sediments in lake and marine sediment cores (Moor et al. 1996; Sneed, 1986). The 10Be flux to sediment of Lake Baikal (Russia) increases toward the last-glacial stage coinciding with an increase of the sediment accumulation rate. During the last-glacial stage, arid conditions in the lake’s watershed caused a marked increase in flux of clay particles with low 10Be concentration to the lake, resulting in an increased flux but lowered concentrations of 10Be in the sediments (Horiuchi et al. 1999). Industrialization and urbanization around San Francisco Bay, California, as well as mining and agriculture in the upstream watersheds of the Sacramento and San Joaquin Rivers, have profoundly increased the sediment accumulation rate of Be throughout the estuary. The transient nature of increased 10Be input (subsurface maximum) suggests that deforestation and agricultural development caused basin-wide erosion of surface soils enriched in 10Be, probably before the turn of the century (van Geen et al. 1999). Silicate minerals from the Union Lake sediments (New Jersey) have a surface concentration of about 5 × 10⁵ atoms 10Be cm-2. Both 10Be and 9Be were greatly enriched in organic matter (Lundberg et al. 1983). Bloom and Crecelius (1983) reported a much stronger affinity of 7Be for inorganic particles (presumably clay minerals) than for organic matter, in marine conditions. Kaste (1999) found that the log Kd
Be of 7Be between stream water and stream sediment or Sphagnum was less than for 9Be but had no explanation, other than possibly an artifact of collection methods.
The origin of labile Be in sediment is basic to understanding biogeochemical cycling of Be and anthropogenic inputs of Be. Total Be in sediment of the Elbe River, Czech Republic ranged between 1.9 and 8.3 mg kg-1, increasing at sites below seepage from power-plant ash dumps (Borovec 1996). Canney et al. (1987) reported stream sediment Be concentrations in northern New Hampshire ranging from 2 to 20 mg kg-1, a granitic Be-rich province. Typically, ≥ 50% of Be in marine (Bourlès et al. 1992) and river (Veselý 1995) sediments is in insoluble detrital particles. Acid soluble Be (0.06M HNO3) in sediment of a small lake in the Czech Republic was 1.5 to 8.9 mg kg-1 (Skřivan et al. 1996). Beryllium is bound in the organic fine-grained fraction of sediment (Lundberg et al. 1983; Veselý 1995; Borovec 1996; Skřivan et al. 1996), and to Fe-(hydr)oxides (Borovec 1996) and Al(OH)3 (Kaste 1999).
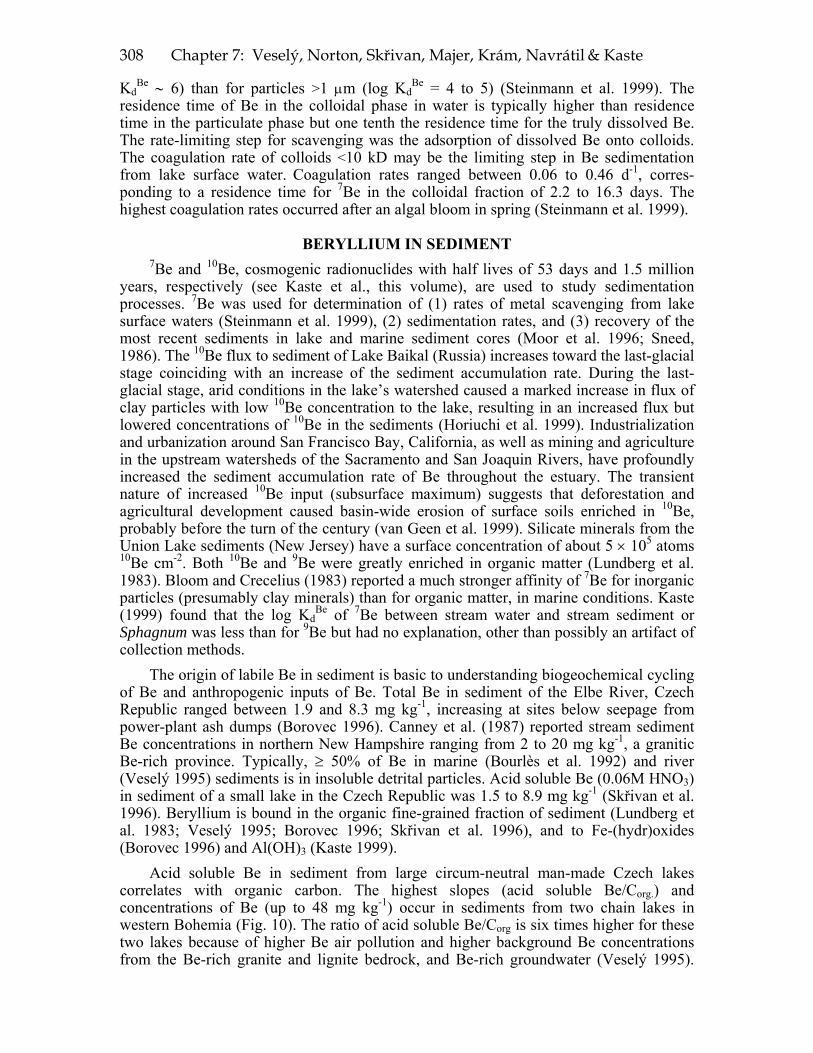
Acid soluble Be in sediment from large circum-neutral man-made Czech lakes correlates with organic carbon. The highest slopes (acid soluble Be/Corg.) and concentrations of Be (up to 48 mg kg-1) occur in sediments from two chain lakes in western Bohemia (Fig. 10). The ratio of acid soluble Be/Corg is six times higher for these two lakes because of higher Be air pollution and higher background Be concentrations from the Be-rich granite and lignite bedrock, and Be-rich groundwater (Veselý 1995).
Environmental Chemistry of Beryllium 309
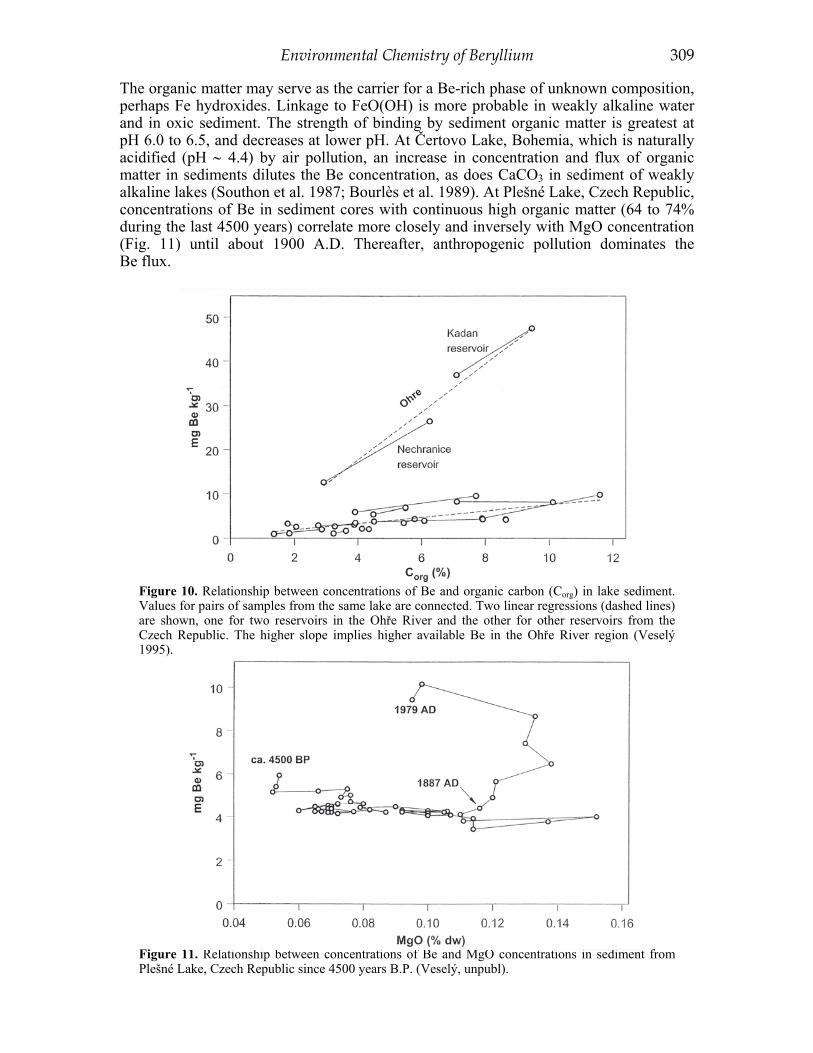
The organic matter may serve as the carrier for a Be-rich phase of unknown composition, perhaps Fe hydroxides. Linkage to FeO(OH) is more probable in weakly alkaline water and in oxic sediment. The strength of binding by sediment organic matter is greatest at pH 6.0 to 6.5, and decreases at lower pH. At Čertovo Lake, Bohemia, which is naturally acidified (pH ∼ 4.4) by air pollution, an increase in concentration and flux of organic matter in sediments dilutes the Be concentration, as does CaCO3 in sediment of weakly alkaline lakes (Southon et al. 1987; Bourlès et al. 1989). At Plešné Lake, Czech Republic, concentrations of Be in sediment cores with continuous high organic matter (64 to 74% during the last 4500 years) correlate more closely and inversely with MgO concentration (Fig. 11) until about 1900 A.D. Thereafter, anthropogenic pollution dominates the Be flux.
Figure 10. Relationship between concentrations of Be and organic carbon (Corg) in lake sediment. Values for pairs of samples from the same lake are connected. Two linear regressions (dashed lines) are shown, one for two reservoirs in the Ohře River and the other for other reservoirs from the Czech Republic. The higher slope implies higher available Be in the Ohře River region (Veselý 1995).
Figure 11. Relationship between concentrations of Be and MgO concentrations in sediment from Plešné Lake, Czech Republic since 4500 years B.P. (Veselý, unpubl).
310 Chapter 7: Veselý, Norton, Skřivan, Majer, Krám, Navrátil & Kaste
Diagenetic processes affecting Be in sediment are poorly known. Isotopic exchange of Be between authigenic and detrital phases of the sediments appears negligible (Wang et al. 1996). Beryllium released to pore water in marine sediment is associated with dissolved Si. Profiles of depth versus dissolved concentrations of Be and Si are probably linked to the solubility of amorphous silica (Bourlès et al. 1989). The general decrease of the pore-water Be/Mn ratio with increasing depth indicates that Be solubilized during diagenesis is partitioned onto sediments more efficiently than Mn. Nevertheless, the flux of Be out of marine sediments at oxic and suboxic sites may be large enough to support the near-bottom Be increases observed in the water column (Bourlès et al. 1989).
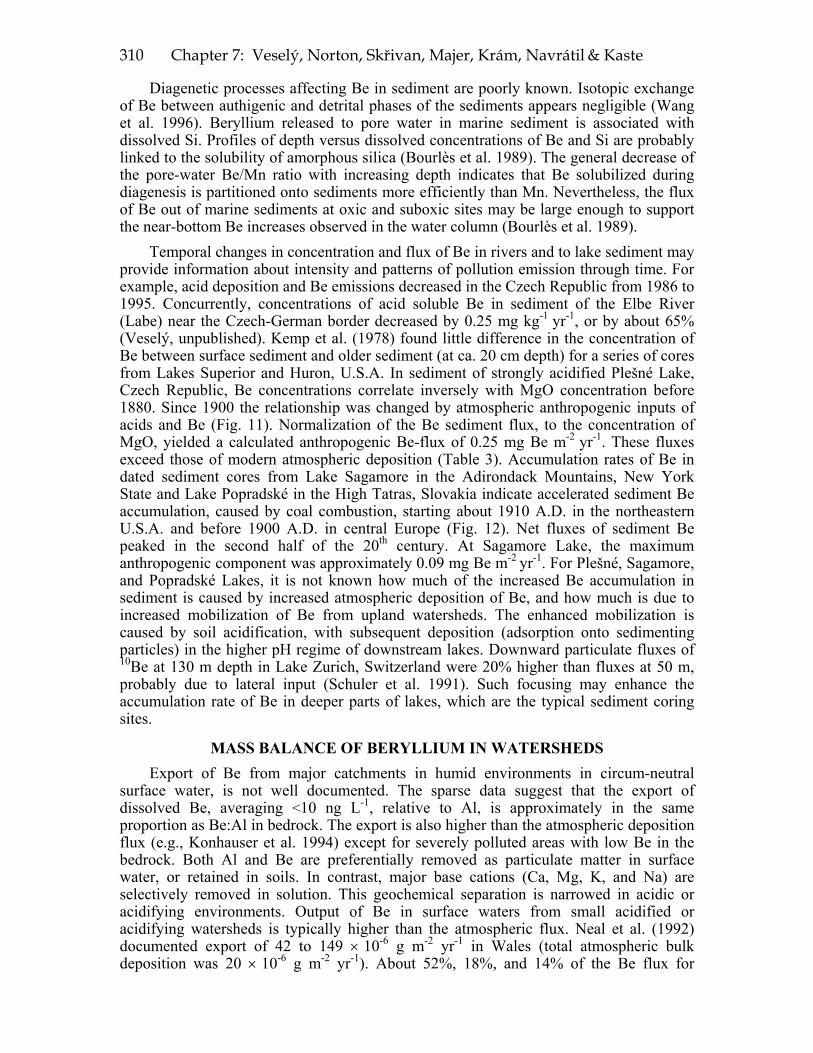
Temporal changes in concentration and flux of Be in rivers and to lake sediment may provide information about intensity and patterns of pollution emission through time. For example, acid deposition and Be emissions decreased in the Czech Republic from 1986 to 1995. Concurrently, concentrations of acid soluble Be in sediment of the Elbe River (Labe) near the Czech-German border decreased by 0.25 mg kg-1 yr-1, or by about 65% (Veselý, unpublished). Kemp et al. (1978) found little difference in the concentration of Be between surface sediment and older sediment (at ca. 20 cm depth) for a series of cores from Lakes Superior and Huron, U.S.A. In sediment of strongly acidified Plešné Lake, Czech Republic, Be concentrations correlate inversely with MgO concentration before 1880. Since 1900 the relationship was changed by atmospheric anthropogenic inputs of acids and Be (Fig. 11). Normalization of the Be sediment flux, to the concentration of MgO, yielded a calculated anthropogenic Be-flux of 0.25 mg Be m-2 yr-1. These fluxes exceed those of modern atmospheric deposition (Table 3). Accumulation rates of Be in dated sediment cores from Lake Sagamore in the Adirondack Mountains, New York State and Lake Popradské in the High Tatras, Slovakia indicate accelerated sediment Be accumulation, caused by coal combustion, starting about 1910 A.D. in the northeastern U.S.A. and before 1900 A.D. in central Europe (Fig. 12). Net fluxes of sediment Be peaked in the second half of the 20th century. At Sagamore Lake, the maximum anthropogenic component was approximately 0.09 mg Be m-2 yr-1. For Plešné, Sagamore, and Popradské Lakes, it is not known how much of the increased Be accumulation in sediment is caused by increased atmospheric deposition of Be, and how much is due to increased mobilization of Be from upland watersheds. The enhanced mobilization is caused by soil acidification, with subsequent deposition (adsorption onto sedimenting particles) in the higher pH regime of downstream lakes. Downward particulate fluxes of 10Be at 130 m depth in Lake Zurich, Switzerland were 20% higher than fluxes at 50 m, probably due to lateral input (Schuler et al. 1991). Such focusing may enhance the accumulation rate of Be in deeper parts of lakes, which are the typical sediment coring sites.
MASS BALANCE OF BERYLLIUM IN WATERSHEDS Export of Be from major catchments in humid environments in circum-neutral
surface water, is not well documented. The sparse data suggest that the export of dissolved Be, averaging <10 ng L-1, relative to Al, is approximately in the same proportion as Be:Al in bedrock. The export is also higher than the atmospheric deposition flux (e.g., Konhauser et al. 1994) except for severely polluted areas with low Be in the bedrock. Both Al and Be are preferentially removed as particulate matter in surface water, or retained in soils. In contrast, major base cations (Ca, Mg, K, and Na) are selectively removed in solution. This geochemical separation is narrowed in acidic or acidifying environments. Output of Be in surface waters from small acidified or acidifying watersheds is typically higher than the atmospheric flux. Neal et al. (1992) documented export of 42 to 149 × 10-6 g m-2 yr-1 in Wales (total atmospheric bulk deposition was 20 × 10-6 g m-2 yr-1). About 52%, 18%, and 14% of the Be flux for
Environmental Chemistry of Beryllium 311
Figure 12. Be accumulation rates in lake sediment from (a) Sagamore Lake, Adirondack Mountains, New York, USA (Norton, unpubl) and (b) Popradské Lake, the High Tatras, Slovakia (Veselý, unpubl.).
drainage from the moorland, forested, and deforested areas, respectively, was from rainfall input. Veselý et al. (1989) estimated atmospheric input of Be at <20% of output for forested watersheds in Bohemia. More recently the percentage has decreased to 3 to 7%. For example, in the mid-1990s wet deposition at Lysina was 45 × 10-6 g Be m-2 yr-1 and drainage outflow was 586 × 10-6g m-2 yr-1 (Krám et al. 1998). The annual export of Be from the acidified Lesní Potok watershed equaled 1,300 × 10-6 g m-2 yr-1 (Skřivan et al. 1996). The average export of Be in the Czech Republic was estimated as 900 × 10-6 g m-2 yr-1 from very acidified mountainous terrain (pH 4.0 to 4.2), and about 120 × 10-6 g m-2 yr-1 dissolved Be at a stream pH of 6.0 to 6.2 (Veselý and Majer, unpublished). There may also be significant export as particulate matter especially at high discharge. These fluxes are substantially higher than that determined for the Elbe River, Czech Republic (6 × 10⁻⁶ g Be m-2 yr-1; Moldan 1991), reflecting the strong influence of bedrock chemistry, surface water acidity, and recent acidification on Be mobilization. Only in acidified watersheds or severely polluted situations has human influence substantially altered the biogeochemistry of Be.
312 Chapter 7: Veselý, Norton, Skřivan, Majer, Krám, Navrátil & Kaste
ACKNOWLEDGMENTS The Czech Republic Ministry of Education (Grant ME147, 1998), Czech Geological
Survey, Charles University, the University of Maine, and the U. S. National Science Foundation (Grant EAR-9725705) provided support for the collaborative research among Veselý, Majer, Skřivan, Krám, and Navrátil (Czech Republic), and Norton and Kaste (U.S.A.). We are grateful to Dr. Jakub Hruška for permission to use unpublished data from Lysina Watershed. We thank Drs. Jana Kubizňáková, Colin Neal, and Edward Grew for their thorough and constructive review of our manuscript.
REFERENCES Aldahan A, Haiping Y, Possnert G (1999) Distribution of beryllium between solution and minerals (biotite
and albite) under atmospheric conditions and variable pH. Chem Geol 156:209-229 Anderson MA, Bertsch PM, Miller WP (1990) Beryllium in selected southeastern soils. J Environ Qual
19:347-348 Anttila R, Grenthe I, Glaser J, Bruno J, Lagerman B (1991) Ternary Metal Complexes. 1. The Be(II)-F(-)-
H2O System. Acta Chem Scand 45:523-525 Baeza A, Delrio LM, Jimenez A, Miro C, Paniagua JM, Rufo M (1996) Analysis of the temporal evolution
of atmospheric Be-7 as a vector of the behavior of other radionuclides in the atmosphere. J Radioanal Nucl Chem 207:331-344
Banks D, Frengstad B, Midtgård AK, Krog, JR, Strand T (1998a) The chemistry of Norwegian ground-waters: I. The distribution of radon, major and minor elements in 1604 crystalline bedrock groundwaters. Sci Total Environ 222:71-91
Banks D, Midtgård AK, Frengstad B, Krog, JR, Strand T (1998b) The chemistry of Norwegian groundwaters: II The chemistry of 72 groundwaters from Quaternary sedimentary aquifers. Sci Total Environ 222, 93-105
Barton WR, Goldsmith CE (1968) New England beryllium investigations. U S Bur Mines Rept Invest 7070:51-122
Baskaran M (1995) A search for the seasonal variability on the depositional fluxes of Be-7 and Pb-210. J Geophys Res 100(D2):2833-2840
Berg T, Røyset O, Steinnes E (1994) Trace elements in atmospheric precipitation at Norwegian background stations (1989-1990) measured by ICP-MS. Atmosph Environ 8:3519-3536
Beus AA, Sobolev BP (1963) Geochemistry of beryllium in high temperature postmagmatic mineralisation. Geochemistry (USSR) 8:316-323 (English version)
Bezačinský M (1980) Behaviour of some trace elements in combustion of Czechoslovak brown coals. Ochrana Ovzduší 12:3-7 (in Czech)
Bezačinský M, Pilátová B, Jiřele V, Bencko V (1984) To the problem of trace elements and hydrocarbons emissions from combustion of coal. J Hyg Epidemiol Microbiol Immunol 28:129-138
Bloom N, Crecelius EA (1983) Solubility behavior of atmospheric 7Be in the marine environment. Mar Chem 12:323–331
Borovec Z (1996) Distribution of toxic metals in stream sediments. Acta Univ Carol Geol 38:91-103 Bourlès DL, Raisbeck GM, Yiou F (1989) 10Be and 9Be in marine sediments and their potential for dating.
Geochim Cosmochim Acta 53:443-452 Bourlès DL, Brown ET, Raisbeck GM, Yiou F, Gieskes JM (1992) Beryllium isotope geochemistry of
hydrothermally altered sediments. Earth Planet Sci Lett 109:47-56 Bouška V (1981) Geochemistry of Coal. Academia Press, Prague Braucher R, Bourlès DL, Brown ET, Colin F, Muller J-P, Braun J-J, Delaune M, Minko AE, Lescouet C,
Raisbeck GM, Yiou F (2000) Application of in situ-produced cosmogenic 10Be and 26Al to the study of lateritic soil development in tropical forest: Theory and examples from Cameroon and Gabon. Chem Geol 170:95-111
Brown ET, Edmond JM, Raisbeck GM, Bourlès DL, Yiou F, Measures CI (1992) Beryllium isotope geochemistry in tropical river basins. Geochim Cosmochim Acta 56:1607-1624
Burr FF (1931) Beryllium in Maine. Rocks and Minerals 6:8-9 Canney FC, Howd FH, Domenico JA, Nakagawa, HM (1987) Geochemical Survey Maps of the
Wildernesses and Roadless Areas in the White Mountain National Forest, Coos, Grafton, and Carroll Counties, New Hampshire. U S Geol Surv Misc Field Studies Map MF-1594C
Chen M, Ma LQ, Harris WG (1999) Baseline concentrations of 15 trace elements in Florida surface soils. J Environ Qual 28:1173-1181
Environmental Chemistry of Beryllium 313
Davis JA, Leckie JO (1978) Effect of adsorbed complexing ligands on trace metal uptake by hydrous oxides. Environ Sci Technol 12:1309-1315
Dittmann J, Höffel I, Müller P, Neunhoeffer O (1984) Use of poplar leaves for the monitoring of environmental beryllium. Naturwiss 71:378-379
Drury JS, Shriner CR, Lewis EB, Towill LE, Hammons AS (1978) Reviews of the Environmental Effects of Pollutants: VI Beryllium. (unpubl work)
Dubanský A, Němec J, Jahoda K (1990) Geochemical role of beryllium in coals of the Northern Bohemian Lignite District. Acta Montana 82:5-50 (in Czech)
Dudka S, Markert B (1992) Baseline concentrations of As, Ba, Be, Li, Nb, Sr, and V in surface soils of Poland. Sci Total Environ 122:279-290
Ďurana L, Chudý M, Masarik J (1996) Investigation of Be-7 in the Bratislava atmosphere. J Radioanal Nucl Chem 207:345-356
Dvořáková M, Moldan B (1989) Atmospheric deposition to small watersheds monitored by the Czech Geological Survey in period 1985 to 1988. Ochrana Ovzduší 6:158-160 (in Czech)
Edmunds WM, Trafford JM (1993) Beryllium in river baseflow, shallow groundwaters and major aquifers of the U.K. Appl Geochem 219:223-233
Edmunds WM, Kinniburgh DG, Moss PD (1992) Trace metals in interstitial waters from sandstones: Acidic inputs to shallow groundwaters. Environ Pollut 77:129-141
EL-Hussein A, Mohamemed A, EL-Hady MA, Ahmed AA, Ali AE, Barakat A (2001) Diurnal and seasonal variation of short-lived radon progeny concentration and atmospheric temporal variations of 210Pb and 7Be in Egypt. Atmos Environ 35:4305-4313
Esteves da Silva JCG, Machado AASC, Ramos MA, Arce F, Rey F (1996) Quantitative study of Be(II) complexation by soil fulvic acids by molecular fluorescence spectroscopy. Environ Sci Techn 30:3155–3160
Ezawa T, Kuwahara S, Sakamoto K, Yoshida T, Saito M (1999) Specific inhibitor and substrate- specificity of alkaline- phosphatase expressed in the symbiotic phase of the arbuscular mycorrhizal fungus, Glomus etunicatum. Mycologia 91:636-641
Fishbein L (1984) Overview of analysis of carcinogenic and/or mutagenic metals in biological and environmental samples. Int’l J Environ Analyt Chem 12:113-170
Frei M, Bielert U, Heinrichs H (2000) Effects of pH, alkalinity and bedrock chemistry on metal concentrations of springs in an acidified catchment (Ecker Dam, Harz Mountains, FRG). Chem Geol 170:221-242
Frengstad B, Banks D, Siewers U (2001) The chemistry of Norwegian groundwaters: IV. The pH-dependence of element concentrations in crystalline bedrock groundwaters. Sci Total Environ 277: 101-117
Gaffney JS, Orlandini KA, Marley NA, Popp CJ. (1994) Measurements of Be-7 and Pb-210 in rain, snow, and hail. J Appl Meteorol 33:869-873
Galloway JN, Norton SA, Church MR (1983) Fresh water acidification from atmospheric deposition of H2SO4 – A conceptual model. Environ Sci Tech 17:541A-545A
Gooddy DC, Shand P, Kinniburgh DG, van Riemsdijk WH (1995) Field-based partition coefficients for trace elements in soil solutions. Eur J Soil Sci 46:265-285
Grigor´yev NA (1984) Distribution of Beryllium on the Earth’s Surface. Nauka, Moscow. 117 p (in Russian)
Grote M, Hofele J, Sietz M (1996) The uptake of beryllium by agricultural plants. Distribution and element speciation. Bioforum 19:556-567 (in German)
Hawley N, Robbins JA, Eadie BJ (1986) The partitioning of 7Be in freshwater. Geochim Cosmochim Acta 50:1127–1131
Heath RC, Miller LM, Perry, CM, Norton SA (1988) Be in surface water: Sources, sinks, mobilization, and potential toxicity. In Trace Metals in Lakes (abstr). SETAC Int’l Symp, Burlington, Ontario
Hirst DM (1962) The geochemistry of modern sediments from the Gulf of Paria—II. The location and distribution of trace elements. Geochim Cosmochim Acta 26:1147-1187
Högfeldt E (1982) Stability Constants of Metal-Ion Complexes. Part A: Inorganic Ligands. Pergamon Press, Oxford
Horiuchi K, Minoura K, Kobayashi K, Nakamura T, Hatori S, Matsuzaki H, Kawai T (1999) Last-glacial to post-glacial 10Be fluctuations in a sediment core from the Academician Ridge, Lake Baikal. Geophys Res Lett 26:1047-1050
Husar RB (1986) Emissions of sulfur dioxide and nitrogen oxides and trends for eastern North America. In Acid Deposition—Long-Term Trends. National Academy Press, Washington, DC, p 48-92
Jagoe C, Haines TA, Matey V (1993) Beryllium ion effects on fish in acid waters analogous to aluminum toxicity. Aq Toxic 24:241-256
314 Chapter 7: Veselý, Norton, Skřivan, Majer, Krám, Navrátil & Kaste
Kaste JM (1999) Dynamics of cosmogenic beryllium-7 and bedrock-derived beryllium-9 in forested ecosystems in Maine, U.S.A. Unpubl MSc thesis, University of Maine, Orono, ME, 96 p
Kemp ALW, Williams JDH, Thomas RL, Gregory ML (1978) Impact of man’s activities on chemical composition of the sediments of the Lake Superior and Huron. Water Air Soil Pollut 10:381-402
Konhauser KO, Fyfe WS, Kronberg BI (1994) Multi-element chemistry of some Amazonian waters and soils. Chem Geology 111:155-175
Kostelnik KM, Lynch JA, Grimm JW, Corbett ES (1989) Sample size requirements for estimation of throughfall chemistry beneath a mixed hardwood forest. J Environ Qual 18:274-280
Krám P, Hruška J, Driscoll CT (1998) Beryllium chemistry in the Lysina catchment, Czech Republic. Water Air Soil Pollut 105:409-415
Ku TL, Kusakabe M, Measures CI, Southon JR, Cusimano G, Vogel JS, Nelson DE, Nakaya S (1990) Beryllium isotope distribution in the western North Atlantic: A comparison to the Pacific. Deep-Sea Res 37(5A):795-808
Kubizňáková J (1983) The occurrence, determination and screening of beryllium in various environmental compartments. PhD dissertation, Charles University, Praha (in Czech)
Kubizňáková J (1987) Beryllium pollution from slag and ashes from thermal power station. Water Air Soil Pollut 34:363-367
Kusakabe M, Ku TL, Southon JR, Shao L, Vogel JS, Nelson DE, Nakaya S, Cusimano G (1991) Be isotopes in rivers/estuaries and their oceanic budgets. Earth Planet Sci Lett 102:265-276
Long S, Lu Z, Hu Z, Xiao G, Tang L (1989) Study on beryllium pollution in China and the background levels of beryllium in the surface waters. Huanjing Kexue 10:83-85 (in Chinese)
Lundberg L, Ticich T, Herzog GF, Hughes T, Ashley G, Moniot RK, Tuniz C, Kruse T, Savin W (1983) 10Be and Be in the Maurice River-Union Lake system of southern New Jersey. J Geophys Res 88 (C7):4498-4504
Macháček V, Šulcek Z, Václ J (1966) Geochemistry of beryllium in the Sokolov Basin. Sbor Geol Věd. TG 7:33-39 (in Czech)
Maňkovská B (1995) Mapping of forest environment load by selected elements through the leaf analysis. Ekologia 14:205-213
Mathur S, Flora SJS, Mathus R, Kannan GM, Dasgupta S (1994) Beryllium-induced biochemical alterations and their prevention following coadministration of meso-2,3-dimercaptosuccinic acid or 2,3 dimercaptopropane sulfonate in rats. J Appl Toxicol 14:263-267
Measures CI, Edmond JM (1983) The geochemical cycle of 9Be: A reconnaissance. Earth Planet Sci Lett 66:101-110
Measures CI , Ku TL, Luo S, Southon JR, Xu X, Kusakabe M (1996) The distribution of 10Be and 9Be in the South Atlantic. Deep-Sea Res 43:987-1009
Meehan WR, Smythe LE (1967) Occurrence of beryllium as a trace element in environment materials. Environ Sci Tech 1:839–844
Merrill JR, Lyden EFX, Honda M, Arnold JR (1960) The sedimentary geochemistry of the beryllium isotopes. Geochim Cosmochim Acta 18:108-129
Minařík L, Burian M, Novák JK (1997) Experimental acid leaching of metals from biotite of the Ricany monzogranite. Bull Czech Geol Survey 72:239-244
Moldan B (1991) Atmospheric Deposition: A Biogeochemical Process. Rozpravy ČSAV, MPV Vol 101. Academic Press, Praha
Moor HC, Schaller T, Sturm M (1996) Recent changes in stable lead isotope ratios in sediments of Lake Zug, Switzerland. Environ Sci Techn 30:2928-2933
Moore JW (1991) Inorganic contaminants of surface water–Research and monitoring priorities (Chapter Beryllium) in Springer Series of Environmental Management, Springer Verlag, New York, p 50-56
Naidu R, Summer ME, Harter RD (1998) Sorption of heavy metals in strongly weathered soils: An overview. Environ Geochem Health 20:5-9
Nakamura I, Maroyama H, Nishida N, Sakaguchi T, Kagami M, Tada O (1983) Atmospheric beryllium concentrations in a copper-beryllium casting factory. Sci Mar Ika Daigaku Zasshi 11:6-13 (in Japanese)
Navrátil T, Skřivan P, Fottová D (2000) Human- and climate-induced changes in the surface stream activity affecting the element cycling. GeoLines 11:45-47
Neal C, Robson AJ (2000) A summary of river water quality data collected within the Land-Ocean Interaction Study: Core data for eastern UK rivers draining to the North Sea. Sci Total Environ 251/252:585-665
Neal C, Jeffery HA, Conway T, Ryland GP, Smith CJ, Neal M, Norton SA (1992) Beryllium concentrations in rainfall, stemflow, throughfall, mist and stream waters for an upland acidified area of mid-Wales. J Hydrol 136:33-49
Environmental Chemistry of Beryllium 315
Neal C, Wilkinson J, Neal M, Harrow M, Wickham H, Hill L and Morfitt C (1997) The hydro-chemistry of the headwaters of the River Severn, Plynlimon. Hydrol Earth Syst Sci 1:583-617
Neal C, Reynolds B, Wilkinson J, Hill T, Neal M, Hill S, Harrow M (1998) The impacts of conifer harvesting on runoff water quality: A regional survey for Wales. Hydrol Earth Syst Sci 2:323-344
Nĕmeček J, Podlešáková E, Pastuszková M (1994) Contamination of feed crops and cereal grains in the north-Bohemian immissions impact region. Rostliná Výroba 40:555-565 (in Czech)
Norton SA, Henrikson A (1983) The importance of CO2 in evaluation of effects of acidic deposition. Vatten 39:346-354
Norton SA, Brownlee JC, Kahl JS (1992) Artificial acidification of a non-acidic and an acidic headwater stream in Maine, U.S.A. Environ Pollut 77:123-128
Norton S, Kahl J, Fernandez I, Haines T, Rustad L, Nodvin S, Scofield J, Strickland T, Erickson H, Wigington P, Lee J (1999) The Bear Brook Watershed, Maine (BBWM), U.S.A. Environ Monit Assess 55:7-51
Norton SA, Wagai R, Navrátil T, Kaste JM, Rissberger FA (2000) Response of a first-order stream in Maine to short-term in-stream acidification. Hydrol Earth Syst Sci 4:383-391
Novikov AI, Kononenko VA, Egorova LA (1977) Coprecipitation of beryllium with iron hydroxide. Radiokhimiya 19:160-165 (in Russian)
Olsen CR, Larsen IL, Lowry PD, Cutshall NH (1986) Geochemistry and deposition of 7Be in river-estuarine and coastal waters. J Geophys Res 91(C1):896-908
Óvári M, Csukás M, Záray G (2001) Speciation of beryllium, nickel, and vanadium in soil samples from Csepel Island, Hungary. Fres J Anal Chem 370:768-775
Pacyna JM (1990) Estimation of the atmospheric emissions of trace elements from anthropogenic sources in Europe. Atmos Environ 18:41-50
Patton SE (1992) Beryllium in soils of the Nevada Test Site: A preliminary assessment. Unpubl work Pellerin B, Kaste J, Fernandez IJ, Norton SA, Kahl JS (1999) Soil cation distribution in the near-stream
zone of New England forested watersheds (abs). Soil Soc Am Ann Mtg, Argonne, Illinois, Abstr 295 Phillips MA (1973) Investigations into levels of both airborne beryllium and beryllium in coal at the
Hayden Power Plant near Hayden, Colorado. Environ Letters 5:183-188 Podlešáková E, Němeček J (1994) Contamination of soils in the North-Bohemian Region by hazardous
elements. Rostl Vyr 40:123-130 (in Czech) Rai D, Zachara J, Schwab A, Schmidt R, Girvin D, Rogers J (1984) Chemical attentuation rates,
coefficients, and constants in leachate migration. 1. A critical review. Report EA-3356 to Electric Power Res Inst, Palo Alto, California
Reimann C, Hall GEM, Siewers U, Bjorvatn K, Morland G, Skarphagen H, Strand T (1996) Radon, fluoride and 62 elements as determined by ICP-MS in 145 Norwegian hard rock groundwater samples. Sci Total Environ 192:1-19
Rissberger FA (1993) Beryllium transport as a result of episodic acidification of a small watershed in Hancock County, Maine. MSc thesis, University of Maine, Orono
Robson AJ, Neal C, Ryland GP, Harrow M (1994) Spatial variations in throughfall chemistry at the small plot scale. J Hydrol 158:107-122
Rose NL (1990) A method for the extraction of carbonaceous particles from lake sediment. J Paleolimnol 3:45-53
Sainsbury CL, Hamilton JC, Huffmann C (1986) Geochemical Cycle of Selected Trace Elements in the Tin-tungsten District, Western Seward Peninsula, Alaska, US. In U S Geol Surv Bull 1242-F. U S Govt Printing Office, Washington, DC
Sajwan KS, Ornes WH, Youngblood TV (1996) Beryllium phytotoxicity in soybeans. Water Air Soil Pollut 86:117-124
Sarosiek J, Kosiba P (1993). The effects of water and hydrosol chemistry on the accumulation of beryllium and germanium in selected species of macrophytes. Water Air Soil Pollut 69:405-411
Schecher WD, McAvoy DC (1998) MINEQL+: A chemical equilibrium program for personal computers. Environmental Research Software, Hallowell, Maine
Schuler C, Wieland E, Santschi PH, Sturm M, Lueck A, Bollhalder S, Beer J, Bonani G, Hofmann HJ, Suter M, Wolfli W (1991) A multitracer study of radionuclides in Lake Zurich, Switzerland 1. Comparison of atmospheric and sedimentary fluxes of 7Be, 10Be, 210Pb, 210Po and 137Cs. J Geophys Res 96 C:17051-17065
Schmidbaur H (2001) Recent contributions to the aqueous coordination chemistry of beryllium. Coor Chem Rev 215:223-242
Šebestová E, Machovic V, Pavlíková H, Lelák J, Minařík L (1996) Environmental impact of brown coal mining in Sokolovo basin with especially trace metal mobility. J Environ Sci Health A31:2453-2463
Seth PC, Pandey GS (1985) Beryllium as pollutant in steel plant particulate fallout. Pollut Res 4:17-20
316 Chapter 7: Veselý, Norton, Skřivan, Majer, Krám, Navrátil & Kaste
Shacklette HT (1984) Element Concentrations in Soils and other Surficial Materials of the Conterminous United States. In US Geol Surv Prof Paper 574-D, I-105. U S Govt Printing Office, Washington DC
Shilin LL, Tsareva LP (1957) The abundance of beryllium in rocks and minerals of pegmatites from the Lovozero and Khibina Tundra. Geochemistry (USSR) 2:383-392 (English version)
Shimizu T, Ohya K, Kawaguchi H, Shijo Y (1999) Determination of ultratrace beryllium in natural water by electrothermal atomic absorption spectrometry after preconcentration with one-drop solvent. Bull Chem Soc Japan 72:249-252
Skjelkvåle BL, Henriksen A, Vadset M, Røyset O (1996) Trace elements in Norwegian lakes. NIVA Report 3457-96. Norway (in Norwegian)
Skřivan P, Minařík L, Burian M, Vach M (1994) Cycling of beryllium in the environment under anthropogenic impact. Scientia Agric Bohem 25:65-75
Skřivan P, Šťastný M, Kotková P, Burian M (1996) Partition of beryllium and several other trace elements in surface waters. Scientia Agric Bohem 27:131-145
Skřivan P, Navrátil T, Burian M (2000) Ten years of monitoring the atmospheric inputs at the Černokostelecko region, Central Bohemia. Scientia Agric Bohem 31:139-154
Skřivan P, Minařík L, Burian M, Martínek J, Žigová A, Dobešová I, Kvídová O, Navrátil T, Fottová D (2001) Biogeochemistry of beryllium in an experimental forested landscape of the ”Lesní potok ” watershed in Central Bohemia, C R GeoLines 12:41-62.
Slonim ARJ (1973) Acute toxicity of beryllium sulfate to the common guppy. Wat Pollut Cont Fed 45:2110-2122
Slonim CB, Slonim AR (1973) Effect of water hardness on the tolerance of the guppy to beryllium sulfate. Bull Environ Contam Toxic 10:295-301
Small EE, Anderson RS, Hancock GS (1999) Estimate of the rate of regolith production using 10Be and 26Al from an alpine hillslope. Geomorph 27:131-150.
Smith RM, Martell AE (1976) Critical Stability Constants. 4. Inorganic Complexes. Plenum Press, New York
Sneed SB (1986) Sediment chronologies in New York Harbor borrow pits. Unpubl MS thesis. State University of New York, Stony Brook
Southon JR, Ku TL, Nelson DE, Reyss JL, Duplessy JC, Vogel JS (1987) 10Be in a deep-sea core: Implications regarding 10Be production changes over the past 420 ka. Earth Planet Sci Lett 85:356-364
Steinmann P, Billen T, Loizeau J-L, Diminik, J (1999) Beryllium-7 as a tracer to study mechanisms and rates of metal scavenging from lake surface waters. Geochim Cosmochim Acta 63:1621-1633
Stunzas AA, Govorov IN (1981) Complex carbonate, fluor-carbonate compounds of Be and their role in the Be migration in natural waters. Geokhimiya 4:517-524 (in Russian)
Tao H, Miyazaki A, Bansho K (1988) Determination of trace beryllium in natural waters by gas chromatography-helium microwave Induced Plasma Emission Spectrometry. Analyt Sci 4:299-302
Teraoka H, Kobayashi J (1980) Concentrations of 21 metals in the suspended solids collected from the principal 166 rivers and 3 lakes in Japan. Geochem J 14:203-226
Thorat DD, Mahadevan TN, Ghosh DK, Narayan S (2001) Beryllium concentrations in ambient air and its source identification. Environ Mon Assess 69:49-61
van Geen A, Valette-Silver NJ, Luoma SN, Fuller CC, Baskaran M, Tera F, Klein J (1999) Constraints on the sedimentation history of San Francisco Bay from 14C and 10Be. Mar Chem 64:29-38
Veselý J (1987) Influence of emissions on the chemical composition of forest soils. Lesnictví 33:385-398 (in Czech)
Veselý J (1990) Stability of the pH and the contents of ammonium and nitrate in precipitation samples. Atmosph Environ 24A:3085-3089
Veselý J (1994) Effects of acidification on trace metal transport in fresh waters. In Steinberg CEW, Wright RF (eds) Acidification of Freshwater Ecosystems: Implications for the Future. Wiley, New York, p 141-151
Veselý J (1995) Drainage sediments in environmental and explorative geochemistry. Bull Czech Geol Survey 70:1-8
Veselý J, Majer V (1996) The effect of pH and atmospheric deposition on concentrations of trace elements in acidified freshwaters: A statistical approach. Water Air Soil Pollut 88:227-246
Veselý J, Beneš P, Ševčík K (1989) Occurrence and speciation of beryllium in acidified freshwaters. Water Res 23:711-717
Veselý J, Hruška J, Norton SA (1998) Trends in water chemistry of acidified Bohemian lakes from 1984 to 1995: II. Trace elements and aluminum. Water Air Soil Pollut 108:425-443
Veselý J, Majer V, Kučera J, Havránek V (2001) Solid-water partitioning of elements in Czech freshwater. Appl Geochem 16:437-450
Vogler S, Jung M, Mangini A (1996) Scavenging of 234Th and 7Be in Lake Constance. Limnol Oceanogr 41:1384–1393
Environmental Chemistry of Beryllium 317
Von Blanckenburg F, Igel H (1999) Lateral mixing and advection of reactive isotope tracers in ocean basins: Observations and mechanisms. Earth Planet Sci Lett 169:113-128
Wang L, Ku, TL, Luo S, Southon JR, Kusakabe M (1996) 26Al-10Be systematics in deep-sea sediments. Geochim Cosmochim Acta 60:109-119
Wedepohl KH (1969) Handbook of Geochemistry. II-1. Springer-Verlag, Berlin Wedepohl KH (1995) The composition of the continental crust. Geochim Cosmochim Acta 59:1217-1232 Wilkinson J, Reynolds B, Neal C, Hill S, Neal M and Harrow M (1997) Major, minor and trace element
composition of cloudwater and rainwater at Plynlimon. Hydrol Earth Syst Sci 1(3):557-569 Yamagata T (1981) Background level of beryllium in the ambient air. Tachikawa Tandai Kiyo 14:103-106
(in Japanese) You C-F, Lee T, Li Y-H (1989) The partition of Be between soil and water. Chem Geol 77:105-118 Zorn HR, Stiefel T, Beurs J, Schlegelmilch R (1988) Beryllium. In Seiler HG, Sigel H, Sigel A (eds)
Handbook on Toxicity of Inorganic Compounds. Marcel Dekker, New York, p 105-114
Related Documents