Radioactive Tracers Scientific Editors Jean-Michel Fernandez Renaud Fichez

Welcome message from author
This document is posted to help you gain knowledge. Please leave a comment to let me know what you think about it! Share it to your friends and learn new things together.
Transcript
Radioactive Tracers
Scientific Editors
Jean-Michel FernandezRenaud Fichez

Environmental Changesand Radioactive Tracers
6th South Pacific EnvironmentalRadioactivity Association Conférence
19-23 June 2000Nouméa IRD Centre - New Caledonia
Environmental Changesand Radioactive Tracers
Scientific Editors
Jean-Michel FernandezRenaud Fichez
IRD EditionsINSTITUT DE RECHERCHE POUR LE DÉVELOPPEMENT
collection Colloques et séminaires
Paris, 2002
Mise en page - FabricationJean-Pierre Mermoud
Maquette de couvertureMichelle Saint-Léger
Maquette intérieureCatherine Plasse
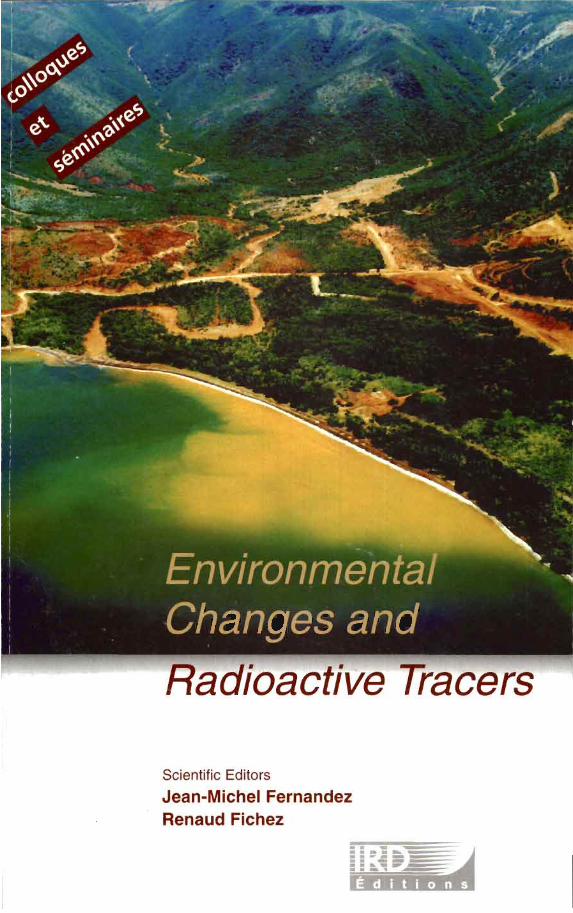
Photo de couverture© QNI Limited: "Impacts on sea after high rainfall events"Photo page 1 04© CEA-Cadarache (DEN/DED)Photos pages : 277, 363, 433© IRD. J. P. Mermoud
La loi du 1» juillet 1992 (code de la propriété intellectuelle, première partie) n'autorisant, auxtermes des alinéas 2 et 3 de l'article L. 122-5, d'une part, que les « copies ou reproductionsstrictement réservées à l'usage du copiste et non destinées à une utilisation collective » et,
d'autre part, que les analyses et les courtes citations dans le but d'exemple ou d'illustration,« toute représentation ou reproduction intégrale ou partielle faite sans le consentement de
fauteur ou de ses ayants droit ou ayants cause est illicite » (alinéa 1- de l'article L. 122-4).
Cette représentation ou reproduction, par quelque procédé que ce soit, constituerait doncune contrefaçon passible des peines prévues au titre III de la loi précitée.
© IRD Éditions, 2002
ISSN : 0767-2896ISBN: 2-7099-1 493-X
Remerciements
La sixième conférence de laSouth Pacific EnvironmentalRadioactivity Association(SPERA-2000) a été organiséegrâce au soutien logistique etfinancier de l'Institut derecherche pour le développement(IRD) et l'implication active deChristian Colin, directeur duCentre IRD de Nouméa.
Cette conférence n'aurait puavoir son plein succès sans lacontribution financière de l'Institutde protection et de sûreténucléaire (IPSN) dont EugènePauli a été le principal promoteur.
L'importance des coûtsengendrés pour l'organisationd'une telle manifestation aégalement nécessité le soutiendes partenaires tels que:l'Australian nuclear science andtechnology organisation(ANSTO-ED) ; Commissariat àl'énergie atomique Direction desapplications militaires -Département d'analyse et desurveillance de l'environnement,France (CEA-DAM/DASE) ; leNational radiation laboratory(NRL), Nouvelle-Zélande.
Le Secrétariat permanent pour lePacifique a permis par son aide,de prendre en charge les frais dedéplacements et de séjour deplusieurs collègues, chercheursdans les pays du Sud. LeCongrès de la Nouvelle-Calédonie, la Province Sud de laNouvelle Calédonie, la ville deNouméa ainsi que le SecrétariatGénéral de la Communauté duPacifique (CPS) ont, pour leurpart, amplement participé àl'accueil de la communautéinternationale des chercheursvenus présenter leurs travaux.
La société Le Nickel (SLN) acontribué à la réussite de cetteconférence tant par le soutienfinancier qu'elle a dispensé quepar l'organisation de la visitemémorable du site minier du« Camp des Sapins ».
Les éditeurs tiennent égalementà remercier très sincèrement :
- les conférenciers invités qui ontouvert chacune des sessions detravail ;
- les présidents des différentessessions et l'ensemble desintervenants qui ont permisle succès scientifique de laconférence ;
- les présidents et chercheurs quiont assuré la relecture etl'arbitrage des textes publiésdans ce document;
- le personnel des servicesadministratifs du centre IRD deNouméa ;
- le personnel de l'atelier dereprographie et en particulierJacqueline Thomas responsablede la cellule de communication etJean-Pierre Mermoud qui aassuré la mise en page des pré¬actes et la mise en forme destextes.
Nous ne saurions oublier toutel'équipe du programmeECOTROPE qui s'est pleinementinvestie dans l'organisation ducongrès.
Un clin d'oeil cordial est adresséaux différents responsables duCEA-Cadarache (DEN/DED)ayant intercédé en faveur del'achèvement de l'ouvragependant les « heures de travail ».
Acknowledgements
The Sixth Conférence of theSouth Pacific EnvironmentalRadioactivity Association(SPERA-2000) enjoyed thelogistical and financial supportof the Institute of research fordevelopment and benefitedfrom the active involvementof Mr Christian Colin, the Directorof IRD Nouméa centre.
This event could not hâve beensuch a success without thefinancial support of the Institut deprotection et de sûreté nucléaire(Institute for nuclear protectionand safety - IPSN) mainlyrepresented by Mr Eugène Pauli.
The substantial cost of hostingsuch an event also required thesupport of sponsors such as theAustralian nuclear science andtechnology organisation(ANSTO-ED); Commissariat àl'énergie atomique; Direction desapplications militaires -Département d'analyse et desurveillance de l'environnement,France (CEA-DAM/DASE) ; leNational radiation laboratory(NRL), Nouvelle-Zélande.
The French permanentSecrétariat for the Pacificcovered the travel andaccommodation costs of anumber of colleagues working asresearchers in southerncountries. The Congress of NewCaledonia, the SouthernProvince of New Caledonia, theCity of Nouméa and theSecrétariat of the PacificCommunity (SPC) ail generouslyhelped to host the international
community of scientists whocame to présent the results oftheir work.
The Le Nickel company (SLN)also contributed to the successof this conférence throughfinancial support and anunforgettable visit to their miningcamp "Camp des Sapins".
The editors also wish to thankvery sincerely:
- the invited speakers whoopened each working session;
- the chairs of the varioussessions and ail the speakerswho made this conférence ascientific success;
- the chairpersons and scientistswho reviewed and edited thetexts published in this document;
- the administrative staff of theIRD Centre;
- the staff of the copying section,and also particularly MrsJacqueline Thomas, the IRDCommunication Officerand Mr Jean-Pierre Mermoud,who laid out the bookof abstracts and thèse publishedtexts.
We should not forget theECOTROPE Programme team,who played a full part in theorganisation of the conférence.
Thanks are also due to thevarious CEA-Cadarache(DEN/DED) staff who contributedto the completion of thispublication during "working hours".
Authors listC. Alonso Hernândez, Radioecology and EnvironmentalSurveillance Dpt, Central Radiological and EnvironmentalSurveillance Laboratory, LVRAC AP #5, Ciudad Nuclear,CP 59 350, Cienfuegos, Cuba
Peter G. Appleby, Department of Mathematical Sciences,University of Liverpool, P.O. Box 143, Liverpool L69 3BX,U.K., email: [email protected]
Gérard Ardisson, Laboratoire de radiochimieet radioécologie, université de Nice-Sophia Antipolis,Faculté des Sciences, 28 avenue Valrose,06108 Nice cedex 2, France, email: [email protected]
Christian Badie, Laboratoire d'étude et de surveillancede l'environnement, CEA/IPSN, BP 519, Papeete, Tahiti,Polynésie française
Geneviève Barci-Funel, Laboratoire de radiochimie etradioécologie, université de Nice-Sophia Antipolis,faculté des sciences, 28 avenue Valrose,06108 Nice cedex 2, France, email: [email protected]
Christian Bernard, Laboratoire d'étude et de surveillancede l'environnement, IPSN/CEA, BP 519, Papeete, Tahiti,Polynésie française
Michael Bickel, European Commission, Joint ResearchCentre, Institute for Référence Materialsand Measurements, Geel, Belgium,email: michael.bickel @ irmm.jrc.be
Lidia D. Blinova, V. G. Khlopin Radium Institute,Saint-Petersburg, Russian Fédération,email: [email protected]
Alexandru Bologa, National Institute for Marine Researchand Development "Grigore Antipa", RO-8700, Constanta,Romania, email: [email protected]
Ludovic Breau, Centre IRD de Nouméa, BP A5, 98848Nouméa, Nouvelle-Calédonie, email: breau ©noumea.ird.nc
François Bréchignac, Institut de protection et de sûreténucléaire (PSN), DPRE-SERLAB, CE Cadarache, BP1,13108 Saint-Paul-lez-Durance, France,email: francois.brechignac @ ipsn.fr
Environmental Changes and Radioactive Tracers
Greg Brunskill, Australian Institute of Marine Science,Townsville, Qld, Australia, email: [email protected]
Paco Bustamante, université de La Rochelle, La Rochelle,France, email: [email protected]
H. Cartas Aguila, Radioecology and EnvironmentalSurveillance Dpt, Central Radiological and EnvironmentalSurveillance Laboratory, LVRAC AP #5, Ciudad Nuclear,CP 59 350, Cienfuegos, Cuba
Jaume Casadesus, Departament de Biologia Végétal,Universitât de Barcelona Diagonal, 645 08028 Barcelona,Spain, email: [email protected]
Alejandra Castillo, Instituto de Ffsica, Facultad deCiências, Universidad Austral de Chile, Valdivia, Chile,email: [email protected]
Douglas Chitty, Laboratoire de radiochimieet radioécologie, université de Nice-Sophia Antipolis,faculté des Sciences, 28 avenue Valrose,06108 Nice cedex 2, France
Claude Colle, Institut de protection et de sûreté nucléaire,DPRE/SERLAB, Centre de Cadarache, bât. 186, BP 1,
13108 Saint-Paul-Lez-Durance cédex, France,email: [email protected]
Olivier Cotret, International Atomic Energy Agency, MarineEnvironment Laboratory, Monaco, email: [email protected]
Elvira Cuingioglu, National Institute for Marine Researchand Development "Grigore Antipa", RO-8700, Constanta,Romania, email: [email protected]
Bruno Danis, Laboratoire de biologie marine (CP 160-15),université libre de Bruxelles, 50 av. F.D. Roosevelt,B-1050 Bruxelles, Belgium, email: [email protected]
Jean-Paul Deschamps, Commissariat à l'énergie atomique,(DAM/DASE/SRCE, direction lle-de France, départementanalyses surveillance environnement, service radioanalyseschimie environnement, BP 12, F-91680, Bruyères-le-Châtel,France, email: [email protected]
Misael Dîaz Asencio, Radioecology and EnvironmentalSurveillance Dpt, Central Radiological and EnvironmentalSurveillance Laboratory, LVRAC AP#5, Ciudad Nuclear,CP 59 350, Cienfuegos, Cuba
Authors list T9
Philippe Dubois, université libre de Bruxelles,50 av. F. D. Roosevelt, B-1050 Bruxelles, Belgique,email: [email protected]
David N. Edgington, Great Lakes Water Institute, Universityof Wisconsin-Milwaukee, Milwuakee, USA,email: [email protected]
Marie Ferland, McNair Scholars Program, CentralWashington University, Ellensburg, WA 98926-7439, USA,email: [email protected]
Jean-Michel Fernandez, Commissariat à l'énergie atomique,CEA/DED/SEP/LCD, bât. 352, CE Cadarache, BP1, 13108Saint-Paul-Lez-Durance, France,email: [email protected]
Renaud Fichez, Centre IRD de Nouméa, BP A5, 98848Nouméa, Nouvelle-Calédonie, email: [email protected]
Jacques Foos, CNAM, Laboratoire des sciencesnucléaires, 292 rue Saint Martin, 75003 Paris, France,email: [email protected]
Sverker Forsberg, Swedish University of AgriculturalSciences, Uppsala, Sweden, email: [email protected]
Scott W. Fowler, International Atomic Energy Agency,Marine Environment Laboratory, Monaco,email: [email protected]
Masami Fukui, Research Reactor Institute, KyotoUniversity: Noda, Kumatori-cho, 590-0494 Osaka, Japan,email: [email protected]
Sitaram Garimella, Department of Physics, The Universityof the South Pacific, Suva, Fiji Islands,email: garimella® usp.ac.fj
Claire Garrigue, Centre IRD de Nouméa, BP A5, 98848Nouméa, Nouvelle-Calédonie, email: garrigue ©noumea.ird.nc
José Marcus de Oliveira Godoy, Instituto de Radioproteçâoe Dosimetria, Comissâo Nacional de Energia Nuclear,Rio de Janeiro, Brazil, email: [email protected]
Valentin N. Golosov, Laboratory of Soil Erosion and FluvialProcesses, Department of Geography, Moscow StateUniversity, Moscow, Russia,email: [email protected]
Marc André Gonze, Institut de protection et de sûreténucléaire, DPRE/SERLAB, Centre de Cadarache, bât. 186,
10T Environmental Changes and Radioactive Tracers
BP 1, 13108 Saint-Paul-Lez-Durance cedex, France,email: [email protected]
Ron Grazioso, Dept. of Chemical and Nuclear Engineering,University of New Mexico, USA
Jacqui Greaves, opération Cétacés, BP 12827, Nouméa,Nouvelle-Calédonie
Gary Hancock, CSIRO Land and Water, Canberra, ACT2601, Australia, email: [email protected]
Koh Harada, National Institute for Resources andEnvironment, 1 6-3 Onogawa, 305-5869 Tsukuba, Japan,email: [email protected]
John R. Harries, ANSTO, Environment Division, AustralianNuclear Science and Technology Organisation (ANSTO),Menai, NSW 2234, Australia,email: [email protected]
Elizabeth Haworth, Institute of Freshwater Ecology,Ferry house, Ambleside, Cumbria LA22 OLP, U.K.,email: [email protected]
Hilde-Elise Heldal, Institute for Marine Research, Bergen,Norway, email: [email protected]
Ann Henderson-Sellers, ANSTO, Environment Division,Menai, NSW 2234, Australia, email: [email protected]
Antonio Hernandez Benitez, CIEMAT, AvenidadComplutense, 08000 Madrid, Spain,email: antonio.hernandez @ ciemat.es
Parvis Irannejad, ANSTO, Environment Division, AustralianNuclear Science and Technology Organisation, Menai,NSW, Australia, email: [email protected]
Takashi Itakura, ANSTO, Environment Division, Menai,NSW 2234, Australia, email: [email protected]
Peter J. Kershaw, CEFAS, Lowestoft, UK,email: [email protected]
Dejanira C. Lauria, Instituto de Radioproteçâo eDosimetria, Comissâo Nacional de Energia Nuclear,Rio de Janeiro, Brazil, email: [email protected]
Gilbert Le Petit, Commissariat à l'énergie atomique(DAM/DASE/SRCE), direction Ile-de-France, départementanalyse surveillance environnement, service radioanalyseschimie environnement, BP 12, F-91680 Bruyères-le-Châtel,France, email: [email protected]
Authors list 11
Hugh D. Livingston, IAEA-MEL (Marine EnvironmentalLaboratory), Monaco, email: [email protected]
Chantai Madoz-Escande, Institut de protection et de sûreténucléaire, DPRE/SERLAB, Centre de Cadarache, bât. 186,BP 1, 13108 Saint-Paul-Lez-Durance cedex, France,email: chantal.madoz-escande @ ipsn.fr
Olivier Magand, International Atomic Energy Agency,Marine Environment Laboratory, Monaco,email: [email protected]
Joanna Marchant, Impérial Collège, London, UnitedKingdom, email: [email protected]
Maxim Vladimirovich Markelov, Laboratory of Soil Erosionand Fluvial Processes, Department of Geography, MoscowState University, Moscow, Russia,email: [email protected]
Alastair McArthur, Department of Physics, The Universityof the South Pacific, Suva, Fiji Islands,email: [email protected]
Gordon D. McOrist, ANSTO, Environment Division, Menai,NSW 2234, Australia, email: [email protected]
Hervé Michel, Laboratoire de radiochimie et radioécologie,université de Nice-Sophia Antipolis,faculté des sciences, 28 avenue Valrose,06108 Nice cedex 2, France, email: [email protected]
Pierre Miramand, université de La Rochelle, La Rochelle,France, email: [email protected]
Benjamin Moreton, Centre IRD de Nouméa, BP A5, 98848Nouméa, Nouvelle-Calédonie, email: moreton ©noumea.ird.nc
Sandor Mulsow, International Atomic Energy Agency,Marine Environment Laboratory, Monaco,email: [email protected]
Alain Munoz Caravaca, Radioecology and EnvironmentalSurveillance Dpt, Central Radiological and EnvironmentalSurveillance Laboratory, LVRAC AP #5, Ciudad Nuclear,CP 59 350, Cienfuegos, Cuba, email: [email protected]
Sunun Nouchpramools, Office of Atomic Energy for Peace,Vibhavadee-Rangsit Rd, Chatuchak, Bangkhen, Bangkok,Thailand
Anselmo S. Paschoa, Pontifîcia Universidade Catôlica doRio de Janeiro (PUC-Rio), Physics Department, OP. 38071,
12' Environmental Changes and Radioactive Tracers
Rio de Janeiro, RJ 22452-970, Brazil,email: [email protected]
Vasile Patrascu, National Institute for Marine Researchand Development "Grigore Antipa", RO-8700, Constanta,Romania, email: [email protected]
Tim E. Payne, ANSTO, Environment Division, Menai, NSW2234, Australia, email: [email protected]
Gillian Peck, ANSTO, Environment Division, PMB 1, Menai,NSW 2234, Australia, email: [email protected]
John Pfitzner, Australian Institute of Marine Science,Townsville, Qld, Australia, email: [email protected]
Riitta Pilvio, National Radiation Laboratory, Christchurch,New Zealand, email: [email protected]
Pavel Povinec, International Atomic Energy Agency,Marine Environment Laboratory, Monaco,email: [email protected]
Pedro Rivas Romero, CIEMAT, Avenidad Complutense,08000 Madrid, Spain, email: [email protected]
Jacques Rivaton, Centre IRD de Nouméa, BP A5, 98848Nouméa, Nouvelle-Calédonie
John A. Robbins, Great Lakes Environmental ResearchLaboratory, National Oceanic and AtmosphericAdministration, Ann-Arbor, USA,email: [email protected]
Pedro F. Rodrîguez-Espinosa, Instituto PolitécnicoNacional, Domicilio provisional: Calle Reforma N° 113 Col.Palmira, 62490 Temixco, Morelos, Mexico,email: [email protected]
Teresa Sauras, Departament de Biologia Végétal,Universitât de Barcelona Diagonal, 645 08028 Barcelona,Spain, email: [email protected]
Paulina Schuller, Instituto de Fisica, Facultad de Ciências,Universidad Austral de Chile, Valdivia, Chile,email: [email protected]
Graeme Shaw, Impérial Collège, T H Huxley School,Silwood Park, Ascot, Berkshire, SL5 7PY, United Kingdom,email: [email protected]
Yoko Shibamoto, National Institute for Resources andEnvironment, 16-3 Onogawa, 305-5869 Tsukuba, Japan,email: [email protected]
Authors list 13
David E. Smiles, CSIRO Land and Water, Canberra, ACT2601, Australia, email: [email protected]
J. David Smith, Marine Chemistry Laboratory, Schoolof Chemistry, University of Melbourne, Parkville 3052,Australia, email: [email protected]
John N. Smith, Bedford Institute of Oceanography,Department of Fisheries and Océans, Dartmouth, B2Y 4A2,Canada, email: [email protected]
Oswin Snehaleela, Department of Physics, The Universityof the South Pacific, Suva, Fiji Islands
E. Suârez Morell, Radioecology and EnvironmentalSurveillance Dpt, Central Radiological and EnvironmentalSurveillance Laboratory, LVRAC AP #5, Ciudad Nuclear,CP 59 350, Cienfuegos, Cuba
Ali Temara, université libre de Bruxelles, Laboratoire debiologie marine, CP 160/15, 50 av. F. Roosevelt,1050 Bruxelles, Belgium, email: [email protected]
Jean-Louis Teyssié, International Atomic Energy Agency,Marine Environment Laboratory, Monaco,email: [email protected]
Yves Thiry, SCK-CEN, Mol, Belgium,email: [email protected]
MarcTrescinski, Laboratoire d'étude et de surveillance del'environnement, CEA/IPSN, BP 519, Papeete, Tahiti,Polynésie française
Rosa Eugenia Trumper, Instituto de Ffsica, Facultad deCiências, Universidad Austral de Chile, Valdivia, Chile,email: rtrumper® valdivia.uca.uach.cl
Ramon Vallejo, University of Barcelona, Facultat Biologia-Principal, Diagonal, 645, 08028 Barcelona, Spain,email: [email protected]
Francisco Vidal Lorandi, Grupo de EstudiosOceanogrâficos, Centro de Investigacion en CienciaAplicada y Tecnologia Avanzada, Instituto PolitécnicoNacional, Domicilio provisional: A. P. 1-475 Centro,Cuernavaca, 62001, Morelos, Mexico
Victor Vidal Lorandi, Grupo de Estudios Oceanogrâficos,Centro de Investigacion en Ciencia Aplicada y TecnologiaAvanzada, Instituto Politécnico Nacional,Domicilio provisional: A. P. 1-475 Centro, Cuernavaca,62001, Morelos, Mexico
14' Environmental Changes and Radioactive Tracers
Nadia Waegeneers, SCK-CEN, Mol, Belgium,email: nadia.waegeneers @ agr.kuleuven.ac.be
Michel Warnau, International Atomic Energy Agency,Marine Environment Laboratory, Monaco,email: [email protected]
Stewart Whittlestone, ANSTO, Environment Division,PMB1, Menai, NSW 2234, Australia,email: [email protected]
Wlodek Zahorowski, ANSTO, Environment Division, PMB1,Menai, NSW 2234, Australia, email: [email protected]
Vladimir L. Zimin, V. G. Khlopin Radium Institute,Saint-Petersburg, Russian Fédération,email: [email protected]

Référées listJean-Michel FernandezGareth R. GilbertGary HancockJohn R. HarriesAntonio Hernandez-BenitezRoss JeffreePeter J. KershawGilbert Le PetitTimothy QuinePaulina SchullerJohn N. SmithRick TinkerJohn Twining

ContentsPréface
Préface
21
23
Radioactivity in biological processes
Fishes as radionuclide bioindicators in the areaof Leningrad nuclear power plant(Gulf of Finland, Baltic Sea) 27
V. L. Zimin, L. D. Blinova
Synthetyc results in the radioactivity assessmentof the Romanian Black Sea sector after 1 992 39
V. Patrascu ef al.
Impact of the human activities on cetaceansin the South West Pacific Océanby measuring 137Cs, 40K and 210Pb 49
C. Garrigue et al.
14C radiolabelling: a sensitive tool for studyingPCB bioaccumulation in echinoderms 59
B. Danis et al.
Cadmium bioaccumulation at différent stagesof the life cycle of cephalopods:a radiotracer (109Cd) investigation 65
P. Bustamante et al.
Heavy metals in the sea star Asterias rubens(echinodermata): basis for the construction of anefficient biomonitoring program 71
A. Temara et al.
Oral/Poster présentations 93
Radioactivity and waste disposai
Radioactive waste management: the rôle of CIEMATin the Spanish and European R+TD programsfor radwaste disposai 107
P. Rivas Romero, A. I.Hernandez Benitez
1 8 T Environmental Changes and Radioactive Tracers
Radionuclide migration in arid soils 129
J. R. Harris et al.
Actinide séparations using extraction chromatography 139
R. Pilviô, M. Bickel
Oral/Poster présentations 149
Radioactivity in sedimentary studies
Seasonally modulated sédimentationin an estuarine depositional régime 157
J. N. Smith
Regionalization of natural and artificial radionuclidesin marine sédiments of the Southern Gulf of Mexico 167
P. F. Rodriguez-Espinosa et al.
Mixing models (advection/diffusion/non-local exchange)and 210Pb sédiment profiles from a wide rangeof marine sédiments 175
S. Mulsow, P. Povinec
Advantages of combining 210Pd and geochemicalsignature déterminations in sédiment record studies:application to coral reef lagoon environments 187
J. M. Fernandez et al.
Concentrations of heavy metals and trace élémentsin the marine sédiments of the Suva Lagoon, Fiji 201
S. Garimella et al.
Comparaison of 210Pb chronology with 238.239-24opu>
241Am and 137Cs sedimentary record capacityin a lake system 213
H. Michel ef al.
Excess 210Pb and 210Po in sédimentfrom the Western North Pacific 223
K. Harada, Y. Shibamoto
Workshop on radiological techniquesin sédimentation studies: methods and applications 233
G. Hancock ef al.
Oral/Poster présentations 253
Contents T 19
Radioactivity in atmospheric studies
Radon measurements for atmospheric tracing 279
W. Zahorowski ef al.
Trace éléments in total atmosphericsuspended particules in a suburban areaof Paris: a study carried out by INAA 299
G. Le Petit et al.
Assessing soil moisture in global climate models:is radon a possible vérification tool? 323
A. Henderson-Sellers, P. Irannejad
Production and release of tritiumfrom a research reactor 339
M. Fukui, P. Grazioso
Oral/Poster présentations 355
Radioactivity in soils and related issues
Application of Chernobyl-derived 137Cs
for assessment of soil redistributionin agricultural catchments of central Russia 367
V. N. Golosov, M. V. Markelov
Use of 137Cs to estimate rates and patternsof soil redistribution on agricultural landin Central-South Chile: models and validation 385
P. Schuller et al.
Soil-radionuclides interaction and subséquent impacton the contamination of plant food products basedon a simulated accidentai source 397
F. Bréchignac et al.
Oral/Poster présentations 421
Radioactivity and water column
Contrasting behaviour of artificial radionuclidesin the Pacific and other océan basins: radionuclidesas tracers of environmental change? 435
P. J. Kershaw et al.
20 T Environmental Changes and Radioactive Tracers
Export fluxes of organic carbon in the WesternNorth Pacific determined by drifting sédimenttrap experiments and 234Th profiles 449
K. Harada, Y. Shibamoto
Uranium decay séries radionuclidesin the Western Equatorial Pacific Océan and theiruse in estimating POC fluxes 459
G. A. Peck, J. D. Smith
Origin and transport of radiumin the water column of Buena Coastal Lagoon 471
D. C. Lauria, J. M. de Oliveira Godoy
Hydric resources radioactive contaminationin the central région of Cuba as a conséquenceof fallout after the atmospheric nuclear bombs tests 483
C. Alonso Hernandez ef al.
Oral/Poster présentations 495
Abstracts 511
Préface
Cela fera bientôt 70 ans que Frédéric et Irène Joliot-Curiemontrèrent ou décrivirent, grâce à la radioactivité dite « arti¬ficielle » qu'ils venaient de découvrir, les diverses applica¬tions possibles des traceurs radioactifs. La radioécologieallait naître tout logiquement quelques années après. C'estainsi que l'utilisation des isotopes radioactifs, naturels ouartificiels, allait se montrer indispensable dans les étudesenvironnementales, aussi bien en hydrologie que dans lessciences de la terre ou les études atmosphériques. Depuisquelques décennies, les traceurs radioactifs sont aussiutilisés pour mieux comprendre les processus biologiques:sciences environnementales et sciences de la vie se retrou¬vent donc - et logiquement - liées. On retrouve là leprogramme scientifique du congrès SPERA 2000.
Les progrès de la radioécologie sont intimement liés auxcompétences des radiochimistes, capables par diversesopérations chimiques de déceler des quantités infimes dematière, utilisant là les propriétés remarquables de laradioactivité mais aussi les nouvelles techniques d'analyseextrêmement performantes.
Je mentionnais plus haut isotopes naturels et artificiels.L'intérêt des seconds me semble considérable à plusieurspoints de vue. Lorsque, en 1987, nous décidions Jean-Claude Guary, Pierre Guegueniat, et moi-même d'accueillir àCherbourg, dans les locaux flambant neufs de l'Institutnational des techniques de la mer (Intechmer) un congrèsinternational intitulé « Radionucléides: un outil pourl'océanographie », à quelques brasses des centresnucléaires de la Hague, de Flamanville et de l'arsenal mili¬taire, nous désirions mettre l'accent, en pleine polémiqueanti-nucléaire, sur les possibilités qu'offraient les infimesrejets de matière radioactive en terme de recherches. Cecongrès eut le succès que l'on connaît. C'est à peu près àcette même époque que l'association SPERA, créée en1985, prit son envol.
J'ai été très heureux de constater, dans ce VIe congrès inter¬national SPERA 2000, les progrès qui ont été réalisés danstous les domaines évoqués plus haut, comment les tech¬niques utilisées permettent de mieux comprendre l'environ¬nement, et également permettent de mieux le contrôler. Cecongrès a réuni 70 participants de 24 pays pour 76 commu¬nications orales ou affichées, regroupées dans 6 rubriques.Sur le plan matériel, l'organisation a été en tous points
22' Environmental Changes and Radioactive Tracers
remarquable, aussi bien dans la maîtrise opérationnelle quedans la convivialité qu'a su transmettre et entretenir celui quien a été l'élément moteur: Jean-Michel Fernandez, qui s'estdépensé sans compter pour que cette conférence interna¬tionale se déroule dans les meilleures conditions. Tous lescongressistes savent l'énergie qu'il convient de dépenserpour réussir une telle organisation et je me fais leur interprètepour le remercier très chaleureusement : ce n'est que justicedans cette préface.
Pour conclure, j'ai le sentiment que ce congrès SPERA 2000a su fédérer tous les thèmes de recherche associant lesradionucléides et l'environnement. C'est maintenant la mis¬
sion des congrès de ce nouveau siècle, dont on s'accorde àdire qu'il sera celui de l'environnement, de développer cesdivers domaines. C'est là aussi la tâche, difficile mais pri¬
mordiale, des radioécologistes d'aujourd'hui.
Professeur Jacques FOOSTitulaire de la chaire
« Rayonnements, Isotopes et Applications »
au Conservatoire national des arts et métiers (CNAM)directeur du Laboratoire des sciences nucléaires (CNAM)
Paris - France
Préface
It is now almost 70 years since Frédéric and Marie Joliot-Curie demonstrated, using 'artificial' radioactivity, that theyhad just discovered various possible applications of radioac¬tive tracers. Radio-ecology would logically émerge a fewyears later. The use of radioactive isotopes, natural and arti¬ficial, would become essential in environmental research, inthe areas of hydrology, earth sciences and atmospheric stud¬ies. For several décades now, radioactive tracers hâve alsobeen used to gain a better understanding of biological pro¬cesses: environmental sciences and life sciences are there¬fore, logically, linked. This is basis of the scientific programmefor the SPERA-2000 Conférence.
Progress in radio-ecology is closely linked to the abilities ofradio-chemists who, from various chemical opérations, arecapable of detecting infinitely small quantifies of matter, usingthe outstanding properties of radioactivity but also new andvery efficient analysis techniques.
I mentioned natural and artificial isotopes. Artificial isotopesseem particularly promising from several points of view. In1987 when we decided (Jean-Claude Guary, PierreGuegueniat and myself) to host an international Congresstitled 'Radionuclides: a tool for oceanography' in the brand-new buildings of the National Institute for Océan Techniques,just a few steps from the nuclear centres of La Hague andFlamanville and close to the Military Arsenal, while antinu-clear feeling was running high, we wanted to reflect upon theresearch possibilities offered by tiny émanations of radio¬active matter. This Congress was a success, as we ail know.It was at about the same time that the SPERA Association,set up in 1985, really took off.
I was very happy to note during the sixth internationalConférence that progress has been made in every areareferred to above and how the techniques used make it pos¬sible to understand the environment better and to manage itmore effectively. This Conférence brought together 70 partici¬pants from 24 countries to deliver 76 papers under six head-ings.
From the practical point of view, the organisation was excel¬lent, both in operational terms and in the friendly atmosphèrethat prevails through the efforts of the driving force, Dr Jean-Michel Fernandez, who worked tirelessly to make this inter¬national conférence run smoothly. Ail the participants knowhow much energy is needed to make a congress a success
24' Environmental Changes and Radioactive Tracers
and I speak on their behalf when I thank him very warmly. It isonly fair to do so in this préface.
To conclude, I hâve the feeling that the 6th InternationalConférence, SPERA-2000, managed to address ail theresearch thèmes associating radionuclides and the environ¬ment. The work of future conférences in this new century,which everyone agrées is the century of the environment, isto further develop the work in thèse areas. This is the difficultbut essential task of today's radio-ecologists.
Professor Jacques FoosChair of 'Radiation, Isotopes and Applications' at the
Conservatoire national des arts et métiers (CNAM)Director of the Laboratory of Nuclear Sciences (CNAM)
Paris, France
Radioactivityin biological processes
Session 1
Chairman: J. Twining
Session opening: R. Jeffree

hishes as radionuclidebioindicators in the areaof Leningrad nuclear powerplant (Gulf of Finland,Baltic Sea)
Vladimir L. Zimin
Lidia D. Blinova
Introduction
The radioactivity of the aquatic environment comprises radionu¬clides of natural origin, global fallout from nuclear weapon tests,
accidents at nuclear facilities and also everyday leakage of radioac¬
tive substances from nuclear power plants.
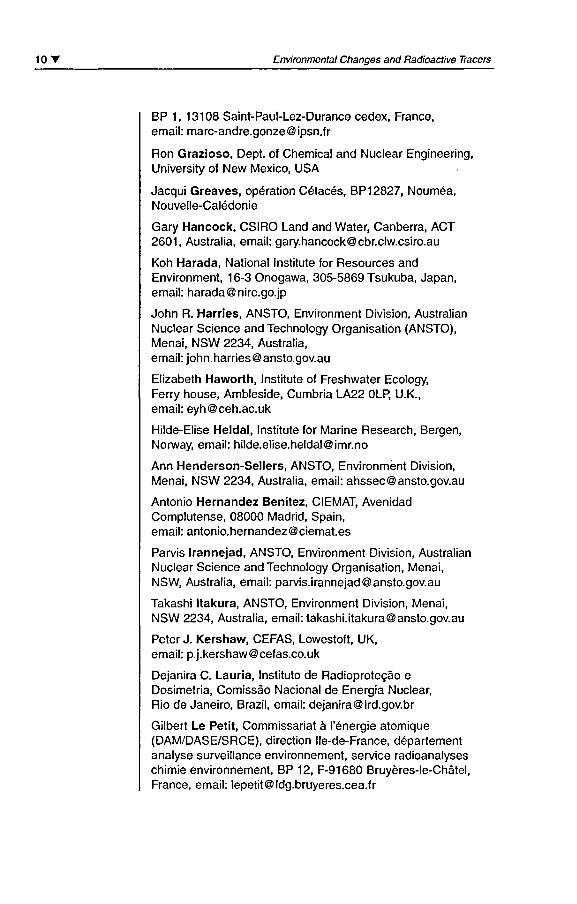
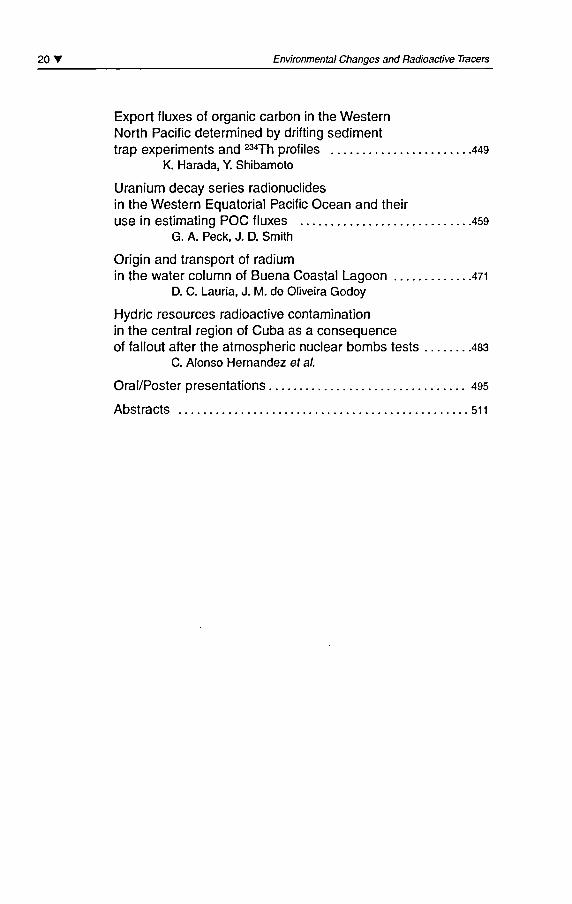
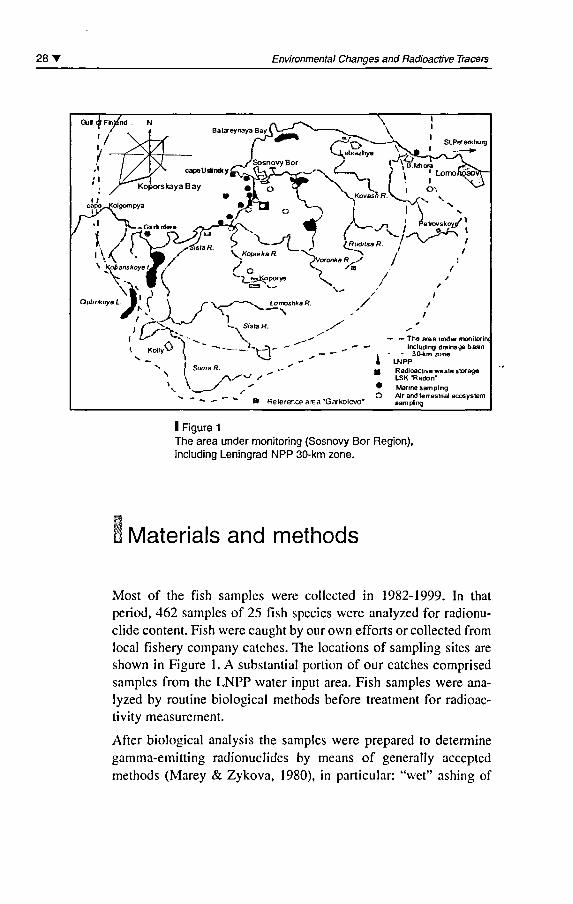
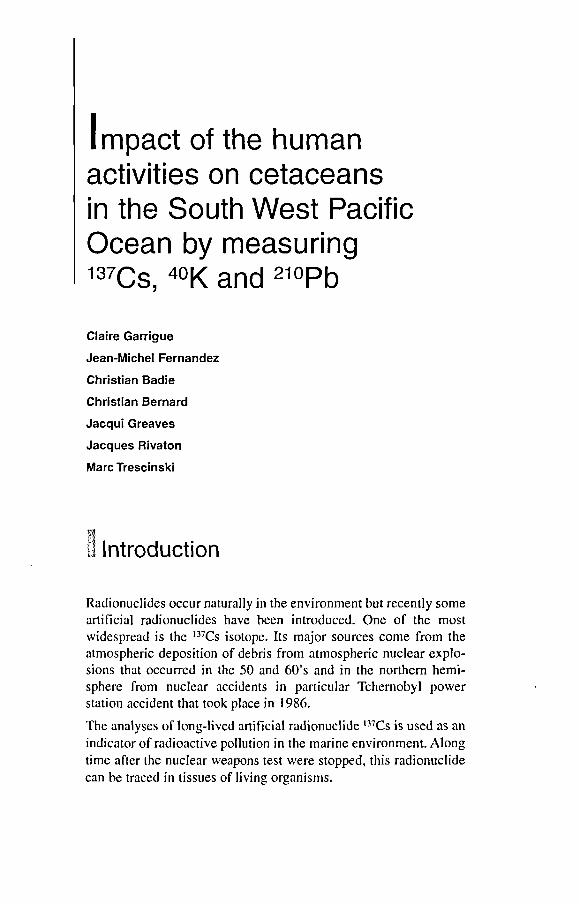
The area under investigation is characterized by a high concentrationof nuclear facilities. Leningrad NPP (LNPP) with 4 RBMK-1000reactors, North-west régional storage facility of low and intermedi¬ate level radioactive wastes (LSK "Radon") and the North-west sci¬
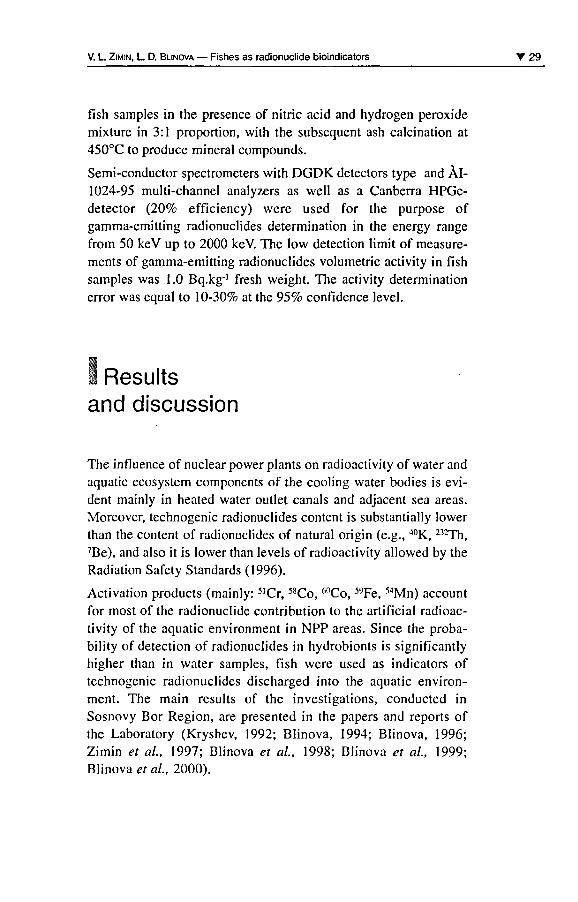
ence and industrial center of atomic energy (Figure 1).
Radioecological monitoring ofthe Koporskaya Bay coastal waters(LNPP cooling water body) as well as rivers and lakes of the baydrainage basin, is a part of the intégral ecological monitoring ofSosnovy Bor Région. The work was carried out at the Régionalenvironmental monitoring laboratory of the V.G. Khlopin RadiumInstitute.
28' Environmental Changes and Radioactive Tracers
Marine sam pingO Air and terreslrial ecosystem
es Référence area "Garkolovo" samping
I Figure 1
The area under monitoring (Sosnovy Bor Région),including Leningrad NPP 30-km zone.
Materials and methods
Most of the fish samples were collected in 1982-1999. In thatperiod, 462 samples of 25 fish species were analyzed for radionu-clide content. Fish were caught by our own efforts or collected fromlocal fishery company catches. The locations of sampling sites are
shown in Figure LA substantial portion of our catches comprisedsamples from the LNPP water input area. Fish samples were ana¬
lyzed by routine biological methods before treatment for radioac¬
tivity measurement.
After biological analysis the samples were prepared to déterminegamma-emitting radionuclides by means of generally accepted
methods (Marey & Zykova, 1980), in particular: "wet" ashing of
V. L. Zimin, L D. Blinova Fishes as radionuclide bioindicators T 29
fish samples in the présence of nitric acid and hydrogen peroxidemixture in 3:1 proportion, with the subséquent ash calcination at
450°C to produce minerai compounds.
Semi-conductor spectrometers with DGDK detectors type and ÀI-1024-95 multi-channel analyzers as well as a Canberra HPGe-detector (20% efficiency) were used for the purpose ofgamma-emitting radionuclides détermination in the energy range
from 50 keV up to 2000 keV. The low détection limit of measure¬
ments of gamma-emitting radionuclides volumetric activity in fishsamples was LO Bq.kg-' fresh weight. The activity déterminationerror was equal to 10-30% at the 95% confidence level.
1 Resultsand discussion
The influence of nuclear power plants on radioactivity of water and
aquatic ecosystem components of the cooling water bodies is évi¬
dent mainly in heated water outlet canals and adjacent sea areas.
Moreover, technogenic radionuclides content is substantially lowerthan the content of radionuclides of natural origin (e.g., 40K, 232Th,
7Be), and also it is lower than levels of radioactivity allowed by the
Radiation Safety Standards (1996).
Activation products (mainly: 5lCr, 5aCo, 60Co, 59Fe, 54Mn) accountfor most of the radionuclide contribution to the artificial radioac¬
tivity of the aquatic environment in NPP areas. Since the proba-bility of détection of radionuclides in hydrobionts is significantlyhigher than in water samples, fish were used as indicators oftechnogenic radionuclides discharged into the aquatic environ¬ment. The main results of the investigations, conducted inSosnovy Bor Région, are presented in the papers and reports ofthe Laboratory (Kryshev, 1992; Blinova, 1994; Blinova, 1996;
Zimin et ai, 1997; Blinova et ai, 1998; Blinova et al., 1999;Blinova et al, 2000).
30' Environmental Changes and Radioactive Tracers
Biological transfer of radioactivity
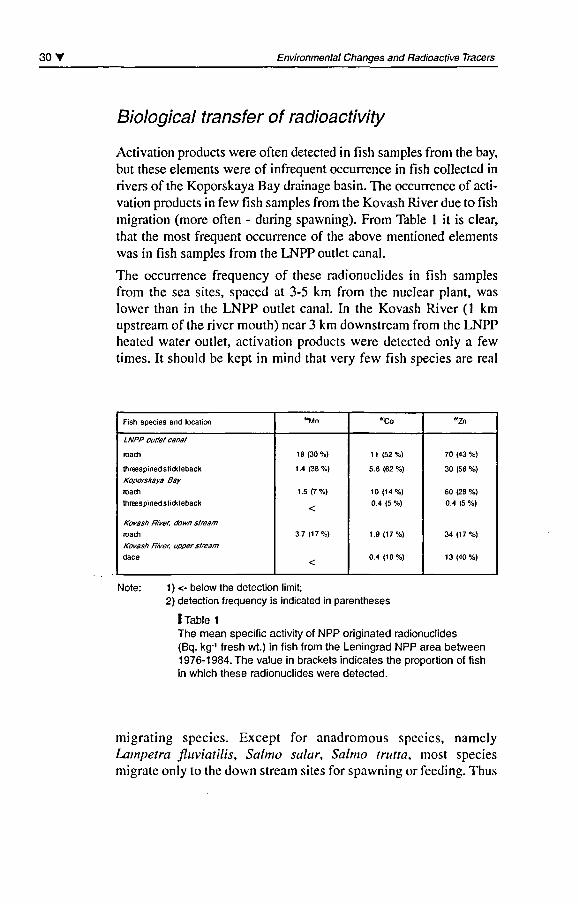
Activation products were often detected in fish samples from the bay,
but thèse éléments were of infrequent occurrence in fish collected inrivers of the Koporskaya Bay drainage basin. The occurrence of acti¬
vation products in few fish samples from the Kovash River due to fishmigration (more often - during spawning). From Table 1 it is clear,that the most fréquent occurrence of the above mentioned élémentswas in fish samples from the LNPP outlet canal.
The occurrence frequency of thèse radionuclides in fish samplesfrom the sea sites, spaced at 3-5 km from the nuclear plant, waslower than in the LNPP outlet canal. In the Kovash River (1 kmupstream of the river mouth) near 3 km downstream from the LNPPheated water outlet, activation products were detected only a fewtimes. It should be kept in mind that very few fish species are real
Fish species and location
LNPP outlet canal
roach
threespined sticklebackKoporskaya Bayroacti
threespined stickleback
Kovash River, down stream
roach
Kovash River, upper stream
dace
"Mn
18 (30%)
1.4 (38%)
1.5 (7%)
<
3.7 (17%)
<
"Co
11 (52%)
5.6 (62 %)
10 (14%)
0.4 (5 %)
1.9 (17%)
0.4 (10%)
"Zn
70 (43 %)
30 (56 %)
60 (28 %)
0.4 (5 %)
34 (17%)
13 (40%)
Note: 1) <- below the détection limit;2) détection frequency is indicated in parenthèses
I Table 1
The mean spécifie activity of NPP originated radionuclides(Bq. kg-' fresh wt.) in fish from the Leningrad NPP area between1976-1984. The value in brackets indicates the proportion of fishin which thèse radionuclides were detected.
migrating species. Except for anadromous species, namelyLampetra fluviatilis, Salmo salar, Salmo trutta, most speciesmigrate only to the down stream sites for spawning or feeding. Thus
V. L. Zimin, L. D. Blinova Fishes as radionuclide bioindicators 31
roach (Rutilus rutilas) dwelling in the Koporskaya Bay nevermigrate to the upper stream part of the river.
In the upper stream of the Kovash River radionuclides originatedfrom the LNPP were registered in only one fish species, namelydace (Leuciscus leuciscus). This may be évidence of the radionu¬clide bio-transfer from the nuclear power plant to the river. Daceusually dwells at streams; its occurrence in the Koporskaya Bay isof low frequency; nevertheless this species, the activation productsin the samples confirm the far migration of this species.
âge
0+
2 +
3+
4+
'"Cs1.0
1.0
0.8
1.2
"Cr32.0
27.2
9.0
<
M.\in
42.3
32.6
19.6
7.6
MCo
30.9
21.1
14.1
5.4
5"Co
13.4
10.5
5.3
3.0
**Zn
16.6
82.8
<
<
5'Fe
45.9
27.9
20.8
7.4
Note: 1) <- below the détection limit;
I Table 2Radionuclide concentrations (Bq.kg-1 fresh wt.) in roach(Rutilus rutilus) of différent âge groups collectedin the NPP outlet canal on 12.08.1983.
Spécial features of radionuclide accumulationin connection with fish âge
Table 2 shows the content of wMn, 5ICr, 6(1Co and other activationproducts in roach collected at the LNPP heated water outlet in thesummer of 1983. The unusual character of accumulation of radionu¬clides was registered for the roach of différent âge groups collectedon 12.08.1983. Ail concentrations of the radionuclides, except for65Zn, clearly decreased in the séries "young fish - old fish".This phenomenon is presumed to be explained by the significant con¬
tribution of the radionuclides absorbed by mucous skin epithelium tothe whole radionuclide content. In view ofthe fact, that small-sized fishhâve a relatively larger skin surface areas than big-sized ones, youngfish individuals can absorb more radionuclides than old fish individu¬als of the same total body weight. It is known, that the mean concen¬
tration factor of radionuclides and the mean body length (or âge) of fish
32 T Environmental Changes and Radioactive Tracers
correlate positively (Rowan & Rasmussen, 1994; Kasamatsu &Ishikawa, 1997), which is associated mainly with food habits and
trophie level. Since, as a rule, an opposite situation takes place.
The fact that the roach was immediately exposed to heated waterwith 54Mn, 51Cr, ^Co and other radionuclides, discharged from the
LNPP, at the outlet canal, plays, of course, the important part in the
process of radionuclide accumulation.
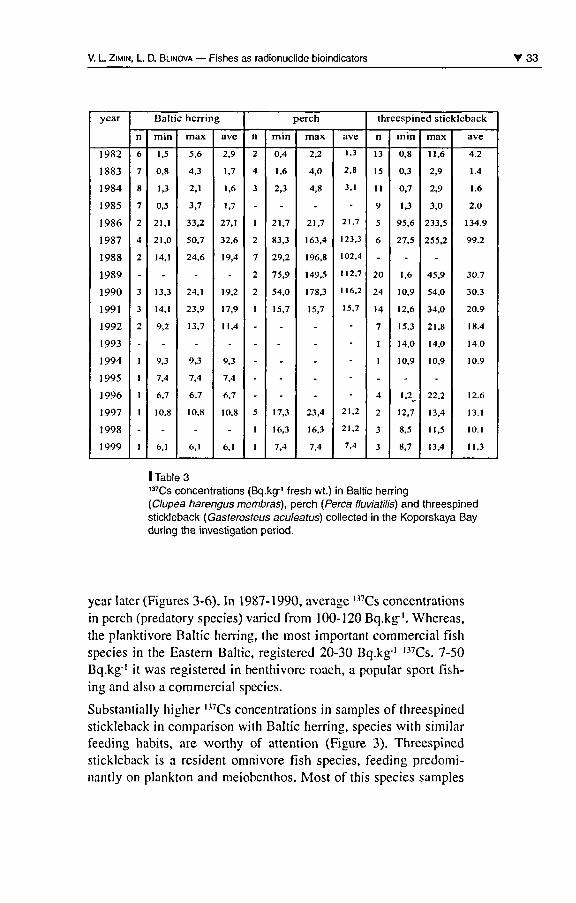
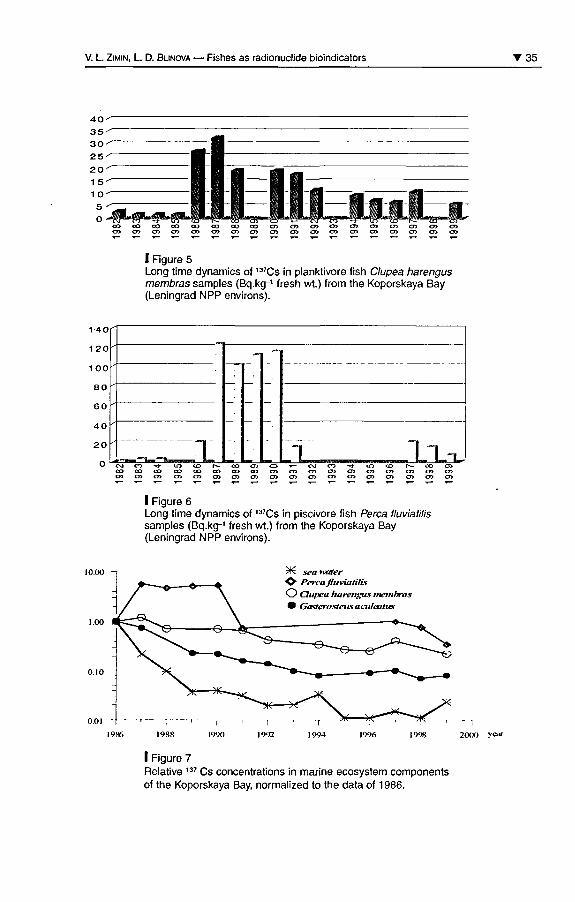
Long time dynamics of 137Cs content in fish
The radiocesium dynamics in populations of some fish species fromthe Koporskaya Bay, as well as from rivers and lakes of the bay
drainage basin, was reviewed. The data available, partly presented
in Table 3, made it possible to characterize radionuclide accumula¬
tion by fish of différent ecological groups and trophie levels and to
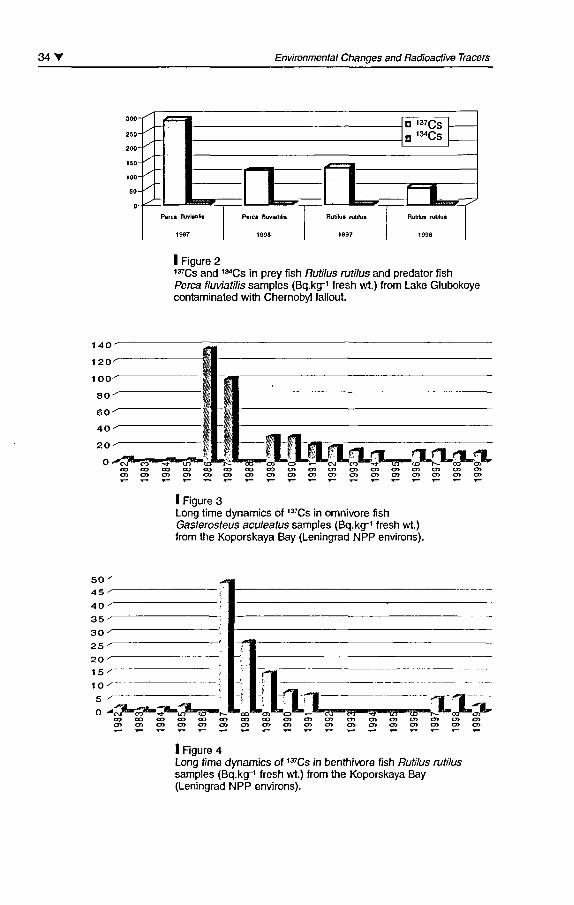
trace its dynamics. Since 1986 (after the accident at ChernobylNPP) up to nowadays, the major contribution to césium content infish was via radionuclides from the Koporskaya Bay drainage basin,which was subjected to Chemobyl fallout mainly in the west part.
At the présent time, considérable radiocesium concentrations wereregistered only in fish caught in Lake Glubokoye (the KoporskayaBay drainage basin); both 137Cs and 134Cs were registered there
(Figure 2). The isotope ratio 137Cs: l34Cs in fish samples from LakeGlubokoye indicated the Chernobyl origin of thèse radionuclides.In 1997 and 1998 137Cs concentrations in perch and roach fromLake Glubokoye were roughly two orders of magnitude greater than
concentrations in the same species from the Koporskaya Baycoastal waters.
Koporskaya Bay has a wide water exchange with the open part ofthe Gulf of Finland, that is why radiocesium contents in coastalwater and hydrobionts, including fish, were significant only in the
first years after the accident at Chernobyl NPP, with their subsé¬
quent fast réduction.
The processes of intake and élimination of ,37Cs by fish of différentfood habits and trophie levels were différent in their character. Themaximum 137Cs concentrations in prey fish species were registeredin 1986-1987. In comparison, predatory species maxima occurred a
V. L. Zimin, L. D. Blinova Fishes as radionuclide bioindicators 33
year
1982
1883
1984
1985
1986
1987
1988
1989
1990
1991
1992
1993
1994
1995
1996
1997
1998
1999
n
6
7
8
7
2
4
2
-
3
3
2
-
1
1
1
1
-
1
Balti
min
1.5
0,8
1,3
0,5
21,1
21,0
14,1
-
13,3
14,1
9,2
-
9,3
7,4
6,7
10,8
-
6,1
c herrin
max
5,6
4,3
2,1
3,7
33,2
50,7
24,6
-
24,1
23,9
13,7
-
9,3
7,4
6,7
10,8
-
6,1
g
ave
2,9
1,7
1,6
1,7
27,1
32,6
19,4
-
19,2
17,9
11,4
-
9,3
7,4
6,7
10,8
-
6,1
perch
n
2
4
3
-
1
2
7
2
2
1
-
-
-
-
-
5
1
1
min
0,4
1,6
2,3
-
21,7
83,3
29,2
75,9
54,0
15,7
-
-
-
-
-
17,3
16,3
7,4
max
2,2
4,0
4,8
-
21,7
163,4
196,8
149,5
178,3
15,7
-
-
-
-
-
23,4
16,3
7,4
ave
1,3
2,8
3,1
-
21,7
123.3
102,4
112,7
116,2
15,7
-
-
-
-
-
21,2
21,2
7,4
threespined stickleback
n
13
15
11
9
5
6
-
20
24
14
7
I
1
-
4
2
3
3
min
0,8
0,3
0,7
1,3
95,6
27,5
-
1,6
10,9
12,6
15,3
14,0
10,9
-
1,2
12,7
8,5
8,7
max
11.6
2,9
2,9
3.0
233,5
255,2
-
45,9
54,0
34,0
21,8
14,0
10,9
-
22,2
13,4
11,5
13,4
ave
4.2
1.4
1.6
2.0
134.9
99.2
30.7
30.3
20.9
18.4
14.0
10.9
12.6
13.1
10.1
11.3
I Table 3137Cs concentrations (Bq.kg1 fresh wt.) in Baltic herring(Clupea harengus membras), perch (Perça fluviatilis) and threespinedstickleback (Gasterosteus aculeatus) collected in the Koporskaya Bayduring the investigation period.
year later (Figures 3-6). In 1987-1990, average l37Cs concentrationsin perch (predatory species) varied from 100-120 Bq.kg1. Whereas,
the planktivore Baltic herring, the most important commercial fishspecies in the Eastern Baltic, registered 20-30 Bq.kg'1 l37Cs. 7-50Bq.kg"1 it was registered in benthivore roach, a popular sport fish¬
ing and also a commercial species.
Substantially higher l37Cs concentrations in samples of threespinedstickleback in comparison with Baltic herring, species with similarfeeding habits, are worthy of attention (Figure 3). Threespinedstickleback is a résident omnivore fish species, feeding predomi-nantly on plankton and meiobenthos. Most of this species samples
34T Environmental Changes and Radioactive Tracers
300-
2S0-
200-
ISO
100-
50-
D '37CSn 134CS
Perça fluvial ilis
1997
Eï1Perça lluviatilis Rutilus rutilus
1997
O^Rutilus rutilul
1998
I Figure 2137Cs and 134Cs in prey fish Rutilus rutilus and predator fishPerça fluviatilis samples (Bq.kg-1 fresh wt.) from Lake Glubokoyecontaminated with Chernobyl fallout.
140-
120-
100-
80-
60-
40-
20-
0 -
I Rgure 3Long time dynamics of 137Cs in omnivore fishGasterosteus aculeatus samples (Bq.kg-1 fresh wt.)from the Koporskaya Bay (Leningrad NPP environs).
50-45 -
40-
35-
30-
25-
20-
15-
10-
5
O i^M^
I Figure 4Long time dynamics of 137Cs in benthivore fish Rutilus rutilussamples (Bq.kg-1 fresh wt.) from the Koporskaya Bay(Leningrad NPP environs).
V. L. Zimin, L. D. Blinova Fishes as radionuclide bioindicators T35
I Figure 5Long time dynamics of 137Cs in planktivore fish Clupea harengusmembras samples (Bq.kg-1 fresh wt.) from the Koporskaya Bay(Leningrad NPP environs).
140"
120-
100'
80 '
60 '
40 '
20 '
- - -
Zl_ Ll^co ** m co r co oi c^ » c\jco**Tu_î<or»-cooïco co co co co co co oï o> en oï oï oï o> oi o> oïen en en o> en o* en o* o> oï oï o» oï oï cjï oï o>
I Figure 6Long time dynamics of 137Cs in piscivore fish Perça fluviatilissamples (Bq.kg-1 fresh wt.) from the Koporskaya Bay(Leningrad NPP environs).
^6 sea water& PerçafluviatilisO Clupea harengus membras
Gasterosteus aculeatus
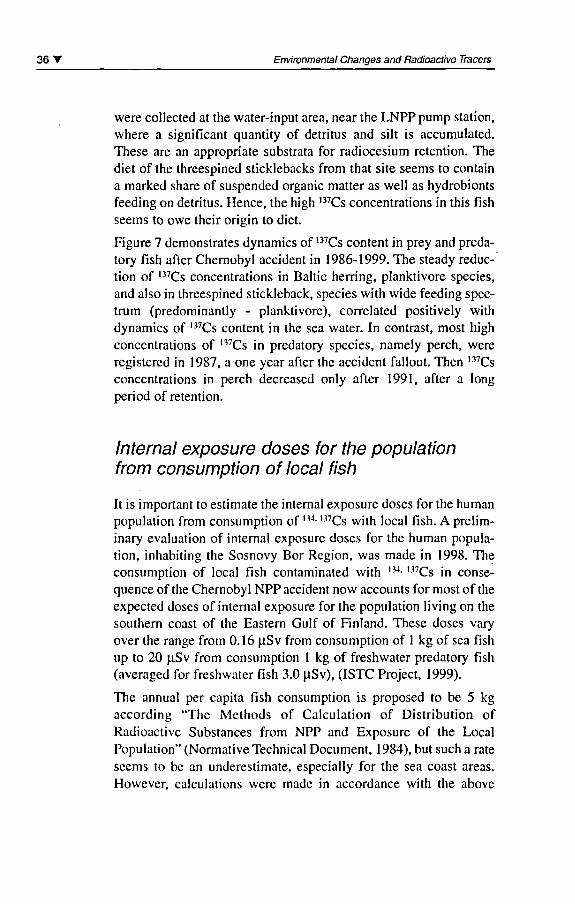
I Figure 7Relative 137 Cs concentrations in marine ecosystem componentsof the Koporskaya Bay, normalized to the data of 1986.
36 T Environmental Changes and Radioactive Tracers
were collected at the water-input area, near the LNPP pump station,where a significant quantity of détritus and silt is accumulated.Thèse are an appropriate substrata for radiocesium rétention. Thediet of the threespined sticklebacks from that site seems to containa marked share of suspended organic matter as well as hydrobiontsfeeding on détritus. Hence, the high 137Cs concentrations in this fishseems to owe their origin to diet.
Figure 7 demonstrates dynamics of 137Cs content in prey and preda-tory fish after Chernobyl accident in 1986-1999. The steady réduc¬
tion of 137Cs concentrations in Baltic herring, planktivore species,
and also in threespined stickleback, species with wide feeding spec¬
trum (predominantly - planktivore), correlated positively withdynamics of 137Cs content in the sea water. In contrast, most highconcentrations of 137Cs in predatory species, namely perch, wereregistered in 1987, a one year after the accident fallout. Then ,37Cs
concentrations in perch decreased only after 1991, after a longperiod of rétention.
Internai exposure doses for the populationfrom consumption of local fish
It is important to estimate the internai exposure doses for the humanpopulation from consumption of ,34- ,37Cs with local fish. A prelim-inary évaluation of internai exposure doses for the human popula¬tion, inhabiting the Sosnovy Bor Région, was made in 1998. Theconsumption of local fish contaminated with 134- 137Cs in consé¬
quence of the Chernobyl NPP accident now accounts for most of the
expected doses of internai exposure for the population living on the
southern coast of the Eastern Gulf of Finland. Thèse doses varyover the range from 0.16 |iSv from consumption of 1 kg of sea fishup to 20 ij.Sv from consumption 1 kg of freshwater predatory fish(averaged for freshwater fish 3.0 ^Sv), (ISTC Project, 1999).
The annual per capita fish consumption is proposed to be 5 kgaccording "The Methods of Calculation of Distribution ofRadioactive Substances from NPP and Exposure of the LocalPopulation" (Normative Technical Document, 1 984), but such a rate
seems to be an underestimate, especially for the sea coast areas.
However, calculations were made in accordance with the above
V. L Zimin, L D. Blinova Fishes as radionuclide bioindicators '37
cited guidelines; and taking into account this fish consumption rate,
the expected doses were evaluated as 0.8 (iSv from consumption ofsea fish or 15.0 |iSv from the freshwater fish.
According to "Sanitary régulations in the design and exploitation ofnuclear power plants (1993)" adopted in the Russian Fédération, theannual limit for population exposure to radioactive substances, orig¬
inated from ail kinds of water usage equals 50 (i.Sv. Thus the con¬
sumption of freshwater fish, caught in the contaminated waterbodies of the Koporskaya Bay drainage basin, may be consideredthe most significant radioactive source in the région.
BibliographyBlinova L. D., 1994St. Petersburg (Leningrad) NPP'srégion radioecological state estimation.ENC 94 International nuclearcongress-Atoms for Energy.Transactions., 2: 37-39.
Blinova L. D., 1996"Littoral ecosystem radioecologicalmonitoring in the région of atomicenergy enterprises". In: Protectionof the Natural Environment,Proceedings of InternationalSymposium on lonizing Radiation,Stockholm, 20-24 May 1996,2: 497-503.
Blinova L. D., Dushin V. N.,Golubeva L V., Michurina T. G., 1 998
"Radioecological Monitoring andRadiological Control in the Région ofSosnovy Bor Nuclear Facilities asBaltic Sea Région Safety Basis. -Radiation protection No1 10". In: Theradiological exposure of the populationof the European Community toradioactivity in the Baltic Sea, EUR19200, Proceedings of Marina BaltSeminar. Stockholm, Sweden,1998:365-372.
Blinova L. D., Dushin V. N.,Golubeva L. V., Michurina T. G., 1 999The development of environmentalprotection approaches in the régionof nuclear facilities at the Russiancoast of the Baltic Sea. In: Radiation.Environmental ProtectionApproaches for Nuclear Facilities.Proceedings of the Second Int.Symposium on lonizing, Canada,Ottawa, 1999, section 6.
Blinova L. D., Dushin V. N.,Zimina L. M., 2000Methodological approaches to theenvironmental protection in the areaof nuclear power plant on theRussian coast of the Baltic Sea. Irr.
Problems of development of atomicenergy in the Don Région. Materialsof science conférence. Rostov-on-Don, 29 February 1 March, 2000. 2:169-175.
ISTC Project, 1999"Ecological assessment of therégion, where radioactivitydangerous enterprises are located.North-west région of Russia". In:Methodological approaches to theorganization of ecological monitoring
38' Environmental Changes and Radioactive Tracers
system in the vicinity of nuclearfacilities. (1999) Final report,#535-97, 149 p.
Kasamatsu F., Ishikawa Y., 1997Natural variations of radionuclide137Cs concentration in marineorganisms with spécial référence tothe effect of food habits and trophielevel. Mar. Ecol. Progr. Ser., 160:109-120.
Kryshev 1. 1., (éd.), 1992Radiological conséquences ofthe Chernobyl accident. Moscow,Nuclear Society International: 142 p.
Marey A., Zykova A., (eds), 1980Methodical recommendations forsanitary monitoring of radioactivesubstances content in theenvironment Moscow.
Normative-Technical Document38.220.56-84, 1984Safety in Atomic Energy.General principles of NPP safety.The Methods of Calculationof Distribution of Radioactive
Substances from NPP and Exposureof the Local Population. Moscow,Energoatomizdat.
Radiation Safety Standards, 1996NRB-96, Hygienic standards GN2.6.1.054-96, Moscow, 127 p.
Régulations and Standardsin Atomic Energy, 1 993Sanitary régulations in the designand exploitation of nuclear powerplants. SP-AS-88/93, Moscow.
Rowan D. J., Rasmussen J. B., 1994Bioaccumulation of radiocesium byfish : the influence of physicochemicalfactors and trophie structure. Can.J. Fish. Aquat Sci., 51: 2388-2410.
Zimin V. L., Blinova L. D.,ZiminaL. M., 1997"Ecological monitoring in the vicinityof nuclear facilities for riskassessment and décision making".In: New risk frontiers. Proceedingsof the Annual meeting of the Societyfor Risk Analysis-Europe., 15-18June 1997, Stockholm, Sweden:746-754.
Oynthetic resultsin the radioactivityassessment of theRomanian Black Seasector after 1992
Vasile Patrascu
Alexandru S. Bologa
Elvira Cuingioglu
Introduction
A semi-enclosed tideless basin bordering six countries, the Black Sea
is still considered a "unicum hidrobiologicum" because of its physi¬
cal, chemical, and biological peculiarities; unlike any other sea, theBlack Sea is permanently déficient in oxygen, or anoxie below a
depth of 150-200 m (Bologa, 1994).
Major factors contributing to the détérioration ofthe Black Sea envi¬
ronment are pollution and improper use of natural resources (Osvathet al, 1998). The Black Sea is an unique marine environment, oneespecially exposed to anthropogenic impact. Almost landlocked,besides the link with the shallow inland Azov Sea, its only exchangeof water with the World Océan is through the narrow Bosporus Strait.
The Black Sea encloses the largest body of permanently anoxiewater in the world: some 90% ofthe sea's 5.37 x 10⁵ km3 total vol¬
ume is deprived of oxygen and rich in hydrogen sulphide. Only theremaining 150 m thick surface water layer is capable of supportingmarine life. The Black Sea drains a surface of land five time larger
40 T Environmental Changes and Radioactive Tracers
than its own area, shared by 17 countries and inhabited by over 160
milion people. Rivers, notably the Danube, Dnieper, Don, Kubanand Bug, bring in about 80% of the pollutants (50% from the
Danube alone). They include agrochemicals, poorly treated indus¬
trial liquid effluents, and domestic wastewater. Atmospheric trans¬
port, predominantly from Europe, and coastal sources, such as
direct industrial waste and sewage discharges or dump sites,
account for the remaining 20%. Riverine input of nutrients, heavymetals, radionuclides, organic compounds and oil is a severe prob¬
lem (Osvath et al, 1998).
As to radioactive contamination, différent IAEA programmesshowed that concentration of anthropogenic radionuclides in the
Black sea environment, although considerably higher than in otherparts of the World Océan, are such that no significant radiologicalconséquences can be expected for the public (Osvath et al, 1998).
Fallout from atmospheric weapon tests and from Chernobyl acci¬
dent provided excellent radiotracers for the Black Sea, such as ^Sr,I37Cs and plutonium isotopes (Osvath et al, 1998). The main inputoccurred through direct déposition on the sea surface. For stron-
tium-90, the Dnieper river became a significant source after the
nuclear accident.
Various radiotracers can be used to trace water mixing and circula¬
tion, as time markers to provide sédiment déposition chronologies,to provide information on fluxes of particles and particle-reactivepollutants, and in planktonic primary production estimâtes by 14C
(relevant to eutrophication).
The Black Sea's radioactivity levels hâve been the subject of rigor-ous research in the riparian countries and among organisations par-ticipating in various international océanographie cruises. After the
Chernobyl accident interest in radiological research of the BlackSea increased. Studies hâve included both radioactivity surveys on
abiotic and biotic compounds, and experiments on the biokinetics ofradionuclides in the marine environment.
For the Romanian Black Sea sector such work has carried particu¬
lar importance. The need for monitoring radioactivity level's is
mainly explained by the continuing existence of fallout, by the
Danube river's présence and by the use of nuclear energy in elec-
V. Patrascu et al. Radioactivity of the Romanian Black Sea after 1992 T 41
tricity génération (Bologa, 1994). The Danube continues to be themain collector of radioactive wastes from seven riparian countriesbefore flowing into the Black Sea; this important river flow (80% ofthe total input of fresh water to the sea) contributes to radiocontam-ination of the marine ecosystem as well. The utilization of nuclearenergy, following the completion of the CANDU nuclear powerplant at Cernavoda/Romania will require environmental monitoringincluding the marine areas.
Studies of radioactivity in environmental components in theRomanian marine sector date back in 1962. Beginning in 1976, the
Romanian Marine Research Institute (RMRI, later NationalInstitute for Marine Research and Development "Grigore Antipa"- NIMRD) initiated the country's systematic study of marineradioactivity using a network of permanent stations located betweenthe Danube mouths, the southern extremity of the Romanian lit¬toral, and occasionally offshore up to 90 nautical miles (Bologaet al., 1994; 1995). The monitoring programme has resulted in a
fairly extensive database covering the last 20 years.
The monitoring is being done for a number of reasons. One objec¬
tive was to define the levels of radioactivity in the marine environ¬ment as a baseline before the new NPP started operating. Anotherobjective was the identification of bioindicators for studying radio-contamination of the marine ecosystem, and experimentally deter¬
mining possible levels of accumulation of critical radionuclides inmarine biota and biological Systems having direct or indirect influ¬ences on the environment and human health.
The main research tasks hâve included completion of the database
on marine radioactive levels. Data hâve been also used for studiesof distribution coefficients (Kds) for marine sédiments and seawa-
ter and of concentration factors (CFs) for relevant local species.
Assessment of external and internai individual and collective doses
from marine radioactivity due to immersion in seawater and/or sea
food consumption is also being made (Patrascu and Bologa, 1990).
Several applications of use of radiotracers in marine research werepromoted by RMRI/NIMRD, in co-operation, since 1970: détermi¬nation of sédiment transport in the nearshore area, détermination ofthe turbulent diffusion coefficients, estimation of planktonic pri¬
mary production.
42 Environmental Changes and Radioactive Tracers
1 Material and method
A network of stations including the whole area between the Danubemouths (Sulina) and the southem limit (Mangalia), from the shore-
line to 90 n.m. offshore has been used for radioactivity monitoringin the Romanian Black Sea sector.
Samples of sédiments, seawater, and biota (macrophytes, molluscs,benthic and pelagic fish hâve been continuously collected, at
monthly, quarterly, and semi-annual intervais, using common meth¬
ods on board (R/V "Steaua de mare"). The material has been pre¬
pared for measurement in the laboratory. The sédiment samples
were dry, the water samples were dried by evaporation underinfrared lamp, and the organic samples were dried and then ashed,
ail those opérations being followed by weighing.
Beta and gamma measurements hâve been used in accordance withinternational methodology. The method of radiochemical séparationin the présence of carriers was used for '"Sr measurements; the beta
activity of its daughter '"Y was measured after it had been kept at
least for 21 days reaching 90Sr - 90Y equilibrium (Cuingioglu et al,1996; 1997). Total beta counts can be an indicator to sélect samples
for radiochemical and gamma investigations.
Nuclear techniques used for beta measurements hâve been two instru¬
ment lines with plastic detectors: NE102Aand ND304. Gamma spec-
trometry analyses were carried out on HPGe Pop Top ORTEC (12%eff, 1.85 keV resolution at 1332 keV), ORTEC-NORLAND 5500multichannel analyzer and NIM associated electronics.
The standards used for calibration are volume sources (l37Cs, 152Eu,
KC1) produced at the Atomic Physics Institute in Bucharest. Themeasuring times are usually between 40,000-100,000 s for gammaand between 1 ,000-6,000 s for beta measurements.
The measuring geometry is cylindrical with F 80x35 mm - gammaand F 50x5 mm for beta ('"Sr is measured on cellulose filter)
Gamma spectrometry was used for analysing emerged and sub-
merged sédiments, seawater, macroalgae, invertebrates and fish ofmarine origin (Bologa et al, 1991).
V. Patrascu et al. Radioactivity of the Romanian Black Sea after 1992 T 43
For ail seawater samples, some physico-chemical parameters such
as température, salinity, pH, and 02 concentration were also mea¬
sured. Gross beta activity, gamma radioactivity of sédiments, sea¬
water and biota hâve been determined.
Results and discussion
Previous studies revealed significant radionuclide CFs for the ura¬
nium-radium and thorium séries in some seaweeds. They furtherfound fission product concentration (originating from earlier atmo¬
spheric nuclear tests and post-Chernobyl environmental contamina¬tion) in différent living and non-living marine components. Giventheir importance, spécial attention was paid to caesium-134 and
137, strontium-90 and plutonium isotopes, for which internationalorganizations established maximum permissible limits for foodproducts. Romanian studies thus particularly focused on Computingthe concentration of caesium-137 and strontium-90 for sédimentand seawater in the pre-Danubian sector of the Black Sea.
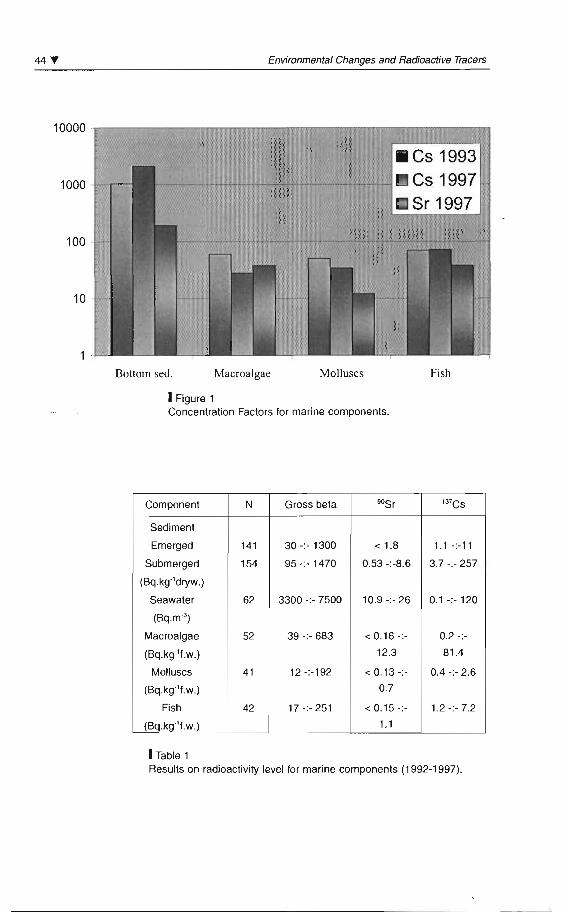
The highest content of artificial gamma emitters was noticed in 1 986,followed by its subséquent decrease in ail components, exceptingsubmerged sédiments that are a sink for the isotopes. EnvironmentalCFs for caesium-137 and strontium-90 in différent Black Sea biotawere also estimated (Figure 1). The radiométrie investigations ofthecoastal marine ecosystem showed the présence of the long-Iivedanthropogenic radionuclides '"Sr and 137Cs (Table 1).
Significant 90Sr activities (0.53-8.6 Bq.kgdry weight (d.w.)) werefound in the submerged sédiments collected from seven profilesbetween the northern and southern limits of the Romanian littoral(Table 1). The maximum values were recorded at the pre-Danubianzone, in good generally corrélation with quality and origin of thesédiments. For 1998 the 90Sr level ranged from 2.1 to 7.8 Bq.kg-'d.w. in 1999 from 3.1 to 8.3 Bq.kg"1 d.w. Emerged sédiments wereunder lower limit of détection (<1.8 Bq.kg-1 d.w.), emphasizingsmall influence of the aquatic environment and their processes.
44 ... Environmental Changes and Radioactive Tracers
Bonom sed. Macroalgae Molluscs Fish
1Figure 1Concenlration Factors for marine componenls.
Component N Gross beta 90Sr 137Cs
Sediment
Emerged 141 30 -:- 1300 < 1.8 1.1 -:-11
Submerged 154 95 -:. 1470 0.53 -:-8.6 3.7 -:- 257
(Bq.kqdryw.)
Seawater 62 3300 -;- 7500 10.9 -;- 26 0.1-;-120
(Bq.m'3)
Macroalgae 52 39 -:- 683 < 0.16 -;- 0.2 -;-
(Bq.kg"f.w.) 12.3 81.4
Molluscs 41 12 -;-192 < 0.13 -;- 0.4 -;- 2.6
(Bq.kg·'f.w.) 0.7
Fish 42 17 -;- 251 < 0.15 -;- 1.2·;·7.2
(Bq.kg·'f.w .) 1.1
1Table 1Results on radioactivity level for marine components (1992-1997).
V. Patrascu et al. Radioactivity of the Romanian Black Sea after 1992 T 45
In surface seawater, wSr récent content varied over a very narrowrange, 19.2-21.8 Bq.nr3 in 1997 and 18.6-21.6 Bq.nv3 in 1998.
The green and red macrophytes had a ^Sr content of 0.3-1.9 Bq.kg"1
fresh weight (f.w.).
Molluscs low values had 0.17±0.09 Bq.kg-1 f.w in 1998 and
0.25±0.12 Bq.kg1 f.w. in 1999. The récent measurement of 90Sr in themost frequently collected benthic fish species resulted in significantvalues of 0.4-1 Bq.kg"1 f.w. in 1998, and 0.5-1.1 Bq.kg"1 f.w. in 1999.
In ail samples caesium-137 persisted after 1986; thus it was possi¬
ble to track the temporal changes in concentrations of caesium-137(Patrascu, 1996; 1997).
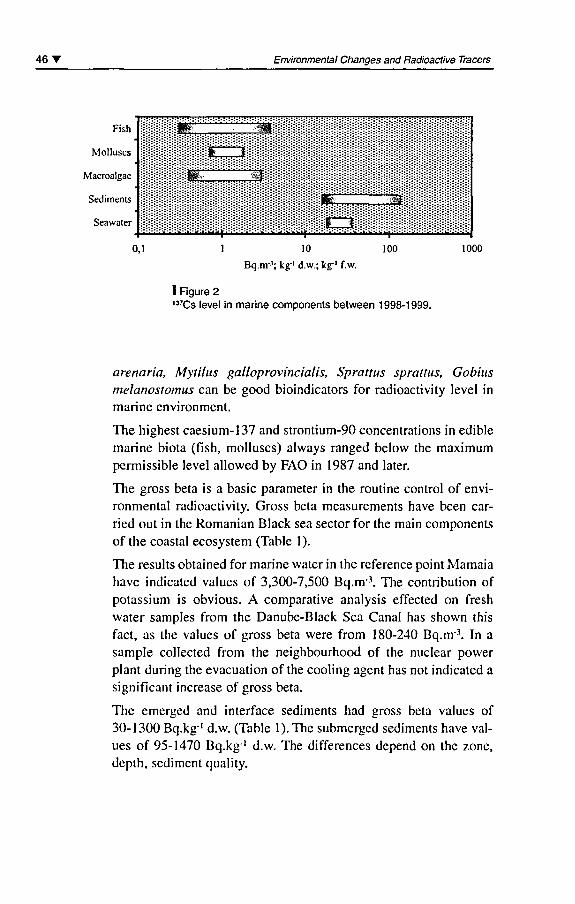
The numerous investigations carried out on environmental pollutionindicated 137Cs concentrations of 3.7-257 Bq.kg"1 d.w. in submergedsédiments from the Romanian Black Sea sector until 1997. Afterthis year, the range has been, 2 1-1 39 Bq.kg"1 d.w. for 1998 and
16-88 Bq.kg"1 d.w. in 1999 (Figure 2). The maximum value was
found off the Danube mouths. The local variations are remarkableand correlate with the hydrodynamic conditions and sédiment qual¬
ity, a fact which could explain the minimum value found in a
nearshore area. The observations were extended along the entirecoast in bottom sédiments up to 70 m depth, resulting in radionu¬clide concentrations of up to 249 Bq.kg1 d.w.; the maximum valuefound at a depth of about 50 m indicated that other marine processes
or phenomena may hâve been involved (e.g. sédiment transport).
The most récent analyses carried out on the emerged sédimentsshowed concentrations between 3.7-6 Bq.kg"1 d.w. (in 1998).
The relatively slow decrease of caesium-137 concentrations in séd¬
iment compared to seawater confirmed the ability of sédiments toconcentrate radionuclides.
The détermination of 137Cs concentrations in a référence seawatersamples (Constanta, offshore and Odessa offshore) showed a levelbetween 18-36 Bq.nr3 (Figure 2).
Marine biota had low caesium-137 concentrations of only a fewBq.kg-1 f.w. The macrophytes had a radionuclide average content of1.4+0.8 Bq.kg"1 f.w, the molluscs of 1 .3+0.3 and the fish of 2.4±0.7Bq.kg"1 f.w. (in 1998). Bryopsis plumosa, Ceramium rubrum, Mya
46 T Environmental Changes and Radioactive Tracers
Fish
Molluscs
Macroalgae
Sédiments
Seawater
Hrî
*...Éf,
n
3y^
lift:,,. -M
m0,1 1 10 100 1000
Bq.nr3; kg"1 d.w.; kg"1 f.w.
I Figure 2137Cs level in marine components between 1998-1999.
arenaria, Mytilus galloprovincialis, Sprattus sprattus, Gobiusmelanostomus can be good bioindicators for radioactivity level inmarine environment.
The highest caesium-137 and strontium-90 concentrations in ediblemarine biota (fish, molluscs) always ranged below the maximumpermissible level allowed by FAO in 1987 and later.
The gross beta is a basic parameter in the routine control of envi¬
ronmental radioactivity. Gross beta measurements hâve been car¬
ried out in the Romanian Black sea sector for the main components
of the coastal ecosystem (Table 1 ).
The results obtained for marine water in the référence point Mamaiahâve indicated values of 3,300-7,500 Bq.nr3. The contribution ofpotassium is obvious. A comparative analysis effected on fresh
water samples from the Danube-Black Sea Canal has shown thisfact, as the values of gross beta were from 180-240 Bq.nr3. In a
sample collected from the neighbourhood of the nuclear powerplant during the évacuation ofthe cooling agent has not indicated a
significant increase of gross beta.
The emerged and interface sédiments had gross beta values of30- 1 300 Bq.kg"1 d.w. (Table 1 ). The submerged sédiments hâve val¬
ues of 95-1470 Bq.kg"1 d.w. The différences dépend on the zone,
depth, sédiment quality.
V. Patrascu étal. Radioactivity of the Romanian Black Sea after 1992 T 47
The fish has a mean value of 100 Bq.kg"1 f.w., an intermediate valuebetween minimum for molluscs (25 Bq.kg1 f.w.) and maximum foralgae (146 Bq.kg"1 f.w.)
The continued monitoring of marine radioactivity is necessaryeither for avoiding of any nuclear risk and for comparative radio¬
métrie studies in the coastal zone (Patrascu and Bologa, 1990;
Bolosa and Patrascu, 1998; Bologa et al, 1998b).The knowledgeand conservation of the environmental factor quality can be sup¬
ported only by concrète results.
Romanian monitoring data of the annual concentrations of gammaemitting radionuclides were used in the IAEA and national data bases.
Conclusions
Several main conclusions resulted from this monitoring in theRomanian Black Sea Sector:
- the radioactivity monitoring in the Romanian marine sector has
enabled the establishement of référence values for ail catégories ofmarine components;
- the Danube River mouths produce an additional impact zoneowing to the Danube contribution;
- the abiotic and biotic components significantly concentrate artifi¬cial radionuclides in relation to the environmental concentrations;
- there is a remarkable concentration of caesium-137 in the sub¬
merged sédiments, as a conséquence of récent human activitiesdealing with nuclear material;
- the maximum concentration of 137Cs and 90Sr in edible marinebiota (i.e. fish and molluscs) were always below "action level" orhighest permissible limits enforced by FAO;
- background références on the présent marine environmental con¬
tamination are required for the characterization of the impact offuture nuclear activities near the Romanian coast (Cernavoda NPP,
Danube-Black Sea Canal, Constanta-Agigea harbour).
48' Environmental Changes and Radioactive Tracers
BibliographyBologa A. S., 1994Radioecological research of theBlack Sea: Report from Romania.IAEA Bulletin., 2: 36-38.
Bologa A. S., Osvath L,Patrascu V., 1994"Monitoring of marine water, sédimentand biota radioactivity in samplesfrom the Romanian sector of theBlack Sea by means of gammaspectrometry". In Povinec P. P., (éd.):Sources of Radioactivity in the MarineEnvironment and their RelativeContribution to Overall DoseAssessment from MarineRadioactivity (MARDOS). IAEA-MEL-R2/94, June.
Bologa A. S., Osvath I.,DovleteC, 1995137Cs moniloring in the Romaniansector of the Black Sea. Rapp.Comm. Int Mer. Médit, 34: 224.
Bologa A. S., Patrascu V., 1998"Radioactivity in the Romanian BlackSea sector one décade afterChernobyl". Irr. One Décade afterChernobyl: Summing up theConséquences of the Accident,IAEA-TECDOC-964., 2, Vienna,469-475.
Bologa A. S., Patrascu V.,Cuingioglu E., 1998aDistribution of total beta radioactivity,"oSr and ,37Cs content in theRomanian and NW Black Sea coast.
Rapp. Comm. Int. Mer. Médit,35(1): 234-235.
Bologa A. S., Apas M., Cociasu A.,Cuingioglu E., Patrascu V.,
Pecheanu I., Piescu V.,
PopaL, 1998bPrésent level of contaminants in theRomanian Black Sea Sector. IAEA-TECDOC-1 094., Vienna, 58-63.
Cuingioglu E., Bologa A.,Balaban D., Dobrescu E.,Patrascu V., 1996/1997Distribution of total beta radioactivityand '"Sr in the Romanian Black Seasector between 1994-1995. Cercetarimarine - Recherches marines.,29-30: 23-35.
Osvath I., Samiei M., Carvalho F.,
Villeneuve J. P., 1998Sustaining development in the Blacksea région: A sea of changing for¬
tunes. IAEA Bulletin., 40 (3): 31-36.
Patrascu V., 1996/1997Évolution post-Chernobylde la concentration du '37Csdans le sédiments du littoral roumainde la mer Noire. Cercetari marineRecherches marines., 29-30: 37-61.
Patrascu V., Bologa A. S., 1990Evolution actuelle concernantl'irradiation humaine par certainescomposantes marines. Cercetarimarine - Recherches marines.,23: 165-170
impact ofthe humanactivities on cetaceansin the South West PacificOcéan by measuring137Cs, 40K and 210Pb
Claire Garrigue
Jean-Michel Fernandez
Christian Badie
Christian Bernard
Jacqui Greaves
Jacques Rivaton
Marc Trescinski
1û Introduction
Radionuclides occur naturally in the environment but recently someartificial radionuclides hâve been introduced. One of the mostwidespread is the I37Cs isotope. Its major sources corne from theatmospheric déposition of débris from atmospheric nuclear explo¬sions that occurred in the 50 and 60's and in the northern hémi¬sphère from nuclear accidents in particular Tchernobyl powerstation accident that took place in 1986.
The analyses of long-lived artificial radionuclide 137Cs is used as an
indicator of radioactive pollution in the marine environment. Alongtime after the nuclear weapons test were stopped, this radionuclidecan be traced in tissues of living organisms.
50 Environmental Changes and Radioactive Tracers
Many data are available on 137Cs concentrations in pelagic fish, espe¬
cially tuna species (Suzuki et al, 1973; Young et al, 1975). Somemeasurements were realized on marine invertebrates (Kasamatsu and
Ishiwaka, 1997) but little information is available on marine mam¬
mals. Osterberg (1964) and Samuel et al. (1970) gave concentrationson mysticetes and Calmet et al. (1992) Berrow et al. (1998) and
Kasatmatsu et al. (1999) did measurements on odoncetes. The diet ofthèse two groupes of marine mammals corne from différent trophielevel. Most of the mysticetes feed on plankton whereas the odonto-cetes or toothed cetacea feed on fish, squid and shrimps.
Recently some studies (Kasatmatsu and Ishiwara, 1997; Watsonet al, 1999) examined the mechanisms of transmission of the
radionuclides in the marine community showing that in fish the137Cs concentration increased with rising trophie level and that thebiomagnification factor (Cs predator/ Cs prey) equals 2.0.
In marine mammals the bioconcentration is thought to be high.Measurements of radionuclides are necessary on the mammals fromthe top of the food chain in order to quantify this bioconcentration.
This paper will présent results of data analysis of 137Cs, 40K and
210Pb realized on four cetaceans stranded in 1997 on the coast ofNew Caledonia marine mammals.
Materials and methods
New Caledonia is situated in the South West of the Pacific Océan
between 18° and 23° latitude South and 158° to 170° longitude East.
In 1997, four marine mammals stranded on the coast of the island:two pilot whales (Globicephala macrorhynchus) and two pygmysperm whales (Kogia breviceps). The conditions of the cadavers var¬
ied from fresh to good for stranded animais dead for a few days priorto sampling. During post-mortem examination, morphological data
were noted and stomach contents were collected for diet analyses.
Skin samples were taken for genetic analyses and teeth wereextracted to détermine the âge by counting the growth layer groups(GLG) (Lockyer, 1995). Then carcasses were dissected and samples
C. Garrigue ef al. '37Cs on cetaceans in the south west Pacific océan T 51
of muscle, blubber and liver were taken in order to measure the con¬
centrations of heavy metals and radionuclides 137Cs, 40K and 210Pb.
Thèse tissues were weighted to get the wet weight. They were thenfreeze-dried and finely grounded. Direct measurements of 137Cs, 40K
and 2l0Pb were carried out by gamma spectrometry on the respec¬
tively energy rays, 0.661 MeV 1.460 MeV and 0.046 MeV. Thecounting time ranged between 50,000 and 80,000 seconds.
Concentrations were expressed in Bq.kg"1 wet weight and the Cs
concentration factor (CFs) was defined as the ratio concentration inthe animal on the concentration in the sea water. As the sea waterconcentration hasn't been measured around New Caledonia, thevalue of 1.3 mBq.l"1 recommended for the SW Pacific by IAEAtechnical document (1995) was used to calculate the CFs.
Results
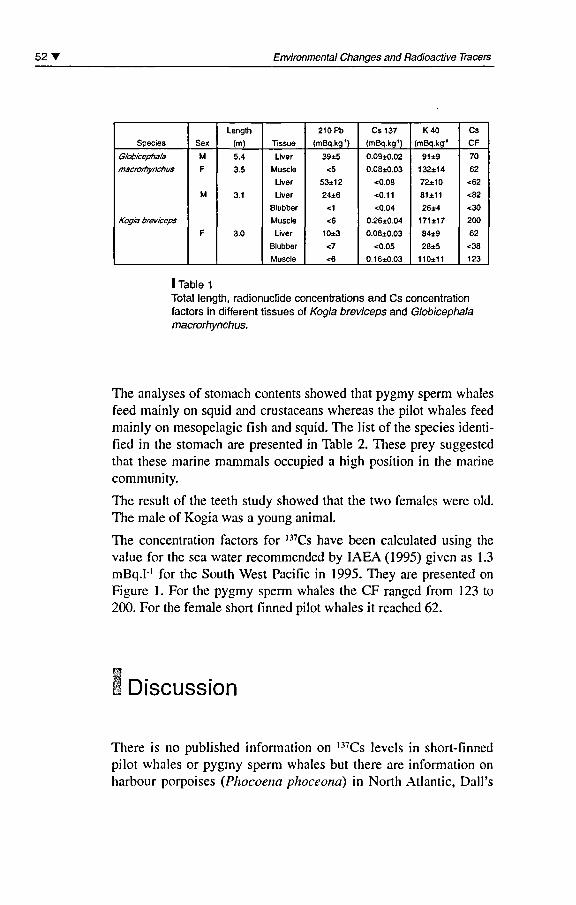
The total length of each animal, its sex, the concentrations of 137Cs,
40K and 210Pb and the Cs concentration factors (CFs), are presentedin Table 1 for the différent tissues of the two marine mammalsspecies sampled.
The 40K concentrations were greater than the 137Cs concentration inthe four animais sampled. For the pygmy sperm whales the concen¬
tration of 137Cs were higher in the muscle than in the liver than in the
blubber. Ali the measurements done in the blubber were at the détec¬
tion limits. The 40K concentrations followed the same pattern. For theshort-finned pilot whales the concentrations of 137Cs measured in the
liver of the two individuals were in the same order of magnitude than
those measured in the pygmy sperm whales. Concerning the femaleit is interesting to note that the concentration found in its muscle was
equal to the value measured in its liver whereas for the 40K the con¬
centration was higher in the muscle than in the liver.
The concentrations of 2l0Pb measured in the muscles and the blubberwere very small compared to those found in the liver. In ail the mea¬
surements, the highest concentrations of 2l0Pb appear in the liver.
52' Environmental Changes and Radioactive Tracers
Species
Globicephala
macroifiynchus
Kogia breviceps
Sex
M
F
M
F
Length
(m)
5.4
3.5
3.1
3.0
Tissue
Liver
Muscle
Lhrer
Liver
Blubber
Muscle
Liver
Blubber
Muscle
210Pb
(mBq.kg*)
39±5
<5
53±12
24±6
<1
<6
10±3
<7
<6
Cs137(mBq.kg')
O.09±0.02
O.08±0.03
<0.08
«0.11
<0.04
0.26*0.04
0.08±0.03
<0.05
0.16±0.03
K40(mBq.kg'
91±9
132±14
72±10
81 ±11
26±4
171±17
84±9
28±5
110±11
Cs
CF
70
62
<62
<82
<30
200
62
<38
123
I Table 1
Total length, radionuclide concentrations and Cs concentrationfactors in différent tissues of Kogia breviceps and Globicephalamacrorhynchus.
The analyses of stomach contents showed that pygmy sperm whalesfeed mainly on squid and crustaceans whereas the pilot whales feed
mainly on mesopelagic fish and squid. The list of the species identi¬
fied in the stomach are presented in Table 2. Thèse prey suggested
that thèse marine mammals occupied a high position in the marinecommunity.
The resuit of the teeth study showed that the two females were old.The maie of Kogia was a young animal.
The concentration factors for 137Cs hâve been calculated using the
value for the sea water recommended by IAEA (1995) given as 1.3
mBq.I"1 for the South West Pacific in 1995. They are presented on
Figure 1. For the pygmy sperm whales the CF ranged from 123 to
200. For the female short finned pilot whales it reached 62.
Discussion
There is no published information on 137Cs levels in short-finnedpilot whales or pygmy sperm whales but there are information on
harbour porpoises (Phocoena phoceona) in North Atlantic, DalPs
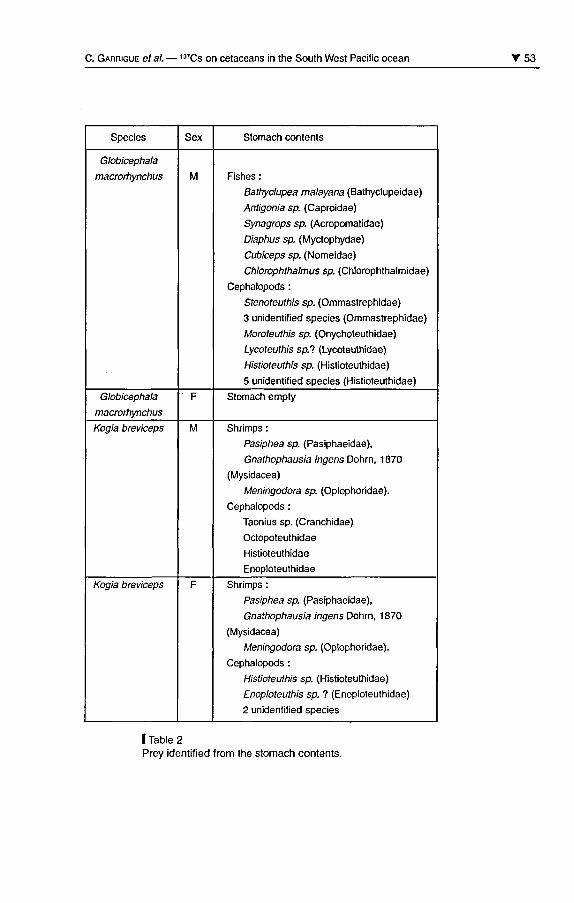
C. Garrigue étal. 137Cs on cetaceans in the South West Pacific océan 53
Species
Globicephala
macrorhynchus
Globicephala
macrorhynchus
Kogia breviceps
Kogia breviceps
Sex
M
F
M
F
Stomach contents
Fishes :
Bathyclupea malayana (Bathyclupeidae)
Antigonia sp. (Caproidae)
Synagrops sp. (Acropomatidae)
Diaphus sp. (Myctophydae)
Cubiceps sp. (Nomeidae)
Chlorophthalmus sp. (Chlorophthalmidae)
Cephalopods :
Stenoteuthis sp. (Ommastrephidae)
3 unidentified species (Ommastrephidae)
Moroteuthis sp. (Onychoteuthidae)
Lycoteuthis sp.? (Lycoteuthidae)
Histioteuthis sp. (Histioteuthidae)
5 unidentified species (Histioteuthidae)
Stomach empty
Shrimps :
Pasiphea sp. (Pasiphaeidae),
Gnathophausia ingens Dohrn, 1 870
(Mysidacea)
Meningodora sp. (Oplophoridae).
Cephalopods :
Taonius sp. (Cranchidae)
Octopoteuthidae
Histioteuthidae
Enoploteuthidae
Shrimps :
Pasiphea sp. (Pasiphaeidae),
Gnathophausia ingens Dohrn, 1870
(Mysidacea)
Meningodora sp. (Oplophoridae).
Cephalopods :
Histioteuthis sp. (Histioteuthidae)
Enoploteuthis sp. ? (Enoploteuthidae)
2 unidentified species
I Table 2Prey identified from the stomach contents.
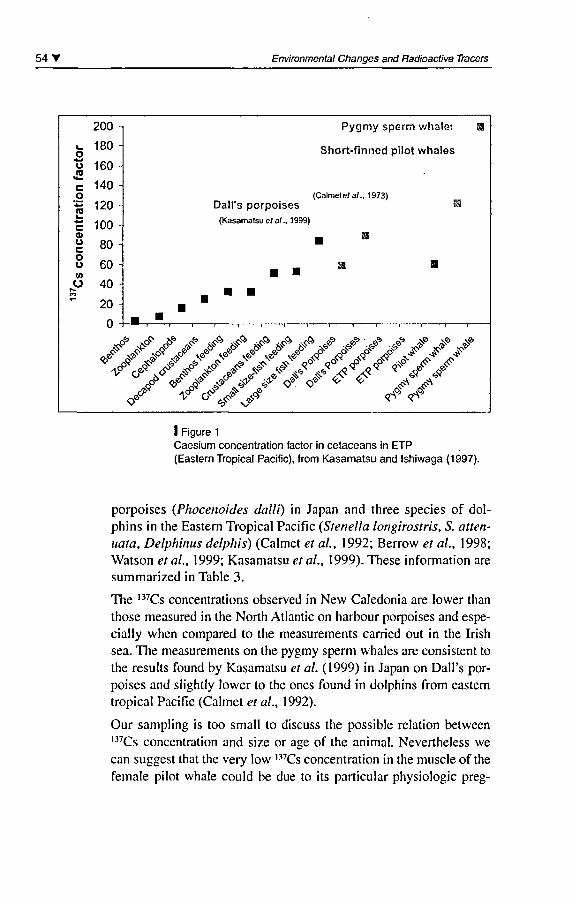
54' Environmental Changes and Radioactive Tracers
u.8co+3m
4-*C0)UCouwo
200
180
160
140
120
100
80
60 -|
40
20 H
Dall's porpoises(Kasamatsu et al ., 1 999)
Pygmy sperm whate:
Short-finned pilot whales
(Calmetefa/.. 1973)
^ S <& ,.<ôr &> &* &$> ,.<& <f ~*V
J1 ^<^>° <f<?
I Figure 1
Caesium concentration factor in cetaceans in ETP(Eastern Tropical Pacific), from Kasamatsu and Ishiwaga (1997).
porpoises (Phocenoides dalli) in Japan and three species of dol-phins in the Eastern Tropical Pacific (Stenella longirostris, S. atten-uata, Delphinus delphis) (Calmet et al, 1992; Berrow et al., 1998;
Watson et al, 1999; Kasamatsu et al., 1999). Thèse information are
summarized in Table 3.
The 137Cs concentrations observed in New Caledonia are lower than
those measured in the North Atlantic on harbour porpoises and espe¬
cially when compared to the measurements carried out in the Irishsea. The measurements on the pygmy sperm whales are consistent tothe results found by Kasamatsu et al. (1999) in Japan on Dall's por¬
poises and slightly lower to the ones found in dolphins from eastemtropical Pacific (Calmet et al., 1992).
Our sampling is too small to discuss the possible relation between
137Cs concentration and size or âge of the animal. Nevertheless wecan suggest that the very low 137Cs concentration in the muscle ofthefemale pilot whale could be due to its particular physiologie preg-
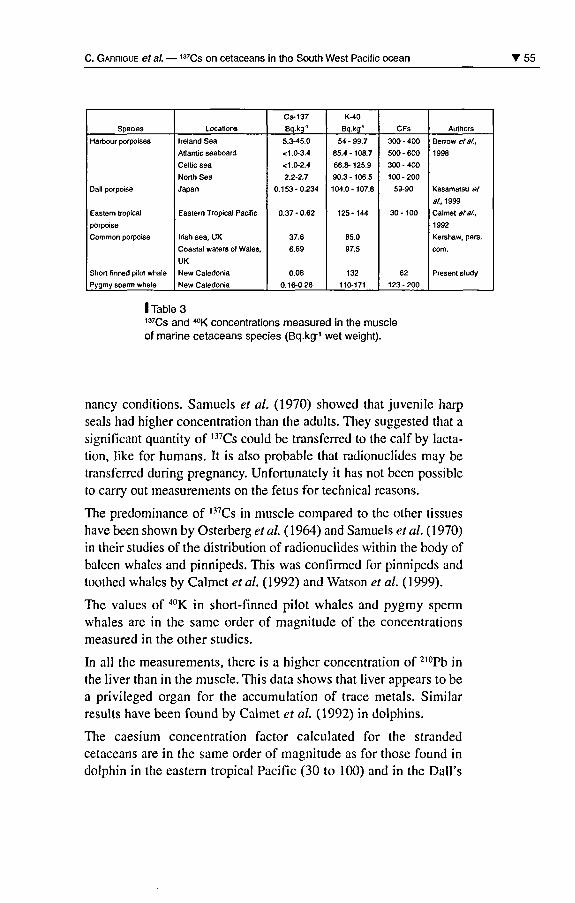
C. Garrigue et al. 137Cs on cetaceans in the South West Pacific océan '55
Species
Harbour porpoises
Dali porpoise
Eastem tropical
porpoise
Common porpoise
Short finned pilot whale
Pygmy sperm whale
Locations
Ireland Sea
Atlantic seaboard
Celtic sea
North Sea
Japan
Eastem Tropical Pacific
Irish sea, UK
Coastal waters ol Wales,
UK
New Caledonia
New Caledonia
Cs-137
Bq.kg''
5.3-45.0
<1.0-3.4
<1.0-2.4
2.2-2.7
0.153-0.234
0.37 - 0.62
37.6
6.69
0.08
0.16-0.26
K-40
Bq.kg-'
54 - 99.7
85.4 - 108.7
66.8- 125.9
90.3-106.5
104.0-107.8
125-144
85.0
97.5
132
110-171
CFs
300-400
500-600
300-400
100-200
59-90
30-100
62
123-200
Authors
Berrow étal..
1998
Kasamatsu et
al, 1999
Calmet étal..
1992
Kershaw, pers.
com.
Présent study
I Table 3,37Cs and 40K concentrations measured in the muscleof marine cetaceans species (Bq.kg-1 wet weight).
nancy conditions. Samuels et al. (1970) showed that juvénile harpseals had higher concentration than the adults. They suggested that a
significant quantity of 137Cs could be transferred to the calf by lacta¬
tion, like for humans. It is also probable that radionuclides may be
transferred during pregnancy. Unfortunately it has not been possibleto carry out measurements on the fétus for technical reasons.
The prédominance of 137Cs in muscle compared to the other tissues
hâve been shown by Osterberg et al. ( 1 964) and Samuels et al. ( 1 970)in their studies ofthe distribution of radionuclides within the body ofbaleen whales and pinnipeds. This was confirmed for pinnipeds and
toothed whales by Calmet et al. (1992) and Watson et al. (1999).
The values of 40K in short-finned pilot whales and pygmy sperm
whales are in the same order of magnitude of the concentrationsmeasured in the other studies.
In ail the measurements, there is a higher concentration of 210Pb inthe liver than in the muscle. This data shows that liver appears to be
a privileged organ for the accumulation of trace metals. Similarresults hâve been found by Calmet et al. (1992) in dolphins.
The caesium concentration factor calculated for the strandedcetaceans are in the same order of magnitude as for those found indolphin in the eastern tropical Pacific (30 to 100) and in the Dall's
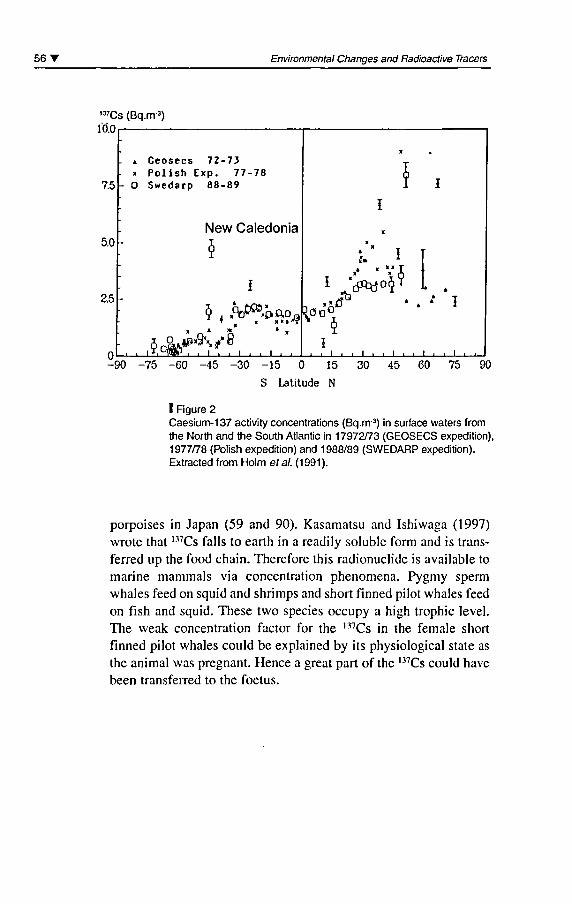
56 T Environmental Changes and Radioactive Tracers
137Cs (Bq.nr3)IU.U
7.5
5.0
2.5
n
. 4 Geosecs 72-73x Polish Exp. 77-78
- 0 Swedarp 88-89
New Caledonia
ï
, , ti,u(MP . , i . , i , . t , ,
X
II
X
' «
i
-90 -75 -60 -45 -30 -15 0 15 30 45 60 75 90
S Latitude N
I Figure 2Caesium-137 activity concentrations (Bq.nr3) in surface waters fromthe North and the South Atlantic in 17972/73 (GEOSECS expédition),1977/78 (Polish expédition) and 1988/89 (SWEDARP expédition).Extracted from Holm et al. (1991).
porpoises in Japan (59 and 90). Kasamatsu and Ishiwaga (1997)wrote that 137Cs falls to earth in a readily soluble form and is trans¬
ferred up the food chain. Therefore this radionuclide is available to
marine mammals via concentration phenomena. Pygmy sperm
whales feed on squid and shrimps and short finned pilot whales feed
on fish and squid. Thèse two species occupy a high trophie level.The weak concentration factor for the 137Cs in the female shortfinned pilot whales could be explained by its physiological state as
the animal was pregnant. Hence a great part of the 137Cs could hâvebeen transferred to the foetus.
C. Garrigue et al. 137Cs on cetaceans in the South West Pacific océan 57
Conclusions
The 137Cs concentrations measured in the four stranded marine mam¬
mals are low compared to the measurements realised elsewhere. Wecould hypothesis that this is due to the variation of the radioactivityconcentrations in différent parts of the océan, reflecting latitudinalimpacts (Young et al, 1975) as shown on the Figure 2 (Holm et al,1 99 1 ) due to the différence in the nuclear past between the two hémi¬sphères (lower fallout in the southern hémisphère than in the north¬ern hémisphère).
AcknowledgementsWe would like to thank Dr Crosnier from MNHM for his helpin the détermination of the shrimps and Dr R. Young from the
University of Hawaii for his help in the détermination of cephalopods.
BibliographyBerrow S. D., Long S. C,McGarry A. T., Pollard D.,
Rogan E., Lockyer C, 1998Radionuclides (137Cs and ""K)in harbour porpoises Phocoenaphocoena) from Bristish and Irishcoastal waters. Marine PollutionBulletin, 36 (8): 569-576.
Calmet D., Woodhead D.,
André J. M., 19922ioPb> i37Cs and 4oK in three Specjes
of porpoises caught in the EasternTropical Pacific. J. Environ.Radioactivity, 15: 153-169.
Holm E., Roos P., Persson R. B. R.,Bojanowski R., Aarkrog A.,Nielsen S. P., Livingston H. D., 1991
"Radiocaesium and plutonium inAtlantic surface waters from 73°Nto 72°S". In Kersahw P.J., WoodheadD.S. (eds): Radionuclides in thestudy of marine process.Amsterdam, Elsevier: 3-11.
Kasamatsu F., Kawabe K., Inatomi N.,Murayama T., 1999A note on radionuclide ,37Cs and """K
concentrations in Dall'sporpoises, Phocoenoides dalli,in coastal waters of Japan.J. Cetacean Res. Manage.,1 (3): 275-278.
Kasamatsu F., IshiwakaY., 1997Natural variation of radionuclide137Cs concentration in marine
58 Environmental Changes and Radioactive Tracers
organisms with spécial référenceto effect of food habits and trophielevel. Mar. Ecol. Prog. Ser.,160:109-120.
LockyerC, 1995A review of factors involvedin zonation in environmental factorsand major life events on harbourporpoise tooth structure. Rep. Int.Whaling Commission Social Issue,16:511-529.
Osterberg C, Pearcy W.,KujalaN., 1964Gamma emitters in a Fin Whale.Nature, 204:1006-1007.
Samuels E. R., Cawthorn M.,Lauer B. H., Baker B. E., 1970Strontium-90 and Caesium-137levels in tissues of fin whale
(Balaenoptera physalus) and harpseal (Pagophilus groenlandicus).Can. J. Zool., 48: 267-269.
Suzuki Y., Nakamura R.,UedaT., 1973Caesium-137 contamination ofmarine fishes from the coasts ofJapan. J. Radiât. Res., 14: 382-391.
Young D. R., Folsom T. R.,HodgeV. F., 1975137Cs and ""K in the flesh of PacificAlbacore. 1964-1974. HealthPhysics, 29: 689-694.
Watson W. S., Sumner D. J.,Baker J. R., Kennedy S., Reid R.,Robinson I., 1999Radionuclides in seals and porpoisesin the coastal waters around the UK.The Sci, Tôt Environ., 234: 1-13.
O radiolabelling:a sensitive tool for studyingPCB bioaccumulationin echinoderms
Bruno Danis
Olivier Cotret
Jean-Louis Teyssie
Paco Bustamante
Scott W. Fowler
Michel Warnau
Polychlorinated biphenyls (PCBs) are strictly anthropogenic Chem¬
icals that constitute one of the most problematic and widespreadgroup of marine contaminants. Thèse xenobiotics (represented by209 congeners) are extremely résistant to any kind of dégradation,are bioconcentrated by living organisms, and can cause variousadverse effects depending on their pattern and degree of chlorinesubstitution (e.g., Harding & Addison, 1986; Livingstone, 1992;Metcalfe, 1994).
Being under the influence of heavy industrialisation and importanturbanization, the North Sea is generally considered as a régionhighly contaminated by numerous contaminants, including PCBs.Therefore, there is a constant need to survey and monitor the qual¬
ity status ofthe marine environment in the North Sea. This is par¬
ticularly true for the benthic ecosystems since, due to their very lowsolubility, PCBs mainly accumulate in the sédiments where theymay become a threat to organisms and ecosystems. However, infor¬mation on PCB bioaccumulation rates in marine benthic organisms
60 Environmental Changes and Radioactive Tracers
is scarce and is generally of Iimited value, since data are mainlyderived from studies using sédiments experimentally contaminatedwith high (unrealistic) PCB concentrations (Meador et al, 1995;
Bocscetal, 1997).
The asteroid Asterias rubens qualifies as a potential bioindicatorspecies of PCB contamination in the marine environment. Widelydistributed, abundant, and preying upon fîlter-feeders, A. rubens is
a key species of various benthic ecosystems in the North Sea
(Menge, 1982; Hostens & Hammerlynck, 1994). It is also an excel¬
lent choice for ecotoxicological studies, since it is a proven bioindi¬cator for other contaminants (e.g. heavy metals; Temara et al,1998) and it can provide early warning signais for the présence oforganic contamination (Everaarts et al, 1998). This species was
therefore selected as a model for an expérimental study of PCBbioaccumulation.
Many studies hâve considered PCB bioaccumulation using com¬
mercial mixtures (e.g. Arochlor) which are not always représenta¬
tive of environmental contamination (Metcalfe, 1994). In the
présent work, bioaccumulation potential was investigated using a
congener-specifïc approach and an extremely sensitive method(radio-analysis using p-spectrometry), which allowed us to studylow (realistic) contaminant concentrations and to directly measure
bioaccumulation in ail the body compartments of the starfish(including very minute organs). PCB congener #153 (2,2',4,4',5,5'hexachloro-biphenyl) is the most abundant congener found in
marine biota (NSTF 1993). It is therefore a good model to investi-gate PCB bioaccumulation and its C-Iabelled form was used inthe présent study.
Asteroids were collected in Audresselles (Nord Pas-de-Calais,France). After being acclimatized for 1 month to laboratory condi¬
tions, starfishes were exposed for 34 days to sea water or sédiments
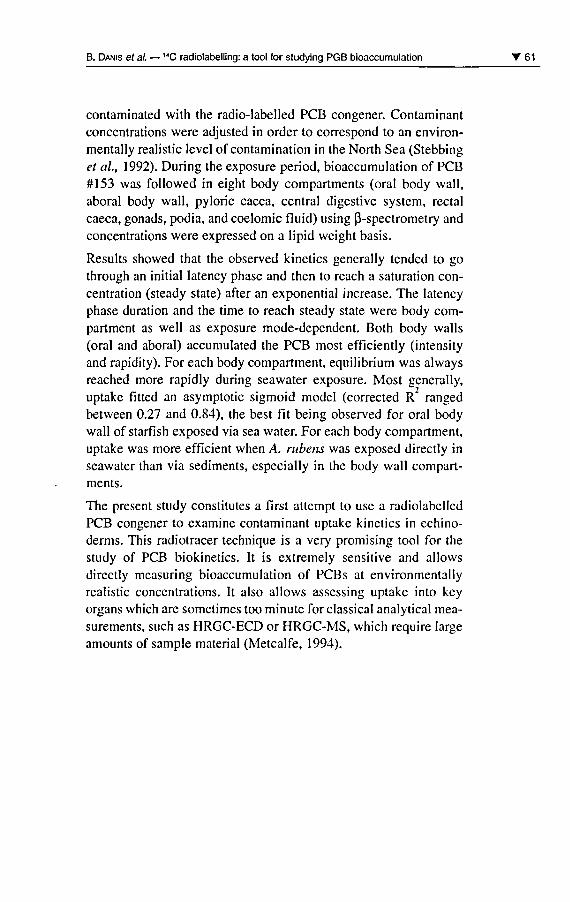
B. Danis et al. "C radiolabelling: a tool for studying PGB bioaccumulation T 61
contaminated with the radio-labelled PCB congener. Contaminantconcentrations were adjusted in order to correspond to an environ-mentally realistic level of contamination in the North Sea (Stebbinget al, 1992). During the exposure period, bioaccumulation of PCB#153 was followed in eight body compartments (oral body wall,aboral body wall, pyloric caeca, central digestive system, rectalcaeca, gonads, podia, and coelomic fluid) using P-spectrometry and
concentrations were expressed on a lipid weight basis.
Results showed that the observed kinetics generally tended to gothrough an initial latency phase and then to reach a saturation con¬
centration (steady state) after an exponential increase. The latencyphase duration and the time to reach steady state were body com-partment as well as exposure mode-dependent. Both body walls(oral and aboral) accumulated the PCB most efficiently (intensityand rapidity). For each body compartment, equilibrium was alwaysreached more rapidly during seawater exposure. Most generally,uptake fitted an asymptotic sigmoid model (corrected R ranged
between 0.27 and 0.84), the best fit being observed for oral bodywall of starfish exposed via sea water. For each body compartment,uptake was more efficient when A. rubens was exposed directly inseawater than via sédiments, especially in the body wall compart¬
ments.
The présent study constitutes a first attempt to use a radiolabelledPCB congener to examine contaminant uptake kinetics in echino-derms. This radiotracer technique is a very promising tool for thestudy of PCB biokinetics. It is extremely sensitive and allowsdirectly measuring bioaccumulation of PCBs at environmentallyrealistic concentrations. It also allows assessing uptake into keyorgans which are sometimes too minute for classical analytical mea¬
surements, such as HRGC-ECD or HRGC-MS, which require largeamounts of sample material (Metcalfe, 1994).
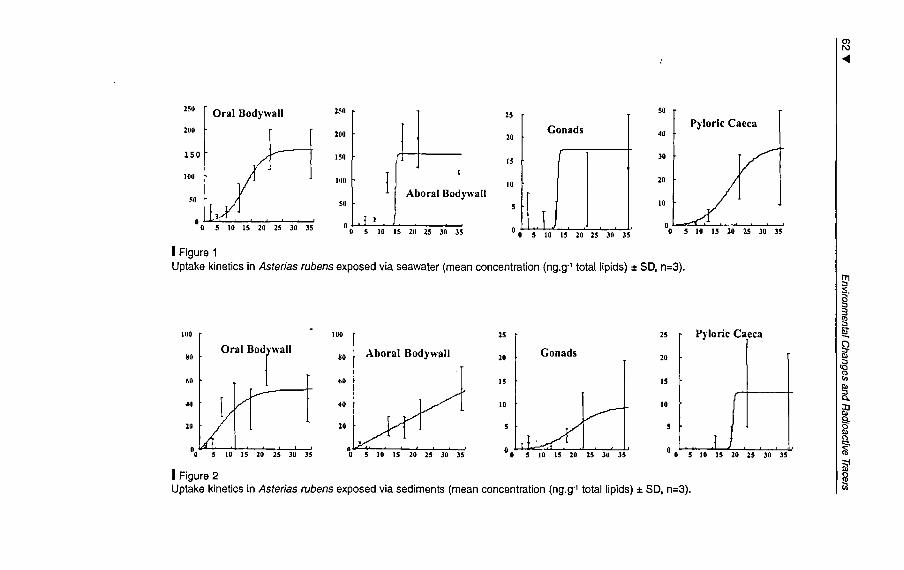
250 Oral Bodywall 250 5025
200
1Gonads
Pyloric Caeca200 20 40
150 150 j lO15
100 1110 2010
50Aboral Bodywall
"[ 1 1050
! 10 0
0 5 10 15 20 25 III as 0 0 5 10 15 20 25 ae l5 0 5 10 \5 20 25 lO 35
1Figure 1Uptake kinetics in Asteriasrubensexposed via seawater (mean concentration (ng.g"' totallipids) :l: 50, n=3).
100 100 25 25 Pyloric Caeca
80 O~IB'dr'" 80 Aboral Bodywall 20 Gonads 20
60 60 IS 15
40 40 10 10
20 20
100 S 10 15 20 25 3D 35 5 10 15 20 2S 3D as o 0 S 10 IS 20 25 se 35
1Figure 2Uptake kinetics in Asterias rubensexposed via sediments (mean concentration (ng.g"' total lipids) :l: 50, n=3).
B. Danis et al. 14C radiolabelling: a tool for studying PGB bioaccumulation 63
BibliographyBoese B. L., Lee H., Echols S., 1997Evaluation of a first order model forthe prédiction of the bioaccumulationof PCBs and DDT from sédimentinto the marine deposit-feeding clamMacoma nasuta. Environ. Toxicol.Chem., 16: 1545-1553.
Everaarts J. M., den Besten P. J.,Hillebrand M. T. J., Halbrook R. S.,ShugartL. R., 1998DNA strand breaks, cytochromeP450-dependant monooxygenasesystem activity and levelsof chlorinated biphenyl congenersin the pyloric caeca of the seastar(Asterias rubens) from the NorthSea. Ecotoxicology, 7: 69-79.
Harding G. C, Addison R. F., 1986"Accumulation and effects of PCBsin marine invertebrates andvertebrates". Irr. Wood J.S. (ed):PCBs and the environment,CRC Press, 2: 9-30.
Hostens K., Hammerlynck O., 1994The mobile epifauna of the softbottoms in the subtidalOosterschelde estuary: structure,function and impact of thestorm-surge barrier. Hydrobiologia,282/283: 479-496.
Livingstone D. R., 1992"Persistent pollutants in marineinvertebrates". Irr. Walker C.H.,Livingstone D.R. (eds). Persistentpollutants in marine ecosystems.Oxford, Pergamon Press: 3-34.
MengeB.A., 1982"Effects of feeding on theenvironment: Asteroidea". Irr.Jangoux M., Lawrence J.M. (eds):Echinoderm nutrition. Rotterdam,Balkema: 521-551.
Metcalfe C. D., 1994"Polychlorinated biphenyls". Irr.
Kiceniuk J.W., Ray S. (eds): Analysisof contaminants in edible aquaticresources, VCH Press : 305-338.
Meador J. R, Casillas E.,Sloan C. A., Varanasi U., 1995Comparative bioaccumulation ofpolycyclic aromatic hydrocarbonsfrom sédiment by two infaunalinvertebrates. Mar. Ecol. Prog. Ser.,123: 107-124.
NSTF-North Sea Task Force, 1993North Sea quality status report 1993.Oslo & Paris Commission, ICES,London, 132 p.
Stebbing A. R. D., Dethlefsen V.,CarrM., 1992Biological effects of contaminants inthe North Sea. Mar. Ecol. Prog. Ser.,91 (spécial édition).
Temara A., Skei J. M., Gillan D.,Warnau M., Jangoux M.,Dubois P., 1998Validation of the asteroid Asteriasrubens (Echinodermata) asa bioindicator of spatialand temporal trends of Pb, Cd,and Zn contamination in the field.Mar. Environ. Res., 45: 341-356.

L/admium bioaccumulationat différent stagesof the life cycleof cephalopods:a radiotracer (109Cd)
investigation
Paco Bustamante
Olivier Cotret
Bruno Danis
Jean-Louis Teyssié
Scott W. Fowler
Pierre Miramand
Michel Wamau
I Introduction
High levels of cadmium in the liver and kidney of marine mam¬
mals and seabirds hâve been reported in polar and sub-polarrégions, areas which are not known to be subjected to particularlyhigh inputs of cadmium (Schneider et al, 1985; Wagemann et al,1990; Caurant & Amiard-Triquet, 1995). Similarly, very high cad¬
mium concentrations in polar and sub-polar cephalopods hâve
been recorded (Bustamante et al, 1998). Since cephalopods are a
primary food source for many cetaceans and seabirds, it has been
66 T Environmental Changes and Radioactive Tracers
proposed that a cephalopod-rich diet may be linked to the highmétal concentrations found in thèse top predators (Honda &Tatsukawa, 1983; Muirhead & Furness, 1988; Bustamante et al,1998).
Despite the probable crucial rôle of cephalopods in the transfer ofcadmium along food webs, only very few studies hâve examinedheavy métal behaviour and fate in cephalopods. For example, thèse
organisms are well known to concentrate cadmium to extremelyhigh levels in their digestive gland (Martin & Flegal, 1975; Finger& Smith, 1987; Miramand & Bentley, 1992); however, the reason
for such a high bioaccumulation is still poorly understood.Therefore, the présent study has examined the biokinetics ofuptake and loss of cadmium in a typical cephalopod, the commoncuttlefish Sepia officinalis, in order to characterise the bioaccumu¬lation and rétention potential of cadmium in this organism. In the
présent work, bioaccumulation in S. officinalis was investigatedusing I09Cd in combination with low (realistic) cadmium concen¬
trations in order to directly measure Cd bioaccumulation in variousbody compartments ofthe cuttlefish.
Adult individuals, collected by net fishing off Monaco or providedby the « Musée Océanographique de Monaco »; were acclimatiscdfor several weeks to laboratory conditions before expérimentation.Numerous eggs were obtained during acclimation of adults and
they were maintained at constant température (17±1°C) in contin-ually aerated sea water. After 8 to 10 weeks, hatching of the cul¬
tured eggs furnished several dozen juvénile cuttlefish.
Cadmium bioaccumulation could thus be studied at différent stages
of the life cycle of 5. officinalis, viz. in embryos, early juvénilesand adults. In addition, bioaccumulation was investigated follow¬ing exposures to the métal via sea water, sédiment, or food.
At the end ofthe exposure periods, l09Cd was measured by g-spec-
trometry in 3 compartments of eggs (capsule membrane, peri-embryonar liquid, and embryo), 3 body compartments of juvéniles(digestive gland, cuttlebone, and remainder), and 13 body com¬
partments of adults (digestive gland, branchial hearts, branchialappendages, gills, kidneys, ink sack, digestive tract, génital tract,
ovocytes, skin, muscles, cuttlebone, and remainder).
P. Bustamante et al. Cadmium bioaccumulation in cycle of cephalopods T 67
Results and discussion
Results showed that during embryonic development, cadmium was
efficiently taken up from sea water by the eggs (concentration fac¬
tor reaching 46 after 8 days of exposure). However, most of the,09Cd burden was found associated with the capsule membrane ofthe egg. Thus, the capsule most probably acts as a very efficientshield against internai cadmium incorporation, which in turn sug¬
gests that this métal could be highly toxic for early embryos.
Once this shield is lost (after hatching), the cuttlefish bioconcen-trates waterborne cadmium. Indeed, juvéniles as well as adults takeup cadmium quite efficiently, particularly in muscles (62% of bodyburden) and digestive gland (25%). When non-contaminated condi¬tions are restored, whole-body loss of cadmium in S. officinalis is
relatively slow (biological half life: ca. 65 days) and its kinetics are
best described by a two-compartment exponential model. In addi¬
tion, the l09Cd burden increases in digestive gland during the dépu¬
ration period reaching 70% ofthe total body burden after one monthof dépuration. This would indicate either a higher rétention effi¬ciency of cadmium in digestive gland than in the other organs, or a
preferential translocation of cadmium from différent organs to the
digestive gland.
Despite their habit to spend most of their time on the bottom sédi¬
ments, bioaccumulation of l09Cd from contaminated sédimentremained very low after one month of exposure. Among the différ¬ent organs, the digestive gland contained most of the métal at the
end of the exposure period.
Regarding cadmium exposure through the food, data analysis indi¬
cates that ingested cadmium is taken up very efficiently by S. offic¬inalis (Figure 1). Calculated assimilation efficiencies (AE) were as
high as 60% for both âge groups. Loss of l09Cd ingested with food(brine shrimps Artemia sp for juvéniles; mussels Mytilus gallo-provincialis for adults) was much slower than loss of cadmiumtaken up via sea water, indicating a very strong rétention efficiencyof dietary cadmium by juvénile as well as adult S. officinalis. As forthe other exposure modes tested (sea water and sédiments), most of
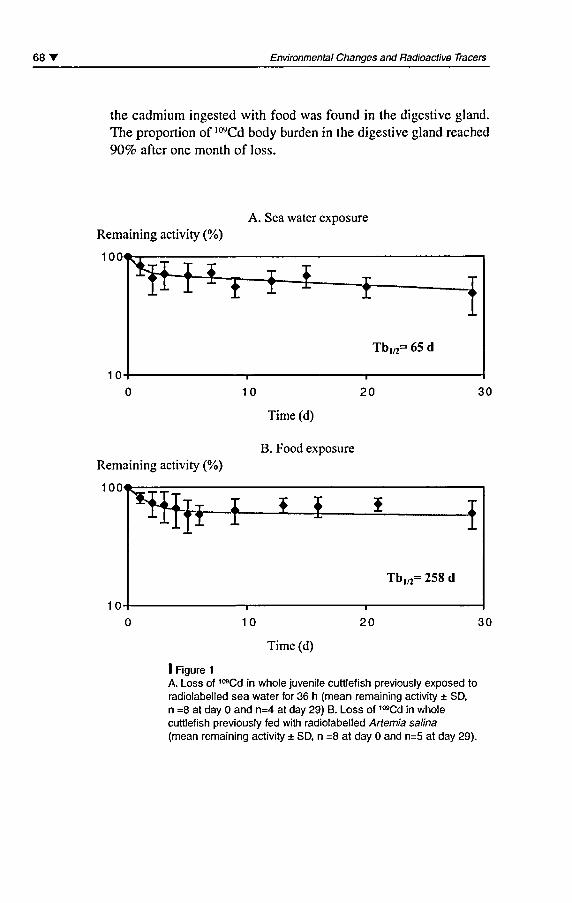
68' Environmental Changes and Radioactive Tracers
the cadmium ingested with food was found in the digestive gland.The proportion of 109Cd body burden in the digestive gland reached
90% after one month of loss.
A. Sea water exposureRemaining activity (%)
""hfr-HrHH i10
Tb)/2= 65 d
10 20
Time (d)
30
B. Food exposureRemaining activity (%)
100
Time (d)
I Figure 1
A. Loss of ,mCd in whole juvénile cuttlefish previously exposed toradiolabelled sea water for 36 h (mean remaining activity ± SD,n =8 at day 0 and n=4 at day 29) B. Loss of 109Cd in wholecuttlefish previously fed with radiolabelled Artemia satina(mean remaining activity ± SD, n =8 at day 0 and n=5 at day 29).
P. Bustamante et al. Cadmium bioaccumulation in cycle of cephalopods 69
Our results clearly demonstrate that food is a major route of cadmiumbioaccumulation in the cephalopod S. officinalis. Whatever the
source of cadmium (water or food), the digestive gland is always the
primary organ that accumulâtes the métal. This form of métal storage
may be related to the detoxification function of the digestive gland(e.g., métal trapping by metalloproteins), which could explain whycadmium reaches extremely high concentrations in this organ.
BibliographyBustamante P., Caurant F.,
Fowler S. W., Miramand P., 1998Cephalopods as a vector for thetransfer of cadmium to top marinepredators in the north-east AtlanticOcéan. Sci. Tôt Environ., 220: 71-80.
Caurant R, Amiard-Triquet C, 1995Cadmium contamination in pilotwhales Globicephala mêlas: sourceand potential hazard to the species.Mar. Pollut Bull., 30 (3): 207-210.
Finger J. M., Smith J. D., 1987Molecular association of Cu, Zn, Cdand 210Po in the digestive gland ofthe squid Nototodarus gouldi.Mar. Biol., 95: 87-91.
Honda K., Tatsukawa R., 1983Distribution of cadmium and zinc intissues and organs, and theirage-related changes in stripeddolphins, Stenella coeruleoalba.Arch. Environ. Contam. Toxicol.,12:543-550.
Martin J. H., Flegal A. R., 1975High copper concentrations in squidlivers in association with elevatedlevels of silver, cadmium, and zinc.Mar. Biol., 30:51-55.
Miramand P., Bentley D., 1992Concentration and distribution of
heavy metals in tissues of twocephalopods, Eledone cirrhosa andSepia officinalis, from the Frenchcoast of the English Channel. Mar.Biol., 114:407-414.
Muirhead S. J., Furness R. W., 1 988Heavy métal concentrations in thetissues of seabirds from GoughIsland, South Atlantic Océan. Mar.Pollut. Bull., 19:278-283.
Schneider R.,Steinhagen-Schneider G.,Drescher H. E., 1985"Organochlorines and heavy metalsin seals and birds from the WeddellSea". In Seigfried W. R., Condy P. R.,Laws R. M., (eds) Antarctic nutrientcycles and food webs. Springer,Berlin, Heildeberg, New York:652-655.
Wagemann R., Stewart R. E. A.,Béland P., Desjardins C, 1990"Heavy metals and séléniumin tissues of béluga whales,Delphinapterus leucas, fromthe Canadian Arctic and the St.Lawrence estuary". In Smith T.G.,St Aubin D. J., Geraci J. R. (eds)Advances in research on the bélugawhale, Delphinapterus leucas. Can.Bull. Fish. Aquat. Sci., 224: 191-206.

Heavy metals in thesea star Asterias rubens(echinodermata): basis forthe construction of anefficient biomonitoringprogram
Ali Temara
Michel Warnau
Philippe Dubois
Introduction
The heavy metals that enter marine trophie chains are naturallydirected towards the benthos in a multiple-step séquence. Physico-chemical processes such as précipitation, adsorption, and com-plexation, incorporate them into the seston. Through grazing and
prédation, zooplankton organisms ingest the heavy metals présentin the seston (Bremer et al, 1990). Only a small proportion ofthèse metals is absorbed by the zooplankton, the major part is eli¬
minated with the fecal pellets. Being denser than seawater, thefecal pellets sink. A large proportion of thèse pellets is swallowed(up to 40%, Joiris et al, 1982) with dead plankton by benthic(micro)heterotrophic organisms. Similarly, thèse benthic orga¬
nisms absorb only a small fraction of the metals présent in theirdiet. Their excréments thus hâve a high content heavy metals as
well. Therefore, both abiotic and biotic processes direct metals
72 Environmental Changes and Radioactive Tracers
towards the sédiments. Heavy metals associated with the sédi¬
ments are bioavailable to benthic organisms through exchangesbetween the water column and the interstitial water, ingestion and
through sédiment resuspension. As resuspension is stimulated byactivity of the in fauna, by human activity (e.g. dredging), and byhydrodynamics, the sédiments become a secondary source ofcontamination. Such a source can sometimes be detected muchlater than the primary contamination (Skei, 1981). Because of thissecondary source of contamination, the benthic zone of littoralecosystems is particularly exposed to métal contaminants. As an
example, the loads of Cd, Pb, and Hg accumulated in the macro-benthos of the North Sea exceed 8 tons (T) Cd, 4T Pb, and IT Hg,mainly from anthropogenic origin (Karbe et al, 1994).
Heavy métal pollution is a major problem in several sites of the
NE Atlantic, particularly in coastal zones and in zones of sedi¬
mentary deposits (NSTF, 1993). Thèse zones are generally ecolo-gically sensitive and are economically important because theyinclude Fisheries and recreational areas. According to Kroncke &Rachor (1992), the macrobenthic communities of the NE Atlanticare affected by the présence of multiple pollutants including heavymetals. The disrupted communities typically hâve larger numbersof species that are of smaller size and shorter lifespan than the
healthy communities. According to NSTF, (1993), four metalsconstitute a major threat to the animal communities in the NEAtlantic: Sn (as tributyltin) affects bivalves and gastropodsthrough endocrine disruption, Cd and Hg constitute a major threatto the top-predators, and Pb is a major threat to mollusc predators.
Bioindicators and complementarity
It is no longer accepted that marine Systems can receive an unre-gulated load of heavy metals, and programs monitoring the healthof ecosystems are required. It is generally recognised that biologi¬cal parameters should be studied in such programs in conjunction
A. Temara er al. Heavy metals in the sea star Asterias ruben (echinodermata) T 73
with both chemical and physical measurements. Nowadays, eco-
toxicological risk assessment has become a tool in several régionsof the world and is used by decision-makers in chemical régula¬
tion. Environmental décision making can be a multi-million dol¬
lar/euros issue and efficient biomonitoring programs musttherefore be based on carefully calibrated bioindicators.
Two types of organisms can be selected for biomonitoring pro¬
grams. If the aim of the program is to protect human health, ediblespecies should be considered. Alternatively, if the aim of the pro¬
gram is to détermine temporal or geographical trends of a conta¬
mination, ubiquitous species should be considered. MusselsMytilus spp hâve a double advantage from the standpoint of eco-toxicology: they are both edible and hâve a wide distribution. Thisis why they are so often used by ecotoxicologists. But musselscannot be considered as the ultimate bioindicator because they are
not ubiquitous [e.g.: Iimited bathymétrie distribution, absence
from some biotopes, such as seagrass meadows (Hayward &Ryland, 1990)], and because they do not always indicate environ-mental conditions. Indeed, according to Coleman et al (1986),there is no simple relationship between the Cd concentrations inMytilus edulis and the concentrations in the seawater. Similarly,Cd, Pb, Cu, and Zn concentrations in the mussels of S0rfjord(Norway) were not correlated to contamination gradients alongthe fjord (NSTF, 1993). If mussels are not the idéal bioindicator,it is likely that no organism is. Indeed, in each organism, the bodyconcentrations indicate the spécifie local bioavailability of theheavy metals rather than the global environmental conditions. Asub-optimal bioindicator should not be replaced by another one.However, in S0rfjord, the asteroid Asterias rubens better indicatedthe environmental conditions than any other species (including M.edulis); the measured body concentrations being highly correlatedto métal concentrations in the sédiments, which represent themajor source of contamination in the area (Temara et al., 1998c).Even so, analyses of métal concentrations in mussels hâve been ofimportance to public health: the détection of highly elevatedlevels ail along the fjord led the régional authorities to ban theirconsumption (Skei, 1995). According to Gray (1989), several spe¬
cies should thus be included in biomonitoring programs. Phillips(1990) reviewed the bioindicators widely used at the time of his
74 T Environmental Changes and Radioactive Tracers
writing; bioindicators were gathered in three groups: macrophytealgae, crustaceans, and molluscs. Each of thèse groups had bothadvantages and disadvantages.
To sélect an adéquate taxon, it has been proposed to focus on the spe¬
cies that qualitatively or quantitatively structure the biocenosis (key-species) (Gray, 1989). This approach could also assist in assessing
the impact of contamination on the whole ecosystem (if one or seve¬
ral key-species are affected, the whole ecosystem is affected).However, according to Hurlbert (1997), the concept of keystonenesshas hardly been demonstrated for most organisms and in the eco-
toxicological perspective, the concept of complementarity might be
more appropriate as far as sélection of bioindicators is concerned. To
be complementary, species should be chosen among biologically dis¬
tancée! taxa. In this view, M. edulis and A. rubens are complemen¬
tary. The first one is a filtrating protostome with an exoskeleton that
keeps the other tissues out of contact with the sédiments [musselssettle on hard bottoms as well as on soft bottoms as aggregates
(Hayward & Ryland, 1990)]; the second one is a predatory deutero-stome with an endoskeleton; the respiratory surfaces, the podia, are
in close contact with the sédiments. Contact with heavy metals,métal bioaccumulation, and sensitivity to metals will thus be drama-tically différent for thèse two species. The joint study of such species
would thus be more représentative ofthe biodiversity in marine eco¬
systems. Macrophyte algae would favourably complément thèse twospecies as thèse organisms mainly bioaccumulate metals from the
dissolved phase (e.g. Phillips, 1990; Warnau et al, 1996a).
The ecotoxicology of M. edulis has extensively been reviewed (see
e.g. références above) and the présent paper describes the ecotoxi-cological information available for A. rubens. It is a top-predatorfeeding mainly on molluscs and is regarded as a keystone predatorin several communities (see hereafter). Therefore, the effects of Cd,Pb, and Hg on this species are likely to hâve an impact on wholecommunities (see above). The présent paper reviews the modes ofbioaccumulation and loss/detoxification of such metals in A. rubensin order to ascertain the value of the species as a bioindicator ofmétal contamination.
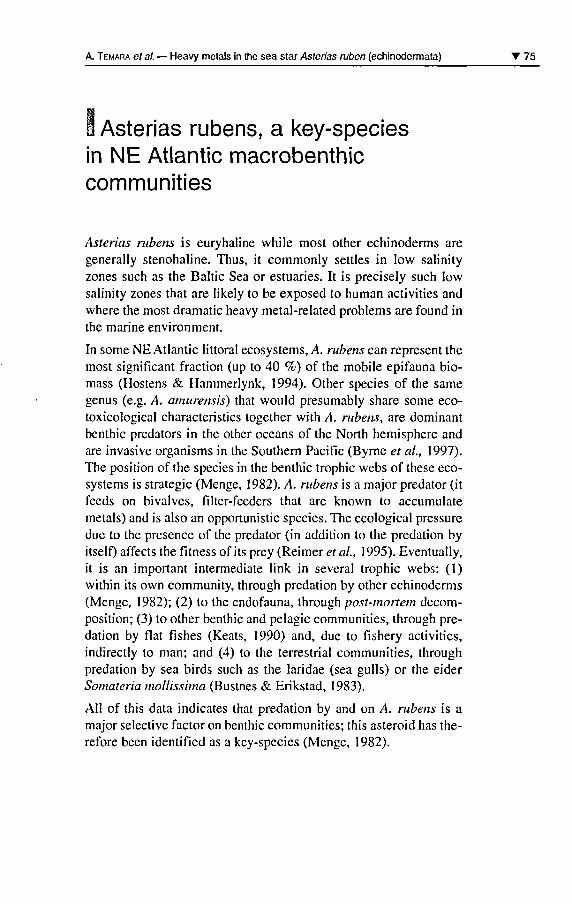
A. Temara et al. Heavy metals in the sea star Asterias ruben (echinodermata) T 75
1 Asterias rubens, a key-speciesin NE Atlantic macrobenthiccommunities
Asterias rubens is euryhaline while most other echinoderms aregenerally stenohaline. Thus, it commonly seules in low salinityzones such as the Baltic Sea or estuaries. It is precisely such lowsalinity zones that are likely to be exposed to human activities and
where the most dramatic heavy metal-related problems are found inthe marine environment.
In some NE Atlantic littoral ecosystems, A. rubens can represent themost significant fraction (up to 40 %) of the mobile epifauna bio¬mass (Hostens & Hammerlynk, 1994). Other species of the same
genus (e.g. A. amurensis) that would presumably share some eco-toxicological characteristics together with A. rubens, are dominantbenthic predators in the other océans of the North hémisphère and
are invasive organisms in the Southem Pacific (Byrne et al, 1997).The position of the species in the benthic trophie webs of thèse eco¬
systems is stratégie (Menge, 1982). A. rubens is a major predator (itfeeds on bivalves, fi Iter- feeders that are known to accumulatemetals) and is also an opportunistic species. The ecological pressuredue to the présence of the predator (in addition to the prédation byitself) affects the fitness of its prey (Reimer et al, 1995). Eventually,it is an important intermediate link in several trophie webs: (1)within its own community, through prédation by other echinoderms(Menge, 1982); (2) to the endofauna, through post-mortem décom¬
position; (3) to other benthic and pelagic communities, through pré¬
dation by flat fishes (Keats, 1990) and, due to fishery activities,indirectly to man; and (4) to the terrestrial communities, throughprédation by sea birds such as the laridae (sea gulls) or the eiderSomateria mollissima (Bustnes & Erikstad, 1983).
Ail of this data indicates that prédation by and on A. rubens is a
major sélective factor on benthic communities; this asteroid has the¬
refore been identified as a key-species (Menge, 1982).
76 T Environmental Changes and Radioactive Tracers
Heavy métal bioaccumulationin A. rubens
Baseline studies on heavy métal contamination of A. rubens hâve
been conducted in the field by several authors (e.g. Everaarts &Fisher, 1989; Everaarts et al, 1990; Vyncke et al, 1991; Temara
et al, 1997a) and the asteroid is now recognised as one of the spe¬
cies that can bioindicate métal contamination of an ecosystem
(NSTF, 1993).
A sampling ofA. rubens from the coastline ofthe Netherlands to the
Dogger Bank (central North Sea) showed that the populations in the
Dogger Bank (a région with high sédiment déposition rate, elevated
organic content, and where métal bioavailability is elevated;Kersten & Kroncke, 1991) had significantly higher Cd concentra¬
tions than the other populations studied (Everaarts et al, 1990),
while Zn and Cu concentrations did not vary significantly along the
transect (Everaarts & Fisher, 1989). According to Vyncke et al.
(1991), A. rubens would be the most suitable species to bioindicateheavy métal (Pb, Cr, Hg, Ni) contamination among the organismsstudied (thèse organisms were the crustaceans Pagurus berhnardusand Macropipus holsatus, the ophiuroid Ophiura texturata, the
bivalve Spisula subtruncata, and A. rubens). According to the latterauthors, métal concentrations in asteroids collected close to the
European coast were significantly higher than the métal concentra¬
tions in asteroids collected offshore.
It is worth noting that in the early studies that hâve used A. rubensto monitor heavy métal contamination in the field, the métalconcentrations were analysed in total asteroid body, without any
distinction of body compartments [an exception is the work byRiley & Segar (1970) who separated several body compartments].However, A. rubens has well differentiated body compartments, and
it has since been shown that they do not accumulate metals similarly(den Besten et al, 1990; Sorensen & Bjerregaard, 1991; Hansen &Bjerregaard, 1995; Temara et al, 1996a, b; 1998a; Warnau et al,1999).
A. Temara et al. Heavy metals in the sea star Asterias ruben (echinodermata) T 77
The importance ofthe factors (body compartment, season, samplingsite, sex) influencing heavy métal concentrations were investigatedin adult asteroids in the southern bight ofthe North Sea. Accordingto multi-way analyses of variance, the considered factors accountedfor a significant proportion of total variability in Pb (93%), Cd(88%), and Hg (27%) concentrations. Body compartment appeared
as the most critical factor (Pb: 88%, Cd: 40%, Hg: 10%) in back-ground environments (Temara et al, 1997a). Concentration ratiostowards prey (invertebrates of various trophie catégories) werelower than 1 for Pb, around 1 for Hg, and up to 7.8 for Cd, indi-cating that Iimited biomagnification may occur in the trophie webA. rubens belongs to (Temara et al, 1 997a). The same study showedthat sex-related différences were significant for Cd concentrations(1.75 times higher in female than in maie gonads). Significant allo-metric relationships were measured and statistically fitted modelswere positive (Cd concentrations in the body wall and the digestivesystem) or négative (Pb concentrations in the digestive system)power functions.
According to Temara et al. (1997a), Pb is particularly concentratedin the skeleton while its concentration in the other tissues is ratherlow in background environments. Pb is known as a calcic skeletal-seeking élément [calcic skeletons represent the vast majority oftypes of mineralised skeletons in the metazoans], rcgardless of thenature of the calcic skeleton [e.g. phosphate skeletons of verte¬
brates, carbonate skeletons of molluscs]. Among the carbonate ske¬
letons, the crystallographic structure seems surprisinglyinconclusive for Pb bioaccumulation that occurs in aragonitic ske¬
letons as well as in calcitic skeletons (Kroncke, 1987; Temara et al,1995; Warnau et al, 1995a). According to Sorensen (1991), theaccumulation of Pb in calcitic skeletons is facilitated by the simila¬rity between the ionic radius of Pb and Ca.
In A. rubens, Cu, Zn, and Fe, which are cofactors of severalenzymes, were preferentially concentrated in body compartmentsthat are characterised by high metabolic activity. Concentrationswere significantly higher in the pyloric caeca (Temara et al,1997a), nutrient storage organs that hâve high metabolic activity(Oudejans et al, 1979). Cu and Zn, as well as other lb and Hb élé¬
ments (Cd, Hg, Ag), generally hâve a high affinity for the -SH pep-
78 T . Environmental Changes and Radioactive Tracers
tidic groups of the tripeptide glutathione and of metallothioneins(MTs) (Roesijadi, 1992). In A. rubens, the quantification of MTs inthe pyloric caeca (Temara et al, 1997b) confirmed the présence ofthis ligand in sufficient quantity to fix accumulated Cd. In contrast,MTs are absent from the gonads (den Besten et al, 1990), accoun-ting for the low Cd concentrations in this compartment. However,Hg concentrations were high in the gonads (Temara et al, 1997a).
As opposed to the MTs of most other organisms studied so far, theMTs in the pyloric caeca of A. rubens showed a low affinity for Hg(Sorensen & Bjerregaard, 1991), which could account for its rapidtransfer to the gonads. Such transfer could take place via the haemalSystem (Rouleau et al, 1993) which is part of the circulatory Sys¬
tem in echinoderms (Ruppert & Barnes, 1994).
Métal sources for the organism can vary according to the élémentand are debatable. According to Voogt et al. (1987), the principalsource of Cd for A. rubens was the water. In contrast, den Besten et al.
(1990) showed that Cd seemed to be accumulated by A. rubensmainly from its diet. According to expérimental exposures (Temaraet al, 1996a), Cd accumulated in the pyloric caeca was mainly ofdietary origin (Figure 1). However, the importance of diet as a
source of Cd is apparently not a rule in echinoderms. Indeed, the
contribution of diet to the Cd load of the echinoid Paracentrotuslividus (grazing sea urchin) is comparatively much lower (Warnau
étal, 1995b; 1996b).
The sources of Pb can be ions dissolved in seawater, Pb présent inthe diet, and Pb adsorbed on particules in suspension. Such parti¬
cules enter the body via the microphagic activity of A. rubens(Jangoux, 1982). The relative importance of such sources has notyet been evaluated. In contrast to Cd that is taken up through the
integument and the digestive tract (Temara et al, 1996), récent stu¬
dies (Temara et al, 1998a) hâve shown that the main entry route ofPb in the organism would be the digestive wall (Figure 2), possiblythrough an antiporter System. Secondary entry routes could be the
podia, the papulae, and the madreporite, viz. structures that controlthe equilibrium of internai fluids and that are involved in respiratoryexchanges. The métal ions associated with dissolved organic mattercould also enter the asteroid through the epidermis ofthe body wall,whose rôle in the absorption of dissolved organic molécules has
been demonstrated by Fergusson (1982).
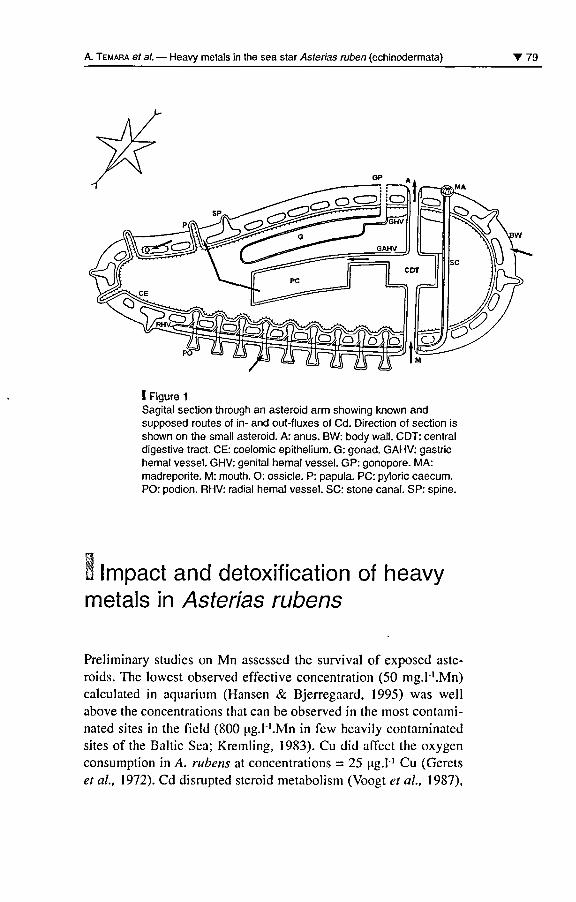
A. Temara et al. Heavy metals in the sea star Asterias ruben (echinodermata) 79
I Figure 1
Sagital section through an asteroid arm showing known andsupposed routes of in- and out-fluxes of Cd. Direction of section isshown on the small asteroid. A: anus. BW: body wall. CDT: centraldigestive tract. CE: coelomic epithelium. G: gonad. GAHV: gastrichemal vessel. GHV: génital hemal vessel. GP: gonopore. MA:madreporite. M: mouth. O: ossicle. P: papula. PC: pyloric caecum.PO: podion. RHV: radial hemal vessel. SC: stone canal. SP: spine.
I Impact and detoxification of heavymetals in Asterias rubens
Preliminary studies on Mn assessed the survival of exposed aste¬
roids. The lowest observed effective concentration (50 mg.l'.Mn)calculated in aquarium (Hansen & Bjerregaard, 1995) was wellabove the concentrations that can be observed in the most contami¬nated sites in the field (800 ug.f'.Mn in few heavily contaminatedsites ofthe Baltic Sea; Kremling, 1983). Cu did affect the oxygenconsumption in A. rubens at concentrations = 25 ug.f Cu (Geretset al, 1972). Cd disrupted steroid metabolism (Voogt et al, 1987),
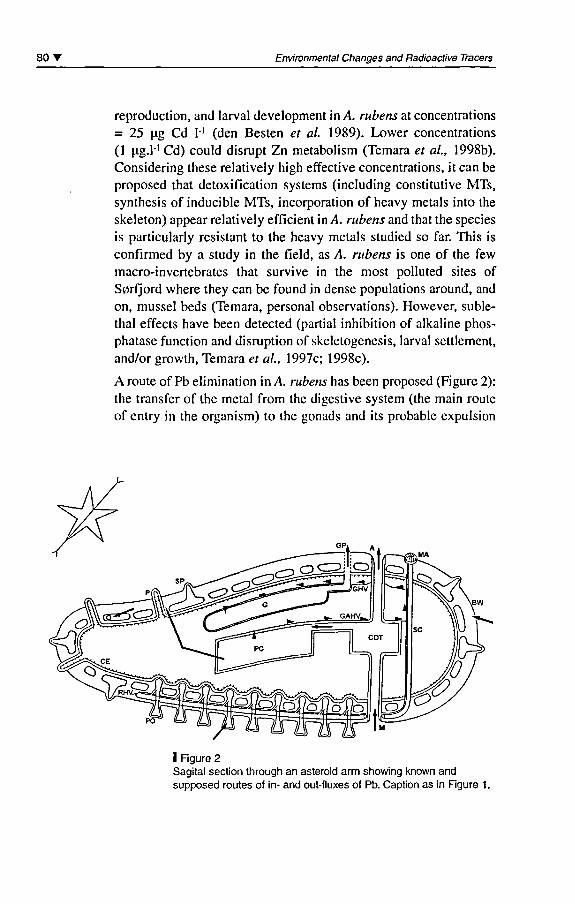
80' Environmental Changes and Radioactive Tracers
reproduction, and larval development in A. rubens at concentrations= 25 ug Cd 1° (den Besten et al 1989). Lower concentrations(1 u.g.1"1 Cd) could disrupt Zn metabolism (Temara et al, 1998b).
Considering thèse relatively high effective concentrations, it can be
proposed that detoxification Systems (including constitutive MTs,synthesis of inducible MTs, incorporation of heavy metals into the
skeleton) appear relatively efficient in A. rubens and that the species
is particularly résistant to the heavy metals studied so far. This isconfirmed by a study in the field, as A. rubens is one of the fewmacro-invertebrates that survive in the most polluted sites ofSorfjord where they can be found in dense populations around, and
on, mussel beds (Temara, personal observations). However, suble-thal effects hâve been detected (partial inhibition of alkaline phos¬
phatase function and disruption of skeletogenesis, larval settlement,and/or growth, Temara et al, 1997c; 1998c).
A route of Pb élimination in A. rubens has been proposed (Figure 2):
the transfer of the métal from the digestive System (the main routeof entry in the organism) to the gonads and its probable expulsion
I Figure 2Sagital section through an asteroid arm showing known andsupposed routes of in- and out-fluxes of Pb. Caption as in Rgure 1 .
A. Temara et al. Heavy metals in the sea star Asterias ruben (echinodermata) T 81
during spawning (Temara et al, 1998a). The toxicity of Pb accu¬
mulated in the gonads towards the maturing gamètes dépends on itschemical speciation and on the type of tissues (somatic or germinal)in which it is stored. It is noteworthy that Pb presented low toxiceffects to mature echinoid gamètes (Dinnel et al, 1989.
The use of biomarkers to detect the biological impact of pollutantsin asteroids has received little attention (Everaarts et al, 1998).
According to Everaarts (1995), assessment of DNA integrity is a
valuable method as a biomarker of polycyclic aromatic hydrocar-bon and polychlorinated biphenyl effects in A. rubens, but no cor-relation with métal content has been calculated. Similarly, P450induction by planar compounds has been reviewed by den Besten
(1998). According to Temara et al. (1997b), the quantification ofMT content in A. rubens is not a valuable biomarker of Cd or Znexposure in asteroids as opposed to several other taxa.
Bioindicative value of A. rubens
In S0rfjord (SW Norway), one of the most heavily metal-pollutedsites in the NE Atlantic, the asteroid populations studied in the 1970s
had very high Cd (18 ug.g"1 Cd dw), Pb (460 ug.g-1 Pb dw), and Zn(1500 ug.g"1 Zn dw) concentrations, i.e. respectively 11, 200, and 7
fold the measured values in populations living at the same period inbackground régions (Bryan, 1984). After remédiai actions in the
fjord, concentrations hâve considerably decreased but are still signi¬
ficantly higher than background levels (Temara et al, 1998c).
The characteristic features of an idéal bioindicator of heavy métalcontamination hâve been described by several authors includingPhillips (1990), Bryan & Hummerstone (1977). It has been reportedthat A. rubens is characterised by most of thèse features (Table 1).
The use of an organism as a bioindicator requires that its bodyconcentrations reflect environmental conditions. An organism thatis able to regulate the body concentrations of the métal studiedcould not be used as a valuable bioindicator (some decapod crusta¬
ceans, for example, control their internai Zn and Cu concentrations.
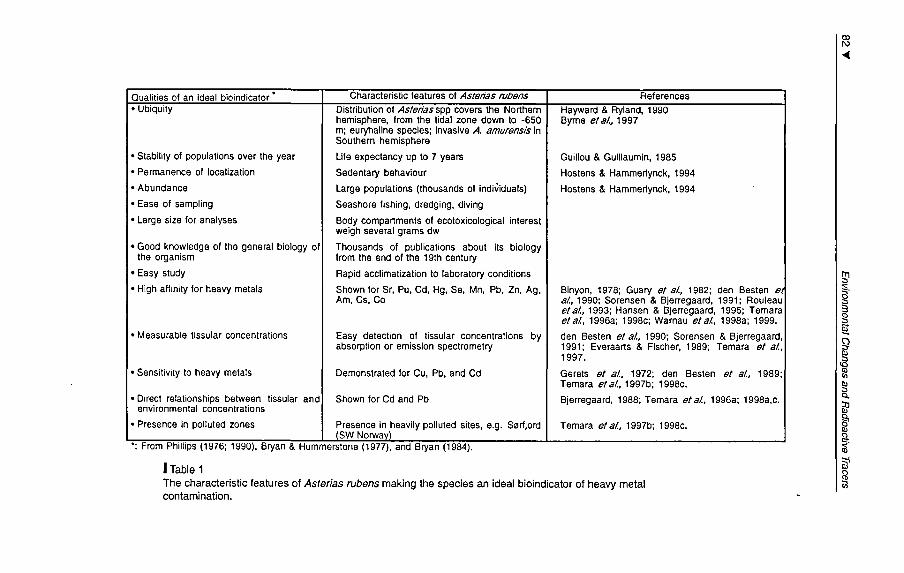
': From Phillips (1976, 1990), Bryan & Hummerstone (1977), and Bryan (1984).
1Table 1The characteristic leatures of Asterias rubens making the species an ideal bioindicator of heavy metalcontamination.
Qualities of an Ideal bioindicator'• Ubiquity
• Stability of populations over the year
• Permanence of localization
• Abundance
• Ease of sampling
• Large size for analyses
• Good knowledge of the general biology ofthe organism
• Easy study
• High affmity for heavy metals
• Measurable tissular concentrations
• Sensitivity to heavy metals
• Direct relationships between tissular andenvironmental concentrations
• Presence in polluted zones
Characteristic features of Astenss ruoensDistribution of Astenesspp covers the Northemhemisphere, from the tidal zone down to ·650rn; euryhaline species; invasive A. amurensis inSouthern hemisphere
Lite expectancy up to 7 years
Sedentary behaviour
Large populations (thousands of individuals)
Seashore fishing, dredging. diving
Body compartments of ecotoxicological lnterestweigh several grams dw
Thousands 01 publications about ils biologyIrom the end 01 the 19th century
Rapid acclimatization to laboratory conditions
Shown for Sr, Pu, Cd. Hg, Se, Mn, Pb, Zn, Ag,Am, Cs, Co
Easy detection of tissular concentrations byabsorption or emission spectrometry
Demonstrated lor Cu, Pb, and Cd
Shown lor Cd and Pb
Presence in heavily polluted sites, e.g. S0rfjord(SW Norwavï
References
Hayward & Ryland, 1990Byme et st, 1997
Guillou & Guillaumin, 1985
Hostens & Hammerlynck, 1994
Hostens & Hammerlynck, 1994
Binyon, 1978; Guary et al., 1982; den Besten eal., 1990; Sorensen & Bjerregaard, 1991; Rouleauet al., 1993; Hansen & Bjerregaard, 1995; Temaraet al, 1996a; 1998c; Warnau et et, 1998a; 1999.
den Besten et et, 1990; Sorensen & Bjerregaard,1991; Everaarts & Fischer, 1989; Temara et al.,1997.
Gerets et al, 1972; den Besten et al., 1989;Temara et al., 1997b; 1998c.
Bjerregaard, 1988; Temara etaI., 1996a; 1998a.c.
Temara et si, 1997b; 1998c.
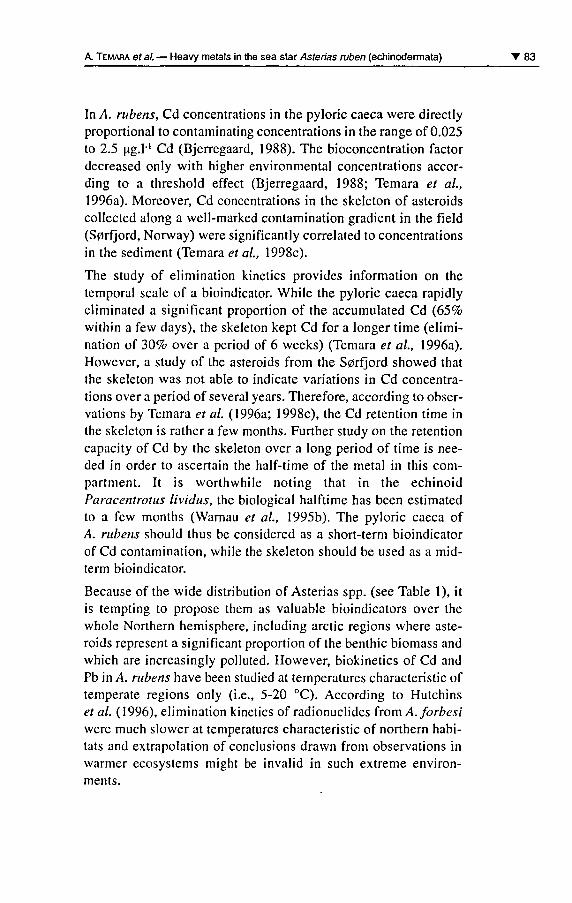
A. Temara et al. Heavy metals in the sea star Asterias ruben (echinodermata) T 83
In A. rubens, Cd concentrations in the pyloric caeca were directlyproportional to contaminating concentrations in the range of 0.025to 2.5 ixg.1-' Cd (Bjerregaard, 1988). The bioconcentration factordecreased only with higher environmental concentrations accor¬
ding to a threshold effect (Bjerregaard, 1988; Temara et al,1996a). Moreover, Cd concentrations in the skeleton of asteroidscollected along a well-marked contamination gradient in the field(S0rfjord, Norway) were significantly correlated to concentrationsin the sédiment (Temara et al, 1998c).
The study of élimination kinetics provides information on the
temporal scale of a bioindicator. While the pyloric caeca rapidlyeliminated a significant proportion of the accumulated Cd (65%within a few days), the skeleton kept Cd for a longer time (élimi¬nation of 30% over a period of 6 weeks) (Temara et al, 1996a).However, a study of the asteroids from the S0rfjord showed thatthe skeleton was not able to indicate variations in Cd concentra¬tions over a period of several years. Therefore, according to obser¬
vations by Temara et al. (1996a; 1998c), the Cd rétention time inthe skeleton is rather a few months. Further study on the rétentioncapacity of Cd by the skeleton over a long period of time is nee-ded in order to ascertain the half-time of the meta! in this com¬
partment. It is worthwhile noting that in the echinoidParacentrotus lividus, the biological halftime has been estimatedto a few months (Warnau et al, 1995b). The pyloric caeca ofA. rubens should thus be considered as a short-term bioindicatorof Cd contamination, while the skeleton should be used as a mid-term bioindicator.
Because ofthe wide distribution of Asterias spp. (see Table 1), itis tempting to propose them as valuable bioindicators over the
whole Northern hémisphère, including arctic régions where aste¬
roids represent a significant proportion ofthe benthic biomass and
which are increasingly polluted. However, biokinetics of Cd and
Pb in A. rubens hâve been studied at températures characteristic oftemperate régions only (i.e., 5-20 °C). According to Hutchinset al. (1996), élimination kinetics of radionuclides from A. forbesiwere much slower at températures characteristic of northern habi¬
tats and extrapolation of conclusions drawn from observations inwarmer ecosystems might be invalid in such extrême environ¬ments.
84 T Environmental Changes and Radioactive Tracers
The Pb accumulation ratios in the asteroid body compartments weredirectly proportional to the environmental contaminating concen¬
trations (Temara et al, 1998a). Study of the contamination of aste¬
roids from the S0rfjord showed that after long-term exposures, the
body concentrations were in good agreement with environmentalconditions at steady-state (Temara et al, 1998c). The digestiveorgans accumulated and eliminated Pb rapidly; in contrast, the ske¬
leton integrated the variations over the lifespan of the asteroid (Le.
several years, Temara et al, 1998a, c).
Based on the information available so far, a sampling strategy ofA. rubens may be proposed for future biomonitoring programs.
Sampling strategy
The variations in heavy métal concentrations in the body compart¬ments of asteroids living in sites located far from any point sources
of contamination hâve clearly shown that some précautions hâve to
be taken in a biomonitoring program based upon that species.
( 1) It is not advised to use A. rubens as an homogeneous compartmentsince the distribution of metals within the organism is sélective.(2) The gonads should not be included in biomonitoring programs:they are not présent during part of the reproductive cycle, whichlimits extemporised samples. Furthermore, gametogenesis inA. rubens dépends closely on water température and on food avai¬
lability, which means that asteroids sampled at the same time but at
différent latitudes could présent différent métal concentrations inthe gonads due to différences in gametogenic stages.
(3) The central digestive System is of Iimited use because of itssmall mass that does not allow various analyses on any one orga¬
nism. Its analysis could, however, be useful in the frame of a bio¬
monitoring program focused on Pb contamination due to its rapidélimination from that compartment.(4) Heavy métal concentrations do vary with the size ofthe asteroid.Therefore, it is advised to sample asteroids of the same size-class.The amplitude ofthe allometric variations being minimal in the lar-
A. Temara et al. Heavy metals in the sea star Asterias ruben (echinodermata) 85
gest size-class, asteroids should be collected among individuals ofthis size-class in each population.(5) As a rule, the advised body compartments are the pyloric caecaand the skeleton (prepared as described in Temara et al, 1996a);they should be sampled on asteroids belonging to the largest size-class in the same gametogenic stage.
The results obtained so far during our study ofthe natural variationsin métal concentrations in A. rubens populations in the NE Atlantic(deposited in the database of the International Council for theExploration of the Sea, and that of the Management Unit of theNorth Scheldt and North Sea Mathematical Model, Belgium;Référence MUMM 94 CF. BE) provided a set of data correspondingto a range of concentration variations in relatively non-contamina-ted environments. The 95lh percentile of such distributions has been
chosen (for each métal) as a critical value beyond which any meanconcentration can be considered as an indication of contamination.According to the variations between compartments, it is necessaryto define différent critical values for each of the compartments.Thèse values are shown in Table 2 for the body compartments selec¬
ted previously and for two of the metals whose concentrations are
known to vary with environmental conditions (Cd and Pb).
PbCd
Skeleton101.2
Pvloric caeca1.1
5.1
Central diqestive svstem1.5
I Table 2Critical values (ug.g-' dw) of heavy metals in the bodycompartments of adult A. rubens. (The central digestive systemis necessary for Pb analyses).
Taking into account the critical values of Table 2 and uptake and éli¬
mination kinetics of Pb, concentrations in the digestive system and inthe skeleton may thus indicate différent situations.
(I) Pb concentrations in the central digestive System and in the skele¬
ton are lower than the critical values: the ecosystem has not been sub-
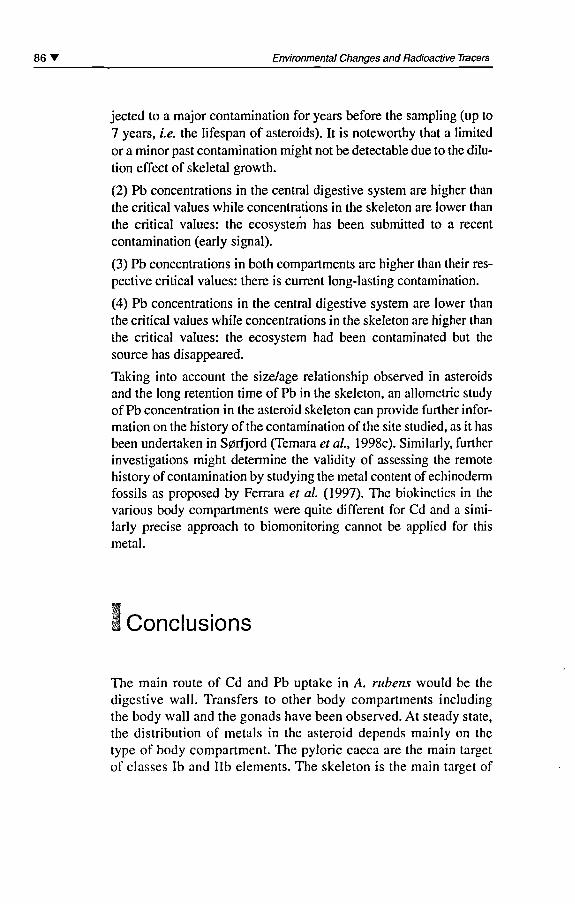
86 T Environmental Changes and Radioactive Tracers
jected to a major contamination for years before the sampling (up to
7 years, Le. the lifespan of asteroids). It is noteworthy that a Iimitedor a minor past contamination might not be détectable due to the dilu¬
tion effect of skeletal growth.
(2) Pb concentrations in the central digestive system are higher than
the critical values while concentrations in the skeleton are lower than
the critical values: the ecosystem has been submitted to a récentcontamination (early signal).
(3) Pb concentrations in both compartments are higher than their res¬
pective critical values: there is current long-lasting contamination.
(4) Pb concentrations in the central digestive system are lower than
the critical values while concentrations in the skeleton are higher than
the critical values: the ecosystem had been contaminated but the
source has disappeared.
Taking into account the size/age relationship observed in asteroidsand the long rétention time of Pb in the skeleton, an allometric studyof Pb concentration in the asteroid skeleton can provide further infor¬mation on the history ofthe contamination ofthe site studied, as it has
been undertaken in S0rfjord (Temara et al, 1998c). Similarly, furtherinvestigations might détermine the validity of assessing the remotehistory of contamination by studying the métal content of echinodermfossils as proposed by Ferrara et al. (1997). The biokinetics in the
various body compartments were quite différent for Cd and a simi¬
larly précise approach to biomonitoring cannot be applied for thismétal.
Conclusions
The main route of Cd and Pb uptake in A. rubens would be the
digestive wall. Transfers to other body compartments includingthe body wall and the gonads hâve been observed. At steady state,the distribution of metals in the asteroid dépends mainly on the
type of body compartment. The pyloric caeca are the main targetof classes lb and Hb éléments. The skeleton is the main target of
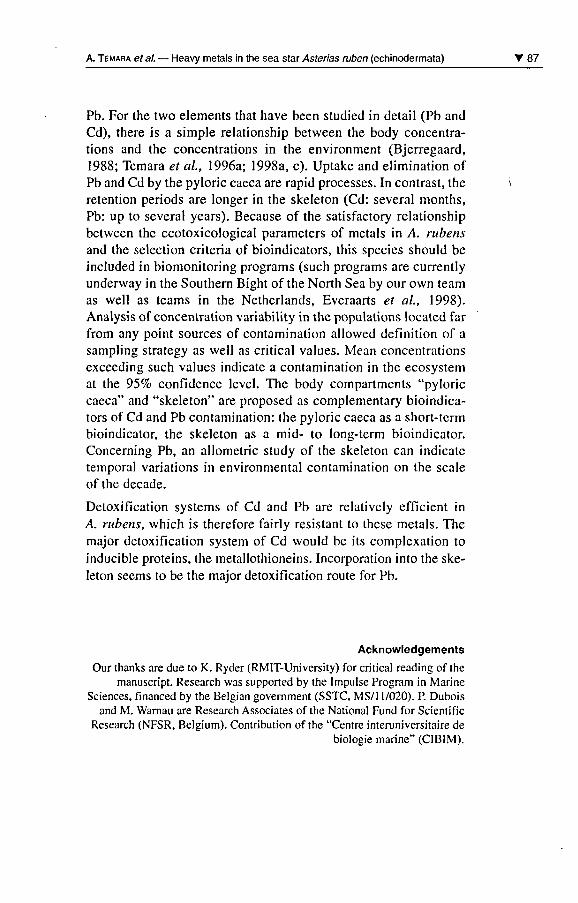
A. Temara et al. Heavy metals in the sea star Asterias ruben (echinodermata) T 87
Pb. For the two éléments that hâve been studied in détail (Pb andCd), there is a simple relationship between the body concentra¬tions and the concentrations in the environment (Bjerregaard,1988; Temara et al, 1996a; 1998a, c). Uptake and élimination ofPb and Cd by the pyloric caeca are rapid processes. In contrast, therétention periods are longer in the skeleton (Cd: several months,Pb: up to several years). Because of the satisfactory relationshipbetween the ecotoxicological parameters of metals in A. rubensand the sélection criteria of bioindicators, this species should beincluded in biomonitoring programs (such programs are currentlyunderway in the Southern Bight of the North Sea by our own teamas well as teams in the Netherlands, Everaarts et al, 1998).Analysis of concentration variability in the populations located farfrom any point sources of contamination allowed définition of a
sampling strategy as well as critical values. Mean concentrationsexceeding such values indicate a contamination in the ecosystemat the 95% confidence level. The body compartments "pyloriccaeca" and "skeleton" are proposed as complementary bioindica¬tors of Cd and Pb contamination: the pyloric caeca as a short-termbioindicator, the skeleton as a mid- to Iong-term bioindicator.Concerning Pb, an allometric study of the skeleton can indicatetemporal variations in environmental contamination on the scaleof the décade.
Detoxification Systems of Cd and Pb are relatively efficient inA. rubens, which is therefore fairly résistant to thèse metals. Themajor detoxification system of Cd would be its complexation toinducible proteins, the metallothioneins. Incorporation into the ske¬
leton seems to be the major detoxification route for Pb.
Acknowledgements
Our thanks are due to K. Ryder (RMIT-University) for critical reading ofthemanuscript. Research was supported by the Impulse Program in Marine
Sciences, fïnanced by the Belgian government (SSTC, MS/1 1/020). P. Duboisand M. Warnau are Research Associates ofthe National Fund for Scientific
Research (NFSR, Belgium). Contribution ofthe "Centre interuniversitaire de
biologie marine" (CIBIM).
88' Environmental Changes and Radioactive Tracers
BibliographyBeijninck F. B., Van Der Sluis I.,VoogtP.A., 1984Turnover rates of fatty acid and aminoacid in the coelomic fluid of the seastar Asterias rubens : implicationsfor the route of nutrient translocationduring vitellogenesis. Comp. Biochem.Physiol, 78B: 761-767.
Bjerregaard P., 1998Effect of Sélénium on Cadmiumuptake in selected benthicinvertebrates. Mar. Ecol. Prog. Ser.,48: 17-28.
Bremer P. J., Barker M. F.,
Loutit M. W., 1990A comparison of the rôles of directabsorption and phytoplanktoningestion in accumulation ofchromium by sea urchin larvae.Mar. Environ. Res., 30: 233-241.
Bryan G. W.,HUMMERSTONE L. G., 1977Indicators of heavy-metalcontamination in the Looe Estuary(Cornwall) with particular regardto silver and lead. J. Mar. Biol. Ass.UK., 57: 75-92.
Bustnes J. O., Erikstad K. E., 1983The diets of sympatric winteringpopulations of common eiderSomateria mollissima and king eiderS. spectabilis in Norway. OmisFennica., 65: 163-168.
Byrne M., Morrice M. G.,WolfB., 1997Introduction of the northern Pacificasteroid Asterias amurensis toTasmania: reproduction and currentdistribution. Mar. Biol, 127: 673-685.
Coleman N., Mann T. F,Mobley M., Hickman N., 1986Mytilus edulis planulatusr.an "integrator" of cadmium pollution?Mar. Biol., 92:1-5.
den Besten P J., 1998Cytochrome P450 monooxygenasesystem in echinoderms. Comp.Biochem. Physiol., C 121: 139-146.
den Besten P. J., Herwig H. J.,Zandee D. I., Voogt P. A., 1989Effects of cadmium and PCBs onreproduction of the sea star Asteriasrubens: aberration in the earlydevelopment. Ecotoxicol. Environ.Sai, 18: 173-180.
den Besten P. J., Herwig H. J.,Zandee D. I., Voogt P. A., 1990Cadmium accumulation andmetallothionein-like proteins in thesea star Asterias rubens. Arch.Environ. Contam. Toxicol,19:858-862.
Dinnel P. A., Link J. M., Stober Q. J.,Letourneau M. W.,Roberts W. E., 1989Comparative sensitivity of sea urchinsperm bioassays to metals andpesticides. Arch. Environ. Contam.Toxicol, 18:748-755.
Everaarts J. M., 1995DNA integrity as a biomarker ofmarine pollution: strand breaks inseastar (Asterias rubens) and dab(Limanda limanda). Mar. Pollut. Bull,31:431-438.
Everaarts J. M., Fischer C. V., 1 989Micro-contaminants in surtacesédiments and macrobenthicinvertebrates of the North sea. NIOZ-Rapport 1989 (6). Nederlands Instituutvoor Onderzoek der Zee. North SeaBenthos Survey (ICES), 44 p.
Everaarts J. M., Otter E.,Fischer C.V., 1990Cadmium and polychlorinatedbiphenyls: différent distributionpatterns in North Sea benthic biota.Neth. J. Sea Res., 26: 75-82.
A. Temara et al. Heavy metals in the sea star Asterias niben (echinodermata) 89
Everaarts J. M., den Besten P J.,Hillebrand M. T. J., Halbrook R. S.,ShugartL. R., 1998DNA strand breaks, cytochromeP-450-dependent monooxygenasesystem activity and levels ofchlorinated biphenyl congénèrein the pyloric caeca of the seastar(Asterias rubens) from the NorthSea. Ecotoxicology, 7: 69-79.
Fergusson J. C, 1982A comparative study of the netmetabolic benefits derived from theuptake and release of free aminoacids by marine invertebrates.Biol. Bull, 162:1-17.
Gerets C, Delahaye W., Perpeet C,Vloebergh M., Jangoux M., 1972Intoxication des moules et desastéries (Asterias rubens) par lesmétaux lourds. CIPS. MathematicalModel of the Pollution in the NorthSea. Technical Report, Brussels.
Gray J. S., 1989Do bioassays adequately predictecological effects of pollutants?Hydrobiologia, 188/189:397-402.
Guillou M., Guillaumin A., 1985"Variations in the growth rate ofAsterias rubens (L.) from west andsouth Brittany (France).Echinodermata". In Keegan B. F,O'Connor B.S.D. (eds) Proceedingsof the Fifth International EchinodermConférence, Galway. A.A. Balkema,Rotterdam: 513-521.
Hansen S. N., Bjerregaard P., 1995Manganèse kinetics in the sea starAsterias rubens (L.) exposed via foodor water. Mar. Pollut Bull,31:127-132.
Hayward J. M., Ryland J. S., 1990The marine fauna of the British Islesand north-west Europe. Il - Molluscsto Chordates. Oxford SciencePublications, New York.
Hostens K., Hammerlynck O., 1994The mobile epifauna of the soft
bottoms in the subtidalOosterschelde estuary: structure,function and impact of thestorm-surge barrier. Hydrobiologia,282/283: 479-496.
Hurlbert S. H., 1997Functional importance vskeystoneness: reformulating somequestions in theoritical biocenology.Austral. J. Ecol, 22: 369-382.
Hutchins D. A., Stupakoff I.,
Fisher N. S., 1996Température effects on accumulationand rétention of radionuclides in thesea star, Asterias forbesr. implicationsfor contaminated northern waters.Mar. Biol, 125:701-706.
Jangoux M., 1 982"Food and feeding mechanisms:Asteroidea". In Jangoux M., LawrenceJ.M. (eds): Echinoderm nutrition.Balkema, Rotterdam: 117-159.
Joiris C, Billen G., Lancelot C,DARO M.H., MOMMAERTS J.R,Bertels A., Bossicart M., Nus J.,HecqJ.H., 1982A budget of carbon cycling in theBelgian coastal zone: relative rôlesof zooplankton, bacterioplankton andbenthos in the utilization of theprimary production. Neth. J. SeaRes., 16:260-275.
Karbe L., Aletsee L., Dûrselen C. D.,Heyer K., Kammann U, Kraux M.,Rick H. J., Steinhout H., 1994"Bioaccumulation and effects ofplankton and benthos on the fate ofcontaminant". In Sûnderman, J. (éd.):Circulation and contaminant fluxes inthe North Sea, Springer-Verlag,Berlin: 556-597.
KeatsD.W., 1990Food of winter flounderPseudopleuronectes americanusin a sea urchin dominatedcommunity in eastern Newfoundland.Mar. Ecol. Prog. Ser., 60: 13-22.
Kersten M., Krôncke I., 1991Bioavailability of lead in North sea
90' Environmental Changes and Radioactive Tracers
sédiments. HelgolânderMeeresunters, 45: 403-409.
KremlingK., 1983The behaviour of Zn, Cd, Cu, Ni, Co,Fe and Mn in anoxie baltic waters.Mar. Chem., 13:87-108.
Krôncke I., 1987Lead and cadmium contents inselected macrofauna species fromthe Dogger Bank and eastern NorthSea. Helgolânder Meeresunters,41:465-475.
Krûncke L, Rachor E., 1992Macrofauna investigations alonga transect from the inner GermanBight towards the Dogger Bank. Mar.Ecol. Prog. Ser., 91: 269-276.
Menge B. A., 1982"Effects of feeding on the environmentAsteroidea". In Jangoux M., LawrenceJ. M. (eds): Echinoderm nutrition.Balkema, Rotterdam: 521-551.NSTF, 1993 - North Sea QualityStatus Report. Oslo and ParisCommissions, London.
Oudejans R.C.H.M., Van Der Sluis I.,
van der Plas A. J., 1979Changes in the biochemicalcomposition of the pyloric caecaof female seastars, Asterias rubens,during their annual reproductivecycle. Mar. Biol, 53: 231-238.
Phillips D. J. H., 1990"Use of macroalgae andinvertebrates as monitors of métallevels in estuaries and coastalwaters". In Furness R. W., RainbowRS. (eds): Heavy Metals in theMarine Environment. CRC Press,Boca Raton, FL: 81-99.
Reimer O., Olsson B.,Tedengren M., 1995Growth, physiological rates andbehaviour of Mytilus edulis exposedto the predator Asterias rubens. Mar.Fresh. Behav. Physiol, 25: 233-244.
Riley J. P., Segar D. A., 1970The distribution of the major andsome minor éléments in marineanimais. I. Echinoderms andCoelenterates. J. Mar. Biol. Ass. UK.,50:721-730.
RoesijadiG., 1992Metallothioneins in métal régulationand toxicity in aquatic animais.Aquat Toxicol, 22: 81-114.
Rouleau C, Pelletier E.,TjâlveH., 1993The uptake and distribution of203
HgCI2 and CH3HgCI2 in the seastar Asterias rubens after 24-hexposure studied by impulse countingand whole body autoradiography.Aquat. Toxicol, 26: 103-116.
Ruppert E. E., Barnes R. D., 1994Invertebrate Zoology. SaundersCollège Publishing, New York.Skei J. M., 1981 - Dispersai andrétention of pollutants in Nomegianfjords. Rapp. P-v. Réun. Cons. Int.Explor. Mer., 181:78-86.
Skei J. M., 1995Tiltaksorienterte undersokelser iSorfjorden og Hardangedjorden1994. Delrapport I.Vannkjemi. NIVA-report (in norvegian), 1 , (3263).
Sorensen E. M. B., 1991Métal poisoning in fish. CRC Press,Boca Raton.
Sorensen M., Bjerregaard P., 1991Interactive accumulation of mercuryand sélénium in the sea star Asteriasrubens. Mar. Biol, 108:269-276.
Temara A., Aboutboul P.,
Warnau M., Jangoux M.,Dubois P., 1995"Kinetics of lead uptake by theskeleton of the asteroid Asteriasrubens (Echinodermata)". In EmsonR. H., Smith A. B., Campbell A. C.(eds): Echinoderm Research 1995,Balkema, Rotterdam: 79-82.
A. Temara et al. Heavy metals in the sea star Asterias ruben (echinodermata) 91
Temara A., Ledent G.,Warnau M., Paucot H.,Jangoux M., Dubois P., 1996aExpérimental cadmium contaminationof Asterias rubens, L (Echinodermata).Mar. Ecol. Prog. Ser., 140: 83-90.
Temara A., Warnau M.,Jangoux M., Dubois P., 1997aFactors controlling heavy métalconcentrations in the asteroidAsterias rubens (Echinodermata).Se. Total Environ., 203: 51-63.
Temara A., Warnau M., Dubois P.,
Langston W.J., 1997bQuantification of metallothioneinsin the common asteroid Asteriasrubens (Echinodermata) exposedexperimentally or naturally tocadmium. Aquat. Toxicol, 38: 17-34.
Temara A., Nguyen Q.A.,Hogarth A.N., Warnau M.,Jangoux M., Dubois P., 1997cHigh sensitivity of skeletogenesis toPb in the asteroid Asterias rubens.Aquat Toxicol, 40: 1-10.
Temara A., Aboutboul P.,
Warnau M., Jangoux M.,Dubois P., 1998aUptake and fate of lead in thecommon asteroid Asterias rubens(Echinodermata). Water Air SoilPollut, 102:201-208.
Temara A., Warnau M., Jangoux M.,puBOisP.. 1998bEffects of exposure to cadmium on
the concentrations of essentialmetals in Asterias rubens(Asteroidea)". In Mooi R., Telford M.(ed) Echinoderm: San francisco.Balkema, Rotterdam: 307-310.
Temara A., Skei J. M.,Gillan D., Warnau M.,Jangoux M., Dubois P., 1 998cValidation of the asteroid Asteriasrubens (Echinodermata) asa bioindicator of spatial and temporaltrends of Pb, Cd, and Zn
contamination in the field. Mar.Environ. Res., 45: 341-356.
Voogt P. A., den Besten P. J.,Kusters G. C. M.,MessingM.W.J., 1987Effects of Cadmium and Zinc onsteroid metabolism and steroid levelin the sea star Asterias rubens L.Comp. Biochem. Physiol., 86C: 83-89.
Vyncke W., Baeteman M.,Guns M., Van Hoeyweghen P.,
Gabriels R., 1991Trace metals in the Belgian dumpingarea for acid wastes from thetitanium dioxide industry (1985-89).Revue de l'Agriculture-Landbouwtijdschrift, 44: 1277-1291.
Warnau M., Ledent G., Temara A.,Jangoux M., Dubois P., 1995aAllometry of heavy métalbioconcentration in the echinoidParacentrotus lividus. Arch. Environ.Contam. Toxicol, 29: 393-399.
Warnau M., Ledent G., Temara A.,Jangoux M., Dubois P., 1995bExpérimental cadmium contaminationof the echinoid Paracentrotus lividus:influence of exposure modeand distribution of the métalin the organism. Mar. Ecol Prog.Ser., 116:117-124.
Warnau M., Teyssié J. L.,FowlerS.W., 1996aBiokinetics of selected heavy metalsand radionuclides in two marinemacrophytes: the seagrassPosidonia oceanica and the algaCaulerpa taxifolia. Mar. Environ.Res., 41:343-362.
Warnau M., Fowler S. W.,Teyssié J.L, 1999Biokinetics of radiocobalt in the aster¬oid Asterias rubens (Echinodermata):sea water and food exposures. Mar.Pollut. Bull, 39: 159-164


Oral/Posterprésentations
Session 1

Session 1 Oral/Poster présentations T 95
i Effect of marine oligotrophy onthe biogeochemistry of radionuclides
Ross A. Jeffree
Oligotrophic or low productivity waters comprise more than 50% ofthe world's océans. Moreover, their extent and degree of oligotro¬phy has increased in one région over the past 50 years. Oligotrophicwaters are characterised by greater a) thermal stratification of thewater column, b) temporal stability in phytoplankton and zooplank¬ton abundances, and c) prominence of picoplankton. With regard tothe présence of nuclides in thèse waters our studies hâve focussedon i) 210Po bioaccumulation in marine organisms, relevant to its pré¬
éminence in human radiological dose from the consumption ofseafoods, and ii) the use of naturally occurring nuclides, such as
234Th, as tracers of biogeochemical processes in the euphotic zone.
A study of 2l0Po concentrations in zooplankton collected from thelow productivity waters of French Polynesia during 1990-1992 has
demonstrated their enhanced uptake of 2l0Po when zooplanktonbiomass is low. 210Po in zooplankton increases exponentially to pre¬
viously unreported levels up to 3200 Bq.kg-' dry weight, as theirbiomass décline to levels as low as 0.14 mg dry weight/cubic mètre.A validated mathematical model, incorporating the established rôleof zooplankton in the removal of 2,0Po from the water column, cap¬
tures the shape of this empirical relationship and also explains thisbiomass-related mechanism that increases 2l0Po concentrations inzooplankton. In a further study the model structure was reviewedto détermine a set of biogeochemical behaviours of 210Po, proposedto be critical to its environmental enhancement under oligotrophy:this set was then used to identify 25 other éléments with compara¬
ble behaviours to 2,0Po. Field investigation in the Timor Sea showedthat four of thèse a priori identified éléments viz. Cd, Co, Pb and
Mn, as well as Cr and Ni, showed elevated water concentrations
96 T Environmental Changes and Radioactive Tracers
with reduced particle removal rates in the euphotic zone, results thatare consistent with those previously obtained for 210Po and the pro¬
posed explanatory model. Thèse findings point to the enhanced sus¬
ceptibility to contamination with particle-reactive éléments ofoligotrophic marine Systems, whose degree and géographie extentmay be enhanced by projected increases in sea surface températuresfrom global warming. Alternative interprétations ofthe inverse rela¬
tionship between biomass and environmental concentrations of par¬
ticle-reactive éléments in the euphotic zone will also be discussed.
Session 1 Oral/Poster présentations T 97
1 Accumulation and releasingof radium in Thypha sp. leavesand detrital materials
Dejanira C. Lauria
V. R. G. Reis
José Marcus O. Godoy
The radium accumulation and libération in Thypha dominguenesPers. green leaves and leaf détritus from a coastal lagoon was stud¬
ied by in situ and lab experiments. From results of leaf sample anal¬
ysis collected in différent locals of the lagoon and the labexperiments, adsorption experiments followed by sequential extrac¬
tion, it was observed the importance of the ionic exchange for the
foliar accumulation. So the salinity plays a very important rôle inthe dynamic of radium accumulation/releasing in the leaf.Décomposition of the leaves was studied by littér bag methods dur¬
ing a period of 6 months. At the end of the experiments the majorcation losses were 96% of K, 76% of Na and 51% of Mg. On theother hand the amount of Ca in the residue increased three times(means a concentration increases of seven times) as well as
increased the total activity of 226Ra and of 228Ra (seven and at least
three times, respectively). In agreement with this observation, lab
experiments showed that the material was able to adsorb quite a
100% ofthe added Ra and its adsorption capacity was estimated as
5 meq (Ba2+)/gdetritus. Radionuclide releasing by sequential extrac¬
tion of the detrital material followed a little bit différent dynamicfrom the green leaf, showing that important fraction of the radiumcan be retained in the littér by carbon mineralization.
98 T Environmental Changes and Radioactive Tracers
1 Biokinetics of selected metalsand radionuclides in echinoderms:a multitracer approach
Michel Warnau
Jean-Louis Teyssié
Scott W. Fowler
The common sea star Asterias rubens and sea urchin Paracentrotuslividus are widely distributed and abundant species in Europeanseas. They hâve been shown to efficiently accumulate metals and
were identified as valuable bioindicators of métal contamination.However, few studies hâve investigated bioaccumulation in thèse
organisms using realistic contaminant concentrations. Hère, bioki¬netics were investigated using radiotracer techniques in order tostudy élément concentrations représentative of those encountered inthe marine environment. High-resolution g-spectrometry allowedthe investigation of several éléments simultaneously (multitracerexperiments). Seven radiotracers were selected: 54Mn, 57Co, 65Zn,
1,0mAg, 10I,Cd, l34Cs, and 24lAm. Bioaccumulation and dépurationwere followed in sea stars and sea urchins exposed via sea water,food, or sédiments in order to détermine prédominant uptakeroute(s) and biological rétention time of the tracers. Except forl14Cs, organisms efficiently bioaccumulated ail the éléments exam¬
ined. Bioconcentration was found to be strongly body-compartmentdépendent. Biological half-lives ranged from a few days to severalmonths depending upon the élément and the exposure route consid¬
ered. Sea urchins bioconcentrated most tracers mainly from sea
water. For sea stars, sea water and food constituted the two mainroutes of uptake (sédiments generally accounted for only a smallproportion in the contamination ofthe organisms).
Session 1 Oral/Poster présentations T 99
I Différence of 137Cs concentrationbetween sex of marine fishes
T. libuchi
Y. Suzuki
Y. Ishikawa
F. Kasamatsu
Monitoring on the artificial radionuclides concentrations of marineorganisms in coastal waters of Japan has been conducted since 1984as a part of the marine environmental radioactive monitoring pro¬
gram sponsored by the Science and Technology Agency of Japan.
The variations of l37Cs concentration in marine organisms and thefactors affecting the variations hâve been investigated.Concentration of l37Cs in marine fishes varied by species, sex, size,and food habits. In this présentation, we demonstrate the différenceof l37Cs concentrations by sex in rockfïsh and flounder togetherwith the différence of stable Cs and stable nitrogen isotope ratio(delta 15N) in thèse fishes, and we discuss the possible factorsaffecting sexual différence of 137Cs concentrations in marine fishes.
1 00 T Environmental Changes and Radioactive Tracers
RadCon: A new Australasianradiological dose assessment model
J. Crawford
R. U. Domel
J. R.Twining
F. F. Harris
ANSTO developed and implemented a radiological dose assessment
model, RadCon, with the emphasis on tropical and subtropical cli-mates. An overview of RadCon will be given in this paper.
Models for dose assessment were developed using information on the
distribution, transport and biological effects from studies mainly in the
temperate and cold régions of the world, almost exclusively in the
Northern Hémisphère. Only Iimited information is currently availablefor tropical and subtropical régions.The original motivation of this work was lo investigate thèse informa¬tion deficiencies and commence targeted research into that data withthe most significant effect on the radiological conséquences for the
Australian and South East Asian région. Aside from the identificationand acquisition of the available data, a computational tool, RadCon,was developed and implemented at ANSTO, to be used in dose assess¬
ment and to assist in the identification of the most relevant data.RadCon was developed as a simple and flexible model to assess the
radiological conséquences, as dose, to humans resulting from short-term release or accidentai release of radionuclides to the atmosphère.RadCon implements internai exposure from inhalation and ingestion as
well as external exposure from the passing cloud and from radionu¬clides deposited on the ground. Atmospheric dispersion and grounddéposition is estimated externally to the program using meteorologicalmodels or measured data. RadCon accepts time-dependent air and
ground concentration which would be the output of an atmospherictransport model suitable for the assessment site.In designing RadCon, the variability of the région (e.g. lifestyle and
diets of groups of the population, soil types, etc.) was taken into
Session 1 Oral/Poster Présentations T 1 01
account. RadCon présents a graphical interface to the user, whichallows the user to set optional parameters over the région under study.In a manner similar to a géographie information system, the user spéc¬
ifies site spécifie information over the two-dimensional région of inter¬est, such as soil type, dietary components of humans and animais, raceand lifestyle.RadCon was written in the Java programming language, resulting inporlability across computer platforms. The estimated dose to man isdisplayed in coloured concentration contours, stepping through time,superimposed on the area of interest and the actual values at a particu¬lar location can be obtained by selecting the particular grid location.To evaluate the RadCon mathematical model and its implementation,ANSTO is participating in the BIOMASS (BlOsphere Modelling andASSessment) model inter-comparison program. BIOMASS is a pro¬
gram sponsored by the International Atomic Energy Agency. ANSTOis participating with the RadCon model in a case study of a contami¬nated area from the Chernobyl accident. The results generated byRadCon for this case study were very encouraging. Areas of potentialmodel improvement were identified and some hâve been incorporated.Data sensitivity analysis was implemented in RadCon, allowing theuser to identify which parameter entered into the model has the mostimpact on the estimated dose, under the conditions ofthe study.
1 02 T Environmental Changes and Radioactive Tracers
Soil-to-plant transfer of radioactivityin tropical Systems: developmentof field study in Northern Australia
JohnTwining
Previous work carried out within an IAEA CRP to evaluate tropicaltransfer of radionuclides into human food showed that soil-to-planttransfer factors were not, on average, différent to those measured intemperate régions (particularly within the Northern Hémisphère).However, closer examination ofthe data showed that some Systems
gave extrême transfer factor values. There also seemed to be a
higher proportion of environments within the tropics and sub-trop-ics that tended towards the extrême. This is to be expected given the
much wider range of conditions and climatic différences observedwhen comparing tropical and temperate régions.
The observed différences were isotope spécifie but not plant spé¬
cifie. That is, if transfer factors were appreciably higher (or lower)than average for any particular isotope then that factor wasobserved in ail samples taken, irrespective of the type of plant.However, it was not necessary that any other isotope would behavesimilarly.
Soil type was identified as the most probable reason behind the
observed différences. Hence, a follow-up study has been designedto identify which soil types are extrême by observing bioaccumula¬tion by an agreed sub-set of two plants (a leafy vegetable and a
grain, which typically give the highest and lowest factors respec¬
tively) growing on a range of différent soil types. The study is alsodesigned to identify the spécifie characteristics of the soil, the cli¬
mate and the agricultural practices that hâve most influence on
transfer to crops.

Session 1 Oral/Poster présentations T 103
This présentation will outline the background and design ofthe cur¬
rent IAEA CRP with spécifie référence to the Australian contribu¬tion that involves a field study of plant uptake following an additionof Cs, Sr and Zn to two soils in the Northern Territory of Australia.Results-to-date from the recently established site will also be
discussed.

Radioactivityand waste disposai
Session 2
Chairman: G. E. Gilbert
Session opening: A. 1. Hernandez-Benitez

Kadioactive wastemanagement: the rôle ofCIEMAT in the Spanish andEuropean R+TD programsfor radwaste disposai
Pedro Rivas Romero
Antonio I. Hernandez Benitez
Introduction
Waste production is a direct conséquence of welfare and industrialdevelopment. The waste volume produced and the hazards some ofthem represent hâve tumcd out in an appeal to rationale production,recycling and the storage of the final products under safe conditions.
Radioactive wastes hâve created the greatest social sensibilization,even though they must corne from activities closely linked to wel¬fare and development, such as nuclear energy production, industrialand diagnostic or therapeutic médical uses.
The "social" positioning on radioactive wastes is sometimes on theedge of rationality. The. military use of nuclear energy, the lack ofknowledge dissémination and biased information are giving place toreactions that go beyond the more elementary social and commonsensés.
Radioactive wastes exist and therefore, they must be adequately man¬
aged (recycling or transmutation) or stored. in a safe way. Their poten¬
tial hazard and long life of some of them impose on our génération the
moral obligation to avoid passing the problem to future générations.
1 08 T Environmental Changes and Radioactive Tracers
The possibility of a permanent storage for high level radioactivewastes on deep geological formations hâve been intensively studiedduring the past twenty years in many countries. Thèse studies are gen-erating the knowledge and technical capabilities needed for buildingand managing a final storage site.
The exercises on long term performance assessment carried out up todate for real or hypothetical scénarios, defined from the knowledge ofnatural Systems, give a reasonable level of confidence on the longterm safety of the storage system.
The long term (104-106 years) assessment is the problem arising moredoubts on the storage System and decreasing its confidence level. On
that sensé, the studies on natural analogues hâve a great relevance forthe conceptual contributions, qualitative and quantitative, that theyoffer to the long or very long term évolution of natural processes and
materials.
Any of the options that might be finally chosen for the final waste
management, will finally end on the necessity of a définitive storage
site.
The design of a Radioactive Waste Geological Storage is based on a
multibarrier System concept (Figure 1). This is established so everybarrier will provide mutual protection to the others. In the case of fail¬
ure of any of the barriers ail the others will act to solve this failure.
The barriers considered are the spent fuel matrix, the canister filling,the storage canister itself, the bentonite seal, the gallery backfill and
the host rock. The ultimate function of the multibarrier System is toavoid or to retard as long as possible the arrivai ofthe radionuclides to
the biosphère with the aim of maintaining a dose to the public belowthe levels of the natural radioactive background for that host rock.
I Objectives
The gênerai objective of the Hydrogeochemical SiteCharacterisation Program of CIEMAT is to study the Long TermBehaviour of the Components of the Radioactive Wastes Storage
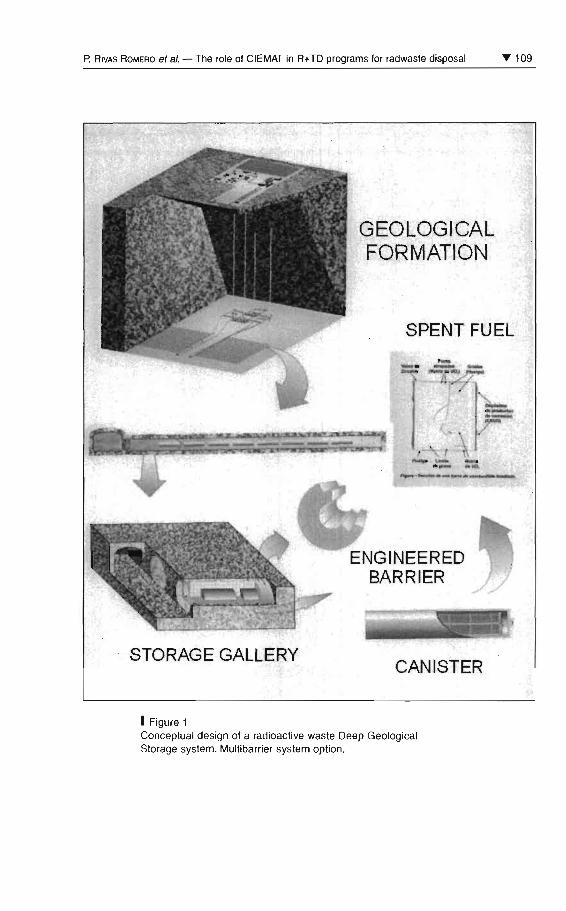
P. RIVAS ROMERO et al. - The raie of CIEMAT in R+TD programs for radwaste disposai T 109
""",," , ---------
1.,/
SPENT FUEL
GEOLOGICALFORMATION
ENGINEEREDBARRIER
STORAGE GALLERYCANISTER
1 Figure 1Conceptual design of a radioactive waste Deep GeologicalStorage system. Multibarrier system option.
1 1 0 T Environmental Changes and Radioactive Tracers
Systems. This objective is focused on the study ofthe processes thatdétermine the behaviour of the backfill and sealing materials, ofgranitic and clayish rocks and of natural analogues, in order to pro¬vide a sound scientific understanding of their rôle.
In the past four years, this objective has broadened to the study ofspent fuel analogues, waste package filling materials and canistercorrosion products. For ail the materials considered, the most rele¬
vant aspect taken into account is their potential capability todecrease radionuclide mobility towards the environment, as theyinteract with the multibarrier system. This retardation or rétentionmechanisms may be of physical or chemical nature or a combina¬tion of différent processes.
Results
The key processes controlling the long term behaviour and safety ofa site act in a coupled way in the system as a whole, presenting a spé¬
cifie relevance for each of the barriers considered. The gêneraiobjective of the Program is to identify those processes, to asses themanner in which they act and to provide a sound scientific under¬standing of their rôle. The results being obtained, presented below,are oriented to fulfil this gênerai objective.
Long term stability of the spent fuel
The key process is the solubilization of the fuel matrix, the releaseof uranium and fission products in an almost dry, reducing, neutraland moderate température environment.
The study is carried out on natural U02+x (Uraninite and
Pitchblende) as a fuel analogue, that has been exposed for millionsof years to the évolution of a natural geochemical environment.The uraninites and pitchblendes studied correspond to the oredeposits of Oklo (Gabon), Palmottu (Finland) (Perez del Villar,2000), Margnac and La Crouzille (France), Sierra Aabarrana, Los
P. Rivas Romero et al. The rôle of CIEMAT in R+TD programs for radwaste disposai T 1 1 1
Ratones and Mina Fe (Spain). They hâve been dated between 2000(Oklo) and 50 Myears (Mina Fe). The more relevant results are thefollowing:
for ail the ore deposits it has been considered that most of the U02+x
(Uraninite and Pitchblende) is original, even if it has undergonehydrothermal and/or meteoric weathering processes;
ail uraninites and pitchblendes are affected by a relatively intense
microfissuration that would had enhanced the weathering processes;
weathering has occurred mainly by pseudoisomorphic replacementof the original minerai specie (Uraninite and Pitchblende) by the
new Uranium minerai without any apparent transport involved;
the kind of weathering dépends on the geochemical environment inwhich it has happened. In high silica reduced environmentsCoffinite (U(IV) silicate) has replaced Uraninite or Pitchblende(Oklo, Mina Fe, Margnac and La Crouzille). In a pegmatitic oxidis-ing environment such as Sierra Albarrana the gummites (complexhydrated U(VI) oxides) hâve partially replaced Uraninite;
ail the weathering processes mentioned imply the mobilisation ofpart of the Uranium from the Uraninite or Pitchblende. The maxi¬
mum mobilisation happens in the weathering to Uranyl phosphates.
The leaching rate and the Uranium concentration in the rock inter-stitial water in contact with the ore do not vary significantly fromthose obtained in Uraninite leaching ( 1 09 1 0"7 g.yr1 for weatheringâges of 50 and 1 Myears respectively). Those values imply Uraniumconcentrations of IO"7 to IO"6 M in the pore water in contact with the
minerai;
in the natural reactor of Bangombé (Gabon) the Uraninite is impov¬erished in 235U due to the fission reaction. However the 234U/238U
and 230Th/234U ratios, with a unity value, indicate that Uraninite has
remained unaltered for at least the last 1.7 Myears. The 206Pb has notbeen mobilised over the last 740 Myears and the Zr, (Te), Ru and
l38Ba hâve remained in the Uraninite where the fission occurred.However, Cs and Sr hâve migrated from that minerai (Gauthier-Lafayeera/., 1999).
From the results showed above one of the main considérations is
that the U mobilisation from natural minerais reflects the behaviourof spent fuel, and the resulting rate of U release from the waste
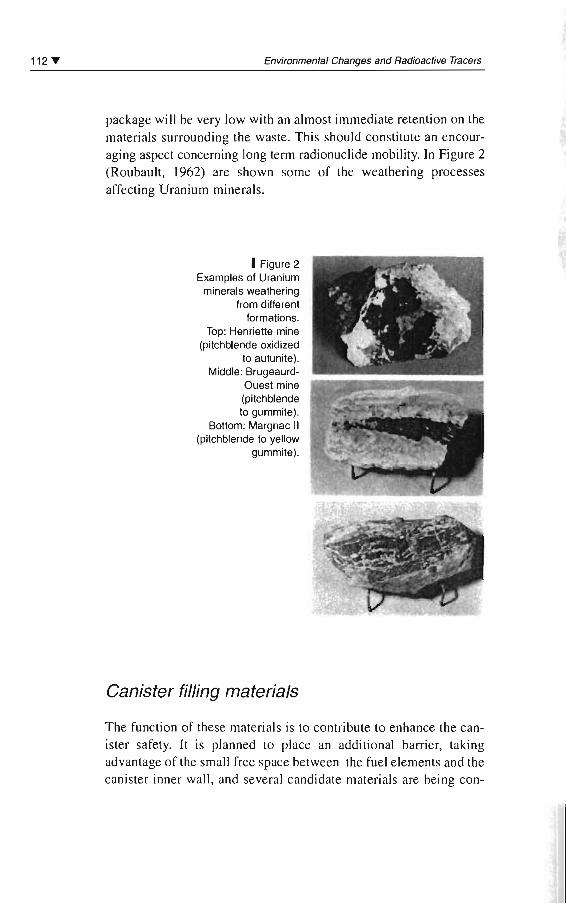
112 T Environmental Changes and Radioacti ve Tracers
pac kage wi ll be very lo w wi th an almos t immediate retent ion on the
ma terials sur round ing the was te. Th is should co nstitute an e ncourag ing aspect co nce mi ng lon g term radionuclide mobility. In Figure 2
(Ro ubault, ] 962) are shown so me of the weathering processes
affecting Uran ium mineraIs.
1Figure 2Examples of Uranium
minerais weatheringfrom differenl
formations.Top: Henriette mine
(pilchblende oxidizedla aulunile) .
Middle: BrugeaurdOuesl mine(pilchblendela gummile).
Boltom: Margnac Il(pilchblende ta yellow
gummite).
Canister fi/ling materials
Th e funct ion of these materi als is 10 contribute to enhance the ca nister safety. I l is planned to place an addi tio nal barrier, tak ing
advantage of the srnall free space bet ween the fue l elements and theca nis ter inner wall, and se veral ca ndidate rna teria ls are bei ng co n-
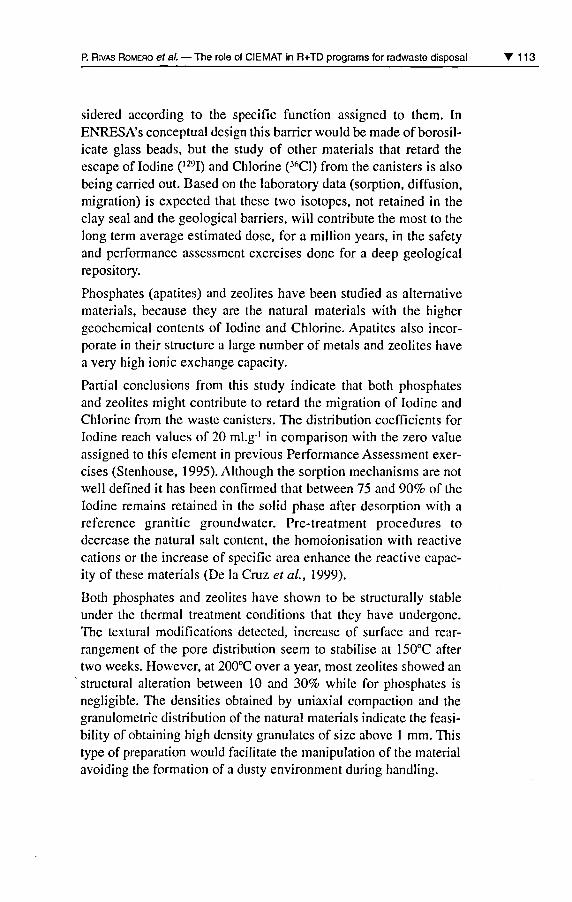
P. Rivas Romero et al. The rôle of CIEMAT in R+TD programs for radwaste disposai T 1 1 3
sidered according to the spécifie function assigned to them. InENRESA's conceptual design this barrier would be made of borosil-icate glass beads, but the study of other materials that retard the
escape of Iodine (I29I) and Chlorine (36C1) from the canisters is also
being carried out. Based on the laboratory data (sorption, diffusion,migration) is expected that thèse two isotopes, not retained in theclay seal and the geological barriers, will contribute the most to the
long term average estimated dose, for a million years, in the safetyand performance assessment exercises done for a deep geologicalrepository.
Phosphates (apatites) and zeolites hâve been studied as alternativematerials, because they are the natural materials with the highergeochemical contents of Iodine and Chlorine. Apatites also incor-porate in their structure a large number of metals and zeolites hâvea very high ionic exchange capacity.
Partial conclusions from this study indicate that both phosphatesand zeolites might contribute to retard the migration of Iodine and
Chlorine from the waste canisters. The distribution coefficients forIodine reach values of 20 ml.g"1 in comparison with the zéro valueassigned to this élément in previous Performance Assessment exer¬
cises (Stenhouse, 1995). Although the sorption mechanisms are notwell defined it has been confirmed that between 75 and 90% oftheIodine remains retained in the solid phase after desorption with a
référence granitic groundwater. Pre-treatment procédures todecrease the natural sait content, the homoionisation with reactivecations or the increase of spécifie area enhance the reactive capac¬
ity of thèse materials (De la Cruz et al, 1999).
Both phosphates and zeolites hâve shown to be structurally stable
under the thermal treatment conditions that they hâve undergone.The textural modifications detected, increase of surface and rear¬
rangement ofthe pore distribution seem to stabilise at 150°C aftertwo weeks. However, at 200°C over a year, most zeolites showed an
structural altération between 10 and 30% while for phosphates is
negligible. The densities obtained by uniaxial compaction and the
granulometric distribution ofthe natural materials indicate the feasi-bility of obtaining high density granulates of size above 1 mm. Thistype of préparation would facilitate the manipulation ofthe materialavoiding the formation of a dusty environment during handling.
1 1 4 T Environmental Changes and Radioactive Tracers
Phosphates most unfavourable characteristic is its low thermal con-ductivity, in the range 0.2 W.nvVK"1. It would be necessary to adjustthis parameter through treatment or mixtures with other materials.
Behaviour of the canister materials
In the Spanish conceptual design of the Deep Geological Storagethe canister material will be constituted by carbon steel or copperalloys (ENRESA, 1997 & 1999). In the case of steel there existboth localised and gênerai corrosion phenomena, with an esti¬
mated mean rate of about 6.5 mm/ year, (Hernandez Benitez,1999). Amongst the dominant corrosion products observed in 18
months experiments under saturated bentonite conditions withhigh HC03- concentrations are Siderite (COj,Fe(s)), Magnetite(Fe304) and Haematite (Fe203) (Azkarate et al, 2000).
Thèse studies hâve been carried out for gathering data on canisterbehaviour, under différent corroding conditions. Thèse results willbe implemented in the framework of the Geochemical Mock Uptest to be carried out along with the FEBEX II Project.
Behaviour of the clay barrier
In relation with this research line has been carried out the FEBEX(Full-scale Engineered Barriers Experiment) project (ENRESA,2000). This project aims at demonstrating the technical feasibilityand studying the behaviour of near-field components of a highlevel radioactive waste repository in crystalline rock. It consists ofan "in situ" test (Grimsel), a "mock-up" (CIEMAT) test and a
séries of complementary laboratory tests as well as modellingwork. In Figure 3 are shown the two expérimental set-up for bothtests. (Huertas et al, 2000).
The clay barrier functions are the following: to facilitate the trans¬
fer of the heat generated by the waste, to act as a low hydraulicconductivity médium between the canister and the host rock, toseal the building discontinuities and fissures ofthe host rock, toretard the diffusive transport phenomena ofthe released radionu-
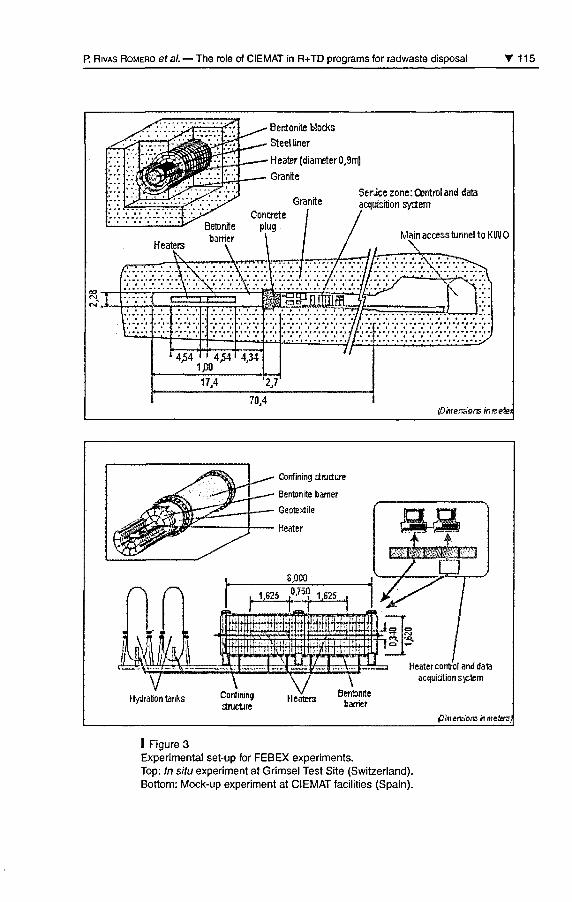
P. Rivas Romero et al. The rôle of CIEMAT in R+TD programs for radwaste disposai 115
Bentonrte blocks
Steel liner
Heater(diameter0.,9mj
Granité
Granité
Heaters
ConaeteBetonite plug
barrier
SerJce zone: Control and dataaajuisition system
Main access tunnel to KIAIO
p'msKMirs inttseiet
VHydration tanks Heaters
Bentonrtebarrier
Heater control and data
acquisition s>ctem
p/rrrenabrs it meters}
I Figure 3Expérimental set-up for FEBEX experiments.Top: In situ experiment at Grimsel Test Site (Switzerland).Bottom: Mock-up experiment at CIEMAT facilities (Spain).
1 1 6 T Environmental Changes and Radioactive Tracers
clides and to provide mechanical support to the host rock protect-ing the canister of possible shear movements of the geologicalformation.
The thermal gradient generated by the radioactive decay and the
hydraulic gradient ofthe rock start the heat flow and water transportin the clay barrier. Thèse two processes give place to the mechani¬
cal reaction of the bentonite and the chemical interactions in themineral/water complex system that form the barrier. The four mainbasic processes (thermal, hydraulic, mechanical and geochemical)function in a coupled manner, producing new minerai phases and
gradients and intrinsic modifications of the porous médium, untilthe gênerai equilibrium of the system is reached.
Therefore, the long term performance assessment requires a deep
knowledge ofthe short term behaviour, identifying and understand¬ing the goveming processes and parameters. This is necessary toprépare a conceptual model as a basis of a numerical model, cali-brated for natural and expérimental évidences, that will guaranteeits long term prédictive capacity.
The research work on the behaviour of clay barriers is being carriedout mainly with the spanish référence bentonite (Serrata de Nijar,Al mena) through laboratory experiments and large scale experi¬
ments in the "mock-up" (CIEMAT) and "in situ" (Grimsel,Switzerland) tests, that are becoming essential to calibrate thefhermo-hydro-mechanical and geochemical coupled numericalmodels (ENRESA, 2000).
The most relevant results, for the basic processes and function ofthe barrier previously mentioned are the following:
Thermal behaviour
In a very short time the clay barrier will reach a quasi-stationary state
and a very regular température distribution, with extrême values ofabout 100°C in the canister interface and 35°C in the contact with the
host rock. The expected mean gradient is on the range FC.cm1.
The heat transfer takes place by convection through water and watervapour phases and during the phase change processes produced bycooling as the distance from the heat source increases.
P. Rivas Romero et al. The rôle of CIEMAT in R+TD programs for radwaste disposai T 1 1 7
The characteristic empirical functions of the clay barrier hâve been
set, relating the thermal conductivity with the hydration state, thespécifie heat with température, and the déformation also with thetempérature (thermal linear expansion coefficient).
The prédictive capacity of the numerical modelling is very good(Gens étal, 1998).
Hydraulic behaviour
The barrier hydration takes place in a radial and centripetal fashion witha relatively homogeneous distribution of relative humidity and presum-
ably of the saturation degree. The construction discontinuities (blockjoints), the structural heterogeneities and of water supply from the host
rock do not seem to produce significant anomalies in the process.
In relatively short time periods the peripheral extemal annulus, ofcentimetric depth, reaches a near saturation while the inner annulusin contact with the canister dries out. However, the hydration rate
reaches extremely low values, due to the low permeability, and thesuction capacity decrease, due to hydration, ofthe clay. Therefore the
clay saturation of the clay barrier will be a process taking several
décades. For the mock-up experiment it has been predicted a 12 years
time to reach a saturation value of 95%.
The hydraulic processes acting are water flow, water vapour diffu¬sion, gas flow, air dissolution in water and dissolved air diffusion.
Up to this moment, to achieve the best fitting level between numeri¬cal prédictions and results for the "mock-up" (CIEMAT) and "in situ"(Grimsel) experiments, it has been indispensable to obtain character¬
istic functions for bentonite; such as permeability as a function of drydensity (pd), of the saturation degree and température; the rétentioncurves expressing the relationship between suction and the saturationdegree at free and constant volumes, or the tortuosity coefficient and
gas permeability as a function of dry density and saturation degree.
Although the prédictive capacity for the barrier hydration processoffers a great degree of confidence, it will be necessary in the nextyears to optimise the adjustments ofthe characteristic functions and todeepen in the study of microestructural modifications and their impacton the characteristic parameters of the barrier (UPC-DrT. 1 999).
1 1 8 T Environmental Changes and Radioactive Tracers
Mechanical behaviour
Processes goveming the mechanical behaviour ofthe barrier are the
thermal expansion and the bentonite porosity variations dependingon the stress, suction (saturation degree) and température fields.
Bentonite has a strong avidity for water, and reacts mechanically, insuch a way that in an open system régime volume can increase up
to 200%. In a closed system régime this process can develop a
swelling pressure during hydration that exponentially dépends on
the initial dry density (Lloret et al., 1999). For the final dry density(pd = 1.60 g.cnr3) of the clay barrier the swelling pressure is about5Mpa.
The first mechanical reaction ofthe clay barrier is the sealing ofthebentonite-rock interface annulus and ofthe discontinuities between
blocks where the free water arrives. From this point the develop¬
ment of pressure is a function of the hydration state, that homoge-neously progresses in a radial and centripetal way as indicated:Hydration implies porosity modifications and therefore of a consid¬
érable amount of bentonite characteristic parameters (water and gas
permeability, thermal conductivity, diffusion coefficient, swellingpressure, etc.).
Prédiction of the barrier mechanical behaviour has an acceptableadjustment with expérimental results. However, is not yet possibleto rigorously analyse the prédictive capacity of the models because
the total pressure sensors response for the mock-up and "in situ"experiments is under local stress adjustments depending on locationand because the hydration state has not produced significantresponses for many of them.
The bentonite mechanical behaviour study has followed an exten¬
sive expérimental programme from which the déformation parame¬
ters as a function of effective stresses, suction and température. Thishas allowed the development on the bentonite thermo-plastic-elas-tic behaviour model.
There hâve been determined the résistance parameter and the elas-
tic shear modulus and the functions relating swelling pressures withdry density and suction hâve been adjusted, as well as the déforma¬tions under load.
P. Rivas Romero et al. The rôle of CIEMAT in R+TD programs for radwaste disposai T 1 1 9
Geochemical behaviour
The geochemical évolution of the clay barrier is produced by theheat flow from the canister and the water flow coming from the rock(granité). At short and médium term the effect of the granitic waterchemistry on the geochemistry of the clay barrier is not significant.
The bentonite minor components solid phases that govern the geo¬
chemical processes by interacting with the hydration water are
Halite Gypsum, Dolomite and Chalcedony. The dissolution kineticsof other minerai components is so slow that they would only wouldaffect the system on a very long term.
Expérimental data indicate that during the hydration transitory state
C" and S042" are transported by the hydration front. As a conserva-tive ion, C1" moves accordingly to the effective porosity determinedwith HTO, while S042" movement is retarded and its concentrationlevels in the advancement front must be regulated by its equilibriumwith Gypsum. Précipitation of Anhydrite occurs in contact with theheat source.
Bicarbonate concentration is controlled by dissolution/précipitationof Calcite and it remains almost practically constant in time for theduration ofthe experiments. Na*, Ca2+, Mg2+ and K+ show a similartrend of mobilisation and concentration around the heat source.
However, the analyses of their stochiometric relationships with theircorresponding anions and of the composition of the bentonite ionicexchange complex show that during transport the exchange reactionswith the smectite hâve occurred. The gênerai trend indicate that thesmectite is enriched in Ca2+ and Mg2+ released by carbonates disso¬
lution and looses Na+ and K+. This is a very favourable aspect
because it would exclude the possibility of smectite illitisation.
The ionic strength ofthe interstitial water varies from 0.07 M in theinlet zone to 1.2 M at the hottest zone, during the hydration transi-tory régime.
Bentonite buffers pH at values close to 8 and the Eh must evolvetowards négative potentials when the residual Oxygen from build¬ing and emplacement is consumed.
Diffusion is the dominant transport process once saturation is
reached. This fact, together with the concentration gradients created
1 20 T Environmental Changes and Radioactive Tracers
by précipitâtes dissolution gives place to sait redistribution and theirleaching by the granitic waters (Cuevas et al, 1998).
The estimation of the barrier interstitial water évolution time seem
to indicate that the bentonite water salinity will be maintained at a
level similar to the initial up to 5000 or 10000 years. So, this timeinterval will be higher than the estimated lifetime ofthe canisters.
The geochemical processes described do not seem to affect the
basic properties of spécifie area, hydraulic conductivity and
swelling pressure of bentonite, according to the measurements per¬
formed after the thermal-hydraulic treatment.
The clay barrier is an efficient filter for the colloids that can be gen-erated as a conséquence of fuel altération. On the other hand, the
high ionic strength of the interstitial water and the pH, close to the
point of zéro charge (PZC) of many interesting colloids, provokestheir immédiate aggregation. A différent situation occurs at the claybarrier/grani te interface, where bentonite and silica colloids can be
présent and are very stable under the physicochemical conditionsexisting in the granitic formation.
The radionuclides will migrate through the barrier by diffusion, and
their movement will be retarded due to sorption reactions with the
clay surface (adsorption/desorption, précipitation, ion exchange, col-loid filtration, etc.). Diffusion data obtained in laboratory experimentswith compacted bentonite at the barrier density vary from 10"11 m2/s
for tritiated water (HTO) to IO14 m2.s"' for Re(VI), as Re042, and
Tc(VII), as Tc04'. Sorption experiments performed on loose bentonite(batch method) hâve demonstrated that Eu(III), Nd(III) and Th(rV)resuit completely retained by bentonite; Cs, Sr and Co hâve high val¬
ues of the distribution coefficient, Kj (Yllera et al, 1998); U(VI) is
slightly retained, and Re(VI), Tc(VII) and I- are not sorbed at ail
(Garcia et al, 1999A). In Figure 4 are shown some of the différenttype of diffusion experiments carried out in clay materials.
It is clear that there it has been a great advance in the knowledge ofthe integrated behaviour of the clay barrier. There are still some
uncertainties, that might be solved in the next research programme.On the other hand, the geochemical models hâve not been calibratedfor the évolution of the key parameters in the large scale experi¬
ments. With this aim it has been proposed the establishment of a
geochemical mock-up experiment.
P. Rivas Romero et al. The rôle of CIEMAT in R+TD programs for radwaste disposai 121
Tracer bilet Cby Tracer outlet
Clay »* Tracer outlet
Tracer btlet Cby < \
PERMEATiONEXPERIMENT
\V
li
V-
IN-DIF FUSIONEXPERIMENT
,.,..,. , . , .
,
/
^Sd s n w
I Figure 4Différent diffusion expérimental set-up usedfor geological material characterization.
Geosphere behaviour
The rôle of the geological formation for site emplacement is thechemical and mechanical protection of the other barriers and toretard the radionuclide transfer to the geosphere. This is achieved as
a conséquence of the structural, hydraulic and geochemical proper¬ties of the geological barrier.
According to the above mentioned functions, the study of the geo¬
logical formation is mainly focused on the obtention of a structuralmodel ofthe discontinuity network, acting as potential flow paths;a groundwater flow model, a geochemical rock-water interactionmodel and a transport model.
The program mainly addresses the geochemical model, and pro¬
vides the basic parameters related to the radionuclide transport. Inthe current program, work is being carried out in granitic, clay andnatural analogue formations.
Some of the most remarkable results are presented in the followingsection:
1 22 T Environmental Changes and Radioactive Tracers
Granitic formations
The first research work in this field made in Spain was started in1989 with the El Berrocal Project (Rivas et al, 1997). The projectwas carried out in a granitic pluton that hosts a number of U minér¬alisations, which were mined over a period of several years,although the mines were definitely abandoned by the late 1960's.The project was an integrated international exercise in geological,geochemical, and hydrogeological characterisation and had the aimof understanding and modelling the past and present-day migrationprocesses that control the behaviour of distribution of naturallyoccurring radionuclides in a fractured granitic environment.
Work at the El Berrocal during the project was extensive. Itincluded geological mapping, structural analysis, mineralogical,lithogeochemical and hydrogeochemical investigations, consider¬ing both stable and radioactive isotopes, colloid and microbial stud¬
ies. Several méthodologies and instrumentation were developed forin situ tracer tests, application of downhole probes, hydrogeologicalcharacterisation and coupled flow and transport modelling. Thefieldwork was supported by a wide laboratory program, which gen-erated valuable data for the interprétation of those phenomenaobserved at natural scale. In Figure 5 are shown the expérimentaland modelled results for the first tracer test performed betweenboreholes S- 13, S- 15 and S-2.
This research constitutes the basis for implementing a methodologythat is used for characterisation of crystalline formations affected by Umobilisation processes. Specially in the case of restoration programsfor abandoned mines, or mill tailings environmental impact studies
(Project Ratoncs, Project MATRIX (Perez del Villar et al, 2000), etc.).
The deep groundwater (= 500 m) of the référence granité (Gomezet al, 1999) used for ENRESA 2000 Performance Assessment exer¬
cise has a sodium/bicarbonate composition presenting a résidence
time of about 20,000 years. The pH is regulated by the equilibriumwith carbonates with neutral or slightly alkaline values. The mea¬
sured redox potential is regulated by the reaction of the redox pairAnkerite (15% Fe)/Goethite presenting a value of -175 mV.
The processes controlling the concentration of the major compo¬
nents of the groundwater are dissolution/précipitation of carbon-
P. Rivas Romero et al. The rôle of CIEMAT in R+TD programs for radwaste disposai 123
.El Berrocal Project: results of the in situ Tracer Test
I Figure 5Tracer test modelling and expérimental results in El Berrocalgranité. First tracer injection /DzO and Uranine)
ates, the ionic exchange (Ca/Na and Mg/Na), montmorillonitisationand précipitation of goethite-Iike iron oxide.
Given the redox potential of this groundwater, uranium concentra¬
tions are below the détection limits, even in the présence of residualUranium mineralization existing in the granité. Those characteris¬tics are considered as highly favourable to minimise the radionu¬
clide mobilisation processes.
The sorption parameters obtained, under oxic conditions, indicatethat more than 90% of Cs, Co and Eu and about 30% of Sr and
Se(IV) are retained by the granité minerais, while Te is not retainedat ail (Garcia et al, 1999b).
Clay formations
The first studies on clay formations for their characterisation to act
as geological barriers hâve been carried out.
The Spanish référence clay formation has a thickness close to 280 m.,being very homogeneous. Thèse sédiments hâve a lacustrine origin,
1 24 T Environmental Changes and Radioactive Tracers
and are Iimited, at top and bottom, by fluvio-alluvial sédiments and
lacustrine-palustrine carbonates, respectively.
Illite and smectite represent more then 80% of the mineralogicalcomposition ofthe formation. The minor minerais that regulate the
groundwater characteristics are Calcite, Dolomite and Gypsum. Theorganic matter content is near 1.5%.
The values of total cation exchange capacity, spécifie area and
hydraulic conductivity are cohérent with the mineralogical compo¬
sition. As a whole, thèse values provide this formation with a highindex of favourability as a site emplacement host rock.
The interstitial waters hâve a sodium/sulphate nature with pH val¬
ues around 7.5. The geochemical modellisation is being performed.
The radionuclide rétention capacity is higher than for the référencegranité. For Cs, Sr, Co and Eu the value of the distribution coeffi¬
cient increases in one or several orders of magnitude.
In the Mt. TERRI Project (Thury & Bossart, 1999), intercompari-son exercises hâve been carried out for the extraction and analyses
of the interstitial water, the geochemical modelling and the déter¬
mination of diffusion coefficients 1.3-2.3 10" m2.s"' for HTO and
2.3-3.0 10'2 m2.s-' for I (Yllera et al, 2000). Ail this work has been
carried out with the Mt TERRI Opalinous Clay formation, a veryConsolidated clay of marine origin.
As a conséquence ofthe start of this research line on bentonite engi-neered barriers, a participation in the GMT Project exists, fïnancedby Japan, to study the gas transport in the référence japanese ben¬
tonite. Also, in the framework of the FEBEX H Project, gas trans¬
port essays in the "in situ" (Grimsel) and in the "geochemicalmock-up" experiments hâve been proposed.
Radionuclides behaviour in the geosphere(natural analogues)
In the host rock of the Bangombé (Gabon) reactor, the Uraniumhas its natural isotopic composition, thus, indicating that theUranium from the reactor has practically not been mobilised.Neither are there évidences of isotopic data that indicate Sr of Morétention.
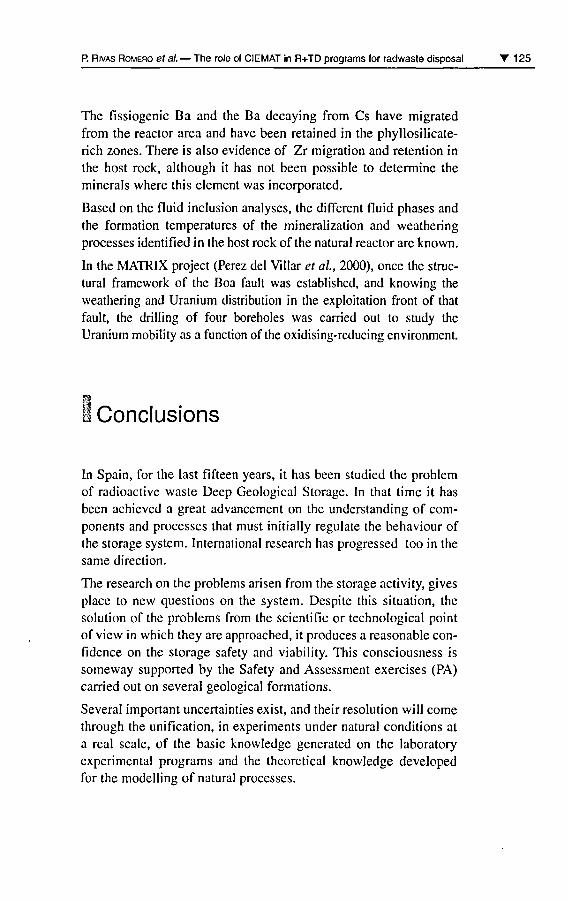
P. Rivas Romero et al. The rôle of CIEMAT in R+TD programs for radwaste disposai T 1 25
The fissiogenic Ba and the Ba decaying from Cs hâve migratedfrom the reactor area and hâve been retained in the phyllosilicate-rich zones. There is also évidence of Zr migration and rétention inthe host rock, although it has not been possible to détermine theminerais where this élément was incorporated.
Based on the fluid inclusion analyses, the différent fluid phases and
the formation températures of the mineralization and weatheringprocesses identified in the host rock ofthe natural reactor are known.
In the MATRIX project (Perez del Villar et al, 2000), once the struc¬
tural framework of the Boa fault was established, and knowing the
weathering and Uranium distribution in the exploitation front of that
fault, the drilling of four boreholes was carried out to study the
Uranium mobility as a function ofthe oxidising-reducing environment.
Conclusions
In Spain, for the last fifteen years, it has been studied the problemof radioactive waste Deep Geological Storage. In that time it has
been achieved a great advancement on the understanding of com¬
ponents and processes that must initially regulate the behaviour ofthe storage system. International research has progressed too in the
same direction.
The research on the problems arisen from the storage activity, givesplace to new questions on the system. Despite this situation, the
solution of the problems from the scientific or technological pointof view in which they are approached, it produces a reasonable con¬
fidence on the storage safety and viability. This consciousness is
someway supported by the Safety and Assessment exercises (PA)carried out on several geological formations.
Several important uncertainties exist, and their resolution will cornethrough the unification, in experiments under natural conditions at
a real scale, of the basic knowledge generated on the laboratoryexpérimental programs and the theoretical knowledge developedfor the modelling of natural processes.
126 T Environmental Changes and Radioactive Tracers
On the other hand, ail the méthodologies and knowledge obtainedin the field of radioactive wastes is applicable to any of the envi¬
ronmental fields that appear every day. In that way CIEMAT has
participated in several projects involving both natural radionuclidesof even metallic contaminants. One of thèse cases was the study ofthe contaminated soils from the Aznalcôllar area, after a miningslurry spill at the end of April, 1998.
AknowledgementsThe différent research programs reflected in this document hâve been carried
out in the framework of ENRESA R+D programs since 1988,
and of the consécutive Framework Programs of the European Union.
BibliographyAZKARATE I., MADINA V.,Insausti M., 2000"Estudio de los productos decorrosion de la capsula y suinteracciôn con la barrera arcillosade ingenien'a". In: ProyectoCORROBEN, Informe Final 1997-1999, INASMET, San Sébastian(Esparia), 51 p.
CUEVAS J., VlLLAR M. V., MARTIN M.,Cobena J. C, Leguey S., 1998Thermal-hydraulic gradients onbentonite; time dépendent distributionof soluble salts, microestructuraleffects and modification of thehydraulic and mechanicalbehaviour". In: Key Issues in WasteIsolation Research, Barcelona,2-4 December 1998.CIEMAT/DIAE/541 1 1/18/98.
De La Cruz B., Rivas R,HernAndez A., Marin C, Villar M. V.,De La Iglesia A, 1999"Materiales alternatives de relleno dela capsula de almacenamiento de
residuos radiactivos de altaactividad". Irr. Proyecto RELLENOS,Informe Técnico ENRESA 1/99,Madrid, 1999), 93 p.
ENRESA, 1997Evaluation del comportamiento y laseguridad de un almacenamientogeolôgico profundo en granito.Informe Técnico ENRESA 6/97,Madrid, 1997), 179 p.
ENRESA, 1999Evaluation del comportamiento y laseguridad de un almacenamientoprofundo en arcilla. Informe TécnicoENRESA 3/99, Madrid, 1999),219 pp.
ENRESA, 2000"Full-scale Engineered BarriersExperiment for a deep geologicalrepository for high level radioactivewaste in crystalline host rock". Irr.FEBEX Project, Informe FinalENRESA 1/00 (ISSN-1134-380X,Madrid, 2000), 354 p.
P. Rivas Romero et al. The rôle of CIEMAT in R+TD programs for radwaste disposai T 127
Huertas F., Fuentes Cantillana J. L.,Julien F., Rivas P., Linares J.,Farina P., Ghoreychi M.,JOCKWER N-, KlCKMAIER W.,Martinez M. A., Samper J.,Alonso E., Elorza F. J. 2000"Full-scale engineered barriersexperiment for a deep geologicalrepository for high-level waste incrystalline host rock". In: FEBEXProject, Informe Final ContractFI4W-CT95-0006 (EUR 19147 EN,Belgium), 362 p.
GarcIa Gutiérrez M., MissanaT.,Yllera A. Mingarro M., 1999a"Sorption and diffusion experimentsin FEBEX bentonite". In: FEBEXProject, Informe Técnico CIEMAT/DIAE/541 11/3/99, Madrid.
GarcIa Gutiérrez M., Yllera A.,Fernandez V., Mingarro M.,MissanaT., 1999b"Cuantificacién de paramétras desorciôn y difusiôn en granitosy arcillas espanolas". In: MYCOProject, Informe Final CIEMAT/DIAE/54231/8/99, Madrid.
Gauthier-Lafaye F, Ledoux E.,Smellie J., Louvat D., Michaud V.,
Perez del Villar L., Oversby V.,
Bruno J., 1999Behaviour of nuclear reactionproducts in a natural environment(the Oklo site, Gabon, WesternAfrica). Final Report CIEMAT/DIAE/54312/13/99, Madrid.
Gens A., GarcIa Molina A. J.,Olivella S., Alonso E. E.,Huertas F, 1998Analysis of a full scale in situ testsimulating repository conditions.Int. J. Num. Anal. Meth. In Geomech.,22:515-548
Gomez P., Garralôn A., Turrero M. J.,SAnchez L., Melon A., Ruiz B.,FernAndezF., 1999Impacto medio-ambiental de larestauration de la Mina Ratones enlas aguas subterrâneas. Modelo
hidrogeoquimico. Informe FinalCIEMAT/DIAE/5421 1/7/99, Madrid.
HernAndez BenItez A., 1999 -Empleo de mezclas de productos decorrosiôn/bentonita en la maquetageoquimica del Proyecto FEBEX-II:Estudio bibliogrâfico y aproxima-ciones realizadas. Informe TécnicoFEBEX, CIEMAT 70-IMA-I-0-05,Madrid, 29 p.
Lloret A., Villar M. V,PintadoX., 1999Ensayos THM: Informe de sintesis.Informe Técnico FEBEX,CIEMAT/DIAE/541 11/1 5/99, Madrid.
Perez del Villar L., 2000CIEMAT contribution to the Palmottuinternational project. Final ReportPalmottu Project, CIEMAT/DIAE/54321/5/00, Madrid.
Perez del Villar L. Cozar J. S.,Pardillo J., Buil B., Pelayo M.,Labajo M. A., 2000Mineralogia y geoquimicade los rellenos fisurales del ProyectoMATRIX; Implication paralos procesos de disoluciôn,migraciôn y rétentionde los radionucleidos naturales yotros elementos anâlogos(Mina Fe, Ciudad Rodrigo).Informe Final Proyecto MATRIX,CIEMAT/DIAE/54331/1/00, Madrid.
Rivas P., Hernân P., Bruno J.,Carrera J., Gômez P., Guimera J.,MarIn C., Perez del villar L., 1997El Berrocal Project: Characterizationand validation of natural radionuclidemigration processes under realconditions on the fissured graniticenvironment. Final Report. ContractFI2W-CT91/0080 (EUR 17478 EN,ISBN 92-827-9673-6),Luxembourg, 522 p.
Stenhouse M. J., 1995Sorption databases for Crystalline,Mari and Bentonite for PedormanceAssesment Nagra Technical ReportNTB-93-06.
128' Environmental Changes and Radioactive Tracers
RoubaultM., 1962Les Minéraux Uranifères françaiset leur gisements. Saclay,institut nationale des scienceset techniques nucléaires, t.ll, 419 p.
Thury M., Bossart P., 1999The Mont Terri rock laboratory, a newinternational research projectin a Mesozoic shale formation,in Switzerland. Engineering Geology,52: 347-359.
UPC-DIT, 1998Febex Project: Thermo-hydro-mechanical (T-H-M) modelling of the"mock up" and "in situ" tests. FEBEX
Technical Report 70-UPC-M-0-05,Barcelona.
Yllera de llano A.,Hernandez Benitez A.,GarcIa Gutiérrez M., 1998Caesium Sorption Studies onSpanish Clay Materials.Radiochimica Acta, 82: 275-278.
Yillera de Llano A.,Mingarro Sainz-Ezquerra M.,GarcIa Gutiérrez M., 2000DI Experiment: Results of theLaboratory Diffusion Experiments.Mont TERRI Project Technical Note99-50, 25 p.
Radionuclide migrationin arid soils
John R. Harris
Takashi Itakura
Gordon D. McOrist
Tim E. Payne
David E. Smiles
Introduction
Australia is siting and establishing a national radioactive waste
repository for the disposai of low level and short lived intermediatelevel waste. The repository will be a near surface facility located inan arid climate. A code of practice for such a facility in Australia,including site sélection criteria, was issued by the National Healthand Médical Research Council (NHMRC, 1992). In February 1998,
a région in the central north of South Australia (CNSA région) was
selected for detailed assessment (BRS, 1997).
The site sélection criteria for the repository include requirementsthat the geological structure and hydrogeological conditions of thesite should enable prédiction of radionuclide migration times and
patterns and that the geochemical and geotechnical properties of the
site should inhibit migration of radionuclides. Migration of radionu¬clides dépends on the rate of water movement and the retardation ofthe radionuclides by chemical reaction with, and adsorption on, theregolith material.
The climate of the CNSA région is characterised by irregular lowrainfall with an average of 198 mm.yr1, low relative humidity, high
1 30 T Environmental Changes and Radioactive Tracers
evaporation and high summer températures. Based on rainfall and
evaporation in the région, Harries et al (1999) calculated that the
deep drainage for typical soils was between 0.004 mm.yr1 and
1.3 mm.yr1 in the présence of végétation and between 1.4 mm.yr1and 7 mm.yr1 in the absence of végétation. Limited field measure¬
ments were consistent with thèse estimâtes. Thèse low water fluxesindicate that the transit time of water moving from the repositorytowards the water table is expected to be many thousand years.
This paper describes technical studies on the retardation of radionu¬
clides undertaken in support of the site sélection and to provideinformation needed for the safety assessment.
Radionuclide retardation
The migration of most radionuclides in groundwater is slower than
the rate of water movement because chemical précipitation and
adsorption remove the radionuclide from the aqueous phase and
deposit it on the solid matrix. Adsorption, by which a soluté is
bound by the surfaces of minerais and organic matter in the soil, sig¬
nificantly retards the movement of ail radioisotopes including those
that are relatively or highly soluble. The complex sorption interac¬
tion can be expressed as a distribution coefficient (Kd), which is the
ratio of the amount of the radionuclide sorbed by the solid (g.g1)divided by the concentration in the equilibrium solution (g.ml1).The Kd value is commonly used as a means of assessing the mobil¬ity of radionuclides in the environment and for comparing adsorp¬
tion data obtained from différent sources (McKinley and Scholtis,1992; Sheppard and Thibault, 1990).
The value ofthe Kd dépends on the élément in question, the chem¬
ical conditions of the regolith solution, and properties of the solid(such as its surface area, surface charge, mineralogy, ete). Some élé¬
ments (such as iodine) hâve relatively low Kd values in a range ofgeochemical environments, whereas others (such as thorium) hâve
very high Kd values and are virtually immobile in most natural envi¬
ronments. However even for a single élément, the value of Kd can
J. R. Harris et al Radionuclide migration in arid soils T 131
cover many orders of magnitude depending on the system in ques¬
tion. We hâve measured Kd values and retardation over a range ofchemical conditions using two différent types of expérimental pro¬
cédure: batch and column experiments.
Batch experiments
Batch experiments assess géologie materials in terms of their abil¬
ity to adsorb radionuclides under a range of expérimental condi¬
tions. The batch technique measures adsorption of radionuclidesfrom a standard solution at a high liquid-to-solid ratio (10:1 or100:1). Thèse high solid-to-liquid ratios are dissimilar to field con¬
ditions in the unsaturated zone of the arid environment, but themeasurement is rapid, reproducible and relatively inexpensive. Thecolumn experiments described in Section 4 use liquid-to-solid ratiosmore comparable to field conditions. In the batch experiment, solid,radionuclide and aqueous phases are mixed for 48 hours, the liquidphase separated by centrifugation and the radionuclide concentra¬
tion in aqueous phase measured.
Batch experiments hâve been used to measure the sorption of ^Co,n7Cs and 218U. The expérimental duration was three days. In the
first 24 hours, the solids were pre-equilibrated with the backgroundelectrolyte. The radionuclide, which is supplied in an acid solution,was then added, and the system immediately adjusted to therequired pH value. The samples were gently shaken in unsealed
centrifuge tubes at room température. After 48 hours contact time,the solid and liquid phases were separated by centrifugation and the
60Co, 137Cs and 238U content ofthe clear supernate was measured byg-spectrometry or kinetic phosphorimetry.
Batch experiments with césium were performed with two différ¬ent concentrations of radionuclide. Trace césium experimentswere undertaken with carrier-free césium- 137, and experiments at
a higher total césium (ECs) of 1 mmol.l"1 were carried out afteradding CsCl. The différent concentrations of césium enable chem-
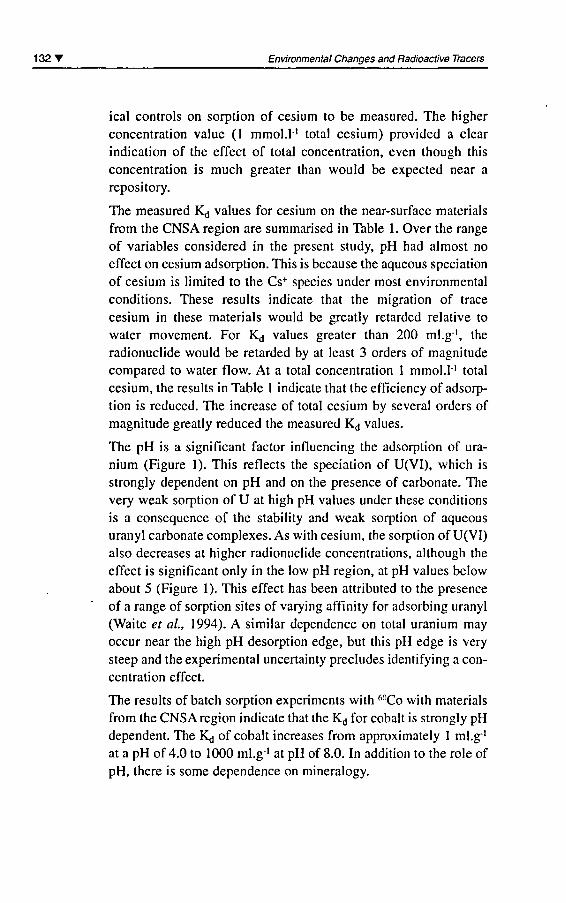
1 32 T Environmental Changes and Radioactive Tracers
ical controls on sorption of césium to be measured. The higherconcentration value (1 mmol.l"1 total césium) provided a clearindication of the effect of total concentration, even though thisconcentration is much greater than would be expected near a
repository.
The measured Kd values for césium on the near-surface materialsfrom the CNSA région are summarised in Table 1. Over the range
of variables considered in the présent study, pH had almost no
effect on césium adsorption. This is because the aqueous speciationof césium is Iimited to the Cs+ species under most environmentalconditions. Thèse results indicate that the migration of trace
césium in thèse materials would be greatly retarded relative towater movement. For K,j values greater than 200 ml.g"1, the
radionuclide would be retarded by at least 3 orders of magnitudecompared to water flow. At a total concentration 1 mmol.l"1 totalcésium, the results in Table 1 indicate that the efficiency of adsorp¬
tion is reduced. The increase of total césium by several orders ofmagnitude greatly reduced the measured Kd values.
The pH is a significant factor influencing the adsorption of ura¬
nium (Figure 1). This reflects the speciation of UfVT), which is
strongly dépendent on pH and on the présence of carbonate. The
very weak sorption of U at high pH values under thèse conditionsis a conséquence of the stability and weak sorption of aqueous
uranyl carbonate complexes. As with césium, the sorption of U(VI)also decreases at higher radionuclide concentrations, although the
effect is significant only in the low pH région, at pH values belowabout 5 (Figure 1). This effect has been attributed to the présence
of a range of sorption sites of varying affinity for adsorbing uranyl(Waite et al, 1994). A similar dependence on total uranium may
occur near the high pH desorption edge, but this pH edge is verysteep and the expérimental uncertainty precludes identifying a con¬
centration effect.
The results of batch sorption experiments with 60Co with materialsfrom the CNSA région indicate that the Kd for cobalt is strongly pHdépendent. The Kj of cobalt increases from approximately I ml.g"1
at a pH of 4.0 to 1000 ml.g1 at pH of 8.0. In addition to the rôle ofpH, there is some dependence on mineralogy.
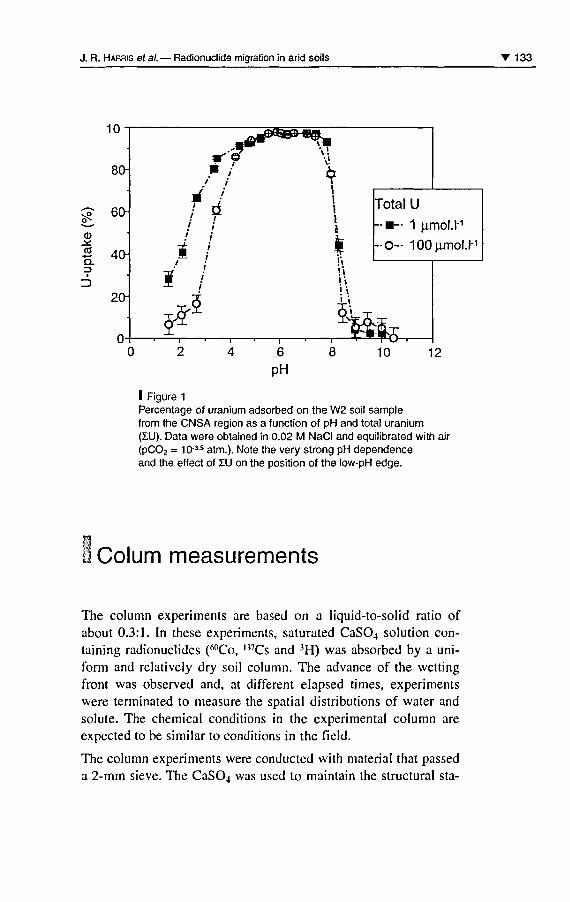
J. R. Harris et al. Radionuclide migration in arid soils 133
| 40HQ.3
Total U
- 1 Limol.l-1
-O- 100umol.l"1
12
I Figure 1
Percentage of uranium adsorbed on the W2 soil samplefrom the CNSA région as a function of pH and total uranium(ZU). Data were obtained in 0.02 M NaCI and equilibrated with air(pC02 = 10" atm.). Note the very strong pH dependenceand the effect of IU on the position of the low-pH edge.
Colum measurements
The column experiments are based on a liquid-to-solid ratio ofabout 0.3:1. In thèse experiments, saturated CaS04 solution con¬
taining radionuclides (6(,Co, 137Cs and 3H) was absorbed by a uni-form and relatively dry soil column. The advance of the wettingfront was observed and, at différent elapsed times, experimentswere terminated to measure the spatial distributions of water and
soluté. The chemical conditions in the expérimental column are
expected to be similar to conditions in the field.
The column experiments were conducted with material that passed
a 2-mm sieve. The CaS04 was used to maintain the structural sta-
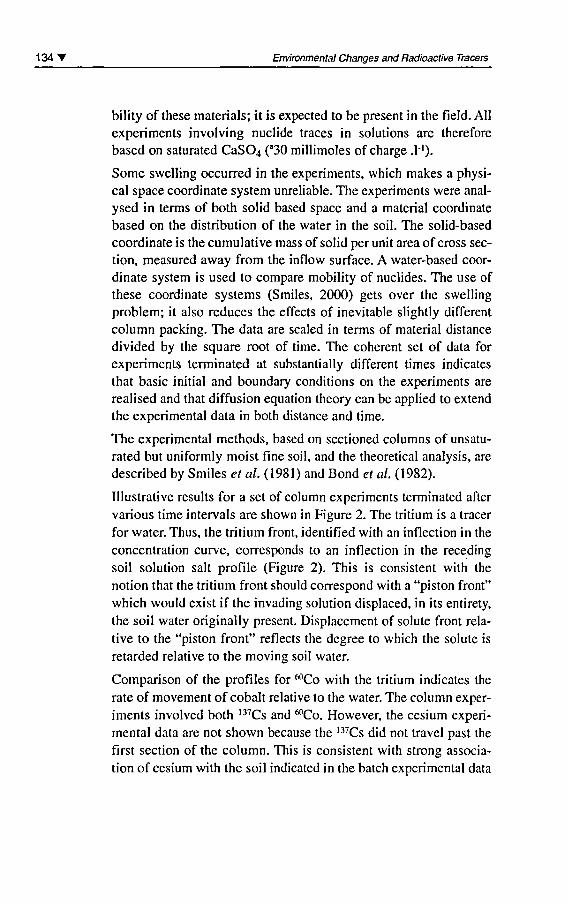
1 34 Environmental Changes and Radioactive Tracers
bility of thèse materials; it is expected to be présent in the field. Ailexperiments involving nuclide traces in solutions are thereforebased on saturated CaS04 (a30 millimoles of charge .l1).
Some swelling occurred in the experiments, which makes a physi¬
cal space coordinate system unreliable. The experiments were anal¬
ysed in terms of both solid based space and a material coordinatebased on the distribution of the water in the soil. The solid-basedcoordinate is the cumulative mass of solid per unit area of cross sec¬
tion, measured away from the inflow surface. A water-based coor¬
dinate System is used to compare mobility of nuclides. The use ofthèse coordinate Systems (Smiles, 2000) gets over the swellingproblem; it also reduces the effects of inévitable slightly différentcolumn packing. The data are scaled in terms of material distancedivided by the square root of time. The cohérent set of data forexperiments terminated at substantially différent times indicatesthat basic initial and boundary conditions on the experiments are
realised and that diffusion équation theory can be applied to extendthe expérimental data in both distance and time.
The expérimental methods, based on sectioned columns of unsatu-
rated but uniformly moist fine soil, and the theoretical analysis, are
described by Smiles et al. (1981) and Bond et al. (1982).
Illustrative results for a set of column experiments terminated aftervarious time intervais are shown in Figure 2. The tritium is a tracer
for water. Thus, the tritium front, identified with an inflection in the
concentration curve, corresponds to an inflection in the recedingsoil solution sait profile (Figure 2). This is consistent with the
notion that the tritium front should correspond with a "piston front"which would exist if the invading solution displaced, in its entirety,the soil water originally présent. Displacement of soluté front rela¬
tive to the "piston front" reflects the degree to which the soluté is
retarded relative to the moving soil water.
Comparison of the profiles for MCo with the tritium indicates the
rate of movement of cobalt relative to the water. The column exper¬
iments involved both 137Cs and "'Co. However, the césium expéri¬
mental data are not shown because the 137Cs did not travel past the
first section of the column. This is consistent with strong associa¬
tion of césium with the soil indicated in the batch expérimental data
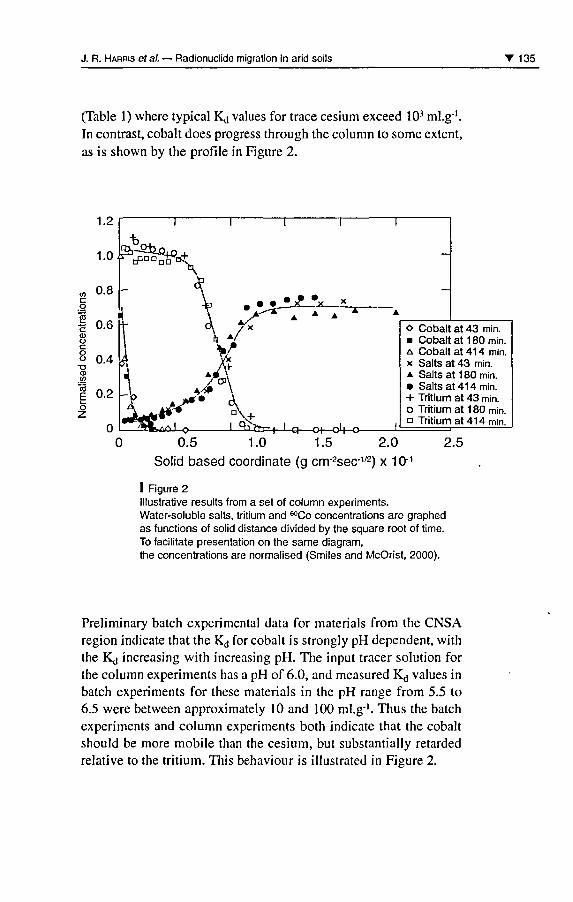
J. R. Harris et al. Radionuclide migration in arid soils 135
(Table 1) where typical Kd values for trace césium exceed IO3 ml.g"1.
In contrast, cobalt does progress through the column to some extent,as is shown by the profile in Figure 2.
1.2
1.0
-t
5,-9^0+0 +^rPDBna°<
0.8 -
£ 0.6
0.4
ca
Eo
0.2
Xc?
ri
xr s*-?*
I °o ca~4- I q en cJ-t-o-
Cobalt at 43 min.Cobalt at 1 80 min.Cobalt at 41 4 min.Salts at 43 min.Salts at 180 min.Salts at 41 4 min.Tritium at 43 min.Tritium at 1 80 min.Tritium at414 min.
0.5 1.0 1.5 2.0 2.5Solid based coordinate (g cnr2sec-1/2) x 10°
I Figure 2lllustrative results from a set of column experiments.Water-soluble salts, tritium and ^Co concentrations are graphedas functions of solid distance divided by the square root of time.To facilitate présentation on the same diagram,the concentrations are normalised (Smiles and McOrist, 2000).
Preliminary batch expérimental data for materials from the CNSArégion indicate that the Kd for cobalt is strongly pH dépendent, withthe Kd increasing with increasing pH. The input tracer solution forthe column experiments has a pH of 6.0, and measured Kd values inbatch experiments for thèse materials in the pH range from 5.5 to6.5 were between approximately 10 and 100 ml.g'1. Thus the batchexperiments and column experiments both indicate that the cobaltshould be more mobile than the césium, but substantially retardedrelative to the tritium. This behaviour is illustrated in Figure 2.
136' Environmental Changes and Radioactive Tracers
Total Césium
Trace Cs
Trace Cs
Trace Cs
ICs = 1 mmol.l '
pH
7.0
8.0
9.0
various
Measured range of Kd
4000 to 9000 ml.g'1
2000 to> 10000 ml.g"1
3000 to> 10000 ml.g"1
170 to 330 ml.g''
I Table 1
Summary of Kd ranges for 1 1 experiments with Césium on W1 andW2 soils from the Australian arid zone (mass loading 0.3 g/ 30 ml).Note the lack of significant pH dependence but a strong effect oftotal césium (ICs).
Conclusions and recommendations
Measurements of radionuclide adsorption in batch experiments, and
measurements of nuclide retardation during absorption of water bycolumns of relatively dry soils, hâve been undertaken. The batchexperiments enable dependence of retardation on geochemical con¬
ditions to be investigated, whilst the column experiments enableretardation under spécifie conditions to be measured under unsatu-rated conditions similar to field conditions.
Repository safety assessment requires prédiction of the behaviourof any radionuclides released from the repository. For an arid zonerepository, this needs to be based on knowledge of water flow and
radionuclide retardation in materials at the site. A combination ofbatch and column experiments can provide the required informationon radionuclide retardation for site spécifie samples.
AknowledgementsSupport for some of this work was provided by the Bureau
of Rural Sciences and the Department of Induslry,Science and Resources.
J. R. Harris et al. Radionuclide migration in arid soils 137
BibliographyBond W. J., Gardiner B. N.,Smiles D. E., 1982Constant Flux Absorption of aTritiated Calcium Chloride Solutionby a Clay Soil. Soil Science Societyof America Journal, 46: 1133-1137.
BRS1997A Radioactive Waste Repository forAustralia: Site Sélection Study ae
Phase 3: Régional Assessment:A Public Discussion Paper. Bureauof Resource Sciences, Canberra.
Harries J. R., Payne T. E.,Kirby J. M., Smiles D. E., 1999"Studies for Selecting a Site for anAustralian Near-Surface Repository".Irr. 7th International Conférence onRadioactive Waste Management andEnvironmental Remediation, Nagoya,Japan, 26-30 September 1999,American Society of MechanicalEngineers (AMSE International).
McKinley I. G., Scholtis A., 1992"Compilation and Comparison ofRadionuclide Sorption Databasesused in Récent PerformanceAssessments". Irr. Proceedings of aNEA Workshop on Radionuclidesfrom the Safety EvaluationPerspective, 16-18 October 1991,Interlaken Switzerland, OECD.
NHMRC (National Health andMédical Research Council), 1992
Code of Practice for the Near-Surtace Disposai of RadioactiveWaste in Australia. Radiation HealthSéries No. 35, AGPS, Canberra, 44 p.
Sheppard M. I., Thibault D. H., 1990Default Soil Solid/Liquid PartitionCoefficients, Kds, for Major SoilTypes: a Compendium. HealthPhysics., 59:471-482.
Smiles D. E., 2000Material coordinates and solutémovement in consolidating clay.Chem. Eng. Sel, 55: 773-781.
Smiles D. E., Perroux K. M.,Zegelin S. J., Raats P. A. C, 1981Hydrodynamic Dispersion DuringConstant-rate Absorption of Water bySoil. Soil Science Society of AmericaJournal, 45: 453-458.
Smiles D. E., McOrist G. D., 2000"Radionuclide movement duringunsteady unsaturated soil waterflow". In. Proceedings of 24thInternational Symposium on theScientific Basis for Nuclear WasteManagement, Sydney.
Waite T. D., Davis J. A., Payne T. E.,Waychunas G. A., Xu N., 1994Uranium(VI) Adsorption toFerrihydrite: Application of a SurfaceComplexation Model. Geochim.Cosmochim. Acta., 58: 5465.

Actinide séparations usingextraction chromatography
Riitta Pilviô
Michael Bickel
Introduction
Radiochemistry has always been and still is a crucial tool in the
field of radionuclide détermination; this holds particularly in thecase of alpha and beta emitters. In environmental samples the con¬
centrations of actinides are very low. Therefore spécial chemicalprocédures are needed for preconcentration and séparation of thèse
nuclides from différent matrices and from each other.
Séparation methods based on extraction chromatography hâve
become increasingly popular in radiochemical analysis. This is due
to their simplicity, rapidity and the savings in reagent and waste dis¬
posai costs compared to the traditional séparation methods based
on, e.g., anion exchange and liquid-liquid extraction.
In solvent extraction, an ion is transferred from the aqueous phase
to the organic phase. Extraction chromatography is a combinationof liquid/liquid extraction and the chromatographie technique. Themobile phase is an aqueous solution and the stationary phase is an
organic solution loaded onto an inert support. In the majority ofcases the compounds to be analysed, flowing through the columnwith the eluent, form an extractable species at the boundary of theaqueous and organic phases. The transfer of the species between the
phases happens simultaneously with the complex formation or asso¬
ciation processes (Siekeirsky et al, 1975).
1 40 T Environmental Changes and Radioactive Tracers
Philip Horwitz and co-workers hâve developed spécial extractionchromatographie resins for the séparation of actinides from différ¬ent sample matrices. They are commercially available fromEichrom Industries, Inc., U.S.A. Thèse resins are comprised ofdifférent organic stationary phases sorbed onto inert polymericsupports.
The resins used in this work were UTEVA Resin, TRU Resin and
TEVA Resin. The UTEVA Resin was developed for the séparationof uranium and fetravalent actinides from différent matrices. It con¬
sists of diamyl amylphosphonate sorbed onto an inert polymericsupport called Amberlite XAD-7 (Horwitz et al, 1992).
The TRU Resin is used for séparation of /ranswranic éléments. Itconsists of octyl(phenyl)-yV,N-diisobutylcarbamoyImethylphos-phine oxide (CMPO) dissolved in tributyl phosphate (TBP) sup¬
ported on an inert substrate Amberlite XAD-7. In addition tosequental séparation of actinides the TRU Resin can be used forgroup séparation of actinides from large amounts of impurities and
other radio-isotopes, e.g. Sr (Horwitz et al, 1990).
The TEVA Resin will strongly adsorb ail tetravalent actinides. Thisresin is comprised of an aliphatic quartemary ammonium sait calledAliquat 336N supported on Amberlite XAD-7 (Horwitz et al, 1993).
A method has been developed for the séparation of Th, U, Pu, and
Am, ail from a single sample (Pilviô et al, 1998; 1 999). However,in environmental samples the natural radionuclides of Th and U are
often présent in far greater quantifies than Pu, and Am, which are ofartificial origin. An average concentration of natural U in seawater
is 3.3 ppb, corresponding to 41 mBq.l"1 (Ivanovich et al, 1982),
while Pu and Am concentrations in most seas are orders of magni¬
tude less. (Sholokovitz et al, 1983; 1989). Th and U are also
enriched in certain minerais, compared to Pu and Am which origi¬nate only from man-made sources. (Hardy et al, 1982; Eisenbud,1987). Therefore two separate methods are also presented: first forthe détermination of Pu and Am and the second for Th (and U).Thèse methods were adapted and optimised from previously pub¬
lished methods (Pilviô et al, 1998; 1999; Maxwell, 1997) and
applied to (i) the détermination of Pu and Am in diluted MOX mate¬
rial and (ii) the analyses of 230Th from soil. The activities ofthe sam¬
ples were determined using alpha spectrometry.
R. Pilviô, M. Bickel Actinide séparations using extraction chromatography T 141
Analytical methods
Séparation of Th, U, Pu and Am from bone ash
Bone is a critical organ for accumulation of many radionuclidesincluding 90Sr and actinides. The National Institute of Standards and
Technology (NIST) prepared bone ash samples in view of produc¬
ing a standard référence material. The détermination of the actinideconcentration in this material was performed using TRU Resin forthe group séparation of actinides from Sr and other major impuri-ties, e.g. Ca and phosphates. After this UTEVA and TRU resinswere used for the sequental séparation of Th, U, Pu and Am. Thesource préparation for alpha spectrometry was done by électrode-position (Talvitie, 1972) (U and Pu) and NdF3 coprecipitation(Hindman, 1983) (Th and Am). The séparation scheme for themethod used is presented in Figure 1. The détails are presented else¬
where. (Pilviô et al, 1998-1999).
Séparation of Pu and Am from MOX
The séparation of Pu and Am from a diluted MOX material was per¬
formed using TEVA and TRU Resins, according to a procédure pub¬
lished earlier. (Maxwell, 1997; Pilviô et al, 2000). The sourcepréparation for alpha spectrometry was performed by NdF3 copre¬
cipitation. (Hindman, 1983). The scheme for the séparation of Pu
and Am is presented in Figure 2.
Séparation of Th from soil
Thorium-230 concentrations in soil samples were analysed using a
procédure shown in Figure 3. Th was coprecipitated with Fe(OH)3and the sample loaded into an anion exchange column in 8 MHN03. Th was eluted from the column with 37% HC1. The chemi¬
cal séparation of Th from the impurities and other radionuclides stillprésent in the sample was performed using UTEVA Resin columns.
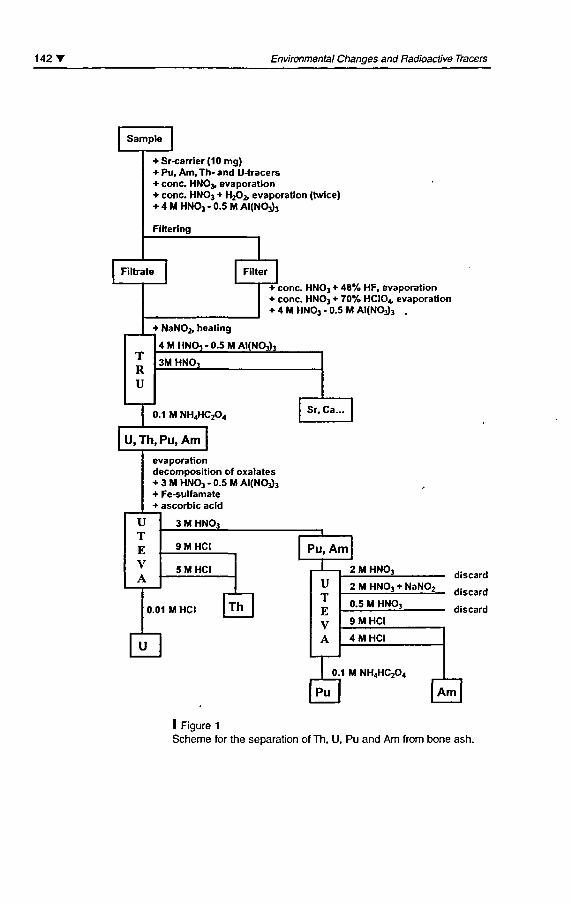
142" Environmental Changes and Radioactive Tracers
Sample
+ Sr-carrier (10 mg)+ Pu, Am, Th- and U-tracers+ conc. HNO3, evaporation+ conc. HNO3 + HJpb evaporation (twice)+ 4 M HNO3 0.5 M Al(N03)3
Filterlng
Filtrate Filter
+ conc. HNOj + 48% HF, evaporation+ conc. HNOj + 70% HCIO* evaporation+ 4 M HNO3 - 0.5 M AlfNOJj .
TRU
+ NaN02, healing
4MHNO,-0.5MAI(NO3h
3M HNO,
0.1 M NH4HC204
U.Th.Pu, Am
evaporationdécomposition of oxalates+ 3 M HNO, 0.5 M AI(NO])j+ Fe-sulfamate+ ascorbic acid
UTEVA
3 M HNO3
9MHCI
5MHCI
0.01 MHCI Th
U
Sr, Ca...
n.
Pu, Am
UTEVA
2 M HNO]
2 M HNO] NaNQ2
0.5 M HNO3
discard
discard
discard9 MHCI
4 MHCI
0.1 M NH4HC2O4
Pu Am
I Figure 1
Scheme for the séparation of Th, U, Pu and Am from bone ash.
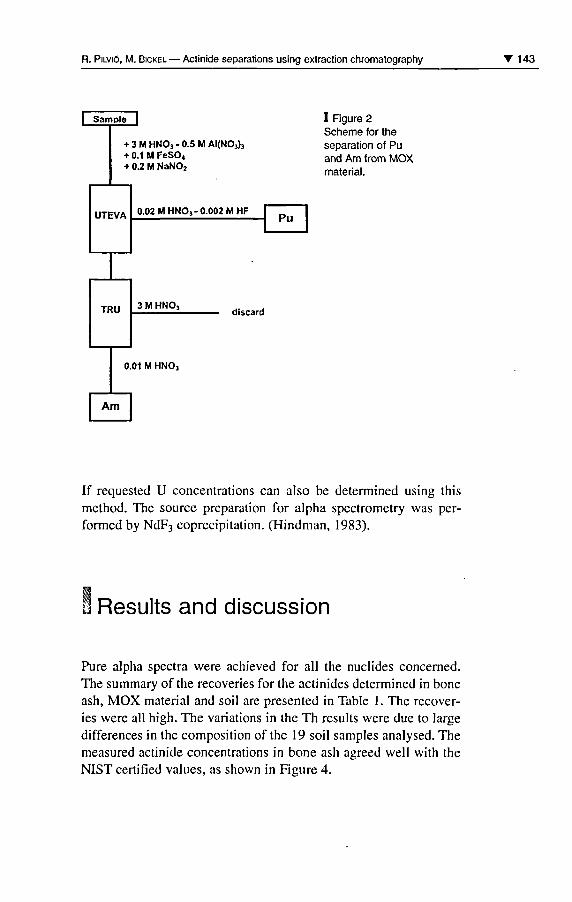
R. Pilviô, M. Bickel Actinide séparations using extraction chromatography 143
| Sample |
+ 3MHNO3-0.5MAI(NO3)3+ 0.1 M FeS04+ 0.2 M NaN02
I Figure 2Scheme for theséparation of Puand Am from MOXmaterial.
UTEVA 0.02 M HNOj -0.002 M HFPu
TRU 3 M HNO,discard
0.01 M HNO]
Am
If requested U concentrations can also be determined using thismethod. The source préparation for alpha spectrometry was per¬
formed by NdF3 coprecipitation. (Hindman, 1983).
Results and discussion
Pure alpha spectra were achieved for ail the nuclides concerned.The summary ofthe recoveries for the actinides determined in boneash, MOX material and soil are presented in Table 1. The recover¬
ies were ail high. The variations in the Th results were due to largedifférences in the composition of the 19 soil samples analysed. Themeasured actinide concentrations in bone ash agreed well with theNIST certified values, as shown in Figure 4.
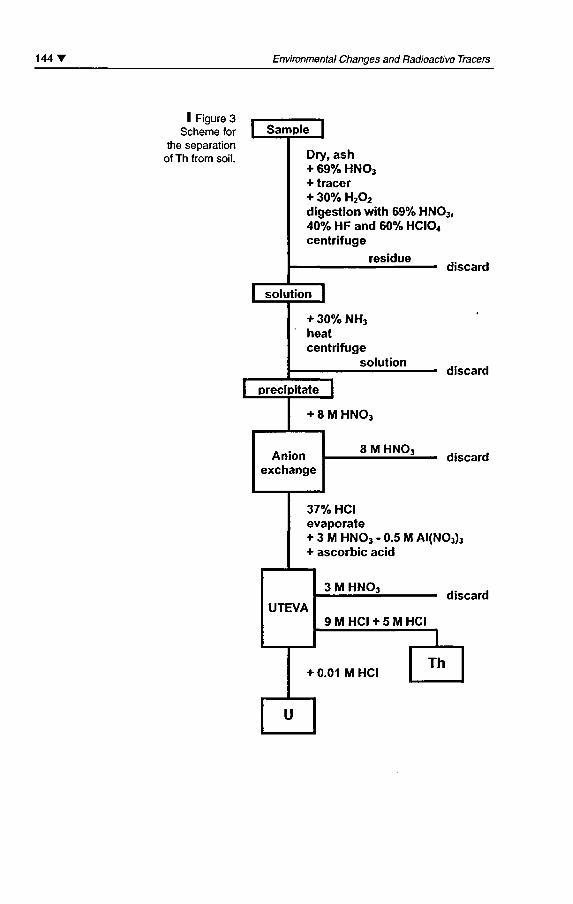
144' Environmental Changes and Radioactive Tracers
Rgure 3Scheme for I Sample |
the séparationof Th from soil. Dry, ash
+ 69% HNOj+ tracer+ 30% H202digestion with 69% HN03,40% HF and 60% HCIO4centrifuge
residue^ ^ discard
solution 1
+ 30% NHjheatcentrifuge
solutiondiscard
I preclpitate |
+ 8 M HNO,
Anionexchange
8 M HN03discard
37% HCIevaporate+ 3 M HNOj - 0.5 M AI(N03)3+ ascorbic acid
3 M HNOj
9 M HCI + 5 M HCI
discard
+ 0.01 M HCITh
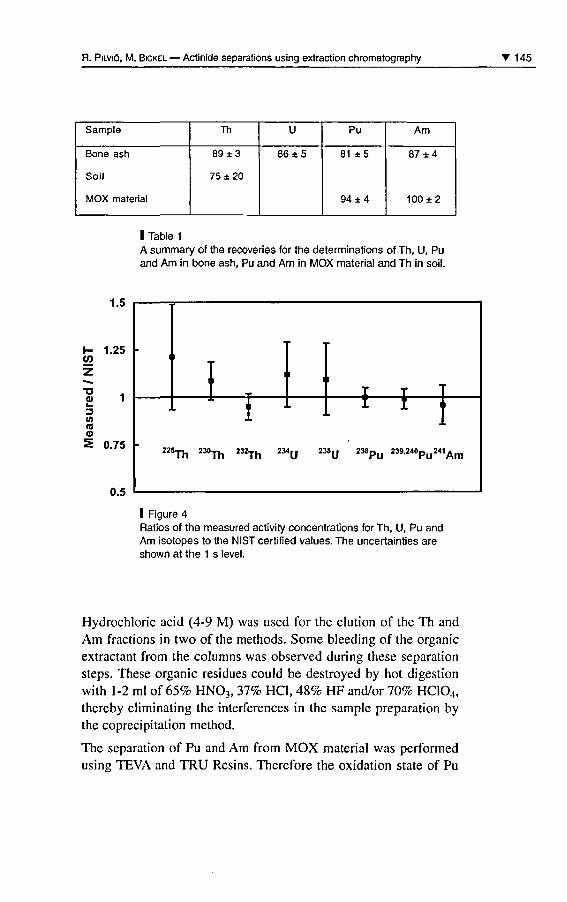
R. Pilviô, M. Bickel Actinide séparations using extraction chromatography T145
Sample
Bone ash
Soil
MOX material
Th
89 ±3
75 ±20
U
86 ±5
Pu
81 ±5
94 ±4
Am
87 ±4
100 ±2
OT
z
od>i-3</>
M«
1.25
0.75
I Table 1
A summary of the recoveries for the déterminations of Th, U, Puand Am in bone ash, Pu and Am in MOX material and Th in soil.
I Figure 4Ratios of the measured activity concentrations for Th, U, Pu andAm isotopes to the NIST certified values. The uncertainties areshown at the 1 s level.
Hydrochloric acid (4-9 M) was used for the elution of the Th and
Am fractions in two of the methods. Some bleeding of the organicextradant from the columns was observed during thèse séparationsteps. Thèse organic residues could be destroyed by hot digestionwith 1-2 ml of 65% HN03, 37% HCI, 48% HF and/or 70% HC104,thereby eliminating the interférences in the sample préparation bythe coprecipi tation method.
The séparation of Pu and Am from MOX material was performedusing TEVA and TRU Resins. Therefore the oxidation state of Pu
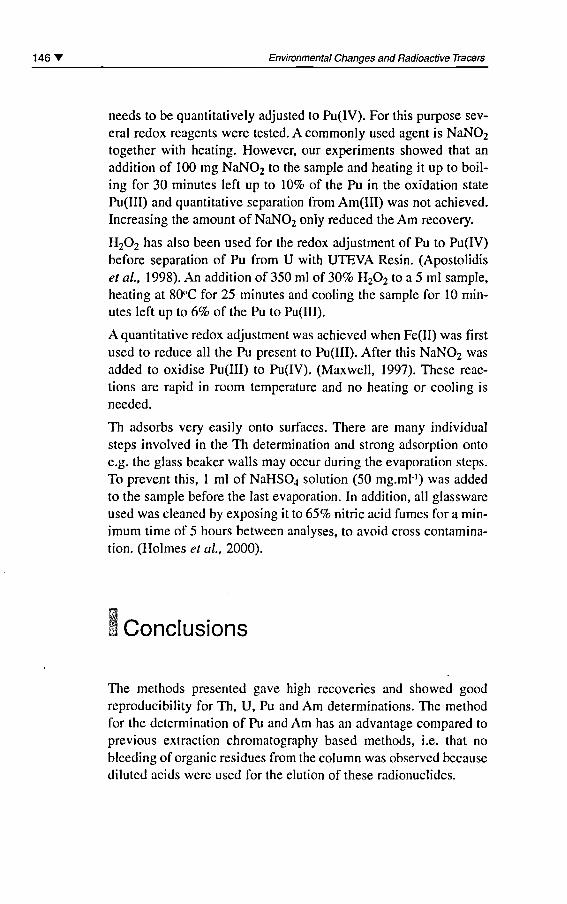
1 46 T Environmental Changes and Radioactive Tracers
needs to be quantitatively adjusted to Pu(IV). For this purpose sev¬
eral redox reagents were tested. A commonly used agent is NaN02together with heating. However, our experiments showed that an
addition of 100 mg NaN02 to the sample and heating it up to boil-ing for 30 minutes left up to 10% of the Pu in the oxidation state
Pu(III) and quantitative séparation from Am(III) was not achieved.Increasing the amount of NaNOz only reduced the Am recovery.
H202 has also been used for the redox adjustment of Pu to Pu(IV)before séparation of Pu from U with UTEVA Resin. (Apostolidiset al, 1 998). An addition of 350 ml of 30% H202 to a 5 ml sample,heating at 80°C for 25 minutes and cooling the sample for 10 min¬
utes left up to 6% of the Pu to Pu(III).
A quantitative redox adjustment was achieved when Fe(II) was firstused to reduce ail the Pu présent to Pu(III). After this NaN02 was
added to oxidise Pu(III) to Pu(IV). (Maxwell, 1997). Thèse reac¬
tions are rapid in room température and no heating or cooling isneeded.
Th adsorbs very easily onto surfaces. There are many individualsteps involved in the Th détermination and strong adsorption ontoe.g. the glass beaker walls may occur during the evaporation steps.
To prevent this, 1 ml of NaHS04 solution (50 mg.ml"') was added
to the sample before the last evaporation. In addition, ail glasswareused was cleaned by exposing it to 65% nitric acid fumes for a min¬
imum time of 5 hours between analyses, to avoid cross contamina¬tion. (Holmes et al, 2000).
Conclusions
The methods presented gave high recoveries and showed goodreproducibility for Th, U, Pu and Am déterminations. The methodfor the détermination of Pu and Am has an advantage compared toprevious extraction chromatography based methods, i.e. that no
blceding of organic residues from the column was observed because
diluted acids were used for the elution of thèse radionuclides.
R. Pilviô, M. Bickel Actinide séparations using extraction chromatography 147
Quantitative redox adjustment of Pu to Pu(IV) was only achievedwhen Fe(II) was used to reduce Pu to Pu(III) and NaN02 to oxidisePu(III) to Pu(IV). Both NaN02 and H202, together with heating, leftpart of the Pu to Pu(III).
Thèse séparation procédures can easily be adapted to différent sam¬
ple matrices by using modem or traditional digestion methods
before loading the samples to the columns.
BibliographySlEKlERSKY S., 1975In Braun T., Gershini G. (eds):Extraction Chromatography. ElsevierScientific Publishing Company,Budabest, p.1-6.
Horwitz E. P., Dietz M. L.,Chiarizia R., Diamond H.,Essling A. M., Graczyk D., 1992Séparation and preconcentrationof uranium from acidic média byextraction chromatography. Anal.Chim. Acta., 266: 25-37.
Horwitz E. P., Dietz M. L.,Nelson D. M., LaRosa J. J.,Fairman W. D., 1 990Concentration and séparationof actinides from urine usinga supported bifunctionalorganophosphorus extradant.Anal. Chim. Acta., 238: 263-271.
Horwitz E. P., Chiarizia R., Dietz M. L.,
Diamond H Nelson D. M., 1993Séparation and preconcentrationof actinides from acidic média byextraction chromatography.Anal Chim. Acta., 281: 361-372.
Pilviô R., Bickel M., 1998Séparation of actinides from a boneash matrix with extractionchromatography. J. Alloys Comp.,271-273:49-53.
Pilviô R., LaRosa J. J., Mouchel D.,
Wordel R., Bickel M.,Altzitzoglou T., 1999Measurement of low-levelradioactivity in bone ash. J. Environ.Radioactivity., 43: 343-356.
Ivanovich M., Harmon R. S., 1982Uranium Séries Disequilibrium:Application to EnvironmentalProblems. Oxford, Claredon Press,40p.
Sholkovitz E. R., 1983The geochemistry of plutonium in freshand marine water environments.Earth-Sti. Rev., 19: 95-161.
Suutarinen R., JaakkolaT,Paatero J., 1989"The behaviour of transuranicéléments in Lake Pâijânne after theChernobyl accident" . In: Proceedingsof the XVth Régional CongressofIRPA, Visby, Sweden, 10-14September, 1989.
Hardy, E. P., Krey, P. W.,Volchok, H. L, 1973Global Inventory and distributionof Fallout Plutonium. Nature.,241:444-445.
EisenbudM., 1987Environmental Radioactivity, FromNatural, Industrial and Military
148' Environmental Changes and Radioactive Tracers
Sources. 3"* éd., Académie Press,New York, 343p.
Maxwell S. L. 1997III, Rapid Actinide Séparation.Radioactivity and Radiochemistry.,8: 36-44.
Talvitie A., 1972Electrodeposition of actinides foralpha spectrometric détermination.Anal. Chem., 44: 280-283.
Hindman F. D., 1 983Neodymium fluoride mounting forspectrometric détermination ofuranium, plutonium and americium.Anal. Chem., 55: 2460-2461.
Pilviô R., Bickel M., 2000Actinoid séparation by extractionchromatography. Appl. Radiât Isot,53: 273-277.
Apostolidis C, Molinet R., Richir P.,
Ougier M., Mayer K., 1998Development and validation ofa simple, rapid and robust methodfor the chemical séparation ofuranium and plutonium. Radiochim.Acta., 83:21-25.
Holmes L, Pilviô R., 2000Détermination of thoriumin environmental and workplacematerials by ICP-MS. Appl.Radiât Isot, 53: 63-68.

Oral/Posterprésentations
Session 2

Session 2 Oral/Poster présentations T 1 51
1 Project Chariot,a nuclear excavation projectin Northern Alaska
G. E. Gilbert
In the mid-1950's, American nuclear scientists, especially those at theLivermore Nuclear Laboratory as well as many within the AtomicEnergy Commission, were extremely interested in initiating a varietyof projects involving underground nuclear détonations ostensibly topromote peaceful uses of atomic energy. This interest resulted in theestablishment in 1957 of a program entitled Project Plowshare (orPNE, Peaceful Uses of Nuclear Explosives). It was reported (Ogle)that if successful this program would counteract the fear of nucleardétonations, at least to some extent. Also, it might keep nuclear explo¬sive design and expérimental work continuing during a moratoriumor test ban period. About a dozen spécifie projects were establishedwithin Project Plowshare including the excavation of a channelthrough the reef at Kapingamarangi (an atoll in the Caroline Islands),a sea-level Panama Canal and the excavation of a harbor along thenorthwest coast of Alaska. The latter project was entitled ProjectChariot. Of ail the Plowshare Projects, Project Chariot became theclosest to fruition. The objective was to create a harbor for the ship-ment of natural resources in the area and, in the process, develop a
better understanding of the use of nuclear energy for large excavationprojects. An outstanding feature of Project Chariot was the conduc¬tion of approximately 50 in-depth physical and biological studies ofthe terrestrial, coastal, oceanic and atmospheric components of thestudy area. As a resuit, the Project Chariot study area could possiblybe the most deeply and widely studied sizeable area in the biosphère.Collectively thèse studies would hâve provided an excellent baselineto evaluate the impact of the use of nuclear détonations for excava¬tion and cratering projects.
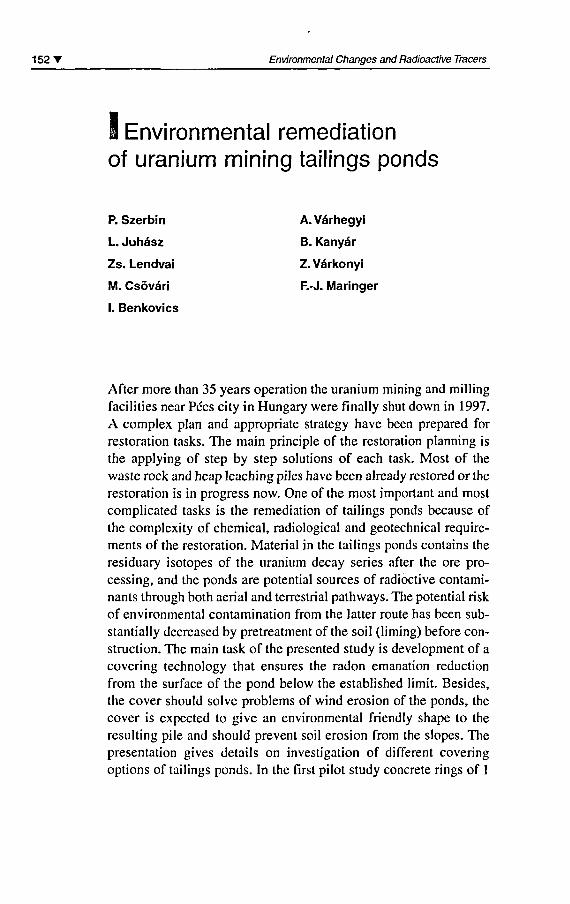
1 52 T Environmental Changes and Radioactive Tracers
I Environmental remediationof uranium mining tailings ponds
P. Szerbin A. Vârhegyi
L. Juhâsz B. Kanyâr
Zs. Lendvai Z. Vârkonyi
M. Csôvâri F.-J. Maringer
I. Benkovics
After more than 35 years opération the uranium mining and millingfacilities near Pécs city in Hungary were finally shut down in 1997.
A complex plan and appropriate strategy hâve been prepared forrestoration tasks. The main principle of the restoration planning is
the applying of step by step solutions of each task. Most of the
waste rock and heap leaching piles hâve been already restored or therestoration is in progress now. One of the most important and mostcomplicated tasks is the remediation of tailings ponds because ofthe complexity of chemical, radiological and geotechnical require¬
ments ofthe restoration. Material in the tailings ponds contains the
residuary isotopes of the uranium decay séries after the ore pro-cessing, and the ponds are potential sources of radioctive contami¬nants through both aerial and terrestrial pathways. The potential riskof environmental contamination from the latter route has been sub-
stantially decreased by pretreatment ofthe soil (liming) before con¬
struction. The main task of the presented study is development of a
covering technology that ensures the radon émanation réductionfrom the surface of the pond below the established limit. Besides,the cover should solve problems of wind érosion of the ponds, the
cover is expected to give an environmental friendly shape to the
resulting pile and should prevent soil érosion from the slopes. Theprésentation gives détails on investigation of différent coveringoptions of tailings ponds. In the first pilot study concrète rings of 1
Session 2 Oral/Poster présentations T 1 53
m diameter filled with test layers of différent materials were used
for in situ examination of radon infiltration. In total 11 columnswere studied, including the uncovered pond as a référence point.Radon concentrations of the layers were measured by monitorsequipped with scintillation soil probe, and in parallel radon fluxwas measured on the top of each column. On the basis of the éval¬
uation of the results two covering options hâve been designed fordetailed studies on in-field on territories cover about 2000 m2.
Radon concentration in the layers, radon émanation from the sur¬
face of the cover were measured. Results of the described above
pilot studies are discussed in the présentation.
1 54 T Environmental Changes and Radioactive Tracers
i Purification and decontaminationfor waste containing radioactive,natural or artificial, trace élément
A. Favre-Reguillon ef al.
Despite récent improvements in both sensitivity and selectivity ofanalytical methods, séparation and preconcentration remain essential
steps in many chemical analyses. In the détermination of radionu¬
clides in environmental and biological samples, the low level of the
nuclides typically encountered and the complexity of the sample
matrix often preclude direct détermination. Séparation and precon¬
centration are also important in the processing of nuclear waste.
They make it possible to reduce the volume of materials requiringfinal disposai and, therefore, lower the cost of waste handling and
treatment. We hâve been working on partitioning for high-level liq¬
uid waste during the past 10 years. Our objectives involved the
sélective extraction of alkali, alkaline-earth metals and platinumgroup's metals and more recently the group séparation of actinidesand lanthanides. To reach thèse objectives, macrocyclic compounds,such as crown ether, thia-crown ether, calixarene and pyridiniumcontaining aza-macrocyclic hâve been synthesized. Depending on
their hydrophilicity, ligands were used in liquid/liquid extraction ornanofiltration-complexation. Characterisation and results obtainedwith the new compounds and Systems are reported. Decontaminationof liquid waste as well as gaseous effluent by chelating resins was
also studied. Immobilisation of macrocycles on various inert sup¬
ports, design of new ion-exchange resins with the "template effect"technique and trapping of gaseous radionucléides will be also pre¬
sented. We describe récent advances in laboratory and process-scaleséparation techniques for removing and recovering several of the
more hazardous éléments of the waste constituents.
Radioactivityin sedimentary studies
Session 3
Chairman: J.-M. Fernandez
Session opening: J. 1\1. Smith

oeasonally modulatedsédimentation inan estuarine depositionalrégime
John N. Smith
Introduction
One commonly employed assumption used to simplify the mod¬
elling of sédiment dynamics and the détermination of geochronolo-gies in complex, estuarine depositional régimes is that of a constantsédimentation rate. However, in most river-estuarine Systems, peri-odic phenomena, such as the seasonal cycle in river discharge orannual phytoplankton blooms, can produce a seasonal variability inthe transport or production of suspended material and a correspond¬ing variation in sédimentation rates in downstream environments.Less predictable "catastrophic" phenomena such as storm events,landslides, etc. can also contribute to seasonally "pulsed" sédimentdischarge events. Short, periodic "bursts" of high sédiment déposi¬
tion can, in some instances, provide the majority of sédiment trans¬
port compared to that delivered during the longer interveningquiescent periods of sédimentation. Under thèse conditions, the
mean sédiment accumulation rate can be very much différent (usu¬
ally, greater) than the most probable rate. The degree to which a séd¬
imentation régime is skewed from its mean value, ie., the dispersionof its instantaneous rate distribution with respect to its mean sédi¬
mentation rate, may hâve an important effect on other environmen¬tal variables such as the composition and activity of benthiccommunity assemblages, the rates of sédiment diagenesis and the
1 58 T Environmental Changes and Radioactive Tracers
efficiency of particle and contaminant transport from the water col¬
umn to the sédiments.
The annual variability in estuarine sédimentation rates could be
determined synoptically using sédiment traps. However, this methodwill provide only the most récent record and will invariably reflectcontemporary climatological and hydrological conditions. An alter¬
native method, employed in the présent study in the Saguenay Fjord,Québec, utilises the séquence of variations in sédimentation rate
recorded in the sédiments in the form of textural varves or particlesize unconformities. This type of analysis can be carried out in estu¬
arine Systems having a bi-modal depositional mechanism in whichpulsed inputs of coarser-grained sands and silts during high Springriver discharge conditions are superimposed on the ambient sédi¬
mentation of finer-grained clays and organic material. In the présentcase, the quantity of sédiment pulsed into the system is estimated bythe extent of dilution of the 2l0Pb signal, assuming that 2l0Pb trans¬
port can be simulated using a Constant Flux (CF) technique. Theapplicability of the CF technique to the Saguenay Fjord sédimentrégime is validated using time-stratigraphic horizons associated withlandslide events and the thresholds for anthropogenic contaminantloadings. The purpose of this study is to evaluate the historicalimportance of sédiment déposition during high energy, Spring riverdischarge conditions compared to ambient sédimentation patterns
that prevail during the remainder of the year.
1 Methods and environmental setting
The Saguenay Fjord is a deep (250 m) glaciated valley carved intothe crystalline rocks of the Canadian Shield, located 300 kmNortheast of Montréal, Québec (Figure 1). Sédimentation rates inthe fine-grained clayey sédiments covering the bottom of the fjorddecrease exponentially with increasing distance from the mouth ofthe Saguenay River. The highest sédimentation rates (> 4 g.cm2.yr';Smith and Ellis, 1982) occur at the head of the fjord where an
abrupt decrease in river water velocity caused by the widening and
J. N. Smith Seasonally moduladed sédimentation in an estuarine depositional régime 159
deepening of the river channel as it enters the fjord promotes therapid déposition of suspended material and bedload. Further, a highflux of terrigeneous organic matter derived from upstream pulp and
paper mills and sawmills located near Arvida (Figure 1) has pro¬
duced an extremely anoxie benthic environment, almost totallydevoid of bioturbating organisms. This unique combination of highsédimentation rate and the absence of sédiment mixing has resultedin well-preserved sédiments containing an excellent record ofchronological events during the past 100 years.
I Figure 1
Sédiment cores D-1, 007 and C-7 were collected from Station D-1
in the Saguenay Fjord in 1979, 1982 and 1997, respectively.
Two depositional events hâve had a pronounced impact on sédimentaccumulation rates in the Saguenay Fjord. In 1971, a landslide at
Saint-Jean Vianney (Figure 1) resulted in the displacement of 25
million tonnes of ancient marine clays into the Saguenay River and
produced a distinct 1971 clayey horizon distinguishable by abrupt
1 60 T Environmental Changes and Radioactive Tracers
changes in texture, colour and geochemical profiles in ail sédimentcores in the upper arm of the fjord (Smith and Wallon, 1980;
Schafer and Smith, 1987). Massive flooding in the Saguenay régionin 1996 produced a second, clayey time-stratigraphie horizon inmore recently collected cores from the fjord.
A 2 mètre, Lehigh gravity core (10 cm I.D.) was collected at StationD-1 in the upper arm ofthe fjord (Figure 1) in 1979. This core was
X-radiographed, subsampled at 1 cm intervais and analysed for a
range of geochemical properties and contaminants at one cm inter¬
vais, including the radionuclide tracers, 137Cs, m240Pu, 226Ra and
2l0Pb using alpha and gamma spectrometric methods outlined inSmith et al (1987). Organic matter, porosity and particle size mea¬
surements were also carried out using methods outlined in Smithand Schafer (1987). The station was re-occupied in 1982 and 1997
when a piston core (core C-7) and another Lehigh gravity core (core007), respectively, were collected.
Previous studies in the upper arm of the Saguenay Fjord hâve indi¬
cated that, despite the seasonal modulation of the 210Pb signal, the
annual flux of 2l(1Pb remains relatively constant. This is due to the
fact that the enhanced inputs of sands and silts during the Springriver discharge carry comparatively little additional excess 2,0Pb
owing to their inefficient scavenging of this particle-reactive tracerfrom the water column. As a resuit, it has been shown (Smith et al,1987) that it is feasible to apply a Constant Flux (CF) 2l0Pb tech¬
nique (Robbins, 1978) to the interprétation of the expérimentalresults. The geochronology for a core is then given by;
T = -]n(U(m)/l0)' 1
A
where, T is the time, A is the radioactive decay constant for 210Pb
(0.0311 y1), I(m) is the inventory of excess 2I0Pb above a sédimentdepth, m and I" is the total inventory of 2,0Pb in the sédiments. Thesédiment accumulation rate, w, is given by;
co=^(l°-l(m)) 2
where, A is the 2iaPb activity at a depth, m. The time-invariant 210Pb
flux for the CF technique is;
F = l°/X 3
J. N. Smith Seasonally moduladed sédimentation in an estuarine depositional régime T 1 61
As noted by Robbins et al. (2000), the CF technique is actually a
mapping method and not a model, because it simply uses an algo-rithm to convert excess 2I0Pb activities into dates and sédimentaccumulation rates and has no prédictive value.
Results
The 210Pb sediment-depth distributions for the three sédiment cores
are illustrated in Figure 2. The impact of the 1971 St. Jean Vianneylandslide is defined by a depositional unconformity of grey clayhaving reduced 210Pb activities in each core. The bottom of thislayer was located at depths of approximately 40 cm, 55 cm and 165
cm in 1979, 1982 and 1997, respectively corresponding to a mean
sédimentation rate of about 6 cm.yr1 at this location. The 1996flood event has produced a similar, 210Pb -déficient unconformitynear the top of core 007 (collected in 1997). The peaks and troughsin 2I0Pb distributions (apart from the Iandslide/flood layers) reflectseasonally-modulated inputs of coarser-grained silts and sands dur¬
ing the spring river discharge of each year, characterised by reduced2l0Pb levels, alternating with the ambient déposition of finer-graineddays and organic matter having higher concentrations of 2,0Pb.
The total 210Pb inventory, 1°, and inventories above a given depth m,I(m), were measured through cores D-1 and 007. Thèse results werethen used to détermine the core geochronology, sédiment accumu¬lation rates and the 2l0Pb flux from équations 1, 2 and 3, respec¬
tively. The values of co for each core are plotted as a function of Tin Figure 3. The entire inventory of excess 210Pb is not contained inthe upper 260 cm of core C-7, and an alternative method must be
employed in order to estimate T. Since the 1971 landslide event ispronounced and easily defined, then this time-stratigraphic horizonwas used to calculate V from Equation 1. This value of 1° was then
used in équations 2 and 3 to calculate the core geochronology.
Obviously, any geochronology determined using the CF techniquemust be validated using independent time-stratigraphic horizons(Robbins and Edgington, 1975), because there is no external con-
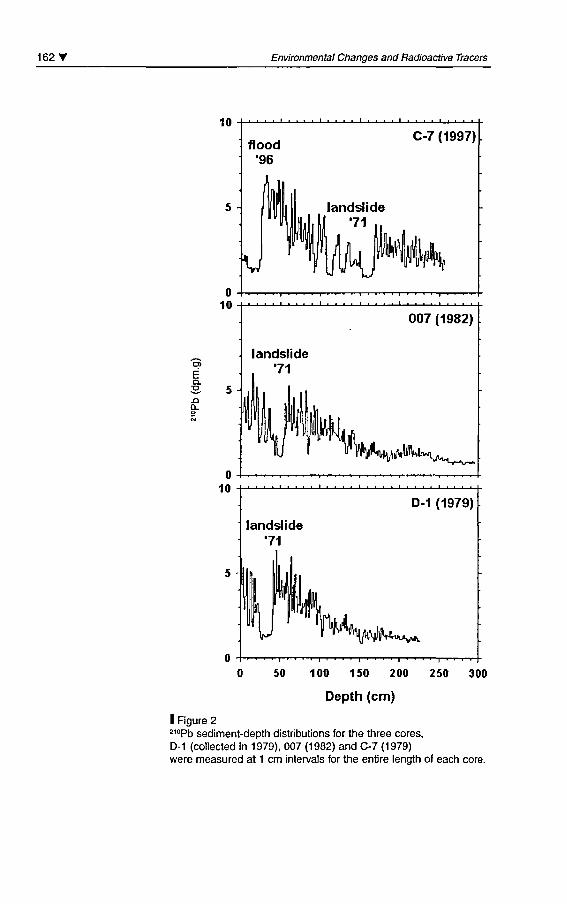
162' Environmental Changes and Radioactive Tracers
en
EQ.
g,
nCL
300
Depth (cm)
I Figure 2210Pb sediment-depth distributions for the three cores,D-1 (collected in 1979), 007 (1982) and C-7 (1979)were measured at 1 cm intervais for the entire length of each core.
J. N. Smith Seasonally moduladed sédimentation in an estuarine depositional régime T 1 63
straint imposed on the data, ie. each 210Pb data point is equally validregardless of its actual value. For cores D-1 and 007, the agreementofthe landslide horizon with a date of 1971 is sufficient validation forthe CF technique. However, an alternative horizon must be employedfor core C-7, because the 1971 horizon was used to estimate the 210Pb
flux, itself. Numerous geochemical and textural horizons hâve been
identified in each of thèse cores, but a séries of horizons common toail are those associated with the déposition and transport of falloutradionuclides. Specifically, the initial introduction of measurable lev¬
els of ,37Cs in 1954 and the maximum l37Cs flux to the sédiments in1964 provide geochemical markers whose positions in each core are
in good agreement with calculated geochronologies (Figure 3). Thisindependent validation ofthe CF results provides some assurance thatthe ensemble of sédiment accumulation rates shown in Figure 3 foreach core bear some semblance to reality. In fact, there are numerousadditional horizons that hâve also been used to validate thegeochronologies for thèse cores including; (1) a 1947 Hg horizonassociated with the construction of a chlor-alkali plant at Arvida(Smith and Loring, 1981; Smith and Schafer, 1999); (2) a 1924 claylandslide horizon associated with a landslide at Kenogami (Smith and
Schafer, 1987), and; (3) a 1910 organic matter horizon resulting fromthe beginning ofthe pulp and paper industry in the Saguenay région(Smith and Schafer, 1987).
The results from thèse three cores show that the 1971 landslideunconformity has survived intact and continues to provide an impor¬tant time-stratigraphic horizon in Saguenay Fjord sédiments. It wasjoined by a second, fiood-produced unconformity in 1996 and,together, the two horizons can produce geochronological référencepoints throughout the fjord sédiments. This time séries of sédimentcores also shows that the history of seasonally modulated maxima in2l0Pb sédimentation rates are preserved over relatively long periods.Sédimentation rate maxima and minima can be cross-correlatedbetween the sédiment cores and can be related to the history of riverdischarge (Smith and Schafer, 1987). The ultimate goal of this studyis to use the record of river discharge events preserved in the sédi¬
ments of the fjord to résolve the history of river discharge during the18lh and 19'h centuries and thereby provide new insights into the his¬
tory of température, précipitation and climate change in EastemCanada.
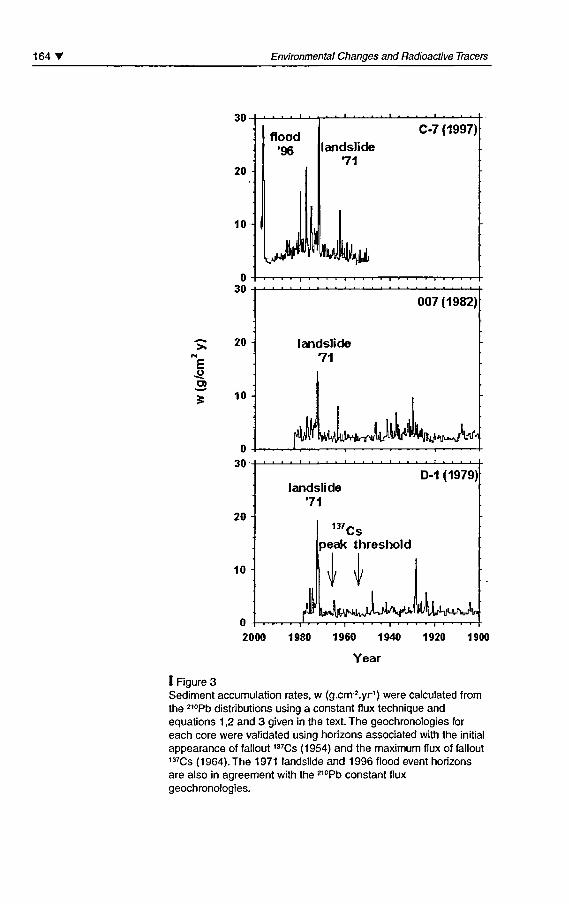
164' Environmental Changes and Radioactive Tracers
30
20
10
30
0
30
20
10
flood96
C-7 (1997)
landslide71
^jMkMkii i | i i i i i i i i i | » i » i r*
"S 20"!PU
E.o
s- 10
007(1982)
landslide71
[W^r^^_l I l__l ' 1 ' ' '
landslide71
137,
D-1 (1979)
Cspeak threshold
il y
i- i i i
2000 1980 1960 1940 1920 1900
Year
I Figure 3Sédiment accumulation rates, w (g.cnr2.yr') were calculated fromthe 210Pb distributions using a constant flux technique andéquations 1 ,2 and 3 given in the text. The geochronologies foreach core were validated using horizons associated with the initialappearance of fallout ,37Cs (1954) and the maximum flux of fallout,37Cs (1964). The 1971 landslide and 1996 flood event horizonsare also in agreement with the z10Pb constant fluxgeochronologies.
J. N. Smith Seasonally moduladed sédimentation in an estuarine depositional régime T 1 65
Bibliography
Robbins J. A.,Edgington D. N., 1975Détermination of récent sédimentationrates in Lake Michigan using 210Pb
and "7Cs. Geochimica etCosmochimica Acta, 39: 285-304.
Robbins J. A., 1978"Geochemical and geophysicalapplications of radioactive leadisotopes'. In J.O. Nriagu (Ed.):Biochemistry of Lead, Amsterdam,Elsevier: 285-393.
Robbins J. A., Holmes C,Reddy K., Newman S., 2000"Mapping schemes versus processmodels for 210Pb dating soil cores:an example from the Evergladesof South Florida, U.S.A". In: SouthPacific Environmental RadioactivityConférence, Nouméa June 19-23,New Caledonia.
Smith J. N., Walton A., 1980Sédiment accumulation rates andgeochronologies measured in theSaguenay Fjord using the 2,0Pb
dating method. Geochimica etCosmochimica Acta, 44: 225-240.
Smith J. N., Loring D. H., 1981Geochronology for mercury pollutionin the sédiments of the SaguenayFjord, Québec. EnvironmentalScience and Technology,15 (8): 944-951.
Smith J. N., Ellis K. M., I982Transport mechanism for 210Pb, 137Cs
and Pu fallout radionuclides throughfluvial-marine Systems. Geochimicaet Cosmochimica Acta, 46: 941-954.
Schafer, C.T., Smith J. N., 1987Hypothesis for a submarine landslideand cohesionless sédiment flowsresulting from a 17th centuryearthquake-triggered landslidein Québec, Canada. Geo-marineLetters, 7:31-37.
Smith, J. N., Schafer C.T., 1987A 20th century record ofclimatologically-modulated sédimentaccumulation rates in a Canadianfjord. Quaternary Research,27: 232-247.
Smith, J. N., Ellis K. M.,Nelson D. M., 1987Time-dependent modelling of falloutradionuclide transport througha drainage basin; significanceof «slow» erosional and «fast»hydrological components. ChemicalGeology, 63: 157-180.
Smith, J. N., Schafer C.T., 1999Radionuclide modellingof sédimentation, bioturbation andHg uptake in the sédiments of theEstuary and Gulf of St. Lawrence.Limnology and Oceanography,44, No. 1,207-219.

Kegionalization of naturaland artificial radionuclidesin marine sédiments of theSouthern Gulf of Mexico
Pedro Francisco Rodrîguez-Espinosa
Francisco V.Vidal Lorandi
Victor M. V. Vidal Lorandi
Introduction
This paper summarizes the results of régional studies of radioactiv¬ity (40K and l37Cs) in marine sédiments of the Southern Gulf ofMexico. Thèse investigations were initiated in 1993 and the firstresults were published by Rodriguez-Espinosa P.F et al, in 1998,
1999a, 1999b and 1999c. They found that the l37Cs, 40K and 2HBi
concentrations measured in five sediment-cores sampled in thesouthern Gulf of Mexico are similar to those reported in the worldinventory for same type of marine sédiments. As would be
expected, the radioactivity concentrations measured vary as a func¬
tion of sedimentary environment. The highest 40K concentrationsare associated mainly with the sédiments of the Panuco River,whose drainage basin inputs sédiments from the Sierra MadréOriental and Central Mexico, where intensive agricultural practicesand heavy use of fertilizers take place. The mid-range 40K concen¬
trations were measured in sédiments of the Grijalva-Usumacintariver fan, and reflected the characteristic properties ofthe Cenozoicand Paleozoic metamorphic rocks of its drainage basin. Finally, thehighest 137Cs concentrations found in the sediment-cores of theGrijalva-Usumacinta river fan sédiments resuit from the higher
1 68 T Environmental Changes and Radioactive Tracers
rainfall (3,000 mm.yr1) over its much greater drainage basin size,
relative to that ofthe Panuco River.
In this paper we now présent the results of 40K and I37Cs concentra¬
tions in another twelve sediment-cores sampled in the SouthernGulf of Mexico. Thèse new radioactivity concentration values willaid to further understand the nature and régional distribution ofradioactivity in Southem Gulf of Mexico marine sédiments.
i1 Methods
Twenty five USNEL Box sediment-cores were collected in waterdepths between 20 to 2,000 m in the Southern Gulf of Mexico ofwhich twelve of them are reported in this paper. The USNEL Boxsediment-cores were collected aboard the R/V Justo Sierra duringthe OGMEX XI, XII and XIII océanographie cruises, during the
summers of 1993, 1994 and 1995 (Figure 1).
The 30-cm deep sediment-cores were sub-sampled in 2-cm thickslides, and frozen for later analyses. Sédiment sub-samples were
analyzed by XRD to détermine minerai composition. The natural40K and artificial l37Cs radionuclide concentrations were measured
using a Ge-Hp Gamma-Spectrometer, and counting for 50-60,000seconds with a ± 5 % uncertainty (95 % confidence limit). The mea¬
surements were made at the Laboratorio de Vigilancia RadiolôgicaAmbiental del Centro at Cienfuegos, Cuba.
Results
We report natural and artificial radioactivity concentrations intwelve ofthe twenty-five sédiment cores sampled. Thèse results are
représentative of the régional radioactivity concentrations in the
Southern Gulf of Mexico.
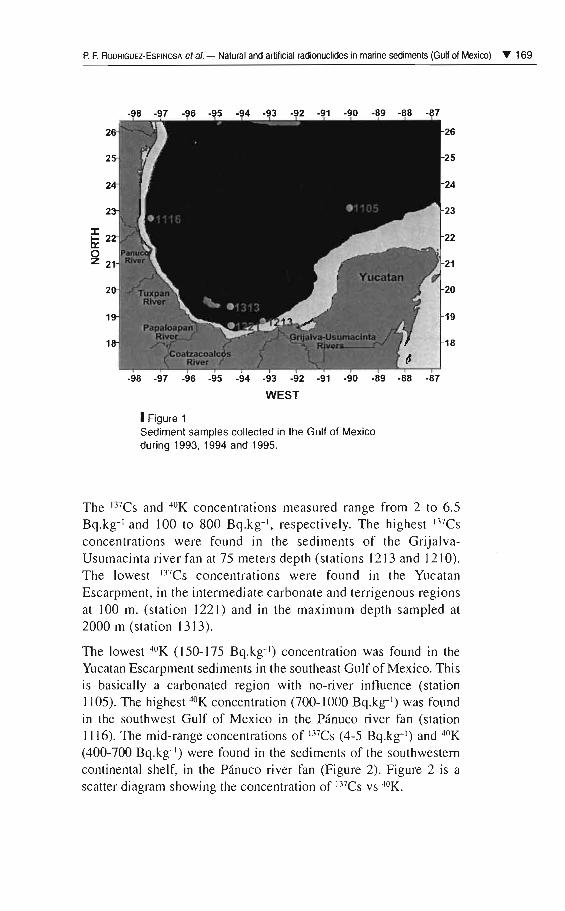
P. F. RODRIGUEZ-ESPINOSA el al. - Natural andarttlicial radionuclides in marine sediments (Gulf of Mexico) ... 169
2
2
2
2
:I:~ 2
~ 21
2
-98 -97 -96 .95 -94 -93 -92 -91 -90 -89 -88 -87
WEST
1Figure 1Sediment sampies collected in the Gulf of Mexicoduring 1993. 1994 and 1995.
26
25
24
23
22
21
20
19
18
The mCs and 40K concentrations measured range From 2 to 6.5Bq.kg- ' and 100 to 800 Bq.kg:'. respectively. The highest mCsconcentrations were found in the sediments of the GrijalvaUsumacinta river fan at 75 meters depth (stations 1213 and 1210).The lowest mcs concentrations were found in the YucatanEscarpment, in the intermediate carbonate and terrigenous regionsat 100 m. (station 1221) and in the maximum depth sam pied at2000 m (station 1313).
The lowest 4°K (150-175 Bq.kg- I ) concentration was found in theYucatan Escarpment sediments in the southeast Gulf of Mexico. Thisis basically a carbonated region with no-river influence (station1105). The highest 4°K concentration (700-1000 Bq .kg:') was foundin the southwest Gulf of Mexico in the Panuco river fan (station1116). The mid-range concentrations of mcs (4-5 Bq .kg- ') and 4°K(400-700 Bq.kg:") were found in the sediments of the southwestemcontinental shelf, in the P ânuco river fan (Figure 2). Figure 2 is ascatter diagram showing the concentration of mcs vs 40K.
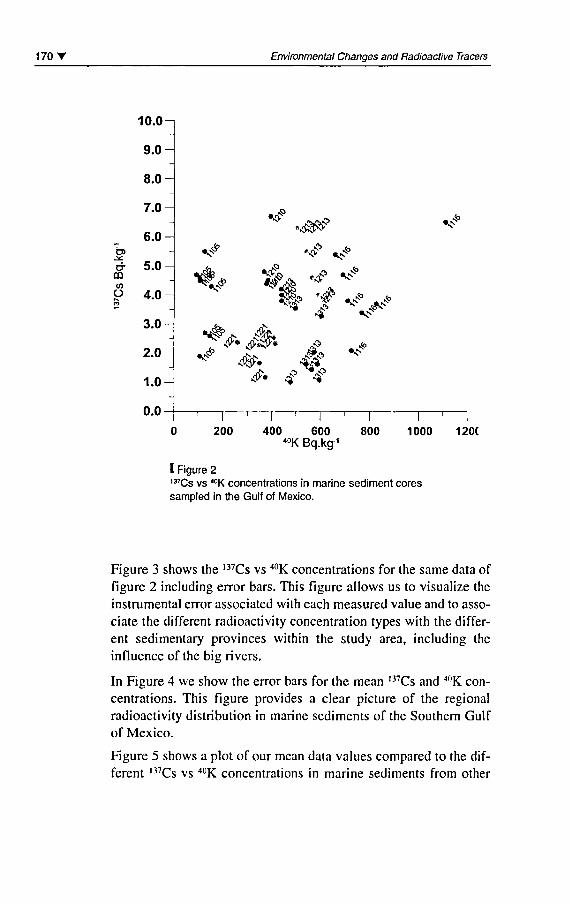
170 Environmental Changes and Radioactive Tracers
crmcoOh*Cl
10.0-
9.0-
8.0-
7.0-
6.0-
5.0-
4.0-
3.0-
2.0-
1.0-
0.0-
(
% 'f ^ .#
, | i i |
) 200 400 600 8004°K Bq.kg1
^
1 ' i
1000 12
I Figure 2137Cs vs "°K concentrations in marine sédiment coressampled in the Gulf of Mexico.
Figure 3 shows the 137Cs vs 40K concentrations for the same data offigure 2 including error bars. This figure allows us to visualize the
instrumental error associated with each measured value and to asso¬
ciate the différent radioactivity concentration types with the différ¬ent sedimentary provinces within the study area, including the
influence ofthe big rivers.
In Figure 4 we show the error bars for the mean I37Cs and 40K con¬
centrations. This figure provides a clear picture of the régionalradioactivity distribution in marine sédiments ofthe Southern Gulfof Mexico.
Figure 5 shows a plot of our mean data values compared to the dif¬
férent ,37Cs vs 40K concentrations in marine sédiments from other
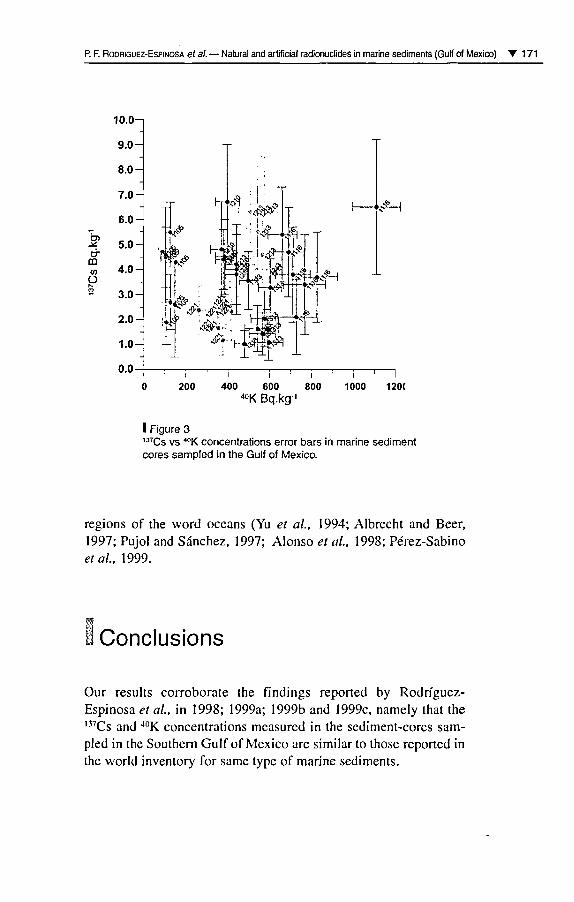
P. F. Rodriguez-Espinosa et al. Natural and artificial radionuclides in marine sédiments (Gulf of Mexico) T 1 71
10.0
9.0 H
8.0
7.0
6.0
5.0
4.0
3.0
&mcoO
&%&
rM '[
WI:
î^JttiCJlB
200 400 600 80040K Bq.kg'
1000 120(
I Figure 3137Cs vs '"K concentrations error bars in marine sédimentcores sampled in the Gulf of Mexico.
régions of the word océans (Yu et al, 1994; Albrecht and Béer,1997; Pujol and Sanchez, 1997; Alonso et al, 1998; Pérez-Sabinoétal, 1999.
Conclusions
Our results corroborate the findings reported by Rodriguez-Espinosa et al, in 1998; 1999a; 1999b and 1999c, namely that thel37Cs and 40K concentrations measured in the sediment-cores sam¬
pled in the Southern Gulf of Mexico are similar to those reported inthe world inventory for same type of marine sédiments.
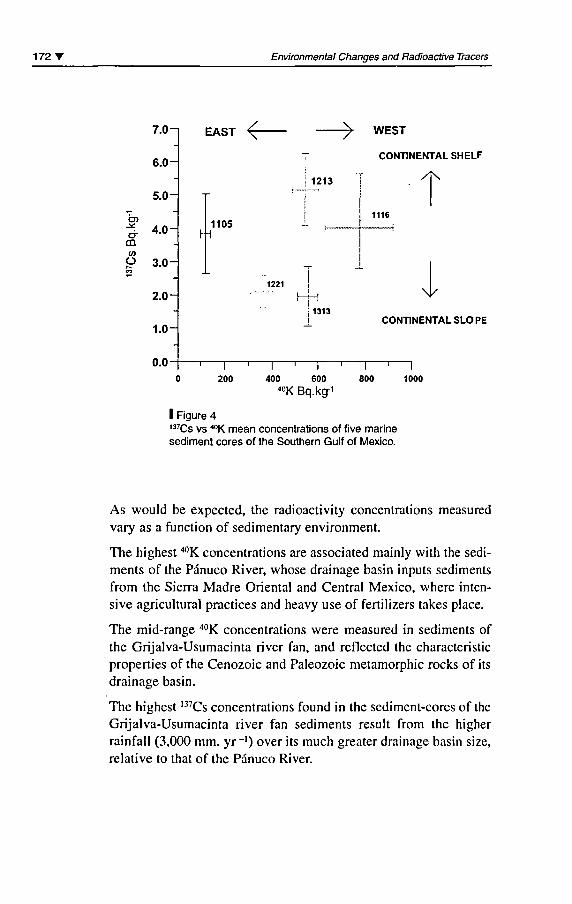
172' Environmental Changes and Radioactive Tracers
7.0
6.0 -\
5.0-
4.0-crmco
y 3.0 h
2.0-
1.0
0.0-
EAST ^-
1213
-^ WEST
CONTINENTAL SHELF
H1105
1116
1313CONTINENTAL SLOPE
200 400 600 800
40K Bq.kg 1
1000
I Figure 4,37Cs vs "°K mean concentrations of five marinesédiment cores of the Southern Gulf of Mexico.
As would be expected, the radioactivity concentrations measured
vary as a function of sedimentary environment.
The highest 40K concentrations are associated mainly with the sédi¬
ments of the Panuco River, whose drainage basin inputs sédiments
from the Sierra Madré Oriental and Central Mexico, where inten¬
sive agricultural practices and heavy use of fertilizers takes place.
The mid-range 40K concentrations were measured in sédiments ofthe Grijalva-Usumacinta river fan, and reflected the characteristicproperties of the Cenozoic and Paleozoic metamorphic rocks of itsdrainage basin.
The highest ,37Cs concentrations found in the sediment-cores oftheGrijalva-Usumacinta river fan sédiments resuit from the higherrainfall (3,000 mm. yr-') over its much greater drainage basin size,
relative to that ofthe Panuco River.
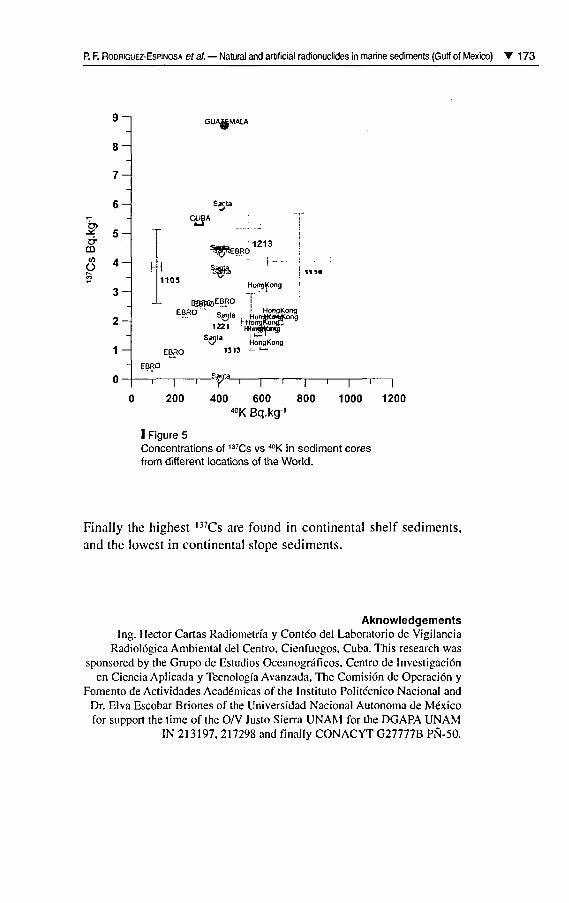
P. F. Rodriguez-Espinosa et al. Natural and artificial radionuclides in marine sédiments (Gulf of Mexico) T 1 73
fc»-S£
crm
O1^
9-
8-
7-
6--
5-
4-
3-
2-
1-
AU
(
h
EBR
I
)
H
1193
GUAM MALA
S^rila
CJJA 'J.
o 1213?WrïfcBRO ;
%|tffe I litsHongKong (
BJ8H&EBRO T
EBRO
D
1
200
*?>" HotigKongT31J J- L-
Santa1 Y ' 1 ' 1 '
400 600 8001 '
1000
I
120040K Bq.kg-'
I Figure 5Concentrations of 137Cs vs 40K in sédiment coresfrom différent locations of the World.
Finally the highest l37Cs are found in continental shelf sédiments,and the lowest in continental slope sédiments.
AknowledgementsIng. Hector Cartas Radiometrfa y Contéo del Laboratorio de Vigilancia
Radiolôgica Ambiental del Centro, Cienfuegos, Cuba. This research wassponsored by the Grupo de Estudios Oceanogrâficos, Centro de Investigacion
en Ciencia Aplicada y Tecnologia Avanzada, The Comisiôn de Operaciôn yFomento de Actividades Académicas of the Institulo Politécnico Nacional and
Dr. Elva Escobar Briones of the Universidad Nacional Autonoma de Mexicofor support the time of the O/V Justo Sierra UNAM for the DGAPA UNAM
IN 213197, 217298 and finally CONACYT G27777B PN-50.
174' Environmental Changes and Radioactive Tracers
BibliographyAlbrecht A., Béer J., 1 997 -Assessment of RadionuclideDistribution in Continental ShelfSédiments (the Gulf of TaranteMeditenanean Sea). Radioprotection-Colloques, 32 C2: 277-285.
Alonso H. C, DIaz A. M., Munoz C. A,SUAREZ MORELL E., Cl_ARO M R., 1998 -Levels of Radioactivity in the CubanMarine Environment. RadiationProtection Dosimetry, 75 (1-4): 69-70.
Davies D.K., Moore W.R., 1970-Dispersal of Mississippi sédimentin the Gulf of Mexico. Jour. Sed.Petrology, 40 (1): 339-353.
Davies D. K., 1972-Mineralogy, petrology and dérivationof sands and silts of the continentalslope, rise and abyssal plain of theGulf of Mexico. Jour. Sed. Petrology,42(1): 59-65.
Pérez-Sabino J. F.,
Oliva de Sandoval B. E.,Orozco-Chilel R. M., AguilarSandoval E., 1999-"Radioactive Contamination of theGuatemalan Marine Environmenf. In:International Symposium on MarinePollution, Monaco, 5-9 October 1998(OIEA ISSN 1011-4289, Vienna,1999): 550-552.
Pujol t. Li., Sanchez C. J.A., 1 997 -Radioactividad del Agua Superficial ylos Sedimentos en la Cuenca delEbro: Utilizaciôn del Tritio comoRadiotrazador en el Tramo Catalan.Radioprotecciôn 5 (15): 95-103.
Rodriguez Espinosa P. R,Vidal Lorandi F. V,Vidal Lorandi V. M. V, 1 998 -"Natural and Artificial Radionuclidesin Southern of Gulf of Mexico MarineSédiments". In: InternationalSymposium on Marine Pollution,Monaco, 5-9 October 1998 (OIEA ISSN101 1-4289. Vienna, 1999): 612-613.
Rodriguez Espinosa P. F.,Vidal Lorandi F.V.,
Vidal Lorandi V.M.V., 1999a -"Natural and Artificial Radionuclidesin Southern of Gulf of Mexico MarineSédiments"./;?: InternationalSymposium on Marine Pollution,Monaco. 5-9 October 1998 (OIEAISSN 1011-4289, Vienna, 1999):555-556.
Rodriguez Espinosa P. R,Vidal Lorandi F.V.,Vidal Lorandi V.M.V., 1999b -"On the Concentration andDistribution of Natural C°K, 2,4Bi and210Pb) and Artificial (137Cs)
Radionuclides in Marine Sédimentsof The Southern Gulf of Mexico". In:International Symposium on Nuclearand Related Techniques inAgriculture, Industry andEnvironment. Proceeding of the 2""NURT, V Workshop on NuclearPhysics, Havana, 26-29 October1998 (ISBN 959-71 36-04-X): 1-4.
Rodriguez Espinosa P. R,Vidal F. V., Vidal V. M. V, 1 999c -"Radioactivity in sédiments of theWestern, Southern and Central-Eastern Gulf of Mexico". In: EOSTrans., AGU, 80 (49), OcéanSciences Meet. Suppl.: p OS14.
Rodriguez Espinosa P. R,Vidal F. V, Vidal V. M. V., 1 996 -Estudio de la Concentration yDistribution de RadionûclidosNaturales y Artificiales enSedimentos Marinos del Golfode Mexico. Informe FinalIIE/UREN/13/5586/I01/R, 374 p.
Van Andel Tj. H., 1960 -Sources and Dispersion of HolocèneSédiments, in North west Gulf ofMexico. Am. Assoc. PetroleumGeologists, 1 : 34-55.
Yu K. N., Guan Z. J., Stokes M. J.,Young E.C. M., 1994-Natural and Artificial Radionuclidesin Seabed Sédiments of Hong Kong.Nucl. Geophys., 8 (1): 45-48.
Mixing models(advection/diffusion/non-local exchange)and 210Pb sédiment profilesfrom a wide rangeof marine sédiments
Sandor Mulsow
Pavel Povinec
Introduction
Particles settling from the water column may enter the sédimentbelow by physical or biological activity. Because thèse transport pro¬
cesses play a rôle during early diagenesis (Aller, 1990), their under¬
standing and quantification is crucial in the fate of many sédimentbound particles reaching the seafloor. Theoretically sédiment accu¬
mulation rates dépends only in the variable or constant supply of par¬
ticles. For many years sédiment bound tracers hâve been used to
estimate sédiment accumulation rates, a commonly used one is con¬
centration profiles of excess 210Pb (Nittrouer et al, 1983; DeMasteret al, 1994). This radiotracer is strongly bound to particulate mate¬
rial, hence its redistribution dépends mainly on the supply at the sed-
iment-water interface, in situ production from 238U via 22fiRa decay,
sédiment accumulation and physical (earthquake, waves) or biologi¬cal mixing. In nature most ofthe particles bearing 2l0Pb are of organicorigin, thus in only few cases biological mixing does not influence
1 76 T Environmental Changes and Radioactive Tracers
activity concentration profiles. This fact is quite important because
violate one of the prerequisite in using tracers as time docks in séd¬
iments, that is, the immobilisation of the tracer upon arrivai to the
sediment-water interface (Kadlec and Robbins, 1984). Biologicalmixing in marine sédiment has been estimated assuming that sédi¬
ment reworking consist of a large number of small events, thus the
resuit over time appears as diffusive and the activity can be quantifyas biological diffusive mixing (Db) (Boudreau, 1986a; Mulsow and
Boudreau, 1999). This coefficient is usually modelled from sedi-
ment-depth profiles of particle bound radioactive tracers. However,empirica! data showed quite often-subsurface maximum (Smith étal,1986) that can not be accounted for as diffusive mixing. Alternativehypothèses are fluctuation in the input sources, burrows or tube'sinfilling or a mechanism that introduce surface (young) sédiment at
depth in the sédiment column. This latter process is call non-localexchange (Boudreau, 1986b). Because of the complexity of such
processes biological-mixing effect on 2l0Pb sédiment profiles is often
ignored and not accounted for. One of the reasons is the lack of sys¬
tematic models that could account for the main biological mixingactivities in marine sédiments. Soetaert et al. (1996) presented a fam¬
ily of bioturbation models including diffusive and non-localexchange processes and demonstrated its applicability and limita¬tions in the interprétation of 2l0Pb sédiment profiles. In this study, we
apply thèse mixing models to 10 sédiment depth profiles of 2l0Pb.
The cores were collected from deep-sea stations (Northwest Pacific)to intermediate depths (Arabian Sea, Mediterranean Sea) and
marginal sédiments from Kara Sea.
i Material and methods
Sédiment collection
Ail the sédiment was collected using a box corer and inserting a
Plexiglas liner of 30 cm in length and 112 mm in diameter. The onlyexception was the sédiment core collected in the Arabian Sea scdi-
S. Mulsow, P. Povinec Mixing models and 210Pb sédiment profiles from marine sédiments T 177
ments. At this station the sédiment was collected using a gravitycorer. The sédiment was sliced on board and freeze-dried. Analiquot of 100-200 mg of sédiment was digested in a mixture ofHF+HCL+HNO3 in a Teflon bomb and microwave. The activity of210Pb was measured by alpha counting of its daughter 210Po consid¬
ered hère as in secular equilibrium. 208Po or 209Po were used as
chemical yield. Standard sédiment sample as well as blanks wereused with each batch of samples analysed. 210Po were spontaneouslydeposited on silver dises. Bulk density and porosity were deter¬
mined from the différence in wet and dried weight after correctionfor salinity content. The activity concentration of 210Pb wasexpressed in dpm ml"' of total activity in order to satisfy the model'srequirement used hère. The supported production is calculated as a
parameter in the models.
û Models
Basically, we used the models proposed by Soetaert et al. (1996)Thèse authors proposed a family of models with increasing com¬
plexity (number of parameters added) of diffusive and non-localexchange mixing processes included in the models. The modelsrequire only a known sédimentation rate and total activity of the
tracer profile. In our study we used the most close sédimentationrate from the literature for each one of the sites and ranged from1-10 cm.kyr'. For détails in the models see Soetaert, et al. (1996).
Results and discussion
The sédiment cores studied corne from a wide range of marineenvironments. Some stations are from coastal areas (Morocco,Kara Sea), others from intermediate depth water from the
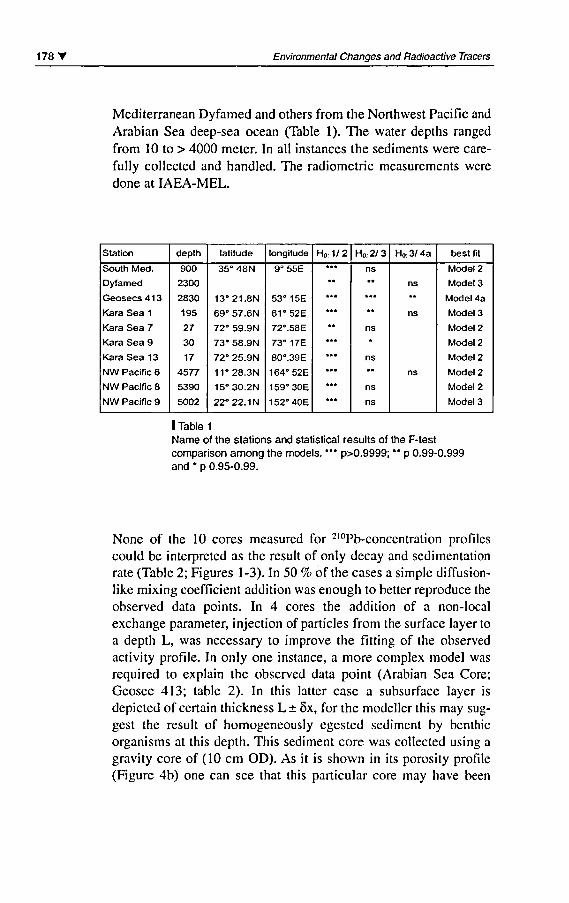
178' Environmental Changes and Radioactive Tracers
Mediterranean Dyfamed and others from the Northwest Pacific and
Arabian Sea deep-sea océan (Table 1). The water depths ranged
from 10 to > 4000 meter. In ail instances the sédiments were care-
fully collected and handled. The radiométrie measurements weredone at IAEA-MEL.
Station
South Med.
Dyfamed
Geosecs413
Kara Sea 1
Kara Sea 7
Kara Sea 9
Kara Sea 13
NW Pacific 6
NW Pacific 8
NW Pacific 9
depth
900
2300
2830
195
27
30
17
4577
5390
5002
latitude
35° 48N
13°21.8N
69° 57.6N
72° 59.9N
73° 58.9N
72° 25.9N
11°28.3N
15° 30.2N
22° 22.1 N
longitude
9°55E
53° 15E
61°52E
72°.58E
73° 17E
80°.39E
164° 52E
159° 30E
152°40E
Ho: 1/ 2
***
**
...
...
*
...
...
...
...
...
Ho: 2/ 3
ns
**
...
**
ns
ns
*
ns
ns
H0: 3/ 4a
ns
*
ns
ns
best fit
Model 2
Model 3
Model 4a
Model 3
Model 2
Model 2
Model 2
Model 2
Model 2
Model 3
I Table 1
Name of the stations and statistical results of the F-testcomparison among the models. *** p>0.9999; ** p 0.99-0.999and * p 0.95-0.99.
None of the 10 cores measured for 2'°Pb-concentration profilescould be interpreted as the resuit of only decay and sédimentationrate (Table 2; Figures 1-3). In 50 % ofthe cases a simple diffusion-like mixing coefficient addition was enough to better reproduce the
observed data points. In 4 cores the addition of a non-localexchange parameter, injection of particles from the surface layer toa depth L, was necessary to improve the fitting of the observedactivity profile. In only one instance, a more complex model was
required to explain the observed data point (Arabian Sea Core;Geosec 413; table 2). In this latter case a subsurface layer is
depicted of certain thickness L ± 5x, for the modeller this may sug¬
gest the resuit of homogeneously egested sédiment by benthicorganisms at this depth. This sédiment core was collected using a
gravity core of (10 cm OD). As it is shown in its porosity profile(Figure 4b) one can see that this particular core may hâve been
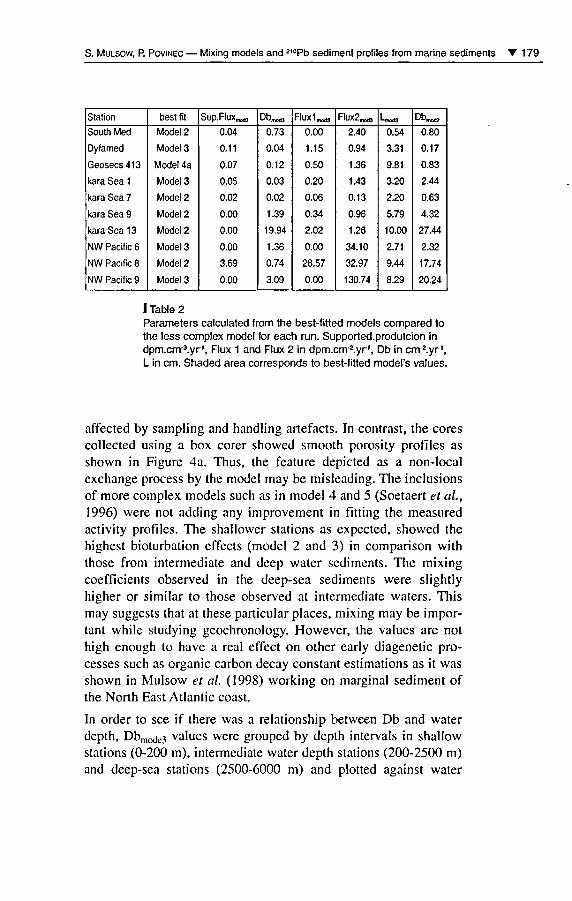
S. Mulsow, P. Povinec Mixing models and 210Pb sédiment profiles from marine sédiments T 179
Station
South Med
Dyfamed
Geosecs413
kara Sea 1
kara Sea 7
kara Sea 9
kara Sea 13
NW Pacific 6
NW Pacific 8
NW Pacific 9
best fit
Model 2
Model 3
Model 4a
Model 3
Model 2
Model 2
Model 2
Model 3
Model 2
Model 3
Sup.FluxmttfI
0.04
0.11
0.07
0.05
0.02
0.00
0.00
0.00
3.69
0.00
Db»,0.73
0.04
0.12
0.03
0.02
1.39
19.94
1.36
0.74
3.09
Fluxl,,0.00
1.15
0.50
0.20
0.06
0.34
2.02
0.00
28.57
0.00
FIux2mod3
2.40
0.94
1.36
1.43
0.13
0.96
1.26
34.10
32.97
130.74
*-mod3
0.54
3.31
9.81
3.20
2.20
5.79
10.00
2.71
9.44
8.29
Db^0.80
0.17
0.83
2.44
0.63
4.32
27.44
2.32
17.74
20.24
I Table 2Parameters calculated from the best-fitted models compared tothe less complex model for each run. Supported.produtcion indpm.cnr'.yr1, Flux 1 and Flux 2 in dpm.cm^.yr1, Db in cm-2.yr\L in cm. Shaded area corresponds to best-fitted model's values.
affected by sampling and handling artefacts. In contrast, the corescollected using a box corer showed smooth porosity profiles as
shown in Figure 4a. Thus, the feature depicted as a non-localexchange process by the model may be misleading. The inclusionsof more complex models such as in model 4 and 5 (Soetaert et al,1996) were not adding any improvement in fitting the measuredactivity profiles. The shallower stations as expected, showed thehighest bioturbation effects (model 2 and 3) in comparison withthose from intermediate and deep water sédiments. The mixingcoefficients observed in the deep-sea sédiments were slightlyhigher or similar to those observed at intermediate waters. Thismay suggests that at thèse particular places, mixing may be impor¬tant while studying geochronology. However, the values are nothigh enough to hâve a real effect on other early diagenetic pro¬
cesses such as organic carbon decay constant estimations as it wasshown in Mulsow et al (1998) working on marginal sédiment ofthe North East Atlantic coast.
In order to see if there was a relationship between Db and waterdepth, Dbmode3 values were grouped by depth intervais in shallowstations (0-200 m), intermediate water depth stations (200-2500 m)and deep-sea stations (2500-6000 m) and plotted against water
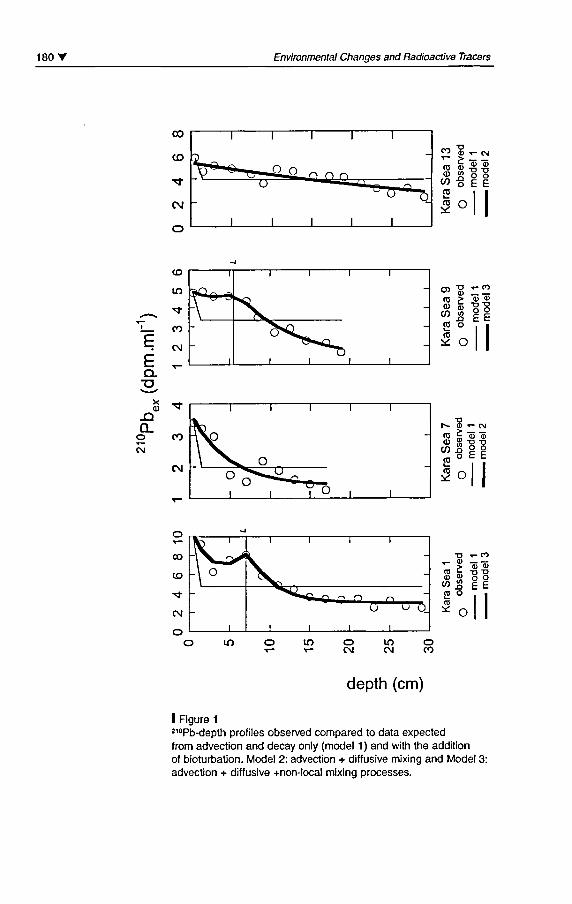
180 Environmental Changes and Radioactive Tracers
£E _Q.
;o,
-QCL
o cocn
CM
CD
IO
«*
CD
CM
I
»<W^
I
I I I
^oX1*Wl I I
I
-
-
I
I
o
1
o
1
o
1
1 1 1
Tô , ,
CD
? CD <D
8 "o "aS g go E E
oil
depth (cm)
I Figure 1
210Pb-depth profiles observed compared to data expectedfrom advection and decay only (model 1 ) and with the additionof bioturbation. Model 2: advection + diffusive mixing and Model 3:advection + diffusive +non-local mixing processes.
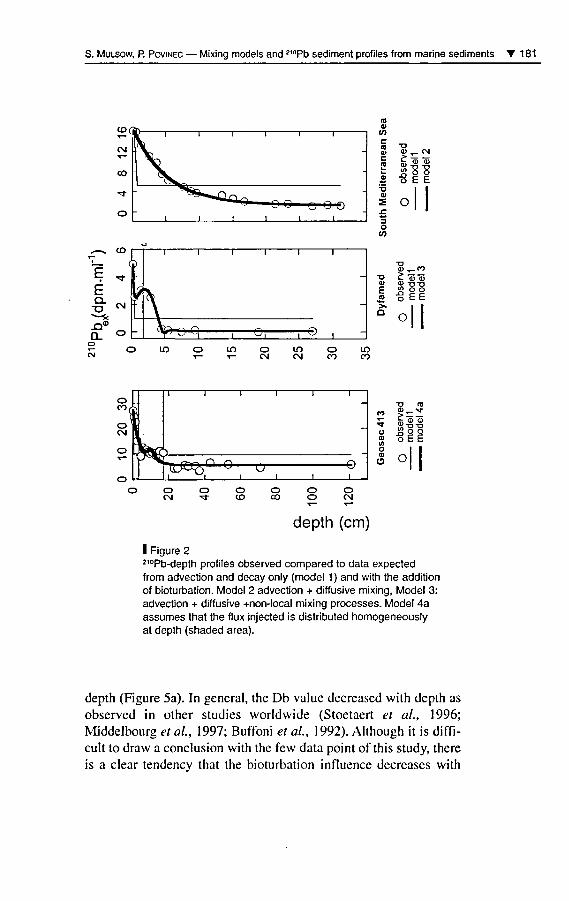
S. Mulsow, P. Povinec Mixing models and °'°Pb sédiment profiles from marine sédiments 181
c
a
S
3Oin
ru ,_ cn
jn "CÛ "Ô)Si "O "D
o E E
O
TJ ro
S"ô>"ô5S)""3"13
oEE
O O
depth (cm)
I Figure 2210Pb-depth profiles observed compared to data expectedfrom advection and decay only (model 1 ) and with the additionof bioturbation. Model 2 advection + diffusive mixing, Model 3:advection + diffusive +non-local mixing processes. Model 4aassumes that the flux injected is distributed homogeneouslyat depth (shaded area).
depth (Figure 5a). In gênerai, the Db value decreased with depth as
observed in other studies Worldwide (Stoetaert et al, 1996;Middelbourg et al, 1997; Buffoni et al, 1992). Although it is diffi¬cult to draw a conclusion with the few data point of this study, thereis a clear tendency that the bioturbation influence decreases with
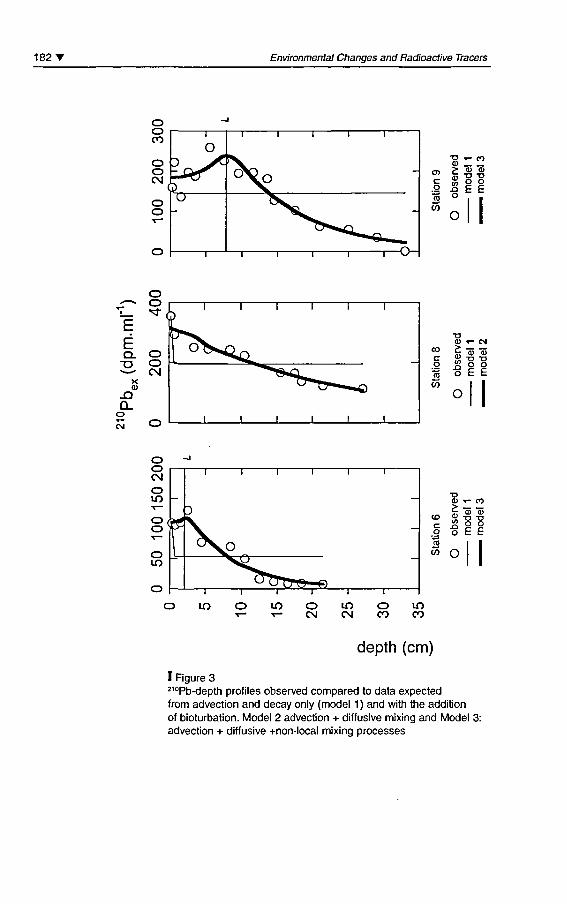
182' Environmental Changes and Radioactive Tracers
OOco
ooCM
OO
U
i
O
I
I
°N
i
i i
^o
I I
I I
-
-i 1 o-
_ co
"SZ52> <B <D
811o ?fo
w
CO T- CM
oo oE E
O
CN
OIO'T_o<U*cr
oLO
rr
1
^Vxa-
i
1 ! 1
Sp^» _
0*ÎTTT©-^i i i
i i
i i
LO
B
LO Ot- CM
LOCM
OCO
LOCO
a> »- co
S! f "DH o oo E E
depth (cm)
I Figure 3210Pb-depth profiles observed compared to data expectedfrom advection and decay only (model 1 ) and with the additionof bioturbation. Model 2 advection + diffusive mixing and Model 3:advection + diffusive +non-local mixing processes
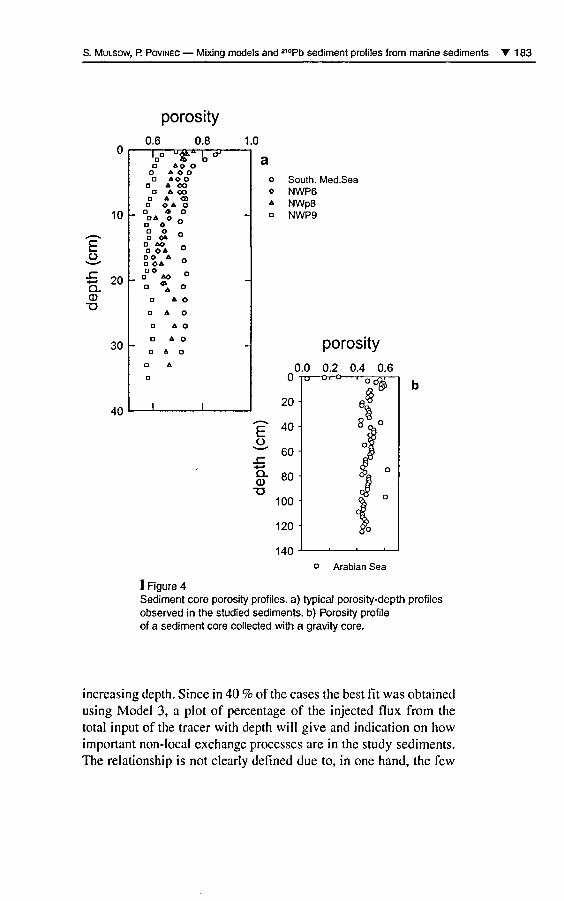
S. Mulsow, P. Povinec Mixing models and 2,0Pb sédiment profiles from marine sédiments T 183
porosity
Eo
Q.
T3
0
10
20
30
0.6 0.8
l" fD AO O
D A o OAO O
A OOA OO
O A <Ba o a o
« oOA O
° * Oa o» °o ao 0o oa °
00 AO OA °OO _
ao °a \ o
D A O
O A O
a a o
O A O
DAO
a
a
I
t*
I
1
-
o South. Med.Seao NWP6a NWp8o NWP9
porosity0.0 0.2 0.4 0.6
TO Ot-O r-
o Arabian Sea
I Figure 4Sédiment core porosity profiles, a) typical porosity-depth profilesobserved in the studied sédiments, b) Porosity profileof a sédiment core collected with a gravity core.
increasing depth. Since in 40 % ofthe cases the best fit was obtainedusing Model 3, a plot of percentage of the injected flux from thetotal input of the tracer with depth will give and indication on howimportant non-local exchange processes are in the study sédiments.The relationship is not clearly defined due to, in one hand, the few
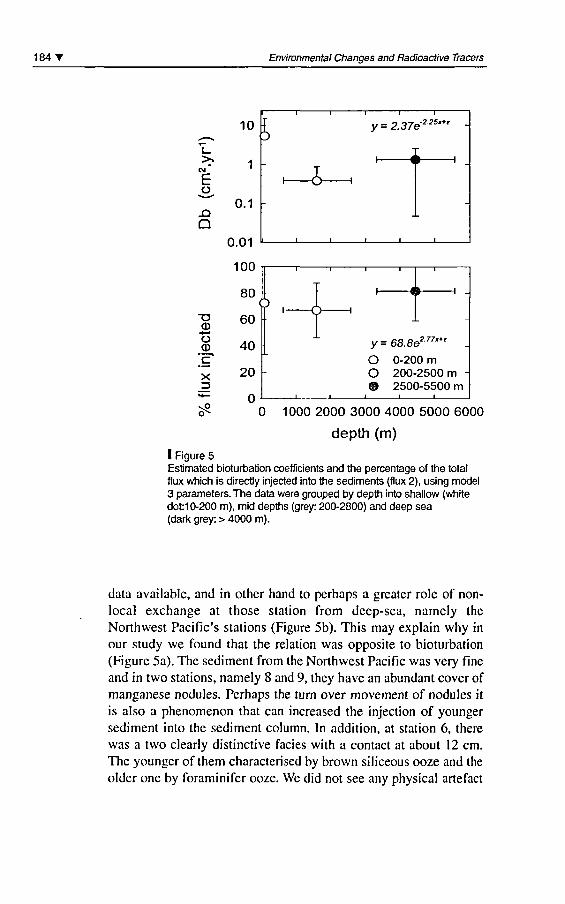
184 T Environmental Changes and Radioactive Tracers
CM*
E
XJQ
njected
X
flu 10
1
0.1
0.01
100
80(
60
40
20
n
H
? H
i I
5<wJ
c
l
J
I I
I I I
y=2.37e22S'*' -
~\
I I i
y=68.8e277**e .O 0-200 mO 200-2500 m -# 2500-5500 m
i i i
c* 0 1000 2000 3000 4000 5000 6000
depth (m)
I Figure 5Estimated bioturbation coefficients and the percentage of the totalflux which is directly injected into the sédiments (flux 2), using model3 parameters. The data were grouped by depth into shallow (whitedot:1 0-200 m), mid depths (grey: 200-2800) and deep sea(dark grey: > 4000 m).
data available, and in other hand to perhaps a greater rôle of non-local exchange at those station from deep-sea, namely the
Northwest Pacific's stations (Figure 5b). This may explain why inour study we found that the relation was opposite to bioturbation(Figure 5a). The sédiment from the Northwest Pacific was very fineand in two stations, namely 8 and 9, they hâve an abundant cover ofmanganèse nodules. Perhaps the turn over movement of nodules itis also a phenomenon that can increased the injection of youngersédiment into the sédiment column. In addition, at station 6, therewas a two clearly distinctive faciès with a contact at about 12 cm.The younger of them characterised by brown siliceous ooze and the
older one by foraminifer ooze. We did not see any physical artefact
S. Mulsow, P. Povinec Mixing models and 210Pb sédiment profiles from marine sédiments T 1 85
based on porosity profiles measured at each one of the stations as
shown in Figure 1. Station 6 is also relatively close to MarshalIsland région, thus perhaps physical mixing may be also playing a
rôle in this diagenetic parameters.
Conclusion
In summary, none of the 210Pb-depth profiles were better fitted ifsédimentation rate and radioactive decay of the tracer was con¬
sidered. Our finding agrée with those found in the literature.Soetaert et al. (1996) found in marginal sédiment cores that the2l0Pb profiles were best fitted using Db and non-local exchangemixing like in our case. However, in their study they clearlyshowed that Db decreased with depth, it is worth to mention thatthèse authors analysed 16 cores and many of them seasonally.Two major conclusions can be drawn from our study. One of themis that the use of 210Pb in geochronology is increasingly doubtfulif only one tracer is used and no attempts to study systematicallythe effect of bioturbation. Secondly, it appears that mixing of trac¬
ers and therefore any other sédiment bound particle, reaching thesediment-water interface at deep-sea océan sédiments are perhapsmore affected by mixing (diffusive/non-local exchange) as previ¬ously thought. Smith et al. (1986) showed that when non-localexchange is included in the analyses of determining bioturbationrates they could be overestimated. It is clear that bioturbation inmarine sédiments during early diagenesis do play a quantitativerôle in the fate of sédiment bound contaminants. From our studyit is also clear that geochronology based uniquely on 210Pb-depth
profiles is not suitable for obtaining sound accumulation rate val¬ues. Although the models can depicted mixing processes (diffu¬sive/non-local mixing) taking place in the sédiment columns, thelack of knowledge on the actors (benthos) who mix soluté andparticles are often a major incognito. Perhaps, a différentapproach must be taken to bring some light to this uncoupling ofsédiment and biota. If one could model the feeding guild of a
dominant group through time on a well define sédiment column,the resulting profile of such an experiment may resemble those
186' Environmental Changes and Radioactive Tracers
found in our study. If this is possible then we can predict whichfeeding guild is responsible, for example, of a characteristic sub¬
surface maxima peak often found on tracer-depth profiles andgenerally disregard as noise.
BibliographyAller R. C, 1990-Bioturbation and manganèse cyclingin hemipelagic sédiments. Phil.Transc.R.Soc.Lond., 331: 51-68.
Boudreau B., 1986a-Mathematics of tracer mixingin sédiments: I spatially-dependent.diffusive mixing.AJ.Sc/., 286:161-198.
Boudreau B., 1986b-Mathematics of tracer mixingin sédiments: Il non-local mixing andbiological conveyor belt phenomena.A J.Scl, 286:199-238.
Buffoni G., Delfanti R.,Papucci C, 1992-Accumulation rates and mixingprocesses in the near-surface NorthAtlantic sédiments: Evidence fromC14and Pu-239-240 downcoreprofiles. Mar.Geol, 109: 159-170.
DeMaster D. J., Hope R. H.,Levin L. A., Blair N. E., 1994 -Biological mixing intensity and ratesof organic carbon accumulation inNorth Carolina slope sédiments.Deep-sea Research, 41: 735-753.
Kadlec R. H., Robbins J. A., 1984 -Sédimentation and sédimentaccretion in Michigan CoastalWetlands (UAS), Chem. Geol,44:119-150.
MlDDELBOURG J. L., SAETAERT K.,Herman P. M.J., 1997-Empirical relationships for use in
global diagenetic models. Deep-seaResearch, 44 (2): 327-344.
Mulsow S., Boudreau B.,Smith J. N., 1999-Bioturbation and porosity gradients.Limn. & Oceanogr., 43 (1): 1-9.
Mulsow, S., Boudreau B.,Smith J. N., 1998-Biological mixing models in theinterprétation of2,0Pb sédimentconcentration profiles. NSK-EKO-II.Helsinki, 1997:1-8.
Nittrouer C A., DeMaster D. J.,McKEE B. A., CUTSHALL N. H.,Larsen I. L, 1983-The effect of sédiment mixing on
10Pb accumulation rates for theWashington shelf. Mar. Geol,54:201-221.
Smith, J. N., Boudreau B. P.,
Noshkin V., 1986-Plutonium and 2,0Pb distributionsin the Northeast Atlantic sédiments:subsurface anomalies caused bynon-local mixing. Earth Planet. Sci.Lett., 81:15-28.
Soetaert K., Herman P. M. J.,MlDDELBOURG J. L, HEIP G.,deStigter H. S., van Weering T. C. E.,Epping E., Helder W., 1996 -Modelling 2,0Pb-derived mixingactivity in océan margin sédiments:diffusive versus non-local mixing.J.Mar. Res., 54: 1207-1227.
Advantages of combining210Pb and geochemicalsignature déterminationsin sédiment record studies:application to coral reeflagoon environments
Jean-Michel Fernandez
Benjamin Moreton
Renaud Fichez
Ludovic Breau
Olivier Magand
Christian Badie
I Introduction
During the past 150 years, terrestrial and coastal environments hâvebeen strongly modified by human activities. In the tropics, popula¬tion growth and économie development imposed serious constraintson lagoon ecosystems (Hatcher et al, 1989). Déforestation and
mining, which are primarily responsible for hyper-sedimentationand métal pollution, are two of the major causes of disturbance incoral-lagoon environments (Carey, 1981; Naidu and Morrisson,1994; Zan, 1994). Traces of thèse upheavals may be preserved inthe sédiment layers that gradually build up a memory of the varioussuccessive events affecting the environment.
1 88 T Environmental Changes and Radioactive Tracers
Interprétation of thèse "sedimentary records" is mostly based on the
dating of deposits, using natural timers such as radionuclides toestablish a geochronology of sédiment déposition. Most of the stud¬
ies dealing with récent sedimentary records of environmentalchanges hâve been based on 2l0Pb déterminations, the decrease inunsupported 2I0Pb permitting âge déterminations back to about 100
years (Faure, 1986). However, deciphering both the geochemical
and sedimentological data collected from thèse layers is not alwaysstraightforward, with results often leading to misinterpretations due
to a lack of converging information.
Four cores hâve been selected hère to demonstrate that in most
cases a combination of excess 210Pb measurements, geochemicaland sedimentary data is necessary to reach a solid interprétation ofrecorded environmental changes. This paper shows how excess
2l0Pb values may be used to distinguish between real human effects
and sampling errors or natural processes.
Materials and methods
Sédiment cores were collected in the coral reef lagoons of NewCaledonia and Fiji in the vicinity of Nouméa and Suva towns(Table 1). Two cores were sampled in the New Caledonia Lagoon(Figure l).The first core was taken adjacent to Nouméa in Sainte
Marie Bay (N12) and the second (M15) was extracted from the
Dumbea sub-marine valley formed during the last glaciation,20 000 years ago, when the sea level was roughly 120 m below pré¬
sent sea level. Sainte Marie Bay is a fairly enclosed system with twonarrow passes Connecting it to Boulari Bay in the northeast part, and
the middle lagoon in the south part. The NI 2 core was extracted inan area where évidence of fine material déposition has been demon¬
strated (Dugas & Debenay, 1979, Chevillon unpublished results).
Core M15 was extracted at the base ofthe northern slope ofthe sub¬
marine valley, close to the Dumbea pass.
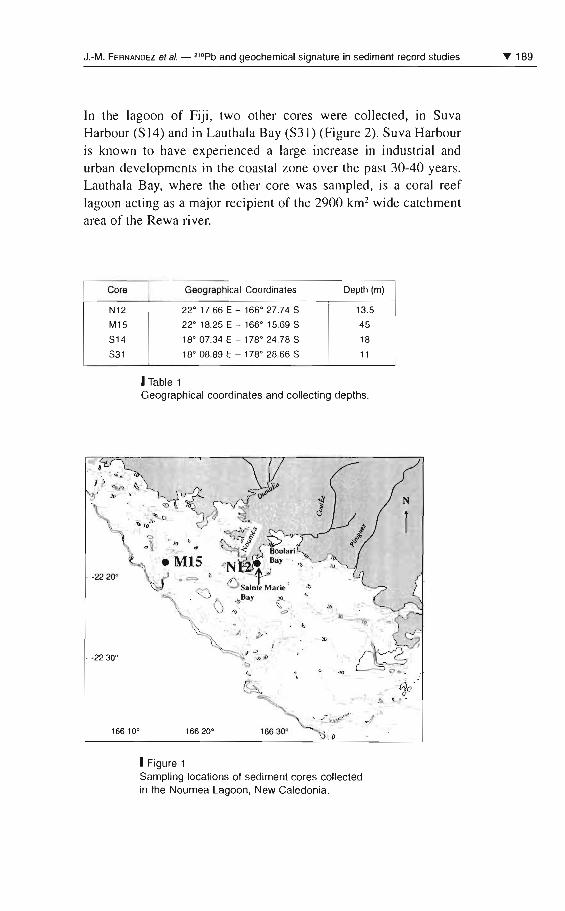
J.-M. FERNANDEZ et al. - 2Iopb and geochemical signalure in sediment record sludies
In the lagoon of Fiji, two other cores were collected, in SuvaHarbour (SI4) and in Lauthala Bay (S31) (Figure 2). Suva Harbouris known to have experienced a large increase in industrial andurban developments in the coastal zone over the past 30-40 years.Lauthala Bay, where the other core was sampled, is a coral reeflagoon acting as a major recipient of the 2900 km2 wide catchrnentarea of the Rewa river.
Core Geographical Coordinates Depth(rn)
N12 22' 17.66 E - 166' 27.74 5 13.5
M15 22' 18.25 E - 166' 15.695 45
514 18' 07.34 E - 178· 24.78 5 18
531 18' 08.89 E - 178' 28.66 5 11
1Table 1Geographical coordinates and collecting depths.
T 189
166 ID' 16620'
.,
1Figure 1Sampling locations of sediment cores collectedin the Noumea Lagoon, New Caledonia .
1 90 T Environmental Changes and Radioactive Tracers
The sédiment cores were sampled using a specially devised PVCcorer operated by SCUBA divers (Harris et al, 2001). The corer con-sisted of a 1.2 mètre long PVC tube, 25 cm in diameter, which had
been eut in half from top to bottom. The two halves were clampedtogether during coring and transportation to sustain the core untilsampling. The corer was forced down into the sédiment by hammer-ing on a cap placed on the top of the corer to about half a meter deep.
The sédiment surrounding it was then pumped away until the bottomcould be sealed with a second cap. The corer was then removed and
kept vertical.
Once onboard the core was allowed to settle vertically, the top was
then removed and the overlying water carefully pumped out. The firstfluid layers were sampled using a spatula and the core was then laidhorizontally and 2 cm slices taken for geochemical and sedimenta-
logical analysis. A sub-sample of each slice was used for 2,0Pb mea¬
surements.
Finally, to obtain water content additional 10 ml sub-samples were
taken and weighed before and after drying, in an oven at 1 10°C untilconstant weight. Results are expressed as a percentage of the initialsédiment dry weight. This was subsequently used to calculate sédi¬
ment accumulation in g.cnr2.
The concentrations of three transition metals (Fe, Mn and Ni) were
determined using a sequential extraction scheme (Tessier, 1979) on
the pelitic (<40jim) fraction of the sample. The residual phase, pri-marily composed of terrigeneous material, was extracted with an
acidic mixture (HCI/HNO3/HF) in a high pressure vessels made ofTFM (Anton Paar, MF100) and subject to micro-wave exposure in an
Anton Paar Multiwave. Metals were analysed by ICP-OES (Perkin-Elmer, 3300DV model). Results are expressed in absolute concentra¬
tion (mg.g-' extracted from the residual phase per mass unit of peliticfraction) and relative concentrations (mg.g-1 extracted from the resid¬
ual phase per unit mass of residual phase).
Geochronology was defined using 2,0Pb activity determined indirectlyby measuring alpha émission from its granddaughter isotope 210Po.
Each sample was spiked with 208Po in order to appraise possible losses
incurred during application of the digestion protocol. The 2,0Po mea-
surement was performed in a NUMELEC gridded-chamber (NU 1 14B
model) by alpha counting.
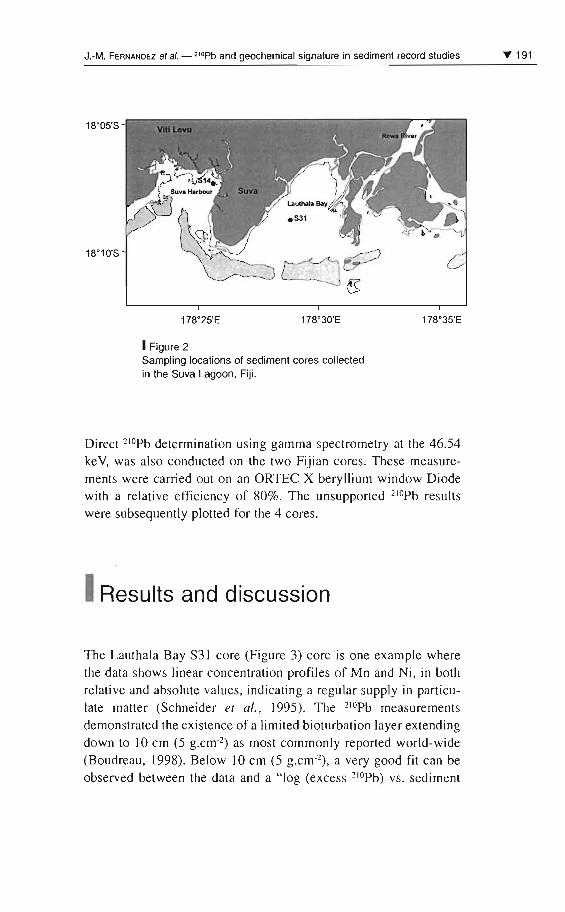
J .-M. FERNANDEZ et al. - "oPb and geochemical signature in sediment record studies 'If 191
178°30'E 178°35'E
1Figure 2Sampling locations of sediment cores collectedin the Suva Lagoon, Fiji.
Direct 210pb determination using gamma spectrometry at the 46.54keV, was also conducted on the two Fijian cores . These measurements were carried out on an ORTEC X beryllium window Diodewith a relative efficiency of 80%. The unsupported 210pb resultswere subsequently plotted for the 4 cores.
1Results and discussion
The Lauthala Bay S31 core (Figure 3) core is one example wherethe data shows Iinear concentration profiles of Mn and Ni, in bothrelative and absolute values, indicating a regular supply in particulate matter (Schneider el al., 1995). The 2l0pb measurementsdemonstrated the existence of a limited bioturbation layer extendingdown 10 10 cm (5 g.crrr") as most commonly reported world-wide(Boudreau , 1998). Below 10 cm (5 g.cm'), a very good fit can beobserved between the data and a "log (excess 2lopb) vs. sediment
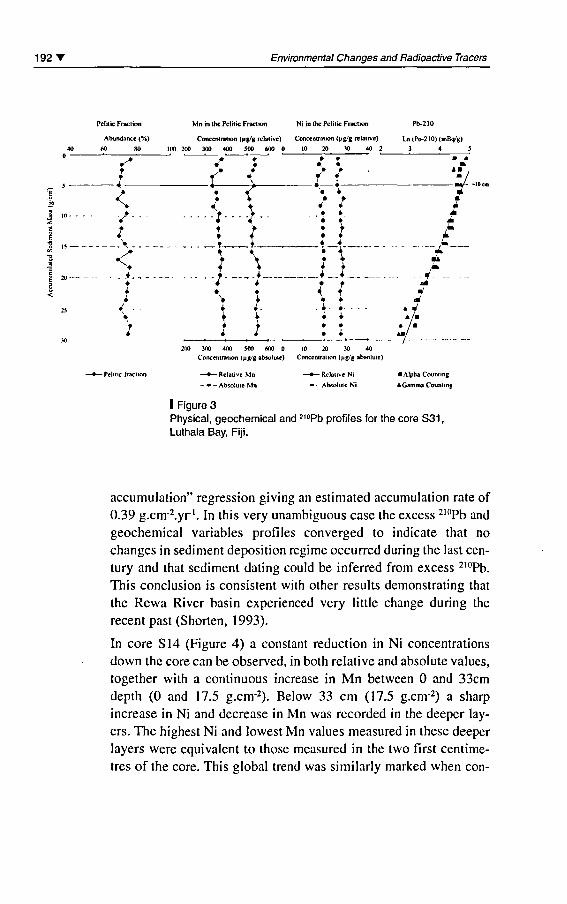
1 92 T Environmental Changes and Radioactive Tracers
Pcliiic Fraction Mn in the Pelhïc Fraction Ni in ihePcliiic Fraction Pb-210
Abundance <%) Concentranon (ug/g relative) Concentration (ug/g relative) Ln (Po-210) (mBa/g)
AO 80 100 200 300 400 500 600 0 10 20 10 40 2 3 4
200 300 400 500 600 0 10 20 30 40
Concentration (ug/g absoluie) Crmccnlraiion (ug/g absoluie)
-Pelitic fraclion Relative Mn Relative Ni «Alpha Countmg
* Absoluie Mn - - Absolute Ni * Gamma Counlmg
I Figure 3Physical, geochemical and 2,0Pb profiles for the core S31,Luthala Bay, Fiji.
accumulation" régression giving an estimated accumulation rate of0.39 g.cnr2.yr'. In this very unambiguous case the excess 210Pb and
geochemical variables profiles converged to indicate that nochanges in sédiment déposition régime occurred during the last cen¬
tury and that sédiment dating could be inferred from excess 2l0Pb.
This conclusion is consistent with other results demonstrating that
the Rewa River basin experienced very little change during the
récent past (Shorten, 1993).
In core S14 (Figure 4) a constant réduction in Ni concentrationsdown the core can be observed, in both relative and absolute values,
together with a continuous increase in Mn between 0 and 33cmdepth (0 and 17.5 g.cnr2). Below 33 cm (17.5 g.cnv2) a sharp
increase in Ni and decrease in Mn was recorded in the deeper lay¬
ers. The highest Ni and lowest Mn values measured in thèse deeper
layers were équivalent to those measured in the two first centimè¬
tres ofthe core. This global trend was similarly marked when con-
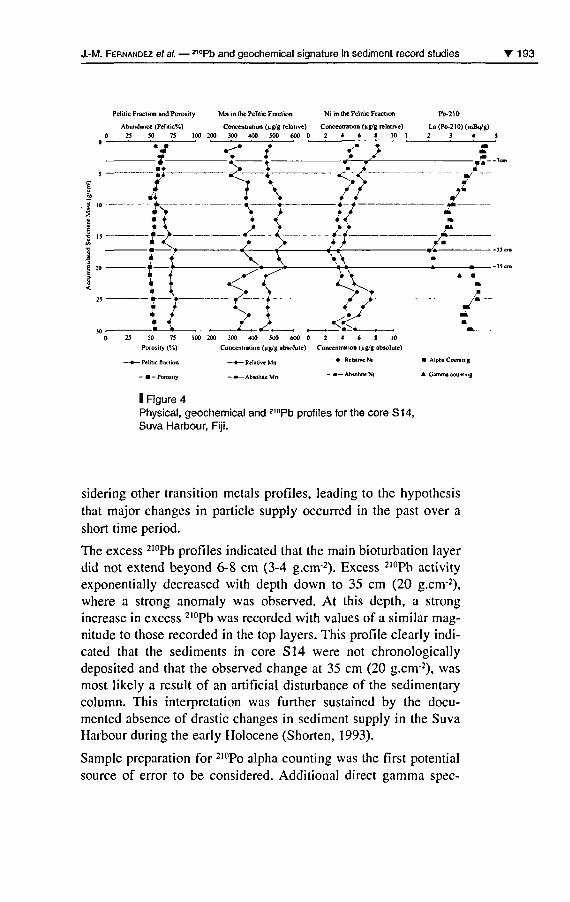
J.-M. Fernandez étal. 21°Pb and geochemical signature in sédiment record studies 193
Pelitic Fraction and Porosity Mn in the Pelitic Fraction Ni in the Pelitic Fraction
Abundance (Pelitic*/.) Concentration (ug/g relative) Concentration (ug/g relative) Ln (Po-210) (mBq/g)0 25 50 75 100 200 30040050060002468 10 1 2 3 4
50 75
Porosity (%)
- Peliiic fraction
Porosity
100 200 300 4005006000 2 4 6 S 10
Concentration (ug/g absoluie) Concentration (ug/g absolute)
- - Relative Ni- Relative Mn
- Absolute Mn -AMoluieNi
Alpha Coumir.g
A Gamma countmg
I Figure 4Physical, geochemical and 210Pb profiles for the core S 14,Suva Harbour, Fiji.
sidering other transition metals profiles, leading to the hypothesisthat major changes in particle supply occurred in the past over a
short time period.
The excess 2I0Pb profiles indicated that the main bioturbation layerdid not extend beyond 6-8 cm (3-4 g.cnv2). Excess 210Pb activityexponentially decreased with depth down to 35 cm (20 g.cnv2),where a strong anomaly was observed. At this depth, a strongincrease in excess 2l0Pb was recorded with values of a similar mag¬
nitude to those recorded in the top layers. This profile clearly indi¬cated that the sédiments in core S14 were not chronologicallydeposited and that the observed change at 35 cm (20 g.cnv2), was
most likely a resuit of an artificial disturbance of the sedimentarycolumn. This interprétation was further sustained by the docu¬
mented absence of drastic changes in sédiment supply in the SuvaHarbour during the early Holocène (Shorten, 1993).
Sample préparation for 210Po alpha counting was the first potentialsource of error to be considered. Additional direct gamma spec-
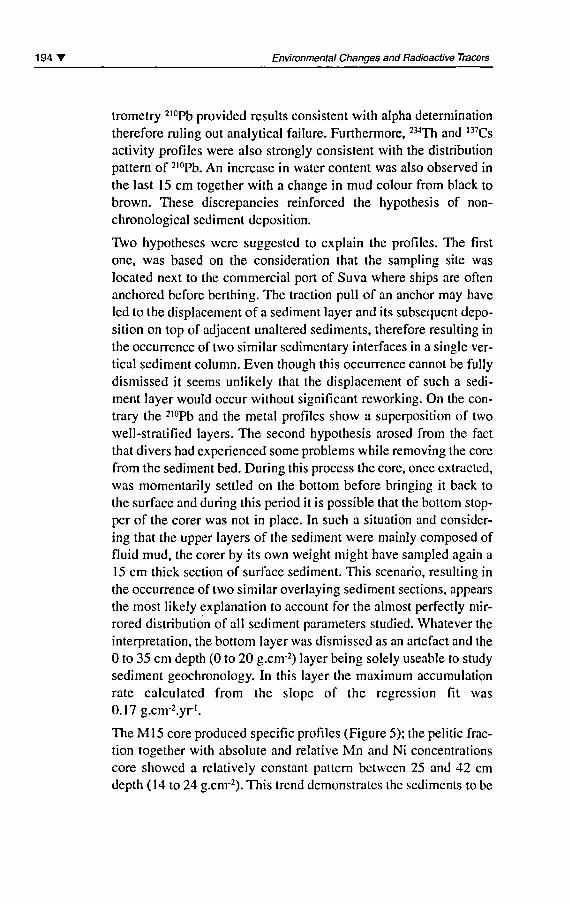
1 94 T Environmental Changes and Radioactive Tracers
trometry 2l0Pb provided results consistent with alpha déterminationtherefore ruling out analytical failure. Furthermore, 234Th and ,37Cs
activity profiles were also strongly consistent with the distributionpattern of 2l0Pb. An increase in water content was also observed inthe last 15 cm together with a change in mud colour from black tobrown. Thèse discrepancies reinforced the hypothesis of non-
chronological sédiment déposition.
Two hypothèses were suggested to explain the profiles. The firstone, was based on the considération that the sampling site was
located next to the commercial port of Suva where ships are oftenanchored before berthing. The traction pull of an anchor may hâve
led to the displacement of a sédiment layer and its subséquent dépo¬
sition on top of adjacent unaltered sédiments, therefore resulting inthe occurrence of two similar sedimentary interfaces in a single ver¬
tical sédiment column. Even though this occurrence cannot be fullydismissed it seems unlikely that the displacement of such a sédi¬
ment layer would occur without significant reworking. On the con¬
trary the 2l0Pb and the métal profiles show a superposition of twowell-stratified layers. The second hypothesis arosed from the factthat divers had experienced some problems while removing the core
from the sédiment bed. During this process the core, once extracted,was momentarily settled on the bottom before bringing it back tothe surface and during this period it is possible that the bottom stop¬
per of the corer was not in place. In such a situation and consider¬
ing that the upper layers of the sédiment were mainly composed offluid mud, the corer by its own weight might hâve sampled again a
15 cm thick section of surface sédiment. This scénario, resulting inthe occurrence of two similar overlaying sédiment sections, appears
the most likely explanation to account for the almost perfectly mir-rored distribution of ail sédiment parameters studied. Whatever the
interprétation, the bottom layer was dismissed as an artefact and the
0 to 35 cm depth (0 to 20 g.cnv2) layer being solely useable to studysédiment geochronology. In this layer the maximum accumulationrate calculated from the slope of the régression fit was
0.17 g.cnv2.yr'.
The Ml 5 core produced spécifie profiles (Figure 5); the pelitic frac¬
tion together with absolute and relative Mn and Ni concentrationscore showed a relatively constant pattern between 25 and 42 cmdepth (14 to 24 g.cnv2). This trend demonstrates the sédiments to be
J.-M. Fernandez et al. J,0Pb and geochemical signature in sédiment record studies 195
Pelitic Fraction
« 5
'È
Mn in the Pelitic Fraction Ni in the Pelitic Fraction
Concentration (rig/g relative) Concentration (ug/g relative)
_50 0 100 200 300 400 Ç 1000 2000 l_
Pb-210
Ln(Po-2IO)(mBo/g)2 3 4 5
/ / --rr-
<S K'\ * i> 1 . i r- I 1 1
6 S 10 12 io 40 50 60 70
Concentration (ug/g absolute) Concentration (ug/g absoluie)
-Pelitic fraction «-Relative Mn Relative NiAbsoluie Mn m Absolute Ni
I Figure 5Physical, geochemical and 2t0Pb profiles for the core M15,Dumbea canyon, New Caledonia.
Alpha Counting
fairly homogeneous over more than 18 cm section of the core. Theunsupported 2l0Pb profile display a very regular and slow decrease
in activity with depth, down to 43 cm (24 g.cnv2), followed by a
rapid decrease below. In the upper layer, strong bioturbation is notevidenced as no homogeneous layer is observed.
A first analysis ofthe 2,0Pb profile suggests a strong change in séd¬
iment déposition rate occurred at43 cm depth. Considering this scé¬
nario, the corresponding sédiment accumulation rates would hâveincrease sharply from 0.11 g.cnv2.yr' below 43 cm depth to 0.56g.cnv2.yr' in the upper layer and the âge of change could be datedat around the year 1952.
A second interprétation of this data might be proposed based on the
location of the sampling site. The core was sampled at 55 m depthin a submarine canyon that is delimited by steep slopes extendingthrough a lagoon area with an average depth of 22 m. The canyon,formed by river érosion during the last low sea-level period, is nowprogressively filling up with sédiments imported from the adjacent
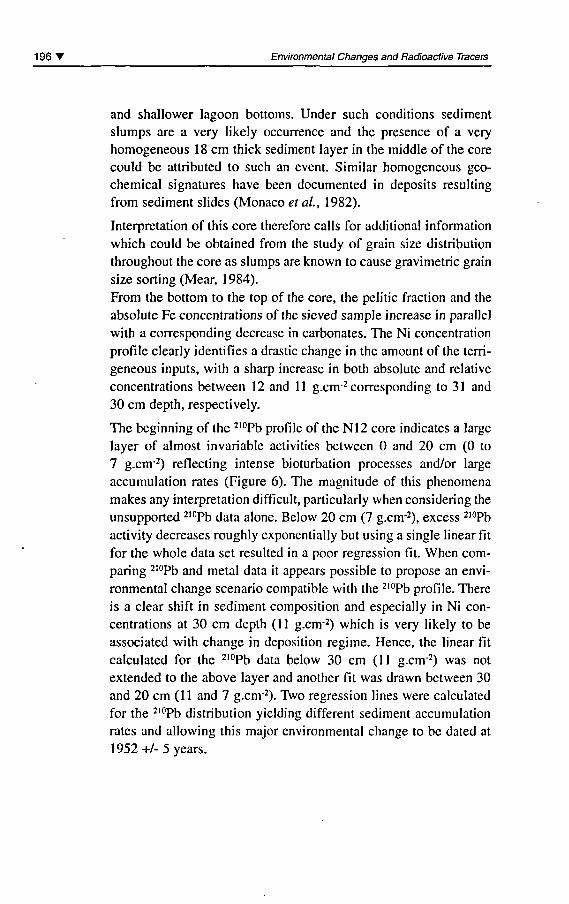
1 96 T Environmental Changes and Radioactive Tracers
and shallower lagoon bottoms. Under such conditions sédimentslumps are a very likely occurrence and the présence of a veryhomogeneous 18 cm thick sédiment layer in the middle of the core
could be attributed to such an event. Similar homogeneous geo¬
chemical signatures hâve been documented in deposits resultingfrom sédiment slides (Monaco et al, 1982).
Interprétation of this core therefore calls for additional informationwhich could be obtained from the study of grain size distributionthroughout the core as slumps are known to cause gravimétrie grainsize sorting (Mear, 1 984).From the bottom to the top of the core, the pelitic fraction and the
absolute Fe concentrations ofthe sieved sample increase in parallelwith a corresponding decrease in carbonates. The Ni concentrationprofile clearly identifies a drastic change in the amount of the terri-geneous inputs, with a sharp increase in both absolute and relativeconcentrations between 12 and 11 g.cnv2 corresponding to 31 and
30 cm depth, respectively.
The beginning of the 2,0Pb profile of the N12 core indicates a large
layer of almost invariable activities between 0 and 20 cm (0 to
7 g.cnv2) reflecting intense bioturbation processes and/or large
accumulation rates (Figure 6). The magnitude of this phenomena
makes any interprétation difficult, particularly when considering the
unsupported 2l0Pb data alone. Below 20 cm (7 g.cnv2), excess 210Pb
activity decreases roughly exponentially but using a single linear fitfor the whole data set resulted in a poor régression fit. When com-paring 2,0Pb and métal data it appears possible to propose an envi¬
ronmental change scénario compatible with the 210Pb profile. Thereis a clear shift in sédiment composition and especially in Ni con¬
centrations at 30 cm depth (11 g.cnv2) which is very likely to be
associated with change in déposition régime. Hence, the linear fitcalculated for the 2,0Pb data below 30 cm (11 g.cnv2) was notextended to the above layer and another fit was drawn between 30
and 20 cm (11 and 7 g.cnv2). Two régression lines were calculatedfor the 2l0Pb distribution yielding différent sédiment accumulationrates and allowing this major environmental change to be dated at
1952+/- 5 years.
J.-M. Fernandez étal. sl0Pb and geochemical signature in sédiment record studies 197
Fe in the Pelitic FractionPclitk Fraction and
Carbonate Fraction
Abundance (Pelitic %) Concentration (ug/g relative)50 60 70 60 70 80
Ni in the Pelitic Fraction
Concentration (ug/g relative) Ln(Po-210)(mBû/g)1 2 3
Abundance (Carbonate %)
- Pelnic fraction
- * Pcrccmajie carbonate
Concentranon (ug/g absoluie)
- Relative Fe
Absoluie Fe
100 200 300 400
Concentration (ug/g absoluie)
- Relative Ni
Absolute Ni
I Figure 6Physical, geochemical and 210Pb profiles for the core N12,Sainte Marie Bay, New Caledonia.
Despite large uncertainties regarding the calculation, the proposeddate of sédimentation change correspondcd with the beginning oflarge scale and extensive open-cast mining activities in the Southernpart of New Caledonia (Bird et al, 1984; Mermoud, 1994). Thosepast activities were responsible for the long term érosion of soilswith the lagoon acting as a final réservoir of ail eroded land mate¬
rial. The influence ofthe mining exploitation has also been clearlyrecorded in another core taken from the Dumbea Bay (Ambatsian,1997), a Bay where sédimentation mechanisms hâve been widelystudied in the past (Launay, 1972). The values from both Bays pré¬
sent converging results regarding the decrease in excess 210Pb withsédiment depth. Unlike Dumbea Bay, Sainte-Marie Bay where ourNI 2 core was sampled is not directly under the influence of riverinputs, the nearest estuary being 1 1 km away, indicating that addi¬
tional terrigeneous inputs related to poor mining practice affectedthe coastal zone on a large scale.
198' Environmental Changes and Radioactive Tracers
1 Conclusion
Most of the sédiment cores we hâve been dealing with are not as
easily interpreted as core S31. This relatively rare case seems toprésent the idéal conditions regarding particle supply and biologicalmixing to obtain reliable estimate of accumulation rates (consistentand constant particulate matter inputs and a reduced bioturbationlayer) and therefore of dating. In sedimentary deposits subject tovarious sources of perturbation including the impact of the human
activities, the combination of excess 210Pb with geochemical data
can provide necessary additional information to allow for a properinterprétation of sédiment déposition processes.
AknowledgementsThis work was part of a research project
financially supported by IRD and the French"Programme National Environnement Côtier" (PNEC).
BibliographyAmbatsian P., Fernex F., Bernât M.,Parron C, Lecolle J., 1997 -High métal inputs to closed seas:the New Caledonian Lagoon. Journalof Geochemical Exploration.,59: 59-74.
Boudreau B.P., 1 998 -Mean mixed depth of sédiments:The wherefore and the why.Limnol Oceanogr., 43: 524-526.
Bird E. C, Dubois J-R,IltisJ.A., 1984-The impacts of opencast miningon the rivers and coasts of NewCaledonia. The United Nations
University, NRTS-25 / UNUP-505,ISBN 92-808-0505-5, 53 p.
Carey J., 1981 -Nickel minning and raffinery wastesin Coral Sea environs. In. Proceed.4m Intern. Coral Reef Symp., Manila,1:137-146.
Dugas F., Debenay J.-R, 1979 -Carte sédimentologique et carteannexe au 1/50 000e de Nouvelle-Calédonie. Orstom. Bondy.
Faure G., 1986-Principles of isotope geology.Wiley & Sons, New York, 374 p.
J.-M. Fernandez et al. 21°Pb and geochemical signature in sédiment record studies 199
Harris P., Fichez R., Fernandez J. M.,Golterman H.L., Badie C, 2001 -Phosphorus enrichment in thePapeete Lagoon (Tahiti, FrenchPoynesia): using sédimentgeochronology to reconstructthe évolution of phosphorus inputsduring the past century.Oceanologica Acta, 24: 1-10.
Hatcher B. G., Johannes R. E.,ROBERTSON A. I., 1989-Review of research relevant to theconservation of shallow tropicalmarine ecosystems. Oceanogr.Mar. Biol. Annu. Rev., 27: 337-414.
Launay J., 1972-La sédimentation en baie deDumbea (Côte ouest - Nouvelle-Calédonie), Cah. Orstom, ér. Géol,IV (1): 25-51.
MearY., 1984-Séquences et unités sédimentairesdu glacis rhodanien (Méditerranéeoccidentale). Thesis., Universityof Perpignan, 214 p.
Monaco A., Aloisi J. C, Bouyé C,Got H., Mear Y., Bellaiche G.,Droz L., Mirabile L., Mattielo L.,Maldonado A., Le Calvez Y.,
Chassefière B., Nelson H., 1982-Essai de reconstitution desmécanismes d'alimentation deséventails sédimentaires profondsde l'Ebre et du Rhône. Bulletinde l'Institut de Géologie du Bassind'Aquitaine, 31 : 99-109.
Naidu S. D, Morrison R. J., 1994 -Contamination of Suva Habour,Fiji. Mar. Poil Bull Spécial Issue.,29:52-61.
Mermoud Y., 1994-Processus de dégradation du milieunaturel dans le bassin versant de laRivière des Pirogues. Mémoire deLicence, Université française duPacifique, centre de Nouméa.
Schneider W., Schmelzer L,WurtzJ., 1995-Sedimentoogical interplay ofsiliticlastic Rewa river inputand organic carbonate productionof the Suva barrier reef, Laucala Bay,Fiji. Technical Report, Marine Studies95/4, The University ofthe South Pacific eds, 12 p.
ShortenG. G., 1993-Stratigraphy, sedimentology andengineering aspects of Holocèneorgano-calcareous silts, SuvaHarbour, Fiji. Marine Geology,110:275-302.
Tessier, A., Campbell P. G. C,Bisson M., 1979-Sequential procédure for thespeciation of particulate tracemetals. Analitycal Chemistry,51:844-851.
ZanL. P., 1994-The status of coral reefs in southwestern Pacific islands. Mar. PoilBull Spécial Issue., 29: 52-61.

Ooncentrations of heavymetals and trace élémentsin the marine sédimentsof the Suva Lagoon, Fiji
Sitaram Garimella
Alastair McArthur
Marie Ferland
Oswin Snehaleela
Introduction
The Suva Lagoon (which includes the Suva Harbour and theLaucala Bay) is located in the south-east of Viti Levu, the largest ofthe Fiji islands. The lagoon is sheltered from the Pacific Océan bya séries of barrier reefs (Figure 1) which are submerged at high tide.Seawater enters the lagoon twice a day mainly through the harbourentrance and the Nukulau and the Nukubuco passages. Freshwaterenters the lagoon predominantly through the Rewa river and to a
lesser extent through the Tamavuva, Lami, Vatuwaqa and theNasinu rivers. The Rewa river continuously brings a large volumeof sédiment into the Laucala Bay with the load increasing signifi¬cantly during periods of heavy rain (Kyaw, 1982). The annual rain¬
fall in the région is about 3000 mm and for most of the year the
south-east trade winds prevail. The turbidity levels in the bay are
high throughout the year.
There is considérable industrial and commercial activity in the Suvarégion (consisting the Lami town, Suva City and Nasinu town)
202 T Environmental Changes and Radioactive Tracers
which has a population of about 170,000. The Suva Harbour is sur¬
rounded by two major industrial zones which contain shipyards,manufacturing plants, oil storage dépôts, food processing industries,and the Lami rubbish dump is located on the edge ofthe waterline.Two sewage treatment plants are located close to the Laucala Bay. Amajor plant at Kinoya discharges effiuents directly into the bay viaan outfall pipe 800 m offshore. A minor plant at Raiwaqa discharges
into the Vatuwaqa river. Another rubbish dump is located along the
Rewa river at Nausori town (not shown in the figure). Two minorindustrial zones (at Vatuwaqa and Laucala Beach Estate) are also
active around the Laucala Bay. Thèse activities inevitably lead to the
discharge of pollutants into the lagoon. According to Naidu and
Morrison (1994), much of Suva is located on mari which does notallow septic tank effiuents to seep into the ground. Most seepages
move into the numerous creeks that discharge into the Suva Lagoon.Further, many storm water drains transport littér from the streets intothe lagoon during periods of heavy rain.
A few studies hâve been done on contamination ofthe Suva Lagoon.Naidu et al. (1991) measured major sewage related contaminants,while Stewart and de Mora (1992) and Maata (1997) found highlevels of TBT in the sédiment ofthe Suva harbour. Using chemicalmethods, Narayan (1993) measured heavy metals in the sédimentand shellfish ofthe Laucala Bay, while Naidu and Morrison (1994)measured the same in parts ofthe Suva Harbour (close to the Lamidump and the battery factory). Tabudravu (1995) measured Zn, Pb
and Cu in sédiments collected from the coastal waters of Lami.
The présent study aimed to measure the concentration of heavy met¬
als, as well as other trace éléments, in sédiments from the entire Suva
Lagoon. Sédiment samples were collected from a wide range of sites
(Figure 2) such that the entire lagoon was well represented in teimsof environment (shipping channel,reef and the harbour), water depth
(range 1-66 m), likely sources of pollution input (industrial areas,
shipyards, seafront hôtels, Lami dump, sewage treatment plants out-falls) and rivers entrances (the Rewa, Nasinu, Samabula, Vatuwaqa,Tamavuva and Lami rivers). This is also the first major environmen¬tal study (in the Suva région) in which the nuclear technique ofinstrumental neutron activation analysis (INAA) has been used todétermine elemental concentrations.
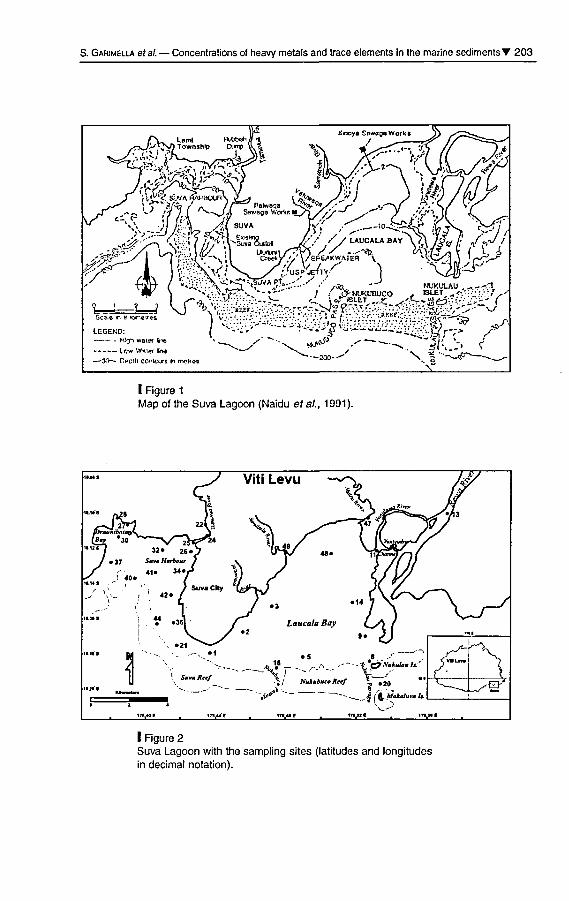
S. Garimella et ai Concentrations of heavy metals and trace éléments in the marine sédiments T 203
Sca.e n k ior--eires
LEGEKD:- - Hâji weter (ne
----- Le* Waiçr Inç-1£r-~ Ocih cc^ioors ti moires
) ..:;-".'.." ../". :.:.",' iV-v.-:v.- ^..Tv:.::--.:-i2t^,-^5i r-...,' ..-.^, ^*- .«^ ^r-, _/^
^- 2tH-- \ 1 --v_^r- ^_^_
I Figure 1
Map ofthe Suva Lagoon (Naidu étal, 1991).
' Suva Reef
5 S. « -, _
."/ NukubucoReef ^ »20.,» . S /- =-
io^ _ --- ilt MeJuUuveli-M ^i7i^ie
I Figure 2Suva Lagoon with the sampling sites (latitudes and longitudesin décimal notation).
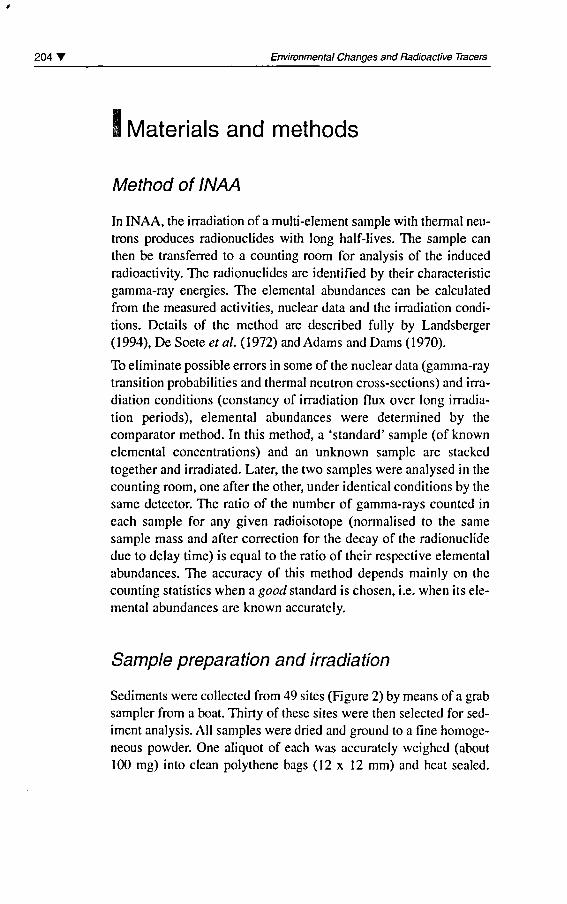
204 T Environmental Changes and Radioactive Tracers
Materials and methods
Method of INAA
In INAA, the irradiation of a multi-element sample with thermal neu¬
trons produces radionuclides with long half-lives. The sample can
then be transferred to a counting room for analysis of the induced
radioactivity. The radionuclides are identified by their characteristicgamma-ray énergies. The elemental abundances can be calculatedfrom the measured activities, nuclear data and the irradiation condi¬
tions. Détails of the method are described fully by Landsberger(1994), De Soete et al (1972) and Adams and Dams (1970).
To eliminate possible errors in some ofthe nuclear data (gamma-raytransition probabilities and thermal neutron cross-sections) and irra¬
diation conditions (constancy of irradiation flux over long irradia¬
tion periods), elemental abundances were determined by the
comparator method. In this method, a 'standard' sample (of knownelemental concentrations) and an unknown sample are stacked
together and irradiated. Later, the two samples were analysed in the
counting room, one after the other, under identical conditions by the
same detector. The ratio of the number of gamma-rays counted ineach sample for any given radioisotope (normalised to the same
sample mass and after correction for the decay of the radionuclidedue to delay time) is equal to the ratio of their respective elementalabundances. The accuracy of this method dépends mainly on the
counting statistics when a good standard is chosen, i.e. when its ele¬
mental abundances are known accurately.
Sample préparation and irradiation
Sédiments were collected from 49 sites (Figure 2) by means of a grab
sampler from a boat. Thirty of thèse sites were then selected for séd¬
iment analysis. Ail samples were dried and ground to a fine homoge¬
neous powder. One aliquot of each was accurately weighed (about100 mg) into clean polythene bags (12 x 12 mm) and heat sealed.
S. Garimella étal. Concentrations of heavy metals and trace éléments in the marine sédiments Y 205
Each sample bag was then sealed into another polythene bag as a pré¬
caution. Three United States Geological Survey standards AGV-1(andésite, four aliquots), RGM-1 (rheolite, two) and STM-1 (syenite,one) and two Community Bureau of Référence standards CRM-38(fiyash, one) and BCR-176 (citywaste, one) were similarly prepared.
The standards and the sédiments were put together into two stacks,
with one aliquot of AGV- 1 at the ends of each stack (to permit cor¬
rection for the neutron flux gradient during irradiation). The stacks
were then loaded into separate aluminium irradiation cans. Since Fijidoes not hâve its own nuclear reactor, the samples were irradiated in
a reactor of the Australian Nuclear Science and TechnologyOrganisation, for 4.0 h at a thermal neutron flux of 4 x IO12 cnr2.s"'.
The irradiated samples were allowed to cool for 5 d, and were flownback to Suva for analysis using a hyperpure germanium (HPGe)gamma-ray spectrometer (efficiency 24.5% and resolution 1 .84 keV).
Measurements
The concentrations of 25 éléments were measured in each of the 30
sédiment samples using the nuclear data provided by Landsberger(1994). The activation products were identified by their characteris¬
tic gamma énergies and were also confirmed later by their half-lives. The measurements on each sample were repeated one or more
number of times, to ensure reproducibility of the data as well as todecrease the counting errors.
The first set of measurements was carried out immediately after the
irradiated samples arrived in Suva. A gamma-ray spectrum for each
sample was taken over a period of 4000 s. From this set, the short-
lived radionuclides (Ti/2 < 7 days) were analysed and the concentra¬
tions of As, Br, La, Lu, Mo, Na, Sb, Sm and U in the samples weredetermined.
A second set of measurements was carried out after about a coolingperiod of 3-4 weeks. A gamma-ray spectrum for each sample was
taken over a period of 6000 s. In this set, the activities of the short-lived nuclides are practically absent and, therefore, the long-livednuclides could be more accurately measured. From thèse measure¬
ments, the concentrations of Ce, Co, Cr, Cs, Eu, Fe, Hf, Hg, Nd, Rb,Se, Sr, Ta, Tb, Th, Yb, Zn and Zr were determined.
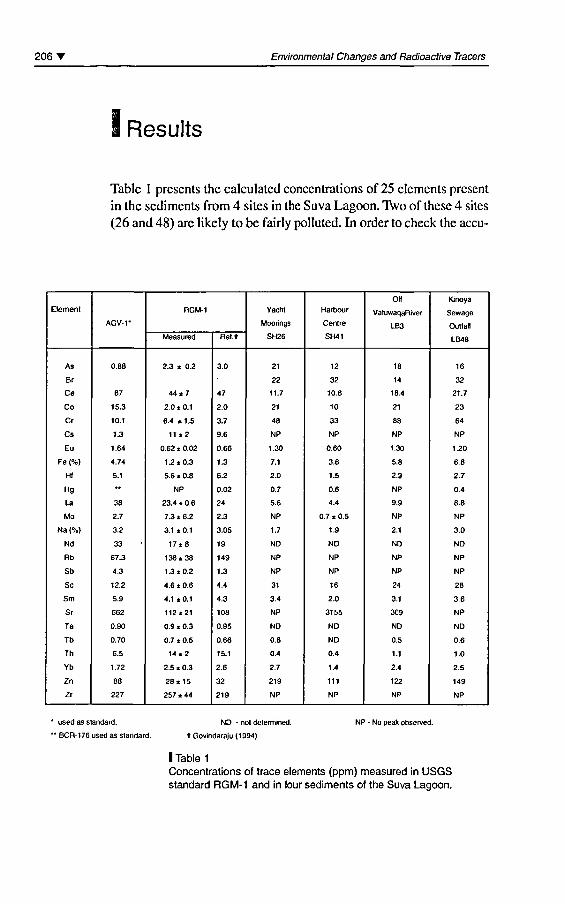
206' Environmental Changes and Radioactive Tracers
1 Results
Table 1 présents the calculated concentrations of 25 éléments présent
in the sédiments from 4 sites in the Suva Lagoon. Two of thèse 4 sites
(26 and 48) are likely to be fairly polluted. In order to check the accu-
Elément
As
Br
Ce
Co
Cr
Cs
Eu
Fe(%)
Ht
Hg
U
Mo
Na (%)
Nd
Rb
Sb
Se
Sm
Sr
Ta
Tb
Th
Yb
Zn
Zr
AGV-1-
0.88
67
15.3
10.1
1.3
1.64
4.74
5.1
38
2.7
3.2
33
67.3
4.3
12.2
5.9
662
0.90
0.70
6.5
1.72
88
227
RGM-1
Measured
2.3 ± 0.2
44*7
2.0 t 0.1
6.4 «1.5
11 ±2
0.62 * 0.02
12*0.3
5.6 ± 0.8
NP
23.4 ± 0.6
7Z * 6.2
3.1 * 0.1
17*8
136*38
1.3*0.2
4 6 * 0.6
4.1 «0.1
112*21
0.9 * 0.3
0.7 * 0.5
14*2
2.5 * 0.3
28*15
257 ± 44
Ref.t
3.0
47
2.0
3.7
9.6
0.66
1.3
6.2
0.02
24
2.3
3.05
19
149
1.3
4.4
4.3
108
0.95
0.66
15.1
2.6
32
219
Yacht
Moorings
SH26
21
22
11.7
21
48
NP
1.30
7.1
2.0
0.7
5.6
NP
1.7
ND
NP
NP
31
3.4
NP
ND
0.6
0.4
2.7
219
NP
Harbour
Centre
SH41
12
32
10.6
10
33
NP
0.60
3.6
1.5
0.6
4.4
0.7 * 0.5
1.9
ND
NP
NP
16
2.0
3155
ND
ND
0.4
1.4
111
NP
Oil
VatuwaqaRiver
LB3
18
14
18.4
21
88
NP
1.30
5.8
2.9
NP
9.9
NP
2.1
ND
NP
NP
24
3.1
369
ND
0.5
1.1
2.4
122
NP
Krnoya
Sewage
Outfall
LB48
16
32
21.7
23
64
NP
1.20
6.8
2.7
0.4
8.8
NP
3.0
ND
NP
NP
28
3.6
NP
ND
0.6
1.0
2.5
149
NP
used as standard.
" BCR-176 used as standard.
ND - not determined.
tGovindaraju(1994)
NP - No peak observed.
I Table 1
Concentrations of trace éléments (ppm) measured in USGSstandard RGM-1 and in four sédiments of the Suva Lagoon.
S. Garimella étal. Concentrations of heavy metals and trace éléments in the marine sédiments T 207
racy and reliability of our analyses, the concentrations of thèse élé¬
ments were also calculated for standards RGM-1, STM-1, CRM-38and BCR-176, treating them as unknowns. As an illustration, theresults thus obtained, together with counting errors (one standarddéviation only), for RGM-1 are shown in Table 1 and compared withréférence values (Govindaraju, 1994). The agreement (measured ver¬
sus référence value) is generally good.
Table 2 shows calculated concentrations of some environmentallyimportant éléments (As, Cr, Fe, Hg, Zn and Sb) in ail 30 sédimentssamples.
Discussion
The elemental concentrations reported in Table 2, were comparedwith the Environmental Protection Agency (ERA) Guidelines forPollution Classification, and with the USGS Sédiment Alert Levels(Batley, 1992). The EPA pollution guidelines prescribe margin con¬
centration values, above which the élément is said to be a pollutantin the environment. The USGS Alert Levels are concentrationsabove which the clément could pose a threat to the ecosystem and
its components. The status of heavy métal pollution in the lagoonwill now be considered.
Arsenic
At most sites in the Suva Lagoon, the level ofAs is 3-7 times the EPAlevel. The highest level of As reported hère, about 20 ppm, was
observed near the Lami dump, near some seafront hôtels in the Lamitown, and at the two sewage treatment outflows. In comparison, Naiduand Morrison (1994) measured As levels of 27-45 ppm at sites close
to the Lami dump, and 3-6 ppm at sites within 100 m of the dump(most of thèse sites hâve water depths less than 5 m). The fairly highlevels of As reported in the présent work at locations farther awayfrom the dump indicate a gênerai increase in As levels since 1994.
208 T Environmental Changes and Radioactive Tracers
Site
LB1
LB2LB3LB5LB8LB9
LB11LB13LB14LB18LB20LB21
LB47LB48LB49
SH22SH24SH25SH26SH27SH28SH30SH32SH34
SH36SH37SH40SH41SH42SH44
RangeAverage
EPA PollutionLevel '
USGS AlertLevel *
As
ND14
18
21
16
NDNDNDNDND16
ND19
16
18
NDNDND21
2216
10
ND18
15
18
ND12
NDND
10-2217
3
200
Cr
41
16088386075731987920692689647844532048228838353471
3065337948
20-19862
25
200
Fe (%)
2.54.9
5.8
4
6.4
11
6.36.76.6
1.5
5.8
1.3
7.3
6.8
6
8.1
7.7
6.37.1
5.9
3.2
6.6
7.35.34.1
2.24
3.6
4.62.8
1.3-11.05.4
1.7
No data
Hg
NPNPNP0.3NPNPNPNPNPNP0.3NP
0.550.360.7
0.790.420.840.70.8
0.480.2NP0.8NP0.50.4
0.640.50.9
0.2-0.90.56
1
20
Zn
5995122
84136138
135951383312832172149
188
258279202219198
88149
301
20894
64
150
111
155
76
32-301142
90
5000
Sb
NPNPNPNPNPNPNPNPNPNPNPNPNPNP
0.49NPNP
0.530.49NPNPNPNPNPNP
0.22NPNPNPNP
7
7
No data
No data
Key: LB - Laucala Bay, SH - Suva Harbour, ND - Not determined. NP - No peak seenEPA - Environmental Protection Agency, USGS - United States Geological Survey
taken Irom Batley (1992)
I Table 2Concentrations (ppm) of some environmentally importantéléments in the sédiments of the Suva Lagoon.
Chromium
The major sources of chromium are industries and workshops thatuse paints. The observed concentrations of Cr are more than threetimes the EPA levels at a third of the sites in the lagoon. Naidu and
S. Garimella étal. Concentrations of heavy metals and trace éléments in the marine sédimentsY 209
Morrison (1994) reported chromium concentrations in the range16-160 ppm in sédiments. At sites close to the Lami dump, theirvalues are in the range of 20-40 ppm. For comparison, our Cr val¬
ues are 53, 20 and 48 ppm at sites 24, 25 and 26 respectively.Thus, there appears to hâve been a small increase in Cr levels insédiments since 1994. The highest concentration of 198 ppm forCr, at site 13 (near mouth ofthe Rewa river) and down stream ofthe Nausori rubbish dump, is close to the USGS Alert Level.
Iron
The concentrations of Fe in the présent work are in the range of1.3-11.0%. Tabudravu (1995) reported Fe values in the range0.13-0.24% in the sédiment samples from the coastal waters ofLami. In the présent study, the sédiment sample from site 32 at themouth of the Lami river had a much higher concentration of 7.3%.However, the Fe concentrations in our work are much below theEPA pollution levels.
Mercury
Mercury contamination in the lagoon may be due to the use ofantifouling paints in the shipyards and other workshops. The con¬
centrations measured in this work are in the range 0.2-0.9 ppm,consistent with those reported (0.3-1.34 ppm) by Naidu and
Morrison (1994). Thus, mercury concentrations in sédiments ofthe lagoon remain below the EPA levels.
Zinc
The principal uses of zinc in this région are in the manufacture ofgalvanised iron, white paint and wood preservatives (which con¬
tain ZnC^). The concentrations of zinc reported hère are in therange 32-301 ppm, with 22 out of 30 sites showing levels higherthan the EPA limit (90 ppm). Naidu and Morrison (1994) reportedzinc concentrations in the range 200-487 ppm in sédiments closeto the Lami dump. Their figures are similar in magnitude to our Zn
2 1 0 T Environmental Changes and Radioactive Tracers
values of 279, 202 and 209 ppm at sites 24, 25 and 26 (which areclose to the dump), respectively. Tabudravu (1995) reported Znvalues in the range 52-514 ppm in the sédiment samples from thecoastal waters of Lami. In the présent study, the highest Zn con¬
centration was 301 ppm in sédiment from site 32 at the mouth ofthe Lami river.
Antimony
Naidu and Morrison (1994) reported Sb concentrations in therange 15-5625 ppm in sédiments close to the seawall near a bat-tery factory (Suva Harbour area). They concluded that the area
could be declared a hazardous waste site. The concentrations of Sbobserved in our study are much lower, in the range 0.2-0.5 ppm.No EPA and USGS values are available for comparison.
In addition to the above, we measured many trace éléments (includ¬ing the rare earth éléments Ce, Eu, La, Nd, Sm, Tb and Yb), in thesédiments of the Suva Lagoon (see Table 1). The significance ofthèse éléments to environmental studies is not known, but their con¬
centrations are reported hère for completeness.
Due to logistic problems (transportation of irradiated samplesfrom abroad), the concentrations of several éléments whichinvolve radioisotopes with low half-lives (eg. As, Au, Mo, and Sb)could not be measured satisfactorily. The éléments Cs, Se, Sr and
Zr are détectable in sédiments using NAA, but the technique is notsensitive enough to measure the existing concentrations. Lead(Pb), which is one of the most environmentally important élé¬
ments, cannot be measured using NAA due to its closed-shellnuclear structure.
Conclusion
The présent work, which was undertaken in the entire région oftheSuva Lagoon, has shown considérable heavy élément contaminationin the sédiments of the Suva Lagoon. The pollution levels at many
S. Garimella étal. Concentrations of heavy metals and trace éléments in the marine sedimentsT 21 1
sites are higher than the EPA limits, but remain much below the
USGS alert levels. Comparison with previous works suggests thatcontamination of the Suva Lagoon is increasing with time.
AknowledgementsThis work was supported by a generous research
grant from the University of the South Pacific.
Bibliography
Adams F., Dams, R., 1970 -Applied gamma-ray spectrometery,Pergamon Press, Oxford, 752 p.
Batley G. E. 1992Toxicants". In Douglas N. Hall (éd.):Port Phillip Bay EnvironmentalStudy: Status Review, Melbourne,Csiro Port Phillip Bay EnvironmentalStudy, Technical Report 9: 80-1 1 1 .
De Soete D., Gijbels R.,Hoste J., 1972-Neutron activation analysis,Wiley-lnterscience, London, 836 p.
Govindaraju K., 1994-Compilation of Working Valuesand Descriptions for 383Geostandards, GeostandardsNewsletter, 18:1-158.
Landsberger S., 1994 -"Delayed instrumental neutronactivation analysis". In Z.B. Alfassi(ed.y. Chemical analysis by nuclearmethods. Chichester, John Wiley, 6.
MaataM., 1997-The décomposition of tributyltin( TBT) in tropical marine sédiments.Unpublished Ph.D., thesis, TheUniversity of the South Pacific, Suva.
Naidu S., Aalbergsberg W.G.L.,Brodie J. E., Fuavou V. A., Maata M.,
Naqasima R, Morrison R. J., 1991 -Water quality studies on selectedSouth Pacific Lagoons. UNEPRégional Seas Reports and StudiesNo. 136, and SPREP Reports andStudies No. 49, South PacificRégional Environmental Programme.
Naidu S. D., Morrison R. J., 1994 -Contamination of the Suva Harbour,Fiji. Marine Pollution Bulletin,29 (1-3): 126-130.
NarayanS. P., 1993-Heavy metals in sédiments andshellfish from Laucala Bay, Fiji.Unpublished MSc thesis, TheUniversity of the South Pacific, Suva.
Stewart X., de Mora Z., 1992 -Elevated tri(n-butyl)tin concentrationsin shellfish and sédiments from SuvaHarbour, Fiji. Applied OrganometalChemistry, 6: 507-512.
Tabudravu Z., 1995-Experimental and field évaluationof enteromorpha flexuosa as anindicator of heavy métal pollutionby zinc, lead and copper in coastalwaters of Lami, Fiji. UnpublishedMSc thesis, The University of theSouth Pacific, Suva.

Oomparaison of 210Pbchronology with 233,239-240 pUj
241 Am and 137Cs
sedimentary record capacityin a lake system
Hervé Michel
Douglas Chitty
Geneviève Barci-Funel
Gérard Ardisson
Peter G. Appleby
Elizabeth Haworth
Introduction
Transuranic éléments hâve been released into the environment on a
global scale since the early 1950s. The main source was atmo¬
spheric testing of nuclear weapons though releases from nuclearinstallations hâve been significant on local and régional scales.
Large quantities of radioactive débris from the explosion of high-yield thermo-nuclear weapons were injected into the stratosphèreand widely dispersed around the world. Graduai re-entry of thisdébris to the troposphère was followed by fallout onto the earth'ssurface. Fallout on lakes was deposited on the bed of lake as part ofthe sédiment record.
The purpose of this paper is to report the results of a study of thetransuranic radionuclides 2,8"9-24opu> 24i^m jn me sediments of
21 4 T Environmental Changes and Radioactive Tracers
Blelham Tarn in Cumbria (UK) and forms part of a project con¬
cerned with the fate of transuranic éléments deposited on lakes and
their catchments.
As sédiments accumulate they capture a high quality record ofthechanging levels of contamination. In this study sédiment cores
taken from the two locations in the lake were sectioned at 1 cmintervais and analysed by alpha spectrometry for 238.239-24opUj 24i^m
to détermine the historical fallout record at this site. The sub-sam-ples were also analysed by gamma spectrometry for the fissionproduct l37Cs and the natural radionuclide 2,0Pb.
137Cs was also part of the débris from nuclear weapons tests thoughfurther amounts were also deposited in 1986 as a resuit of falloutfrom the Chernobyl reactor accident. Comparisons between 137Cs
and the transuranic éléments provide information on their relativetransport rates through the environment.
The 2l0Pb flux is proportional to the annual précipitation on the lakeand provides a chronology of the sub-samples of the cores.
Site Description
Blelham Tarn is a small lake situated off the North-West shore ofthe North basin of Windermere. The basic morphometric character¬
istics are given in Table 1. It has a fairly simple bathymetry, withtwo main basins (figure 1). The lake is mildly enriched, receivinginputs from some of the area's naturally richer soils on the westernside of Windermere. The streams are nutrient enhanced due to localagriculture and a small sewage works for Outgate (a small village 2
miles away). Blelham Tarn has been a site of scientific interest since
the 1930's and has been the subject of many palaeolimnologicalstudies including some of the earliest studies of fallout radionu¬
clides in récent sédiments (Pennington et al, 1976).
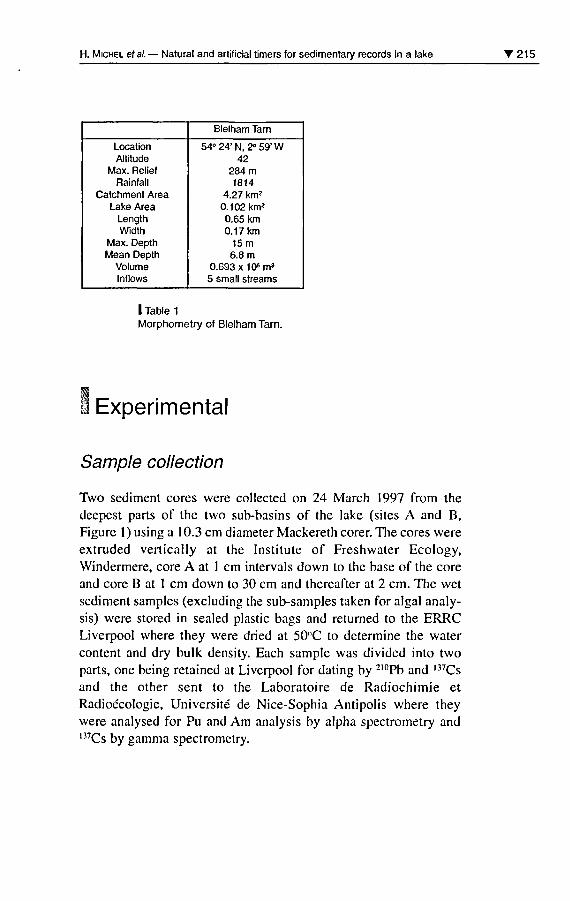
H. Michel étal. Natural and artificial timers for sedimentary records in a lake 215
LocationAltitude
Max. ReliefRainfall
Catchment AreaLake Area
LengthWidth
Max. DepthMean Depth
VolumeInflows
Blelham Tarn
54» 24' N, 2° 59' W42
284 m1814
4.27 km2
0.102 km20.65 km0.17 km
15m6.8 m
0.693 x 10⁶ m3
5 small streams
I Table 1
Morphometry of Blelham Tarn.
Expérimental
Sample collection
Two sédiment cores were collected on 24 March 1997 from thedeepest parts of the two sub-basins of the lake (sites A and B,Figure 1) using a 10.3 cm diameter Mackereth corer. The cores wereextruded verlically at the Institute of Freshwater Ecology,Windermere, core A at 1 cm intervais down to the base of the coreand core B at 1 cm down to 30 cm and thereafter at 2 cm. The wetsédiment samples (excluding the sub-samples taken for algal analy¬sis) were stored in sealed plastic bags and returned to the ERRCLiverpool where they were dried at 50"C to détermine the watercontent and dry bulk density. Each sample was divided into twoparts, one being retained at Liverpool for dating by 2,0Pb and l37Cs
and the other sent to the Laboratoire de Radiochimie etRadioécologie, Université de Nice-Sophia Antipolis where theywere analysed for Pu and Am analysis by alpha spectrometry and
137Cs by gamma spectrometry.
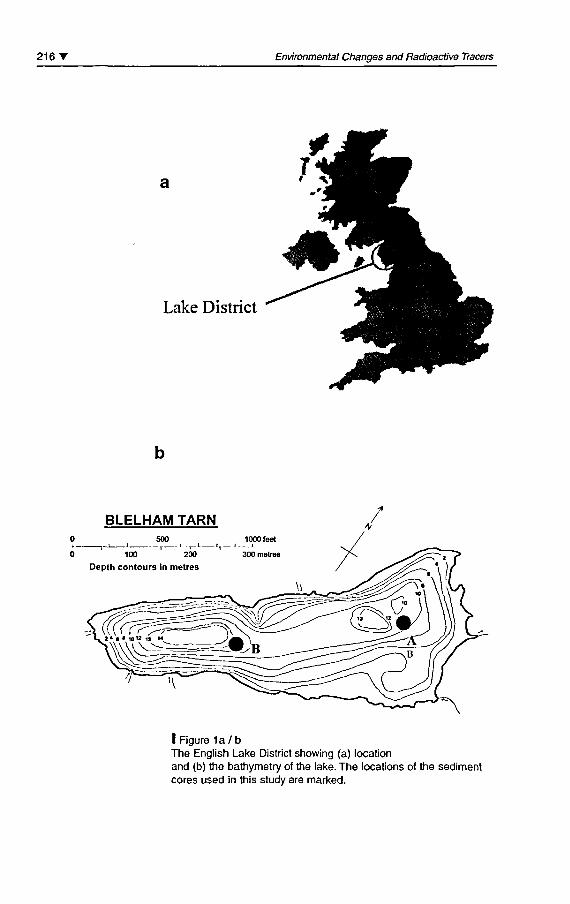
216 Environmental Changes and Radioactive Tracers
Lake District
BLELHAM TARN0 500 1000 feet
0 100 200 300 maires
Depth contours in mètres
/
I Figure 1a /bThe English Lake District showing (a) locationand (b) the bathymetry of the lake. The locations of the sédimentcores used in this study are marked.
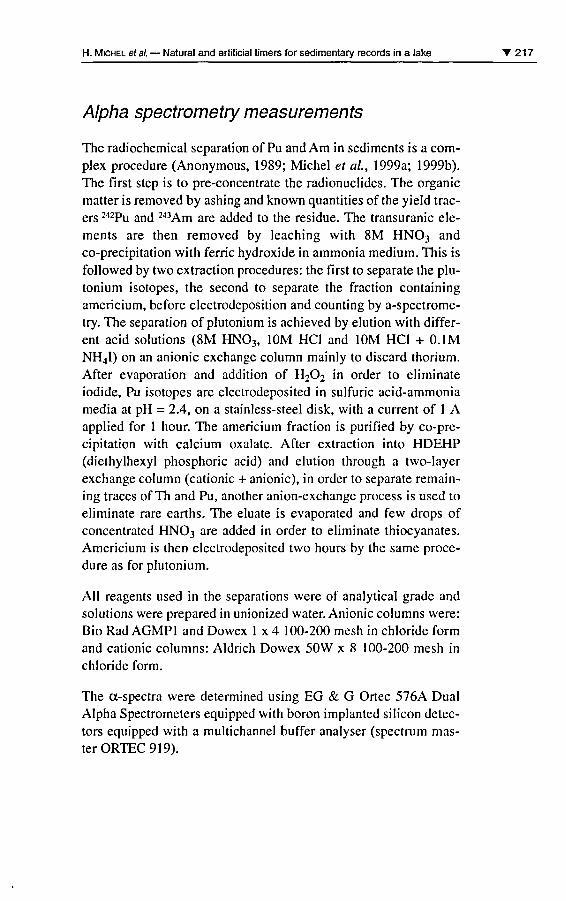
H. Michel ef al. Natural and artificial timers for sedimentary records in a lake T 21 7
Alpha spectrometry measurements
The radiochemical séparation of Pu and Am in sédiments is a com¬
plex procédure (Anonymous, 1989; Michel et al, 1999a; 1999b).The first step is to pre-concentrate the radionuclides. The organicmatter is removed by ashing and known quantifies of the yield trac¬
ers 242Pu and 243Am are added to the residue. The transuranic élé¬
ments are then removed by leaching with 8M HN03 and
co-precipi tation with ferrie hydroxide in ammonia médium. This isfollowed by two extraction procédures: the first to separate the plu¬
tonium isotopes, the second to separate the fraction containingamericium, before electrodeposition and counting by a-spectrome-try. The séparation of plutonium is achieved by elution with différ¬ent acid solutions (8M HN03, 10M HCI and 10M HCI + 0.1 MNH4I) on an anionic exchange column mainly to discard thorium.After evaporation and addition of H202 in order to eliminateiodide, Pu isotopes are electrodeposited in sulfuric acid-ammoniamédia at pH = 2.4, on a stainless-steel disk, with a current of 1 Aapplied for 1 hour. The americium fraction is purified by co-pre-cipitation with calcium oxalate. After extraction into HDEHP(diethylhexyl phosphoric acid) and elution through a two-layerexchange column (cationic + anionic), in order to separate remain¬ing traces of Th and Pu, another anion-exchange process is used toeliminate rare earths. The eluate is evaporated and few drops ofconcentrated HNO3 are added in order to eliminate thiocyanates.Americium is then electrodeposited two hours by the same procé¬
dure as for plutonium.
Ail reagents used in the séparations were of analytical grade and
solutions were prepared in unionized water. Anionic columns were:Bio Rad AGMP1 and Dowex 1 x 4 100-200 mesh in chloride formand cationic columns: Aldrich Dowex 50W x 8 100-200 mesh inchloride form.
The a-spectra were determined using EG & G Ortec 576A DualAlpha Spectrometers equipped with boron implanted silicon detec-tors equipped with a multichannel buffer analyser (spectrum mas¬
ter ORTEC 919).
21 8 T Environmental Changes and Radioactive Tracers
Gamma-spectrometry measurements
137Cs measurements at Nice were carried out by standard g-spec-trometry using methods described in (Barci-Funel et al, 1988;
1992; Holm et al, 1994). The sédiment samples were oven-dried at
100°C, homogenized and packed into plastic containers and
counted on a coaxial HPGe detector (EG&G ORTEC) of 17% rela¬
tive efficiency with an energy resolution FWHM (Full Width at
Half Maximum) of 1.9 keV at 1.33 MeV. The efficiency of detectorwas determined using standard sources with the same geometricalconfiguration as the samples being measured. Background radiationwas reduced by placing the detector inside a 5 cm thick lead castle
with a 2 mm thick copper lining. The spectra were collected usinga multi-channel buffer analyzer (Spectrum Master ORTEC 919).
Results and discussion
Figure 2 plots concentrations of the transuranic radionuclides ver¬
sus depth in core A. The corresponding results for core B are givenin Figure 3. Figure 4 shows the I37Cs results for both cores. Thetransuranic radionuclides ail hâve a single well-resolved peak intheir activity. In core A thèse occur at a depth of 14-16 cm. In core
B they occur at 15-17 cm. Thepeaksin transuranic activity coincidewith similar well-resolved peaks in the l37Cs activity and almostcertainly record the fallout maximum in 1963 from the atmospherictesting of nuclear weapons. Concern about fallout levels followingthe early tests resulted in a moratorium in atmospheric testing in1958. Its breakdown in 1961 was followed by a period of intensivetesting resulting in very high fallout during the years 1962-63.Implementation of the 1963 test ban treaty led to a rapid décline infallout during the next few years and values in 1966 were just 10%
of those in 1963. Nearly 50% of ail fallout occurred during 1962-
64, a space of just 3 years, giving rise to the very high concentra¬
tions recorded in the sédiments of Blelham Tarn from this period.
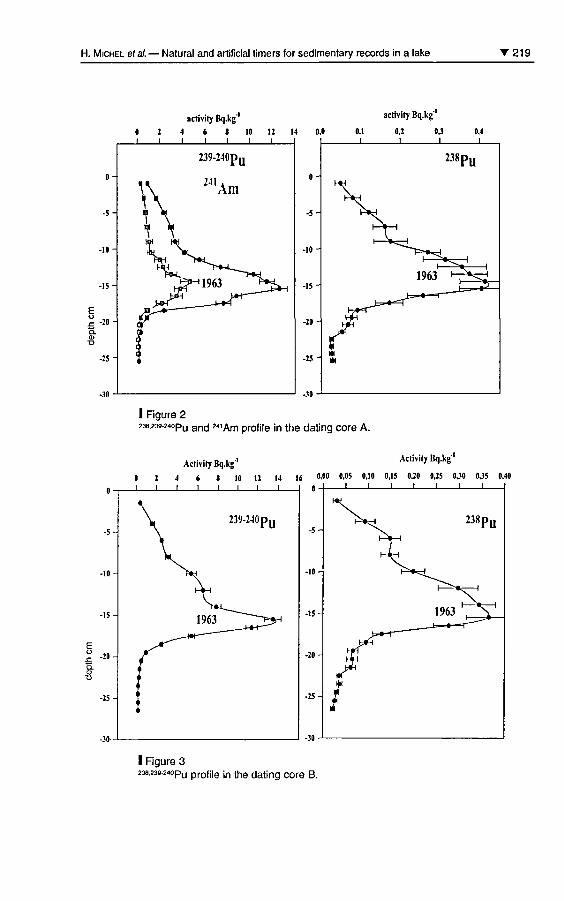
H. Michel et al. Natural and artificial timers for sedimentary records in a lake '219
activity Bq.kg" activity Bq.kg'
-5-
-25
-30
0 2 4 6 < 10 12 14 0,0 0,1 0,2 OJ 0,4
_J I I I I I 1_
239-240pu
2-11,
J 1 | L
I Figure 2238.239-24opu and 241Am pr0fj|e jn the dating core A.
Activity Bq.kg 'Activity Bq.kg
0 2 4 t S 10 12 14 16 0,00 0.05 0,10 0,15 0.20 045 0J0 0J5 0,40
J I I I I I I I 0- J I I I L _l_
I Figure 323a.239240pu profj|e jp Jpg dat|ng core B

220' Environmental Changes and Radioactive Tracers
activity Bq.kg" activity Bq.kg'
-10
OcQ.% -20
-25
I Figure 4137Cs profile in the dating core A and B.
In contrast to the transuranic éléments, the ,37Cs profiles hâve a sec¬
ond more récent peak, at depths 6-7 cm in core A and 8-9 cm in core
B. Thèse features are almost certainly a record of fallout from the
Chernobyl accident in 1986. Although the short-lived radionuclide,34Cs associated with Chernobyl fallout was below limits of détec¬
tion in the présent cores, it was observed clearly in an earlier ( 1 990)core from Blelham Tarn (van der Post, 1997). The 134Cs peak in the
1990 core occurred at the same depth as the n7Cs peak associated
with Chernobyl fallout, and in the correct activity ratio. The absence
of transuranic radionuclides in Chernobyl fallout is due to the factthat thèse radionuclides were mainly on heavier refractory particlesand were deposited relatively near to the accident site.
Taken together the above results illustrate the extent to which sédi¬
ments accurately recorded contamination of surface waters, in thiscase by radioactive fallout. They also show how dated events can be
used to help provide accurate chronologies of récent sédiments on
timescales of just a few years. Sédiments at 6-7 cm depth in core A
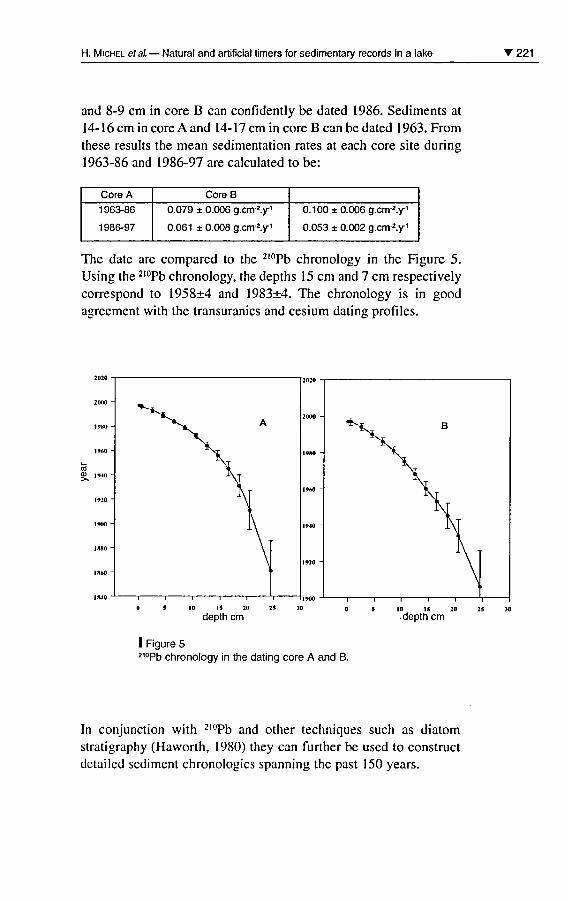
H. Michel et al. Natural and artificial timers for sedimentary records in a lake 221
and 8-9 cm in core B can confidently be dated 1986. Sédiments at
14-16cmincoreAand 14-17 cm in core B can be dated 1963. Fromthèse results the mean sédimentation rates at each core site during1963-86 and 1986-97 are calculated to be:
Core A
1963-86
1986-97
CoreB0.079 ± 0.006 g.cm 2.y'
0.061 ± 0.008 g.cm-2.y'
0.100 ± 0.006 g.cm2.y'
0.053 ± 0.002 g.cnr2.y'
The date are compared to the 210Pb chronology in the Figure 5.
Using the 210Pb chronology, the depths 15 cm and 7 cm respectivelycorrespond to 1958+4 and 1983±4. The chronology is in goodagreement with the transuranics and césium dating profiles.
2000 -
1VMO -
i960 -
O 1940 ~
1920 "
1900 -
1880 -
1860 ~
*-*
I I 1 1 1
A
1
2000
19K0
1960
1940
1920
"
4^i B
10 15 20 25
depth cm10 15 20 25
depth cm
I Figure 5210Pb chronology in the dating core A and B.
In conjunction with 2l0Pb and other techniques such as diatomstratigraphy (Haworth, 1980) they can further be used to constructdetailed sédiment chronologies spanning the past 150 years.
222 T Environmental Changes and Radioactive Tracers
AknowledgementsThis work is part of a research project
financially supported by the European Commission,Nuclear Fission Safety Programme,
Contract N° FI4P-CT96-0046 (DG12-WSMN).
Bibliography
Anonymous, 1 989Measurement of Radionuclides infood and the environment. Vienna,IAEA, Technical reports n° 295.
Barci-Funel G., Dalmasso J.,ArdissonG., 1988Chernobyl fallout in someMediterranean biotas,Sti. Tôt Environ., 70, p. 373.
Barci-Funel G., Dalmasso J.,ArdissonG., 1992Indirect détermination of 241Pu
activity in soils using low energyphoton spectrometer.J. Radioanal Nucl. Chem., 156, p. 83.
Haworth E.Y., 1980Comparison of continuousphytoplankton records with thediatom stratigraphy in the récentsédiments of Blelham Tarn.Limnol. Oceanogr. 25, p. 1093.
Holm E., Ballestra S., Lôpez J. J.,Bulos A., Whitehead N. E.,Barci-Funel G., Ardisson G., 1994Radionuclides in macroalgae atMonaco following the Chernobyl
accident. J. Radioanal. Nucl. Chem.,177, p. 51.
Michel H., Barci-Funel G.,Dalmasso J., Ardisson G., 1999aOne step ion exchange process forthe radiochemical séparation ofamericium, plutonium and neptuniumin sédiments. J. Radioanal.Nucl. Chem., 240, p. 467.
Michel H., Gasparro J., Barci-Funel G.,Dalmasso J., Ardisson G., 1999b.Radioanalytical détermination ofactinides and fission products inBelarus soils. Talanta, 48, p. 821.
Pennington W., Cambray R. S,Eakins J. D., Harkness D. D., 1976Radionuclide dating of the récentsédiments of Blelham Tarn.Freshwat Biol, 6, p. 317.
van der Post K. D., Oldfield F,
Haworth E. Y, Crooks P. J.,ApplebyR G., 1997A record of accelerated érosion inthe récent sédiments of BlelhamTarn in the English Lake District.J. Palaeolimnology, 1 8, p. 1 03.
E:.xcess 210Pb and 210Po
in sédiment from theWestern North Pacific
Koh Harada
Yoko Shibamoto
Introduction
Particles in most surficial marine sédiments are mixed mostly bythe biological activities on the sea floors and the mixing is called as
bioturbation. Knowledge ofthe mechanisms and rates ofthe biotur¬bation is critical to understand rates of the recycling and burial oforganic matter, biogenic silica, carbonate and manganèse (Bemer,1980; Emerson, 1985; Aller, 1990).
To détermine the rate of the bioturbation, excess 2l0Pb, which wasproduced ultimately from 226Ra and scavenged by settling or resus-pended particles, has been widely used (e.g., Nozaki et al, 1977;Peng et al, 1979; DeMaster and Cochran, 1982).
The western North Pacific has relatively high biological activity in sur¬
face water compared to the eastern North Pacific. This means rain rate
of organic carbon to the sea floor in the western North Pacific is highand high bioturbation rate is expected. To clarify the rate, 2inPb profilein the sédiment from the western North Pacific was determined.
Activity ratio of 2l0Po to 21cPb in particulate matter in water columnis generally over unity (Harada and Tsunogai, 1986). This suggeststhat significant amount of 210Po reaches to the sea floor and some
part of the 2H,Po exists in the sédiment even though half-life of 2l0Po
is short, 138 days. To test this hypothesis, 21()Po in the sédiment wasalso determined.
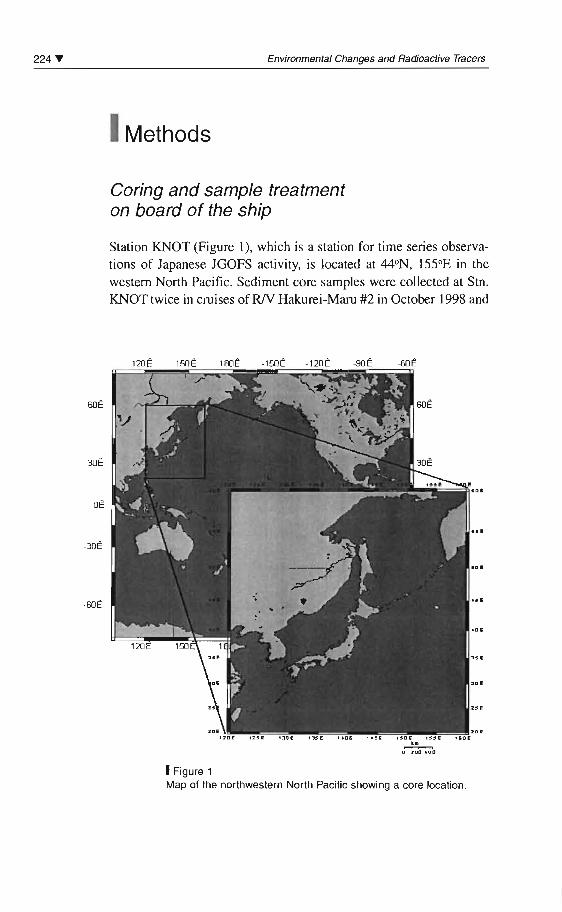
224 ... Environmental Changes and Radioactive Tracers
1Methods
Coring and sample treatmenton board of the ship
Station KNOT (Figure 1), which is a station for time series observations of Japanese JGOFS activity, is located at M oN, 155°E in thewestern North Pacifie. Sediment core samples were collected at Stn .KNOT twice in cruises of RJV Hakurei-Maru #2 in October 1998 and
60 Ê
3DÊ
DÊ
-3DÊ
-60Ê
180Ê -15DÊ -l 20Ê
' 2 5 1' I:IIDE I :U:,E t tas
-9DÊ .SlJË
1 sa! I !CS'..~
D l'DO HJa
1Figure 1Map of the northwestern North Pacifie showing a core location .
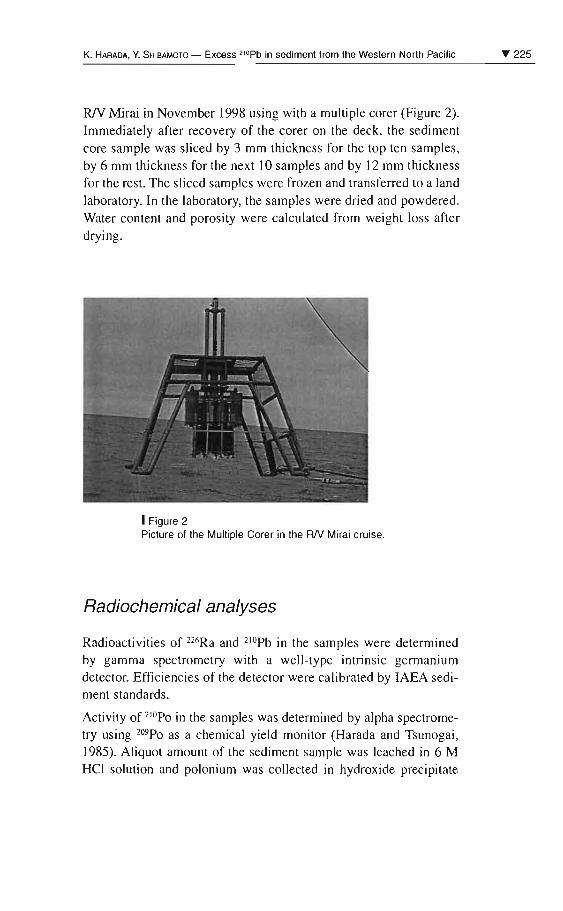
K. HARADA, Y. SHIBAMOTO - Exœss 2l0pb in sediment 'rom the Western North Pacifie
RN Mirai in November 1998 using with a multiple corer (Figure 2).Immediately after recovery of the corer on the deck, the sedimentcore sampIe was sliced by 3 mm thickness for the top ten sarnples,by 6 mm thickness for the next 10 samples and by 12 mm thicknessfor the rest. The sliced samples were frozen and transferred to a landlaboratory. In the 1aboratory, the samples were dried and powdered .Water content and porosity were calculated from weight Joss afterdrying.
1Figure 2Picture of the Multiple Corer in the RN Mirai cruise .
Radiochemical analyses
Radioactivities of 22fiRa and 2IOPb in the samples were determinedby gamma spectrometry with a well-type intrinsic germaniumdetector. Efficiencies of the detector were calibrated by IAEA sediment standards.
Activity of 210Po in the samples was determined by alpha spectrometry using 209PO as a chemical yield monitor (Harada and Tsunogai,1985). Aliquot arnount of the sediment sampJe was leached in 6 MHel solution and polonium was collected in hydroxide precipitate
.... 225
226 T Environmental Changes and Radioactive Tracers
from the leachate. Activities of 209Po and 210Po were determined bysilicon surface barrier detectors after spontaneous déposition of polo-nium onto a sil ver disk from 0. 1 M HCI that dissolved the precipitate.
Results and discussion
226Ra and 210Pb in the sédiment at Stn. KNOT
Vertical distributions of 226Ra and 210Pb in the two sédiment cores
from Stn. KNOT were shown in Figure 3. Concentration of 2,0Pb
decreased rapidly from surface down to 1 cm depth, and then
decreased gradually down to 6 cm depth. Below the depth, the con¬
centration was almost constant, whereas there was a peak at 8 cm
depth in the 1998 sample core. Contrastively, concentration of226Ra, which is a precursor of 2l0Pb, was almost constant in the
cores, ranging between 3.5 to 8.0 dpm.g1.
The vertical profiles of 226Ra and 2l0Pb showed that there was excess
210Pb over its precursor 226Ra from surface down to 6 cm depth.
This excess 2l0Pb must be supported by an input from outside of the
sédiment, which is an input of 210Pb from the water column by set¬
tling particles.
Fluxes of210Pb from the bottom waterto the sédiment
Assuming a steady state condition, the 2l0Pb flux from the overlyingwater column to the sédiment can be calculated from inventories of226Ra and 210Pb in the sédiment from following relation,
F, = Mi l
where À,j is a decay constant of nuclide i (day-1) and I; is an inven¬
tory in the sédiment of the nuclide i (dpm.nr2).
K. Harada, Y. Shibamoto Excess 210Pb in sédiment from the Western North Pacific 227
dpm.g-'100 150 200
dpm.g-'0 50 100 150 200
10
15
20
y s '
1 November '
.... i ... .
98
2J6Ra
2,0Pb
....
-
....
I Figure 3Vertical distibutions of 226Ra and 210Pb
in the sédiment core at Stn. KNOT.
The flux of 210Pb was calculated as 81.9 and 64.2 dpm.m"2.day"'respectively from the October and November, 1 998 profiles. This cal¬
culated flux can be compared with the flux observed by a sédimenttrap experiment. Unfortunately, 2,0Pb in the sédiment trap sampleshâve not been determined so far, whereas the experiment at Stn.KNOT was carried out by the other group. Judging from previouspapers, 2,0Pb flux observed by the sédiment trap in the North Pacificranged from 20 to 100 dpm.m2.day_l. The calculated fluxes from theprofiles in the sédiment seem to be comparable with the fluxesobserved by the sédiment traps in the biologically productive area inthe North Pacific.
210Po in the sédiment
Using the sédiment samples collected in November 1998, 2I0Po wasalso determined, which is a daughter nuclide of 2l0Pb. The vertical
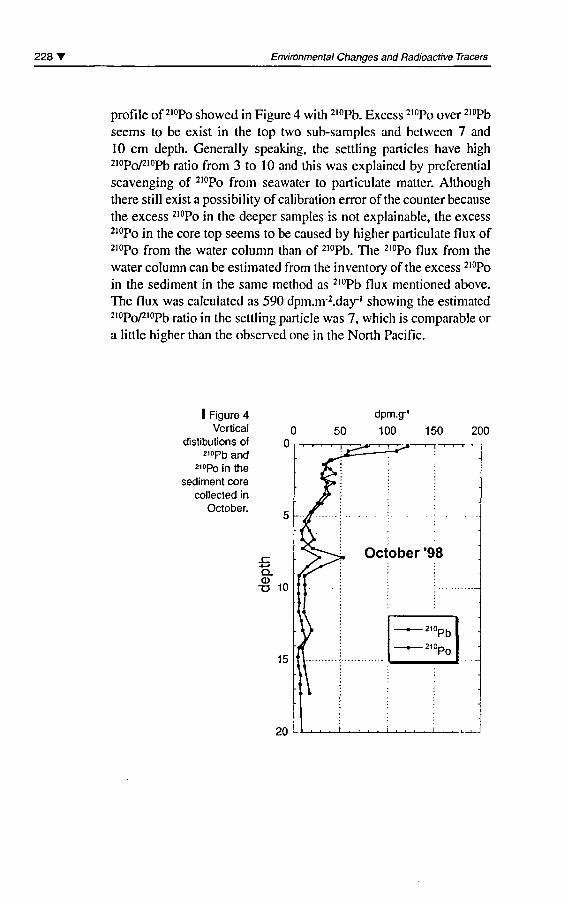
228' Environmental Changes and Radioactive Tracers
profile of 2l0Po showed in Figure 4 with 2l0Pb. Excess 210Po over 2l0Pb
seems to be exist in the top two sub-samples and between 7 and
10 cm depth. Generally speaking, the settling particles hâve high2l0Po/210Pb ratio from 3 to 10 and this was explained by preferentialscavenging of 210Po from seawater to particulate matter. Althoughthere still exist a possibility of calibration error ofthe counter because
the excess 210Po in the deeper samples is not explainable, the excess
210Po in the core top seems to be caused by higher particulate flux of210Po from the water column than of 2,0Pb. The 210Po flux from the
water column can be estimated from the inventory ofthe excess 210Po
in the sédiment in the same method as 2l0Pb flux mentioned above.
The flux was calculated as 590 dpm.m^.day"' showing the estimated2iop0/2iopD rau-0 jn tne settiing particle was 7, which is comparable or
a little higher than the observed one in the North Pacific.
I Figure 4Vertical
distibutions of2,0Pb and
2,0Po in thesédiment core
collected inOctober.
dpm.g-'
50 100 150 200
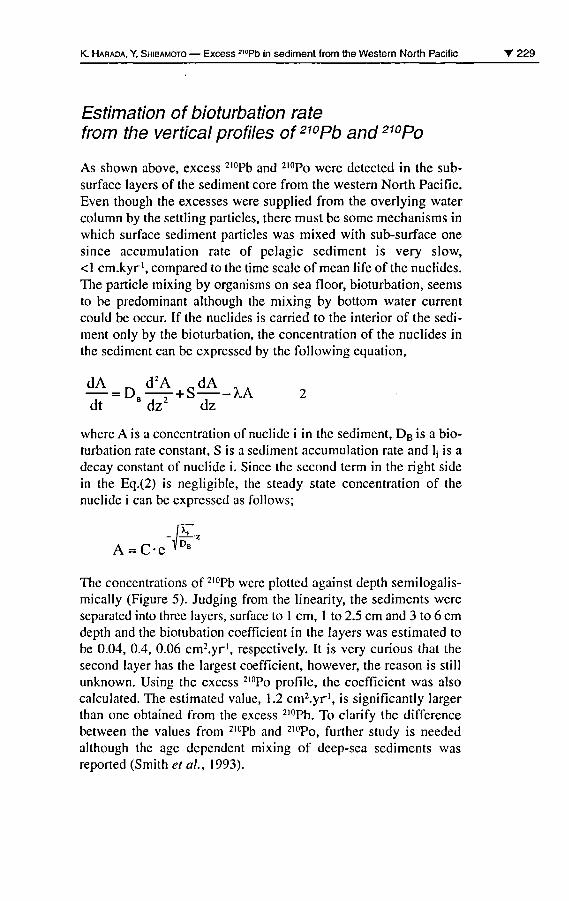
K. Harada, Y. Shibamoto Excess 2,0Pb in sédiment from the Western North Pacific T 229
Estimation of bioturbation ratefrom the vertical profiles of210Pb and2WPo
As shown above, excess 2l0Pb and 2,0Po were detected in the sub¬
surface layers of the sédiment core from the western North Pacific.Even though the excesses were supplied from the overlying watercolumn by the settling particles, there must be some mechanisms inwhich surface sédiment particles was mixed with sub-surface onesince accumulation rate of pelagic sédiment is very slow,<1 cm.kyr1, compared to the time scale of mean life ofthe nuclides.The particle mixing by organisms on sea floor, bioturbation, seems
to be prédominant although the mixing by bottom water currentcould be occur. If the nuclides is carried to the interior of the sédi¬
ment only by the bioturbation, the concentration of the nuclides inthe sédiment can be expressed by the following équation,
dA d2A 0dA ^ A
= Da r + S -XA 2dt B dz2 dz
where A is a concentration of nuclide i in the sédiment, DB is a bio¬turbation rate constant, S is a sédiment accumulation rate and lj is a
decay constant of nuclide i. Since the second term in the right sidein the Eq.(2) is negligible, the steady state concentration of thenuclide i can be expressed as follows;
-Ie*A = C-e^B
The concentrations of 2l0Pb were plotted against depth semilogalis-mically (Figure 5). Judging from the linearity, the sédiments wereseparated into three layers, surface to 1 cm, 1 to 2.5 cm and 3 to 6 cmdepth and the biotubation coefficient in the layers was estimated tobe 0.04, 0.4, 0.06 cm2.yr', respectively. It is very curious that thesecond layer has the largest coefficient, however, the reason is stillunknown. Using the excess 210Po profile, the coefficient was alsocalculated. The estimated value, 1.2 cm2.yr', is significantly largerthan one obtained from the excess 2l0Pb. To clarify the différencebetween the values from 210Pb and 2,0Po, further study is neededalthough the âge dépendent mixing of deep-sea sédiments wasreported (Smith et al, 1993).
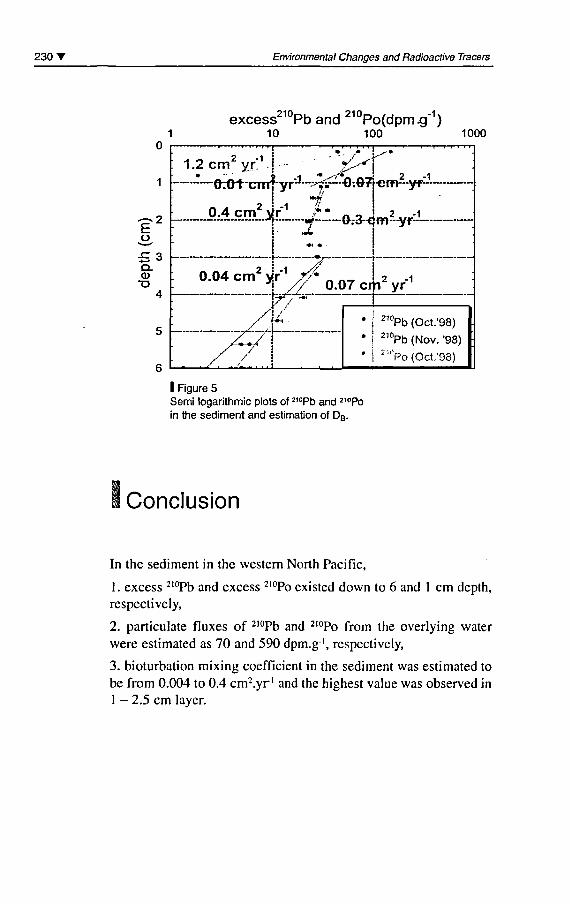
230' Environmental Changes and Radioactive Tracers
excess210Pb and 210Po(dpm.g'1)1 10 100 1000
: 1.2cm2yr1
E
£ 3Q.(D
r t t r T-r-r r i i i i i i ' i ' i ri r i
mtr0.4cm2yr"1 ,- ... 2 -1
0.04 cm2 yr 1 77- rt -, 12 -1'i /y 0.07 crn yr
^°Pb (Oct.'98)
210Pb (Nov. "98)
21l>o (Oct/98)
I Figure 5Semi logarithmic plots of 2,0Pb and 2'°Poin the sédiment and estimation of DB.
Conclusion
In the sédiment in the western North Pacific,
1. excess 2l0Pb and excess 2l0Po existed down to 6 and 1 cm depth,respectively,
2. particulate fluxes of 2l0Pb and 210Po from the overlying waterwere estimated as 70 and 590 dpm.g1, respectively,
3. bioturbation mixing coefficient in the sédiment was estimated tobe from 0.004 to 0.4 cm2.yr' and the highest value was observed in1 - 2.5 cm layer.
K. Harada, Y. Shibamoto Excess 2,0Pb in sédiment from the Western North Pacific 231
AknowledgementsThe authors would like to thank scientists,
technicians and crew members on IW Miraifor their help of sample collection.
Bibliography
Aller R. C, 1990"Bioturbation and manganèse cyclingin hemipelagic sédiments".In H. Charnock et al. (eds) The DeepSea Bed: Its Physics, Chemistry andBiology, Cambridge.University Press:51-68.
Berner R.A., 1980Early Diagenesis: A TheoreticalApproarch. Prinston, University Press.
DeMaster D.J.,CochranJ.K., 1984Particle mixing rates in deep-seasédiments determined from excess2'°Pb and 32Si profiles. Earth Planet.Sti. Lett., 61: 257.
Emerson S. R., 1985"Organic carbon préservation inmarine sédiments". In: SundquistE.T., Broecker W.S. (eds): TheCarbon Cycle and Atmospheric CÛ2:Natural Variations Archean toPrésent, AGU Geophys: 78-86.
Harada K., Tsunogai S., 1 985A practical method for the
simultaneous détermination of 234Th,
226Ra, 210Pb and 2'°Po in seawater.J. Oceanogr. Soc. Japan, 41: 98.
Harada K., Tsunogai S., 1986Fluxes of 234Th, 2,°Po and 210Pb
determined by sédiment trapexperiments in pelagic océans.J. Oceanogr. Soc. Japan, 42: 192.
Nozaki Y., Cochran J. K.,Turekian K. K., Keller G., 1977Radiocarbon and 21°Pb distributionin submersible-taken deep-sea coresfrom project FAMOUS. Earth Planet.Sci. Lett., 34: 167.
Peng T. H., Broeker W.S.,Berger W. H., 1979Rates of benthic mixing in deep-seasédiments as determined byradioactive tracers.Quat.Res., 11:141.
Smith C. R., Pope R. P.,
DeMaster D.J., Magaard L., 1993Age-dependent mixing of deep-seasédiments. Geochim. Cosmochim.Acta, 57: 1473.

Workshop on radiologicaltechniques in sédimentationstudies: methodsand applications
Gary Hancock
David N. Edgington
John A. Robbins
John N. Smith
Greg Brunskill
John Pfitzner
The following document summarises the important issues raisedduring the 3 hour discussion period of the Workshop on"Radiological Techniques in Sédimentation Studies", held on June
22, 2000. The document includes contributions from the aboveauthors summarising, and in some cases illustrating important fea¬
tures of the discussion. The discussion issues covered:
- problems associated with the use of "mapping" algorithms, partic¬ularly CRS, to give unsubstantiated 210Pb "dates";
- the necessity to validate 2l0Pb déposition historiés;
- the trend in research journals to publish 210Pb chronologies withsupporting data;
- the effect of drainage basin résidence times on fallout nuclide séd¬
iment profiles;
- the low activity of fallout tracers in the southern hémisphère, and
the implications for sample core collection, analysis and geochrono-logical usage.
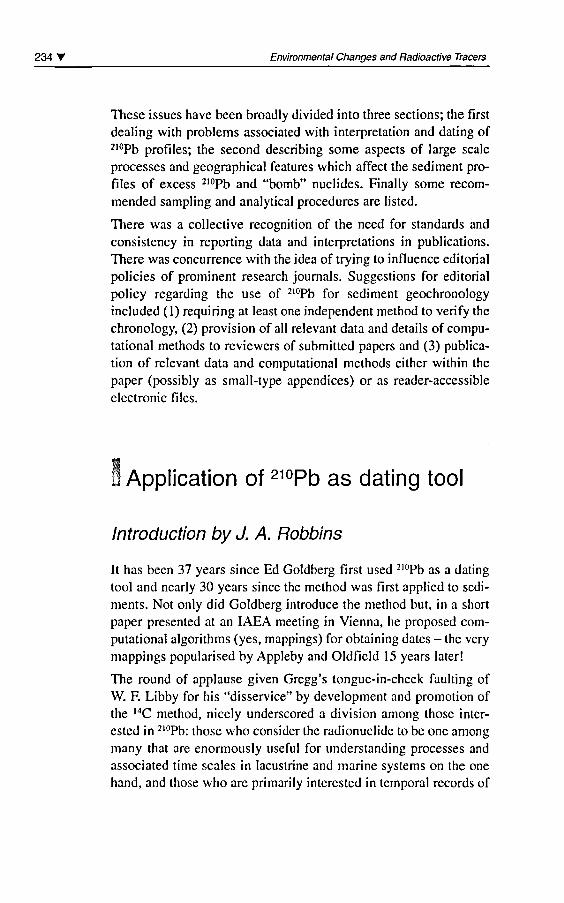
234 T Environmental Changes and Radioactive Tracers
Thèse issues hâve been broadly divided into three sections; the firstdealing with problems associated with interprétation and dating of2l0Pb profiles; the second describing some aspects of large scale
processes and geographical features which affect the sédiment pro¬
files of excess 2l0Pb and "bomb" nuclides. Finally some recom-mended sampling and analytical procédures are listed.
There was a collective récognition of the need for standards and
consistency in reporting data and interprétations in publications.There was concurrence with the idea of trying to influence editorialpolicies of prominent research journals. Suggestions for editorialpolicy regarding the use of 210Pb for sédiment geochronologyincluded (1) requiring at least one independent method to verify the
chronology, (2) provision of ail relevant data and détails of compu-tational methods to reviewers of submitted papers and (3) publica¬tion of relevant data and computational methods either within the
paper (possibly as small-type appendices) or as reader-accessible
electronic files.
Application of 210Pb as dating tool
Introduction by J. A. Robbins
It has been 37 years since Ed Goldberg first used 2l0Pb as a datingtool and nearly 30 years since the method was first applied to sédi¬
ments. Not only did Goldberg introduce the method but, in a shortpaper presented at an IAEA meeting in Vienna, he proposed com¬
putational algorithms (yes, mappings) for obtaining dates - the verymappings popularised by Appleby and Oldfield 15 years later!
The round of applause given Gregg's tongue-in-cheek faulting ofW. F. Libby for his "disservice" by development and promotion ofthe HC method, nicely underscored a division among those inter¬
ested in 210Pb: those who consider the radionuclide to be one amongmany that are enormously useful for understanding processes and
associated time scales in Iacustrine and marine Systems on the one
hand, and those who are primarily interested in temporal records of
G. Hancock et al. Workshop on radiological techniques in sédimentation studies T 235
chemical and biological changes in ecosystems on the other. I sus¬
pect the first group consists of mathematicians, physicists and
chemists, comparatively well versed in quantitative process mod¬
elling, while the second group consists of biologists, ecologists and
paleolimnologists. The first group is more inclined to think thatwhen 210Pb can provide chronological information it's nice but ifnot, it still may tell us something interesting about how a system
works. The second group, with first or second hand knowledge ofthe comparative ease and benefits of 14C dating, wants some analo-gous 210Pb dates and maybe some associated uncertainties so as totell a history, but wishes understandably to shun complexities,rigours and equivocations of quantitative process modelling. Ofcourse with 210Pb that's not possible - ever. Thus, while 210Pb can be
a valuable tool for dating sédiments up to about a century old, itsprimary use is to evaluate processes of sédiment transport, focusing,mixing and accumulation in lacustrine and coastal marine Systems.
The method is not analogous to 14C dating, is never routine and
chronological information culled from sédiment 2l0Pb profiles mustalways be verified by independent means. Perhaps the most impor¬tant implication of a quite évident disparity in outlooks is that thereshould be more coopération between the explicators of process and
the tellers of history!
I am among those who are aggravated by the détérioration in report-ing of 210Pb data and interprétations in peer-reviewed publications.I applaud John Smith's forthcoming editorial in Journal ofEnvironmental Radioactivity that addresses the problem and pro¬
poses standards for publication of 210Pb results. I believe that weshould use the SPERA-2000 Workshop summary document as
another vehicle for promoting appropriate standards for journalpublications.
Comment from D. N. Edgington
Over the last 20 years the measurement of 210Pb in sédiment coreshas become a very popular method for determining sédimentationrates over a time-span of approximately 100 years. Unfortunately,this method appears to be far simpler than it really is and there is
considérable misuse as evidenced by many papers appearing in the
236 T Environmental Changes and Radioactive Tracers
literature. Based on my quick assessment of papers appearing inmajor journals in the field such as Environmental Science &Technology and Limnology & Oceanography approximately 75% ofthe papers published in the last year or so did not présent any ofthe2,0Pb data or an age-depth relationship to justify their interprétation,merely presenting the y data versus a totally unsubstantiated x axis.
This reflects a serious problem with quality of reviewing, or the
understanding of the problems of using 2l0Pb data to ascribe dates
by reviewers, even for the most prestigious journals. It is now verycommon to assume that this method is so simple and cut-and-driedthat it is no longer considered necessary to publish the derived age-
depth relationships, let alone the data on which the dating is based.
As a resuit there are many papers appearing in the literature inwhich the discussion of changes in contaminant concentrations orfluxes with time observed in sédiment profiles based on dates
derived from 2l0Pb cannot be evaluated. This is because thèse dis¬
cussions are based on an unreviewable or unevaluable time-scale,thus making thèse papers essentially meaningless. This situation is
untenable and very unhealthy for our science.
Comment from G. Brunskill and J. Pfitzner
Libby gave us the ability to estimate the âge of an organic or carbon¬
ate carbon sample from the ratio l4C/12C, and Claire Patterson gave us
the ability to estimate the âge of the earth and météorites from ura-
nium/lead ratios. Despite the many sources of uncertainty and con¬
tamination of samples, the language used for results from thèse
methods suggests that thèse methods give our best estimate ofthe real
âge of each sample analysed. Thèse methods can be used to estimate
a unique âge (with associated uncertainty) of a single sample.
The use of sédimentation tracers such as excess 210Pb, 234Th, and 7Be
is a fundamentally différent enterprise, as thèse particle-reactivetracers provide no unique "âge" for one sample of mud. The infor¬mation package from thèse tracer methods is contained in the mag¬
nitude and shape of the core profile over sédiment depth, usuallyinvolving 20-100 samples in one sédiment core. Thèse isotopes are
annually supplied to the sédiment surface by natural production,and in most cases we do not know what sedimentary phases hosts
G. Hancock ef al. Workshop on radiological techniques in sédimentation studies T 237
each isotope. The most obvious and useful parameters that can
sometimes be derived from thèse sédiment core profiles of short-lived nuclides are the rate of présent day accumulation, the corehorizons that are mixed, and the excess or depletion of thèse iso¬
topes related to non-deposition, érosion, resuspension, and focusingof sédiment labelled with thèse tracers. It is helpful to know thesource and hopefully "steady state" rate of supply of thèse isotopesto the sédiment column, and this can usually be estimated fromatmospheric and water column measurements. If the rate of accu¬
mulation of bulk sédiment can be estimated from more than one ofthèse isotopes, then something approximating an "average âge" fora given core slice can be calculated, and this average âge uncer¬
tainty should include the time équivalent ofthe surface mixed layer,pore water diffusion smoothing, and ail the analytical uncertaintiesof field sampling and measurement. Where other sedimentary infor¬mation provides constraints on depositional history, such as varves,known contaminant inputs, or known natural episodic events, thèse
isotopic tracers usually estimate accumulation rate in a reasonablemanner. Except for very few unusual cases, it is inappropriate and
misleading to provide a unique âge for each sédiment core sample.
Comment on Interpreting 210Pb Profilesby J. A. Robbins
Profiles of 2l0Pb are the end resuit of a complex of processes con-trolling the delivery of sédiments and the radionuclide to coringsites over a time span of about one century. Proper quantitativemodelling of profiles dépends on an astute sélection of a criticalsubset of those processes and an accurate mathematical représenta¬
tion of their rôle. This is not an easy task! 2l0Pb sédiment chronolo¬gies, if they can be established at ail, should be the resuit of a
self-consistent application of quantitative process models (QPMs)to 2I0Pb and other ancillary data.
Because QPMs are difficult to develop, often require extensive sup-porting data as well as long observational (as well as computa-tional) expérience with spécifie Systems, several simplifiedapproaches hâve arisen for extracting chronologies from excess
2l0Pb profiles: curve fitting and mappings.
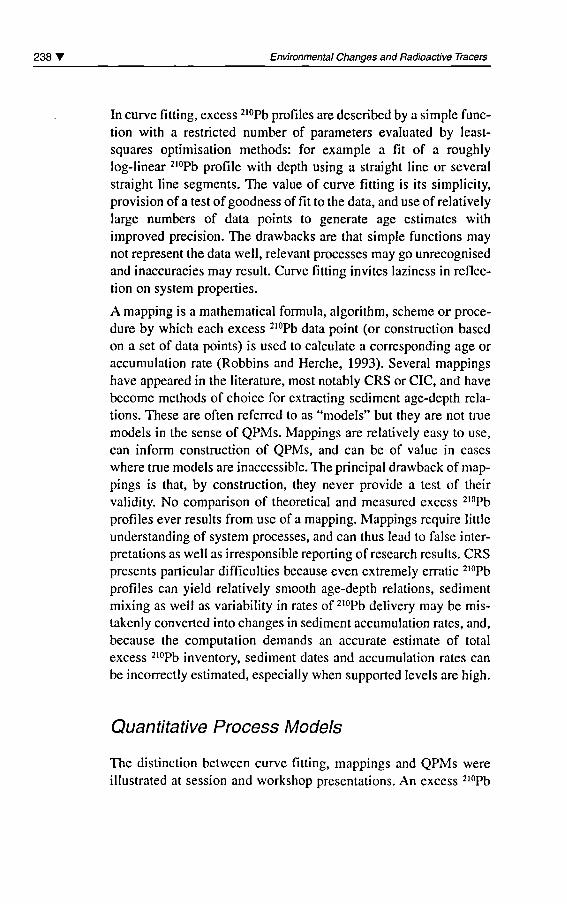
238 T Environmental Changes and Radioactive Tracers
In curve fitting, excess 210Pb profiles are described by a simple func¬
tion with a restricted number of parameters evaluated by least-squares optimisation methods: for example a fit of a roughlylog-linear 2l0Pb profile with depth using a straight line or several
straight line segments. The value of curve fitting is its simplicity,provision of a test of goodness of fit to the data, and use of relativelylarge numbers of data points to generate âge estimâtes withimproved précision. The drawbacks are that simple functions maynot represent the data well, relevant processes may go unrecognisedand inaccuracies may resuit. Curve fitting invites laziness in reflec¬tion on System properties.
A mapping is a mathematical formula, algorithm, scheme or procé¬
dure by which each excess 210Pb data point (or construction based
on a set of data points) is used to calculate a corresponding âge oraccumulation rate (Robbins and Herche, 1993). Several mappingshâve appeared in the literature, most notably CRS or CIC, and hâve
become methods of choice for extracting sédiment age-depth rela¬
tions. Thèse are often referred to as "models" but they are not truemodels in the sensé of QPMs. Mappings are relatively easy to use,
can inform construction of QPMs, and can be of value in cases
where true models are inaccessible. The principal drawback of map¬
pings is that, by construction, they never provide a test of theirvalidity. No comparison of theoretical and measured excess 210Pb
profiles ever results from use of a mapping. Mappings require littleunderstanding of system processes, and can thus lead to false inter¬
prétations as well as irresponsible reporting of research results. CRSprésents particular difficulties because even extremely erratic 210Pb
profiles can yield relatively smooth age-depth relations, sédimentmixing as well as variability in rates of 210Pb delivery may be mis-takenly converted into changes in sédiment accumulation rates, and,
because the computation demands an accurate estimate of totalexcess 2l0Pb inventory, sédiment dates and accumulation rates can
be incorrectly estimated, especially when supported levels are high.
Quantitative Process Models
The distinction between curve fitting, mappings and QPMs wereillustrated at session and workshop présentations. An excess 2l(,Pb
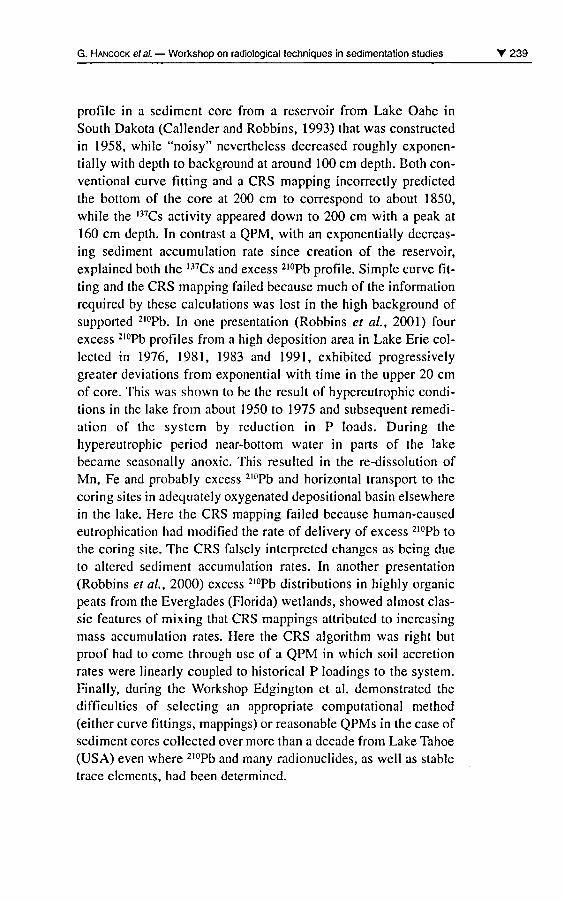
G. Hancock et al. Workshop on radiological techniques in sédimentation studies T 239
profile in a sédiment core from a réservoir from Lake Oahe inSouth Dakota (Callender and Robbins, 1993) that was constructedin 1958, while "noisy" nevertheless decreased roughly exponen-tially with depth to background at around 100 cm depth. Both con¬
ventional curve fitting and a CRS mapping incorrectly predictedthe bottom of the core at 200 cm to correspond to about 1850,
while the l37Cs activity appeared down to 200 cm with a peak at
160 cm depth. In contrast a QPM, with an exponentially decreas¬
ing sédiment accumulation rate since création of the réservoir,explained both the 137Cs and excess 210Pb profile. Simple curve fit¬
ting and the CRS mapping failed because much ofthe informationrequired by thèse calculations was lost in the high background ofsupported 2l0Pb. In one présentation (Robbins et al, 2001) fourexcess 2,0Pb profiles from a high déposition area in Lake Erie col¬
lected in 1976, 1981, 1983 and 1991, exhibited progressivelygreater déviations from exponential with time in the upper 20 cm
of core. This was shown to be the resuit of hypereutrophic condi¬
tions in the lake from about 1950 to 1975 and subséquent remedi¬
ation of the system by réduction in P loads. During thehypereutrophic period near-bottom water in parts of the lakebecame seasonally anoxie. This resulted in the re-dissolution ofMn, Fe and probably excess 2l0Pb and horizontal transport to thecoring sites in adequately oxygenated depositional basin elsewherein the lake. Hère the CRS mapping failed because human-causedeutrophication had modified the rate of delivery of excess 210Pb tothe coring site. The CRS falsely interpreted changes as being due
to altered sédiment accumulation rates. In another présentation(Robbins et al, 2000) excess 2l0Pb distributions in highly organicpeats from the Everglades (Florida) wetlands, showed almost clas-sic features of mixing that CRS mappings attributed to increasingmass accumulation rates. Hère the CRS algorithm was right butproof had to corne through use of a QPM in which soil accretionrates were linearly coupled to historical P Ioadings to the System.
Finally, during the Workshop Edgington et al. demonstrated the
difficulties of selecting an appropriate computational method(either curve fittings, mappings) or reasonable QPMs in the case ofsédiment cores collected over more than a décade from Lake Tahoe
(USA) even where 2,0Pb and many radionuclides, as well as stabletrace éléments, had been determined.
240 T Environmental Changes and Radioactive Tracers
Vérification
In the absence of supporting information, no 210Pb profile can be
"explained" and no chronology derived from 210Pb should be con¬
sidered reliable! The proof of this is easy enough. A perfectly expo-nential decrease in an excess 2,0Pb profile with depth can be due toradioactive decay plus sédimentation alone, uniform diffusive mix¬
ing alone or some combination of thèse two alternative transportprocesses. In the extrême case where there is no net sédimentation,an exponential 210Pb profile cannot yield a chronology. Only inde-pendent information can résolve the profound ambiguity. Knowingthe relevant process is critical to whether meaningful dates can be
obtained even from an idéal 210Pb profile.
It is common practice in the published literature to make Iimited use
sédiment profiles of fallout ,37Cs as a primary source of independentchronological information. Rather typically, 2l0Pb chronologies are
considered "verified" if subsurface l37Cs peaks in sédiments are
located at depths where 210Pb dates "agrée" with the "date" falloutmaximum, 1963-1964. Rarely is any attention paid to what consti¬
tutes acceptable agreement. The ,37Cs peak method is weak since itconfirms, at best, merely one curve fitting or mapping date assign-ment. If mappings such as CRS or CIC are inappropriately appliedto sédiments subject to near-surface, steady-state mixing, they gén¬
érale artificially high estimâtes of accumulation rates that can, inturn, falsely agrée with 137Cs peak locations which hâve been dis-placed downward by mixing. At minimum, one should also try totest the 2l0Pb chronology by comparing the âge assignaient of the
137Cs horizon (deepest level where activity can be detected) againsta 1952 date of onset of atmospheric nuclear testing. Agreementstrengthens the assertion of a valid 2,0Pb chronology, while dis-agreement is an invitation to consider reasons and présent them inpublished discussions. Horizon is more sensitive than peak depth tosteady-state sédiment mixing and diffusive migration. In the south¬
ern hémisphère horizons may be artificially closer to the surface insédiment cores due to détection problems.
More satisfactory approaches include building QPMs that accountfor entire 2l0Pb and ,37Cs profiles, and the use of tracers such as sta¬
ble Pb (at least in the northern hémisphère) where a well-developed,
G. Hancock et al. Workshop on radiological techniques in sédimentation studies 241
roughly 100 year-long record of atmospheric Pb concentrationsmay be compared with sedimentary Pb temporal records based on210Pb dating. In this case, QPMs must account for 210Pb, 137Cs and Pb
(Robbins et al, 2000).
Comment on CRS and model validationby D. N. Edgington
The lack of published data supporting 210Pb dates (outlined above)is made worse by the almost universal use of the Constant Rate ofSupply mapping or transformation (CRS) to calculate âges, whereeach data point translates into an independent âge or sédimentationrate. The method requires the assumption that the input of excess
210Pb is invariant and the observed sédiment column is in steady-state (i.e. the inventory of excess 2l0Pb is constant). Under thèse
conditions any variation from a perfect exponential decay of 210Pb
downcore must be ascribed to changes in sédimentation rate.
In most of the papers published where data hâve been presented,there has been no attempt either to validate the assumptions, or toshow that age-depth relationships are reproducible from core tocore or from sampling time to sampling time. The problem is con-founded by the easy availability of 210Pb data from a variety of com¬
mercial analytical services. It must be stressed that whilegamma-ray spectrometry may be essentially a turn-key opération,the interprétation of the data is the crucial step in the assignment ofsédimentation rates and requires a strong knowledge of local condi¬tions. It must also be understood that ail profiles are not inter¬
prétable. In those few cases where 2l0Pb data were presented, therewas no vérification of the interprétation using either 137Cs or othernon-radiological markers in the sédiment.
Several years ago John Robbins put together a set of "regrettablefacts" regarding the use of 210Pb for sédiment dating. They deservereiterating:
1 Not ail cores hâve interprétable profiles;
2 Sédiment dating is critical for paleolimnology. Often dating isgiven short schrift;
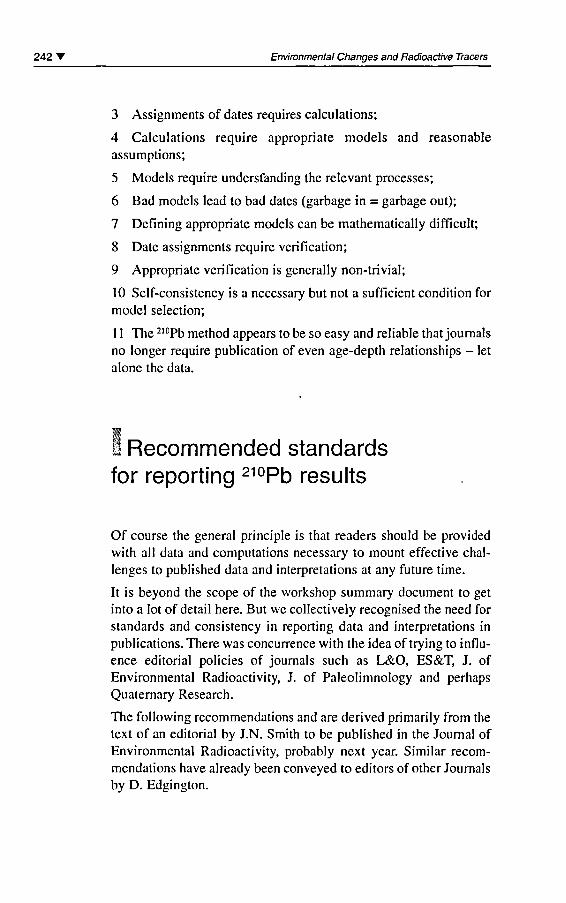
242 T Environmental Changes and Radioactive Tracers
3 Assignments of dates requires calculations;
4 Calculations require appropriate models and reasonableassumptions;
5 Models require understanding the relevant processes;
6 Bad models lead to bad dates (garbage in = garbage out);
7 Defining appropriate models can be mathematically difficult;
8 Date assignments require vérification;
9 Appropriate vérification is generally non-trivial;
10 Self-consistency is a necessary but not a sufficient condition formodel sélection;
1 1 The 210Pb method appears to be so easy and reliable that journalsno longer require publication of even age-depth relationships - letalone the data.
1 Recommended standardsfor reporting 210Pb results
Of course the gênerai principle is that readers should be providedwith ail data and computations necessary to mount effective chal¬
lenges to published data and interprétations at any future time.
It is beyond the scope of the workshop summary document to getinto a lot of détail hère. But we collectively recognised the need forstandards and consistency in reporting data and interprétations inpublications. There was concurrence with the idea of trying to influ¬ence editorial policies of journals such as L&O, ES&T, J. ofEnvironmental Radioactivity, J. of Paleolimnology and perhaps
Quaternary Research.
The following recommendations and are derived primarily from the
text of an editorial by J.N. Smith to be published in the Journal ofEnvironmental Radioactivity, probably next year. Similar recom¬
mendations hâve already been conveyed to editors of other Journalsby D. Edgington.
G. Hancock ef al. Workshop on radiological techniques in sédimentation studies T 243
Validation of210Pb geochronology
2l0Pb geochronology must be validated using at least one indepen-dent tracer that separately provides an unambiguous time-strati¬graphic horizon. This should be considered as fundamental to thevalidation of 2l0Pb sédimentation models in as much as the use ofradioactive tracers and standards is to the quality control and vérifi¬cation of analytical méthodologies. Independent validation of 210Pb
geochronologies must become an intégral part of the overall expér¬
imental methodology. If the validation is inconclusive, then either a
more appropriate particle transport model must be formulated and
applied to the interprétation of the expérimental results or the coremust be considered to be undateable.
Data Présentation
At the time of review, (1) ail authors submitting manuscripts toresearch journals must be expected to provide figures ofthe data ora hard-copy appendix containing the data and a description of themethods of calculation, including vérification, and (2) the editorspublish the figures and/or this appendix in smaller type or providean easily accessible electronic version for readers.
i Large scale effects on 210Pb and"bomb" nuclide sédiment profiles
Comment on Drainage basin résidence timesby J. N. Smith
It has been shown over the past 20 years that radionuclide tracerdistributions in sédiments are a function of the rates of tracer trans¬
port through various phases (soils, water column, biota, transientsédiment réservoirs, etc.) of the environment. For radionuclides
244 T Environmental Changes and Radioactive Tracers
that can be considered to hâve a constant steady-state input flux(such as 210Pb under many conditions), their rétention in variousenvironmental réservoirs will affect the overall flux to the sédi¬
ments, but not necessarily the shapes of the sediment-depth pro¬
files. In contrast, radionuclide tracers having time-dependent inputfunctions (such as fallout l37Cs and 239240Pu) will hâve sediment-depth distributions whose both shape and magnitude are affectedby their history of transport through the différent phases of the
environment.
In some cases, the effect of a "delay" of the fallout radionuclide inan environmental phase prior to final déposition in permanentlydeposited sédiments can be simulated by a box model employing a
single résidence time representing tracer transport through the per¬
tinent environmental phase. This is commonly observed in lake
sédiments having relatively small drainage basins where there is
transient tracer pooling in near shore sédiment régimes prior to
resuspension and subséquent déposition in the deeper, permanentsédiment deposits. In other types of aquatic or marine Systems,
several environmental phases having very différent tracer rési¬
dence times must be employed to simulate the expérimentalresults. One example of this latter system is a lake or estuary witha relatively large drainage basin having a soil/litter phase in whichtracers are delayed (on average) by thousands of years and a sec¬
ond environmental phase (eg. water column) that causes delays ofonly months to years.
One of the primary confounding factors of tracer "delay" in envi¬
ronmental phases prior to permanent déposition in the sédimentsmay be to produce sédiment distributions that appear to hâve
undergone mixing. For example, the 1963-64 peak in the sediment-depth distribution of fallout radionuclides corresponding to the
period of maximum atmospheric déposition will tend to be skewed
towards the surface depending on the extent of tracer "delay" in
various environmental phases. Further, récent sédiments will be
characterised by a significant depositional flux of fallout radionu¬
clides despite the fact that the present-day atmospheric deposi¬
tional flux is practically zéro. The point is that thèse features can
also be simulated by various combinations of sédimentation and
G. Hancock étal. Workshop on radiological techniques in sédimentation studies T 245
mixing and tracer delays in the environment can be mis-interpretedas having been caused by sédiment mixing. It is therefore criticalto properly evaluate tracer transport mechanisms and rates for theirpassage through the environment by comparisons of the distribu¬tions of tracers (such as 137Cs) having time-dependent input func¬
tions with those of tracers (such as 210Pb) having steady-state inputfunctions.
Comment on Southern Hémisphère Falloutby G. Brunskill and J. Pfitzner
The flux of 210Pb from the atmosphère to the land and sea is muchsmaller in the southern hémisphère, due to the large ratio ofocean/land. Rain fluxes and soil inventories suggest that the annualsupply of excess 2I0Pb in tropical Australia is about 50 Bq.nv2.yr',whereas European and North American excess 2l0Pb supply isapproximately 300-400 Bq.nr2.yr'.
The situation is similar for "bomb" fallout nuclides, although for a
différent reason. Most of the bombs were exploded in the northernhémisphère, and many of the bomb nuclides commonly used as
chronological markers in the northern hémisphère (238-239Pu, 241Am)
are very difficult to detect south of the equator. The history and
magnitude of bomb fallout nuclide supply to North Americanecosystems are known to be sharply focused in 1962-65, with a
peak input that is 10+ times greater than 1950-60, and 1970-pre-sent activities (Figure 1). Inventories of 137Cs in North Americansoils and sédiments are typically 2-5 kBq.nv2. Fallout history and
magnitude is différent in the southern hémisphère, and particularlyin tropical Australia and New Zealand. The peak input is only 2
times greater than 1950-1960 or 1980-present, and the peak inputwas supplied over 1954-1974 as a resuit of smaller local bombexplosions (Murorora, Maralinga, Monte Bello Island) in the late1950s and early 1970s. Undisturbed soil profiles in northQueensland usually hâve I37Cs inventories of <400 Bq.nv2.Therefore, we should not expect sédiment core profiles of ,37Cs tohâve a sharp 1963 peak (as in North American examples), butrather a broad plateau of low activity (Figure 1).
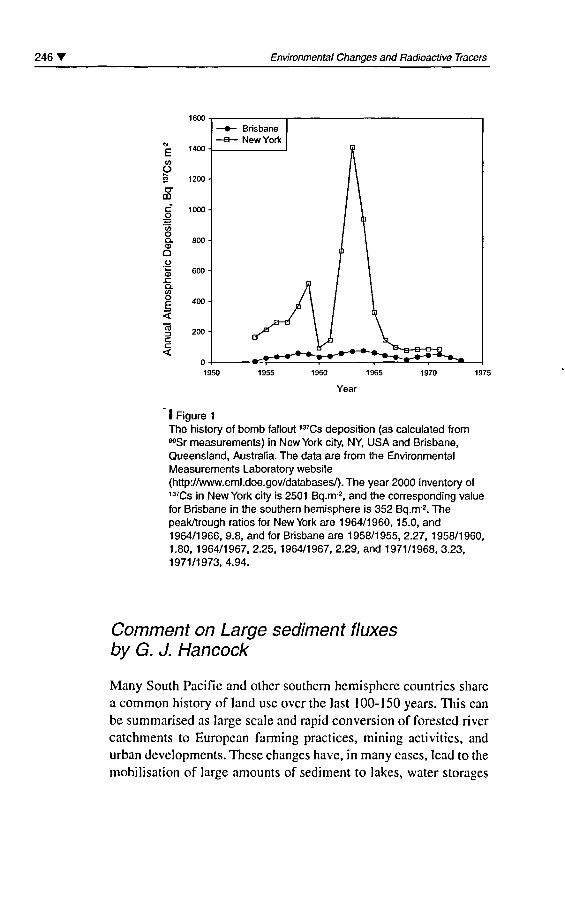
246' Environmental Changes and Radioactive Tracers
1400
tnO
CTmco
oQ.CD
O
<r>
siCLtnO£<
cc<
BrisbaneNew York
1950
Year
I Figure 1
The history of bomb fallout '37Cs déposition (as calculated fromo°Sr measurements) in New York city, NY, USA and Brisbane,Queensland, Australia. The data are from the EnvironmentalMeasurements Laboratory website(http://www.eml.doe.gov/databases/). The year 2000 inventory of137Cs in New York city is 2501 Bq.nr2, and the corresponding valuefor Brisbane in the southern hémisphère is 352 Bq.nr2. Thepeak/trough ratios for New York are 1964/1960, 15.0, and1964/1966, 9.8, and for Brisbane are 1958/1955, 2.27, 1958/1960,1.80, 1964/1967, 2.25, 1964/1967, 2.29, and 1971/1968, 3.23,1971/1973,4.94.
Comment on Large sédiment fluxesby G. J. Hancock
Many South Pacific and other southern hémisphère countries share
a common history of land use over the last 100-150 years. This can
be summarised as large scale and rapid conversion of forested rivercatchments to European farming practices, mining activities, and
urban developments. Thèse changes hâve, in many cases, lead to the
mobilisation of large amounts of sédiment to lakes, water storages
G. Hancock ef al. Workshop on radiological techniques in sédimentation studies 247
and estuaries. The rapid rates of sédiment accumulation associated
with thèse catchment changes has resulted in the dilution of theactivities of fallout tracers used in sédiment dating (excess 210Pb and
137Cs), compounding the problem of low southern hémisphère activ¬
ities of thèse nuclides described above by Brunskill and Pfitzner.The présence of l37Cs and excess 2l0Pb in undisturbed sédiment usu¬
ally means that layer has been deposited in the last 40 years and 100
years respectively, although chemical mobility of l37Cs in some séd¬
iments may invalidate its use as a chronometer. However, the com¬
bined effects of high sédiment fluxes and low fallout activitiesmeans that the lack of détectable l37Cs and excess 210Pb in sédiments
does not necessarily mean that the sédiment has been depositedprior to the release of bomb ,37Cs into the atmosphère. This is illus-trated by a core from the Murrah floodplain in SE Australia. Excess
2l0Pb and 137Cs is undetectable in the upper one meter layer of séd¬
iment. This layer overlies a deeper layer containing high 137Cs activ¬
ity, proving the upper one meter of sédiment has been laid downwithin the last 40 years. This example illustrâtes the extrême effectsthat variable sédiment fluxes can hâve on the sédiment profiles offallout nuclides, and highlights the necessity to corroborate dates byindependent methods.
Recommended sample collectionand analysis procédures
Comment on Core Collection by J. A. Robbins
Where possible we use modified Soutar type box cores and takeopen tube sub-cores from the box core and achieve alignment ofinterfaces inside and outside of the tube by hand regulated varia¬
tions in a partial vacuum applied to the air space above sédimentsinsider the tube.
We also hâve used piston coring in situations where there is visuallyverifiable préservation ofthe sediment-water interface.
248 T Environmental Changes and Radioactive Tracers
Gravity coring, especially using core catchers or plunger typevalves, can distort the sédiment column and is not a désirable,although sometimes necessary collection method.
In many cases it is désirable to X-ray cores (or replicate ones) tocharacterise sédiment stratigraphy.
Core Sectioning
Sectioning should be quantitative with respect to wet sédiment con¬
tent. Where it is necessary to trim an annulus from sédiment sec¬
tions, the trimmed material should be saved for calculating totalsédiment wet weight of each section.
Measurements
Section interval thickness, z (cm).
Section dry weight g, (g.cnv2 of core cross-sectional area).
Fractional dry weight of section, fdw, (g.dry/g.wet).
Grain size distribution, (especially % less than ca. 65 microns). Thisis especially indicated where there appear to be localised anomaliesin 2l0Pb and other profiles.
Gamma counting of sealed whole-dry sédiments, equilibrated forradon in-growth, preferably using detectors with enhanced efficien-cies below 100 KeV, is the method of choice in many cases. Report210Pb, 7Be, 226Ra, ,37Cs and 40K and sometimes 228Th. At least near-
surface samples should be counted soon enough to detect 7Be (t]/2 =53.4 days). This radionuclide is useful for confirming recovery ofsurface sédiments. However there are circumstances in which Be-7may decay away before reaching sédiments! There are cases whereexcess 228Th (t1/2=l .9 years) occurs in near-surface sédiments. LakeTahoe is an example. This nuclide may be useful for determiningrates of near-surface mixing and/or sédiment accumulation. Lookfor the 208T1 peak at 583.19 KeV and the 212Pb peak at 238.63 KeV.
In the case of this latter peak, there may be a removable interférencedue to 2I4Pb from 226Ra at 241.98 KeV to deal with. The 40K is use-
G. Hancock ef al. Workshop on radiological techniques in sédimentation studies T 249
fui for identifying stratigraphie anomalies and should be reportedwhen gamma counting is done. 226Ra can best be determined fromseveral peaks associated with decay of 222Rn (295.21, 351.92 and
609.31 KeV) using a weighted average of activities. The gamma at
186.21 KeV arising directly from 226Ra may be subject to interfér¬ence from an unresolvable peak at 185.7 KeV from 23,U.
Enhanced efficiency gamma counting for 2,0Pb (46.5 KeV) is gen¬
erally not as rapid in terms of counting or as précise as the standardisotope-dilution alpha spectroscopy method in which 2l0Po (in equi-librium with 210Pb) in acid extracts of samples receiving calibrated209Po or 208Po spikes are plated on to silver planchets and counted.We use this method in combination with gamma counting in manycases where establishing sédiment chronologies as the primary goal.
A complète profile (with no missing intervais) should be generated
and extend well into the background région of supported 210Pb.
Estimating mean âges and time resolutionof core sections
In cases where there is no évident mixing of near-surface sédimentsat a site, précision in mean 210Pb âges of sédiment sections can be
calculated by conventional error estimation procédures includingMonte Carlo methods for mappings and QPMs. However mean âge
précision can be somewhat misleading because it is not necessarilyindicative of the time resolution with which historical records maybe developed. Another time that we routinely calculate for " 2l0Pb
datable" cores is the ratio ofthe sédiment section thickness (g.cnv2)to the mass accumulation rate for the section (g.cnv2.yr'). Sincesections are presumably homogenized prior to analysis, this timeindicates the best attainable time resolution for tracer "events" mea¬
sured in a particular sectioned core. For example if the ratio is 5
years in a core section dated at 1945 ±1 year, then two spikes of a
given tracer delivered to the sédiment coring sites a times less thanfive years apart (say 1943 and 1946) cannot be separated (resolvcd)in the sedimentary record. Where there is évidence of mixing, mean
âge assignments, précision and time resolution can sometimes be
meaningfully estimated by time averaging over appropriate QPM-
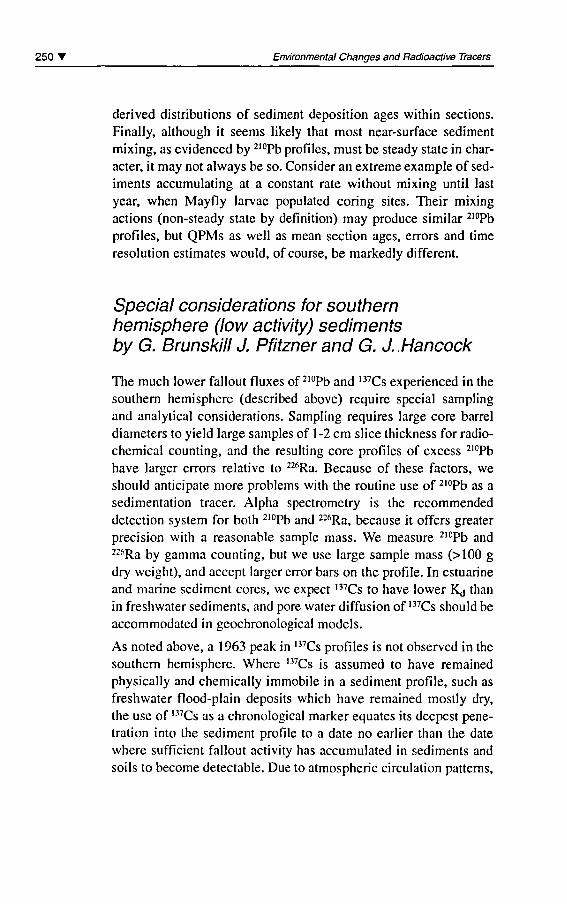
250 T Environmental Changes and Radioactive Tracers
derived distributions of sédiment déposition âges within sections.
Finally, although it seems likely that most near-surface sédimentmixing, as evidenced by 210Pb profiles, must be steady state in char¬
acter, it may not always be so. Consider an extrême example of séd¬
iments accumulating at a constant rate without mixing until last
year, when Mayfly larvae populated coring sites. Their mixingactions (non-steady state by définition) may produce similar 210Pb
profiles, but QPMs as well as mean section âges, errors and timeresolution estimâtes would, of course, be markedly différent.
Spécial considérations for southernhémisphère (low activity) sédimentsby G. Brunskill J. Pfitzner and G. J..Hancock
The much lower fallout fluxes of 2l0Pb and ,37Cs experienced in the
southern hémisphère (described above) require spécial samplingand analytical considérations. Sampling requires large core barreldiameters to yield large samples of 1-2 cm slice thickness for radio¬
chemical counting, and the resulting core profiles of excess 210Pb
hâve larger errors relative to 226Ra. Because of thèse factors, weshould anticipate more problems with the routine use of 2l0Pb as a
sédimentation tracer. Alpha spectrometry is the recommendeddétection system for both 210Pb and 226Ra, because it offers greaterprécision with a reasonable sample mass. We measure 2l0Pb and
226Ra by gamma counting, but we use large sample mass (>100 g
dry weight), and accept larger error bars on the profile. In estuarineand marine sédiment cores, we expect ,37Cs to hâve lower Kd than
in freshwater sédiments, and pore water diffusion of ,37Cs should be
accommodated in geochronological models.
As noted above, a 1963 peak in l37Cs profiles is not observed in the
southern hémisphère. Where l37Cs is assumed to hâve remainedphysically and chemically immobile in a sédiment profile, such as
freshwater flood-plain deposits which hâve remained mostly dry,
the use of l37Cs as a chronological marker equates its deepest péné¬
tration into the sédiment profile to a date no earlier than the date
where sufficient fallout activity has accumulated in sédiments and
soils to become détectable. Due to atmospheric circulation patterns,
G. Hancock ef al. Workshop on radiological techniques in sédimentation studies '251
and much lower fallout input, this date is later in the southern hémi¬
sphère than the northern. At CSIRO in Canberra we currently cal¬
culate the date of first détectable appearance of 137Cs in Australianfine-grained soil and sédiment to be 1958. This date is based on theperformance of our gamma-ray detectors, counting System, samplegeometry and sample weight. Because atmospheric input of 137Cs
has essentially ceased, the activity of ,37Cs in the landscape isdecaying. The date of first détection is therefore not stable, and ismoving forward at a rate dictated by the ,37Cs half-life and fallouthistory.
BibliographyCallender, E. C,Robbins J. A., 1993Radionuclide and trace élémenttransport and accumulation in aMissouri River réservoir, WaterResources Res. 29: 1787-1804.
Robbins J. A., Herche L. R., 1993Models and uncertainty in Pb-210dating of sédiments, Verh. Internat.Verein. Limnol, 25: 271-222.
Robbins J. A., Holmes C, Halley R.,Bothner M., Shinn E., Graney J.,Keeler G., tenBrink M.,Orlandini K. A., Rudnick D., 2000
Time-averaged fluxes of lead andfallout radionuclides to sédimentsof Florida Bay, J. Geophys. Res.
Robbins J. A., Rosmann R.,MUDROCH A., ROOD R., MOREHEAD N.,Edgington D. N., 2001
"Effect of récurrent épisodes of LakeErie on accumulation of manganèseand 210Pb in sédiments."In: Fernandez J. M., Fichez R. (eds):Environmental Changes andRadioactive Tracers,IRD Editions, Paris, p. 262.Océans, 105, C12: 28 805-28 821.


Oral/Posterprésentations
Session 3

Session 3 Oral/Poster présentations T 255
3 Applications of radionuclide tracersto studies of mixing and accumulationin modem sédiments
John N. Smith
The authors of the first paper on 2l0Pb dating in marine sédimentshad the good sensé to validate their method by performing theirmeasurements in varved sédiments in the Santa Barbara Basin, offCalifornia for which the time-stratigraphic horizons had been wellestablished. Several years later, Robbins & Edgington (1975)pointed out that most sédiment régimes in lake and marine environ¬ments undergo mixing or bioturbation in the upper 10-20 cm,mainly as the resuit of the feeding and physiological activities ofbenthic organisms. Mixing confounds the time-stratigraphic resolu¬
tion of the sedimentary record and éliminâtes the possibility ofdetermining 20lh century, contaminant geochronologies in mostmarine and aquatic sédiment régimes. The only recourse of the
tracer geochemist is to formulate a model that simulâtes particleuptake and post-depositional mixing and apply it to the interpréta¬tion of radionuclide and contaminant sédiment profiles.Geochemists accept this reality reluctantly, because of the enor-mous loss of chronological information resulting from even verylow rates of sédiment mixing. The interplay of sédiment mixing and
accumulation can be illustrated using examples from a variety ofdepositional régimes ranging from the slowly accumulating sédi¬
ments of the Arctic Océan basins to high sédimentation rate envi¬
ronments in the Saguenay Fjord, Québec. The intention of thispaper is to identify the pitfalls of ignoring the impact of mixing onthe interprétation of geochemical features in marine sédiments and
to highlight the insights into animal-sediment interactions that can
be gained from a more realistic approach to thèse types of studies.
256 T Environmental Changes and Radioactive Tracers
I Building a self-consistentinterprétation of radionuclide profilsin Lake Tahoe sédiments:other geochemical parametersare required as well
David N. Edgington A. Heyvaert
John A. Robbins D. Olaniyi
2ioPb) 239+240pUj 228Tht 226Ra> 235TJ and 4oK were measured jn a sédiment
core collected in 1998. The 2l0Pb results may be compared with ear¬
lier profiles measured in 1982 and 1991. 137Cs was measured in 1991
and 1 998. Trace éléments, e.g., Mn, Fe, and Pb, and organic carbonwere measured in the same samples. The sédiment record in Tahoeexhibits classical redox subsurface peaks of manganèse, with ironimmediately below (where phosphate also peaks), at depths from 2.5to 4 cm., indicative of little mixing by organisms below this zone. Theexcess 2l0Pb profiles are not a simple exponential, but may reflect a
higher sédimentation rate since about 1975, corresponding to a factorof > 2 than in earlier times. This change in rate is consistent with thedecrease in organic carbon content concomitant with the disturbanceof low organic carbon soils resulting from construction activity in the
basin. However, a comparison ofthe ,37Cs and 210Pb profiles are alsoconsistent with mixing down to 5-6 cm. But the 2-19+24°Pu profileexhibits pénétration and subsurface maximum at depths apparentlyconsistent with sédimentation rates calculated from the 210Pb data.The 228Th profile shows mixing in the upper 2-3 cm of sédiment,which is consistent with the position of the redox boundary.Geochemical changes associated with the redox zone lead to mini¬mum values for 235U and 40K, and a small maximum for 226Ra.
Development of a self-consistent model needs to reconcile the largedifférences between the ,37Cs and 239+240Pu profiles in relation to theirdifférences in geochemical properties in the water and interactionwith sédiments.
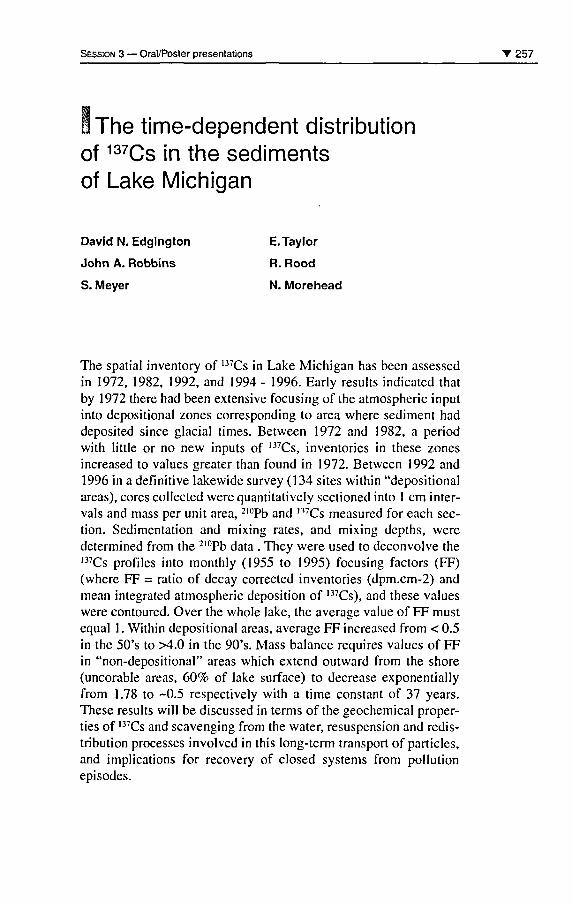
Session 3 Oral/Poster présentations T 257
iThe time-dependent distributionof 137Cs in the sédimentsof Lake Michigan
David N. Edgington E. Taylor
John A. Robbins R. Rood
S. Meyer N. Morehead
The spatial inventory of 137Cs in Lake Michigan has been assessed
in 1972, 1982, 1992, and 1994 - 1996. Early results indicated thatby 1972 there had been extensive focusing of the atmospheric inputinto depositional zones corresponding to area where sédiment haddeposited since glacial times. Between 1972 and 1982, a periodwith little or no new inputs of ,37Cs, inventories in thèse zonesincreased to values greater than found in 1972. Between 1992 and1996 in a définitive lakewide survey (134 sites within "depositionalareas), cores collected were quantitatively sectioned into 1 cm inter¬vais and mass per unit area, 2l0Pb and n7Cs measured for each sec¬
tion. Sédimentation and mixing rates, and mixing depths, weredetermined from the 2l0Pb data . They were used to deconvolve the137Cs profiles into monthly (1955 to 1995) focusing factors (FF)(where FF = ratio of decay corrected inventories (dpm.cm-2) andmean integrated atmospheric déposition of 137Cs), and thèse valueswere contoured. Over the whole lake, the average value of FF mustequal 1 . Within depositional areas, average FF increased from < 0.5in the 50's to >4.0 in the 90's. Mass balance requires values of FFin "non-depositional" areas which extend outward from the shore(uncorable areas, 60% of lake surface) to decrease exponentiallyfrom 1.78 to -0.5 respectively with a time constant of 37 years.Thèse results will be discussed in terms ofthe geochemical proper¬ties of l37Cs and scavenging from the water, resuspension and redis¬tribution processes involved in this Iong-term transport of particles,and implications for recovery of closed Systems from pollutionépisodes.
258 T Environmental Changes and Radioactive Tracers
I Time-average fluxes of lead andfallout radionuclides to sédimentsin Florida Bay, Florida, USA
John A. Robbins J. Graney
C. W. Holmes, G. Keeler
R. Halley M. Tenbrink
M. Bothner K. A. Orlandini
E. Shinn D. Rudnick
Récent, unmixed sédiments from mud banks of central Florida Baywere dated using 210Pb/226Ra, and chronologies were verified bycomparing sédiment lead temporal record with Pb/Ca ratios inannual layers of a coral (Montastrea annularis). Dates of sédimentlead peaks (1978 ± 2) accord with prior observations of a six-yearIag between occurrences of maximum atmospheric lead in 1972 and
peak coral lead in 1 978. Smaller lags of 1 -2 years occur between theyear of maximum fallout and the sédiment record of 137Cs and Pu.
Such lags are conséquences of system-time averaging (STA) inwhich atmospherically derived material accumulâtes and mixbefore removal to the sédiments and coral. Using time-dependantatmospheric inputs, STA model calculations produced optimizedprofiles in excellent accord with measured sédiment l37Cs, Pu lead
and corals distributions. Derived résidence times of thèse particletracers (16 ± 1, 15.7 ± 0.7, 19 ± 3, and 16 ± 2 years, respectively)are comparable despite différences in sampling locations, in accu-mulating média, and in élément loading historiés and geochemicalproperties. For a sixteen-year, weighed-mean résidence time, STAgénérâtes the observed six-year lead peak lag. This study showsthat, when transient tracers are used to verify 2l0Pb chronologies,potential Iag effects resulting from STA processes must be consid¬
ered. Because of réservoir effects, significant levels or non-degrad-

Session 3 Oral/Poster présentations T 259
able, particle-associated contaminants can persist in Florida Bay formany décades following élimination of extemal inputs. Présent
results, in combination with STA-models analysis of previouslyreported radionuclide profiles; indicate that décade- scale time aver-aging may occur widely in récent coastal marine environments.
260 T Environmental Changes and Radioactive Tracers
1 Sédiment budget in the East ChinaSea elucidated from fallout nuclides
C. A. Huh
C.-C. Su
Using three fallout nuclides (210Pb, ,37Cs and 239-240Pu) as tracers, an
attempt was made to elucidate the budgets, sources and pathways ofsédiments and thèse nuclides in the East China Sea (ECS). A large
number of box and gravity cores were collected from this marginalsea and analyzed for this purpose. Multiplying the area of the ECS
as defined in this study (353,000 km2) by the 137Cs-based mean séd¬
imentation rate (0.372 g.cnr2.yr') yields an annual sédiment flux of1.3xl09tons.yr'.Thisis about twice the sum of the reported annual
discharge from the Yangtze River (~5xl 08 tons.yr1) and érosionfrom Taiwan (-2 xlO8 tons.yr1). To account for the substantialimbalance, input from the Yellow River's dispersai system from the
north is required. Spatial distribution of sédiment inventories of,37Cs and 239-240Pu shows that input from the Yangtze Rivers'sdrainage basin constitutes the dominant source of thèse two anthro-pogenic nuclides in the ECS. As for the natural nuclide 210Pb,
boundary scavenging and atmospheric fallout are equally importantwhereas riverine input is negligible. By comparing the mean sédi¬
ment inventories of 2,0Pb, l37Cs and 239-240Pu in the study area (71,
5.2 and 0.72 dpm.cnr2, respectively) with corresponding values
expected from global fallout (37, 7.1 and 0.21 dpm.cnv2, respec¬
tively), it can be seen that 2l0Pb and 239240Pu precipitated from the
atmosphère are effectively scavenging from the water column,whereas l37Cs is not.
Session 3 Oral/Poster présentations T 261
1 Reconstruction of Pléistocènehistory of métal pollutionin a natural swamp using 210Pb
geochronometer
K. H. Kim
D. S. Moon
J. S. Yang
We report detailed profiles of 210Pb and I37Cs activities in a sédimentcore collected from Woopo Swamp, a 20 km2-wide Pléistocènemarshland in southern part of Korea. Activities of the two radionu¬clides were measured by non-destructive gamma spectroscopy utiliz-ing a high-purity germanium detector. Since the bottom sédiments ofthe swamp were highly anoxie with very high organic content derivedfrom flourishing aquatic plants, no indication of biological particlemixing was recognized in the core. The excess 210Pb activities showedan exponential decrease with depth as in the case of organic carboncontent. A least-squares best-fit line drawn to the excess 210Pb datapoints yielded a sédimentation rate of 0.44±0.04 cm.yr1. This esti¬
mated rate was in a good agreement with the resuit from anotherstratigraphie marker, the depth of l37Cs peak occurring around 15 cmbelow the surface. Fifteen éléments including Al, As, Ba, Ca, Cd, Cr,Cu, Fe, Hg, Mn, Ni, Pb, Sr, Ti and Zn were determined as well in thesame core by inductively coupled plasma atomic émission spec¬
troscopy. They were classified into 3 groups: volatile (As, Cd, Hg, Ni,Pb), refractory (AI, Ba, Ca, Sr, Ti), and diagenetic groups (Cr, Cu, Fe,Mn, Zn). The concentrations of the refractory éléments hâveremained relatively constant with time for last 160 years. On the con¬
trary, the volatile and diagenetic éléments showed increase since thebeginning ofthe 20th century. The steep increase of volatile élémentsin swamp sédiments may be due to the anthropogenic input associ¬
ated with the population growth in Korea.
262 T Environmental Changes and Radioactive Tracers
! Effect of récurrent épisodesof hypolimnetic oxygen depletionin Lake Erie on accumulationof manganèse and 210Pb in sédiments
John A. Robbins R. Rood
R. Rossmann N. Morehead
A. Mudroch David N. Edgington
The eastern depositional basin of Lake Erie (North America) wouldseem to be an idéal environment for 2l0Pb dating. Sédiment accumula¬tion rates are high (-1 cm/year) and profiles of 137Cs in four cores (col¬lected in 1976, 1981, 1983 & 1991) hâve sharply defined peaks.However marked departures of 210Pb profiles (0-20 cm depth) fromidéal exponential shape, particularly by 1991, are not explained bymixing of surface sédiments or by changing rates of sédiment accu¬
mulation. In cores dated initially by l37Cs, decay-corrected excess210Pb activities correlate well with Mn concentrations and with totalphosphorus loading between 1800 and 1982. Evidently rate of supplyof 2l0Pb the eastern basin increased with human-caused eutrophicationofthe lake especially from the 1960s through early 1970s, and subse¬
quently diminished in concert with réductions in phosphorus loads.Because of eutrophication, hypolimnetic waters over large areas ofcentral lake were depleted in oxygen during the summer and early fall,causing Mn (and presumably 210Pb) to dissolve from surface sédi¬
ments. Subséquent mixing and re-oxygenation ofthe water column re-precipitated Mn that then was transported to the eastern basin and
delivered to sédiments. A quantitative model linearly coupling con¬
centrations of excess 2l0Pb and Mn produces excellent 2l0Pb profile fitsyielding accumulation rates consistent with those from 137Cs. TheLake Erie case exemplifies the failure of mapping schemes, such as
CRS, whose validity dépends on a constant rate of supply of 210Pb.
Since mapping schemes do not yield model profiles for comparisonwith data, faults in derived age-depth relations may go unrecognized.
Session 3 Oral/Poster présentations T 263
1 Mapping schemes versus processmodels for 210Pb dating soil cores:an example from the evergladesof South Florida, U.S.A.
John A. Robbins
C. Holmes
K. Reddy
S. Newman
Two contrasting approaches hâve emerged for extracting sédimentâge information from 2l0Pb profiles: one using algorithms, such as
CRS or CIC, to convert individual excess 2lt)Pb activities into dates;
the other using process models to "explain" 210Pb profiles and sup¬
ply chronological information. Thèse are illustrated using data froma nutrient-impacted area of the Everglades wetlands in southFlorida. The study area (WCA2A) is bounded by a system of canals,one of which has been a long-term source of phosphorus fromupstream agricultural activities. Near the canal, in the stronglyimpacted area, cattails (Typha domingensis) dominate the plantcommunity. Further along a transect extending away from the canal,the community consists of a mix of cattails and sawgrass (Cladiumjamaicense), and finally, beyond about 8 km, is dominantly saw¬
grass with interspersed open-water sloughs. A CRS mappingscheme applied to excess 2l0Pb profiles in cores collected along thetransect, générâtes age-depth relations consistent with depths ofpeak 137Cs activity. The process model treats plant growth as beingcontrolled by extraction of P from soils via anchoring root net¬
works, and from water and surface soils by adventitious roots. Bycoupling net soil accretion rates, and indirectly biomass production,to near-surface soil total P concentrations, quite unusual 2,0Pb pro¬
files are quantitatively well described. Both process model and
264 T Environmental Changes and Radioactive Tracers
mapping scheme yield sédiment accumulation rates increasingexponentially at impacted sites during the past several décades.
Although successful process models can potentially reinforce inac-curate notions of mechanisms producing observed 2,0Pb profiles,mapping schemes should be nevertheless considered dating tech¬
niques of last resort.
Session 3 Oral/Poster présentations T 265
|2iopo anc| 2iopb disequilibriumin mangrove coastal waterand sédiment
Y.Tateda
Y. Ikeda
K. Fukami
K. Kurosawa
210Po concentrations in oligotrophic open water are generally con¬
trolled by density and size of zooplankton of high Po affinity,because the rate of Po removal from surface water is coincided with
210downward transport fluxes of Po-rich biogenic débris originated tozooplankton. Thus the Po levels in oligotrophic water are goodindex of zooplankton density and grazing activity in open waters.However, in coastal area, Po is sometimes reported to be excess
210than Pb, which ascribed to be the release from coastal sédiment. Inlow latitude area of pacifie océan, the coastal area is mostly coveredwith coral reefs and mangroves, and the mangrove could be the sig¬
nificant Po source because of its high organic and inorganic matterdischarges. Briefly, the Po and Pb concentrations in mangrovecoastal water are expected to be controlled by atmospheric dépositionflux, in- and out-flux along with tidal water exchange, input flux orig¬inated from oxic-anoxic environment change of sédiment, and fromorganic matter décomposition by heterotrophic benthos. To clarify thesignificant source of thèse nuclides, we analyzed the Po and Pbconcentrations in coastal water and sédiment of mangrove area at
Fukidou River in Ishigaki Island Japan. By flux estimation, we esti¬
mate the balance of Po and Pb in the water column in and aroundthe mangrove area and discuss the relation between thèse nuclidesand other environmental component. The resuit indicated that the
mangrove area is the source of Po in coastal waters, and the organicmatter décomposition or benthic biota activities are suggested to be
_ . r2'°T>important sources or Po in mangrove area.
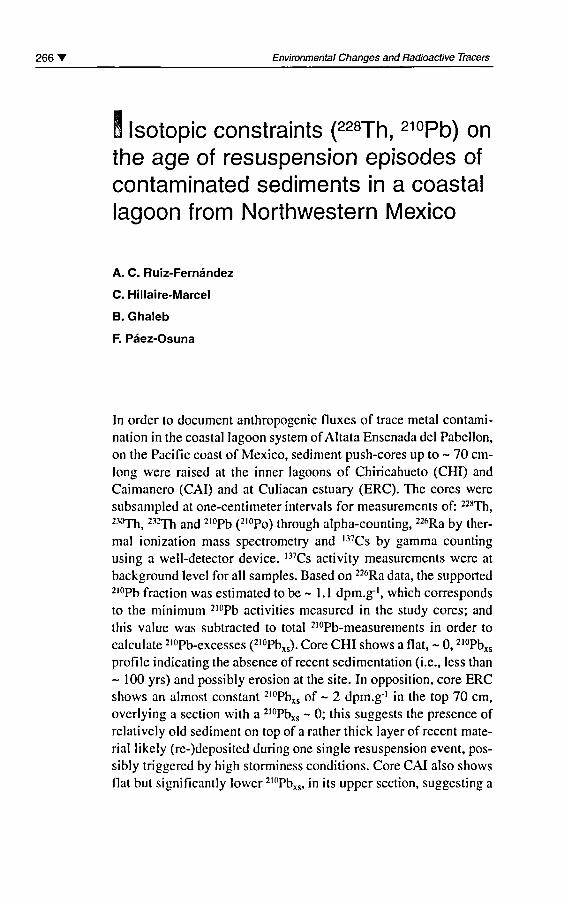
266 T Environmental Changes and Radioactive Tracers
S Isotopic constraints (228Th, 210Pb) onthe âge of resuspension épisodes ofcontaminated sédiments in a coastallagoon from Northwestern Mexico
A. C. Ruiz-Fernéndez
C. Hillaire-Marcel
B. Ghaleb
F. Pâez-Osuna
In order to document anthropogenic fluxes of trace métal contami¬nation in the coastal lagoon system ofAltata Ensenada del Pabellon,on the Pacific coast of Mexico, sédiment push-cores up to - 70 cm-long were raised at the inner lagoons of Chiricahueto (CHI) and
Caimanero (CAI) and at Culiacan estuary (ERC). The cores weresubsampled at one-centimeter intervais for measurements of: 228Th,
230Th, 232Th and 2l0Pb (2,0Po) through alpha-counting, 226Ra by ther¬
mal ionization mass spectrometry and l37Cs by gamma countingusing a well-detector device. l37Cs activity measurements were at
background level for ail samples. Based on 226Ra data, the supported2l0Pb fraction was estimated to be ~ 1.1 dpm.g1, which correspondsto the minimum 2,0Pb activities measured in the study cores; and
this value was subtracted to total 2l0Pb-measurements in order tocalculate 2l(,Pb-excesses (210Pbxs). Core CHI shows a flat, ~ 0, 2,0Pbxs
profile indicating the absence of récent sédimentation (i.e., less than
- 100 yrs) and possibly érosion at the site. In opposition, core ERCshows an almost constant 210Pbxs of ~ 2 dpm.g-' in the top 70 cm,overlying a section with a 210Pbxs - 0; this suggests the présence ofrelatively old sédiment on top of a rather thick layer of récent mate¬
rial likely (re-)deposited during one single resuspension event, pos¬
sibly triggered by high storminess conditions. Core CAI also showsflat but significantly lower 210Pbxs, in its upper section, suggesting a
Session 3 Oral/Poster présentations T 267
more older resuspension event at the origin of the correspondinglayer, or the resuspension of sédiment with a lesser 210Pbxs. At site
ERC, large 228Th-excesses over 232Th are observed, suggesting thatthe resuspension event, at the origin of the déposition of the upperhigh-2l0Pbxs layer, occurred less than 10 years ago (i.e., less than 5
half-lives of 228Th). It is concluded that the contaminated sédimentof the lagoon are likely to be frequently resuspended, re-oxy-genated, and therefore that the contaminating trace métal will con¬
tinue to be easily remobilized in the food chain.
268 T Environmental Changes and Radioactive Tracers
1 Patterns of 210Pb and 137Cs
accumulation in sédimentson australian/PNG coastal shelvesof high and low continentalsédiment supply
G reg J. Brunskill
John P. Pfitzner
An overview of patterns of accumulation of 2l0Pb (excess) and ,37Cs
in continental shelf sédiments of NE Queensland, the NW Shelf ofAustralia, and the Gulf of Papua is given. Atmospheric supply ofthèse sédimentation tracer nuclides for NE Queensland is approxi¬mately 50 Bq 2l0Pb.m-2.yr' and a 1950-1990 inventory of 400 Bql37Cs m2, based upon terrestrial soil profiles and rain collections.Thèse supply rates are much lower than in the northern hémisphère,and spécial efforts are required to use thèse sédiment tracers in séd¬
imentation models derived from high supply régions. The scaveng¬
ing of thèse nuclides in coastal seas, and delivery to the sédimentinventory, is probably a function of terrestrial sédiment supply byrivers. River sédiment plumes and resuspended fine sédimentsrcmove thèse atmospherically derived nuclides from the water col¬
umn rapidly, whereas clear offshore waters that hâve low supplyrates of fine particles deliver much smaller inventories of thèse
nuclides to sédiments. On the NW Shelf of Australia, river inflow isvery small, and continental shelf sédiment cores hâve low invento¬
ries of 2l0Pb and l37Cs. On the north Queensland continental shelf,small fluxes of water and terrestrial sédiment are delivered to the
inner shelf ofthe lagoon ofthe Great Barrier Reef. Thèse river séd¬
iment inputs trap thèse tracer nuclides in fine riverine sédiments ofcoastal estuaries, mangrove mud aprons, and shallow wind-pro-tected embayments ofthe inner shelf, and we frequently find inven-
Session 3 Oral/Poster présentations T 269
tories of both tracers 2-10 times greater than atmospheric supplyrates. In the Gulf of Papua, where globally significant inputs of riverwater, solutés, and fine sédiment are injected into the South PacificOcéan, large fluxes (2-20 times atmospheric supply rates) of excess2iop(j Were found in the fine riverine sédiments ofthe inner shelf and
at the base of the continental slope. This région is a good exampleof an estuarine trap for particle reactive tracers, and exhibits océan
margin scavenging of continental slope-advected oceanic waterfrom the Coral Sea and South Pacific Océan.
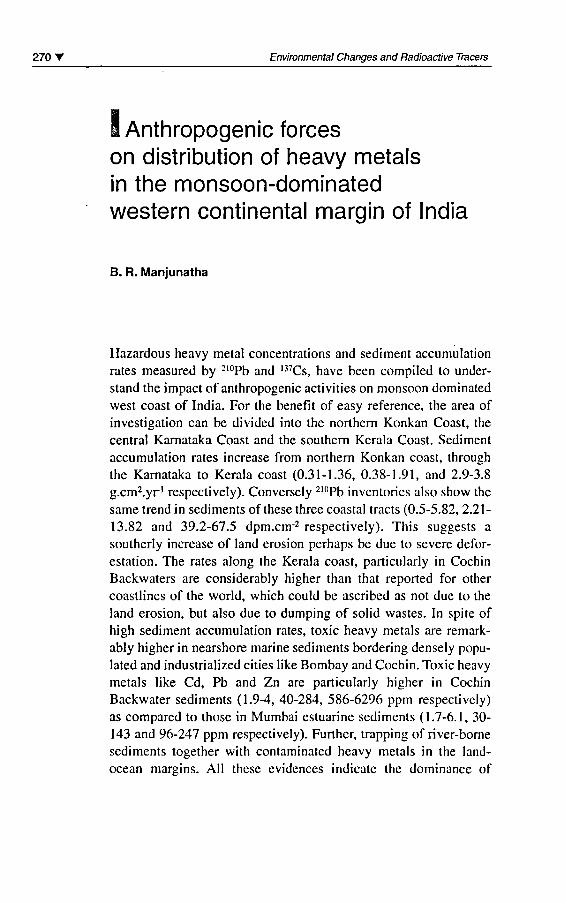
270 T Environmental Changes and Radioactive Tracers
I Anthropogenic forceson distribution of heavy metalsin the monsoon-dominatedwestern continental margin of India
B. R. Manjunatha
Hazardous heavy métal concentrations and sédiment accumulationrates measured by 210Pb and 137Cs, hâve been compiled to under¬
stand the impact of anthropogenic activities on monsoon dominatedwest coast of India. For the benefit of easy référence, the area ofinvestigation can be divided into the northern Konkan Coast, the
central Karnataka Coast and the southern Kerala Coast. Sédimentaccumulation rates increase from northern Konkan coast, throughthe Karnataka to Kerala coast (0.31-1.36, 0.38-1.91, and 2.9-3.8g.cm2.yr' respectively). Conversely 210Pb inventories also show the
same trend in sédiments of thèse three coastal tracts (0.5-5.82, 2.21-13.82 and 39.2-67.5 dpm.cm2 respectively). This suggests a
southerly increase of land érosion perhaps be due to severe défor¬
estation. The rates along the Kerala coast, particularly in CochinBackwaters are considerably higher than that reported for othercoastlines of the world, which could be ascribed as not due to the
land érosion, but also due to dumping of solid wastes. In spite ofhigh sédiment accumulation rates, toxic heavy metals are remark-ably higher in nearshore marine sédiments bordering densely popu-lated and industrialized cities like Bombay and Cochin. Toxic heavymetals like Cd, Pb and Zn are particularly higher in CochinBackwater sédiments (1.9-4, 40-284, 586-6296 ppm respectively)as compared to those in Mumbai estuarine sédiments (1.7-6.1, 30-143 and 96-247 ppm respectively). Further, trapping of river-bornesédiments together with contaminated heavy metals in the land-ocean margins. Ail thèse évidences indicate the dominance of
Session 3 Oral/Poster présentations T 271
anthropogenic activities over the natural processes. Nevertheless,estuarine and marshy sédiments along the Karnataka coast as wellas inner shelf sédiments off the West Coast of India thèse toxic met¬
als are fairly within the background levels.
272 T Environmental Changes and Radioactive Tracers
1 Dating sédiment profiles usingradionuclides: the needfor corroborating évidence
Gary J. Hancock
Radionuclides provide important, and often unique ways of datingof soil and sédiment profiles. However, changes in the rate and
mechanism of delivery of radionuclides to sédiments, and biogeo¬
chemical processes operating in the sédiment profile invalidatemany of the assumptions required for âge détermination. In thèse
cases direct application of radionuclide dating models can yieldspurious âges, and interprétation without corroborating évidence isrisky. This présentation will explore the effects of some of thèse
confounding processes by discussing a séries of case studies. LakeBarrine, a tropical crater lake in Northern Australia exhibits manycharacteristics suitable for successful application of radionuclidedating techniques; ie. a small catchment relatively undisturbed byEuropean settlement. Distinct laminations in the deposited sédimentindicate little or no post-depositional mixing. Sédiment core and
frozen slabs samples covering a period of up to 5000 yr BP hâve
been collected and dated using ,4C, excess 210Pb and 226Ra, togetherwith proxy âge indications from charcoal, exotic pollen and meteo-rological data. Thèse laminations are probably due to thermallyinduced water column overturn events, allowing the formation ofexcess 226Ra in bottom sédiment by co-precipi tation of dissolved226Ra delivered from the catchment with Fe accumulated in anoxiebottom waters. In the period 1000-4000 yr BP ,4C and excess 226Ra
âges agrée well. However in younger sédiment the spread of UC
âges increases to the point where many of the "C âges are clearlymuch too old. The spread is probably due to the delay in transportof organic material from the shallows to deeper water. Taking the
youngest UC âges, and extrapolating the excess 226Ra depth vs âge
Session 3 Oral/Poster présentations T 273
curve gives acceptable âges up to 1000 yr BP. Sections of the 210Pb
profile closely approximate the exponential décline expected in a
system where récent sédimentation rates hâve been approximatelyconstant. However the profile is separated by a thick amorphouslayer, below which the sédiment âges estimated by the two com-monly used dating models (the CRS and CIC models) differ. Exoticpollen and charcoal data support CRS âges for sédiment below theamorphous band. The 2,0Pb âges provide évidence for the 14C 'con¬
tamination' of young sédiment by organic material with an older l4C
signature. In many Australian lakes sédiment profiles show 210Pb
profiles characteristic of highly variable sédiment influx. Non-monotonie decreases in 210Pb activity are common, and can be
related to catchment disturbance associated with European settle¬
ment. In thèse sédiments, the CRS model is usually the most appro¬
priate, but âges should checked by independent means. Exampleswill be presented which show how dilution of 2l0Pb activity by largesédiment infiuxes could lead to the erroneously old âges. Mixing ofthe upper layers of sédiments is common in near-shore marine séd¬
iment, and if not recognised can lead to the détermination of spuri-ously young âges in the mixed zone. Mixing depths can varygreatly, as can the mixing process. Examples of simple 2-layer mix¬ing models will be presented, where the sédimentation accumula¬tion rate is determined from the 2,l,Pb below the mixing zone.
Knowledge ofthe mixing time constant can help constrain the accu¬
mulation rate within the mixed layer, and the présence of second
tracer with a half-life différent to 2l0Pb can allow the estimation ofboth mixing and accumulation rates. This approach has been
applied in Port Philip Bay, using the decay profiles of excess 210Pb
and 228Th.
274 T Environmental Changes and Radioactive Tracers
S A preliminary study of 210Pb
geochemistry in the Pearl River Estuary
S. Pan
Pearl River Estuary is a drainage basin of Pearl River system. Theamount of yearly average runoff is totally 3.42x10'° m3,and the
amount of annual suspended silt is 83.36 million tons, 80% ofwhich into the Pearl River Estuary. A large area of silt-clay or sandy
deposits has been formed under the interaction of the river and the
sea. A suite of sédiment cores, collected between June 1995 and
April 1998 from Pearl River Estuary, were analyzed for 210Pb activ¬
ities and textural parameters. It was found that both vertical and
horizontal distribution of 210Pb follow certain laws in this area. Thevertical distribution of 2l0Pb in Pearl River Estuary can be dividedinto two types (normal type and abnormal type). The normal typeconsists of three région, two région and one région forms, and the
abnormal type consists of parallel, upside-down and disorderforms.The normal type of 21f)Pb in sédiment core reflects the relativesteady sedimentary environment and the sédimentation rates can be
determined. The abnormal profile of 2l0Pb reflects the unsteady-state sedimentary environment, some events, such as bioturbation,resuspension, dredging, dumping and sliding, may take place inthèse stations, différent environmental events caused the origin and
genesis mechanisms of différent anomalous fluctuations of 2l0Pb.
Sédimentation rates were calculated using constant flux/sedimenta-tion rate(CFS) model.
Session 3 Oral/Poster présentations T 275
i Evidence of human inducedenvironmental altération: preliminaryresults from the study of sedimentaryrecords in the Bay of Sainte Marie,New Caledonia
Jean-Michel Fernandez
Ludovic Breau
Renaud Fichez
Christian Badie
Past environmental changes hâve been studied in the sédiments ofthe lagoon of New-Caledonian, sédiments possess the capacity tointegrate and store various information relative to modification and
altération. Extracting and deciphering those natural archives are
central to the understanding of past and présent sedimentary pro¬
cesses and provide a dynamic view on the évolution of environ-mental conditions. A core of 56 cm was extracted from the bottomof Sainte Marie Bay (New Caledonia) that is subject to significanturban inputs from the city of Nouméa. The core was sampled in2 cm thick slices and sédiments were dated using 210Pb unsupportedradioactivity. Carbonate content was determined and 8 metals (Fe,Mn, Al, Ni, Cr, Co, Cu, Zn) were analysed in the oxidizable, acid-soluble, reducible and refractory phases. Carbonate distribution and
grain size composition profiles, yielded évidence of a progressivedecrease of the marine influence over the time in the bay. Thisassumption is supported by concentrations of Ni, Mn and Fe whichunderline a drastic change in the nature and the amounts of terrige-neous inputs. The distribution of nickel normalised by manganèse,both in the refractory geochemical phase, versus depth confirms thealtération in sedimentary signatures during the last 100 years.
276 T Environmental Changes and Radioactive Tracers
Despite the évidence of a significant bioturbation layer extendingdown to a maximum of 10 cm in depth, two average accumulationrates hâve been estimated : 0.2 g.cm 2.yr' from 1945 to the présentday and 0.1 g.cnv2.yr' before 1945. Thèse modifications demon-strate that the Sainte Marie Bay has been impacted on since the
beginning of open-cast mining and déforestation activities in the
Southern New Caledonia (La Coulée and Les Pirogues catchmentbasins).
Radioactivityin atmospheric stuclies
Session 4
Chairman: G. Le Petit
Session opening: J. Harries

Kadon measurementsfor atmospheric tracing
Wlodek Zahorowski
Stewart Whittlestone
John R. Harries
Introduction
Radon is a useful tracer of atmospheric dynamics because of itssimple source and sink. Radon is a noble gas; as such it does notreact chemically with other atmospheric species; its sink is pre-dominantly by radioactive decay, with a half-life of 3.81 days. Thehalf life of radon is comparable with the chemical lifetimes of short-lived air pollutants such as NOx, S02, CO, 03. It is also comparablewith the résident times of such important atmospheric constituentslike water and aérosols. Many important dynamic atmospheric fea¬
tures occur on a time scale in the order of days.
Radon cornes from land. The flux dépends on the mineralogy and
varies depending on changes in atmospheric pressure and soil mois-ture. The oceanic radon flux is on average at least 100 times smallerthan that from land. This makes radon présent in air samples at char¬
acteristic levels indicative of contact with land within the previousfew weeks.
Radon flux from the soil to the lower atmosphère is always positiveor zéro as in water saturated soils or in présence of surface barrierslike ice sheets. The flux from the soil to the atmosphère is main-tained by a strong concentration gradient with the concentrationabove the ground about 1000 times lower than a few cm below the
ground.
280 T Environmental Changes and Radioactive Tracers
Once injected into the atmosphère radon can be used as a tracer on
local, régional and global scales. Sub-grid mixing processes as wellas long-range transport cause significant changes in radon concen¬
trations which can be analysed in the context of local mixingschemes or régional/global circulation models.
Changes in the radon concentration are characteristic ofthe mixingand transport processes in the atmosphère. Thèse changes can be
measured continuously with adéquate précision in ground stationsusing automated detectors. Vertical profiles up to 13 km hâve also
been measured using grab samples collected from aircraft plat-forms; detectors hâve been developed for in situ airborne measure¬
ments within the boundary layer.
Thoron (radon-220) and its decay product lead-212 complémentvery well radon tracing capabilities on smaller time and spatialscales. Thoron (half-life 55.6s) is a gas and like radon, émanâtes
from land. It is used as an effective tracer within a few meters abovethe surface. Airborne lead-212 (half-life 10.6h) is indicative of con¬
tact with local land.
This paper will describe récent developments in the measurementand application of atmospheric radon for baseline air pollution sta¬
tions, the characterisation of local and régional transport processes,
and the development and vérification of global transport models.
Instrumentation
Radon concentration in marine air can be as low as a few radon
atoms per litre of air. This makes the task of measuring radon lev¬
els with a time resolution matching prevailing weather conditions a
demanding task. Radon measuring techniques and commerciallyavailable instrumentation developed for radiation protection are
inadéquate for the atmospheric research.
The volume of air which needs to be analysed for radon has to be
large since the expected radon concentrations can be very low. Forinstance, in the air at Cape Grim that has not been in contact with a
W. Zahorowski et al. Radon measurements for atmospheric tracing T 281
land mass has only 10 to 100 mBq.m 3 radon, which corresponds tobetween 5 and 50 radon atoms per litre of air. In a hypotheticaldetector of with a volume of 1 m3, 100% counting efficiency forradon decays and no background, radon concentration at 10 mBq.m3level would resuit in 18 counts per half hour. In practice, countingefficiency is significantly lower than 50% and instrumental back¬
ground is a serious problem for concentrations below 20 mBq.m3.
ANSTO detectors for measurementof radon times séries
In the last décade, ANSTO has developed and commissioned twotypes of radon detectors with the sensitivity matching baseline con¬
centrations (Whittlestone and Zahorowski, 1995; Whittlestone and
Zahorowski, 1998). Both designs are based on the two-filter methodwhich relies on the sampled air being drawn continuously throughone filter which removes ail radon decay products, then through a
delay chamber in which some new progeny are produced. Finallyair passes through a second filter which collects the progeny at a
rate proportional to the radon concentration. The larger the delay
chamber volume, the more sensitive the detector will be since moreprogeny are produced in the chamber.
A major challenge in the design of high sensitive two filter detec¬
tors is to prevent the progeny from being plated out on the walls ofthe delay chamber. Most two-filter detectors use a high flow rate toensure that the air passes from the inlet to the outlet filters in a timeshort compared to the mean plate-out time. In a detector with a vol¬
ume of one or two cubic mètres, the plate-out time is a few minutes.This implies that flow rates of about a cubic mètre per minute wouldbe necessary. As a resuit, pumping power and the second filter had
to be unacceptably large.
One can solve this problem by injecting and maintaining a constantconcentration of sub-micron particles in the delay chamber. This has
been done in the first of the two designs (Whittlestone and
Zahorowski, 1996). With particles in the chamber, the progenybecome attached to the particles, which hâve a mean plate-out time ofmany hours in delay chambers of a volume greater than about 2 m3.
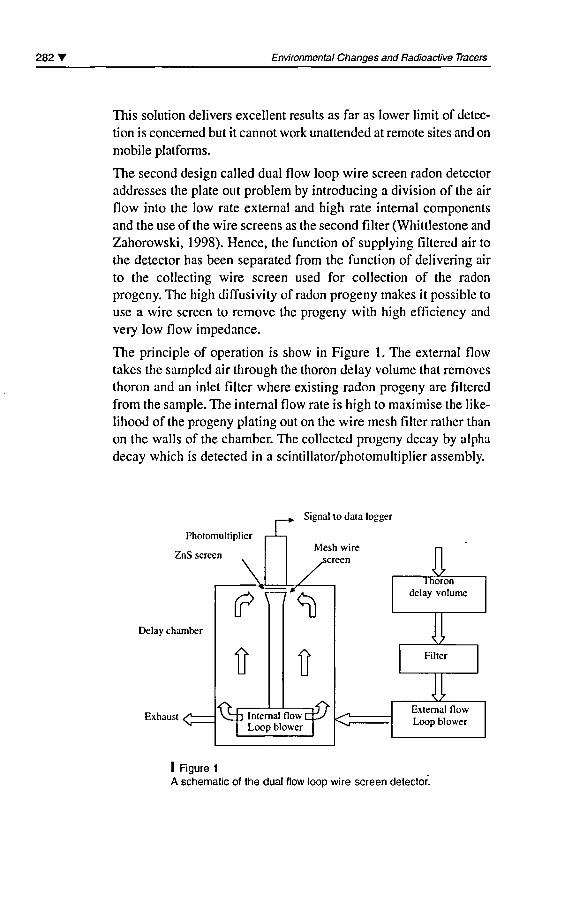
282' Environmental Changes and Radioactive Tracers
This solution delivers excellent results as far as lower limit of détec¬
tion is concerned but it cannot work unattended at remote sites and on
mobile platforms.
The second design called dual flow loop wire screen radon detectoraddresses the plate out problem by introducing a division of the airflow into the low rate external and high rate internai componentsand the use ofthe wire screens as the second filter (Whittlestone and
Zahorowski, 1998). Hence, the function of supplying filtered air tothe detector has been separated from the function of delivering airto the collecting wire screen used for collection of the radon
progeny. The high diffusivity of radon progeny makes it possible to
use a wire screen to remove the progeny with high efficiency and
very low flow impédance.
The principle of opération is show in Figure 1. The external flowtakes the sampled air through the thoron delay volume that removes
thoron and an inlet filter where existing radon progeny are filteredfrom the sample. The internai flow rate is high to maximise the like¬
lihood ofthe progeny plating out on the wire mesh filter rather than
on the walls of the chamber. The collected progeny decay by alpha
decay which is detected in a scintillator/photomultiplier assembly.
Photomultiplier
ZnS screen
Delay chamber
Exhaust C
rSignal lo data logger
Mesh wirescreen
E=T
Internai flow I
Loop blowera^ <?
IThôrôn
delay volume
SZ.Filter
Iz.External flowLoop blower
I Figure 1
A schematic of the dual flow loop wire screen detector.
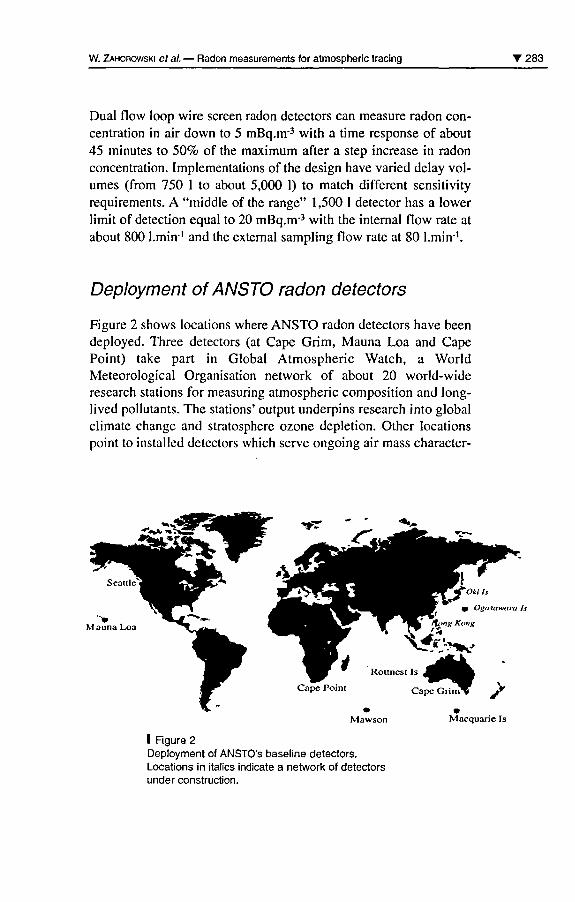
W. Zahorowski étal. Radon measurements for atmospheric tracing '283
Dual flow loop wire screen radon detectors can measure radon con¬
centration in air down to 5 mBq.m 3 with a time response of about45 minutes to 50% of the maximum after a step increase in radonconcentration. Implementations ofthe design hâve varied delay vol¬
umes (from 750 1 to about 5,000 1) to match différent sensitivityrequirements. A "middle of the range" 1,500 1 detector has a lowerlimit of détection equal to 20 mBq.m3 with the internai flow rate at
about 800 l.min"' and the external sampling flow rate at 80 l.min1.
Deployment of ANSTO radon detectors
Figure 2 shows locations where ANSTO radon detectors hâve been
deployed. Three detectors (at Cape Grim, Mauna Loa and CapePoint) take part in Global Atmospheric Watch, a WorldMeteorological Organisation network of about 20 world-wideresearch stations for measuring atmospheric composition and long-lived pollutants. The stations' output underpins research into globalclimate change and stratosphère ozone depletion. Other locationspoint to installed detectors which serve ongoing air mass character-
Mauna Loa
Ogasawtira Is
l%gng Kong
Cape Point
Mawson
I Figure 2Deployment of ANSTO's baseline detectors.Locations in italics indicate a network of detectorsunder construction.
\ftvKottncst Is J^H^^M
"l Cape GrimT J>
Macquarie Is
284 T Environmental Changes and Radioactive Tracers
isation and recording of long term radon time séries for modeldevelopment and vérification. A new set of detectors has been pro¬
posed and is now being established in the international AérosolCharacterisation Experiment (ACE-Asia) in East Asia and the
Northern Pacific.
I Local and régional land surface/atmosphère characteristics derivedfrom radon
Both radon and thoron hâve been used as a tracer of near-surfacemixing processes.
At the soil-air interface the typical radon profile changes dramati-cally: above the surface at lm height the radon concentration is
10 Bq.nr3 and at 1000 m is half of that; below the surface at a depthof 5cm it is between 500-1000 Bq.nr3 and the equilibrium concen¬
tration of between 70,000-90,000 Bq.nr3 is reached at a depth of2 m. For thoron, the concentration gradient is much steeper, owingto its much shorter half-life, with the depth and height at which halfof the surface level are reached being 1.5 cm and 14 cm, respec¬
tively.
Local vertical mixing
Vertical distribution of a radioactive tracer concentration C(z) can
be estimated using a simplified vertical diffusion équation:
«£-.!(*, 9£ï-a-cdt dz\ dz
where kz is the vertical eddy diffusivity and 1 is the decay constantof the tracer.
W. Zahorowski et al. Radon measurements for atmospheric tracing T 285
The vertical eddy diffusivities can be estimated from radon obser¬
vations at différent vertical scales within the boundary layer.Alternatively, modeled vertical eddy diffusivities can be validatedby comparing calculated with observed profiles.
Lee and Larsen (1997) sampled radon profiles in the boundary layeras a function of altitude (up to the top of the layer) and time of dayusing an instrument designed for in situ aircraft measurements. Themeasured profiles were used to examine distributions of the profilesof the vertical eddy diffusivities kz(z,t). In particular, it was possi¬
ble to validate modeled distributions of vertical eddy diffusivitiesby comparing measured radon profiles with simulated ones
obtained by solving the above vertical diffusion model with themodeled profiles ofthe vertical eddy diffusivities.
In another study, radon was shown to provide an independent esti¬
mate of the trace gas exchange at the biosphère-atmosphère inter¬face (Ussler et al, 1993). Radon time séries were recorded at
différent heights up to 18m of a micrometeorological tower locatedin a dry, open-canopy forest. Radon flux was estimated indepen¬
dently of the profile measurements. From the expérimental data a
time évolution of the forest canopy trace gas exchange coefficientwas derived as well as the average total forest canopy résistance.The results compared well with those obtained by eddy corrélationtechniques. The study demonstrated that automated radon measure¬
ments of concentrations in air can be successfully employed inremote locations where daily maintenance required to standardmicrometeorological equipment (such as a sonic anemometers) is
not possible.
Butterweck étal (1994) characterised vertical diffusion in the near-surface atmosphère (0-5m) from continuous measurement of radonand thoron concentrations within and above a wheat field over thecomplète végétation cycle of the crop. They used the data to calcu¬
late vertical eddy diffusivities for two horizontal layers: one withinthe crop (0.14-1.5 m) and the other above the crop (1.5-5 m). Meanvertical diffusivities for three weather conditions and two verticaltempérature gradient intervais were then calculated. When com¬
pared with results obtained from meteorological data for the abovecrop layer (1.4-5 m) good agreement was obtained. It was claimedthat the tracer method was superior especially inside the crop where
286 T Environmental Changes and Radioactive Tracers
meteorological methods are not effective. Thoron proved to be
complementary to radon in the lower interval within the crop wherethe vertical change in radon concentration was to small to dérive the
gradient with a satisfactory précision.
Régional trace gas émissions
Trace gas émissions originating from large land areas can be esti¬
mated using radon as a marker for émission from soil. This has been
demonstrated by Wilson et al (1997). They used a 9 year database
of nitrous oxide and radon recorded at Cape Grim to assess the ori¬
gin of N20 by examining the cross covariance between N20 and
radon signais originated from land surface. A clear maximum in the
cross covariance very close to the zéro time delay indicated the
same source régions of the two gases. With the common origin ofthe investigated radon and N20 signais established, they calculatedthe average flux of N20 by assuming that the ratio of fluxes is
directly proportional to the average ratio of the individual measure¬
ments of radon and N20 from land:
fNlO-fRn\ ^ \'C
where c is a unit-dependent conversion factor. The précision ofsuch estimâtes benefits from précision and accuracy of the radonconcentration measurements. Another advantage is that such esti¬
mâtes are averaged over hundred of square km of land. Seasonal
and inter-annual variations were also retrieved from the data withthe authors showing that the nitrous oxide flux was higher for rain¬
fall periods. Clear peaks in angular radon and N20 signais made itpossible to obtain independent flux estimâtes from two main landmasses.
The uncertainties of the above method can be made smaller with a
better knowledge of radon fluxes in régional areas. The studydemonstrated that the method can be used as an independentmethod of évaluation of régional trace gases emitted from soil.
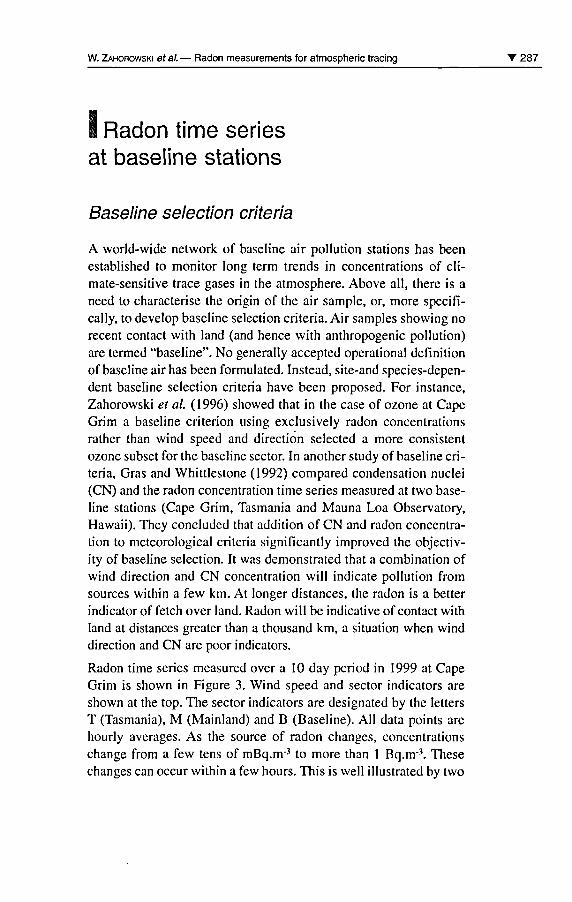
W. Zahorowski et al. Radon measurements for atmospheric tracing 287
1 Radon time sériesat baseline stations
Baseline sélection criteria
A world-wide network of baseline air pollution stations has been
established to monitor long term trends in concentrations of cli-mate-sensitive trace gases in the atmosphère. Above ail, there is a
need to characterise the origin ofthe air sample, or, more specifi-cally, to develop baseline sélection criteria. Air samples showing norécent contact with land (and hence with anthropogenic pollution)are termed "baseline". No generally accepted operational définitionof baseline air has been formulated. Instead, site-and species-depen-dent baseline sélection criteria hâve been proposed. For instance,Zahorowski et al. (1996) showed that in the case of ozone at Cape
Grim a baseline criterion using exclusively radon concentrationsrather than wind speed and direction selected a more consistentozone subset for the baseline sector. In another study of baseline cri¬
teria, Gras and Whittlestone (1992) compared condensation nuclei(CN) and the radon concentration time séries measured at two base¬
line stations (Cape Grim, Tasmania and Mauna Loa Observatory,Hawaii). They concluded that addition of CN and radon concentra¬
tion to meteorological criteria significantly improved the objectiv-ity of baseline sélection. It was demonstrated that a combination ofwind direction and CN concentration will indicate pollution fromsources within a few km. At longer distances, the radon is a betterindicator of fetch over land. Radon will be indicative of contact withland at distances greater than a thousand km, a situation when winddirection and CN are poor indicators.
Radon time séries measured over a 10 day period in 1999 at Cape
Grim is shown in Figure 3. Wind speed and sector indicators are
shown at the top. The sector indicators are designated by the lettersT (Tasmania), M (Mainland) and B (Baseline). Ail data points are
hourly averages. As the source of radon changes, concentrationschange from a few tens of mBq.m3 to more than 1 Bq.nr3. Thèsechanges can occur within a few hours. This is well illustrated by two
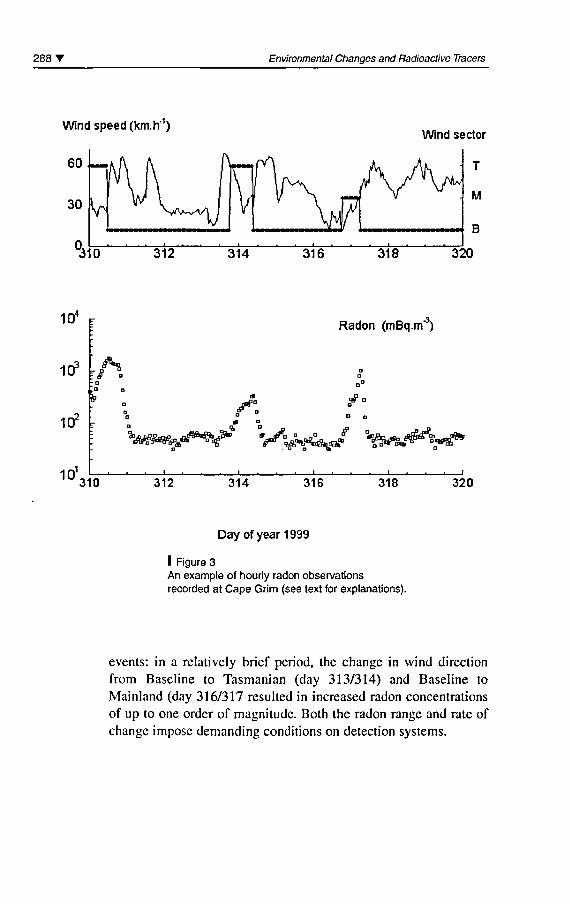
288' Environmental Changes and Radioactive Tracers
Wind speed (km.h )
60
104
103
102
101
:
: S n-o
;> o
o -
Radon (mBq.m"3)
oa
o"
o
W^*.*^ V^A*/ "^fr^tf^V8**i ... i ... 1 , r . . . r
310 312 314 316 318 320
Day of year 1999
I Figure 3An example of hourly radon observationsrecorded at Cape Grim (see text for explanations).
events: in a relatively brief period, the change in wind directionfrom Baseline to Tasmanian (day 313/314) and Baseline toMainland (day 316/317 resulted in increased radon concentrationsof up to one order of magnitude. Both the radon range and rate ofchange impose demanding conditions on détection Systems.
W. Zahorowski et al. Radon measurements for atmospheric tracing T 289
Local influence
An important issue in baseline observations is the problem of localinfluence on the chemical/elemental composition of air samples.
The local influence is site-specific, depending on a combination ofthe location of the station, synoptic meteorology and availabilityand spatial distribution of local sources of radon and thoron. Theproblem of tracking and séparation of the local signal is difficult tosolve for continental sites. At coastal and island sites, lead-212 has
been used in combination with radon to separate local from distantevents (Polian et al, 1986; Whittlestone et al, 1996a). A localknowledge of radon and thoron fluxes in the vicinity of a baselinestation can be important in this context. For instance, high sensitiv¬
ity thoron flux measurements were required for an évaluation ofthethoron source term from barren lava around the Mauna LoaObservatory in Hawaii (Whittlestone et al, 1996b).
The problem of local influence also affects modelers who view it as
a sub-grid source problem beyond their control. Mahowald et al.
(1997) and Dentener et al. (1999) reported that in order to make
meaningful model-observation comparisons they had to filter radon
time séries to remove the local influence. This needed to be done forKerguelen and Crozet Is sites where about 13% of the radon datawere rejected using simultaneous measurement of lead-212. In case
of Mauna Loa Observatory data where the supporting in lead-212data were not available for the investigated period only night data
(12 pm till 7 am) were used to exclude daytime up slope conditionsbringing local radon from the island (Dentener et al, 1999). Atsome sites (Bermuda and Cape Grim) applying a wind sector crite¬
rion is sufficient to remove the locally influence from the data
(Mahowald et al, 1997 and Dentener et al, 1999). However, con¬
current measurements of lead-212 is always désirable: first, for an
independent expérimental vérification of any data rejection scheme,
second, for préservation of as much of the data as possible because
the wind sélection criterion is not précise and hence its effectiveapplication leads to rejection of some unaffected data.
290 T Environmental Changes and Radioactive Tracers
9 Simulation of radonwith global circulation models
The last décade has witnessed the first serious attempts to modelradon concentrations on the global and régional scale and to com¬
pare the modeled results with observations. The purpose of radon
simulations varied; some aimed at the development or validation ofsub-grid mixing schemes and indication of régions associated withlargest uncertainties (e.g. Jacob and Prather, 1990; Stockwell et al,1998), others at the comparison of models (e.g. Genthon and
Armengaud, 1995; Jacob et al, 1997) or the comparison of différ¬ent meteorological input data sets (e.g. Mahowald et al, 1997).
More generally, a better understanding of ail key atmospheric fea¬
tures which control the transport, mixing and distribution of radon
has been sought by detailed comparisons ofthe modeled radon timeséries and vertical profiles with best available radon data sets (e.g.
Mahowald et al, 1997; Dentener et al, 1999; Stockwell et al,1998).
The most comprehensive comparison between modeled and
observed vertical radon profiles in the boundary layer and the tro¬
posphère covering the range 0-12 km was published by Stockwellet al. (1998). They parameterised radon émissions in a global off-Iine three-dimensional chemical transport model forced using mete¬
orological analyses. Sensitivity analysis was performed using twohorizontal resolutions (2.8° x 2.8° and 7.5" x 7.5°). The effect ofimplementing vertical diffusion and moist convection was also
tested. The inclusion of both vertical diffusion and moist convectionas well as the higher resolution was necessary for a realistic simu¬
lation of radon. An analysis of model-observation corrélationsrevealed that the modeled radon concentrations higher than thoseobserved very close to the surface and generally much lower than
those observed in the planetary boundary layer/lower troposphère.This was attributed to insufficient vertical mixing. An inclusion ofa non-local vertical diffusion scheme was postulated, which was
expected to give a better mixed planetary boundary layer.
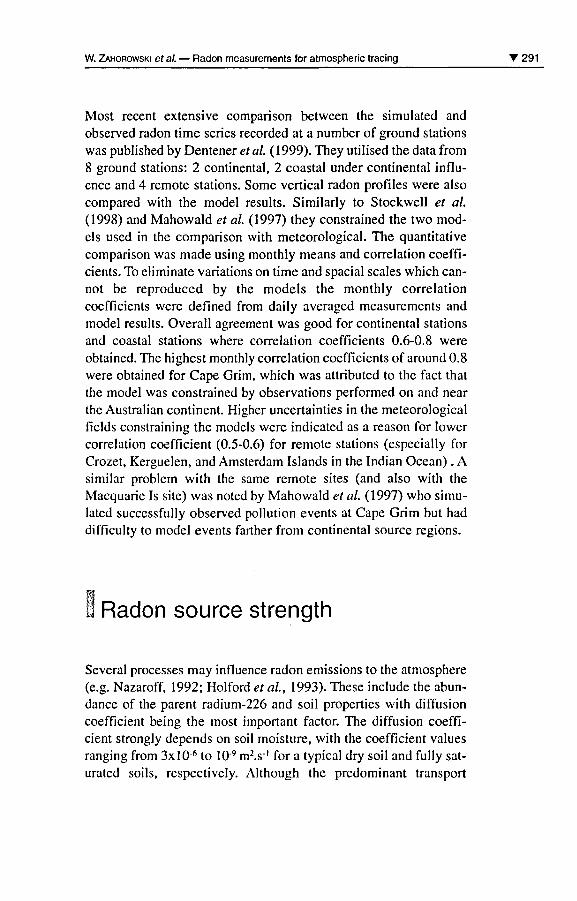
W. Zahorowski et al. Radon measurements for atmospheric tracing T 291
Most récent extensive comparison between the simulated and
observed radon time séries recorded at a number of ground stationswas published by Dentener et al (1999). They utilised the data from8 ground stations: 2 continental, 2 coastal under continental influ¬ence and 4 remote stations. Some vertical radon profiles were alsocompared with the model results. Similarly to Stockwell et al.(1998) and Mahowald et al. (1997) they constrained the two mod¬
els used in the comparison with meteorological. The quantitativecomparison was made using monthly means and corrélation coeffi¬cients. To eliminate variations on time and spacial scales which can¬
not be reproduced by the models the monthly corrélationcoefficients were defined from daily averaged measurements and
model results. Overall agreement was good for continental stationsand coastal stations where corrélation coefficients 0.6-0.8 wereobtained. The highest monthly corrélation coefficients of around 0.8were obtained for Cape Grim, which was attributed to the fact thatthe model was constrained by observations performed on and nearthe Australian continent. Higher uncertainties in the meteorologicalfields constraining the models were indicated as a reason for lowercorrélation coefficient (0.5-0.6) for remote stations (especially forCrozet, Kerguelen, and Amsterdam Islands in the Indian Océan) . Asimilar problem with the same remote sites (and also with theMacquarie Is site) was noted by Mahowald et al. (1997) who simu¬
lated successfully observed pollution events at Cape Grim but had
difficulty to model events farther from continental source régions.
Radon source strength
Several processes may influence radon émissions to the atmosphère(e.g. Nazaroff, 1992; Holford et al, 1993). Thèse include the abun¬
dance of the parent radium-226 and soil properties with diffusioncoefficient being the most important factor. The diffusion coeffi¬cient strongly dépends on soil moisture, with the coefficient valuesranging from 3x10 6 to IO"9 m2.s"' for a typical dry soil and fully sat¬
urated soils, respectively. Although the prédominant transport
292' Environmental Changes and Radioactive Tracers
mechanism responsible for delivering radon to the surface is bymolecular diffusion, the flux is also sensitive to changes in atmo¬
spheric pressure. Soil freezing also affect the radon flux (Dôrr and
Miinnich, 1990). The flux to the atmosphère is inhibited by snowand ice covers.
Even with this variability, there can be large areas where there is
relative uniformity of radon émanation rate. However, a task of con-structing radon émission maps is far from simple.
Spot measurement of radon flux
A radon flux survey aimed at covering large, frequently remote areas
needs spécifie instrumentation. The main requirement, besides the
lower limit of détection matching expected flux levels, is an adé¬
quate sampling frequency. ANSTO has developed a fast, gênerai
purpose emanometer for measuring radon and thoron fluxes(Zahorowski and Whittlestone, 1996). Figure 4 shows the essential
features ofthe emanometer. The principle of opération ofthe instru¬
ment is as follows. At the start of the measurement the accumulationchamber (A) is placed over the ground. Air is drawn from the cham-
INLET(ambient air)
OUTLET
F P'
rkihi]*
SCI
PMT
DELAY LINE
DA&C
_J
F,
SC 2
PMT
I Figure 4A simplifiée! diagram of the fast emanometer.A, accumulator chamber; DA&C, data acquisition and control;F, filter; PMT, photomultiplier tubes; SC, scintillation cells.
W. Zahorowski et al. Radon measurements for atmospheric tracing T 293
ber into the first scintillation cell (SCI) which records counts fromboth radon and thoron. From hère, the air passes via a 6 minute delaytube in which thoron decays, into the second cell (SC2) whichrecords radon counts. For a one hour measurement the lower limit ofdétection is 1 mBq.m2.s"' for radon and 20 mBq.m 2.s_l for thoron.Lower limits can be achieved by counting for longer. One can set up
the instrument for a semi-continuous flux monitoring by fitting an
automatically operated ventilation lid to ensure a quick ventilation ofthe accumulator. Such a system is capable of unattended recordingof hourly radon and flux measurements for many days.
It has been demonstrated (Whittlestone et al, 1996b) that a highsensitivity thoron emanometer can be assembled in situationsrequiring thoron flux estimâtes down to 1 mBq.nr2.s~'. Due tothoron short half-life such an instrument has to operate at a highflow rate and mesh filters similar to the ones used in dual flow loopradon detectors hâve to be fitted for lead-212 collection.
Régional radon fluxes
Spot flux measurements are too resource intensive for constructionof régional or continental radon émission maps.
Some large area estimâtes hâve been done in the past. Apart fromsome early coarse estimâtes (Turckian et al, 1977) and some Iim¬
ited area studies, no large régional or continental émission maps
was published. Nevertheless, a commonly held assumption is thatthe radon flux is quite uniform and equal to 1 atom.cm2.s"'.
A map for the Australian continent has been constructed based on
radon émissions combined with data from airbome gamma survey(Zahorowski and Whittlestone, 1997). In a first step maps wereselected covering areas of 100x120 km for which both radon fluxesand airborne gamma data were available. An average gamma countfor the area was found and converted to a map average radon flux.The maps were then matched as well as possible to the 5°x4" grid,and grid averages obtained.
The results of the flux évaluation procédure is shown in Figure 5.
The top number in a cell is derived from spot radon measurementsand the bottom from airborne gamma data. The two values, when
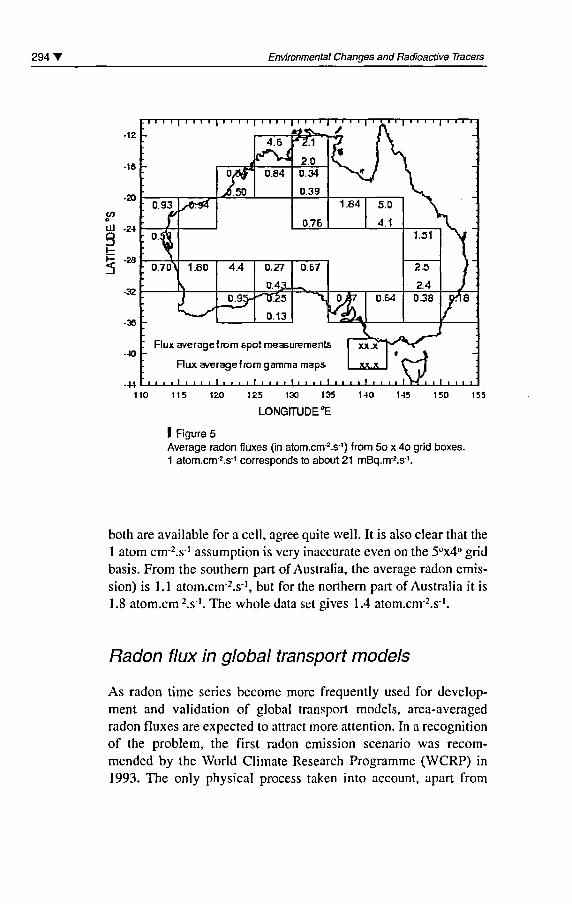
294' Environmental Changes and Radioactive Tracers
-12
16 -
-20
UJ -24QID
H -285
32
-36
-40 -
-H
Flux average from spot measurements
Flux average from gamma map
i i i i i i i i i i i i i i i i i i
ps I xxx 1 r-HfI i 1 i i t i I t t i i I ni \ | j_i_
110 115 120 125 130 135 140 145 150 155
LONGITUDE0E
I Figure 5Average radon fluxes (in atom.cm^.s-') from 5o x 4o grid boxes.1 atom.crrr2.s-1 corresponds to about 21 mBq.nr'.s"1.
both are available for a cell, agrée quite well. It is also clear that the
1 atom cnr2.s-1 assumption is very inaccurate even on the 5°x4° gridbasis. From the southern part of Australia, the average radon émis¬
sion) is 1.1 atom.cnr2.s"\ but for the northern part of Australia it is
1.8 atom.cnr2.s"'. The whole data set gives 1.4 atom.cnr2.s"'.
Radon flux in global transport models
As radon time séries become more frequently used for develop¬ment and validation of global transport models, area-averagedradon fluxes are expected to attract more attention. In a récognitionof the problem, the first radon émission scénario was recom-mended by the World Climate Research Programme (WCRP) in1993. The only physical process taken into account, apart from
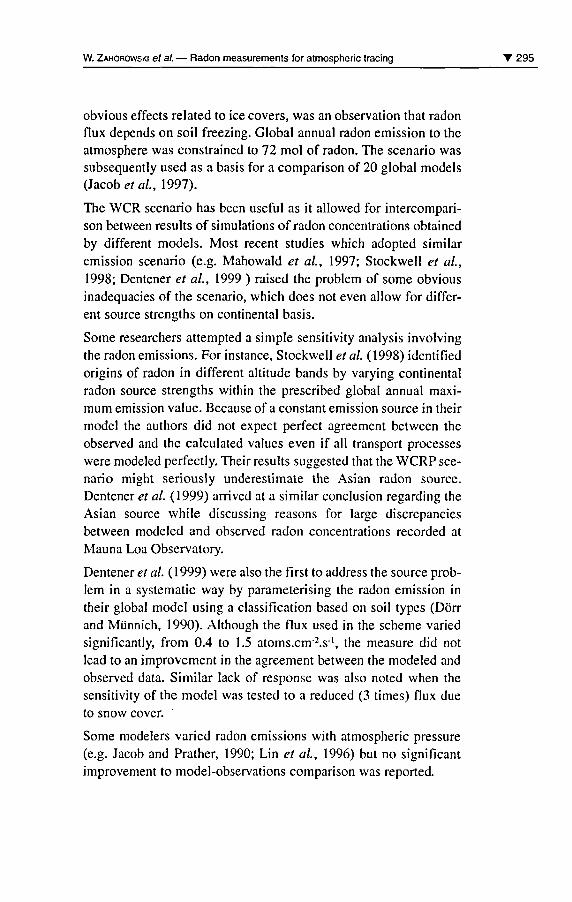
W. Zahorowski et al. Radon measurements for atmospheric tracing T 295
obvious effects related to ice covers, was an observation that radonflux dépends on soil freezing. Global annual radon émission to theatmosphère was constrained to 72 mol of radon. The scénario was
subsequently used as a basis for a comparison of 20 global models(Jacobs al, 1997).
The WCR scénario has been useful as it allowed for intercompari-son between results of simulations of radon concentrations obtainedby différent models. Most récent studies which adopted similarémission scénario (e.g. Mahowald et al, 1997; Stockwell et al,1998; Dentener et al, 1999 ) raised the problem of some obviousinadequacies of the scénario, which does not even allow for différ¬ent source strengths on continental basis.
Some researchers attempted a simple sensitivity analysis involvingthe radon émissions. For instance, Stockwell et al. (1998) identifiedorigins of radon in différent altitude bands by varying continentalradon source strengths within the prescribed global annual maxi¬
mum émission value. Because of a constant émission source in theirmodel the authors did not expect perfect agreement between the
observed and the calculated values even if ail transport processes
were modeled perfectly. Their results suggested that the WCRP scé¬
nario might seriously underestimate the Asian radon source.Dentener et al. (1999) arrived at a similar conclusion regarding the
Asian source while discussing reasons for large discrepanciesbetween modeled and observed radon concentrations recorded at
Mauna Loa Observatory.
Dentener et al. (1999) were also the first to address the source prob¬
lem in a systematic way by parameterising the radon émission in
their global model using a classification based on soil types (Dôrrand Mûnnich, 1990). Although the flux used in the scheme variedsignificantly, from 0.4 to 1.5 atoms.cnr2.s"', the measure did notlead to an improvement in the agreement between the modeled and
observed data. Similar lack of response was also noted when the
sensitivity of the model was tested to a reduced (3 times) flux due
to snow cover.
Some modelers varied radon émissions with atmospheric pressure
(e.g. Jacob and Pralher, 1990; Lin et al, 1996) but no significantimprovement to model-observations comparison was reported.
296 T Environmental Changes and Radioactive Tracers
Conclusions
The accuracy and précision of radon instrumentation is now morethan adéquate to provide the radon time séries required for compar¬
ing with the simulated ones obtained from régional and global cir¬
culation models. The measured high quality radon time séries data
from selected locations will continue to contribute to the develop¬
ment and validation of the models.
Only a few Iimited sensitivity analyses involving continental radon
sources hâve been performed. There are no systematic sensitivityanalysis that consider variation of grid-averaged fluxes withinexperimentally derived constrains is required. Furthermore, circula¬
tion model performance strongly dépends on the quality ofthe con-straining meteorological data. Model-observation corrélationcoefficients fro radon levels as low as 0.5 and as high as 0.8 hâve
been calculated depending solely on the quality of the meteorolog¬ical input. Such a strong dependence of model performance on
meteorological data indicates that radon is a sensitive tracer formodel évaluation.
The présent World Climate Research radon émission scénario needs
to be improved by incorporating parameterisations of important fac¬
tors controlling radon émanation like soil moisture. Improved area-
averaged radon fluxes can be constructed from the geographicalabundance of radium-226 (through airborne or car-borne radiomet-rics or geological data) with spot measurements providing a means
to verify area émissions.
More observation stations will help to constrain the radon émis¬
sions. More régional stations will provide additional opportunitiesfor pseudo-Lagrangian experiments and in new possibilities formodel development and data interprétation.
Radon is a valuable tool for investigating atmospheric transport and
mixing on différent horizontal and vertical scales. In the last décade
significant advances hâve been made both in radon instrumentationand simulation of radon concentration in the atmosphère usingglobal circulation models.
W. Zahorowski et al. Radon measurements for atmospheric tracing '297
Bibliography
Butterweck G., Reineking A.,Kesten J., Porstendôrfer J., 1994The use of the natural radioactivenoble gases radon and thoronas tracers for the study of turbulentexchange in the atmosphericboundary layer - Case study in andabove a wheat field. AtmosphericEnvironment, 28: 1963-1969.
Dentener F., Feichter J.,Jeuken A., 1999Simulation of the transport of 222Rn
using on-line and off-line global modelsat différent horizontal resolutions: adetailed comparison with measure¬ments. Tellus, 51 B: 573-602.
Dôrr H., Mûnnich O., 1990222Rn flux and soil air concentrationprofiles in West Germany. Soil 222Rn
as a tracer for gas transport in theunsaturated soil zone. Tellus,42B: 20-28.
Genthon, C, Armengaud A., 1992Radon 222 as a comparative tracerof transport and mixing in twogênerai circulation modelsof the atmosphère. J. Geophys. Res.,100:2849-2866.
Gras J. L., Whittlestone S., 1992Radon and CN: complementary tracersof polluted air masses at coastal andisland sites. J. Radioanal. andNuclear Chemistry, 1 61 : 293-306.
Holford D. J., Schery S. D.,
Wilson J. L, Phillips F. M., 1993Modeling Radon Transport in Dry,Cracked Soil. J. Geophys. Res.,98: 567-580.
Jacob D. J., Prather M. J., 1990Radon222 as a test of convectivetransport in a gênerai circulationmodel. Tellus 42B: 118-134.
Jacob D. J., étal, 1997Evaluation of intercomparison of
global atmospheric transport modelsusing ^Rn and other short-livedtracers. J. Geophys. Res.,102:5953-5970.
Kritz M. A., Rosner S. W.,Stockwell D. Z., 1998Validation of an off-line three-dimensional chemical transportmodel using observed radon profiles1 . Observations. J. Geophys. Res.,103:8425-8432.
Lee H. N., Larsen R. J., 1 997Vertical Diffusion in the LowerAtmosphère Using Aircraftmeasurements of 222Rn.
J. Appl Meteor., 36: 1262-1270.
Lin X., Zaucker F, Hsie E.Y.,Traîner M., McKeen S. A., 1996Radon222 simulations as a test of athree-dimensional transport model.J. Geophys. fîes.,101 (19): 165-177.
Mahowald N. M., Rasch P. J.,Eaton B. E., Whittlestone S.,Prinn R. G., 1997Transport of 222radon to the remotetroposphère using the Modelof Atmospheric Transport andChemistry and assimilated windsfrom ECMWF and the NationalCenter for Environmental Prédiction/NCAR. J. Geophys. Res.,102 (28): 139-151.
Nazaroff W. W, 1992Radon transport from soil to air.Rev. Geophys., 30: 137-160.
Polian G., Lambert G.,Ardouin B., Jegou A., 1986Long-range transportof continental radonin subantarctic and antarctic areas.TérVus, 38B: 178-189.
Stockwell D. Z., Kritz M. A.,Chippperfield M. R, Pyle J. A., 1 998Validation of an off-line three-
298 V Environmental Changes and Radioactive Tracers
dimensional chemical transportmodel using observed radon profiles2. Model results. J. Geophys.Res., 103: 8433-8445.
Turekian K. K, Nozaki Y.,
Benninger L. K., 1977Geochemistry of atmospheric radonand radon products. Ann. Rev. EarthPlanet. Sci.,5: 227-255.
Ussler W., Chanton J. P.,
Radon 222 tracing of soil and forestcanopy trace gas exchangein an open canopy boréal forest.J. Geophys. Res., 99: 1953-1963.
Whittlestone S.,Zahorowski W., 1995"The Cape Grim huge radondetector". In Baseline AtmosphericProgram(Australia) 1992: 26-30.
Whittlestone S., Schery S. D.,LiY., 1996aPb-212 as a tracer for local influenceon air samples at Mauna LoaObservatory, Hawaii. J. Geophys.fîes.,101 (14): 777-785.
Whittlestone S., Schery S. D.,LiY, 1996bThoron and radon fluxes fromthe island of Hawaii.J. Geophys. /?es.,101 (14): 787-794.
Whittlestone S.,Zahorowski W., 1998Baseline radon detectors forshipboard use: Development
and deployment in the First AérosolCharacterisation experiment (ACE1 ). J. Geophys. Res.,103 (16): 743-751.
Wilson S. R., Dick A. L, Fraser P J.,Whittlestone S., 1997Nitrous oxide flux estimâtesfor South-Eastern Australia.J. Atm. Chem. 26: 169-188.
Zahorowski W, Galbally L. E.,
Whittlestone S., Meyer CR, 1996"Ozone and radon at Cape Grim: Astudy of their interdependence".In Baseline Atmospheric Program(Australia) 1999. 30-37.
Zahorowski W.,Whittlestone S., 1996A fast portable emanometer for fieldmeasurement of radon and thoronflux. Radiât. Prot Dosim.,67: 109-120.
Zahorowski W.,Whittlestone S., 1 997"Application of sensitive andsupersensitive radon detectors forradon flux density and radonconcentration in environmentalmonitoring". Proceedings of aTechnical Committee meeting onUranium exploration data andtechniques applied to the préparationof radioélément maps, Vienna,13-17 May, 1996, IAEA-TECDOC-980: 223-236.
Trace éléments in totalatmospheric suspendedparticles in a suburban areaof Paris: a study carriedout by INAA
Gilbert Le Petit
Jean-Paul Deschamps
Sunun Nouchpramools
Introduction
Atmospheric pollution is a major concern world-wide, in particularfor the inhabitants of certain large urban areas. Its many and variedcomponents attack the environment and health directly or indirectly.The main pollutants are sulphur dioxide, carbon monoxide, reactivehydrocarbons, nitrogen oxides, ozone, lead and particulate matter.
The primary contributions to atmospheric pollution in the form ofsolid aérosols corne from either natural sources such as redispersionof crustal material, volcanic éruptions, aérosols of marine originand pollens or from anthropogenic sources such as combustion offuel oil and coal, combustion of fuels related to vehicular traffic,and various émissions related to industrial and human activities. Itis generally accepted that the level in the atmosphère of particulatematter of natural origin is less than 10 P-g.m3. In urban areas withhigh population density, such as the great megalopolises in devel¬
oping countries, the concentrations in the atmosphère are regularlyhigher than the guideline values recommended by the World Health
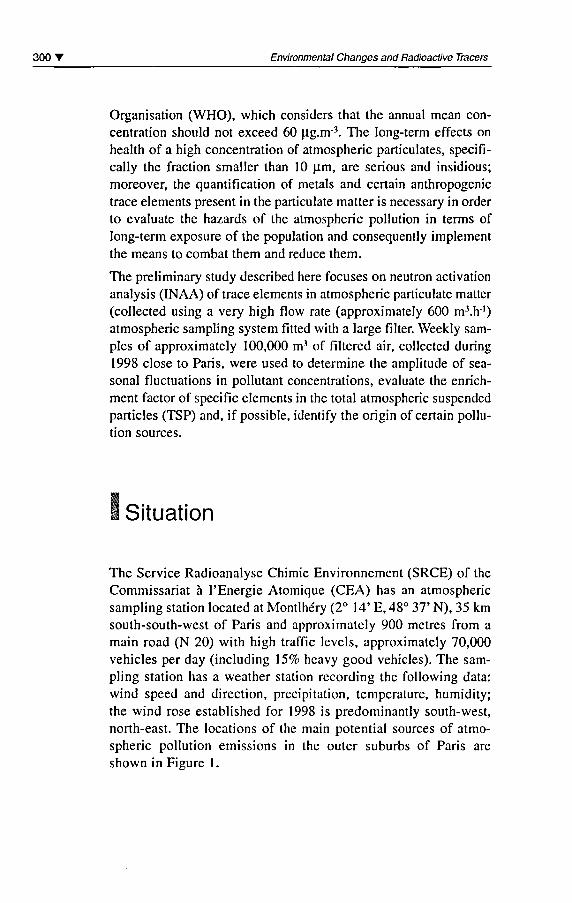
300 T Environmental Changes and Radioactive Tracers
Organisation (WHO), which considers that the annual mean con¬
centration should not exceed 60 pig.nr3. The long-term effects on
health of a high concentration of atmospheric particulates, specifi-cally the fraction smaller than 10 \im, are serious and insidious;moreover, the quantification of metals and certain anthropogenictrace éléments présent in the particulate matter is necessary in orderto evaluate the hazards of the atmospheric pollution in terms oflong-term exposure of the population and consequently implementthe means to combat them and reduce them.
The preliminary study described hère focuses on neutron activationanalysis (INAA) of trace éléments in atmospheric particulate matter(collected using a very high flow rate (approximately 600 m3.h ')atmospheric sampling system fitted with a large filter. Weekly sam¬
ples of approximately 100,000 m3 of filtered air, collected during1998 close to Paris, were used to détermine the amplitude of sea¬
sonal fluctuations in pollutant concentrations, evaluate the enrich-ment factor of spécifie éléments in the total atmospheric suspended
particles (TSP) and, if possible, identify the origin of certain pollu¬
tion sources.
Situation
The Service Radioanalyse Chimie Environnement (SRCE) of the
Commissariat à l'Energie Atomique (CEA) has an atmosphericsampling station located at Montlhe'ry (2° 14' E, 48° 37' N), 35 kmsouth-south-west of Paris and approximately 900 mètres from a
main road (N 20) with high traffic levels, approximately 70,000vehicles per day (including 15% heavy good vehicles). The sam¬
pling station has a weather station recording the following data:
wind speed and direction, précipitation, température, humidity;the wind rose established for 1998 is predominantly south-west,north-east. The locations of the main potential sources of atmo¬
spheric pollution émissions in the outer suburbs of Paris are
shown in Figure 1.
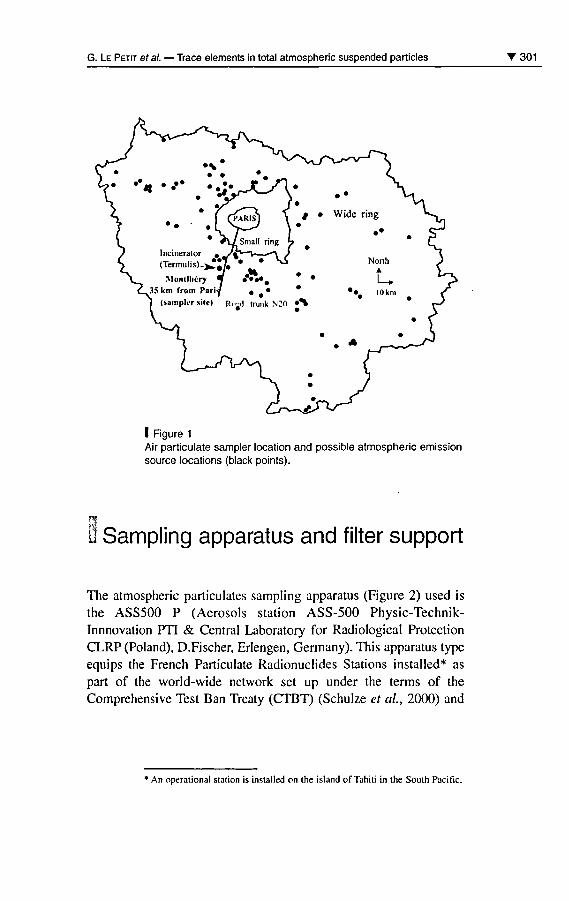
G. Le Petit ef al. Trace éléments in total atmospheric suspended particles 301
I Figure 1
Air particulate sampler location and possible atmospheric émissionsource locations (black points).
Sampling apparatus and filter support
The atmospheric particulates sampling apparatus (Figure 2) used is
the ASS500 P (Aérosols station ASS-500 Physic-Technik-Innnovation PTI & Central Laboratory for Radiological ProtectionCLRP (Poland), D.Fischer, Erlengen, Germany). This apparatus typeequips the French Particulate Radionuclides Stations installed* as
part of the world-wide network set up under the terms of the
Comprehensive Test Ban Treaty (CTBT) (Schulze et al, 2000) and
' An operational station is installed on the island of Tahiti in the Soulh Pacific.
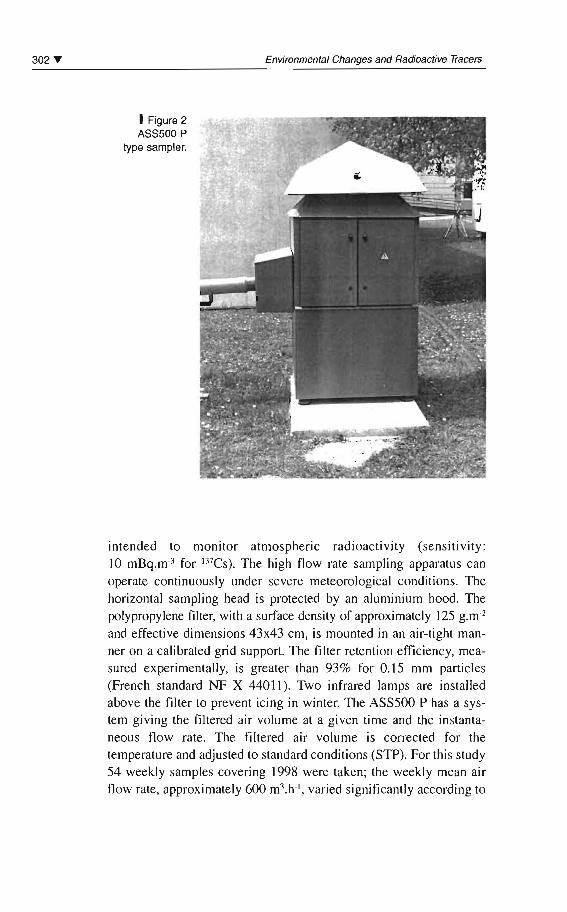
302 .... Environmenlal Changes and Radioactive Tracers
1Figure 2ASSSOO P
type sampler.
intended to monitor atmospheric radioactivity (sensitivity:10 mllq.rn' for 137es). The high tlow rate sampling apparatus canoperate continuously under severe meteoroJogical conditions. Thehorizontal sampling head is protected by an aluminium hood. Thepolypropylene filter, with a surface density of approximately 125 g.m?and effective dimensions 43x43 cm, is mounted in an air-tight manner on a calibrated grid support. The filter retention efficiency, measured experimentally, is greater than 93% for 0.15 mm particles(French standard NF X 44011). Two infrared lamps are installedabove the filter to prevent icing in winter. The ASS500 P has a system giving the filtered air volume at a given time and the instantaneous tlow rate. The filtered air volume is corrected for thetemperature and adjusted to standard conditions (STP). For this study54 week..ly samples covering 1998 were taken; the weekly mean airtlow rate, approximately 600 rri' .h", varied significantly according to
G. Le Petit et al. Trace éléments in total atmospheric suspended particles '303
the meteorological conditions observed during sampling; at certain
times of the year, when the température inversion layer is low, the
resulting atmospheric dust level is higher, whereas at other timesheavy rainfall can cause a substantial decrease in the flow rate. Theweekly mean flow rates obtained during 1998 are shown in Figure 3;
it can be seen that the minimum flow rate (440 m3.h') was obtainedin winter.
750-
700-
f- 650-
2 600^_
g 550
O)
2 500-CD>ca
450'
mr n yiy m
u400 | ' ' I I | ' » I ' | ' I ' » | TT TT | I ri | I I I I | I I I I | I I I I
0 5 10 15 20 25 30 35 40 45 50
Week number (1998)
I Figure 3Average flow rate observed on the sampler during year 98.
I Sample préparation protocol
The atmospheric particulate matter is sampled for one week, with¬out particle-size cutoff. Each filter is oven-dried for 6 hours at 90° C,then weighed on a précision balance, before it is placed in the sam¬
pling apparatus. On withdrawal, the aerosol-loaded filter is driedand weighed again; the mean weight loss after drying is about 4%
304' Environmental Changes and Radioactive Tracers
of the total mass. The distribution of the aérosol masses (mg.nr3 fil¬tered air) collected on each weekly filter and measured in 1998 is
shown in Figure 4. It can be seen that, in winter, atmospheric dustlevels in the Paris région can reach 80 mg.nr3 (weekly mean), a
value that is slightly above the maximum annual limit adopted bythe WHO (60 mg.nr3).
m
hO)
c
m>Cl)
,
UJ3Q
80-
70-
60-
50-.40-
30-.
20-
10-
il
H r^
r^J TJ Lr tJ M Ul
i i i i | i i i t j t i i i 'i'"? i i i | i i i r
10 20 30 40
Week number (year 98)
I Figure 4Dust concentration during year 98 observed at Montlhéry.
50
The filters are then compacted and reduced to ash in a pro¬
grammable oven, using a protocol giving a slow température rise to
400 °C over a period of 8 hours. In parallel, blank filters loaded withstable tracers (standards), prepared under the same conditions as the
samples and undergoing the same protocol, were used to déterminethe calcination yield after INAA analysis for each élément investi¬
gated in the atmospheric aérosols (except Pb, analyzed by ICP-MSafter solubilization). The reproducibility of the calcination yieldsobtained was verified by three independent values for each élément.
G. Le Petit et al. Trace éléments in total atmospheric suspended particles T 305
After calcination, 50 mg of sample were placed in a high-puritypolyethylene container and heat-sealed. A set of blank filters, pre¬
pared under identical conditions to the samples, was analyzed toidentify and quantify impurities (major constituents: Al, Cl, Cu, Na, K).In addition, for the same purpose, impurity concentrations of theempty container were determined, as the gamma spectrometry mea¬
surements on the samples were made in the présence of the con¬
tainer (major constituents: Al, Mg). The results obtained were takeninto account in the détermination of the élément concentrations inthe atmospheric particulate matter.
I Sample irradiation andinduced activity measurements
Although the INAA technique cannot quantify certain élémentssuch as Pb, Hg and S that are of particular interest as atmosphericpollutants, it is one of the most powerful non-destructive multi-ele-ment analysis techniques (Sarmani et al, 1998; Djingova et al,1998), capable of determining some forty éléments (lanthanides,rare earths, metals, K, Na, etc.).
The samples were irradiated using the HERMA pneumatic system
installed on the periphery of the core of the OSIRIS reactor at the
Centre d'Etudes Nucléaire at Saclay (CEA). This apparatus has a
very fast transport system for shuttles carrying the container and the
sample; the transfer time between the reactor core and the gammaspectrometry laboratory located in a peripheral gallery is about 2 to3 seconds, which enables détection and measurement of radioélé¬ments with half-lives of a few minutes. A distributor managing eightshuttles simultaneously means that the irradiation system can
séquence the irradiation cycles. The associated laboratory can per-form two types of measurement: HPGe gamma spectrometry mea¬
surement and measurement of delayed neutrons by 3He proportionalcounter for the fissile éléments such as 235U, 238U, 239Pu. The sampleswere irradiated in a thermal neutron flux of approximately
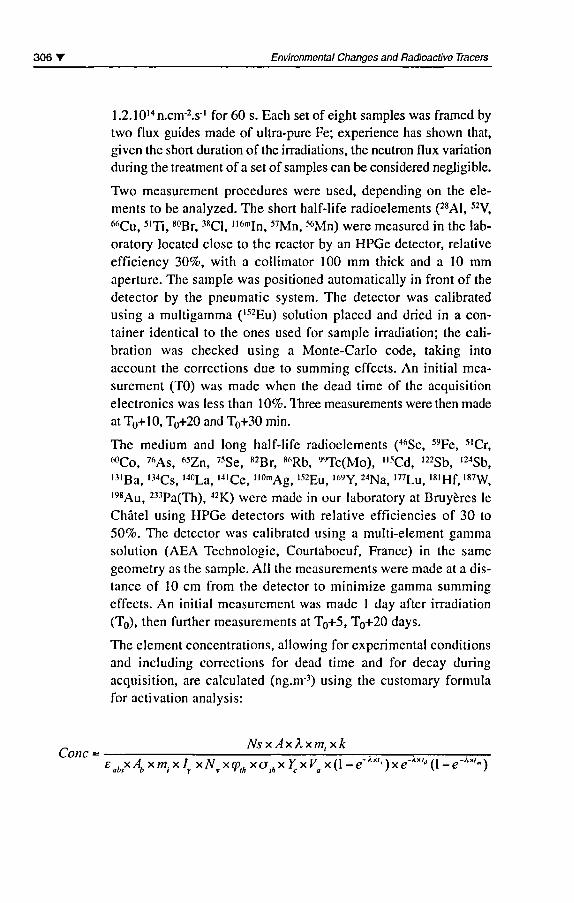
306 T Environmental Changes and Radioactive Tracers
1.2.10,4n.cnr2.S"1 for 60 s. Each set of eight samples was framed bytwo flux guides made of ultra-pure Fe; expérience has shown that,given the short duration ofthe irradiations, the neutron flux variationduring the treatment of a set of samples can be considered negligible.
Two measurement procédures were used, depending on the élé¬
ments to be analyzed. The short half-life radioéléments (28A1, 52V,
^Cu, 5lTi, 80Br, 38C1, ll6mIn, 57Mn, 56Mn) were measured in the lab¬
oratory located close to the reactor by an HPGe detector, relativeefficiency 30%, with a collimator 100 mm thick and a 10 mmaperture. The sample was positioned automatically in front of the
detector by the pneumatic System. The detector was calibratedusing a multigamma (1,2Eu) solution placed and dried in a con¬
tainer identical to the ones used for sample irradiation; the cali¬
bration was checked using a Monte-Carlo code, taking intoaccount the corrections due to summing effects. An initial mea¬
surement (T0) was made when the dead time of the acquisitionelectronics was less than 10%. Three measurements were then made
at T0+10, T0+20 and T0+30 min.
The médium and long half-life radioéléments (46Sc, 59Fe, 51Cr,
60Co, 76As, 65Zn, 75Se, 82Br, 86Rb, "Tc(Mo), ll5Cd, 122Sb, 124Sb,
,3,Ba, l34Cs, 140La, ,4,Ce, "0mAg, 152Eu, ,69Y, 24Na, 177Lu, 18lHf,187W,
l98Au, 233Pa(Th), 42K) were made in our laboratory at Bruyères le
Châtel using HPGe detectors with relative efficiencies of 30 to50%. The detector was calibrated using a multi-element gammasolution (AEA Technologie, Courtaboeuf, France) in the same
geometry as the sample. Ail the measurements were made at a dis¬
tance of 10 cm from the detector to minimize gamma summingeffects. An initial measurement was made 1 day after irradiation(T0), then further measurements at T0+5, T0+20 days.
The élément concentrations, allowing for expérimental conditionsand including corrections for dead time and for decay duringacquisition, are calculated (ng.nr3) using the customary formulafor activation analysis:
Conc =NsxAxA.xm,xk
£ihx^xm(x/rx^xç,lixailxi;xr',X(l-e-A-')«-""G-^)
G. Le Petit ef al. Trace éléments in total atmospheric suspended particles T 307
where:
k: constantNs: net area of the total gamma absorption peak
A: atomic number of the activated élémentX: decay constant of the activated élémenteabs: absolute détection efficiencyAb: isotopic abundance
1^: mass of irradiated sample
mt: total mass collectedLj absolute gamma émission intensityNv: Avogadro's numberYc: calcination yieldVa: volume of air sampled<pth: thermal fluxath: thermal neutron absorption cross-sectiontj, td, tm: irradiation, cooling and measurement times, respectively
The gamma spectrograms were processed using the GW software(Westmeir Gesellschaft fur Kernspektrometrie mbH - BeratungSoftware ). Ail the nuclear data (thermal neutron absorption cross-sections, gamma émission intensities) were taken from "The K0-Consistent 1RI gamma-ray Catalogue for Instrumental NeutronAnalysis (Menno Blaauw Interfacultair Reactor Instituut van de
Technische Universiteit Delft, 1996) and the Neutron activationTables (Gerhard Erdtmann, 1976). The Innovator in Elemental and
Isotopic Mass Spectrometry relative. The Minimum DétectableConcentration (MDC) calculation was based on the définition ofCurrie (1968) and complies with the expressions defined by the inter¬
national organization overseeing the CTBT (Schultze et al, 2000).
Kx 2.7 1 + 4.65 /> count,
MDC.massW tmxsabsxVaxKsxKwxKc
where:
ROI is defined as ± 1.25 Full Width Half Maximum on either side ofthe hypothetical peak Ka, Ks, Kw, Yy. respectively factors related to the
conversion mass/Bq, decay corrections during activation time,between end of activation and acquisition start, during acquisition time
308 T Environmental Changes and Radioactive Tracers
The overall uncertainties assigned to the results are given by the fol¬
lowing équation, for a standard déviation:
n r KW, -ANb AI Âë~ Ârôj Âm~, AKo AKC Aç>AConc = Concx /- i-+ 2 L+ L.+ -+ !_+ L.+ 1_+ L_+ _UÎ_
"» ', m, /v %
where Nb: area under the gamma peak.
Validation of the expérimental method
The validity and the reliability of the results obtained using ourexpérimental method were verified by irradiating an IAEA 1632Aparticulate matter standard (Table 1).
Elément
As
Ce
Cs
Cr
Eu
Fe
Hf
K
La
Na
Rb
Se
Th
Yb
Certified valuesIAEA 1632A(ppm)
9.3 ± 1.0
29.0 ± 2 .0
2.3 ± 0.2
34.3 ± 1.5
0.52 ± 0.04
11 100 ±200
1.62 ± 1.00
4110 ±200
15+/- 2
828 ± 77
30 +/- 2
6.3 ± 0.3
4.5 ± 0.1
1.08 ±0.09
Our work(ppm)
11.1 ± 1.0
28.5 ± 1.7
3.0 ±1.8
31.5 ± 1.5
0.52 ± 0.06
10755 ±220
1.67 ± 1.00
4063 ± 230
13.5 ±2.0
834 ± 69
33.7 ± 2.1
6.9 ± 0.6
5.3 ± 1.0
1.3 ± 0.4
Détection limit(ppm)
0.55
1.8
0.7
4.0
0.1
645
0.3
1.6
0.06
5.2
1.5
0.04
0.7
0.6
I Table 1
Comparison of measured and certified values.
G. Le Petit et al. Trace éléments in total atmospheric suspended particles T 309
1 Atmospheric pollution monitoringin the Paris région
AIRPARIF (1998), the entity responsible for air quality monitoringin the Paris région, has three types of station for measuring the mainprimary atmospheric pollutants (CO, NO, N02, 03, SO2) coveringa radius of approximately 100 km around Paris:
- urban background stations: installed away from the direct influ¬ence of any source of industrial or vehicular pollution, for exam¬
ple in parks, school grounds; the AIRPARIF network includes 60stations of this type;
- rural background stations: installed on the edge of the Paris
conurbation, intended to measure the impact of certain pollutantsgenerated by chemical reaction, such as 03; the network includes3 stations of this type;
- proximity stations: installed in immédiate proximity to vehiculartraffic; the network includes 9 stations of this type.
The concentrations of primary pollutants measured by an urbanbackground station (located in Paris, 500 mètres from the Place
d'Italie), représentative of climatic events observed at the scale ofthe Paris région, were compared with the levels in the atmosphèreof the stable éléments determined by this study.
For this purpose the daily measurements made by AIRPARIF in1998 hâve been matched to the corresponding weeks of ASS500 P
atmospheric sampling.
U Results and discussion
A certain number of éléments présent in the aérosols are used as
markers of certain sources of atmospheric pollution, of anthro¬
pogenic or natural origin. The various sources of urban pollution
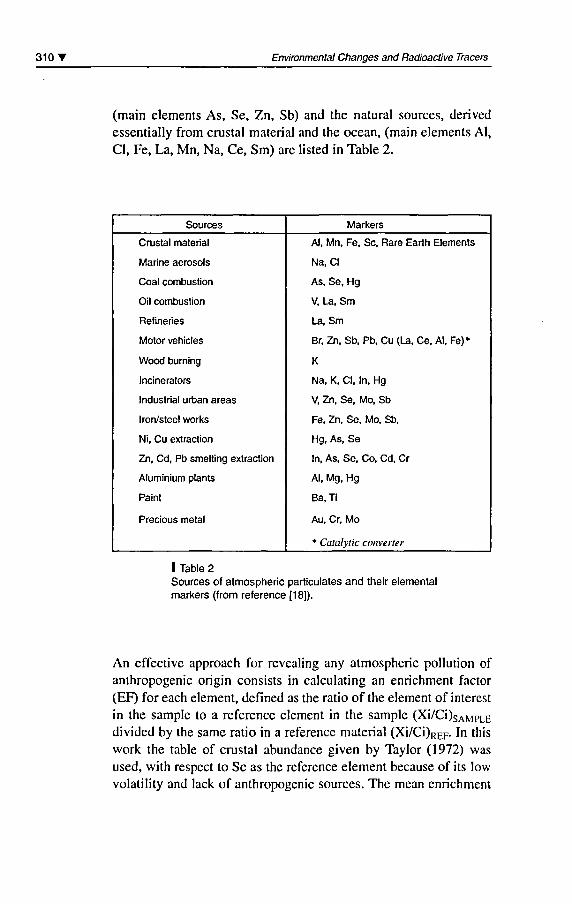
310' Environmental Changes and Radioactive Tracers
(main éléments As, Se, Zn, Sb) and the natural sources, derivedessentially from crustal material and the océan, (main éléments Al,CI, Fe, La, Mn, Na, Ce, Sm) are listed in Table 2.
Sources
Crustal material
Marine aérosols
Coal combustion
Oil combustion
Refineries
Motor vehicles
Wood burning
Incinerators
Industrial urban areas
Iron/steel works
Ni, Cu extraction
Zn, Cd, Pb smelting extraction
Aluminium plants
Paint
Precious métal
Markers
Al, Mn, Fe, Se, Rare Earth Eléments
Na, Cl
As, Se, Hg
V, La, Sm
La, Sm
Br, Zn, Sb, Pb, Cu (La, Ce, Al, Fe)*
K
Na, K, Cl, In, Hg
V, Zn, Se, Mo, Sb
Fe, Zn, Se, Mo, Sb,
Hg, As, Se
In, As, Se, Co, Cd, Cr
Al, Mg, Hg
Ba.Ti
Au, Cr, Mo
* Catalytic converter
I Table 2Sources of atmospheric particulates and their elementalmarkers (from référence [18]).
An effective approach for revealing any atmospheric pollution ofanthropogenic origin consists in calculating an enrichment factor(EF) for each élément, defined as the ratio of the élément of interest
in the sample to a référence élément in the sample (Xi/Ci)SAMPLEdivided by the same ratio in a référence material (Xi/Ci)R£F. In thiswork the table of crustal abundance given by Taylor (1972) was
used, with respect to Se as the référence élément because of its lowvolatility and lack of anthropogenic sources. The mean enrichment
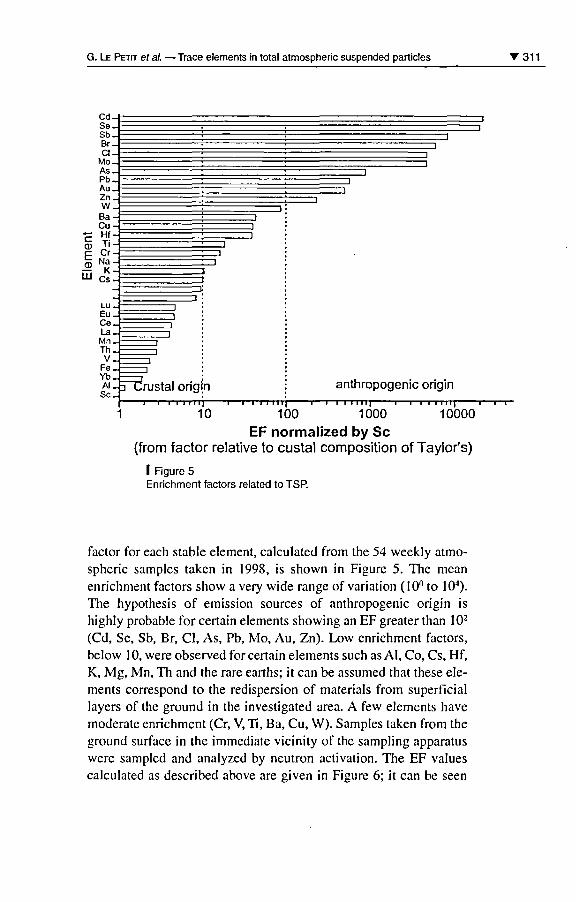
G. Le Petit et al. Trace éléments in total atmospheric suspended particles 311
Cd-Se_Sb-Br-CI-
Mo-As-Pb_Au-Zn_W_Ba-Cu-
tr Hf-S Tirs Cr-
uj dy
LU-Eu JCe-La-Mn_Th-v_
Fe_Yb-Al_Se-
i
" - li
i
i
i
' : i
i
i'
i
i: i
i - 3
1
C
i :
i
ii
i :
i :
i
i :
i :
TTJrustal origi'ni i i i i 1 1 1 1 i i i i i nr
i
i
anthropogenic origin
10 10000100 1000
EF normalized by Se(from factor relative to custal composition of Taylor's)
I Figure 5Enrichment factors related to TSP.
factor for each stable élément, calculated from the 54 weekly atmo¬
spheric samples taken in 1998, is shown in Figure 5. The meanenrichment factors show a very wide range of variation (10° to IO4).
The hypothesis of émission sources of anthropogenic origin ishighly probable for certain éléments showing an EF greater than 102
(Cd, Se, Sb, Br, Cl, As, Pb, Mo, Au, Zn). Low enrichment factors,below 10, were observed for certain éléments such as AI, Co, Cs, Hf,K, Mg, Mn, Th and the rare earths; it can be assumed that thèse élé¬
ments correspond to the redispersion of materials from superficiallayers of the ground in the investigated area. A few éléments hâvemoderate enrichment (Cr, V, Ti, Ba, Cu, W). Samples taken from theground surface in the immédiate vicinity ofthe sampling apparatus
were sampled and analyzed by neutron activation. The EF valuescalculated as described above are given in Figure 6; it can be seen
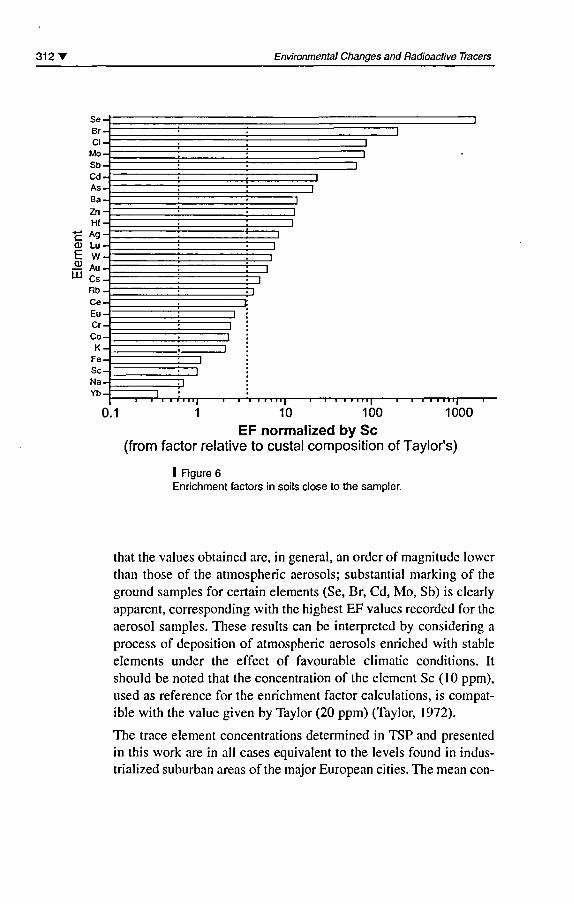
312' Environmental Changes and Radioactive Tracers
Se-Br-Cl-
MoSb-Cd-AsBa-Zn-Hl-
£ Ag-Q) Lu-E W-£ Au-ULt Cs-
Rb-Ce-Eu-Cr-Co-K-
Fe-ScNa-Yb-
I
i ' i i r nj 1 i 'i i i i ii| 1 i i i i i ii| i i i i j
0.1 1 10 100 1000
EF normalized by Se(from factor relative to custal composition of Taylor's)
I Figure 6Enrichment factors in soils close to the sampler.
that the values obtained are, in gênerai, an order of magnitude lowerthan those of the atmospheric aérosols; substantial marking of the
ground samples for certain éléments (Se, Br, Cd, Mo, Sb) is clearlyapparent, corresponding with the highest EF values recorded for the
aérosol samples. Thèse results can be interpreted by considering a
process of déposition of atmospheric aérosols enriched with stable
éléments under the effect of favourable climatic conditions. Itshould be noted that the concentration of the élément Se (10 ppm),used as référence for the enrichment factor calculations, is compat¬
ible with the value given by Taylor (20 ppm) (Taylor, 1972).
The trace élément concentrations determined in TSP and presentedin this work are in ail cases équivalent to the levels found in indus-trialized suburban areas ofthe major European cities. The mean con-
G. Le Petit et al. Trace éléments in total atmospheric suspended particles T 313
centrations (1998) of stable éléments measured in the Paris suburbs,expressed in ng.nv3, the values published by several authors (Chunget al, 1997; Gallorini et al, 1998; Querol et al, 1997; Krivan &Egger, 1986) for différent cities in Europe and in Asia, and the min-ima and maxima for the USA are given in Table 3. The mean con¬
centrations measured near Paris are characteristic of the majorindustrial cities and give an idea, despite the wide seasonal variation,of the total quantifies of trace éléments présent in atmosphericaérosols in urban areas and ofthe nature ofthe main pollutants; thèse
data, coupled with other parameters such as meteorological data, are
essential dues for identifying the émission sources.
The mean Br/Na ratio calculated for 1998 (0.045) is an order of mag¬
nitude greater than the oceanic ratio (0.0062) (Nouchpramool et al,1998); this resuit indicates a local émission source for the élémentNa; the probable origin is an incinerator located 10 km from thesampling point (Figure 1), Na and Cl being characteristic markers ofthis type of pollution (Gone et al, 2000).
The Cl/Pb ratio is an indication of fresh particles emitted in the
exhaust by engines burning petrol; this ratio is about 0.14 (Ozbenet al, 1998). However, it should be noted that this ratio can be sig¬
nificantly différent in France depending on the type of fuel pro¬
duced. In this work the Cl/Br ratio was found to be 91, a very highvalue, which supports the hypothesis of the incinerator as potentialémission source.
The Br/Pb ratio, a characteristic of fuel quality, can vary from 0.28to 0.47 (Ozben et al, 1998). The mean annual Br/Pb ratio found inthis work is close to 2; this resuit, much higher than the expectedvalue considering the sampling apparatus is located 800 mètres
from a main road with heavy traffic, may indicate the involvementof a substantial émission source for Br, independent of the one
related to road traffic.
In contrast the high enrichment factors for éléments Cd, Pb and Sbcan be assumed to indicate pollution for which the main émissionsource is road traffic; other éléments (Cu, Ce, La, etc.) could hâvethe same origin, as suggested by Huang et al. (1994).
The éléments As and Se, in trace amounts in the atmosphericaérosols but showing high EF values, could originate in the use offossil fuels (district heating, etc.).
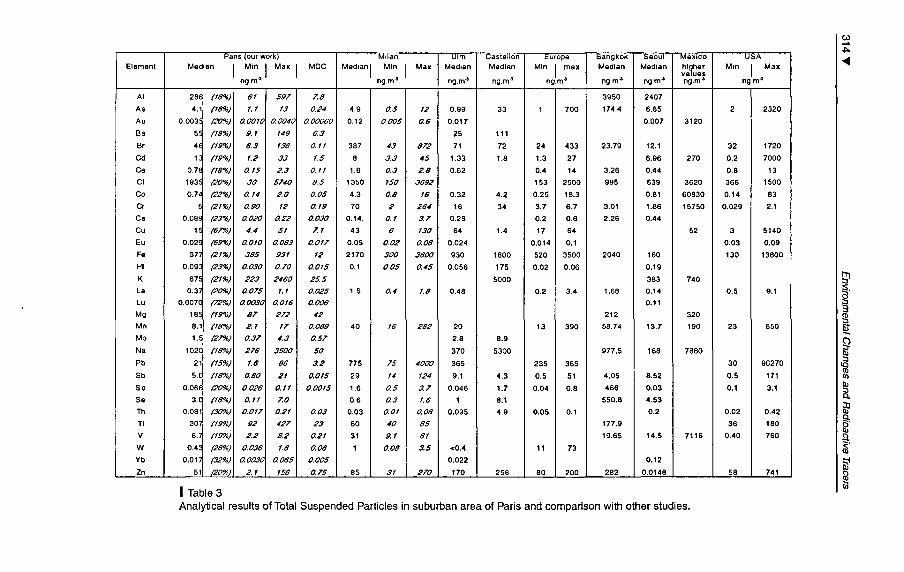
t'ans (our won'l Milan Ulm Castalion Europe l:IangKoK Seoul MeXIco USAElement Median 1 Min 1 Max
1MDC Medlanl Min
1Mu Median Median Min 1 max Median Median
~~~~:~Min
1Mu
ngm~ ng.m..1 ng.m" ng.m" ng.m"" ng.m" ngm"' ng.m,) ng.m"
AI 28 (18%) 61 S9T 7.8 3950 2407
As 4.1 (18%) 1.1 13 0.24 4.9 as 12 0.99 33 1 700 174.4 8.85 2 2320
Au 0.003 (20%) 0.0010 0.0040 0.00060 0.12 o.OOS 0.6 0.017 0.007 3120
Ba 5 (18%) 9.1 149 6.3 25 111
Br 41 (19%) 6.3 136 0.11 387 43 8T2 71 72 24 433 23.79 12.1 32 1720
Cd 1 (19%) 1.2 33 I.S 8 3.3 4S 1.33 1.8 1.3 27 6.96 270 0.2 7000
Ce 0.7 (18%) a rs 2.3 0.11 1.8 0.3 2.8 0.62 0.4 14 3.26 0.44 0.8 13
Cl 193 (20%) 30 SUO 8.S 1350 ISO 3692 153 2500 995 639 3620 366 1500
Co 0.7 (22%) 0.14 2.0 0.OS 4.3 0.8 16 0.32 4.2 0.25 18.3 0.81 60830 0.14 83
Cr e (21%) 0.90 12 0.19 70 2 264 16 34 3.7 6.7 3.01 1.86 15750 0.029 2.1
Cs 0.08( (23%) 0.020 0.22 0.030 0.14. 0.1 3.T 0.28 0.2 0.6 2.26 0.44
Cu 1( (67%) 4.4 SI 7.1 43 6 130 64 1.4 17 64 52 3 5140
Eu 0.02( (69%) 0.010 0.083 O.OIT 0.05 0.02 0.08 0.024 0.014 0.1 0.03 0.09
Fe 37 (21%) 38S 931 12 2170 300 3600 930 1800 520 3500 2040 160 130 13800
HI 0.09 (2.1%) 0.030 010 0.015 0.1 0.05 0.45 0.056 175 0.02 0.06 0.19
K 67 (21%) 223 2460 25.5 5000 383 740
Le 0.3 (20%) 0.OT5 1.1 0.025 1.5 0.4 1.8 0.48 0.2 3.4 1.68 0.14 0.5 9.1
Lu 0.007C (T2%) 0.00.30 0.016 0.006 0.11
Mg 18! (19%) 8T 2T2 42 212 320
Mn 8.1 (18%) 2.1 1T 0.089 40 16 282 20 13 390 58.74 13.7 190 23 850
Mo 1. (27%) 0.3T 4.3 0.5T 2.8 8.9
Na 102C (18%) 2T6 3500 50 370 5300 977.5 168 7880
Pb 21 (15%) 1.6 86 3.2 775 T5 4000 365 235 365 30 96270
Sb 5.C (18%) 0.80 21 0.015 29 14 124 9.1 4.3 0.5 51 4.05 8.52 0.5 171
Sc 0.06 (20%) 0.026 0.11 0.0015 1.6 0.5 3.T 0.046 1.7 0.04 0.8 466 0.03 0.1 3.1
Se 3. (18%) 0.11 7.0 0.6 0.3 1.6 1 8.1 550.8 4.53
Th 0.081 (:JO%) O.OIT 0.21 0.03 0.03 0.01 0.08 0.095 4.9 0.05 0.1 0.2 0.02 0.42
TI 30 (19%) 92 42T 23 60 40 85 177.9 36 180
V 6. (19%) 2.2 8.2 0.21 31 9.1 61 19.65 14.5 7116 0.40 760
W 0.4 (2890) 0.036 1.8 0.08 1 0.08 3.5 <0.4 11 73
Yb 0.01 (32%) 0.0030 0.065 0.005 0.022 0.12
Zn 51 (20% 2.1 156 o.T5 85 31 2TO 170 256 80 200 282 0.0148 58 741
1Table 3Analytical results of Total Suspended Partlcles in suburban area of Paris and comparison with other studies.
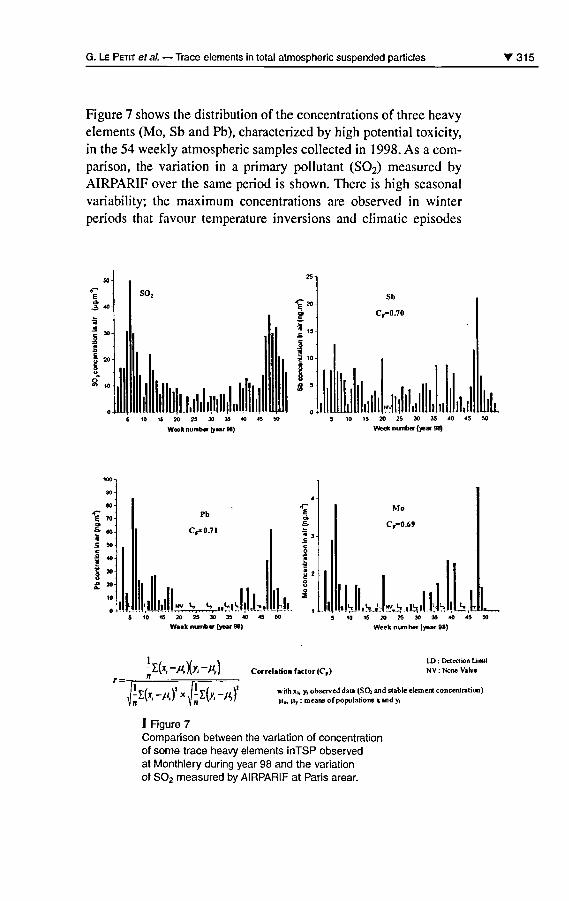
G. Le Petit et al. Trace éléments in total atmospheric suspended particles '315
Figure 7 shows the distribution ofthe concentrations of three heavyéléments (Mo, Sb and Pb), characterized by high potential toxicity,in the 54 weekly atmospheric samples collected in 1998. As a com¬
parison, the variation in a primary pollutant (S02) measured byAIRPARIF over the same period is shown. There is high seasonal
variability; the maximum concentrations are observed in winterperiods that favour température inversions and climatic épisodes
E
3
15 20 25 » 35
Week number (year 98)
Sb
Cp-0.70
lllllll nJRtl10 15 20 25 30 35 40 « 50
Week numto {year 98)
M
o
£- 60HÇ soc
ojlt
Pb
C^=0.7I
III,Week number (year 96)
Ss5 M3
Mo
C.-0.69
'IMltH» r.YilSiii LiLWeek number (year 98)
Corrélation factor (C,)LD : Détection UmilNV : None Value
whh Xi, yi observed data (SOi and stable élément concentration)u.,, p, : means of populations xand yi
I Figure 7Comparison between the variation of concentrationof some trace heavy éléments inTSP observedat Monthlery during year 98 and the variationof S02 measured by AIRPARIF at Paris arear.
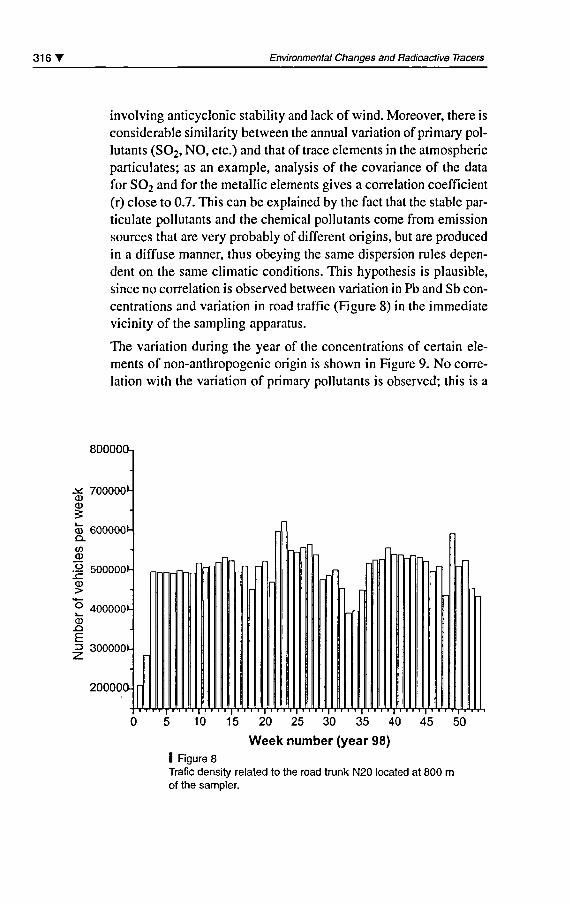
316 Environmental Changes and Radioactive Tracers
involving anticyclonic stability and lack of wind. Moreover, there is
considérable similarity between the annual variation of primary pol¬
lutants (S02, NO, etc.) and that of trace éléments in the atmosphericparticulates; as an example, analysis of the covariance of the data
for S02 and for the metallic éléments gives a corrélation coefficient(r) close to 0.7. This can be explained by the fact that the stable par¬
ticulate pollutants and the chemical pollutants corne from émissionsources that are very probably of différent origins, but are producedin a diffuse manner, thus obeying the same dispersion rules dépen¬
dent on the same climatic conditions. This hypothesis is plausible,since no corrélation is observed between variation in Pb and Sb con¬
centrations and variation in road traffic (Figure 8) in the immédiatevicinity of the sampling apparatus.
The variation during the year of the concentrations of certain élé¬
ments of non-anthropogenic origin is shown in Figure 9. No corré¬
lation with the variation of primary pollutants is observed; this is a
800000-,
^ 700000»-a>CD
cû 600000»-Q.
£ 5000001-(D>
Week number (year 98)
I Figure 8Trafic density related to the road trunk N20 located at 800 mof the sampler.
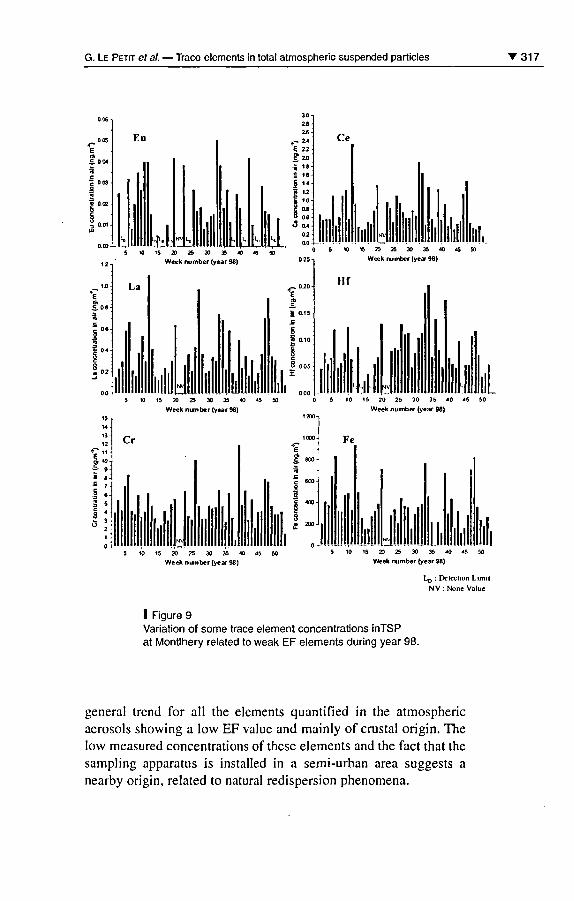
G. Le Petit et al. Trace éléments in total atmospheric suspended particles '317
15 20 25 30 35
Week number (year 98)
10 15 20 25 30 35
Week number (year 98)
Lp : Détection LimitNV:None Value
I Figure 9Variation of some trace élément concentrations inTSPat Montlhery related to weak EF éléments during year 98.
gênerai trend for ail the éléments quantified in the atmosphericaérosols showing a low EF value and mainly of crustal origin. Thelow measured concentrations of thèse éléments and the fact that the
sampling apparatus is installed in a semi-urban area suggests a
nearby origin, related to natural redispersion phenomena.
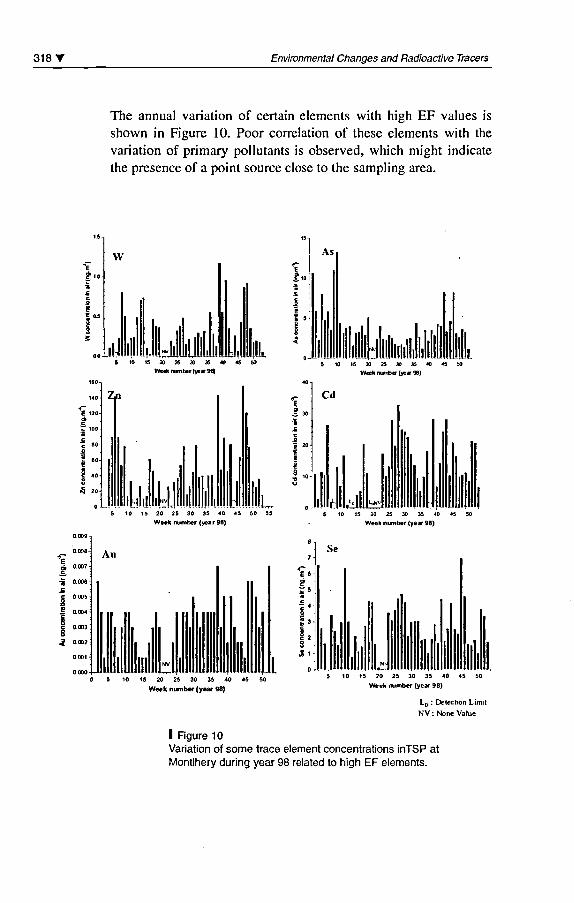
318 T Environmental Changes and Radioactive Tracers
The annual variation of certain éléments with high EF values is
shown in Figure 10. Poor corrélation of thèse éléments with the
variation of primary pollutants is observed, which might indicatethe présence of a point source close to the sampling area.
10 15 20 25 30 35 40 45 50 S»
Week number (year W)15 20 25 30 3î
Weeh number (year 96)
0.009 t
0.008-
0.007:
0.006-
0 005-
O004-
0.003
0.002
0 001-
0 000+-
Au
E *P
8
Se
J10 15 20 25 30 35 40 45
Week number (year 98)
10 15 20 25 30 35 40 45 50
Week number (year 98)
Lp : Détection LimitNV : None Value
I Rgure 10Variation of some trace élément concentrations inTSP atMontlhery during year 98 related to high EF éléments.
G. Le Petit ef al. Trace éléments in total atmospheric suspended particles T 31 9
Conclusion
The characterization of trace éléments in suspended particulate mat¬
ter in major industrial cities has recently become a subject ofresearch, since the public authorities became aware ofthe absence ordéficit of data on possible toxicological and physiological impacts ofcertain éléments on health. Furthermore, standards for maximumpermitted concentrations in the atmosphère, including for the aérosol
fraction smaller than 2.5 mm, the most harmful to the human respi-ratory system, are now being introduced. Although the data providedby this study concern only the total atmospheric suspended particu-lates (TSP), the entire particle-size range was included, as the effi¬ciency ofthe filter médium remains high down to submicron particlesizes. However, the relationship between the analysis and the parti¬
cle size class was not studied. The nature of the éléments and the
concentrations detected in the atmosphère during 1998 identify the
major anthropogenic pollutants and show their seasonal variations.Thèse data provide a guide for further investigation ofthe impact on
man. This study is the first of its type carried out in France; the
results obtained could be used as référence indicators for evaluatingthe long-term overall variation of atmospheric pollution in the Parisrégion, particularly the heavy métal levels.
Furthermore, in addition to the measurements provided by the typeof study described hère, it is necessary to set up collaborations withthe various protagonists concerned to a greater or lesser extent byurban pollution in order to obtain the most complète possible syn¬
thesis of the available data, in particular those relating to the émis¬
sions ofthe various industrial activities, which are rarely published.Knowledge of thèse data, coupled with atmospheric modelling tak¬
ing into account local weather, should enable more précise détermi¬nation ofthe origin of émission sources for the major pollutants.
This study has also shown that neutron activation analysis remains a
powerful, non-destructive, multi-element analysis method, with a
measurement sensitivity that remains acceptable for this type ofstudy. Nevertheless, although more than 30 éléments were measured
by this technique, knowledge of the atmospheric concentrations of
320' Environmental Changes and Radioactive Tracers
certain éléments (Pb, Hg, S) that are of particular interest in terms oftheir impact on man necessitate the use of other techniques in addi¬
tion to neutron activation (ICP-AE, ICP-MS, ED-XRF, AAS, etc.).
AcknowledgementsThe authors wish greatly to thanks J. C. Carbonnelle, J. Moro, F. Raynaud
and F. Mietlicki (AIRPARIF) for their participation in this work.
BibliographyAIRPARIF, 1998Surveillance de la qualité de l'air enIle-de-France. Rapport d'activité, 1 08 p.
Chung Y. S., Chung Y. J.,Jeong E. S., Cho S. Y, 1998Study on air pollution monitoringin Korea using instrumental neutronactivation analysis. Journal ofRdioanalytical Nuclear Chemistry,217(1): 83-89.
CurrieLA., 1968Abundances.of Naturally OccuringIsotopes. Anal. Chem., 40: 586-593.
De Bievre P., Branes I. L, 1992 -Handbook of Chemistry andPhysics 73"" Edition. CRC Press:11,28-11,132.
Djingova R., Ivanova J. U.,KuleffI., 1998Comparative évaluation of thepossibilities of INAA, ED-XRF,ICP-AES and AAS in the analysisof plants. Journal of RdioanalyticalChemistry, 237 (1-2): 25-34.
Gallorini M., Borrini P. A.,Bonardi M., Rolla A., 1998Trace éléments in the atmosphericparticulate of Milan and suburbanareas: a study carried out by INAA.
Journal of Radioanalytical andNuclear Chemistry,235 (1-2): 241-247.
Erdtmann G., 1976"Neutron activation Tables ". In:Kernchemie in Einzeldarstellangen.New York, Verlagchemie, t.VI.
Querol X., Alastuey A.,Lopez-Soler A., 1997Trace élément contentsin atmospheric suspendedparticules: Interférences frominstrumental neutron activationanalysis Fresenius. J. Anal Chem.,357: 934-940.
Sarmani S., Abugassa L,Hamzah A., 1998Instrument neutron activation analysisof environmental samples using theK0-standardization method.Journal of RadioanalyticalChemistry, 234 (1-2): 17-20.
SCHULZE J., AUER M.,Rwerzi R., 2000Low level radioactivity measurementin support of the CTBTO. AppliedRadiation and Isotopes, 52: 23-30.
Taylor S. R., 1972Abundance of chemical éléments in
G. Le Petit et al. Trace éléments in total atmospheric suspended particles '321
the continental crust : a new table.Geochim. and Cosmochim. Acta,28: 1973-1985.
Krivan V., Egger K. P., 1986Multielementanalyse vonSchwebstâuben der Stadt Ulm undVergleich der Lufbelastung mitanderen Regionen Frezenus Z.Analytical Chemistry, 325: 41-49.
Nouchpramool N., Sumitra T.,
Leenanuphunt V., 1998"Characterization of fine airboneparticulates in Bangkok urban areaby neutron activation analysis". In:Nuclear Analytical Methods inthe Life Sciences (NAMLS), Beijing,China, October 26-30, 5p.
Gone J. K., Olmez I.,Ames M. R., 2000Size distribution and probablesources of trace éléments insubmicron atmospheric particulatematerial. Journal of Radioanalyticaland Nuclear Chemistry,244(1): 133-139.
Ozben C, Belin B., Gûven H., 1998Analysis of aérosols at theBosphorus bridge of Istanbul.Journal of Radioanalytical andNuclear Chemistry,238 (1-2): 101-104.
Huang X., Olmez L, Aras N. K., 1 994Journal of Atmospheric Environment,28:1385-1990.

Assessing soil moisturein global climate models:is radon a possiblevérification tool?
Ann Henderson-Sellers
Parvis Irannejad
Global Climate Model Evaluation
The natural greenhouse effect maintains the Earth's climate at tem¬
pératures hospitable to life. Human activities hâve been recognized as
contributing radiatively active trace gases to the atmosphère for overa century (Henderson-Sellers and Jones, 1990). The potential impactsof human-induced global warming prompted the WorldMeteorological Organization (WMO) and the United NationsEnvironment Programme (UNEP) to establish the IntergovemmentalPanel on Climate Change (IPCC) in 1988. Open to ail membernations ofthe UNEP and WMO, the IPCC has a mandate to assess thescientific, technical and socio-economic information relevant for theunderstanding of the risk of human-induced climate change. It bases
its assessment on published and peer reviewed scientific technical lit¬erature. Working Group I assesses the scientific aspects ofthe climateSystem and climate change. Working Group II addresses the vulnera¬bility of socio-economic and natural Systems to climate change, nég¬
ative and positive conséquences of climate change, and options foradapting to it. Working Group III assesses options for limiting green¬
house gas émissions and otherwise mitigating climate change. TheIntergovemmental Panel on Climate Change (IPCC) SecondAssessment Report published in 1996 stated:
324 T Environmental Changes and Radioactive Tracers
"Our ability to quantify the human influence on global climate is
currently Iimited because the expected signal is still emerging fromthe noise of natural variability, and because there are uncertaintiesin key factors. Thèse include the magnitude and patterns of longterm natural variability and the time-evolving pattern of forcing by,
and response to, changes in concentrations of greenhouse gases and
aérosols, and land surface changes. Nevertheless, the balance ofévidence suggests that there is a discemible human influence on
global climate." (Houghton étal, 1996, p 5)
Thus it is established that human activities are impacting the cli¬
mate system; in particular atmospheric concentrations of green¬
house gases are increasing at a rapid rate (e.g. Keeling et al, 1976,
1995). Over the last few years, models and observations hâve com¬
bined to confirm that thèse increases are causing climate change
(Houghton et al, 1996). As a resuit, treaties and protocols are beingdeveloped and agreed which aim to reduce, and perhaps ultimatelyreverse, thèse human-induced disturbances to the climate system
(e.g. Taplin, 1996; Wigley, 1998). The tools with which future cli-mates are to be predicted are climate models. However, before mod¬
els can be used with confidence, they must be tested againstobservations and their prédictive skills verified (Gates et al, 1996).
The IPCC includes a Task Force on National Greenhouse Gas
Inventories which oversccs the members' national efforts to account
for and measure greenhouse gas sources and sinks. The IPCC has
been at the forefront of international efforts to evaluate and verifyglobal climate models. Its Second Assessment Report concluded that:
"The most powerful tools available with which to assess future cli¬
mate are coupled climate models, which include three-dimensionalreprésentations of the atmosphère, océan, cryosphere and land sur¬
face... (and)... More detailed and accurate simulations are expectedas models are further developed and improved." Gates et al. (1996,p233)
Climate models are tools employed to enhance understanding oftheclimate system and to aid prédiction of future climates. The aim ofail global climate models (GCMs) is the calculation of the fullthree-dimensional character of the climate comprising at least the
global atmosphère, the continental surfaces and the océans. If a
model were to be constructed which included the entirety of our
A. HENDERSON-SELLERS, P. IRANNEJAD - 15 radon a possible verification tool? T 325
knowledge on the atrnosphere-ocean-Iand system, it would not bepossible to run it on even the fastest computer. For this reason,GCMs, currently the most complicated numerical models, can onlybe simplifications of our current knowledge of the climate system(Figure 1).
WITHIN THE OCEAN COLUMNCUITent vecton, temperalure andsalinly
Ocean grid
\" "<,\ Verll~1 BXchàng~., elWeèn J!,els . -
Climate model schematic
1Figure 1Illustration of the basic characteristics and processes withina general circulation model, showing the manner in which theatmosphere and ocean are split into columns. The atmosphere,land and ocean are modelled as a set of interacling columnsdistributed across the Earth's surface. The resolutions of theatmosphere, land and ocean models are olten different becausethe processes differ and have different timescales and equilibrationtimes. Typically many types of c1ouds, soils and vegetat ion arelreated . In this example, soil moisture is modelled in a number oflayers and Iropospheric and stralospheric aerosols are includedclimate model schemalic (alter Henderson-Sellers and McGuffie, 2000).
326 Environmental Changes and Radioactive Tracers
Although there hâve been great advances made in the discipline ofclimate modelling over its forty year history, even the most sophis¬
ticated models remain very much simpler than the full climate Sys¬
tem (e.g. Henderson-Sellers and McGuffie, 2000). Indeed, such
simplicity is an intended attribute of climate models (e.g.Washington and Parkinson, 1986; McGuffie and Henderson-Sellers, 1997). Modelling of a system that encompasses such a widevariety of components as the climate system is a formidable task
and it requires co-operation between many disciplines if reliableconclusions are to be drawn. Intercomparisons such as theAtmospheric Model Intercomparison Project (AMIP) Phase II(AMIPII) are now an intégral part of climate science and an impor¬tant means for advancement of understanding ofthe climate system
(Gates et al, 1999). For climate models to be accepted as usefultools for climate analysis their évaluation must progress beyondsimply intercomparison to vérification.
This process of vérification is now termed model "évaluation",although many researchers still use the term "validation". The for¬
mer term has been chosen over the latter by Working Group I of the
IPCC for its Third Assessment Report, because it is argued that"évaluation" dénotes a comparison while "validation" appears tooffer some form of approval. In this paper, a novel method for the
évaluation of prédictions of large-scale soil moisture by climatemodels is proposed.
IWhy Investigate Radonas an Evaluation Tool?
Large-scale (roughly an American or Australian state or a Europeannation) soil moisture variability is now recognized as an importantcause of variability in weather & climate Systems (e.g. Beljaars et al,1993; Sellers étal, 1997; Douville and Chauvin, 2000). The GlobalEnergy & Water Cycle Experiment (GEWEX) and the BiosphericAspects of the Hydrologie Cycle (BAHC) are developing interna-
A. Henderson-Sellers, P. Irannejad ls radon a possible vérification tool? T 327
tional programmes of soil moisture measurement, analysis & pré¬
diction (e.g. Sorooshian, 2000).
Arguably the most useful range of soil moisture vérification fornumerical model évaluation is for intermediate wetness conditionsbecause very arid and permanently saturated soils behave in knownand well-simulated ways (Shao & Henderson-Sellers, 1996; Woodet al, 1998). Variations among land-surface simulations of latentheat fluxes are largest at intermediate soil wetnesses (Irannejad et al,1995). Thèse temporally transient and spatially heterogeneous con¬
ditions are the most difficult conditions under which to try to mea¬
sure "areal" soil moisture. Neither satellite-derived proxies for soilmoisture nor summations of point-measured moisture contents canadequately deliver large-scale areal values of continental soil mois¬
ture (e.g. Robock et al, 1998). The resuit is that the most importanttype of model prédiction of continental soil moisture is the most dif¬ficult to evaluate because of the lack of appropriate observations.
Radon (222Rn) is produced by the radioactive decay of radium(226Ra) ubiquitous in rocks and soils. It is a noble gas with a half life3.8 days: chemically inert & short-lived enough for tracking, radonhas been successfully used in atmospheric tracer studies for e.g. ver¬
tical mixing and air mass history (Genthon and Armengaud, 1995;
Jacob et al, 1997). Radon escapes from the soil by plant transpira-lion and diffusion through soil pores (Armengaud and Genthon,1993). The émanation of radon from land surfaces is known to be a
function of soil température and also believed to be dépendent upon:(i) soil porosity; (ii) depth of soil; (iii) soil moisture; (iv) végétation- thèse probably in decreasing importance (Pearson and Jones, 1 966;Stockwell et al, 1998). Océan fluxes are at least 100 times less than
land fluxes (Broecker et al, 1967) while ice cover strongly inhibitsradon émanations and frozen soils exhibit much lower fluxes than
non-frozen (Feichter and Crutzen, 1990).
Radon is believed to hâve a mean global land émission rate of~1 atom.cm^.s"1 (Lambert et al, 1982) with a rough constraint thattotal global annual radon source is around 15 kg (Stockwell et al,1998). Measurements of fluxes of radon range typical ly from-0.004 atom.cm-2.s"' in New Zealand to ~2.5 atom.cm2.s"' in Illinois(Turekian et al, 1977) although Schery (1986) found fluxes of upto 5 atom.cm"2.s"'.
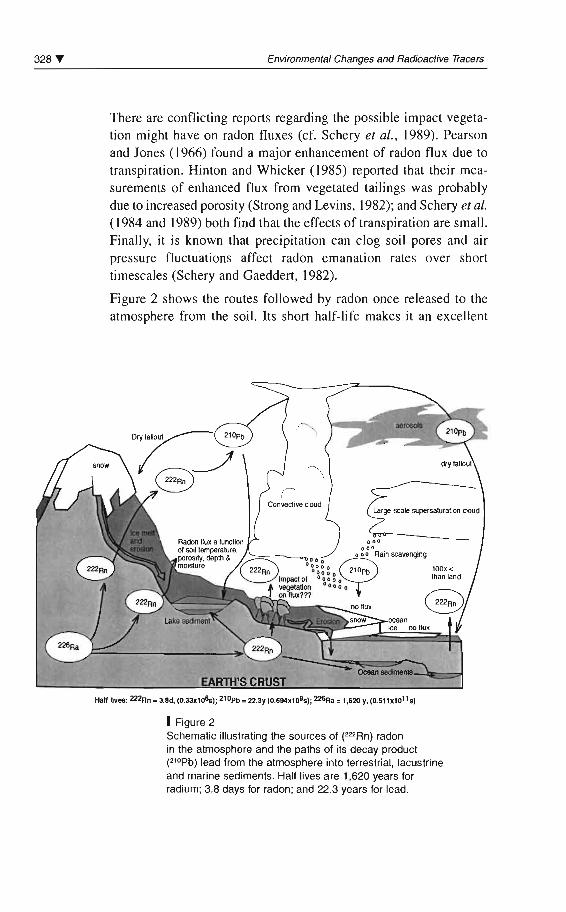
328 T Environmental Changes and Radioactive Tracers
There are conflicting reports regarding the possible impact vegetation might have on radon fluxes (cf. Schery el al., 1989). Pearsonand Jones (1966) found a major enhancement of radon flux due totranspiration. Hinton and Whicker (1985) reported that their measurements of enhanced flux from vegetated tailings was probablydue to increased porosity (Strong and Levins, 1982); and Schery el al.
(1984 and 1989) both find that the effects of transpiration are small.Finally, it is known that precipitation can clog soil pores and ai rpressure fluctuations affect radon emanation rates over shorttimescales (Schery and Gaeddert, 1982 ).
Figure 2 shows the routes followed by radon once released to theatmosphere from the soil. Ils short half-life makes il an excellent
~ OCean sedmentsEARTH'S CRUST -..q~::::'l
Ha~ liv...: 222Rn = 3.8d, (O.33Xl06s); 210pb = 22.3y (0.694xlol's) ; 226Ra = 1,620 Y.(0.511Xl011s)
1 Figure 2Schematic illustrating the sources of (222Rn) radonin the atmosphere and the paths of its decay product(210pb) lead from the atmosphere into terrestrial , lacustrineand marine sediments. Half lives are 1,620 years forradium; 3.8 days for radon ; and 22.3 years for lead.
A. Henderson-Sellers, P. Irannejad ls radon a possible vérification tool? T 329
tool for atmospheric tracing and global modelling studies (e.g. Rindand Lerner, 1996). 222Rn decays to 2,0Pb which is removed from the
atmosphère either directly by dry fall-out or by wash-out or rain-outfollowing incorporation of the lead into cloud droplets and hence
précipitation.
As well as the records of atmospheric radon from around the globethere are also archives of 210Pb in océan and lake sédiments (e.g.Preiss et al, 1996). Together, thèse radionuclide inventories form a
powerful and synergistic archivai record of continental-surfaceradon émanation to the atmosphère around the world and, thus, per¬
haps, of large-scale continental soil moisture variations over time.
1 Exploiting the Relationshipbetween Radon and Soil Moisturefor Climate Model Vérification
Various initiatives of the UN-sponsored World Climate Research
Programme (WCRP) are directed toward "validation and diagnosis"of GCM performance. Among thèse, the Atmospheric ModelIntercomparison Project (AMIP) is an especially apt framework forassessing model performance at the atmosphere-Iand interface(Henderson-Sellers étal, 1996; Gates et al, 1999). Since 1992, forexample, a Diagnostic Subproject on Land-surface Processes and
Parameterizations has investigated AMIP model experiments withcommon spécifications of radiative forcings and océan boundaryconditions. This subproject has analyzed selected 10-year climatesimulations from the initial AMIP I phase of this intercomparisonexperiment (e.g. Love et al, 1995, Qu and Henderson-Sellers,1998), and currently investigations are being undertaken to validateand diagnose the 17-year simulations from the AMIP II phase thatis in progress (e.g. Phillips et al, 2000). AMIP II also has anotherDiagnostic Subproject specifically studying soil moisture simula¬tions by participating AGCMs (Robock et al, 1998).
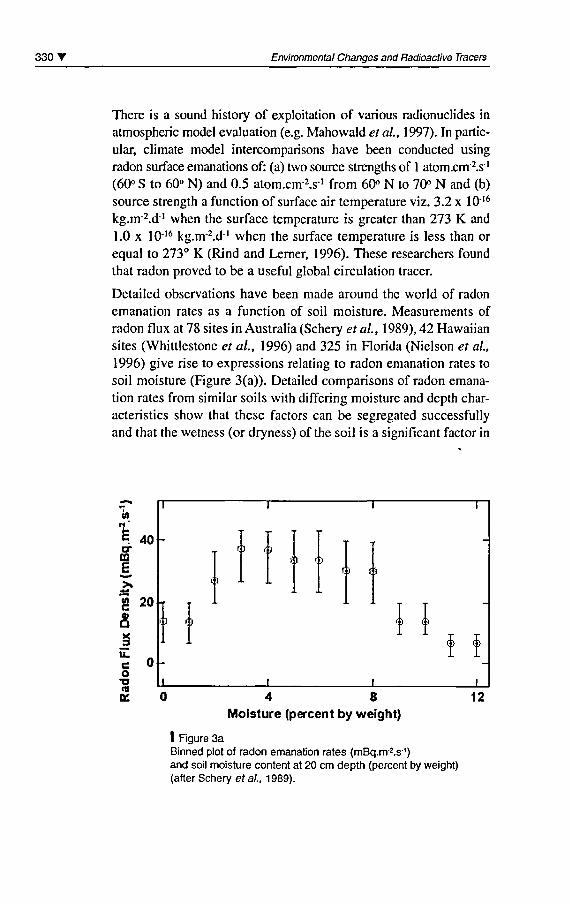
330' Environmental Changes and Radioactive Tracers
There is a sound history of exploitation of various radionuclides inatmospheric model évaluation (e.g. Mahowald et al, 1997). In partic¬
ular, climate model intercomparisons hâve been conducted using
radon surface émanations of: (a) two source strengths of 1 atom.cnr2.s']
(60° S to 60° N) and 0.5 atom.cmls-1 from 60° N to 70° N and (b)
source strength a function of surface air température viz. 3.2 x 10 16
kg.m2.d-' when the surface température is greater than 273 K and
1.0 x IO16 kg.nv2.d ' when the surface température is less than orequal to 273° K (Rind and Lerner, 1996). Thèse researchers foundthat radon proved to be a useful global circulation tracer.
Detailed observations hâve been made around the world of radon
émanation rates as a function of soil moisture. Measurements ofradon flux at 78 sites in Australia (Schery et al, 1989), 42 Hawaiiansites (Whittlestone et al, 1996) and 325 in Florida (Nielson et al,1996) give rise to expressions relating to radon émanation rates to
soil moisture (Figure 3(a)). Detailed comparisons of radon émana¬
tion rates from similar soils with differing moisture and depth char¬
acteristics show that thèse factors can be segregated successfullyand that the wetness (or dryness) ofthe soil is a significant factor in
c An -
SE
40
g 20
â3
c 0o
on
o <>
u o
n
t ) oO Cl
o o
_L
I 4 8
Moisture (percent by weight)
I Figure 3aBinned plot of radon émanation rates (mBq.m 2.s')and soil moisture content at 20 cm depth (percent by weight)(after Schery et al, 1989).
_l_12
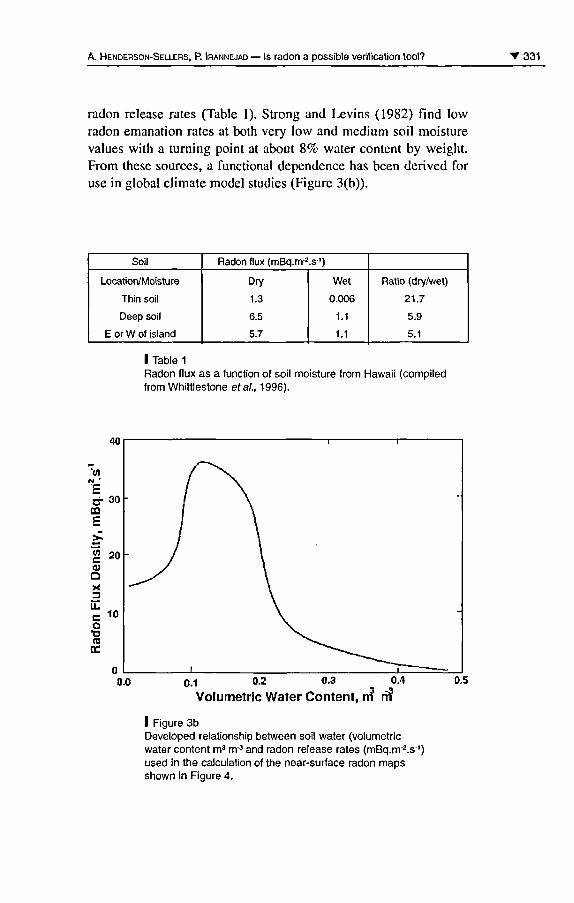
A. Henderson-Sellers, P. Irannejad ls radon a possible vérification tool? 331
radon release rates (Table 1). Strong and Levins (1982) find lowradon émanation rates at both very low and médium soil moisturevalues with a turning point at about 8% water content by weight.From thèse sources, a functional dependence has been derived foruse in global climate model studies (Figure 3(b)).
Soil
Location/Moisture
Thin soil
Deep soil
E or W of island
Radon flux (mBq.m-2
Dry
1.3
6.5
5.7
S"')
Wet
0.006
1.1
1.1
Ratio (dry/wet)
21.7
5.9
5.1
I Table 1
Radon flux as a function of soil moisture from Hawaii (compiledfrom Whittlestone étal, 1996).
0.0 0.1 0.2 0-3 0.4
Volumetric Water Content, rr? rr?
I Figure 3bDeveloped relationship between soil water (volumetricwater content m3 nr3 and radon release rates (mBq.m^.S'1)used in the calculation of the near-surface radon mapsshown in Figure 4.
332 T Environmental Changes and Radioactive Tracers
As a resuit of many recommendations from project participants, the
AMIP Co-ordinating Panel has provided for the possibility of some
expérimentation within the framework of Phase II ofAMIP. In thèse
global simulation sensitivity projects, the intention is to address
fundamental issues associated with atmospheric GCMs and theirdevelopment. It is envisaged that some working hypothèses war-ranting expérimentation will resuit from the AMIP II DiagnosticSubprojects.
We propose that an AMIP II Expérimental Subproject be performedin which the 222Rn source strength is a function of simulated soilmoisture. The nature of the relationship is open for discussion.Suggestions include: 222Rn flux be inversely proportional to the
square root of soil moisture (Nielson et al, 1996); 222Rn flux be
given by the relationship in Schery et al. (1989) i.e. Figure 3(a); orthe use of the function shown in Figure 3(b). Proposais for AMIPExpérimental Subprojects are evaluated in terms of their capacity to
address: 1) fundamental issues associated with AGCMs; 2) definedand practical questions; 3) implementation (demonstrated with at
least one AMIP AGCM); 4) demonstrated need for intercomparativestudy; and 5) interest of at least three modelling groups participat¬ing in AMIP identified.
The first step in making such a proposai is to involve one AGCMgroup and ultimately two others. To this end, we propose the fol¬
lowing hypothèses be examined by at least one AGCM in AMIP II:
(i) does the addition of a functional dependence of radon émanationon soil moisture improve the fit of predicted near-surface 222Rn to
observations?
(ii) does the addition of a functional dependence of radon émana¬
tion on soil moisture improve the fit of archived 210Pb to observa¬
tions? and, if either of thèse return an affirmative reply, then;
(iii) can 222Rn or210Pbbe used as a novel monitorof areal soil mois¬
ture and hence, ultimately, a tool for vérification of global climatemodels?
The benefits of proposing a séries ofAGCMs experiments under the
auspices of AMIP II are illustrated in Figure 4. This shows the sim¬
ulated distributions of surface to atmosphère émanation rates ofradon based on the soil moisture function given in Figure 3(b).
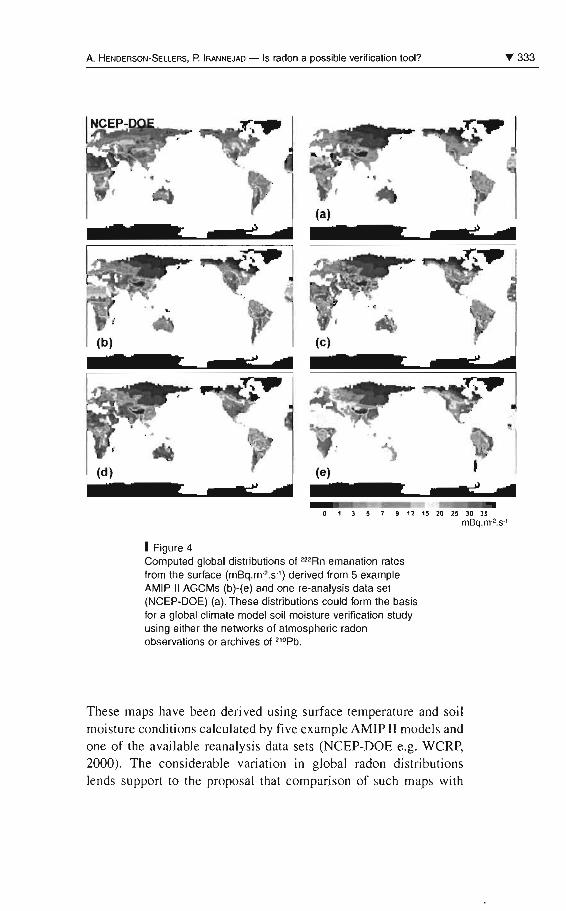
A. HENDERSON-SELLERS, P. IRANNEJAD - Is radon a possible verification tool? "'333
J.
J
J7 ~
(e)S
o , J s 1 9 " ,~ 20 2~ JO J ~
mêq.rrr-.s"
1 Figure 4Computed global distributions of 222Rn emanation ratesfrom the surface (rnêq.rrre.s') derived from 5 exampleAMIP Il AGCMs (b)-(e) and one re-analysis data set(NCEP-DOE) (a). These distributions could form the basisfor a global climate model soil moisture verification studyusing either the networks of atmospheric radonobservations or archives of 21OPb.
These maps have been derived using surface temperature and soil
moisture conditions calculated by five example AMIP II models andone of the available reanalysis data sets (NCEP-DOE e.g. WCRP,2000). The considerable variation in global radon distributions
lends support to the proposai that comparison of such maps with
334 Environmental Changes and Radioactive Tracers
global observations of 222Rn could provide a novel and valuablemeans of vérification of a poorly understood but critically importantsurface climate characteristic: soil water content.
Bibliography
Armengaud A., Genthon C, 1993 -"Modelling global distributions of222Rn, 2,0Pb and 7Be in theatmosphère with gênerai circulationmodels ". In: Isotope Techniquesin the Study of Past and CurrentEnvironmental Changes in theHydrosphère and the Atmosphère,Vienna International Atomic EnergyAgency, SM-329: 15-24.
BELJAARS A. C. M., VlTERBO P.,
Miller M.J., 1993-The anomalous rainfall over theUnited States during July 1 993:Sensitivity to land surfaceparameterization and soil moistureanomalies. Mon. Wea. Rev.,124:362-383.
Broecker W. E., Li Y. H.,Cromwell J., 1 967 -Radium-226 and radon-222:concentrations in Atlantic and PacificOcéans. Science, 158: 1307-1310.
Douville, H., Chauvin F., 2000 -"Relevance of soil moisture forseasonal climate prédictions",Procs. Second WCRP InternationalConférence on Reanalyses, Geneva,WCRP-1 09, WMOrTD-NO.985:169-172.
Feichter J., Crutzen P. J., 1990 -Parameterisation of vertical tracertransport due to deep cumulusconvection in a global transportmodel and its évaluation with^radon measurements. Tellus,42B: 100-117.
Gates W. L., Henderson-Sellers A.,Boer G. J., Folland C. K., Kitoh A.,McAvaney B. J., Semazzi F, Smith N.,Weaver A. J., Zeng Q.-C, 1996 -"Climate Models - évaluation".In J.T. Houghton et al. (eds.) :
Climate Change 1995: The Scienceof Climate Change, CambridgeUniversity Press: 229-284.
Gates W. L., Boyle J. S., Covey C,Dease C. G., Doutriaux C. M.,Drach R. S., Fiorino M., Gleckler P. J.,Hnilo J. J., Marlais S. M., Phillips T. J.,Potter G. L., Santer B. D.,Sperber K. R., Taylor K. E.,Williams D. N., 1999An overview of the results of theAtmospheric Model IntercomparisonProject (AMIP). Bulletin of theAmerican Meteorological Society,80: 29-55.
Genthon C, Armengaud A., 1995 -Radon-222 as a comparative tracerof transport and mixing in twogênerai circulation models of theatmosphère. J. Geophys. Res.,100:2849-2966.
Henderson-Sellers A.,Jones M. D. H., 1990-History of the greenhouse effect.Progress in Physical Geography,14:1-18.
Henderson-Sellers A.,McGuffie K., 2000 -Forty years of numerical climatemodeling. Int J. Climatol,in the press.
A. Henderson-Sellers, P. Irannejad ls radon a possible vérification tool? '335
Henderson-Sellers A.,McGuffie K., Pitman A. J., 1996 -The Project for Intercomparison ofLand-surface ParametrizationSchemes (PILPS): 1992 to 1995.Climate Dynamics, 12: 849-859.
Hinton T. G., Whicker F. W., 1985 -A field experiment on Rn flux fromreclaimed uranium mill tailings.Health Phys., 48, 421-427.
Houghton J. T., Mera Filho L. G.,Callander B. A., Harris N.,Kattenberg A., Maskell K., 1996 -Climate Change 1995, The Scienceof Climate Change: Contribution ofWorking Group 1 to the SecondAssessment Report of theIntergovemmental Panel on ClimateChange, Cambridge, CambridgeUniversity Press: 572 p.
Irannejad P., Henderson-Sellers A.,ShaoY., Love P. K., 1995-"Comparison of AMIP and PILPSoff-line landsurface simulations".In: Procs. of The First InternationalAMIP Scientific Conférence,Monterey, CA, USA, 15-19 May1995, (ed. W.L Gates), WMCvTD,732, Geneva, WCRP: 465-470.
Jacob D. J étal, 1997-Evaluation and intercomparison ofglobal atmospheric transport modelsusing 222Rn and other short livedtracers. J. Geophys. Res.,102: 5953-5970.
Keeling C. D., Bacastow R. B.,Bainbridge A. E., Ekdahl C. A.,Guenther P. R., Waterman L. S.,ChinJ. F.S., 1976-Atmospheric carbon dioxidevariations at Mauna LoaObservatory, Hawaii. Tellus,28:538-551.
KeELiNG C. D., Whorf T. P.,
Wahlen M., van der Plicht J., 1995 -Interannual extrêmes in the rate ofrise of atmospheric carbon dioxidesince 1980. Nature, 375: 666-670.
Lambert G., Polion G., Sanak J.,Ardouin B., Buisson A., Jegou A.,LeRoulley J. C, 1982-Application à l'étude des échangestroposphère-stratosphère.Annal. Geophys., 48: 497-531 .
Love P. K., Henderson-Sellers A.,Irannejad P., 1995-"AMIP diagnostic subproject 12(PILPS Phase 3): Land-surfaceProcesses". In: Proceedings of theFirst International AMIP ScientificConférence, , Monterey, CA, USA,15-19 May 1995, (ed. W.L. Gates),WMOTD, 732, Geneva,WCRP: 101-106.
McGuffie K.,Henderson-Sellers A., 1997-A Climate Modelling Primer,Chichester, 2nd édition, John Wileyand Sons, 254 p.
Mahowald N. M., Rasch P. J.,Eaton B. E., Whittlestone S.,Prinn R. G., 1997-Transport of 222radon to the remotetroposphère using the model ofatmospheric transport and chemistryand assimilated winds from ECMWFand the National Center forEnvironmental Prédiction.J. Geophys. Res. (Atmosphère),102 D23(28): 139-157.
Nielson K. K., Rogers V. C,HoltR. B., 1996-Measurements and calculations ofsoil radon flux at 326 sitesthroughout Florida. Env. Int.,22(1):S471-S476.
Pearson J. E., Jones G. E., 1966 -Soil concentration of emanatingradium-226 and the émanation ofradon from soils and plants.Tellus, 18:655662.
Phillips T. J., Henderson-Sellers A.,Irannejad R, McGuffie K.,Zhang H., 2000 -On validation and diagnosis ofland-surface climate simulations.
336 T Environmental Changes and Radioactive Tracers
Climate Change Newsletter, 12(1): 3-5and http://www.bre.gcw.aii/publications/ccn/ccn 1 2v1 /research.html.
Preiss N., Mélières M-A.,PourchetM., 1996-A compilation of data on lead 210concentration in surface air andfluxes at the air-surface andwater-sediment interfaces.J. Geophys. Res., 101 D22(28): 847-862.
Ou W., Henderson-Sellers A., 1998 -Comparing the scatter in PILPSoff-line experiments with that inAMIP I coupled experiments.Global and Planetary Change,19 (1-4): 209 223.
Rind D., Lerner J., 1996-Use of on-line tracers as a diagnostictool in gênerai circulation modeldevelopment 1. Horizontal and verticaltransport in the troposphère.J. Geophys. Res., 101 (12): 667-683.
ROBOCK A., SCHLOSSER C. A.,Vinnikov K. Ya., Speranskaya N. A.,Entin J. K., Qiu, S., 1998-Evaluation of the AMIP soil moisturesimulations. Glob. Plan. Chng.,19:181-208.
Schery S. D., Gaeddert D. H., 1982 -Measurements of the effect of cyclicatmospheric pressure variation onthe flux of 222Rn from soil.Geophys. Res. Letts., 9: 835-838.
Schery S. D., Gaeddert D. H.,Wilkening M. H., 1984-Factors affecting exhalationof radon from a gravelly sandy loam.J. Geophys. Res., 89: 7299-7309.
Schery S. D., 1986-Studies of thoron and thoron progeny:implications for transport of airborneradioactivity from soil to indoor air.Indoor Radon, SP-54, Air Poil. Cont.Assoc, Pittsburgh RA: 25-36.
Schery S. D., Whittlestone S.,Hart K. P., Hill S. E., 1989-
The flux of radon and thoron fromAustralian soils. J. Geophys. Res.,94(D6): 8567-8576.
Sellers P. J., Dickinson R. E.,Randall D. A., Betts A. K., Hall F. G.,Berry J. A., Collatz G. J.,Denning A. S., Mooney H. A.,Nobre C. A., Sato N., Field C. B.,Henderson-Sellers A., 1997-Modeling the exchange of energy,
water and carbon betweencontinents and the atmosphère.Science, 275: 502-509.
Shao Y, Henderson-Sellers A.,1996-Modelling soil moisture: a Project forIntercomparison of Land SurfaceParameterisation Schemes Phase2(b). J. Geophys. Res., 101 (D3),7227-7250.
Sorooshian S., 2000 -GEWEX Phase II, (editorial).GEWEX News, March 2000: 2-3
Stockwell D. Z., Kritz M. A.,Chipperfield M. P., Pyle J. A., 1998 -Validation of an off-line three-dimensional transport model usingobserved radon profiles. 2 Modelresults. J. Geophys. Res.,103 (D7): 8433-8445.
Strong K. P., Levins D. M., 1982 -Effect of moisture content on radonémanation from uranium ore andtailings. Health Phys., 42: 27-32.
Taplin R., 1996-"Climate science and politics: theroad to Rio and beyond".In Giambellucca, T. and Henderson-Sellers, A. (eds): Climate Change:Developing Southern Hémisphèreperspectives, Chichester, John Wiley& Sons: 377-396.
Turekian K. K., Nozaki Y,BenningerL. K., 1977-Geochemistry of atmospheric radonand radon products. Ann. Rev. EarthPlant Sel, 5: 227-255.
A. Henderson-Sellers, P. Irannejad ls radon a possible vérification tool? 337
Washington W. M.,Parkinson CL, 1986-An Introduction to Three-Dimensional Climate Modelling.Mill Valley, CA, University ScienceBooks, 422 p.
WCRP, 2000 -"Second WCRP InternationalConférence on Reanlaysis".Proceedings, WCRP-109,\Nor\dMeteorological Organisation,Geneva, 452 p.
Whittlestone S., Schery S. D.,
LlY, 1996-Thoron and radon fluxes from theisland of Hawaii. J. Geophys. Res.,1 01 (D9): 787-794.
Wigley T. M. L, 1998-The Kyoto protocol: C02, CH4 and
climate implications, Geophys. Res.Lett., 25: 2285-2288.
Wood E. E, Lettenmaier D. P.,
Liang X., Lohmann D., Boone A.,Chang S., Chen F, Dai Y,Dickinson R. E., Duan Q., Ek M.,Gusev Y. M., Habets F., Irannejad P.,
Koster R., Mitchel K. E.,Nasonova O. N., Hoilhan J.,SCHAAKE J-, SCHLOSSER A., SHAO Y,Shmakin A. B., Verseghy D.,Warrach K., Wetzel P., Xue Y,Yang Z.-L, Zeng Q.-C, 1998 -The Project for Intercomparisonof Land-surface ParameterizationSchemes (PILPS) Phase 2(c) RedArkansas River basin experiment:1 . Experiment description andsummary intercomparisons. Globaland Planetary Change,19(1-4): 115-135.

p,roduction and releaseof tritium from a researchreactor
Masami Fukui
Ron Grazioso
Introduction
The Kyoto University Research Reactor (KURR) is a light watermoderated research reactor. It commenced opération in 1964 at
1 MWjj, and the power was raised to 5 MWlh in 1968. The ventilationsystem in the containment building works at ca.350 m'.mn"1 orderto cover the duration of the reactor opération cycle of 70-80 h.wk/1
from Tuesday through Friday. Using a Ge(Li) detector the concen¬
trations of radionuclides in the exhaust air during opération at5 MWlh hâve been confirmed to be in the order of 10 2 Bq.cnr3 for4,Ar, IO"6 Bq.cnr3 for tritium, 108 Bq.cnr3 for ,3T and IO9 Bq.cnr3 forl3lI. As a resuit of the routine monitoring by a 22-L ionizationchamber set for the stack exhaust, the présence of most radionu¬
clides in the stream is usually masked by the reading of 4lAr; this isespecially true for tritium vapor.
As shown in Figure 1 the reactor core is submerged in a moderatingpool of 30 m3 of demineralized light water. The reactor supports twomajor sources of tritium: aD20 facility (Installed in 1964: ca. 2 m3)
and a Cold Neutron Source (CNS) facility (Installed in 1986: ca. 40dm3 liquid deuterium).
This report is divided into three major sections: 1) monitoring thetritiated water (HTO) vapor in the stack exhaust in order to assess
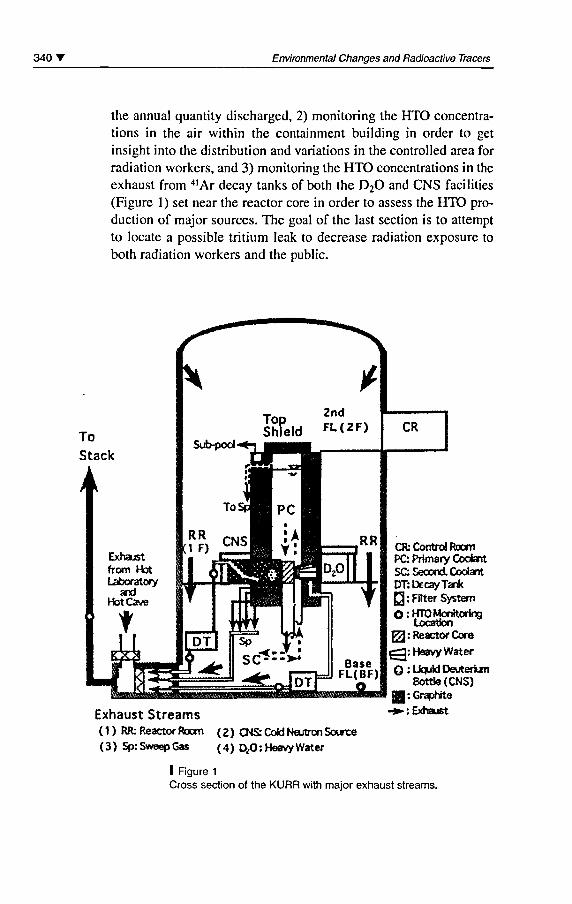
340' Environmental Changes and Radioactive Tracers
the annual quantity discharged, 2) monitoring the HTO concentra¬
tions in the air within the containment building in order to get
insight into the distribution and variations in the controlled area forradiation workers, and 3) monitoring the HTO concentrations in the
exhaust from 4,Ar decay tanks of both the D20 and CNS facilities(Figure 1) set near the reactor core in order to assess the HTO pro¬
duction of major sources. The goal ofthe last section is to attemptto locate a possible tritium Ieak to decrease radiation exposure toboth radiation workers and the public.
Exhaust Streams(1) RR: Reactor Room
(3) Sp:SweepGas
CR: Control RoomPC: Primary CodantSC Second CodantDT: Decay Tank
0 : Fflter SystemO : HTO Monitoring
Location0: Reactor Core
^: Heavy Water
O : Lkjuid DeuteriumBottle (CNS)
jJ: Graphite
-*»-: Exhaust
(2) CNS: Cold Neutron Source
(4) DiO: Heavy Water
I Figure 1
Cross section of the KURR with major exhaust streams.
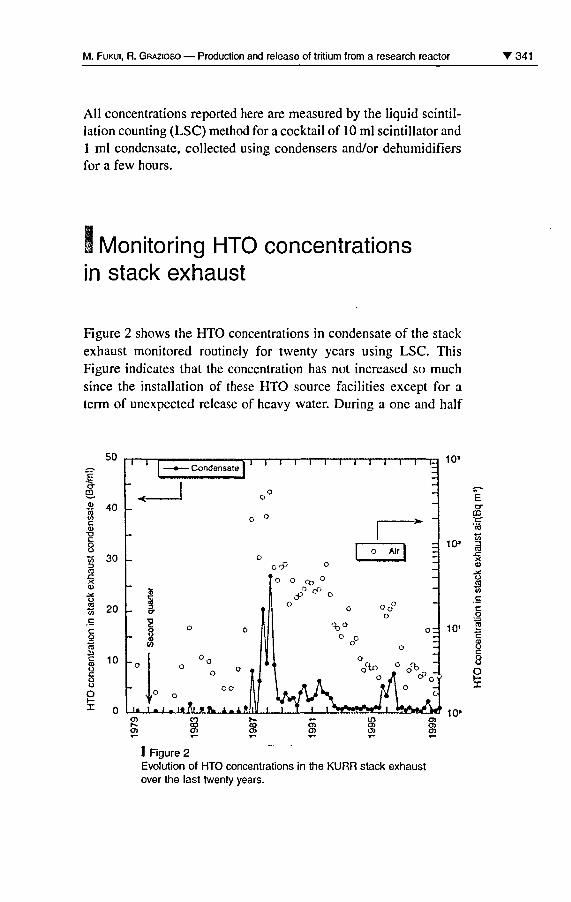
M. Fukui, R. Grazioso Production and release of tritium from a research reactor '341
Ail concentrations reported hère are measured by the liquid scintil¬lation counting (LSC) method for a cocktail of 10 ml scintillator and
1 ml condensate, collected using condensers and/or dehumidifiersfor a few hours.
S Monitoring HTO concentrationsin stack exhaust
Figure 2 shows the HTO concentrations in condensate of the stack
exhaust monitored routinely for twenty years using LSC. ThisFigure indicates that the concentration has not increased so muchsince the installation of thèse HTO source facilities except for a
term of unexpected release of heavy water. During a one and half
E
ri
50
40
«> 30
S 20
10
i r« Condensate
i i i i i i r ~i i i r
r°Il I » I , iAi »*. hEMI i i
OJ
en
10'
I Figure 2Evolution of HTO concentrations in the KURR stack exhaustover the last twenty years.
m
2x
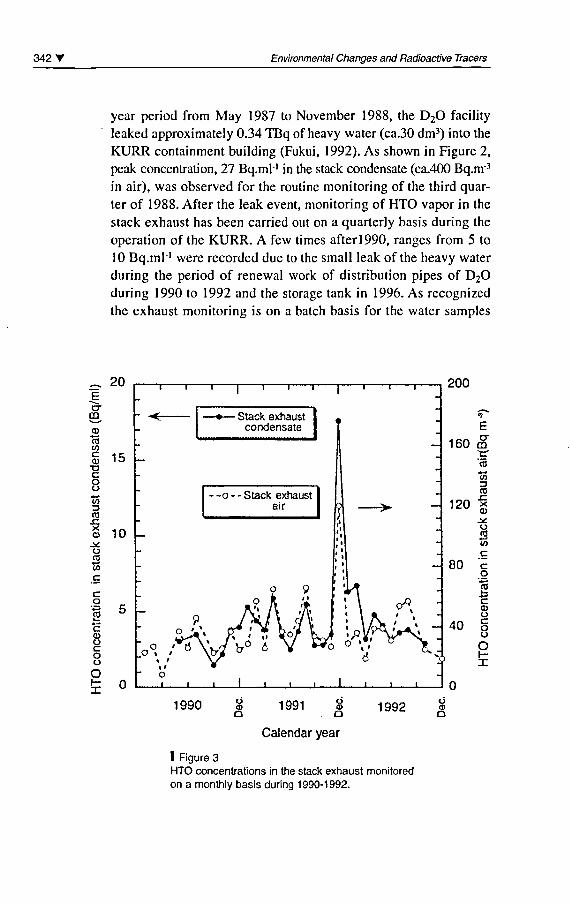
342' Environmental Changes and Radioactive Tracers
year period from May 1987 to November 1988, the D20 facilityleaked approximately 0.34 TBq of heavy water (ca.30 dm3) into the
KURR containment building (Fukui, 1992). As shown in Figure 2,
peak concentration, 27 Bq.mr1 in the stack condensate (ca.400 Bq.nr3
in air), was observed for the routine monitoring ofthe third quar¬
ter of 1988. After the leak event, monitoring of HTO vapor in the
stack exhaust has been carried out on a quarterly basis during the
opération of the KURR. A few times afterl990, ranges from 5 to10 Bq.ml"1 were recorded due to the small leak ofthe heavy waterduring the period of renewal work of distribution pipes of D20during 1990 to 1992 and the storage tank in 1996. As recognizedthe exhaust monitoring is on a batch basis for the water samples
20
crm - -<
O
15
totnc0)TJCoo
r/>3ro
sz
© 10o3wc
I *C03OCoo
Stack exhaustcondensate
-o - - Stack exhaustair
i^rvv
200
160 m
«/i3(0SZX0)
om
120
80
40
ï.1990 o
(Da
1991 oroÛ 1992
o<sO
Calendar year
I Rgure 3HTO concentrations in the stack exhaust monitoredon a monthly basis during 1990-1992.
co
c(DOCoo
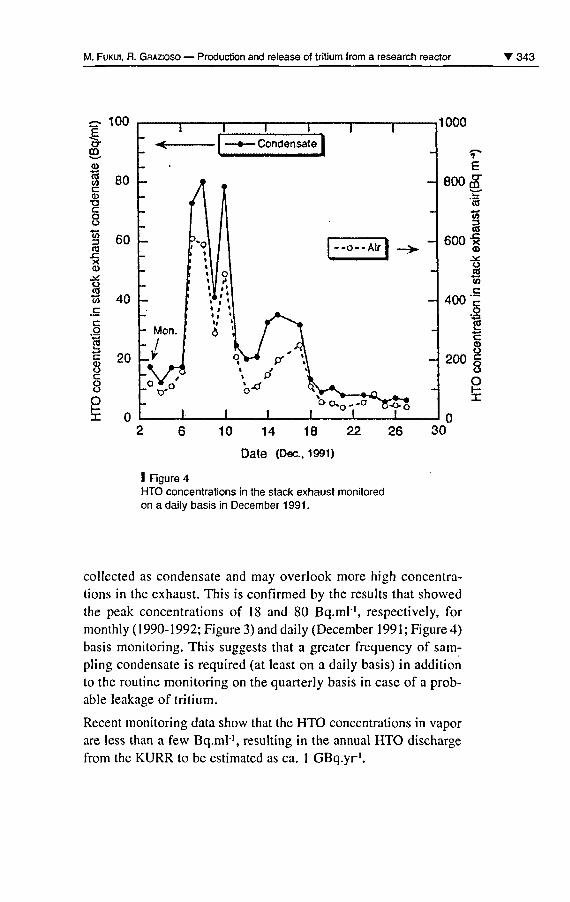
M. Fukui, R. Grazioso Production and release of tritium from a research reactor '343
100
orCO
<D
C03nczoo
1353taszX©
omoîc
co
coocoo
X
i i r
]- Condensate
-o-.Air
1000
7
E800 S"
m3CO
600 "SCD
OiSu
400 c+3
Sc
i8o
200
30
Date (Dec.. 1991)
I Rgure 4HTO concentrations in the stack exhaust monitoredon a daily basis in December 1991.
collected as condensate and may overlook more high concentra¬
tions in the exhaust. This is confirmed by the results that showedthe peak concentrations of 18 and 80 Bq.ml1, respectively, formonthly (1990-1992; Figure 3) and daily (December 1991; Figure 4)basis monitoring. This suggests that a greater frequency of sam¬
pling condensate is required (at least on a daily basis) in additionto the routine monitoring on the quarterly basis in case of a prob¬
able leakage of tritium.
Récent monitoring data show that the HTO concentrations in vaporare less than a few Bq.ml1, resulting in the annual HTO dischargefrom the KURR to be estimated as ca. 1 GBq.yr1.
344 Environmental Changes and Radioactive Tracers
Monitoring HTO concentrationsin containment building air
Procédure for assessmentof HTO concentrations in the air usinglaboratory dishes
The transfer of HTO vapor, Cv, from the air into dish water is pri-marily a function of two processes: exchange and evaporation.Exchange refers to the net transport of HTO into or out of the waterdish. Exchange is dépendent on the différence in spécifie activitiesbetween the water in the dish and the vapor in the air. Evaporationaffects the amount of HTO that leaves the water and retums to the
air. Thèse phenomena were modeled mathematically (Fukui, 1992).
The change in the HTO concentration, Cw, in the dish waterexposed to the HTO concentration in vapor, Cv, is expressed as:
Cw = Cv{l-(l-ket/H)^}/â, (1)
where:
Cw : the HTO concentration of the water sample (Bq.ml1);â : the ratio of isotropic concentrations (H3)/(H') in the
saturated vapor and liquid phases of tritiated;Cv : the HTO concentration in vapor (Bq.ml1);kc : the exchange rate constant (cm.h1);ke : the apparent evaporation rate constant (cm.h1);t : the elapsed time after exposure (h), and
H : the initial depth of water in the dish (cm).
Thus from eqn. (1), the average concentration in vapor during expo¬
sure time, t, is given by:
Cv=âCw/{ l-(l-ket/H)k^}. (2)
Finally, the concentration of HTO in air, Ca, is related to Cv by the
following équation:
Ca = KCV, (3)
where:
K = 2.9x10^ P1(273+T)'R/100, (4)
M. Fukui, R. Grazioso Production and release of tritium from a research reactor T 345
P is the saturated vapor pressure (mmHg) at température T(°C)(Anazawa et al, 1972), and R is the relative humidity (%). The iso¬
tope ratios, â, were found by measurement to be approximately 0.90to 0.92 (Sepall, 1960). The ratio kjke is estimated approximately as
1.8 for the given ambient température and humidity in the contain-ment building. Estimation of other parameter values including kc
and ke is described elsewhere (Fukui, 1993). Thus, ail constants can
be calculated or are given in order to monitor Ca.
A liquid scintillation counter was used to détermine the spécifie activ¬
ity of the water sample, from which the tritiated water vapor concen¬
tration was calculated. The samples were counted for three 10-minutecycles for tritium (3H) and carbon 14 (14C) as a reassurance that tri¬
tium was the main radioactive nuclide in the water samples.
Distribution of HTO concentrationin the containment building air duringventilation cessation using laboratory dishes
The distribution ofthe HTO concentration in the air ofthe contain¬ment building was determined from 30 laboratory dishes whichwere filled with 25 ml of tap water and placed on the floor and/ordesks. The reactor was shutdown at 16:00 on Fri., July 18, 1997 and
ventilation in the building ceased at 18:00 that day. After 40 hoursthe ventilation cessation, the dishes were exposed for 24 hours untillJuly 21, then they were weighed in order to estimate the evapora¬
tion rate and water sampling for radiometry on July 21 . The averageconcentration of HTO, Cv, estimated by the methodology describedabove was 54.5 Bq.ml"1 in the containment building and is shownfor each of the locations as the différence (Bq.ml1) from the aver¬
age concentration in Figure 5 together with the location numbers.The HTO concentrations in vapor in Figure 5 show a little depen¬
dence on the location of the sample. The values range from 30(No.24) to 75 Bq.ml-1 (No.8) with the lowest concentrations comingfrom the basement (heat exchange room). The heat exchange roomis isolated by a wall in the basement and the lowest downstream ofthe containment building, i.e. is connected to the exhaust stack, sug-gesting air exchange between the heat exchange room in the con¬
tainment building and field during venting cessation. The highest
346 T Environmental Changes and Radioactive Tracers
10*
o 10»
I 10«
§
I 10'ec
O 10°
10'
n i i rn i i tt v
--o-
2FCont Room
-IFDpFac.
-BF
I I I I
Mar. 24, 1997(Mon.) Jun. 2
Aug.11
I I I I.\,
8 10 12 14 16 18 20
Time elapsed (Weeks)
I Rgure 5Distribution of HTO concentrations in the vapor, CV, estimatedusing laboratorydishes filled with tap water (25 ml) set at 30locations for 24 hrs during ventingcessation in the KURRcontainment building. Bars indicate the différence in Bq.ml-1
from the average concentration for the 30 locations (54.5 Bq.ml 1).
concentration (No.8) that appeared near the D20 facility on the firstfloor may link to No. 16 in the basement, the location with the sec¬
ond highest concentration via. An open gallery under the A stairs.Thus, the local high concentration was found to be attributable tothe small leak of heavy water and/or HTO impregnated wastes
related to the D2O facility. From the above, this technique using lab¬
oratory dishes provides an adéquate distribution of HTO concentra¬tions within the three floors of the containment building. Figure 6
shows the HTO concentrations in dish water, Cw, at 30 locations,the vapor concentration estimated from eqn. (2), Cv, and the HTOconcentration in air, Ca, converted from eqn. (3). This indicates thatthe measured concentrations in dish water exposed for 24 hours fall
M. Fukui, R. Grazioso Production and release of tritium from a research reactor '347
10*
E
©
c<DTJC
8c
cri
8c
8
10'
10»
10-'
I I I I I I I I II I I I I 1 I r i i i i i i I i i i i--l
Ct--
--V-
fflO
-*-
- 2F Top shield- 1 F Elevator-1FB4- 1F CNS-1FB1BF ValveBF Ion exch.
-Stack
I I I I I I I I I I I I I I I I I I I I III
0 10 20 30 40 50 60
Time elapsed after venting resumptjon (h)
I Figure 6HTO concentrations in dish water, vapor and airat the 30 locations.
from 40 to 80% of Cv, depending on the température and humidityof each location. The highest concentration in air, 1.3 kBq.nr3, was
found at location No.16 in the basement. It is below the maximumconcentration limit for an average over three months, restricted bythe law, 700 kBq.nr3.
Changes in HTO concentration in vapor in thecontainment building after venting resumption
Four dehumidifiers were set in the containment building to investi-gate the changes in concentrations with time after venting resump¬
tion. As seen in Figure 7, the concentrations at the four locations on
348' Environmental Changes and Radioactive Tracers
I Rgure 7Changes in the HTO
concentrationin condensate within
the containment buildingafter venting resumption.
Bars: Différence from averagr*
HTO concentration m
vapor water (64.5 Bqjn) <)'*
Second Floorf~l Sampling Location
First Floor
Basement Floor
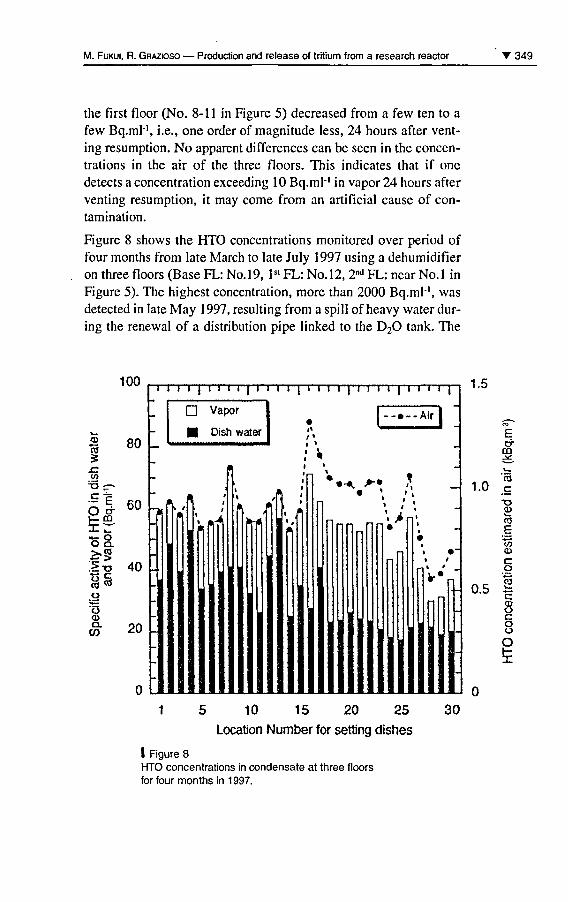
M. Fukui, R. Grazioso Production and release of tritium from a research reactor 349
the first floor (No. 8-11 in Figure 5) decreased from a few ten to a
few Bq.ml1, i.e., one order of magnitude less, 24 hours after vent¬
ing resumption. No apparent différences can be seen in the concen¬
trations in the air of the three floors. This indicates that if one
detects a concentration exceeding 10 Bq.ml-' in vapor 24 hours afterventing resumption, it may corne from an artificial cause of con¬
tamination.
Figure 8 shows the HTO concentrations monitored over period offour months from late March to late July 1997 using a dehumidifieron three floors (Base FL: No. 19, 1S,FL: No.12, 2ndFL: nearNo.l inFigure 5). The highest concentration, more than 2000 Bq.ml1, was
detected in late May 1997, resulting from a spill of heavy water dur¬
ing the renewal of a distribution pipe linked to the D20 tank. The
100
g 80
sz<nn ^-
stO &
s oO Q.
:Itj« «J
,o
73<DO.W
60
40
20
i i i i | i i i i | i i i i | i i i i | i i i i | i i i i |
D Vapor
Dish water
---Air
frA IU/
<
1.5
1 5 10 15 20 25
Location Number for setting dishes
I Figure 8HTO concentrations in condensate at three floorsfor four months in 1 997.
30
1.0
crm
co_ç
d)03
.§toQ>
CO
0.5 fOJocoo
O
350 T Environmental Changes and Radioactive Tracers
work for the renewal of the distribution pipe and tank finished inlate July 1997. Nevertheless, ingrowth ofthe HTO concentration invapor was shown in the containment building during venting cessa¬
tion after reactor shutdown. Monitoring the concentrations in vapornear the reactor core was then planned to Iocate a possible tritiumleak other than that from the D20 facility.
1 Monitoring HTO concentrationsin vapor in decay tank exhaust
Many source points in KURR were sampled in order to Iocate a
higher source of tritium activity or any other radionuclide that couldbe causing a higher spécifie activity in the air. The sources that weresampled includeed the: exhaust stack, reactor room exhaust, reactorroom filter chamber, expérimental pipe to the biological shielding,exhaust from the CNS and D20 facilities and air samples from ailthree floors of KURR. Among thèse, only the CNS and D20 facili¬ties showed an abnormally high spécifie activity. The 4 dm3 liquiddeuterium in a bottle as a neutron moderator set near the reactorcore is isolated by three layered aluminum conduit (5 mm thick)including a vacuum, a He and a Ne gas layer. The CNS system sur¬
rounded by a graphite block layer is isolated by sealing from whichexhaust air is introduced to decay tanks (1.3 m3) at a rate of ca. 2dm'.mn'1 in order to lower 4lAr concentration. The exhaust linepump for the CNS and D20 (flow rate: 0.53 dm'.mn-1, decay tankvolume: 0.56 m3) facilities only works to cover the reactor opéra¬
tion. Figure 9 shows the activity ofthe CNS and D20 exhaust vapor.The higher spécifie activities ranging from 130 to 200 kBq.ml-'were found at the inlet of the decay tank from the CNS graphite.Thèse values do not fluctuate because of the présence of the
graphite which can absorb tritium near the CNS facility and release
it depending on venting resumption by the pump set in the exhaustline. That is, the graphite may normalize the tritium concentrationwith time. On the other hand, the concentrations at the outlet ofthe
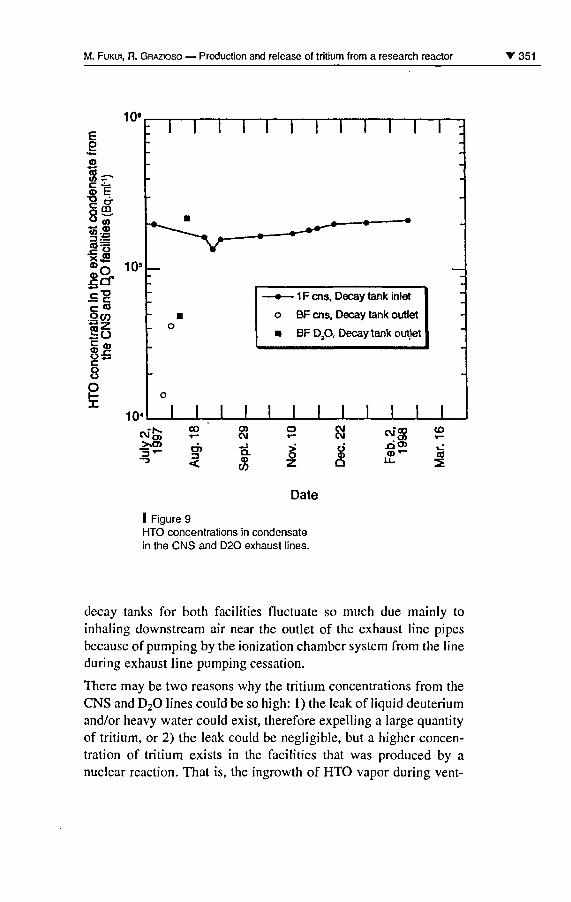
M. Fukui, R. Grazioso Production and release of tritium from a research reactor '351
EE
II; CDi'.PPlas?s".Qc/>
8
10»
m*
o
o
I I I I
I I I I I I I
1 F ens, Decay tank inlet
o BF ens, Decay tank outlet
BF DaO, Decay tank outlet
I I I I I I I
i.1i_Jl_i_
-
T11111
-
ll1
1
rxi"^ a
^ <
$ 81
& 6 u. 2
Date
I Figure 9HTO concentrations in condensatein the CNS and D20 exhaust lines.
decay tanks for both facilities fluctuate so much due mainly toinhaling downstream air near the outlet of the exhaust line pipesbecause of pumping by the ionization chamber system from the lineduring exhaust line pumping cessation.
There may be two reasons why the tritium concentrations from theCNS and D20 lines could be so high: 1) the leak of liquid deuteriumand/or heavy water could exist, therefore expelling a large quantityof tritium, or 2) the leak could be negligible, but a higher concen¬
tration of tritium exists in the facilities that was produced by a
nuclear reaction. That is, the ingrowth of HTO vapor during vent-
352 T Environmental Changes and Radioactive Tracers
ing cessation in the containment building may be caused by the
14N(n, 3H)12C reaction ofthe irradiation of nitrogen in air. Assumingthe constant concentration of 200 kBq.ml"1 is in a steady state in the
exhaust line vapor which is trapped by the CNS condenser, the pro¬
duction rate of HTO from the CNS line is estimated as 0.6 GBq.yr1.Considering the above and HTO sources of other exhaust lines fromthe KURR, the annual release rate based on the monitoring data
from the stack exhaust, 0.6 GBq.yr1, may increase by a factor. Theproduction of a large content of tritium from the D20 facility couldnot be discarded through the 6Li(n,à)3H reaction. The probablesource of tritium, Li, was removed from the expérimental devices inJuly 1997. Ail ofthe water samples collected were also counted for14C, which was thought to hâve contributed to the higher than
expected activities. But the constituent of 14C in the activity ofthesamples was less than a few percent and, therefore, considered to be
minimal.
Précise estimation for the amount of discharge from the KURR is
under investigation using not only a LSC method but also a 1.5 1
portable ionization chamber focused on near core exhaust.
Conclusions
The use of laboratory dishes in estimating the HTO concentration inair proved to be very simple and effective. The laboratory dish
method did provide us with the useful information of a low HTOconcentration in the containment building air. Unfortunately, since
the HTO concentrations within the containment building air werenot so différent, a positive location of a tritium leak could not be
identified. Even after the renewal of distribution pipes, valves and
tank for heavy water, which were likely points of HTO leakage,
higher than concentrations were found in the exhaust air from facil¬
ities adjacent to the reactor core. This was a cause of ingrowth in the
HTO concentration in the containment building during venting ces¬
sation. Our next step must be to concentrate the sampling aroundthe reactor core in order to pinpoint the précise location ofthe leak
M. Fukui, R. Grazioso Production and release of tritium from a research reactor 353
and/or to estimate the production rate by the neutron reaction. Theproduction and leak should be located and rectified in order to lowerthe tritium concentration throughout the containment building.Though the annual discharge of tritium from the KURR was esti¬
mated to be around 1 GBq.yr1, This must be done in accordancewith ALARA. It is hoped that the leak is small, and that a large per¬
centage ofthe tritium leaking is from a nitrogen reaction not an arti¬
ficial one.
AcknowledgementsThis research was supported, in part,
by Grant-in Aid for Scientific Research from the Ministry of Education,Science, Sports and Culture, Japan.
A portion of this work was done while R. Grazioso,University of New Mexico, USA was an exchange student
at the Kyoto University. Mr. T. Yoshimoto provided technical assistancein monitoring activities.
BibliographyAnazawa Y., Kokubu M.,FujitaK., 1972-Monitoring of Tritium in the WorkingEnvironment. Hoken Butsuri (JapanJ. Health Phys.), 7: 27-35.
Fukui M., 1992Modeling the Behavior of TritiatedWater Vapor in a Research ReactorContainment Building. Health Phys.,62:144-154.
Fukui, M., 1993-Development of a ConvenientMonitoring Method for Tritiated WaterVapour in Air using Small WaterDishes as Passive Samplers. RadiâtProt Dosimetry, 48: 169-178.
Sepall O., Mason S. G., 1960 -Vapor/Liquid Partition of Tritium inTriated Water. Can. J. Chem.38: 2024-2025.


Oral/Posterprésentations
Session 4

Session 4 Oral/Poster présentations T 357
S Particulate radionuclide monitoringin the South Pacific and compliancewith the comprehensivenuclear-test-ban treaty (CTBT)
R. A.Tinker
Following the opening for signing of the Comprehensive Nuclear-Test-Ban Treaty (CTBT) by the United Nations member countries,in September 1996, vérification of Treaty compliance is now an
important international issue with NRL atmospheric monitoringstations becoming part of the global vérification network. In 2000major upgrades to stations at Kaitaia, New Zealand, and Rarotonga,Cook Islands, were completed, and a new atmospheric monitoringstation installed at Chatham Islands, New Zealand. Thèse stationsnow comply with the CTBT technical spécifications. Majorequipment at thèse stations consist of thin window 50% BroadEnergy Canberra Ge detectors and PTI 900 m3 high-volume airsamplers. Stations operate daily with a 24 hours sampling period, a
24 hours decay period, and a 24 hours gamma spectrometricanalysis. Acquisition data and station state of health information(eg. Indoor température and humidity) are sent via the GlobalCommunication Infrastructure every 2 hours. Data is analysed bythe International Data Centre (IDC), Vienna, and the NRL. A stationis graded on its ability to achieve a Ba-140 (half-life = 12.8 days)Minimum Détectable Concentration (MDC) of less than 30 uBq.nv3and to maintain 95% data availability (a maximum of 14 days downtime a year). The Ba-140 MDC at Kaitaia and Chatham Islandsstations were recorded at 5 uBq.nv3, while at Rarotonga an MDC of10 uBq.nr3 was measured. To support a 95% data availability, a
comprehensive spare parts inventory is maintained in addition to a
358 T Environmental Changes and Radioactive Tracers
robust quality management system for preventative maintenance.An overview of CTBT requirements, station opérations and
management will be presented. Analytical data obtained at thèse
stations, including minimum détectable concentrations and dailynaturally occurring radionuclide trends, will be presented and
interprétation of observations suggested.
Session 4 Oral/Poster présentations T 359
S Uranium and thorium sériesradionuclides in rainwater samplesover several tropical storms
P. Martin
Most studies of radionuclides in précipitation involve sample col¬
lection periods of days or longer, in order to détermine long-termaverage fluxes to the Earth's surface. However, where knowledge ofthe dynamics of précipitation scavenging is desired, otherapproaches may prove valuable. In the présent study, rainwatersamples were collected at two locations, Jabiru and Jabiru East, inthe Northern Territory of Australia. The main purpose of the studywas to improve our understanding of the dispersion and dépositionof airborne dust originating from the nearby Ranger U mine.Collections were restricted to single rainstorm events. The mea¬
sured 232Th/230Th ration in rainstorm samples from the two sites var¬
ied between 0.01 and 0.5, implying a contribution from dustoriginating from the minesite. Concentrations of 238U, 234U, 230Th,
226Ra and 2l0Pb were generally in the range of 0.5-50 mBq.l '.Concentrations of 2I0Pb were higher, reflecting the additional con¬
tribution of ingrowth from 222Rn in the atmosphère. For six events,sequential intra-storm samples were collected, primarily in an
attempt to distinguish the source of radioactivity as being from rain-out (activity captured by précipitation below the raincloud) orwashout (captured within the cloud). Concentrations of U, 230Th and
226Ra generally decreased over the course of rainstorms, implyingrainout from the air column below the cloud, but the results for 210Pb
and 210Po are more complex.
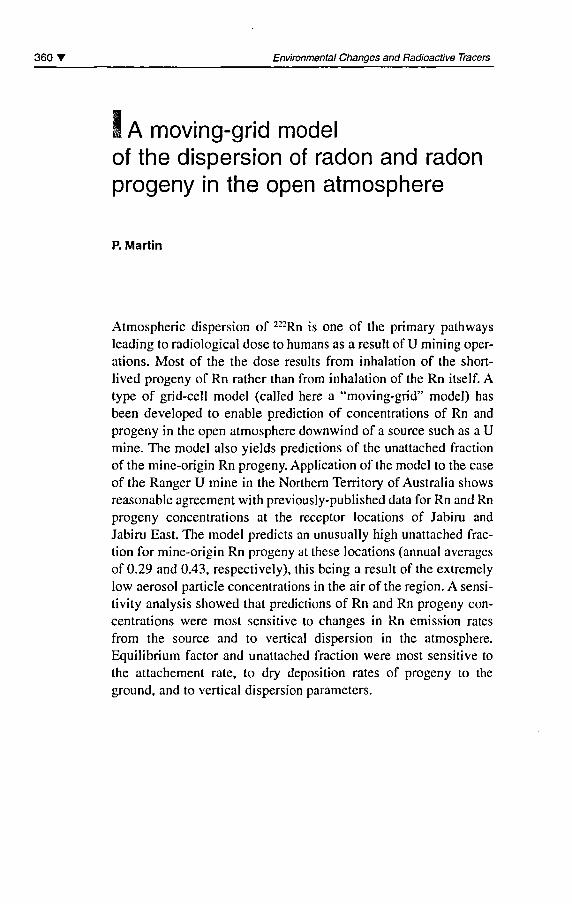
360 T Environmental Changes and Radioactive Tracers
S A moving-grid modelof the dispersion of radon and radonprogeny in the open atmosphère
P. Martin
Atmospheric dispersion of 222Rn is one of the primary pathwaysleading to radiological dose to humans as a resuit of U mining opér¬
ations. Most of the the dose results from inhalation of the short-lived progeny of Rn rather than from inhalation of the Rn itself. Atype of grid-cell model (called hère a "moving-grid" model) has
been developed to enable prédiction of concentrations of Rn and
progeny in the open atmosphère downwind of a source such as a Umine. The model also yields prédictions of the unattached fractionofthe mine-origin Rn progeny. Application ofthe model to the case
of the Ranger U mine in the Northern Territory of Australia showsreasonable agreement with previously-published data for Rn and Rn
progeny concentrations at the receptor locations of Jabiru and
Jabiru East. The model predicts an unusually high unattached frac¬
tion for mine-origin Rn progeny at thèse locations (annual averages
of 0.29 and 0.43, respectively), this being a resuit of the extremelylow aérosol particle concentrations in the air ofthe région. A sensi¬
tivity analysis showed that prédictions of Rn and Rn progeny con¬
centrations were most sensitive to changes in Rn émission rates
from the source and to vertical dispersion in the atmosphère.Equilibrium factor and unattached fraction were most sensitive to
the attachement rate, to dry déposition rates of progeny to the
ground, and to vertical dispersion parameters.
Session 4 Oral/Poster présentations T 361
l210Po and 210Pb air-surfacedéposition fluxesin Japanese coastal area
Y.Tateda K. Shimoike
K. Iwao M. Ouya
210Atmospheric déposition of Pb is important in calculating down-ward transport fluxes of Po-adsorptive débris in open water, while
Po atmospheric déposition is generally negligible in océan surface.However, in coastal area, the Pb déposition is higher and variable,
210and the excess Po atmospheric déposition is sometimes detectedprobably because of land-born wind-driven re-suspended soil parti-cle's déposition. In the estimation of particle removal rate by particlereactive thèse nuclides in coastal waters, the sight spécifie atmo¬
spheric déposition flux estimation will be necessary. In high latitudeAsian coastal area of North Pacific Océan, the Chinese continental
210air-mass and wind-driven particles are the significant source of Po
and Pb. Briefly, the Po and Pb concentrations are expected tobe raised under the conditions of land-originated wind blows from theChinese continent. To clarify the generality and variations of thèse
nuclide's atmospheric déposition fluxes around Japanese coastal area,
we analyzed the Po and Pb concentrations in dry and wet fallouton Japanese coastal area. We estimate the balance of Po and Pb
déposition flux on Japanese coastal area and discuss the origin and
variations of thèse nuclide's déposition fluxes. The resuit indicated210 210
that the large seasonal variations of Po and Pb atmospheric dépo¬
sitions in Okinawa coastal area, which shows high in late winter and
low in summer, indicating the main source of Po and Pb are esti¬
mated to be Chinese continent origin, because the NW monsoon fromcontinent is dominant in winter. While in coastal area of mainlandarc, Po and Pb déposition fluxes are high during winter and rainyseasons, indicating the mainland is other source of thèse nuclides.
362 T Environmental Changes and Radioactive Tracers
I Atmospheric 7Be/210Pb as a toolfor determining the origin of detritalmaterial in ombrogenous sédiment:a hypothesis
C. W. Holmes
E. Shinn
M. E. Marot
7Be and 210Pb distribution in sédiments and in the atmosphère are
potentially useful in studying the dynamics of surface processes. 210Pb
in the atmosphère origin lies in the degassing of 222Rn from continen¬
tal surfaces. As the 222Rn flux from the océan is negligible, and thus
210Pb may be a useful tracer of continental material transport. 7Be, on
the other hand, is produced via cosmic ray spallation reactions withnitrogen and oxygen. The measured ratio of thèse two isotopes inaérosols over the Atlantic is being used to examine the transport ofAfrican Dust to the southeastem United States. The 'Be/^Pb activityratio of material collected in the Azores during a storm event at the
end of February averaged 4.0 ± 0.2, with concentrations varyingbeing 50-150 Bq.g"1 for 210Pb and 180 and 750 Bq.g-1 for 7Be.
Comparing thèse ratios with the historical record in Miami indicatedmuch of the material is transport across the Atlantic within a veryshort time. In south Florida, there is growing body of évidence thatsuggests that much of the trace métal load in ombrogeneous sédi¬
ments of the Florida Everglades is derived from extemal sources.
What is unknown at this time is whether this material is derived fromrégional sources or part of the Worldwide atmospheric transport ofmaterial. Using thèse ratios and the measured elemental concentra¬
tions the sources appeared to be defined. In the ombrogeneous sédi¬
ment of south Florida, there is significant évidence that metals maybe derived from transported aérosols with some contribution as detri¬
tal material transported with Africa as dust during the summer.
Session 4 Oral/Poster présentations T 363
I A rapid estimationof 210Po and 210Po in rainwater
G. A. Peck
J. D. Smith
A method for détermination of 2,0Po and 210Pb in rainwater samples
is described. This method was developed to permit measurement ofthe radionuclides in rainwater samples collected at short time inter¬
vais (2 weeks) on a small area (0.5 m2) and to give results with theminimum delay. 2I0Pb was estimated from counts of the daughter210Bi after allowing 30 days for ingrowth. 2,0Po was measured
directly by alpha-spectrometry. The radionuclides were collectedfrom rainwater samples by co-precipitation with manganèse dioxideand dissolution of the precipitate in a small volume of HCI/H2O2.2iop0 was p]ated onto silver and counted immediately and stable Biwas added to the solution which was allowed to stand for 30 days.
After this time 2l0Bi was separated from the 2,0Pb by extraction into0.2% DDTC in chloroform and precipitated as bismuth oxychlo-ride. The bismuth oxychloride was collected by filtration and the
2l0Bi counted using a gas-flow proportional counter. 210Pb activitywas inferred from the 210Bi activity. This procédure allowed rapid,sensitive and cost effective measurement of 2l0Bi in rain water witha limit of détection 4.2 mBq and a coefficient of variation of 2% forfour replicate analyses at the 1.0 Bq level.

Radioactivityin soils and related issues
Session 5
Chai rman: P. Schuller
Session opening: T. Quine

Application of Chernobyl-derived 137Cs for assessmentof soil redistributionin agricultural catchmentsof central Russia
Valentin N. Golosov
Maxim Vladimirovich Markelov
Introduction
Problems of soil dégradation and water pollution are very signifi¬cant for agricultural zone of Russia, because of two reasons: rela¬
tively high soil érosion rates and Chernobyl contamination of vastareas within Russian Plain. The northern part of Srednerusskayaupland is one of the hot plots, where combination both high inten¬
sity of soil érosion and extremely high level of radionuclide con¬
tamination are observed. This area 200-300 km south of Moscow ischaracterized by very contrast relief with deep river and balka val¬
ley and the high érosion index of rain-storms. The cultivated area
varies from 60% to 75% from total area ofthe small river basin. Themost part of the land is cultivating during 300-350 years and as faras 120-130 years ago the area of arable lands reached the maximumup to 80%. Even extremely steep valley slopes were ploughed inthis period. As a resuit the increase the sheet, rill and gully érosionwas observed. About 40-50% of small creek and some of the smallrivers were completely filled and they transformed into dry valleywith relatively flat bottom without permanent flow, which are
named locally balka. Now the balka basin is the main area of sedi-
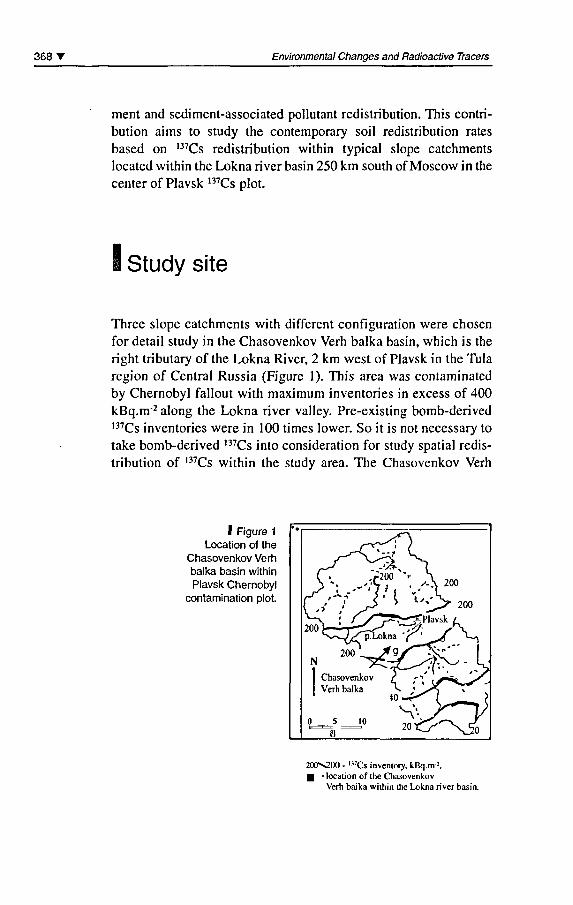
368' Environmental Changes and Radioactive Tracers
ment and sediment-associated pollutant redistribution. This contri¬bution aims to study the contemporary soil redistribution rates
based on 137Cs redistribution within typical slope catchmentslocated within the Lokna river basin 250 km south of Moscow in the
center of Plavsk 137Cs plot.
1 Study site
Three slope catchments with différent configuration were chosenfor détail study in the Chasovenkov Verh balka basin, which is the
right tributary of the Lokna River, 2 km west of Plavsk in the Tularégion of Central Russia (Figure 1). This area was contaminatedby Chernobyl fallout with maximum inventories in excess of 400kBq.nr2 along the Lokna river valley. Pre-existing bomb-derived137Cs inventories were in 100 times lower. So it is not necessary totake bomb-derived ,37Cs into considération for study spatial redis¬
tribution of 137Cs within the study area. The Chasovenkov Verh
I Figure 1
Location of theChasovenkov Verhbalka basin withinPlavsk Chernobyl
contamination plot.
200>s200 - l37Cs inventory, kBq.m 2.
g - location of the ChasovenkovVerh baika within the Lokjia river basin.
V. N. Golosov, M. V. Markelov Chernobyl-derived 137Cs for assessment of soil redistributionY 369
balka is the former river (according of the map produced in themiddle of XIX century) which were completely filled by sédimentdue to intensive gully and rill érosion in the end of XIX century.Recently gullies stop their growth and most part of sédiment deliv¬ered to the balka bottom from cultivated slope as a product of rilland sheet érosion. The underlying geology of the both catchmentsis limestone with clay layers overlying Holocène loess. Meanannual précipitation is 650 mm with about half of them during coldperiod as snow.
The soils are primarily typical and leaching chernozem, with a
loamy texture. The most part of cultivated soil lost about half oftheir initial humus content in the upper 10 cm layer during the
period of cultivation. The upper parts of cultivated slopes are occu-pied by typical chernozem and the lower relatively steep parts ofcultivated slopes are occupied by leaching chernozem.
Three slope catchments of différent configuration were chosen fordétail study of érosion rates within the Chasovenkov Verh balkabasin (Table 1). The first catchment has complex longitudinal form
Site 1
Site 2
Site 3
Areaha
0.92
6.6
7.7
Slopelength, m
200-250
200-400
450-550
Slopegradient, %
6-15
4-8
5-10
Configuration
convex slope
hollow catchment
straight slope
Soil
leaching chernozem
leaching+typical chernozem
leaching chernozem
Humuscontent, %
2.4-3.8
2.4-3.84.6-5.5
2.4-3.8
I Table 1
Catchments characteristics.
with maximum angle in the bottom of cultivated part (Figure 2).The small hollow watershed is the second site. This catchment has
asymmetrical form with relatively steep short south slopes and
more gentle north slopes (Figure 2). The catchment located on the
lower part of slope and part of surface runoff and sédiments fromthe upper slopes cross the ground road, located upper border of this
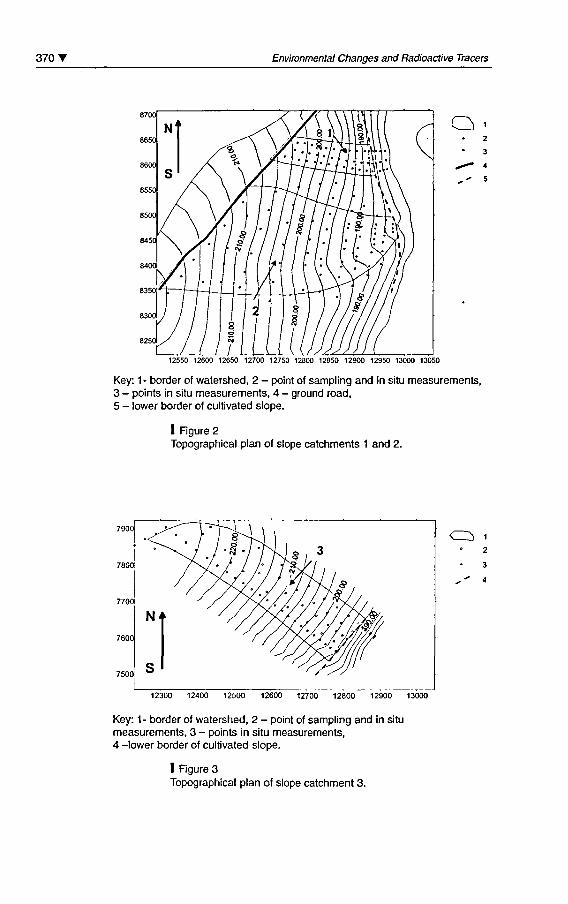
370 T Environmental Changes and Radioactive Tracers
Q
12550 12600 12650 12700 12750 12800 12850 129O0 12950 13000 13050
Key: 1- border of watershed, 2 - point of sampling and in situ measurements,3 - points in situ measurements, 4 - ground road,5 - lower border of cultivated slope.
1 Figure 2Topographical plan of slope catchments 1 and 2.
7700I
7600
12300 12400 12500 12600 12700 12800 12900
Key: 1- border of watershed, 2 - point of sampling and in situmeasurements, 3 - points in situ measurements,4 -lower border of cultivated slope.
I Figure 3Topographical plan of slope catchment 3.
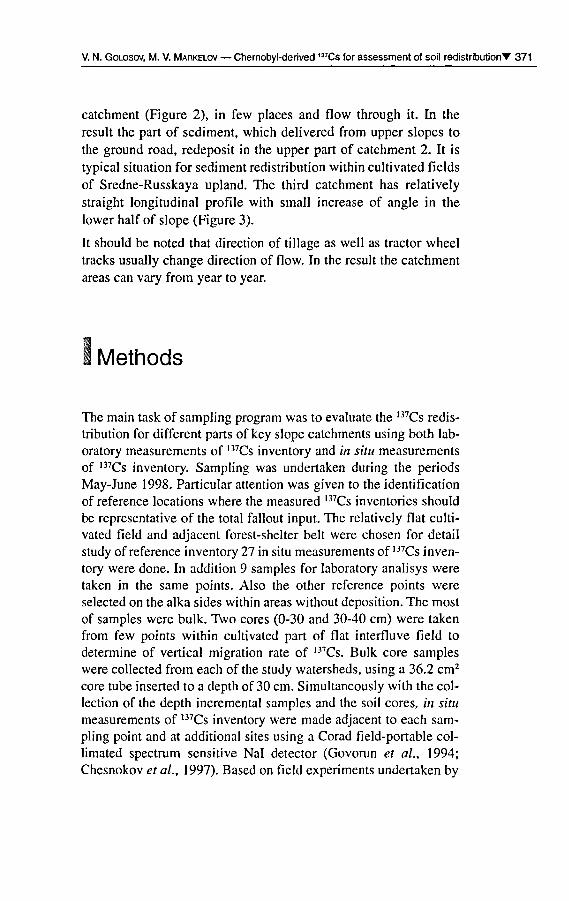
V. N. Golosov, M. V. Markelov Chernobyl-derived 137Cs for assessment of soil redistributionT 371
catchment (Figure 2), in few places and flow through it. In the
resuit the part of sédiment, which delivered from upper slopes tothe ground road, redeposit in the upper part of catchment 2. It is
typical situation for sédiment redistribution within cultivated fieldsof Sredne-Russkaya upland. The third catchment has relativelystraight longitudinal profile with small increase of angle in thelower half of slope (Figure 3).
It should be noted that direction of tillage as well as tractor wheeltracks usually change direction of flow. In the resuit the catchmentareas can vary from year to year.
i Methods
The main task of sampling program was to evaluate the l37Cs redis¬tribution for différent parts of key slope catchments using both lab¬
oratory measurements of l37Cs inventory and in situ measurementsof 137Cs inventory. Sampling was undertaken during the periodsMay-June 1998. Particular attention was given to the identificationof référence locations where the measured 137Cs inventories shouldbe représentative of the total fallout input. The relatively flat culti¬vated field and adjacent forest-shelter belt were chosen for détailstudy of référence inventory 27 in situ measurements of 1J7Cs inven¬tory were done. In addition 9 samples for laboratory analisys weretaken in the same points. Also the other référence points wereselected on the alka sides within areas without déposition. The mostof samples were bulk. Two cores (0-30 and 30-40 cm) were takenfrom few points within cultivated part of flat interfluve field todétermine of vertical migration rate of 137Cs. Bulk core sampleswere collected from each ofthe study watersheds, using a 36.2 cm2
core tube inserted to a depth of 30 cm. Simultaneously with the col¬
lection of the depth incrémental samples and the soil cores, in situmeasurements of 137Cs inventory were made adjacent to each sam¬
pling point and at additional sites using a Corad field-portable col-limated spectrum sensitive Nal detector (Govorun et al., 1994;Chesnokov et al, 1997). Based on field experiments undertaken by
372 T Environmental Changes and Radioactive Tracers
the designers of the Corad equipment, the detector is capable ofmeasuring 137Cs inventories in the range 0.37 - 5.55xl02 kBq.nr2 todepths of up to 40 cm with a précision better than ±20%. Because
ofthe high levels of 137Cs présent in the soil ofthe study area, prob¬
lems associated with interférence by other radionuclide are min-imised and the in situ measurements required count times of only a
few minutes. The possibilities of use in situ 137Cs inventory mea¬
surements for analysis of 137Cs redistribution were discussed else¬
where (Golosov et al, 2000).
A detailed topographie survey of the each key watershed, the sam¬
pling and measurements points was made using a differential GPS
System, which provided measurements of height and position witha maximum error of ±2cm. The resulting data were used to produce1:2000 plans ofthe study catchment (Figure 2, 3).
Ail soil samples were dried and sieved to <2mm prior to laboratorymeasurement of their 137Cs content by gamma spectrometry using an
HPGe coaxial detector calibrated with Standard Référence Materialsand laboratory standards made using standard solutions. Count timeswere sufficient to provide a typical analytical précision of ±4-5%.
The information about crop rotation and peculiarities of soil culti¬vation was collected for period 1986-1998 for each watershed fromlocal farmers. Also additional meteorological information forperiod 1986-1998 were received from meteorological station,which is located in 1.5 km east of key catchments. Data about soilcharacteristics were taken from Agricultural Institute of the CentralRégion, which are located near the Lokna river basin.
The proportional and standard mass-balance models were used forcalculation of érosion and déposition rates for each key catchment,using software elaborated by D.E. Walling and Q. He. The propor¬
tional model can be represented as follows:
, BdXY = 10 IôôtF (1)
where: Y - mean annual soil loss (tons.ha1 .yr1); d - depth of ploughor cultivation layer (m); B- bulk density of soil (kg.nv3); X - per¬
centage réduction in total 137Cs inventory; T - time elapsed sinceinitiation 137Cs accumulation (yr); P- particle size correction factor.
V. N. Golosov, M. V. Markelov Chernobyl-derived ,37Cs for assessment of soil redistribution^ 373
Percentage réduction in total 137Cs inventory defined as:
A -AX = ^- xlOO (2)
where:Aref_ local 137Cs référence inventory (Bq.nr2);A - measured total 137Cs inventory at the sampling point (Bq.nr2).Standard Mass Balance Model (MBM-1) was used for calculationerosion-deposition rates within each sites. For calculation of érosionrates the following équation was applied:
v=12#|i-H-^l I o.[/ X \ 1/(M986)"1
where:Y- mean annual soil loss (tons.ha'.yr1); d- depth of plough or cul¬
tivation layer (m);5 - bulk density of soil (kg nr3); X - percentageréduction in total 137Cs inventory defined as (Aref-A)/Aref x 100);/-time (yr); P - particle size correction factor .
Déposition rate was estimated from the 137Cs concentration of thedeposited sédiment according to:
R AM At)~Aef (4)
JCa(f)ûx(f-f>df fCJf)ex(t-nd1936 1986
where:Aex(t) - excess 137Cs inventory ofthe sampling point over référenceinventory at year t' (Bq.nr2); CJt') - 137Cs concentration ofdeposited sédiment at year t' (Bq.kg1); X - decay constant for 137Cs
(yr1), Z5'- particle size correction factor.
Calculation of soil érosion rate using modified version of USLE(for assessment of rain érosion) and model of State HydrologicalInstitute (for assessment of érosion during snow-melting period)(Larionov, 1 993) was made for each key catchment. In the resuit thesoil érosion maps for each site were produced.
374 T Environmental Changes and Radioactive Tracers
i Results
The comparison results of calculations with actual soil losses fromdifférent cultivated slope of Russian Plain demonstrate that in the
cases érosion models (modified version of USLE and StateHydrological Institute model) results overestimated annual sédi¬
ment output from slope catchments mostly on 20-40%, but some¬
times even in two times (Golosov, 1998). However it probably can
be explain the absent of correct information about crop rotation forthe entire period of calculation. In our study we hâve the détailinformation about crop rotation from 1986. Soil érosion map withannual soil losses for the period 1986-1998 were produced for each
key catchment. Using USLE, the mean annual érosion rates for ailcatchments are in one range: 11.5; 11.8 and 13.8 Mg.ha-1 fromcatchment 1, 2 and 3 respectively.
Because in situ and laboratory measurement of l37Cs inventory weremade, it is necessary to compare both sets of data. First it should be
noted that the measurements provided by the Corad equipmentrelate to a surface area of 2.1 m2, which represents the field of viewbelow the detector collimator, whereas those for the cores relate toan area of only 36.2 cm2. In view of the microscale spatial variabil¬ity of 137Cs inventories, which has been widely reported in the liter¬
ature (Sutherland, 1991, 1994; Owens and Walling étal, 1996), the
larger surface area sampled by the in situ detector could be expectedto reduce the effects of this variability and should therefore resuit inlower values of standard déviation, coefficient of variation and
range for the in situ measurements.
As our previous study demonstrate (Golosov et al, 2000), in the
case of the cultivated areas différence between in situ and labora¬
tory measurement is not high. This reflects the mixing caused byploughing and cultivation, which reduce the microscale variabilityof 137Cs inventories and thus the potential contrast between the twosets of measurements. The enough good corrélation between twodata sets was received for two catchments of the Chasovenkovbalka basin (Figure 4). The each sampling point represent the mean
value between rill and interrill surfaces. In situ measurement char-
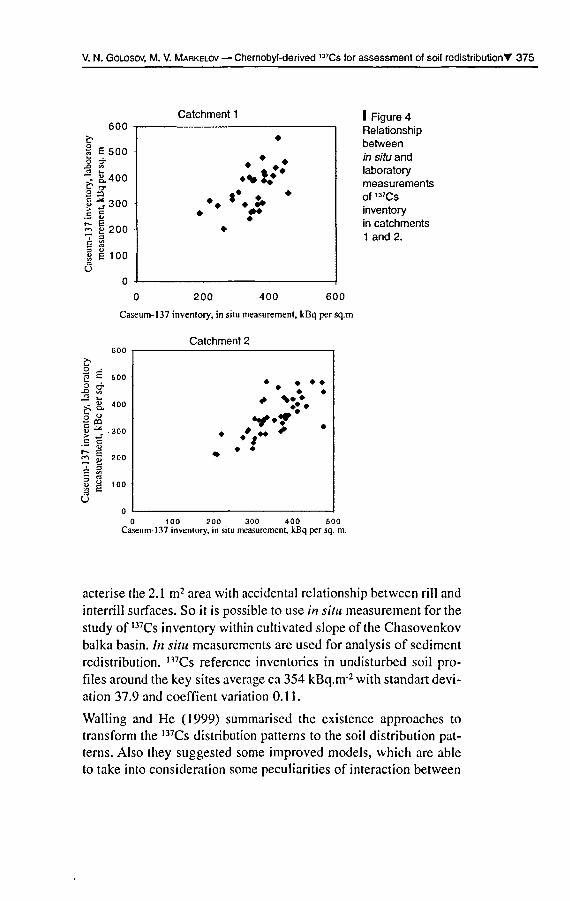
V. N. Golosov, M. V. Markelov Chernobyl-derived 137Cs for assessment of soil redistributionT 375
Catchment 1
600I Figure 4Relationshipbetweenin situ andlaboratorymeasurementsof ,37Cs
inventoryin catchments1 and 2.
en
200 400 600
Caseum- 1 37 inventory, in situ measurement, kBq per sq.m
500
400
300
200
100
Catchment 2
*
* *%*
0 100 200 300 400 500Caseum- 137 inventory, in situ measurement, kBq per sq. m.
acterise the 2.1 m2 area with accidentai relationship between rill and
interrill surfaces. So it is possible to use in situ measurement for thestudy of 137Cs inventory within cultivated slope ofthe Chasovenkovbalka basin. In situ measurements are used for analysis of sédimentredistribution. 137Cs référence inventories in undisturbed soil pro¬
files around the key sites average ca 354 kBq.nr2 with standart dévi¬ation 37.9 and coeffient variation 0.11.
Walling and He (1999) summarised the existence approaches totransform the 137Cs distribution patterns to the soil distribution pat¬
terns. Also they suggested some improved models, which are ableto take into considération some peculiarities of interaction between
376 T Environmental Changes and Radioactive Tracers
fresh bomb-derived ,37Cs fallout, grain size and tillage. Howeverthe proportional model (Mitchell et al, 1980; Walling and Quineet al, 1990) and standard mass balance model (Kachanoski and de
Jong, 1984; Quine, 1989; Walling and Quine, 1990; Ostrova et al,1990) is enough correct for area with Chemobyl-derived 137Cs,
because Chernobyl radionuclide fallout accumulation was occurredduring very short period of time (27 April- 15 May 1986) and theail bare slopes were cultivated shortly after the fallout input.Uncertainties associated with the fate of freshly deposited 137Cs
prior to its incorporation into the plough layer by cultivation are
substantially reduced. This is also true for fields under winter cornand perennial grass, because according of observation érosion rate
is very low under thèse crops during summer period. According ofresults of comparison of grain size distribution of suspended sédi¬
ment, which were taken from flow near lower border of cultivatedfield, and samples of surface soil from cultivated field fromChasovenkov Verh balka basin demonstrates, that they are verysimilar (Walling et al, in press). Tillage effect is not significant yetfor cultivated slope of the Lokna river basin, because only twelveyears pass from 1986 with only maximum two tillalage opérationsper year. However the tillage opération influence on the soil redis¬
tribution within shoulders of the local catchments. The proportionaland standard mass-balance models were used for calculation of éro¬
sion and déposition rates for each key catchment, using softwareelaborated by D.E. Walling and Q. He.
The results of calculation the érosion and sédimentation rates are
presented in Tables 2 and 3. If it is compare the patterns of soilredistribution, which were received used proportional and standardmass-balance models, there are no essential différences (Figure 5).However some disparity can be found between values of gross and
net érosion rates and déposition rates. Mass-balance model givemore contrast results (Table 3, 4). It is interesting that area of erod-ing sites decrease with complication of relief pattern from relativelysimple catchment 3 to hollow catchment 2 (Table 3, 4). Howeverarea of aggrading sites is enough vast within the ail sites. The soilaggradation in the upper part connects with transport of soil particlewith runoff from the fields located upper the road and their redepo-sition within the top part of catchment 2. As we observed duringrain storm, stream formed along road overflows through the roadedge during extrême érosion events.
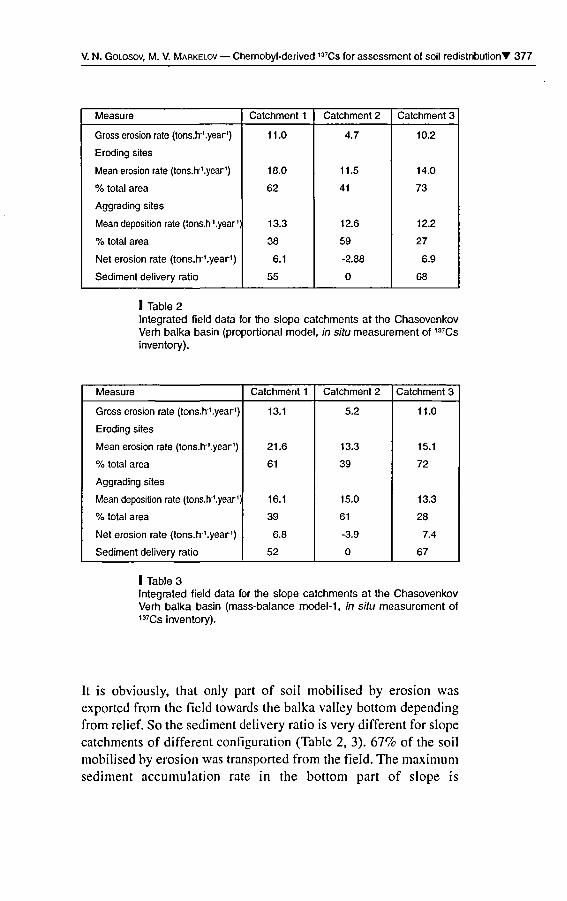
V. N. Golosov, M. V. Markelov Chernobyl-derived 137Cs for assessment of soil redistributionT 377
Measure
Gross érosion rate (tons.lï'.year1)
Eroding sites
Mean érosion rate (tons.h'.year1)
% total area
Aggrading sites
Mean déposition rate (tons.h'.year1)
% total area
Net érosion rate (tons.h'.year1)
Sédiment delivery ratio
Catchment 1
11.0
18.0
62
13.3
38
6.1
55
Catchment 2
4.7
11.5
41
12.6
59
-2.88
0
Catchment 3
10.2
14.0
73
12.2
27
6.9
68
I Table 2Integrated field data for the slope catchments at the ChasovenkovVerh balka basin (proportional model, in situ measurement of 137Cs
inventory).
Measure
Gross érosion rate (tons.h'.year1)
Eroding sites
Mean érosion rate (tons.h'.year1)
% total area
Aggrading sites
Mean déposition rate (tons.lv1 .year1)
% total area
Net érosion rate (tons.lr'.year1)
Sédiment delivery ratio
Catchment 1
13.1
21.6
61
16.1
39
6.8
52
Catchment 2
5.2
13.3
39
15.0
61
-3.9
0
Catchment 3
11.0
15.1
72
13.3
28
7.4
67
I Table 3Integrated field data for the slope catchments at the ChasovenkovVerh balka basin (mass-balance model-1, in situ measurement of137Cs inventory).
It is obviously, that only part of soil mobilised by érosion wasexported from the field towards the balka valley bottom dependingfrom relief. So the sédiment delivery ratio is very différent for slopecatchments of différent configuration (Table 2, 3). 67% of the soilmobilised by érosion was transported from the field. The maximumsédiment accumulation rate in the bottom part of slope is
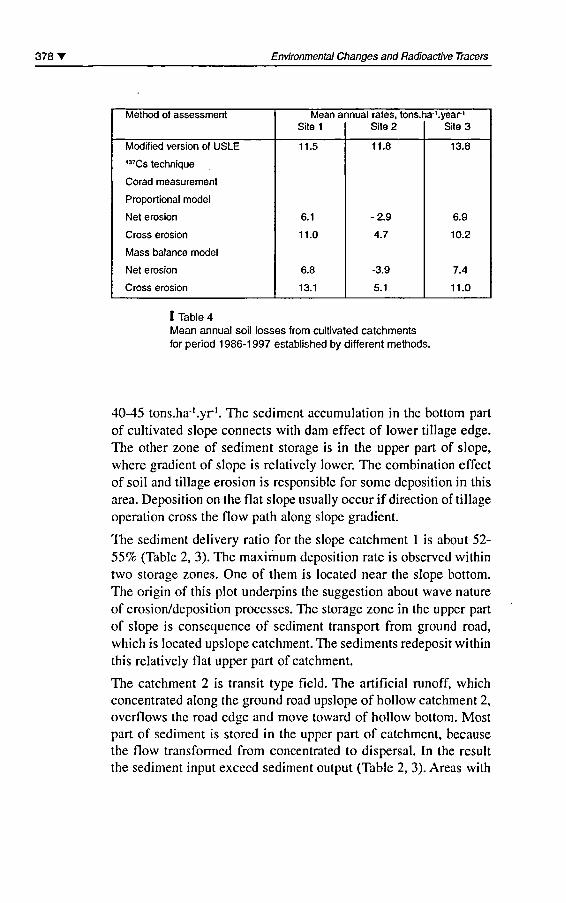
378' Environmental Changes and Radioactive Tracers
Method of assessment
Modified version of USLE
137Cs technique
Corad measurement
Proportional model
Net érosion
Cross érosion
Mass balance model
Net érosion
Cross érosion
Mean annual rates, tons.ha'.year'Site 1
11.5
6.1
11.0
6.8
13.1
Site 2
11.8
-2.9
4.7
-3.9
5.1
Site 3
13.8
6.9
10.2
7.4
11.0
I Table 4Mean annual soil losses from cultivated catchmentsfor period 1986-1997 established by différent methods.
40-45 tons.ha'.yr1. The sédiment accumulation in the bottom partof cultivated slope connects with dam effect of lower tillage edge.
The other zone of sédiment storage is in the upper part of slope,where gradient of slope is relatively lower. The combination effectof soil and tillage érosion is responsible for some déposition in thisarea. Déposition on the flat slope usually occur if direction of tillageopération cross the flow path along slope gradient.
The sédiment delivery ratio for the slope catchment 1 is about 52-55% (Table 2, 3). The maximum déposition rate is observed withintwo storage zones. One of them is located near the slope bottom.The origin of this plot underpins the suggestion about wave natureof erosion/deposition processes. The storage zone in the upper partof slope is conséquence of sédiment transport from ground road,which is located upslope catchment. The sédiments redeposit withinthis relatively flat upper part of catchment.
The catchment 2 is transit type field. The artificial runoff, whichconcentrated along the ground road upslope of hollow catchment 2,
overflows the road edge and move toward of hollow bottom. Mostpart of sédiment is stored in the upper part of catchment, becausethe flow transformed from concentrated to dispersai. In the resuitthe sédiment input exceed sédiment output (Table 2, 3). Areas with
V. N. Golosov, M. V. Markelov Chernobyl-derived '37Cs for assessment of soil redistributionT 379
maximum érosion rates are located along the hollow bottom,because of flow concentrations, (answer on question L). Typicallyeven direction of tillage can influence on the increase or decrease oferosion/deposition rates within gentle slopes. From the other handprobably the density of measurement points was not enough withinupper part of this catchment (Figure 2-II). It is obviously, thattwelve years passed from 1 986 is not enough time for forming thepattern of rill net within gentle slopes. At least it is possible to sug¬
gest that some 137Cs input was delivered to the upper parts of catch¬ments 1 and 2 during spring-summer 1986, because of dust transferfrom ground road.
Discussion and conclusion
Attempt to use Chernobyl-derived 137Cs for assessment sédimentredistribution demonstrates that only 12 years after Chernobyl acci¬
dent it is possible to identify the areas with high érosion and dépo¬
sition rates. However some areas within slope catchments, whichare named stable (Figure 5), can not be defined as loss/gain sites,because the changes of 137Cs do not exceed the initial variability ofChernobyl-derived 137Cs fallout.
Soil losses, which were received by calculation of érosion ratesusing modified version of USLE and SGI model, are much moreclose to gross érosion rates, which were received using 137Cs tech¬
nique (Table 4). Erosion models were validated for Russian condi¬tions previously (Golosov, 1998). Thèse érosion models do not takein account intra-field déposition. However déposition is actuallyobserved within cultivated fields. Also it should be noted, that 137Cs
technique allow to détermine soil déposition for transit catchments.Probably 137Cs technique is unique opportunity to détermine theactual pattern of soil loss/gain areas within cultivated field, becausetraditional soil-morphological method demand much more fieldwork and so more expensive.
It should be noted that 15 years after Chernobyl accident I37Cs tech¬
nique can be apply for assessment of érosion and déposition rates
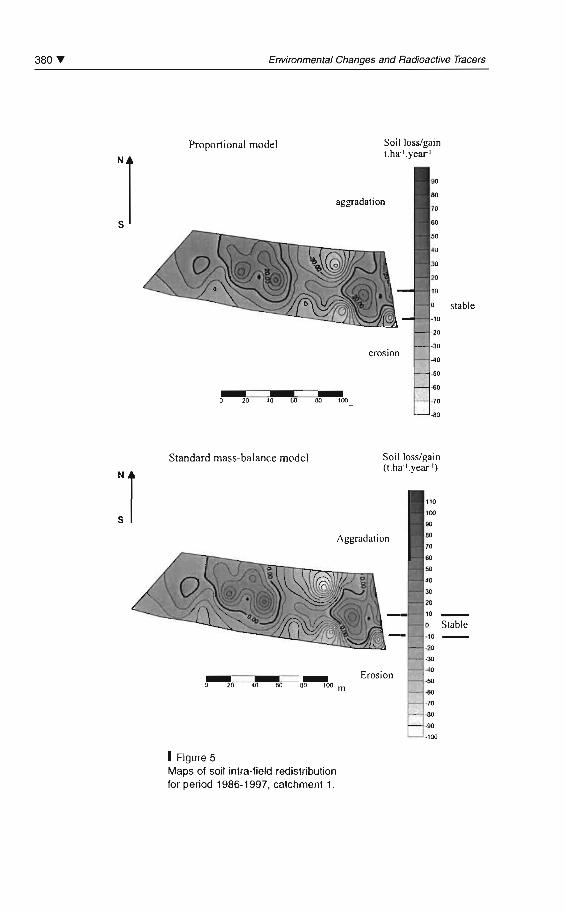
380 T Environmental Changes and Radioactive Tracers
Soillosslgaint.hat .year '
aggradation
stable·10
-20
·30erosion
-40
-50
-60
20 40 60 60 100 ·10
-80
Proportional model
N15
Soil loss/gain(t.ha't.year')
Stable· 10
·20
.JO
"' 0
-50
.6Q
-la.6Q
-90
· 100
Erosion
Aggradation
Standard mass-balance model
:r
1 Figure 5Maps of soil intra-field redistributionfor period 1986-1997. catchment 1.
V. N. Golosov, M. V. Markelov Chernobyl-derived 137Cs for assessment of soil redistributionT 381
for sites with mean annual érosion rates exceed 10 tons.ha'1. Theabsolutely correct results can be received for areas within part offields with annual soil losses 20 tons.ha"1 (Litvin et al, 1994). Thereare no essential différences between using in situ and laboratorymeasurements of l37Cs inventory for calculation erosion/depositionrates. However in situ measurements allow defining more correctpattern of soil redistribution because the larger surface area sampledby the in situ detector could be expected to reduce the effects of ran¬
dom variability of 137Cs inventory.
Application of 137Cs technique for assessment of erosion/depositionrate allows to receive pattern of soil redistribution within study area,
including influence sheet, rill and tillage érosion, as well as somepossible input of soil because of sédiment transit from topographi-cally upper located fields or local wind érosion. Maps of intra-fieldérosion demonstrate that maximum soil losses are observed withinlower half of midslopes. Usually few strips with high soil losses
usually alternate with strips where érosion rates are lower. It is con¬
séquences of wave nature of erosion/deposition processes. Theupper boundary of the area of high soil losses dépends from con¬
figuration of slope profile and as a rule it is very close to shoulderbetween relatively gentle and relatively steep part of slope. Bottomof cultivated hollows is the other area of extrême érosion rates.
However some compensation of soil losses in hollow bottoms hap¬
pen in period between érosion events because of redistribution ofsoil by tillage érosion processes. So the actual soil losses from hol¬
low bottom can be identified by ,37Cs technique only if monitoringof 137Cs redistribution is organised for hollow site.
The values of sédiment delivery ratio (SDR) change in very widerange for key catchments. The SDR coefficient increases proportion-ally to gradient of slope. However it is necessary to take into consid¬
ération the type of slope catchment and 3-dimension model of slope.
AknowledgementsThe authors gratefully acknowledge financial support from INTAS-RFBR
(Grant no. 95-0734) and from the IAEA Co-ordinated Research Projecton the Assessment of Soil Erosion through the Use of n7Cs
and Related Techniques (IAEA Contract 9044).
382' Environmental Changes and Radioactive Tracers
BibliographyChesnokov A. V., Fedin V. I.,Govorun A. P., Ivanov O. P.,
Liksonov V. I., Potapov V. N.,Smirnov S. V., Scherbak S. B.,Urutskoev V. I., 1997Collimated detector techniquefor measuring a 137Cs depositin soil under a clean protected layer.Applied Radiation and Isotopes,48: 1265-1272.
Golosov V. N., 1998Redistribution of sédimentswithin small river catchments in theagricultural zone of Russia.Géomorphologie: relief.processus,environnement, 1 : 53-64.
Golosov V. N., Walling D. E.,Kvasnikova E.V., Stukin E. D.,Nikolaev A. N., Panin, A. V., 2000Application of a field-portablescintillation detector for studyingthe distribution of '37Cs inventoriesin a small basin in Central Russia.J. Environmental Radioactivity,48(1): 79-94.
Golosov V. N., Walling D. E.,Panin A. V., Stukin E. D.,Kvasnikova E. V.,IvanovaN. N., 1999The spatial variability of Chernobyl-derived 137Cs inventories in a smallagricultural drainage basinin Central Russia. Applied Radiationand Isotopes, 51 (3): 341-352.
Govorun A. P., Liksonov V. I.,Romasko V. P., Fedin V. I.,Urutskoev L. I.,Chesnokov A. V., 1 994Spectrum sensitive portablecollimated gamma-radiometerCORAD. Pribory i TekhnikaExpérimenta, 5: 207-208.(in Russian).
Kachanoski R. G., de Jong E., 1 984Predicting tthe temporal relationshipbetween soil caesium-137 losses
and érosion rates. Caa J. Soil Sci.,67:117-137.
Mitchell J. K., Bubenzer G. D.,
McHenry J. R., Ritchie J. C, 1980"Soil losses estimation from thefallout césium- 137 measurements".In DeBoodt M., Gabriels D. (éd.):Assessment of érosion,Chichester.UK, 393-401,John Wiley & Sons.
Ostrova I. V., Silant'ev A. N.,Litvin L. F., Golosov V. N.,Shkuratova I. V., 1990Assessment of Soil Erosion andSédimentation Intensity Using 137Cs
Content in the Soil. Vestnik MSU,geography, 5: 79-85(in Russian).
Laroniov, G.A., 1993Soil and Wind Erosion: MainRegularities and QuantitativeEstimation. Izd-vo MSU, Moscow,200 p. (in Russian).
Litvin L. F., Golosov V. N.,Dobrovol'skaya, Ivanova N. N.,KlRYUKHINA Z. P.,
Krasnov S.E, 1994Redistribution of '37Cs by theProcesses of Water Erosion of Soils.Water Resources, 23 (3): 286-291.
Owens P. N., Walling D. E., 1996Spatial variability of caesium-137inventories at référence sites:an example from two contrastingsites in England and Zimbabwe.Applied Radiation and Isotopes,47: 699-707.
Quine T. A., 1989Use of a simple model to estimaterates of soil érosion fromcaesium-137 data.J. Water Resourc, 8: 54-81.
Sutherland R. A., 1991Examination of caesium-137 areal
V. N. Golosov, M. V. Markelov Chernobyl-derived ,37Cs for assessment of soil redistribution^ 383
activities in control (uneroded)locations. Soil Technology, 4: 33-50.
SUTHERLAND R. A., 1994Spatial variability of '37Cs and theinfluence of sampling on estimâtesof sédiment redistribution.Catena, 21:57-71.
Walling D. E., He Q., 1999Improved Models for estimation SoilErosion Rates from Cesium-137Measurements. J. Environ. Quai,28:611-622.
Walling D. E., Quine T. A., 1990Calibration of caesium-137measurements to provide quantitaiveérosion rate data. Land Degrad.Rehab., 2:161-175.
Walling D. E., Golosov V. N.,Panin A. V., He Q., 1999"Use of radiocaesium to investigateérosion and sédimentation in areaswith high levels of Chernobyl fallout".In Foster I.D.L. (éd.): Tracers inGeomorphology, John Wiley & Sons(in press).

Use of 137Cs
to estimate rates and patternsof soil redistributionon agricultural landin Central-South Chile:models and validation
Paulina Schuller
Rosa Eugenia Trumper
A. Castillo
Introduction
Soil conservation and sustainability is of maximum rclevance toguarantee the increasing demand for food and raw materials in the
world. Therefore, soil dégradation and détérioration occurringduring the past need to be evaluated. For this purpose, reliable tech¬
niques for quantifying soil érosion and sédimentation hâve to be
improved. Developments made during the last décades in the use ofthe anthropogenic radionuclide 137Cs as a tracer for determiningrates and patterns of soil redistribution were considered by manyauthors as an important advance that overcomes many limitations ofthe conventional monitoring techniques (Loughran, 1989; RitchieandMcHenry, 1990; Quine, 1997; Walling, 1998).
The purpose of this research was to evaluate the applicability oftheconventional 137Cs technique and a simplified and faster method for
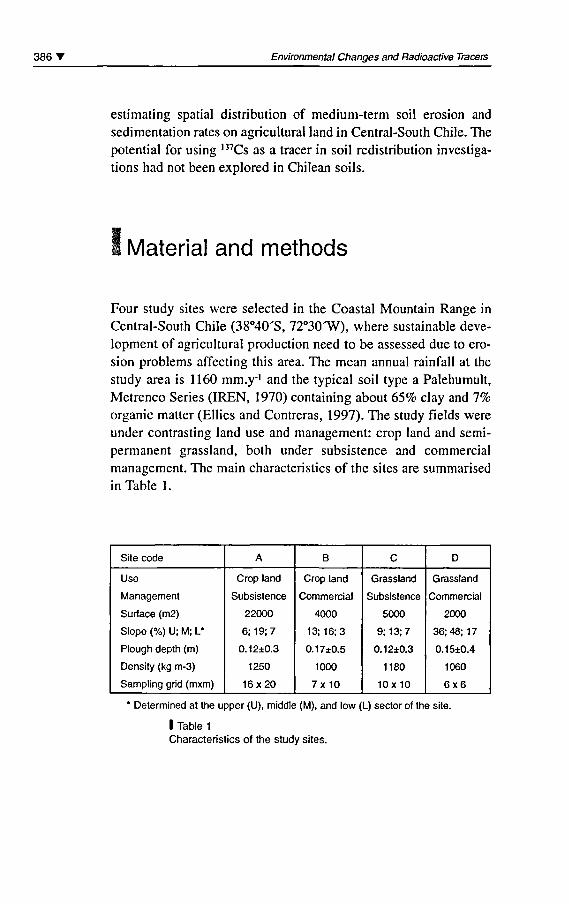
386' Environmental Changes and Radioactive Tracers
estimating spatial distribution of medium-term soil érosion and
sédimentation rates on agricultural land in Central-South Chile. The
potential for using 137Cs as a tracer in soil redistribution investiga¬
tions had not been explored in Chilean soils.
Material and methods
Four study sites were selected in the Coastal Mountain Range inCentral-South Chile (38°40'S, 72°30'W), where sustainable deve¬
lopment of agricultural production need to be assessed due to éro¬
sion problems affecting this area. The mean annual rainfall at the
study area is 1160 mm.y1 and the typical soil type a Palehumult,Metrenco Séries (IREN, 1970) containing about 65% clay and 7%
organic matter (Ellies and Contreras, 1997). The study fields wereunder contrasting land use and management: crop land and semi-permanent grassland, both under subsistence and commercialmanagement. The main characteristics ofthe sites are summarisedin Table 1 .
Site code
Use
Management
Surface (m2)
Slope (%) U; M; L'
Plough depth (m)
Density (kg m-3)
Sampling grid (mxm)
A
Crop land
Subsistence
22000
6; 19; 7
0.12±0.3
1250
16x20
B
Crop land
Commercial
4000
13:16:3
0.17±0.5
1000
7x10
C
Grassland
Subsistence
5000
9; 13; 7
0.12±0.3
1180
10x10
D
Grassland
Commercial
2000
36; 48; 17
0.15±0.4
1060
6x6
Determined at the upper (U), middle (M), and low (L) sector of the site.
I Table 1
Characteristics of the study sites.
P. Schuller ef al. Use of '37Cs to estimate soil redistribution on agricultural land T 387
To estimate the 137Cs référence inventory, four appropriate sites thathad been under herbaceous cover for at least four décades were cho-sen. For measuring the 137Cs inventories, soil cores of 0.072 m indiameter were collected with an auger down to at least the pénétra¬
tion depth between June and August 1998. At the référence sitesamples were taken on a 6 m by 6 m grid. The grid spacing at thestudy sites are shown in Table 1 .
To save time on the gamma analysis, the feasibility of measuring137Cs inventories of composite soil samples for estimating soil redis¬
tribution was also tested at ail four sites. For this purpose, inOctober and November 1999 soil samples were collected at thesame grid spacing as previously, but ail cores from transects alongthe same contour line were bulked proportionally. The viability ofthis approach relies on the similar topography in parallel downslopetransects, and on the almost uniform soil properties of each analy¬
sed site. Additionally, it is based on the assumption that soil redis¬
tribution occurred approximately to the same extend in paralleldownslope transects of the field.
Soil redistribution rates were quantified using the refined mass
balance model for cultivated soils incorporating soil movement bytillage described by Walling and He (1999), adapted to the site spé¬
cifie conditions of the studied fields. The time-course of the 137Cs
deposit within the study area was estimated on the basis of theannual deposit of 90Sr and 137Cs reported at the nearest site, locatedat 41°26'S, 73°07'W (Health and Safety Laboratory, 1977; Juzdan,1988; Larsen, 1985; Larsen and Juzdan, 1986; Monetti and Larsen,1991; UNSCEAR, 1982), and considering the activity ratio'"Cs/^Sr in déposition constant at 1.6 (UNSCEAR, 1982).
In order to examine the validity of the results obtained by the 137Cs
method, expérimental érosion plots of 10 m2 were installed in the
upper part of the fields A and C for obtaining référence values of theannual sédiment flux at the corresponding area. In addition, theresults obtained by the 137Cs method were compared with redistri¬bution rates obtained by pedological observations, comparing thedepths ofthe horizon ofthe area affected by soil redistribution withthat of a référence area with scarce intervention.
388 T Environmental Changes and Radioactive Tracers
S Results and discussion
The measured référence inventory was 525+12 Bq.nr2 (a= 94Bq.nv2, n=61, référence date: January 1998). The plough depthdetermined at the studied fields (Table 1) varied according to the
tillage technique employed, ranging from 0.12±0.03 m depth at
sites ploughed by animal traction to 0.17±0.05 m in sites ploughedby mechanical traction. The 137Cs pénétration depth ranged accor¬
ding to the position along the slope transects, from 0.12 m at erodedpoints to 0.34 m at points of sédiment accumulation. Other valuesfor the parameters required were taken from the literature (Wallingand He, 1999) or estimated by using information on local soil pro¬
perties and annual distribution and intensity ofthe rainfall.
Figure 1 represents the soil érosion (négative values) and dépositionrates (positive values) estimated at the four analysed areas as a func¬
tion ofthe field topography using the conventional grid frameworksampling and évaluation of 137Cs inventory at each point. The gra¬
phies were obtained using Surfer 7, and kriging geostatistics.
The results shown in Figure 1 allow a comparison of the modelledestimâtes of the net soil redistribution rates and their spatial distri¬
bution at the four studied sites.
At the crop land site under subsistence management (A) high éro¬
sion rates were observed at the upper border, due to repeated plou-ghing normal to the downslope gradient and due to the obstructionof sédiment flux from the adjacent area into this field by a dense
shrub fence. The other sector of high érosion rates is located in the
area of maximum slope, which also promotes higher amounts ofsoil érosion. The sédimentation area is positioned at the sector ofminimal slope located at hillfoot in water run-on sites. Intensiveannual cultivation processes and fréquent transit of animal ploughSystems could influence the high érosion rates obtained in this field(Schuller et al, 1999).
Similar spatial distribution of soil érosion rates was observed on the
crop land under commercial management (B): The highest érosionrates were estimated at the top ofthe field and at the sector of maxi¬
mum slope. The highest sédimentation rates were obtained at a
-4 -2 o 21Figure 1Soil redistribution rates estimated by 137C S inventory evaluation at grid points: crop land under subsistence (A)and commercial management (8), grassland under subsistance (C) and commercial management (0) .
390 T Environmental Changes and Radioactive Tracers
dépression at the hillfoot. The érosion rates quantified in field B are
lower than in field A. The soil loss estimated in field A is influen¬ced by the site isolation from upper and latéral surrounding fields,which hinder sédiment input into the study area. The field B is notisolated from surrounding crop fields, and therefore part of the soilloss could be compensated by sédiment input moving from adjacentareas.
A form of expressing tolerable érosion is that the soil loss shouldnot exceed their natural production (Hudson, 1971). Due to the dif¬
ficulty in measuring this last parameter it is considered that the soiluse is sustainable, when the annual loss does not exceed a thou-sandth of their total mass (Peralta, 1976). The values ofthe érosionrates measured in the crop land sites are mostly below this tolerablelimit estimated at about 1 kg.nr2.yr', but in sectors with large slope
it exceeds this value by far.
At the semi-permanent grassland site under subsistence manage¬
ment (C) the areas showing the highest érosion rates are located inthe middle sector of the field, where the slope is steepest. At thisfield, high sédimentation rates caused by sédiment flow into an
adjacent stream and by sédiment accumulation during the swellingperiods of the stream were observed at the hillfoot.
At the non-permanent grassland site under commercial manage¬
ment (D) the prédominant process caused by soil movement was
sédimentation. This area could be affected by déposition of sédi¬
ments moving from an upper flat adjacent cultivated area, whichwas ploughed perpendicular to the hillslope ofthe grassland throu¬
ghout several décades. The highest sédimentation areas were loca¬
ted in water flow concentration sites: at footslope and at the
midslope where the inclination is maximal. The midslope sector is
positioned at a concavity of latéral hillslopes, and could be thereforeaffected by sédiment coming from latéral pronounced slopes. Bothgrassland sites are not isolated from the surrounding fields, and are
probably affected by soil movement from and towards the adjacentareas.
As shown in Figure I, the 137Cs method allows to discriminate bet¬
ween the long-term soil redistribution processes according to the
use (crop or grassland) and management (commercial or subsis¬
tence) ofthe soil.
P. Schuller et al. Use of t37Cs to estimate soil redistribution on agricultural land T 391
The soil érosion rates estimated by the 137Cs method were first com¬
pared with sédiment flux measured at érosion plots during threeyears. The mean annual sédiment loss determined with an expéri¬mental plot located at the upper sector of site A was 0.28 + 0.08kg.m"2.yr'. The calculated érosion rate at the sampling points adja¬
cent to the plot area varied from 0.09 to 0.6 kg.m^.yr1 (mean value0.25 kg.m^.yr1). The sédiment flux determined with the expéri¬
mental plot simulating the management conditions of grassland Cwas 0.10 ± 0.03 kg.m"2.yr' and the calculated érosion rates at sam¬
pling points of similar slope in that grassland fluctuated between
0.04 and 0.19 kg.m'2.yr' (mean value 0.11 kg.m^.yr1). The annualsédiment loss measured with érosion plots is in good agreementwith the estimated érosion rates at adjacent positions in the fields.Nevertheless, the measured flux represents net soil export from theplots, because of their isolation from the soil redistribution pro¬
cesses operating in the surrounding area. Moreover, sédiment fluxis time dépendent and therefore valid for the period for which it iscalculated.
The soil redistribution rates quantified by the l37Cs technique repre¬
sent a time-integrated, medium-term, average for the last 40-45years, and are therefore less influenced by extrême events.Additional redistribution rates obtained by pedological observa¬
tions, which also consider the accumulative effect of past soil redis¬
tribution processes, are represented in Figure 2. The rates estimatedby the pedological observations reflect a similar pattern of spatialdistribution, in relation to the soil redistribution rates quantified bythe 137Cs method. Nevertheless, the values of érosion and sédimen¬
tation rates obtained by this method are expressed on relative scales,
because ofthe difficulty in determining the period of cultivation ofeach field and the depth of the référence horizons. Therefore, addi¬
tional medium-term estimations of érosion and sédimentation rates
are required for validating the values estimated by the I37Cs method.In the future, it is also necessary to study the applicability of themethod under other climatic conditions and soil types occurring inChile in which érosion is not so évident, in order to prevent it.
The érosion and sédimentation rates caused by tillage, water and thenet rates obtained along the slope transect at each study site usingthe simplified 137Cs inventory évaluation are represented in Figure 3.
-1 o 1
--r--r·+--r--r·-r·
2
1 Figure 2Soil redistribution rates estimated by pedolog ical obser vations: crop land under subsistence (A) and commerc ial management (B),grassland under subsistance (C) and commerc ial management (0) .
1 ··.··Rt 1
··.··Rw r----~
~r-, A.<,h-/
1c(/)
ID
a
:0fq:I:Crrm:Il
!.tIII:-
20
18
16
146 10Relative heigth (m)
8 12Relative helgth (m)
4
2
o
.1 .L- l..-__-.J. -'- -'-__--'
10
25
8
20
4 6Relative heigth (m)
10 15
Relative heigth (m)
2
5
.-1-~1 ··.··Rt··.··Rw
...~\ .'~ ..... ~."11!:-Rn 1
"'-~.'
.~4 !1 ~ ï1.v:\....•~ '.-
r:·8
o
(/)CD
ë ·2C.2'5 -4.0.-=<;; ·6'6CDa:
(/)CD
"§ 2CoS:g 0<;;'6CDa: .2
o
A:: 4
~Ë 2ci>::s 0
1Figure 3Soil redistribution ratescausedby tillage (At), by water (Aw), and net rates (An) along the slope transectestimaledby mcsinvenloryevalualion al contourlines:crop land under subsistence (A) and commercial management (8),grassland undersubsistence (C) and commercial management (0).
394 T Environmental Changes and Radioactive Tracers
Comparing the mean redistribution rates estimated at similar alti¬
tude along the slope transects obtained by a 137Cs inventory évalua¬
tion of individual samples collected in a grid pattern with the ones
obtained by an inventory évaluation in composed samples taken at
contour lines, the corrélations between the redistribution rates cau¬
sed by tillage, by water and net rates are strongly significant at the
0.01 level in each site, with exception of redistribution caused bywater (significant at level 0.05) in site A. The simplified method is
suitable for giving assessment on soil loss and sédiment accumula¬
tion in areas exhibiting simple topography, showing almost similarslopes at constant-altitude transects. It reduces considerably the
measuring time to estimate the soil redistribution.
The simplified method allows a fast estimation of soil redistributionrates, providing the possibility to estimate soil redistribution in lar¬
ger areas in a shorter time. Nevertheless, the sampling and 137Cs
inventory quantification strategy must be selected according to the
resolution of the required information, and extension and com¬
plexity of the landscape relief.
AknowledgementsThis study was supported by the Fondo Nacional de Investigacion Cientifica
y Tecnolôgica, Chile (FONDECYT 1970662),the International Atomic Energy Agency (IAEA CHI-8899),
and the Direction de Investigacion y Desarrollo,Universidad Austral de Chile. The authors wish
to thank thèse institutions for their financial support.
P. Schuller ef al. Use of '37Cs to estimate soil redistribution on agricultural land '395
BibliographyEllies A., Contreras C, 1997Modificaciones estructurales deun Palehumult sometido a distintosmanejos. Agricultura Técnica,57:15-21.
Health and Safety Laboratory, 1977Final tabulation of monthly "'Srfallout data: 1954-1976. U. S.Energy Research and DevelopmentAdministration. New York, USA.HASL-329 Report, UC-1 1 . 323 p.
HudsonN., 1971Soil conservation. Cornell UniversityPress, Ithaca, New York. 320 p.
IREN, 1970Integrated studies on naturalresources in Cautin. Instituto deRecursos Naturales, Santiago, Chile.29(2), 140 p. (in Spanish).
Juzdan Z. R., 1988Worldwide déposition de ^Srthrough 1985. Department of Energy,New York, USA. EnvironmentalMeasurements Laboratory Report.EML-515.34p.
Larsen R. J., 1985Worldwide déposition de 90Srthrough 1983. Department of Energy,New York, USA. EnvironmentalMeasurements Laboratory Report.EML-444. 159 p.
Larsen R. J., Juzdan Z. R., 1986Worldwide déposition of ^Sr through1984. Department of Energy,New York, USA. EnvironmentalMeasurements Laboratory Report.EML-457. 159 p.
Loughran R. J., 1989The measurement of soil érosion.Prog. Phys. Geogr. 13: 216-233.
Monetti M. A., Larsen R. J., 1991Worldwide déposition de ""Srthrough 1986. Department of Energy,New York, USA. EnvironmentalMeasurements Laboratory Report.EML-533. 31 p.
PeraltaM., 1976Soil use, classificationand conservation. Servicio Agricolay Ganadero. Santiago, Chile. 337 p.(in Spanish).
Quine T. A., Govers G., Walling D. E.,Zhang X., Desmet P. J. J.,Zhang Y., Vandaele K., 1997Erosion processes and landformévolution on agricultural land -New perspectives from '37Csmeasurementsand topographic-based érosionmodelling. Earth sudace processesand landforms. 22: 799-81 6.
Ritchie J. C, McHenry J. R., 1990Application of radioactive falloutcesium-137 for measuringsoil érosion and sédimentaccumulation rates and patterns:A review. J. Environ.Quai 19:215-233.
Schuller P., Sepûlved, A.,Ellies A., Castillo A., 1999Utilizaciôn de ,37Cs en cuantificaciônde érosion y sedimentaciôn en unPalehumult de la IX Région. AgroSur 27: 29-36.
United Nations Scientific Committeeon the Effects of Atomic Radiation1982lonizing radiation: Sourcesand biological effects.United Nations. 773 p.
Walling D. E., 1998Use of 137Cs and other falloutradionuclides in soil érosioninvestigations: Progress, problemsand prospects, in use of 137Cs
in the study of soil érosionand sédimentation,IAEA TECDOC-1 028, Vienna, 39-62.
Walling D. E., He Q., 1999)Improved models for estimating soil
érosion rates from cesium-137measurements. J. Environ. Quai.28(2): 611-622.

s oil-radionuclidesinteraction and subséquentimpact on the contaminationof plant food products basedon a simulated accidentaisource
François Bréchignac
YvesThiry
Nadia Waegeneers
Ramon Vallejo
Teresa Sauras
Jaume Casadesus
Graeme Shaw
Joanna Marchant
Sverker Forsberg
Chatal Madoz-Escande
Claude Colle
Marc André Gonze
Introduction
The Chernobyl accident, which resulted in a substantial release ofradioactive materials in the atmosphère, demonstrated that large
environmental areas may be contaminated by fall-out déposition of
398 T Environmental Changes and Radioactive Tracers
radioactivity. In particular, contamination by 137Cs and 90Sr of agro-
ecosystems where food production is taking place is most liable to
contribute to population radiation dose (Strand et al, 1996).
Nuclear safety analysis shows that the possibility, although verysmall, of an accident occurring on a pressurized water reactor(PWR) cannot be completely ruled out. In such a situation, deci-sion-making and management ofthe contaminated agricultural sur¬
faces largely dépends on our ability to predict how, and to whichextent, the initial contamination may cause foodstuffs to be pol-luted. Furthermore, the efficiency of the prédiction models relies
on our level of understanding of the mechanisms governing the
transfer of radionuclides in the soil-plant system.
Gaining an understanding of thèse mechanisms from in situ obser¬
vations of environmental areas contaminated by past events is dif¬
ficult due to the lack of knowledge and control on both, the
contamination itself, arising from a critical situation, and the natu¬
ral environment, which is highly variable, temporally and spatially.
Such conditions prevent a clear identification ofthe most relevantparameters influencing the radionuclides transfer and thereby the
prédiction goal from being achieved. This is why IPSN developed
a unique research facility capable of generating, in closed and con¬
trolled environmental conditions, a mini-accident with release ofradioactive aérosols onto small-scale, but realistic, samples ofcrops. Thèse crops are grown on undisturbed soil monoliths, fea-
turing several soil types from various European countries, man¬
aged in advanced lysimeters, and placed in greenhouses where
various climatic conditions can be reproduced artificially under
computer control.
The PEACE Programme, gathering a European scientific collab¬
oration around this facility, has been designed to tackle the con¬
séquences of an accidentai release of ,37Cs and 90Sr on the
soil-plant system of agricultural lands. The research conductedhas focused on the interaction of radionuclides with soils with a
view to improve our understanding ofthe mechanisms governingtheir transfer to plants via the roots, and their modelling forprédiction.
F. Brechignac et al Soil-radionuclides interaction on the contamination of plant food productsT 399
Materials and methods
A detailed description of the performances of the IPSN ControlledLysimetric Environmental facility and its various technological com¬
ponents has already been published elsewhere (Brechignac et al,1996; Brechignac et al, 1998; Madoz-Escande et al, 1999). Onlythe essential features are briefly recalled in the following.
The climates and the soils in the controlledlysimetric environmental facility
Located at Cadarache (Bouches-du-Rhône, France), the facility is
a 2000 m2 leak-proof (depressurized) laboratory consisting in fourexpérimental greenhouses where artificial reproduction of prede-fined climatic and hydric conditions is made possible by means ofcomputer based régulation. Thèse greenhouses host variouslysimeters made of soil monoliths which hâve been sampled in one
block (12 tons) without disturbing the pedological stratification,and further fitted in metallic casings (1.5 m deep, 3.2 m2 area).
Sampled in Belgium (Mol), Germany (Jùlich), France (Belleville),Spain (Barcelona) and the United Kingdom (Wellesbourne), theycorrespond to several soil types commonly encountered in westernEurope. Prior to installing a soil monolith in its dedicated green¬
house, the bottom face of the Iysimeter is fitted with a water réser¬
voir interfacing the soil via a porous ceramic layer. This uniqueSystem allows the exchange of water which occurs naturallybetween the water table and the soil to be simulated artificially.Thus, the soil moisture can be mastered. The top side ofthe Iysime¬
ter to be cultivated is next brought to fit a hole in the greenhousefloor in such a way that the soil surface appears in the greenhousewhere the climatic conditions prevailing at its sampling site are
artificially reproduced. The underground parts of ail the lysimetersare located in a common hall where température can be controlled
400 T Environmental Changes and Radioactive Tracers
independently from that which is controlled above the soil surface,
in the greenhouses. Climatic control and corresponding data acqui¬
sition (température, hygrometry, light and rainfall) are performedautomatically. For the purpose of this study, three différent cli-mates hâve been reconstructed (temperate, Mediterranean and tran¬
sition temperate-Mediterranean) within independent greenhouses
by means of a dedicated software which reproduces the nycteme-rial and seasonal climatic parameters variations in real time.
Contamination of the lysimetersfor accident simulation
Simulation ofan accidentai contamination is performed by using an
induction furnace that produces aérosols similar to those whichwould be produced in the event of severe failure in a pressurized
water reactor (PWR) with core fusion (about 3000°C). Aérosols are
generated in a water-saturated atmosphère enclosed in a polyethy-lene envelope which can be made to communicate with a similarenvelope covering the lysimeter surface to be contaminated. Theyare produced from a mixture of éléments représentative ofthe mate¬
rials constituting a 900 MW reactor: the nuclear fuel (as uraniumoxide), the structural materials of the reactor core, the componentsofthe fuel sheath and the control bars. The proportions of éléments
within this mixture correspond to the relative quantities of the
nuclear core inventory, reduced by IO7. 137Cs and 90Sr, the tworadioactive fission products most detrimental to the environment ina radiation protection perspective, are included in this expérimentalmixture. In order to produce such aérosols, the mixture is broughtup, as powder, to a température of 2950 °C (reached within 30 min¬
utes and maintained for 15 minutes) in a water-saturated atmo¬
sphère. A thorough physico-chemical characterization of thèse
aérosols showed that they were produced as numerous oxides ofcombined éléments, with a mean aerodynamic diameter of 3.5 um.
The total dissolution rates (in rain water) of the 137Cs and the '"Srcontained in thèse aérosols amounted to 85-95 % after 1 day, and
75-85 % after 5 days, respectively.
F. Brechignac étal Soil-radionuclides interaction on the contamination of plant food productsT 401
Expérimental protocolfor radio-contamination follow up
The gênerai expérimental protocol of lysimeter studies starts offwith the aérosol déposition on the lysimeters soils and their crops,which took place in 1994 and 1995. Subséquent to contamination,several annual crops (barley, lettuce and beans) hâve been grownsuccessively for several years, and in parallel on the various soils,with realistic rainfall cycles in order to simulate natural conditions.Two perennial crops (rye-grass and lucerne) hâve also been sown onsome plots, either before or after the contamination event, and fol¬
lowed up to five successive years in order to simulate a cattle feed¬
ing semi-natural ecosystem. Migration profiles of radionuclideswithin untilled plots ofthe soils hâve been determined by samplingvertical soil cores (down to 50 cm), taking due care of potentialcompaction and in-depth contamination transport associated to thismethod. The same procédure has been applied to the tilled plots ofthe soils (down to 20-30 cm) in order to check for the vertical dis¬
tribution homogeneity in this layer, and to détermine the soil spé¬
cifie activity for each radionuclide. Plants hâve been sampledperiodically, and annual crops harvested upon maturity, for deter¬
mining their radio-contamination status.
Radionuclides and ionic déterminationsin soils and plants
Measurements of radionuclides and major ions species (K, Ca, Mg)hâve been carried out on various sample types: bulk dry soil, soilinterstitial water (soil solution) and plants (leaves and seeds, sepa-
rately as appropriate). The soil solution has been extracted by highspeed centrifugation of moist soil samples. Stable ionic specieshâve been determined based on atomic absorption spectroscopy.137Cs has been determined using a Germanium coaxial g émissiondetector, whilst 90Sr has been measured by liquid scintillation afterrapid séparation/purification as previously described (Tormosétal, 1995).
402' Environmental Changes and Radioactive Tracers
I Results and discussion
Soils physico-chemical characterization
The soils studied show contrasted properties with respect to texture,clay content and pH (Table 1). The soils texture range fromsandy/sandy-loamy (Mol, Belleville, Wellesbourne), typical of allu¬
vial and fluvio-glacial sédiments, to loamy, characteristic of loess
sédiments présent in Central Europe (Jùlich), or derived fromancient pedogenesis of alluvial sédiments typical of Mediterraneanareas (Barcelona). The clay content varies from 4.1% (Mol) up to13.9% (Barcelona), whereas the soils pH ranges from acidic (Moland Belleville) up to about neutral (Wellesbourne, Julien and
Barcelona). The soils rétention properties for 137Cs and 90Sr hâve
been quantified respectively by determining their RIP(Radiocaesium Interception Potential) and their CEC (Cationic
Geographical sampling site
FAO classification
Soil texture
Particle size
% clay
% silt
% sand
Chemistry
pH (KCI)
% organic matter
Total carbonates (%)
RlP(ueq.g')
CEC (cmoUq ')
Mol
(Belgium)
orthicpodzol
(Loamy)sand
4.1
14.6
78.4
4.6
3
=0
443
11.7
Belleville
(France)
fluvisol
Loamysand
5.8
13.7
79.0
4.1
1.5
-0
1126
5.8
Wellesbourne
(U.K.)
eutric fluvisol
Sandy loam
9.5
19.7
66.6
6.3
3.9
0.3
2316
17.8
Jùlich
(Germany)
orthicluvisol
Silt loam
11.2
78.8
8.4
7.1
1.5
0.2
2328
13.4
Barcelona
(Spain)
calcicluvisol
Loam
13.9
28.8
47.7
7.3
2.3
7.2
2732
16.4
I Table 1
Main physico-chemical characteristicsof the various European soils in the plough layer.
F. Brechignac et al. Soil-radionuclides interaction on the contamination of plant food productsT 403
Exchange Capacity). The Radiocaesium Interception Potential isthe product of the capacity of the Frayed Edge Sites (FES) of clayminerais to adsorb radiocaesium, and the selectivity coefficient ofcaesium with respect to K for thèse exchange sites (Wauters et al,1994). Highly sélective, and located at the interlayer edges ofweathered micaceous clay minerais, such sites hâve been demon¬
strated to govem radiocaesium sorption (Maes et al, 1998; Maes
et al, 1999). This approach allows to take due account of the com¬
pétitive effect of K and Ca+Mg ions for 137Cs and 90Sr sorption,respectively, which influence their respective solid-liquid partitioncoefficients (KDCs=RIP/[K] and KDSr=CEC/[Ca]+[Mg], Sweeck
et al, 1990).
Another approach to identifying the degree of radionuclides fixa¬tion on soil matrices relies on the estimation of the exchangeablefractions as displaced by NH4Ac (1 N), and expressed as a percent¬
age ofthe total amount initially fixed. Thèse hâve been measured onthe various soils and amounted to 12-20 % for 137Cs, and to 35-60 %
for 90Sr (Figure 1), therefore featuring a chemical availability of 90Sr
in the soils larger than that of 137Cs which should reflect theirrespective mobilities in the soil-plant system with respect to both,migration and root uptake. More detailed analysis on the chemical
0,00(Loamy) sand Loamy sand Sandy loam Silt loam Loam (cale.)
(Mol) (Belleville) (Wellesbourne) (Jùlich) (Barcelona)
Soil types
I Figure 1
Exchangeable fractions of 137Cs and 90Sr in various soilsas measured from displacement by NH4 Acétate (1 N).
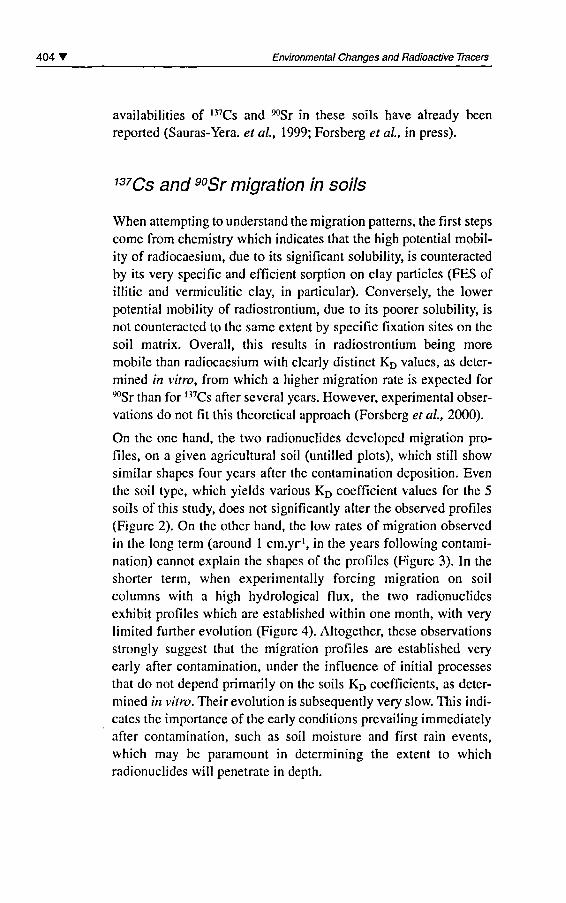
404 T Environmental Changes and Radioactive Tracers
availabilities of 137Cs and 90Sr in thèse soils hâve already been
reported (Sauras-Yera. et al, 1999; Forsberg et al, in press).
137Cs and 90Sr migration in soils
When attempting to understand the migration patterns, the first steps
corne from chemistry which indicates that the high potential mobil¬ity of radiocaesium, due to its significant solubility, is counteractedby its very spécifie and efficient sorption on clay particles (FES ofillitic and vermiculitic clay, in particular). Conversely, the lowerpotential mobility of radiostrontium, due to its poorer solubility, is
not counteracted to the same extent by spécifie fixation sites on the
soil matrix. Overall, this results in radiostrontium being moremobile than radiocaesium with clearly distinct KD values, as deter¬
mined in vitro, from which a higher migration rate is expected for90Sr than for 137Cs after several years. However, expérimental obser¬
vations do not fit this theoretical approach (Forsberg et al, 2000).
On the one hand, the two radionuclides developed migration pro¬
files, on a given agricultural soil (untilled plots), which still showsimilar shapes four years after the contamination déposition. Even
the soil type, which yields various KD coefficient values for the 5
soils of this study, does not significantly alter the observed profiles(Figure 2). On the other hand, the low rates of migration observedin the long term (around 1 cm.yr1, in the years following contami¬
nation) cannot explain the shapes of the profiles (Figure 3). In the
shorter term, when experimentally forcing migration on soilcolumns with a high hydrological flux, the two radionuclidesexhibit profiles which are established within one month, with veryIimited further évolution (Figure 4). Altogether, thèse observationsstrongly suggest that the migration profiles are established veryearly after contamination, under the influence of initial processes
that do not dépend primarily on the soils KD coefficients, as deter¬
mined in vitro. Their évolution is subsequently very slow. This indi¬
cates the importance of the early conditions prevailing immediatelyafter contamination, such as soil moisture and first rain events,
which may be paramount in determining the extent to whichradionuclides will penetrate in depth.
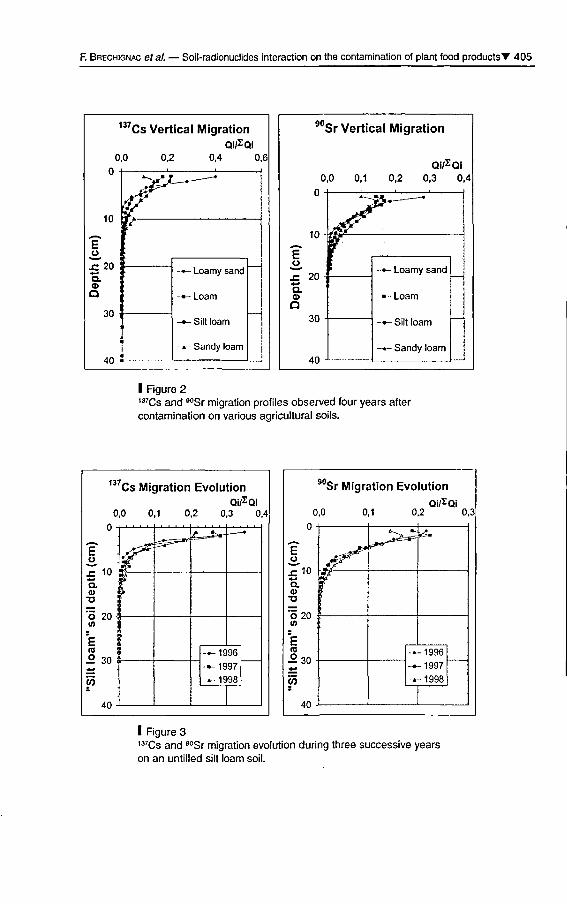
F. Brechignac et al. Soil-radionuclides interaction on the contamination of plant food productsT 405
Cs Vertical MigrationQi/2Ql
0,0 0,2 0,4 0,6
JC 20Q.
Q
30 -
40
-- Loamy sand
--Loam
-*- Silt loam
-*- Sandy loam
90Sr Vertical Migration
Qi/zQi0,0 0,1 0,2 0,3 0,4
I Figure 2t37Cs and 90Sr migration profiles observed four years aftercontamination on various agricultural soils.
137,Cs Migration EvolutionQi/ZQi
0,0 0,1 0,2 0,3 0,4
10
20
Q.o>O
'5IA
Erao° 30 *-
W
40
yjf*^
ma
|
1996
1997
»-- 1998
90Sr Migration Evolution
0,0 0,1Qi/2Qi
0,2 0,3
Eu
£10Q.a>
O20 Xm
Era
2. 30
tn
40
/""fI
1
y>* é,
1996
-«-1997
.-1998
I Figure 3137Cs and 90Sr migration évolution during three successive yearson an untilled silt loam soil.
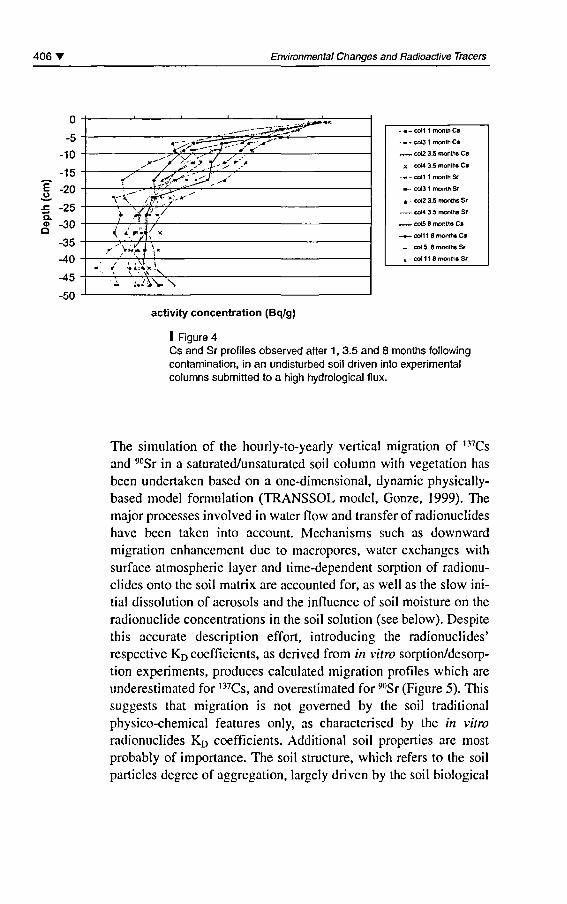
406' Environmental Changes and Radioactive Tracers
- - con 1 monm Cs
-»~ COI3 1 month Cs
.~ COI2 3.5 months Cs
X col4 3.5 monlhs Cs
-*- COI1 1 monrhSr
»- col3 1 month Sr
- t - CCV2 3.5 months Sr
~ CC44 3.5 months Sr
COI5 B months Cs
-*-. coli 1 6 monrhs Cs
-- col 5 8 months Sr
« col 11 8 monlhs Sr
activity concentration (Bq/g)
I Figure 4Cs and Sr profiles observed after 1 , 3.5 and 8 months followingcontamination, in an undisturbed soil driven into expérimentalcolumns submitted to a high hydrological flux.
The simulation of the hourly-to-yearly vertical migration of 137Cs
and 90Sr in a saturated/unsaturated soil column with végétation has
been undertaken based on a one-dimensional, dynamic physically-based model formulation (TRANSSOL model, Gonze, 1999). Themajor processes involved in water flow and transfer of radionuclideshâve been taken into account. Mechanisms such as downwardmigration enhancement due to macropores, water exchanges withsurface atmospheric layer and time-dependent sorption of radionu¬
clides onto the soil matrix are accounted for, as well as the slow ini¬
tial dissolution of aérosols and the influence of soil moisture on the
radionuclide concentrations in the soil solution (see below). Despitethis accurate description effort, introducing the radionuclides'respective KD coefficients, as derived from in vitro sorption/desorp-tion experiments, produces calculated migration profiles which are
underestimated for 137Cs, and overestimated for 90Sr (Figure 5). Thissuggests that migration is not governed by the soil traditionalphysico-chemical features only, as characterised by the in vitroradionuclides KD coefficients. Additional soil properties arc mostprobably of importance. The soil structure, which refers to the soil
particles degree of aggregation, largely driven by the soil biological
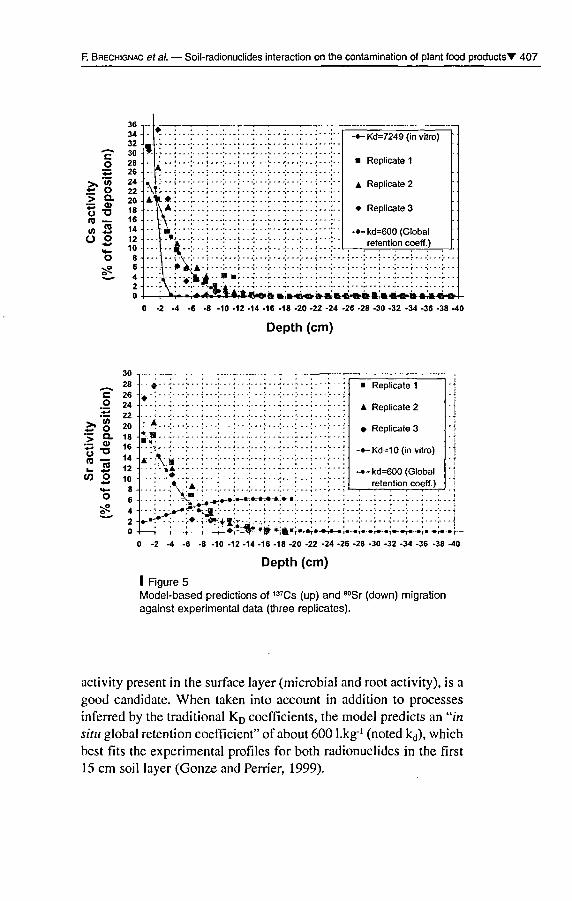
F. Brechignac et al. Soil-radionuclides interaction on the contamination of plant food productsT 407
co
> is.s o> CL^ O)O T3raw 3O O
3634323028262422201816141210
%
\Â.
..... .... . . . -
fc* :...:...;...:...:.. :...:.. :...:... -..:..KA:...:...:...:...:..;...i..:...i. .:...:..
...I..:...;...;...;..;..,..;...:...;...:..
-^Kd=7249 (in vitro)
Replicate 1
A Replicate 2
Replicate 3
- kd=600 (Globalrétention coeff.)
*L»*ivT; :::::::::-2 -4 -6 -8 -10 -12 -14 -16 -18 -20 -22 -24 -26 -28 -30 -32 -34 -36 -38 -40
Depth (cm)
2 -4 -6 -8 -10 -12-14-16-18 -20 -22 -24 -26 -28 -30 -32 -34 -36 -38
Depth (cm)
I Figure 5Model-based prédictions of 137Cs (up) and 90Sr (down) migrationagainst expérimental data (three replicates).
activity présent in the surface layer (microbial and root activity), is a
good candidate. When taken into account in addition to processes
inferred by the traditional KD coefficients, the model predicts an "insitu global rétention coefficient" of about 600 l.kg1 (noted kd), whichbest fits the expérimental profiles for both radionuclides in the first15 cm soil layer (Gonze and Perrier, 1999).
408 T Environmental Changes and Radioactive Tracers
Soil influence on 137Cs and 90Sr root transferto annual crops
Once contamination has reached the soil, long term pollution ofplant food products occurs essentially via root uptake. Prédictionmodels hâve first tackled this problem by applying a "transfer fac¬
tor" coefficient, similar to a "concentration ratio" defined as the
ratio between the spécifie activity in the plant and the spécifie activ¬
ity in the soil. This empirical approach, however, suffers from highand poorly documented variabilities, which can largely be
accounted for by the plant species considered, but also by the com¬
plexity and diversity of the soil compartment (IUR, 1989; Erikssonand Rosen, 1991). This is illustrated by the 137Cs and 90Sr concen¬
tration ratios (CR) which hâve been simultaneously measured on
the five soil types for three différent plant consumables: barleygrains, bean pods and lettuce (Figure 6). For 90Sr, the classificationof the observed Concentration Ratios (CR) lies in gênerai agree¬
ment with the soils' respective CEC values. For this radionuclide,the CR values are also 2 orders of magnitude larger than for 137Cs,
irrespective ofthe plant considered, illustrating its larger mobility inagreement with the chemical availability studies previously men¬
tioned. For 137Cs, however, the soils physico-chemical characteris¬
tics of relevance (such as RIP and % clay) do not fully explain the
observed CR values. Whilst confirming previous observations(Frissel et al, 1990; Smolders et al, 1997), such characteristics are
not sufficient to establish an accurate prédiction of 137Cs transfer to
plants. This lack of agreement results from complex variations ofthe soil solution composition which need to be elucidated. In par¬
ticular, the soil water composition does not only dépend on soiltype, but also on a number of other parameters such as soil mois¬
ture, climate, fertilization (particularly with K and Ca) and rootuptake activity.
Elucidating the parameters which influence the "soil solution" com¬
position is of paramount importance since this is the very place
where roots absorb radionuclides along with dissolved minerainutrients. Current prédictive assessment models usually involve the
soil-specific KD concept (soil solid/liquid partition coefficient)which reflects the radionuclide rétention on the solid matrix (sorp-
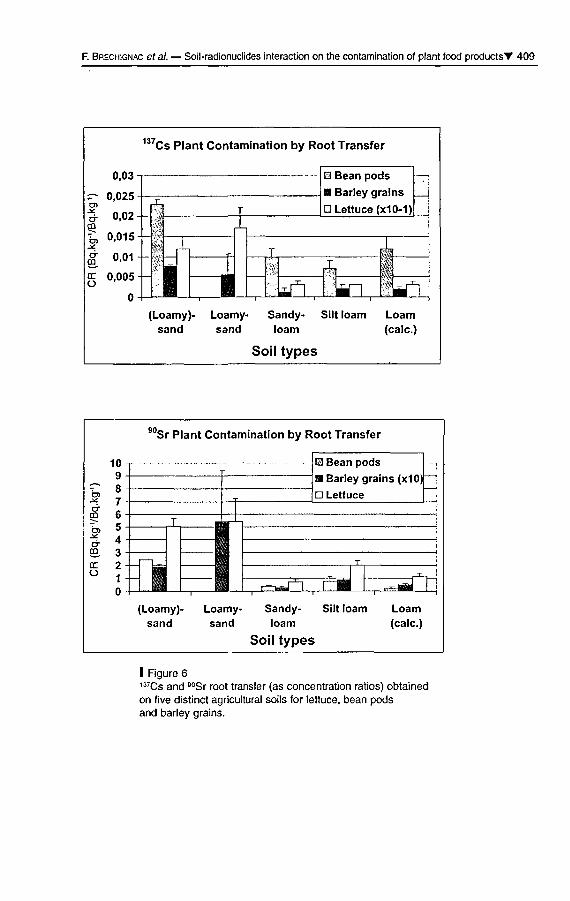
F. Brechignac étal Soil-radionuclides interaction on the contamination of plant food productsT 409
137,Cs Plant Contamination by Root Transfer
0,03
0,025
0,02-
0,015 -h
0,01
0,005
0
±
H Bean podsBarley grains
D Lettuce (x1 0-1)
liFJ hbri<p%
IéO.(Loamy)-
sandLoamy-sand
Sandy-loam
Soil types
Silt loam
Wi;Loam(cale.)
10987654321
0
90,Sr Plant Contamination by Root Transfer
E2 Bean pods
B Barley grains (x10)
D Lettuce
r-^jy t EBa
(Loamy)-sand
Loamy-sand
Sandy-loam
Soil types
Silt loam
SO]Loam(cale.)
I Figure 6,37Cs and 90Sr root transfer (as concentration ratios) obtainedon five distinct agricultural soils for lettuce, bean podsand barley grains.
41 0 T Environmental Changes and Radioactive Tracers
tion potential of a given soil) with respect to its solubility in inter¬
stitial water (potential availability to plant roots). The large sorptionrate of 137Cs on most minerai soils détermine trace concentrations ininterstitial water. The radionuclides dissolved concentrations in soilwater are further influenced to a large extent by the abundance ofother ionic nutritive éléments. As previously mentioned, this rootsfrom the often reported compétition occurring between Cs and Kfor adsorption on the FES of clay particles (Smolders et al, 1997;
Delvaux et al, 2000; Thiry et al, 2000), or between Sr and Ca+Mgfor adsorption on the argilo-humic complex. However, inhérent lim¬
its to adequately describing the soil water composition also arise
from the equilibrium nature ofthe KD coefficient, which is usuallydetermined in water saturated conditions. Such conditions are rarelyencountered in real nature, due, for example, to the continuouspumping activity of the roots or to climate-driven variations in soilmoisture.
A previous investigation on pasture plants in northern Germanyindicated that Cs and Sr root uptake were controlled by their con¬
centrations in soil water which were reported to increase at reduced
soil moistures (Kirchner and Ehlken, 1997). Based on a séries of invitro experiments carried out on samples from the soils consideredin the présent study, soil moisture is indeed demonstrated tomarkedly influence the radionuclides concentrations in soil water.
For example, reducing soil moisture promotes an increase in Cs
concentration, thereby reducing its KD (Figure 7), an effect which ina first approach would tend to favour root uptake. However, the Kconcentration is also increased in parallel, to an extent proportion-ally even greater than for Cs (Cs/K lower at reduced soil moisture),hence promoting a larger compétition with Cs for fixation on clayminerais. Similar observations hâve been obtained for 90Sr and
Ca+Mg. When considering the soil matrix-liquid interface only, the
radionuclides availability to root uptake will therefore resuit fromthe combination of both effects.
In turn, when considering the interface between the root surfaceand the soil water, an increased K concentration in the soil water(as measured upon plant harvest) promotes a réduction of 137Cs
uptake expressed as a concentration factor (Figure 8, with CF=spécifie activity in plants/specific activity in soil water). Similar
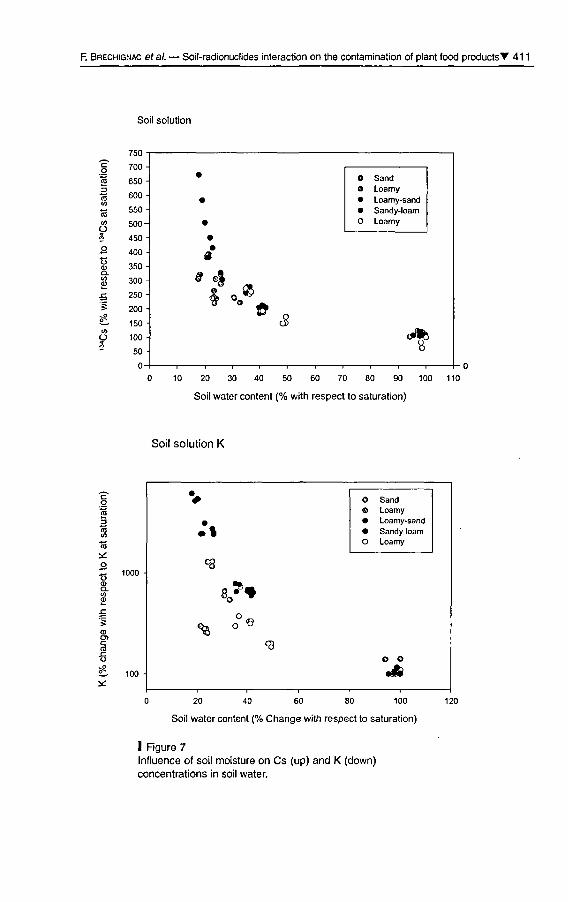
F. Brechignac et al. Soil-radionuclides interaction on the contamination of plant food productsT 41 1
Soil solution
o
o
0 10 20 30 40 50 60 70 80 90 100 110
Soil water content (% with respect to saturation)
Soil solution K
3raOi
ra
o1000
100 -
°«<3
0o
o
SandLoamyLoamy-sandSandy-loamLoamy
O o
A
0 20 40 60 80 100
Soil water content (% Change with respect to saturation)
I Figure 7Influence of soil moisture on Cs (up) and K (down)concentrations in soil water.
120
412 Environmental Changes and Radioactive Tracers
observations hâve been obtained for 90Sr and Ca+Mg. The log-logplot of the 137Cs CF versus K concentration in soil water showsthat this effect is more pronounced in the low range of K concen¬
trations, most likely in soils with reduced fertility. Having been
obtained from measurements on différent soil types, the corréla¬
tion between CF and the concentration in analogue ionic species
suggests that plant contamination is primarily susceptible to the
status of analogues in the soil water, irrespective ofthe soil type.Récent studies undertaken on a wide spectrum of différent soiltypes, either minerai or organic, hâve established a similar com¬
pétition promoted by K in soil water for root uptake of 137Cs, an
effect most pronounced below ImM K (Smolders et al, 1997;
Sanchez et al, 1999). This agrées with the principle of radionu¬clide compétition with its analogue ion occurring at the root levelfor membrane-based ionic transport Systems.
ura
co
10000
1000
S D>coocoO
O
O10
0,1
ï^^fe
a Lettuce
Bean plants
a Bean pods
Linear régressions
1 10
[K] in soil water (mM)
100
I Figure 8
Influence of the K concentration in soil wateron the 137Cs
Concentration Factor in lettuce and bean.
F. Brechignac étal Soil-radionuclides interaction on the contamination of plant food productsT 413
When considering finally the overall soil-plant system, it has been
suggested that plant uptake could be described, provided some
assumptions, by a séries of two reactions (as for Cs, Smolders et al,1997):
KD CF-< ^- Cv ~* ** r<:
soil ^^soil water ^^plant
From this model, the overall transfer factor (expressed as the con¬
centration ratio CR=Cspiam [spécifie activity in plant]/Cssoi] [spé¬
cifie activity in soil]) can be derived: CR=CF/KD. CF (plantroot/soil water interface) and KD (soil matrix/soil water interface)are both depending on the K status of soil water, but with oppositetrends. In particular, when increasing K in soil water, the Cs avail¬
ability at the soil matrix-liquid interface (Ko) is increased (a featurewhich would favour root uptake) concurrently with a stimulation ofthe compétition at the root level which tends to reduce root uptake.The ultimate plant contamination rate results therefore from thecomplex combination of thèse two interface-related processes, fur¬
ther explaining why CR is not easily linked to soil properties. Thisdemonstrates the central rôle played by the soil water chemicalcomposition, not only with respect to the trace amounts of radionu¬clides, but also with regard to their ionic analogues (K, Ca+Mg), as
a key élément contributing to the variability of the observed trans¬
fer factors. In other words, an accurate prédiction of the soil watercomposition, as experienced by the roots of the plants duringgrowth, will most probably résolve a large part of the transfer fac¬
tors variability.
Kinetics of 137Cs and 90Sr transfer to cropsvia root uptake.
Further to the influence of the soil parameters (such as texture,moisture, analogue ions availability, ...ete), the soil water composi¬tion is also influenced by the root uptake activity itself, as governedby the plant physiological requirements for homeostasis. Primarilydesigned to supply such nutrients as K and Ca to the plants inamounts suitable to support appropriate growth, the root uptake
414 T Environmental Changes and Radioactive Tracers
activity is regulated by the plants physiological requirements. Thiscan be illustrated by the variations during the growth cycle ofthe Cs
accumulation rate in an annual crop (barley, Figure 9). Based on the
finding that 137Cs and ^Sr are withdrawn respectively by the K- and
Ca-membrane transport mechanisms, an analytical model describ¬
ing Root Uptake of Radionuclides (RUR, Casadesus, 1999;
Casadesus et al, 1999) has been developed with particular empha¬
sis on the depletion zone in the rhizosphere. This model accuratelysimulâtes the observed kinetics of radionuclides accumulation inplants. By integrating the physiology of plant growth, and in partic¬
ular the regulatory mechanisms which overcome potential drasticdepletion of nutrients in the root vicinity, this model accounts forthe plant's ability to adjust the rate of supply to its demand.
m
g
U)O
CTco
V)Oota
e
500
400
300
200
100
0
2Predicted CsObserved CsPredicted K
120 150
time, days
I Figure 9Cs and K évolution at the root vicinity during a barley crop,and their observed /predicted accumulation in plants.
F. Brechignac étal. Soil-radionuclides interaction on the contamination of plant food productsT 415
In addition to spatial variability, most often associated to soil type,such an in-year seasonality also contributes to puzzling the accuratedétermination of the longer-term contamination évolution withinperennial végétation, a prerequisite for valid long-term prédictions.This is illustrated by the 137Cs and '"Sr activity concentrations in a
rye-grass crop, grown on a silt-loam (Jùlich) and a sandy loam soil(Wellesbourne), which hâve been followed up to 4.5 years after thecontaminating déposition (Figure 10). Already présent upon dépo¬
sition, the contamination of the crop grown on the sandy loam(Wellesbourne) exhibits a rate of décline which can be decomposedinto several successive phases with distinct characteristic times. For137Cs contamination, the fast initial rate of décline during the firstfew months following déposition is attributed to foliar transfers as
affected by rain wash-off and growth-mediated dilution. During thisinitial phase, the 137Cs contamination absorbed by the foliage is also
translocated towards the roots. This root-accumulated pool will nextbe discharged to the rest ofthe plants, therefore promoting a slowerrate of décline in the végétation up to 2 years after contamination.Interestingly, 90Sr does not exhibit such an intermediate phase due
to its reduced mobility within plants which prevents a similar pool
Rye-grass
à "Sr Sandy loam a "7Cs Sandy loam""Sr Silt loam '"Cs Silt loam
Model fitting (Sandy loam) Model fittingModel fitting (Silt loam)
730 1095 1460
Time elapsed after déposition (days)
I Figure 10,37Cs and 90Sr contamination évolution in Rye-grass during4.5 years after déposition, and current model fitting of expérimentalvalues (ASTRAL Model).
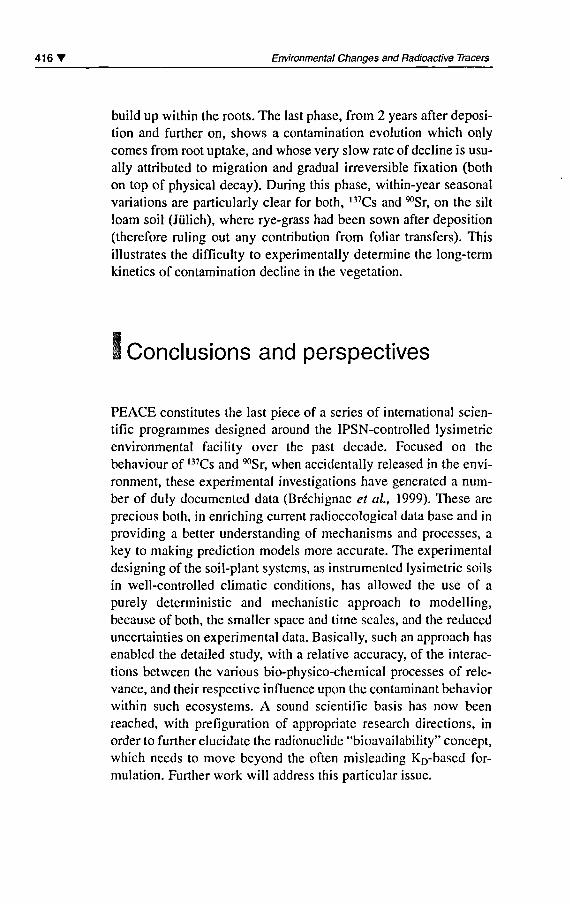
41 6 T Environmental Changes and Radioactive Tracers
build up within the roots. The last phase, from 2 years after déposi¬
tion and further on, shows a contamination évolution which onlycornes from root uptake, and whose very slow rate of décline is usu¬
ally attributed to migration and graduai irréversible fixation (bothon top of physical decay). During this phase, within-year seasonal
variations are particularly clear for both, 137Cs and 90Sr, on the siltloam soil (Jùlich), where rye-grass had been sown after déposition(therefore ruling out any contribution from foliar transfers). Thisillustrâtes the difficulty to experimentally détermine the long-termkinetics of contamination décline in the végétation.
Conclusions and perspectives
PEACE constitutes the last pièce of a séries of international scien¬
tific programmes designed around the IPSN-controlled lysimetricenvironmental facility over the past décade. Focused on the
behaviour of 137Cs and 90Sr, when accidentally released in the envi¬
ronment, thèse expérimental investigations hâve generated a num¬
ber of duly documented data (Brechignac et al, 1999). Thèse are
precious both, in enriching current radioecological data base and inproviding a better understanding of mechanisms and processes, a
key to making prédiction models more accurate. The expérimentaldesigning ofthe soil-plant Systems, as instrumented lysimetric soilsin well-controlled climatic conditions, has allowed the use of a
purely deterministic and mechanistic approach to modelling,because of both, the smaller space and time scales, and the reduceduncertainties on expérimental data. Basically, such an approach has
enabled the detailed study, with a relative accuracy, ofthe interac¬
tions between the various bio-physico-chemical processes of rele-vance, and their respective influence upon the contaminant behaviorwithin such ecosystems. A sound scientific basis has now been
reached, with préfiguration of appropriate research directions, in
order to further elucidate the radionuclide "bioavailability" concept,which needs to move beyond the often misleading KD-based for¬
mulation. Further work will address this particular issue.
F. Brechignac étal. Soil-radionuclides interaction on the contamination of plant food productsT 417
Bibliography
Brechignac F., Colle C, Hugon J.,Madoz-Escande C, Rongier P.,
Sanchez A., 1996"RESSAC: A research facility forstudying radionuclides behaviourwithin ecosystems". In Proceedingsof IRPA International Congress onRadiation Protection, Vienna,Austria, April 14-19, 1996,3:137-139.
Brechignac F., Rongier R, Hugon J.,Dubois E., Colle C,Madoz-Escande C, 1998"Controlled lysimetric environmentalfacility at IPSN: assessing accidentairadioactive contamination".In Proceedings of InternationalMeeting on Influence of ClimaticCharacteristics upon Behaviorof Radioactive Eléments, Rokkasho,Aomori, Japan, October 14-16,1997:35-42.
Brechignac F., Vallejo R.V.,Sauras Yera T., Casadesus J.,Thiry Y., Waegeneers N.,Forsberg S., Shaw G.,Madoz-Escande C,Gonze M.-A., 1999PEACE : Programme for Evaluatingthe impact of AccidentsContaminating the Environment-Soil-radionuclides processesof interaction and modelling of theirimpact on contamination of plantfood products. Final Report,European Atomic Energy CommunityContract F14-CT96-0039a. (IPSN-DPRE/SERLAB Report 99-017(P)).
Casadesus J., 1999Root uptake of radionuclides -Model description. Technical Note,European Atomic Energy CommunityContract F14-CT96-0039a.
Casadesus J., Sauras Yera T.,
ROCA M. C.,Vallejo V. R., 1999Root uptake model validation.Technical Note, European Atomic
Energy Community ContractF14-CT96-0039a.
Delvaux B., Kruytz N.,Cremers A., 2000Rhyzospheric mobilizationof radiocaesium in soils.Environmental Science andTechnology, 34: 1489-1493.
Eriksson A., Rosen K., 1991Transfer of caesium to hay grassand grain crops after Chernobyl".In Moberg L. (ed): The Chernobylfallout in Sweden - Results froma research programmeon environmental radiology,Stockholm, The Swedish RadiationProtection Institute: 291-304.
Forsberg S., Rosén K.,Fernandez V., Juhan H., 2000Migration of 137Cs and 9°Srin undisturbed soil profiles undercontrolled and close-to-realconditions. Journal of EnvironmentalRadioactivity, 50 (3): 235-252.
Forsberg S., Rosén K.,Brechignac F., 2000Chemical availability of 137Cs and^Sr in undisturbed lysimeter soilsdriven under controlledand close-to-real conditions.Journal of EnvironmentalRadioactivity, in press.
Frissel M. J., Noordijk H.,Van Bergeuk K. E., 1990"The impact of extrême environmentalconditions, as occurring in naturalecosystems, on the soil-to-planttransfer of radionuclides". In DesmetG., Nassimbeni P., Belli M. (eds) :
Transfer of radionucides in naturaland semi-natural environments,Brussels and Luxembourg, ElsevierScience Publishers: 40-47.
Gonze M.-A., 1999A physically-based modelfor simulating the soil-to-plant
418 Environmental Changes and Radioactive Tracers
transfer of ,37Cs and xSr radionuclides:the TRANSSOL code (updatedrelease version 2.0), Technical Note,European Atomic Energy CommunityContract F14-CT96-0039a.
Gonze M.-A., Perrier T., 1999Numerical simulations of 137Cs
and '"Sr migration: TRANSSOLversus lysimeter experiments.Technical Note, European AtomicEnergy Community ContractF14-CT96-0039a.
IUR, 1989Workgroup of the International Unionof Radioecologists on soil-to-plantsTransfer Factors. Report VI. RIVM,Bilthoven, The Netherlands.
Kirchner G., Ehlken S., 1997"Climatic influence on root uptakeof Cs and Sr by pasture plants:évidence from field experimentsin northern Germany". In Ohmomo Y,Sakurai N. (eds) : Proceedingsof International Meeting on Influenceof Climatic Characteristics uponBehaviour of Radioactive Eléments,Aomori, Japan, Institutefor Environmental Sciences: 83-90.
Madoz-Escande C, Brechignac F.,Colle C, Dubois E., Hugon J.,JOUGLET H., MOUTIER M., RONGIER P.,
Sanchez A., Schulte E. H.,Zanon R., 1999Expérimental installation forradioecology research on definedecosystems subjectedto contamination in controlledconditions. Nuclear Scienceand Engineering, 133: 178-191.
Maes E., Delvaux B.,ThiryY, 1998Fixation of radiocaesium in an acidbrown forest soil. European Journalof Soil Science, 49: 1 33-1 40.
Maes E., Iserentant A.,Herbauts J., Delvaux B., 1999Influence of the natureof clay minerais on the fixationof radiocaesium traces in an acidbrown earth-podzol weatheringséquence. European Journalof Soil Science, 50: 1 1 7-1 25.
Sanchez A. L, Wright S. M.,Smolders E., Naylor C,Stevens P. A., Kennedy V. H.,Dodd B. A., Singleton D. L.,BarnettC. L, 1999High plant uptake of radiocesiumfrom organic soils due to Cs mobilityand low soil K content.Environmental Scienceand Technology, 33: 2752-2757.
Sauras Yera T., Vallejo V. R.,Valcke E., Colle C, Fôrstel H.,Millan R., Jouglet H., 1999,37Cs and 90Sr root uptake underclose to real controlled conditions.Journal of EnvironmentalRadioactivity, 45(3): 191-218.
Smolders E., Van den Brande K.,Merckx R., 1997Concentrations of 137Cs and K in soilsolution predict the plant availabilityof ,37Cs in soils. EnvironmentalScience and Technology,31:3432-3438.
Strand P., Balonov M., Skuterud L,Hove L., Howard B., Prister B. S.,Travnikova I., Radnikov A., 1996"Exposures from consumptionof agricultural ans semi-naturalproducts". In Karaoglou A., DesmetG., Kelly G.N., Menzel H.G. (eds):The Radiological Conséquences ofthe Chernobyl Acciden, EN-Luxembourg, Eur 16544: 261-269.
Sweeck L., Wauters J., Valcke E.,Cremers A., 1990"The spécifie interception potential ofsoils for radiocaesium". In DesmetG., Nassimbeni P., Belli M. (eds):Transfer of radionucides in naturaland semi-natural environments,Brussels and Luxembourg, ElsevierScience Publishers: 249-258.
Thiry Y, Kruyts N., Delvaux B., 2000Respective horizon contributions tocesium-137 soil-to-plant transfer: apot experiment approach. Journal ofEnvironmental Quality, 29, in press.
Tormos J., Jouve A., Revy D.,Millan-Gomez R., Zanon R.,ErarioM. J., 1995

F. Brechignac étal. Soil-radionuclides interaction on the contamination of plant food productsT 419
A rapid method for determiningstrontium-90 in contaminatedsamples of soil and plant. Journalof Environmental Radioactivity,27(3): 193-206.
Wauters J., Sweeck L., Valcke E.,Elsen A., Cremers A., 1994Availability of radiocaesium in soils:a new methodology. The Science ofthe Total Environment, 157: 239-248.


Oral/Posterprésentations
Session 5

Session 5 Oral/Poster présentations T 423
S Linking érosion and environmentalchange the potentialof fallout radionuclides
T. A. Quine
Y. Zhang
P. Wallbrink
The need to document and predict erosional responses to environ-mental change présents an important challenge to research scien¬
tists, particularly in the light of growing concern over future climatechange and increased pressure on land resources. Widespread appli¬
cations of caesium-137 in érosion investigations and the morerécent use of excess lead-210 hâve demonstrated the great potentialof fallout radionuclides for assembling rétrospective érosion rate
data. However, if thèse data are to be used to address erosionalresponses to environmental change there is a need to dérive infor¬mation concerning changing rates of érosion. This paper considersapproaches to deriving such data that include: comparison ofradionuclide derived rates with contemporary expérimental data;
use of radionuclide data in érosion model validation; and compari¬son of data derived using différent radionuclides. Examples fromEurope and Australia will be used and attention will focus on tillageand water érosion. In comparison of data derived from différentradionuclides, synchronous simulations are used in order to ensure
internai consistency. The merits and limitations of this approach and
the implications of dichotomies in data derived from différentradionuclides are discussed.
424 T Environmental Changes and Radioactive Tracers
8 Beyond érosion: relationshipsbetween soil redistribution,soil properties and crop productionwithin an agricultural fieldin Devon, UK
T. A. Quine
Y. Zhang
This paper uses érosion data derived from caesium-137measurements and field survey of rill networks to explore the rôleof tillage érosion and water érosion in the development of observedwithin-field spatial variation in soil properties and crop production.It is suggested that soil redistribution by tillage is a majorcontributor to the observed spatial variation in soil properties.Relationships between crop production and soil properties and
érosion rates were found to be complex and non-linear. Simulationof a further 40 years of tillage érosion suggests that spatial variationin soil properties will become more extrême and is likely to hâve a
deleterious impact on crop production.
Session 5 Oral/Poster présentations T 425
I Combining tracers and landscapemodelling to predict sourcesof sédiments and phosphorusto waterways
Ck. Bundella C. J. Wilson
P. J. Wallbrink C. Martin
The Liverpool plains in the Namoi River basin, NSW, is one ofthemost productive agricultural régions in Australia. However sédi¬
mentation in the streams and rivers running through it has resultedin severe environmental dégradation. Eutrophication is also a majorassociated issue, algal blooms persistently occur. The occurrence ofthèse blooms is associated with excess available Phosphorus. Thisphosphorus is derived as either particle bound from érosion of dif¬
fuse sources or as runoff of fertiliser p from cultivated and pasture-Iand areas. The three major érosion sources of particle bound P are:
i) sheet érosion of the 40% land surface under cultivation, ii) sub-soil érosion from the significant number of channels and gullies thatdrain the région and iii) surface érosion from the pastureland and
forested parts of the catchment. Fertilisers based on Nitrogen, P and
K are used extensively in the catchment. The Bundella Ck catch¬
ment within the Namoi system, contains each of thèse landuses. Assuch it is an idéal location to détermine the influence of thèse dif¬
férent diffuse sources to fluxes of sédiments and p in this landscape.
In this paper we use fallout tracers to quantify the proportionatecontributions of sédiments and diffuse P from thèse différentsources. We also use measurements of REE and strontium isotopesto ascertain the contribution of fertilizer derived P compared to thatfrom diffuse native P. We also create a topographie model to inde¬
pendently predict the contributions of sédiment and P from thèse
différent sources. The strength ofthe model is its ability to charac-
426 T Environmental Changes and Radioactive Tracers
terize not only fluxes of material from surface érosion, but also thatfrom subsoil channel and gully érosion processes. We compare the
results of sédiment and P fluxes from the tracers and the topo¬
graphie model and investigate the potential for applying the modelto other parts of the landscape in which tracer data is not available.
Session 5 Oral/Poster présentations T 427
I Studies of naturaland artificial radioactivity in Brazil
A. S. Paschoa
Studies of natural and artificial radioactivity started in Brazil, as
well as in other countries, as a conséquence of the 1956 recommen¬dations of the United Nations Scientific Committee on the Effectsof Atomic Radiation (UNSCEAR). Brazilian scientists from thePontificia Universidade Catolica do Rio de Janeiro and theBiophysics Institute of the then Universidade do Brasil (now,Universidade Fédéral do Rio de Janeiro - UFRJ) joined their effortswith American scientists from the New York University, with thesupport of the United States Atomic Energy Commission (USAEC)and the Brazilian Nuclear Energy Commission (Comissâo Nacionalde Energia Nuclear - CNEN). Such efforts resulted in wide researchspectrum encompassing studies from radioactive fallout fromweapons tests to natural radioactivity in soils and plants. The stud¬
ies of natural radioactivity were carried out mostly in Morro doFerro, Guarapari, and Araxa, which are known to be areas of ele¬
vated natural radioactive background. The radioactive fallout mea¬
surements were concentrated in Rio de Janeiro. In some cases theareas of elevated natural radioactivity are associated with rare earth
sands (Guarapari), pyrochlore and apatite (Araxâ), and bauxite(Morro do Ferro). Thus, such areas présent opportunities to com¬
pare the original radioactive baseline vis-a-vis the current situationof the technologically enhanced naturally occurring radioactivematerials (TENORM) in the same site. The studies of artificialradioactivity provide information on circulation of radionuclidesfrom the weapons tests in the Southern Hémisphère. The paper willdiscuss the importance of re-examining the available data undernew light.
428 T Environmental Changes and Radioactive Tracers
i Results of Iimited gammaspectrometry intercomparisonon minerai sand productsand associated issues
R. Kleinschmidt
G. Godwin
New radiation control législation in Queensland, Australia providesfor the exemption of abrasive blast material upon meeting a speci¬
fied release criteria. Calculation of the release criteria is based on
the measurement of uranium and thorium séries radionuclides in the
abrasive blast média. Past expérience has shown that results fromdifférent facilities vary to the extent that the material may be
exempt based on the results of one laboratory but not another.
Queensland Health Scientific Services embarked on the trail of run-ning a Iimited intercomparison for a sample of ilmenite, a com-monly used minerai sand abrasive blast material, to establish
sources of variation in reported results. The results of the programare presented with comment on their implications.
Session 5 Oral/Poster présentations T 429
In situ déterminationof the depth distributionof 137Cs by means of gammaspectrometry of primaryand forward scattered photons
T. Hjerpe
C. Samuelsson
Stationary or mobile in situ gamma ray spectrometry is a useful toolfor rapid estimations of environmental radioactivity inventories inthe ground. A week point however, is that the vertical distribution ofthe activity in the ground must be known, in order to calculate the
activity per unit surface area from an observed photon fiucnce rate.
In the case of stationary measurements, the depth distribution in soilis commonly determined by analysing core samples by gamma spec¬
trometry afterwards in the laboratory. In order to be représentative,the number of samples to be analysed in the lab is roughly one hun¬
dred for each a 10x10 m2 surface and a 30 cm depth module moni-tored. During mobile in situ spectrometry, large areas are coveredand an on-line présentation of the resuit is given high priority.During such circumstances, traditional core sampling methods are
not feasible and other more direct methods hâve to be used. Onepromising method for conversion of incoming spectral data in real
time to both true area activity density and activity depth distributionis based on an analysis ofthe ratio between count rates from primaryand forward scattered photons. The method is frequently referred toas the peak-to-valley ratio method. This contribution will describeour plans to adopt the peak-to-valley method to car-borne mobilegamma spectrometry using a large HPGe detector. Preliminaryresults from testing the method in the field, utilising a point sourceat différent depths, will be presented.
430 T Environmental Changes and Radioactive Tracers
3 Investigation of uraniumand radium plant uptakefrom cover soil of uranium miningtailings ponds
P. Szerbin
E. Koblinger-Bokori
L. Juhâsz
The only Hungarian uranium mine in the vicinity of Pécs (SouthHungary) was shut down in 1997. During the former opérationresidue of the ore processing was placed in natural environment.This action has lead to many environmental problems, first of ail, ithas created several environmentally unfriendly artificial forma¬tions. Such formations are the tailings ponds, which are potentialsources of radioactive contaminants like uranium and radium.Uranium and 226Ra contents of the pond water are 0.1 mg.l1 and
5.2 Bq.l ', respectively; those of the solid phase of the pond mate¬
rial are 70 g.ton"1 and 12.7 Bq.g1, respectively. Thèse contaminantsmay increase the radiation burden of population in this area via bothaerial and terrestrial pathways. The partially dried-out tailingsponds are planned to be covered with différent materials in order toreduce radon émanation and the plant uptake ofthe radioactive élé¬
ments. Green plant cover is foreseen to reduce radionuclide releaseby wind and soil érosion. For this reason column experiments and
pilot studies on the surface of the ponds hâve been carried out tofind optimal solution for cover system. Environmental restorationof the uranium mining and milling sites will be performed on the
basis ofthe results of those pilot studies In spite of thèse actions, theradioactive materials may still reach the upper layers by long-timemigration and become available for plants. Bio-availability ofradionuclides in soil is influenced by their chemical form and asso-
Session 5 Oral/Poster présentations T 431
ciation with différent geo-chemical phases. Consequently, the bio-available part of the radionuclides may enter the terrestrial food-chain pathway. The présentation deals with the results ofinvestigations of plant uptake of uranium and radium from the soilof the uppermost pond covering layer. The investigation was carriedout in laboratory conditions. The soil was labelled with uranium and
226Ra. Four species of plants were selected for the study: Loliummultiflorum, Festuca rubra, Sinapis alba and Panikum miliaceum.The amount of mobile form of radionuclide in soil was determinedby parallel extraction. Two types of extradants were used to déter¬
mine radionuclide association with readily exchangeable forms and
carbonate phases. The total amount of radionuclide was determinedafter extraction with nitric acid. A set of concentration factors was
calculated from the ratio of soil and plant activity concentrations,for various soil extradants and plant types. Values of radium con¬
centration factors related to the total amount of radionuclide in soilvaried between 1.3 IO1 and 5.03 10', whereas the uranium concen¬
tration factors were between 3.8 10' and 1.2 10"'.These values are
one order of magnitude higher if the concentration factors are
related to the bio-available amount.
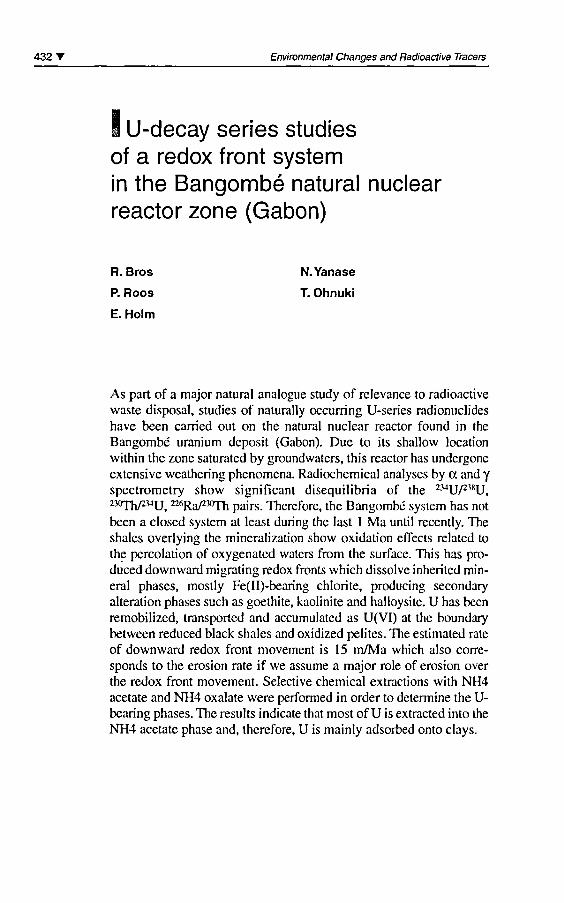
432 T Environmental Changes and Radioactive Tracers
I U-decay séries studiesof a redox front systemin the Bangombé natural nuclearreactor zone (Gabon)
R. Bros N.Yanase
P. Roos T. Ohnuki
E. Holm
As part of a major natural analogue study of relevance to radioactivewaste disposai, studies of naturally occurring U-series radionuclideshâve been carried out on the natural nuclear reactor found in the
Bangombé uranium deposit (Gabon). Due to its shallow locationwithin the zone saturated by groundwaters, this reactor has undergoneextensive weathering phenomena. Radiochemical analyses by a and yspectrometry show significant disequilibria of the 234U/218U,
23>rrhPiAU, 22fSRa/230Th pairs. Therefore, the Bangombé system has notbeen a closed System at least during the last 1 Ma until recently. Theshales overlying the mincralization show oxidation effects related tothe percolation of oxygenated waters from the surface. This has pro¬
duced downward migrating redox fronts which dissolve inherited min¬erai phases, mostly Fe(II)-bearing chlorite, producing secondaryaltération phases such as goethite, kaolinite and halloysite. U has been
remobilized, transported and accumulated as U(VI) at the boundarybetween reduced black shales and oxidized pelites. The estimated rateof downward redox front movement is 15 m/Ma which also corre¬
sponds to the érosion rate if we assume a major rôle of érosion overthe redox front movement. Sélective chemical extractions with NH4acétate and NH4 oxalate were performed in order to détermine the U-bearing phases. The results indicate that most of U is extracted into the
NH4 acétate phase and, therefore, U is mainly adsorbed onto days.
Radioactivityand water column
Session 6
Chairman: R. Tinker
Session opening: P. Kershaw

Oontrasting behaviourof artificial radionuclidesin the Pacific and otherocéan basins:radionuclides as tracersof environmental change?
Peter J. Kershaw
Hugh D. Livingston
Pavel Povinec
Hilde-Elise Heldal
Introduction
Océan basins hâve received artificial radionuclides from a numberof sources, including: global fallout from weapons testing, close-infallout (e.g. Marshall Islands, Mururoa Atoll, Novaya Zemlya),dumped wastes (e.g. Sea of Japan, NE Atlantic, Kara Sea), acciden¬
tai losses (e.g. SNAP-9A satellite, nuclear-powered vessels, nuclearweapons) and discharges into coastal régions (e.g. nuclear repro-cessing facilities at Sellafield (UK) and La Hague (France)). Insome cases the sources are well defined and in others it is more a
case of estimating the size of the source from environmental mea¬
surements. Thèse phenomena hâve provided a variety of tracerswhich can be used to describe the behaviour of artificial radionu¬clides in the water column and provide information on the underly¬ing physics, biology and chemistry controlling their re-distribution.
436 T Environmental Changes and Radioactive Tracers
This provides an opportunity to enquire whether artificial radiotrac¬ers can hâve a rôle in describing and quantifying the extent of envi¬
ronmental variability and change. In order to do this it is necessary
to pose 2 fundamental questions:
What can observations of artificial radionuclide distributions tell us
about océan processes?
What can this information about observations and processes tell us
about climate variability and environmental change?
To answer the first question we need to be able to clearly define the
source terms and make adéquate observations, both in space and
time, of the radionuclide distributions. However, it is also essential
to relate the observations to an adéquate understanding of the
underlying physics, biology and chemistry of the environmentwhich are moderating the radionuclide behaviour. Some examplesare presented below, from the Pacific and other océan basins, toillustrate this point. To answer the second question we hâve to be
able to define the variability, in space and time, ofthe observationsand processes and link this to some index of environmental/climatevariability. One example is presented, from the North Atlantic/Arctic, where this approach is being attempted, comparing the dis¬
tribution of mainly Sellafield-derived radionuclides with fluctua¬tions in the North Atlantic Oscillation (NAO) as the index ofenvironmental variability.
a Radiotracers and océan processes
Some datasets allow direct comparisons to be made betweenradionuclide distributions in différent océan basins. For example,Bourlat et al (1996) presented ,37Cs, 90Sr and 2»-2«Pu concentra¬tions in surface waters from the Pacific, Atlantic and Indian Océans,
from samples collected in 1992-1994. l37Cs and wSr both showed a
latitudinal dependence but, in addition, concentrations in the Pacificwere consistently higher (by ~ 0.5 Bq.m3) between 50" N and 30° S.
The l37Cs/,,flSr remained relatively constant (~ 1 .7). The consistently
P. J. Kershaw et al. Behaviour of artificial radionuclides in the Pacific and other océan basins 437
higher surface concentrations in thèse Pacific latitudes most likelyresults from the residual effects of the additional close-in tropo-spheric testing from the U. S. Pacific weapons tests in the MarshallIslands. This différence was évident in the 1950's and 60's (Volchoket al, 1971), in the 1970's (Livingston et al, 1985) and still remains(IAEA, 1985). A decrease in I37Cs concentrations in surface watershas also been observed in the Mediterranean Sea, with a conséquentincrease in deeper waters. In this case the transfer is intimatelylinked to convection and the seasonal formation of deep and inter¬
mediate water (Papucci et al, 1996). The Mediterranean alsoreceived a significant additional input of 137Cs as a conséquence ofthe Chernobyl accident. The pénétration of tritium to deeper layersin the Atlantic provided good évidence of the degree to which ven¬
tilation was taking place, following the contamination of surfacewaters by bomb-tritium and subséquent formation of intermediateand deep water in the Nordic Seas (Nyffeler et al, 1996).
In oligotrophic régions, covering much of the world océan, most ofthe plutonium has remained in the water column, unlike in coastaland shelf régions where there is significant removal on biologicalparticles in highly productive shelf areas and through contact withhigher shelf sédiment particulates. The situation in the NW Pacificwith respect to plutonium is less straightforward, both because ofthe more complex environmental behaviour of plutonium, com¬
pared with Cs and Sr, and because there are 2 significant sources. Inaddition to stratospheric global fallout (maximum input in the early1960s) there was a significant contribution from tropospheric fall¬out, originating from the Marshall Islands proving grounds fromtests conducted in the early 1950s (Bikini and Enewetak Atolls).Many of thèse tests were conducted at or near ground level. Thissource has a higher 240Pu/239Pu ratio (0.24 vs. 0.18) and appears tobe more rapidly removed from surface waters (Buesseler, 1997). Ithas also contributed to an increase in 239.24opu concentrations in bot¬
tom waters, as well as the underlying sédiments. Thèse surface tests
tended to produce relatively large calcium-rich particles, unlike thesmaller iron-rich particles associated with stratospheric fallout. Anoverview of plutonium behaviour in the Pacific was recently pre¬
sented by (Livingston et al, 1999). They also concluded that tropo¬
spheric fallout had contributed to plutonium inventories in the NWPacific. This study benefited from having access to the large GLO-
438 T Environmental Changes and Radioactive Tracers
MARD database (Global Marine Radioactivity Database), underdevelopment at the IAEA-MEL (IAEA in press;www.iaea.org/monaco/gIomard). Sédiment and water columninventories, based on GLOMARD data, decreased with both lati¬
tude and longitude from the Marshall Islands, consistent with an
additional localised source. In contrast, the French weapons pro¬
gramme conducted at Mururoa and Fangataufa did not produce a
significant tropospheric footprint, beyond a few km from the atolls.This was as a resuit of the conditions under which the détonationstook place (underground, under water, and at a height of several
100s m). The lagoons act as a local source of radioactivity but thisis not significant on a régional scale.
Livingston et al (1999) compared water column profiles of pluto¬
nium concentrations from common sampling locations visited in1973 (GEOSECS), 1978, 1980, 1982 and 1997. Certain commonfeatures were revealed, in particular the persistence of sub-surface239.24opu concentration maxima (Figure 1). However, profiles fromthe central NW Pacific showed a consistent trend, with the sub-sur¬
face maxima both deepening and becoming less intense with time.The authors took ail available data within a defined région (20° -40° N and 135° - 175° E) and established a doubling-depth of the
239.24opu maximum of about 40 years, and a half-value of the con¬
centration of about 22 years. Although it is tempting to concludethat this re-distribution is entirely biologically mediated - i.e. re-
mineralisation of sinking biogenic particles (Hirose 1997) - there is
reason to believe that physical processes may hâve a significantinfluence. Profiles of 137Cs and 90Sr, which are not expected to be
involved in biomediation, also revealed a decrease in concentrationsand inventories, having corrected for decay. This implies that waterwith lower concentrations has been advected into the région at
depth. The need to consider a horizontal advective component wheninterpreting open océan plutonium profiles has been discussed pre¬
viously in respect of the NW Atlantic, and the southwards flow ofhigh-plutonium North Atlantic Deep Water at intermediate depths
(35-50% contribution) (Cochran et al, 1987). The NW Pacific pro¬
files also featured an increase in 239-24opu concentrations in bottomwaters of about a factor of 2. This latter observation has not been
recorded in the NE Pacific. Upper océan profiles in the immédiatevicinity of Bikini Atoll, which lies in the westward-flowing North
P. J. Kershaw et al. Behaviour of artificial radionuclides in the Pacific and other océan basins T 439
"uPu(mBq/L)0.02 0.04 0.06 0.08 0.1
u
1000
2000
£3000c
Q
4000
5000
Annn
» *
« x
* DjACr
DX
r*o
ZD A
X
a
o
A
a
A
A
4 » O
°* °DO
X «>
D
GEOSECS(1973)
- GX-223
» GX-224
a GX-225
o GX-226
KII-80-2(1980)« CY-11
IAEA 97 (1997)
Stn-1
Stn-3
CEOSECS:OX-223-226
KH-80-2CY-1 1
lAEA97:Sln 1+3
I Figure 1
Vertical distribution of 2*>-2*>Pu (Bq.nr3) in the NW Pacific, in 1 973,1980 and 1997; from Livingston et al, in press.
Equatorial Current, revealed that 239240Pu concentrations and inven¬
tories did not change significantly between 1 973 and 1 997. It is sug¬
gested that the concentrations were maintained by the continuaire-supply of low-productivity water.
It is clear that observations of artificial radionuclide distributions as
time-series at spécifie locations, vertical water-column profiles and
440 T Environmental Changes and Radioactive Tracers
spatial surveys can ail provide insights into océan processes on a
range of space and time scales. However, it is also apparent thatinterprétation of the data will be seriously compromised if due
account is not taken of the underlying factors controlling the distri¬bution. Some factors may be common to many régions of the worldocéan but others may be spécifie to particular situations. One
advantage of using water column measurements is that it may be
easier to achieve sample homogeneity compared with sédimentsampling.
1 Radiotracersand environmental variability
Water column radiotracer data can be used to identify transportmechanisms/pathways and sometimes to quantify the rate at whichtransport is taking place. This alone may require a considérableeffort. However, to attempt to establish the degree of variability, and
systematic change, in such processes présents a formidable chal¬
lenge. The great advantage of utilising sédiment core samples is thatthey can be dated, often independently, and a single core mayencompass the entire period of interest. For water column work it isusually necessary to establish time-series of observations, as well as
spatial distributions, and such data sets are often Iimited to particu¬lar locations or régions because of a spécifie radiological concern(e.g. Sellafield, La Hague, Marshall Islands, French Polynesia) orbecause of proximity to a research centre (e.g. La Spezia, Italy,annual sampling from 1960 to the présent; Papucci et al, 1996).
Thèse studies would hâve been undertaken for a variety of reasons
in a variety of circumstances and this may limit their usefulness forenvironmental change investigations. However, they do provide an
excellent basis for designing future programmes.
Fortunately there are examples of where the necessary combinationof well-defined radiotracer inputs, oceanography and climateindices occur. The NE Atlantic has received a considérable input ofartificial radionuclides as resuit of nuclear fuel reprocessing activi-
P. J. Kershaw et al. Behaviour of artificial radionuclides in the Pacific and other océan basins T 441
ties at Sellafield (UK, discharging into the Irish Sea since 1952) and
La Hague (France, discharging into the English Channel since1966). One ofthe main purposes of conducting distribution studiesthroughout the 1960s-1980s was to assess the likely impact of thereleases, from the consumption of contaminated fish, by the wholepopulation (i.e. calculating the Collective Dose). However, a num¬
ber of investigators saw the value in using thèse freely-availabletracers to examine transport pathways, transit times and transferfactors across the shelf and consequently the releases hâve been
traced from the pipelines throughout the NW European Shelf, intothe Baltic Sea, across the Nordic Seas (Norwegian, Greenland,Barents) and into the Arctic (see références cited in: Kershaw andBaxter, 1995). Of particular value from Sellafield were 134Cs, ,37Cs,
90Sr, "Te and 129I although Pu isotopes hâve also been used. Thetotal quantities discharged from La Hague were much lower butalso included characteristic tracers such as 125Sb which has been
measured extensively in the English Channel and the North Sea
(Guegueniat et al, 1997). In récent years there has been a tendencyfor discharges of most radionuclides from both sites to decreasesubstantially. This may hâve resulted in welcome réductions in thedose to human populations but it has meant that the analytical chal¬
lenge of making the measurements has increased.
As a conséquence of the réductions in direct discharges, the sédi¬
ments of the Irish Sea, which represent a substantial repository ofl37Cs and transuranic éléments, hâve become a significant source of137Cs and plutonium into the water column. This is in response tothe lower water concentrations following flushing by AtlanticWater, characterised by background levels of activity. Despite thismechanism, the outflow from the Baltic Sea, contaminated byChernobyl, has been the largest source of 137Cs to the North Sea forthe past décade. The l37Cs/?°Sr ratio due to Chernobyl contamina¬tion falls in the same range as that from Sellafield, introducingambiguity in applying this ratio to transport studies. Fortunately,developments during the 1990s, both analytical and in waste treat¬
ment procédures, hâve provided a further opportunity to utilisereprocessing tracers and compare the results of récent studies withthose conducted in earlier years. There has been a steep increase inthe quantity of I29I discharged from La Hague, due to increased fuelthroughput, and this nuclide can now be detected in small volumesamples using the extremely sensitive technique of Accelerator
442' Environmental Changes and Radioactive Tracers
Mass Spectrometry (AMS) (Smith et al, 1998). Likewise, at
Sellafield there has been an increase in the quantity of "Te dis¬
charged (Figure 2), although this has been in the form of a 'puise'extending over a number of years, rather than the continuousincrease in 129I seen at La Hague. There has also been an increase in,29I discharged from Sellafield (about 20% ofthe combined release).The development of AMS for "Te has been problematic but several
groups are now using ICP-MS routinely. Careful séparation stages
are required to remove interférences, as is the case for more stan¬
dard radiométrie methods.
1000000
100000
10000
1000 -
St Becs Cape Wralh Hartlepool Utsira Vikna Ingoy
I Rgure 2Discharge of "Te (TBq.yr1)1978-1998.
from Sellafield (UK) in to the Irish Sea
The transport of the initial leading edge of the 1990s "Te 'plume'(Figure 3) was much more rapid than had been anticipated, on the
basis ofthe earlier transport time studies, especially within the first2 years (Figure 4). Seawater samples were augmented with brownseaweed (Fucus vesiculosus) collected from around the coast ofthe
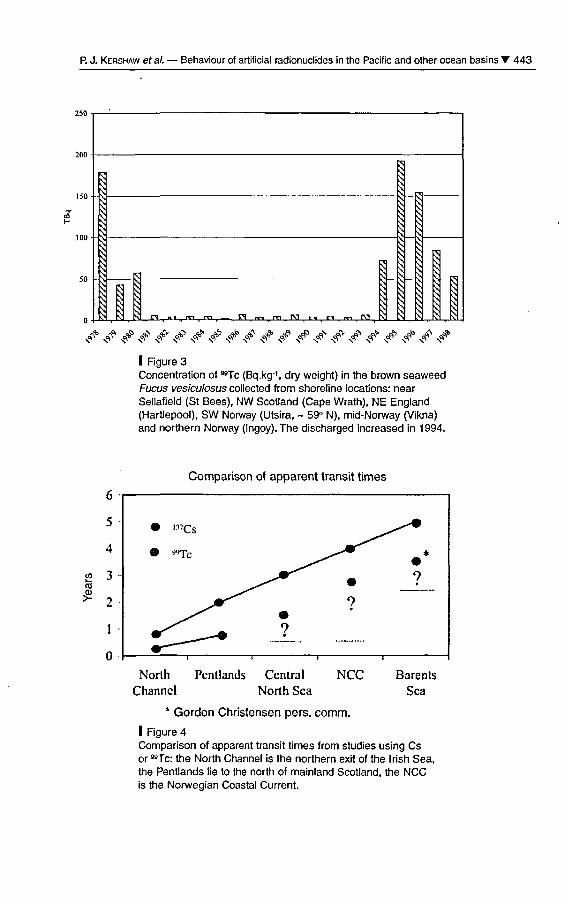
P. J. Kershaw et al. Behaviour of artificial radionuclides in the Pacific and other océan basins T 443
1
M
i rg^rdm_CTnr,mr^1r.r>-.ra
1
!
1
1
1
_
I
pn
Ix^ ** ^ N# ^ & ^ J> ^ / Nc# N^ xdsf N=ç>N ^ j> & tf> Jr / ^
I Rgure 3Concentration of "Te (Bq.kg1, dry weight) in the brown seaweedFucus vesiculosus collected from shoreline locations: nearSellafield (St Bées), NW Scotland (Cape Wrath), NE England(Hartlepool), SW Norway (Utsira, ~ 59° N), mid-Norway (Vikna)and northern Norway (Ingoy).The discharged increased in 1994.
5
4
J2 3
* 2
1
0
Comparison of apparent transit times
fr
"7Cs
"Te
1
7
i 1
7
-
*
7
NorthChannel
Pentlands CentralNorth Sea
NCC BarentsSea
* Gordon Christensen pers. comm.
I Rgure 4Comparison of apparent transit times from studies using Csor "Te: the North Channel is the northern exit of the Irish Sea,the Pentlands lie to the north of mainland Scotland, the NCCis the Norwegian Coastal Current.
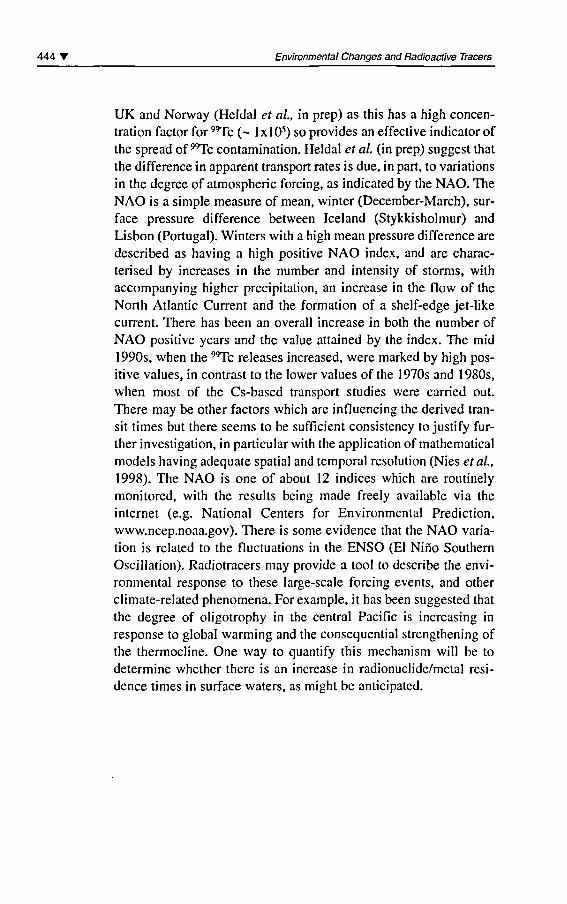
444 T Environmental Changes and Radioactive Tracers
UK and Norway (Heldal et al, in prep) as this has a high concen¬
tration factor for "Te (~ lxlO5) so provides an effective indicator ofthe spread of "Te contamination. Heldal et al. (in prep) suggest thatthe différence in apparent transport rates is due, in part, to variationsin the degree of atmospheric forcing, as indicated by the NAO. TheNAO is a simple measure of mean, winter (December-March), sur¬
face pressure différence between Iceland (Stykkisholmur) and
Lisbon (Portugal). Winters with a high mean pressure différence are
described as having a high positive NAO index, and are charac¬
terised by increases in the number and intensity of storms, withaccompanying higher précipitation, an increase in the flow of the
North Atlantic Current and the formation of a shelf-edge jet-likecurrent. There has been an overall increase in both the number ofNAO positive years and the value attained by the index. The mid1990s, when the "Te releases increased, were marked by high pos¬
itive values, in contrast to the lower values ofthe 1970s and 1980s,
when most of the Cs-based transport studies were carried out.
There may be other factors which are influencing the derived tran¬
sit times but there seems to be sufficient consistency to justify fur¬
ther investigation, in particular with the application of mathematicalmodels having adéquate spatial and temporal resolution (Nies étal,1998). The NAO is one of about 12 indices which are routinelymonitored, with the results being made freely available via the
internet (e.g. National Centers for Environmental Prédiction,www.ncep.noaa.gov). There is some évidence that the NAO varia¬
tion is related to the fluctuations in the ENSO (El Nino SouthernOscillation). Radiotracers may provide a tool to describe the envi¬
ronmental response to thèse large-scale forcing events, and otherclimate-related phenomena. For example, it has been suggested thatthe degree of oligotrophy in the central Pacific is increasing inresponse to global warming and the consequential strengthening ofthe thermocline. One way to quantify this mechanism will be todétermine whether there is an increase in radionuclide/metal rési¬
dence times in surface waters, as might be anticipated.
P. J. Kershaw et al. Behaviour of artificial radionuclides in the Pacific and other océan basins T 445
Conclusions
Observations of artificial radionuclide distributions in the water col¬
umn, in time and space, can provide valuable insights into the prés¬
ence and rates of océan processes - on physical scales from local tobasin-wide and time-scales of days to decadal - providing some¬
thing is known about the source term; i.e. the quantity, location and
rate of entry into the marine environment, and the chemicalbehaviour of the radionuclides (i.e. conservative vs. non-conserva-tive). Global stratospheric fallout represents the most significantsource on a global scale, although it has had a strong latitudinaldependence and significantly higher déposition in the northernhémisphère (N:S, 3:1), as a resuit ofthe history of détonations and
resulting yields. The distribution of 3H has been particularly usefulin illustrating the extent of ventilation in the North Atlantic. Verticalprofiles of 239240Pu in the open océan tend to exhibit a characteris¬
tic sub-surface maximum. This can be attributed partly to biologi¬cal médiation but it is apparent that in the NW Pacific a componentis due to latéral advection - a phenomenon also observed in the
North Atlantic. It has been demonstrated, in the NW Pacific, that themagnitude of the sub-surface maxima has decreased and the posi¬
tion in the water column has deepened. Close-in fallout in the
Pacific has had a minor impact in the environment around Mururoaand Fangataufa atolls, but near-ground tests in the Marshall Islandshâve contributed a significant input of plutonium to the NW Pacific.The addition of 23iiPu, preferentially into the southern hémisphère,as a resuit of the SNAP-9A satellite accident represents an under-utilised tracer.
The controlled but variable releases of radionuclides from Europeanreprocessing facilities, combined with the relative proximity ofpotential sampling sites to centres of population, hâve provided the
446' Environmental Changes and Radioactive Tracers
best opportunity so far to test whether radiotracers can be used as
indicators of environmental variability. A comparison of transporttimes, from Sellafield to various locations in the North Atlantic and
Nordic Seas, based on récent releases of "Te (mid 1990s onwards)and older releases of 137Cs (1970s-1980s) has revealed an apparentdifférence, with the former being faster. It is conjectured that thisdifférence, at least in part, may be due to différences in environ-mental forcing linked to phenomena which can be characterised byfluctuations in the NAO. To test the validity of this initial conclu¬sion it will be necessary to conduct simulations using sophisticatedcoupled ocean-ice models, covering the range of years for whichSellafield has been operating.
AknowledgementsThe first author (PJK) is indebted to the SPERA organisation
for their generous support, allowing his participation.The project received support from the Ministry of Agriculture,
Fisheries & Food (England & Wales) (PJK, project A 1215),the IAEA (HDL & PPP) and the Norwegian Research Council (H-EH).
BibliographyBOURLAT Y., MlLLIES-LACROIX J.-C,Le Petit G., Bourguignon J., 1996"«"Sr, 137Cs and î»-m°Pu in worldocéan water samples collectedfrom 1992 to 1994". In GuegueniatP., Germain P., and Metivier H. (eds):Radionuclides in the Océans Inputsand Inventories, Les Ulis,les éditions de physique: 75-93.
Buesseler K. O., 1997The isotopic signature of falloutplutonium in the North Pacific.J. Environ. Radioact, 36 (1): 69-83.
Cochran J. K., Livingston H. D.,Hirschberg D. J.,Surprenant L. D., 1987
Natural and anthropogenicradionuclide distributions inthe Northwest Atlantic Océan.Earth Planet Sci. Lett., 84: 2-3.
Guegueniat P., Kershaw P.,
Hermann J., Du Bois P. B., 1997New estimation of La Haguecontribution to the artificialradioactivity of Norwegian waters(1992-1995) and Barents Sea(1992-1 997). EnvironmentalRadioactivity in the Arctic,Strand P. (ed), 202:1-3.
Heldal H.-E., Kershaw P. J.,Christensen G.C. (in prep).Transport of "Te from Sellafield
P. J. Kershaw et al Behaviour of artificial radionuclides in the Pacific and other océan basins T 447
along the Norwegian Coastal Currentto the Arctic.
HiroseK., 1997Complexation-scavengingof plutonium in the océan.Radioprotection, 32 (C2): 225-230.
IAEA. (in press).Global Marine RadioactivityDatabase (GLOMARD), IAEA,Vienna.
IAEA., 1995Sources of radioactivity in the marineenvironment and their relativecontributions to overall doseassessment from marineradioactivity (MARDOS). Vienna,IAEA-TECDOC-838.
Kershaw P., Baxter A., 1995The transfer of reprocessing wastesfrom northwest Europe to the Arctic.Deep Sea Res., 42 (6): 1413-1448.
Livingston H. D., Bowen V.T., CassoS. A., Volchok H. L., Noshkin V. E.,Wong K. M., Beasley T. M., 1985Fallout Radionuclides in Atlanticand Pacific Water Columns fromGEOSECS Data, Technical Report,WHOI-85-19, Woods Hole.
Livingston H. D Povinec P. P.,
Toshimichi I., Togawa O., 1999The behaviour of plutonium in thePacific Océan. Plutonium inthe environment, Osaka, Japan.
Nies H., Harms I. H., Karcher M. J.,Dethleff D., Bahe C, Kuhlmann G.,Oberhuber J. M., Backhaus J. O.,
Kleine E., Loewe P., Matishov D.,Stepanov A., Vasiliev O. F., 1998Anthropogenic radioactivity in theNordic Seas and the Arctic Ocean-results of a joint project. DeutscheHydrographische Zeitschrift,50 (4): 313-343.
Nyffeler F., Cigna A. A.,Dahlgaard H.,Livingston H. D., 1996"Radionuclides in the Atlantic Océan:a survey". In Guegueniat P., GermainP., Metivier H. (eds): Radionuclides inthe Océans Inputs and Inventories,Les Ulis, les éditions de physique.
Papucci C, Charmasson S.,Delfanti R., Gasco C, Mitchell R,Sanchez-Cabeza J. A., 1996"Time évolution and levels ofman-made radioactivity in theMediterranean Sea". In GuegueniatP., Germain P., Metivier H. (eds):Radionuclides in the Océans Inputsand Inventories, Les Ulis,les éditions de physique.
Smith J. N., Ellis K. M.,KiliusL.R., 1998129l and 137Cs tracer measurementsin the Arctic Océan. Deep SeaResearch, 45 (I): 959-984.
Volchok H. L., Bowen V.T.,Folsom T. R., Broecker W. S.,Schuert E. A., Bien G. S., 1971Oceanic Distributions ofRadionuclides from NuclearExplosions. Radioactivity in theMarine Environment NationalAcademy of Sciences, WashingtonD.C. 42-89.

txport fluxes of organiccarbon in the WesternNorth Pacific determinedby drifting sédimenttrap experimentsand 234Th profiles
Koh Harada
Yoko Shibamoto
Introduction
The s of carbon cycling on the Earth's surface is becoming moreimportant because of increasing attention to the global climatechange caused by the increasing C02 level in the atmosphère.Océans are one of the largest sinks for atmospheric C02 makingcarbon cycling in the océan also as important. Inorganic and orga¬
nic carbon concentrations in seawater are controlled not only byphysical and chemical processes, but also by biological processes.
The biological processes vary season by season and day by day.This is a reason why a shorter time scale observation is needed.
In JGOFS studies, a time séries observation in the subtropicalrégion near Hawaii has been conducted (Karl and Lukas, 1996) and
the Canadian group continues the observation at a station in the sub-
arctic eastern North Pacific (Wong et al, 1998). Since the diffé¬rence between the eastem and western sides ofthe Pacific has been
recognized, the Japanese group decided to initiate the time séries
450 T Environmental Changes and Radioactive Tracers
observation in the western side of the Pacific. We started the obser¬
vation from June 1998 at 44°N, 155°E in the western North Pacific,where the biological activity in the surface océan is relatively high.The station is named Stn. KNOT which means "Coopérative NorthPacific Océan Time Séries".
In this time séries study, we are investigating carbonate chemistry,gas constituents, nutrient dynamics, primary, new and export pro¬
ductions and biological communities.
In this paper, I will introduce primary results ofthe export flux. Theexport flux is a flux of materials from the surface layer to the dee¬
per océan, and it is mainly controlled by settling particles that is
produced in the euphotic layer in the océan surface. This process isvery important because it controls the concentration of inorganiccarbon in surface water and the concentration controls C02exchange rate with the atmosphère. The drifting sédiment tap expe¬
riment is very useful to estimate the export flux because we can col¬
lect the settling particles directly and many chemical componentscan be analyzed. However, the export flux estimated by the shallowsédiment trap was doubtful because of the complicated flows in the
upper océan (Buesseler, 1991). Recently, 234Th, a short-lived inso¬
luble natural radionuclide in the uranium decay séries, is widelyused to estimate particulate fluxes and to calibrate the sédiment trapfluxes (e.g. Coale and Bruland, 1985, Buesseler et al, 1992,
Cochran et al, 1993). In this paper, I introduce the primary resultsof estimation of the export fluxes in the western North Pacific bythe drifting sédiment trap and 234Th profiles.
Methods
Station KNOT, which is a station for time séries observations ofJapanese JGOFS activity, is located at 44"N, 155°E in the westernNorth Pacific (Figure 1).
The drifting sédiment trap experiments were carried out three timesin November, December 1998 and May 1999 at the station in the
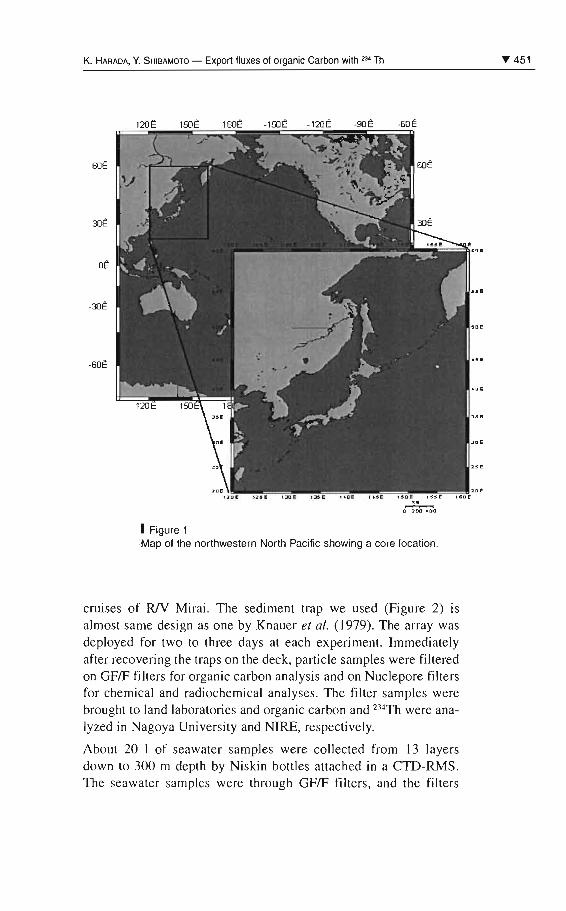
K. HARAOA, Y. SHIBAMOTO - Export fluxes of organic Carbon wilh 234 Th T 451
120Ê 15DÊ 1BOÊ -150Ê -120Ê .9DÊ -60Ê
60Ê
30Ê
oË
-30Ê
-SDÊ
,zifl ':JOr ,:KI: 11 a r 'l sI 15e r 15SE
c ::0 ICC
1 Figure 1:Map of the northwestern North Pacifie showing a core location.
cruises of RN Mirai. The sediment trap we used (Figure 2) isalmost sa me design as one by Knauer et al. (1979). The array wasdeployed for two to three days at each experiment. Irnrnediatelyafter recovering the traps on the deck, particle samples were filteredon GFIF filters for organic carbon analysis and on Nuclepore filtersfor chemical and radiochemical analyses . The filter samples werebrought 10 land laboratories and organic carbon and 2:14Th were anaIyzed in Nagoya University and NlRE, respectively.
About 20 1 of seawater samples were collected from 13 layersdown ta 300 m depth by Niskin boules auached in a CTD-RMS.The seawater samples were through GFIF filters, and the filters
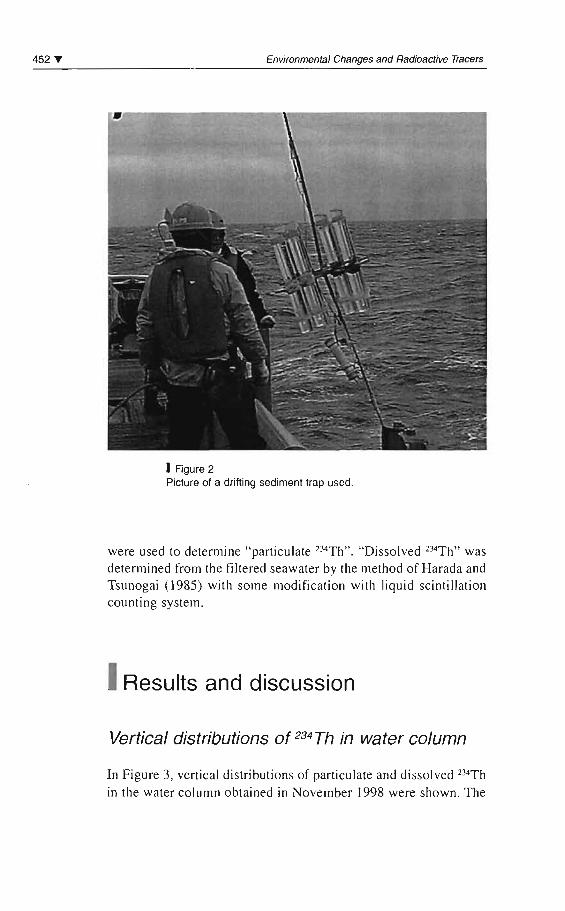
452 T Environmenlal Changes and Radioactive 'ïœcers
1 Figure 2Picture 01 a drilting sediment trap used .
were used to determine "particulate 234Th". "Dissolved 234Th" wasdetermined from the filtered seawater by the method of Harada andTsunogai (1985) with sorne modification with liquid scintillationcounting system.
1Results and discussion
Vertical distributions of 234 Th in water column
In Figure 3, vertical distributions of particulate and dissolved 234Thin the water column obtained in November 1998 were shown. The
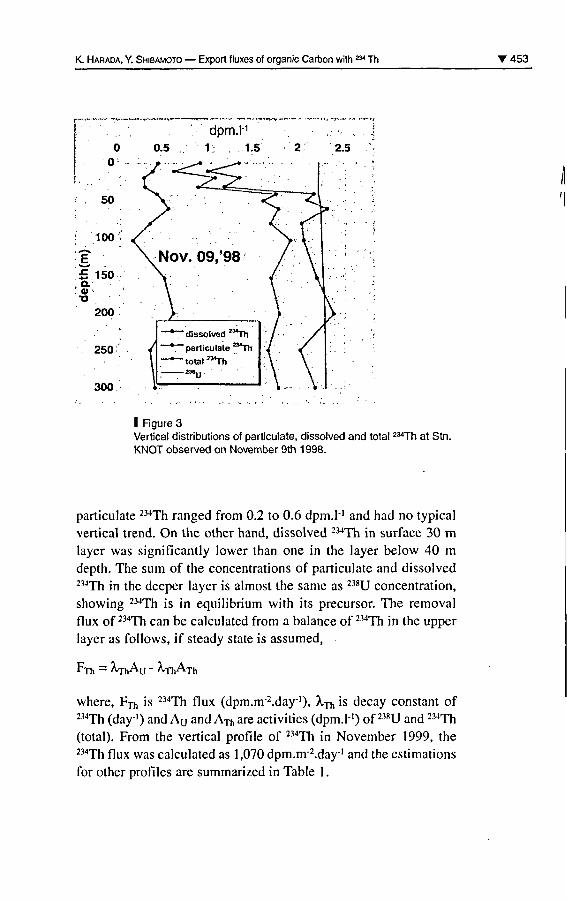
K. Harada, Y. Shibamoto Export fluxes of organic Carbon with 2M Th '453
I Figure 3Vertical distributions of particulate, dissolved and total 234Th at Stn.KNOT observed on November 9th 1998.
particulate 234Th ranged from 0.2 to 0.6 dpm.l1 and had no typicalvertical trend. On the other hand, dissolved 234Th in surface 30 mlayer was significantly lower than one in the layer below 40 m
depth. The sum of the concentrations of particulate and dissolved214Th in the deeper layer is almost the same as 238U concentration,showing 234Th is in equilibrium with its precursor. The removalflux of 234Th can be calculated from a balance of 234Th in the upperlayer as follows, if steady state is assumed,
FTh = /Vj-hAij - XrhATh
where, F-n, is 234Th flux (dpm.m^.day-1), A/j-r, is decay constant of234Th (day1) and Au and A are activities (dpm.l1) of 238U and 234Th
(total). From the vertical profile of 234Th in November 1999, the234Th flux was calculated as 1,070 dpm.nr2.day"' and the estimationsfor other profiles are summarized in Table 1.
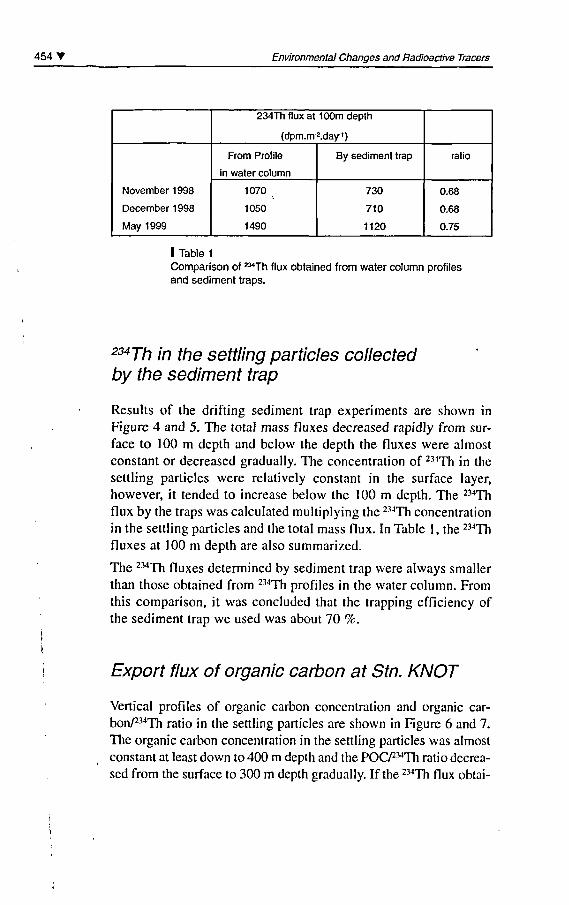
454' Environmental Changes and Radioactive Tracers
November 1998
December 1998
May 1999
234Th flux at 100m depth
(dpm.m2.day')
From Profile
in water column
1070
1050
1490
By sédiment trap
730
710
1120
ratio
0.68
0.68
0.75
I Table 1
Comparison of 234Th flux obtained from water column profilesand sédiment traps.
234 Th in the settling particles collectedby the sédiment trap
Results of the drifting sédiment trap experiments are shown inFigure 4 and 5. The total mass fluxes decreased rapidly from sur¬
face to 100 m depth and below the depth the fluxes were almostconstant or decreased gradually. The concentration of 234Th in the
settling particles were relatively constant in the surface layer,however, it tended to increase below the 100 m depth. The 234Th
flux by the traps was calculated multiplying the 234Th concentrationin the settling particles and the total mass flux. In Table 1, the 234Th
fluxes at 100 m depth are also summarized.
The 234Th fluxes determined by sédiment trap were always smallerthan those obtained from 234Th profiles in the water column. Fromthis comparison, it was concluded that the trapping efficiency ofthe sédiment trap we used was about 70 %.
Export flux of organic carbon at Stn. KNOT
Vertical profiles of organic carbon concentration and organic car-bon/234!!! ratio in the settling particles are shown in Figure 6 and 7.
The organic carbon concentration in the settling particles was almostconstant at least down to 400 m depth and the POC/234Th ratio decrea¬
sed from the surface to 300 m depth gradually. If the 234Th flux obtai-
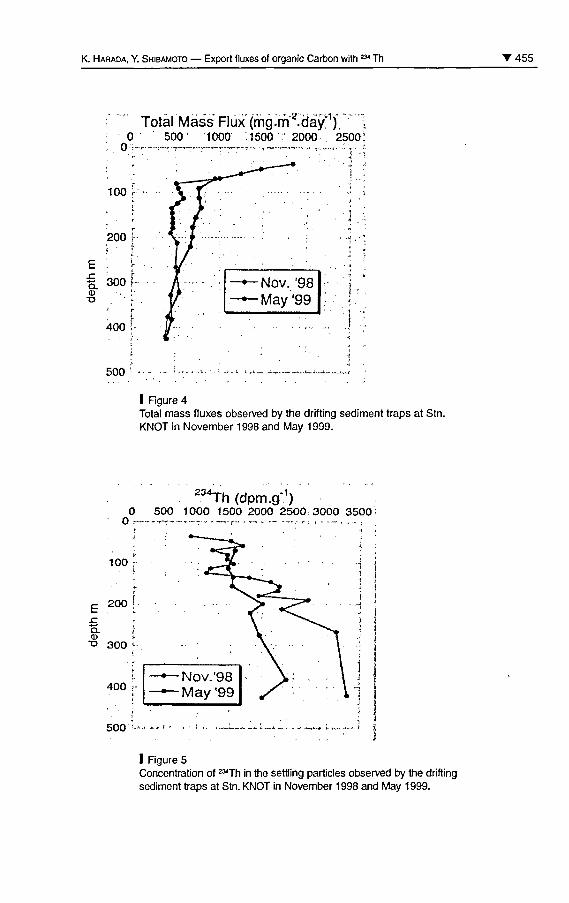
K. Harada, Y. Shibamoto Export fluxes of organic Carbon with a* Th '455
Total Mass Flux (mg.m .day; J. -,
0 500' 1000 1500 '.- 2000, 25002
100 r-
200 f-; - i
S. 300 f-r»T3
400
500 !
I Rgure 4Total mass fluxes observed by the drifting sédiment traps at Stn.KNOT in November 1998 and May 1999.
23-
500 '--
"Th (dpm.g 1)0 500 1000 1500 2000 2500 3000 3500 ;
I Figure 5Concentration of 234Th in the settling particles observed by the driftingsédiment traps at Stn. KNOT in November 1998 and May 1999.
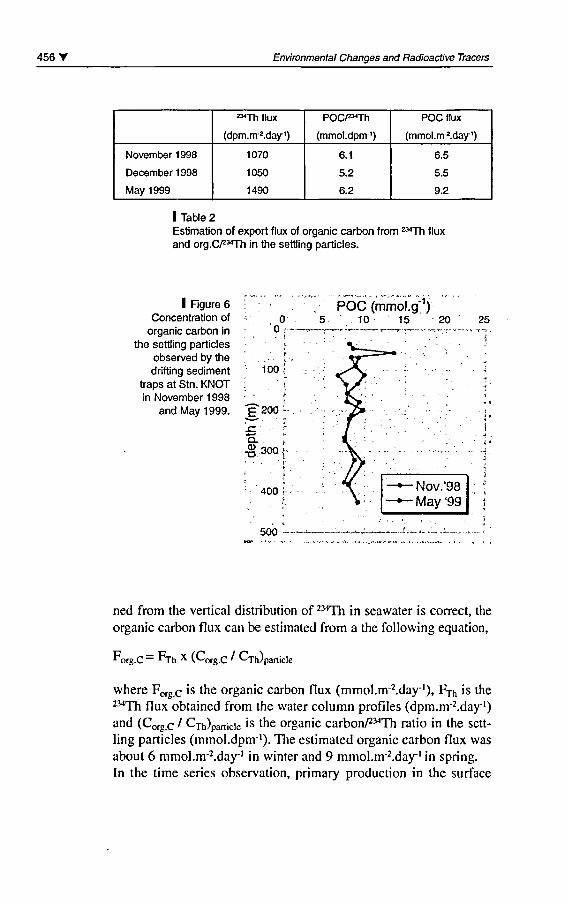
456' Environmental Changes and Radioactive Tracers
November 1998
December 1998
May 1999
234Th flux
(dpm.m2.day')
1070
1050
1490
POC/^Th
(mmol.dpnr1)
6.1
5.2
6.2
POC flux
(mmol.m^.day1)
6.5
5.5
9.2
I Table 2Estimation of export flux of organic carbon from 234Th fluxand org.C/^Th in the settling particles.
1 Figure 6Concentration of
organic carbon inthe settling particles
observed by thedrifting sédiment
traps at Stn. KNOTin November 1 998
and May 1999.
00 f
*"'
f
100/
' 1
. f
^200 '-
O 300 {-
400 r
500
POC (mmol.g;1)10 15 '20 25
ned from the vertical distribution of 234Th in seawater is correct, the
organic carbon flux can be estimated from a the following équation,
Forg.C = F-'Th x (Corg.C ' C-rh)partic1e
where ForgC is the organic carbon flux (mmol.m^.day1), FTh is the
234Th flux obtained from the water column profiles (dpm.m^.day1)and (Corg c / CTh)paitide is the organic carbon/234!!! ratio in the sett¬
ling particles (mmol.dpm ). The estimated organic carbon flux wasabout 6 mmol.m2.day"' in winter and 9 mmol.m^.day1 in spring.In the time séries observation, primary production in the surface
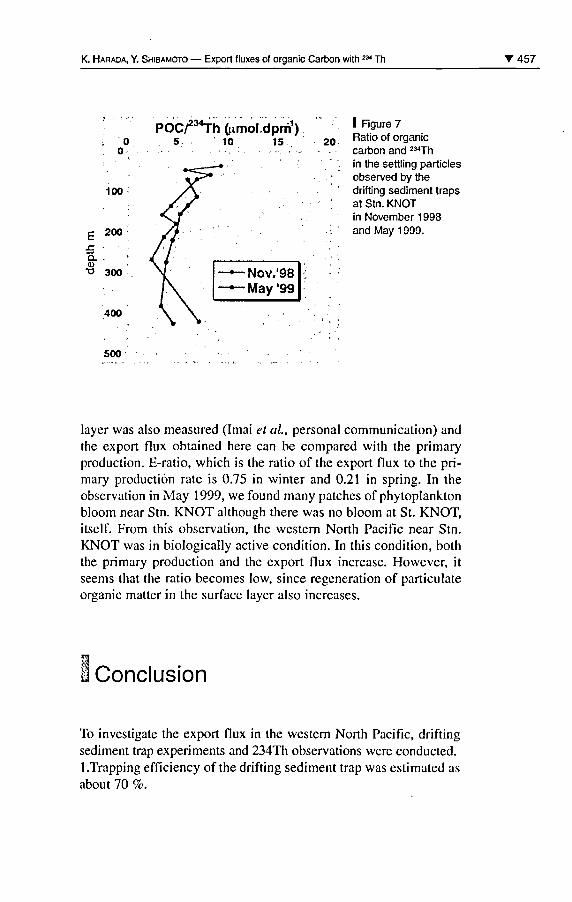
K. Harada, Y. Shibamoto Export fluxes of organic Carbon with 2M Th 457
POC/234 (umol.dprrï1)5 10 15
100 :
E 20°sz -.
Q. .d)O 300
400
I Figure 72Q Ratio of organic
carbon and 234Th
" '. in the settling particlesobserved by thedrifting sédiment traps
; at Stn. KNOTin November 1998
f. and May 1999.
500
layer was also measured (Imai et al, personal communication) andthe export flux obtained hère can be compared with the primaryproduction. E-ratio, which is the ratio of the export flux to the pri¬mary production rate is 0.75 in winter and 0.21 in spring. In theobservation in May 1999, we found many patches of phytoplanktonbloom near Stn. KNOT although there was no bloom at St. KNOT,itself. From this observation, the western North Pacific near Stn.KNOT was in biologically active condition. In this condition, boththe primary production and the export flux increase. However, itseems that the ratio becomes low, since régénération of particulateorganic matter in the surface layer also increases.
Conclusion
To investigate the export flux in the western North Pacific, driftingsédiment trap experiments and 234Th observations were conducted.1.Trapping efficiency ofthe drifting sédiment trap was estimated as
about 70 %.
458' Environmental Changes and Radioactive Tracers
2.0rganic carbon flux at Stn. KONT was about 6 mmol.m^.day' inwinter and 9 mmol.m^.dajr1 in spring.3.E-ratio in spring (0.21) was significantly lower than in winter(0.75), although the export flux in spring was high.
AknowledgementsThe authors would like to thank Dr. Narita, Hokkaido University,
for helping sédiment trap works and radiochemical analysisand also to thank scientists, technicians and crew on R/V Mirai
for their help of sample collection.
Bibliography
Buesseler K. O., 1991Do upper-ocean sédiment trapsprovide an accurate recordof particle flux ? Nature, 353: 420.
Buesseler K. O., Bacon M. P.,
Cochran J. K.,Livingston H.D., 1992Carbon and nitrogen export duringthe JGOFS North Atlantic BloomExperiment estimated from234Th:238U disequilibria.Deep-Sea Res. I, 39: 1115.
Coale K. H., Bruland K.W., 1985 -234Th:238U disequilibria withinthe California Current. Limnol.Oceanogr., 3081:22.
Cochran J. K., Buesseler K. O.,Bacon M. P., Livingston H. D., 1993 -Thorium isotopes as indicatorsof particle dynamics in the upperocéan: Results from the JGOFSNorth Atlantic Bloom Experiment.Deep-Sea Res., 40: 1569.
Harada K., Tsunogai S., 1985A practical method for thesimultaneous détermination of 234Th,226Ra> 2iopD and 2iop0 jn seawater.
J. Oceanogr. Soc. Japan, 41 : 98.
Karl D. M., Lukas R., 1996The Hawaii Océan Time-series(HOT) program: Background,rationale and field implementation.Deep-Sea Res. Il, 43 (2-3): 129.
Knauer G. A., Martin J. H.,Bruland K. W., 1979Fluxes of particulate carbon, nitrogenand phosphorus in the upper watercolumn of the northeast Pacific.Deep-Sea res., 26: 97.
Wong C. S., Matear R. J.,Whitney F. A., Iseki. K., 1998Enhancement of new productionin the Northeast Subarctic PacificOcéan during négative North PacificIndex events. Limnol. Oceanogr.,43 (7): 1418.
Uranium decay sériesradionuclides in the WesternEquatorial Pacific Océanand their use in estimatingPOC fluxes
Gillian Peck
J. David Smith
Introduction
The naturally occurring radionuclides 226Ra, 210Pb and 210Po are
members of the 238U decay séries and hâve been used to study thekinetic aspects of material cycling in the océan (Bacon et al, 1976;Ritchie and Shimmield, 1991). Thèse studies utilise the observedradioactive disequilibria in the 226Ra, 210Pb and 210Po system.Particle fluxes may also be studied using disequilibria among natu¬
rally occurring radionuclides. ^Ra/^Pb and 2l0Pb/210Po ratioscover time scales of months to years and are suitable tracers forstudying particle fluxes in the upper layer of the océan.
2I0Pb is added to the upper océan by fallout from the atmosphère and
by decay of 226Ra in the water column. 210Po is produced in seawaterby decay of the 2,0Pb. Both 2l0Pb and 210Po are removed from theupper océan by radioactive decay and by adsorption onto particlesfollowed by sinking. The input of 2l0Pb from the atmosphère and
removal by sinking particles combine to give a vertical concentra¬tion profile that can be used to calculate the ratios of the contribut-ing processes. Measurements ofthe fractions ofthe radionuclides inthe dissolved and particulate phases hâve been used in steady-state
460 T Environmental Changes and Radioactive Tracers
box-models of adsorption/settling and radioactive decay to calculateradionuclide résidence times (Bacon et al, 1976; Ritchie and
Shimmield, 1991;Towler and Smith, 1997). A likely mechanism forthe removal of thèse radionuclides is adsorption onto other non-liv-ing biogenic material followed by sinking. Carbon dioxide in the
atmosphère dissolves in the surface layer of the océan. Transfer ofcarbon to the deep océan is facilitated by fixation into particulateorganic matter in the euphotic zone. Sinking of thèse biogenic parti¬
cles from the upper layers of the océan to the deeper layers is an
important pathway in the global carbon cycle. Particle fluxes mustbe quantified if accurate carbon cycle models are to be developed.
Analyses were carried out on water samples of 30-40 1 for particu¬late matter and 10 1 for dissolved species using specially developedmethods. Thèse methods were developed with the spécifie aim ofusing small volumes of seawater to reduce the sampling timerequired when at sea. 226Ra, 2,0Pb and 210Po profiles for the BismarckSea and western equatorial Pacific Océan are presented. Using the226Ra, 2,0Pb and 210Po data, and a box-model based on that proposedby Bacon étal, 1976, the average résidence times of dissolved 210Po
and 2,0Pb and particulate 2l0Po in two layers of the upper 300 m ofthe océan were estimated. The résidence time of particulate 210Po
was used with the concentration of particulate organic carbon(POC) to estimate the flux of POC from the upper layer of the watercolumn to the deeper layer. This work was a contribution to theinternational Tropical River-Ocean Processes in Coastal Settings(TROPICS) project.
Sampling
Water samples were collected at 5 locations in the Bismarck Sea
and western equatorial Pacific Océan during a strong El Nifio phase
on the August 1 997 cruise of the R. V. Franklin (FR07/97) (Table 1 ).
10 1 poly-vinyl chloride Niskin bottles on a rosette sampler wereused to collect water from five depths at each station. This permit-ted collection of 3 bottles at 5m, 50m and 100m depth, and 4 bot¬
tles at 200m and 300m depth in two casts.
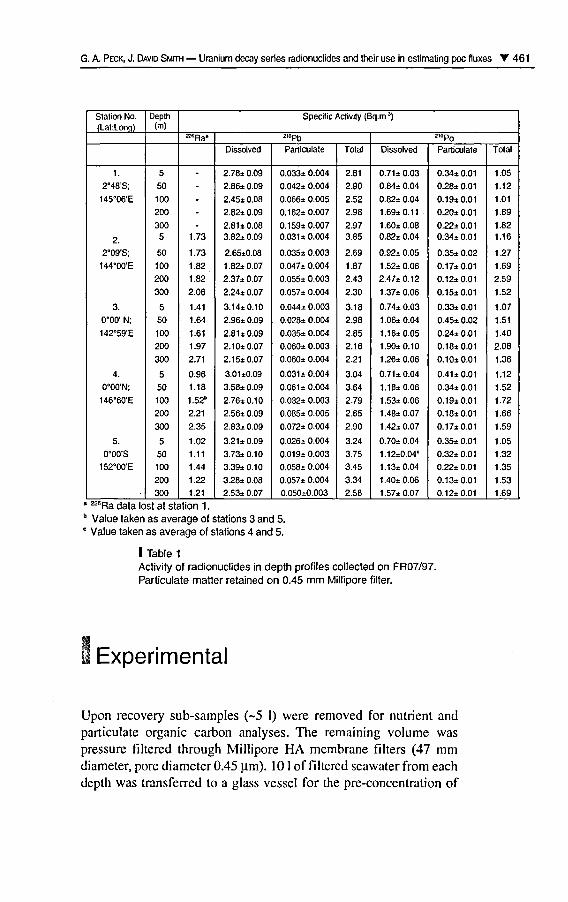
G. A. Peck, J. David Suin» Uranium decay séries radionuclides and their use in estimating poc fluxes T 461
Station No.(Lat;Lonq)
1.
2-48'S;
145°06'E
2.
2°09'S;
144WE
3.
0°00' N;
142°59'E
4.
0°00'N;
146°60'E
5.
0-00'S
152WE
Depth(m)
5
50
100
200
3005
50
100
200
300
5
50
100
200
300
5
50
100
200
300
5
50
100
200
300
Spécifie Activity (Bq.m 3)
^Ra*
-
-
-
-
1.73
1.73
1.82
1.82
2.06
1.41
1.64
1.61
1.97
2.71
0.96
1.18
1.52"
2.21
2.35
1.02
1.11
1.44
1.22
1.21
2rc.pt,
Dissolved
2.78± 0.09
2.86± 0.09
2.45± 0.08
2.82± 0.09
2.81 ±0.083.82± 0.09
2.65±0.08
1.82±0.07
2.37±0.07
2.24± 0.07
3.14±0.10
2.96±0.09
2.8U0.092.10±0.07
2.1 5± 0.07
3.0U0.09
3.58± 0.09
2.76±0.102.56± 0.09
2.83± 0.09
3.21 ±0.09
3.73±0.10
3.39±0.10
3.28± 0.08
2.53± 0.07
Particulate
0.033± 0.004
0.042± 0.004
0.066± 0.005
0.1 62± 0.007
0.159± 0.0070.031± 0.004
0.035± 0.003
0.047± 0.004
0.055± 0.003
0.057± 0.004
0.044± 0.003
0.028± 0.004
0.035± 0.004
0.060± 0.003
0.060± 0.004
0.031 ±0.004
0.061 ±0.004
0.032± 0.003
0.085± 0.005
0.072± 0.004
0.026± 0.004
0.01 9± 0.003
0.058± 0.004
0.057± 0.004
0.050±0.003
Total
2.81
2.90
2.52
2.98
2.973.85
2.69
1.87
2.43
2.30
3.18
2.98
2.85
2.16
2.21
3.04
3.64
2.79
2.65
2.90
3.24
3.75
3.45
3.34
2.58
2,opo
Dissolved
0.71± 0.03
0.84± 0.04
0.82± 0.04
1.69±0.11
1.60±0.080.82± 0.04
0.92± 0.05
1.52±0.06
2.47±0.12
1.37±0.06
0.74± 0.03
1.06±0.04
1.16±0.05
1.90±0.10
1.26±0.06
0.71 ±0.041.18±0.06
1.53±0.06
1.48±0.07
1.42±0.07
0.70± 0.04
1.12±0.04c
1.13±0.04
1.40±0.06
1.57±0.07
Particulate
0.34±0.01
0.28± 0.01
0.19±0.01
0.20± 0.01
0.22± 0.01
0.34±0.01
0.35± 0.02
0.17±0.01
0.12±0.01
0.15±0.01
0.33± 0.01
0.45± 0.02
0.24± 0.01
0.18±0.01
0.10±0.01
0.41±0.01
0.34± 0.01
0.19±0.01
0.18±0.01
0.17±0.01
0.35± 0.01
0.32±0.01
0.22± 0.01
0.13±0.01
0.12±0.01
Total
1.05
1.12
1.01
1.89
1.821.16
1.27
1.69
2.59
1.52
1.07
1.51
1.40
2.08
1.36
1.12
1.52
1.72
1.66
1.59
1.05
1.32
1.35
1.53
1.69
a226Ra data lost at station 1.
b Value taken as average ofc Value taken as average of
stations 3 and 5.stations 4 and 5.
I Table 1
Activity of radionuclides in depth profiles collected on FR07/97.Particulate matter retained on 0.45 mm Millipore filter.
Expérimental
Upon recovery sub-samples (~5 l) were removed for nutrient and
particulate organic carbon analyses. The remaining volume waspressure filtered through Millipore HA membrane filters (47 mmdiameter, pore diameter 0.45 [im). 1 0 1 of filtered seawater from each
depth was transferred to a glass vessel for the pre-concentration of
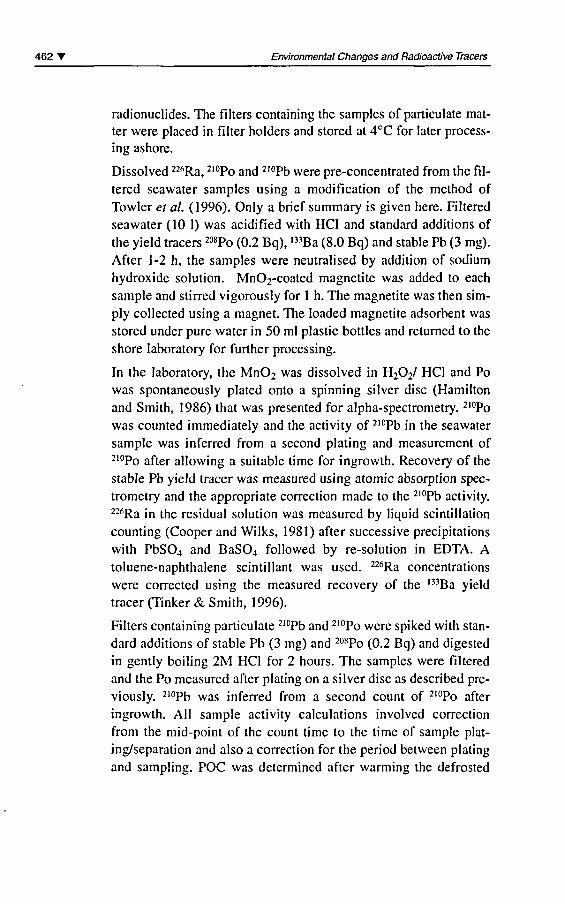
462 T Environmental Changes and Radioactive Tracers
radionuclides. The filters containing the samples of particulate mat¬
ter were placed in filter holders and stored at 4°C for later process-
ing ashore.
Dissolved 226Ra, 2l0Po and 2l0Pb were pre-concentrated from the fil¬tered seawater samples using a modification of the method ofTowler et al (1996). Only a brief summary is given hère. Filteredseawater (10 1) was acidified with HCI and standard additions ofthe yield tracers 208Po (0.2 Bq), '"Ba (8.0 Bq) and stable Pb (3 mg).
After 1-2 h, the samples were neutralised by addition of sodiumhydroxide solution. Mn02-coated magnetite was added to each
sample and stirred vigorously for 1 h. The magnetite was then sim¬
ply collected using a magnet. The loaded magnetite adsorbent was
stored under pure water in 50 ml plastic bottles and returned to the
shore laboratory for further processing.
In the laboratory, the Mn02 was dissolved in H2O2/ HCI and Po
was spontaneously plated onto a spinning silver dise (Hamiltonand Smith, 1986) that was presented for alpha-spectrometry. 2l0Po
was counted immediately and the activity of 210Pb in the seawater
sample was inferred from a second plating and measurement of210Po after allowing a suitable time for ingrowth. Recovery ofthestable Pb yield tracer was measured using atomic absorption spec¬
trometry and the appropriate correction made to the 210Pb activity.226Ra in the residual solution was measured by liquid scintillationcounting (Cooper and Wilks, 1981) after successive précipitationswith PbS04 and BaS04 followed by re-solution in EDTA. Atoluene-naphthalene scintillant was used. 226Ra concentrationswere corrected using the measured recovery of the l33Ba yieldtracer (Tinker & Smith, 1996).
Filters containing particulate 2l0Pb and 210Po were spiked with stan¬
dard additions of stable Pb (3 mg) and 208Po (0.2 Bq) and digestedin gently boiling 2M HCI for 2 hours. The samples were filteredand the Po measured after plating on a silver dise as described pre¬
viously. 210Pb was inferred from a second count of 2,0Po afteringrowth. Ail sample activity calculations involved correctionfrom the mid-point of the count time to the time of sample plat-ing/separation and also a correction for the period between platingand sampling. POC was determined after warming the defrosted
G. A. Peck, J. David Smith Uranium decay séries radionuclides and their use in estimating poc fluxes T 463
filters in super clean HCI in alumina ceramic micro boats, toremove PIC. This was followed by analysis of samples in the solidsample chamber of a Shimadzu 500 high température (900°C) cat-alytic analyser.
Results
Radionuclide data for the two Bismarck Sea and three equatorialPacific Océan profiles are summarised in Table 1. Ail errors are
based on la counting errors. Thèse results are discussed in moredétail elsewhere (Peck and Smith, 2000).
Modeling
Material balance équations based on the steady-state model ofBacon et al (1976) were used to estimate the résidence times and
fluxes of 2l0Pb and 210Po from the upper layer of the océan via thesinking of particles. A number of assumptions were required and are
discussed in greater détail elsewhere (Peck and Smith, 2000).Density profiles plotted as ct vs. depth indicated that the base ofthethermocline was at approximately 100 m depth, this correspondingto the base ofthe main pycnocline. Calculations, therefore, assumeda surface layer that was 100 m thick. This surface layer is referredto as Layer 1 in the model. The remaining samples were collectedfrom 100-300 m depth. This range was chosen as the second layerand is referred to as Layer 2. The inventories in each layer were cal¬
culated for dissolved 226Ra, dissolved and particulate 210Pb and dis¬
solved and particulate 2l0Po. Thèse inventories were then entered inthe material balance équations that follow to calculate the flux and
résidence times of dissolved and particulate 210Pb and 2,0Po. Usingthe flux of 210Pb, 2,0Po and the concentrations of particulate organic
464 T Environmental Changes and Radioactive Tracers
carbon, estimations of particulate organic carbon flux were made.
The particulate organic carbon (POC) flux, R (mg C cnv2.year'),was estimated using the équation shown below (15).
R = P,Po
'c_
Where Pp0 is the removal rate of particulate 2l0Po (mBq.cm^.year1),from each layer, calculated in the box model, C is the inventory ofthe POC (mg C cm2) calculated for each layer and AP is the inven¬
tory of the radionuclide (mBq.cnr2) for each layer. Thèse results are
multiplied by 27.4 to convert from mg C cm^.year1 to mg C nv2.day"'.
The results are summarised in Table 1.
Discussion
The equatorial Pacific Océan is the largest oceanic source of C02 tothe atmosphère and has also been proposed to be a major site oforganic carbon export to the deep sea (Murray et al, 1994). Muchof what is known about the equatorial Pacific has corne from the US
Joint Global Océan Flux Study (JGOFS-EqPac). The JGOFS stud¬
ies set out to better characterise carbon fluxes in the high nutrientlow chlorophyll (HNLC) régions of the central and eastern equato¬
rial Pacific Océan. Thèse studies hâve suggested that the variabilityof remote winds in the western Pacific Océan and tropical instabil-ity waves are major factors controlling physical and biological vari¬
ability of thèse waters (Murray et al, 1994). Carbon fluxes stronglydépend on climate variability and in the equatorial Pacific Océan
the El Nino Southern Oscillation (ENSO) plays a major rôle in sea¬
sonal and annual variability in the productivity of thèse waters.
In contrast to the eastern/central equatorial Pacific Océan, muchless work has been done in the western equatorial Pacific Océan.
Barber and Kogelschutz, 1990, suggested that the ENSO, throughmodulation of the east-west tilt of the equatorial nitracline, was a
G. A. Peck, J. David Smith Uranium decay séries radionuclides and their use in estimating poc fluxes T 465
primary source of new production variability, reducing new pro¬
duction in the eastem Pacific and increasing it in the western Pacificduring El Nino. Primary production in the western equatorialPacific has been reported from the Australian JGOFS program dur¬
ing non El Nino and El Nino phases (Mackey et al, 1997). In 1990
(FR08/90) from 5°S to 5°N along 155°E primary productivities of96-241 mg C nv2.day_1 were recorded, productivities for the 1992
(FR05/92) and 1993 (FR08/93) cruises were in the range 220-620mg C m^.day-1 (Mackey et al, 1997). The 1990 cruise was after the1988/89 La-Nina but before the 1991/92 El-Nino. The 1992 and
1993 cruises were at the middle to end of a prolonged El-Ninoevent. This increase in productivity during an El-Nino phase sup¬
ports the link proposed by Barber and Kogelschutz (1990).
Until recently POC fluxes in the western equatorial Pacific had notbeen recorded (Dunne et al, 2000). In this study POC fluxes werecalculated using the POC inventory with the removal rate and
inventory of particulate 210Po. The average POC flux sinking out ofLayer 1 was 104 mg C nr2.day"' and from Layer 2 was 180 mgC m 2.day', an increase of POC flux with depth. In the westernequatorial Pacific Océan POC fluxes of 49.2 mg C m^.day"1 at
0°N,167°E (Rodier and Leborgne, 1997), 118.8 mg C m^.day1 for0°N,165°E and 97.2 mg C nr2.day-' at 0°N,175°E (Dunne et al,2000) hâve been reported for depths of 100 m, 120 m and 120 m
respectively. Thèse POC fluxes are in a similar range to the fluxesreported in this study for Layer 1. However, increase in carbon fluxdown the water column is not expected in the western equatorialPacific Océan and the results from this work are not strongly sup¬
ported by the productivity results for this région. Increased fluxes ofparticulate matter of 130 mg C nr2.day"' at 50 m and 210 mg C nr2.day''at 250 m in the Mediterranean Sea, off Monaco hâve been reportedby Fowler et al, 1 986. POC fluxes for the central and eastern equa¬
torial Pacific Océan hâve been more widely studied and those citedin this paper range from 23-146 mg C m 2.day'. POC fluxes calcu¬
lated from data collected on FR07/97 and comparative results fromthe literature are summarised in Table 2.
Carbon flux dépends strongly on the physical processes; horizontaladvection, diffusion, upwelling rates and wind speeds. In the equa¬
torial Pacific thèse processes hâve been shown to cause variation in
466' Environmental Changes and Radioactive Tracers
Location
This Study*2°48'S, 145°06'E2°09,S, 144°00'E0°00'N, 142°59'E0°00'N, 146°60'EOWS, 152°00'E
Rodier & Leborgne 1 9970°N. 167°E0°N, 150°W
Dunne étal. 20000°N, 165°E0°N, 150°W
0°N, 165°E0°N, 175°E
Murray étal. 19960°N, 140°W0°N, 140°W
Bacon étal. 19960°N, 140°W
Raimbault étal. 19990°N, 150°W
Fov/\er e/al. 1986Off Monaco
Buesseler et al. 19950°N, 140°W
Karl étal. 1996Station ALOHA22°45'N>158°W
Central North Pacific
Depth(m)
100
300
100100
120120
120120
120120
120120
200
50150250
100
150
POC Flux(mg C nr'day1)
70-125104 ±21
150-210180 ±22
49.2204
70.8146.4
118.897.2
72120
2329
80-90
130136210
36-60
29
Year of Sampling
August 1997(El-Nino)
October 1994(El-Nino)
October 1994El-Nino
April 1996Mild La-Nina
February 1992August 1 992
(El-Nino)
March-April 1992October 1992
(El-Nino)
November 1994(El-Nino)
N/A
1992
Average over1990-1992
Method
Box Model:Polonium-210
Driftingsédiment trap
Combineddrifting
sédimenttrap/Th-234
Combineddrifting
sédimenttrap/Th-234
Th-234
Driftingsédiment trap
Sédiment trap
Th-234
Driftingsédiment trap
aPOC fluxes reported are the range and average values for the five sampling sites.
I Table 2Particulate organic carbon fluxes for oceanic seawater samples.
primary productivity with strong interannual and seasonal variabil¬ity (Mackey et al, 1997). Variability in the physical processes ofhorizontal advection, diffusion and wind speed would play a greater
G. A. Peck, J. David Smith Uranium decay séries radionuclides and their use in estimating poc fluxes T 467
rôle in the variability of POC flux from the upper layer ofthe océan
at the equator in the Pacific Océan. Thèse processes would noteffect the lower layer to the same extent. Possible explanations forthe observed increase in POC flux from the lower layer are;
upwelling of nutrient rich water or diel migration of zooplankton.Estimâtes of POC export flux using 234Th found an increase inupwelling by a factor of two causing the POC export flux toincrease by 50% at the equator (Buesseler et al, 1995).
Steinberg et al. (2000) found that approximately 15-50% of zoo¬
plankton biomass above 500 m vertically migrâtes into surfacewaters at night. Zooplankton biomass in the upper 160 m can
nearly double at night due to vertically migrating zooplankton.This migration can cause increased POC fluxes in the mid-layersof the océan.
Conclusion
There is a wide range of reported POC fluxes in the upper layers ofthe océan. It is a common feature of the use of radionuclides as trac¬
ers of marine processes, that radionuclides of différent half-livesyield particle fluxes of différent magnitudes. Particle fluxes esti¬
mated using the same radionuclide system by différent workers are
generally similar. Care must be taken if particle fluxes obtainedusing one radionuclide system are to be compared with those
obtained using différent radionuclides or from the use of sédimenttraps.
Comparisons of POC fluxes obtained from the same study site
using différent radionuclide Systems and using sédiment trap mea¬
surements would help quantify the aspects of particle sinking that
each method actually détermines. This work has added to the liter¬
ature for estimâtes of POC fluxes in the western equatorial PacificOcéan, but highlights that future studies aimed at further under¬
standing the relationship between the chemical, physical and bio¬
logical processes in the océan are warranted.
468' Environmental Changes and Radioactive Tracers
AknowledgementsWe thank the Hydrography Group of CSIRO, Marine Research,
Hobart and particularly D. Mackey as cruise leader. We thank the masterand crew on the R.V. Franklin. We also thank Dr Kathy Burns
ofthe Australian Institute of Marine Science for POC déterminationsand the Australian Research Council for financial support.
BibliographyBacon M. P., Spencer D. W.,Brewer P. G., 1976-2,0pb/226Ra and 2r0po/210Pb
disequilibria in seawaterand suspended particulate matter.Earth & Planetary Science Letters32: 277-296.
Bacon M. P., Cochran J. K.,Hirschberg D., Hammar T. R.,FleerA. P., 1996-Export flux of carbon at the equatorduring the EqPac time-series cruisesestimated from 234Th measurements.Deep-Sea Research II,43:1133-1153.
Barber R.T.,Kogelschatz J.E., 1990 -"Nutrients and productivity duringthe 1982/83 El-Nino ". In: Glynn P.W.
(ed.) : Global conséquencesof the 1982/83 El Niho-SouthernOscillation Event Elsevier, Amsterdam.
Buesseler K. O., Andrews J. A.,Hartman M. C, Belastock R.,Chai F, 1995-Regional estimâtes of the export fluxof particulate organic carbon derivedfrom thorium-234 during the JGOFSEqPac program. Deep-Sea ResearchII, 42 (2-3): 777-804.
Cooper M. B., Wilks M. J. 1 981 -An analytical method for radiumf26Ra) in environmental samplesby the use of liquid scintillation
counting. Australian RadiationLaboratories, Melbourne,ARL/TR040.
Dunne J., Murray J. W., Rodier M.,Hansell, D. A., 2000 -Export flux in the westernand central equatorial Pacific: zonaland temporal variability. Deep-SeaResearch L, 47: 901-936.
Fowler S. W., Heussner S.,Heyraud M., LaRosa J.,Bojanowski R., 1986 -"Vertical transport studies in thecoastal Mediterranean". InternationalLaboratory of Marine Radioactivity.Biennial Report 1983-1984. IAEA,Vienna, IAEA-TECDOC-380.
Hamilton T. F., Smith J. D., 1986 -Improved alpha energy resolutionfor the détermination of poloniumisotopes by alpha-spectrometry.Applied Radiation and Isotopes.,37: 628-630.
Karl D. M., Christian J. R., Dore J. E.,Hebel D. V., Letelier, R. M.,Tupas, L. M., Winn, C. D., 1996 -Seasonal and interannual variabilityin primary production and particleflux at Station ALOHA. Deep-SeaResearch II. 43 (2-3) 539-568.
Mackey D. J., Parslow J.,Griffiths F. B., Higgins H. W.,Tilbrook B., 1 997 -
G. A. Peck, J. David Smith Uranium decay séries radionuclides and their use in estimating poc fluxes T 469
Phytoplankton productivityand the carbon cycle in the westernequatorial Pacific under El Ninoand non-EI Nino conditions.Deep-Sea Research II.,44 (9-10): 1951-1978.
Murray J. W., Barber R. T.,Roman M. R., Bacon M. P.,
FeelyR.A., 1994-Physical and biological controlson carbon cycling in the equatorialPacific. Science., 266: 58-65.
Murray J. W., Young J., Newton J.,Dunne J., Chapin T., Paul B.,McCarthy J. J., 1996-Export flux of particulate organiccarbon from the central equatorialPacific determined using a combineddrifting trap-2MTh approach.Deep-Sea Research IL,43, (4-6): 1095-1132.
Peck G. A. Smith J. D., 2000 -Distribution of dissolvedand particulate 226Ra, 2,0Pb and 210Po
in the Bismarck Sea and westernequatorial Pacific Océan. Marine &
Freshwater Research., 51 : 647-658.
Raimbault P., Slawyk G.,BOUDJELLAL B., COATANOAN C,Conan P., Coste B., Garcia N.,Moutin T., Pujo-Pay M., 1999 -Carbon and nitrogen uptakeand export in the equatorial Pacificat 1 50°W: Evidence of an efficientregenerated production cycle.Journal of Geophysical Research.,104:3341-3356.
Ritchie G. D.,
Shimmield G. B., 1991 -
The use of ^«Po/^Pb disequilibriain the study of the fate of marineparticulate matter ". In: Kershaw P. J.,Woodhead D. S. (eds.) Radionuclidesin the Study of Marine Processes.Elsevier Applied Science: 142-153.
Rodier M., Leborgne R., 1997 -Export flux of particles at the equatorin the western and central equatorialPacific Océan. Deep-Sea Research II,44 (9-10): 2085-2113.
Steinberg D. K., Carlson C. A.,Bâtes N. R., Goldthwait S. A.,Laurence P. M.,Micheals A. F., 2000 -Zooplankton vertical migrationand the active transport of dissolvedorganic and inorganic carbon in theSargasso Sea. Deep-Sea Research L,
47:137-158.
Tinker R. A., Smith J. D., 1996 -Simultaneous measurement ofradium-226 and barium-133 usingliquid scintillation counting with puiseshape discrimination., AnalyticaChimica Acta., 332: 291-297.
Towler P. H., Smith J. D.,Dixon D. R., 1996-Magnetic recovery of radium,lead and polonium from seawatersamples after preconcentration on amagnetic adsorbent of manganèsedioxide coated magnetite. AnalyticaChimica Acta., 328: 53-59.
Towler P. H., Smith J. D., 1997 -Distribution of 226Ra and 2,0Pb in themixed layer of the western equatorialPacific Océan. Marine andFreshwater Research., 48: 371-375.

Origin and transportof radiumin the water columnof Buena Coastal Lagoon
Dejanira C. Lauria
José Marcus de Oliveira Godoy
I Introduction
The radium concentration in surface waters normally ranges from0.01 to O.lBq.I1 (Iyengar, 1990), with high values found inwaters close to uranium mining and milling (Iyengar, 1990;
Paschoa et al., 1979 and Benes, 1990). In groundwater, the Ra
concentration can reach values up to 38 Bq.l ', depending on fac¬
tors such as the kind of aquifer rock as well as chemical and phy¬
sical characteristics of water (Gascoyne, 1989). Based on
groundwater data, a corrélation between salinity and radium isexpected (Kramer and Reid, 1984; Langmuir, 1985); therefore,among others the lower concentration of radium in surface watersthan in ground waters could be credited to the lower values ofsalinity normally found in surface waters. Well known is theincrease of the dissolved radium concentrations in the estuarinerégion due to salinity effects (Hancock and Murray, 1996; Mooreand Shaw,1998).
The so-called Buena Lagoon is a high sait coastal lagoon locatedclose to the border between Rio de Janeiro and Espirito SantoStates, Brazil, in a monazite rich région. Its waters are used by a
hydrogravimetric monazite sand séparation mill. In the waters of
472 T Environmental Changes and Radioactive Tracers
Buena lagoon abnormal concentrations of 226Ra and 228Ra were
found, which at first could be credited to the activities at this mill.However, the high chemical and mechanical stability of the
monazite is responsible for the negligible releasing of radionu¬clides from it and consequently the short contact time of thewater with the sand minerais during the hydrogravimetric pro-cessing would not be sufficient to promote the releasing of radio¬
nuclides from the ore. Additionally, higher radium concentrationswere observed upstream instead of downstream from the effluentdischarge point. So, the aim of this research was to identify the
origin ofthe observed high radium concentrations and to study itstransport in the water column of the lagoon.
Material and methods
The study area
Buena Lagoon is located in Rio de Janeiro State, Brazil, betweenthe coordinates 21° 23'- 21° 24' S and 41° 00'- 41° 03' W(Figure 1). Its watercourse surface area is 0.11 km2 (113 000 m2),
its length is 5.4 km and it is on average 21 m wide. Its wetlandhas an area of 0.67 km2, largely covered by aquatic végétation,mainly Typha Dominguesis Pers., and its catchment area com¬
prises 7.5 km2. The lagoon is separated from the océan by a bar¬
rier of sand approximately 15 meters wide. Once or two times a
year, fishers open its mouth and its water inflows in the directionof the sea. A physical séparation plant aiming the heavy mineraiséparations uses the water of Buena Lagoon and after the water isused, it is returned to the place where it was taken from (samplingstation 5, Figure 1). The régions climate is tropical, warm and
wet, with rainy (approximately October-February) and dry(approximately March-September) seasons. Mean annual rainfallis about 760 mm.
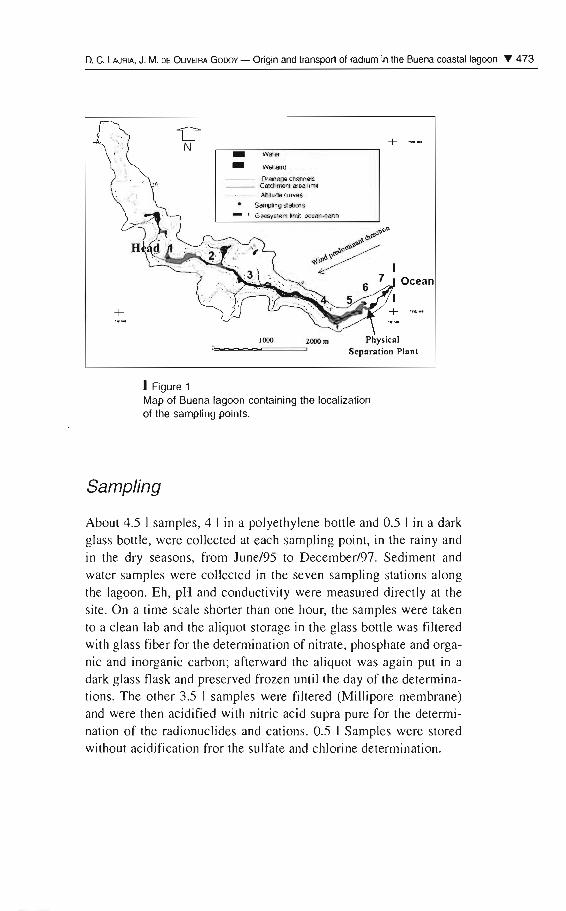
D.C.l.AURIA. J. M. DE OLIVEIRA GODOY - Origin and transport of radium in the Buenacoastallagoon T 473
+
UN
+ ,~ ..-- Dren eqe cnenne ts__ Cetcttment arealime
AJldude curves
Samplll1 g s aecos- , Gecsvs tem bmil oceao-eertb
1000 2000 m Physicalo.....~"""'''''==== Separation Piani
1 Figure 1Map of Buena lagoon containing the localizationof the sampling points.
Sampling
About 4.5 1samples, 4 1in a polyethylene bottle and 0.5 1in a darkglass bottle, were collected at each sampling point, in the rainy andin the dry seasons, from June/95 to December/97. Sediment andwater sarnples were collected in the seven sarnpling stations alongthe lagoon. Eh, pH and conductivity were measured directly at thesite. On a time scale shorter than one hour, the sarnples were takento a cJean lab and the aliquot storage in the glass bottle was filteredwith glass fiber for the determination of nitrate, phosphate and organic and inorganic carbon; afterward the aliquot was again put in adark glass flask and preserved frozen until the day of the determinations. The other 3.5 1 samples were filtered (Millipore membrane)and were then acidified with nitric acid supra pure for the determination of the radionuclides and cations. 0.5 1 Samples were storedwithout acidification fror the sulfate and chlorine determination.
474 T Environmental Changes and Radioactive Tracers
Chemical analysis methods
Anions: Classical chemical methods were applied to the détermina¬
tion of anions in the water samples. Sulfate was determined by tur-bidimetry, chloride by the Volhard's argentometric method, nitrateby spectrophotometric method after its réduction to nitrite on a cad-
mium/copper column and phosphate by the ammonium molib-date/ascorbic acid method and the alkalinity by acid tritation(Standard Methods, 1975).
Organic and inorganic carbon: Both organic and inorganic carbon
were determined by a Carbon Analyzer Beckman 915B.
Cations: Cations in gênerai, including major cations, rare earth élé¬
ments, uranium and thorium were analyzed by inductively coupledplasma-mass spectrometry, ICP-MS, Perkin-Elmer ELAN 5000,after a dilution 1 :20 with water quality Milli-Q, applying the so-cal-led "TotalQuant" method using In and Tl as internai standards. Atotal of 27 éléments were used for the equipment mass efficiencycalibration.
228Ra and 226Ra: Using 1-liter sample, 228Ra and 226Ra were analyzedapplying the procédure described by Godoy (1990). The accuracyof such détermination is routinely tested by inter-laboratory exer¬
cises organized by the EPA/USA and the Radionuclide MetrologyDivision of IRD/CNEN (Vianna, Tauhata, de Oliveira, Clain and
Ferreira, 1998).
Results and discussion
Among seven and four sampling campaigns were performed at each
sampling station, as station one was the last station discovered, onlyfour sampling campaigns were performed at this station. The com¬
plète data set was composed by 1065 single measurements ofthe 28
variables (Na, K, Mg, Ca, Mn, Fe, Al, Si, La, Ce, Pr, Nd, Sm, Th,U, 226Ra, 228Ra, 2,0Pb, P, CV, S042", N03-, Dissolved OrganicCarbon, Inorganic Carbon, pH, Eh, Alkalinity and Conductivity).
D. C. Lauria, J. M. de Oliveira Godoy Origin and transport of radium in the Buena coastal lagoon T 475
Comparing the values ofthe variables at the same station, no signi¬
ficant différences among the values in the dry and in the rainy sea¬
sons was observed. The normality distribution tests for each
variable showed that the data were Iog-normally distributed.Statistical tests were performed with the data transformed into theirlogarithms allowing the central tendency and dispersion to be repre¬
sented by the géométrie mean and géométrie standard déviation foreach station (Wayne,1990). The exception was the pH data set. Thecentral tendency and dispersion were represented by arithmeticmean and standard déviation as the pH data set was already in thelogarithm form. The central tendency and the dispersion for the
most représentative variables (Th, U, 228Ra, 226Ra, Cl" and pH ) at thesampling stations are shown in Table 1.
The comparison of the géométrie mean and the géométrie standarddéviation of each variable among the sampling stations (respecti¬
vely by t-test and F-test) showed four différent distribution patternsalong the lagoon: i) the mean is the représentative value of concen¬
tration for ail stations, including the behavior of Th, Fe, Mn and dis¬
solved organic carbon; ii) the highest values of concentration werefound at station 1, while in ail the other stations the concentrationshad the same mean value. The variables of this set are Si, Eh and
nitrate. Uranium belongs to this set, however its behavior is a littlebit différent, since at station 7 its concentration value increased; iii)the concentrations increased with the proximity of the sea. To thisdata set belongs the major ions (Na, K, Ca, Mg, Cl-, F- , S042) and
the pH and iv); the fourth data set showed a behavior opposite to thelast distribution, the values of the concentration decreased withproximity to the sea. To this variable set belongs the radium iso¬
topes and the light rare earth éléments.
Investigating the radium origin
In order to identify the main sources of ions to the lagoon water, fac¬
tor analysis was employed, using the complète data set. Factor analy¬
sis is a technique suitable for simplifying large and complex data sets,
creating a Iimited number of factors, each representing a cluster ofinterrelated variables within a data set (Zhu et al, 1997). For theextraction methods the Principal Component Analysis method (PCA)
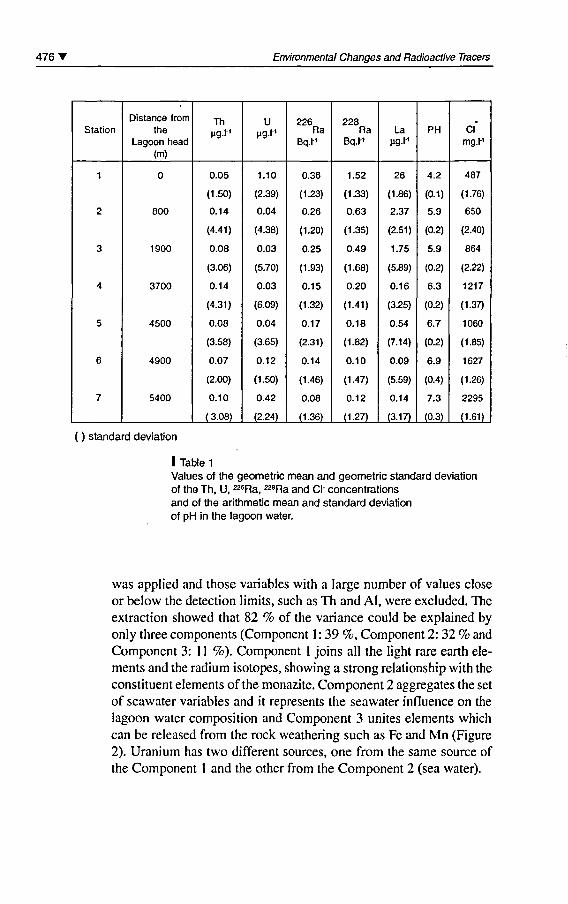
476' Environmental Changes and Radioactive Tracers
Station
1
2
3
4
5
6
7
Distance fromthe
Lagoon head(m)
0
800
1900
3700
4500
4900
5400
Thpgi"'
0.05
(1.50)
0.14
(4.41)
0.08
(3.06)
0.14
(4.31)
0.08
(3.58)
0.07
(2.00)
0.10
( 3.08)
U
1.10
(2.39)
0.04
(4.38)
0.03
(5.70)
0.03
(6.09)
0.04
(3.65)
0.12
(1.50)
0.42
(2.24)
226Ra
Bq.M
0.36
(1.23)
0.26
(1.20)
0.25
(1.93)
0.15
(1.32)
0.17
(2.31)
0.14
(1.46)
0.08
(1.36)
228Ra
Bq.l-'
1.52
(1.33)
0.63
(1.35)
0.49
(1.68)
0.20
(1.41)
0.18
(1.82)
0.10
(1.47)
0.12
(1.27)
LaiigM
26
(1.86)
2.37
(2.51)
1.75
(5.89)
0.16
(3.25)
0.54
(7.14)
0.09
(5.59)
0.14
(3.17)
PH
4.2
(0.1)
5.9
(0.2)
5.9
(0.2)
6.3
(0.2)
6.7
(0.2)
6.9
(0.4)
7.3
(0.3)
Cl'mg.h'
487
(1.76)
650
(2.40)
864
(2.22)
1217
(1.37)
1060
(1.85)
1627
(1.26)
2295
(1.61)
( ) standard déviation
I Table 1
Values of the géométrie mean and géométrie standard déviationof the Th, U, 226Ra, 228Ra and CI- concentrationsand of the arithmetic mean and standard déviationof pH in the lagoon water.
was applied and those variables with a large number of values closeor below the détection limits, such as Th and Al, were excluded. Theextraction showed that 82 % of the variance could be explained byonly three components (Component 1 : 39 %, Component 2: 32 % and
Component 3: 1 1 %). Component 1 joins ail the light rare earth élé¬
ments and the radium isotopes, showing a strong relationship with the
constituent éléments ofthe monazite. Component 2 aggregates the set
of seawater variables and it represents the seawater influence on the
lagoon water composition and Component 3 unités éléments whichcan be released from the rock weathering such as Fe and Mn (Figure2). Uranium has two différent sources, one from the same source ofthe Component 1 and the other from the Component 2 (sea water).
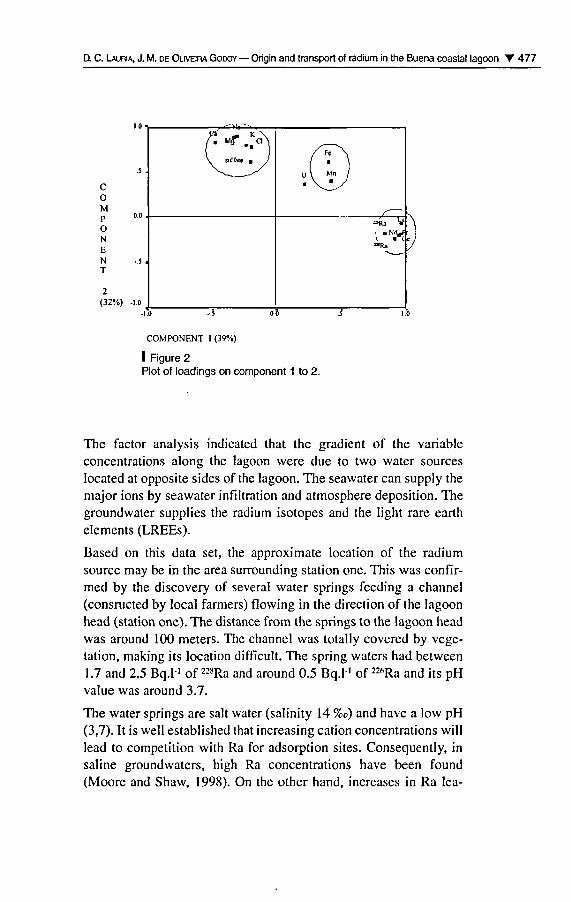
D. C. Lauria, J. M. de Oliveira Godoy Origin and transport of radium in the Buena coastal lagoon T 477
CoMP
NENT
2(32%)
.5 .
00 ,
-5 ,
-1.0
F* tu K \/. MfT . en
V sulfate J
^ -^//
A
yr\\
M. /^yy
Ra V
l"NW"Ra
05
COMPONENT I (39%)
I Figure 2Plot of loadings on component 1 to 2.
The factor analysis indicated that the gradient of the variableconcentrations along the lagoon were due to two water sources
located at opposite sides of the lagoon. The seawater can supply themajor ions by seawater infiltration and atmosphère déposition. Thegroundwater supplies the radium isotopes and the light rare earth
éléments (LREEs).
Based on this data set, the approximate location of the radiumsource may be in the area surrounding station one. This was confir¬med by the discovery of several water springs feeding a channel(consructed by local farmers) flowing in the direction of the lagoonhead (station one). The distance from the springs to the lagoon head
was around 100 meters. The channel was totally covered by végé¬
tation, making its location difficult. The spring waters had between1.7 and 2.5 Bq.l"1 of 228Ra and around 0.5 Bq.l-1 of 226Ra and its pHvalue was around 3.7.
The water springs are sait water (salinity 14 %o) and hâve a low pH(3,7). It is well established that increasing cation concentrations willlead to compétition with Ra for adsorption sites. Consequently, insaline groundwaters, high Ra concentrations hâve been found(Moore and Shaw, 1998). On the other hand, increases in Ra lea-
478 T Environmental Changes and Radioactive Tracers
ching from ores was observed at a pH lower than 4 (Benes, 1984).The low pH value observed for the water springs can also contributeto the high Ra concentrations in it. The strong relationship amongthe Ra isotopes, the light rare earth éléments and U is compellingévidence that thèse éléments dérive from the same source. Then the
possibility of the monazite being the source of Ra in the groundwa¬ter and consequently to the lagoon water hâve to be considered.
Evaluating the radium transportalong the lagoon
The activity ratio of 22iRaP16Ra can be used as a tracer of Ra mobi¬lity in the water column if it does not vary with the evaporation, pré¬
cipitation or biological activity, but varies only with the radiumdecays. To use this ratio some assumptions must be made: i) theratio of the concentrations of 228Ra and 226Ra is constant at the
source and ii) there is only one source of radium which is located atthe head of the lagoon.
The Ra concentrations observed in other lagoons of the région,located around 20 Km from Buena Lagoon, showed a mean value(for four measurements) of 226Ra= 0.16 ± 0.05 and 228Ra= 0.21 ±0.11 Bq.l'. Considering this concentration as the régions back¬
ground and subtracting this value from the Ra concentrations at the
différent stations (Table 1), the "real concentration" of Ra in the
water can be estimated as well as the concentration ratios (Table 2).
Once the concentration ratio of the Ra isotopes at each station is
known and knowing that the decay of 226Ra is negligible (226Ra half-life 1600 years), the time spent by the radium to move from one sta¬
tion to another can be evaluated (using the activity decay équation).As the distances among the stations are known, the migration velo-city can be estimated. Therefore it was estimated a period of around6.7 years for the radium to move 1900 meters, resulting in a mean
migration velocity of 283 meters per year.
/Ra228\ , . /Ra228\ , ,. , e-*Ra228T( ^ ,,, J station = I =--r. ) station 1 :\Ra226/ \Ra226/ e^R^T
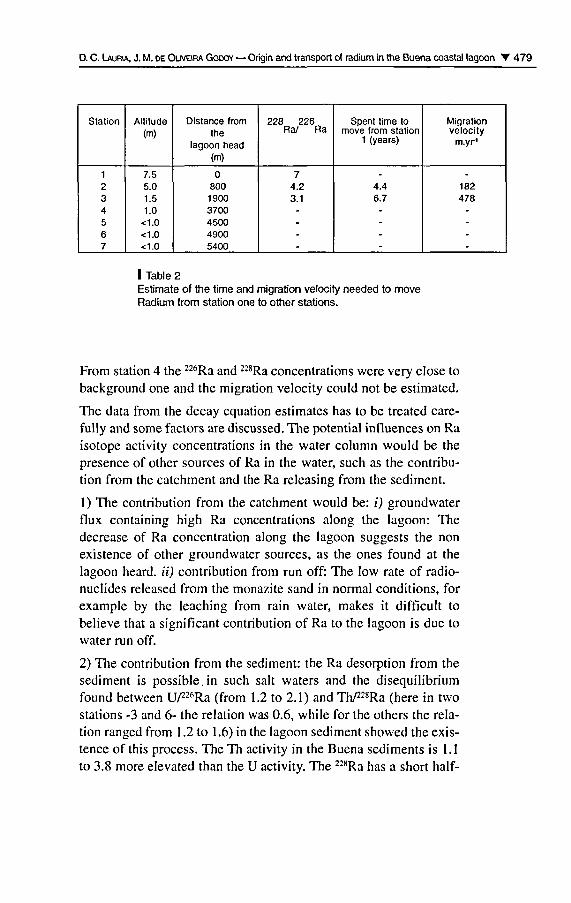
D. C. Lauria, J. M. de Oliveira Godoy Origin and transport of radium in the Buena coastal lagoon T 479
Station
1
234567
Altitude(m)
7.55.01.51.0
<1.0<1.0<1.0
Distance fromthe
lagoon head(m)
080019003700450049005400
228 226Ra/ Ra
74.23.1
-
-
-
-
Spent time tomove from station
1 (years)
-
4.46.7
-
-
-
-
Migrationvelocity
m.yr1
-
182478
-
-
-
-
I Table 2Estimate of the time and migration velocity needed to moveRadium from station one to other stations.
From station 4 the 226Ra and 228Ra concentrations were very close tobackground one and the migration velocity could not be estimated.
The data from the decay équation estimâtes has to be treated care-fully and some factors are discussed. The potential influences on Raisotope activity concentrations in the water column would be theprésence of other sources of Ra in the water, such as the contribu¬tion from the catchment and the Ra releasing from the sédiment.
1) The contribution from the catchment would be: i) groundwaterflux containing high Ra concentrations along the lagoon: Thedecrease of Ra concentration along the lagoon suggests the non
existence of other groundwater sources, as the ones found at thelagoon heard. ii) contribution from run off: The low rate of radio¬nuclides released from the monazite sand in normal conditions, forexample by the leaching from rain water, makes it difficult tobelieve that a significant contribution of Ra to the lagoon is due towater run off.
2) The contribution from the sédiment: the Ra desorption from thesédiment is possible, in such sait waters and the disequilibriumfound between U/^Ra (from 1.2 to 2.1) and Th/^Ra (hère in twostations -3 and 6- the relation was 0.6, while for the others the rela¬
tion ranged from 1.2 to 1.6) in the lagoon sédiment showed the exis¬
tence of this process. The Th activity in the Buena sédiments is 1.1
to 3.8 more elevated than the U activity. The 228Ra has a short half-
480 T Environmental Changes and Radioactive Tracers
life and is almost directly produced by the 232Th decay, while 226Ra
has a long half-life and its ingrowth dépends on the decay of three
radionuclides of long half-life: 238U, 234U and 230Th. Because of that,
the production rate of 228Ra in the sédiment is more elevated than
226Ra and probably the 228Ra amount is also desorpted from the sédi¬
ment. Thus, the value of the ratio activity 228Ra/226Ra found in the
water would be due to the decay of the spring's 228Ra and to the
radium desorpted from the sédiment. Considering the activity ratio^Ra/^Ra desorpted from the sédiment is higher than one, the timeand the migration velocity estimated from équation I and pre¬
sented in Table 2 would be underestimated. The radium migrationin the water column of the lagoon is very low and the remainingtime in the water column is long. This long radium remaining timein the column water of the lagoon could be explained by the highwater salinity and the conséquent compétition among the cations forthe exchange sites ofthe sédiment as observed in sait groundwater.
Quantifying the radium amountin the water column
The distribution of the radium concentrations (Table 1) can be fit¬
ted by exponential functions, where the variation of the radionu¬clide concentrations with the distance can be expressed as:
228Ra (Bq.nr3) =1 180.e00005d and 226Ra (Bq.nr3) = 351e00oo2d
where d is the distance from the sampling point to the head of the
lagoon (m). The values of the corrélation coefficients were respec¬
tively R2 = 0.9565 and 0.8632.
If thèse functions were integrated along the 5,400 m of the lagoon,it is possible to estimate the total amount of the radionuclide in the
water. The area ofthe lagoon is 113,000 m2 and the mean width isaround 21 meters. The depth ofthe lagoon is variable (between 10
cm and 3 m), however it is possible to estimate it at around 0.80 m,
resulting in a transverse section of 16.8 m2. So in the water of the
lagoon the total amount ofthe Ra isotopes are estimated as : 3.7 107
Bq of 228Ra (40MBq) and 1 .9 IO7 Bq (20 MBq) of 226Ra.
D. C. Lauria, J. M. de Oliveira Godoy Origin and transport of radium in the Buena coastal lagoon T 481
Conclusion
The outcropping of groundwater containing high concentrations ofRa is responsible for the observed Ra concentrations in the water ofthe lagoon. The water of the lagoon is basically composed by twosources of ions located at opposite sides ofthe lagoon. The seawa¬
ter supplies the major ions and the groundwater supplies the radiumand the rare earth éléments, possibly by the leaching of the mona¬
zite. The data points to a slow migration velocity ofthe radium iso¬
topes in the water column, which could be attributed to the highsalinity of the water. A total activity of 40MBq of 228Ra and 20MBqof 226Ra remains in the water column.
AknowledgementsThe authors thank the Fundaçâo de Amparo e Pesquisa
do Estado do Rio de Janeiro (FAPERJ) and the International Atomic EnergyAgency (IAEA), which partially provided funding for this research.
Thanks are also due to colleagues at Divisâo de AnâliseAmbiental/DEPRA/IRD, who analyzed part ofthe samples of this study.
The constructive suggestions of Luigi Monte is especially acknowledged.
482 T Environmental Changes and Radioactive Tracers
BibliographyBenesP., 1984-Migration of Radium in the TerrestrialHydrosphère. The Behaviorof Radium in Waterways andAquifers. IAEA-TECDOC-301,Vienna, 119-173.
BenesP., 1990-Radium in (Continental) SuriaceWater. The Environmental Behaviorof Radium, IAEA. Technical ReportsSéries, n° 310: 373-418.
GascoyneM., 1989-High Levels of Uranium and Radiumin Groundwater at Canada'sUnderground Research Laboratory,Lac du Bonnet, Manitoba, Canada.Applied Geochemistry., 4: 557-591 .
GodoyJ. M., 1990-Methods for Measuring RadiumIsotopes: Gross Alpha and BetaCounting. InternationalEnvironmental Behavior of Radium.IAEA, Vienna, Technical ReportsSéries, n" 310(1): 205-221.
Hancock G. J., Murray A. S., 1996 -Source and distribution of dissolvedradium in the Bega river estuary,Southeastern Australia. Earth andplanetary science Letters.,138: 145-155.
Iyengar M. A. R., 1990-The Natural Distribution of Radium,The Environmental Behaviorof Radium. IAEA, Technical ReportsSéries, n" 310: 59-128.
Kraemer T. F, Reid D. F., 1984 -The Occurrence and Behavior ofRadium in Saline Formation Waterof the U.S. Gulf Coast Région.Isotope Geoscience., 2: 153-174.
Langmuir D., 1985-The Thermodynamic Propertiesof Radium. Geochimicaet Cosmochimica Acta.,49: 1593-1601.
Monte L., Baldini E., Battella C,Fratarcangeli S., Pompei F., 1997 -"Modelling the Radionuclide Balancein some Water Bodies of CentralItaly", J. Environ. Radioactivity.,37 (3): 269-285.
Moore W. S. e Shaw T. J., 1 998 -Chemical Signais from SubmarineFluid Advection onto the ContinentalShelf. Journal of GeophysicalResearch, September.,103 (C10): 21543-21552.
Paschoa A. S., Baptista G. B.,Monténégro E. C, Miranda A. C.SigaudG. M., 1979-"Radium-226 Concentrations in theHydrographie Basins near UraniumMining and Milling in Brazil".Irr. Mid Year Topical Symp.,Low Level Radioactive WasteManagement, Williamsburg,VA: 337-343
Standard Methods for Examinationof Water and Wastewater, 1 975 -14th édition, American Public HealthAssociation, Washington.
Vianna M. E. C. M., Tauata L.,Oliveira A. E., Oliveira J. P.,
Clain A. F, Ferreira A. C. M., 1998 -Evaluation of BrazilianIntercomparison Program Datafrom 1991 to 1995 of RadionuclideAssays in Environmental Samples.Appl. Radiât Isto.,49 (9-11): 1463-1466.
WayneR.O., 1990-A Physical Explanationof the Lognormality of PollutantConcentrations, J. Air WasteManage. Assoc., 40: 1378-1383.
Zhu W., Kennedy M., Leer E. W. B.,Zhou H., Alaerts G. J. F. R., 1997 -Distribution and Modelling of RareEarth Eléments in Chinese RiverSédiments. The Science of TotalEnvironment, 204: 233-243.
Hydric resources
radioactive contaminationin the central régionof Cuba as a conséquenceof fallout afterthe atmospheric nuclearbombs tests
C. Alonso Hernândez
A. Munoz Caravaca
M. Diaz Asencio
H. Cartas Aguila
E. Suârez Morell
Introduction
With the birth of the nuclear era a new group of contaminants hâvebeen introduced into the atmosphère, they are the artificial radionu¬clides. From 1945 up to 1980, with the high scale nuclear bombs
tests, more than 960 PBq of 137Cs has been released into the atmo¬
sphère in 545 Mt predicted released power (UNSCEAR, 1983).
Besides, the nuclear fuel cycle (mainly as a resuit of nuclear powerplant accidents) has promoted radioactivity releases becomeanother important source of artificial radionuclides contaminatingour atmosphère.
484 T Environmental Changes and Radioactive Tracers
Not ail radionuclides releases in the atmosphère remain for indef-inite time, their présence in the atmosphère dépend upon physical-chemical properties in relation with their interaction capacity inthis média. For thèse reasons the radioactivity releases hâve
caused one of the greatest changes of ail times in the atmosphère
composition, and hâve brought about the contamination of almostevery environmental component, not only in the testing or powerplant sites, but also ail around the world because of the GlobalFallout.
The Cuban water masses, as well as the rest of the natural com¬
ponents of our ecosystems, are not free of this source of globalcontamination. Although the contamination coming from this
source is not an imminent danger to the populations using thèse
water, it has been seen as an increase in the radiological back¬
ground of the main hydrological resources of the country. Thèse
resources are used for direct consumption, food production and
irrigation of crops. Furthermore, it is perceivable the présence ofartificial radionuclides in the underground waters, despite theirdifférent self-cleaning mechanisms and the slow speed ofthe con¬
tamination processes characterizing thèse water masses (CRESL,1993; CRESL, 1994; CRESL, 1995a2,3,4,5).
The use of radioactive tracers implies the implementation and
évaluation of every measurement methodology. It permits us todétermine their distributions in the environment and to understand
the dynamic processes that control their behavior in the environ¬
ment. The Radiological and Environmental SurveillanceLaboratory hâve developed a monitoring program for some envi¬
ronmental variables, among which the 137Cs concentration in sev¬
eral environmental samples such as soil, grass, milk, foods,
surface and underground waters and air, are measured. Thereforethe natural cycle of thèse radionuclides has been studied thor-oughly. This article main goal is to présent the ,37Cs activity level
determined in atmospheric and hydric samples, as well as some
considérations about transference processes of thèse radionuclidesthroughout some environmental components.
C. Alonso Hernandez étal Hydric resources radioactive contamination in Cuba T 485
Methods
The studied zone, was located around the Juragua Nuclear PowerPlant (Central-South région of the country, Cienfuegos province)and it was 10 000 km2 wide. We fixed six sampling places dis¬
tributed as follow: three sampling places for surface waters in themost important dams (Hanabanilla Dam, Abreus Dam and AvilésDam), two samples places in the Juragua water bearing for under¬
ground waters, and one place for continuous air monitoring in ourlaboratory.
The period of study was five years long (1994-1998). The air sam¬
ples were collected weekly. Aérosol samples were collected byPRIMUS, an air pump designed in our laboratory (CRESL, 1995b).It has a 800-1400 mtO-h"' air flux, a collecting area 0.65m2 and uses
a Petrianov filter (FPP-15-1.5) able to retain the particles withdimensions greater than 3mm (99%) and avoid the resuspension indry season. Each filter was exposed for 168 hours (1200 mn.h ' airflux average), after that each samples was dry ashed and measuredby gamma spectrometry. Fallout samples were collected in try cov¬
ered with the same Petrianov filter. Each filter was exposed during30 days, after that each sample was dry ashed (350 °C). Due to l37Cs
low level, each quarter samples xere unified and measured bygamma spectrometry.
The waters were sampled after three months and were collected in50 1 cleaned bottles (CPHR, 1990a; CPHR, 1990b; EML, 1990). Todétermine 137Cs, 20 I samples were filtered trough a qualitative fil¬ter paper and nitric acid or hydrochloric acid up to 1.5 pH wasadded. To détermine 137Cs in water, AMP was used to concentrate itand then it was measured by gamma spectrometry. A germaniumdetector was used for comparative measurements: HPGe detectorhaving 11.1% relative efficiency, geometry Hole P-Type, andenergy Resolution FWHM of 2.26 keV on 1.33 MeV photopeak of60Co, (CPHR, 1990a; CPHR, 1990c; CRESL, 1995c). The puiseswere analyzed with a multichannel buffer, Silena Spectrometer
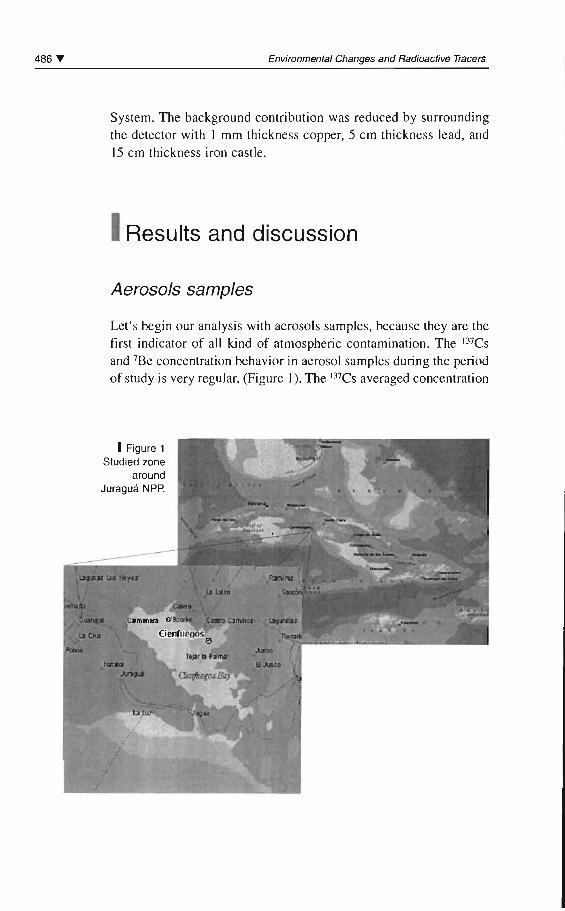
486 'Y Environmenlal Changes and Radioactive Tracers
System. The background contribution was reduced by surroundingthe detector with 1 mm thickness copper, 5 cm thickness lcad, and15 cm thickness iron castle.
1Results and discussion
Aerosols samples
Let's begin our analysis with aerosols sampJes, because they are thefirst indicator of ail kind of atmospheric contamination. The 137Csand 7Be concentration behavior in aerosol samples during the periodof study is very reguJar, (Figure J). The mcs averaged concentration
1 Figure 1Studied zone
aroundJuraquà NPP.
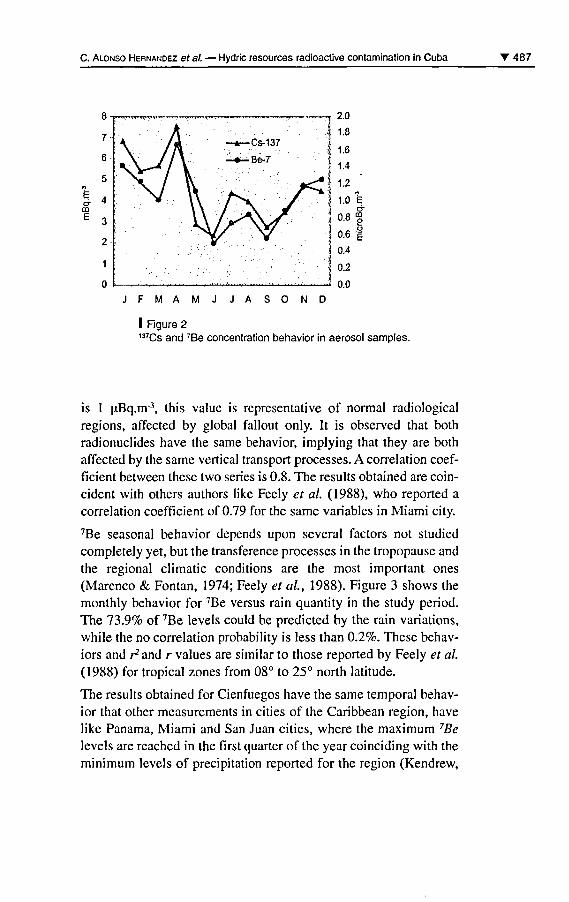
C. Alonso Hernandez et al. Hydric resources radioactive contamination in Cuba '487
me
JFMAMJJASOND
I Rgure 2137Cs and 7Be concentration behavior in aérosol samples.
is 1 LiBq.m3, this value is représentative of normal radiologicalrégions, affected by global fallout only. It is observed that bothradionuclides hâve the same behavior, implying that they are bothaffected by the same vertical transport processes. A corrélation coef¬
ficient between thèse two séries is 0.8. The results obtained are coïn¬
cident with others authors like Feely et al. (1988), who reported a
corrélation coefficient of 0.79 for the same variables in Miami city.
7Be seasonal behavior dépends upon several factors not studiedcompletely yet, but the transference processes in the tropopause and
the régional climatic conditions are the most important ones
(Marenco & Fontan, 1974; Feely et al, 1988). Figure 3 shows themonthly behavior for 7Be versus rain quantity in the study period.The 73.9% of 7Be levels could be predicted by the rain variations,while the no corrélation probability is less than 0.2%. Thèse behav¬
iors and Hand r values are similar to those reported by Feely et al.
(1988) for tropical zones from 08° to 25° north latitude.
The results obtained for Cienfuegos hâve the same temporal behav¬
ior that other measurements in cities of the Caribbean région, hâve
like Panama, Miami and San Juan cities, where the maximum 7Be
levels are reached in the first quarter of the year coinciding with the
minimum levels of précipitation reported for the région (Kendrew,
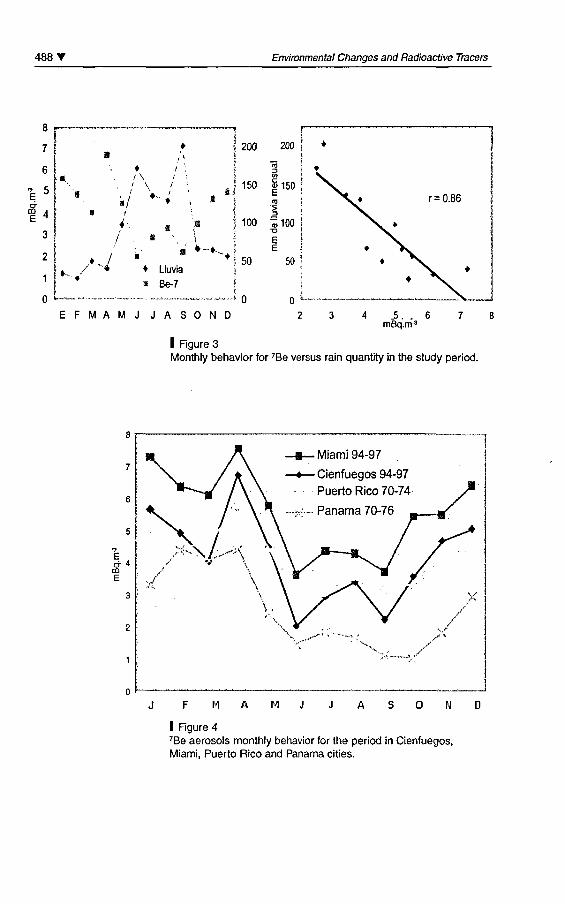
488' Environmental Changes and Radioactive Tracers
8 f
M6
I*
E5[E 4
I
i ^
./
f /1 |*-v
/ - «
4 \
200 200
J 150 «150Si E
I100 Ô100
\
î 50Lluvia
s Be-7 \
EFMAMJ JASOND 4 .5. . 6mBq.m3
I Rgure 3Monthly behavior for 7Be versus rain quantity in the study period.
5
mE
0 <"
Miami 94-97
- Cienfuegos 94-97
Puerto Rico 70-74
Panama 70-76
M M N
I Figure 47Be aérosols monthly behavior for the period in Cienfuegos,Miami, Puerto Rico and Panama cities.
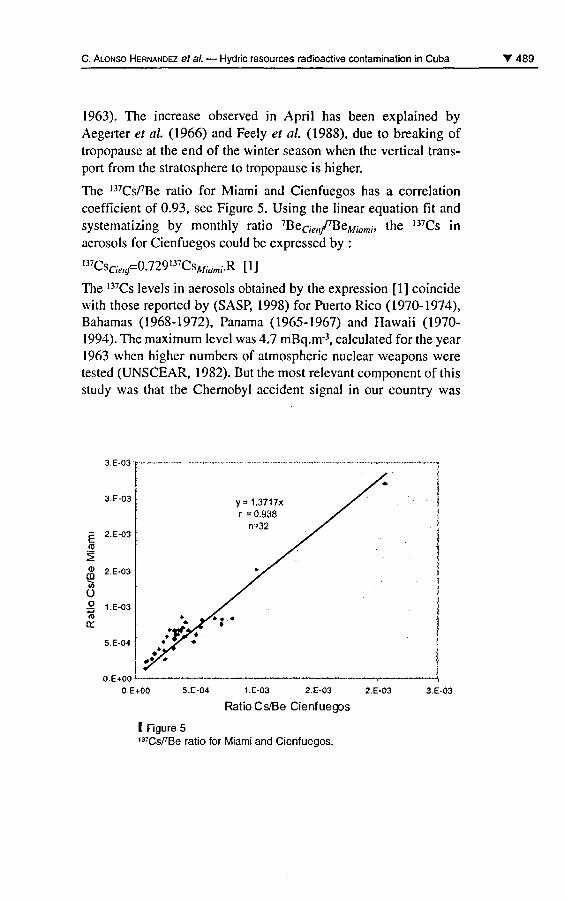
C. Alonso Hernandez et al. Hydric resources radioactive contamination in Cuba 489
1963). The increase observed in April has been explained byAegerter et al. (1966) and Feely et al. (1988), due to breaking oftropopause at the end of the winter season when the vertical trans¬
port from the stratosphère to tropopause is higher.
The niCsPBe ratio for Miami and Cienfuegos has a corrélationcoefficient of 0.93, see Figure 5. Using the linear équation fit and
systematizing by monthly ratio 7Bec,e/7Bew,om;, the I37Cs inaérosols for Cienfuegos could be expressed by :
,37CsCjVy=0.729137CsA/;am,R [1]
The 137Cs levels in aérosols obtained by the expression [1] coincidewith those reported by (SASP, 1998) for Puerto Rico (1970-1974),Bahamas (1968-1972), Panama (1965-1967) and Hawaii (1970-1994). The maximum level was 4.7 mBq.m3, calculated for the year1963 when higher numbers of atmospheric nuclear weapons weretested (UNSCEAR, 1982). But the most relevant component of thisstudy was that the Chernobyl accident signal in our country was
3.E-03
3.E-03
F
Miai Cs/Be tio2.E-03
2.E-03
1.E-03
or
5.E-04
0.E+00
y = 1.3717xr =0.938
n=32
0.E+00 S.E-04 1.E-03 2.E-03 2.E-03
Ratio Cs/Be Cienfuegos
I Figure 5'^Cs/'Be ratio for Miami and Cienfuegos.
3.E-03
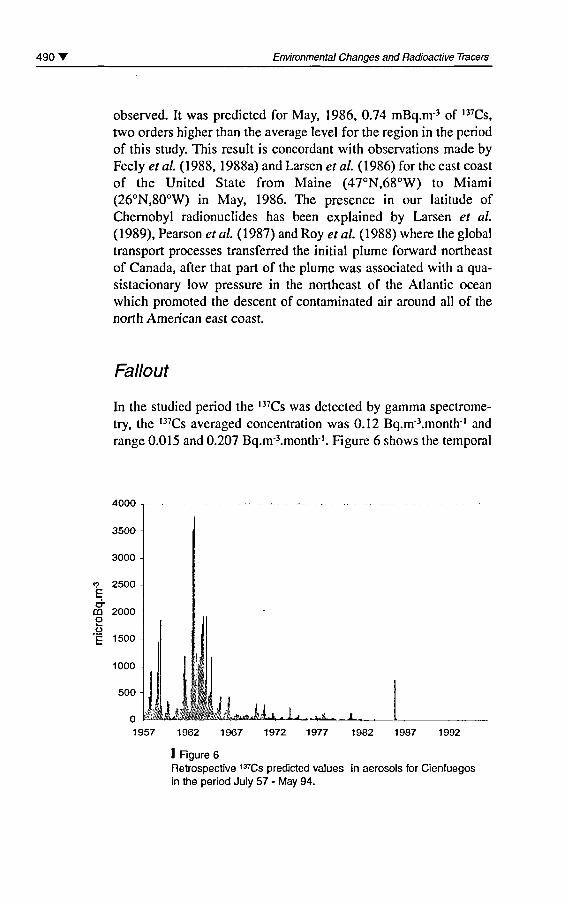
490' Environmental Changes and Radioactive Tracers
observed. It was predicted for May, 1986, 0.74 mBq.m3 of l37Cs,
two orders higher than the average level for the région in the periodof this study. This resuit is concordant with observations made byFeely étal (1988, 1988a) and Larsen et al. (1986) for the east coastof the United State from Maine (47°N,68°W) to Miami(26°N,80°W) in May, 1986. The présence in our latitude ofChernobyl radionuclides has been explained by Larsen et al.(1989), Pearson et al. (1987) and Roy et al. (1988) where the globaltransport processes transferred the initial plume forward northeastof Canada, after that part of the plume was associated with a qua-sistacionary low pressure in the northeast of the Atlantic océan
which promoted the descent of contaminated air around ail of thenorth American east coast.
Fallout
In the studied period the l37Cs was detected by gamma spectrome¬
try, the I37Cs averaged concentration was 0.12 Bq.m^.month"1 and
range 0.015 and 0.207 Bq.nr'.montlv1. Figure 6 shows the temporal
4000
3500
3000
<? 2500E
m" 2000oo'g 1500
1000
500
M,Jfa«aÂ!..i. . Lj ..li .. i1957 1962 1967 1972 1977 1982 1987 1992
I Rgure 6Rétrospective 137Cs predicted values in aérosols for Cienfuegosin the period July 57 - May 94.
C. Alonso Hernandez et al. Hydric resources radioactive contamination in Cuba T 491
I Figure 7137Cs total fallout and précipitationfor period June 94 - December 98 in Cienfuegos.
behavior of fallout déposition. A good corrélation with précipitationlevels in the period was observed, where the higher values are inwet season (May-October) and diminish rapidly in the dry season.
A corrélation analysis indicates that the 71% 137Cs fluctuations are
explained by the fluctuations in précipitation régime. This variableis the principal in the vertical transport processes of ,37Cs from lowtroposphère to the surface ground and agrées with observationsmade by Feely et al. (1988) in the 1970-1985 period for Miami city.
Waters
The I37Cs radionuclide was detected by gamma spectrometry in sur¬
faces and underground waters after radiochemical extraction. Theconcentrations range determined in surface waters was 0.34 - 9.04mBq.l"1, averaging 7.9 mBq.f1 Underground waters hâve a 2.73mBq.l"1 average concentration and a 1.38 - 5.28 mBq.l-' range.
492' Environmental Changes and Radioactive Tracers
There are no significative différences between the results obtainedfor the différent sampling places in both média. It is observed thatunderground waters hâve a I37Cs concentration lower than surfacewaters. This shows that the speed of the contamination processes is
slow and that their self-cleaning mechanisms characterize thèse
water masses.
Averaged concentration 137Cs [mBq.l-1
Control Media
Underground waters
Surface waters
Period
88-97
1998
1999
88-97
1998
1999
Activity levels
2.83 ±1.86
1.68 ±0.30
3.88 ± 1.40
6.46 ± 2.58
3.75 ±1.54
0.84 ± 0.50
I Table 1
137Cs range and averaged concentration in undergroundand surface waters.
The 137Cs in aquatic fish and aquatic végétation is 0.18 ±0.1 and
0.18 ± 0.06 10 Bq.kg1 wet weight respectively. Those values are
représentative of zones affected by Global Fallout only.
Conclusions
The results drawn by our studies show the présence of 137Cs nuclearfission product in ail the studied areas, and it having an activityabove the détection limits of our measurement Systems.
The 137Cs concentration in aérosols samples show a good corréla¬
tion with the behavior of local atmospheric perturbations, which
C. Alonso Hernandez et al Hydric resources radioactive contamination in Cuba '493
are more fréquent in the summer season (May-September). Thisbehavior has been associated with a greater transport in the précip¬itation processes from the atmosphère to earth. The increaseobserved in April has been explained by Aegerter et al (1966) and
Feely et al. (1988), due to breaking of tropopause at the end of thewinter season when the vertical transport from the stratosphère totropopause is higher.
It is perceivable that the présence of 137Cs in the underground watersand in aquatic biognosis, despite their différent self-cleaning mech¬
anisms, is due to the slow speed ofthe contamination processes thatcharacterize thèse water masses.
We conclude that our hydrological resources hâve been contami¬nated by the 137Cs nuclear fission product coming from the past
nuclear weapons tests by means of Global Fallout. The level of spé¬
cifie activity of this radionuclide is very similar with those reportedin the scientific literature for zones affected by Global Fallout only(UNSCEAR, 1983; UNSCEAR, 1993).
BibliographyAegerter S., Bhandari N., Rama H.,Tamhane A. S., 1966Be7and P32 in ground level air.Tellus, 18:212-15.
CPHR, 1990aGuide for collection and registerof environmental samples aroundnuclear sites. CPHR-MA-87,Havana, Cuba.
CPHR, 1990bMethodological guidefor environmental samplespretreatment Havana, Cuba.
CPHR, 1990cGuide for 137Cs déterminationin environmentalsamples. CPHR-MA04-87,Havana, Cuba.
CRESL, 1993Natural radioactive levels aroundJuragua Nuclear Power Plant site.Central Radiologicaland Environmental SurveillanceLaboratory, LVRAC Cienfuegos,Cuba,
CRESL, 1994Radiological Monitoring Program.Juragua Nuclear Power Plant site.Report 1 994, Central Radiologicaland Environmental SurveillanceLaboratory, LVRAC Cienfuegos,Cuba.
CRESL, 1995aRadiological Monitoring Program.Juragua Nuclear Power Plant site.Report 1995, Central Radiologicaland Environmental Surveillance
494' Environmental Changes and Radioactive Tracers
Laboratory, LVRAC Cienfuegos,Cuba.
CRESL, 1995bDesign and put in practice of aérosolcollector system PRIMUS. CentralRadiological and EnvironmentalSurveillance Laboratory, LVRACCienfuegos, Cuba, 1995.
CRESL, 1995cProcédures Manual MIP SA-32.Central Radiological andEnvironmental SurveillanceLaboratory, LVRAC Cienfuegos,Cuba.
EML, 1990Procédures Manual. EnvironmentalMeasurements Lab.,Hasl-300-Ed-27, NY, USA.
FeelyH.W., LasenR.J.,Sanderson C. G, 1988Annual Report of the sudace airsampling programs. New York,Department of Energy Repot.EML-447.
FeelyH.W., HelferI.K.,Juzdan Z. R., Klusek C. S.,Lasen R. J., Leifer R.,Sanderson C. G., 1 988aFallout in the New York MetropolitanArea Following the ChernobylAccident. J. Environ. Radioactivity,7: 177-191.
FeelyH.W., LasenR.J.,Sanderson C.G., 1989Factors that cause seasonal varia¬tions in beryllium-7 in surface air.J. Environ. Radioactivity, 9: 223-249.
KendrewW. G., 1963The climates of the Continents.Oxford, The Claredon Press.
Larsen R. J., Sanderson C. G.,Rivera W., Zamiquieli M., 1986"The caracterization of radionuclidesin the North American and Hawaiian
surface air and déposition followingthe Chernobyl accident".
In Volchok H. L., Chieco N. A. (eds) :
A Compendium of the EnvironmentalMeasurement Laboratory's ResearchProjects Related to the ChernobylNuclear Accident, New York,US Department of EnergyReport EML-460: 1-104.
Larsen R. J., Haagenson P L.,ReissN.M., 1989Transport Processes Associated withthe initial elevated concentrations ofChernobyl Radioactivity in Surfaceair in the United States. J. Environ.Radioactivity, 10 (1): 1-18.
Marenco A., Fontan J., 1974Étude des variations des 7Be,^R^Sr, 210Pb et 10Po dansla troposphère. Tellus., 26: 386-401 .
Persson C, Rodhe H.,DeGeerL, 1987The Chernobyl accident-A meteorological analysis of howradionuclides reached and weredeposited in Sweden. AMBIO,16:20-31.
Roy J., Cote J. E., Mahfoud A.,Villenuve S., Turcotte J., 1 988On the trasport of Chernobylradioactivity to the eastern Canada.J. Envirom. Radioactivity, 6: 121-30.
SASP, 1998Surface Air Sampling Program.(EML-572) (on line).http://www.eml.doe.gOv/databases/SASP/sasp_data_search.htm
UNSCEAR, 1983United Nations Scientific Committeeon the Effect of Atomic Radiation,1982. NY, USA.
UNSCEAR, 1983United Nations Scientific Committeeon the Effect of Atomic Radiation,1993. NY, USA.

Oral/Posterprésentations
Session 6

Session 6 Oral/Poster présentations T 497
1 Estimating the Indonesianthroughflow from the Indo-Pacifictritium concentration gradient
P. Jean-Baptiste
V. Leboucher
The Indonesian throughflow is a major feature of the Indian and
Pacific océans equatorial circulation and an important componentof world océan circulation (Gordon, 1986). It results from the pres¬
sure gradient which exists between the Indian and Pacific océans, as
the mean sea level is higher on the Pacific side than on the Indianside. The various methods used to estimate its strength lead to muchscatter, with values comprised between -2.6±9 Sv and 18.6±7 Sv.
Hère, we focus on the tritium (3H) distribution. 3H was injected inthe atmosphère by atmospheric thermonuclear weapons tests duringthe 1950s and 1960s. First, the ratio of thermonuclear 14C to 3H
inventories is used to trace the North Pacific origin of the through¬flow waters. Then, the comparison of the 3H inventory on both sides
of the Indonesian seas, in Pacific and Indian océans, allows us todérive a new estimate ofthe Indonesian throughflow. Unlike directcurrent measurements or geostrophy, the présent approach gives a
value which is averaged over the transit time ofthe waters throughthe Indonesian archipelago (i.e., over several years) and makes itpossible to remove much ofthe seasonal and interannual variabilityof the throughflow.
498 T Environmental Changes and Radioactive Tracers
I Circulation in the Arcticand North Atlantic Océans revealedby 129l and 137Cs tracersfrom European nuclearfuel reprocessing plants
J. N. Smith
The development during the past 10 years of analytical techniquesto measure 129I by accelerator mass spectrometry has led to récentadvances in its use as an océanographie tracer, particularly in the
Arctic Océan. Large quantifies of ,29I (tl/2 = 16 x 106yr) hâve been
discharged from the Sellafield (UK) and La Hague (France) nuclearfuel reprocessing plants into the Irish Sea and English Channel,respectively since the 1960s. Together with l37Cs (tl/2 = 30 yr),derived mainly from Sellafield, the 129I reprocessing signal is trans¬
ported into the North Sea and Norwegian Coastal Current and then
enters the Arctic Océan through Fram Strait and the Barents Sea
where both tracers independently reflect the circulation of Atlanticorigin halocline and intermediate water. Combined measurementsof 129I and 137Cs, together with a knowledge of the historical recordof reprocessing plant discharges, can be used to identify a givenyear of transport through the Norwegian Coastal Current (NCC),thereby permiting the détermination of a transit time from the NCCto a given sampling location, similar to a ventilation âge determinedusing atmospherically-derived tracers such as tritium and chloroflu-orocarbon compounds (CFC's). Measurements of 129I and 137Cs con¬
ducted on seawater samples collected during icebreaker and USNavy nuclear submarine cruises to the Central Arctic Océan clearlydelineate circulation features such as the boundary between Atlanticand Pacific-origin water that is presently aligned with theMendeleyev Ridge. Thèse results hâve been interpreted using a
Session 6 Oral/Poster présentations T 499
transit time model which provided estimâtes of 6-7 yr (± 0.5 y) forthe passage of Atlantic Water from the Norwegian Coastal Current(60°N) to the Eurasian slope ofthe Makarov Basin, 8-10 years tothe Mendeleyev Ridge and > 10 yr to the interior of the CanadaBasin.
500 T Environmental Changes and Radioactive Tracers
I Application of 238U/234Th ratiosto détermine particle fluxand trace élément résidence timesin tropical marine Systems
R. Szymczak
M. Zaw
Particles of ail sizes and various sources play a central rôle in thescavenging of natural and pollutant chemical species in marine Sys¬
tems. In estuaries and coastal waters particle concentrations are
generally several orders of magnitude higher than in the deep sea
and consequently very important in determining the biogeochemi¬cal behaviour of associated pollutants. Further offshore, biologicalprocesses become increasingly important in regulating the flux ofthèse materials. An understanding of the formation and résidence
times of particles in marine environments will greatly assist in the
interprétation of several key issues associated with (1) the fate ofnatural terrestrial material during mixing of rivers and océans in the
coastal zone, and (2) the chemical behaviour and environmentalconséquence of pollutants in coastal and oceanic Systems. The par-ent-daughter association of primordial, chemically conservative and
long-lived (half-life 4.5x1 09 years) uranium-238 and thorium-234,with a half-life of 24.1 days and high affinity to bind with seawaterparticles, provides an excellent tracer to study thèse processes withtemporal ranges from days to months. When combined with phase
associations measurements of other éléments (heavy metals, rare
earth éléments and noble metals) observations of disequilibrium inuranium-238/thorium-234 ratios provide an understanding of the
time dependence of particle formation and elemental scavenging, orremoval, processes.
Session 6 Oral/Poster présentations T 501
I Contamination of waterwaysin the Czech Republicwith radionuclidesfrom uranium mining and milling
P. Benes F. Sebesta
J.John J.Vesely
Data on the contents of uranium, thorium, 22fiRa, 228Ra and 228Th inbottom sédiments in the catchment of Labe (Elbe) River in theCzech Republic are analyzed. It is shown that some rivers and réser¬
voirs are extensively contaminated with uranium and 226Ra from the
past uranium mining and milling, whereas the activities of thorium,228Ra and 228Th are rather evenly distributed without apparentanthropogenic effects. The background concentrations of ail the
radionuclides are established and the sources of local contaminationare identified. Some of the sources represent old liabilities of the
mining and milling whose remediation remains important task forfuture. Analysis of radioactive equilibria (""U/^Ra and 232Th/228Ra)
in the sédiments hâve indicated that the uneontaminated river sédi¬
ments contain 226Ra mainly bound inside minerai particles in equi-librium with 238U, but a large part of 226Ra in the contaminated riversédiments is adsorbed on the surface of sédiment grains. The frac¬
tion adsorbed is large also in ail réservoir sédiments and particularlyin suspended solids of river water. 228Ra is bound by adsorptionmore than 226Ra in uneontaminated sédiments. Comparison of the
activities of uranium and 226Ra in the river sédiments with similaractivities in the adjacent river water revealed rather small variabi¬lity of the ratio of the sediment/water activities among différentsampling sites. The ratio represents a kind of modified "Kd" value.Significance and possible uses of this value are discussed.
502 T Environmental Changes and Radioactive Tracers
U-series disequilibriain deep fracture zonein the Vienne granitoidsas an indicator of uraniummigration processes
J. Casanova
J. F. Aranyossy
Uranium concentration and activity ratios (2MUP3SU and 230Th/234U)
in groundwater, fracture coatings and adjoining rock matrix were
studied in the Vienne granitoids, France. The aim was to developand test a conceptual model of the groundwater flow system. Thesmall to moderate disequilibrium (1.87 < 234U/238U < 3.36) observedin the deep groundwater, together with very low uranium concen¬
tration, is characteristic of reducing conditions. It is very likely thatdeep groundwaters with uranium contents as low as 0.022 ppb,underwent activity ratio increase due to the alpha-recoil process,
while shallow groundwaters, with uranium content close to 24 ppb,resuit from preferential 234U -solution processes. Activity ratios as a
function of distance from fractures surface (sample at 342m) showclear absolute uranium release up to 5 to 6 cm's from the fracturesurface. Both 230Th/234U and 234U/238U profile indicates episodic 234U
mass flow events within the last 350,000 years. A workinghypothèse to relate observed absolute uranium release and isotopicfractionation between isotopes 234U and 238U is based on the radioac¬
tive decay induced oxidation of 234U to U(VI), that is the more sol¬
uble oxidation state of uranium. In this situation the oxygenconcentration in groundwater plays an important rôle. If there ismuch oxygen it can actually oxidise and release the bulk of uraniumwhich would not lead to marked isotopic fractionation. If there are
Session 6 Oral/Poster présentations T 503
small amounts of oxygen, the already oxidised 234U is easier toremove leading to clear isotopic fractionation. If finally there is
very little or no oxygen, it would hâve no effect even for 234U inwhich case there would not be absolute release nor preferential 234U
release.
504 T Environmental Changes and Radioactive Tracers
I lodine-131 and technetium-99:sewerage plume tracers?
R. Kleinschmidt
The radioisotopes ,31I and "Te are frequently used in diagnosticand therapeutic médical procédures. Waste products associated withthèse procédures are typically discharged to the sewer. Gammaspectrometry of passive bioaccumulators collected in the vicinity ofa local sewerage treatment plant outfall hâve shown that the con¬
centration of thèse, plus other médical radionuclides, is significant(e.g. ,31I in macro algae, 1 kBq.kg1)- A pilot study based in Brisbane,Australia suggests that the discharge of thèse waste products and
their progeny into the Brisbane River may provide a sensitivemeans of mapping the sewerage plume distribution within the riverand nearby Moreton Bay.
Session 6 Oral/Poster présentations T 505
i Results of a Iimitedgamma spectrometryintercomparisonon minerai sand productsand associated issues
Kleinschmidt
G. Godwin
New radiation control législation in Queensland, Australia providesfor the exemption of abrasive blast material upon meeting a speci¬
fied release criteria. Calculation of the release criteria is based on
the measurement of uranium and thorium séries radionuclides in theabrasive blast média. Past expérience has shown that results fromdifférent facilities vary to the extent that the material may be
exempt based on the results of one laboratory but not another.Queensland Health Scientific Services embarked on the trail of run-ning a Iimited intercomparison for a sample of ilmenite, a com-monly used minerai sand abrasive blast material, to establishsources of variation in reported results. The results of the programare presented with comment on their implications.
506 T Environmental Changes and Radioactive Tracers
IThermodynamicand hydrogeochemical controlsof the redox speciation of uraniumin the marine environment
G. Kniewald
M. Branica
The chemical speciation and redox equilibria of uranium in seawa¬
ter (and natural waters in gênerai) are controlled by a suite ofphysico-chemical processes. Among thèse, of primary significancefrom the thermodynamic point of view are major and trace con¬
stituent interactions, redox processes and sorption phenomena. Thecomplex redox System of uranium in natural waters, involving at
least three of the five known oxidation states of this élément, is
highly sensitive to changes ofthe redox potential (Eh) ofthe milieu.Several hydrogeochemical equilibrium models were applied to the
calculation of uranium distribution between the oxidation states VI,V and IV. Subroutines for inclusion of varying redox potentials, sol¬
ubility products and stability constants were used to identify ther-modynamically feasible reactions, the predominating oxidationstates of uranium and the respective solubility-limiting solids. Theresults indicate that the redox equilibria of uranium do not necessar¬
ily follow the classic concept of soluble UfVT) vs. insoluble U(IV)species. The présence and geochemical relevance of transient redoxstate of uranium (V) has to be accounted for in models predicting the
redox speciation of uranium and its mass tranfser reactions in the
marine environment. Significant environmental implications includethe reaction pathways of uranium précipitation and remobilization inanoxie environments, but also coastal waters, with a possibly delri-mental effect on the environmental quality of such areas.
Session 6 Oral/Poster présentations T 507
§3-D modelling of 137Cs and 90Sr
transport in Dnieper-Boog Estuary
N.Yu. Margvelashvili
V. S. Maderich
M. J. Zheleznyak
The developed recently 3-D numerical model of hydrodynamics, séd¬
iment transport and pollutant dispersion (THREETOX) is applied tosimulate radionuclide fate in stratified water bodies. Hydrodynamicsof THREETOX is similar to Blumberg-Mellor model, also known as
Princeton Océan Model. Suspended sédiment transport is describedby advection- diffusion équations. Transport of the radionuclides iscalculated separately for the liquid and solid phases. The paper pré¬
sents the methodology and results of the model implementation toDnieper -Boog Estuary (Dnieper River, Ukraine), that is the largestestuary of the Black Sea with a surface area of 1006.3 km2, and a vol¬ume of 4.24 km3. The régime of this drowned-river water body variesfrom stratified to partially mixed. The sources of fresh water dis¬
charge are the Dnieper and Southern Boog rivers. Dnieper-BoogEstuary (DBE) is the end of Chernobyl radionuclide's riverine path¬
way from Chernobyl into the Black Sea. The simulation of the l37Cs
and 90Sr distribution in the DBE and calculation of the relevantradionuclide fluxes to\from Black Sea were done on the basis of themeasured radionuclide influxes into the DBE from the Dniper Riverin 1986-1989. The simulated radionuclide concentrations on sédi¬
ments and in dilute where compared with the measured data. It wasshown that the spatial corrélation between l37Cs and salinity in DBEis strongly nonlinear due to sorption of the radionuclides on the finesédiment particles. The water stratification, compared with the windaction, has minor effect on the sédiment and radionuclide fluxes inmajor part ofthe estuary except the ship channel, where the sait wageis formed.
508 T Environmental Changes and Radioactive Tracers
1 Numerical studyof radionuclide dispersionin Chernobyl Cooling Pond
N.Yu. Margvelashvili S. A.Yushenko
V. S. Maderich M. J. Zheleznyak
Three-dimensional model of radionuclide dispersion (THREETOX)was applied to simulate fate of 137Cs in the Cooling Pond of the
Chernobyl Nuclear Power Plant (NPP). The length of ChemobylCooling Pond (CCP) is 11.5 km, the maximum width is 2.2 km, the
capacity is 0.16 km3. The water level in the CCPis supported by the
permanent pumping of water from Pripyat River to compensate the
losses due to seepage and evaporation. The currents in the CCP are
driven by releases of hot water from the NPP, by the cooled waterintake to it and by the wind. The CCP was heavy contaminated dur¬
ing the Chemobyl accident in April-May, 1986. Till today the lev¬
els of ,37Cs and ^Sr concentrations in the bottom déposition are
rather high. The measurements revealed redistribution and accumu¬
lation of the radionuclide in deepest parts of the cooling pond. Themodelling studies ofthe radionuclide fate in the CPPare stimulatednow by the needs to hâve assessments of the radionuclide re-distri-butions after Chernobyl NPP shut down and resulting shut down ofthe water pumping from the river. The simulation of the radionu¬clide fate in the CCP during 1986-1992 was provided on the basis
of the initial atmospheric fallout data. The reasonable agreementbetween measured and simulated data is reached for the radionu¬clide concentration in the water and bed. Both cohesive sédimentsand radionuclides are accumulated with higher rate in deepest partsof the cooling pond. Spatial distribution of 137Cs in the bed sincemid of 1987 correlates well with the fine sédiment distribution and
does not correlate with initial fallout data. The analysis of the effi¬ciency of the chosen mud transport model is provided treating theradionuclide as a tracer.
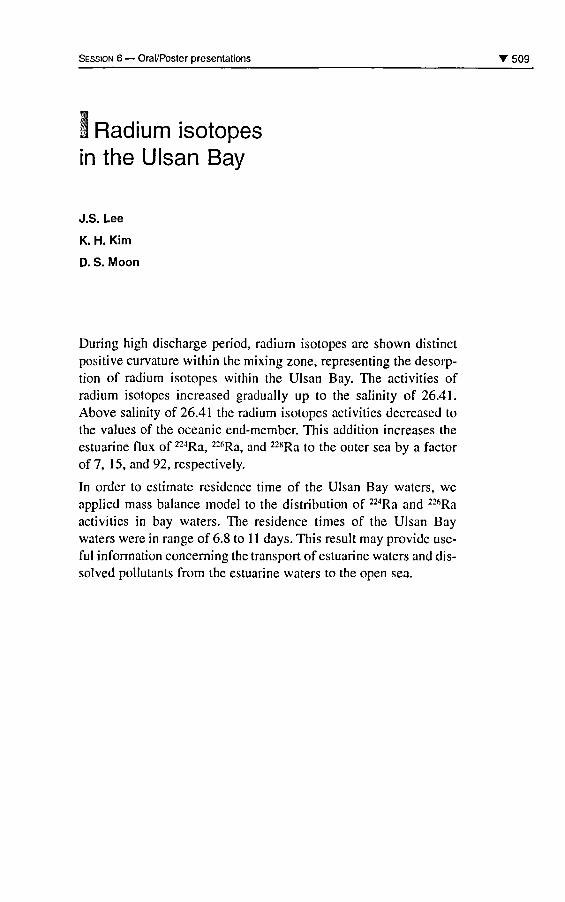
Session 6 Oral/Poster présentations T 509
1 Radium isotopesin the Ulsan Bay
J.S. Lee
K. H. Kim
D. S. Moon
During high discharge period, radium isotopes are shown distinctpositive curvature within the mixing zone, representing the desorp-tion of radium isotopes within the Ulsan Bay. The activities ofradium isotopes increased gradually up to the salinity of 26.41.Above salinity of 26.41 the radium isotopes activities decreased tothe values of the oceanic end-membcr. This addition increases the
estuarine flux of 224Ra, 226Ra, and 228Ra to the outer sea by a factorof 7, 15, and 92, respectively.
In order to estimate résidence time of the Ulsan Bay waters, weapplied mass balance model to the distribution of 224Ra and 226Ra
activities in bay waters. The résidence times of the Ulsan Baywaters were in range of 6.8 to 1 1 days. This resuit may provide use¬
ful information concerning the transport of estuarine waters and dis¬
solved pollutants from the estuarine waters to the open sea.
51 0 T Environmental Changes and Radioactive Tracers
S Spatial variations of 137Cs and90Sr concentrations in coastal watersof Japan
N. Inatomi
Y. Nagaya
F. Kasamatsu
The artificial radionuclides concentrations (137Cs and 90Sr) in sea
waters and sédiments in coastal waters of Japan has been monitor¬
ing since 1984 as a part of the marine environmental radioactivemonitoring program sponsored by the Science and TechnologyAgency of Japan. The spatial and temporal variations of 137Cs and
90Sr concentration in seawaters and the factors affecting the varia¬
tions hâve been investigated. The concentrations in cold water cur¬
rents (Oyashio currents system) are lower than those in warm water
currents (Kuroshio currents system). The concentrations of 137Cs
and 90Sr in coastal waters of northeast Japan hâve been substantiallyinfluenced by the occurrence and strength of the Kuroshio currentssystem/Oyashio currents system. Relatively constant concentrationsof ,37Cs and 90Sr were observed in waters above 200m depth withsharp gradient below 200m depth. We also discuss the characteris¬
tics ofthe vertical distribution of 239+240Pu in coastal waters of Japan.
Abstracts
Vladimir L. Zimin: "Fishes as radionuclide bioindicators in the areaof Leningrad nuclear power plant (Gulf of Finland, Baltic Sea)"
Since the early 1980s the long time dynamics of migration ofradionuclides in water, aquatic plants, fish and bottom sédi¬
ments, sampled in the Koporskaya Bay ofthe Gulf of Finlandas well as in rivers and lakes of the bay drainage basin hâve
been traced. This work comprises the Monitoring Program inthe NPP sanitary zone. In this paper a part of data, preciselyfish materials, were analyzed. The results reflect the complexcharacter of the radioactive contamination in Sosnovy BorRégion (the Koporskaya Bay drainage basin). Fish were cho-sen as spécifie concentrators and bio-transferors of anthropo¬
genic radionuclides, and to obtain information on exposuredoses for the human population of the Région resulting fromconsumption of the local food products.
Keywords: Radionuclide Fish Contamination Bioindicator.
Vasile Patrascu: "Synthetyc results in the radioactivity assessmentof the Romanian Black Sea sector after 1992"
The ecosystem state and marine environmental qualityresearch developed in our institute involve the follwingdirections:- monitoring of the physico-chemicals factors (température,currents, salinity, nutrients);- monitoring ofthe living resources (phyto and zooplankton,macrophite algae, molluscs, fish);- monitoring of pollution (radioactivity, heavy metals, oil,organic substance, microbiology);- study ofthe pollution effects (ecotoxicology);- coastal zone and marine environmental protection (éro¬
sion, ICZM, aquaculture, biodiversity).Water, sédiments and marine organisms are sampling fromnetwork stations between Danube mouth and Varna Veche
(245 km). Marine radioactivity is measured by gross beta,
gamma spectrometry and radiochemical methods.
Keywords: Radionuclide Marine sciences Black Sea.
5 1 2 T Environmental Changes and Radioactive Tracers
Claire Garrigue: "Impact of the human activities on cetaceans inthe South West Pacific Océan by measuring 137Cs, ^K and 210Pb"
Radioactivity occurs naturally in the environment, howeversome artificial radionuclides hâve also been introduced since
the 60's. One of the most widespread is the isotope 137Cs the
source of which is the global atmospheric fallout generated
from airbone nuclear explosions. In the more récent past the
Chernobyl nuclear accident injected important amounts ofartificial radioactivity in the Northern hémisphère. The ana¬
lyses of long-lived artificial and natural redionuclides can be
used as tracers of the global human impact on the marineenvironment. In particular 137Cs and 210Pb hâve been traced
in muscle tissues and the livers of whales stranded along the
coast of New Caledonia. The highest concentrations of137Cs were systematically found in the muscle tissues (0.08
to 0.26 Bq.kg"1 wet wt) in agreement with the literaturevalues. However an exception was observed in a pregnantfemale whose liver showed concentrations similar to those
measured in its muscle. Despite the relatively low number ofcetaceans sampled, globally the concentrations in 137Cs are
at least two times lower than those observed in the animaisnetted in the Northern hémisphère. This results probablyreflects the différences in the nuclear past (weapons testing,nuclear plant accidents) between the two hémisphères.
Keywords: Radionuclides 137Cs, "°K, 2,0Pb South PacificOcéan Short-finned pilot whale Pygmy sperm whale.
Bruno Danis: "14C radiolabelling: a sensitive tool for studying pcbbioaccumulation in echinoderms"
Uptake kinetics of PCB were investigated in the commonNE Atlantic sea star Asterias rubens, using congener #153
(viz. the most abundant congener in biota) as a model.
Organisms were exposed to the 14C labelled contaminant for34 days via either sea water or sédiments. Kinetics were fol¬
lowed in eight body compartments (oral body wall, aboral
body wall, cardiac stomach, pyloric caeca, rectal caeca,
gonads, podia, and coelomic fluid). Results indicate that bio¬
accumulation of PCB#153 varied with both the body com¬
partment and the exposure mode. A. rubens accumulated the
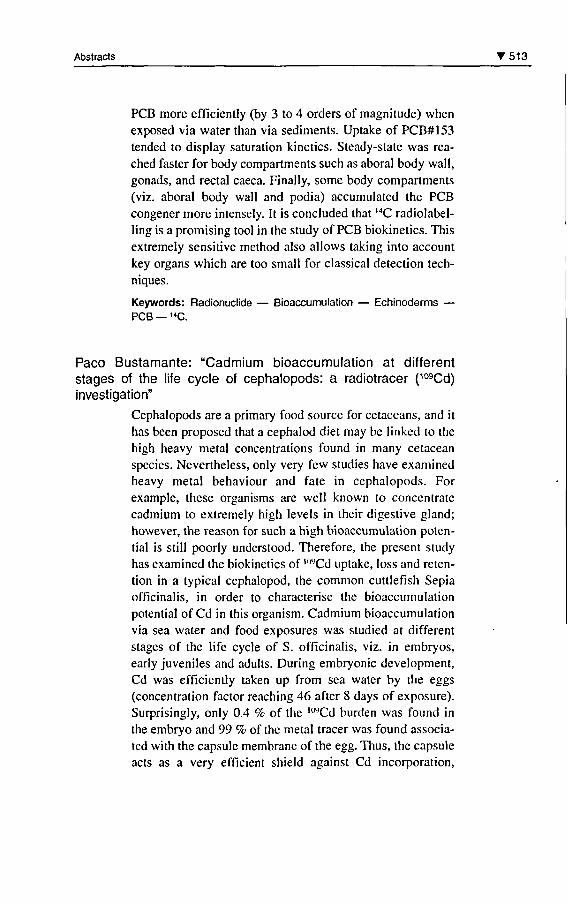
Abstracts T 513
PCB more efficiently (by 3 to 4 orders of magnitude) whenexposed via water than via sédiments. Uptake of PCB#153tended to display saturation kinetics. Steady-state was rea¬
ched faster for body compartments such as aboral body wall,gonads, and rectal caeca. Finally, some body compartments(viz. aboral body wall and podia) accumulated the PCBcongener more intensely. It is concluded that 14C radiolabel-ling is a promising tool in the study of PCB biokinetics. Thisextremely sensitive method also allows taking into accountkey organs which are too small for classical détection tech¬
niques.
Keywords: Radionuclide Bioaccumulation EchinodermsPCB ,4C.
Paco Bustamante: "Cadmium bioaccumulation at différentstages of the life cycle of cephalopods: a radiotracer (109Cd)
investigation"
Cephalopods are a primary food source for cetaceans, and ithas been proposed that a cephalod diet may be linked to the
high heavy métal concentrations found in many cetacean
species. Nevertheless, only very few studies hâve examinedheavy métal behaviour and fate in cephalopods. Forexample, thèse organisms are well known to concentratecadmium to extremely high levels in their digestive gland;however, the reason for such a high bioaccumulation poten¬
tial is still poorly understood. Therefore, the présent studyhas examined the biokinetics of 109Cd uptake, loss and réten¬
tion in a typical cephalopod, the common cuttlefish Sepia
officinalis, in order to characterise the bioaccumulationpotential of Cd in this organism. Cadmium bioaccumulationvia sea water and food exposures was studied at différentstages of the life cycle of S. officinalis, viz. in embryos,early juvéniles and adults. During embryonic development,Cd was efficiently taken up from sea water by the eggs
(concentration factor reaching 46 after 8 days of exposure).Surprisingly, only 0.4 % of the ,(WCd burden was found inthe embryo and 99 % of the métal tracer was found associa¬
ted with the capsule membrane ofthe egg. Thus, the capsuleacts as a very efficient shield against Cd incorporation,
514V Environmental Changes and Radioactive Tracers
which in turn suggests that this métal could be highly toxicfor early embryos. Once this shield is lost (after hatching),the cuttlefish may bioconcentrate waterborne Cd. Indeed,juvéniles as well as adults take up Cd efficiently, particularlyin the muscle (62 % of body burden) and digestive gland(25 %). When S. officinalis is replaced in non-contaminatedsea water, the whole body loss of Cd is relatively slow (bio¬
logical half life: ca. 65 days) and proportion of l09Cd bodyburden increases in digestive gland during the dépurationperiod (42 % after 6 days and 70 % after 29 days of loss).This indicates either a longer rétention time of Cd in diges¬
tive gland than in other organs, or a preferential transloca¬
tion of Cd from the organs to the digestive gland. Loss of"wCd ingested with food (brine shrimp for juvéniles; mussels
for adults) was even slower than Cd taken up via sea water(biological half life > 257 days), indicating a very strongrétention of dietary Cd by juvénile and adult S. officinalis.Assimilation efficiencies were as high as 60 % for both âge
groups, and the proportion of l09Cd body burden reached
90% in the digestive gland after 29 days of loss. Our resultsclearly demonstrate that food is the major route of Cd bio¬
accumulation in the cephalopod S. officinalis. Whatever the
source of Cd (water or food), the digestive gland is the pri¬
mary organ that accumulâtes Cd. This form of métal storage
may be related to the detoxification function of the digestivegland (e.g., métal trapping by metalloproteins) and couldexplain why Cd reaches extremely high concentrations inthis organ.
Keywords: Radionuclide Bioaccumulation CadmiumCéphalopode Radiotracer.
Ali Temara: "Heavy metals in the sea star Asterias Rubens(echinodermata): basis for the construction of an efficientbiomonitoring program"
Asterias rubens has been considered as a useful bioindicatorof heavy métal contamination by various teams around the
NE Atlantic. However, a sound sampling strategy based
upon the actual parameters that affect uptake and loss kine¬
tics of heavy metals by asteroids has not yet been designed.
The most critical factor that accounts for heavy métal
Abstracts T 515
concentration variability in A. rubens living either in back¬
ground environments or exposed to a métal source is the
body compartment. The main route of Cd and Pb uptake,
either directly from the water or indirectly through the diet,appears to be the digestive wall; though transfers to othercompartments including the body wall and the gonads hâve
been quantified. At steady state, there is a simple relation¬
ship between Cd and Pb concentrations in the body and
concentrations in the environment (water column or sédi¬
ments, as observed in the laboratory or in the field).Asteroids hâve developed efficient detoxification mecha¬
nisms (including constitutive or inducible metallothioneins,incorporation of heavy metals into the skeleton) and thus are
able to settle and survive in highly impacted environments.According to its ecotoxicological features (ubiquity, tempo¬
ral and geographical stability, abundance, sampling easiness,
size, affinity for and sensitivity to heavy metals, présence inpolluted zones), A. rubens qualifies as a valuable bioindica¬tor of heavy métal contamination. A sampling strategy and
critical values, developed in accordance with the biology ofthe asteroid and biokinetics of heavy metals described in A.
rubens, are proposed to assist ecotoxicological risk assess¬
ment in marine environments.
Keywords: Radionuclide Asterias rubens BioindicatorHeavy Metals Detoxification Echinoderms.
Pedro Rivas Romero: "Radioactive waste management: the rôleof CIEMAT in the Spanish and European R+TD programs forradwaste disposai"
The Spanish concept for RADWASTE disposai is based on
a multibarrier confinement system that can be applied to dif¬
férent host rocks acting as final barrier against radionuclidemovement. Such Systems require a detailed characterisationof each barrier subsystem to know the potential transferenceof radioisotopes from the spent fuel towards the environ¬
ment. From this starting point CIEMAT is involved in pro¬
viding scientific support to the research projects undertaken
in the frameworks of ENRESA (Spain) and EU R+TD pro¬
grams for RADWASTE management. With this purposeClEMAT's research groups focus their investigations in the
516V Environmental Changes and Radioactive Tracers
more relevant fields for the safety of a repository in deep
geological formations. The main research lines cover the
behaviour of engineered barrier sealing materials, the hydro¬
geochemical characterisation of geological formations and
studies of radionuclide retardation processes in the forma¬
tions considered. There is also a research line for the study
of natural analogues, to validate the results obtained in other
research lines. The studies of naturally occurring radionu¬
clides (U séries, Tritium or l4C) as well as artificial radionu¬
clides or their chemical analogues are used to ascertain the
rôle played by the main transport mechanisms characteristicof each type of formation. Advective processes are studied
in crystalline formations (El Berrocal, ASPÔ or HIDRO-CAR Projects). Diffusive phenomena are being studied, both
in laboratory and "in situ", in projects where clay backfillmaterials are involved (FEBEX-I, RESEAL) or clay forma¬
tions are regarded as potential host rocks (Mt Terri, MARProjects). Natural analogues (MATRIX, OKLO and PAL¬
MOTTU projects) are employed to evaluate the évolution ofnatural radionuclides in several scénarios (redox fronts,meteoric weathering, etc..) at a geological time scale.
Keywords: Radionuclide Rradioactive waste Management.
John R. Harris: "Radionuclide migration in arid soils"
For a near-surface repository in an arid climate, the unsatu-
rated zone is an important barrier to the release of radionu¬
clides to the environment. The rate of migration ofradionuclides dépends on the water velocity and the retarda¬
tion of the radionuclides with respect to water flow. This
paper outlines expérimental studies ofthe radionuclide retar¬
dation properties of soil and regolith samples from the
région being investigated for the Australian repository.Retardation was measured using both batch sorption experi¬
ments (high liquid-to-solid ratio) and column experiments(low liquid-to-solid ratio). The use of radionuclides in thèse
experiments enabled sorption and migration properties to be
measured at trace concentrations. Batch sorption measure¬
ments using I37Cs and 238U were undertaken over a range ofpH, ionic strength and radionuclide concentrations. The
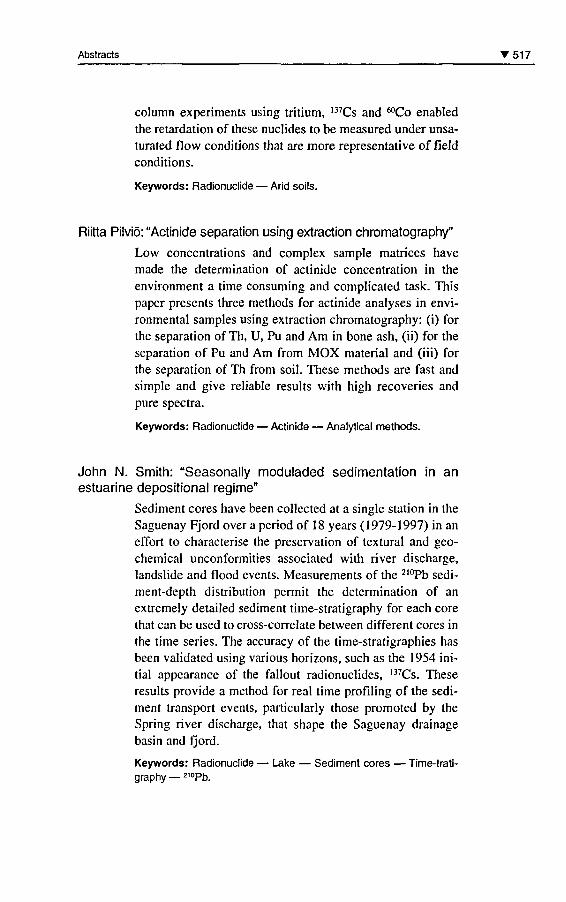
Abstracts V517
column experiments using tritium, 137Cs and MCo enabled
the retardation of thèse nuclides to be measured under unsa-turated flow conditions that are more représentative of fieldconditions.
Keywords: Radionuclide Arid soils.
Riitta Pilviô: "Actinide séparation using extraction chromatography"
Low concentrations and complex sample matrices hâve
made the détermination of actinide concentration in the
environment a time consuming and complicated task. Thispaper présents three methods for actinide analyses in envi¬
ronmental samples using extraction chromatography: (i) forthe séparation of Th, U, Pu and Am in bone ash, (ii) for the
séparation of Pu and Am from MOX material and (iii) forthe séparation of Th from soil. Thèse methods are fast and
simple and give reliable results with high recoveries and
pure spectra.
Keywords: Radionuclide Actinide Analytical methods.
John N. Smith: "Seasonally moduladed sédimentation in anestuarine depositional régime"
Sédiment cores hâve been collected at a single station in the
Saguenay Fjord over a period of 18 years (1979-1997) in an
effort to characterise the préservation of textural and geo¬
chemical unconformities associated with river discharge,landslide and flood events. Measurements of the 210Pb sedi¬
ment-depth distribution permit the détermination of an
extremely detailed sédiment time-stratigraphy for each corethat can be used to cross-correlate between différent cores inthe time séries. The accuracy of the time-stratigraphies has
been validated using various horizons, such as the 1954 ini¬
tial appearance of the fallout radionuclides, l37Cs. Thèse
results provide a method for real time profiling of the sédi¬
ment transport events, particularly those promoted by the
Spring river discharge, that shape the Saguenay drainagebasin and fjord.
Keywords: Radionuclide Lake Sédiment cores Time-trati-graphy 2,0Pb.
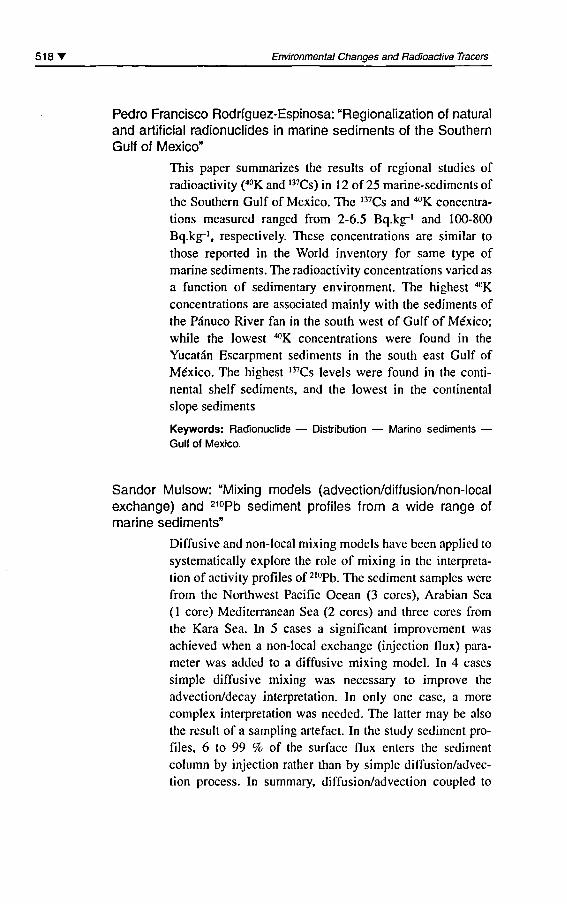
518 V Environmental Changes and Radioactive Tracers
Pedro Francisco Rodriguez-Espinosa: "Regionalization of naturaland artificial radionuclides in marine sédiments of the SouthernGulf of Mexico"
This paper summarizes the results of régional studies ofradioactivity (""K and 137Cs) in 12 of 25 marine-sediments ofthe Southern Gulf of Mexico. The ,37Cs and "°K concentra¬
tions measured ranged from 2-6.5 Bq.kg-1 and 100-800
Bq.kg-1, respectively. Thèse concentrations are similar to
those reported in the World inventory for same type ofmarine sédiments. The radioactivity concentrations varied as
a function of sedimentary environment. The highest 4"K
concentrations are associated mainly with the sédiments ofthe Panuco River fan in the south west of Gulf of Mexico;while the lowest ""K concentrations were found in the
Yucatan Escarpment sédiments in the south east Gulf ofMexico. The highest l37Cs levels were found in the conti¬
nental shelf sédiments, and the lowest in the continentalslope sédiments
Keywords: Radionuclide Distribution Marine sédimentsGulf of Mexico.
Sandor Mulsow: "Mixing models (advection/diffusion/non-localexchange) and 210Pb sédiment profiles from a wide range ofmarine sédiments"
Diffusive and non-local mixing models hâve been applied to
systematically explore the rôle of mixing in the interpréta¬
tion of activity profiles of 210Pb. The sédiment samples were
from the Northwest Pacific Océan (3 cores), Arabian Sea
(1 core) Mediterranean Sea (2 cores) and three cores fromthe Kara Sea. In 5 cases a significant improvement was
achieved when a non-local exchange (injection flux) para¬
meter was added to a diffusive mixing model. In 4 cases
simple diffusive mixing was necessary to improve the
advection/decay interprétation. In only one case, a more
complex interprétation was needed. The latter may be also
the resuit of a sampling artefact. In the study sédiment pro¬
files, 6 to 99 % of the surface flux enters the sédiment
column by injection rather than by simple diffusion/advec-tion process. In summary, diffusion/advection coupled to
Abstracts V519
non-local mixing processes appears to be more common inmarine sédiments, thus complicating and stressing the use of210Pb radiotracer as a geochronological tool. The systematicexploration of mixing models in the interprétation of radio¬
tracer profiles should be a prerequisite to study accumula¬
tion rates in marine sédiments. Ancillary parameters such as
porosity gradients are useful techniques to rule out samplingartefacts from real variations on radiotracer activity profilesin sédiments
Keywords: Radionuclide Marine sédiments Cores Mixingmodels 2,0Pb.
Jean-Michel Fernandez: "Advantages of combining 210Pb
and geochemical signature déterminations in sédiment recordstudies; application to coral reef lagoon environments"
Human activities hâve impacted our natural environment,especially since the middle ofthe 19th century. The memoryof past environmental conditions is partly recorded in the
layers of the sédiment réservoirs of lakes and seas.
Geochemical approaches applied to sédiment cores can pro¬
vide information on past changes in heavy métal concentra¬
tions and other environmental tracers that are indicative ofspécifie environmental modifications. However, thèse stu¬
dies cannot be self-supported and hâve to be combined withdating techniques such as the 2,"Pb method. In the présentpaper we provide several application examples from coralreef environments that illustrate différent cases. Sédimentcores were sampled in the lagoons of New-Caledonia and
Fiji which differ in their, geological, morphological and
environmental contexts. Each core, représentative of a parti¬
cular set of environmental conditions, has been studied interms of heavy métal concentration (sequential extractions)and 210Pb unsupported radioactivity. 2,"Pb data allowed the
impact of real human activities to be distinguished from phe¬
nomena due to natural occurrences (e.g. slumps) and defi-ciency in sampling techniques. Although relatively distantfrom the main terrigeneous sources (La Coulée & Les
Pirogues rivers), Sainte-Marie Bay still proves to be stronglyinfluenced by past mining activities. In Laucala Bay (Fiji),
520 V Environmental Changes and Radioactive Tracers
the results showed that the inputs of terrigeneous particulatematter originating from the Rewa river remained high and
constant over time, resulting in an extremely Iimited biotur¬
bation layer. In contrast, profiles from a submarine valley inthe middle lagoon of New Caledonia and from Suva
Harbour in Fiji displayed anomalies that can be attributed totwo différent type of phenomena: natural occurrence ofslumps in the valley and sampling artefact in Suva Harbour.
Keywords: Radionuclide Marine sédiments Cores Coralreef lagons 210Pb.
Sitaram Garimella: "Concentrations of heavy metals and traceéléments in the marine sédiments of the Suva Lagoon, Fiji"
Sédiment samples from 30 sites in the Suva lagoon were col¬
lected and their elemental abundances analysed by the tech¬
nique of instrumental neutron activation. The sédiment
samples were irradiated for 4 h at a thermal neutron flux of4xl012 n.s'.cm2 in a nuclear reactor in Australia. Five days
later, the samples were flown back to Fiji for analysis using a
HPGe gamma-ray spectrometer ofthe Department of Physics.
From the above measurements, concentrations of two majoréléments (Na and Fe) and 23 trace éléments (As, Br, Ce, Co,
Cr, Cs, Eu, Hf, Hg, La, Mo, Nd, Rb, Sb, Se, Sm, Sr, Ta, Tb,Th, Yb, Zn and Zr) were determined in the above sédiments.
Concentrations of several éléments at most sites were higherthan the EPA (Environmental Protection Agency) limits.
Keywords: Radionuclide Heavy metals Neutron activationMarine sédiments Coral reef lagon.
Hervé Michel: "Comparaison of 210Pb chronology with 23a.239-24opu>
241Am and 137Cs sedimentary record capacity in a lake system"
238Pu, 239-240Pu, and 24lAm were measured, by counting afterradiochemical séparation, in two lake sédiment cores. The
profiles of thèse transuranics were compared to those ofthefission product ,37Cs and natural radionuclide 2l0Pb. Datationof nuclear events and data on behaviour of the studied élé¬
ments were deduced.
Keywords: Radionuclide Lake Time stratigraphy.
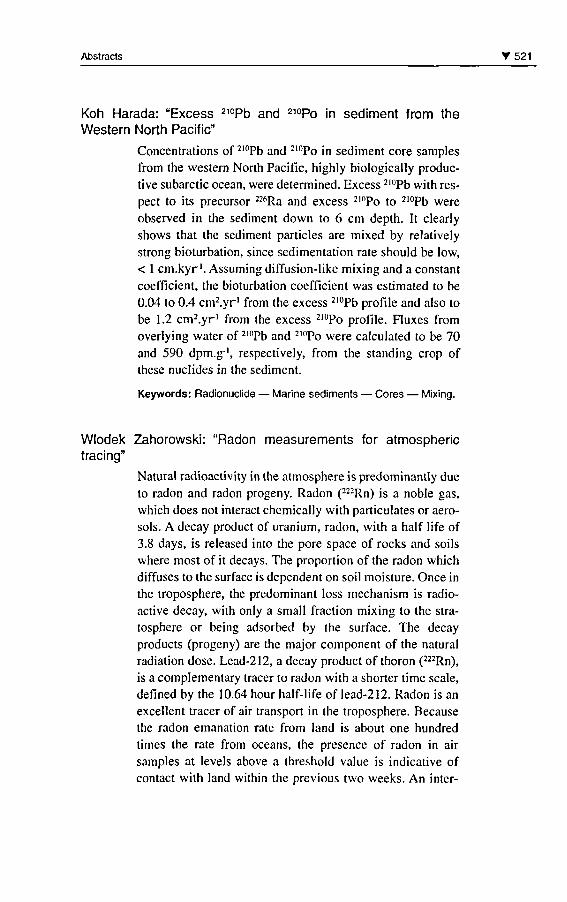
Abstracts V 521
Koh Harada: "Excess 210Pb and 210Po in sédiment from theWestern North Pacific"
Concentrations of 210Pb and 210Po in sédiment core samples
from the western North Pacific, highly biologically produc¬
tive subarctic océan, were determined. Excess 2I(,Pb with res¬
pect to its precursor 226Ra and excess 2l0Po to 210Pb were
observed in the sédiment down to 6 cm depth. It clearlyshows that the sédiment particles are mixed by relativelystrong bioturbation, since sédimentation rate should be low,< 1 cm.kyr1. Assuming diffusion-like mixing and a constantcoefficient, the bioturbation coefficient was estimated to be
0.04 to 0.4 cm2.yr' from the excess 210Pb profile and also tobe 1.2 cm2.yr' from the excess 210Po profile. Fluxes fromoverlying water of 2l0Pb and 2,0Po were calculated to be 70and 590 dpm.g1, respectively, from the standing crop ofthèse nuclides in the sédiment.
Keywords: Radionuclide Marine sédiments Cores Mixing.
Wlodek Zahorowski: "Radon measurements for atmospherictracing"
Natural radioactivity in the atmosphère is predominantly due
to radon and radon progeny. Radon (222Rn) is a noble gas,
which does not interact chemically with particulates or aéro¬
sols. A decay product of uranium, radon, with a half life of3.8 days, is released into the pore space of rocks and soilswhere most of it decays. The proportion of the radon whichdiffuses to the surface is dépendent on soil moisture. Once inthe troposphère, the prédominant loss mechanism is radio¬
active decay, with only a small fraction mixing to the stra¬
tosphère or being adsorbed by the surface. The decay
products (progeny) are the major component of the naturalradiation dose. Lead-212, a decay product of thoron (222Rn),
is a complementary tracer to radon with a shorter time scale,
defined by the 10.64 hour half-life of lead-212. Radon is an
excellent tracer of air transport in the troposphère. Because
the radon émanation rate from land is about one hundred
times the rate from océans, the présence of radon in airsamples at levels above a threshold value is indicative ofcontact with land within the previous two weeks. An inter-
522 V Environmental Changes and Radioactive Tracers
national network of baseline monitoring stations has been
established to record the concentration of climate-sensitivegases far away from their sources. An air sample that has notbeen perturbed by récent passage over land is consideredbaseline and the lack of radon is a direct indication that an
air sample has not recently travelled over land. ANSTO has
extensive expérience in the measurement of radon and tho¬
ron in the atmosphère. Radon concentration in baseline aircan be as low as a few radon atoms per litre of air. Thismakes the task of measuring radon levels with a time reso¬
lution matching prevailing weather conditions a demandingtask. Radon measuring techniques and instrumentationdeveloped for radiation protection are inadéquate for the cli¬
mate research. ANSTO has developed new radon detectorswith the sensitivity and ruggedness required for climateresearch. In thèse detectors, the function of supplying filte¬
red air to the detector is separated from the function of deli-vering air to the collecting wire screen used for plating-outthe radon progeny. The high diffusivity of radon progenymakes it possible to use a wire screen to remove the progenywith high efficiency and very low flow impédance. The pré¬
sent detectors can measure radon concentration in baseline
air down to 10 mBq.m3 with a time resolution of less than 1
hour. Thèse detectors hâve been installed at several atmos¬
pheric baseline stations and will be used in the internationalAérosol Characterisation Experiment (ACE-Asia) in East
Asia and the Northern Pacific. Radon is a better indicator ofbaseline air than other parameters commonly used for the
same purpose, such as condensation nuclei, wind directionand speed. The application of radon as a criterion for base¬
line air generally improves the quality of trace gases data
attributed to baseline conditions. Measurement of both
radon and 2l2Pb at the Mauna Loa Observatory in Hawaiiwas able to quantify the degree of contact of the air parcelswith local (Hawaiian) land. A local knowledge of radon and
thoron flux in the vicinity of a baseline station can be impor¬tant. Low level thoron flux measurements led to an évalua¬
tion of the thoron source term from barren lava around the
Mauna Loa Observatory in Hawaii. A thoron emanometerspecifically assembled for the survey achieved a lower limitof détection of 1 mBq.m2.s''. Radon transport can be simu-
Abstracts V 523
lated by gênerai circulation models by implementing the
parameterisation for passive tracers. Such a procédure can
be used for calibrating and verifying the transport compo¬
nent of the model, as well as providing a better understan¬
ding ofthe atmospheric features that control the distributionof radon. With the lack of radon émanation data, it is com-monly assumed that the radon production term is constant on
the global scale, which is clearly a poor approximation toreality. Good quality data regarding the radon flux is requi¬
red. ANSTO has developed expérimental methods for mea¬
suring radon and thoron flux émanation in the context ofclimate research. The spot flux measurements hâve been
combined with data from airborne gamma surveys toconstruct a self-consistent map of radon flux from 5° X 4°grid boxes over Australia. Even on such a scale, the radon
flux estimate vary by more than one order of magnitudefrom one grid box to another.
Keywords: Radionuclide Radon Atmosphère Climate.
Gilbert Le Petit: "Trace éléments in total atmospheric suspendedparticules in a suburban area of Paris: a study carried out byINAA"
The atmospheric particulate matter of industrialised citieshâve become a mixture of potentially basic substances
whose concentration hâve to be monitored to assess the pol¬
lution levels. Anthropogenic éléments, particularly trace
métal, are part of thèse pollutants and the knowledge of theirtotal concentration in the air is necessary to evaluate the pol¬
lution risk in term of maximum levels and long term expo¬
sure. In the présent work a preliminary study initiated formonitoring the trace élément levels présent in total atmos¬
pheric suspended particles (TSP) of the suburban areas ofParis in France is presented. More than 30 éléments hâve
been determined using a high volume air sampler, about600 m3.h"', installed near a busy highway and equipped withlarge filters for weekly collection of atmospheric aérosols.
The study covers a period of a whole year (1998) and diffé¬
rent weather conditions. Instrumental Neutron ActivationAnalysis (INAA) from the OS1RIS research reactor (neutron
524 V Environmental Changes and Radioactive Tracers
flux: 1.2xI014 n.s'.cnr2) at the Commissariat à 1' Energie
Atomique, Saclay centre, has been used for the détermina¬
tion of the great part of élément whereas ICP-MS has been
employed for détermination of lead. The reliability of ourINAA methodology was demonstrated using a standard
internai référence. Enrichment factors were used to investi-gate trends, émission sources. Evolution in time of stable
élément concentrations and possible origin of certain pollu¬
tion sources, has been investigated.
Keywords: Radionuclide Trace éléments Neutron activationAtmosphère Particles.
Ann Henderson-Sellers: "Assessing soil moisture in globalclimate models: is radon a possible vérification tool?"
A noble gas with a half life of 3.8 days, radon has been
used successfully in many atmospheric tracer studies.
Radon is generated in soil by the radioactive decay ofradium and escapes by diffusion through soil pores and
plant transpiration. Emanation rates are a function of soil
température, soil porosity, depth of soil, soil moisture and
the underlying geology. It is proposed hère that radon data
be investigated as a possible source of information about
large-scale soil moisture: a quantity important for globalclimate model vérification and difficult to measure by
other means. Measurements of radon flux at seventy eightsites in Australia, thee hundred and twenty five sites inFlorida and forty two Hawaiian sites hâve generated
expressions relating radon émanation rates to soil mois¬
ture. It is both feasible and potentially valuable to exploitthis relationship in a new Global Climate Model (GCM)intercomparison. We propose that a new ExperimentSubproject of the Atmospheric Model IntercomparisonProject (AMIP) II programme be created in which the 222Rn
source strength is a function of model-simulated soil mois¬
ture. Hypothèses to be examined include (i) does the addi¬
tion of a functional dependence of radon émanation on soil
moisture improve the fit of predicted near-surface 222Rn to
observations; (ii) does the addition of a functional depen¬
dence of radon émanation on soil moisture improve the fit
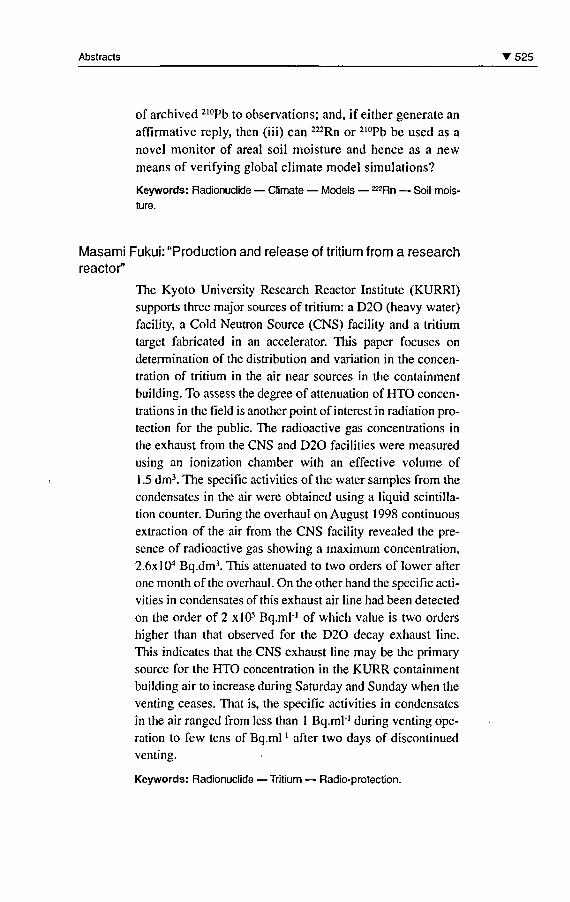
Abstracts V 525
of archived 210Pb to observations; and, if either generate an
affirmative reply, then (iii) can 222Rn or 210Pb be used as a
novel monitor of areal soil moisture and hence as a new
means of verifying global climate model simulations?
Keywords: Radionuclide Climate Models ^Rn Soil mois¬
ture.
Masami Fukui: "Production and release of tritium from a researchreactor"
The Kyoto University Research Reactor Institute (KURRI)supports three major sources of tritium: a D20 (heavy water)facility, a Cold Neutron Source (CNS) facility and a tritiumtarget fabricated in an accelerator. This paper focuses on
détermination ofthe distribution and variation in the concen¬
tration of tritium in the air near sources in the containmentbuilding. To assess the degree of atténuation of HTO concen¬
trations in the field is another point of interest in radiation pro¬
tection for the public. The radioactive gas concentrations in
the exhaust from the CNS and D20 facilities were measured
using an ionization chamber with an effective volume of1 .5 dm3. The spécifie activities of the water samples from the
condensâtes in the air were obtained using a liquid scintilla¬
tion counter. During the overhaul on August 1998 continuous
extraction of the air from the CNS facility revealed the pré¬
sence of radioactive gas showing a maximum concentration,
2.6X10⁴ Bq.dm3. This attenuated to two orders of lower afterone month ofthe overhaul. On the other hand the spécifie acti¬
vities in condensâtes of this exhaust air line had been detected
on the order of 2 xlO5 Bq.ml'1 of which value is two orders
higher than that observed for the D20 decay exhaust line.This indicates that the CNS exhaust line may be the primarysource for the HTO concentration in the KURR containmentbuilding air to increase during Saturday and Sunday when the
venting ceases. That is, the spécifie activities in condensâtes
in the air ranged from less than 1 Bq.ml"1 during venting ope-
ration to few tens of Bq.mf1 after two days of discontinuedventing.
Keywords: Radionuclide Tritium Radio-protection.
526 V Environmental Changes and Radioactive Tracers
Valentin N. Golosov: "Application of Chernobyl-derived 137Cs forassessment of soil redistribution in agricultural catchments ofCentral Russia"
Vast areas of Russian Plain were contaminated by radionu¬
clides after Chernobyl Power Station explosion. Because
more than 99 % of radionuclides fall on the ground duringvery short period of time, the layer with contaminants can
serve as a marker for assessment of soil and sédiment redis¬
tribution for period from May 1986. Détail study of érosionand déposition rates within 4 agricultural catchments withdifférent slope configuration were made in the Lokna riverbasin, Tula région, Central .Russia. Initial fallout inventorywithin the Lokna river basin was more than 200 kBq.m2.
Both grid and transect sampling procédures were applied forcollection of samples for laboratory analysis of gamma-spectrometry. In addition in situ measurement of 137Cs
inventories were made. Results of assessment demonstrate
that 137Cs technique can be used for assessment of soil redis¬
tribution in areas affected by Chernobyl contamination. Twoapproaches can be applied. First is the use of proportionaland mass-balance model"1 for assessment of soil redistribu¬tion for each site. Second is the calculation ofthe 137Cs bud¬
get for the cultivated areas and adjacent area of dépositionwithin dry creek valley. Independent calculation of soil éro¬
sion rates for each site were made using modified version ofUSLE and State Hydrological Institute model. Results ofassessment of érosion rates using différent approaches
demonstrate that proportional and mass-balance calibrationmodels can be applied for sites with érosion rates 20 kg perm2 and more because only 13 years hâve passed from the
Chernobyl explosion. 137Cs budget approach are more usefulfor areas with low érosion rates. The détail study of déposi¬
tion area should be done in the latter case.
Keywords: Radionuclide 137Cs Chernobyl ContaminationSoil transport Modelling.
Abstracts V 527
Paulina Schuller: "Use of 137Cs to estimate rates and patterns ofsoil redistribution on agricultural land in Central-South Chile:models and validation"
The objective ofthe présent study was to evaluate the appli-cability of a conventional and a simplified technique to esti¬
mate rates and patterns of soil redistribution on agriculturalland in Central-South Chile. Four fields of Palehumult soilshowing contrasting land use and management were selectedin the Coastal Mountain Range (38° 40'S, 72° SO'W): cropfields and semi-permanent grasslands, both under subsis¬
tence and commercial management. A software was desi¬
gned to estimate the amounts and spatial distribution of the
soil érosion and sédimentation based on existing models.The rates and patterns of soil redistribution estimated by a
l37Cs inventory évaluation of individual samples collected ina grid pattern were very similar to the ones obtained by an
inventory évaluation in composed samples taken at constant-élévation transects. The second method is suitable for givingassessment on soil loss and sédiment accumulation in areas
exhibiting simple topography, showing almost similar slopes
at constant-altitude transects. It reduces considerably the
measuring time and the costs ofthe soil redistribution quan¬
tification. The results obtained using both methods were inaccordance with the local annual sédiment loss measured inérosion plots and with the pattern of soil redistribution rates
estimated by pedological observations. The I37Cs techniqueis seen as an efficient method to obtain long-term soil redis¬
tribution rates under the climatic conditions and the soil typeselected in Chile. In order to optimise the costs and benefitsofthe 137Cs technique, the sampling and inventory quantifi¬cation strategy must be selected according to the resolutionof the required information, and extension and complexityof the landscape relief.
Keywords: Radionuclide 137Cs Chile Soil transportModelling.
528 V Environmental Changes and Radioactive Tracers
François Brechignac: "Soil-radionuclides interaction and subsé¬quent impact on the contamination of plant food products basedon a simulated accidentai source"
The PEACE* European Programme has studied the consé¬
quences on the agricultural environment of the atmospheric
release of radio-contaminants which would occur in case of a
severe accident in a PWR nuclear reactor. Beyond the quanti¬
fication of traditional radioecological features (transfer fac¬
tors), this programme has looked for a better understanding ofthe mechanisms which govern the kinetic behaviour of l37Cs
and '"Sr in soils, and their transfer to plants, in view of impro¬
ving the accuracy of assessment model prédictions. A mecha-
nistic modelling of migration and root absorption has been
confronted to the results of original experiments undertaken inthe unique IPSN facility designed for simulating a radioactivecontamination in controlled conditions and following it up
during several years. Contamination in ^Sr of ail investigated
plants by root uptake exceeds that of 137Cs, with variationswhich cannot be accounted for based on the physico-chemicalproperties of the soils solid matrix only. The complex and
essential rôle of the soil solution has been identified. As an
interface compartment, its composition results from the
double interaction with the soil solid matrix, in the one hand,
and the root absorbing surfaces, in the other hand. It is throughtheir effects on the soil solution chemical composition (com¬
pétitive ions K, Ca and Mg, in particular) that parameters such
as soil type, agricultural practices, time and climatic condi¬
tions, promote a variability of the radionuclides transfer fac¬
tors. Vertical migration is reduced in minerai agriculturalsoils. Profiles are established early on after the contaminationevent (less than one month) suggesting the importance of the
initial soil moisture and the first rains. Furthermore, they
remain similar on ail the studied soils, without a clear diffe¬
rentiation between 137Cs and '"Sr despite their quite distinctrespective KD values. Reliable prédictions, therefore, cannot
be achieved from a soil description reduced to the only classi¬
cal KD concept.(* PEACE: Programme for Evaluating the impact of AccidentsContaminating the Environment).
Keywords: Radionuclide Soil Plant 137Cs ContaminationModelling ^Sr.
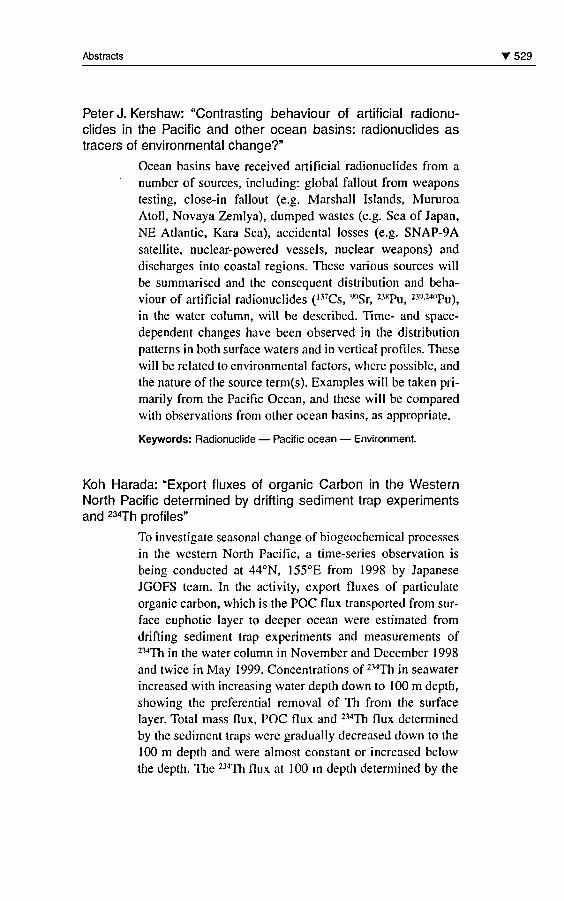
Abstracts V 529
Peter J. Kershaw: "Contrasting behaviour of artificial radionu¬clides in the Pacific and other océan basins: radionuclides astracers of environmental change?"
Océan basins hâve received artificial radionuclides from a
number of sources, including: global fallout from weapons
testing, close-in fallout (e.g. Marshall Islands, MururoaAtoll, Novaya Zemlya), dumped wastes (e.g. Sea of Japan,
NE Atlantic, Kara Sea), accidentai losses (e.g. SNAP-9Asatellite, nuclear-powered vessels, nuclear weapons) and
discharges into coastal régions. Thèse various sources willbe summarised and the conséquent distribution and beha¬
viour of artificial radionuclides (137Cs, 9()Sr, 238Pu, "^"Pu),in the water column, will be described. Time- and space-
dependent changes hâve been observed in the distributionpatterns in both surface waters and in vertical profiles. Thèsewill be related to environmental factors, where possible, and
the nature of the source term(s). Examples will be taken pri-marily from the Pacific Océan, and thèse will be comparedwith observations from other océan basins, as appropriate.
Keywords: Radionuclide Pacific océan Environment.
Koh Harada: "Export fluxes of organic Carbon in the WesternNorth Pacific determined by drifting sédiment trap experimentsand 234Th profiles"
To investigate seasonal change of biogeochemical processes
in the western North Pacific, a time-series observation is
being conducted at 44°N, 155°E from 1998 by Japanese
JGOFS team. In the activity, export fluxes of particulateorganic carbon, which is the POC flux transported from sur¬
face euphotic layer to deeper océan were estimated fromdrifting sédiment trap experiments and measurements of234Th in the water column in November and December 1998
and twice in May 1999. Concentrations of 234Th in seawater
increased with increasing water depth down to 100 m depth,showing the preferential removal of Th from the surfacelayer. Total mass flux, POC flux and 214Th flux determinedby the sédiment traps were gradually decreased down to the
100 m depth and were almost constant or increased belowthe depth. The 234Th flux at 100 m depth determined by the
530 V Environmental Changes and Radioactive Tracers
sédiment trap were about 30 % smaller than the flux estima¬
ted from the water column profiles of 234Th. This suggested
that collection of particulate materials by the sédiment trap
was not quantitative. Therefore, the export flux of POC was
estimated from the 234Th flux from the water column profileand the POC/234Th ratio in the settling particle to be 6.6, 5.5
and 9.2 mmol.m^.day1, respectively in November,December 1998 and May 1999.
Keywords: Radionuclide Pacific océan Sédiment trap234Th Organic carbon.
Gillian Peck: "Uranium decay séries radionuclides in the WesternEquatorial Pacific Océan and their use in estimating poc fluxes"
The uranium decay séries radionuclides, 226Ra, 210Pb and
2l0Po were measured in dissolved phase (< 0.45 mm) and
2l0Pb and 210Po in the particulate phase (> 0.45 mm), in the
upper 300 m of the Bismarck Sea and the western equatorialPacific Océan, along the equator from 143°E to 152°E. Boxmodel calculations were then used to estimate the flux ofparticulate 2l(,Po and 21cPb from the upper layers of the
océan. The downward flux of particulate organic carbon was
then estimated using the flux of particulate 210Po and the
ratio of FOCPw?o in each layer.The downward flux of particulate organic carbon was calcu¬
lated to be 104 mg.nrld'1 from the upper 100 m and 180
mg.m"2.d_1 from the 100-300 m layer of the WesternEquatorial Pacific Océan and Bismarck Sea.
Keywords: Radionuclide Pacific océan Uranium ParticuleFlux Organic carbon.
Dejanira C. Lauria: "Origin and transport of radium in the watercolumn of Buena coastal lagoon"
The origin and transport of radium in the surface water of a
coastal lagoon was studied. The water analysis showed a
decrease in the radium concentration, and an increase ofthepH and salinity in the seaward direction The gradient of the
radium concentration along the lagoon pointed to the source
of radium in the lagoon water, leading to the discovery of
Abstracts V 531
spring waters located at the less brackish zone of the lagoon.The groundwater supplies the Ra isotopes, probably frommonazite leaching, while the seawater supplies major ions.Both of ion sources are located in opposite sides of the
lagoon. From the 228Ra/226Ra concentration ratios, a radiummigration velocity of around 300 m/years along the lagoon'sfirst 1 .9 km was estimated. The high salinity of the waterseems to play an important rôle for the long résidence timeof radium in the waters of the Buena lagoon. The totalamount of 228Ra and 226Ra in the water column was estima¬
ted as 40 MBq and 20 MBq respectively
Keywords: Radionuclide Lagoon Radium Résidence time.
C. Alonso Hernândez: "Hydric resources radioactive contamina¬tion in the central région of Cuba as a conséquence of falloutafter the atmospheric nuclear bombs tests"
The 137Cs activity levels determined in atmospheric and
hydric samples, collected in Cienfuegos province (Central-South région ofthe country), during five years (1994-1998)are presented. Some graphies of the 137Cs behavior in the
period of study are shown, as well as some considérationsabout their transference processes throughout some environ-mental components are explained. It has been concluded thatour hydrological resources hâve been contaminated bynuclear fission products coming from the past nuclearbombs tests by means of Global Fallout.
Keywords: Radionuclide Cuba Freshwater Atmosphère137Cs.
Achevé d'imprimer en février 2002
Imprimé par l'atelier de reprographie
du Centre IRD de Nouméa
Dépôt légal : février 2002
"nsto
Radionuclide - radioactivity - Iracers - environment - atmosphere -water - sediment - biology - soil - waste. J
SPERA 2000 forming the 6th biennial Conference from the SouthPacific Environmental Radioactivity Association (SPERA) wasorganised at the Institut de recherche pour le développement(1 RD) in Noumea, New Caledonia on the 19th to 23rd of June2000. The contributions to this conference which focused on"Environmental Changes and Radioactive Tracers" are gathered inthe present publication. For several decades, naturally occurringradionuclides have been studied primarily to assess their distributions in the environment but also to understand the dynamic processes that controllheir behaviour. More recently, injection of bothnatural and artificial radionuclides due to human activltles haveprovided new tools for the study of environmental processes atlocal, regional and global scales. The most recent environmentalradionuclide studies using both natural and artiücial emitlers invarious research fields were presented during SPERA 2000. TheConference included 6 sessions covering atmospheric, water,sediment, soils, waste disposai and biological radionuclides inaddition to a workshop on "Radiological techniques in sedimentation studies: Methods and applications".
Le congrès SPERA 2000, qui constituait la Vie conférence de laSouth Pacific Environmental Radioactivity Association (SPERA),s'est tenu à l'Institut de recherche pour le développement (IRD) àNouméa, Nouvelle-Calédonie , du 19 au 23 juin 2000. Cel ouvragerassemble les contributions à ce congrès ayant pour thème centrai " Modifications environnementales etlraceurs radioactifs » , LeSPERA 2000 a permis de présenter les travaux les plus récentssur l'étude des radionucléides artificiels et naturels dans différentschamps d'investigation des sciences de l'environnement. Laconférence rassemblait 6 sessions liées à l'étude des compartiments atmosphérique, aquatique, biologique ou sédimentaire, outraitant des problèmes d'érosion des sols ou de stockage desdéchets ainsi qu'une table ronde dédiée à " L'apport des techniquesradiologiques dans les études sédimentaires : méthodes et applications » .
Radionucléide - radioactivité - traceurs - environnementatmosphère - eau - sédiment - biologie - sol - déchets.
182709 914932
Related Documents