Slide 1 Randolph E. Kirchain 1 , Elsa A. Olivetti 1 , Melissa L. Zgola 1 , Christopher Weber 2 , Sarah Boyd 3 , Ramzy Kahhat 4 , Eric Williams 4 1 Massachusetts Institute of Technology, 2 Carnegie Mellon University, 3 University of California at Berkeley and 4 Arizona State University Environmental Assessment of IT Products Development of the PAIA Tool

Welcome message from author
This document is posted to help you gain knowledge. Please leave a comment to let me know what you think about it! Share it to your friends and learn new things together.
Transcript

Slide 1
Randolph E. Kirchain1, Elsa A. Olivetti1, Melissa L. Zgola1,
Christopher Weber2, Sarah Boyd3, Ramzy Kahhat4, Eric Williams4
1Massachusetts Institute of Technology, 2Carnegie Mellon University, 3University of California at Berkeley and 4Arizona State University
Environmental Assessment of IT ProductsDevelopment of the PAIA Tool

Slide 4Slide 4
Meeting the Need of ICT for QuantificationIdentifying the Challenges
• Data availability
– Process Data
• Specialized materials and processes
• Depth / dynamics of the supply chain
– Product Data
• Number / diversity of products
• Complexity and dynamics of product
• "Distance" between designer and impact
• Cost / Speed• Data collection and analysis
• Action-ability• Relating design and operations decisions to
product impact
• Credibility• Significant uncertainty exists in estimates; must
be acknowledged and accommodated
Clear need: Efficient &
effective
approach
to LCA
Slide 5Slide 5
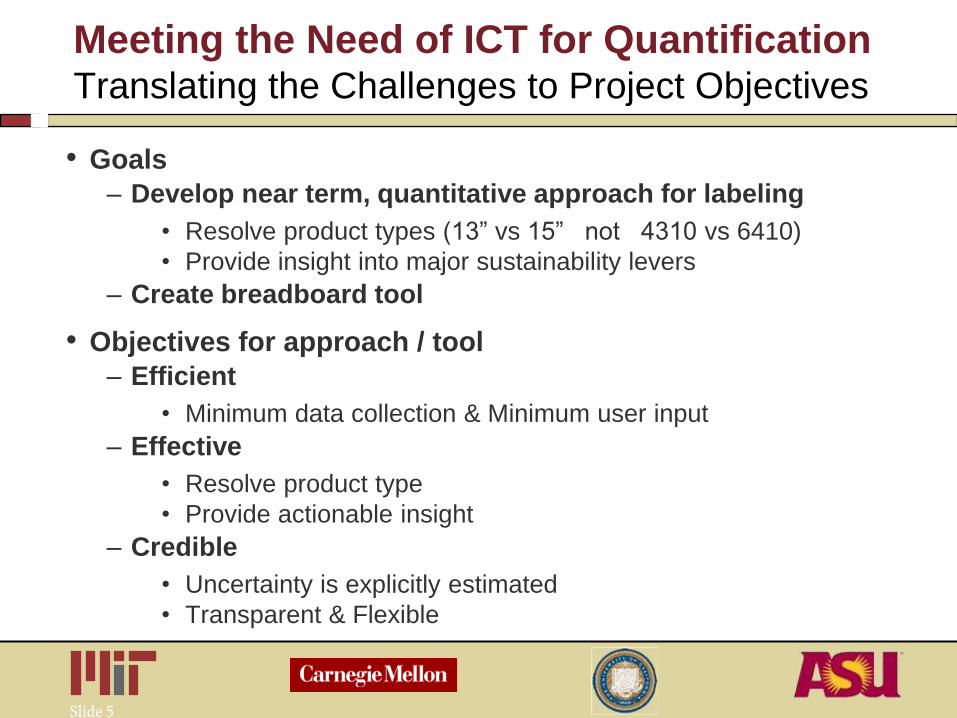
Meeting the Need of ICT for QuantificationTranslating the Challenges to Project Objectives
• Goals
– Develop near term, quantitative approach for labeling
• Resolve product types (13” vs 15” not 4310 vs 6410)
• Provide insight into major sustainability levers
– Create breadboard tool
• Objectives for approach / tool
– Efficient
• Minimum data collection & Minimum user input
– Effective
• Resolve product type
• Provide actionable insight
– Credible
• Uncertainty is explicitly estimated
• Transparent & Flexible

Slide 6Slide 6
Project Strategy:Realizing Efficient / Effective IT LCA
Two major strategies to meet goals
1. Probabilistic Triage and Progressive Refinement
2. Product Attribute to Impact Algorithm (PAIA)
– An approach that maps product attributes to their environmental impact
Initial focus
– Product: Laptop
– Impacts: Energy & carbon

Slide 7Slide 7
Realizing Quantitative Streamlined LCA:Tradeoff between Comprehensiveness and Specificity
Comprehensiveness
Specificity
Idealized
Goal
Results precise
Resource intensive
Omissions indefensible
Results accurate
Targeted resources
Significant uncertainty
Screening

Slide 8Slide 8
Examples of Sources of Uncertainty
• Data availability concerning
– Bill of materials (laptop vs. particular model)
– Suppliers practices and location
• Representativeness of secondary data
– Variation in supplier technology
– Geographic variation
• Grid mix, efficiency, transportation
– Temporal variation
• Process and process evolution
Uncertainty may be resolvable at an acceptable cost

Slide 9Slide 9
Supplier Derived Variability:Significant Variation Exists in Real-world Suppliers
International Aluminum Institute 2003

Slide 11Slide 11
Project Strategy:Realizing Efficient / Effective IT LCA
Two major strategies to meet goals
1. Probabilistic Triage and Progressive Refinement
2. Product Attribute to Impact Algorithm (PAIA)
– An approach that maps product attributes to their environmental impact
Initial focus
– Product: Laptop
– Impacts: Energy & carbon
PAIA Streamlines Process
Slide 12Slide 12
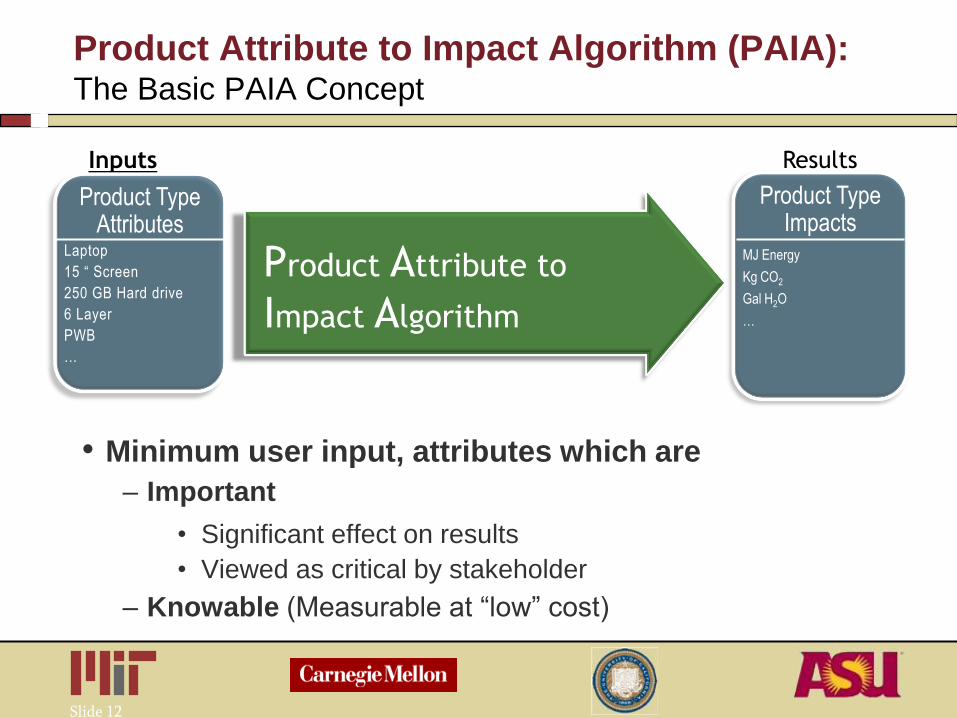
Product Attribute to Impact Algorithm (PAIA): The Basic PAIA Concept
• Minimum user input, attributes which are
– Important
• Significant effect on results
• Viewed as critical by stakeholder
– Knowable (Measurable at “low” cost)
Inputs Results
Product Type Attributes
Laptop
15 “ Screen
250 GB Hard drive
6 Layer
PWB
…
Product Type Impacts
MJ Energy
Kg CO2
Gal H2O
…
Product Attribute to
Impact Algorithm

Slide 13Slide 13
Attribute-
to-Activity
Model
Impact
Assessment
Model
BOA
LCI
Inventory
Database
Existing LC tools
Realizing the Product Attribute to Impact Algorithm
Incorporating Engineering Models with Existing Tools
Inputs Results
Product Type Attributes
Laptop
15 “ Screen
250 GB Hard drive
6 Layer
PWB
…
Product Type Impacts
MJ Energy
Kg CO2
Gal H2O
…
Activity Amount
Aluminum 20 g
Electricity 140 KWh
Lithography 0.5 g
Inj. molding 40 g
Transport 4 tkm
Activity Amount
Anhydrite, in ground 0.1 kg
Carbon dioxide, in air 1.2 kg
Oil crude, in ground 3.6 g
Land Transformation 40 km2
Zinc, in ground 0.2 kg
Total g Al = a*LCDsize + b*HDD capacity
Total g PC = c*Chassis + d*PWB area
g Lithography = e* layers PWB +
d*Ictype
Etc…
Numbers are for illustration only

Slide 15Slide 15
Overall Triage Approach to Creating PAIA
1. Leverage existing data to create best available estimate
– Gather existing BOA and LCI data
– Assemble uncertainty information
• LCI database mining and data reduction
• Manufacturing and grid market data
• Government or third party usage studies
• Extreme conditions(e.g., rail vs. truck)
2. Develop & execute LCI simulation (Monte Carlo) model
3. Triage (screen) for high impact activities
4. Develop PAIA modules to relate attributes to activities– Assemble training LCAs
– Create correlative models

Slide 16Slide 16
Developing the Laptop PAIA
Manufacturing
Logistics
PackagingUse
EoL

Slide 17Slide 17
Comprehensive Probabilistic Triage:
Analysis breakdown by LC phase
95% of statistical trials indicate that
90% of the impact attributed to
Matls & Mfg and Use phase * transport phase
-50
50
150
250
350
450
550
650
GW
P (
kg C
O2
-e
q)/
pro
du
ct c
lass
Overall
Coefficient
of Variation ~35%

Slide 18Slide 18
Comprehensive Probabilistic Triage:
Analysis of Components (Matls & Mfg.)
95% of trials indicate that 75%
of the impact attributed to
LCD, Mainboard, and Chassis
0
50
100
150
200
250
300
GW
P (
kg C
O2
-e
q)/
pro
du
ct c
lass

Slide 21Slide 21
Targeted analysis around LCD:
Each resolved driver lowers COV
0
0.1
0.2
0.3
0.4
0.5
Unresolved Screen size
PFC abatement
Location Energy intensity
IC/PWB area
Co
eff
icie
nt
of
Vari
ati
on

Slide 22Slide 22
Current set of overall model inputs:
Main drivers of impact
• Manufacturing Context– Location and efficiency
• LCD– Size
– PFC abatement
– Bulb technology
– IC/PWBs
• Mainboard– IC impact node, chip area,
integration, PFC abatement
– PWB area
• Chassis– Materials (Mg vs. Plastic)
– Inner cages
• Hard drive– Capacity
– Technology (SSD-future tech)
• Battery – Number of cells
• Transportation –assembly to customer
– Mode, distance
• Packaging*– Mass and recycled content
• Use phase– Duty cycle, power, grid,
lifetime
*More a hot button issue than a hot spot

Slide 23Slide 23
Current model screenshot
Front page example, includes inputs/levers
Example only, not actual results

Slide 24Slide 24
-50
50
150
250
350
450
550
650
Targeted assessment:
Results in lower overall variation
Targetedassessment
Overall COV ~ 10%
Comprehensive assessment
Overall COV ~ 35%
-50
50
150
250
350
450
550
650
GW
P (
kg C
O2
-e
q)/
pro
du
ct c
lass

Slide 25Slide 25
Project Accomplishments
• Project accomplishments
– Triage and targeted refinement identifies
• important inputs for user
• Important focus for data refinement
– Mapping attributes to impacts is possible / promising
• Limited levers account for majority of variation
• Continuing work– Testing resolution of current Laptop model
– Extending to Desktops and
– Deeper look into LCD Modules
– Primary data collection
– Harmonize with existing efforts
Slide 26Slide 26
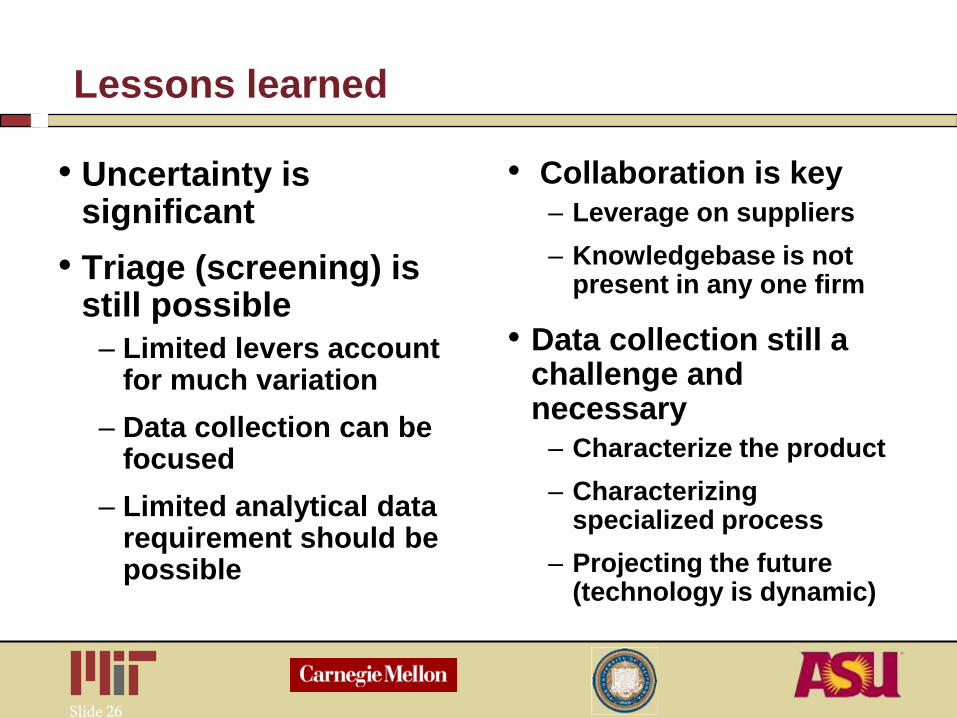
Lessons learned
• Uncertainty is significant
• Triage (screening) is still possible
– Limited levers account for much variation
– Data collection can be focused
– Limited analytical data requirement should be possible
• Collaboration is key
– Leverage on suppliers
– Knowledgebase is not present in any one firm
• Data collection still a challenge and necessary
– Characterize the product
– Characterizing specialized process
– Projecting the future (technology is dynamic)

Slide 27Slide 27
Applying Triage to Firm-wide (Scope 3) AnalysisLow cost corporate carbon footprint analysis
• Perform quantitative footprint analysis of supply chain
• WRI/WBCSD GHG protocol Scope 3 “road test”
GHG Protocol: Scope 1, 2 & 3
GHG Protocol: Scope 3 categories

Slide 28Slide 28
Triage Approach Applied to Scope 3
Road Test Project
SAP Query Result
We have adopted Economic I/O LCA to distill:
•More than 600,000 data entries of firm transactions
•Into to ~60 assumptions (I/O sectors)
•Then we calculate carbon impact
Mapping Value Chain

Slide 29Slide 29
Triage Approach Provides Significant Screening:Apply Data Collection Efforts to Critical Areas
Farming31%
Materials29%
Ingredients24%
Outsourced Production
11%
Other Goods & Services
5%
Purchased Goods & Services
71%
Downstream Transport & Distribution
14%
Upstream Transport & Distribution
5%
Capital Equipment
3%
Consumer Waste
3% Other4%
•Understand biggest opportunities for innovation
•Provide feedback to GHG Protocol Scope 3 standard
Graphs show percentage of impact from pieces of the value chain

Slide 31Slide 31
Why Worry about Resource Use Now?Some Impacts Permanent (Historic Case)
• Historic example of materials constraint: Cobalt in the Late 1970’s
• Zaire compared to World in 1977– Population 0.04%
– GDP 0.09%
– Cobalt resources 40%
• Small scale rebellion in 1977 led to:
– Short term constraint
– Global speculation
Sources: Adelman, K. L. R. Afr. Soc. 1978, v77.
Blechman and Sloss. National Security and Strategic
Minerals, 1985. Canadian Minerals Yearbook 1886-
2004. and USGS Mineral Yearbook and Mineral
Commodity Summary 1932-2006,

Slide 32Slide 32
Why Worry about Resource Use Now?Some Impacts Permanent (Historic Outcomes)
• Supply constraint led to ...
– Geography
• Supply relocation
– Operations
• Recycling
• Stockpiling
– Technology
• Process efficiency
• Materials substitution
• Some industries that switched away from Cobalt, have never switched back.
0
20
40
60
80
100
120
140
1950 1960 1970 1980 1990 2000
Rea
l P
ric
e o
f C
o (
'00
0s
98
$/t
)
Primary Outcome: Price Increase
Even though price changes
were temporary, effects to firms were permanent

Slide 33Slide 33
Can We Identify Materials at Risk?Simple Metrics Fall Short, Models Provide Novel Insights
• Simple metrics
– provide some insight
– do not capture
interrelated aspects of
materials use
• Modeling materials
system provides
insight into
– sources of risk
– impact of strategies to
address it

Slide 34Slide 34
Model-based Conclusion:Value of Recycling as a fast-responding supply
0
20
40
60
80
0.7 0.8 0.9 1
Fraction of Base Case Recycling
Avera
ge P
rice (
$/g
)
High Levels of Recycling…– Reduces use of primary supply - slows down ore degradation
– Stabilizes inventory of metal and hence price
• Experiences less significant price variability
• Recovers more quickly
– Reduces supply chain risk

Slide 35
Thanks to our sponsors
Randolph Kirchain
Materials Systems Laboratory
Massachusetts Institute of Technology
Related Documents