Welcome message from author
This document is posted to help you gain knowledge. Please leave a comment to let me know what you think about it! Share it to your friends and learn new things together.
Transcript

ENVIRONMENT STATISTICS COMPENDIUM
[Framework for the Development of Environment Statistics]
2020
GHANA STATISTICAL SERVICE
OCTOBER 2020
Copyright © 2020
Ghana
Ghana Statistical Service
Head Office,
P. O. Box GP 1098,
Head Office Building,
Location: Finance Close, Accra, Ghana.
Ghana Post GPS: GA-144-0036
Fax : +233-302-664304
E-mail : [email protected]
Environmental Protection Agency
91 Starlets Road
Energy Close
Ministries
P.O. Box M326
Accra
Ghana Post GPS: GA-107-1998
E-mail: [email protected]
All rights reserved worldwide
ISSN: 2720-7625
Citation:
GSS/EPA (2020). Environment Statistics Compendium, 2020. Ghana Statistical Service and Environmental
Protection Agency, Accra. 180 pages.

i
Preface
This is Ghana’s first Compendium on Environment Statistics adopting the FDES 2013.The Framework of
Environment Statistics (FDES) provides an organised structure to guide the collection and compilation of
environment statistics at the national level, bringing together data from the various relevant subject areas
and sources. Thus, it is a multipurpose statistical framework that is comprehensive and integrative in nature
and defines the scope of environment statistics. The framework is broad and holistic in nature, covering the
issues and aspects of the environment that are relevant for policy analysis and decision making.
The 2013 FDES is a flexible framework that provides a standardized structure to guide the collection,
compilation and synthesis of data from various subject areas and sources, covering the issues and aspects
of the environment that are relevant for analysis, decision-making and policy formulation. It is compatible
with other frameworks and systems, both statistical and analytical, such as the System of Environmental-
Economic Accounting (SEEA), the Driving force Pressure-State-Impact-Response (DPSIR) framework,
and the Sustainable Development Goals (SDGs) framework.
In addition to providing data for planning, data from the FDES will also help policy makers monitor the
progress towards the attainment of the Sustainable Development Goals (SDGs), the African Union Agenda
2063, the Coordinated Programme of Economic and Social Development Policies 2017-2024, the National
Medium-Term Development Policy Framework and other relevant national policy initiatives.
The development of environment statistics in the past had been uncoordinated and fragmented in its
approach. However, in recent times efforts are being made to strengthen and harmonize environment
statistics through the implementation of the Framework for the Development of Environment Statistics
(FDES). This process began with Ghana’s participation in a capacity building programme in the
development of environment statistics provided by the African Centre for Statistics under the auspices of
the United Nations Economic Commission for Africa (UNECA) in September 2017. As part of the
programme, Ghana was selected to receive technical assistance from the ECA to prepare a Compendium
of Environment Statistics. The process led to country-wide assessment of the state of environment statistics
through the use of the Environment Statistics Self-Assessment Tool (ESSAT) and national stakeholders’
consultation. Prior to this technical assistance, the country had also benefited from other capacity
development programmes by the United Nations Statistical Division (UNSD) and the Economic
Commission of West African States (ECOWAS).
This compendium is the first publication on Environment Statistics to be published in the country as
environmental sustainability is at the centre of the SDGs. It will help policy makers understand the
ii
interlinkages within and between environment-related goals and targets; promote policy coherence and
integration of the environmental dimensions of the SDGs; and help develop indicators to monitor the SDGs,
among others. Additionally, it will enhance understanding of the effectiveness of the various environmental
interventions initiated by Government and its development partners.
The compendium has been prepared by the National Implementation Team (NIT), a collaboration between
Ghana Statistical Service (GSS) and Environmental Protection Agency (EPA) based on the Basic Set of
Environment Statistics (BSES) contained in the Framework for the Development of Environment Statistics
(FDES 2013). Although there are still some data gaps that need to be addresses going forward, we are
satisfied with the results herein.
PROF. SAMUEL K. ANNIM MR. JOHN A. PWAMANG
(GOVERNMENT STATISTICIAN) (EXECUTIVE DIRECTOR, EPA)
iii
Acknowledgements
The Framework for the Development of Environment Statistics (FDES) 2019 of Ghana is an outcome of
the active participation of various experts from the institutions in the field of environment. The Ghana
Statistical Service (GSS) and the Environment Protection Agency (EPA) would like to acknowledge the
invaluable contribution of institutions and individuals to the successful compilation of 2019 Ghana FDES.
We acknowledge with thanks the support of the following Institutions: Ghana Meteorological Agency
(GMet), Forestry Commission; the Minerals Commission; Driver and Vehicle Licensing Authority
(DVLA), Plant Regulatory Protection Directorate (PRPD), Vertinary Department and the Statistics,
Research and Information Directorate (SRID) of Ministry of Food and Agriculture; the Hydrological
Services Department; Ghana Geological Survey Authority and the Energy Commission. The others are: the
Ghana Water Company Ltd.; the Water Resource Commission; Ghana Irrigation Development Authority
(GIDA), CSIR-Soil Research Institute, and the Water Research Institute (WRI). Also, worth mentioning
are the Soil Research Institute, Ghana Health Services, Fisheries Commission and National Disaster
Management Organization (NADMO).
We are grateful for the exemplary and inspiring leadership provided by the Management of both Institutions
(GSS and EPA) and in particular the Government Statistician Prof. Samuel K. Annim, and the Executive
Director of EPA, Mr. John A. Pwamang.
Special gratitude goes to the United Nations Economic Commission for Africa (UNECA) for financial and
technical support. We further acknowledge the head of the Technical assistance team, Mr David Boko
(UNECA) and Mr Manasa Viriri (FDES Consultant) for technical support during the preparations and
implementation of Ghana’s FDES. Our appreciation also goes to the Acting Director of Strategic
Environmental Assessment (SEA) and Legal Affairs of EPA, Dr Christine O. Asare, the former Head of
Agriculture and Environment Statistics Section, Mr Francis Dzah and the Director of Economic Statistics
Directorate, Mr Edward Asuo Afram, for their inspiration, technical support and supervisory roles to the
National Implementation Team during the programme.
Finally, we wish to acknowledge with gratitude the contribution of all the officers who worked under
challenging conditions to collect the required information from institutions across the country, and all the
institutions who generously provided the data that are contained in this report.
iv
Table of Contents
Preface ........................................................................................................................................................... i
Acknowledgements .................................................................................................................................... iii
List of Figures ............................................................................................................................................. ix
Acronyms ..................................................................................................................................................... x
Glossary ..................................................................................................................................................... xii
Chapter 1 Introduction ............................................................................................................................... 1
1.1 Background ................................................................................................................................... 1
1.2 National Medium-Term Development Framework ...................................................................... 1
1.3 Policy, Legal and Institutional Framework ........................................................................................ 1
1.3.2 Statistical Service, Ghana (GSS) ................................................................................................ 2
1.3.3 Environmental Protection Agency (EPA) ................................................................................... 2
1.4 Socio-economic Demography ............................................................................................................ 2
1.5 Development of Environment Statistics in Ghana ............................................................................. 3
1.5.1 Implementation of the Framework for the Development of Environment Statistics (FDES) ..... 3
1.6 Framework for the Development of Environment Statistics (FDES 2013) ....................................... 4
1.7 Components of FDES ........................................................................................................................ 5
1.8 Linkages of FDES with Other Sustainability Frameworks ................................................................ 6
Chapter 2 Environmental Conditions and Quality .................................................................................. 7
2.1 Introduction ........................................................................................................................................ 7
2.2 Physical Conditions ........................................................................................................................... 7
2.2.1 Atmosphere, Climate and Weather ............................................................................................. 7
2.2.2 Temperature ................................................................................................................................ 7
2.2.3 Precipitation .............................................................................................................................. 10
2.2.4 Watersheds ................................................................................................................................ 15
2.2.5 The Black Volta River Basin .................................................................................................... 15
2.2.6 Densu Basin .............................................................................................................................. 15
2.2.7 Pra Basin ................................................................................................................................... 16
2.2.8 Ankobra Basin .......................................................................................................................... 18
2.3 Geological and geographical information ........................................................................................ 20
2.3.1 Geographical Conditions........................................................................................................... 21
Source: Marine Fisheries Research Division, 2003 ............................................................................ 22
2.3.2 Geological Conditions of Ghana ............................................................................................... 22
2.3.3 Soil Characteristics ................................................................................................................... 24
v
2.4 Land Cover ....................................................................................................................................... 36
2.5 Ecosystems and Biodiversity ........................................................................................................... 37
2.5.1 Wetlands ................................................................................................................................... 37
2.5.2 Flora species .............................................................................................................................. 41
2.5.3 Fauna species ............................................................................................................................ 41
2.6 Forests Area ..................................................................................................................................... 42
2.6.1 Forest Protected Areas .............................................................................................................. 45
2.6.2 Forest Management ................................................................................................................... 46
2.7 Air Quality ....................................................................................................................................... 48
2.7.1 PM10 Permanent Monitoring Locations .................................................................................... 48
2.7.2 PM10 Roadside Monitoring Locations ....................................................................................... 48
2.8 Freshwater Quality .......................................................................................................................... 50
2.9 Marine Water Quality ...................................................................................................................... 51
Chapter 3 Environmental Resources and their Use ............................................................................... 53
3.1 Introduction ...................................................................................................................................... 53
3.2 Mineral Resources ........................................................................................................................... 53
3.2.1 Extraction of Gold ..................................................................................................................... 53
3.2. Extraction of Diamond ................................................................................................................ 54
3.2.3 Manganese ................................................................................................................................ 55
3.2.4 Bauxite ...................................................................................................................................... 55
3.3 Energy Resources ............................................................................................................................. 56
3.3.1 Extraction of Energy Resources ................................................................................................ 57
3.4 Production, Trade and Consumption of Energy ............................................................................... 57
3.4.1 Primary Energy Production ....................................................................................................... 58
3.4.2 Secondary Energy Production ................................................................................................... 59
3.4.3 Total Energy supply .................................................................................................................. 59
3.4.4 Final Consumption of Energy ................................................................................................... 61
3.5 Land Use ......................................................................................................................................... 63
3.5.1 Use of Forest Land .................................................................................................................... 63
3.6 Timber Resources ............................................................................................................................ 64
3.6.1 Export of Timber ....................................................................................................................... 64
3.6.2 Fertilizers .................................................................................................................................. 64
3.7 Water Resources .............................................................................................................................. 66
3.7.1 Abstraction, Use and Returns of Water..................................................................................... 66

vi
Chapter 4 Residuals .................................................................................................................................. 69
4.1 Introduction ...................................................................................................................................... 69
4.2 Emissions of Greenhouse Gases (GHG) ......................................................................................... 69
4.2.1 Total National Greenhouse Gas Emission ................................................................................ 69
4.2.2 Net Carbon dioxide (CO2) Emissions by sectors in Mt ............................................................ 70
4.2.3 Nitrous Oxide (N2O) Emissions per sector in MtCO2e ............................................................. 72
4.2.4 Methane emissions by sectors in MtCo2e ................................................................................. 74
4.2.5 Perfluorocarbon (PFC) Emissions per Sector ........................................................................... 76
4.2.6 Hydrofluorocarbon (HFC) Emission per Sector expressed in MtCO2e .................................... 78
4.2.7 Precursors and Local Air Pollutants Gg/Year ........................................................................... 79
4.3 Generation and Management of Waste .......................................................................................... 109
4.3.1 Generation of Solid Waste ...................................................................................................... 109
4.3.2 Composition of Solid Waste ................................................................................................... 110
4.3.3 Generation of Waste by Sector ............................................................................................... 111
4.3.4 Solid Waste Disposal .............................................................................................................. 113
Chapter 5 Extreme Events and Disasters ............................................................................................. 114
5.1 Introduction .................................................................................................................................... 114
5.2. Ghana’s Disaster Profile ............................................................................................................... 114
5.2.1 Major Disasters in Ghana ........................................................................................................ 115
5.3 Occurrence of Natural Extreme Events and Disasters .................................................................. 115
5.4 Impact of Natural Extreme Events and Disasters .......................................................................... 116
5.4.1 People Affected by Natural Extreme and Disasters ................................................................ 118
Chapter 6 Human Settlement and Environmental Health .................................................................. 119
6.1 Introduction ................................................................................................................................... 119
6.2 Access to Selected Basic Services ................................................................................................. 119
6.2.1 Improved Drinking water ........................................................................................................ 119
6.2.4 Population supplied by water supply industry ........................................................................ 122
6.3 Environmental Concerns Specific to Urban Settlements ............................................................... 123
6.3.1 Total Number of Vehicles Registered in Ghana by Category ................................................. 123
6.4 Water-Related Diseases and Conditions ........................................................................................ 125
6.4.1 Water-Related Diseases and Conditions ................................................................................. 125
Chapter 7 Environmental Protection, Management and Engagement .............................................. 127
7.1 Introduction .................................................................................................................................... 127
7.2 Environmental Regulation and Instruments ................................................................................... 127

vii
7.3 Participation in MEAs and Environmental Conventions .............................................................. 143
7.3.1 Agreement on the Conservation of African-Eurasian Migratory Water birds (AEWA) ........ 143
7.3.2 Cartagena Protocol .................................................................................................................. 143
7.3.3 Convention on Biological Diversity (CBD) ............................................................................ 143
7.3.4 Gaborone Declaration for the Sustainability of Africa (GDSA) ....................................... 144
7.3.5 Minamata Convention on Mercury ......................................................................................... 144
7.3.6 Montreal Protocol ................................................................................................................... 144
7.3.7 Stockholm Convention ............................................................................................................ 144
7.3.8 Sustainable Development Goals (SDGs) ................................................................................ 145
7.3.9 United Nations Convention to Combat Desertification (UNCCD) ......................................... 145
7.3.10 United Nations Framework Convention on Climate Change (UNFCCC) ............................ 145
7.3.11 United Nations Convention on the Law of the Sea (UNCLOS) ........................................... 145
Reference ................................................................................................................................................. 146
National Implementation Team (NIT) & Authors ............................................................................... 148
Stakeholder Consultations/Validation on Data .................................................................................... 149
Annexes .................................................................................................................................................... 150
Annex 1: Threatened plant species and Threat categories of Ghanaian plants species listed on the
IUCN Red Data ....................................................................................................................................... 150
Annex 2: Types of Soils in Ghana .......................................................................................................... 153
Annex 3: Fresh Surface Water Abstraction Data for Irrigation per Region .................................... 185

viii
List of Tables
Table 2.1: Temperature Measured in Degree Celsius (Monthly Average) ................................................... 9
Table 2.2: Rainfall Measured in Milliliters (mm) from 1981-2018 for Saltpond ....................................... 11 Table 2.3: Rainfall Measured in Millimeters (mm) from 1981-2018 Sefwi Bekwai .................................. 11
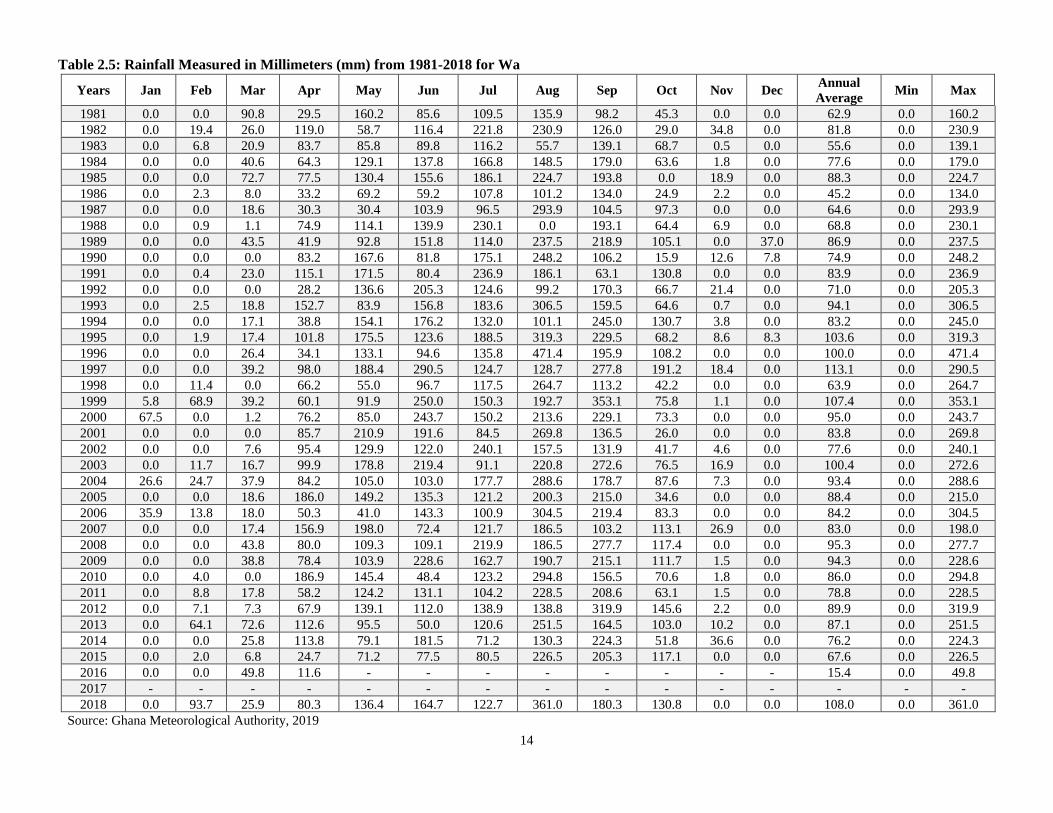
Table 2.4: Rainfall measured in Millimeters (mm) from 1981-2010 for Sunyani ...................................... 13 Table 2.5: Rainfall Measured in Millimeters (mm) from 1981-2018 for Wa ............................................. 14
Table 2.6: Geographical Conditions of Ghana ............................................................................................ 22 Table 2.7: Types of Soils ............................................................................................................................ 28
Table 2.8: Land Use by Type of Ecosystem in Hectares ............................................................................ 37 Table 2.9: Changes in Habitat of Coastal Ramsar Sites in Hectares (Ha) .................................................. 37
Table 2.10.: Known Flora Species by Number (Indigenous) ...................................................................... 41 Table 2.11: Known Fauna Species by Numbers in 2017 (Indigenous) ....................................................... 41
Table 2.12: Summary of Threatened Vertebrate Species ............................................................................ 42 Table 2.13A: Total Forest Areas by Region (Hectares, ha) ........................................................................ 43
Table 2.13B: Total Forest Areas by Region (Hectares, ha) ........................................................................ 44 Table 2.14: Area of Forest Reserves in the High Forest Zone .................................................................... 45
Table 3.1: Extraction of Selected Minerals, 1980 - 2017 ........................................................................... 56 Table 3.2: Extraction of Energy Resources from 2008-2018 ..................................................................... 57
Table 3.3: Primary Energy Production by Primary Energy Resources (ktoe) ............................................ 58 Table 3.4: Secondary Energy Production (ktoe), 2000-2018 ...................................................................... 59
Table 3.5: Total Energy Supply by Energy Product (ktoe), 2000-2018 ..................................................... 60 Table 3.6: Final Consumption of Energy (ktoe) ......................................................................................... 62
Table 3.7: Land Use (National Data) .......................................................................................................... 63 Table 3.8: Export of Timber Products (Wood & Wood Products) ............................................................. 64
Table 3.9: Fertilizers and Pesticides Use .................................................................................................... 65 Table 3.10: Summary of Fresh Surface Water Abstraction Data for Irrigation .......................................... 67
Table 3.11: Irrigated Agricultural Lands per Year ...................................................................................... 68 Table 4.1: Net Carbon dioxide (CO2) Emissions by sectors in Mt ............................................................ 72
Table 4.2: Nitrous Oxide (N2O) Emissions per sector in MtCO2e .............................................................. 74 Table 4.3: Methane emissions by sectors (MtCo2e) ................................................................................... 76
Table 4.4: Per fluorocarbon (PFC) Emissions Per Sector ........................................................................... 78 Table 4.5: Hydro Fluorocarbon (HFC) Emission per Sector expressed (MtCO2e) ..................................... 79
Table 4.6: Precursors and Local Air Pollutants Gg/Year ............................................................................ 82 Table 4.7: Percentage Composition of Solid Waste (2005 – 2015) .......................................................... 111
Table 4.8: Waste Generated by Sectors .................................................................................................... 111 Table 4.9: Regional Breakdown of Disposal Sites in Ghana, 2015 .......................................................... 113
Table 4.10: Engineered Landfills in Ghana as of 2015 ............................................................................. 113 Table 5.1: Types of Hazards/Disasters and Coverage Area ...................................................................... 114
Table 5.2: Number of Disasters Recorded ................................................................................................ 116
Table 5.3: Economic Losses Due to Natural Extreme Events and Disasters ............................................ 117 Table 5.4: People Affected by Natural Extreme and Disasters ................................................................. 118
Tables 6.1: Distribution of Persons with Access to Drinking Water by Source ....................................... 120 Table 6.2: Population Distribution by Sanitation Facility ........................................................................ 120
Table 6.3: Method of Solid and Liquid Waste Disposal ........................................................................... 121 Table 6.4: Vehicles Registered in Ghana by Category ............................................................................. 124
Table 6.5: Environmental-Related Diseases (Outpatient Morbidity), 2002-2016 .................................... 126
Table 7.3: List of Some Regulated Pollutants ........................................................................................... 130

ix
List of Figures
Figure 1.1: Components of the FDES ........................................................................................................... 5
Figure 1.2: Relationship of the FDES to Other Frameworks, Systems and Indicator Sets ........................... 6 Figure 2.1: Annual Averages (Rainfall) ...................................................................................................... 10
Figure 2.2: Forest Management Categories ................................................................................................ 46 Figure 2.3. Annual Mean PM10 Concentrations for Permanent .................................................................. 48
Monitoring Locations (2008-2018) ............................................................................................................. 48 Figure 2.4 Annual Mean PM10 Concentrations (µgm-3) for the Roadside ................................................. 49
Monitoring Locations (2008-2018) ............................................................................................................. 49 Figure 2.5: Monthly Mean PM2.5 Concentrations for Roadside Monitoring Locations .............................. 50
(Jul-Sep, 2019) ............................................................................................................................................ 50 Figure 3.1: Average Gold Production, 1980 - 2017 .................................................................................... 54
Figure 3.2: Average Diamond Production, 1980 - 2017 ............................................................................. 54 Figure 3.3: Average Manganese Production, 1980 - 2017 .......................................................................... 55
Figure 3.4: Average Bauxite Production, 1980 - 2017 ............................................................................... 55 Figure 3.5: Annual Fresh Surface Water Abstraction for Irrigation ........................................................... 68
Figure 4.1: Annual Carbon Dioxide (CO2) Emissions Per Sector in Mt ..................................................... 71 Figure 4.2: Annual Nitrous Oxide (N2O) Emissions Per Sector ................................................................. 73
Figure 4.3: Annual Methane emissions per sector in MtCO2e .................................................................... 75 Figure 4.4: Perfluorocarbon Emissions in MtCO2e .................................................................................... 77
Figure 4.5: Annual Hydro fluorocarbon emission in MtCO2e .................................................................... 79 Figure 4.6: Precursors and Local Air Pollutants Gg/Year .......................................................................... 81
Figure 4.7: Trend in Daily Solid Waste Generation in Accra and Kumasi (2000 - 2015) ........................ 110 Figure 4.8: Population Supplied by Water - m3/Day ................................................................................ 122
List of Maps
Map 2.1: Temperature Maps, 1981- 2010 .................................................................................................... 8
Map 2.2: Topography of the Densu Basin ................................................................................................. 17
Map 2.3: Pra and Sub-Basins ..................................................................................................................... 18
Map 2.4: Topography of Ankobra Basin ................................................................................................... 19
Map 2.5: Geological Map of Ghana ........................................................................................................... 23
Map 2.6: Satellite Imagery of Songor Ramsar Site in 2000 and 2014 ....................................................... 38
Map 2.7: Satellite Imagery of Sakumo Ramsar Site in 2000 and 2014 ..................................................... 39
Map 2.8: Satellite Imagery of Densu delta in 2000 and 2014 .................................................................... 40
Map 2.9: Canopy Cover Map of Forest Reserves in Ghana ...................................................................... 47

x
Acronyms
AFOLU Agriculture, Forestry and other Land Use
AMA Accra Metropolitan Assembly
AU Africa Union
CSM Cerebro Spinal Meningitis
DPSIR Driving Forces-Pressures-State-Impacts-Responses
ECOWAS Economic Community of West African States
EEZ Exclusive Economic Zone
EPA Environnemental Protection Agency
ESSAT Environment Statistics Self-Assessment Tool
FAO Food and Agriculture Organization
FDES Framework for the Development of Environment Statistics
GAMA Greater Accra Metropolitan Area
GAPS Ghana Agricultural Production Survey
GAR Greater Accra Region
GDP Gross Domestic Product
GHG Green House Gas
GLSS Ghana Living Standards Survey
GSS Ghana Statistical Service
HFC Hydrofluorocarbon
IPPU Industrial Processes and Product Use
ISRI International Soil Reference and Information Centre
ISSS International Society of Soil Science
IUCN International Union for Conservation of Nature
KMA Kumasi Metropolitan Assembly
LFG Land Fill Gas
MDAs Ministries, Departments and Agencies
MDG Millennium Development Goals
MICS Multiple Indicator Cluster Survey
MMDA Metropolitan, Municipal and District Assemblies
MoFA Ministry of Food and Agriculture
MRACLS Multi Round Annual Crop & Livestock Survey
MTNDPF Medium-term National Development Policy Framework
NADMO National Disaster Management Organization

xi
NIT National Implementation Team
NMVOC Non-Methane Volatile Organic Compounds
NR Northern Region
NSO National Statistical Office
NSS National Statistical System
PFC Perfluorocarbons
PM Particulate Matter
SDGs Sustainable Development Goals
SDI Sustainable Development Indicators
SEEA-CF System of Environmental Economic Accounting – Central Framework
SNA System of National Accounts
SRID Statistics, Research and Information Directorate
UER Upper East Region
UN United Nations
UNECA United Nations Economic Commission for Africa
UNSD United Nations Statistical Division
UWR Upper West Region
VALCO Volta Aluminium Company Limited
WRB World Reference Base for Soil Resources

xii
Glossary
Agro-ecological zones Geographical areas exhibiting similar soil and climatic conditions that
determine their ability to support rain-fed agriculture.
Aquaculture (fish farming) The farming of aquatic organisms such as fish, molluscs, crustaceans,
plants, crocodiles, alligators and other amphibians. In this context, farming
refers to some intervention in the rearing process to enhance production,
such as regular stocking, feeding and protection from predators.
Arable crops Crops that mature within a short period of time, usually less than one year.
Examples of arable crops are plantain, cocoyam, cassava, yam, etc.
Biomass Organic material that comes from plants and animals, and it is a renewable
source of energy.
Capture fisheries Fishing from the wild (i.e. from the marine and inland waters)
Forest tree planting The growing of trees for the purpose of afforestation or production of
wood
Fossil fuel Fuel (such as coal, oil, or natural gas) formed in the earth from plant or
animal remains.
Landfill Gas A complex mix of different gases created by the action
of microorganisms within a landfill. Landfill gas is approximately forty to
sixty percent methane, with the remainder being mostly carbon dioxide.
Leachate Liquid that drains or ‘leaches’ from a landfill. It varies widely in
composition regarding the age of the landfill and the type of waste that it
contains.
Locality A locality is classified as urban if it has 5,000 or more inhabitants.
Particulate Matter (PM) The sum of all solid and liquid particles suspended in air many of which
are hazardous. This complex mixture includes
both organic and inorganic particles, such as dust, pollen, soot, smoke,
and liquid droplets and the particles vary greatly in size, composition, and
origin.
Perfluorocarbon (PFC) A Chemical by product of aluminum smelting and semiconductor
manufacturing, it consists of one or two carbon atoms combined with four
to six fluorine atoms but no chlorine.

xiii
Precursor Gases that are not greenhouse gases at the point of release, but when they
get into the atmosphere they can contribute to global warming, and/or local
and regional air pollution with its attendant public health challenges.
Wetlands Wetlands are areas of marsh, fen, peat land or water, whether natural or
artificial, permanent or temporary, with water that is static or flowing,
fresh, brackish or salt, including areas of marine water the depth of which
at low tide does not exceed six meters.
1
Chapter 1
Introduction
1.1 Background
In 2016, Ghana signed onto and adopted the Sustainable Development Goals (SDG) as the Global Agenda
for Transformation. The achievement of the SDGs will to a large extent end poverty and hunger, secure
education and basic services for all, achieve gender equality and empower the vulnerable in society, protect
the environment, fight climate change, foster inclusive economic growth, among others. Ultimately, this
will put Ghana on a sustainable development path that ensures that “no-one is left behind”. Unlike in the
Millennium Development Goals (MDGs), environmental sustainability issues have also been adequately
integrated into the Sustainable Development Goals (SDGs). In Ghana, the SDGs have been adequately
mainstreamed into the Medium-Term National Development Policy Framework (2018-2021) also referred
to as “An Agenda for Jobs: Creating Prosperity and Equal Opportunity for All”. This makes quality,
reliable, and timely environmental data and statistics vital to better inform policy and decision-making at
various level, and to ensure accountability and transparency in environmental management and governance.
1.2 National Medium-Term Development Framework
Within the national development system, environment data are key to the success of monitoring and
evaluation of policies, plans and programmes at the national, sector and district levels. Monitoring and
evaluation of the national development agenda has been provided for in the National Development Planning
System Act, 1994 (Act 480), and all implementing institutions are enjoined by law to undertake monitoring
and evaluation of their respective policies, plans, programmes and projects.
1.3 Policy, Legal and Institutional Framework
This section discusses the legal and institutional mandates of relevant institutions as well as the strategy for
the development of statistics in Ghana.
1.3.1 National Strategy for the Development of Statistics (2018-2022)
The National Strategy for the Development of Statistics 2018‐2022 is a comprehensive strategic document
which guides the evolution of the National Statistical System (NSS) to enable it to produce the statistical
knowledge the country needs in order to fulfil its development potential. Environment statistics have been
identified as very crucial within the national statistical system which calls for continuous capacity building
and resourcing of the relevant stakeholders in the NSS.
2
1.3.2 Statistical Service, Ghana (GSS)
The Statistical Service Act 2019, (Act 1003) mandates Ghana Statistical Service (GSS) as the central
statistics producing and coordinating institution for the National Statistical System and to strengthen the
production of quality statistics and to provide for related matters quality, relevant, accurate and timely
statistical information for the purpose of national development. Vests in it, the responsibility for the
collection, compilation, analysis, publication and dissemination of statistical information related to the
commercial, industrial, financial, social, demographic, economic and other activities and conditions of the
people of this country through the conduct of surveys and national censuses, including population, housing,
economic and agricultural censuses in Ghana for general and administrative purposes. The Act also among
others prescribes the coordination role of the Service in the developments in statistics outside the GSS.
Clause 24 of the Act gives GSS the mandate to consider statistics produced by public corporation or partner
institutions as official statistics if it is accepted to be of standards.
1.3.3 Environmental Protection Agency (EPA)
The Environmental Protection Agency Act, 1994 Act 490 established the EPA to among others, promote
studies, research, survey and analyses for the improvement and protection of the environment and the
maintenance of sound ecological systems in Ghana. The EPA is also mandated to develop a comprehensive
database on the environment and environmental protection for the information of the public.
1.4 Socio-economic Demography
Ghana has a projected population of 30.3 million as of 20191 with respect to 2010 Population and Housing
Census in 2010 of 24.6 million. Females constitute 50.8 percent, while males 49.2 percent. Urbanization is
on the rise with 50.9% of the population living in urban localities in 2010 compared to 43.8% in 2000. The
life expectancy for Ghana in 2019 was 63.91 years, a 0.41% increase from 2018. The life expectancy for
Ghana in 2018 was 63.65 years.
With the rebase of the Gross Domestic product (GDP)2 and 2013 as the base year, the GDP of Ghana in
20193 was estimated at US$ 66,984 million including oil with a per capita GDP of US$2,212. This put
Ghana into the range of low-middle-income countries based on the World Bank per capita GDP threshold4
1 GSS 2019 2 Gross domestic product (GDP) the total value of goods produced and services provided in a country during one
year. 3 2019 GDP estimates are provisional and are subject to change 4 datatopics.worldbank.org/world.../the-classification-of-countries-by-income.html || accessed Wednesday, April 24,
2019 at 10:23hrs.
3
of countries income classification of US$ 996-3,895. GDP without oil is estimated at US$ 64,138 million.
The economy recorded an average growth rate of 3.8% between 2014 and 2019.
Until 2010, Agriculture was considered the most important sector of the economy, with regards to its
contribution to GDP and its share of the labor force. Before the rebasing, Agriculture contributes 48.8% to
the country’s GDP. However, after the rebasing, the Services sector has overtaken the Agriculture sector
as its contribution to GDP increased from 41.4% in 2013 to 47.2% in 2019, while the Agriculture sector
contributed 21.7% in 2013 and declined to 18.5% in 2019. The country’s major exports include gold,
diamonds, other metals, and cocoa. Major imports include transport and equipment, machinery and
equipment, electrical and electronic equipment, etc.
1.5 Development of Environment Statistics in Ghana
Environmental issues are cross-cutting in nature and therefore requires a multi-faceted approach to
effectively address them. According to the Ghana State of Environment 2016 Report, some of the major
environmental challenges of the country include; climate change, waste and sanitation, air pollution, land
degradation, biodiversity loss, coastal erosion, water pollution, deforestation, among others. This makes it
crucial for the availability of the relevant data and statistics to monitor the state of progress in addressing
the challenges.
1.5.1 Implementation of the Framework for the Development of Environment Statistics (FDES)
The development of environment statistics in Ghana in the past has been uncoordinated and fragmented in
its approach. However, in recent times efforts are being made to strengthen and harmonize environment
statistics through the implementation of the Framework for the Development of Environment Statistics
(FDES). The process began with the country’s participation in a capacity building programme in the
development of environment statistics provided by the African Centre for Statistics under the auspices of
the United Nations Economic Commission for Africa (UNECA) in September 2017.
As part of the programme, Ghana received technical assistance from the ECA to prepare a Compendium of
Environment Statistics in Ghana. The process led to a country-wide assessment of the state of environment
statistics through the use of the Environment Statistics Self-Assessment Tool (ESSAT) and national
stakeholders consultations. Prior to this technical assistance, the country had also participated in capacity
development programmes organized by the United Nations Statistical Division (UNSD) and the Economic
Commission of West African States (ECOWAS).
4
1.6 Framework for the Development of Environment Statistics (FDES 2013)5
The FDES 2013 is a flexible, multipurpose conceptual and statistical framework that is comprehensive and
integrative in nature. It marks out the scope of environment statistics and provides an organizing structure
to guide their collection and compilation and to synthesize data from various subject areas and sources,
covering the issues and aspects of the environment that are relevant for analysis, policy- and decision-
making.
The FDES 2013 targets a broad user community, including environmental statisticians in national statistical
offices (NSOs), environmental ministries and agencies, as well as other producers of environment statistics.
It helps to mark out the roles of the different data producers, thus facilitating coordination at different levels.
It is structured in a way that allows links to economic and social domains. It seeks to be compatible with
other frameworks and systems, both statistical and analytical, such as the System of Environmental-
Economic Accounting (SEEA), the Driving force Pressure-State-Impact-Response (DPSIR) framework,
and the Millennium Development Goals (MDGs), SDGs and the sustainable development indicator (SDI)
frameworks. When applicable, it is based on existing statistical classifications. As such, the FDES 2013
facilitates data integration within environment statistics and with economic and social statistics.
The FDES 2013 organizes environment statistics into six (6) components and each of them is broken down
into subcomponents and further into statistical topics. The six components cover environmental conditions
and quality; the availability and use of environmental resources and related human activities; the use of the
environment as a sink for residuals and related human activities; extreme events and disasters; human
settlements and environmental health; and social and economic measures to protect and manage the
environment. The statistical topics represent the quantifiable aspects of the components and are grouped
under subcomponents, taking into account the types and sources of the statistics needed to describe them.
The FDES 2013 sets out a comprehensive, though not exhaustive, list of statistics (the Basic Set of
Environment Statistics) that can be used to measure the statistical topics. The Basic Set is organized into
three tiers, based on the level of relevance, availability and methodological development of the statistics.
Within this scope, a Core Set of Environment Statistics has been identified as Tier 1. The objective of the
Core Set is to serve as an agreed, limited set of environment statistics that are of high priority and relevance
to most countries.
The FDES 2013 is relevant and recommended for use by countries at all stages of development. However,
it is particularly useful for guiding the formulation of environment statistics programmes in countries at the
5 More information on the FDES can be found on the United Nations Statistical Division (UNSD) website via:
https://unstats.un.org/unsd/environment/FDES/FDES-2015-supporting-tools/FDES.pdf
5
early stages of developing environment statistics such as Ghana as it (i) identifies the scope and constituent
components, subcomponents and statistical topics relevant for them; (ii) contributes to the assessment of
data requirements, sources, availability and gaps; (iii) guides the development of multipurpose data
collection processes and databases; and (iv) assists in the coordination and organization of environment
statistics, given the interinstitutional nature of the domain.
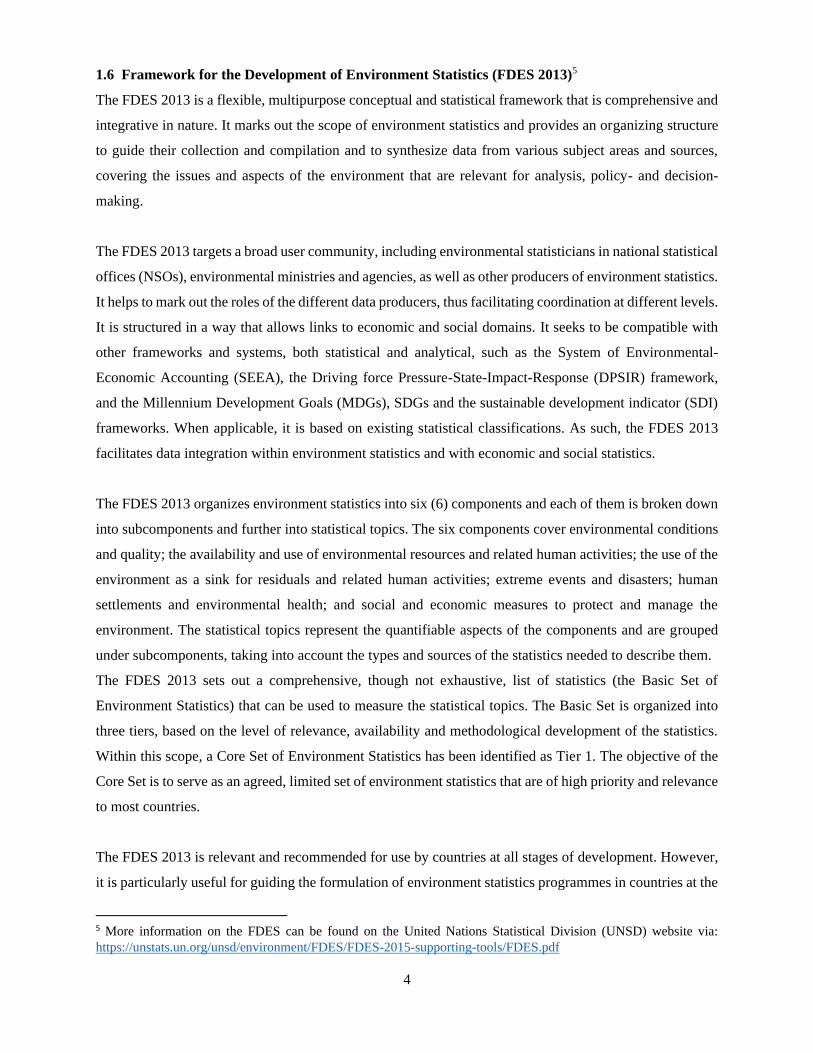
1.7 Components of FDES
Using a multilevel approach, the FDES organizes environment statistics into a structure composed of
components, subcomponents, statistical topics, and individual statistics. The first level of the structure
consists of six (6) fundamental components that follow the FDES conceptual framework. The first
component, Environmental Conditions and Quality, brings together statistics related to the conditions and
quality of the natural environment and changes in those conditions and quality. The second component,
Environmental Resources and their Use, groups statistics related to the availability and use of environmental
resources (ecosystem provisioning services, land and subsoil resources). The third component, Residuals,
includes statistics related to the use of regulating services of the environment for the discharge of residuals
from production and consumption processes. Statistics related to Extreme Events and Disasters (both
natural and technological) and their impacts are covered by the fourth component. The fifth component
brings together statistics related to Human Settlements and Environmental Health. The sixth component,
Environmental Protection, Management and Engagement, group statistics relevant to societal responses and
economic measures aimed at protecting the environment and managing environmental resources.
Figure 1.1: Components of the FDES

6
Environmental Conditions and Quality (Component 1) are central to the FDES. The other five (5)
components have been established based on their relationship to the central component. As shown in Figure
1.1, all six (6) components are intrinsically related to each other. The dotted lines separating the components
indicate the continuous interactions among them. These interactions exist between and among all the
components of the FDES.
1.8 Linkages of FDES with Other Sustainability Frameworks
The FDES is closely related to and supports other systems and frameworks that are frequently used at
the national and international levels. Figure 1.2 provides a simplified illustration of the relationship
between environmental data, the FDES, the SEEA6 and indicator frameworks. The FDES is shown
here as a tool to bring together and transform primary statistical and non-statistical data into
environment statistics. These environment statistics can then be used to produce statistical series and
indicators organized according to different analytical or policy frameworks. They may also be used in
combination with economic statistics to produce environmental-economic accounts that link
environment statistics with the System of National Accounts (SNA7).
Figure 1.2: Relationship of the FDES to Other Frameworks, Systems and Indicator Sets
6 The System of Environmental-Economic Accounting (SEEA) is a framework that integrates economic and
environmental data to provide a more comprehensive and multipurpose view of the interrelationships between the
economy and the environment and the stocks and changes in stocks of environmental assets, as they bring benefits to
humanity. For more information access: https://seea.un.org/. 7 The System of National Accounts (SNA) is the internationally agreed standard set of recommendations on how to
compile measures of economic activity. The SNA describes a coherent, consistent and integrated set of
macroeconomic accounts in the context of a set of internationally agreed concepts, definitions, classifications and
accounting rules.
7
Chapter 2
Environmental Conditions and Quality
2.1 Introduction
This chapter presents information on physical conditions; land cover, ecosystems and biodiversity; and
quality of the environment. The condition of the environment is very important as it directly affects the
health and quality of life of people. Poor air quality can lead to health problems such as cancer, and
respiratory and cardiovascular diseases and premature death. Sources of data for the computation of this
component include remote sensing and monitoring data from environmental, meteorological, hydrological,
geological and geographical institutions.
2.2 Physical Conditions
Ghana has a unique global position, lying just above the Equator and also been traversed by the Greenwich
meridian. The country is bordered on the East with the Republic of Togo, Côte d'Ivoire to the west, Burkina
Faso to the north and north-west, and the Gulf of Guinea (Atlantic Ocean) to the south. The focus areas
under the physical conditions of the environment include; the atmosphere, climate, weather, geology,
geography and soil characteristics.
2.2.1 Atmosphere, Climate and Weather
Ghana has two main seasons, the dry and wet seasons. The rainy season begins from April to September.
The dry season also referred to as harmattan usually begins from November to March. This section provides
data on climatic and weather conditions across the country from 1981 to 2018. Data on climate and weather
were recorded from a network of monitoring stations across the country.
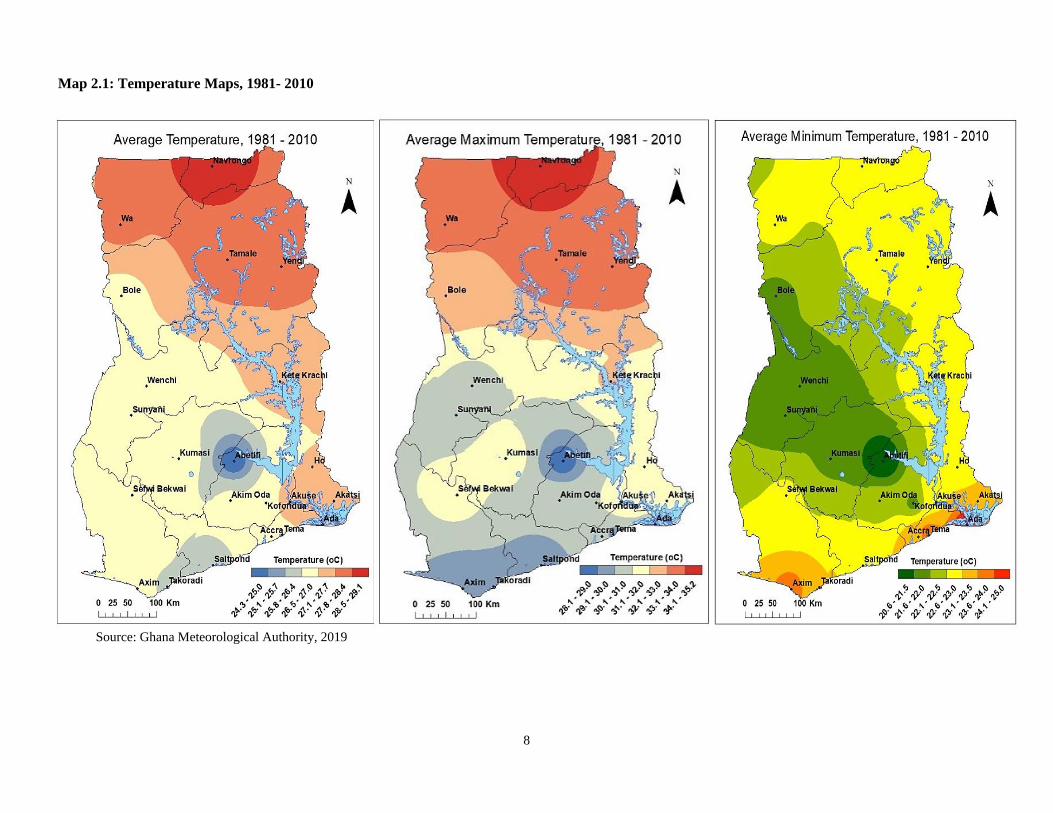
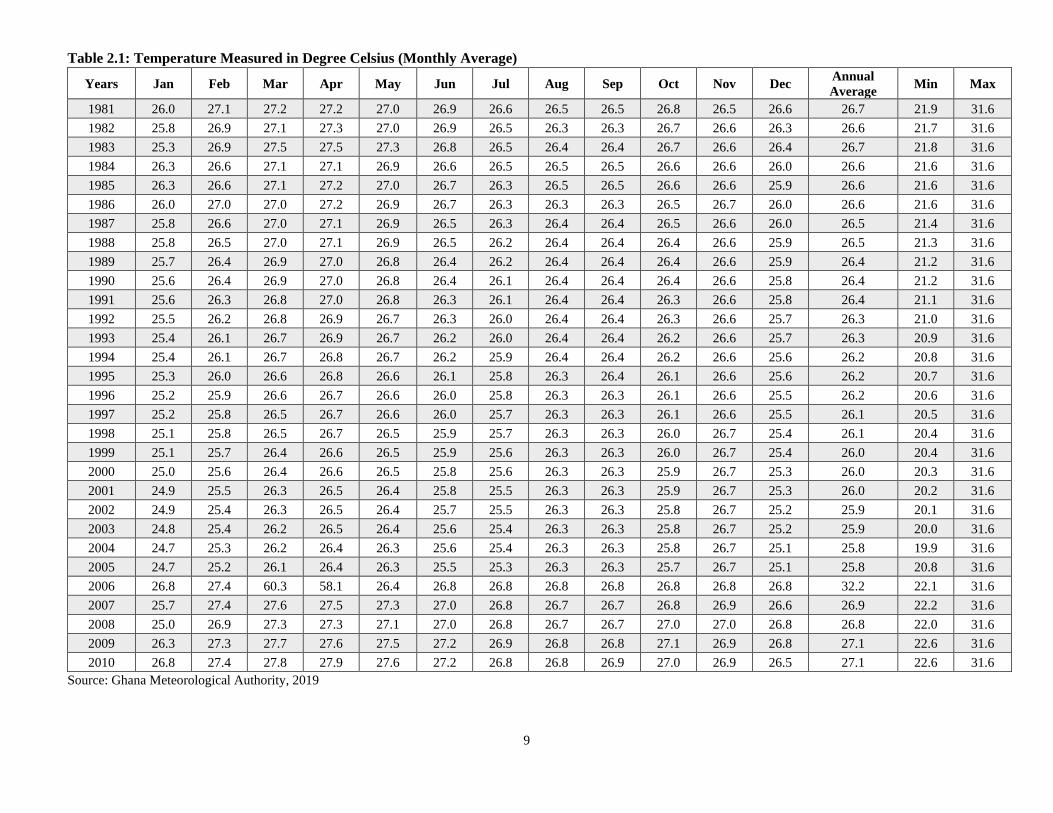
2.2.2 Temperature
A maximum monthly average temperature of 31oC. This was recorded throughout the period under review
1981-2010 and a minimum average of 21oC (Table 2.1 and Map 2.1).
8
Map 2.1: Temperature Maps, 1981- 2010
Source: Ghana Meteorological Authority, 2019
9
Table 2.1: Temperature Measured in Degree Celsius (Monthly Average)
Years Jan Feb Mar Apr May Jun Jul Aug Sep Oct Nov Dec Annual
Average Min Max
1981 26.0 27.1 27.2 27.2 27.0 26.9 26.6 26.5 26.5 26.8 26.5 26.6 26.7 21.9 31.6
1982 25.8 26.9 27.1 27.3 27.0 26.9 26.5 26.3 26.3 26.7 26.6 26.3 26.6 21.7 31.6
1983 25.3 26.9 27.5 27.5 27.3 26.8 26.5 26.4 26.4 26.7 26.6 26.4 26.7 21.8 31.6
1984 26.3 26.6 27.1 27.1 26.9 26.6 26.5 26.5 26.5 26.6 26.6 26.0 26.6 21.6 31.6
1985 26.3 26.6 27.1 27.2 27.0 26.7 26.3 26.5 26.5 26.6 26.6 25.9 26.6 21.6 31.6
1986 26.0 27.0 27.0 27.2 26.9 26.7 26.3 26.3 26.3 26.5 26.7 26.0 26.6 21.6 31.6
1987 25.8 26.6 27.0 27.1 26.9 26.5 26.3 26.4 26.4 26.5 26.6 26.0 26.5 21.4 31.6
1988 25.8 26.5 27.0 27.1 26.9 26.5 26.2 26.4 26.4 26.4 26.6 25.9 26.5 21.3 31.6
1989 25.7 26.4 26.9 27.0 26.8 26.4 26.2 26.4 26.4 26.4 26.6 25.9 26.4 21.2 31.6
1990 25.6 26.4 26.9 27.0 26.8 26.4 26.1 26.4 26.4 26.4 26.6 25.8 26.4 21.2 31.6
1991 25.6 26.3 26.8 27.0 26.8 26.3 26.1 26.4 26.4 26.3 26.6 25.8 26.4 21.1 31.6
1992 25.5 26.2 26.8 26.9 26.7 26.3 26.0 26.4 26.4 26.3 26.6 25.7 26.3 21.0 31.6
1993 25.4 26.1 26.7 26.9 26.7 26.2 26.0 26.4 26.4 26.2 26.6 25.7 26.3 20.9 31.6
1994 25.4 26.1 26.7 26.8 26.7 26.2 25.9 26.4 26.4 26.2 26.6 25.6 26.2 20.8 31.6
1995 25.3 26.0 26.6 26.8 26.6 26.1 25.8 26.3 26.4 26.1 26.6 25.6 26.2 20.7 31.6
1996 25.2 25.9 26.6 26.7 26.6 26.0 25.8 26.3 26.3 26.1 26.6 25.5 26.2 20.6 31.6
1997 25.2 25.8 26.5 26.7 26.6 26.0 25.7 26.3 26.3 26.1 26.6 25.5 26.1 20.5 31.6
1998 25.1 25.8 26.5 26.7 26.5 25.9 25.7 26.3 26.3 26.0 26.7 25.4 26.1 20.4 31.6
1999 25.1 25.7 26.4 26.6 26.5 25.9 25.6 26.3 26.3 26.0 26.7 25.4 26.0 20.4 31.6
2000 25.0 25.6 26.4 26.6 26.5 25.8 25.6 26.3 26.3 25.9 26.7 25.3 26.0 20.3 31.6
2001 24.9 25.5 26.3 26.5 26.4 25.8 25.5 26.3 26.3 25.9 26.7 25.3 26.0 20.2 31.6
2002 24.9 25.4 26.3 26.5 26.4 25.7 25.5 26.3 26.3 25.8 26.7 25.2 25.9 20.1 31.6
2003 24.8 25.4 26.2 26.5 26.4 25.6 25.4 26.3 26.3 25.8 26.7 25.2 25.9 20.0 31.6
2004 24.7 25.3 26.2 26.4 26.3 25.6 25.4 26.3 26.3 25.8 26.7 25.1 25.8 19.9 31.6
2005 24.7 25.2 26.1 26.4 26.3 25.5 25.3 26.3 26.3 25.7 26.7 25.1 25.8 20.8 31.6
2006 26.8 27.4 60.3 58.1 26.4 26.8 26.8 26.8 26.8 26.8 26.8 26.8 32.2 22.1 31.6
2007 25.7 27.4 27.6 27.5 27.3 27.0 26.8 26.7 26.7 26.8 26.9 26.6 26.9 22.2 31.6
2008 25.0 26.9 27.3 27.3 27.1 27.0 26.8 26.7 26.7 27.0 27.0 26.8 26.8 22.0 31.6
2009 26.3 27.3 27.7 27.6 27.5 27.2 26.9 26.8 26.8 27.1 26.9 26.8 27.1 22.6 31.6
2010 26.8 27.4 27.8 27.9 27.6 27.2 26.8 26.8 26.9 27.0 26.9 26.5 27.1 22.6 31.6
Source: Ghana Meteorological Authority, 2019
10
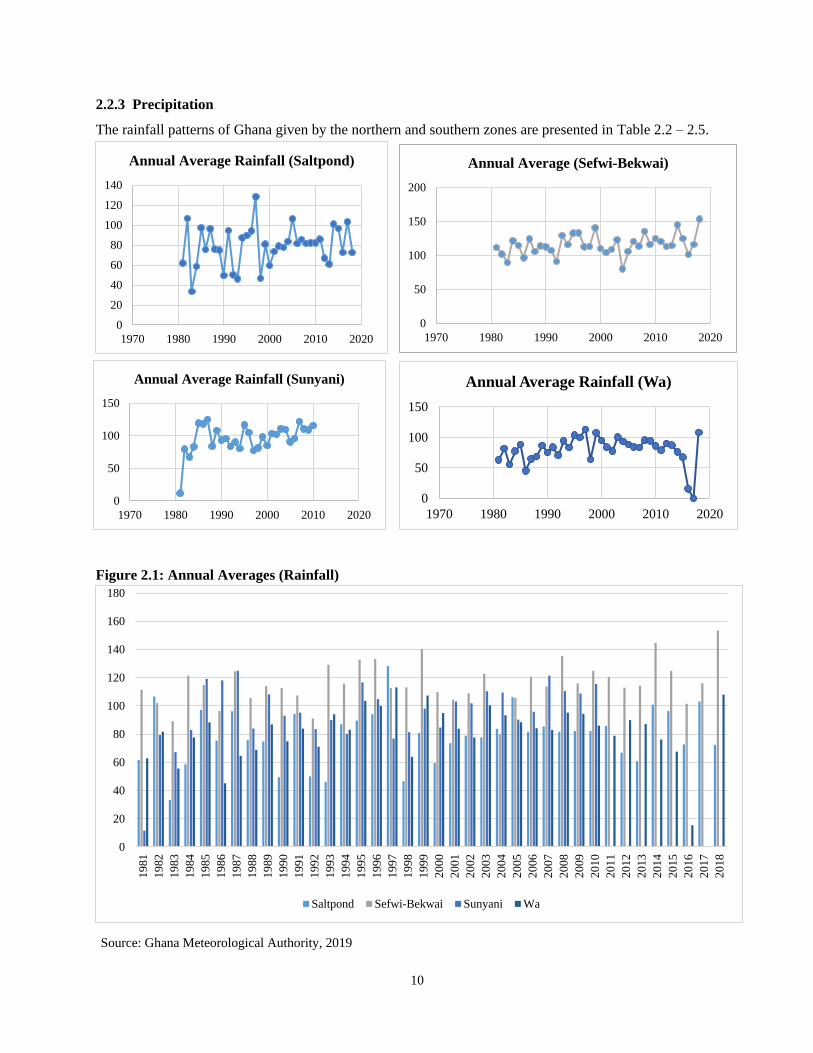
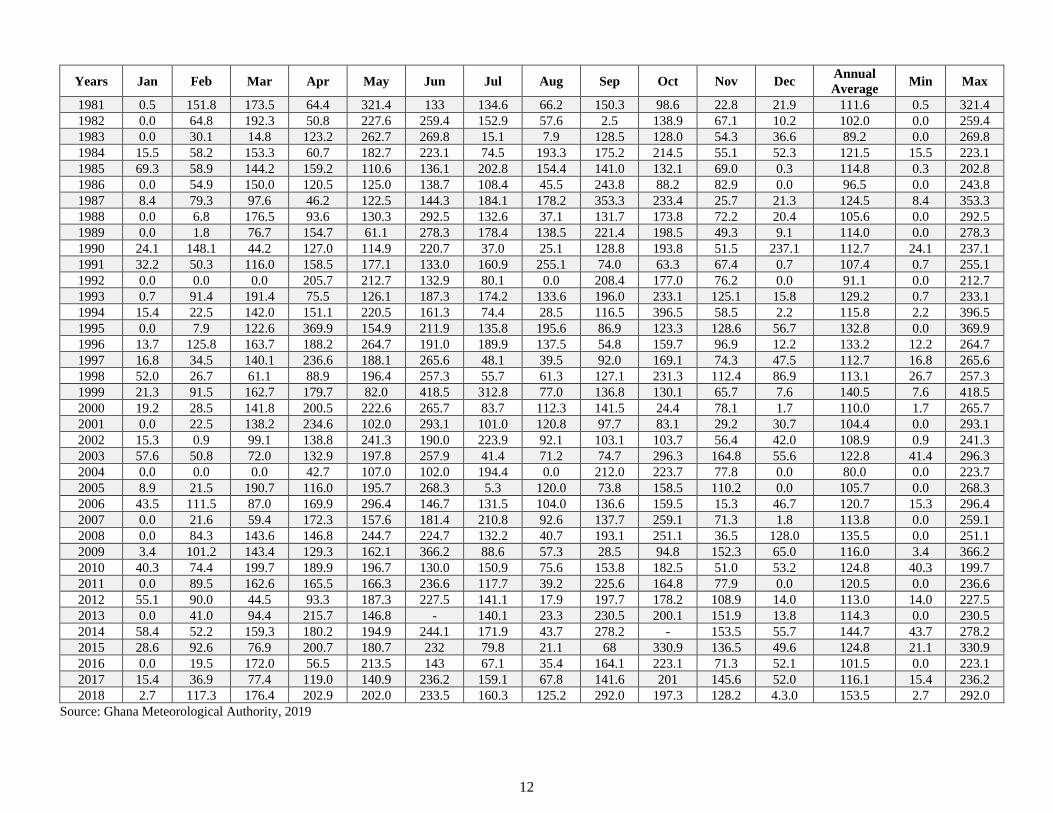
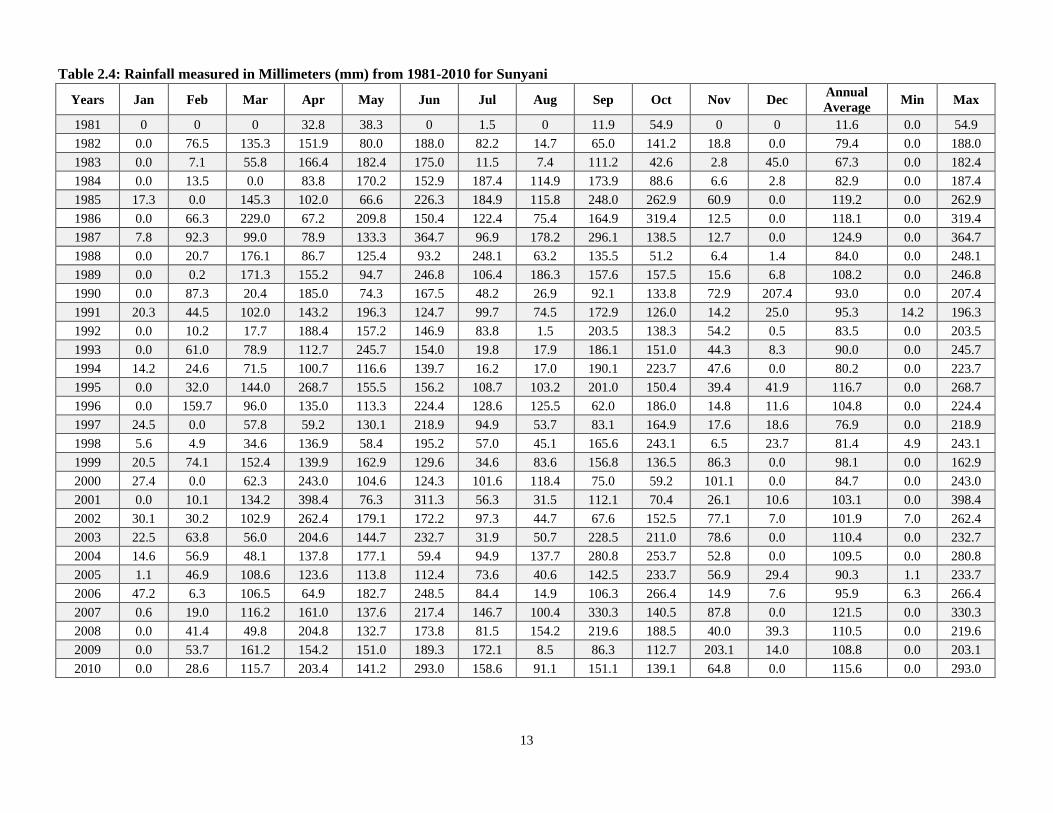
2.2.3 Precipitation
The rainfall patterns of Ghana given by the northern and southern zones are presented in Table 2.2 – 2.5.
Figure 2.1: Annual Averages (Rainfall)
Source: Ghana Meteorological Authority, 2019
0
20
40
60
80
100
120
140
160
180
1981
1982
1983
1984
1985
1986
1987
1988
1989
1990
1991
1992
1993
1994
1995
1996
1997
1998
1999
2000
2001
2002
2003
2004
2005
2006
2007
2008
2009
2010
2011
2012
2013
2014
2015
2016
2017
2018
Saltpond Sefwi-Bekwai Sunyani Wa
0
50
100
150
1970 1980 1990 2000 2010 2020
Annual Average Rainfall (Sunyani)
0
20
40
60
80
100
120
140
1970 1980 1990 2000 2010 2020
Annual Average Rainfall (Saltpond)
0
50
100
150
200
1970 1980 1990 2000 2010 2020
Annual Average (Sefwi-Bekwai)
0
50
100
150
1970 1980 1990 2000 2010 2020
Annual Average Rainfall (Wa)

11
Table 2.2: Rainfall Measured in Milliliters (mm) from 1981-2018 for Saltpond
Source: Ghana Meteorological Authority, 2019
Table 2.3: Rainfall Measured in Millimeters (mm) from 1981-2018 Sefwi Bekwai
Years Jan Feb Mar Apr May Jun Jul Aug Sep Oct Nov Dec Annual
Average Min Max
1981 0.8 8.9 104.1 93.5 108.9 288.9 87.2 0.8 0.5 48.0 0.0 0.0 61.8 0.0 288.9
1982 10.2 35.5 69.3 157.0 404.1 284.4 116.2 9.3 0.6 175.1 7.3 11.6 106.7 0.6 404.1
1983 0.0 0.0 0.0 18.9 230.8 86.2 3.7 7.0 26.3 9.9 0.0 17.4 33.4 0.0 230.8
1984 35.3 0.0 7.8 94.0 156.7 88.7 33.8 63.4 66.6 120.9 26.1 11.0 58.7 0.0 156.7
1985 54.6 28.1 63.7 175.7 366.4 319.8 37.7 15.8 24.1 45.4 35.5 0.0 97.2 0.0 366.4
1986 4.3 50.6 32.4 78.5 135.3 337.3 30.8 8.3 7.9 87.5 120.4 12.1 75.4 4.3 337.3
1987 9.5 0.0 114.0 47.3 106.8 31.7 68.2 110.2 382.7 207.2 76.7 0.0 96.2 0.0 382.7
1988 0.0 18.7 60.9 30.8 176.6 233.9 35.4 11.8 129.2 167.8 20.5 23.9 75.8 0.0 233.9
1989 10.6 5.2 121.7 88.6 195.7 313.4 46.5 17.4 22.6 73.6 2.2 0.0 74.8 0.0 313.4
1990 7.0 0.6 70.1 43.5 60.3 109.4 23.2 2.8 32.8 124.2 21.7 97.7 49.4 0.6 124.2
1991 51.8 1.0 13.3 104.8 440.0 166.3 199.1 45.7 52.5 57.0 1.0 0.0 94.4 0.0 440.0
1992 0.0 5.6 64.7 80.0 275.3 17.2 21.4 4.8 54.5 28.9 24.0 24.8 50.1 0.0 275.3
1993 17.0 27.0 73.9 45.5 57.5 143.9 1.6 21.5 65.5 41.3 44.2 14.6 46.1 1.6 143.9
1994 30.3 43.8 85.7 48.6 308.7 160.6 13.9 13.3 84.4 172.2 80.0 2.5 87.0 2.5 308.7
1995 0.0 0.8 94.4 223.0 223.4 339.4 61.1 38.8 25.1 56.6 9.4 2.9 89.6 0.0 339.4
1996 5.8 17.2 31.4 120.2 255.8 340.2 37.9 80.3 13.5 66.3 140.5 20.2 94.1 5.8 340.2
1997 8.5 63.9 184.7 123.1 346.0 465.4 41.4 2.3 12.5 156.8 53.0 82.3 128.3 2.3 465.4
1998 22.3 0.0 14.1 57.6 199.4 60.9 32.2 3.0 3.8 156.9 7.2 2.5 46.7 0.0 199.4
1999 43.7 14.7 60.3 155.7 81.1 379.3 65.2 55.7 13.6 32.1 59.6 9.3 80.9 9.3 379.3
2000 14.3 0.0 124.1 88.8 151.5 184.8 31.8 9.4 7.0 33.8 56.8 12.0 59.5 0.0 184.8
2001 0.0 29.3 124.6 90.6 324.1 108.9 51.6 14.5 44.5 38.1 38.6 17.3 73.5 0.0 324.1
2002 31.2 91.0 84.8 188.9 108.8 251.0 79.3 19.0 5.3 39.9 45.3 2.2 78.9 2.2 251.0
2003 3.9 17.0 128.0 119.4 235.0 187.0 13.4 4.6 35.4 129.6 42.8 16.8 77.7 3.9 235.0
2004 27.8 18.7 25.4 46.0 187.9 175.0 126.1 12.0 125.5 204.4 44.9 11.1 83.7 11.1 204.4
2005 30.3 11.1 133.5 90.7 320.4 377.6 33.1 11.4 68.4 144.7 45.7 7.2 106.2 7.2 377.6
2006 2.4 3.0 20.7 72.3 337.9 179.7 49.6 22.0 49.6 183.9 54.4 3.8 81.6 2.4 337.9
2007 0.0 19.3 99.3 85.4 194.6 124.8 84.8 66.9 82.0 214.3 20.5 32.8 85.4 0.0 214.3
2008 2.7 6.6 32.7 135.5 245.6 160.0 38.2 40.4 23.7 65.6 160.5 69.4 81.7 2.7 245.6
2009 20.1 39.2 37.9 125.5 94.0 319.7 286.8 2.3 4.4 10.0 11.8 34.0 82.1 2.3 319.7
2010 4.3 36.9 37.3 41.1 230.6 259.9 49.6 38.4 66.3 61.3 116.5 43.5 82.1 4.3 259.9
2011 0.0 13.7 0.5 204.1 165.5 263.4 129.7 50.6 46.2 99.6 2.3 53.2 85.7 0.0 263.4
2012 1.3 1.8 13.0 45.7 247.5 193.4 36.9 24.5 23.8 184.9 13.5 16.3 66.9 1.3 247.5
2013 31.6 14.3 89.7 52.3 172.5 165.0 40.8 1.9 52.9 63.3 30.6 15.8 60.9 1.9 172.5
2014 56.3 73.0 68.1 82.3 379.2 229.6 69.1 54.4 37.3 64.5 63.0 34.5 100.9 34.5 379.2
2015 13.5 66.0 116.0 59.8 178.3 353.6 43.4 5.3 2.4 203.8 113.1 2.8 96.5 2.4 353.6
2016 0.0 1.3 250.4 58.2 103.1 226.8 39.6 36.7 50.2 99.5 3.3 3.4 72.7 0.0 250.4
2017 73.4 28.1 28.3 114.2 158.3 296.7 52.3 38.5 92.1 131.7 110.4 113.1 103.1 28.1 296.7
2018 0.0 25.2 0.0 40.5 197.0 251.6 6.4 26.1 75.0 160.2 63.1 24.0 72.4 0.0 251.6
12
Years Jan Feb Mar Apr May Jun Jul Aug Sep Oct Nov Dec Annual
Average Min Max
1981 0.5 151.8 173.5 64.4 321.4 133 134.6 66.2 150.3 98.6 22.8 21.9 111.6 0.5 321.4
1982 0.0 64.8 192.3 50.8 227.6 259.4 152.9 57.6 2.5 138.9 67.1 10.2 102.0 0.0 259.4
1983 0.0 30.1 14.8 123.2 262.7 269.8 15.1 7.9 128.5 128.0 54.3 36.6 89.2 0.0 269.8
1984 15.5 58.2 153.3 60.7 182.7 223.1 74.5 193.3 175.2 214.5 55.1 52.3 121.5 15.5 223.1
1985 69.3 58.9 144.2 159.2 110.6 136.1 202.8 154.4 141.0 132.1 69.0 0.3 114.8 0.3 202.8
1986 0.0 54.9 150.0 120.5 125.0 138.7 108.4 45.5 243.8 88.2 82.9 0.0 96.5 0.0 243.8
1987 8.4 79.3 97.6 46.2 122.5 144.3 184.1 178.2 353.3 233.4 25.7 21.3 124.5 8.4 353.3
1988 0.0 6.8 176.5 93.6 130.3 292.5 132.6 37.1 131.7 173.8 72.2 20.4 105.6 0.0 292.5
1989 0.0 1.8 76.7 154.7 61.1 278.3 178.4 138.5 221.4 198.5 49.3 9.1 114.0 0.0 278.3
1990 24.1 148.1 44.2 127.0 114.9 220.7 37.0 25.1 128.8 193.8 51.5 237.1 112.7 24.1 237.1
1991 32.2 50.3 116.0 158.5 177.1 133.0 160.9 255.1 74.0 63.3 67.4 0.7 107.4 0.7 255.1
1992 0.0 0.0 0.0 205.7 212.7 132.9 80.1 0.0 208.4 177.0 76.2 0.0 91.1 0.0 212.7
1993 0.7 91.4 191.4 75.5 126.1 187.3 174.2 133.6 196.0 233.1 125.1 15.8 129.2 0.7 233.1
1994 15.4 22.5 142.0 151.1 220.5 161.3 74.4 28.5 116.5 396.5 58.5 2.2 115.8 2.2 396.5
1995 0.0 7.9 122.6 369.9 154.9 211.9 135.8 195.6 86.9 123.3 128.6 56.7 132.8 0.0 369.9
1996 13.7 125.8 163.7 188.2 264.7 191.0 189.9 137.5 54.8 159.7 96.9 12.2 133.2 12.2 264.7
1997 16.8 34.5 140.1 236.6 188.1 265.6 48.1 39.5 92.0 169.1 74.3 47.5 112.7 16.8 265.6
1998 52.0 26.7 61.1 88.9 196.4 257.3 55.7 61.3 127.1 231.3 112.4 86.9 113.1 26.7 257.3
1999 21.3 91.5 162.7 179.7 82.0 418.5 312.8 77.0 136.8 130.1 65.7 7.6 140.5 7.6 418.5
2000 19.2 28.5 141.8 200.5 222.6 265.7 83.7 112.3 141.5 24.4 78.1 1.7 110.0 1.7 265.7
2001 0.0 22.5 138.2 234.6 102.0 293.1 101.0 120.8 97.7 83.1 29.2 30.7 104.4 0.0 293.1
2002 15.3 0.9 99.1 138.8 241.3 190.0 223.9 92.1 103.1 103.7 56.4 42.0 108.9 0.9 241.3
2003 57.6 50.8 72.0 132.9 197.8 257.9 41.4 71.2 74.7 296.3 164.8 55.6 122.8 41.4 296.3
2004 0.0 0.0 0.0 42.7 107.0 102.0 194.4 0.0 212.0 223.7 77.8 0.0 80.0 0.0 223.7
2005 8.9 21.5 190.7 116.0 195.7 268.3 5.3 120.0 73.8 158.5 110.2 0.0 105.7 0.0 268.3
2006 43.5 111.5 87.0 169.9 296.4 146.7 131.5 104.0 136.6 159.5 15.3 46.7 120.7 15.3 296.4
2007 0.0 21.6 59.4 172.3 157.6 181.4 210.8 92.6 137.7 259.1 71.3 1.8 113.8 0.0 259.1
2008 0.0 84.3 143.6 146.8 244.7 224.7 132.2 40.7 193.1 251.1 36.5 128.0 135.5 0.0 251.1
2009 3.4 101.2 143.4 129.3 162.1 366.2 88.6 57.3 28.5 94.8 152.3 65.0 116.0 3.4 366.2
2010 40.3 74.4 199.7 189.9 196.7 130.0 150.9 75.6 153.8 182.5 51.0 53.2 124.8 40.3 199.7
2011 0.0 89.5 162.6 165.5 166.3 236.6 117.7 39.2 225.6 164.8 77.9 0.0 120.5 0.0 236.6
2012 55.1 90.0 44.5 93.3 187.3 227.5 141.1 17.9 197.7 178.2 108.9 14.0 113.0 14.0 227.5
2013 0.0 41.0 94.4 215.7 146.8 - 140.1 23.3 230.5 200.1 151.9 13.8 114.3 0.0 230.5
2014 58.4 52.2 159.3 180.2 194.9 244.1 171.9 43.7 278.2 - 153.5 55.7 144.7 43.7 278.2
2015 28.6 92.6 76.9 200.7 180.7 232 79.8 21.1 68 330.9 136.5 49.6 124.8 21.1 330.9
2016 0.0 19.5 172.0 56.5 213.5 143 67.1 35.4 164.1 223.1 71.3 52.1 101.5 0.0 223.1
2017 15.4 36.9 77.4 119.0 140.9 236.2 159.1 67.8 141.6 201 145.6 52.0 116.1 15.4 236.2
2018 2.7 117.3 176.4 202.9 202.0 233.5 160.3 125.2 292.0 197.3 128.2 4.3.0 153.5 2.7 292.0
Source: Ghana Meteorological Authority, 2019
13
Table 2.4: Rainfall measured in Millimeters (mm) from 1981-2010 for Sunyani
Years Jan Feb Mar Apr May Jun Jul Aug Sep Oct Nov Dec Annual
Average Min Max
1981 0 0 0 32.8 38.3 0 1.5 0 11.9 54.9 0 0 11.6 0.0 54.9
1982 0.0 76.5 135.3 151.9 80.0 188.0 82.2 14.7 65.0 141.2 18.8 0.0 79.4 0.0 188.0
1983 0.0 7.1 55.8 166.4 182.4 175.0 11.5 7.4 111.2 42.6 2.8 45.0 67.3 0.0 182.4
1984 0.0 13.5 0.0 83.8 170.2 152.9 187.4 114.9 173.9 88.6 6.6 2.8 82.9 0.0 187.4
1985 17.3 0.0 145.3 102.0 66.6 226.3 184.9 115.8 248.0 262.9 60.9 0.0 119.2 0.0 262.9
1986 0.0 66.3 229.0 67.2 209.8 150.4 122.4 75.4 164.9 319.4 12.5 0.0 118.1 0.0 319.4
1987 7.8 92.3 99.0 78.9 133.3 364.7 96.9 178.2 296.1 138.5 12.7 0.0 124.9 0.0 364.7
1988 0.0 20.7 176.1 86.7 125.4 93.2 248.1 63.2 135.5 51.2 6.4 1.4 84.0 0.0 248.1
1989 0.0 0.2 171.3 155.2 94.7 246.8 106.4 186.3 157.6 157.5 15.6 6.8 108.2 0.0 246.8
1990 0.0 87.3 20.4 185.0 74.3 167.5 48.2 26.9 92.1 133.8 72.9 207.4 93.0 0.0 207.4
1991 20.3 44.5 102.0 143.2 196.3 124.7 99.7 74.5 172.9 126.0 14.2 25.0 95.3 14.2 196.3
1992 0.0 10.2 17.7 188.4 157.2 146.9 83.8 1.5 203.5 138.3 54.2 0.5 83.5 0.0 203.5
1993 0.0 61.0 78.9 112.7 245.7 154.0 19.8 17.9 186.1 151.0 44.3 8.3 90.0 0.0 245.7
1994 14.2 24.6 71.5 100.7 116.6 139.7 16.2 17.0 190.1 223.7 47.6 0.0 80.2 0.0 223.7
1995 0.0 32.0 144.0 268.7 155.5 156.2 108.7 103.2 201.0 150.4 39.4 41.9 116.7 0.0 268.7
1996 0.0 159.7 96.0 135.0 113.3 224.4 128.6 125.5 62.0 186.0 14.8 11.6 104.8 0.0 224.4
1997 24.5 0.0 57.8 59.2 130.1 218.9 94.9 53.7 83.1 164.9 17.6 18.6 76.9 0.0 218.9
1998 5.6 4.9 34.6 136.9 58.4 195.2 57.0 45.1 165.6 243.1 6.5 23.7 81.4 4.9 243.1
1999 20.5 74.1 152.4 139.9 162.9 129.6 34.6 83.6 156.8 136.5 86.3 0.0 98.1 0.0 162.9
2000 27.4 0.0 62.3 243.0 104.6 124.3 101.6 118.4 75.0 59.2 101.1 0.0 84.7 0.0 243.0
2001 0.0 10.1 134.2 398.4 76.3 311.3 56.3 31.5 112.1 70.4 26.1 10.6 103.1 0.0 398.4
2002 30.1 30.2 102.9 262.4 179.1 172.2 97.3 44.7 67.6 152.5 77.1 7.0 101.9 7.0 262.4
2003 22.5 63.8 56.0 204.6 144.7 232.7 31.9 50.7 228.5 211.0 78.6 0.0 110.4 0.0 232.7
2004 14.6 56.9 48.1 137.8 177.1 59.4 94.9 137.7 280.8 253.7 52.8 0.0 109.5 0.0 280.8
2005 1.1 46.9 108.6 123.6 113.8 112.4 73.6 40.6 142.5 233.7 56.9 29.4 90.3 1.1 233.7
2006 47.2 6.3 106.5 64.9 182.7 248.5 84.4 14.9 106.3 266.4 14.9 7.6 95.9 6.3 266.4
2007 0.6 19.0 116.2 161.0 137.6 217.4 146.7 100.4 330.3 140.5 87.8 0.0 121.5 0.0 330.3
2008 0.0 41.4 49.8 204.8 132.7 173.8 81.5 154.2 219.6 188.5 40.0 39.3 110.5 0.0 219.6
2009 0.0 53.7 161.2 154.2 151.0 189.3 172.1 8.5 86.3 112.7 203.1 14.0 108.8 0.0 203.1
2010 0.0 28.6 115.7 203.4 141.2 293.0 158.6 91.1 151.1 139.1 64.8 0.0 115.6 0.0 293.0
14
Table 2.5: Rainfall Measured in Millimeters (mm) from 1981-2018 for Wa
Years Jan Feb Mar Apr May Jun Jul Aug Sep Oct Nov Dec Annual
Average Min Max
1981 0.0 0.0 90.8 29.5 160.2 85.6 109.5 135.9 98.2 45.3 0.0 0.0 62.9 0.0 160.2
1982 0.0 19.4 26.0 119.0 58.7 116.4 221.8 230.9 126.0 29.0 34.8 0.0 81.8 0.0 230.9
1983 0.0 6.8 20.9 83.7 85.8 89.8 116.2 55.7 139.1 68.7 0.5 0.0 55.6 0.0 139.1
1984 0.0 0.0 40.6 64.3 129.1 137.8 166.8 148.5 179.0 63.6 1.8 0.0 77.6 0.0 179.0
1985 0.0 0.0 72.7 77.5 130.4 155.6 186.1 224.7 193.8 0.0 18.9 0.0 88.3 0.0 224.7
1986 0.0 2.3 8.0 33.2 69.2 59.2 107.8 101.2 134.0 24.9 2.2 0.0 45.2 0.0 134.0
1987 0.0 0.0 18.6 30.3 30.4 103.9 96.5 293.9 104.5 97.3 0.0 0.0 64.6 0.0 293.9
1988 0.0 0.9 1.1 74.9 114.1 139.9 230.1 0.0 193.1 64.4 6.9 0.0 68.8 0.0 230.1
1989 0.0 0.0 43.5 41.9 92.8 151.8 114.0 237.5 218.9 105.1 0.0 37.0 86.9 0.0 237.5
1990 0.0 0.0 0.0 83.2 167.6 81.8 175.1 248.2 106.2 15.9 12.6 7.8 74.9 0.0 248.2
1991 0.0 0.4 23.0 115.1 171.5 80.4 236.9 186.1 63.1 130.8 0.0 0.0 83.9 0.0 236.9
1992 0.0 0.0 0.0 28.2 136.6 205.3 124.6 99.2 170.3 66.7 21.4 0.0 71.0 0.0 205.3
1993 0.0 2.5 18.8 152.7 83.9 156.8 183.6 306.5 159.5 64.6 0.7 0.0 94.1 0.0 306.5
1994 0.0 0.0 17.1 38.8 154.1 176.2 132.0 101.1 245.0 130.7 3.8 0.0 83.2 0.0 245.0
1995 0.0 1.9 17.4 101.8 175.5 123.6 188.5 319.3 229.5 68.2 8.6 8.3 103.6 0.0 319.3
1996 0.0 0.0 26.4 34.1 133.1 94.6 135.8 471.4 195.9 108.2 0.0 0.0 100.0 0.0 471.4
1997 0.0 0.0 39.2 98.0 188.4 290.5 124.7 128.7 277.8 191.2 18.4 0.0 113.1 0.0 290.5
1998 0.0 11.4 0.0 66.2 55.0 96.7 117.5 264.7 113.2 42.2 0.0 0.0 63.9 0.0 264.7
1999 5.8 68.9 39.2 60.1 91.9 250.0 150.3 192.7 353.1 75.8 1.1 0.0 107.4 0.0 353.1
2000 67.5 0.0 1.2 76.2 85.0 243.7 150.2 213.6 229.1 73.3 0.0 0.0 95.0 0.0 243.7
2001 0.0 0.0 0.0 85.7 210.9 191.6 84.5 269.8 136.5 26.0 0.0 0.0 83.8 0.0 269.8
2002 0.0 0.0 7.6 95.4 129.9 122.0 240.1 157.5 131.9 41.7 4.6 0.0 77.6 0.0 240.1
2003 0.0 11.7 16.7 99.9 178.8 219.4 91.1 220.8 272.6 76.5 16.9 0.0 100.4 0.0 272.6
2004 26.6 24.7 37.9 84.2 105.0 103.0 177.7 288.6 178.7 87.6 7.3 0.0 93.4 0.0 288.6
2005 0.0 0.0 18.6 186.0 149.2 135.3 121.2 200.3 215.0 34.6 0.0 0.0 88.4 0.0 215.0
2006 35.9 13.8 18.0 50.3 41.0 143.3 100.9 304.5 219.4 83.3 0.0 0.0 84.2 0.0 304.5
2007 0.0 0.0 17.4 156.9 198.0 72.4 121.7 186.5 103.2 113.1 26.9 0.0 83.0 0.0 198.0
2008 0.0 0.0 43.8 80.0 109.3 109.1 219.9 186.5 277.7 117.4 0.0 0.0 95.3 0.0 277.7
2009 0.0 0.0 38.8 78.4 103.9 228.6 162.7 190.7 215.1 111.7 1.5 0.0 94.3 0.0 228.6
2010 0.0 4.0 0.0 186.9 145.4 48.4 123.2 294.8 156.5 70.6 1.8 0.0 86.0 0.0 294.8
2011 0.0 8.8 17.8 58.2 124.2 131.1 104.2 228.5 208.6 63.1 1.5 0.0 78.8 0.0 228.5
2012 0.0 7.1 7.3 67.9 139.1 112.0 138.9 138.8 319.9 145.6 2.2 0.0 89.9 0.0 319.9
2013 0.0 64.1 72.6 112.6 95.5 50.0 120.6 251.5 164.5 103.0 10.2 0.0 87.1 0.0 251.5
2014 0.0 0.0 25.8 113.8 79.1 181.5 71.2 130.3 224.3 51.8 36.6 0.0 76.2 0.0 224.3
2015 0.0 2.0 6.8 24.7 71.2 77.5 80.5 226.5 205.3 117.1 0.0 0.0 67.6 0.0 226.5
2016 0.0 0.0 49.8 11.6 - - - - - - - - 15.4 0.0 49.8
2017 - - - - - - - - - - - - - - -
2018 0.0 93.7 25.9 80.3 136.4 164.7 122.7 361.0 180.3 130.8 0.0 0.0 108.0 0.0 361.0
Source: Ghana Meteorological Authority, 2019

15
2.2.4 Watersheds
Ghana is drained by the Volta, South-Western and Coastal Rivers Systems covering 70%, 22% and 8%,
respectively, of the total area of the country. The Volta River System comprises the White, Black and Red
Volta and Oti Rivers. The South-Western Rivers System comprises the Bia, Tano, Ankobra and Pra Rivers.
The Coastal Rivers System comprises the Kakum/Bruku, Ochi-Nakwa, Ayensu, Densu, Odaw and
Tordzie/Aka Rivers. Ghana shares the Volta River basin with Burkina Faso, Togo, Cote d’Ivoire and Mali.
It also shares the Bia and Tano River basins with Cote d’Ivoire. The total annual runoff for Ghana is about
54.4 billion m3 out of which the Volta, South-western and Coastal Rivers Systems contribute a total of 38.3
billion m3 in the proportions of 64.7%, 29.2% and 6.1%, respectively.
2.2.5 The Black Volta River Basin
The Black Volta River Basin is a trans-national river system that stretches from the north to the south
through Mali, Burkina Faso, Ghana and Cote d’Ivoire, and from the west to the east, Burkina Faso, Cote
d’Ivoire and Ghana. The basin is drained by the Bougouriba, Gbongbo, Grand Bale, VounHou, Sourou,
Wenare, Bambassou, Bondami, Mouhoun (main Black Volta), Tain and Poni rivers as main tributaries. The
Ghana portion of the basin covers an area of 18,384 km2 constituting 14% of the basin and six (6) sub-
catchments which are Lerinord, Nwokuy, Bui, Dapola, Noumbiel and Bamboi.
2.2.6 Densu Basin
The Densu Basin is located at the South-Eastern part of Ghana and lies within longitudes 10 30'W -10 45'W
and latitudes 50 45'N - 60 15'N. It shares its catchment boundary with the Odaw and Volta Basins to the
east and north, the Birim in the northwest and the Ayensu and Okrudu in the west. The Densu River Basin
has an area of 2,490 km2 and spans 11 Local Government Assemblies in three regions (i.e. Central Region,
Eastern Region and the Greater Accra Region). There are about 200 settlements in the Basin and the total
population is over 600,000, with a density of 240 persons per km2. The density is higher than the national
average of about 100 persons per km2. The main economic activity is agriculture, which engages about 40%
of the economically active population.
The vegetation consists of coastal savannah, thicket and grassland in the south, and moist semi-deciduous
forest in the north. The river takes its source from the Atewa Range near Kibi and flows for 116 km into
the Weija Reservoir before entering the Gulf of Guinea through the Densu Delta Ramsar Site. The mean
annual runoff is 500 x 106 m3. The Densu River is of specific importance since it includes the Weija
Reservoir which supplies water for approximately half of the Accra Metropolitan Area. From the source to
the Gulf of Guinea, the Densu River traverses upper Birimian rocks (phyllites, schists, tuffs and grey
16
wackes) in the upper reaches, middle Birimian rocks (granites and granodiorites) in the middle segments
and Togo series (quartzites, shale and phyllites) in the lower portions. The Densu Basin is generally low
lying with undulating topography and isolated ridges forming the characteristic landscape features in many
places.
The soils are mainly well-drained, friable, porous, loamy savanna Ochrosols mostly red or reddish brown
in colour. They are generally low in nutrients especially phosphorus and nitrogen. In the northern parts of
the Basin are forest Ochrosols, red or reddish-brown, orange-brown or brown in colour with adequate
amounts of nutrients. Animals such as deer, African python, alligators, antelopes and crocodiles used to be
common in the Basin but all are now extinct. These animal species have been replaced by grasscutters and
rats. There are about 18 fish species in the Densu including the Weija Reservoir. However, the most
commonly fished species are Tilapia and Mud-fish. The map below shows the topography of the Basin.
2.2.7 Pra Basin
The Pra Basin is located between Latitudes 50 N and 70 30’ N, and Longitudes 20 30’ W, and 00 30’ W,
in south-central Ghana. The drainage network comprises the main Pra and its major tributaries of Birim,
Anum, and Offin rivers and their tributaries. The drainage area is about 22,106km2, with an average
elevation of about 300m and generally less than 600m above sea level. It features the Lake Bosomtwe,
which is a natural lake that stands out as a prominent protected area. It is believed to have been created as
a result of a meteoritic impact and is an object of intense interest to both national and international
researchers. It is also a significant tourist site.
The Offin sub-basin is the main source of water supply to Kumasi and its environs, through two reservoirs,
namely Barekese and Owabi dams. The Birim sub-basin is located predominantly in the Eastern Region
and has attractive historic places and nine forest reserves. For instance, the Esen Epan forest reserve near
Akim Oda is a tourist site with the biggest tree in West Africa at 12m in circumference and 66.5m tall.
The Pra River and its tributaries constitute a major source of water supply to communities within the basin.
The major tributaries are perennial and constitute all-year-round reliable water source. However, human
activities such as mining, logging etc. are having adverse impacts and degrading the surface water resources
of the basin. The Pra Basin is one of the most extensively and intensively used river basin areas in Ghana
in terms of settlement, agriculture, logging and mining. The basin contains most of the large cocoa growing
areas in the Eastern, Ashanti, and Central regions.
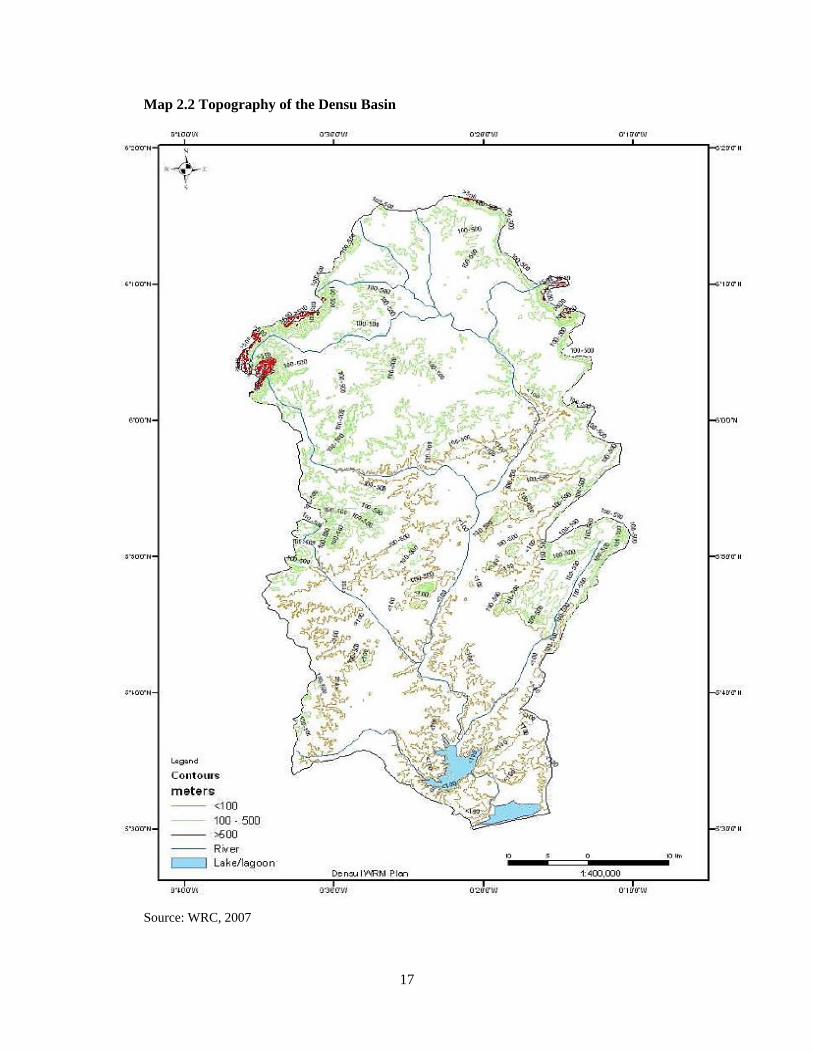
17
Map 2.2 Topography of the Densu Basin
Source: WRC, 2007

18
Map 2.3: Pra and Sub-Basins
Source: WRC, 2007
2.2.8 Ankobra Basin
The Ankobra Basin is one of the south-western basins of Ghana. It is located within latitudes 4o 52'N and
6o 27'N, and longitudes 1o 42'W and 2o 33'W. It is bounded to the East; West and South by the Pra Basin,
Tano Basin and the Gulf of Guinea, respectively. The basin has an area of 8,403 km2 spanning 11 districts
in three regions with Wassa Amenfi, Wassa West and Nzema East Districts making 81% of the total area.
The basin falls under the South-Western Equatorial and the Wet Semi-Equatorial climatic regions. The
South-Western Equatorial is the wettest climatic region in Ghana with mean annual rainfall above 1900mm.
The vegetation of the basin comprises the Rain forest as well as the Moist-semi deciduous forest.

19
Map 2.4: Topography of Ankobra Basin
Source: WRC, 2007
20
2.3 Geological and geographical information
Ghana is located along the Gulf of Guinea and the Atlantic Ocean in the sub-region of West Africa. The
geology of the country falls mainly within the Precambrian Leo-Man Shield of West Africa. Ghana can be
subdivided into four distinct major lithostratigraphic/lithotectonic complexes:
i. Paleoproterozoic supercrustal and intrusive rocks which was formed between 2195 Ma and 2072
Ma;
ii. Neoproterozoic to Early Cambrian, lithologically diverse platform sediments (Voltaian
Supergroup), consisting of 1000 Ma to 950 Ma old Kwahu- ‘Morago’ (Bombouaka) Group at the
base, followed after a hiatus of 300 Ma by the Oti-Pendjari Group, which was deposited after 630
Ma, and the late Neoproterozoic to Early Cambrian Obosum Group at the top;
iii. Rocks of the Panafrican Dahomeyide orogenic belt, which include-listed according to increasing
degree of deformation and metamorphism - the Buem Structural Unit, the Togo Structural Unit, as
well as variety of gneisses of the Dahomeyan Supergroup (peak metamorphism at c.600 Ma) and
some interleaved Eburnean protoliths; and
iv. Isolated and spatially restricted coastal sedimentary basins of Ordovician to Cretaceous age, mostly
related to the opening of the Atlantic or proto-Atlantic Ocean (Sekondian Group, Accraian Group,
Amisian, Apollonian Group).
The Birimian Supergroup comprises belt and basin terrains that are respectively made up of dominantly
tholeiitic basalts (Hirdes et al., 1993; Zitzmann et al., 1997), minor andesites (Loh and Hirdes, 1999) and
rhyolites, and folded metasediments comprising wacke, argillite, chemical sediments and volcanoclastics
(Hirdes et al., 1993). The Tarkwaian Group comprises primarily a sequence of folded, faulted and
metamorphosed sandstones, conglomerates and shale (Sestini, 1973; Eisenlohr and Hirdes, 1992).
The intrusive rocks comprise both granitoid and mafic types. The granitoid intrusions are historically
divided into the “belt” and “basin” types (Dixcove and Cape Coast granitoids, respectively). The “belt”
granitoids are considered more commonly diorite to granodiorite, whilst “basin” types tend to be
granodioritic to granitic in composition (Griffis et al., 2002). The Mafic intrusions occur in most of the
volcanic belts of Ghana but are particularly abundant in the Ashanti Belt and to a lesser degree in the Sefwi
Belt. Compositionally they are mostly gabbroic to pyroxenitic (Loh and Hirdes, 1999). The rocks of the
Togo Structural Unit consist of chert, phyllite, quarzitic sandstone, quartzite, mica schist and minor
sandstone.

21
The Dahomeyan Supergroup comprises mafic to felsic schists, gneiss and migmatites considered to have
been metamorphosed during the Pan-African tectonothermal event (approximately 500 Ma). The Buem
Structural Unit consists of a thick, lower sequence of clastic sediments with some carbonate and tillite units
succeeded by clastics and volcanics that include mafic flow units and pyroclastic rocks (Kesse, 1985).
The Voltaian Supergroup consists mainly of flat lying or very gently dipping sediments that apparently
defines the eastern margin of a large West African cratonic block and sits on a major Precambrian erosional
unconformity. The Voltaian Supergroup is subdivided into the lower Bombouaka Group, the middle Oti-
Pendjari Group and the upper Obosum Group. The lower Bombouaka Group is approximately 1000m thick
and dominated by mature sandstones and a central section of siliceous and clay-rich units.
The middle Oti-Pendjari Group sediments is about 2500m thick succession and include a distinctive lower
sequence with tillite and sandstones, carbonate, and fine-grained cherty sediments (silexite). The upper
Obosum Group is only about 500 m thick and consists of a basal section that also includes glacial tillites.
These are overlain mainly by cross-bedded quartz sandstones with subordinate shale and mudstones which
are now interpreted to represent a foreland molasse basin (Affaton et al., 1980). The rocks of the Accraian
Group are composed of sandstone interbedded with shale, finely laminated mudstone and medium grained
thickly bedded sandstone. They cover approximately 28 square miles in the vicinity of Accra. The rocks of
the Sekondian Group consist of feldspathic sandstones, siltstones and shales. The rocks of the Amisian
Group consist of conglomerate, micaceous sandstone, arkose and mudstone. The rocks of the Apollonian
Group consist of limestone, marl, mudstone with intercalated sandy beds. Sedimentation in coastal basins
continued as evidenced by Tertiary and Quaternary clastic sediments widespread in the Keta and Tano
basins.
2.3.1 Geographical Conditions
This section provides information on Ghana’s geographical conditions such as the area, elevation and length
of marine coastline, among others as presented in Table 2.6.
Ghana’s coastal area is a low lying plain rising from the Atlantic coast and the altitude is generally low not
more than 200 m above sea level except in the east. It has a narrow continental shelf extending outward to
between 20 and 35 km, except off Takoradi where it reaches between 80 and 90 km. The Economic
Exclusion Zone (EEZ) of 200 nautical miles has a surface area of nearly 200,000 km2. The coast consists
of low-lying plains and sandy shores which is interspersed with rocky shores, numerous lagoons (92 in
total), and estuaries. The area is also intersected by several rivers and streams, most of which are navigable
only by canoe. Two large capes (Cape Three Points on the west and Cape St. Paul on the east) are important
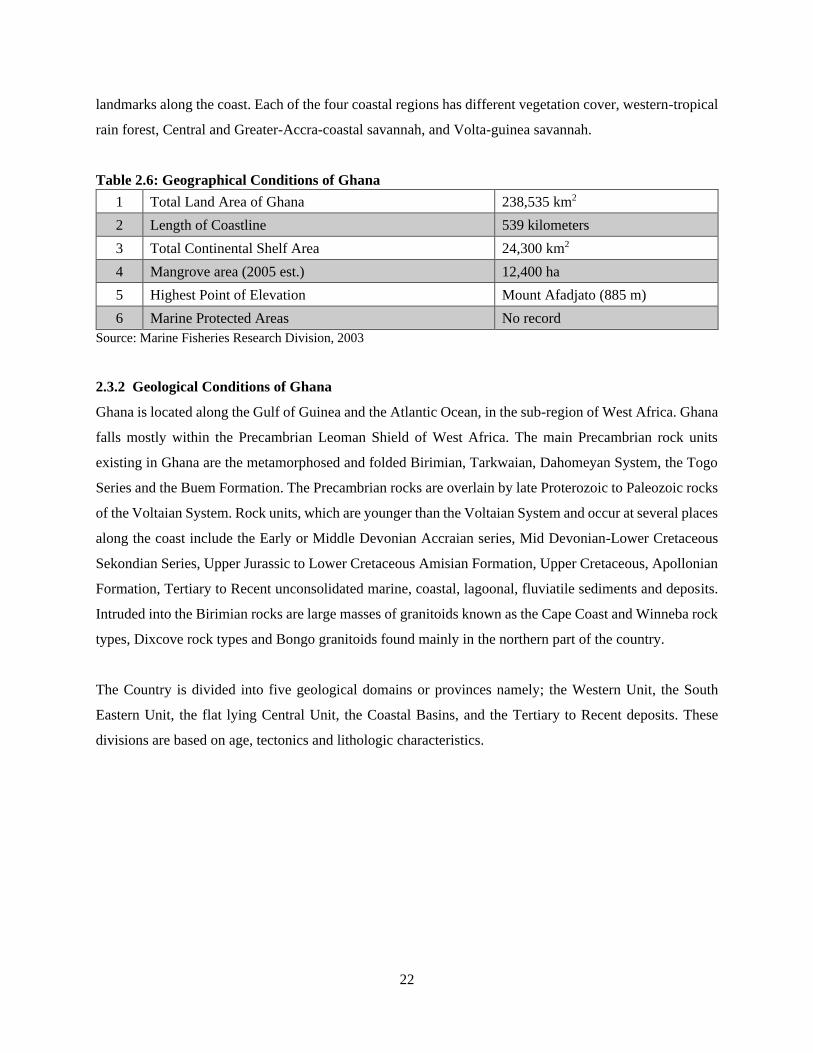
22
landmarks along the coast. Each of the four coastal regions has different vegetation cover, western-tropical
rain forest, Central and Greater-Accra-coastal savannah, and Volta-guinea savannah.
Table 2.6: Geographical Conditions of Ghana
1 Total Land Area of Ghana 238,535 km2
2 Length of Coastline 539 kilometers
3 Total Continental Shelf Area 24,300 km2
4 Mangrove area (2005 est.) 12,400 ha
5 Highest Point of Elevation Mount Afadjato (885 m)
6 Marine Protected Areas No record
Source: Marine Fisheries Research Division, 2003
2.3.2 Geological Conditions of Ghana
Ghana is located along the Gulf of Guinea and the Atlantic Ocean, in the sub-region of West Africa. Ghana
falls mostly within the Precambrian Leoman Shield of West Africa. The main Precambrian rock units
existing in Ghana are the metamorphosed and folded Birimian, Tarkwaian, Dahomeyan System, the Togo
Series and the Buem Formation. The Precambrian rocks are overlain by late Proterozoic to Paleozoic rocks
of the Voltaian System. Rock units, which are younger than the Voltaian System and occur at several places
along the coast include the Early or Middle Devonian Accraian series, Mid Devonian-Lower Cretaceous
Sekondian Series, Upper Jurassic to Lower Cretaceous Amisian Formation, Upper Cretaceous, Apollonian
Formation, Tertiary to Recent unconsolidated marine, coastal, lagoonal, fluviatile sediments and deposits.
Intruded into the Birimian rocks are large masses of granitoids known as the Cape Coast and Winneba rock
types, Dixcove rock types and Bongo granitoids found mainly in the northern part of the country.
The Country is divided into five geological domains or provinces namely; the Western Unit, the South
Eastern Unit, the flat lying Central Unit, the Coastal Basins, and the Tertiary to Recent deposits. These
divisions are based on age, tectonics and lithologic characteristics.
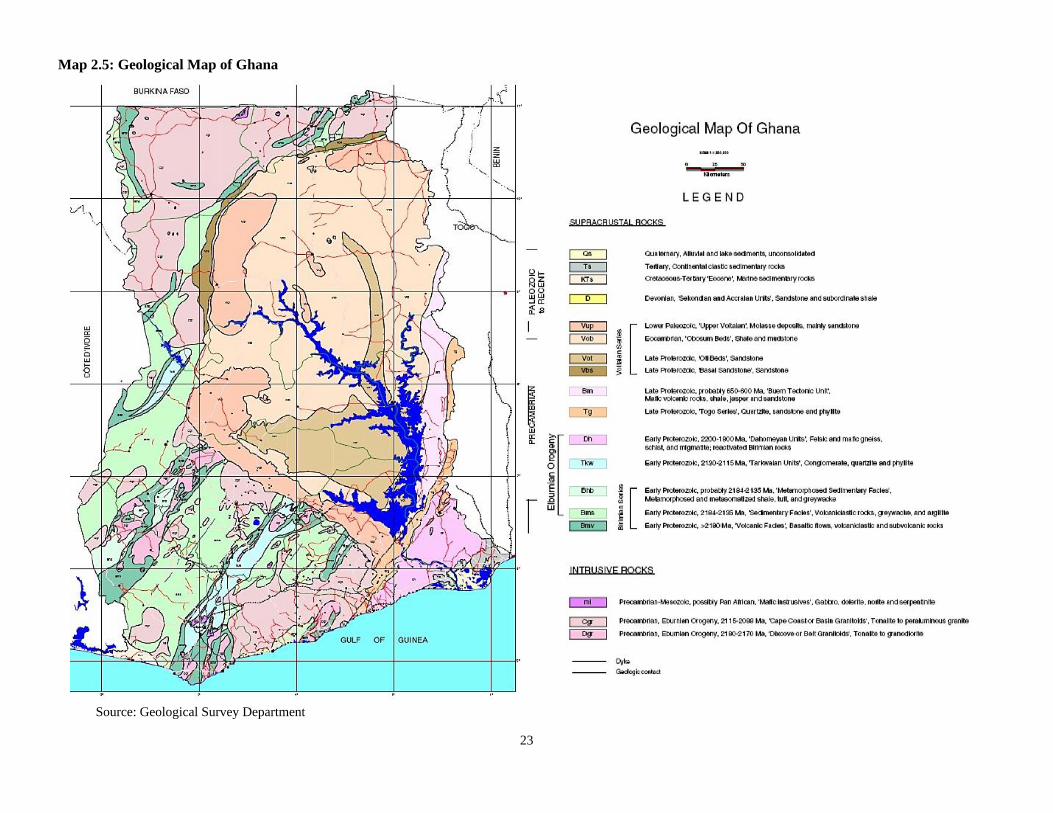
23
Map 2.5: Geological Map of Ghana
Source: Geological Survey Department
24
2.3.3 Soil Characteristics
The interim Ghana soil classification system (Brammer, 1962) identified forty-two (42) dominant soil
groups. The dominant ones include the Forest Ochrosols (Acrisols & Lixisols World Reference Base
(WRB)8, 1998), Savanna Ochrosols (Acrisols, Lixisols, Nitisols & Plinthosols WRB, 1998) and Forest
Oxysols (Acrisols & Ferralsols WRB,1998). They are deeply weathered soils belonging to the Latosol soil
group family at the preceding higher level. They are similar to the Zonal soils described in the broad soil
classification system of Vine (1966), and by Webster and Wilson (1980). Other extensive soils include the
Groundwater Laterites (Plinthosols & Lixisols – WRB, 1998), Tropical Black Earths (Vertisols &
Cambisols–WRB,1998) and Tropical Grey Earths (Solonetz –WRB,1998), as noted by Adjei-Gyapong and
Asiamah (2002). The soils of Ghana have also been studied extensively and correlated to the international
soil classification systems, such as the WRB Ahenkorah et al (1994) and Amatekpor and Dowuona (1998).
2.3.3.1 Forest Ochrosols
The soils of the Forest Ochrosols (Acrisols, Lixisols – WRB, 1998) are deeply weathered soils found in the
semi-deciduous forest and parts of the forest-savanna transition agro-ecological zones of Ghana. These
zones stretch from Wa to the East along the middle portions of the country across the Volta Lake. Together,
the soils cover an extensive area of 3,144,575 ha. The soil profiles are matured and often show clay
accumulation in the subsoil. They consist of thin (about 20 cm), dark greyish brown, humus-stained, sandy
loam and silt loam top soils which are usually moderate fine granular in structure and friable in consistency.
The sub soils are thick, often more than 120 cm thick over the weathered substratum. They may be red or
brown to yellowish brown showing faint mottles as influenced by physiography and internal drainage.
Coarse and prominent mottles occur in plinthic horizons.
The texture of the subsoil is highly variable. It may be sandy clay loam, silty clay loam, sandy clay or silty
clay with common to many (10-40%) quartz gravels and stones and hard iron and manganese dioxide
concretions. The soils are moderate to strong medium subangular blocky to angular blocky structured with
a firm to very firm consistency. Non-gravelly, none-concretionary materials of about 50-120 cm thick from
the surface may develop in what is locally termed as drift materials on small hills and upland depressions.
Soil colour is an important criterion in grouping these soils at the succeeding lower taxonomic level (Great
soil subgroup) under which we have Red and Yellow Forest Ochrosols. These are further subdivided
according to parent material and topography with its influence on soil colour (topohydro sequence) into
8 http://www.fao.org/soils-portal/soil-survey/soil-classification/world-reference-base/en/ | accessed Wednesday 6,
2019 at 20:30hrs
25
various soils series. These soils are suitable for a wide range of crops especially tree crops such as cocoa,
coffee, oil palm, para-rubber, citrus and food crops such as plantain, cocoyam, maize, yam and cassava.
Soil management measures should involve mixed cropping, use of cover crops and mulching to maintain
organic matter and surface moisture and check runoff, agroforestry, manuring and inorganic fertilizer
application to boost the fertility status of the soil, planting along the contour and minimizing clearing of
forest during mechanized cultivation because of the steep slopes and the presence of gravels and ironstone
concretions within the plough layer.
2.3.3.2 Forest Oxysols
The Forest Oxysols (Acrisols, Ferralsols – WRB, 1998) cover approximately 647,773 ha land area and are
mainly found in the high rainforest zone and consist of moderately shallow to deep, highly weathered,
yellowish brown, well-drained, gravelly and concretionary to light or gritty clay upland soils developed
over phyllite or biotite granite with silty clay loam textures. In some areas, the soils are very deep, well-
drained, gravel-free, yellowish brown sandy clay loams developed from Tertiary sands. All the Forest
Oxysols exhibit chemical properties that show little variation from each other. They are severely leached
of bases, as a result, the pH values vary from 4.1 to 5.5. The CEC does not exceed 13 cmol(+)kg with
kaolinite as the dominant clay mineral. Organic carbon is generally more than 1% in the A horizon
decreasing to less than 10g/kg in the subsoil. Total N varies from 0.5% in the A horizon to as low as 0.35
g/kg in the lower horizons. The soils are suitable for the cultivation of both tree crops such as oil palm,
rubber, citrus and coconut as we as arable crops which include cassava, pineapple and groundnut.
The soils are susceptible to erosion and hence soil management measures should be adhered to. Topsoil
clearance should be kept to the barest minimum because of the heavy rainfall within the High Rain Forest
Agroecological Zone, where these soils occur. This will maintain the fragile topsoil structure, check erosion
through reduced runoff and maintain the nutrient status. This conservation measure must be rigidly
observed for soils on steep slopes. Cultivation of plantation crops with closed canopies must be encouraged
to reduce direct impact by raindrops. Mixed cropping systems are also recommended. Liming to bring the
pH to appropriate levels and to improve the fertility status is necessary for most arable crops.
2.3.3.3 Savanna Ochrosols
The soils of the Savannah Ochrosols (Acrisols, Lixisols, Nitisols, Plinthosols – WRB, 1998) are similar to
the Forest Ochrosols except that they occur in the savanna areas with semi-arid climatic conditions.
Together, they cover an area of about 2.35m ha. Though the soils are moderately deep to deep, the solum

26
is relatively thinner than the forest counterparts. Decomposing rock or hard rock may be encountered within
150 cm depth. The topsoils are generally thin.
The Savanna Ochrosols have generally low organic matter due to insufficient accumulation of biomass (less
than 2% in the topsoil) under savanna conditions. Soil reaction ranges from near neutral, pH 6.0 – 7.0 in
the A horizon, becoming slightly to moderately acid with depth. Cation exchange capacity is generally
between 1 and 15 cmol(+)/kg. Morphologically, the soils consist of three major groups namely, the shallow
to very shallow, the moderately shallow to moderately deep, and the deep to very deep soils.
The shallow to very shallow phase are susceptible to erosion and are marginal and therefore are best left
under the natural vegetation or used as pasture. The moderately shallow to moderately deep, and the deep
to very deep soils are suitable for tree crops like cashew and mango, and arable crops like yam, guinea corn,
millet, maize, cowpea and groundnut, cassava, pineapple etc., as well as suitable for pasture grazing. The
bulk of the country’s food crops are grown on these soils. Soil management measures should include
manuring, fertilizer application, especially N and P and crop rotation to improve and maintain the fertility
status. Mulching, contour ploughing, strip cropping and terracing, especially on the upland members,
should also be adopted to check erosion.
2.3.3.4 Groundwater Laterites
The Groundwater Laterites (Plinthosols, Lixisols) cover about 2.7 million hectares of land and occur over
Voltaian shales and sandstones, granites and phyllites within the Interior Savanna and Transitional Zone
where they constitute almost 50% of the soils in the zone. The soils are mostly found on a level to near
level upper and lower slopes and consist of a thin pale-coloured, sandy or silty loam material overlying a
vesicular, highly mottled in situ developed ironpan, which is underlain at varying depths by partially
weathered or highly mottled material and mudstones or by phyllite or granite. The Groundwater Laterites
have pH values similar to the Savanna Ochrosols; the surface layer is near-neutral with the surface being
moderate to very acid. Organic and total nitrogen contents are below 20 g/kg and 0.3 g/kg, respectively.
Cation exchange capacity (CEC) is generally less than 10 cmol(+)/kg due to presence of high activity clays.
The soils are shallow and very poor in fertility and therefore are unsuitable for large-scale mechanized
cultivation of arable crops. However, they can be put under cultivation by using bullock plough or hand
implements, given good management practices. However, the deep variants are suitable for mechanized
cultivation of arable crops. Suitable crops on the shallow soils include rice and vegetables. Suitable crops
on the deep soils include rice, sugar cane, maize, millet, guinea corn and groundnut. Pasture for livestock

27
grazing may be undertaken on both variants. Soil management measures may involve manuring, application
of fertilizers, crop rotation, involving especially leguminous crops, and mulching, strip cropping and
leaving the residue after harvest.
2.3.3.5 Tropical Black Earths
The most extensive Tropical Black Earths (Vertisols and Cambisols) occur within the Coastal Savanna and
the Interior Savanna agro-ecological zones of Ghana. Within the Coastal Savanna Zone where they cover
about 70,0000 ha of land. The soils are developed over basic gneiss on low uplands and are associated on
the valley flats by the plastic and acid variants. Within the Interior Savanna Zone, the soils are very limited
in extent and occur in pockets and are underlain by basic intrusive rocks in the north-west and along the
White Volta river to the extreme north-east of the zone. The soil reaction is near-neutral or moderately acid
to acid in the topsoil and becomes increasing alkaline with depth because of the accumulation of calcium
carbonate concretions. Iron-manganese concretions are also present in the subsoil. Organic matter content
is less than 20 g/kg while total nitrogen is less than 1 g/kg. The clay content is more than 30% and CEC is
greater than 30 cmol(+)/kg because of the dominance of high activity clays such as smectites and
vermiculites.
The soils are very productive and can support a wide variety of crops given appropriate machinery and
proper management practices. However, because of the presence of high activity clays (Vertisols), the soils
become saturated with water during the rainy season and dry out almost completely, developing cracks,
during the dry season making their cultivation with simple implements very difficult. The presence of
vermiculite causes problems for K availability while the Fe-Mn concretions sorb a large amount of
phosphorus. Arable crops like rice, cotton, sugar cane, cowpea and vegetables are suitable on these soils.
Soil management measures should involve manuring, application of fertilizers, crop rotation, involving
especially leguminous crops, and improved land preparation (such as cambered beds, ridges) to drain excess
water and to conserve moisture during the dry season.
2.3.3.6 Tropical Grey Earths
The Tropical Grey Earths (Solonetz) are soils developed from acidic gneisses and schists at very gentle
topography mainly within the Coastal Savanna Zone, especially in the South-eastern sections. These soils
occur at upland sites and together cover about 150,000 ha of land within the zone. They are low in organic
matter, total nitrogen and phosphorus. The pH is near neutral in the topsoils, becoming increasingly alkaline
with depth. Exchangeable Na is uniquely high in the subsoil, especially below the clay pan. The CEC
varies from 5 cmol(+)/kg in the topsoil to more than 20 cmol(+)/kg in the subsoil. Both kaolinite and
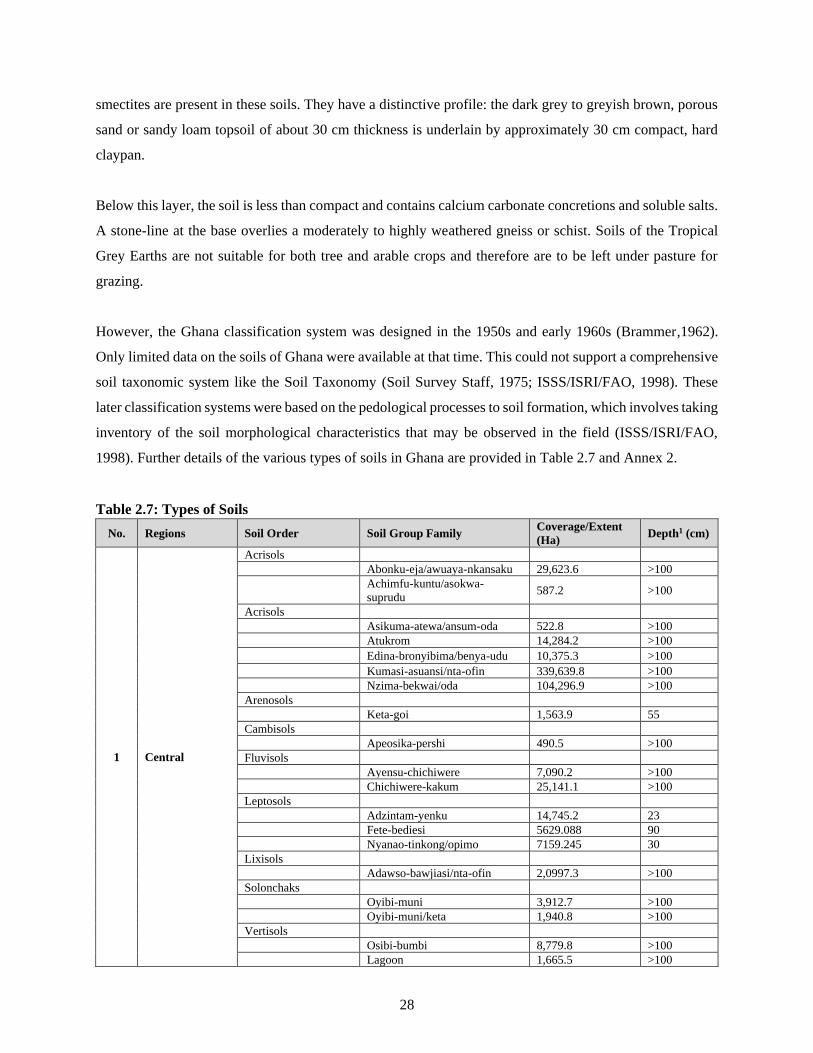
28
smectites are present in these soils. They have a distinctive profile: the dark grey to greyish brown, porous
sand or sandy loam topsoil of about 30 cm thickness is underlain by approximately 30 cm compact, hard
claypan.
Below this layer, the soil is less than compact and contains calcium carbonate concretions and soluble salts.
A stone-line at the base overlies a moderately to highly weathered gneiss or schist. Soils of the Tropical
Grey Earths are not suitable for both tree and arable crops and therefore are to be left under pasture for
grazing.
However, the Ghana classification system was designed in the 1950s and early 1960s (Brammer,1962).
Only limited data on the soils of Ghana were available at that time. This could not support a comprehensive
soil taxonomic system like the Soil Taxonomy (Soil Survey Staff, 1975; ISSS/ISRI/FAO, 1998). These
later classification systems were based on the pedological processes to soil formation, which involves taking
inventory of the soil morphological characteristics that may be observed in the field (ISSS/ISRI/FAO,
1998). Further details of the various types of soils in Ghana are provided in Table 2.7 and Annex 2.
Table 2.7: Types of Soils
No. Regions Soil Order Soil Group Family Coverage/Extent
(Ha) Depth1 (cm)
1 Central
Acrisols
Abonku-eja/awuaya-nkansaku 29,623.6 >100
Achimfu-kuntu/asokwa-
suprudu 587.2 >100
Acrisols
Asikuma-atewa/ansum-oda 522.8 >100 Atukrom 14,284.2 >100 Edina-bronyibima/benya-udu 10,375.3 >100 Kumasi-asuansi/nta-ofin 339,639.8 >100 Nzima-bekwai/oda 104,296.9 >100
Arenosols
Keta-goi 1,563.9 55
Cambisols
Apeosika-pershi 490.5 >100
Fluvisols
Ayensu-chichiwere 7,090.2 >100 Chichiwere-kakum 25,141.1 >100
Leptosols
Adzintam-yenku 14,745.2 23 Fete-bediesi 5629.088 90 Nyanao-tinkong/opimo 7159.245 30
Lixisols
Adawso-bawjiasi/nta-ofin 2,0997.3 >100
Solonchaks
Oyibi-muni 3,912.7 >100 Oyibi-muni/keta 1,940.8 >100
Vertisols
Osibi-bumbi 8,779.8 >100 Lagoon 1,665.5 >100
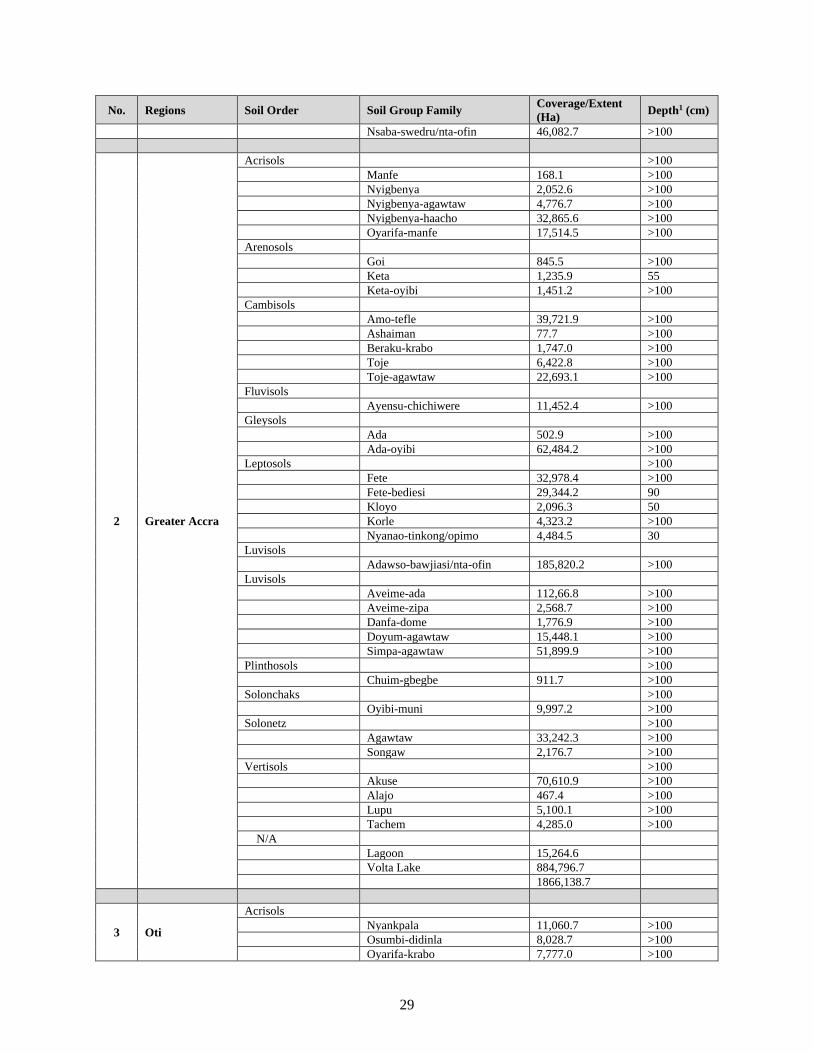
29
No. Regions Soil Order Soil Group Family Coverage/Extent
(Ha) Depth1 (cm)
Nsaba-swedru/nta-ofin 46,082.7 >100
2 Greater Accra
Acrisols >100 Manfe 168.1 >100 Nyigbenya 2,052.6 >100 Nyigbenya-agawtaw 4,776.7 >100 Nyigbenya-haacho 32,865.6 >100 Oyarifa-manfe 17,514.5 >100
Arenosols
Goi 845.5 >100 Keta 1,235.9 55 Keta-oyibi 1,451.2 >100
Cambisols
Amo-tefle 39,721.9 >100 Ashaiman 77.7 >100 Beraku-krabo 1,747.0 >100 Toje 6,422.8 >100 Toje-agawtaw 22,693.1 >100
Fluvisols
Ayensu-chichiwere 11,452.4 >100
Gleysols
Ada 502.9 >100 Ada-oyibi 62,484.2 >100
Leptosols >100 Fete 32,978.4 >100 Fete-bediesi 29,344.2 90 Kloyo 2,096.3 50 Korle 4,323.2 >100 Nyanao-tinkong/opimo 4,484.5 30
Luvisols
Adawso-bawjiasi/nta-ofin 185,820.2 >100
Luvisols
Aveime-ada 112,66.8 >100 Aveime-zipa 2,568.7 >100 Danfa-dome 1,776.9 >100 Doyum-agawtaw 15,448.1 >100 Simpa-agawtaw 51,899.9 >100
Plinthosols >100 Chuim-gbegbe 911.7 >100
Solonchaks >100 Oyibi-muni 9,997.2 >100
Solonetz >100 Agawtaw 33,242.3 >100 Songaw 2,176.7 >100
Vertisols >100 Akuse 70,610.9 >100 Alajo 467.4 >100 Lupu 5,100.1 >100 Tachem 4,285.0 >100
N/A
Lagoon 15,264.6
Volta Lake 884,796.7
1866,138.7
3 Oti
Acrisols
Nyankpala 11,060.7 >100 Osumbi-didinla 8,028.7 >100 Oyarifa-krabo 7,777.0 >100

30
No. Regions Soil Order Soil Group Family Coverage/Extent
(Ha) Depth1 (cm)
Techiman 5126.2 >100
Arenosols
Ketre-sangebi/banda-chaiso 16,252.1 >100
Cambisols 12,649.5 >100 Amo-chichiwere/dayi-angela 12,649.5 >100
Fluvisols
Adankpa 2,463.7 >100 Nterso-zaw 3,408.0 >100
Leptosols
Adomi-kpeyi 50,741.7 >100 Agramma-nyanfo/torkor 7,160.9 >100 Domanbin-denteso 54,777.8 >100 Fete-salom 37,714.7 >100 Fete-salom/abotakyi-kitasi 4,161.2 >100 Kadjebi-wawa/ketre-konsu 3,739.2 >100 Kintampo 50,56.9 20 Salom-mate/banda-chaiso 18,650.9 >100
Luvisols
Kpelesawgu 266,116.7 >100
Luvisols
Dadiekro-lima 8,583.5 >100 Ejura-amantin/denteso 59,248.8 >100
Planosols >100 Blengo-botoku/kudzra-edo 101,477.5 >100 Lima-volta 4,600.1 >100
N/A 9,127.9 >100 No data
Pegi-agu 1,850.8 >100
4 Eastern
Acrisols
Adujansu-bechem/nta-ofin 9,386.7 >100 Atewa-ansum 44,333.3 >100 Kumasi-asuansi/nta-ofin 12,082.5 >100 Manfe-fete 11,769.0 >100 Nzima-bekwai/oda 821.3 >100 Oyarifa-krabo 11,644.4 >100 Oyarifa-manfe 1,118.6 >100 Wiawso-shi 716.4 >100
Arenosols
Atewiredu 275.8 >100 Atewiredu-katie 2,215.6 >100 Bediesi-sikaben 53,452.9 >100
Cambisols
Amo-chichiwere/dayi-angela 386.0 >100 Amo-tefle 268.4 >100
Fluvisols
Birim-awaham/kakum-
chichiwere 142.8 >100
Denteso-sene 13,432.5 >100 Dewasi-wayo 16,839.5 >100
Leptosols
Adomi-kpeyi 15,715.5 >100 Fete-salom 9,260.3 90 Kintampo 2,902.7 20 Korle-okwe 1,567.2 >100
Kowani-techiman-
santaboma/bediesi 29,953.4 58
Nyanao-tinkong/opimo 17,545.7 >100
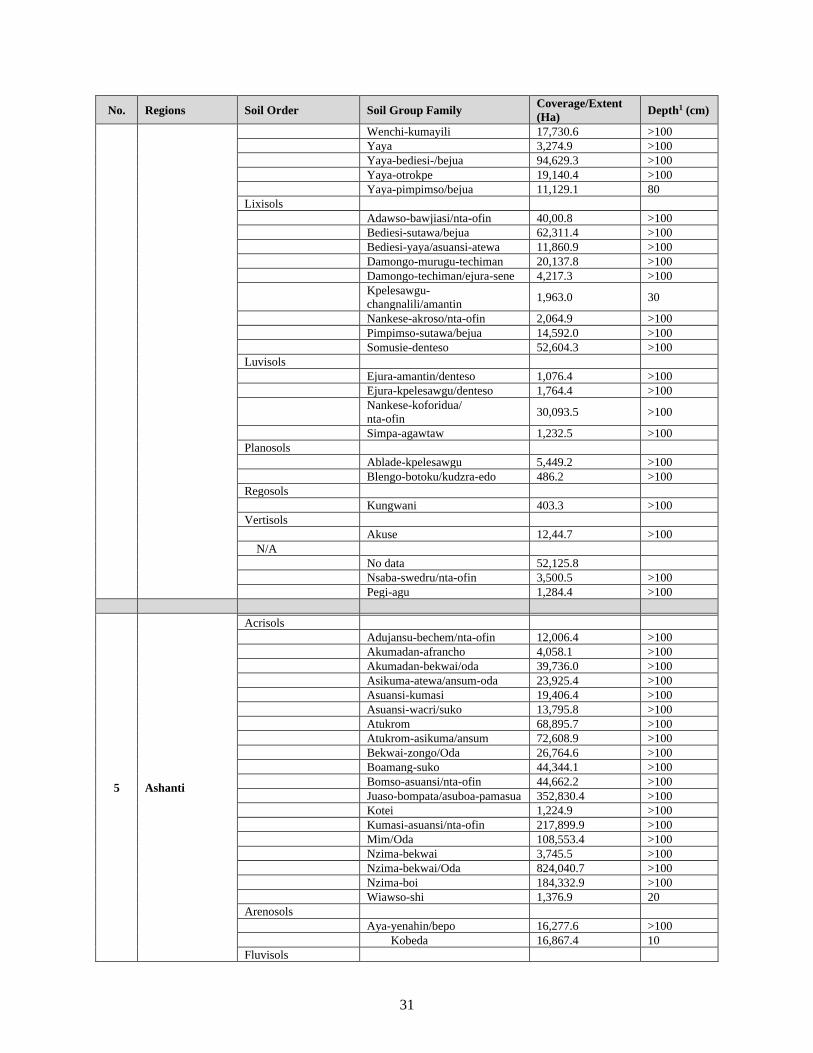
31
No. Regions Soil Order Soil Group Family Coverage/Extent
(Ha) Depth1 (cm)
Wenchi-kumayili 17,730.6 >100 Yaya 3,274.9 >100 Yaya-bediesi-/bejua 94,629.3 >100 Yaya-otrokpe 19,140.4 >100 Yaya-pimpimso/bejua 11,129.1 80
Lixisols
Adawso-bawjiasi/nta-ofin 40,00.8 >100 Bediesi-sutawa/bejua 62,311.4 >100 Bediesi-yaya/asuansi-atewa 11,860.9 >100 Damongo-murugu-techiman 20,137.8 >100 Damongo-techiman/ejura-sene 4,217.3 >100
Kpelesawgu-
changnalili/amantin 1,963.0 30
Nankese-akroso/nta-ofin 2,064.9 >100 Pimpimso-sutawa/bejua 14,592.0 >100 Somusie-denteso 52,604.3 >100
Luvisols
Ejura-amantin/denteso 1,076.4 >100 Ejura-kpelesawgu/denteso 1,764.4 >100
Nankese-koforidua/
nta-ofin 30,093.5 >100
Simpa-agawtaw 1,232.5 >100
Planosols
Ablade-kpelesawgu 5,449.2 >100 Blengo-botoku/kudzra-edo 486.2 >100
Regosols
Kungwani 403.3 >100
Vertisols
Akuse 12,44.7 >100
N/A
No data 52,125.8
Nsaba-swedru/nta-ofin 3,500.5 >100 Pegi-agu 1,284.4 >100
5 Ashanti
Acrisols
Adujansu-bechem/nta-ofin 12,006.4 >100 Akumadan-afrancho 4,058.1 >100 Akumadan-bekwai/oda 39,736.0 >100 Asikuma-atewa/ansum-oda 23,925.4 >100 Asuansi-kumasi 19,406.4 >100 Asuansi-wacri/suko 13,795.8 >100 Atukrom 68,895.7 >100 Atukrom-asikuma/ansum 72,608.9 >100 Bekwai-zongo/Oda 26,764.6 >100 Boamang-suko 44,344.1 >100 Bomso-asuansi/nta-ofin 44,662.2 >100 Juaso-bompata/asuboa-pamasua 352,830.4 >100 Kotei 1,224.9 >100 Kumasi-asuansi/nta-ofin 217,899.9 >100 Mim/Oda 108,553.4 >100 Nzima-bekwai 3,745.5 >100 Nzima-bekwai/Oda 824,040.7 >100 Nzima-boi 184,332.9 >100 Wiawso-shi 1,376.9 20
Arenosols
Aya-yenahin/bepo 16,277.6 >100 Kobeda 16,867.4 10
Fluvisols
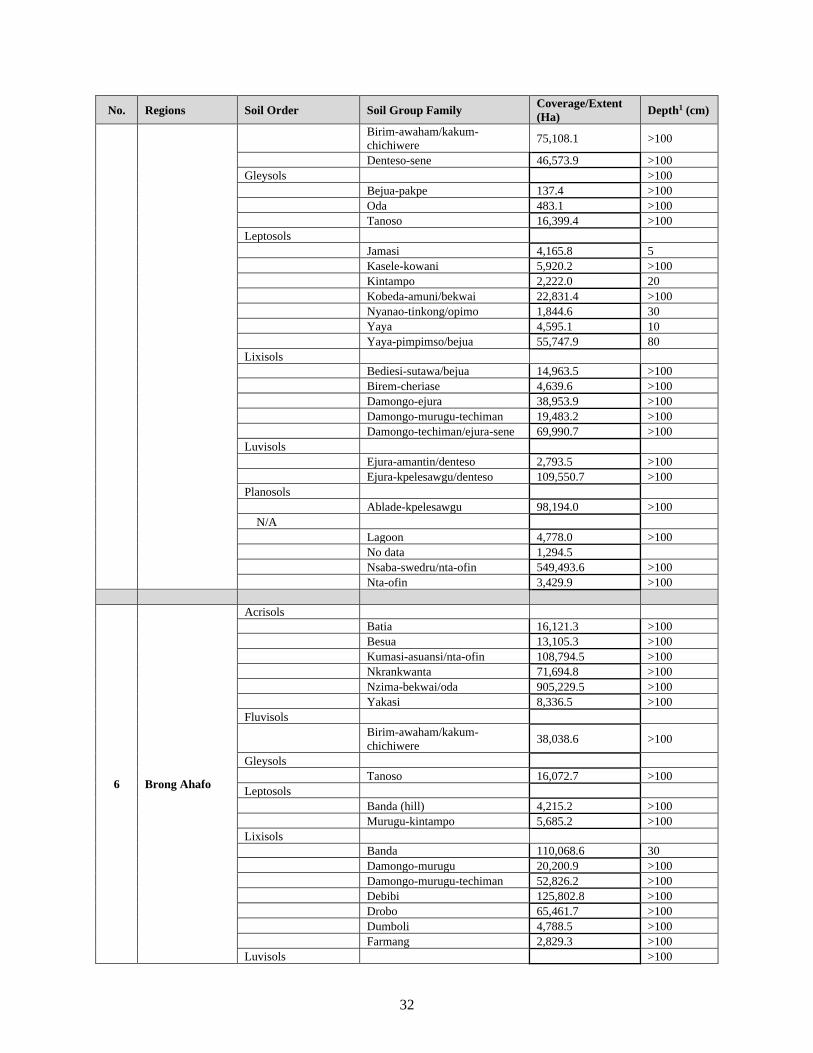
32
No. Regions Soil Order Soil Group Family Coverage/Extent
(Ha) Depth1 (cm)
Birim-awaham/kakum-
chichiwere 75,108.1 >100
Denteso-sene 46,573.9 >100
Gleysols >100 Bejua-pakpe 137.4 >100 Oda 483.1 >100 Tanoso 16,399.4 >100
Leptosols
Jamasi 4,165.8 5 Kasele-kowani 5,920.2 >100 Kintampo 2,222.0 20 Kobeda-amuni/bekwai 22,831.4 >100 Nyanao-tinkong/opimo 1,844.6 30 Yaya 4,595.1 10 Yaya-pimpimso/bejua 55,747.9 80
Lixisols
Bediesi-sutawa/bejua 14,963.5 >100 Birem-cheriase 4,639.6 >100 Damongo-ejura 38,953.9 >100 Damongo-murugu-techiman 19,483.2 >100 Damongo-techiman/ejura-sene 69,990.7 >100
Luvisols
Ejura-amantin/denteso 2,793.5 >100 Ejura-kpelesawgu/denteso 109,550.7 >100
Planosols
Ablade-kpelesawgu 98,194.0 >100
N/A
Lagoon 4,778.0 >100 No data 1,294.5
Nsaba-swedru/nta-ofin 549,493.6 >100 Nta-ofin 3,429.9 >100
6 Brong Ahafo
Acrisols
Batia 16,121.3 >100 Besua 13,105.3 >100 Kumasi-asuansi/nta-ofin 108,794.5 >100 Nkrankwanta 71,694.8 >100 Nzima-bekwai/oda 905,229.5 >100 Yakasi 8,336.5 >100
Fluvisols
Birim-awaham/kakum-
chichiwere 38,038.6 >100
Gleysols
Tanoso 16,072.7 >100
Leptosols
Banda (hill) 4,215.2 >100 Murugu-kintampo 5,685.2 >100
Lixisols
Banda 110,068.6 30 Damongo-murugu 20,200.9 >100 Damongo-murugu-techiman 52,826.2 >100 Debibi 125,802.8 >100 Drobo 65,461.7 >100 Dumboli 4,788.5 >100 Farmang 2,829.3 >100
Luvisols >100

33
No. Regions Soil Order Soil Group Family Coverage/Extent
(Ha) Depth1 (cm)
Botokrom 2,959.6 >100
N/A >100 Gyapekrom 7,312.4 20
7 Ahafo
Acrisols
Adujansu-bechem/nta-ofin 132,102.1 >100 Asuansi-kumasi 13,704.6 >100 Atukrom 109,843.8 >100 Atukrom-subin-adujansu 67,264.4 >100 Hwidiem 29,508.7 >100 Kumasi-asuansi/nta-ofin 8,462.9 >100 Nzima-bekwai 3,449.5 >100 Nzima-bekwai/oda 16,876.6 >100
Fluvisols
Alluvial 9,447.5 >100
Gleysols
Oda 178.8 >100
Nitisols
Susan 134,429.8 >100
N/A
Nta-ofin 892.8 >100
8 Bono East
Fluvisols
Denteso-sene 155,136.6 >100 Sene 7,765.8 >100
Gleysols
Bejua-pakpe 8,692.8 >100 Tanoso 59,263.5 >100
Leptosols
Kowani-kasele/kpelesawgu 13,117.3 58 Kowani-santaboma/kete-krachi 2,298.1 58
Kowani-techiman-
santaboma/bediesi 27,754.4 58
Murugu-kintampo 2,171.9 >100 Wenchi (boval) 9,158.0 5 Wenchi-kumayili 5,411.8 10
Lixisols
Bediesi-sutawa 78,870.3 >100 Bediesi-sutawa/bejua 270,614.3 >100 Damongo-murugu 233,513.3 >100 Damongo-murugu-techiman 95,495.2 >100 Damongo-techiman/ejura-sene 60,447.4 >100
Kowani-santaboma/denteso-
sene 1,438.6 >100
Kowani-santaboma/kete-krachi 5,600.1 >100 Kpelesawgu-changnalili 302,113.2 30
Kpelesawgu-changnalili-
kungawni 23,626.2 30
Kpelesawgu-kumayili-wenchi 65,034.6 50 Somusie-denteso 88,132.9 >100
Luvisols
Ejura-amantin/denteso 430,747.7 >100
Planosols
Lima 52,710.2 >100 Lima-volta 119,334.7 >100
N/A
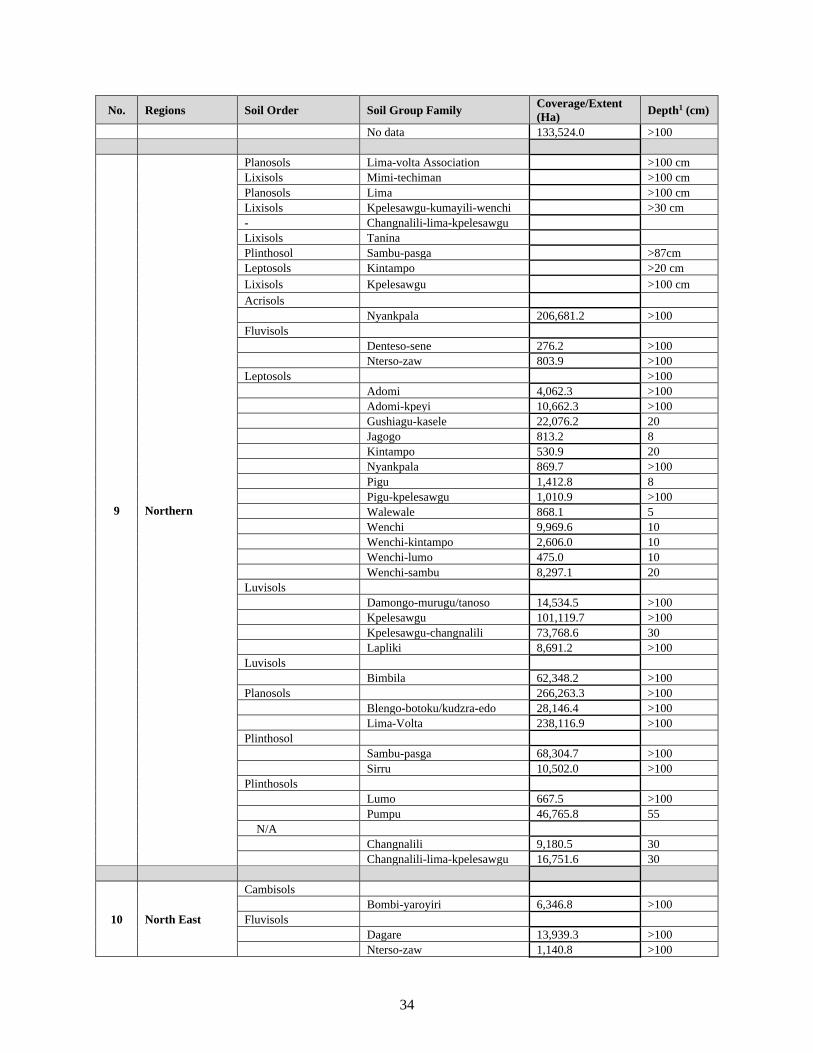
34
No. Regions Soil Order Soil Group Family Coverage/Extent
(Ha) Depth1 (cm)
No data 133,524.0 >100
9 Northern
Planosols Lima-volta Association >100 cm
Lixisols Mimi-techiman >100 cm
Planosols Lima >100 cm
Lixisols Kpelesawgu-kumayili-wenchi >30 cm
- Changnalili-lima-kpelesawgu
Lixisols Tanina
Plinthosol Sambu-pasga >87cm
Leptosols Kintampo >20 cm
Lixisols Kpelesawgu >100 cm
Acrisols
Nyankpala 206,681.2 >100
Fluvisols
Denteso-sene 276.2 >100 Nterso-zaw 803.9 >100
Leptosols >100 Adomi 4,062.3 >100 Adomi-kpeyi 10,662.3 >100 Gushiagu-kasele 22,076.2 20 Jagogo 813.2 8 Kintampo 530.9 20 Nyankpala 869.7 >100 Pigu 1,412.8 8 Pigu-kpelesawgu 1,010.9 >100 Walewale 868.1 5 Wenchi 9,969.6 10 Wenchi-kintampo 2,606.0 10 Wenchi-lumo 475.0 10 Wenchi-sambu 8,297.1 20
Luvisols
Damongo-murugu/tanoso 14,534.5 >100 Kpelesawgu 101,119.7 >100 Kpelesawgu-changnalili 73,768.6 30 Lapliki 8,691.2 >100
Luvisols
Bimbila 62,348.2 >100
Planosols 266,263.3 >100 Blengo-botoku/kudzra-edo 28,146.4 >100 Lima-Volta 238,116.9 >100
Plinthosol
Sambu-pasga 68,304.7 >100 Sirru 10,502.0 >100
Plinthosols
Lumo 667.5 >100 Pumpu 46,765.8 55
N/A
Changnalili 9,180.5 30 Changnalili-lima-kpelesawgu 16,751.6 30
10 North East
Cambisols
Bombi-yaroyiri 6,346.8 >100
Fluvisols
Dagare 13,939.3 >100 Nterso-zaw 1,140.8 >100
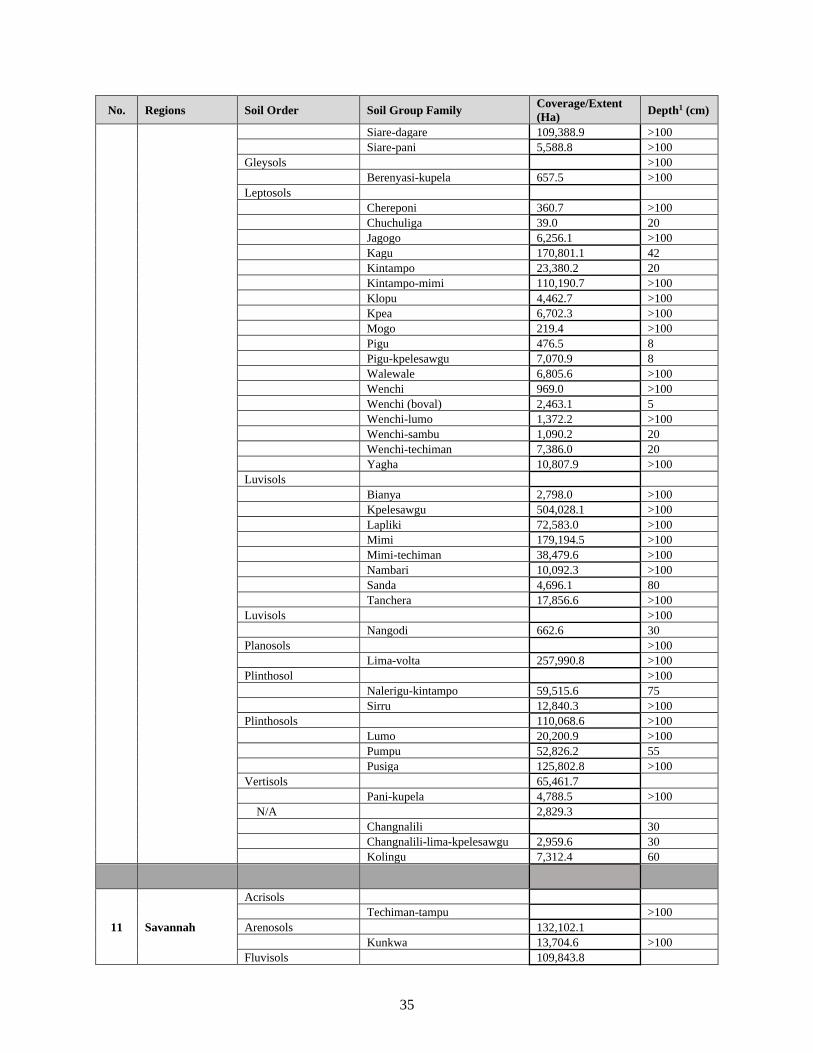
35
No. Regions Soil Order Soil Group Family Coverage/Extent
(Ha) Depth1 (cm)
Siare-dagare 109,388.9 >100 Siare-pani 5,588.8 >100
Gleysols >100 Berenyasi-kupela 657.5 >100
Leptosols
Chereponi 360.7 >100 Chuchuliga 39.0 20 Jagogo 6,256.1 >100 Kagu 170,801.1 42 Kintampo 23,380.2 20 Kintampo-mimi 110,190.7 >100 Klopu 4,462.7 >100 Kpea 6,702.3 >100 Mogo 219.4 >100 Pigu 476.5 8 Pigu-kpelesawgu 7,070.9 8 Walewale 6,805.6 >100 Wenchi 969.0 >100 Wenchi (boval) 2,463.1 5 Wenchi-lumo 1,372.2 >100 Wenchi-sambu 1,090.2 20 Wenchi-techiman 7,386.0 20 Yagha 10,807.9 >100
Luvisols
Bianya 2,798.0 >100 Kpelesawgu 504,028.1 >100 Lapliki 72,583.0 >100 Mimi 179,194.5 >100 Mimi-techiman 38,479.6 >100 Nambari 10,092.3 >100 Sanda 4,696.1 80 Tanchera 17,856.6 >100
Luvisols >100 Nangodi 662.6 30
Planosols >100 Lima-volta 257,990.8 >100
Plinthosol >100 Nalerigu-kintampo 59,515.6 75 Sirru 12,840.3 >100
Plinthosols 110,068.6 >100 Lumo 20,200.9 >100 Pumpu 52,826.2 55 Pusiga 125,802.8 >100
Vertisols 65,461.7
Pani-kupela 4,788.5 >100
N/A 2,829.3
Changnalili 30 Changnalili-lima-kpelesawgu 2,959.6 30 Kolingu 7,312.4 60
11 Savannah
Acrisols
Techiman-tampu >100
Arenosols 132,102.1
Kunkwa 13,704.6 >100
Fluvisols 109,843.8

36
No. Regions Soil Order Soil Group Family Coverage/Extent
(Ha) Depth1 (cm)
Dagare-kunkwa 67,264.4 >100 Nterso-zaw 29,508.7 >100 Siare-dagare 8,462.9 >100 Siare-lapliki 3,449.5 >100
Leptosols 16,876.6
Kagu 42
Kintampo 9,447.5 20
12 Upper East
Planosols Lima-Volta Association - >100 cm
Lixisols Lapliki - >100 cm
Lixisols Tanchera - >100 cm
Plinthosols Pusiga - >30 cm
Leptosols Wenchi-kintampo - >10 cm
Gleysols Berenyasi-kupela - >100 cm
Leptosols Kintampo-mimi - >100 cm
Luvisols Nangodi - >30 cm
Leptosols Yagha - >100 cm
Leptosols Tongo - >10 cm
Leptosols Chuchuliga - >20 cm
Leptosols Bongo - >40 cm
Lixisols Bianya - >100 cm
Lixisols Varempere-tafali - >100 cm
Fluvisols Dagare - >100 cm
Lixisols Mimi - >100 cm
13 Upper West
Arenosols Kunkwa Consociation - >100 cm
Fluvisols Siare-dagare Association - >100 cm
Vertisols Pani-kupela Association - >100 cm
Leptosols Kagu Consociation - >100 cm
Lixisols Tanina Consociation - >100 cm Kolingu Consociation - >60 cm
Source: Council for Scientific and Industrial Research (CSIR) – Soil Research Institute
2.4 Land Cover
Between 2000 and 2010, forest increased from 8.9million hectors to almost 9.2 million hectors, land used
for cropping also increased from 3.9 million to 5.2 million hectares. There was an increase in wetlands area
from 792,678.80 to 878,783.90 hectares as well as land used for settlement from 203844.20 hectares to
345,048.30. In the case of grassland and other land types categories there was a reduction in grassland area
from 9.95 million to almost 8.2 million hectares and other land cover types from 156,683.00 to 109,724,10
hectares (Table 2.8).

37
Table 2.8: Land Use by Type of Ecosystem in Hectares
No. Ecosystem Type Location 2000 2010
1 Forests - 8,911,425.6 9,195,136.6
2 Cropland - 3,904,571.6 5,221,448.5
3 Grassland - 9,954,340.0 8,173,402.6
4 Settlements - 203,844.2 345,048.3
5 Wetlands - 792,678.8 878,783.9
6 Other - 156,683.0 109,724.1
Total 23,923,543.2 23,923,544.0
Source: Forestry Commission, 2010
2.5 Ecosystems and Biodiversity
The section provides information on wetlands, known flora and fauna.
2.5.1 Wetlands
Wetlands are important ecosystems that contribute significantly to human well-being, local and national
economies, as well as environmental health and sustainability. Wetland functions (e.g. groundwater re-
charge, sediment trapping, water filtration and purification through sediment trapping, nutrient recycling,
flood control and storm protection) and values (e.g. food and protein sources, fibre, fuelwood) make
wetlands some of the most productive and dynamic habitats in the world and great examples of ecosystem
services. Wetlands are recognized also as vital for biodiversity conservation. Wetlands on the coast of
Ghana include, estuaries and lagoon habitats (e.g. Amansure, Narkwa, Amisa, Songor and Keta Lagoons),
open and closed lagoon systems (e.g. Muni, Korle, Sakumo), estuarine and salt pan complexes (e.g. Densu
delta). Information on extent of inland wetlands remain scanty (Table 2.9).
Table 2.9: Changes in Habitat of Coastal Ramsar Sites in Hectares (Ha)
Type/Year Songor Densu delta Sakumo Muni
2000 2014 2000 2014 2000 2014 2000 2015
Healthy Vegetation 839.25 673.2 466.52 271.80 0 0 1335.34 538.65
Dense Shrubland 10138.94 6959.43 2959.21 1957.05 4467.80 2580.66 1960.66 1640.52
Shrub
herbaceous/grass 8585.49 8991.70 1329.76 647.82 4018.97 2882.34 2504.98 3098.52
Grass herbaceous 3166.81 5353.48 2059.03 676.62 6735.72 2030.49 746.46 1399.32
Bare Surface & Built
up 1422.10 1918.26 8853.61 12237.20 9744.79 17787.10 256.86 167.58
Water body 6445.15 6701.67 2996.33 2873.97 959.42 646.11 152.42 112.14
Source: Ghana State of Environment 2016 Report
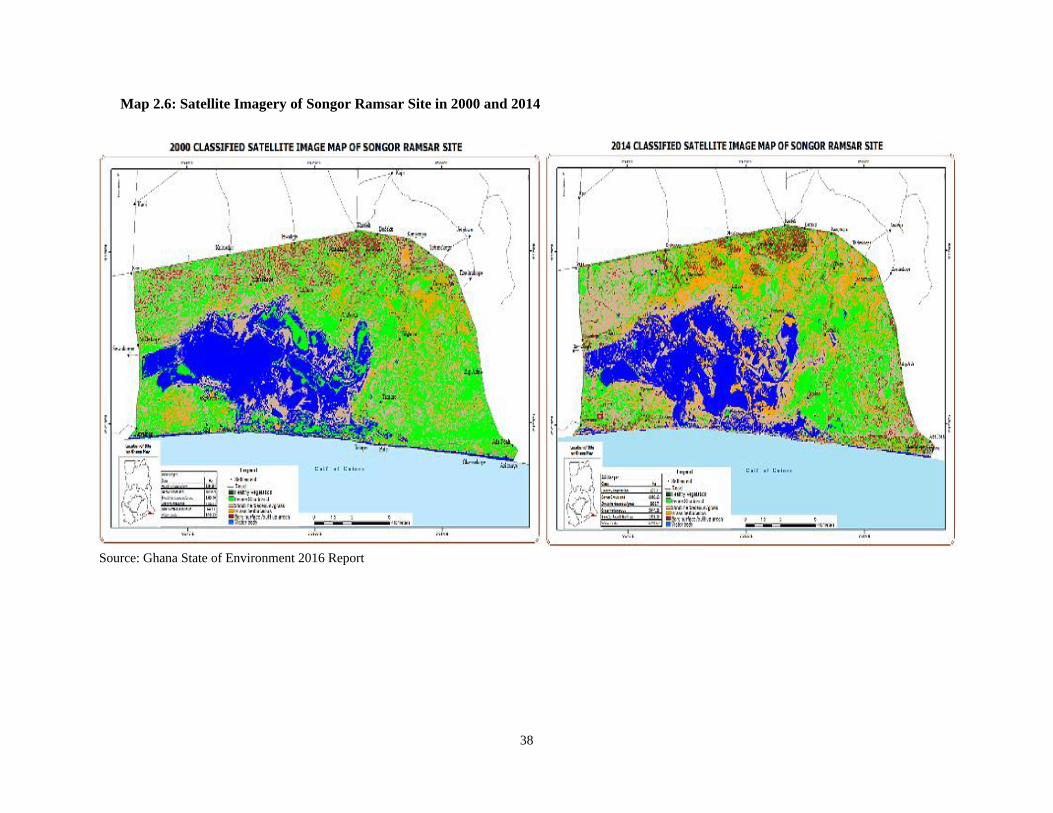
38
Map 2.6: Satellite Imagery of Songor Ramsar Site in 2000 and 2014
Source: Ghana State of Environment 2016 Report
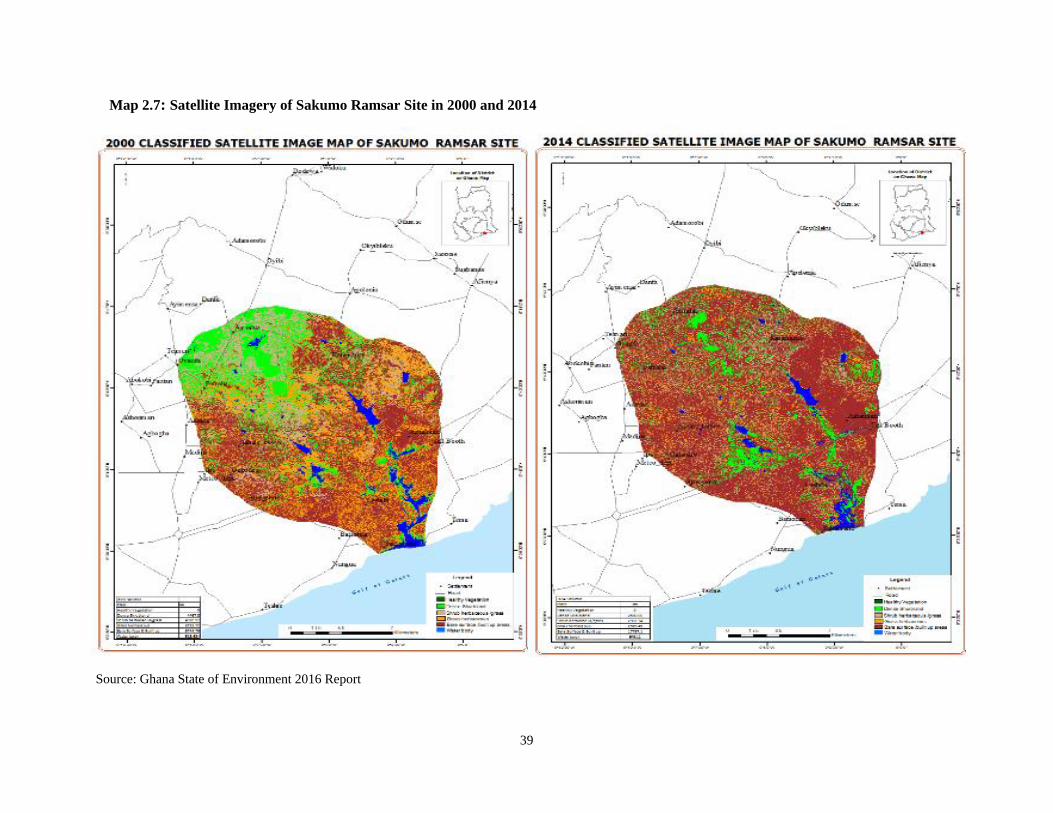
39
Map 2.7: Satellite Imagery of Sakumo Ramsar Site in 2000 and 2014
Source: Ghana State of Environment 2016 Report
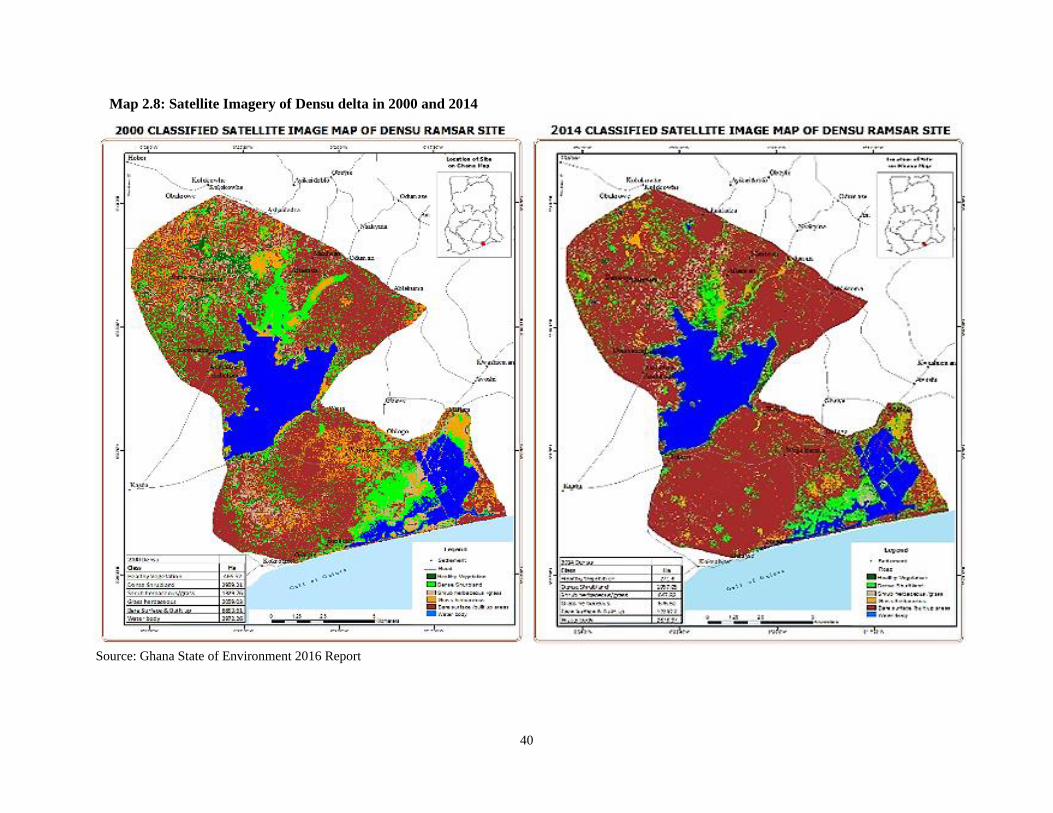
40
Map 2.8: Satellite Imagery of Densu delta in 2000 and 2014
Source: Ghana State of Environment 2016 Report

41
2.5.2 Flora species
The dominant flora species in Ghana is the Angiosperms which stands at a population of 5,217. The
Gymnosperms are the least whose population stands at seven (7) as shown in Table 2.10.
Table 2.10.: Known Flora Species by Number (Indigenous)
No. Group name Number
1 Angiosperms 5,217
2 Bryophytes 46
3 Lycophytes 12
4 Gymnosperms 7 Total 5,282
Source: IUCN (2017)
2.5.2.1 Threatened species of Flora
Ghana has rich floral diversity, with the tropical forest, in particular the wet evergreen forest in the
southwestern part of Ghana, exhibiting the highest level of endemism and species numbers. The three
taxonomic groups adds to a total number of 3227 angiosperms (comprising 2974 indigenous and 253
introduced species); a single gymnosperm (one known indigenous species and a few others introduced) and
124 pteridophytes. The IUCN threatened species information includes a list of threatened flora in Ghana,
as well as information on threat categories, which provides a useful indicator for monitoring the status of
floral diversity in the country. 119 plant species occurring in Ghana are listed on the IUCN Red Data List
comprising three species that are critically endangered (CR), 20 that are endangered (EN) and 96 Vulnerable
(VU). Refer to Annex 1 for threatened plant species and threat categories of Ghanaian plant species listed
on the IUCN Red Data.
2.5.3 Fauna species
Butterflies were the dominant Fauna species in 2017, (925) followed by 794 birds, 377 Amphibian and
Reptiles and 327 Mammals (Table 2.11).
Table 2.11: Known Fauna Species by Numbers in 2017 (Indigenous)
No. Name of Species Status category Class Number
1 Mammals - - 327
2 Birds - - 794
3 Amphibians and Reptiles - - 377
4 butterflies - - 925
Total 2423
Source: Forestry Commission, 2017

42
2.5.3.1 Threatened species of Fauna
Terrestrial fauna is better known than the marine and aquatic fauna. The 2016-2020 National Biodiversity
Strategy and Action Plan reports 221 species of amphibians and reptiles, 724 species of birds and 225
species of mammals. Marine and aquatic biodiversity amount to 392 marine species including 347 fish
species and 157 freshwater fish species. Table 2.12 provides a summary of the status of threatened species
listed in the IUCN Red Data List for the various taxonomic groups. The threatened species of fauna recorded
for Ghana includes 56 species of fish, 11 species of amphibians, 7 species of Reptiles, 22 species of birds
and 20 species of mammals.
Table 2.12: Summary of Threatened Vertebrate Species
Taxonomic
Group9
Critically Endangered
(CR)
Endangered
(EN)
Vulnerable
(VU) Total
Fishes* 2 18 36 56
Amphibians 2 5 4 11
Reptiles* 2 0 5 7
Birds 4 1 17 22
Mammals 1 6 13 20
Total 11 30 75 116
Source: Forestry Commission, 2017
2.6 Forests Area
The Ashanti, Western North and the Western regions have the most forest areas as at 2015. Ashanti,
353,655.54 hectares, Western North, 351,000.63 hectares and Western, 316,119.60 hectares. The region
with the least forest area as at 2015 is the Greater Accra Region with a forest area of 5,211.09 hectares.
Apart from Ahafo, Bono, Central, Eastern, Western and Western North Regions, all the other regions have
their forest areas in 2017 being higher than what existed in the year 1990. Table 2.13 shows the extent of
forest by region.
9 *Groups not fully assessed; data comprises number of species known to be threatened within groups assessed to
date.

43
Table 2.13A: Total Forest Areas by Region (Hectares, ha) 1990 2000
Region Close forest Open forest Total Close forest Open forest Total
Ahafo 122,217.9 10,334.1 132,552.0 122,784.5 8,264.6 131,049.1
Ashanti 213,278.9 116,481.4 329,760.4 219,696.0 102,929.5 322,625.5
Bono 93,065.4 50,346.4 143,411.8 56,482.7 78,268.4 134,751.2
Bono East 977.2 143,870.9 144,848.1 1,881.7 159,543.6 161,425.4
Central 81,277.9 4,299.1 85,577.0 80,680.5 3,219.5 83,900.0
Eastern 100,967.0 37,292.9 138,260.0 102,868.9 24,275.3 127,144.3
Greater Accra 191.4 1,104.7 1,296.1 5.5 269.1 274.6
Northern 587.7 21,206.6 21,794.3 635.7 26,318.3 26,953.9
North East 545.9 3,916.9 4,462.7 588.0 4,386.3 4,974.3
Oti 11,551.7 46,801.2 58,352.9 16,178.0 38,748.0 54,925.9
Savannah 5,402.1 119,782.8 125,184.9 10,978.1 122,806.9 133,785.0
Upper East 2,006.9 13,559.1 15,566.0 3,051.9 24,886.3 27,938.2
Upper West 320.2 17,734.6 18,054.8 1,962.7 22,947.4 24,910.1
Volta 575.1 5,212.4 5,787.5 2,195.5 5,171.8 7,367.2
Western 308,635.2 18,914.4 327,549.6 313,898.2 13,210.1 327,108.3
Western North 326,668.1 51,011.9 377,680.1 288,099.6 84,716.3 372,815.9
Total 1,268,268.8 661,869.4 1,930,138.1 1,221,987.5 719,961.3 1,941,948.8
Source: Forestry Commission, 2000

44
Table 2.13B: Total Forest Areas by Region (Hectares, ha) 2010 2012 2015
Region Close forest Open forest Total Close forest Open forest Total Close forest Open forest Total
Ahafo 120,546.9 9,104.2 129,651.1 119,055.2 10,036.9 129,092.1 108,828.5 22,186.9 131,015.4
Ashanti 206,850.0 84,781.6 291,631.6 204,711.5 89,264.0 293,975.5 166,379.0 187,276.5 353,655.5
Bono 42,987.3 77,384.3 120,371.6 37,622.3 93,347.5 130,969.8 35,073.3 86,310.3 121,383.5
Bono East 1,296.7 196,430.2 197,726.9 5,876.7 126,028.2 131,904.9 134.1 217,288.1 217,422.2
Central 73,557.5 8,704.5 82,262.1 71,219.4 10,676.0 81,895.4 66,554.3 15,006.7 81,561.0
Eastern 73,557.5 8,704.5 82,262.1 80,241.8 48,205.0 128,446.7 78,036.3 57,031.1 135,067.4
Greater Accra 25.0 1,524.0 1,549.0 50.9 1,431.3 1,482.2 - 5,211.1 5,211.1
Northern 589.2 35,202.8 35,792.0 1,279.9 36,093.5 37,373.4 0.1 53,732.3 53,732.3
North East 536.9 4,119.8 4,656.8 784.4 5,728.0 6,512.3 837.7 13,812.0 14,649.8
Oti 13,782.2 47,092.1 60,874.4 15,463.8 43,574.6 59,038.4 25,693.9 50,853.3 76,547.3
Savannah 10,170.4 189,565.4 199,735.7 13,179.9 222,119.4 235,299.2 2,401.4 212,481.5 214,882.9
Upper East 1,813.9 16,733.9 18,547.7 3,587.8 32,586.5 36,174.2 50.1 57,117.6 57,167.7
Upper West 1,741.6 23,741.3 25,482.9 3,189.0 40,980.2 44,169.2 349.8 66,371.1 66,721.0
Volta 1,982.6 5,518.3 7,500.9 2,415.9 5,173.3 7,589.2 369.3 11,604.1 11,973.3
Western 297,033.4 23,123.0 320,156.4 291,103.7 27,194.9 318,298.7 266,136.5 49,983.1 316,119.6
Western
North 311,468.4 51,849.4 363,317.8 308,614.3 51,170.0 359,784.3 258,664.7 92,336.0 351,000.6
Total 1,157,939.6 783,579.2 1,941,518.9 1,158,396.5 843,609.1 2,002,005.5 1,009,509.0 1,198,601.6 2,208,110.7
Source: Forestry Commission, 2015
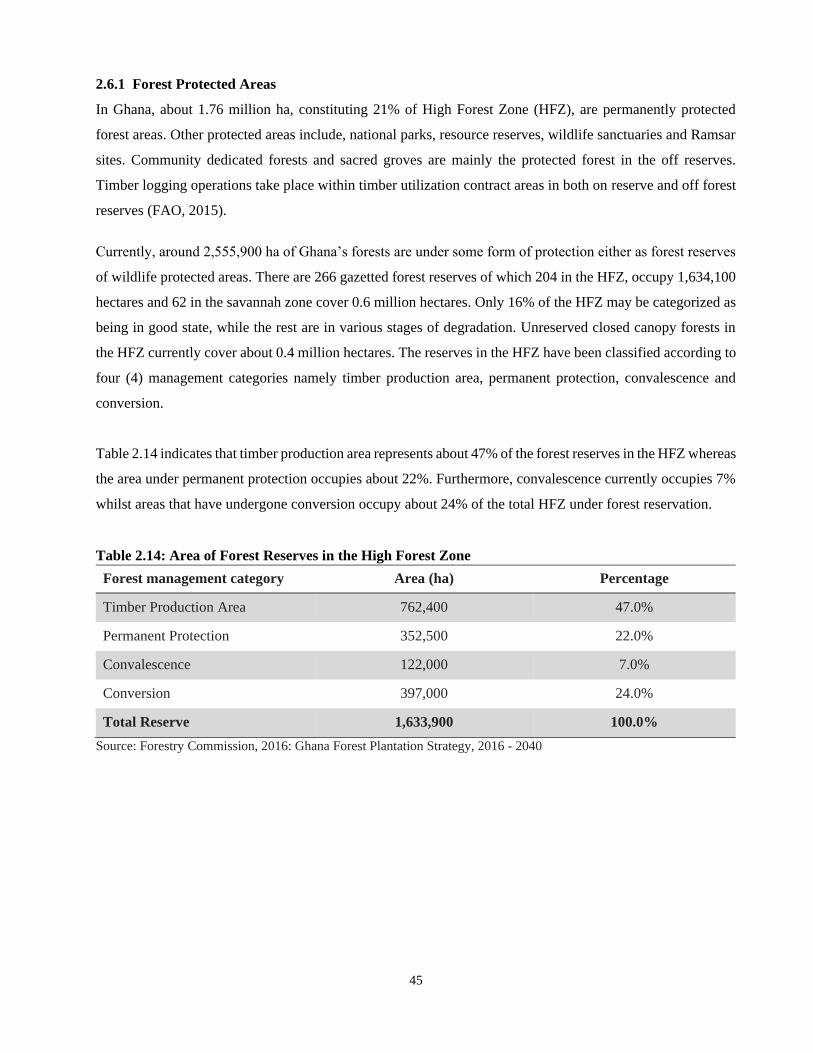
45
2.6.1 Forest Protected Areas
In Ghana, about 1.76 million ha, constituting 21% of High Forest Zone (HFZ), are permanently protected
forest areas. Other protected areas include, national parks, resource reserves, wildlife sanctuaries and Ramsar
sites. Community dedicated forests and sacred groves are mainly the protected forest in the off reserves.
Timber logging operations take place within timber utilization contract areas in both on reserve and off forest
reserves (FAO, 2015).
Currently, around 2,555,900 ha of Ghana’s forests are under some form of protection either as forest reserves
of wildlife protected areas. There are 266 gazetted forest reserves of which 204 in the HFZ, occupy 1,634,100
hectares and 62 in the savannah zone cover 0.6 million hectares. Only 16% of the HFZ may be categorized as
being in good state, while the rest are in various stages of degradation. Unreserved closed canopy forests in
the HFZ currently cover about 0.4 million hectares. The reserves in the HFZ have been classified according to
four (4) management categories namely timber production area, permanent protection, convalescence and
conversion.
Table 2.14 indicates that timber production area represents about 47% of the forest reserves in the HFZ whereas
the area under permanent protection occupies about 22%. Furthermore, convalescence currently occupies 7%
whilst areas that have undergone conversion occupy about 24% of the total HFZ under forest reservation.
Table 2.14: Area of Forest Reserves in the High Forest Zone
Forest management category Area (ha) Percentage
Timber Production Area 762,400 47.0%
Permanent Protection 352,500 22.0%
Convalescence 122,000 7.0%
Conversion 397,000 24.0%
Total Reserve 1,633,900 100.0%
Source: Forestry Commission, 2016: Ghana Forest Plantation Strategy, 2016 - 2040

46
2.6.2 Forest Management
Between 1990 and 2010, the total forest area under reservation decreased from 1.8 million ha to 0.7 million
ha partly as a result of the categorisation of the area into protection and production functions. The categories
include forest areas in permanent forest estate, forest areas within permanent protection, forest area under
forest management and forest area with management plans. Figure 2.2 shows that whereas forest areas in
permanent protection had remained constant, forest areas in permanent forest estate had reduced
consistently over the years. On the other hand, forest area under forest management and forest area with
management plans have both experienced negative and positive changes.
Figure 2.2: Forest Management Categories
Source: Forestry Commission (2012)
7051
5697
5120
4543
43 43 43 43
1694
1100 12001380
850
482 599
971
0
1000
2000
3000
4000
5000
6000
7000
8000
1990 2000 2005 2010
Are
a (
'00
0 h
a)
Forest area in permanent forest estate Forest area within protected area
Forest area under forest management Forest area with management plans
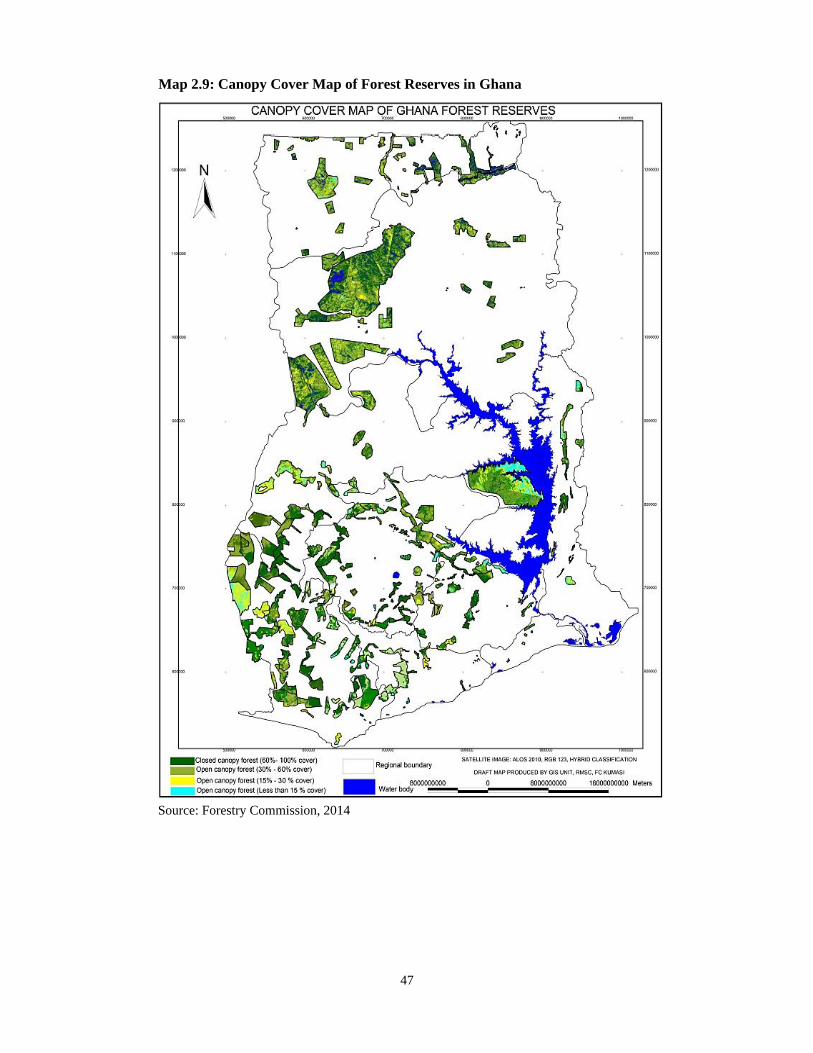
47
Map 2.9: Canopy Cover Map of Forest Reserves in Ghana
Source: Forestry Commission, 2014

48
2.7 Air Quality
The EPA, Ghana operates an air quality monitoring network that collects PM10 and limited PM2.5 data from
sixteen (16) locations throughout the city of Accra and its environs. The network is made up of 6 monitoring
locations in selected Residential, Commercial and Industrial Areas in Accra and 10 roadside monitoring
locations.
2.7.1 PM10 Permanent Monitoring Locations
Annual mean PM10 concentrations (µgm-3) for permanent monitoring locations between 2008 and 2018 are
illustrated in Figure 2.3. The concentrations ranged from 47-182 µgm-3, with the minimum and maximum
at Dansoman in 2017 and 2012 in Asylum Down respectively. With the exception of North Industrial Area
(2018), East Legon (2016), Dansoman (2014, 2016, 2017 and 2018), and Asylum Down (2010)10 all the
annual PM10 concentrations recorded between 2008 and 2018 were above the 70 µgm-3 Ghana Standard for
ambient PM10 (Figure 2.3). Similarly, apart from the Dansoman (2017, 2018)11 all annual mean PM10
concentrations recorded over the same period were above the 50µgm-3 World Health Organization (WHO)
guideline.
Figure 2.3. Annual Mean PM10 Concentrations for Permanent Monitoring Locations (2008-2018)
Source: Environmental Protection Agency (EPA), 2019
2.7.2 PM10 Roadside Monitoring Locations
10 Environmental Protection Agency (EPA), 2019 11 Environmental Protection Agency (EPA), 2019
0
20
40
60
80
100
120
140
160
180
200
2008 2009 2010 2011 2012 2013 2014 2015 2016 2017 2018
Co
nce
ntr
ati
on
(µ
gm
-3)
YearNorth Industrial Area South Industrial Area East Legon Dansoman Odorkor Asylum Down
Ghana Standard (70µgm-3)
WHO Guideline (50µgm-3)

49
Figure 2.4 shows the annual mean PM10 concentrations (µgm-3) for the Roadside monitoring locations
between 2008 and 2018. The concentrations recorded for the period ranged from106 -356 µgm-3, with the
minimum and maximum at Achimota in 2018 and 2017 in Weija respectively. All the annual PM10
concentrations recorded over the period were above both the Ghana standard and WHO Guideline for
ambient PM10 (Figure 2.4).
Figure 2.4 Annual Mean PM10 Concentrations (µgm-3) for the Roadside Monitoring Locations
(2008-2018)
Source: Environmental Protection Agency (EPA), 2019
2.7.3 PM2.5 Roadside Monitoring Locations
Monitoring data on the concentration levels of PM2.5 were limited in nature and scope during the preparation
of this compendium. Figure 2.5 shows the annual mean PM2.5 concentrations (µgm-3) for the Roadside
monitoring locations between July and September 2019. The concentrations recorded for the period ranged
from 36 - 111 µgm-3, with the minimum recorded at Tantra Hill (Aug. 2019)12 and the maximum recorded
at Tetteh Quarshie (Sep. 2019). All the PM10 concentrations recorded over the period were above both the
Ghana standard and WHO Guideline for PM2.5.
12 Environmental Protection Agency (EPA), 2019
0
20
40
60
80
100
120
140
160
180
200
220
240
260
280
300
320
340
360
380
2008 2009 2010 2011 2012 2013 2014 2015 2016 2017 2018
Co
nce
ntr
ati
on
(µ
gm
-3)
YearGraphic Road Achimota Overpass Tetteh Quarshie Interchange
Mallam Junction Weija Kasoa
Labadi T Junction Tantra Hills Amasaman
Kaneshie
Ghana Standard (70µgm-3)
WHO Guideline (50µgm-3)
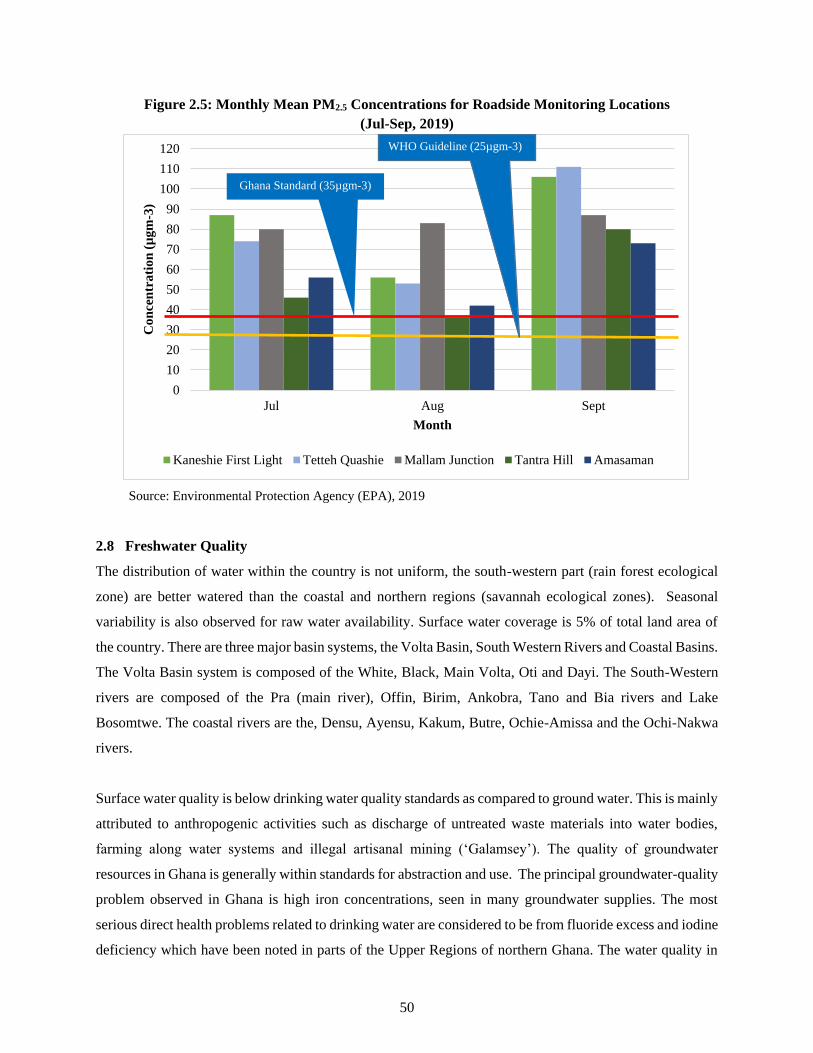
50
Figure 2.5: Monthly Mean PM2.5 Concentrations for Roadside Monitoring Locations
(Jul-Sep, 2019)
Source: Environmental Protection Agency (EPA), 2019
2.8 Freshwater Quality
The distribution of water within the country is not uniform, the south-western part (rain forest ecological
zone) are better watered than the coastal and northern regions (savannah ecological zones). Seasonal
variability is also observed for raw water availability. Surface water coverage is 5% of total land area of
the country. There are three major basin systems, the Volta Basin, South Western Rivers and Coastal Basins.
The Volta Basin system is composed of the White, Black, Main Volta, Oti and Dayi. The South-Western
rivers are composed of the Pra (main river), Offin, Birim, Ankobra, Tano and Bia rivers and Lake
Bosomtwe. The coastal rivers are the, Densu, Ayensu, Kakum, Butre, Ochie-Amissa and the Ochi-Nakwa
rivers.
Surface water quality is below drinking water quality standards as compared to ground water. This is mainly
attributed to anthropogenic activities such as discharge of untreated waste materials into water bodies,
farming along water systems and illegal artisanal mining (‘Galamsey’). The quality of groundwater
resources in Ghana is generally within standards for abstraction and use. The principal groundwater-quality
problem observed in Ghana is high iron concentrations, seen in many groundwater supplies. The most
serious direct health problems related to drinking water are considered to be from fluoride excess and iodine
deficiency which have been noted in parts of the Upper Regions of northern Ghana. The water quality in
0
10
20
30
40
50
60
70
80
90
100
110
120
Jul Aug Sept
Co
nce
ntr
ati
on
(µ
gm
-3)
Month
Kaneshie First Light Tetteh Quashie Mallam Junction Tantra Hill Amasaman
Ghana Standard (35µgm-3)
WHO Guideline (25µgm-3)

51
many of Ghana’s surface water system has been declining since 2004. Water quality analyses between
2005 and 2014 showed a decreasing water quality over the period (Figure 2.6).
Figure 2.6: Water Quality Index in the Major Water Systems in Ghana
Source: Ghana State of Environment 2016 Report
2.9 Marine Water Quality
The rich marine biodiversity within Ghana’s Exclusive Economic Zone (EEZ) is influenced on the larger
scale by changes in air-sea interactions that drive key oceanographic processes such as changes in the
direction and speeds of wind-induced currents, fronts and upwelling. These processes generate the needed
nutrients for primary production in the sun-lit column of the upper ocean through photosynthesis and
feeding during secondary and tertiary production. The duration, intensity and spatial stretch of upwelling
is an important process for assessing the productivity of marine ecosystem, and is monitored with sea
surface temperature measurements.
Figure 2.7 shows monthly average of sea surface temperature measurements from the space-borne sensor
MODIS. It captures the seasonal and inter-annual variability patterns that are associated with the changing
intensity of the upwelling off the coast of Ghana and the warm/cool years from 2006 to 2019. It depicts
the seasonal variation in surface temperatures and the resulting intensity and duration of stratification
(warm) and upwelling (cold) periods. Details of the variations for the different months and years shows that
2012 was a relatively cool year with a short-lived intense minor upwelling in February and relatively cool
period of stratification from March to June.
0
10
20
30
40
50
60
70
2005 2006 2007 2008 2010 2011 2012 2013 2014
Per
cen
tag
e
Coastal River System South Western River System Volta River System

52
These suggest the EEZ of Ghana may have had high nutrient levels to promote phytoplankton growth and
secondary production. Very warm sea surface temperatures were measured in 2010 and from 2016 to 2019.
During these years, the minor upwelling was absent and the major upwelling from July to September was
relatively warm and short-lived. There was reduced upsurge and mixing of nutrient-rich bottom water
required for increased biological production.
The trend line in shows that there is a steady rise of 0.04°C/year in sea surface temperature within Ghana’s
EEZ. The continuous warming of the ocean of the coast of Ghana is expected to adversely affect fish catch
especially among the artisanal and semi-industrial sector who target pelagic fishes (fishes that occupy the
shallow depths of the ocean).
Figure 2.7: Analysis of sea surface temperature variability off the coast of Ghana
Source: Ghana State of Environment 2016 Report

53
Chapter 3
Environmental Resources and their Use
3.1 Introduction
The focus of the chapter is on statistical information on environmental resources and their use. This includes
measurement of stocks and changes in stocks of these resources and their use for production and
consumption. Changes in the stocks of environmental resources include additions and reductions, from both
anthropogenic and natural activities. In the case of non-renewable resources, unsustainable exploitation
leads to the depletion13 of the resource. For renewable resources, if extraction (e.g., abstraction, removal
and harvesting) exceeds natural regeneration and human made replenishment, the resource is depleted.
3.2 Mineral Resources
Minerals14 include metal ores (including precious metals and rare earths); non-metallic minerals such as
coal, oil, gas, stone, sand and clay; chemical and fertilizer minerals; salt; and various other minerals such
as gemstones, abrasive minerals, graphite, asphalt, natural solid bitumen, quartz and mica. Classes of known
mineral deposits include commercially recoverable deposits; potential commercially recoverable deposits;
and non-commercial and other known deposits.
3.2.1 Extraction of Gold
The extraction of gold has been increasing consistently from the lowest average of 330,537 ounces through
(1980-1989) to a peak of 2,857,983 ounces during (2010- 2017). During 1980-1989, an average of 330,537
ounces were produced annually and it increased 5 times to an average of 1,512,506 ounces within the period
(1990-1999). Average Gold production increased from 2,779,532 ounces to 2,857,983 ounces, respectively,
during the period (2000 -2009) and (2010 - 2017). The favorable gold prices on the international market
coupled with new technologies and new mines contributed to the increase in gold production in Ghana over
the three-decade period (Table 3.1).
13 Depletion, in physical terms, is the decrease in the quantity of the stock of a natural resource over an accounting
period that is due to the extraction of the natural resource by economic units occurring at a level greater than that of
regeneration. 14 Minerals are elements or compounds composed of a concentration of naturally occurring solid, liquid or gaseous
materials in or on the earth’s crust
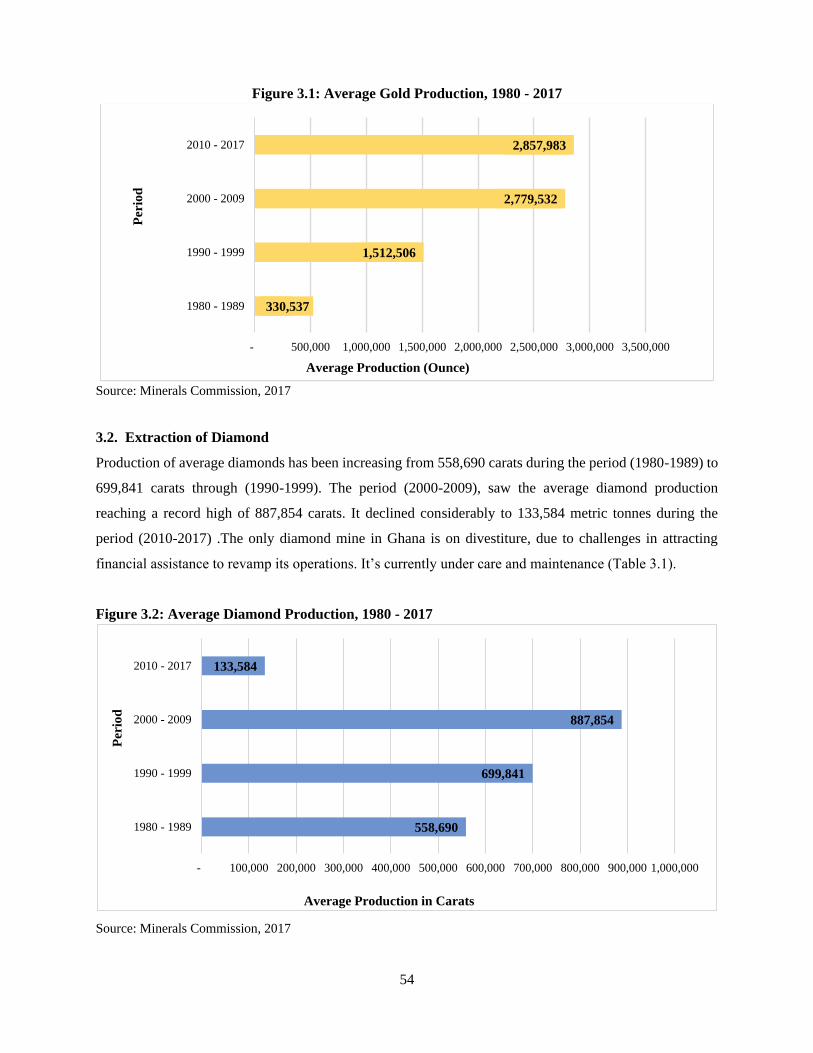
54
Figure 3.1: Average Gold Production, 1980 - 2017
Source: Minerals Commission, 2017
3.2. Extraction of Diamond
Production of average diamonds has been increasing from 558,690 carats during the period (1980-1989) to
699,841 carats through (1990-1999). The period (2000-2009), saw the average diamond production
reaching a record high of 887,854 carats. It declined considerably to 133,584 metric tonnes during the
period (2010-2017) .The only diamond mine in Ghana is on divestiture, due to challenges in attracting
financial assistance to revamp its operations. It’s currently under care and maintenance (Table 3.1).
Figure 3.2: Average Diamond Production, 1980 - 2017
Source: Minerals Commission, 2017
330,537
1,512,506
2,779,532
2,857,983
- 500,000 1,000,000 1,500,000 2,000,000 2,500,000 3,000,000 3,500,000
1980 - 1989
1990 - 1999
2000 - 2009
2010 - 2017
Average Production (Ounce)
Per
iod
558,690
699,841
887,854
133,584
- 100,000 200,000 300,000 400,000 500,000 600,000 700,000 800,000 900,000 1,000,000
1980 - 1989
1990 - 1999
2000 - 2009
2010 - 2017
Average Production in Carats
Per
iod

55
3.2.3 Manganese
The best average production period of Manganese was through 2000-2009 as it recorded all time high of
1,477,234 Metric Tonnes (MT) whiles 243,445 metric tonnes were recorded as the lowest during the period
1980-198).The acquisition of new machinery and trucks coupled with increasing shift time has contributed
to growth in the operations of Ghana manganese over the period Source: Minerals Commission (Table 3.1).
Figure 3.3: Average Manganese Production, 1980 - 2017
Source: Minerals Commission, 2017
3.2.4 Bauxite
Bauxite reached its average peak at 706,172 MT during the period 2000-2009. Average production
increased from 180,008 metric tonnes through the period (1980-1988) to 405,544 MT during 1990-1999.
The injection of millions of dollars into the operations of Ghana Bauxite Company Limited accounted for
the significant increase in bauxite production over the period (Table 3.1).
Figure 3.4: Average Bauxite Production, 1980 - 2017
Source: Minerals Commission, 2017
243,445
317,897
1,477,234
1,308,112
- 200,000 400,000 600,000 800,000 1,000,000 1,200,000 1,400,000 1,600,000
1980 - 1989
1990 - 1999
2000 - 2009
2010 - 2017
Average Production (Metric Tonnes)
Per
iod
180,008
405,544
706,172
654,768
- 100,000 200,000 300,000 400,000 500,000 600,000 700,000 800,000
1980 - 1989
1990 - 1999
2000 - 2009
2010 - 2017
Average Production (Metric Tonnes)
Per
iod
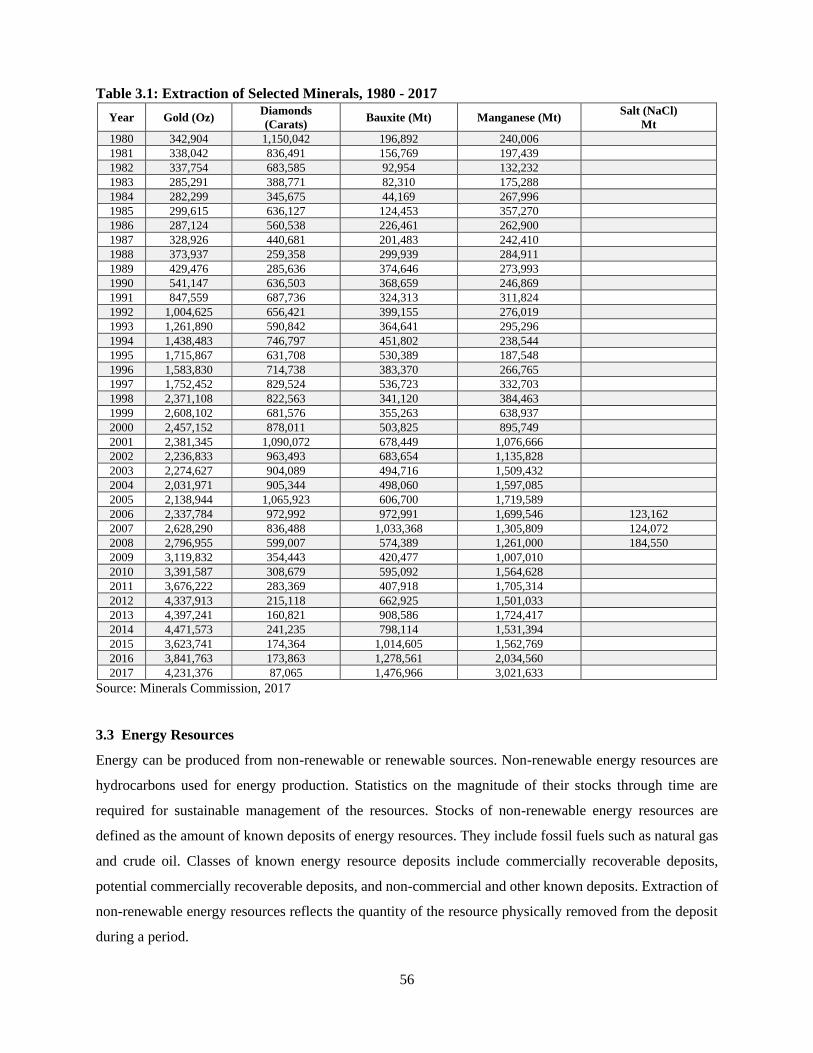
56
Table 3.1: Extraction of Selected Minerals, 1980 - 2017
Year Gold (Oz) Diamonds
(Carats) Bauxite (Mt) Manganese (Mt)
Salt (NaCl)
Mt
1980 342,904 1,150,042 196,892 240,006
1981 338,042 836,491 156,769 197,439
1982 337,754 683,585 92,954 132,232
1983 285,291 388,771 82,310 175,288
1984 282,299 345,675 44,169 267,996
1985 299,615 636,127 124,453 357,270
1986 287,124 560,538 226,461 262,900
1987 328,926 440,681 201,483 242,410
1988 373,937 259,358 299,939 284,911
1989 429,476 285,636 374,646 273,993
1990 541,147 636,503 368,659 246,869
1991 847,559 687,736 324,313 311,824
1992 1,004,625 656,421 399,155 276,019
1993 1,261,890 590,842 364,641 295,296
1994 1,438,483 746,797 451,802 238,544
1995 1,715,867 631,708 530,389 187,548
1996 1,583,830 714,738 383,370 266,765
1997 1,752,452 829,524 536,723 332,703
1998 2,371,108 822,563 341,120 384,463
1999 2,608,102 681,576 355,263 638,937
2000 2,457,152 878,011 503,825 895,749
2001 2,381,345 1,090,072 678,449 1,076,666
2002 2,236,833 963,493 683,654 1,135,828
2003 2,274,627 904,089 494,716 1,509,432
2004 2,031,971 905,344 498,060 1,597,085
2005 2,138,944 1,065,923 606,700 1,719,589
2006 2,337,784 972,992 972,991 1,699,546 123,162
2007 2,628,290 836,488 1,033,368 1,305,809 124,072
2008 2,796,955 599,007 574,389 1,261,000 184,550
2009 3,119,832 354,443 420,477 1,007,010
2010 3,391,587 308,679 595,092 1,564,628
2011 3,676,222 283,369 407,918 1,705,314
2012 4,337,913 215,118 662,925 1,501,033
2013 4,397,241 160,821 908,586 1,724,417
2014 4,471,573 241,235 798,114 1,531,394
2015 3,623,741 174,364 1,014,605 1,562,769
2016 3,841,763 173,863 1,278,561 2,034,560
2017 4,231,376 87,065 1,476,966 3,021,633
Source: Minerals Commission, 2017
3.3 Energy Resources
Energy can be produced from non-renewable or renewable sources. Non-renewable energy resources are
hydrocarbons used for energy production. Statistics on the magnitude of their stocks through time are
required for sustainable management of the resources. Stocks of non-renewable energy resources are
defined as the amount of known deposits of energy resources. They include fossil fuels such as natural gas
and crude oil. Classes of known energy resource deposits include commercially recoverable deposits,
potential commercially recoverable deposits, and non-commercial and other known deposits. Extraction of
non-renewable energy resources reflects the quantity of the resource physically removed from the deposit
during a period.

57
3.3.1 Extraction of Energy Resources
The extraction of natural gas peaked in 2018 with a value of 86.7mmscf per day after it has started slowly
from 5.2 mmscf per day at the inception in 2015. On the other hand, extraction of crude oil recorded its
highest output in 2018, with 58.66 mmbo and the lowest in 2010 with 0.17mmbo. Output of natural gas
declined from 2016 to 2018. However, output of crude oil increased from 2012 to 2016, but decreased
slightly in 2017. Table 3.2 provides additional details on the extraction of natural gas and crude oil.
Table 3.2: Extraction of Energy Resources from 2008-2018
Year Natural Gas (mmscf / day) Crude Oil (mmbo)
2008 - 0.19
2009 - 0.21
2010 - 0.17
2011 - 1.37
2012 - 23.83
2013 - 28.94
2014 - 36.86
2015 5.2 37.30
2016 67.8 37.46
2017 60.3 32.30
2018 86.7 58.66
Source: Energy Commission, 2018
3.4 Production, Trade and Consumption of Energy
Energy production refers to the capture, extraction or manufacture of fuels or other energy products in
forms which are ready for general use. Energy products are produced in a number of ways, depending on
the energy source. Energy production, transformation, distribution and use are processes characterized by
different efficiency rates, which cause distinct environmental impacts (including land use change, air
pollution, GHG emissions and waste). Total energy production originates from sources that can be
classified as non-renewable or renewable. These constitute key environment statistics that can assist when
analyzing the sustainability of the energy mix at the national level. Energy production includes the
production of primary and secondary energy. Energy imports and exports refer to the amount of fuels,
electricity and heat obtained from or supplied to other countries. Total energy supply is intended to show
flows that represent energy entering the national territory for the first time, energy removed from the
national territory and stock changes. It represents the amount of energy available on the national territory
during the reference period. Final energy consumption refers to the consumption of primary and secondary
energy by households and through economic activities. Therefore, producing statistics to describe these
activities are key to informing environmental sustainability policy.

58
3.4.1 Primary Energy Production
Production of energy from oil increased from 9.0 ktoe at its inception in 2002 to 5351.0 ktoe in 2015. It
slowed in 2016 to 4614.0 ktoe and then increased to 887l.0 ktoe in 2018. Production of natural gas increased
sharply from 51.4 ktoe in 2014 to 665.1 ktoe in 2015. However, it declined slightly to 591.5 ktoe in 2016
but increase to 850.5 ktoe in 2017. It declined to 820.8 ktoe in 2018. The highest production of Hydro
energy was recorded in the year 2014 with 721.2 ktoe. It decreased between the year 2001 and 2003 but
resumed an upward trend until 2005.
It further decreased until 2007 and then resumed an upward trend again until 2014 where it peaked. It
declined consistently to the year 2017 (Table 3.3). Solar energy production has been constant since its
inception in 2017 producing 2.0ktoe. Primary energy production of Biomass has declined consistently from
2000 to 2007 (3890.6ktoe to 3068.1ktoe). It increased steadily to 3903.3ktoe in 2017 but declined to 3881.3
ktoe.
Table 3.3: Primary Energy Production by Primary Energy Resources (ktoe)
Year Non-Renewable Renewable Crude Oil Natural Gas Hydro Solar Biomass
2000 0.0 - 568.4 - 3890.6
2001 0.0 - 568.3 - 3705.2
2002 9.0 - 433.1 - 3541.2
2003 10.0 - 334.1 - 3398.0
2004 23.0 - 454.1 - 3276.7
2005 12.0 - 484.1 - 3178.4
2006 23.0 - 483.2 - 3102.5
2007 27.0 - 320.5 - 3068.1
2008 31.0 - 532.9 - 3070.4
2009 25.0 0.0 591.4 - 3127.0
2010 195.0 0.0 601.6 - 3207.0
2011 3405.0 0.0 650.2 - 3370.7
2012 4134.0 0.0 694.1 - 3409.2
2013 5266.0 0.0 708.0 - 3553.9
2014 5328.0 51.4 721.2 0.0 3629.0
2015 5351.0 665.1 502.6 0.0 3618.0
2016 4614.0 591.5 478.3 0.0 3602.4
2017 8380 850.5 482.9 2 3903.3
2018 8876 820.8 517.5 2 3881.3
Source: Energy Commission, 2018

59
3.4.2 Secondary Energy Production
The secondary energy production of electricity recorded its maximum in 2018 (1387.1ktoe) and lowest in
2003 (505.8 ktoe). Generally, it has had increasing trend from 2000 to 2018. LPG has had a generally very
fluctuating trend, recording low productions in 2001 (7.5ktoe), 2006 (38.7 ktoe), 2009 (15.1 ktoe) and 2015
(2.2ktoe). LPG’s highest productions was recorded in 2016 (123.4ktoe) while the lowest was in 2015 (2.2
ktoe). In addition, Kerosene recorded its maximum in the year 2011 (173.6 ktoe) and the lowest in the year
2000 (0.1 ktoe).
Also, ATK peaked in the year 2005 (121.4ktoe) with the lowest in the year 2017 (0.1ktoe). Furthermore,
Gas oil recorded its highest in the year 2004 (613.8ktoe) and the lowest in 2017 (6.6ktoe). Also, Fuel oils
recorded its maximum in the year 2000 (254.1) with the lowest in the year 2017 (1.2ktoe) as indicated in
Table 3.4.
Table 3.4: Secondary Energy Production (ktoe), 2000-2018
Year Electricity LPG Gasoline Kerosene ATK Gas Oil Fuel Oils
2000 621.2 10.4 250.6 0.1 110.5 386.7 254.1
2001 675.8 7.5 300.6 88 65.3 381.8 253.2
2002 625.5 26.3 363.5 115.3 83.2 482.3 189.8
2003 505.8 56.8 455.5 53.3 87.3 547.1 158.6
2004 519.2 70.8 580.7 101 109 613.8 193.1
2005 583.7 81.3 595.4 62.9 121.4 525.2 199.3
2006 724.9 38.7 309.1 112.9 47.2 317.7 150.9
2007 623.8 72.7 517.6 114.4 67.1 430 47.2
2008 728.5 58.9 410.8 90.4 21.7 389.4 218.7
2009 770.4 15.1 141.8 67.1 1.3 111 24.6
2010 874.3 34.1 354.6 125.6 119 316 93.9
2011 963.2 48.1 361.5 173.6 118.4 334.6 87.9
2012 1,034.00 28.9 165.6 50.2 48.6 131.3 76.8
2013 1,106.80 27.7 175.7 73.1 61 122.4 42.1
2014 1,114.80 3.5 42.4 54.2 9.6 30.1 42.4
2015 988.3 2.2 33.4 21.8 18.5 30.3 8.7
2016 1,120.00 123.4 256.2 15 38.3 275.1 62.1
2017 1,209.80 123.1 6.8 4.7 0.1 6.6 1.2
2018 1,397.10 94.9 106.7 34.1 22.1 115.3 30.6
Source: Energy Commission, 2018
3.4.3 Total Energy supply
Crude oil recorded its highest supply in 2007 (2094.8ktoe) with its lowest supply of energy in 2017 (169.2
ktoe). There was a constant increase from 2000 to 2006. During the years 2006, 2013, 2015 and 2018, the
supply of crude oil fluctuated. In the year 2018 natural gas sector recorded the highest supply of energy
(1458.8ktoe) with its lowest in 2009 (5.0ktoe). The supply of natural gas varied during the decade (2009 –
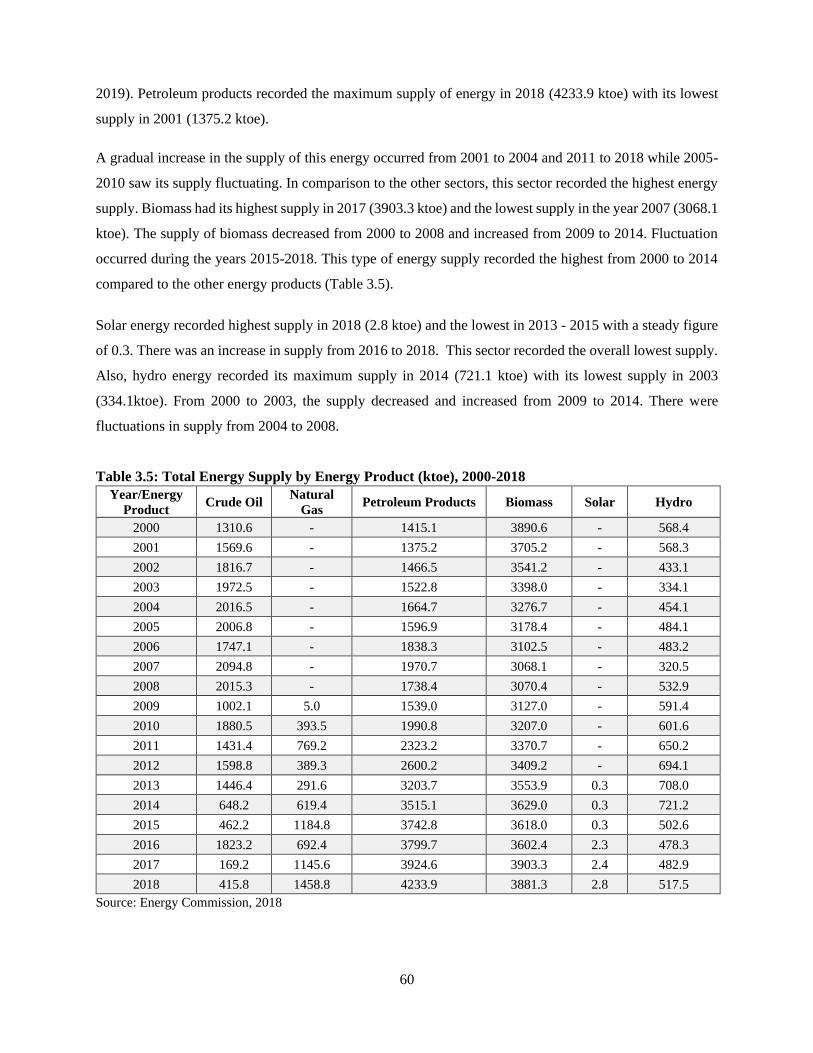
60
2019). Petroleum products recorded the maximum supply of energy in 2018 (4233.9 ktoe) with its lowest
supply in 2001 (1375.2 ktoe).
A gradual increase in the supply of this energy occurred from 2001 to 2004 and 2011 to 2018 while 2005-
2010 saw its supply fluctuating. In comparison to the other sectors, this sector recorded the highest energy
supply. Biomass had its highest supply in 2017 (3903.3 ktoe) and the lowest supply in the year 2007 (3068.1
ktoe). The supply of biomass decreased from 2000 to 2008 and increased from 2009 to 2014. Fluctuation
occurred during the years 2015-2018. This type of energy supply recorded the highest from 2000 to 2014
compared to the other energy products (Table 3.5).
Solar energy recorded highest supply in 2018 (2.8 ktoe) and the lowest in 2013 - 2015 with a steady figure
of 0.3. There was an increase in supply from 2016 to 2018. This sector recorded the overall lowest supply.
Also, hydro energy recorded its maximum supply in 2014 (721.1 ktoe) with its lowest supply in 2003
(334.1ktoe). From 2000 to 2003, the supply decreased and increased from 2009 to 2014. There were
fluctuations in supply from 2004 to 2008.
Table 3.5: Total Energy Supply by Energy Product (ktoe), 2000-2018
Year/Energy
Product Crude Oil
Natural
Gas Petroleum Products Biomass Solar Hydro
2000 1310.6 - 1415.1 3890.6 - 568.4
2001 1569.6 - 1375.2 3705.2 - 568.3
2002 1816.7 - 1466.5 3541.2 - 433.1
2003 1972.5 - 1522.8 3398.0 - 334.1
2004 2016.5 - 1664.7 3276.7 - 454.1
2005 2006.8 - 1596.9 3178.4 - 484.1
2006 1747.1 - 1838.3 3102.5 - 483.2
2007 2094.8 - 1970.7 3068.1 - 320.5
2008 2015.3 - 1738.4 3070.4 - 532.9
2009 1002.1 5.0 1539.0 3127.0 - 591.4
2010 1880.5 393.5 1990.8 3207.0 - 601.6
2011 1431.4 769.2 2323.2 3370.7 - 650.2
2012 1598.8 389.3 2600.2 3409.2 - 694.1
2013 1446.4 291.6 3203.7 3553.9 0.3 708.0
2014 648.2 619.4 3515.1 3629.0 0.3 721.2
2015 462.2 1184.8 3742.8 3618.0 0.3 502.6
2016 1823.2 692.4 3799.7 3602.4 2.3 478.3
2017 169.2 1145.6 3924.6 3903.3 2.4 482.9
2018 415.8 1458.8 4233.9 3881.3 2.8 517.5
Source: Energy Commission, 2018
61
3.4.4 Final Consumption of Energy
Under Grid electricity energy consumption, residential consumption of energy recorded it highest in 2018
(555ktoe), with its lowest in 2000 (196.5ktoe). It increased consistently from 2000 to 2018. Commerce &
Service recorded its highest consumption in 2017 (242.5ktoe), whiles 2007 turned out to be its lowest
(33.9ktoe), and thereafter, there was a continuous increase from 2007 to 2014 with fluctuations from 2014
to 2018. The Industry recorded its maximum in 2001 (363.4ktoe) and lowest in 2004 (166ktoe) and
fluctuated from 2005 to 2011.
Residential consumption of petroleum peaked in the year 2009 (204ktoe) and recorded its lowest
consumption in 2000 (88ktoe) with a continuous increase from 2000 to 2006. The Industry recorded the
highest consumption of petroleum in 2011 (434ktoe) whiles Commerce and Service also recorded the
lowest (5 ktoe) consumption of petroleum in 2000, 2001, and 2005.
Residential consumption of Biomass recorded the highest consumption of energy from 2000 to 2011.
Agriculture and transport for grid electricity recorded the lowest consumption of energy as compared to the
other sectors. For the petroleum sector, transport recorded the highest on yearly basis. The overall highest
and lowest consumption of energy recorded for Biomass and grid electricity were residential, agriculture
and fisheries (Table 3.6).

62
Table 3.6: Final Consumption of Energy (ktoe)
2000 2001 2002 2003 2004 2005 2006 2007 2008 2009 2010 2011 2012 2013 2014 2015 2016 2017 2018
Grid Electricity
Residential 196.5 209.0 219.8 231.4 244.4 273.5 252.2 222.4 250.6 328.6 351.7 380.6 419.8 448.6 453.5 429.6 502.8 533.7 555.0
Commerce & Service 38.8 40.0 41.1 42.4 43.5 47.9 40.9 33.9 36.3 48.5 124.2 138.4 159.4 178.8 185.0 181.8 221.0 242.5 228.6
Industry 356.6 363.4 320.8 170.7 166.0 187.3 326.8 281.2 309.1 236.6 197.5 252.0 271.7 280.5 280.6 220.6 256.5 264.7 349.4
Agriculture & Fisheries 0.2 0.3 0.4 0.5 0.6 0.7 0.7 0.7 0.8 1.1 0.1 0.1 0.2 0.2 0.2 0.2 0.3 0.3 0.3
Transport 0.3 0.3 0.3 1.0 1.2 0.8 0.8 1.0 0.9 0.6 0.7 0.9 0.7 0.3 0.5 0.8 1.0 0.5 0.7
Total 592 613 582 446 456 510 621 539 598 615 674 772 852 908 920 833 982 1,042 1,134
Petroleum (Oil & Gas)
Residential 88 90 100 100 106 112 121 110 99 204 144 176 198 173 153 174 177 176 181.6
Industry 131 142 148 157 180 198 287 334 334 384 384 434 402 412 384 396 356 337 406.6
Commerce & Service 5 5 6 7 5 6 7 8 7 13 8 11 12 12 11 14 15 15 16.6
Agriculture & Fisheries 58 55 58 54 60 58 57 64 60 71 70 77 88 91 89 92 83 142 94.8
Transport 1148 1163 1220 1161 1337 1319 1392 1603 1567 1913 1877 2118 2467 2611 2633 2868 2642 2449 2847.2
Total 1,430 1,455 1,532 1,479 1,689 1,692 1,863 2,118 2,066 2,585 2,484 2,817 3,167 3,299 3,271 3,544 3,273 3,119 3,547
Biomass
Residential 3127 2941 2792 2642 2560 2470 2398 2322 2247 2218 2183 2285 2291 2363 2461 2448 2440 2471 2451.6
Commerce & Service 75 75 77 77 80 83 87 89 90 93 95 93 98 106 117 119 122 130 116.3
Industry 230 222 214 206 199 192 186 183 181 183 186 197 200 207 214 217 221 228 226.6
Agriculture & Fisheries 0 0 0 0 0 0 0 0 0 0 0 0 0 0 0 0 0 0 -
Transport 0 0 0 0 0 0 0 0 0 0 0 0 0 0 0 0 0 0 -
Total 3,432 3,238 3,082 2,925 2,839 2,745 2,671 2,594 2,518 2,493 2,464 2,576 2,589 2,676 2,792 2,785 2,783 2,828 2,795
Source: Energy Commission, 2018
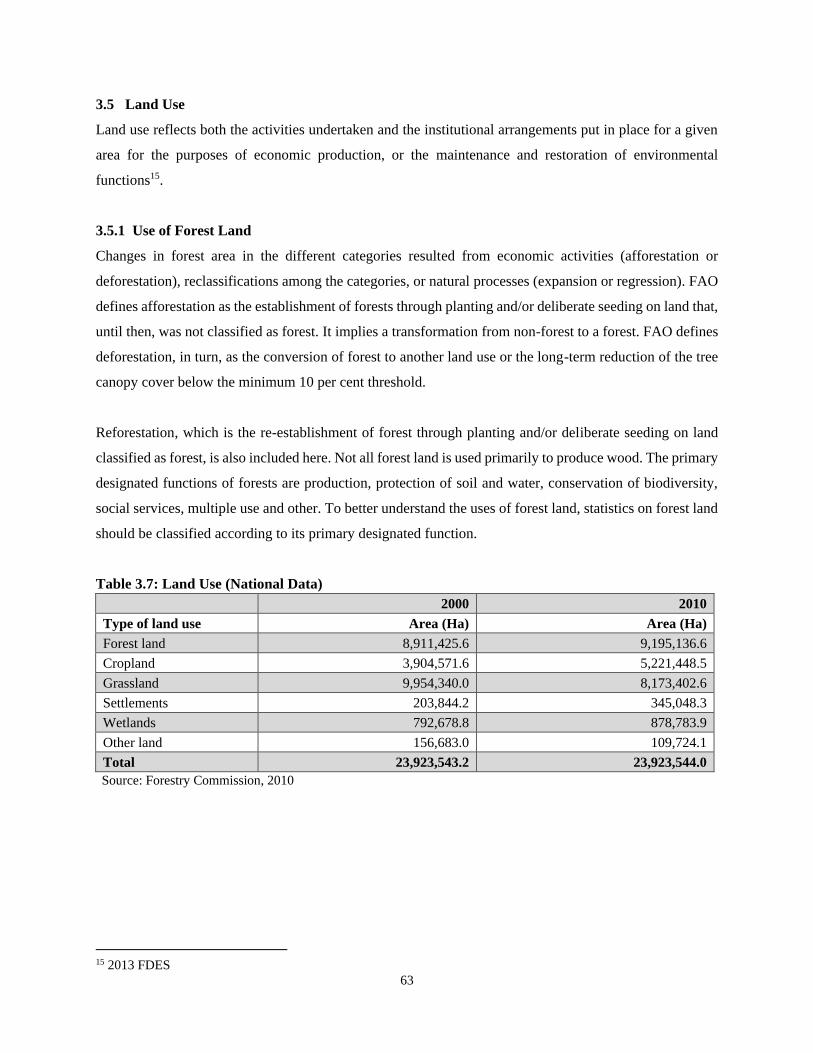
63
3.5 Land Use
Land use reflects both the activities undertaken and the institutional arrangements put in place for a given
area for the purposes of economic production, or the maintenance and restoration of environmental
functions15.
3.5.1 Use of Forest Land
Changes in forest area in the different categories resulted from economic activities (afforestation or
deforestation), reclassifications among the categories, or natural processes (expansion or regression). FAO
defines afforestation as the establishment of forests through planting and/or deliberate seeding on land that,
until then, was not classified as forest. It implies a transformation from non-forest to a forest. FAO defines
deforestation, in turn, as the conversion of forest to another land use or the long-term reduction of the tree
canopy cover below the minimum 10 per cent threshold.
Reforestation, which is the re-establishment of forest through planting and/or deliberate seeding on land
classified as forest, is also included here. Not all forest land is used primarily to produce wood. The primary
designated functions of forests are production, protection of soil and water, conservation of biodiversity,
social services, multiple use and other. To better understand the uses of forest land, statistics on forest land
should be classified according to its primary designated function.
Table 3.7: Land Use (National Data)
2000 2010
Type of land use Area (Ha) Area (Ha)
Forest land 8,911,425.6 9,195,136.6
Cropland 3,904,571.6 5,221,448.5
Grassland 9,954,340.0 8,173,402.6
Settlements 203,844.2 345,048.3
Wetlands 792,678.8 878,783.9
Other land 156,683.0 109,724.1
Total 23,923,543.2 23,923,544.0
Source: Forestry Commission, 2010
15 2013 FDES

64
3.6 Timber Resources
Timber resources can be natural or cultivated and are important environmental resources in many
countries. They provide inputs for construction and the production of furniture, cardboard, cellulose,
paper and other products, and are also a fuel source. Timber resources are defined by the volume of
trees, living and dead, which can still be used for timber or fuel. This includes all trees regardless of
diameter or tops of stems.
3.6.1 Export of Timber
The year 2012 recorded the smallest amount of timber exports (251,245.6m3), whiles the year 2008
(545,915.1m3) recorded the largest amount of timber exports (Table 3.8). There was a continuous increase
in the volume of timber exported from 2006 to 2008, and from 2013 to 2016, and conversely 2008 to 2012
recorded a continuous decrease volumes of timber exported.
Table 3.8: Export of Timber Products (Wood & Wood Products)
Year Volume (m3) Value (US$M) Year Volume (m3) Value (US$M)
1997 442,078.2 308.0 2008 545,915.1 214.6
1998 415,700.8 171.0 2009 426,221.9 147.5
1999 433,125.1 173.8 2010 403,254.1 158.5
2000 498,843.3 175.2 2011 319,842.9 123.5
2001 476,500.5 169.0 2012 251,245.6 114.8
2002 472,426.6 210.9 2013 271,722.2 137.2
2003 444,388.3 187.4 2014 356,036.0 158.9
2004 455,180.4 196.1 2015 267,379.5 155.3
2005 466,155.3 211.6 2016 396,991.5 258.7
2006 451,608.0 195.6 2017 339,226.6 218.4
2007 528,570.1 211.8 2018 332,927.0 216.1
Source: Forestry Commission, 2018
3.6.2 Fertilizers
In 2006, Muriate of potash was the minimum fertilizer used with a record of 19Mt whiles 2,692,580 MT of
NPK liquid (Lt) was used in 2012. The most commonly used fertilizer from 2004 to 2018 was NPK with a
total sum of 1,852,325.15 MT, because NPK had the highest usage in 2005, 2006, 2007, 2009, 2016, 2017,
and 2018. On the contrary, Potassium Sulphate had the lowest total usage of 76,784 MT.

65
Table 3.9 : Fertilizers and Pesticides Use
No. Type of Input 2004 2005 2006 2007 2008 2009 2010 2011 2012 2013 2014 2015 2016 2017 2018
1 NPK (Mt) 18,223 38,978 84,907 87,388 18,873 197,631 30,560 70,359 230,723 227,571 89332 121509.83 258290.19 153767.13 224202
2 NPK Liquid
(Lt) 11,521 844,543 2,692,580 264,649 1,345,562 71,800 127,565 14,351.00
3 Urea (Mt) 250 4,540 9,072 4,962 13,773 25,028 16,079 48,552 31,950 51,044 3,864 23,594.27 16,353.40 78,590.56 42,149
4 Muriate of
Potash (Mt) 822 1,000 19 109 8853 15,007 12077 62,338 43384 43,441 28642 25,572.81 14,267.82 26,018.00 16495
5 Sulphate of
Ammonia (Mt) 7,688 15,000 19090 17,458 4172 4,616 52117 20,140 83840 68,979 7551 59,676.16 14,417.39 36,833.10 10429
6 Phosphates (Mt) 1,850 1000 99 504 15,440 66501 236,547 108862 78,355 63700 17182 43,040.11 109,960.87 23,279.53 3239
7 Nitrates (Mt) 95,312 157 52,601 52823 64,085 110 157 267 407 49,319 49,491.79 3,450.04 2,203.41 90022
8 Potassium
Sulphate (Mt) 72,000 135 103 321 371 3,626.52 227
9 Insecticides
(Mt) 610 5,982 6,921 9,979 5,121 5,078 8,735 832,810 543,000 1,539 6,513 3,695 5,742.20 1,619.50
10 Fungicides (Mt) 770 1,713 2,148 2,575 2,767 1,248 4,955 596,000 180,000 4,599 1,167 1,328 4,706.90 4,482.00
11 Herbicides (Mt) 1096 5,340 8,780 8,932 10,835 4,555 854,400 991,300 4,723 7,889 294,009 32,947.10 19,112.50
Source: Plant Protection & Regulatory Services Directorate, MoFA

66
3.7 Water Resources
Water resources consist of freshwater and brackish water, regardless of their quality, in inland water bodies,
including surface water, groundwater and soil water. Inland water stocks are the volume of water contained
in surface water and groundwater bodies and the soil at a point in time. Water resources are also measured
in terms of flows to and out of the inland water resources during a period of time. Surface water comprises
all water that flows over or is stored on the ground’s surface, regardless of its salinity levels. Surface water
includes water in artificial reservoirs, lakes, rivers and streams, snow, ice and glaciers. Groundwater
comprises water that collects in porous layers of underground formations known as aquifers.
Statistics on water resources include the volume of water generated within the country or territory as the
result of precipitation, the volume of water lost to evapotranspiration, the inflow of water from neighboring
countries, and the outflow of water to neighboring countries or the sea.
3.7.1 Abstraction, Use and Returns of Water
Abstraction, use and returns of water are the flows of water between the environment and the human
subsystem and within the human subsystem. Water abstraction is the amount of water that is removed from
any source, either permanently or temporarily, in a given period of time. Water is abstracted from surface
water and groundwater resources by economic activities and households. It can be abstracted for own use
or distribution to other users.
The freshwater abstraction data provided is for the formal irrigation schemes which are under the
management of the Ghana Irrigation Development Authority (GIDA). This data is exclusive of water
abstraction by informal irrigation sector both the smallholder and large-scale commercial farms. There are
56 formal irrigation schemes currently under the management of GIDA contributing about 6% of irrigated
lands. Most irrigated lands fall under the informal irrigated sectors as shown in Table 3.11.
The water abstraction data as summarized in Table 3.10 was compiled from 29 of the formal irrigation
schemes between the period of 2009 and 2017. These irrigation schemes use fresh surface water, no
groundwater data were included. The rest of the 56 formal irrigation schemes are not captured because of
non-availability of data or the scheme being nonoperational or under rehabilitation. The abstraction data
was estimated from the annual Crop Production figures and the net irrigation requirement for the crops
under production. Further details on fresh surface water abstraction for irrigation is provide in Annex 3.

67
From Figure 3.5, irrigation development has been growing steadily over the years. It declined in 2014, 2015
but rose rapidly in 2016. This trend is expected to continue with more investment in the sector. The
Authority has also taken steps to address the challenges in managing the informal sector. It must however
be noted that the large-scale informal sectors are located on the GIDA schemes.
Table 3.10: Summary of Fresh Surface Water Abstraction Data for Irrigation
Regions Fresh Surface Water Abstraction for Irrigation in Agriculture (mio m3)
2008 2009 2010 2011 2012 2013 2014 2015 2016 2017
Western 0.000 0.000 0.000 0.000 0.000 0.000 0.000 0.000 0.000 0.000
Central 0.000 0.320 0.796 0.348 0.530 0.790 0.050 0.605 0.963 0.101
Greater Accra 16.218 20.362 25.390 25.550 27.210 31.400 22.160 32.050 33.709 22.170
Eastern 0.000 0.191 0.078 0.122 0.000 0.000 0.000 0.000 0.000 0.000
Volta 8.670 12.776 10.020 12.716 13.931 13.763 14.783 12.918 10.785 18.871
Ashanti 0.297 0.166 0.978 0.839 1.163 0.862 0.811 0.697 0.827 0.946
Brong Ahafo 0.446 0.417 0.448 0.485 0.412 0.323 0.329 0.309 0.135 0.083
Northern 2.405 3.581 3.524 4.071 3.933 4.452 4.798 3.472 5.613 3.911
Upper East 8.836 12.115 13.418 17.403 13.782 13.846 15.459 5.932 29.265 22.634
Total Surface
Water Abstraction
for Irrigation
(mio m3/y)
36.87 49.93 54.65 61.54 60.96 65.44 58.39 55.98 81.30 68.72
Source: Ghana Irrigation Development Authority (GIDA), 2019

68
Figure 3.5: Annual Fresh Surface Water Abstraction for Irrigation
Source: Ghana Irrigation Development Authority (GIDA), 2019
Table 3.11: Irrigated Agricultural Lands per Year
Year
Irrigation Type
Total Formal
Irrigation
Informal Irrigation
(Smallholder)
Informal Irrigation
(Large Scale Commercial)
2009 12,168 - 17,636 29,804
2010 12,633 - 17,636 30,269
2011 11,709 - 17,636 29,345
2012 11,709 - 17,636 29,345
2013 10,668 - 17,636 28,304
2014 10,668 - 17,636 28,304
2015 11,000 189,000 21,000 221,000
2016 11,000 189,000 21,000 221,000
2017 12,003 189,000 21,000 222,003
2018 12,978 189,000 21,000 222,978
Source: Ghana Irrigation Development Authority (GIDA), 2019
0.00
10.00
20.00
30.00
40.00
50.00
60.00
70.00
80.00
90.00
2007 2008 2009 2010 2011 2012 2013 2014 2015 2016 2017 2018
Wa
ter
Ab
stra
ctio
n(m
io m
3/y
)
Year

69
Chapter 4
Residuals
4.1 Introduction
This chapter contains statistics on the amount and characteristics of residuals generated by human
production and consumption processes, their management, and their final release to the environment.
Residuals are flows of solid, liquid and gaseous materials, and energy that are discarded, discharged or
emitted by establishments and households through processes of production, consumption or accumulation.
Residuals may be discarded, discharged or emitted directly to the environment or be captured, collected,
treated, recycled or reused.
4.2 Emissions of Greenhouse Gases (GHG)
Behind the struggle to address global warming and climate change lies the increase in greenhouse gases in
our atmosphere. A greenhouse gas is any gaseous compound in the atmosphere that is capable of absorbing
infrared radiation, thereby trapping and holding heat in the atmosphere. By increasing the heat in the
atmosphere, greenhouse gases are responsible for the greenhouse effect, which ultimately leads to global
warming. Greenhouse gas concentrations have increased rapidly, and human activities are the primary
cause. The result is a worldwide, unnatural warming that's driving other changes in our environment. Hence,
the need to monitor the rate at which these gases are emitted into the atmosphere. Below are the data that
depicts the quantity of Greenhouse gas emission in Ghana.
4.2.1 Total National Greenhouse Gas Emission
The country recorded a total national greenhouse gas emission of 42.2 MtCO2e (million tonnes carbon
dioxide equivalent) in 2016 compared to 25.3 MtCO2e in 1990, 27.6 MtCO2e in 2012. The 2016 emissions
are 66.4%, 53% and 7.1% more than the previously reported net emission levels for 1990, 2000 and 2012,
respectively, thus a significant increase in emissions between 1990 and 2016. In all, the national emissions
increased at 2.1% annual growth rate during 1990-2016. The visible drop in the emissions between 2004
and 2005 was as a result of the reductions in fuel consumption in the transport and electricity categories.
All sectors have recorded emission increases over the 26-year inventory period. But for the emissions that
occurred between 2012 and 2016, the waste sector saw the highest increase of 17% followed by the energy
sector (14.2%) and then by the Agriculture, Forestry and other Land Use (AFOLU) sector (4.0%).
70
On the other hand, emissions from the IPPU sector notably decreased from 1.52 MtCO2e to 1.04 MtCO2e
representing a 31.3% reduction. Stationary and mobile combustions were the main sources of emissions in
the energy sector, so in terms of the trends, they both recorded 22.7% and 7.2% increases, respectively,
within the same timeframe. The fugitive emissions have also increased over the period 2012-2016 largely
due to the increased oil and gas production.
4.2.2 Net Carbon dioxide (CO2) Emissions by sectors in Mt
The total CO2 emissions grew from 16.84 Mt in 1990 to 27.29 Mt in 2016 representing a 62% increase. The
Energy and Agriculture, Forestry and other Land Use (AFOLU) sectors were the key sources of CO2
emissions mainly from fossil fuel combustion and land-use change. While CO2 in the energy sector saw a
454% increment (from 2.52 Mt to 13.97 Mt) that of the AFOLU sector dropped by 7.9% from 14.02 Mt in
1990 to 12.91 Mt in 2016.
The energy sector CO2 emissions increased by 15% for the period 2012-2016 and AFOLU CO2 slightly
declined by nearly 1% in the same period. CO2 emissions from industrial processes and product use also
increased from 0.29Mt to 0.3 between 1990 to 1995 saw some declined and appreciation from 1996 to
2016. CO2 emissions from the waste sector was consistent with a value of 0.003Mt from 1990 to 2000,
appreciated to 0.004 from 2001 to 2006, 0.005 in 2007 and gradually increased to 0.009 in 2016. Carbon
dioxide per sector (Figure 4.1).
Although, agriculture, forestry and other land use generated the highest record of net carbon dioxide
emission for the years being reported, except for years 2015 and 2016 where the energy sector recorded the
highest. Also, there were fluctuations from year 2000 to 2016. Industrial processes & product use was the
second lowest contributor in the generation of carbon dioxide emission. It also experienced constant
fluctuation and with year 2012 recording the highest (0.54) with the least (0.005) being 2003 and 2004
(Table 4.1).
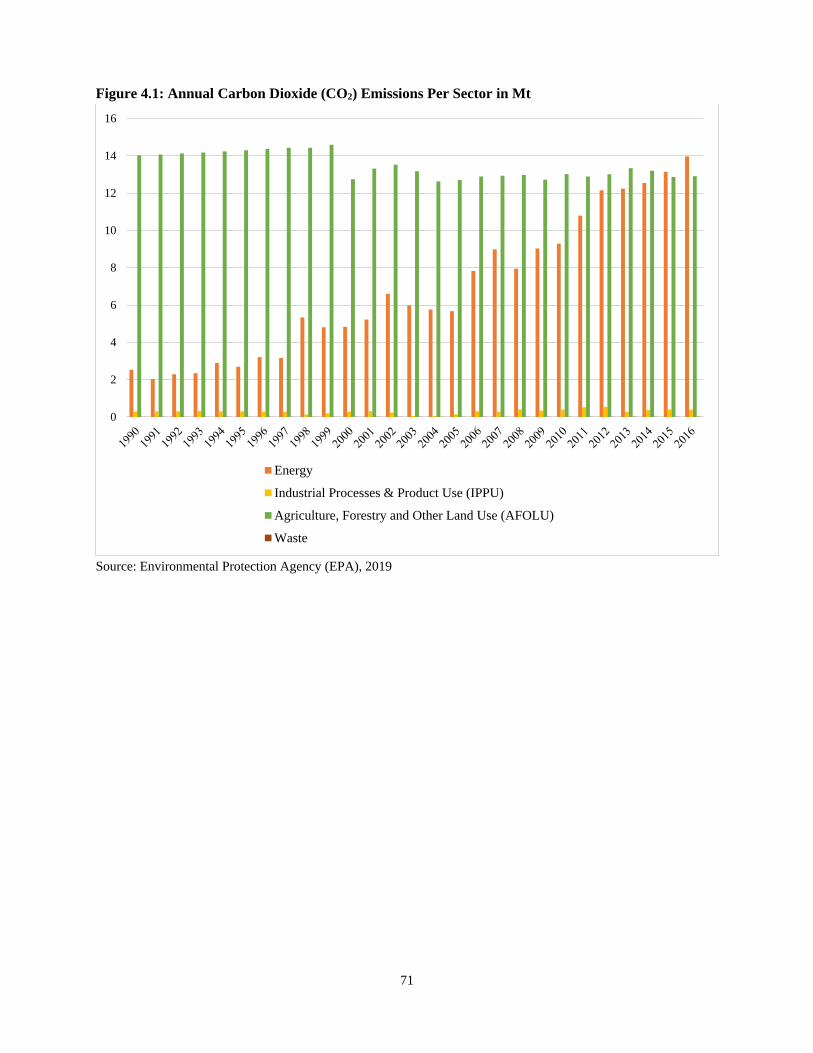
71
Figure 4.1: Annual Carbon Dioxide (CO2) Emissions Per Sector in Mt
Source: Environmental Protection Agency (EPA), 2019
0
2
4
6
8
10
12
14
16
Energy
Industrial Processes & Product Use (IPPU)
Agriculture, Forestry and Other Land Use (AFOLU)
Waste
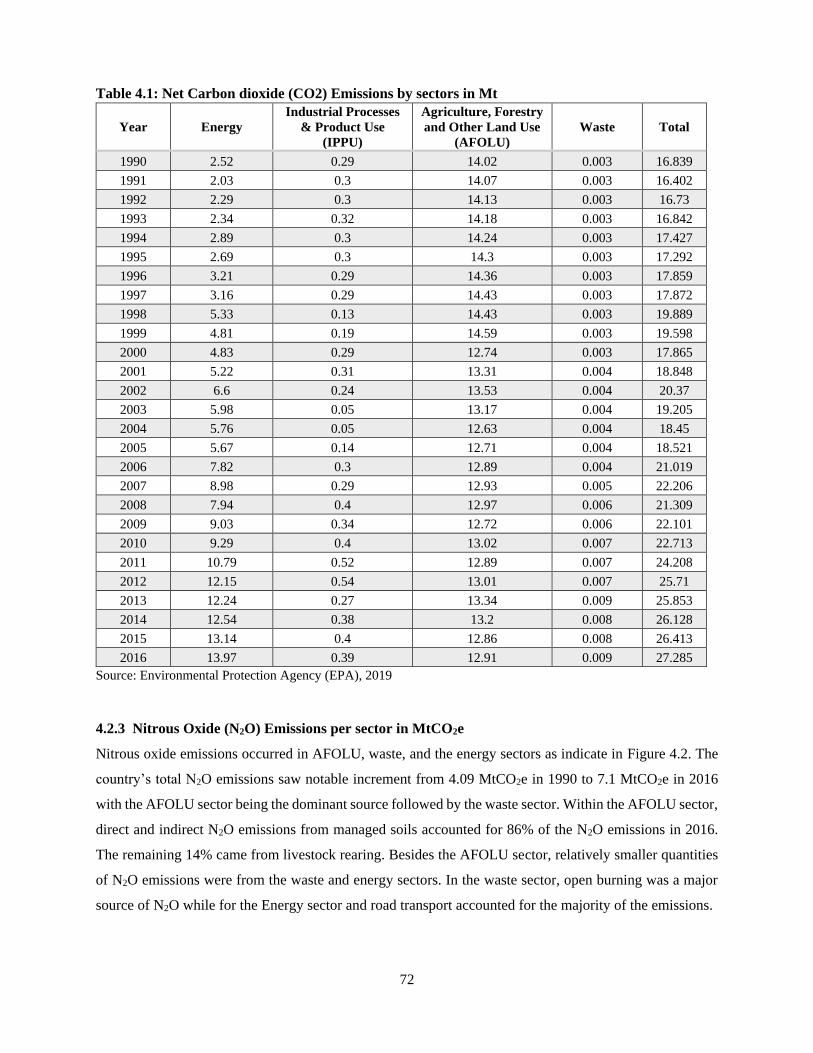
72
Table 4.1: Net Carbon dioxide (CO2) Emissions by sectors in Mt
Year Energy
Industrial Processes
& Product Use
(IPPU)
Agriculture, Forestry
and Other Land Use
(AFOLU)
Waste Total
1990 2.52 0.29 14.02 0.003 16.839
1991 2.03 0.3 14.07 0.003 16.402
1992 2.29 0.3 14.13 0.003 16.73
1993 2.34 0.32 14.18 0.003 16.842
1994 2.89 0.3 14.24 0.003 17.427
1995 2.69 0.3 14.3 0.003 17.292
1996 3.21 0.29 14.36 0.003 17.859
1997 3.16 0.29 14.43 0.003 17.872
1998 5.33 0.13 14.43 0.003 19.889
1999 4.81 0.19 14.59 0.003 19.598
2000 4.83 0.29 12.74 0.003 17.865
2001 5.22 0.31 13.31 0.004 18.848
2002 6.6 0.24 13.53 0.004 20.37
2003 5.98 0.05 13.17 0.004 19.205
2004 5.76 0.05 12.63 0.004 18.45
2005 5.67 0.14 12.71 0.004 18.521
2006 7.82 0.3 12.89 0.004 21.019
2007 8.98 0.29 12.93 0.005 22.206
2008 7.94 0.4 12.97 0.006 21.309
2009 9.03 0.34 12.72 0.006 22.101
2010 9.29 0.4 13.02 0.007 22.713
2011 10.79 0.52 12.89 0.007 24.208
2012 12.15 0.54 13.01 0.007 25.71
2013 12.24 0.27 13.34 0.009 25.853
2014 12.54 0.38 13.2 0.008 26.128
2015 13.14 0.4 12.86 0.008 26.413
2016 13.97 0.39 12.91 0.009 27.285
Source: Environmental Protection Agency (EPA), 2019
4.2.3 Nitrous Oxide (N2O) Emissions per sector in MtCO2e
Nitrous oxide emissions occurred in AFOLU, waste, and the energy sectors as indicate in Figure 4.2. The
country’s total N2O emissions saw notable increment from 4.09 MtCO2e in 1990 to 7.1 MtCO2e in 2016
with the AFOLU sector being the dominant source followed by the waste sector. Within the AFOLU sector,
direct and indirect N2O emissions from managed soils accounted for 86% of the N2O emissions in 2016.
The remaining 14% came from livestock rearing. Besides the AFOLU sector, relatively smaller quantities
of N2O emissions were from the waste and energy sectors. In the waste sector, open burning was a major
source of N2O while for the Energy sector and road transport accounted for the majority of the emissions.
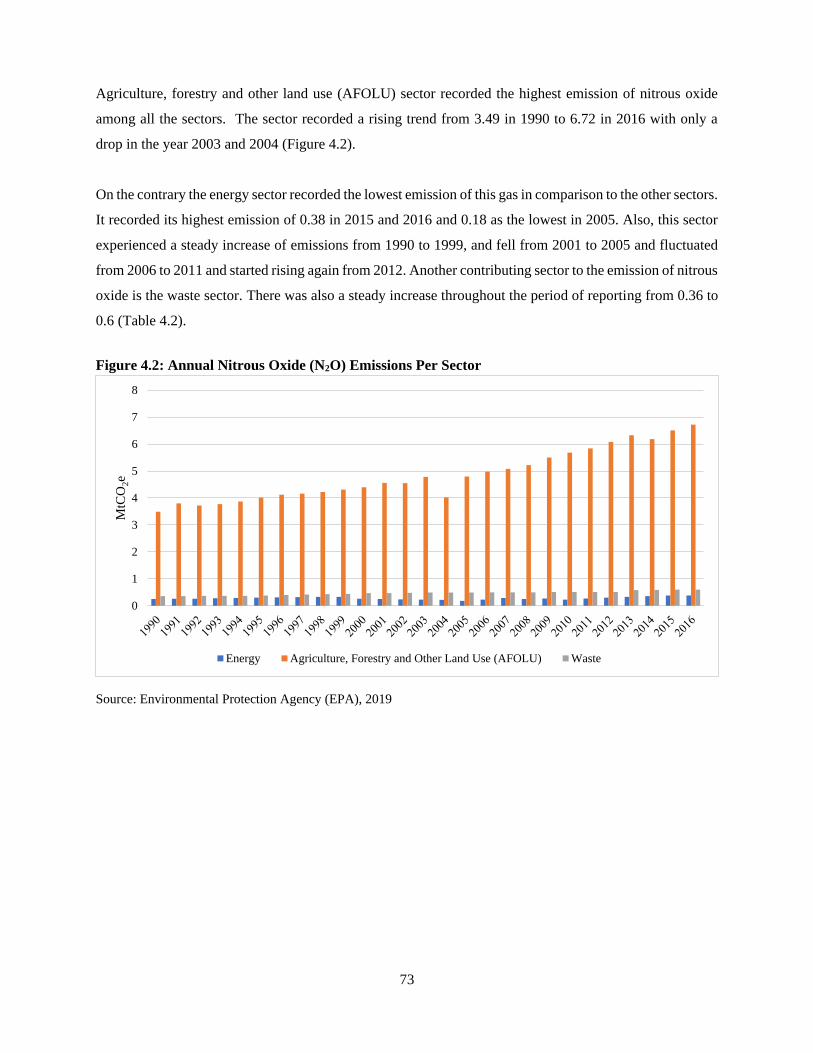
73
Agriculture, forestry and other land use (AFOLU) sector recorded the highest emission of nitrous oxide
among all the sectors. The sector recorded a rising trend from 3.49 in 1990 to 6.72 in 2016 with only a
drop in the year 2003 and 2004 (Figure 4.2).
On the contrary the energy sector recorded the lowest emission of this gas in comparison to the other sectors.
It recorded its highest emission of 0.38 in 2015 and 2016 and 0.18 as the lowest in 2005. Also, this sector
experienced a steady increase of emissions from 1990 to 1999, and fell from 2001 to 2005 and fluctuated
from 2006 to 2011 and started rising again from 2012. Another contributing sector to the emission of nitrous
oxide is the waste sector. There was also a steady increase throughout the period of reporting from 0.36 to
0.6 (Table 4.2).
Figure 4.2: Annual Nitrous Oxide (N2O) Emissions Per Sector
Source: Environmental Protection Agency (EPA), 2019
0
1
2
3
4
5
6
7
8
MtC
O2e
Energy Agriculture, Forestry and Other Land Use (AFOLU) Waste
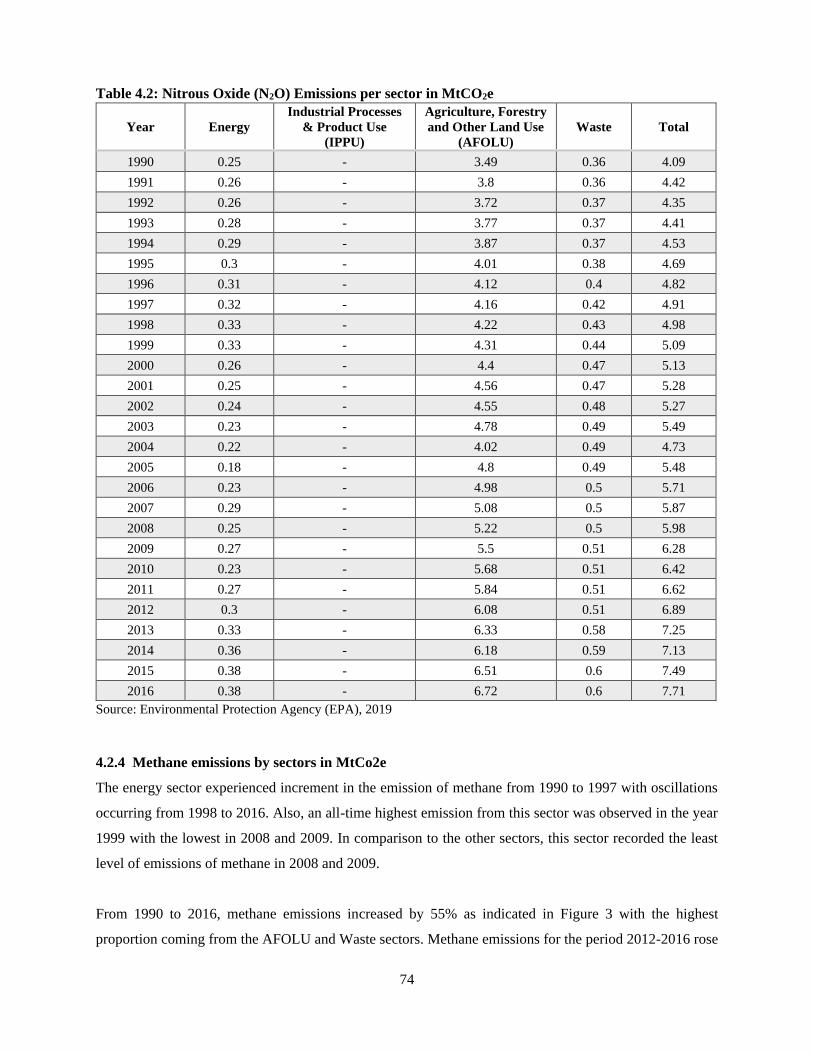
74
Table 4.2: Nitrous Oxide (N2O) Emissions per sector in MtCO2e
Year Energy
Industrial Processes
& Product Use
(IPPU)
Agriculture, Forestry
and Other Land Use
(AFOLU)
Waste Total
1990 0.25 - 3.49 0.36 4.09
1991 0.26 - 3.8 0.36 4.42
1992 0.26 - 3.72 0.37 4.35
1993 0.28 - 3.77 0.37 4.41
1994 0.29 - 3.87 0.37 4.53
1995 0.3 - 4.01 0.38 4.69
1996 0.31 - 4.12 0.4 4.82
1997 0.32 - 4.16 0.42 4.91
1998 0.33 - 4.22 0.43 4.98
1999 0.33 - 4.31 0.44 5.09
2000 0.26 - 4.4 0.47 5.13
2001 0.25 - 4.56 0.47 5.28
2002 0.24 - 4.55 0.48 5.27
2003 0.23 - 4.78 0.49 5.49
2004 0.22 - 4.02 0.49 4.73
2005 0.18 - 4.8 0.49 5.48
2006 0.23 - 4.98 0.5 5.71
2007 0.29 - 5.08 0.5 5.87
2008 0.25 - 5.22 0.5 5.98
2009 0.27 - 5.5 0.51 6.28
2010 0.23 - 5.68 0.51 6.42
2011 0.27 - 5.84 0.51 6.62
2012 0.3 - 6.08 0.51 6.89
2013 0.33 - 6.33 0.58 7.25
2014 0.36 - 6.18 0.59 7.13
2015 0.38 - 6.51 0.6 7.49
2016 0.38 - 6.72 0.6 7.71
Source: Environmental Protection Agency (EPA), 2019
4.2.4 Methane emissions by sectors in MtCo2e
The energy sector experienced increment in the emission of methane from 1990 to 1997 with oscillations
occurring from 1998 to 2016. Also, an all-time highest emission from this sector was observed in the year
1999 with the lowest in 2008 and 2009. In comparison to the other sectors, this sector recorded the least
level of emissions of methane in 2008 and 2009.
From 1990 to 2016, methane emissions increased by 55% as indicated in Figure 3 with the highest
proportion coming from the AFOLU and Waste sectors. Methane emissions for the period 2012-2016 rose
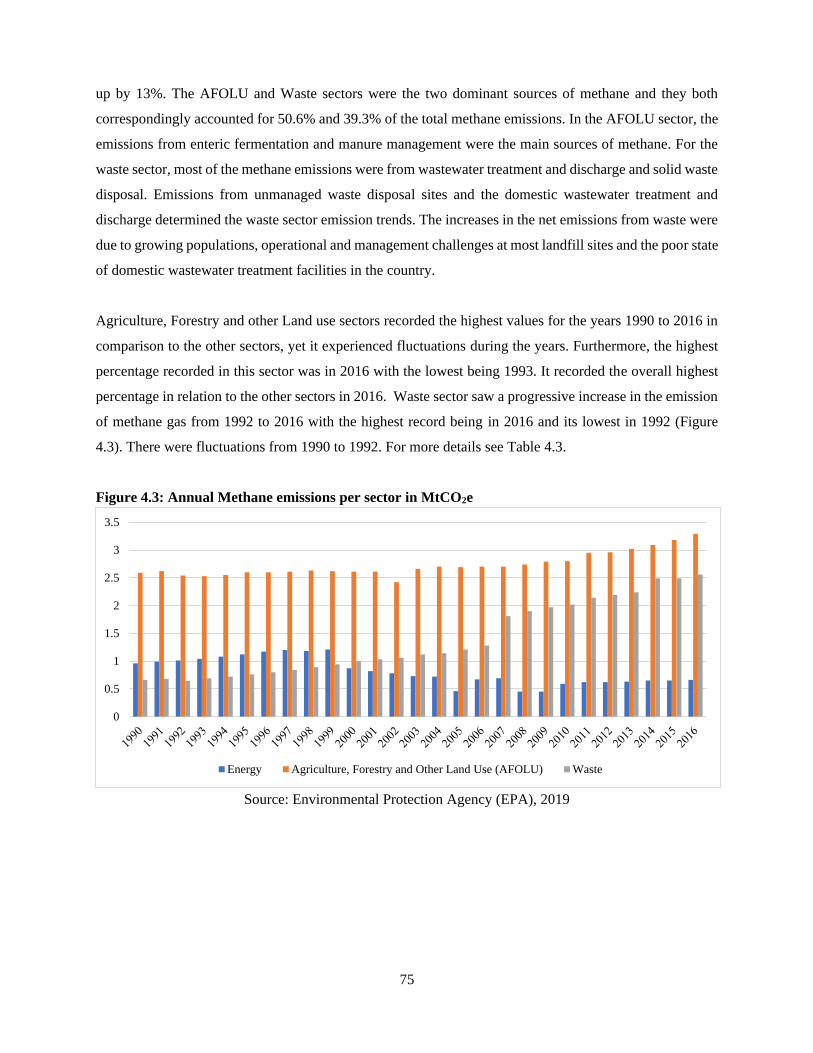
75
up by 13%. The AFOLU and Waste sectors were the two dominant sources of methane and they both
correspondingly accounted for 50.6% and 39.3% of the total methane emissions. In the AFOLU sector, the
emissions from enteric fermentation and manure management were the main sources of methane. For the
waste sector, most of the methane emissions were from wastewater treatment and discharge and solid waste
disposal. Emissions from unmanaged waste disposal sites and the domestic wastewater treatment and
discharge determined the waste sector emission trends. The increases in the net emissions from waste were
due to growing populations, operational and management challenges at most landfill sites and the poor state
of domestic wastewater treatment facilities in the country.
Agriculture, Forestry and other Land use sectors recorded the highest values for the years 1990 to 2016 in
comparison to the other sectors, yet it experienced fluctuations during the years. Furthermore, the highest
percentage recorded in this sector was in 2016 with the lowest being 1993. It recorded the overall highest
percentage in relation to the other sectors in 2016. Waste sector saw a progressive increase in the emission
of methane gas from 1992 to 2016 with the highest record being in 2016 and its lowest in 1992 (Figure
4.3). There were fluctuations from 1990 to 1992. For more details see Table 4.3.
Figure 4.3: Annual Methane emissions per sector in MtCO2e
Source: Environmental Protection Agency (EPA), 2019
0
0.5
1
1.5
2
2.5
3
3.5
Energy Agriculture, Forestry and Other Land Use (AFOLU) Waste
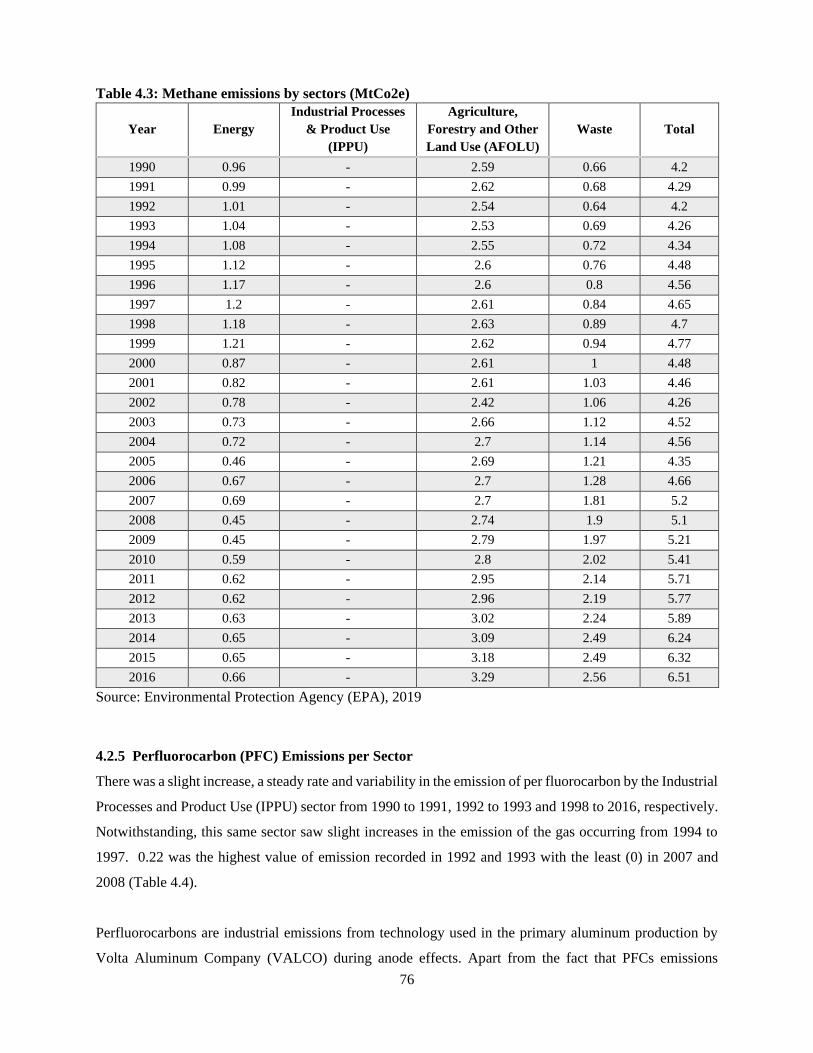
76
Table 4.3: Methane emissions by sectors (MtCo2e)
Year Energy
Industrial Processes
& Product Use
(IPPU)
Agriculture,
Forestry and Other
Land Use (AFOLU)
Waste Total
1990 0.96 - 2.59 0.66 4.2
1991 0.99 - 2.62 0.68 4.29
1992 1.01 - 2.54 0.64 4.2
1993 1.04 - 2.53 0.69 4.26
1994 1.08 - 2.55 0.72 4.34
1995 1.12 - 2.6 0.76 4.48
1996 1.17 - 2.6 0.8 4.56
1997 1.2 - 2.61 0.84 4.65
1998 1.18 - 2.63 0.89 4.7
1999 1.21 - 2.62 0.94 4.77
2000 0.87 - 2.61 1 4.48
2001 0.82 - 2.61 1.03 4.46
2002 0.78 - 2.42 1.06 4.26
2003 0.73 - 2.66 1.12 4.52
2004 0.72 - 2.7 1.14 4.56
2005 0.46 - 2.69 1.21 4.35
2006 0.67 - 2.7 1.28 4.66
2007 0.69 - 2.7 1.81 5.2
2008 0.45 - 2.74 1.9 5.1
2009 0.45 - 2.79 1.97 5.21
2010 0.59 - 2.8 2.02 5.41
2011 0.62 - 2.95 2.14 5.71
2012 0.62 - 2.96 2.19 5.77
2013 0.63 - 3.02 2.24 5.89
2014 0.65 - 3.09 2.49 6.24
2015 0.65 - 3.18 2.49 6.32
2016 0.66 - 3.29 2.56 6.51
Source: Environmental Protection Agency (EPA), 2019
4.2.5 Perfluorocarbon (PFC) Emissions per Sector
There was a slight increase, a steady rate and variability in the emission of per fluorocarbon by the Industrial
Processes and Product Use (IPPU) sector from 1990 to 1991, 1992 to 1993 and 1998 to 2016, respectively.
Notwithstanding, this same sector saw slight increases in the emission of the gas occurring from 1994 to
1997. 0.22 was the highest value of emission recorded in 1992 and 1993 with the least (0) in 2007 and
2008 (Table 4.4).
Perfluorocarbons are industrial emissions from technology used in the primary aluminum production by
Volta Aluminum Company (VALCO) during anode effects. Apart from the fact that PFCs emissions

77
generally depict a declining trend of -85% between 1999-2016, there were years (2002, 2003, 2009, and
2010) that the emissions were completely missing because the aluminum plant (VALCO) was not operating
at all. Since VALCO's operations have been consistent, though, on a limited capacity (running a single pot),
PFC emissions have increased by 100% between 2011 and 2016 as indicated in Figure 4.4.
Figure 4.4: Perfluorocarbon Emissions in MtCO2e
Source: Environmental Protection Agency (EPA), 2019
0
0.05
0.1
0.15
0.2
0.25
MtC
O2e
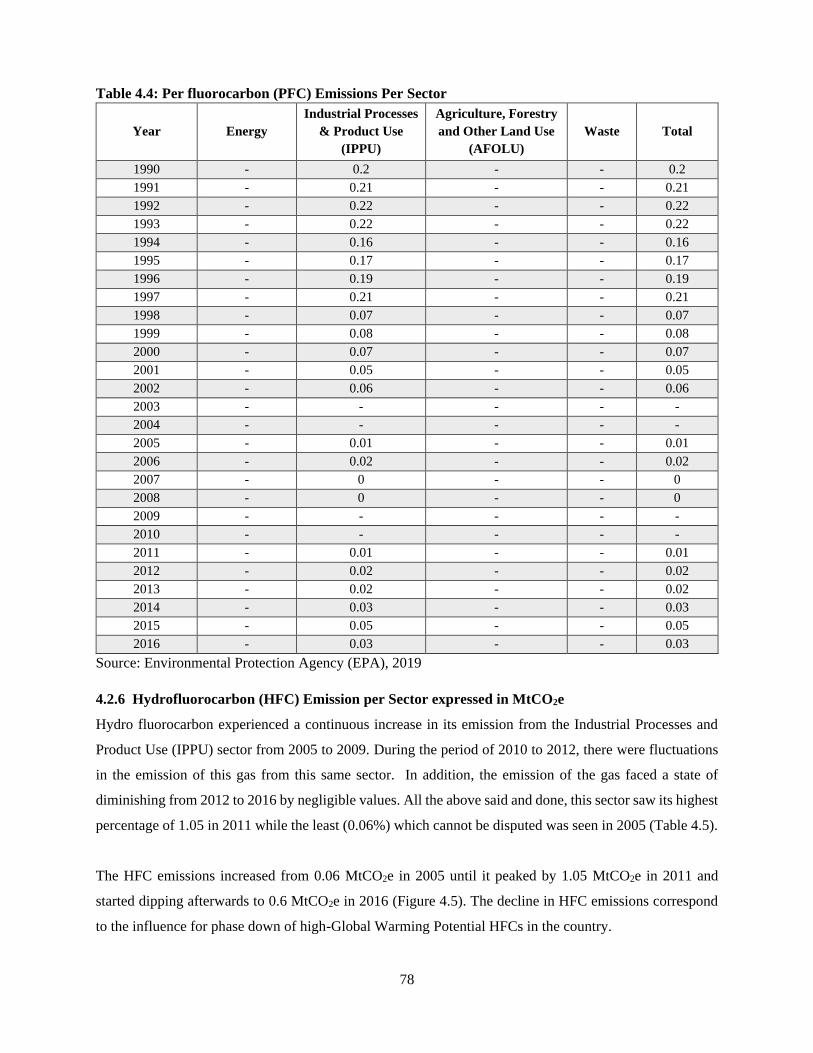
78
Table 4.4: Per fluorocarbon (PFC) Emissions Per Sector
Year Energy
Industrial Processes
& Product Use
(IPPU)
Agriculture, Forestry
and Other Land Use
(AFOLU)
Waste Total
1990 - 0.2 - - 0.2
1991 - 0.21 - - 0.21
1992 - 0.22 - - 0.22
1993 - 0.22 - - 0.22
1994 - 0.16 - - 0.16
1995 - 0.17 - - 0.17
1996 - 0.19 - - 0.19
1997 - 0.21 - - 0.21
1998 - 0.07 - - 0.07
1999 - 0.08 - - 0.08
2000 - 0.07 - - 0.07
2001 - 0.05 - - 0.05
2002 - 0.06 - - 0.06
2003 - - - - -
2004 - - - - -
2005 - 0.01 - - 0.01
2006 - 0.02 - - 0.02
2007 - 0 - - 0
2008 - 0 - - 0
2009 - - - - -
2010 - - - - -
2011 - 0.01 - - 0.01
2012 - 0.02 - - 0.02
2013 - 0.02 - - 0.02
2014 - 0.03 - - 0.03
2015 - 0.05 - - 0.05
2016 - 0.03 - - 0.03
Source: Environmental Protection Agency (EPA), 2019
4.2.6 Hydrofluorocarbon (HFC) Emission per Sector expressed in MtCO2e
Hydro fluorocarbon experienced a continuous increase in its emission from the Industrial Processes and
Product Use (IPPU) sector from 2005 to 2009. During the period of 2010 to 2012, there were fluctuations
in the emission of this gas from this same sector. In addition, the emission of the gas faced a state of
diminishing from 2012 to 2016 by negligible values. All the above said and done, this sector saw its highest
percentage of 1.05 in 2011 while the least (0.06%) which cannot be disputed was seen in 2005 (Table 4.5).
The HFC emissions increased from 0.06 MtCO2e in 2005 until it peaked by 1.05 MtCO2e in 2011 and
started dipping afterwards to 0.6 MtCO2e in 2016 (Figure 4.5). The decline in HFC emissions correspond
to the influence for phase down of high-Global Warming Potential HFCs in the country.

79
Figure 4.5: Annual Hydro fluorocarbon emission in MtCO2e
Source: Environmental Protection Agency (EPA), 2019
Table 4.5: Hydro Fluorocarbon (HFC) Emission per Sector expressed (MtCO2e)
Year Energy
Industrial Processes
& Product Use
(IPPU)
Agriculture,
Forestry and Other
Land Use (AFOLU)
Waste Total
2005 - 0.06 - - 0.06
2006 - 0.12 - - 0.12
2007 - 0.20 - - 0.20
2008 - 0.36 - - 0.36
2009 - 0.82 - - 0.82
2010 - 0.70 - - 0.70
2011 - 1.05 - - 1.05
2012 - 0.96 - - 0.96
2013 - 0.86 - - 0.86
2014 - 0.75 - - 0.75
2015 - 0.69 - - 0.69
2016 - 0.61 - - 0.61
Source: Environmental Protection Agency (EPA), 2019
4.2.7 Precursors and Local Air Pollutants Gg/Year
Carbon monoxide (CO) contributed the highest gas emission compared to other gases. Also, in the year
1997 Carbon monoxide recorded the highest (2334.33Gg) with it lowest (1707.92Gg) in 2008. Furthermore,
there was a consistent increase from 1992 to 1997 with a gradual decrease from 1998 to 2005 and
fluctuations from 2006 to 2016 (Table 4.6).
0
0.2
0.4
0.6
0.8
1
1.2
2005 2006 2007 2008 2009 2010 2011 2012 2013 2014 2015 2016
MtC
O2e
80
Particulate Matter2.5 (PM2.5) and Non-methane volatile organic compounds (NMVOC) recorded a
continuous increase from 1990 to 1997, the latter year recorded the highest for each of the gases. Non-
methane volatile organic compounds (NMVOC) had a gradual decrease from 1999 to 2005 and slight
fluctuations from 2006 to 2016. In 2005, PM2.5 decreased largely by 135.29 compared to the 2004 record.
Nitrogen Oxide (NOx) recorded the lowest (97.24) emission of gas as compared to the other gas emission,
with a rise and fall in NOx from 1990 to 2016 by small margin. Black carbon (BC) had a continuous increase
from 1990 to 1999, with 1999 being the highest (267.66) and the lowest (146.64) in 2005. The trends of
NOx, CO, BC, NMVOCs and PM2.5 emissions for the period 1990-2016. Except CO that saw a decline, the
rest of the pollutants showed a rising pattern. Nitrogen oxides are a group of poisonous, highly reactive
gases. NOx gases form when burned at high temperatures. Between 1990 and 2016, NOx emission levels
increased by 21.6%.
Carbon monoxide (CO) is a common industrial hazard resulting from the incomplete burning of natural gas
and any other material containing carbon such as gasoline, kerosene or wood etc. (Figure 4.6). In 2016,
most (80.4%) of the NOx emissions came from the energy sector through the burning of fossil fuels. The
remaining 19.6% were from the burning activities in the AFOLU (18%) and waste (1.7%) sectors
respectively. Most of the CO emissions were from the energy sector (69.2%) and followed by the AFOLU
(29.9%) and waste (0.9%) sectors. The patterns of CO emissions indicated a steady decline by 22.5%
between 1990 and 2016.
Black carbon is a constituent of PM2.5 and is produced from the incomplete burning of fossil fuels and
biomass. The data figure shows a total black carbon emission in Ghana to be 234.3 Gg in 2016, mainly
from road transport and residential cooking activities under the sector. The 2016 BC emission was 17.6%
higher than the 1990 levels and increased at 0.6% annual growth
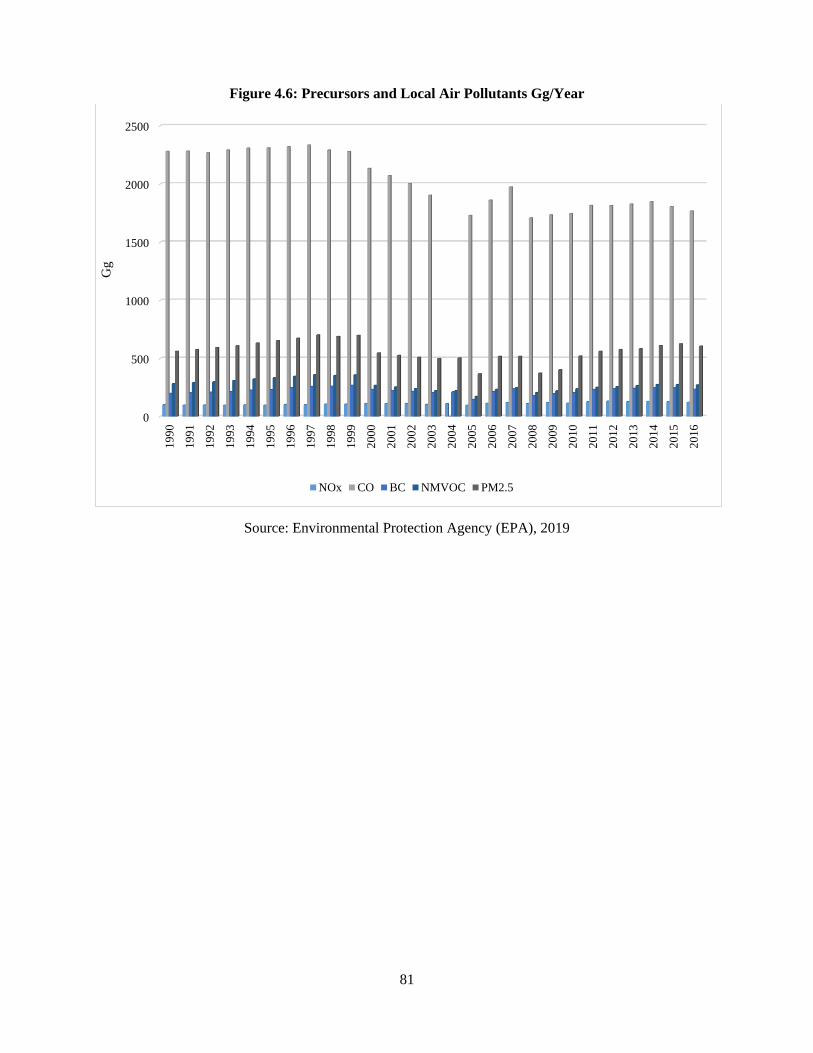
81
Figure 4.6: Precursors and Local Air Pollutants Gg/Year
Source: Environmental Protection Agency (EPA), 2019
0
500
1000
1500
2000
2500
1990
1991
1992
1993
1994
1995
1996
1997
1998
1999
2000
2001
2002
2003
2004
2005
2006
2007
2008
2009
2010
2011
2012
2013
2014
2015
2016
Gg
NOx CO BC NMVOC PM2.5
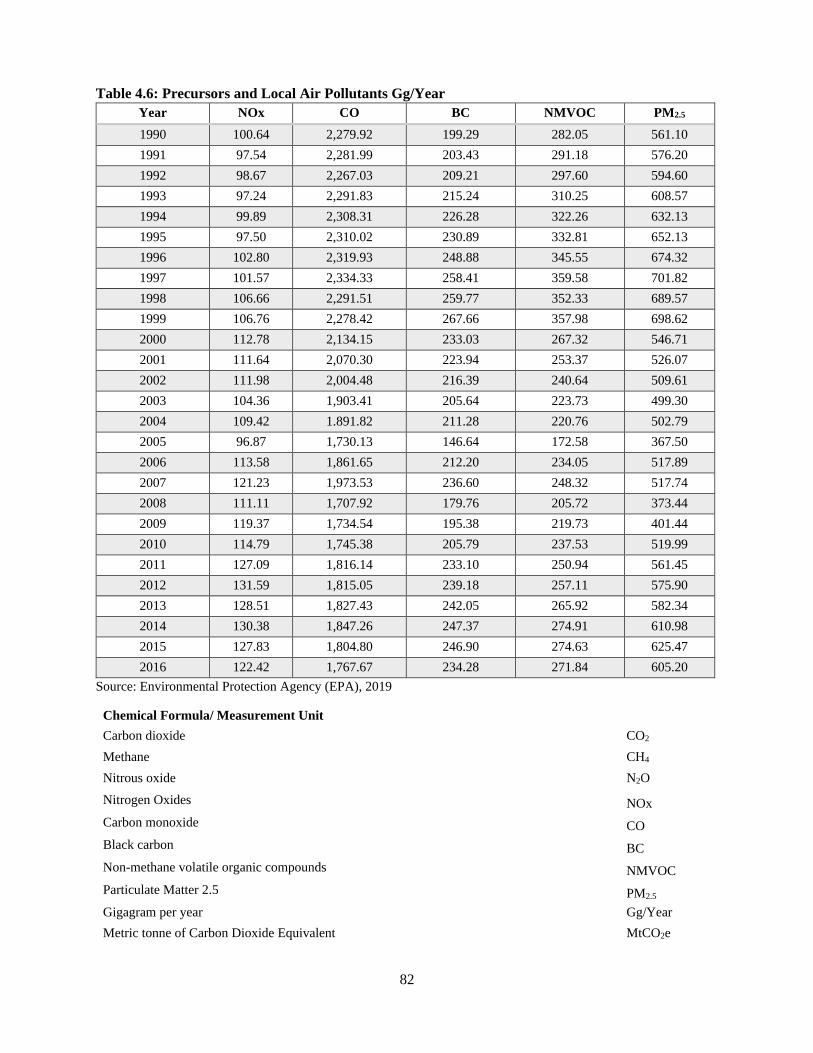
82
Table 4.6: Precursors and Local Air Pollutants Gg/Year
Year NOx CO BC NMVOC PM2.5
1990 100.64 2,279.92 199.29 282.05 561.10
1991 97.54 2,281.99 203.43 291.18 576.20
1992 98.67 2,267.03 209.21 297.60 594.60
1993 97.24 2,291.83 215.24 310.25 608.57
1994 99.89 2,308.31 226.28 322.26 632.13
1995 97.50 2,310.02 230.89 332.81 652.13
1996 102.80 2,319.93 248.88 345.55 674.32
1997 101.57 2,334.33 258.41 359.58 701.82
1998 106.66 2,291.51 259.77 352.33 689.57
1999 106.76 2,278.42 267.66 357.98 698.62
2000 112.78 2,134.15 233.03 267.32 546.71
2001 111.64 2,070.30 223.94 253.37 526.07
2002 111.98 2,004.48 216.39 240.64 509.61
2003 104.36 1,903.41 205.64 223.73 499.30
2004 109.42 1.891.82 211.28 220.76 502.79
2005 96.87 1,730.13 146.64 172.58 367.50
2006 113.58 1,861.65 212.20 234.05 517.89
2007 121.23 1,973.53 236.60 248.32 517.74
2008 111.11 1,707.92 179.76 205.72 373.44
2009 119.37 1,734.54 195.38 219.73 401.44
2010 114.79 1,745.38 205.79 237.53 519.99
2011 127.09 1,816.14 233.10 250.94 561.45
2012 131.59 1,815.05 239.18 257.11 575.90
2013 128.51 1,827.43 242.05 265.92 582.34
2014 130.38 1,847.26 247.37 274.91 610.98
2015 127.83 1,804.80 246.90 274.63 625.47
2016 122.42 1,767.67 234.28 271.84 605.20
Source: Environmental Protection Agency (EPA), 2019
Chemical Formula/ Measurement Unit
Carbon dioxide CO2
Methane CH4
Nitrous oxide N2O
Nitrogen Oxides NOx
Carbon monoxide CO
Black carbon BC
Non-methane volatile organic compounds NMVOC
Particulate Matter 2.5 PM2.5
Gigagram per year Gg/Year
Metric tonne of Carbon Dioxide Equivalent MtCO2e

109
4.3 Generation and Management of Waste
The focus of this section is to provide information on the generation and management of waste (solid and
liquid) in the country.
4.3.1 Generation of Solid Waste
Solid waste generation in Ghana currently ranges between 0.2 and 0.8 kg/person/day (Miezah et al., 2015),
with an estimated volume of 13,500 tonnes of solid waste being produced daily nationwide, based on an
estimated 2015 population of 27 million (GSS, 2012). Per capita waste generation has increased over the
last decade, with average per capita generation per day in Accra, for instance, increasing from
0.4kg/person/day in 2005 to 0.7kg/person/day in 2015 (Miezah et al., 2015). The two largest cities, Accra
and Kumasi, together, generate over 4000 tonnes of solid waste daily, with per capita generation estimated
at 0.75 kg/person/day. Figure 4.7 shows the trend in daily solid waste generation in Accra and Kumasi from
2000 to 2015. There was a general increase in rates of waste generation in Accra and Kumasi, with estimated
daily generated volumes of 1500, 1800 and 2500 tonnes per day, for Accra, in 2005, 2010 and 2013,
respectively, to a current generation rate of 2800 tonnes per day.
Accra a major city in Ghana generates nearly 900,000 metric tons of solid waste per year, approximately
67% of which is organic matter. The rate of waste generation is approximately 0.5 kilograms per person
per day. Solid waste collection in Accra is mostly privatized. The city contracts with 10 waste collection
firms that are responsible for all residential, commercial, and industrial waste generated in their respective
collection districts. The firms recover their costs by collecting city‐regulated fees from waste generators.
The city estimates that 88% of waste generated in areas where it provides collection services is collected.
However, waste collection services are only provided in a limited area; only 40% of households in the city
have waste collection bins. Accra is working to increase its waste collection coverage, especially in low‐
income areas of the city.
Accra’s waste disposal sites are currently closed; the city has no waste disposal site of its own. Collected
waste is currently transported from Accra to a landfill in Tema, approximately 37 kilometers outside Accra.
The landfill was constructed to accept 700 tons per day, but currently receives more than double that amount
(more than two‐thirds comes from Accra). The city recently entered into a contract for the construction of
a new landfill, but a site has not been determined and financing is not certain. It is unknown whether the
new landfill will include leachate and LFG collection systems. Accra generates a large amount of organic
waste that is high in moisture content. There is no formal dedicated organics collection service provided by
the city, but there are two innovative models currently in place in Accra: a community‐based, small‐scale
composting project and a large‐scale, and open‐windrow facility with a materials recovery unit.
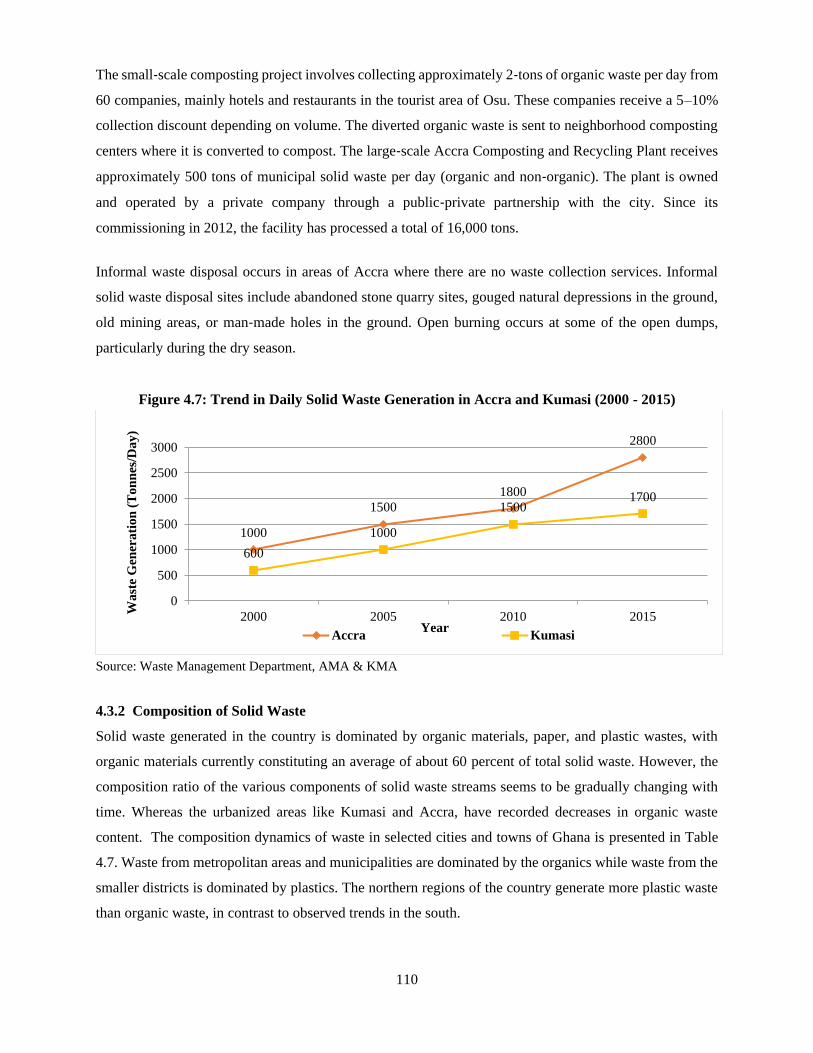
110
The small‐scale composting project involves collecting approximately 2‐tons of organic waste per day from
60 companies, mainly hotels and restaurants in the tourist area of Osu. These companies receive a 5–10%
collection discount depending on volume. The diverted organic waste is sent to neighborhood composting
centers where it is converted to compost. The large‐scale Accra Composting and Recycling Plant receives
approximately 500 tons of municipal solid waste per day (organic and non‐organic). The plant is owned
and operated by a private company through a public‐private partnership with the city. Since its
commissioning in 2012, the facility has processed a total of 16,000 tons.
Informal waste disposal occurs in areas of Accra where there are no waste collection services. Informal
solid waste disposal sites include abandoned stone quarry sites, gouged natural depressions in the ground,
old mining areas, or man‐made holes in the ground. Open burning occurs at some of the open dumps,
particularly during the dry season.
Figure 4.7: Trend in Daily Solid Waste Generation in Accra and Kumasi (2000 - 2015)
Source: Waste Management Department, AMA & KMA
4.3.2 Composition of Solid Waste
Solid waste generated in the country is dominated by organic materials, paper, and plastic wastes, with
organic materials currently constituting an average of about 60 percent of total solid waste. However, the
composition ratio of the various components of solid waste streams seems to be gradually changing with
time. Whereas the urbanized areas like Kumasi and Accra, have recorded decreases in organic waste
content. The composition dynamics of waste in selected cities and towns of Ghana is presented in Table
4.7. Waste from metropolitan areas and municipalities are dominated by the organics while waste from the
smaller districts is dominated by plastics. The northern regions of the country generate more plastic waste
than organic waste, in contrast to observed trends in the south.
1000
1500
1800
2800
600
1000
15001700
0
500
1000
1500
2000
2500
3000
2000 2005 2010 2015
Wa
ste
Gen
era
tio
n (
To
nn
es/D
ay
)
YearAccra Kumasi
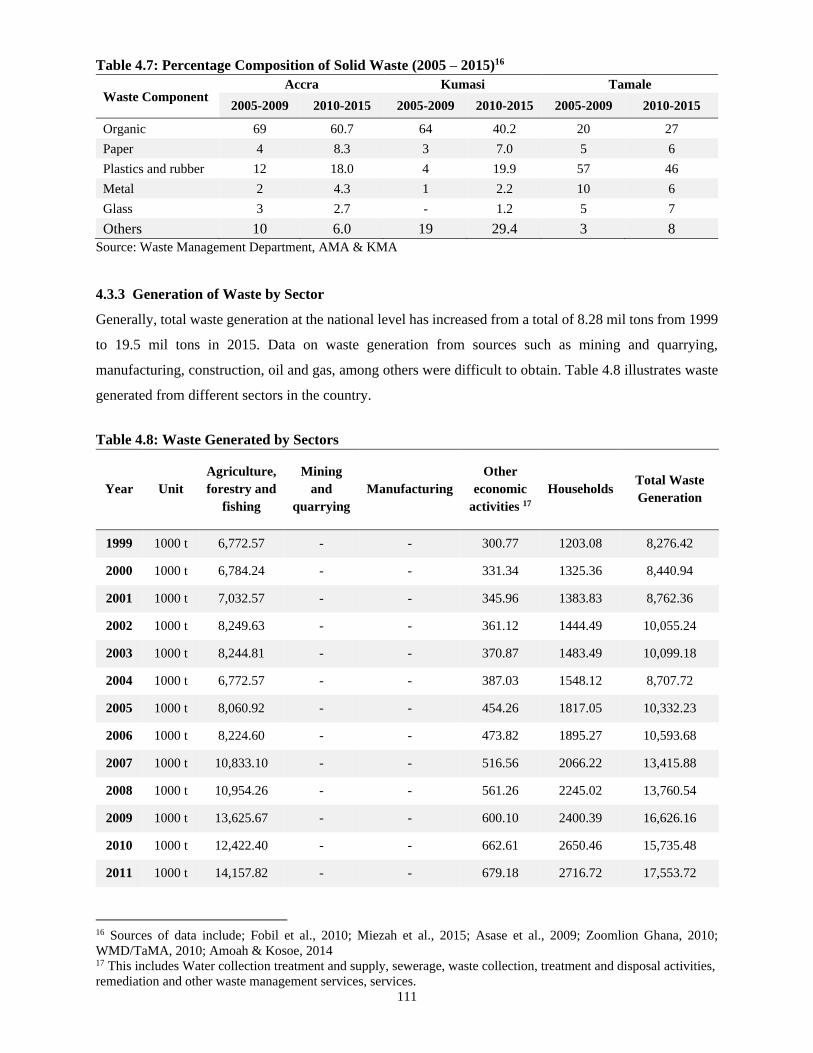
111
Table 4.7: Percentage Composition of Solid Waste (2005 – 2015)16
Waste Component Accra Kumasi Tamale
2005-2009 2010-2015 2005-2009 2010-2015 2005-2009 2010-2015
Organic 69 60.7 64 40.2 20 27
Paper 4 8.3 3 7.0 5 6
Plastics and rubber 12 18.0 4 19.9 57 46
Metal 2 4.3 1 2.2 10 6
Glass 3 2.7 - 1.2 5 7
Others 10 6.0 19 29.4 3 8
Source: Waste Management Department, AMA & KMA
4.3.3 Generation of Waste by Sector
Generally, total waste generation at the national level has increased from a total of 8.28 mil tons from 1999
to 19.5 mil tons in 2015. Data on waste generation from sources such as mining and quarrying,
manufacturing, construction, oil and gas, among others were difficult to obtain. Table 4.8 illustrates waste
generated from different sectors in the country.
Table 4.8: Waste Generated by Sectors
Year Unit
Agriculture,
forestry and
fishing
Mining
and
quarrying
Manufacturing
Other
economic
activities 17
Households Total Waste
Generation
1999 1000 t 6,772.57 - - 300.77 1203.08 8,276.42
2000 1000 t 6,784.24 - - 331.34 1325.36 8,440.94
2001 1000 t 7,032.57 - - 345.96 1383.83 8,762.36
2002 1000 t 8,249.63 - - 361.12 1444.49 10,055.24
2003 1000 t 8,244.81 - - 370.87 1483.49 10,099.18
2004 1000 t 6,772.57 - - 387.03 1548.12 8,707.72
2005 1000 t 8,060.92 - - 454.26 1817.05 10,332.23
2006 1000 t 8,224.60 - - 473.82 1895.27 10,593.68
2007 1000 t 10,833.10 - - 516.56 2066.22 13,415.88
2008 1000 t 10,954.26 - - 561.26 2245.02 13,760.54
2009 1000 t 13,625.67 - - 600.10 2400.39 16,626.16
2010 1000 t 12,422.40 - - 662.61 2650.46 15,735.48
2011 1000 t 14,157.82 - - 679.18 2716.72 17,553.72
16 Sources of data include; Fobil et al., 2010; Miezah et al., 2015; Asase et al., 2009; Zoomlion Ghana, 2010;
WMD/TaMA, 2010; Amoah & Kosoe, 2014 17 This includes Water collection treatment and supply, sewerage, waste collection, treatment and disposal activities,
remediation and other waste management services, services.
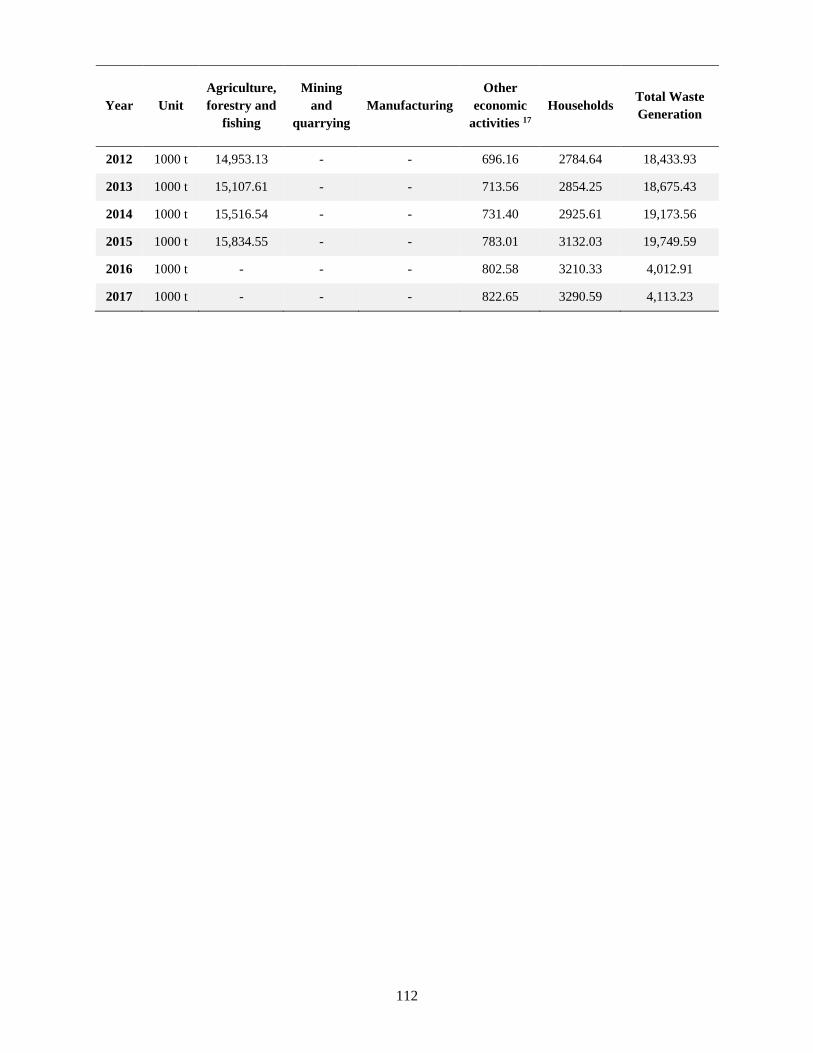
112
Year Unit
Agriculture,
forestry and
fishing
Mining
and
quarrying
Manufacturing
Other
economic
activities 17
Households Total Waste
Generation
2012 1000 t 14,953.13 - - 696.16 2784.64 18,433.93
2013 1000 t 15,107.61 - - 713.56 2854.25 18,675.43
2014 1000 t 15,516.54 - - 731.40 2925.61 19,173.56
2015 1000 t 15,834.55 - - 783.01 3132.03 19,749.59
2016 1000 t - - - 802.58 3210.33 4,012.91
2017 1000 t - - - 822.65 3290.59 4,113.23
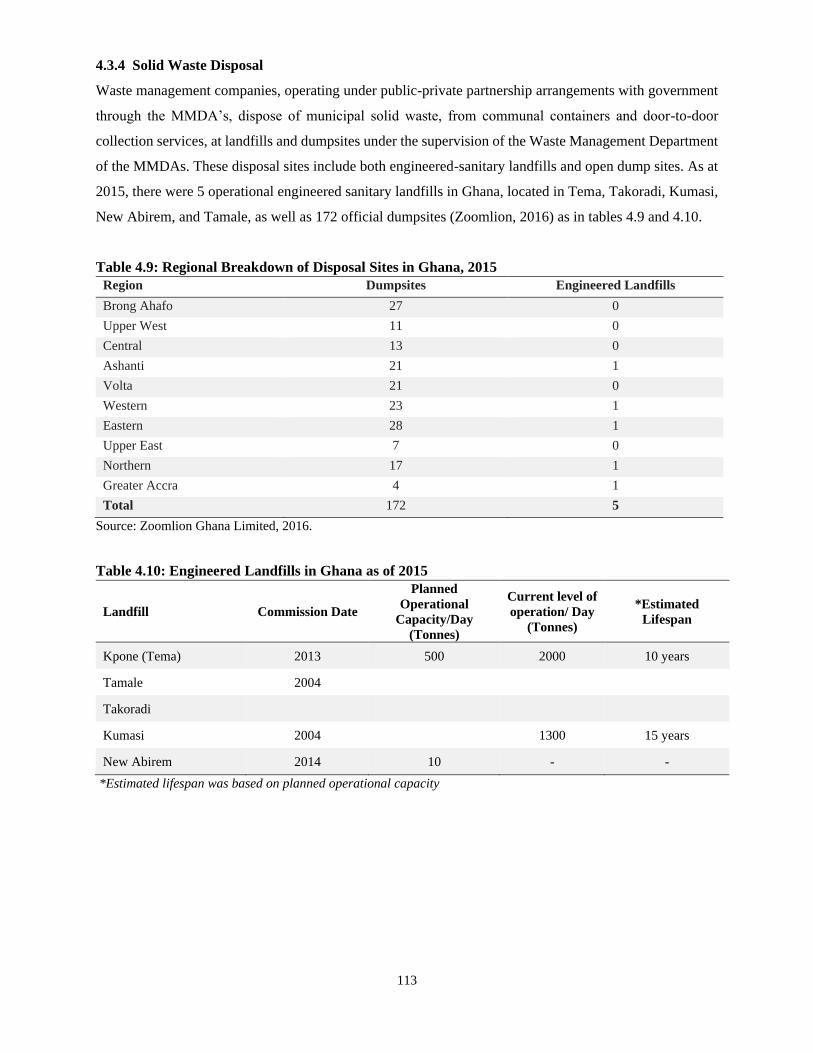
113
4.3.4 Solid Waste Disposal
Waste management companies, operating under public-private partnership arrangements with government
through the MMDA’s, dispose of municipal solid waste, from communal containers and door-to-door
collection services, at landfills and dumpsites under the supervision of the Waste Management Department
of the MMDAs. These disposal sites include both engineered-sanitary landfills and open dump sites. As at
2015, there were 5 operational engineered sanitary landfills in Ghana, located in Tema, Takoradi, Kumasi,
New Abirem, and Tamale, as well as 172 official dumpsites (Zoomlion, 2016) as in tables 4.9 and 4.10.
Table 4.9: Regional Breakdown of Disposal Sites in Ghana, 2015
Region Dumpsites Engineered Landfills
Brong Ahafo 27 0
Upper West 11 0
Central 13 0
Ashanti 21 1
Volta 21 0
Western 23 1
Eastern 28 1
Upper East 7 0
Northern 17 1
Greater Accra 4 1
Total 172 5
Source: Zoomlion Ghana Limited, 2016.
Table 4.10: Engineered Landfills in Ghana as of 2015
Landfill Commission Date
Planned
Operational
Capacity/Day
(Tonnes)
Current level of
operation/ Day
(Tonnes)
*Estimated
Lifespan
Kpone (Tema) 2013 500 2000 10 years
Tamale 2004
Takoradi
Kumasi 2004 1300 15 years
New Abirem 2014 10 - -
*Estimated lifespan was based on planned operational capacity

114
Chapter 5
Extreme Events and Disasters
5.1 Introduction
This chapter organizes statistics on the occurrence of extreme events and disasters and their impacts on
human well-being and infrastructure in Ghana. Extreme events, such as widespread flooding, or very strong
storms, have the potential to cause extensive damage and impacts on people, infrastructure, and the
environment.
5.2. Ghana’s Disaster Profile
The National Disaster Management Organization (NADMO) is the foremost institution in Ghana by ACT
517 of 1996 to manage disasters and similar emergencies in the country. Table 5.1 indicates the types of
disaster which been identified for redress in Ghana.
Table 5.1: Types of Hazards/Disasters and Coverage Area
Types of Hazards/Disasters Coverage Area
Hydro-meteorological Disasters Flood, Windstorm, Rainstorm, Drought and Tidal waves.
Pest and Insect Infestation Disasters Armyworm, Anthrax, Blackfly, Locust, Larger Grain Borer etc.
Geological/ Nuclear Radiological Disasters Earthquakes, Tsunamis, Gas Emission and Landslide etc.
Fires and Lightning Disasters Bush/Wild fires, Domestic and Industrial fires and Lightening.
Disease Epidemics Disasters Cholera, Yellow Fever, Cerebro -Spinal Meningitis (CSM),
Pandemic Influenza etc.
Man-Made Disasters
Social conflicts, Collapse of Building, Vehicular and Aviation
Accidents, Lake/ Boat Accidents Marine and Railway Disasters,
etc.
Source: National Disaster Management Organisation (NADMO), 2019
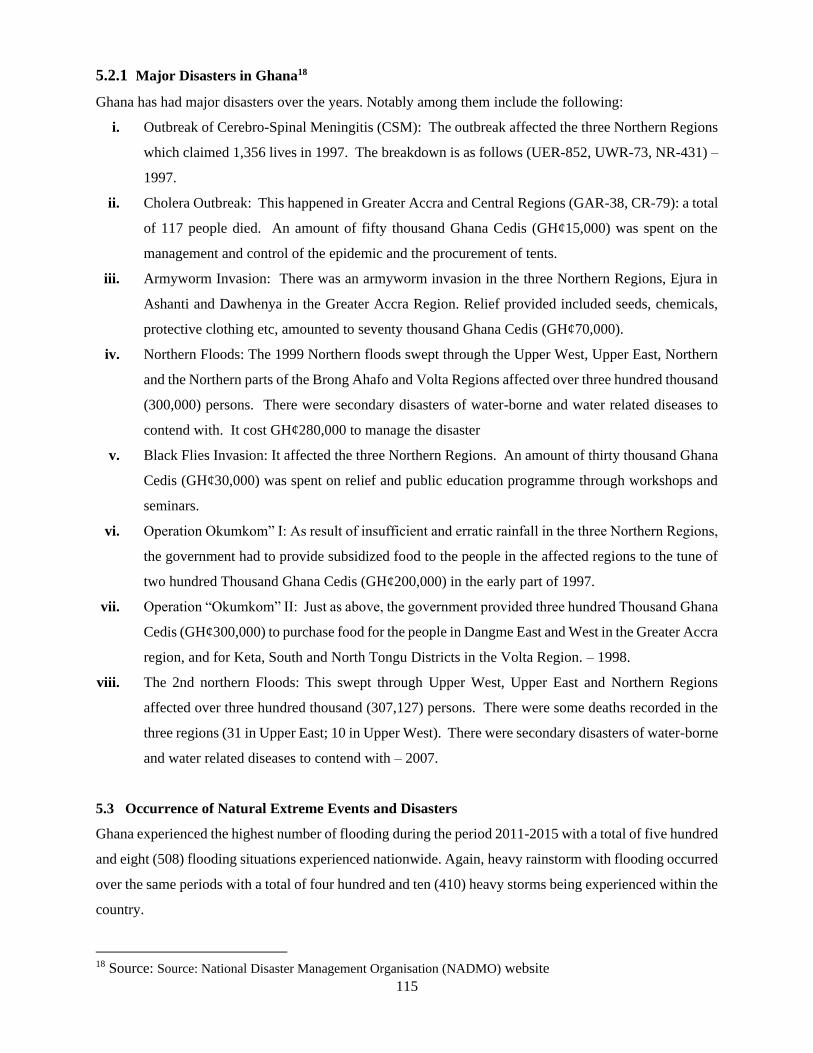
115
5.2.1 Major Disasters in Ghana18
Ghana has had major disasters over the years. Notably among them include the following:
i. Outbreak of Cerebro-Spinal Meningitis (CSM): The outbreak affected the three Northern Regions
which claimed 1,356 lives in 1997. The breakdown is as follows (UER-852, UWR-73, NR-431) –
1997.
ii. Cholera Outbreak: This happened in Greater Accra and Central Regions (GAR-38, CR-79): a total
of 117 people died. An amount of fifty thousand Ghana Cedis (GH¢15,000) was spent on the
management and control of the epidemic and the procurement of tents.
iii. Armyworm Invasion: There was an armyworm invasion in the three Northern Regions, Ejura in
Ashanti and Dawhenya in the Greater Accra Region. Relief provided included seeds, chemicals,
protective clothing etc, amounted to seventy thousand Ghana Cedis (GH¢70,000).
iv. Northern Floods: The 1999 Northern floods swept through the Upper West, Upper East, Northern
and the Northern parts of the Brong Ahafo and Volta Regions affected over three hundred thousand
(300,000) persons. There were secondary disasters of water-borne and water related diseases to
contend with. It cost GH¢280,000 to manage the disaster
v. Black Flies Invasion: It affected the three Northern Regions. An amount of thirty thousand Ghana
Cedis (GH¢30,000) was spent on relief and public education programme through workshops and
seminars.
vi. Operation Okumkom” I: As result of insufficient and erratic rainfall in the three Northern Regions,
the government had to provide subsidized food to the people in the affected regions to the tune of
two hundred Thousand Ghana Cedis (GH¢200,000) in the early part of 1997.
vii. Operation “Okumkom” II: Just as above, the government provided three hundred Thousand Ghana
Cedis (GH¢300,000) to purchase food for the people in Dangme East and West in the Greater Accra
region, and for Keta, South and North Tongu Districts in the Volta Region. – 1998.
viii. The 2nd northern Floods: This swept through Upper West, Upper East and Northern Regions
affected over three hundred thousand (307,127) persons. There were some deaths recorded in the
three regions (31 in Upper East; 10 in Upper West). There were secondary disasters of water-borne
and water related diseases to contend with – 2007.
5.3 Occurrence of Natural Extreme Events and Disasters
Ghana experienced the highest number of flooding during the period 2011-2015 with a total of five hundred
and eight (508) flooding situations experienced nationwide. Again, heavy rainstorm with flooding occurred
over the same periods with a total of four hundred and ten (410) heavy storms being experienced within the
country.
18 Source: Source: National Disaster Management Organisation (NADMO) website

116
This is quite significant and has direct and negative repercussions on human lives and infrastructure. Over
the thirty (30) year period, one (1) earth quake was recorded during the period 2011-2015 and one (1) sea
erosion during the period 2006-2010. Between 2006 and 2010, Ghana had a total of fifty-three (53) outbreak
of diseases compared to eight (8) between 1985 to 1990.The highest numbers of droughts and water
shortages were experienced over the years 1991 -1995 and between 2011 and 2015 with a total of 5 records.
Extreme natural disasters occur at extreme temperature and weather conditions most of them caused by
anthropogenic activities. Over the years, there have been the occurrence of extreme disasters and this has
been recorded by the National Disaster Management Organization (NADMO). The number of disasters
during the years 1985 to 2015 and recorded by NADMO are shown in Table 5.2.
Table 5.2: Number of Disasters Recorded
1985-1990 1991-1995 1996-2000 2001-2005 2006-2010 2011-2015
Disease Epidemics 8 9 34 12 53 14
Drought/Water
Shortage 4 5 2 4 4 5
Fire 17 27 29 37 82 70
Flood 27 28 43 46 207 508
Flood/Rainstorm 0 0 0 0 1 410
Storm 20 33 19 20 37 19
Wild Fire 10 17 6 2 6 6
Agric Diseases/Pest 8 3 3 2 3 2
Thunder/Lightening 0 0 0 0 0 2
Earth Quake 0 0 0 0 0 1
Sea Erosion 0 0 0 0 1 0
Source: National Disaster Management Organisation (NADMO)
5.4 Impact of Natural Extreme Events and Disasters
The impact of Natural disasters is felt over all walks of life when it happens. The destruction of
infrastructure, farmlands, loss of lives of humans and animals, famine etc. Table 4.2 shows the cost of
economic activities loss as a result of disasters and Table 5.3 shows the destruction of economic activities
and lives lost due to extreme disasters.

117
Table 5.3: Economic Losses Due to Natural Extreme Events and Disasters
Year Western
Region
Central
Region
Greater
Accra Region
Volta
Region
Eastern
Region
Ashanti
Region
Brong
Ahafo
Region
Northern
Region
Upper East
Region
Upper West
Region
1987
1988 200 490
1989
1990
1991 3
1992
1993
1994
1995 2375
1996
1997
1998
1999 1961 874 1155
2000
2001
2002
2003
2004 8.08
2005 1470 20
2006 0.25 6.06 80
2007 20000 100000 150700 1000000 102000
2008 622680 1900 98000
2009 1213947 1777214 162 47980 25936
2010
2011 80000 170000
2012 1230880 734438 29780 307754 710520 181000 64695 769057
2013 55000 50500 123608
Source: National Disaster Management Organisation (NADMO)
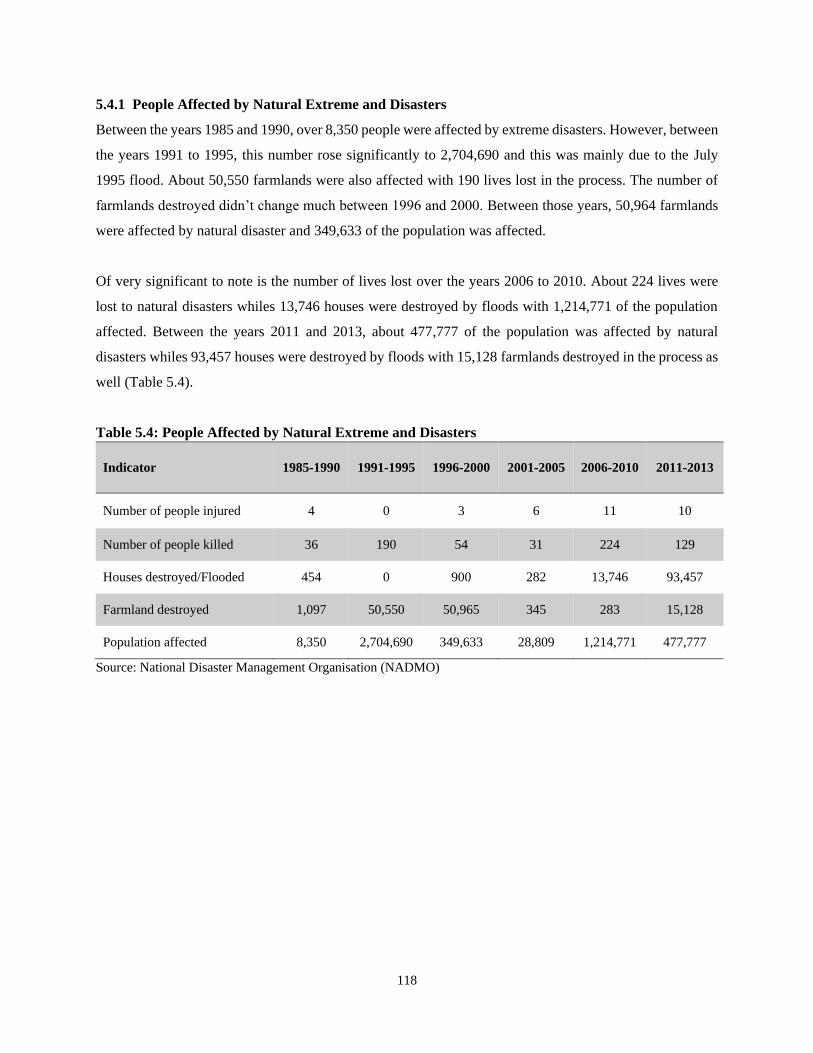
118
5.4.1 People Affected by Natural Extreme and Disasters
Between the years 1985 and 1990, over 8,350 people were affected by extreme disasters. However, between
the years 1991 to 1995, this number rose significantly to 2,704,690 and this was mainly due to the July
1995 flood. About 50,550 farmlands were also affected with 190 lives lost in the process. The number of
farmlands destroyed didn’t change much between 1996 and 2000. Between those years, 50,964 farmlands
were affected by natural disaster and 349,633 of the population was affected.
Of very significant to note is the number of lives lost over the years 2006 to 2010. About 224 lives were
lost to natural disasters whiles 13,746 houses were destroyed by floods with 1,214,771 of the population
affected. Between the years 2011 and 2013, about 477,777 of the population was affected by natural
disasters whiles 93,457 houses were destroyed by floods with 15,128 farmlands destroyed in the process as
well (Table 5.4).
Table 5.4: People Affected by Natural Extreme and Disasters
Indicator 1985-1990 1991-1995 1996-2000 2001-2005 2006-2010 2011-2013
Number of people injured 4 0 3 6 11 10
Number of people killed 36 190 54 31 224 129
Houses destroyed/Flooded 454 0 900 282 13,746 93,457
Farmland destroyed 1,097 50,550 50,965 345 283 15,128
Population affected 8,350 2,704,690 349,633 28,809 1,214,771 477,777
Source: National Disaster Management Organisation (NADMO)
119
Chapter 6
Human Settlement and Environmental Health
6.1 Introduction
This chapter contains statistics on the environment with respect to living conditions and environmental
health. These statistics are important for the management and improvement of conditions related to human
settlements, shelter conditions, safe water, sanitation and health in the context of rapid urbanization,
increasing pollution, environmental degradation, disasters, extreme events and climate change.
The capacity of the environment to cope with the environmental impacts caused by human habitation can
influence both the health of human settlements and the natural environment. The well-being and health
risks associated with the environment and those posed by extreme events and disasters can be mitigated
substantially by the prevailing conditions and characteristics of human settlements. Several factors can
mitigate or increase the effect of environmental and settlement-related risks on human well-being. These
factors include the appropriate infrastructure that can provide water and sanitation, adequate waste disposal,
sustainable land use planning, clean and safe transportation, safe building design and other measures of
good housing, and ecosystem health. These conditions can improve a given human settlement, human well-
being and health. Conversely, vulnerable human settlements are often more impacted by the changing
environment and recover more slowly from pollution, environmental degradation, and extreme events and
disasters.
6.2 Access to Selected Basic Services
Access to water, sanitation, waste removal services and energy have a positive effect on human health and
well-being as they contribute to improved environmental quality.
6.2.1 Improved Drinking water
The distribution of persons with access to drinking water by source as at 2017/2018. The category basic
water service contributes 79 percent of the population. The percentages of populations with access to basic
drinking water service in urban and rural areas were 93 and 68, respectively. Basic water service refers to
access to basic drinking water service as defined by SDG 1.4.1 which looks at water from an improved
source. The water collection time, inclusive of queuing, is not more than 30 minutes for a roundtrip. The
limited, unimproved and surface water categories compose unimproved water sources.
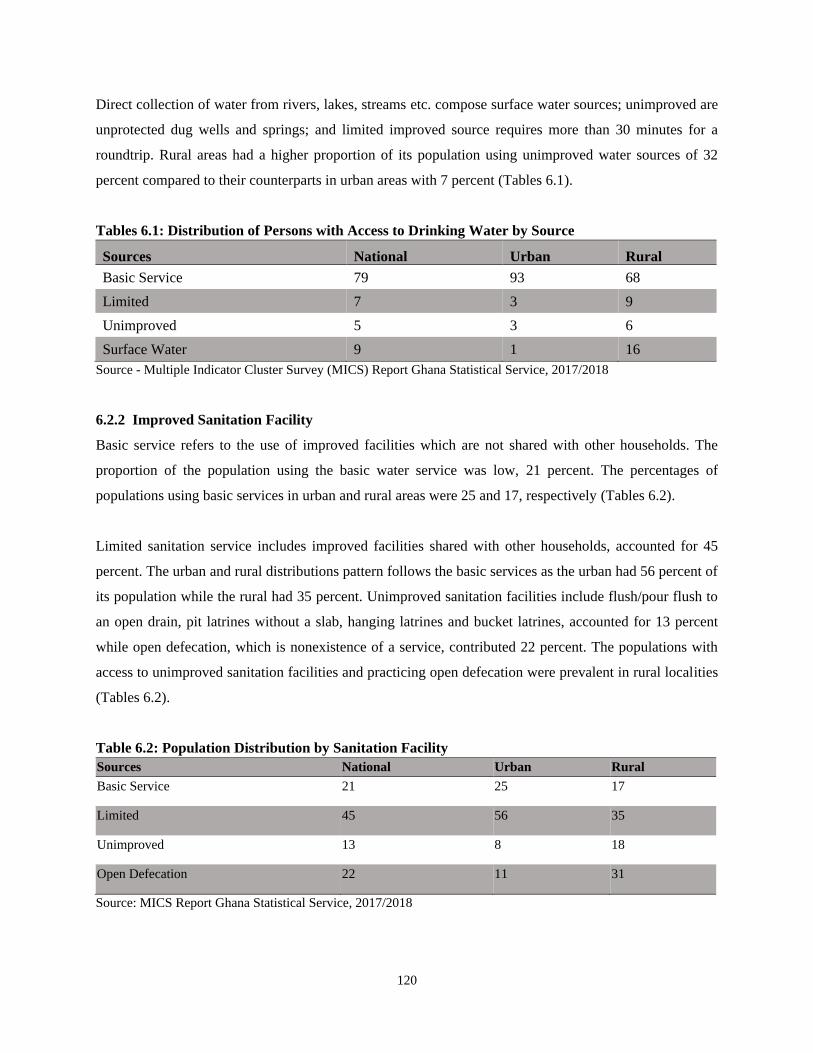
120
Direct collection of water from rivers, lakes, streams etc. compose surface water sources; unimproved are
unprotected dug wells and springs; and limited improved source requires more than 30 minutes for a
roundtrip. Rural areas had a higher proportion of its population using unimproved water sources of 32
percent compared to their counterparts in urban areas with 7 percent (Tables 6.1).
Tables 6.1: Distribution of Persons with Access to Drinking Water by Source
Sources National Urban Rural
Basic Service 79 93 68
Limited 7 3 9
Unimproved 5 3 6
Surface Water 9 1 16
Source - Multiple Indicator Cluster Survey (MICS) Report Ghana Statistical Service, 2017/2018
6.2.2 Improved Sanitation Facility
Basic service refers to the use of improved facilities which are not shared with other households. The
proportion of the population using the basic water service was low, 21 percent. The percentages of
populations using basic services in urban and rural areas were 25 and 17, respectively (Tables 6.2).
Limited sanitation service includes improved facilities shared with other households, accounted for 45
percent. The urban and rural distributions pattern follows the basic services as the urban had 56 percent of
its population while the rural had 35 percent. Unimproved sanitation facilities include flush/pour flush to
an open drain, pit latrines without a slab, hanging latrines and bucket latrines, accounted for 13 percent
while open defecation, which is nonexistence of a service, contributed 22 percent. The populations with
access to unimproved sanitation facilities and practicing open defecation were prevalent in rural localities
(Tables 6.2).
Table 6.2: Population Distribution by Sanitation Facility
Sources National Urban Rural
Basic Service 21 25 17
Limited 45 56 35
Unimproved 13 8 18
Open Defecation 22 11 31
Source: MICS Report Ghana Statistical Service, 2017/2018

121
6.2.3 Population Served by Municipal Solid Waste Collection and Disposal of Liquid Waste Water
(percent)
The predominant method of solid waste disposal by most households in Ghana is through public refuse
dumps. This constitute 47.8 percent of the population (Table 6.3). Of this, a higher proportion of the
population in the rural areas (52.9%) dispose of solid waste at public dumps compared to the urban
population (43.7%). Other methods of disposing solid waste among the populace includes collected by
refuse collecting companies (21.9%), burning (19.5%), and dumping indiscriminately (10.8%).
Disposal of solid waste at public dumps is the most common method used in the Regions. Three out of four
in Western (75.0%), more than two-thirds in Central (68.2%) and Brong Ahafo (67.0%), and more than
half in Ashanti (57.5%) and Eastern (55.9%) regions. However, less than two-thirds (65.4%) of the
population in Greater Accra method of disposing of solid waste is through collection by refuse collecting
companies
Further, the table indicates that a higher proportion of the population in the rural area (93.6%) compared to
the urban areas (49.3%) predominantly discharged waste water into open areas. This method, is the most
common practice also in all ten regions with the exception of the Greater Accra where more than half of
the population (53.6%) discharged waste water into drains (Table 6.3).
Table 6.3: Method of Solid and Liquid Waste Disposal
Solid/Waste
Water Disposal
Method Ghana
Locality Region
Urban Rural Western Central
Greater
Accra Volta Eastern Ashanti
Brong
Ahafo Northern
Upper
East
Upper
West
Method of solid waste disposal
Collected 21.9 36.2 3.7 8.0 7.3 65.4 5.7 5.9 27.7 2.6 6.2 8.1 12.5
Burned by
household 19.5 16.1 23.8 11.1 18.8 14.6 39.8 28.8 11.5 15.9 23.4 52.8 23.3
Public dump 47.8 43.7 52.9 75.0 68.2 17.4 31.6 55.9 57.5 67.0 33.1 7.2 25.4
Dumped
indiscriminately 10.8 3.9 19.6 5.9 5.7 2.7 22.8 9.4 3.3 14.4 37.3 31.9 38.8
Total 100.0 100.0 100.0 100.0 100.0 100.0 100.0 100.0 100.0 100.0 100.0 100.0 100.0
Method of liquid waste water disposal
Discharged in
open area 68.8 49.3 93.6 78.6 79.5 32.4 86.4 80.0 55.5 91.0 92.3 97.4 95.8
Discharged into
drains 25.9 43.1 3.9 15.7 18.6 53.6 6.3 17.6 40.9 7.4 5.3 1.9 2.7
Septic tank 3.7 5.5 1.4 5.1 1.4 12.0 2.0 1.8 1.0 1.4 1.8 0.6 1.2
Discharge into
sewer 0.9 1.2 0.6 0.2 0.4 2.0 0.3 0.6 1.8 0.1 0.2 0.2 0.2
Other 0.7 0.8 0.5 0.3 0.1 0.0 4.9 0.0 0.9 0.1 0.4 0.0 0.2
Total 100.0 100.0 100.0 100.0 100.0 100.0 100.0 100.0 100.0 100.0 100.0 100.0 100.0
Source: Ghana Living Standard Surveys 2018, GSS
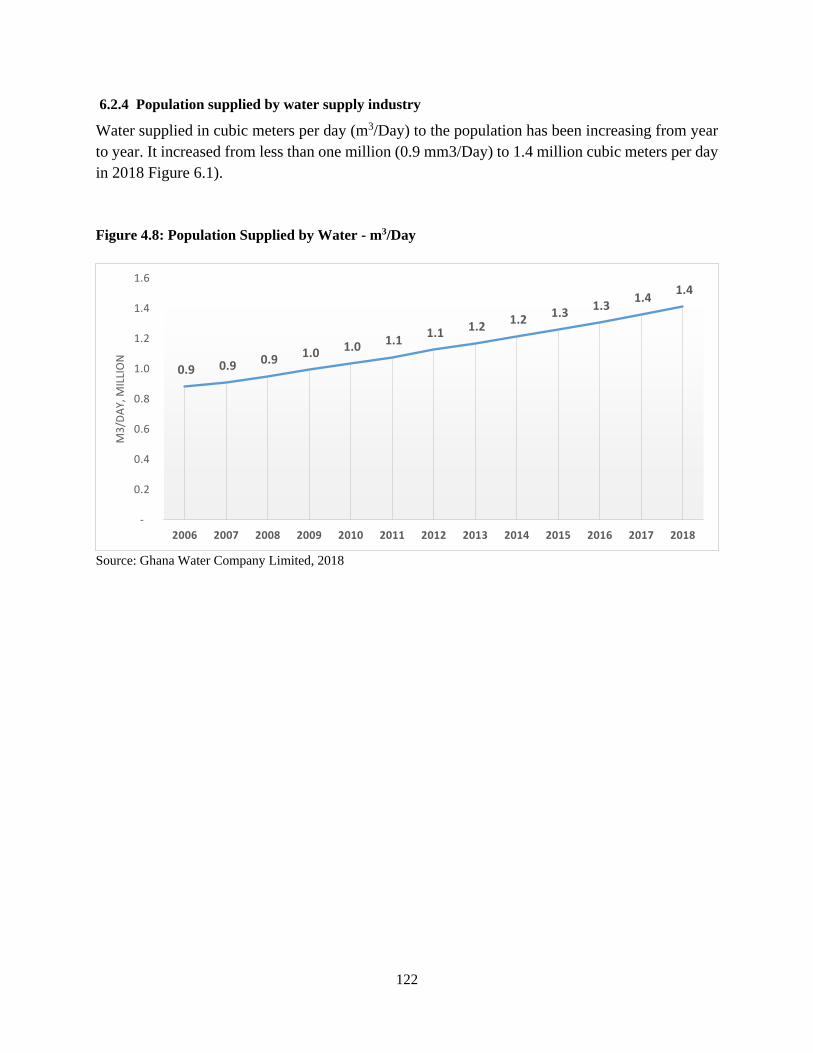
122
6.2.4 Population supplied by water supply industry
Water supplied in cubic meters per day (m3/Day) to the population has been increasing from year
to year. It increased from less than one million (0.9 mm3/Day) to 1.4 million cubic meters per day
in 2018 Figure 6.1).
Figure 4.8: Population Supplied by Water - m3/Day
Source: Ghana Water Company Limited, 2018
0.9 0.9 0.9 1.0 1.0 1.1 1.1 1.2
1.2 1.3
1.3 1.4
1.4
-
0.2
0.4
0.6
0.8
1.0
1.2
1.4
1.6
2006 2007 2008 2009 2010 2011 2012 2013 2014 2015 2016 2017 2018
M3
/DA
Y, M
ILLI
ON
123
6.3 Environmental Concerns Specific to Urban Settlements
The rapid population growth rate in Ghana is presently exerting immense pressure on the natural resources,
as well as creating waste management problems in the major towns and cities. The environmental problems
associated with urban overpopulation in Ghana are those that have direct bearing on human health, such as
basic sanitation and disposal of waste, the shortage of essential facilities and disregard for approved land
use allocations. Other problems are overcrowding of commercial and private transports facilities.
6.3.1 Total Number of Vehicles Registered in Ghana by Category
The highest number of vehicles registered of capacities 2000cc and below, for both private and commercial
vehicles, were recorded in 1996, 112.991 and 36.475, respectively. The least number of private motor
vehicle were of capacity above 2000cc category was 6 recorded in 1995. Private Buses & Coaches also
recorded the highest registration in 1996 with a total of 42,501. Private motor vehicles of capacities above
2000cc were most registered in 2013 with 29,074.
During the period the most registered vehicle categories were private motor vehicles of capacity below
2000cc with a record of 731,093, while the least number of vehicle category was private motor vehicle of
capacity above 2000cc with 6,372. During the period the highest number of private vehicle registration,
156.559, was recorded in 1996, while commercial vehicle registration had 39,671 as its highest record in
2013. Overall, private registration had the highest number of above 1.2 million (Table 6.5).
For private car registration, the highest was recorded in 1996 year with a total of 156, 559, while commercial
car registration recorded the biggest in 2013(39,671 over the twenty-four years). In all, private registration
had the highest in total over 1.2 million over the twenty-four years.
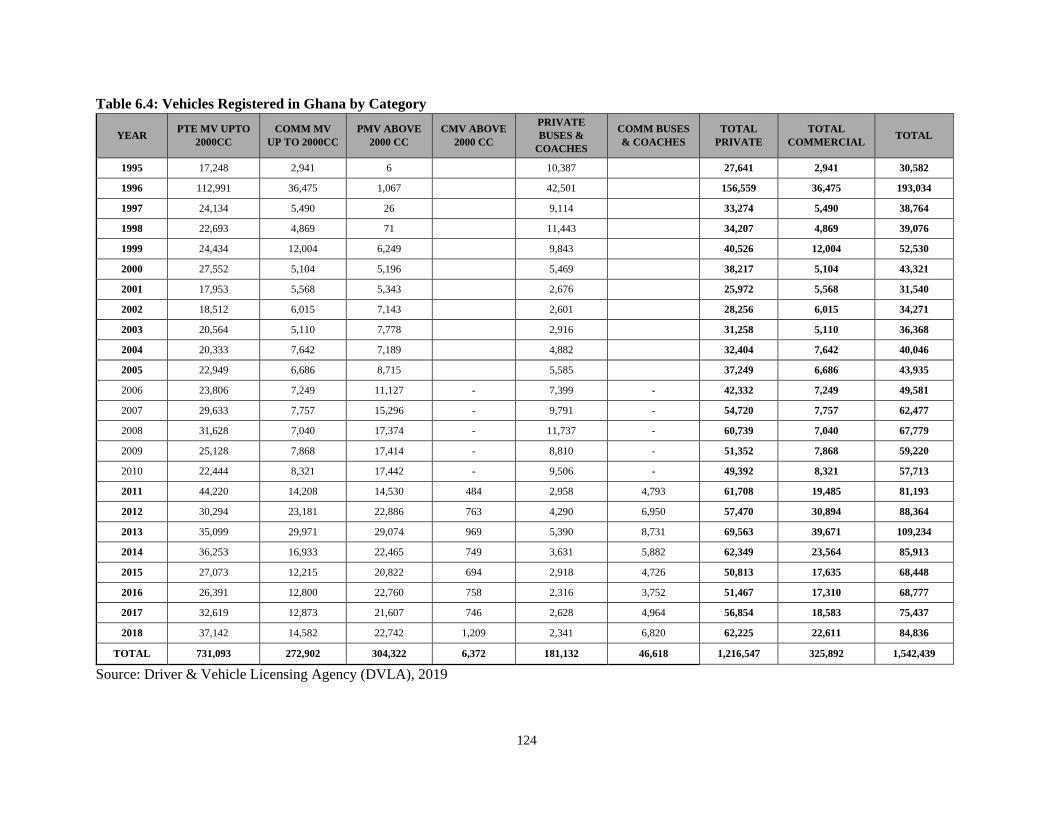
124
Table 6.4: Vehicles Registered in Ghana by Category
YEAR PTE MV UPTO
2000CC
COMM MV
UP TO 2000CC
PMV ABOVE
2000 CC
CMV ABOVE
2000 CC
PRIVATE
BUSES &
COACHES
COMM BUSES
& COACHES
TOTAL
PRIVATE
TOTAL
COMMERCIAL TOTAL
1995 17,248 2,941 6 10,387 27,641 2,941 30,582
1996 112,991 36,475 1,067 42,501 156,559 36,475 193,034
1997 24,134 5,490 26 9,114 33,274 5,490 38,764
1998 22,693 4,869 71 11,443 34,207 4,869 39,076
1999 24,434 12,004 6,249 9,843 40,526 12,004 52,530
2000 27,552 5,104 5,196 5,469 38,217 5,104 43,321
2001 17,953 5,568 5,343 2,676 25,972 5,568 31,540
2002 18,512 6,015 7,143 2,601 28,256 6,015 34,271
2003 20,564 5,110 7,778 2,916 31,258 5,110 36,368
2004 20,333 7,642 7,189 4,882 32,404 7,642 40,046
2005 22,949 6,686 8,715 5,585 37,249 6,686 43,935
2006 23,806 7,249 11,127 - 7,399 - 42,332 7,249 49,581
2007 29,633 7,757 15,296 - 9,791 - 54,720 7,757 62,477
2008 31,628 7,040 17,374 - 11,737 - 60,739 7,040 67,779
2009 25,128 7,868 17,414 - 8,810 - 51,352 7,868 59,220
2010 22,444 8,321 17,442 - 9,506 - 49,392 8,321 57,713
2011 44,220 14,208 14,530 484 2,958 4,793 61,708 19,485 81,193
2012 30,294 23,181 22,886 763 4,290 6,950 57,470 30,894 88,364
2013 35,099 29,971 29,074 969 5,390 8,731 69,563 39,671 109,234
2014 36,253 16,933 22,465 749 3,631 5,882 62,349 23,564 85,913
2015 27,073 12,215 20,822 694 2,918 4,726 50,813 17,635 68,448
2016 26,391 12,800 22,760 758 2,316 3,752 51,467 17,310 68,777
2017 32,619 12,873 21,607 746 2,628 4,964 56,854 18,583 75,437
2018 37,142 14,582 22,742 1,209 2,341 6,820 62,225 22,611 84,836
TOTAL 731,093 272,902 304,322 6,372 181,132 46,618 1,216,547 325,892 1,542,439
Source: Driver & Vehicle Licensing Agency (DVLA), 2019

125
6.4 Water-Related Diseases and Conditions
Water is essential to the existence of man and all living things. Water, SDG 6 is a crosscutting element and
linked to more than eight Goals. Improving water services and uses are essential for increasing hygiene and
sanitation services that affect productive life of peoples, health, and nutrition and food production.
According to GLSS 7 report, the main source of water supply for drinking is through the pipe-borne
(27.3%), well (28.5%), and other, 36.1 percent. Further, lack of potable water, occurrence of drought or
floods expose the population to water- related diseases.
6.4.1 Water-Related Diseases and Conditions
The highest reported cases of outpatient morbidity environmental-related water diseases in Ghana is
Malaria. The reported cases increased from 3.1 million in 2002 to 10.8 million in 2013. It then, declined to
7.0 million in 2014 and further to 6.9 million in 2016 (Table 6.6). This is followed by upper respiratory
tract infections recording a total case of 27.6 million cases from 2002 to 2016. The highest number of cases
was recorded in 2015 (3.9 million) and the least, 0.52 million in 2003.
With regards to Diarrhea, the highest number of reported cases were recorded in 2016 (1.6 million) with
the least in 2002 (0.3 million). Nationally, whilst Diarrhea recorded a total of 12.2 million cases, skin
diseases, rheumatism and other joint pains, intestinal worms, chickenpox, Typhoid fever, and pneumonia
recorded cases ranging between 1.9 million to 11.5 million.
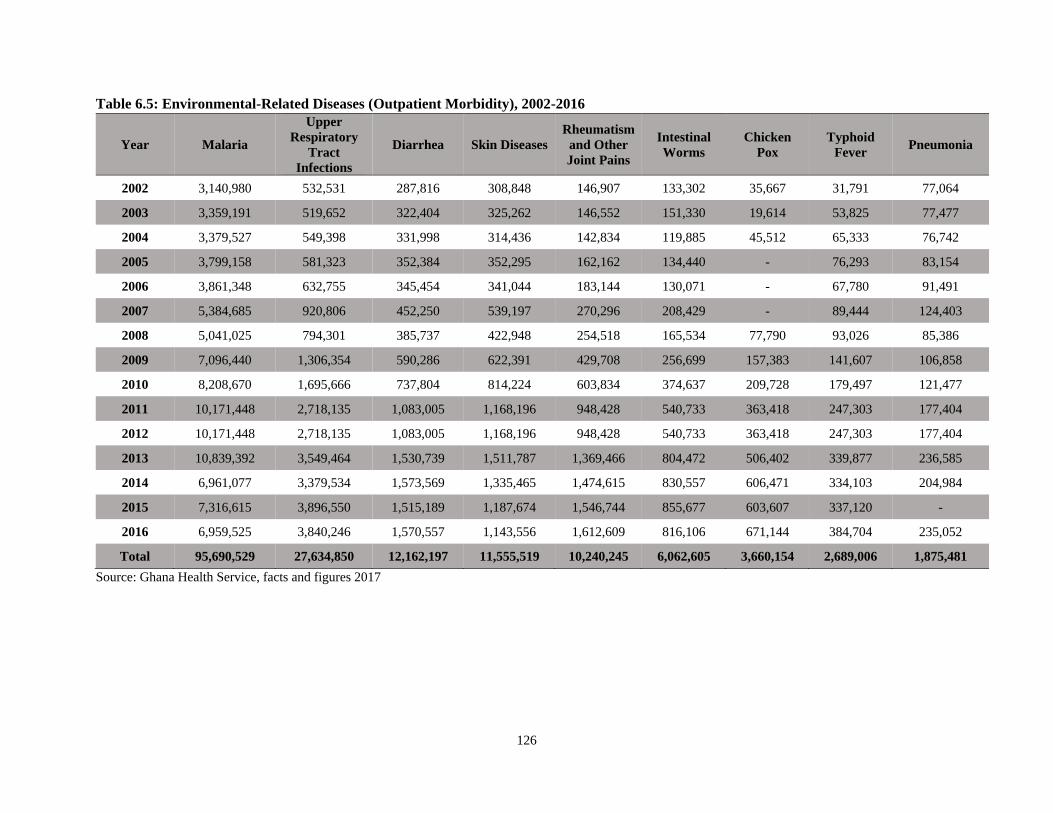
126
Table 6.5: Environmental-Related Diseases (Outpatient Morbidity), 2002-2016
Year Malaria
Upper
Respiratory
Tract
Infections
Diarrhea Skin Diseases
Rheumatism
and Other
Joint Pains
Intestinal
Worms
Chicken
Pox
Typhoid
Fever Pneumonia
2002 3,140,980 532,531 287,816 308,848 146,907 133,302 35,667 31,791 77,064
2003 3,359,191 519,652 322,404 325,262 146,552 151,330 19,614 53,825 77,477
2004 3,379,527 549,398 331,998 314,436 142,834 119,885 45,512 65,333 76,742
2005 3,799,158 581,323 352,384 352,295 162,162 134,440 - 76,293 83,154
2006 3,861,348 632,755 345,454 341,044 183,144 130,071 - 67,780 91,491
2007 5,384,685 920,806 452,250 539,197 270,296 208,429 - 89,444 124,403
2008 5,041,025 794,301 385,737 422,948 254,518 165,534 77,790 93,026 85,386
2009 7,096,440 1,306,354 590,286 622,391 429,708 256,699 157,383 141,607 106,858
2010 8,208,670 1,695,666 737,804 814,224 603,834 374,637 209,728 179,497 121,477
2011 10,171,448 2,718,135 1,083,005 1,168,196 948,428 540,733 363,418 247,303 177,404
2012 10,171,448 2,718,135 1,083,005 1,168,196 948,428 540,733 363,418 247,303 177,404
2013 10,839,392 3,549,464 1,530,739 1,511,787 1,369,466 804,472 506,402 339,877 236,585
2014 6,961,077 3,379,534 1,573,569 1,335,465 1,474,615 830,557 606,471 334,103 204,984
2015 7,316,615 3,896,550 1,515,189 1,187,674 1,546,744 855,677 603,607 337,120 -
2016 6,959,525 3,840,246 1,570,557 1,143,556 1,612,609 816,106 671,144 384,704 235,052
Total 95,690,529 27,634,850 12,162,197 11,555,519 10,240,245 6,062,605 3,660,154 2,689,006 1,875,481
Source: Ghana Health Service, facts and figures 2017
127
Chapter 7
Environmental Protection, Management and Engagement
7.1 Introduction
This chapter provides information on environmental protection and resource management expenditure to
improve the environment and maintain ecosystem health. Statistics on environmental governance,
institutional strength, enforcement of regulations and extreme event preparedness are also considered. The
chapter also provides brief information on the regulatory instruments, Multilateral Environment
Agreements (MEAs) and Conventions the country has signed onto as part of global efforts to addressing a
wide array of emerging environmental issues.
7.2 Environmental Regulation and Instruments
In Ghana, the Environmental Protection Agency (EPA) is mandated as the lead institution in environment
to provide technical advice on environmental protection and sustainable development to the Ministry of
Environment, Science, Technology and Innovation.
The functions of the EPA among others include the promotion of environmental education, research,
monitoring and regulation, and preparation of standards and guidelines for environmental management.
The EPA is also responsible for the protection and improvement of Ghana’ environment. This includes
enforcing environmental policy and legislation, prescribing standards and guidelines, inspecting and
regulating businesses and responding to emergency incidents, issuance of environmental permits and
pollution abatement notices for controlling waste discharges, emissions, deposits or others sources of
pollutants and issuing directives, procedures or warnings for the purpose of controlling noise.
A number of institutions including the Forestry Commission, Minerals Commission, Energy Commission,
Water Resources Commission, Fisheries Commission, Lands Commission, among others are also mandated
by law to regulate various aspects of the environment. Table 7.2 and 7.3 presents a list of legislation in
grouped under different environment themes and a schedule of some regulated pollutants in Ghana.

128
Table 7.2: List of Legislation in Grouped Under Different Environment Themes
No. Environment Theme Legislation
1 Air Pollution
• Environmental Protection Agency Act, 1994 (Act 490)
• Management of Ozone Depleting Substances and Products
Regulations,2005
2 Coastal and Marine Environment
• Fisheries Act, 2002
• Maritime Zone (Delimitation) Act,1986
• Wetlands Management (RAMSAR Sites) Regulations,1999
3 Energy and Mineral Resources
• Atomic Energy Commission Act,2000
• Diamonds Act,1972
• Energy Commission Act, 1997
• Ghana National Petroleum Act,1983
• Minerals Commission Act,1993
• Minerals Export Duty (Abolition) Act,1987
• Minerals Health Areas Act,1925
• Small Scale Gold Mining Act,1989
• Volta River Development Act,1961
• West African Gas Pipeline Act,2004
4 Flora and Fauna
• Animals (Artificial Insemination) Act,1955
• Animals (Control and Importation) Act,1952
• Control and Prevention of Bush Fires Act,1990
• Economic Plants Protection Act,197
• Forest Plantation Development Act,2000
• Timber Resource Management Regulation Act,1998
• Timber Operations Act
• Tree and Timber Act,1974
• Timber Resource Management Regulations,1998
• Timber Industry and Ghana Timber Marketing Board
Act,1977
• Wild Animals Preservation Act 1961(Act 43)
5 Human Development and Settlement
• Concessions Act,1939
• Concessions Act,1962
• Copyright Act,2005
• Centre For Scientific and Industrial Research Act,1996
• Centre For Scientific Research into Plant Medicine
Act,1975
• Confiscated Assets (Recovery and Disposal) Committee
Act,1979
• Food and Drugs Board• Administration of Lands, Act 1962
• Ghana Ports and Harbors Authority Act,1986
• Ghana Maritime Security Act, 2004
• Ghana Maritime Authority Act,2002
• Ghana Shipping Act,2003
• Ghana National Fire Service Act, 1997
• Ghana Meteorological Agency Act,2004
• Ghana Tourist Control Authority Act,1973
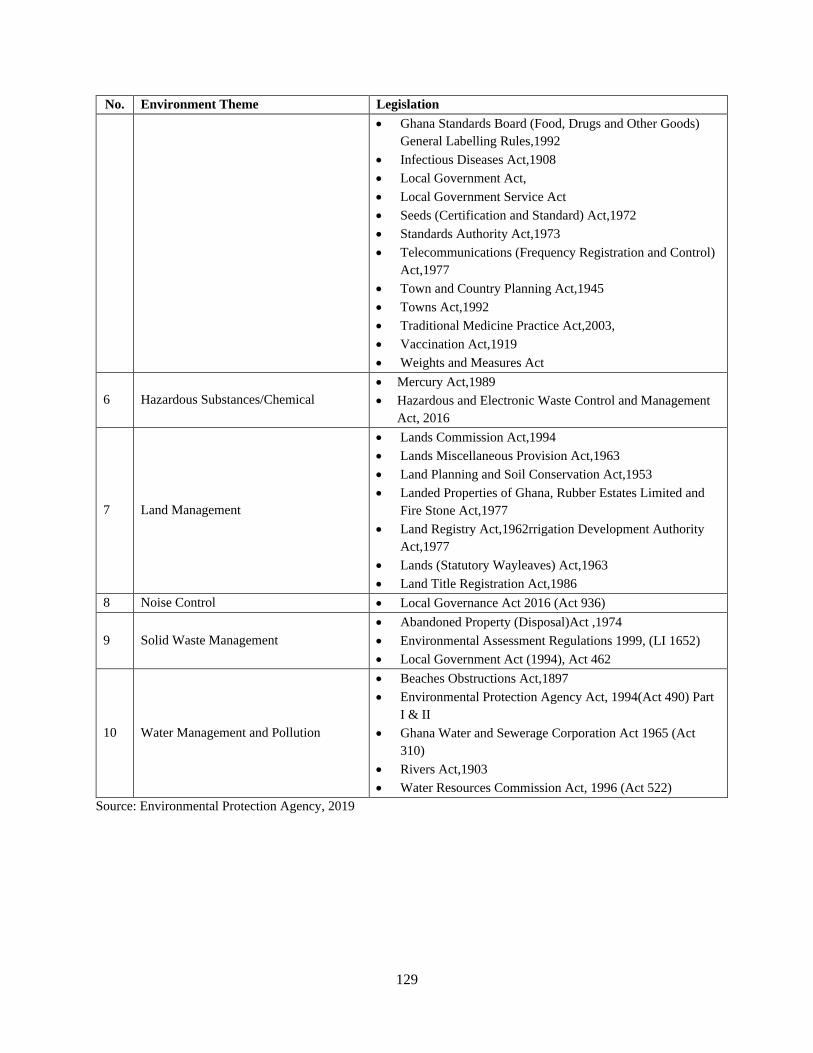
129
No. Environment Theme Legislation
• Ghana Standards Board (Food, Drugs and Other Goods)
General Labelling Rules,1992
• Infectious Diseases Act,1908
• Local Government Act,
• Local Government Service Act
• Seeds (Certification and Standard) Act,1972
• Standards Authority Act,1973
• Telecommunications (Frequency Registration and Control)
Act,1977
• Town and Country Planning Act,1945
• Towns Act,1992
• Traditional Medicine Practice Act,2003,
• Vaccination Act,1919
• Weights and Measures Act
6 Hazardous Substances/Chemical
• Mercury Act,1989
• Hazardous and Electronic Waste Control and Management
Act, 2016
7 Land Management
• Lands Commission Act,1994
• Lands Miscellaneous Provision Act,1963
• Land Planning and Soil Conservation Act,1953
• Landed Properties of Ghana, Rubber Estates Limited and
Fire Stone Act,1977
• Land Registry Act,1962rrigation Development Authority
Act,1977
• Lands (Statutory Wayleaves) Act,1963
• Land Title Registration Act,1986
8 Noise Control • Local Governance Act 2016 (Act 936)
9 Solid Waste Management
• Abandoned Property (Disposal)Act ,1974
• Environmental Assessment Regulations 1999, (LI 1652)
• Local Government Act (1994), Act 462
10 Water Management and Pollution
• Beaches Obstructions Act,1897
• Environmental Protection Agency Act, 1994(Act 490) Part
I & II
• Ghana Water and Sewerage Corporation Act 1965 (Act
310)
• Rivers Act,1903
• Water Resources Commission Act, 1996 (Act 522)
Source: Environmental Protection Agency, 2019

130
Table 7.3: List of Some Regulated Pollutants
No. Name
Chemical
Abstracts
Service (CAS)
Numbers
Categories
Maximum
Allowable
Levels
Year
Adopted Brief Description
1. 2,4,5-T and its salts and esters 93-76-5 (*) Pesticide
2,4,5-Trichlorophenoxyacetic acid, a
synthetic auxin, is a chlorophenoxy acetic
acid herbicide used to defoliate broad-leafed
plants
2. Alachlor 15972-60-8 Pesticide
Alachlor is an herbicide from the
chloroacetanilide family. It is an odorless, white
solid. The greatest use of alachlor is for control
of annual grasses and broadleaf weeds in crops.
3. Aldicarb 116-06-3 Pesticide
Aldicarb is a carbamate insecticide which is the
active substance in the pesticide Temik. It is
effective against thrips, aphids, spider
mites, lygus, fleahoppers, and leafminers, but is
primarily used as a nematicide.
4. Aldrin 309-00-2 Pesticide
Aldrin is an organochlorine insecticide that was
widely used until the 1990s, when it was banned
in most countries. Aldrin is a member of the so-
called "classic organochlorines" (COC) group of
pesticides.
5. Azinphos-methyl 86-50-0 Pesticide
Azinphos-methyl (Guthion) is a broad-
spectrum organophosphate insecticide. Like
other pesticides in this class, it owes its
insecticidal properties (and human toxicity) to
the fact that it is
an acetylcholinesterase inhibitor (the same
mechanism is responsible for the toxic effects of
the V-series nerve agent chemical weapons).
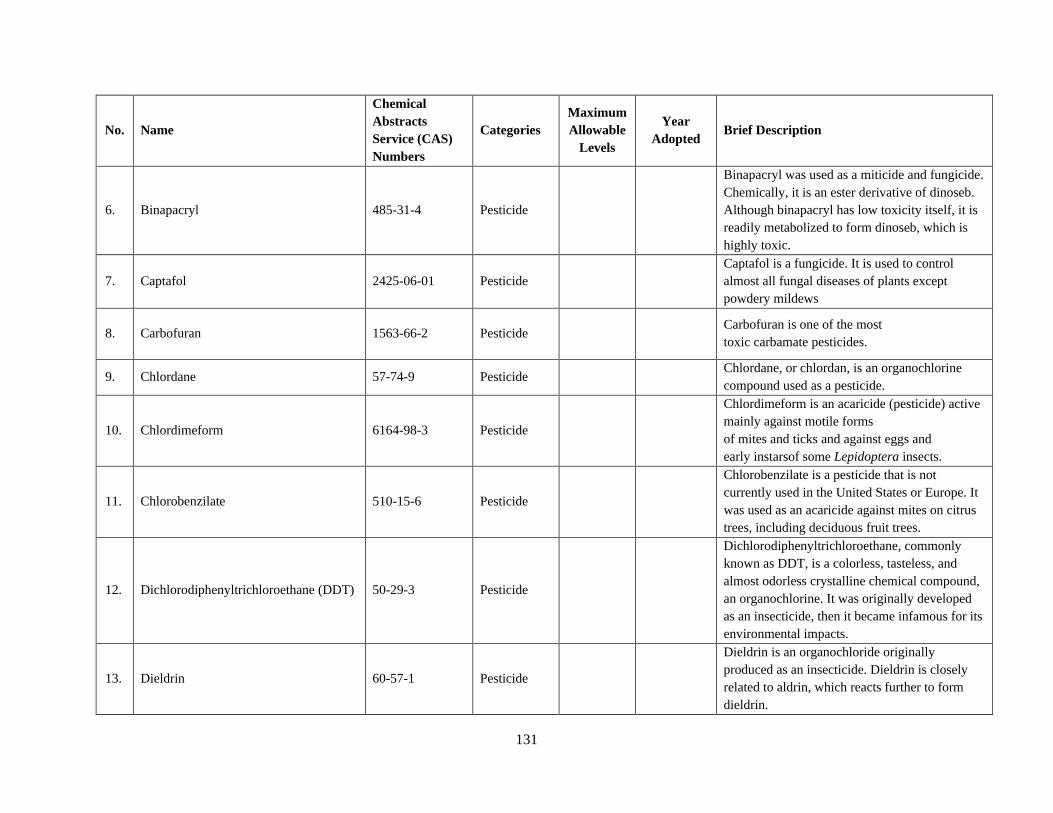
131
No. Name
Chemical
Abstracts
Service (CAS)
Numbers
Categories
Maximum
Allowable
Levels
Year
Adopted Brief Description
6. Binapacryl 485-31-4 Pesticide
Binapacryl was used as a miticide and fungicide.
Chemically, it is an ester derivative of dinoseb.
Although binapacryl has low toxicity itself, it is
readily metabolized to form dinoseb, which is
highly toxic.
7. Captafol 2425-06-01 Pesticide
Captafol is a fungicide. It is used to control
almost all fungal diseases of plants except
powdery mildews
8. Carbofuran 1563-66-2 Pesticide Carbofuran is one of the most
toxic carbamate pesticides.
9. Chlordane 57-74-9 Pesticide Chlordane, or chlordan, is an organochlorine
compound used as a pesticide.
10. Chlordimeform 6164-98-3 Pesticide
Chlordimeform is an acaricide (pesticide) active
mainly against motile forms
of mites and ticks and against eggs and
early instarsof some Lepidoptera insects.
11. Chlorobenzilate 510-15-6 Pesticide
Chlorobenzilate is a pesticide that is not
currently used in the United States or Europe. It
was used as an acaricide against mites on citrus
trees, including deciduous fruit trees.
12. Dichlorodiphenyltrichloroethane (DDT) 50-29-3 Pesticide
Dichlorodiphenyltrichloroethane, commonly
known as DDT, is a colorless, tasteless, and
almost odorless crystalline chemical compound,
an organochlorine. It was originally developed
as an insecticide, then it became infamous for its
environmental impacts.
13. Dieldrin 60-57-1 Pesticide
Dieldrin is an organochloride originally
produced as an insecticide. Dieldrin is closely
related to aldrin, which reacts further to form
dieldrin.

132
No. Name
Chemical
Abstracts
Service (CAS)
Numbers
Categories
Maximum
Allowable
Levels
Year
Adopted Brief Description
14.
Dinitro-ortho-cresol (DNOC) and its
salts (such as ammonium salt, potassium
salt and sodium salt)
534-52-1 Pesticide
Dinitro-ortho-cresol (DNOC) is an organic
compound with the structural
formula CH3C6H2(NO2)2OH. It is a yellow solid
that is only slightly soluble in water. DNOC and
some related derivatives have been used
as herbicides.
15. Dinoseb and its salts and esters 88-85-7 (*) Pesticide
Dinoseb is a common industry name for 6-sec-
butyl-2,4-dinitrophenol, a herbicide in
the dinitrophenol family. It is a crystalline
orange solid which does not readily dissolve in
water. Dinoseb is banned as an herbicide in the
EU and USA because of its toxicity
16. EDB (1,2-dibromoethane) 106-93-4 Pesticide
1,2-Dibromoethane, also known as ethylene
dibromide (EDB), is an organobromine
compound with the chemical formula (CH2Br2).
Although trace amounts occur naturally in
the ocean, where it is formed probably
by algae and kelp, it is mainly synthetic. It is a
dense colorless liquid with a faint sweet odor,
detectable at 10 ppm, is a widely used and
sometimes-controversial fumigant. The
combustion of 1,2-dibromoethane
produces hydrogen bromide gas that is
significantly corrosive.t has been used as a
pesticide in soil and on various crops.
17. Endosulfan 115-29-7 Pesticide
Endosulfan is an off-patent organochlorine
insecticide and acaricide that is being phased out
globally.
18. Ethylene dichloride 107-06-2 Pesticide The chemical compound 1,2-dichloroethane,
commonly known as ethylene dichloride (EDC),

133
No. Name
Chemical
Abstracts
Service (CAS)
Numbers
Categories
Maximum
Allowable
Levels
Year
Adopted Brief Description
is a chlorinated hydrocarbon. It is a
colourless liquid with a chloroform-like odour.
19. Ethylene oxide 75-21-8 Pesticide
Ethylene oxide is an organic compound. It is a
cyclic ether and the simplest epoxide: a three-
membered ring consisting of one oxygen atom
and two carbon atoms. Ethylene oxide is a
colorless and flammable gas with a faintly sweet
odour.
20. Fluoroacetamide 640-19-7 Pesticide
Fluoroacetamide is an organic compound based
on acetamide with one fluorine atom replacing
hydrogen on the methyl group. it is a metabolic
poison which disrupts the citric acid cycle and
was used as a rodenticide.
21. HCH (mixed isomers) 608-73-1 Pesticide
Hexachlorocyclohexane (HCH), formally known
as benzene hexachloride (BHC), is a synthetic
chemical that exists in eight chemical forms
called isomers. The different isomers are named
according to the position of the hydrogen atoms
in the structure of the chemical. However,
imported γ-HCH is available in the United States
for insecticide use as a dust, powder, liquid, or
concentrate. It is also available as a prescription
medicine (lotion, cream, or shampoo) to treat
and/or control scabies (mites) and head lice in
humans.
22. Heptachlor 76-44-8 Pesticide
Heptachlor is an organochlorine compound that
was used as an insecticide. Usually sold as a
white or tan powder, heptachlor is one of
the cyclodiene insecticides.
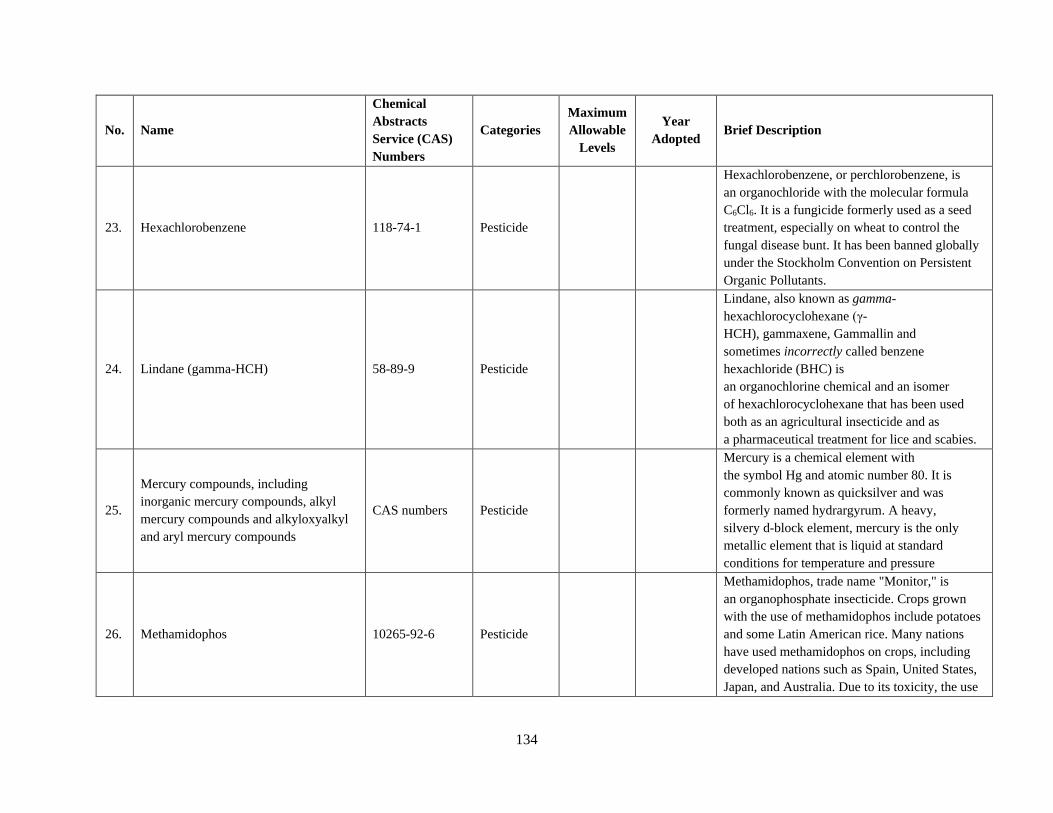
134
No. Name
Chemical
Abstracts
Service (CAS)
Numbers
Categories
Maximum
Allowable
Levels
Year
Adopted Brief Description
23. Hexachlorobenzene 118-74-1 Pesticide
Hexachlorobenzene, or perchlorobenzene, is
an organochloride with the molecular formula
C6Cl6. It is a fungicide formerly used as a seed
treatment, especially on wheat to control the
fungal disease bunt. It has been banned globally
under the Stockholm Convention on Persistent
Organic Pollutants.
24. Lindane (gamma-HCH) 58-89-9 Pesticide
Lindane, also known as gamma-
hexachlorocyclohexane (γ-
HCH), gammaxene, Gammallin and
sometimes incorrectly called benzene
hexachloride (BHC) is
an organochlorine chemical and an isomer
of hexachlorocyclohexane that has been used
both as an agricultural insecticide and as
a pharmaceutical treatment for lice and scabies.
25.
Mercury compounds, including
inorganic mercury compounds, alkyl
mercury compounds and alkyloxyalkyl
and aryl mercury compounds
CAS numbers Pesticide
Mercury is a chemical element with
the symbol Hg and atomic number 80. It is
commonly known as quicksilver and was
formerly named hydrargyrum. A heavy,
silvery d-block element, mercury is the only
metallic element that is liquid at standard
conditions for temperature and pressure
26. Methamidophos 10265-92-6 Pesticide
Methamidophos, trade name "Monitor," is
an organophosphate insecticide. Crops grown
with the use of methamidophos include potatoes
and some Latin American rice. Many nations
have used methamidophos on crops, including
developed nations such as Spain, United States,
Japan, and Australia. Due to its toxicity, the use
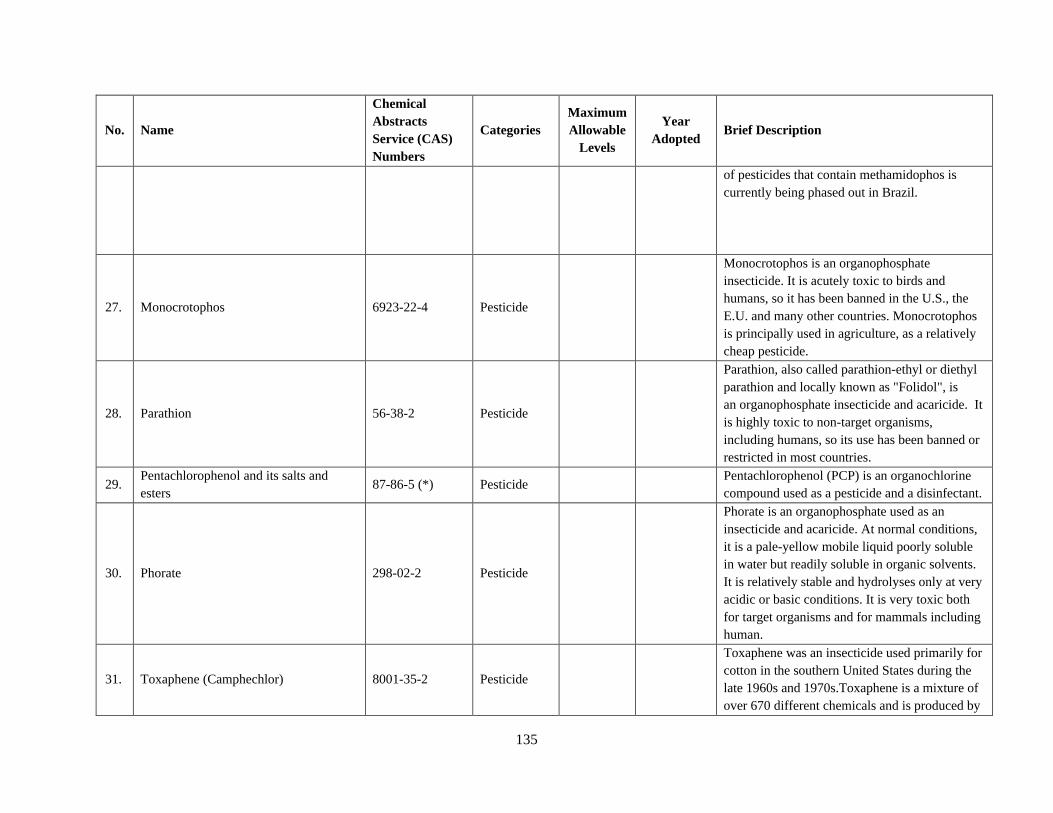
135
No. Name
Chemical
Abstracts
Service (CAS)
Numbers
Categories
Maximum
Allowable
Levels
Year
Adopted Brief Description
of pesticides that contain methamidophos is
currently being phased out in Brazil.
27. Monocrotophos 6923-22-4 Pesticide
Monocrotophos is an organophosphate
insecticide. It is acutely toxic to birds and
humans, so it has been banned in the U.S., the
E.U. and many other countries. Monocrotophos
is principally used in agriculture, as a relatively
cheap pesticide.
28. Parathion 56-38-2 Pesticide
Parathion, also called parathion-ethyl or diethyl
parathion and locally known as "Folidol", is
an organophosphate insecticide and acaricide. It
is highly toxic to non-target organisms,
including humans, so its use has been banned or
restricted in most countries.
29. Pentachlorophenol and its salts and
esters 87-86-5 (*) Pesticide
Pentachlorophenol (PCP) is an organochlorine
compound used as a pesticide and a disinfectant.
30. Phorate 298-02-2 Pesticide
Phorate is an organophosphate used as an
insecticide and acaricide. At normal conditions,
it is a pale-yellow mobile liquid poorly soluble
in water but readily soluble in organic solvents.
It is relatively stable and hydrolyses only at very
acidic or basic conditions. It is very toxic both
for target organisms and for mammals including
human.
31. Toxaphene (Camphechlor) 8001-35-2 Pesticide
Toxaphene was an insecticide used primarily for
cotton in the southern United States during the
late 1960s and 1970s.Toxaphene is a mixture of
over 670 different chemicals and is produced by
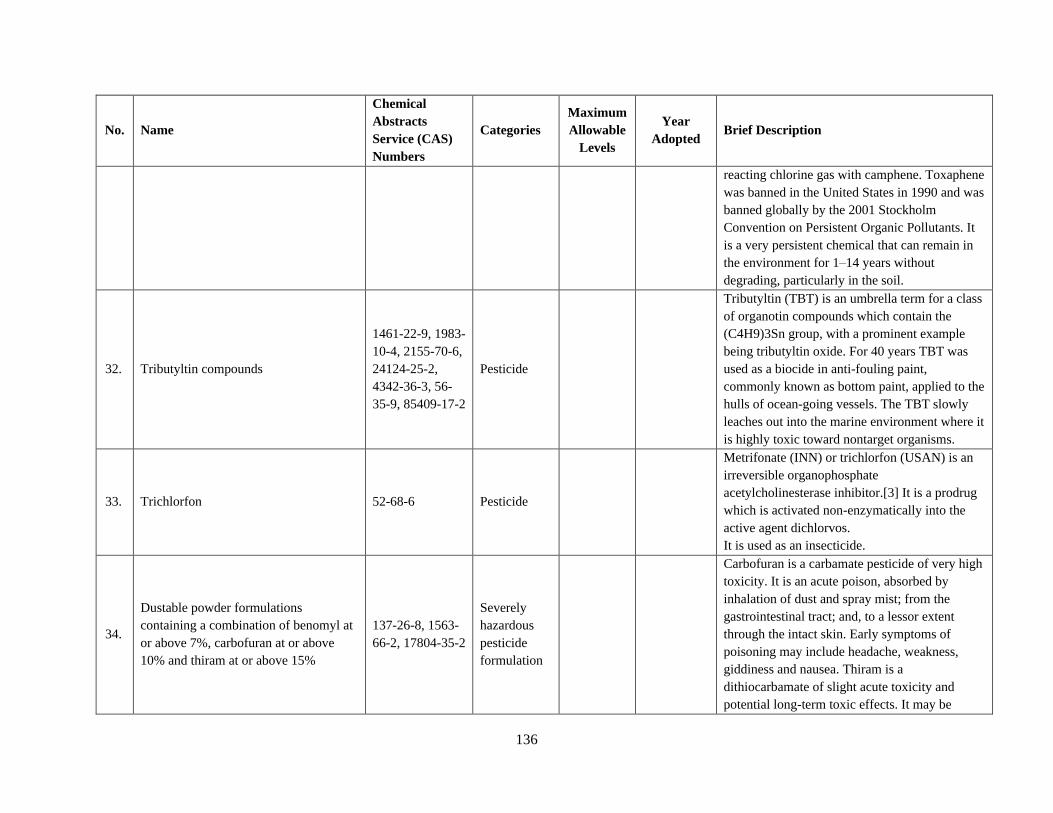
136
No. Name
Chemical
Abstracts
Service (CAS)
Numbers
Categories
Maximum
Allowable
Levels
Year
Adopted Brief Description
reacting chlorine gas with camphene. Toxaphene
was banned in the United States in 1990 and was
banned globally by the 2001 Stockholm
Convention on Persistent Organic Pollutants. It
is a very persistent chemical that can remain in
the environment for 1–14 years without
degrading, particularly in the soil.
32. Tributyltin compounds
1461-22-9, 1983-
10-4, 2155-70-6,
24124-25-2,
4342-36-3, 56-
35-9, 85409-17-2
Pesticide
Tributyltin (TBT) is an umbrella term for a class
of organotin compounds which contain the
(C4H9)3Sn group, with a prominent example
being tributyltin oxide. For 40 years TBT was
used as a biocide in anti-fouling paint,
commonly known as bottom paint, applied to the
hulls of ocean-going vessels. The TBT slowly
leaches out into the marine environment where it
is highly toxic toward nontarget organisms.
33. Trichlorfon 52-68-6 Pesticide
Metrifonate (INN) or trichlorfon (USAN) is an
irreversible organophosphate
acetylcholinesterase inhibitor.[3] It is a prodrug
which is activated non-enzymatically into the
active agent dichlorvos.
It is used as an insecticide.
34.
Dustable powder formulations
containing a combination of benomyl at
or above 7%, carbofuran at or above
10% and thiram at or above 15%
137-26-8, 1563-
66-2, 17804-35-2
Severely
hazardous
pesticide
formulation
Carbofuran is a carbamate pesticide of very high
toxicity. It is an acute poison, absorbed by
inhalation of dust and spray mist; from the
gastrointestinal tract; and, to a lessor extent
through the intact skin. Early symptoms of
poisoning may include headache, weakness,
giddiness and nausea. Thiram is a
dithiocarbamate of slight acute toxicity and
potential long-term toxic effects. It may be
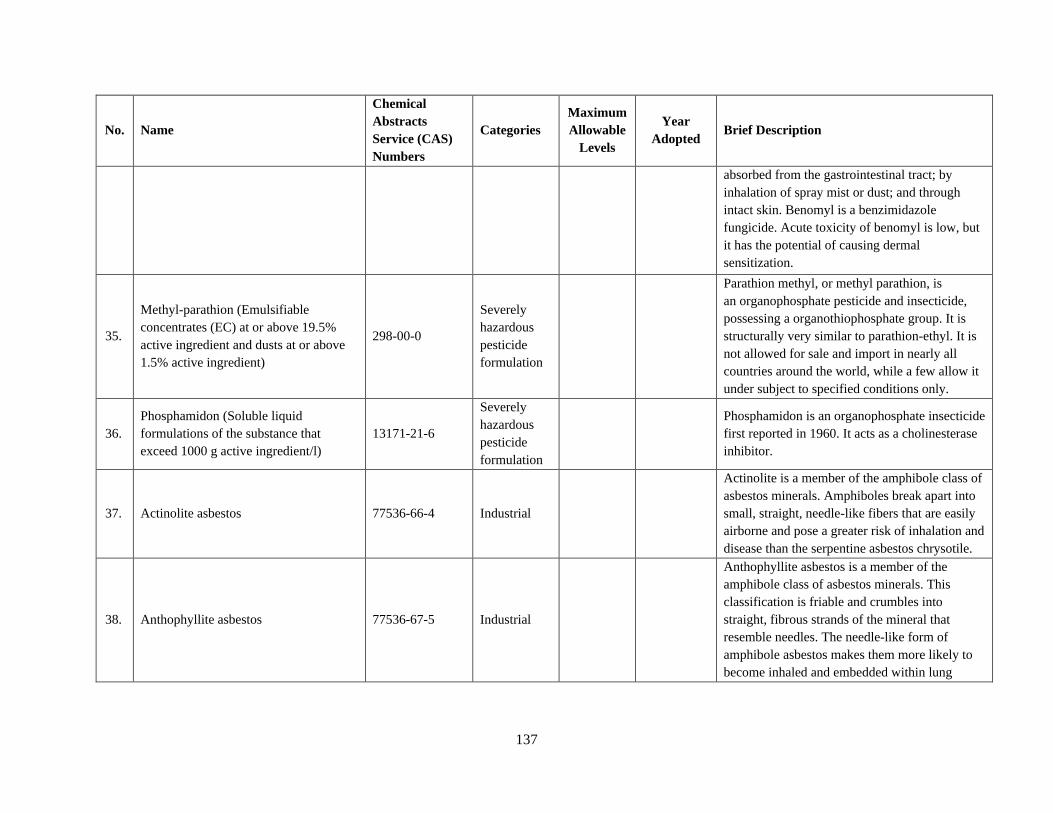
137
No. Name
Chemical
Abstracts
Service (CAS)
Numbers
Categories
Maximum
Allowable
Levels
Year
Adopted Brief Description
absorbed from the gastrointestinal tract; by
inhalation of spray mist or dust; and through
intact skin. Benomyl is a benzimidazole
fungicide. Acute toxicity of benomyl is low, but
it has the potential of causing dermal
sensitization.
35.
Methyl-parathion (Emulsifiable
concentrates (EC) at or above 19.5%
active ingredient and dusts at or above
1.5% active ingredient)
298-00-0
Severely
hazardous
pesticide
formulation
Parathion methyl, or methyl parathion, is
an organophosphate pesticide and insecticide,
possessing a organothiophosphate group. It is
structurally very similar to parathion-ethyl. It is
not allowed for sale and import in nearly all
countries around the world, while a few allow it
under subject to specified conditions only.
36.
Phosphamidon (Soluble liquid
formulations of the substance that
exceed 1000 g active ingredient/l)
13171-21-6
Severely
hazardous
pesticide
formulation
Phosphamidon is an organophosphate insecticide
first reported in 1960. It acts as a cholinesterase
inhibitor.
37. Actinolite asbestos 77536-66-4 Industrial
Actinolite is a member of the amphibole class of
asbestos minerals. Amphiboles break apart into
small, straight, needle-like fibers that are easily
airborne and pose a greater risk of inhalation and
disease than the serpentine asbestos chrysotile.
38. Anthophyllite asbestos 77536-67-5 Industrial
Anthophyllite asbestos is a member of the
amphibole class of asbestos minerals. This
classification is friable and crumbles into
straight, fibrous strands of the mineral that
resemble needles. The needle-like form of
amphibole asbestos makes them more likely to
become inhaled and embedded within lung
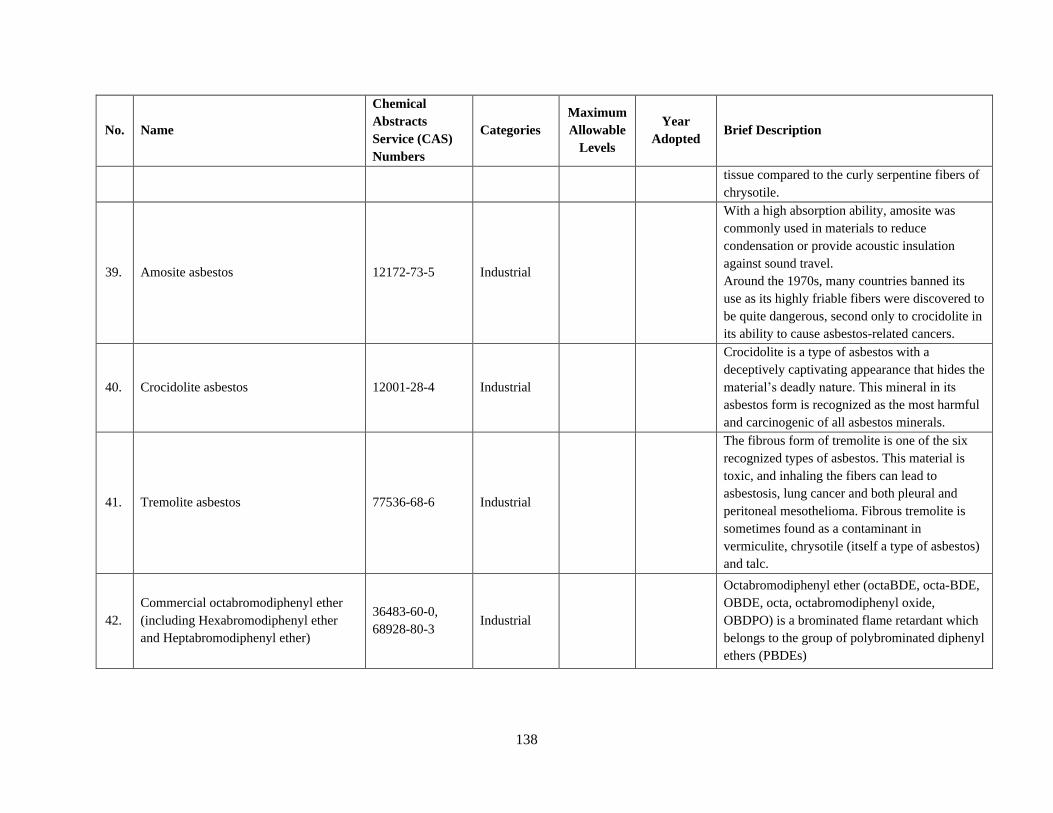
138
No. Name
Chemical
Abstracts
Service (CAS)
Numbers
Categories
Maximum
Allowable
Levels
Year
Adopted Brief Description
tissue compared to the curly serpentine fibers of
chrysotile.
39. Amosite asbestos 12172-73-5 Industrial
With a high absorption ability, amosite was
commonly used in materials to reduce
condensation or provide acoustic insulation
against sound travel.
Around the 1970s, many countries banned its
use as its highly friable fibers were discovered to
be quite dangerous, second only to crocidolite in
its ability to cause asbestos-related cancers.
40. Crocidolite asbestos 12001-28-4 Industrial
Crocidolite is a type of asbestos with a
deceptively captivating appearance that hides the
material’s deadly nature. This mineral in its
asbestos form is recognized as the most harmful
and carcinogenic of all asbestos minerals.
41. Tremolite asbestos 77536-68-6 Industrial
The fibrous form of tremolite is one of the six
recognized types of asbestos. This material is
toxic, and inhaling the fibers can lead to
asbestosis, lung cancer and both pleural and
peritoneal mesothelioma. Fibrous tremolite is
sometimes found as a contaminant in
vermiculite, chrysotile (itself a type of asbestos)
and talc.
42.
Commercial octabromodiphenyl ether
(including Hexabromodiphenyl ether
and Heptabromodiphenyl ether)
36483-60-0,
68928-80-3 Industrial
Octabromodiphenyl ether (octaBDE, octa-BDE,
OBDE, octa, octabromodiphenyl oxide,
OBDPO) is a brominated flame retardant which
belongs to the group of polybrominated diphenyl
ethers (PBDEs)

139
No. Name
Chemical
Abstracts
Service (CAS)
Numbers
Categories
Maximum
Allowable
Levels
Year
Adopted Brief Description
43.
Commercial pentabromodiphenyl ether
(including tetrabromodiphenyl ether and
pentabromodiphenyl ether)
32534-81-9,
40088-47-9 Industrial
Pentabromodiphenyl ether (also known
as pentabromodiphenyl oxide) is a brominated
flame retardant which belongs to the group
of polybrominated diphenyl ethers (PBDEs).
Because of their toxicity and persistence, their
industrial production is to be eliminated under
the Stockholm Convention, a treaty to control
and phase out major persistent organic
pollutants (POP)
44. Hexabromocyclododecane
134237-50-6,
134237-51-7,
134237-52-8,
25637-99-4,
3194-55-6
Industrial
Hexabromocyclododecane (HBCD or HBCDD)
is a brominated flame retardant. Its primary
application is in extruded (XPS) and expanded
(EPS) polystyrene foam that is used as thermal
insulation in the building industry. Other uses
are upholstered furniture, automobile interior
textiles, car cushions and insulation blocks in
trucks, packaging material, video cassette
recorder housing and electric and electronic
equipment.
45.
Perfluorooctane sulfonic acid,
perfluorooctane sulfonates,
perfluorooctane sulfonamides and
perfluorooctane sulfonyls
1691-99-2, 1763-
23-1, 24448-09-
7, 251099-16-8,
2795-39-3,
29081-56-9,
29457-72-5, 307-
35-7, 31506-32-
8, 4151-50-2,
56773-42-3,
70225-14-8
Industrial
Perfluorooctanesulfonic acid (conjugate
base perfluorooctanesulfonate) (PFOS) is an
anthropogenic fluorosurfactant and
global pollutant. PFOS was the key ingredient
in Scotchgard, a fabric protector made by 3M,
and numerous stain repellents.
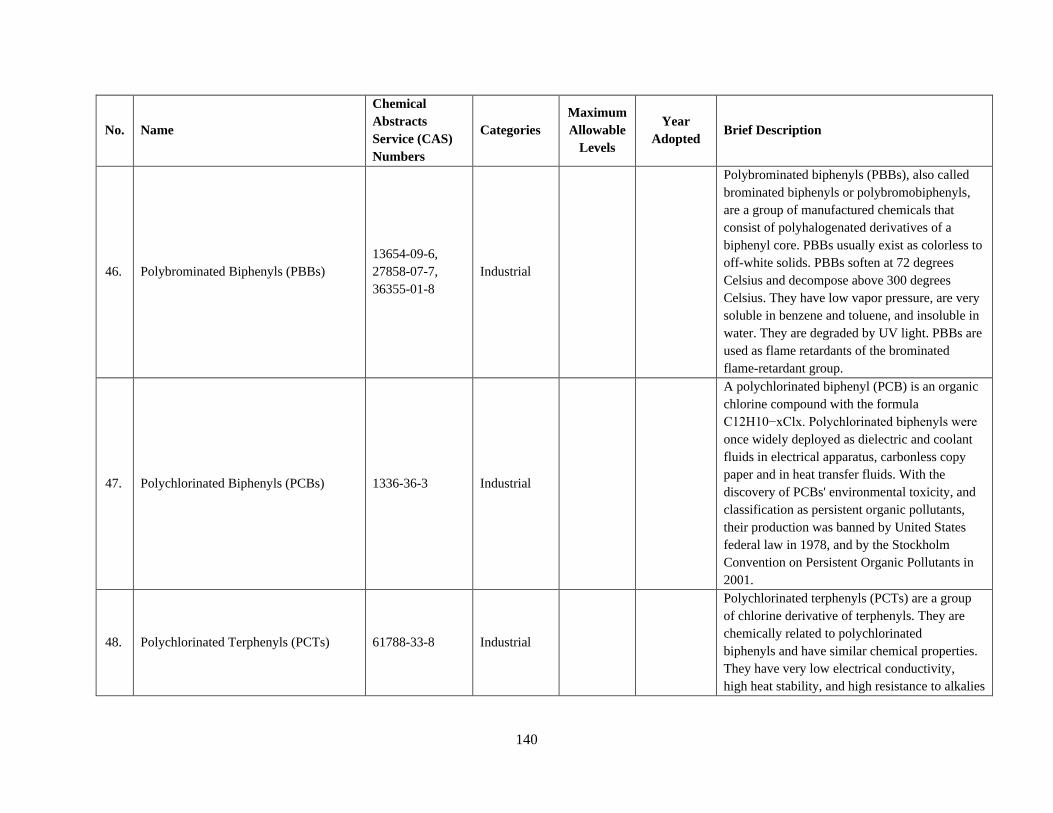
140
No. Name
Chemical
Abstracts
Service (CAS)
Numbers
Categories
Maximum
Allowable
Levels
Year
Adopted Brief Description
46. Polybrominated Biphenyls (PBBs)
13654-09-6,
27858-07-7,
36355-01-8
Industrial
Polybrominated biphenyls (PBBs), also called
brominated biphenyls or polybromobiphenyls,
are a group of manufactured chemicals that
consist of polyhalogenated derivatives of a
biphenyl core. PBBs usually exist as colorless to
off-white solids. PBBs soften at 72 degrees
Celsius and decompose above 300 degrees
Celsius. They have low vapor pressure, are very
soluble in benzene and toluene, and insoluble in
water. They are degraded by UV light. PBBs are
used as flame retardants of the brominated
flame-retardant group.
47. Polychlorinated Biphenyls (PCBs) 1336-36-3 Industrial
A polychlorinated biphenyl (PCB) is an organic
chlorine compound with the formula
C12H10−xClx. Polychlorinated biphenyls were
once widely deployed as dielectric and coolant
fluids in electrical apparatus, carbonless copy
paper and in heat transfer fluids. With the
discovery of PCBs' environmental toxicity, and
classification as persistent organic pollutants,
their production was banned by United States
federal law in 1978, and by the Stockholm
Convention on Persistent Organic Pollutants in
2001.
48. Polychlorinated Terphenyls (PCTs) 61788-33-8 Industrial
Polychlorinated terphenyls (PCTs) are a group
of chlorine derivative of terphenyls. They are
chemically related to polychlorinated
biphenyls and have similar chemical properties.
They have very low electrical conductivity,
high heat stability, and high resistance to alkalies

141
No. Name
Chemical
Abstracts
Service (CAS)
Numbers
Categories
Maximum
Allowable
Levels
Year
Adopted Brief Description
and strong acids. They are non-flammable and
insoluble in water.
49. Short-chain chlorinated paraffins
(SCCP) 85535-84-8 Industrial
SCCPs are primarily used in metalworking
applications and in polyvinyl chloride (PVC)
processing. SCCPs are also used as plasticizers
and flame retardants in a variety of applications,
including in paints, adhesives and sealants,
leather fat liquors, plastics, rubber, textiles and
polymeric materials.
50. Tetraethyl lead 78-00-2 Industrial
TEL is a petro-fuel additive, first being mixed
with gasoline (petrol) beginning in the 1920s as
a patented octane rating booster that
allowed engine compression to be raised
substantially. This in turn caused increased
vehicle performance and fuel economy.
51. Tetramethyl lead 75-74-1 Industrial
Tetramethyllead, also called tetra
methyllead and lead tetramethyl, is a chemical
compound used as an antiknock additive
for gasoline.[1] Its use is being phased out for
environmental considerations
52. Tributyltin compounds
1461-22-9, 1983-
10-4, 2155-70-6,
24124-25-2,
4342-36-3, 56-
35-9, 85409-17-2
Industrial
Tributyltin (TBT) is an umbrella term for a class
of organotin compounds with a prominent
example being tributyltin oxide. For 40 years
TBT was used as a biocide in anti-fouling paint,
commonly known as bottom paint, applied to the
hulls of ocean-going vessels. Bottom paint
improves ship performance and durability as it
reduces the rate of biofouling (the growth of
organisms on the ship's hull).
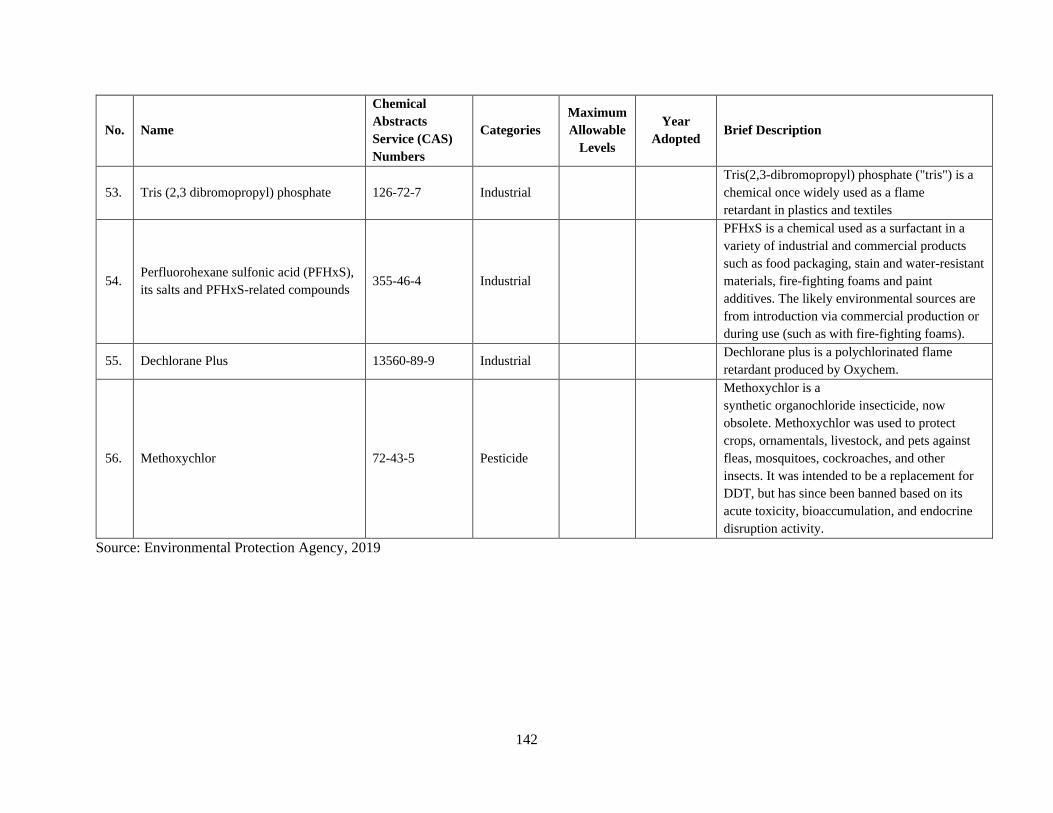
142
No. Name
Chemical
Abstracts
Service (CAS)
Numbers
Categories
Maximum
Allowable
Levels
Year
Adopted Brief Description
53. Tris (2,3 dibromopropyl) phosphate 126-72-7 Industrial
Tris(2,3-dibromopropyl) phosphate ("tris") is a
chemical once widely used as a flame
retardant in plastics and textiles
54. Perfluorohexane sulfonic acid (PFHxS),
its salts and PFHxS-related compounds 355-46-4 Industrial
PFHxS is a chemical used as a surfactant in a
variety of industrial and commercial products
such as food packaging, stain and water-resistant
materials, fire-fighting foams and paint
additives. The likely environmental sources are
from introduction via commercial production or
during use (such as with fire-fighting foams).
55. Dechlorane Plus 13560-89-9 Industrial Dechlorane plus is a polychlorinated flame
retardant produced by Oxychem.
56. Methoxychlor 72-43-5 Pesticide
Methoxychlor is a
synthetic organochloride insecticide, now
obsolete. Methoxychlor was used to protect
crops, ornamentals, livestock, and pets against
fleas, mosquitoes, cockroaches, and other
insects. It was intended to be a replacement for
DDT, but has since been banned based on its
acute toxicity, bioaccumulation, and endocrine
disruption activity.
Source: Environmental Protection Agency, 2019

143
7.3 Participation in MEAs and Environmental Conventions
Ghana is a party to a number of various Multilateral Environment Agreements (MEAs) and has ratified,
and signed onto these Agreements and Conventions to protect and conserve the environment. The
underlisted MEAs and Conventions have been adopted by Ghana.
7.3.1 Agreement on the Conservation of African-Eurasian Migratory Water birds (AEWA)
The Agreement on the Conservation of African-Eurasian Migratory Water birds (AEWA) is an
intergovernmental treaty dedicated to the conservation of migratory water birds and their habitats across
Africa, Europe, the Middle East, Central Asia, Greenland and the Canadian Archipelago. Developed under
the framework of the Convention on Migratory Species (CMS) and administered by the United Nations
Environment Programme (UNEP), AEWA brings together countries and the wider international
conservation community in an effort to establish coordinated conservation and management of migratory
water birds throughout their entire migratory range. This was signed on Friday, April 1, 1988 and ratified
on Saturday, October 1, 2005. The implementing agency is the Wildlife Division of the Forestry
Commission is Name of organization: Wildlife Division of the Forestry Commission.
7.3.2 Cartagena Protocol
The Cartagena Protocol on Bio safety to the Convention on Biological Diversity is an international
agreement which aims to ensure the safe handling, transport and use of living modified organisms (LMOs)
resulting from modern biotechnology that may have adverse effects on biological diversity, taking also into
account risks to human health. It was adopted on 29 January 2000 and entered into force on 11 September
2003. This agreement was signed on Friday, June 12, 1992. It has an accession status with the implementing
organization being Environmental Protection Agency (EPA).
7.3.3 Convention on Biological Diversity (CBD)
The Convention on Biological Diversity (CBD) entered into force on 29 December 1993. It has 3 main
objectives; the conservation of biological diversity, the sustainable use of the components of biological
diversity and the fair and equitable sharing of the benefits arising out of the utilization of genetic resources.
The agreement was signed on Friday, June 12, 1992 and ratified on Monday, August 29, 1994. It has a
ratification status with Ministry of Environment, Science, and Technology & Innovation (MESTI) being
the implementing agency.

144
7.3.4 Gaborone Declaration for the Sustainability of Africa (GDSA)
The Gaborone Declaration for Sustainability in Africa stemmed from a 2012 Summit on Sustainability with
visionary, corporate leaders and heads of states of nine African countries including the host country,
Botswana. The succession to signature was done on October, 2012 and this was ratified on Monday, August
29, 1994. The implementing agency is Ministry of Environment, Science, and Technology & Innovation
(MESTI).
7.3.5 Minamata Convention on Mercury
The Minamata Convention on Mercury is a global treaty to protect human health and the environment from
the adverse effects of mercury. It was agreed at the fifth session of the Intergovernmental Negotiating
Committee on mercury in Geneva, Switzerland at 7 a.m. on the morning of Saturday, 19 January 2013 and
adopted later that year on 10 October 2013 at a Diplomatic Conference (Conference of Plenipotentiaries),
held in Kumamoto, Japan. The Succession to Signature was held on Wednesday, September 24, 2014 and
Ratified on Thursday, March 23, 2017. Environmental Protection Agency (EPA) is the implementing
agency {Enviromental Protection Agency, 2017 #658}.
7.3.6 Montreal Protocol
The Montreal Protocol, finalized in 1987, is a global agreement to protect the stratospheric ozone layer by
phasing out the production and consumption of ozone-depleting substances (ODS). The stratospheric ozone
layer filters out harmful ultraviolet radiation, which is associated with an increased prevalence of skin
cancer and cataracts, reduced agricultural productivity, and disruption of marine ecosystems. The United
States ratified the Montreal Protocol in 1988 and has joined four subsequent amendments. The United States
has been a leader within the Protocol throughout its existence, and has taken strong domestic action to phase
out the production and consumption of ODS such as chlorofluorocarbons (CFCs) and halons. The
Succession to Signature was done on Wednesday, September 16, 1987 and Ratification held on Tuesday,
July 14, 1992. Environmental Protection Agency (EPA) is the implementing agency.
7.3.7 Stockholm Convention
The Stockholm Convention on Persistent Organic Pollutants was adopted by the Conference of
Plenipotentiaries on 22 May 2001 in Stockholm, Sweden. The Convention entered into force on 17 May
2004. It is a global treaty to protect human health and the environment from chemicals that remain intact
in the environment for long periods, become widely distributed geographically, accumulate in the fatty
tissue of humans and wildlife, and have harmful impacts on human health or on the environment. The
Succession to Signature was done on Wednesday, May 23, 2001 with the ratification status signed on
Friday, May 30, 2003. The implementing organization is Environmental Protection Agency (EPA).
145
7.3.8 Sustainable Development Goals (SDGs)
In September 2015, the General Assembly adopted the 2030 Agenda for Sustainable Development that
includes 17 Sustainable Development Goals (SDGs). Building on the principle of “leaving no one behind”,
the new Agenda emphasizes a holistic approach to achieving sustainable development for all. The
Succession to Signature was done In September 2015 and Ratified in September 2015, bearing a status of
member. Environmental Protection Agency (EPA) is the agency in charge of implementation.
7.3.9 United Nations Convention to Combat Desertification (UNCCD)
The United Nations Convention to Combat Desertification (UNCCD) is the sole legally binding
international agreement linking environment and development to sustainable land management. The
Convention addresses specifically the arid, semi-arid and dry sub-humid areas, known as the dry lands,
where some of the most vulnerable ecosystems and peoples can be found. Succession to Signature was
done in Saturday, October 15, 1994 and the Ratification held on Friday, December 27, 1996. The
Environmental Protection Agency (EPA) is the focal organization in charge of implementation.
7.3.10 United Nations Framework Convention on Climate Change (UNFCCC)
The United Nations Convention on the Law of the Sea also called the Law of the Sea Convention or the
Law of the Sea treaty is the international agreement that resulted from the third United Nations Conference
on the Law of the Sea, which took place between 1973 and 1982. The Succession to Signature was held on
Friday, December 10, 1982 and Ratified on Tuesday, June 7, 1983. Environmental Protection Agency
(EPA) is the implementing agency.
7.3.11 United Nations Convention on the Law of the Sea (UNCLOS)
The United Nations Convention on the Law of the Sea also called the Law of the Sea Convention or the
Law of the Sea treaty is the international agreement that resulted from the third United Nations Conference
on the Law of the Sea, which took place between 1973 and 1982. The agreement was signed on Friday,
December 10, 1982 and ratified on Tuesday, June 7, 1983. Environmental Protection Agency (EPA) is the
implementing agency.

146
Reference
Adjei-Gyapong, T., & Asiamah, R. (2002). The interim Ghana soil classification system and its relation
with the World Reference Base for Soil Resources.
Affaton, P., Sougy, J. and Trompette, R., (1980). The tectonostratigraphic relationships between the upper
Precambrian and lower Palaeozoic Volta Basin and the Pan-African Dahomeyide orogenic belt (West
Africa). American Journal of Science, 280, pp. 224-248
Ahenkorah, Y., Amatekpor, J.K., Dowuona, G.N. Dua-Yentumi,S. (1994). Soil and water resources of
Ghana: Their conservation, management and constraints to their utilization for sustainable development.
United Nations University - Institute for Natural Resources in Africa (UNU/INRA) Survey Series No. A1,
UNU/INRA, Legon. 131 pp.
Amatekpor, J.K. and G.N. Dowuona. (1998). Soil Resource Base of Ghana. In E. Laing, E.Y. Safo and
G.N. Dowuona (Editors) National Soil Fertility Management Action Plan, Crop Services Directorate,
Ministry of Food and Agriculture, Accra. 159 pp.
Asiamah, R.D. Adjei-Gyapong, T., Yeboah, E. Fening, J.O., Ampontuah, E.O. & Gaisie, E. 2000. Soil
characterization and evaluation of four primary cassava multiplication sites (Mampong, Wenchi, Asuansi
and Kpeve) in Ghana. SRI Technical Report No. 200, Kumasi.
Brammer, H. (1962). Soils of Ghana. pp. 88-126. In: Brian Wills (Editor.). Agriculture and land use in
Ghana. Oxford University Press, London.
Eisenlohr, B. N., and Hirdes, W., (1992). Structural development of the early Proterozoic Birimian and
Tarkwaian rocks of southwest Ghana, West Africa Journal. Afr. Earth Science., v 14/3, pp. 313-325
EPA (2017). Ghana State of the Environment 2016 Report. Environmental Protection Agency, Ministry of
Environment, Science, Technology and Innovation, Accra. 410 pages.
FAO, W. (1998). World Reference Base for Soil Resources - World Soil Resource. Reports FAO, ISRIC,
ISSS, Rome.
Griffiths, R.J., Barning, K., Agezo, F.L. and Akisah, F. K., (2002). Gold Deposits of Ghana. Accra Minerals
Commission of Ghana, 432p.
Hirdes, W., Senger, R., Adjei, Efa, E., Loh, G., and Tettey, A., (1993). Explanatory notes for the Geological
Map of Southwest Ghana 1:100,000 (Wiawso, Asafo, Kukuom, Sunyani and Berekum sheets). Geol.
Jahrbuch Reibe B, Heft 83, 139p
ISSS/ISRIC/FAO. 1998. World Reference Base for Soil Resources. World Soil Resources Report 84, FAO,
Rome.
Kesse, G O. The mineral and rock resources of Ghana. United States: N. p., 1985. Web.
Loh, G., and W. Hirdes, (1996). Explanatory Notes for the Geological Map of Southwest Ghana-1:100,000
scale (Axim and Takoradi sheets). Ghana Geological Survey Bulletin 49, 63p., Accra.
Sestini, G., (1973). Sedimentology of a paleoplacer: the gold bearing Tarkwaian of Ghana; in Amstutz,
G.C. and A.J. Bernard (Eds): Ores in Sediments, pp. 275-305, Springer-Verlag, Heidelberg.
Vine, H. (1966). Tropical soils. Agriculture in the Tropics (eds. Webster CC, Wilson PN-1st Ed.)
Longmans, London, UK.

147
Soil Survey Staff. 1975. Soil Taxonomy: A basic system of soil classification for making and interpreting
soil surveys. United States Department of Agriculture, Soil Conservation Service.
Webster, C.C. & Wilson, P.N. 1980. Agriculture in the Tropics. English Language Book Society and
Longman Group Ltd.
Zitzmann, A., Kiessling, R., and Loh, G., (1997). Geology of the Bui Belt Area in Ghana; in A. Zitzmann
(ed), Geological, Geophysical and Geochemical Investigation in the Bui belt Area in Ghana. Geol. Jb. Reihe
B, Heft 88,269p.

148
National Implementation Team (NIT) & Authors
1. Ms. Bernice Serwah Ofosu-Baadu Ghana Statistical Service
2. Mr. Elliot Ansah Ghana Statistical Service
3. Ms. Mabel Appiah-Danso Ghana Statistical Service
4. Mr. Kwame B. Fredua Environmental Protection Agency
5. Mr. Emmanuel Cofie Environment Protection Agency
6. Mr. Felix Mote Environment Protection Agency
7. Dr. Christine O. Asare Environment Protection Agency
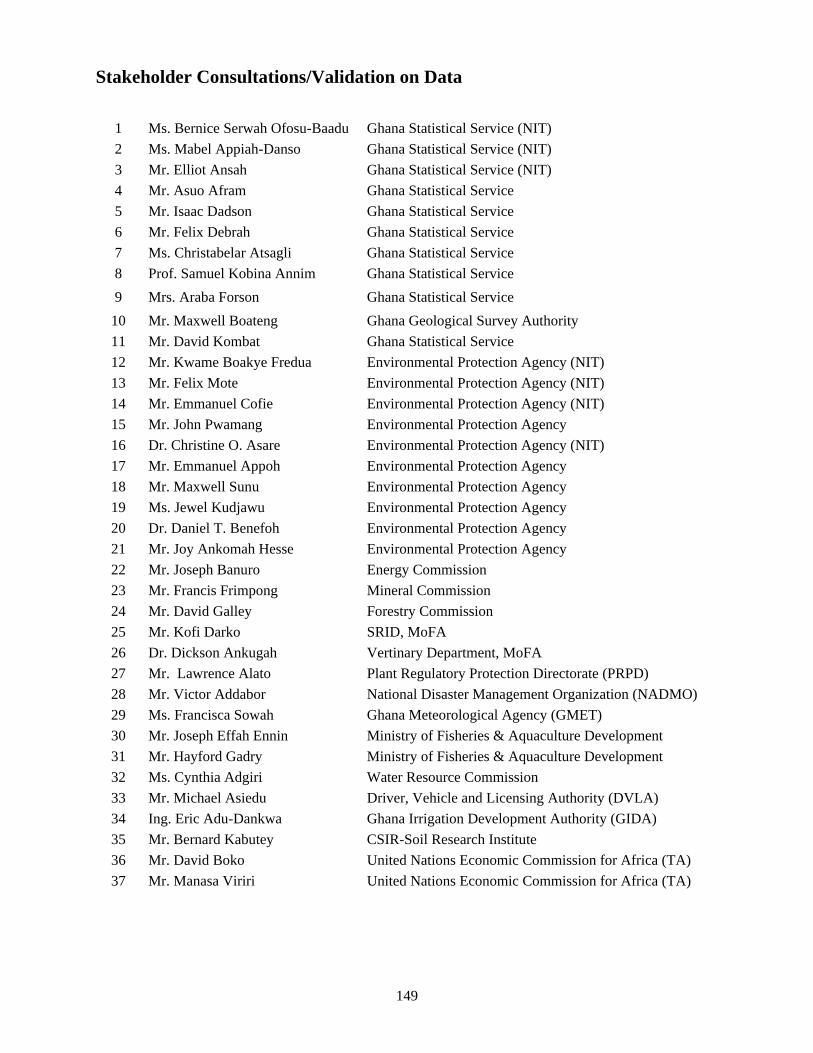
149
Stakeholder Consultations/Validation on Data
1 Ms. Bernice Serwah Ofosu-Baadu Ghana Statistical Service (NIT)
2 Ms. Mabel Appiah-Danso Ghana Statistical Service (NIT)
3 Mr. Elliot Ansah Ghana Statistical Service (NIT)
4 Mr. Asuo Afram Ghana Statistical Service
5 Mr. Isaac Dadson Ghana Statistical Service
6 Mr. Felix Debrah Ghana Statistical Service
7 Ms. Christabelar Atsagli Ghana Statistical Service
8 Prof. Samuel Kobina Annim Ghana Statistical Service
9 Mrs. Araba Forson Ghana Statistical Service
10 Mr. Maxwell Boateng Ghana Geological Survey Authority
11 Mr. David Kombat Ghana Statistical Service
12 Mr. Kwame Boakye Fredua Environmental Protection Agency (NIT)
13 Mr. Felix Mote Environmental Protection Agency (NIT)
14 Mr. Emmanuel Cofie Environmental Protection Agency (NIT)
15 Mr. John Pwamang Environmental Protection Agency
16 Dr. Christine O. Asare Environmental Protection Agency (NIT)
17 Mr. Emmanuel Appoh Environmental Protection Agency
18 Mr. Maxwell Sunu Environmental Protection Agency
19 Ms. Jewel Kudjawu Environmental Protection Agency
20 Dr. Daniel T. Benefoh Environmental Protection Agency
21 Mr. Joy Ankomah Hesse Environmental Protection Agency
22 Mr. Joseph Banuro Energy Commission
23 Mr. Francis Frimpong Mineral Commission
24 Mr. David Galley Forestry Commission
25 Mr. Kofi Darko SRID, MoFA
26 Dr. Dickson Ankugah Vertinary Department, MoFA
27 Mr. Lawrence Alato Plant Regulatory Protection Directorate (PRPD)
28 Mr. Victor Addabor National Disaster Management Organization (NADMO)
29 Ms. Francisca Sowah Ghana Meteorological Agency (GMET)
30 Mr. Joseph Effah Ennin Ministry of Fisheries & Aquaculture Development
31 Mr. Hayford Gadry Ministry of Fisheries & Aquaculture Development
32 Ms. Cynthia Adgiri Water Resource Commission
33 Mr. Michael Asiedu Driver, Vehicle and Licensing Authority (DVLA)
34 Ing. Eric Adu-Dankwa Ghana Irrigation Development Authority (GIDA)
35 Mr. Bernard Kabutey CSIR-Soil Research Institute
36 Mr. David Boko United Nations Economic Commission for Africa (TA)
37 Mr. Manasa Viriri United Nations Economic Commission for Africa (TA)
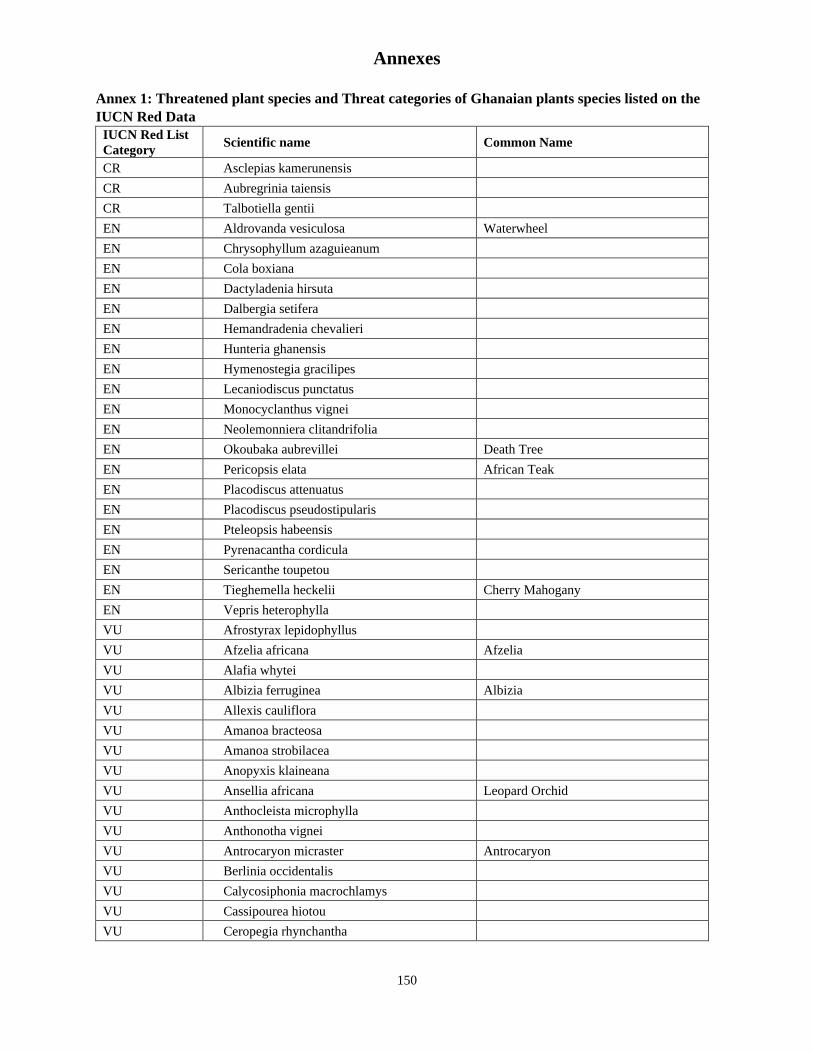
150
Annexes
Annex 1: Threatened plant species and Threat categories of Ghanaian plants species listed on the
IUCN Red Data
IUCN Red List
Category Scientific name Common Name
CR Asclepias kamerunensis
CR Aubregrinia taiensis
CR Talbotiella gentii
EN Aldrovanda vesiculosa Waterwheel
EN Chrysophyllum azaguieanum
EN Cola boxiana
EN Dactyladenia hirsuta
EN Dalbergia setifera
EN Hemandradenia chevalieri
EN Hunteria ghanensis
EN Hymenostegia gracilipes
EN Lecaniodiscus punctatus
EN Monocyclanthus vignei
EN Neolemonniera clitandrifolia
EN Okoubaka aubrevillei Death Tree
EN Pericopsis elata African Teak
EN Placodiscus attenuatus
EN Placodiscus pseudostipularis
EN Pteleopsis habeensis
EN Pyrenacantha cordicula
EN Sericanthe toupetou
EN Tieghemella heckelii Cherry Mahogany
EN Vepris heterophylla
VU Afrostyrax lepidophyllus
VU Afzelia africana Afzelia
VU Alafia whytei
VU Albizia ferruginea Albizia
VU Allexis cauliflora
VU Amanoa bracteosa
VU Amanoa strobilacea
VU Anopyxis klaineana
VU Ansellia africana Leopard Orchid
VU Anthocleista microphylla
VU Anthonotha vignei
VU Antrocaryon micraster Antrocaryon
VU Berlinia occidentalis
VU Calycosiphonia macrochlamys
VU Cassipourea hiotou
VU Ceropegia rhynchantha
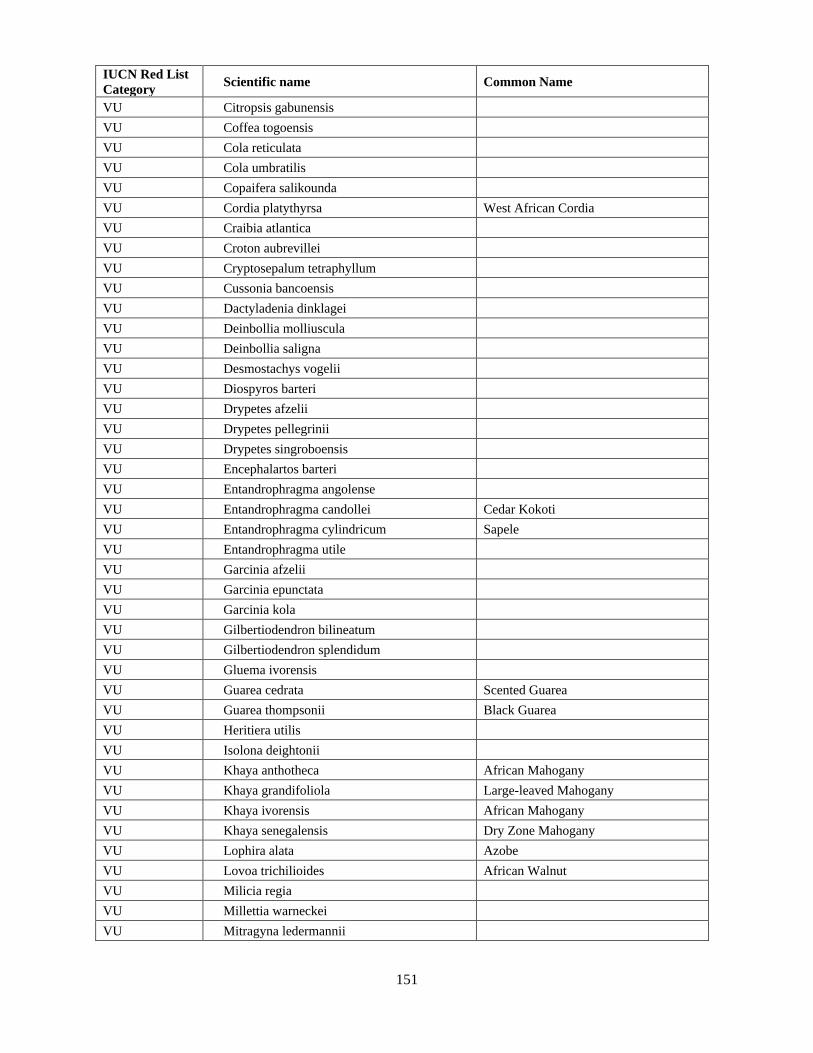
151
IUCN Red List
Category Scientific name Common Name
VU Citropsis gabunensis
VU Coffea togoensis
VU Cola reticulata
VU Cola umbratilis
VU Copaifera salikounda
VU Cordia platythyrsa West African Cordia
VU Craibia atlantica
VU Croton aubrevillei
VU Cryptosepalum tetraphyllum
VU Cussonia bancoensis
VU Dactyladenia dinklagei
VU Deinbollia molliuscula
VU Deinbollia saligna
VU Desmostachys vogelii
VU Diospyros barteri
VU Drypetes afzelii
VU Drypetes pellegrinii
VU Drypetes singroboensis
VU Encephalartos barteri
VU Entandrophragma angolense
VU Entandrophragma candollei Cedar Kokoti
VU Entandrophragma cylindricum Sapele
VU Entandrophragma utile
VU Garcinia afzelii
VU Garcinia epunctata
VU Garcinia kola
VU Gilbertiodendron bilineatum
VU Gilbertiodendron splendidum
VU Gluema ivorensis
VU Guarea cedrata Scented Guarea
VU Guarea thompsonii Black Guarea
VU Heritiera utilis
VU Isolona deightonii
VU Khaya anthotheca African Mahogany
VU Khaya grandifoliola Large-leaved Mahogany
VU Khaya ivorensis African Mahogany
VU Khaya senegalensis Dry Zone Mahogany
VU Lophira alata Azobe
VU Lovoa trichilioides African Walnut
VU Milicia regia
VU Millettia warneckei
VU Mitragyna ledermannii
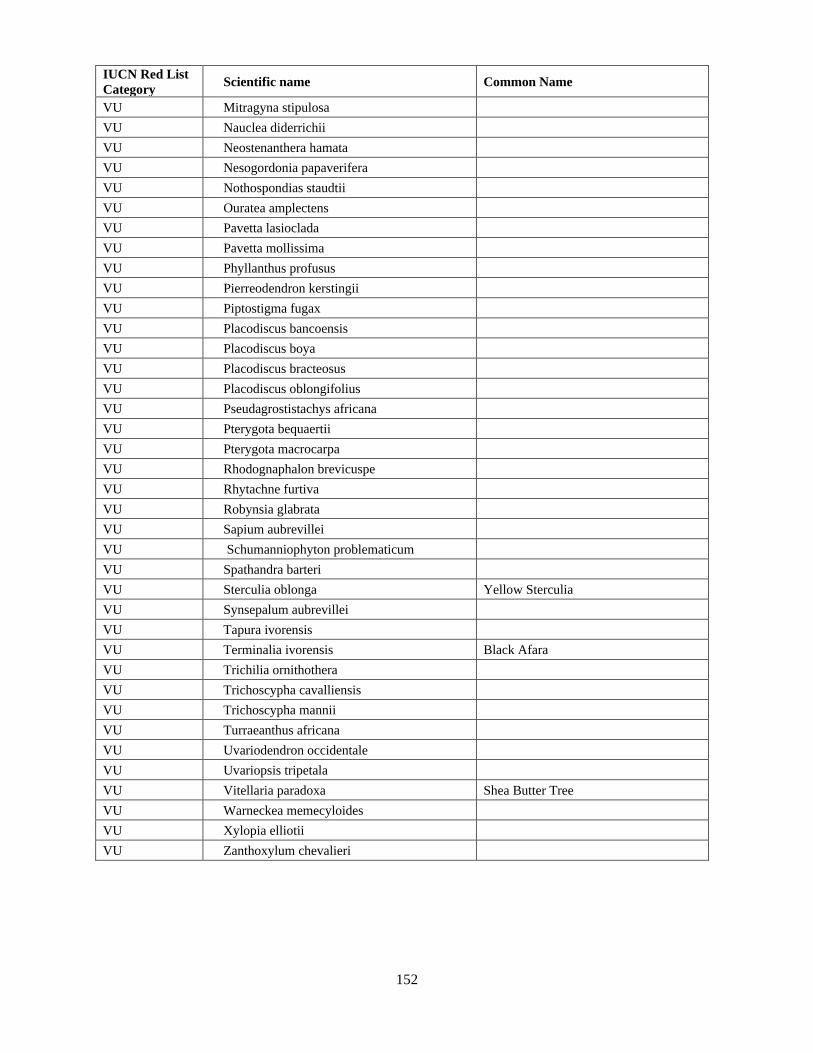
152
IUCN Red List
Category Scientific name Common Name
VU Mitragyna stipulosa
VU Nauclea diderrichii
VU Neostenanthera hamata
VU Nesogordonia papaverifera
VU Nothospondias staudtii
VU Ouratea amplectens
VU Pavetta lasioclada
VU Pavetta mollissima
VU Phyllanthus profusus
VU Pierreodendron kerstingii
VU Piptostigma fugax
VU Placodiscus bancoensis
VU Placodiscus boya
VU Placodiscus bracteosus
VU Placodiscus oblongifolius
VU Pseudagrostistachys africana
VU Pterygota bequaertii
VU Pterygota macrocarpa
VU Rhodognaphalon brevicuspe
VU Rhytachne furtiva
VU Robynsia glabrata
VU Sapium aubrevillei
VU Schumanniophyton problematicum
VU Spathandra barteri
VU Sterculia oblonga Yellow Sterculia
VU Synsepalum aubrevillei
VU Tapura ivorensis
VU Terminalia ivorensis Black Afara
VU Trichilia ornithothera
VU Trichoscypha cavalliensis
VU Trichoscypha mannii
VU Turraeanthus africana
VU Uvariodendron occidentale
VU Uvariopsis tripetala
VU Vitellaria paradoxa Shea Butter Tree
VU Warneckea memecyloides
VU Xylopia elliotii
VU Zanthoxylum chevalieri

153
Annex 2: Types of Soils in Ghana
2018 Types of Soils in Ghana
No. Regions Soil Order Soil Group
Family
Coverage/
Extent (Ha)
Depth1
(cm) General Description
Area affected by
Soil Erosion (Ha)
Area affected
by
desertification
(Ha)
1 Central
Acrisols
Acrisols are defined by the presence of a
subsurface layer of
accumulated kaolinitic clays and also by
the lack of an extensively leached layer
below the surface horizon
Abonku-eja/awuaya-
nkansaku 29623.553 >100
Achimfu-kuntu/asokwa-
suprudu 587.209 >100
Acrisols
Acrisols are defined by the presence of a
subsurface layer of
accumulated kaolinitic clays and also by
the lack of an extensively leached layer
below the surface horizon
Asikuma-atewa/ansum-
oda 522.797 >100
Atukrom 14284.172 >100
Edina-bronyibima/benya-
udu 10375.288 >100
Kumasi-asuansi/nta-ofin 339639.837 >100
Nzima-bekwai/oda 104296.948 >100
Arenosols Arenosols have very low water-holding
capacities. They are highly siliceous and
also extremely low in all essential nutrients
Keta-goi 1563.953 55
Cambisols
Cambisols are characterized by the absence
of a layer of accumulated clay, humus,
soluble salts, or iron and aluminum oxides.
They differ from unweathered parent
material in their aggregate structure,
colour, clay content, carbonate content, or
other properties that give some evidence of
soil-forming processes.
Apeosika-pershi 490.516 >100
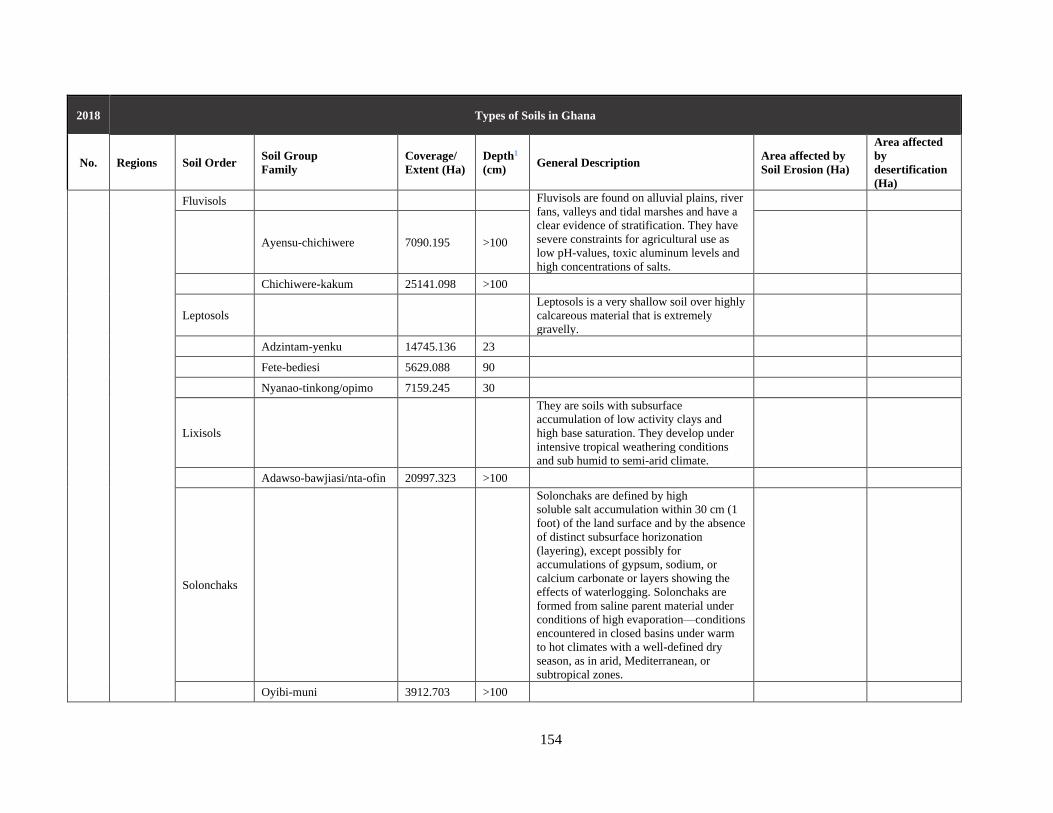
154
2018 Types of Soils in Ghana
No. Regions Soil Order Soil Group
Family
Coverage/
Extent (Ha)
Depth1
(cm) General Description
Area affected by
Soil Erosion (Ha)
Area affected
by
desertification
(Ha)
Fluvisols Fluvisols are found on alluvial plains, river
fans, valleys and tidal marshes and have a
clear evidence of stratification. They have
severe constraints for agricultural use as
low pH-values, toxic aluminum levels and
high concentrations of salts.
Ayensu-chichiwere 7090.195 >100
Chichiwere-kakum 25141.098 >100
Leptosols Leptosols is a very shallow soil over highly
calcareous material that is extremely
gravelly.
Adzintam-yenku 14745.136 23
Fete-bediesi 5629.088 90
Nyanao-tinkong/opimo 7159.245 30
Lixisols
They are soils with subsurface
accumulation of low activity clays and
high base saturation. They develop under
intensive tropical weathering conditions
and sub humid to semi-arid climate.
Adawso-bawjiasi/nta-ofin 20997.323 >100
Solonchaks
Solonchaks are defined by high
soluble salt accumulation within 30 cm (1
foot) of the land surface and by the absence
of distinct subsurface horizonation
(layering), except possibly for
accumulations of gypsum, sodium, or
calcium carbonate or layers showing the
effects of waterlogging. Solonchaks are
formed from saline parent material under
conditions of high evaporation—conditions
encountered in closed basins under warm
to hot climates with a well-defined dry
season, as in arid, Mediterranean, or
subtropical zones.
Oyibi-muni 3912.703 >100
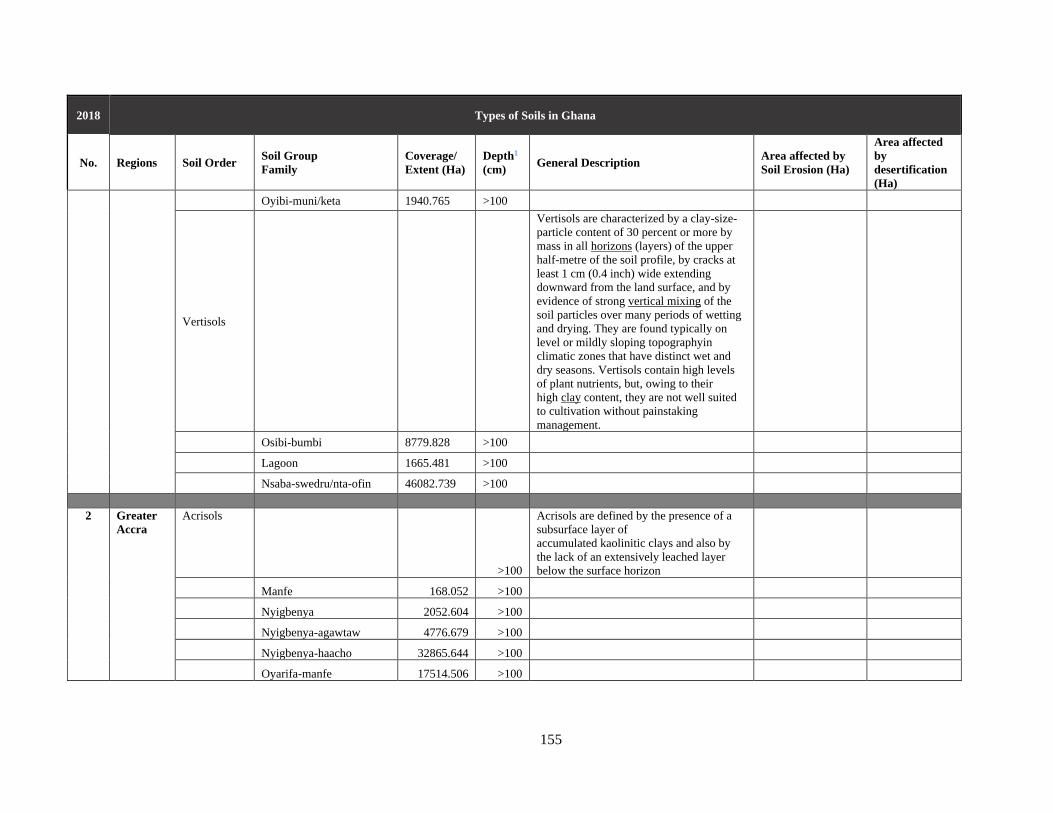
155
2018 Types of Soils in Ghana
No. Regions Soil Order Soil Group
Family
Coverage/
Extent (Ha)
Depth1
(cm) General Description
Area affected by
Soil Erosion (Ha)
Area affected
by
desertification
(Ha) Oyibi-muni/keta 1940.765 >100
Vertisols
Vertisols are characterized by a clay-size-
particle content of 30 percent or more by
mass in all horizons (layers) of the upper
half-metre of the soil profile, by cracks at
least 1 cm (0.4 inch) wide extending
downward from the land surface, and by
evidence of strong vertical mixing of the
soil particles over many periods of wetting
and drying. They are found typically on
level or mildly sloping topographyin
climatic zones that have distinct wet and
dry seasons. Vertisols contain high levels
of plant nutrients, but, owing to their
high clay content, they are not well suited
to cultivation without painstaking
management.
Osibi-bumbi 8779.828 >100
Lagoon 1665.481 >100
Nsaba-swedru/nta-ofin 46082.739 >100
2 Greater
Accra
Acrisols
>100
Acrisols are defined by the presence of a
subsurface layer of
accumulated kaolinitic clays and also by
the lack of an extensively leached layer
below the surface horizon
Manfe 168.052 >100
Nyigbenya 2052.604 >100
Nyigbenya-agawtaw 4776.679 >100
Nyigbenya-haacho 32865.644 >100
Oyarifa-manfe 17514.506 >100
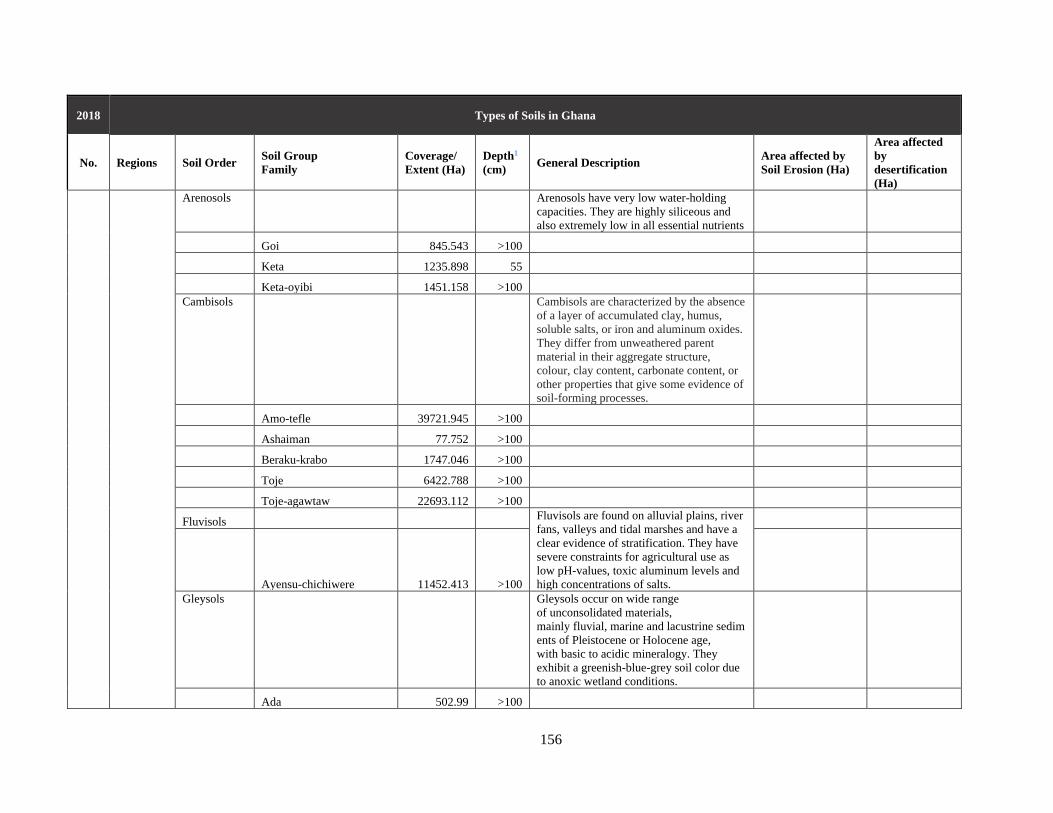
156
2018 Types of Soils in Ghana
No. Regions Soil Order Soil Group
Family
Coverage/
Extent (Ha)
Depth1
(cm) General Description
Area affected by
Soil Erosion (Ha)
Area affected
by
desertification
(Ha)
Arenosols
Arenosols have very low water-holding
capacities. They are highly siliceous and
also extremely low in all essential nutrients
Goi 845.543 >100
Keta 1235.898 55
Keta-oyibi 1451.158 >100
Cambisols
Cambisols are characterized by the absence
of a layer of accumulated clay, humus,
soluble salts, or iron and aluminum oxides.
They differ from unweathered parent
material in their aggregate structure,
colour, clay content, carbonate content, or
other properties that give some evidence of
soil-forming processes.
Amo-tefle 39721.945 >100
Ashaiman 77.752 >100
Beraku-krabo 1747.046 >100
Toje 6422.788 >100
Toje-agawtaw 22693.112 >100
Fluvisols Fluvisols are found on alluvial plains, river
fans, valleys and tidal marshes and have a
clear evidence of stratification. They have
severe constraints for agricultural use as
low pH-values, toxic aluminum levels and
high concentrations of salts.
Ayensu-chichiwere 11452.413 >100
Gleysols
Gleysols occur on wide range
of unconsolidated materials,
mainly fluvial, marine and lacustrine sedim
ents of Pleistocene or Holocene age,
with basic to acidic mineralogy. They
exhibit a greenish-blue-grey soil color due
to anoxic wetland conditions.
Ada 502.99 >100

157
2018 Types of Soils in Ghana
No. Regions Soil Order Soil Group
Family
Coverage/
Extent (Ha)
Depth1
(cm) General Description
Area affected by
Soil Erosion (Ha)
Area affected
by
desertification
(Ha)
Ada-oyibi 62484.152 >100
Leptosols
>100
Leptosols is a very shallow soil over highly
calcareous material that is extremely
gravelly .
Fete 32978.413 >100
Fete-bediesi 29344.171 90
Kloyo 2096.318 50
Korle 4323.174 >100
Nyanao-tinkong/opimo 4484.484 30
Luvisols
Luvisols have mixed mineralogy, high
nutrient content, and good drainage which
make them suitable for a wide range of
agriculture such as grains , orchards and
vineyards
Adawso-bawjiasi/nta-ofin 185820.242 >100
Luvisols
Luvisols have mixed mineralogy, high
nutrient content, and good drainage which
make them suitable for a wide range of
agriculture such as grains , orchards and
vineyards
Aveime-ada 11266.844 >100
Aveime-zipa 2568.739 >100
Danfa-dome 1776.907 >100
Doyum-agawtaw 15448.123 >100
Simpa-agawtaw 51899.959 >100
Plinthosols
>100
Plinthosols form under a variety of climatic
and topographic conditions. They are
defined by a subsurface layer containing an
iron-rich mixture of clay minerals
(chiefly kaolinite) and silica that hardens
on exposure into ironstone concretions
known as plinthite. The impenetrability of
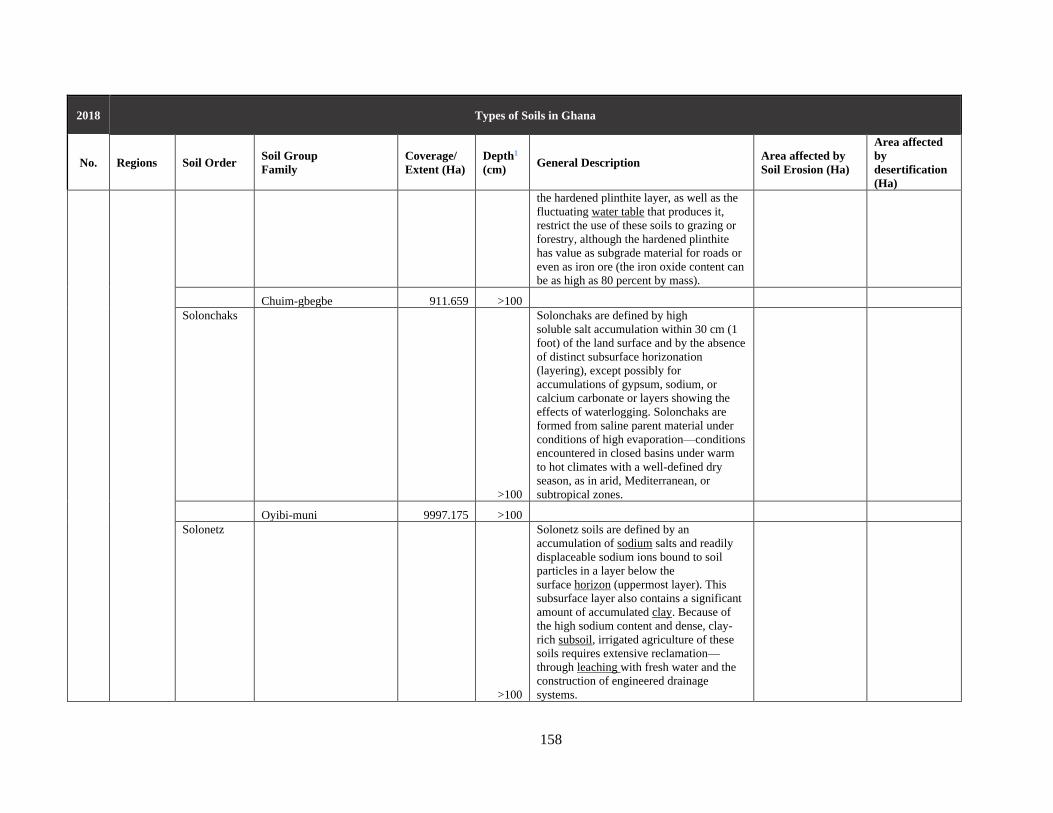
158
2018 Types of Soils in Ghana
No. Regions Soil Order Soil Group
Family
Coverage/
Extent (Ha)
Depth1
(cm) General Description
Area affected by
Soil Erosion (Ha)
Area affected
by
desertification
(Ha)
the hardened plinthite layer, as well as the
fluctuating water table that produces it,
restrict the use of these soils to grazing or
forestry, although the hardened plinthite
has value as subgrade material for roads or
even as iron ore (the iron oxide content can
be as high as 80 percent by mass).
Chuim-gbegbe 911.659 >100
Solonchaks
>100
Solonchaks are defined by high
soluble salt accumulation within 30 cm (1
foot) of the land surface and by the absence
of distinct subsurface horizonation
(layering), except possibly for
accumulations of gypsum, sodium, or
calcium carbonate or layers showing the
effects of waterlogging. Solonchaks are
formed from saline parent material under
conditions of high evaporation—conditions
encountered in closed basins under warm
to hot climates with a well-defined dry
season, as in arid, Mediterranean, or
subtropical zones.
Oyibi-muni 9997.175 >100
Solonetz
>100
Solonetz soils are defined by an
accumulation of sodium salts and readily
displaceable sodium ions bound to soil
particles in a layer below the
surface horizon (uppermost layer). This
subsurface layer also contains a significant
amount of accumulated clay. Because of
the high sodium content and dense, clay-
rich subsoil, irrigated agriculture of these
soils requires extensive reclamation—
through leaching with fresh water and the
construction of engineered drainage
systems.
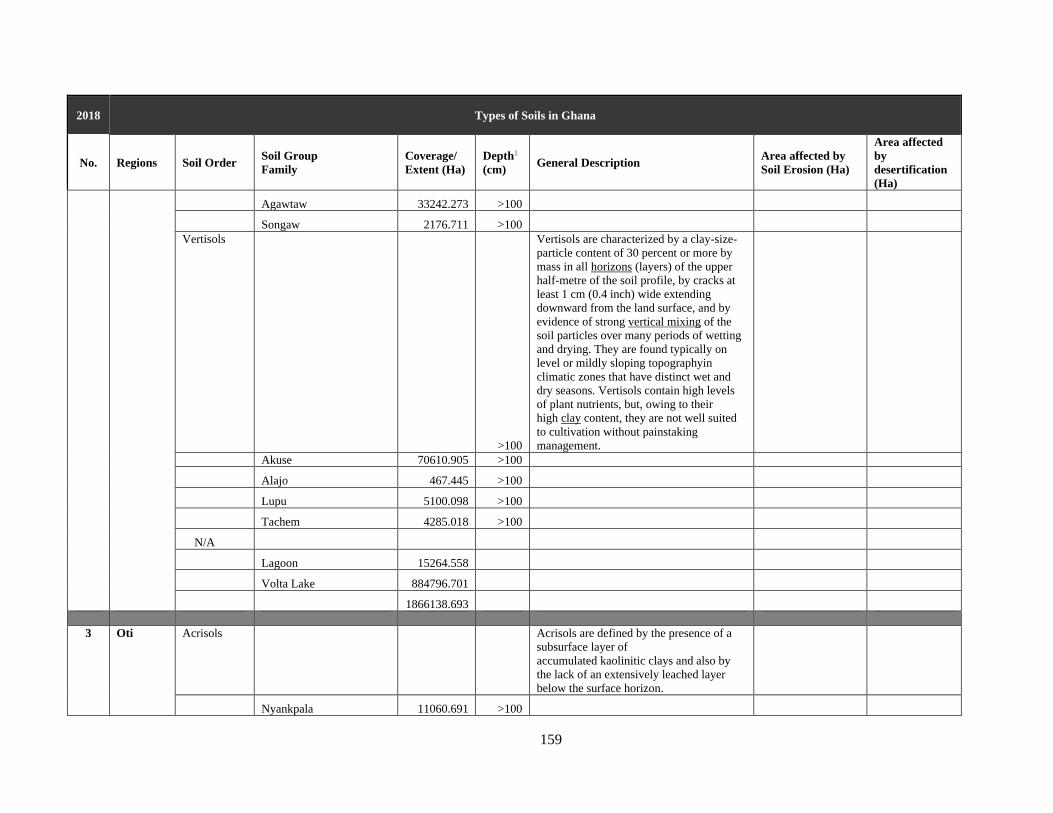
159
2018 Types of Soils in Ghana
No. Regions Soil Order Soil Group
Family
Coverage/
Extent (Ha)
Depth1
(cm) General Description
Area affected by
Soil Erosion (Ha)
Area affected
by
desertification
(Ha)
Agawtaw 33242.273 >100
Songaw 2176.711 >100
Vertisols
>100
Vertisols are characterized by a clay-size-
particle content of 30 percent or more by
mass in all horizons (layers) of the upper
half-metre of the soil profile, by cracks at
least 1 cm (0.4 inch) wide extending
downward from the land surface, and by
evidence of strong vertical mixing of the
soil particles over many periods of wetting
and drying. They are found typically on
level or mildly sloping topographyin
climatic zones that have distinct wet and
dry seasons. Vertisols contain high levels
of plant nutrients, but, owing to their
high clay content, they are not well suited
to cultivation without painstaking
management.
Akuse 70610.905 >100
Alajo 467.445 >100
Lupu 5100.098 >100
Tachem 4285.018 >100
N/A
Lagoon 15264.558
Volta Lake 884796.701
1866138.693
3 Oti Acrisols
Acrisols are defined by the presence of a
subsurface layer of
accumulated kaolinitic clays and also by
the lack of an extensively leached layer
below the surface horizon.
Nyankpala 11060.691 >100
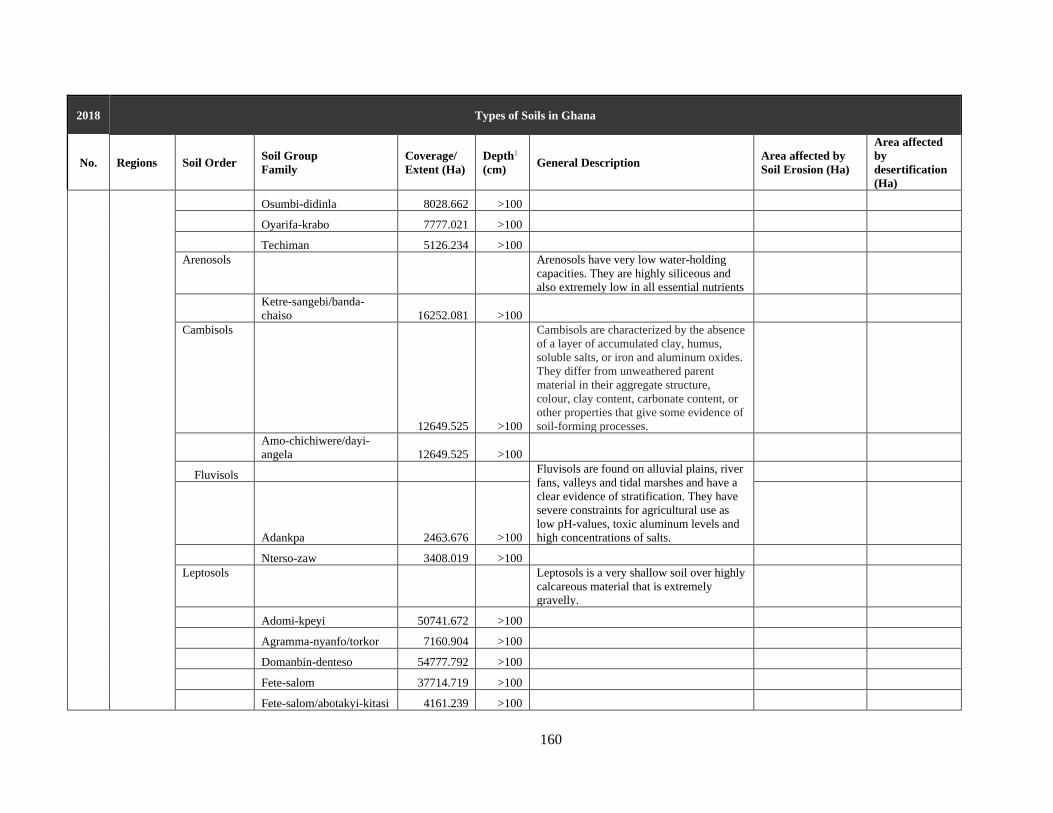
160
2018 Types of Soils in Ghana
No. Regions Soil Order Soil Group
Family
Coverage/
Extent (Ha)
Depth1
(cm) General Description
Area affected by
Soil Erosion (Ha)
Area affected
by
desertification
(Ha)
Osumbi-didinla 8028.662 >100
Oyarifa-krabo 7777.021 >100
Techiman 5126.234 >100
Arenosols
Arenosols have very low water-holding
capacities. They are highly siliceous and
also extremely low in all essential nutrients
Ketre-sangebi/banda-
chaiso 16252.081 >100
Cambisols
12649.525 >100
Cambisols are characterized by the absence
of a layer of accumulated clay, humus,
soluble salts, or iron and aluminum oxides.
They differ from unweathered parent
material in their aggregate structure,
colour, clay content, carbonate content, or
other properties that give some evidence of
soil-forming processes.
Amo-chichiwere/dayi-
angela 12649.525 >100
Fluvisols Fluvisols are found on alluvial plains, river
fans, valleys and tidal marshes and have a
clear evidence of stratification. They have
severe constraints for agricultural use as
low pH-values, toxic aluminum levels and
high concentrations of salts.
Adankpa 2463.676 >100
Nterso-zaw 3408.019 >100
Leptosols
Leptosols is a very shallow soil over highly
calcareous material that is extremely
gravelly.
Adomi-kpeyi 50741.672 >100
Agramma-nyanfo/torkor 7160.904 >100
Domanbin-denteso 54777.792 >100
Fete-salom 37714.719 >100
Fete-salom/abotakyi-kitasi 4161.239 >100
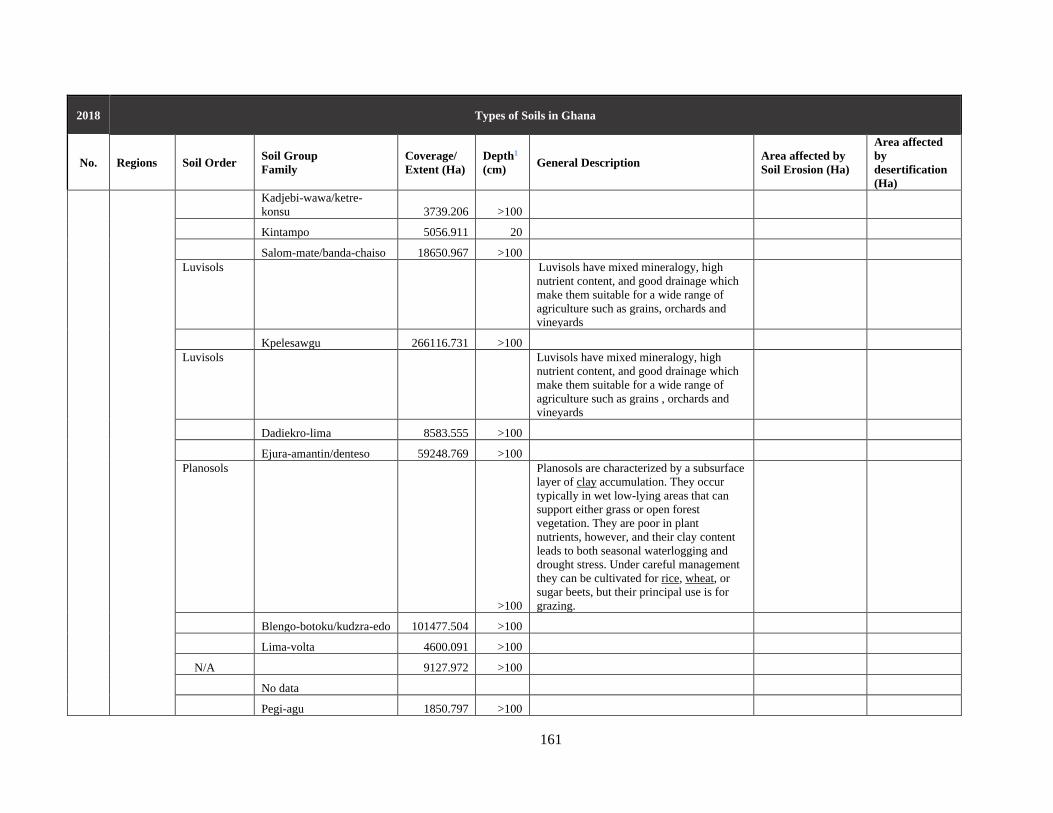
161
2018 Types of Soils in Ghana
No. Regions Soil Order Soil Group
Family
Coverage/
Extent (Ha)
Depth1
(cm) General Description
Area affected by
Soil Erosion (Ha)
Area affected
by
desertification
(Ha)
Kadjebi-wawa/ketre-
konsu 3739.206 >100
Kintampo 5056.911 20
Salom-mate/banda-chaiso 18650.967 >100
Luvisols
Luvisols have mixed mineralogy, high
nutrient content, and good drainage which
make them suitable for a wide range of
agriculture such as grains, orchards and
vineyards
Kpelesawgu 266116.731 >100
Luvisols
Luvisols have mixed mineralogy, high
nutrient content, and good drainage which
make them suitable for a wide range of
agriculture such as grains , orchards and
vineyards
Dadiekro-lima 8583.555 >100
Ejura-amantin/denteso 59248.769 >100
Planosols
>100
Planosols are characterized by a subsurface
layer of clay accumulation. They occur
typically in wet low-lying areas that can
support either grass or open forest
vegetation. They are poor in plant
nutrients, however, and their clay content
leads to both seasonal waterlogging and
drought stress. Under careful management
they can be cultivated for rice, wheat, or
sugar beets, but their principal use is for
grazing.
Blengo-botoku/kudzra-edo 101477.504 >100
Lima-volta 4600.091 >100
N/A 9127.972 >100
No data
Pegi-agu 1850.797 >100
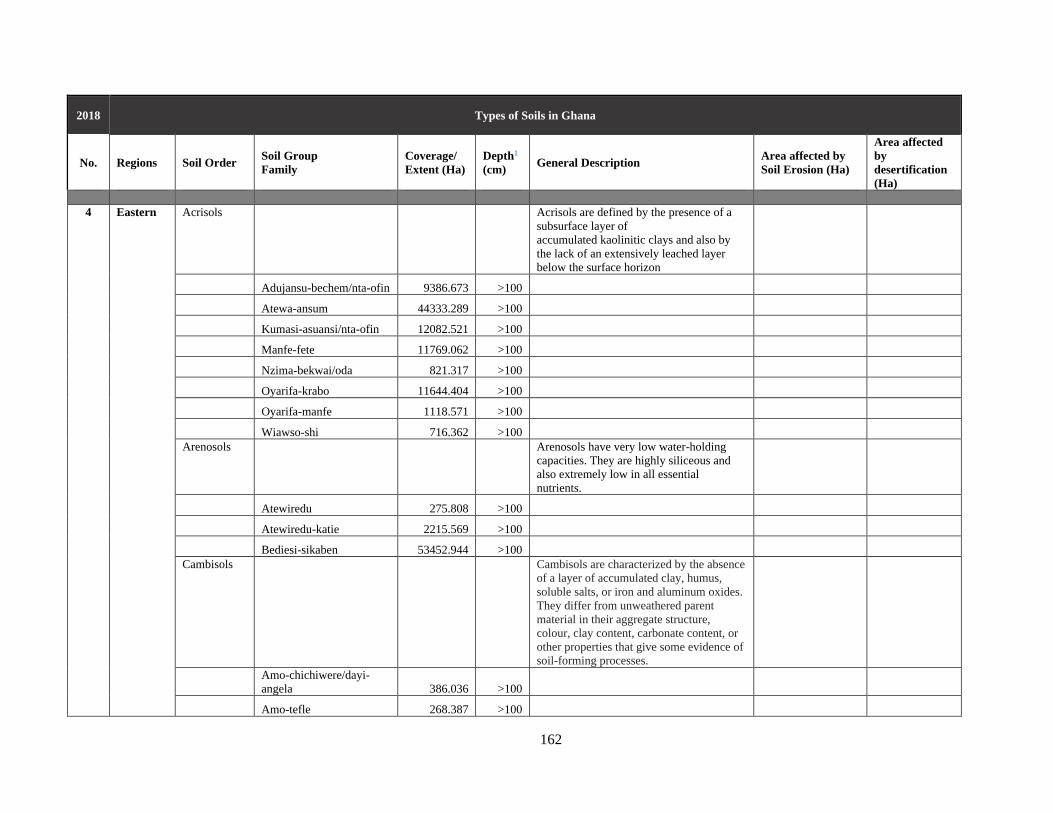
162
2018 Types of Soils in Ghana
No. Regions Soil Order Soil Group
Family
Coverage/
Extent (Ha)
Depth1
(cm) General Description
Area affected by
Soil Erosion (Ha)
Area affected
by
desertification
(Ha)
4 Eastern Acrisols
Acrisols are defined by the presence of a
subsurface layer of
accumulated kaolinitic clays and also by
the lack of an extensively leached layer
below the surface horizon
Adujansu-bechem/nta-ofin 9386.673 >100
Atewa-ansum 44333.289 >100
Kumasi-asuansi/nta-ofin 12082.521 >100
Manfe-fete 11769.062 >100
Nzima-bekwai/oda 821.317 >100
Oyarifa-krabo 11644.404 >100
Oyarifa-manfe 1118.571 >100
Wiawso-shi 716.362 >100
Arenosols
Arenosols have very low water-holding
capacities. They are highly siliceous and
also extremely low in all essential
nutrients.
Atewiredu 275.808 >100
Atewiredu-katie 2215.569 >100
Bediesi-sikaben 53452.944 >100
Cambisols
Cambisols are characterized by the absence
of a layer of accumulated clay, humus,
soluble salts, or iron and aluminum oxides.
They differ from unweathered parent
material in their aggregate structure,
colour, clay content, carbonate content, or
other properties that give some evidence of
soil-forming processes.
Amo-chichiwere/dayi-
angela 386.036 >100
Amo-tefle 268.387 >100

163
2018 Types of Soils in Ghana
No. Regions Soil Order Soil Group
Family
Coverage/
Extent (Ha)
Depth1
(cm) General Description
Area affected by
Soil Erosion (Ha)
Area affected
by
desertification
(Ha)
Fluvisols
Fluvisols are found on alluvial plains, river
fans, valleys and tidal marshes and have a
clear evidence of stratification. They have
severe constraints for agricultural use as
low pH-values, toxic aluminum levels and
high concentrations of salts.
Birim-awaham/kakum-
chichiwere 142.824 >100
Denteso-sene 13432.538 >100
Dewasi-wayo 16839.484 >100
Leptosols
Leptosols is a very shallow soil over highly
calcareous material that is extremely
gravelly.
Adomi-kpeyi 15715.52 >100
Fete-salom 9260.283 90
Kintampo 2902.679 20
Korle-okwe 1567.207 >100
Kowani-techiman-
santaboma/bediesi 29953.399 58
Nyanao-tinkong/opimo 17545.716 >100
Wenchi-kumayili 17730.602 >100
Yaya 3274.861 >100
Yaya-bediesi-/bejua 94629.341 >100
Yaya-otrokpe 19140.448 >100
Yaya-pimpimso/bejua 11129.098 80
Lixisols
They are soils with subsurface
accumulation of low activity clays and
high base saturation. They develop under
intensive tropical weathering conditions
and sub humid to semi-arid climate.
Adawso-bawjiasi/nta-ofin 4000.849 >100
Bediesi-sutawa/bejua 62311.453 >100

164
2018 Types of Soils in Ghana
No. Regions Soil Order Soil Group
Family
Coverage/
Extent (Ha)
Depth1
(cm) General Description
Area affected by
Soil Erosion (Ha)
Area affected
by
desertification
(Ha)
Bediesi-yaya/asuansi-
atewa 11860.916 >100
Damongo-murugu-
techiman 20137.798 >100
Damongo-techiman/ejura-
sene 4217.27 >100
Kpelesawgu-
changnalili/amantin 1963.049 30
Nankese-akroso/nta-ofin 2064.964 >100
Pimpimso-sutawa/bejua 14592.035 >100
Somusie-denteso 52604.273 >100
Luvisols
Luvisols have mixed mineralogy, high
nutrient content, and good drainage which
make them suitable for a wide range of
agriculture such as grains , orchards and
vineyards
Ejura-amantin/denteso 1076.384 >100
Ejura-kpelesawgu/denteso 1764.381 >100
Nankese-koforidua/
nta-ofin 30093.528 >100
Simpa-agawtaw 1232.54 >100
Planosols
Planosols are characterized by a
subsurface layer of clay accumulation.
They occur typically in wet low-lying areas
that can support either grass or open forest
vegetation. They are poor in plant
nutrients, however, and their clay content
leads to both seasonal waterlogging and
drought stress. Under careful management
they can be cultivated for rice, wheat, or
sugar beets, but their principal use is for
grazing.
Ablade-kpelesawgu 5449.2 >100

165
2018 Types of Soils in Ghana
No. Regions Soil Order Soil Group
Family
Coverage/
Extent (Ha)
Depth1
(cm) General Description
Area affected by
Soil Erosion (Ha)
Area affected
by
desertification
(Ha)
Blengo-botoku/kudzra-edo 486.216 >100
Regosols
Regosols are characterized by shallow,
medium- to fine-textured, unconsolidated
parent material that may be of alluvial origin
and by the lack of a significant
soil horizon (layer) formation because of
dry or cold climatic conditions. Regosols
occur mainly in polar and desert regions,
occupying about 2 percent of the continental
land area on Earth.
Kungwani 403.279 >100
Vertisols
Vertisols are characterized by a clay-size-
particle content of 30 percent or more by
mass in all horizons (layers) of the upper
half-metre of the soil profile, by cracks at
least 1 cm (0.4 inch) wide extending
downward from the land surface, and by
evidence of strong vertical mixing of the
soil particles over many periods of wetting
and drying. They are found typically on
level or mildly sloping topographyin
climatic zones that have distinct wet and
dry seasons. Vertisols contain high levels
of plant nutrients, but, owing to their
high clay content, they are not well suited
to cultivation without painstaking
management.
Akuse 1244.672 >100
N/A
No data 52125.846
Nsaba-swedru/nta-ofin 3500.517 >100
Pegi-agu 1284.403 >100
5 Ashanti

166
2018 Types of Soils in Ghana
No. Regions Soil Order Soil Group
Family
Coverage/
Extent (Ha)
Depth1
(cm) General Description
Area affected by
Soil Erosion (Ha)
Area affected
by
desertification
(Ha)
Acrisols
Acrisols are defined by the presence of a
subsurface layer of
accumulated kaolinitic clays and also by
the lack of an extensively leached layer
below the surface horizon
Adujansu-bechem/nta-ofin 12006.393 >100
Akumadan-afrancho 4058.118 >100
Akumadan-bekwai/oda 39736.042 >100
Asikuma-atewa/ansum-
oda 23925.388 >100
Asuansi-kumasi 19406.39 >100
Asuansi-wacri/suko 13795.788 >100
Atukrom 68895.685 >100
Atukrom-asikuma/ansum 72608.953 >100
Bekwai-zongo/Oda 26764.588 >100
Boamang-suko 44344.056 >100
Bomso-asuansi/nta-ofin 44662.17 >100
Juaso-bompata/asuboa-
pamasua 352830.444 >100
Kotei 1224.948 >100
Kumasi-asuansi/nta-ofin 217899.956 >100
Mim/Oda 108553.417 >100
Nzima-bekwai 3745.46 >100
Nzima-bekwai/Oda 824040.706 >100
Nzima-boi 184332.93 >100
Wiawso-shi 1376.883 20
Arenosols
Arenosols have very low water-holding
capacities. They are highly siliceous and
also extremely low in all essential nutrients

167
2018 Types of Soils in Ghana
No. Regions Soil Order Soil Group
Family
Coverage/
Extent (Ha)
Depth1
(cm) General Description
Area affected by
Soil Erosion (Ha)
Area affected
by
desertification
(Ha)
Aya-yenahin/bepo 16277.589 >100
Kobeda 16867.418 10
Fluvisols
Fluvisols are found on alluvial plains, river
fans, valleys and tidal marshes and have a
clear evidence of stratification. They have
severe constraints for agricultural use as
low pH-values, toxic aluminum levels and
high concentrations of salts.
Birim-awaham/kakum-
chichiwere 75108.083 >100
Denteso-sene 46573.932 >100
Gleysols
>100
Gleysols occur on wide range
of unconsolidated materials,
mainly fluvial, marine and lacustrine sedim
ents of Pleistocene or Holocene age,
with basic to acidic mineralogy. They
exhibit a greenish-blue-grey soil color due
to anoxic wetland conditions.
Bejua-pakpe 137.356 >100
Oda 483.071 >100
Tanoso 16399.431 >100
Leptosols
Leptosols is a very shallow soil over highly
calcareous material that is extremely
gravelly.
Jamasi 4165.823 5
Kasele-kowani 5920.154 >100
Kintampo 2222.038 20
Kobeda-amuni/bekwai 22831.439 >100
Nyanao-tinkong/opimo 1844.638 30
Yaya 4595.143 10
Yaya-pimpimso/bejua 55747.866 80
Lixisols
They are soils with subsurface
accumulation of low activity clays and

168
2018 Types of Soils in Ghana
No. Regions Soil Order Soil Group
Family
Coverage/
Extent (Ha)
Depth1
(cm) General Description
Area affected by
Soil Erosion (Ha)
Area affected
by
desertification
(Ha)
high base saturation. They develop under
intensive tropical weathering conditions
and sub humid to semi-arid climate.
Bediesi-sutawa/bejua 14963.527 >100
Birem-cheriase 4639.647 >100
Damongo-ejura 38953.907 >100
Damongo-murugu-
techiman 19483.237 >100
Damongo-techiman/ejura-
sene 69990.672 >100
Luvisols
Luvisols have mixed mineralogy, high
nutrient content, and good drainage which
make them suitable for a wide range of
agriculture such as grains , orchards and
vineyards
Ejura-amantin/denteso 2793.522 >100
Ejura-kpelesawgu/denteso 109550.658 >100
Planosols
Planosols are a type of intrazonal soil of
humid or sub humid uplands having a
strongly leached upper layer overlying a
clay hardpan. They have an E soil horizon
that results from prolonged exposure to
stagnant water within 100cm of the surface.
Ablade-kpelesawgu 98193.987 >100
N/A
Lagoon 4777.954 >100
No data 1294.471
Nsaba-swedru/nta-ofin 549493.567 >100
Nta-ofin 3429.911 >100
6 Brong
Ahafo
Acrisols
Acrisols are defined by the presence of a
subsurface layer of

169
2018 Types of Soils in Ghana
No. Regions Soil Order Soil Group
Family
Coverage/
Extent (Ha)
Depth1
(cm) General Description
Area affected by
Soil Erosion (Ha)
Area affected
by
desertification
(Ha)
accumulated kaolinitic clays and also by
the lack of an extensively leached layer
below the surface horizon.
Batia 16121.347 >100
Besua 13105.268 >100
Kumasi-asuansi/nta-ofin 108794.498 >100
Nkrankwanta 71694.757 >100
Nzima-bekwai/oda 905229.494 >100
Yakasi 8336.518 >100
Fluvisols
Fluvisols are found on alluvial plains, river
fans, valleys and tidal marshes and have a
clear evidence of stratification. They have
severe constraints for agricultural use as
low pH-values, toxic aluminum levels and
high concentrations of salts.
Birim-awaham/kakum-
chichiwere 38038.55 >100
Gleysols
Gleysols occur on wide range
of unconsolidated materials,
mainly fluvial, marine and lacustrine sedim
ents of Pleistocene or Holocene age,
with basic to acidic mineralogy. They
exhibit a greenish-blue-grey soil color due
to anoxic wetland conditions.
Tanoso 16072.684 >100
Leptosols
Leptosols is a very shallow soil over highly
calcareous material that is extremely
gravelly.
Banda (hill) 4215.184 >100
Murugu-kintampo 5685.225 >100
Lixisols
They are soils with subsurface
accumulation of low activity clays and
high base saturation. They develop under
intensive tropical weathering conditions
and sub humid to semi-arid climate.
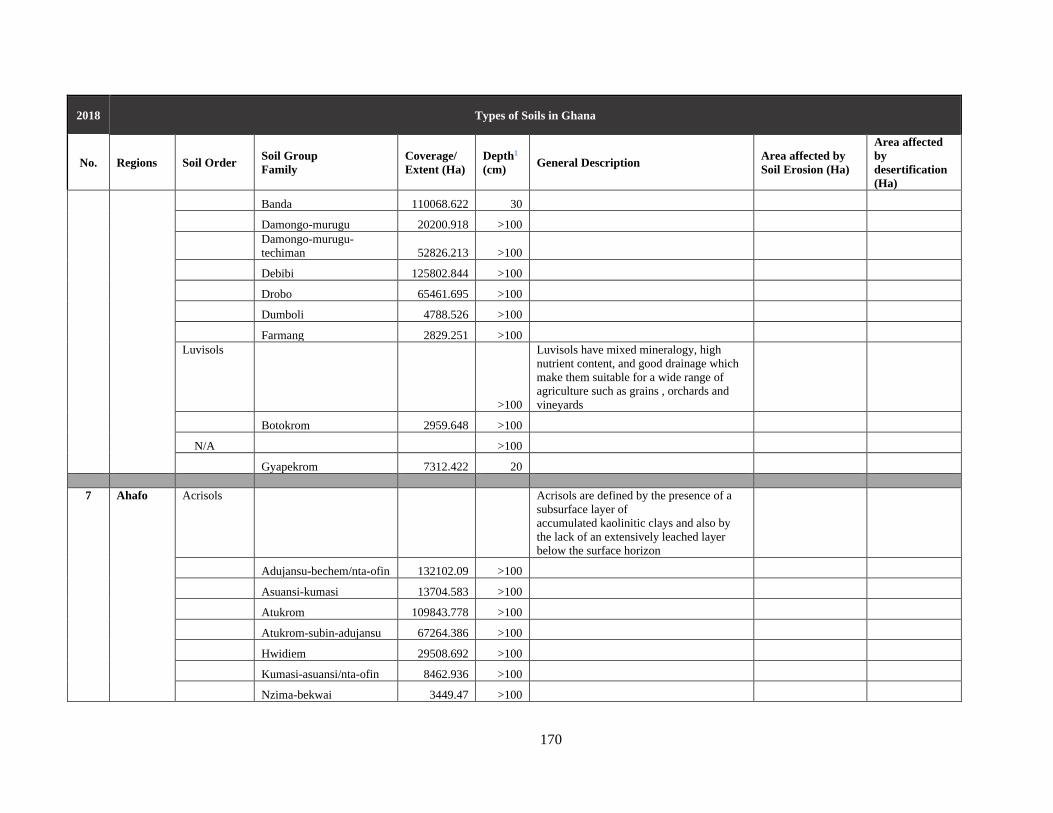
170
2018 Types of Soils in Ghana
No. Regions Soil Order Soil Group
Family
Coverage/
Extent (Ha)
Depth1
(cm) General Description
Area affected by
Soil Erosion (Ha)
Area affected
by
desertification
(Ha)
Banda 110068.622 30
Damongo-murugu 20200.918 >100
Damongo-murugu-
techiman 52826.213 >100
Debibi 125802.844 >100
Drobo 65461.695 >100
Dumboli 4788.526 >100
Farmang 2829.251 >100
Luvisols
>100
Luvisols have mixed mineralogy, high
nutrient content, and good drainage which
make them suitable for a wide range of
agriculture such as grains , orchards and
vineyards
Botokrom 2959.648 >100
N/A >100
Gyapekrom 7312.422 20
7 Ahafo Acrisols
Acrisols are defined by the presence of a
subsurface layer of
accumulated kaolinitic clays and also by
the lack of an extensively leached layer
below the surface horizon
Adujansu-bechem/nta-ofin 132102.09 >100
Asuansi-kumasi 13704.583 >100
Atukrom 109843.778 >100
Atukrom-subin-adujansu 67264.386 >100
Hwidiem 29508.692 >100
Kumasi-asuansi/nta-ofin 8462.936 >100
Nzima-bekwai 3449.47 >100

171
2018 Types of Soils in Ghana
No. Regions Soil Order Soil Group
Family
Coverage/
Extent (Ha)
Depth1
(cm) General Description
Area affected by
Soil Erosion (Ha)
Area affected
by
desertification
(Ha)
Nzima-bekwai/oda 16876.58 >100
Fluvisols
Fluvisols are found on alluvial plains, river
fans, valleys and tidal marshes and have a
clear evidence of stratification. They have
severe constraints for agricultural use as
low pH-values, toxic aluminum levels and
high concentrations of salts.
Alluvial 9447.494 >100
Gleysols
Gleysols occur on wide range
of unconsolidated materials,
mainly fluvial, marine and lacustrine sedim
ents of Pleistocene or Holocene age,
with basic to acidic mineralogy. They
exhibit a greenish-blue-grey soil color due
to anoxic wetland conditions.
Oda 178.795 >100
Nitisols
Nitisols is a deep, red, well-
drained soil with a clay content of more
than 30% and a blocky structure.
Susan 134429.75 >100
N/A
Nta-ofin 892.77 >100
8 Bono
East
Fluvisols
Fluvisols are found on alluvial plains, river
fans, valleys and tidal marshes and have a
clear evidence of stratification. They have
severe constraints for agricultural use as
low pH-values, toxic aluminum levels and
high concentrations of salts.
Denteso-sene 155136.576 >100
Sene 7765.776 >100
Gleysols
Gleysols occur on wide range
of unconsolidated materials,
mainly fluvial, marine and lacustrine sedim
ents of Pleistocene or Holocene age,
with basic to acidic mineralogy. They

172
2018 Types of Soils in Ghana
No. Regions Soil Order Soil Group
Family
Coverage/
Extent (Ha)
Depth1
(cm) General Description
Area affected by
Soil Erosion (Ha)
Area affected
by
desertification
(Ha)
exhibit a greenish-blue-grey soil color due
to anoxic wetland conditions.
Bejua-pakpe 8692.805 >100
Tanoso 59263.524 >100
Leptosols
Leptosols is a very shallow soil over highly
calcareous material that is extremely
gravelly.
Kowani-
kasele/kpelesawgu 13117.275 58
Kowani-santaboma/kete-
krachi 2298.07 58
Kowani-techiman-
santaboma/bediesi 27754.381 58
Murugu-kintampo 2171.927 >100
Wenchi (boval) 9158.049 5
Wenchi-kumayili 5411.785 10
Lixisols
They are soils with subsurface
accumulation of low activity clays and
high base saturation. They develop under
intensive tropical weathering conditions
and sub humid to semi-arid climate.
Bediesi-sutawa 78870.338 >100
Bediesi-sutawa/bejua 270614.255 >100
Damongo-murugu 233513.257 >100
Damongo-murugu-
techiman 95495.24 >100
Damongo-techiman/ejura-
sene 60447.424 >100
Kowani-
santaboma/denteso-sene 1438.557 >100
Kowani-santaboma/kete-
krachi 5600.128 >100
Kpelesawgu-changnalili 302113.222 30
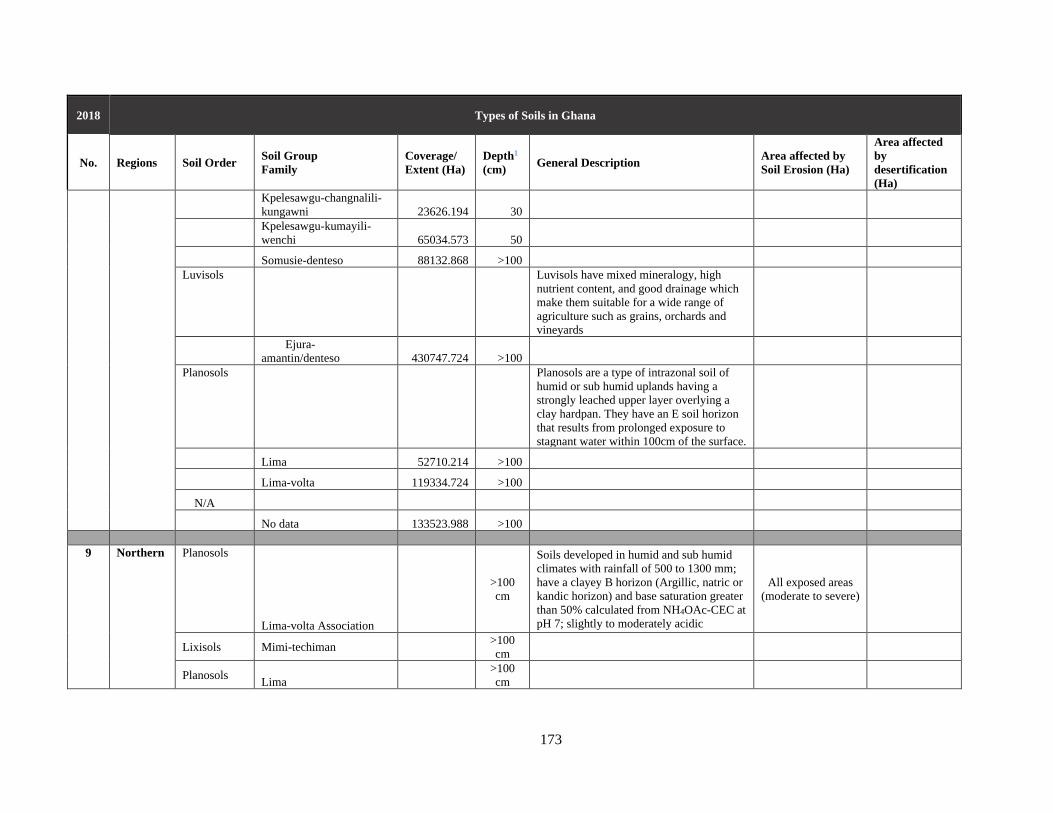
173
2018 Types of Soils in Ghana
No. Regions Soil Order Soil Group
Family
Coverage/
Extent (Ha)
Depth1
(cm) General Description
Area affected by
Soil Erosion (Ha)
Area affected
by
desertification
(Ha)
Kpelesawgu-changnalili-
kungawni 23626.194 30
Kpelesawgu-kumayili-
wenchi 65034.573 50
Somusie-denteso 88132.868 >100
Luvisols
Luvisols have mixed mineralogy, high
nutrient content, and good drainage which
make them suitable for a wide range of
agriculture such as grains, orchards and
vineyards
Ejura-
amantin/denteso 430747.724 >100
Planosols
Planosols are a type of intrazonal soil of
humid or sub humid uplands having a
strongly leached upper layer overlying a
clay hardpan. They have an E soil horizon
that results from prolonged exposure to
stagnant water within 100cm of the surface.
Lima 52710.214 >100
Lima-volta 119334.724 >100
N/A
No data 133523.988 >100
9 Northern Planosols
Lima-volta Association
>100
cm
Soils developed in humid and sub humid
climates with rainfall of 500 to 1300 mm;
have a clayey B horizon (Argillic, natric or
kandic horizon) and base saturation greater
than 50% calculated from NH4OAc-CEC at
pH 7; slightly to moderately acidic
All exposed areas
(moderate to severe)
Lixisols Mimi-techiman >100
cm
Planosols Lima
>100
cm
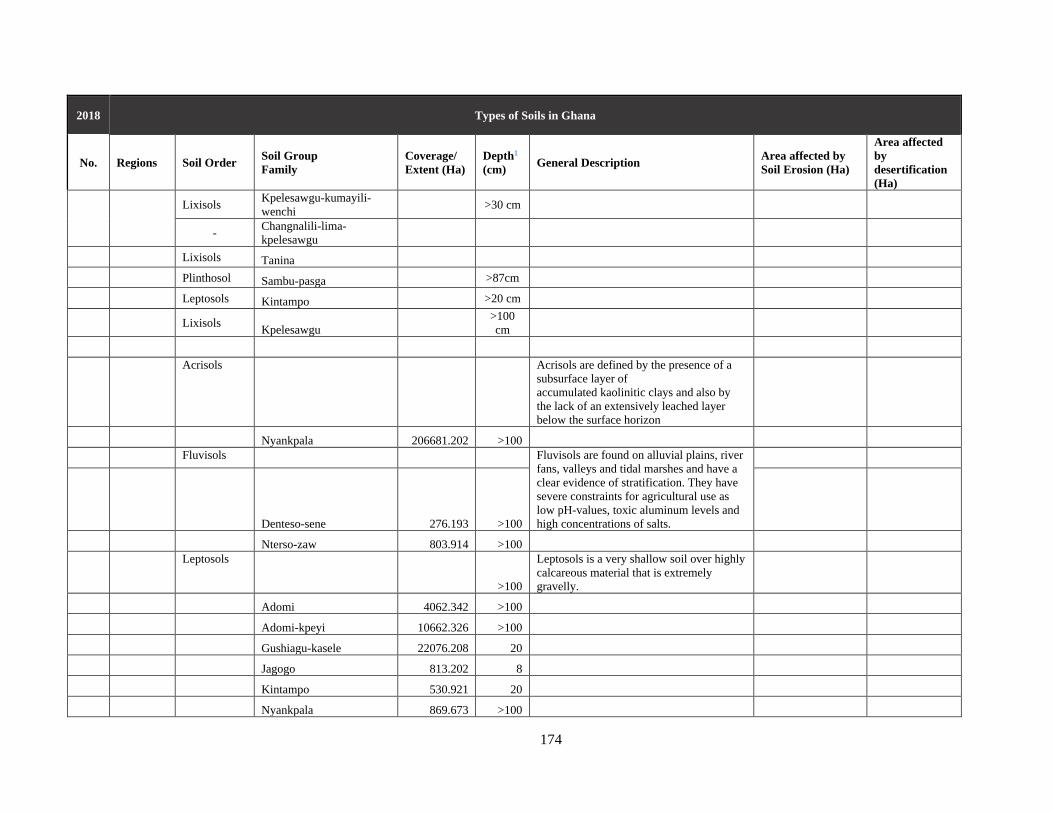
174
2018 Types of Soils in Ghana
No. Regions Soil Order Soil Group
Family
Coverage/
Extent (Ha)
Depth1
(cm) General Description
Area affected by
Soil Erosion (Ha)
Area affected
by
desertification
(Ha)
Lixisols Kpelesawgu-kumayili-
wenchi >30 cm
- Changnalili-lima-
kpelesawgu
Lixisols Tanina
Plinthosol Sambu-pasga >87cm
Leptosols Kintampo >20 cm
Lixisols Kpelesawgu
>100
cm
Acrisols
Acrisols are defined by the presence of a
subsurface layer of
accumulated kaolinitic clays and also by
the lack of an extensively leached layer
below the surface horizon
Nyankpala 206681.202 >100
Fluvisols
Fluvisols are found on alluvial plains, river
fans, valleys and tidal marshes and have a
clear evidence of stratification. They have
severe constraints for agricultural use as
low pH-values, toxic aluminum levels and
high concentrations of salts.
Denteso-sene 276.193 >100
Nterso-zaw 803.914 >100
Leptosols
>100
Leptosols is a very shallow soil over highly
calcareous material that is extremely
gravelly.
Adomi 4062.342 >100
Adomi-kpeyi 10662.326 >100
Gushiagu-kasele 22076.208 20
Jagogo 813.202 8
Kintampo 530.921 20
Nyankpala 869.673 >100

175
2018 Types of Soils in Ghana
No. Regions Soil Order Soil Group
Family
Coverage/
Extent (Ha)
Depth1
(cm) General Description
Area affected by
Soil Erosion (Ha)
Area affected
by
desertification
(Ha)
Pigu 1412.814 8
Pigu-kpelesawgu 1010.936 >100
Walewale 868.068 5
Wenchi 9969.584 10
Wenchi-kintampo 2605.998 10
Wenchi-lumo 475.032 10
Wenchi-sambu 8297.109 20
Luvisols
Luvisols have mixed mineralogy, high
nutrient content, and good drainage which
make them suitable for a wide range of
agriculture such as grains , orchards and
vineyards
Damongo-murugu/tanoso 14534.477 >100
Kpelesawgu 101119.737 >100
Kpelesawgu-changnalili 73768.568 30
Lapliki 8691.155 >100
Luvisols
Luvisols have mixed mineralogy, high
nutrient content, and good drainage which
make them suitable for a wide range of
agriculture such as grains , orchards and
vineyards
Bimbila 62348.204 >100
Planosols
266263.255 >100
Planosols are characterized by a
subsurface layer of clay accumulation.
They occur typically in wet low-lying areas
that can support either grass or open forest
vegetation. They are poor in plant
nutrients, however, and their clay content
leads to both seasonal waterlogging and
drought stress. Under careful management
they can be cultivated for rice, wheat, or

176
2018 Types of Soils in Ghana
No. Regions Soil Order Soil Group
Family
Coverage/
Extent (Ha)
Depth1
(cm) General Description
Area affected by
Soil Erosion (Ha)
Area affected
by
desertification
(Ha)
sugar beets, but their principal use is for
grazing.
Blengo-botoku/kudzra-edo 28146.402 >100
Lima-Volta 238116.853 >100
Plinthosol
Plinthosols form under a variety of climatic
and topographic conditions. They are
defined by a subsurface layer containing an
iron-rich mixture of clay minerals
(chiefly kaolinite) and silica that hardens
on exposure into ironstone concretions
known as plinthite. The impenetrability of
the hardened plinthite layer, as well as the
fluctuating water table that produces it,
restrict the use of these soils to grazing or
forestry, although the hardened plinthite
has value as subgrade material for roads or
even as iron ore (the iron oxide content can
be as high as 80 percent by mass).
Sambu-pasga 68304.721 >100
Sirru 10502.04 >100
Plinthosols
Plinthosols form under a variety of climatic
and topographic conditions. They are
defined by a subsurface layer containing an
iron-rich mixture of clay minerals
(chiefly kaolinite) and silica that hardens
on exposure into ironstone concretions
known as plinthite. The impenetrability of
the hardened plinthite layer, as well as the
fluctuating water table that produces it,
restrict the use of these soils to grazing or
forestry, although the hardened plinthite
has value as subgrade material for roads or
even as iron ore (the iron oxide content can
be as high as 80 percent by mass).
Lumo 667.487 >100
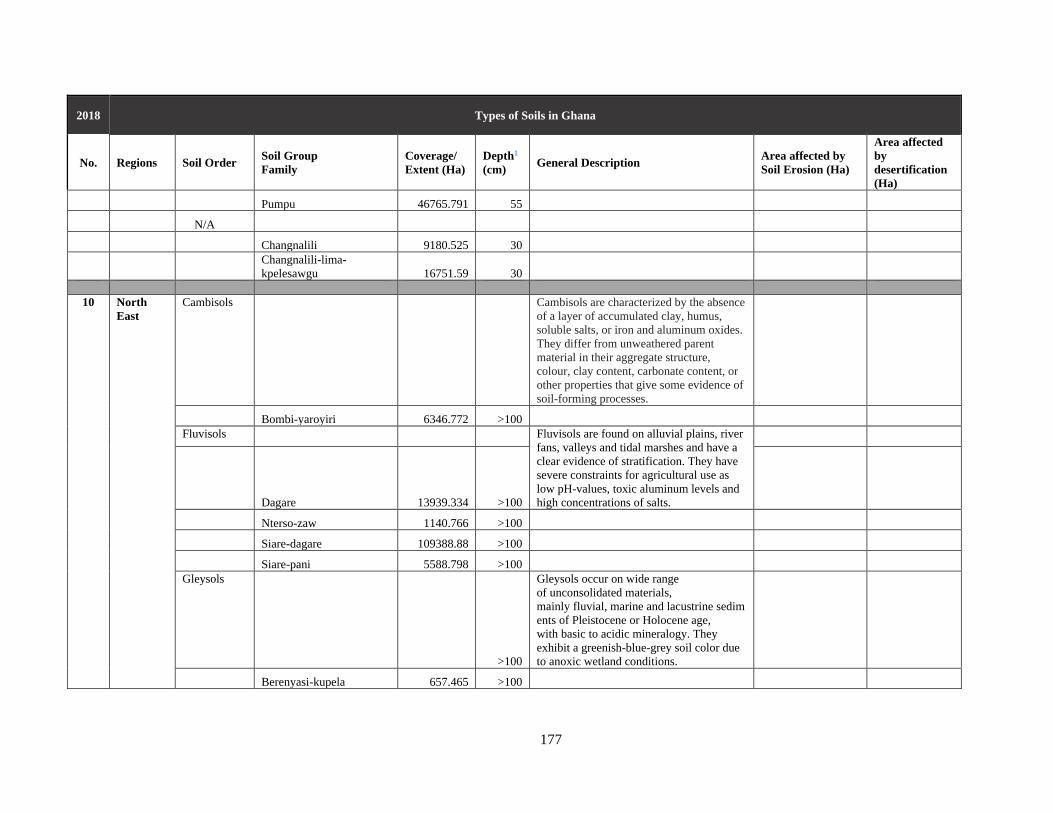
177
2018 Types of Soils in Ghana
No. Regions Soil Order Soil Group
Family
Coverage/
Extent (Ha)
Depth1
(cm) General Description
Area affected by
Soil Erosion (Ha)
Area affected
by
desertification
(Ha)
Pumpu 46765.791 55
N/A
Changnalili 9180.525 30
Changnalili-lima-
kpelesawgu 16751.59 30
10 North
East
Cambisols
Cambisols are characterized by the absence
of a layer of accumulated clay, humus,
soluble salts, or iron and aluminum oxides.
They differ from unweathered parent
material in their aggregate structure,
colour, clay content, carbonate content, or
other properties that give some evidence of
soil-forming processes.
Bombi-yaroyiri 6346.772 >100
Fluvisols
Fluvisols are found on alluvial plains, river
fans, valleys and tidal marshes and have a
clear evidence of stratification. They have
severe constraints for agricultural use as
low pH-values, toxic aluminum levels and
high concentrations of salts.
Dagare 13939.334 >100
Nterso-zaw 1140.766 >100
Siare-dagare 109388.88 >100
Siare-pani 5588.798 >100
Gleysols
>100
Gleysols occur on wide range
of unconsolidated materials,
mainly fluvial, marine and lacustrine sedim
ents of Pleistocene or Holocene age,
with basic to acidic mineralogy. They
exhibit a greenish-blue-grey soil color due
to anoxic wetland conditions.
Berenyasi-kupela 657.465 >100
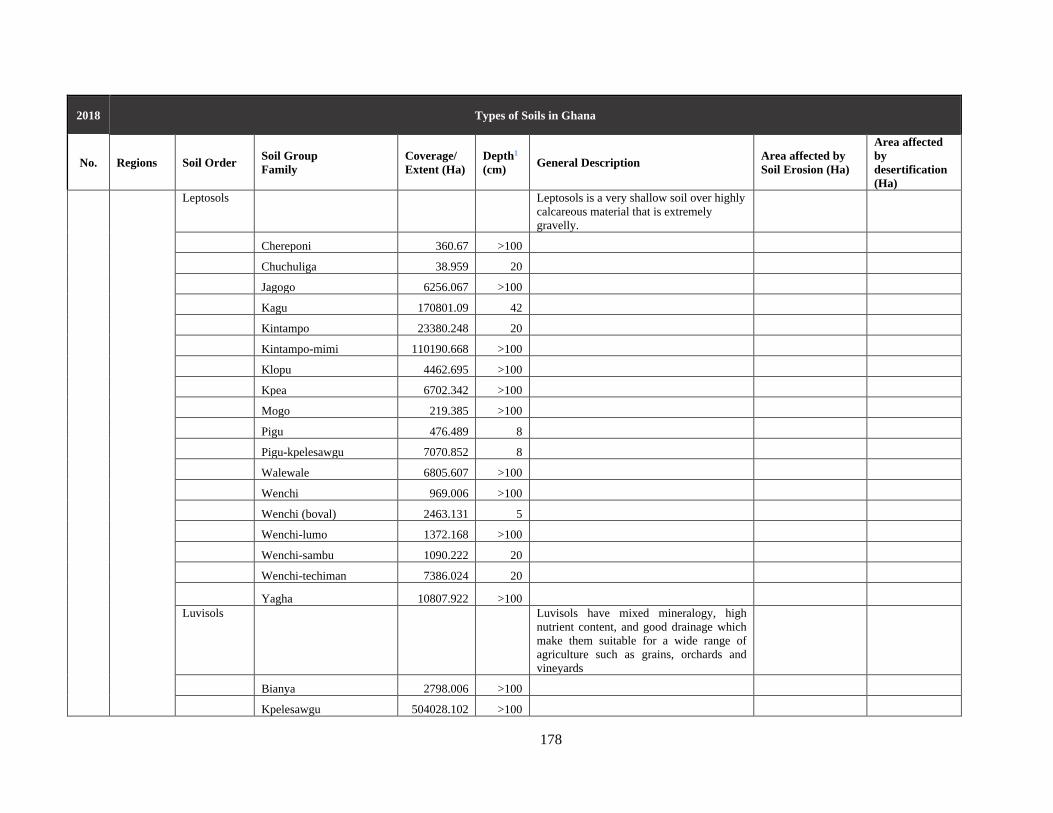
178
2018 Types of Soils in Ghana
No. Regions Soil Order Soil Group
Family
Coverage/
Extent (Ha)
Depth1
(cm) General Description
Area affected by
Soil Erosion (Ha)
Area affected
by
desertification
(Ha)
Leptosols
Leptosols is a very shallow soil over highly
calcareous material that is extremely
gravelly.
Chereponi 360.67 >100
Chuchuliga 38.959 20
Jagogo 6256.067 >100
Kagu 170801.09 42
Kintampo 23380.248 20
Kintampo-mimi 110190.668 >100
Klopu 4462.695 >100
Kpea 6702.342 >100
Mogo 219.385 >100
Pigu 476.489 8
Pigu-kpelesawgu 7070.852 8
Walewale 6805.607 >100
Wenchi 969.006 >100
Wenchi (boval) 2463.131 5
Wenchi-lumo 1372.168 >100
Wenchi-sambu 1090.222 20
Wenchi-techiman 7386.024 20
Yagha 10807.922 >100
Luvisols
Luvisols have mixed mineralogy, high
nutrient content, and good drainage which
make them suitable for a wide range of
agriculture such as grains, orchards and
vineyards
Bianya 2798.006 >100
Kpelesawgu 504028.102 >100
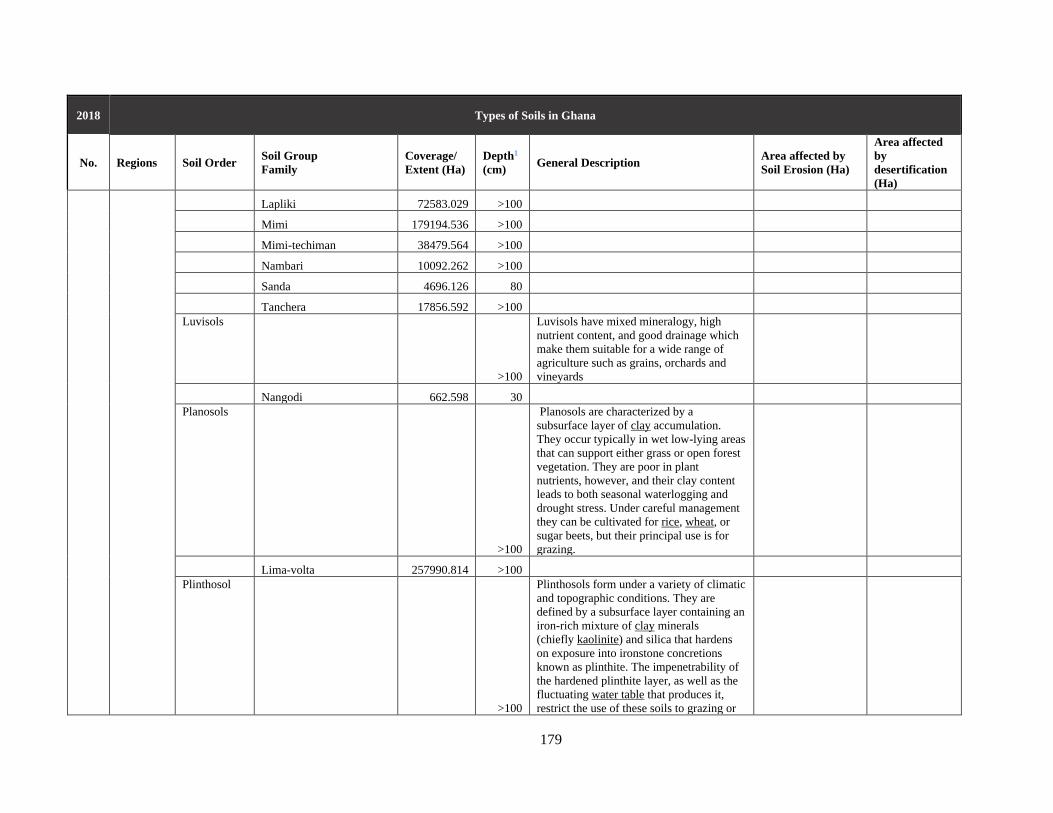
179
2018 Types of Soils in Ghana
No. Regions Soil Order Soil Group
Family
Coverage/
Extent (Ha)
Depth1
(cm) General Description
Area affected by
Soil Erosion (Ha)
Area affected
by
desertification
(Ha)
Lapliki 72583.029 >100
Mimi 179194.536 >100
Mimi-techiman 38479.564 >100
Nambari 10092.262 >100
Sanda 4696.126 80
Tanchera 17856.592 >100
Luvisols
>100
Luvisols have mixed mineralogy, high
nutrient content, and good drainage which
make them suitable for a wide range of
agriculture such as grains, orchards and
vineyards
Nangodi 662.598 30
Planosols
>100
Planosols are characterized by a
subsurface layer of clay accumulation.
They occur typically in wet low-lying areas
that can support either grass or open forest
vegetation. They are poor in plant
nutrients, however, and their clay content
leads to both seasonal waterlogging and
drought stress. Under careful management
they can be cultivated for rice, wheat, or
sugar beets, but their principal use is for
grazing.
Lima-volta 257990.814 >100
Plinthosol
>100
Plinthosols form under a variety of climatic
and topographic conditions. They are
defined by a subsurface layer containing an
iron-rich mixture of clay minerals
(chiefly kaolinite) and silica that hardens
on exposure into ironstone concretions
known as plinthite. The impenetrability of
the hardened plinthite layer, as well as the
fluctuating water table that produces it,
restrict the use of these soils to grazing or
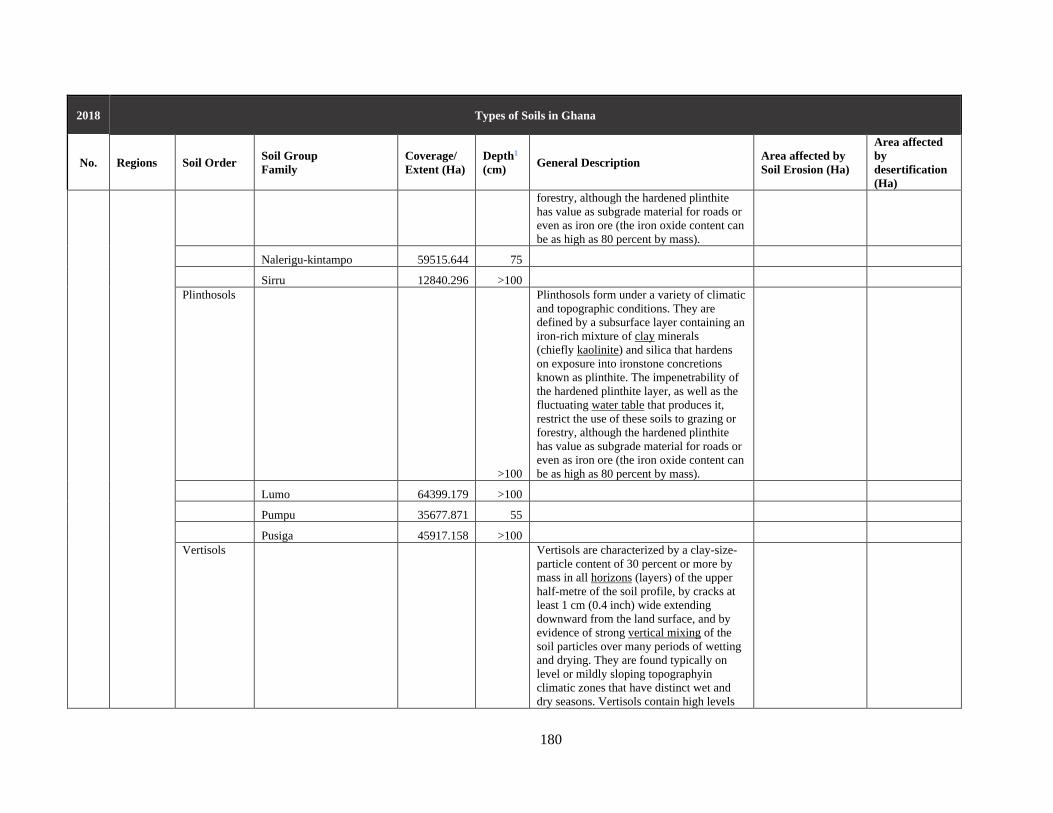
180
2018 Types of Soils in Ghana
No. Regions Soil Order Soil Group
Family
Coverage/
Extent (Ha)
Depth1
(cm) General Description
Area affected by
Soil Erosion (Ha)
Area affected
by
desertification
(Ha)
forestry, although the hardened plinthite
has value as subgrade material for roads or
even as iron ore (the iron oxide content can
be as high as 80 percent by mass).
Nalerigu-kintampo 59515.644 75
Sirru 12840.296 >100
Plinthosols
>100
Plinthosols form under a variety of climatic
and topographic conditions. They are
defined by a subsurface layer containing an
iron-rich mixture of clay minerals
(chiefly kaolinite) and silica that hardens
on exposure into ironstone concretions
known as plinthite. The impenetrability of
the hardened plinthite layer, as well as the
fluctuating water table that produces it,
restrict the use of these soils to grazing or
forestry, although the hardened plinthite
has value as subgrade material for roads or
even as iron ore (the iron oxide content can
be as high as 80 percent by mass).
Lumo 64399.179 >100
Pumpu 35677.871 55
Pusiga 45917.158 >100
Vertisols
Vertisols are characterized by a clay-size-
particle content of 30 percent or more by
mass in all horizons (layers) of the upper
half-metre of the soil profile, by cracks at
least 1 cm (0.4 inch) wide extending
downward from the land surface, and by
evidence of strong vertical mixing of the
soil particles over many periods of wetting
and drying. They are found typically on
level or mildly sloping topographyin
climatic zones that have distinct wet and
dry seasons. Vertisols contain high levels

181
2018 Types of Soils in Ghana
No. Regions Soil Order Soil Group
Family
Coverage/
Extent (Ha)
Depth1
(cm) General Description
Area affected by
Soil Erosion (Ha)
Area affected
by
desertification
(Ha)
of plant nutrients, but, owing to their
high clay content, they are not well suited
to cultivation without painstaking
management.
Pani-kupela 12188.416 >100
N/A
Changnalili 12079.396 30
Changnalili-lima-
kpelesawgu 2570.055 30
Kolingu 34653.489 60
11 Savannah Acrisols
Acrisols are defined by the presence of a
subsurface layer of
accumulated kaolinitic clays and also by
the lack of an extensively leached layer
below the surface horizon
Techiman-tampu 391995.58 >100
Arenosols
Arenosols have very low water-holding
capacities. They are highly siliceous and
also extremely low in all essential nutrients
Kunkwa 5855.778 >100
Fluvisols
Fluvisols are found on alluvial plains, river
fans, valleys and tidal marshes and have a
clear evidence of stratification. They have
severe constraints for agricultural use as low
pH-values, toxic aluminum levels and high
concentrations of salts.
Dagare-kunkwa 2655.668 >100
Nterso-zaw 7089.733 >100
Siare-dagare 74015.022 >100
Siare-lapliki 4496.577 >100
Leptosols
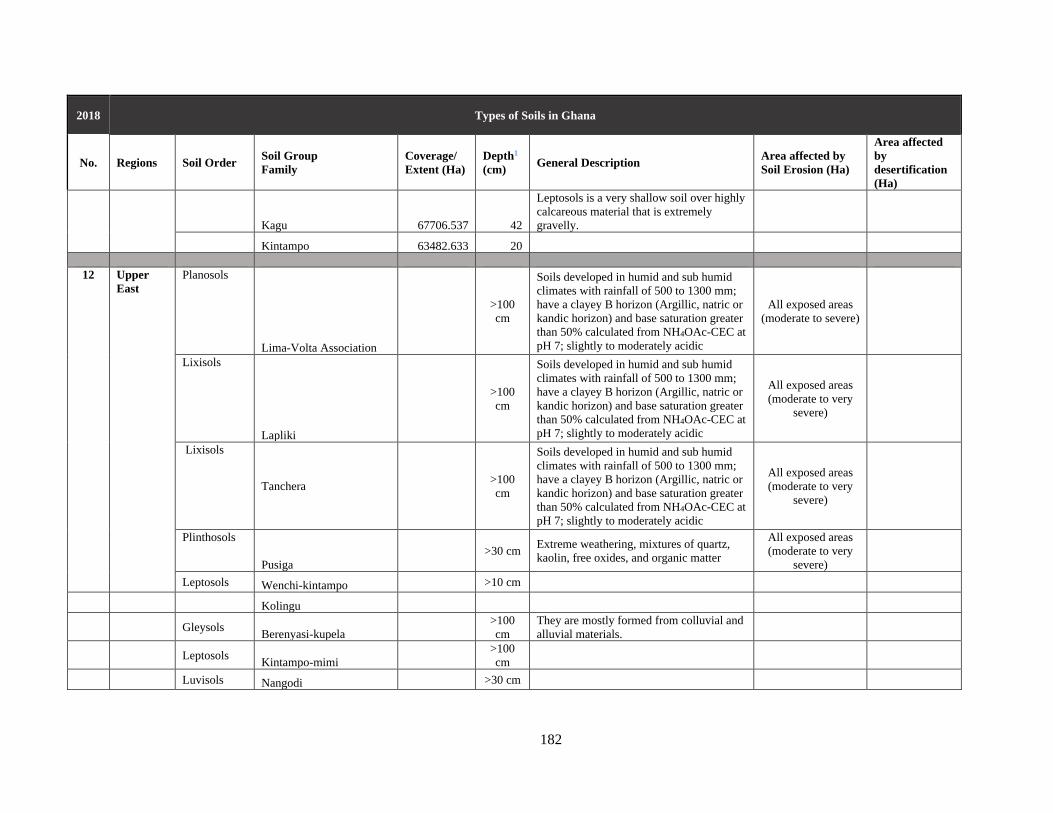
182
2018 Types of Soils in Ghana
No. Regions Soil Order Soil Group
Family
Coverage/
Extent (Ha)
Depth1
(cm) General Description
Area affected by
Soil Erosion (Ha)
Area affected
by
desertification
(Ha)
Kagu 67706.537 42
Leptosols is a very shallow soil over highly
calcareous material that is extremely
gravelly.
Kintampo 63482.633 20
12 Upper
East
Planosols
Lima-Volta Association
>100
cm
Soils developed in humid and sub humid
climates with rainfall of 500 to 1300 mm;
have a clayey B horizon (Argillic, natric or
kandic horizon) and base saturation greater
than 50% calculated from NH4OAc-CEC at
pH 7; slightly to moderately acidic
All exposed areas
(moderate to severe)
Lixisols
Lapliki
>100
cm
Soils developed in humid and sub humid
climates with rainfall of 500 to 1300 mm;
have a clayey B horizon (Argillic, natric or
kandic horizon) and base saturation greater
than 50% calculated from NH4OAc-CEC at
pH 7; slightly to moderately acidic
All exposed areas
(moderate to very
severe)
Lixisols
Tanchera >100
cm
Soils developed in humid and sub humid
climates with rainfall of 500 to 1300 mm;
have a clayey B horizon (Argillic, natric or
kandic horizon) and base saturation greater
than 50% calculated from NH4OAc-CEC at
pH 7; slightly to moderately acidic
All exposed areas
(moderate to very
severe)
Plinthosols
Pusiga
>30 cm Extreme weathering, mixtures of quartz,
kaolin, free oxides, and organic matter
All exposed areas
(moderate to very
severe)
Leptosols Wenchi-kintampo >10 cm
Kolingu
Gleysols Berenyasi-kupela
>100
cm
They are mostly formed from colluvial and
alluvial materials.
Leptosols Kintampo-mimi
>100
cm
Luvisols Nangodi >30 cm

183
2018 Types of Soils in Ghana
No. Regions Soil Order Soil Group
Family
Coverage/
Extent (Ha)
Depth1
(cm) General Description
Area affected by
Soil Erosion (Ha)
Area affected
by
desertification
(Ha)
Leptosols Yagha
>100
cm
Leptosols Tongo >10 cm
Leptosols Chuchuliga >20 cm
Leptosols Bongo >40 cm
Lixisols Bianya
>100
cm
Lixisols Varempere-tafali
>100
cm
Fluvisols
Dagare
>100
cm
Young soils with have weak to moderate
horizon development. They are mostly
formed from colluvial and alluvial
materials.
All exposed areas
(moderate to very
severe)
Lixisols Mimi
>100
cm
13 Upper
West
Arenosols
Kunkwa Consociation >100
cm
Soils of arid regions, such as desert soils;
some are saline or sodic, have calcic,
gypsic horizons; may have ochric
epipedon, sometimes argillic or natric
horizons
All exposed areas
(slight to moderate)
Fluvisols Siare-dagare Association
>100
cm
Young soils with little or no profile
development
All exposed areas
(slight to moderate)
Vertisols
Pani-kupela Association
>100
cm
Dark clay soils containing large amounts of
swelling clay minerals (smectite), soils
crack widely during the dry season and
become very sticky in the wet season
All exposed areas
(slight to moderate)
Leptosols Kagu Consociation
>100
cm
All exposed areas
(moderate to very
severe)
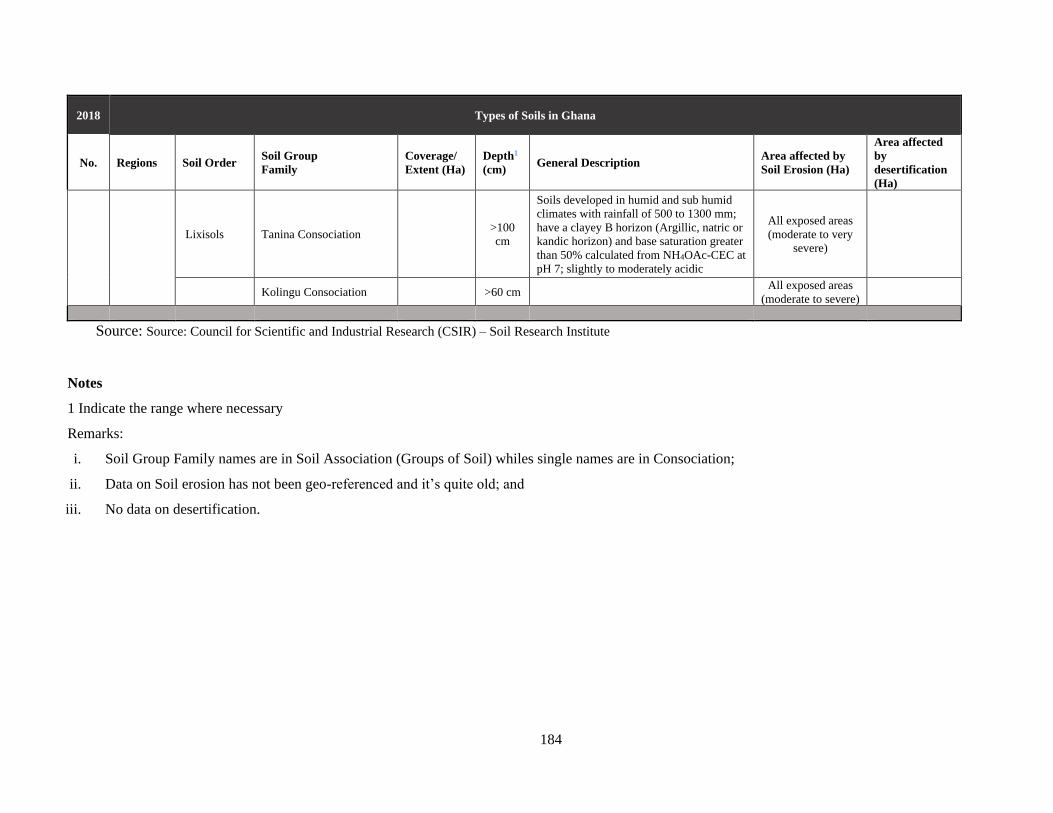
184
2018 Types of Soils in Ghana
No. Regions Soil Order Soil Group
Family
Coverage/
Extent (Ha)
Depth1
(cm) General Description
Area affected by
Soil Erosion (Ha)
Area affected
by
desertification
(Ha)
Lixisols Tanina Consociation
>100
cm
Soils developed in humid and sub humid
climates with rainfall of 500 to 1300 mm;
have a clayey B horizon (Argillic, natric or
kandic horizon) and base saturation greater
than 50% calculated from NH4OAc-CEC at
pH 7; slightly to moderately acidic
All exposed areas
(moderate to very
severe)
Kolingu Consociation
>60 cm
All exposed areas
(moderate to severe)
Source: Source: Council for Scientific and Industrial Research (CSIR) – Soil Research Institute
Notes
1 Indicate the range where necessary
Remarks:
i. Soil Group Family names are in Soil Association (Groups of Soil) whiles single names are in Consociation;
ii. Data on Soil erosion has not been geo-referenced and it’s quite old; and
iii. No data on desertification.
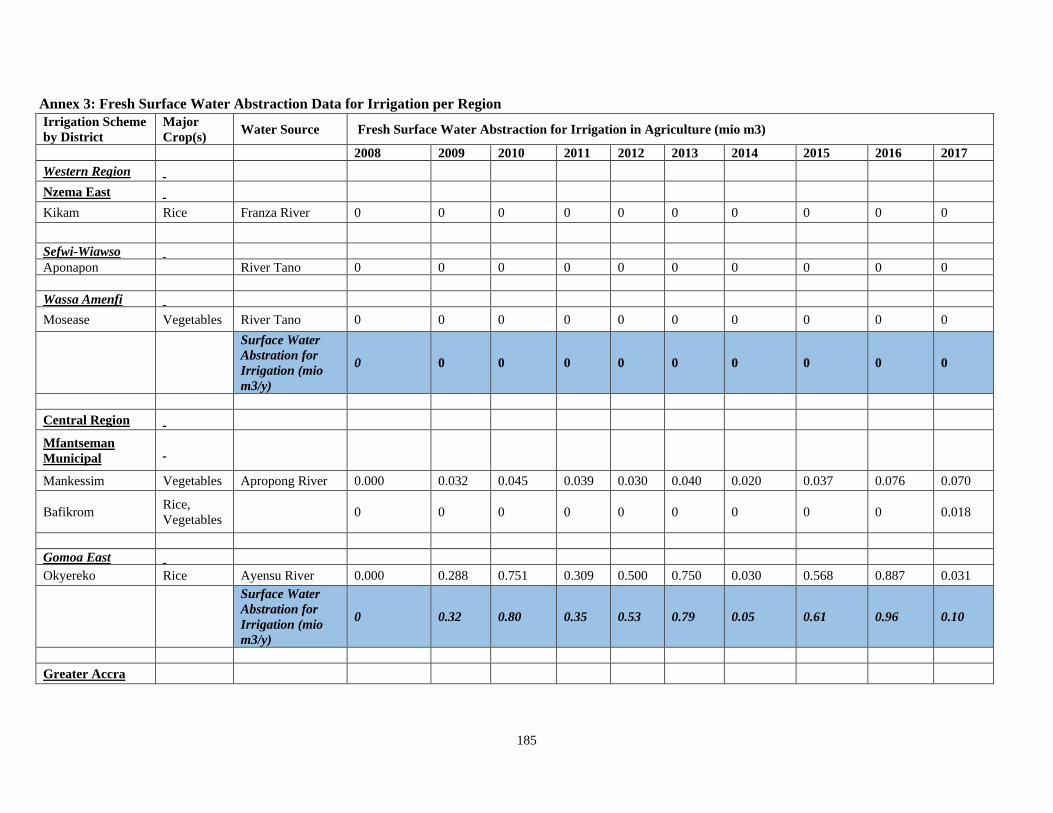
185
Annex 3: Fresh Surface Water Abstraction Data for Irrigation per Region
Irrigation Scheme
by District
Major
Crop(s) Water Source Fresh Surface Water Abstraction for Irrigation in Agriculture (mio m3)
2008 2009 2010 2011 2012 2013 2014 2015 2016 2017
Western Region
Nzema East
Kikam Rice Franza River 0 0 0 0 0 0 0 0 0 0
Sefwi-Wiawso
Aponapon River Tano 0 0 0 0 0 0 0 0 0 0
Wassa Amenfi
Mosease Vegetables River Tano 0 0 0 0 0 0 0 0 0 0
Surface Water
Abstration for
Irrigation (mio
m3/y)
0 0 0 0 0 0 0 0 0 0
Central Region
Mfantseman
Municipal
Mankessim Vegetables Apropong River 0.000 0.032 0.045 0.039 0.030 0.040 0.020 0.037 0.076 0.070
Bafikrom Rice,
Vegetables 0 0 0 0 0 0 0 0 0 0.018
Gomoa East
Okyereko Rice Ayensu River 0.000 0.288 0.751 0.309 0.500 0.750 0.030 0.568 0.887 0.031
Surface Water
Abstration for
Irrigation (mio
m3/y)
0 0.32 0.80 0.35 0.53 0.79 0.05 0.61 0.96 0.10
Greater Accra
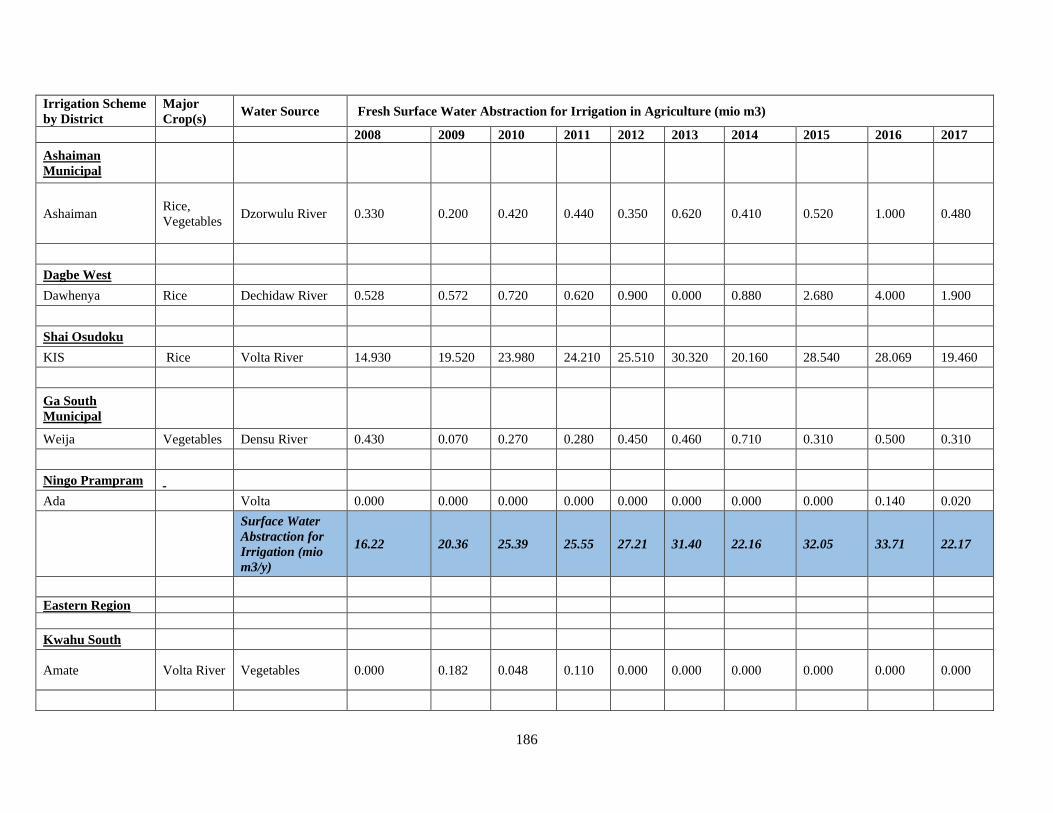
186
Irrigation Scheme
by District
Major
Crop(s) Water Source Fresh Surface Water Abstraction for Irrigation in Agriculture (mio m3)
2008 2009 2010 2011 2012 2013 2014 2015 2016 2017
Ashaiman
Municipal
Ashaiman Rice,
Vegetables Dzorwulu River 0.330 0.200 0.420 0.440 0.350 0.620 0.410 0.520 1.000 0.480
Dagbe West
Dawhenya Rice Dechidaw River 0.528 0.572 0.720 0.620 0.900 0.000 0.880 2.680 4.000 1.900
Shai Osudoku
KIS Rice Volta River 14.930 19.520 23.980 24.210 25.510 30.320 20.160 28.540 28.069 19.460
Ga South
Municipal
Weija Vegetables Densu River 0.430 0.070 0.270 0.280 0.450 0.460 0.710 0.310 0.500 0.310
Ningo Prampram
Ada Volta 0.000 0.000 0.000 0.000 0.000 0.000 0.000 0.000 0.140 0.020
Surface Water
Abstraction for
Irrigation (mio
m3/y)
16.22 20.36 25.39 25.55 27.21 31.40 22.16 32.05 33.71 22.17
Eastern Region
Kwahu South
Amate Volta River Vegetables 0.000 0.182 0.048 0.110 0.000 0.000 0.000 0.000 0.000 0.000
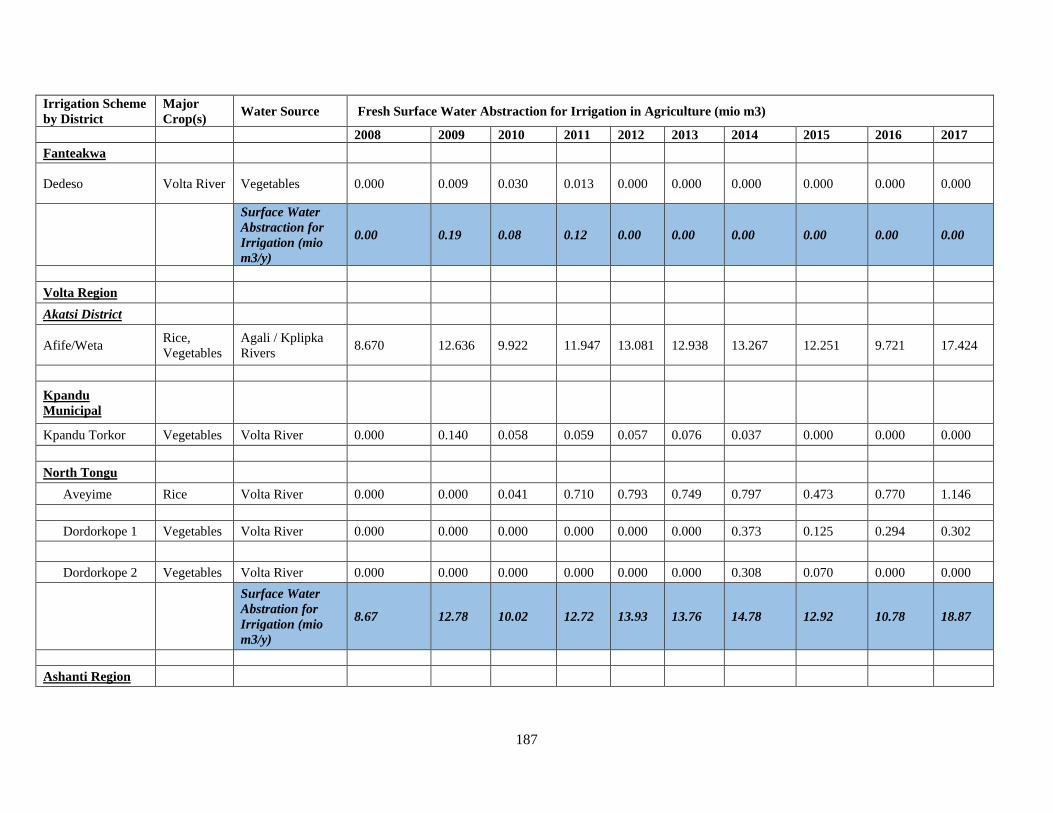
187
Irrigation Scheme
by District
Major
Crop(s) Water Source Fresh Surface Water Abstraction for Irrigation in Agriculture (mio m3)
2008 2009 2010 2011 2012 2013 2014 2015 2016 2017
Fanteakwa
Dedeso Volta River Vegetables 0.000 0.009 0.030 0.013 0.000 0.000 0.000 0.000 0.000 0.000
Surface Water
Abstraction for
Irrigation (mio
m3/y)
0.00 0.19 0.08 0.12 0.00 0.00 0.00 0.00 0.00 0.00
Volta Region
Akatsi District
Afife/Weta Rice,
Vegetables
Agali / Kplipka
Rivers 8.670 12.636 9.922 11.947 13.081 12.938 13.267 12.251 9.721 17.424
Kpandu
Municipal
Kpandu Torkor Vegetables Volta River 0.000 0.140 0.058 0.059 0.057 0.076 0.037 0.000 0.000 0.000
North Tongu
Aveyime Rice Volta River 0.000 0.000 0.041 0.710 0.793 0.749 0.797 0.473 0.770 1.146
Dordorkope 1 Vegetables Volta River 0.000 0.000 0.000 0.000 0.000 0.000 0.373 0.125 0.294 0.302
Dordorkope 2 Vegetables Volta River 0.000 0.000 0.000 0.000 0.000 0.000 0.308 0.070 0.000 0.000
Surface Water
Abstration for
Irrigation (mio
m3/y)
8.67 12.78 10.02 12.72 13.93 13.76 14.78 12.92 10.78 18.87
Ashanti Region

188
Irrigation Scheme
by District
Major
Crop(s) Water Source Fresh Surface Water Abstraction for Irrigation in Agriculture (mio m3)
2008 2009 2010 2011 2012 2013 2014 2015 2016 2017
Asante Akim
North
Annum valley rice,
vegetables
Anum & Oweri
Rivers 0.297 0.000 0.869 0.538 0.779 0.644 0.260 0.425 0.741 0.789
Offinso North
Akumadan Vegetables Akumadan River 0.000 0.166 0.109 0.301 0.384 0.219 0.551 0.272 0.086 0.157
Surface Water
Abstration for
Irrigation (mio
m3/y)
0.30 0.17 0.98 0.84 1.16 0.86 0.81 0.70 0.83 0.95
Brong Ahafo
Wenchi East
Akurobi Vegetables Yoyo River 0.000 0.000 0.000 0.000 0.000 0.028 0.083 0.029 0.000 0.000
Subinja Vegetables Subin River 0.172 0.173 0.219 0.153 0.105 0.032 0.011 0.058 0.033 0.018
NewLongoro Vegetables Sambel/Chiridi 0.000 0.000 0.000 0.000 0.042 0.037 0.092 0.007 0.000 0.000
Techiman
Municipal
Tanoso Vegetables Tano River 0.274 0.162 0.193 0.256 0.206 0.085 0.053 0.092 0.042 0.042
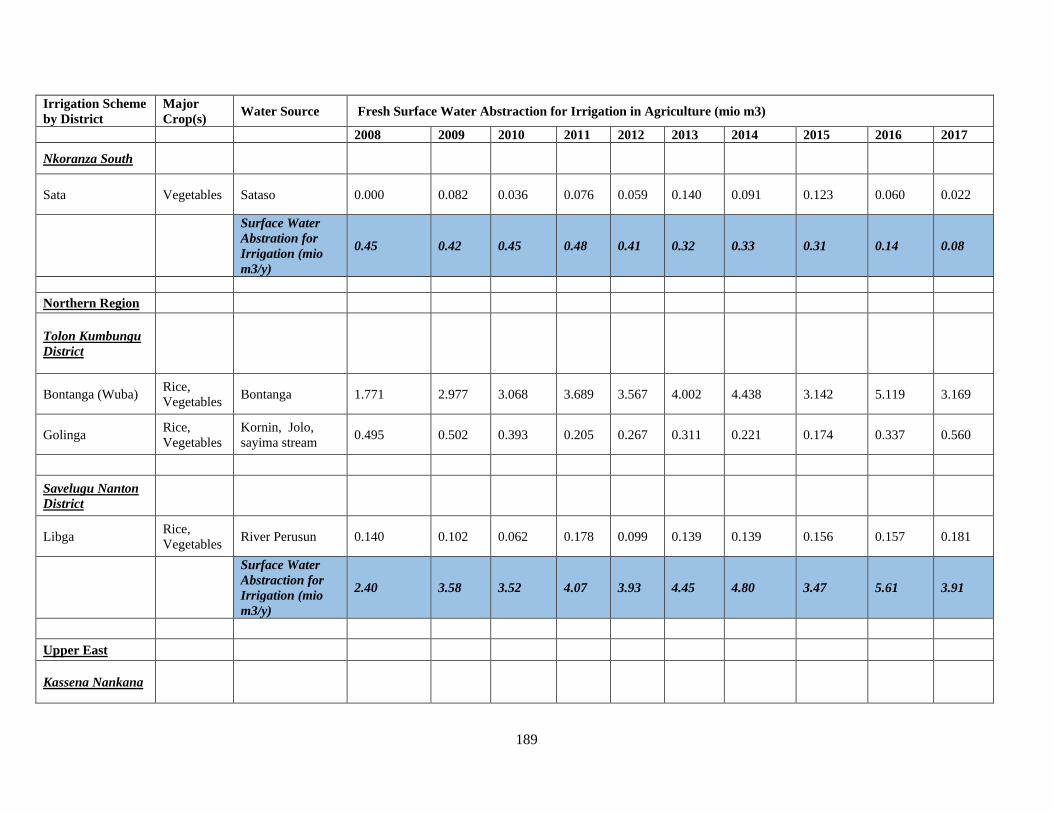
189
Irrigation Scheme
by District
Major
Crop(s) Water Source Fresh Surface Water Abstraction for Irrigation in Agriculture (mio m3)
2008 2009 2010 2011 2012 2013 2014 2015 2016 2017
Nkoranza South
Sata Vegetables Sataso 0.000 0.082 0.036 0.076 0.059 0.140 0.091 0.123 0.060 0.022
Surface Water
Abstration for
Irrigation (mio
m3/y)
0.45 0.42 0.45 0.48 0.41 0.32 0.33 0.31 0.14 0.08
Northern Region
Tolon Kumbungu
District
Bontanga (Wuba) Rice,
Vegetables Bontanga 1.771 2.977 3.068 3.689 3.567 4.002 4.438 3.142 5.119 3.169
Golinga Rice,
Vegetables
Kornin, Jolo,
sayima stream 0.495 0.502 0.393 0.205 0.267 0.311 0.221 0.174 0.337 0.560
Savelugu Nanton
District
Libga Rice,
Vegetables River Perusun 0.140 0.102 0.062 0.178 0.099 0.139 0.139 0.156 0.157 0.181
Surface Water
Abstraction for
Irrigation (mio
m3/y)
2.40 3.58 3.52 4.07 3.93 4.45 4.80 3.47 5.61 3.91
Upper East
Kassena Nankana

190
Irrigation Scheme
by District
Major
Crop(s) Water Source Fresh Surface Water Abstraction for Irrigation in Agriculture (mio m3)
2008 2009 2010 2011 2012 2013 2014 2015 2016 2017
Tono Rice,
Vegetables River Tono 6.144 9.543 12.028 16.014 12.713 13.025 14.247 4.500 26.700 20.400
Bolgatanga
Municipal
Baare Cereals,
Vegetables Baareboka river 0.000 0.000 0.000 0.000 0.000 0.000 0.058 0.067 0.057 0.018
Bongo District
Vea Rice,
Vegetables Yarigatanga River 2.692 2.572 1.390 1.123 1.070 0.821 0.652 0.748 1.783 1.271
Bawku West
District
Goog Vegetables Sambolekuliga
river 0.000 0.000 0.000 0.267 0.000 0.000 0.501 0.618 0.724 0.945
Surface Water
Abstraction for
Irrigation (mio
m3/y)
8.84 12.11 13.42 17.40 13.78 13.85 15.46 5.93 29.26 22.63
Source: Ghana Irrigation Development Authority (GIDA)
Related Documents