Learn what you can do to make Berks County greener through simple, everyday choices. STATE F THE ENVIRONMENT BERKS COUNTY, PA Brought to you by:

Welcome message from author
This document is posted to help you gain knowledge. Please leave a comment to let me know what you think about it! Share it to your friends and learn new things together.
Transcript

Learn what you can do to make Berks County greener through simple, everyday choices.
STATE F THEENVIRONMENT
B E R K S C O U N T Y , P A
Brought to you by:
Table of Contents
WATER 8
Groundwater Elevations 10
Miles of Impaired Streams 11
Water Systems with Protection Plans 12
Status of Sewage Facility Plans (Municipal PA Act 537) 13
Aquatic Life in Streams 15
ENERGY 16
Vehicle Miles Traveled Per Year 18
Residents Using Public Transportation 19
Electricity Generation and Use 20
Household Energy Use 22
GreenCertificationConstruction 24
AIR 26
Number of “Bad” Air Days 28
Percentage of Days Exceeding Criteria for PM2.5 30
Air Quality Criteria Attainment Status - PM2.5 31
Air Quality Criteria Attainment Status at Lead Monitors 32
Ambient Air Monitoring of Lead 33
WASTE 34
Waste Generated in Berks County 36
Waste Disposed of in Berks County 37
Recycling Rate 38
Special Waste Collections 40
Clean-Up Our American Lands and Streams (COALS) 41
LAND 42
Protected Land 44
Tree Cover 45
Impervious Cover 46
Multi-Municipal Cooperation 47
Outdoor Recreation Areas 48
Brought to you by:
25 North 11th StreetReading, PA 19601
Phone 610-372-4992Fax 610-372-2917
Download a copy of this report atwww.greenberks.com
BERkS CoNSERvANCY STAffNeil Brantley
John L. HackmanJackie B. Isamoyer-Rollman
Kim R. LewisLawrence E. LloydKimberly J. MurphyJeanne Barrett OrtizVerlin S. Renner, Jr.Katherine Z. Seyler
Tami J. ShimpLorri K. Swan
Executive Summary 3Summary of Indicators 4County of Berks Map and Demographics 525 Tips to Go Green 6The Interrelationship of Environmental Health and Personal Health 7
High Conservation Value Map 50Where do we go from here? 53Sources 54Sponsors 55
2009 BoARD of DIRECToRSOfficers
Christopher J. Hartman, ChairmanScott L. Rehr, Vice-Chairman
Jeffrey C. Euclide, Corporate SecretaryBrian G. McCoy, Treasurer
DirectorsLinda M. AndersonMartha W. AynardiJeffrey C. Euclide
Terry D. HandChristopher J. Hartman
Keith A. HillEric W. Jenkins
J. Thomas KearseJohn P. Kramer
Frederick C. LeveringRisa A. Marmontello
Brian G. McCoyJoni S. NaugleScott L. Rehr
Crystal A. SeitzPamela J. ShuppDavid L. StrobelWilliam J. Vitale

STATE of ThE ENvIRoNmENTSTEERING CommITTEE
David Bell, Ph.D., Consultant Barry Isett & Associates, Inc.
Gavin Biebuyck, Air ChairLiberty Environmental, Inc.
Matthew Bixler, Water ChairSpotts Stevens McCoy
Eric Grindrod, Water Spotts Stevens McCoy
John Hackman, Land Chair Berks Conservancy
Eric Jenkins, Committee Co-Chair CH Briggs Company
Eileen Kahley, Communications Spotts Stevens McCoy
Kim Lewis, Communications Berks Conservancy
Jane Meeks, Waste Chair Solid Waste Authority of Berks County
Christine Mildner, Consultant Barry Isett & Associates, Inc.
Kimberly Murphy, Program Berks Conservancy
Joni Naugle, Committee Co-Chair Focused, LLC
Shannon Rossman, Program Berks County Planning Commission
Tami Shimp, Program Berks Conservancy
Lorri Swan, Program Berks Conservancy
Jason Zerbe, Energy Chair EnerSys
Welcome to the first State of the Environmentreport for Berks County. Why a report and why now? Lately the world is all about “going green”. We can hardly turn on the television or pick up the paper without hearing the latest and greatest ways to conserve energy andprotectourenvironment.However,“goinggreen”withoutanyspecificgoalsinmindwillultimately leave us wondering if our hard work and actions have truly made a difference. With the philosophy of “what gets measured, gets done” in mind, the Berks Conservancy has taken on the firstcomprehensivestateof theenvironmentreportforBerkscounty.Throughthisreportandits associated programs, the Conservancy seeks to raise awareness of conservation choices that Berks County residents and institutions can make that will improve the environment.
This report evaluates specific data and trends in five environmental categories: Air,Energy,Land,Waste,andWater.Withineachcategory,severalspecificquantitativeindicatorsareevalu-atedusingavailabledata,trendsinthedataareassessed,andspecificactionitemsthatresidentscanpracticetomakeeachspecificindicatormore“positive”areidentified.Thefivegeneralenvi-ronmentalcategories,aswellasthespecificenvironmentalindicatorsevaluated,wereselectedbyan interactive process. The Conservancy established subcommittees for each category, with each subcommitteeheadedbyaprofessionalwithsubstantialexperienceinthespecificfield.Thesesubcommittees discussed candidate indicators, and narrowed down the list of indicators to be usedto4-5specificindicatorswherequantitativedatawereavailable.
While we could have selected many indicators regarding the health of the environment, our panel of experts chose the 25 contained in this report as a start. We pursued measureable, actionable data that would allow individuals, corporations and organizations to see where they could make lifestyle changes that would have increasingly positive effects on our local environment, the state, the country and the world. We used a third party consultant to research and write up the indica-tors and data. While we have tried to be as neutral as possible, obviously the Conservancy has a bias toward environmental conservation and protection. Rest assured, the data contained in this report is accurate and the facts will ultimately speak for themselves. We hope you learn something new, consider changing some of your behaviors as a result, and we invite you to become engaged in our work and that of other conservation and environmental organizations; the health of our community depends on it.
– Kim Murphy President, Berks Conservancy
About the Berks ConservancyTheBerksConservancyisanon-profitorganizationwhosemissionistobetheleadingagentforthe conservation of the environment in Berks County. Serving the community since 1974, the Conservancy has established partnerships with businesses, municipalities across Berks County, community leaders and its 1000+ members to help protect special places, manage sensitive en-vironmental habitats and encourage growth in the right places. Conservancy activities include land and water protection, municipal relationships, urban gardening, environmental education, support of the agricultural community, land management, GIS mapping, trail creation, and coor-dination of events for our members. To date, we have permanently preserved nearly 6000 acres through conservation easements, acquisitions, and transfers. As important as these land preserva-tion efforts are, we also realize that a healthy community needs economic growth. By using our County’s Comprehensive Plan as a guide, we continue to work with municipalities and developers to promote growth in the proper places, such as areas surrounding existing development and away from lands that have a high natural resource value. Most local residents that learn about the Berks Conservancy soon realize that it plays an important role in maintaining the unique charac-teristics that make Berks County a special place to live, work, and play.
Executive Summary
This report may be copied for educational purposes with acknowledgement of the Berks Conservancy. All or parts may be downloaded from our website at www.greenberks.com. To order a printed copy contact [email protected]. A minimal charge including shipping and handling for quantities greater than 5 will be assessed.
3

ThUmBS UP This is generally encouraging; keep up the good work!
Summary of IndicatorsSTATE of ThE ENvIRoNmENT IN BERkS CoUNTY
1. Groundwater Elevations
Groundwater at Fleetwood well relatively constant;
Berks could use more moni-toring wells.
2. Miles of Impaired Streams
About 361 miles of Berks streams and rivers are listed
by PADEP as impaired.
3. Source Water Protection Plans
Only 6 of 63 community water suppliers have water
protection plans so far.
1. Vehicle Miles Traveled Per Year
Berks residents travel less in vehicles than State average; but number is increasing.
2. Use of Public Transportation
Berks residents use public transportation less than
average PA resident.
Berks County relies mainly on fossil fuel for energy,
with few alternative sources available.
1. Number of “Bad” Air Days
Number of “bad” air days per year declining, but some standards not
attained.
2. Exceedances of Particulate Matter
(PM2.5) StandardNumber of “bad” and “moderate” air days per
year declining.
3. PM2.5 Attainment
Weighted annual mean PM2.5 below standard for
last three years.
1. Waste GenerationEven with increased
recycling, the percentage of waste generated in Berks is outpacing the percentage
of population growth.
2. Waste Disposal Tonnage of wastes
disposed of in Berks declining slightly in recent years.
3. Recycling Rate Recycling percentage for Berks County well over
State goal of 35% for last three years.
1. Protected Land About 11 percent of Berks’
lands are permanently protected.
2. Tree CoverForested lands make up the largest land-cover category
in Berks County (236,014 acres or 42.6%).
3. Impervious CoverMore than 12% of the land in Berks County
isclassifiedas impervious cover.
ThUmBS DoWN This is not tracking the way we want to see it; hard work to do.
ThUmBS NEUTRAL We’ll need to track this a while longer to see what happens.
WATER
ENERGY
AIR
WASTE
LAND
4
3. Energy Generation & Use
4. Act 537 Sewage Facility Plans
Most Berks County 537 plans are more than 10
years old (updating is trig-gered by major change).
5. Aquatic Life in Streams
Measures of stream health based on organisms in Berks County streams
are mixed.
4. Household Energy Use Many Berks residents rely on fuel oil and electric for heat; and should consider
alternative and more renewable sources.
5. “Green” Construction
Berks has only a few building projects that have
been LEED-registered.
4. Attainment Status at Special Purpose
MonitorsLead-in-air is sometimes
above standard near Berks lead factories.
5. Ambient Air Monitoring of LeadBackground lead-in-air
concentrations well below standard.
4. Special Waste Collections
More participation and more special wastes
collected as programs become known.
5. Clean Up Our American Lands
and Streams COALS cleanup program
very successful.
4. Multi-Municipal Cooperation
Participation is high in joint comprehensive planning, zoning, and
special planning.
5. Outdoor Recreation Areas
About 7% of Berks is clas-sifiedasoutdoorrecreation.Connections and regional
planning are necessary.
STATE of ThE ENvIRoNmENT IN BERkS CoUNTY
County of BerksAlbany Township Alsace Township Amity Township s Bally Borough Bechtelsville Borough Bern Township Bernville Borough Bethel Township s Birdsboro Borough Boyertown Borough Brecknock Township Caernarvon Township Centerport Borough Centre Township Colebrookdale Township Cumru Township s District Township s Douglass Township Earl Township Exeter Township s Fleetwood Borough Greenwich TownshipHamburg Borough Heidelberg Township Hereford Township s Jefferson Township
HEIDELBERG
PIKE
ALBANY
HEREFORD
READING
ALSACE
JEFFERSON
AMITYKenhorst
W. Reading
Shillington
Wyomissing
ROBESON
Bally
Kutztown
Strausstown
Wernersville
Womelsdorf
Robesonia
Mohnton
Bechtelsville
Laureldale
ROCKLAND
BERN
Leesport
Centerport
Shoemakersville
RUSCOMBMANORBernville
Lenhartsville
SaintLawrence
BETHEL
LONGSWAMP
Birdsboro
LOWERALSACE
Boyertown
LOWERHEIDELBERG
SinkingSpring
BRECKNOCK
SOUTHHEIDELBERG
SPRING
MAIDENCREEK
MARION
TILDEN
CENTRE
MAXATAWNY
TULPEHOCKEN
CUMRU
MountPenn
UNION
DISTRICT
MUHLENBERG
UPPER BERN
DOUGLASS
UPPERTULPEHOCKEN
EARL
NORTHHEIDELBERG
Blue MarshLake
LakeOntelaunee
SchuylkillRiver
WASHINGTON
OLEY
EXETER
ONTELAUNEE
WINDSOR
PERRY
PENN
GREENWICH
Hamburg
Topton
Lyons
Fleetwood
NewMorgan
CAERNARVON
COLEBROOKDALE
RICHMOND
Kenhorst Borough Kutztown Borough s Laureldale Borough Leesport Borough Lenhartsville Borough Longswamp Township s Lower Alsace Township Lower Heidelberg Township Lyons Borough Maidencreek Township Marion Township Maxatawny Township Mohnton Borough Mount Penn Borough Muhlenberg Township New Morgan BoroughNorth Heidelberg Township Oley TownshipOntelaunee Township Penn Township Perry Township Pike Township s Reading City s Richmond Township
Robeson Township s Robesonia Borough sRockland Township Ruscombmanor Township Saint Lawrence Borough Shillington Borough Shoemakersville Borough Sinking Spring Borough South Heidelberg TownshipSpring Township Strausstown Borough Tilden Township s Topton Borough Tulpehocken Township Union Township s Upper Bern Township s Upper Tulpehocken Township
Washington Township sWernersville Borough West Reading BoroughWindsor Township Womelsdorf BoroughWyomissing Borough
5
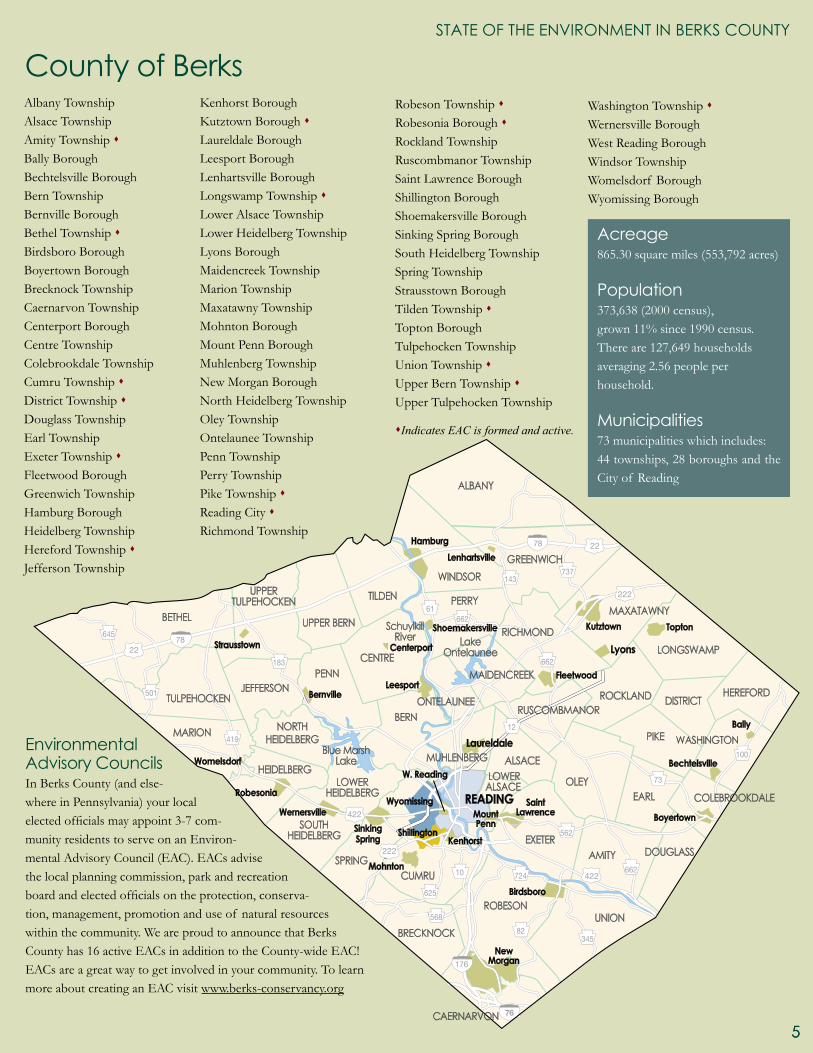
Environmental Advisory CouncilsIn Berks County (and else-where in Pennsylvania) your local electedofficialsmayappoint3-7com-munity residents to serve on an Environ-mental Advisory Council (EAC). EACs advise the local planning commission, park and recreation boardandelectedofficialsontheprotection,conserva-tion, management, promotion and use of natural resources within the community. We are proud to announce that Berks County has 16 active EACs in addition to the County-wide EAC! EACs are a great way to get involved in your community. To learn more about creating an EAC visit www.berks-conservancy.org
Acreage865.30 square miles (553,792 acres)
Population373,638 (2000 census), grown 11% since 1990 census.There are 127,649 households averaging 2.56 people per household.
municipalities 73 municipalities which includes: 44 townships, 28 boroughs and the City of Reading
5
sIndicates EAC is formed and active.

WATER 1. Save water by turning the water off when you are not using it such as brushing your teeth and washing the dishes. Check for leaks in your faucets and toilet. Install a water-saving showerhead and faucet.
2. Never dump anything into storm drains or streams. Everything that enters the storm drains ends up into streams, rivers and drinking water. Don’t dump oil, trash, leaves, pet waste or any other material into the drains. Avoid pesti-cides and lawn chemicals that will harm aquatic life.
3. If you have well wa-ter, get your well water tested periodically. Be aware of changes in land use around you. New de-velopments or land use practices could affect lo-cal groundwater quality and/or quantity.
4. The toilet isn’t a garbage disposal. Nev-er flush medicine, cat litter, disposable diapers, sanitary napkins, tam-pons, paper towels, facial tissues, coffee grounds, or cigarette butts. If you have a septic tank, perform regular mainte-nance.
5. Protect riparian buf-fers (streambank plant-ings). Don’t mow to the edge of streambanks. Allow native vegetation to grow freely in at least a 10-foot strip along the bank to reduce erosion andfilteroutpollutants.
ENERGY1. Green your commute to work or school. Start a carpool at work. Make several errands in one trip. Utilize the school bus for your children.
2. Familiarize yourself with BARTA routes and bus stop locations. Utilize bus transport for traveling around town and out of town.
3. Conserve energy. You cansavesignificantener-gy and money with sim-ple measures such as ad-justing your thermostat or shutting down equip-ment. Unplugging appli-ances such as televisions, stereos, and computers while not in use can have a big impact. Use power strips for easier on/off powering to multiple electronic devices.
4. Make sure your home is energy efficient.Haveyour home insulated, windows caulked and check weatherstripping. Utilize residential energy use analyzers from your utility provider. Ask your electricity provider if you can purchase Renewable Energy for your home.
5. Plant trees. Trees and other plants absorb car-bon dioxide and convert it into oxygen which is released into the atmo-sphere. Planting a tree in your neighborhood can help beautify the area while absorbing 2,000 pounds of CO2 over its lifetime.
AIR 1. Reduce waste. Manu-facturing of unnecessary or disposable goods often produces air pollution, so reduced purchasing of disposables will help.
2. Eliminate toxic chemi-cal use at home. A surprising number of household or home shop chemicals are toxic and volatile. Many release vapors into the air, inside the home and out. This can be a serious health threat to your family, and contributes to com-munity-wide levels of air pollutants.
3. Modify your trans-portation. Your car is a significant source of airpollution, so switching to a more gas-efficient ve-hicle will be a big help.
4. Check your home for radon levels. Radon is a cancer-causing radioac-tive, odorless, colorless gas, known to exist in Berks County. Testing is the only way to know your home’s radon levels, and you can administer the test yourself. Test kits can be purchased at most hardware stores.
5. Talk to your legislators. Many of our current governmental regulations are not strong enough to address our air pollution problems. Citizens need to contact their legisla-tors and ask for better policies.
WASTE 1. Compost. Composting is a natural process that breaks down organic ma-terial into a rich, organic fertilizer. By compost-ing, you can reduce the amount of garbage you sendtothelandfill,growhealthier plants, and save money. It is easy to do at home.
2. Reduce waste you generate by reducing the number of disposable (i.e., throw-away) items you buy and use, and by recycling those materi-als that are accepted in their existing municipal or county recycling pro-grams.
3. Recycle! Make sure you know what items can be recycled, set up con-tainers in your house or business for storage of recyclables, and know the municipal schedule for pick-ups or drop-offs.
4. Become aware of Berks County’s special waste collections - what they accept, and when and where the collection events are scheduled. Items such as tires, phar-maceuticals, and other hazardous materials are collected seasonally. Visit www.co.berks.pa .us/ recycling/site/default.asp for a complete schedule.
5. Never dump garbage, rubbish, old building materials, or other solid wastes on Berks County lands.
LAND1. Utilize the open space and recreational resourc-es that exist in Berks. Help promote these pub-lic resources and get in-volved/volunteer to help maintain them. This will help allow the govern-ments and organizations that manage these re-sources to devote more time and energy to plan-ning for future parks.
2. If your property in-cludes forested areas, try to keep some or all of those areas intact; if your property lacks trees, con-sider planting trees where they are compatible with property use.
3. Establish a rain gar-den! Rain gardens are landscaped areas planted with wildflowers andother native vegetation that soak up rain water.
4. Landscape organi-cally with native plants. Native plants are the trees, shrubs, flowers,grasses, ferns and other plants that have evolved in a particular area over thousands of years. They are well-adapted to local conditions, therefore re-quiring little maintenance once established.
5. Get involved in your community through an Environmental Advisory Council (EAC). EACs advise the local planning commission, park and recreation board and elected officials on theprotection, conservation, management, promotion and use of natural re-sources in the commnity.
6
25 Tips to Go GreenSTATE of ThE ENvIRoNmENT IN BERkS CoUNTY

STATE of ThE ENvIRoNmENT IN BERkS CoUNTY
The Interrelationship of Environmental health and Personal healthBiologists tend to describe the natural systems they study in “levels of organization,” starting with the smallest building units and work-ing up to the most complex systems. Thus, biologists distinguish broad categories of atoms, molecules, cells, tissues, organs, individu-als, populations, communities, and ecosystems. We generally think of the individual as having a sense of self—an awareness of existence and well-being as a functioning unit.
As humans, we perceive ourselves as individuals whose survival de-pends on the health of our internal environment – our organ sys-tems, our tissues, and our cells. We spend lots of time and lots of moneytomaintainourinternalenvironmentinfineworkingorder.We routinely go for checkups to monitor the health of our internal environment, and ask physicians to measure indicators of our inter-nal health (e.g., cholesterol level, blood pressure, eyesight, hearing, etc.). If we perceive that some part of our internal environment is notworkingproperly,wepromptlyseekprofessionalhelptofixthefaulty parts or to make our internal systems run smoothly again. We even buy special products to keep the outside of our person clean, other products to make our person smell good, and shiny things to decorate our exteriors. This concern over the health and hygiene of our personal self and internal environment seems entirely natural, appropriate, and useful, and there are probably few who would argue that such concerns are unwarranted.
In the 20th century, ecologists such as Rachel Carson, Eugene Odum, Paul Ehrlich, and Barry Commoner drew attention to our external environment, i.e., the “higher” levels of biological organiza-tion such as populations, communities, and ecosystems, and pointed out how the health of our external environment was linked to our personal health. From their studies, we can reasonably conclude that the billions we spend on our internal health (our examinations, medi-cations, surgeries, health insurance) are ill-spent if our external envi-ronment is severely degraded. We can’t separate ourselves from our surroundings; we need to breathe the air, and drink the water, and eat the food, and raise our children in the external environment that we have changed for better or worse. It has taken a few decades for this outward focus on our external environment to become incorporated into majority public opinion, but most of us now acknowledge that ourpersonalhealth,andourqualityof life,issignificantlyaffectedbythe condition of our external environment.
Just as doctors can make measurements of your internal environment and discuss indicators of your personal health, ecologists can make measurements of our external environment and derive indicators of the state of that environment. These measurements and indicators, followed over time, can provide an assessment of whether the qual-ity of our environment is improving or degrading. As with medical therapies, indicators can reveal whether a particular course of treat-mentorenvironmentalmanagementishavingpositivebenefits.
It is with this sense of the linkage between internal and external conditions that the Berks Conservancy has undertaken the task of developing a set of environmental indicators for Berks County, in-corporating these indicators and the underlying data into a State of the Environment report. This is the start of an ongoing process that will continue to assess these environmental indicators over time; this 2009 report sets, in essence, a baseline for following environ-mental changes in Berks County. It is probable, and commendable, that readers will quibble over which data were selected for use in this report, and how the data have been interpreted; it is hoped that these critiques will be constructive, and can be used by the Berks Conser-vancy and others to guide the preparation of future reports.
77
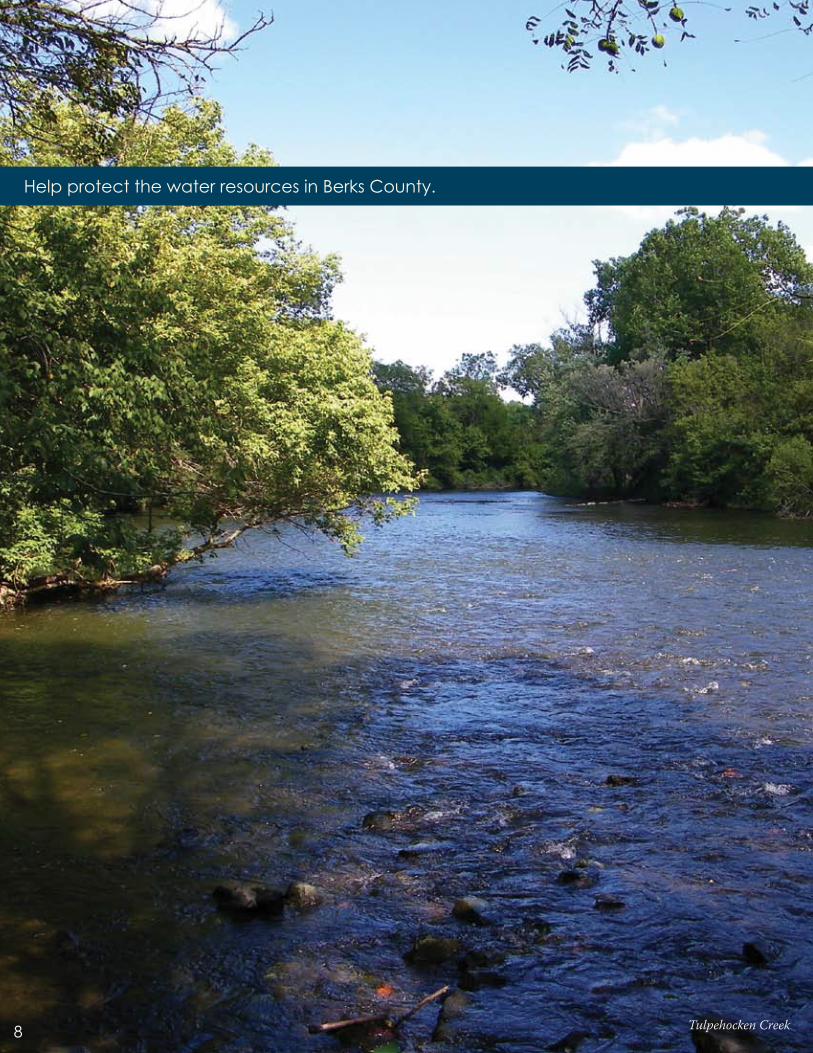
help protect the water resources in Berks County.
Tulpehocken Creek8

WaterWithout a doubt, clean water is considered by most people to be a fundamental measure of environmental health. We rely on surface water and groundwater for our drinking water supplies, for irrigation of crops, for industrial processes, and for outdoor recreation. Moreover, clean waters, whether they be free-flowing streams and rivers or serene ponds and lakes, have always been visited and admired for their natural beauty. monitor-ing and protecting the health of surface water and groundwater resources has generally been at the forefront of environmental laws and regulations at the federal, state, and local level.
STATE of ThE ENvIRoNmENT IN BERkS CoUNTY
Many of our regulations that apply to water resources are di-rectly or indirectly linked to the Federal Water Pollution Control Amendments of 1972, which substantially strengthened prior Federal legislation addressing water quality. Major amendments were added in the Clean Water Act of 1977 and the Water Qual-ity Act of 1987.
There are many aspects of our water resources that can be, and are, monitored quantitatively. The amount of rainfall is one of these, and our television weather reports commonly talk about whether our region is in a water deficit or surplus, based oncomparisons with long-term averages. The amount of rainfall that percolates into underground aquifers, the “groundwater” resource, is another critical measure. We rely on wells for much of our drinking water, and if the aquifers are not recharged, our wells may run dry.
Rainwater that does not percolate into underground aquifers contributes to flows in our streams and rivers, and is oftenstored in surface reservoirs as drinking water supplies. Water flowingacrossthelandsurfacewillcarrywithitsoilparticlesand chemicals, and these materials may adversely affect the qualityof thewatereventuallyflowingintostreamsandriv-ers. Anything you place on the ground, be it antifreeze, oil, pesticides or herbicides, fertilizers, industrial chemicals, or trash, is likely to make its way into your local streams and rivers.
Humans are, of course, not the only organisms that depend on high quality water for survival. Clean streams and rivers support a diversity of fishes and invertebrates (animalswithout backbones), while polluted or stressed surface waters generally support a lower diversity and different group of aquatic organisms or none at all. Stream health, therefore, can be gauged not only by measuring water quality and chemistry directly, but also by sampling the communities of organisms that live in that water.
Our Water Indicators look at groundwater resources, stream con-dition and health, and plans in place to protect water resources in Berks County.l Groundwater Elevationsl Miles of Impaired Streamsl Water Systems with Protection Plansl Status of Sewage Facility Plans (Municipal PA Act 537)l Aquatic Life in Streams
9
WA
TER
Source: USGS Surface-Water Annual Statistics for the Nation: USGS 402615075530501 BE Berks County Observation Well
Ways to SAvE WATER
Groundwater at fleetwood well is relatively constant, but Berks County could use more monitoring wells.
Water Indicator one
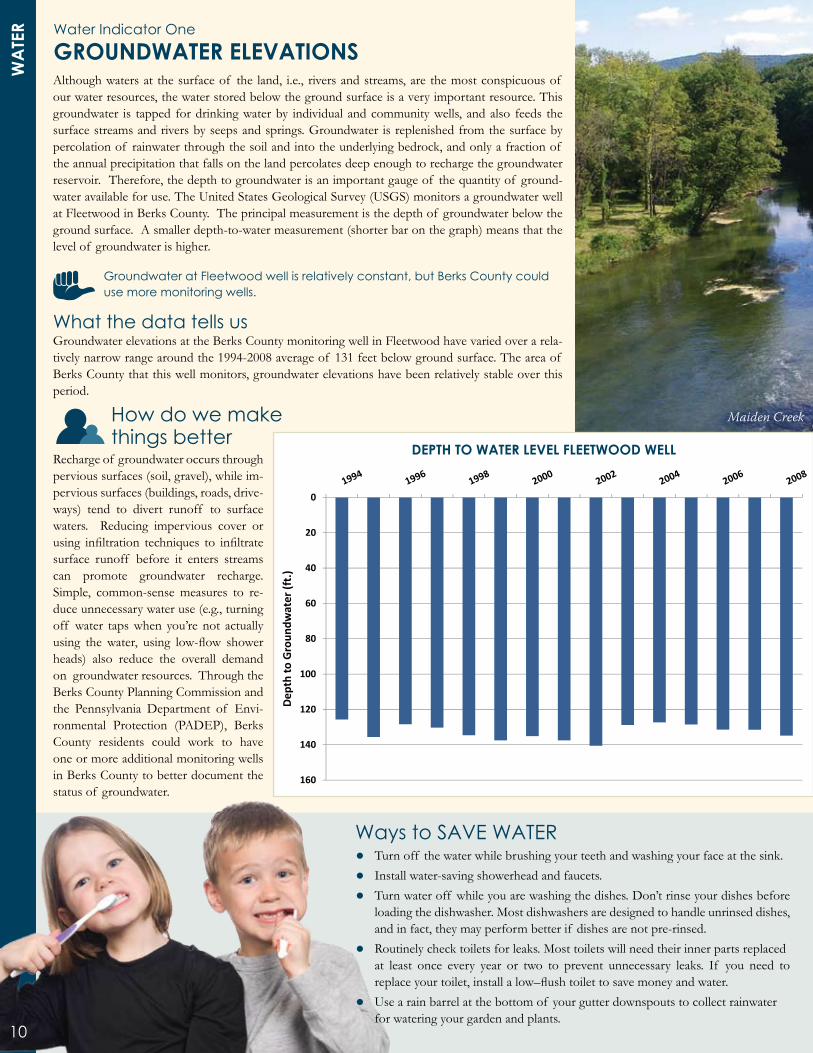
GRoundWATER ElEvATionsAlthough waters at the surface of the land, i.e., rivers and streams, are the most conspicuous of our water resources, the water stored below the ground surface is a very important resource. This groundwater is tapped for drinking water by individual and community wells, and also feeds the surface streams and rivers by seeps and springs. Groundwater is replenished from the surface by percolation of rainwater through the soil and into the underlying bedrock, and only a fraction of the annual precipitation that falls on the land percolates deep enough to recharge the groundwater reservoir. Therefore, the depth to groundwater is an important gauge of the quantity of ground-water available for use. The United States Geological Survey (USGS) monitors a groundwater well at Fleetwood in Berks County. The principal measurement is the depth of groundwater below the ground surface. A smaller depth-to-water measurement (shorter bar on the graph) means that the level of groundwater is higher.
What the data tells usGroundwater elevations at the Berks County monitoring well in Fleetwood have varied over a rela-tively narrow range around the 1994-2008 average of 131 feet below ground surface. The area of Berks County that this well monitors, groundwater elevations have been relatively stable over this period.
Maiden Creek
WA
TER
Recharge of groundwater occurs through pervious surfaces (soil, gravel), while im-pervious surfaces (buildings, roads, drive-ways) tend to divert runoff to surface waters. Reducing impervious cover or using infiltration techniques to infiltratesurface runoff before it enters streams can promote groundwater recharge. Simple, common-sense measures to re-duce unnecessary water use (e.g., turning off water taps when you’re not actually using the water, using low-flow showerheads) also reduce the overall demand on groundwater resources. Through the Berks County Planning Commission and the Pennsylvania Department of Envi-ronmental Protection (PADEP), Berks County residents could work to have one or more additional monitoring wells in Berks County to better document the status of groundwater.
how do we make things better
dEPTH To WATER lEvEl FlEETWood WEll
00
20
0
20
40
60
water
(ft.)
0
20
40
60
80
100toGroun
dwater
(ft.)
0
20
40
60
80
100
120Dep
thto
Groun
dwater
(ft.)
0
20
40
60
80
100
120
140
160
Dep
thto
Groun
dwater
(ft.)
0
20
40
60
80
100
120
140
160
Dep
thto
Groun
dwater
(ft.)
0
20
40
60
80
100
120
140
160
Dep
thto
Groun
dwater
(ft.)
0
20
40
60
80
100
120
140
160
Dep
thto
Groun
dwater
(ft.)
0
20
40
60
80
100
120
140
160
Dep
thto
Groun
dwater
(ft.)
0
20
40
60
80
100
120
140
160
Dep
thto
Groun
dwater
(ft.)
l Turn off the water while brushing your teeth and washing your face at the sink. l Install water-saving showerhead and faucets. l Turn water off while you are washing the dishes. Don’t rinse your dishes before loading the dishwasher. Most dishwashers are designed to handle unrinsed dishes, and in fact, they may perform better if dishes are not pre-rinsed. l Routinely check toilets for leaks. Most toilets will need their inner parts replaced at least once every year or two to prevent unnecessary leaks. If you need to replaceyourtoilet,installalow–flushtoilettosavemoneyandwater.l Use a rain barrel at the bottom of your gutter downspouts to collect rainwater for watering your garden and plants.
10
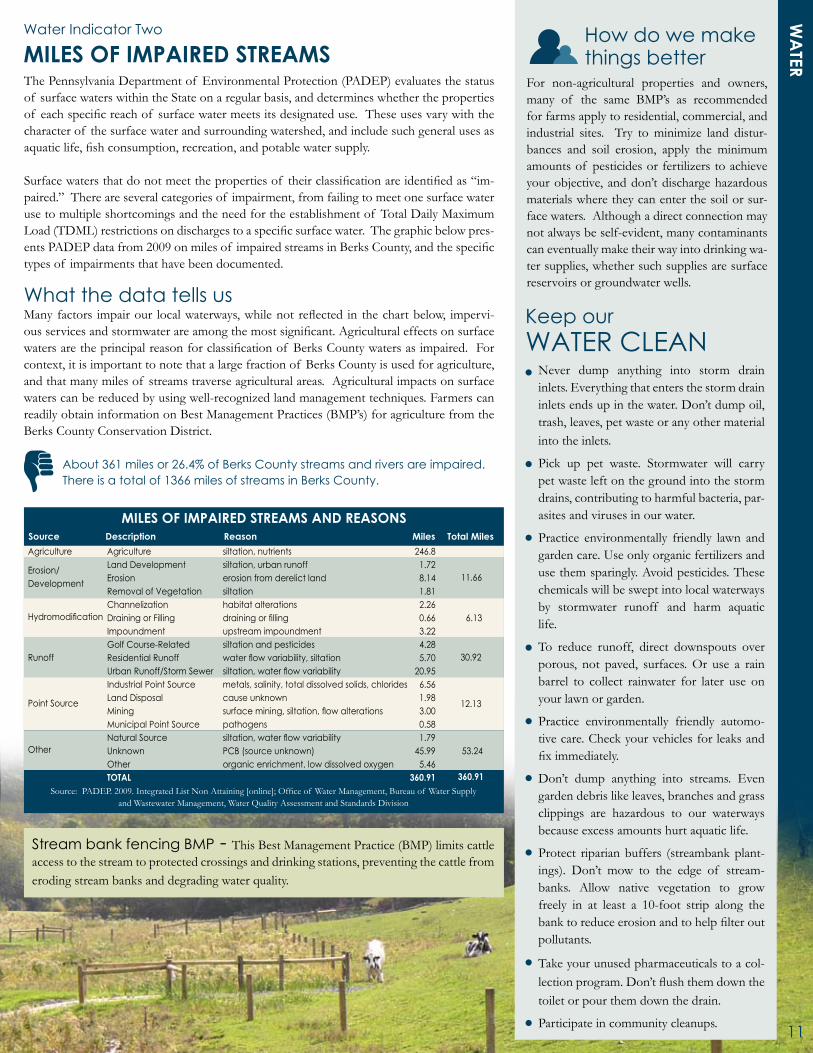
The Pennsylvania Department of Environmental Protection (PADEP) evaluates the status of surface waters within the State on a regular basis, and determines whether the properties of eachspecificreachof surfacewatermeetsitsdesignateduse.Theseusesvarywiththecharacter of the surface water and surrounding watershed, and include such general uses as aquaticlife,fishconsumption,recreation,andpotablewatersupply.
Surfacewatersthatdonotmeetthepropertiesof theirclassificationareidentifiedas“im-paired.” There are several categories of impairment, from failing to meet one surface water use to multiple shortcomings and the need for the establishment of Total Daily Maximum Load(TDML)restrictionsondischargestoaspecificsurfacewater.Thegraphicbelowpres-entsPADEPdatafrom2009onmilesof impairedstreamsinBerksCounty,andthespecifictypes of impairments that have been documented.
WA
TER
Never dump anything into storm drain inlets. Everything that enters the storm drain inlets ends up in the water. Don’t dump oil, trash, leaves, pet waste or any other material into the inlets.
Pick up pet waste. Stormwater will carry pet waste left on the ground into the storm drains, contributing to harmful bacteria, par-asites and viruses in our water.
Practice environmentally friendly lawn and garden care. Use only organic fertilizers and use them sparingly. Avoid pesticides. These chemicals will be swept into local waterways by stormwater runoff and harm aquatic life.
To reduce runoff, direct downspouts over porous, not paved, surfaces. Or use a rain barrel to collect rainwater for later use on your lawn or garden.
Practice environmentally friendly automo-tive care. Check your vehicles for leaks and fiximmediately.
Don’t dump anything into streams. Even garden debris like leaves, branches and grass clippings are hazardous to our waterways because excess amounts hurt aquatic life.
Protect riparian buffers (streambank plant-ings). Don’t mow to the edge of stream-banks. Allow native vegetation to grow freely in at least a 10-foot strip along the banktoreduceerosionandtohelpfilteroutpollutants.
Take your unused pharmaceuticals to a col-lectionprogram.Don’tflushthemdownthetoilet or pour them down the drain.
Participate in community cleanups.
l
l
l
l
l
l
l
l
About 361 miles or 26.4% of Berks County streams and rivers are impaired. There is a total of 1366 miles of streams in Berks County.
What the data tells usManyfactors impairour localwaterways,whilenotreflected in thechartbelow, impervi-ousservicesandstormwaterareamongthemostsignificant.Agriculturaleffectsonsurfacewatersaretheprincipalreasonforclassificationof BerksCountywatersasimpaired.Forcontext, it is important to note that a large fraction of Berks County is used for agriculture, and that many miles of streams traverse agricultural areas. Agricultural impacts on surface waters can be reduced by using well-recognized land management techniques. Farmers can readily obtain information on Best Management Practices (BMP’s) for agriculture from the Berks County Conservation District.
Water Indicator Two
MilEs oF iMPAiREd sTREAMsFor non-agricultural properties and owners, many of the same BMP’s as recommended for farms apply to residential, commercial, and industrial sites. Try to minimize land distur-bances and soil erosion, apply the minimum amounts of pesticides or fertilizers to achieve your objective, and don’t discharge hazardous materials where they can enter the soil or sur-face waters. Although a direct connection may not always be self-evident, many contaminants can eventually make their way into drinking wa-ter supplies, whether such supplies are surface reservoirs or groundwater wells.
how do we make things better
11
Source:PADEP.2009.IntegratedListNonAttaining[online];Officeof WaterManagement,Bureauof WaterSupply and Wastewater Management, Water Quality Assessment and Standards Division
Agriculture siltation, nutrients 246.8Land Development siltation, urban runoff 1.72Erosion erosion from derelict land 8.14 Removal of vegetation siltation 1.81 Channelization habitat alterations 2.26Draining or Filling draining or filling 0.66Impoundment upstream impoundment 3.22 Golf Course-Related siltation and pesticides 4.28Residential Runoff water flow variability, siltation 5.70Urban Runoff/Storm Sewer siltation, water flow variability 20.95 Industrial Point Source metals, salinity, total dissolved solids, chlorides 6.56 Land Disposal cause unknown 1.98 Mining surface mining, siltation, flow alterations 3.00 municipal Point Source pathogens 0.58Natural Source siltation, water flow variability 1.79Unknown PCB (source unknown) 45.99other organic enrichment, low dissolved oxygen 5.46ToTAl 360.91
Erosion/ Development
Hydromodification
Runoff
Point Source
other
Agriculture source description Reason Miles Total Miles
11.66
6.13
30.92
12.13
53.24
360.91
MilEs oF iMPAiREd sTREAMs And REAsons
keep our WATER CLEAN
l
Stream bank fencing BmP - This Best Management Practice (BMP) limits cattle access to the stream to protected crossings and drinking stations, preventing the cattle from eroding stream banks and degrading water quality.
The Safe Drinking Water Act (SDWA) Amendments of 1996 require that each state develop a Source Water Assessment and Protection (SWAP) Program for all drinking water sources - groundwater and surface water - that serve community water systems. The require-ments for the SWAP program were adopted by the Department of Environmental Protection (DEP) as regulations (Title 25, Chapter 109). The SWAP program for a Community Water System (CWS) consists of two parts: assessment and protection. The assessment part is mandatory. Many of the assessments were completed in the early 2000s, and provided a very general evaluation of the immediate protection area for existing water sources.
The second part of SWAP - protection - is voluntary. This is the source water protection plan indicator selected for this report. A CWS may voluntarily choose to develop a more detailed, comprehensive, and community-oriented source water protection (SWP) plan follow-ing DEP’s regulations in Chapter 109. For several years there was a grant program available for interested water systems. In 2007, DEP initiated the Source Water Protection Technical Assistance Program (SWPTAP) to help community water suppliers develop a protection plan for their water sources. All Community Water Systems are eligible toparticipateinthisprogramthroughtheirregionalDEPoffice.
BERKs CounTY PuBliC WATER sYsTEMs WiTH souRCE WATER PRoTECTion PlAns
Bernville Borough AuthorityKutztown Borough
Lyons Borough Municipal AuthorityMaxatawny Township
Reading Area Water AuthorityWomelsdorf/Robesonia Joint Authority
Source: Spotts, Stevens and McCoy, 2009
6
What the data tells usThe SWAP program is relatively new and the voluntary “protection” phase of the program follows the assessment phase, so the low number of Berks water suppliers with a source water protection plan in place is not a distressing statistic. However, the hope would be that the number of Berks water suppliers with source water protection plans shows a substantial increase over the next few years.
Upon completion of SWAPs, public meetings are held to discuss results, recom-mendations, and enhancements. Find out about the status of source water protec-tion plans for your area, and try to attend public meetings discussing these issues. Encourage your water supplier and municipality to participate in the SWAP pro-gram. Landowners, commercial, and industrial facilities in proximity to designated source water protection areas should evaluate the potential for their sites to affect source waters, and take reasonable steps to reduce potential adverse impacts (e.g., spill protection plans).
how do we make things better
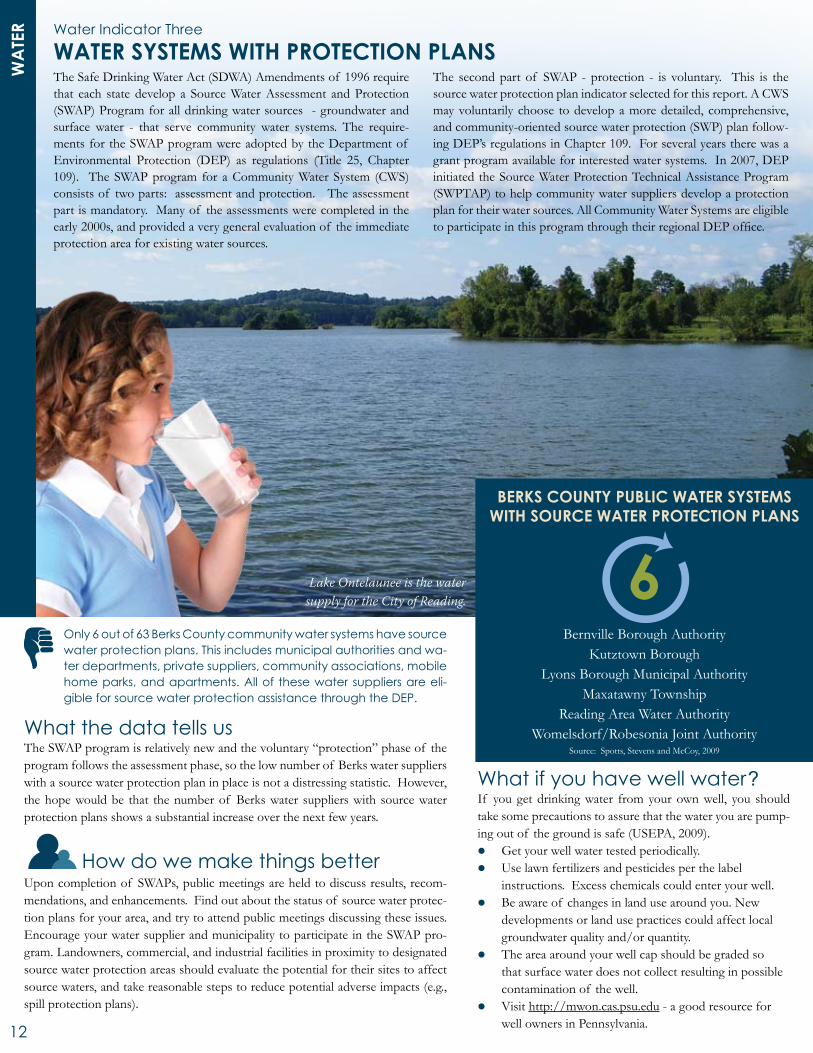
only 6 out of 63 Berks County community water systems have source water protection plans. This includes municipal authorities and wa-ter departments, private suppliers, community associations, mobile home parks, and apartments. All of these water suppliers are eli-gible for source water protection assistance through the DEP.
What if you have well water ?If you get drinking water from your own well, you should take some precautions to assure that the water you are pump-ing out of the ground is safe (USEPA, 2009).l Get your well water tested periodically.l Use lawn fertilizers and pesticides per the label instructions. Excess chemicals could enter your well.l Be aware of changes in land use around you. New developments or land use practices could affect local groundwater quality and/or quantity.l The area around your well cap should be graded so that surface water does not collect resulting in possible contamination of the well.l Visit http://mwon.cas.psu.edu - a good resource for well owners in Pennsylvania.
Lake Ontelaunee is the water supply for the City of Reading.
Water Indicator Three
WATER sYsTEMs WiTH PRoTECTion PlAnsW
ATE
R
12

Whenever people live in close proximity, they must ad-dress two basic environmental concerns: clean drinking water, and treatment/disposal of sewage. While farm-steads might have been able to rely on a well and a privy to meet these needs, increased density of development requires more comprehensive planning to protect hu-man health and water resources.
A 537 Plan is a Wastewater Management Plan that com-plies with the requirements of Act 537, the Pennsylvania Sewage Facilities Act. Act 537 was enacted in 1966 to correct existing sewage disposal problems and prevent future problems by requiring proper planning and per-mitting of all types of sewage facilities ranging from municipal wastewater treatment plants to individual on-lot disposal systems (septic systems).
Under Act 537, all municipalities must develop and im-plementanofficial sewageplan thataddressescurrentand future sewage disposal needs. These 537 Plans may require revision due to new land development projects or other changes in demands on a municipality’s sewage disposal capabilities. Changes in municipal 537 plans are reviewed by the Pennsylvania Department of Envi-ronmental Protection (PA DEP). The chart at right lists the “ages” of Berks County 537 plans, i.e., how long the plan has gone without revision.
most Berks County 537 plans are more than 10 years old.
AGE OF MUNICIPAL 537 PLAN
35
30
2525
20
15
10AGE OF MUNICIPAL 537 PLAN
5
0
20 YEARS OLD 10 20 YEARS OLD 5 10 YEARS OLD 5 YEARS OLD>20 YEARS OLD 10 20 YEARS OLD 5 10 YEARS OLD <5 YEARS OLD
AGE oF MuniCiPAl 537 PlAn
Source:PADEP
What the data tells usBecause a 537 Plan needs be revised only when a munic-ipality’s sewage disposal needs change, an “older” 537 plan is not necessarily outdated. However, revisions to 537 plans generally incorporate technical improvements that have become working practices for the engineering and water treatment professions.
Everyone should be aware that water conserved is water that does not have to be treated, either in an individual on-lot system or in a public wastewater treatment plant. So,prudentconsumptionof waterisagoodfirststepwe all can take. Property owners with on-lot septic sys-tems can practice good management by having their sys-tems pumped out on a regular schedule. On-lot septic systems serving individual residences should be pumped out every 3-5 years, depending on the number of users. However, because some municipalities may have ordi-nances specifying pump-out intervals for on-lot septic systems, it is good practice to consult your municipal officialsbeforesettingyourschedule.
how do we make things better
Tips to Care for your SEPTIC TANkDivert rainwater from the septic drain-field.Asoggydrainfieldwon’tabsorband neutralize liquid waste. Plan land-scaping and roof gutter drains so that excess water is diverted.
Perform regular maintenance. Check with a septic professional to see how often you need to do removal.
The toilet isn’t a garbage disposal. Never flushmedicine, cat litter, dis-posable diapers, sanitary napkins, tampons, paper towels, facial tissues, coffee grounds, or cigarette butts.
Keep trees at least 100 feet away from the septic system. Tree roots that in-vade your septic system can do major damage.
Avoid hazardous chemicals. Varnish, paint thinners, motor oils, gasoline and other chemicals can ruin your system and are a hazard to groundwa-ter. Dispose of them properly.
Thesepticdrainfieldshouldbegrad-ed so that stormwater does not accu-mulateandstandonthedrainfield.
INDIvIDUAL oN-LoT SYSTEmSMunicipalities or local agencies are required to employ Sewage Enforce-mentOfficers(SEO’s)whoarecertifiedbythestateandareresponsible,among other duties, for reviewing permits for construction of on-lot septic systems.
l
l
l
l
l
l
WA
TERWater Indicator four
sTATus oF sEWAGE FACiliTY PlAns (MuniCiPAl 537 PlAns)
13

Sacony Creek and WatershedProtectingthesurfacewaterandgroundwaterthatflowsthroughtheentireSaconyCreekWatershedand Kutztown Borough Wellheads is important to the quantity and quality of the drinking water that is ultimately available in people’s homes. The headwaters of the Sacony Creek originate in the pristine Oley Hills and travel through rural agricultural areas until they make their way to the Borough of Kutztown, and eventually to the Maiden Creek (which feeds Lake Ontelaunee – the City of Reading’s drinking water supply). New trails, native plants, educational stations, a protected marsh and healthy vegetation now serve as a companion next to this important creek as it makes its journey. How did this creek and its surrounding watershed get so lucky?
Community ActionSeveral years ago members of the greater Kutztown community worked together to raise funds to help protect the Sacony Marsh (an important freshwater natu-ral feature in Kutztown). This group of citizens and businesses, Friends of Sacony Marsh, is still active today. To-gether, with the Berks Conservancy, Maiden Creek Watershed Association, County of Berks grant funds, and the Borough of Kutztown, the “Friends” have done much more than protect the marsh. They’ve helped the dedicated staff of the Borough create trails, install benches, build an observation deck, develop signage, and plant vegetation along the creek.
This group of partners has utilized grant funds to install best management practices along the Sacony Creek to improve eroded areas – this helps to ensure healthy water in the stream. In addition, walking and biking trails were created that meander next to the creek, and Kutztown Borough completed the construction of an observation deck that overlooks the creek and marsh. This deck includes educa-tional stations so that visitors can appreciate the importance of the natural resources that are surround-ing them.
What makes this project extremely special is that a portion of the trail and the observation deck are located along the Kutztown Area School District’s property line. As a result, hundreds of Elementary and Jr/Sr High School students utilize the trail to learn about the importance of the creek and marsh. The teachers and students have taken an active role in utilizing this special natural resource and the Kutztown Area School District should be commended for their participation.
Now, one can enjoy a walk or bike ride along the completed trail that takes you from the Sacony Marsh and observation deck over to Main Street in Kutztown. But that’s not all…In 2009, the focus of the partnership turned to the protection of the borough’s wellhead property (drinking water supply). Nu-merous land management techniques were implemented on the property, including the addition of 850 nativetreesandshrubsinbufferstohelpfilterandprotectthewater.Thisprojectinvolvednearly1580volunteers to assist in this major tree planting effort – including the Environmental Club at Kutztown University, Kutztown Middle School Students, Maidencreek Watershed Association members, and vol-unteers of the Berks Conservancy’s Environmental Committee. The cooperation of many partners and volunteers made this project successful. This partnership, simply aimed to improve natural resources in the Sacony Creek Watershed, can serve as a model for similar projects involving municipalities, school districts,andnon-profitorganizationselsewhereinBerksCounty.For more information about com-munity partnerships addressing the Schuylkill River, visit www.schuylkillwaters.org.
how can local partnerships lead to trails, education, And WATER PRoTECTion?
WA
TER
1114 Sacony Creek

one important measure of stream health is whether a waterbody supports a diverse community of plants and animals. one group of animals monitored for indications of stream health are the larger invertebrate animals that typically spend some or all of their life cycles in fresh water.
What the data tells usManatawny Creek scores “good” on the MAIS benthic invertebrate score, while Hay Creek, Angelica Creek, Maiden Creek, and Northkill Creek score in the upper half of the “fair” range of MAIS scores. Only Tulpe-hocken Creek among this group scores in the “poor” range of scores. Stroud has published a detailed dis-cussion of the sampling results from Tulpehocken Creek; that discussion can be found in Understanding Stream Conditions ..., available on Stroud’s website at www.stroundcenter.org/schuylkill/report.htm.
Conditionsinsurfacewatersreflectwhatishappeninginthesurroundingwater-shed, i.e., the land area that provides water to a particular stream or river. Lawn and farm fertilizers increase algae growth and may promote episodes of low oxygen in streams; motor oils, antifreeze, and other chemicals can enter streams fromroadsideculvertsanddrains;cuttingbacklawnsandfieldstotheedgesof streams can elevate water temperatures and increase sediment loads in the stream waters. Reducing fertilizer, sediment, and contaminant inputs, and maintaining vegetated buffers and canopies along streams, are easy ways to promote healthy streams and rivers in Berks County.
These animals are referred to as “benthic macroinvertebrates,” and can be quantita-tivelysampledusingnetsamplers.Aftertheinvertebratesarecountedandidentified,the data can be evaluated using a variety of ecological measures or “metrics.”
The Stroud Water Research Center in Avondale, PA, has implemented a long-term as-sessment of streams in the Schuylkill River Basin, sampling benthic macroinvertebrates at 19 locations in that basin. The data are assessed using a metric termed the Macroin-vertebrate Aggregated Index for Streams (MAIS), which combines or aggregates sev-eral conventional ways of as-sessing the health of a stream’s invertebrate community. The MAIS score ranges from 0 to 20, with scores from 13.1 to 20yieldingaclassificationof “Good,” 6.1 to 13 as “Fair,” and 0-6 as “Poor.” Basically, the higher the quantity and diversity of aquatic life, the better the water quality.
The graphic at right is a Stroud Research Center representa-tion of the MAIS scores for the six Stroud stream moni-toring locations within Berks County. These locations are on Manatawny Creek, Hay Creek, Angelica Creek, Maid-en Creek, Northkill Creek, and Tulpehocken Creek.
measures of stream health based on organisms in streams are mixed.
how do we make things better
Why is this ImPoRTANT To YoU & YoUR fAmILY ?
WA
TERWater Indicator five
AQuATiC liFE in sTREAMs
MACRoinvERTEBRATE AGGREGATEd indEx FoR sTREAMs (MAis) BERKs CounTY sAMPlinG loCATions
14.112.9
14.0
16.0
10.910.1
11.9
10.0
12.0
5 06.0
8.0
5.0
2 0
4.0
0.0
2.0
Manatawny Creek Hay Creek Angelica Creek Maiden Creek Northkill Creek Tulpehocken Creek
Source:StroundResearchCenter;SchuylkillProject;19Long-TermSamplingSites(2009).
Benthic macroinvertebrates are animals without backbones living on the bottom of streams andponds.Thisgroupincludescrayfish,snails,clams,andmanyimmatureformsof insects
(e.g.,mayflies,caddisflies,gnats,midges,dragonflies).
Source: Stround Research Center; Schuylkill Project; 19Long-Term Sampling Sites (2009).
13.1-20 Good6.1-13 FAiR0-6 PooR
Conditionsinsurfacewatersreflectwhatishappen-
ing in the surrounding watershed, i.e., the land area that provides water to a particular stream or river. The
quality of the stream, and the types of organisms that live in the stream, are affected by how the watershed is developed, what is carried off these lands into the streams during rainstorms, how much vegetation re-mains along stream banks, etc.
15

Learn simple steps to reduce energy use and costs.
16
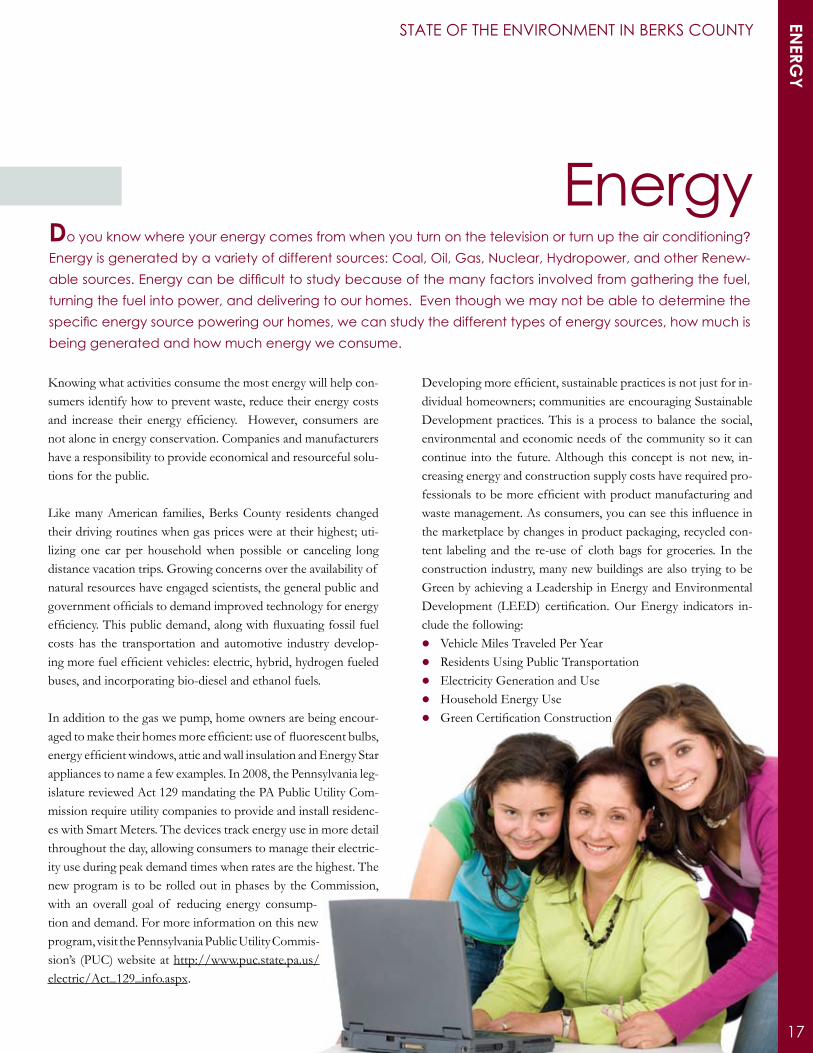
Energydo you know where your energy comes from when you turn on the television or turn up the air conditioning? Energy is generated by a variety of different sources: Coal, oil, Gas, Nuclear, hydropower, and other Renew-able sources. Energy can be difficult to study because of the many factors involved from gathering the fuel, turning the fuel into power, and delivering to our homes. Even though we may not be able to determine the specific energy source powering our homes, we can study the different types of energy sources, how much is being generated and how much energy we consume.
STATE of ThE ENvIRoNmENT IN BERkS CoUNTY
Knowing what activities consume the most energy will help con-sumers identify how to prevent waste, reduce their energy costs and increase their energy efficiency. However, consumers arenot alone in energy conservation. Companies and manufacturers have a responsibility to provide economical and resourceful solu-tions for the public.
Like many American families, Berks County residents changed their driving routines when gas prices were at their highest; uti-lizing one car per household when possible or canceling long distance vacation trips. Growing concerns over the availability of natural resources have engaged scientists, the general public and governmentofficialstodemandimprovedtechnologyforenergyefficiency.Thispublicdemand,alongwithfluxuatingfossilfuelcosts has the transportation and automotive industry develop-ingmorefuelefficientvehicles:electric,hybrid,hydrogenfueledbuses, and incorporating bio-diesel and ethanol fuels.
In addition to the gas we pump, home owners are being encour-agedtomaketheirhomesmoreefficient:useof fluorescentbulbs,energyefficientwindows,atticandwallinsulationandEnergyStarappliances to name a few examples. In 2008, the Pennsylvania leg-islature reviewed Act 129 mandating the PA Public Utility Com-mission require utility companies to provide and install residenc-es with Smart Meters. The devices track energy use in more detail throughout the day, allowing consumers to manage their electric-ity use during peak demand times when rates are the highest. The new program is to be rolled out in phases by the Commission, with an overall goal of reducing energy consump-tion and demand. For more information on this new program, visit the Pennsylvania Public Utility Commis-sion’s (PUC) website at http://www.puc.state.pa.us/ electric/Act_129_info.aspx.
Developingmoreefficient,sustainablepracticesisnotjustforin-dividual homeowners; communities are encouraging Sustainable Development practices. This is a process to balance the social, environmental and economic needs of the community so it can continue into the future. Although this concept is not new, in-creasing energy and construction supply costs have required pro-fessionalstobemoreefficientwithproductmanufacturingandwastemanagement.Asconsumers,youcanseethisinfluenceinthe marketplace by changes in product packaging, recycled con-tent labeling and the re-use of cloth bags for groceries. In the construction industry, many new buildings are also trying to be Green by achieving a Leadership in Energy and Environmental Development (LEED) certification.OurEnergy indicators in-clude the following:l Vehicle Miles Traveled Per Yearl Residents Using Public Transportationl Electricity Generation and Usel Household Energy Usel GreenCertificationConstruction
17
EnERG
Y

Commuting to work is a common practice for most Americans and Berks County residents are no exception. In 2003, the U.S. Census Bureau estimated that Berks County residents spend 22 minutes commuting to work which is just under the average Pennsylvanian time of 23.8 minutes.
Trafficreportseachmorningandafternoonwarnusof congestedtrafficareasandaccidents where our commuting time can be extended even further. With 10% of Berks County residents carpooling and only 1.9% utilizing public transportation, roads continue to be congested with single passenger vehicles.
Consumption of fossil fuel remains one of the easiest energy conservation items we can self regulate. We can control the amount of miles we travel on a daily, weekly ormonthlybasisinadditiontotheefficiencyof thevehicleswedrive.PennDOTassesses vehicle miles traveled per year on a county basis, and the graph below dem-onstrates that Berks County residents appear to be more conservative than the state average in total miles traveled.
Berks residents travel less in personal or single passenger vehicles than the average person in Pennsylvania; thus, using less gas. But, the trend is increasing.
l Start a carpool at work.l Make several errands in one trip.l When possible, buy local goods and services.l Explore the local Berks County’s parks and recreational areas instead of traveling a long distance.l Ride your bike, walk, or use the bus for short trips.l Utilize the school bus for your children.
how do we make things better
What the data tells usThe number of miles traveled can indicate that Berks County residents live in closer proximity to their jobs, schools, recreational activities, shopping and service areas than the average Pennsylvanian. By increasing the type and variety of local com-merce, Berks County residents have less need to travel farther, beyond the county line for goods or services on a regular basis.
7000
7200
7400
7600
7800
8000
8200
8400
8600
8800
9000
2003 2004 2005 2006 2007
Mile
s Pe
r Ye
ar P
er R
esid
ent
MILES TRAVELED PER RESIDENT PER YEAR
Berks County
Statewide
MilEs TRAvElEd PER REsidEnT PER YEARBERKs CounTYsTATEWidE
Source: Pennsylvania Department of Transportation (PennDOT) online database July 2009
18
EnER
GY Energy Indicator one
vEHiClE-MilEs TRAvElEd PER YEAR
What the data tells usBARTA reviews ridership trends and changes routes to meet the community’s needs, however; ridership re-mains below the national average as residents continue to use their personal vehicles. To expand options to riders, BARTA’s newest addition of bicycle racks to its buses increases ridership to passengers beyond the nearest bus stop.
l Utilize bus transport for traveling around town.l Familiarize yourself with BARTA routes and bus stop locations.l Avoid paying parking fees by using public transportation to special events: concerts, NYC or Philadelphia trips, college sporting events.
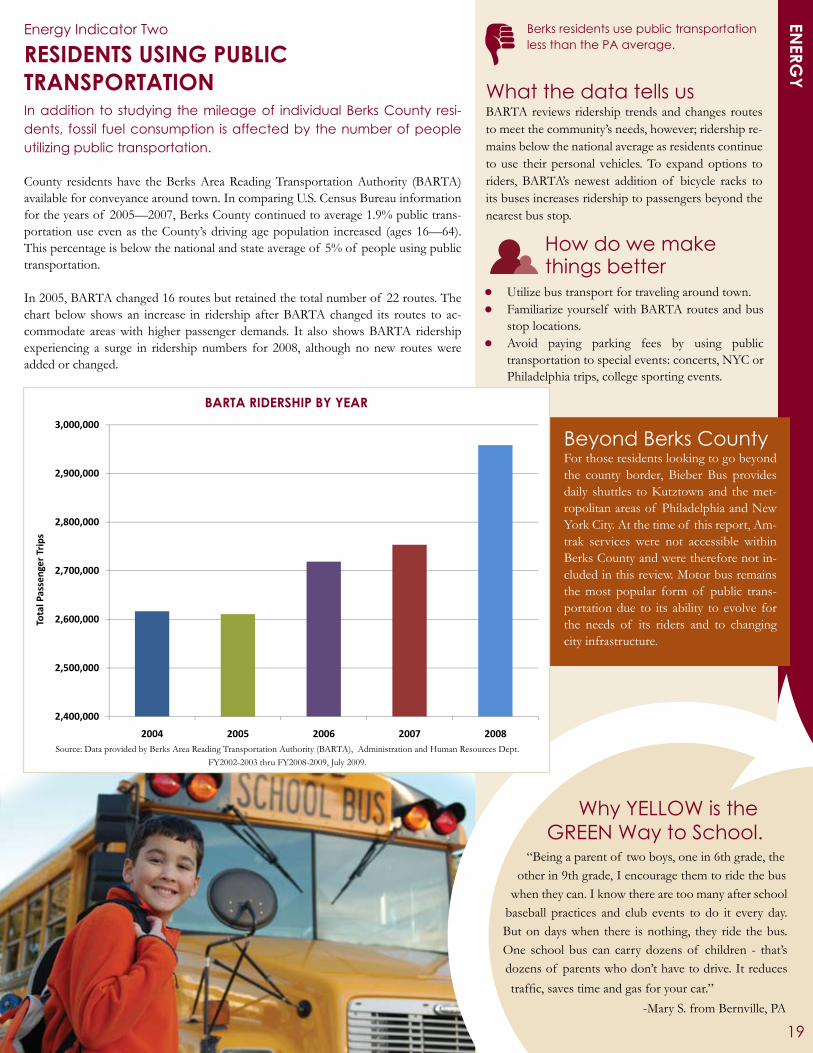
In addition to studying the mileage of individual Berks County resi-dents, fossil fuel consumption is affected by the number of people utilizing public transportation.
County residents have the Berks Area Reading Transportation Authority (BARTA) available for conveyance around town. In comparing U.S. Census Bureau information for the years of 2005—2007, Berks County continued to average 1.9% public trans-portation use even as the County’s driving age population increased (ages 16—64). This percentage is below the national and state average of 5% of people using public transportation.
In 2005, BARTA changed 16 routes but retained the total number of 22 routes. The chart below shows an increase in ridership after BARTA changed its routes to ac-commodate areas with higher passenger demands. It also shows BARTA ridership experiencing a surge in ridership numbers for 2008, although no new routes were added or changed.
Berks residents use public transportation less than the PA average.
how do we make things better
Why YELLoW is the GREEN Way to School.
“Being a parent of two boys, one in 6th grade, the other in 9th grade, I encourage them to ride the bus
when they can. I know there are too many after school baseball practices and club events to do it every day. But on days when there is nothing, they ride the bus. One school bus can carry dozens of children - that’s dozens of parents who don’t have to drive. It reduces traffic,savestimeandgasforyourcar.”
-Mary S. from Bernville, PA
19
EnERG
YEnergy Indicator Two
REsidEnTs usinG PuBliC TRAnsPoRTATion
BARTA RidERsHiP BY YEAR
2,900,000
3,000,000
BARTA Ridership by Year
2,700,000
2,800,000
2,900,000
3,000,000
TotalPassengers
BARTA Ridership by Year
2004
2005
2006
2007
2,400,000
2,500,000
2,600,000
2,700,000
2,800,000
2,900,000
3,000,000
TotalPassengers
BARTA Ridership by Year
2004
2005
2006
2007
2008
2,400,000
2,500,000
2,600,000
2,700,000
2,800,000
2,900,000
3,000,000
2004 2005 2006 2007 2008
TotalPassengers
Year
BARTA Ridership by Year
2004
2005
2006
2007
2008
Beyond Berks CountyFor those residents looking to go beyond the county border, Bieber Bus provides daily shuttles to Kutztown and the met-ropolitan areas of Philadelphia and New York City. At the time of this report, Am-trak services were not accessible within Berks County and were therefore not in-cluded in this review. Motor bus remains the most popular form of public trans-portation due to its ability to evolve for the needs of its riders and to changing city infrastructure.
Source: Data provided by Berks Area Reading Transportation Authority (BARTA), Administration and Human Resources Dept. FY2002-2003 thru FY2008-2009, July 2009.
Tota
l Pas
seng
er T
rips

Berks County relies mainly on fossil fuel for energy, with few alternative sources available.
l Conserve electricity. Consider getting a home energy audit done to identify where you might be wasting energy.l Research Tax incentives for renewable energies available for your home, for example solar panels.l Write to elected officials to request developing renewable energy generation in PA.l Ask your electricity provider if you can purchase Renewable Energy for your home.l
how do we make things better
Source of Energy Generatedby Type for RFCE Sub Region
Source of Energy Generatedby Type for RFCE Sub Region
Coal Gas Oil Nuclear Hydro Renewable Non hydro
4%
39%1%
Source of Energy Generatedby Type for RFCE Sub Region
Coal Gas Oil Nuclear Hydro Renewable Non hydro
10%
4%
39%1%
2%
Source of Energy Generatedby Type for RFCE Sub Region
Coal Gas Oil Nuclear Hydro Renewable Non hydro
45%
10%
4%
39%1%
1%
2%
Source of Energy Generatedby Type for RFCE Sub Region
Coal Gas Oil Nuclear Hydro Renewable Non hydro
45%
10%
4%
39%1%
1%
2%
Source of Energy Generatedby Type for RFCE Sub Region
Coal Gas Oil Nuclear Hydro Renewable Non hydro
45%
10%
4%
39%1%
1%
2%
Source of Energy Generatedby Type for RFCE Sub Region
Coal Gas Oil Nuclear Hydro Renewable Non hydro
45%
10%
4%
39%1%
1%
2%
Source of Energy Generatedby Type for RFCE Sub Region
Coal Gas Oil Nuclear Hydro Renewable Non hydro
45%
10%
4%
39%1%
1%
2%
Source of Energy Generatedby Type for RFCE Sub Region
Coal Gas Oil Nuclear Hydro Renewable Non hydro
45%
10%
4%
39%1%
1%
2%
Source of Energy Generatedby Type for RFCE Sub Region
Coal Gas Oil Nuclear Hydro Renewable Non hydro
45%
10%
4%
39%1%
1%
2%
Source of Energy Generatedby Type for RFCE Sub Region
Coal Gas Oil Nuclear Hydro Renewable Non hydro
souRCE oF EnERGY GEnERATEd
CoAlGAsoilnuClEARHYdRo (1%)REnEWABlE non-HYdRo (1%)
by Type for RFCE sub-Region
20
EnER
GY Energy Indicator Three
ElECTRiCiTY GEnERATion & usE
For more information about renewable energy, visit the Mid-Atlantic Renewable Energy Association’s (MAREA) website at www.themarea.org.MAREAisanonprofitorganization, dedicated to informing and educating the public on renewable energy production,energyefficiency,andsustain-able living through meetings, workshops, educational materials, and energy fairs.
Berks County is a part of the Reliability First /Central – East (RFCE) Sub-Region of the US power grid. The region is grouped together by areas of similar weather conditions, energy resources and emissions. According to the US Nuclear Regulatory Commis-sion, Pennsylvania has the most operating nuclear power reactors of the RFCE sub-region states with 5 plants, none of which are located within Berks County. When reviewing natural resources, the Energy InformationAdministration (EIA) identifies traditional oil, gasorcoal reserves are available within the RFCE region, but again none arewithinBerks.OtherPAcountiesdeficientinnaturalresourcesaregenerating new sources for energy generation, such as wind farms in the Poconos and Northeast PA landscape. The adjacent chart shows the different sources used to generate energy consumed daily by Berks County and other RFCE sub-region residents.
For each type of energy generation, the Department of Energy has calculated the amount of CO2 released into the atmosphere for each unit of electrical power generated. By using this information and the percentage of each generation type in the chart above, we can calculate the amount of CO2 we emit for the electricity we use and compare that to other regions. The percentage of Renewable energy is important because it produces no CO2 emissions (wind, solar, geothermal, hydropower) or produces CO2 emissions that will be offset in a short period of time (biomass). This chart shows the amount of CO2 emitted and percent Renewable generation for our RFCE region, the CAMX (California) region, and theUSAverage.ThedatashowsthatthattheRFCEsub-regionissignificantlybehindthenational leader CAMX and below the national average in utilizing non-hydropower renewable resources. The RFCE region has less CO2 emissions than the national average but trails the CAMXsignificantly.TheRFCEisalsotrendingupwardinCO2 emissions per MWh.
What the data tells usThe RFCE region produces less CO2 per MWh when compared to the national average due to our abundant nuclear generation. However, since we have not built any new nuclear reac-tors in decades, any new demand is being met with higher CO2 emitting sources in the RFCE. The RFCE is behind the national average in Renewables generation.
0.548
0.440
0.685
0.57
0.36
0.67
Tons of CO2 per MWh Generated and % Renewables
1.4%
9.7%
2.6%1.2%
9.4%
2.5%
RFCE CAMX US AVE
Source: Energy Information Agency (EIA) of the Department of Energy, Renewables Generation online database October 2009
Tons oF Co2 PER MWH GEnERATEd And % REnEWABlEs
2004 Tons Co2/MWH2005 Tons Co2/MWH2004 % REnEWABlEs2005 % REnEWABlEs
REGion

how do we make things better
EnERG
YRenewable energy is energy generated from natural resources—such as sunlight, wind, rain, tides, and geothermal heat—which are renewable or naturally replenished.
Solar EnergyThe sun has produced energy for billions of years. Solar energy is the sun’s rays (solar radiation) that reach the Earth. This energy can be converted into other forms of energy, such as heat and electricity. You can capture and convert solar radiation into useful forms of energy, using a variety of technologies. Solar energy can be converted to electricity in two ways:l Photovoltaic (PV devices) or “solar cells” change sunlight directly into electricity. PV systems are often used in remote locations that are not connected to the electric grid. They are also used to power watches, calculators, and lighted road signs.l Concentrating Solar Power Plants generate electricity by using the heat from solar thermal collectors to heat a fluid which produces steam that is used to power the generator. Out of the eleven known concentrating solar power generating units operating in the United States at the end of 2008; nine of these are in California, one in Arizona, and one in Nevada.
Wind EnergyWind is simply air in motion. It is caused by the uneven heating of the Earth’s surface by the sun. Wind energy is mainly used to generate electricity. Wind is a renewable energy source because the wind will blow as long as the sun shines.
There are two types of wind machines (turbines) used today, based on the direction of the rotating shaft (axis): horizontal-axis wind machines and vertical-axis wind machines. The size of wind machines varies widely. Small turbines used to power a single home or business can have a capacity of less than 100 kilowatts. Large commercial-sized tur-bines can have a capacity of 5 megawatts which are often grouped together into wind farms that provide power to the electrical grid. According to the PA Department of Environmental Protection (PADEP), Pennsylvania is a leader on the east coast of the United States in wind energy production. There are currently over 300 megawatts of wind power generation installed in Pennsylvania with several more wind farms planned. For more information about wind energy, visit www.depweb.state.pa.us and type in the search: wind energy.
Geothermal heatWhile temperatures above ground change a lot from day to day and season to season, temperatures 10 feet below the Earth’s surface hold nearly constant between 50° and 60°F. For most areas, this means that soil temperatures are usually warmer than the air in winter and cooler than the air in summer. Geothermal heat pumps use the Earth’s constant temperatures to heat and cool buildings. They transfer heat from the ground (or water) into buildings in winter and reverse the process in the summer.
Geothermalheatpumpsareenergyefficientandcosteffective.AccordingtotheU.S. Environmental Protection Agency (EPA), geothermal heat pumps are the most energyefficient,environmentallyclean,andcosteffectivesystemsfortemperaturecontrol. Although most homes still use traditional furnaces and air conditioners, geothermal heat pumps are becoming more popular. One example of a building using geothermal heat in Berks County is the Green Valley Elementary School in Wilson School District. The school has many features which are green such as the heating, cooling and lighting systems. The school uses geothermal heating which boostsefficiencyandreducestheoperationalcostsof theschool.
What do you mean by REnEWABlE EnERGY?
What are YoU doing to BE GREEN?
Principal Dr. Dina Wert at Green Valley Elementary School wants their LEED certified
school building to be an educational tool in itself. She wants to connect the children’s curriculum to being
greener and showcase the features of the green build-ing to the parents and community. Some of her goals for the future are to explore composting the cafeteria food waste and create an outdoor environmental setting for the teachers and students to enjoy. The goal is to create habits and a knowledge base for children now,
so that it becomes part of how they live their life.
21

In 2010, Berks County residents will notice a change in their utility bills as rate caps expire. Since 1997, increases to PA utility rates have been limited by the state even though services, maintenance and upgrades have continued to increase for its providers. In prepara-tion for the rate cap expiration, utility companies have been working with customers to educate and provide payment options to alleviate possible economic strains. The increase in utility rates will require businesses and home owners to evaluate buildings and their own energyefficiency.
The Pennsylvania Utility Commission (PUC) estimates that half of each electricity bill accounts for generation costs leaving consum-ers to evaluate their own energy consumption habits. There have been improvements to many electronic devices to include energy saving modes, however many businesses and households have in-creased the quantity of electronic devices: such as multiple televisions and computers per build-ing. Devices plugged in to receptacles still draw electrical power (standby power) when turned off. The table below shows the average energy consumed by common residential ap-pliances turned off or on standby power, as studied and reported in 2009 by The Lawrence Berkeley National Laboratory.
As previously discussed, the intent of using Smart Meters is to pro-vide home owners with details on their energy use throughout the day so energy demands can be shifted when grid demands and rates are reduced. This practice is feasible for many activities, however some energy demands can not be turned off, such as heating. Resi-dentialheatingisinfluencedmorebyweatherforecasts,costof fuel,efficiencyof theheatingsystemandheatlossfactorsof thehouse.According to data provided by PPL utility company, electrical heat-ing accounts for the majority of energy demand by PPL customers. The chart below demonstrates that while the state rate caps were in place, electrical heating demands have cycled around 1400 kilo-watts per month while general electricity demand has been on the increase. As utility rates change in future months, it is anticipated that electrical use will shift as consumers modify their usage.
Conserve energy.You can save significant energy andmoneywithsimple measures such as adjusting your thermostat or shutting down equipment. Unplugging appliances such as televisions, stereos, and computers while not in use can have a big impact. Use power strips for easier on/off powering to multiple electronic devices. Individual devices may appear to draw small amounts of energy, but when add-edtogetherenergyconsumptioncanbesignificantandcostly.
Buy Energy Star appliances. The Energy Star designation is awarded to appliances, electronics, and equipment that meet strict energy ef-ficiencyguidelinessetbytheUSEnvironmentalProtectionAgencyand US Department of Energy. More information about the Energy Star program can be found at www.energystar.gov.
Make sure your home is energy efficient.Reviewhomeowner taxincentives available for energy efficiency improvements.Make sureyour home is insulated, windows caulked and check weatherstripping. Utilize residential energy use analyzers from your utility provider.
Plant trees. Trees and other plants absorb carbon dioxide and convert it into oxygen which is released into the atmosphere. Planting a tree in your neighborhood can help beautify the area while absorbing 2,000 pounds of CO2 over its lifetime.
Recycling can decrease your carbon emissions. By reducing your gar-bage by only 10%, you can reduce your CO2 emissions by as much as 1,200 pounds a year. Reusing durable manufactured goods such as furniture and household appliances can help cut down the waste you produce and the CO2 emitted to produce them.
how can YoU make a difference ?l l
22
EnER
GY Energy Indicator four
HousEHold EnERGY usE
1,600
Average Electric Use per Customer(Residential)
600
800
1,000
1,200
1,400
1,600
.kWhpe
rmon
th
Average Electric Use per Customer(Residential)
Electric Heating
Electrical Use (General)
0
200
400
600
800
1,000
1,200
1,400
1,600
2000 2001 2002 2003 2004 2005 2006 2007 2008
Avg.kWhpe
rmon
th
Year
Average Electric Use per Customer(Residential)
Electric Heating
Electrical Use (General)
0
200
400
600
800
1,000
1,200
1,400
1,600
2000 2001 2002 2003 2004 2005 2006 2007 2008
Avg.kWhpe
rmon
th
Year
Average Electric Use per Customer(Residential)
Electric Heating
Electrical Use (General)
AvERAGE ElECTRiC usE PER CusToMER(REsidEnTiAl)
Source: Data provided by PPL Utilities Corporation, ETN Division July 2009
Watts per Household ProductProduct Avg. kWh per YearCoffee Maker (off) 9.98Computer Desktop (off) 2.41Computer Desktop (sleep mode) 17.96Computer Notebook (off) 7.56Computer Notebook (sleep mode) 13.40Television, typical CRT (off ) 2.60Television, rear projection (off) 5.92VCR (off) 3.97DVD Player (on, but not in use) 6.41Game Console (stand by, not in use) 19.84
l
l
l
ElECTRiC HEATinGElECTRiCAl usE(GEnERAl)

Residential heating accounts for a significant portion of household utility bills. Berks County residents have a variety of heating sources available for their homes, as demonstrat-ed in the chart to the left. These sources may also be used for producing hot water. Space heating and water heating are typically half of your home energy use. For the average US citizen, the CO2 emitted by heating their home will be similar to the CO2 emitted by driving their car.
Each fuel source outputs a certain amount of heat per quantity used and contains a different amount of carbon. The furnaces or appliances used to burn the fuel also have different efficiencies. When you study all the factors in-volved, you can determine the amount of Carbon Dioxide (CO2) that is emitted for each type of heating. The chart below compares average Carbon Dioxide (CO2) emissions per million BTU generated for typical Berks County heating sources.Thesevaluesdonotfactorintheefficiencyof thefurnace. When comparing Energy Star rated systems, con-sumerscanachievetypicalcombustionefficienciesof 90%for natural gas and propane fuels and 83% using heating oil.Coalfurnacesaretypicallytheleastefficientobtaining70-80%combustionefficiency.Electricbaseboardheatingemits the highest level of CO2. This is because a power plantsburningfuelhaveamuchlowerefficiencyingenerat-ing electricity (30-40%) and 5% or more is lost in transmis-sion to our homes.
What the data tells usAs you can see in the pie chart, 61% of Berks homes are heated by fuel oil or electric, while only 33% use natu-ral gas, which has a very low carbon emission rate. For comparable geo-graphic areas, Berks residents prob-ably have similar CO2 footprints. It is difficult to determine the exact CO2 emission rates for Berks home heating, because it is highly dependent upon furnaceefficiencies,thesizeof homes,and the quality of insulation. You can compare your carbon footprint to other similar people in the US, by vis-iting www.epa.gov/climatechange/ emissions/ind_calculator.html .
many Berks residents rely on fuel oil and electric to heat their homes; and should consider alternative and more renewable sources.
23
EnERG
Y
Source: US Census Bureau, 2000 Census of Population and Housing, Issued July 2007
BERKs CounTY HEATinG souRCE TYPEsREsidEnTiAl
WOOD OTHER
GAS33%
FUEL OIL45%
COAL1%
WOOD1%
SOLAR0%
OTHER1%
NO FUEL0%
GAS33%
TANK3%
ELECTRIC16%
FUEL OIL45%
COAL1%
WOOD1%
SOLAR0%
OTHER1%
NO FUEL0%
GAS33%
TANK3%
ELECTRIC16%
FUEL OIL45%
COAL1%
WOOD1%
SOLAR0%
OTHER1%
NO FUEL0%nATuRAl
TAnK/liQuEFiEd PETRolEuM GAs
souRCEs
WOOD OTHER
GAS33%
FUEL OIL45%
COAL1%
WOOD1%
SOLAR0%
OTHER1%
NO FUEL0%
GAS33%
TANK3%
ELECTRIC16%
FUEL OIL45%
COAL1%
WOOD1%
SOLAR0%
OTHER1%
NO FUEL0%
GAS33%
TANK3%
ELECTRIC16%
FUEL OIL45%
COAL1%
WOOD1%
SOLAR0%
OTHER1%
NO FUEL0%
Output of Carbon Dioxide (CO2) per Million BTU
364 7
400.0
Output of Carbon Dioxide (CO2) per Million BTU
364.7
350.0
400.0
Output of Carbon Dioxide (CO2) per Million BTU
364.7
300 0
350.0
400.0
Output of Carbon Dioxide (CO2) per Million BTU
364.7
300.0
350.0
400.0
ns
Output of Carbon Dioxide (CO2) per Million BTU
227.4
364.7
250.0
300.0
350.0
400.0
mission
s
Output of Carbon Dioxide (CO2) per Million BTU
173 9
227.4
364.7
200.0
250.0
300.0
350.0
400.0
CO2Em
ission
s
Output of Carbon Dioxide (CO2) per Million BTU
139.2
173.9
227.4
364.7
150.0
200.0
250.0
300.0
350.0
400.0
ndsof
CO2Em
ission
s
Output of Carbon Dioxide (CO2) per Million BTU
117.0
139.2
173.9
227.4
364.7
150.0
200.0
250.0
300.0
350.0
400.0
Poun
dsof
CO2Em
ission
s
Output of Carbon Dioxide (CO2) per Million BTU
117.0
139.2
173.9
227.4
364.7
100.0
150.0
200.0
250.0
300.0
350.0
400.0
Poun
dsof
CO2Em
ission
s
Output of Carbon Dioxide (CO2) per Million BTU
117.0
139.2
173.9
227.4
364.7
50.0
100.0
150.0
200.0
250.0
300.0
350.0
400.0
Poun
dsof
CO2Em
ission
s
Output of Carbon Dioxide (CO2) per Million BTU
117.0
139.2
173.9
227.4
364.7
0 0
50.0
100.0
150.0
200.0
250.0
300.0
350.0
400.0
Poun
dsof
CO2Em
ission
s
Output of Carbon Dioxide (CO2) per Million BTU
117.0
139.2
173.9
227.4
364.7
0.0
50.0
100.0
150.0
200.0
250.0
300.0
350.0
400.0
Natural Gas Propane Heating Oil Anthracite Coal PA Electric Baseboard
Poun
dsof
CO2Em
ission
s
Output of Carbon Dioxide (CO2) per Million BTU
117.0
139.2
173.9
227.4
364.7
0.0
50.0
100.0
150.0
200.0
250.0
300.0
350.0
400.0
Natural Gas Propane Heating Oil Anthracite Coal PA Electric Baseboard
Poun
dsof
CO2Em
ission
s
Residential Heating Source
Output of Carbon Dioxide (CO2) per Million BTU
117.0
139.2
173.9
227.4
364.7
0.0
50.0
100.0
150.0
200.0
250.0
300.0
350.0
400.0
Natural Gas Propane Heating Oil Anthracite Coal PA Electric Baseboard
Poun
dsof
CO2Em
ission
s
Residential Heating Source
Output of Carbon Dioxide (CO2) per Million BTU
117.0
139.2
173.9
227.4
364.7
0.0
50.0
100.0
150.0
200.0
250.0
300.0
350.0
400.0
Natural Gas Propane Heating Oil Anthracite Coal PA Electric Baseboard
Poun
dsof
CO2Em
ission
s
Residential Heating Source
Output of Carbon Dioxide (CO2) per Million BTU
117.0
139.2
173.9
227.4
364.7
0.0
50.0
100.0
150.0
200.0
250.0
300.0
350.0
400.0
Natural Gas Propane Heating Oil Anthracite Coal PA Electric Baseboard
Poun
dsof
CO2Em
ission
s
Residential Heating Source
Output of Carbon Dioxide (CO2) per Million BTU
117.0
139.2
173.9
227.4
364.7
0.0
50.0
100.0
150.0
200.0
250.0
300.0
350.0
400.0
Natural Gas Propane Heating Oil Anthracite Coal PA Electric Baseboard
Poun
dsof
CO2Em
ission
s
Residential Heating Source
Output of Carbon Dioxide (CO2) per Million BTUouTPuT oF CARBon dioxidE (Co2) PER Million BTu
Source: Energy Information Administration, Voluntary Reporting of Greenhouse Gases Program 2009
What is a carbon footprint ?According to Carbon Footprint Ltd., it is a measure of the impact our activities have on the environ-ment and in particular climate change. There are many calculators available on the internet to help explain and demonstrate how our daily activities produce green house gases. When evaluating hab-its, most individuals have direct control over their vehicles (the amount of miles traveled), electricity consumption and heating. These 3 primary factors contribute to about half of an individual’s overall carbon footprint.

Navigating the growing commerce of “Green” can be very confusing with so many organizations providing dif-ferent environmental solutions, products and rating sys-tems for consumers. For the purpose of this study, we reviewed The Leadership in Energy and Environmental Design(LEED)Certificationsof newbuildingconstruc-tion as rated by the US Green Building Council (USGBC). The USGBC has been a leader in developing guidelines for moreefficientbuildingsandeducatingprofessionalssince1993. As of 2009, 12 Federal Agencies and 36 states have implemented legislation with LEED guidelines making it the most referenced rating system in the US.
The Environmental Protection Agency estimated that the average person spends 90% of their day indoors and this can have a direct effect on our health. One goal of creat-ing healthier indoor environments is to reduce energy and maintenancecosts;forexample,automatedbathroomfix-tures, automated lighting which turns lights off when the room is not in use, and orientation of buildings to utilize more windows and natural light (daylighting). Buildings are evaluated on the LEED objectives it incorporates and arethengivenarating:certified,silver,goldandplatinum.‘Certified’buildingshavethefewestLEEDmeasuresand‘Platinum’ buildings incorporate the highest number of measures. At the time of this report, Berks County has 1 LEEDcertifiedbuildingand9projectsregisteredwiththeUSGBC,butareawaitingtheirLEEDcertification.
Berks has only a few projects that have been LEED registered.
how do you GREEN YoUR homE ?
What the data tells usLEEDcertificationencouragesprojectsthatre-useexistingbuildingsites,brown-fieldsand/orurbanareasincloseproximitytopublictransportationandculturaldistricts, therefore LEED buildings are more common in urban areas. However, the Federal government has created grants for schools that incorporate energy efficienttechnologyandsustainabledesignpractices.
lEEd PRoJECTs REGisTEREd(Projects may not be completed at this time.)
AEM Architects
Albright College
Berks County Community FoundationOfficesand
Community Conference Center
Berks Women in Crisis
Green Valley Elementary School
GovernorMifflinElem.School
New Exeter Twp Elem. School
Opportunity House Daycare Center
PSU Berks Classroom Lab Bldg.
Reading Utilities Lab & Admin Bldg
Source: USGBC online database for LEED registered projects July 2009.
Incorporate green initiatives in your own home:l Replace your incandescent light bulbs with ENERGY STAR® qualified compactfluorescentlightbulbs(CFLs)anddisposeof themproperly. At any Home Depot store, customers can bring in any expired, unbroken CFL bulbs, and simply give them to the store associate behind the returns desk to recycle. l Use Low-VOC (volatile organic compound) products such as low or no-VOCpaintsandfinisheswhenpainting.Whencleaningaroundthehouse, use non-toxic natural products or make your own cleaning products.l Save money on your heating and cooling costs just by setting your thermostat back when you’re not home and while you’re sleeping. Program your thermostat to 78 degrees F or higher in the summer and 62 degrees F or lower in the winter. l Air leaks are the greatest energy waster in the home, but they can be simple to plug. Install weatherstripping and caulk to stop those expensive drafts.l Installlow-flowshowerheadsandfaucetaeratorstosaveresourceswithout sacrificingwaterpressure.l Install an insulative jacket around your hot water heater, and insulate the pipes around the water heater. Consider turning down the temperature on the water heater.l Shadetreescansignificantlyloweryourcoolingcosts.Theyalsomakeyour home more comfortable, and provide habitat for birds. In addition, properly placed trees and shrubs act as windbreaks, shielding your home from cold winds and reducing heating costs.
What else can I do ?Ask people at your schools and federal buildings what sustainable practices they have incorporated into their buildings and maintenance procedures. Volunteer andattendyour localUSGBCchapteroraffiliategroupmeetings,educationalsessions and events to learn more about sustainable design practices and initia-tives.
24
EnER
GY Energy Indicator five
nEW ConsTRuCTion WiTH GREEn CERTiFiCATion

Benefits of Landscaping With Native PlantsNativeplantsarethetrees,shrubs,flowers,grasses,fernsandotherplantsthathaveevolvedinaparticulararea(such as southeast Pennsylvania) over thousands of years. Over this long period of time, the plants have adapted to the particular growing conditions present here, including temperature, rainfall, winds, soils, slopes and wildlife.If you haven’t worked with native plants before, you may be wondering how natives are different than any other plant. The following information answers these questions and will help you begin to see why using at least some natives inyourgardencanbebeneficialtotheenvironmentallwhilesavingyoutimeand money:l Native plants are beautiful, providing an entirely new palate of plants to a traditional landscape.l They are well-adapted to local conditions, therefore requiring little maintenance once established. They eliminateorsignificantlyreducetheneedforfertilizers,pesticides,waterandmaintenanceequipment. Theyalsooftenattractbeneficialinsects,whichpreyuponpests,decreasingtheneedforpesticides.l Most native species are perennial, or self-seeding biennial plants. This means you don’t have to purchase and plant them each year – they remain in your landscape – and are sure to bring onto you the admiration of thenextgenerationwhowillbenefitfromyourforesight.l Nativeplantsattractournativesongbirdsandbutterflies.l Using native plants promotes biodiversity. Planting a small meadow that once was lawn replaces one plant specieswithmany,increasingtheopportunitiesforbeneficialwildlifeandinsectstolive.l Native plants reduce air pollution and energy consumption, improve water quality and reduce soil erosion. Using native vegetation, unlike cultivated landscapes, does not require the use of lawn maintenance equipment, a major contributor to air pollution. They improve water quality by filtering contaminated stormwater, and reduce soil erosion by stabilizing soils with their deep root systems.l Native plants maintain our natural heritage and our community’s character. What would Berks County look like without its majestic oaks and familiar meadow plants?l Native plants are less expensive to maintain. U.S. EPA reports that a meadow or wetland costs approximately $150 a year per acre to maintain, while the same amount of lawn costs $1,000 per year per acre to maintain.
organic practices protects the life of the soil, which is essential to a balanced ecosystem in the garden. It also greatly reduces your exposure to pesticides, which have been linked to health problems. Organic gardeners tend to use “muscle-power” rather than “machine-power” for gardening tasks, thereby getting exercise.
Reduce lawn mowing for cleaner air. According to the Environmental Protection Agency, a gas-powered push lawn mower emits as much pollution per hour as 11 cars. A riding lawn mower emits as much pollution as 34 cars. This pollution is in the form of carbon dioxide, a greenhouse gas, and volatile organic compounds, which con-tribute to ozone formation. You can improve air quality by making these mowing changes:l Mowing on cooler days or in the evening.l Upgradingequipmenttomoreefficientgasengines, electric engines or manual tools.l Reducing mowing time by removing all or part of the lawn and replace it with a vegetable garden, plants or native species. l Pouring gas smoothly with a funnel to avoid spilling. l Tightening gas caps completely.
EnERG
Yhow do you GREEN your GARdEn And lAndsCAPinG?
“Our entire corporate philosophy is based around providing local consumers native plants
and organic and clean-air gardening products, all of which are sustainable, “green” practices. We stock
over 250 varieties of native plants, including perennials and shrubs. We carry organic gardening products and encourage their use in people’s gardens. We also carry push-reel and electric mowers, which have little to no impact on the environment. Most of our products are sourced from local suppliers which contributes
positively to the vibrancy of our economy.” -Anne-Marie M., Sugarbush Nursery
What are YoU doing to BE GREEN?
25
The Pennsylvania Department of Conservation & Natural Resources maintains a native plant reference list. Visit www.dcnr.state.pa.us/forestry/wildplant/native.aspx to learn what types of plants to buy for your new native garden! Also visit http://nativeseedbank.blogspot.com - a GREAT resource for Berks County!
Do your part to help keep our air healthy.
Kittattiny Ridge26

AirAir is the medium we breathe - the way we obtain oxygen, and expel carbon dioxide from our bodies. An average adult breathes about 12 times per minute, exchanging approximately 0.4 – 0.5 liters of air in each breath. At this rate, you would breathe on the order of 8,640 liters of air each day. We don’t normally breathe through fine filters, so we tend to breathe in the contaminants in air as well as the life-giving oxygen. For this simple reason, the composition of our air is a fundamental measurement of the quality of our environment.
STATE of ThE ENvIRoNmENT IN BERkS CoUNTY
The Federal government, recognizing the importance of clean air as a primary environmental resource, enacted the Air Pollution Control Act in 1955, and the Clean Air Act in 1963. Additional legislation included the Air Quality Act of 1967, the Clean Air Act of 1970, and Clean Air Act Amendments in 1977 and 1990. The Clean Air Act of 1970 was notable in part because it charged a newly created Federal agency, the United States Environmental Protection Agency (USEPA) with developing and enforcing reg-ulations to protect the general public from exposure to airborne contaminants known to be hazardous to human health.
Air contaminants that are commonly monitored as indicative of air quality include ozone, carbon monoxide, oxides of nitrogen (NOx), sulfur dioxide (SO2), particulate matter (PM), and lead. In Berks County, ozone, particulate matter, and other air pollut-ants are monitored at the Reading Airport air pollution monitor-ing station and ozone is measured at the Kutztown University monitoring station. The air quality indicators discussed below rely on data acquired at these air monitoring stations over the past several years. The indicators selected for inclusion in this reportfocusonozone,fineparticulatematter,andlead,becauseother air contaminants (e.g., NOx, SO2) rarely exceed applicable air standards.
It should be noted that the USEPA has recently focused on other airpollutants that are classifiedas “air toxics,” and there is an ongoing investigation into possible health concerns associated with air toxics in the outdoor air in the vicinity of schools. Air toxic monitoring has been conducted since 2007 at the Reading Airport and Kutztown University
monitoring stations, but this data has not been included in this report pending the ongoing study of air toxics. Our Air Indica-tors include the following:
l Number of “Bad” Air Days
l Percentage of Days Exceeding Criteria for PM2.5
l Air Quality Criteria Attainment Status - PM2.5
l Air Quality Criteria Attainment Status at Lead Monitors
l Ambient Air Monitoring of Lead
Lastly, it is also important to note that indoor air quality is very important to humanhealth and can often bemore significantthan outdoor air pollution. Examples of indoor air pollutants thatrepresentsignificanthealthrisksincluderadon,secondhandtobacco smoke, and mold. This report does not include data on indoor air quality, but it is well known that radon levels can be very high in many parts of Berks County, and everyone should make sure their basements and homes are checked for radon.
27
AiR

Ozone is an atmospheric gas comprised of three atoms of oxygen bonded together (chemically written as O3). Ozone is a quite reactive mol-ecule, and will tend to break down organic compounds that it contacts. It can damage human tissue, mainly tissues in the respiratory system. Ozoneintheatmospherewebreatheisasignificanthealthconcernandwarrantsclosemonitoring.
Ozone is found in elevated concentrations in two separate layers of the atmosphere: the upper atmosphere or stratosphere, and the lower atmo-sphere, or troposphere. The high concentrations of ozone in the stratosphere, the “ozone layer,” absorb substantial ultraviolet (UV) radiation fromthesun,protectingUV-sensitivelifeattheplanet’ssurface.Certainairemissions,notablytheorganicmolecules(chlorofluorocarbons)commonly used in refrigerators and air conditioners, react with stratospheric ozone, reducing ozone concentrations and allowing more high-energy UV radiation to reach the surface of the earth.
Ozone is naturally formed in the lower atmosphere around high-energy discharges such as lightning strikes, but also results from the reaction of sunlight with hydrocar-bons and nitrogen oxides in the air (this is called “ground-level” ozone).
The graphic used in this indicator depicts summary air quality data for the Reading AirportandKutztownUniversityairmonitoringsites,specifically,thenumberof dayswhen ozone was measured in excess of 0.075 parts per million. These would be classi-fiedas“badairdays.”(MonitoringattheKutztownlocationwasdiscontinuedin2004due to a change in location of the monitor. Monitoring resumed in 2008 to include ozone and air toxics.)
AiR
What the data tells usIn general, the number of “bad air days” for ozone have been decreasing, which is a good trend at the Berks County level. However, it is likely that, within any given year or monitoring period, ozone concen-trations will continue to show wide variation with season, temperature, prevailing winds, and even time of day. For example, by August 15 of 2008, the Reading Airport location had recorded 11 days over the ozone standard. By August 15 of 2009, only one bad air day had been recorded at the Reading Airport location; 2009 had a cooler, wetter summer than 2008.
On days when ozone levels are expected to be high - conserve electricity and set your air conditioner at a higher temperature. Use a cleaner commute - share a ride or use public transportation. Bike or walk when doing errands if possible. Combine errands and reduce trips. Limit engine idling, and refuel vehicles after dusk. Use household, workshop, and garden chemicals in ways that keep evapora-tion to a minimum, or try to delay using them when poor air quality is forecast. You may think, “How can I make a difference?” Collectively, if all of Berks County would think about their actions, there would be a great impact.
how do we make things better
The number of “bad” air days per year are declining for ground-level ozone.
nuMBER oF dAYs WiTH oZonE ExCEEdAnCEsBERKs CounTY And suRRoundinGs
City 2007 2006 2005 2004 Reading 2 1 4 1 Allentown 2 3 6 3Lancaster 2 4 6 1Harrisburg 1 1 3 1 York 3 0 6 1State-Wide 1.4 1.3 3.3 0.7Average
Sources: Summary of Daily Maximum Averages above the NAAQS 8-Hour Ozone Standard (85 ppm) in Pennsylvania (2007, 2006, 2005, 2005).
What does this mean to YoU & YoUR fAmILY ?
If ozone concentrations are high in air breathed into the lungs, damage to the lining of airways can occur, leading to irritation, coughing, and shortness of breath. Children, the elderly, and people with respiratory prob-lems are at highest risk for adverse effects when ground-level ozone concentrations are high.
Check the PADEP current air quality index site at www.dep.state.pa.us/dep/deputate/airwaste/
aq/aqm/psiscent.htm for information and guidance.
Source: USEPA Air Quality System: Quick Look Report, June 15, 2009
nuMBER oF BAd AiR dAYs (MAxiMuM dAilY oZonE > 0.075 PARTs PER Million)
dAYs
25
30
20
10
15
5
0
1999 2000 2001 2002 2003 2004 2005 2006 2007 2008
KuTZToWn univERsiTY REAdinG AiRPoRT
28
Air Indicator one
nuMBER oF “BAd AiR dAYs”

AiR
According to the EPA, passenger cars, vans, minivans, SUVs, and pickup trucks -- account for 62 percent of all greenhouse gas emissions in the U.S. Using public transportation, biking, or walking are all great ways to get started on a greener commute, even if it’s just one day per week, or for part of your commute. If youhavetocommutebycar,there’salotyoucando,includingdrivingmoreefficiently,carpooling,oropting for a hybrid vehicle.
Use public transportationUsing public transportation is more than just a green way to get to work, it can be a great way to meetyourneighbors,avoidtraffic,savemoney,and catch up on work, reading or relaxing. Start slow if it’s hard for you: Go one day per week by bus, or drive only part way. For more informa-tion, visit these local carriers: Berks Area Reading Transportation Authority, www.bartabus.com; Greyhound Lines, Inc., www.greyhound.com; and Bieber Tourways, www.biebertourways.com.
Ride your bikeRiding your bike to work is a great way to incor-porate exercise into your daily commute. Cycling offers pleasure, companionship if you ride with a friend, cost savings especially if you eliminate a motor vehicle, time saving when you combine your workout with a commute, reduced stress, and cardiovas-cularfitness.FormoreinformationaboutbikinginBerksCounty,visithttp://walkbikeberks.blogspot.com.
CarpoolingHow many people at work live near you? Is there any chance of sharing the ride? Carpooling can be as simple as two co-workers or even a husband and wife sharing the ride to work. Commuter Services (www.pacommuterservices.com) is a organization funded by federal Congestion Mitigation & Air Qual-ityfunds.Throughtheirfreeservices,theyworktoreducetrafficcongestionbyhelpingcommutersfindalternatives, other than driving alone, and by reaching out to employers so they can help their workforce findthoseoptions.
Buy a more fuel-efficient carConsidertradinginyourvehicleinforasmaller,moreefficientone,orahybrid.Thegasoline-electrichybridcarisacrossbetweenagasoline-poweredcarandanelectriccar.Itsignificantlyincreasesthemiles per gallon and reduces the emissions of a gas-powered car. If you want to learn more about hy-brid cars, visit your local dealer and test drive one.
Drive your car more efficientlyRegular maintenance of your car not only means it lasts longer, it will also save money on fuel. Make sureyourtiresarealwaysinflatedproperly,changetheoilregularly,andtakeunnecessaryweightoutof thetrunktoensurefuelefficiency.If youaregoingtowaitforlongerthan30seconds,itisbettertokillthe engine than to leave it running. This saves gas and also keeps emissions out of the surrounding air. Stayingatorbelow55milesperhourvastlyimprovesyourfuelefficiency.
Use a budget to see how much it’s costing you to drive, and then make goals to reduce. If you have errands to run, do them on the way to and from work. If you’re moving, factor in ease of travel when considering where to live. A bit of planning goes a long way in reducing your reliance on the car, and it makes you life so much easier too.
how do you GREEN yourCoMMuTE To WoRK And sCHool?
29
Jim Schlegel, shown at left, moved into the Centre Park Historic District of Reading and thought he would try Read-ing’s public transportation and see if he liked it. That was 5 years ago. He is still riding the bus and is now on the board of directors of BARTA.
Jim realized that riding the bus was convenient, saved money, and created less stress. “The bus goes most everywhere... I can go grocery shopping, to doctor appointments, and visit my parents and friends outside the city,” said Jim.
Another plus to riding the bus is getting to know the people on the bus. “When you ride the same bus to and from work,” said Jim, “you have community interaction. You can’t get that in the car driving by yourself.”
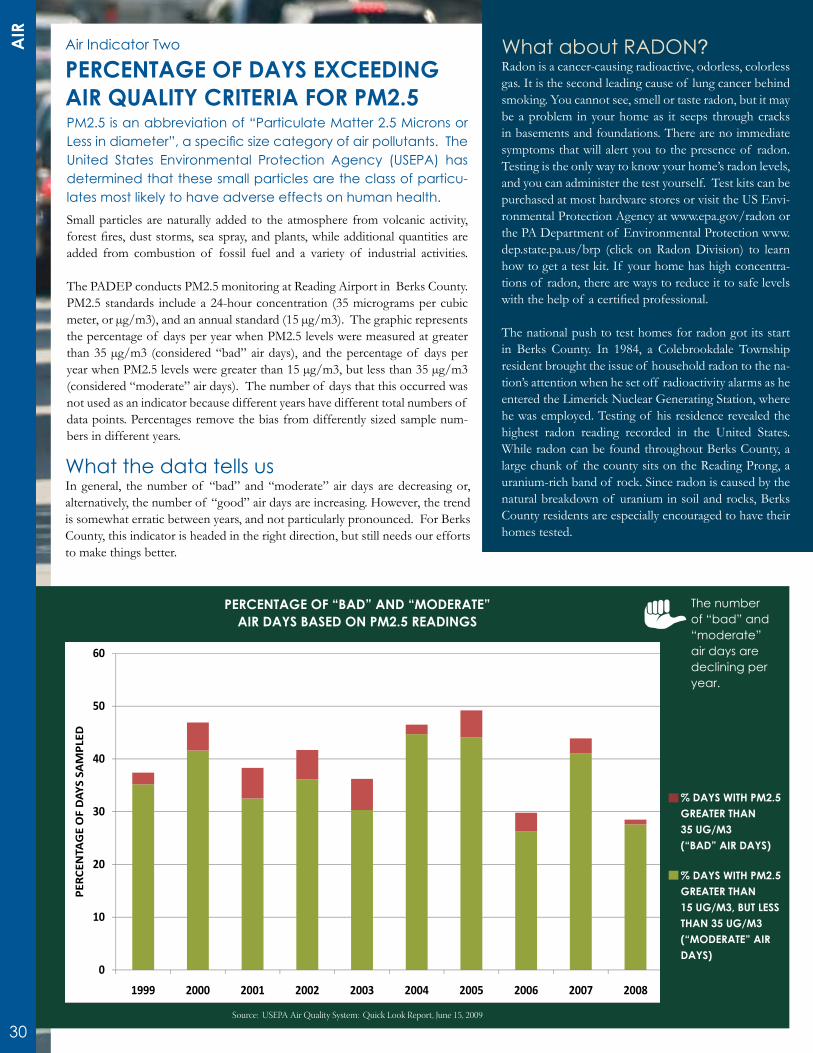
50
60
20
30
40
50
60
NTA
GEOFDAYS
SAMPLED
0
10
20
30
40
50
60
1999 2000 2001 2002 2003 2004 2005 2006 2007 2008
PER
CEN
TAGEOFDAYS
SAMPLED
0
10
20
30
40
50
60
1999 2000 2001 2002 2003 2004 2005 2006 2007 2008
PER
CEN
TAGEOFDAYS
SAMPLED
0
10
20
30
40
50
60
1999 2000 2001 2002 2003 2004 2005 2006 2007 2008
PER
CEN
TAGEOFDAYS
SAMPLED
PERCEnTAGE oF “BAd” And “ModERATE” AiR dAYs BAsEd on PM2.5 REAdinGs
Source:USEPAAirQualitySystem:QuickLookReport,June15,2009
Pm2.5 is an abbreviation of “Particulate matter 2.5 microns or Less in diameter”, a specific size category of air pollutants. The United States Environmental Protection Agency (USEPA) has determined that these small particles are the class of particu-lates most likely to have adverse effects on human health. Small particles are naturally added to the atmosphere from volcanic activity, forestfires,duststorms,seaspray,andplants,whileadditionalquantitiesareadded from combustion of fossil fuel and a variety of industrial activities.
The PADEP conducts PM2.5 monitoring at Reading Airport in Berks County. PM2.5 standards include a 24-hour concentration (35 micrograms per cubic meter, or µg/m3), and an annual standard (15 µg/m3). The graphic represents the percentage of days per year when PM2.5 levels were measured at greater than 35 µg/m3 (considered “bad” air days), and the percentage of days per year when PM2.5 levels were greater than 15 µg/m3, but less than 35 µg/m3 (considered “moderate” air days). The number of days that this occurred was not used as an indicator because different years have different total numbers of data points. Percentages remove the bias from differently sized sample num-bers in different years.
What the data tells usIn general, the number of “bad” and “moderate” air days are decreasing or, alternatively, the number of “good” air days are increasing. However, the trend is somewhat erratic between years, and not particularly pronounced. For Berks County, this indicator is headed in the right direction, but still needs our efforts to make things better.
What about RADoN?Radon is a cancer-causing radioactive, odorless, colorless gas. It is the second leading cause of lung cancer behind smoking. You cannot see, smell or taste radon, but it may be a problem in your home as it seeps through cracks in basements and foundations. There are no immediate symptoms that will alert you to the presence of radon. Testing is the only way to know your home’s radon levels, and you can administer the test yourself. Test kits can be purchased at most hardware stores or visit the US Envi-ronmental Protection Agency at www.epa.gov/radon or the PA Department of Environmental Protection www.dep.state.pa.us/brp (click on Radon Division) to learn how to get a test kit. If your home has high concentra-tions of radon, there are ways to reduce it to safe levels withthehelpof acertifiedprofessional.
The national push to test homes for radon got its start in Berks County. In 1984, a Colebrookdale Township resident brought the issue of household radon to the na-tion’s attention when he set off radioactivity alarms as he entered the Limerick Nuclear Generating Station, where he was employed. Testing of his residence revealed the highest radon reading recorded in the United States. While radon can be found throughout Berks County, a large chunk of the county sits on the Reading Prong, a uranium-rich band of rock. Since radon is caused by the natural breakdown of uranium in soil and rocks, Berks County residents are especially encouraged to have their homes tested.
% dAYs WiTH PM2.5 GREATER THAn 35 uG/M3 (“BAd” AiR dAYs)
% dAYs WiTH PM2.5 GREATER THAn 15 uG/M3, BuT lEss THAn 35 uG/M3 (“ModERATE” AiR dAYs)
The number of “bad” and “moderate” air days are declining per year.
30
AiR
Air Indicator Two
PERCEnTAGE oF dAYs ExCEEdinG AiR QuAliTY CRiTERiA FoR PM2.5

As noted in the discussion of the prior air indicator, the PADEP assesses PM2.5 concentrations at its Reading Airport monitoring station with re-spect to daily and annual standards. The annual standard against which PM2.5 values are gauged is 15 micrograms per cubic meter. The graphic below uses published PADEP/USEPA data to depict and compare weight-ed annual average PM2.5 concentrations at the Berks County monitoring location over the 1999-2008 period.
Weighted annual mean Pm2.5 below standard for last three years.
how can you helpREduCE AiR PolluTion?
Modify your transportation.Yourcarisasignificantsourceof airpollution,soswitching toamoregas-efficientvehiclewill be a big help. Carpool or use public transportation a few days per week.
Conserve energy. Your home energy consumption translates intoairpollution, thereforeanyenergyconservationoreffi-ciency improvements you make will help.
Reduce waste. Manufacturing of unnecessary or disposable goods often produces air pollution, so reduced purchasing of disposables will help.
Eliminate toxic chemical use at home. A surprising num-ber of household or home shop chemicals are toxic and vola-tile. Many release vapors into the air, inside the home and out. This can be a serious health threat to your family, and contributes to community-wide levels of air pollutants. Visit the American Lung Association’s website at www.lungusa.org for more information.
Avoid burning trash. Uncontrolled burning can be harmful, especially when many people are doing it. Many plastics, coat-ings, inks, paints, metals and treated woods will produce toxic chemical air pollutants such as lead, arsenic, and chromium.
Cut back or eliminate lawn mowing. Gasoline-powered lawn mowers and similar yard equipment can produce much higher rates of air pollution than an equivalent horsepower in a car, due to engine inefficiencies and the lack of catalytic
converters. You can help reduce these emissions by con-verting some of your lawn to trees, shrubs and easy-care
What the data tells usThe weighted annual mean for PM2.5 has been varying rather closely around the air standard of 15 micrograms per cubic meter. The weighted annual mean for the last three years (2006-2008) have been below the stan-dard, an encouraging trend for quality of air in the County.
l
native perennials. Then use a non-motorized push-style lawnmower to cut your re-maining lawn.
Plant native trees and shrubs. Deciduous trees and shrubsareexcellentairfiltersto help reduce smog and cool the air on hot summer days.
Ride your bike.Go for family bike rides and have outings locally.
Talk to your legislators.Many of our current govern-mental regulations are not strong enough to address our air pollution problems. Citizens need to contact their legislators and ask for better policies.
l
l
l
l
l
l
18
16
1414
ter
12
icmet
10
ercub
8
amspe
6icrogra
4
Mi
4
2
0
1999 2000 2001 2002 2003 2004 2005 2006 2007 2008
AiR QuAliTY CRiTERiA ATTAinMEnT sTATusPM2.5
Source:USEPAAirQualitySystem:QuickLookReport,June15,2009
WEiGHTEd AnnuAl MEAnsTAndARd
What does this mean to your health ?Theadversehealtheffectsof fineparticulatemat-ter come mainly from their inhalation; particles 10 microns or smaller (PM10) can settle in the bronchi and lungs, and even smaller particles (i.e., the PM2.5 category) can penetrate deep into the gas-exchange areas of the lungs. Medical studies have associated heart disease and hardening of the arteries with exposure to elevated levels of PM2.5.
31
AiRAir Indicator Three
AiR QuAliTY CRiTERiA ATTAinMEnT sTATus - PM2.5
l
l

The health-based standard for lead in air was formerly 1.5 micro-grams per cubic meter (1.5 µg/m3) on a quarterly average basis, but in October of 2008, the United States Environmental Protection Agency revised the lead standard downward by an order of magni-tude to 0.15 µg/m3 on a 3-month average basis. Thus, in examining trends in Berks County lead measurements over time, it is impor-tant to note that the lower air standard as of late 2008 means, for example, that a lead concentration of 1.0 µg/m3 would have been assessed as meeting the lead standard up to late 2008, but would be assessed as not meeting the lead standard after that date.
The PADEP has been monitoring lead in air at three “special pur-pose monitors” at Berks County locations: Lyons South, Lyons East, and Laureldale, since 2002. It is important to note that these monitoring locations are located adjacent to or on properties where
East Penn Manufacturing Co., Inc. and Exide Technologies, Inc. op-erate secondary lead smelters for production of lead used to manu-facture lead-acid batteries. Therefore, the data from these locations likelydoesnotreflectgeneralconditionsacrossBerksCounty.ThePADEP does monitor lead-in-air quality at Reading Airport, and thenon-profitPennsylvaniaInstituteforChildren’sEnvironmentalHealth (PICEH), in partnership with the PADEP monitors lead-in-air quality at Kutztown University. Monitoring results from these latter locations are discussed under Indicator 5, which follows. The graphic below depicts lead concentrations at the Berks three special-purpose monitors as three-month rolling averages between 2002 and 2008. The rolling average computation smoothes out some of the point-to-point variation in measured values and can be compared with the new lead-in-air standard of 0.15 µg/m3 on a 3-month aver-age basis.
Lead-in-air is sometimes above standard near Berks lead factories.
What the data tells usLead-in-air concentrations at the Lyons South monitor are below the new standard of 0.15 ug/m3. Lead-in-air concentrations at the Lyons East and Laureldale moni-tors have at times been above the new standard. The PADEP will likely need to work with the Berks lead smelters to reduce lead emissions to ensure the new lead-in-air standard is met throughout Berks County.
The primary sources of lead-in-air are industrial (lead smelters, battery plants, iron/steel mills) and airports (aviation fuel for propeller planes is still leaded), so making an individual impact to the lead-in-air issue is not direct and straight-forward. How-ever, responsible disposal and recycling of lead batteries and other lead-containing products still contributes to the overall reduction of lead in the environment.
how do we make things better
0.4
0.45
THREE MONTH ROLLING AVERAGES FOR LEAD AT BERKS SPECIAL PURPOSE MONITORING LOCATIONS
0.3
0.35
0.4
meter
0.2
0.25
mspe
rcubicm
LYONS S
LYONS E
0.1
0.15
Microgra LAUREL
2008 ST
0
0.05
2 2 2 2 3 3 3 3 4 4 4 4 5 5 5 5 6 6 6 6 7 7 7 7 8 8 8 8
1/20
0
4/20
0
7/20
0
10/200
1/20
0
4/20
0
7/20
0
10/200
1/20
0
4/20
0
7/20
0
10/200
1/20
0
4/20
0
7/20
0
10/200
1/20
0
4/20
0
7/20
0
10/200
1/20
0
4/20
0
7/20
0
10/200
1/20
0
4/20
0
7/20
0
10/200
THREE-MonTH RollinG AvERAGEs FoR lEAd AT BERKs sPECiAl-PuRPosE MoniToRinG loCATions
lAuREldAlE lYons EAsTlYons souTH 2008 sTAndARd
32
AiR Air Indicator four
AiR QuAliTY CRiTERiA ATTAinMEnT sTATus FoR lEAdAT sPECiAl PuRPosE MoniToRs
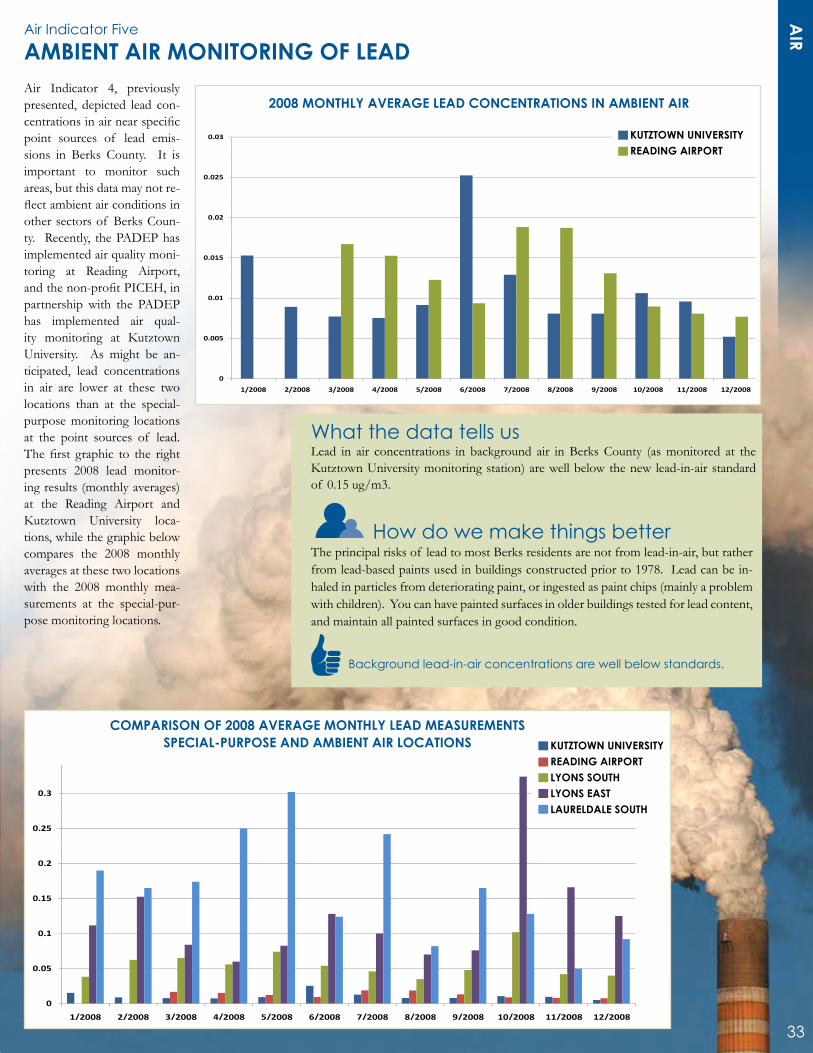
Air Indicator 4, previously presented, depicted lead con-centrationsinairnearspecificpoint sources of lead emis-sions in Berks County. It is important to monitor such areas, but this data may not re-flectambientairconditionsinother sectors of Berks Coun-ty. Recently, the PADEP has implemented air quality moni-toring at Reading Airport, andthenon-profitPICEH,inpartnership with the PADEP has implemented air qual-ity monitoring at Kutztown University. As might be an-ticipated, lead concentrations in air are lower at these two locations than at the special-purpose monitoring locations at the point sources of lead. Thefirst graphic to the rightpresents 2008 lead monitor-ing results (monthly averages) at the Reading Airport and Kutztown University loca-tions, while the graphic below compares the 2008 monthly averages at these two locations with the 2008 monthly mea-surements at the special-pur-pose monitoring locations.
Background lead-in-air concentrations are well below standards.
OK CHART
how do we make things better
2008 MONTHLY AVERAGE LEAD CONCENTRATIONS IN AMBIENT AIR
0.03
0 0250.025
0.02
0.015
0.01
0.005
0
1/2008 2/2008 3/2008 4/2008 5/2008 6/2008 7/2008 8/2008 9/2008 10/2008 11/2008 12/2008
2008 MonTHlY AvERAGE lEAd ConCEnTRATions in AMBiEnT AiR
KuTZToWn univERsiTYREAdinG AiRPoRT
COMPARISON OF 2008 AVERAGE MONTHLY LEAD MEASUREMENTSSPECIAL PURPOSE AND AMBIENT AIR LOCATIONS
0.35
0.3
0.25
0.2 KUTZTOWN
0.15
READING
LYONS SOUTH
LYONS EAST
0 1
LAURELDALE SOUTH
0.1
0.05
0
1/2008 2/2008 3/2008 4/2008 5/2008 6/2008 7/2008 8/2008 9/2008 10/2008 11/2008 12/2008
CoMPARison oF 2008 AvERAGE MonTHlY lEAd MEAsuREMEnTs sPECiAl-PuRPosE And AMBiEnT AiR loCATions KuTZToWn univERsiTY
REAdinG AiRPoRTlYons souTHlYons EAsTlAuREldAlE souTH
What the data tells usLead in air concentrations in background air in Berks County (as monitored at the Kutztown University monitoring station) are well below the new lead-in-air standard of 0.15 ug/m3.
The principal risks of lead to most Berks residents are not from lead-in-air, but rather from lead-based paints used in buildings constructed prior to 1978. Lead can be in-haled in particles from deteriorating paint, or ingested as paint chips (mainly a problem with children). You can have painted surfaces in older buildings tested for lead content, and maintain all painted surfaces in good condition.
how do we make things better
33
AiRAir Indicator five
AMBiEnT AiR MoniToRinG oF lEAd

There are many ways to reduce waste and recycle more.
34

Wastelife on our planet is a dynamic cycle whereby living organisms consume resources and eliminate wastes. When there were far fewer of us on the planet, the disposal of wastes was a much simpler process, but as we began living at higher and higher densities, the proper disposal of wastes became a major environmental and health issue. In today’s world, we have highly engineered systems for collecting and treating human wastes, and are placing more and more emphasis on the recycling of waste materials that need not be dumped into disposal sites.
STATE of ThE ENvIRoNmENT IN BERkS CoUNTY
The Berks County Solid Waste Authority (SWA) is responsible for the development and implementation of the County Solid Waste Management Plan that 1) ensures adequate disposal ca-pacity for county-generated waste for a period of ten years, 2) evaluates the county’s recycling program and achieves the state-wide goal of 35% recycling, 3) develops and administers collec-tion programs for special wastes, and 4) provides assistance to municipalities. The County Solid Waste Management Plan was approved by PADEP in 2005 and is required to be revised every 10 years.
Indicators we used for Waste are:
l Waste Generated in Berks County
l Waste Disposed of in Berks County
l Recycling Rate
l Special Waste Collections
l Clean-Up Our American Lands and Streams (COALS)
35
WA
sTE
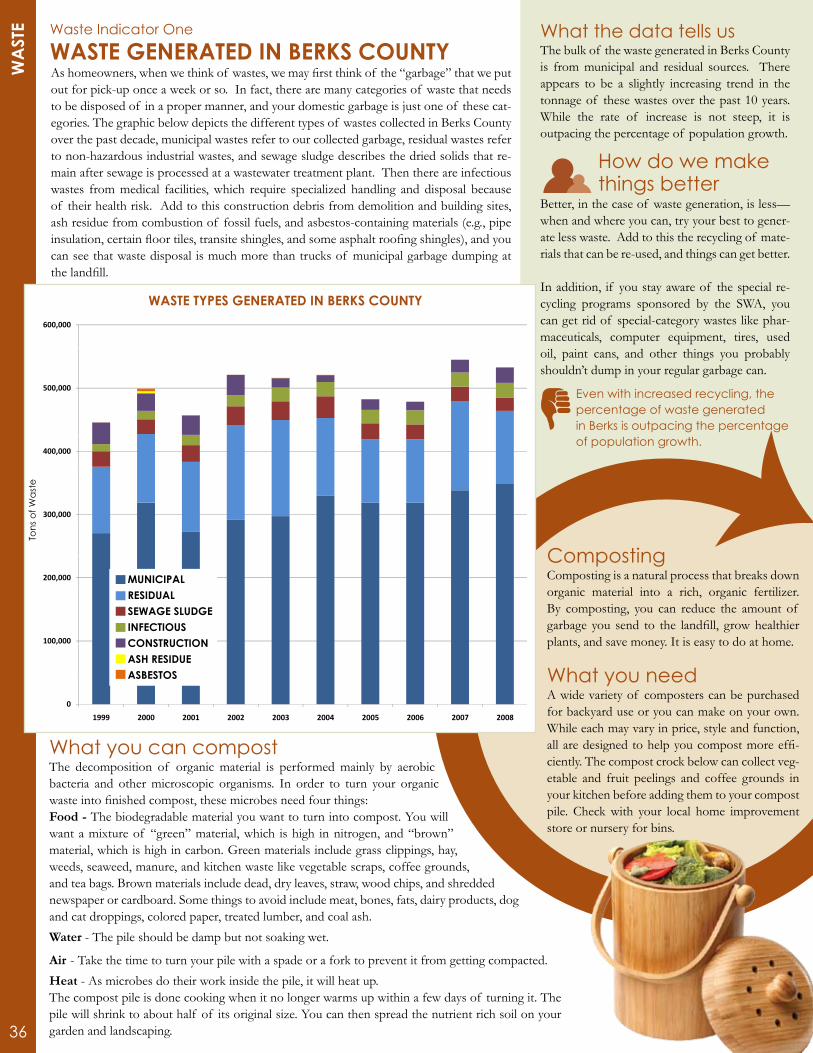
Ashomeowners,whenwethinkof wastes,wemayfirstthinkof the“garbage”thatweputout for pick-up once a week or so. In fact, there are many categories of waste that needs to be disposed of in a proper manner, and your domestic garbage is just one of these cat-egories. The graphic below depicts the different types of wastes collected in Berks County over the past decade, municipal wastes refer to our collected garbage, residual wastes refer to non-hazardous industrial wastes, and sewage sludge describes the dried solids that re-main after sewage is processed at a wastewater treatment plant. Then there are infectious wastes from medical facilities, which require specialized handling and disposal because of their health risk. Add to this construction debris from demolition and building sites, ash residue from combustion of fossil fuels, and asbestos-containing materials (e.g., pipe insulation,certainfloortiles,transiteshingles,andsomeasphaltroofingshingles),andyoucan see that waste disposal is much more than trucks of municipal garbage dumping at thelandfill.
Even with increased recycling, the percentage of waste generated in Berks is outpacing the percentage of population growth.
Better, in the case of waste generation, is less—when and where you can, try your best to gener-ate less waste. Add to this the recycling of mate-rials that can be re-used, and things can get better.
In addition, if you stay aware of the special re-cycling programs sponsored by the SWA, you can get rid of special-category wastes like phar-maceuticals, computer equipment, tires, used oil, paint cans, and other things you probably shouldn’t dump in your regular garbage can.
how do we make things better
What the data tells usThe bulk of the waste generated in Berks County is from municipal and residual sources. There appears to be a slightly increasing trend in the tonnage of these wastes over the past 10 years. While the rate of increase is not steep, it is outpacing the percentage of population growth.
Waste Types Generated in Berks County
Asbestos
600,000
Ash Residue
500,000
Construction
400,000
InfectiousInfectious
300,000Sewage Sludge
200,000 Residual
100,000
Municipal
00
1999 2000 2001 2002 2003 2004 2005 2006 2007 2008
WAsTE TYPEs GEnERATEd in BERKs CounTY
MuniCiPAlREsiduAlsEWAGE sludGEinFECTiousConsTRuCTionAsH REsiduEAsBEsTos
Tons
of W
aste
What you can compostThe decomposition of organic material is performed mainly by aerobic bacteria and other microscopic organisms. In order to turn your organic wasteintofinishedcompost,thesemicrobesneedfourthings:Food - The biodegradable material you want to turn into compost. You will want a mixture of “green” material, which is high in nitrogen, and “brown” material, which is high in carbon. Green materials include grass clippings, hay, weeds, seaweed, manure, and kitchen waste like vegetable scraps, coffee grounds, and tea bags. Brown materials include dead, dry leaves, straw, wood chips, and shredded newspaper or cardboard. Some things to avoid include meat, bones, fats, dairy products, dog and cat droppings, colored paper, treated lumber, and coal ash. Water - The pile should be damp but not soaking wet. Air - Take the time to turn your pile with a spade or a fork to prevent it from getting compacted. Heat - As microbes do their work inside the pile, it will heat up.The compost pile is done cooking when it no longer warms up within a few days of turning it. The pile will shrink to about half of its original size. You can then spread the nutrient rich soil on your garden and landscaping.
CompostingComposting is a natural process that breaks down organic material into a rich, organic fertilizer. By composting, you can reduce the amount of garbage you send to the landfill, growhealthierplants, and save money. It is easy to do at home.
What you needA wide variety of composters can be purchased for backyard use or you can make on your own. While each may vary in price, style and function, allaredesignedtohelpyoucompostmoreeffi-ciently. The compost crock below can collect veg-etable and fruit peelings and coffee grounds in your kitchen before adding them to your compost pile. Check with your local home improvement store or nursery for bins.
36
WA
sTE Waste Indicator one
WAsTE GEnERATEd in BERKs CounTY
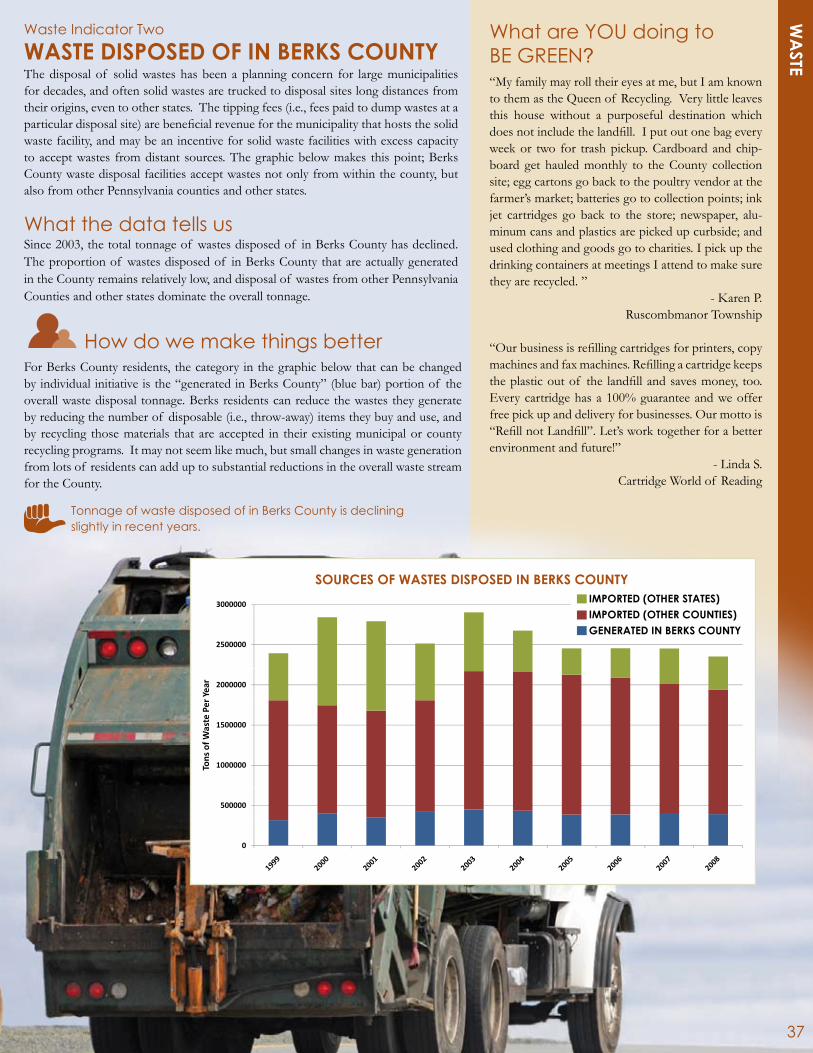
For Berks County residents, the category in the graphic below that can be changed by individual initiative is the “generated in Berks County” (blue bar) portion of the overall waste disposal tonnage. Berks residents can reduce the wastes they generate by reducing the number of disposable (i.e., throw-away) items they buy and use, and by recycling those materials that are accepted in their existing municipal or county recycling programs. It may not seem like much, but small changes in waste generation from lots of residents can add up to substantial reductions in the overall waste stream for the County.
The disposal of solid wastes has been a planning concern for large municipalities for decades, and often solid wastes are trucked to disposal sites long distances from their origins, even to other states. The tipping fees (i.e., fees paid to dump wastes at a particulardisposalsite)arebeneficialrevenueforthemunicipalitythathoststhesolidwaste facility, and may be an incentive for solid waste facilities with excess capacity to accept wastes from distant sources. The graphic below makes this point; Berks County waste disposal facilities accept wastes not only from within the county, but also from other Pennsylvania counties and other states.
What the data tells usSince 2003, the total tonnage of wastes disposed of in Berks County has declined. The proportion of wastes disposed of in Berks County that are actually generated in the County remains relatively low, and disposal of wastes from other Pennsylvania Counties and other states dominate the overall tonnage.
Tonnage of waste disposed of in Berks County is declining slightly in recent years.
how do we make things better
What are YoU doing to BE GREEN? “My family may roll their eyes at me, but I am known to them as the Queen of Recycling. Very little leaves this house without a purposeful destination which doesnotincludethelandfill.Iputoutonebageveryweek or two for trash pickup. Cardboard and chip-board get hauled monthly to the County collection site; egg cartons go back to the poultry vendor at the farmer’s market; batteries go to collection points; ink jet cartridges go back to the store; newspaper, alu-minum cans and plastics are picked up curbside; and used clothing and goods go to charities. I pick up the drinking containers at meetings I attend to make sure they are recycled. ”
- Karen P. Ruscombmanor Township
“Ourbusinessisrefillingcartridgesforprinters,copymachinesandfaxmachines.Refillingacartridgekeepstheplasticoutof the landfillandsavesmoney, too.Every cartridge has a 100% guarantee and we offer free pick up and delivery for businesses. Our motto is “RefillnotLandfill”.Let’sworktogetherforabetterenvironment and future!”
- Linda S. Cartridge World of Reading
37
WA
sTEWaste Indicator Two
WAsTE disPosEd oF in BERKs CounTY
3000000
SOURCES OF WASTES DISPOSED IN BERKS COUNTY
2500000
2000000
Year
1500000aste
Per
nsof
Wa
1000000Ton
500000
00
souRCEs oF WAsTEs disPosEd in BERKs CounTYiMPoRTEd (oTHER sTATEs)iMPoRTEd (oTHER CounTiEs)GEnERATEd in BERKs CounTY

In January of 2008, the Berks County Solid Waste Authority assumed all recycling operations for the County, which included the operation of both the rural recycling program, which currently services twelve municipalities on a rotating basis, as well as the full time recycling center onHilltopRoadinBernTownship.Duringthefirstyearof operation the Authority invested much needed funds into the appearance of the recycling centers, and installed equipment to greatly reduce operating costs, which saved the Authority approximately $25,000 during 2008. In ad-dition, the Authority entered into an Agreement, with Easy Does It, Inc., a rehabilitation center located adjacent to the full-time recycling center on Hilltop Rd., to oversee the operations of the center.
One objective of the Berks County Solid Waste Manage-ment Plan that was approved in December of 2005 was to meet the State goal of 35% recycling by 2012. At the time the Plan was approved, the County recycling rate was 22%, up from 16.7% in 2004. Of our seventy-three municipalities, only fourteen are mandated under Act 101 (State Law) to implement curbside recycling programs for their residents. As of December 31, 2008, thirty-two of our municipalities provide curbside recycling collection; sixteen provide drop-off programs for their residents, of which thirteen are operated by the County, with twenty-seven providing no recycling services to their residents. One of the twenty-seven implemented a curbside trash and recycling programs on January 1, 2009. Another will implement a drop-off recycling program in the spring of 2010. In 2009, the Authority continued to work with our non-mandated municipalities to gather recycling data from their haulers who are providing recycling services to their residents and businesses.
What the data tells usThe County recycling rate rose from 22% in 2005 to 59% in 2006 simply by evaluat-ing the County’s non-mandated municipalities and properly reporting all recycling programs. The percentage of recycling dropped to 56% in 2007 and 2008, due largely to the struggling economy, still exceeding the 35% State goal.
BERKS COUNTY RECYCLING PERCENTAGE
50%
60%
70%
30%
40%
50%
10%
20%
0%
2004 2005 2006 2007 2008
BERKs CounTY RECYClinG PERCEnTAGE
This is not rocket science! Make sure you know what items can be recycled, set up containers in your house or business for storage of recyclables, and know the municipal schedule for pick-ups (if that system is in place) or the location of other recycling centers throughout the County. Information on recycling can be found at the SWA website at: www.co.berks.pa.us/swa.
how do we make things better
Recycling percentage for Berks County well over State goal of 35% for last three years.
38
WA
sTE Waste Indicator Three
RECYClinG RATE

ACT 101 - JulY 1988PENNSYLvANIA`S “mUNICIPAL WASTE PLANNING, RECYCLING AND WASTE
REDUCTIoN ACT”
PURPoSE of ThE LAWAct 101 mandates recycling in Pennsylvania`s larger municipalities, requires counties to develop municipal waste management plans, and provides for grants to offset expenses. The goals of the Act are to reduce Pennsylvania`s municipal waste generation; recycle at least 35% of waste generated; procure and use recycled andrecyclablematerialsinstategovernmentalagencies;andeducatethepublicastothebenefitsof recyclingand waste reduction. RECYCLINGMunicipalities with populations of at least 10,000 had to implement curbside recycling programs by Septem-ber 26, 1990. Municipalities with populations between 5,000 and 10,000 and more than 300 persons per square mile had to implement curbside programs by September 26, 1991. All disposal facilities are required to provide recycling drop-off centers. Mandated municipalities are required to collect at least 3 of the following materials: clearglass;coloredglass;plastics;aluminum;steelandbimetalliccans;highgradeofficepaper;corrugatedpaperandnewsprint.Commercial,municipalandinstitutionalestablishmentswithinamandatedmunicipalityarerequiredtorecyclealuminum,high-gradeofficepaper and corrugated paper in addition to other materials chosen by the municipality.
Albany Township No YesAlsace Township No NoAmity Township Yes NoBally Borough Yes NoBechtelsville Borough No NoBern Township Yes YesBernville Borough Yes YesBethel Township No YesBirdsboro Borough Yes YesBoyertown Borough No YesBrecknock Township No NoCaernarvon Township No NoCenterport Borough No NoCentre Township No YesColebrookdale Borough Yes NoCumru Township Yes NoDistrict Township No NoDouglass Township No NoEarl Township No NoExeter Township Yes YesFleetwood Borough No NoGreenwich Township No YesHamburg Borough Yes NoHeidelberg Township Yes NoHereford Township No YesJefferson Township No NoKenhorst Borough Yes NoKutztown Borough Yes Yes
Laureldale Borough Yes NoLeesport Borough Yes YesLenhartsville Borough Yes NoLongswamp Township No NoLower Alsace Township No NoLower Heidelberg Twp. Yes NoLyons Borough No NoMaidencreek Township Yes YesMarion Township Yes YesMaxatawny Township No NoMohnton Borough Yes NoMount Penn Borough Yes NoMuhlenberg Township Yes NoNew Morgan Borough No NoNorth Heidelberg Twp No NoOley Township No NoOntelaunee Township No NoPenn Township No NoPerry Township No NoPike Township No NoReading City Yes NoRichmond Township No YesRobeson Township No YesRobesonia Borough Yes NoRockland Township No NoRuscombamanor Twp No NoShillington Borough Yes NoShoemakersville Borough Yes No
Sinking Spring Borough Yes YesSouth Heidelberg Twp Yes YesSpring Township Yes YesSt. Lawrence Borough Yes NoStrausstown Borough No NoTilden Township No NoTopton Borough No YesTulpehocken Township No YesUnion Township No NoUpper Bern Township No NoUpper Tulpehocken Twp No YesWashington Township No YesWernersville Borough Yes NoWest Reading Borough Yes NoWindsor Township No YesWomelsdorf Borough Yes NoWyomissing Borough Yes No
MunicipalityCurbsideRecycle
DropoffRecycle Municipality
CurbsideRecycle
DropoffRecycle Municipality
CurbsideRecycle
DropoffRecycle
Recycling by municipality
39
WA
sTE
What if my municipality doesn’t offer recycling?The Berks County Solid Waste Authority has drop off locations throughout the County. Visit www.co.berks.pa.us/recycling/site/default.asp tofindalocationnearyourhome.
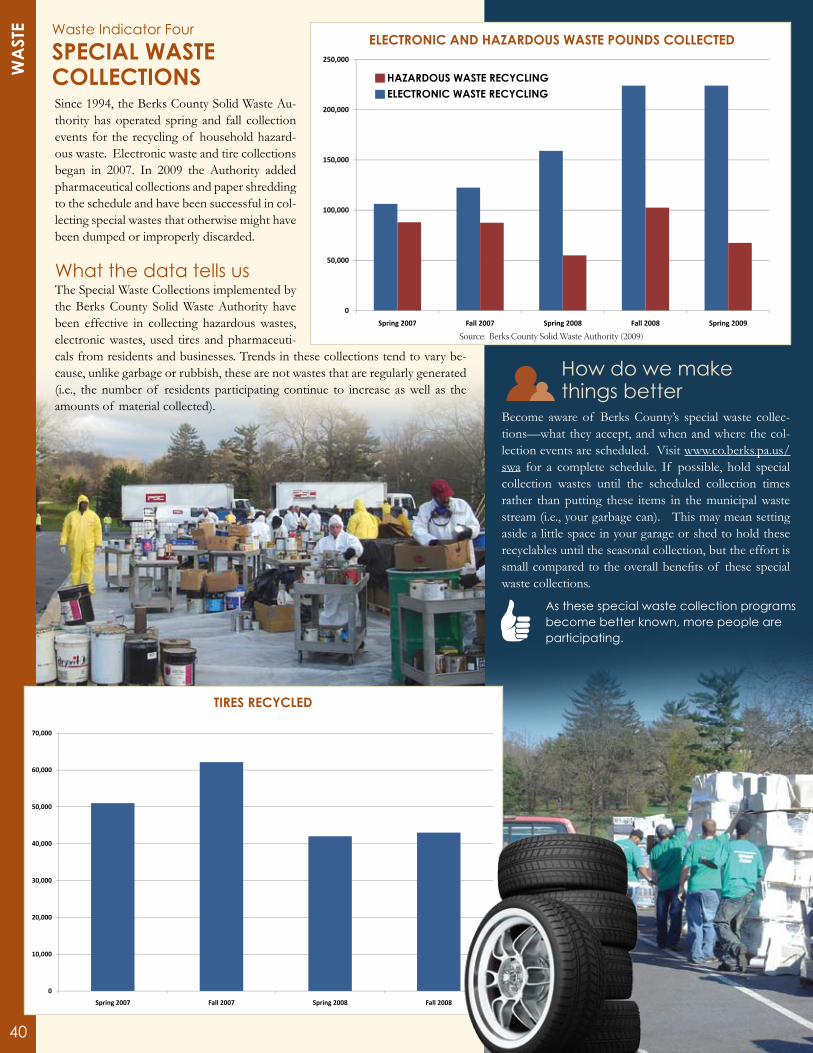
As these special waste collection programs become better known, more people are participating.
Become aware of Berks County’s special waste collec-tions—what they accept, and when and where the col-lection events are scheduled. Visit www.co.berks.pa.us/swa for a complete schedule. If possible, hold special collection wastes until the scheduled collection times rather than putting these items in the municipal waste stream (i.e., your garbage can). This may mean setting aside a little space in your garage or shed to hold these recyclables until the seasonal collection, but the effort is smallcomparedtotheoverallbenefitsof thesespecialwaste collections.
250,000
200,000
150,000
100,000
50,000
0
Spring 2007 Fall 2007 Spring 2008 Fall 2008 Spring 2009Spring 2007 Fall 2007 Spring 2008 Fall 2008 Spring 2009
ElECTRoniC And HAZARdous WAsTE Pounds CollECTEd
Since 1994, the Berks County Solid Waste Au-thority has operated spring and fall collection events for the recycling of household hazard-ous waste. Electronic waste and tire collections began in 2007. In 2009 the Authority added pharmaceutical collections and paper shredding to the schedule and have been successful in col-lecting special wastes that otherwise might have been dumped or improperly discarded.
What the data tells usThe Special Waste Collections implemented by the Berks County Solid Waste Authority have been effective in collecting hazardous wastes, electronic wastes, used tires and pharmaceuti-cals from residents and businesses. Trends in these collections tend to vary be-cause, unlike garbage or rubbish, these are not wastes that are regularly generated (i.e., the number of residents participating continue to increase as well as the amounts of material collected).
Tires
70,000
60,000
50 00050,000
40,000
30,000,
20,000
10,000
0
Spring 2007 Fall 2007 Spring 2008 Fall 2008
TiREs RECYClEd
how do we make things better
HAZARdous WAsTE RECYClinG ElECTRoniC WAsTE RECYClinG
40
WA
sTE Waste Indicator four
sPECiAl WAsTE CollECTions
Source:BerksCountySolidWasteAuthority(2009)

COALS is a program to remove illegally dumped garbage and trash through a partnership among en-vironmental groups, business and industry, including Pennsylvania Department of Environmental Pro-tection (PADEP), waste companies, volunteers, and local, county and state governments. The program was piloted in Columbia and Northumberland coun-ties and has expanded to 37 counties. The COALS program is a multi-faceted initiative, which includes cleanups, developing recycling programs, education and outreach, surveillance and enforcement. The Pennsylvania Environmental Council (PEC) and PADEP have developed a coalition of committed partners. In June of 2008, the Berks County Solid Waste Au-thority received the Pennsylvania CleanWays Illegal Dump Survey for Berks County. This survey identi-fied100illegaldumpsitesintheCounty,withoneor more of these in 34 of the 73 Berks municipali-ties. The SWA began working with the PADEP to develop a plan to clean up these sites. The SWA contacted each of the 34 municipalities to request additionalinformationontheidentifiedsites,andof-fered assistance with both labor and cleanup costs. Cleanups began at Berks County dumping sites in July of 2008 and continued through December. By the end of 2008, 59 sites had either been cleaned uporclassifiedasafarmdump(notaddressedbythis program). Three sites were completed in Janu-ary of 2009, 14 sites are still awaiting completion of paperwork for cleanup by the SWA, and an ad-ditionaleight sitesareawaitingcleanupbyspecificmunicipalities, with disposal capacity being provided by JP Mascaro, a COALS program sponsor. Sixteen property owners have not yet responded to SWA’s notifications.
COALS cleanup program very successful in the first year of operation.
What the data tells usInjustthefirstyearof dealingwiththeidentifieddumpingsitesinBerksCoun-ty, almost two-thirds of the sites have been cleaned-up or found to be farm dump sites which are not eligible for funding through the COALS program. Thisisaveryauspiciousstarttoaddressingasignificantenvironmentalissue,and SWA deserves to be commended for leading this effort.
The Berks County Solid Waste Authority has been very active in creating and implementing programs to accept and manage solid waste materials from its residents. Given the scope of these programs, there is no excuse for dumping garbage, rubbish, old building materials, or other solid wastes on Berks County lands. Visit the Berks County SWA website or check with your municipal of-ficialstofindlocationsandschedulesforproperdisposalof wastes.
how do we make things better
70
Berks County COALS Project Status
60
70
50
SSites
62
40
ofCO
ALS
62
20
30
umbe
ro
14 1610
20
Nu
148
0
Cleaned up or Scheduled To Be Scheduled To be Awaiting ResponseCleaned up orClassified as Farm
Dump
Scheduled To BeCleaned up by SWA
Scheduled To beCleaned up byMunicipalities
Awaiting Responsefrom Property
Owners
BERKs CounTY CoAls PRoJECT sTATus
“CoAls” duMP siTEs idEnTiFiEd in BERKs And nEARBY CounTiEs
County sites Year
Berks 100 2008
Dauphin 138 2006
Lancaster 16 2009
Luzerne 159 2007
Schuylkill 74 2008
Sources: PA CleanWays Illegal Dump Surveys
41
WA
sTEWaste Indicator five
ClEAn-uP ouR AMERiCAn lAnds And sTREAMs (CoAls)

help use land wisely in Berks County.
View of Albany Township from the Appalachian Trail 42

Landin the 19th century, the noted American humorist mark Twain advised, “Buy land, they’re not making it any more.” Certainly, the acquisition and development of land has been a driving force in the American way of life. In the 20th century, the emerging environmental sciences documented the damage that man can do to the land if prudent land management measures were not practiced. Ecologists documented topsoil losses, adverse affects of persistent pesticides, wide-scale filling of wetland habitats, and contamination of small and large waterways, reductions in plant and animal diversity, changes in rainfall runoff patterns, and a host of other environmental changes related to imprudent land use.
STATE of ThE ENvIRoNmENT IN BERkS CoUNTY
In the early years of the 21st century, we emphasized sustain-ableusesforourland—usesthatallowustogainbenefitsfromthe land while preserving the quality, useful properties, and aes-thetic beauty of that resource. The concept of “sustainability” refers to using the land (and other resources) in such ways as to preserveitsbeneficialfeatures,evenenhancingsuchfeaturesif possible.
Berks County is blessed with abundant natural resources: for-ested ridges, numerous streams and rivers, fertile topsoil, and abundant rainfall. Agriculture was, and remains, a dominant in-fluenceintheCounty.Theindustrialoperationsthatcatalyzedthe growth of Reading and its surroundings have declined over the past few decades, while the commercial, professional, and retail sectors have been growing.
The indicators selected by the Conservancy for describing the state of land within Berks County relate directly to its heritage—its fertile farm-lands—and to factors associated with sustain-
ability of land uses. Preservation of agricultural lands and for-ested tracts has been accelerated by conservation easement and tax relief programs, while the many municipalities that make up the County continue to increase their cooperative efforts in planning and zoning.
Indicators we used for land are:
l Protected Land
l Tree Cover
l Impervious Cover
l Multi-Municipal Cooperation
l Outdoor Recreation Areas
43
lAn
d
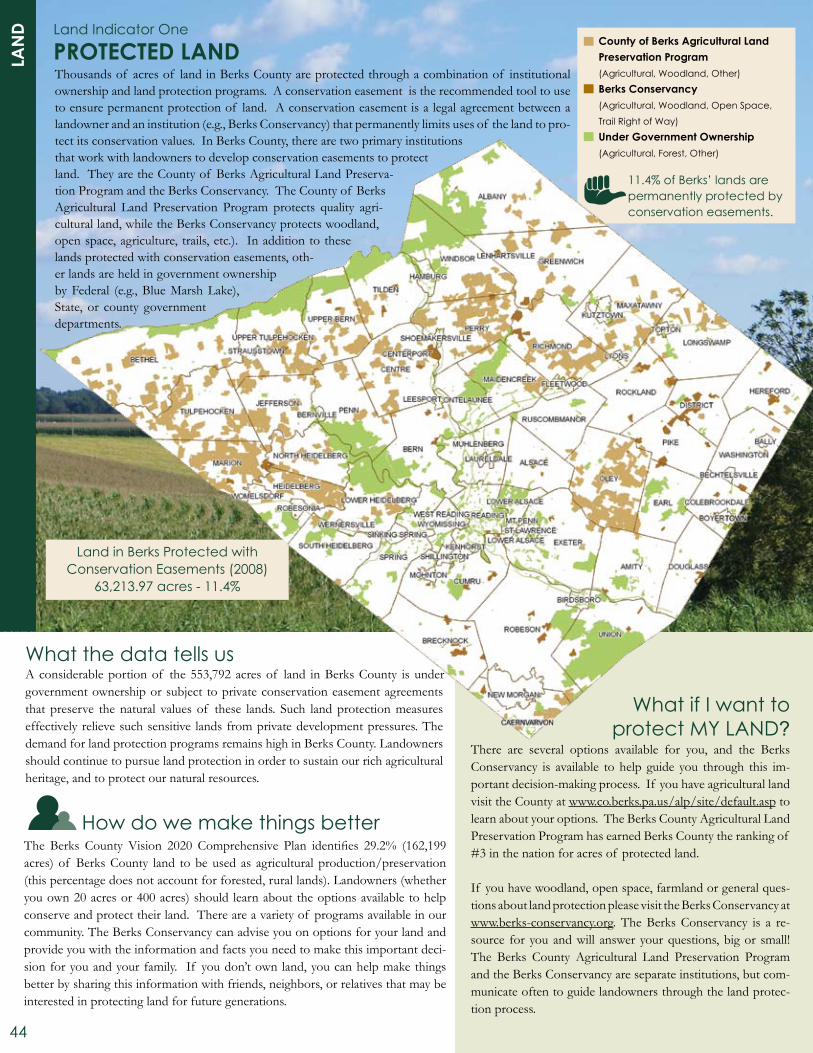
Thousands of acres of land in Berks County are protected through a combination of institutional ownership and land protection programs. A conservation easement is the recommended tool to use to ensure permanent protection of land. A conservation easement is a legal agreement between a landowner and an institution (e.g., Berks Conservancy) that permanently limits uses of the land to pro-tect its conservation values. In Berks County, there are two primary institutions that work with landowners to develop conservation easements to protect land. They are the County of Berks Agricultural Land Preserva-tion Program and the Berks Conservancy. The County of Berks Agricultural Land Preservation Program protects quality agri-cultural land, while the Berks Conservancy protects woodland, open space, agriculture, trails, etc.). In addition to these lands protected with conservation easements, oth-er lands are held in government ownership by Federal (e.g., Blue Marsh Lake), State, or county government departments.
What the data tells usA considerable portion of the 553,792 acres of land in Berks County is under government ownership or subject to private conservation easement agreements that preserve the natural values of these lands. Such land protection measures effectively relieve such sensitive lands from private development pressures. The demand for land protection programs remains high in Berks County. Landowners should continue to pursue land protection in order to sustain our rich agricultural heritage, and to protect our natural resources.
how do we make things better
Land in Berks Protected with Conservation Easements (2008)
63,213.97 acres - 11.4%
County of Berks Agricultural land Preservation Program (Agricultural, Woodland, other)
Berks Conservancy (Agricultural, Woodland, open Space,
Trail Right of Way)
under Government ownership(Agricultural, forest, other)
44
lAn
d Land Indicator one
PRoTECTEd lAnd
What if I want to protect mY LAND?
The Berks County Vision 2020 Comprehensive Plan identifies 29.2% (162,199acres) of Berks County land to be used as agricultural production/preservation (this percentage does not account for forested, rural lands). Landowners (whether you own 20 acres or 400 acres) should learn about the options available to help conserve and protect their land. There are a variety of programs available in our community. The Berks Conservancy can advise you on options for your land and provide you with the information and facts you need to make this important deci-sion for you and your family. If you don’t own land, you can help make things better by sharing this information with friends, neighbors, or relatives that may be interested in protecting land for future generations.
There are several options available for you, and the Berks Conservancy is available to help guide you through this im-portant decision-making process. If you have agricultural land visit the County at www.co.berks.pa.us/alp/site/default.asp to learn about your options. The Berks County Agricultural Land Preservation Program has earned Berks County the ranking of #3 in the nation for acres of protected land.
If you have woodland, open space, farmland or general ques-tions about land protection please visit the Berks Conservancy at www.berks-conservancy.org. The Berks Conservancy is a re-source for you and will answer your questions, big or small! The Berks County Agricultural Land Preservation Program and the Berks Conservancy are separate institutions, but com-municate often to guide landowners through the land protec-tion process.
11.4% of Berks’ lands are permanently protected by conservation easements.
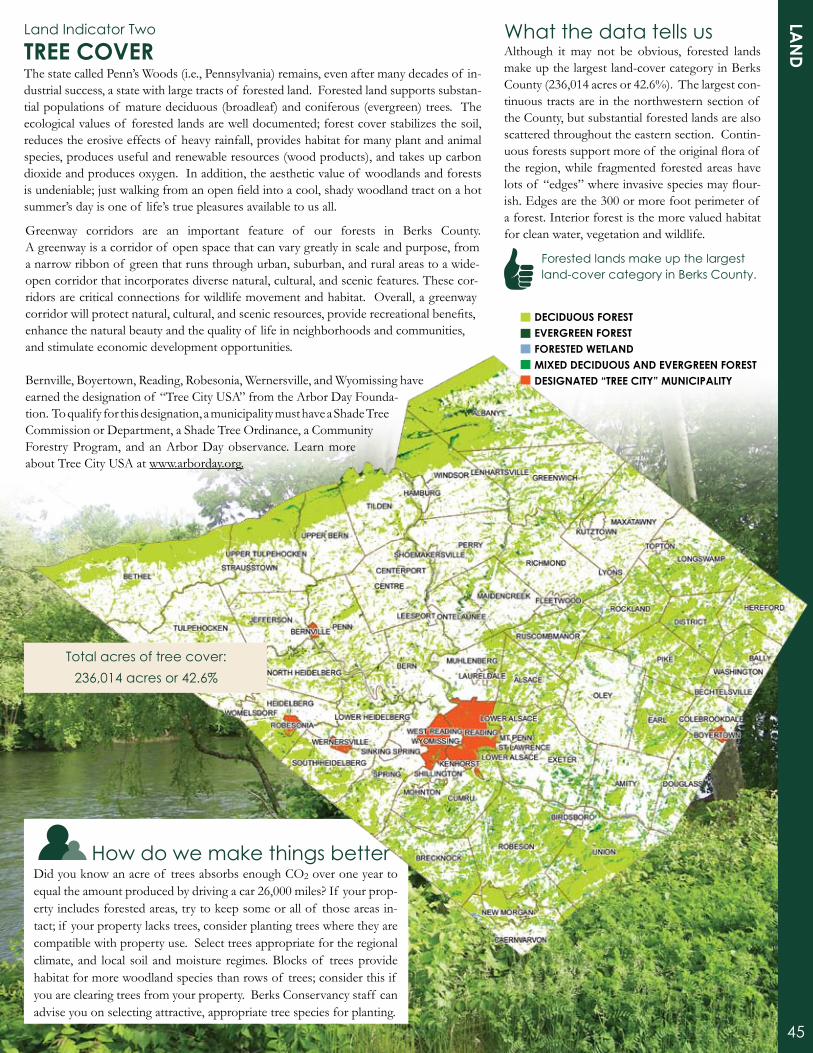
The state called Penn’s Woods (i.e., Pennsylvania) remains, even after many decades of in-dustrial success, a state with large tracts of forested land. Forested land supports substan-tial populations of mature deciduous (broadleaf) and coniferous (evergreen) trees. The ecological values of forested lands are well documented; forest cover stabilizes the soil, reduces the erosive effects of heavy rainfall, provides habitat for many plant and animal species, produces useful and renewable resources (wood products), and takes up carbon dioxide and produces oxygen. In addition, the aesthetic value of woodlands and forests isundeniable;justwalkingfromanopenfieldintoacool,shadywoodlandtractonahotsummer’s day is one of life’s true pleasures available to us all.
What the data tells usAlthough it may not be obvious, forested lands make up the largest land-cover category in Berks County (236,014 acres or 42.6%). The largest con-tinuous tracts are in the northwestern section of the County, but substantial forested lands are also scattered throughout the eastern section. Contin-uousforestssupportmoreof theoriginalfloraof the region, while fragmented forested areas have lotsof “edges”whereinvasivespeciesmayflour-ish. Edges are the 300 or more foot perimeter of a forest. Interior forest is the more valued habitat for clean water, vegetation and wildlife.
Did you know an acre of trees absorbs enough CO2 over one year to equal the amount produced by driving a car 26,000 miles? If your prop-erty includes forested areas, try to keep some or all of those areas in-tact; if your property lacks trees, consider planting trees where they are compatible with property use. Select trees appropriate for the regional climate, and local soil and moisture regimes. Blocks of trees provide habitat for more woodland species than rows of trees; consider this if you are clearing trees from your property. Berks Conservancy staff can advise you on selecting attractive, appropriate tree species for planting.
Greenway corridors are an important feature of our forests in Berks County. A greenway is a corridor of open space that can vary greatly in scale and purpose, from a narrow ribbon of green that runs through urban, suburban, and rural areas to a wide-open corridor that incorporates diverse natural, cultural, and scenic features. These cor-ridors are critical connections for wildlife movement and habitat. Overall, a greenway corridorwillprotectnatural,cultural,andscenicresources,providerecreationalbenefits,enhance the natural beauty and the quality of life in neighborhoods and communities, and stimulate economic development opportunities.
Bernville, Boyertown, Reading, Robesonia, Wernersville, and Wyomissing have earned the designation of “Tree City USA” from the Arbor Day Founda-tion. To qualify for this designation, a municipality must have a Shade Tree Commission or Department, a Shade Tree Ordinance, a Community Forestry Program, and an Arbor Day observance. Learn more about Tree City USA at www.arborday.org.
Total acres of tree cover: 236,014 acres or 42.6%
forested lands make up the largest land-cover category in Berks County.
dECiduous FoREsTEvERGREEn FoREsTFoREsTEd WETlAndMixEd dECiduous And EvERGREEn FoREsTdEsiGnATEd “TREE CiTY” MuniCiPAliTY
45
lAn
dLand Indicator Two
TREE CovER
how do we make things better

What the data tells usThe densest areas of impervious cover are, as ex-pected, in urban areas and along major roadways. Al-though Berks County is not considered highly devel-oped, more than 10 percent of the land is considered impervious.
Permeable surfaces (e.g., pavers, porous asphalt) can be used for driveways, parking areas, and other flatareas traditionally paved with asphalt or concrete. The permeablesurfacesallowsomeinfiltrationof storm-water, reducing the volumes and rates of stormwa-ter runoff into streams and rivers immediately after storms. Consider a permeable surface for renovations or new construction. Also, collect stormwater run-off in rain gardens and rain barrels to help increase groundwater recharge.
how do we make things better
more than 12% of the land in Berks County is classified as impervious cover.
lAn
d
Impervious surfaces are roadways, driveways, parking lots, build-ings, and other areas where natural movement of rainwater into the soil is partially or completely blocked. This reduces the amount of rainfall that recharges groundwater resources, and increases surface runoff to streams and rivers. Increased surface runoff not only in-creases thepotential forerosionandflooding,butalsocarriesmoresoil particles, nutrients, and contaminants into the streams and rivers receiving this runoff. This latter effect is commonly referred to as “non-point source pollution.” These changes in the natural distribu-tion of rainfall into surface water and groundwater compartments can be offset in part by stormwater management designs that promote infiltration, detain or slow surface runoff, or recycle runoff into ir-rigation systems. Reduction in the area of impervious surfaces re-quiredfordevelopmentisanobviousfirststepinaddressingthisissue.
Land Indicator Three
iMPERvious CovER
Establish a rain garden!Do you have a small yard and still wonder how you can make a difference? Homeowners in many parts of the country are catching on to rain gardens –landscapedareasplantedwithwildflowersandothernativevegetationthatsoakuprainwater,mainlyfromtheroof of ahouseorotherbuilding.Theraingardenfillswithafewinchesof waterafterastormandthewaterslowlyfiltersintothegroundratherthanrunningoff toastormdrain.Compared to a conventional patch of lawn, a rain garden allows about 30% more water to soak into the ground.
Why are rain gardens important? As cities and suburbs grow and replace forests and agricultural land, increased storm-water runoff from impervious surfaces becomes a problem. Stormwater runoff from developedareasincreasesflooding;carriespollutantsfromstreets,parkinglotsandeven lawns into local streams and lakes; and leads to costly municipal improve-ments in stormwater treatment structures. By reducing stormwater runoff, rain gardens can be a valuable part of changing these trends. While an indi-vidual rain garden may seem like a small thing, collectively they produce sub-stantialneighborhoodandcommunityenvironmentalbenefits.Raingardenswork for us in several ways by protecting water, recharging groundwater, and providing valuable habitat for Berks County wildlife!
ThE 10% “RULE”Studies evaluating the degree of impervious cover in watersheds have found that most stream health indica-tors decline when watershed impervious cover exceeds 10 percent (Schueler and Holland, 2000).
PERCENT of BERkS CoUNTY WITh ImPERvIoUS CovER
12.5%
46

Municipal master plans, zoning plans, and sensitive area plans are used toestablishclassificationsystems, regulations, andcriteria forland development within a particular municipality. These plans rep-resent the municipality’s sense of how land uses should be assigned, and how development should proceed in various sections of the mu-nicipality. Given the number of municipalities generating their own master plans, zoning plans, and other plans for particular categories of land,conflictsordiscontinuitiesinlandusecancommonlyoccur.This occurs particularly at municipal boundaries, where, for example, one municipality’s commercial zone might butt up against another municipality’s rural residential zone.
Theseconflictscanbereducedinnumberandseveritywhenseveralmunicipalities coordinate land use plans, i.e., prepare multi-municipal plans. The Berks County Planning Commission has promoted the development of Joint Comprehensive Plans and Joint Zoning Ordi-nances among municipalities to coordinate land-use planning.
What the data tells usBerks County is clearly moving in the direction of joint planning and zoning among its constituent municipalities, addressing both general andspecificlanduses. Thesejointeffortsareultimatelybeneficialto the residents of the County - development can be directed into areas with the capacity to accommodate such land-use changes, while sensitive areas that cross municipal boundaries can be preserved.
Municipalities that have not yet developed agreements and arrangements for joint planning and/or zoning with their neighbors should consider the pros and cons of creating such agreements. Berks County residents should be aware that the decisions made by planning commissions and zoning boards have long-term effects on the development of lands in their communities, and should participate in such planning efforts when possible. Meetings where planning and zon-ing decisions are voted upon are open to the public. Visit the county’s planning website at www.co.berks.pa.us/planning/site/default.asp.
Environmental Advisory CouncilsInBerksCounty,yourlocalelectedofficialsmayappoint3-7communityresidentstoserveonanEnvironmental Advisory Council (EAC). EACs advise the local planning commission, park and recreationboardandelectedofficialsontheprotection,conservation,management,promotionand use of natural resources within the community. EACs are a great way to get involved in your community. Learn more about creating an EAC at www.berks-conservancy.org
how do we make things better
more than 12% of the land in Berks County is classified as impervious cover.
Participation is high in joint comprehensive planning, zoning, and special planning.
47
lAn
dLand Indicator four
MulTi-MuniCiPAl CooPERATion
municipalities with Joint Zoningl N. Heidelberg, Heidelberg, Womelsdorf, Robesonia
l L. Heidelberg, S. Heidelberg, Wernersville
l Bally, Bechtelsville
l Boyertown, Colebrookdale, Pike (in process)
AZIP and CZIPWhile AZIP and CZIP alone do not advance multi-municipal cooperation, they are effective incentive programs for munici-palities. The objective of the Agricultural Zoning Incentive Pro-gram (AZIP) was to implement the agricultural element of the Berks County Comprehensive Plan, which contains the goal of protecting and stabilizing agriculture in areas of productive soils and promoting agriculture as an ongoing viable component in the County’s economy. In return for successful adoption of effec-tive agricultural zoning by any municipality in Berks County, the County reimbursed up to $6,000, the costs associated with amend-ing or revising the municipality’s zoning ordinance.
Through the Conservation Zoning Incentive Program (CZIP), Berks County will reimburse a municipality up to $10,000 for the costs associated with amending or revising the municipality’s zon-ing ordinance to enact effective conservation zoning regulations in natural resource areas.
In both the AZIP and CZIP programs, the County and the mu-nicipality will be bound by a contractual agreement and no pay-ment will be made until the municipality has adopted the required zoning provisions.
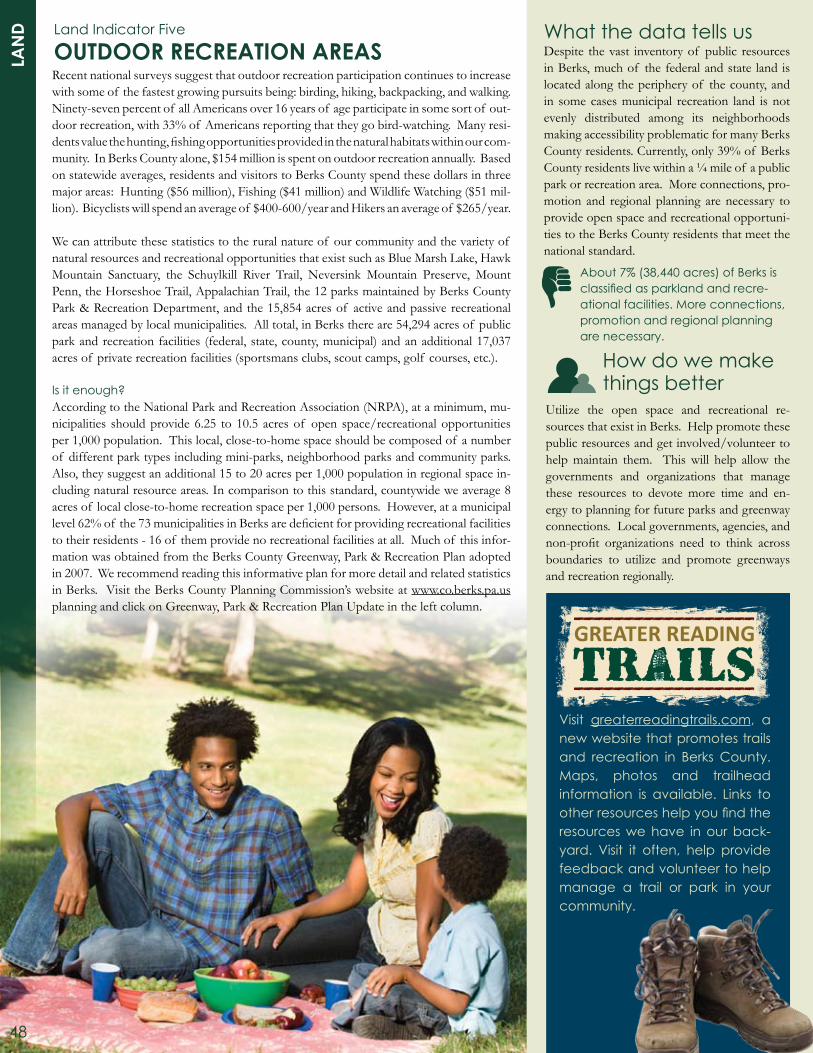
lAn
d Land Indicator five
ouTdooR RECREATion AREAsWhat the data tells usDespite the vast inventory of public resources in Berks, much of the federal and state land is located along the periphery of the county, and in some cases municipal recreation land is not evenly distributed among its neighborhoods making accessibility problematic for many Berks County residents. Currently, only 39% of Berks County residents live within a ¼ mile of a public park or recreation area. More connections, pro-motion and regional planning are necessary to provide open space and recreational opportuni-ties to the Berks County residents that meet the national standard.
Utilize the open space and recreational re-sources that exist in Berks. Help promote these public resources and get involved/volunteer to help maintain them. This will help allow the governments and organizations that manage these resources to devote more time and en-ergy to planning for future parks and greenway connections. Local governments, agencies, and non-profit organizations need to think acrossboundaries to utilize and promote greenways and recreation regionally.
how do we make things better
About 7% (38,440 acres) of Berks is classified as parkland and recre-ational facilities. more connections, promotion and regional planning are necessary.
Recent national surveys suggest that outdoor recreation participation continues to increase with some of the fastest growing pursuits being: birding, hiking, backpacking, and walking. Ninety-seven percent of all Americans over 16 years of age participate in some sort of out-door recreation, with 33% of Americans reporting that they go bird-watching. Many resi-dentsvaluethehunting,fishingopportunitiesprovidedinthenaturalhabitatswithinourcom-munity. In Berks County alone, $154 million is spent on outdoor recreation annually. Based on statewide averages, residents and visitors to Berks County spend these dollars in three major areas: Hunting ($56 million), Fishing ($41 million) and Wildlife Watching ($51 mil-lion). Bicyclists will spend an average of $400-600/year and Hikers an average of $265/year.
We can attribute these statistics to the rural nature of our community and the variety of natural resources and recreational opportunities that exist such as Blue Marsh Lake, Hawk Mountain Sanctuary, the Schuylkill River Trail, Neversink Mountain Preserve, Mount Penn, the Horseshoe Trail, Appalachian Trail, the 12 parks maintained by Berks County Park & Recreation Department, and the 15,854 acres of active and passive recreational areas managed by local municipalities. All total, in Berks there are 54,294 acres of public park and recreation facilities (federal, state, county, municipal) and an additional 17,037 acres of private recreation facilities (sportsmans clubs, scout camps, golf courses, etc.).
Is it enough?According to the National Park and Recreation Association (NRPA), at a minimum, mu-nicipalities should provide 6.25 to 10.5 acres of open space/recreational opportunities per 1,000 population. This local, close-to-home space should be composed of a number of different park types including mini-parks, neighborhood parks and community parks. Also, they suggest an additional 15 to 20 acres per 1,000 population in regional space in-cluding natural resource areas. In comparison to this standard, countywide we average 8 acres of local close-to-home recreation space per 1,000 persons. However, at a municipal level62%of the73municipalitiesinBerksaredeficientforprovidingrecreationalfacilitiesto their residents - 16 of them provide no recreational facilities at all. Much of this infor-mation was obtained from the Berks County Greenway, Park & Recreation Plan adopted in 2007. We recommend reading this informative plan for more detail and related statistics in Berks. Visit the Berks County Planning Commission’s website at www.co.berks.pa.us planning and click on Greenway, Park & Recreation Plan Update in the left column.
48
visit greaterreadingtrails.com, a new website that promotes trails and recreation in Berks County. maps, photos and trailhead information is available. Links to other resources help you find the resources we have in our back-yard. visit it often, help provide feedback and volunteer to help manage a trail or park in your community.
GREATER READING
TRAILS------------------
------------------

2
lAn
d
49
Private LandownersWilhelmRoscher grew up in theOleyHillswith his parents andfive siblings.Asa teenager,hepurchasedanoldPiperCubfor$425and learnedhowtoflyat the Kutztown Airport. His adventures took him all over the country, but healwaysflewhometohis“sacredOleyHills”.EvenwhenWilhelmwasapi-lot for United Airlines and his homebase was New York City, he lived in the Oley Hills and commuted to work. He always had an appreciation for the 400 acres his parents owned that was later broken up among Wilhelm and his sib-lings when his parents died. His lifelong goal has been to make this property “whole”again.Afteryearsof purchasinglandfromhisfamily,hefinallypiecedback together the entire estate where he was raised. A developer offered $9 mil-lion for the estate, but Wilhelm declined. He knew that it needed to be preserved.
What makes this property so special? Besides the fact that Wilhelm was born and raised on the property, one of his goals was to protect the wildlife. Deer, bats and barn swallows are often seen roaming on the land. It also serves as home to the headwaters of the Oysterville and Pine Creek - an exceptional value stream in the Oley Hills.
What does that mean for the future? After working with the Berks Conservancy, Wilhelm protected 336 acres of his property through a conservation easement. A conservation easement is a legal agreement between a landowner and a land trust (like the Berks Conservancy) or government agency that permanently limits uses of the land in order to protect its conservation values. Wilhelm’s lifelong legacy of protecting his sacred homestead will remain as it is today...forever and unchanged.
How do you protect your land? Call the Berks Conservancy at 610-372-4992 to talk with the land protection staff to discuss your special property and your wishes. If there are others in your com-munity who may be interested in learning more, we welcome the opportunity to speak at a borough/township meeting. We encourage you to involve your legal and/orfinancialadvisorsduringthisimportantdecision-makingprocess.
What are landowners doing to Go GREEn?
Wilhelm Roscher and Anne Stewart Coldren
It doesn’t matter whether you own 100 acres in the country or a small house in the city, there are ways to make your land green. From planting native flowers and establishing a rain garden to preserving your property for future generations, your actions can make a difference.,
municipalitiesLike most municipalities, Union Township in southern Berks County owns and man-ages a lot of land. In an effort to reduce maintenance costs and to help the envi-ronment, the township’s recreation board worked with volunteers to reduce mainte-nance on portions of a 154-acre municipal property by establishing nativewildflowermeadows and wilderness areas.
Over a 3-year period (2007-2009) the dedi-cation of many volunteers has resulted in nearly 800 native plants being planted on the property; and thousands and thousands of seeds introduced to the land to establish the meadow area! This not only has intro-duced a more diverse, healthy, low-mainte-nance natural landscape to the municipal land, but will serve as a location to collect native seeds to continue similar projects all over the county.
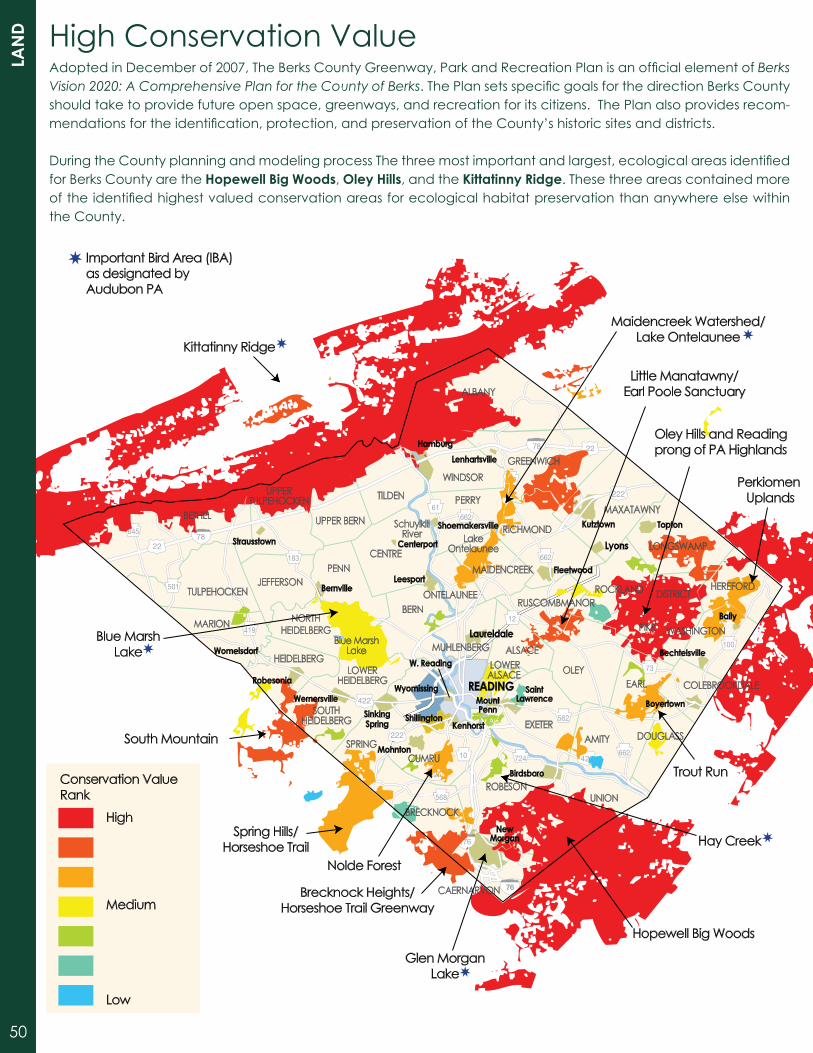
READING
Kenhorst
W. Reading
Shillington
Wyomissing
Bally
Kutztown
Strausstown
Kittatinny Ridge
Wernersville
Womelsdorf
Robesonia
Mohnton
Bechtelsville
Laureldale
Leesport
Centerport
Shoemakersville
Bernville
Lenhartsville
SaintLawrence
Birdsboro
BoyertownSinkingSpring
MountPenn
Hamburg
Topton
Lyons
Fleetwood
NewMorgan
HEIDELBERG
PIKE
ALSACE
JEFFERSON
AMITY
ROBESON
BERN RUSCOMBMANOR
BETHEL
LOWERALSACE LOWER
HEIDELBERG
BRECKNOCK
SOUTHHEIDELBERG
SPRING
MAIDENCREEK
MARION
TILDEN
CENTRE
MAXATAWNY
TULPEHOCKEN
CUMRU
MUHLENBERG
UPPER BERN
DOUGLASS
EARL
NORTHHEIDELBERG
LakeOntelaunee
SchuylkillRiver
WASHINGTON
OLEY
EXETER
ONTELAUNEE
WINDSOR
PERRY
PENN
CAERNARVON
COLEBROOKDALE
RICHMOND
UNION
UPPERTULPEHOCKEN
ALBANY
LONGSWAMP
ROCKLAND DISTRICT
GREENWICH
HEREFORD
Blue MarshLake
Conservation ValueRank
High
Medium
Low
South Mountain
Spring Hills/Horseshoe Trail
Brecknock Heights/Horseshoe Trail Greenway
Hopewell Big Woods
Nolde Forest
Glen MorganLake
Hay Creek
Blue MarshLake
Important Bird Area (IBA)as designated byAudubon PA
Maidencreek Watershed/Lake Ontelaunee
Little Manatawny/Earl Poole Sanctuary
Oley Hills and Readingprong of PA Highlands
Perkiomen Uplands
Trout Run
lAn
d
50
high Conservation valueAdopted in December of 2007, The Berks County Greenway, Park and Recreation Plan is an official element of Berks Vision 2020: A Comprehensive Plan for the County of Berks. The Plan sets specific goals for the direction Berks County should take to provide future open space, greenways, and recreation for its citizens. The Plan also provides recom-mendations for the identification, protection, and preservation of the County’s historic sites and districts.
During the County planning and modeling process The three most important and largest, ecological areas identified for Berks County are the Hopewell Big Woods, oley Hills, and the Kittatinny Ridge. These three areas contained more of the identified highest valued conservation areas for ecological habitat preservation than anywhere else within the County.

lAn
d
The kittatinny Ridge (also known as Blue Mountain) is a long mountain ridge that winds 185 miles through eastern and central Pennsylvania, totheMarylandline.TheRidgeisaglobally-significantfallmigrationflywayusedannuallybytensof thousandsof raptorsandvulturesandmillions of songbirds, and has been designated by Audubon Pennsylvania, as the largest of the state’s “Important Bird Areas.” Home to the Appalachian Trail and Hawk Mountain Sanctuary, the many rock outcroppings along the ridge also make it an excellent place to hike and watch migrating hawks, eagles and vultures.
51
The hopewell Big Woods area is the last large unbroken for-ested area in South Eastern Pennsylvania, encompassing nearly 73,000 acres. It is home to the French Creek State Park and the Historic Hopewell Furnace national heritage site.
The oley hillscontainsbeautifulscenicvistas,fivestatedesignat-edexceptionalvaluestreams,significantwoodlands,varyinggeol-ogy, and a rich assortment of cultural and historical resources and isthesignificantpartof thePAHighlands.
Lake ontelaunee is a 1,082-acre reservoir owned by the City of Reading. The lake was created in 1926 by the damming of Maiden Creek to extend and improve the water supply to the city. Inaddition,thelakeprovidesavenueforhunters,fishermen,andhikers. It is a designated “important bird area” by Audubon Penn-sylvania.
Neversink mountain is home to an abundance of flora andfauna and is managed for both people and wildlife. During your visit of nearly 900 acres of wildlife and trails, you may encounter deer, turkeys, a variety of birds, small mammals, amphibians – and Neversink Mountain is known for a diverse population of butter-fliesandmoths.
Blue marsh Lake is an US Army Corps of Engineers project, adopted as part of the Flood Control Act of 1962 and provides for multiplepurposedevelopmentforwatersupply,floodcontrol,andrecreation. The summer or recreation pool where the lake is gener-ally maintained from April through September covers 1,150 acres, runs 8 miles long, and has 35 miles of shoreline. It is a designated “important bird area” by Audubon Pennsylvania.
South mountain is a name applied to features in the mountain range extending south and south west from the Lehigh Valley to the Lebanon Valley regions of Pennsylvania. The southern prong of this feature extends west along U.S. Route 422 and the south-eastern border of Berks County, most notably in the Wernersville, Denver areas. The southernmost peaks were at one time home to many exclusive sanitariums and resorts.

A vision for the future
52

Where do we go from here?
STATE of ThE ENvIRoNmENT IN BERkS CoUNTY
We hope that this report has shown that we live in a complex, changing and interconnected ecosystem. The categories addressed in this report have been selected to span a wide spectrum of envi-ronmentalconcernsinBerksCounty,whilethespecificindicatorshavebeenselectedtoreflectquantitativeassessmentsof particularenvironmental measurements. Although presented in separate dis-cussions, it becomes clear upon reading the report that the indica-tors are fundamentally related; for example, changes in use of pub-lic transportation affect, at a minimum, energy use and air quality. As Berks County residents and the Conservancy look to the future, these indicators can be useful in assessing trends in environmental improvementsintheCounty,andcanidentifyspecificareaswhereadditional action is desirable.
In addition to providing an overview of the environment in Berks County, this report serves as a benchmark for assessing the success of ongoing and new initiatives to protect and enhance our envi-ronmental and natural resources. By tracking the data presented, we will be able to determine whether present strategies are suc-ceeding.
The environment has a lot to do with our sense of place & qual-ity of life. Physical settings can provide a sense of comfort and identityandreflectacommunity’simage,valuesandpractices.Thedecisions we need to make do not need to be an either/or or a have/have not decision. We can have compatible economic growth and respect the value our natural resources provide for us. Of the $643+ million dollars that is spent on travel and tourism each year inBerksCounty(2008statetourismfigures)$154+millionisspenton outdoor recreation. Maintaining key recreational and natural as-sets translates in to maintaining a segment of our economy that is often taken for granted.
The Conservancy won’t be the only organization to address these issues.Weinvitepartnershipandefficienciesamongthenon-profitand governmental agencies, businesses and individuals - there is plenty of work out there for everyone and the impact of our work is
andwillcontinuetobereadilyvisiblethroughfreeflowingstreams,natural vistas, open space and farmland, clean water, healthy for-ests and environment and sustainable economic growth.
Ultimately we believe the state of the environment needs to be a community conversation about setting goals, changing behaviors and thinking of new ways of doing things that help conserve the resources that sustain our lives.
The Conservancy encourages you to:
l Implement one or more of the actionable items contained within this report.
l Share this report with family & friends.
l Share with us issues that this report raises for you and your community.
l Consider ways your place of business or organization might be able to partner with the Conservancy and other conservation organizations to move our indicators in a positive direction.
l Talk about the areas where we are doing well so we can celebrate the progress and good work that is already occurring in our communities.
l Join us on Facebook, GreenBerks.com, and our blog at www.berks-conservancy.org to be a part of the online conversation.
7
WHERE do
WE G
o FRo
M HERE?
53
STATE of ThE ENvIRoNmENT IN BERkS CoUNTY
SourcesAIR 1. NUMBER OF DAYS PER YEAR EXCEEDING AIR QUALITY
CRITERIA FOR OZONE
United States Environmental Protection Agency (USEPA). 2009.
Quick Look Report: Ozone. Air Quality System; June 15, 2009.
2. PERCENTAGE OF MONITORING DAYS PER YEAR EXCEEDING
AIR QUALITY CRITERIA FOR PM2.5
United States Environmental Protection Agency (USEPA). 2009.
Quick Look Report: PM2.5. Air Quality System; June 15, 2009.
3. AIR QUALITY CRITERIA ATTAINMENT STATUS: PM2.5
United States Environmental Protection Agency (USEPA). 2009.
Quick Look Report: PM2.5. Air Quality System; June 15, 2009.
4. AIR QUALITY CRITERIA ATTAINMENT STATUS:
LEAD - SPECIAL PURPOSE MONITORS
Pennsylvania Department of Environmental Protection (PADEP). 2009.
BerksCountyLeadDatafrom1999to2008(Excelfile).
5. AMBIENT AIR MONITORING OF LEAD: NON-SPECIAL
PURPOSE MONITORS
Pennsylvania Department of Environmental Protection (PADEP). 2009.
BerksCountyLeadDatafrom1999to2008(Excelfile).
ENERGY1. VEHICLE-MILES TRAVELLED PER YEAR
Pennsylvania Department of Transportation (PennDOT) online database.
July 2009
2. RESIDENTS USING PUBLIC TRANSPORTATION
Berks Area Reading Transportation Authority (BARTA), Administration
and Human Resources Department, FY2002-2003 through FY 2008-2009.
July 2009.
3. GENERATION AND DISTRIBUTION
U.S.EnvironmentalProtectionAgency (USEPA),Officeof Atmospheric
Programs, Emissions & Generation Resource Integrated Database for Data
Years 1996-2000. Prepared by E.H. Pechan & Associates, Inc., April 2003.
4. HOUSEHOLD ENERGY USE
PPL Utilities Corporation, ETN Division. 2009. U.S. Census Bureau, 2000
Census of Population and Housing. 2007.
Department of Energy (DOE) Information Administration (EIA),
Voluntary Reporting of Greenhouse Gases Program, 1605(b) Program.
October 2008.
5. NEW CONSTRUCTION WITH GREEN CERTIFICATION
U.S. Green Building Council (USGBC) online database for LEED-
registered projects. July 2009.
LAND1. PROTECTED LAND
Pennsylvania State University PAMAP Land Cover for Pennsylvania, 2005;
Berks County Mapping Department, Tax Assessment Data by Municipality,
2009; Berks County Conservancy, 2009. Berks County Vision 2020
Comprehensive Plan.
2. IMPERVIOUS COVER
Pennsylvania State University PAMAP Land Cover for Pennsylvania, 2005;
Berks County Conservancy, 2009.
3. TREE COVER
Pennsylvania State University PAMAP Land Cover for Pennsylvania, 2005;
Berks County Conservancy, 2009.
4. MULTI-MUNICIPAL COOPERATION
Berks County Planning Commission, 2009.
5. RECREATION AREAS
Berks County Greenway, Park & Recreation Plan, 2007.
WASTE1. BERKS COUNTY WASTE GENERATION
PADEP Waste Destination Reports, 2000-2008.
2. BERKS COUNTY WASTE DISPOSALS
PADEPLandfillWasteReceipts,2000-2008.
3. BERKS COUNTY RECYCLING RATE
Berks County Solid Waste Authority (SWA). 2008 Year-End Report.
4. SPECIAL WASTE COLLECTIONS
Berks County Solid Waste Authority (SWA). 2008 Year-End Report.
5. CLEAN UP OUR AMERICAN LANDS AND STREAMS (COALS)
PROGRAM
Berks County Solid Waste Authority (SWA). 2008 Year End Report.
WATER 1. GROUNDWATER ELEVATIONS
USGS Surface-Water Annual Statistics for the Nation:
USGS 402615075530501 BE Berks County Observation Well. 2009.
2. MILES OF IMPAIRED STREAMS
PADEP 2009. Integrated List Non-Attaining [online]; Office of Water
Management, Bureau of Water Supply and Wastewater Management;
Water Quality Assessment and Standards Division.
3. WATER SYSTEMS WITH PROTECTION PLANS
Spotts, Stevens & McCoy, 2009.
4. STATUS OF SEWAGE FACILITY PLANS
PADEP2009. Act 537 Official Plan Aging—Southcentral Pennsylvania.
http://www.depweb.state.pa.us/watersupply/cwp/view.asp?a=1260&Q=449480
5. AQUATIC LIFE IN BERKS COUNTY STREAMS
Stroud Research Center; Schuylkill Project; 19 Long-term Sampling Sites.
2009.
54

STATE of ThE ENvIRoNmENT IN BERkS CoUNTY
Sponsors
Associated Construction & Mgmt. Corp.
Martha Aynardi
Bellairs Real Estate
Berks County Bar Association
Burkey Construction Co.
C.H. Briggs
Colonial Oaks Foundation
Comcast
East Penn Manufacturing Co. Inc.
Entech Engineering
EthoSource
Fromm Electric Supply
Fulton Bank
Great Valley Consultants
Hartman Shurr
Herbein + Company
The Keeler Company, Inc.
Kutztown Publishing Company
Launch Dynamic Media
Meister Architects
Muhlenberg Greene Architects
National Penn
PA American Water
PA Dept. of Environmental Protection
PaperlessHandbook.com
ParenteBeard LLC
Sentry Abstract Co.
VF Outlet, Inc.
Wert Investment Consulting Group -
Wells Fargo Advisors
William Penn Foundation
The Berks Conservancy would like to thank the following businesses, individuals and foundations for their support of our State of the Environment in Berks program. Your support of our organization and this new initiative is greatly appreciated. Through this support, the Berks Conservancy will continue to raise awareness of conservation choices we can make in Berks that will improve the environment.
Presenting Sponsor: Spotts Stevens McCoy
55

LYON STATION, PA 19536
www.dekabatteries.com
Batteries & AccessoriesBatteries & AccessoriesEast Penn is committed to preserving the surroundingenvironment of our Berks County community. With thehighest environmental manufacturing
standards and a “green” culture, East Pennis recognized as a model for the industry and
a world-class, premier battery recycler.
LEAD-ACID BATTERIESARE RECYCLABLE!
4 X 2.625:4 x 2.625 10/20/09 10:14 AM Page 1
Thank you,Berks Conservancy,for thinking of our
Great-great grandchildren!

You can help the environment by taking simple measures to conserve energy and recycle.
Each person can make a difference.
Entech Engineering Supports the Berks County Conservancy!
Entech Engineering, Inc.
Reading Pottsville Mountaintop Lititz800-825-1372
www.entecheng.com
WE CARE ABOUT WATER. IT’S WHAT WE DO.
Be Water Wise.At Pennsylvania American Water, we work every day to manage our water systems and resources in an environmentally responsible manner. We also sponsor programs that educate customers on the importance of protecting our drinking water supplies.
Visit us at www.pennsylvaniaamwater.com for more information and for tips on how to use water wisely, because every drop counts!
Gregory C. Hartman Christopher J. Hartman Andrew N. Howe Cheryl J. Allerton
Charles N. Shurr, Jr.Richard V. Grimes, Jr.Elizabeth A. MagovernDominic A. DeCecco
Bethany W. EmkeyBrett M. FegelyGeorge T. Faris, IV
Hartman Shurr is a general practice law firm offering legal expertise to our clients in the following areas of practice:
Municipal LawEquine Law
Real Estate LawAgricultural Law
Wills & Estate PlanningBusiness & Corporate
Estate Administration/Probate
Zoning LawLabor & Employment Law
Commercial Finance/Banking LawNon-Profit Corporate Law
Accidents/InjuriesLitigation
Creditor Rights
Innovative Attorneys. Traditional Values.1100 Berkshire Blvd., Suite 301, PO Box 5828, Wyomissing, PA 19610
3821 E. Main Street, Morgantown, PA 19543 Telephone: 610-779-0772 | Fax: 610-779-7473 | HartmanShurr.com

Enhancing the Quality of LifeOur work enhances the quality of life for our clients, our
employees, and the people touched by our work. It touches
this generation and future generations. We celebrate the
earth everyday with our approach to operations,
integration of LEED concepts, and application of green
solutions or sustainable designs.
Bringing Engineering Solutions to Life
> Civil Engineering
> Environmental, Health and Safety
> Facilities Engineering
> Municipal Engineering and Planning
> Site Engineering and Infrastructure
> Water and Wastewater
SPOTTS | STEVENS | McCOYEngineers and Consultants
ssmgroup.com
READING | 610.621.2000
LEHIGH VALLEY | 610.849.9700

YES! I’d like more information about the Berks Conservancy.
Name:
Address:
City: State: Zip Code:
Phone:
Email: Please send me an additional copy of the State of the Environment in Berks County.
Please subscribe me to the e-newsletter, “Conservation in your Community”. Please subscribe me to the e-newsletter, “GreenBerks”. I am interested in learning more about becoming a member of the Berks Conservancy. I would like to join your mailing list for information about your projects, nature walks and other community events.
I am interested in volunteer opportunities.
I am interested in
The Berks Conservancy does not sell or share our database.
To learn more about our projects or to become a member, visit www.berks-conservancy.org or send the postcard below.
The Berks Conservancy is dedicatedto connecting people to nature through trail
creation, water protection, land use projects, community gardens, municipal relationships
and education for the community.
We’re saving a place for you...
for regular “Going Green” tips and local on-line conversations, visit GreenBerks.com.
Want to get more involved? Become a member of Berks Conservancy at www.berks-conservancy.org.
for regular “Going Green” tips and local on-line conversations, visit GreenBerks.com.
BERKS COUNTY CONSERVANCY 25 NORTH 11TH ST READING PA 19601-9912
NO POSTAGENECESSARY
IF MAILEDIN THE
UNITED STATES
BUSINESS REPLY MAILFIRST-CLASS MAIL READING PAPERMIT NO 4
POSTAGE WILL BE PAID BY ADDRESSEE
Artwork for User Defined (5.5" x 7.5")Layout: sample BRM card.lytAugust 6, 2009
Produced by DAZzle, Version 9.0.05(c) 1993-2009, Endicia, www.Endicia.comU.S. Postal Service, Serial #
IMPORTANT: DO NOT ENLARGE, REDUCE OR MOVE the FIM and POSTNET barcodes. They are only valid as printed! Special care must be taken to ensure FIM and POSTNET barcode are actual size AND placed properly on the mail piece to meet both USPS regulations and automation compatibility standards.
Related Documents