Entry regulations and labour market outcomes: Evidence from the Italian retail trade sector Eliana Viviano Bank of Italy La valutazione dell’impatto di interventi pubblici: metodi e studi di caso Firenze, 18-19 Gennaio 2007

Welcome message from author
This document is posted to help you gain knowledge. Please leave a comment to let me know what you think about it! Share it to your friends and learn new things together.
Transcript

Entry regulations and labour market outcomes: Evidence from the Italian retail
trade sector
Eliana VivianoBank of Italy
La valutazione dell’impatto di interventi pubblici: metodi e studi di caso
Firenze, 18-19 Gennaio 2007

Introduction:
• Regulation not only of the labour market, but also the product market affects employment growth
• In this paper I focus on the relationship between entry barriers (a type of product market regulation) and employment.
• Entry barriers are rules that prevent the entrance of new firms in a given sector.
• Retail trade sector in Italy
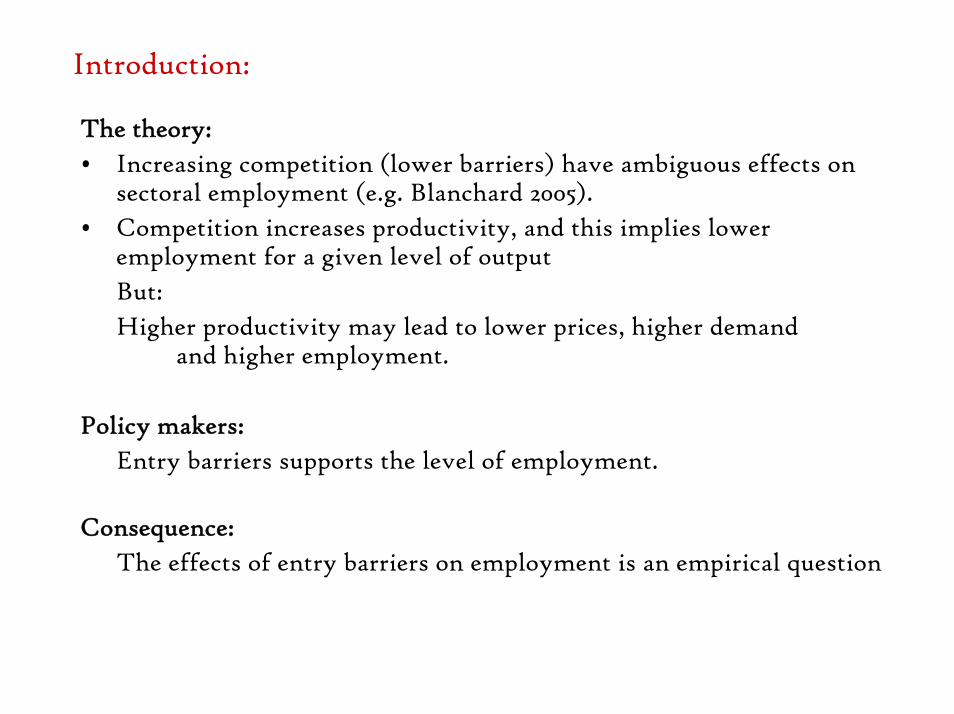
The theory:• Increasing competition (lower barriers) have ambiguous effects on
sectoral employment (e.g. Blanchard 2005). • Competition increases productivity, and this implies lower
employment for a given level of outputBut:Higher productivity may lead to lower prices, higher demand
and higher employment.
Policy makers:Entry barriers supports the level of employment.
Consequence:The effects of entry barriers on employment is an empirical question
Introduction:

Increasing empirical literature:
Newmark & Zhang & Ciccarella S., (2005), ``The effects of Wal-Mart on local labour markets'', NBER Working paper Series No. 11782.
Burda & Weil , (2005), ``Blue Laws'', Working paper.
Bertrand & Kramarz (2002): `` Does entry deterrence hinder job creation? Evidence from the French Retail Industry'' QJE.
Introduction:

The focus: The effects of entry barriers on employment in the Italian retail trade sector, which is currently regulated by the Bersani law issued in 1998.
What’s new?1. Evidence on the effects of increasing competition on the “incumbents”;2. Evidence for Italy
The plan of the presentation:1. The Bersani Law2. Evidence for Italy3. The strategy for identifying the effects of regulations4. Results5. Robustness checks
Introduction:
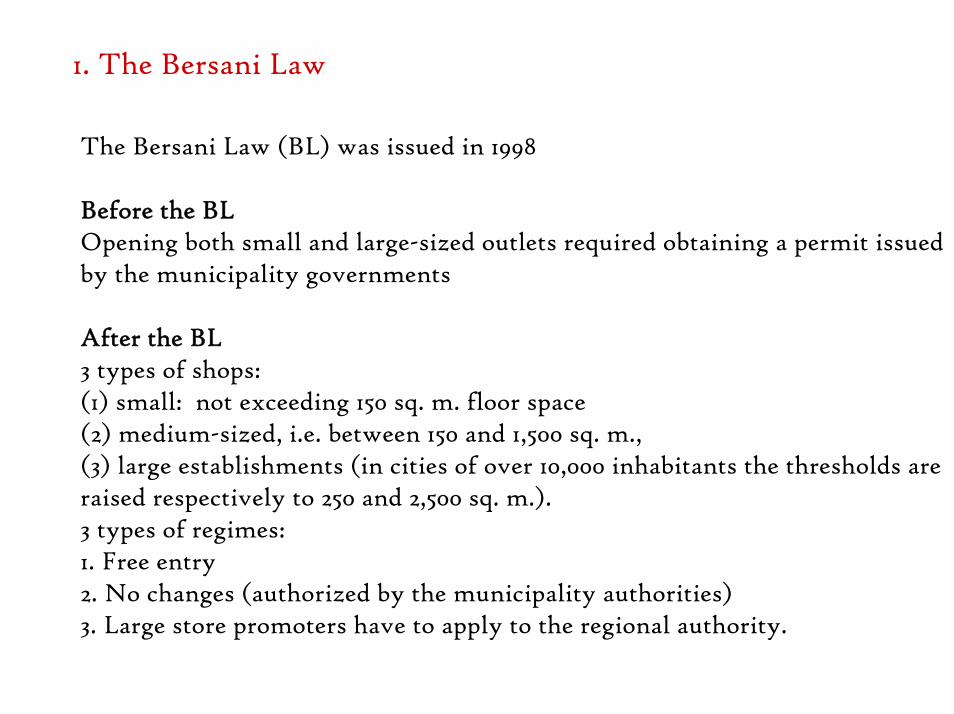
The Bersani Law (BL) was issued in 1998
Before the BLOpening both small and large-sized outlets required obtaining a permit issued by the municipality governments
After the BL3 types of shops:(1) small: not exceeding 150 sq. m. floor space (2) medium-sized, i.e. between 150 and 1,500 sq. m., (3) large establishments (in cities of over 10,000 inhabitants the thresholds are raised respectively to 250 and 2,500 sq. m.).3 types of regimes:1. Free entry 2. No changes (authorized by the municipality authorities) 3. Large store promoters have to apply to the regional authority.
1. The Bersani Law
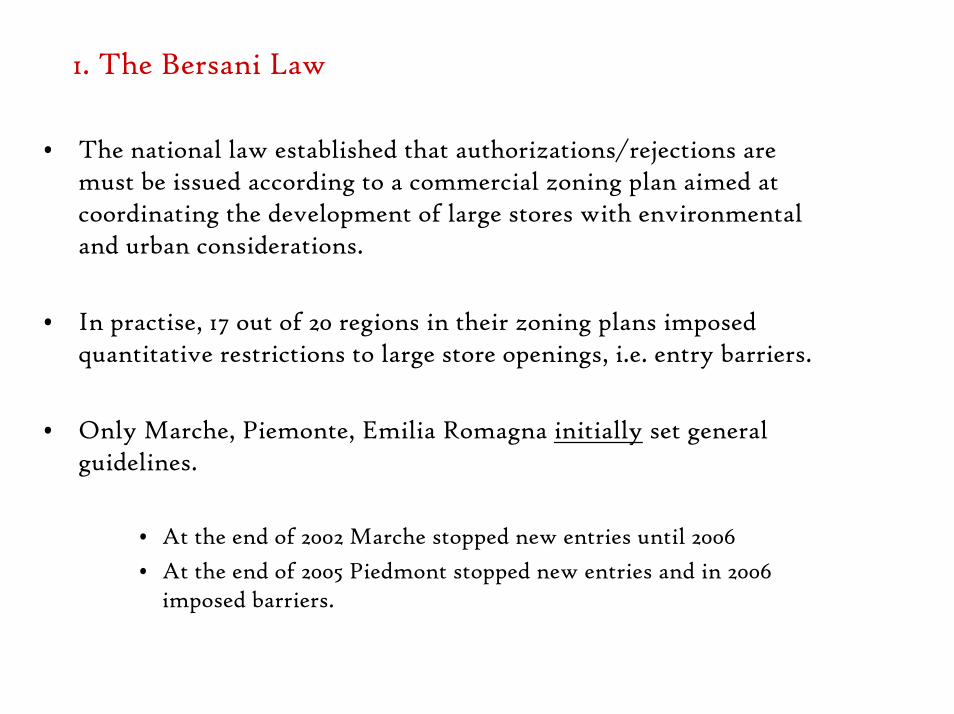
• The national law established that authorizations/rejections are must be issued according to a commercial zoning plan aimed at coordinating the development of large stores with environmental and urban considerations.
• In practise, 17 out of 20 regions in their zoning plans imposed quantitative restrictions to large store openings, i.e. entry barriers.
• Only Marche, Piemonte, Emilia Romagna initially set general guidelines.
• At the end of 2002 Marche stopped new entries until 2006• At the end of 2005 Piedmont stopped new entries and in 2006
imposed barriers.
1. The Bersani Law
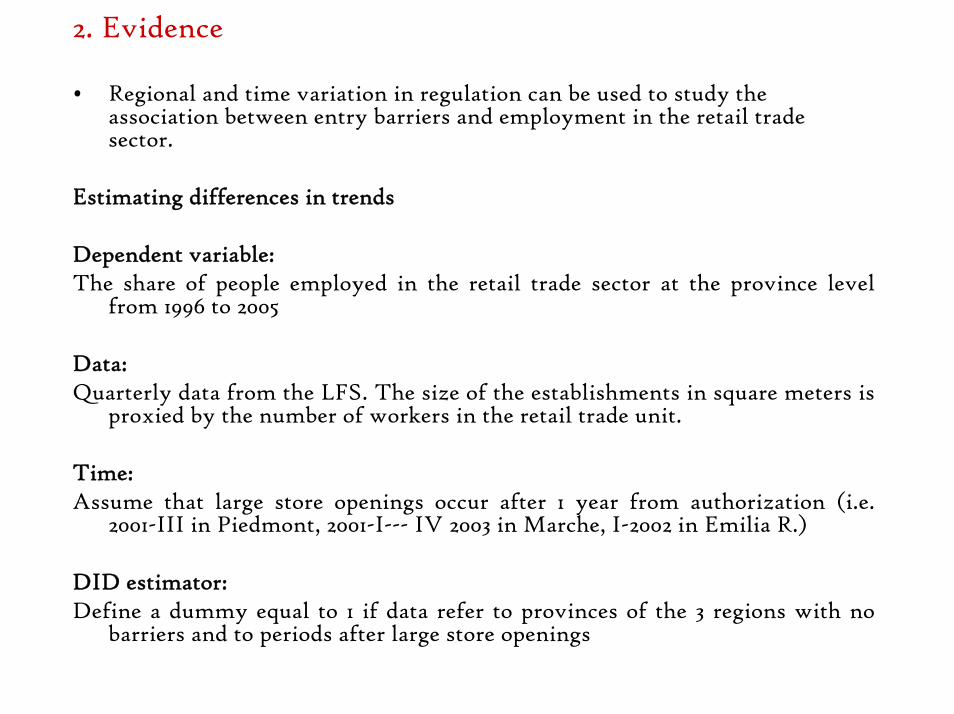
• Regional and time variation in regulation can be used to study the association between entry barriers and employment in the retail trade sector.
Estimating differences in trends
Dependent variable: The share of people employed in the retail trade sector at the province level
from 1996 to 2005
Data:Quarterly data from the LFS. The size of the establishments in square meters is
proxied by the number of workers in the retail trade unit.
Time:Assume that large store openings occur after 1 year from authorization (i.e.
2001-III in Piedmont, 2001-I--- IV 2003 in Marche, I-2002 in Emilia R.)
DID estimator:Define a dummy equal to 1 if data refer to provinces of the 3 regions with no
barriers and to periods after large store openings
2. Evidence
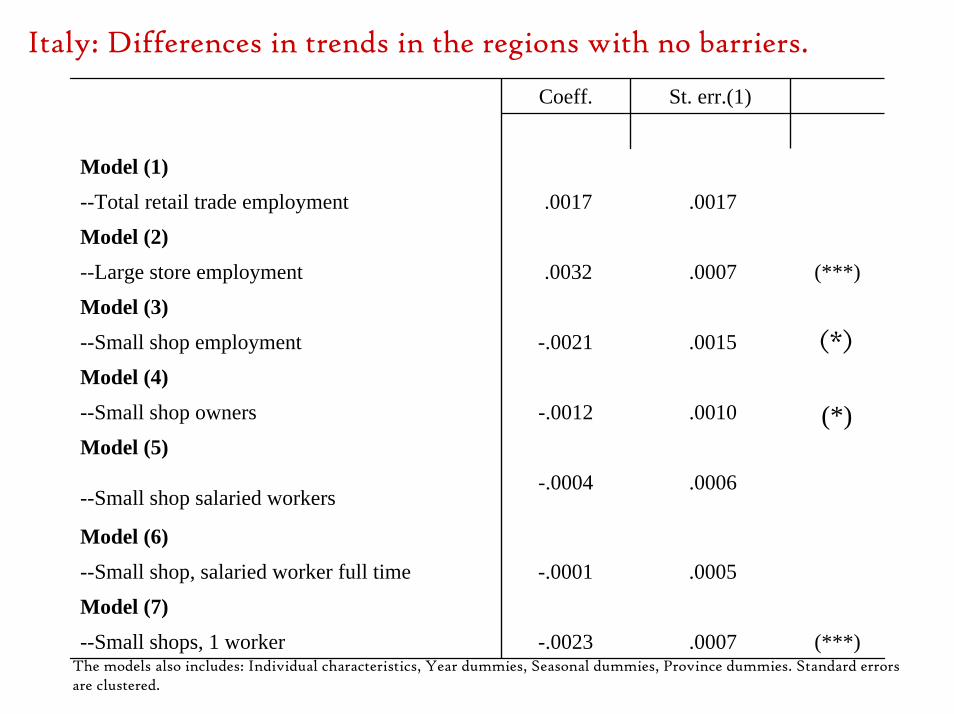
Italy: Differences in trends in the regions with no barriers.
The models also includes: Individual characteristics, Year dummies, Seasonal dummies, Province dummies. Standard errors are clustered.
Coeff. St. err.(1)
Model (1)
--Total retail trade employment .0017 .0017
Model (2)
--Large store employment .0032 .0007 (***)
Model (3)
--Small shop employment -.0021 .0015
Model (4)
--Small shop owners -.0012 .0010 (*)Model (5)
--Small shop salaried workers-.0004 .0006
Model (6)
--Small shop, salaried worker full time -.0001 .0005
Model (7)
--Small shops, 1 worker -.0023 .0007 (***)
(*)
The DID estimates may have causal interpretation when1. The liberalizing and restrictive regions must be similar before the
treatment2. Changes observed after the treatment must be due to the treatment
and not to other economic factors.
I can compare employment in two close and similar regions before and after the inception of the regional regulations
However:How to find similar regions with different regulation? If the regions
are similar why they should adopt different policies?
Remember: After 2002 Marche stopped entries. The policies of Marche do not differ in the long run from the policy of other liberalizing regions!
3. The identification strategy
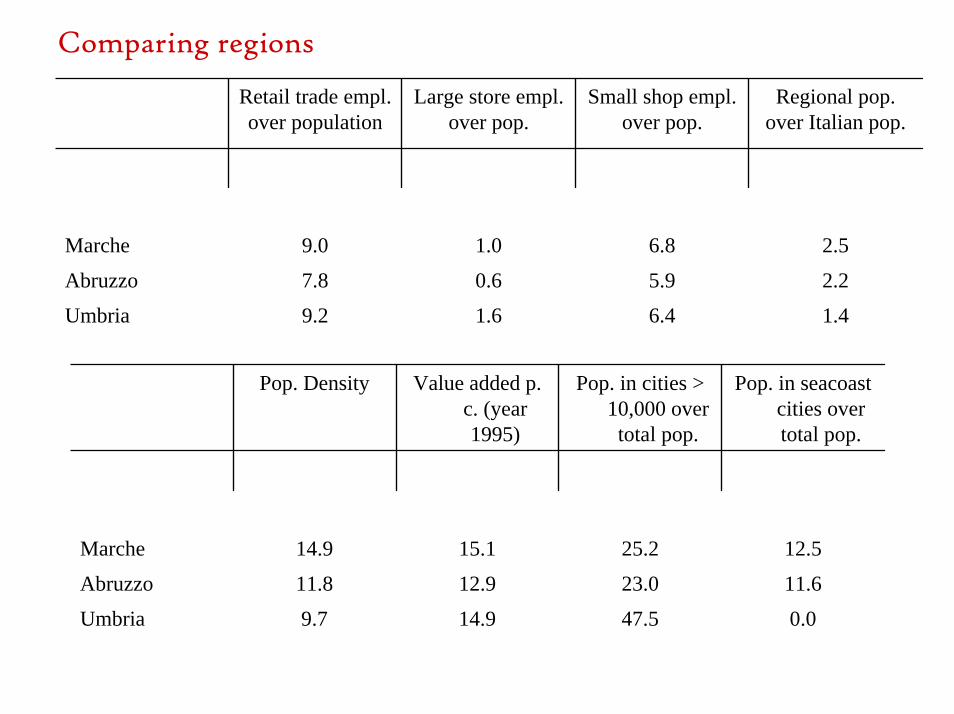
Retail trade empl. over population
Large store empl. over pop.
Small shop empl. over pop.
Regional pop. over Italian pop.
Marche 9.0 1.0 6.8 2.5
Abruzzo 7.8 0.6 5.9 2.2
Umbria 9.2 1.6 6.4 1.4
Comparing regions
Pop. Density Value added p. c. (year 1995)
Pop. in cities > 10,000 over total pop.
Pop. in seacoast cities over total pop.
Marche 14.9 15.1 25.2 12.5
Abruzzo 11.8 12.9 23.0 11.6
Umbria 9.7 14.9 47.5 0.0
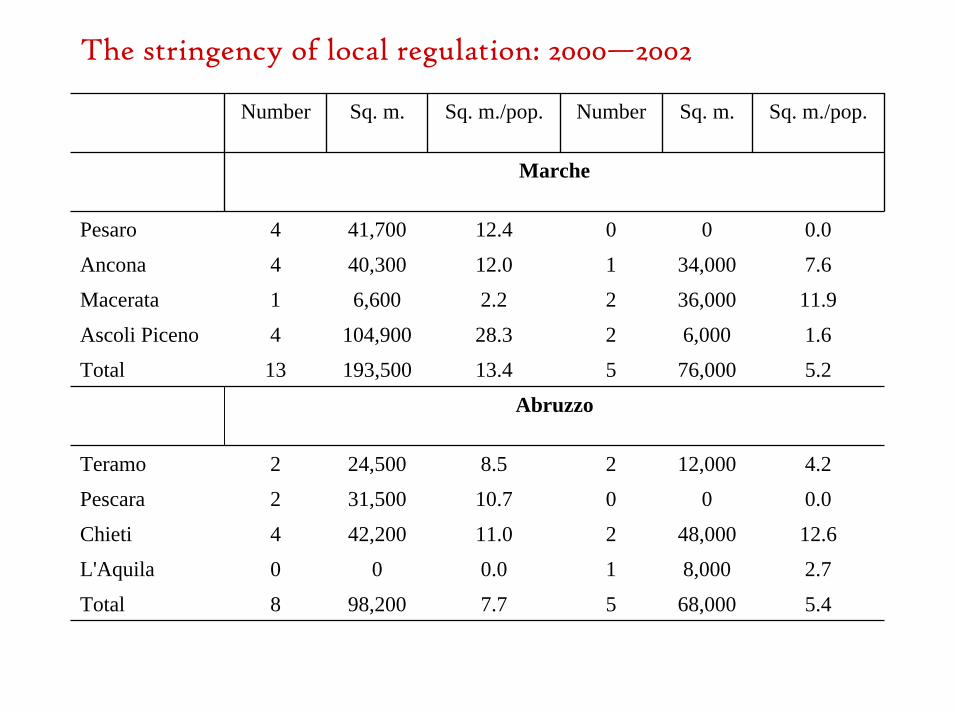
The stringency of local regulation: 2000—2002
Number Sq. m. Sq. m./pop. Number Sq. m. Sq. m./pop.
Marche
Pesaro 4 41,700 12.4 0 0 0.0
Ancona 4 40,300 12.0 1 34,000 7.6
Macerata 1 6,600 2.2 2 36,000 11.9
Ascoli Piceno 4 104,900 28.3 2 6,000 1.6
Total 13 193,500 13.4 5 76,000 5.2
Abruzzo
Teramo 2 24,500 8.5 2 12,000 4.2
Pescara 2 31,500 10.7 0 0 0.0
Chieti 4 42,200 11.0 2 48,000 12.6
L'Aquila 0 0 0.0 1 8,000 2.7
Total 8 98,200 7.7 5 68,000 5.4
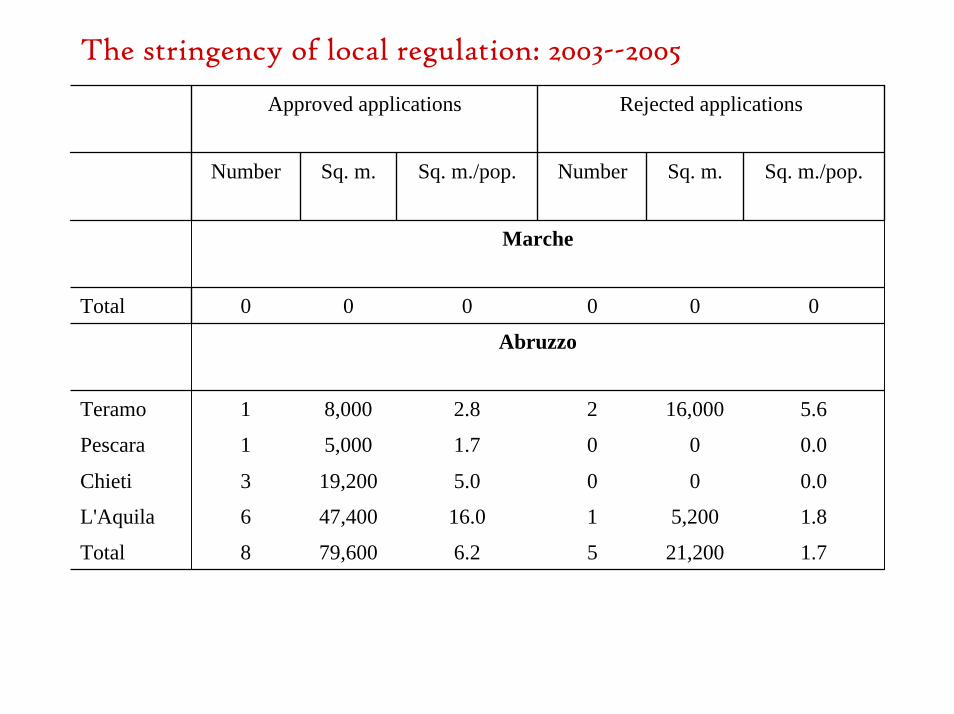
The stringency of local regulation: 2003--2005
Approved applications Rejected applications
Number Sq. m. Sq. m./pop. Number Sq. m. Sq. m./pop.
Marche
Total 0 0 0 0 0 0
Abruzzo
Teramo 1 8,000 2.8 2 16,000 5.6
Pescara 1 5,000 1.7 0 0 0.0
Chieti 3 19,200 5.0 0 0 0.0
L'Aquila 6 47,400 16.0 1 5,200 1.8
Total 8 79,600 6.2 5 21,200 1.7
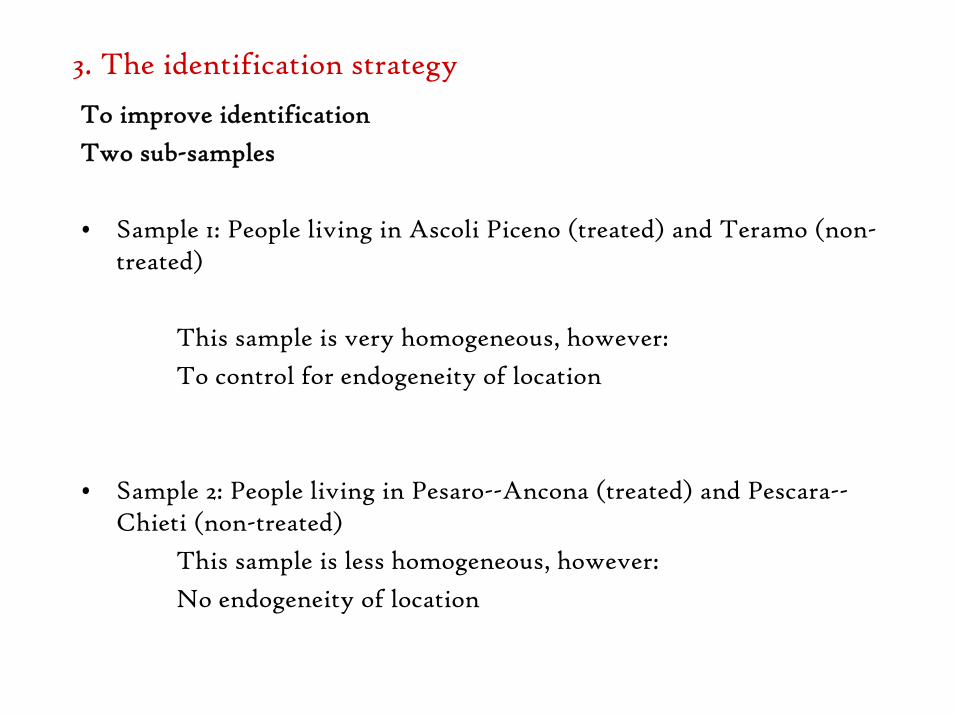
To improve identificationTwo sub-samples
• Sample 1: People living in Ascoli Piceno (treated) and Teramo (non-treated)
This sample is very homogeneous, however:To control for endogeneity of location
• Sample 2: People living in Pesaro--Ancona (treated) and Pescara--Chieti (non-treated)
This sample is less homogeneous, however:No endogeneity of location
3. The identification strategy
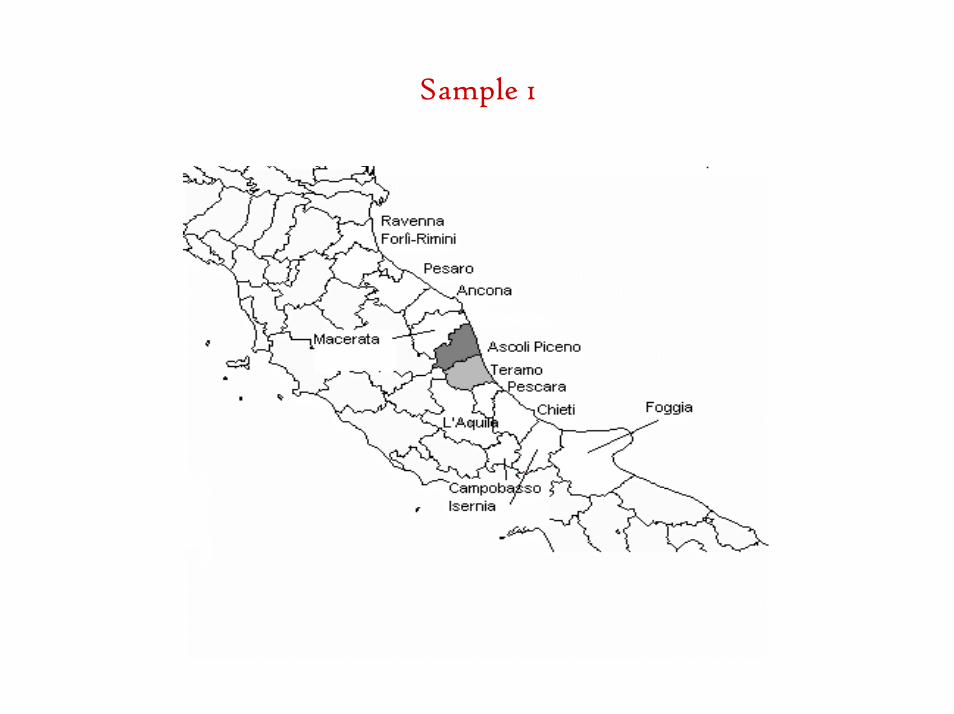
Sample 1
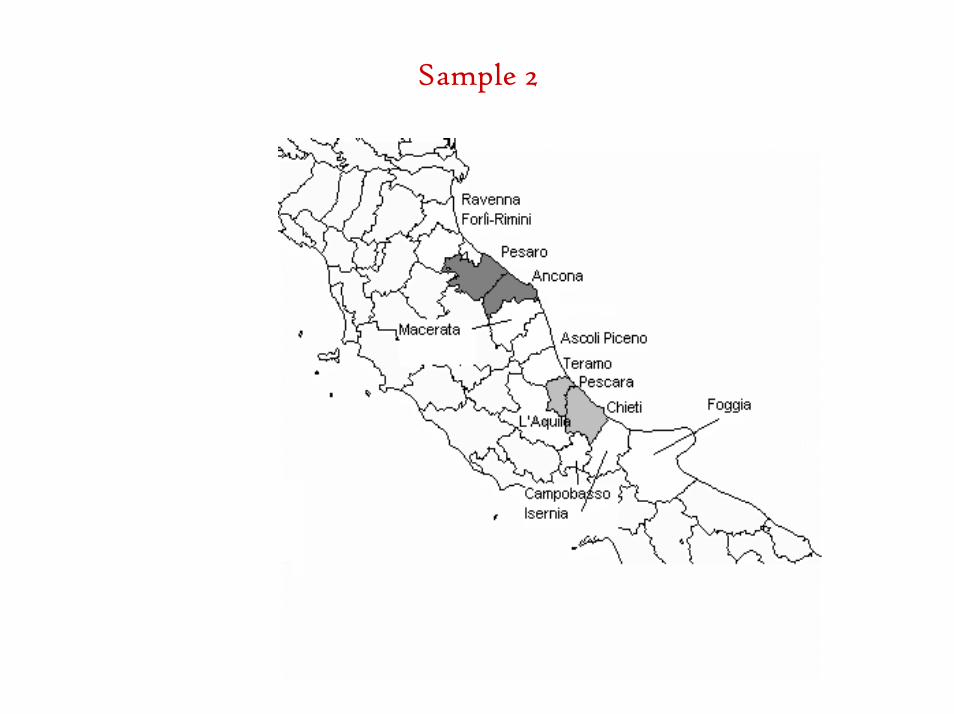
Sample 2
Treated Non-treated
Before After Before After
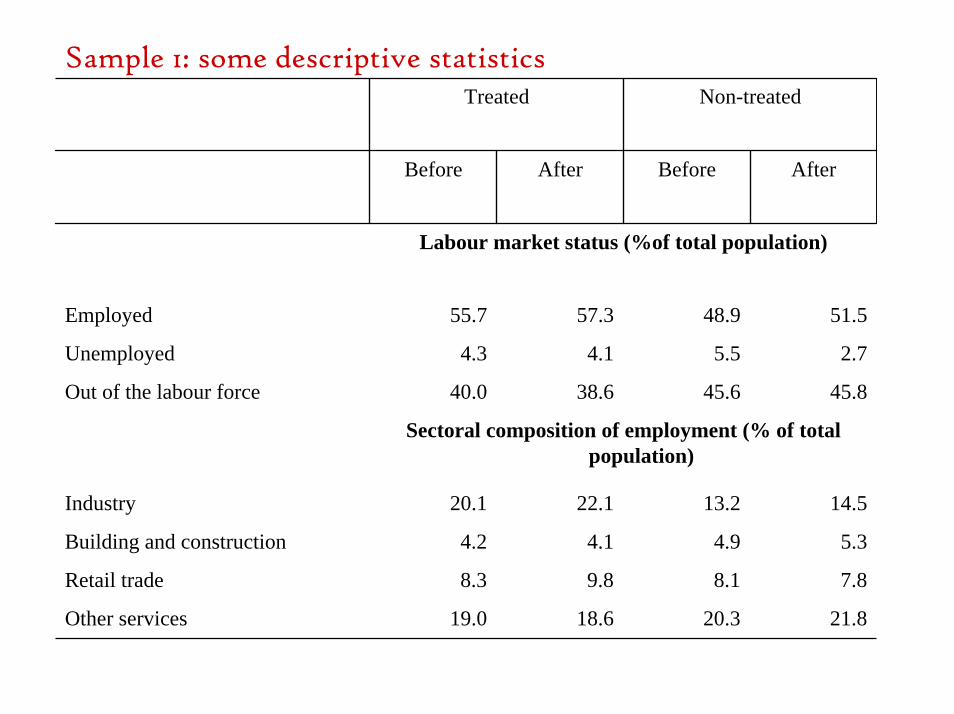
Labour market status (%of total population)
Employed 55.7 57.3 48.9 51.5
Unemployed 4.3 4.1 5.5 2.7
Out of the labour force 40.0 38.6 45.6 45.8
Sectoral composition of employment (% of total population)
Industry 20.1 22.1 13.2 14.5
Building and construction 4.2 4.1 4.9 5.3
Retail trade 8.3 9.8 8.1 7.8
Other services 19.0 18.6 20.3 21.8
Sample 1: some descriptive statistics
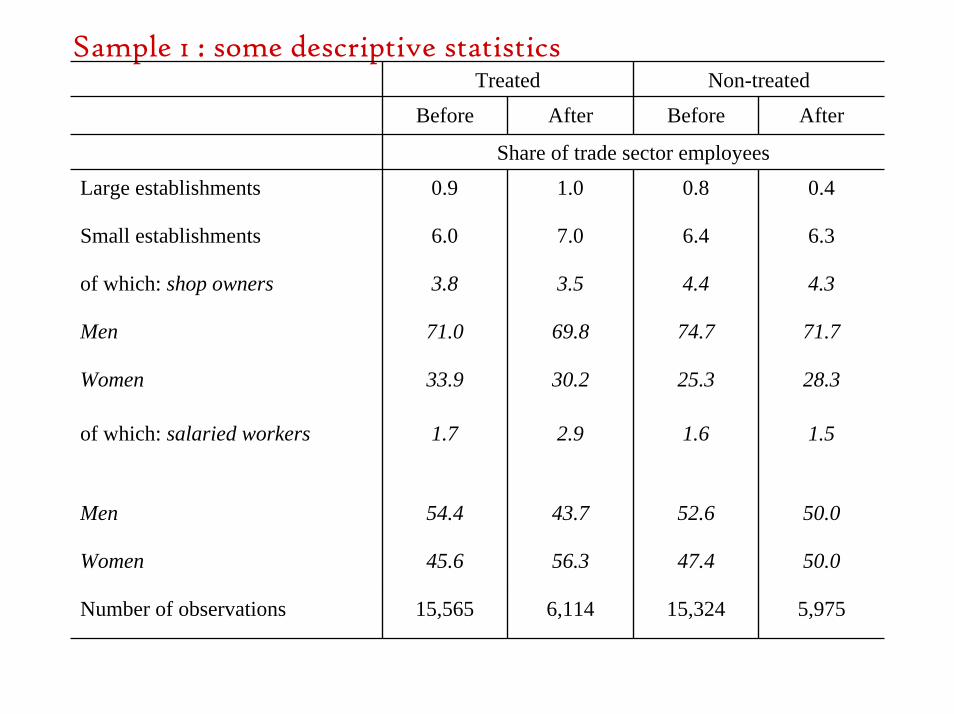
Sample 1 : some descriptive statisticsTreated Non-treated
After Before AfterBefore
Share of trade sector employees
Large establishments 0.9 1.0 0.8 0.4
Small establishments 6.0 7.0 6.4 6.3
of which: shop owners 3.8 3.5 4.4 4.3
Men 71.0 69.8 74.7 71.7
Women 33.9 30.2 25.3 28.3
of which: salaried workers 1.7 2.9 1.6 1.5
Men 54.4 43.7 52.6 50.0
Women 45.6 56.3 47.4 50.0
Number of observations 15,565 6,114 15,324 5,975
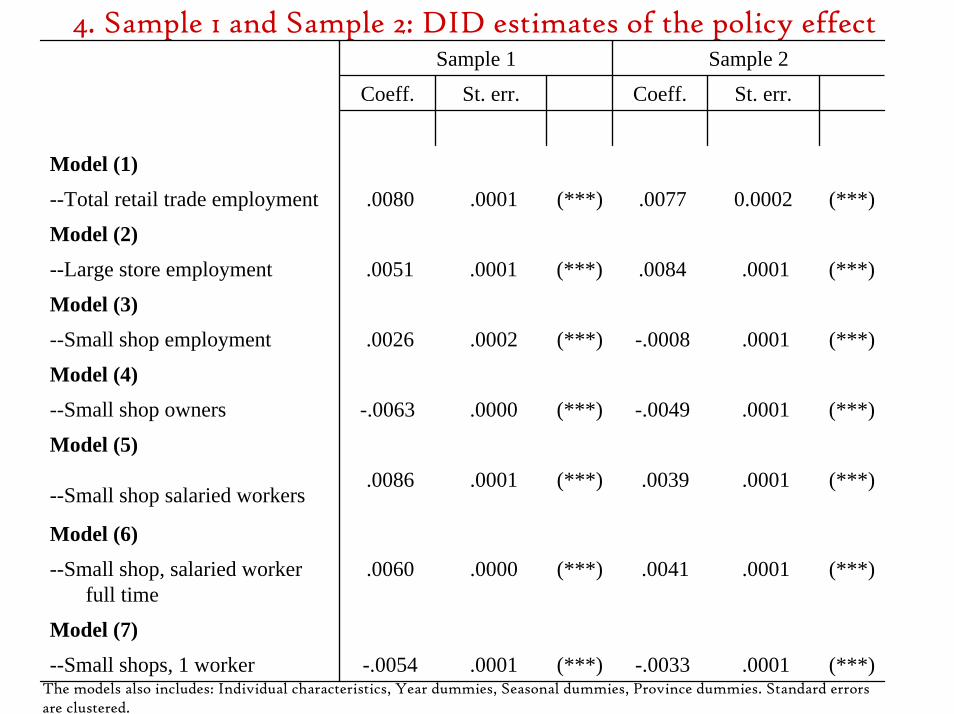
4. Sample 1 and Sample 2: DID estimates of the policy effectSample 1 Sample 2
Coeff. St. err. Coeff. St. err.
Model (1)
--Total retail trade employment .0080 .0001 (***) .0077 0.0002 (***)
Model (2)
--Large store employment .0051 .0001 (***) .0084 .0001 (***)
Model (3)
--Small shop employment .0026 .0002 (***) -.0008 .0001 (***)
Model (4)
--Small shop owners -.0063 .0000 (***) -.0049 .0001 (***)
Model (5)
--Small shop salaried workers.0086 .0001 (***) .0039 .0001 (***)
Model (6)
--Small shop, salaried worker full time
.0060 .0000 (***) .0041 .0001 (***)
Model (7)
--Small shops, 1 worker -.0054 .0001 (***) -.0033 .0001 (***)The models also includes: Individual characteristics, Year dummies, Seasonal dummies, Province dummies. Standard errors are clustered.
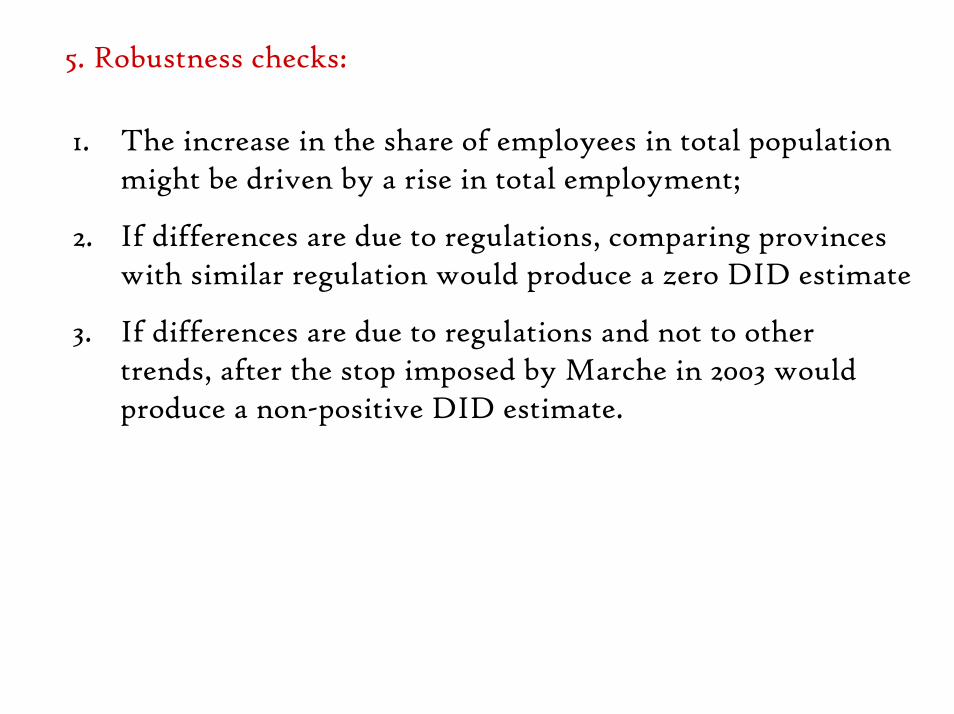
5. Robustness checks:
1. The increase in the share of employees in total populationmight be driven by a rise in total employment;
2. If differences are due to regulations, comparing provinceswith similar regulation would produce a zero DID estimate
3. If differences are due to regulations and not to othertrends, after the stop imposed by Marche in 2003 wouldproduce a non-positive DID estimate.
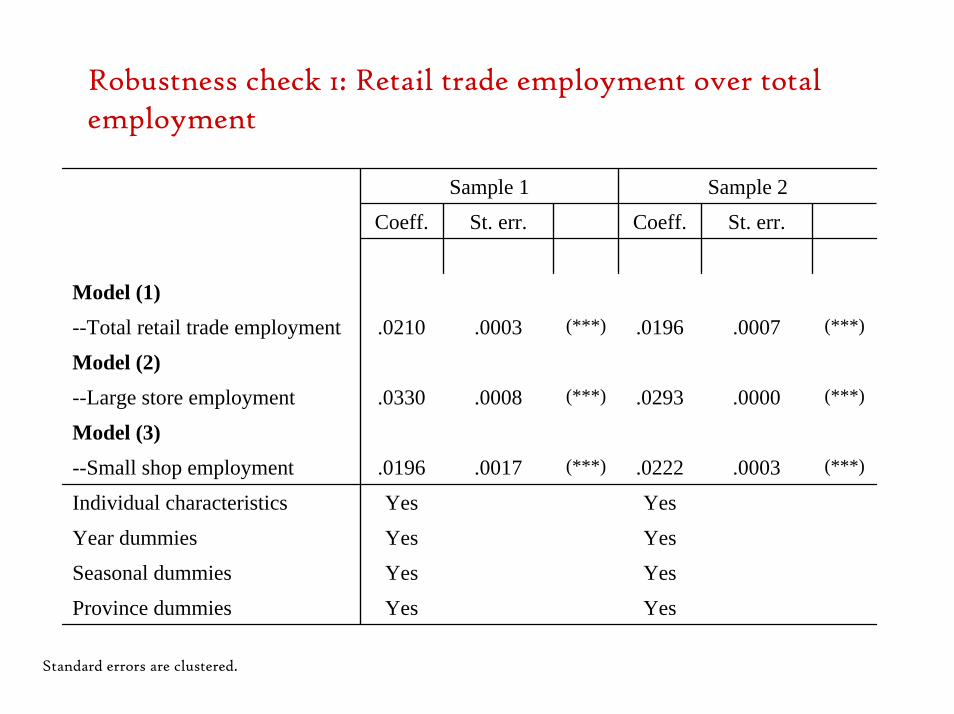
Sample 1 Sample 2
Coeff. St. err. Coeff. St. err.
Model (1)
--Total retail trade employment .0210 .0003 (***) .0196 .0007 (***)
Model (2)
--Large store employment .0330 .0008 (***) .0293 .0000 (***)
Model (3)
--Small shop employment .0196 .0017 (***) .0222 .0003 (***)
Individual characteristics Yes Yes
Year dummies Yes Yes
Seasonal dummies Yes Yes
Province dummies Yes Yes
Robustness check 1: Retail trade employment over total employment
Standard errors are clustered.
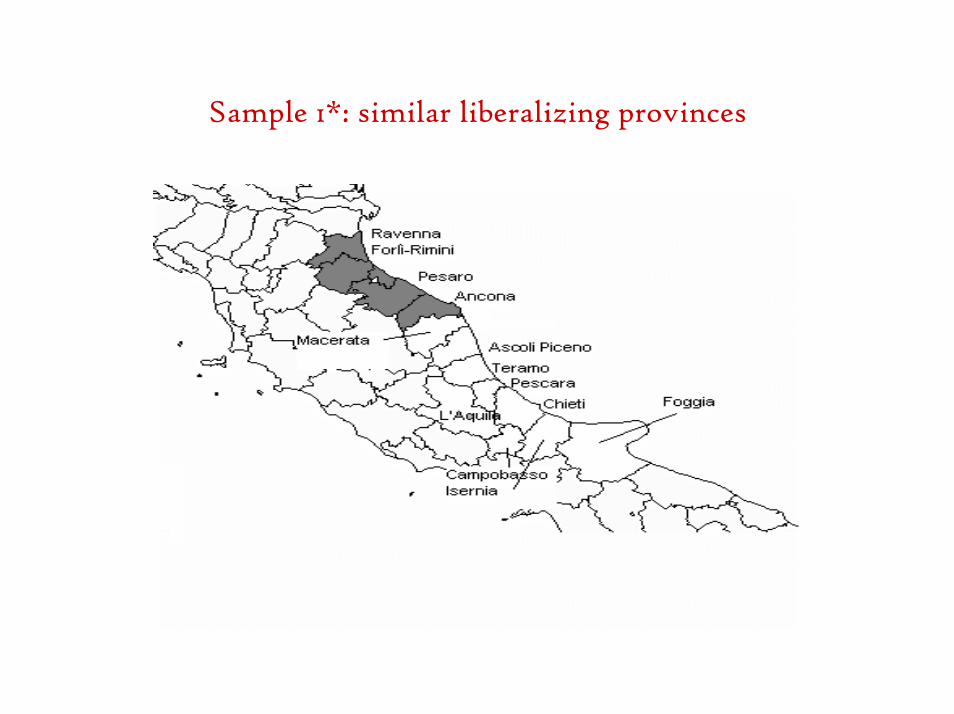
Sample 1*: similar liberalizing provinces
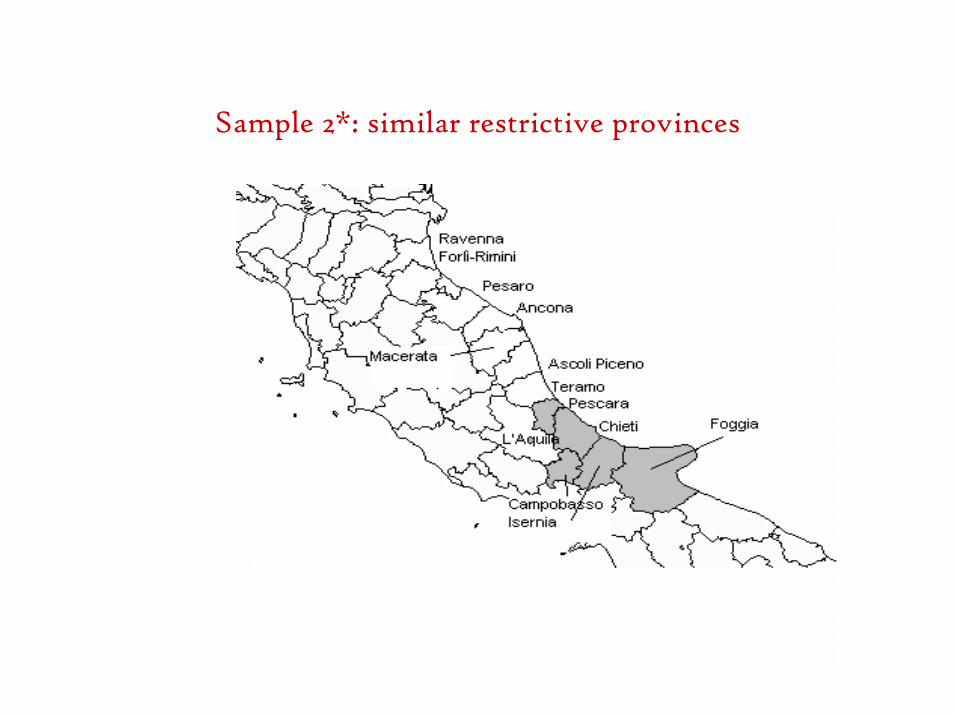
Sample 2*: similar restrictive provinces
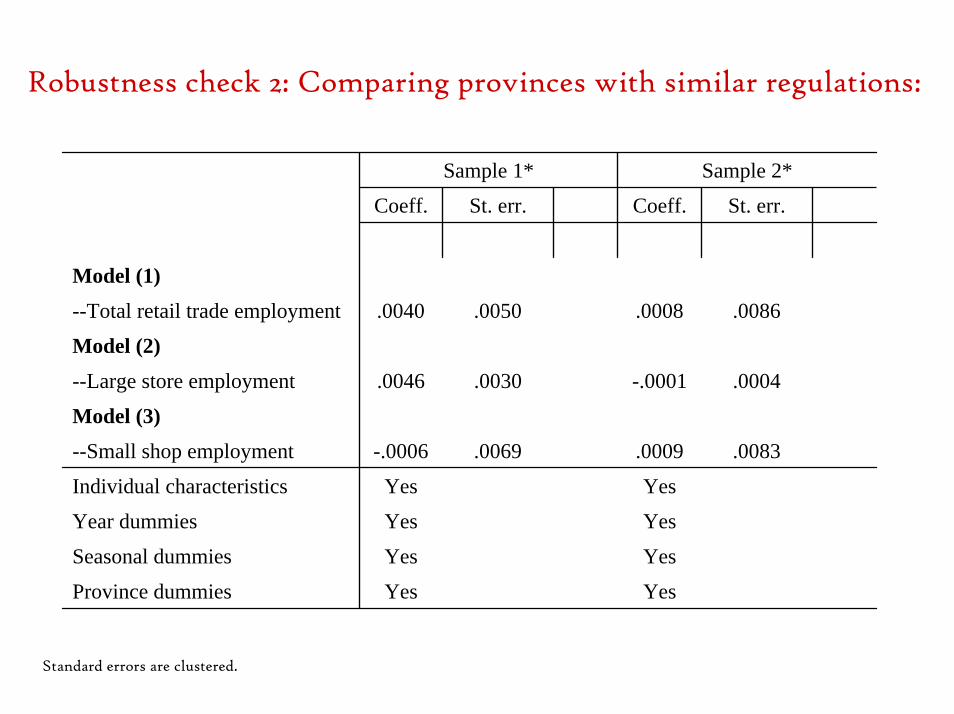
Robustness check 2: Comparing provinces with similar regulations:
Sample 1* Sample 2*
Coeff. St. err. Coeff. St. err.
Model (1)
--Total retail trade employment .0040 .0050 .0008 .0086
Model (2)
--Large store employment .0046 .0030 -.0001 .0004
Model (3)
--Small shop employment -.0006 .0069 .0009 .0083
Individual characteristics Yes Yes
Year dummies Yes Yes
Seasonal dummies Yes Yes
Province dummies Yes Yes
Standard errors are clustered.
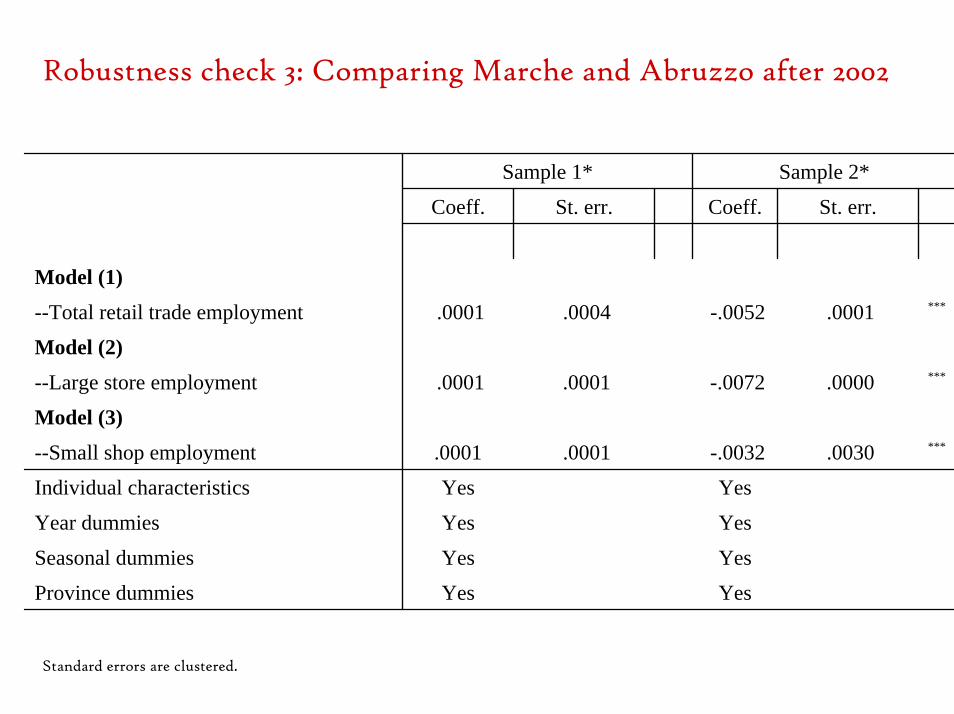
Sample 1* Sample 2*
Coeff. St. err. Coeff. St. err.
Model (1)
--Total retail trade employment .0001 .0004 -.0052 .0001 ***
Model (2)
--Large store employment .0001 .0001 -.0072 .0000 ***
Model (3)
--Small shop employment .0001 .0001 -.0032 .0030 ***
Individual characteristics Yes Yes
Year dummies Yes Yes
Seasonal dummies Yes Yes
Province dummies Yes Yes
Robustness check 3: Comparing Marche and Abruzzo after 2002
Standard errors are clustered.
•Evidence that barriers negatively affect sectoral employment;
•Rising competition may produce a recomposition effect in favour of full-time dependent employment
•Some evidence tha small shops increase their size
5. Conclusions:
Related Documents