1 Entrepreneurial orientation: A Remedy for Receding Productivity of Small and Medium scale Enterprise A Nigeria perspective. Omolomo odunayo TOBORA Universiti of Malaysia, Sawarak Faculty of Economics and Business (FEB) 94300 Kota Samarahan, Sawarak Email address: [email protected] ABSTRACT Nigeria is experiencing immense structural changes which are affecting the economy. Entrepreneurial orientation(EO) is a vital force in the economy of any nation because of the strategic role it plays in the achievement of productivity.The aim of this paper is to provide more insight into EO as a remedy for productivity for small and medium scale enterprises in Nigeria by providing in-depth knowledge of the nature and behavior of an entrepreneur and its dimensions toward risk taking , proactivness and the ag- gressivess. How all these can lead to entrepreneurship through(EO) also formed the vanguard of modern enterprises. The creation of a country’s wealth and dynamism depends upon the Entrepreneurial orienta- tion of its firms and this, in turn, relies fundamentally on the capabilities of its entrepreneurs and manag- ers. Keywords: Productivity, Entrepreneurial Orientation, Small and Medium Enterprises. Entrepreneurship

Welcome message from author
This document is posted to help you gain knowledge. Please leave a comment to let me know what you think about it! Share it to your friends and learn new things together.
Transcript
1
Entrepreneurial orientation: A Remedy for Receding Productivity
of Small and Medium scale Enterprise A Nigeria perspective.
Omolomo odunayo TOBORA
Universiti of Malaysia, Sawarak
Faculty of Economics and Business (FEB)
94300 Kota Samarahan, Sawarak
Email address: [email protected]
ABSTRACT
Nigeria is experiencing immense structural changes which are affecting the economy. Entrepreneurial
orientation(EO) is a vital force in the economy of any nation because of the strategic role it plays in the
achievement of productivity.The aim of this paper is to provide more insight into EO as a remedy for
productivity for small and medium scale enterprises in Nigeria by providing in-depth knowledge of the
nature and behavior of an entrepreneur and its dimensions toward risk taking , proactivness and the ag-
gressivess. How all these can lead to entrepreneurship through(EO) also formed the vanguard of modern
enterprises. The creation of a country’s wealth and dynamism depends upon the Entrepreneurial orienta-
tion of its firms and this, in turn, relies fundamentally on the capabilities of its entrepreneurs and manag-
ers.
Keywords: Productivity, Entrepreneurial Orientation, Small and Medium Enterprises. Entrepreneurship
2
1. INTRODUCTION
One of the main challenges in defining a cross-country SME is the absence of a universal defini-
tion of what constitutes an SME. A number of efforts aim to streamline and harmonize SME def-
initions (OECD, 2004), although the heterogeneity of SMEs themselves and the nature of the
economy, they operate in might mean that establishing a global definition is not feasible.
Oshagbemi (1982) highlights some major criteria used in the definitions of Small, Medium
Scale Enterprises (SMEs) to include:
i. Number of employees.
ii. Financial strength
iii. Sales value
iv. Initial capital outlay
v. Relative size
vi. Independent ownership
vii. The type of industry
Small and medium scale Enterprises (SMEs) are as much an important economic catalyst in in-
dustrialised countries as they are in the developing world. In many developed countries, more
than 98% of all enterprises belong to the SME sector. 80% of the total industrial labour force in
Japan, 50% in Germany and 46% in the USA are employed in smaller firms. In USA, small
business contributes nearly 39% to the national income. Udechukwu (2009) posit that, contrary
to the general impression, Figures in many developed countries are even higher. In the past three
decades, Nigeria as developing countries has observed a progressive business ownership, par-
ticularly in micro and small businesses in the informal sector. Their involvement in business
ownership has not only affected household economies and division of labour but also bears sig-
nificant impact on the way Nigerian do business. Small and Medium Enterprises (SMEs) have
been the backbone of economic growth of an economy in driving industrial development (Hoq,
Ha, & Said, (2009) Mohd Aris N, (2006) Mohd Asri & Mohd Isa, (2000) According to Hallberg
3
(2000) Small- and medium-scale enterprises (SMEs) are a very heterogeneous group. They in-
clude a wide variety of forms – village handicraft makers, small machine shops, restaurants, and
computer software firms – that possess a wide range of sophistication and skills, and operate in
very different markets and social environments. Their owners may or may not be poor. Some
are dynamic, innovative, and growth-oriented; others are traditional "lifestyle" enterprises that
are satisfied to remain small. According to Matlay, H Westhead, P, (2005), “SMEs make signifi-
cant contributions to the socioeconomic and political environment of most developed and devel-
oping nations as well In some countries, SME owners and workers are (or are perceived to be)
dominated by members of particular ethnic groups, such as the native pribumi in Indonesia or
indigenous groups in Bolivia, the Chinese in Malaysia and the Igbos in Nigeria. According to
miller (1983, p.780): in general theorist would not call a firm entrepreneurial if it changed its technology or
product line-… simply by directly imitating competitors while refusing to take any risks. Some proactiveness would be
essential as well. By the same token, risk-taking firms that are highly leveraged financially are not necessarily entre-
preneurial. They must engage in product- market or technological innovation.
In a global context, a general definition of SMEs using size and scale of operation is not easy,
but within the fixed coordinates of national boundaries, (Nigeria) it might be relatively easier.
At the 13th Council meeting of the National Council on Industry held in July, 2001 Micro, Small
and Medium Enterprises (MSMEs) were defined by the Council as follows:
Micro/Cottage Industry An industry with a labour size of not more than 10 workers, or total
cost of not more than N1.50 million, including working capital but excluding the cost of land.
Small-scale Industry An industry with a labor size of 11-100 workers or a total cost of not more
thanN50 million, including working capital but excluding the cost of land.
Medium Scale Industry: An industry with a labour size of between 101-300 workers or a total
cost of over N50 million but not more than N200 million, including working capital but exclud-
ing the cost of land. A large scale industry with a labour size of over 300 workers or a total cost
of over N200 million, including working capital but excluding the cost of land. All this at a time
Nigeria has devalued her currency. Small and Medium Size Enterprises (SME) are the most
common employers across the world. In 48 out of 76 nations covered in Ayyagari, Beck and
4
Demirgüç-Kunt (2007), SMEs employed more than 50% of the formal workforce. In addition,
Ayyagari, Demirgüç-Contained Vojislav (2011) finds that small firms and mature firms have the
highest levels of total employment and small firms and young firms have the highest rates of job
creation.SMEs are a fundamental part of a dynamic and healthy economy.
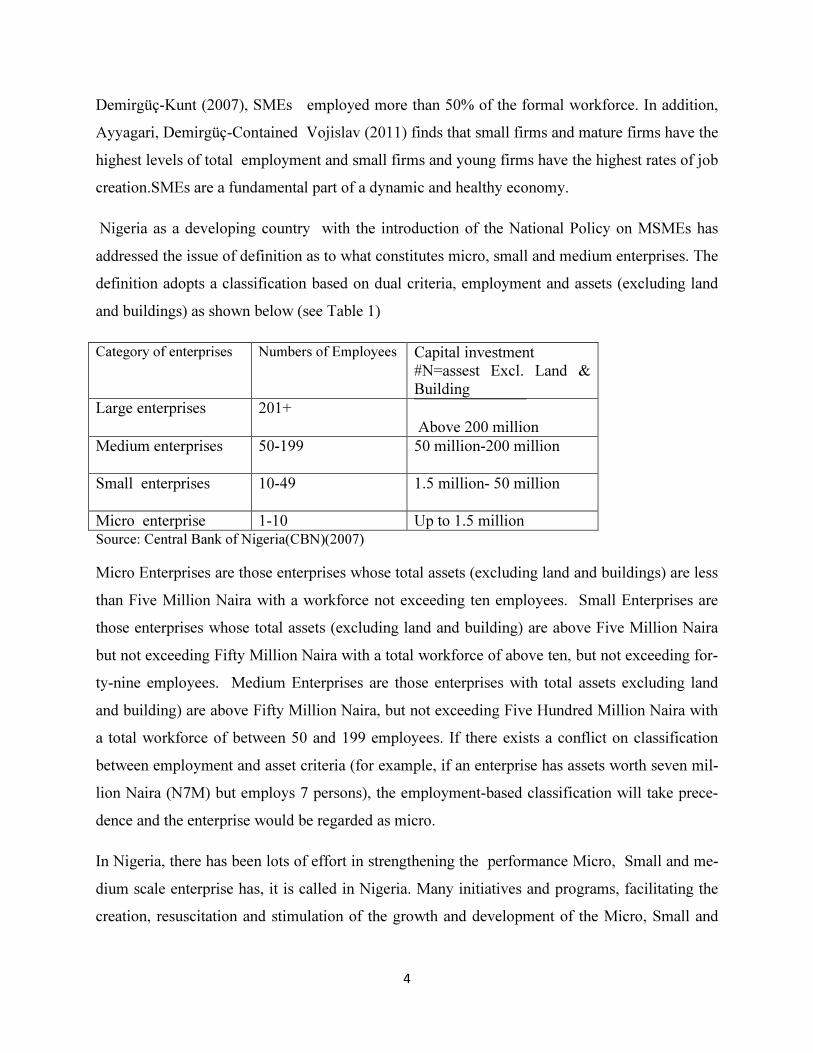
Nigeria as a developing country with the introduction of the National Policy on MSMEs has
addressed the issue of definition as to what constitutes micro, small and medium enterprises. The
definition adopts a classification based on dual criteria, employment and assets (excluding land
and buildings) as shown below (see Table 1)
Category of enterprises Numbers of Employees Capital investment
#N=assest Excl. Land &
Building
Large enterprises 201+
Above 200 million
Medium enterprises
50-199 50 million-200 million
Small enterprises 10-49 1.5 million- 50 million
Micro enterprise 1-10 Up to 1.5 million Source: Central Bank of Nigeria(CBN)(2007)
Micro Enterprises are those enterprises whose total assets (excluding land and buildings) are less
than Five Million Naira with a workforce not exceeding ten employees. Small Enterprises are
those enterprises whose total assets (excluding land and building) are above Five Million Naira
but not exceeding Fifty Million Naira with a total workforce of above ten, but not exceeding for-
ty-nine employees. Medium Enterprises are those enterprises with total assets excluding land
and building) are above Fifty Million Naira, but not exceeding Five Hundred Million Naira with
a total workforce of between 50 and 199 employees. If there exists a conflict on classification
between employment and asset criteria (for example, if an enterprise has assets worth seven mil-
lion Naira (N7M) but employs 7 persons), the employment-based classification will take prece-
dence and the enterprise would be regarded as micro.
In Nigeria, there has been lots of effort in strengthening the performance Micro, Small and me-
dium scale enterprise has, it is called in Nigeria. Many initiatives and programs, facilitating the
creation, resuscitation and stimulation of the growth and development of the Micro, Small and
5
Medium Enterprises sector of the Nigerian economy. Other recent government efforts to stimu-
late the sector include the following:
(i) The Microfinance Policy, Regulatory, and Supervisory Framework for Nigeria.
(ii) The Small and Medium Enterprises Equity Investment Scheme (SMEEIS)
(iii) The N200 billion Small and Medium Scale Enterprises Guarantee Scheme (SMECGS)
(iv) The N200 billion SME Restructuring/Refinancing Fund
(v) The N100 billion Cotton, Textile and Garment (CTG) Fund
(vi) The N2 billion NERFUND Facility
(vii) The N5 billion Dangote Fund for MSMEs
(viii) The Counterpart Funding Scheme of the Bank of Industry
(ix) The Youth Enterprise with Innovation in Nigeria (You Win) Programme
(x) Train to Work (TRATOW) Initiative
(xi) Campaign for Patronage of Made-in-Nigeria Products
The Micro, Small and Medium Enterprises Sub-sector has been identified as one of the critical
elements to the achievement of the country‟s vision 20-2020. MEMEs preliminary report (2010)
The sub-sector has been globally acknowledged as the engine that drives the socioeconomic
transformation of both the developing and developed countries. A nurtured and the well struc-
tured (MSMEs) sector contributes significantly to employment generation, wealth creation, pov-
erty reduction and sustainable economic growth and development. In parallel to this, the role of
entrepreneurs has been undeniable and can never be circumvented. It must be known that entre-
preneurs have to be entrepreneurial oriented and improve the level of entrepreneurial in order to
strengthen the resilience of the economy in a competitive and challenging environment.
6
The best of all the best criterion for entrepreneurs who want to be successful which has been ar-
gued by researchers is requiring them to have an Entrepreneurial Orientation (EO) Lumpin &
Dess (2001) Covin and Adler (1989) suggest that the strength of the relationship between entrepreneurs’
orientation and firm performance is contingent upon the set of business practices and competitive tactics chosen by
the firm.
Entrepreneurial Orientation is defined as the willingness of firms to display proactive and inno-
vative actions and to take calculated risks in an effort to create and exploit environment, oppor-
tunities (Kreiser 2002; Covin & Slevin, 1989; Miller, 1983; Miller & Friesen, 1982). The several
of the dimensions of EO such as innovation, pro-activeness and risk taking qualities will be imi-
tated and significant to the growth and business performance of SMEs in the area (Fairoz, 2010).
In addition, EO (Madsen, 2007b) may be used as a medium by management to discover and ex-
ploit opportunities and implicitly affects firm performance.
Schollhammer (1982) sited “Entrpreneurship is the key element for gaining competitive advantage and conse-
quently greater financial rewards. “ Accordingly, any system or “macro” models of entrepreneurship, and certainly
any model of entreprenership as firm behavior, would be remiss to ignore or subordinate the firm performance .
Many reasons have been adduced for the non-encouraging situation of the SMEs in Nigeria and
many scholars have documented financial resources, poor infrastructure, managerial inefficiency,
and unnecessary interventions by the government as factors affecting SME performance (Oso-
timehin, Jegede, and Olajide 2012; Udjo 2011; Akande and Ojokuku 2008; Alarape 2007b), yet
only a few studies linked the firm’s entrepreneurial orientation (EO) to SME performance in Ni-
geria.According to Alarape (2013) The majority of the ‘EO–performance’ studies were done on
SMEs in America, Europe, and Asia. A far less number of studies were from South, East, and
North Africa. Within the available studies, there are controversies about the nature of the rela-
tionship between EO and firm performance. For examples, Ferreira and Azevedo (2007) ex-
pressed the relationship between EO and firm performance as positive, Hart (1992) described it
as negative, while Rauch et al. (2004) did not find any significant relationship between EO and
firm performance. Lumpkin and Dess (2001) found a positive relationship, but concluded that the
relationship is not a simple one but contingent upon environmental conditions.
7
However, Brown and Kirchhoff (1997) failed to identify any direct impact of the environmental
variables upon the relationship between EO and firm performance.
This study is intended to contribute to the precarious dearth of small and medium enterprise in
Nigeria and highlight the importance EO as the remedy for the productivity of the SMEs and per-
formance of SMEs in Nigeria and West Africa, to also shed light on the intricacies of the effects
of EO on firm performance by X-raying the contributions of the SMEs in Nigeria. Hence, it will
enriches the knowledge of the contributions of EO influence the productivity. Additionally, it
will also consider the attitudes of entrepreneur and its influence on the EO which will lead to
productivity, so that it will stop the mis-specification of the relationship of how EO is being
driven and executed across the functional activities of SMEs.
2. LOCUS OF SME IN NIGERIA ECONOMY.
SMEs are major contributors to private sector employment in Nigeria Empirical studies have shown that SMEs contribute to over 55% of
GDP and over 65% of total employment in high income countries.SMEs and informal enterprises, account for over 60% of GDP and
over 70% of total employment in low income countries, while they contribute about 70% of GDP and 95% of total employment in mid-
dle income countries. SMEs also play significant contribution in the transition of agriculture-led economies to industrial ones furnishing
plain opportunities for processing activities which can generate a sustainable source of revenue and enhance the development process.
Small and Medium-sized Enterprises (SMEs) in Nigeria, as defined by Small and Medium Indus-
tries Equity Investment Scheme (SMIEIS), are enterprises with a total capital employed not less
than N1.5 million, but not exceeding N200 million, including working capital, but excluding the
cost of land and/or with a staff strength of not less than 10 and not more than 300. In this work,
this definition was adopted, however an observation of some of the surveyed SMEs are with a
total capital less than N1.5 million and a lower staff strength. They are estimated to generate
about 50% of the Gross Domestic Product (Odeyemi, 2003) and employ about 70% of the indus-
trial work force in the country (Adebusuyi, 1997). The SMEs is made up of a mixed blend of
businesses ranging from distributive trade, which constitute about 50% of the SMEs, 10% in
manufacturing, 30% in agriculture and 10% in services all operating in different parts of the
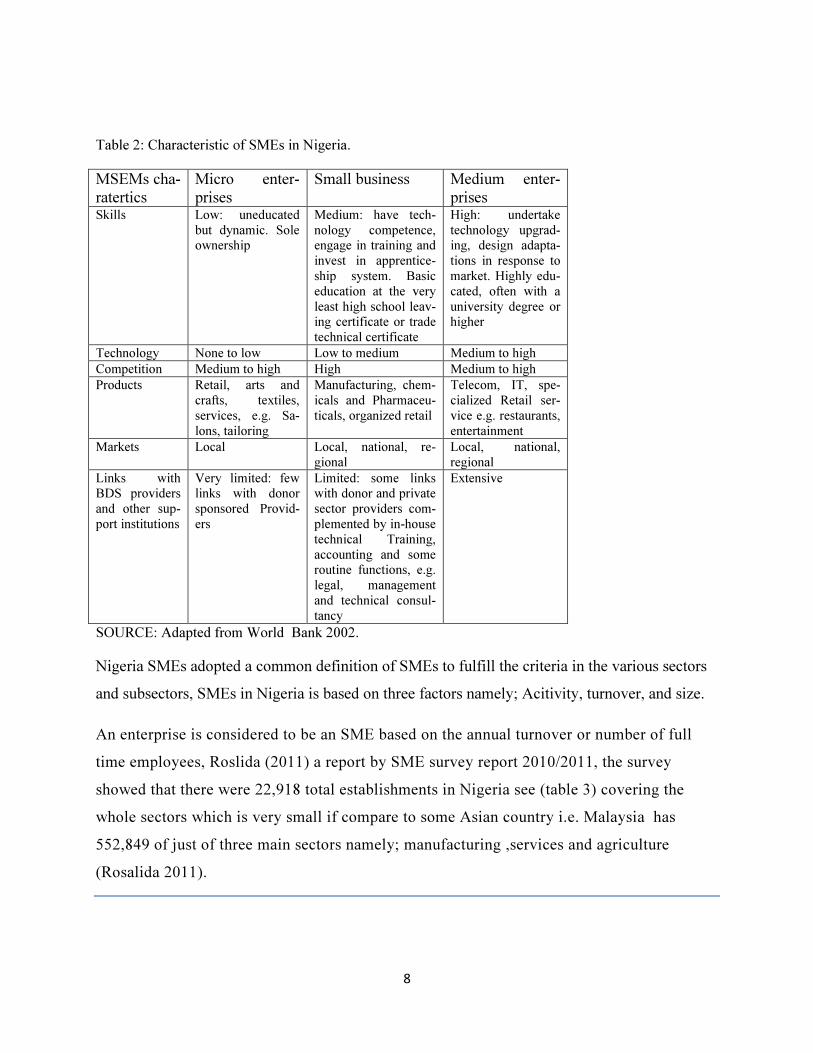
country. (See table 2)
8
Table 2: Characteristic of SMEs in Nigeria.
MSEMs cha-
ratertics
Micro enter-
prises
Small business Medium enter-
prises Skills Low: uneducated
but dynamic. Sole
ownership
Medium: have tech-
nology competence,
engage in training and
invest in apprentice-
ship system. Basic
education at the very
least high school leav-
ing certificate or trade
technical certificate
High: undertake
technology upgrad-
ing, design adapta-
tions in response to
market. Highly edu-
cated, often with a
university degree or
higher
Technology None to low Low to medium Medium to high
Competition Medium to high High Medium to high
Products Retail, arts and
crafts, textiles,
services, e.g. Sa-
lons, tailoring
Manufacturing, chem-
icals and Pharmaceu-
ticals, organized retail
Telecom, IT, spe-
cialized Retail ser-
vice e.g. restaurants,
entertainment
Markets Local Local, national, re-
gional
Local, national,
regional
Links with
BDS providers
and other sup-
port institutions
Very limited: few
links with donor
sponsored Provid-
ers
Limited: some links
with donor and private
sector providers com-
plemented by in-house
technical Training,
accounting and some
routine functions, e.g.
legal, management
and technical consul-
tancy
Extensive
SOURCE: Adapted from World Bank 2002.
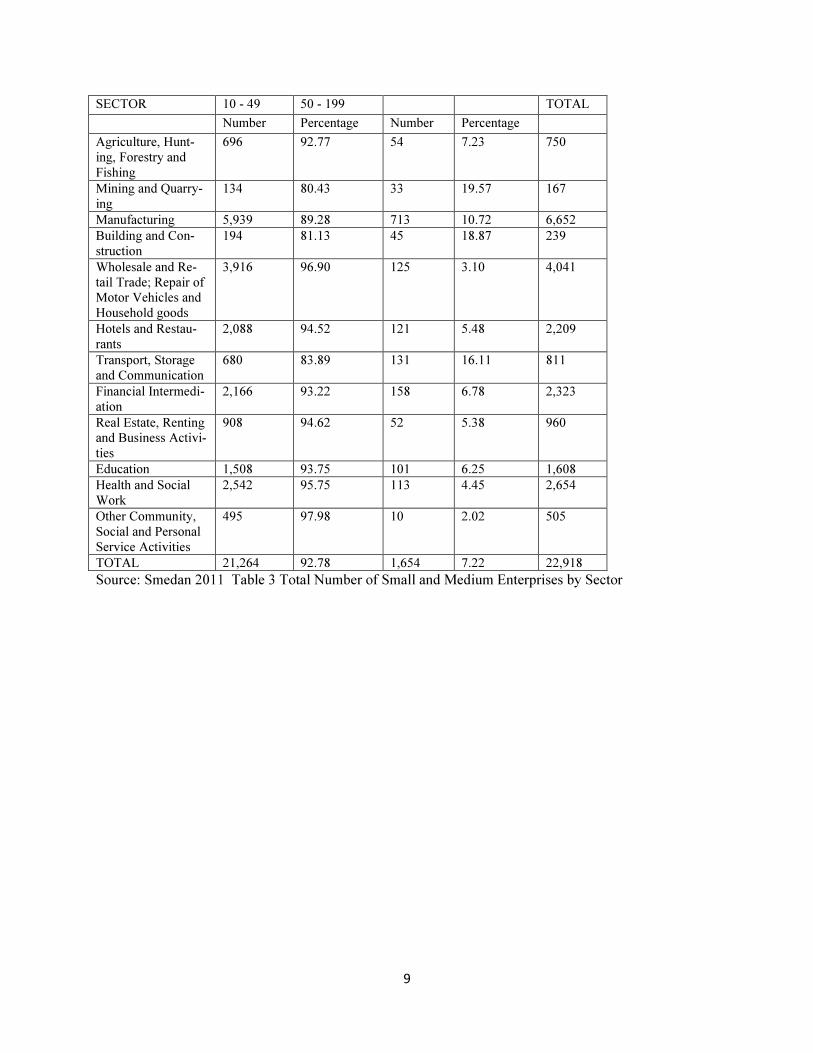
Nigeria SMEs adopted a common definition of SMEs to fulfill the criteria in the various sectors
and subsectors, SMEs in Nigeria is based on three factors namely; Acitivity, turnover, and size.
An enterprise is considered to be an SME based on the annual turnover or number of full
time employees, Roslida (2011) a report by SME survey report 2010/2011, the survey
showed that there were 22,918 total establishments in Nigeria see (table 3) covering the
whole sectors which is very small if compare to some Asian country i.e. Malaysia has
552,849 of just of three main sectors namely; manufacturing ,services and agriculture
(Rosalida 2011).
9
SECTOR 10 - 49 50 - 199 TOTAL
Number Percentage Number Percentage Agriculture, Hunt-
ing, Forestry and
Fishing
696 92.77 54 7.23 750
Mining and Quarry-
ing 134 80.43 33 19.57 167
Manufacturing 5,939 89.28 713 10.72 6,652
Building and Con-
struction
194 81.13 45 18.87 239
Wholesale and Re-
tail Trade; Repair of
Motor Vehicles and
Household goods
3,916 96.90 125 3.10 4,041
Hotels and Restau-
rants
2,088 94.52 121 5.48 2,209
Transport, Storage
and Communication
680 83.89 131 16.11 811
Financial Intermedi-
ation
2,166 93.22 158 6.78 2,323
Real Estate, Renting
and Business Activi-
ties
908 94.62 52 5.38 960
Education 1,508 93.75 101 6.25 1,608
Health and Social
Work
2,542 95.75 113 4.45 2,654
Other Community,
Social and Personal
Service Activities
495 97.98 10 2.02 505
TOTAL 21,264 92.78 1,654 7.22 22,918
Source: Smedan 2011 Table 3 Total Number of Small and Medium Enterprises by Sector
10
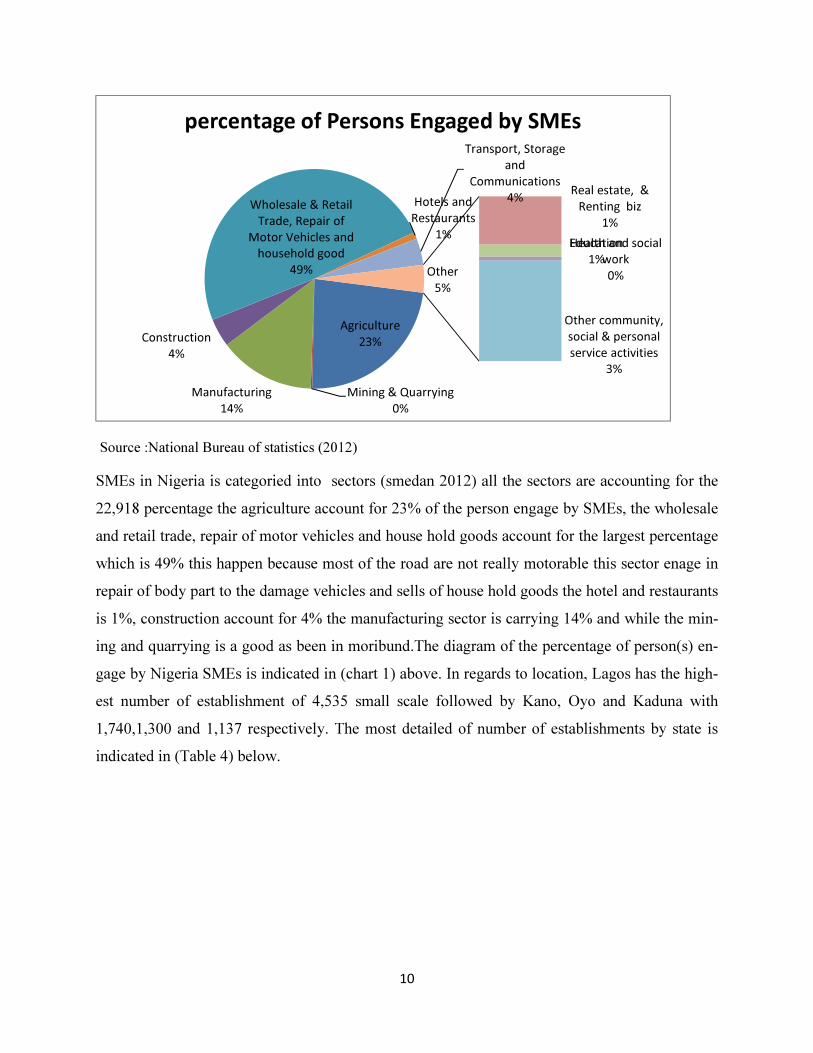
Source :National Bureau of statistics (2012)
SMEs in Nigeria is categoried into sectors (smedan 2012) all the sectors are accounting for the
22,918 percentage the agriculture account for 23% of the person engage by SMEs, the wholesale
and retail trade, repair of motor vehicles and house hold goods account for the largest percentage
which is 49% this happen because most of the road are not really motorable this sector enage in
repair of body part to the damage vehicles and sells of house hold goods the hotel and restaurants
is 1%, construction account for 4% the manufacturing sector is carrying 14% and while the min-
ing and quarrying is a good as been in moribund.The diagram of the percentage of person(s) en-
gage by Nigeria SMEs is indicated in (chart 1) above. In regards to location, Lagos has the high-
est number of establishment of 4,535 small scale followed by Kano, Oyo and Kaduna with
1,740,1,300 and 1,137 respectively. The most detailed of number of establishments by state is
indicated in (Table 4) below.
Agriculture
23%
Mining & Quarrying
0%
Manufacturing
14%
Construction
4%
Wholesale & Retail
Trade, Repair of
Motor Vehicles and
household good
49%
Hotels and
Restaurants
1%
Transport, Storage
and
Communications
4%Real estate, &
Renting biz
1%
Education
1%
Health and social
work
0%
Other community,
social & personal
service activities
3%
Other
5%
percentage of Persons Engaged by SMEs
11
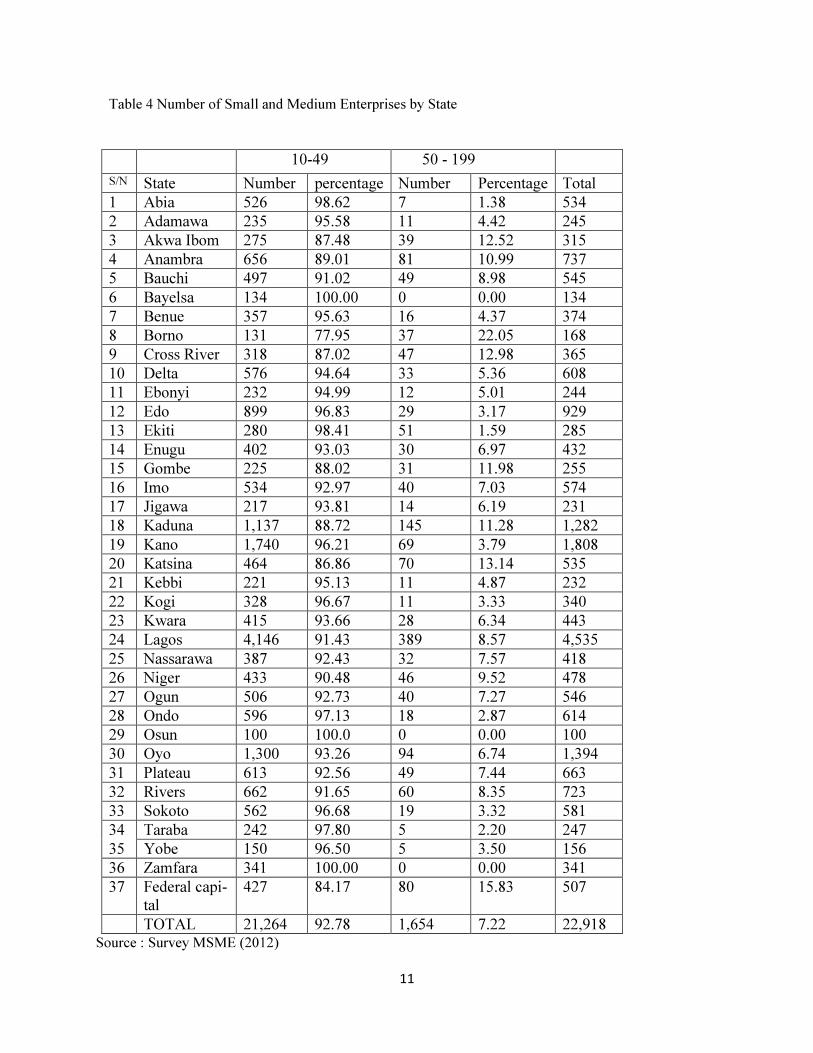
Table 4 Number of Small and Medium Enterprises by State
10-49 50 - 199
S/N State Number percentage Number Percentage Total
1 Abia 526 98.62 7 1.38 534
2 Adamawa 235 95.58 11 4.42 245
3 Akwa Ibom 275 87.48 39 12.52 315
4 Anambra 656 89.01 81 10.99 737
5 Bauchi 497 91.02 49 8.98 545
6 Bayelsa 134 100.00 0 0.00 134
7 Benue 357 95.63 16 4.37 374
8 Borno 131 77.95 37 22.05 168
9 Cross River 318 87.02 47 12.98 365
10 Delta 576 94.64 33 5.36 608
11 Ebonyi 232 94.99 12 5.01 244
12 Edo 899 96.83 29 3.17 929
13 Ekiti 280 98.41 51 1.59 285
14 Enugu 402 93.03 30 6.97 432
15 Gombe 225 88.02 31 11.98 255
16 Imo 534 92.97 40 7.03 574
17 Jigawa 217 93.81 14 6.19 231
18 Kaduna 1,137 88.72 145 11.28 1,282
19 Kano 1,740 96.21 69 3.79 1,808
20 Katsina 464 86.86 70 13.14 535
21 Kebbi 221 95.13 11 4.87 232
22 Kogi 328 96.67 11 3.33 340
23 Kwara 415 93.66 28 6.34 443
24 Lagos 4,146 91.43 389 8.57 4,535
25 Nassarawa 387 92.43 32 7.57 418
26 Niger 433 90.48 46 9.52 478
27 Ogun 506 92.73 40 7.27 546
28 Ondo 596 97.13 18 2.87 614
29 Osun 100 100.0 0 0.00 100
30 Oyo 1,300 93.26 94 6.74 1,394
31 Plateau 613 92.56 49 7.44 663
32 Rivers 662 91.65 60 8.35 723
33 Sokoto 562 96.68 19 3.32 581
34 Taraba 242 97.80 5 2.20 247
35 Yobe 150 96.50 5 3.50 156
36 Zamfara 341 100.00 0 0.00 341
37 Federal capi-
tal
427 84.17 80 15.83 507
TOTAL 21,264 92.78 1,654 7.22 22,918 Source : Survey MSME (2012)
12
In regards to location, According to survey of report of SMEs in Nigeria (2012) Lagos has the
highest number of establishment of 8.57% (4,535), followed by Kano and Oyo respectively.
This scenario of which a huge amount of SMEs establishment has a location in Lagos state is
because of the population (http://www.lagosstate.gov.ng/pagelinks.php?p=6) as of 2006, the
population of Lagos state was 17.5, the former capital of Nigeria located in the southwestern of
the country which double as the industrialized location equipped with port services. In term of
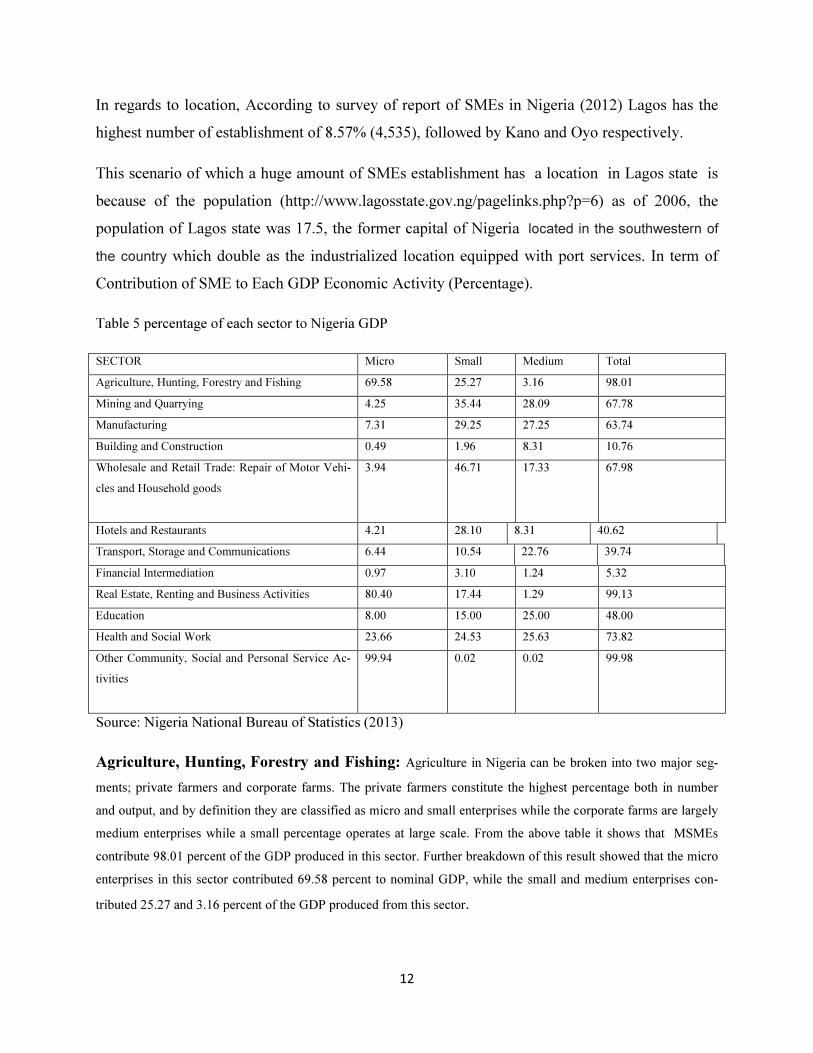
Contribution of SME to Each GDP Economic Activity (Percentage).
Table 5 percentage of each sector to Nigeria GDP
SECTOR Micro Small Medium Total
Agriculture, Hunting, Forestry and Fishing 69.58 25.27 3.16 98.01
Mining and Quarrying 4.25 35.44 28.09 67.78
Manufacturing 7.31 29.25 27.25 63.74
Building and Construction 0.49 1.96 8.31 10.76
Wholesale and Retail Trade: Repair of Motor Vehi-
cles and Household goods
3.94 46.71 17.33 67.98
Hotels and Restaurants 4.21 28.10 8.31 40.62
Transport, Storage and Communications 6.44 10.54 22.76 39.74
Financial Intermediation 0.97 3.10 1.24 5.32
Real Estate, Renting and Business Activities 80.40 17.44 1.29 99.13
Education 8.00 15.00 25.00 48.00
Health and Social Work 23.66 24.53 25.63 73.82
Other Community, Social and Personal Service Ac-
tivities
99.94 0.02 0.02 99.98
Source: Nigeria National Bureau of Statistics (2013)
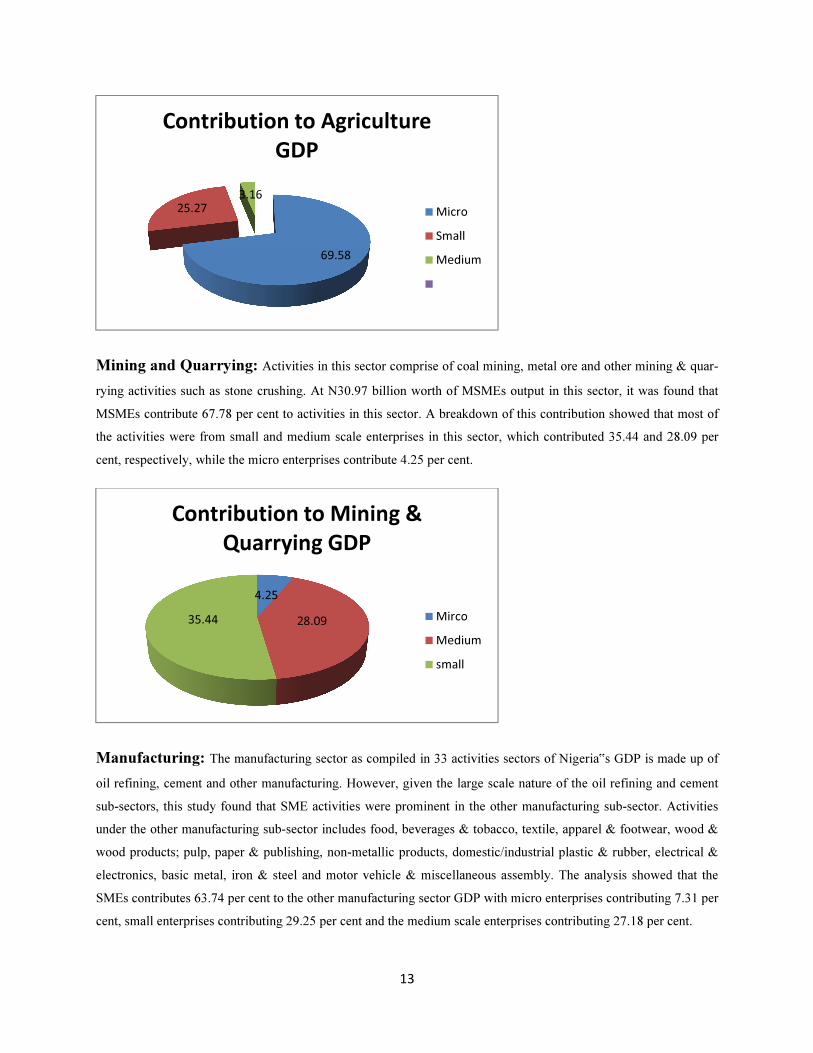
Agriculture, Hunting, Forestry and Fishing: Agriculture in Nigeria can be broken into two major seg-
ments; private farmers and corporate farms. The private farmers constitute the highest percentage both in number
and output, and by definition they are classified as micro and small enterprises while the corporate farms are largely
medium enterprises while a small percentage operates at large scale. From the above table it shows that MSMEs
contribute 98.01 percent of the GDP produced in this sector. Further breakdown of this result showed that the micro
enterprises in this sector contributed 69.58 percent to nominal GDP, while the small and medium enterprises con-
tributed 25.27 and 3.16 percent of the GDP produced from this sector.
13
Mining and Quarrying: Activities in this sector comprise of coal mining, metal ore and other mining & quar-
rying activities such as stone crushing. At N30.97 billion worth of MSMEs output in this sector, it was found that
MSMEs contribute 67.78 per cent to activities in this sector. A breakdown of this contribution showed that most of
the activities were from small and medium scale enterprises in this sector, which contributed 35.44 and 28.09 per
cent, respectively, while the micro enterprises contribute 4.25 per cent.
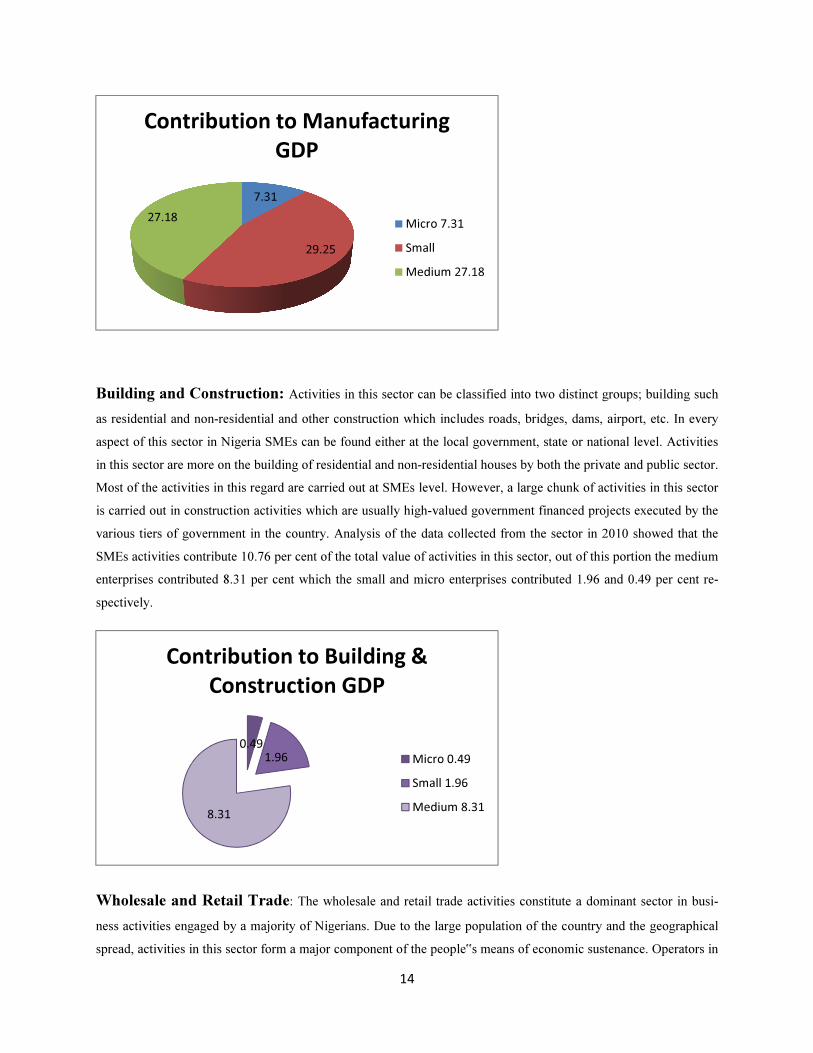
Manufacturing: The manufacturing sector as compiled in 33 activities sectors of Nigeria‟s GDP is made up of
oil refining, cement and other manufacturing. However, given the large scale nature of the oil refining and cement
sub-sectors, this study found that SME activities were prominent in the other manufacturing sub-sector. Activities
under the other manufacturing sub-sector includes food, beverages & tobacco, textile, apparel & footwear, wood &
wood products; pulp, paper & publishing, non-metallic products, domestic/industrial plastic & rubber, electrical &
electronics, basic metal, iron & steel and motor vehicle & miscellaneous assembly. The analysis showed that the
SMEs contributes 63.74 per cent to the other manufacturing sector GDP with micro enterprises contributing 7.31 per
cent, small enterprises contributing 29.25 per cent and the medium scale enterprises contributing 27.18 per cent.
69.58
25.273.16
Contribution to Agriculture
GDP
Micro
Small
Medium
4.25
28.0935.44
Contribution to Mining &
Quarrying GDP
Mirco
Medium
small
14
Building and Construction: Activities in this sector can be classified into two distinct groups; building such
as residential and non-residential and other construction which includes roads, bridges, dams, airport, etc. In every
aspect of this sector in Nigeria SMEs can be found either at the local government, state or national level. Activities
in this sector are more on the building of residential and non-residential houses by both the private and public sector.
Most of the activities in this regard are carried out at SMEs level. However, a large chunk of activities in this sector
is carried out in construction activities which are usually high-valued government financed projects executed by the
various tiers of government in the country. Analysis of the data collected from the sector in 2010 showed that the
SMEs activities contribute 10.76 per cent of the total value of activities in this sector, out of this portion the medium
enterprises contributed 8.31 per cent which the small and micro enterprises contributed 1.96 and 0.49 per cent re-
spectively.
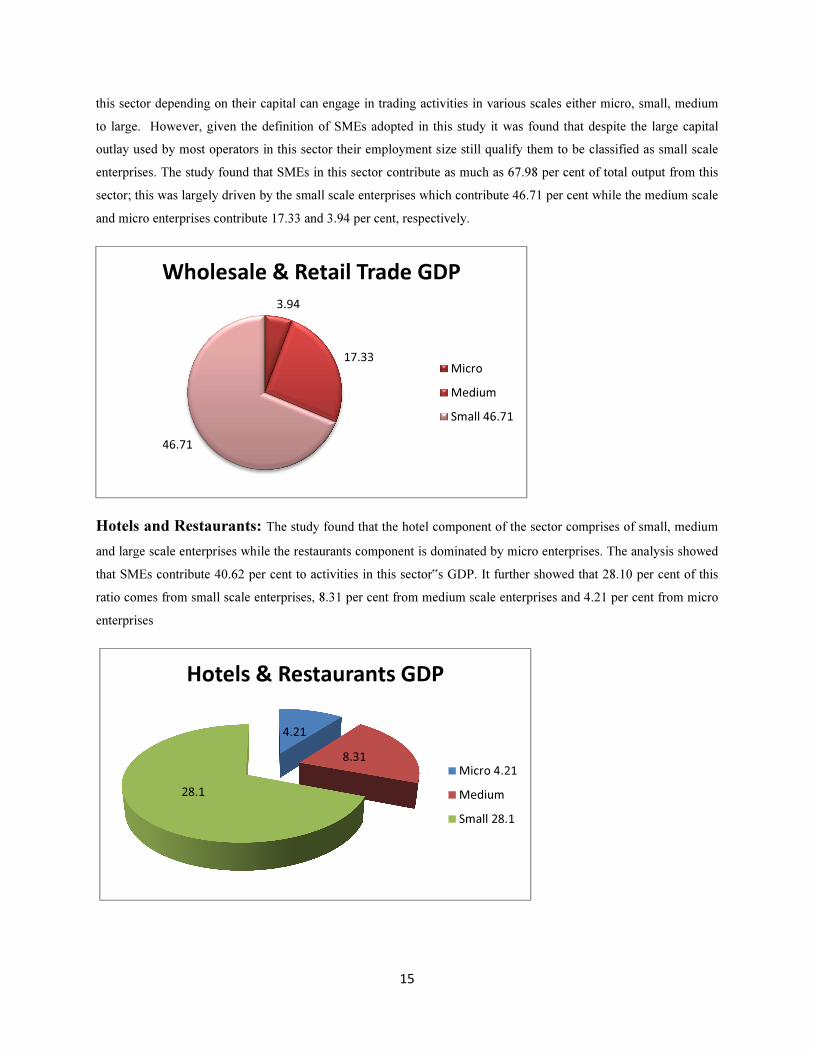
Wholesale and Retail Trade: The wholesale and retail trade activities constitute a dominant sector in busi-
ness activities engaged by a majority of Nigerians. Due to the large population of the country and the geographical
spread, activities in this sector form a major component of the people‟s means of economic sustenance. Operators in
7.31
29.25
27.18
Contribution to Manufacturing
GDP
Micro 7.31
Small
Medium 27.18
0.491.96
8.31
Contribution to Building &
Construction GDP
Micro 0.49
Small 1.96
Medium 8.31
15
this sector depending on their capital can engage in trading activities in various scales either micro, small, medium
to large. However, given the definition of SMEs adopted in this study it was found that despite the large capital
outlay used by most operators in this sector their employment size still qualify them to be classified as small scale
enterprises. The study found that SMEs in this sector contribute as much as 67.98 per cent of total output from this
sector; this was largely driven by the small scale enterprises which contribute 46.71 per cent while the medium scale
and micro enterprises contribute 17.33 and 3.94 per cent, respectively.
Hotels and Restaurants: The study found that the hotel component of the sector comprises of small, medium
and large scale enterprises while the restaurants component is dominated by micro enterprises. The analysis showed
that SMEs contribute 40.62 per cent to activities in this sector‟s GDP. It further showed that 28.10 per cent of this
ratio comes from small scale enterprises, 8.31 per cent from medium scale enterprises and 4.21 per cent from micro
enterprises
3.94
17.33
46.71
Wholesale & Retail Trade GDP
Micro
Medium
Small 46.71
4.21
8.31
28.1
Hotels & Restaurants GDP
Micro 4.21
Medium
Small 28.1
16
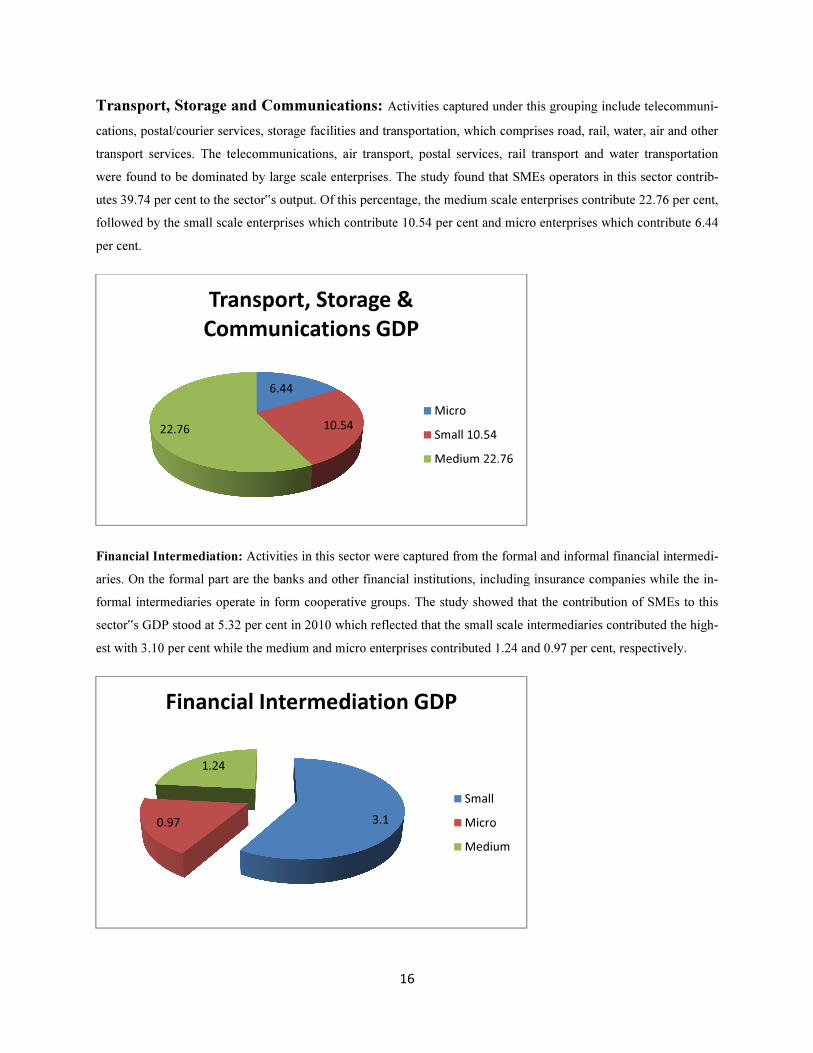
Transport, Storage and Communications: Activities captured under this grouping include telecommuni-
cations, postal/courier services, storage facilities and transportation, which comprises road, rail, water, air and other
transport services. The telecommunications, air transport, postal services, rail transport and water transportation
were found to be dominated by large scale enterprises. The study found that SMEs operators in this sector contrib-
utes 39.74 per cent to the sector‟s output. Of this percentage, the medium scale enterprises contribute 22.76 per cent,
followed by the small scale enterprises which contribute 10.54 per cent and micro enterprises which contribute 6.44
per cent.
Financial Intermediation: Activities in this sector were captured from the formal and informal financial intermedi-
aries. On the formal part are the banks and other financial institutions, including insurance companies while the in-
formal intermediaries operate in form cooperative groups. The study showed that the contribution of SMEs to this
sector‟s GDP stood at 5.32 per cent in 2010 which reflected that the small scale intermediaries contributed the high-
est with 3.10 per cent while the medium and micro enterprises contributed 1.24 and 0.97 per cent, respectively.
6.44
10.5422.76
Transport, Storage &
Communications GDP
Micro
Small 10.54
Medium 22.76
3.10.97
1.24
Financial Intermediation GDP
Small
Micro
Medium
17
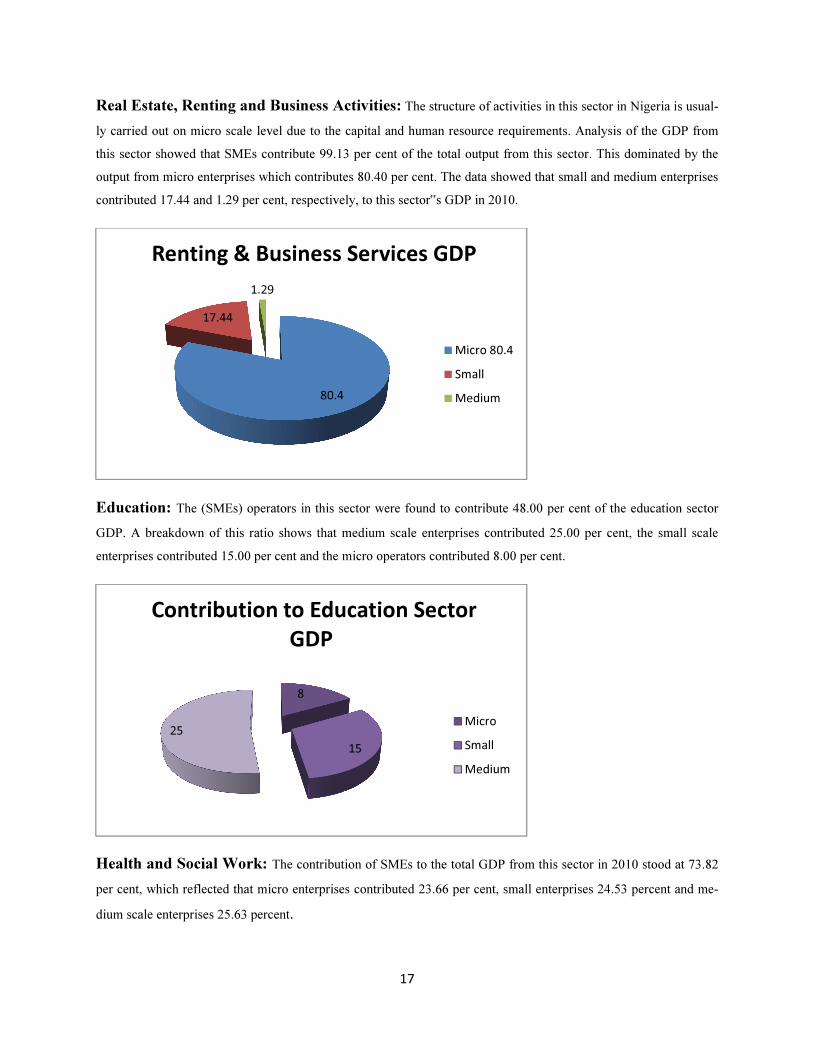
Real Estate, Renting and Business Activities: The structure of activities in this sector in Nigeria is usual-
ly carried out on micro scale level due to the capital and human resource requirements. Analysis of the GDP from
this sector showed that SMEs contribute 99.13 per cent of the total output from this sector. This dominated by the
output from micro enterprises which contributes 80.40 per cent. The data showed that small and medium enterprises
contributed 17.44 and 1.29 per cent, respectively, to this sector‟s GDP in 2010.
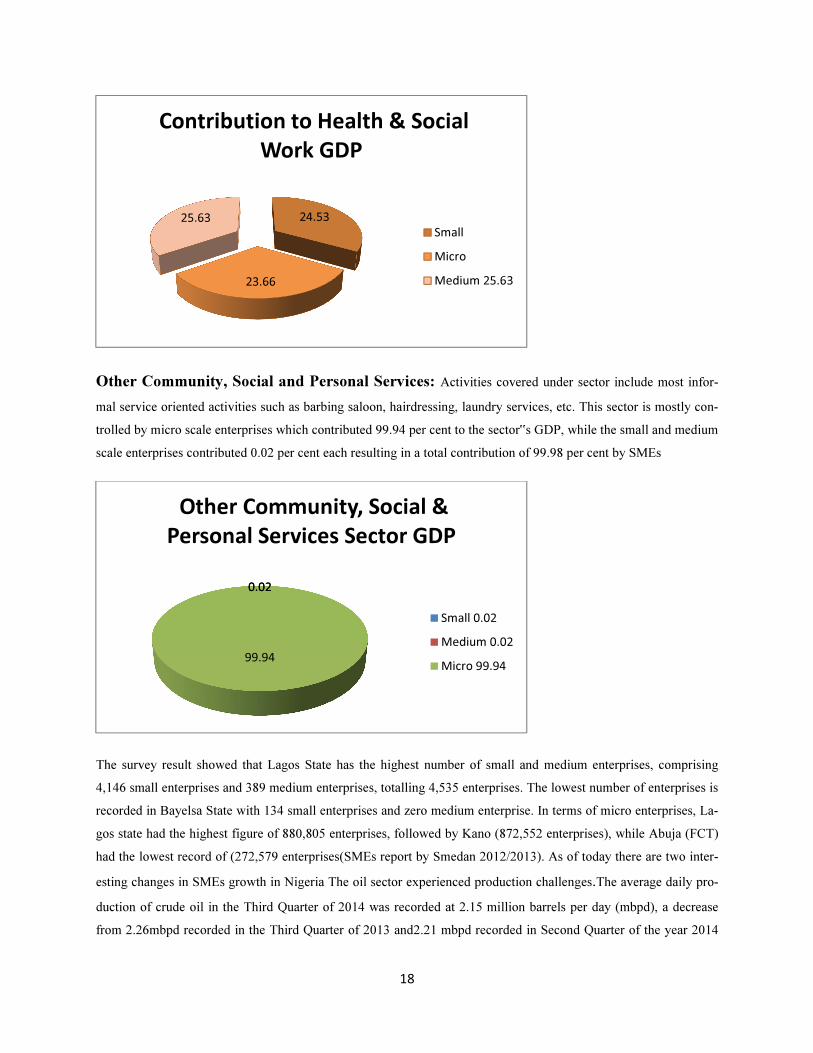
Education: The (SMEs) operators in this sector were found to contribute 48.00 per cent of the education sector
GDP. A breakdown of this ratio shows that medium scale enterprises contributed 25.00 per cent, the small scale
enterprises contributed 15.00 per cent and the micro operators contributed 8.00 per cent.
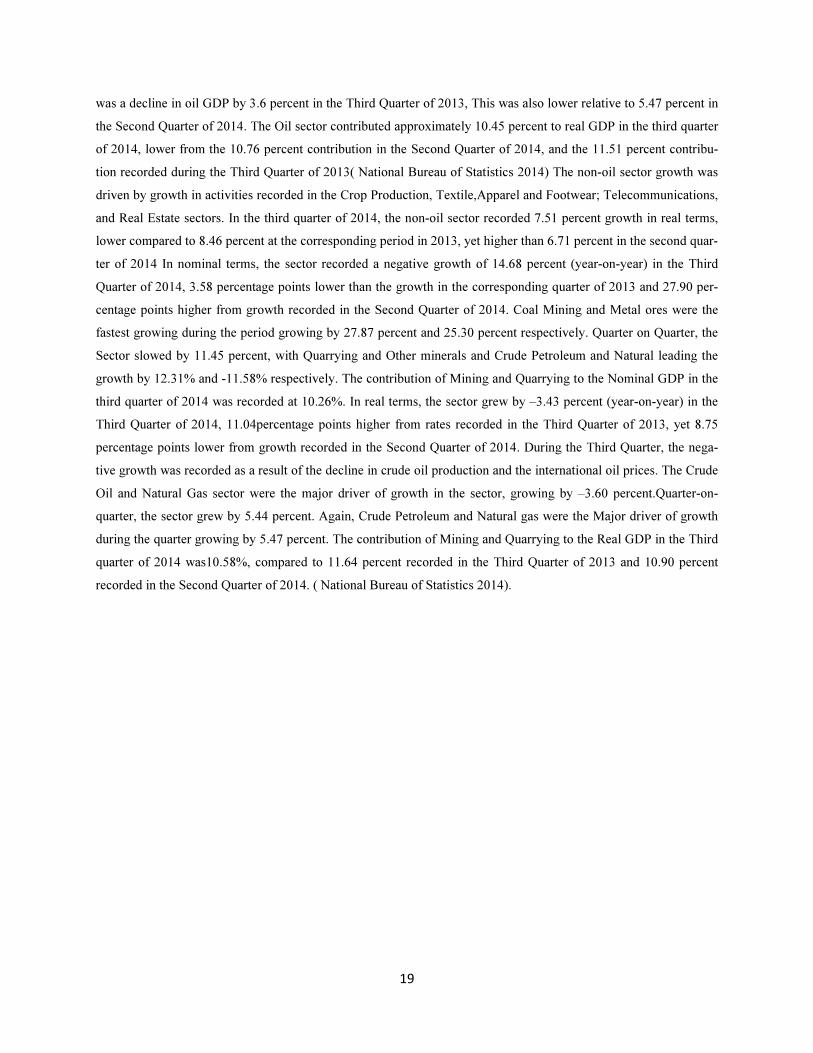
Health and Social Work: The contribution of SMEs to the total GDP from this sector in 2010 stood at 73.82
per cent, which reflected that micro enterprises contributed 23.66 per cent, small enterprises 24.53 percent and me-
dium scale enterprises 25.63 percent.
80.4
17.44
1.29
Renting & Business Services GDP
Micro 80.4
Small
Medium
8
15
25
Contribution to Education Sector
GDP
Micro
Small
Medium
18
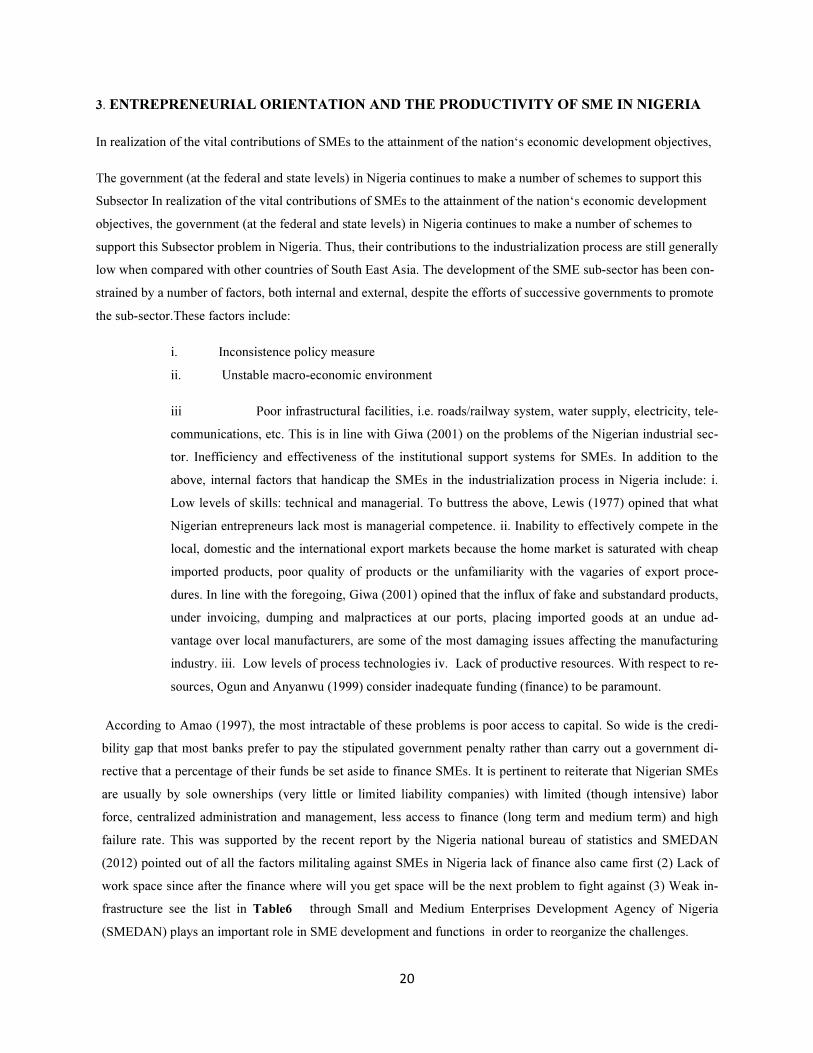
Other Community, Social and Personal Services: Activities covered under sector include most infor-
mal service oriented activities such as barbing saloon, hairdressing, laundry services, etc. This sector is mostly con-
trolled by micro scale enterprises which contributed 99.94 per cent to the sector‟s GDP, while the small and medium
scale enterprises contributed 0.02 per cent each resulting in a total contribution of 99.98 per cent by SMEs
The survey result showed that Lagos State has the highest number of small and medium enterprises, comprising
4,146 small enterprises and 389 medium enterprises, totalling 4,535 enterprises. The lowest number of enterprises is
recorded in Bayelsa State with 134 small enterprises and zero medium enterprise. In terms of micro enterprises, La-
gos state had the highest figure of 880,805 enterprises, followed by Kano (872,552 enterprises), while Abuja (FCT)
had the lowest record of (272,579 enterprises(SMEs report by Smedan 2012/2013). As of today there are two inter-
esting changes in SMEs growth in Nigeria The oil sector experienced production challenges.The average daily pro-
duction of crude oil in the Third Quarter of 2014 was recorded at 2.15 million barrels per day (mbpd), a decrease
from 2.26mbpd recorded in the Third Quarter of 2013 and2.21 mbpd recorded in Second Quarter of the year 2014
24.53
23.66
25.63
Contribution to Health & Social
Work GDP
Small
Micro
Medium 25.63
0.020.02
99.94
Other Community, Social &
Personal Services Sector GDP
Small 0.02
Medium 0.02
Micro 99.94
19
was a decline in oil GDP by 3.6 percent in the Third Quarter of 2013, This was also lower relative to 5.47 percent in
the Second Quarter of 2014. The Oil sector contributed approximately 10.45 percent to real GDP in the third quarter
of 2014, lower from the 10.76 percent contribution in the Second Quarter of 2014, and the 11.51 percent contribu-
tion recorded during the Third Quarter of 2013( National Bureau of Statistics 2014) The non-oil sector growth was
driven by growth in activities recorded in the Crop Production, Textile,Apparel and Footwear; Telecommunications,
and Real Estate sectors. In the third quarter of 2014, the non-oil sector recorded 7.51 percent growth in real terms,
lower compared to 8.46 percent at the corresponding period in 2013, yet higher than 6.71 percent in the second quar-
ter of 2014 In nominal terms, the sector recorded a negative growth of 14.68 percent (year-on-year) in the Third
Quarter of 2014, 3.58 percentage points lower than the growth in the corresponding quarter of 2013 and 27.90 per-
centage points higher from growth recorded in the Second Quarter of 2014. Coal Mining and Metal ores were the
fastest growing during the period growing by 27.87 percent and 25.30 percent respectively. Quarter on Quarter, the
Sector slowed by 11.45 percent, with Quarrying and Other minerals and Crude Petroleum and Natural leading the
growth by 12.31% and -11.58% respectively. The contribution of Mining and Quarrying to the Nominal GDP in the
third quarter of 2014 was recorded at 10.26%. In real terms, the sector grew by –3.43 percent (year-on-year) in the
Third Quarter of 2014, 11.04percentage points higher from rates recorded in the Third Quarter of 2013, yet 8.75
percentage points lower from growth recorded in the Second Quarter of 2014. During the Third Quarter, the nega-
tive growth was recorded as a result of the decline in crude oil production and the international oil prices. The Crude
Oil and Natural Gas sector were the major driver of growth in the sector, growing by –3.60 percent.Quarter-on-
quarter, the sector grew by 5.44 percent. Again, Crude Petroleum and Natural gas were the Major driver of growth
during the quarter growing by 5.47 percent. The contribution of Mining and Quarrying to the Real GDP in the Third
quarter of 2014 was10.58%, compared to 11.64 percent recorded in the Third Quarter of 2013 and 10.90 percent
recorded in the Second Quarter of 2014. ( National Bureau of Statistics 2014).
20
3. ENTREPRENEURIAL ORIENTATION AND THE PRODUCTIVITY OF SME IN NIGERIA
In realization of the vital contributions of SMEs to the attainment of the nation‘s economic development objectives,
The government (at the federal and state levels) in Nigeria continues to make a number of schemes to support this
Subsector In realization of the vital contributions of SMEs to the attainment of the nation‘s economic development
objectives, the government (at the federal and state levels) in Nigeria continues to make a number of schemes to
support this Subsector problem in Nigeria. Thus, their contributions to the industrialization process are still generally
low when compared with other countries of South East Asia. The development of the SME sub-sector has been con-
strained by a number of factors, both internal and external, despite the efforts of successive governments to promote
the sub-sector.These factors include:
i. Inconsistence policy measure
ii. Unstable macro-economic environment
iii Poor infrastructural facilities, i.e. roads/railway system, water supply, electricity, tele-
communications, etc. This is in line with Giwa (2001) on the problems of the Nigerian industrial sec-
tor. Inefficiency and effectiveness of the institutional support systems for SMEs. In addition to the
above, internal factors that handicap the SMEs in the industrialization process in Nigeria include: i.
Low levels of skills: technical and managerial. To buttress the above, Lewis (1977) opined that what
Nigerian entrepreneurs lack most is managerial competence. ii. Inability to effectively compete in the
local, domestic and the international export markets because the home market is saturated with cheap
imported products, poor quality of products or the unfamiliarity with the vagaries of export proce-
dures. In line with the foregoing, Giwa (2001) opined that the influx of fake and substandard products,
under invoicing, dumping and malpractices at our ports, placing imported goods at an undue ad-
vantage over local manufacturers, are some of the most damaging issues affecting the manufacturing
industry. iii. Low levels of process technologies iv. Lack of productive resources. With respect to re-
sources, Ogun and Anyanwu (1999) consider inadequate funding (finance) to be paramount.
According to Amao (1997), the most intractable of these problems is poor access to capital. So wide is the credi-
bility gap that most banks prefer to pay the stipulated government penalty rather than carry out a government di-
rective that a percentage of their funds be set aside to finance SMEs. It is pertinent to reiterate that Nigerian SMEs
are usually by sole ownerships (very little or limited liability companies) with limited (though intensive) labor
force, centralized administration and management, less access to finance (long term and medium term) and high
failure rate. This was supported by the recent report by the Nigeria national bureau of statistics and SMEDAN
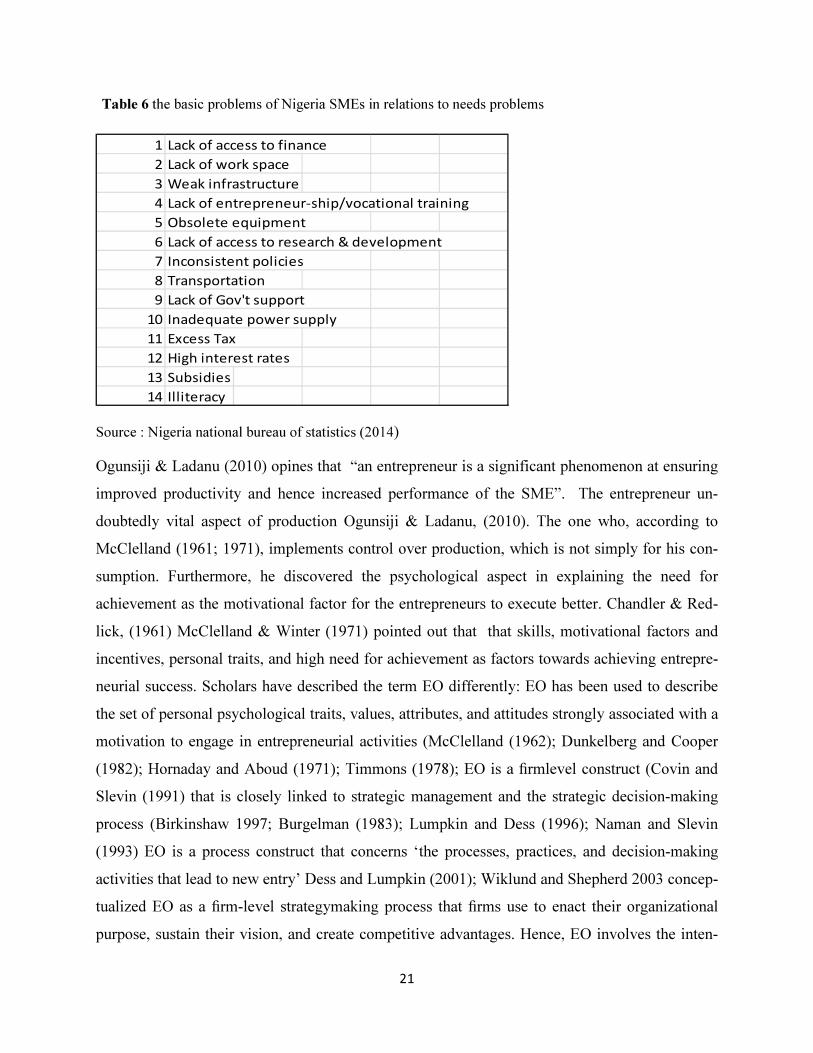
(2012) pointed out of all the factors militaling against SMEs in Nigeria lack of finance also came first (2) Lack of
work space since after the finance where will you get space will be the next problem to fight against (3) Weak in-
frastructure see the list in Table6 through Small and Medium Enterprises Development Agency of Nigeria
(SMEDAN) plays an important role in SME development and functions in order to reorganize the challenges.
21
Table 6 the basic problems of Nigeria SMEs in relations to needs problems
1 Lack of access to finance
2 Lack of work space
3 Weak infrastructure
4 Lack of entrepreneur-ship/vocational training
5 Obsolete equipment
6 Lack of access to research & development
7 Inconsistent policies
8 Transportation
9 Lack of Gov't support
10 Inadequate power supply
11 Excess Tax
12 High interest rates
13 Subsidies
14 Illiteracy
Source : Nigeria national bureau of statistics (2014)
Ogunsiji & Ladanu (2010) opines that “an entrepreneur is a significant phenomenon at ensuring
improved productivity and hence increased performance of the SME”. The entrepreneur un-
doubtedly vital aspect of production Ogunsiji & Ladanu, (2010). The one who, according to
McClelland (1961; 1971), implements control over production, which is not simply for his con-
sumption. Furthermore, he discovered the psychological aspect in explaining the need for
achievement as the motivational factor for the entrepreneurs to execute better. Chandler & Red-
lick, (1961) McClelland & Winter (1971) pointed out that that skills, motivational factors and
incentives, personal traits, and high need for achievement as factors towards achieving entrepre-
neurial success. Scholars have described the term EO differently: EO has been used to describe
the set of personal psychological traits, values, attributes, and attitudes strongly associated with a
motivation to engage in entrepreneurial activities (McClelland (1962); Dunkelberg and Cooper
(1982); Hornaday and Aboud (1971); Timmons (1978); EO is a firmlevel construct (Covin and
Slevin (1991) that is closely linked to strategic management and the strategic decision-making
process (Birkinshaw 1997; Burgelman (1983); Lumpkin and Dess (1996); Naman and Slevin
(1993) EO is a process construct that concerns ‘the processes, practices, and decision-making
activities that lead to new entry’ Dess and Lumpkin (2001); Wiklund and Shepherd 2003 concep-
tualized EO as a firm-level strategymaking process that firms use to enact their organizational
purpose, sustain their vision, and create competitive advantages. Hence, EO involves the inten-
22
tions and actions of individual business owners and/or key management decision makers func-
tioning in the complex process of making strategic choices aimed at the achievement of desired
business objectives (financial and non-financial). Therefore, EO is not only an individual phe-
nomenal, but also a firm-level phenomenon or construct. The firm objectives are an extension of
the individual entrepreneurial manager objectives. Consequently, firm level behavior is but a
reflection of the underlying business posture of the owner/manager.
A popular measure for operationalizing EO in both the entrepreneurship and the strategic man-
agement was developed by Covin and Slevin (1989), based on the earlier work of Khandwalla
(1977) and Miller and Friesen (1982). This measure is known as the three dimensions of EO (3D
of EO). In developing this measure, Covin and Slevin theorized that the 3D of EO – innovation,
proactiveness, and risk-taking – acted together to ‘comprise a basic uni-dimensional strategic
orientation’ and should be aggregated together when conducting research in the field of entrepre-
neurship Covin and Slevin (1989). Drawing on the previous research, Lumpkin and Dess (1996)
explained EO in five dimensions: autonomy,innovativeness, risk-taking, proactiveness, and com-
petitive aggressiveness. These five dimensions of EO construct vary independently and firms can
have different combinations of these five dimensions. Lumpkin and Dess (2001) found that the
EO dimensions of proactiveness and competitive aggressiveness are only conceptually distinct,
but they do not vary with each other. Each considered the internal structure of the firm and the
external environment within which the firm operates; however, the representations of these fac-
tors and relationships are all different. The Covin and Slevin (1991) presents a less generic view
of corporate entrepreneurship, focusing on the concept of EO defined as firm-level behavior. The
key points of the external variable, strategic variables. And internal variables all have a strong
effect on EO. Entrepreneurial orientation affects the three categories of variables, although weak-
ly. EO also strongly affects firm performance, and in the reverse, firm performance has a weaker
effect on EO. Another key feature of the Covin and Slevin (1991) indicates that the three catego-
ries of variables (internal, strategic, and external) have a moderating effect on the relationship
between EO and productivity. This is in line with other studies Covin and Slevin (1991); Lump-
kin and Dess (1996); Miller (1983); Venkatraman (1989) on the relationship between EO and
performance of SMEs. Therefore, the EO of a firm reveals itself by the evidence of how innova-
tive is the firm, the firm’s attitude to risk-taking, how proactive (i.e. alert) is it to business oppor-
tunities, and how responsive is it to trends and developments in the marketplace. Hence, the sub-
23
variables or parameters explaining the firm innovativeness are new product development, em-
phasis on Research and Development (R&D), and reorganization; risk-taking is explained by
proclivity for risky projects, risk-handling, and reward style. Proactiveness is described by envi-
ronmental scanning, opportunity identification methods, and firms alertness to competition in the
marketplace. How the firms reflect these parameters determines the firm’s orientation with re-
spect to innovativeness, risk-taking, and proactiveness, and the aggregation of these three dimen-
sional variables explains the firm’s EO. Thus, they individually and collectively affect the EO,
and the EO affects the productivity.
24
4. CONCLUSION AND RECOMMENDATIONS
Entrepreneurial Orientation has a significant remedy for productivity, but the direction of the re-
lation is not static, In situations like this if the Nigeria government wants to meet up with with
2020 where Nigeria will be one of the 20 largest economies in the world, able to consolidate its
leadership role in Africa and establish itself as a significant player in the global economic and
political arena. As has embarked on the journey towards vision 20-2020, where to become a
high income and high productivity economy will be undeniable. Nigeria government must create
conducive environment to unleash economic growth which can be done by developing the SMEs
as the bedrock of growth and innovation .For Nigeria ,where several issues as unemployment
which remain at 23.90% in 2014, poverty rate remain at world bank data for poverty incidence at
46.0% in 2010 growth rate at 7.4% in 2014, challenges and uncertainties at the global level
(globalization, liberalization and fake and supe standize goods from countries from China, India,
intensified the competition for trade and investment) and internal challenges (providing a condu-
cive investment environment and high quality human capital) are still mingle around the corner
We furthermore reflect on entrepreneurial orientation as an innovation that not only holistic but
proactive in action to materialize the conception of new resources and in new ways of combining
available resources for increased productivity. The entrepreneurs need to have a cognitive per-
spective as with the way the entrepreneurs think and how they arrive at decisions, thus lead to the
entrepreneurial orientation of the SMEs and ultimately lead to increased productivity.
25
References
Amao, J.O. (1997). ―Modes of Financing Small Scale Industries in B.U.Nǁ Igwe et al (eds.).
―Proceedings of the Conference on Small-Scale Industries and the Development of Nigeria‖.
NISER, Ibadan, March, PP. 360-394
Birkinshaw, J. 1997. “Entrepreneurship in Multinational Corporation: The Characteristics of
Subsidiary Initiatives.” Strategic Management Journal 18 (3): 207–229.
Brown, T. E., and B. A. Kirchhoff. 1997. “The Effects of Resource Availability and Entrepre-
neurial Orientation on Firm Growth.” In Frontiers of Entrepreneurship Research, edited by P. D.
Reynolds, W. D. Bygrave, N. Carter, P. Davidsson, W. B. Gartner, and P. P. McDougall. Welles-
ley, MA: Babson College.
Burgelman, R. A. 1983. “Corporate Entrepreneurship and Strategic Management: Insights from a
Process Study.” Management Science 29: 1349–1364.
Covin, J. G., and D. P. Slevin. 1991. “A Conceptual Model of Entrepreneurship as Firm Behav-
ior.” Entrepreneurship Theory and Practice (Fall): 7–25.
Covin, J. G., & Slevin, D. P. (1989). Strategic Management of Small Firms in Hostile and Be-
nign Environment. Strategic Management Journal, 10 (1), 75 - 87.
Covin, J.G, & Adler, P (1989). Strategic behavior, strategy pattens and performance levels of
small entrepreneurial and conservative firms. Southern Management Assocation Proceeding,
250-252
Central Bank of Nigeria(CBN)(2007), Economic Report for the Second Quarter of 2007
http://data.worldbank.org/country/nigeria downloaded at 5.50 pm December 2014
http://www.tradingeconomics.com/nigeria/unemployment-rate downloaded at 5.00 pm Decem-
ber 2014
Dess, G. G., and G. T. Lumpkin. (2001) “Emerging Issues in Strategy Process Research.” In The
Blackwell Handbook of Strategic Management, edited by M. A. Hitt, R. E. Freeman, and J. S.
Harrison, 3–4. Malden, MA: Blackwell Publishers.
Dunkelberg, W. C., and A. C. Cooper. (1982). “Entrepreneurial Typologies.” In Frontiers of En-
trepreneurship Research, edited by K. H. Vesper, 1–15. Wellesley, MA: Babson Centre for En-
trepreneurial Studies.
26
Fairoz, F. M. (2010). Entrepreneurial Orientation and Business Performance of Small and Medi-
um Scale Enterprises of Hambantota District, Sri Lanka. Asian Social Science, 6(3), 34-46.
Ferreira, Jo~ao, and S. G. Susana Azevedo. (2007). “The Impact of Entrepreneurial Orientation
and Resource-Based View on Growth of Small Firms.” Paper presented at the 30th Conference
of the Institute of Small Business and Entrepreneurship, Glasgow, Scotland, November 7–9.
Hart, S. 1992. “An Integrative Framework for Strategy-Making Process.” Academy of Manage-
ment Journal 17: 327–351.
Hurst, E., & B. W. Pugsley. (2011). What do small businesses so? Brookings Papers on Econom-
ic Activity, 2011(2) (Fall), 73-118. http://dx.doi.org/10.1353/eca.2011.0017
Hoq, M. Z., Ha, N. C., & Said, S. M. (2009). SMEs in the Malaysian Economy. International
Journal of Marketing Studies, 1(2), 3-17.
Hornaday, J. A., and J. Aboud.( 1971). “Characteristics of Successful Entrepreneurs”, Personnel
Psychology 24: 141–153.
McClelland, D. (1987). Characteristics of Successful Entrepreneurs. Journal of Creative Behav-
iour, 21(3), 219-233.
McClelland, D. C. 1962. “Business Drive and National Achievement.” Harvard Business Review
(July–August): 99–112.
Miller, D (1983). The correlates of entrepreneurship in three types of firms. Management sci-
ences, 29 770-791
Miller, D., & Friesen, P. H. (1982). Innovation in conservative and entrepreneurial firms: two
models of strategic momentum. Strategic Management Journal 3(1), 1-25.
Madsen, E. L. (2007). The significance of sustained entrepreneurial orientation on performance
of firms - A longitudinal analysis. Entrepreneurship and Regional Development, 19(2), 185-204
Mohd Aris, N. (2006). SMEs: Building Blocks for Economic Growth. Paper presented at the The
National Statistics Conference .
Mohd Asri, A., & Mohd. Isa, B. (2000). Small and Medium Enterprises in Asian Pacific Coun-
tries: Development prospects.
Naman, J. L., and D.P. Slevin. 1993. “Entrepreneurship and Concept of Fit: A Model and Empir-
ical Tests.” Strategic Management Journal 14: 137–153.
Surienty, L., Hong, K. T., & Hung, D. K. M. (Producer). (2011, 20/2/2011) Occupational Safety
and Health (OSH) in SMEs in Malaysia: A Preliminary Investigation.
27
Survey Report on MSMEs in Nigeria. Retrieved 18/12/2014, page 25 by 6:44 pm.
Timmons, J. A. (1978) “Characteristics and Role Demand of Entrepreneurship.” American Jour-
nal of Small Business 3: 5–17.
Rauch, A., J. Wiklund, M. Frese, and G. T. Lumpkin. (2004). “Entrepreneurial Orientation and
Business Performance: Cumulative Empirical Evidence.” In Frontiers of Entrepreneurship Re-
search 2004. Proceedings of the Twenty-Fourth Annual Entrepreneurship Research Conference,
edited by S. A. Zahra et al., 164–177. Braintree: P and R Publications.
Lumpkin, G. T., and G. G. Dess. (2001). “Linking Two Dimensions of Entrepreneurial Orienta-
tion to Firm Performance: The Moderating Role of Environment and Industry Life Cycle.” Jour-
nal of Business Venturing 16: 429–451.
Lewis, W.A. (1997). ―Reflections on the Structure of Nigerian Manufacturing Industryǁ in O.
Teriba and M.O. Kayode (eds.). Industrial Development in Nigeria: Patterns, Problems and Pro-
spects. Ibadan University Press, P. 337
Giwa, R. (May, 2001). ―How to Revive Nigeria‘s Ailing Industrial Sectorǁ. The Guardian.
Oshagbemi, T.A. (1982). Small Business Management in Nigeria. Longman, London. P.3
Ogun, O. and Anyanwu, J.C. (1999). ―Financing Small and Medium Enterprises in Nigeria:
Lessons from International Experiences‖. The Nigerian Financial Review. Vol. 8, No. 1, March,
P.12.
Ogunsiji, P. A. S., & Ladanu, W. K. (2010). Entrepreneurial Orientation as a Panacea for the
Ebbing Productivity in Nigerian Small and Medium Enterprises: A Theoretical Perspective. In-
ternational Business Research, 3(4), 192 -199.
Wiklund, J., and D. Shepherd. 2003. “Knowledge-Based Resources, Entrepreneurial Orientation,
and the Performance of Small and Medium-sized Businesses.” Strategic Management Journal 24:
1307–1314.

28

29
Related Documents


