Entrepreneurial Exits and Innovation * Vikas A. Aggarwal INSEAD Boulevard de Constance 77300 Fontainebleau France [email protected] David H. Hsu The Wharton School University of Pennsylvania 2028 Steinberg-Dietrich Hall Philadelphia, PA 19104 [email protected] March 2013 ABSTRACT We examine how IPOs and acquisitions affect entrepreneurial innovation as measured by patent counts and forward patent citations. We construct a firm-year panel dataset of all venture capital-backed biotechnology firms founded between 1980 and 2000, tracked yearly through 2006. We address the possibility of unobserved self-selection into exit mode by using coarsened exact matching (CEM), and in two additional ways: (1) we compare firms that filed for an IPO (or announced a merger) with those who did not complete the transaction for reasons unrelated to innovation, and (2) we use an instrumental variables approach based on the relative level of IPO versus acquisitions market “heat”. Our across- and within-mode results are consistent with altered project selection and incentives associated with differing levels of information disclosure to outsiders shaping innovation outcomes. These firm-level results are not explained by an alternative mechanism of inventor-level turnover following exit events. Keywords: Entrepreneurial exits; innovation; information confidentiality. * We thank Iain Cockburn, Florian Ederer, Joan Farre-Mensa, Josh Lerner, and audience members at the IFN Conference on Entrepreneurship, Firm Growth and Ownership Change, the NBER productivity lunch, Queen’s University Economics of Entrepreneurship and Innovation Conference, Stanford, the Strategic Management Society annual meeting, Temple Fox School, Tilburg Entrepreneurial Finance Conference, and the UCLA Entrepreneurship & Innovation seminar for helpful comments. We also thank Sean Nicholson and Simon Wakeman for providing biotechnology product and alliance data, and Andy Wu for excellent research assistance. We acknowledge funding from the Wharton Entrepreneurship and Family Business Research Centre at CERT, the Centre of Excellence for Applied Research and Training Term Fund, and the Wharton-INSEAD Center for Global Research and Education.

Welcome message from author
This document is posted to help you gain knowledge. Please leave a comment to let me know what you think about it! Share it to your friends and learn new things together.
Transcript
Entrepreneurial Exits and Innovation*
Vikas A. Aggarwal INSEAD
Boulevard de Constance 77300 Fontainebleau
France [email protected]
David H. Hsu The Wharton School
University of Pennsylvania 2028 Steinberg-Dietrich Hall
Philadelphia, PA 19104 [email protected]
March 2013
ABSTRACT
We examine how IPOs and acquisitions affect entrepreneurial innovation as measured by patent counts and forward patent citations. We construct a firm-year panel dataset of all venture capital-backed biotechnology firms founded between 1980 and 2000, tracked yearly through 2006. We address the possibility of unobserved self-selection into exit mode by using coarsened exact matching (CEM), and in two additional ways: (1) we compare firms that filed for an IPO (or announced a merger) with those who did not complete the transaction for reasons unrelated to innovation, and (2) we use an instrumental variables approach based on the relative level of IPO versus acquisitions market “heat”. Our across- and within-mode results are consistent with altered project selection and incentives associated with differing levels of information disclosure to outsiders shaping innovation outcomes. These firm-level results are not explained by an alternative mechanism of inventor-level turnover following exit events.
Keywords: Entrepreneurial exits; innovation; information confidentiality.
* We thank Iain Cockburn, Florian Ederer, Joan Farre-Mensa, Josh Lerner, and audience members at the IFN Conference on Entrepreneurship, Firm Growth and Ownership Change, the NBER productivity lunch, Queen’s University Economics of Entrepreneurship and Innovation Conference, Stanford, the Strategic Management Society annual meeting, Temple Fox School, Tilburg Entrepreneurial Finance Conference, and the UCLA Entrepreneurship & Innovation seminar for helpful comments. We also thank Sean Nicholson and Simon Wakeman for providing biotechnology product and alliance data, and Andy Wu for excellent research assistance. We acknowledge funding from the Wharton Entrepreneurship and Family Business Research Centre at CERT, the Centre of Excellence for Applied Research and Training Term Fund, and the Wharton-INSEAD Center for Global Research and Education.
2
1. Introduction
Equity investments in entrepreneurial start-ups are illiquid until an exit (or liquidity) event such
as an IPO or acquisition by another entity.1 As a result, a leading performance measure that researchers in
the entrepreneurship literature investigate is the likelihood of an exit event. The main motivation for
studying such outcomes is that these events offer liquidity and financial returns to the entrepreneurial
founders, their investors, and other shareholders. We know little, however, about the relationship between
entrepreneurial exit modes and organizational innovation, particularly when taking into account self-
selection. Understanding the link between exits modes and innovation outcomes is important to start-up
entrepreneurs and managers at established companies alike. For entrepreneurs, alternate exit mode
choices involve tradeoffs in organizational structure, governance, incentives, resources, and degree of
information disclosure – all of which can shape innovation outcomes. For industry incumbents, a deeper
understanding of the consequences of organizational changes accompanying the going public process and
the entrepreneurial acquisition process can be important in assessing the innovation profile of potential
competitors.2 We therefore examine the research question of the relationship between entrepreneurial exit
mode and innovation while taking into account the role of (unobserved) entrepreneurial self-selection into
exit mode.
To illustrate the phenomenon we study, consider the example of Pixar, the computer animation
studio. In the fall of 1994, before Pixar released its first hit, Toy Story, Pixar majority owner Steve Jobs
considered selling the studio to Microsoft. The chief negotiator on behalf of Microsoft was Nathan
Myhrvold, then head of Microsoft Research, who recalled why Microsoft was interested in the deal: “I
was interested in them initially because we were interested in graphics, and we had the idea that maybe
there’s some technology that we could invest in early on that would be relevant to PCs [personal
computers] later.” (Price, 2008: 140). Jobs subsequently had a change of heart in selling out and instead
licensed several patents covering technologies such as motion blur and realistic depth of field to
Microsoft for a fixed fee of $6.5 million. Pixar went on to conduct an IPO in 1995 and raised $140
million, edging out the Netscape IPO for the largest public offering of that year. Disney eventually
acquired Pixar in 2006. While it is of course not possible to know what would have happened to the
1 We use the terms “exit event” and “liquidity event” interchangeably. These refer to the ability of the entrepreneur or venture capitalist (VC) to fully or partially sell their equity stake in a VC-backed start-up firm. 2 Another motivation for investigating the relationship between entrepreneurial exit modes and innovation outcomes is to better assess the public policy implications of the shifting balance of entrepreneurial exit modes away from initial public offerings and toward mergers and acquisitions. Figure 1 plots the ratio of deal (and deal value) from VC-backed M&As to IPOs over the 1992 to 2007 time period. The same data series are plotted for VC-backed biotechnology firms (the industry subject of this study) in Figure 2. Acquisitions have clearly outstripped IPOs as the modal form of entrepreneurial exit. While assessing the welfare implications of this shift is beyond the scope of this paper, the innovation consequences are a key component to such an analysis.
3
creative output of a Microsoft-owned Pixar or an independent Pixar post-2006, it would be interesting to
understand the relationship between corporate ownership and innovation.
This anecdote exemplifies a key difficulty in designing a study investigating the innovation
consequences of entrepreneurial liquidity mode: the possible issue of self-selection into mode based on
unobserved factors (not all instances will involve a serendipitous change of heart as in the Jobs and Pixar
example). Clearly the gold standard of random assignment of ventures to exit mode is not available. Not
only is being in the position to consider a liquidity event (of any sort) not a random occurrence, the choice
between exit modes may be importantly influenced by unobserved factors. While we recognize that
disentangling the co-mingling of exit mode selection and treatment effects is challenging, we employ
three approaches enabled by our panel dataset of the universe of VC-funded US biotechnology start-ups
founded between 1980 and 2000. First, we employ a coarsened exact matching (CEM) algorithm to our
data to define more closely aligned treatment and control samples. Second, we conduct a quasi-
experiment in which we compare the innovation profiles of firms experiencing a given exit event to
subsamples of firms which “nearly” experienced the event, but for reasons unrelated to innovation, did
not complete the exit process. Finally, we employ an instrumental variables strategy centered on the
relative liquidity of alternative exit outcomes for the start-ups.
Across the range of our comparisons, we find a decline in innovation quality (as measured by
patent citations) as a causal effect of both the IPO and M&A treatments, with the IPO effects larger in
magnitude. While the quantity of innovations (as measured by patent counts) also declines following an
IPO, we find an increase in this measure following an M&A. These results are consistent with an
information confidentiality mechanism, in which different levels of information disclosure associated
with alternative exit modes influence innovation rates (going public entails the largest information
disclosure, while remaining privately-held involves the least, with being acquired in between). We
conduct within-exit mode analyses to sharpen our evidence for this mechanism. For firms going public,
there is a significant negative interaction on innovation quality between stock market analyst attention and
the level of preclinical trial products firms have in their pipeline. For biotechnology firms, the veil of
secrecy may be most important during the preclinical phase of drug development, and the interaction with
analyst coverage is consistent with an information disclosure mechanism. Furthermore, among acquired
firms, we find being acquired by a private rather than a public acquirer (the latter associated with higher
information disclosure) results in higher innovation quality among M&As. In addition, our results point to
an important role for managerial incentives in M&As: greater technology overlap between the acquiring
and acquired firms boosts patent quantity but reduces quality, suggesting that in more competitive
settings, once the firm becomes part of another organization, acquired firm managers prefer short-run
observable outcomes (patent quantity) at the expense of outcomes which may not be observable until the
4
longer-run (patent quality). Finally, we investigate the extent to which inventor turnover following
liquidity events might account for these empirical patterns by constructing an inventor-year panel dataset
covering inventor histories both in- and out-of-sample with regard to our focal firms. We find that the
inventor-level turnover effects cannot explain the firm-level patterns, which are instead consistent with
information confidentiality mechanisms.
2. Literature
A key pre-condition to the entrepreneurial choice among exit modes is building a significant
business to warrant further expansion. Conditional on this, there have been just a few papers to our
knowledge that deal with this choice, with these papers suggesting four categories of explanatory factors.
In the context of significant VC involvement, a first set of explanations suggests that financing
contractual design can influence exit outcomes, as VCs negotiate certain control rights based on their
assessment of entrepreneurial quality (e.g., Hellmann, 2006; Cumming, 2008). A second set of
explanations centers on industry or market characteristics, such as the industry degree of leverage and
concentration, or public equity hotness (e.g., Brau et al., 2003; Bayar & Chemmanur, 2011, 2012). A third
set of explanations relates to the role of firm and product market characteristics, such as growth potential,
capital constraints, degree of information asymmetry, and complementarity with the potential acquirer
(e.g. Poulsen & Stegemoller, 2008; Bayar & Chemmanur, 2011, 2012). Finally, founder characteristics,
most notably entrepreneurial preferences for control versus value creation, can play a role. Schweinbacher
(2008) argues in a theoretical model that because entrepreneurs value control, which is more likely under
an IPO exit, they are driven to be more innovative in order to reduce the likelihood of being acquired.
While there is therefore a limited but growing literature examining the entrepreneurial choice
among multiple exit modes, the Schweinbacher paper is the only one to our knowledge that aims to link
this choice directly to entrepreneurial innovation. While we do not believe that any empirical study has
addressed this topic, there are two mechanisms through which this choice might impact innovation: a first
mechanism relates exit mode innovation outcomes to project selection incentives under different
ownership regimes; a second mechanism relates to whom information is revealed under varied ownership
structures to innovation outcomes. While both relate innovation to the degree of information
confidentiality the enterprise is able to retain without disclosing to various parties, we discuss each
mechanism and its associated empirical implications separately as each operates in a different way.
Organizational ownership, project selection, and innovation. Under private ownership, the
classic agency issues associated with the separation of ownership and corporate control are typically not
as severe, as the (concentrated) insiders are also the managers. By contrast, under public ownership, due
to the expanded number of possible shareholders, the regulatory requirements associated with going
5
public include regular public disclosures on firm operations. These disclosures may have innovation
effects. If managers know that they will have to report project status on a regular basis, they may be
incentivized to select projects that are more likely to yield steady progress. Developing important
innovations, however, is a process that not only involves a longer time horizon, but also offers returns
with higher variance relative to more certain investment activities. Moreover, innovation often requires
experimentation, which may be curtailed if managers know they have to report results on a quarterly
basis. As such, for situations in which managers want to incentivize exploratory (rather than exploitative)
behavior, private rather than public firm ownership might be optimal (Ferreira, et al., forthcoming). The
empirical results of Lerner, et al. (2011) are consistent with these ideas. In that study, the authors use the
private equity context to evaluate whether firms’ innovation profiles change as a result of being acquired
via buyout, finding an overall increase in the innovative output of private equity-acquired firms over the
long-term (as a result, going private from a publicly-held status improves innovation outcomes).
Therefore, information disclosure to a broad audience under public ownership can negatively impact
innovation quantity and quality by reducing the tolerance for failure (Manso, 2011; Ferreira, et al.,
forthcoming).
With regard to acquisitions, while in concept there are synergies of personnel and organizations
that should benefit the acquisition target (the entrepreneurial firm), the act of merging, typically into a
larger organization, can impose costs that might dampen innovation. Seru (forthcoming) argues that as a
division within a conglomerate, the acquired firm may have skewed managerial incentives to oversell the
true prospects of a given technology in an effort to acquire more resources for the business unit (or to
target projects with near-term as opposed to longer-term payoffs). The result is that managers in the
conglomerate are less willing to fund innovative projects in the first place, as they are not able to assess
the true quality of projects.
We would therefore expect the following ordering of innovation outcomes associated with project
selection incentives resulting from varied ownership structures: privately-held would be ahead of the
other two exit modes of publicly-held and acquisition with regard to innovation quality. There is evidence
in the literature consistent with this ordering, but little or no within-industry evidence taking into account
the full spectrum of entrepreneurial liquidity options, while also addressing issues of self-selection into
exit mode. There have, however, been a few efforts to order innovation outcomes by ownership structure
on a pairwise basis (publicly-held versus privately-held and acquisition versus privately-held) while
taking into account possible selection effects. For example, research contemporaneous with our study
suggests that firms pursuing an IPO realize a decline in the quality of their innovations, largely due to
skilled inventor departures and post-IPO productivity decreases (Bernstein, 2012). However, the same
study finds that more entrenched managers experience a smaller decline in innovation productivity. The
6
Bernstein study complements our own by evaluating a multi-industry context, with a focus solely on the
IPO mode of exit (and so is unable to assess how acquisitions fit in comparatively). In addition, in a study
using the medical device industry as the empirical context, Wu (2012) finds similar post-IPO effects as
Bernstein with respect to innovation quality (a decrease in patent impact following an IPO), but at the
same time finds an increase in the quantity of patents after an IPO (in contrast with Bernstein, who finds
no effect of the IPO treatment on this same metric). Likewise, for acquisitions, Seru (forthcoming) finds
lower patent grants and forward citations following acquisition as compared to exogenously uncompleted
acquisitions, especially for firms with active internal capital markets.3 Of course, studies comparing only
one liquidity mode to private ownership cannot estimate the relative ordering of expected outcomes
among a broader set of alternatives in a causal way, which is our objective in this paper.
Together, these studies point to the likely importance of factors determining within-event
heterogeneity, as well as the need to examine multiple dimensions of innovative outcomes – e.g., patent
quantity and quality. Overall, according to this first information confidentiality mechanism of project
selection, private ownership appears to dominate IPOs and acquisitions with regard to innovation output,
though the latter two exit modes are not clearly ordered among themselves in this regard.
Organizational ownership, information disclosure, and innovation. Under private-ownership,
details of a product or service innovation can more likely remain hidden from potential competitors. For
acquired firms, such information is only disclosed to a small set of outsiders who are evaluating the firm
as a suitable acquisition target.4 By contrast, publicly-held organizations must routinely make public
disclosures, which can provide important information to organizational outsiders. Consider the following
quote from the founder of the movie rental company, Netflix: “In retrospect, Mr. Hastings [the Netflix
founder] wishes he had waited longer to go public…'In hindsight, what triggered Amazon and
Blockbuster to compete with us is they could see how profitable we were and how fast we were
growing.'” (Rivlin, 2005: G8). Entrepreneurs therefore sacrifice the opportunity to operate “under the
radar” with respect to announcing their offerings, in exchange for liquidity and other benefits of a public
offering. Nevertheless, the decision to go public likely involves a tradeoff between early liquidity and the
risks of information disclosure to product market competitors, as the theoretical models of Bhattacharya
& Ritter (1983), Maksimovic & Pichler (2001) and Spiegel & Tookes (2008) suggest.
3 According to this “dark side” explanation of internal capital markets of conglomerates, however, it would seem that business unit managers (including those acquired) would have incentives to over-represent their innovation potential as measured by innovation quantity, even if doing so may be at the cost of developing higher quality inventions. Seru does not find this effect, though we do in our empirics. 4 If the acquirer is publicly-held, however, the transaction could receive more scrutiny by antitrust and/or shareholders of the acquiring firm (in which case there would be more information disclosed to a broader audience). We exploit this within-acquisition event heterogeneity in our empirics to sharpen our empirical evidence beyond across exit mode innovation ordering for this information confidentiality mechanism.
7
In an empirical analysis of U.S. manufacturing firms, Chemmanur et al. (2012) build on these
models, finding that product market characteristics can drive firms’ choice of exit mode in ways that are
consistent with predictions based on the relative degree of expected information confidentiality under
alternate ownership structures (private, M&A and public). The Chemmanur et al. study examines a cross-
industry sample of manufacturing firms and finds evidence for a greater decrease in total factor
productivity (TFP) following an IPO as compared to an acquisition, consistent with the mechanism of
information confidentiality. This study provides complementary insights to ours, with our study in the
context of entrepreneurial biotechnology firms differing in its emphasis on innovative output, as
compared to production and product market characteristics.
A small, related literature is the connection between corporate governance and innovation
outcomes. With private-ownership, in addition to innate entrepreneurial preferences or benefits associated
with control, less distributed control rights allow entrepreneurs to retain relative autonomy in making
decisions in the face of differences of opinion with outsiders (Boot et al., 2006). The net impact of
concentrated versus more distributed ownership (as would be the case with public-ownership) on
innovation, however, is theoretically ambiguous as it depends on the relative productivity differences
associated with more versus less concentrated corporate governance. Typically the corporate board of
directors expands in the ramp-up to an IPO (Baker & Gompers, 2003). Unfortunately there is little
literature on the direct impact of expanded boards or of tighter corporate governance more generally on
innovation. While earlier literature found a negative relationship between anti-takeover provisions and
innovation investments (e.g., Meulbroek, et al. 1990), a recent study (O’Connor & Rafferty, 2012) finds
no relation between broad measures of corporate governance and innovation levels once simultaneity is
taken into account in their empirical models.
Taken together, this second information confidentiality mechanism, focusing on to whom
information is disclosed under different ownership structures, predicts acquisitions as middling in
innovation performance, with better outcomes than going public and worse outcomes relative to
remaining private.
3. Methodology
Overview. Examining the causal implications of alternate exit mode choices requires a
methodology that takes into account possible self-selection of firms into particular modes based on
unobserved factors. In addition to our aim of drawing causal inferences on the effects of exit mode
treatments, we also seek to frame our results in the context of the prior literature. As discussed in the
previous section, there are two streams of work related to information confidentiality that are potentially
helpful in understanding the potential mechanisms at work: altered project selection, and disclosures to
8
external parties, both of which operate through managerial channels. While these two mechanisms are
conceptually distinct, they yield similar predictions with regard to the relationship between ownership
structure and innovation patterns. As a result, we will not be able to untangle the mechanisms empirically,
especially since the first mechanism of project selection from a choice set of alternatives is unobservable
to us. Nevertheless, the two mechanisms of information confidentiality imply an ordering of innovation
outcomes across ownership modes and some empirical patterns within exit mode. Our analyses are
accordingly structured to test the empirical salience of the two information confidentiality mechanisms.
To the degree that our effects might be alternatively explained solely through inventor-level changes
(rather than managerial level effects associated with project selection incentives or direct information
disclosure), however, we supplement our firm-level analyses with inventor-level analyses, examining the
role of inventor movements and inventor productivity around exit events.
Sample. We sample the universe of VC-funded biotechnology firms founded between 1980 and
2000, identifying these firms using the VentureXpert database. We focus on start-ups receiving venture
capital funding because the quality screen of VC involvement (Kortum & Lerner, 2000) offers a desirable
dimension of homogeneity among firms in the sample, with liquidity needs arising from the venture
capital cycle (Gompers & Lerner, 2004; Inderst & Muller, 2004) creating pressures to pursue exit
opportunities. A second desirable dimension of homogeneity is the use of biotechnology as the industry
context. The importance of patenting to the appropriation and valuation of innovations is particularly
important in biotechnology relative to other sectors (e.g., Levin et al., 1987). A single industry context
enables us to obtain relevant measures of the value and importance of innovations, an objective that
would be significantly more challenging in a multi-industry setting. We focus on firms founded in the 21-
year period between 1980 and 2000 to ensure that our results are generalizable across a range of initial
industry conditions, as well as to ensure that we can observe firm outcomes for a sufficiently long period
of time post-founding. The sample consists of the 476 U.S.-based firms in the human biotechnology
industry (SIC codes 2833-2836) founded during these years.
The primary dataset is structured as an unbalanced firm-year panel, with observations for each
firm starting with the year of founding. Since the most recent founding year is 2000, and the data are
collected through 2006, we observe each firm for a minimum of seven years, except in cases where the
firm is dissolved prior to 2006.5 Our dataset thus includes observations at the firm-year level for each year
in which the firm is in operation, including those years following an exit event (which can be either an
IPO or an M&A). We do not, however, include observations for those years after which a firm ceases to
exist as a consequence of a dissolution event. Left-censoring is not an issue since we observe firms
5 The average lifespan of a venture fund during this timeframe is eight to ten years and so VC-backed firms in this industry thus have strong incentives to pursue an exit event within five to seven years post-founding.
9
beginning with their date of founding. The final observation year of 2006 is chosen in accordance with
our use of forward citations as one of our two measures of innovative output (described in more detail
below), for which we utilize a 4-year post-application observation window. In addition to the firm-year
panel we assemble an inventor-year panel dataset (described in more detail below) to understand the role
of individual inventors in influencing our results.
We utilize several archival sources to assemble our datasets. For exit events this includes news
article searches from Factiva, combined with data from Thomson One Banker, Zephyr, and SEC filings.
For measures of innovation we draw on the IQSS Patent Network database (see Lai et al., 2011 for a
description), which incorporates the U.S. Patent and Trademark Office (USPTO) data on all patents
applied for since 1975. This allows us to construct patent-based measures of innovation output at the
firm-year level, and in addition, to identify unique inventors associated with these patents, thereby
enabling the construction of inventor career histories. We also collect data on firms’ VC funding histories,
strategic alliances, product pipelines, as well as (for post-IPO firms) coverage from stock market analysts.
These data draw respectively on the following sources: VentureXpert, Deloitte Recap RNDA,
PharmaProjects and Inteleos, and I/B/E/S. Finally, to construct an instrument for the level of “heat” in the
IPO market relative to the M&A market, we collect data on IPO and M&A market volume from multiple
sources, including Jay Ritter’s IPO data website6 and SDC.
Empirical strategy. Our main empirical strategy employs the “coarsened exact matching” (CEM)
procedure (Iacus et al., 2011, 2012) to construct treatment and control samples that are balanced on pre-
treatment covariates (discussed in more detail below). We use the matched control group to run, for
example, difference-in-differences estimates of the treatment effect of alternate exit modes.7 We employ
two additional empirical strategies on the CEM-matched data to mitigate any additional concerns of bias
due to unobserved pre-treatment characteristics: (1) a quasi-experiment based on “near” exit events –
those which were started but not completed for exogenous reasons; and (2) an instrument variables
strategy to address the possible endogenous selection of IPO vs. M&A liquidity events. To better
understand the mechanisms driving our results, we then conduct within-exit mode analyses, along with an
analysis at the inventor-year level. We first describe the construction of the various measures in our firm-
year dataset, including innovation outcomes, exit events, firm characteristics, and an instrument for the
IPO vs. M&A choice. We then discuss the CEM process we employ to generate the matched control
samples. We end the section by detailing how we construct our inventor-year dataset.
6 This data, updated through 2012, uses the methodology in Ibbotson, Sindelar and Ritter (1994), with the most recent version found here: http://bear.warrington.ufl.edu/ritter/ipoisr.htm 7 Recent examples of studies employing the CEM technique to construct matched control samples include Azoulay et al. (2010) and Singh and Agrawal (2011).

10
Innovation outcomes. We begin with our measures of innovation, for which we utilize patent
data. To identify all patents associated the firms in our sample we first extract from the IQSS Patent
Network database (Lai et al., 2011) all patents applied for between 1975 and 2010 where the “assignee”
name matches our focal firms’ current or former name(s). To ensure that we are comprehensive in our
data collection process we conduct the search using an algorithm that matches various permutations of the
company name (e.g., we would code patents from “Amgen” and “Amgen Inc.” as being associated with
the same firm). The patent numbers we collect for our focal firms enable us to collect a range of other
patent-based characteristics including forward citations and patent classes. Our sample of 476 firms
includes 15,439 patents and 45,789 forward citations associated with these patents.
Identifying patents for firms undergoing an M&A exit raises the issue that post-M&A patent
applications associated with inventions of the acquired firm may be made with the acquirer listed as the
assignee. As a consequence, it may be difficult to track the innovation outcomes of firms after an
acquisition, unless the acquired firm operates as an independent entity, with future patents accruing to the
subsidiary rather than to the parent. We use an inventor matching algorithm to address this issue. We first
assemble a database of inventors associated with pre-acquisition patents applied for by the focal
(acquired) firm. We then search patent applications where the acquirer is the assignee during the post-
acquisition period, and consider patents from this set of inventors as having originated from the acquired
firm. Thus, the list of patents for a focal firm in our sample undergoing an M&A includes those patents
associated directly with the acquired firm before and after the acquisition, as well the subset of the
acquiring firm’s patents that were invented by the acquired entity (i.e., the focal firm) after the
acquisition.
We utilize two measures of patent-based innovation output: patent applications and forward
citations. These two characteristics of firm-level output represent, respectively, the quantity and quality of
innovation. Prior work (Trajtenberg, 1990) suggests, moreover, that forward citations in particular have a
strong correlation with economic value. We define the firm-year variables patent applications stock as the
number of patent applications applied for by the firm up to and including the firm-year, and forward
patent citations 4 years stock as the number of patent citations within a four-year post-issue window to
patents applied for (and subsequently granted) by the focal firm up to and including the firm-year.8,9 We
measure both through 2006 (the forward citations window constraints our final observation year).
8 We also examine the robustness of our results to using our forward citation measure less self-citations (the two versions of the variable are pairwise correlated at 92%). Removing self-citations strengthens the results, and so we report the more conservative full forward citations in our empirical tables. 9 We use the stock versions of these variables as we believe these have a more natural interpretation given our difference-in-differences approach with firm fixed effects and firm age controls (as discussed later); our results are, however, robust to alternatively using the flow measures.
11
Exit events. We observe variation in the modes by which entrepreneurs and their stakeholders
achieve exit. From the time of founding, each firm can undergo multiple exit or “near-exit” events (those
for which the process was begun, but never consummated). For M&A events we are concerned
specifically with situations in which the focal firm is the target in the acquisition (thereby creating a
liquidity event for the founders and investors). We conduct an exhaustive archival search using news
articles from Factiva, triangulated with Thomson One Banker, Zephyr, and SEC filings, to identify
realized exit events for our focal firms (from founding through 2006). We utilize in our specifications a
set of indicator variables for sub-samples of firms that underwent an IPO or M&A, as well as indicator
variables for the 3-year period of time following the IPO or M&A. These latter variables, focal, post-IPO
(1,3) and focal, post-M&A (1,3), allow us to obtain difference-in-differences estimates of the IPO and
M&A effects on our CEM matched sample, as we discuss in detail in Section 4.10
In addition to identifying realized exit events from our archival data search, we also identify those
exit events that were “withdrawn” in the sense that the exit process started but was never taken to
completion. For IPOs, a withdrawn event represents situations in which the firm filed for an IPO but
subsequently did not go public due to exogenous market conditions. Withdrawn M&A events represent
similar situations in which a deal was announced but never consummated. These two sets of events enable
us to conduct a quasi-experiment to identify the treatment effect of exits (IPO or M&A) using sub-
samples that pool realized-exit and near-exit events (IPO/near-IPO in one case and M&A/near-M&A in
the other). An assumption of this approach is that a firm’s withdrawal from a previously planned exit
event is uncorrelated with its innovation capacity and with other firm-level characteristics. For withdrawn
IPO events we verify through news articles that the withdrawal is a function of unstable or volatile market
conditions, factors exogenous to our model specifications. For withdrawn M&A events we similarly
verify that withdrawals are due to shareholder objections or to regulatory oversight.11 Furthermore, we
regress the likelihood of (IPO or M&A) withdrawal on our innovation variables and our full set of (time-
lagged) firm characteristics (described later), finding all effects to be insignificant. This increases our
confidence that exit withdrawals are not systematically related to either innovation or firm characteristics.
Our firm-year dataset is structured to account for the fact that a firm can undergo multiple “near”
and “realized” exit events throughout its lifetime. We code the full history of such events, and can
therefore observe situations where, for example, the firm experiences a withdrawn IPO or M&A event,
and subsequently exits via one of these modes. Similarly, we can observe situations in which one mode of
10 We also researched the incidence of publicly-held firms being taken private (as in the Lerner, et al. 2011 study). Among our sample companies, we did not find a single such case. 11 Although we can were able to confirm that the reasons for an M&A withdrawal are externally-driven, we cannot determine whether the decision to withdraw as a consequence of such external changes came from the target or from the acquirer.
12
exit (e.g., an IPO) is followed by another (an M&A). One additional category of firm-level outcomes is
the complete dissolution, or liquidation, of a firm in our sample. Such situations differ importantly from
our two modes of exit (IPO and M&A) in that the firm ceases to exist as a going concern and can thus no
longer continue its innovation output. For firms that are dissolved, we use the year of dissolution as the
final observation year for the firm in our firm-year panel dataset.
In addition to the indicator variables for different exit modes and the 3-year post-exit windows,
we utilize two additional exit event-related measures that are specific to the sub-sample of acquired firms.
First, we create an indicator variable for whether the acquiring entity is private (the private dummy).
Second, following Jaffe (1986), we define technology overlap as the angular separation between the
primary U.S. patent class vectors of the acquiring and acquired (focal) firms. Each vector has a dimension
of 987, and is indexed by unique patent classes; a given value within a vector represents the proportion of
the firm’s stock of patents (applied for prior to and until the date of acquisition) assigned to the patent
class associated with the index for that value. The technology overlap measure is the angular dot product
of the two vectors: a value of 1 represents vectors with perfect overlap, while a value of 0 represents
orthogonal patent class vectors. We interact both the private dummy and the technology overlap measure
with the focal, post-M&A (1,3) indicator variable to examine the role of particular organizational
mechanisms in influencing innovation output within the M&A mode of exit.
Firm characteristics. We employ a set of firm-level controls to account for any residual time-
varying unobserved heterogeneity in our models (we utilize firm fixed effects in most specifications). To
account for firm-level quality and life cycle considerations we use firm age, which is the age of the firm
since founding, along with VC inflows stock, which measures the cumulative amount of VC funding
received by the firm through the current firm-year (collected using VentureXpert). In addition, we use the
Deloitte Recap RDNA database to collect data on the cumulative stock of strategic alliances a firm has
entered up to the current firm-year, strategic alliance stock, a further measure of firm quality (e.g., Stuart,
Hoang & Hybels, 1999).12
In addition to age, VC funding and strategic alliances, we use a firm’s product portfolio as a final
firm-level characteristic. In the empirical context of biotechnology, a relevant metric for product
development is the stage of an individual drug compound in the FDA approval process. To construct our
two product-related measures, we utilize the Inteleos and PharmaProjects databases to compile the
number of products each firm has at different stages of development in a given firm-year. We track the
trajectory of an individual drug compound over time by combining Inteleos, for which we have data for
years 1990-2001, and PharmaProjects (which we use to collect 2002-2006 data, matching these with drug
12 Firms’ strategic alliance stock is correlated with VC inflows stock at the 66% level, and so in the empirical tables, we only use the latter variable, though the results are robust to using the former variable instead.
13
compounds identified in Inteleos).13 We measure the number of products in a given firm-year at four
stages of the FDA approval process: pre-clinical, stage 1, stage 2 and stage 3. Our measure of early-stage
innovations, preclinical products, enables us test the conditions under which information disclosure may
be most significant. In addition, as an aggregate measure of a firm’s product portfolio value in a given
firm-year (which we use as a control variables), we construct a measure, weighted products, which
weights the number of products based on their stage, putting arbitrary values of 1, 2, 5, and 10,
respectively, on the four development stages, reflecting the relative degree of economic value of the
firm’s portfolio based on the likelihood of eventual product commercialization (our results are similar
with un-weighted counts of firm product portfolios).
Finally, for the sub-sample of firms that undergo an IPO, we collect from I/B/E/S a measure of
stock market analyst coverage, analyst reports, which measures the total number of analyst reports
published about the firm in the firm-year. Prior studies have discussed the role that analysts play in
influencing both information availability and incentive structures, which can influence innovation
(Chemmanur, et al., 2012; Ferreira, et al., forthcoming; He & Tian, forthcoming). We thus use this
variable, which measures the degree of scrutiny on the firm by outside parties, to examine the information
confidentiality mechanism in our sample of firms that have gone public.
Instrumental variable. As discussed previously, one component of our strategy for addressing
the possibility of unobserved self-selection into exit mode involves instrumenting for the endogenous
selection between the IPO and M&A modes of exit. We utilize as our instrument the relative level of
“heat” in one market as compared to the other. Prior literature has typically used volume-based measures
of IPO market heat. Yung, et al. (2008), for example, define market heat in two ways: first, by comparing
the four-quarter moving average to the historical quarterly volume; and second, by examining IPO market
underpricing relative to the historical average. While other studies of IPO market heat utilize variants of
this approach, the commonality is using volume-based measures (e.g., Helwege and Liang, 2004). For
M&As, “merger waves” are an analogous concept to “hot markets” in IPOs (e.g., Harford, 2005), and in
this case transaction volume is similarly used as the key metric. We thus focus on volume in the IPO and
M&A markets as this offers an approach to measuring market heat that is common to both markets. We
build on the methodology used in Yung et al. (2008) to develop our metric for relative IPO market
attractiveness. Using IPO volume data from Jay Ritter’s website, and M&A volume data from SDC, we
first identify the number of quarters in each firm-year where the four-quarter moving average of IPO (or
M&A) volume is 25% above the quarterly average from the prior five years. We then construct a measure
13 We compile product pipeline data only for firms founded post-1989 due to time period coverage limitations associated with these two data sources. However, since our unit of analysis is an individual drug compound as it moves through the FDA approval process, we are able to track product portfolios post-M&A as well.
14
of IPO relative to M&A market heat (IPO vs. M&A liquidity) by taking the ratio of the IPO measure to
the M&A measure. When we discuss our results using this instrumental variable (IV) in the next section,
we will also discuss how the IV is both correlated with the possibly endogenous variable but satisfies the
exclusion restriction by being unrelated to firm-level innovation outcomes.
Coarsened exact matching (CEM) procedure. Table 1 summarizes the definitions and
descriptive statistics of the measures used in our analyses. In Table 2 we show that the CEM procedure
helps balance the pre-event sub-samples, which we use as the basis for our main difference-in-differences
specifications. As Iacus, et al. (2011) note, CEM is part of a general class of methods termed “monotonic
imbalance bounding” (MIB), which has beneficial statistical properties as compared to prior “equal
percent bias reducing” (EPRB) models (Rubin, 1976), of which propensity score matching and
Mahalanobis distance are examples.14 MIB generalizes the EPRB class, eliminating many of the
assumptions required for unbiased estimates of treatment effects, and outperforming EPRB in most
situations, including those specifically designed to meet the EPRB assumptions (Iacus et al., 2011, 2012).
A key difference in practice lies in the sequence of data pre-processing: whereas methods such as
propensity score matching (PSM) require determining ex ante the size of the matched control sample,
then ensuring balance ex post, CEM performs the balancing ex ante (Iacus et al., 2012). CEM entails
“coarsening” a set of observed covariates, performing exact matching on the coarsened data, “pruning”
observations so that strata have at least one treatment and one control unit, then running estimations using
the original (but pruned) uncoarsened data (Blackwell et al., 2009).
A key goal of any matching process is to ensure that the treated and control groups are
“balanced” in the sense that their covariates have (approximately) equal distributional characteristics.
Table 2 shows the outcome of our application of the CEM process. We focus on four key pre-treatment
observables, age, VC inflow stock, strategic alliance stock, and weighted products, creating separate
treatment and control samples post-CEM for the IPO and M&A treatments. The four variables we use to
balance the treatment and control samples represent observable quality dimensions that we expect would
be correlated with the IPO and M&A treatments. As the “pre-CEM” column shows, the IPO and M&A
treatment and control sub-samples are significantly different (at the 5% level) across the board for the full
set of covariates. These differences are reduced, however, post-CEM, with none of the treatment-control
differences significant at higher than 5%, suggesting balance in the two sets of samples.
[Insert Tables 1 & 2 here]
14 In summarizing a series of analytical and numerical tests of the CEM method, Iacus, et al. (2011, p. 359) note: “[CEM] … generates matching solutions that are better balanced and estimates of the causal quantity of interest that have lower root mean square error than methods under the older existing class, such as based on propensity scores, Mahalanobis distance, nearest neighbors, and optimal matching.”
15
Inventor-year dataset. Finally, while our primary aim is to empirically assess the role of
information confidentiality in the relationship between entrepreneurial exits and innovation, an alternative
to such mechanisms based in human resource turnover might instead be a primary driver of innovation
patterns. For example, Stuart and Sorenson (2003) suggest that IPO and M&A liquidity events are
organizationally disruptive for the focal enterprise, and link the geographic distribution of new firm
foundings to the regional pattern of such entrepreneurial liquidity events. They find support for an
employee spinoff mechanism behind the empirical pattern. More generally, in acquisitions, there may be
personnel adjustment costs that can result from changes in corporate culture and/or from turnover in
personnel composition. Similarly for employees holding stock options, IPOs could loosen the bonds of
employment for personnel not subject to lock-up restrictions. We therefore wish to assess the degree to
which our firm-year results are wholly explained by inventor-level turnover. If they are, the information
confidentiality mechanisms, which operate at the managerial policy level rather than at the inventor level,
may be less important in explaining the firm-level empirical patterns. We therefore construct an inventor-
year dataset by identifying all inventors associated with patents of our focal firm sample, and constructing
full inventor histories for each of these individuals.
These inventor histories include patenting activities both within and outside our focal firms,15
with the resulting inventor-year dataset consisting of 12,769 inventors associated with 15,439 focal firm
patents, each observed on average for 11.3 years (the total number of patents within and outside the focal
firm associated with these inventors is 57,803). We define the variables change in (mean: 0.46; s.d.: 0.50)
and change out (mean: 0.02; s.d.: 0.15) as indicators for whether a given inventor either joined or
departed a focal firm in a given year. For inventors joining a focal firm in our sample, we set the variable
change in to equal 1 in the first year in which the inventor applies for a patent in the focal firm. A
departure, captured by change out, is identified when an inventor who has patented in one of our focal
firms is observed to subsequently patent outside this same focal firm. This variable is equal to 1 in the
year the inventor patents in the “new” firm. We additionally define the variable years since first invention
at the inventor-year level to reflect the length of the inventor’s career to date. Finally, we create patent
outcome measures similar to the firm-year measures discussed previously (patent applications stock and
forward patent citations 4 years stock), except that these are specific to the inventor and defined at the
inventor-year level.
15 We track inventor histories starting from 1975 to ensure that we capture a sufficient window of history for inventors prior to their joining the focal firm.
16
4. Empirical Results
Post-event versus pre-event comparisons. We begin our analysis in Table 3 with a simple
regression analysis of the innovation patterns for firms that experienced an IPO or an acquisition,
comparing the post- as compared to the pre-event innovation profiles. This analysis does not confine the
sample to observations matched via CEM, as we initially want to describe the innovation patterns
comparing post- versus pre-events for the sample of firms undergoing each event. In subsequent analyses,
we will adopt methods to address possible selection issues associated with firms of different
characteristics choosing liquidity modes. We examine two innovation outcomes throughout our empirics,
patent applications stock and forward patent citations 4 years stock, with the former measure
corresponding to innovation quantity and the latter a proxy for innovation quality. We take the log value
of these outcome variables and run firm fixed effects OLS regressions on our firm-year sample. Negative
binomial count models (of unlogged outcomes) yield similar estimates for the specifications that converge
in estimation. For the sake of consistency throughout the tables, we report OLS results.
We first compare the innovation profiles of the 202 firms in our sample undergoing an IPO in the
first four columns of Table 3. The first two columns report the effect of being in the post-IPO period, with
the first column including no controls beyond the firm fixed effects and the second adding to the model a
variety of (logged) time-varying firm controls: age, VC inflows stock, and weighted products. VC inflows
stock proxies for differential firm resource inputs, while age and weighted products aim to control for
possible innovation rate differences across the firm and product life cycle. Chemmanur, et al. (2010), for
example, find that IPOs occur at the peak of firms’ productivity cycle. The key independent variable,
focal, post-event (1,3) variable is negative and significant in both specifications, with the estimate in (3-2)
suggesting a 36 percent decline in patent applications in the three years post-IPO. The analogous
specifications for the forward patent citation outcome are contained in the next two columns of Table 3.
The only difference is that we normalize these forward patent citations regressions by including the log of
patent applications stock as a regressor (a structure we adopt throughout our empirical specifications
when we analyze this outcome variable). Dropping this normalization does not alter the statistical
significance of the estimates, though the independent variable of interest is typically estimated with a
larger coefficient. The key independent variable, focal, post-event (1,3) variable is positive but only
significantly so in specification (3-4), with the estimate suggesting a five percent increase in forward
patent citations stock within four years of patent application in the three years post-IPO.
The final four columns of the table report analogous specifications for the 180 firms undergoing
an M&A, comparing post- with pre-M&A innovation rates. With the full slate of controls, we find that
the post-M&A (1,3) window is associated with a 22 percent increase in patent applications and a seven
percent decrease in forward patent citations (both estimates are statistically significant at the one percent
17
level). These estimates have not taken into consideration the possible self-selection into exit mode based
on unobservables, however. We therefore employ several strategies including CEM matching, an
instrumental variables analysis, and a comparison of actual versus “near” liquidity events to better
understand the relationship between exit modes and innovation patterns.
[Insert Table 3 here]
Coarsened exact matching (CEM) estimates. In Table 4, we use the CEM technique, balanced
on the log values of age, VC inflows stock, alliance stock, and weighted products to define an IPO
treatment and control sample (we omit the alliance stock variable as a regressor in our models because it
significantly reduces our sample size and because it is significantly correlated with our VC inflows
variable). The first three columns of Table 4 examine the outcome variable log patent applications stock.
Each OLS specification contains our full set of firm controls, event year fixed effects, and firm fixed
effects. The specifications differ on the sample analyzed. We start with the entire CEM-balanced sample
employing 328 firms. The difference-in-differences estimate, focal, post-IPO (1,3), after controlling for
the focal IPO sample, is negative and significant, with an implied 40 percent drop in patent applications
post-IPO (the comparison group is therefore firms which were either private or experienced an M&A).
The next two columns restrict the sample successively by first removing firms which remained privately-
held over the duration of the study window (reducing the sample size to 200 firms and 1,872 firm-years,
with the comparison group as firms undergoing an M&A) and then examining just the subsample of firms
experiencing both an IPO and an M&A (yielding 79 firms and 817 firm-year observations). In both cases,
focal, post-IPO (1,3) is negative and significant at the one percent level, though the estimated effect drops
to 35 and 28 percent, respectively. These estimates are in line with the estimates produced from the
simple post- versus pre-IPO analysis of Table 3. We also note that the CEM balancing procedure seems
successful, as the coefficient on the focal event sample in these and subsequent specifications is not
different than zero, suggesting no pre-event differences in trends in the comparison groups. A final note is
that in (4-3), since the sample contains firms undergoing both liquidity events (almost always in the order
of IPO followed by M&A), we can also estimate a focal, post-M&A (1,3) variable. That estimated
coefficient is not different than zero.
The final three columns of Table 4 examine the forward patent citations outcome, following a
parallel model structure and subsample comparison as the first group of analyses in this table. Here, we
find a reversal of the empirical patterns produced by a simple post- versus pre-IPO comparison. Recall
that in that analysis, we found a positive and significant effect of citations post-IPO. Using the CEM-
balancing procedure, we instead find a negative and significant effect at the one percent level across the
various samples. Using the entire sample, we find a 19 percent drop. Under the logic that firms remaining
private for the entire study period may be qualitatively different (in unobservables) compared to firms
18
achieving liquidity, and so should be left aside in the analysis, we estimate a 15 percent drop in forward
citations. Finally, restricting the sample to firms undergoing both events produces a 24 percent estimated
decline in forward citations post-IPO as compared to a 12 percent (and statistically significant) decline
post-M&A (the two coefficients are statistically different from each other). Therefore using a CEM-
balanced sample of IPO treatment versus control, we find that IPOs are associated with both worse
innovation quantity and quality.
In Table 5, we report a similar table but for M&A treatment and control samples using CEM
balancing. We follow an analogous structure as in Table 4 with regard to model specification and sample
comparisons. For patent applications, our results are similar to what we find in the post- versus pre-M&A
sample: a positive and significant effect. However, across the range of samples used in this table, our
estimated effects here are 25 to 50 percent of the economic size of the prior analysis, which did not
account for selection. On the other hand, our analysis of forward patent citations yields both similar
statistical and economic significance as the simple post versus pre-M&A analysis: a negative and
significant decline in forward patent citations. In addition, the negative and significant effect of the post-
IPO window for (5-3) and (5-6) associated with patent applications and forward citations, respectively, is
consistent with the results from Table 4 (the former coefficient is statistically different and of opposite
sign than the focal, post-M&A (1,3) coefficient in the same specification; the latter coefficient is
statistically lower than its corresponding focal, post-M&A (1,3) coefficient). Finally, note that the focal
M&A sample dummy is also not statistically different than zero in all the specifications in Table 5, again
implying a successful CEM-balancing procedure.
[Insert Tables 4 & 5 here]
Endogenous choice of IPO versus M&A. One concern with the CEM-balanced estimates
presented in the prior two tables is that the matching procedure is only as good as the observables upon
which we could possibly balance the treated and control samples. As a result, there could still be
unobserved selection issues associated with those estimates. We therefore employ two additional
empirical strategies to estimate our effects, both of which use CEM matching as the first step to sample
construction. In our first strategy, we conduct extensive research into the firms within our original sample
that nearly completed a liquidity event, but for reasons unrelated to innovation did not complete the event.
We compare actual versus “near” IPO events, post-CEM matching, in the first two columns of Table 6 for
both of our outcome variables (in unreported analyses, we find that the balance between the treatment and
control samples for the actual versus near IPOs and M&As reported in Table 2 is maintained). We include
in each specification our full set of time-varying firm controls and report firm fixed effects OLS models.
Our results are consistent with the CEM analyses in Table 4, in which we find negative and significant
difference-in-differences post-IPO time window effects for patent quantity and quality. In the third and
19
fourth columns of Table 6, we conduct an analogous examination using actual versus near acquisitions.
Again, our results echo our findings from Table 5, with a positive and significant post-M&A window
effect on patent applications, but a negative and significant coefficient for the same window on forward
patent citations. For both pairs of actual versus near event analyses, we regressed the likelihood of
withdrawal on our innovation variables and our full set of firm characteristics (with time lags) and found
all regressors insignificant (available on request from the authors). This lends support to our quasi-
experimental strategy in that withdrawn events are not systematically related to innovation or firm
characteristics in a regression framework.
Our second empirical strategy to address selection of liquidity mode based on unobservables adds
an instrumental variables strategy to an IPO-treatment CEM-balanced sample. For this analysis, we
confine the sample to firms experiencing either an IPO or M&A liquidity event and instrument for the
potentially endogenous variable, IPO year indicator. We do so by constructing a variable, IPO vs. M&A
liquidity. As noted above, this variable is defined at the biotechnology industry level and is a measure of
the comparative deal volume of each liquidity mode over a rolling time window. The higher the value of
IPO vs. M&A liquidity, the “hotter” is the IPO market relative to the M&A market for biotechnology
transactions. As a result, all else equal, the higher the instrumental variable (IV) the more likely a given
firm will choose an IPO as a result of the comparative “money chasing deals” IPO environment. This
logic is borne out when we regress IPO year indicator on IPO vs. M&A liquidity and our slate of firm
controls. The resulting coefficient is positive and statistically significant at the one percent level. This is
the first stage regression in both specifications (6-5) and (6-6) in which we run two stage least squares
(2SLS) regressions. The F-statistic for our first stage regression is 31.8, strongly suggesting that our IV is
not weak. Durbin and Wu-Hausman tests (with values of 25 and 30) reject the null hypothesis that IPO
year indicator is exogenous.
In addition, the requirement that the IV is uncorrelated with firm innovation outcomes is likely
satisfied in our case. The IV is a measure of industry-level relative liquidity, while our ultimate outcome
variables are at the firm level. Furthermore, the IV is a measure of relative liquidity of exit mode rather
than a measure of differences in factor inputs that might be correlated with firm-level innovation
outcomes. Finally, it is notoriously difficult to predict the degree to which a financing channel will be
“hot” (e.g., Lowry, 2003), but also the relative degree to which one market will be more active than
another. This suggests that it will be very difficult or not possible for entrepreneurs with (possibly
unobserved) innovation expectations to correctly anticipate relatively “hot” financing modes. While our
instrumental variable allows us to meet the order condition for identification, there is no direct statistical
test of the exclusion restriction. Using this empirical framework, our results on innovation quantity and
quality are consistent with the estimates we obtained from using CEM-matching alone (Table 4) and
20
CEM-matching coupled with actual versus near IPOs (first two columns of Table 6). Furthermore, the
2SLS results are robust to omitting the CEM-balancing scheme (which has the effect of nearly tripling the
number of usable firm-year observations).
The results thus far are consistent with the information confidentiality mechanism in that
innovation outcomes are worse post-IPO relative to post-M&A, and seem to be best under private
ownership. This pattern holds for patent applications (comparing (6-1) to (6-3) and (6-5)) and for forward
patent citations (comparing (6-2) to (6-4) and (6-6)), even after addressing the role of possible self-
selection into liquidity mode. Information confidentiality is best preserved under private ownership and is
partially compromised under an acquisition (information is spread to the acquirer or candidate acquirers).
IPOs represent the structure with the most information revelation to the most number of outsiders among
the ownership structures, consistent with the predictions of the information confidentiality mechanisms.
We now examine situations within liquidity mode in which the information confidentiality effects are
likely to be more or less severe to provide another dimension of empirical evidence for this mechanism as
it might connect to firm-level innovation outcomes.
[Insert Table 6 here]
Within-event heterogeneity. We begin by examining heterogeneous within-IPO effects. While all
IPOs in the U.S. necessitate regulatory compliance with the Securities and Exchange Commission with
regard to information disclosure, we believe that the negative effect of information confidentiality on
innovation outcomes may be most salient under two concurrent conditions: namely, when the focal
biotechnology firm has many early-stage projects (as proxied by the number of preclinical products), and
at the same time the firm itself receives considerable scrutiny (leading to increased information flows to
outsiders) by stock analysts. Stock analysts therefore work in the opposite direction as information
confidentiality, exposing information and firm analysis to the outside. In the first two columns of Table 7,
we analyze the interaction effect of log analyst reports and log preclinical products on our two innovation
outcomes. While we do not find a significant patent applications effect, we do find a negative and
statistically significant effect of this interaction on our measure of innovation quality. While the direct
effect of analyst coverage is positive on innovation, the interaction effect suggests that for a given level of
preclinical products, the marginal impact of increasing analyst attention as measured by analyst reports by
one standard deviation results in a decrease of 2.2 percent in forward patent citations.
To probe the within-IPO sample for possible evidence of organizational governance effects, we
collected information on whether the executive officers (including the chief executive officer) of the firm
at the time of IPO were also founders of the firm. While there could be varied reasons for observing such
instances, we examine whether there are consequences for innovation depending on such executive
officer status. On the one hand, we might conjecture incentive alignment because founders typically
21
possess a large share of equity, even at the time of IPO. On the other hand, the literature has reported
founder control tendencies (e.g., Boot et al., 2006; Schwienbacher, 2008), and so the net effect is
theoretically ambiguous. We define two variables to capture the phenomenon: (1) an indicator variable
for whether the CEO at the time of IPO is also a founder, and (2) the percentage of executive officers at
the time of IPO who were founders. In both cases (when interacted with the post-IPO time window), we
find no significant effect on forward patent citations, though we do find a significant positive effect using
the CEO variable on patent applications (results available on request).
Similarly, we examine heterogeneity within the M&A sample with an eye to testing the
information confidentiality mechanism. First, we conjecture that there might be differential information
disclosure effects associated with acquisition by a public versus private acquirer. Since such an
acquisition happens only once, to estimate the effect, we interact an indicator for private acquirer with the
key difference-in-differences variable focal, post-M&A (1,3) in our OLS panel firm fixed effects
framework. While we do not find an effect of this interaction on patent applications, the effect is positive
and significant for forward patent citations. This suggests that relative to the post-M&A window of public
acquirers, biotechnology targets acquired by private entities receive a nearly eight percent boost in
innovation quality. Naturally, private acquirers retain more information confidentiality relative to public
acquirers.
Taken together, these two empirical patterns of within-event heterogeneity provide additional
evidence consistent with the information confidentiality mechanism. With regard to M&As, the Seru
(forthcoming) and related theories suggest an additional within-M&A pattern. Recall that this theory
relates business unit manager incentives for innovation in the context of a competitive internal capital and
labor market of a conglomerate (which the acquired innovator joins in the case of an acquisition). Due to
such competition at least in the short run, individual managers may have the incentive to over-represent
their unit’s innovation prospects. We empirically examine acquisitions that differ in the degree to which
such incentives may play out by measuring the degree of technological overlap between acquirer and
target. We do so by constructing the tech overlap measure at the time of acquisition, which follows the
Jaffe (1986) method of comparing patent classifications of the entire portfolio of patents between the
acquirer and the acquired firms. High values of tech overlap suggest more similar technical alignment
between the parties, and this is a situation in which the incentives for business unit managers are more
likely to be competitive. We interact tech overlap with the focal, post-M&A (1,3) variable in the final two
columns of Table 7. Consistent with the Seru project selection mechanism on internal incentives, we find
that the interaction effect is significantly positively correlated with patent applications but significantly
negatively correlated with forward patent citations. This suggests that in such competitive settings,
managers are incentivized to display outcomes that are observable in the near term (a 3.7 percent increase
22
in patent applications for a one standard deviation increase in tech overlap) while sacrificing quality,
which is only apparent over the longer run (a 7.7 percent decrease in forward patent citations for the same
tech overlap increase).
[Insert Table 7 here]
Event window result robustness. Throughout the analyses thus far, we have mainly employed a
one to three year post-event window in assessing our results. In Table 8, we report results that vary this
event window. Each cell in the table represents a different regression using all the same non-window right
hand side regressors as the specification stated in the third row of the table, with only the estimated
coefficient associated with the relevant time window variable reported. For ease of comparison, we repeat
the estimates using the (1,3) window under the different estimation strategies. We then show the results of
the same models, but replace the (1,3) window with (1,4), (1,5) and (1,10) time windows. The results are
quite robust to these alternative time windows, and the longer time windows suggest that the effects we
report are not necessarily transitory – but rather are more consistent with a regime shift (as would hold
under the information confidentiality mechanisms).
[Insert Table 8 here]
Inventor-level analysis. To examine the extent to which these firm-year patterns are driven by
inventor-level effects, we rebuild our entire database at the inventor-year level (rather than the firm-year
level) and construct inventor career histories for the focal inventors who have invented in our focal set of
firms. As described in Section 3, we construct the inventor histories backward (to 1975 when the
electronic patent records are first available) and forward (to 2006, when the inventor database has been
disambiguated) in time.
We explore two sets of outcomes at the inventor level, patent applications and forward patent
citations. Note that while these mirror the outcomes we examine at the firm level, the results in this table
should be interpreted at the inventor-year level of analysis. We wish to evaluate these outcomes for
inventors as they transition into an IPO or M&A ownership regime. In particular, we want to assess three
dimensions of inventor-level impact: average inventor productivity within firms in the time window
following the liquidity event, average productivity of inventors being hired into firms after the liquidity
event, and average productivity of inventors departing the firm after a given liquidity event.
To estimate the first dimension, we examine the focal, post-event (1,3) variable, as in our firm-
year analysis. This captures the change in inventor innovation productivity for the focal sample in the
time window after the event. To estimate the second and third dimensions, we interact focal, post-event
(1,3) with either inventor change out or inventor change in, respectively. After preparing the inventor-
year data in the manner described in Section 3, we use a CEM algorithm to define a treatment and control
sample. We match based on log years since first invention (a proxy for inventor age), log firm age, and
23
log VC inflows stock. In each specification in Table 9, we include firm and event year fixed effects, as
well as controls for firm age, VC inflow stock, and years since first invention. In addition, when we
analyze the outcome variable log forward patent citations 4 years stock, we include an additional
regressor as before, log patent applications stock. All models are estimated via OLS.
The first four columns of Table 9 examine post-IPO inventor effects by analyzing each of the two
innovation outcome variables using two different samples, first the CEM sample defining an IPO
treatment versus control sample, and second, an actual versus near IPO sample following the CEM
process (the former subsample is “treated”). Across the two estimating techniques, we find a fairly
consistent set of results. First, patent applications decline while forward patent citations increase on
average for inventors in the firm post-IPO. Second, following an IPO, the inventors departing the firm are
the ones underperforming with regard to patent applications (though departing inventors did not differ
with regard to forward patent citations). Finally, following an IPO, inventors joining the newly-public
firm underperform with respect to both patent applications and patent citations. Taken together, these
analyses suggest that the firm-level drop in innovation quantity and quality, when evaluated from the
dimension of inventor-level productivity, results both from factors related to changes in innovative
productivity of the technical staff within firms undergoing an IPO, and also from the quality of inventors
attracted to and departing from the firm in the post-event window. In the case of forward citations post-
IPO, the negative effect of the quality of inventors entering the firm overwhelms the positive productivity
effect experienced by the scientist-inventors at the firm. While the net result of the inventor analysis is
consistent with Bernstein (2012), that study finds that inventors entering the firm produce higher quality
innovations, while the quality of those staying declines. The difference may be partially due to the cross-
industry setting used in that analysis. The results of inventor fixed effects models are similar to what we
have reported, though because such fixed effects models cannot also accommodate the CEM weighting,
we do not formally report those models.
The final four columns of Table 9 reports similar model specifications, again employing the same
two sampling strategies, except analyzing post-M&A innovation effects. Here, we find much less with
regard to changes in inventor productivity in the time window post-M&A. There is no effect in the post-
M&A window of inventor productivity changes (in contrast to Seru’s [forthcoming] finding of a drop in
post-M&A inventor productivity). Similarly, there is no difference in the quality of inventors departing
the firm post-M&A. There is mixed evidence suggesting that inventors hired into the newly-merged
company are slightly worse as measured by forward patent citations (but only using the actual versus
near-M&A comparison). Taken as a whole, these results suggest that inventor-level effects are not driving
the overall firm-level patterns (the same conclusion applies to inventor fixed effects models, which we do
not formally report for the same reason as before). As a consequence, there is little support for the
24
alternative explanation that inventor-level turnover as a result of the entrepreneurial exit events (both IPO
and M&A) explains the firm-level empirical patterns.
[Insert Table 9 here]
5. Conclusion
We examine the impact of entrepreneurial exit mode on innovation outcomes, as measured by
patent quantity and quality. We construct a firm-year panel dataset of all venture capital funded
biotechnology firms founded between 1980 and 2000, tracking these firms through the end of 2006, to
evaluate the innovation implications of entrepreneurial firms’ choice among a menu of alternative exit
mode options. Our empirical methods address the challenge of inference based on self-selection effects by
controlling for firm-level qualities by using Coarsened Exact Matching (CEM) alone, and variously
coupled with a quasi-experiment utilizing both exit event and “near-exit” event observations, as well as an
instrumental variable approach by instrumenting for the exit event using the relative “hotness” of different
exit mode channels. We find support for information confidentiality mechanisms in which project
selection and information disclosure stratified by ownership structure explain our empirical patterns. We
find that innovation quality is best promoted under private ownership and least productive under public-
ownership, with acquisition intermediate between the two. Moreover, these patterns are not driven
entirely by inventor-level turnover behavior. We therefore conclude that entrepreneurial firms’ exit modes
affect subsequent innovation outcomes.
25
References Azoulay, P., J. S. Graff Zivin, J. Wang. 2010. Superstar extinction. Quarterly Journal of Economics 125(2):
549-589.
Baker, M., P. A. Gompers. 2003. The determinants of board structure at the initial public offering. Journal of
Law and Economics 46: 569-598.
Bayar, O., T. J. Chemmanur. 2011. IPOs versus acquisitions and the valuation premium puzzle: A theory of exit choice by entrepreneurs and venture capitalists. Journal of Financial and Quantitative Analysis 46(6): 1755-1793.
Bayar, O., T. J. Chemmanur. 2012. What drives the valuation premium in IPOs versus acquisitions? An empirical analysis. Journal of Corporate Finance 18: 451-475.
Bernstein, S. 2012. Does going public affect innovation? Working Paper, Stanford University.
Bhattacharya, S., J. Ritter. 1983. Innovation and communication: Signaling with partial disclosure. Review of
Economic Studies 50(2): 331-346.
Blackwell, A., S. Iacus, G. King, G. Porro. 2009. CEM: Coarsened exact matching in Stata. The Stata Journal
9(4): 524-546.
Boot, A. W. A., R. Gopalan, A. V. Thakor. 2006. The entrepreneur’s choice between private and public ownership. Journal of Finance 61(2): 803-836.
Brau, J., F. Francis, N. Kohers. 2003. The choice of IPO versus takeover: Empirical evidence. Journal of
Business 76(4): 583-612.
Chemmanur, T. J., S. He, D. K. Nandy. 2010. The going-public decision and the product market. Review of
Financial Studies 23(5): 1855-1908.
Chemmanur, T. J., J. He, S. He, D. K. Nandy. 2012. The exit choices of entrepreneurial firms. Working Paper, Boston College.
Cumming, D. 2008. Contracts and exits in venture capital finance. Review of Financial Studies 21(5): 1947-1982.
Ferreira, D., G. Manso, A. C. Silva. Forthcoming. Incentives to innovate and the decision to go public or private. Review of Financial Studies.
Gompers, P., J. Lerner. 2004. The Venture Capital Cycle. MIT Press, Cambridge, MA.
Harford, J. 2005. What drives merger waves? Journal of Financial Economics 77(3): 529-560.
He, J., X. Tian. Forthcoming. The dark side of analyst coverage: The case of innovation. Journal of Financial
Economics.
Hellmann, T. 2006. IPOs, acquisitions, and the use of convertible securities in venture capital. Journal of
Financial Economics 81(3): 649-679.
Helwege, J., N. Liang. 2004. Initial public offerings in hot and cold markets. Journal of Financial and
Quantitative Analysis 39(3): 541-569.
Iacus, S. M., G. King, G. Porro. 2011. Multivariate matching methods that are monotonic imbalance bounding. Journal of the American Statistical Association 106(493): 345-361.
Iacus, S. M., G. King, G. Porro. 2012. Causal inference without balance checking: Coarsened exact matching. Political Analysis 20(1): 1-24.
Ibbotson, R. G., J. L. Sindelar, J. R. Ritter. 1994. The market's problems with the pricing of initial public offerings. Journal of Applied Corporate Finance 7(1): 66-74.
Inderst, R., H. Muller. 2004. The effect of capital market characteristics on the value of start-up firms. Journal
of Financial Economics 72(2): 319-356.
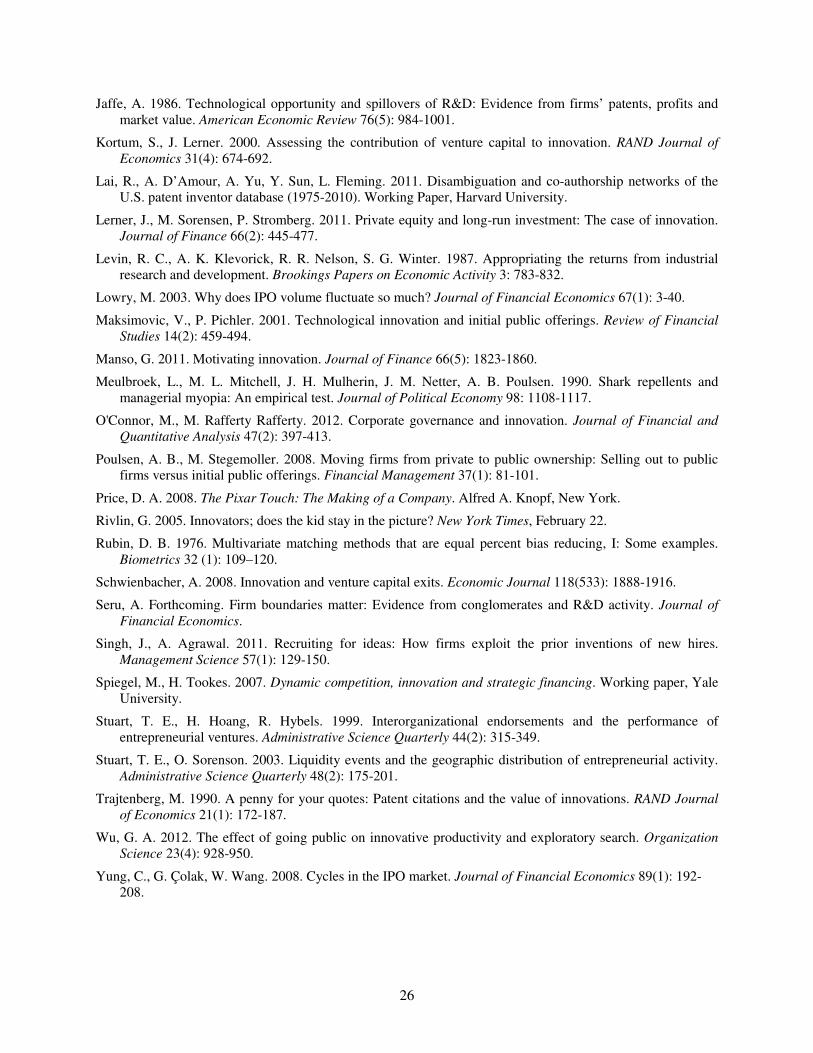
26
Jaffe, A. 1986. Technological opportunity and spillovers of R&D: Evidence from firms’ patents, profits and market value. American Economic Review 76(5): 984-1001.
Kortum, S., J. Lerner. 2000. Assessing the contribution of venture capital to innovation. RAND Journal of
Economics 31(4): 674-692.
Lai, R., A. D’Amour, A. Yu, Y. Sun, L. Fleming. 2011. Disambiguation and co-authorship networks of the U.S. patent inventor database (1975-2010). Working Paper, Harvard University.
Lerner, J., M. Sorensen, P. Stromberg. 2011. Private equity and long-run investment: The case of innovation. Journal of Finance 66(2): 445-477.
Levin, R. C., A. K. Klevorick, R. R. Nelson, S. G. Winter. 1987. Appropriating the returns from industrial research and development. Brookings Papers on Economic Activity 3: 783-832.
Lowry, M. 2003. Why does IPO volume fluctuate so much? Journal of Financial Economics 67(1): 3-40.
Maksimovic, V., P. Pichler. 2001. Technological innovation and initial public offerings. Review of Financial
Studies 14(2): 459-494.
Manso, G. 2011. Motivating innovation. Journal of Finance 66(5): 1823-1860.
Meulbroek, L., M. L. Mitchell, J. H. Mulherin, J. M. Netter, A. B. Poulsen. 1990. Shark repellents and managerial myopia: An empirical test. Journal of Political Economy 98: 1108-1117.
O'Connor, M., M. Rafferty Rafferty. 2012. Corporate governance and innovation. Journal of Financial and
Quantitative Analysis 47(2): 397-413.
Poulsen, A. B., M. Stegemoller. 2008. Moving firms from private to public ownership: Selling out to public firms versus initial public offerings. Financial Management 37(1): 81-101.
Price, D. A. 2008. The Pixar Touch: The Making of a Company. Alfred A. Knopf, New York.
Rivlin, G. 2005. Innovators; does the kid stay in the picture? New York Times, February 22.
Rubin, D. B. 1976. Multivariate matching methods that are equal percent bias reducing, I: Some examples. Biometrics 32 (1): 109–120.
Schwienbacher, A. 2008. Innovation and venture capital exits. Economic Journal 118(533): 1888-1916.
Seru, A. Forthcoming. Firm boundaries matter: Evidence from conglomerates and R&D activity. Journal of
Financial Economics.
Singh, J., A. Agrawal. 2011. Recruiting for ideas: How firms exploit the prior inventions of new hires. Management Science 57(1): 129-150.
Spiegel, M., H. Tookes. 2007. Dynamic competition, innovation and strategic financing. Working paper, Yale University.
Stuart, T. E., H. Hoang, R. Hybels. 1999. Interorganizational endorsements and the performance of entrepreneurial ventures. Administrative Science Quarterly 44(2): 315-349.
Stuart, T. E., O. Sorenson. 2003. Liquidity events and the geographic distribution of entrepreneurial activity. Administrative Science Quarterly 48(2): 175-201.
Trajtenberg, M. 1990. A penny for your quotes: Patent citations and the value of innovations. RAND Journal
of Economics 21(1): 172-187.
Wu, G. A. 2012. The effect of going public on innovative productivity and exploratory search. Organization
Science 23(4): 928-950.
Yung, C., G. Çolak, W. Wang. 2008. Cycles in the IPO market. Journal of Financial Economics 89(1): 192-208.
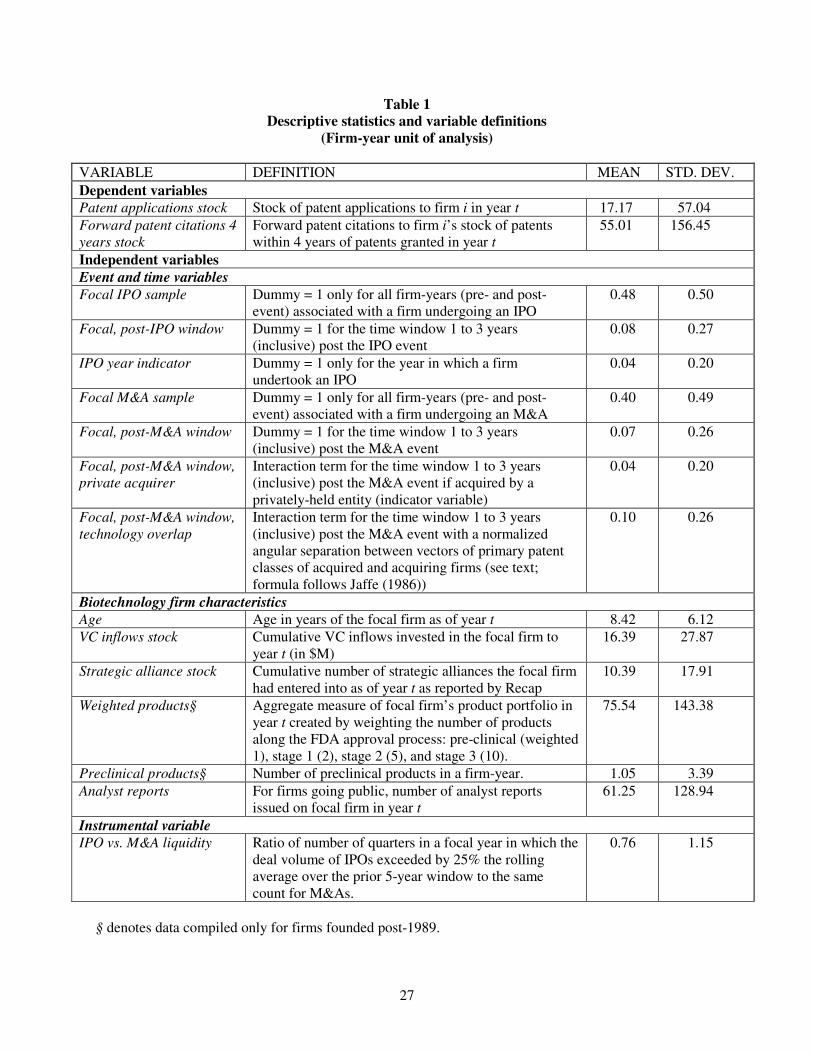
27
Table 1
Descriptive statistics and variable definitions
(Firm-year unit of analysis)
VARIABLE DEFINITION MEAN STD. DEV.
Dependent variables
Patent applications stock Stock of patent applications to firm i in year t 17.17 57.04
Forward patent citations 4
years stock
Forward patent citations to firm i’s stock of patents within 4 years of patents granted in year t
55.01 156.45
Independent variables
Event and time variables
Focal IPO sample Dummy = 1 only for all firm-years (pre- and post-event) associated with a firm undergoing an IPO
0.48 0.50
Focal, post-IPO window Dummy = 1 for the time window 1 to 3 years (inclusive) post the IPO event
0.08 0.27
IPO year indicator Dummy = 1 only for the year in which a firm undertook an IPO
0.04 0.20
Focal M&A sample Dummy = 1 only for all firm-years (pre- and post-event) associated with a firm undergoing an M&A
0.40 0.49
Focal, post-M&A window Dummy = 1 for the time window 1 to 3 years (inclusive) post the M&A event
0.07 0.26
Focal, post-M&A window,
private acquirer
Interaction term for the time window 1 to 3 years (inclusive) post the M&A event if acquired by a privately-held entity (indicator variable)
0.04 0.20
Focal, post-M&A window,
technology overlap
Interaction term for the time window 1 to 3 years (inclusive) post the M&A event with a normalized angular separation between vectors of primary patent classes of acquired and acquiring firms (see text; formula follows Jaffe (1986))
0.10 0.26
Biotechnology firm characteristics Age Age in years of the focal firm as of year t 8.42 6.12
VC inflows stock Cumulative VC inflows invested in the focal firm to year t (in $M)
16.39 27.87
Strategic alliance stock Cumulative number of strategic alliances the focal firm had entered into as of year t as reported by Recap
10.39 17.91
Weighted products§ Aggregate measure of focal firm’s product portfolio in year t created by weighting the number of products along the FDA approval process: pre-clinical (weighted 1), stage 1 (2), stage 2 (5), and stage 3 (10).
75.54 143.38
Preclinical products§ Number of preclinical products in a firm-year. 1.05 3.39
Analyst reports For firms going public, number of analyst reports issued on focal firm in year t
61.25 128.94
Instrumental variable IPO vs. M&A liquidity Ratio of number of quarters in a focal year in which the
deal volume of IPOs exceeded by 25% the rolling average over the prior 5-year window to the same count for M&As.
0.76 1.15
§ denotes data compiled only for firms founded post-1989.
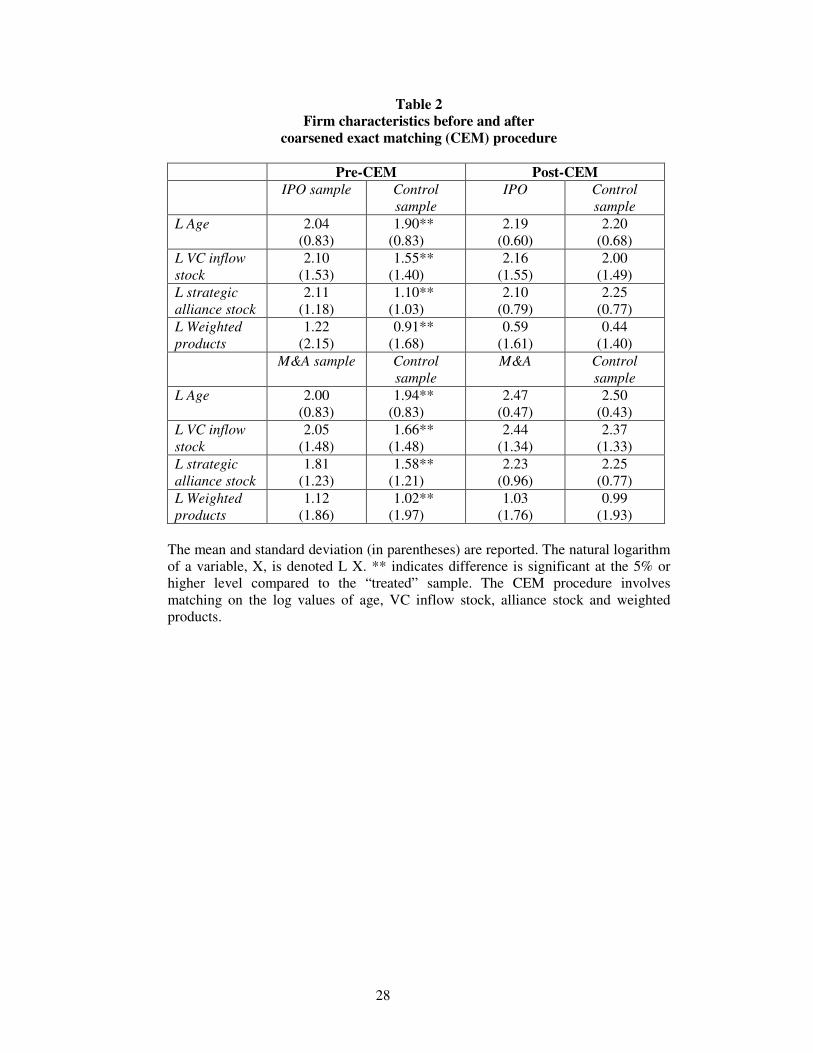
28
Table 2
Firm characteristics before and after
coarsened exact matching (CEM) procedure
Pre-CEM Post-CEM
IPO sample Control
sample
IPO Control
sample
L Age 2.04 (0.83)
1.90** (0.83)
2.19 (0.60)
2.20 (0.68)
L VC inflow
stock
2.10 (1.53)
1.55** (1.40)
2.16 (1.55)
2.00 (1.49)
L strategic
alliance stock
2.11 (1.18)
1.10** (1.03)
2.10 (0.79)
2.25 (0.77)
L Weighted
products
1.22 (2.15)
0.91** (1.68)
0.59 (1.61)
0.44 (1.40)
M&A sample Control
sample
M&A Control
sample
L Age 2.00 (0.83)
1.94** (0.83)
2.47 (0.47)
2.50 (0.43)
L VC inflow
stock
2.05 (1.48)
1.66** (1.48)
2.44 (1.34)
2.37 (1.33)
L strategic
alliance stock
1.81 (1.23)
1.58** (1.21)
2.23 (0.96)
2.25 (0.77)
L Weighted
products
1.12 (1.86)
1.02** (1.97)
1.03 (1.76)
0.99 (1.93)
The mean and standard deviation (in parentheses) are reported. The natural logarithm of a variable, X, is denoted L X. ** indicates difference is significant at the 5% or higher level compared to the “treated” sample. The CEM procedure involves matching on the log values of age, VC inflow stock, alliance stock and weighted products.
29
Table 3
Post- vs. pre-event innovation comparisons (firm-year level of analysis)
OLS regression coefficients reported
Post- vs. pre-IPO
innovation comparisons
Post- vs. pre-M&A
innovation comparisons
Dependent variable
L patent applications stock L forward patent citations
4 years stock
L patent applications stock L forward patent citations
4 years stock
(3-1) (3-2) (3-3) (3-4) (3-5) (3-6) (3-7) (3-8)
Focal, post-
event (1,3)
-1.069*** (0.054)
-0.361*** (0.032)
0.022 (0.022)
0.049** (0.023)
0.508*** (0.051)
0.223*** (0.032)
-0.066*** (0.020)
-0.073*** (0.021)
Firm-level
controls
No Yes No Yes No Yes No Yes
Event year FE No Yes No Yes No Yes No Yes
Firm FE Yes Yes Yes Yes Yes Yes Yes Yes
Constant 2.339*** (0.021)
-0.308*** (0.034)
0.276*** (0.018)
0.219*** (0.024)
1.759*** (0.021)
-0.320*** (0.033)
0.278*** (0.015)
0.264*** (0.022)
# observations (firms)
3498 (202) 3498 (202) 3498 (202) 3498 (202) 2934 (180) 2934 (180) 2934 (180) 2934 (180)
*, ** or *** indicates statistical significance at 10%, 5%, and 1%. Firm-level controls include L age, L VC inflows stock, and L weighted products. L
patent applications stock is also a control for (3-3), (3-4), (3-7) and (3-8). Note: the samples are not CEM matched because the comparisons simply reflect innovation rates post vs. pre-event for the sample of firms undergoing each event.
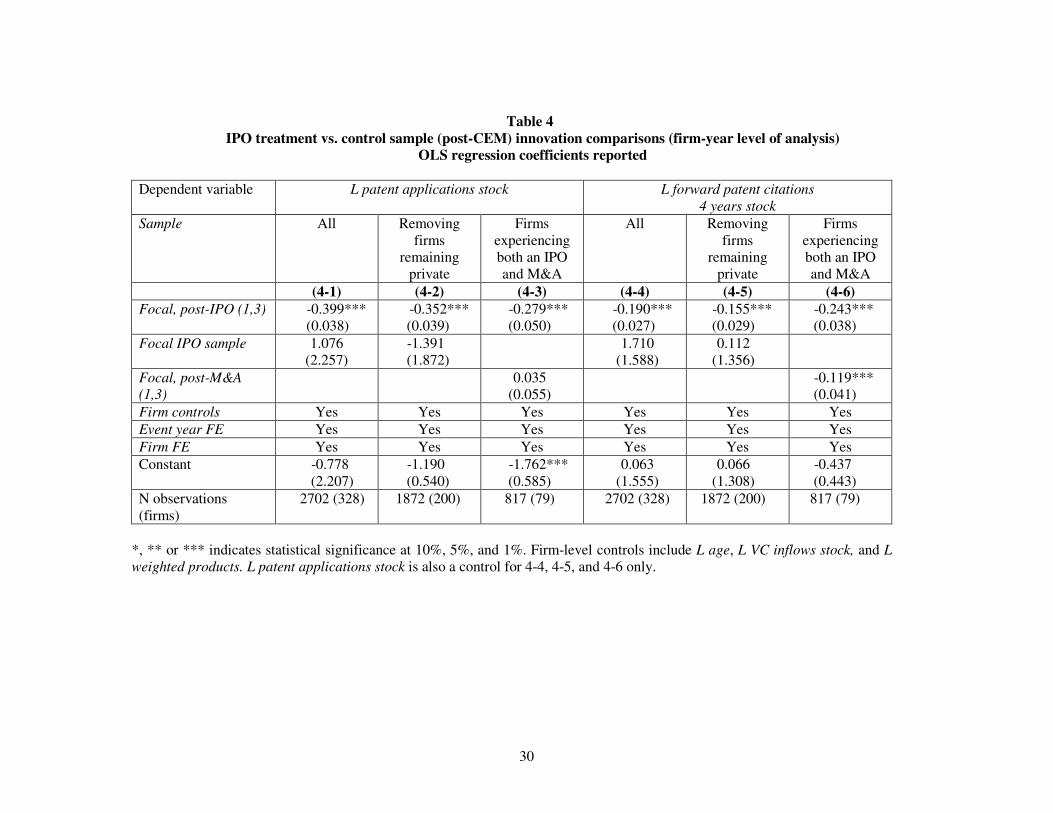
30
Table 4
IPO treatment vs. control sample (post-CEM) innovation comparisons (firm-year level of analysis)
OLS regression coefficients reported
Dependent variable L patent applications stock L forward patent citations
4 years stock
Sample All Removing firms
remaining private
Firms experiencing both an IPO and M&A
All Removing firms
remaining private
Firms experiencing both an IPO and M&A
(4-1) (4-2) (4-3) (4-4) (4-5) (4-6)
Focal, post-IPO (1,3) -0.399*** (0.038)
-0.352*** (0.039)
-0.279*** (0.050)
-0.190*** (0.027)
-0.155*** (0.029)
-0.243*** (0.038)
Focal IPO sample 1.076 (2.257)
-1.391 (1.872)
1.710 (1.588)
0.112 (1.356)
Focal, post-M&A
(1,3)
0.035 (0.055)
-0.119*** (0.041)
Firm controls Yes Yes Yes Yes Yes Yes
Event year FE Yes Yes Yes Yes Yes Yes
Firm FE Yes Yes Yes Yes Yes Yes
Constant -0.778 (2.207)
-1.190 (0.540)
-1.762*** (0.585)
0.063 (1.555)
0.066 (1.308)
-0.437 (0.443)
N observations (firms)
2702 (328) 1872 (200) 817 (79) 2702 (328) 1872 (200) 817 (79)
*, ** or *** indicates statistical significance at 10%, 5%, and 1%. Firm-level controls include L age, L VC inflows stock, and L
weighted products. L patent applications stock is also a control for 4-4, 4-5, and 4-6 only.
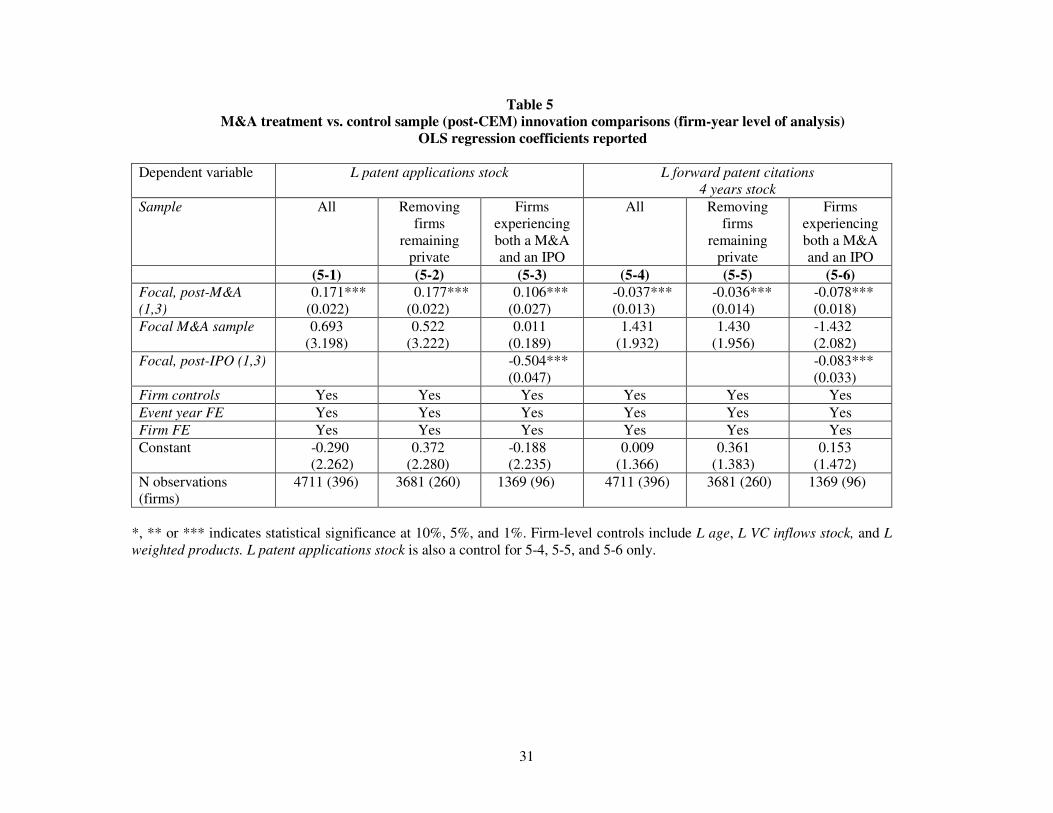
31
Table 5
M&A treatment vs. control sample (post-CEM) innovation comparisons (firm-year level of analysis)
OLS regression coefficients reported
Dependent variable L patent applications stock L forward patent citations
4 years stock
Sample All Removing firms
remaining private
Firms experiencing both a M&A and an IPO
All Removing firms
remaining private
Firms experiencing both a M&A and an IPO
(5-1) (5-2) (5-3) (5-4) (5-5) (5-6)
Focal, post-M&A
(1,3)
0.171*** (0.022)
0.177*** (0.022)
0.106*** (0.027)
-0.037*** (0.013)
-0.036*** (0.014)
-0.078*** (0.018)
Focal M&A sample 0.693 (3.198)
0.522 (3.222)
0.011 (0.189)
1.431 (1.932)
1.430 (1.956)
-1.432 (2.082)
Focal, post-IPO (1,3) -0.504*** (0.047)
-0.083*** (0.033)
Firm controls Yes Yes Yes Yes Yes Yes
Event year FE Yes Yes Yes Yes Yes Yes
Firm FE Yes Yes Yes Yes Yes Yes
Constant -0.290 (2.262)
0.372 (2.280)
-0.188 (2.235)
0.009 (1.366)
0.361 (1.383)
0.153 (1.472)
N observations (firms)
4711 (396) 3681 (260) 1369 (96) 4711 (396) 3681 (260) 1369 (96)
*, ** or *** indicates statistical significance at 10%, 5%, and 1%. Firm-level controls include L age, L VC inflows stock, and L
weighted products. L patent applications stock is also a control for 5-4, 5-5, and 5-6 only.
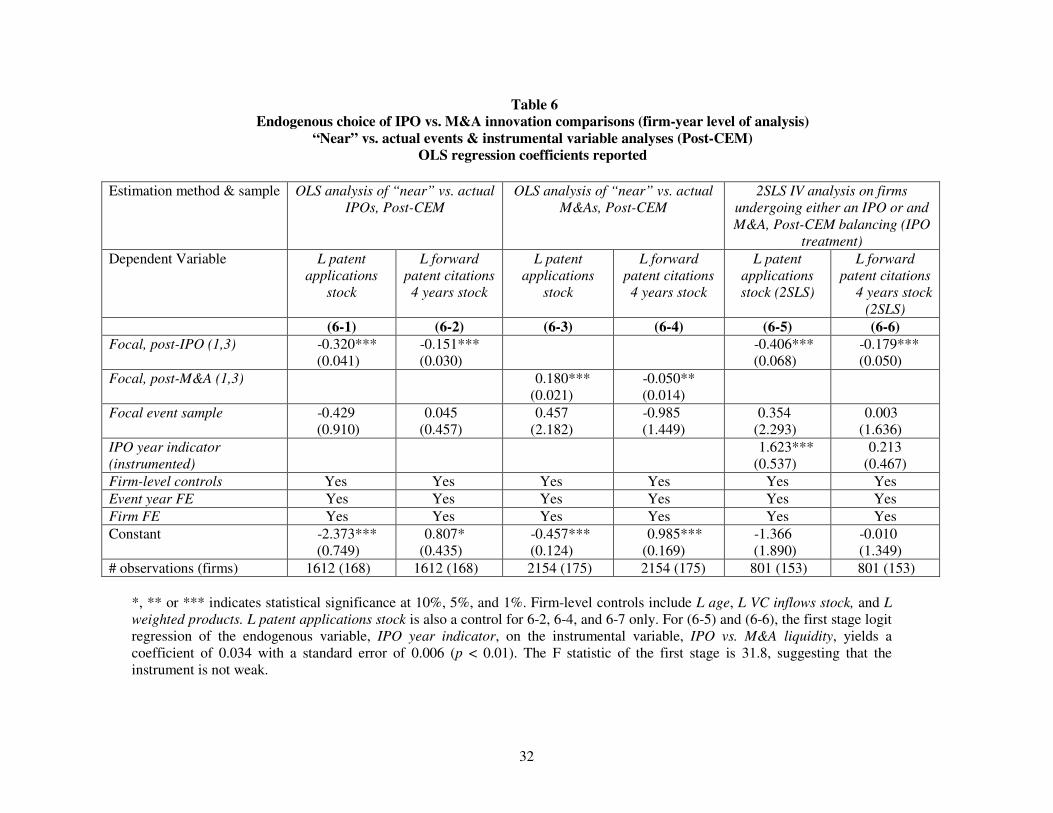
32
Table 6
Endogenous choice of IPO vs. M&A innovation comparisons (firm-year level of analysis)
“Near” vs. actual events & instrumental variable analyses (Post-CEM)
OLS regression coefficients reported
Estimation method & sample OLS analysis of “near” vs. actual
IPOs, Post-CEM
OLS analysis of “near” vs. actual
M&As, Post-CEM
2SLS IV analysis on firms
undergoing either an IPO or and
M&A, Post-CEM balancing (IPO
treatment)
Dependent Variable L patent
applications
stock
L forward
patent citations
4 years stock
L patent
applications
stock
L forward
patent citations
4 years stock
L patent
applications
stock (2SLS)
L forward
patent citations
4 years stock
(2SLS)
(6-1) (6-2) (6-3) (6-4) (6-5) (6-6)
Focal, post-IPO (1,3) -0.320*** (0.041)
-0.151*** (0.030)
-0.406*** (0.068)
-0.179*** (0.050)
Focal, post-M&A (1,3) 0.180*** (0.021)
-0.050** (0.014)
Focal event sample -0.429 (0.910)
0.045 (0.457)
0.457 (2.182)
-0.985 (1.449)
0.354 (2.293)
0.003 (1.636)
IPO year indicator
(instrumented)
1.623*** (0.537)
0.213 (0.467)
Firm-level controls Yes Yes Yes Yes Yes Yes
Event year FE Yes Yes Yes Yes Yes Yes
Firm FE Yes Yes Yes Yes Yes Yes
Constant -2.373*** (0.749)
0.807* (0.435)
-0.457*** (0.124)
0.985*** (0.169)
-1.366 (1.890)
-0.010 (1.349)
# observations (firms) 1612 (168) 1612 (168) 2154 (175) 2154 (175) 801 (153) 801 (153)
*, ** or *** indicates statistical significance at 10%, 5%, and 1%. Firm-level controls include L age, L VC inflows stock, and L
weighted products. L patent applications stock is also a control for 6-2, 6-4, and 6-7 only. For (6-5) and (6-6), the first stage logit regression of the endogenous variable, IPO year indicator, on the instrumental variable, IPO vs. M&A liquidity, yields a coefficient of 0.034 with a standard error of 0.006 (p < 0.01). The F statistic of the first stage is 31.8, suggesting that the instrument is not weak.
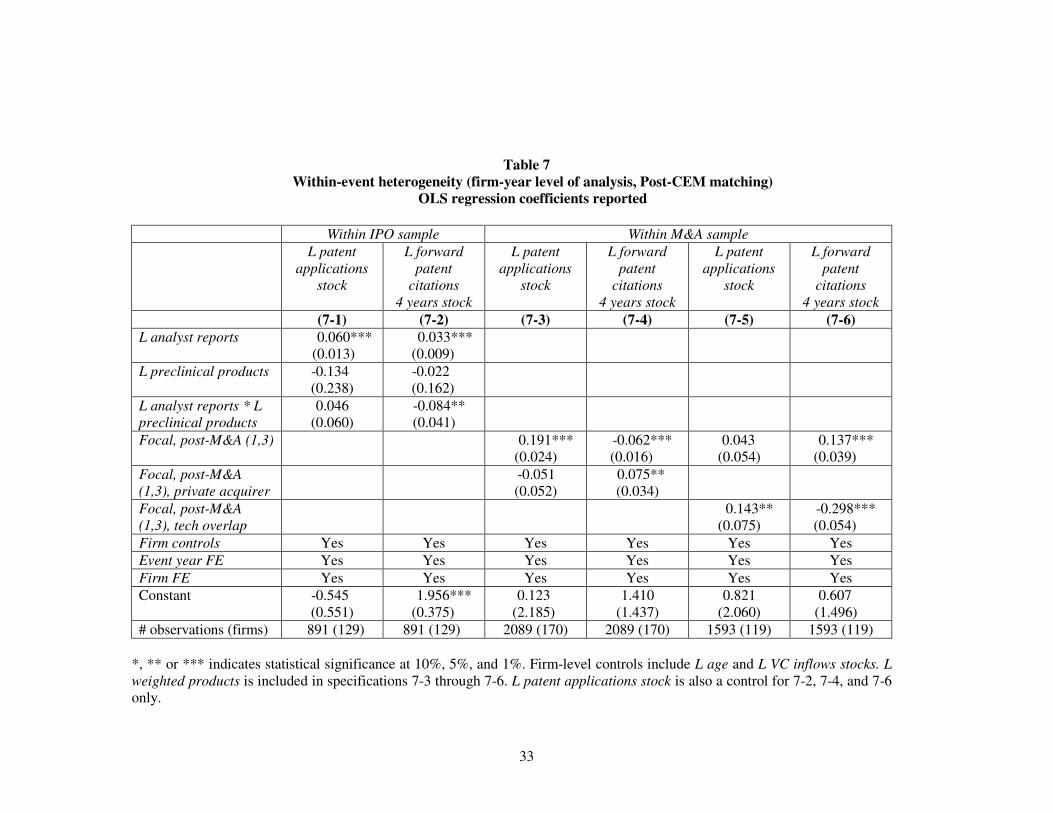
33
Table 7 Within-event heterogeneity (firm-year level of analysis, Post-CEM matching)
OLS regression coefficients reported
Within IPO sample Within M&A sample
L patent
applications
stock
L forward
patent
citations
4 years stock
L patent
applications
stock
L forward
patent
citations
4 years stock
L patent
applications
stock
L forward
patent
citations
4 years stock
(7-1) (7-2) (7-3) (7-4) (7-5) (7-6)
L analyst reports 0.060*** (0.013)
0.033*** (0.009)
L preclinical products -0.134 (0.238)
-0.022 (0.162)
L analyst reports * L
preclinical products
0.046 (0.060)
-0.084** (0.041)
Focal, post-M&A (1,3) 0.191*** (0.024)
-0.062*** (0.016)
0.043 (0.054)
0.137*** (0.039)
Focal, post-M&A
(1,3), private acquirer
-0.051 (0.052)
0.075** (0.034)
Focal, post-M&A
(1,3), tech overlap
0.143** (0.075)
-0.298*** (0.054)
Firm controls Yes Yes Yes Yes Yes Yes
Event year FE Yes Yes Yes Yes Yes Yes
Firm FE Yes Yes Yes Yes Yes Yes
Constant -0.545 (0.551)
1.956*** (0.375)
0.123 (2.185)
1.410 (1.437)
0.821 (2.060)
0.607 (1.496)
# observations (firms) 891 (129) 891 (129) 2089 (170) 2089 (170) 1593 (119) 1593 (119)
*, ** or *** indicates statistical significance at 10%, 5%, and 1%. Firm-level controls include L age and L VC inflows stocks. L
weighted products is included in specifications 7-3 through 7-6. L patent applications stock is also a control for 7-2, 7-4, and 7-6 only.
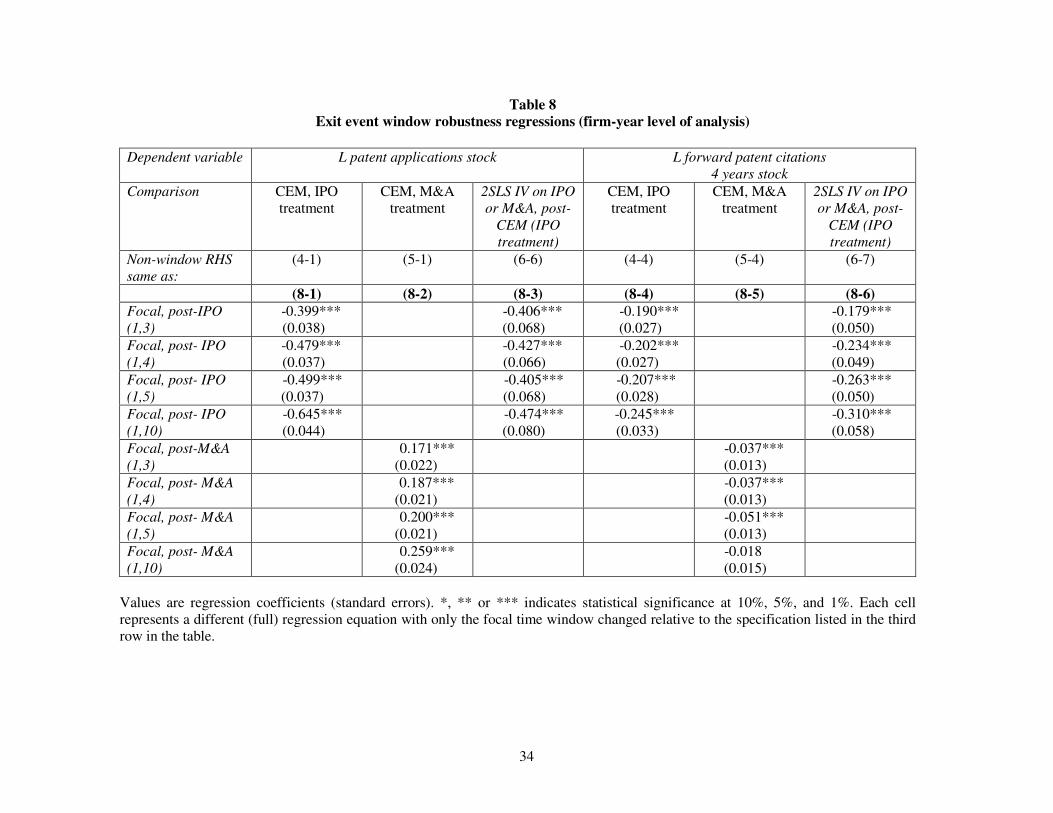
34
Table 8
Exit event window robustness regressions (firm-year level of analysis)
Dependent variable L patent applications stock L forward patent citations
4 years stock
Comparison
CEM, IPO treatment
CEM, M&A treatment
2SLS IV on IPO
or M&A, post-
CEM (IPO
treatment)
CEM, IPO treatment
CEM, M&A treatment
2SLS IV on IPO
or M&A, post-
CEM (IPO
treatment)
Non-window RHS
same as:
(4-1) (5-1) (6-6) (4-4) (5-4) (6-7)
(8-1) (8-2) (8-3) (8-4) (8-5) (8-6)
Focal, post-IPO
(1,3)
-0.399*** (0.038)
-0.406*** (0.068)
-0.190*** (0.027)
-0.179*** (0.050)
Focal, post- IPO
(1,4)
-0.479*** (0.037)
-0.427*** (0.066)
-0.202*** (0.027)
-0.234*** (0.049)
Focal, post- IPO
(1,5)
-0.499*** (0.037)
-0.405*** (0.068)
-0.207*** (0.028)
-0.263*** (0.050)
Focal, post- IPO
(1,10)
-0.645*** (0.044)
-0.474*** (0.080)
-0.245*** (0.033)
-0.310*** (0.058)
Focal, post-M&A
(1,3)
0.171*** (0.022)
-0.037*** (0.013)
Focal, post- M&A
(1,4)
0.187*** (0.021)
-0.037*** (0.013)
Focal, post- M&A
(1,5)
0.200*** (0.021)
-0.051*** (0.013)
Focal, post- M&A
(1,10)
0.259*** (0.024)
-0.018 (0.015)
Values are regression coefficients (standard errors). *, ** or *** indicates statistical significance at 10%, 5%, and 1%. Each cell represents a different (full) regression equation with only the focal time window changed relative to the specification listed in the third row in the table.
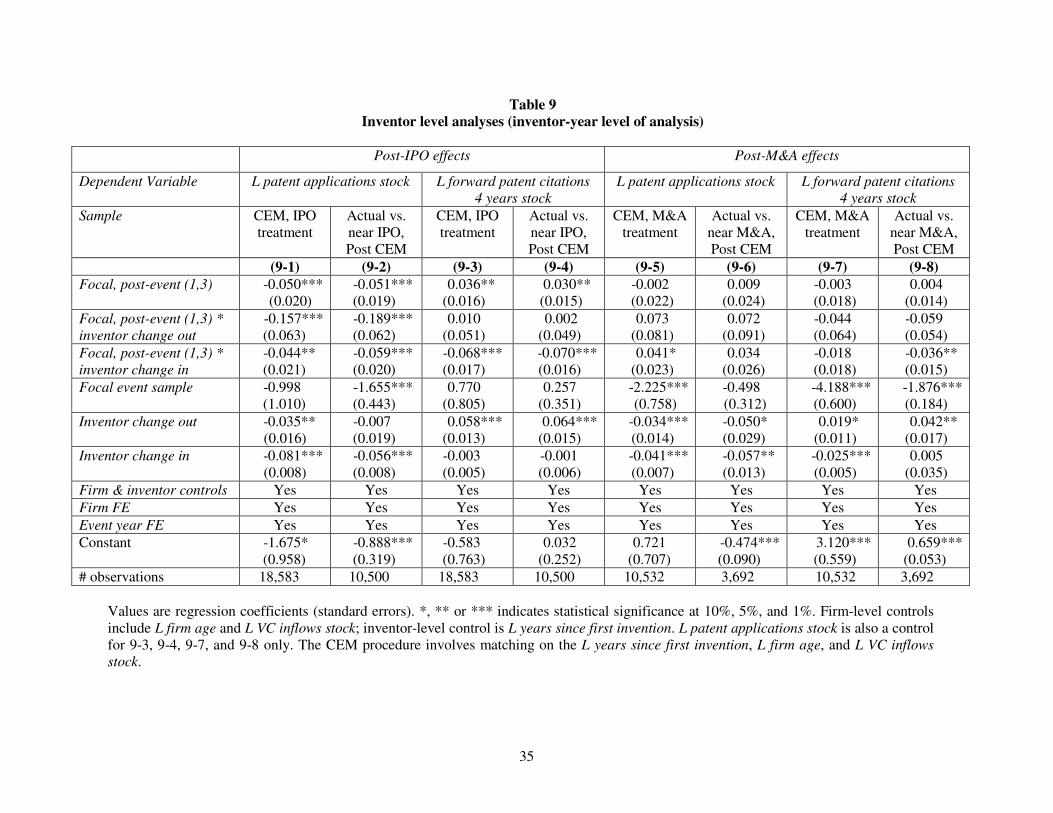
35
Table 9
Inventor level analyses (inventor-year level of analysis)
Post-IPO effects Post-M&A effects
Dependent Variable L patent applications stock L forward patent citations
4 years stock L patent applications stock L forward patent citations
4 years stock
Sample CEM, IPO treatment
Actual vs. near IPO, Post CEM
CEM, IPO treatment
Actual vs. near IPO, Post CEM
CEM, M&A treatment
Actual vs. near M&A, Post CEM
CEM, M&A treatment
Actual vs. near M&A, Post CEM
(9-1) (9-2) (9-3) (9-4) (9-5) (9-6) (9-7) (9-8)
Focal, post-event (1,3) -0.050*** (0.020)
-0.051*** (0.019)
0.036** (0.016)
0.030** (0.015)
-0.002 (0.022)
0.009 (0.024)
-0.003 (0.018)
0.004 (0.014)
Focal, post-event (1,3) *
inventor change out
-0.157*** (0.063)
-0.189*** (0.062)
0.010 (0.051)
0.002 (0.049)
0.073 (0.081)
0.072 (0.091)
-0.044 (0.064)
-0.059 (0.054)
Focal, post-event (1,3) *
inventor change in
-0.044** (0.021)
-0.059*** (0.020)
-0.068*** (0.017)
-0.070*** (0.016)
0.041* (0.023)
0.034 (0.026)
-0.018 (0.018)
-0.036** (0.015)
Focal event sample -0.998 (1.010)
-1.655*** (0.443)
0.770 (0.805)
0.257 (0.351)
-2.225*** (0.758)
-0.498 (0.312)
-4.188*** (0.600)
-1.876*** (0.184)
Inventor change out
-0.035** (0.016)
-0.007 (0.019)
0.058*** (0.013)
0.064*** (0.015)
-0.034*** (0.014)
-0.050* (0.029)
0.019* (0.011)
0.042** (0.017)
Inventor change in
-0.081*** (0.008)
-0.056*** (0.008)
-0.003 (0.005)
-0.001 (0.006)
-0.041*** (0.007)
-0.057** (0.013)
-0.025*** (0.005)
0.005 (0.035)
Firm & inventor controls Yes Yes Yes Yes Yes Yes Yes Yes
Firm FE Yes Yes Yes Yes Yes Yes Yes Yes
Event year FE Yes Yes Yes Yes Yes Yes Yes Yes
Constant -1.675* (0.958)
-0.888*** (0.319)
-0.583 (0.763)
0.032 (0.252)
0.721 (0.707)
-0.474*** (0.090)
3.120*** (0.559)
0.659*** (0.053)
# observations 18,583 10,500 18,583 10,500 10,532 3,692 10,532 3,692
Values are regression coefficients (standard errors). *, ** or *** indicates statistical significance at 10%, 5%, and 1%. Firm-level controls include L firm age and L VC inflows stock; inventor-level control is L years since first invention. L patent applications stock is also a control for 9-3, 9-4, 9-7, and 9-8 only. The CEM procedure involves matching on the L years since first invention, L firm age, and L VC inflows
stock.
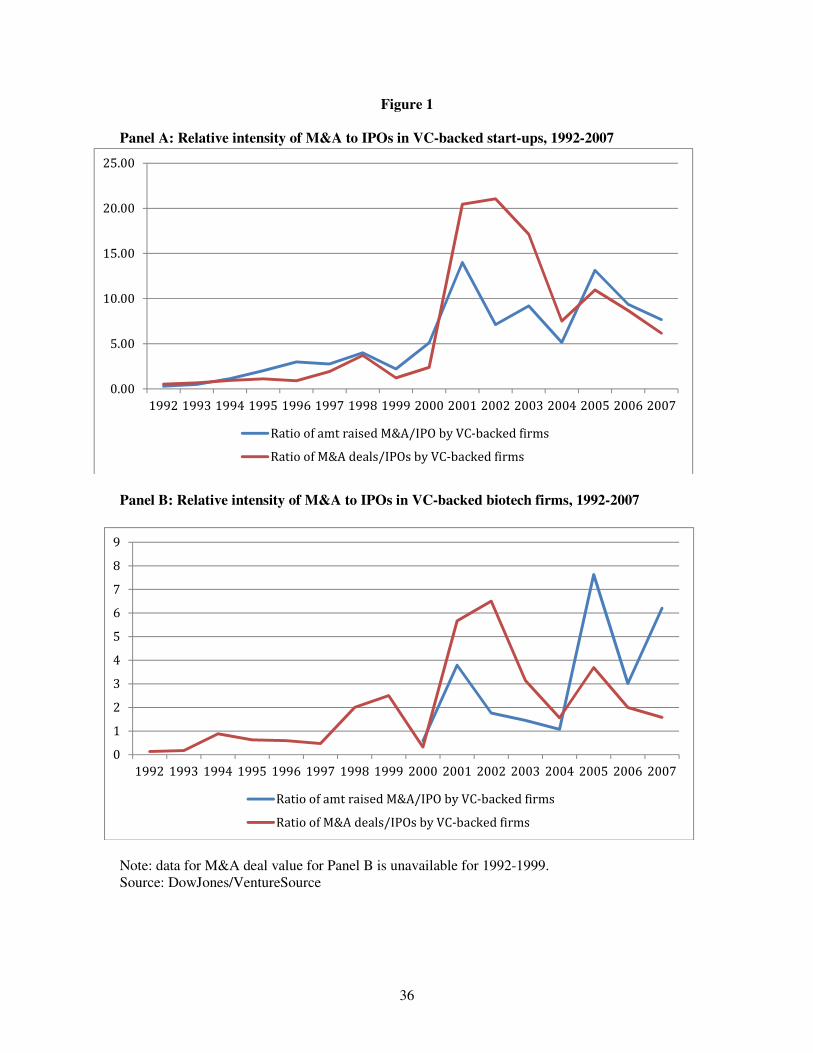
36
Figure 1
Panel A: Relative intensity of M&A to IPOs in VC-backed start-ups, 1992-2007
Panel B: Relative intensity of M&A to IPOs in VC-backed biotech firms, 1992-2007
Note: data for M&A deal value for Panel B is unavailable for 1992-1999. Source: DowJones/VentureSource
0.00
5.00
10.00
15.00
20.00
25.00
1992 1993 1994 1995 1996 1997 1998 1999 2000 2001 2002 2003 2004 2005 2006 2007
Ratio of amt raised M&A/IPO by VC-backed firms
Ratio of M&A deals/IPOs by VC-backed firms
0
1
2
3
4
5
6
7
8
9
1992 1993 1994 1995 1996 1997 1998 1999 2000 2001 2002 2003 2004 2005 2006 2007
Ratio of amt raised M&A/IPO by VC-backed firms
Ratio of M&A deals/IPOs by VC-backed firms
Related Documents