1 Entrenched Political Dynasties and Development under Competitive Clientelism: Evidence from Pakistan* Adeel Malik, Rinchan Mirza, and Jean-Philippe Platteau (Oxford University, Kent University, and Namur University, respectively) Version: 19 July 2021 Abstract How political dynasties affect economic development in the context of poor countries is a moot question. Theoretical predictions do not yield a clear answer and empirical studies, albeit recently on the increase, remain few. In this paper, we estimate the impact of dynastic families on local development in Pakistan’s largest province, Punjab. Toward this purpose, we compile an original database on political genealogies, which includes information about the personal and family characteristics of both elected representatives and the main contenders in elections for the last one hundred years covering both elections held under colonial rule and Pakistan’s modern political existence. Using a close elections regression discontinuity design, we obtain several results. First, entrenched dynasts operating under conditions of competitive clientelism show worse development performance than non-dynasts. This conclusion also holds when the effect of entrenched personal power, which measures the incumbency advantage of the individual election winners, is controlled for. Yet, it does not hold any more when the dynastic politician has won an election comfortably rather than by a close margin. Second, the behavior of traditional elites, which are overwhelmingly represented among dynasts, does not erase the effect of dynasticism per se. Where it occurs, it is the conjunction of entrenched political power with a traditional family setup characterized by strongly hierarchical relationships that accounts for poor development . An interpretative story is offered that is inspired by the political theory of economic backwardness of Acemoglu and Robinson as well as by a rich socio-anthropological literature. *The authors gratefully acknowledge the useful feedback received on an earlier draft of the paper from Jean-Marie Baland, Irma Clots-Figueroas, Catherine Guirkinger, Anne Michels, Dilip Mookherjee, Marc Sangnier, and Zaki Wahhaj. We are also thankful to seminar participants at the University of Namur, Belgium, and Kent University, UK, for their constructive comments.

Welcome message from author
This document is posted to help you gain knowledge. Please leave a comment to let me know what you think about it! Share it to your friends and learn new things together.
Transcript
1
Entrenched Political Dynasties and Development
under Competitive Clientelism: Evidence from
Pakistan*
Adeel Malik, Rinchan Mirza, and Jean-Philippe Platteau
(Oxford University, Kent University, and Namur University, respectively)
Version: 19 July 2021
Abstract
How political dynasties affect economic development in the context of poor countries is a moot question.
Theoretical predictions do not yield a clear answer and empirical studies, albeit recently on the increase,
remain few. In this paper, we estimate the impact of dynastic families on local development in Pakistan’s
largest province, Punjab. Toward this purpose, we compile an original database on political genealogies,
which includes information about the personal and family characteristics of both elected representatives
and the main contenders in elections for the last one hundred years covering both elections held under
colonial rule and Pakistan’s modern political existence. Using a close elections regression discontinuity
design, we obtain several results. First, entrenched dynasts operating under conditions of competitive
clientelism show worse development performance than non-dynasts. This conclusion also holds when
the effect of entrenched personal power, which measures the incumbency advantage of the individual
election winners, is controlled for. Yet, it does not hold any more when the dynastic politician has won
an election comfortably rather than by a close margin. Second, the behavior of traditional elites, which
are overwhelmingly represented among dynasts, does not erase the effect of dynasticism per se. Where
it occurs, it is the conjunction of entrenched political power with a traditional family setup characterized
by strongly hierarchical relationships that accounts for poor development . An interpretative story is
offered that is inspired by the political theory of economic backwardness of Acemoglu and Robinson as
well as by a rich socio-anthropological literature.
*The authors gratefully acknowledge the useful feedback received on an earlier draft of the paper from Jean-Marie
Baland, Irma Clots-Figueroas, Catherine Guirkinger, Anne Michels, Dilip Mookherjee, Marc Sangnier, and Zaki
Wahhaj. We are also thankful to seminar participants at the University of Namur, Belgium, and Kent University,
UK, for their constructive comments.

2
1. Introduction
Elites that have come to form political dynasties over time have received growing attention
among social scientists, including economists. Two possibly interrelated questions are
addressed in this literature: how dynastic families emerge and how they affect development
performances? The emergence of dynastic power is generally explained by the intergenerational
transmissibility of political capital which confers an electoral advantage on the offspring of
politicians by lowering the cost of entry into the political profession. Components of political
capital include name recognition, close acquaintance with high-level politicians, bureaucrats,
and party leaders, and a strong capacity to buy votes thanks to the financial and organizational
support of the family network. Heritability of human capital in the form of skills useful for
political careers and for negotiating with public authorities is another channel through which
descendants may secure a relatively easy access to power. Whether one explanation is more
valid than the other is an empirical question, and evidence tends to show that political capital
plays an important role in the intra-family transmission of political power (Cheema et al., 2009;
Querubin, 2016; Geys and Smith, 2017; Dal Bo et al., 2019; George, 2019).
The second question is the one that retains our attention in this paper. In the specific context
of competitive clientelism as it prevails in the province of Punjab (Pakistan), we measure the
impact of dynastic families on a comprehensive indicator of long-term growth, i.e. night time
luminosity. Toward that purpose, we harness an extensive set of data that include electoral
outcomes, the family background of politicians, and economic and social outcomes. Although
we limit our attention to the three recent election rounds of 2002, 2008 and 2013 (at both the
national Assembly and Provincial Assembly levels), our knowledge about election results goes
as far back as 1921, thus allowing us to trace the existence of political dynasties with remarkable
accuracy over a period that covers pre- and post-independent Pakistan. We have also
painstakingly collected supplementary data about the family and individual characteristics of
all election winners and runners-up, so that we are able to establish interesting relationships
between political families and their attributes. In sum, we propose an original contribution to
the interrelated literatures dealing with the persistence of elites and institutions, the role of
political dynasties, and clientelistic politics.
A priori, it is unclear whether dynastic power is conducive to development. A positive
effect is expected if hereditary leadership improves policy incentives because, like in a

3
relational contract, the reputations of the leaders help surmount moral hazard problems (Besley,
2005; Besley and Reynal-Querol, 2017). Dynastic transmission of power thus induces
politicians to exert more effort and increase their performance to the extent that they care their
offspring will follow them in office (they enjoy a sort of ‘warm glow’ effect). George (2019),
however, ascribes this advantage only to the founder of a dynasty, not to the descendants. Since
the latter inherit voters loyal to their predecessor, their incentive to perform well in office is
relatively weak. Thanks to their free access to the political capital accumulated by their
ascendants, they can persist in power despite their under-achievements. Under-achievements
may also be caused by problems of negative selection relative to other politicians.
Finally, Asako et al. (2015) predict that dynastic leaders, who enjoy a higher probability of
winning and a higher vote share, tend to harm the economic performance of their district despite
the large amount of distributive benefits brought to their own constituents. The problem stems
from the fact that their advantages are put at the service of rent-seeking policies that benefit
only a fraction of the voters belonging to their support group. This is at the expense of policies
aimed at encouraging growth through investment in the socio-economic infrastructure and the
expansion of job opportunities in an entire district. Underlying this argument is a political
system based on a particular type of electoral competition, one that takes place between big
men whose power is based on clientelistic networks, which are informal. In the words of
Acemoglu and Robinson (2006, 2008a, 2008b), a combination of de jure and de facto political
powers is involved, and “captured democracy” is a likely outcome.
Under political clientelism, competition and the fight for political power mainly take place
across political families, not across ideology-based parties, which remain weakly organized
(Kaufmann et al., 2003; Ferraz et al., 2020). In contrast to public goods that every resident
receives in the same quantity (due to their non-excludability), the incumbent can typically
withhold the distribution of private benefits to residents who did not vote for him/her in the
previous election.1 In this setup, a key determinant of vote-generating effectiveness of private
benefits is the incumbency advantage, that is, the voters’ beliefs that the incumbent will be re-
elected. This is precisely where dynastic families make a difference since voters may have
formed the expectation that politicians of a particular family have better chances of winning
1 A central assumption is therefore that secret ballots can be circumvented and political leaders or
brokers are able to monitor how each citizen votes (Sarkar, 2014; Bardhan et al., 2020). Evidence for
Pakistan is provided by Martin (2016: 141).
4
thanks to their strong and transmissible political capital. What then takes place is ‘contagious
voting’ (Sarkar, 2014).
Political clientelism, which aims at benefitting narrow subsets of intended beneficiary
groups, suffers from a comparison with what Bardhan and Mookherjee (2012) have called
program politics. By creating a bias towards private transfer programs with short-term payoffs
at the expense of public goods or private benefits of a long-run nature such as education or
health services, strategic transfers made by political patrons often come at the expense of long-
term development (Bardhan and Mookherjee, 2012). The problem is especially serious when
public resources mobilized at the central level are made available to local dynasts who use them
for patronage purposes.
Focusing on a binary comparison between clientelistic and program politics, where there
exists only one form of clientelism and program politics is abstracted from incentive problems
inherent in party organizations, may not allow to consider the actual working of politics in many
poor countries. Thus, when patronage networks are based on horizontal family ties rather than
on hierarchical relationships of the patron-client type, involvement of their heads in politics
may not discourage the supply of public goods. For example, Fafchamps (2016) and Cruz et al.
(2017) argue that extended family networks may be more effective at dispensing patronage and
providing services to supporters than party networks. The reason is that the former are built on
bonds of kinship, which motivate political brokers in the network to exert more effort on behalf
of their candidates. In contrast, ordinary party workers may be tempted to defect to other
candidates, embezzle campaign funds, and fail to sincerely deliver on the candidate’s patronage
promises. Moreover, when politicians rather than communities are responsible for the provision
of public goods, social fractionalization may decrease the risk of elite capture and stimulate the
production of public goods and electoral competition. The underlying mechanism has been
aptly precised by Lizzeri and Persico (2004): when a society or community is divided into a
higher number of family networks, politicians have greater incentives to provide public goods
or follow strategies that yield diffuse benefits. The reason is that the transaction and agency
costs of engaging in the clientelistic exchange of private transfers are then relatively high
compared to a situation where a strong leader at the head of a large group has enough bargaining
power to demand private, targeted and excludable transfers in exchange for electoral support
(Cruz et al., 2020: 3).
The choice of Pakistan as a case study is particularly appropriate for several reasons that
become clearer in the light of the above considerations. First, the country’s politics has been

5
thoroughly penetrated at every level by long-lasting political families which form the backbone
of party machines (Cheema et al., 2009: 2; Yadav, 2020: 1046-7). Second, competitive
clientelism seems to prevail in many locations and political parties are dominated by big
families. Third, dating back to General Zia, special development grants have been awarded to
members of provincial and national assemblies to enable them to satisfy their supporters at very
localized levels. Control over these funds is discretionary and escapes any audit (Cheema et al.,
2005: 13, 27), a feature that has helped shape a particular formal institutional context for
political clientelism in the country. Fourth, two types of clientelism seem to prevail that may
be coexisting and competing for votes. They are anchored in two different types of extended
families, one feudalistic and the other relatively horizontal, that provide different sorts of
service to their client voters: livelihood-protecting services for the former and livelihood-
enhancing goods and services for the latter. They form the informal scaffolding of Pakistan’s
political system.
The measure the impact of dynastic power, we use the close elections regression
discontinuity method, which has become best practice in similar works of political economy
(see, e.g., Querubin, 2016; Dal Bo et al., 2009; George, 2019; Sarkar, 2019; Prakash et al.,
2019). We find that entrenched dynasts, defined as legislators who won more than 10 tenures
over successive election rounds, show significantly worse performances than non-dynastic
legislators. This remains true even after we control for the effect of entrenched personal power,
which measures the incumbency advantage of the individual election winners, is controlled for.
The result nevertheless vanishes when the dynastic politician has won an election comfortably
rather than by a close margin. On the other hand, even though an overwhelming majority of
entrenched dynasts come from traditional (historic landlord or shrine) families, the effect of
dynastic power persists when family characteristics are controlled for. Where it occurs, it is the
conjunction of entrenched political power with a traditional family setup characterized by strongly
hierarchical relationships that accounts for bad development performances.
Putting these findings together, we propose an interpretative story that sets the political
theory of economic backwardness of Acemoglu and Robinson (2006b) in the context of two
competing types of clientelism. Once entrenched and mildly sheltered from the pressure of
political competition, instead of relaxing their efforts, dynasts redirect them toward the
objective of blocking development so as to undermine challenges to their power. Because most
of them belong to historic and/or religious families that are based on hierachical patron-client
6
relationships, the implication is that they use this vertical organization even more intensely than
before becoming entrenched.
The remainder of the paper is as follows. In Section 2, we undertake a brief overview of
the relevant empirical literature and we discuss the motivations that can possibly drive political
dynasts to neglect or even block development. Section 3 characterizes the political system of
Pakistan and the way it has changed over time, placing emphasis on the role of political families.
In Section 4, we offer details about the data that we have been able to collect, distinguishing
between election results, the profiles of politicians, and various outcomes of the actions of
elected representatives. Descriptive statistics are supplied thereafter. Section 5 is then devoted
to the exposition of the methodology followed to measure the impact of political dynasties on
these outcomes. Section 6 proceeds by presenting the results of our basic regressions that
estimate the effects of entrenched dynasticism on development outcomes. A general discussion
of possible interpretations of these results unfolds in Section 7. Following an attempt to
combine theoretical insights with major findings from micro-level socio-anthropological
studies, we present a series of complementary pieces of empirical evidence aimed at elucidating
the role of family background in relation to the formation of dynastic power. Section 8
concludes.
2. The adverse effects of dynastic power
2.1 A short review of the empirical literature
Given recent interest in the field, it is not surprising that there are only a few rigorous
studies about the impact of political dynasties in developing countries where competitive
elections are held down to the village level.2 Let us consider them in turn.3 Based on a regression
discontinuity design, George (2019) shows that descendants of dynasts in India worsen poverty
and public good provision in villages they represent. Their under-performance is attributable to
2 We thus ignore the studies of African village politics, such as the one of Acemoglu et al. (2014) on
Sierra Leone. In that particular study, development outcomes are found to be significantly worse today
in communities where chiefs face less political competition owing to the presence of fewer ruling
families (those originally recognized by British colonial authorities).
3 Studies based on correlations converge in concluding that politicians belonging to dynastic families
are associated with worse outcomes than other politicians, with the range of outcomes varying from
poverty relief, development spending, and delivery of public services (electrification, literacy, running
water) to crime rates and gender asymmetry (see, e.g., Yadav, 2020: 1050, for references).
7
both moral hazard (which explains about 40 percent of the performance gap between them and
non-dynasts) and to negative selection. As for founders of dynastic families, they have positive
effects on economic development, which is partly driven by the bequest motive: politicians with
a son are twice as likely to establish a dynasty and exert more effort while in office than other
politicians. The overall effect of dynasties, aggregating founder and descendant effects, is
clearly negative, implying that once the second and subsequent generations of politicians enter
into politics, their performance deteriorates so badly that people exposed to them become poorer
and have fewer public goods.
Turning to neighboring Pakistan, a study by Ali (2016) explores whether dynastic
politicians hinder or promote development. To infer causality, the author uses variation in an
exogenous event, namely the massive floods that followed the monsoon season of 2010 and
were one of the worst natural disasters in the country. She then looks at how dynasts and non-
dynasts spent on development programs in their home constituencies over the years 2008-2013
(with 2008 as an election year). The results show that local development expenditures decreased
in flooded constituencies, yet the decrease was more pronounced in areas ruled by dynastic
politicians, thereby pointing to their lower effort in response to natural disasters.
In their study of Brazil, Ferraz et al. (2020) exploit the following fact: in 1964 the country’s
political regime transitioned to a military dictatorship (for 21 years) that confronted the power
of the traditional elites in order to establish a strong central state. Toward that purpose, the
military brought a new class of more reliable local politicians to compete in local elections. The
authors show that a reversal of fortune occurred as a result of this tactic: while prior to the
dictatorship, municipalities (mostly rural, less populated and more reliant on plantation crops,
such as sugar and cotton) that were more dominated by traditional elites were also less
economically developed, some sixty years later (in 2000) they became relatively richer than the
other municipalities where power was less concentrated and less entrenched. Moreover, the
former municipalities became more competitive over time, plausibly explaining why they also
became more prosperous. Finally, in the Philippines, there is greater public good provision and
political competition in villages with more fragmented social networks, thus confirming
theoretical predictions in the presence of horizontal networks of clients (Cruz et al., 2020; see
also Wilfahrt, 2018).
8
2.2 Mechanisms
Empirical evidence thus suggests that dynastic power has negative effects on development,
at least when it is embedded in political families that rely on hierarchical organizations of the
patron-client type. The question arises as to what can motivate dynastic families or persisting
traditional elites to block or hamper development. Three main explanations can be drawn from
the existing literature. According to the first explanation, dynasts behave as political patrons
concerned with satisfying the narrow interests of their clientelistic network or voting bloc. The
problem, here, is precisely that nothing differentiates dynasts from the heads of patronage
networks. The second explanation does not suffer from this shortcoming since it explicitly
refers to a specific feature of dynasts: because they feel relatively well assured of remaining in
power, (descendant) dynasts tend to relax their efforts to cater to voter demands (George, 2019).
Since these efforts are costly and, given the effort, their probability of winning is perceived to
be quite high, they are ready to trade-off some decrease in this probability against additional
leisure. Consequently, dynasts are expected to perform less well than non-dynasts, an effect
possibly reinforced by the adverse selection problem.
The third explanation is more radical in the sense that it is based on the idea that dynasts
may deliberately thwart or slow down development. This possibility is highlighted in the
political theory of economic backwardness advanced by Acemoglu and Robinson (2006b). The
basic intuition is that political elites face a trade-off between economic gains and power. All
else being equal, they prefer technological progress and prosperity-inducing reforms that might
increase their economic rents in the future. Yet all else is not equal because such changes can
potentially erode their political advantages relative to other groups. They will thus decide to
“block beneficial economic and institutional change when they are afraid that these changes
will destabilize the existing system and make it more likely that they will lose political power
and future rents” (pp. 115-6).
The theory predicts a non-monotonic impact of political competition on resistance to
development: while political elites that are either subject to intense competition or do not face
any competition due to their complete domination of the electoral landscape adopt new
technologies, elites occupying an intermediate position between these two extremes will adopt
the opposite attitude. This is underpinned by a straightforward rationale: with intense political
competition, elites prefer to innovate lest they should risk being replaced, whereas strongly
entrenched elites do not fear losing political power so that for them there is no trade-off between
economic gains and power. By contrast, elites that are ‘somewhat entrenched’ but are still afraid
9
of being replaced are tempted to block innovation to prevent such replacement from happening
(p. 116). The crucial element behind the mechanism is therefore that what matters are not the
“economic rents that will be destroyed by the introduction of new technologies, but the erosion
in the political power of the elites” (p. 117).
Two issues arise. The first one concerns the second explanation specifically. If we can
understand that strongly entrenched dynasts, owing to their monopoly position, are able to bring
their clients into submission and therefore dispense with the need to offer them advantages in
return for their votes, such is not the case for the “somewhat entrenched” dynasts. Being
exposed to some degree of political competition, the latter must provide some services to voters.
And, in the logic of Acemoglu and Robinson’s theory, these services must be of a sort that
inhibits, or at least does not promote development. One promising way of overcoming this
difficulty consists of drawing a distinction between livelihood-enhancing goods and services,
which stimulate development and are supplied by political elites driven by electoral
competition, on the one hand, and livelihood-protecting services, which do not encourage
development and tend to be supplied by better sheltered elites, on the other hand. Later in the
paper, we will further elaborate this distinction and offer empirical evidence correlating
dynastic power with the type of patronage offered.
The second issue relates to the formation process of dynastic power. A family does not
become dynastic at once and its entrenchment in politics may involve several stages during
which its power is being consolidated. If a dynastic family adversely affects local development,
we may wonder when it starts having this negative impact. George (2019) contrasts founders
and descendants and attributes negative effects only to the latter. Founders have different
motivations and, as argued by Besley and Reynal-Querol (2017), could take actions favourable
to development. By contrast, the argument in Acemoglu and Robinson (2006b) mainly revolves
around persistent or well-established political elites. Nevertheless, it is possible to interpret their
results in the following manner. When in a formative stage, a political family is subject to strong
competition and therefore acts in development-promoting ways. When it has achieved stronger
political roots, but is still subject to competition, it turns to actions that are detrimental to
development. And, finally, if it succeeds in achieving a monopoly power position, the trade-off
between economic rents and power disappears and it reverts back to development-promoting
actions. We will later see how we can attempt to test this result on the basis of our Pakistani
data.
10
3. Political Clientelism in Pakistan: A Historical Perspective
Three important features of the Pakistani political system, as well as their historical
antecedents and evolution, need to be brought to light because they form critical elements of
the context in which our empirical analysis will subsequently unfold.
3.1 Role of land elites
Big landowning families have historically played a crucial role in the country’s politics.
Together with the military and the civil bureaucracy, they formed the ruling triad when Pakistan
was born as a Muslim state (in 1947) under the impulse of the All India Muslim League.4 The
landowning class was not homogeneous, however. As stressed by Jan (2019), it has
schematically consisted of two main groups: the ‘aristocratic’ large landowning families, on the
one hand, and the landowners from the ‘peasant castes’ comprised of middle-range landowners,
traders and agro-processors, on the other.
The first group, which enjoyed high traditional status and special protection under the
British, is the Muslim ashraf (elite) made of the Syeds (who claim descent from the Prophet’s
family and lead various Sufi shrines), the Rajputs (old warrior caste) and the Mughals (who
claim descent from the erstwhile Mughal nobility). Forming a large part of the class of local
intermediaries upon whom the colonial state rested for indirect rule, they were rewarded for
their support through landed gentry grants, official appointments, titles, and awards, especially
in Punjab where grants of colony lands were massively awarded in the hope of creating a loyal
native class of supporters (Cheema et al., 2005: 4; Ali 1989). The relationships of this
traditional elite with lower caste dependents was framed in the mode of strongly hierarchical
patron-client ties. Its influence has been particularly enduring in areas where land markets are
rather inactive (Akhtar, 2008; Cheema et al., 2009; Javid, 2011). Its most dynamic members,
though, proved able to invest in new lines of economic activities and in the education of their
children who, in turn, became professionals (engineers, doctors, lawyers, teachers). It is worth
noting is that even in these cases and even when they resided in cities or towns, they retained a
keen interest in their native constituency and its (factional) politics (see also Ali, 1987, 2004).
As for the second group, lower in the caste hierarchy, it included traditionally self-
cultivating family farmers who belonged to the ‘agricultural tribes’, or the biraderis (kinship
4 While, initially, the main support of the League came from cities, Jinnah quickly understood that his
party will not reach a pre-eminent political position if it did not extend its reach to big families in the
countryside.
11
groups). Numerically more important than the ‘aristocratic’ families, they gained importance
once some of them received land grants from the colonial government and used this opportunity
to develop their property. Interestingly, with the peasant castes they have emerged from, they
share kinship ties organized around an ideology of ‘corporate solidarity’, meaning that they are
based on mutual obligations and reciprocity along horizontal lines. Not surprisingly, they have
a strong feeling of identity and see themselves as distinct from the large landlords, whom they
refer to as ‘bade zamindars’ (big landowners) and ‘jagirdars’ (feudal/estate owners). Their
‘middle-class’ self-identity was crucial “as a means through which they seek to access the state,
using both clientelism and populist mobilization to demand resources and organizing under
their leadership small and poor peasants with whom they share ties of kinship” (Jan, 2019: 187).
The identity and self-assurance of the rural middle class was reinforced when General
Ayub Khan (1958-1969) decided to patronize middle-ranking and gentry people so as to
counterbalance the power of ‘aristocratic’ landowners. In the Punjab province, in particular, its
entrepreneurs could thus benefit immensely from the green revolution package of irrigation,
fertilizers, and high-yielding seed varieties (Jan, 2019: 188; Martin, 2016: 122-3). In sum,
members of this non-aristocratic landed class gradually emerged as a genuine political force in
the countryside, able to bargain politically and to connect with local bureaucrats and officials
with a view to obtaining advantages for their factions and biraderis [clans]. Their rise has been
described in detail in several ethnographic and field accounts (see, in particular, Zaidi, 2015,
2019; Martin, 2018; Mohmand, 2019).
3.2 Weak party structures and personalization of politics: the dominant role of the military
Party structures, which are weak in Pakistan, are characterized by a high degree of
personalization. In particular, there are no internal elections for the leader or the key posts, and
factional struggles are rife inside the party (Hasnain, 2008: 146). In the words of Cheema, Javid
and Naseer (2013), the organizational form of politics that has emerged “is a hybrid with
political party apparatuses being built on an edifice of dynastic families and their networks
rather than party machines organized around ideology, ethnicity, class and/or programmatic
platform” (p. 2). Political parties have thus chosen to forge alliances with dynastic politicians
rather than build effective party machineries around dedicated party cadres. (It is revealing in
this context that voters admit that their voting choice has almost never been influenced by visits
of party cadres).5 Hence a vicious cycle that feeds both the success of dynasties and the weak
5 Data come from the FAFEN (Free And Fair Election Network) survey (2011).

12
organisational structure of the parties. Not surprisingly, in this context, the frequent switching
of political parties by members of these families and the sprouting of various like-minded
factions have become the norm in politics (p. 3; see also Yadav, 2020: 1055; Lyon, 2019: 109).
Not only do dynastic leaders often indulge in party switching, easily shifting their loyalty if
they feel a move better serves their interest, but their families may also be engaged
simultaneously in different parties. These features attest to their lack of ideological commitment
and their opportunistic determination to see that their patronage tactics are not foiled by
changing political circumstances. Their constant concern is to act in such ways that they can
enhance their personal reputations and carry them across party lines if needed (Hasnain, 2008:
145).
It is General Zia ul-Haq (1977-1988), moved by his ambition to suppress mass-appealing
parties based on ideology, who laid the groundwork for a persisting change in the way politics
is run in Pakistan (Hasnain, 2008: 145; Ziring, 1988: 804; Martin, 2016: 74). Under his rule,
indeed, the allocation of party tickets and ministries became more and more patently “an
outcome of individual bargaining between powerful local brokers and party leaders” (Cheema
et al., 2005: 13). The system was given a strong boost in the mid-1980s when Zia gave elected
politicians direct control over the allocation of special development funds. This practice, which
allowed federal and provincial politicians to obtain unaudited control over local-level
development allocations, continued unabated under all civilian governments after him and
continues to grease the wheels of patronage politics until today. A major step toward the
“localization and personalization of politics at the local level” (Wilder, 1999) has been the
bridling of direct bureaucratic representation in local governments so as to create greater
autonomy for the elected tier at the local level (Cheema et al., 2005: 28).6 In this framework,
kinship ties assumed great political force as a means to fragment popular political opposition
(Martin, 2016: 93).
The approach stressing the localization of politics was again at the heart of the
decentralization reform of Pervez Musharraf (1999-2008). Local-level provincial
administration became accountable to elected officials at the local level and “the vast majority
of public services that were previously under the local provincial administration, have been
transferred to the local governments, substantially increasing their scope and responsibilities”
(Cheema et al., 2005: 16-17). The idea of Musharraf was apparently “to create a political
6 To this effect, the provincial bureaucracy at such level was made accountable to the elected heads of
district and Tehsil Municipal Administration.
13
constituency that could be easily manipulated through the granting and withholding of
government funds and patronage” (Martin, 2016: 124).7
The important lesson is that, because local politicians could now deliver political support
even in the absence of bureaucratic patronage, the power of the new elites was no longer
exclusively dependent on the support of the bureaucracy. This effect has been reinforced by
blatant and growing interference of MPs (Members of Parliament) in administrative issues,
including matters of postings, transfers, and promotions of key officials, such as provincial
police heads.8 It is apparently this weakened capacity of district bureaucrats to deliver political
support for the military together with the increased organizational autonomy of local elites that
explains why the military chose to abandon the bureaucratic control model and assign wide-
ranging functional responsibilities and resources to locally elected politicians (Cheema et al.,
2005: 29). In urban areas, it is the support of business families which has mattered most, but
they maintained narrow links with rural politics. Zia chose to promote the interests of a rising
group of Punjabi businessmen at the expense of the Muhajir (immigrants from India at the time
of the partition) businessmen of Karachi.9 These new business families, known as Navay Raje
(‘new lords’), had long histories and roots in the local communities in which they lived. Many
of them were able and willing to use their status as local employers and landowners to generate
significant political support among the rural people who were dependent on the wages and
protection they provided. In return for their support to the military, they received substantial
advantages, including the ability to establish and maintain mutually beneficial business
partnerships with members of the army (Armytage, 2019: 167-9).
7 For Cheema et al. (2005), Musharraf’s local government reforms represented a continuity of the
country’s central historical tendency, which consisted for central power (the British Imperial state first,
the Pakistani military, later) to seek legitimacy by creating a localized patronage structure that produces
a class of ‘collaborative politicians’ acting as a conduit between local-level constituencies and the non-
representative center. As a result, all attempts at centralization of political power considerably weakened
the organizational structure of political parties and distorted electoral competition at the provincial and
central levels, not least by selectively disqualifying political party representatives and at times outrightly
banning all or certain parties (p. 25).
8 See, for instance, the scandal denounced in Dawn, May 24, 2021 (“Lodhran DPO transferred on Tareen
camp demand”): a competent District Police Officer with the required seniority was removed to make
way for a young officer imposed by a clan acting behind the coalition of parties in power. 9 Zia moved the country’s capital city from Karachi (in Sindh province) to Islamabad (in his native
Punjab province).

14
3.3 Growing political competition at local level: the role of kin networks and factions
There is growing micro-evidence that considerable spatial variation exists with regard to
the political influence of historically embedded landed elites. The power of the landed gentry
is no longer automatic or guaranteed and their political power is increasingly contested in some
regions, forcing them to bargain with a new class of agricultural entrepreneurs, agro-processors,
brokers, and intermediaries. In other words, in many local areas, several candidates backed by
their voting blocs are contending for power. In many cases, moreover, political competition
appears to be quite acute. As pointed out by Cheema et al. (2013), “The highly competitive nature
of Punjab’s elections can be seen from the fact that a 5 percentage-point swing against incumbent parties
in the coming election, all else equal, can topple as many as 30% of the national assembly seats in the
province” (p. 1)
Voting blocs may be organized vertically, especially when rural voters are economically
dependent on the leader and relate with him individually in the context of a patron-client
relationship. The client is then expected to support the patron politically. This is the dominant
pattern in villages characterised by high land inequality. Alternatively, voting blocs may be
organized horizontally, usually on the basis of kinship groups or through a ‘broker clientelism’.
These horizontal blocs are a frequent feature of more egalitarian villages, and the most cohesive
of them are made of kin-related economically independent landholders who possibly want to
assert their common interests against bigger landlords (Martin, 2016: 118; Mohmand, 2019:
Chap. 6). In these villages, moreover, members of the lower castes are no longer the captured
vote bank of the landed aristocracy and they may shift alliances depending on the circumstances
(Jan, 2019: 190), thus giving rise to a “democratization of patronage politics” (p. 194 –citing
Wilder, 1999: 199).
Contrary to a simplified view, kinship groups (biraderis) do not necessarily form the basis
of a voting bloc. Martin (2016: 117) even argues that in Punjab the extended biraderi is rarely
the main unit of political activity. A given biraderi may actually be divided into different
factions (dharras) because of personality rivalries or the perceived need to diversify risks. In
the former instance, factions can ally themselves with outsiders against their own clan members
and even their close kin (owing to competition over land or over local dominance), sometimes
leading to violent and enduring feuds. Bitter fights involve religious as well as secular elites
and, in the latter instance, the biraderi’s potential voting influence is put into several baskets

15
(vote blocs) so as to avoid being stuck with a losing candidate.10 Factions are then the outcome
of a coordinated decision and their insurance function is especially important in contexts where
the landed elite, eager to retain its erstwhile power and prerogatives, compete vigorously for
vote bloc members (Mohmand, 2019: 250; Lyon, 2019: 109; Yadav, 2020: 1053). In many
cases, the core of a faction seems to be based on cooperation between male siblings and
preferential cousin marriages, as it yields prestige to keep daughters within the biraderi (Martin,
2016: 96, 117).
Competition between voting blocs at local level does not appear to erode political
dynasticism. As early as after the elections of 1985 and 1988, there was thus “a substantial
infusion of new entrants into the dynastic pool”, yet at the same time, “a large share of these
individual non-dynastic entrants into politics thrived and formed successful dynastic families
in their own right. This suggests that the emergence of a new pool of politicians may not imply
a weakening of the dynastic system of politics and, instead, may only result in the replacement
of one set of dynastic families by another” (Cheema et al., 2013: 4). Especially worth noting is
that, since the elections of 1985, business-owning, trading and professional elites are
increasingly successful in forming dynastic families, thus explaining why a significant presence
of dynasticism also exists in the less landed and more equal central-eastern districts of the
Punjab province.11
Before turning to the next section, it is useful to provide a summary picture of the
succession of rulers and regimes since the Pakistani independence, together with the dates of
all the intervening elections. While taking cognizance of Figure 1, we should keep in mind that,
for most of Pakistan’s short history (the exception is Z.A. Bhutto’s rule), the country was
trapped in a sort of “self-perpetuating cycle whereby civilian governments characterised by the
10 Internal fights are illustrated by the old confrontation between the Gilani and Quraishi pîr
families in Multan district. 11 Given the competitive nature of most electoral contests, people’s belief that the political
system is extremely uncompetitive may seem odd. The clue behind this paradox is precisely
that the political class is heavily dominated by dynasties, held together by ties of blood and
marriage. Hence, “while Punjab’s politics appear competitive as members of dynastic factions
aggressively compete against each other using different party platforms, they are
simultaneously uncompetitive because the dynasties, and the pursuit of their interests, trump
other concerns in political party, public policy and development-related matters” (Cheema et
al., 2013: 1).

16
factional politics of patronage were ousted by military governments who further entrenched
factional politics by stunting political development” (Martin, 2016: 82).
4. Data
In this section, we describe the type and sources of data used in our empirical analysis.
Broadly speaking, we construct two highly fine-grained databases to capture the core
dimensions of political and economic development for the National Assembly and Provincial
Assembly constituencies of Punjab.
4.1 Political data
We compiled data on elections and political families in Punjab that dates back around a
century and covers the period, 1921-2013. This is the most comprehensive data collection effort
carried out for Punjab to date. In the first stage, we compiled the list of candidates and their
election results. In the second stage we collated primary information on candidates and their
relatives.
ELECTORAL DATA. In total, we have collected data for no less than 19 elections out of which
13 were held in the post-independence period. We discuss below the list of pre- and post-
independence election rounds and the accompanying data sources.
First, we compiled data for the six election rounds held during the pre-partition period,
which are as follows: 1921, 1923, 1925, 1929, 1937 and 1945 elections. For this we relied on
British archives detailing election results in the pre-partition period.12 Under British rule limited
enfranchisement was introduced as part of the Government of India Act of 1919. The first
Punjab Legislative Council was constituted in 1921 with 70 percent of its 93 members elected
and the rest appointed or nominated. In the West Punjab nominated members were typically
tribal chiefs, members of landed gentry, and other elite groups patronized by the colonial
12 India Office. 1921. Return Showing the Results of Elections in India. London, H.M. Stationery Office,
Cmd. 1261; India Office.1924. Return Showing the Results of Elections in India, 1923. London, H.M.
Stationery Office, Cmd. 2154 ; India Office. 1927. Return Showing the Results of Elections in India
1925 and 1926. London, H.M. Stationery Office, Cmd. 2923 ; India Office. 1931. Return Showing the
Results of Elections in India 1930 and 1931. London, H.M. Stationery Office, Cmd. 3922 ; India Office.
1937. Return Showing the Results of Elections in India 1937. London, H.M. Stationery Office, Cmd.
5589 ; Government of India. 1948. Return Showing the Results of Elections to the Central Legislative
Assembly and the Provincial Legislatures in 1945-46. Delhi: Manager, Government of India Press.
17
authority. For the first three Legislative Councils (1921, 1923, and 1925), we collected
information for both elected and non-elected candidates. Data for the remaining four elections
in the pre-partition era mainly involve elected candidates. We used the historic delimitation
files to identify respective colonial-era districts in West Punjab in which these candidates ran
for elections.
We then extended this data to include electoral records for three early post-partition
election rounds held in 1951, 1962, and 1965. Information for these was obtained from the
respective Gazetteers of the Government of Pakistan available at the Library of National
Assembly of Pakistan. The corresponding provincial assembly results for these election rounds
were obtained from the web pages of the Provincial Assembly of Punjab
(https://pap.gov.pk/en/members/past-members). Finally, we compiled detailed election results
for ten contemporary rounds of national and provincial assembly (NA and PA) elections held
since 1970. These include the following general elections: 1970, 1977, 1985, 1988, 1990, 1993,
1997, 2002, 2008, and 2013. Data for these election rounds is consistently available from the
Election Commission of Pakistan and published reports of Free and Fair Election Network
(FAFEN). The FAFEN reports contain all essential electoral data, including total votes
registered in a constituency, votes polled for each candidate, the margin of victory, etc. We
extended this data backward to include electoral records for three early post-partition election
rounds held in 1951, 1962, and 1965. Information for these was obtained from the respective
Gazetteers of the Government of Pakistan available at the Library of National Assembly of
Pakistan. The corresponding provincial assembly results were obtained from the web pages of
the Provincial Assembly of the Punjab (https://pap.gov.pk/en/members/past-members).
DATA ON POLITICAL FAMILIES. We collected detailed information on the profiles of the top three
candidates in each constituency and election year. A four-step procedure was followed for this
purpose. First, we compiled publicly available information on elected members from the online
directory of the Punjab Assembly’s website. Apart from information on age, education, and
professional associations (e.g. membership of legislative committees), this online repository
contains detailed information on relatives who have been elected to past or present legislatures.
This information is consistently provided for elected members since 2002. Second, we
expanded this information over time and across candidates using a rich literature on Punjab’s
electoral politics in Urdu (Ismail 1986; Anjum, 1990, 1995; Jaffrey, 2007). We supplemented
this source with newspaper profiles, election supplements of local newspapers, Facebook pages
of election candidates, and their Wikipedia entries. Thus, we developed an extensive database
18
reporting the family ties of the top three candidates for each constituency, considering family
relations of both direct (based on blood ties) and indirect (based on marriage alliances) types.13
Third, to fill in the remaining gaps, we carried out a specialized telephone survey aimed at
constructing a complete personal profile for each election candidate as well as a list of socio-
economic characteristics for each constituency. Carried out by the chief election reporter of a
major Urdu newspaper (Dunya), the survey allowed us to build a detailed dataset containing
information about the relatives (direct or indirect) of each candidate, when they appeared to
have participated in elections, whether they won a seat or not. For each district, the surveyor
was assisted by correspondents of local newspapers who possess detailed knowledge of the
leading political families. Information could thus be obtained on the age, education, profession,
and pre-partition or colonial-era position of the key members of all political families. We also
know whether a candidate belongs to a major landed family and to historical nobility. To
determine whether a candidate’s family enjoyed historical influence in the colonial period, we
relied on a range of sources published in Urdu and, in particular, on the colonial-era District
Gazetteers. As a matter of fact, these sources reveal the identity of key families and tribes,
namely those that received colonial land grants, benefited from official appointments (e.g. tax
collectors/zaildars, assistant commissioners, darbaris, etc.), or participated in legislative
elections under British rule.
Finally, we conducted a separate verification exercise through a quick survey made by a
senior journalist who covers the election beat of a major English daily (Dawn) in Islamabad.
Assisted by a network of local reporters, we used this verification survey to weed out incorrect
entries, add new relations, and fill gaps in the database. Eventually, we succeeded in
constructing a database on political families in Punjab that covers a period spanning around a
hundred years. This is the most comprehensive and systematic data collection effort
accomplished to date. Table A1 in the Online Appendix provides a snapshot of the overall
format in which the requisite family-level information was compiled for the Attock district
(north Punjab).14
13 For example, brothers and their children are directly related family members, whereas their spouses
or the spouses of their children have become part of the family through marriage. 14 Consider the first candidate for illustrative purposes. Our information bears not only on the
participation of Sardar Shaukat Hayat in different election rounds but also on the possible participation
of his relatives. In this instance, the only relative to have participated in elections is a son named Sardar
Sikandar. Information was collected on the particular year in which this son contested or won an
election.

19
In order to identify for each district the most entrenched political figures, such as those who
have retained a strong electoral foothold since the pre-partition period, we created separate
family charts. Figure 2, which provides a visual illustration for the Leghari clan of south Punjab,
shows that it has enjoyed electoral presence since 1921. Its members have continuously
participated in successive electoral contests, and they have been represented in all legislatures
during the last century. This means that they have held more than 80 parliamentary seats during
the period considered.
Since outcome data are measured at the decentralized level of the union council (UC) for
which electoral data are not available, we need to spatially connect each UC in Punjab with the
relevant parliamentary constituency, be it the National Assembly (NA) or the Provincial
Assembly (PA). This has been done for the three most recent electoral rounds, 2002, 2008, and
2013. These election years are suitable for our purpose as they are close to the year during
which the outcome data have been measured. Using our database on political families, we then
define a political family as an entrenched dynasty if it held at least 11 distinct tenures over the
entire electoral history of Punjab going from 1921 to 2013. A UC is considered to have been
represented by an entrenched dynast if the politician elected in the constituency to which it
belongs (NA or PA) is a member of an entrenched dynastic family thus defined. The threshold
of 11 tenures or above is obtained from the 90th percentile of the distribution of tenures in our
sample. Holding 11 tenures essentially means that the family has held power continuously, or
almost continuously, since the early independence period. 15 Focusing on distinct tenures rather
than all tenures has an important implication: if several members of a family won parliamentary
seats in different locations in the course of the same electoral contest—as is the case with the
Leghari clan (Figure 2)—we count these multiple electoral wins as a single tenure when
determining whether the political family concerned is an entrenched dynasty. Clearly, our
definitional approach is quite restrictive, aiming to pick up only the oldest and most entrenched
political families.
4.2 Development outcomes and covariates
To properly test for the local development impact of dynastic power, we require a
development outcome measured after the electoral cycle and does not represent pre-existing
trend. . We thus ideally need variables in the nature of flows or changes in stock, such as they
15 Bear in mind that we consider a period covering 19 election events, any family can hold at most 19
tenures.

20
are observed at the UC level after the election in question. Unfortunately, only one variable that
strictly satisfies these requirements is available to us, namely night light luminosity. For this
outcome, we have data for both the pre-election level as well as variation observed after the
election. The growth in night-time luminosity will therefore be our key development outcome
of interest.
In addition to this general measure of growth and development, we have several other
development indicators that are observed only for a single point in time. They are extracted
from a large and representative household-level survey conducted across all the UCs of the
Punjab. One of them is a measure of human capital and is a flow variable: the proportion of
households in which no child at all was attending school at the time of the survey. Another
variable is a household wealth measure based on the consumption and productive assets owned
by a household. Measures of different assets are conceived as binary answers to the question as
to whether a household owns them or not, and a value can be computed for each household by
using multivariate analysis. More precisely, the asset index is constructed by taking the
principal component of the variables representing the ownership of each of the five different
assets in our dataset (television, car, refrigerator, washing machine and tractor). The index
values thus obtained can, in turn, be aggregated over all the sampled households in each UC.
The final step consists of assigning UCs a percentile rank (between 0 and 1) based on their
index score. A key limitation in using this asset measure is that we do not have data for pre-
election years. Yet, and although caution remains necessary, we believe that the problem is
mitigated by the fact that we select assets that are durable consumption and production goods
rather than fixed assets, such as house, farm buildings and land.
Because of their methodological limitations, estimates using the above education variable
and household asset index, as well as road density (a measure of public goods), will be treated
as supplementary evidence. We next provide details on the chosen development indicators.
NIGHTTIME LUMINOSITY. To construct the luminosity measure, we use fine-grained data on
nighttime light intensity. Based on satellite images, the nighttime luminosity data is increasingly
used as a proxy for economic activity and development at the subnational level where GDP data
is either unavailable or unreliable. Studies have demonstrated a strong correlation between the
nighttime light intensity and subnational economic and human development indicators
(Henderson, Storeygard and Weil 2012; Costinot, Donaldson and Smith 2016; Donaldson and
Storeygard 2016; Bruederle and Hodler 2018). While there are some caveats involved in
interpreting the effects of night lights intensity, it is a convincing multi-dimensional measure

21
of development at the local level (Asher, Lunt, Matsuura, and Novosad, 2021). Our dataset on
luminosity is based on the latest VIIRS compilation, which is based on a higher geo-spatial
resolution and uses a procedure to correct for stray lights. We have obtained annual data
spanning over the period 2014-2019, on the basis of which we compute the percentage growth
in observed night lights during this period using VIIRS Stray light corrected day/night band
composites. Road density (the proportion of an area covered by paved roads) is also obtained
by using geo-spatial data.
HOUSEHOLD DATA. To construct our supplementary development outcomes, we leverage a large
dataset for around 15 million households in Punjab. The database forms part of the National
Socio-Economic Registry and was originally compiled to identify beneficiaries for the Benazir
Income Support Program (BISP), one of South Asia’s largest cash transfer programmes.16 Apart
from building a poverty profile of the surveyed households, the BISP survey collected
information on a dozen key indicators, including household size, the type and quality of
dwelling, educational status of family members, and household assets. Using the geo-coded
information on households, we compute the proportion of households in each UC with different
educational and wealth status at the time of the baseline survey (2011). 17 Specifically, based
on the education module we compute the total proportion of households where no child was
attending school and, based on the asset module, we obtain the proportions of households in a
UC who own one of the following assets: television, refrigerator, washing machine, tractor, and
a motorcycle.
COVARIATES. We construct several UC-level measures to be used as covariates in our
analysis. To construct a battery of pre-determined covariates, we relied on the Union Council
Reports for the 1998 Census and collected data on population density, the proportion of
households with electricity connection, piped water, and the proportion of households using
wood fuel. We also use geo-spatial tools to construct a measure of the distance of a UC from
the nearest city.
16 Inspired by the World Bank’s Poverty Scorecard, the BISP survey is a specialized door-to-door
survey, which used the representative sampling frame of the Pakistan Social and Living Standards
Measurement (PSLM) and collected core socio-economic data at household level.
17 The baseline survey was followed by four subsequent rounds in 2013, 2014, 2016 and 2019.

22
4.3 Summary statistics
Using detailed political genealogies, we were able to map a total of 718 families that have
at least one relative who either contested or won an election since 1921. Of these, 32 families
have enjoyed at least 11 distinct tenures between 1921 and 2013. These are very large families
with dozens of relatives participating in different election rounds (see Figure 2 for an
illustration), and which have consistently been in power. In our sample there are 1,335 seats for
which elections were held across national and provincial assemblies between 2002 and 2013.
We count a total of 135 winners (or 10 percent) and 152 runners-up (11%) who are
characterized as entrenched dynasts.18
At the lower level, we find that 2,606 UCs belong to constituencies that were held by
dynasts while 2,855 UCs belong to constituencies where a dynast was a runner-up. Our
empirical identification is based on close electoral contests where dynasts either narrowly won
over or lost against a non-dynast. When the margin of victory is characterized as 7 percent,
about 23 percent of the total electoral contests can be characterized as close elections. When
the margin of victory is considered as 5 percent and 3 percent, the corresponding ratios of close
elections are 13 percent and 10 percent, respectively. The summary statistics for our core
variables are presented in Table 1. We present both mean values of our main variables and the
difference between means of these variables in UCs served by dynasts versus non-dynasts. As
Table 1 shows, there is a statistically significant difference in our main development outcomes
between dynastic and non-dynastic regions. Specifically, areas ruled by dynasts have
significantly lower luminosity growth, less educational attendance, and lower proportion of
household assets. We will probe these patterns more systematically in Section 6.
5. Empirical strategy
5.1 Close elections regression discontinuity design: the approach
To identify the effect of dynasts on development we make use of the close elections
regression discontinuity design. As applied to our case, this approach approximates an ideal
experiment that randomly assigns dynasts to UCs, and then compares measures of economic
18 The 135 winners come from the 32 dynastic families mentioned above. Note that disaggregating
numbers by NA and PA elections yields a broadly similar distribution across the two types of
legislatures.

23
development in UCs that have elected a dynast to those that have elected a non-dynast. The
approximation works by restricting attention to close elections between a dynast and a non-
dynast, with the exposure of UCs to dynasts considered to be essentially random. Such an
assumption has been used extensively in the empirical literatures on politics (Brollo and
Nannicini 2012; Pettersson-Lidbom 2008; Fiva and Smith 2018) and development economics
(Asher and Novosad 2017; George 2020; Prakash, Rockmore and Uppal 2019; Clots-Figueras
2012). It is also well grounded in the established literature on applied econometrics (Eggers et
al. 2015; Lee and Lemieux 2010; Lee 2008; Imbens and Lemieux 2008).
In formally documenting the impact of dynasticism on economic development, we estimate
the following regression model:
Yi = α + β Dynast wini + f (Dynast vote margin)i + δXi + εit (1)
In the above specification, Yi denotes the development outcome measured in the post-
election period in UC i, Dynast wini is a binary variable indicating whether a dynast has
represented UCi in either the national or provincial elections during the period 2002 to 2013.
The running variable Dynast vote margini is the difference between the dynast and the non-
dynast vote shares. Xi is a vector of union council-level characteristics that are included as
controls in our analysis. Finally, in all our main specifications f(.) is a non-linear function of the
running variable (Dynast vote margin i) that is approximated through kernel-weighted
(triangular kernel) local linear regression.
The coefficient of interest in equation 1 is β. It measures the average difference in the
development outcome Yi between UCs where a dynast narrowly wins (strictly speaking, UCs
belonging to a constituency where a dynast narrowly wins) and UCs where a dynast narrowly
loses (belonging to a constituency where a dynast narrowly loses). Concretely, β measures the
average difference in the growth of nighttime luminosity between the two types of UCs.
An important decision to make when implementing the close elections RD design is the
choice of the bandwidth for margin of victory values that constitute a close election, in this
instance the bandwidth around the dynastic margin cut-off for computing the RD estimate. In
making this choice we follow standard practice in the applied econometrics literature by
adopting a data-driven approach for bandwidth selection. Specifically, we followed the
suggestion in Cattaneo et al. (2019) and chose the approach that minimizes the mean squared
error (MSE) of our local polynomial RD point estimator. Based on our main measure of local
economic activity (i.e., growth in nighttime luminosity), for example, we also show the

24
robustness of our results to the manual selection of bandwidths that are 7%, 5% and 3% to the
left and right of the dynastic margin cut-off, respectively. 5.2 Close elections regression
discontinuity design: the issue of validity
To demonstrate the validity of the close elections RD design in our setting, we need to
carry out a number of tests. To begin with, we show that areas that narrowly elect a dynast are
similar along a series of important development dimensions to areas that narrowly miss electing
a dynast. All these dimensions are determined prior to the earliest election year in our dataset
and, therefore, can be considered as relatively pre-determined. They consist of pre-period
population density, pre-period public goods provision and distance to the nearest city. In Table
2 we carry out formal tests for continuity around the dynastic margin cut-off for each of these
dimensions. As the estimates in Table2 show, none of the pre-determined covariates shows a
discontinuity across the dynastic margin cut-off of zero. For each covariate, the RD estimate in
column 2 is insignificant and the confidence interval in column 4 includes zero. The smoothness
of these important pre-determined covariates around the dynastic margin cut-off provides
evidence against our ‘dynastic effect’ being driven by pre-existing differences in development
between areas that narrowly elect a dynast and those that narrowly elect a non-dynast.
Another important concern concerning the applicability of the close elections RD design
to our setting is the possibility that the electoral system is being manipulated by dynasts in ways
that systematically favor their election. If this were the case, we should observe a discontinuity
in the density of our running variable around the dynastic margin cut-off.19 Accordingly, in
Table 3 we perform both the McCrary (2008) and the Cattaneo et al. (2019) tests for detecting
a discontinuity in the density of our running variable at the dynastic margin threshold of zero.
As the results show, neither of the two tests rejects continuity in the running variable around
the dynastic margin cut-off. Figure 3, which is based on the McCrary test and is visual analogue
of Table 3 (the bold curves give the estimates while the dashed curves correspond to a 95%
confidence interval), confirms the result that dynastic candidates are not able to systematically
manipulate the electoral process in ways that affect their chances of election.20
In this connection, it is revealing that when asked about whether they have been persuaded
to vote through bulling and threats, the overwhelming majority of respondents in a nationally
19 If, close to the zero-margin threshold, a lot of dynasts appear to have won the contested seat, there is
a suspicion that they have manipulated the electoral process. 20 The figure based on the other test is pretty similar and is therefore not displayed.
25
representative electoral survey (FAFEN 2017) have answered negatively. This lends further
support to the identifying assumption for our RD analysis.
6. Main results
Using regression discontinuity research design as set out in equation (1), we estimate the
impact of high-tenure (entrenched) dynasts relative to non-dynasts on different development
outcomes measured at the UC level and using the time window around elections. We present
results for our main indicator, growth in nighttime luminosity, and for a series of supplementary
measures: measures of public goods provision in the form of human capital (school attendance)
and infrastructure (road density), and for private (consumption and production) goods
represented by household assets. As is standard practice in the literature, we show visual
evidence of discontinuities before presenting the RD estimates.
6.1 Visual evidence of discontinuities
In Figures 4-6 we provide a visual evidence of the RD estimates in equation 1. Each figure
contains a set of scatterplots of the conditional mean of the relevant development outcome on
the y-axis and the margin of victory for the high-tenure dynast on the x-axis. Locations to the
right of the zero line were narrowly won by high-tenure dynasts while those on the left of the
zero cut-off were narrowly lost by them. Each point represents the mean of the relevant
development outcome within the bins of margins of victory on each side of the cut-off. In panel
(a) of each figure, we display the linear best fit, represented through solid lines on either side
of the cut-off, while the corresponding confidence intervals are represented by dashed lines. In
panel (b), fitted lines are estimated semi-parametrically through kernel-weighted local linear
regression, with MSE-optimal bandwidth. As before, the dashed lines represent 95 percent
confidence intervals.
Figure 4 provides a visual evidence of the discontinuity for the growth of nighttime
luminosity during the period 2014-2019. Both panels (a) and (b) reveal a sizeable negative
discontinuity for luminosity growth for locations in constituencies where high-tenure dynasts
narrowly won over other candidates. In the said period, Pakistan was suffering from widespread
electricity shortages as is evident from the overall negative range of luminosity growth.
However, the growth in nighttime lights intensity was noticeably more negative in regions

26
where high-tenure dynasts narrowly won over non-dynasts (compared with regions where high-
tenure dynasts narrowly lost to their rivals).
Next, we provide visual evidence of discontinuities around the threshold for win margin
regarding our supplementary development indicators. Figure 5 does this for educational
attendance, measured as the proportion of households where no children were attending school
at the time of the survey (Figure 5). As Figure 5 shows, there are noticeable discontinuities
along the zero threshold regardless of whether we use a linear fit (panel a) or semi-parametric
fit (panel b) for the scatter plot. There is a sharp discontinuity at the threshold, showing a
noticeably higher proportion of the outcome variable to the right of zero. Thus, regions that fell
in constituencies where high-tenure dynasts had a narrow win tend to have significantly higher
proportion of households whose children were not attending school. Finally, in Figure 6 we
display a scatterplot for the unconditional mean of an asset index that aggregates household-
level information for ownership of television, car, refrigerator, washing machine, and tractor.
Again, there is a discernible discontinuity reflected in a clear jump at the cut-off for margin of
victory: significantly lower values of the asset index are observed for regions to the right of the
zero line.
6.2 RD Estimates
We next present regression discontinuity estimates of the effect of an entrenched dynast on
constituency-level development outcomes, defining such a dynast as someone who belongs to
a family with at least 11 distinct tenures in the parliament. Bear in mind that by distinct tenures,
we mean seats won over different elections, with a maximum of one seat for a separate election
(either in a PA or a NA). The (main) outcome variable is growth in night-time luminosity during
the electoral term in which a candidate is elected (eg. between 2008 and 2013 for a candidate
elected in 2008 for a 5-year term). The sample compares union councils (UCs) located in
constituencies where a dynast narrowly won to UCs in constituencies where a dynast narrowly
lost. All specifications include the following pre-determined covariates as controls: the natural
log of the distance to the nearest city, the log of distance to the UC border, the length of railroad
coverage per square kilometer measured in 1992, the length of waterways in square kilometers
in 1992, and prior luminosity growth as measured over the period 1992-99. . Standard errors,
clustered at the sub-district level, are reported in parentheses. Results are presented in Table 4.
In Columns (1) to (3), we impose bandwidths of 7%, 5% and 3%, respectively, while in Column
(4), we use a bandwidth endogenously generated through the MSE-Optimal option. The
estimate on dynastic legislator indicates that, where elections were closest, constituencies with
27
entrenched dynasts exhibited significantly lower growth in nighttime luminosity over the
relevant electoral cycle. The estimated effect is negative and statistically significant (even highy
significant for bandwidths of 3% and 5%) across all specifications displayed in Table 4.
In Table 5, we investigate the effect of a dynastic legislator on several supplementary
indicators derived from the BISP dataset. As indicated earlier, these results should be read with
a degree of caution as the underlying household data is available at only one point in time,
precluding us from computing growth over the electoral cycle. As in Table 4, all specifications
include the set of pre-determined covariates. Local linear estimates are obtained by using the
MSE Optimal bandwidth. Column 1 reports the estimated effect of a dynastic legislator on the
proportion of households with children of school-going age who did not have a single child
attending school at the time of the BISP survey. This is a good proxy for the incidence of out-
of-school children, which is a persisting concern in Pakistan. Consistent with the visual
evidence presented earlier, we find that in constituencies where a dynast narrowly won over a
non-dynast, the proportion of such households is significantly lower. The estimated effect of a
dynastic legislator is negative and statistically significant at the 95 percent level.
In column (2), we present the results for an aggregate asset index constructed by using
multivariate analysis for five different assets: television, car, refrigerator, washing machine,
and tractor. With the exception of the tractor, which is a productive asset in agriculture, the
asset index primarily consists of durable consumption goods. Each component of the asset index
corresponds to the proportion of households in a UC who own the relevant asset. As is evident
from column (2), the coefficient is negative and statistically significant: constituencies with a
dynastic legislator exhibit a significantly lower value of household wealth. Finally, in column
(3), we consider the effect of dynastic power on the log of road density, and find that the effect
is statistically insignificant. We defer to Section 7 the discussion of this ambiguous result. To
summarize, our results using multiple proxies for local development paint a consistent picture.
Entrenched political power causes lower economic development as reflected in relatively lower
luminosity growth. There is also evidence that constituencies where entrenched political
dynasts narrowly won have had worse educational attendance performances and lower asset
ownership than those where they narrowly lost.
6.3 Robustness and falsification tests
Before delving into the interpretation of our results, we perform several robustness tests. We
start by verifying that the effect of entrenched dynastic power is not explained away by the

28
confounding effect of entrenched personal power or incumbency advantage. In other words,
does the adverse effect of entrenched family dynastic families persist after controlling for the
past personal electoral achievements of the close winner? To test for this is possibility, we
construct a variable that measures a winning candidate’s personal hold over power as opposed
to his family's, which is what our dynast variable accounts for. We call this variable the
‘personal power index’. In constructing the index, to ensure that every winning candidate starts
from the same base, we assign a value 1 to each winning candidate in our dataset. We then add
to that base value the value of the ratio of the number of past victories to the number of past
contests for the winning candidate, weighing that ratio by the number of his past victories. The
weighting is done so that a candidate who has won more victories in the past gets a higher score
on the index regardless of the ratio between past victories and past contests.21
The personal power index is used in two ways. First, we test for the discontinuity of its
values around the cut-off point. As the final row in Table 2 shows, the RD estimate for the
personal power index is negative but statistically insignificant. Also, the confidence interval for
the estimate includes zero (see column 4). There is thus no evidence of significant discontinuity
for the index in constituencies where high-tenure dynasts narrowly won over non-dynasts.
Second, we assess the robustness of our main result on luminosity growth by controlling for the
personal power index. This is done by adding it to our list of covariates in Table 6. The results
are documented for different bandwidths: 7% (cols. 1-2), 5% (cols 3-4), 3% (cols. 5-6), and
MSE optimal (cols. 7-8). As the results indicate, both the coefficients and statistical significance
of the RD estimate for dynastic legislator remain unchanged after the inclusion of an index of
personal power
Next, we perform a sensitivity analysis to examine how the impact of dynastic families on
local development might change when we gradually lower the tenure threshold used to define
an (entrenched) dynast. This is done in Table 7 where we see that the effects on two of our
development indicators (night lights growth and asset index) start to become inconsistent once
the level of 7 tenures is reached. Moreover, when the threshold is further lowered, the direction
of the effect is inverted: (low key) dynasts have a positive impact on local development, thus
underlining the contrast between the behaviors of entrenched and non-entrenched dynasts.
21 For instance, a winning candidate who has won three out of six electoral contests gets a higher score
on our index than a candidate who has won two out of four electoral contests.

29
We also carry out an important falsification test by re-estimating our baseline regression
discontinuity specification using placebo cut-offs for the MSE-Optimal bandwidth. The
objective is to investigate the possible discontinuities in luminosity growth as we move further
away from the true threshold associated with electoral wins. Finding significant discontinuities
by using these placebo thresholds would cast doubt on the smoothness assumption needed to
validate the RD design. Results using placebo thresholds are reported in Table 8. The first two
rows of Table 8 report the estimate for the RD specification using placebo cut-offs below the
zero threshold, while the final two rows report the corresponding RD estimates for two placebo
cut-offs above zero. In row 3, we reproduce the estimates for our baseline specification. The
corresponding p-values and confidence intervals are reported in columns 3 and 4, respectively.
As the results indicate, there is no evidence for significant discontinuities when using any of
the placebo thresholds. This provides reassuring evidence for the statistical validity of our RD
design.
Finally, as another falsification exercise, we conduct the donut-hole analysis that assesses
the robustness of our main RD results to the exclusion of observations that are very close to the
cutoff. In our close-elections RD design, observations that are closest to the cut-off are
vulnerable to manipulation, which can cast doubt on statistical validity. Apart from ruling out
the possibility of manipulation, another benefit of this exercise is that it helps to assess the
sensitivity of local polynomial estimation to a few observations closest to the cutoff (Cattaneo
et al. 2019). Accordingly, we exclude observations that fall within the radius of two
progressively increasing thresholds. The first radius (i.e., 0.20) results in the exclusion of 7
closest observations to the right of the threshold whereas the second radius (i.e., 0.25) results
in the exclusion of 32 observations to the left of the cutoff. As Table 9 shows, our main findings
are largely insensitive to excluding these observations close to the threshold. The RD estimates
remain negative and statistically significant.
7. Building up a consistent story: qualitative insights and further results
7.1 Combining theoretical and field study insights
Our results suggest that political dynasties are harmful to development, thus invalidating
the predictions of Asako et al. (2015) and Besley and Reynal-Querol (2017). In this section, we
propose an interpretation that is consistent with our data and anthropological evidence drawn

30
from micro-field studies. Before we proceed further, a preliminary remark is in order. As
emphasized in Section 3, clientelism is an all-pervasive feature of Pakistani politics. Therefore,
we cannot seek an explanation simply based on the opposition between dynasts operating under
clientelistic politics and non-dynasts operating under what Bardhan et al. (2020) have called
program politics. This forecloses the possible explanation according to which non-dynasts are
more motivated to provide public goods and foster local development because they escape the
narrow logic of clientelism. Relatedly, the point of departure for our discussion is a query
suggested by another lesson from Section 3: political clientelism in Pakistan is generally
competitive. If local political monopoly may exist in some UCs, these are not the localities that
our methodology picks up since our sample is deliberately restricted to those UCs where either
a dynast narrowly won against a non-dynast, or a non-dynast narrowly won against a dynast. In
the light of these considerations, both factual and methodological, the question arises as to how
entrenched dynasts can afford to be under-performing when they have to seriously compete
with other contenders who also resort to clientelistic practices in order to seduce voters?
There are three possible ways to solve this puzzle. First, if it seems difficult to imagine that
dynasts relax their efforts in the presence of a serious political opposition, it is not unrealistic
to think that their political strength is negatively affected by a problem of adverse selection (see
George, 2019). Having been nurtured in the comfortable environment of election victories,
scions of big political families who have been propelled to the electoral battlefield do not
necessarily have the qualities and skills required to be effective leaders. If they nevertheless
win the elections they contest, it is presumably because advantages conferred by dynastic
families, such as financial and other form of support from the network, a better ability to bargain
with higher-level authorities, and name recognition (Asako et al., 2015), outweigh their
shortcomings. Still, in the long-repeated game of successive elections, it is hard to see how
dynasties can be sustainably maintained in power in a competitive environment in which their
representatives are under-performing.
A second explanation is grounded in the role of electoral competition in the Acemoglu and
Robinson’s political theory of economic backwardness (2006b). As pointed out in Section 2,
the central idea is that when they are exposed to strong competition political elites strive to
increase their future economic rents, which implies that they promote technological and other
change conducive to local development. By contrast, when they are in an intermediate situation
between intense competition and power monopoly, they have an interest in blocking
development to preserve their political domination. We can plausibly hypothesize that what we
31
call entrenched dynasts occupy the intermediate position since, although they are subject to
close competition, their families have been able to maintain themselves in power through most
of the election period. Under this hypothesis, the prediction of Acemoglu-Robinson appears to
be borne out by our results of Section 6. Under the alternative hypothesis that entrenched
dynasts are exposed to indisputably strong competition, the opposite conclusion is reached (the
theory is invalidated). We propose a way to test which of the two hypotheses is more valid. We
can compare the impact of dynastic power on local development in two different political
contexts: the context in which a dynast has narrowly won against a non-dynast (the close
election setup used in Section 6) and the context in which a dynast won by a comfortable
margin, thus indicating an easy electoral victory.
A third approach, directly inspired by in-depth field studies of micro-level social and
political processes, distinguishes between two brands of clientelism, one reactionary and the
other progressive. Depending on which kind they belong to, the patrons deliver differentiated
services to their voting blocs: while entrenched dynasts supply livelihood-protecting services
(LPS), which are hampering development, non-dynasts offer livelihood-enhancing goods and
services (LEGS), which promote development. It bears emphasis that if the available outcome
indicators can measure LEGS reasonably well, they essentially miss the LPS. Therefore, the
asymmetry of performances between dynasts and non-dynasts in our data does not indicate the
inability of dynasts to deliver advantages in comparison to non-dynasts, but a measurement
bias: different types of political patrons need to be judged according to different yardsticks
while these yardsticks are unequally detectable in the data. Let us now give some precisions
about what constitutes the LPS and the LEGS and the characteristics of the political leaders or
brokers who provide them to their client voters.
As we have learned from Section 3.3, micro-field studies reveal that, schematically, two
main types of political leaders or brokers coexist. On one side, we find ‘traditional’ elites whose
power and influence are rooted in land, religion and historic status. They have a vertical,
individualized patron-client relationship with their constituents who depend on them
economically and therefore wield weak bargaining power.22 The voting blocs are thus
22 Here is how Nicholas Martin (2016: 33) describes the behavior and perceptions of reality among the
common people dependent upon big traditional landlords: “People’s mentality was such that if a kammi
stood up to contest elections everyone would laugh at him. Not only would the chowdris laugh at him
(and possibly punish him for insubordination), but his fellow kammis would also find him ridiculous…
people would completely discount a poor politician who didn’t campaign with a large convoy of cars
and cohort of gunmen”. The poor worship the outward signs of power and wealth, and believe that only
the rich and powerful can effectively deliver patronage. Moreover, “most kammis were illiterate and

32
hierarchical organizations and, in exchange for their allegiance, which involves voting as their
landlord prescribes, the clients are entitled to benefit from a variety of services aimed at helping
them surmount temporary difficulties, guarantee their physical security and maintain their scant
livelihood. Among the most-oft cited services required of their patron are: supplying
consumption loans meant to tide over the lean season, face income shortfalls, or meet social
and medical expenditures; granting identity cards that allow access to subsidized subsistence
goods; providing help to get admitted into hospital; ensuring protection against the local police
and legal defense in local court cases, particularly those involving land disputes.23 These are
precisely the sort of livelihood-protecting services that are never systematically measured in
field surveys, especially when run on a large scale.
On the other side are political patrons coming from upwardly mobile sections of the
population, such as the members of the peasant castes described by Jan (2019) or the ‘Navay
Raje’ described by Armytage (2019). Many of them are political and economic entrepreneurs
possessing a modern outlook and eager to prove themselves through self-made achievements
rather than through inherited wealth and prestige. Typically engaged in multiple activities
including non-agricultural pursuits, they rely on the horizontal networks of their clan (biraderi)
or on portions of their extended family network combined with outside allies (Mohmand, 2019:
Chap. 6). In matters of labour relations, in particular, they tend to use cooperative arrangements
instead of vertical patron-client relationships. Because their voting blocs resemble the sort of
kinship-based organizations reported by Cruz et al. (2017) for the Philippines, these political
elites are more likely to promote public goods that benefit the whole group, especially if the
factions constituting the voting blocs are fractionalized (see Section 1).
Among local public goods, there seems to be a preference of politicians for rural roads: in
Pakistan the largest proportion of development funds allotted to MNAs and MPAs by the central
government (see Section 2) have been spent on roads, more particularly small feeder and farm-
to-market roads (Hasnain, 2008: 141; Malik, 2019: 5). There are three reasons for this. First
would therefore be unable to deal with the bureaucratic paperwork that characterized most encounters
with the state… unlike the Gondals, kammis didn’t have the social capital in terms of connections with
influential officials that would allow them to deliver patronage”.
23 Bardhan and Mookherjee (2012) call ‘inferior’ consumption goods these LPS made in favour of select
poor groups of voters in an implicit quid pro quo for their political support. As illustration, they cite
access to employment in public works, subsidized food, low-income housing or help in coping with
personal emergencies, all of which create a bias in favor of recurring private benefits rather than one-
time long-term benefits (Bardhan and Mookherjee, 2012).
33
and foremost, these funds are explicitly required to be earmarked for infrastructural investment.
Second, since it is rather easy to establish the relationship between the action of a particular
politician and the result, credit can be claimed for the ensuing project.24 Third, we know from
other studies (Olken, 2007, for Indonesia) that funds used for road construction and similar
types of investments have a great potential for resource capture.
In general, clients under this more progressive system of patronage tend to favor personal
advantages in the form of jobs (including fake ones), licenses, contracts, fake high school
matriculation certificates, etc. (Hasnain, 2008: 142-5; Martin, 2016: 67, 83-6, 132).25 Access to
jobs is the most prized among these advantages (Wilder, 2009: 34). The regular earnings of a
stable employment, in particular, are actively sought after because they serve as an insurance
against all sorts of hazards as well as a capital fund available for (risky) investments.26 Overall,
these goods and services are more conducive to development than the services provided by
traditional patrons-cum-politicians.
To yield a consistent story, the differentiation of the political market must be verified not
only on the supply side –political families or networks with different characteristics offer
different patronage services in exchange for votes– but also on the demand side. If demand
were homogeneous, one would see that one form of patronage is gradually displaced by the
other. Thus, if people all wanted to get access to education and jobs in the formal sector, for
themselves or their children, traditional political patrons offering LPS would have to adjust to
that demand or face the prospect of disappearing from the political scene. The reality looks
different, though. Some people, because they are quite poor and vulnerable to shocks, prefer to
place themselves, or remain, under the dependence and protection of a powerful landlord who
24 Hasnain (2008) argues that to get elected politicians must credibly communicate to voters that they
were personally responsible for certain improvements in their lives, and this requirement tends to favor
targeted benefits, or patronage, rather than public goods (p. 130). In fact, voters are also likely to know
who is responsible for the delivery of public goods and, hence, Hasnain’s argument is insufficient to
explain the predominance of private goods or services under patronage politics. 25 Illustrations of fake jobs abound in Martin’s book. For instance, he tells the story of a domestic servant
of the younger brother of a newly emerging (Gondal) political patron. He was placed into the payroll of
the South-Korean company Daewoo, although he never actually worked for the company. The
arrangement basically allowed his master to have a servant for free, and, as the salary was quite high,
the master also appropriated part of it for himself (Martin, 2016: 85, footnote; 89). 26 Robinson and Verdier (2013) have provided a theory of clientelism, which explains why redistribution
often takes the form of public sector employment rather than income transfers or public goods: they
argue that a job is a credible, selective and reversible method of redistribution which ties the continuation
utility of a voter to the political success of a political patron. Even if individual votes are unobservable,
this renders the clientelistic exchange incentive compatible, thus overcoming the two-sided problems of
enforcement involved in such exchange.
34
guarantees their subsistence yet requires a submissive attitude and opposes any emancipatory
move (see Scott, 1976, for a detailed account). Other people, however, are eager to improve
their lot, and they wish to enter into the network or the voting bloc of a more progressive patron
from whom LEGS can be obtained.
Congruent with Acemoglu and Robinson (2006b), traditional elites may deliberately seek
to block development. A preferred way to achieve this end is by thwarting efforts to promote
universal education, as argued by Bourguignon and Verdier (2000). There is evidence that such
a mechanism is also at work in Pakistan, and in the Punjab province in particular. Martin (2016,
p. 87) thus explicitly mentions the tendency of traditional landlords to oppose the (secular)
education of their dependents lest they should seek emancipation and develop “unrealistic
expectations”, and thereby cause a shortage of cheap agricultural labor. They prefer to
encourage Islamic education, which inculcates moral values through the reading of the Quran
(p. 87). It is therefore not surprising that when they act as political leaders or brokers, these
landlords may go as far as diverting school buildings from their intended function by using
them as cowsheds, farm buildings, accommodation for some relatives, and the like (p. 133).
Moreover, schools are often of poor quality because of commissions given to contractors.
Teachers themselves are then ‘ghost teachers’ who never turn up for their duty, and place false
entries into the attendance registers (p. 88). Their time and energies are diverted to other uses
that serve the interests of their patrons who protect them from disciplinary action. In some cases,
primary school teacher posts are sold by politicians and bureaucrats for large amounts of
money, thus inducing the beneficiaries to take side jobs to repay their loans (Hasnain, 1988:
137).
These circumstances are far from exceptional: the phenomenon of ‘ghost schools’ is well-
known in the country following a survey (1998) which found those schools to number over
5,000 in a single division (Zahab, 2020: 82). Because the enumerators were pre-announced in
the selected villages, the figures provided by this survey were obviously underestimated,
however. Being based on unannounced inspections, a later survey is more reliable (Gazdar,
2000). It concludes that 38% of the sampled rural schools are functional, 33% are partly
functional, and 29% are dysfunctional. Because the requirements for being functional are
relatively modest, this study paints a bleak picture of the situation. The same study shows that
there exists a wide discrepancy between enrolment and attendance: in around a quarter of the
schools which were opened at the time of the survey, less than 50% of the enrolled pupils were
in attendance and less than half of the opened schools had pupil attendance rates of 75% or
35
more (p. 52). Interestingly, Gazdar stresses that school failure is partly due to weak demand for
public education on the part of some groups or communities (p. 78).27 It barely needs to be
added that the problems afflicting schools also exist for health units and dispensaries, post
offices, and other public services. This helps explain why Pakistan performs so poorly on social
outcomes, controlling for income levels and growth (Easterly, 2003).
In the foregoing account, we suggest that two types of clientelism tend to coexist and
compete for votes. In this milieu, it seems difficult for non-entrenched dynasts to adopt behavior
characteristic of well-entrenched elites, simply because they do not possess the type of vertical
patronage organization available to the latter. This perspective suggests a possible approach to
combine the insights derived from the political theory of economic backwardness of Acemoglu-
Robinson with the micro-study evidence provided by social scientists. When they are subject
to intense competition, traditional elites opt for a mitigation of their anti-development strategies
whereas they give vent to these strategies when their political power is more comfortably
installed and they have become entrenched dynasts. They are then in the position of what the
aforementioned authors have called “semi-entrenched dynasts”: political leaders whose power
is well established yet not enough to shelter them fully against the effects of political
competition.
In order to bring empirical support for this story, two sets of exercises can be performed
on the basis of the quantitative data available. First, we verify that the entrenched dynasts
typically belong to traditional elites and provide LPS to their client voters. Second, we examine
whether the behavior of these patrons varies depending upon the intensity of competition they
are exposed to. For the first task, we will verify the existence of an association between dynastic
power and the reactionary type of political patronage, as measured, successively, by selected
socio-political attitudes of the voters and by the historical antecedents of political families. As
for the second task, we investigate whether the adverse effect of entrenched dynasticism on
local development persists after controlling for the possible influence of family background.
Then we check whether the impact of dynastic power possibly varies according to whether
dynasts win elections by a close or a comfortable margin.
27 Another worthy observation is that teachers may in some cases be willing to surrender as much as half
their salaries in order to escape the duty of attending school. They are essentially happy with the reward
consisting of the lumpsum pension of 2-3 lakhs that they receive at the end of their careers (p. 80).
36
7.2 Looking for quantitative evidence: the first task
DYNASTIC DOMINATION AND SOCIO-POLITICAL ATTITUDES OF VOTERS
Does a correlation exist between dynastic power and the reactionary type of political
patronage? To address this question, we first combine our dataset with a representative
constituency-level survey of voters conducted by FAFEN (Free And Fair Election Network). A
constituency (a UC) is characterized as dynastic when more than half of the candidates elected
to the national assembly between 2002 and 2013 have been entrenched dynasts. For our analysis
we select questions in the FAFEN survey that are presumed to be good proxy measures of the
forms of clientelism discussed previously. Specifically, we examine three sets of questions:
those bearing on the determinants of voting decisions, those measuring trust in formal
institutions, and those investigating the role of informal arrangements for dispute resolution.
We are interested in whether voter responses differ significantly between dynastic and non-
dynastic constituencies.
Results are reported in Table 10. We report both mean responses in the sample and the
difference in means between dynastic and non-dynastic constituencies. As Table 10 shows,
there are statistically significant differences in voter responses to the selected questions in
dynastic constituencies relative to non-dynastic areas. First and foremost, the voting decisions
of people living in dynastic UCs are significantly more influenced by traditional leaders, such
as tribal chiefs, and by considerations related to their physical security (protection in front of
the police and the courts). By contrast, they are less influenced by local development outcomes,
such as past projects (see Panel A). Second, although mistrust in formal institutions is
distressingly high in Pakistan, it is significantly more pronounced in dynastic UCs (see Panel
B). Lastly, in the same UCs, people tend to express a stronger preference for having their
disputes, whether personal or collective, resolved by the panchayat which, in Pakistan, is an
informal institution (see Panel C). The idea here is that preference for informal, highly
personalized arrangements is more characteristic of localities persistently dominated by
traditional authorities. While purely suggestive, this evidence is consistent with the different
type of clientelism that we believe is prevalent in dynastic constituencies. Voters in these
constituencies are tied in vertical forms of patronage where dispute resolution is personalized,
tribal authority shapes political preferences, and assistance with police and courts determines
voter choices. This is remarkably consistent with our prior that entrenched dynasts specialize
in livelihood-protecting services (LPS) rather than the more generic livelihood-enhancing
goods and services (LEGS).
37
DYNASTIC POWER AND FAMILY PROFILE
For our second exercise, we want to check whether we can find evidence in our data of a
correspondence between entrenched dynasts and traditional elites. A straightforward way of
proceeding is by comparing the distribution of dynasts and non-dynasts as per their status and
their occupation. To measure a traditional elite status, we consider the three following
categories: zamindars, historical elites, and shrine guardians (or pîrs). Zamindar is a broad
category that encompasses the main pool of agrarian elites from which dynastic families have
emerged in rural Pakistan. Within them are large and medium land-owning families, and
families with more or less historic influence. Next, we have the historic elites that are narrowly
defined as those who participated in pre-partition elections held under British rule. These are
typically members of agricultural tribes who were major landed aristocracies of Punjab and
benefited from the restricted enfranchisement of the British in the 1920s. Historical elites are
typically families whose ancestors were officially recognized by the British colonial authorities
as important pillars of their rule, and whose names are therefore featured in official documents
and gazettes of the time.
The last category is of shrine elites who are associated with prestigious religious
institutions of Sufi culture. Seen as historical missionaries of Islam, they used to dispense
important welfare and judicial functions (distributing food, healing ill people, acting as
mediators in local land disputes, punishing deviant behaviour, enforcing norms of decency),
and they have historically acted as a crucial link between the rural populace and central political
authority. Being the guardians of religious pilgrimage sites, they (or their descendants) are
considered holy and therefore wield considerable spiritual influence. Because, over successive
generations, they have accumulated a lot of wealth as a result of gifts from disciples and
patronage from the courts in Delhi and later from the British colonial authorities, they have also
come to form a strong landed aristocracy embodying material as well as spiritual power (Martin,
2016: 150, 157).28 The pîrs command a large network of devotees, which explains why they are
actively coveted by politicians and why there is a deep connection between Sufism and politics
(Malik and Malik, 2017). Interestingly, a recent study (Malik and Mirza, 2018) shows that areas
28 Today, the material success of pîrs possibly casts doubt on their religious legitimacy among common
people. According to Martin (2016), the latter see them as hypocrites, more interested in their Lexus
Land Cruisers and suburban homes than in people’s welfare. They are perceived as exploiting their
position to extract rents, pray for the sake of showing off, preach Islam while they themselves drink,
frequent prostitutes, steal government money, and protect smugglers and thieves. This is a far cry from
the ascetic behavior of the original Sufi masters (pp. 157-8, 163).

38
with a greater concentration of shrines experienced a substantially retarded growth in literacy
over the long run. The explanation adduced by the authors is that, being more wary of modern
education that can undermine their power, the pîrs suppressed its expansion in the areas under
their control. This explanation obviously echoes our previous discussion under Subsection 7.1.
It is important to emphasize that some of these categories are overlapping: for example, the
shrine dynasts are invariably also members of landed gentry, and many of them actually entered
into electoral races during colonial rule. In addition to their family background, the composition
of dynasts is also described in terms of their occupational status (e.g., agriculture, business,
public administration, etc.). The occupation categories are ascribed to individual contestants
rather than families. All the required information has been obtained through detailed searches,
based on a wide variety of sources, into the characteristics of close election winners and losers
and their families. Note that unlike the status categories, occupational categories are mutually
exclusive so that an occupation indicates the main activity of a politician.
Tables 11 and 12 display the distributions of entrenched dynasts and non-dynasts, across
status and occupation, distinguishing between NA and PA elections. The tables aggregate data
from 2002, 2008 and 2013 elections, and distinguish between different definitions of what
makes a dynast or a non-dynast. From the comparison of the two tables, several striking results
emerge.
First, a majority of legislators are zamindars, whether dynasts or non-dynasts and whether
we adopt our definition of dynasts (≥11 tenures) or an even more stringent one (≥13 tenures):
this is the case for 85% and more of the entrenched dynasts and for more than 70% of the non-
dynasts.29 This lack of substantial difference is the result of the fact that the zamindar category
is heterogeneous in the sense that it encompasses both large and medium-sized landed families.
Unfortunately, we do not have precise data on land-ownership size that would enable us to
make the necessary distinctions. Zamindar dynasts generally come from well-established
landed aristocracies (the ‘bade zamindars’ mentioned in Section 3) while, as we can judge from
a careful look at the names of the families, the non-dynast zamindars are typically middle-level
agriculturists many of whom are members of the upper peasantry (a “gentry”).
Second, there is a marked difference in the representation of historical families between
dynasts and non-dynasts. Thus, about two-thirds of the dynasts come from historic families if
29 To have held 13 tenures actually means that the family has been continuously in power since the start
of the independence period.

39
we adopt the 11-tenure definition of dynastic power and the proportion is even higher (85-90%)
if we adopt the 13-tenure definition. By contrast, the representation of historic families among
non-dynasts amounts to hardly 3%, regardless of the definition used and whether we consider
NA or PA seats. The same pattern is observed for religious authorities (shrine guardians):
whereas close to one-third of the dynasts belong to religious families according to the 11-tenure
definition, and even more (38-42%) if we use the 13-tenure definition, the corresponding
proportions for non-dynasts are of the order of 10% for the NA and only 3% for the PA. Clearly,
in Punjab, an overwhelming majority of entrenched dynasts come from old landlord families,
some of whom also claim shrine-based religious authority.
Third, turning to the lower half of Tables 11 and 12, we detect another stark contrast
between dynasts and non-dynasts: while the former are pre-dominantly engaged in agriculture,
this is not the case for the latter. At least 85% of the dynasts are involved in agricultural
activities as compared to about 60% for the non-dynasts. Business comes second as the most
important occupation among non-dynasts, since about one-fourth of them are business people
(compared to a maximum of 9% for dynasts). Moreover, when we look at correlations between
status and occupation for dynasts (see Appendix Table A2), we find that the zamindar,
historical, and shrine families are significantly associated with agriculture. As expected, the
correlation between status and occupation (agriculture) is especially strong for zamindar
families. Also, as expected, there is a significant correlation between historic and religious
families. The picture is somewhat different when we look at the correlations for non-dynasts
(see Appendix Table A3). There is now a significantly negative correlation between belonging
to a zamindar or a shrine guardian family (or even a historic family) and involvement in
business. Also, the correlation between belonging to a historic family and involvement in
agriculture is now much lower, and the same holds true for shrine families.
To summarize, political dynasties in Punjab essentially consist of traditional landed elites
with aristocratic claims, thus confirming the view that landed power remains the mainstay of
the economic and political power in rural Punjab (see, e.g., Javid, 2012: Chap. 5-6). They thus
continue to be a pivotal basis of support for the government and the powerful military who
continue to play an outsized role in the country’s politics.

40
7.3 Looking for quantitative evidence: the second task
CONTROLLING FOR FAMILY TYPE
Given the strong correlation between entrenched dynasticism and traditional family
background, we need to verify that the latter is not a confounder in our analysis. To test for a
possible confounding effect of dynasticism, we re-estimate our basic regressions by adding
family profile to the list of covariates, and check whether the coefficients of the original
explanatory variable (dynasticism) remains significant. The results for growth in night time
luminosity are presented in Table 6 where in addition to controlling for the personal power of
the winning candidate we also control for his (or her) shrine, historic and business status. The
results show that the coefficient of the dynastic variable remains highly significant and retains
the same sign and about the same magnitude as in the main regression.
We carry out the same test of robustness to the family status of the winner for our other
development outcomes (asset index, educational attendance and road density). Controlling for
whether the winner comes from a traditional family also maintains the basic pattern of results
for these other development outcomes. We have not shown these results in the paper, but they
are available upon request. Overall, the effect of dynastic power remains robust to controlling
for the winner family’s traditional status.
To further reinforce our results, we conduct a formal continuity-based analysis for pre-
determined candidate characteristics, as is the standard practice in close elections RD designs.
The outcome variable is a demographic or political characteristic of the winning candidate
during the period 2002 to 2013. Here, we consider several possibly pre-determined
characteristics picked up by separate indicators for whether or not a candidate is affiliated with:
a religious shrine, historically-influential family, or business. The final two outcomes are the
number of past elections won or contested. Our sample compares union councils located in
constituencies where a dynast narrowly won over union councils in constituencies where a
dynast narrowly lost. Results for this exercise are reported in Table 13. Consistent with the
evidence furnished above, we do not find evidence of a significant discontinuity in any of the
above five candidate characteristics. This is indicated by high p-values and the inclusion of zero
in confidence intervals.
Another empirical exercise consists of estimating the influence of family profile on
luminosity growth irrespective of whether the legislator is a dynast or not. We can then compare

41
these results with our baseline model where the explanatory variable is a dynastic legislator.30
As the results in Table 14 show, family profile does not appear as a powerful predictor of
development outcomes. Thus, the coefficients of the family profile variables are statistically
insignificant in all specifications. The same conclusion is reached for the asset index and also
for educational attendance as can be seen in Table 15. Finally, the effect on road density is
highly significant whichever way family type is defined, and the size of the effect is particularly
large for religious families. The latter result is broadly in line with the effects found for
entrenched dynasts in the sense that the impact on road density is generally positive, even
though the coefficient may be statistically insignificant. We have explained earlier why the
impact on road density differs from the impact on other development outcomes.
To sum up, although there is a significant correlation between dynasticism and family
background, the two effects are not completely replaceable or substitutable. Accounting for the
winner’s family status does not cancel out the effect of dynasticism. In general, the effect of
entrenched political families that make up our dynastic measure is stronger and more consistent
than the effect of traditional families alone. The emphasis put by social scientists on family
background characteristics of dynastic legislators is not misplaced, yet it conceals the even more
important role played by entrenched dynasticism. This conclusion is actually suggested by the
presence of shrine and historic families among the non-dynastic category. The following
question then arises: are members of these families to be considered as willing or would-be
dynasts who do not adopt anti-development strategies as long as their political power has not
become sufficiently entrenched, or are they leaders who are not on the trajectory to becoming
dynasts?
To answer that question, we look at the political histories of non-dynastic families with a
view to assessing whether they have recently won a series of consecutive tenures. If this is the
case, we can presume that these families are on their way to becoming entrenched dynasties in
the near or proximate future: in other words, they are would-be dynasts. If, on the other hand,
election victories are sparse or are rather frequent but scattered, we draw the opposite
30 It would be useful to investigate if the effect of dynasticism on development differs according to
whether the dynast belongs to the shrine gentry or the larger historic category. This would entail carrying
out a heterogeneity analysis that would apply our original close elections RD approach to subsamples
differentiated according to the family background of the close winner. Unfortunately, such an attempt
proved unsuccessful. The problem comes from the fact that there are very few constituencies that are
classified as "traditional" or "non-traditional" where we have the dynast and the non-dynast holding the
top two positions.30 We therefore lack power and no sensible results can be obtained.
42
conclusion. Once would-be dynasts are identified, we check whether they tend to belong to
traditional elite families.
What we find is that very few of the families with recent consecutive wins are traditional.
Furthermore, majority of non-dynasts do not meet our definition of willing dynasts. This is true
even when we loosen the definition, for example by defining as willing dynasts not only
families with three consecutive wins during the last three elections but also those with three
consecutive wins during the last four elections, and even those with three wins during the last
four elections, whether consecutive or not (results not shown). These observations suggest that
traditional families dominating politics in Punjab have occupied the centre stage since quite
some time. Few political dynasties are on the making, especially if attention is limited to
families belonging to the traditional elite.
Because most non-dynastic traditional families involved in politics do not appear to be on
track to reach entrenched power, we may infer that the vertical organization at their command
is not strong enough for the purpose, or their representatives lack leadership qualities and other
skills required to make it an effective political machine. Conversely, in order to become
entrenched dynasties and produce adverse effects on local development, representatives of
traditional elite families must wield effective control of a hierarchical patronage organization
strong enough to win over political competitors. It is in this sense that the conjunction of
entrenched dynasticism and traditional family background retards development. Finally, the
fact that not many families with relatively low numbers of electoral wins seem to be on their
way to become political dynasties suggests that they are exposed to intense competition. We
will exploit this finding in our tentative, indirect test of Acemoglu-Robinson’s political theory
of economic backwardness, to which we now turn our attention.
DIRECTLY MEASURING THE EFFECT OF COMPETITION
In order to assess the effect of competition, we can compare the developmental effect of
winning dynasts who won an election by a close margin to the effect attributable to dynasts
who won by a comfortable margin. It bears emphasis that by expanding the margin of victory
we are effectively departing from the close elections setup. Thus, we cannot claim causality
and, strictly speaking, the results should be interpreted as correlations. As seen from Table 16,
the size of the (absolute) value of the coefficient measuring the impact of entrenched dynastic
power on variations in night lights continuously decreases: from -0.164 for the optimal MSE,
to -0.127 for a 20% bandwidth, -0.084 for a 30% bandwidth, -0.061 for a 40% bandwidth, and

43
-0.049 for a 50% bandwidth. This seems to support Acemoglu-Robinson’s political theory of
economic backwardness, according to which dynasts should be less inclined to adopt anti-
development strategies when they are more assured of their power. In the present exercise, this
assurance is proxied by the margin of victory over the runner-up in the elections.
To have a complete picture of the way our results match the predictions of A-R’s theory,
we must add that the situation of non-dynastic close winners plausibly corresponds to the
situation of intense competition depicted by its authors. In line with their predictions, the impact
of this category of winners on local development is positive. Table 17 summarizes our results
when they are thus situated in the framework of A-R’s theory, thus proposing a tentative test of
the same.
Table 17: Comparing our results to the predictions of Acemoglu-Robinson’s political theory of
economic backwardness
Situations defined by
Acemoglu-Robinson
Situations defined in this
paper
Outcome: predictions
of A-R
Outcome: our
findings
Intense competition Non-dynastic close winners Pro-development Pro-development
(relatively)
Semi-entrenched
elite
(Entrenched) dynastic close
winners
Anti-development Anti-development
(relatively)
Power monopoly Winners by a wide margin Pro-development Weakly anti-
development
Finally, analogously with what we have done before for non-dynasts, we can approach the
problem of political competition by going through the individual political histories of
(entrenched) dynastic families. The idea is to figure out whether they are characterized by more
or less consecutive election wins. Using the dynastic family as the unit of observation, we find
that the correlation coefficient between the average number of consecutive tenures and the total
number of tenures is 0.39 while the correlation coefficient between the maximum number of
consecutive tenures and the total number of tenures is as high as 0.59.31 Moreover, it is
interesting to note that when a series of consecutive wins is not observed, the breaks, whether
due to losing an election or not participating in it (unfortunately, we cannot always distinguish
between the two), are rather few and always spread out (results not shown). As this evidence
31 Thus, if a family has won 3 consecutive tenures followed by 2 electoral defeats, themselves followed
by 5 consecutive wins, the average number of consecutive wins is 4, and the maximum of consecutive
wins is 5.

44
strongly suggests, entrenched dynasties are families that have not only been long established in
Punjab’s politics, but also almost continuously active. Such conclusion, even if put in the
context of close elections outcomes, tends to support the hypothesis underpinning our indirect
test of A-R’s theory: because entrenched dynastic families benefit from considerable
advantages derived from a long and persisting presence on the political stage, they are better
considered as falling in an intermediate situation between power monopoly and full-fledged
competition, i.e., what A-R describe as “semi-entrenched” dynasticism.
8. Conclusion
When legislators are distinguished on the basis of the longevity of the period during which
their family has been in power, dynasts appear to have a significantly worse local development
impact than non-dynasts. This conclusion also holds when the effect of entrenched personal
power, which measures the incumbency advantage of the individual election winners, is
controlled for. Yet, it does not hold any more when the dynastic politician has won an election
comfortably rather than by a close margin. Moreover, an overwhelming majority of entrenched
dynasts come from historic big landlord families, including religious families headed by Sufi
masters who guard local shrines, and many of them have had a continuous, or almost continuous
presence in Punjab’s politics. The question then naturally arises as to whether bad development
outcomes are to be attributed to the intrinsic characteristics of these old families rather than to
their dynastic presence on the political scene. This interpretation is strongly suggested by the
social science literature dealing with micro-level political realities in Pakistan, and in the Punjab
province in particular. However, when the family profile of the dynasts and the non-dynasts is
controlled for, the effect of dynastic power unambiguously persists. Dynasticism thus seems to
have adverse effects on development regardless of the family characteristics of the legislators.
To account for these different findings, we must bear in mind that the political context is
one of competitive clientelism and two main types of clientelistic ties schematically prevail.
One type, reactionary, is based on a vertical patronage organization in which the clients’
physical and economic security is highly dependent upon the economic power of their political
patrons. In the other, more progressive type, the relatively horizontal ties of extended families
or clans dominate and the role of the patrons consists more of enhancing, rather than protecting,
the livelihoods of the clients. With the help of the political theory of economic backwardness
of Acemoglu and Robinson (2006b), we attempt to build up an interpretative story that fits both
45
the socio-anthropological literature and our own results. In conditions where members of
entrenched dynastic families win comfortable victories, presumably reflecting conditions in
which their political power is well assured, they do not adopt anti-development strategies. By
contrast, when their victories are close and they do not feel as secure in their holding of power,
they deliberately seek to block development-promoting initiatives. Practically, in conditions
where, albeit entrenched, they are exposed to serious political competition, they tend to
mobilize their vertical, rent-extracting patronage organization with a view to undermining
challenges to their economic and political power. This interpretation, it must be stressed, is not
equivalent to the usual account of the negative effects of dynastic power, such as found in
George (2019): rather than relaxing their efforts, (descendant) dynasts redirect them toward
socially harmful tasks.

46
References
Acemoglu, D., and Robinson, J.A., 2006a. “De Facto Political Power and Institutional
Persistence”, American Economic Review, 96(2), pp. 325-330.
Acemoglu, D., and Robinson, J.A., 2006b. “Economic Backwardness in Political Perspective”.
American Political Science Review, 100(1), pp. 115-131.
Acemoglu, D., and Robinson, J.A., 2008a. “Persistence of Power, Elites, and Institutions”,
American Economic Review, 98(1), pp. 267-293.
Acemoglu, D., and Robinson, J.A., 2008b. “The Persistence and Change of Institutions in the
Americas”, Southern Economic Journal, 75(2), pp. 282-299.
Acemoglu, D., Reed, T., and Robinson, J.A., 2014. “Chiefs: Economic Development and Elite
Control of Civil Society in Sierra Leone”, Journal of Political Economy, 122(2), pp. 319-368.
Ali, A., 2016. “Do Political Dynasties Hinder Development? Evidence From a Natural
Disaster”. International Growth Centre (ICG) Working Paper S-89207-PAK-1.
Ali, I., 2004. “Historical Impacts on Political Economy in Pakistan”. Asian Journal of
Management Cases, 1(2), pp. 129-146.
Armytage, R., 2019. “An Evolving Class Structure? Pakistan’s Ruling Elites and the
Implications for Pakistan’s Political Economy”. In Macartney, M., and Zaidi, S.A. (Eds),
New Perspectives on Pakistan’s Political Economy: State, Class and Social Change. Chap.
7, pp. 153-175.
Asako, Y., Iida, T., Matsubayashi, T., and Ueda, M., 2015. “Dynastic Politicians: Theory and
Evidence from Japan”, Japanese Journal of Political Science, 16(1), pp. 5-32.
Banerjee, A., Iyer, L., and Somanathan, R., 2005. “History, Social Divisions, and Public Goods
in Rural India”. Journal of the European Economic Association, 3(2-3), pp. 639-647.
Bardhan, P., and Mookherjee, D., 2012. “Political Clientelism-cum-Capture: Theory and
Evidence from West Bengal”, Working Paper, Institute for Economic Development,
Boston University.
Bardhan, P., and Mookherjee, D., 2020. “Clientelistic Politics and Economic Development”.
In: Baland, J.M., Bourguignon, F., Platteau, J.P., and Verdier, T. (Eds.). The Handbook of
Economic Development and Institutions. Princeton & Oxford: Princeton University Press,
pp. 84-102.
Bardhan, P., Mitra, S., Mookherjee, D., and Nath, A., 2020. “How Do Voters Respond to
Welfare vis-a-vis Infrastructure Programs? Evidence for Clientelism in West Bengal”.
Mimeo.
Besley, T., 2005. “Political Selection”. Journal of Economic Perspectives, 19(3), pp. 43-60.
Besley, T., and Reynal-Querol, M., 2017. “The Logic of Hereditary Rule: Theory and
Evidence”. Journal of Economic Growth, 22, pp. 123-144.

47
Bourguignon, F. and Verdier, T., 2000. “Oligarchy, Democracy, Inequality and Growth”.
Journal of Development Economics, 62 (August), pp. 285-313.
Cheema., A., Khwaja, A.I., and Qadir, A., 2005. “Decentralization in Pakistan: Context,
Content and Causes”. Faculty Research Working Papers Series, RWP05-034, Harvard
University, John F. Kennedy School of Government.
Cheema, A., Javid, H., and Naseer, M.F., 2013. “Dynastic Politics in Punjab: Facts, Myths and
their Implications”. Institute of Development and Economic Alternatives, Working Paper
No 01-13.
Cheema, A., Mohmand, S.K., and Patnam, M., 2009. “Colonial Proprietary Elites and
Institutions: The Persistence of De Facto Political Dominance”. Mimeo.
Cruz, C., Labonne, J., and Querubin, P., 2017. “Politician Family Networks and Electoral
Outcomes”. American Economic Review, 107(10), pp. 3006-3037.
Cruz, C., Labonne, J. and Querubin, P., 2020. “Social Network Structures and the Politics of
Public Goods Provision: Evidence from the Philippines”. American Political Science
Review, pp. 1-16.
Dal Bo, E., Dal Bo, P., and Snyder, J., 2009. “Political Dynasties”. Review of Economic Studies,
76, pp. 115-142.
Easterly, W., 2003. “The Political Economy of Growth without Development: A Case Study of
Pakistan”. In Rodrick, D. (Ed.), In Search of Prosperity: Analytical Narratives on
Economic Growth. Princeton, N.J.: Princeton University Press, pp. 439-472.
Fafchamps, M., 2016. “Family Networks and Distributive Politics”. Working Paper No 11245,
Center for Economic Policy Research, Washington, DC.
Fafchamps, M. And Labonne, J., 2019. “Family Networks and Distributive Politics”. Journal
of the European Economic Association, 18(4), pp. 1697-1725.
Ferraz, C., Finan, F., and Martinez-Bravo, M., 2020. “Political Power, Elite Control, and Long-
Run Development: Evidence from Brazil”. Mimeo.
Gazdar, H., 2000. “State, Community, and Universal Education: A Political Economy of Public
Schooling in Rural Pakistan”. Asia Research Centre and London School of Economics,
draft paper.
George, S.E., 2019. “Like Father, Like Son? The Effect of Political Dynasties on Economic
Development”. Mimeo.
Gethin, A., Mehmood; S., and Piketty, T., 2020. “Social Inequality and the Dynamics of
Political and Ethnolinguistic Divides in Pakistan, 1970-2018”. World Inequality Lab
Working Paper No 2020/16.
Geys, B., and D.M. Smith, 2017. “Political Dynasties in Democracies: Causes, Consequences
and Remaining Puzzles”. Economic Journal, 127, pp. F446-F454.
Hasnain, Z., 2008. “The Politics of Service Delivery in Pakistan: Political Parties and the
Incentive for Patronage, 1988-1999”. The Pakistan Development Review, 47(2), pp. 129-
151.
48
Jan, M.A., 2019. “The Segmented ‘Rural Elite’: Agrarian Transformation and Rural Politics in
Pakistani Punjab”. In Macartney, M., and Zaidi, S.A. (Eds). New Perspectives on
Pakistan’s Political Economy: State, Class and Social Change. Chap. 8, pp. 176-198.
Kaufmann, D., M. Mastruzzi, and D. Zavaleta, 2003. “Sustained Macroeconomic Reforms,
Tepid Growth: A Governance Puzzle in Bolivia?”. In Rodrick, D. (Ed.), In Search of
Prosperity: Analytical Narratives on Economic Growth, Princeton, NJ: Princeton
University Press, Chap. 12, pp. 334-398.
Lizzeri, A., and Persico, N., 2004. “Why Did the Elites Extend the Suffrage? Democracy and
the Scope of Government, with an Application to Britain’s ‘Age of Reform’”. Quarterly
Journal of Economics, 119(2), pp. 707-765.
Lyon, S., 2019. Political Kinship in Pakistan: Descent, Marriage, and Government Stability.
Cambridge: Cambridge University Press.
Malik, R., 2019. “(A)Political Constituency Development Funds: Evidence from Pakistan”.
British Journal of Political Science, pp. 1-18.
Malik, A., and Malik, T., 2017. “Pirs and Politics in Punjab”, Modern Asian Studies, 51(6), pp.
1818-1861.
Malik, A., and Mirza, R., 2018. “Pre-colonial Religious Institutions and Development:
Evidence through a Military Coup”, Working Paper, Centre for the Study of African
Economies (CSAE), University of Oxford.
Martin, N., 2016. Politics, Landlords and Islam in Pakistan. London & New York: Routledge.
Mohmand, S.K., 2019. Crafty Oligarchs, Savvy Voters: Democracy Under Inequality in Rural
Pakistan. Cambridge: Cambridge University Press.
Olken, B.A., 2007. “Monitoring Corruption: Evidence from a Field Experiment”, Journal of
Political Economy, 115(2), pp. 200-249.
Prakash, N., Rockmore, M., and Uppal, Y., 2019. “Do Criminally Accused Politicians Affect
Economic Outcomes? Evidence from India?”, Journal of Development Economics, 141,
pp.
Robinson, J.A., and Verdier, T. 2013. “The Political Economy of Clientelism”, Scandinavian
Journal of Economics, 115(2), pp. 260-291.
Querubin, P., 2012. “Political Reform and Elite Persistence: Term Limits and Political
Dynasties in the Philippines”. Mimeo.
Querubin, P., 2016. “Family and Politics: Dynastic Persistence in the Philippines”. Quarterly
Journal of Political Science, 11(2), pp. 151-181.
Sarkar, S., 2014. “Clientelism, Contagious Voting and Quality of Electoral Institutions”.
Working Paper, Economics Research Unit, Indian Statistical Institute, Kolkata.
Sarkar, S., 2019. “Votes and Policies: Evidence from Close Elections in India”. Mimeo.
Scott, J., 1976. The Moral Economy of the Peasant. New Haven & London: Yale University
Press.

49
Wilder, A., 2009. “The Politics of Civil Service Reform in Pakistan”. Journal of International
Affairs, 63(1), pp. 19-37.
Wilfahrt, M., 2018. “Precolonial Legacies and Institutional Congruence in Public Goods
Delivery: Evidence from Decentralized West Africa”. World Politics, 70(2), pp. 239-274.
Yadav, V., “Political Families and Support for Democracy in Pakistan”. Asian Survey, 60(6),
pp. 1044-1071.
Zahab. M. A., 2020. Pakistan: A Kaleidoscope of Islam. London: Hurst Publishers
Zaidi, S.A., 2005. “State, Military and Social Transition: Improbable Future of Democracy in
Pakistan”. Economic and Political Weekly, December Issue, pp. 5173-5181.
Ziring, L., 1988. “Public Policy Dilemmas and Pakistan’s Nationality Problem: The Legacy of
Zia ul-Haq”. Asian Survey, 28(8), pp. 795-812.

50
Figure 1: A timeline of elections, 1921-2018

51
Figure 2: Dynastic profile of the Legharis of Dera Ghazi Khan
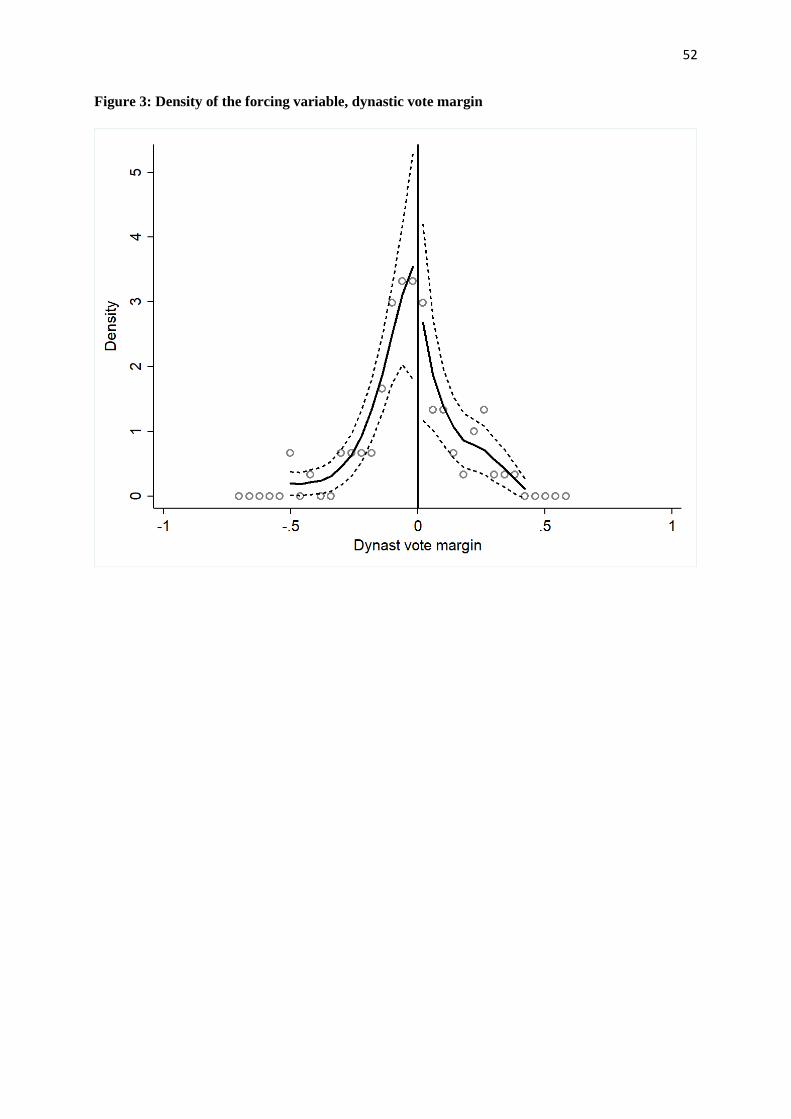
52
Figure 3: Density of the forcing variable, dynastic vote margin

53
Figure 4: Luminosity growth and dynastic vote margin
Panel (a)
Panel (b)

54
Figure 5: Proportion of households that never attended school and dynastic vote margin
Panel (a)
Panel (b)

55
Figure 6: Household-level asset ownership index and dynastic vote margin
Panel (a)
Panel (b)
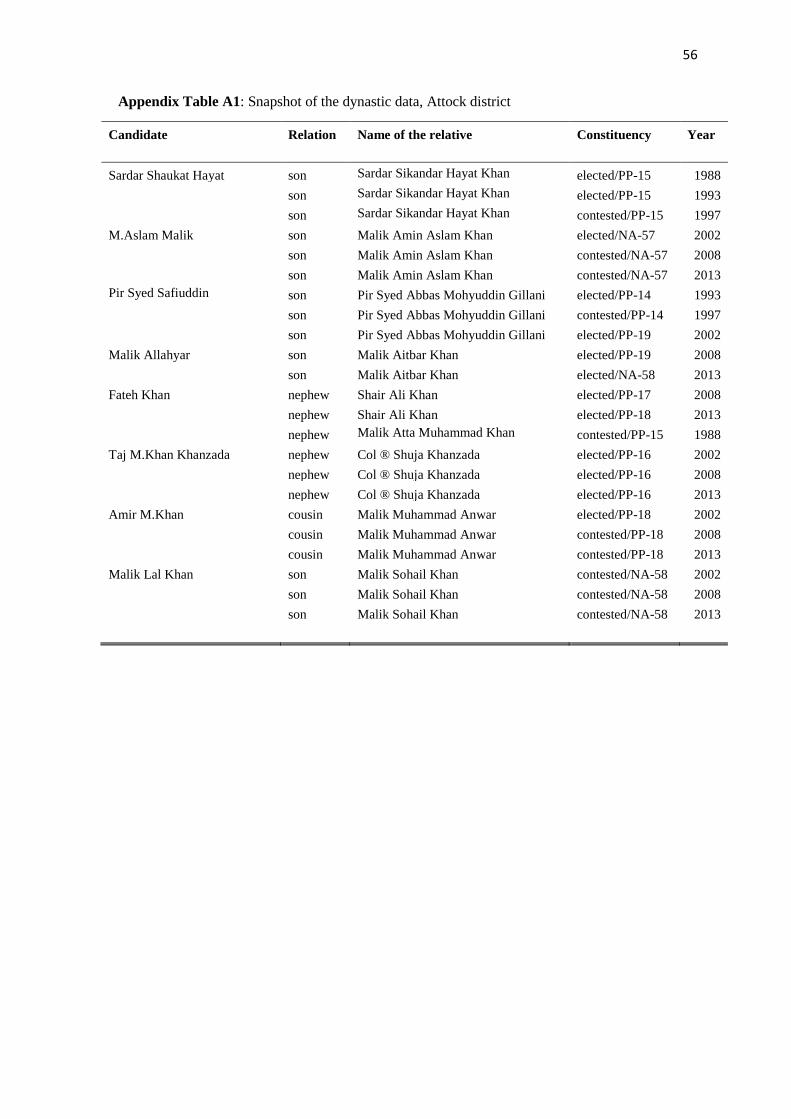
56
Appendix Table A1: Snapshot of the dynastic data, Attock district
Candidate Relation Name of the relative Constituency Year
Sardar Shaukat Hayat son Sardar Sikandar Hayat Khan elected/PP-15 1988
son Sardar Sikandar Hayat Khan elected/PP-15 1993
son Sardar Sikandar Hayat Khan contested/PP-15 1997
M.Aslam Malik son Malik Amin Aslam Khan elected/NA-57 2002
son Malik Amin Aslam Khan contested/NA-57 2008
son Malik Amin Aslam Khan contested/NA-57 2013
Pir Syed Safiuddin son Pir Syed Abbas Mohyuddin Gillani elected/PP-14 1993
son Pir Syed Abbas Mohyuddin Gillani contested/PP-14 1997
son Pir Syed Abbas Mohyuddin Gillani elected/PP-19 2002
Malik Allahyar son Malik Aitbar Khan elected/PP-19 2008
son Malik Aitbar Khan elected/NA-58 2013
Fateh Khan nephew Shair Ali Khan elected/PP-17 2008
nephew Shair Ali Khan elected/PP-18 2013
nephew Malik Atta Muhammad Khan contested/PP-15 1988
Taj M.Khan Khanzada nephew Col ® Shuja Khanzada elected/PP-16 2002
nephew Col ® Shuja Khanzada elected/PP-16 2008
nephew Col ® Shuja Khanzada elected/PP-16 2013
Amir M.Khan cousin Malik Muhammad Anwar elected/PP-18 2002
cousin Malik Muhammad Anwar contested/PP-18 2008
cousin Malik Muhammad Anwar contested/PP-18 2013
Malik Lal Khan son Malik Sohail Khan contested/NA-58 2002
son Malik Sohail Khan contested/NA-58 2008
son Malik Sohail Khan contested/NA-58 2013
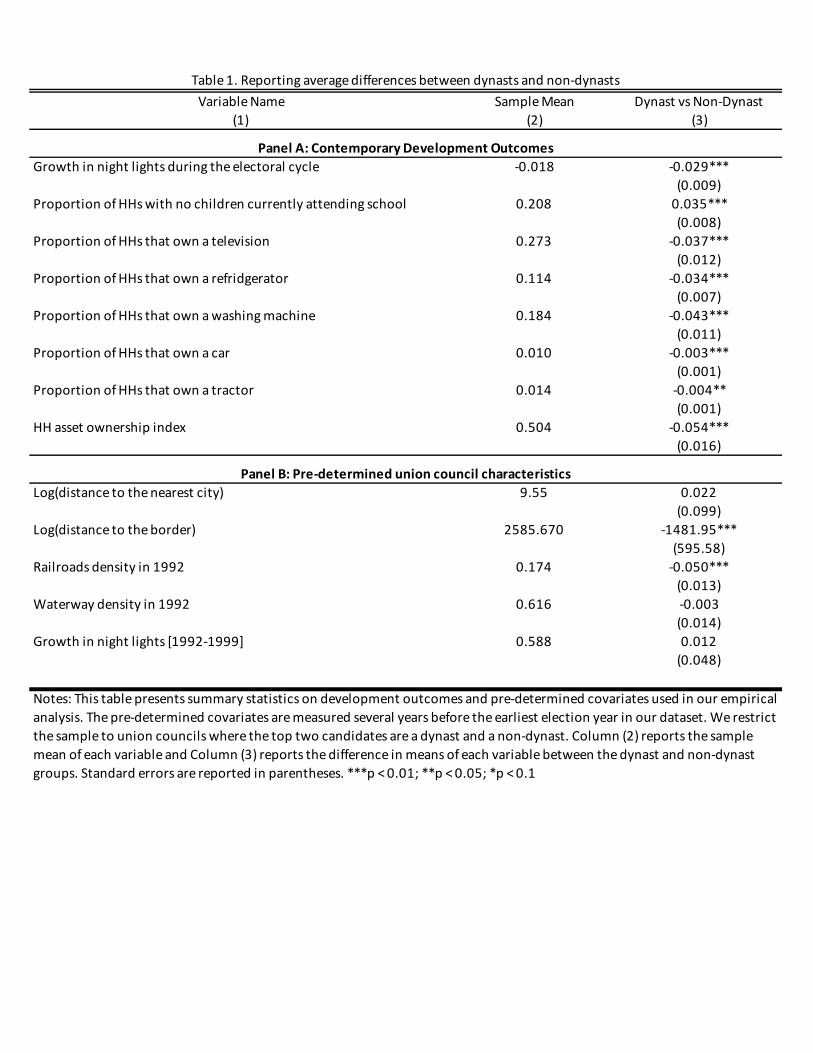
Variable Name Sample Mean Dynast vs Non-Dynast(1) (2) (3)
Growth in night lights during the electoral cycle -0.018 -0.029***(0.009)
Proportion of HHs with no children currently attending school 0.208 0.035***(0.008)
Proportion of HHs that own a television 0.273 -0.037***(0.012)
Proportion of HHs that own a refridgerator 0.114 -0.034***(0.007)
Proportion of HHs that own a washing machine 0.184 -0.043***(0.011)
Proportion of HHs that own a car 0.010 -0.003***(0.001)
Proportion of HHs that own a tractor 0.014 -0.004**(0.001)
HH asset ownership index 0.504 -0.054***(0.016)
Log(distance to the nearest city) 9.55 0.022(0.099)
Log(distance to the border) 2585.670 -1481.95***(595.58)
Railroads density in 1992 0.174 -0.050***(0.013)
Waterway density in 1992 0.616 -0.003(0.014)
Growth in night lights [1992-1999] 0.588 0.012(0.048)
Table 1. Reporting average differences between dynasts and non-dynasts
Panel A: Contemporary Development Outcomes
Panel B: Pre-determined union council characteristics
Notes: This table presents summary statistics on development outcomes and pre-determined covariates used in our empirical analysis. The pre-determined covariates are measured several years before the earliest election year in our dataset. We restrict the sample to union councils where the top two candidates are a dynast and a non-dynast. Column (2) reports the sample mean of each variable and Column (3) reports the difference in means of each variable between the dynast and non-dynast groups. Standard errors are reported in parentheses. ***p < 0.01; **p < 0.05; *p < 0.1

p-value Conf. Int.
(1) (2) (3) (4) (5)
log(distance to the nearest city) 0.090 0.228 0.596 [-0.5155, 0.8976] 1641
log(distance to the border) 0.074 0.094 0.758 [-0.6021, 0.8263] 1340
railroads density in 1992 0.098 -0.009 0.369 [-0.0345, 0.0128] 1776
waterway density in 1992 0.076 0.043 0.309 [-0.0376, 0.1187] 1373
night lights growth 1992-2002 0.079 0.127 0.506 [-0.2035, 0.4127] 1396
personal power index 0.076 -2.894 0.283 [-7.8943, 2.3063] 1377
McCrary CJM
(1) (2)
T-stat -1.12 0.37
p-value 0.28 0.71
Table 3. Tests for discontinuity in the running variable at the threshold
Notes: The 'McCrary' column reports the results of the McCrary (2008)
manipulation test; the 'CJM' column reports results of the Cattaneo et al. (2017)
test. Both procedures test the null hypothesis of a discontinuity in the distribution
of the running variable (dynastic margin) at the cutoff.
Eff. Number of
Observations
Table 2. Formal continuity-based analysis for pre-determined UC characteristics
Robust Inference
Notes: All outcomes are measured prior to the earliest election in our dataset (i.e. 2002) and can therefore be considered as pre-determined. For each
outcome variable, the specifications provide ‘conventional’ estimates using the RD Robust Package in STATA. Bandwidths were selected using the CERRD-
Optimal option of the RD Robust Package in STATA. The procedure for selecting the optimal bandwidth is as suggested in Calonico et al. (2018). Standard
errors, clustered at the subdistrict level, are reported in parentheses. ***p < 0.01; **p < 0.05; *p < 0.1
CERRD-Optimal
BandwidthRD Estimator
Variable

(1) (2) (3) (4)
Dynastic legislator -0.16839* -0.18272*** -0.28466*** -0.16409**
(0.13749) (0.13697) (0.13981) (0.07868)
N 3515 3515 3515 3515
RD bandwidth 7% 5% 3% MSE-Optimal
Specification Local linear Local linear Local linear Local linear
No children currently attendingAsset Index Log (Road Density)
(1) (2) (3)
Dynastic legislator 0.11381** -0.21169** -0.523
(0.06468) (0.11355) (1.1181)
N 1402 1402 1402
RD bandwidth MSE-Optimal MSE-Optimal MSE-Optimal
Specification Local linear Local linear Local linear
Notes: The table estimates the specification Yi = α + βDynast win i + f (Dynast margin i) + γXi + εit. The outcome
variable Yi is growth in night time luminosity during the electoral term in which a candidate is elected (eg. between
2008 and 2013 for a candidate elected in 2008 for a 5 year term). The sample compares union councils located in
constituencies where a dynast narrowly won to union councils in constituencies where a dynast narrowly lost. We
report conventional estimates using the RD Robust Package in STATA. In Columns (1) to (3) we impose bandwidths of
7%, 5% and 3%, respectively. Column (4) imposes a bandwidth that was selected using the MSE-Optimal option of
the RD Robust Package in STATA. All specifications include the following pre-determined covariates as controls:
log(distance to the nearest city), log(distance to the border), railroads density in 1992, waterway density in 1992 and
night lights growth in the period 1992-1999. Standard errors, clustered at the constituency level, are reported in
parentheses. ***p < 0.01; **p < 0.05; *p < 0.1
Table 4. Effect of dynastic power on growth in night time luminosity
Depvar: union council level night lights growth
Table 5. Effect of dynastic power on other outcomes
Notes: The table estimates the specification Yi = α + βDynast win i + f (Dynast margin i) + γXi +
εit. The outcome variables Yi are different contemporary outcomes measured at a single point
in time (i.e. 2013). The sample compares union councils located in constituencies where a
dynast narrowly won to union councils in constituencies where a dynast narrowly lost. We
report conventional estimates using the RD Robust Package in STATA. All columns impose a
bandwidth that was selected using the MSE-Optimal option of the RD Robust Package in
STATA. All specifications include the following pre-determined covariates as controls:
log(distance to the nearest city), log(distance to the border), railroads density in 1992,
waterway density in 1992 and night lights growth in the period 1992-1999. Standard errors,
clustered at the constituency level, are reported in parentheses. ***p < 0.01; **p < 0.05; *p <
0.1
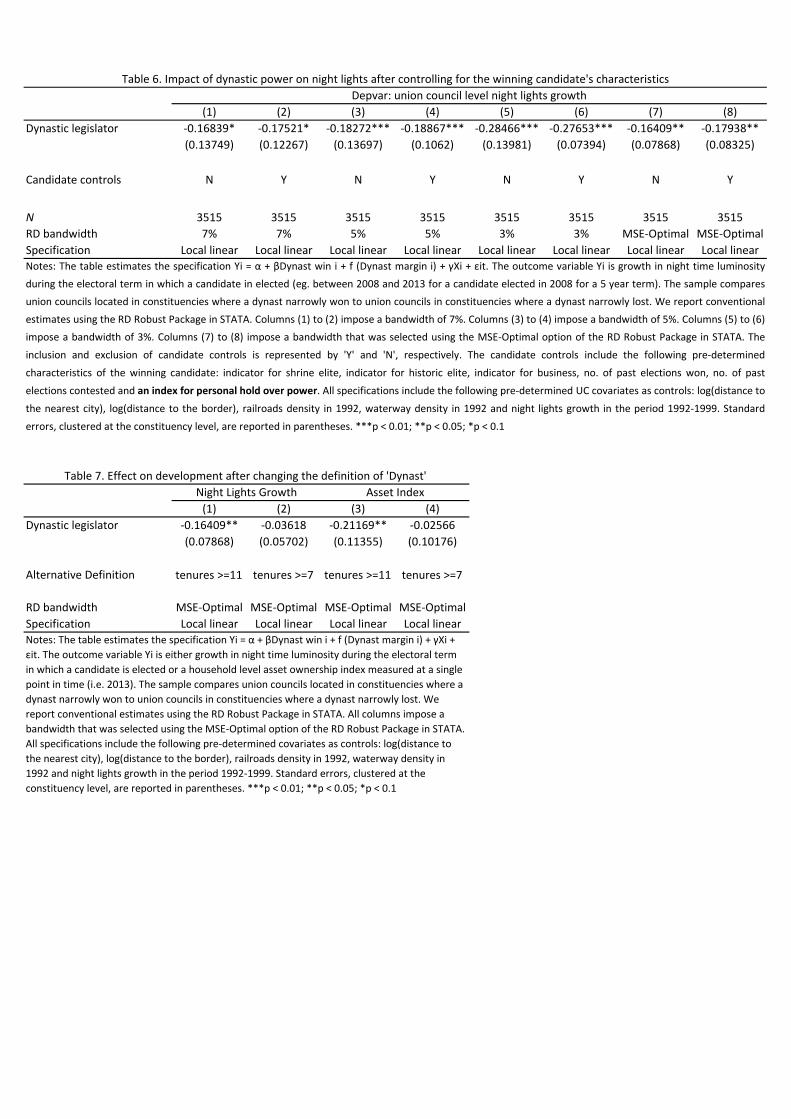
(1) (2) (3) (4) (5) (6) (7) (8)
Dynastic legislator -0.16839* -0.17521* -0.18272*** -0.18867*** -0.28466*** -0.27653*** -0.16409** -0.17938**
(0.13749) (0.12267) (0.13697) (0.1062) (0.13981) (0.07394) (0.07868) (0.08325)
Candidate controls N Y N Y N Y N Y
N 3515 3515 3515 3515 3515 3515 3515 3515
RD bandwidth 7% 7% 5% 5% 3% 3% MSE-Optimal MSE-Optimal
Specification Local linear Local linear Local linear Local linear Local linear Local linear Local linear Local linear
(1) (2) (3) (4)
Dynastic legislator -0.16409** -0.03618 -0.21169** -0.02566
(0.07868) (0.05702) (0.11355) (0.10176)
Alternative Definition tenures >=11 tenures >=7 tenures >=11 tenures >=7
RD bandwidth MSE-Optimal MSE-Optimal MSE-Optimal MSE-Optimal
Specification Local linear Local linear Local linear Local linear
Notes: The table estimates the specification Yi = α + βDynast win i + f (Dynast margin i) + γXi +
εit. The outcome variable Yi is either growth in night time luminosity during the electoral term
in which a candidate is elected or a household level asset ownership index measured at a single
point in time (i.e. 2013). The sample compares union councils located in constituencies where a
dynast narrowly won to union councils in constituencies where a dynast narrowly lost. We
report conventional estimates using the RD Robust Package in STATA. All columns impose a
bandwidth that was selected using the MSE-Optimal option of the RD Robust Package in STATA.
All specifications include the following pre-determined covariates as controls: log(distance to
the nearest city), log(distance to the border), railroads density in 1992, waterway density in
1992 and night lights growth in the period 1992-1999. Standard errors, clustered at the
constituency level, are reported in parentheses. ***p < 0.01; **p < 0.05; *p < 0.1
Table 6. Impact of dynastic power on night lights after controlling for the winning candidate's characteristics
Depvar: union council level night lights growth
Notes: The table estimates the specification Yi = α + βDynast win i + f (Dynast margin i) + γXi + εit. The outcome variable Yi is growth in night time luminosity
during the electoral term in which a candidate in elected (eg. between 2008 and 2013 for a candidate elected in 2008 for a 5 year term). The sample compares
union councils located in constituencies where a dynast narrowly won to union councils in constituencies where a dynast narrowly lost. We report conventional
estimates using the RD Robust Package in STATA. Columns (1) to (2) impose a bandwidth of 7%. Columns (3) to (4) impose a bandwidth of 5%. Columns (5) to (6)
impose a bandwidth of 3%. Columns (7) to (8) impose a bandwidth that was selected using the MSE-Optimal option of the RD Robust Package in STATA. The
inclusion and exclusion of candidate controls is represented by 'Y' and 'N', respectively. The candidate controls include the following pre-determined
characteristics of the winning candidate: indicator for shrine elite, indicator for historic elite, indicator for business, no. of past elections won, no. of past
elections contested and an index for personal hold over power. All specifications include the following pre-determined UC covariates as controls: log(distance to
the nearest city), log(distance to the border), railroads density in 1992, waterway density in 1992 and night lights growth in the period 1992-1999. Standard
errors, clustered at the constituency level, are reported in parentheses. ***p < 0.01; **p < 0.05; *p < 0.1
Table 7. Effect on development after changing the definition of 'Dynast'
Night Lights Growth Asset Index
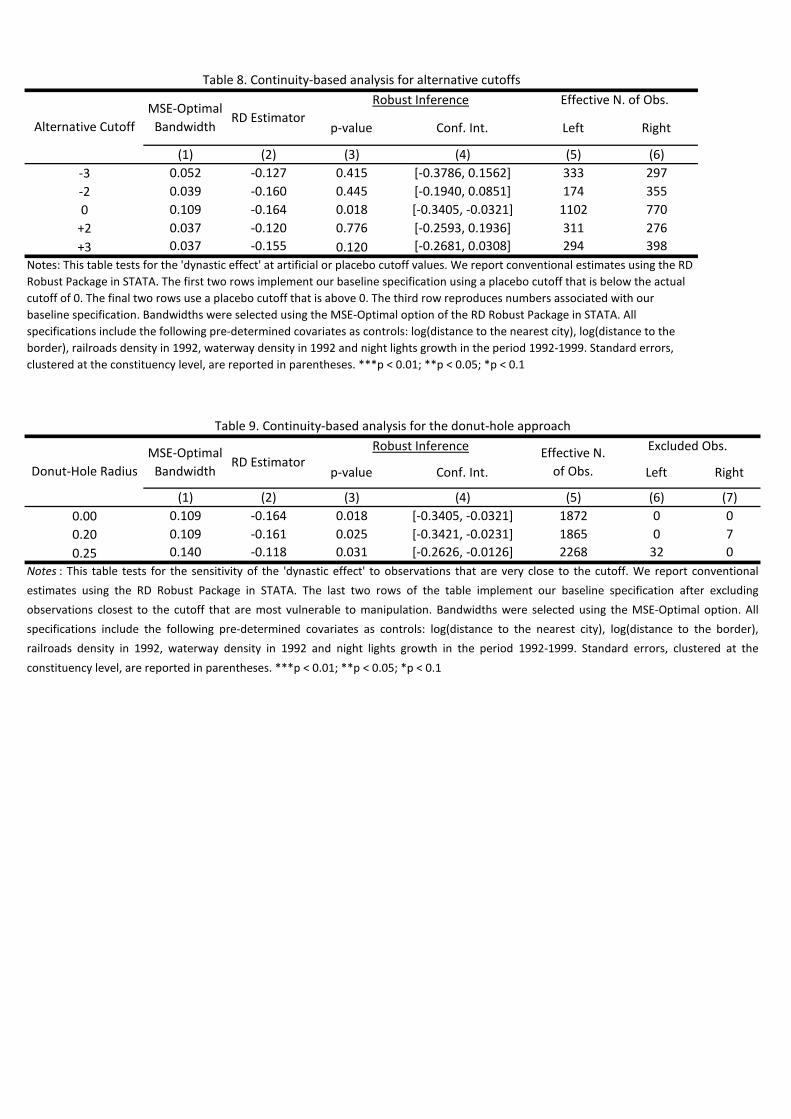
p-value Conf. Int. Left Right
(1) (2) (3) (4) (5) (6)
-3 0.052 -0.127 0.415 [-0.3786, 0.1562] 333 297
-2 0.039 -0.160 0.445 [-0.1940, 0.0851] 174 355
0 0.109 -0.164 0.018 [-0.3405, -0.0321] 1102 770
+2 0.037 -0.120 0.776 [-0.2593, 0.1936] 311 276
+3 0.037 -0.155 0.120 [-0.2681, 0.0308] 294 398
p-value Conf. Int. Left Right
(1) (2) (3) (4) (5) (6) (7)
0.00 0.109 -0.164 0.018 [-0.3405, -0.0321] 1872 0 0
0.20 0.109 -0.161 0.025 [-0.3421, -0.0231] 1865 0 7
0.25 0.140 -0.118 0.031 [-0.2626, -0.0126] 2268 32 0
Notes: This table tests for the 'dynastic effect' at artificial or placebo cutoff values. We report conventional estimates using the RD
Robust Package in STATA. The first two rows implement our baseline specification using a placebo cutoff that is below the actual
cutoff of 0. The final two rows use a placebo cutoff that is above 0. The third row reproduces numbers associated with our
baseline specification. Bandwidths were selected using the MSE-Optimal option of the RD Robust Package in STATA. All
specifications include the following pre-determined covariates as controls: log(distance to the nearest city), log(distance to the
border), railroads density in 1992, waterway density in 1992 and night lights growth in the period 1992-1999. Standard errors,
clustered at the constituency level, are reported in parentheses. ***p < 0.01; **p < 0.05; *p < 0.1
Effective N. of Obs.
Table 8. Continuity-based analysis for alternative cutoffs
Alternative Cutoff
MSE-Optimal
BandwidthRD Estimator
Robust Inference
Notes : This table tests for the sensitivity of the 'dynastic effect' to observations that are very close to the cutoff. We report conventional
estimates using the RD Robust Package in STATA. The last two rows of the table implement our baseline specification after excluding
observations closest to the cutoff that are most vulnerable to manipulation. Bandwidths were selected using the MSE-Optimal option. All
specifications include the following pre-determined covariates as controls: log(distance to the nearest city), log(distance to the border),
railroads density in 1992, waterway density in 1992 and night lights growth in the period 1992-1999. Standard errors, clustered at the
constituency level, are reported in parentheses. ***p < 0.01; **p < 0.05; *p < 0.1
Table 9. Continuity-based analysis for the donut-hole approach
Donut-Hole Radius
MSE-Optimal
BandwidthRD Estimator
Robust InferenceEffective N.
of Obs.
Excluded Obs.

Variable Name Sample Mean Dynast vs Non-Dynast(1) (2) (3)
Voting decision based on assistance with police and courts 0.048 0.051***(0.012)
Voting decision based on opinion of tribal chiefs 0.405 0.170***(0.027)
Voting decision based on threats or bullying 0.020 0.008(0.008)
Voting decision based on past development projects 0.515 -0.069***(0.028)
Voting decision based on any other prior projects 0.122 -0.046***(0.018)
Very little to no trust in parliament 0.654 0.037*(0.026)
Very little to no trust in district court 0.624 0.075***(0.027)
Very little to no trust in high court 0.535 0.096***(0.028)
Very little to no trust in supreme court 0.495 0.151***(0.028)
Very little to no trust in federal government 0.630 0.073***(0.027)
Very little to no trust in provincial government 0.590 0.058**(0.027)
Very little to no trust in local government 0.603 0.046**
Community disputes taken to panchayat for resolution 0.253 0.060***(0.024)
Personal disputes taken to panchayat for resolution 0.362 0.130***(0.027)
Table 10. Reporting average differences between dynasts and non-dynasts
Panel A: Factors influencing voting decisions
Panel B: Trust in institutions
Notes: This table presents summary statistics on a series of outcomes that proxy for livelihood preserving services. The data comes from a contemporary survey that collects information on the socio-political profile of national assembly constituencies. The survey was conducted by the Free and Fair Election Network of Pakistan. Column (2) reports the sample mean of each variable and Column (3) reports the difference in means of each variable between the dynast and non-dynast groups. The dynast group consists of all those households that fall in constituencies where more than half of the candidates elected to the national assembly between 2002 and 2013 are dynasts. Conversely, the non-dynast group consists of all those households that fall in constituencies where less than half of the candidates elected to the national assembly between 2002 and 2013 are dynasts. Standard errors are reported in parentheses. ***p < 0.01; **p < 0.05; *p < 0.1
Panel C: Dispute resolution

Tenures ≥ 11 Tenures ≥ 13 Tenures ≥ 11 Tenures ≥ 13 Tenures ≥ 11 Tenures ≥ 13
Status-based categories
zamindar 0.856 0.930 0.915 0.943 0.885 0.937
historic 0.658 0.907 0.688 0.852 0.672 0.879
shrine 0.329 0.419 0.326 0.386 0.328 0.402
Occupational categories
Agriculture 0.863 0.860 0.879 0.886 0.871 0.874
Business 0.089 0.070 0.057 0.045 0.073 0.057
Lawyer 0.000 0.000 0.007 0.000 0.003 0.000
Religion 0.000 0.000 0.000 0.000 0.000 0.000
Military 0.000 0.000 0.000 0.000 0.000 0.000
Government 0.000 0.000 0.007 0.000 0.003 0.000
Tenures ≤ 3 Tenures ≤ 5 Tenures ≤ 3 Tenures ≤ 5 Tenures ≤ 3 Tenures ≤ 5
Status-based categories
zamindar 0.733 0.757 0.728 0.736 0.729 0.742
historic 0.018 0.034 0.010 0.025 0.012 0.027
shrine 0.081 0.110 0.030 0.034 0.043 0.056
Occupational categories
Agriculture 0.571 0.596 0.604 0.614 0.595 0.609
Business 0.252 0.234 0.242 0.235 0.245 0.235
Lawyer 0.052 0.049 0.051 0.047 0.051 0.048
Religion 0.018 0.021 0.012 0.011 0.014 0.014
Military 0.011 0.009 0.013 0.016 0.012 0.014
Government 0.013 0.015 0.021 0.020 0.019 0.018
National Assembly Provincial Assembly Total
Table 11: Distribution of dynasts according to 'status' and 'occupation'
National Assembly Provincial Assembly Total
Table 12: Distribution of non-dynasts according to 'status' and 'occupation'

p-value Conf. Int.
(1) (2) (3) (4) (5)
indicator for shrine elite 0.075 0.040 0.949 [-0.3940, 0.4205] 1361
indicator for historic elite 0.052 0.328 0.207 [-0.1567, 0.7241] 1039
indicator for business 0.068 -0.233 0.118 [-0.6276, 0.0709] 1309
no. of past elections won 0.076 -0.611 0.373 [-1.7931, 0.6718] 1377
no. of past elections contested 0.077 -1.200 0.263 [-3.1480, 0.8510] 1387
personal power index 0.076 -2.894 0.283 [-7.8943, 2.3063] 1377
(1) (2) (3) (4)
Legislator is [Traditional Elite] 0.04528 0.02017 -0.04122 -0.01181
(0.09538) (0.11013) (0.14057) (0.05684)
RD bandwidth 7% 5% 3% MSE-Optimal
Specification Local linear Local linear Local linear Local linear
Table 14. Effects of traditional status and occupation on growth in night time luminosity
Depvar: union council level night lights growth
Notes: The table estimates the specification Yi = α + βLegislator is [Traditional] win i + f (Legislator [Traditional Elite] margin i) +
γXi + εit. The outcome variable Yi is growth in night time luminosity during the electoral term (eg. between 2008 and 2013 for a
candidate elected in 2008 for a 5 year term). The sample compares union councils located in constituencies where a legislator
who fits the criteria in the square brackets [...] above narrowly won to union councils in constituencies where such a legislator
narrowly lost. We report conventional estimates using the RD Robust Package in STATA. In Columns (1) to (3) we impose
bandwidths of 7%, 5% and 3%, respectively. Column (4) imposes a bandwidth that was selected using the MSE-Optimal option of
the RD Robust Package in STATA. All specifications include the following pre-determined covariates as controls: Log(distance to
the nearest city), population density, proportion houses with piped water, proportion houses with electricity and proportion
houses with kerosene fuel. Standard errors, clustered at the subdistrict level, are reported in parentheses. ***p < 0.01; **p <
0.05; *p < 0.1
Notes: The table estimates the specification Yi = α + βDynast win i + f (Dynast margin i) + γXi + εit. The outcome variable Yi is a demographic or
political characteristic of the winning candidate during the period 2002 to 2013. The sample compares union councils located in constituencies
where a dynast narrowly won to union councils in constituencies where a dynast narrowly lost. For each outcome variable, the specifications provide
‘conventional’ estimates using the RD Robust Package in STATA. Bandwidths were selected using the CERRD-Optimal option of the RD Robust
Package in STATA. The procedure for selecting the optimal bandwidth is as suggested in Calonico et al. (2018). Standard errors, clustered at the
constituency level, are reported in parentheses. ***p < 0.01; **p < 0.05; *p < 0.1
Table 13. Formal continuity-based analysis for pre-determined candidate characteristics
Variable
CERRD-Optimal
BandwidthRD Estimator
Robust Inference Eff. Number of
Observations
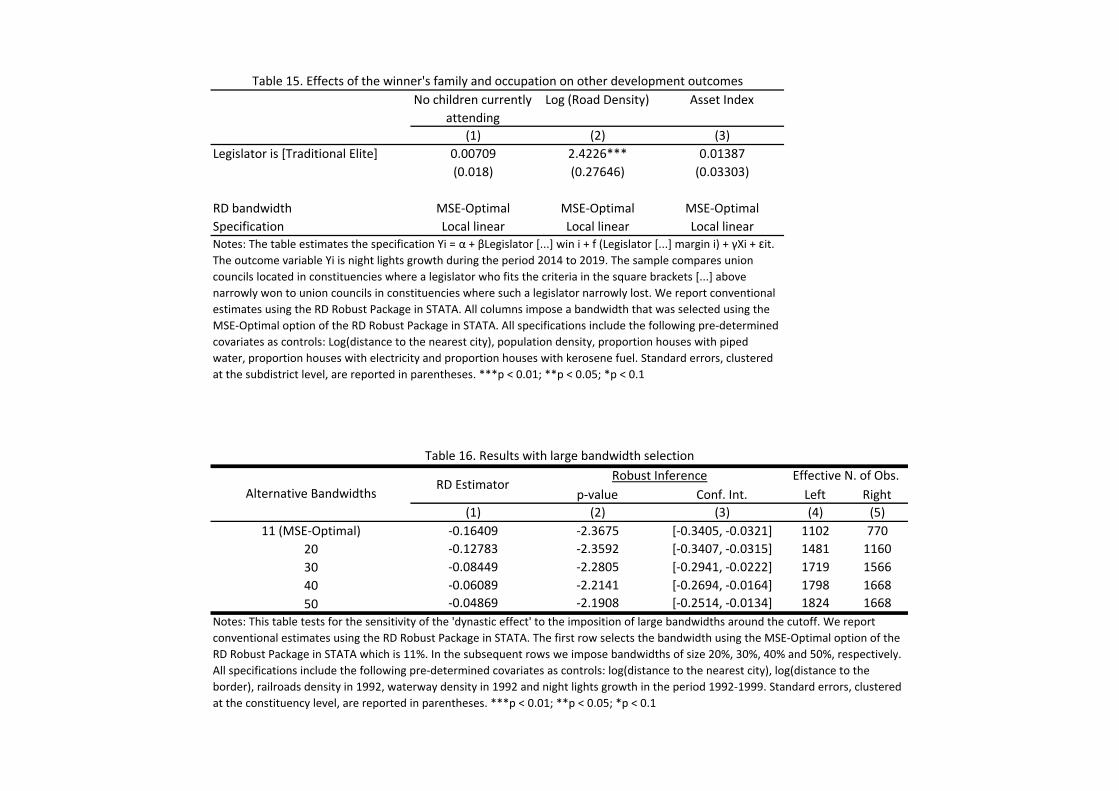
No children currently
attending
Log (Road Density) Asset Index
(1) (2) (3)
Legislator is [Traditional Elite] 0.00709 2.4226*** 0.01387
(0.018) (0.27646) (0.03303)
RD bandwidth MSE-Optimal MSE-Optimal MSE-Optimal
Specification Local linear Local linear Local linear
p-value Conf. Int. Left Right
(1) (2) (3) (4) (5)
11 (MSE-Optimal) -0.16409 -2.3675 [-0.3405, -0.0321] 1102 770
20 -0.12783 -2.3592 [-0.3407, -0.0315] 1481 1160
30 -0.08449 -2.2805 [-0.2941, -0.0222] 1719 1566
40 -0.06089 -2.2141 [-0.2694, -0.0164] 1798 1668
50 -0.04869 -2.1908 [-0.2514, -0.0134] 1824 1668
Notes: This table tests for the sensitivity of the 'dynastic effect' to the imposition of large bandwidths around the cutoff. We report
conventional estimates using the RD Robust Package in STATA. The first row selects the bandwidth using the MSE-Optimal option of the
RD Robust Package in STATA which is 11%. In the subsequent rows we impose bandwidths of size 20%, 30%, 40% and 50%, respectively.
All specifications include the following pre-determined covariates as controls: log(distance to the nearest city), log(distance to the
border), railroads density in 1992, waterway density in 1992 and night lights growth in the period 1992-1999. Standard errors, clustered
at the constituency level, are reported in parentheses. ***p < 0.01; **p < 0.05; *p < 0.1
Table 15. Effects of the winner's family and occupation on other development outcomes
Notes: The table estimates the specification Yi = α + βLegislator [...] win i + f (Legislator [...] margin i) + γXi + εit.
The outcome variable Yi is night lights growth during the period 2014 to 2019. The sample compares union
councils located in constituencies where a legislator who fits the criteria in the square brackets [...] above
narrowly won to union councils in constituencies where such a legislator narrowly lost. We report conventional
estimates using the RD Robust Package in STATA. All columns impose a bandwidth that was selected using the
MSE-Optimal option of the RD Robust Package in STATA. All specifications include the following pre-determined
covariates as controls: Log(distance to the nearest city), population density, proportion houses with piped
water, proportion houses with electricity and proportion houses with kerosene fuel. Standard errors, clustered
at the subdistrict level, are reported in parentheses. ***p < 0.01; **p < 0.05; *p < 0.1
Table 16. Results with large bandwidth selection
Alternative BandwidthsRD Estimator
Robust Inference Effective N. of Obs.

zamindar historic shrine agriculture business other
zamindar 1.000
historic 0.807*** 1.000
shrine 0.576*** 0.530*** 1.000
agriculture 0.955*** 0.771*** 0.566*** 1.000
business 0.024 0.034 -0.011 -1.000 1.000
other 0.031 0.153*** -0.010 -1.000 -1.000 1.000
zamindar 1.000
historic 0.906*** 1.000
shrine 0.585*** 0.471*** 1.000
agriculture 0.986*** 0.890*** 0.5931*** 1.000
business 0.111*** 0.117*** -0.0039 -1.000 1.000
other -0.012 0.203*** -0.0068 -1.000 -1.000 1.000
Appendix Table A2: Correlation between 'status' and 'occupation' categories - [Dynasts]
Panel A: tenures ≥ 11
Panel B: tenures ≥ 13
Notes: The above table shows the correlation coefficients for the relationship between the various status and occupation based
categories for each given level of tenure length. The sample is based on winners for the national and provincial assembly
elections held in 2002, 2003 and 2013. ***p < 0.01; **p < 0.05; *p < 0.1

zamindar historic shrine agriculture business other
zamindar 1.000
historic 0.102*** 1.000
shrine 0.204*** 0.022 1.000
agriculture 0.778*** 0.079*** 0.221*** 1.000
business -0.086*** -0.024 -0.058** -1.000 1.000
other 0.135*** 0.032 -0.016 -1.000 -1.000 1.000
zamindar 1.000
historic 0.136*** 1.000
shrine 0.182*** 0.052* 1.000
agriculture 0.755*** 0.143*** 0.215*** 1.000
business -0.157*** -0.050* -0.082*** -1.000 1.000
other 0.105*** -0.010 -0.009 -1.000 -1.000 1.000
Table A3: Correlation between 'status' and 'occupation' categories - [Non-Dynasts]
Panel A: tenures ≤ 3
Panel B: tenures ≤ 5
Notes: The above table shows the correlation coefficients for the relationship between the various status and occupation based
categories for each given level of tenure length. The sample is based on winners for the national and provincial assembly
elections held in 2002, 2003 and 2013. ***p < 0.01; **p < 0.05; *p < 0.1
Related Documents