Enterprise Improvement Corporate Turnaround and Restructuring Financial Advisory Services Information Management Services © AlixPartners, LLP, 2010 Commercial Real Estate: The Next Tsunami Approaches American Bankruptcy Institute 22 nd Annual Winter Leadership Conference December 10, 2010 www.alixpartners.com Dennis P. Yeskey Senior Advisor +1.212.490.2500 [email protected]

Enterprise Improvement Corporate Turnaround and Restructuring Financial Advisory Services Information Management Services © AlixPartners, LLP, 2010 Commercial.
Dec 21, 2015
Welcome message from author
This document is posted to help you gain knowledge. Please leave a comment to let me know what you think about it! Share it to your friends and learn new things together.
Transcript

www.alixpartners.com
Enterprise Improvement Corporate Turnaroundand Restructuring
Financial AdvisoryServices
Information ManagementServices
© AlixPartners, LLP, 2010
Commercial Real Estate: The Next Tsunami ApproachesAmerican Bankruptcy Institute 22nd Annual Winter Leadership ConferenceDecember 10, 2010
Dennis P. YeskeySenior Advisor
This report was prepared by AlixPartners LLP (“AlixPartners”) for general information and distribution on a strictly non-reliance basis. No one in possession of this report may rely on any portion of this report. The recipients of the report accept that they will make their own investigation, analysis and decision relating to any possible transactions and/or matter related to such and will not use or rely upon this report to form the basis of any such decisions.
This report may be based, in whole or in part, on projections or forecasts of future events. A forecast, by its nature, is speculative and includes estimates and assumptions which may prove to be wrong. Actual results may, and frequently do, differ from those projected or forecast. Those differences may be material. Items which could impact actual results include, but are not limited to, unforeseen micro or macro economic developments and/or business or industry events.
This report may contain certain statements which are or could be considered to be forward-looking statements. Such statements are not guarantees of future performance and involve risks and uncertainties which are not possible to predict. Actual results and trends may differ materially from those described in such statements.
The information in this report reflects conditions and our views as of this date, all of which are subject to change. We undertake no obligation to update or provide any revisions to the report to reflect events, circumstances or changes that occur after the date the report was prepared. In preparing this report, AlixPartners has relied upon and assumed, without independent verification, the accuracy and completeness of all information available from public sources or which was otherwise provided to us. AlixPartners has not audited or verified the data reviewed in connection with the preparation of this report.
AlixPartners makes no representation or warranty regarding any actions the Company may take in reliance on or in reference to matters presented in this report. To the extent that it is lawfully able to do so, no liability or responsibility whatsoever is accepted by AlixPartners for any loss howsoever arising from any use of, or in connection with, the Report.
Neither this report nor any of its contents may be copied, reproduced, disseminated, quoted or referred to in any presentation, agreement or document with attribution to AlixPartners, at any time or in any manner other than for the internal use of the Company, without the express, prior written consent of AlixPartners.
Disclaimer – Important Information Regarding This Report
2www.alixpartners.com

www.alixpartners.com
Overview
•Commercial Real Estate
•Debt & Equity
• Debt
• Equity
Outline
3
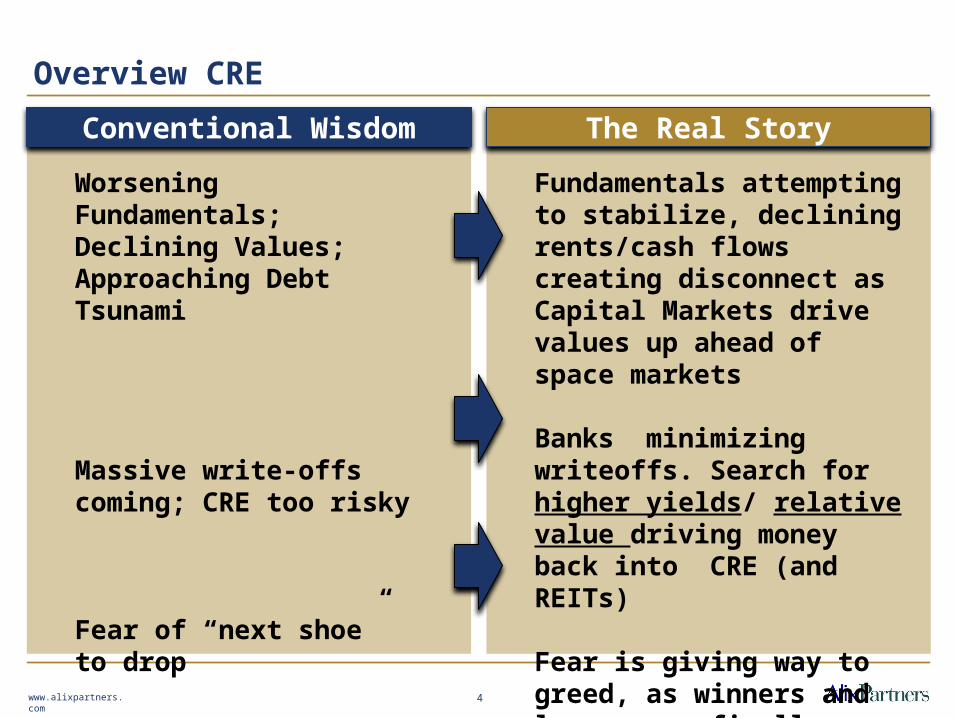
Fundamentals attempting to stabilize, declining rents/cash flows creating disconnect as Capital Markets drive values up ahead of space markets
Banks minimizing writeoffs. Search for higher yields/ relative value driving money back into CRE (and REITs)
Fear is giving way to greed, as winners and losers are finally beginning to emerge
Worsening Fundamentals; Declining Values; Approaching Debt Tsunami
Massive write-offs coming; CRE too risky
Fear of “next shoe” to drop
Overview CRE
www.alixpartners.com 4
Conventional Wisdom The Real Story

Much longer recovery than normal required
– This “Great Recession” requires increasingly longer recovery to create job backlog
2009 bottom? 2010 bottom? Think 2012; longer for hardest hit markets
True for CRE, especially REITs
Confused optimism blended with nervousness and skepticism
− GDP driven by “consumer spending”
Improving Residential
Improving Capital Markets
The Economy?
www.alixpartners.com 5
Conventional Wisdom The Real Story
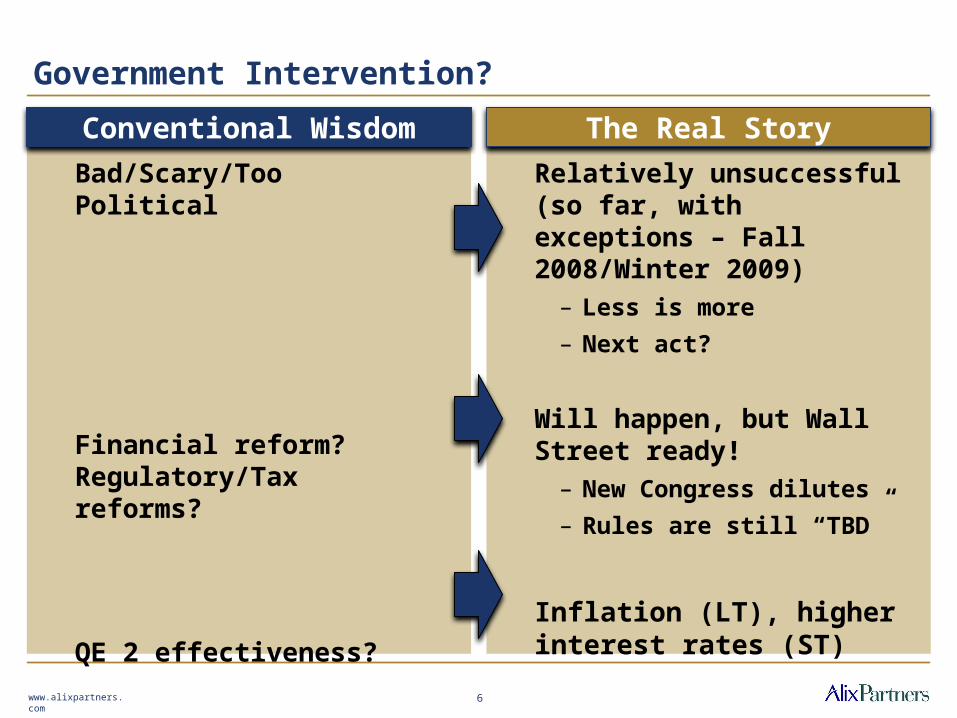
Relatively unsuccessful (so far, with exceptions – Fall 2008/Winter 2009)
– Less is more
– Next act?
Will happen, but Wall Street ready!
– New Congress dilutes
– Rules are still “TBD”
Inflation (LT), higher interest rates (ST)
Bad/Scary/Too Political
Financial reform? Regulatory/Tax reforms?
QE 2 effectiveness?
Government Intervention?
www.alixpartners.com 6
Conventional Wisdom The Real Story
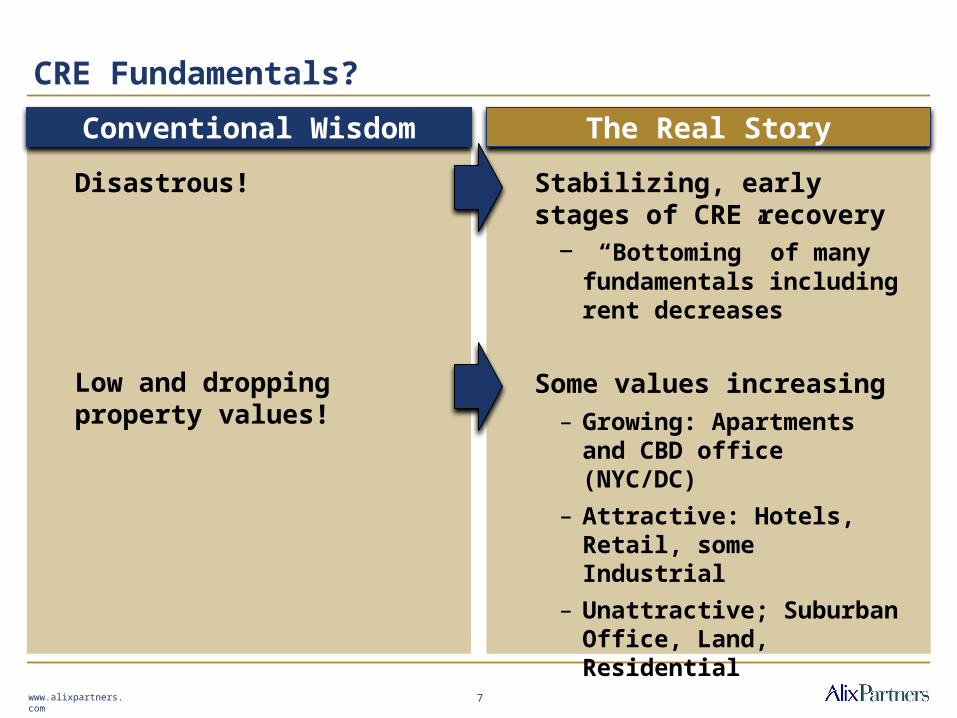
Stabilizing, early stages of CRE recovery
− “Bottoming” of many fundamentals including rent decreases
Some values increasing– Growing: Apartments and
CBD office (NYC/DC)
– Attractive: Hotels, Retail, some Industrial
– Unattractive; Suburban Office, Land, Residential
Disastrous!
Low and dropping property values!
CRE Fundamentals?
www.alixpartners.com 7
Conventional Wisdom The Real Story

False – CRE liquidity returning selectively at historically low interest rates (5% to 6%)
– Tier 1: Core properties – 65% LTV, Apartments (F/F), Trophy Properties
– Tier 2: Specials (?)
– Tier 3: All other
Getting resolved slowly− New CMBS expected in 2011
($25B-$50B)
Expected to be amended and extended, with a new major exception – “Bye Bye”
Nonexistent/Expensive
CMBS time bomb
Approaching Debt Tsunami
Debt Markets?
www.alixpartners.com 8
Conventional Wisdom The Real Story
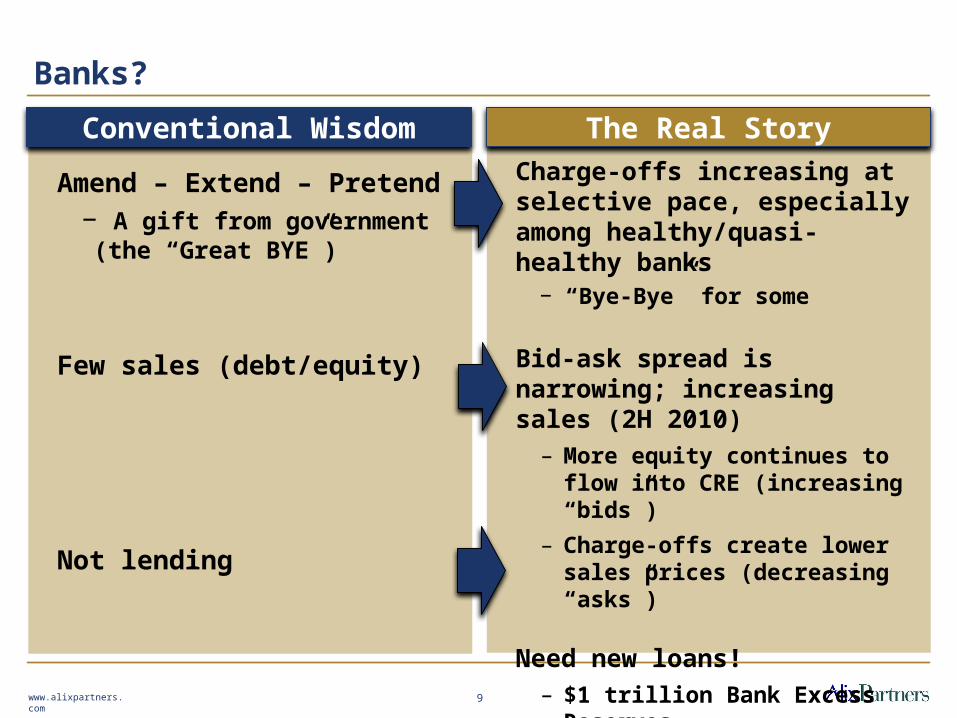
Charge-offs increasing at selective pace, especially among healthy/quasi-healthy banks
− “Bye-Bye” for some
Bid-ask spread is narrowing; increasing sales (2H 2010)
– More equity continues to flow into CRE (increasing “bids”)
– Charge-offs create lower sales prices (decreasing “asks”)
Need new loans!– $1 trillion Bank Excess Reserves
– Improving Bank (and corporate) profitability
Amend – Extend – Pretend − A gift from government (the “Great BYE”)
Few sales (debt/equity)
Not lending
Banks?
www.alixpartners.com 9
Conventional Wisdom The Real Story

Plentiful (if debt is restructured!)− Good operators only
− “Slow” deal flow increases in 2011
Overvalued? More IPO’s? Public interest high as REIT stocks trade 20% over NAV
CRE values selectively increasing (as rates decreasing!)
− NCREIF 3Q 2010 = 5% (?)− Attractive risk adjusted returns− Bottom of underwriting cycle
normally creates best new CRE loans and equity returns
Scarce
Booming REITs (?)
Poor CRE returns
Equity?
www.alixpartners.com 10
Conventional Wisdom The Real Story
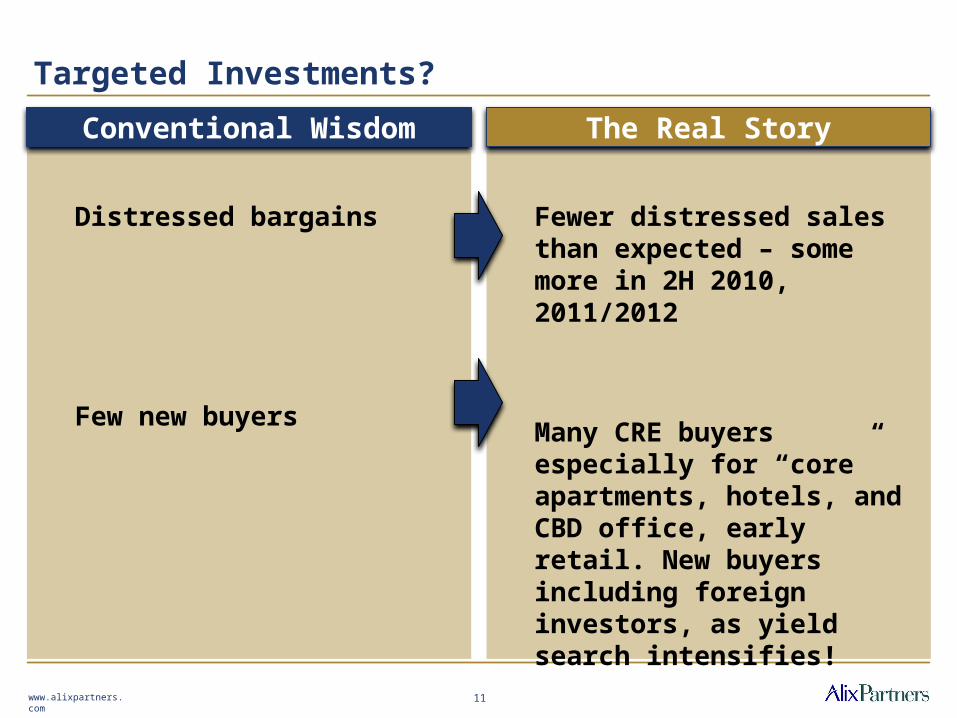
Fewer distressed sales than expected – some more in 2H 2010, 2011/2012
Many CRE buyers especially for “core” apartments, hotels, and CBD office, early retail. New buyers including foreign investors, as yield search intensifies!
Distressed bargains
Few new buyers
Targeted Investments?
www.alixpartners.com 11
Conventional Wisdom The Real Story

“Real” workouts increasing (new equity / write-offs required). More foreclosures, debt sales and bankruptcies result in 2011-2012.
Few bankruptcies or foreclosures
Operators?
www.alixpartners.com 12
Conventional Wisdom The Real Story

www.alixpartners.com
•Overview
Commercial Real Estate
•Debt & Equity
• Debt
• Equity
Outline
13
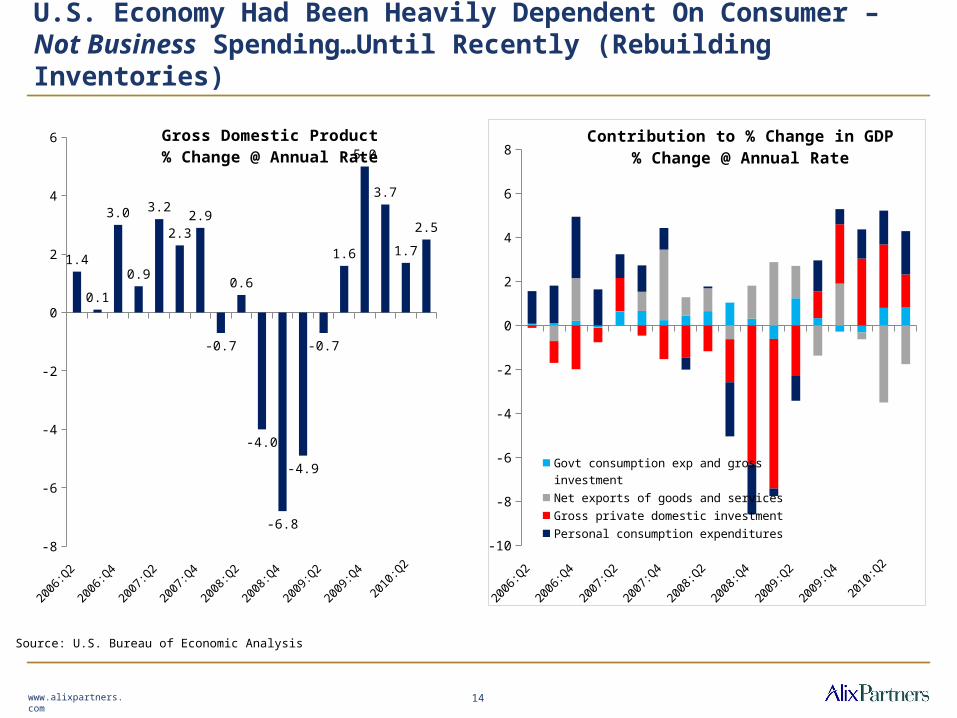
U.S. Economy Had Been Heavily Dependent On Consumer – Not Business Spending…Until Recently (Rebuilding Inventories)
Source: U.S. Bureau of Economic Analysis
14
-8
-6
-4
-2
0
2
4
6
1.4
0.1
3.0
0.9
3.2
2.32.9
-0.7
0.6
-4.0
-6.8
-4.9
-0.7
1.6
5.0
3.7
1.7
2.5
Gross Domestic Product% Change @ Annual Rate
2006
:Q2
2006
:Q3
2006
:Q4
2007
:Q1
2007
:Q2
2007
:Q3
2007
:Q4
2008
:Q1
2008
:Q2
2008
:Q3
2008
:Q4
2009
:Q1
2009
:Q2
2009
:Q3
2009
:Q4
2010
:Q1
2010
:Q2
2010
:Q3
-10
-8
-6
-4
-2
0
2
4
6
8Contribution to % Change in GDP
% Change @ Annual Rate
Govt consumption exp and gross investment
Net exports of goods and services
Gross private domestic investment
Personal consumption expenditures
www.alixpartners.com

Q1-07
Q2-07
Q3-07
Q4-07
Q1-08
Q2-08
Q3-08
Q4-08
Q1-09
Q2-09
Q3-09
Q4-09
Q1-10
Q2-10
Q3-10
Q4-10F
Q1-11F
Q2-11F
Q3-11F
Q4-11F
-8
-6
-4
-2
0
2
4
6
0.9
3.22.3
2.9
-0.7
0.6
-4.0
-6.8
-4.9
-0.7
1.6
5.0
3.7
1.72.5 2.3 2.5
3.0 3.0 3.2
U.S. GDP Growth
Qu
art
erl
y A
nn
ua
l Gro
wth
(%
)U.S. Economy Is Expected to Grow, Albeit Slowly; Double Dip Not Expected but Unemployment Remains High (Above 8% to 9%) for Several Years
www.alixpartners.com 15
Recession
Source: The Blue Chip Economist Consensus Forecast, Federal Reserve Board
Forecast

Unfortunately, Employment Gains Will Take Significantly Longer Than Hoped – Each Recession Has Taken Progressively Longer To Recover Jobs!
www.alixpartners.com 16
0
20,000
40,000
60,000
80,000
100,000
120,000
140,000
160,000
Non-Farm Employment Trends1960-2010
All
Non F
arm
Em
plo
yees (
000s)
19 months to previ-ous peak
27 months to pre-vious peak
32 months to pre-vious peak
48 months to pre-vious peak ???
Source: U.S. Bureau of Labor Statistics
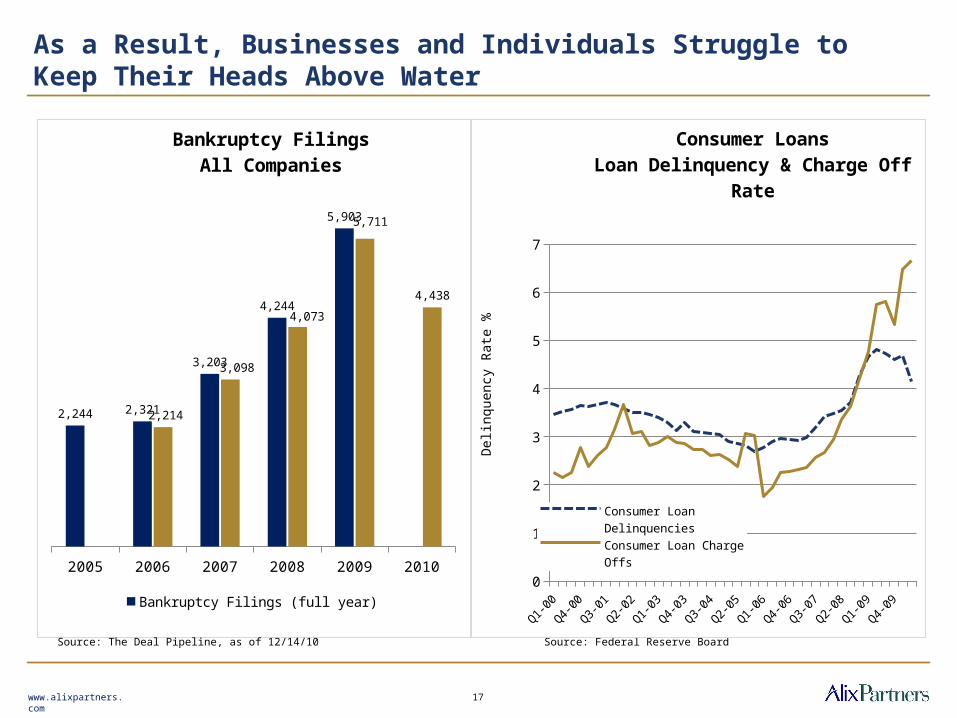
As a Result, Businesses and Individuals Struggle to Keep Their Heads Above Water
2005 2006 2007 2008 2009 2010
2,244 2,321
3,203
4,244
5,903
2,214
3,098
4,073
5,711
4,438
Bankruptcy FilingsAll Companies
Bankruptcy Filings (full year) Bankruptcy Filings (YTD)
Source: The Deal Pipeline, as of 12/14/10 Source: Federal Reserve Board
0
1
2
3
4
5
6
7
Consumer LoansLoan Delinquency & Charge Off Rate
Consumer Loan Delinquencies
Consumer Loan Charge Offs
Del
inqu
ency
Rat
e %
17www.alixpartners.com

Business Bankruptcy Filings Have Been Below Projected Levels
www.alixpartners.com 18
Q1-94
Q1-95
Q1-96
Q1-97
Q1-98
Q1-99
Q1-00
Q1-01
Q1-02
Q1-03
Q1-04
Q1-05
Q1-06
Q1-07
Q1-08
Q1-09
Q1-10
0
2,000
4,000
6,000
8,000
10,000
12,000
14,000
16,000
18,000
Bankruptcy Filings
Source: ABI
1994
1996
1998
2000
2002
2004
2006
2008
2010
(YTD)
0
10,000
20,000
30,000
40,000
50,000
60,000
70,000
Bankruptcy Filings(annual)

Both Residential Loan Delinquencies and US Housing Starts Appear to Be Leveling at Historic Levels
Q4-07
Q1-08
Q2-08
Q3-08
Q4-08
Q1-09
Q2-09
Q3-09
Q4-09
Q1-10
Q2-10
0%
5%
10%
15%
20%
25%
Seriously Delinquent Mortgages
Prime Alt-A Subprime Overall
Source: Office of the Comptroller of the Currency (www.occ.treas.gov) Source: U.S. Census Bureau, 3-month moving avg., SAAR
Jun-
01
Jan-
02
Aug-0
2
Mar
-03
Oct-03
May
-04
Dec-0
4
Jul-0
5
Feb-
06
Sep-0
6
Apr-0
7
Nov-0
7
Jun-
08
Jan-
09
Aug-0
9
Mar
-10
0
500
1,000
1,500
2,000
2,500
U.S. Housing Starts and Building Permits
Housing Starts Building Permits
19www.alixpartners.com

Consumers Lost Confidence, and Billions In Retail Sales Came “Off the Table” and Will Also Take Longer to Recover
Aug-0
7
Sep-0
7
Oct
-07
Nov-0
7
Dec-0
7
Jan-
08
Feb-0
8
Mar
-08
Apr-0
8
May
-08
Jun-
08
Jul-0
8
Aug-0
8
Sep-0
8
Oct
-08
Nov-0
8
Dec-0
8
Jan-
09
Feb-0
9
Mar
-09
Apr-0
9
May
-09
Jun-
09
Jul-0
9
Aug-0
9
Sep-0
9
Oct
-09
Nov-0
9
Dec-0
9
Jan-
10
Feb-1
0
Mar
-10
Apr-1
0
May
-10
Jun-
10
Jul-1
0
Aug-1
0
Sep-1
0
Oct
-10
$310,000
$320,000
$330,000
$340,000
$350,000
$360,000
$370,000
$380,000
$390,000
Total Monthly Retail Sales U.S. Census Bureau
$ m
illi
on
s
20www.alixpartners.com

2010 AlixPartners Holiday Spending Outlook Survey
• 85% of consumers say they are spending “the same or less” this year on retail purchases
• 86% of consumers say they plan to spend “the same or less” on holiday gifts in 2010
• Holiday gift spending could decrease by more than 8% this year as consumers continue to show caution due to the uncertain economic climate
Americans Have Become Even More Pessimistic About a Quick Recovery, with 76% Now Saying 2012 at the Earliest (vs. 63% in May)
www.alixpartners.com
2010 2011 2012 2013 or later
Not sure Never
20
%
27
%
18
%
19
%
13
%
3%
8%
21
%
18
%
23
%
23
%
5%
5%
12
%
23
%
34
%
19
%
6%
1%
9%
26
%
46
%
14
%
4%
Expectations Regarding Timing of Recovery
Feb-09 Nov-09 May-10 Sep-10
When do you expect the U.S. economy to recover to what you consider “normal times”?
Source: AlixPartners consumer research
21
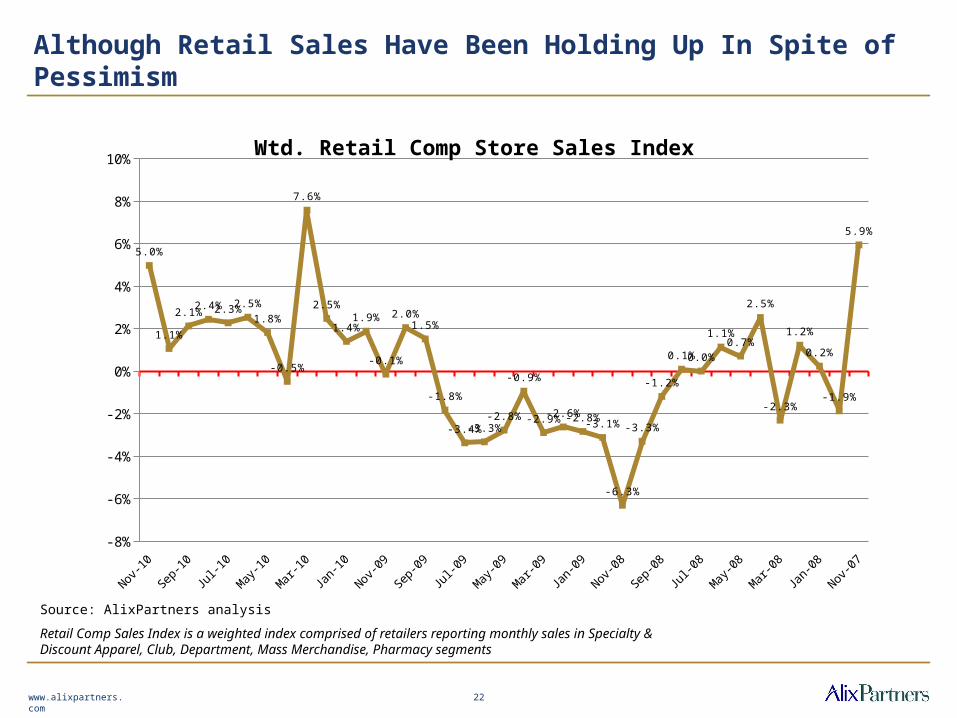
Although Retail Sales Have Been Holding Up In Spite of Pessimism
Source: AlixPartners analysis
Retail Comp Sales Index is a weighted index comprised of retailers reporting monthly sales in Specialty & Discount Apparel, Club, Department, Mass Merchandise, Pharmacy segments
22www.alixpartners.com
Nov-0
7
Jan-
08
Mar
-08
May
-08
Jul-0
8
Sep-0
8
Nov-0
8
Jan-
09
Mar
-09
May
-09
Jul-0
9
Sep-0
9
Nov-0
9
Jan-
10
Mar
-10
May
-10
Jul-1
0
Sep-1
0
Nov-1
0
-8%
-6%
-4%
-2%
0%
2%
4%
6%
8%
10%
5.9%
-1.9%
0.2%
1.2%
-2.3%
2.5%
0.7%1.1%
0.0%0.1%
-1.2%
-3.3%
-6.3%
-3.1%-2.8%-2.6%-2.9%
-0.9%
-2.8%-3.3%-3.4%
-1.8%
1.5%2.0%
-0.1%
1.9%1.4%
2.5%
7.6%
-0.5%
1.8%
2.5%2.3%2.4%2.1%
1.1%
5.0%
Wtd. Retail Comp Store Sales Index

Feb
-01
May
-01
Aug
-01
Nov
-01
Feb
-02
May
-02
Aug
-02
Nov
-02
Feb
-03
May
-03
Aug
-03
Nov
-03
Feb
-04
May
-04
Aug
-04
Nov
-04
Feb
-05
May
-05
Aug
-05
Nov
-05
Feb
-06
May
-06
Aug
-06
Nov
-06
Feb
-07
May
-07
Aug
-07
Nov
-07
Feb
-08
May
-08
Aug
-08
Nov
-08
Feb
-09
May
-09
Aug
-09
Nov
-09
Feb
-10
May
-10
Aug
-10
-
50
100
150
200
250
Moody's REAL CPPI & Schiller 20-City Index
National All Properties Schiller 20-City Index
Commercial Property values still over 40% below Oct 2007 high
Source: © Real Capital Analytics www.rcanalytics.com
23
Commercial and Residential Real Estate Values Have Declined to Pre-2004 Levels
www.alixpartners.com
Residential values still over 25% below 2005 highs
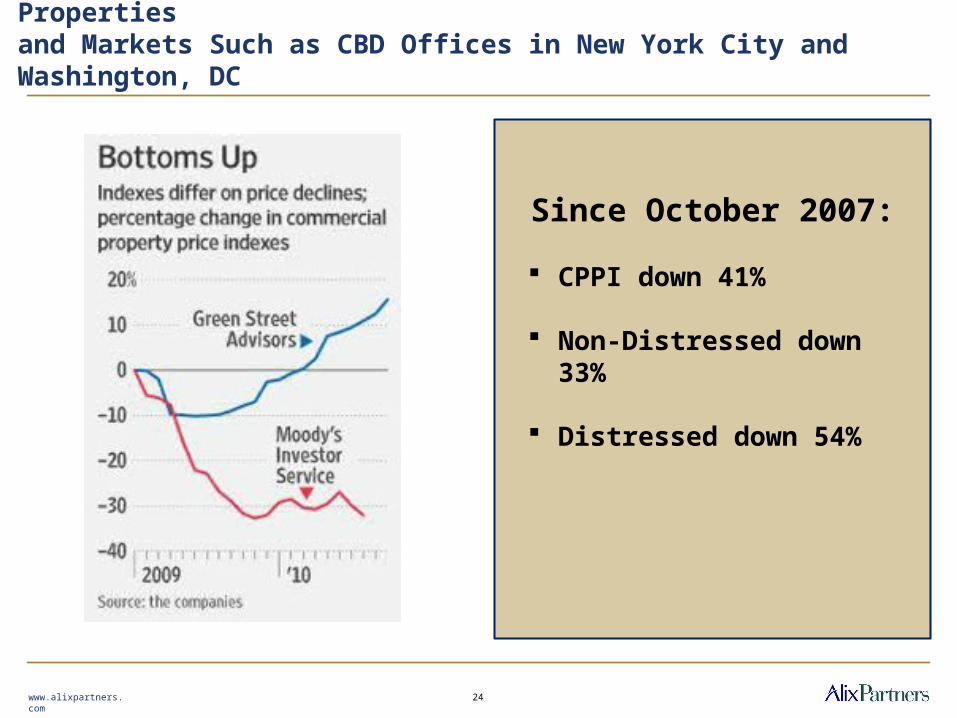
However, CRE Values Are Recovering Quickly for Selected Properties and Markets Such as CBD Offices in New York City and Washington, DC
www.alixpartners.com
Since October 2007:
CPPI down 41%
Non-Distressed down 33%
Distressed down 54%
24

And REITs Appear to Be Leading the Way (for CRE and the Economy)
Asset Class 2005 2006 2007 2008 2009 2010 YTD
Equity REITS 12.16% 35.06% -15.69% -37.73% 27.99% 24.70%
All REITS 8.29% 34.35% -17.83% -37.34% 27.24% 23.90%
Gold 35.56% 24.01% 29.09% -27.80% 44.72% 20.50%
Private Equity -13.67% -65.96% 30.20% 16.65%
Russell 2000 4.55% 17.00% -2.75% -34.80% 25.22% 12.78%
NASDAQ 1.37% 9.52% 9.81% -40.54% 43.89% 8.84%
Hedge Funds 7.85% 11.40% 11.23% -19.83% 24.85% 6.75%
Dow Jones Industrial Average -0.61% 16.29% 6.43% -33.84% 18.82% 5.71%
S&P 500 4.91% 15.79% 5.49% -37.00% 23.45% 5.67%
Barclays Aggregate Bond 2.20% 4.50% 6.90% 5.70% -0.97% 3.87%
Commodities 17.55% -2.71% 11.08% -36.61% 18.72% 2.85%
U.S. Dollar 11.02% -8.25% -8.98% 5.94% -3.29% -3.20%
iShares S&P GSCI Commodity-Indexed Trust -18.64% 31.62% -45.75% 11.22% -3.49%
www.alixpartners.com
Source: AlixPartners analysis, public financial reports, thru 9/8/2010
25
www.alixpartners.com
•Overview
•Commercial Real Estate
Debt & Equity
• Debt
• Equity
Outline
26

www.alixpartners.com
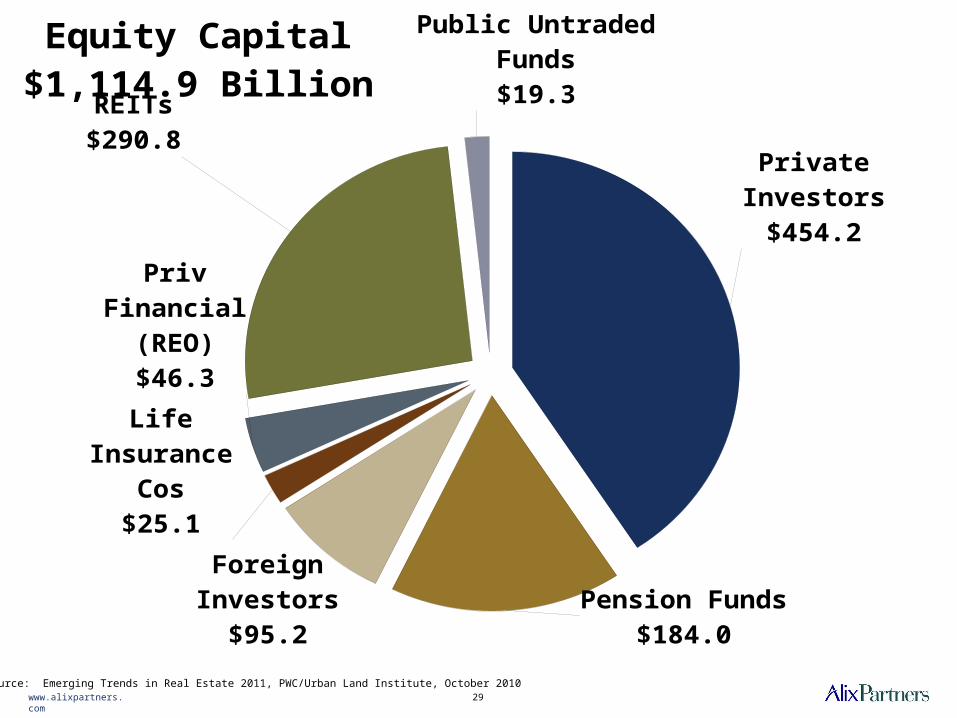
Commercial Real Estate 2010: Sources of Capital
Banks, S&Ls, Mu-tual Sav-
ings Banks;
$1,735.4
Life In-surance;
$240.1
REIT Un-secured
Debt; $160.6
Pension Funds; $17.6
Comm Mortgage
Securities; $614.6
Govt Credit Agencies; $150.9
Mortgage REITs; $23.7
Debt Capital $2,994 Billion
Private Investors;
$454.2
Pension Funds; $184.0
Foreign Investors;
$95.2Life In-surance
Cos; $25.1
Priv Finan-
cial (REO); $46.3
REITs; $290.8 Public Untraded
Funds; $19.3
Equity Capital$1,114.9 Billion
Source: Emerging Trends in Real Estate 2011, PWC/Urban Land Institute, October 2010
27

www.alixpartners.com
Debt Capital $2,994 Billion
Source: Emerging Trends in Real Estate 2011, PWC/Urban Land Institute, October 2010
28
Banks$1.7T
Life Insurance$240.1
REIT Unsecured Debt
$160.6
Pension Funds$17.6
CMBS$600B
Govt Credit Agencies$150.9
Mortgage REITs$23.7
Debt Capital $2,994 Billion
www.alixpartners.com
Private Investors
$454.2
Pension Funds$184.0
Foreign Investors
$95.2
Life Insurance Cos
$25.1
Priv Financial (REO)$46.3
REITs$290.8
Public Untraded Funds$19.3
Equity Capital$1,114.9 Billion
Source: Emerging Trends in Real Estate 2011, PWC/Urban Land Institute, October 2010 29

Industry Estimates Are Expecting More Sales Transactions in 2011
www.alixpartners.com
Source: Emerging Trends in Real Estate 2011, PWC/Urban Land Institute, October 2010
2011 Forecast
30
Sell
2004 2005 2006 2007 2008 2009 2010 20111
2
3
4
5
6
7
8
9
Emerging Trends Survey PWC/ULI
Buy Hold Sell
www.alixpartners.com
•Overview
•Commercial Real Estate
•Debt & Equity
Debt
• Equity
Outline
31
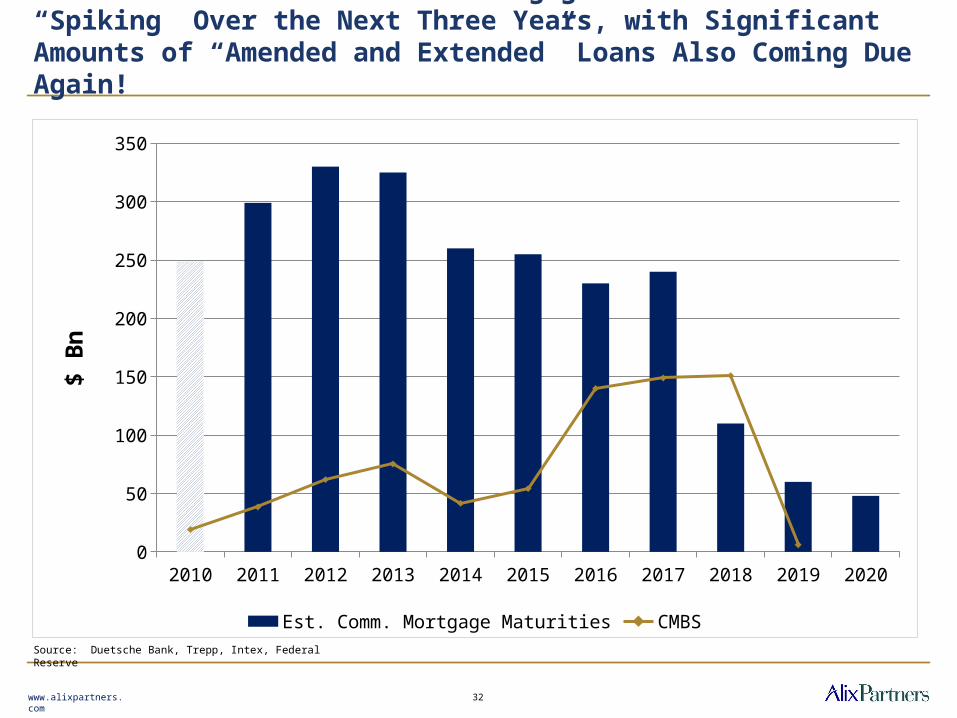
Estimated Total Commercial Mortgage Maturities Are “Spiking” Over the Next Three Years, with Significant Amounts of “Amended and Extended” Loans Also Coming Due Again!
2010 2011 2012 2013 2014 2015 2016 2017 2018 2019 20200
50
100
150
200
250
300
350
Est. Comm. Mortgage Maturities CMBS
$ B
n
Source: Duetsche Bank, Trepp, Intex, Federal Reserve
32www.alixpartners.com

Q1-00
Q3-00
Q1-01
Q3-01
Q1-02
Q3-02
Q1-03
Q3-03
Q1-04
Q3-04
Q1-05
Q3-05
Q1-06
Q3-06
Q1-07
Q3-07
Q1-08
Q3-08
Q1-09
Q3-09
Q1-10
0
1
2
3
4
5
6
7
8
9
10
Commercial Real Estate Loans (All Banks) Loan Delinquency & Charge Off Rate
Delinquency %
% o
f lo
ans
CRE Bank Loan Delinquencies and Charge Offs Continue To Rise.
Source: Federal Reserve Board
www.alixpartners.com
Commercial real estate loans include construction and land development loans, loans secured by multifamily residences, and loans secured by nonfarm, nonresidential real estate, booked in domestic offices only
33

CMBS Loan Delinquencies Also Have Been Rising (Until Recently)
www.alixpartners.com 34
Sep-0
8
Nov-0
8
Jan-
09
Mar
-09
May
-09
Jul-0
9
Sep-0
9
Nov-0
9
Jan-
10
Mar
-10
May
-10
Jul-1
0$0
$10
$20
$30
$40
$50
$60
$70Monthly CMBS Delinquencies
($B)
2000
2001
2002
2003
2004
2005
2006
2007
2008
2009
2010
f
2011
f$0
$50
$100
$150
$200
$250
CMBS Securitization Vol. ($B)
Source: Realpoint Source: ING Clarion Research, Comm Mortgage Alerts
General Forecasts for 2011
range from $25 - $ 50
billion
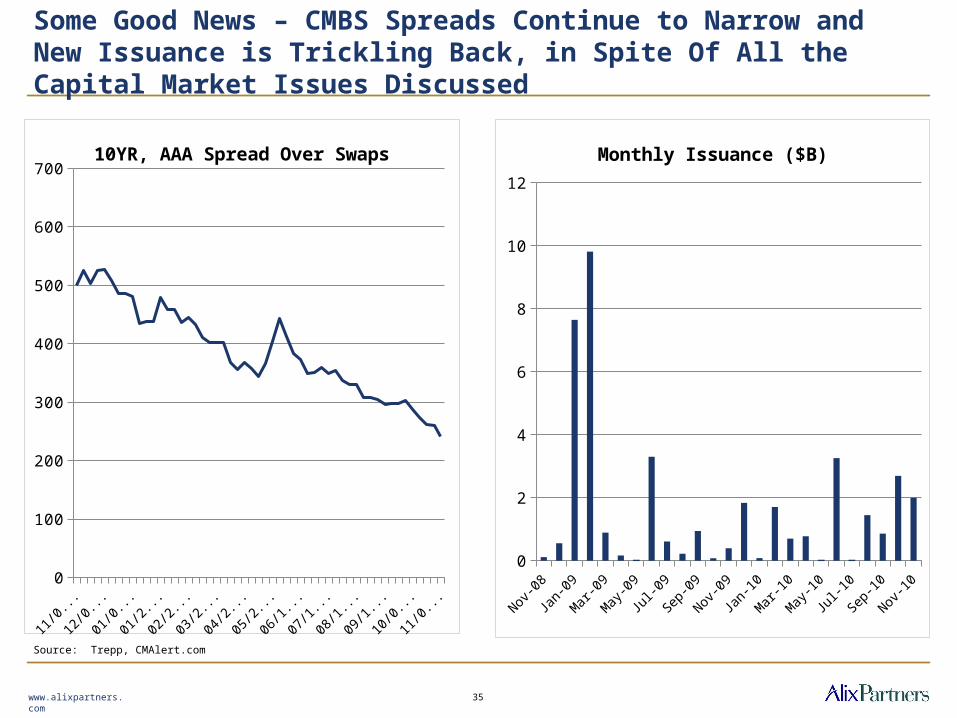
Some Good News – CMBS Spreads Continue to Narrow and New Issuance is Trickling Back, in Spite Of All the Capital Market Issues Discussed
www.alixpartners.com
Nov-0
9
Feb-1
0
May
-10
Aug-1
0
Nov-1
00
100
200
300
400
500
600
70010YR, AAA Spread Over Swaps
Nov-0
8
Jan-
09
Mar
-09
May
-09
Jul-0
9
Sep-0
9
Nov-0
9
Jan-
10
Mar
-10
May
-10
Jul-1
0
Sep-1
0
Nov-1
00
2
4
6
8
10
12
Monthly Issuance ($B)
35
Source: Trepp, CMAlert.com
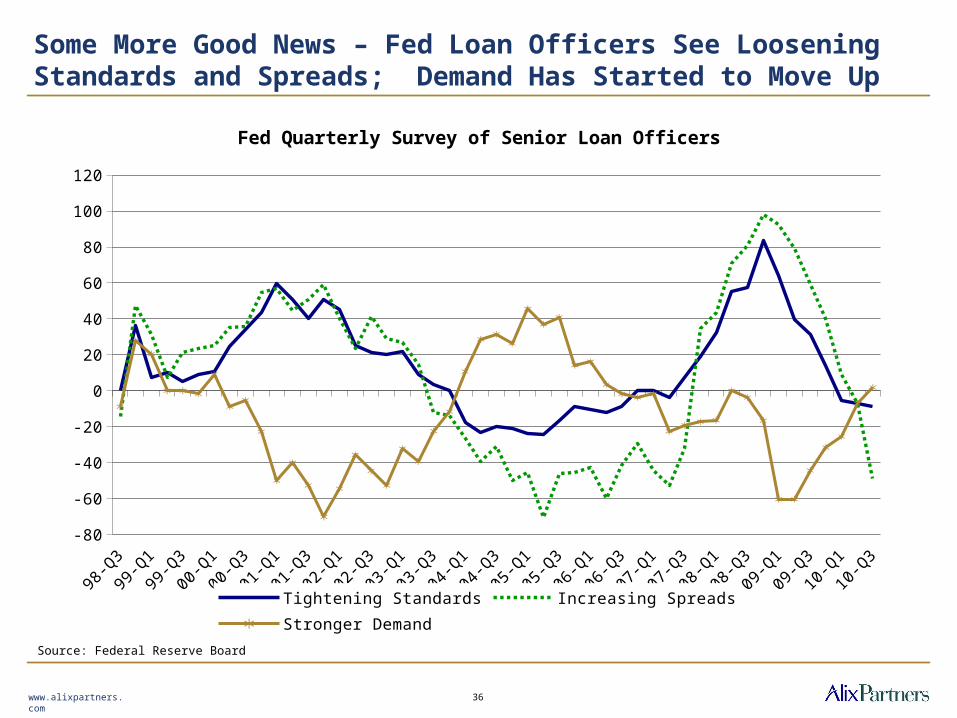
Some More Good News – Fed Loan Officers See Loosening Standards and Spreads; Demand Has Started to Move Up
www.alixpartners.com
98-Q
3
99-Q
1
99-Q
3
00-Q
1
00-Q
3
01-Q
1
01-Q
3
02-Q
1
02-Q
3
03-Q
1
03-Q
3
04-Q
1
04-Q
3
05-Q
1
05-Q
3
06-Q
1
06-Q
3
07-Q
1
07-Q
3
08-Q
1
08-Q
3
09-Q
1
09-Q
3
10-Q
1
10-Q
3-80
-60
-40
-20
0
20
40
60
80
100
120
Tightening Standards Increasing Spreads Stronger Demand
Fed Quarterly Survey of Senior Loan Officers
Source: Federal Reserve Board
36
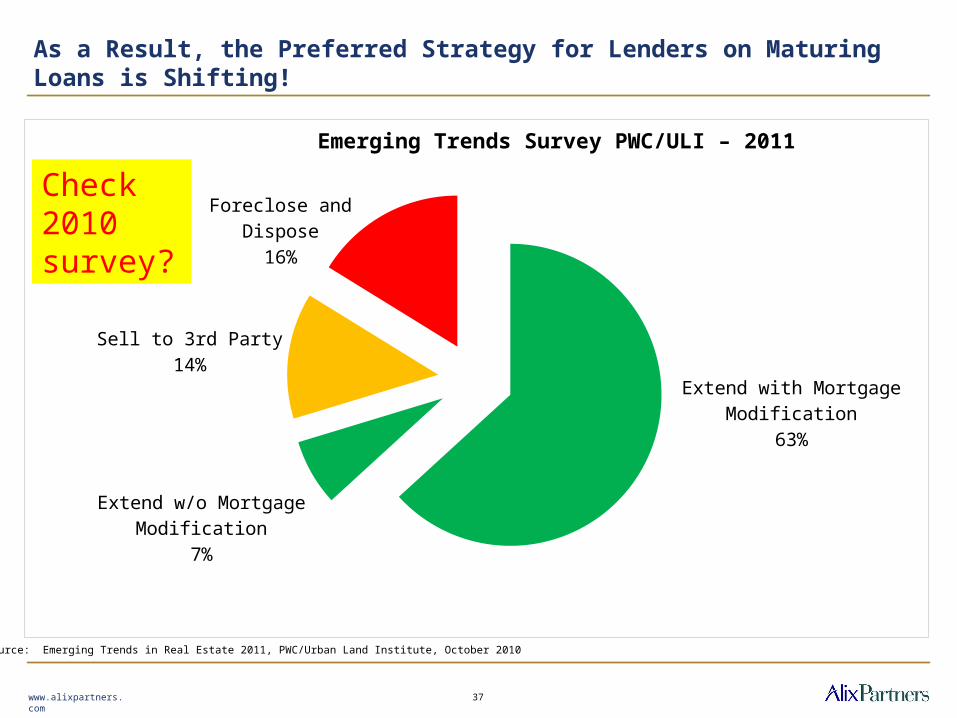
As a Result, the Preferred Strategy for Lenders on Maturing Loans is Shifting!
www.alixpartners.com
Extend with Mortgage Modification
63%
Extend w/o Mortgage Modification
7%
Sell to 3rd Party13%
Foreclose and Dispose16%
Emerging Trends Survey PWC/ULI – 2011
Source: Emerging Trends in Real Estate 2011, PWC/Urban Land Institute, October 2010
37
Check 2010 survey?
www.alixpartners.com
•Overview
•Commercial Real Estate
•Debt & Equity
• Debt
Equity
Outline
38

www.alixpartners.com
U.S. Real Estate Returns (CRE) and Economic Growth (GDP) Are Highly Correlated!
Q1-97
Q3-97
Q1-98
Q3-98
Q1-99
Q3-99
Q1-00
Q3-00
Q1-01
Q3-01
Q1-02
Q3-02
Q1-03
Q3-03
Q1-04
Q3-04
Q1-05
Q3-05
Q1-06
Q3-06
Q1-07
Q3-07
Q1-08
Q3-08
Q1-09
Q3-09
Q1-10
Q3-10
-15%
-10%
-5%
0%
5%
10%
15%
NCREIF Index Returns vs. GDP Growth
NCREIF Index GDP
Source: NCREIF, Federal Reserve Board
39
www.alixpartners.com
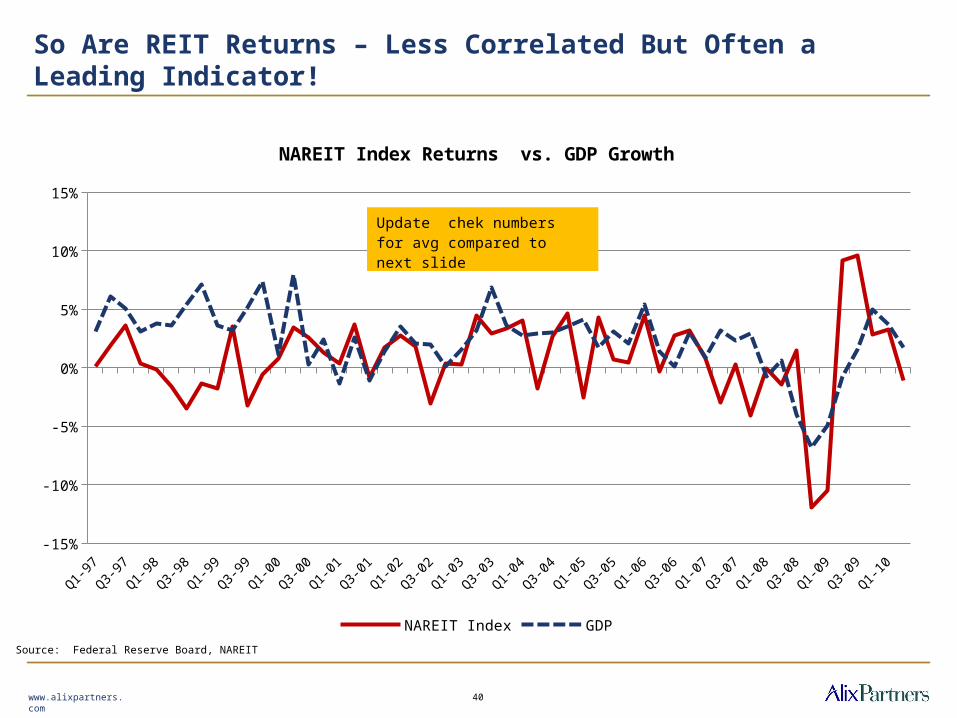
So Are REIT Returns – Less Correlated But Often a Leading Indicator!
Q1-97
Q3-97
Q1-98
Q3-98
Q1-99
Q3-99
Q1-00
Q3-00
Q1-01
Q3-01
Q1-02
Q3-02
Q1-03
Q3-03
Q1-04
Q3-04
Q1-05
Q3-05
Q1-06
Q3-06
Q1-07
Q3-07
Q1-08
Q3-08
Q1-09
Q3-09
Q1-10
-15%
-10%
-5%
0%
5%
10%
15%
NAREIT Index Returns vs. GDP Growth
NAREIT Index GDP
Update chek numbers for avg compared to next slide
Source: Federal Reserve Board, NAREIT
40

1994 1995 1996 1997 1998 1999 2000 2001 2002 2003 2004 2005 2006 2007 2008 2009 2010 YTD
-80
-60
-40
-20
0
20
40
60Investment Performance by Property Sector and Subsector
Office Industrial Retail Residential
REITs Are One of the Better Stock Market Performers – In 2010 and Over the Last 15 Years
Source: REIT.com
www.alixpartners.com 41
Update check numbers for avg compared to next slide
2000
2001
2002
2003
2004
2005
2006
2007
2008
2009
2010
2011
2012
2013
2014
4%
5%
6%
7%
8%
9%
10%
11%
12%
13%
$3.90
$4.00
$4.10
$4.20
$4.30
$4.40
$4.50
$4.60
$4.70
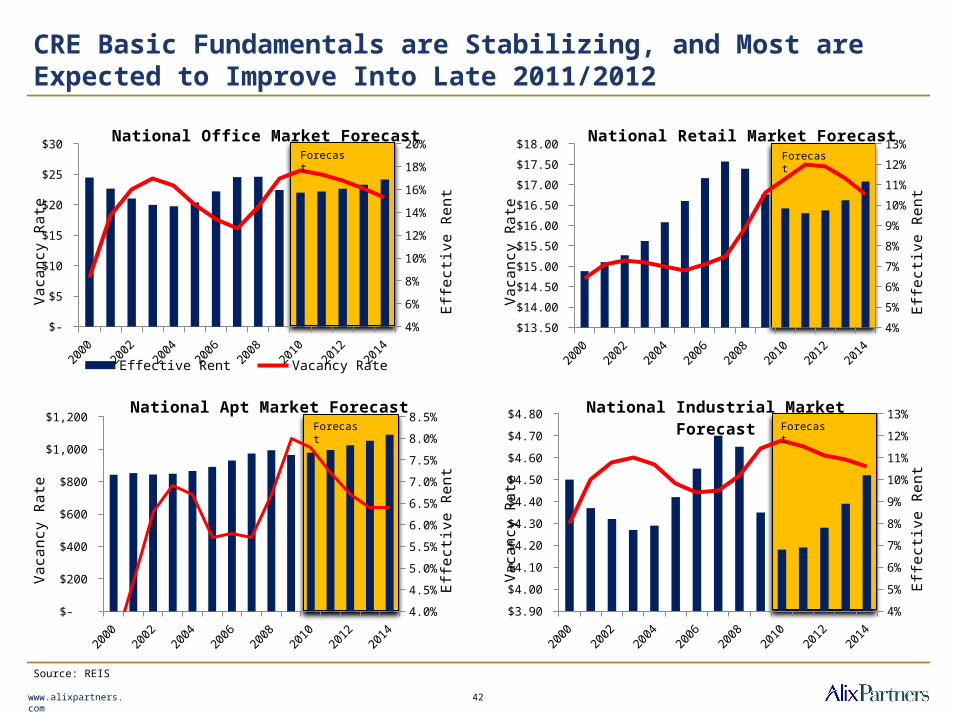
$4.80 National Industrial Market Forecast
Vac
ancy
Rat
e
Effe
ctiv
e R
ent
2000
2002
2004
2006
2008
2010
2012
2014
4.0%
4.5%
5.0%
5.5%
6.0%
6.5%
7.0%
7.5%
8.0%
8.5%
$-
$200
$400
$600
$800
$1,000
$1,200 National Apt Market Forecast
Vac
ancy
Rat
e
Effe
ctiv
e R
ent
2000
2001
2002
2003
2004
2005
2006
2007
2008
2009
2010
2011
2012
2013
2014
4%
5%
6%
7%
8%
9%
10%
11%
12%
13%
$13.50
$14.00
$14.50
$15.00
$15.50
$16.00
$16.50
$17.00
$17.50
$18.00 National Retail Market Forecast
Effective Rent Vacancy Rate
Vac
ancy
Rat
e
Effe
ctiv
e R
ent
2000
2001
2002
2003
2004
2005
2006
2007
2008
2009
2010
2011
2012
2013
2014
4%
6%
8%
10%
12%
14%
16%
18%
20%
$-
$5
$10
$15
$20
$25
$30 National Office Market Forecast
Effective Rent Vacancy Rate
Vac
ancy
Rat
e
Effe
ctiv
e R
ent
CRE Basic Fundamentals are Stabilizing, and Most are Expected to Improve Into Late 2011/2012
Source: REIS
ForecastForecast
ForecastForecast
42www.alixpartners.com
Q3-91
Q1-92
Q3-92
Q1-93
Q3-93
Q1-94
Q3-94
Q1-95
Q3-95
Q1-96
Q3-96
Q1-97
Q3-97
Q1-98
Q3-98
Q1-99
Q3-99
Q1-00
Q3-00
Q1-01
Q3-01
Q1-02
Q3-02
Q1-03
Q3-03
Q1-04
Q3-04
Q1-05
Q3-05
Q1-06
Q3-06
Q1-07
Q3-07
Q1-08
Q3-08
Q1-09
Q3-09
Q1-10
Q3-10
0
50
100
150
200
250
300
350
400
450
500
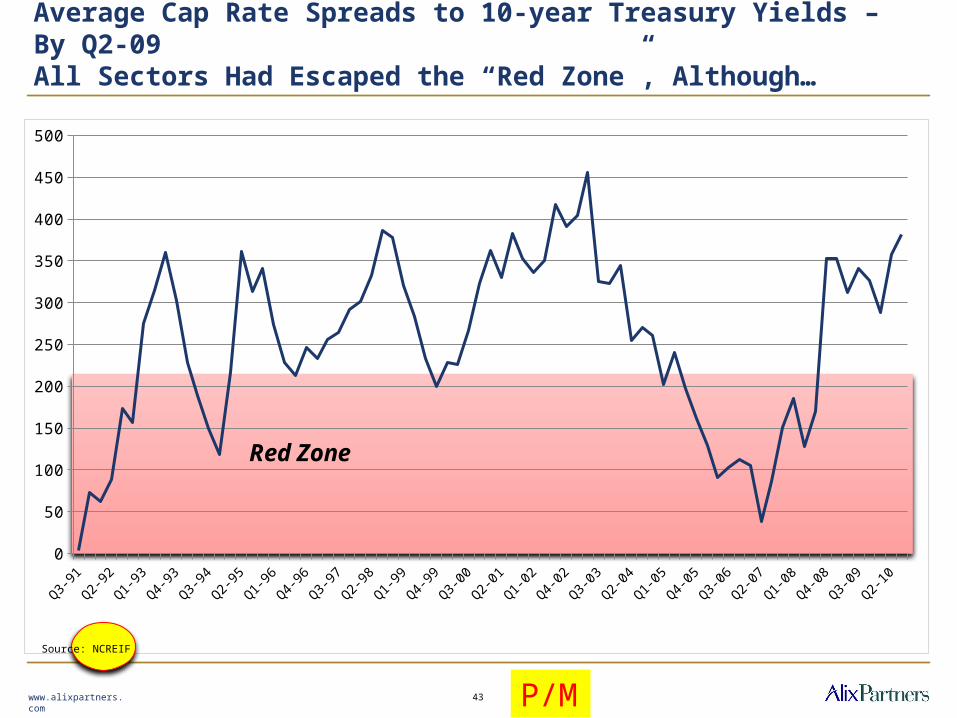
Red Zone
Average Cap Rate Spreads to 10-year Treasury Yields – By Q2-09 All Sectors Had Escaped the “Red Zone”, Although…
www.alixpartners.com
Source: NCREIF
43 P/M
Jan-01 Jul-01 Jan-02 Jul-02 Jan-03 Jul-03 Jan-04 Jul-04 Jan-05 Jul-05 Jan-06 Jul-06 Jan-07 Jul-07 Jan-08 Jul-08 Jan-09 Jul-09 Jan-100
100
200
300
400
500
600
700
Apt Industrial Office CBD Office (Sub) Strip All Core
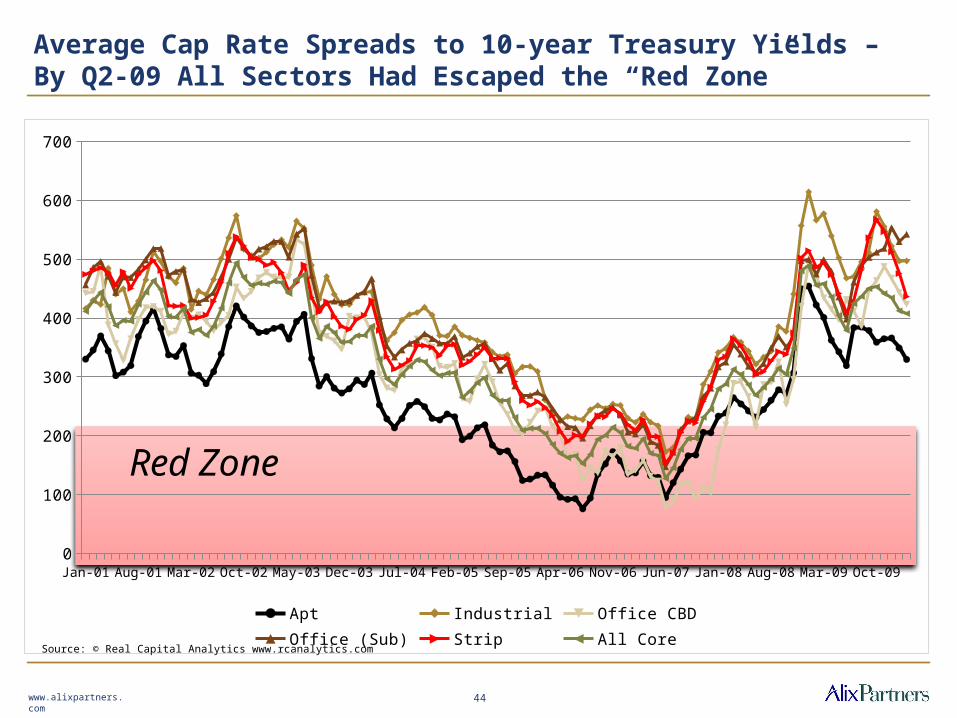
Red Zone
Average Cap Rate Spreads to 10-year Treasury Yields – By Q2-09 All Sectors Had Escaped the “Red Zone”
www.alixpartners.com 44
Source: © Real Capital Analytics www.rcanalytics.com

Cap rate increases have flattened and selectively decreased in 2010
www.alixpartners.com 45
Q1
-80
Q2
-81
Q3
-82
Q4
-83
Q1
-85
Q2
-86
Q3
-87
Q4
-88
Q1
-90
Q2
-91
Q3
-92
Q4
-93
Q1
-95
Q2
-96
Q3
-97
Q4
-98
Q1
-00
Q2
-01
Q3
-02
Q4
-03
Q1
-05
Q2
-06
Q3
-07
Q4
-08
Q1
-10
0%
2%
4%
6%
8%
10%
12%
14%
16%
18%
Cap Rate HistorySource: NCREIF
Eq Wtd Cap Rate 10-year Treasury
Q1-80
Q4-81
Q3-83
Q2-85
Q1-87
Q4-88
Q3-90
Q2-92
Q1-94
Q4-95
Q3-97
Q2-99
Q1-01
Q4-02
Q3-04
Q2-06
Q1-08
Q4-09
-1,000
-800
-600
-400
-200
0
200
400
600
Cap Rate HistorySource: NCREIF
Spread
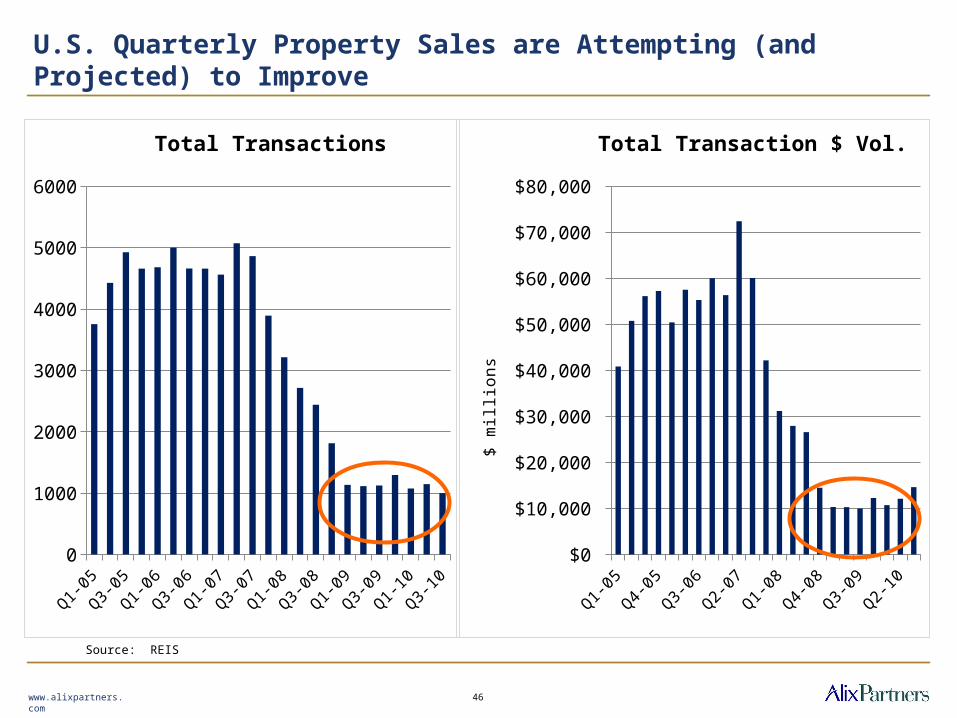
U.S. Quarterly Property Sales are Attempting (and Projected) to Improve
www.alixpartners.com
Q1-05
Q3-05
Q1-06
Q3-06
Q1-07
Q3-07
Q1-08
Q3-08
Q1-09
Q3-09
Q1-10
Q3-10
0
1000
2000
3000
4000
5000
6000
Total Transactions
Source: REIS
46
Q1-05
Q3-05
Q1-06
Q3-06
Q1-07
Q3-07
Q1-08
Q3-08
Q1-09
Q3-09
Q1-10
Q3-10
$0
$10,000
$20,000
$30,000
$40,000
$50,000
$60,000
$70,000
$80,000
Total Transaction $ Vol.
$ m
illio
ns

Private Equity Real Estate Funding Is Also Attempting to Rise
www.alixpartners.com
Q1-07 Q1-08 Q1-09 Q2-09 Q3-09 Q4-09 Q1-10 Q2-10 Q3-10 -
200
400
600
800
1,000
1,200
1,400
1,600
1,800
918
1,304
1,624 1,673
1,622 1,574 1,582 1,562
1,510
396
705
889 887
807 754
691 636
557
Funds on the Road - Historical
# of Funds Raising Aggregate Target ($bn)
Real E
state
Buyou
t
Ventu
re
Infra
struc
ture
Fund
s of F
unds
Distre
ssed
PE
Mez
zani
ne
Secon
darie
s
Nat R
esou
rces
Other
0
50
100
150
200
250
300
350
400
450
500Value & Number of Funds
# Funds on Road
Aggregate Target ($bn)
Source: Preqin
47

Early Indicators Are That PERE Capital Inflows Will Increase for the First Time Since 2007
www.alixpartners.com 48
2001 2002 2003 2004 2005 2006 2007 2008 2009 2010f0
10
20
30
40
50
60
70
80
$31$28
$34
$44
$51
$59
$71
$42
$18
$34
Annual Inflows – US Private Equity Real Estate
Ne
w C
ap
ita
l Allo
ca
tio
n (
$B
)
Source: Institutional Real Estate, Kingsley Assoc., ING Clarion

Pension Funds Are Moving Back to Real Estate Investments in 2010
www.alixpartners.com
Other
Private Equity (Core/Core-Plus)
Private Equity (Opportunistic)
Private Equity (Value-Added)
$8.8
$12.5
$7.0
$6.0
$3.2
$2.8
$6.0
$6.0
Capital Flows to Real Estate($ billions)
2009 2010 ProjectedSource: Institutional Real Estate, Kingsley
49

And Estimated Strategic Investment Allocation Preferences for 2011 Are Also Attractive for CRE
www.alixpartners.com
Core Investments27%
Opportunistic In-vestments
25%
Value-Added In-vestments
22%
Core -Plus Investments16%
Development11%
Emerging Trends Survey PWC/ULI – 2011
Source: Emerging Trends in Real Estate 2011, PWC/Urban Land Institute, October 2010
50
Dallas2101 Cedar Springs Road
Suite 1100 Dallas, TX 75201
214.647.7500
Global Locations
London20 North Audley Street
London W1K 6WEUnited Kingdom
+44.20.7098.7400
Chicago300 N. LaSalle Street
Suite 1900Chicago, IL 60654
312.346.2500
Detroit2000 Town Center
Suite 2400Southfield, MI 48075
248. 358.4420
Los Angeles515 S. Flower Street
Suite 3050Los Angeles, CA 90071
213.437.7100
New York40 West 57th Street
New York, NY 10019212.490.2500
MilanCorso Matteotti 9
20121 MilanItaly
+39.02.360.12000
MunichMauerkircherstr. 1 a
81679 MunchenGermany
+49.89.20.30.40.00
DüsseldorfKönigsallee 59 a40215 Düsseldorf
Germany+49.211.97.55.10.00
TokyoMarunouchi Building 33F
2-4-1 MarunouchiChiyoda-ku
Tokyo 100-6333 Japan+81.3.5533.4800
ShanghaiSuite 6111
Plaza 66 Building I1266 Nan Jing West RoadShanghai, 200040 China
+8621.6171.7555
Paris49/51 Avenue George V
75008 ParisFrance
+33.1.76.74.72.00
San Francisco4 Embarcadero Center31st Floor, Suite 3110
San Francisco, CA 94111415.848.0283
Washington, DC1602 L Street, NW
Suite 300Washington, DC 20036
202.756.9000
AlixPartners is ready to field a team of relevant experts whenever
and wherever they are needed. Our professionals work from 15
global offices in more than a dozen different countries. They speak
more than 50 languages, and have experience in every corner
of the world. Call us, we’ll be there when it really matters.
DubaiGate Village 10, Level 03
P.O. Box 125115Dubai Intl Financial Centre
Dubai, United Arab Emirates+971.4.401.9246
51www.alixpartners.com
Related Documents