Actual Actual Amended Estimated Adopted Adopted 2008-09 2009-10 2010-11 2010-11 2011-12 % 2012-13 % (1) (2) (2/1) (3) (3/2) Revenues Benicia Marina Fund 409,125 404,170 581,785 556,970 562,405 -3% 568,505 1% Benicia Transit Fund 739,500 984,475 947,140 852,710 0 -100% 0 - Wastewater Utility 7,752,075 7,434,760 8,822,760 7,747,060 6,882,210 -22% 8,071,435 17% Water Utility 11,389,570 7,398,155 8,430,500 7,162,510 8,436,575 0% 7,676,700 -9% Revenue Total $ 20,290,270 16,221,560 18,782,185 16,319,250 15,881,190 -15% 16,316,640 3% Expenses Benicia Marina Fund 555,180 441,645 557,725 553,850 562,405 1% 568,505 1% Benicia Transit Fund 1,198,585 1,010,040 1,189,455 845,120 0 -100% 0 - Wastewater Utility 9,145,015 7,468,405 10,412,480 8,621,485 7,917,890 -24% 7,820,110 -1% Water Utility 15,322,135 8,230,905 11,306,065 8,402,360 11,502,715 2% 9,133,315 -21% Expense Total $ 26,220,915 17,150,995 23,465,725 18,422,815 19,983,010 -15% 17,521,930 -12% Combined Surplus/(Deficit) (5,930,645) (929,435) (4,683,540) (2,103,565) (4,101,820) (1,205,290) Working Capital Benicia Marina Fund (8,905) (30,780) (6,720) 0 0 -100% 0 - Benicia Transit Fund 0 0 0 0 0 - 0 - Wastewater Utility 8,466,095 8,432,450 6,388,535 7,558,025 6,522,345 2% 6,773,670 4% Water Utility 12,496,510 11,664,085 8,088,520 10,424,235 7,358,095 -9% 5,901,480 -20% Total Working Capital $ 20,953,700 20,065,755 14,470,335 17,982,260 13,880,440 -4% 12,675,150 -9% Enterprise Funds 7/18/2011 at 11:54 AM Section 7 - Page 1

Welcome message from author
This document is posted to help you gain knowledge. Please leave a comment to let me know what you think about it! Share it to your friends and learn new things together.
Transcript

Actual Actual Amended Estimated Adopted Adopted2008-09 2009-10 2010-11 2010-11 2011-12 % 2012-13 %
(1) (2) (2/1) (3) (3/2)
Revenues
Benicia Marina Fund 409,125 404,170 581,785 556,970 562,405 -3% 568,505 1%Benicia Transit Fund 739,500 984,475 947,140 852,710 0 -100% 0 -Wastewater Utility 7,752,075 7,434,760 8,822,760 7,747,060 6,882,210 -22% 8,071,435 17%Water Utility 11,389,570 7,398,155 8,430,500 7,162,510 8,436,575 0% 7,676,700 -9%
Revenue Total $ 20,290,270 16,221,560 18,782,185 16,319,250 15,881,190 -15% 16,316,640 3%
Expenses
Benicia Marina Fund 555,180 441,645 557,725 553,850 562,405 1% 568,505 1%Benicia Transit Fund 1,198,585 1,010,040 1,189,455 845,120 0 -100% 0 -Wastewater Utility 9,145,015 7,468,405 10,412,480 8,621,485 7,917,890 -24% 7,820,110 -1%Water Utility 15,322,135 8,230,905 11,306,065 8,402,360 11,502,715 2% 9,133,315 -21%
Expense Total $ 26,220,915 17,150,995 23,465,725 18,422,815 19,983,010 -15% 17,521,930 -12%
Combined Surplus/(Deficit) (5,930,645) (929,435) (4,683,540) (2,103,565) (4,101,820) (1,205,290)
Working Capital
Benicia Marina Fund (8,905) (30,780) (6,720) 0 0 -100% 0 -Benicia Transit Fund 0 0 0 0 0 - 0 -Wastewater Utility 8,466,095 8,432,450 6,388,535 7,558,025 6,522,345 2% 6,773,670 4%Water Utility 12,496,510 11,664,085 8,088,520 10,424,235 7,358,095 -9% 5,901,480 -20%
Total Working Capital $ 20,953,700 20,065,755 14,470,335 17,982,260 13,880,440 -4% 12,675,150 -9%
Enterprise Funds
7/18/2011 at 11:54 AM
Section 7 - Page 1

Actual Actual Amended Estimated Adopted Adopted Acct Fund 060 Division 8060 2008-09 2009-10 2010-11 2010-11 2011-12 % 2012-13 %
(1) (2) (2/1) (3) (3/2)
Revenues
7011 Property Tax-Secured 16,000 16,000 16,000 16,000 16,000 0% 16,000 0%7012 Property Tax-Unsecured 48,000 48,000 48,000 48,000 48,000 0% 48,000 0%7214 Transfer Fees 1,680 7,505 2,000 9,510 6,000 200% 6,000 0%7411 Investment Earnings 22,095 21,400 16,000 20,675 20,000 25% 19,400 -3%7455 B Rents & Concessions 277,710 277,610 314,710 277,710 277,610 -12% 277,610 0%7458 Percentage Rents 43,640 33,655 35,000 35,000 30,000 -14% 30,000 0%7999 Interfund Transfer In 0 0 150,075 150,075 164,795 10% 171,495 4%
Revenue Total $ 409,125 404,170 581,785 556,970 562,405 -3% 568,505 1%
Expenses
8106 Prof & Tech Services 96,345 116,455 36,250 36,250 35,000 -3% 35,000 0%8900 Marina Dredging 134,885 1,250 197,530 193,655 203,460 3% 209,560 3%
Services & Supplies $ 231,230 117,705 233,780 229,905 238,460 2% 244,560 3%
9008 B Note-Principal 143,985 150,460 157,235 157,235 164,310 4% 171,705 5%9009 Note-Interest 179,965 173,480 166,710 166,710 159,635 -4% 152,240 -5%
Debt Service Total $ 323,950 323,940 323,945 323,945 323,945 0% 323,945 0%
Expense Total $ 555,180 441,645 557,725 553,850 562,405 1% 568,505 1%
Net Contribution / (Use) $ (146,055) (37,475) 24,060 3,120 0 0
Adjustments (22,320) 15,600 27,660
Working Capital $ (8,905) (30,780) (6,720) 0 0 - 0 -
Marina OperationsThis fund accounts for the revenues and expenses associated with the operations, management, and debt service of the City's Marina. The original California Department of Boating loan, the source of funding for construction of the Marina, was for $5.2 million with an interest rate of 4.5%, and isdue to be retired August, 2027.
7/18/2011 at 4:54 PM
Section 7 - Page 2
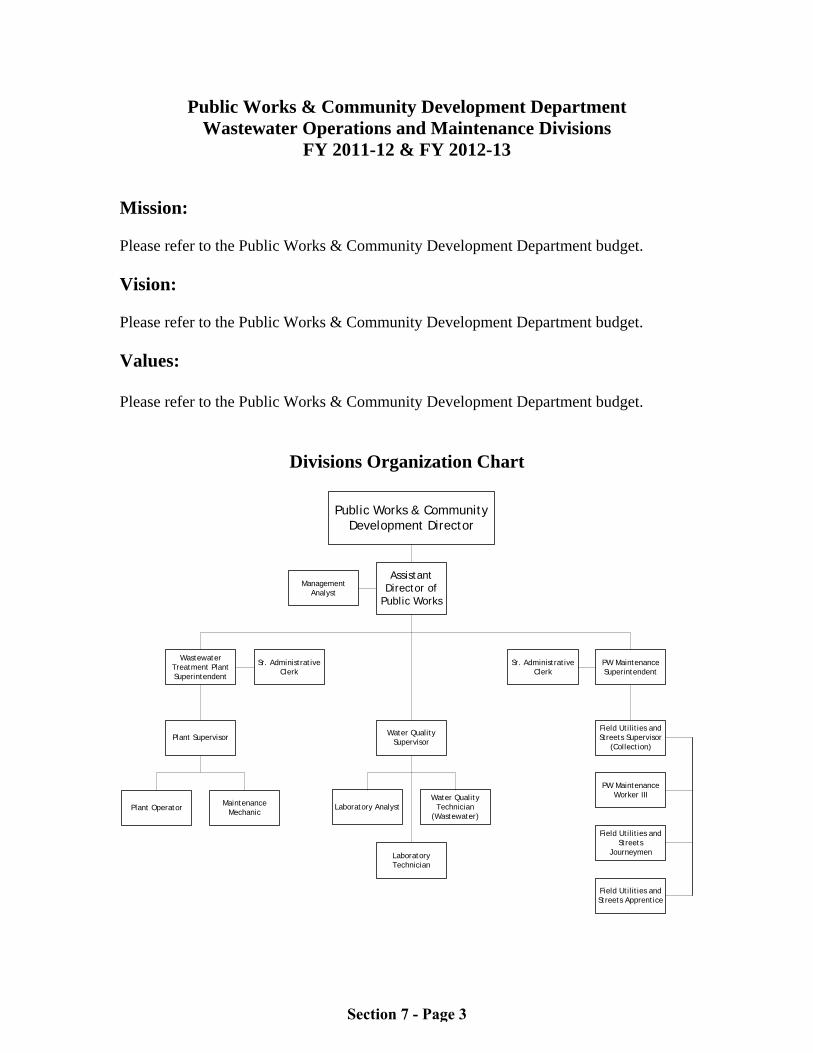
Public Works & Community Development Department Wastewater Operations and Maintenance Divisions
FY 2011-12 & FY 2012-13
Mission: Please refer to the Public Works & Community Development Department budget.
Vision: Please refer to the Public Works & Community Development Department budget. Values: Please refer to the Public Works & Community Development Department budget.
Divisions Organization Chart
Management Analyst
Sr. Administrative Clerk
Maintenance Mechanic
Plant Operator
Plant Supervisor
Wastewater Treatment Plant Superintendent
Laboratory AnalystWater Quality
Technician (Wastewater)
Sr. Administrative Clerk
PW Maintenance Worker III
Field Utilities and Streets
Journeymen
Field Utilities and Streets Apprentice
Field Utilities and Streets Supervisor
(Collection)
PW Maintenance Superintendent
Assistant Director of
Public Works
Public Works & Community Development Director
Laboratory Technician
Water Quality Supervisor
Section 7 - Page 3
Division Responsibilities: The Wastewater Operations and Maintenance Divisions provide for the operation, maintenance, repair, and capital improvements of the Wastewater Treatment Plant (WWTP) and collection and discharge systems. The treatment plant operates under a National Pollutant Discharge Elimination System (NPDES) permit issued by the San Francisco Regional Water Quality Control Board and has a permitted dry weather capacity of 4.5 million gallons per day and a short-term hydraulic capacity of 24 million gallons per day. There are over 400 major plant process equipment components that endure a severe duty cycle including corrosive gases, abrasive liquids, and continuous operation. The collection system consists of 24 lift stations, approximately 150 miles of sewer pipelines, a 3-mile wet weather relief (interceptor) pipeline, and 6 wet weather control structures. The discharge system consists of a 1,100-foot long outfall pipeline and a 150-foot long outfall diffuser pipeline. Costs for wastewater-related activities of the Water Quality staff are included in the Wastewater Operations budget. These efforts include the implementation of environmental programs mandated by state and federal statutes and an environmental laboratory providing process control and regulatory monitoring. Accomplishments/Milestones FY 2009 – 2011:
Completed implementation of SCADA telemetry for all lift stations for control and monitoring of equipment and acquisition and logging of critical data.
Completed an update of the Sewer System Master Plan. Designed improvements to correct deficiencies in the cathodic system
protecting wastewater treatment facilities from corrosion. Completed assessment that will be used to repair or replace elements
within the odor scrubber system that are not functioning as designed. Completed repairs to a failed section of the treatment plant's final effluent
pipeline, and installed a new flow meter and structure. Enhanced the Division’s involvement with the community and in public
education through neighborhood meetings, open houses, educational displays, school education programs, recycling events, pollution prevention events and special tours of facilities.
Hosted the annual Coastal Cleanup with a total of 1,853 volunteers collecting 21,112 pounds of trash, collecting 1,221 pounds of recyclables, and cleaning 40.5 miles of beaches, creeks and roads for 2009 and 2010.
Distributed 10,000 "No Drugs Down the Drain" and 10,000 "The Toilet is Not a Trash Can" mailers to the public.
Section 7 - Page 4
Distributed various public education aids to residents encouraging the use of recycled products, pollution prevention, and fats, oils and grease (FOG) reduction.
Conducted over 45 classroom and field trip presentations to over 1,200 students each year covering topics such as pollution prevention, marine debris (plastics in the ocean), and water and wastewater treatment.
Conducted over 150 inspections of industries that have the potential to impact the collection system and/or the wastewater treatment plant.
Conducted the pretreatment program in accordance with the regulations stated in 40 CFR 403 and Attachment H of the WWTP NPDES permit.
Conducted the Pollution Prevention program in accordance with the regulations enforced by the Regional Water Quality Control Board.
Treated more than one billion gallons of wastewater annually to State discharge standards.
Processed over 170 laboratory samples per month, performing over 400 analyses.
Flushed and/or debris cleared 156,000 feet annually of sewer pipelines.
Additional Division Priorities:
Be an active participant in implementing integrated sustainable wastewater management solutions that balance and reconcile the economic, ecological, and social concerns of our citizens to enhance the well being of all, both now and in the future.
Provide for the continued operation and maintenance of the City’s utility systems (including capital improvements) to deliver a quality product for our customers, meeting or exceeding regulatory requirements, within existing rate structures and funding levels.
Maintain an ongoing training program to enhance staff’s capabilities and assure continued staff safety.
Section 7 - Page 5
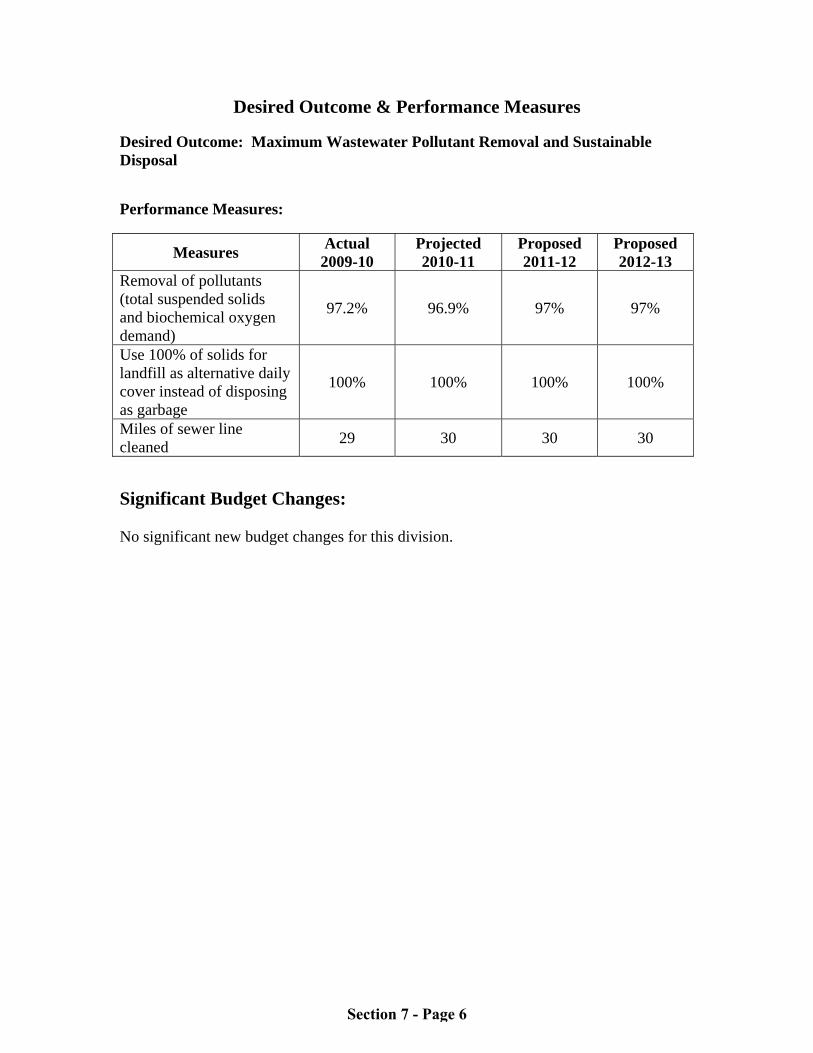
Desired Outcome & Performance Measures Desired Outcome: Maximum Wastewater Pollutant Removal and Sustainable Disposal Performance Measures:
Measures Actual 2009-10
Projected 2010-11
Proposed 2011-12
Proposed 2012-13
Removal of pollutants (total suspended solids and biochemical oxygen demand)
97.2% 96.9% 97% 97%
Use 100% of solids for landfill as alternative daily cover instead of disposing as garbage
100% 100% 100% 100%
Miles of sewer line cleaned
29 30 30 30
Significant Budget Changes: No significant new budget changes for this division.
Section 7 - Page 6
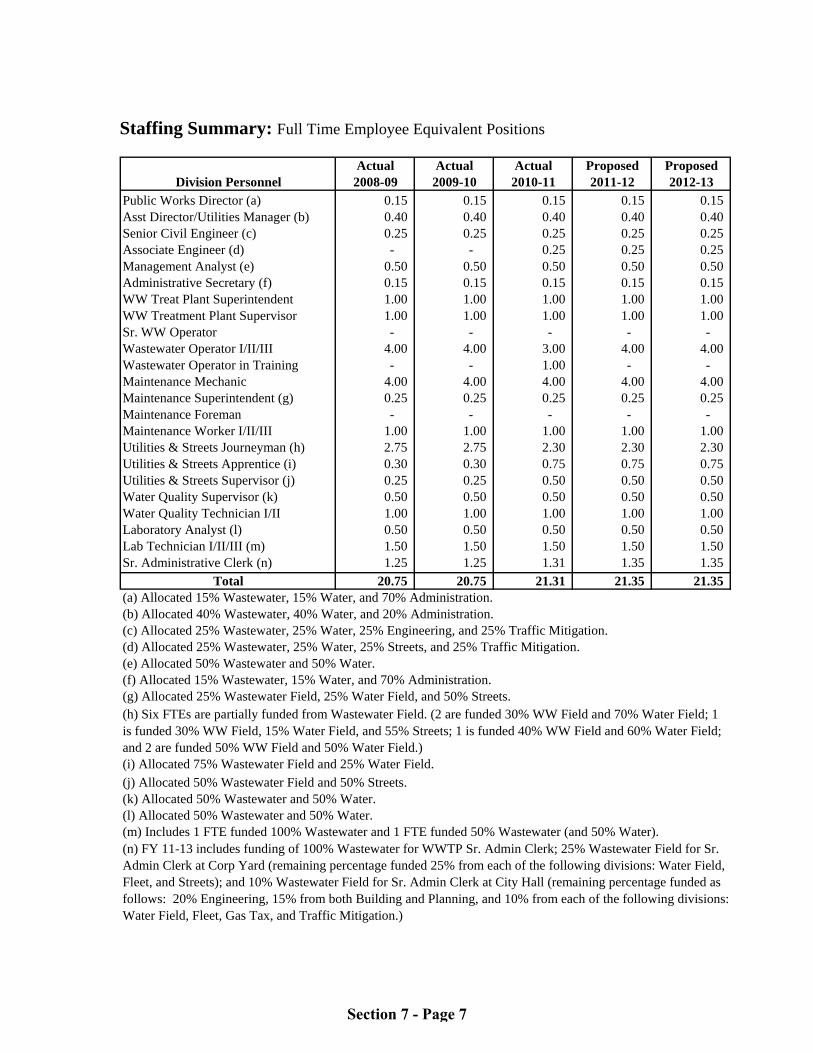
Staffing Summary: Full Time Employee Equivalent Positions
Actual Actual Actual Proposed ProposedDivision Personnel 2008-09 2009-10 2010-11 2011-12 2012-13
Public Works Director (a) 0.15 0.15 0.15 0.15 0.15 Asst Director/Utilities Manager (b) 0.40 0.40 0.40 0.40 0.40 Senior Civil Engineer (c) 0.25 0.25 0.25 0.25 0.25 Associate Engineer (d) - - 0.25 0.25 0.25 Management Analyst (e) 0.50 0.50 0.50 0.50 0.50 Administrative Secretary (f) 0.15 0.15 0.15 0.15 0.15 WW Treat Plant Superintendent 1.00 1.00 1.00 1.00 1.00 WW Treatment Plant Supervisor 1.00 1.00 1.00 1.00 1.00 Sr. WW Operator - - - - - Wastewater Operator I/II/III 4.00 4.00 3.00 4.00 4.00 Wastewater Operator in Training - - 1.00 - - Maintenance Mechanic 4.00 4.00 4.00 4.00 4.00 Maintenance Superintendent (g) 0.25 0.25 0.25 0.25 0.25 Maintenance Foreman - - - - - Maintenance Worker I/II/III 1.00 1.00 1.00 1.00 1.00 Utilities & Streets Journeyman (h) 2.75 2.75 2.30 2.30 2.30 Utilities & Streets Apprentice (i) 0.30 0.30 0.75 0.75 0.75 Utilities & Streets Supervisor (j) 0.25 0.25 0.50 0.50 0.50 Water Quality Supervisor (k) 0.50 0.50 0.50 0.50 0.50 Water Quality Technician I/II 1.00 1.00 1.00 1.00 1.00 Laboratory Analyst (l) 0.50 0.50 0.50 0.50 0.50 Lab Technician I/II/III (m) 1.50 1.50 1.50 1.50 1.50 Sr. Administrative Clerk (n) 1.25 1.25 1.31 1.35 1.35
Total 20.75 20.75 21.31 21.35 21.35
(m) Includes 1 FTE funded 100% Wastewater and 1 FTE funded 50% Wastewater (and 50% Water).(n) FY 11-13 includes funding of 100% Wastewater for WWTP Sr. Admin Clerk; 25% Wastewater Field for Sr. Admin Clerk at Corp Yard (remaining percentage funded 25% from each of the following divisions: Water Field, Fleet, and Streets); and 10% Wastewater Field for Sr. Admin Clerk at City Hall (remaining percentage funded as follows: 20% Engineering, 15% from both Building and Planning, and 10% from each of the following divisions: Water Field, Fleet, Gas Tax, and Traffic Mitigation.)
(i) Allocated 75% Wastewater Field and 25% Water Field.
(j) Allocated 50% Wastewater Field and 50% Streets.(k) Allocated 50% Wastewater and 50% Water.(l) Allocated 50% Wastewater and 50% Water.
(e) Allocated 50% Wastewater and 50% Water.(f) Allocated 15% Wastewater, 15% Water, and 70% Administration.(g) Allocated 25% Wastewater Field, 25% Water Field, and 50% Streets.(h) Six FTEs are partially funded from Wastewater Field. (2 are funded 30% WW Field and 70% Water Field; 1 is funded 30% WW Field, 15% Water Field, and 55% Streets; 1 is funded 40% WW Field and 60% Water Field; and 2 are funded 50% WW Field and 50% Water Field.)
(a) Allocated 15% Wastewater, 15% Water, and 70% Administration.(b) Allocated 40% Wastewater, 40% Water, and 20% Administration.(c) Allocated 25% Wastewater, 25% Water, 25% Engineering, and 25% Traffic Mitigation.(d) Allocated 25% Wastewater, 25% Water, 25% Streets, and 25% Traffic Mitigation.
Section 7 - Page 7
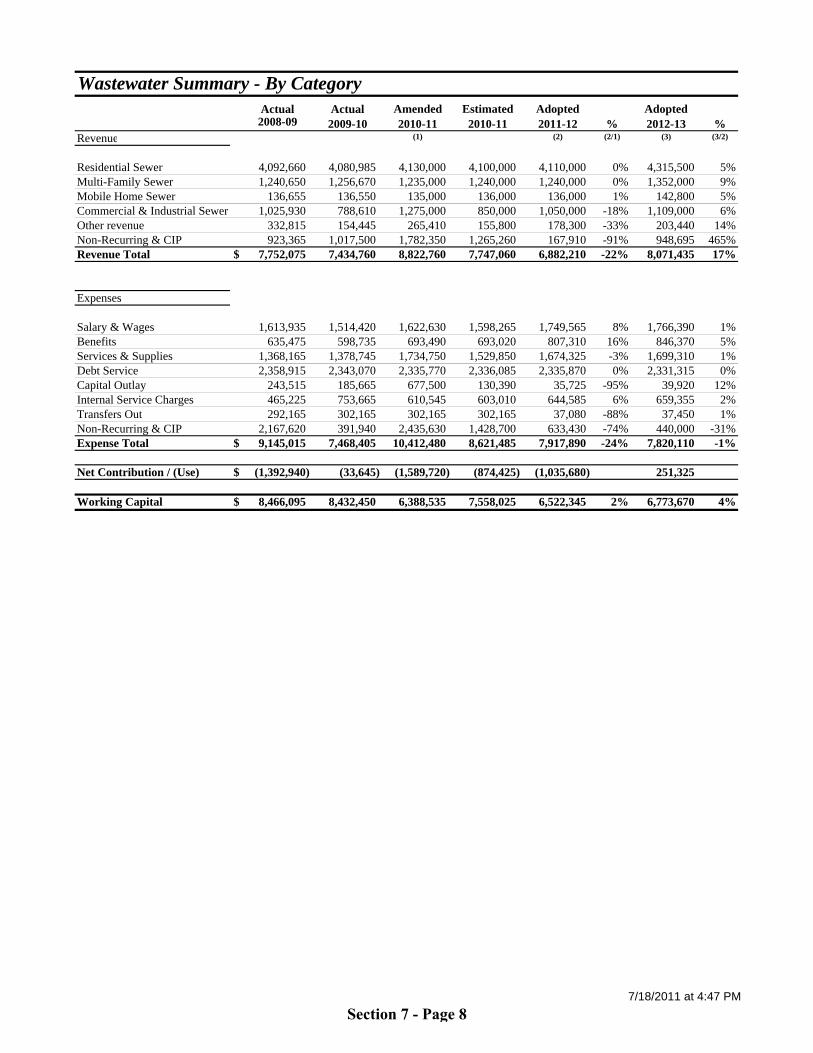
Actual Actual Amended Estimated Adopted Adopted 2008-09 2009-10 2010-11 2010-11 2011-12 % 2012-13 %
Revenue (1) (2) (2/1) (3) (3/2)
Residential Sewer 4,092,660 4,080,985 4,130,000 4,100,000 4,110,000 0% 4,315,500 5%Multi-Family Sewer 1,240,650 1,256,670 1,235,000 1,240,000 1,240,000 0% 1,352,000 9%Mobile Home Sewer 136,655 136,550 135,000 136,000 136,000 1% 142,800 5%Commercial & Industrial Sewer 1,025,930 788,610 1,275,000 850,000 1,050,000 -18% 1,109,000 6%Other revenue 332,815 154,445 265,410 155,800 178,300 -33% 203,440 14%Non-Recurring & CIP 923,365 1,017,500 1,782,350 1,265,260 167,910 -91% 948,695 465%Revenue Total $ 7,752,075 7,434,760 8,822,760 7,747,060 6,882,210 -22% 8,071,435 17%
Expenses
Salary & Wages 1,613,935 1,514,420 1,622,630 1,598,265 1,749,565 8% 1,766,390 1%Benefits 635,475 598,735 693,490 693,020 807,310 16% 846,370 5%Services & Supplies 1,368,165 1,378,745 1,734,750 1,529,850 1,674,325 -3% 1,699,310 1%Debt Service 2,358,915 2,343,070 2,335,770 2,336,085 2,335,870 0% 2,331,315 0%Capital Outlay 243,515 185,665 677,500 130,390 35,725 -95% 39,920 12%Internal Service Charges 465,225 753,665 610,545 603,010 644,585 6% 659,355 2%Transfers Out 292,165 302,165 302,165 302,165 37,080 -88% 37,450 1%Non-Recurring & CIP 2,167,620 391,940 2,435,630 1,428,700 633,430 -74% 440,000 -31%Expense Total $ 9,145,015 7,468,405 10,412,480 8,621,485 7,917,890 -24% 7,820,110 -1%
Net Contribution / (Use) $ (1,392,940) (33,645) (1,589,720) (874,425) (1,035,680) 251,325
Working Capital $ 8,466,095 8,432,450 6,388,535 7,558,025 6,522,345 2% 6,773,670 4%
Wastewater Summary - By Category
7/18/2011 at 4:47 PM
Section 7 - Page 8
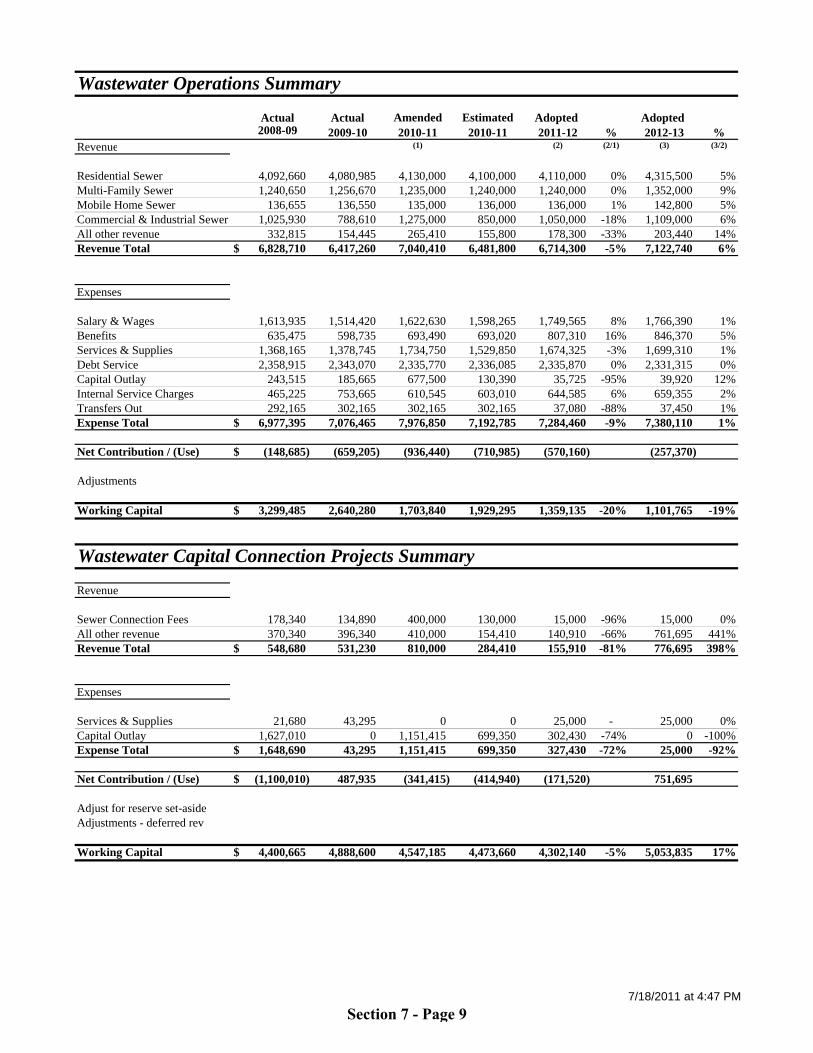
Actual Actual Amended Estimated Adopted Adopted 2008-09 2009-10 2010-11 2010-11 2011-12 % 2012-13 %
Revenue (1) (2) (2/1) (3) (3/2)
Residential Sewer 4,092,660 4,080,985 4,130,000 4,100,000 4,110,000 0% 4,315,500 5%Multi-Family Sewer 1,240,650 1,256,670 1,235,000 1,240,000 1,240,000 0% 1,352,000 9%Mobile Home Sewer 136,655 136,550 135,000 136,000 136,000 1% 142,800 5%Commercial & Industrial Sewer 1,025,930 788,610 1,275,000 850,000 1,050,000 -18% 1,109,000 6%All other revenue 332,815 154,445 265,410 155,800 178,300 -33% 203,440 14%Revenue Total $ 6,828,710 6,417,260 7,040,410 6,481,800 6,714,300 -5% 7,122,740 6%
Expenses
Salary & Wages 1,613,935 1,514,420 1,622,630 1,598,265 1,749,565 8% 1,766,390 1%Benefits 635,475 598,735 693,490 693,020 807,310 16% 846,370 5%Services & Supplies 1,368,165 1,378,745 1,734,750 1,529,850 1,674,325 -3% 1,699,310 1%Debt Service 2,358,915 2,343,070 2,335,770 2,336,085 2,335,870 0% 2,331,315 0%Capital Outlay 243,515 185,665 677,500 130,390 35,725 -95% 39,920 12%Internal Service Charges 465,225 753,665 610,545 603,010 644,585 6% 659,355 2%Transfers Out 292,165 302,165 302,165 302,165 37,080 -88% 37,450 1%Expense Total $ 6,977,395 7,076,465 7,976,850 7,192,785 7,284,460 -9% 7,380,110 1%
Net Contribution / (Use) $ (148,685) (659,205) (936,440) (710,985) (570,160) (257,370)
Adjustments
Working Capital $ 3,299,485 2,640,280 1,703,840 1,929,295 1,359,135 -20% 1,101,765 -19%
Revenue
Sewer Connection Fees 178,340 134,890 400,000 130,000 15,000 -96% 15,000 0%All other revenue 370,340 396,340 410,000 154,410 140,910 -66% 761,695 441%Revenue Total $ 548,680 531,230 810,000 284,410 155,910 -81% 776,695 398%
Expenses
Services & Supplies 21,680 43,295 0 0 25,000 - 25,000 0%Capital Outlay 1,627,010 0 1,151,415 699,350 302,430 -74% 0 -100%Expense Total $ 1,648,690 43,295 1,151,415 699,350 327,430 -72% 25,000 -92%
Net Contribution / (Use) $ (1,100,010) 487,935 (341,415) (414,940) (171,520) 751,695
Adjust for reserve set-asideAdjustments - deferred rev
Working Capital $ 4,400,665 4,888,600 4,547,185 4,473,660 4,302,140 -5% 5,053,835 17%
Wastewater Operations Summary
Wastewater Capital Connection Projects Summary
7/18/2011 at 4:47 PM
Section 7 - Page 9

Actual Actual Amended Estimated Adopted Adopted 2008-09 2009-10 2010-11 2010-11 2011-12 % 2012-13 %
Revenue (1) (2) (2/1) (3) (3/2)
Equipment/Vehicle Replacement 69,115 74,535 73,000 73,500 4,000 -95% 4,000 0%System Replacement 217,570 211,715 200,000 206,000 6,000 -97% 6,000 0%Major Equip/Veh Replacement 88,000 20 0 0 0 - 160,000 -Major Capital Project Replacement 0 200,000 699,350 701,350 2,000 -100% 2,000 0%Revenue Total $ 374,685 486,270 972,350 980,850 12,000 -99% 172,000 -
Expenses
Equipment/Vehicle Replacement 132,210 18,855 73,310 0 21,000 -71% 160,000 662%System Replacement 299,780 280,005 361,340 30,000 135,000 -63% 95,000 -30%Major Equip/Veh Replacement 86,940 0 0 0 0 - 160,000 -Major Capital Project Replacement 0 49,785 849,565 699,350 150,000 -82% 0 -100%Expense Total $ 518,930 348,645 1,284,215 729,350 306,000 -76% 415,000 36%
Net Contribution / (Use) $ (144,245) 137,625 (311,865) 251,500 (294,000) (243,000)
Working Capital $ 765,945 903,570 137,510 1,155,070 861,070 526% 618,070 -28%
Wastewater Replacement Reserve Summary
7/18/2011 at 4:47 PM
Section 7 - Page 10

Actual Actual Amended Estimated Adopted AdoptedFund 014 2008-09 2009-10 2010-11 2010-11 2011-12 2012-13
(1) (2) (2/1) (3) (3/2)
Revenue Total $ 6,828,710 6,417,260 7,040,410 6,481,800 6,714,300 -5% 7,122,740 6%
Expenses
Salary & Wages $ 1,613,935 1,514,420 1,622,630 1,598,265 1,749,565 8% 1,766,390 1%
Benefits 635,475 598,735 693,490 693,020 807,310 16% 846,370 5%
Services & Supplies 1,368,165 1,378,745 1,734,750 1,529,850 1,674,325 -3% 1,699,310 1%
Debt Service 2,358,915 2,343,070 2,335,770 2,336,085 2,335,870 0% 2,331,315 0%
Capital Outlay & Transfers 535,680 487,830 979,665 432,555 72,805 -93% 77,370 6%
Internal Service Charges 465,225 753,665 610,545 603,010 644,585 6% 659,355 2%
Expense Total $ 6,977,395 7,076,465 7,976,850 7,192,785 7,284,460 -9% 7,380,110 1%
Adjustments - timing difference 0 0 0 0 0 0
Net Contribution / (Use) $ (148,685) (659,205) (936,440) (710,985) (570,160) (257,370)
Working Capital $ 3,299,485 2,640,280 1,703,840 1,929,295 1,359,135 1,101,765
Wastewater Operations
Revenue and Expenditure History
$0
$1,000,000
$2,000,000
$3,000,000
$4,000,000
$5,000,000
$6,000,000
$7,000,000
$8,000,000
$9,000,000
Actual 08-09 Actual 09-10 Budget 10-11 Adopted 11-12 Adopted 12-13
-10%
-5%
0%
5%
10%
15%
Revenues Expenditures Expenditure % Change
7/18/2011 at 4:47 PM
Section 7 - Page 11

Actual Actual Amended Estimated Adopted Adopted Acct Fund 515 Division 8356 2008-09 2009-10 2010-11 2010-11 2011-12 2012-13
(1) (2) (3)
Revenues
7411 Investment Earnings 9,115 4,535 3,000 3,500 4,000 4,0007999 Interfund Transfer In 60,000 70,000 70,000 70,000 0 0
Revenue Total $ 69,115 74,535 73,000 73,500 4,000 4,000
Expenses
9959 Equipment Replacement 44,210 18,855 73,310 0 21,000 09999 Interfund Transfer to Major Equip 88,000 0 0 0 0 160,000
Capital Outlay Total $ 132,210 18,855 73,310 0 21,000 160,000
Expense Total $ 132,210 18,855 73,310 0 21,000 160,000
Net Contribution / (Use) $ (63,095) 55,680 (310) 73,500 (17,000) (156,000)
Working Capital $ 222,470 278,150 277,840 351,650 334,650 178,650
Wastewater Equipment/Vehicle Replacement
7/18/2011 at 4:47 PM
Section 7 - Page 12
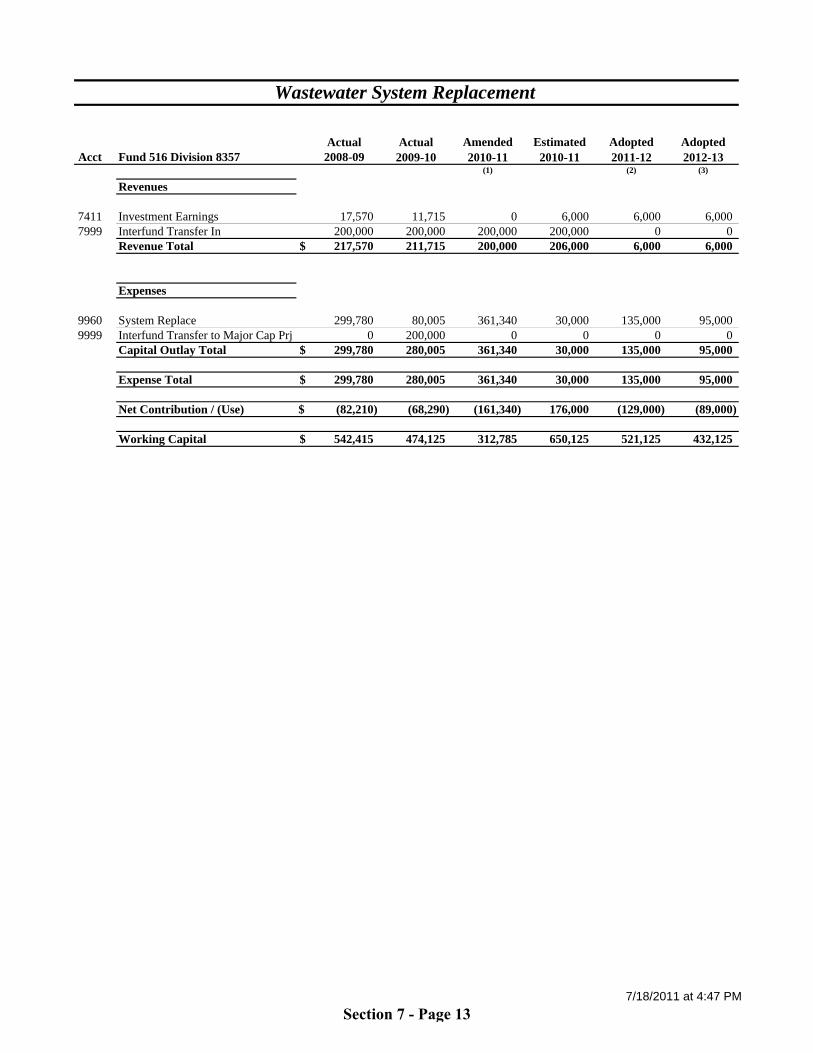
Actual Actual Amended Estimated Adopted Adopted Acct Fund 516 Division 8357 2008-09 2009-10 2010-11 2010-11 2011-12 2012-13
(1) (2) (3)
Revenues
7411 Investment Earnings 17,570 11,715 0 6,000 6,000 6,0007999 Interfund Transfer In 200,000 200,000 200,000 200,000 0 0
Revenue Total $ 217,570 211,715 200,000 206,000 6,000 6,000
Expenses
9960 System Replace 299,780 80,005 361,340 30,000 135,000 95,0009999 Interfund Transfer to Major Cap Prj 0 200,000 0 0 0 0
Capital Outlay Total $ 299,780 280,005 361,340 30,000 135,000 95,000
Expense Total $ 299,780 280,005 361,340 30,000 135,000 95,000
Net Contribution / (Use) $ (82,210) (68,290) (161,340) 176,000 (129,000) (89,000)
Working Capital $ 542,415 474,125 312,785 650,125 521,125 432,125
Wastewater System Replacement
7/18/2011 at 4:47 PM
Section 7 - Page 13
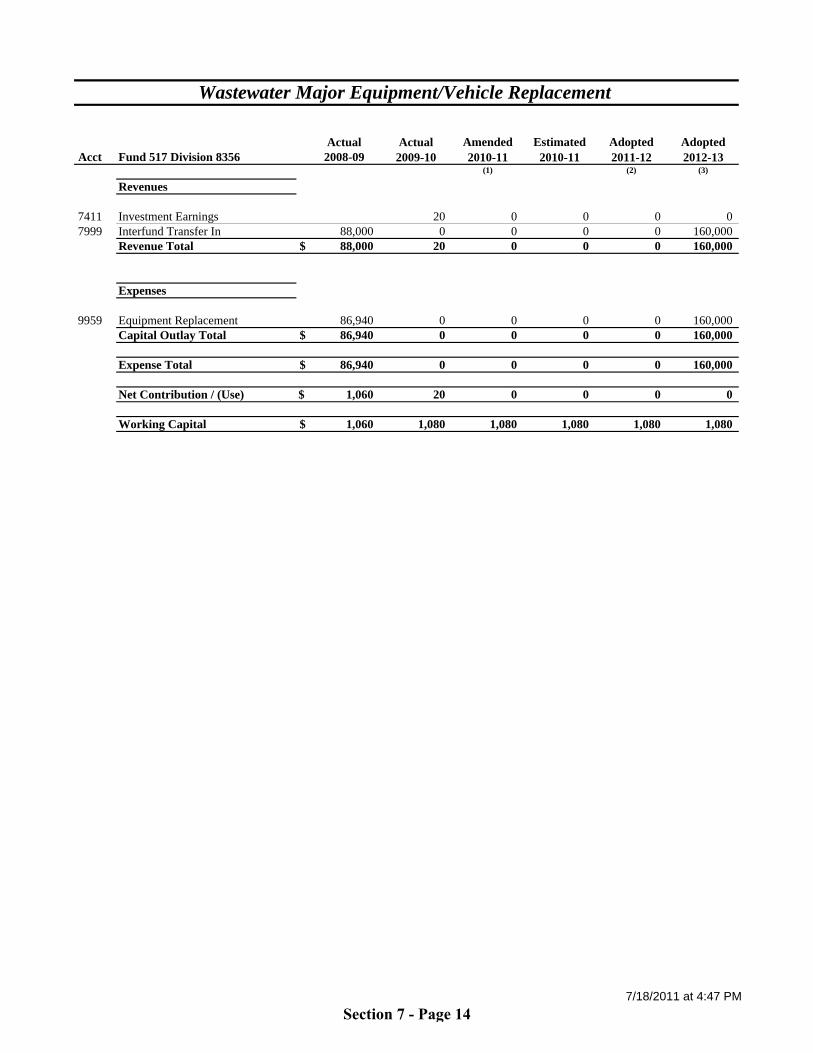
Actual Actual Amended Estimated Adopted Adopted Acct Fund 517 Division 8356 2008-09 2009-10 2010-11 2010-11 2011-12 2012-13
(1) (2) (3)
Revenues
7411 Investment Earnings 20 0 0 0 07999 Interfund Transfer In 88,000 0 0 0 0 160,000
Revenue Total $ 88,000 20 0 0 0 160,000
Expenses
9959 Equipment Replacement 86,940 0 0 0 0 160,000Capital Outlay Total $ 86,940 0 0 0 0 160,000
Expense Total $ 86,940 0 0 0 0 160,000
Net Contribution / (Use) $ 1,060 20 0 0 0 0
Working Capital $ 1,060 1,080 1,080 1,080 1,080 1,080
Wastewater Major Equipment/Vehicle Replacement
7/18/2011 at 4:47 PM
Section 7 - Page 14

Actual Actual Amended Estimated Adopted Adopted Acct Fund 518 Division 8357 2008-09 2009-10 2010-11 2010-11 2011-12 2012-13
(1) (2) (3)
Revenues
7411 Investment Earnings 0 0 0 2,000 2,000 2,0007999 Interfund Transfer In-WW Prj 0 200,000 699,350 699,350 0 0
Revenue Total $ 0 200,000 699,350 701,350 2,000 2,000
Expenses
9960 System Replacement 0 49,785 849,565 699,350 150,000 0Capital Outlay Total $ 0 49,785 849,565 699,350 150,000 0
Expense Total $ 0 49,785 849,565 699,350 150,000 0
Net Contribution / (Use) $ 0 150,215 (150,215) 2,000 (148,000) 2,000
Working Capital $ 0 150,215 0 152,215 4,215 6,215
Wastewater Major Capital Project Replacement
7/18/2011 at 4:47 PM
Section 7 - Page 15
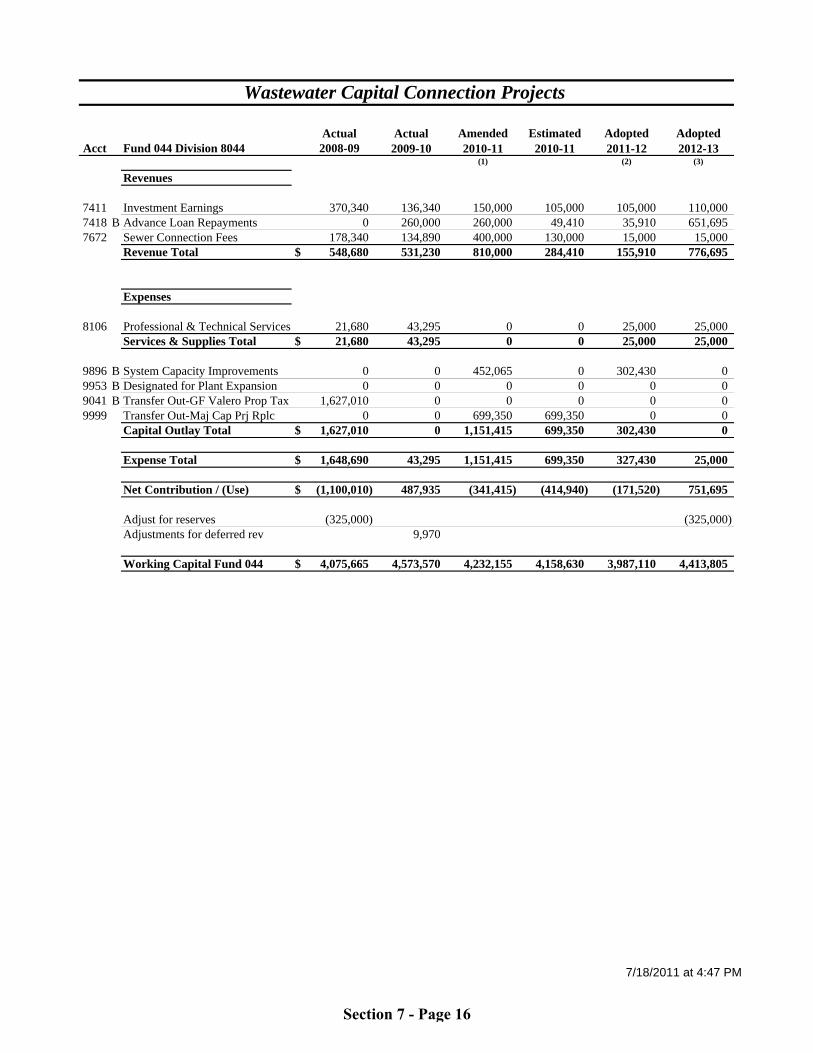
Actual Actual Amended Estimated Adopted Adopted Acct Fund 044 Division 8044 2008-09 2009-10 2010-11 2010-11 2011-12 2012-13
(1) (2) (3)
Revenues
7411 Investment Earnings 370,340 136,340 150,000 105,000 105,000 110,0007418 B Advance Loan Repayments 0 260,000 260,000 49,410 35,910 651,6957672 Sewer Connection Fees 178,340 134,890 400,000 130,000 15,000 15,000
Revenue Total $ 548,680 531,230 810,000 284,410 155,910 776,695
Expenses
8106 Professional & Technical Services 21,680 43,295 0 0 25,000 25,000Services & Supplies Total $ 21,680 43,295 0 0 25,000 25,000
9896 B System Capacity Improvements 0 0 452,065 0 302,430 09953 B Designated for Plant Expansion 0 0 0 0 0 09041 B Transfer Out-GF Valero Prop Tax 1,627,010 0 0 0 0 09999 Transfer Out-Maj Cap Prj Rplc 0 0 699,350 699,350 0 0
Capital Outlay Total $ 1,627,010 0 1,151,415 699,350 302,430 0
Expense Total $ 1,648,690 43,295 1,151,415 699,350 327,430 25,000
Net Contribution / (Use) $ (1,100,010) 487,935 (341,415) (414,940) (171,520) 751,695
Adjust for reserves (325,000) (325,000)Adjustments for deferred rev 9,970
Working Capital Fund 044 $ 4,075,665 4,573,570 4,232,155 4,158,630 3,987,110 4,413,805
Wastewater Capital Connection Projects
7/18/2011 at 4:47 PM
Section 7 - Page 16

Public Works & Community Development Department Water Operations and Maintenance Divisions
FY 2011-12 & FY 2012-13
Mission: Please refer to the Public Works & Community Development Department budget. Vision: Please refer to the Public Works & Community Development Department budget. Values:
Please refer to the Public Works & Community Development Department budget.
Divisions Organization Chart
Management Analyst
Sr. Administrative Clerk
Plant Supervisor
Plant OperatorMaintenance
Mechanic
Water Treatment Plant
Superintendent
Water Quality Technician (Water)
Water Quality Supervisor
Sr. Administrative Clerk
PW Maintenance Worker III
Field Utilities and Streets
Journeymen
Field Utilities and Streets Apprentice
Field Utilities and Streets Supervisor
(Distribution)
PW Maintenance Superintendent
Assistant Director of
Public Works
Public Works & Community Development Director
Laboratory Analyst
Laboratory Technician
Section 7 - Page 17
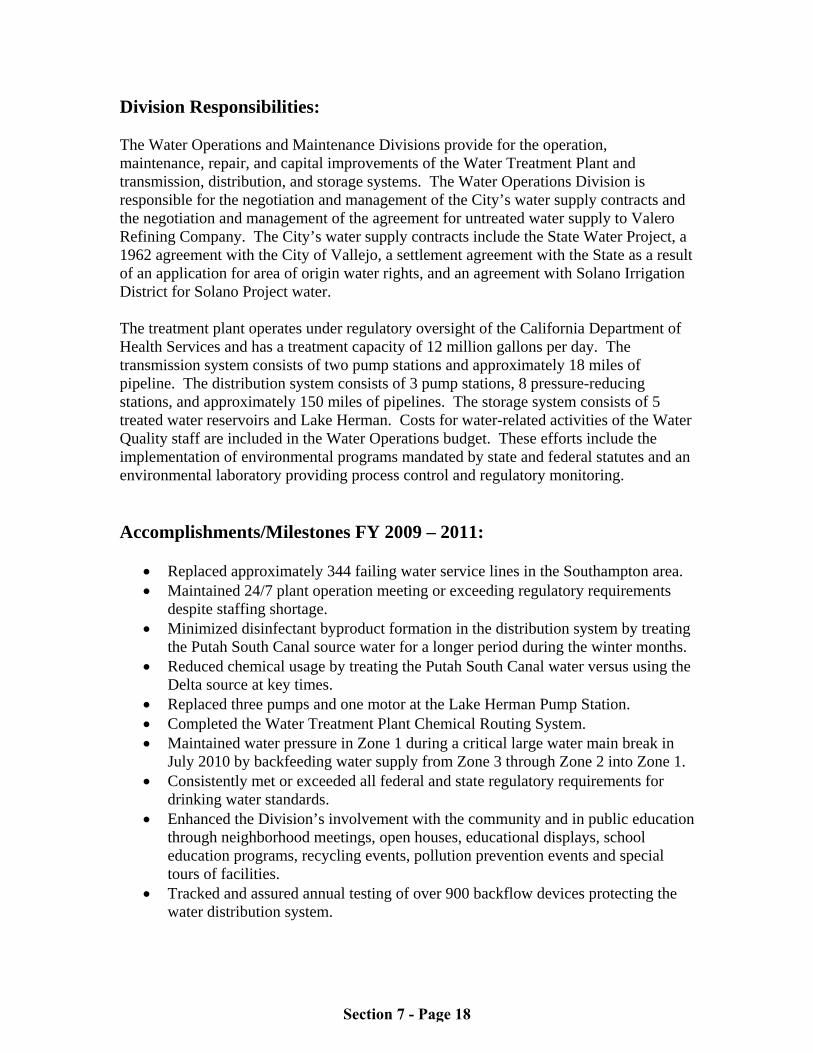
Division Responsibilities: The Water Operations and Maintenance Divisions provide for the operation, maintenance, repair, and capital improvements of the Water Treatment Plant and transmission, distribution, and storage systems. The Water Operations Division is responsible for the negotiation and management of the City’s water supply contracts and the negotiation and management of the agreement for untreated water supply to Valero Refining Company. The City’s water supply contracts include the State Water Project, a 1962 agreement with the City of Vallejo, a settlement agreement with the State as a result of an application for area of origin water rights, and an agreement with Solano Irrigation District for Solano Project water. The treatment plant operates under regulatory oversight of the California Department of Health Services and has a treatment capacity of 12 million gallons per day. The transmission system consists of two pump stations and approximately 18 miles of pipeline. The distribution system consists of 3 pump stations, 8 pressure-reducing stations, and approximately 150 miles of pipelines. The storage system consists of 5 treated water reservoirs and Lake Herman. Costs for water-related activities of the Water Quality staff are included in the Water Operations budget. These efforts include the implementation of environmental programs mandated by state and federal statutes and an environmental laboratory providing process control and regulatory monitoring. Accomplishments/Milestones FY 2009 – 2011:
Replaced approximately 344 failing water service lines in the Southampton area. Maintained 24/7 plant operation meeting or exceeding regulatory requirements
despite staffing shortage. Minimized disinfectant byproduct formation in the distribution system by treating
the Putah South Canal source water for a longer period during the winter months. Reduced chemical usage by treating the Putah South Canal water versus using the
Delta source at key times. Replaced three pumps and one motor at the Lake Herman Pump Station. Completed the Water Treatment Plant Chemical Routing System. Maintained water pressure in Zone 1 during a critical large water main break in
July 2010 by backfeeding water supply from Zone 3 through Zone 2 into Zone 1. Consistently met or exceeded all federal and state regulatory requirements for
drinking water standards. Enhanced the Division’s involvement with the community and in public education
through neighborhood meetings, open houses, educational displays, school education programs, recycling events, pollution prevention events and special tours of facilities.
Tracked and assured annual testing of over 900 backflow devices protecting the water distribution system.
Section 7 - Page 18
Along with the City of Vallejo, hosted annual free water-wise landscaping workshops for the public. The workshops are presented in cooperation with the Master Gardeners and Benicia Community Garden and occurred at locations in both cities. Topics included water-wise basics, irrigation design, and water-wise plant selection.
Conducted over 45 classroom presentations to over 1,200 students each year covering topics such as water conservation.
Treated more than 1.7 billion gallons of water annually to safe drinking water standards.
Read more than 4,600 water meters each month with less than a 1% error rate. Distributed 10,000 annual Consumer Confidence Reports to the public providing
information about drinking water quality, water conservation and rebates for purchasing high efficient toilets and/or clothes washers.
Conducted weekly monitoring of the water distribution system collecting over 780 samples a year.
Through the water conservation program, 280 residential water audits were conducted.
Processed over 170 laboratory samples per month, performing over 400 analyses. Additional Division Priorities:
Implement a sustainable water management strategy by assuring an adequate supply of water is maintained through source contracts and conservation, and the demands of customers are met through an efficient treatment process and distribution system.
Provide for the continued operation and maintenance of the raw water transmission system, water treatment plant, and distribution system to deliver high quality drinking water to customers at a reasonable cost.
Promote advancement among WTP staff through continual education and certification.
Maintain an ongoing training program to enhance staff capabilities and assure continued staff safety.
Section 7 - Page 19
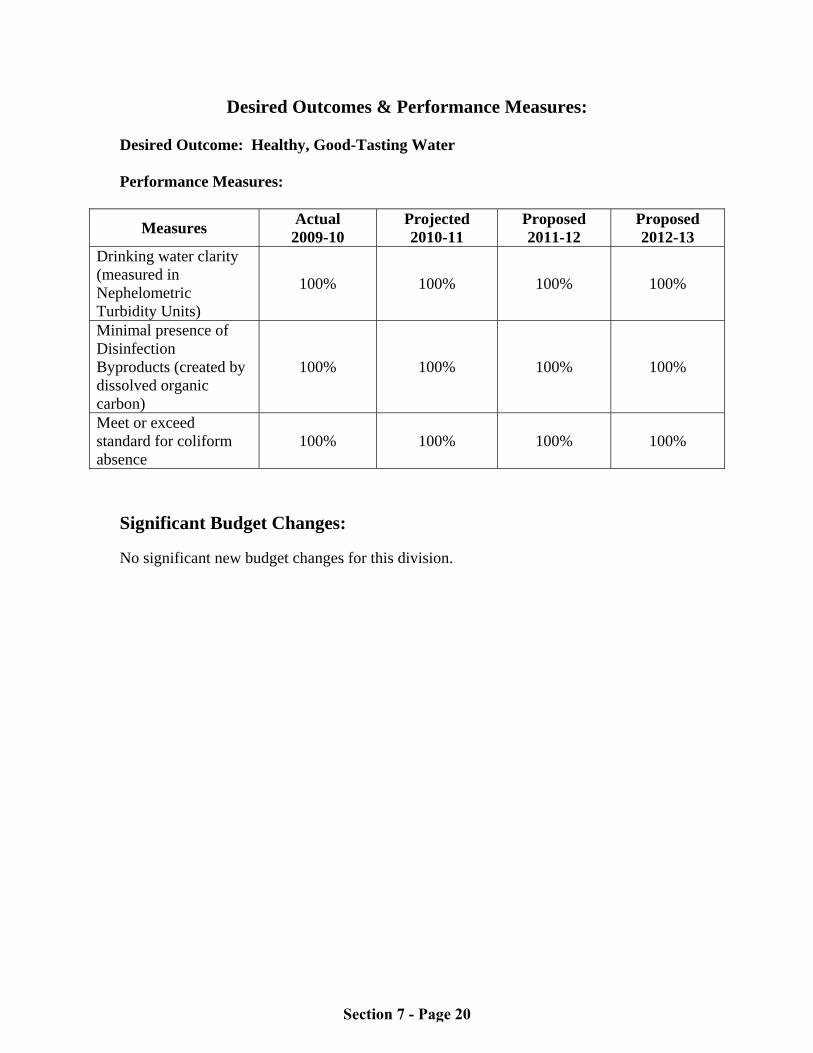
Desired Outcomes & Performance Measures: Desired Outcome: Healthy, Good-Tasting Water Performance Measures:
Measures Actual 2009-10
Projected 2010-11
Proposed 2011-12
Proposed 2012-13
Drinking water clarity (measured in Nephelometric Turbidity Units)
100% 100% 100% 100%
Minimal presence of Disinfection Byproducts (created by dissolved organic carbon)
100% 100% 100% 100%
Meet or exceed standard for coliform absence
100% 100% 100% 100%
Significant Budget Changes: No significant new budget changes for this division.
Section 7 - Page 20

Staffing Summary: Full Time Employee Equivalent Positions
Actual Actual Actual Proposed ProposedDivision Personnel 2008-09 2009-10 2010-11 2011-12 2012-13
Public Works Director (a) 0.15 0.15 0.15 0.15 0.15 Asst. Director/Utilities Mngr (b) 0.40 0.40 0.40 0.40 0.40 Senior Civil Engineer (c) 0.25 0.25 0.25 0.25 0.25 Associate Engineer (d) - - 0.25 0.25 0.25 Management Analyst (e) 0.50 0.50 0.50 0.50 0.50 Administrative Secretary (f) 0.15 0.15 0.15 0.15 0.15 Treatment Plant Superintendent 1.00 1.00 1.00 1.00 1.00 Treatment Plan Supervisor 1.00 1.00 1.00 1.00 1.00 Advanced Water Operator - - - 2.00 2.00 Water Operator 6.00 6.00 6.00 4.00 4.00 Assistant Water Operator - - - - - Operator in Training - - - - - Maintenance Mechanic 2.00 2.00 2.00 2.00 2.00 Maintenance Superintendent (g) 0.25 0.25 0.25 0.25 0.25 Utilities & Streets Supervisor 1.00 1.00 1.00 1.00 1.00 Maintenance Foreman - - - - - Maintenance Worker I/II/III 1.00 1.00 1.00 1.00 1.00 Utilities & Streets Journeyman (h) 3.25 3.25 3.15 3.15 4.15 Utilities & Streets Apprentice (i) 1.15 1.15 1.25 1.25 0.25 Water Quality Supervisor (j) 0.50 0.50 0.50 0.50 0.50 Water Quality Technician I/II 1.00 1.00 1.00 1.00 1.00 Laboratory Analyst (k) 0.50 0.50 0.50 0.50 0.50 Lab Technician I/II/III (l) 1.50 1.50 1.50 1.50 1.50 Senior Administrative Clerk (m) 1.25 1.25 1.31 1.35 1.35
Total 22.85 22.85 23.16 23.20 23.20 (a) Allocated 15% Water, 15% Wastewater, and 70% Administration.(b) Allocated 40% Water, 40% Wastewater, and 20% Administration.(c) Allocated 25% Water, 25% Wastewater, 25% Engineering, and 25% Traffic Mitigation.(d) Allocated 25% Water, 25% Wastewater, 25% Streets, and 25% Traffic Mitigation.(e) Allocated 50% Water and 50% Wastewater.(f) Allocated 15% Water, 15% Wastewater, and 70% Administration.(g) Allocated 25% Water Field, 25% Wastewater Field, and 50% Streets.(h) Six FTEs are partially funded from Water Field. (2 are funded 70% Water Field and 30% Wastewater Field; 1 is funded 15% Water Field, 30% WW Field, and 55% Streets; 1 is funded 60% Water Field and 40% WW Field; and 2 are funded 50% Water Field and 50% WW Field.)
(l) Includes 1 FTE funded 100% Water and 1 FTE funded 50% Water (and 50% Wastewater).(m) FY 11-13 includes funding of 100% Water for WTP Sr. Admin Clerk; 25% Water Field for Sr. Admin Clerk at Corp Yard (remaining percentage funded 25% from each of the following divisions: Wastewater Field, Fleet, and Streets); and 10% Water Field for Sr. Admin Clerk at City Hall (remaining percentage funded as follows: 20% Engineering, 15% from both Building and Planning, and 10% from each of the following divisions: Wastewater Field, Fleet, Gas Tax, and Traffic Mitigation.)
(i) Allocated 25% Water Field and 75% Wastewater Field.(j) Allocated 50% Water and 50% Wastewater.(k) Allocated 50% Water and 50% Wastewater.
Section 7 - Page 21

Actual Actual Amended Estimated Adopted Adopted 2008-09 2009-10 2010-11 2010-11 2011-12 % 2012-13 %
Revenue
Investment Earnings 233,930 74,655 250,000 60,000 75,000 -70% 80,000 7%Rents & Concessions 148,020 149,125 0 3,000 3,000 - 3,000 0%Residential Accounts 3,210,370 2,964,515 3,575,000 3,140,000 3,200,000 -10% 3,412,500 7%Multi-Family Accounts 623,975 615,270 645,000 600,000 610,000 -5% 651,000 7%Commercial Accounts 1,146,655 1,002,305 1,300,000 1,010,000 1,100,000 -15% 1,155,000 5%Industrial Accounts 147,440 132,910 200,000 135,000 140,000 -30% 147,000 5%Metered Municipal Sales 371,935 333,975 350,000 350,000 360,000 3% 378,000 5%Valero Untreated Water 829,225 1,018,620 1,000,000 1,000,000 1,000,000 0% 1,000,000 0%All other revenue 189,375 161,400 175,500 164,935 175,000 0% 183,625 5%Non-Recurring & CIP 5,788,645 945,705 235,000 699,575 1,773,575 655% 666,575 -62%Revenue Total $ 12,689,570 7,398,480 7,730,500 7,162,510 8,436,575 9% 7,676,700 -9%
Expenses
Salary & Wages 1,718,440 1,736,145 1,787,740 1,786,430 1,882,205 5% 1,910,170 1%Benefits 706,585 699,605 772,160 771,630 857,710 11% 901,650 5%Services & Supplies 2,386,905 2,169,870 2,668,760 2,163,175 2,390,090 -10% 2,359,925 -1%Debt Service 1,750,270 1,691,190 1,681,040 1,686,235 1,688,875 0% 1,684,035 0%Capital Outlay 516,985 235,940 1,256,515 194,605 210,625 -83% 196,695 -7%Internal Service Charges 404,705 554,535 518,935 630,740 559,950 8% 568,545 2%Transfers Out 570,875 343,250 243,250 243,250 385,735 59% 386,295 0%Non-Recurring & CIP 7,267,370 800,370 2,377,665 926,295 3,527,525 48% 1,126,000 -68%Expense Total $ 15,322,135 8,230,905 11,306,065 8,402,360 11,502,715 2% 9,133,315 -21%
Net Contribution / (Use) $ (2,632,565) (832,425) (3,575,565) (1,239,850) (3,066,140) (1,456,615)
Working Capital $ 12,496,510 11,664,085 8,088,520 10,424,235 7,358,095 -9% 5,901,480 -20%
Water Summary - By Category
7/18/2011 at 4:32 PM
Section 7 - Page 22
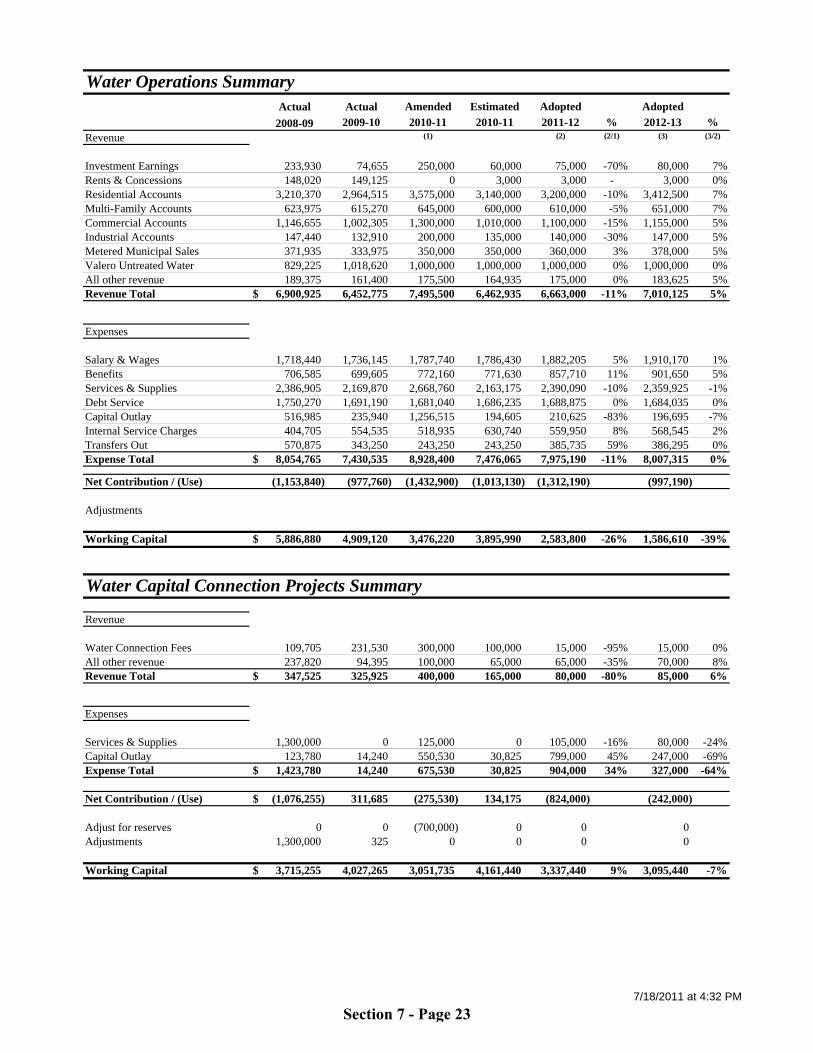
Actual Actual Amended Estimated Adopted Adopted
2008-09 2009-10 2010-11 2010-11 2011-12 % 2012-13 %Revenue (1) (2) (2/1) (3) (3/2)
Investment Earnings 233,930 74,655 250,000 60,000 75,000 -70% 80,000 7%Rents & Concessions 148,020 149,125 0 3,000 3,000 - 3,000 0%Residential Accounts 3,210,370 2,964,515 3,575,000 3,140,000 3,200,000 -10% 3,412,500 7%Multi-Family Accounts 623,975 615,270 645,000 600,000 610,000 -5% 651,000 7%Commercial Accounts 1,146,655 1,002,305 1,300,000 1,010,000 1,100,000 -15% 1,155,000 5%Industrial Accounts 147,440 132,910 200,000 135,000 140,000 -30% 147,000 5%Metered Municipal Sales 371,935 333,975 350,000 350,000 360,000 3% 378,000 5%Valero Untreated Water 829,225 1,018,620 1,000,000 1,000,000 1,000,000 0% 1,000,000 0%All other revenue 189,375 161,400 175,500 164,935 175,000 0% 183,625 5%Revenue Total $ 6,900,925 6,452,775 7,495,500 6,462,935 6,663,000 -11% 7,010,125 5%
Expenses
Salary & Wages 1,718,440 1,736,145 1,787,740 1,786,430 1,882,205 5% 1,910,170 1%Benefits 706,585 699,605 772,160 771,630 857,710 11% 901,650 5%Services & Supplies 2,386,905 2,169,870 2,668,760 2,163,175 2,390,090 -10% 2,359,925 -1%Debt Service 1,750,270 1,691,190 1,681,040 1,686,235 1,688,875 0% 1,684,035 0%Capital Outlay 516,985 235,940 1,256,515 194,605 210,625 -83% 196,695 -7%Internal Service Charges 404,705 554,535 518,935 630,740 559,950 8% 568,545 2%Transfers Out 570,875 343,250 243,250 243,250 385,735 59% 386,295 0%Expense Total $ 8,054,765 7,430,535 8,928,400 7,476,065 7,975,190 -11% 8,007,315 0%
Net Contribution / (Use) (1,153,840) (977,760) (1,432,900) (1,013,130) (1,312,190) (997,190)
Adjustments
Working Capital $ 5,886,880 4,909,120 3,476,220 3,895,990 2,583,800 -26% 1,586,610 -39%
Revenue
Water Connection Fees 109,705 231,530 300,000 100,000 15,000 -95% 15,000 0%All other revenue 237,820 94,395 100,000 65,000 65,000 -35% 70,000 8%Revenue Total $ 347,525 325,925 400,000 165,000 80,000 -80% 85,000 6%
Expenses
Services & Supplies 1,300,000 0 125,000 0 105,000 -16% 80,000 -24%Capital Outlay 123,780 14,240 550,530 30,825 799,000 45% 247,000 -69%Expense Total $ 1,423,780 14,240 675,530 30,825 904,000 34% 327,000 -64%
Net Contribution / (Use) $ (1,076,255) 311,685 (275,530) 134,175 (824,000) (242,000)
Adjust for reserves 0 0 (700,000) 0 0 0Adjustments 1,300,000 325 0 0 0 0
Working Capital $ 3,715,255 4,027,265 3,051,735 4,161,440 3,337,440 9% 3,095,440 -7%
Water Capital Connection Projects Summary
Water Operations Summary
7/18/2011 at 4:32 PM
Section 7 - Page 23
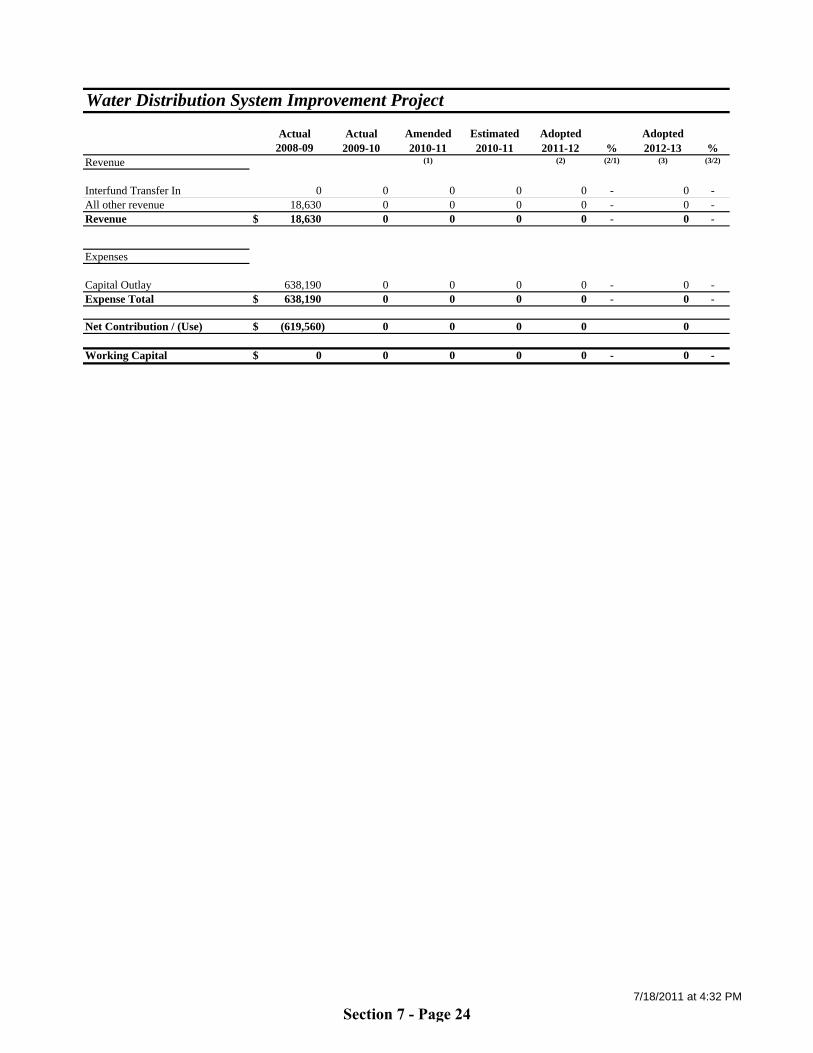
Actual Actual Amended Estimated Adopted Adopted 2008-09 2009-10 2010-11 2010-11 2011-12 % 2012-13 %
Revenue (1) (2) (2/1) (3) (3/2)
Interfund Transfer In 0 0 0 0 0 - 0 -All other revenue 18,630 0 0 0 0 - 0 -Revenue $ 18,630 0 0 0 0 - 0 -
Expenses
Capital Outlay 638,190 0 0 0 0 - 0 -Expense Total $ 638,190 0 0 0 0 - 0 -
Net Contribution / (Use) $ (619,560) 0 0 0 0 0
Working Capital $ 0 0 0 0 0 - 0 -
Water Distribution System Improvement Project
7/18/2011 at 4:32 PM
Section 7 - Page 24
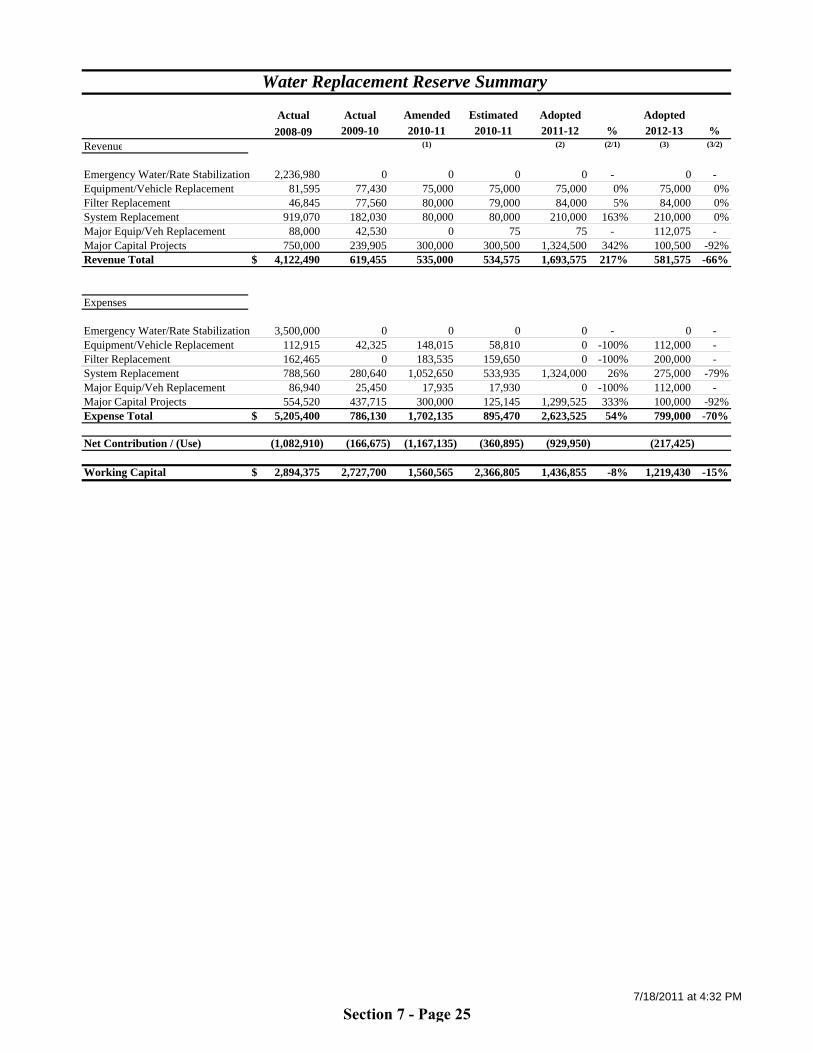
Actual Actual Amended Estimated Adopted Adopted
2008-09 2009-10 2010-11 2010-11 2011-12 % 2012-13 %Revenue (1) (2) (2/1) (3) (3/2)
Emergency Water/Rate Stabilization 2,236,980 0 0 0 0 - 0 -Equipment/Vehicle Replacement 81,595 77,430 75,000 75,000 75,000 0% 75,000 0%Filter Replacement 46,845 77,560 80,000 79,000 84,000 5% 84,000 0%System Replacement 919,070 182,030 80,000 80,000 210,000 163% 210,000 0%Major Equip/Veh Replacement 88,000 42,530 0 75 75 - 112,075 -Major Capital Projects 750,000 239,905 300,000 300,500 1,324,500 342% 100,500 -92%Revenue Total $ 4,122,490 619,455 535,000 534,575 1,693,575 217% 581,575 -66%
Expenses
Emergency Water/Rate Stabilization 3,500,000 0 0 0 0 - 0 -Equipment/Vehicle Replacement 112,915 42,325 148,015 58,810 0 -100% 112,000 -Filter Replacement 162,465 0 183,535 159,650 0 -100% 200,000 -System Replacement 788,560 280,640 1,052,650 533,935 1,324,000 26% 275,000 -79%Major Equip/Veh Replacement 86,940 25,450 17,935 17,930 0 -100% 112,000 -Major Capital Projects 554,520 437,715 300,000 125,145 1,299,525 333% 100,000 -92%Expense Total $ 5,205,400 786,130 1,702,135 895,470 2,623,525 54% 799,000 -70%
Net Contribution / (Use) (1,082,910) (166,675) (1,167,135) (360,895) (929,950) (217,425)
Working Capital $ 2,894,375 2,727,700 1,560,565 2,366,805 1,436,855 -8% 1,219,430 -15%
Water Replacement Reserve Summary
7/18/2011 at 4:32 PM
Section 7 - Page 25

Actual Actual Amended Estimated Adopted AdoptedFund 090 2008-09 2009-10 2010-11 2010-11 2011-12 2012-13
(1) (2) (2/1) (3) (3/2)
Revenue Total $ 6,900,925 6,452,775 7,495,500 6,462,935 6,663,000 -11% 7,010,125 5%
Expenditures
Salary & Wages $ 1,718,440 1,736,145 1,787,740 1,786,430 1,882,205 5% 1,910,170 1%
Benefits 706,585 699,605 772,160 771,630 857,710 11% 901,650 5%
Services & Supplies 2,386,905 2,169,870 2,668,760 2,163,175 2,390,090 -10% 2,359,925 -1%
Capital Outlay & Transfers 1,087,860 579,190 1,499,765 437,855 596,360 -60% 582,990 -2%
Internal Service Charges 404,705 554,535 518,935 630,740 559,950 8% 568,545 2%
Debt Service 1,750,270 1,691,190 1,681,040 1,686,235 1,688,875 0% 1,684,035 0%
Expenditure Total $ 8,054,765 7,430,535 8,928,400 7,476,065 7,975,190 -11% 8,007,315 0%
Adjustments 0 0 0 0 0 0
Net Contribution / (Use) $ (1,153,840) (977,760) (1,432,900) (1,013,130) (1,312,190) (997,190)
Working Capital $ 5,886,880 4,909,120 3,476,220 3,895,990 2,583,800 1,586,610
Water Operations
Revenue and Expenditure History
$0
$1,000,000
$2,000,000
$3,000,000
$4,000,000
$5,000,000
$6,000,000
$7,000,000
$8,000,000
$9,000,000
$10,000,000
Actual 08-09 Actual 09-10 Budget 10-11 Adopted 11-12 Adopted 12-13
-15%
-10%
-5%
0%
5%
10%
15%
20%
25%
Revenues Expenditures Expenditure % Change
7/18/2011 at 4:32 PM
Section 7 - Page 26
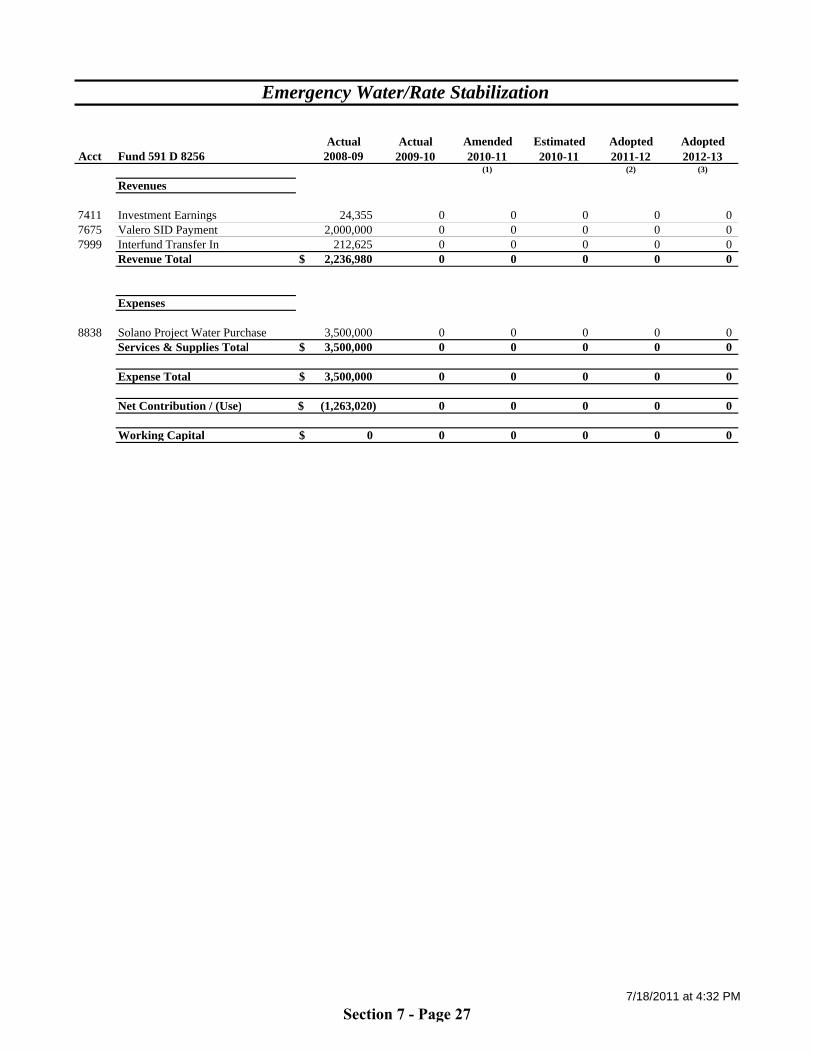
Actual Actual Amended Estimated Adopted Adopted Acct Fund 591 D 8256 2008-09 2009-10 2010-11 2010-11 2011-12 2012-13
(1) (2) (3)
Revenues
7411 Investment Earnings 24,355 0 0 0 0 07675 Valero SID Payment 2,000,000 0 0 0 0 07999 Interfund Transfer In 212,625 0 0 0 0 0
Revenue Total $ 2,236,980 0 0 0 0 0
Expenses
8838 Solano Project Water Purchase 3,500,000 0 0 0 0 0Services & Supplies Total $ 3,500,000 0 0 0 0 0
Expense Total $ 3,500,000 0 0 0 0 0
Net Contribution / (Use) $ (1,263,020) 0 0 0 0 0
Working Capital $ 0 0 0 0 0 0
Emergency Water/Rate Stabilization
7/18/2011 at 4:32 PM
Section 7 - Page 27
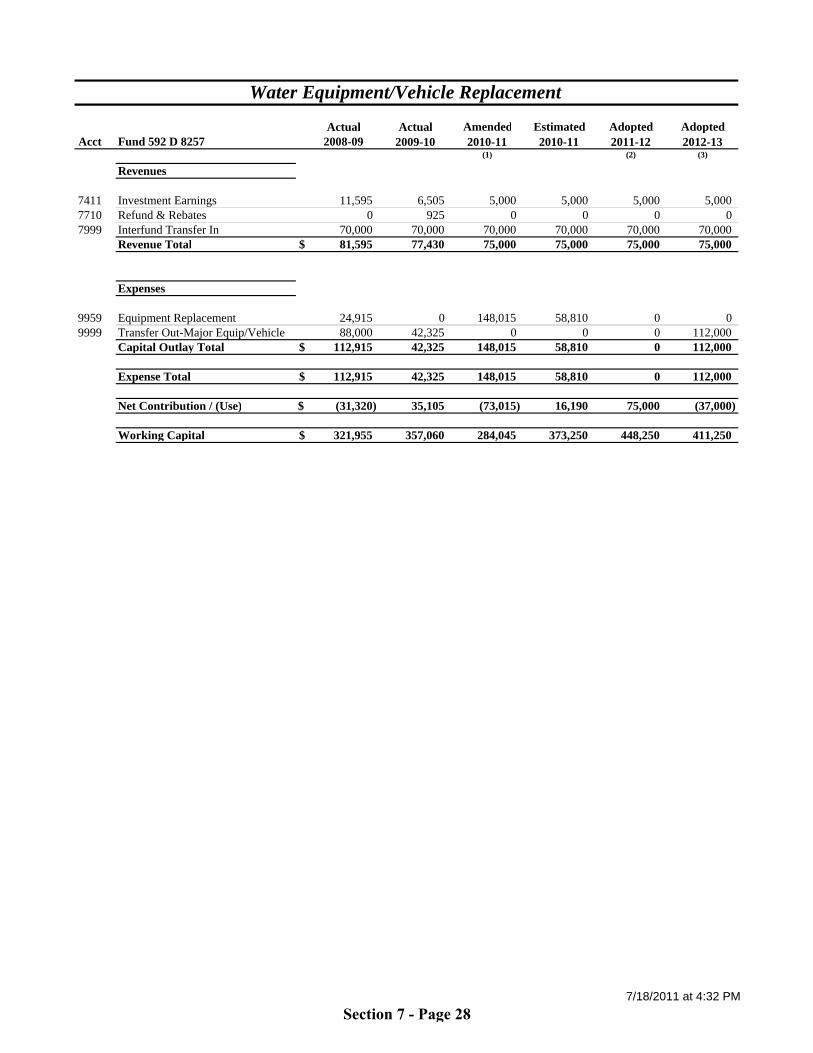
Actual Actual Amended Estimated Adopted Adopted Acct Fund 592 D 8257 2008-09 2009-10 2010-11 2010-11 2011-12 2012-13
(1) (2) (3)
Revenues
7411 Investment Earnings 11,595 6,505 5,000 5,000 5,000 5,0007710 Refund & Rebates 0 925 0 0 0 07999 Interfund Transfer In 70,000 70,000 70,000 70,000 70,000 70,000
Revenue Total $ 81,595 77,430 75,000 75,000 75,000 75,000
Expenses
9959 Equipment Replacement 24,915 0 148,015 58,810 0 09999 Transfer Out-Major Equip/Vehicle 88,000 42,325 0 0 0 112,000
Capital Outlay Total $ 112,915 42,325 148,015 58,810 0 112,000
Expense Total $ 112,915 42,325 148,015 58,810 0 112,000
Net Contribution / (Use) $ (31,320) 35,105 (73,015) 16,190 75,000 (37,000)
Working Capital $ 321,955 357,060 284,045 373,250 448,250 411,250
Water Equipment/Vehicle Replacement
7/18/2011 at 4:32 PM
Section 7 - Page 28

Actual Actual Amended Estimated Adopted Adopted Acct Fund 595 D 8257 2008-09 2009-10 2010-11 2010-11 2011-12 2012-13
(1) (2) (3)
Revenues
7411 Investment Earnings 0 205 0 75 75 757999 Interfund Transfer In 88,000 42,325 0 0 0 112,000
Revenue Total $ 88,000 42,530 0 75 75 112,075
Expenses
9959 Major Equip/Veh Replacement 86,940 25,450 17,935 17,930 0 112,000Capital Outlay Total $ 86,940 25,450 17,935 17,930 0 112,000
Expense Total $ 86,940 25,450 17,935 17,930 0 112,000
Net Contribution / (Use) $ 1,060 17,080 (17,935) (17,855) 75 75
Working Capital $ 1,060 18,140 205 285 360 435
Water Major Equipment/Vehicle Replacement
7/18/2011 at 4:32 PM
Section 7 - Page 29

Actual Actual Amended Estimated Adopted Adopted Acct Fund 593 D 8258 2008-09 2009-10 2010-11 2010-11 2011-12 2012-13
(1) (2) (3)
Revenues
7411 Investment Earnings 6,845 2,560 5,000 4,000 4,000 4,0007999 Interfund Transfer In 40,000 75,000 75,000 75,000 80,000 80,000
Revenue Total $ 46,845 77,560 80,000 79,000 84,000 84,000
Expenses
9958 Filter Replacement 162,465 0 183,535 159,650 0 200,000Capital Outlay Total $ 162,465 0 183,535 159,650 0 200,000
Expense Total $ 162,465 0 183,535 159,650 0 200,000
Net Contribution / (Use) $ (115,620) 77,560 (103,535) (80,650) 84,000 (116,000)
Working Capital $ 110,300 187,860 84,325 107,210 191,210 75,210
Water Filter Replacement
7/18/2011 at 4:32 PM
Section 7 - Page 30
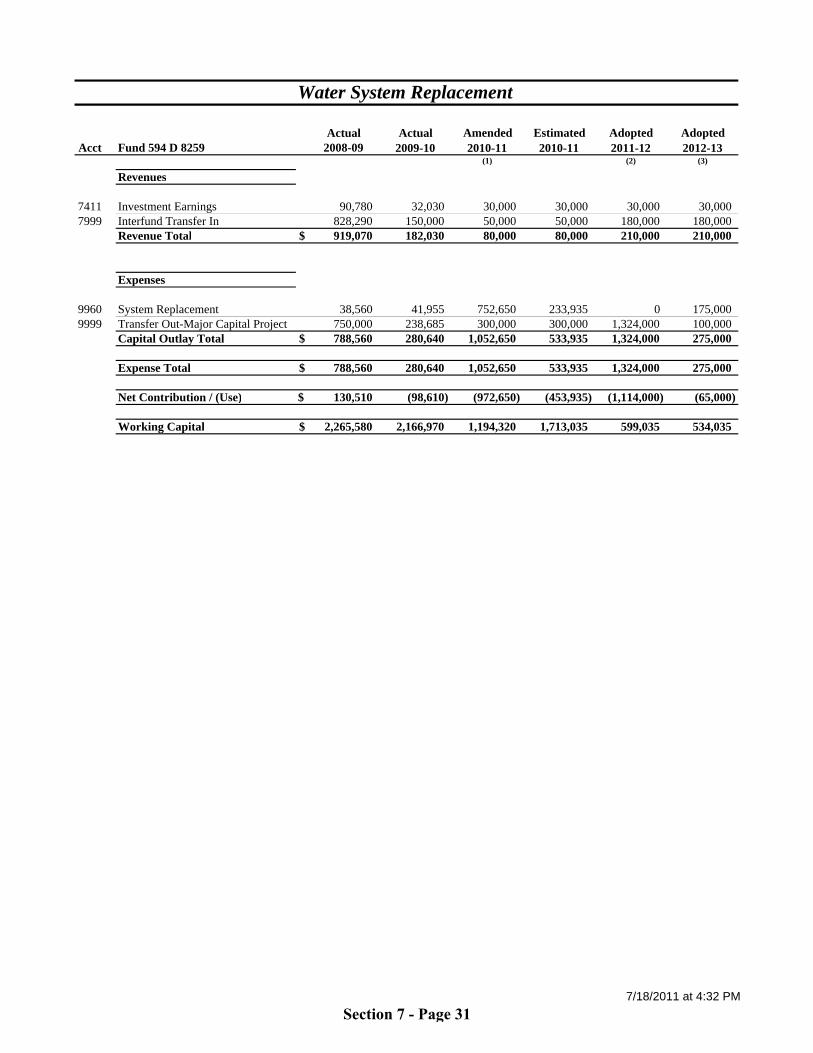
Actual Actual Amended Estimated Adopted Adopted Acct Fund 594 D 8259 2008-09 2009-10 2010-11 2010-11 2011-12 2012-13
(1) (2) (3)
Revenues
7411 Investment Earnings 90,780 32,030 30,000 30,000 30,000 30,0007999 Interfund Transfer In 828,290 150,000 50,000 50,000 180,000 180,000
Revenue Total $ 919,070 182,030 80,000 80,000 210,000 210,000
Expenses
9960 System Replacement 38,560 41,955 752,650 233,935 0 175,0009999 Transfer Out-Major Capital Project 750,000 238,685 300,000 300,000 1,324,000 100,000
Capital Outlay Total $ 788,560 280,640 1,052,650 533,935 1,324,000 275,000
Expense Total $ 788,560 280,640 1,052,650 533,935 1,324,000 275,000
Net Contribution / (Use) $ 130,510 (98,610) (972,650) (453,935) (1,114,000) (65,000)
Working Capital $ 2,265,580 2,166,970 1,194,320 1,713,035 599,035 534,035
Water System Replacement
7/18/2011 at 4:32 PM
Section 7 - Page 31
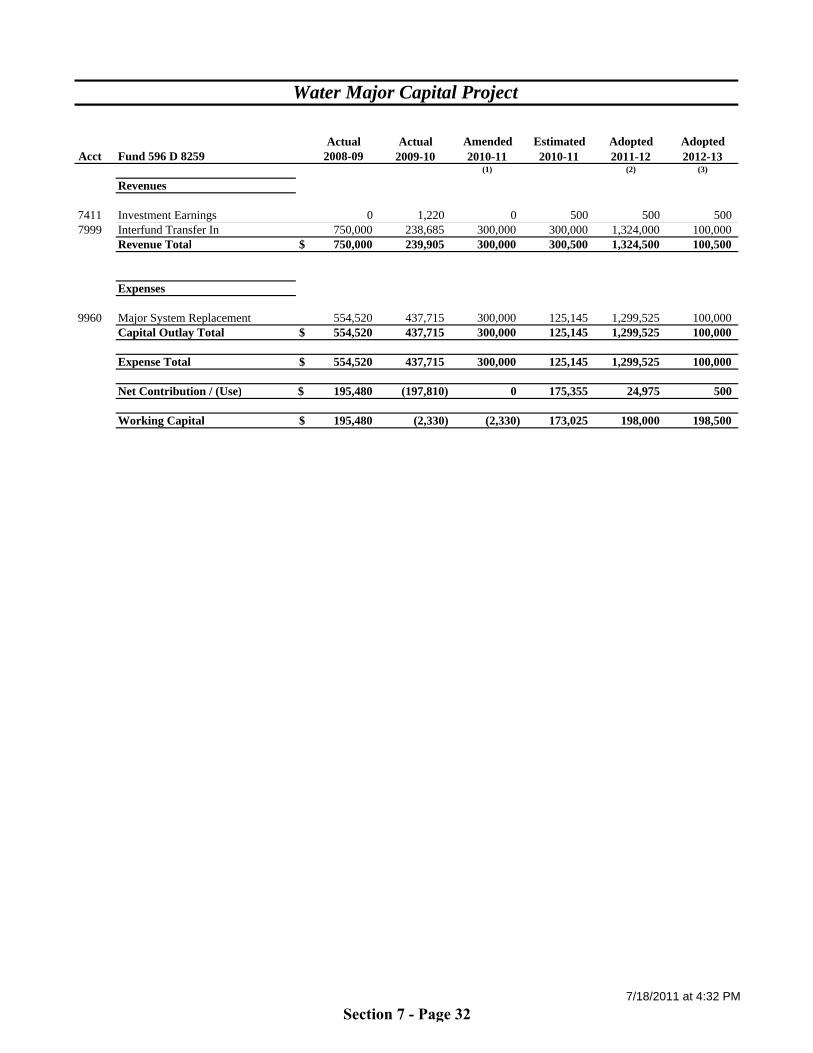
Actual Actual Amended Estimated Adopted Adopted Acct Fund 596 D 8259 2008-09 2009-10 2010-11 2010-11 2011-12 2012-13
(1) (2) (3)
Revenues
7411 Investment Earnings 0 1,220 0 500 500 5007999 Interfund Transfer In 750,000 238,685 300,000 300,000 1,324,000 100,000
Revenue Total $ 750,000 239,905 300,000 300,500 1,324,500 100,500
Expenses
9960 Major System Replacement 554,520 437,715 300,000 125,145 1,299,525 100,000Capital Outlay Total $ 554,520 437,715 300,000 125,145 1,299,525 100,000
Expense Total $ 554,520 437,715 300,000 125,145 1,299,525 100,000
Net Contribution / (Use) $ 195,480 (197,810) 0 175,355 24,975 500
Working Capital $ 195,480 (2,330) (2,330) 173,025 198,000 198,500
Water Major Capital Project
7/18/2011 at 4:32 PM
Section 7 - Page 32

Actual Actual Amended Estimated Adopted Adopted Acct Fund 045 Division 8045 2008-09 2009-10 2010-11 2010-11 2011-12 2012-13
(1) (2) (3)
Revenues
7411 Investment Earnings 237,820 94,395 100,000 65,000 65,000 70,0007676 Water Connection Fees 109,705 231,530 300,000 100,000 15,000 15,000
Revenue Total $ 347,525 325,925 400,000 165,000 80,000 85,000
Expenses
8106 Prof & Tech Services 0 0 75,000 0 105,000 80,0008838 Solano Project Water Purchase 1,300,000 0 0 0 0 08839 Water Purchase 0 0 50,000 0 0 0
Services & Supplies Total $ 1,300,000 0 125,000 0 105,000 80,000
9842 Solano Water Authority Project 63,700 0 75,000 2,600 0 09850 Lake Herman Capacity Enhance 39,690 14,240 195,920 28,225 75,000 75,0009896 System Capacity Improvements 20,390 0 279,610 0 724,000 172,000
Capital Outlay Total $ 123,780 14,240 550,530 30,825 799,000 247,000
Expense Total $ 1,423,780 14,240 675,530 30,825 904,000 327,000
Net Contribution / (Use) $ (1,076,255) 311,685 (275,530) 134,175 (824,000) (242,000)
Adjust for reserves (700,000)Adjustments 1,300,000 325
Working Capital $ 3,715,255 4,027,265 3,051,735 4,161,440 3,337,440 3,095,440
Water Capital Connection Projects
7/18/2011 at 4:32 PM
Section 7 - Page 33

Actual Actual Amended Estimated Adopted Adopted Acct Fund 076 Division 8076 2008-09 2009-10 2010-11 2010-11 2011-12 2012-13
(1) (2) (3)
Revenues
7411 Investment Earnings 18,630 0 0 0 0 0Revenue Total $ 18,630 0 0 0 0 0
Expenses
9192 Construction Eng/Tech Svc 9,900 0 0 0 0 09193 Construction Management 0 0 0 0 0 09194 Construction Contingency 0 0 0 0 0 09884 Plant Construction 0 0 0 0 0 09999 Interfund Transfers - System Replace 628,290 0 0 0 0 0
Capital Outlay Total $ 638,190 0 0 0 0 0
Expense Total $ 638,190 0 0 0 0 0
Net Contribution / (Use) $ (619,560) 0 0 0 0 0
Working Capital $ 0 0 0 0 0 0
Water Distribution System Improvement Project
7/18/2011 at 4:32 PM
Section 7 - Page 34
Related Documents