ENSILING AND PROCESSING OF CORN SILAGE AND HIGH MOISTURE CORNS AND LABORATORY METHOD COMPARISON OF STARCH DIGESTION IN RUMINANTS by COURTNEY RUTHE HEUER A thesis submitted in partial fulfillment of the requirements for the degree of MASTER OF SCIENCE (Dairy Science) at the UNIVERSITY OF WISCONSIN – MADISON 2014

Welcome message from author
This document is posted to help you gain knowledge. Please leave a comment to let me know what you think about it! Share it to your friends and learn new things together.
Transcript

ENSILING AND PROCESSING OF CORN SILAGE AND HIGH MOISTURE CORNS
AND LABORATORY METHOD COMPARISON OF STARCH DIGESTION IN
RUMINANTS
by
COURTNEY RUTHE HEUER
A thesis submitted in partial fulfillment of
the requirements for the degree of
MASTER OF SCIENCE
(Dairy Science)
at the
UNIVERSITY OF WISCONSIN – MADISON
2014

i
ACKNOWLEDGEMENTS
I wish to express my sincere appreciation to Dr. Randy Shaver and to Rock River
Laboratory, Inc. for the opportunity to continue my education at the University of
Wisconsin – Madison. Dr. Shaver’s guidance and support has been invaluable. I would
also like to thank Dr. Joe Lauer and Dr. Victor Cabrera for serving on my graduate
committee.
A special thank you to Rock River Laboratory, Inc. and Don Meyer for seeing my
eagerness to continue my education while employed and fully supporting my graduate
education financially and the constant encouragement. I would like to thank all of the
employees of Rock River Laboratory for laboratory assistance and completing my trials.
A special thank you to Dr. John Goeser for being a mentor through my undergraduate
and graduate career, and setting aside time and effort to review and aid in my statistics
and with this manuscript, and serving on my graduate committee.
I would like to thank everyone in my family, my parents Roger and Cindy Heuer,
my brother Carl Heuer, grandparents, aunts, uncles and cousin for the support, prayers
and encouragement they have provided me over the years. My thanks cannot be
expressed adequately in words to know that whatever I take on I have full support from
all of you.
Finally I would like to thank Travis Duxbury for his love, support and patience
during my master’s studies and writing of this thesis.

ii
Table of Contents
Page
Acknowledgements……………………………………………………………………………………..……........…..i
Table of Contents…………………………………………………………………………………………....…….…...ii
List of Tables……………………………………………………………………………………………….……...........iv
List of Figures………………………………………………………………………………………….……….……….v
CHAPTER I. Review of the Literature
Introduction…………………………………………………………………………………………………...…………1
1.0 Corn grain and whole-plant corn silage physical and chemical characteristic effects
upon starch digestion
1.1 Kernel endosperm properties……………………………………………………….…….. ……3
1.2 Kernel particle size and processing…………………………………………………..………...6
1.3 Ensiling……………………………………………………………………………………………………..7
2.0 Analytic measures that may be related to in vivo rumen starch degradation
2.1 Prolamin content………………………………………………………………………………………8
2.2 Ammonia-N and Soluble-CP……………………………………………………………………..10
2.3 Particle Size…………………………………………………………………………………………….11
2.4 Kernel Processing Score…………………………………………………………………………..12
2.5 Degree of starch access……………………………………………………………………………13
2.6 In vitro rumen starch digestibility……………………………………………………………15
2.7 In vitro rumen gas production………………………………………………………………….16
2.8 Ruminal in situ starch digestibility……………………………………………………..........17

iii 2.9 In vivo rumen starch digestion………………………………………………………….........19
Conclusions……………………………………………………………………………………………………………20
References……………………………………………………………………………………………………………..21
CHAPTER II. Survey of Starch Digestibility on Wisconsin Dairy Farms across
winter months
Abstract………………………………………………………………………………………………………………….26
Introduction……………………………………………………………………………………………………………28
Materials and Methods…………………………………………………………………………………………….29
Results and Discussion…………………………………………………………………………………………….32
Conclusions………………………………………………………………………………………………………..…..34
Acknowledgements……………...………………………………………………………………………………….35
References………………………………..……………………………………………………………………………..36
CHAPTER III. In vitro starch digestion methods compared to in situ starch
digestion
Abstract…..…………………………………………………………………………………………………….…..……50
Introduction…………………………………………………………...……………………………………………….52
Materials and Methods………………………………………………………………………………………….…55
Results and Discussion………………………………………………………………………………………….…59
Conclusions……………………………………………………………………………………………………………..64
Acknowledgements……………...………………………………………………………………………………….64
References……………………………………………………………………………………………………………....65

iv
List of Tables
CHAPTER I. Review of the Literature CHAPTER II. Survey of Starch Digestibility on Wisconsin Dairy Farms across winter months Table 1. Survey data of WPCS, HMC, DC and fecal samples from commercial dairies submitted in the fall season………………………………………………………….…………..………………38 Table 2. Survey data of WPCS, HMC, DC and fecal samples from commercial dairies submitted in the spring season………………………………………………………………………..……….39 Table 3. WPCS, HMC, and DC dry matter least square means submitted from commercial dairy farms………………………………………………………………………….…………………………………..40 Table 4. WPCS kernel processing score least square means submitted from commercial dairy farms………………………………………………………………………….………………..40 Table 5. Ruminal in vitro starch digestion (7hr) means by sample type and season of submission for commercial dairy farms………………………………………………………...………….40 Table 6. Mean particle size means by feed type submitted from commercial dairy farms………………………………………………………………………………………………………………………41 Table 7. Starch (%DM) means by sample type submitted from commercial dairy farms…………………………………………………………………………………………..…………………………..41 Table 8. TTSD (%) averaged by season based on fecal starch…………....……………………….41 CHAPTER III. In vitro starch digestion methods compared to in situ starch digestion Table 1. Experiment 1 ruminal starch digestion (%) results by treatment ………………………….67 Table 2. Experiment 1 rumen starch digestion means for two different feed types and two weeks…………………………………………………………………………………………………………………………………68 Table 3. Experiment 2 ruminal starch digestion (%) means for multiple feed types and digestion time lengths……………………………………………………………………………………………...69 Table 4. Rumen in situ 3h and 7h starch digestion (%) descriptive statistics……………..70

v
List of Figures
CHAPTER I. Review of the Literature CHAPTER II. Survey of Starch Digestibility on Wisconsin Dairy Farms across winter months Figure 1: Sample DM% for WPCS submitted in the survey from commercial dairy farms…………………………………………………………………………………………………………………...….42 Figure 2: Relationship between ruminal starch digestion (7h) and KPS in WPCS submitted from commercial dairy farms………………………………………………………………..…43 Figure 3: Distribution of WPCS KPS% for all samples submitted from commercial dairy farms……………………………………………………………………………………………...………………44 Figure 4: WPCS ruminal in vitro starch digestion, % results by season of submission from commercial dairy farms…………………………………………………………………………………...45 Figure 5: Distribution of HMC DM% for all samples submitted from commercial dairy farms…………………………………………………………………………………………….………………………...46 Figure 6: Distribution of HMC MPS for all samples submitted from commercial dairy farms………………………………………………………………………………………………………………………47 Figure 7: HMC ruminal starch digestion, % results by season of submission from commercial dairy farms……………………………………………………………………………………….…..48 Figure 8: Distribution of TMR predicted total tract starch digestion (TTSD,%). TTSD% was predicted using the following equation: TTSD% = (100 * (0.9997 – 0.0125 * fecal starch, % of DM)); R2 = 0.94 (Ferraretto, L. and R. D. Shaver., et al 2012)……………………………………………………………………………………………………………………...49 CHAPTER III. In vitro starch digestion methods compared to in situ starch digestion Figure 1. Experiment 1 rumen starch digestion, averaged across 3 h and 7 h, for 5 different techniques and treatments and two feed types…………………………………………...71 Figure 2. Experiment 1 rumen starch digestion, averaged across 3 h and 7 h for 5 different techniques and treatments and two weeks…………………………………………………72

vi
Figure 3. Experiment 1 rumen starch digestion, for 5 different techniques and treatments ……………………………………………………………………………………………………………...73 Figure 4. Experiment 2 effect of time of digestion by treatment on ruminal starch digestibility, %............................................................................................................. ......................74 Figure 5. Rumen in situ 3h and 7h starch digestion distributions for DCG, HMC, and WPCS……………………………………………………………………………………………………………………...75

1
CHAPTER I: Review of the Literature
Introduction
In lactating dairy cows, starch can comprise 20% - 40% of ration dry matter intake
(DMI) depending on the level of milk production, stage of lactation, ration formulation
strategies or models, and ingredient availability and prices. The interest in improving
starch digestibility in ruminant diets has been stimulated by a recent rise in the price of
high-starch cereal grains (Fredin et al., 2013). Corn and corn silages are an important
dietary ingredient for lactating dairy cows, as well as many other ruminants, and starch
supplied through these are a vital source of dietary energy. Ruminal and total tract
starch digestibility can be highly variable across forages and grains (Orskov et al.,
1986). Site of starch digestion alters the amount and nature of nutrients delivered to
the animal and further affects ruminant metabolic efficiency. The rate at which starch
is degraded in the rumen affects rumen fermentation and fiber digestibility in dairy
cattle (Orskov et al., 1986).
Through extensive and (or) rapid rumen starch digestion, potentially due to
greater degree of corn processing, extended silo fermentation or a flourier endosperm,
negative associative effects on rumen fermentation can occur. Excessive rapidly
degradable starch can result in greater fluctuation in production of a potent acid within
the rumen and reduce rumen pH. Rumen acidosis (pH < 5.5) can decrease rumen fiber
digestibility, milk fat, and (or) DMI, negating improvements in ruminal and total tract
starch digestibility (Firkins et al., 2001). It has been found that propionic acid produced

2
from high starch diets can cause problems in milk production. If the quantity of
propionic acid absorbed exceeds the capacity of the liver to remove it from the blood, it
will stimulate insulin production. This will results in an increased uptake of nutrients
by tissues and a reduction in lipolysis and cause a reduction in milk yield and milk fat
(Orskov et al., 1986).
A high concentration of starch may alter ruminal fiber digestion by negatively
affecting the ruminal pH. Grant and Mertens (1992) observed a negative effect of starch
on fiber digestion in vitro when the pH was controlled pH of 6.2 and lowered to 5.8. A
similar effect was observed in Mertens and Loften (1978) where cornstarch was added
to fibrous forages and fiber digestion kinetics was determined in vitro. The addition of
starch results in a linear increase in lag time of fiber digestion and a decrease of the
extent of fiber digestion. Lopes et al. (2009) also fed corn differing in endosperm type.
It was found that feeding a less vitreous corn to dairy cows increased starch digestion,
but decreased fiber digestion.
Measuring nutrient digestibilities is challenging for both individual nutrients as well
as total mixed rations. In commercial forage testing laboratories in vitro and in situ
techniques are most often utilized, but cannot be related to dairy cattle performance. In
vivo apparent total-tract nutrient digestibilities using markers is common among
researchers, but is time and cost prohibitive on a commercial level (Schalla et al., 2012).
Other methods of determining in vivo ruminal starch digestion include marker
techniques, duodenal cannula sampling, omasal sampling, as well as rumen evacuation
(Huhtanen et al., 2006).

3
Total tract starch digestibility can increase milk and milk protein yield and improve
feed efficiency (Firkins et al., 2001). In dairy cows, total tract starch digestibility can
range from 70% - 100% (Firkins et al., 2001; Ferraretto et al., 2013). Fredin et al.
(2014) found that fecal starch concentration in lactating dairy cows is closely and
linearly related to total-tract starch digestibility (R2 = 0.94). The equation is as follows:
Total-tract starch digestibility, % = 100% - (1.25 x fecal starch%)
Considerable variation in the site and extent of starch digestion remains to be
quantified for predictive purposes in models and ration evaluation software used for
lactating dairy cows diets. Therefore, accurately determining rumen starch digestion is
essential. Variation in extent and site of starch digestion affect the quality and the
quantity of the nutrients delivered to the animal.
Determining starch digestibility is important for proper ration carbohydrate
formulation. Adequate energy must be supplied to support continued lactation
performance gains, however, excessive starch loads must be avoided. Assays are
capable of determining starch digestion across laboratories, while in agreement with in
vivo results, and have become imperative to the field of ruminant nutrition. The
objective of this literature review evaluate techniques that may be related to in vivo
digestion.
1.0 Corn grain and whole-plant corn silage physical and chemical characteristic
effects upon starch digestion
1.1 Kernel endosperm properties

4
Corn is comprised of three basic parts: pericarp, germ, and endosperm. The
endosperm represents approximately 75%-80% of the corn grain (Huntington, 1997;
Correa et al., 2002). The endosperm also contains hydrophobic proteins that encase the
starch granules. These non-starchy, hydrophobic components limit starch availability to
ruminal microorganisms for digestion (McAllister et al, 1993). Unlike floury
endosperm, which contains microfissures or void spaces, starch granules in vitreous
endosperm are enclosed in a continuous protein matrix (Philippeau and Michalet-
Doreau, 1998). Kernel vitreousness is the ration of vitreous to floury endosperm (Lopes
et al., 2009).
Endosperm development can be evaluated by the light box method (Felker and
Paulis, 1993), manual dissection (Dombrink-Kurtzman and Bietz, 1993) or Stenvert
kernel hardness (Pomeranz et al., 1985). The light box method technique provides a
mean of estimating vitreosity of corn kernels by quantifying the brightness of the corn
kernel images obtained by viewing kernels on a light box. It is subjective to visual
classification of kernel vitreosity and not very reproducible. This method depends
heavily on skill, experience, and visual acuity of the rater. Proportions of hard, vitreous
kernels based on this measurement correlated well with visually determined
proportions (Felker and Paulis, 1993). Dombrink-Kurtzman and Bietz (1993)
described another method of manual dissection of the kernels to obtain horny and
floury endosperm fractions for comparison. This method is more labor intensive, but
does not rely of subjectivity like the light box method does. Stenvert Hardness Test as
described in Pomeranz et al. (1985) utilizes grinding resistance, column height of

5
freshly ground grain, and the ration of coarse to fine particles to determine endosperm
composition.
Philippeau et al. (1999) evaluated genetic variation by comparing flint and dent
corns and found that flint corn has a greater proportion of vitreous endosperm than
dent corn. The effective rumen starch degradability was higher for dent than for flint
corns, averaging 61.9% and 46.2% of starch, respectively. These two corn types
differed in vitreousness, averaging 51.4% and 71.8%, respectively.
Kernel vitreousness may be a useful parameter for which to select corn hybrids
for high ruminal starch availability. Correa et al. (2002) found correlations between
kernel vitreousness and ruminal starch availability (-0.93). With advancing maturity,
kernel vitreousness increased while ruminal starch digestion decreased. To test
maturity levels, corn was harvested at three different maturity levels: half milk line
(HM), black layer (BL), and mature (MT) stages of maturity. Starch remained
unchanged throughout the maturity levels (79.3%, 80.1%, and 79.9%, respectively) but
vitreousness increased with maturity (42.8%, 46.1%, and 48.2%, respectively).
Philippeau et al., 1999 stated that ruminal corn grain starch degradability could
be accurately predicted using grain vitreousness and rapidly measurable physical traits.
Better understanding the relationship between kernel vitreousness and starch
digestibility may improve corn hybrid selection for silage and grain production and
possibly result in improved corn-based diet performance by ruminants (Correa et al.,
2002).

6
1.2 Kernel particle size and processing
Chemical and physical treatments applied to corn grain and whole-plant silages
are commonly meant to increase starch degradability. This can be accomplished
through particle size reduction, gelatinization and the disruption of the protein matrix
encapsulating the starch granules. These processing treatments increase digestibility
by providing opportunity for bacterial attachment to starch granules (Huntington,
1997). The starch granules in corn that are encapsulated by prolamin-starch matrix and
have been recognized to be negatively related to starch degradability (Philippeau et al.,
2000). These physical treatments increase the starch availability to both rumen
microbes and digestive enzymes or work to solubilize the starch-protein matrix.
Gelatinization can lead to chemical and physical changes in the starch granule.
Disrupting prolamin hydrogen bonds and absorbing water facilitate microbial or
enzyme attachment and degradation of the starch granule (Offner et al., 2003).
Ruminal and total tract starch digestibilities are inversely related to particle size
for dry corns (Remond et al., 2004; Theurer et al., 1999; and Dhiman et al., 2002).
Remond et al. (2004) observed a 23% increase in ruminal starch digestion when
microns size was 3668 microns compared to 730 microns (35.5% vs. 58.6%). Similarly,
Dhiman et al. (2002) saw an increase of total tract starch digestibility from fine ground
corn (1130 microns; 93.6%) to course ground corn (1650 microns; 96.1%).

7
Dhiman et al. (2002) compared not only coarse ground corn (MPS) and fine
ground corn (MPS), but included steam flaked corn (flaked density) as well and
observed a total tract starch digestibility of 99.1%. In the process of steam flaking
grains, grain is steamed for 30 to 60 minutes in a vertical, stainless steal chamber to
increase moisture to 18%-20%, then flaked between preheated large rollers (Theurer
et al., 1999). This is followed by grain compression of the starch between rollers to
rupture the starch granules and damage the protein matrix; it is important to hydrate
the starch with moist heat to gelatinize the starch granules.
Cows fed steam flaked corn excreted 410 grams per day less starch than coarse
ground corn and 245 grams per day less starch than fine ground corn. These results
suggest that corn grain steam flaking reduced starch excretion in the feces compared
with coarse ground corn or fine ground corn. Theurer et al. (1999) observed similar
results seeing a 19% increase in total tract starch digestibility between dry rolled corn
and steam flaked corn.
1.3 Ensiling
The fermentation process in the ensiling high moisture corn grains and silages
result in a partial solubilization of the hydrophobic starch-protein matrix in the corn
endosperm (Baron et al., 1986, Philippeau et al., 1997). Moreover, the hydrophobic
starch-protein matrix encapsulating the starch granules breaks down during ensiling
(Philippeau et al., 1999). Increased ruminal starch degradability after ensiling is likely a
result of degraded endosperm proteins (Philippeau et al., 1997).

8
Greater ruminal and total-tract starch digestibility is well established in dairy
cows fed high-moisture corn compared with dry corn (Firkins et al., 2001). Ensiling
high moisture corn grain increased the mean in vivo ruminal dry matter and starch
degradability by 5.6% and 5.9%, respectively, (Philippeau et al., 1997). Ferraretto et al.
(2014) assessed ensiling impact by surveying results over time. The authors used the
month of the samples submission as an indicator of length of ensiling period. The data
set included samples submitted from March 2011 to May 2013. An observation of 9%
unit in vitro starch digestion increase from October to August of the following year. An
increase of ammonia-N and soluble crude protein concentrations was also observed
(155% and 49%, respectively). Positive relationships between in vitro starch digestion
and ammonia-N (R2 = 0.61) and soluble crude protein (R2 = 0.55) were detected
(Ferraretto et al., 2014). Hoffman et al. (2011) also observed an increase in ammonia-N
and soluble crude protein, appearing to be a function of the extent of fermentation.
Hoffman et al. (2011) confirmed the prolamin proteolysis, finding that the
reduced zein protein subunits that cross-link the starch granules were degraded by
proteolytic activity over a 240 d extended ensiling period through electron
micrographs.
2.0 Analytical measures that may be related to in vivo rumen starch
2.1 Prolamin
Corn prolamin proteins, often referred to as zein, are essentially insoluble in the
rumen due to their hydrophobic nature (Philippeau et al., 2000). A modified

9
turbidimetric zein method (Larson and Hoffman, 2008) may be utilized to determine
zein content in corn grain based on previous methods that divide corn endosperm
proteins into multiple protein fractions (Landry et al., 2000).
Larson and Hoffman (2008) defined the rapid turbidimetric (rTM) laboratory
procedure to quantify prolamin proteins in dry corns. This assay was defined as dried
ground corn that is defatted using acetone, filtered, and dried and acetone-insoluble dry
matter is retained. There was a close agreement (R2 = 0.88) between alcohol soluble
protein of acetone insoluble dry matter (Landry et al., 2000) and zein contents
determined in Larson and Hoffman (2008). In determining prolamin proteins (zein)
the rTM method was found to be reasonable if distinguishing variable endosperm types
in dry corns. This assay was moderately precise, but Larson et al., 2008 concluded that
improvements to this assay to increase the accuracy should be pursued.
Nellis et al. (2013) evaluated this procedure for high moisture corns as well.
Modifications were made to improve biological function in determining prolamin:
defatting the sample with acetone was replaced with a borate phosphate buffer
extraction to remove buffer-soluble proteins, tert-butanol was used to more efficiently
extract the prolamins, and since the use of tert-butenol without the defatting using
acetone would influence turbidity measurements, turbididty was abandoned and
replaced with a Bradford protein assay (rBM) (Bradford, 1974). Dry corns mean
prolamin concentrations estimated by rTM and rBM were similar (3.65% vs. 3.66%,
respectively). Prolamin concentrations estimated by rTM yielded a higher mean than
rBM in high moisture corns (4.19% vs. 3.24%, respectively) suggesting that the rTM

10
method previously described by Larson and Hoffman (2008) may over estimate
prolamin in fermented feeds such as high moisture corn. (Nellis et al., 2008). Both dry
corn and high moisture corn were negatively related to peak absolute rates of in vitro
gas production (Nellis et al., 2008; Hoffman et al., 2012).
2.2 Ammonia-N and Soluble-CP
Ammonia-N has been suggested in combination with mean particle size (MPS),
dry matter content, and length of silage fermentation time in determining ruminal
starch digestion (Hoffman et al., 2012). Soluble crude protein (CP) is analyzed by the
borate-phosphate buffer extraction as described in Krishnamoorthy et al. (1983).
Borate-phosphate buffer had a correlation coefficient of 0.92 with insoluble nitrogen
obtained with autoclaved rumen fluid (Krishnamoorthy et al., 1983). Hoffman et al.,
(2011) observed an increase of soluble CP in high moisture corns from day 0 (1.5% -
2%) to day 240 (>4%) of fermentation. Observations of higher ammonia-N results from
day 0 to day 240 were reported as well. Ferraretto et al., 2014 observed positive
relationships between in vitro starch digestibility and ammonia-N (R2 = 0.61; P = 0.001)
and soluble CP (R2 = 0.55; P = 0.001) that may suggest that ammonia-N or soluble CP
are an indicator of starch digestion in HMC. Ammonia-N and soluble CP may be
valuable measurements that will be useful in predicting animal responses once
validated again in vivo measurements.

11
2.3 Particle Size
Assessing dry or HM corn particle size is typically done using MPS (Hoffman et
al., 2012). The American Society of Agricultural Engineers (ASAE) defined procedure is
based on a log-normal distribution of the ground particles (S319.3). Within this
technique a complete sieve analysis is used to determine particle size and distribution
in feed materials, including dry and high moisture corns. The ASAE method uses 14 test
sieves and vigorously sifts feed material through them. The fraction of each sieve is
weighed and used to compute a geometric mean particle size. The MPS refers to the
mid point of the distribution (mean), where 50% of the material is coarser by weight,
and 50% of the material by weight is finer. The standard sieve sizes by nominal
opening are 4.76, 3.36, 2.38, 1.68, 1.191, 0.841, 0.594, 0.420, 0.297, 0.212, 0.150, 0.103,
0.073, and 0.053 millimeters.
While gross differences can be evident, MPS is challenging to use within a feed or
ration evaluation system because starch digestibility is significantly different for dry
corns compared to high moisture corns. Meaning the same MPS corns may in fact have
different digestibility values. Therefore an index system based on MPS and nutritional
chemistries was developed to better predict the fermentation potential of corns termed
effective mean particle size (eMPS) (Hoffman et al., 2012). Adjustments are made to the
MPS based upon additional nutritive measures to better reflect the grain energy
potential to develop eMPS.
To calculate eMPS the following equation is used: eMPS = MPS – MPS x rrMPSdry or
eMPS = MPS – MPS x rrMPSHM for dry and high moisture corns, respectively, where

12
rrMPSdry = 0.58 – 0.15 x (prolamin protein) and rrMPSHM = 0.21 + 0.08 x (NH3-N, % of
N). Starch digestion variation between corns was better explained with eMPS than
using only MPS (R2 = 0.84 vs R2 = 0.50, respectively) (Hoffman et al., 2012).
2.4 Kernel Processing Score
Determining the available energy in whole plant corn silages can be difficult due
to varying physical form of the grain and stover. Each part can differ in chemical
composition presenting unique challenges (Ferreira and Mertens, 2005). There has
been an increased interest in kernel processing of whole plant corn silages using
harvesters equipped with onboard processing rolls (Cooke and Bernard, 2004). Cooke
and Bernard (2004) observed greater apparent digestibility of starch for diets contain
2mm roller opening vs. 8mm roller opening processed silage (85.4% vs. 75.6%).
Ferriera and Mertens (2005) developed a system using sieves with appertures
>4.75mm that separate intact and large kernel fragments. These portions are used to
measure minimally fragmented starch (Starch>4.75). The concentration of minimally
fragmented starch was found to be highly variable (CV = 50%). The proportion of
minimally fragmented starch is related to the in vitro disappearance of whole silages
(R2 = 0.67). This suggests that Starch>4.75 may provide a classification as processed or
unprocessed to describe the impact on starch digestibility.
The percentage of starch minimally fragments was calculated by dividing
Starch>4.75 by total starch in silage DM (Starch>4.75/Total). Starch>4.75/Total was positively
correlated with mean particle size (r = 0.46). They proposed that the inverse of

13
Starch>4.75/Total be used as a corn silage fragmentation index (CSFI) (Ferreira and
Mertens, 2005):
CSFI = 100 - Starch>4.75/Total
The proportion of minimally fragmented starch provides an index for whole
plant corn silage this is related to in vitro digestion of whole silages. When it is
validated by in vivo trials it may be a useful substitute for processing adjustment factor
(Ferreria and Mertens, 2005).
2.5 Degree of Starch Access
A laboratory method for degree of starch gelatinization was modified for the
evaluation of starch recovery in corn grain and silages. The modifications included
using an undried and unground sample to account for the differences in particle size,
dry matter content, and endosperm type. The sample amount was increased to ensure
a representative sample of corn grains and corn silages that have not been dried or
ground. This assay is used to evaluate starch recovery by enzymatic hydrolysis. The
amended assay was renamed the degree of starch access (DSA) to describe the degree
of enzyme access to starch after gelatinization of undried and unground feeds (Blasel et
al., 2006).
DSA is described as
DSA (g/kg starch) = [recovered starch : undried/unground] x 1000
Total starch

14
With corn grains, particle size was related to DSA (Blasel et al., 2006). The DSA
was reduced 2.7% for each increase of 100 μm in particle size. Dry matter content of
corn grains was also related DSA. For each 1.0% increase in dry matter content the DSA
decreased 2.0% (Blasel et al., 2006).
To test the effects related to kernel vitreousness, samples were ground through
an 8-mm screen. Even when samples were all ground through the same size screen,
floury samples were, on average, 200 μm less in MPS than flint or highly vitreous corn
grain samples. This is due to samples with greater vitreous endosperm having a higher
kernel density, which could influence post-grinding particle size. The DSA assay
accounted for about 60% of the variation of endosperm type, and suggested that
ruminal starch degradation is higher in corn grain samples with a low vitreous
endosperm.
Particle size, dry matter, and vitreousness have been related to starch digestion. In
describing DSA relationships with each of these parameters, one can hypothesize that
DSA may be useful to measure the potential of starch digestion in corn grain samples.
However DSA has not yet been directly related to starch digestion.
Whole plant silage, however, is more difficult to analyze due to its heterogeneous
nature of the stalk, cob and leaves. The starch fraction cannot be readily separated
from the forage portion. In corn silages, both the dry matter and starch content were
negatively related to the DSA . The MPS of corn silage was negatively correlated to the
DSA assay (P<0.003, r = -0.67). This implies that as the particle size of starch decreases
the DSA increases.

15
The standard deviation for total starch averaged 1.8%, the recovered starch and
DSA were less precise averaging 2.0% and 3.8%, respectively. Poor precision for the
DSA is expected because of the heterogeneous nature of undried and unground samples
(Blasel et al., 2006).
The DSA assay is relatively simple to preform in a laboratory setting and may be
related to starch digestion in corn grains and corn silages, however limitations include
poor repeatability and the assay still requires evaluations to relate it to in vivo starch
digestion to acquire the full potential of the measure.
2.6 In vitro rumen starch digestibility
Rumen in vitro digestion techniques are meant to simulate in vivo digestion.
Starch degradation is commonly measure in vitro by directly measuring starch
disappearance after incubation for various time intervals (Menke et al., 1979). The
premise to this technique is to assess starch level both before and after simulated
rumen digestion (Richards et al., 1995). Determination of starch residues requires a
complete hydrolysis of starch to glucose, but only starch degraded when it is completed
degraded in to glucose is considered (Huhtanen et al., 2006).
The intention of in vitro systems is to evaluate the intrinsic characteristics of the
feed, a substrate-limited system should be created, with optimal conditions for ruminal
microbial activity regarding pH, anerobiosis, microbial numbers, and essential nutrients
(Huhtanen et al., 2006). Other factors affecting in vitro starch digestion measures
include: source of rumen fluid (animal), donor animal diet, ration of rumen fluid to

16
artificial saliva, and grinder type. In vitro starch digestion results should be compared
within an in vitro run because of variable rumen fluid nature from run to run; sample
rankings can be compared within or between runs (Richards et al. 1995). The in vitro
system estimated degradability are on average about one third lower than in situ
values, and are also lower than what would be expected in vivo (Offner and Sauvant,
2004).
2.7 In vitro rumen gas production
Gas production techniques are similar to in vitro rumen starch digestion except
that gas production is continuously measured over time, starch level is not determined
post digestion and gas pressure is assumed related to carbohydrate metabolization.
Cumulative in vitro gas production pressures of all samples are recorded, with
adjustment for the gas production of the blank sample (Hoffman et al., 2012). Gas
production pressure readings are converted to gas volume and expressed as mL/0.2
grams of dry matter. This results in an expression of gas production volumes between
0 and 100 mL (Parissi et al., 2005). Gas production based techniques can yield hundreds
or thousands of data points and have allowed researchers to develop elaborate
digestion kinetic models for different feedstuff nutritive components.
Digestion information provides relevant nutritional values for feedstuffs, the
response by the animal, as well as some impacts to the environment (Krishnamoorthy
et al., 2005). Tahir et al. (2013) predicted ruminal starch digestion using gas
production data closely matching in vivo data (R2 = 0.81) in starch-rich feedstuffs.

17
2.8 In situ rumen starch digestibility
Determining rumen starch digestion by the in situ technique may be a better
approach to simulating the rumen environment due to exposing feedstuff to living
rumen, without a given feeding regimen (Huhuanen et al., 2006). Under this approach,
the feed is directly suspended into the rumen of a cow that is fit with a rumen fistula.
This allows immediate contact of the test feed with the rumen environment. The test
feed though, is not subject to the total ruminal experience including mastication,
rumination and passage (Nocek et al., 1988).
Samples are weighed into a nylon bag (Ankom Co, Fairport, NY; pore size: 53 um;
internal dimensions: 5x10 cm) and introduced in to the rumen for various times, with
no less than 3 replications per sample (Offner et al., 2003). Bags are then removed after
incubation periods and rinsed in cold water, frozen, and washed until water is clear.
Sample bags are dried for 48 hours in an 80 degrees Celsius oven and weighed. Starch
content is determined on the incubation residues (Philippeau et al., 1997, Philippeau et
al., 1999, and Remond et al., 2004).
Although the in situ technique directly uses the rumen environment, this
technique may have limitations. Offner et al. (2003) confirmed there are large
differences due to intrinsic properties of the feed. There is a strong influence of
processing, especially on feedstuffs containing slowly degrading starch. Using a porous
bag to contain the feed has been debated. Bag porosity is a compromise between
limiting influx of rumen contents not associated with the test feed and allowing influx of

18
microbial populations to degrade the test feed, while at the same time limiting the efflux
of undegradable feed particles.
Feed particles or starch may be solubilized and lost from the bag prior to
ruminal incubation. Feedstuff particles lost through pores but not due to rumen
digestion can be considered soluble. The actual digestibility of the soluble fraction is not
quantifiable through the in situ technique but is often assumed to be rapidly and
completely degraded within the rumen (NRC, 2001). However others have proposed
that the soluble or washout fraction is not completely degraded and in fact may flow
quickly through the rumen with liquid phase material. The loss of fine particles through
the nylon bag under this theory would then correspond to overestimating the starch
degradability (Michalet-Doreau and Cerneau, 1991, Dewhurst et al., 1995). As a result
of debate, the in situ rumen technique may not be ideal for finely ground.
Researchers have also opted to use a pre-incubation wash to quantify and
remove this questionable fraction, as well as to pre-wet the sample to mimic salivation
(Nocek et al., 1988). The proportion of starch and DM that passes through the pores of
the bag without being degraded can be determined by weighing sample into nylon bags,
immersed in 250 ml of a buffer solution at pH 6.9 and agitated for 2 hours in a 39
degrees Celsius water bath. After removal, the bags were rapidly washed with distilled
water. Lost particles were recovered from the solution by filtration. The filters were
dried at 80 degrees Celsius for 48 hours and weighed, and the starch content was
determined (Philippeau et al., 1999).
19
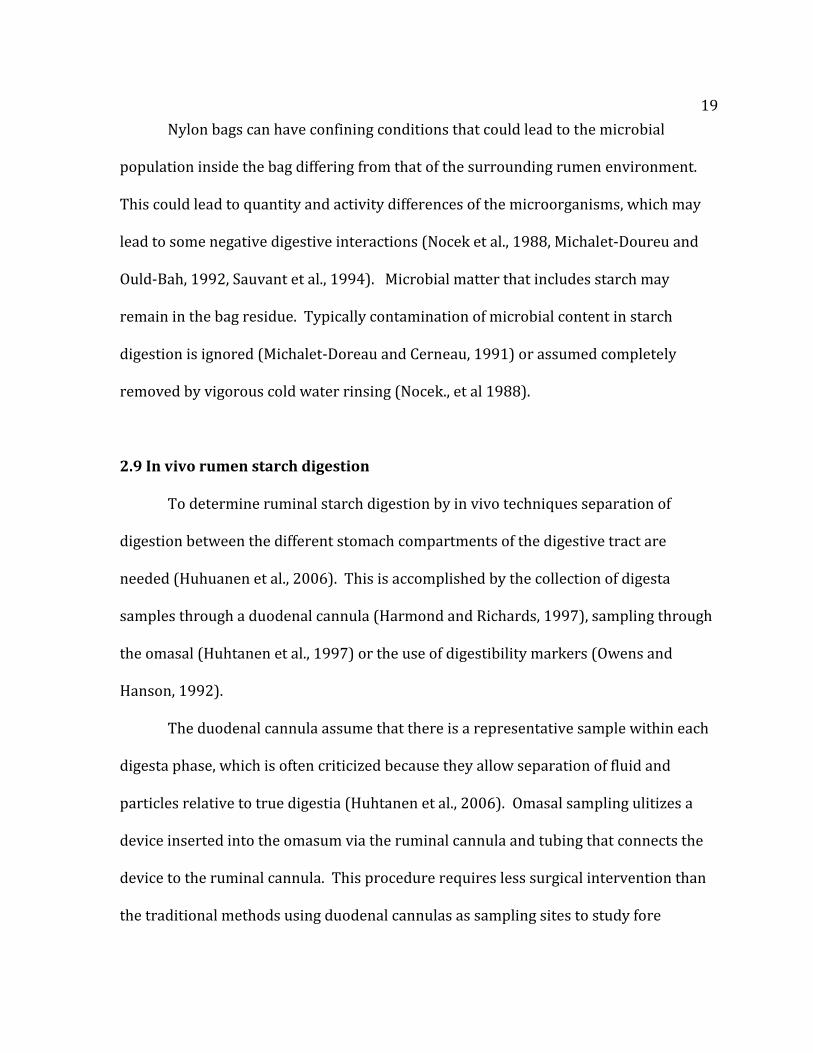
Nylon bags can have confining conditions that could lead to the microbial
population inside the bag differing from that of the surrounding rumen environment.
This could lead to quantity and activity differences of the microorganisms, which may
lead to some negative digestive interactions (Nocek et al., 1988, Michalet-Doureu and
Ould-Bah, 1992, Sauvant et al., 1994). Microbial matter that includes starch may
remain in the bag residue. Typically contamination of microbial content in starch
digestion is ignored (Michalet-Doreau and Cerneau, 1991) or assumed completely
removed by vigorous cold water rinsing (Nocek., et al 1988).
2.9 In vivo rumen starch digestion
To determine ruminal starch digestion by in vivo techniques separation of
digestion between the different stomach compartments of the digestive tract are
needed (Huhuanen et al., 2006). This is accomplished by the collection of digesta
samples through a duodenal cannula (Harmond and Richards, 1997), sampling through
the omasal (Huhtanen et al., 1997) or the use of digestibility markers (Owens and
Hanson, 1992).
The duodenal cannula assume that there is a representative sample within each
digesta phase, which is often criticized because they allow separation of fluid and
particles relative to true digestia (Huhtanen et al., 2006). Omasal sampling ulitizes a
device inserted into the omasum via the ruminal cannula and tubing that connects the
device to the ruminal cannula. This procedure requires less surgical intervention than
the traditional methods using duodenal cannulas as sampling sites to study fore

20
stomach digestion and avoids potentially confounding endogenous secretions of the
abomasum (Huhtanen, et al., 1997). Although this method has some advantages, it is
more laborious compared with duodenal sampling and it has not been widely tested for
the determination of ruminal starch digestibility (Huhtanen et al., 2006). A marker is
not always suitable as well; possible problems that can occur can include marker
migration, phase separation, inhibition of digestion and osmotic effects within the gut
(Owens and Hanson, 1992).
Conclusions
Starch digestion in ruminants is an ever-expanding research area. Several
approaches to forecast in vivo rumen starch digestion have been described here. There
are numerous treatments available that can be applied to corn grains and whole plant
corn silages to improve starch degradation and utilization in the rumen, however,
accurately assessing starch potential remains challenging.
There has been considerable research evaluating starch digestion techniques,
however, the industry continues searching for a practical, accurate and precise assay
that is applicable across feed types and laboratories. The aim of this research is to
evaluate effects of starch digestibltiy on dairy farms as well as gauge similarties
between two common starch digestion assay in commercial laborities, the in vitro and
in situ method.
21
References
American Society of Agricultural Engineers (ASAE). Feb 2003. Method of determining and expressing fineness of feed materials by sieving. S319.3. Baron, V. S., K. R. Stevenson, and J. G. Buchanau-Smith. 1986. Proteolysis and fermentation of corn-grain ensiled at several moisture levels and under several simulated storage methods. Can. J. Anim. Sci. 66:451-461. Blasel, H. M., P. C. Hoffman, and R. D. Shaver. 2006. Degree of starch access: An
enzymatic method to determine starch degradation potential of corn grain and corn silage. Anim. Feed Sci. and Technol. 128:96-107.
Bradford, M. M. 1976. A rapid an sensitive method for the quantitation of microgram quantities of protein utilization the principle of protein-dye binding. Anal. Biochem. 72: 248-254. Cooke, K. M., and J. K. Bernard. 2005. Effect of length of cut and kernel processing on use of corn silage by lactating dairy cows. J. Dairy Sci. 88: 310-316. Correa, C. E. S., R. D. Shaver, M. N. Pereira, J. G. Lauer, and K. Kohn. 2002. Relationship between corn vitreousness and ruminal in situ starch degradability. J. Dairy Sci. 85:3008-3012. Dewhurst, R. J., D. Hepper, and A. J. F. Webster. 1995. Comparison of in sacco and in vitro techniques for estimating the rate and extent of rumen fermentation of a range of dietary ingredients. Anim. Feed Sci. Technol. 51:211-229. Dhiman, T. R., M. S. Zaman, I. S. MacQueen, and R. L. Boman. 2001. Influence of corn processing and frequency of feeding on cow performance. J. Dairy Sci. 85:217- 226. Dombrink-Kurtzman, M. A., and J. A. Bietz. 1993. Zein composition in hard and soft endosperm of maize. Cereal Chem. 70: 105-108. Felker, F. C., and J. W. Paulis. 1993. Quantitative estimation of corn endosperm vitreosity by video image analysis. Cereal Chem. 70: 685-689. Ferraretto, L. F., P. M. Crump, and R. D. Shaver. 2013. Effect of cereal grain type and corn grain harvesting and processing methods on intake, digestion, and milk production by dairy cows through a meta-analysis. J. Dairy Sci. 96:533-550.

22
Ferraretto, L. F., K. Taysom, D. M. Taysom, R. D. Shaver, and P. C. Hoffman. 2014. Relationships between dry matter content, ensiling, ammonia-nitrogen, and ruminal in vitro starch digestibility in high-moisture corn samples. J. Dairy Sci. 97:1-7. Ferreira, G. and D. R. Mertens. 2005. Chemical and physical characteristics of corn silages and their effects on in vitro disappearance. J. Dairy Sci. 88: 4414- 4425. Firkins, J. L., M. L. Eastridge, N. R. St-Pierre, and S. M. Nofsger. 2001. Effects of grain variability and processing on starch utilization by lactating dairy cattle. J. Anim. Sci. 79 (E Suppl.):E218-E238. Fredin, S. M., L. F. Ferraretto, M. S. Akins, P. C. Hoffman, and R. D. Shaver. 2014. Fecal starch as an indicator of total-tract starch digestibility by lactating dairy cows. J. Dairy Sci. 97:1862-1871. Grant, R. J., and D. R. Mertens. 1992. Influence of buffer pH and raw corn starch addition on in vitro fiber digestion kinetics. J. Dairy Sci. 75: 2762-2768. Harmon, D. I., and C. J. Richards. 1997. Considerations for gastrointestinal cannulations in ruminants. J. Anim. Sci. 75: 2248-2255. Hoffman, P. C., D. R. Mertens, J. Larson, W. K. Coblentz, and R.D. Shaver. 2012. A query for effective mean particle size in dry and high-moisture corns. J. Dairy Sci. 95:3467-3477. Hoffman, P. C., N. M. Esser, R. D. Shaver, W. K. Coblentz, M. P. Scott, A. L. Bodnar, R. J. Schmidt, and R. C. Charley. 2011. Influence of ensiling time and inoculation on alternation of the starch-protein matrix in high-moisture corn. J. Dairy Sci. 94:2465-2474. Huhtanen, P. and J. Sveinbjornsson. 2006. Evaluation of methods for estimating starch digestibility and digestion kinetics in ruminants. Anim. Feed Sci. and Technol 130:95-113. Huhtanen, P., P. G. Brotz, and L. D. Satter. 1997. Omasal sampling technique for assessing fermentative digestion in the fore-stomach of dairy cows. J. Anim. Sci.
75: 1380-1392. Huntington, G. B. 1997. Starch utilization by ruminants: From basics to bunk. J. Dairy Sci. 75: 852-867

23
Krishnamoorthy, U., C. Rymer, P. H. Robinson. 2005. The in vitro gas production technique: Limitations and opportunities. Ani. Feed Sci. and Technol. 123- 124:1-7. Krishnamoorthy, U., T. V. Muscato, C. J. Sniffen, and P. J. Van Soest. 1980. Nitrogen fractions in selected feedstuffs. J. Dairy Sci. 65: 217-225. Landry, J., S. Delhaye, and C. Damerval. 2000. Improved method for isolating and quantitating amino nitrogen as nonprotein, true protein, salt-soluble proteins, zeins, and true glutelins in maize endosperm. Cereal Chem. 77:620-626. Larson, J., and P. C. Hoffman. 2008. Technical Note: A method to quantify prolamin proteins in corn that are negatively related to starch digestibility in ruminants. J. Dairy Sci. 91:4834-4839. Lopes, J. C., R. D. Shaver, P. C. Hoffman, M. S. Akins, S. J. Bertics, H. Gencoglu, and J. G. Coors. 2009. Type of corn endosperm influences nutrient digestibility in lactating dairy cows. J. Dairy Sci. 92:4541-4548. McAllister, T. A., R. C. Phillippe, L. M. Rode, and K. J. Cheng. 1993. Effect of the protein matrix on the digestion of cereal grains by ruminal microorganisms. J. Anim. Sci.
71:205-212. Menke, K.H., Raab, L., Salewaski, A., Steingass, H., Fritz, D., and Schneider, W. 1980. The estimation of the digestibility and metabolizable energy content of ruminant feedingstuffs from the gas production when they are incubated with rumen liquor in vitro. J. Agric. Sci. 93: 217–222. Mertens, D. R., and J. R. Loften. 1980. The effect of starch on forage fiber digestion kinetics in vitro. J. Dairy Sci. 63: 1437-1446. Michalet-Doreau, B. and P. Cerneau. 1991. Influence of foodstuff particle size on in situ degradation of nitrogen in the rumen. Anim. Feed Sci. Techno. 35:69-81. Michalet-Doreau, B., and M. Y. Ould-Bah. 1992. In vitro and in sacco methods for the estimation of dietary nitrogen degradability in the rumen: a review. Anim. Feed Sci. Technol. 40:57-86. National Research Council. 2001. Nutrient Requirements of Dairy Cattle. 7th. Rev. ed. Natl. Acad. Sci., Washington, DC. Nellis, S. E., P. C. Hoffman, and R. D. Shaver. 2013. A modified method to quantify prolamin proteins in dry and high-moisture corn. J. Dairy Sci. 96: 4647-4652.

24
Nocek, J. E. 1988. In situ and other methods to estmate ruminal protein and energy digestibility: a review. J. Dairy Sci. 71:2051-2069. Offner, A., A. Bach, and D. Sauvant. 2003. Quantitative review of in situ starch degradation in the rumen. Anim. Feed Sci. Technol. 106:81-93. Orskov, E. R. 1986. Starch Digestion and Utilization in Ruminants. J. Anim. Sci. 63:1624-1633. Parissi, Z. M., T. G. Papachristou, A. S. Nastis. 2005. Effect of drying method on estimated nutritive value of browse species using an in vitro gas production technique. 123-124:119-128. Patton, R. A., J. R. Patton, S. E. Boucher. 2012. Defining ruminal and total-tract starch degradation for adult dairy cattle using in vivo data. J. Dairy. Sci. 95:765-782. Philippeau, C., J. Landry, and B. Michalet-Doteau. 2000. Influence of the protein distribution of maize endosperm on ruminal starch degradability. J. Sci. Food Agric. 80:404-408. Philippeau, C., F. Le Deschault de Monredon, and B. Michalet-Doreau. 1999. Relationship between ruminal starch degradation and the physical characteristics of corn grain. J. Anim. Sci. 77:238-243. Philippeau, C. and B. Michalet-Doreau. 1997. Influence of genotype and ensiling of corn grain on in situ degradation of starch in the rumen. J. Dairy Sci. 81:2178- 2184. Pomeranz, Y., Z. Czuchajowska, C. R. Martin, and F. S. Lai. 1985. Determination of corn hardness by the Stenvert Hardness Test. Cereal Chem. 62: 108-112. Remond, D., J. I. Cabrera-Estrada, M. Champion, B. Chauveau, R. Coudure, and C. Poncet. 2004. Effect of corn article size on site and extent of starch digestion in lactating dairy cows. J. Dairy Sci. 87:1389-1399. Richards, C. J., J. F. Pedersen, R. A. Britton, R. A. Stock, and C. R. Krehbiel. 1995. In vitro starch disappearance procedure modifications. Anim. Feed Sci. and Technol. 55:35-45. Sauvant, D., P. Chapoutot, and H. Archimded. 1994. Starch digestion by ruminants and its consequences. INRA Prod. Anim. 7:115-124. Schalla, A., L. Meyer, Z. Meyer, S. Onetti, A. Shultz, and J. Goeaser. 2012. Apparent total-tract nutrient digestibilities measure commercially using 120-hour in

25
vitro indigestible neutral detergent fiber as a marker are related to commercial dairy cattle performance. J. Dairy Sci. 95: 5109-5114. Tahir, M. N., M. Hetta, M. Larson, P. Lund, P. Huhtanen. 2013. In vitro estimations of the rate and extent of ruminal digestion of starch-rich feed fractions compared to in vivo data. Anim. Feed Sci. and Technol. 179: 36-45. Theurer, C. B., J. T. Huber, A. Delgado-Elorduy, and R. Wanderley. 1999. Invited Review: Summary of steam-flaking corn or sorghum grain for lactating dairy cows. J. Dairy Sci. 82:1950-1959.

26
CHAPTER II: Survey of Starch Digestibility on Wisconsin Dairy Farms
across winter months
Abstract
A field survey was conducted on 30 commercial Wisconsin dairy farms to
estimate variations in starch digestion from harvest (November 2011) through the
winter (April 2012). Commercial dairy farms that participated milked 223 +/- 206
cows with bulk tank averages of 32.7 +/- 5.5 kg/day per cow. Whole plant corn silage
(WPCS), high moisture corn (HMC) and dry corn (DC) that would be fed in the fall into
the spring were collected from each farm. Each sample was analyzed for dry matter
content, starch content, particle size and 7-hour ruminal in vitro starch digestibility
(IVSD; % of starch). A composite manure sample was also collected from each farm by
combining fecal grab samples from 10 cows within the herd between 45-120 days in
milk (DIM). Each sample was analyzed for starch content, which was then used to
calculate total tract starch digestibility (TTSD). For WPCS the dry matter content (DM;
35.0% +/- 4.5 vs. 36.2% +/- 5.1), starch content (34.7% +/- 4.8 vs. 34.1% +/- 4.8), and
kernel processing score (KPS; 57% +/- 11.1 vs. 61.1% +/- 12.4) were similar for fall
(Nov. 2011) and spring (Apr. 2012) sampling periods, respectively. For WPCS the IVSD
was 6.6% units greater for spring than fall collected samples (90.3% +/- 3.7 vs. 83.7%
+/- 7.5). For HMC the DM content (72.0% +/- 7.2 vs. 74.8% +/- 5.9), mean particle size
(MPS; 1725μ+/- 562 vs. 1548μ+/- 626), and IVSD (75.7% +/- 8.2 vs. 74.5% +/- 7.2)
were similar for fall (Nov. 2011) and spring (Apr. 2012) sampling periods, respectively.

27
The fecal starch content (3.3% +/- 3.0 vs. 4.1% +/- 4.0) and calculated TTSD (95.9% +/-
3.7 vs. 94.9% +/- 5.0) were similar for the fall and spring sampling periods,
respectively. Results suggest that improved control of WPCS and HMC harvest and
processing practices and longer WPCS ensiling times would increase starch digestibility
in dairy cows.

28
Introduction
The predominant forage used by the dairy industry today in the United States is
WPCS (Johnson et al., 1999). Corn that is harvested for silage differs from other forage
sources because of the presence of grain, which represents about 45% of the whole-
plant DM (Philippeau & Michalet-Doreau et al., 1998). Dairy producers often are forced
to feed forages, including WPCS that have only been ensiled for a few days or weeks to
due low inventory (Young et al., 2012). Approximately 50% of the WPCS energy value
is derived from starch. By being able to improve WPCS starch digestibility (starchD) it
could improve lactaction performance in dairy cattle.
Starch digestibility can be influenced by WPCS harvest maturity, kernel
processing (Johnson et al., 1999) and length of ensiling (Young et al., 2012). Ferraretto
et al., (2012) reported that DM content of WPCS increases with advancing maturity.
Ferreira and Mertens (2005) defined kernel processing based on the amount of
material that passes through the 4.75 mm sieve resulting in a kernel processing score
(KPS). Scores greater than 70%, 50-69%, and less than 50% are considered to be
optimal, adequate, and poor kernel processing, respectively. Young et al., (2012) found
an increased starchD as time of ensiling increased in a controlled lab setting from fresh,
45-day, and 150-day of 66.3%, 75.2%, and 80.7%, respectively.
Corns are typically processed before feeding to enhance their nutritional value
for lactating dairy cows (Hoffman et al., 2012). The extent of processing for corns is
typically measure by mean particle size (MPS). Starch digestibility can be improved by
lowering the MPS and in HMC ensiling time. Hoffman et al (2011) reported that ensiling

29
HMC for 240-days reduced the zein-protein subunits that cross-link starch granules and
suggested that the starch-protein matrix was degraded over the long ensiling period.
Similar results were reported in Ferraretto et al (2014) where a 9% unit increase of
IVSD was observed in samples submitted in October of 2011 versus August 2012.
The objective of this survey was to better understand the effects of ensiling
WPCS and corns over an extended ensiling period has on IVSD would allow dairy
farmers and nutritionist to optimize diets.
Materials and Methods
Farms included for this survey needed to plan to feed 2011 WPCS and corns in
the fall and that would still be feeding the same WPCS and corns in the spring. Farms
were invited to participate in the survey by their local county-based agriculture agent.
There were thirty farms that participated that were located in the following Wisconsin
counties: Buffalo, Calumet, Chippewa, Clark, Fond du Lac, Jackson, Monroe, Oconto
Outagamie, Price, Shawano, Sheboygan, and Waupaca. Farms in the study milked on
average 223 cows, herd size ranged from 38 to 1,000 milking cows. Bulk tank milk
yield average was 32.7 kg per cow and ranged from 20.4 – 42.2 kg per cow per day.
Samples of WPCS, HMC, and DC were collected in November 2011 and April
2012 to determine for DM content, starch content, particle size and 7 hour IVSD. A
fecal sample was also collected from each farm through a recal grab done by a county
agent. The fecal sample was a composite of fecal grab samples of ten cows that were

30
between 45 and 120 days in milk (DIM). The fecal was analyzed for starch content and
estimated for TTSD.
Samples were dried to a constant weight at 105°C to determine DM content.
Starch content on the samples was determined and corrected for free glucose according
to the procedures described by Hall (2009), with modifications for samples to be
analyzed on a YSI Biochemistry Analyzer (YSI Inc, Yellow Springs, OH). Fecal starch was
analyzed on the manure samples and used to determine TTSD using the following
equation: TTSD% = (100 * (0.9997 – 0.0125 * fecal starch, % of DM)); R2 = 0.94
(Ferraretto, L. and R. D. Shaver., et al 2012).
Kernel Processing Score (KPS) was determined by drying approximately 150
grams of sample in a 50 degree Celsius oven for 24 hours. Samples were sieved through
8 screens (19, 13.2, 9.5, 6.7, 4.75, 2.36, 1.18, 0.50 mm) by aggressively shaking on a
vertical shaker for ten minutes. The amount of material that passed through the 4.75
mm sieve was analyzed for the starch content, this in turn becomes the processing
score based on Ferreira and Mertens (2005) found that the percentage of starch greater
than 4.75 mm (minimally fragmented) was positively correlated to mean particle size.
The particle size of HMC and DC was determined using the American Society of
Agricultural Engineers (ASAE) defined procedure based on a lognormal distribution of
the ground particles. This technique utilizes a complete sieve analysis to determine
particle size and distribution in the corns. The 7 sieves used for this trial had nominal
openings of 2, 1, 0.850, 0.500, 0.250, 0.150, 0.100 millimeters.

31
Samples were dried in a 50° Celsius forced air oven for 24 hours. Dried samples
are poured into the tower of sieves and allowed to sift through the sieves by vigorously
shaking the sieves for ten minutes on a vertical shaker. The fraction of each sieve was
weighed and used to compute the MPS, which refers to the mid point where 50% of the
grain is coarser by weight and 50% of the grain is finer by weight.
Ruminal 7-hr IVSD was analyzed according to Richards (et al., 1995), with
modified rumen fluid collection according to the Goeser and Combs (2009) technique.
Data evaluating the effects of ensiling over winter months was analyzed using
SAS JMP version 11.0. This was a completely randomized experimental design, with
season of sample submission as a fixed effect. Sample means were first regressed
against model parameters using backwards elimination through JMP mixed modeling.
Parameters previously outlined as well as two-way interactions were accessed within
the model. The final model for IVSD was:
Yab = + Ta + Sb + TSab + eab
Where Yab = IVSD, response variable, = population mean, Ta = class effect of sample
type, Sb = fixed effect of season of sample submission, TSab = type and season
interaction, and eab = random residual error, assumed to be normally distributed.
The final model for starch (%DM), DM%, and MPS was:
Yab = + Ta + ea
Where Yab = starch (%DM), DM%, or MPS, response variable, = population mean, Ta =
class effect of sample type, and ea = random residual error, assumed to be normally
distributed.

32
The final model for KPS and TTSD was:
Yab = + Sb + eb
Where Yab = KPS or TTSD, response variable, = population mean, Sb = class effect of
sample type, and eb = random residual error, assumed to be normally distributed.
Results and Discussion
Descriptive statistics for WPCS, HMC, DC, and fecal samples by season of sample
submission are in Tables 1 (Fall) and 2 (Spring). Dry matter content in WPCS ranged
approximately 25% units for the total survey. This suggests there could be more
opportunity to control the maturity at harvest. In this survey there were about 20% of
the farms with WPCS with greater than 40% DM (Figure 1). Ferraretto and Shaver
(2012) found that WPCS with greater than 40% DM content could reduce digestibility.
The DM content means for DC, HMC, and CS are in Table 3; there was no statistical
difference between season of sample submission.
The KPS score, determined by Ferreira and Mertens (2005), reports that
the degrees of kernel damage in WPCS (percent of starch passing through 4.75 mm
screen) is related to in vitro starch digestibility. There was a slight linear increase in
IVSD by KPS, but no statistical relationship (p = 0.395) found in this study (Figure 2).
Measurements of KPS for fall and spring samples are described in Table 4. Although on
average the WPCS were adequately processed, approximately 25% of the samples were
below 50% KPS falling into the poor quality (Figure 3).

33
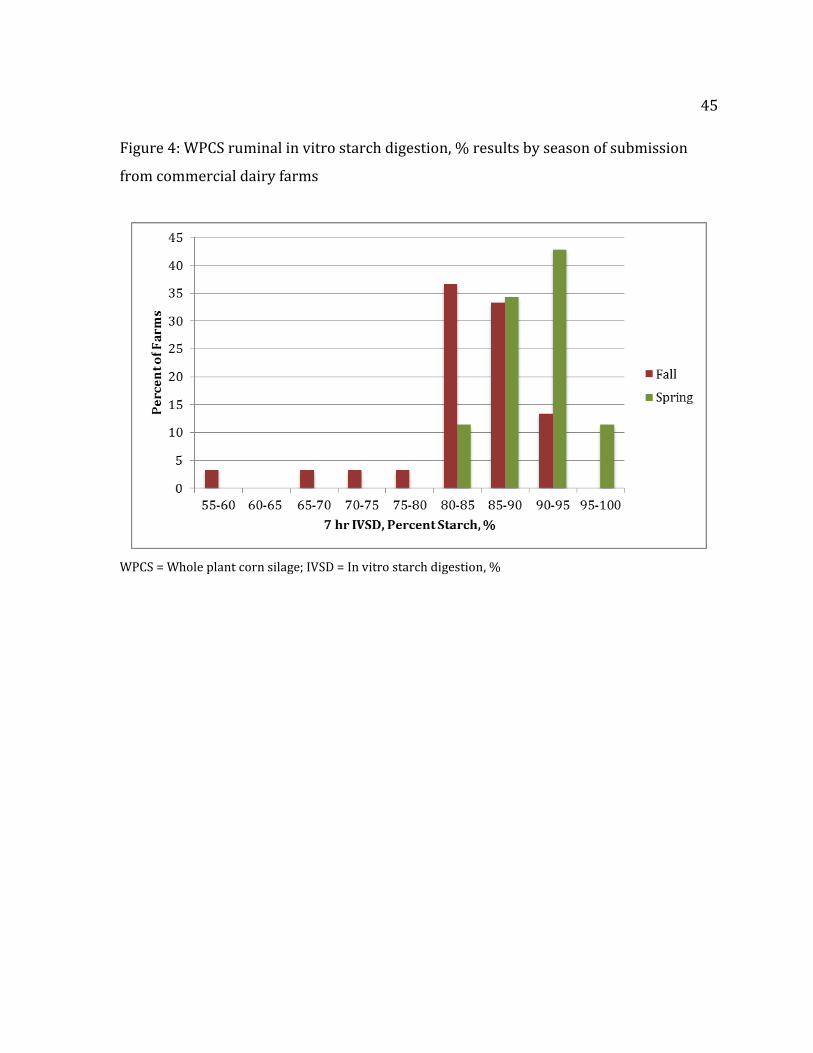
On average, spring WPCS samples were approximately 7% units greater
compared to the fall samples for IVSD (Table 5), though this was not a completely
controlled study, as not the exact same WPCS were analyzed after short and long
ensiling periods, these results do suggest that the starch digestibility of WPCS increased
over an extended ensiling period (Figure 4). These observations are in agreement with
truly controlled experiments done by Young (el al., 2012) that evaluated length of silo
fermentation effects of starch digestibility in WPCS.
Results of IVSD between season for HMC are in conflict with the hypothesis that
starch digestibility increasing with lengthened ensiling periods. It also did not agree
with previous research (Hoffman et al., 2011) with controlled research trials.
Unlike WPCS, in HMC the IVSD was not statistically different between fall and
spring samples (Table 5). In this trial cold ambient temperatures at harvest and
throughout storage may slow the silo fermentation for HMC. The fermentation may not
speed up until the ambient temperature rises throughout the end of spring to early
summer. With sample collections of November and April this may have not been a long
enough time period to see a significant increase in starch digestibility.
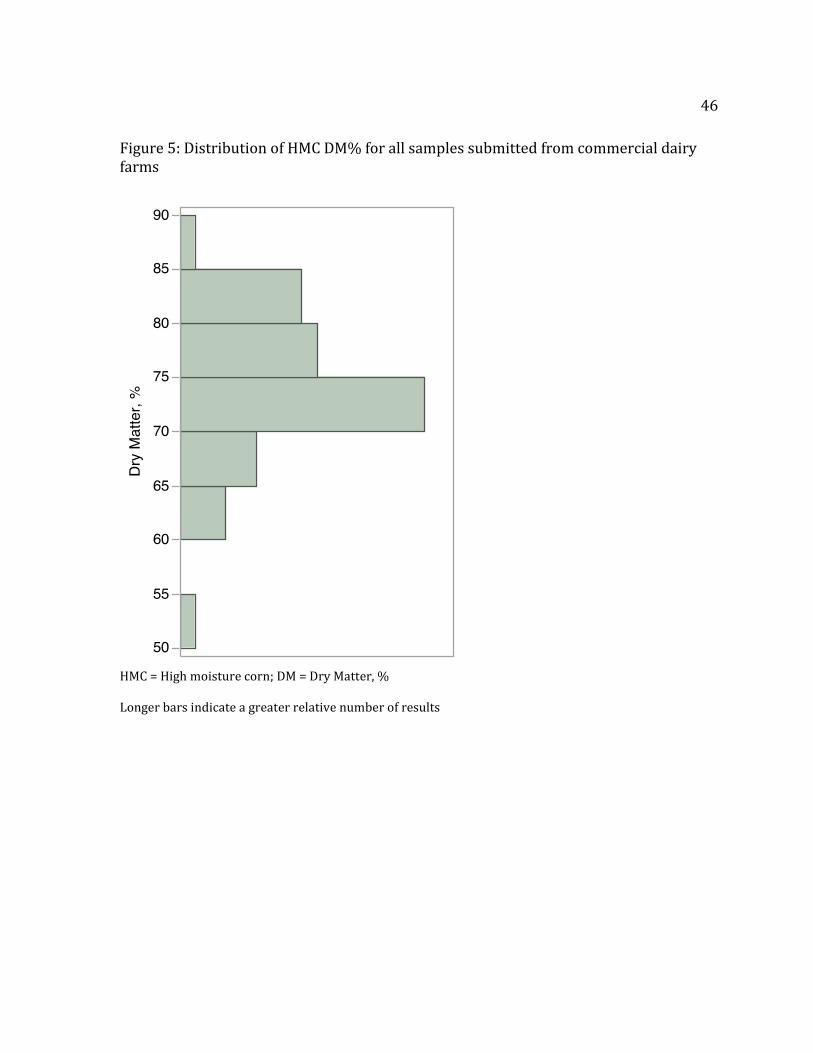
Another factor could have been the samples DM. On average the samples were
74% dry in the fall and spring collected samples (Table 3). Approximately 45% of the
samples were above 74% DM (Figure 5). A high DM content can limit the extent of
fermentation.
The HMC samples collected averaged approximately 1635 microns (Table 6), but
about 35% of the samples had a MPS of greater than 2000 microns (Figure 6). Starch

34
digestibility is found to be inversely related with MPS (Hoffman el at., 2012). With
greater moisture contents, warmer ambient temperatures at harvest and sampling later
than April, we may have been able to observe an increase in starch digestibility with a
lengthened ensiling period (Figure 7).
There were very few DC samples submitted for this trial. The samples were on
average finely ground (550 microns, Table 6) which lead to an average of 71.73% and
74.30% IVSD for spring and fall samples (Table 5).
The average starch content for the fecal samples was 3.68% (DM basis) for fall
and spring samples (Table 7). The TTSD resulted in an average of 94.8% and 95.9% for
fall and spring samples (Table 8), with a maximum of 99% for fall and spring (Figure 8).
Higher fecal starch contents from 15% to 20% resulted in the lower TTSD samples
shown in Figure 8.
Differences in the WPCS IVSD that were observed between the sampling periods
were likely not great enough to be able to detect a difference in TTSD. Post-ruminal
digestion, DIM, and differences in rations may be factors in the lack of difference in fecal
starch and TTSD between the fall and spring sampling periods.
Conclusion
With fermented feeds, especially WPCS, our data suggests that a longer storage
time can make a significant difference in starch digestibility. It would be beneficial for
farms to ensile feeds for a longer period of time before feeding out. In many cases this
is not possible due to the inventory available, but there are other ways to improve

35
starch digestibility. Such as harvesting WPCS and HMC at lower DM contents to
enhance fermentation and greater kernel processing at harvest. Fecal sampling is an
easy and inexpensive approach to gauge starch digestibly on farm, and make any
necessary adjustments to harvesting and processing in the fall and (or) ration
formulation throughout the year.
Acknowledgements
Appreciation is extended to Abby (Huibregtse) Bauer of Oconto County UW-Extension
for arranging the farms and sample submission and to Pat Hoffman of UW-Madison for
his technical assistance.

36
References
American Society of Agricultural Engineers (ASAE). Feb 2003. Method of determining and expressing fineness of feed materials by sieving. S319.3. Ferraretto, L. F. and R. D. Shaver. 2012. Meta-analysis: Effect of corn silage harvest practices on intake, digestion, and milk production by dairy cows. Prof. Ani. Sci.
28: 141-149. Ferraretto, L. F., K. Taysom, D. M. Taysom, R. D. Shaver, and P. C. Hoffman. 2014. Relationship between dry matter content, ensiling, ammonia-nitrogen, and ruminal in vitro starch digestibility in high-moisture corn samples. J. Dairy Sci.
97:1-7. Ferreira, G. and D. R. Mertens. 2005. Chemical and physical characteristics of corn silages and their effects on in vitro disappearance. J. Dairy Sci. 88: 4414- 4425. Goeser, J. P., & Combs, D. K. 2009. An alternative method to assess 24-h ruminal in vitro neutral detergent fiber digestibility. J. Dairy Sci. 92: 3833-3841. Hall, M. B. 2008. Determination of starch, including maltooligosaccharides, in animal feeds: Comparison of methods and a method recommended for AOAC collaborative study. Journal of AOAC International. 92: 42-49. Hoffman, P. C., N. M. Esser, R. D. Shaver, W. K. Coblentz, M. P. Scott, and A. L. Bodnar. 2011. Influence of ensiling time and inoculation on alteration of the starch- protein matrix in high-moisture corn. J. Dairy Sci. 94:2465-2474. Hoffman, P. C., D. R. Mertens, J. Larson, W. K. Coblentz, and R. D. Shaver. 2012. A query for effective mean particle size of dry and high moisture corns. J. Dairy Sci. 95:3467-3477. Johnson, L., J. H. Harrison, C. Hunt, K. Shinners, C. G. Doggett, and D. Sapienza. 1999. Nutritive value of corn silage as affected by maturity and mechanical processing: A contemporary review. J. Dairy Sci. 86:208. Philippeau, C. and B. Michalet-Doreau. 1998. Influence of genotype and ensiling of corn grain on in situ degradation of starch in the rumen. J. Dairy Sci. 81:2178- 2184. Richards, C. J., J. F. Pedersen, R. A. Britton, R. A. Stock, and C. R. Krehbiel. 1995. In vitro starch disappearance procedure modifications. Anim. Feed Sci. and Technol. 55:35-45.

37
Young, K. M., J. M. Linn, M. C. Der Bedrosian, and L. Kung Jr. 2012. Effect of exogenous protease enzymes on the fermentation and nutritive value of corn silage. 2012. J. Dairy Sci. 95: 6687-6694.

38
Table 1. Survey data of WPCS, HMC, DC and fecal samples from commercial dairies submitted in the fall season
Type Analtye Average n Stdev Min Max
WPCS Starch % DM 34.7 30 5.4 16.0 44.1 HMSC Starch % DM 72.1 19 6.2 56.9 81.8 DC Starch % DM 74.9 6 6.4 70.6 89.8 Fecal Starch % DM 3.3 29 3.0 0.4 15.2 WPCS IVSD (7hr) 83.7 29 7.4 58.1 93.9 HMSC IVSD (7hr) 75.7 19 8.2 65.4 89.6
DC IVSD (7hr) 73.5 6 4.1 70.0 81.5 WPCS DM % 35.0 31 5.7 28.7 55.1 HMSC DM % 72.0 20 7.3 51.4 82.4 DC DM % 84.1 6 3.7 76.3 86.2 WPCS KPS, % 57.0 29 11.0 34.9 74.3 HMSC MPS, microns 1725.0 20 585.7 780.0 2710.0 DC MPS, microns 550.0 5 66.5 461.0 619.0 Fecal TTSD, % 95.9 29 3.71 80.9 99.5
Type: WPCS = Whole plant corn silage; HMC = High moisture corn; DC = Dry corn Analytic: IVSD = In vitro starch digestion, %; DM = Dry matter, %; KPS = Kernel processing score, % starch >4.75mm; TTSD = Total tract starch digestion, %

39
Table 2. Survey data of WPCS, HMC, DC and fecal samples from commercial dairies submitted in the spring season
Type Analtye Average n Stdev Min Max
WPCS Starch % DM 34.1 35 4.8 23.9 41.9 HMSC Starch % DM 68.3 23 9.3 48.3 79.1 DC Starch % DM 74.9 3 2.6 75.1 80.2 Fecal Starch % DM 4.1 30 4.0 0.6 19.6 WPCS IVSD (7hr) 90.3 35 3.7 82.5 96.2 HMSC IVSD (7hr) 74.5 23 7.2 61.6 85.8 DC IVSD (7hr) 73.5 3 4.4 68.6 76.8
WPCS DM % 36.2 32 5.2 28.1 50.5 HMSC DM % 74.8 23 5.9 60.1 86.6 DC DM % 84.1 3 2.3 85.9 90.0 WPCS KPS, % 61.1 35 12.4 38.6 88.7 HMSC MPS, microns 1548.0 23 625.8 539.0 2684.0 DC MPS, microns 550.0 3 58.5 530.0 635.0 Fecal TTSD, % 94.9 30 5.0 75.5 99.2
Type: WPCS = Whole plant corn silage; HMC = High moisture corn; DC = Dry corn Analytic: IVSD = In vitro starch digestion, %; DM = Dry matter, %; KPS = Kernel processing score, % starch >4.75mm; TTSD = Total tract starch digestion, %

40
Table 3. WPCS, HMC, and DC dry matter least square means submitted from commercial dairy farms
Type DM,%1 Std Error
DC 84.1a 1.93
HMC 73.75b 0.86
WPCS 35.92c 0.73 Type: WPCS = Whole plant corn silage; HMC = High moisture corn; DC = Dry corn 1 = Least square means Least square means with differing superscript differ at P < 0.05
Table 4. WPCS kernel processing score least square means submitted from commercial dairy farms
Season KPS,%1 Std Error
Spring 61.08a 2.2
Fall 56.97a 1.99 WPCS = Whole plant corn silage; KPS = Kernel processing score,% starch <4.75mm 1 = Least square means Least square means with differing superscript differ at P < 0.05
Table 5. Ruminal in vitro starch digestion (7hr) means by sample type and season of submission for commercial dairy farms
Type*Season IVSD,%1 Std Error
WPCS*spring 90.34a 1.09
WPCS*fall 83.72b 1.20
HMC*spring 74.53c 1.34
HMC*fall 75.67c 1.47
DC*spring 71.73c 3.72
DC*fall 74.30c 2.63 Type: WPCS = Whole plant corn silage; HMC = High moisture corn; DC = Dry corn; IVSD = In vitro starch digestion, % 1 = Least square means Least square means with differing superscript differ at P < 0.05

41
Table 6. Mean particle size means by feed type submitted from commercial dairy farms
Type MPS,
mircons1 Std Error
HMC 1652.16a 86.32
DC 550.362b 200.11 HMC = High moisture corn; DC = Dry corn; MPS = Mean particle size 1 = Least square means Least square means with differing superscript differ at P < 0.05
Table 7. Starch (%DM) means by sample type submitted from commercial dairy farms
Type Starch,%1 Std Error
DC 74.86a 2.47
HMC 69.97a 0.85
WPCS 34.36b 0.69
Fecal 3.68c 0.72 Type: WPCS = Whole plant corn silage; HMC = High moisture corn; DC = Dry corn 1 = Least square means Least square means with differing superscript differ at P < 0.05
Table 8. TTSD (%) averaged by season based on fecal starch
Season TTSD,%1 Std Error
Spring 95.88a 0.8
Fall 94.87a 0.81 TTSD = Total tract starch digestibility 1 = Least square means Least square means with differing superscript differ at P < 0.05

42
Figure 1: Sample DM% for WPCS submitted in the survey from commercial dairy farms
Type: WPCS = Whole plant corn silage Longer bars indicate a greater relative number of results

43
Figure 2: Relationship between ruminal starch digestion (7h) and KPS in WPCS submitted from commercial dairy farms
WPCS = Whole plant corn silage; IVSD = In vitro starch digestion; KPS = Kernel Processing Score, % of starch <4.75mm

44
Figure 3: Distribution of WPCS KPS% for all samples submitted from commercial dairy farms
WPCS = Whole plant corn silage; KPS = Kernel Processing Score Longer bars indicate a greater relative number of results
45
Figure 4: WPCS ruminal in vitro starch digestion, % results by season of submission
from commercial dairy farms
WPCS = Whole plant corn silage; IVSD = In vitro starch digestion, %
46
Figure 5: Distribution of HMC DM% for all samples submitted from commercial dairy farms
HMC = High moisture corn; DM = Dry Matter, % Longer bars indicate a greater relative number of results

47
Figure 6: Distribution of HMC MPS for all samples submitted from commercial dairy farms
HMC = High moisture corn; MPS = Mean particle size Longer bars indicate a greater relative number of results

48
Figure 7: HMC ruminal starch digestion, % results by season of submission from
commercial dairy farms
HMC = High moisture corn; IVSD = In vitro starch digestion, %

49
Figure 8: Distribution of TMR predicted total tract starch digestion (TTSD,%). TTSD% was predicted using the following equation: TTSD% = (100 * (0.9997 – 0.0125 * fecal starch, % of DM)); R2 = 0.94 (Ferraretto, L. and R. D. Shaver., et al 2012).
TTSD = Total tract starch digestibility, % Longer bars indicate a greater relative number of results

50
CHAPTER III: In vitro starch digestion methods compared to
in situ starch digestion
Abstract
Ruminal starch digestibility is highly variable across and within feed types.
Factors such as particle size, genetics and ensiling can contribute to the ruminal starch
digestion variability in different feedstuffs. Accurately determining rumen starch
digestion is important to continue advancing ruminant nutrition and dairy
performance and minimize wasted nutrients. Two experiments were conducted to
determine if an in vitro rumen starch digestion method yielded comparable results to
an in situ rumen starch digestion technique. Whole plant corn silage (WPCS), dry corn
grain (DCG), and high moisture corn (HMC) samples were collected from a commercial
feed analysis laboratory (Rock River Laboratory, Inc in Watertown, WI). In experiment
1 two standard samples were collected (DCG n=1 and WPCS n=1) and expected to differ
in starch digestibility. Four different in vitro treatments were compared to the in situ
method for 3h and 7h incubations. The treatments were as followed: SLP =
standardized rumen fluid – low pH (5.0); SHP = standardized rumen fluid – high pH
(7.0); NLP = non-standardized rumen fluid – low pH (5.0); NHP = non-standardized
rumen fluid – high pH (7.0). Goeser et al. (2009) observed improved repeatability in
fiber digestion with a standardized priming technique. This technique was evaluated to
assess for determination of rumen in vitro starch digestion. The pH of the in vitro
rumen solution after digestion was evaluated at two levels. Experiment 1 suggested
51
NLP was most closely related to rumen in situ starch digestion based on a non-
statistical difference between NLP and in situ results.
Experiment 2 then further tested the relationship between NLP and IS on a
larger set of samples (WPCS n= 10, HMC n=10, and DCG n= 4). Samples were analyzed
using both NLP and IS for rumen starch digestion. Experiment 2 resulted in a statistical
difference between the NLP and rumen in situ starch digestions. When investigating the
difference in results from Experiment 1, we hypothesized that environmental factors
affected the experiment. As a result, the rumen in vitro technique was reanalyzed.
Rumen in vitro results were biologically acceptable, yet still were significantly different
from the in situ results, contradicting results observed in experiment 1. Results should
be interpreted with caution due to the several month difference in time between NLP
and in situ techniques. The rumen cannulated cows experienced differing diets and
environments, which likely affected results. Experiment 2 suggests further research is
warranted under a more controlled setting.
Following experiment 2, a larger set of WPCS, HMC, and DCG (n = 75, n = 75, and
n = 25, respectively) were incubated in situ for 3h and 7h to describe feedstuff
population statistics. We observed substantial variability in rumen in situ starch
digestion for WPCS, HMC, and DCG. The coefficient of variation was greater than 18%
for all sample types and both time lengths. Sample types ranked by most digestible to
least were WPCS > HMC > DCG.

52
Introduction
Starch in the kernels of whole plant corn silage (WPCS), high moisture corn
(HMC), and dry corn (DC) provide substantial energy to diets fed to lactating dairy
cows. However, the site of starch digestion determines whether starch serves as an
energy source for ruminal microbes or becomes available in the intestines (van
Zweieten et al., 2008). In a review of lactation studies, Theurer et al. (1999) concluded
that greater ruminal starch digestion lead to improvements in performance by lactating
dairy cows.
Accurately estimating starch digestibility for feedstuffs in the rumen is valuable
to forecast performance changes resulting when switching feeds within these feed
types. There have been many academic and practical approaches evaluated as
measures for predicting starch digestion, each differing in the using the actual rumen
environment or a simulated environment. The two techniques used in this study were
rumen in situ and in vitro digestion procedures. Both rumen in vitro (IV) and rumen in
situ (IS) starch digestion techniques are commonly used in commercial feed analysis
laboratories around the country and world to estimate ruminal NDF and starch
digestibility.
The rumen IS procedure used in estimating starch degradation is often justified
because it involves the actual rumen environment (Huhtanen and Sveinbjornsson,
2006). This is a possible advantage over any IV technique, as the only other measures
that utilize the actual rumen are in vivo measures (Kitessa et al. 1999), however, these

53
are invasive and extremely time consuming. The IS technique is a simple and direct
method (Offner et al., 2003); nutrient (including starch) digestion can be estimated by
incubating feeds in porous nylon bags in the rumen for various lengths of time. While
in situ offers potential advantages in accuracy relative to in vivo over in vitro, grind size
used during the IS technique can affect the degradability significantly. Michalet-Doreau
and Cerneau (1991) compared three grind sizes, 0.8 mm, 3.0 mm, and 6.0 mm for dry
matter degradation when washed in water for 15 minutes, and observed14.6%, 8.9%
and 1.8% degradability for corn grain. The NRC (2001) considers these small particles
lost through the pores of the bag to be immediately degraded in the rumen. Using IS
technique on very fine feedstuff particles is not recommended (Offner et al., 2003), due
to potentially greater losses through the bag pores. Another advantage with rumen IS
starch digestion measures is that multiple time periods can be assessed to model starch
digestion kinetics (Orskov and McDonald, 1979). Digestion parameters can then be
used in diet formulation software.
In a quantitative review of the IS method by Offner et al. (2003), they observed
that there was not a significant interaction between laboratory and sample type. This
observation suggests that there was not difference in the ranking of results from
different laboratories. Offner and Sauvant (2004) observed that estimates of IS starch
degradability were comparable to numerous observations for starch digestibility in
vivo. Results showed that the IS technique accurately predicted starch digestion in the
rumen and the total tract. Offner et al. (2003) also suggests that no less than 3
replicates should be used when utilizing the IS technique to account for variation.

54
However, starch digestion for feedstuffs with slowly degrading starch was
underestimated, whereas starch digestion was overestimated with rapidly degradable
starch when analyzed by the IS method. Underestimation of starch digestion in nylon
bags can be explained by high proportions of vitreous endosperm (van Zwieten et al,
2008), while overestimation could be due to the nylon bag pore size relative to sample
grind size.
Hindle et al. (2005) suggested that IS techniques should be performed in animals
that have been adapted to a starch source similar to that of interest to provide a more
accurate simulation of the in vivo system. While potentially more accurate and
informative rumen IS techniques can be expensive and less efficient than IV techniques.
Rumen IV digestions can be characterized as being completely removed from the
animal and carried out in a simulated environment. Many factors affect rumen in vitro
incubations: ratio of feed to rumen fluid, ratio of rumen fluid to IV media, composition
of the IV media, and type of mill used for grinding, grinder screen size and diet of the
donor animal (Huhtanen and Sveinbjornsson, 2006). Repeatability from one run to the
next has challenged IV techniques, however, Goeser et al. (2009) observed a reduction
in inter-assay error in fiber digestion when the rumen fluid inoculum was primed with
a simulated total mixed ration to standardize the activity of the rumen fluid digesting
bacteria before inoculation. Results suggest that by using this method, in vitro fiber
digestion estimates are less likely to be affected by varying rumen fluid inoculum
activity (Goeser et al., 2009). This method has yet to be assessed for ruminal in vitro
starch digestion assays.

55
Our objective was to determine if an IV rumen starch digestion method yielded
comparable results to rumen IS starch digestion technique. This could result in a more
cost effective assay for dairy nutritionists and producers to utilize to determine ruminal
starch digestion.
Materials and Methods
Experiment 1
Two samples were collected from a commercial feed analysis laboratory (Rock
River Laboratory, Inc. in Watertown, WI); DC (n=1) and WPCS (n=1) to test high and
low digestible starch samples. Samples were dried and ground to pass a 1 mm Udy
cyclone mill (Udy Corporation, Fort Collins, CO) for dry matter and starch analysis, 4
mm Wiley mill (Thomas Scientific, Swedesboro, NJ) for IV methods, and 6 mm Wiley
mill (Thomas Scientific, Swedesboro, NJ) for IS methods. Treatments were set up in a
factorial arrangement to test pH and standardization of rumen fluid in relation to IS.
Four IV treatments (trt) were compared to the rumen IS starch digestion method. SLP =
standardized rumen fluid – low pH (5.0); SHP = standardized rumen fluid – high pH
(7.0); NLP = non-standardized rumen fluid – low pH (5.0); NHP = non-standardized
rumen fluid – high pH (7.0).
Samples were dried at 105°C to determine DM content for 3 h. Starch content
was determined and corrected for free glucose according to the procedures described
by Hall (2008), with modifications to allow for sample analysis on a YSI Biochemistry

56
Analyzer (YSI Inc, Yellow Springs, OH). Starch was calculated as 100 X [(volume/WT.) X
(glucose) X (0.9)/1000].
For the IV methods, samples were weighed (0.5 g +/- 0.05 g) into 125 ml
Erlenmeyer flasks. Samples were then digested in triplicate for 3h and 7h time points.
For SLP and SHP, rumen fluid inoculum collection and standardization was done
according to Goeser et al. (2009). For NHP and NHP rumen fluid collection was done
according to Richards el al. (1995). Rumen fluid inoculum was collected and added to
the samples at approximately 8:30 am. After incubation, 15 mL of 0.1 M sodium acetate
buffer (pH 5.0) was added to stop digestion, samples in SLP and NLP were titrated to a
pH of 5.0 – 5.5 using 0.5 M hydrochloric acid. The in vitro solution pH was assessed
after the sample was digested. In the starch assay (Hall, 2008) the sodium acetate
buffer solution is described to be at a pH of 5.0. Yet Hoffman (personal communication,
2013) helped identify that solution pH may not be at 5.0. We tested the in vitro solution
pH after the sodium acetate buffer was included per the Richards et al. (1995) IV
technique and found the pH to average 7.0. Solution pH is critical because
amyloglucosidase, which is used to solubilize the starch in the Hall (2008) procedure,
has a specific activity at pH of 4.5 – 5.5 (Megazyme, Bray, Ireland).
Samples analyzed using IS were weighed (6 g per bag) in triplicate into 5 cm x 10
cm nylon bags with 50 micron porosity (Ankom Technology, Macedon, NY). One
replicate was placed in each of three different ruminally-cannulated lactating dairy
cows consuming a 58% forage diet with a 50:50 ratio of WPCS to legume (DM basis) for
7 h and 3 h. Rumen IS bags were introduced to the rumen at 900h for 7 h analysis,

57
1300h for 3 h analysis, and all residue bags were removed together at 1600h. Bags
were placed immediately into ice water to terminate microbial digestion. Bags
containing digested residue were rinsed until effluent was clear by hand washing to
remove all microbial protein. Rinsed bags were dried in a 50 degrees Celsius forced air
oven for 24 hours and weighed to determine sample dry matter digestion. Residue
samples were composited and ground to 1 mm to determine starch content.
Starch content in the residues was then determined as previously described.
Rumen starch digestion was calculated as 100 X [(Starchoriginal – Starchresidue) /
(Starchoriginal)].
Data were analyzed using SAS JMP version 11.0. Sample type, hour, and
treatment were considered to be fixed effects. Week was considered to be a random
effect. Backwards elimination was used to determine the final model. A lower AIC and
BIC was considered superior and effects were removed from the model accordingly.
Least square means were provided for all fixed and random effects through SAS JMP
version 11.0. The final model included:
Yijkl = + Ti + Hj + Rk + TRik + TWil + HRjk + RWkl + eijkl
Where Yijkl = starch digestion, response variable, = population mean, Ti = sample type,
Hj = time (hour), Rk = treatment, TRik = sample type and treatment interaction, TWil =
sample type and week interaction, HRjk = hour and treatment interaction, RWkl =
treatment and week interaction, and eijkl = random residual error, assumed to be
normally distributed. Main effects considered significant at P < 0.05.

58
Experiment 2
Following experiment 1, WPCS (n=10), HMSC (n=10), and DC (n=4) were
obtained from a commercial feed analysis laboratory (Rock River Laboratory, Inc. in
Watertown, WI) from August 2013 to December 2013. Samples were selected to be
diverse in chemical and physical characteristics. Samples were analyzed on a near
infrared spectroscopy instrument, samples varying in starch (% of dry matter) and
soluble protein (% of crude protein) were chosen to capture samples that we assumed
would vary in starch digestibility. Sample preparation and the rumen IS technique was
the same as previously described.
For the IV methods, samples were weighed (0.5 g +/- 0.05 g) into 125 ml
Erlenmeyer flasks. Samples were then digested in triplicate for 3h and 7h time points.
Rumen fluid collection was done according to Richards el al. (1995). Rumen fluid
inoculum was collected and used to inoculate samples at approximately 830 h. After
incubation, 15 mL of 0.1 M sodium acetate buffer (pH 5.0) was added to terminate
digestion. Samples were titrated to a pH of 5.0 – 5.5 using 0.5 M hydrochloric acid. In
vitro solution pH was determined after the sample was digested.
Data were analyzed using SAS JMP version 11.0. Sample type, hour, and
treatment were considered fixed effects. The final model was:
Yijk = + Ti + Hj + Rk + RHij + eijkl

59
Where Yijkl = starch digestion, response variable, = population mean, Ti = sample type,
Hj = time (hour), Rk = treatment, RHij = treatment and hour interaction, and eijkl =
random residual error, assumed to be normally distributed. Main effects were
considered significant at P < 0.05.
Following Experiment 2, a larger set of samples were analyzed for rumen starch
digestion through the IS approach. These samples were chosen at random from a
commercial feed analysis laboratory (Rock River Laboratory, Inc. in Watertown, WI).
These were included to further explain descriptive statistics for rumen starch digestion
in WPCS, HMC, and DG. An additional WPCS (n = 65), HMC (n = 65), and DCG (n = 21)
were included. This resulted in a total set of WPCS (n =75), HMC (n = 75) and DCG (n
=25) analyzed as previously described in Experiment 1 for the rumen IS starch
digestion.
Results and Discussion
Experiment 1
Experiment 1 aimed to evaluate rumen IV starch digestion techniques relative to
a standard rumen IS starch digestion approach. We observed statistically insignificant
differences between trt NLP and IS, yielding similar starch digestion means when
averaged across the 3h and 7 h incubation time points (73.53% vs. 73.52%,
respectively) suggesting these two techniques were comparable. Equivalence test was
preformed to analyze the of means between the NLP and IS treatments. A difference of
4.5 still did not yield a significant p-value, means are to be considered equivalent.

60
All other treatments were significantly different in starch digestion relative to the IS
technique as shown in Table 1. Treatment means, treatment means by sample type,
treatment means by length of digestion, and treatments by week due to interactions are
in Table 1.
For SHP and NHP, where the pH remained 7.0 due to heavily buffered rumen IV
media, the results were not significantly different. This suggests that if the pH is held
near 7.0, the rumen fluid standardization technique described by Goeser et al. (2009)
had no effect. But for SLP and NLP where the pH was lowered to 5.0 – 5.5, there were s
lower values with standardized rumen fluid fort SLP (69.36% vs. 73.53%).
In Figure 1 is the interaction between sample type and treatment. The IS
showed a greater difference between DC and WPCS than any of the IV methods (SLP,
SHP, NLP and NHP), suggesting that the IS technique captures greater variation in
ruminal starch digestion. For IV with DCG ,the Goeser et al. (2009) procedure for
rumen primed fluid showed no difference, but in WPCS the non-standardized fluid
yielded higher digestibility results than the standardized; treat mentmeans shown in
Table 1. This contradicts what Goeser et al. (2009) found that there was no impact of
priming rumen fluid on neutral detergent fiber digestibility. We hypothesize that
amylase activity in the rumen fluid may decrease while the rumen fluid is allowed to
standardize.
The treatments with a pH of 7 (SHP and NHP) also yielded greater values forboth
DC and WPCS. This could be explained by the starch remaining in the IV solution not
being completely hydrolyzed, because the amyloglucosidase pH specific activity level is

61
4.5 – 5.5 according to Megazyme (Megazyme International, Bray, Ireland). A more basic
pH (> 5.5) would lead to decreased enzyme activity, which could result in lowered
recovered starch therebyleading to higher n starch digestion values.
Treatment week was considered to be a random variable, yet in Figure 2 the
treatments were separated by week to demonstrate an interaction. Each of the IV
methods increase in starch digestibility from week 1 to week 2, while the IS method
stayed relatively constant between week 1 and week 2 (74.0% vs. 73.6%, respectively).
These results suggest that the IS method may be more consistent across weeks than the
in vitro method, although additional work is warranted. A possible explanation could
be that IV methods are completely removed from the animal and environmental effects
may have a greater impact on IV relative to IS methods where the direct ruminal
environment is utilized. Table 2 demonstrates the sample type means by week of
digestion. We observed an increase in rumen starch digestion in both WPCS and DCG
from week 1 to week 2 (12.6% and 7.3%, respectively), due to the increases in all of the
IV treatments.
In Figure 3 is the between 3h and 7h digestion across techniques and
treatments. Rumen IS technique detected the widest range between 3h and 7h
incubation time points. Higher 3h digestion values were observed compared to 7h
digestion in SHP which is not possible (Figure 3). The pH appeared to have the largest
affect on DCG and WPCS starch digestion. Samples with a post digestion pH of 7.0 were
greater at both time points than samples that were pH 5.0 – 5.5. We believe this is due
to greater amyloglucosidase activity during the starch assay, causing greater residual

62
starch recovered after digestion than samples with a pH of 7.0 where starch residue
determination is theorized to be incomplete. When all of the starch in the residual
samples is not hydrolyzed and recovered, this results in higher ruminal starch digestion
results. We observed that using non-standardized rumen fluid and adjusting the pH to
between 5.0 – 5.5 may be comparable to IS ruminal starch digestion results.
Experiment 2
In Experiment 2, results observed in Experiment 1 were to be verified on a
larger sample set. However, we observed NLP yielded lower starch digestion than IS
(Table 3), which contradicts results in Experiment 1. There was a statistical difference
in rumen starch digestion when a larger sample set was analyzed for the IV NLP
technique and IS technique.
In Figure 4 is the effect of digestion method and treatment hour on starch
digestibility. The IV method yielded lower results for both 3h and 7h than the IS
technique. There was a greater difference between the IV 3h and 7h than the IS 3h and
7h (20.7%-units vs. 11.0%-units). This experiment was run in the winter months,
where it was unseasonably cold. Due to this complication, the IV technique was
repeated in the following months. This delay in analyzing ruminal IV starch digestion
could have affected our results due to diet and environmental changes that the donor
cows endured. These inconclusive results suggest that the IV and IS technique do not
produce comparable results.

63
After we observed contradictory results, additional samples were analyzed using
rumen in situ starch digestion technique to further describe population statistics. In
Table 4 are the population statistics for WPCS, HMC, and DCG by time of incubation.
The coefficient of variation for rumen starch digestion was greater than 18% for all
sample types and digestion times, suggesting great variability within feed sample type.
In Figure 5 is the distribution of all sample types by length of digestion. However, the
rumen in situ starch digestions were assessed for normality using Shaprio-Wilk (1965)
goodness of fit test and were found to not be normal. Suggesting these samples do not
represent a normal population.
The average for all corn types (HMC and DCG) for 7h ruminal IS starch digestion
in this experiment was similar to the results of Patton et al. (2012) in a literature review
of in vivo ruminal starch digestion for corn (53.2% vs. 54.6%). Firkins et al. (2001)
found similar results in DCG for rumen starch digestibility compared to results we
observed (47.0% vs. 49.9%, respectively). A similar range of rumen IS starch digestion
for DCG was observed by Correa et al. (2002), where kernel virtuousness was tested.
They observed a range of 34.9% to 62.3% with a mean of 48.2%, similar to our results
that ranged 31.7% to 74.3% with a mean of 49.9%. We observed that HMC had a
greater ruminal starch digestibility than DCG, which agrees with previous research
(Firkins et al., 2001; Hoffman et al., 2012). Our observations, in collaboration with cited
work, suggest that the IS technique may be a more suitable technique if it can be
practically applied.

64
Conclusion
Results observed in Experiment 1 suggested that using non-standardized rumen
fluid and adjusting the pH to between 5.0 – 5.5 may yield comparable to IS ruminal
starch digestion results. When evaluating additional samples to further test this
hypothesis in Experiment 2, there was a statistical difference between the in vitro
starch digestion and in situ starch digestion results.
These could have been caused by many varying factors that could have led to
these differing outcomes. In Experiment 1 the in vitro and in situ samples were run in
the same week. Due to complications with cold weather temperatures during
Experiment 2 we had to repeat the in vitro starch digestions a few months later. The
change in season and in diets could have affected the rumen fluid collected for in the in
vitro digestions. This trial warrants further research testing the in situ and in vitro
techniques in a more controlled setting, as well as the effects of differing rumen fluid
due to diet and temperature on starch digestion.
Additional samples analyzed for rumen IS starch digestion suggests that there is
large variability in rumen starch digestion within feed type for WPCS, HMC, and DCG.
Acknowledgements
Appreciation is extended to Pat Hoffman of UW-Madison for his technical assistance in
understanding limitation in the in vitro starch digestion method.

65
References
Correa, C. E. S., R. D. Shaver, M. N. Pereira, J. G. Lauer, and K. Kohn. 2002. Relationship between corn vitreousness and ruminal in situ starch degradability. J. Dairy Sci. 85:3008-3012.
Firkins, J. L., M. L. Eastridge, N. R. St-Pierre, and S. M. Nofsger. 2001. Effects of grain variability and processing on starch utilization by lactating dairy cattle. J. Anim. Sci. 79 (E Suppl.):E218-E238.
Goeser, J. P., and Combs, D. K. 2009. An alternative method to assess 24-h ruminal in
vitro neutral detergent fiber digestibility. J. Dairy Sci. 92: 3833-3841.
Goeser., J. P., P. C. Hoffman, and D. K. Combs. 2009. Modification of a rumen fluid
priming technique for measuring in vitro neutral detergent fiber digestibility.
J. Dairy Sci. 92: 3842-3848.
Hall, M. B. 2008. Determination of starch, including maltooligosaccharides, in animal
feeds: Comparison of methods and a method recommended for AOAC
collaborative study. Journal of AOAC International. 92: 42-49.
Hindle, V. A., A. M. van Vuuren, A. Klop, A. A. Mathijssen-Kamman, A. H. van Gelder
and J. W. Cone. 2005. Site and extent of starch degradation in the dairy cow – a
comparison between in vivo, in situ, and in vitro measurements. J. of Anim.
Phys. and anim. nutri. 89: 158-165.
Hoffman, P. C., D. R. Mertens, J. Larson, W. K. Coblentz, and R. D. Shaver. 2012. A
query for effective mean particle size in dry and high moisture corns. J. Dairy Sci.
95: 3467-3477.
Huhtanen, P. and J. Sveinbjornsson. 2006. Evaluation of methods for estimating
starch digestibility and digestion kinetics in ruminants. Anim. Feed Sci. and
Technol 130:95-113.
Kitessa, S., P. C. Flinn, and G. C. Irish. 1999. Comparison of methods used to predict the
in vivo digestibility of feeds in ruminants. Aust. J. Agric. Res. 50: 825-841.
Megazyme Incorporated. Amyloglucosidase (Aspergillus niger) Enzyme. EC 3.2.1.3.
Bray, Ireland.

66
Michallet-Doreau, B., and P. Cerneau. 1991. Influence of feedstuff particle size on in
situ degradation of nitrogen in the rumen. Anim. Feed Sci. Technol. 35: 69-81.
Offner, A., A. Bach, and D. Sauvant. 2003. Quantitative review of in situ starch degradation in the rumen. Anim. Feed Sci. Technol. 106:81-93. Offner, A., and D. Sauvant. 2004. Prediction of in vivo starch digestion in cattle from in
situ data. Anim. Feed Sci. Technol. 111: 41-56.
Orskov, E. R. and P. McDonald. 1979. The estimation of protein degradability in the
rumen from incubation measurements weighted according to rate of passage.
J. Agric. Sci. Camb. 92:499-503.
Patton R. A., J. R. Patton, and S. E. Boucher. 2012. Defining ruminal and total tract
starch degradation for adult dairy cattle using in vivo data. J. Dairy Sci. 95:
765-782.
Richards, C. J., J. F. Pedersen, R. A. Britton, R. A. Stock, and C. R. Krehbiel. 1995. In
vitro starch disappearance procedure modifications. Anim. Feed Sci. and
Technol. 55:35-45.
Shapiro, S. S., and M. B. Wilk. 1965. An analysis of variance test for normality (complete
samples). Biometrika 52:591-611.
Theurer, C. B., J. T. Huber, A Delgado-Elorduy, and R. Wanderley. 1999. Invited
review: summary of steam flaking corn or sorghum grain for lactating dairy
cows. J. Dairy Sci. 82:1950-1959.
van Zweiten, J. T., A. M. van Vuuren, J. Dijkstra. 2008. Effect of nylon bag and protozoa
on in vitro corn starch disappearance. J. Dairy Sci. 91: 1133-1139.

67
Table 1. Experiment 1 ruminal starch digestion (% of starch) results by treatment
Treatments1
SLP SHP NLP NHP IS SE3 P <
Type DCG
67.5c 84.6a,b 67.9c 84.2a,b 60.4d 5.2 0.0001 WPCS
71.2c 85.3a,b 79.5b 88.4a 87.2a
Time (hour)
3
68.2e 86.6a 71.3d,e 84.9a,b 69.2d,e 5.2 0.001 7
70.5d,e 83.3a,b 75.7c,d 87.8a 78.4b,c
Week
1
62.6d 78.7b 67.7c,d 80.2b 74.0b,c 1.5 0.0001 2
76.2b 91.1a 79.4b 92.5a 73.6b,c
Treatment2 69.4a 85.0b 73.5c 86.3b 73.8c 5.0 0.0001 1 Treatments: SLP = Standardized rumen fluid - low pH; SHP = Standardized rumen fluid - high pH; NLP = Non-standardized rumen fluid - low pH; NHP = Non-standardized rumen fluid - high pH; IS = In situ 2 Treatment means for 3h and 7h starch digestion
3SE = Standard Error
a, b, c, d & e not connected by the same letter in Type, Time, Week and Treatments are significantly different (P < 0.05) Treatment by type (P < 0.001), treatment by time (P < 0.01), and treatment by week (P < 0.001) interactions. Type: DCG = Dry corn grain, WPCS = Whole plant corn silage

68
Table 2. Experiment 1 rumen starch digestion (% of starch) means for two different feed types and two weeks
Week1
Type 1 2 SE2 P <
DCG 69.2c 76.5b 0.94 0.01
WPCS 76.0b 88.6a
1 Sample week means for 3h and 7h starch digestion 2 SE = Standard Error Type: DCG = Dry corn grain, WPCS = Whole plant corn silage a, b, & c not connected are significantly different (P < 0.05)

69
Table 3. Experiment 2 ruminal starch digestion (% of starch) means for multiple feed types and digestion time lengths Mean SE4 P <
Type2
HMC 49.6b 1.4 0.01
WPCS 55.6a 1.4 DCG 47.6b 2.2
Time (hour) 3 43.0a 1.4 0.0001
7 58.9b 1.4
Treatment1,2 IS 56.9a 1.4 0.0001
NLP 44.8b 1.4
1 Treatments: NLP = Non-standardized rumen fluid - low pH; IS = In situ
2 Means for 3h & 7h starch digestion
4SE = Standard Error a & b not connected by the same letter in Type, Time, and Treatments are significantly different (P < 0.05) Type: DCG = Dry corn grain, WPCS = Whole plant corn silage, HMC = High moisture corn

70
Table 4. Rumen in situ 3h and 7h starch digestion (% of starch) descriptive statistics Type Mean St.dev.1 Minimum Maximum C.V4
WPCS 3 61.0 19.8 0.9 88.2 32.5
7 75.2 13.8 16.9 93.8 18.4
HMSC 3 46.0 13.7 24.4 91.4 29.8
7 56.4 12.8 32.3 91.3 22.7
DCG 3 38.1 13.7 20.1 67.7 36.0
7 49.9 11.2 31.7 74.3 22.4
Type: WPCS = Whole plant corn silage, HMC = High moisture corn, DCG = Dry corn grain 1 Standard Deviation 4 Coefficient of Variation

71
Figure 1. Experiment 1 rumen starch digestion, averaged across 3 h and 7 h, for 5 different techniques and treatments and two feed types
1 Treatments: SLP = Standardized rumen fluid - low pH; SHP = Standardized rumen fluid - high pH; NLP = Non-standardized rumen fluid - low pH; NHP = Non-standardized rumen fluid - high pH; IS = In situ 2 Treatment means for 3h & 7h starch digestion
Treatment * type interaction (P < 0.001)

72
Figure 2. Experiment 1 rumen starch digestion, averaged across 3 h and 7 h for 5 different techniques and treatments and two weeks
1 Treatments: SLP = Standardized rumen fluid - low pH; SHP = Standardized rumen fluid - high pH; NLP = Non-standardized rumen fluid - low pH; NHP = Non-standardized rumen fluid - high pH; IS = In situ 2 Treatment means for 3h & 7h starch digestion
Treatment by week interaction (P < 0.001)
SLP SHP NLP NHP IS
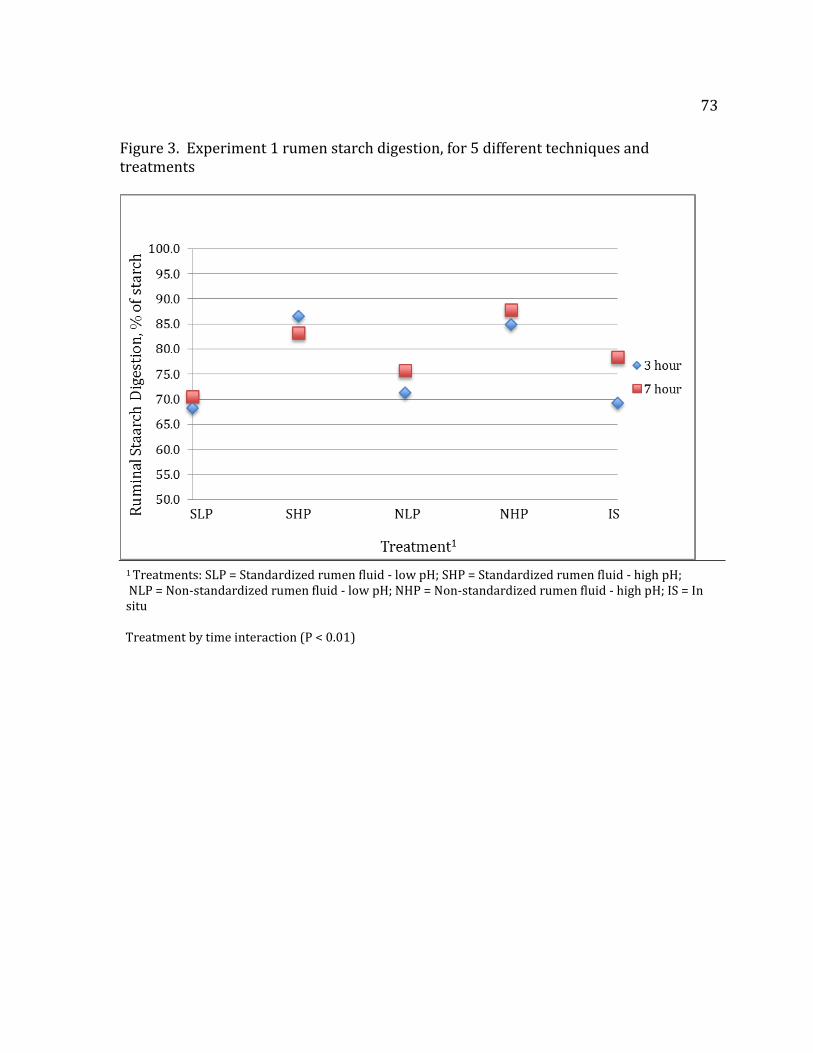
73
Figure 3. Experiment 1 rumen starch digestion, for 5 different techniques and treatments
1 Treatments: SLP = Standardized rumen fluid - low pH; SHP = Standardized rumen fluid - high pH; NLP = Non-standardized rumen fluid - low pH; NHP = Non-standardized rumen fluid - high pH; IS = In situ
Treatment by time interaction (P < 0.01)

74
Figure 4. Experiment 2 effect of time of digestion by treatment on ruminal starch digestibility, %
Treatments: NLP = Non-standardized rumen fluid - low pH; IS = In situ Treatment by time interaction (P < 0.01)
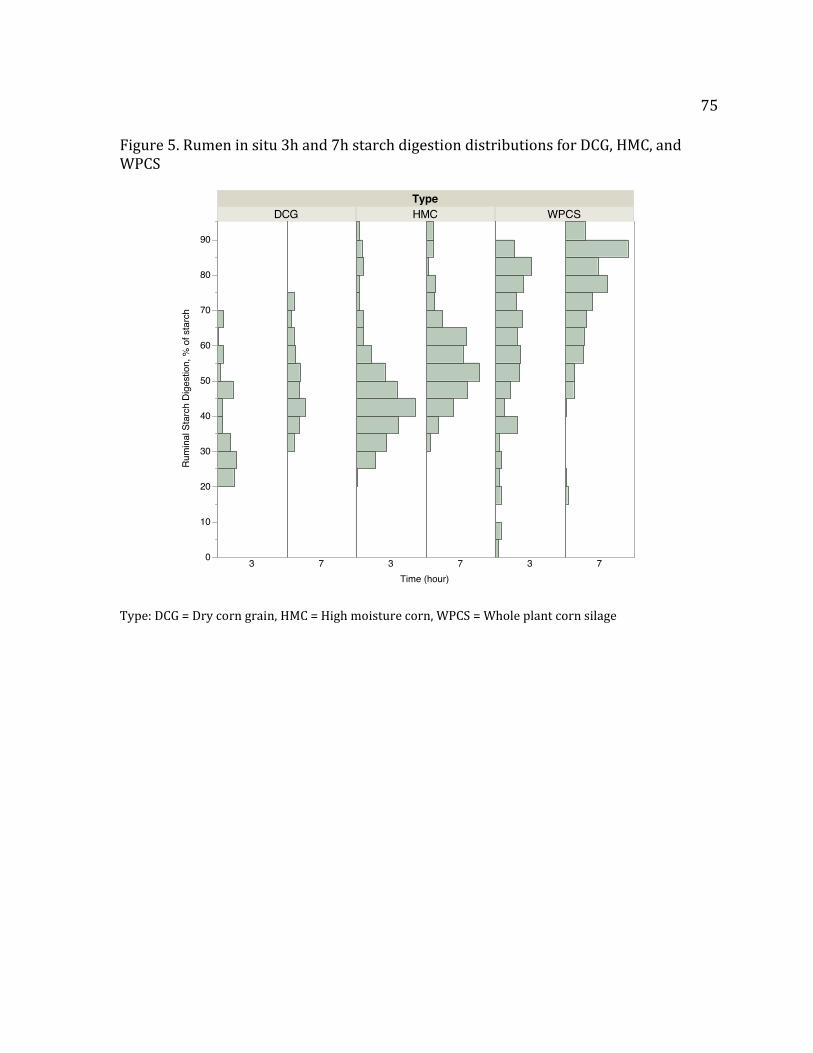
75
Figure 5. Rumen in situ 3h and 7h starch digestion distributions for DCG, HMC, and WPCS
Type: DCG = Dry corn grain, HMC = High moisture corn, WPCS = Whole plant corn silage
Related Documents