Importance of agriculture in africa fao 2012 Enset Value Chain Analysis and its Determinants: The Case of Rural Households in AbeshgeWoreda Gurage Zone, Ethiopia By Mistre Zergaw August, 2019 Addis Ababa

Welcome message from author
This document is posted to help you gain knowledge. Please leave a comment to let me know what you think about it! Share it to your friends and learn new things together.
Transcript

Importance of agriculture in africa fao 2012
Enset Value Chain Analysis and its Determinants: The Case of
Rural Households in AbeshgeWoreda Gurage Zone, Ethiopia
By
Mistre Zergaw
August, 2019 Addis Ababa

Enset Value Chain Analysis and its Determinants: The Case of Rural Households in Abeshge Woreda Gurage Zone, Ethiopia
Mistre Zergaw
Advisor: Abrham Seyoum (PhD)
A Thesis Submitted to the School of Graduate Studies of Addis Ababa University in Partial Fulfillment of the Requirements for the Degree of
Masters in Rural Livelihood and Development
Addis Ababa University, College of Development Studies
Addis Ababa, Ethiopia
I | P a g e
Addis Ababa University
School of Graduate Studies
This is to certify that the thesis prepared by Mistre Zergaw entitled: Value Chain Analysis and its
Determinants: The Case of Rural Households in AbeshgeWoreda Gurage Zone, Ethiopia and
submitted in fulfilment of the requirements for the Degree of Masters in Rural Livelihood and
Development complies with the regulations of the University and meets the accepted standards
with respect to originality and quality.
Approved by the board of examiners:
____________________________ ______________ _____________
Advisor Signature Date
____________________________ ______________ _____________
Internal Examiner Signature Date
____________________________ ______________ _____________
External Examiner Signature Date
II | P a g e
ACKNOWLEDGEMENTS
First of all, I would like to express my inestimable gratitude to Almighty God and the mother of
God, Virgin Mary, who always helped me in all circumstances and give everything in reaching me
to this position to finish my thesis.
This study would have not been possible without the support of many people. I would like to
express my deepest and foremost gratitude to my advisor Dr. Abrham Seyoum, for his
indispensable advice, constructive comments and encouragement which guided me in all phases of
the study.
My earnest appreciation extends to Dr. Demis Zergaw, for his excellent advising in good manner
and best as academician has taught me a lot and editing my thesis. This research simply would not
exist without your unreserved support and lovely approaches have extensive positive impact on my
life, besides encouragement right from its beginning to completion. Thank you for being the best
brother and mentor in all of my ways.
I do not have words to express my gratitude to OSSREA staff especially Dr. Truphena E. Mukuna
for constructive scholarly advice and supporting me thought out my study. My sincere gratitude
goes to Mr. Bikila Keno for his immeasurable favor right from the start. Additionally, I want to
give my thankfulness to Mr. Neway Woldeyes and His wife W/ro Seble Mamo, facilitating and
supporting during data collection planning to implement. Mr. Merkeb and Elias, Wolkite
Agricultural and Natural resource experts helping me on facilitate the data collection to be in a
good manner. My warmest heartfelt goes to Mr. Mesgistu and Mr.Alemu Fersha who help me
during data collection. I would like to extend my foremost gratefulness to Mrs. Seblewongel
Beyene for editing my final thesis during the printing process.
Lastly, but not the least, I would like to thank my mom for her sweet nurture and strong prayer
together with my precious daughter Honey for being understanding child and for her borderless
love.
Thank you All!

III | P a g e
DECLARATION
I declare that this thesis is my original work and all sources of materials used for this thesis have
been duly acknowledged. This thesis has been submitted to the Center for Rural Livelihood and
Development in partial fulfillment of the requirements for the award of Master of Social Science
degree in Developmental Studies at Addis Ababa University. I seriously pronounce that this thesis
is not submitted to any other institution anywhere for the award of any academic degree, diploma,
or certificate.
Name: Mistre Zergaw Woldegiorgis
Place: Addis Ababa University, Main Campus
Date of submission: June, 2019
IV | P a g e
DEDICATION
I dedicate this thesis to my beloved brother Dr. Demis Zergaw and Late sister Mrs. Senait Zergaw
for nursing me with affection, unreserved assistance and for them dedicated encouragement in my
academic carrier. I always pray Almighty God to rest her soul in peace at heaven.
V | P a g e
BIOGRAPHICAL SKETCH
The author was born in Yirgalem town of Southern Nation, Nationalities and Peoples Region
(SNNP). She attended her elementary & secondary School at Yirgalem Secondary school.
Then after she joined St’Mary University College in 2005 and graduated with Diploma in
Secretarial Science and Office Management 20th July, 2007. After graduation she worked in
Ministry of Agriculture for four years and then Ethiopian Civil Aviation for three years, as senior
secretary. From February 11, 2013 to date, in Organization for Social Science Research in
Eastern and Southern Africa (OSSREA) working as a secretary. She has done her BA degree in
Public Administration and Development Management at Addis Ababa University in June 2011.
She joined Addis Ababa University to follow her MA degree in Rural Livelihood and
Development program.

VI | P a g e
Table of Contents
Page
ACKNOWLEDGEMENTS …………………………………………………………………... II
DECLARATION……………………………………………………………………………… III
DEDICATION……………………………………………………………………………….. IV
BIOGRAPHICAL SKETCH…………………………………………………………............. V
LIST OF TABLES…………………………………………………………………….............. IX
LIST OF FIGURES AND PICTURES……………………………………………………….. X
ABBREVIATIONS AND ACRONYMS…………………………………………………….. XI
CHAPTER ONE……………………………………………………………………………... 1
1.1 Background of the Study………………………………………………………………….. 1
1.2 Statement of the Problem………………………………………………………….............. 3
1.3 Objective of the Study…………………………………………………………………….. 5
1.3.1 Specific Objectives…………………………………………………………………. 5
1.4 Research Questions……………………………………………………………………….. 5
1. 5 Scope and Limitation of the study………………………………………………………... 5
1.6 Significance of the Study………………………………………………………………….. 5
1.7 Organization of the Thesis………………………………………………………………… 6
CHAPTER TWO……………………………………………………………………………. 7
REVIEW OF RELATED LITERATURE……………………………………………………. 7
2.1 Basic Concepts and terms in Enset production and Value chain………………………… 7
2.1.1 Definitions of Concepts and Terms………………………………………………… 7
2.1.2 Concepts in Enset product and value chain………………………………………… 8
2.1.3 Value Addition……………………………………………………………………… 8
2.1.4 Gender Role in Rural Households………………………………………………….. 9
2.1.5 Mapping a Value Chain……………………………………………………………. 9
2.1.6 Definitions of Important Terms……………………………………………………. 10
2.2 Review of Empirical studies……………………………………………………………….. 11
2.2.1 Gender Analysis, Policies and Strategies…………………………………………… 11
VII | P a g e
Cont…
2.2.2 Enset production, Consumption and Marketing in Ethiopia……………………….. 12
2.2.3 Level of Consumption……………………………………………………………… 14
2.2.4 Women Role in a value chain………………………………………………………. 15
2.2.5 Marketing Value chain……………………………………………………………… 15
2.3 Conceptual Framework……………………………………………………………………. 17
CHAPTER THREE………………………………………………………………………….. 18
METHODOLOGY…………………………………………………………………………… 18
3.1 Introduction………………………………………………………………………………… 18
3.1.1 Description of the study area………………………………………………………... 18
3.1.1.1 Demographic characteristics of the study Area…………………………….. 18
3.1.1.2 Socio-economic characteristics of the study Area………………………….. 18
3.2 Research Design and Approach…………………………………………………………… 19
3.3 Data Source and Method of Data Collection………………………………………………. 19
3.3.1. Data Source………………………………………………………………………… 19
3.4 Sample Size and Method of Sampling……………………………………………………... 20
3.5 Method of Data Analysis and Interpretation………………………………………………. 21
3.5.1 Descriptive statistics………………………………………………………………... 21
3.5.2 Analysis of Kocho & Bulla value chain performance……………………………… 21
3.6 Econometrics Analysis………………………………………………………………….. 24
3.6.1 Market supply model……………………………………………………………….. 24
3.6.2 Market outlet choice model…………………………………………………………. 25
3.6.3 Regression diagnostics……………………………………………………………… 26
3.7 Hypothesis, Variable Definitions and their expected Signs……………………………….. 27
3.7.1 Dependent Variables………………………………………………………………... 27
3.7.2 Independent Variables……………………………………………………………… 28
CHAPTER FOUR…………………………………………………………………………… 31
RESULT AND DISCUSSIONS……………………………………………………………. 31
4.1 Descriptive Statistics………………………………………………………………………. 31
4.1.1 Demographic and socioeconomic characteristics of sampled households………….. 31

VIII | P a g e
Cont…
4.1.2 Production overview............................................................................................... 33
4.2 Value Chain Analysis........................................................................................................ 35
4.2.1 Value chain channel of Enset producers in the study area...................................... 35
4.2.2 Actors, their role and linkage in enset value chain.................................................. 36
4.2.3 Value chain governance........................................................................................... 40
4.3 Marketing Channels and Performance Analysis............................................................... 41
4.3.1 Marketing channels.................................................................................................. 41
4.4 Performance of Kocho and Bulla market......................................................................... 43
4.4.1 Kocho market performance……………………………………………………… 44
4.4.2 Cost and profitability analysis of Kocho for producers, retailers and
wholesalers……………………………………………………………………….
44
4.4.3 Marketing margins………………………………………………………………... 47
4.4.4 Marketing and profit margins…………………………………………………….. 48
4.5 Econometric Model Results…………………………………………………………… 50
4.5.1 Results for Multiple Linear Regression Model…………………………………. 50
4.5.2 Determinants of Kocho and Bulla market supply……………………………….. 52
4.5.3 Result for Multivariate Probit model…………………………………………….. 53
4.6 Value Chain Constraints and Opportunities……………………………………………. 58
CHAPTER FIVE………………………………………………………………………….. 60
SUMMAY, CONCLUSION AND RECOMMENDATIONS…………………………. 60
5.1 Summary and Conclusion………………………………………………………………. 60
5.2 Recommendations……………………………………………………………………… 63
REFERENCE………………………………………………………………………………. 64
Appendices…………………………………………………………………………………. 85
IX | P a g e
LIST OF TABLES
Tables Page
Table 1: Sample distribution in the selected 2 sample rural kebeles .. .. .. …………… 21
Table 2: Description of the dependent and independent variables used in the model … 30
Table 3: Demographic and Socioeconomic characteristics of sampled households.. .. . 32
Table 4: Statistical test of dummy variables for demographic and socioeconomic
characteristics of samples…………………………………………………….
32
Table 5: Amount of Enset produced in 2018/19…………………………………….. 33
Table 6: Trend of Enset Market.............................................................................. 33
Table 7: Access to services by sample respondents ………………………………………. 40
Table 8: Kocho & Bulla marketing costs and benefit shares for producers, retailers
and wholesalers……………………………………………………………….
46
Table 9: Marketing and profit margins of kocho in 2019 G.C………………………… 48
Table 10: Marketing and profit margin of Bulla in 2018/19 G.C……………………… 49
Table 11: Determinants of Kocho and Bulla quantity supplied to the market…………. 51
Table 12: Multivariate probit model results of the determinants of Kocho and Bulla
market outlet choice…………………………………………………………
57
X | P a g e
LIST OF FIGURES AND PICTURES
Page
Figure 1: Conceptual framework of kocho and Bulla along the value chain .. .. .. .. 17
Figure 2: Geographical location of the study area .. .. .. .. .. .. .. .. .. .. .. .. .. .. 19
Figure 3: Value chain map of kocho and bulla products and role of actors.. .. .. .. .. . 35
Picture 1: Growing and Production process of enset in the study area . . .. .. .. 37
Figure 4: Kocho marketing channels.. .. .. .. .. .. .. .. .. .. .. .. .. .. .. .. .. .. .. 42
Picture 5: Planting after develop from enset seed .. .. .. .. .. .. .. .. .. .. .. .. .. .. . 39
Picture 2: Focus Group Discussions with Women HHs about the production
of enset & its Constraints.. .. .. .. .. .. .. .. .. .. .. .. .. .. .. ..
58
XI | P a g e
ABBREVIATIONS AND ACRONYMS
AU African Union
AWANRO Abeshge woreda Agriculture and natural resource office
CSA Central Statistics Agency
DRMFS Disaster Risk Management and Food Security
EASPIF Ethiopia’s Agricultural Sector Policy and Investment
Framework
ERDPS The Ethiopian Rural Development Policy and Strategies
IFAD International Fund for Agricultural Development
FAO Food and Agriculture Organization
MVL Multivariate Probit Model
OLS Ordinary List Square
TLU Tropical Livestock Unit
TGMM Total Gross Marketing Margin
UNIDO United Nations Industrial Development Organization
SNNPRS
CLR
Southern Nation, Nationalities & Peoples Regional States
Classical Linear Regression
VIF Variance Inflation Factor

Value Chain Analysis and Its Determinants: The Case of Rural Households in Abeshge Woreda, Gurage Zone, Ethiopia
ABSTRACT
The aim of this research was to investigate the Value Chain Analysis and its Determinants: The
Case of Rural Households in Abeshge Woreda Gurage Zone. Data was collected from primary
and secondary sources. Primary data for this survey was taken from two sample kebeles
where154 households randomly selected from farmer households, 5 collectors, 15 wholesalers, 8
consumers and 5 key informants. To analyze the data, descriptive statistics and econometric
models were used. The finding revealed that the production of Kocho and Bulla were used more
for consumption while the rest was sold. This finding indicates that Kocho and Bulla are the
staple food for the sampled kebeles. In addition, interview and observation results also showed
that the production of Kocho and Bulla declined because of disease that destroyed the plant.
The value chain analysis discovered that value chain actors in the sample kebeles were input
suppliers/producers, wholesalers, retailers and end users/consumers. But there was lack of
access to markets and roads, weak market information, lack of extension service and credit
facilitation also a constraint to the producer share. The total marketing and profit margin share
along the value chain actors (Producer, Wholesaler and Retailer). The findings indicate that
retailer is more profitable followed by the wholesale side of the production. Multiple linear
regressions also revealed that the market supply chain also increased because of the nearest
access to transportation, age of the producer and production of kocho and bulla which could
increase the amount of Kocho and Bulla. The Multivariate probit Model revealed that
producers’ likelihood of using the channels that maximize market outlet choice to get more profit
would have been appropriate. Therefore, Government interventions in terms of policy on Kocho
and Bulla value chain on marketing would help the producer get more profit. In the mean time,
lack of access roads to the market and weak linkage to agricultural credit facilitations, has
significantly affected the farmers to get profit and input supply. Hence, government has to create
proper policies that will increase production that will sustain the society as a whole and the
study area in particular, and this will support the value chains that need proper intervention to
encourage the actors along the chain.
Keywords: Value chain, Enset, Abeshge woreda, Multivariate Probit model, Market outlet
choice
1
CHAPTER ONE
INTRODUCTION
1.1 Background of the Study
Agriculture is an important source of livelihood for most African countries, and as such a lot of
investments and policies have gone towards promoting it (FAO, 2012). However, food
insecurity, which is mainly attributed to low productivity of traditional agriculture, continues to
be one of the greatest challenges facing many African countries. According to AU (2014) the
prevalence of undernourishment in Sub-Saharan Africa stood at 23.8% with most countries being
characterised as food and nutrition insecure.
Agricultural productivity can play a vital role in economic growth by linking the supply and
demand side (Johnston and Mellor, 1961) Kaplinsky (2000) and Kaplinsky and Morris (2001)
cited by Ashenafi C. 2017; Value chain is the full range of activities which are required to
bring a product or service from conception, through the different phase of production which
involving a combination of physical transformation and the input of various producer
services, delivery to final consumers, and final disposal after use. In value chain system
independent actors are performing a sequence of value adding activities from conception over to
phase of production to final consumption.” The value chain can also be defined as a “sequence
of related enterprises conducting activities so as to add value to a product from its primary
production, through its processing and marketing to the final of the product to consumers
(Macfadyen et al., 2012).
The base for the economy of Ethiopia is Agriculture, from those; 85% employ its population,
over 43% of the country’s gross domestic product (GDP) and over 80% of foreign exchange
earnings. Irrespective of this fact, production method is dominated by small-scale subsistence
farming system mostly based on low-input and low-output rain-fed agriculture, MoFED, 2010,
cited by Asnake B. Et al, 2018.
2
Gender roles and relationships influence the division of work, the use of resources, and the
sharing of the benefits of production between women and men. FAO, (1984) asserts that African
small-scale farmers are predominantly women living in rural areas who spend up to 60% of their
time in agriculture-related activities. These women mainly depend on their local community-
based agricultural knowledge and innovation systems for agricultural production.
As Chaka A. (2016) stated post-harvest losses are a global problem and are of critical importance
in food-insecure in countries such as Ethiopia. Losses of root and tuber crops are known to be
high in developing countries. This includes “Warqe” (Enseteventricosum), a staple crop in
Ethiopia on which a considerable portion of the population depends. Main value adding activities
in this value chain are sorting and grading, weighing and packaging, storing and selling of both
“Kocho”and “Bulla”. In Kocho, separation of fiber from the products is done to improve its
quality and all these value adding activities are done by women for whose families Enset foods
have been one of the staple foods.
Value chain analysis in agricultural marketing is a good means of assessing growth distribution
issues and gender equitable growth. Besides, it helps to analyze the relative importance of factors
affecting competitiveness, cost and earning of those involved in the value chain while identifying
weaknesses in value chain performance and improving value chain performance (Macfadyenet
al., 2012).
In addition, value chain analysis is important in determining the relationships and linkages
between buyers and suppliers and a range of market actors in between (Wenz and Bokelmann,
2011). Thus value chain analysis of warqe is required to identify key players in the chain and to
provide an understanding of their interactions and linkages within the chain. Food value chain
analysis is a vital and flexible methodology to improve the value to producers and end
consumers (Van Hoang, 2014).
While the role played by women in the process of production and marketing is huge, it has not
been significantly appreciated and investigated particularly in relation to the place they hold in
the Enset value chain. As Brandt et al. (1997) indicated, this food item in the production of
which women play an important role is used as staple and co-staple food for millions of
Ethiopians, particularly in Addis Ababa, Awassa, Dilla, Adama, Jimma, Wolayita Sodo,

3
Hosaena, Wolkite, Woliso, Bonga and Arba Minch and in other town and cities. It is such a
magnitude of consumption of the item in many regions and urban areas of Ethiopia that served as
a basis for the claim made by Chaka, A. (2016) that more than 50% of the Ethiopian population
consume warqe regularly. Yet, not much is known about the contribution of women to the
production and marketing of the product. Therefore, this study is intended to investigate the
Enset production processing along the value chain and its determinants in Abeshge woreda
Gurage Zone, Southern Ethiopia.
1.2 Statement of the Problem
Agriculture has a great contribution in the economies of African countries. However, as reported
by Dessie et al, (2017), most farmers are not getting the right share of consumer price because of
excessive cost margin arising mainly from inefficient and costly transport. Agriculture is central
to Africa’s agenda, and efforts have made to link production with agribusiness for better growth
in the sector. However, the crops value chains reveal common and well-known constraints, such
as poor infrastructure; fragmented and risky markets; poorly functioning input markets;
difficulties accessing land, water, and finance; and inadequate skills and technology. More
revealing, however, is the big differences across value chains (World Bank, 2013). In the
Ethiopian case, besides transport problems, majorities of agricultural products are produced by
small land holders who are not producing and selling their produce and agricultural inputs in an
organized manner which makes it easier for middlemen to enjoy some of the benefits of sold
products.
The Ethiopian farmers in general and in Southern nation and nationalities and peoples region in
particular affected by low producer's price, on one hand, and high consumer's price, on the other
hand. One of the reasons for this according to Wolday and Eleni (2003) is lack of proper
transport facilities and other infrastructure services. In addition, Ethiopian agricultural output
markets characterized by inadequate transport network, inadequate capital facilities, high
handling costs, inadequate market information system, weak bargaining power of farmers and
underdeveloped industrial sectors (Jema, 2008). Enset products are important sources of food
and income, its production is crucial in Ethiopia. However, this huge potential of production has
not fully exploited and promoted in the country. Poor marketing infrastructure, use of traditional

4
technologies, limited supply, and lack of marketing support services and market information
contribute to under exploitation of Enset production potential (Steven et al., 1997). In addition,
land shortage, recurrent drought, disease, lack of improved clones in terms of yield and disease
resistance; labor shortage, lack of improved processing and storage technologies, improper or
traditional agronomic practice, financial shortage and longtime maturity are the major challenge
in Enset production (Abrham et al., 2012). Moreover, food security, income generating and
poverty alleviating capacity of Enset through collaborative work of value chain actors have not
been fully addressed. The primary reasons, among others seems to be poor collaboration among
and between value chain actors, inefficient Enset marketing characterized by high margins and
poor marketing facilities and services is considered to be a major constraint to combating poverty
(Ashenafi et al., 2017).
In the past, most of interventions to develop Enset farm focused more on increasing production,
especially the so-called high potential areas and with less attention to marketing system and
value chain. However, the development of improved marketing system and linkages among
actors (including input, suppliers, producers, collectors, wholesalers, retailers, and hotels and
restaurants) are pivotal to increase production (Abebe and Paul, 2015).
The major value adding activities of enset products in Abeshge woreda : production, processing,
marketing and consumption activities are not corresponding to create competitiveness and
efficiency. Existing scenario indicates that enset value chain actors do not get opportunities to
talk to each other about issues affecting the entire value chain (Nuri, 2016). As a result,
information asymmetry in markets is ubiquitous and farmers may not be able to co-evolve with
changing market conditions. Although, modern markets that give emphasis to quality and safety
are believe to replace traditional markets and reduce market outlets for enset farmers. There is
no empirical studies had conducted on estimating the status of enset value addition in the study
area. The study on value addition could make enset products attractive for high value market
opportunities. Interventions to improve the performance of enset products value chains need to
be based on an understanding of the constraints and opportunities available and which are based
on sound theoretical and empirical analysis. Accordingly, in this study, efforts have been made
to analyze the value chain of enset in Abeshge woreda, Gurage zone. Additionally, this study
also examines enset value chain options and the performance of actors in the chain; identify the
5
determinants of enset supply to the market and factors affecting market outlet choice decisions of
enset producers in the study area.
1.3 Objective of the Study
The general objective of this study was investigating Enset value chain and its determinants
by taking the case of rural Households in Abeshge Woreda, Gurage Zone.
1.3.1 Specific Objectives
The specific objectives of the study were to:
- Examine Enset value chain options and actors performance in the study area.
- Identifying determinates of Enset supply to the market in the study area.
- Identifying factors affecting market outlet choice decision of Enset producers in the
study area.
1.4 Research Questions
1. How well does Enset value chain perform in the study area?
2. What are the factors that determine Enset production and supply in the value?
3. What is the determinant factors affecting the market choice in the study area?
1. 5 Scope and Limitation of the study
The study is concerned with Enset value chain and its determinants in rural households of
Abeshge worda of Gurage Zone. Enset value chain was selected for the study since this
study has not been studied. Additionally, the study was also geographically limited to
Abeshge Woreda of Gurage Zone for lack of any studies conducted focusing on the
Woreda.
1.6 Significance of the Study
This study is intended to generate empirical data and relevant information on the Enset
production process and its determinants in the study area and beyond the stakeholders’
involvement along the value chain. Besides, the results will be useful for both academics

6
and practitioners to obtain first hand woreda experience on the particular topic, which they
can use as a spring board for further studies elsewhere in other Enset culture societies in the
country. Moreover, local policy makers, planners and NGOs working on women’s
contribution on smallholder agriculture and rural livelihoods will use the results of the
study to guide related studies or support their further commitment.
1.7 Organization of the Thesis
This thesis is divided in to 5 chapters, the 1st chapter has Introduction, Statement of the
Problem, General & specific Objectives, Research questions, Scope and Significance of the
Study. Chapter 2 presents review of literature on Enset Production and value chain analysis
from different sources. Chapter 3 deals with description of the study area and design and
methodologies of the study. In Chapter 4, both descriptive and econometric results are
presented in detail and discussed. The final Chapter 5 summarizes the major findings of the
study and draws conclusion and recommendations.

7
CHAPTER TWO
REVIEW OF RELATED LITERATURE
This chapter deals with the related literature reviewed on Enset value chain and its determinants
in relation to rural households. This review has four parts. The first part describes the
theoretical review; the second part describes about review of empirical studies and the third one
dedicated to the conceptual framework of the study.
2.1 Basic Concepts and terms in Enset production and Value chain
As Kaplinsky and Morris (2001), the evolution of global value chains, and increased competition
among firms at different stages of the value chain, has resulted in new opportunities and
challenges for new entrants. One the one hand, the global fragmentation of production in theory
means that many low income countries can plug into global value chains and therefore benefit
from „catch-up‟ growth (through resultant technology transfer, learning by doing, etc). On the
other hand, some of the routes used in the past to achieve industrial development may not be as
viable. Global value chain analysis focuses on the dynamics of inter-firm linkages within this
system, and the way in which firms and countries are integrated globally. But it also goes beyond
firm-specific linkages to reveal the dynamic flow of economic, organisational and coercive
activities between producers within different sectors on a global scale.
2.1.1 Definitions of Concepts and Terms
Enset Cultivation
The cultivation system of Enset is one of the last remaining sustainable, indigenous
agricultural systems found in Africa. Enset occurs in wild forms in East, Central, and South
Africa. It became an emergency food during the Second World War in Vietnam (Asia). But,
it is cultivated only in Ethiopia, where the crop was first domesticated possibly around
8000 years ago(Tsegaye and Westphal (2002) as cited by Mesfin Sahle, et al, (2018).
Enset (Ensete ventricosum) is distributed as a wild species in many parts of Sub-Saharan Africa,
Tumescent Maule et al., (2014) cited Africa Mojo, (2017). It is the main crop of a sustainable

8
indigenous African system that ensures food security in a country that is food deficient. Ethiopia
is one of the centers of diversity and origin for various agricultural crops (IBC, 2007). Among
those crops, Enset which is also one of the oldest cultivated plants of Ethiopia. The country is
the only one to domesticate the plant over large swaths of land and uses it as food and fiber crop
(Aare Serif and Daniel Fatima, 2016). Yemane T & Fassil K 2006) also aserted that records
mentioned that Enset has grown in Ethiopia for more than 10,000 years. According to Abraham
Shumbolo et al. (2012), the cultivation of Enset in Ethiopia was estimated to spread over 67,000
square kilometers and ENSET planting is one of the major activities of agriculture in southern
Nation, Nationalities and Peoples Regional State.
2.1.2 Concepts in Enset product and value chain
The value chain concept gained in importance for developing countries because it became
obvious that successful exporters from developing countries were often linked to global value
chains. A more systemic view of value chain development needs to take into account not only
of the firms that are part of the actual core production chain, but also other actors that are
impacting on the chain (Andreas Stamm/Christian von Drachenfels, 2011).
The history of value chain analysis goes back to the early 1990s as a novel methodological tool
for understanding the dynamics of economic globalization and international trade. The approach
focuses on ‘vertical’ relationships between buyers and suppliers and the movement of goods or
services from producer to consumer. As an analytical tool, value chain analysis has become a
key approach in both research and policy fields, with an increasing number of bilateral and
multilateral aid organizations adopting it to guide several of their development interventions
(Lone Riisgaard, et al: 2012).
2.1.3 Value Addition
Value-addition is a measure for the wealth created in the economy. Referring to the definition
used in systems of national accounting, total value-added is equivalent to the total value of all
services and products produced in the economy for consumption and investment (the gross
domestic product - GDP), net of depreciation. To arrive at the value-added generated by a
particular value chain, the cost of bought-in materials, components and services has to be
deducted from the sales value (GTZ, 2007, as cited by Mulugeta G. 2018).

9
2.1.4 Gender Role in Rural Households
Gender is conceptualized as the socially constructed difference between women and men
(Kabeer, 1999). Thus gender is about how society gives meaning to differences in femininity
and masculinity, and the power relations and dynamics that come about as a result of this
(Laven et al., 2009). Most women especially in low-income countries have triple roles. The first
is their reproductive role, which comprises child bearing, child rearing, and domestic tasks
required in guaranteeing the maintenance and reproduction of the labor force in the household.
The second is the productive role that women play as income earners, which in most rural
settings usually comprises agricultural work. As agricultural workers, women, play a significant
role in the production of Enset. That explains the argument by Chaka, A. (2016) who claimed
that it is mandatory to improve Enset production and processing activities by supporting gender
sensitive value chain.
2.1.5 Mapping a Value Chain
Mapping a value chain facilitates a clear understanding of the sequence of activities and the key
actors and relationships involved in the value chain. This exercise is carried out in qualitative
and quantitative terms through graphs presenting the various actors of the chain, their linkages
and all operations of the chain from pre-production (supply of inputs) to industrial processing
and marketing (UNIDO, 2009).
Mapping the chain means giving a visual representation of the connections between actors and
tracing a product flow through an entire channel from the point of product concept to the point
of consumption. It is an ideal tool for measuring and quantifying the cost of administrative
distortions that hinder competitiveness of products and industries. In its simplest form, the value
chain is merely a flow diagram. Value chain can be complex and contains a big number of
actors. Each actor can also be connected to more than one value chain. Therefore, it is important
to know the aim of the study and the point of interest. Thereafter, decision can be made on
where in the chain to start and what to include in the chain analysis. The first step in a value
chain study is to identify the actors and the connections between them to get the chain mapped
out. This can be done with a qualitative study, followed by a quantitative study when the map of
the chain is completed. The quantitative study gives more information about activities and
10
relations in the chain and makes the study more certain (Kaplinsky and Morris 2000 and Hellin
and Meijer, 2006) cited by Henok T. 2018.
2.1.6 Definitions of Important Terms
• Enset
Enset is one of the potential indigenous crops for food production which can be grown
everywhere in Ethiopia. Asres Ayele and Omprakash Sahu,(2014) cited Taye, 1984; Endale,
(1997), it is also a staple food and cash crop in the study area.
• Kocho
Kocho is starchy food product obtained from a mixture of the scraped pulp of pseudo stem
and pulverizedcorm of Enset plant (Enseteventricosum). Enset ventricosum is a drought
resistant plant which can be cultivated as an alternative food source for food security problem
around the globe. Hence, it is a final product obtained from Enset for consumption and
income generating in the study area.
• Bulla
The scraped leaf sheaths, peduncle and grated corm provide Bulla, which is the white-
colored starch concentrate obtained from Enset plant (Demekech, 2008 as cited by
Alemayehu A. 2017). Bulla is a high quality product obtained from further processing of
Kocho which removes some byproducts. As a result, the price of Bulla in the market is
higher than the price of Kocho. Thus, it is one of the marketable cash crops obtained from
Enset in the study area.
• Value chain
Value chain can be defined as a “sequence of related enterprises conducting activities so as to
add value to a product from its primary production, through its processing and marketing to
the final supply of the product to consumers” (Macfadyenet al., 2012, pp 18-27).
11
2.2 Review of Empirical studies
2.2.1 Gender Analysis, Policies and Strategies
Agriculture plays a major role in the Ethiopian economy and this is expected to remain so for
some years to come. This situation makes over 80 percent of the population of the country
dependent on agriculture for food and as a source of income. To this, Negash, A. (2001)
added that the agricultural sector is the basis for the entire socio-economic structure of the
country and has a major influence on all other economic sectors and development processes.
Gender analysis is the first step towards understanding the gender issues that are relevant to
value chain operations. Gender analysis identifies the gender relations that structure how
smallholder households are organized and how they interact with other firms and economic
processes.
A Handbook entitled, “Promoting Gender Equitable Opportunities in Agricultural Value
Chains: is based on research studies and training programs conducted under the Greater
Access to Trade Expansion (GATE) Project. The following statement by Hillary Clinton
stated:
“Women are the backbone of farming in Africa, just as they are in most of the
world. They plant the seeds, they till the fields, they harvest the crops, they bring
them to market, they prepare the meals for their families. So, to succeed in this
work, we must work with women. And so, we need a good collaboration to make
sure that women are equal partners with men farmers all the way through the
process… to enable… farmers who are women to make a contribution that will
transform agriculture, add to the gross domestic product of their country, give them
more income to educate their children to have a better life.’ (Secretary of State
Hillary Clinton in Kenya, August 5, 2009).”
Women are the backbone of farming in Africa, just as they are in most of the
The claim made by Clinton (2009) suggests that women need to be given what they deserve as a
result of their engagement in multitudes of work along the chain of value in production and
marketing.
Gender disparities significantly impede women’s empowerment. While the constitution of FDRE
guarantees gender equality and supports affirmative action, on average, women have fewer years
of schooling and heavier workloads than men. They perform a significant portion of farm work
12
but tend to be excluded from control of farm income and inheritance of property. Women also
suffer disproportionately from environmental degradation as they have to walk longer distances
to collect water and firewood. The lack of draught animal power tends to intensify their
vulnerability. They also shoulder a greater burden of rural poverty because of their vulnerable
socio-economic position (EASPIF, 2010-2020).
Ethiopia’s Agricultural Sector Policy and Investment Framework (EASPIF, 2010-2020)
indicated that the agricultural sector is critically important to both overall economic performance
and poverty alleviation and has performed strongly over most of the last decade. Yet, there is still
substantial scope to sustainably improve productivity, production and market linkages.
Government has demonstrated strong commitment to the sector through allocation of more than
15% of the total budget, although a significant portion of this is spent on the Disaster Risk
Management and Food Security (DRMFS) program. The sector remains dominated by
subsistence, low input, low output, rain-fed farming system in which drought periodically
reverses performance gains with devastating effects on household food security and poverty
levels. The Policy and Investment Framework (PIF, 2010-2020) also indicated that Agricultural
Development Led Industrialization (ADLI) is a central pillar of economic policy. It also claimed
that in the agricultural sector, Ethiopia has a comprehensive and consistent set of policies and
strategies which reflect the importance of the sector in the nation’s development aspirations.
However, the institutional capacity to implement these is generally limited.
The Ethiopian Rural Development Policy and Strategies (RDPS, 2003) identified five basic
directions for agricultural development which envisage building on experiences and indigenous
knowledge at the same time as exploring opportunities for deploying new technologies. Yet,
these have not been utilized in Enset production process due to the absence of any technology
employed to that effect. This is despite the fact that, Enset is used as a cash crop in the study
area and a large amount of Kocho and Bulla produced is supplied to the central market.
2.2.2 Enset production, Consumption and Marketing in Ethiopia
More than 20 percent of the population of the country found in the highlands of southern and
south western and eastern Ethiopia depends upon Enset for food, fiber, animal forage,
construction materials, medicine, means of earning cash and insurance against hunger.

13
(Alemayehu A. 2018). As claimed by Belachew G. et al, (2017, Enset is a multi-purpose plant
used only in Ethiopia for food and fiber particularly in the southern and south western and
eastern parts of the country.
Cultivation of enset starting from planting up to the time it becomes ripe is totally the
responsibility of men. In addition, it is also men who cut the leaves and feed animals until the
plant matures for use as food. The hard and time-consuming task of processing it for food and
the market is the exclusive responsibility of women in the family (Almeida, 2004).
The plant is harvested before it flowers. After harvesting, the process of production starts
(Alemayehu A. (2017). The plant collected from the farm is stored at room temperature and later
washed to avoid soil, insects, dust and any unwanted impurities which may decrease the quality
of the product. The next step is the separation of leaf sheath from the plant starting with the older
leaf sheaths (Ayele A. and Omprakash Sahu, 2014). The final outcomes of the production
process are used for food and cash crop. Although women play a very significant role in the
production and marketing process, they have not been able to get their fair share owing to the
influence of many factors including systems which allow local collectors to determine the price
of the produce.
2. 2.2.1 Uses of Enset
Enset can be harvested and consumed before it matures and these qualities of the crop have in
part contributed to the fact that Enset areas are not characterized by a history of famine
(Rahmato, 1996). The cultivation of Enset as food and fiber crop is limited to Ethiopia. As a
cultivated plant, it is not known elsewhere in the world (Vavilov 1951). It is used both as a
staple food and a source of income.
In addition, as Shumbulo A. et al. (2012) pointed out that although Enset production plays major
economic and social roles, it is not included widely in extension packages. Little attention was
given to research and extension services. Even though, substantial research and development
has been carried out in Enset growing areas of the country for processing of Enset in order to
facilitate its consumption by ever wider communities. As Admasu. T. & P. C. Struik (2002, p.
292) indicated citing farmers who claimed that “Enset is the enemy of hunger, and human and
14
livestock life is impossible without it”. Despite its importance for food security and
environmental sustainability, however, little research and development work has been done on
Enset in modern production systems.
2.2.2.2 Enset Production and Marketing
According to Taye, 1984; Endale, 1997 cited Asres Ayele and Omprakash Sahu, 2014, enset is
one of the potential indigenous crops for food production and can be grown everywhere in
Ethiopia. Even though it is grown in many administrative regions, the dwellers of the central and
southwestern parts of Ethiopia are the only people that use enset as a staple and co-staple crop
(Simmonds, 1958). Regarding enset marketing, there is more than one channel that the product
(kocho and bulla) gone from the producer to end users. The marketing process took traditional
way that used different channel to reach to the consumer and not as such efficient.
2.2.2.3 The Role of Women on Enset Production Process
The Ethiopian proverb "A home without a woman is like a barn without cattle" indicates
awareness about the important role of women both in the house and on the farm. Hardly
anywhere were target groups taken as equal partners on the basis of respect for their knowledge,
technology, world views and capability (Negash, 2001)
The preparation of Enset is a very time-consuming and hard work. Almost all the operations
connected with Enset processing are the exclusive responsibility of women in the family
(Almeida, 2004). Moreover, women farmers are particularly aware of the usefulness of plant
genetic diversity, as they are the ones who bear the primary responsibility for the production of
subsistence crops that are essential to household food security. They hold the knowledge of
traditional varieties, their cultivation and maintenance as well as their utilization in the
household. (Negash, 2001)
2.2.3 Level of Consumption
As indicated above, more than 20 percent population of the country living in the highlands of
southern and south eastern Ethiopia depends heavily on Enset. More specifically, the Enset-
based farming system is practiced by the Omotic and Eastern Cushitic speaking agriculturalists
15
of the highlands of Southwestern Ethiopia and the Ethio-Semetic speaking Gurage peoples of
the southern central parts of the country. These people, who belong to over 45 ethnic groups, are
significantly dependent on Enset primarily for food, though it is utilized for other household
needs such as fiber, animal forage, construction materials, medicine, means of earning cash,
income, and insurance against hunger (Chaka A., 2016).
According to CSA (2014), a total of 130,630,473 Enset (warqe) plants were harvested in
Ethiopia in 2014 and produced 34,723.6 tonnes of Kocho, 12,259.4 tonnes of Bulla and 311.3
tonnes of amicho. In that period, 1,169,348 warqe plants were harvested in the major warqe
growing area of west Shoa and 1,929,028 in south-west Shoa. Some of the food produced was
supplied to local and central markets.
2.2.4 Women Role in a value chain
Understanding women’s position in a value chain, how changes in a value chain might affect
gender inequality, and the main constraints for women in terms of gaining from value chain
participation requires one to place gender in the context of intra-household bargaining and of
broader social processes dimensions, (Lone Riisgaard, et al. 2012, took from Wyrod, 2008:
Parpart et al., 2002; Laven et al., 2009). Despite their crucial role in the chain, women are not
appropriately rewarded.
Since women are in the first level of the chain which is the producer level, their share of the
income is low. In other words, as Negash (2001) asserted, the performance of Kocho value
chain was not efficient since farmers did not get a better share of the of consumers’ price.
Farmers generated the most added values in the chain but only gained a small share of profit
(27 %).
2.2.5 Marketing Value chain
According to Urgessa M. (2011), marketing channel is a set of interdependent organizations that
ease the transfer of ownership as products move from producer to consumer. Lamb et al (2004)
added that a marketing channel can be viewed as a large canal or pipeline through which
products, their ownership, communication, financing and payment and accompanying risk flow
to the consumer.
16
Usually marketing follows a fairly well established channel from producers to consumers;
Mendoza (1995) defined marketing channel as the path goods follow from their sources of
original production to their ultimate destination for final use. Hence, the analysis of marketing
channels is intended to provide a systematic knowledge of the flow of goods and services from
their origin (producer) to their final destination (consumer).

17
2.3 Conceptual Framework
The focus of value chain framework is developing an effective way of coordinating the
hierarchical stages in the value chain to meet consumer demand in an efficient manner.
Effective vertical coordination of value chain stages requires partnership, actor interactions,
information flow along the chain and coordination of the activities of chain actors. Hence, the
competitiveness of a value chain is greatly influenced by the partnership and collaboration for
innovation that can be realized by chain actors. Moreover, the development and operation of
enabling and supportive business development services (e.g. market information, transport,
credit) play critical role in how well the value chain responds to consumer demands.
(Anandajayasekeram and Berhanu, 2009 cited by Mullugeta, 2018)
Figure. 1: Conceptual framework of kocho and bulla
Demographic Factor
➢ Age
➢ Education
➢ Gender
➢ Marital
status
Kocho and Bulla
Value chain Analysis
Institutional Factor
➢ Extension Service
➢ Credit service
➢ Extension Service
type
Technological Factor
➢ Modern production
materials
➢ Skilled man power
➢
Market Factor
➢ Market Information
➢ Types of product sale to
the market
➢ Market access
➢ Quality of the product
➢
Infrastructural Factor
➢ Distance to
transport(road)
➢ Means of transport
➢
Source: Own design, 2019
Kocho and Bulla
Market Supply and
Market outlet choice
Other Income
generating activities ➢ Livestock ➢ Nonfarm
activities
➢
18
CHAPTER THREE
METHODOLOGY
This section of the thesis discusses research methodology (Quantitative & Qualitative)
implemented in the research. These are description of the study area, the research design and
approach, sources of data, samples and sampling procedures, and data collection, analysis and
interpretation methods. Econometric analysis, definitions of variables and their expected signs
are also treated in this chapter.
3.1 Introduction
3.1.1 Description of the study area
This study is based on examining the contribution of women in Enset value chain and its
determinants in rural households of the Abeshge Woreda, Gurage zone. Abeshge Woreda is one
of the Woredas in Gurage Zone of Southern Nations, Nationalities, and Peoples' Regional State
(SNNPRS). Abeshge is bordered on the south by the Wabe River which separates it from
Cheha, on the west and north by the Oromia Region, and on the east by Kebena. It was part of
former Goro Woreda (CSA, 2007).
3.1.1.1 Demographic characteristics of the study Area
Based on the (2007) census conducted by the CSA, this Woreda has a total population of
61,424, of whom 32,450 are men and 28,974 women. The Woreda is categorized as rural. Most
inhabitants (50.8%) are followers of the Ethiopian Orthodox Church while the remaining
31.96%, 15.82% and 1.28% belong to the Muslim, Protestant and Catholic faith.
3.1.1.2 Socio-economic characteristics of the study Area
Abeshge Woreda has a total of 26 rural kebeles. From those, 14 kebeles grow Enset and a
mixture of different food and cash crops while the remaining 7 kebeles are predominantly Enset
growing which they used for both consumption and for marketing.
19
3.2 Research Design and Approach
This study used a mixed research approach in which both qualitative and quantitative data
collection and analysis methods were employed.
3.3 Data Source and Method of Data Collection
3.3.1. Data Source
Primary and Secondary Data Sources and Instruments
Primary data were collected from Enset producers, heads of households, heads of villagers
and communities, local buyers, wholesalers and retailers using questionnaire. Data were
also collected using the following instruments.
▪ Key Informant interview (KII): Heads of villages and communes, Regional Agricultural
Heads and offficers using checklist.
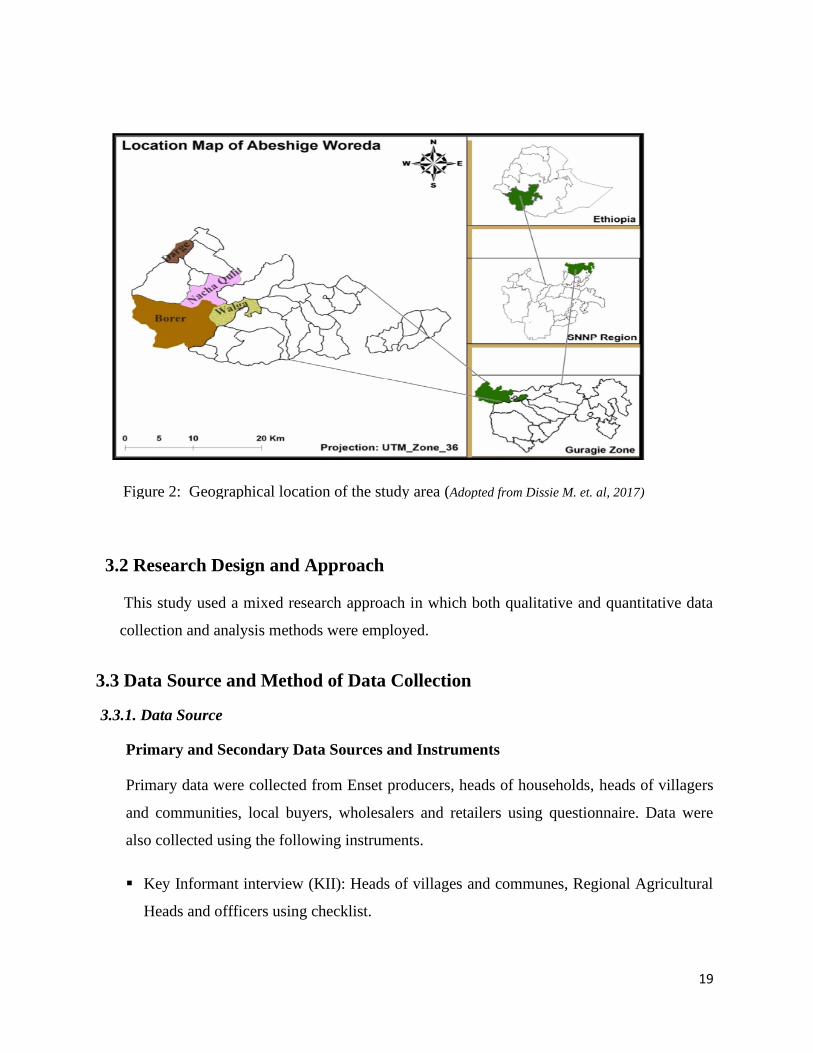
Figure 2: Geographical location of the study area (Adopted from Dissie M. et. al, 2017)

20
▪ Focus Group Discussion (FGD): Producers, Local authorities and other related
stakeholders, to share some information relevant to enset value chain using semi-
structured questionnaires;
▪ Observation:
Secondary data were collected from Gurage zone, Abeshege Woreda Agriculture and
Natural Resource Office reports, Central Statistical Authority, etc.
3.4 Sample Size and Method of Sampling
Samples were drawn from the population and taken based on what was indicated in the
sampling frame. Before deciding on the survey areas, preliminary information was obtained
from the study area and discussions held with the Abeshge Woreda Agriculture and Natural
Resource Office (AWANRO).
Abeshge Woreda has 26 kebeles. Of them, 7 kebeles were purposively selected based on the
Enset growers and traders among the other kebeles. Of the 7 kebeles, 2 kebeles selected.
Namely Lay Geraba and Boketa. Based on the advice of experts and informants from the
woreda Natural resource and agricultural office, households selected and local traders,
retailers, wholesalers and village leaders were purposively and equal number of sample
respondents selected for the study.
As regards the number of households, Lay Geraba had 359 while Boketa had 424 bringing
the total to 783. The level of precision used by the study was ±7%. This percent of sampling
error was employed to complete the study within the time available.
Sample size of households was determined using a simplified formula provided by Yamane
(1967:886) as follows.
n= 𝑁
1+𝑁(𝑒)2

21
Where, n= sample size of the respondents
N= Total number of Households in the two selected enset producer kebeles.
e = margin of errors/level of precision. The level of precision is the range in which the true
value of the population is estimated to be; it is expressed in percentage points (+7); based on
this sample size on this study will be 154.
Table 1: Sample distribution in the selected 2 sample rural kebeles
Woreda’s
Name
Name of
Kebeles
Total number of
households in
kebeles
Number of sample
households
Abeshge Boketa 424 77
Lay Geraba 359 77
Total 783 154
Source: Abeshge woreda Agricultural and Natural Resource Office, 2019
3.5 Method of Data Analysis and Interpretation
3.5.1 Descriptive statistics
The data collected from the sample Enset producers and traders were analyzed using
descriptive statistics which included mean, standard deviation, frequency, and percentiles.
Therefore, the study adopted tools that allowed researchers to look at who does what, who
has access to what resources, what the rules are and power differences between men and
women and how these affected adoption of post-harvest technologies as well as ability to
benefit from value chain and new market opportunities.
3.5.2 Analysis of Kocho & Bulla value chain performance
Estimation of the marketing margins was the best tools to analyze performance of the market.
Marketing margin was calculated by taking the difference between Enset producer and
consumers prices. Analyses of Enset value chain performance were done using market share
and gross margin analysis. The producers share is the commonly employed ratio calculated
mathematically as, the ratio of producers’ price to consumers’ price.

22
Analysis of Enset value chain performance was done by using the commodity sub-system
approach based on market cost and margin devised by Mendoza (1995).
Mathematically, producers’ share can be expressed as:
Ps=Pp
𝑐𝑝 =1-
𝑀𝑀
𝐶𝑝 (1)
Where: PS= Producer’s share
Pp= Producer’s price
Cp = Consumer price
MM = marketing margin
Where in the present case Pp the producers’ price is for Kocho or Bulla, Pr is the retail price of
Kocho or Bulla, i.e. the consumer price, and MM is the marketing margin. Simple leaner
regression model was used to analyze the determinant factors that affect the production of
Kocho, bulla and income.
Marketing Margin (MM) was calculated at each marketing node along the Koch & Bulla value
chain. The following mathematical relationship was employed.
MM=𝐺𝑟𝑜𝑠𝑠 𝑚𝑎𝑟𝑘𝑒𝑡𝑖𝑛𝑔 𝑚𝑎𝑟𝑔𝑖𝑛−𝑀𝑎𝑟𝑘𝑒𝑡𝑖𝑛𝑔 𝐶𝑜𝑠𝑡
𝐶𝑜𝑛𝑠𝑢𝑚𝑒𝑟 𝑃𝑟𝑖𝑐𝑒x100 (2)
Calculating the total marketing margin was done by using the following formula. Computing
the Total Gross Marketing Margin (TGMM) is always related to the final price paid by the
end buyer and is expressed as a percentage (Mendoza, 1995)
𝑇𝐺𝑀𝑀 −𝐶𝑜𝑛𝑠𝑢𝑚𝑒𝑟 𝑝𝑟𝑖𝑐𝑒−𝑃𝑟𝑜𝑑𝑢𝑐𝑒𝑟 𝑝𝑟𝑖𝑐𝑒
𝐶𝑜𝑛𝑠𝑢𝑚𝑒𝑟 𝑝𝑟𝑖𝑐𝑒𝑋 100 (3)
Where, TGMM=Total gross marketing margin.
23
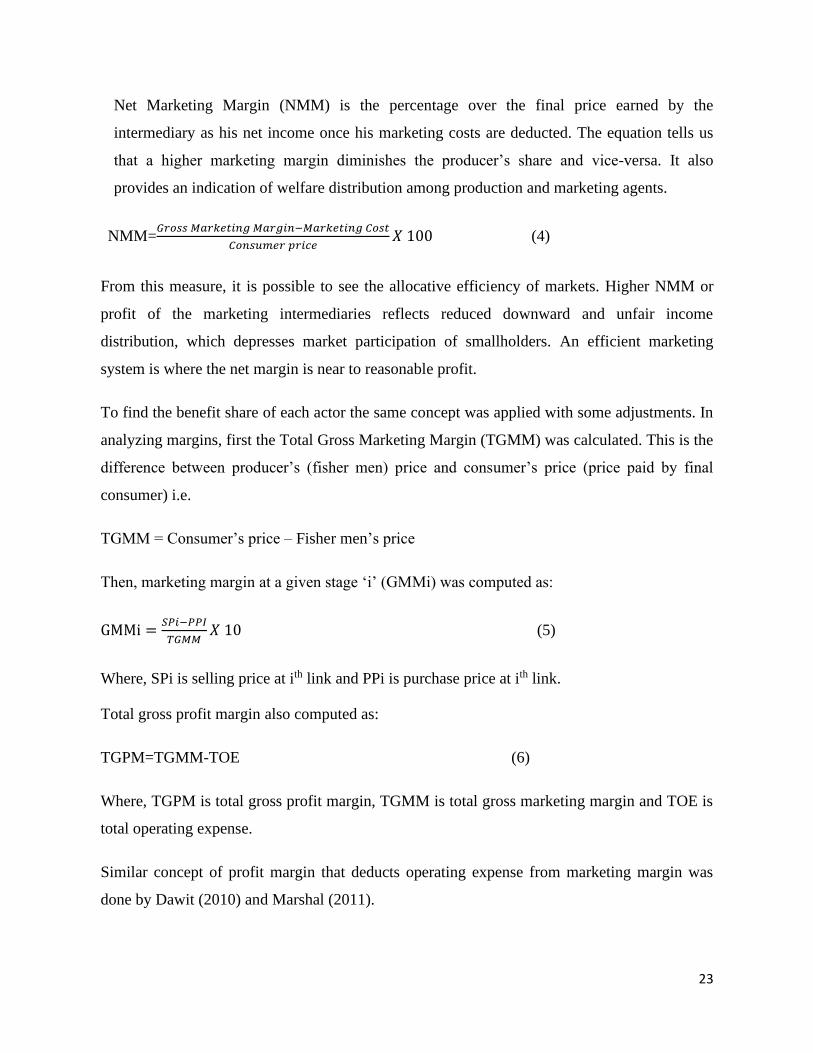
Net Marketing Margin (NMM) is the percentage over the final price earned by the
intermediary as his net income once his marketing costs are deducted. The equation tells us
that a higher marketing margin diminishes the producer’s share and vice-versa. It also
provides an indication of welfare distribution among production and marketing agents.
NMM=𝐺𝑟𝑜𝑠𝑠 𝑀𝑎𝑟𝑘𝑒𝑡𝑖𝑛𝑔 𝑀𝑎𝑟𝑔𝑖𝑛−𝑀𝑎𝑟𝑘𝑒𝑡𝑖𝑛𝑔 𝐶𝑜𝑠𝑡
𝐶𝑜𝑛𝑠𝑢𝑚𝑒𝑟 𝑝𝑟𝑖𝑐𝑒𝑋 100 (4)
From this measure, it is possible to see the allocative efficiency of markets. Higher NMM or
profit of the marketing intermediaries reflects reduced downward and unfair income
distribution, which depresses market participation of smallholders. An efficient marketing
system is where the net margin is near to reasonable profit.
To find the benefit share of each actor the same concept was applied with some adjustments. In
analyzing margins, first the Total Gross Marketing Margin (TGMM) was calculated. This is the
difference between producer’s (fisher men) price and consumer’s price (price paid by final
consumer) i.e.
TGMM = Consumer’s price – Fisher men’s price
Then, marketing margin at a given stage ‘i’ (GMMi) was computed as:
GMMi =𝑆𝑃𝑖−𝑃𝑃𝐼
𝑇𝐺𝑀𝑀𝑋 10 (5)
Where, SPi is selling price at ith link and PPi is purchase price at ith link.
Total gross profit margin also computed as:
TGPM=TGMM-TOE (6)
Where, TGPM is total gross profit margin, TGMM is total gross marketing margin and TOE is
total operating expense.
Similar concept of profit margin that deducts operating expense from marketing margin was
done by Dawit (2010) and Marshal (2011).
24
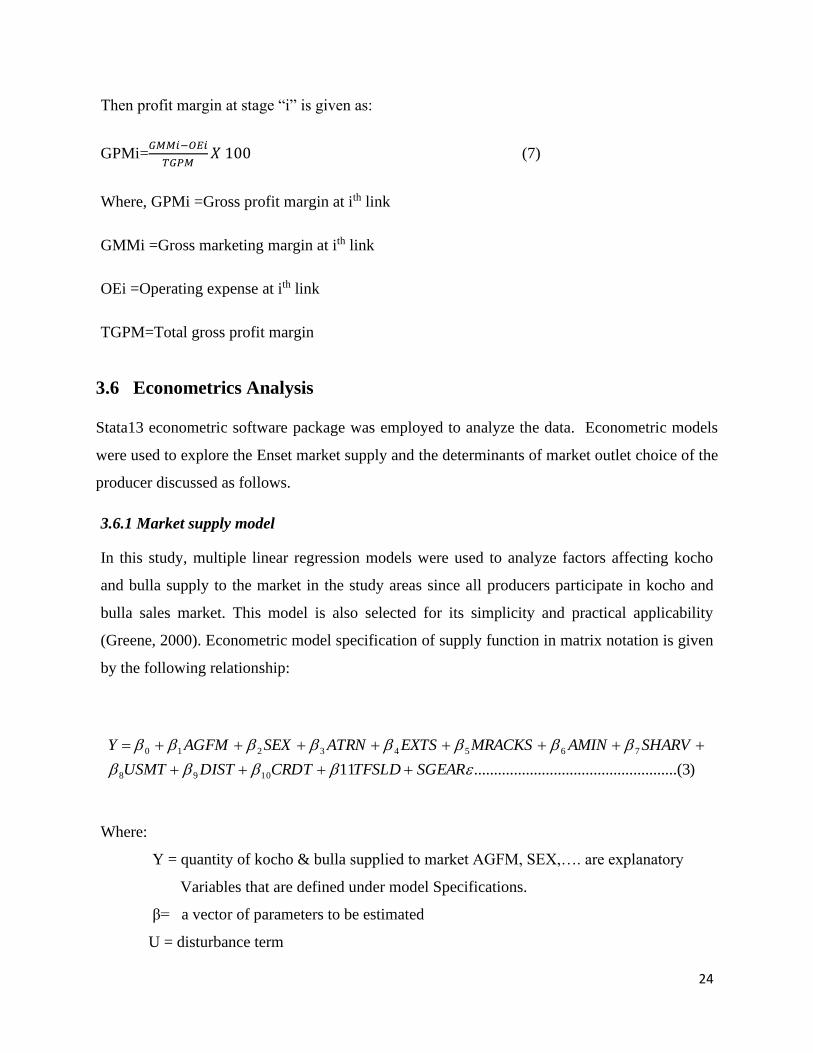
Then profit margin at stage “i” is given as:
GPMi=𝐺𝑀𝑀𝑖−𝑂𝐸𝑖
𝑇𝐺𝑃𝑀𝑋 100 (7)
Where, GPMi =Gross profit margin at ith link
GMMi =Gross marketing margin at ith link
OEi =Operating expense at ith link
TGPM=Total gross profit margin
3.6 Econometrics Analysis
Stata13 econometric software package was employed to analyze the data. Econometric models
were used to explore the Enset market supply and the determinants of market outlet choice of the
producer discussed as follows.
3.6.1 Market supply model
In this study, multiple linear regression models were used to analyze factors affecting kocho
and bulla supply to the market in the study areas since all producers participate in kocho and
bulla sales market. This model is also selected for its simplicity and practical applicability
(Greene, 2000). Econometric model specification of supply function in matrix notation is given
by the following relationship:
)3.(..................................................111098
76543210
SGEARTFSLDCRDTDISTUSMT
SHARVAMINMRACKSEXTSATRNSEXAGFMY
++++
++++++++=
Where:
Y = quantity of kocho & bulla supplied to market AGFM, SEX,…. are explanatory
Variables that are defined under model Specifications.
β= a vector of parameters to be estimated
U = disturbance term

25
3.6.2 Market outlet choice model
To identify factors affecting market outlet choices decision of kocho and bulla producers at the
individual household level, multivariate probit model was used. The multivariate probit model is
an extension of the probit model and is used to estimate several correlated binary outcomes
jointly. Generally, the multivariate probit model can be written as:
M equation multivariate probit model:
Yim * = 𝛽m`Xim + im , m = 1, …, M
Yim = 1 if yim * > 0 and 0 otherwise
im , m = 1, …, M, are error terms distributed as multivariate normal, each with a mean of zero,
and variance-covariance matrix V, where V has values of 1 on the leading diagonal and
correlations Pjk = Pkj as off-diagonal elements, Where (m= 1... k) represent the dependent
variable of Enset market outlet selected by the ith farmer. (i = 1… n). The dependent variables are
polychotomous variable indicating whether sales are made through the relevant marketing outlet.
The outlet was aggregated into three groups: wholesalers, retailers, and consumers. Each farm
can use one or more marketing outlet. Xim is a 1 × k independent variable that affects the choice
of marketing outlet decisions and βm is a k × 1 vector of unknown parameters to be estimated
εim, m = 1, …, m are the error terms distributed as multivariate normal, each with a mean of
zero, and variance covariance matrix V, where V has values of 1 on the leading diagonal and
correlations.
The aforementioned equation is a system of m equations shown in the following equations:
i=i+1i
2i=22i+2i
3i=33i+3i
The latent dependent variables are observed through the decision to adopt or not (yki) such that:
yim = {10
if yk*> 0 k=1,2,3 otherwise
26
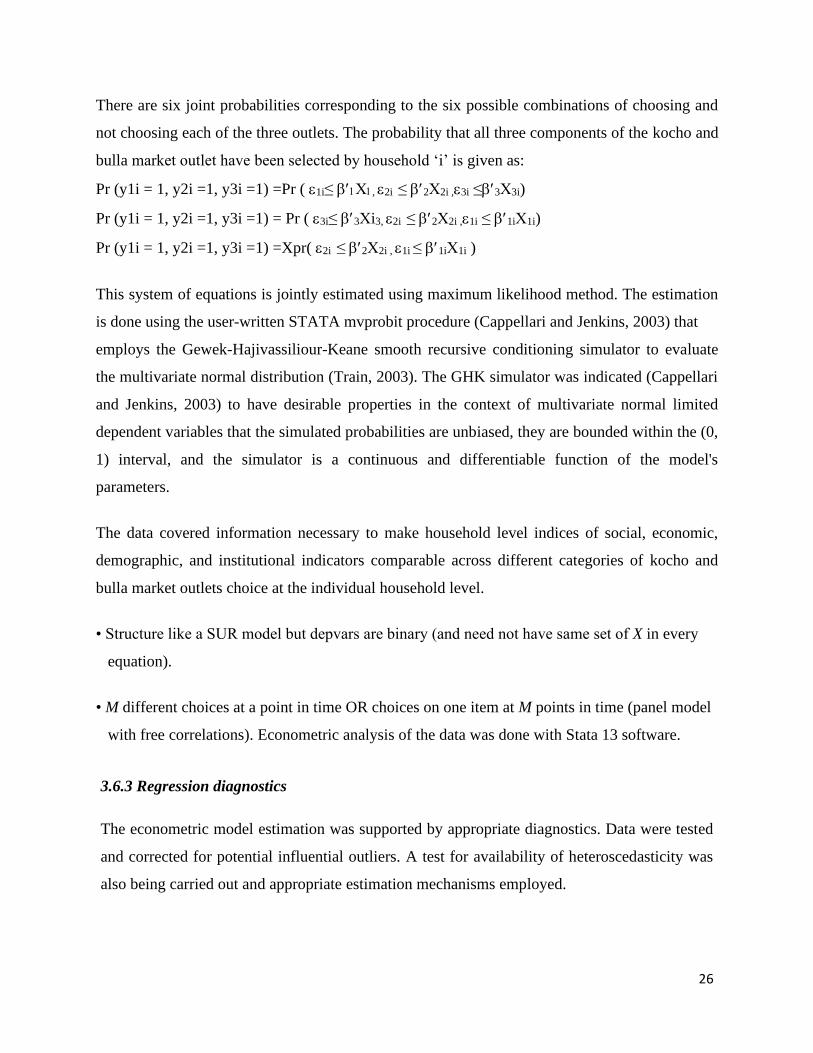
There are six joint probabilities corresponding to the six possible combinations of choosing and
not choosing each of the three outlets. The probability that all three components of the kocho and
bulla market outlet have been selected by household ‘i’ is given as:
Pr (y1i = 1, y2i =1, y3i =1) =Pr ( 1i≤ , 2i ≤ 22i ,3i ≤33i)
Pr (y1i = 1, y2i =1, y3i =1) = Pr ( 3i≤ 3i3, 2i ≤ 22i ,1i ≤ 1i1i)
Pr (y1i = 1, y2i =1, y3i =1) =Xpr( 2i ≤ 22i , 1i ≤ 1i1i )
This system of equations is jointly estimated using maximum likelihood method. The estimation
is done using the user-written STATA mvprobit procedure (Cappellari and Jenkins, 2003) that
employs the Gewek-Hajivassiliour-Keane smooth recursive conditioning simulator to evaluate
the multivariate normal distribution (Train, 2003). The GHK simulator was indicated (Cappellari
and Jenkins, 2003) to have desirable properties in the context of multivariate normal limited
dependent variables that the simulated probabilities are unbiased, they are bounded within the (0,
1) interval, and the simulator is a continuous and differentiable function of the model's
parameters.
The data covered information necessary to make household level indices of social, economic,
demographic, and institutional indicators comparable across different categories of kocho and
bulla market outlets choice at the individual household level.
• Structure like a SUR model but depvars are binary (and need not have same set of X in every
equation).
• M different choices at a point in time OR choices on one item at M points in time (panel model
with free correlations). Econometric analysis of the data was done with Stata 13 software.
3.6.3 Regression diagnostics
The econometric model estimation was supported by appropriate diagnostics. Data were tested
and corrected for potential influential outliers. A test for availability of heteroscedasticity was
also being carried out and appropriate estimation mechanisms employed.
27
Variance inflation factors (VIF) technique was employed to detect multicolinearity in
explanatory variables. According to Gujarati (2003) VIF (Xj) can be defined as:
VIF (xj) =1
1−𝑅𝑗2
Where, Rj is the multiple correlation coefficient between Xj and other explanatory variables.
Where there was heteroscedasticity problem in the data set, the Breusch-Pagan test of
heteroscedasticity was employed for detecting heteroscedasticity in this study.
3.7 Hypothesis, Variable Definitions and their expected Signs
The dependent variable was used in this research, the volume of Enset sale and Marketing
Outlet whereas, the independent variables, those which the study was used for the production of
kocho and bulla on the study area.
3.7.1 Dependent Variables
In this study the dependent variables were:
1. Volume of Enset Sale (VoES): -
It is continuous dependent variable used in the multiple linear regression model equation.
It is measured in kg and represents the actual supply by the farmer household to the
market in the survey year.
2. Marketing Outlet (MOUT): -
Marketing Outlet (MktO): In the analysis it was measured by the probability of selling
kocho and bulla to either of the markets. The outlet choices might be along farmers’
decision involved in three alternative markets. It is represented in the model as Y0 for
households, who choose to sell kocho and bulla mainly to wholesalers, Y1 for producers
that mainly sell their kocho and bulla to retailers and Y2 for producers who mainly sell
kocho and bulla for consumers (income earning from sale of kocho and bulla).
28
3.7.2 Independent Variables
The independent variables used in this research were:
Land size of household (LAND): it was a continuous independent variable and measured by the
number of hectares of farm land owned by a farmer who is head of a household. It is
hypothesized that the larger the size of the farm the higher annual increase in the income of a
household.
Amount of kocho/ Enset produced (AKProd): it is a continuous independent variable
measured in terms of kilograms. It is hypothesized that there is a positive relationship between
the size of an Enset plant and the number of kgs of Kocho it produces.
Amount of Bulla Produced (ABProd): it is a continuous independent variable measured in
terms of kilograms. It is hypothesized that there is a positive relationship between the size of an
Enset plant and the number of kgs of Bulla it produces.
Age of farm household participating on Enset production and marketing (age): It is a
continuous independent variable which is measured in years. The older a farmer is the better the
experience and the more the production and marketing of Enset.
Family size of Enset producer household head (Famsize): It is a continuous independent
variable measured by the number of members each family holds. It is hypothesized that the
larger the family, the more the labor force and the more the produce.
Education level of Enset producer household head (Educ): it is a dummy variable measured
in terms of 0 for Non-formal education and 1 otherwise:
Distance to Nearest Market (DNM): It is the location of the producer household from the
nearest kocho and bulla market and is measured in kilometer. The closer the kocho and bulla
market to producer household, the lesser would be the transportation charges, loss due to
handling and better access to market information and facilities. Rural road improvement and
nearness to market increases total acreage for crops and increases value of agricultural output.

29
Therefore, distance to nearest Enset product market is hypothesized to be negatively related to
value addition.
Access to Enset production Extension Service (ACCEXT): This variable is measured as a
dummy variable taking a value of Zero if the producer has access to kocho & bulla production
extension service and zero otherwise. It is expected that extension service widens the
household’s knowledge with regard to the use of improved enset production technologies and
has positive impact on enset market participation decision and volume of honey marketed
(Holloway et al., 2000). Number of extension visits improves the household’s intellectual
capitals, which improves enset production. Therefore, frequency of extension is important.
Market alternative Price of Kocho and Bulla (PrKB): This is a continuous variable measured
by the amount of Birr expended to buy a kg of Kocho and Bulla for household consumption per
year on an average and market information. It is hypothesized that market information is related
to whole sale marketing outlet and those Kocho and Bulla purchasers who obtain market
information shift the market demand to expensive ones.
Kocho and Bulla Quality Preference (KBQlty): it is a dummy variable which is taking value
of 0 if the buyer prefers fresh and 1 if the buyer prefers the processed one.
Kocho and Bulla supplied to the market to sell per household (market): it is continuous
variable measured by kg and hypostasized to know the link of Kocho and Bulla supplied to the
market per household producers with obtained income.
Processing Kocho and Bulla by household (processing): It is a dummy variable and measured
by level of participants. It takes zero for female participants and one for male in Kocho, Bulla
and fiber processing. This helps to know the contribution of male and female in Kocho and Bulla
processing.
Access to markets (AM): It is continuous variable measured the distance of kocho & bulla
producer households from the local market in hours of transportation time. The closer the
market, the lesser the transportation charges, reduced walking time, and reduced other
marketing costs, better access to market information and facilities.

30
Table 2: Description of the dependent and independent variables used in the model.
Variable Description Type Value
Dependant Variables
HMEPr
Women contribution to Enset
Production Continuous volume in Kg
HMESPK
Women contribution to Kocho
and Bulla marketing Continuous volume in Kg
Independent Variables
Kert Land size in kert Continuous size in hectare
Kocho Amount of Enset produces or
output Continuous Amount in kg
Bulla Amount of Bulla produces or
output Continuous Amount in kg
Year(+) Age of Household Head Continuous number of years
Number (+) Family Size Continuous number of families
EDEPH(+) Education level of Enset
producer household head dummy
0- Non-formal edu, 1- edu. formal
DNM (-) Distance to Nearest Market Continuous distance in Km
ACCEXT(+) Access to Enset production
Extension Service Categorical
0= No extension service nea by,
1. Possessed requi. 2. Avialiblity
3.don’t have time to get 4. others
Price Market alternative price of
Kocho and Bulla Continuous Br/kg
Quality Kocho and Bulla quality
(Quality):
Limited
response
0, high quality 1, middle
quality, and 2 low quality.
Market Kocho and Bulla supplied to the
market to sell per household Continuous Amount in kg
Process Processing Kocho and Bulla by
household dummy 0 - Female, 1- Male
AM Access to markets Continuous Kilometer
31
CHAPTER FOUR
RESULT AND DISCUSSIONS
This chapter presents the results obtained from descriptive, value chain map, value chain actors
market performance and econometric analyses. In the descriptive statistics; mean, percentages
and standard deviation were computed in the process of examining and describing
socioeconomic and demographic characteristics of Enset value chain actors. In the value chain
analysis description of major Enset value chain actors, their functions relationships among
them, to assess enset production and value chain, to identify determinates of enset products and
value chain performance in the study area along Enset product value chain was done. The
econometric analyses were employed to identify determinants of farmers’ market outlet choices
and value addition of Bulla and Kocho at farmer levels of the marketing value chain in the
study area.
4.1 Descriptive Statistics
4.1.1 Demographic and socioeconomic characteristics of sampled households
Demographic and socioeconomic characteristics of the sample respondents are presented in
Table 3. The number of sample respondents handled during the survey was 154. All
respondents were female, who participated and responsible both in Enset production and
marketing in the household, the average family size of sample households was 5.8 with the
minimum and maximum of 1 and 12 in adult equivalent respectively (Table 3 ). The mean age
of the sampled households is 50.43 which imply that there is high dependency ratio as the
result depicts. The mean age of the respondent person of the households was 50.4, indicating
that the responsible person for production and marketing of Enset in the household has good
experience. As age is considered as a crucial factor since, it determines whether the household
benefits from the experience of an older person or has to base its decisions on the risk-taking
attitudes of younger farmers. Educational level also considered to contribute positively to Enset
production and marketing. The average educational level of respondents was 2.62 in year of
schooling with minimum of 1 and maximum of 5.In this study, experience in production of

32
Enset were also considered since, farm experience in general; farming experience in Enset
production in particular is considered to positively contribute to the production and marketing
of Enset from accumulated knowledge and skill. The results depict that the average farming
experiences of respondents for Enset were about 1.6 year with standard deviation of 0.512. This
shows family member who is responsible for Enset production and marketing have an
intermediate experience level.
Table 3: Demographics and Socioeconomic characteristics of sampled households
Variable N Min Max Mean Std. Dev
Age of respondent 154 35 75 50.43 7.736
Education level of respondent 154 1 5 2.62 1.539
Family size 154 1 12 5.84 2.356
Rate of experience with your
neighbor
154 1 4 1.67 .512
Source: Own computation from survey data (N= 154)
The total sample size of farm respondents handled during the survey was 154. Of the total
sample respondents, 81.82 % were male-headed households and 18.18 were female-headed in
the two selected kebeles of the woreda. In terms of marital statuses of respondents, 75.9 were
married, 0.65 %single, 7.7 % divorced and 15.58 were widowed. Religion distribution shows
that 62.99 % of respondents are orthodox and 37.01 % were Muslim.
Table 4: Statistical test of dummy variables for demographic and socioeconomic
Characteristics of samples
Variables Items N Percent χ2-test
Sex Male 126 81.82 7.003
Female 28 18.18
154 100.0
Marital Status Single 1 0.65 5.132
Married
Divorced
Widowed
117
12
24
75.97
7.79
15.58
Religion Orthodox 97 62.99 11.1
Muslim 57 37.01
Source: Own computation from survey data (N= 154)

33
4.1.2 Production overview
From total respondents of 154 households, 63,981 kg of enset was produced in total. From this
total production 11,535 kg of bulla was produced by sample respondents with average of 415.4
kg of enset and 74.9 kg of bulla per household in the selected kebeles. In those of the two
kebeles almost all of sample households produce enset (100%) (Table 5). Enset producers
personally have significance at greater than 10% significant level if they have access to
infrastructure and other accessibilities in selected two kebeles of Abeshege woreda.
Table 5: Amount of Enset produced in 2018/19
Variable N
Min Max
Sum/ Total
Production Mean Std.Dev t-test
How many enset
produced
154 0 800 63,981 415.4 156.159 32.397***
How many Bulla
produced
154 0 200 11,535 74.90 41.792 22.242***
Source: Own computation from survey result, 2019
4.1.2.1. Trend of Enset Market
Regarding the trend of enset and bulla production, all of the respondents responded that the
production of enset decreasing and there is food security problem in the study area. As shown
in table 4. 66 respondents of the sampled households responded as enset production is
decreasing.
Table 6: Trend of Enset Market
Kebele of
respondents Trend of price per unit of kocho/enset
Increasing Decreasing The same Total
Boketa 22 34 21 77
Lay Geraba 37 32 8 77
59 66 29 154
Source: Own computation from survey data (N= 154)

34
In addition to decreasing of Enset production during the field visit, the producers (women)
reported that there is also enset disease, which is found in the inner part of the decorticated
(scraped) leaf sheaths. It affects the production process and volume of product. It was a great
loss for them that, enset took 5-8 years to mature and ready for production; but, the farmers
have decided to avoid who have it, by using their indigenous knowledge that tried to tackle the
disease from transmitting to other plant. They used an experience of burning the whole enset
which has a symptom of disease that showed to dry. It was a great loss for the farmers. In
addition, by taking this critical problem, the researcher raised this idea to Wolkite Zone
agricultural and natural resource officer and he told that the office know the problem and tried
to create a linkage with Wolkite University to control this disease by creating a research center
and it is on progress. But there is no any finding declared till this current study completed.

35
4.2 Value Chain Analysis
4.2.1 Value chain channel of Enset producers in the study area
According to McCormick and Schmitz (2002), value chain mapping enables to visualize the flow of the product from conception to
end consumer through various actors. It also helps to identify the different actors involved in enset value chain, and to understand their
roles and linkages. Consequently, the current value chain map of enset value chain in Abeshge woreda was depicted below.
and technologies
Represents one-way flow of information
Kocho &Bulla
Farmers
Associati
on
Represents physical flow of inputs &
products
Represents two-way flow of
information and technologies
Represents one-way flow of information
Represents the flow of much of products
Enset Producer
(M1)
Women &
Girls
Post-Harvesting
Process
Production
Process
Participants on
Post-harvest
Women preparing
instruments for the
Process
Women are the main
participant of the
production process
Men
Product Kocho
& Bulla
Plantation &
Caring during
growth stage
Consumers Local Buyers
Collectors (M2)
Whole Sellers (M3) Retailer (M4) Consumer
ACTORS
Fu
nct
ion
WZA&
NR
AWANR
Figure 3: Value chain map of kocho and bulla products and role of actors
36
4.2.2 Actors, their role and linkage in enset value chain
The value chain highlighted the involvement of diverse actors who participated directly or
indirectly in the value chain. According to KIT et al. (2006), the direct actors are those involved
in commercial activities in the chain (input suppliers, producers, traders, consumers) and indirect
actors are those that provide financial or non-financial support services, such as business service
providers, government, cooperatives, researchers and extension agents.
4.2.2.1 Primary actors
The primary actors in Enset value chain in Abshege woreda were the farmers (enset producers),
input suppliers, traders and consumers. Each of these actors add value in the process of changing
product title. Some functions or roles are performed by more than one actor, and some actors
perform more than one role.
Input Suppliers
Value chain analysis in agricultural activities commence in utilizing input supply level. In this
stage of the value chain, there are actors who are involved directly or indirectly in agricultural
input supply in the study area. Farmers themselves, district rural development agriculture and
natural resource office and private input suppliers are the main sources of input supply. All such
actors are responsible to supply agricultural inputs like improved seed varieties, manure
(fertilizer) and farm implements, which are essential inputs at the production stage. However, the
sampled farmer, use Enset seed and manure from their own sources. Labor is an important factor
of agricultural production and it is employed in Enset production from land preparation to
harvest. Respondents utilize both family labor and labor exchange as source of labor.
Producers
Enset producers are the major actors who perform most of the value chain functions right from
the farm backyard inputs preparation on their production activities or procurement of the inputs
from other sources to facilitate the production activities and marketing. The major value chain
activities that Enset growers perform include plaguing, planting, fertilization, pest/disease

37
controlling, harvesting and post-harvest handling. Enset production in these 2 Kebeleswas based
on rain fed agriculture. The farmers themselves or traders do post-harvest handling,
independently with attaining activities like cleaning, cutting, packing, storing, transportation,
loading and unloading. If Enset products are sold at the farm gate, the traders perform some of
aforesaid activities. Most of the farmers use pits, underground storage and ground floor of their
residential house as a store in both of Boketa and Lay Geraba Kebeles.
Diffused animal dung and house
residuals through enset plant as a
natural fertilizer
Decorticated enset putted on the
pit for fermentation
Market Actors
Market actors like collectors, whole sellers, consumers and hotels/restaurants are the main
identified actors in the study area. From observation made during survey period, most producers
sold their products in the nearby local markets. The means of transportation varies among
farmers but predominately producers use pack animals and vehicles. However, local collectors
also go to the farmer’s field, negotiate price, purchase it and ultimately transport mostly Kocho
and Bulla products to urban markets. Farmers were also sold Kocho and Bulla to Collectors,
wholesalers and consumers and processors (hotels and restaurants).
Picture 2: Planting after develop from enset
seed
38
Retailers
Retailers are mainly involved in buying enset from the farmer directly in larger volume than any
other actors and supplying them to whole sellers and consumers. They have a vehicle and they
simply transport to the central market in Addis Ababa. Survey result indicates that collectors’
markets are the main assemblage centres for kocho and bulla in their respective surrounding
areas. They have better storage, transport and communication access than other traders. Almost
all retailers take from warehouse of the farmer. They are located in Woliso, Wolkite and Addis
Ababa.
Wholesalers
Wholesalers involvement in the chain includes buying of enset and bulla, transport to shops,
grading, displaying and selling to consumers. Wholesalers are key actors in enset value chain in
selected kebeles of Abshege district. They are the last link between producers and consumers.
They mostly buy from collectors and sell to urban consumers. Sometimes they could also
directly buy from the farmer. Consumers usually buy the product from wholesalers as they offer
according to requirement and purchasing power of the buyers. Wholesalers come from areas and
sell to urban consumers.
Enset and Bulla consumers
Consumers are those purchasing the products for consumption. Two types of enet and bulla
consumers were identified: households and restaurants. Average income of 8 consumer
respondents is 25,750 birr per annum. The private consumers are employees, urban and rural
residents who purchase and consume enset with an average of 21.4% of their income per annum
and purchase enset and bulla by 12.5 % of their income per month in Wolkite and Addis Ababa
towns as the survey from purposely contacted 8 consumers result depicts. (Appendix table 8).
Private consumers purchase enset and bulla directly from producers, collectors and wholesalers
though most of the consumers purchase from collectors and wholesalers. Enset producers also
make important segment of the rural consumers since they consume part of their products. The
survey result also revealed that 63,981 kg of enset was produced and from these 11,535 kg bulla
39
produced by processing and value addition. As the survey result of consumers revealed 62 %
Consumers prefer a well fresh, sanitized and well processed kocho and bulla.
4.2.2.2 Supporting actors
Such actors are those who provide supportive services including training and extension,
information, financial and research services. According to Martin et al. (2007), access to
information or knowledge, technology and finance determines the state of success of value chain
actors. NGO`s, research centers and OoARD, primary cooperatives, micro finance Banks are
main supporting actors who play a central role in the provision of such services.
1. Financial services, Training and Extension Services
Supportive actors are those who provide dedicated services including training and advisory,
information, financial and research services. According to Martin et al. (2007), access to
market information or knowledge, technology and finance determines the state of success of
value chain actors. The main supporters of the Enset value chain in the study area should be
office of Agriculture and Natural Resource (OoANRD), marketing and cooperative
development and Office of Trade and Industry, Wolkite University, and development agents
since they are in nearby to them. But as the result depicts, in table 5, 55.2 % of the
respondents lack extension service provision. In addition to this the producers of kocho and
bulla from the surveyed two kebeles have no access to credit to their product. As the result in
table 5 shows, 74 % the farmers got market information access from the extension agents.
Supporting actors are outsiders to the regular business process and restrict themselves to
temporarily facilitating a chain upgrading strategy. Typical facilitation tasks include creating
awareness, facilitating joint strategy building action, and the coordination of support activities.
These actors also play a central role in the provision of enabling environments include the
policies and infrastructure. From the broader perspective, agricultural focused policy of the
country might be considered as supportive policy for proper functioning of Enset value chain
development in the country in general and in study area in particular.
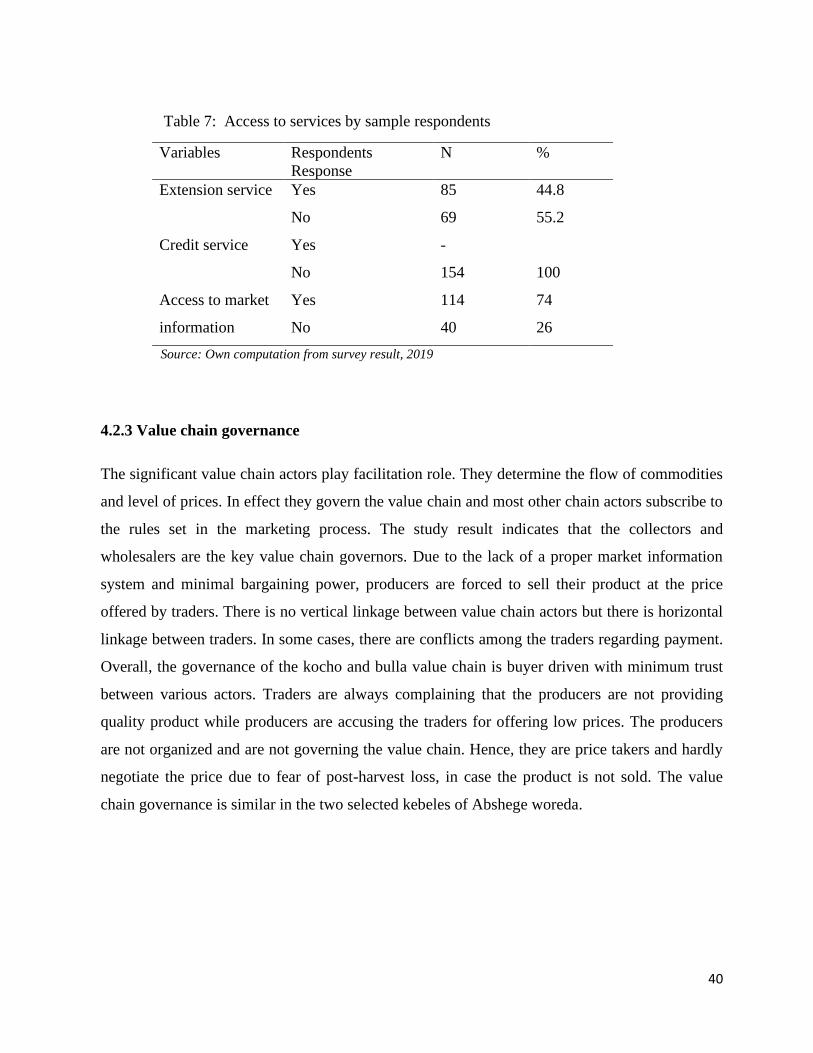
40
Table 7: Access to services by sample respondents
Variables Respondents
Response
N %
Extension service Yes 85 44.8
No 69 55.2
Credit service Yes -
No 154 100
Access to market
information
Yes 114 74
No 40 26
Source: Own computation from survey result, 2019
4.2.3 Value chain governance
The significant value chain actors play facilitation role. They determine the flow of commodities
and level of prices. In effect they govern the value chain and most other chain actors subscribe to
the rules set in the marketing process. The study result indicates that the collectors and
wholesalers are the key value chain governors. Due to the lack of a proper market information
system and minimal bargaining power, producers are forced to sell their product at the price
offered by traders. There is no vertical linkage between value chain actors but there is horizontal
linkage between traders. In some cases, there are conflicts among the traders regarding payment.
Overall, the governance of the kocho and bulla value chain is buyer driven with minimum trust
between various actors. Traders are always complaining that the producers are not providing
quality product while producers are accusing the traders for offering low prices. The producers
are not organized and are not governing the value chain. Hence, they are price takers and hardly
negotiate the price due to fear of post-harvest loss, in case the product is not sold. The value
chain governance is similar in the two selected kebeles of Abshege woreda.
41
4.3 Marketing Channels and Performance Analysis
4.3.1 Marketing channels
A marketing channel is a business structure of interdependent organizations that reach from the
point of product origin to the consumer with the purpose of moving products to their final
consumption destination (Kolter and Armstrong, 2003). The analysis of marketing channels is
intended to provide a systematic knowledge of the flow of the goods and services from their
origin (producer) to the final destination (consumer). Since the marketing channels for kocho and
bulla products are different, the analysis was carried out for Kocho and Bulla products
separately. This section presents results for the identified marketing channels.
4.3.1.1 Enset/ Kocho marketing channels
In this study, three marketing channels are identified for Kocho and bulla of which two went out
of the zone. Throughout the year as depicted above from, 63,981 kg production of enset 21,243
kg of enset was supplied by the sample farmers. From 11,535 kg of bulla production 3480 kg of
bulla was supplied to the market. The channel comparison was made based on amount that
passed through each channel.
Accordingly, channel I (the Producer-Collector-Wholesaler-Central market channel) carried the
largest volume, 8,325 kg of enset with account 39 percent of the total volume marketed of Enset
(Kocho)followed by channel II (Producer-Wholesaler –Consumer market channel) which carried
a total volume of 6,249 kg which accounts 33.8 % of the total market of Enset (kocho). Channel
III, the Producers- Wholesalers-Consumer (Central market) is the third most important channel
with 27.3 % of the total supply.
Channel I. Producers → Retailers→ Wholesalers→ (Central market) Consumer (39 %)
Channel II. Producers→ Whole Seller →Consumers (33.8%)
Channel III. Producers→ Retailer → Whole Seller →Hotel/Restaurants →Consumers (27.3 %)

42
4.3.2 Bulla marketing channel
4.3.1.2 Bulla marketing channels
In this study, three channels are identified for Bulla of which two went out of the zone. Through
the year 2018/19 the sample farmers supplied 4030 kg of Bulla. The channel comparison was
made based on amount that passed through each channel. Accordingly, channel I (the producer-
Retailer-consumers market channel) carried the largest volume amounted to 1520 kg which is
44% of the total amount followed by channel II (Producers•¨ Wholesalers ¨ (central market)
which carried a total volume of 1235Kg of Bulla and is about 34% of the total marketed Bulla.
While, Channel III Producers - Retailers - Wholesaler - Consumers market channel is the most
Figure 4: Enset/kocho marketing channels, 2019
Consumer
Wholesaler
Producer
Retailers
Central
Market/
Consumer
27.3%% %
33.8%% %
Channel I
Channel II
Channel III
Retailers
Hotel/
Restaurants
39 %
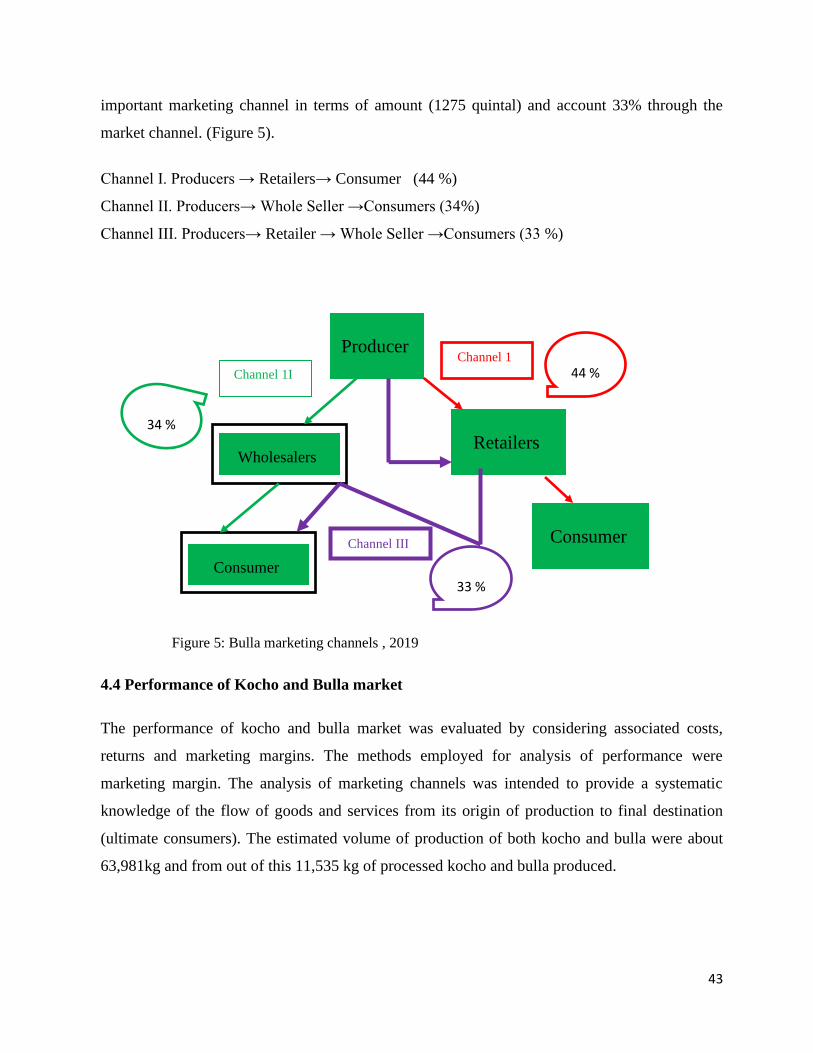
43
important marketing channel in terms of amount (1275 quintal) and account 33% through the
market channel. (Figure 5).
Channel I. Producers → Retailers→ Consumer (44 %)
Channel II. Producers→ Whole Seller →Consumers (34%)
Channel III. Producers→ Retailer → Whole Seller →Consumers (33 %)
Figure 5: Bulla marketing channels , 2019
4.4 Performance of Kocho and Bulla market
The performance of kocho and bulla market was evaluated by considering associated costs,
returns and marketing margins. The methods employed for analysis of performance were
marketing margin. The analysis of marketing channels was intended to provide a systematic
knowledge of the flow of goods and services from its origin of production to final destination
(ultimate consumers). The estimated volume of production of both kocho and bulla were about
63,981kg and from out of this 11,535 kg of processed kocho and bulla produced.
44 %
34 %
33 %
Producer
Retailers
Consumer
Wholesalers
Consumer
Channel 1
Channel III
Channel 1I

44
The distribution of costs and gross income at different levels is important in the business of
kocho and bulla. Being highly perishable, fresh enset require greater attention during harvesting,
processing, packaging and transporting from the point of production to the final market. The
marketing cost of the enset mainly involves the cost of post-harvest activities incurred before
reaching the consumer. This includes cost of post harvesting (material costs), handling (cleaning,
processing and packing). Generally, these components constitute a large share in the total margin
between the final traders’ price and the cost of production. The margin calculation is done to
show the distribution throughout the various actors as kocho and bulla move from production to
collectors, wholesalers and finally to consumers. Marketing margin can be used to measure the
share of the final selling price that is captured by a particular agent in the value chain. The
relative size of various market participants’ gross margins can indicate where in the marketing
chain value is added and/or profits are made. In order to calculate the marketing margin of an
agent, the average price of kocho and bulla for that particular agent was taken. For instance, the
buying price of consumers was obtained by taking the average purchasing price of consumers. In
order to measure the market, share of each agent, the marketing channel where all agents have
participated was selected. Marketing margins, associated costs and benefit share of value chain
actors and marketing margins through different main channels was presented below.
4.4.1 Kocho market performance
Marketing costs and benefit shares of actors in Enset value chain Table 6 indicates, different
types of marketing cost related to the transaction of enset by key market chain actors and the
benefit share of each marketing actors. The arrangement of marketing cost revealed that
perishability loss is the highest cost for each marketing agents is not possible to deliver it to
markets that are located far from the production points, due to its perishable nature. Thus, the
cost of loss is the highest amount followed by packing material cost.
4.4.2 Cost and profitability analysis of Kocho for producers, retailers and wholesalers
This section of the study focused on activities related to enset production at the farm site and
marketing performance of the chain actors that shows a signal about the performance for enset
and bulla market. Thus, the production cost and cost of loss is the highest costs in the marketing
45
cost of producers’ side. Average costs and sales prices of the producers, retailers and whole
sellers were used (Table 7). Concerning cost and profitability analysis of the sample enset
wholesalers in the sample traders, as the table below clearly shows wholesalers were profitable.
This indicates that wholesalers obtain a profit of ETB 19.05 per kg at sale level which was higher
when compared to retailers. Relating to cost of operation of wholesalers, rent for shop is the
highest (2.35 birr per kg) followed by transportation cost (0.20 birr per kg).
Marketing costs and benefit shares of actors in Bulla value chain Table 6; indicates different
types of marketing cost linked to the transaction of bulla by fundamental market chain
performers and the benefit share of each marketing actors. The arrangement of marketing cost
has shown that perishability is the maximum cost for producers. This is due to the perishable
nature of the bulla. Thus, the cost of loss is the highest amount followed by packing material
cost. This shows a hint about the performance for bulla market. Thus, the cost for perishability
and of the bulla is the highest costs in the marketing cost.
Regarding cost and profitability analysis of wholesalers in the sample traders, as the (Table 8)
clearly shows wholesalers were profitable. This indicates that wholesalers can obtain a profit of
ETB 25 per kg at wholesale level which was higher when compared to retailers and producers by
16 and 11 birr of retailers and producers respectively. Concerning to cost of operation of
wholesalers, rent for shop is the highest 2.30 birr followed by transportation cost (0.50 birr).
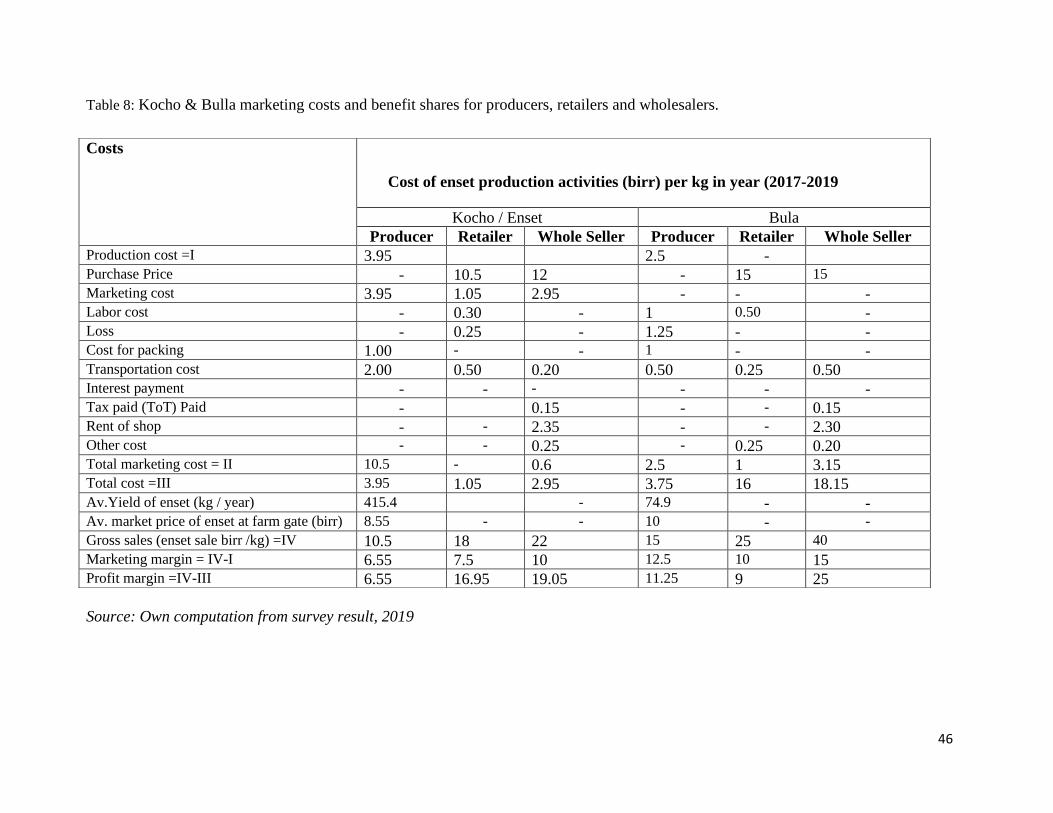
46
Table 8: Kocho & Bulla marketing costs and benefit shares for producers, retailers and wholesalers.
Source: Own computation from survey result, 2019
Costs
Cost of enset production activities (birr) per kg in year (2017-2019
Kocho / Enset Bula
Producer Retailer Whole Seller Producer Retailer Whole Seller
Production cost =I 3.95 2.5 -
Purchase Price - 10.5 12 - 15 15
Marketing cost 3.95 1.05 2.95 - - - Labor cost - 0.30 - 1 0.50 - Loss - 0.25 - 1.25 - - Cost for packing 1.00 - - 1 - - Transportation cost 2.00 0.50 0.20 0.50 0.25 0.50
Interest payment - - - - - - Tax paid (ToT) Paid - 0.15 - - 0.15
Rent of shop - - 2.35 - - 2.30
Other cost - - 0.25 - 0.25 0.20
Total marketing cost = II 10.5 - 0.6 2.5 1 3.15
Total cost =III 3.95 1.05 2.95 3.75 16 18.15
Av.Yield of enset (kg / year) 415.4 - 74.9 - - Av. market price of enset at farm gate (birr) 8.55 - - 10 - -
Gross sales (enset sale birr /kg) =IV 10.5 18 22 15 25 40
Marketing margin = IV-I 6.55 7.5 10 12.5 10 15
Profit margin =IV-III 6.55 16.95 19.05 11.25 9 25
47
As table 8 depicts; cost and profitability analysis of enset for 2018/19 G.C production year in the
study area was as much as possible not satisfactory regarding its profitability. This shows that
kocho and bulla producer with 415.4 kg average annual productions of kocho and bulla with
average market price of kocho 6.55 Birr; on farm the farmer generates profit margin of ETB 8.55
/kg. With regarding to the cost items labor, transportation and packing cost shares 0.95,1 and 2
ETB respectively. This profit is low with case of lack of transportation and market in nearby. The
result of table 8 above shows that retailers acquired 16.95 birr per kg profit of enset. This
indicates that the performance of marketing of enset for the specified year 2018/19G.C was
showing a good profit when we compare with that of producers. The marketing cost and
transportation cost incur the highest cost of 0.50 birr. Second cost incurred due to labor is 0.30.
As table 8 depicts; cost and profitability analysis of bulla for 2018/19 G.C production year in the
study area was not satisfactory as regards to its profitability. This shows that bulla producer with
74.9 kg average annual productions of bulla with average market price of 15 Birr at farm gate
were generate profit margin of ETB 11.25/kg. With regarding to the production the cost is not
satisfactory to the farmer. There is loss of cost which account 1.25 birr due to lack of extension
education on post-harvest loss and accessibility of packing material.
As table 8 shows, retailers achieved 9 birr per kg profit of bulla. This describes that the
performance of marketing of bulla for the specified year 2018/19 G.C show less profit when we
compare with that of bulla producers. The table also indicates that from marketing cost, labor
costs incur the highest cost of 2.34 % and 1.87 % for transportation cost and profitability analysis
of bulla for wholesalers is illustrated in the table 8 above. Average costs and sale prices of
wholesalers also were undertaken.
4.4.3 Marketing margins
Marketing margins are the difference between prices at two market levels. The term market
margin is most commonly used to refer to the difference between producer prices of an
equivalent quantity and quality of a commodity. However, it may also describe price differences
between other points in the marketing chain, for example, between producer and collectors, or
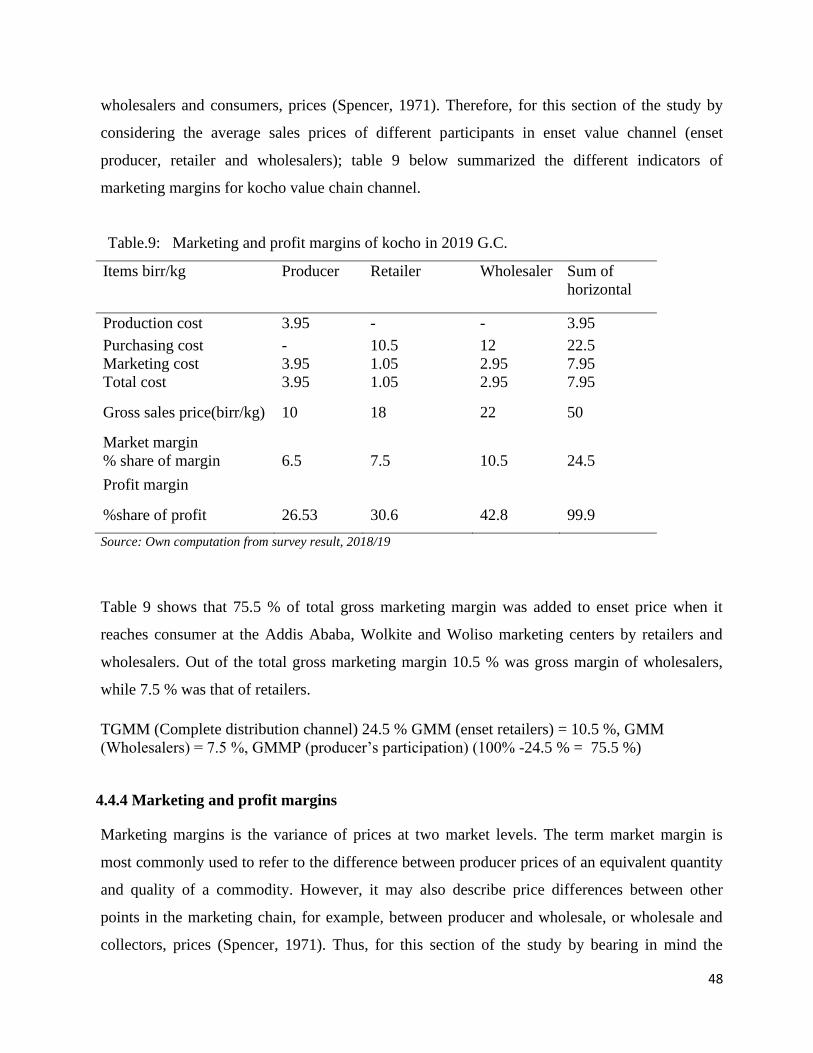
48
wholesalers and consumers, prices (Spencer, 1971). Therefore, for this section of the study by
considering the average sales prices of different participants in enset value channel (enset
producer, retailer and wholesalers); table 9 below summarized the different indicators of
marketing margins for kocho value chain channel.
Table.9: Marketing and profit margins of kocho in 2019 G.C.
Items birr/kg Producer Retailer Wholesaler Sum of
horizontal
Production cost 3.95 - - 3.95
Purchasing cost - 10.5 12 22.5
Marketing cost 3.95 1.05 2.95 7.95
Total cost 3.95 1.05 2.95 7.95
Gross sales price(birr/kg) 10 18 22 50
Market margin
% share of margin 6.5 7.5 10.5 24.5
Profit margin
%share of profit 26.53 30.6 42.8 99.9
Source: Own computation from survey result, 2018/19
Table 9 shows that 75.5 % of total gross marketing margin was added to enset price when it
reaches consumer at the Addis Ababa, Wolkite and Woliso marketing centers by retailers and
wholesalers. Out of the total gross marketing margin 10.5 % was gross margin of wholesalers,
while 7.5 % was that of retailers.
TGMM (Complete distribution channel) 24.5 % GMM (enset retailers) = 10.5 %, GMM
(Wholesalers) = 7.5 %, GMMP (producer’s participation) (100% -24.5 % = 75.5 %)
4.4.4 Marketing and profit margins
Marketing margins is the variance of prices at two market levels. The term market margin is
most commonly used to refer to the difference between producer prices of an equivalent quantity
and quality of a commodity. However, it may also describe price differences between other
points in the marketing chain, for example, between producer and wholesale, or wholesale and
collectors, prices (Spencer, 1971). Thus, for this section of the study by bearing in mind the

49
average sales prices of different participants in bulla value channel (producer, wholesaler and
retailer), Table 13, summarized the different pointers of marketing margins for bulla value chain
Channel.
Table.10: Marketing and profit margin of bulla in 2018/19 G.C.
Items birr/kg Producer Collector Wholesaler Sum of
horizontal
Production cost 2.5 - - 2.5
Purchasing cost - 15 15 30
Marketing cost 2.5 1 3.5 7
Total cost 3.75 16 18.15 37.9
Gross sales
price(birr/kg)
15 25 40 80
Market margin 12.5 24 36.5 73
% share of margin
Profit margin 17.12 32.8 50 99.7
%share of profit
Source: Own computation from survey result, 2018/19
TGMM (Complete distribution channel) 73 % GMM (bulla retailers) = 36.5 % GMM (whole
salers) = 24 % GMMP (producers’ participation) 100% -73% = 27 %
Table 10 shows that 73 % of total gross marketing margin was added to bulla price when it
reaches consumer at the Addis Ababa, Wolkite and Woliso marketing centers by retailers and
wholesalers. Out of the total gross marketing margin, 36.5 % was gross margin of wholesalers,
while 24 % was that of retailers.
50
4.5 Econometric Model Results
4.5.1 Results for Multiple Linear Regression Model
This section focuses on the results from the econometric analysis using multiple leaner
regression model to identify the determinants for enset supply.
Enset is produced for market and consumption and important as income generating in Abshege
woreda. According to the result of this study, all sample households are good suppliers of kocho
and bulla to the market. Analysis of factors affecting farm level marketable supply of kocho and
bulla was found to be important to identify factors constraining kocho and bulla supply to the
market. The analysis was done separately. The numbers of kocho and bulla producers were 154.
Multiple linear regression model were employed to identify the factors. For the parameter
estimates to be efficient, unbiased and consistent assumptions of Classical Linear Regression
(CLR) model should hold true. Hence, multicolliniarity, endogeniety and heteroscedasticity
detection tests were performed using appropriate test statistics.
To start with, to check whether multicollinearity is present or not a simple correlation coefficient
matrix was conveyed. Gujarati (2003) establishes a rule of thumb, which says that
multicollinearity is a serious problem when the correlation coefficient is 0.8 or above. Thus,
though correlation is present, multicollinearity is not a serious problem in our data (Appendix:
6). The command robust (in Stata) was used to correct for heteroscedasticity. There is no
multicollinearity problem since VIF results are less than 10 (Appendix Table 7). But before
estimation was done, data exploration is an important step.
To test the significance of the multiple regression model; F- test, the R2 are used. The
computation result for R2 is 41 %, this results show that the models are statistically acceptable as
41.5 % of the variation is explained in the multiple regression model (table 11). The test that is
used to confirm the validity of the all variables jointly estimation was F-test. The F-test shows
that the model is significant at 1 percent level of significance showing that the overall model is a
good fit and p value is too small, Prob> F = 0.0000. The calculated value is higher than the
tabulated value at one percent significance level. Therefore, the F-test of goodness-of fit under

51
the null hypothesis that all parameters are zero can be rejected. Hence, our data fits the multiple
linear regression models very well. (See table 11).
Table 11: Determinants of Kocho and Bulla quantity supplied to the market
Variable Coef. Std. Err. t P>|t|
Age (Age of enset producer) -.9099747** .5150431 -1.77 0.079
EduLevel (Education level of enset)
producer
.2070339 2.649326 0.08 0.938
FamlSize -3.179256 2.322056 -1.37 -1.37
NoOfWom 2.65333 2.526554 1.05 0.295
EnsProdInDay 9.628325 12.28202 0.78 0.434
AcsblTrn 15.73017 18.58902 0.85 0.399
Mrakc 5.644907 9.207774 0.61 0.541
HMEPr .2581805*** .0448327 5.76 0.000
HMBPr .2387773** .1242041 1.92 0.057
HMLO -3.443568 2.771648 -1.24 0.216
ExtContServ -6.502558 8.617429 -0.75 0.452
RateOfExp 21.99996** 8.648039 2.54 0.012
_cons -3.867215 53.77189 -0.07 0.943
Number of obs = 154 Prob> F = 0.0000
Root MSE = 52.499 R-squared = 0.4151
F( 12, 141) = 12.28
Source: Own computation from survey result, 2019
Note: Dependent variable is the amount of kocho and bulla soled in kg. ***, ** and * are
statistically significant at 1%, 5% and 10%, respectively. Amount is an instrument for quantity
of kocho and bulla supplied. In most econometric data particularly in cross-sectional data, we
are more likely to encounter heteroscedasticity problem. Since our data is cross sectional by its
nature we are likely to encounter with the problem of heteroscedasticity. To correct these
problem robust standard errors were estimated.

52
4.5.2 Determinants of Kocho and Bulla market supply
Table 11 shows the different demographic and socio-economic factors of respondents on enset
supply. The dependent variable is a continuous variable measured in kg per year. The findings of
the multiple linear along with its test statistics are discussed below.
Age of respondent (Year): -the variable negatively affects and significant at less than 5 %level
of significance. As age of the producer increased work force number of the farming family
increased and produce more. In addition to these, as age of the producer’s family is below ratio
of work force, the number of work force or labor decreases.
Market Access (Mrakc): It affects marketed supply of kocho and bulla positively and
significantly affect at less than 10% significance level. The amount of kocho and bulla supplied
to the market increase by 5.6 quintal. This suggests that access to market increases motivation of
enset producers towards their kocho and bulla production and channel choice. The closer the
market, the lesser the transportation charges, reduced walking time, and reduced other marketing
costs, better access to market information and facilities. The implication is that obtaining and
accessing to market helps supply more quantity of kocho and bulla. This is in line with Abreham
(2013) as the distance to the market center increases transportation cost increases; since cabbage
is highly perishable and bulky product its loss and other marketing costs increased.
How much enset produced (HMEPr):-As hypothesized, the regression result shows that
quantity produced significantly affected kocho and bulla quantity supplied to the market at 1%
significance level. The result also implied that, a quintal increase in the quantity of kocho and
bulla production has caused an increase of 25.8 quintal of marketable kocho and bulla. This is in
line with Abay (2007); Adugna (2009) and Ayelech (2011) who illustrated an increase of tomato,
mango, avocado and papaya production by farming households has augmented marketable
supply of the commodities significantly.
How much bulla produced (HMBPr):-the variable positively affect at less than 5 % level of
significance. The result also implies that, a quintal increase in the quantity of bulla production
has caused an increase of 23.8 quintal of marketable quintal. This is in line with Abay (2007);
Adugna (2009) and Ayelech (2011) who illustrated an increase of tomato, mango, avocado and
53
papaya production by farming households has augmented marketable supply of the commodities
significantly.
4.5.3 Result for Multivariate Probit model
Multivariate probit model was used to identify factors affecting Kocho market outlet choice
decision of the farm households. Wald test (χ2 (154) =51.43, p=0.0878) is significant at less than
1% probability level. This result implies that the coefficients are jointly significant and the
explanatory power of the factors included in the model is satisfactory.
Furthermore, results of likelihood ratio test of the model (LR χ2(10) =75.035, χ2= 0.0000) is
statistically significant at 1% significance level, indicating that the independence of the
disturbance terms (independence of market outlet choice) is rejected and there are significant
joint correlations for two estimated coefficients across the equations in the models. The
correlation coefficients are statistically different from zero in 5 of the 14 cases, confirming the
appropriateness of the multivariate probit specification and market choice outlets are not
mutually independent. The results on correlation coefficients of the error terms indicate that
there are complementarities (positive correlation) and substitutability (negative correlation)
between different market outlet choices being used by farmers. The SML estimation results
suggested that there was positive and significant interdependence between household decisions
to choose consumer and retailer. The SML estimation results also suggested that there is
negative and significant interdependence between household decisions to choose retailers outlet
and wholesaler outlet; retailer outlet and consumer outlet (Table12).
The result of multivariate probit model shows that the likelihood of households to use
wholesalers, retailers and consumers market outlet for Kocho were 58.4 %, 55.8 %and 62.3 %
respectively. The result also shows that the joint probability of using all outlet choice was
0.0013577 for success and 0.0676308 for failure of joint probability to use all outlets. As
depicted in Table 12 out of thirty explanatory variables included in multivariate probit model,
three variables significantly affected wholesaler market outlet, two variables significantly
affected retailers market outlet; three variable significantly affected consumer outlet at 1, 5 and
10% probability levels.
54
Table 12 presents, the results of multivariate probit model. The result indicates that the
correlation coefficients among the equations are highly significant, which means that the
multivariate probit model is superior to the individual probit models. In addition, a likelihood
ratio test rejects the restrictions implied by separate probit models for the three outlets.
According to Fafchamps and Hill (2005), the correlation is positive between the wholesalers and
the retailers but is negative between the wholesalers and the retailers’ outlets as well as
wholesalers and consumers. This suggests that farmers who start using an alternative chain to the
wholesaler one are more prone to using another one. In this study the result shows that the three
alternative channels wholesalers, retailers and consumers are negatively related. This suggests
that there is an inverse relationship among the choice channels; when the farmers want to sell
kocho and bulla if the price of consumer decreases the price of retailer and wholesaler may a
prone choose to the farmer to earn a good income.
The amount of enset produced per day has negative effect and significant on both wholesaler and
retailer whereas positively associated with producer. This indicates that the amount of enset
produced per day affects the income of wholesaler while retailers gain profit as the amount of
enset produced per day increased. Distance from the nearest market has positive and significant
on both wholesaler, and retailers market outlet choice whereas has negative effect on consumer
market outlet choice.
Access to market has positively associated and on both retailer and consumer market outlet
though taking negative effect on consumer market outlet. As the market center is in nearby to
the farmer the chance to access retailer market outlet is better and benefited. In the consumer
side as the market center is far they lack to access the product. This indicates that households
who are closer to market were assumed to have more probability to choose wholesalers and
consumers outlet whereas household who are far from the market were expected to be associated
with sales to the retailer market outlet Fafchamps and Hill (2005). This is may be due to the
reason that as the distance to the market center increases transportation and other marketing costs
increased.
55
Number of women participated (NoOfWom): the number of women participated in the
production of enset and bulla was positively associated with retailer and consumer at significant
level of 10 % significance level. Women’s plays crucial role in production process of kocho and
bulla; after producing enset through value addition bulla will be produced.
Number of women participated in kocho and bulla production negatively affect retailer and
significant on both retailer and consumer market outlet with positive association to consumer.
This implies that as amount of women participated in production process of kocho and bulla the
amount supplied to the market become high. Thus as the amount of kocho and bulla supplied to
the market increased consumers become benefited.
Amount of enset produced per day (EnsProdInDay): it is hypothesized, amount of kocho and
bulla produced negatively influence both wholesaler and consumer with positive association to
retailer. Significantly influence at less than 1 %.
Value addition to bulla (VAdB): It has a significant and positive relationship with likelihood of
choosing wholesalers outlet at 1 % and 1 % significant level. Value addition on bulla negatively
influences both retailer and consumer. This result shows that bulla producers who add more value
would more likely to choose wholesaler market outlets. This result is consistent with the findings
of Abraham (2013) that showed that post-harvest handling is negatively and significantly related
with producer market outlet. Post-harvest value addition practice will increase the probability of
households‟ decision to sell Kocho to consumer and processors marketing channels and will
decrease the probability of households‟ to choose wholesaler and retailer’s outlet. The reason may
be selling to consumer and retailer market outlet requires transporting the product to urban centers,
who seek better quality and farmers secure better price than retailers and consumers market outlet.
Access to Market Center (MrktCent): - The likelihood of choosing wholesalers and consumer
market outlet was positively and significantly affected by kocho and bulla at 1% and 5% level of
significance respectively. Lack of market access in nearby negatively influence consumers market
outlet. This means that large number of the farmer preference increases the likelihood of selling
kocho and bulla to wholesalers and consumers market outlets.

56
This is due to the fact that wholesalers buy in large volume relative to other market channels for
making proper benefit. The result is consistent with Nuri (2016) who indicated that large quantity
of bulla increases the likelihood of selling bulla to wholesalers’ market outlets.
Family size (FamlSize): -The likelihood of choosing retailers market outlet was negatively and
significantly affected by family size at 5% significant level. This result shows that farmers having
more family size would less likely sell kocho/bulla to retailers compared to those household who
had less family size. The possible reason might be as household size increase, consumption level
increase, which in turn decrease quantity supply. Therefore, as the quantity supplied is small, they
would not prefer retailer outlets rather they will prefer wholesaler or consumer.
Access to transport (AcsblTrn): -Influenced the choice of consumer’s outlets positively at 10%
level of significance. Farmers having own transport facilities are more likely to choose consumer
market outlets and less likely to choose other market outlets. This might be due to the reason that,
farmers who have transport facility could supply their product to urban center and sale to
consumer directly by getting better price, which might go to other outlets. This shows that the
availability of transportation facilities helps to reduce long market distance constraints, offering
greater depth in marketing choices. This result is in line with that of Fikru et al.(2017) who found
that owning transport facilities influenced the choice of collector’s outlet negatively and
significantly. Thus, when we compare farmer who have own transport facility with the farmer who
do not have own transport facility value addition per kilogram is higher (greater) by 1.37 and 1.60
birr for Kocho and Bulla respectively. This might be due to the fact that own transport facility
reduces transport cost which in turn increase value addition. This finding is supported by that of
Gebremedhin et al. (2009) who found that ownership of equines as a means of transport increased
market participation because equines reduce marketing costs. In addition, this finding is in line
with Nuri (2016) who indicate ownership of transport facility increase Kocho value addition.

57
Table 12: Multivariate probit results of the determinants of Kocho market outlet choice
Variable Whole seller Retailer Consumer
Coef. Std. Err. Z Coef. Std. Err. Z Coef. Std. Err. Z
FamlSize -.0791939 * .06804 -1.16 -.148555** .0694385 -2.14 .002604 .0740891 0.04
EnsProdInDay -.4848816 .27995 -1.73 .1604505 .2662526 0.60 -.067471 .2643173 -0.26
NoOfWom -.0328254 .06395 -0.51 .1204117** .0667298 1.80 .110817* .0653127 1.70
VAdK .3916437 .36693 1.07 .0940808 .2863245 0.33 -.492367 .317376 -1.55
VAdB 1.343296** .54877 2.45 -.050831 .4722398 -0.11 -.934751 6370792 -1.47
HMEPr .001817 .00162 1.12 .0007926 .0017131 0.46 -.000976 .0015432 -0.63
ExtContServ -.2145521 .22151 -0.97 -.065095 .2122351 -0.31 -.194282 .2044679 -0.95
AcsblTrn -.4831434 .37489 -1.29 .239565 .3108641 0.77 .634027** .3829468 1.66
MrktCent .5424465** .21714 2.50 .1872625 .2048347 0.91 -.602674*** .1987891 -3.03
QConsd -.0015824 .00171 -0.92 -.001342 .0017621 -0.76 -.000127 .0016888 -0.08
QSdPr .0384943 .03355 1.15 -.006220 .0325632 -0.19 -.012045 .0313457 -0.38
HMBPr -.0030128 .00353 -0.85 .0006878 .0035381 0.19 .000314 .003415 0.09
HMLO .0863861 .06971 1.24 .1013247 .0811794 1.25 -.106319 .074495 -1.43
_cons .5040821 .96646 0.52 -.930228 .8882741 -1.05 1.20178 1.098185 1.09
Wholesalers Retailers Consumer
rho21 0.034
rho31 0.000
rho32 0.001
Predicted probability
Joint probability(success) .0013577 Joint probability(failure) .0676308
Number of observations 154Number of simulations 5Log likelihood -244.4222
Prob > chi2 = 0.08780.000Wald chi2(39) = 51.43
Likelihood ratio test of rho21 = rho31 = rho32 = 0: chi2(3) = 75.035 Prob > chi2 = 0.0000
Note: “Coef” and “Std. Err” represents coefficient and standard error respectively. “***”, “**”&”*” represents 1%, 5% and 10%
level of significance, respectively.
Source: own computation from survey result (N=154)
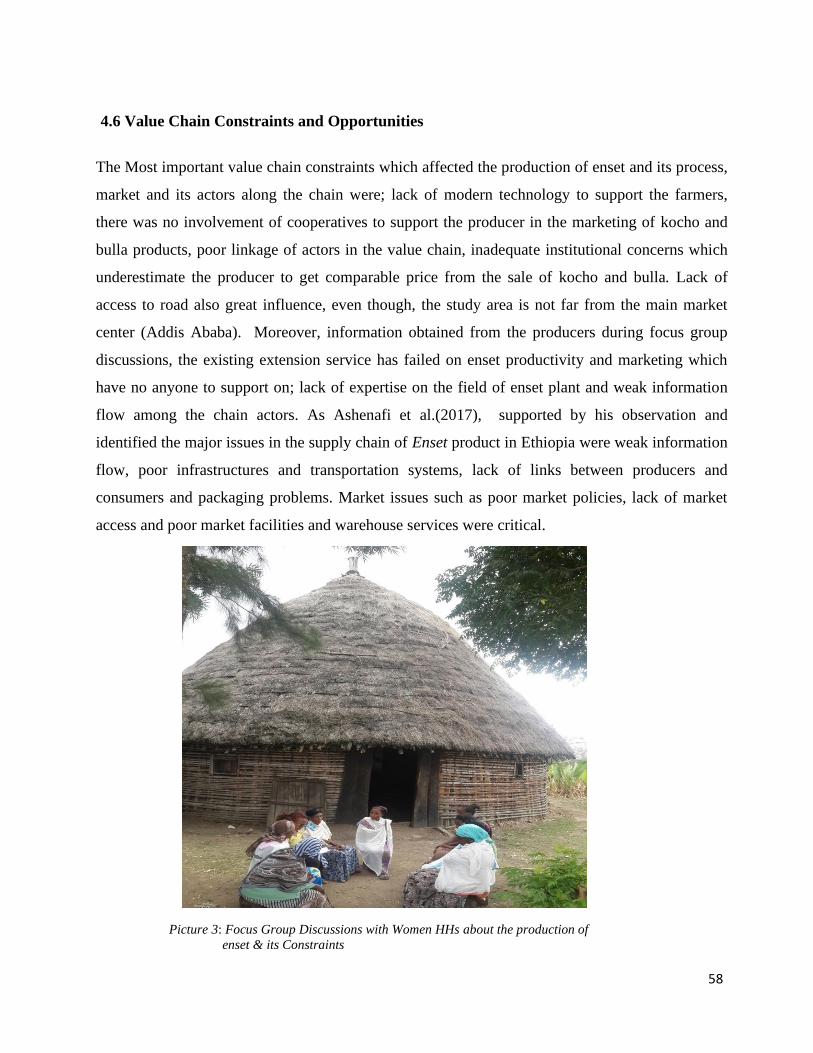
58
4.6 Value Chain Constraints and Opportunities
The Most important value chain constraints which affected the production of enset and its process,
market and its actors along the chain were; lack of modern technology to support the farmers,
there was no involvement of cooperatives to support the producer in the marketing of kocho and
bulla products, poor linkage of actors in the value chain, inadequate institutional concerns which
underestimate the producer to get comparable price from the sale of kocho and bulla. Lack of
access to road also great influence, even though, the study area is not far from the main market
center (Addis Ababa). Moreover, information obtained from the producers during focus group
discussions, the existing extension service has failed on enset productivity and marketing which
have no anyone to support on; lack of expertise on the field of enset plant and weak information
flow among the chain actors. As Ashenafi et al.(2017), supported by his observation and
identified the major issues in the supply chain of Enset product in Ethiopia were weak information
flow, poor infrastructures and transportation systems, lack of links between producers and
consumers and packaging problems. Market issues such as poor market policies, lack of market
access and poor market facilities and warehouse services were critical.
Picture 3: Focus Group Discussions with Women HHs about the production of
enset & its Constraints
59
Additionally, during focus group discussions with women and found out that constraint on
transport and distance from the nearest market that holds the producer not chooses the best market
channel. A woman gone to the local market, to sell kocho and bulla even though, the selling price
was cheap. It is because of lack of transport access and rural road that they prefer to sell on the
nearest market.
With all aforementioned constraints, there are also opportunities that can benefit enset value
chain actors in Abeshge woreda. Among the opportunities, now a day’s most of the Ethiopian
cultural foods, made up of raw meat ( kitfo) needs bread made up of kocho and also used
complement with vegetables. The demand increasing, especially in Addis Ababa, which has
more than 5 million dweller. In addition, the main road built by asphalt, the chain actors,
specially the farmers can create an association to link with the central market (merkato), they can
sale their product easily and maximize their profit accordingly.
As Henok T. (2018); found out that the rising of cereal prices also increase demand for Enset
products as a cheaper substitute. If consumption increases, this can encourage increased Enset
production and expand the pos itive impact that Enset has on Ethiopian food security. Moreover,
the increase in awareness toward nutritional as well as medicinal value of Enset food products also
creates additional demand.
60
CHAPTER FIVE
SUMMAY, CONCLUSION AND RECOMMENDATIONS
5.1 Summary and Conclusion
This study aimed at investigating Enset value chain and its determinants of rural households in
Abeshge woreda, Gurage Zone, Southern Ethiopia. The specific objective of this study were
contain examining enset value chain options and actors performance, identifying determinates of
enset supply to the market, finding out factors affecting market outlet choice decision and
opportunities and constraints of enset producers along the value chain.
The survey implemented primary data collection by using questionnaire from 2 sample kebeles of
154 enset producer households proportionally and 10 traders, 15 consumers of kocho and bulla
from two towns (wolkite and Addis Ababa) were interviewed through pre-prepared checklists.
Key informants of Gurage zone agricultural office Head also done by using pre-tested structured
schedule questionnaire and interview. This survey also got the secondary data from Wolkite
agricultural and natural resource office and from published and unpublished resources to develop
and support the findings. The methods of analyzing the data were descriptive statistics and
econometric analysis to get determinant factors of enset along the value chain. Multiple Linear
Regression model used to identify the determinant factors of kocho and bulla supply to the
market. Multivariate tobit Regression model applied to analyze factors affecting market outlet
choice of kocho and bulla selling in the study areas. The findings of this study are summarized as
follows.
The two sampled kebeles of Abeshge woreda enset value chain actors are producers (suppliers),
wholesalers and retailers. Regarding input supply, farmers themselves and private input suppliers
are the main sources of input supply. Producers can seold their products either of the wholesaler
or retailers at different levels. Wholesalers are mainly bought the product from local market and
sold to consumer and retailers. Retailers are found in towns and the last market chain actors to
collect from the wholesalers and sell to the consumers.

61
The findings of this study revealed that lack of adequate institutions, improved varieties, lack of
government involvement in supply input and facilitating market of the product are the main
production and market constraints. In addition,
The value chain analysis of kocho and bulla in the study area discovered that the main value chain
actors are kocho and bulla producers, wholesalers, retailers and consumers. Kocho and bulla
producers were the main actors who were involved in the production and input supply activities.
Wholesalers purchase the products from the producers and sell to consumers and retailers. In
addition to this the consumer also directly bought from the producers. Retailer purchases kocho
and bulla from wholesalers and sell to end users/consumers.
Regarding value chain performance of the study area, lack of efficient processing devices and
inefficient linkage of chain actors, the marketing got constraints in the process. On the other
hand, the road constructed by asphalt specially the small towns near to the producers nowadays
the price of cereals are increasing time to time, the dwellers increased the purchase of kocho and
bulla, with this situation the price of the product increased and in the mean time the producers
income increased, this is a good opportunity to them.
kocho and bulla producers in the study area supply their products to the market. To identify the
determinates that affect the supply of their product to the market, multiple linear regression
model used.
The result of the multiple linear regression model indicates that marketable supply of kocho and
bulla is significantly affected by gender, age of the family member, access to market and
distance to nearest market. Therefore, these variables require special attention if marketable
supply is to be increased.
Kocho and bulla producers in the study areas supply their product through different market
outlets. Producers were classified into three categories according to their outlet choice decision:
those who have supplied most of their kocho and bulla product to the market. The multivariate
tobit model was run to identify factors determining producers’ market outlet choice decision. The
model results indicated that the probability to choose the retailer outlet was significantly affected
62
by age of the producer, educational level of the producer, amount of kocho and bulla soled, and
distance to the nearest market determined as the selection of retailers as market options. In
addition to this sex of the producer, harvesting time and distance to the nearest market affect that
of retailers. Access to market, harvesting time is determining choice of consumer outlet. In
addition to this distance to the market considered as continuous and affect the choice of
consumer outlet access to extension service, amount, access to market information, credit access
and kocho and bulla soled compared to wholesale outlet. Similarly, the probability of choosing
consumer marketing outlet was affected by age, amount of products sell and access to extension
services compared to wholesale outlet. Therefore the above indicators require special attention
for the producer that got from sell of the product and the improvement of their livelihood as well.
The other point raised in Focus Group discussions with women tells constraint on transport and
distance from the nearest market that holds the producer not chooses the best market channel. A
woman goes to and leads preferred the local market and sell kocho and bulla even though, the
selling price is cheap. It is because of lack of transport access and rural road that they prefer to
sell on the nearest market.
Furthermore, the study identified that amount of value addition and quantity of kocho and bulla
supplied are important factors observed to influence the producer to choose the appropriate market
outlets. When farmers add value, the quality and quantity of the demand for the product will
increase which will in turn increase their probability of choosing appropriate market outlets for
their benefit maximization.
63
5.2 Recommendations
The findings of this study need to recommend points that help to improve kocho and bulla
production and efficient marketing system in the study area.
There are many actors involved and playing roles in kocho and bulla value chain in the study area.
But their role was not as such effective to benefit the producers. It is because of weak and
unproductive linkages of chains among the actors. In addition, there were also weak responsible
body who is relevant direct responsible to the sector. On the other hand, promoting the
development of kocho and bulla value chain is required. In particular, positive attitudes toward
partnership, networking and learning need to be developed among main actors in the value chain
to benefit the producer and to encourage on supporting the product regularly.
In the study area, farmers took trainings about increasing production and productivity. However,
with the shortage of land size and population increment in a household level, farmers need to plant
seasonal crops than perennial plant like enset. On the contrary the demand of kocho and bulla
within the country especially, in many large cities increasing. So the farmers need intensive
training how to develop their production and productivity in line with facilitating marketing and
value addition knowledge also important.
When there is value addition on the product, it enhances the choice of appropriate market outlets
for the producer. Hence, attention should be given to value addition of enset products and
increasing the quantity of kocho and bulla products. The problem of transportation facility and
distance from the nearest market are other important factor that influence the choice of suitable
market channels and the profit from it. Moreover, Enset is a staple food for the study area and
tremendous benefit is received from it. Hence, Concern government bodies, NGO’s and other
related institutions can participate on providing modern technologies that help the producer to
increase their product and productivity. Government has to build more rural road infrastructure,
Extension service and develop modern production materials that have a significant role in
increasing production and the choices of pertinent market channel on the study area.

64
REFERENCE
A Handbook by USAID (2012): Promoting Gender Equitable Opportunities in Agricultural Value
Chain
A.A. Enete and T.A Amusa 2002. Determinates of Women’s Contribution to Farming Decisions
in Cocoa Based Agroforestry Households oe Ekiti State, Nigeria
Abay Akalu, 2007. Vegetable Market Chain Analysis: The case of Fogera woreda in ANRS of
Ethiopia
Abebe Uma and Paul, 2015: Enset value chain analysis. The case of Dire Enchini woreda,
Oromia regional state, Ethiopia
Abraham S., Yishak G. and Melese T., 2012: Diversity, Challenges and Potentials of Enset (Ensete
Ventricosum) Production: In Case of Offa Woreda, Wolaita Zone, Southern Ethiopia.
Abraham Tegegn. 2013. Value Chain Anlysis of Vegetables: The cae of Habro and Kombolcha
Woredas in Oromia region.
Addis T., Azerefegne F. and Blomme G., (2008). Density and distribution of enset root meal
bugs on enset
ADMASU. T. and P. C. STRUIK, (2002). Analysis Of Enset (Ensete Ventricosum) Indigenous
Production Methods And Farmbased Biodiversity In Major Enset-Growing Regions Of
Southern Ethiopia
Adugna Gessesse, 2009. Analysis of Fruit and Vegetable Market Chain in Alamata, Southern
Zone of Tigray: The cae of Onion, Tomato and Papaya.
Alem S. (2007). Determinants of Food Insecurity in Rural Households in Tehuludere Woreda,
South Wello Zone of the Amhara Region
Alemayehu A. (2017). The Role of Women in Enset Markt Chain the Cause of Dawuro Zone,
Southern Nations Nationalities and Peoples Regional State, Ethiopia
Alemayehu A. (2018). The Role of Women in Enset Markt Chain the Cause of Dawuro Zone,
Southern Nations Nationalities and Peoples Regional State, Ethiopia
Alemayehu Tsegaye & P.C. TRUIK,(2002). Analysis Of Enset (Ensete Ventricosum) Indigenous
Production Methods And Farm-Based Biodiversity In Major Enset-Growing Regions Of
Southern Ethiopia, actors-in-agricultural-value-chain, 2019 analysis and development: a

65
staff working paper, Vienna and its relation to household food and livelihood securityin
South-western Ethiopia
Andreas Stamm / Christian von Drachenfels (2011). Value Chain Development Approaches and
activities by seven UN agencies and opportunities for interagency cooperation.
Aregu, L., Puskur, R., & Bishop-Sambrook, C. (2011). The role of gender in crop value chain in
Ethiopia.
Ashenafi Chaka Tuffa, Tadesse Kenea Amentae, and Girma Gebresenbet (2017): Value Chain
Analysis of Warque Food Products in Ethiopia.
Asnake B. et al. (2018), Suitability Analysis for Enset (Ensete ventricosum Cheesman (Welw))
Cultivation in Maraka District, Dawuro Zone, Southern Ethiopia
Asres Ayele and Omprakash Sahu (2014): Extension of Enset Plant Product for Rural
Development in Ethiopia.
Ayele, A., & Sahu, O. (2014). Extension of Enset plant product for rural development in
Ethiopia. J Agric Econ Extens Rural Develop, 2(3), 031-040.
Ayelech Tadesse, 2011.Market chain analysis of fruits for Gommadistrict, Jimma zone, Oromia
National Regional State. M.Sc. thesis presented to School of Graduate Studies, Haramaya
University.p110.
Belachew G. et al.(2017). Indigenous Knowledge of Enset (Ensete ventricosum (Welw.)
Cheesman) Cultivation and Management Practice by Shekicho People, South west
Ethiopia.
Berhanu Geberemedin and Moti Jaleta. 2010. Commercialization of smallhodlers: does Market
oreinttion translate in to Market participation? Improving productiviety and market success
(IPMS) of Ethiopian farmer project working paper 22. Nairobi Kenya, ILRI.
Brandt, S.A., Spring, A., Hiebsch, C., McCabe, J.T., Tabogie, E., Diro, M., Wolde-Michael, G.,
Yntiso, G., Shigeta, M. and Tesfaye, S. (1997). The tree against hunger. Enset-based
agricultural systems in Ethiopia; American Association for the Advancement of Science
Chaka, A. (2016). Supply and value chain analyses of warqe food products in relation to post-
harvest losses (Vol. 89). Available at: https://smallbusiness.chron.com/market-value-chain-
analysis-77384.html (Accessed on: 28/9/2018) Cliffs.
66
Dawit Gebregziabher, 2010. Market chain analysis of poultry: The case of Alamata and Atsbi-
Wonbertadistricts of Tigray Region. M.Sc thesis submitted to the School of Graduate
Studies, Haramaya University. 80p. Doctoral Dissertation, Haramaya University,
Haramaya, Ethiopia.
Drucza, K. and Abebe, W. (2017). Gender transformative methodologies in Ethiopia’s agricultural
sector: A review. CIMMYT, Addis Ababa, Ethiopia
E.F. Fabiyi1, B.B. Danladi1, K.E. Akande1 and Y. Mahmood (2007). Role of Women in
Agricultural Development and Their Constraints: A Case Study of Biliri Local Government
Area, Gombe State, Nigeria
Ending Hunger in Africa, 2014: The African Union’s Malabo Declaration on Agriculture
Transformation.
Enete, A.A., F.I. Nweke and E.Tollens.(2002). Determinants of cassava cash income in female
headed households of Africa. Quarterly Journal of International Agriculture, 41.
FAO (2012) The State of Food Insecurity in the World: Economic Growth is Necessary but Not
Sufficient to Accelerate Reduction of Hunger and Malnutrition, Rome: FAO,
http://www.fao.org/docrep/016/i3027e/i3027e.pdf
FAO, (2011). Women in agriculture: closing the gender gap for development
Greene, W. 2000: Econometric Analysis.4th edn. NJ: Prentice Hall, Englewood
Gujarati, D., 2003: Basic Econometrics.4th edition.Tata McGraw-Hill Publishing Company
Limited, New Delhi, India. 614p. https://agriculturenigeria.com/research/articles/
Henok T.,(2018): Value Chain Anlysis of Esnet (Ventricosum): THE CASE OF CHEHA
DISTRICT, GRURAGE ZONE, ETHIOPIA.
Hunduma T.K, Sadessa, E. Hailu and M.oil (2015). Evaluation of enset clones resistance
against enset bacteria wilt disease (xanthomonascamp estripv.musacearum)
Hunduma,T., &Ashenafi, M. (2011). Traditional Enset (Enseteventricosum), processing
techniques in some parts of West Shewa Zone, Ethiopia.
IFAD (2011): (International Fund for Agricultural Development). Women and rural development:
Enabling poor rural people to overcome poverty. Rome, Italy
Jema Haji, 2008. Economic efficiency and marketing performance of vegetable production in the
Eastern and Central Parts of Ethiopia. PhD Dissertation, Swedish University of
Agricultural Sciences, Uppsala, pp64.
67
Johnson, K.(2018), Market Value Chain. Hearst Newspaper. Available at: JOSEPH OKPAIRE:
ACTORS IN AGRICULTURAL VALUE CHAINS - Agriculture Nigeria
Johnston, B. F. and J. W. Mellor, (1961). “The Role of Agriculture in Economic Development.
The American Economic Review 51 (4): 566 – 593.
Kaplinsky, R. and Morris, M., 2001. A handbook for value chain research (Vol. 113). Ottawa:
IDRC.
Kaplinsky, R., 2000. `Globalisation and Unequalisation: What Can Be Learned from Value Chain
Analysis?`, The Journal of Development Studies, vol. 37, no.2, pp 117-146. Available online
at DOI:10.1080/713600071
Kassa Tarekegn Jema Maji Bosena Tegegne. 2017. Determinants of honey producer market outlet
choice in Cheha District, Southern Ethiopia: A multivariate Tobit regression analysis. Journal
of Agricultural and Food Economic, doi. 10.1186/s40100.107-0090-0
KENO B.(2015): Fish Value Chain Analysis On Fincha Amarti Nashe Reservoir: The Case Of
Horo Guduru Wollega Zone, Oromia, Ethiopia
Kolter P.G., Armstrong, 2003. Principle of Marketing, 10th Edition, Hall of India. Pvt. Ltd., New
Delhi, pp 5-12.
Macfadyen, G., Nasr-Alla, A.M., Al-Kenawy, D., Fathi, M., Hebicha, H., Diab, A.M., Hussein,
S.M.,Abou-Zeid, R.M. and El-Naggar, G., 2012. ´Value-chain analysis-An assessment
methodology toestimate Egyptian aquaculture sector performance`, Aquaculture, 362-363:
pp18-27. Available online at doi:10.1016/ j.aquaculture.2012.05.042
Magule, T.O, B. Tesfaye. M. Catellania and M. Enrico Pe’(2014). Indigenous, use and on-farm
management of enset enset ventricosum (welw) diversity in wolaita, Southern Ethiopia
Marshal Nigussie, 2011. Value chain analysis of sugarcane: The case of Kalu district, South
Wollo zone of Amhara National Regional state, Ethiopia. M.Sc thesis submitted to the
School of Graduate Studies, Haramaya University. 83p.
Martin G., O. Boualay and B. Julio, 2007.North Houaphanh bamboo value chain analysis
Netherland.
Mc Causland, A. (2010). Enset – the ‘False Banana’ Gives Food Security.
McFadden, D., 1978. Quintal choice analysis: a survey. Annals of Economic and Social
Measurement, 5(1976):363-390.
68
Mendoza, G., 1995. A premier on marketing channel and margins. Lyme Rimer Publishers Inc.,
USA.
Mesfine S. et al. (2018). Cultivation, preparation and consumption of ensete (ensete ventricosum)
in Ethiopia
Mulualem T. and Walle T.(2014). Farmers indeginous knowledge and assessment of enset
(enset ventricosum (welw). Cheermail cultivars for major enset pests in Ojoijia water
shade kembata tembaro zone, South Ethiopia
Mulugeta Geleta, (2018). Honey Value Chain Analysis with Especial Emphasis to Tarmaber
Woreda, North Shoa Zone of Ethiopia.
Nahusenay A.(2017): The Roles of Rural Women on Agricultural Labor Conscriptions in
Ethiopia: The Case of Delanta District, South Wello Zone
Nahusenay, A. & Tesfaye, T. (2015). Roles of rural women in livelihood and sustainable food
security in Ethiopia: A case study from Delanta Dawunt District, North Wollo Zone. Int. J.
Nutr. Food Sci, 4(3), 343-355.
Negash, A. (2001): Diversity and conservation of Enset (EnseteventricosumWelw. Cheesman)
Nuri Lefebo, (2016): Value chain analysis of Enset (Enset ventricosum) in Hadiya zone.
Riisgaard, L., Fibla, A. M., & Ponte, S. (2010). Evaluation study: gender and value chain
development. Copenhagen: The Evaluation Department of the Danish Foreign Ministry.
Sarah Mayanja et. al, (2016): Expanding Utilization of Roots, Tubers and Bananas and
Reducing Their Postharvest Losses
Shumbulo A. et al. (2012).Diversity, Challenges and Potentials of Enset (Ensete ventricosum)
Production: In Case of Offa Woreda, Wolaita Zone, and Southern Ethiopia
Simmonds NW (1958). Ensete Cultivation in the Southern Highlands of Ethiopia: A review.
Tropical Agriculture, 35:302-307.
Steven A. Brandt, Anita Spring, Clifton Hiebsch, J. Terrence McCabe, Endale Tabogie, Mulugeta
Diro, Gizachew Wolde-Michael Gebre Yntiso, Masayoshi Shigeta, and Shiferaw Tesfaye,(*1997):
The “Tree Against Hunger” Enset-Based Agricultural Systems in Ethiopia
Tadessa Daba &Masayoshi Shigeta,(2016). Enset (Ensete Ventricosum) Production in Ethiopia:
Its Nutritional and Socio-Cultural Values
Taye B, Feleke A, Regassa B (1984): The Cultivation of the Genus Ensete in Ethiopia. Soil and
Crop Sci. Soc. (Florida), 27:133-141.

69
Tesfaye H. (2008). Value Chain Analysis of Enset (Enset Ventricosum): The Case of Cheha
District, Gurage Zone, Southern Ethiopia
The SOFA Team and Cheryl Doss, (2011): The role of women in agriculture
Tsehaye Y., and Kebebew F. (2006); Diversity and cultural use of enset (enset ventricosum
(welw) checsman in Bonga in situ conservation site, Ethiopia
Tuffa, A. C., Amentae, T. K., & Gebresenbet, G.(2017). Value Chain Analysis of Warqe Food
Products in Ethiopia.
Tuffa, A. C.,(2016). Supply and Value Chain Analyses of Warqe Food Products in Relation to
Post-harvest Losses
UNIDO (United Nations Industrial Development Organization), (2009): Agro-value chain
Urgessa, M. (2011).Market chain analysis of teff and wheat production in Halaba Special Woreda,
southern Ethiopia (Doctoral dissertation, Haramaya University)
Welch F. (1978): The role of investment in human capital in agriculture. In: Schultz T.W. (Ed),
Distortion of Agricultural Incentives. Bloomington: Indiana University Press.
Wolday A. and Eleni G.(2003): Policies for Improved Land Management and Agricultural market
Development in the Ethiopian Highlands.
World Bank (2012): Scaling up School Feeding: Keeping Children in School while improving
their Learning and Health, Washington, DC: World Bank,
http://siteresources.worldbank.org/EDUCATION/Resources/278200-1334777272566/
Results2012-SB-HDN-Update-SchoolFeeding.pdf
World Bank.2011: World Development Report 2012: Gender Equality and Development.
Washington, DC: World Bank.
70
Appendices
Appendices One: Household survey
QUESTIONNAIRE
This questionnaire is designed to collect data for academic purpose only. This is to enable the
researcher, at Addis Ababa University, Collage of Developmental Studies, the Department of
Rural Livelihood and Development. The purpose of the questionnaire is to collect data on a
research topic entitled; Enset Value Chain and its determinants: The Case of Rural
Households in Abeshge Woreda, Gurage Zone.
Your response to the questions will be kept confidential. The reliability of your response will
help the quality of the research and hence be honest in giving the responses. I would like to
express my deepest gratitude for your willingness to spare your precious time to fill this
questionnaire.
Instruction
➢ You don’t need to write your name.
➢ Kindly put (X) mark on your choice.
➢ Your answer/opinion has great significance for the analysis of this study!
SECTION 1:
1. General Information
1.1 Name of the Kebele______________________
Name of the Household/respondent _______________________
1.2) Sex; 1=Male/ወንድ/ ------------ 2=Female ------------
1.3) Marital status: 1=single 2= Married 3= Divorced 4= widowed/(widower)
1.4) Educational Status: 1. Illiterate 2. Religious school 3.Non-formal Education 4. Grade 1-8 5. >
grade 8
1.5) Religion: 1=Orthodox 2=Protestant 3=Catholic 4=Muslim 5=Others (specify)__
1.6) Family size _____________________________
1.7) Number of members <15 years _____________
Number of members <64 years _____________
Number of members >64 years _______________
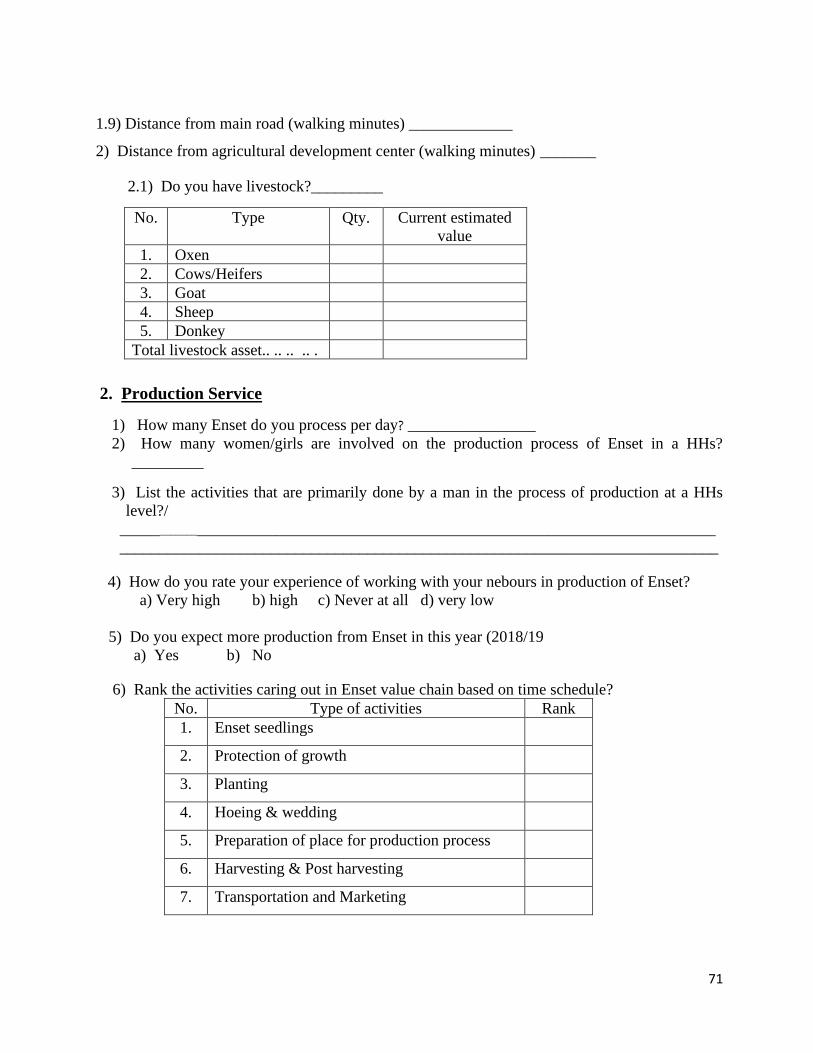
71
1.9) Distance from main road (walking minutes) _____________
2) Distance from agricultural development center (walking minutes) _______
2.1) Do you have livestock?_________
No. Type Qty. Current estimated
value
1. Oxen
2. Cows/Heifers
3. Goat
4. Sheep
5. Donkey
Total livestock asset.. .. .. .. .
2. Production Service
1) How many Enset do you process per day? ________________
2) How many women/girls are involved on the production process of Enset in a HHs?
_________
3) List the activities that are primarily done by a man in the process of production at a HHs
level?/ _____________________________________________________________________________
___________________________________________________________________________
4) How do you rate your experience of working with your nebours in production of Enset?
a) Very high b) high c) Never at all d) very low
5) Do you expect more production from Enset in this year (2018/19
a) Yes b) No
6) Rank the activities caring out in Enset value chain based on time schedule?
No. Type of activities Rank
1. Enset seedlings
2. Protection of growth
3. Planting
4. Hoeing & wedding
5. Preparation of place for production process
6. Harvesting & Post harvesting
7. Transportation and Marketing

72
Table 1: Draft- The activities of Enset plantation starting from preparing seedlings to production process and Marketing
No. Activities/
Processes
No. of Male
Participant
No. of days
in total
No. of Female
Participant
No. of
working in
total
Ave. daily
payment for
Male Labor
Ave. daily
payment for
Female Labor
% of cont.
by male ከ100%
% of cont.
by women 100%
Remark
1. Propagate/ enset seedlings
and preparing protection from
animals.
2. Planting enset
3. Hoeing and weeding
(duping animal dug and west
materials as fertilizer)
4. Preparing the place for
production process(Clearing
the land, materials will be
used etc.
5. Harvesting and
Post- harvest processing
6. Production Processing, storage
and making ready for
consumption
7. Transporting and marketing
activities
8.
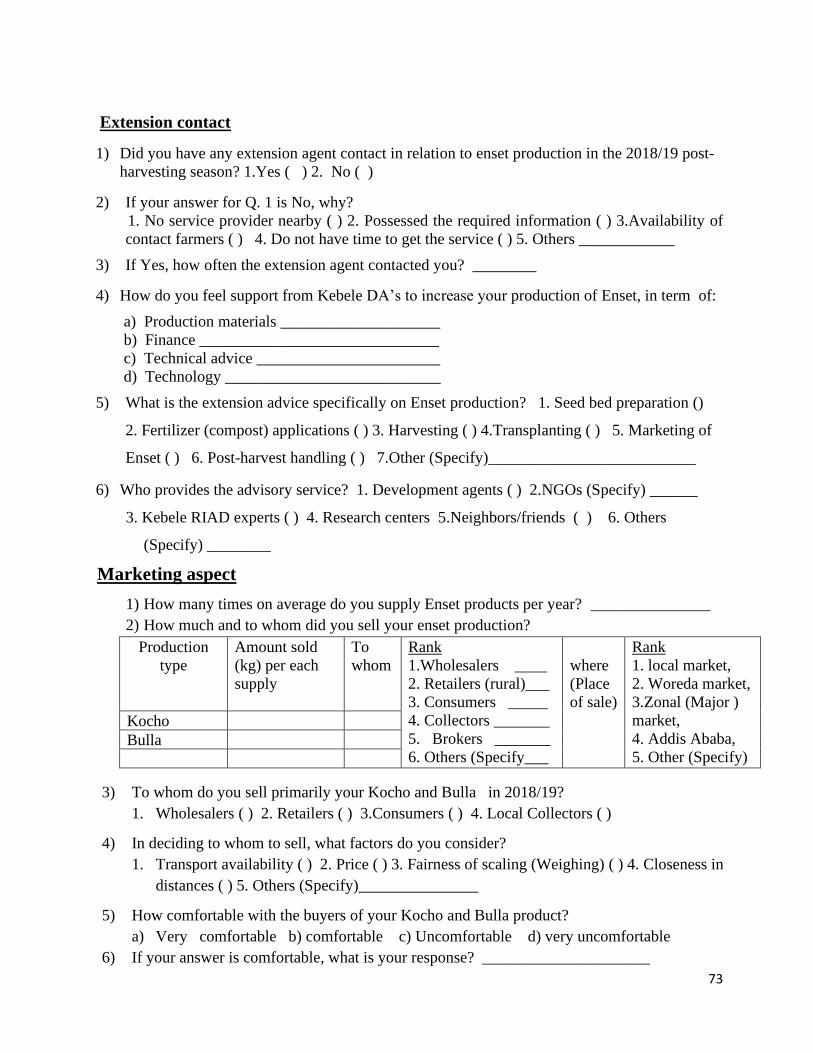
73
Extension contact
1) Did you have any extension agent contact in relation to enset production in the 2018/19 post-
harvesting season? 1.Yes ( ) 2. No ( )
2) If your answer for Q. 1 is No, why?
1. No service provider nearby ( ) 2. Possessed the required information ( ) 3.Availability of
contact farmers ( ) 4. Do not have time to get the service ( ) 5. Others ____________
3) If Yes, how often the extension agent contacted you? ________
4) How do you feel support from Kebele DA’s to increase your production of Enset, in term of:
a) Production materials ____________________
b) Finance ______________________________
c) Technical advice _______________________
d) Technology ___________________________
5) What is the extension advice specifically on Enset production? 1. Seed bed preparation ()
2. Fertilizer (compost) applications ( ) 3. Harvesting ( ) 4.Transplanting ( ) 5. Marketing of
Enset ( ) 6. Post-harvest handling ( ) 7.Other (Specify)__________________________
6) Who provides the advisory service? 1. Development agents ( ) 2.NGOs (Specify) ______
3. Kebele RIAD experts ( ) 4. Research centers 5.Neighbors/friends ( ) 6. Others
(Specify) ________
Marketing aspect
1) How many times on average do you supply Enset products per year? _______________
2) How much and to whom did you sell your enset production?
Production
type
Amount sold
(kg) per each
supply
To
whom
Rank
1.Wholesalers ____
2. Retailers (rural)___
3. Consumers _____
4. Collectors _______
5. Brokers _______
6. Others (Specify___
where
(Place
of sale)
Rank
1. local market,
2. Woreda market,
3.Zonal (Major )
market,
4. Addis Ababa,
5. Other (Specify)
Kocho
Bulla
3) To whom do you sell primarily your Kocho and Bulla in 2018/19?
1. Wholesalers ( ) 2. Retailers ( ) 3.Consumers ( ) 4. Local Collectors ( )
4) In deciding to whom to sell, what factors do you consider?
1. Transport availability ( ) 2. Price ( ) 3. Fairness of scaling (Weighing) ( ) 4. Closeness in
distances ( ) 5. Others (Specify)_______________
5) How comfortable with the buyers of your Kocho and Bulla product?
a) Very comfortable b) comfortable c) Uncomfortable d) very uncomfortable
6) If your answer is comfortable, what is your response? _____________________

74
7) If your answer is not comfortable, what is your response _________________
8) To which one of the following marketing center do you have access? (✓)
a) Local Market b) Welkite c) Weliso d) Addis Ababa e) if other _________
9) Who sets the market price primarily for you from the following?
1. Rural Collectors 2.Consumers ( ) 3. Wholesalers ( ) 4. Retailers ( ) 5. Processors ( ) 6.
Brokers ( ) 7 Others (Specify)______
10) Means of transportation used: 1.Vehicles ( ) 2. Manpower 3. [ ] Back of animals 4. [ ] Cart
5. Others (Specify)_______
11) If you used vehicles, how accessible is it?
A) High accessible b) moderately accessible c) Least accessible d) Not accessible
12) Average selling price of kocho in harvesting season__________Birr/kg,
13) Average selling price of bulla in harvesting season _______________Birr/kg,
14) How is the trend of price per unit of sales of kocho during the last 5 years? (√)?
Product type Increasing Decreasing The same
Kocho
Bulla
15) If increasing, why? ____________________________
16) If decreasing, why? ? ____________________
17) Do your kocho & bulla products have preferred qualities by buyers? (√)
1.Yes ( ) 2. No ( )
18) If your answer for Q.16 is No, what interventions are needed to improve quantity of kocho &
bulla production to attract better prices___
19) Do you consider quality requirement of your customers in your production process? 1. ( )
Yes 2.No ( )
20) If your answer for Q.19 is Yes, what quality requirement do you consider for?
1. Kocho________________
2. Bulla_________________
21) What was your source of information about quality requirement of your customers?
22) Do you have made any value addition on your kocho? A) Yes B) No
23) Do you have made any value addition on your Bulla? A) Yes B) No
24) If your answer for Q.22 & 23 is Yes, what are those value adding activities?
Crop type Value adding
activates*
How much it
costs? (Birr/qt)
Kocho 1. Cleaning
2. Cutting
3. Storage
4. Others
(Specify)
Bulla
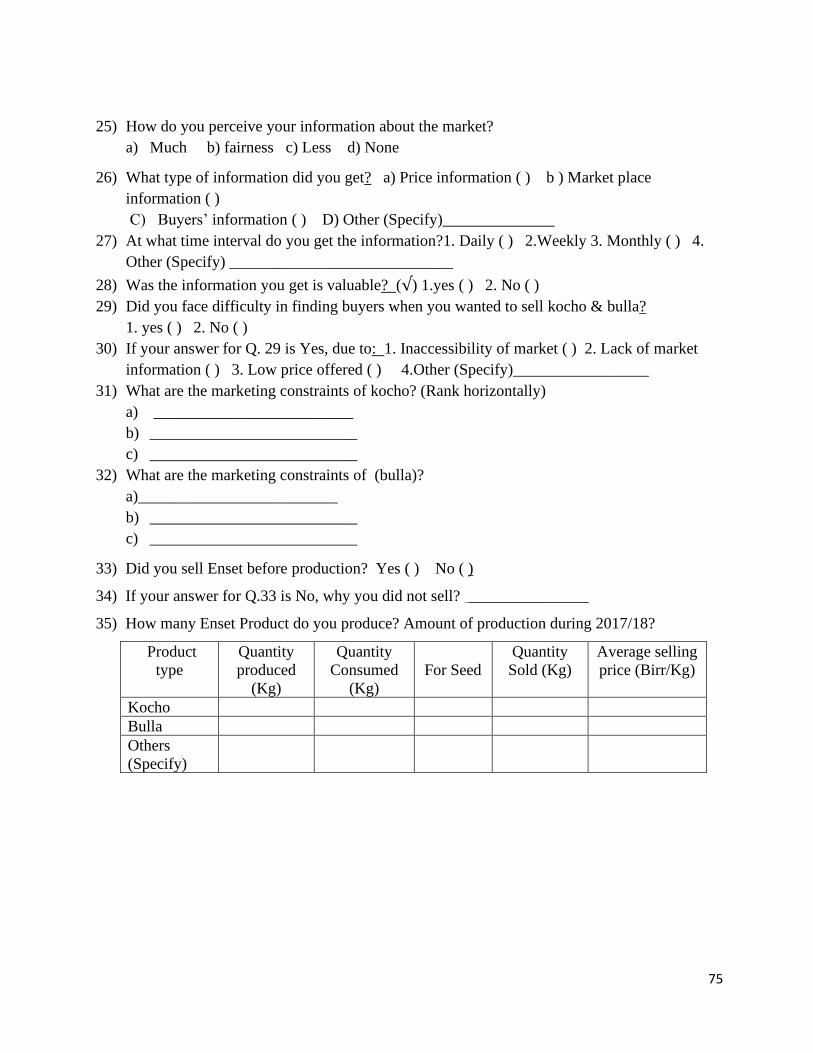
75
25) How do you perceive your information about the market?
a) Much b) fairness c) Less d) None
26) What type of information did you get? a) Price information ( ) b ) Market place
information ( )
C) Buyers’ information ( ) D) Other (Specify)______________
27) At what time interval do you get the information?1. Daily ( ) 2.Weekly 3. Monthly ( ) 4.
Other (Specify) ____________________________
28) Was the information you get is valuable? (√) 1.yes ( ) 2. No ( )
29) Did you face difficulty in finding buyers when you wanted to sell kocho & bulla?
1. yes ( ) 2. No ( )
30) If your answer for Q. 29 is Yes, due to: 1. Inaccessibility of market ( ) 2. Lack of market
information ( ) 3. Low price offered ( ) 4.Other (Specify)_________________
31) What are the marketing constraints of kocho? (Rank horizontally)
a) _________________________
b) __________________________
c) __________________________
32) What are the marketing constraints of (bulla)?
a)_________________________
b) __________________________
c) __________________________
33) Did you sell Enset before production? Yes ( ) No ( )
34) If your answer for Q.33 is No, why you did not sell? _______________
35) How many Enset Product do you produce? Amount of production during 2017/18?
Product
type
Quantity
produced
(Kg)
Quantity
Consumed
(Kg)
For Seed
Quantity
Sold (Kg)
Average selling
price (Birr/Kg)
Kocho
Bulla
Others
(Specify)
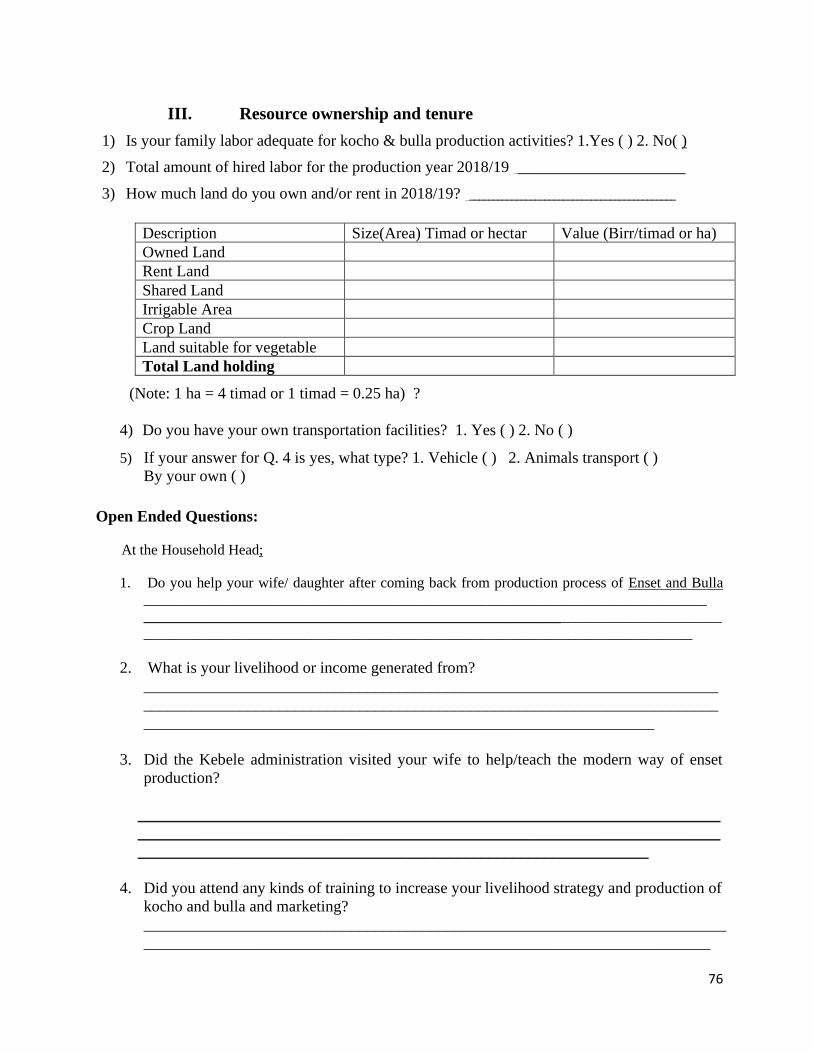
76
III. Resource ownership and tenure
1) Is your family labor adequate for kocho & bulla production activities? 1.Yes ( ) 2. No( )
2) Total amount of hired labor for the production year 2018/19 _____________________
3) How much land do you own and/or rent in 2018/19? ____________________________________________
Description Size(Area) Timad or hectar Value (Birr/timad or ha)
Owned Land
Rent Land
Shared Land
Irrigable Area
Crop Land
Land suitable for vegetable
Total Land holding
(Note: 1 ha = 4 timad or 1 timad = 0.25 ha) ?
4) Do you have your own transportation facilities? 1. Yes ( ) 2. No ( )
5) If your answer for Q. 4 is yes, what type? 1. Vehicle ( ) 2. Animals transport ( )
By your own ( )
Open Ended Questions:
At the Household Head;
1. Do you help your wife/ daughter after coming back from production process of Enset and Bulla
_____________________________________________________________________________
_______________________________________________________________________________
___________________________________________________________________________
2. What is your livelihood or income generated from?
________________________________________________________________________
________________________________________________________________________
________________________________________________________________
3. Did the Kebele administration visited your wife to help/teach the modern way of enset
production?
_________________________________________________________________________
_________________________________________________________________________
________________________________________________________________
4. Did you attend any kinds of training to increase your livelihood strategy and production of
kocho and bulla and marketing? _________________________________________________________________________
_______________________________________________________________________
77
5. The kebele administration officers tried on organizing women in cooperatives for mutual
support and credit facilitation?
_______________________________________________________________________
________________________________________________________________________
_________________________________________________________________
6. Any association//NGO or others may help you on value adding activities that to get more
profit from the product? _________________________________________________________________________
_______________________________________________________________________
7. Did any organization help to facilitate transportation and market to your product?
________________________________________________________________________
________________________________________________________________________
___________________________________________________________________
8. The product you may get from it will help you for consumption and getting income from it
or is there any other income for your livelihood?
_________________________________________________________________________
_________________________________________________________________________
_________________________________________________________________________
9. Do you get any support from your family member working outside the country?
_________________________________________________________________________
_________________________________________________________________________
_________________________________________________________________________
10. Did you participate in activity in the past 12 months that is during the last one/two cropping
seasons?(Food crop farming: crops that are grown primarily for HH food consumption)
___________________________________________________________________________
_________________________________________________________________________
11. How much input did you have in decisions on the use of income generated from activity?
___________________________________________________________________________
___________________________________________________________________________
______________________________________________________________________
__________________________________________________________________________________________________________________________________
__________________________________________________________________________________________________________________________________
__________________________________________________________________________________________________________________________________
78
14. Who is more participated on plantation of enset? __________________________________
15. Who is following the growth and development of enset in the farm?
__________________________________________________________________________
16. Did anyone can give an advice for the growth of enset in your farm land?
__________________________________________________________________________
Thank you very much for responding to the questions.

79
Appendices Two
Checklist Guideline for Focus Group Discussion
1. What are the input supplier channels available? List
2. Which channels are always available and easy to you?
3. What do you think can be done to access market outlets?
________________________________________________________________________________
4. What pre-conditions would need to be in place before you would do business with each
other?
5. Who decide how much products to sell to the market or for others?
6. What difference do you observe selling to cooperatives, traders, petty traders, wholesalers
and for other?
7. How are the price established?
8. How often the price changed?
9. Is there shortage of Kocho & Bulla from the land? And when is this shortage greatest?
Why?
10. What are the typical distances to Kocho & Bulla traders and consumer along each supply
channels?
11. What is the payment mechanism at each level?
12. What sources of credit are available to you to enable you to buy materials for selling to be
upgrading the value of Kocho & Bulla at different stages?
13. Is the term of credit is suitable for you? What is your recommendation?
14. What advantages or disadvantages you get from each other?
15. What is the mode of transport used for kocho and bulla product?
16. What are the main constraints to kocho & bulla sales?
17. What buying and selling arrangements do you see as being able to be performed by
different group?
18. Who are the primary actors in your kocho & bulla value chain?
19. What is your relationship with each of the actors?
20. What are the factors affecting the working relationship between these actors?

80
Appendices Three

81
Thank you very much for responding to the questions.
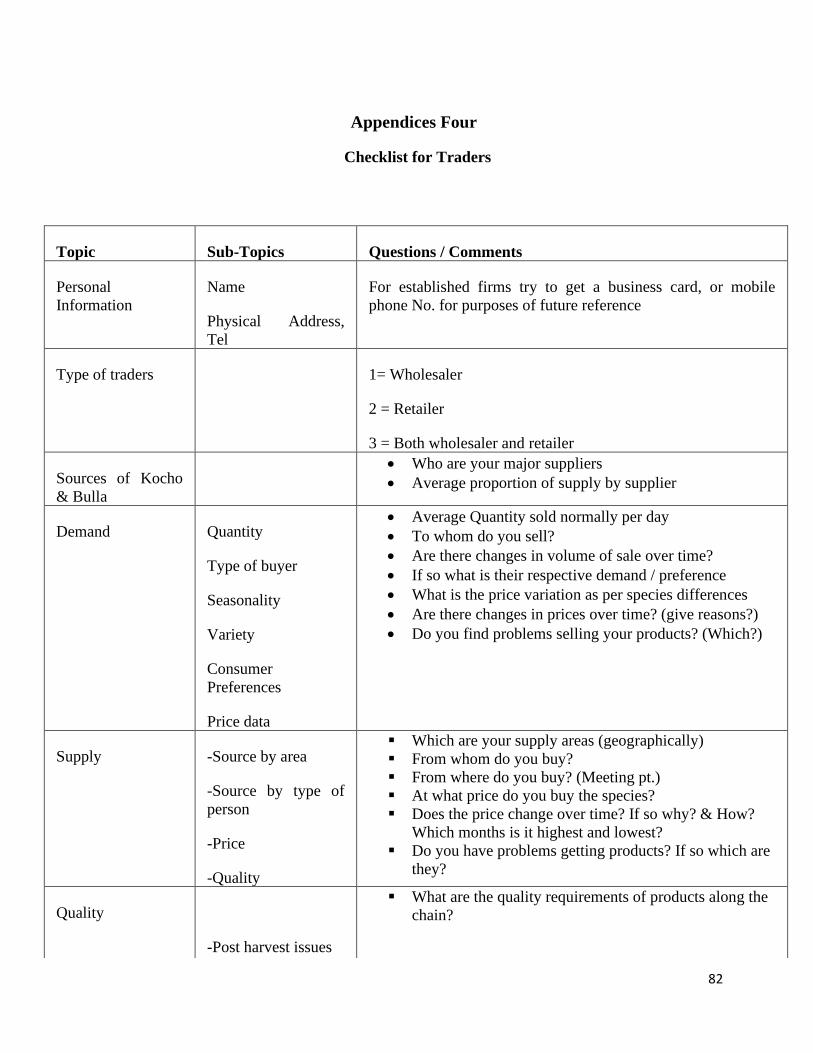
82
Appendices Four
Checklist for Traders
Topic Sub-Topics Questions / Comments
Personal
Information
Name
Physical Address,
Tel
For established firms try to get a business card, or mobile
phone No. for purposes of future reference
Type of traders 1= Wholesaler
2 = Retailer
3 = Both wholesaler and retailer
Sources of Kocho
& Bulla
• Who are your major suppliers
• Average proportion of supply by supplier
Demand Quantity
Type of buyer
Seasonality
Variety
Consumer
Preferences
Price data
• Average Quantity sold normally per day
• To whom do you sell?
• Are there changes in volume of sale over time?
• If so what is their respective demand / preference
• What is the price variation as per species differences
• Are there changes in prices over time? (give reasons?)
• Do you find problems selling your products? (Which?)
Supply
-Source by area
-Source by type of
person
-Price
-Quality
▪ Which are your supply areas (geographically)
▪ From whom do you buy?
▪ From where do you buy? (Meeting pt.)
▪ At what price do you buy the species?
▪ Does the price change over time? If so why? & How?
Which months is it highest and lowest?
▪ Do you have problems getting products? If so which are
they?
Quality
-Post harvest issues
▪ What are the quality requirements of products along the
chain?
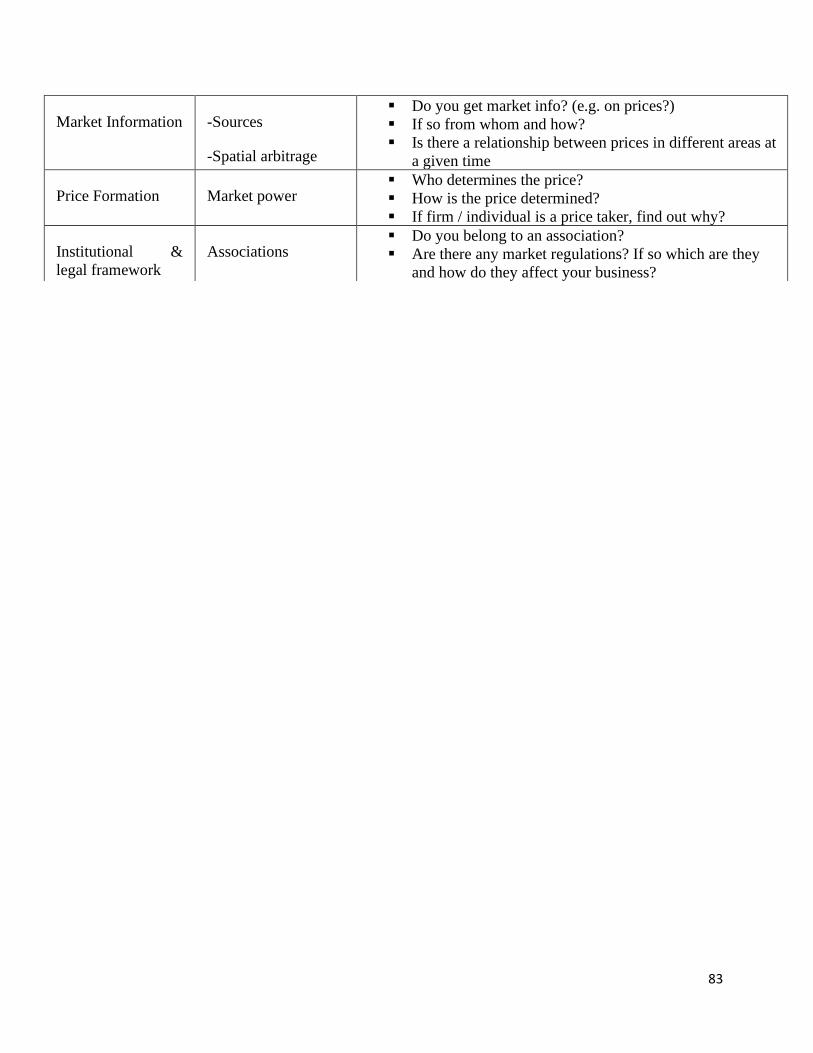
83
Market Information -Sources
-Spatial arbitrage
▪ Do you get market info? (e.g. on prices?)
▪ If so from whom and how?
▪ Is there a relationship between prices in different areas at
a given time
Price Formation Market power ▪ Who determines the price?
▪ How is the price determined?
▪ If firm / individual is a price taker, find out why?
Institutional &
legal framework
Associations ▪ Do you belong to an association?
▪ Are there any market regulations? If so which are they
and how do they affect your business?

84
Appendices Five
Consumers Interview Schedule
I. General Information
1. Name of Respondent: ____________________________________
2. Zone: _________ Woreda: ______________ Kebele: ___________ Village: __________
3. Age of the respondent: [___] years
4. Sex of the respondent (√): 1. [ ] Male 2. [ ] Female
5. Education level of the respondent (√): 1. [ ] No formal education 2. [ ] 6th grade or less
3. [ ] 7th to 12th grade 4. [ ] Certificate 5.[ ] Diploma 6. [ ] Degree
6. Marital status (√): 1. [ ] Married2. [ ] Single 3. [ ] Divorce 4. [ ] Widowed
7. Religion
1. Protestant [ ] 2. Orthodox [ ] 3. Muslim [ ] 4.Wakefata [ ]5. Others/specify___________
8. Distance to nearest town: [______]OR [______] hrs walk
9. What is your major means of income generation?
1. [ ] Farming 2. [ ] Trade 3. [ ] Employment 4. [ ] Others _________________
10. How much do you earn per year (estimate based on weekly, monthly income):_________Birr
11. Is Kocho & Bulla consumed in your family? 1. [ ] Yes 2. [ ] No
12. If no consumption of Kocho and Bulla product, why?
_________________________________________________________________________________
13. Experience in Kocho & Bulla products consumption? _____ Years
14. Do you produce and consume or purchase? 1. [ ] Purchase2. [ ] Produce
15. If you purchase, what is the proportion of your income used for purchase of Kocho & Bulla product?
II. Demand for the Kocho products
1. What type kocho and bulla products purchased for consumption? Please respond to the
following questions. (*Multiple response is possible)
Kocho and
Bulla type
Quantity
purchased (per
market day)
No. of
market
day per
weak
Low
price
paid
(birr/
kg)
No. of
months
you may
buy at
lower price
High
price paid
(birr/kg)
No. of
months you
may buy at
higher price
*From
whom do
you buy
Kocho
Bulla
2. Do you consider any quality requirements to purchase Kocho and Bulla? 1. [ ] Yes 2. [ ] No
3. If yes, what quality requirement do you consider for?
4. Where do you purchase the Kocho and Bulla from? 5. How much did you pay for it by species and product?
6. Which species and product is preferred by your household and why?
_________________. Why?_______________________________________________
7. What are the constraints hindering consumption of Kocho and Bulla ? Rank horizontally
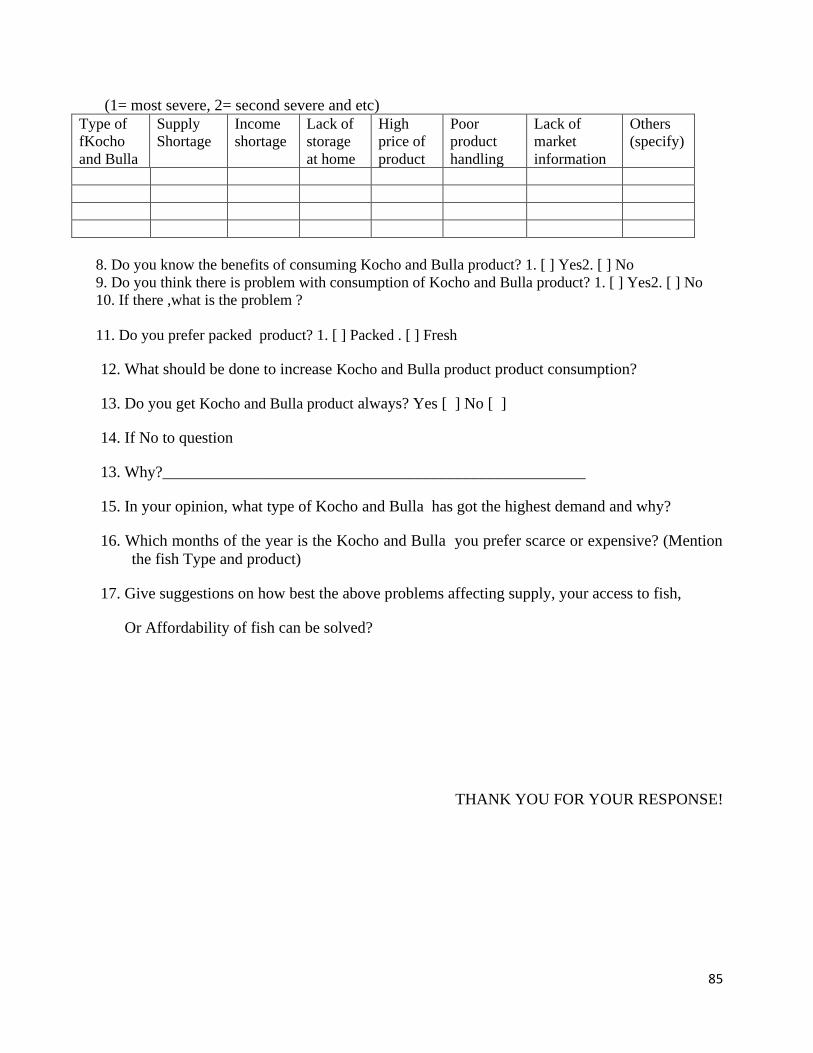
85
(1= most severe, 2= second severe and etc)
Type of
fKocho
and Bulla
Supply
Shortage
Income
shortage
Lack of
storage
at home
High
price of
product
Poor
product
handling
Lack of
market
information
Others
(specify)
8. Do you know the benefits of consuming Kocho and Bulla product? 1. [ ] Yes2. [ ] No
9. Do you think there is problem with consumption of Kocho and Bulla product? 1. [ ] Yes2. [ ] No
10. If there ,what is the problem ?
11. Do you prefer packed product? 1. [ ] Packed . [ ] Fresh
12. What should be done to increase Kocho and Bulla product product consumption?
13. Do you get Kocho and Bulla product always? Yes [ ] No [ ]
14. If No to question
13. Why?_____________________________________________________
15. In your opinion, what type of Kocho and Bulla has got the highest demand and why?
16. Which months of the year is the Kocho and Bulla you prefer scarce or expensive? (Mention
the fish Type and product)
17. Give suggestions on how best the above problems affecting supply, your access to fish,
Or Affordability of fish can be solved?
THANK YOU FOR YOUR RESPONSE!
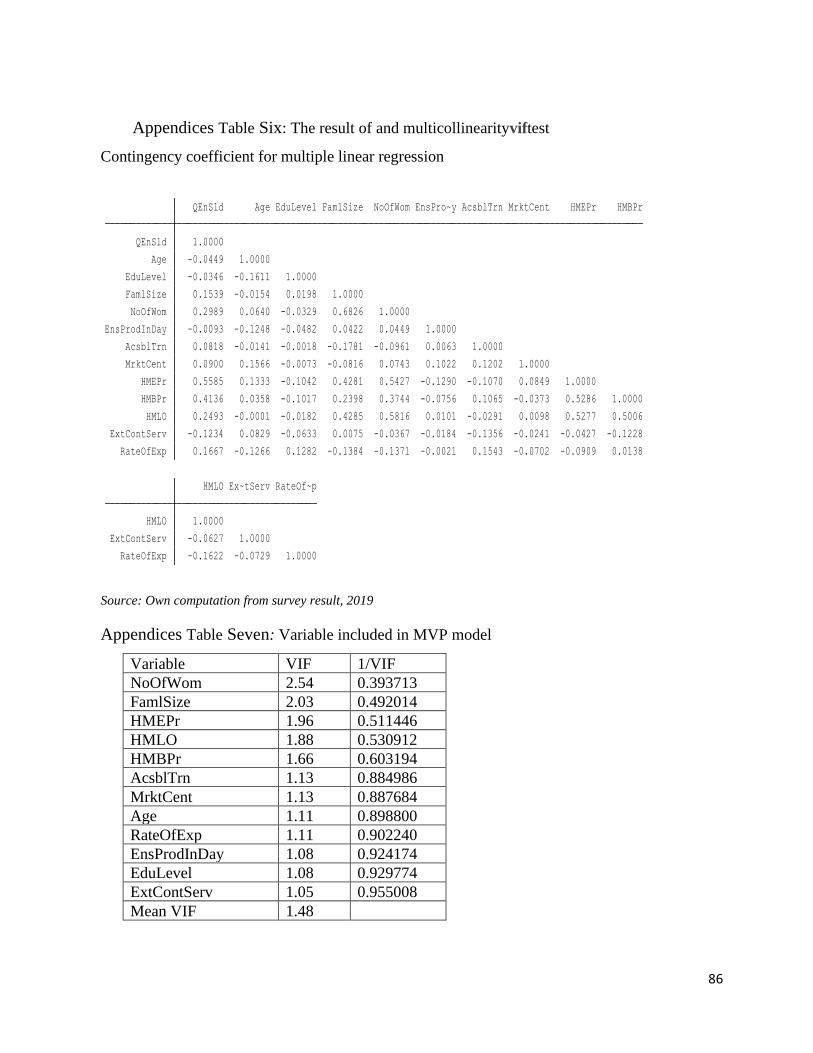
86
Appendices Table Six: The result of and multicollinearityviftest
Contingency coefficient for multiple linear regression
Source: Own computation from survey result, 2019
Appendices Table Seven: Variable included in MVP model
Variable VIF 1/VIF
NoOfWom 2.54 0.393713
FamlSize 2.03 0.492014
HMEPr 1.96 0.511446
HMLO 1.88 0.530912
HMBPr 1.66 0.603194
AcsblTrn 1.13 0.884986
MrktCent 1.13 0.887684
Age 1.11 0.898800
RateOfExp 1.11 0.902240
EnsProdInDay 1.08 0.924174
EduLevel 1.08 0.929774
ExtContServ 1.05 0.955008
Mean VIF 1.48
RateOfExp -0.1622 -0.0729 1.0000
ExtContServ -0.0627 1.0000
HMLO 1.0000
HMLO Ex~tServ RateOf~p
RateOfExp 0.1667 -0.1266 0.1282 -0.1384 -0.1371 -0.0021 0.1543 -0.0702 -0.0909 0.0138
ExtContServ -0.1234 0.0829 -0.0633 0.0075 -0.0367 -0.0184 -0.1356 -0.0241 -0.0427 -0.1228
HMLO 0.2493 -0.0001 -0.0182 0.4285 0.5816 0.0101 -0.0291 0.0098 0.5277 0.5006
HMBPr 0.4136 0.0358 -0.1017 0.2398 0.3744 -0.0756 0.1065 -0.0373 0.5286 1.0000
HMEPr 0.5585 0.1333 -0.1042 0.4281 0.5427 -0.1290 -0.1070 0.0849 1.0000
MrktCent 0.0900 0.1566 -0.0073 -0.0816 0.0743 0.1022 0.1202 1.0000
AcsblTrn 0.0818 -0.0141 -0.0018 -0.1781 -0.0961 0.0063 1.0000
EnsProdInDay -0.0093 -0.1248 -0.0482 0.0422 0.0449 1.0000
NoOfWom 0.2989 0.0640 -0.0329 0.6826 1.0000
FamlSize 0.1539 -0.0154 0.0198 1.0000
EduLevel -0.0346 -0.1611 1.0000
Age -0.0449 1.0000
QEnSld 1.0000
QEnSld Age EduLevel FamlSize NoOfWom EnsPro~y AcsblTrn MrktCent HMEPr HMBPr

87
Appendices Table Eight: Conversion factor used to compute tropical
livestock unit (TLU)
Livestock Category Conversion factor
Calf 0.25
Oxen / Cow 1.00
Bull
0.75
Heifer
0.75
Horse /mules 1.10
Donkey adult 0.70
Donkey young 0.35
Goats /sheep adult 0.13
Goat /Sheep young 0.06
Poultry birds 0.013
Weaned calf 0.34
Source: Alem S. (2007) (as cited in Rehima 2006).
Related Documents