ENM 317 Engineering Statistics Ilgın ACAR, Fall’15

Welcome message from author
This document is posted to help you gain knowledge. Please leave a comment to let me know what you think about it! Share it to your friends and learn new things together.
Transcript

ENM 317 Engineering Statistics
Ilgın ACAR, Fall’15

What is Statistics?
???????
A Body of Knowledge that enables one to: Ø Draw useful conclusions from numerical information Ø Make decisions in a rational and objective way Ø Predict and control events Ø Increase quality and productivity

Statistics
Descriptive Statistics consists of methods dealing with the collection, tabulation, summarization, and presentation of data.
Inferential Statistics consists of methods that permit one to reach
conclusions and make estimates about populations based upon information from a sample.

Definitions Ø A population or universe consists of all members of a class or
category of interest. Its size is usually denoted by “N”. Ø A sample is some portion or subset of a population. Its size is
usually denoted by “n”.
Ø A census is an enumeration or evaluation of every member of a population
Ø A parameter is a summary measure of the individual observations made in a census of an entire population.
Ø A statistic is a summary measure of the individual observations
made by evaluation of a sample.

Why Should an Engineer Study
Statistics?
Ø To know how to present and describe numerical information properly.
Ø To know how to draw conclusions about large populations from
sample information only. Ø To know how to improve processes and how to engineer quality into
a product.
Ø To design experiments to learn more about the natural world and to model physical relationships.
Ø To know how to obtain reliable forecasts or predictions of real-world responses.

Forms of Data Ø Constants are characteristics that have values that do not change.
l e.g: pi = 3.14159265 Ø Variables can be defined as a characteristic that can take different
values. Ex. Temperature, height, weight, cost and gender. l Categorical Variables – values are placed only into categories or
classes. l Numerical Variables – yield numerical value.
• Discrete variables are countable, in that there is a gap between each possible value. Most often, these variables result from a process of counting and are thus restricted to whole numbers or integer values.
• Continuous variables represent numerical measurements on a continuous dimension or scale and can take any numerical value within a continuum or interval.

Levels of Measurement – Scales
Ø Nominal scales identify, name, classify, or categorize objects or events with no natural ordering of categories. (E.g., gender)
Ø Ø Ordinal scales, like nominal scales, identify, name, classify, or
categorize objects or events, but they have the additional property of a logical or natural order to the categories or values. (E.g., college class)
Ø Ø Interval scales identify, have ordered values, and have the
additional property of equal distances or intervals between scale values. (E.g., temperature (Celsius and Fahrenheit)
Ø Ø Ratio scales identify, order, represent equal distances between
score values, and have an absolute zero point. Ø (E.g., speed)


Sampling
‘A sample is selected, evaluated and studied in an effort to gain information about the larger population from which the sample
was drawn.’ Advantages of Sampling (vs. Census)? Ø Cost Ø Time Ø Accuracy Ø Feasibility Ø Scope of Information

Types of Samples: 1) Probability samples
The probability or chance of selecting an element from a population is known. l Simple random sample
• All elements of a population have an equal chance of being selected;
• All possible samples of a given size have an equal probability of being selected.
Sampling with replacement: A member of the population can be represented more than once in a sample.
Sampling without replacement: We disregard any numbers that have already been selected for inclusion in the sample.
l Systematic random sample: Starting from an element selected at random, every kth element in the frame is selected for inclusion in the sample.

Types of Samples: 2) Non-probability samples:
l Convenience samples Take what is easily available?
l Judgment Samples Opinion of Expert
l Quota Samples
Meet minimum number for each category

Displaying Data: Tables, Charts & Graphs Ø Time-Order Plot (Run Chart) – plot of the variable of interest (Y-
axis) versus time (X-axis) - Looking for patterns and trends over time
Ø Tables and Graphs for Numerical Data: l Stem-and-Leaf Displays l The Frequency Distribution l Histograms

Steam and Leaf

Frequency Distribution A frequency distribution is a summary table in which the data are
arranged into conveniently established, numerically ordered class groupings or categories.
DETERMINING THE WIDTH OF A CLASS INTERVAL Width of interval ≅ range___________
number of desired class groupings The class boundaries are the points defining the boundaries of a class. The class midpoint is the point halfway between the boundaries of a class and is
representative of the data within that class.

Frequency Distribution Definitions:
The relative frequency distribution is formed by dividing the frequencies in each class of the frequency distribution by the total number of observations.
A percentage distribution can be formed by multiplying each relative frequency or proportion by 100.0.
A cumulative percentage (frequency) distribution is constructed by first recording the lower boundaries of each class of the distribution and then adding an additional boundary at the end.
A Cumulative Relative Frequency Distribution


Graphing Numerical Data
A histogram is a vertical bar chart in which the rectangle bars are constructed at the boundaries of each class.
The percentage polygon is formed by having a value in each class represent the data in that class and then connecting the sequence of points at their respective class percentages (typically midpoint).
The cumulative polygon or ogive is a graphic representation of a cumulative distribution table.


Tables and Charts for Categorical Data Check sheets and Summary Tables: A check sheet consists of a tally of the number of occurrences in each
category of the variable studied. A summary table represents a tally of the frequency of occurrence in
each category and the corresponding percentage in the category.

Graphing Categorical Data In Bar charts, each category is depicted by a bar, the length of which
represents the frequency or percentage of observations falling into a category.
A Pie chart is based on the fact that the circle has 3600. The pie is
divided into slices according to the percentage in each category. A Pareto Chart (Diagram) is a special type of vertical bar chart in which
the categorized responses are plotted in the descending rank order of their frequencies and combined with a cumulative polygon on the same scale.


Tables and Charts for Bivariate
Categorical Data Ø The Contingency Table
In order to study the responses to two categorical variables simultaneously, a two-way table of cross-classification is formed, known as contingency table or cross-classification table.
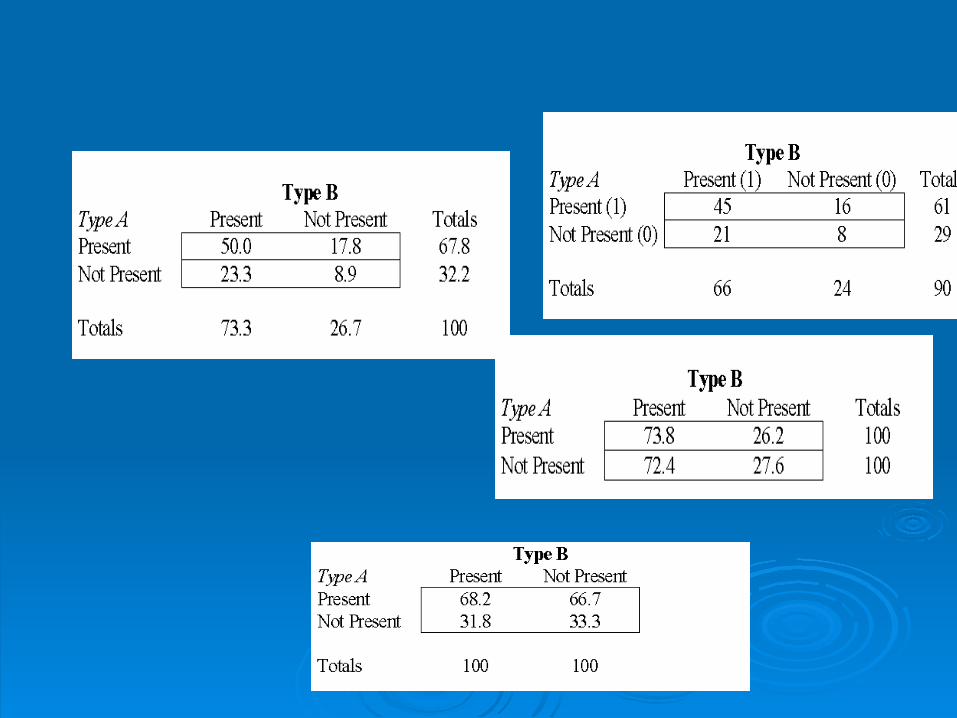
Example: Product defects Type A & Type B Two types of defects, A and B are frequently seen in the output of a
certain manufacturing process. Each item can be classified into one of the four classes AB, , , and , where denotes the absence of a type-A defect. For 90 inspected items, the following frequencies are observed:

Example: Product defects Type A & B

The Contingency Table Contingency Table Displaying the Presence of a Type A Defect and
a Type B Defect (frequency).
Contingency Table Displaying the Presence of a Type A Defect and a Type B Defect (based on total percentages).
Contingency Table Displaying the Presence of a Type A Defect and
a Type B Defect (based on row percentages). Contingency Table Displaying the Presence of a Type A Defect and
a Type B Defect (based on column percentages).

The Side-by-Side Bar Chart Ø The Side-by-Side Bar Chart A useful way to display bivariate categorical data visually, when looking
for patterns or relationships, is by constructing a Side-by-Side Bar Chart.
Related Documents


![RollOver (71.139) [Corr y Enm]](https://static.cupdf.com/doc/110x72/5695cf181a28ab9b028c93a8/rollover-71139-corr-y-enm.jpg)