University of Texas at Tyler Scholar Works at UT Tyler Human Resource Development eses and Dissertations Human Resource Development Fall 1-8-2015 Enhancing the Cohesiveness of a Cognitive Diverse Team: the Role of Leadership Upatham Atiwate Follow this and additional works at: hps://scholarworks.uyler.edu/hrd_grad Part of the Human Resources Management Commons is Dissertation is brought to you for free and open access by the Human Resource Development at Scholar Works at UT Tyler. It has been accepted for inclusion in Human Resource Development eses and Dissertations by an authorized administrator of Scholar Works at UT Tyler. For more information, please contact [email protected]. Recommended Citation Atiwate, Upatham, "Enhancing the Cohesiveness of a Cognitive Diverse Team: the Role of Leadership" (2015). Human Resource Development eses and Dissertations. Paper 6. hp://hdl.handle.net/10950/241

Welcome message from author
This document is posted to help you gain knowledge. Please leave a comment to let me know what you think about it! Share it to your friends and learn new things together.
Transcript

University of Texas at TylerScholar Works at UT Tyler
Human Resource Development Theses andDissertations Human Resource Development
Fall 1-8-2015
Enhancing the Cohesiveness of a CognitiveDiverse Team: the Role of LeadershipUpatham Atiwate
Follow this and additional works at: https://scholarworks.uttyler.edu/hrd_grad
Part of the Human Resources Management Commons
This Dissertation is brought to you for free and open access by the HumanResource Development at Scholar Works at UT Tyler. It has been acceptedfor inclusion in Human Resource Development Theses and Dissertationsby an authorized administrator of Scholar Works at UT Tyler. For moreinformation, please contact [email protected].
Recommended CitationAtiwate, Upatham, "Enhancing the Cohesiveness of a Cognitive Diverse Team: the Role of Leadership" (2015). Human ResourceDevelopment Theses and Dissertations. Paper 6.http://hdl.handle.net/10950/241

ENHANCING THE COHESIVENESS OF A COGNITIVE DIVERSE TEAM:
THE ROLE OF LEADERSHIP
by
ATIWATE UPATHAM
A dissertation submitted in partial fulfillment
of the requirements for the degree of
Doctor of Philosophy
Department of Human Resource Development and Technology
Jerry W. Gilley, Ed.D., and Judy Yi Sun, Ph.D., Committee Co-Chair
College of Business
The University of Texas at Tyler
December 2014


© Copyright by Atiwate Upatham 2014All rights reserved

Acknowledgements
I am deeply thankful for my dissertation committee for helping me to become the
researcher and writer that I am today. I am thankful for both my committee Chair, Jerry
Gilley, Ed.D., and my Co-Chair, Judy Sun, Ph.D., for their continuous and tireless
support and input. I am thankful for my methodologist, Sherry Jackson, Ph.D., for
answering my many questions on the methods used in this dissertation. I am thankful
for my committee member, Ann Gilley, Ph.D., for her advice on how to improve my
dissertation.
For my family, I appreciate their constant push for me to finish my research,
analysis, and writing of this dissertation. I appreciate their continuous support and
encouragement. Their believing in my ability to pursue this Ph.D., has allowed me to
reach this point of completion today.
To my dear friends Kathrine Harclerode and Nicha Chowpaknam, thank you for
your countless hours of reviewing, proof reading, and discussing my dissertation writing
with me. I will always be appreciative of your kindness.
Lastly, I owe a debt of gratitude to my Ph.D. cohort. The amazing support
structure that all of you provided helped me through the great many challenges of being a
Ph.D. student. Most of all, the thought of the friendships that resulted from this
wonderful journey will always make me smile.

i
Table of Contents
List of Tables ...................................................................................................................... v
List of Figures ................................................................................................................... vii
Abstract ............................................................................................................................ viii
Chapter 1: Introduction ....................................................................................................... 1
Background to the Problems........................................................................................................ 1
Statement of the Problems ........................................................................................................... 3
Research Questions...................................................................................................................... 9
Significance of the Study ........................................................................................................... 10
The Terms and Definitions ........................................................................................................ 12
Team: ..................................................................................................................................... 12
Team Cohesiveness:............................................................................................................... 13
Cognitive Diversity:............................................................................................................... 13
Charismatic Leadership: ........................................................................................................ 13
Transactional Leadership: ...................................................................................................... 13
Transformational Leadership: ................................................................................................ 13
Servant Leadership: ............................................................................................................... 14

ii
Leadership Charismatic Trait:................................................................................................ 14
Leadership Empowering Trait: .............................................................................................. 14
Leadership Individualistic Trait:............................................................................................ 14
Chapter 2: Literature Review............................................................................................ 16
Teams......................................................................................................................................... 16
Team Cohesiveness.................................................................................................................... 19
Diversity..................................................................................................................................... 19
Diversity in Teams..................................................................................................................... 23
Team Conflicts Due to Diversity ............................................................................................... 25
Leadership in Teams .................................................................................................................. 27
Leadership in Diverse Teams................................................................................................. 30
Theoretical Underpinning of the Study...................................................................................... 39
Conclusion ................................................................................................................................. 42
Chapter 3: Methodology............................................................................................................. 43
Data Collection .......................................................................................................................... 45
The Instruments ......................................................................................................................... 49
Analysis Technique.................................................................................................................... 52

iii
Reliability, Validity, and Common Method Biases ................................................................... 56
Chapter 4: Results......................................................................................................................... 58
Data Description ........................................................................................................................ 58
Gender ................................................................................................................................... 58
Age ......................................................................................................................................... 58
Ethnicity ................................................................................................................................. 59
Team Type.............................................................................................................................. 60
Industry Type ......................................................................................................................... 61
Organization Size................................................................................................................... 62
Job Position ........................................................................................................................... 63
Common Method Variance (CMV) ........................................................................................... 64
Factor Analysis .......................................................................................................................... 65
Regression Analysis................................................................................................................... 67
Chapter 5: Discussion ................................................................................................................... 74
General Discussion and Findings............................................................................................... 74
Limitations and Future Research ............................................................................................... 79
Limitations ............................................................................................................................. 79

iv
Future Research..................................................................................................................... 80
Contributions and Implications.................................................................................................. 81
Literature Contribution.......................................................................................................... 81
Practical Implication ............................................................................................................. 82
Conclusion ................................................................................................................................. 87
References......................................................................................................................... 89
Appendix A: IRB Approval ............................................................................................ 106
Appendix B: The Survey Instrument .............................................................................. 108

v
List of Tables
Table 1: Leadership Traits Comparison............................................................................ 39
Table 2: Team Cohesiveness ............................................................................................ 49
Table 3: Charismatic Trait Instrument .............................................................................. 50
Table 4: Cognitive Diversity Instrument .......................................................................... 51
Table 5: Empowering Trait Instrument............................................................................. 51
Table 6: Individualistic Trait Instrument .......................................................................... 52
Table 7: Gender................................................................................................................. 58
Table 8: Age...................................................................................................................... 59
Table 9: Ethnicity.............................................................................................................. 60
Table 10: Team Type ........................................................................................................ 61
Table 11: Industry Type.................................................................................................... 62
Table 12: Organization Size.............................................................................................. 63
Table 13: Job Position....................................................................................................... 64
Table 14: Harman’s Single Factor Test for Common Method Variance .......................... 65
Table 15: Factor Loadings ................................................................................................ 67
Table 16: Effects of Team Cognitive Diversity and the Leadership Traits on Team
Cohesiveness..................................................................................................................... 69
Table 17: Effects of Team Cognitive Diversity and Combined Leadership Traits on Team
Cohesiveness..................................................................................................................... 69

vi
Table 18: Effects of Team Cognitive Diversity and Moderating Leadership Traits on
Team Cohesiveness........................................................................................................... 71

vii
List of Figures
Figure 1: Leadership Traits Commonality Among the Leadership Styles ......................... 8
Figure 2: Relationship Among Terms............................................................................... 15
Figure 3: Proposed Research Model ................................................................................. 44
Figure 4: Moderating Role of Empowering Leadership Trait .......................................... 72

viii
Abstract
Researchers have been interested in the concepts of leadership, cognitive
diversity, and team cohesiveness and much research has been done in these areas
separately. The uniformity of the topics is still lacking in terms of the relationship
among these variables. This research set out to explore the relationship between
cognitive diversity and team cohesiveness as it was enhanced by the different leadership
characteristic traits. These leadership characteristic traits consisted of charisma,
individualism, and empowerment. The multiple regression analysis method was used to
study the relationship among these variables.
Based upon data collected from a sample of 1,015 participants in six different
types of industries, I found that that there was a positive relationship between cognitive
diversity and team cohesiveness. I also found that leadership individualistic trait did not
have any relationship to team cohesiveness. Leadership charismatic trait did explain
some variance on team cohesiveness but did not moderate the relationship between
cognitive diversity and team cohesiveness. Lastly, leadership empowering trait had a
direct relationship to team cohesiveness as well as moderated the relationship between
cognitive diversity and team cohesiveness.

1
Chapter 1: Introduction
Background to the Problems
The definition of diversity is being redefined and studied differently, thus moving
away from demographic quantifiers alone (Egan, 2005). The traditional demographic
quantifiers most commonly used to describe diversity are gender, age, ethnicity,
nationality, education, and workplace status (Podsiadlowski, Groschke, Kogler, Springer,
& van der Zee, 2013). It is argued that even though there are no differences in
demographic quantifiers, it is possible for a homogeneous team to still be diverse
cognitively (Olson, Paryitam, & Bao, 2007).
In today’s complex, ambiguous, and fast moving business climate (Ante &
Schuelke, 2011), it is more important than ever that organizations assemble and lead
cognitively diverse teams capable of generating multiple ideas, alternatives, and decisions
that ultimately lead to a better outcome in the form of higher performance (Egan, 2005;
Gilley, Gilley, McConnell, & Veliquette, 2010; Groves & Feyerhern, 2010; Malik, et al.,
2012; Olson et al., 2007). This business environment has also been partially moderated
by the changing level of competition in the market place, forcing many companies to
redesign their structures and become more customer-oriented (Berber & Rofcanin, 2012).
As a result, organizations’ clients also become more diverse, which leads to different
types of demands (Egan, 2005). Shin, Kim, Lee, and Bain (2012) reported that when
transformational leadership was high, it helped moderate the level of positive relationship
between cognitive diversity and individual creativity. Artiz and Waler (2014) found that
leadership styles could have influence over the members’ participation, contribution,
feelings of inclusion, and satisfaction. However, there is a minimal amount of research
2
literature that examines leadership characteristic factors needed to lead successful
cognitively diverse teams.
Organizations are changing at a rapid rate (Bass, Avolio, Jung, & Berson, 2003),
which is particularly evident as organizations become increasingly globalized (Armache,
2012; Milliken & Martins, 1996; Shaw & Barrett-Power, 1998; Webber & Donahue,
2001), or are forced to change through mergers and acquisitions (Thompson, Wallace, &
Flecker, 1992). Globalization of the corporations leads to the increase of the diversity in
background, knowledge, and expert integration of employees (Horwitz, 2005;
Podsiadlowski, Groschke, Kogler, Springer, & Van der Zee, 2013). These organizations
have become dependent upon the aggregate skill sets of teams more now than in the past
(Kearney, Gerbert, & Voelpel, 2009; Shen & Chen, 2007), and this team diversity creates
challenges in terms of differences among individual values, cognitions, and cultural
composition (Groves & Feyerhern, 2011; Thompson, Wallace, & Flecker, 1992).
Globalization has not only created the need to understand team diversity as
mentioned above but also the need to understand how to lead diverse teams. The
effective leadership of the diverse team is a new reality that organizations must
accomplish in order to be successful (Aritz & Walker, 2014). Leadership may directly
influence the workforce diversity and cannot be ignored (Podsiadlowski et al., 2013).
Podsiadlowski et al. (2013) indicated that the management of the diverse workforce
should fluidly adapt to the type of the dominant diversity represented. Aritz and Walker
(2014), in the cultural diversity study, suggested that leadership styles may affect the
team members’ “feelings of inclusion and satisfaction within the group” (p. 72).

3
Statement of the Problems
In today’s highly competitive business environment (Ante & Schuelke, 2011), it
is critical that organizations amass cognitively diverse teams and use these teams to
generate cutting edge ideas, alternatives, and decisions that ultimately lead to higher
performance and the prevention of market share erosion (Gilley & Gilley, 2000; Gilley,
Gilley, McConnell, & Veliquette, 2010; Olson et al., 2007).
Unfortunately, not all members within a team perform well together (Hackman &
Morris, 1975) and conflicts accompany team diversity (Jehn & Mannix, 2001), which can
negatively affect a team’s effort and performance (Shen & Chen, 2007). It is the
characteristics and skills of team leaders who can effectively lead and moderate these
cognitively diverse teams (Gilley et al., 2010). Concurrently organizations must seek
ways to manage or prevent the negative effects of cognitive diversity within teams
(Kearney, Gerbert, & Voelpel, 2009). Creating a synchronous and harmonious team
may not be as simple as one may think.
“Although in theory it may sound easy to place diverse individuals together into
work teams and await superior performance, often in reality, many irreconcilable
divisions among heterogeneous individuals lead to dysfunctional team interactions and,
thus poor performance and decreased morale” (Horwitz, 2005, p. 220).
Wang et al. (2005) indicated that cohesion can predict group behavior and that
group cohesion is defined as the amount “group members feel a part of the group and
desire to remain in the group” (p. 175). Leadership style also has a direct influence on
team cohesiveness (Kasemsap, 2013; Wang et al., 2005). Soldan (2010) indicates that
when diversity in groups is low, group cohesiveness was found to be uncorrelated to team

4
performance. On the other hand, Woehr, Arciniega, and Poling (2013) indicate that high
levels of team diversity are correlated to low levels of team cohesion.
The definition and concept of diversity are being redefined, moving away from
demographics alone (Egan, 2005). However, it is possible for a homogeneous team to
have cognitive diversity (Olson, Paryitam, & Bao, 2007). Therefore, the study of
cognitive diversity may be necessary especially in the area of leadership characteristic
factors needed to lead a successful, cognitively diverse team. In more complex, higher-
level decision-making type teams, cognitive diversity plays a role in influencing the
team’s outcome. Tegarden, Tegarden, and Sheetz (2009) stated that cognitive diversity
can have an effect on team performance, especially during strategic planning.
Leadership types are known to directly affect teams. Kearney and Gebert (2009)
indicated that high levels of transformational leadership were positively related to team
performance. Transformational leadership exhibits traits that consist of charisma,
individualistic, empowering, and visionary (Bass, 1990). They further confirmed that
“transformational leadership moderates the relationship of age, nationality, and
educational diversity with team performance” (Kearney & Gerbert, 2009, p. 86).
Transformational leadership exhibits traits that consist of charisma, individualistic,
empowering, and visionary (Bass, 1990).
Charismatic leadership has also been reported as an effective leadership style that
may foster team cohesiveness (Wang, Chou, & Jiang, 2005). Charismatic leaders are
believed to exhibit traits that consist of “envisioning, empathy, and empowerment” (Choi,
2006, p.24).

5
Kasemsap (2013) further reported that empowering leadership is positively
related to team cohesiveness. Empowering leaders exhibit traits that consist of
empowering, individual concerns, motivational, and supportive (Amundsen, Martinsen,
& Campbell, 2013; Martin, Liao, & Campbell, 2013).
Servant leadership has also been associated with team performance and team
potency (Hu & Liden, 2011). Dennis and Bocarnea (2005) cited Patterson (2003), who
described servant leaders as having the individualistic, humility, altruistic, visionary,
trusting, serving, and empowering traits.
The charismatic trait in a leader is defined as the leader’s ability to energize and
excite followers (Bono & Ilies, 2006). Shamir, House, and Arthur (1993) indicate that
leaders with the charismatic trait are able to engage their followers to believe and be
excited about the mission. Furthermore, leaders with the charismatic trait can
emotionally express their visions and goals (Bono & Ilies, 2006). Bono and Ilies (2006)
indicate that leaders with charisma also express positive emotions, which may be
transmitted to the followers. This is significant because these positive emotions are
associated with leaders’ perceived effectiveness and followers’ attraction to leaders
(Bono & Ilies, 2006). Followers also feel the attachments, both emotional and
motivational, that consequently lead them to believe and support the expressed mission
(Bass, 1990; Shamir et al., 1993). Employees trust in leaders with the charismatic trait
and strive to identify with these leaders (Bass, 1990).
The empowerment trait consists of the willingness of the leader to share power
with subordinates and help facilitate their development (Amundsen & Martinsen, 2013;
Conger & Kanungo, 1988). This power sharing goes beyond task delegation. It

6
includes the process of “enhancing feelings of self-efficacy among organizational
members” (Conger & Kanungo, 1988, p. 474). The empowerment trait is important
because leaders who empower their employees create teams that are adaptive to
organizational change and meet performance goals (Conger & Kanungo, 1988). Leaders
who empower team members are able to produce better outcomes. Individual
empowerment has been linked to team performance since empowered individuals believe
that they have the autonomy to contribute work that will help organizations succeed
(Chen, Kirkman, Kanfer, & Allen, 2007).
The individualistic trait commonly refers to individual consideration. This trait
refers to the behavior of a leader that focuses on fostering the growth and needs of
followers (Bono & Judge, 2004). Judge and Bono (2000) indicate that leaders with the
individualistic trait help coach and mentor individual followers. Leaders with
individualistic traits are constantly on the search for potential leaders among employees
(Bass, 1985). They strive to meet each employee’s emotional needs (Bass, 1985; Bass,
1990). Individual consideration also means that leaders “pay close attention to
differences among their employees” (Bass, 1990, p. 21). This is significant because
managers are observed to pattern their leadership style after previous leaders (Bass,
1990). The individualistic trait may directly influence future leaders of the organization.
Bass (1990) suggests that if top level executives exhibit transformational type behaviors,
lower level managers will also emulate the behaviors; thus making the individualistic
traits critical. Most important, employees reporting to leaders with individualistic trait
feel that they are part of the team (Bass, 1985).

7
Ruggieri and Abbate (2013) further link leadership to team cohesiveness, which
leads to the team’s success. Wang and Huang (2009) reported that transformational
leadership may be positively associated with team cohesiveness. Researchers have
found that the cohesiveness factor is directly related to team performance (Chen, 2013;
Kasemsap, 2013; Ruggieri & Abbate, 2013; Sivasubramaniam, Liebowitz, & Lackman,
2012; Soldan, 2010; Wang, Chou, & Jiang, 2005; Wang & Huang, 2009; Wendt et al.,
2009).
Many leadership styles seem to enhance team performance as well as promote
cohesiveness. It is unclear whether leadership styles or leadership traits dominate the
enhancing effects of team performance and team cohesion. Little can be found that links
leadership traits and skills, in a synchronous manner, to the cohesiveness of cognitively
diverse teams.
Figure 1 demonstrates the cross section of the different traits among leadership
styles. There are many traits that are common across the leadership styles. The three
prime focuses of this dissertation research are the charismatic, empowerment, and
individualistic traits.

8
Figure 1: Leadership Traits Commonality Among the Leadership Styles
Organizations are becoming more diverse as they expand globally. The nature of
the work has become more complex as organizations try to maintain a competitive edge.
The need of the team is critical due to the complex nature of work. Teams are
demographically diverse and also cognitively diverse. Cognitively diverse teams, when
not managed properly, can cause deterioration in the team due to the lack of
cohesiveness. Leadership is known to moderate team cohesiveness, which is linked
directly to team performance. There are three primary shared traits between several
leadership styles: charisma, empowerment, and individualism. Although researchers
have explored these topics, there is very little literature on how leadership traits affect the
relationship between team cognitive diversity and team cohesiveness.

9
The Purpose of the Study
Leadership traits, rather than leadership styles, may enhance team outcomes.
This research studied leadership traits and their enhancing effects on the relationship
between team cognitive diversity and team cohesiveness. The study explored the impact
of leadership traits commonly shared across leadership styles on cognitively diverse
teams because “effective leaders are especially capable of fostering group cohesiveness
and promoting efficacy in goal attainment” (Ruggieri & Abbate, 2013, p. 1171). Avolio,
Bass, and Jung (1999) indicated that a few leadership styles share certain characteristics.
This study tested the commonality in the traits between styles and how they affected the
cohesiveness of cognitively diverse teams.
Research Questions
The research aimed to address the specific gap in the literature that exists in the
relationships between cognitive diversity, team cohesiveness, and leadership
characteristic traits. More specifically, this research explored the influence that
leadership characteristic traits have on the relationship between cognitive diversity and
team cohesiveness. The research questions are divided into two major, overarching
questions. They are as follows:
1. Is there a relationship, positive or negative, between a team’s cognitive diversity
and team cohesiveness?
2. Are there any specific character traits of leaders that moderate the
relationship between team cognitive diversity and team cohesiveness?

10
Significance of the Study
Diversity is being viewed as effective business strategy that allows organizations
to access global customers (Podsiadlowski, et al., 2013). This research may provide a
unique perspective from a cognitive point of view. There is a need for the study of a
more complex level of diversity; specifically, to explore diversity at the cognitive level
(Kilduff et al., 2000; Tegarden et al., 2009). This research may provide the Human
Resource Development (HRD) field some understanding of the interactions between
cognitive diversity, team leadership traits, and team cohesion. This is an important
contribution because as organizations expand and become more complex, individuals can
no longer handle complex tasks on their own.
Organizations are gaining competitive advantage in both manufacturing and
engineering functions through acquisitions and outsourcing (Brown, 2009; Chang, Kuo,
& Chen, 2008). The usage of teams becomes necessary in order to accomplish complex
tasks. New demands and requirements create problems that organizations must solve,
and as they become more complex, this increasing complexity cannot be addressed by an
individual within the organization alone (Hackman & Morris, 1975).
Cognitive diversity in teams may create discord problems, especially in the area
of team cohesiveness, if not managed properly. It is also important to realize that work
team performance is directly linked to team cohesiveness (Wang & Huang, 2009) and
that cohesiveness has been shown to be a critical determinant of team performance
(Sivasubramaniam, Liebowitz, & Lackman, 2012). Team cohesiveness is important
because organizations can only harvest the benefits of work efficiency, higher profit
margins, and quality product outputs when employees are fully committed to the vision

11
and mission of the firm (Fritz, O'Neil, Popp, Williams, & Arnett, 2013). This research
will contribute quantitative data to help with the understanding of this relationship
between leadership traits and resulting team cohesiveness.
Cognitive diversity, when managed properly, has been shown to have a positive
effect on team performance (Tegarden et al., 2009), although it is not typically addressed
in research on cognitive diversity (Kilduff et al., 2000).
Organizations need effective leaders more than ever; as the “rapid accelerating
pace of organizational change has made effective leadership imperative” (Gilley,
McMillan, & Gilley, 2009, p. 38). An organization’s growing demographic diversity
may result in the increase of cognitive diversity (Kilduff, Angelmar, & Mehra, 2000).
Kaiser and Overfield (2010) also indicated that effective leaders add value to their
organizations in terms of organizational revenue performance by leading teams to
outperform the competitors in the market place.
There exists literature espousing the role of leadership on team performance
(Hackman & Morris, 1975) and literature on the importance of cognitive diversity within
teams. Leadership styles alone might not be enough to determine the necessary needed
skills to lead teams due to the complexity of leadership styles. Specific leadership traits
may provide a simpler way to select and train today’s leaders in effective leadership
skills. It is possible that the results of this study might influence organizations to select
and train leaders and managers who have the traits needed to be more effective at leading
cognitively diverse teams.
Human Resource Development (HRD) professionals and scholars alike may
address these organizational challenges by managing, adjusting, and developing

12
intellectual resources by creating and mentoring effective leadership. The knowledge
gaps in this area must be filled as organizations expand and acquire vast and complex
intellectual resources. The results of this study are expected to contribute and add to the
empirical data and overall HRD knowledge on how leadership traits influence cohesion
level of cognitively diverse teams.
The field of HRD has been interested in organizational change for a long time.
Many organizations have utilized HRD professionals to lead change and create a smooth
transition with succession planning. The research need is directly related to external
economic influences causing organizations to adjust and overcome new challenges.
Economic conditions require organizations to become increasingly more flexible and
adaptable (Becker, Carbo II, & Langella, 2010), as the changing level of competition in
the market place is forcing many companies to redesign their structures and become more
customer-oriented (Berber & Rofcanin, 2012).
It is the intent of this study to explore those leadership traits, in the order of
impact on teams. With increased levels of transparency, characteristic traits may be a
better way of measuring and training future leaders in order to gain the ability to lead
cognitively diverse teams.
The Terms and Definitions
Team:
A team is defined as a group of people containing two or more members who work
together toward a common goal (Tannenbaum, Mathieu, Salas, & Cohen, 2012).

13
Team Cohesiveness:
Festinger, Schachter, and Back (1950), as cited in Wang & Huang (2009), posited that a
team’s level of cohesiveness indicated the amount of professional attraction that
demonstrated the members were willing to work and stay together as a team.
Cognitive Diversity:
Cognitive diversity is defined as the differences in beliefs, preferences, or world views of
team members (Melone, 1994; Miller, Burke, & Glick, 1998).
Charismatic Leadership:
Charismatic leadership is defined as the type of leader who exhibits the traits that consist
of “envisioning, empathy, and empowerment” (Choi, 2006, p.24).
Transactional Leadership:
Transactional leadership is defined as the type of leader who primarily employs exchange
type of techniques such as giving praise and incentives to employees for meeting
expectations or punishments for missing expectations (Bass 1985; Burke, Stagl, Klein,
Goodwin, Eduardo, & Halpin, 2006).
Transformational Leadership:
Transformational leadership is defined as a leader who encourages and motivates his or
her constituents to do more than normally expected, raising the level of awareness about
task outcomes, motivating team members to rise beyond their self-interest, and moved the
individual’s needs level up the Maslow’s pyramid (Bass, 1985).

14
Empowering Leadership:
Empowering leadership is defined as the type of leader who “shares power with
employees by delineating the significance of the employees’ jobs, providing greater
decision-making autonomy, expressing confidence in their capabilities, and removing
hindrances to performance” (Zhang & Bartol, 2010, p 109).
Servant Leadership:
Servant leadership is defined as the type of leader who purposefully takes on the role of
the servant in helping teams (Russell & Stone, 2002).
Leadership Charismatic Trait:
The charismatic trait in a leader is defined as the leader’s ability to energize and excite
followers as well as engage them to believe in and be excited about the mission of the
organization (Bono & Ilies, 2006; Shamir, House, & Arthur, 1993).
Leadership Empowering Trait:
The empowering trait in a leader consists of empowering, individual concerns,
motivational, and supportive (Amundsen, Martinsen, & Campbell, 2013; Martin, Liao, &
Campbell, 2013).
Leadership Individualistic Trait:
The individualistic trait in a leader refers to the behavior of a leader that focuses on
fostering the growth and needs of followers (Bono & Judge, 2004).
Figure 2, pictorially, demonstrates relationships among terms. Both leadership
and diversity in this case are subsets of a team as shown nested inside team superset.

15
Further exploration indicates that leadership traits are shown to be a subset of the team
leadership style set. Cognitive diversity is shown to be a subset of team diversity.
Figure 2: Relationship Among Terms
In conclusion, there exists a wide variety of diversity types. Cognitive diversity,
which is a subset of diversity, is a deep level and more complex type of diversity. Such
diversity can affect the function of a team. Cognitive diversity may cause conflict in the
team and thereby reduce team cohesiveness which is critical to team effectiveness. I
proposed that leadership traits, which are the subsets of leadership styles, may moderate
the level of the relationship between cognitive diversity and team cohesiveness. This
research explored how leadership trait may influence the level of the relationship between
cognitive diversity and team cohesiveness.

16
Chapter 2: Literature Review
This chapter reviews, analyzes, and critiques the literature in team diversity, team
cohesiveness, leadership in teams, leadership types, leadership in relationship to teams,
and leadership preference in diverse teams. The purpose of this review is to identify a
research gap and lay the groundwork for this study.
This review will be organized into seven sections. The first section reviews
teams and team cohesiveness. The second section reviews diversity and its definitions
and types. The third section reviews diversity in teams as well as how diversity
influences the team. The fourth section reviews leadership in teams. The fifth section
reviews leadership in relation to teams and diversity. The sixth section reviews
leadership preference in diverse teams. The last section addresses the theoretical
underpinning literature supporting the study of this research.
The following databases were used to search relevant literature: Business Source
Complete, Emerald, Sage: Management & Organization, PsycINFO, Science Direct,
Springer Link, and Wiley Online through The University of Texas at Tyler library
connection. Google Scholar was also employed to search relevant terms. These
relevant terms include teams, team diversity, cognitive diversity, team leadership,
leadership for diverse team, and leadership for cognitively diverse team.
Teams
Teams are essential components of organizations. Organizations have been
utilizing and employing team-based structures due to their valuable contributions to
productivity and creativity outcomes (Dixon & Panteli, 2010). Boyett and Conn (1991),

17
as cited in Jehn and Mannix (2011), stated that organizations are migrating to team-based
structures as the demand for efficiency increases as well as the need to be more effective
in generating better solutions that require the support of others (Maier, 1967). Teams
tended to produce more as well as hold larger amount of knowledge than individual
members; according to Mailer (1967) “there is more information in a group than in any of
its members” (p. 239).
Salas, Dickinson, Converse, and Tannenbaum (1992) declared that, to be
considered a team, there must be at least a set of two or more members who collaborate
synchronously toward a common outcome and that these members must be assigned
certain responsibilities to accomplish (Tannenbaum, Mathieu, Salas, & Cohen, 2012).
Kozlowski and Bell (2003), as cited in Tanenbaum et al. (2012), defined a team as a
collection of members who assemble to accomplish tasks assigned by the organization
such that these individuals work toward a common goal while operating within social
norms. The traditional team definition held four common themes including stable tenure
of members, exclusive membership to the team, stability of tasks definitions, and team
member colocation (Tannenbaum et al., 2012).
Horwitz (2005) stated that “humans are social animals in that they are inclined to
congregate and act in groups” (p. 223) and that in team through group interaction, there
was exchange of information as well as knowledge. Tannenbaum et al. (2012) indicated
that teams are changing and that they are no longer collocated. In fact, teams are now
more dispersed geographically than they have ever been.
The traditional types of team include production, decision-making, and action
teams (Tannenbaum et al., 2012). Recently other teams such as flash teams, emergency

18
large scale teams (Tannenbaum et al., 2012), and virtual teams (Dixon & Panteli, 2010)
have become prevalent. Berber and Rofcanin (2012) suggested that flexible dynamic
teams, that do not last a long period of time, have also emerged. Dixon and Panteli
(2010) indicated that virtual teams are teams that utilize the communication technologies
to replace the face-to-face interactions. The use of technology by virtual teams allowed
members not only to overcome physical space limitations and to cross the geographical
boundaries but also be more adaptive and representative in the changing nature of
organizational teams (Dixon & Panteli, 2012; Tannenbaum et al., 2012).
West and Lyubovnikova (2012) took a different approach in their commentaries
to Tannenbaum et al. (2012). They segregated teams into two primary types: real teams
and pseudo teams. Richardson (2010), as cited in West and Lyubovnikova (2010),
argued that a real team is a recognized group of people working toward achieving
common objectives with unique roles and responsibilities. The author laid out six
criteria that a team must have in order to be considered a real team. These criteria are:
collaboration, common goals, self-regulation, bidirectional relationships, finite roles, and
unique roles (West & Lyubovnikova, 2011). On the other hand, Richardson (2010), as
cited in West and Lyubovnikova (2010), pointed out that other teams appointed by the
managers in the organization that do not meet the aforementioned criteria may be
considered pseudo teams. As one can see above, the definitions and types of teams are
evolving thus requiring a great deal of attention for the years to come.

19
Team Cohesiveness
Amabile et al. (2004) and Littlepage et al. (1989), as cited in Kasemsap (2013),
indicated that team cohesiveness is defined as the level of commitment that team
members have toward common goals as well as activities. Festinger, Schachter, and
Back (1950), as cited in Wang and Huang (2009), posited that a team’s level of
cohesiveness indicated the amount of professional attraction and that the members were
willing to work and stay together as a team. Carron et al. (1985) identified two types of
team cohesiveness, which are task cohesiveness, being that the team works together
toward common objectives, and social cohesiveness, representing the relationships
between the team members (Kasemsap, 2013). Team cohesiveness is important because
the cohesiveness factor is directly linked to team performance (Chen, 2013; Kasemsap,
2013; Ruggieri & Abbate, 2013; Sivasubramaniam, Liebowitz, & Lackman, 2012; Wang,
Chou, & Jiang, 2005; Wang & Huang, 2009; Wendt et al., 2009). Stinson and
Hellerbrandt (1972) did, however, indicate that Stogdill (1959) found the relationship
between team cohesiveness and team performance to be negatively correlated.
Diversity
Increasingly diverse organizations and work places have driven the need to
understand different points of view that influence decision-making (Olson, Paryitam, &
Bao, 2007). Githens (2011) defined diversity as “race, gender, ethnicity, sexuality, age,
class, or disability” (p. 41). Githens (2011) cited the work of Mor-Barak (2011),
presenting the three views of diversity, which included narrow category-based (gender,
racial, national origin, disability, and age), broad category-based, and conceptual

20
articulations. The second category, the broad category-based, includes “cultural
background, social class, marital status, education, length of tenure in the organization,
and skills” (Githens, 2011, p. 42). Pelled, Eisenhardt, and Xin (1999) defined
demographic diversity as the “degree to which a unit (e.g., a work group or organization)
is heterogeneous with respect to demographic attributes” (p. 1). These attributes
included age, gender, and ethnicity (Pelled et al., 1999). Kormanik (2009) explored a
definition of diversity that included sexual orientation, gender, and identity.
Simon and Rowland (2011) described the need for differentiation in functional
and social diversity that could have direct effects on organizational policies. The
underlining idea stated that those who did not share commonalities tended not to form the
social ties which are needed to create effective teamwork (Simon & Rowland, 2011).
They posited that diversity could be truly sub-divided in two main categories. The first
was the function or job-related diversity that included functional expertise, education, and
organizational tenure, similar to Githens’ (2011) definition. The second category was
the bio-demographic diversity that included age, gender, and race (Simon & Rowland,
2011). This definition was in agreement with Githens’ narrow category-based
definition.
Milliken and Martins (1996), Shaw (1990), and Shaw and Barrett-Power (1998)
similarly divided diversity into two groups. These groups included the readily detectable
attributes type and the less visible attribute type of diversity. The readily detectable
features as described by Cumming et al. (1993), Jackson et al. (1995), and Tsui et al.
(1992), as cited in Milliken and Martins (1996), included race, age, and gender whereas
the less visible type included “education, technical abilities, functional background,

21
tenure in the organization, socioeconomic background, and values” (p.404). Similarly,
Harrison, Price, & Bell (1998) categorized diversity into two dimensions: surface-level
and deep-level diversity. The surface-level diversity, according to Harrison et al. (1998),
included observable features like age, sex, and race. The deep-level diversity, on the
other hand, encompassed features like “attitudes, beliefs, and values” (Harrison et al.,
1998, p.98).
Egan (2005) posited that through the qualitative research, the interviewees
identified diversity to be beyond race, gender, ethnicity, age, and disability. In fact,
other broader definitions like education, expertise, department, location, race, personality,
and ability were also included (Egan, 2005). “Educational diversity is defined as range
of individual differences, comprising a set of social and personal factors, which form a
key aspect in any and every educational setting” (Rayner, 2009, p. 433). Glick, Miller,
and Huber (1993), as cited in Miller, Burke, and Glick (1998), found that demographic
diversity actually has indirect effects on the outcomes of decision-making through
cognitive diversity. In fact, according to Shaw (1990), characteristics like culture and
socioeconomic status influenced an individual cognitive schema. Effectively, the
individual background, gender, and culture influenced his or her cognitive structure. In
light of this factor, cognitive diversity will be the primary concentration of this research.
Cognitive diversity has typically existed in the form of the variation in
preferences, beliefs, and thought processes. Miller et al. (1998) defined cognitive
diversity as the variations in beliefs as well as preferences, addressing the cause-effect
interplay. Olson et al. (2007) pointed to a very fundamental difference in people, in
terms of cognitive diversity such that even if a team could have members who were of the

22
same functional background, race, and gender, cognitive diversity could still be
prevalent. Demographic diversity itself might have very little bearing on the cognitive
diversity, which indicated that the effects on the outcome might be very little. In fact,
Glick et al. (1993) found that the relationship between demographic and cognitive
diversity did not exist at all in some cases (Miller et al., 1998). Melone (1994)
discovered that different types of professionals might interpret the same data in
completely different ways depending on their professional world views and mental
models.
Miller et al. (1998) indicated that there was support for both positive and negative
outcomes of cognitive diversity. The positive outcome could be the constructive
disagreement, in which individuals come together to share knowledge to solve the
problems. Mitchell, Nicholas, and Boyle (2009) studied the openness of team as it
affects cognitive diversity and found that there was a relationship between the openness
to cognitive diversity and knowledge creation. They posited that this openness allowed
team members to openly discuss their ideas thoroughly and exhaustively, and, as a result,
the best solution was picked for the problem.
Miller et al. (1998) stated that diversity could imply that strong unwavering
preferences and beliefs existed and such preferences and beliefs could cause
disagreement among team members. They also suggested that such cognitive diversity
could create a breakdown in the communication process that, in turn, could inhibit the
productive outcome.

23
Diversity in Teams
Horwitz (2005) identified two compelling theories governing teams’ diversity,
which includes the similarity-attraction paradigm and cognitive resource diversity theory.
The similarity-attraction paradigm states that members of the teams tended to gravitate to
those who possessed similar demographic attributes (Horwitz, 2005). This paradigm
suggests that homogenous teams would be more productive and more efficient than the
heterogeneous teams due to the mutual attraction in characteristics, which led to teams’
harmony (Horwitz, 2005). Horwitz (2005) asserted that heterogeneous teams tended to
be less productive because of the lower team cohesion arisen from tensions and conflicts
indicative to the differences in membership.
Cognitive resource diversity theory indicates that unique cognitive variation in
teams creates heterogeneous groups that increase the level of “creativity, innovation, and
problem-solving” (Horwitz, 2005, p. 225). Horwitz concluded that people of different
cultures, races, and experiences brought to the team unique contributions in terms of
problem-solving and decision-making.
McGrath et al. (1995), as cited in Sauer, Felsing, Franke, and Ruttinger (2006),
defined the attributes of team diversity into five clusters: demographics, including age,
gender, functional background; task-oriented knowledge, such as skill sets and
capabilities; personal beliefs and values; cognitive makeup and personality; and
organizational-level status. Klein, Knight, Ziegert, Lim, and Saltz (2011) moved beyond
normal demographic definitions of diversity and identified diversity to be value diversity
that encompassed knowledge, skills, values, beliefs, personality, cognition, behavior
styles, and organizational statuses. Horwitz (2005) classified diversity in teams into two

24
primary categories, which include biodemographic attributes and job-related attributes.
Biodemographic attributes consisted of “age, gender, and race” whereas job-related
attributes contained “functional expertise, education and organizational tenure” (Horwitz,
2005, p. 222). Horwitz claimed that the two categories contained the majority of the
characteristics of the teams. Simons, Pelled, and Smith (1999) examined four kinds of
diversity in teams that included “diversity in functional background, educational level,
tenure, and age” (p. 663). They also claimed that out of the four types of diversity
previously mentioned, functional, educational, and tenure were directly related to job
functions. Due to such diversity, team members might respond differently to situations
even though the context might be the same (Shin S. J., Kim , Lee, & Bain, 2012).
Egan’s (2005) finding indicated that individuals defined team diversity as “a large
variety of individuals’ similarities and differences” and as a “collection of individuals
whose unique characteristics provide a variety of perspectives aimed at the problem or
task that the team is undertaking” (p 212). Maier (1967) stated that teams had a higher
advantage when it comes to solving problems because each individual served as
knowledge gap filler, and Miller et al. (2009) agreed that teams could bridge the gaps in
knowledge between functional areas. Accordingly, “homogenous teams are less likely
to develop creative ideas” (Egan, 2005, p. 213).
Mitchell et al. (2009) found teams were able to facilitate a knowledge creation
process through a process known as engaging debate. Simons et al. (1999) defined
debate as an open discussion that was related to tasks where each member presented his
or her own different points of view and problem-solving approaches. Simon et al.
(1999) argued that without these debates, it was not likely that the benefit of team

25
diversity could be realized, and they also discovered that debate was more fruitful when it
was task related. People from different sections of the organization tended to bring fresh
new perspectives to the team, which increased the teams’ knowledge, skill sets, and
effectiveness (Egan, 2005).
Although diverse teams were more creative as a whole, there were certain
liabilities that must be monitored. These liabilities consisted of social pressure, that
Maier (1967) described as the need for members to conform, valence of solutions in
which a member with good manipulative skill might have a disproportionally higher
influence on the group, and individual domination, which indicated that a single member
might have more persistence in getting his or her way without regard to his or her talent
in solving team problems. Therefore, diverse teams could pose threats and present
opportunities (Horwitz, 2005).
Team Conflicts Due to Diversity
The negative side of diversity must be carefully managed in order to minimize its
effects on the team and its members. Pfeffer (1983) argued through similarity attraction
theory that similar individuals tended to appreciate each other more. Shin et al. (2012)
contended that dissimilarity might create friction as well as activate social categorization
process. Miller et al. (1998) reported that researchers found that diversity could have a
negative effect on decision-making, which in turn reduced performance outcomes. This
was in agreement with Shin et al., (2012), when they wrote that “if a team suffers from
dysfunctional conflicts caused by diversity, the team members are less likely to engage in
creative process such as building, experimenting, and elaborating ideas with one another”

26
(p. 199). Further, Klein, Knight, Ziegert, Lim, and Saltz (2011) found that value
diversity could create disruption within teams. Teams with members who were not
authentic might create conflict and undesirable social interaction (Hannah, Walumbwa, &
Fry, 2011). There were a few components influencing teams; some of these components
could be assets to the teams, others could be liabilities, and yet others could be either
(Maier, 1967). According to Pelled et al. (1999), diversity could shape conflicts and
these conflicts could improve performance or reduce teams’ outcome depending on the
type of conflicts. Shen and Chen (2007) indicated that conflicts reduced the teams’
abilities to process and evaluate new information as well as diminished team members’
willingness to work together. Pelled et al. (1999) posited two types of conflicts, which
included task conflicts and emotional conflicts. The functional background diversity
was found to be closely related to the task conflicts, whereas the race and tenure diversity
tended to increase emotional conflicts (Pelled et al., 1999). Task-related conflict was
deemed to help increased performance while emotional conflicts reduced the output of
the team (Pelled et al., 1999).
Diversity does not always reduce cohesiveness of the team. In fact, diversity in
teams could actually promote the relationship between team cohesiveness and team
performance. Soldan (2010) found that there was a relationship between team
cohesiveness and team performance but more interestingly, this relationship was
moderated by the team diversity. The relationship level between team cohesiveness and
team performance was high when the diversity level was high. However, Condon and
Crano (1988) suggested that cognitive diversity could affect the cohesion factor in a
negative way, which was cited in Miller et al. (1998). Miller et al. (1998) suggested that

27
cohesion influenced groupthink due to the individual team members’ desire to be liked
and to get along as well as “the fear of ostracism and fear of membership loss” (p. 42).
Therefore, if cognitive diversity existed in the team, the cohesiveness of the team might
be reduced due to the cognitive conflicts, which in turn reduced the team performance.
Miller et al. (1998) suggested that teams with less cohesiveness tended to challenge each
other’s opinions. Interestingly, Webber and Donahue (2001) used a meta-analysis
method to research the relationship between different types of diversity and team
cohesiveness. They found no relationship between the types of diversity and team
cohesion.
There seems to be disagreement on how diversity affects the team cohesiveness
and, therefore, the gap in literature exists for this relationship. Specifically, the gap
exists in the relationship between the cognitive diversity and team cohesiveness because
of a lack of literature on this relationship.
Hypothesis 1: There will be a direct and negative correlation between team
cohesiveness and team cognitive diversity.
Leadership in Teams
“Quantum leaps in performance may result when a group is roused out of its
despair by a leader with innovative or revolutionary ideas and a vision of future
possibilities” (Bass, 1985, p. 27). Leaders of teams often hold more responsibility than
most of the team members. Leaders often had dual responsibilities to the team as
members of the team and as the leaders of the team (Barnett & McCormick, 2012).
Team leaders must be good communicators in order for the team to be successful.

28
DuBrin (2004), as cited in Yang, Hung, and Wu (2011), indicated that leadership was the
process of using communication to accomplish a set goal. However, many teams never
reached their potential, while others failed (Barnett & McCormick, 2012). Hannah et al.
(2011) emphasized the importance of team leadership by stating that “team leader
authenticity predicted the average levels of authenticity of their team members” (p. 792).
Bennett and McCormick (2012) indicated that leadership structure had migrated
from a single central structure to one that was more team-oriented. Accordingly, this
indicated that team leadership might have direct influence on team members. Antes and
Schuelke (2011) cited several researchers (Basadur, 2004; Dess & Picken, 2000; Zheng,
Khoury, & Grobmeier, 2010; Zhou & George, 2003), who posited that leadership could
be the key to team creativity when leaders provided support, supplied resources, and led
the team. Leadership had enhanced team performance and affected the level of
teamwork and team cohesiveness (Shen & Chen, 2007; Yang et al., 2011). Leaders that
coached and mentored team members while providing feedback, enabled members to
grow and evolve (Antes & Schuelke, 2011). These behaviors enhanced organizational
performance regardless of their leadership level (Antonakis, Finley, & Liechti, 2011).
Yang et al. (2011) found that leadership, teamwork, and project performance were
significantly correlated. Egan (2005) reported that primary characteristics that team
leaders looked for in creating diverse teams are individual creativity, intellectual
engagement, and readiness to explore assumptions. Maier (1967) believed leaders had
great influence over the outcome of the team because they increased the level of
cohesiveness in the relationship among team members (Yang et al., 2011). Team
cohesiveness was also strongly associated with leadership effectiveness. Ruggieri and

29
Abbate (2013) indicated that “effective leaders were especially capable of fostering group
cohesiveness” (p. 1171). Literature indicated that leadership could strengthen the
cohesiveness of the team but it was still unclear whether such influence might influence
the relationship between cognitive diversity and team cohesiveness.
Hypothesis 2: The presence of leadership will moderate the relationship between team
cohesiveness and team cognitive diversity.
Berber and Rofcanin (2012) studied leadership in dynamic teams, in which
leadership was shared among team members instead of residing in the leader only. They
claimed that the strength of the team could be increased by distributing the leadership
across the teams. Hoch, Pearce, and Welzel (2010) defined shared leadership as the
creation of a unique team that was the result of the leader’s ability to share decision
making among team members. Hannah et al. (2011) claimed that teams, with high levels
of authentic leadership, produced more as well as have better teamwork. When
leadership was shared, leaders became a communal responsibility instead of authoritative
(Berber & Rofcanin, 2012). According to Berber and Rofcanin (2012), this flexible
structure created a new concept of teamwork that surpassed the traditional static work
unit structure; they argued that this concept created employee satisfaction that increased
organization’s profitability. Hoch et al. (2010), however, found that shared leadership
might not be effective in all situations. They discovered that if the team diversity was
low, the effect of the shared leadership was more effective; whereas, if the diversity level
was high, the shared leadership was less effective.
Gilley, Gilley, McConnell, and Veliquette (2010) reported that leaders must have
certain competencies in order to lead successful teams. These competencies included the

30
abilities to coach, communicate, motivate, and foster growth (Gilley, Gilley, McConnell,
& Veliquette, 2010). Burke, Stagl, Klein, Goodwin, Salas, and Halpin (2006) indicated
that leaders of teams provided vision and direction, organized structures, and coaching.
The leader’s knowledge of the working environment could be used to solve problems
(Burke et al., 2006). Zhang and Bartol (2010) found that employee’s creativity was
highly dependent upon the support of the leader. Even with all of the benefits described,
Yang et al. (2011) still indicated that “lack of information regarding leadership benefits
along with uncertain competitive advantage from teamwork had resulted in a manager’s
reluctance to adopt different leadership styles” (p. 258).
Leadership in Diverse Teams
Visagie, Linde, and Havenga (2011) suggested that in order for organizations to
be successful, leaders must be capable, flexible, innovative, and able to manage diversity.
Egan (2005) indicated that leaders, who were successful in leading creative programs,
admitted that diverse teams generated better and more creative outputs, which directly
affected organizational success. Differing diversity in teams, could be both benefits and
conflicts (Sauer et al., 2006) if not managed correctly. Shin et al. (2012) indicated that
the right leadership might reduce the negative effects of the team conflict. Klein,
Knight, Ziegert, Lim, and Saltz (2011) suggested that team conflicts might change in
either positive or negative directions depending on the type of leadership that led the
team. Such leadership could be viewed from two different perspectives as studied by
Klein et al. (2011). They had identified both tasked-focused leadership as well as
person-focused leadership. Accordingly, they found that tasked-focused leadership

31
reduced the influencing effects of the value diversity in terms of team conflict, while
person-focused leadership aggravated the value diversity effects.
The relationship between the members of cognitively diverse teams was
dependent upon the leadership type (Shin et al., 2012). Egan (2005) found that leaders
of successful teams preferred individuals who brought in a variety of views representing
different parts of the organization as well as those who had different education,
experience background, personality, and attitude.
Burke et al. (2006) also identified the same primary types of leadership. They
believe task-focused leadership type was “transactional, initiating structure and
boundary-spanning as the primarily leadership behaviors” (Burke et al., 2006, p. 291).
Task-focused leadership concentrated on communicating the clarity of task requirements,
the procedure by which the tasks were to be accomplished, and the actual acquisition of
the tasks themselves (Burke et al., 2006). Second, they contended person-focused or
individualistic leadership, and the behaviors belonging to this type consisted of
behavioral “interactions, cognitive structures, and the cohesive attitude development”
(Burke et al., 2006, p.291). In other words, person-centered leadership focused more on
the human and cognitive factors of the team and less on the actual procedures and
transactional elements. According to Burke et al. (2006), person-focused leadership
consisted of the “transformational, consideration, empowerment, and motivational” (p.
292) behaviors. Wang and Huang (2009) further suggested transformational leadership
behaviors are positively correlated to team cohesiveness. Wendt et al. (2009) discovered
that person-centered leadership and level of effectiveness of the leaders had direct and
positive correlations to the level of team cohesiveness.

32
Hypothesis 3: Leadership individualistic trait will moderate the relationship
between team cohesiveness and team cognitive diversity.
Maier (1967) indicated that the leadership style might be the key to maximize the
assets of the group diversity and minimize its liabilities. Leaders could use their
positions to moderate and create constructive conflicts that were required for innovation,
and they might do this without risking the negative conflict (Maier, 1967).
Klein et al. (2011) discovered that leaders had the ability to equally shape the
effects of demographical diversity, informational diversity, and value diversity among
team members. Maier (1967) argued that effective leaders should “receive information,
facilitate communications between the individuals, relay messages, and integrate the
incoming responses so that a single unified response occurs” (p. 246). Ahearne,
Mathieu, and Rapp (2005) posited that empowering leadership accentuated the
importance of the work while encouraging the employees to participate in decision-
making processes, which built confidence in teams’ abilities to resolve problems (Zhang
& Bartol, 2010). Leadership behaviors, therefore, might increase as well as decrease the
diversity conflicts (Klein et al., 2011).
It is argued that shared leadership should be the future of leadership studies
(Berber & Rofcanin, 2012; Hannah et al., 2011; Hoch et al., 2010). Hoch et al. (2010)
found that team leadership effectiveness was dependent upon the condition of the team as
well as the diversity level of the team. Thus, it was argued that shared leadership alone
was not enough to mediate the effectiveness and cohesiveness of a cognitively diverse
team. “Leadership style plays a venerable role in fostering creativity as well as

33
productivity within a team environment; it encourages innovation and co-ordination
among employees” (Malik et al., 2012, p. 738).
Yang et al. (2011) claimed that good leaders have emotional intelligence that
included “self-awareness, self-regulation, motivation, empathy, and social skill” (p.259).
They also indicated that empathy influences the emotional ability of the leader. Yang et
al. (2011) compared transactional and transformational leadership in their research on
project management and teams. They indicated that transactional leadership rewarded
employees in exchange for meeting the goals. Burke et al. (2006) reported that
transactional behaviors involved exchanges of praise and incentives when team members
meet expectations but also included punishments when expectations were not met. In
other words, transactional leadership used contingency of rewards as well as active and
passive management by exception. Bass (1985) indicated that transactional leadership
could only produce a marginal amount of improvement because a transactional leader
depended upon rewards as a motivator, and many did not have the ability to deliver that
reward.
In contrast, transformational leaders did not have the ability to generate a higher
level of improvement (Bass, 1985). Although Podsakoff et al. (2010) disagreed with this
concept, they argued that certain elements of transactional leadership such as contingent
reward and punishment behaviors might have great benefits in employees’ performance
perception. On the other hand, Groves and Feyerhern (2011) contended that leaders with
high cultural intelligence were able to better address team diversity. Malik et al. (2012)
indicated that changes in leadership style could significantly improve team building
effectiveness.

34
There were types of leaders that help facilitate the differences within diverse
teams. Kearney and Gebert (2009) discovered that a high level of transformational
leadership significantly influenced the relationship between nationality as well as
educational diversity and team performance, thus, eliminating the negative effects of the
diverse team, like low-level cohesiveness. Transformational leadership behaviors could
help facilitate the team performance outcomes in the major areas including material
management and human resource management (Burke et al., 2006). Bass (1985) pointed
out that transformational leaders encouraged and motivated their constituents to do more
than normally expected. These leaders not only raised the level of awareness about the
importance of task performance outcomes; they also motivated the team members to rise
beyond their self-interest (Bass, 1985).
Transformational leaders exhibited charisma, pride, respect, trust, and vision as
well as showed consideration to the individual team members (Yang et al., 2011). Bass
(1985) also agreed when he described the factors that transformational leaders possessed
as charisma, individual consideration, and intellectual stimulation. Burke et al. (2006)
indicated that when mixing transformational leaders’ charisma with intellectual
stimulation and individual consideration, leaders could create compelling direction for
the team to follow. This enabled them to motivate the team members in coaching
situations, thus, allowing them to create effective team performance.
Transformational leadership established a bond between leaders and team
members (Kearney & Gebert, 2009). Van Dieredonck and Nuijten (2011) suggested
transformational leadership was very similar to servant leadership in that the service was
built into the leader-follower relationship. Avolio and Bass (2004) categorized

35
transformational leadership as providing role models, motivation, stimulation, and
individualized consideration (Kearney & Gebert, 2009). Employees tended to improve
their performance when their leaders were “charismatic, individualizing, and
intellectually stimulating” (Bass, 1985, p. 33).
Choi (2006) posited that charismatic leaders possessed three components, which
included vision, empathy, and empowerment. Bass (1985) stated that charisma was an
essential part of leadership due to its inspiring, enthusiasm creating, and trust-gaining
nature. Charismatic leaders’ actions and visions activated their followers’ needs for
affiliation and power (Choi, 2006). Charisma typically separated a good leader from an
ordinary one (Bass, 1985). In terms of team effectiveness, charismatic leaders put strong
emphasis on teams as well team cohesiveness, and, as a result, members were more
willing to support each other (Choi, 2006). Wang et al. (2005) suggested that leaders
should exhibit more of the charismatic behaviors since these behaviors were found to
help improve both team members’ cohesiveness and team performance. This was
because charismatic leaders were able to combine the members’ personal goals with the
teams’ goals (Wang et al., 2005).
Hypothesis 4: Leadership charismatic trait will moderate the relationship
between team cohesiveness and team cognitive diversity.
Beyond transformational and charismatic leadership, van Dieredonck and Nuijten
(2011) indicated that servant leaders did not depend on their power in order to
accomplish tasks, but instead they rely on their persuasive skill to improve employee
performance. Servant leadership occurred when leaders take on the role of the servant in
helping their teams (Russell & Stone, 2002). The servant leadership characteristics were

36
listed as empowerment, accountability, standing back, humility, authenticity, courage,
interpersonal acceptance, and stewardship (van Dieredonck & Nuijten, 2011).
Empowerment allowed the employee to take initiative and be pro-active; held employee
accountable for results; provided support and acknowledgement to the employee;
demonstrated humility because the leader recognizes his or her own limitation; showed
authenticity; demonstrated courage; provided empathy and responses to the diversity of
team members; and provided stewardship (Van Dieredonck & Nuijten, 2011).
Additionally, Russell and Stone (2002) identified nine functional attributes and
eleven accompanying attributes for servant leadership. The functional attributes
included vision, honesty, integrity, trust, service, modeling, pioneering, appreciation of
others, and empowering. The accompanying attributes included communication,
credibility, competence, stewardship, visibility, influence, persuasion, listening,
encouragement, teaching, and delegation (Russell and Stone, 2002). Finally, Yang et al.
(2011) contended that empathy is very crucial in the role of leadership.
Empowering leadership was defined by Zhang and Bartol (2010) as the process of
“sharing power with an employee by delineating the significance of the employee’s job,
providing greater decision-making autonomy, expressing confidence in their capabilities,
and removing hindrances to performance” (p. 109). Zhang and Bartol (2010) indicated
empowering leadership helps employees realize how valuable they are to the work and
organization while building and communicating the confidence in the employees’
abilities to be successful as well as giving them the autonomy to make decisions. Chen,
Kirkman, Kanfer, Allen, and Rosen (2007) linked the individual empowerment to the
team performance. They indicated that the two levels were closely related. It was

37
discovered through a meta-analysis that empowering leadership’s behavior accounted for
about thirty percent of the variance in team learning (Burke et al., 2006). These shared
traits exist between transformational, empowering, charismatic, and servant leadership.
Kasemsap (2013) argued that empowering leadership, as well as team cohesiveness, had
strong influence on the success of the team.
Hypothesis 5: Leadership empowering trait will moderate the relationship
between team cohesiveness and team cognitive diversity.
Kearney and Gebert (2009) did not find any relationship between age diversity
and team performance when transformational leadership level was high; however, the
negative effect was discovered when the transformational leadership level was low.
Kearney and Gebert (2009) also found that transformational leadership helped harvest the
benefits of the diversity in teams as well as helped prevent the possible harmful effects of
individual differences.
In summary, Burke et al. (2006) described transactional behaviors as being
primarily an exchange type that gave praise and incentives for meeting expectations and
punishment for missing expectations. Thus, transactional leadership managed through
contingency of reward as well as active and passive management by exception. While
transactional leadership provides more of a concrete cause and effect relationship for its
employees, transformational leadership’s relationship with its employees is more abstract
(Burke et al., 2006). Transformational leaders exhibited charisma, pride, respect, trust,
and vision as well as showed consideration to the individual team members (Yang et al.,
2011). Bass (1985) described the factors that transformational leaders possessed to be
charismatic leadership, individual consideration, and intellectual stimulation.

38
Empowering leadership was defined by Zhang and Bartol (2010) as the process of
“sharing power with an employee by delineating the significance of the employee’s job,
providing greater decision-making autonomy, expressing confidence in their capabilities,
and removing hindrances to performance” (p. 109). Therefore empowering leadership
includes many of the characteristic traits from the servant leadership as well as those of
transformational leadership. Chen, et al. (2007) described the empowering leaders as
those who developed personal relationship with individual employees. The common
traits among these researches on the various leadership styles include charisma,
empowerment, and individualist. These are the characteristic traits of leadership that are
proposed to be tested in this research study.
Table 1 summarizes the characteristics found in each leadership style described
above.

39
Table 1: Leadership Traits Comparison
Leadership BehaviorsTransformational Empowering Servant Charismatic
Idealized influence Participative Management EmpowermentIndividualConsideration
Inspirational Goal Setting Standing Back EnvisioningIntellectualStimulation
Job Enrichment Accountability Empathy
IndividualizedConsideration
Intrinsic Motivation Forgiveness Empowerment
Creativity Courage Inspirational
Empowerment Role Identity AuthenticityEnthusiasmCreation
Leadership Encouragement ofCreativity
Humility Trust
StewardshipIndividualConsiderationVisionaryTrustingService
Theoretical Underpinning of the Study
It is important to understand how implicit leadership theory is appropriate to
underpin this study. “The implicit theories provide a degree of stability and
predictability to dyadic relations in addition to simplifying the information-processing
demands associated with social interactions” (Engle & Lord, 1997, p.991). Implicit
leadership theory relied on social cognitive theory to explain how employees rated and
classified individuals into leader or non-leader categories, which references upon a
leader’s own knowledge structure, past experiences, and previous relationship
interactions (Shondrick, Dinh, & Lord, 2010). Lord and Maher (1991) indicated there
were two ways that leaders can be perceived: inferred or recognized as cited in Hartog et
al. (1999). The inference was typically based on the outcome of the leadership

40
performance in that recognition was based on the match-up between the observed traits
and the observers’ implicit ideas of the leadership traits (Hartog et al., 1999; Moorman,
Darnold, & Priesemuth, 2013). Claims are made that transformational leaders’ (Wang &
Huang, 2009), charismatic leaders’ (Wang, Chow, & Jiang, 2005), empowering leaders’
(Kasemsap, 2013), and servant leaders’ (Dennis & Bocarnea, 2005) behaviors alike can
influence the level of team performance. According to Bass, Avolio, Jung, and Berson
(2003), “followers identify with and want to emulate their leaders” (p. 208). Wang and
Huang (2009) indicated that a leader can only influence his or her team if the members
“seek to identify with, and want to emulate him or her” (p.381). It is through the lens of
implicit leadership theory that the effects of common leadership characteristic traits are
seen on the cohesiveness of cognitively diverse teams.
Schyns and Meindl (2005) describe implicit leadership theory as the images that
are associated with behaviors and characteristics of leaders that employees may have
(Schyns, Kiefer, Kerschreiter, & Tymon, 2011). Individuals typically develop their own
preconception of what the leaders and leadership should be; and, therefore, set certain
expectations in the leaders’ characteristics (Hartog et al., 1999). Schyns et al. (2011)
also indicated “when meeting or observing a “leader” certain leader images are activated,
and the behavior of this “leader” is interpreted in line with these images” (p. 399).
Berber and Rofcanin (2012) indicated that implicit leadership theory crossed the domains
of organizational behavior as well as psychology where the effective leadership
represented the organizational behavior domain when the cognitive studies into the
implicit leadership mental model fit in the psychological domain. Shondrick et al.
(2010) mentioned three categories of leadership prototypical representations in their

41
research. These representations consisted of a superordinate level, basic level, and
subordinate level (Shondrick et al., 2010). The superordinate level contained more
abstract as well as general information that distinguished leaders from non-leaders, where
basic level contained more contextual information about the leader that can be altered.
Furthermore, the subordinate level contained information that indicated the distinct types
of leaders (Shondrick et al., 2010). Hannah, Walumbwa, and Fry (2011) argued that
leaders could become role models if the follower were attracted to their qualities as well
as developed the desire to be associated with the leader, in which case the leaders’
authenticity could be transferred to the team members. According to Bass, Avolio, Jung,
and Berson (2003), “followers identify with and want to emulate their leaders” (p. 208).
Wang and Huang (2009) also indicated that a leader could only influence his or her team
if the members “seek to identify with, and want to emulate him or her” (p.381).
This study seeks to address the gap between the characteristic traits necessary for
leaders to possess in order to lead and establish a cohesive, cognitively diverse team. In
this study, team performance will not be studied because literature on the topic already
exists on the direct correlation between team’s cohesiveness and team’s performance
(Chen, 2013; Kasemsap, 2013; Ruggieri & Abbate, 2013; Sivasubramaniam, Liebowitz,
& Lackman, 2012; Wang et al., 2005; Wang & Huang, 2009; Wendt et al., 2009).
Researchers could not agree on the claims regarding which of the multiple styles of
leadership were necessary to lead and create cohesiveness in teams coupled with the
rapid globalization of organizations creating cognitively diverse teams. This study seeks
to focus on the characteristic traits common in multiple leadership styles instead of any
one particular style. These traits are charismatic, empowering, and individualistic.

42
Conclusion
The major concepts that are directly relevant to this research have been identified.
These concepts include team, team cohesiveness, diversity, diversity in teams, team
conflicts due to diversity, leadership in teams, leadership in diverse teams, leadership
preferences in diverse teams, and the theoretical underpinning of this study.
Three main concepts have been reviewed. First, multiple leadership styles seemingly are
very effective in enhancing team performance. Second, homogenous teams can still be
cognitively diverse. Third, ineffective leadership could lead to poor team performance.
Literature also indicates that transformational leadership style described by Burke
et al. (2006), servant leadership style described by Russell and Stone (2002) and Dennis
and Bocarnea (2005), charismatic leadership style described by Choi (2006), and
empowering leadership style described by Amundsen et al. (2013) and Martin and Liao
(2013), held common traits like charisma, empowerment, and individualistic.

43
Chapter 3: Methodology
The purpose of this research is to study the interaction and moderating effects
between four primary variables. The research aims to address the specific gap in the
relationship between cognitive diversity and team cohesiveness. The overarching
research questions are:
1. Is there a negative relationship between a team’s cognitive diversity
and team cohesiveness?
2. Are there any specific character traits of leaders that may moderate the
relationship between team cognitive diversity and team cohesiveness?
The moderating factors are addressed in this research in order to capture the
leadership traits that influence the relationship between cognitive diversity and team
cohesiveness. Following is the tested model representing relationships for each of the
hypotheses. The model hypothesizes the main relationship between the team’s cognitive
diversity and team cohesiveness. It also hypothesizes leadership traits as the moderating
factors. These traits include charisma, empowerment, and individuality. Figure 3
represents the aforementioned model.

44
Figure 3: Proposed Research Model
Hypothesis 1: There will be a direct and negative correlation between team
cohesiveness and team cognitive diversity.
This hypothesis is tested using two instruments. The instrument shown in Table 2 and
Table 4 measure the team cohesiveness components and cognitive diversity among
participants.
Hypothesis 2: The presence of leadership will moderate the relationship between
team cohesiveness and team cognitive diversity.
The second hypothesis represents regression analysis with all of the independent
variables being run together in one step to generate a general regression model.
Hypothesis 3: Leadership individualistic trait will moderate the relationship
between team cohesiveness and team cognitive diversity.

45
The third hypothesis represents the moderating relationship of the individualistic trait
acting on the relationship between a team’s cognitive diversity component and team
cohesion component.
Hypothesis 4: Leadership charismatic trait will moderate the relationship
between team cohesiveness and team cognitive diversity.
The fourth hypothesis represents the moderating relationship of the charismatic trait,
acting on the relationship between a team’s cognitive diversity component and team
cohesion component.
Hypothesis 5: Leadership empowering trait will moderate the relationship
between team cohesiveness and team cognitive diversity.
The fifth hypothesis represents the moderating relationship of the empowering trait acting
on the relationship between a team’s cognitive diversity component and team cohesion
component.
The moderating relationships were hypothesized due to the nature of the
leadership trait variables in question. These variables affect “the direction and/or
strength of the relationship between an independent or predictor variable and a dependent
or criterion variable” (Baron & Kenny, 1986, p. 1174). The moderating terms are
created by the creation of the product of the independent variable and the moderating
variables. The product terms become part of the regression equation.
Data Collection
Regression analysis is the most suitable method to investigate the relationship
among variables (Chen & Dang, 2008; Chen, Hsueh, & Chang, 2013; Kao & Chyu, 2003;

46
Tutmez, 2012); it is appropriated that a survey-style quantitative study is used in this
research. The survey was administered via an online distribution and collection system.
The target of the survey distribution was teams in organizations that have divisions across
the United States. The samples were obtained using Qualtrics
(http://www.qualtrics.com). Qualtrics is a private software research company
specializing in collecting data across the globe.
Panel data collection process has become more common as a way of collecting
needed information for research (Thornton, Autry, Gligor, & Brik, 2013). As long as the
panelists are screened for qualification in advance, it is considered to be a valid usage
(Thornton et al., 2013).
Qualtrics organization utilizes a research firm called ClearVoice Research
(http://clearvoiceresearch.com) to collect the needed panel data. ClearVoice Research
was established after the organization was successful in developing two other well-
known panelist recruitment online sites, namely www.surveyclub.com and
www.surveyscout.com. These sites have been used for the purpose of online sampling
as well as panelist recruitments. Historically, ClearVoice Research has used its panel for
market research only. The combined memberships of all three sites/organizations total
over 12 million members, although the survey club site was viewed as a database rather
than a panel.
ClearVoice Research also has access to several hard-to-reach groups due to the
census representative nature of the panel. The organization encourages the participation
of the members via the partnership among other companies that may own these hard-to-

47
reach databases of the individuals and provide incentives for participation through
revenue sharing.
ClearVoice Research does collect demographic data on the participating panelists.
These data include name, e-mail address, postal address, gender, date of birth, and
language. The participants are also asked to complete profile information as part of the
membership process. In order to ensure a good and valid population sample, ClearVoice
Research verifies all of the participants’ postal addresses, flash cookies, and computer IP
addresses. The process limits multiple accounts within the same household, prevents
multiple registrations from the same computer, and verifies the countries of origin. In
order to prevent the same member from filling out the survey twice, ClearVoice Research
assigns its members a GUID for each survey. A survey invitation is then sent only once
per e-mail address per that particular survey. The tracking cookies are also used to
ensure that each member is only invited once per survey.
The surveys were deployed according to the clients’ criteria as to which group of
representative samples was pulled from the overall pool. A randomization technique is
also used in order to ensure that a good mixture of members receive the requests to fill
out the research surveys. If a minority group is desired, additional incentives are
provided to ensure a higher response rate.
The boundaries were set such that the types of teams will be made up of sales,
marketing, accounting, engineering, finance, and human resource across multiple
business units and countries to ensure diversity in the data. The sample size for this
study is around 1,000 respondents due to the high number of scales on the instruments as
well as to ensure the data normality (Jaccard, Guilamo-Ramos, Johansson, & Bouris,

48
2006). Tabachnick and Fidell (2007) indicated that the sample size that should be taken
into consideration for a social study is around N > 50 +8m where m is the number of
independent variables. In our case, there were 4 independent variables to be considered.
Applying the Tabachnick and Fidell equation, we would need an N greater than 50 + 8*4
or 82. The number of respondents collected were sufficient for this research.
Demographic data such as age, gender, race, and educational level were collected for
further testing. Data associated with identity of participants were not collected in order
to protect the participants, as well as to eliminate social desirability bias. All data
collected are kept confidential, and any additional identifiable features such as IP
addresses were erased. The data is kept on the secure .NET platform servers that are
located in the secure data center.
The data collection was divided into two phases. These phases included the soft
launch and full launch. The soft launch was the initial launch of the survey. The soft
launch collected about 10 percent of the total needed respondents. Since the total needed
respondents was 1,000, the soft launch collected approximately 100 respondents. The
data collected from the soft launch was used to test the initial reliability of the survey
scales. This is critical because the four items team cognitive diversity scale is adapted
from the original scale used to test executive leadership cognitive diversity.
Once the initial data was deemed to be valid, the second phase, the full launch,
was implemented and additional respondents were added to the survey pool. A larger
than needed number of respondents was targeted in order to achieve the total of 900
additional respondents. The number of respondents collected was 1,015 by the closing
of the survey.

49
The Instruments
One single instrument consisting of five separate scales was utilized in this
research. The scales included were team cohesiveness, leader charismatic trait, team
cognitive diversity, leader empowering trait, and leader individualistic trait.
The scale for team cohesiveness as represented in Table 2 is published in Wang et
al. (2005). This scale was developed by Hoegl and Gemuenden (2001). It is made up
of four items rating from 1 to 5, with 1 being never and 5 being always. The Cronbach’s
alpha value of the scale is tested to be 0.918. Since the Cronbach’s alpha values were
greater than 0.70, the scales were considered to be reliable. Nunnally (1978) as cited in
Pallant (2010) “recommended a minimum level of .7 Cronbach alpha value” (p. 6).
Table 2: Team Cohesiveness
Team Cohesiveness Instrument (Wang,Chou, & Jiang, 2005)
Never Always
It was important to the members of ourteam to be part of the project
1 2 3 4 5
The team members strongly attached tothis project
1 2 3 4 5
The members of our team felt proud tobe part of the team
1 2 3 4 5
Every team member felt responsible formaintaining and protecting the team
1 2 3 4 5
The scale for charismatic leadership as represented in Table 3 was developed by Cheung
et al. (2001) and published in Wang et al. (2005). It is made up of six items rating from
1 to 5 with 1 being never and 5 being always. The scale was modified to range from 1
through 7 to keep with the consistency and ease of analysis. Appendix B shows this
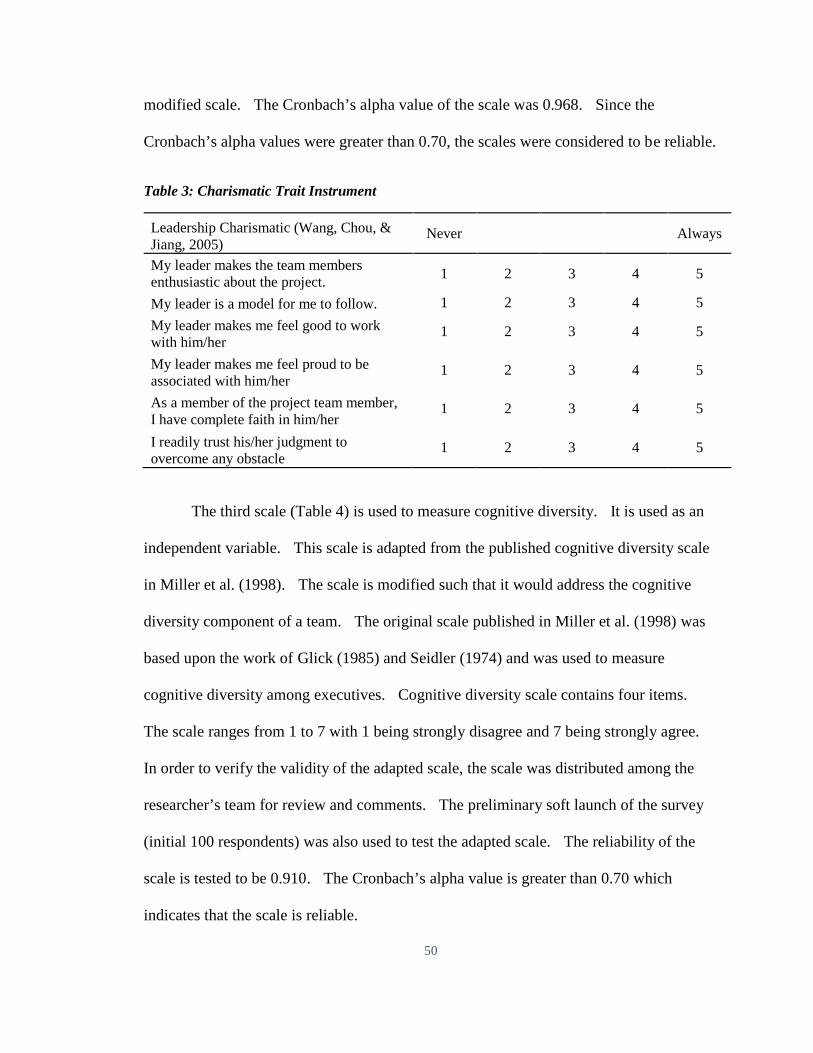
50
modified scale. The Cronbach’s alpha value of the scale was 0.968. Since the
Cronbach’s alpha values were greater than 0.70, the scales were considered to be reliable.
Table 3: Charismatic Trait Instrument
Leadership Charismatic (Wang, Chou, &Jiang, 2005)
Never Always
My leader makes the team membersenthusiastic about the project.
1 2 3 4 5
My leader is a model for me to follow. 1 2 3 4 5
My leader makes me feel good to workwith him/her
1 2 3 4 5
My leader makes me feel proud to beassociated with him/her
1 2 3 4 5
As a member of the project team member,I have complete faith in him/her
1 2 3 4 5
I readily trust his/her judgment toovercome any obstacle
1 2 3 4 5
The third scale (Table 4) is used to measure cognitive diversity. It is used as an
independent variable. This scale is adapted from the published cognitive diversity scale
in Miller et al. (1998). The scale is modified such that it would address the cognitive
diversity component of a team. The original scale published in Miller et al. (1998) was
based upon the work of Glick (1985) and Seidler (1974) and was used to measure
cognitive diversity among executives. Cognitive diversity scale contains four items.
The scale ranges from 1 to 7 with 1 being strongly disagree and 7 being strongly agree.
In order to verify the validity of the adapted scale, the scale was distributed among the
researcher’s team for review and comments. The preliminary soft launch of the survey
(initial 100 respondents) was also used to test the adapted scale. The reliability of the
scale is tested to be 0.910. The Cronbach’s alpha value is greater than 0.70 which
indicates that the scale is reliable.

51
Table 4: Cognitive Diversity Instrument
Cognitive Diversity (Glick,1985; Seidler, 1974)
StronglyDisagree
StronglyAgree
The best way to maximizethe team's performance. 1 2 3 4 5 6 7What the team's goalpriorities should be? 1 2 3 4 5 6 7The best way to ensure theteam's long-term success. 1 2 3 4 5 6 7Which team objectivesshould be considered mostimportant? 1 2 3 4 5 6 7
The fourth scale (Table 5) was used to measure the empowering moderating
variable, and the fifth scale (Table 6) was used to measure the individualistic moderating
variable. Dennis and Bocarnea (2005) developed these instruments to measure servant
leadership traits. The empowering traits scale is made up of five items. The items are
rated from 1 to 7 with 1 being total disagreement and 7 being most agreement possible.
The Cronbach’s alpha value for the individualistic scale is tested to be 0.942. The
Cronbach’s alpha value is greater than 0.70 which indicates that the scale is reliable.
Table 5: Empowering Trait Instrument
Empowering (Dennis &Bocarnea, 2005)
TotalDisagreement
MostAgreement
My leader empowers me withopportunities so that I develop myskills.
1 2 3 4 5 6 7
My leader turns over somecontrol to me so that I may acceptmore responsibility.
1 2 3 4 5 6 7
My leader entrusts me to makedecisions.
1 2 3 4 5 6 7
My leader gives me the authorityI need to do my job.
1 2 3 4 5 6 7
My leader lets me make decisionswith increasing responsibility.
1 2 3 4 5 7 7

52
The individualistic traits scale as represented in Table 6 is made up of five items.
The items are rated from 1 to 7 with 1 being total disagreement and 7 being most
agreement possible. The Cronbach’s alpha value for the individualistic scale is tested to
be 0.958. The Cronbach’s alpha value is greater than 0.70, which indicates that the scale
is reliable.
Table 6: Individualistic Trait Instrument
Individualistic (Dennis &Bocarnea, 2005)
TotalDisagreement
MostAgreement
My leader is genuinelyinterested in me as a person.
1 2 3 4 5 6 7
My leader has shown his or hercare for me by encouraging me.
1 2 3 4 5 6 7
My leader has showncompassion in his or heractions toward me.
1 2 3 4 5 6 7
My leader shows concern forme.
1 2 3 4 5 6 7
My leader creates a culture thatfosters high standard of ethics.
1 2 3 4 5 5 7
Analysis Technique
Although there are several analysis techniques used in this research, regression
analysis was used as a primary analytical method for this research. The other analysis
methods used in this research were confirmative factor analysis to ensure the correct
loading of the variables. There are three main steps to factor analysis as described by
Pallant (2010). The first step was the “assessment of the suitability of the data for factor
analysis” (Pallant, 2010, p. 182). This step requires that the sample size is large enough
in order for the result to be reliable. Tabachnick and Fidell (2007) posit that at least 300
cases are needed to produce both a reliable and generalizable result. The second step

53
was the factor extraction. This step consisted of finding the smallest quantity of factors
that best represent the relationships among variables (Pallant, 2010). The third and last
step consists of factor rotation. Factor rotation allows researchers to see the patterns of
loadings in simpler ways and are, thus, easier to interpret (Pallant, 2010). The
orthogonal rotation technique is used in this analysis.
The explorative factor analysis was used to determine the loading of the un-
rotated variables in order to test for the Harman’s single-factor test, and similar to Gilley
et al. (2010), multiple regression analysis is used to isolate and prioritize the effects of
each trait, explaining the relationship. “Multiple regression is used to test a theory about
presumed causal influences on the criterion variable” (Jaccard et al., 2006, p. 456).
Chen et al. (2013) indicated that regression analysis is typically used to explore “the
relationships between independent (or input, explanatory) and dependent (or output,
response) variables” (p.302). Chen and Dang (2008) as well as Kao and Chyu (2003)
indicated that regression analysis is the most commonly used method to analyze the
relationship among multiple explanatory variables. “The regression analysis is used to
investigate the functional relationship among variables” (Tutmez, 2012, p. 2). It was
hypothesized, a single dependent variable that is team cohesiveness will have a negative
relationship with the cognitive diversity independent variable. The independent
moderating variables are the leadership traits of charisma, empowerment, and
individualism. Regression analysis is picked as an approach for this study because there
is a single continuous dependent variable and multiple continuous independent variables
(Jaccard et al., 2006; Stevens, 1946). The dependent and independent variables have the
following relationships:

54
Y = α +β1X1 + β2X2 + … + βnXn + ε (eq. 1)
The equation representing my current model is as follows:
Let Y = Team Cohesiveness
X1 = Cognitive Diversity
X2 = Charismatic Trait
X3 = Empowering Trait
X4 = Individualistic trait
Therefore:
Y = α +β1X1 + β2X2 + β3X3 + β4X4 + β5X1 X2 + β6X1 X3 + β7X1 X4 + ε (eq. 2)
Where Y is a dependent variable, X’s are the independent variables, α is the constant or
intercept, β’s are the constant representing the change in Y in the particular X variable of
interest while holding all other X’s variable constant, and ε is the error term resulting
from non-linearity in the data (Jaccard et al., 2006). The product terms (Jaccard et al.,
2006) (X1 X2, X1 X3, and X1 X4) represent the three interaction terms moderating the
relationship between team’s cognitive diversity and team cohesiveness. Regression
technique is the simple, straight forward, and elegant technique for handling this type of
data set.
There are four criteria that must be met to ensure both validity and reliability of
the data being analyzed. These criteria are linearity, independence, homoscedasticity,
and normality. Linearity describes the relationship between dependent and independent
variables. Multiple regression analysis is utilized when researchers make the assumption
that the predictor and criterion variables in the population have linear relationships
(Jaccard et al., 2006). The sample size should be large enough so that the relationship

55
becomes linear. The criteria for the observation of this linearity lies in the observed
versus predicted values plot. The points must be symmetrically spread along the
diagonal line of the plot. Any bow in the pattern indicates a problem in linearity.
Independence of errors indicates that there are no correlations among the error
terms themselves to affect the apparent relationships to the dependent variable that in turn
could cause miss-specification of the model under test. This is tested through the
Durbin-Watson test. The criteria value for this test is 2.0. If the value gravitates toward
0, there exists a positive correlation. If the value gravitates toward 4, there exists a
negative correlation.
Homoscedasticity describes the normality in standard deviation or constant
variance of the error terms that should be normally distributed and can be tested using the
Levene’s test. The criterion for Levene’s test is that the significance (p) value must be
greater than 0.05. It is the reverse of other statistical significance tests where the desired
value of p is less than 0.05.
Lastly, normality follows Gaussian distribution shape for the data. Violation of
this assumption can cause coefficients estimation to be unreliable (Jaccard et al, 2006).
Although researchers typically delete data points that cause the skew in the normality
curve, sometimes it may be impractical to delete points if there are not enough data.
In summary, similar to Rodell and Judge (2009) and Thornton et al. (2013) who
used online data (recruit participants from www.Craiglist.org) for their research, the
Qualtrics panel data via ClearVoice Research is used for this study to test the relationship
between a team’s cognitive diversity and team cohesiveness. The research tested the
moderating relationships between leadership traits, team’s cognitive diversity, and team

56
cohesiveness. Multiple regression analysis was used as an appropriate analysis
technique to test the relationships. The proximal and psychological separation was used
to help minimize the problem of variance. The Harman’s single-factor test was used to
isolate the common method variance once the data has been collected.
Reliability, Validity, and Common Method Biases
In order to address the issue of reliability and validity, existing and proven
surveys were used to collect the data. This would increase reliability of data collected
for this study. The instruments used have the reliability; Cronbach’s alpha values were
greater than 0.70. In order to ensure internal validity, the instruments were taken from
the scholastic publications where they had been used and reused by many researchers.
The external validity that addressed how well the study could be generalized was
accommodated through the data pool using Qualtrics’ resource pool. This should ensure
diversity in data as well as minimize validity problems.
Although Doty and Glick (1998) discovered that a high percentage of common
method bias did not invalidate the majority of research findings, it was still important to
consider common method biases when collecting data. The scale length was kept to the
absolute minimum in order to “minimize the decay of previous responses in short-term
memory” (Podsakoff, MacKenzie, Lee, & Podsakoff, 2003) as well as “enhancing the
observed relationships between scale items” (p. 885). Since it was necessary to this
research to collect both dependent and independent data from the same source, care was
taken to eliminate or minimize the common method biases created during the data
collection process. Podsakoff et al. (2003) noted that the common method variance

57
could “threaten the validity of the conclusions” (p. 879). Two techniques were deployed
to help resolve common method biases issues. These techniques include proximal and
psychological separation (Podsakoff et al., 2003; Podsakoff et al., 2012)
The first technique is the proximal separation in which the distance between the
measurements is increased (Podsakoff et al., 2012). Weijters, Geuens, & Schillewaert
(2009) via Podsakoff et al. (2012) suggested that proximal separation between similar
constructs can help prevent item correlations as long as the measures are separated at
least six items apart.
The second technique used was psychological separation. This technique created
an illusion of non-relatedness in the respondents’ minds whereby the predictor was
disconnected from criterion variables (Podsakoff et al., 2003). Psychological separation
could be utilized by creating a “cover story to make it appear that the measurement of the
predictor variable was not connected with or related to the measurement of the criterion
variable” (Podsakoff et al., 2003, p. 887; Podsakoff, et al., 2012). In the case of this
research, the dependent and independent variables were psychologically separated by a
set of business belief questions that was unrelated to the rest of the questions.
The common method variance was tested after the data was collected. The
method used to test the common method variance in the data set was Harman’s one-factor
test. Podsakoff and Organ (1986) described the test as the part of the factor analysis test.
The variables were loaded into a factor analysis and the un-rotated factor results were
explored for a single factor that dominates the majority of the covariance in both
dependent and independent variables (Podsakoff & Organ, 1986).

58
Chapter 4: Results
This chapter presents the data descriptions that include demographic data such as
gender, age, and ethnicity as well as the organizational-related data. These
organizational related data include team and industry types as well as organization size
and participants’ job positions. Research findings using the common method variance
test, factor analysis, and regression analysis tools are also discussed.
Data Description
The survey was sent out with a goal of acquiring at least N = 1,000 by the
Qualtrics organization. The survey was completed with N = 1,015. All of the questions
were completed fully. The frequency analysis was run in order to observe the
percentage makeup of the population relating to the demographic data.
Gender
Of the respondents, 49.9 percent were males and 50.1 percent were females.
Table 7: Gender
Gender Frequency Percent
Male 506 49.9
Female 509 50.1
Total 1015 100.0
Age
The age category question was divided into four age ranges. The first age range
covered 12 to 18; which, if selected, the respondents would be screened out and forced to

59
exit the survey. The second age range was 18 – 33. This range made up 22.9 percent of
the total number of respondents. The third age range was 34 – 51. This range made up
44.8 percent of the total respondents. The fourth age range was 51 to 65. This age
range made up 32.3 percent of the total respondents.
Table 8: Age
Age Frequency Percent18 - 33 232 22.9
34 -51 455 44.8
51 -65 328 32.3
Total 1015 100.0
Ethnicity
The ethnicity question was divided into five categories. These categories
included Asian, African American, Caucasian, Hispanic, and Other. The ethnicity
breakdown was as follows: 4.8 percent of the total respondents were Asians, 6.0 percent
of the total respondents were African Americans, 79.2 percent were Caucasians, 8.5
percent of the total respondents were Hispanics, and 1.5 percent of the total respondents
selected Other. The optional “fill-in-the-blank” was provided for this Other category.
The respondents were asked to fill in their ethnicity if it was not included in one of the
choices given. The responses included Italian American, Unknown, Mix, Mix
Caucasian – Asian, Pacific Islander, Samoan, Native American, Multi Race, and Mix
Caucasian – Native American.

60
Table 9: Ethnicity
Ethnicity Frequency PercentAsian 49 4.8
African American 61 6.0
Caucasian 804 79.2
Hispanic 86 8.5
Other 15 1.5
Total 1015 100.0
Team Type
The respondents were asked to indicate the types of teams to which they belong.
The teams were divided into seven categories. These categories included management,
marketing/sales, technical/engineering, manufacturing, finance, human resource, and
other types of teams. The result of the survey indicated that 46.1 percent of the total
respondents work in management teams, 17.9 percent of the total respondents worked in
marketing/sales teams, 22.1 percent of the total respondents worked in
technical/engineering teams, 11.4 percent of the total respondents worked in production
teams (teams that worked on the manufacturing floor), 0.7 percent of the total
respondents worked in finance teams, 0.5 percent of the total respondents worked in
human resource teams, and 1.3 percent of the respondents indicate that they worked in
other types of teams. The respondents were asked to fill in the blank if they selected the
other option. The respondents indicated other types of teams to be healthcare, service,
service delivery, electrician, customer service, meat department, investigation,
administrative, analytical, instructional, social service, and policy making.

61
Table 10: Team Type
Team Type Frequency PercentManagement 468 46.1Marketing/ Sales 182 17.9
Technical/ Engineering 224 22.1Manufacturing 116 11.4Finance 7 0.7Human Resource 5 0.5Other 13 1.3Total 1015 100.0
Industry Type
The respondents were asked to indicate the types of industries in which they were
employed. The question was divided into six categories. These categories included
manufacturing, service, education, professional, government, and non-profit industries.
The result of the survey indicated that 22.6 percent of the respondents were employed by
the manufacturing type of industry, 28.8 percent of the respondents were employed by
the service type of the industry, 7.9 percent of the respondents were employed by the
education type of the industry, 27.7 percent of the respondents were employed by the
professional type of the industry, 6.6 percent of the respondents were employed by the
government type of the industry, and 6.5 percent of the respondents were employed by
the non-profit type of the industry.

62
Table 11: Industry Type
Industry Type Frequency PercentManufacturing 229 22.6Service 292 28.8Education 80 7.9Professional 281 27.7Government 67 6.6Non-Profit 66 6.5Total 1015 100.0
Organization Size
The respondents were asked to indicate the size of the organizations in which they
were employed. The question was divided into seven categories. These categories
included unknown, 101 to 500, 501 to 1,000, 1001 to 2,500, 2,501 to 5,000, 5,001 to
10,000, and 10,001 and above. The result of the survey indicated that 27.8 percent of the
respondents did not know the size of their organizations, 18.1 percent of the respondents
were employed by the organizations that employ 101 to 500 employees, 13.0 percent of
the respondents were employed by the organizations that employ 501 to 1,000
employees, 10.6 percent of the respondents were employed by the organizations that
employ 1,001 to 2,500 employees, 7.3 percent of the respondents were employed by the
organizations that employ 2,501 to 5,000 employees, 7.3 percent of the respondents were
employed by the organizations that employ 5,001 to 10,000 employees, and 15.9 percent
of the respondents were employed by the organizations that employ 10,001 or more
employees.

63
Table 12: Organization Size
Organization size Frequency Percent1 - 100 282 27.8
101 - 500 184 18.1501 - 1000 132 13.01001 - 2500 108 10.62501 - 5000 74 7.35001 - 10,000 74 7.310,001 + 161 15.9Total 1015 100.0
Job Position
The respondents were asked to indicate their positions in the organizations in
which they were employed. The question was divided into four categories. These
categories included front line employee/ team member, supervisor or team leader, mid-
level executive manager, and other. The result of the survey indicated that 36.1 percent
of the respondents held the front line employee/ team member type of positions, 29.8
percent of the respondents held the supervisor or team leader type of positions, 25.8
percent of the respondents held the mid-level executive manager type of positions, and
8.4 percent of the respondents selected other as position held. The text box was
provided for the respondents to provide the positions held that were not covered in the
presented categories. The other positions included operation associate, senior
management, department head, owner, project manager, manager, solo practice
physician, CEO director of sales and marketing, Co-owner, custom technical writer and
instructor, student, business owner, office manager, laminator, intern architect, engineer,
VP/ CFO, senior VP, and coordinator.

64
Table 13: Job Position
Job Position Frequency PercentFront line employee 366 36.1
Supervisor/ team leader 302 29.8
Mid-Level executive 262 25.8
Other 85 8.4
Total 1015 100.0
Common Method Variance (CMV)
The result of the Harman’s single factor test indicated that although one variable
did explain the majority of the variance, CMV may not be an issue in this data set.
Generally, when examining the un-rotated factor test result, one looks for an emergence
of a single factor that accounts for the majority of the covariance in the measurements
(Podsakoff et al., 2003). There is not a single variable in the factor analysis test that
explains more than 50 percent of the total variance and, therefore, the data set should be
valid (Gaskin, 2011).

65
Table 14: Harman’s Single Factor Test for Common Method Variance
Total Variance Explained
Component
Initial Eigenvalues Extraction Sums of Squared Loadings
Total% ofVariance
Cumulative% Total
% ofVariance
Cumulative%
1 20.416 44.383 44.838 20.416 44.383 44.3832 5.619 12.215 56.5983 1.892 4.113 60.7114 1.638 3.560 64.2715 1.114 2.421 66.6936 1.072 2.330 69.0227 1.018 2.212 71.2358 0.988 2.148 73.3839 0.879 1.911 75.294
10 0.684 1.487 76.78111 0.643 1.397 78.17812 0.604 1.314 79.49213 0.577 1.254 80.74614 0.540 1.175 81.92115 0.526 1.144 83.06616 0.509 1.106 84.17117 0.449 0.977 85.14818 0.421 0.915 86.06419 0.382 0.830 86.89420 0.372 0.809 87.70321 0.357 0.776 88.48022 0.352 0.766 89.24623 0.335 0.728 89.97424 0.325 0.707 90.681
Factor Analysis
Factor analysis by the way of principle component analysis (PCA) tested and
grouped the variables into smaller clumps of variables. PCA is commonly used to
reduce the large set of variables down to smaller groups of factors by searching for
groups of linear combinations in such a way that all variables are used in the process
(Pallant, 2010). Tabachnick and Fidell (2007) stated that PCA is a good technique to

66
extract the “empirical summary of the data set” (p. 635). Pallant (2010) also indicated
that PCA technique is also commonly used prior to regression analysis.
The Kaiser-Meyer-Olkin measure of sampling adequacy and Bartlet’s test of
sphericity were used to test the data for the factor analysis appropriateness. The result of
Kaiser-Meyer-Olkin measure of sampling adequacy is 0.971, which is greater than 0.6.
The Bartlet’s test of sphericity is significant (p = 0.000), which indicates that the data set
is suitable for the use of factor analysis (Pallant, 2010).
The result of the PCA indicated that most of the independent variables loaded into
three main factors. All of the factors have at least required three items loaded (Pallant,
2010). Leadership charismatic trait and leadership individualistic trait loaded highly
(>0.8) into one factor as seen in Table 15. This meant that both charismatic and
individualistic leadership traits were highly correlated and that they were not independent
of each other as predictors. Leadership empowering trait loaded highly (> 0.75), except
for one questionnaire item, into a single individual factor. The analysis results show no
significant cross-loadings between variables except for the one empowering item.
Lastly, cognitive diversity questions all loaded highly (>0.8) into one factor. The result
of the factor analysis, in conjunction with the initial regression analysis test, led me to
drop the individualistic trait as well as one question from the leadership empowering trait
scale results. The leadership empowering trait scale was retested for reliability and
validity. The resultant Cronbach Alpha was 0.941, indicating a valid scale. As
mentioned later on in this chapter, the individualistic trait was dropped because it did not
test significant to the dependent variable (team cohesiveness). When tested as a
moderator, the individualistic trait also did not test to be significant.

67
Table 15: Factor Loadings
Pattern Matrix
Component
1 2 3CHARIS1 .824 .142CHARIS2 .951CHARIS3 .907CHARIS4 .927CHARIS5 .919CHARIS6 .897INDIV1 .863INDIV2 .884INDIV3 .879INDIV4 .910INDIV5 .838EMPWR1 .465 .415EMPWR2 .958EMPWR3 .950EMPWR4 .123 .754COGND1 .850COGND2 .872COGND3 .893COGND4 .893EMPWR5 .878
Regression Analysis
The standard regression analysis was used in which all of the predictors were
simultaneously entered into the equation. The sample size was confirmed to be
appropriate for the multiple regression method. Steven (1996) quoted in Pallant (2010)
indicated that at least 15 participants are needed per predictor used in the multiple
regression equation. In the case of this research, four primary predictors included team
cognitive diversity, leadership charismatic, individualistic, and empowering traits. The
recommended number of participants needed were 60. After the extreme outliers were

68
removed by inspection of the Mahalanobis Distance results, the usable sample size left
was 1,008 respondents.
The data were also checked for multicollinearity. This was done using two
values. The first value was the coefficients tolerance. This value indicated the level of
“variability of the specified independent variable that was not explained by the other
independent variables in the model” (Pallant, 2010, p. 158). According to Pallant
(2010), this value must be greater than 0.10 for low amount of multicollinearity. All of
the included variables tolerance values are above 0.10, indicating a low level of
multicollinearity. The second value was the coefficient variance inflation factor (VIF)
value. VIF was the inverse of the coefficient and the value should be under 10 (Pallant,
2010). All of the included variables VIF values in this data set were under 10, also
indicating low multicollinearity. The normal probability plot (P-P) of the regression
standardized residual and the scatter plot were inspected for major deviations from the
normality.
The software used for the regression analysis was IBM SPSS Statistics version
20. The initial regression analysis was run only with dependent and independent
variables without any moderation effects to test the direct effects between dependent
variable against its predictors. The result indicated a significant relationship between
team cohesiveness and team cognitive diversity (β= .34, p = 0.000). There was a
significant relationship between team cohesiveness and leadership charismatic trait (β=
.35, p = 0.000). There was a significant relationship between team cohesiveness and
leadership empowering trait (β= .20, p = 0.000). However, there was not a significant

69
relationship between team cohesiveness and leadership individualistic trait (β= -.040, p =
0.389).
Table 16: Effects of Team Cognitive Diversity and the Leadership Traits on TeamCohesiveness
Predictor
UnstandardizedCoefficients
StandardizedCoefficients
B SE βCognitive Diversity .350 .026 0.34*
Charismatic Trait .264 .036 0.35*
Empowering Trait .175 .033 0.20*
Individualistic Trait -.030 .034 -.040
*p < .001
Hypothesis 1 indicated that there would be a direct and negative correlation
between team cohesiveness and team cognitive diversity. The results indicated that there
was a direct relationship between team cohesiveness and team cognitive diversity,
although the relationship was not negative. Hypothesis 1 was not supported.
Table 17: Effects of Team Cognitive Diversity and Combined Leadership Traits on TeamCohesiveness
Predictorβ R² ΔR²
Step 1 .557** .558**
Cognitive Diversity 0.360**
Leadership combined traits .509**
Step 2 0.559* .003*
Leadership moderatingvariable
.059*
*p < .01, **p < .0005
Hypothesis 2 indicated that the presence of leadership would positively moderate
the relationship levels between team cohesiveness and team cognitive diversity.
Leadership variable was created by taking a mean of charismatic and empowering traits.

70
The regression analysis shows that there was a relationship between combined leadership
traits and team cohesiveness (β= .509, p = 0.000), and the combined leadership traits did
moderate the relationship between team cognitive diversity and team cohesiveness (β=
.059, p = 0.009). Hypothesis 2 is supported.
Hypothesis 3 indicated that the leadership individualistic trait would have a
positive influence such that it would positively moderate the level of relationship between
team cohesiveness and team cognitive diversity. The individualistic trait was tested to
be non-significant. Hypothesis 3 was not supported. Factor analysis also indicated that
both charismatic and individualistic traits loaded together as one factor. The
individualistic trait was dropped from the further analysis since it loaded highly with the
charismatic trait and tested non-significant to the team cohesiveness dependent variable.
The remaining leadership traits were the charismatic and empowering traits.
Hypothesis 4 indicated that the team leadership charismatic trait would have a
positive influence such that it would positively moderate the relationship between team
cohesiveness and team cognitive diversity. Charismatic leadership trait tested significant
to have a positive relationship to team cohesiveness (β= .336, p = .000). It did not,
however, moderate the relationship between team cognitive diversity and team
cohesiveness as can be seen in the moderation test result (β= -.046, p = .218).
Hypothesis 4 was partially supported due to the significant direct effect of the charismatic
leadership trait on team cohesiveness.

71
Table 18: Effects of Team Cognitive Diversity and Moderating Leadership Traits on TeamCohesiveness
Predictor
β R² ΔR²Step 1 .556** .558**
Cognitive Diversity .354**
Charismatic Trait .336**
Empowering Trait .211**
Step 2 .561* .006*
Charismatic Trait ModeratingVariable
-.046
Empowering Trait ModeratingVariable
.112*
*p < .01, **p < .0005
Hypothesis 5 indicated that the leadership empowering trait will positively
moderate the relationship between team cohesiveness and team cognitive diversity. The
regression result indicated that there was a significant relationship between the leadership
empowering trait and team cohesiveness (β= .211, p = .000). Leadership empowering
trait also tested to positively moderate the relationship between team cognitive diversity
and team cohesiveness (β= .112, p = .003). Hypothesis 5 is supported.
The overall model summary indicated that 56.1 percent of the unique and shared
variances in the dependent variable, team cohesiveness, was explained by the model (R²=
.561, p = .002). The correlations part coefficients were examined in order to isolate the
unique contribution of each variable. The cognitive diversity variable uniquely
contributed 8.4 percent to the overall regression model. Charismatic leadership trait
uniquely contributed 4.3 percent to the overall regression model. The empowering
leadership trait uniquely contributed 1.7 percent to the overall regression model. Lastly,

72
the moderating variable, empowering leadership trait, uniquely contributed the additional
0.4 percent to the overall regression model when it was added to the overall relationship.
Figure 4 pictorially demonstrated the influence of the leadership empowering trait
on the relationship between cognitive diversity and team cohesiveness. The level of the
relationship was positively moderated as the leadership empowering trait was increased.
Figure 4: Moderating Role of Empowering Leadership Trait
In conclusion, the results of the analysis indicate that Hypothesis 1 is partially
supported due to the positive effect of cognitive diversity on team cohesiveness.
2.0832.437
2.7913.145
3.4993.853
4.2074.561
4.9152.611
2.965
3.319
3.673
4.027
4.381
4.735
5.089
5.443
1 2 3 4 5 6 7 8 9
Team
Coh
esiv
enes
s
Cognitive Diversity
Team Cohesiveness Versus CognitiveDiversity
Low Empowering Trait High Empowering Trait

73
Hypothesis 2 is supported due to both the significant direct (leadership traits combined)
effect and the significant moderating effect on the relationship between team cognitive
diversity and team cohesiveness. Hypothesis 3 is not supported due to the non-
significant direct effect of leader individualistic trait on the team cohesiveness.
Hypothesis 4 is only partially supported due to the significant direct effect of leadership
charismatic trait on team cohesiveness and non-significant interaction effect of
charismatic trait and cognitive diversity on the team cohesiveness. Hypothesis 5 is
supported due to the significant direct effect of leadership empowering trait on team
cohesiveness and the significant interaction effect of leadership empowering trait and
team cognitive diversity on team cohesiveness.

74
Chapter 5: Discussion
In this chapter, the results and findings of this research will be discussed along
with limitations and future research needs. The contributions and implication will also
be given.
This research study aims to explore the relationship between cognitive diversity
and team cohesiveness as it is moderated by three different leadership characteristic
traits. The literature research indicates that the relationships between leadership traits
exist in terms of leadership influencing the cohesiveness of teams. The literature
research also indicates teams that are cognitively diverse can affect team cohesiveness
due to the differences in mental processes. This research is based on the implicit
leadership theory specifically addressing the idea that followers tend to mimic the
behavior of the leaders whom they admire. The end goal is to identify the most
important traits and behaviors that organizations should include in their leadership
training in order to create cognitively diverse cohesive teams.
General Discussion and Findings
Research in the area of how leadership affects the cohesiveness of the team that is
cognitively diverse is still under developed. Literature indicates that there is a direct link
between team performance and team cohesiveness. Literature also indicates that there is
a relationship between team leadership behavior and team cohesiveness. Lastly,
literature indicates that there is a relationship between cognitive diversity and team
cohesiveness. However, there has been very little research on the links between all three
components.

75
The research findings from the current study indicate that there are relationships
between cognitive diversity and team cohesiveness but surprisingly, the relationship is in
the positive direction instead of the negative direction. This seems to contradict the
publication by Miller et al. (1998), who suggested that team cohesiveness may be
reduced due to cognitive conflict, and the findings of Woehr et al. (2013), who suggested
that “ more similarity resulted in more team cohesion” (p. 107). There are two possible
explanations for this phenomenon. The first explanation is that the population sample
largely strives on having cognitive diversity in the team and that little to no cognitive
conflict due to the cognitive diversity exists in this sample (i.e., the majority of the
population sample have similar cognitive make up). In fact, when tested for cognitive
diversity variation, approximately 35 percent of the total sample population have the
same coefficient of variance (standard deviation/ mean), while 71.9 percent have exactly
or less than 10 percent variance. This indicates that the population sample has relatively
high homogeneity and low levels of cognitive diversity, and may explain for less
cognitive conflict.
The second explanation is related to the types of conflict that exist within team
diversity. A few authors have noted that there were different types of conflict related to
diversity. These conflicts were affective and cognitive conflict (Ensley, Pearson, &
Amason, 2002). Affective conflict was defined by Ensley et al. (2002) as the
disagreement among team members on the personal level when team members had
interpersonal dislikes for each other. Cognitive conflicts, on the other hand, as defined
by Amason et al. (1997), were functional, strategic, and task-oriented conflict related to
team member disagreement on how to achieve objectives (Ensley et al., 2002). Ensley et

76
al. (2002) suggested that cognitive conflict was directly correlated to team cohesion
because high levels of cognitive conflict had been found with high levels of team
cohesion. They also suggested that high levels of affective conflict would decrease the
level of team cohesion. This indicates that the increase in levels of cognitive conflict
and team cohesion may help reduce the affective conflict level in the team (Ensley et al.,
2002).
Pelled, Eisenhardt, and Xin (1999), as cited in Harrison et al. (2002), reported that
emotional types of conflicts were reduced over a period of time. Jehn et al. (1999), as
cited in Harrison et al. (2002), suggested that social category type of diversity “may
become less relevant overtime” (p. 1033). Harris et al. (1998, 2002), as cited in Van
Knippenberg and Schippers (2007), reported that teams gained familiarity and experience
in working together over time. Such experience could help reduce the effects that
diversity may have on team conflict (Van Knippenberg & Schippers, 2007).
This could help explain the phenomenon that was revealed in this research. It is
possible that team members have been working together for an extended period of time
such that the effect of cognitive diversity on the team cohesiveness has been reduced and
may even increase in the positive direction as per Ensley et al. (2002) findings. It is also
possible that those who have had irreconcilable affective conflicts with teams have left
the team, thereby leaving team members who know how to manage cognitive conflicts.
This would explain the positive relationship between cognitive diversity and team
cohesiveness.
One interesting discovery was that there is no relationship between the leadership
individualistic trait and team cohesiveness. This is very surprising since several

77
leadership styles, such as transformational, servant, and charismatic, encompass this trait.
It is possible that this trait needs to be combined with other leadership traits in order to
create an overall system effect on team cohesiveness. Leaders with the charismatic
leadership trait can appear to show concern for the individual team member and could be
mistaken for the individualistic trait. This would explain why the charismatic trait and
the individualistic trait loaded together as one factor when factor analysis was applied.
Since leadership charismatic trait and individualistic trait load together as one and
individualistic trait is not significant, the leadership individualistic trait was dropped from
the study in order to strengthen the remaining variables. The result of the analysis
indicates that Hypothesis 3 is not supported.
It is also possible that leadership individualistic trait, when applied, is perceived
as micromanaging or special treatment. This could explain the lack of significance the
trait has on team cohesiveness. If a leader shows concern and spends a lot of time with
one team member more than others, two things may be anticipated. One, the team
member to whom the attention is directed may feel that he or she is being micromanaged
while the rest of the group is empowered and trusted. This could create disengagement
in team cohesiveness. The other perception is that the other members of the team may
perceive the individualistic act as a leader giving special treatment to a particular team
member. Both scenarios violate the principle in the implicit leadership theory in which
leaders must fit the followers’ expectations in order for the leaders to have any influence
on the team members. This, therefore, could cause the insignificant finding between the
leadership individualistic trait and team cohesiveness.

78
The analysis results also indicate that there are relationships between the
leadership traits and team cohesiveness. The charismatic trait is positively related to
team cohesiveness. This result agrees with the literature; Wang et al. (2005) indicate
that leadership charismatic trait can influence the cohesiveness of a team. This means
that the additional increase in the charismatic trait in leaders will also increase team
cohesiveness. This characteristic trait was also tested for the moderating affect.
Surprisingly, charismatic trait does not moderate the relationship between cognitive
diversity and team cohesiveness. This indicated that Hypothesis 4 is only partially
supported. Although the moderating relationship does not exist between cognitive
diversity and team cohesiveness, there may exist other relationships, such as the
mediation relationship. It is possible that there is a strong relationship between cognitive
diversity and team cohesiveness because the leadership charismatic trait is mediating the
relationship.
Leadership empowering trait was found to be positively correlated to team
cohesiveness. This finding is in agreement with Kasemsap (2013), who reported that
empowering leadership, as well as team cohesiveness, had strong influence on the
success of the team. This finding indicates that there is a direct relationship between this
particular leadership trait and the team cohesiveness such that an increase in the
empowering leadership trait influences an increase in team cohesiveness.
The leadership empowering trait was also tested for the moderating relationship.
This relationship was tested significant, which fully supports Hypothesis 5. The result
indicates that leadership empowering trait does moderate the relationship between
cognitive diversity and team cohesiveness. If the level of the empowering trait

79
increases, then the level of the relationship between cognitive diversity and team
cohesiveness also increases. This finding adds to the body of literature and provides
new knowledge to the field.
When the leadership traits were combined as a single variable, the leadership
variable is positively related to team cohesiveness. This result agrees with previous
publication studies. Leadership has been proven to be associated with the enhancement
of team performance and significantly affects the level of teamwork and team
cohesiveness (Shen & Chen, 2007; Yang et al., 2011). Ruggieri and Abbate (2013)
indicated that “effective leaders were especially capable of fostering group cohesiveness”
(p. 1171).
The leadership component also helps moderate the relationship between team
cohesiveness and team cognitive diversity. This indicates that leadership traits play an
important role in moderating the relationship between cognitive diversity and team
cohesiveness such that increasing the level of the leadership trait will also increase the
relationship level. This supports the validity of Hypothesis 2 and a new contribution to
the body of literature.
Limitations and Future Research
Limitations
This research has some limitations that must be considered. First, there is a high
level of correlation between leadership charismatic trait and leadership individualistic
trait. This may be due to the questionnaire used to collect the data. Further
investigation may be needed to analyze the questions being asked on the scale. The

80
second option is to use the leadership individualistic scale on its own. The
individualistic trait can then be tested against the dependent variable.
The second limitation is related to the method used to do this research.
Quantitative research and analysis method are only as good as the instruments used to
collect the data. Many variables can affect the relationships proposed in this research.
In order to make this research manageable, variables were limited. Additional variables
might make the instrument long and tedious, which might create a respondent fatigue
problem. Qualitative research allows researchers to probe deeply into the phenomenon
by asking probing questions through interviews. Therefore, qualitative research on the
relationships of the variables examined in the current study could be employed as the
next step of the study. This may be an alternative research method that can be used to
address this limitation.
The third limitation is in relation to the moderating relationship hypothesis. The
moderating effect assumes that a relationship between two variables exists already;
however, the level of relationship will increase when a moderating variable is added to
the relationship. Unlike moderation, the mediation effect is an effect that explains the
existing relationship between variables. It may be possible that the reason for the strong
relationship between cognitive diversity and team cohesiveness is due to the mediation
effects of the various leadership traits and could be tested in future research.
Future Research
Future research should include applying the qualitative research method to this
topic of research in order to explore additional variables that may influence the
relationship between cognitive diversity and team cohesiveness. The qualitative method

81
may also uncover different variables from the perspective of both the team leaders and
team members. These additional variables may also be used to create additional scales
for quantitative survey and analysis.
Due to the high percentage of Caucasians in the sample, the race demographic
variables may also be tested in the future regression analysis. Using this mixed method
will allow researchers to have both the depth and quantifiable data to address this
research topic.
Another possible future research is to explore the relationship between the
cognitive diversity and team cohesiveness variables using leadership traits as mediators.
This can be done using structural equation modeling. This will allow us to determine
whether the leadership characteristic traits do explain the strong relationship between
cognitive diversity and team cohesiveness. Literature also indicates that team
cohesiveness is directly linked to team effectiveness. The team effectiveness variable
could be added to the structural equation modeling in order to explore cause and effect
relationships.
Contributions and Implications
Literature Contribution
This research adds to the body of literature by providing a quantitative link
between cognitive diversity and team cohesiveness. It also provides new knowledge in
terms of leadership traits moderating and influencing the relationship between cognitive
diversity and team cohesiveness. This research proposes that leadership traits will
increase the level of relationship between cognitive diversity and team cohesiveness.
The result of this research also indicates that the empowering leadership trait, in

82
particular, helps moderate the relationship between cognitive diversity and team
cohesiveness such that the increase in the empowering trait will also increase the
relationship between team cohesiveness and its predictors.
This contribution adds to the leadership body of literature in which there are few
studies in the area involving team cohesiveness, cognitive diversity, and leadership traits.
Most leadership literature presents and discusses leadership styles instead of traits. This
research digs deeper into leadership traits by isolating the traits that may take on the
primary influences that make the leadership styles effective. For example, most
leadership styles share multiple traits such as charismatic, individualistic, and
empowerment traits. This research posits that individualistic traits may have no real
influence in the style’s effectiveness. Charismatic and empowerment traits, however,
may influence and moderate leadership style effectiveness.
Practical Implication
Organizational mergers and acquisitions create cognitive diversity among team
members. It is important to know how to handle this diversity when teams are combined
in order to work on and solve complex tasks.
The field of HRD has been interested in organizational change for a long time.
Many organizations have utilized HRD professionals to lead change and create a smooth
transition to make change less painful. These changes are externally influenced by
economic conditions that require organizations to become increasingly more flexible and
adaptable (Becker, Carbo II, & Langella, 2010), as the changing level of competition in
the market place is forcing many companies to redesign their structures and become more

83
customer oriented (Berber & Rofcanin, 2012). The research requirements in HRD are
becoming more prevalent to satisfy such needs.
Diversity, including diverse teams, is also being viewed as an effective business
strategy that allows organizations to meet the needs of global customers (Podsiadlowski,
Groschke, Kogler, Springer, & van der Zee, 2013). The results of this research study
provide a unique perspective on team diversity from a cognition point of view. The need
for understanding a more complex technical team cognition may be more important than
what is known as typical demographic-type diversity. This research provides several
implications to HRD practice, which can help organizations better train leaders and
manage teams. These implications include validation of the positive relationship
between cognitive diversity and team cohesiveness. Literature indicated that positive
cognitive conflicts were very productive for teams and that team cohesiveness may help
increase cognitive conflict in a positive and productive way. This research may add
some contributions to the work of Ensley et al. (2002) and Harris et al. (2002). It is
possible that cognitive diversity in teams may not lead to negative conflict (affective
conflict) but that over time, it increases team cohesiveness that may lead to the increase
of cognitive conflict. This conflict can actually increase the level of team productivity
and innovation.
The literature confirms that team cohesiveness leads to team effectiveness. It is
also important to realize that work team performance is directly linked to team
cohesiveness (Wang & Huang, 2009) and that cohesiveness has been shown as a critical
determinant of team performance (Sivasubramaniam, Liebowitz, & Lackman, 2012).

84
This research also explores the effects of leadership traits that help moderate the
relationship between cognitive diversity and team cohesiveness.
This work may be used in the academic community and in organizational
management practices. Hartog et al. (1999) indicated that followers matched the
observed traits of their leaders to what their ideas of leadership traits should be. This
helps members make decisions on whether to follow leaders. Bass, Avolio, Jung, and
Berson (2003) also indicated that followers who identify with their leaders tend to imitate
the actions of their leaders. Wang and Huang (2009) indicated that a leader can only
influence his or her team if the members “seek to identify with, and want to emulate him
or her” (p.381).
This is crucial because leadership traits can be replicated throughout teams and
create more holistic teams. If team members exhibit both empowering and charismatic
behaviors toward each other, it may be possible to influence and increase the
cohesiveness among team members. The additional implication to practice is that it can
be used and tested in leadership situations and also in peer-to-peer interactions.
This research provides the HRD field with increased understanding of the
interactions between cognitive diversity, team leadership traits, and team cohesion.
This is an important implication because as organizations expand and acquire more
complex systems, the development of diverse teams to meet these complex task needs is
required. New demands and requirements create problems that organizations must solve
as they become more complex; this increasing complexity cannot be solved or expected
to be solved by an individual within the organizations alone (Hackman & Morris, 1975).
This complexity includes the combination of individuals from different backgrounds,

85
whether demographic, functional, or experience. These backgrounds lead to different
cognitive makeups. Organizations end up with teams that have wide ranges of cognitive
diversity. It is imperative that cognitively diverse teams are lead effectively.
Leaders are essential to communicate the needs of the organization to team
members. Leaders also serve the critical roles of orchestrating the seemless work
interface among team members. Organizations only benefit when employees are fully
committed to the vision and mission of the organization (Fritz, O'Neil, Popp, Williams, &
Arnett, 2013). This research contributes quantitative data that will further the
understanding of this relationship.
“As cultural diversity increases, however, social comparison and
categorization processes occur, and in-groups/out-groups and cognitive biases
may emerge, creating barriers to social intercourse (Blau, 1977; Smith, Smith,
Olian, Sims, O’Bannon,& Scully, 1994; Tsui et al., 1992). Therefore, as
heterogeneity in management groups reaches moderate levels, the psychological
processes associated with social identity theory and self-categorization processes
may be more likely to occur. These processes generate individual behaviors such
as solidarity with others in a race- or gender-based group, conformity to the
norms of one’s group, and discrimination against out-groups (Tajfel & Turner,
1985). To the extent that multiple subcultures exist in moderately heterogeneous
groups, conflict is potentially maximized (Earley & Mosakowski, 2000; Lau &
Murnighan, 1998), and intergroup interaction and communication may be
blocked (Alexander, Nuchols, Bloom, & Lee, 1995; Blau, 1977)” (Richard,
Barett, Dwyer, & Chadwick, 2004, p. 256).

86
The research also provides a basic understanding of future research needs on how
leadership can help moderate and influence teams.
In terms of business applications, this research may help lower costs and increase
profits when applied to the team dynamics. Organizations have growing needs to use
decision making teams; therefore, it is important to understand team dynamics and their
decision-making processes (Chou, Lin, and Chou, 2012). Gilley, Gilley, & McMillan
(2009) found that many managers’ skills and behaviors can influence leadership
effectiveness. This means that when leadership of the team is effective the team is more
productive, which in turn produces results faster and with higher quality.
The results of this research show that leadership traits in general are related to
team cohesiveness; an increase in level of leadership traits increases the level of team
cohesiveness. Most important, the empowering leadership trait is shown to moderate the
relationship between cognitive diversity and team cohesiveness. Charismatic leadership
trait, although not shown to moderate the relationship between cognitive diversity and
team cohesiveness, has a strong influence on team cohesiveness. Results suggest that
organizations should concentrate their resources on building the empowerment trait in
their leaders since this trait makes the most impact on the relationship between team
cognitive diversity and team cohesiveness. Organizations should also concentrate on
leadership charismatic trait since this trait also has an impact on team cohesiveness.
These two traits are found to have significant impacts on the team cohesiveness
component and should be utilized by the organizations to increase the team cohesiveness
and as result team effectiveness.

87
Conclusion
Globalization has driven business needs for diversity study, which this research
contributes to in terms of cognitive diversity relating to member cohesiveness in teams.
As a result of globalization, organizations’ customers have also become more diverse,
which leads to different types of demands as well (Egan, 2005). With increasing
diversity in teams it is more crucial than ever that research provide additional
understanding of the relationship between cognitive diversity, leadership, and team
cohesion. Chou et al. (2012) concluded that it is important to understand team cognition
because it is important to teams’ decision making. Teams’ effective decision making
ability can become a much needed advantage for organizations in today’s global market.
“Organizations are increasingly using teamwork for effective strategic decision making
with the air of acquiring a sustainable competitive advantage in a rapid changing business
environment” (Chou et al., 2013, p. 382).
As global expansion occurs and the rising pressure for leaders to become more
culturally intelligent increases, there are more demands for leaders who are capable of
leading diverse teams (Groves & Feyerhern, 2011). This research extends the findings
from Shin, Kim, and Bain (2012), who found that demographic diversity alone will not
guarantee creativity within teams. High levels of cognitive diversity in teams require
more attention from team leaders; without guidance, diverse cognitive resources may not
be realized by teams (Shin et al., 2012). This research provides more quantitative data
on the leadership traits necessary to lead and moderate the level of cognitive diversity and
member cohesiveness within teams.

88
The results of this research help identify, train, and prepare future leaders for the
expanding landscape of cognitively diverse teams as organizations expand their footprints
across the world. More specifically, this research identifies the crucial leadership traits
such as charisma and empowerment, necessary to lead cognitively diverse teams.
Organizations can concentrate their resources on these identified traits to maximize
benefits and performance effectiveness. Egan (2005) interviewed team leaders of
Fortune 500 teams and concluded that team diversity was essential to their successes and
creativity and that leaders of these diverse teams play major roles in creating and leading
high performance teams (Malik, et al., 2012).

89
References
Amundsen, S., & Martinsen, O. L. (2013). Empowering leadership: Construct clarification,
conceptualization, and validation of a new scale. The Leadership Quaterly, 1-25.
doi:10.1016/j.leaqua.2013.11.009
Antes, A. L., & Schuelke, M. J. (2011). Leveraging technology to develop creative leadership
capacity. Advances in Developing Human Resources, 13(3), 318-365.
doi:10.1177/1523422311424710
Antonakis, J., Fenley, M., & Liechti, S. (2011). Can charisma be taught? Tests of two
interventions. Academy of Management Learning & Education, 10(3), 374-396.
doi:10.5465/amle.2010.0012
Aritz, J., & Walker, R. C. (2014). Leadership style in multicultural groups: Americans and east
asians working together. International Journal of Business Communication, 51(1), 72-92.
doi:10.1177/2329488413516211
Armache, J. (2012). Diversity in the workplace: Benefits and challenges. International Journal of
Diversity, 2012(1), 59-75.
Avolio, B. J., Bass, B. M., & Jung, D. I. (1999). Re-examining the components of
transformational and transactional leadership using the Multifactor Leadership
Questionnaire. Journal of Occupational and Organizational Psychology, 72, 441-462.

90
Barnett, K., & McCormick, J. (2012). Leadership and team dynamics in senior executive
leadership teams. Educational Management Administration & Leadership, 40(6), 653-
671. doi:10.1177/1741143212456909
Baron, R. M., & Kenny, D. A. (1986). The moderator-mediator variable distinction in social
psychological research: Conceptual, strategic and statistical considerations. Journal of
Personality and Social Psychology, 51(6), 1173-1182.
Bass, B. M. (1985). Leadership: Good, better, best. Organizational Dynamics, 13(3), 26-40.
Retrieved from
http://ehis.ebscohost.com.ezproxy.uttyler.edu:2048/eds/detail?vid=3&sid=f1928926-
85d1-453f-878b-
1acd3c83aced@sessionmgr15&hid=2&bdata=JnNpdGU9ZWRzLWxpdmUmc2NvcGU9
c2l0ZQ==#db=bth&AN=4640624
Bass, B. M. (1990). From transactional to transformational leadership: Learning to share the
vision. Organizational Dynamics, 18(3), 19-31.
Bass, B. M., Avolio, B. J., Jung, D. I., & Berson, Y. (2003). Predicting unit performance by
assessing transformational and transactional leadership. Journal of Applied Psychology,
88(2), 207-218. doi:10.1037/0021-9010.88.2.207
Becker, W. S., Carbo II, J. A., & Langella, I. M. (2010). Beyond self-interest: Integrating socal
responsibility and supply chain management with human resource development. Human
Resource Development Review, 9(2), 144-168. doi:10.1177/15344843309357877

91
Berber, A., & Rofcanin, Y. (2012). Linking flexible-dynamic team structures through distributed
leadership: A qualitative evaluation with single design case approach and application of
roster method. Jouranal of Business Research-Turk, 4(3), 55-69.
Bono, J. E., & Ilies, R. (2006). Charisma, positive emotions, and mood contagion. The
Leadership Quarterly, 17, 317-334. doi:10.1016/j.leaqua.2006.04.008
Bono, J. E., & Judge, T. A. (2004). Personality and transformational and transactional leadership.
Journal of Applied Psychology, 89(5), 901-910. doi:10.1037/0021-90010.89.5.901
Brown, A. S. (2009). A shift in engineering offshore. Mechanical Engineering, 131(3), 24-29.
Burke, C. S., Stagl, K. C., Klein, C., Goodwin, G. F., Eduardo, S., & Halpin, S. M. (2006). What
type of leadership behavior are fucntional in teams? A meta-analysis. The Leadership
Quarterly, 17, 288-306. doi:10.1016/j.leaqua.2006.02.007
Chang, D. S., KUO, Y. C., & Chen, T. Y. (2008). Productivity measurement of the manufacturing
process of outsourcing decisions: The case of a Taiwanese printed circuit board
manufacturer. 46(24), 6981-6995. doi:10.1080/00207540701429934
Chen, C. C. (2013). How does paternalistic style leadership relate to team cohesiveness in soccer
coachinng? Social Behavior and Personalit, 41(1), 83-94. doi:10.2224/sbp.2013.41.1.83
Chen, G., Kirkman, B. L., Kanfer, R., Allen, D., & Rosen, B. (2007). A multilevel study of
leadership, empowering, and performance in teams. Journal of Applied Psychology,
92(2), 331-346. doi:10.1037/0021-9010.92.2.331

92
Chen, L.-H., Hsueh, C.-C., & Chang, C.-J. (2013). A two-stage approach for formulating fuzzy
regression models. Knowledge-Based Systems, 52, 302-310.
doi:10.1016/j..knosys.2013.08.010
Chen, S.-P., & Dang, J.-F. (2008). A variable spread fuzzy regression model with higher
explanatory power and forecasting accuracy. Information Sciences, 3973-3988.
doi:10.1016/j.ins.2008.06.005
Choi, J. (2006). A motivational theory of charismatic leadership: Envisioning, empathy and
empowerment. Journal of Leadership & Organizational Studies, 13(1), 24-43.
doi:10.1177/10717919070130010501
Chou, H. -W., Lin, Y. -H., & Chou, S. -B. (2012). Team cognition, collective efficacy, and
performance in strategic decision-making teams. Social Behavior and Personality, 40(3),
381-394. doi:10.2224/sbp.2012.40.3.381
Conger, J. A., & Kanungo, R. N. (1988). The empowerment process: Integrating theory and
practice. Academy of Management Review, 13(3), 471-482.
Dennis, R. S., & Bocarnea, M. (2005). Development of the servant leadership assessment
instrument. Leadership & Organization Development Journal, 26(8), 600-615.
Dixon, K. R., & Panteli, N. (2010). From virtual teams to virtuality. Human Relations, 63(8),
1177-1197. doi:10.1177/0018726709354784

93
Doty, D. H., & Glick, W. H. (1998). Common methods bias: Does common methods variance
really bias results? Organizational Research Methods, 1(4), 374-406.
doi:10.1177/109442819814002
Egan, T. M. (2005). Creativity in the context of team diversity: team leader perspectives.
Advances in Developing Human Resources, 7(2), 207-225.
doi:10.1177/1523422305274526
Engle, E. M., & Lord, R. G. (1997). Implicit theories, self-schemas, and leader-member
exchange. Academy of Management Journal, 40(4), 988-1010.
Ensley, M. D., Pearson, A. W., & Amason, A. C. (2002). Understanding the dynamics of new
venture top managements teams cohesion, conflict, and new venture performance.
Journal of Business Venturing, 17, 365-386.
Fritz, J. H., O'Neil, N. B., Popp, A. M., Williams, C., & Arnett, R. C. (2013). The influence of
supervisory behavor integrity on intent to comply with organizational ethical standards
and organizational commitment. Journal of Business Ethics, 114, 251-264.
doi:10.1007/s10551-012-1345-z
Gaskin, J. (2011, March 25). Youtube. Retrieved from Youtube:
http://www.youtube.com/watch?v=w7zZCBlRXog
Gilley, A., Gilley, J. W., & McMillan, H. S. (2009). Organizational change: Motivation,
communication, and leadership effectiveness. Performance Improvement Quarterly,
21(4), 75-94. doi:10.1002/piq.20039

94
Gilley, A., Gilley, J. W., McConell, C. W., & Veliquette, A. (2010). The competencies used by
effective managers to build teams: An emperical study. Advances in Developing Human
Resources, 12(1), 29-45. doi:10.1177/1523422310365720
Gilley, A., McMillan, H. S., & Gilley, J. W. (2009). Organizational change and characteristics of
leadership effectiveness. Journal of Leadership & Organizational Studies, 16(1), 38-47.
doi:10.1177/1548051809334191
Gilley, J. W., & Maycunich, A. (2000). Beyond the learning organization. New York: Perseus
Books.
Githens, R. P. (2011). Diversity and incivility: Toward an action-oriented approach. Advances in
Developing Human Resources, 13(1), 40-53. doi:10.1177/1523422311410646
Groves, K. S., & Feyerhern, A. E. (2011). Leader cultural intelligence in context: Testing the
moderating effects of team cultural diversity on leader and team performance. Group &
Organization Management, 36(5), 535-566. doi:10.1177/1059601111415664
Hackman, J. R., & Morris, C. G. (1975). Group tasks, group interaction process, and group
performance effectiveness: A review and proposed integration. Advances in Experimental
Social Psychology, 8, 45-100.
Hannah, S. T., Walumbwa, F. O., & Fry, L. W. (2011). Leadership in action teams: Team leader
and members' authenticity strength, and team outcomes. Personnel Psychology, 64, 771-
802.

95
Harrion, D. A., Price, K. H., Gavin, J. H., & Glorey, A. T. (2002). Time, teams, and task
performance: Changing effects of surface- and deep-level diversity on group functioning.
Academy of Management Journal, 45(5), 1029-1045.
Harrison, D. A., Price, K. H., & Bell, M. p. (1998). Beyond relational demography: Time and
effects of surface- and deep-level diversity on work group cohesion. Academy of
Management Journal, 41(1), 96-107.
Hartog, D. D., House, R. J., Hanges, P. J., Ruiz-Quintanilla, S. A., & Dorfman, P. W. (1999).
Culture Specific and cross-culturally generalizable implicit leadership theories: Are
attributes of charismatic/transformational leadership universally endorsed? The
Leadership Quarterly, 10(2), 219-256. doi:10.1016/S1048-9843(99)00018-1
Hoch, J. E., Pearce, C. L., & Welzel, L. (2010). Is the most effective team leadership share? The
impact of shared leadership, age diversity, and corrdination on team performance.
Journal of Personnel Psychology, 9(3), 105-116. doi:10.1027/1866-5888/a000020
Horwitz, S. K. (2005). The compositional impact of team diversity on performance: The
theoretical considerations. Human Resource Development Review, 4(2), 219-245.
doi:10.1177/1534484305275847
Hu, J., & Liden, R. C. (2011). Antecedents of team potency and team effectiveness: An
examination of goal and process clarity and servant leadership. Journal of Applied
Psychology, 96(4), 851-862. doi:10.1037/a0022465

96
Jaccard, J., Guilamo-Ramos, V., Johansson, M., & Bouris, A. (2006). Multiple regression
analysis in clinical child and adolescent psychology. Journal of Clinical Child and
Adolescent Psychology, 35(3), 456-479.
Jehn, K. A., & Mannix, E. A. (2001). The dynamic nature of conflict: A longitudinal study of
intragroup conflict and group performance. Academy of Management Journal, 44(2),
238-251.
Judge, T. A., & Bono, J. E. (2000). Five-factor model of personality and transformational
leadership. Journal of Applied Psychology, 85(5), 751-765. doi:10.1037//0021-
9010.85.5.751
Kaiser, R. B., & Overfield, D. V. (2010). The leadership value chain. The Psychologist-Manager
Journal, 13, 164-183. doi:10.1080/10887156.2010.500261
Kao, C., & Chyu, C.-L. (2003). Least-squares estimates in fuzzy regression analysis. European
Journal of Operational Research, 148, 426-435. doi:10.1016/S0377-2217(02)00423-X
Kasemsap, K. (2013). Strategic business management: A practical framework and causal model
of empowering leadership, team cohesion, knowledge-sharing behavior, and team
performance. Journal of Social and Development Sciences, 4(3), 100-106.
Kearney, E., & Gebert, D. (2009). Managing diversity and enhancing team outcomes: The
promise of transformational leadership. Journal of applied psychology, 94(1), 77-89.
doi:10.1037/a0013077

97
Kearney, E., Gerbert, D., & Voelpel, S. C. (2009). When and how diversity benefits teams: The
importance of team memeber's need for cognition. Academy of Management Journal,
52(3), 581-598.
Kilduff, M., Angelmar, R., & Mehra, A. (2000). Top management-team diversity and firm
performance: Examining the role of cognitions. Organization Science, 11(1), 21-34.
Klein, K. J., Knight, A. P., Ziegert, J. C., Lim, B. C., & Saltz, J. L. (2011). When team members'
values differ: The moderating role of team leadership. Organizational Behavior and
Human Decision Processes, 114, 25-36. doi:10.1016/j.obhdp.2010.08.004
Kormanik, M. B. (2009). Sexuality as a diversity factor: An examination of awareness. Advances
in Developing Human Resources, 11(1), 24-36. doi:10.1177/1523422308329369
Maier, N. F. (1967). Assets and liabilities in group problem solving: The need for an integrative
function. Psychological Review, 74(4), 239-249.
Malik, M. E., Munir, Y., Zainab, Z., Hussain, S., Munawar, S., & Bashir, A. (2012). Empirical
investigation of leadership style on enhhancing team building skills. Interdisciplinary
Journal of Contemporary Research in Business, 4(8), 738-749.
Martin, S. L., Liao, H., & Campbell, E. M. (2013). Directive versus empowering leadership: A
field experiment comparing impacts on task proficiency and proactivity. Academy of
Management Journal, 56(5), 1372-1395. doi:10.5465/amj.2011.0113

98
Melone, N. P. (1994). Reasoning in the executive suite: The influence of role/experience-based
expertise on decision processes of coporate executives. Organizational Science, 5(3),
438-455.
Miller, C. C., Burke, L. M., & Glick, W. H. (1998). Cognitive diversity among upper-echelon
executives: Implications for strategice decision processes. Strategic Management
Journal, 19, 39-58.
Milliken, F. J., & Martins, L. L. (1996). Searching for common threads: Understanding the
multiple effects of diveristy in organizational groups. Academy of Management Review,
21(2), 402 - 433.
Mitchell, R., Nicholas, S., & Boyle, B. (2009). The role of openness to coginitive diversity and
group processes in knowledge creation. Small Group Research, 40(5), 535-554.
doi:10.1177/1046496409338302
Moorman, R. M., Darnold, T. C., & Priesemuth, M. (2013). Perceived leader integrity:
Supporting the construct validity and utility of a multi-dimensional measure in two
samples. The Leadership Quarterly, 24, 427-444. doi:10.1016/j.leaqua.2013.02.003
Olson, B., Paryitam, S., & Bao, Y. (2007). Strategic decision making: The effects of cognitive
diversity, conflict, and trust on decision outcomes. Journal of Management, 33(2), 196-
222. doi:10.1177/0149206306298657
Pallant, J. (2010). SPSS survial manual (4th ed.). New York, NY, USA: McGraw-Hill.

99
Pelled, L. H., Eisenhardt, K. M., & Xin, K. R. (1999). Exploring the black box: An analysis of
work group diversity, conflcit, and performance. Administrative Science Quarterly, 44, 1-
28.
Podsakoff, N. P., Podsakoff, P. M., & Kuskova, V. V. (2010). Dispelling misconceptions and
providing guildlines for leader reward and punishement behavior. Business Horizons, 53,
291-303. doi:10.1016/j.bushor.2010.01.003
Podsakoff, P. M., & Organ, D. W. (1986). Self-report in organizational research: Problems and
prospects. Journal of Management, 12(4), 531-543.
Podsakoff, P. M., MacKenzie, S. B., & Podsakoff, N. P. (2012). Sources of method bias in social
science research and recommendations on how to control it. Annual Revew of
Psychology, 63, 539-569. doi:10.1146/annurev-psych-120710-100452
Podsakoff, P. M., MacKenzie, S. B., Lee, J. -Y., & Podsakoff, N. P. (2003). Common method
biases in behavioral research: A critical review of the literature and recommended
remedies. Journal of Applied Psychology, 88(5), 879-903. doi:10.1037/0021-
9010.88.5.879
Podsiadlowski, A., Groschke, D., Kogler, M., Springer, C., & van der Zee, K. (2013). Managing a
culturally diverse workforce: Diversity perspectives in organizations. International
Journal of Intercultural Relations, 37, 159-175.

100
Rayner, S. (2009). Educational diversity and learning leadership: A proposition, some principles
and a model of inclusive leadership? Educational Review, 61(4), 433-447.
doi:10.1080/000131910903404004
Richard, O. C., Barnett, T., Dwyer, S., & Chadwick, K. (2004). Cultural diversity in management,
firm performance, and the moderating role of entrepreneurial orientation dimensions.
Academy of Management Journal, 47(2), 255-266.
Rodell, J. B., & Judge, T. A. (2009). Can “good” stressors spark “bad” behaviors? the mediating
role of emotions in links of challenge and hindrance stressors with citizenship and
Counterproductive Behaviors. Journal of Applied Psychology, 94(6), 1438-1451.
doi:10.1037/a0016752
Ruggieri, S., & Abbate, C. S. (2013). Leadership style, self-sacrifice and team identication. Social
Behavior and Personality, 41(7), 1171-1178.
Russell, R. F., & Stone, A. G. (2002). A review of servant leadership attributes: Developing a
practical model. Leadership & Organization Development Journal, 23(3), 145-157.
doi:10.1108/01437730210424084
Sauer, J., Felsing, T., Franke, H., & Ruttinger, B. (2006). Cognitive diversity and team
performance in a complex multiple task environment. Ergonomics, 49(10), 934-954.
doi:10.1080/00140130600577502
Schyns, B., Kiefer, T., Kerschreiter, R., & Tymon, A. (2011). Teaching implicit leadership
theories to develop leaders and leadership: How and why it can make a difference.

101
Academy of Management Learning & Education, 10(3), 397-408.
doi:10.5465/amle.2010.0015
Senior, B., & Swailes, S. (2007). Inside management teams: developing a teamwork survey
instrument. British Journal of Management, 18, 138-153. doi:10.1111/j.1467-
8551.2006.00507x
Shamir, B., House, R. J., & Arthur, M. B. (1993). The motivational effect of charismatic
leadership: A self-concept based theory. Organization Science, 4(4), 557-594. Retrieved
from www.jstor.org/stable/2635081
Shaw, J. B. (1990). A coginitive categorization model for the study of intercultural management.
Academy of Management Review, 15(4), 626-645.
Shaw, J. B., & Barrett-Power, E. (1998). The effects of diversity on small work group processes
and performance. Human Relations, 51(10), 1307-1325.
Shen, M. -J., & Chen, M. -C. (2007). The relationship of leadership, team trust and team
performance: A comparison of the service and manufacturing industries. Social Behavior
and Personality, 35(5), 643-658.
Shin, S. J., Kim , T. Y., Lee, T. Y., & Bain, L. (2012). Cognitive team diversity and individual tea
member creativity: A cross level interaction. Academy of Management Journal, 55(1),
197-212. doi:10.5465/amj.2010.0270
Shondrick, S. J., Dinh, J. E., & Lord, R. G. (2010). Developments in implicit leadership theory
and cognitive science: Applications to improving measurement and understanding

102
alternatives to hierarchical leadership. The Leadership Quarterly, 21, 959-978.
doi:10.1016/j.leagua.2010.10.004
Simon, S. M., & Rowland, K. N. (2011). Diversity and its impact on organizational performance:
The influence of diversity constructions on expectations and outcomes. Journal of
Technology Management & Innovation, 6(3), 171-182.
Simons, T., Pelled, L. H., & Smith, K. A. (1999). Making use of differences: Diversity, debate,
and decision comprehensiveness in top anagement teams. Academy of Management
Journal, 42(6), 662-673.
Sivasubramaniam, N., Liebowitz, S. J., & Lackman, C. L. (2012). Determinants of new product
development team performance: A meta-analytic review. J Prod Innov Mang, 29(5), 803-
820.
Soldan, Z. (2010). Group cohesiveness and performance: The moderating effect of diversity. The
International Journal of Interdisciplinary Social Sciences, 5(4), 155-168. Retrieved from
www.SocialSciences-Journal.com
Stevens, S. S. (1946). On the theory of scales of measurement. American Assoication for the
Advancement of Science, 103(2684), 677-680.
Stinson, J. E., & Hellebrandt, E. T. (1972). Group cohesiveness, productivity, and strength of
formal leadership. The Journal of Social Psychology, 87, 99-105.
Tabachnick, B. G., & Fidell, L. S. (2007). Using multivariate statistics. Boston, MA: Pearson
Education, Inc.

103
Tannenbaum, S. I., Mathieu, J. E., Salas, E., & Cohen, D. (2012). Teams are changing: Are
research andpractice evolving fast enough? Industrial of Organizational Psychology, 5,
2-24.
Tegarden, D. P., Tegarden, L. F., & Sheetz, S. D. (2009). Cognitive factions in a top management
team: Surfacing and analyzing cognitive diversity using causal maps. Group Decis Negot,
18, 537-566. doi:10.1007/s10726-007-9099-1
Thompson, P., Wallace, T., & Flecker, J. (1992). The urge to merge: Organization change in the
merger and acquisitions process in Europe. The International Journal of Human
Resource Management, 3(2), 285-306. Retrieved from
http://ehis.ebscohost.com/eds/pdfviewer/pdfviewer?vid=3&sid=fe8a0568-c28c-4e4f-
8daa-2a9decd859c0%40sessionmgr110&hid=5
Thornton, L. M., Autry, C. W., Gligor, D. M., & Brik, A. B. (2013). Does socially responsible
supplier selection pay off for customer firms? A cross-cultural comparison . Journal of
Supply Chain Management, 49(3), 66-89.
Tutmez, B. (2011). Spatial dependence-based fuzzy regression clustering. Applied Soft
Computing, 12, 1-13. doi:10.1016/jasoc.2011.09.012
Van Dieredonck, D., & Nuijten, I. (2011). The servant leadership survey: Development and
validation of multidimentional measure. Journal of Business Psychology, 26, 249-267.
doi:10.1007/s10869-010-9194-1

104
Van Knippenberg, D., & Schippers, M. C. (2007). Work group diversity. The Annual Review of
Psychology, 58, 515-541. doi:10.1146/annurev.psych.58.110405.085546
Visagie, J., Linde, H., & Havenga, W. (2011). Leadership competencies for managing diversity.
Managing Global Transition, 9(3), 225-247.
Wang, E., Chow, H. -W., & Jiang, J. (2005). The impacts of charismatic leadership style on team
cohesiveness and overall performance during EPR implementation. International Journal
of Project Management, 23, 173-180.
Wang, Y. S., & Huang, T. C. (2009). The relationship of transformational leadership with group
cohesiveness and emotional intellegence. Social Behavior and Personality, 37(3), 379-
392. doi:10.2224/sbp.2009.37.3.379
Webber, S. S., & Donahue, L. M. (2001). Impact of higly and less job-related diversityon work
group cohesion and performance: A meta-analysis. Journal of Management, 27, 141-162.
Wendt, H., Euwema, M. C., & van Emmerik, I. H. (2009). Leadership and team cohesiveness
across cultures. The Leadership Quarterly, 358-370.
West, M. A., & Lyubovnikova, J. (2012). Real teams or pseudo teams? The changing landscape
needs a better map. Industrial and Organizational Psychology, 5, 25-55.
Woehr, D. J., Arciniega, L. M., & Poling, T. L. (2013). Exploring the effects of value diversity on
team effectiveness. Journal of Business Psychology, 28, 107 - 121. doi:10.1007/s10869-
012-9267-4

105
Yang, L. R., Huang, C. F., & Wu, K. S. (2011). The association among project manager's
leadership style, teamwork, and project success. International Journal of Project
Management, 29, 258-267. doi:10.1016/j.ijproman.2010.03.006
Zhang, X., & Bartol, K. (2010). Linking empowering leadership and employee creativity: the
influence of psychological empowerment, intrinsic motivation, and creative process
engagement. Academy of Management Journal, 53(1), 107-128.

106
Appendix A: IRB Approval
Office of Research andTechnology Transfer
Institutional ReviewBoard
May 12, 2014
Dear Mr. Upatham,
Your request to conduct the study: Enhancing the Cohesivenss of a Cognitively DiverseTeam: The Role of Leadership IRB #F2013-34 has been approved by The University ofTexas at Tyler Institutional Review Board under expedited review. This approvalincludes a waiver of written informed consent and assurance that participants areinformed of the following prior to study participation: this is a research study;participation is completely voluntary with no obligations to continue participating, withno adverse consequences for non-participation; and assurance of confidentiality of theirdata.
In addition, please ensure that any research assistants are knowledgeable about researchethics and confidentiality, and any co-investigators have completed human protectiontraining within the past three years, and have forwarded their certificates to the IRBoffice (G. Duke).
Please review the UT Tyler IRB Principal Investigator Responsibilities, andacknowledge your understanding of these responsibilities and the following throughreturn of this email to the IRB Chair within one week after receipt of this approvalletter:
This approval is for one year, as of the date of the approval letter Request for Continuing Review must be completed for projects extending past
one year Prompt reporting to the UT Tyler IRB of any proposed changes to this research
activity
THE UNIVERSITY OF TEXAS AT TYLER3900 University Blvd. • Tyler, TX 75799 • 903.565.5774 • FAX:
903.565.5858

107
Appendix A: Continued
Prompt reporting to the UT Tyler IRB and academic departmentadministration will be done of any unanticipated problems involving risks tosubjects or others
Suspension or termination of approval may be done if there is evidence of anyserious or continuing noncompliance with Federal Regulations or any aberrationsin original proposal.
Any change in proposal procedures must be promptly reported to the IRB prior toimplementing any changes except when necessary to eliminate apparentimmediate hazards to the subject.
Best of luck in your research, and do not hesitate to contact me if you need any furtherassistance.
Sincerely,
Gloria Duke, PhD, RNChair, UT Tyler IRB

108
Appendix B: The Survey Instrument
Cognitive Diversity
Atiwate (Joe) Upatham, together with the advising committee at The University of Texasat Tyler, have created a survey that seeks to explore the effects of cognitive diversity onteams’ cohesion. You have been selected to participate in this research project becauseyou have been screened and deemed suitable for this research. Your taking part in thisweb survey is completely voluntary. It should only take you about 15-20 minutes. Yoursurvey responses will be confidential and only seen by the research team at TheUniversity of Texas of Tyler. The survey instrument does not collect any identifyinginformation and Joe and his research team will make sure that the information collected iskept private and used only for the purpose of the study. Joe may use the data to supporthis research interests through publication or conference venues, but no identifiablecharacteristics will be used. If you have any questions or concerns, let me know([email protected]) or direct your questions to Dr. Gloria Duke, Chair of theThe University of Texas at Tyler Institutional Review Board at (903) 566-7023,or [email protected].
I understand and acknowledge that this survey is completely voluntary. (1) I do not wish to participate. (2)
Q1 What is your gender? Male (1) Female (2)
Q2 What is your age range? 12 - 18 (1) 18-33 (2) 34-51 (3) 51-65 (4)
Q3 What is your ethnicity? Asian (1) African American (2) Caucasian (3) Hispanic (4) Other (please specify) (5) ____________________

109
Appendix B: Continued
Q4 Type of team in which you were most recently a member: Management (1) Marketing/ Sales (2) Technical/ Engineering (3) Manufacturing (4) I have not worked on a team in the last 12 months (5) Finance (6) Human Resources (7) Other (8) ____________________
Q5 Type of industry in which you work currently or most recently: Manufacturing (1) Service (2) Education (3) Professional (4) Government (5) Non-profit (6)
Q6 Total number of employees in your current or most recent organization: (1) 101-500 (2) 501-1000 (3) 1001-2500 (4) 2501-5000 (5) 5001-10,000 (6) 10,001+ (7)
Q7 Your current or most recent position: Front line employee/ team member (1) Supervisor or team leader (2) Mid-level executive manager (3) Other (please specify) (4) ____________________

110
Appendix B: Continued
Q10 Please reflect on your most recent team involvement and rate the followings:
StronglyDisagre
e (1)
Disagree (2)
Somewhat Disagree
(3)
NeitherAgree
norDisagre
e (4)
Somewhat Agree
(5)
Agree (6)
Strongly Agree
(7)
It wasimportant
to themembers
of our teamto be part
of theproject (1)
The teammembersstrongly
attached tothis project
(2)
Themembers
of our teamfelt proudto be part
of the team(3)
Every teammember
feltresponsible
formaintainin
g andprotectingthe team
(4)

111
Appendix B: Continued
Q11 Please reflect on your most recent team involvement and rate the followings on theteam leader:
StronglyDisagre
e (1)
Disagree (2)
Somewhat Disagree
(3)
NeitherAgree
norDisagre
e (4)
Somewhat Agree
(5)
Agree (6)
Strongly Agree
(7)
My leadermakes the
teammembers
enthusiastic about theproject (1)
My leaderis a modelfor me tofollow (2)
My leadermakes mefeel goodto work
withhim/her (3)
My leadermakes mefeel proud
to beassociated
withhim/her (4)
As amember ofthe project
teammember, I
havecompletefaith in
him/her (5)

112
Appendix B: Continued
I readily trusthis/her
judgment toovercome
any obstacle(6)
My leader isgenuinely
interested inme as a
person (7)
My leaderhas shownhis or her
care for meby
encouragingme (8)
My leaderhas shown
compassionin his or her
actionstoward me
(9)
My leadershows
concern forme (10)
My leadercreates a
culture thatfosters highstandard ofethics (11)
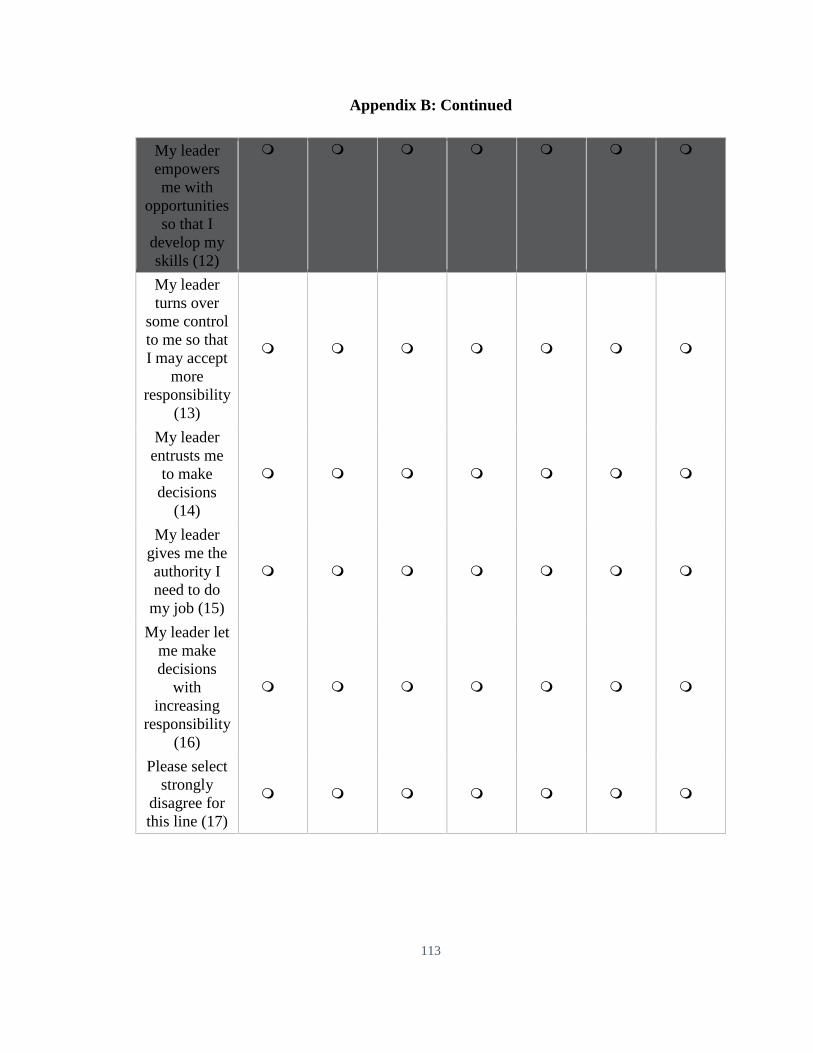
113
Appendix B: Continued
My leaderempowersme with
opportunitiesso that I
develop myskills (12)
My leaderturns over
some controlto me so thatI may accept
moreresponsibility
(13)
My leaderentrusts me
to makedecisions
(14)
My leadergives me theauthority Ineed to do
my job (15)
My leader letme makedecisions
withincreasing
responsibility(16)
Please selectstrongly
disagree forthis line (17)

114
Appendix B: Continued
Q13 Please reflect on your most recent team involvement and rate the followings in termof how strongly do team members agree or disagree with each other about the followings:
StronglyDisagre
e (1)
Disagree (2)
Somewhat Disagree
(3)
NeitherAgree
norDisagre
e (4)
Somewhat Agree
(5)
Agree (6)
Strongly Agree
(7)
The bestway to
maximizethe team's
performance (1)
What theteam's goalpriorities
should be?(2)
The bestway to
ensure theteam's long-
termsuccess (3)
Which teamobjectivesshould beconsidered
mostimportant?
(4)
Related Documents


