Slide 1 Enhancing the Climate Resilience of African Hydropower and Irrigation Infrastructure David Groves Zhimin Mao Robert Lempert 2015 AWRA Annual Meeting Denver, CO Water and Climate Resilience Center

Welcome message from author
This document is posted to help you gain knowledge. Please leave a comment to let me know what you think about it! Share it to your friends and learn new things together.
Transcript

Slide 1
Enhancing the Climate Resilience of African
Hydropower and Irrigation Infrastructure
David Groves Zhimin Mao
Robert Lempert
2015 AWRA Annual Meeting Denver, CO
Water and Climate Resilience Center

Slide 2
Work a Part of Recently Completed World Bank Funded Study
1. Continent-wide evaluation of water and energy sectors
2. Water and energy facility scale case studies

Slide 3
Huge Water and Energy Infrastructure Needs Now and Into the Future
• Annual infrastructure investment needs around $80 billion per year

Slide 4
Large investment projects likely to meet much of the need
Program for Infrastructure Development in Africa (PIDA)
• Hydropower generation (>54 GW)
• Water storage (20,000 km3)
• Irrigation canals

Slide 5
How Might Climate Change Affect Africa’s Needs and the PIDA Strategy?

Slide 6
How Might Climate Change Affect Africa’s Needs and the PIDA Strategy?
Potential Change Risk Opportunity Increasing temperatures • Water stress;
higher irrigation needs
Increasing precipitation trends
• Flooding • Higher hydropower production
• Lower irrigation needs
Decreasing precipitation trends
• Lower hydropower production
Increased hydrologic variability
• More severe droughts/flooding
• Lower returns on infrastructure investments
• Higher returns on infrastructure investments

Slide 7
Developed Integrated Modeling System to Evaluate Climate Impacts on Water and Energy Infrastructure

Slide 8
Used Robust Decision Making to Structure Vulnerability and Adaptation Analyses
1. Decision Structuring
2. Case Generation
3. Vulnerability Analysis
4. Tradeoff Analysis
Descriptions of key vulnerabilities
Robust Designs
Alternative Designs
www.rand.org/rdmlab
Slide 9
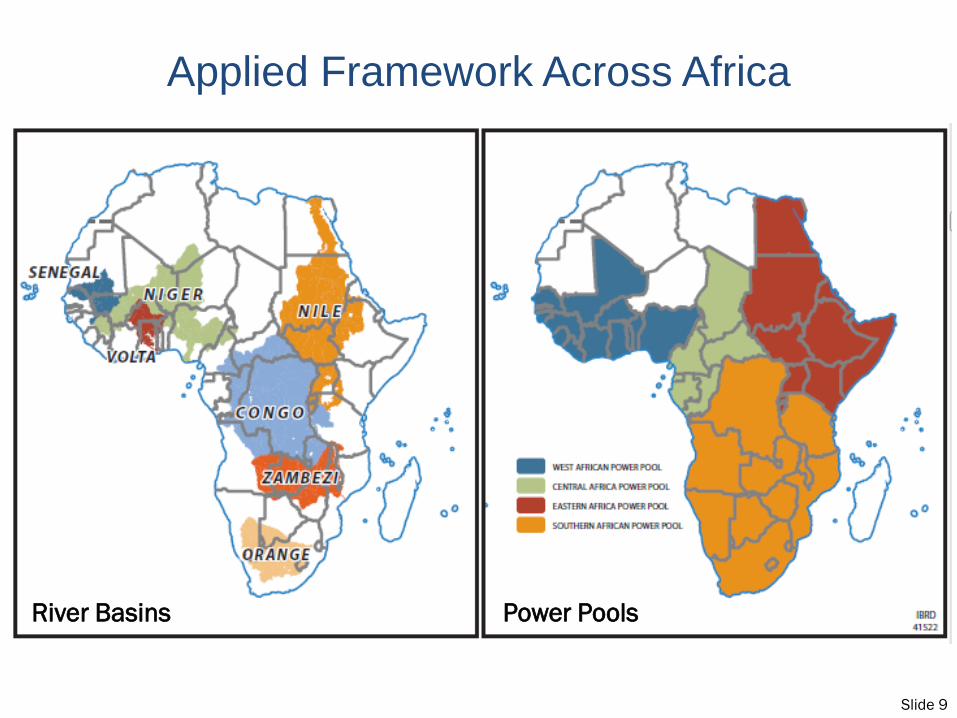
Applied Framework Across Africa
River Basins Power Pools
Slide 10
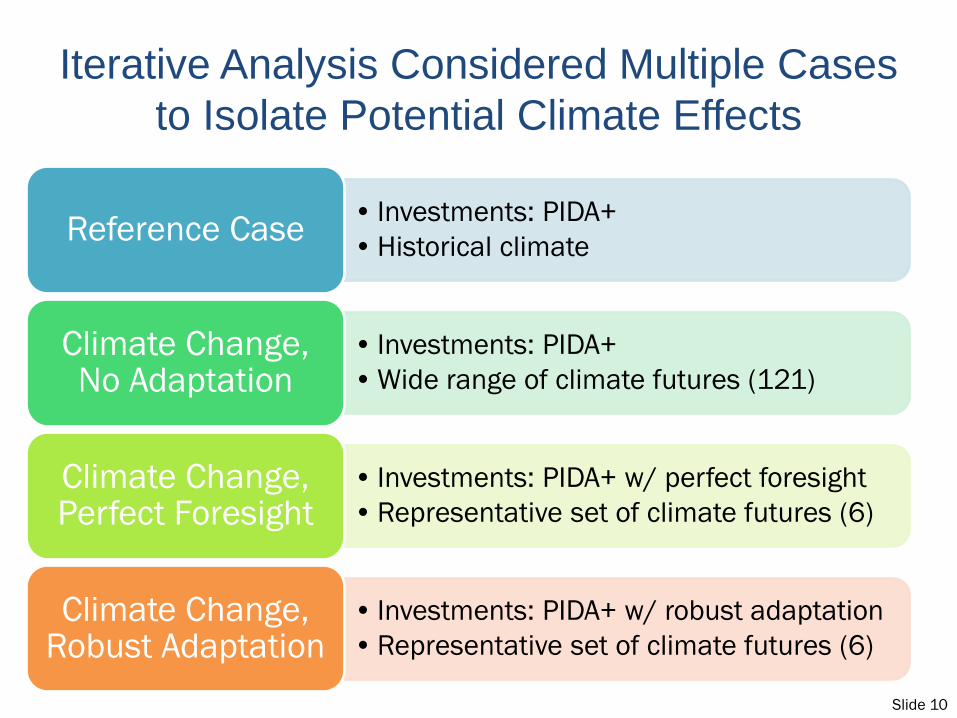
Iterative Analysis Considered Multiple Cases to Isolate Potential Climate Effects
• Investments: PIDA+ •Historical climate Reference Case
• Investments: PIDA+ •Wide range of climate futures (121)
Climate Change, No Adaptation
• Investments: PIDA+ w/ perfect foresight •Representative set of climate futures (6)
Climate Change, Perfect Foresight
• Investments: PIDA+ w/ robust adaptation •Representative set of climate futures (6)
Climate Change, Robust Adaptation

Slide 11
Wide Range of Climate Effects for Southern Africa Power Pool Basins

Slide 12
Wide Range of Climate Effects for West African Power Pool Basins

Slide 13
Significant Negative Impacts Without Adaptation in the South African Power Pool
Hydropower
Irrigation

Slide 14
Wide Range of Impacts (positive and negative) Without Adaptation in the West African Power Pool
WAPP
Hydropower
Irrigation

Slide 15
Developed Perfect Foresight Strategies for Specific Climate Futures
• Basin level infrastructure adaptations – Planned turbine capacity – Reservoir storage – Mean conveyance irrigation efficiency
• Farm level adaptations – Planned irrigation area – Use of deficit irrigation – Field-level irrigation efficiency
Adaptation limited to adjustments to planned infrastructure

Slide 16
Perfect Foresight Adaptation Can Provide Modest Performance Improvement
Zambezi Hydropower
Economic Benefit from Baseline Projects
Economic Benefit from Adaptation
Scaled Net Revenues

Slide 17
Effects of Adapting in the Wrong Way Are Large
Picking the wrong adaptation Not adapting at all

Slide 18
By Exploring “Regret” Across Futures, Robust Strategies Are Identified
(PIDA+ or Perfect Foresight)
Strategies with low regret • Range of regret for PIDA+
across futures is always positive
• Implies that PIDA+ is not optimal for any future (including historical conditions)

Slide 19
By Exploring “Regret” Across Futures, Robust Strategies Are Identified
(PIDA+ or Perfect Foresight)
Strategies with low regret

Slide 20
Savings from Robust Adaptation Could be Significant In Some Basins
(SAPP) (SAPP) (WAPP) (WAPP) (WAPP) (EAPP)

Slide 21
Costs of Adaptation Are Generally Modest

Slide 22
Summary of Key Findings
• Africa-wide study identified significant potential climate change impacts to the water and power sectors
• Adjusting infrastructure plans can improve performance in climate change futures
• Uncertainty about future climate makes potential regret significant
• Identified robust adaptations can reduce regret and improve outcomes

Slide 23
Limitations and Possible Extensions
• Analysis focuses on large infrastructure
• Small and distributed infrastructure may be: – Less vulnerable to climate – More adaptable and thus have lower
regrets
• Plausible climate futures derived from downscaled global climate models only – May underestimate effects of variability

Water and Climate Resilience Center www.rand.org/jie/centers/water-climate-resilience.html Project Report: http://goo.gl/2iAX4C David Groves [email protected]
Slide 25
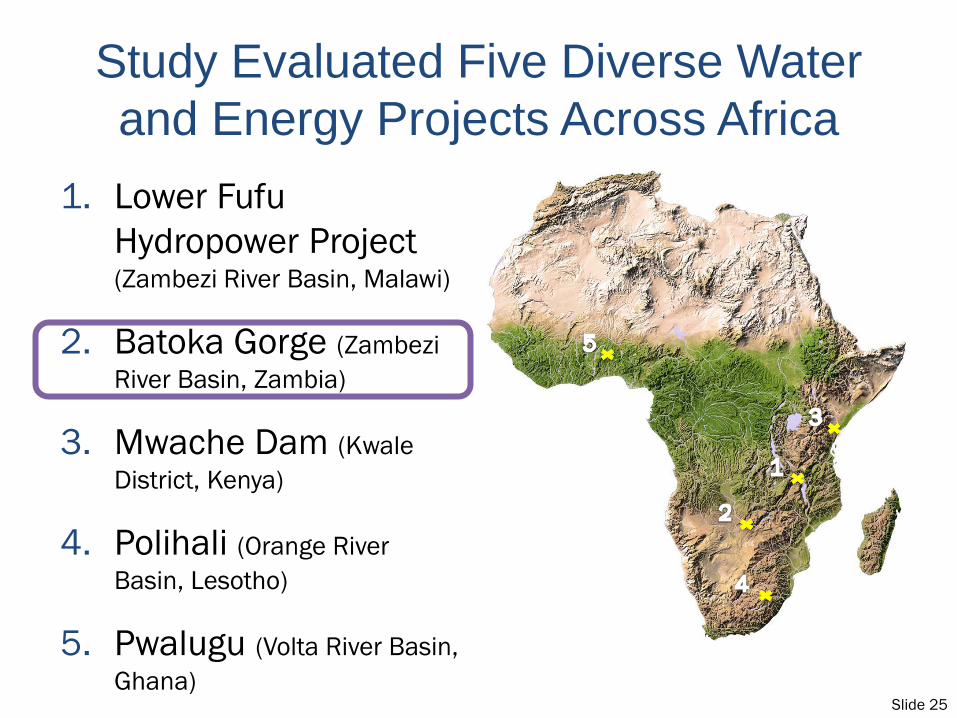
Study Evaluated Five Diverse Water and Energy Projects Across Africa
1. Lower Fufu Hydropower Project (Zambezi River Basin, Malawi)
2. Batoka Gorge (Zambezi River Basin, Zambia)
3. Mwache Dam (Kwale District, Kenya)
4. Polihali (Orange River Basin, Lesotho)
5. Pwalugu (Volta River Basin, Ghana)
Slide 26
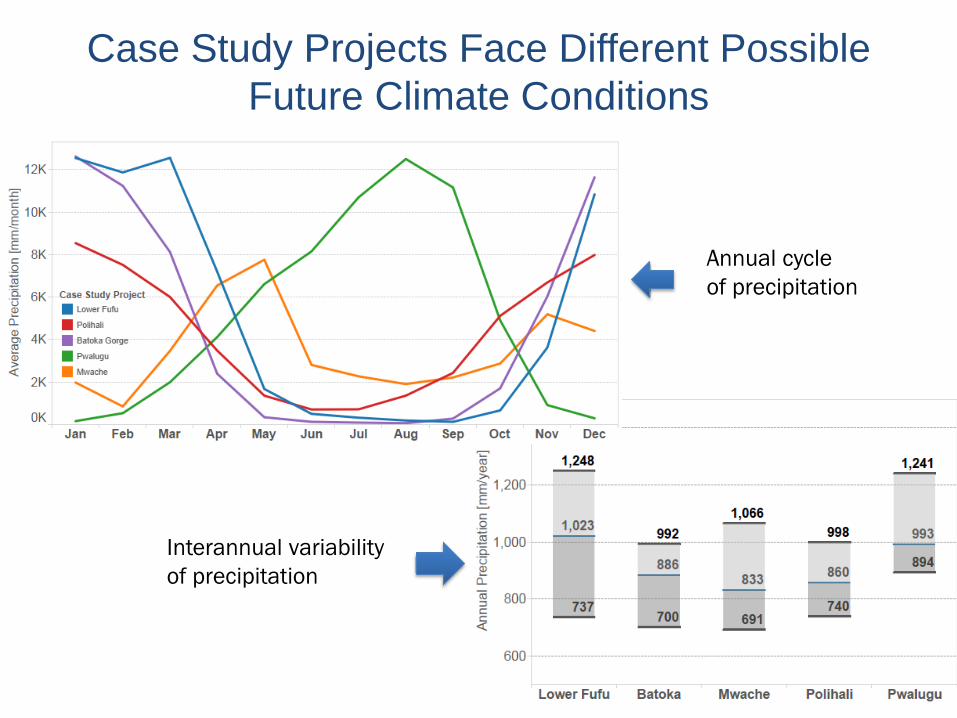
Case Study Projects Face Different Possible Future Climate Conditions
Annual cycle of precipitation
Interannual variability of precipitation

Slide 27
Case Studies Used DMUU Methods to Evaluate Vulnerabilities and Design Robust Alternatives
1. Decision Structuring
2. Case Generation
3. Vulnerability Analysis
4. Tradeoff Analysis
Descriptions of key vulnerabilities
Robust Designs
Robust Decision Making (RDM)
Alternative Designs

Slide 28
Case Studies Demonstrate Approach That Could Be Applied in Feasibility Design Stage
• Case Studies: – Use data from pre-feasibility reports – Based on limited interaction with host country – Use models that were externally validated only
• Results are illustrative
Methodology can be applied by feasibility study team to ensure climate
resilience of final project

Slide 29
This Talk Focuses on the Batoka Gorge Case Study
• Zambezi River
• 181 meter-high dam; 1,680 million m3 storage
• Two power stations – Eight turbines – 1600 MW capacity
• Baseload and peaking capacity benefits – Zambia – Zimbabwe
Does Considering Climate Change Suggest an Alternative Project Design?

Slide 30
Each Case Study Focused on Key Uncertainties, Adaptation Options, and Performance Metrics
1. Decision Structuring
2. Case Generation
3. Vulnerability Analysis
4. Tradeoff Analysis
Descriptions of key vulnerabilities
Robust Designs
Alternative Designs

Slide 31
How Would Each Project Perform Under Different Plausible Futures?
• Climate change
Batoka

Slide 32
How Would Each Project Perform Under Different Plausible Futures?
• Irrigation and urban demands
Pwalugu

Slide 33
How Would Each Project Perform Under Different Plausible Futures?
• Project Benefit Factors – Power purchase agreements – Price for delivered water
• Project Costs – Penalties for under-production or delivery – Irrigation area expansion

Slide 34
Alternative Infrastructure Designs
Considered
• Facility size (dam height and storage capacity)
• Facility capacity (turbines, transfer volumes)
Slide 35
Alternative Designs Compared by Net Present Value
• Benefits – Hydropower production – Irrigation water supply – Volumes of water transferred
• Costs – Capital and O&M costs – Under-performance penalties

Slide 36
Analyses Use DMUU Methods to Evaluate Vulnerabilities and Design Robust Projects
1. Decision Structuring
2. Case Generation
3. Vulnerability Analysis
4. Tradeoff Analysis
Descriptions of key vulnerabilities
Robust Designs
Alternative Designs

Slide 37
Alternative Batoka Gorge Designs Proposed and Costed
35 alternative designs
– 5 dam heights /reservoir storage sizes
– 7 turbine flow capacities
Design cost tool – Estimate capital
and O&M costs for alternative project designs

Slide 38
Alternative Designs Simulated Across Hundreds of Plausible Futures
• Water management model (WEAP) – Estimate runoff from
climate data – Simulate operations of
alternative project designs
– Capture other system constraints (inflow requirements, other demands)

Slide 39
Analyses Use DMUU Methods to Evaluate Vulnerabilities of Alternative Designs
1. Decision Structuring
2. Case Generation
3. Vulnerability Analysis
4. Tradeoff Analysis
Descriptions of key vulnerabilities
Robust Designs
Alternative Designs

Slide 40
We First Identified the Historical Optimal Batoka Design for Reference…
• Highest NPV for historical climate conditions

Slide 41
Then We Evaluated the Vulnerability of this Design to Other Futures
• 145 different climate futures

Slide 42
Tradeoff Analysis Helps Compare and Identify Robust Designs
1. Decision Structuring
2. Case Generation
3. Vulnerability Analysis
4. Tradeoff Analysis
Descriptions of key vulnerabilities
Robust Designs
Alternatives Designs

Slide 43
Different Criteria Used to Measure Robustness
1. Minimize maximum regret
2. Satisfice or a wide range of future conditions
3. Satisfice over a wide range of likelihoods for future conditions
Net Present Value Regret: • Difference between NPV for a particular
design and the best performing design

Slide 44
Batoka Design Minimizing Maximum Regret Depends Upon the Power Purchase Agreement

Slide 45
Satisficing Batoka Design Depends on the Expected Flow and Power Purchase Agreement
Historical Optimal Design
Increased Capacity
Smaller Size & Decreased Capacity
Decreased Capacity
Historical Optimal Design
$1 billion regret threshold

Slide 46
Satisficing Batoka Design Depends on the Expected Flow and Power Purchase Agreement
Historical Optimal Design
Increased Capacity
Smaller Size & Decreased Capacity
Decreased Capacity

Slide 47
What Next?
• Use visualizations to support stakeholder and decision maker deliberation over tradeoffs
OR
• Develop new approaches to mitigate residual uncertainty

Slide 48
In Conclusion: Across All Case Studies We Find…
• Performance of project designs can be sensitive to future climate
• Adaptation can reduce maximum regrets
Improvements in the most favorable futures
Improvements in the least favorable futures

Slide 49
… and Robust Infrastructure Designs
• Are often smaller than the best design for the historical climate
• May be robust over a wide range of climate futures if paired with flexibility in the choice of water or power contracts

Look for the Final Report to be released in the coming months by the World Bank…..
Related Documents