Enhancing Risk Analysis Capacities for Flood, Tropical Cyclone Severe Wind and Earthquake for Greater Metro Manila Area Component 1 – High Resolution Digital Elevation Data and Imagery NATIONAL MAPPING AND RESOURCE INFORMATION AUTHORITY GEOSCIENCE AUSTRALIA Ofelia T. Castro 1 , Leo B. Grafil 1 , Luke Peel 2 1. National Mapping and Resource Information Authority 2. Geoscience Australia © Republic of the Philippines and the Commonwealth of Australia (Geoscience Australia) 2014

Welcome message from author
This document is posted to help you gain knowledge. Please leave a comment to let me know what you think about it! Share it to your friends and learn new things together.
Transcript

Enhancing Risk Analysis Capacities for Flood, Tropical Cyclone Severe Wind and Earthquake for Greater Metro Manila Area
Component 1 – High Resolution Digital Elevation Data and Imagery
NATIONAL MAPPING AND RESOURCE INFORMATION AUTHORITY
GEOSCIENCE AUSTRALIA
Ofelia T. Castro1, Leo B. Grafil1, Luke Peel
2
1. National Mapping and Resource Information Authority 2. Geoscience Australia
© Republic of the Philippines and the Commonwealth of Australia (Geoscience Australia) 2014


Enhancing Risk Analysis Capacities for Earthquake, Tropical Cyclone Severe Wind and Flood for the iii Greater Metro Manila Area – High Resolution Digital Elevation Data and Imagery
Contents
1 Introduction ............................................................................................................................................ 1
1.1 Area covered by LiDAR and aerial photography ............................................................................. 1
1.2 Data requirements ........................................................................................................................... 1
2 Data ....................................................................................................................................................... 2
2.1 Data collection ................................................................................................................................. 2
3 Methods ................................................................................................................................................. 4
3.1 Sensors ............................................................................................................................................ 4
3.2 GPS station and Ground Control Point (GCP) ................................................................................ 4
3.3 Data processing ............................................................................................................................... 5
3.4 QA / QC............................................................................................................................................ 5
3.4.1 Vertical accuracy assessment .................................................................................................... 6
3.4.2 Horizontal accuracy assessment ............................................................................................... 6
3.4.3 Classification assessment .......................................................................................................... 7
3.4.4 LiDAR-derived DEM assessment ............................................................................................... 7
3.4.5 Ortho-rectified imagery assessment .......................................................................................... 8
4 Conclusion ............................................................................................................................................. 9
5 Acknowledgements .............................................................................................................................10
6 References ..........................................................................................................................................11
7 Attachments .........................................................................................................................................12

iv Enhancing Risk Analysis Capacities for Earthquake, Tropical Cyclone Severe Wind and Flood for the Greater Metro Manila Area – High Resolution Digital Elevation Data and Imagery
Enhancing Risk Analysis Capacities for Earthquake, Tropical Cyclone Severe Wind and Flood for the v Greater Metro Manila Area – High Resolution Digital Elevation Data and Imagery
Executive Summary
Due to its geographical location, the Philippines is highly prone to natural disasters resulting from
earthquakes, volcanic eruptions, tsunamis, tropical cyclones, flooding, extreme winds and landslides.
The effect of climate change, urbanization and rapid population growth increase the frequency and
intensity of disasters in the Philippines.
The Greater Metro Manila Area (GMMA), comprising 16 cities and one municipality of Metro Manila,
and the provinces of Laguna, Rizal, Cavite, and Bulacan, is particularly vulnerable to the devastating
effects of natural disasters. It has a population of 21 million residing on land that is cut by active
earthquake faults and subject to intense riverine flooding. GMMA is also frequently affected by
typhoons, which can result in severe wind damage, storm surge, intense flooding and landslides. The
risk from these natural hazards is further exacerbated by informal settlers living along flood drainage
and riverbanks, areas frequently affected by flooding.
The project “Enhancing Risk Analysis Capacities for Flood, Typhoon, Severe Wind and Earthquake for
Greater Metro Manila Area” or Risk Analysis Project (RAP) aims to analyse the risk from flood, severe
wind and earthquake. An essential input to this activity is high resolution Digital Elevation Model
(DEM), a highly detailed representation of the earth’s surface. Without a high-resolution DEM it is
extremely difficult, if not impossible, to develop a flood risk model in densely urbanized areas like
Metro Manila which has a very flat topography.
The most appropriate methodology to derive high-resolution DEM is through topographic LiDAR.
LiDAR is an aerial survey technique that produces a very high-resolution DEM with vertical accuracy
of <15 cm. It has added benefit of accurately defining the height of features such as buildings and
forest canopies. The aerial photographs will compliment LiDAR in the classification of points, 3D
visualization and 3D modelling.
Acquisition of airborne LiDAR and imagery will provide other benefits to the Government of the
Philippines including detection and mapping of active fault lines, improved ability to develop accurate
exposure information for GMMA, and an ability to accurately determine the impact of different sea
level rise scenarios in the Manila area.
The High Resolution Elevation Data and Imagery (LiDAR and Aerial Photography) Component is one
of the six Components of the “Enhancing Risk Analysis Capacities for Flood, Typhoon, Severe Wind
and Earthquake for Greater Metro Manila Area” or Risk Analysis Project (RAP). The primary purpose
of this component was to develop a high resolution Digital Elevation Model (DEM) derived from Light
Detection and Ranging (LiDAR) technology and orthoimagery from digital aerial photography. The
DEM will be used as the base dataset for natural hazard risk analysis and climate change impacts.
The deliverables included an orthoimage from digital aerial photographs, unclassified and classified
point cloud, LiDAR derived products such as intensity, DEM comprising of Digital Terrain Model
(DTM), Digital Surface Model (DSM), Canopy Elevation Model (CEM) and Foliage Cover Model
(FCM). The extent of these outputs is the cities and municipalities of Metro Manila, along with parts of
Bulacan, Rizal, Laguna and Cavite provinces.
vi Enhancing Risk Analysis Capacities for Earthquake, Tropical Cyclone Severe Wind and Flood for the Greater Metro Manila Area – High Resolution Digital Elevation Data and Imagery
This report documents the acquisition of LiDAR and aerial photography by Fugro Spatial Solutions
(FSS) from Australia from March to April 2011 and the processing of derived products. The results of
the comprehensive QA/QC process conducted by Geoscience Australia (GA) and National Mapping
and Resource Information Authority (NAMRIA) on the deliverables are also presented in this report.
This project was funded by the Australian Agency for International Development (AusAID)
implemented by Office of Civil Defense (OCD) through the National Disaster Risk Reduction and
Management Council (NDRRMC) in partnership with Geoscience Australia (GA) and the Collective
Strengthening of Community Awareness of Natural Disaster (CSCAND) agencies composed of the
Mines and Geosciences Bureau (MGB), the Philippine Institute of Volcanology and Seismology
(PHIVOLCS), the Philippine Atmospheric, Geophysical and Astronomical Services Administration
(PAGASA), and the National Mapping and Resource Information Authority (NAMRIA).
Enhancing Risk Analysis Capacities for Earthquake, Tropical Cyclone Severe Wind and Flood for the 1 Greater Metro Manila Area – High Resolution Digital Elevation Data and Imagery
1 Introduction
Light Detection and Ranging (LiDAR) technology is now widely accepted for the collection of terrain
data to generate high resolution DEMs. It offers fast acquisition and processing of data with minimum
human dependence since most of the processing is done automatically and is capable of day and
night data collection.
As agreed on by the partner agencies, the LiDAR mission was carried out to develop a seamless high
resolution elevation dataset for Greater Metro Manila Area (GMMA). Since there was no LiDAR
service provider in the Philippines at the time of the project, a Request for Quotation based on tender
specifications was issued by the Optical, Geospatial, Radar, and Elevation (OGRE) Supplies and
Services Panel of Geoscience Australia (GA) to all Optical Services Providers in Australia for the
acquisition of LiDAR and photography for the GMMA coverage area. There were three companies that
submitted proposals of which Fugro Spatial Solution (FSS) was selected based on the OGRE
assessment.
This report is based on the final report submitted by FSS covering the LiDAR and aerial photography
mission details, data processing, deliverables and QA/QC results of the generated data by GA and
NAMRIA.
1.1 Area covered by LiDAR and aerial photography
The total project area is approximately 1,232 km2 covering GMMA including the flood investigation
area, fault, Pasig-Marikina river basin, and the shoreline of Manila Bay extending from Bulacan to
Cavite.
1.2 Data requirements
The project area requires high resolution DEM through airborne LiDAR and digital aerial photography
for GMMA. Specifications for data acquisition and products are defined in the Tender Specifications
developed by OGRE with inputs from CSCAND agencies. The next section discusses the important
requirements and specifications.
2 Enhancing Risk Analysis Capacities for Earthquake, Tropical Cyclone Severe Wind and Flood for the Greater Metro Manila Area – High Resolution Digital Elevation Data and Imagery
2 Data
2.1 Data collection
Aerial photography and LiDAR were collected separately. FSS in consultation with GA, decided to
capture aerial photography first since LiDAR could be captured at night and under poorer weather
conditions. Both LiDAR and aerial photography are weather dependent. Data acquisition is limited
during the dry season between January and May. Cloud free imagery is preferred, and atmospheric
and sun effects including sun reflection from water surfaces should be minimised or avoided.
The acquisition for aerial imagery used a metric digital camera to generate seamless ortho-rectified
imagery. The preferred Ground Sample Distance (GSD) is<=20cm with 3 or 4 band multispectral RGB
and infrared channels. The horizontal accuracy required is <= +/- 45cm at the 68% confidence interval.
The aerial photography survey started on 13th March 2011 and continued for 16 days using a Leica
ADS40 digital camera flying at a nominal height of 2,750 meters above mean sea level.
The preferred GSD of <=20cm was not achievable due to limitations in flying time and height (not
allowed to fly below 9,000ft) imposed by the Civil Aviation Authority of the Philippines (CAAP). As a
result, the GSD was increased to 25cm. The northern part following the West Valley Fault (WVF) was
covered by clouds throughout the aerial photography mission. A decision was made not to wait for a
clear sky in that particular area so as not to cause substantial delay in the project
Similarly CAAP restrictions applied to the LiDAR acquisition. The day and night LiDAR mission lasted
for 15 days and was completed on 12th April 2011 covering the entire project area. A Leica ALS50
system was used in the LiDAR survey flying at a nominal height of 2,750 meters above mean sea
level with a swath width of 602 meters and 12.5 degrees field of view. LiDAR and aerial photography
project coverage is shown in Figure 1 covering an area of 1,311km2and 1,291 km
2 respectively. The
total area is more than the required area due to water boundaries along the coast. This resulted in a
variation to the contract to cover the bigger area and additional work.
A minimum Nominal Post Spacing (NPS) of two outbound LiDAR pulses per square meter with 10%
flight line overlap was required. All unclassified and classified point clouds, meaning all returns (all
collected points) were fully calibrated and adjusted to the Philippine Reference System of 1992
(PRS92) datum and required to be LASer File Format (LAS) v1.2 or v1.3 compliant. Deliverables were
provided in orthometric and ellipsoidal vertical datum and in Philippine Transverse Mercator Zone 3
projection system (PTM - Zone III). Fundamental spatial accuracy of the survey must conform to the
Intergovernmental Committee on Surveying and Mapping (ICSM) Category 1 standard with
Fundamental Vertical Accuracy (FVA) of <= +/- 30cm and Fundamental Horizontal Accuracy (FHA) of
<= +/- 80cm both at 95% confidence interval. All classified point cloud data must adhere to the
American Society for Photogrammetry and Remote Sensing (ASPRS) classification scheme based on
ICSM’s level 2 classification.
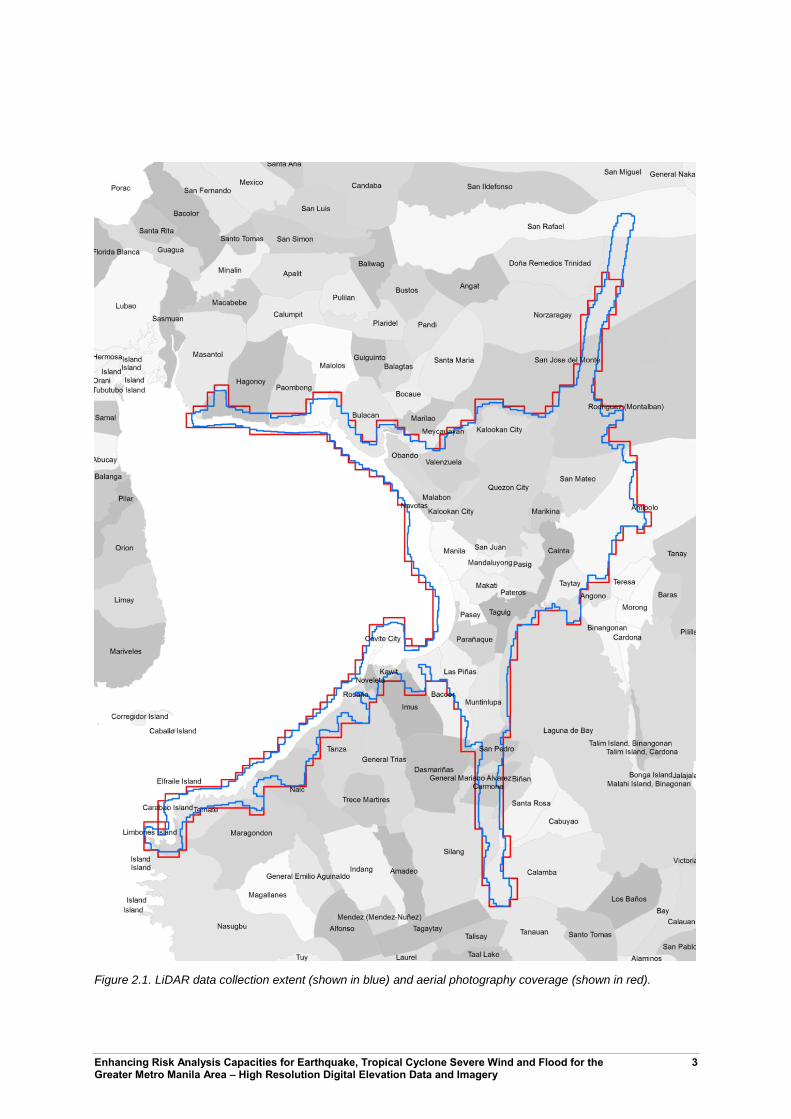
The extents of the LiDAR and aerial photography are detailed in Figure 2.1.
Enhancing Risk Analysis Capacities for Earthquake, Tropical Cyclone Severe Wind and Flood for the 3 Greater Metro Manila Area – High Resolution Digital Elevation Data and Imagery
Figure 2.1. LiDAR data collection extent (shown in blue) and aerial photography coverage (shown in red).
4 Enhancing Risk Analysis Capacities for Earthquake, Tropical Cyclone Severe Wind and Flood for the Greater Metro Manila Area – High Resolution Digital Elevation Data and Imagery
3 Methods
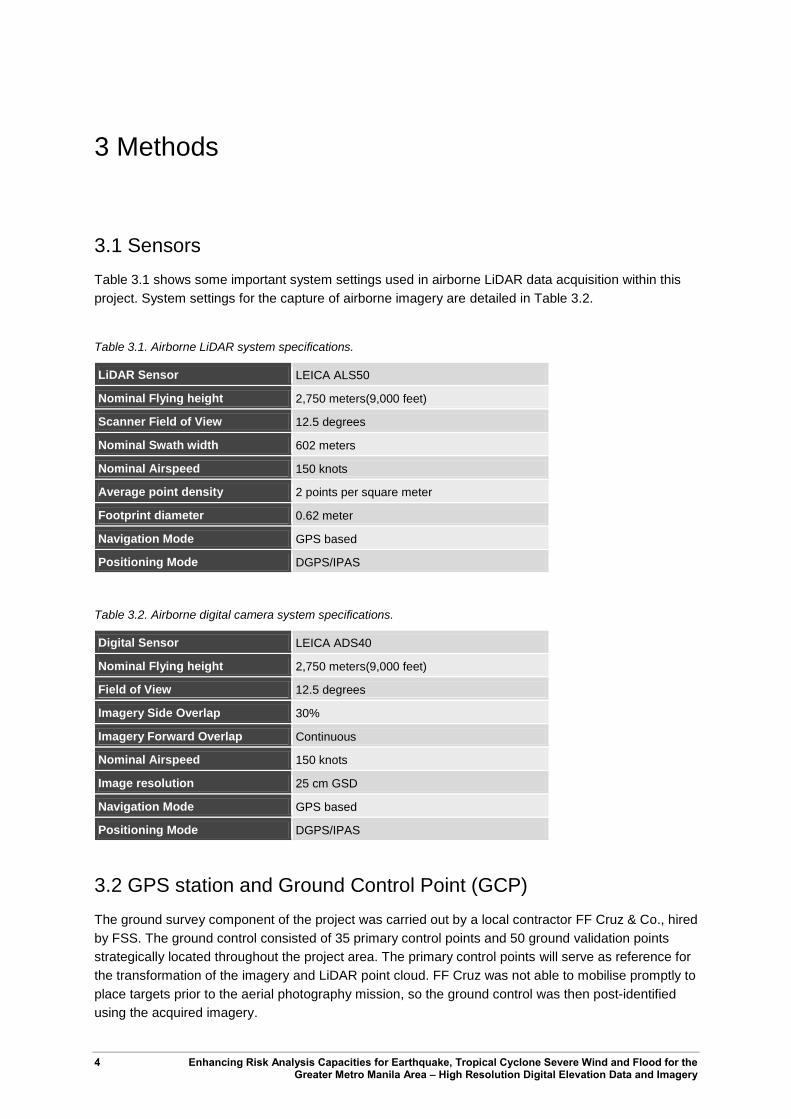
3.1 Sensors
Table 3.1 shows some important system settings used in airborne LiDAR data acquisition within this
project. System settings for the capture of airborne imagery are detailed in Table 3.2.
Table 3.1. Airborne LiDAR system specifications.
LiDAR Sensor LEICA ALS50
Nominal Flying height 2,750 meters(9,000 feet)
Scanner Field of View 12.5 degrees
Nominal Swath width 602 meters
Nominal Airspeed 150 knots
Average point density 2 points per square meter
Footprint diameter 0.62 meter
Navigation Mode GPS based
Positioning Mode DGPS/IPAS
Table 3.2. Airborne digital camera system specifications.
Digital Sensor LEICA ADS40
Nominal Flying height 2,750 meters(9,000 feet)
Field of View 12.5 degrees
Imagery Side Overlap 30%
Imagery Forward Overlap Continuous
Nominal Airspeed 150 knots
Image resolution 25 cm GSD
Navigation Mode GPS based
Positioning Mode DGPS/IPAS
3.2 GPS station and Ground Control Point (GCP)
The ground survey component of the project was carried out by a local contractor FF Cruz & Co., hired
by FSS. The ground control consisted of 35 primary control points and 50 ground validation points
strategically located throughout the project area. The primary control points will serve as reference for
the transformation of the imagery and LiDAR point cloud. FF Cruz was not able to mobilise promptly to
place targets prior to the aerial photography mission, so the ground control was then post-identified
using the acquired imagery.
Enhancing Risk Analysis Capacities for Earthquake, Tropical Cyclone Severe Wind and Flood for the 5 Greater Metro Manila Area – High Resolution Digital Elevation Data and Imagery
The Differential Global Positioning System (DGPS) method of control survey referencing nearby
ground control stations was adopted. A base station was established at the main airport in Manila.
This was used to position the LiDAR and imagery sensors in the aircraft. The base station was
surveyed with respect to surrounding major control points and a large GPS dataset was collected to
enable an accurate calculated point position in the International Terrestrial Reference Frame 2005
(ITRF05) datum. The survey returns were turned over to FSS on April 19, 2011.
3.3 Data processing
Full details of LiDAR and aerial photography processing are provided in Attachment A. This includes
the initial post processing of the DGPS observations to obtain the in-flight positions of the LiDAR
sensor. The LiDAR point cloud was subjected to an automatic filtering to classify each point in
accordance to the project specification. Based on the resulting classified point cloud, DEM (DTM and
DSM) were generated and formatted into 1 km by 1 km tiles. The LiDAR DEM was best fitted to the
primary Ground Control Points (GCP). A comparison was made with the adjusted LiDAR heights that
yielded a good correlation between the LiDAR data and the GCP. All products have undergone a
comprehensive accuracy validation. Hydro flattening, a data manipulation process that creates planar
surfaces for waterways and water bodies, has been undertaken for natural and mad-made water
bodies and water courses but is limited to non-tidal water bodies with surface area > 625m2 and
nominal width > 30 m.
Main LiDAR derived products are the 1 meter DSM generated from the “first return”, which includes
ground and non-ground points such as vegetation and buildings, DTM from LiDAR mass point data
classified as “Ground” only, so that it defines the “bare earth” surface, CEM that represents the height
of the tree canopy and FCM that represents density of vegetation greater than 2 meters high, and the
intensity image.
The Leica ADS40 is a pushbroom digital camera using the three-line-scanner principle, whereby linear
arrays on the focal plane capture imagery looking forwards, downwards and backwards from the
aircraft. The ADS40 simultaneously captures data from three panchromatic and four multispectral
bands. Together with the collected GPS and IMU data during flights, the raw images were processed
and combined to generate image strips. Afterwards, aerial triangulation to determine the exact location
and orientation of the image at the time of exposure was carried out using the primary ground controls.
The LiDAR derived DTM was used to rectify the image strips to derive a seamless ortho-rectified
imagery. Image corrections and enhancements have been applied to minimize the effect of cloud
shadows, contrast changes, colour balance and hot spots issues. The orthorectified imagery was
delivered as 1 km x 1 km tiles with 4 bands (RGBI) in TIF format.
3.4 QA / QC
Quality assurance and quality control procedures for the LiDAR derived products and ortho-rectified
imagery were performed primarily by GA with NAMRIA working as a training assistant. The methods of
evaluation include vertical, horizontal, and point cloud classification accuracy validation, file naming
and spatial format specification confirmation, hydro-flattening validation, and to ensure that all data
requirements are met.
6 Enhancing Risk Analysis Capacities for Earthquake, Tropical Cyclone Severe Wind and Flood for the Greater Metro Manila Area – High Resolution Digital Elevation Data and Imagery
3.4.1 Vertical accuracy assessment
Vertical accuracy is the principal criterion in specifying the quality of elevation data, and vertical
accuracy requirements depend upon the intended user applications. For error that is not normally
distributed, ASPRS recommends Accuracy in height be determined by 95th percentile testing. A
normal distribution can be tested by calculating the skewness of the dataset. If the skew exceeds ±0.5
this is a strong indicator of asymmetry in the data and further investigation should be completed to
determine the cause.
This assessment is derived from ground validation points and compared against the elevation of the
derived DEM.
The resulting Root Mean Squared Error (RMSE) for the collected data = 0.109 meter.
NAMRIA further collected additional survey checkpoints and used them to verify the accuracy of
LiDAR and orthophoto. A total of 79 checkpoints were evaluated and resulted in RMSE of 0.11 meter.
The result of the assessment is shown in Table 3.3.
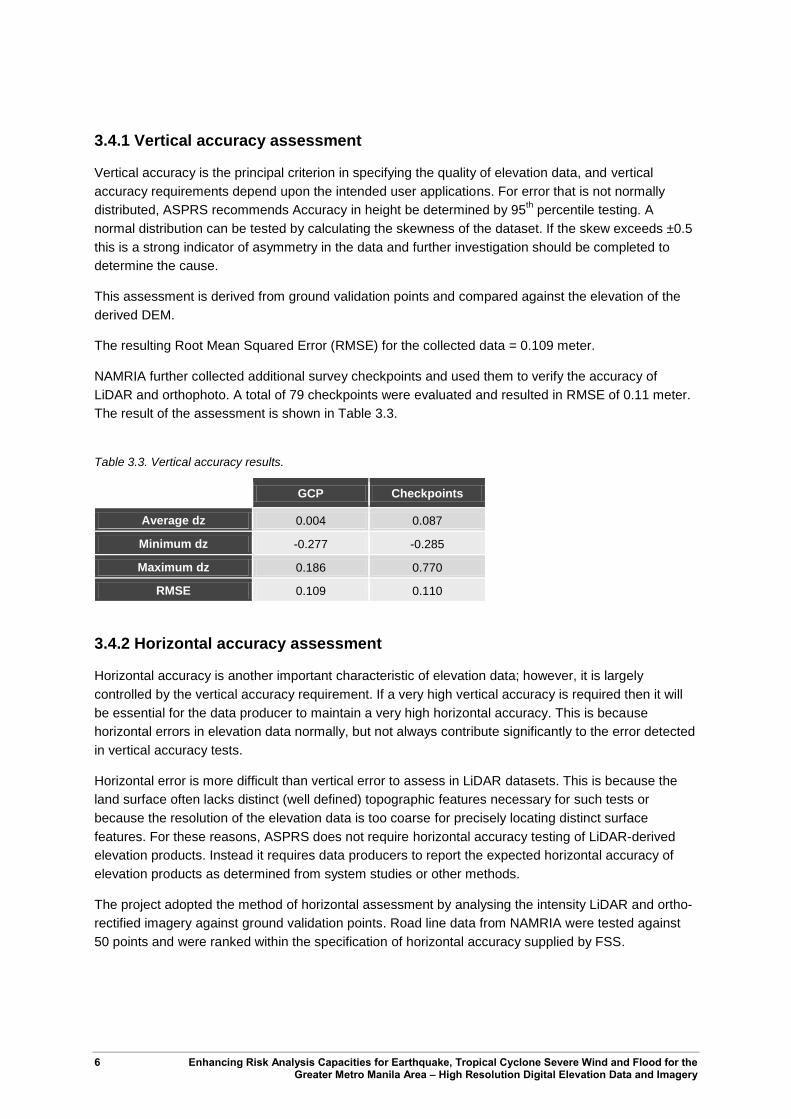
Table 3.3. Vertical accuracy results.
GCP Checkpoints
Average dz 0.004 0.087
Minimum dz -0.277 -0.285
Maximum dz 0.186 0.770
RMSE 0.109 0.110
3.4.2 Horizontal accuracy assessment
Horizontal accuracy is another important characteristic of elevation data; however, it is largely
controlled by the vertical accuracy requirement. If a very high vertical accuracy is required then it will
be essential for the data producer to maintain a very high horizontal accuracy. This is because
horizontal errors in elevation data normally, but not always contribute significantly to the error detected
in vertical accuracy tests.
Horizontal error is more difficult than vertical error to assess in LiDAR datasets. This is because the
land surface often lacks distinct (well defined) topographic features necessary for such tests or
because the resolution of the elevation data is too coarse for precisely locating distinct surface
features. For these reasons, ASPRS does not require horizontal accuracy testing of LiDAR-derived
elevation products. Instead it requires data producers to report the expected horizontal accuracy of
elevation products as determined from system studies or other methods.
The project adopted the method of horizontal assessment by analysing the intensity LiDAR and ortho-
rectified imagery against ground validation points. Road line data from NAMRIA were tested against
50 points and were ranked within the specification of horizontal accuracy supplied by FSS.
Enhancing Risk Analysis Capacities for Earthquake, Tropical Cyclone Severe Wind and Flood for the 7 Greater Metro Manila Area – High Resolution Digital Elevation Data and Imagery
3.4.3 Classification assessment
The classified point clouds are delivered in 1 km x 1 km tile fully compliant to LAS v1.2 format. Visual
inspection was conducted using LP360 QA/QC functionalities on various sampling sites with differing
infrastructures to gain a good cross section. Manual editing was performed to further improve the
classification of the LiDAR point cloud on water bodies, vegetation and buildings. A revised and final
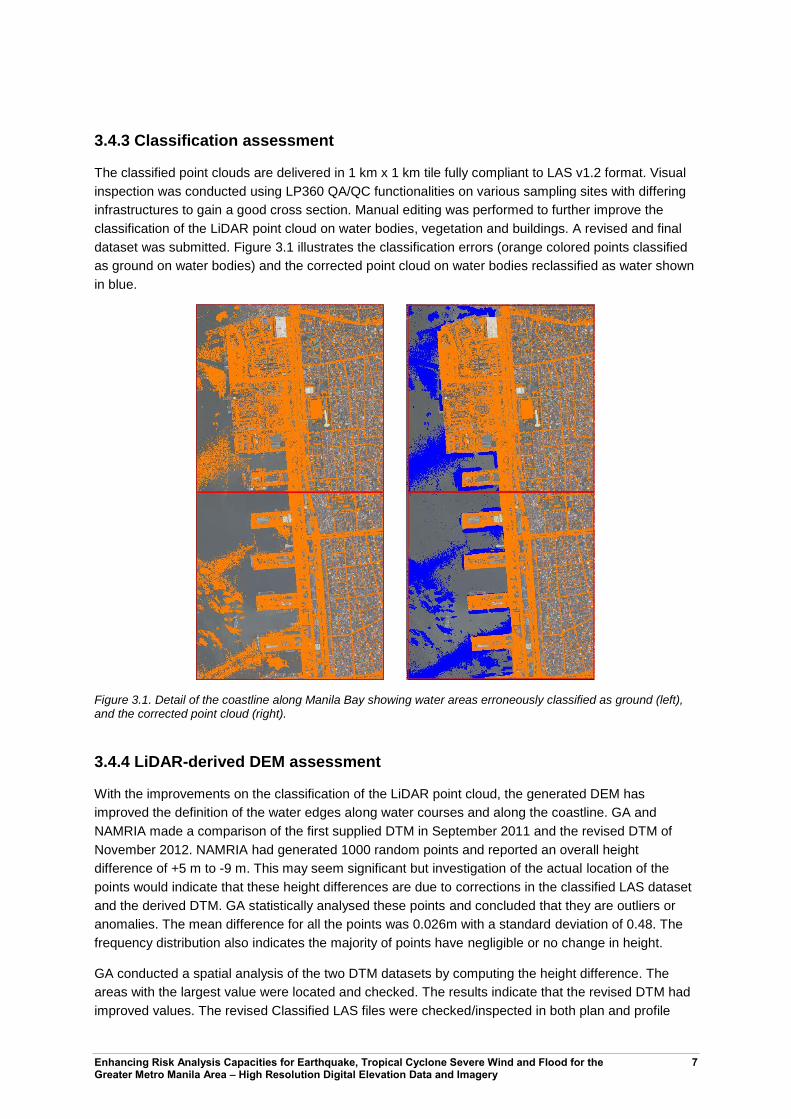
dataset was submitted. Figure 3.1 illustrates the classification errors (orange colored points classified
as ground on water bodies) and the corrected point cloud on water bodies reclassified as water shown
in blue.
Figure 3.1. Detail of the coastline along Manila Bay showing water areas erroneously classified as ground (left), and the corrected point cloud (right).
3.4.4 LiDAR-derived DEM assessment
With the improvements on the classification of the LiDAR point cloud, the generated DEM has
improved the definition of the water edges along water courses and along the coastline. GA and
NAMRIA made a comparison of the first supplied DTM in September 2011 and the revised DTM of
November 2012. NAMRIA had generated 1000 random points and reported an overall height
difference of +5 m to -9 m. This may seem significant but investigation of the actual location of the
points would indicate that these height differences are due to corrections in the classified LAS dataset
and the derived DTM. GA statistically analysed these points and concluded that they are outliers or
anomalies. The mean difference for all the points was 0.026m with a standard deviation of 0.48. The
frequency distribution also indicates the majority of points have negligible or no change in height.
GA conducted a spatial analysis of the two DTM datasets by computing the height difference. The
areas with the largest value were located and checked. The results indicate that the revised DTM had
improved values. The revised Classified LAS files were checked/inspected in both plan and profile
8 Enhancing Risk Analysis Capacities for Earthquake, Tropical Cyclone Severe Wind and Flood for the Greater Metro Manila Area – High Resolution Digital Elevation Data and Imagery
view to ensure classification was improved in areas with buildings, vegetation, edges of the coastline,
and where hydro-flattening was applied such as in water courses especially in the tidal areas, that
were not done correctly in the original DTM. The difference surface indicates the spatial distribution of
any height alterations between the two datasets. As the statistics indicate there is little or no significant
height difference and if viewed to the full extents of the image layer there is very little distinction to
observe. The revised DTM provides improvement across the whole project area. This has resulted in a
DTM that is appropriate for detailed flood modeling.
The GMMA LiDAR data meets the ICSM category 1 standard. The overall RMSE of 0.11 m meets the
RMSE <= 30 cm at 95% confidence interval specification based on the ICSM Guidelines for Digital
Elevation Data, Version 1.0.
3.4.5 Ortho-rectified imagery assessment
The preferred GSD for aerial photography was reduced to 25 cm resolution due to the flying height
restriction, i.e. not below 9,000 ft. The accuracy of the generated ortho-rectified imagery ( 46 cm in
easting) was just over the prescribed specification of 45 cm based on FSS’s aerial triangulation
results. This was due to several factors such as the reduction of image spatial resolution, limited
photographic period and bad weather conditions.
Enhancing Risk Analysis Capacities for Earthquake, Tropical Cyclone Severe Wind and Flood for the 9 Greater Metro Manila Area – High Resolution Digital Elevation Data and Imagery
4 Conclusion
The LiDAR and aerial photography mission in GMMA successfully acquired high resolution DEM and
imagery. A total of 1,291 km2 for digital aerial photography and 1,311 km
2 for LiDAR were captured
within a period of 16 and 15 days respectively. The data were processed and the resulting products
passed the QA/QC procedure conducted by GA and NAMRIA. Based on the Tender Specifications, all
delivered products for the GMMA-Risk Analysis Project conformed to project specifications.
Some issues encountered during the implementation of this project include the late delivery of primary
and validation GCPs that resulted in significant delays in the data processing. Another factor was the
limited flying time allowed by CAAP due to air traffic within the project area. Less than ideal weather
conditions were also a problem as not all the project areas (the northern end part following West
Valley Fault) were captured by aerial photography.

10 Enhancing Risk Analysis Capacities for Earthquake, Tropical Cyclone Severe Wind and Flood for the Greater Metro Manila Area – High Resolution Digital Elevation Data and Imagery
5 Acknowledgements
This project component was undertaken jointly with the NDRRMC-CSCAND agencies of the
Government of the Philippines and Geoscience Australia (GA) with the funding from the Australian
Agency for International Development (AusAID). The following organizations and individuals are
hereby acknowledged for their input into this project: Phil Tickle, Andreia Siqueira, Kriton Glenn,
Vesna Regulic, Hamish Anderson, Luke Peel, Andrew Clive (Geoscience Australia), Anne Orquiza
(AusAID), Linda SD. Papa, John Santiago F. Fabic, Ofelia T. Castro (NAMRIA), Owen Temby (Fugro
Spatial Solutions), OCD-NDRRMC, PHIVOLCS, PAGASA, and MGB.
Enhancing Risk Analysis Capacities for Earthquake, Tropical Cyclone Severe Wind and Flood for the 11 Greater Metro Manila Area – High Resolution Digital Elevation Data and Imagery
6 References
ICSM Guidelines for Digital Elevation Data, Version 1.0, http://www.icsm.gov.au/elevation/ICSM-GuidelinesDigitalElevationDataV1.pdf [accessed 11 June 2011]
ICSM LiDAR Acquisition Specifications and Tender Template, Version 1.0, November 2010, http://www.icsm.gov.au/elevation/LiDAR_Specifications_and_Tender_Template.pdf [accessed 11 June 2011]

12 Enhancing Risk Analysis Capacities for Earthquake, Tropical Cyclone Severe Wind and Flood for the Greater Metro Manila Area – High Resolution Digital Elevation Data and Imagery
7 Attachments
Owen Temby, Final Project Report for Aerial LiDAR and Imagery Surveys of Metro Area of Manila in
the Philippines, Fugro Spatial Solutions Pty. Ltd.
Related Documents