W&M ScholarWorks W&M ScholarWorks Dissertations, Theses, and Masters Projects Theses, Dissertations, & Master Projects Winter 2017 Enhancing Energy Efficiency and Privacy Protection of Smart Enhancing Energy Efficiency and Privacy Protection of Smart Devices Devices Ge Peng College of William and Mary - Arts & Sciences, [email protected] Follow this and additional works at: https://scholarworks.wm.edu/etd Part of the Computer Sciences Commons Recommended Citation Recommended Citation Peng, Ge, "Enhancing Energy Efficiency and Privacy Protection of Smart Devices" (2017). Dissertations, Theses, and Masters Projects. Paper 1499450047. http://doi.org/10.21220/S29S96 This Dissertation is brought to you for free and open access by the Theses, Dissertations, & Master Projects at W&M ScholarWorks. It has been accepted for inclusion in Dissertations, Theses, and Masters Projects by an authorized administrator of W&M ScholarWorks. For more information, please contact [email protected].

Welcome message from author
This document is posted to help you gain knowledge. Please leave a comment to let me know what you think about it! Share it to your friends and learn new things together.
Transcript
W&M ScholarWorks W&M ScholarWorks
Dissertations, Theses, and Masters Projects Theses, Dissertations, & Master Projects
Winter 2017
Enhancing Energy Efficiency and Privacy Protection of Smart Enhancing Energy Efficiency and Privacy Protection of Smart
Devices Devices
Ge Peng College of William and Mary - Arts & Sciences, [email protected]
Follow this and additional works at: https://scholarworks.wm.edu/etd
Part of the Computer Sciences Commons
Recommended Citation Recommended Citation Peng, Ge, "Enhancing Energy Efficiency and Privacy Protection of Smart Devices" (2017). Dissertations, Theses, and Masters Projects. Paper 1499450047. http://doi.org/10.21220/S29S96
This Dissertation is brought to you for free and open access by the Theses, Dissertations, & Master Projects at W&M ScholarWorks. It has been accepted for inclusion in Dissertations, Theses, and Masters Projects by an authorized administrator of W&M ScholarWorks. For more information, please contact [email protected].
Enhancing Energy E�ciency and Privacy Protection of Smart Devices
Ge Peng
Hengyang, Hunan, China
Bachelor of Engineering, National University of Defense Technology, China, 2008
A Dissertation presented to the Graduate Facultyof The College of William & Mary in Candidacy for the Degree of
Doctor of Philosophy
Department of Computer Science
College of William & MaryMay 2017

c� Copyright by Ge Peng 2017
COMPLIANCE PAGE
Research approved by
The College of William & Mary Protection of Human Subjects Committee
Protocol number(s): PHSC-2014-11-25-9981-gzhou
Date(s) of approval: 12/03/2014
ABSTRACT
Smart devices are experiencing rapid development and great popularity. Varioussmart products available nowadays have largely enriched people’s lives. Whileusers are enjoying their smart devices, there are two major user concerns: energye�ciency and privacy protection. In this dissertation, we propose solutions toenhance energy e�ciency and privacy protection on smart devices.
First, we study di↵erent ways to handle WiFi broadcast frames duringsmartphone suspend mode. We reveal the dilemma of existing methods: eitherreceive all of them su↵ering high power consumption, or receive none of themsacrificing functionalities. To address the dilemma, we propose SoftwareBroadcast Filter (SBF). SBF is smarter than the “receive-none” method as itonly blocks useless broadcast frames and does not impair applicationfunctionalities. SBF is also more energy e�cient than the “receive-all” method.Our trace driven evaluation shows that SBF saves up to 49.9% energyconsumption compared to the “receive-all” method.
Second, we design a system, namely HIDE, to further reduce smartphone energywasted on useless WiFi broadcast frames. With the HIDE system, smartphonesin suspend mode do not receive useless broadcast frames or wake up to processuseless broadcast frames. Our trace-driven simulation shows that the HIDEsystem saves 34%-75% energy for the Nexus One phone when 10% of thebroadcast frames are useful to the smartphone. Our overhead analysisdemonstrates that the HIDE system has negligible impact on network capacityand packet delay.
Third, to better protect user privacy, we propose a continuous and non-invasiveauthentication system for wearable glasses, namely GlassGuard. GlassGuarddiscriminates the owner and an imposter with biometric features from touchgestures and voice commands, which are all available during normal userinteractions. With data collected from 32 users on Google Glass, we show thatGlassGuard achieves a 99% detection rate and a 0.5% false alarm rate after 3.5user events on average when all types of user events are available with equalprobability. Under five typical usage scenarios, the system has a detection rateabove 93% and a false alarm rate below 3% after less than 5 user events.
TABLE OF CONTENTS
Acknowledgments iv
Dedication v
List of Tables vi
List of Figures vii
1 Introduction 2
1.1 Problem Statements . . . . . . . . . . . . . . . . . . . . . . . . . . 3
1.2 Contributions . . . . . . . . . . . . . . . . . . . . . . . . . . . . . 5
1.3 Dissertation Organization . . . . . . . . . . . . . . . . . . . . . . . 7
2 Related Work 8
2.1 Energy E�ciency on Smartphones . . . . . . . . . . . . . . . . . . 8
2.2 Tra�c Management for Smartphones . . . . . . . . . . . . . . . . 10
2.3 User Authentication on Smart Devices . . . . . . . . . . . . . . . . 11
3 All or None? The Dilemma of Handling WiFi Broadcast Tra�c in Smart-
phone Suspend Mode 13
3.1 Introduction . . . . . . . . . . . . . . . . . . . . . . . . . . . . . . 13
3.2 Revealing The Dilemma With Experiments . . . . . . . . . . . . . 15
3.2.1 Understanding Existing Solutions on Modern Smartphones 16
3.2.2 Real World WiFi Broadcast Tra�c Analysis . . . . . . . . . 17
3.2.3 Power Impact Measurements . . . . . . . . . . . . . . . . . 20
3.3 Software Broadcast Filter Design and Energy Saving Analysis . . . 22
i
3.3.1 SBF Design . . . . . . . . . . . . . . . . . . . . . . . . . . . 23
3.3.2 Energy Characterization . . . . . . . . . . . . . . . . . . . . 24
3.3.3 Energy Saving Modeling . . . . . . . . . . . . . . . . . . . . 26
3.4 SBF Performance Evaluation . . . . . . . . . . . . . . . . . . . . . 31
3.4.1 Energy Saving . . . . . . . . . . . . . . . . . . . . . . . . . 32
3.4.2 Delay Overhead . . . . . . . . . . . . . . . . . . . . . . . . 34
3.5 Conclusion and Future Work . . . . . . . . . . . . . . . . . . . . . 35
4 HIDE: AP-assisted Broadcast Tra�c Management to Save Smartphone
Energy 36
4.1 Introduction . . . . . . . . . . . . . . . . . . . . . . . . . . . . . . 36
4.2 Background . . . . . . . . . . . . . . . . . . . . . . . . . . . . . . 39
4.3 Proposed System . . . . . . . . . . . . . . . . . . . . . . . . . . . 40
4.3.1 System Overview . . . . . . . . . . . . . . . . . . . . . . . . 41
4.3.2 UDP Port Information Synchronization . . . . . . . . . . . 42
4.3.3 Tra�c Di↵erentiation at AP . . . . . . . . . . . . . . . . . 43
4.3.4 Broadcast Tra�c Notification . . . . . . . . . . . . . . . . . 44
4.4 Energy Modeling . . . . . . . . . . . . . . . . . . . . . . . . . . . . 45
4.5 Network Capacity and Delay Analysis . . . . . . . . . . . . . . . . 50
4.5.1 Network Capacity . . . . . . . . . . . . . . . . . . . . . . . 50
4.5.2 Network Delay . . . . . . . . . . . . . . . . . . . . . . . . . 51
4.6 Evaluation . . . . . . . . . . . . . . . . . . . . . . . . . . . . . . . 53
4.6.1 Energy E�ciency . . . . . . . . . . . . . . . . . . . . . . . . 53
4.6.1.1 Solutions for Comparison . . . . . . . . . . . . . . 53
4.6.1.2 Trace-driven Simulation . . . . . . . . . . . . . . . 54
4.6.2 Impact on Network Capacity and Delay . . . . . . . . . . . 58
4.7 Conclusion and Future Work . . . . . . . . . . . . . . . . . . . . . 61
ii
5 Continuous Authentication with Touch Behavioral Biometrics and Voice
on Wearable Glasses 62
5.1 Introduction . . . . . . . . . . . . . . . . . . . . . . . . . . . . . . 62
5.2 Features for Continuous User Authentication . . . . . . . . . . . . 65
5.2.1 Key User Events . . . . . . . . . . . . . . . . . . . . . . . . 66
5.2.2 Proposed Features . . . . . . . . . . . . . . . . . . . . . . . 66
5.2.3 User Study . . . . . . . . . . . . . . . . . . . . . . . . . . . 71
5.2.4 Feature Selection . . . . . . . . . . . . . . . . . . . . . . . . 72
5.3 The GlassGuard System . . . . . . . . . . . . . . . . . . . . . . . 74
5.3.1 Event Monitor . . . . . . . . . . . . . . . . . . . . . . . . . 74
5.3.2 Classifiers . . . . . . . . . . . . . . . . . . . . . . . . . . . . 74
5.3.3 Aggregator . . . . . . . . . . . . . . . . . . . . . . . . . . . 76
5.3.4 Power Control . . . . . . . . . . . . . . . . . . . . . . . . . 79
5.4 Evaluation . . . . . . . . . . . . . . . . . . . . . . . . . . . . . . . 80
5.4.1 Performance of Classification . . . . . . . . . . . . . . . . . 81
5.4.2 Performance of GlassGuard . . . . . . . . . . . . . . . . . . 83
5.4.3 Performance Comparison . . . . . . . . . . . . . . . . . . . 88
5.5 Conclusion and Future Work . . . . . . . . . . . . . . . . . . . . . 90
6 Conclusion 92
Bibliography 94
iii

ACKNOWLEDGMENTS
This dissertation is written with the support and help from many individuals. Iwould like to thank all of them.
First and foremost, I would like to express my deepest appreciation to myadvisor, Dr. Gang Zhou. Without his guidance in my research, encouragement inmy life, and confidence in my abilities, this dissertation would not have beenpossible.
I would also like to thank my dissertation committee, Dr. Virginia Torczon, Dr.Qun Li, Dr. Xu Liu, and Dr. Shan Lin, for serving on my Ph.D committee aswell as their insightful comments.
My sincere thanks also go to all members of the LENS group past and present,Dr. Andy Pyles, Dr. Xin Qi, Dr. David T. Nguyen, Dr. Daniel Graham, QingYang, George Simmons, Kyle Wallace, Dr. Yantao Li, Dr. Shuangquan Wang,Amanda Watson, Hongyang Zhao, and Yongsen Ma, for the stimulatingdiscussions, constructive suggestions, generous assistance, and e↵ective teamwork.
Futhurmore, I would like to thank the faculty and sta↵ at the Computer ScienceDepartment of the College of William & Mary. Special thanks to VanessaGodwin, Jacqulyn Johnson, and Dale Hayes for their considerate and e↵ectiveassistance.
Last but not the least, I would like to thank my family. Thanks to my parents,whose unwavering love and support has made me who I am today. Thanks to myhusband, Daiping Liu, for lighting up my life with so much love and joy.
This dissertation was supported in part by the U.S. National Science Foundationunder grants CNS-1250180 and CNS-1253506 (CAREER).
iv
This dissertation is dedicated to my beloved parents and my lovely husband fortheir endless and selfless love and support.
v
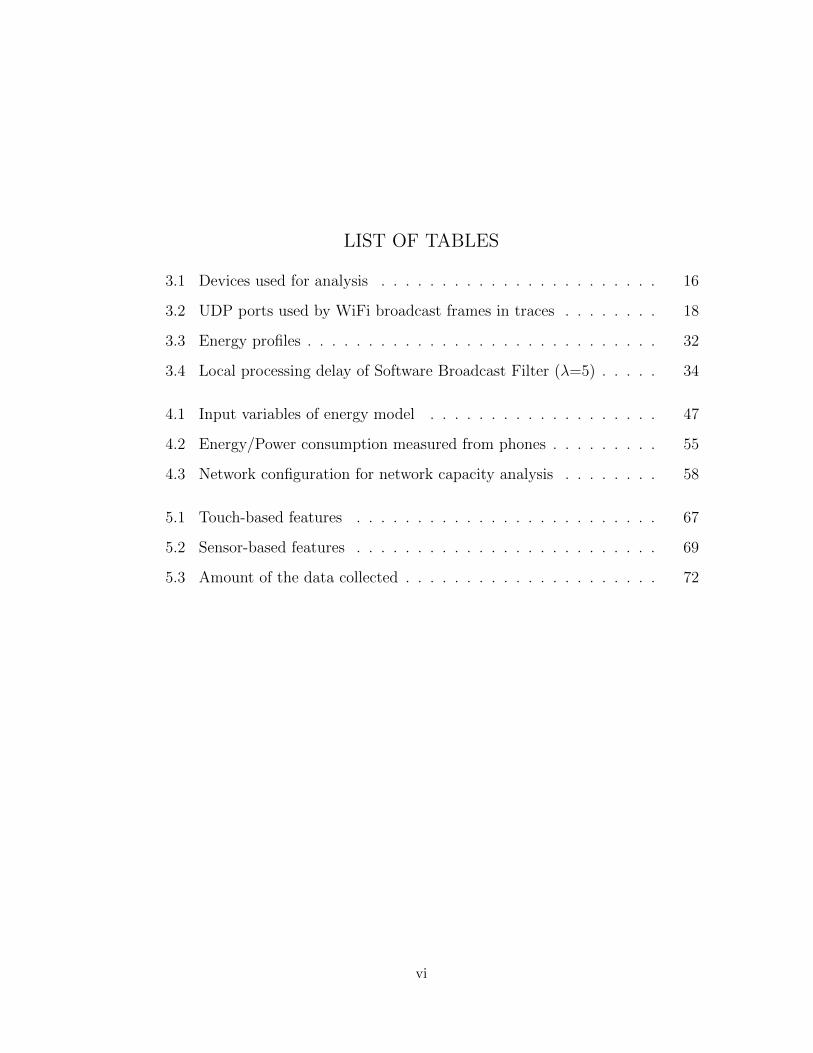
LIST OF TABLES
3.1 Devices used for analysis . . . . . . . . . . . . . . . . . . . . . . . 16
3.2 UDP ports used by WiFi broadcast frames in traces . . . . . . . . 18
3.3 Energy profiles . . . . . . . . . . . . . . . . . . . . . . . . . . . . . 32
3.4 Local processing delay of Software Broadcast Filter (�=5) . . . . . 34
4.1 Input variables of energy model . . . . . . . . . . . . . . . . . . . 47
4.2 Energy/Power consumption measured from phones . . . . . . . . . 55
4.3 Network configuration for network capacity analysis . . . . . . . . 58
5.1 Touch-based features . . . . . . . . . . . . . . . . . . . . . . . . . 67
5.2 Sensor-based features . . . . . . . . . . . . . . . . . . . . . . . . . 69
5.3 Amount of the data collected . . . . . . . . . . . . . . . . . . . . . 72
vi
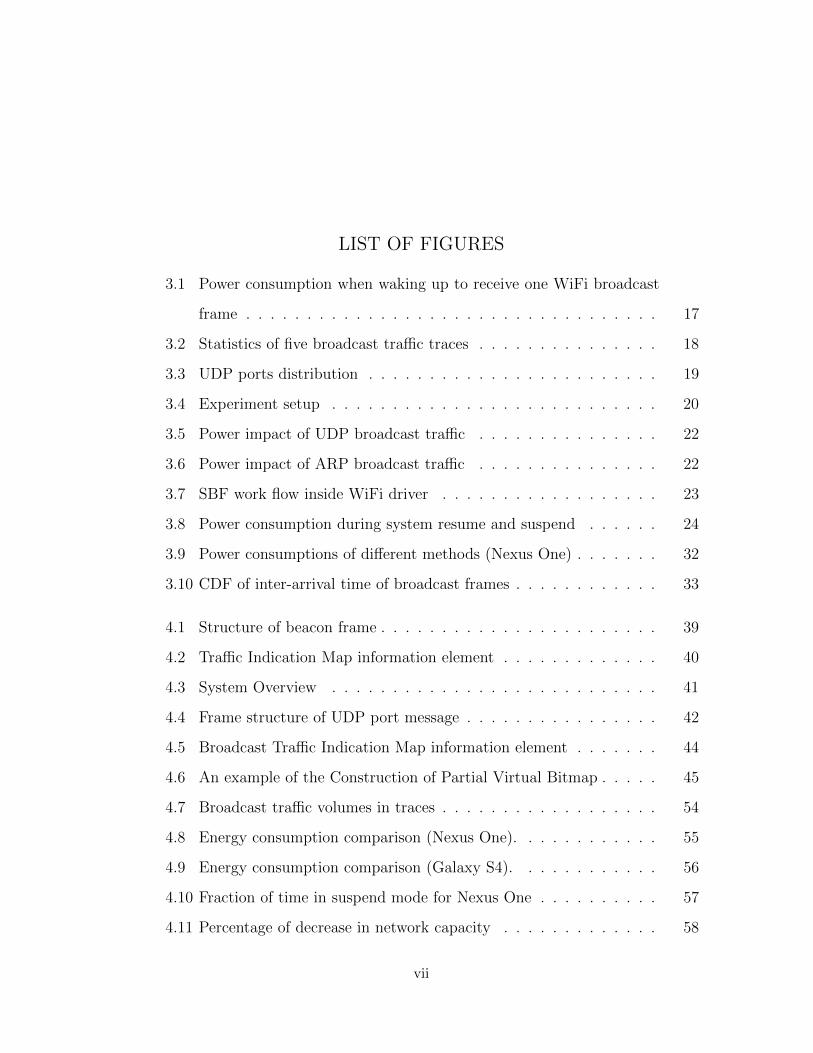
LIST OF FIGURES
3.1 Power consumption when waking up to receive one WiFi broadcast
frame . . . . . . . . . . . . . . . . . . . . . . . . . . . . . . . . . . 17
3.2 Statistics of five broadcast tra�c traces . . . . . . . . . . . . . . . 18
3.3 UDP ports distribution . . . . . . . . . . . . . . . . . . . . . . . . 19
3.4 Experiment setup . . . . . . . . . . . . . . . . . . . . . . . . . . . 20
3.5 Power impact of UDP broadcast tra�c . . . . . . . . . . . . . . . 22
3.6 Power impact of ARP broadcast tra�c . . . . . . . . . . . . . . . 22
3.7 SBF work flow inside WiFi driver . . . . . . . . . . . . . . . . . . 23
3.8 Power consumption during system resume and suspend . . . . . . 24
3.9 Power consumptions of di↵erent methods (Nexus One) . . . . . . . 32
3.10 CDF of inter-arrival time of broadcast frames . . . . . . . . . . . . 33
4.1 Structure of beacon frame . . . . . . . . . . . . . . . . . . . . . . . 39
4.2 Tra�c Indication Map information element . . . . . . . . . . . . . 40
4.3 System Overview . . . . . . . . . . . . . . . . . . . . . . . . . . . 41
4.4 Frame structure of UDP port message . . . . . . . . . . . . . . . . 42
4.5 Broadcast Tra�c Indication Map information element . . . . . . . 44
4.6 An example of the Construction of Partial Virtual Bitmap . . . . . 45
4.7 Broadcast tra�c volumes in traces . . . . . . . . . . . . . . . . . . 54
4.8 Energy consumption comparison (Nexus One). . . . . . . . . . . . 55
4.9 Energy consumption comparison (Galaxy S4). . . . . . . . . . . . 56
4.10 Fraction of time in suspend mode for Nexus One . . . . . . . . . . 57
4.11 Percentage of decrease in network capacity . . . . . . . . . . . . . 58
vii
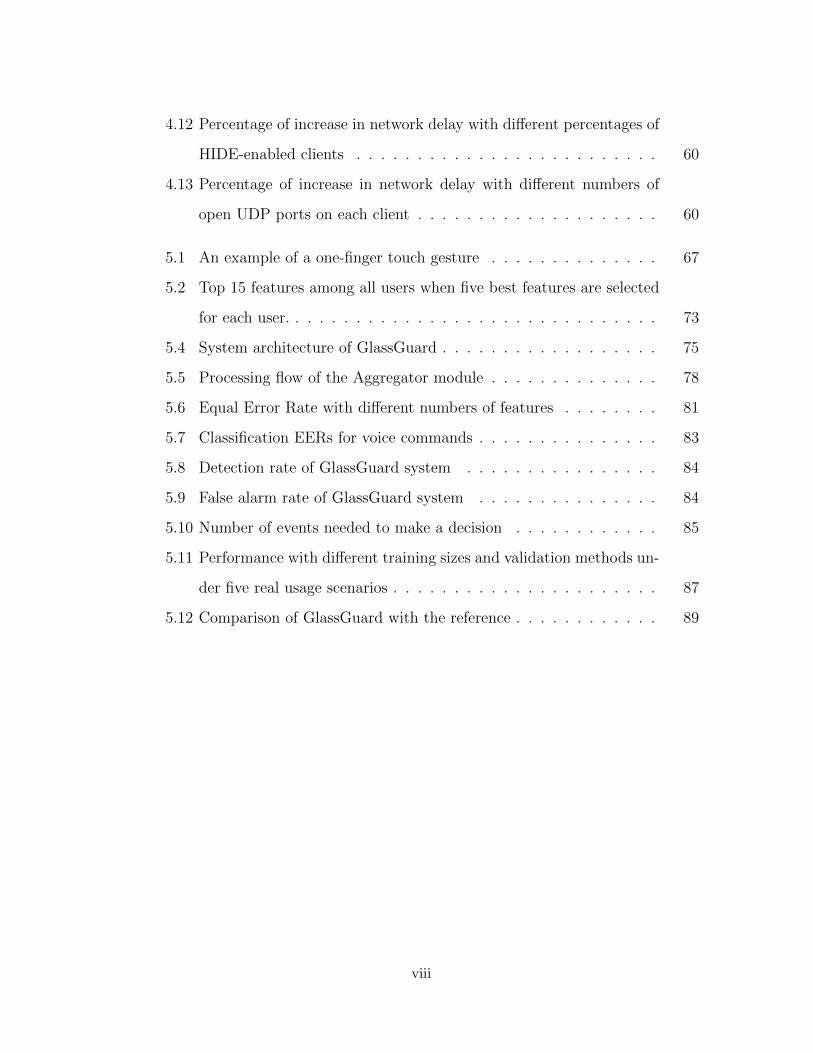
4.12 Percentage of increase in network delay with di↵erent percentages of
HIDE-enabled clients . . . . . . . . . . . . . . . . . . . . . . . . . 60
4.13 Percentage of increase in network delay with di↵erent numbers of
open UDP ports on each client . . . . . . . . . . . . . . . . . . . . 60
5.1 An example of a one-finger touch gesture . . . . . . . . . . . . . . 67
5.2 Top 15 features among all users when five best features are selected
for each user. . . . . . . . . . . . . . . . . . . . . . . . . . . . . . . 73
5.4 System architecture of GlassGuard . . . . . . . . . . . . . . . . . . 75
5.5 Processing flow of the Aggregator module . . . . . . . . . . . . . . 78
5.6 Equal Error Rate with di↵erent numbers of features . . . . . . . . 81
5.7 Classification EERs for voice commands . . . . . . . . . . . . . . . 83
5.8 Detection rate of GlassGuard system . . . . . . . . . . . . . . . . 84
5.9 False alarm rate of GlassGuard system . . . . . . . . . . . . . . . 84
5.10 Number of events needed to make a decision . . . . . . . . . . . . 85
5.11 Performance with di↵erent training sizes and validation methods un-
der five real usage scenarios . . . . . . . . . . . . . . . . . . . . . . 87
5.12 Comparison of GlassGuard with the reference . . . . . . . . . . . . 89
viii
Enhancing Energy E�ciency and Privacy Protection of Smart
Devices
Chapter 1
Introduction
Smartphone users have exploded in recent years. It is reported that worldwide smart-
phone sales to end users totaled nearly 1.5 billion units in 2016, five times as compared
with 2010 [1]. The share of Americans that own smartphones reaches 77% in 2016, up
from just 35% in 2011 [2]. With the wide spread of smartphones, other types of smart
devices, such as tablets, smart watches, and smart wristbands, are also becoming more
and more popular. Smart glasses, as a relatively new type of smart devices, are be-
lieved to become even more popular than smartphones in 10 years [3]. It is estimated
that shipments of smart glasses will hit 1 billion around 2020, surpassing the expected
shipments of mobile phones by 2025 [3]. These myriads of smart devices have largely
enriched people’s lives and people are now “addicted” to smart devices. According to a
recent study, 89% of US and 77% of global consumers saying they can not live without
their smartphone or always have it within arm’s reach [4].
While users are enjoying their smart devices, there are two major user concerns. The
first is energy e�ciency. Users are spending more and more time on smartphones for
games, music, Internet access, instant communications, and so on. Smartphone applica-
tions also tend to incorporate more complex functions, which require more computing
capability and energy consumption. However, smartphone battery capacity has not kept
up with the increase of user demands of smartphone usage and complexity of smartphone
applications. Surveys [5, 6] show that improved battery life is the number one feature
2
that users want from a new smartphone. The second user concern is privacy protection.
On one hand, applications store various personal and sensitive data on the device, such
as photos, emails, bank accounts, locations. On the other hand, people carry their smart
devices around. The device can be easily misplaced, lost, or stolen. In the United States
someone loses a cell phone every 3.5 seconds [7]. And in 96% of cases, a person who finds
a lost smartphone tries to access sensitive data [8]. Moreover, research [9] has shown
that privacy threats come from not only strangers but also insiders, e.g. friends and
family, which imposes even bigger challenges for privacy protection on smart devices.
1.1 Problem Statements
In this dissertation, we propose solutions to enhance energy e�ciency and privacy pro-
tection on smart devices. Specifically, we work on the following three problems.
(1) Handing WiFi Broadcast Tra�c During Smartphone Suspend Mode.
To enhance energy e�ciency, one important and e↵ective mechanism in smartphones is
to enter low power suspend mode (i.e., the system-on-chip (SoC) of the device including
CPU, ROM, and the micro-controller circuits for various components are suspended
[10]) when the user becomes inactive. During user inactivity, a user is not actively
interacting with the smartphone, but may be waiting for events from applications, such as
application data received byWiFi. In addition to application data (unicast or broadcast),
WiFi radio also receives background WiFi broadcast data, such as broadcast packets
for printer discovery. To process these broadcast data, a smartphone needs to switch
to high power active mode and stay there for a while. This definitely increases the
power consumption and impairs smartphone energy e�ciency, especially when useless
broadcast tra�c constitutes the majority of WiFi tra�c. The question is how to handle
broadcast tra�c during smartphone suspend mode in an energy e�cient way, without
compromising normal function of applications in need of broadcast packets. To answer
this question, we examine how current smartphones deal with broadcast tra�c when they
are in suspend mode and how these solutions impact smartphone energy consumption
3
and functionality. Based on the findings, we propose Software Broadcast Filter to filter
out useless broadcast frames in the WiFi driver and improve the energy e�ciency during
smartphone suspend mode.
(2) AP-assisted Broadcast Tra�c Management to Save Smartphone En-
ergy. WiFi energy consumption is critical to smartphone battery life. To save energy,
one way is to reduce energy consumed by useless WiFi tra�c, such as malicious tra�c
from attackers [11] and background broadcast tra�c. In our first work, we study how to
e�ciently filter out useless WiFi broadcast tra�c at client (smartphone) side after they
are received by smartphones. However, in this way, smartphone energy is still wasted
to receive and process these useless frames. Moreover, if a smartphone is in suspend
mode, it still needs to wake up in order to do the processing. A smarter way is to fil-
ter out useless broadcast frames before they are received by smartphones. To achieve
this, we propose a framework for cooperation between an AP and smartphone clients
to deal with unwanted broadcast tra�c. With the proposed system, presence of useless
broadcast frames is hidden by the AP from smartphones. As a result, smartphones in
suspend mode do not receive these useless broadcast frames as they never exist. Hence,
smartphone energy for receiving and processing these unwanted tra�c and for waking
up from suspend mode is saved.
(3) Continuous and Non-invasive User Authentication on Wearable Glasses.
As wearable glasses are becoming more and more popular, there is an urgent need to
protect user privacy on these devices. An e↵ective measure to protect user privacy is
performing user authentication to prevent unauthorized access. A one-time authentica-
tion system, which only authenticates a user once when he/she tries to unlock the device,
fails under various circumstances, for example when the owner is temporarily away from
his/her device with the device unlocked and unattended, or when the password/PIN is
acquired by an insider. Therefore, a continuous authentication system which continu-
ously authenticates the user during the whole time of user operation is needed to better
protect user privacy. To accomplish this, we propose a continuous and non-invasive
4
authentication system for wearable glasses with the example of Google Glass which au-
thenticates users with touch behavioral biometrics and voice features.
1.2 Contributions
This dissertation proposes three solutions towards enhancing energy e�ciency or user
privacy protection on smart devices. The overall contributions are as follows.
Handing WiFi Broadcast Tra�c During Smartphone Suspend Mode. We re-
veal the dilemma of dealing with WiFi broadcast tra�c on modern smartphones during
suspend mode: receive all and su↵er high power consumption, or receive none and sac-
rifice functionalities. We address the dilemma by designing a flexible packet filter that
enables fine-grained policies to handle WiFi broadcast frames. Specifically, we make two
contributions.
• Through measurements and analysis, we investigate how existing smartphones deal
with broadcast tra�c when in suspend mode. Four smartphones are used for the
study: HTC Hero, Nexus One, Galaxy Nexus, and Galaxy S4. Through power
consumption and functionality analysis, we reveal the problem of existing solutions,
which we refer to as the dilemma of handling WiFi broadcast tra�c during a
smartphone’s suspend mode.
• We propose Software Broadcast Filter (SBF) to address the dilemma, and com-
pare it with solutions on modern smartphones. Through energy modeling and trace
driven performance evaluation, we demonstrate the performance of the proposed
method. Compared to the “receive-none” solution, SBF does not impair function-
alities of smartphone applications. Compared to the “receive-all” solution, SBF
reduces the power consumption by up to 49.9%.
AP-assisted Broadcast Tra�c Management to Save Smartphone Energy. We
propose a solution to filter out useless broadcast frames at APs before they are received
5
by smartphones. Our main contributions are:
• We design a framework, namely HIDE, working between an AP and smartphone
clients to reduce smartphone energy wasted on useless broadcast tra�c. In our
system, broadcast frames are managed at the AP. The AP hides presence of useless
broadcast frames from each client. As a result, smartphones in suspend mode do
not need to receive and wake up to process useless broadcast frames.
• We demonstrate the energy saving of our system with energy modeling and trace-
driven simulation. With five broadcast tra�c traces collected in five di↵erent real-
world scenarios, we show that the HIDE system saves 34%-75% smartphone energy
for Nexus One when 10% of the broadcast tra�c are useful to the smartphone. Our
overhead analysis demonstrates that our system has negligible impact on network
capacity and packet round-trip time.
Continuous and Non-invasive User Authentication on Wearable Glasses. We
design a continuous and non-invasive authentication system for wearable glasses with the
example of Google Glass. The system authenticates users based on biometric features
extracted from touch events and voice commands. Our main contributions are:
• We conduct a user study on Google Glass and collect user interaction data from 32
human subjects. The data we collect includes touch event data with corresponding
sensor readings and voice commands. Six types of gestures are covered in the study:
single tap, swipe forward, swipe backward, swipe down, two-finger swipe forward,
and two-finger swipe backward.
• With the data collected, we define and extract 99 behavioral features for one-finger
touch gestures, 156 features for two-finger touch gestures, and 19 voice features for
user voice commands. We evaluate the discriminability of these features with one-
class SVM model for user authentication purpose on Google Glass. Using the
features selected by Sequential Forward Search, the average classification EERs
6
(Equal Error Rate) with only one touch event range from 9% to 18.5%, for di↵erent
types of touch gestures. With one voice command, the EERs for di↵erent users are
between 1% and 11.8%.
• We design a simple but e↵ective online user authentication system for wearable
glasses, named GlassGuard, which works in a continuous and non-invasive way.
GlassGuard employs a mechanism adapted from Threshold Random Walking to
make a decision from multiple user events only when it is confident. Our prelimi-
nary results indicate that it achieves a detection rate of of 99% and a false alarm
rate of 0.5% after 3.5 user events on average when all types of user events are
available with equal probability. Under 5 typical usage scenarios, the system has
a detection rate above 93% and a false alarm rate below 3% after less than 5 user
events.
1.3 Dissertation Organization
The rest of this dissertation is structured as follows. In Chapter 2, we discuss related
work. In Chapter 3, we present our study of broadcast tra�c management on smart-
phones during suspend mode. In Chapter 4, we propose our system with AP-assisted
broadcast tra�c management to save smartphone energy. In Chapter 5, we propose
GlassGuard, a continuous and non-invasive authentication system for wearable glasses.
Finally, we conclude the dissertation in Chapter 6.
7
Chapter 2
Related Work
This chapter reviews related work in energy e�ciency on smartphones, tra�c manage-
ment for smartphones, and user authentication on smart devices respectively.
2.1 Energy E�ciency on Smartphones
A number of prior solutions have been proposed to reduce energy consumption on smart-
phones. We focus on those most closely related to our work.
Measuring WiFi Power Consumption. Balasubramanian et al. [12] measure en-
ergy consumption of di↵erent components of WiFi with downloading/uploading streams.
Carroll et al. [13] measure WiFi power consumption under various scenarios, such as
system suspend, system idle, emailing, SMS messaging and so on. Perrucci et al. [14]
measure power consumption in di↵erent stages of WiFi when the phone is downloading
data. Cuervo et al. [15] also measure WiFi power consumption with di↵erent amounts
of downloading data. All these works focus on power consumed by application commu-
nication, while our work focuses on power consumption caused by background tra�c.
Reducing WiFi Power Consumption. Catnap [16] takes advantage of the bandwidth
gap between wireless and wired links. They batch the time that WiFi is idle listening
for data from wired network and put WiFi into sleep mode during this time. Liu et
al. [17] leverage tra�c prediction to exploit idle intervals as short as several hundred
8
microseconds. All these methods reduce the time a WiFi module stays at a high power
active state. However, our method reduces the time an operating system spends in high
power active state when the phone is not actively used. During this time, the WiFi
driver is mostly in low power sleep state. So, these work are complementary to ours.
Pyles et al. [18] also check destination port number in WiFi frames to determine
if there is a process listening on that port. They use this information to determine
whether a frame is delay sensitive or not. However, transmission of broadcast frames are
scheduled by AP for the whole local network. It can not be delayed for a specific client.
Hence, their solution does not apply in our case.
Deng et al. [19] propose a solution to reduce energy consumed by 3G/LTE interface
staying in active mode unnecessarily. Rozner et al. [20] try to mitigate power consump-
tion increase when there is competitive background tra�c. Bharadwaj et al. [21] study
PSM (Power Save Mode) timeout in WiFi driver. These works control how wireless radio
switches between active and sleep modes. We control how the system switches between
suspend and active modes.
The authors in [10, 22] study energy bugs caused by wakelocks. The case they study
is when a wakelock is activated but is unable to be released. In our work, the wakelock
triggered by WiFi driver is due to normal behavior not a bug, as it can be released
normally after the timer expires.
A similar work reducing system wakeup energy overhead caused by WiFi is done on
PC [23]. They employ a peripheral low power processor to receive all broadcast/unicast
frames with less energy cost when a PC is in suspend mode. In contrast, we determine
whether to take actions for a broadcast frame or not, such as activating a wakelock,
putting packet data into system network stack. As far as we know, we propose the first
work that studies solutions for handling WiFi broadcast frames during a smartphone’s
suspend mode.
9
2.2 Tra�c Management for Smartphones
Detecting/Filtering Unwanted Tra�c. The authors in [24, 25] measure the impact
of unwanted tra�c on 3G networks. Raghavendra et al. [26] measure the impact of un-
wanted link layer WiFi frames due to client association/dissociation and probe activities.
In this work, we focus on WiFi broadcast frames generated by upper-layer applications
with UDP payload.
The authors in [27, 28] detect data tra�c sent from DDoS attackers. Lu et al. [29]
propose an authentication scheme to filter out false data from injected nodes in wireless
sensor network. Gu et al. [30] consider null data frames from attackers as unwanted
tra�c and propose defense mechanisms against it. These works focus on detecting and
filtering abnormal tra�c from malicious nodes. However, in our work, we study WiFi
broadcast frames that are normal tra�c from benign nodes.
Singh et al. [31] detect and prevent smartphone tra�c incurred by infrequently used
applications. Their focus is more about outgoing tra�c while our focus is about incoming
tra�c.
Smartphone Tra�c Reduction. The authors in [32, 33, 34] propose to reduce data
received by smartphones during video chatting or streaming. However, these methods
target at unicast frames for a specific type of application. In this work, we consider
broadcast frames that come from various applications.
Kim et al. [35] propose to let the server selectively send the data to a smartphone
according to the smartphone’s battery status. Smartphone advertising is also one source
of unnecessary or unwanted tra�c [36, 37]. Applications, such as Adblock [38], have
been provided to block such kind of unwanted tra�c. Again, all of these work study
unicast tra�c. We study broadcast tra�c.
Qian et al. [39] propose to reduce general data tra�c of smartphones by applying
redundancy elimination at di↵erent protocol layers. Their work is orthogonal to ours.
10
2.3 User Authentication on Smart Devices
Continuous and Transparent Authentication. User authentication has been done
via voice recognition [40] and face recognition [41]. However, voice commands are not
always available. Asking users to speak from time to time is invasive. Google Glass
only has a camera facing away from the wearers. As a result, methods based on face
recognition does not work. Moreover, using a camera brings privacy concern.
Early research has studied continuous authentication on personal computers via
mouse movements and keystroke dynamics [42, 43, 44]. These two biometrics are much
di↵erent from touch gestures on wearable glasses.
The idea of using touch behavioral biometrics for user authentication has been vali-
dated for multi-touch devices [45, 46]. Since then, various touch behavioral base contin-
uous authentication systems have been proposed. Some of them are based on keystrokes
on smartphones [47, 48, 49]. These methods do not work with touch pads on wearable
glasses since they do not support keystrokes. Others are based on touch gestures with
features extracted from screen touch data [50, 51, 52] and/or features extracted from sen-
sor data during a touch event [53, 54, 55]. However, due to di↵erences in user interaction
with wearable glasses and that with smartphones, these authentication systems cannot
be directly applied to wearable glasses. The discriminability of those features needs to
be evaluated on wearable glasses. Furthermore, users can control wearable glasses with
voice commands and easily circumvent the touch-based authentication systems.
Gait information has also been studied [56, 57] for continuous authentication purpose.
These works are complimentary to ours as we study the case when users are static.
Conti et al. [58] propose to authenticate a user based on how the user answers or
places a phone call, e.g. the movement pattern during the process of bringing the phone
to the ear after pressing the “start” button to initiate the call. This method, however,
is specific to smartphones. It is not applicable on wearable glasses.
User Authentication on Wearable Devices. Physical characteristics of users are
11
explored to do user authentication on wearable devices. Yang et al. [59] measure the
di↵erence in user responses to a vibration excitation. This method is intrusive. Cornelius
et al. [60] design a new sensor that measures how tissue responds to an electrical current
to verify identities of wearers. Similarly, Rasmussen et al. [61] propose to authenticate
users based on the human body’s response to an electric square pulse signal. These
two methods require a specific hardware that is not available in today’s smart glasses.
Moreover, to apply them in the real world, user safety needs to be addressed.
Chan et al. [62] propose to use the glass camera to scan a QR code displayed on the
user’s smartphone for authentication. Li et al. [63] propose to authenticate users based
on head movements in response to a music cue played on the Google Glass. Both of
these options are intrusive.
A similar work to ours is presented by Chauhan et al. [64]. Our comparison in
Subsection 5.4.3 shows that our system is more flexible and achieves better performance.
Other Sources for User Authentication. Das et al. [65] verify users with questions
about the owner’s day-to-day experience. This is invasive as users need to answer ques-
tions. Usage patterns of smartphone, such as SMS and voice call records, have also been
used to do active authentication [66]. This method has long authentication delay as it
needs to collect usage data during a long time interval to achieve high accuracy.
Shafagh et al. [67] use information of nearby devices to authenticate a user. Other
novel features are also proposed, such as clothes [68] and shoes that a user wears [69].
These methods have potential to be applied in wearable glasses. However, they do not
work well alone as a solution for continuous user authentication on wearable glasses
because these features are not stable even for the owner. It requires re-training when
a user visits a new place or gets new shoes or clothes. However, they can be combined
with our system to provide more accurate predictions. Our work is complementary to
theirs.
12
Chapter 3
All or None? The Dilemma of
Handling WiFi Broadcast Tra�c
in Smartphone Suspend Mode
3.1 Introduction
Smartphones spend a large amount of time in a state where they are not actively used.
This state is usually referred to as suspend or sleep mode. In this mode, the system-
on-chip (SoC) of the device including CPU, ROM, and the micro-controller circuits for
various components are suspended [10], so the phone consumes very little power. For
example, power consumption of Nexus One is 11 mW in suspend mode while it is above
120 mW in active mode. By turning smartphones into suspend mode while they are not
in use, considerable energy can be saved.
However, incoming WiFi tra�c interrupts a smartphone’s suspend mode and triggers
the switch to the high power active mode. One example is application notification when
the screen is o↵. Another example, which is often overlooked, is WiFi broadcast tra�c.
On some smartphones, such as Nexus One, the WiFi driver wakes up the whole system
upon receiving a WiFi broadcast frame during suspend mode. Moreover, in order to
allow enough time to process the frame and possible following transmission events, WiFi
13
driver acquires a wakelock [70] of one second. The phone stays in active mode until the
wakelock expires. As a result, battery drains fast even when a user is doing nothing on
the smartphone. Many users have been complaining about this problem [71, 72, 73].
WLAN is not designed for smartphones at the beginning. Although WiFi broadcast
frames are destined to the whole local area network, not all of them are useful to a smart-
phone, e.g., WiFi broadcast frames for printer service discovery. It is energy ine�cient
to wake up the whole system and stay awake just because of these useless background
broadcast frames. Smartphones have very limited battery life. It is important to handle
WiFi broadcast tra�c in an energy e�cient way. To improve energy e�ciency, some
smartphones, such as Galaxy Nexus and Galaxy S4, receive no broadcast frames except
ARP and Multicast DNS frames when they are in suspend mode. With this policy,
higher energy e�ciency is achieved. However, this impairs the functionalities as appli-
cations can not receive any broadcast frame during suspend mode. Broadcast tra�c is
pervasive and important in modern networks. Many network protocols rely on broadcast
to perform correctly or e↵ectively, such as ARP, DHCP, and DNS. Some system services
employ broadcast packets for resource discovery, such as NetBIOS Name Resolution.
Applications also embrace broadcast packets to communicate with neighbors, such as
LAN sync feature of Dropbox [74], neighbor discovery of Spotify [75], and crowdsourcing
based content sharing applications [76, 77]. Failure to receive these broadcast frames
results in malfunction of system services or user applications. Complaints regarding this
issue [78, 79, 80, 81] have also been posted in many technical forums.
Whether to receive a broadcast frame or not? It is di�cult to tell because WiFi
driver has no information about what broadcast frames are needed by system services
and user applications. This leads to the dilemma of dealing with WiFi broadcast tra�c
on modern smartphones during suspend mode: receive all and su↵er high power con-
sumption, or receive none and sacrifice functionalities. In this work, we address the
dilemma by designing a flexible packet filter that enables fine-grained policies to handle
WiFi broadcast frames. Specifically, we make two contributions.
14
• Through measurements and analysis, we investigate how existing smartphones deal
with broadcast tra�c when in suspend mode. Four smartphones are used for the
study: HTC Hero, Nexus One, Galaxy Nexus, and Galaxy S4. Through power
consumption and functionality analysis, we reveal the problem of existing solutions,
which we refer to as the dilemma of handling WiFi broadcast tra�c during a
smartphone’s suspend mode.
• We propose Software Broadcast Filter (SBF) to address the dilemma, and com-
pare it with solutions on modern smartphones. Through energy modeling and trace
driven performance evaluation, we demonstrate the performance of the proposed
method. Compared to the “receive-none” solution, SBF does not impair function-
alities of smartphone applications. Compared to the “receive-all” solution, SBF
reduces the power consumption by up to 49.9%.
In literature, existing research mainly focuses on designing energy e�cient broad-
cast/multicast protocols for wireless networks [82, 83] or reducing energy consumption
of WiFi unicast tra�c when a smartphone is in active mode [16, 84, 85]. However, we
are di↵erent in that we study the impact of WiFi broadcast tra�c when a smartphone
is in suspend mode. This problem deserves attention because: (1) Broadcast tra�c has
a broad impact as it a↵ects all nodes in a network. (2) Broadcast tra�c is passive and
typically arrives unexpectedly. To the best of our knowledge, we are the first to present
measurements and analysis of di↵erent ways to deal with WiFi broadcast tra�c during
smartphone suspend mode.
3.2 Revealing The Dilemma With Experiments
To reveal the dilemma, we first introduce existing solutions on four modern smartphones.
Then, we carry out experiments to show how they perform in terms of functionality and
energy e�ciency when WiFi broadcast tra�c exists.
15
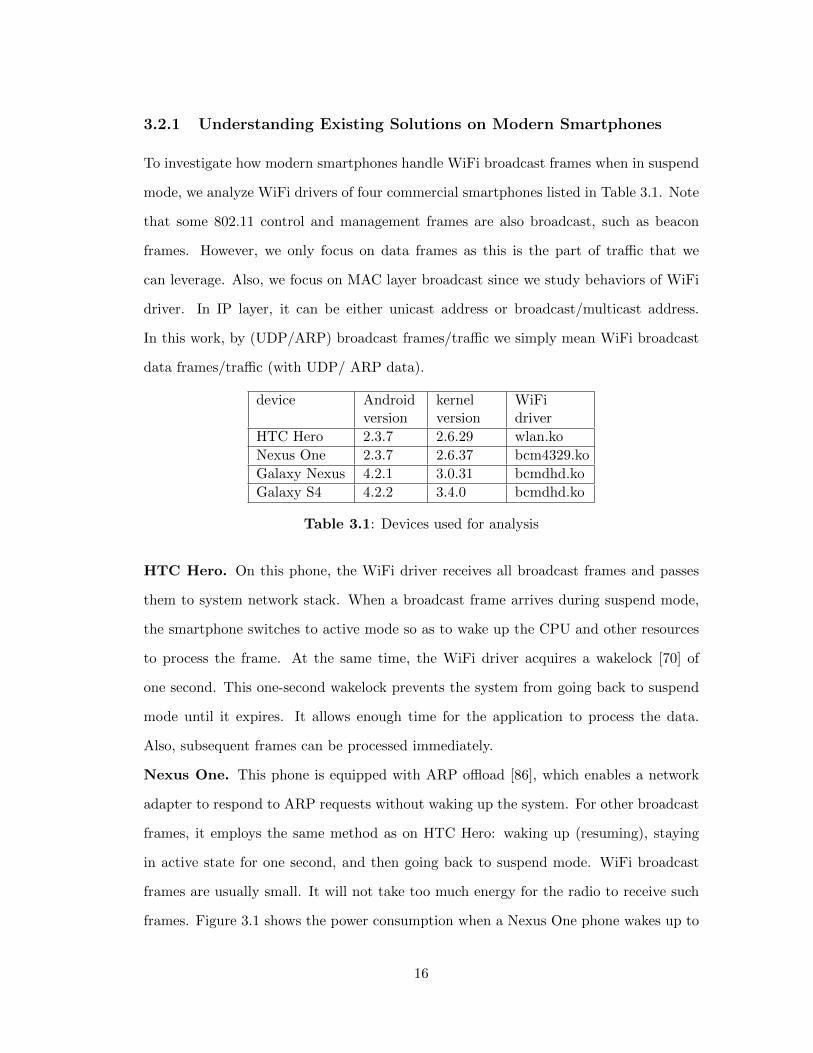
3.2.1 Understanding Existing Solutions on Modern Smartphones
To investigate how modern smartphones handle WiFi broadcast frames when in suspend
mode, we analyze WiFi drivers of four commercial smartphones listed in Table 3.1. Note
that some 802.11 control and management frames are also broadcast, such as beacon
frames. However, we only focus on data frames as this is the part of tra�c that we
can leverage. Also, we focus on MAC layer broadcast since we study behaviors of WiFi
driver. In IP layer, it can be either unicast address or broadcast/multicast address.
In this work, by (UDP/ARP) broadcast frames/tra�c we simply mean WiFi broadcast
data frames/tra�c (with UDP/ ARP data).
device Androidversion
kernelversion
WiFidriver
HTC Hero 2.3.7 2.6.29 wlan.koNexus One 2.3.7 2.6.37 bcm4329.koGalaxy Nexus 4.2.1 3.0.31 bcmdhd.koGalaxy S4 4.2.2 3.4.0 bcmdhd.ko
Table 3.1: Devices used for analysis
HTC Hero. On this phone, the WiFi driver receives all broadcast frames and passes
them to system network stack. When a broadcast frame arrives during suspend mode,
the smartphone switches to active mode so as to wake up the CPU and other resources
to process the frame. At the same time, the WiFi driver acquires a wakelock [70] of
one second. This one-second wakelock prevents the system from going back to suspend
mode until it expires. It allows enough time for the application to process the data.
Also, subsequent frames can be processed immediately.
Nexus One. This phone is equipped with ARP o✏oad [86], which enables a network
adapter to respond to ARP requests without waking up the system. For other broadcast
frames, it employs the same method as on HTC Hero: waking up (resuming), staying
in active state for one second, and then going back to suspend mode. WiFi broadcast
frames are usually small. It will not take too much energy for the radio to receive such
frames. Figure 3.1 shows the power consumption when a Nexus One phone wakes up to
16
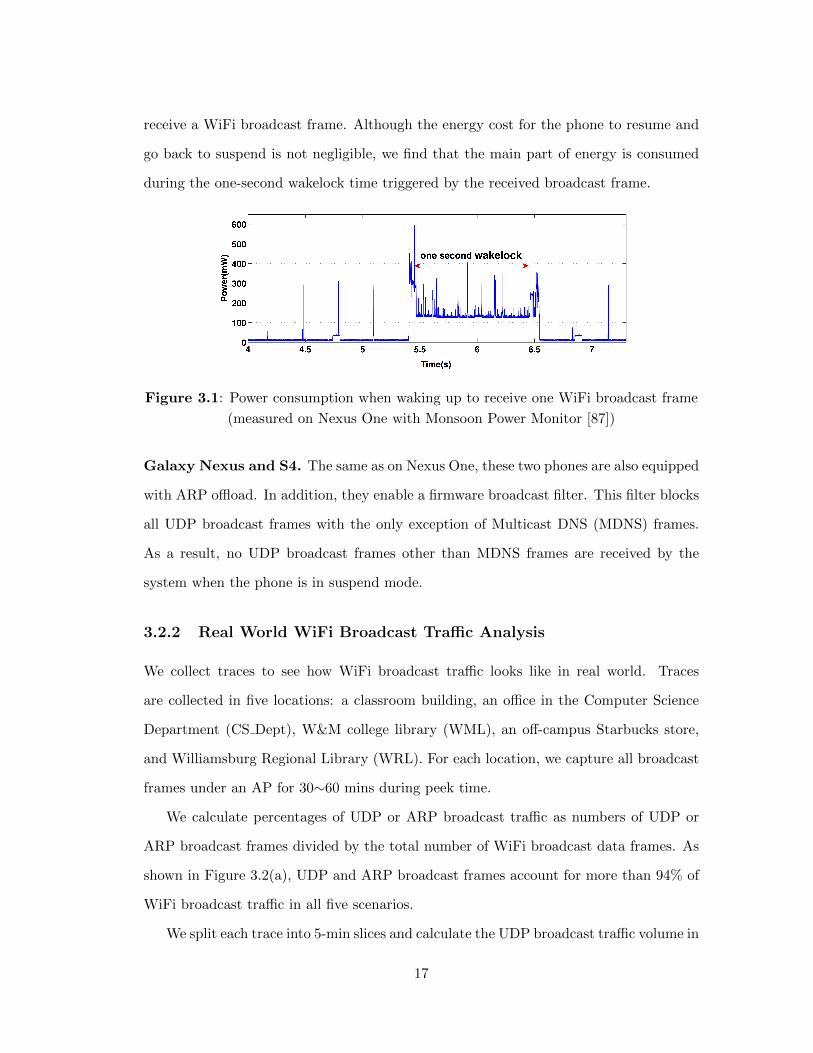
receive a WiFi broadcast frame. Although the energy cost for the phone to resume and
go back to suspend is not negligible, we find that the main part of energy is consumed
during the one-second wakelock time triggered by the received broadcast frame.
Figure 3.1: Power consumption when waking up to receive one WiFi broadcast frame
(measured on Nexus One with Monsoon Power Monitor [87])
Galaxy Nexus and S4. The same as on Nexus One, these two phones are also equipped
with ARP o✏oad. In addition, they enable a firmware broadcast filter. This filter blocks
all UDP broadcast frames with the only exception of Multicast DNS (MDNS) frames.
As a result, no UDP broadcast frames other than MDNS frames are received by the
system when the phone is in suspend mode.
3.2.2 Real World WiFi Broadcast Tra�c Analysis
We collect traces to see how WiFi broadcast tra�c looks like in real world. Traces
are collected in five locations: a classroom building, an o�ce in the Computer Science
Department (CS Dept), W&M college library (WML), an o↵-campus Starbucks store,
and Williamsburg Regional Library (WRL). For each location, we capture all broadcast
frames under an AP for 30⇠60 mins during peek time.
We calculate percentages of UDP or ARP broadcast tra�c as numbers of UDP or
ARP broadcast frames divided by the total number of WiFi broadcast data frames. As
shown in Figure 3.2(a), UDP and ARP broadcast frames account for more than 94% of
WiFi broadcast tra�c in all five scenarios.
We split each trace into 5-min slices and calculate the UDP broadcast tra�c volume in
17
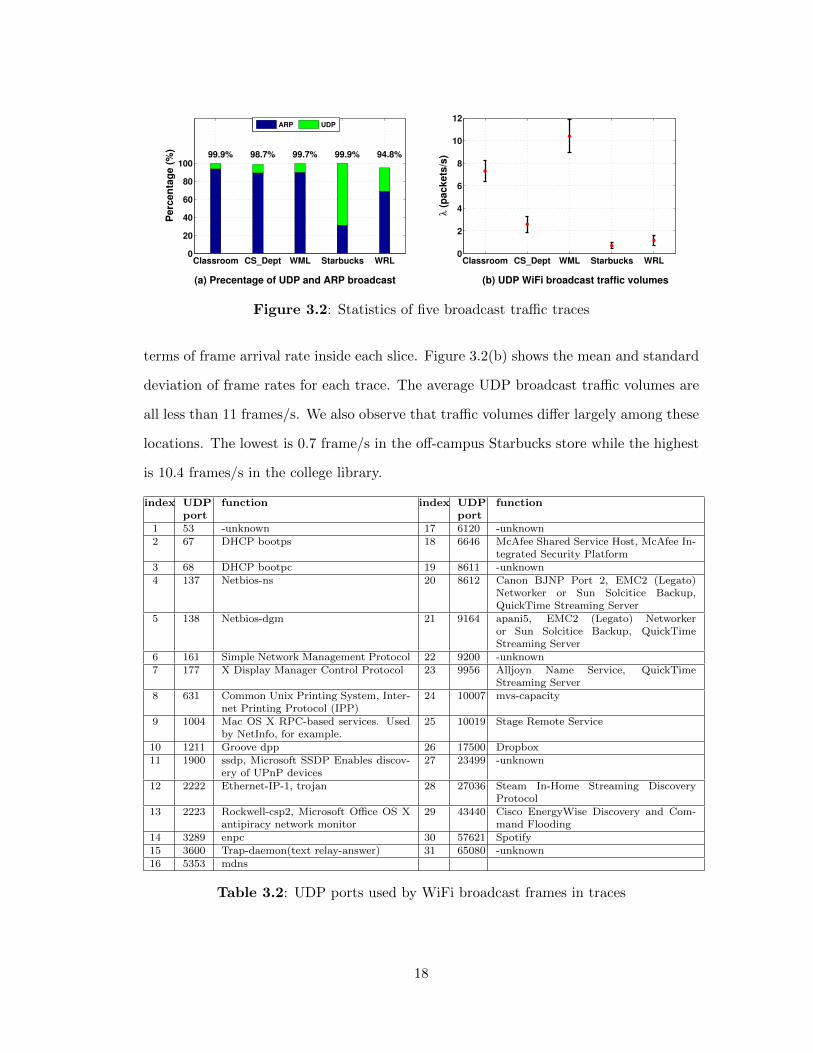
Classroom CS_Dept WML Starbucks WRL0
20
40
60
80
100P
erc
en
tag
e (
%)
99.9% 98.7% 99.7% 99.9% 94.8%
Classroom CS_Dept WML Starbucks WRL0
2
4
6
8
10
12
λ (
pa
ck
ets
/s)
ARP UDP
(a) Precentage of UDP and ARP broadcast (b) UDP WiFi broadcast traffic volumes
Figure 3.2: Statistics of five broadcast tra�c traces
terms of frame arrival rate inside each slice. Figure 3.2(b) shows the mean and standard
deviation of frame rates for each trace. The average UDP broadcast tra�c volumes are
all less than 11 frames/s. We also observe that tra�c volumes di↵er largely among these
locations. The lowest is 0.7 frame/s in the o↵-campus Starbucks store while the highest
is 10.4 frames/s in the college library.
index UDP
port
function index UDP
port
function
1 53 -unknown 17 6120 -unknown2 67 DHCP bootps 18 6646 McAfee Shared Service Host, McAfee In-
tegrated Security Platform3 68 DHCP bootpc 19 8611 -unknown4 137 Netbios-ns 20 8612 Canon BJNP Port 2, EMC2 (Legato)
Networker or Sun Solcitice Backup,QuickTime Streaming Server
5 138 Netbios-dgm 21 9164 apani5, EMC2 (Legato) Networkeror Sun Solcitice Backup, QuickTimeStreaming Server
6 161 Simple Network Management Protocol 22 9200 -unknown7 177 X Display Manager Control Protocol 23 9956 Alljoyn Name Service, QuickTime
Streaming Server8 631 Common Unix Printing System, Inter-
net Printing Protocol (IPP)24 10007 mvs-capacity
9 1004 Mac OS X RPC-based services. Usedby NetInfo, for example.
25 10019 Stage Remote Service
10 1211 Groove dpp 26 17500 Dropbox11 1900 ssdp, Microsoft SSDP Enables discov-
ery of UPnP devices27 23499 -unknown
12 2222 Ethernet-IP-1, trojan 28 27036 Steam In-Home Streaming DiscoveryProtocol
13 2223 Rockwell-csp2, Microsoft O�ce OS Xantipiracy network monitor
29 43440 Cisco EnergyWise Discovery and Com-mand Flooding
14 3289 enpc 30 57621 Spotify15 3600 Trap-daemon(text relay-answer) 31 65080 -unknown16 5353 mdns
Table 3.2: UDP ports used by WiFi broadcast frames in traces
18
00.20.40.60.8
1
00.20.40.60.8
1
00.20.40.60.8
1
00.20.40.60.8
1
1 2 3 4 5 6 7 8 9 10 11 12 13 14 15 16 17 18 19 20 21 22 23 24 25 26 27 28 29 30 310
0.20.40.60.8
1
WRL
Starbucks
WML
CS_Dept
Classroom
index of port number
Figure 3.3: UDP ports distribution
(Indices are defined in Table 3.2)
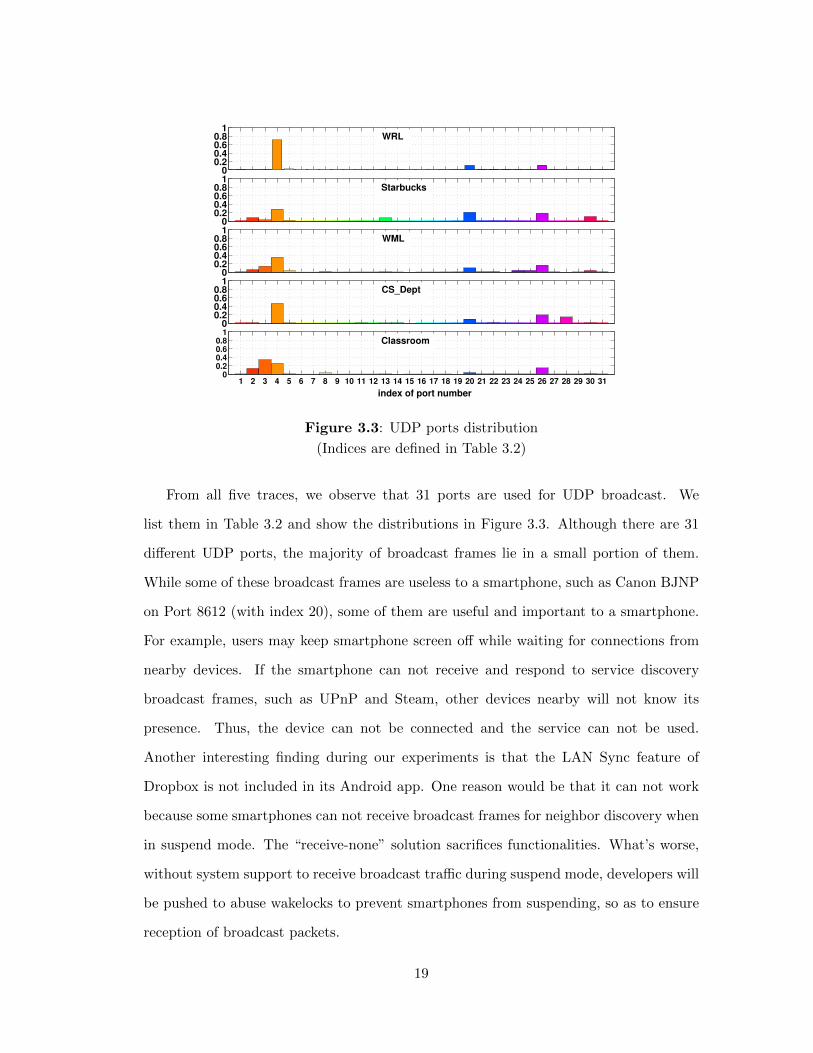
From all five traces, we observe that 31 ports are used for UDP broadcast. We
list them in Table 3.2 and show the distributions in Figure 3.3. Although there are 31
di↵erent UDP ports, the majority of broadcast frames lie in a small portion of them.
While some of these broadcast frames are useless to a smartphone, such as Canon BJNP
on Port 8612 (with index 20), some of them are useful and important to a smartphone.
For example, users may keep smartphone screen o↵ while waiting for connections from
nearby devices. If the smartphone can not receive and respond to service discovery
broadcast frames, such as UPnP and Steam, other devices nearby will not know its
presence. Thus, the device can not be connected and the service can not be used.
Another interesting finding during our experiments is that the LAN Sync feature of
Dropbox is not included in its Android app. One reason would be that it can not work
because some smartphones can not receive broadcast frames for neighbor discovery when
in suspend mode. The “receive-none” solution sacrifices functionalities. What’s worse,
without system support to receive broadcast tra�c during suspend mode, developers will
be pushed to abuse wakelocks to prevent smartphones from suspending, so as to ensure
reception of broadcast packets.
19
3.2.3 Power Impact Measurements
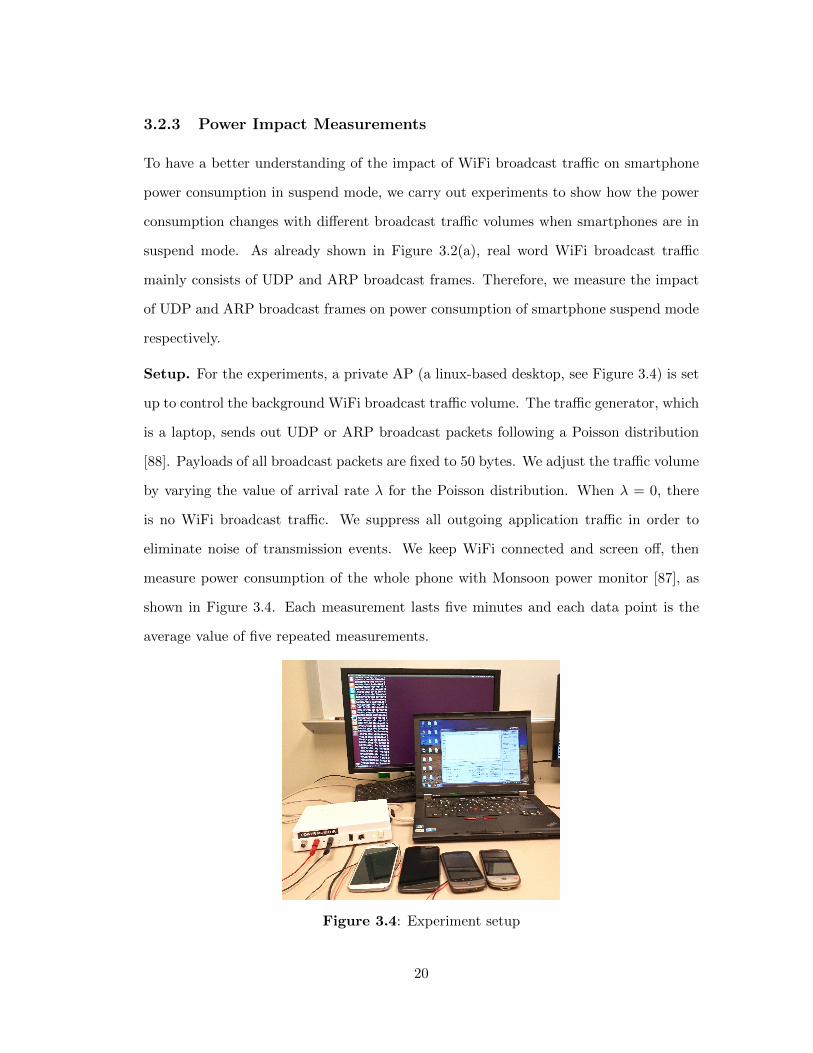
To have a better understanding of the impact of WiFi broadcast tra�c on smartphone
power consumption in suspend mode, we carry out experiments to show how the power
consumption changes with di↵erent broadcast tra�c volumes when smartphones are in
suspend mode. As already shown in Figure 3.2(a), real word WiFi broadcast tra�c
mainly consists of UDP and ARP broadcast frames. Therefore, we measure the impact
of UDP and ARP broadcast frames on power consumption of smartphone suspend mode
respectively.
Setup. For the experiments, a private AP (a linux-based desktop, see Figure 3.4) is set
up to control the background WiFi broadcast tra�c volume. The tra�c generator, which
is a laptop, sends out UDP or ARP broadcast packets following a Poisson distribution
[88]. Payloads of all broadcast packets are fixed to 50 bytes. We adjust the tra�c volume
by varying the value of arrival rate � for the Poisson distribution. When � = 0, there
is no WiFi broadcast tra�c. We suppress all outgoing application tra�c in order to
eliminate noise of transmission events. We keep WiFi connected and screen o↵, then
measure power consumption of the whole phone with Monsoon power monitor [87], as
shown in Figure 3.4. Each measurement lasts five minutes and each data point is the
average value of five repeated measurements.
Figure 3.4: Experiment setup
20
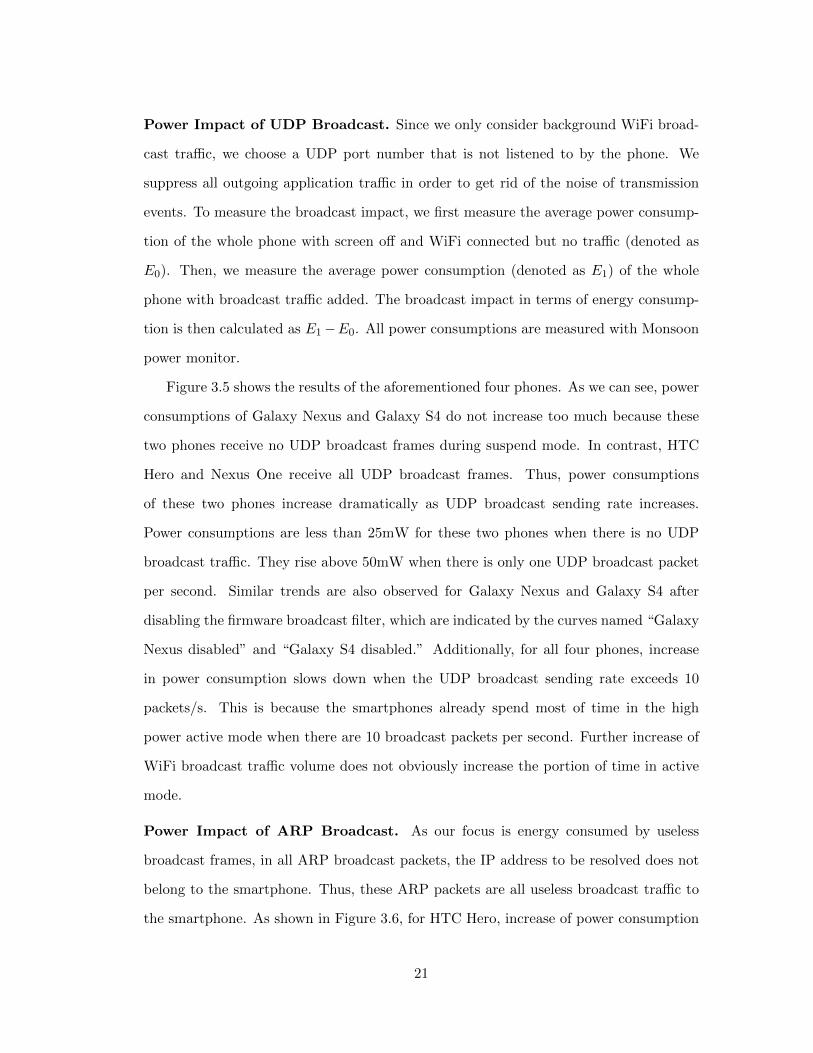
Power Impact of UDP Broadcast. Since we only consider background WiFi broad-
cast tra�c, we choose a UDP port number that is not listened to by the phone. We
suppress all outgoing application tra�c in order to get rid of the noise of transmission
events. To measure the broadcast impact, we first measure the average power consump-
tion of the whole phone with screen o↵ and WiFi connected but no tra�c (denoted as
E0). Then, we measure the average power consumption (denoted as E1) of the whole
phone with broadcast tra�c added. The broadcast impact in terms of energy consump-
tion is then calculated as E1�E0. All power consumptions are measured with Monsoon
power monitor.
Figure 3.5 shows the results of the aforementioned four phones. As we can see, power
consumptions of Galaxy Nexus and Galaxy S4 do not increase too much because these
two phones receive no UDP broadcast frames during suspend mode. In contrast, HTC
Hero and Nexus One receive all UDP broadcast frames. Thus, power consumptions
of these two phones increase dramatically as UDP broadcast sending rate increases.
Power consumptions are less than 25mW for these two phones when there is no UDP
broadcast tra�c. They rise above 50mW when there is only one UDP broadcast packet
per second. Similar trends are also observed for Galaxy Nexus and Galaxy S4 after
disabling the firmware broadcast filter, which are indicated by the curves named “Galaxy
Nexus disabled” and “Galaxy S4 disabled.” Additionally, for all four phones, increase
in power consumption slows down when the UDP broadcast sending rate exceeds 10
packets/s. This is because the smartphones already spend most of time in the high
power active mode when there are 10 broadcast packets per second. Further increase of
WiFi broadcast tra�c volume does not obviously increase the portion of time in active
mode.
Power Impact of ARP Broadcast. As our focus is energy consumed by useless
broadcast frames, in all ARP broadcast packets, the IP address to be resolved does not
belong to the smartphone. Thus, these ARP packets are all useless broadcast tra�c to
the smartphone. As shown in Figure 3.6, for HTC Hero, increase of power consumption
21
0 1 2 5 10 200
50
100
150
200
250
λ (number of frames/s)
Po
we
r (m
W)
Nexus One
HTC Hero
Galaxy Nexus
Galaxy S4
Galaxy Nexus disabled
Galaxy S4 disabled
Figure 3.5: Power impact of UDP broad-cast tra�c
0 1 2 5 10 200
50
100
150
200
250
λ (number of frames/s)
Po
we
r (m
W)
Nexus OneHTC HeroGalaxy NexusGalaxy S4
Figure 3.6: Power impact of ARP broad-cast tra�c
under ARP broadcast tra�c is similar to that under UDP broadcast tra�c. However,
ARP broadcast tra�c is observed to have little impact on the other three phones. For
example, power consumption of Nexus One increases by less than 8mW when we increase
the ARP broadcast tra�c from 1 to 20 packets/s. From our analysis in the previous
section, we learn that the reason is ARP o✏oad. As observed, ARP o✏oad is e�cient
enough to deal with ARP broadcast tra�c. Therefore, in the rest of this work, we target
at UDP broadcast tra�c.
3.3 Software Broadcast Filter Design and Energy Saving
Analysis
As we have demonstrated, current solutions of receiving all or no broadcast frames sac-
rifice either functionalities or battery life of a smartphone. To address the dilemma, we
design a flexible and fine-grained Software Broadcast Filter (SBF). To demonstrate the
energy e�ciency of SBF, we first characterize the energy consumption when a smart-
phone system wakes up to receive a broadcast frame. Then, we calculate the energy
saving of SBF by modeling the energy consumptions of both SBF and “receive-all”
methods.
22
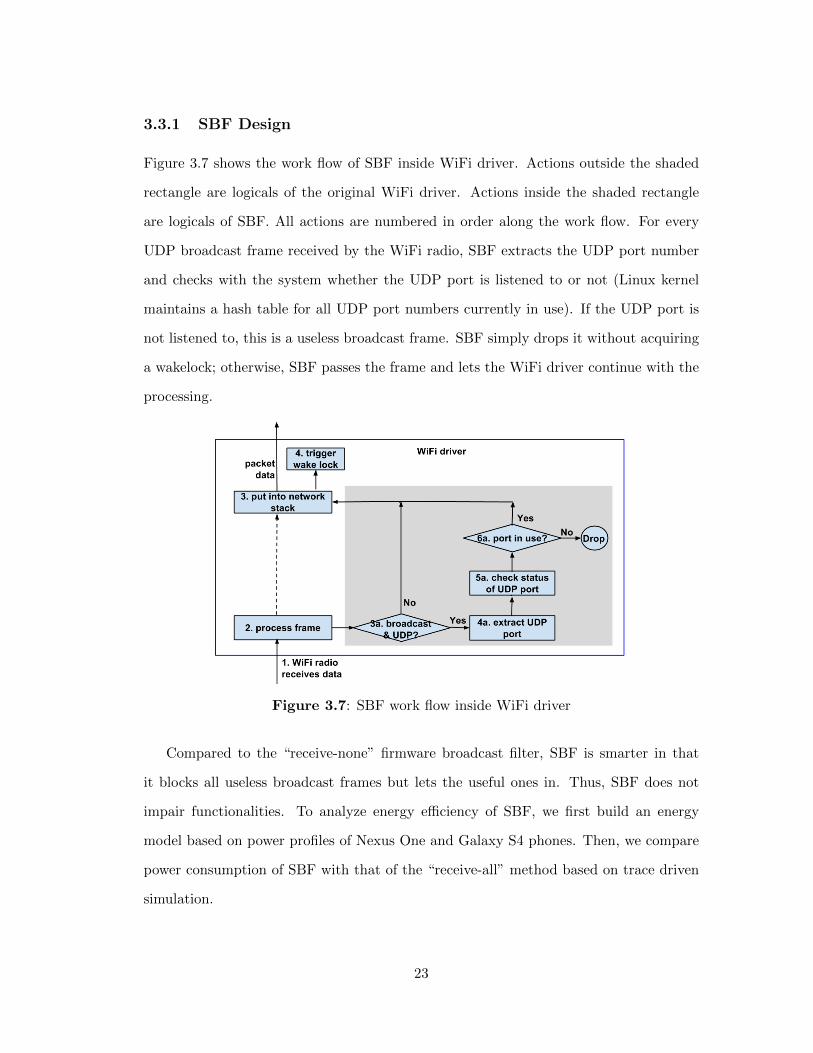
3.3.1 SBF Design
Figure 3.7 shows the work flow of SBF inside WiFi driver. Actions outside the shaded
rectangle are logicals of the original WiFi driver. Actions inside the shaded rectangle
are logicals of SBF. All actions are numbered in order along the work flow. For every
UDP broadcast frame received by the WiFi radio, SBF extracts the UDP port number
and checks with the system whether the UDP port is listened to or not (Linux kernel
maintains a hash table for all UDP port numbers currently in use). If the UDP port is
not listened to, this is a useless broadcast frame. SBF simply drops it without acquiring
a wakelock; otherwise, SBF passes the frame and lets the WiFi driver continue with the
processing.
Figure 3.7: SBF work flow inside WiFi driver
Compared to the “receive-none” firmware broadcast filter, SBF is smarter in that
it blocks all useless broadcast frames but lets the useful ones in. Thus, SBF does not
impair functionalities. To analyze energy e�ciency of SBF, we first build an energy
model based on power profiles of Nexus One and Galaxy S4 phones. Then, we compare
power consumption of SBF with that of the “receive-all” method based on trace driven
simulation.
23
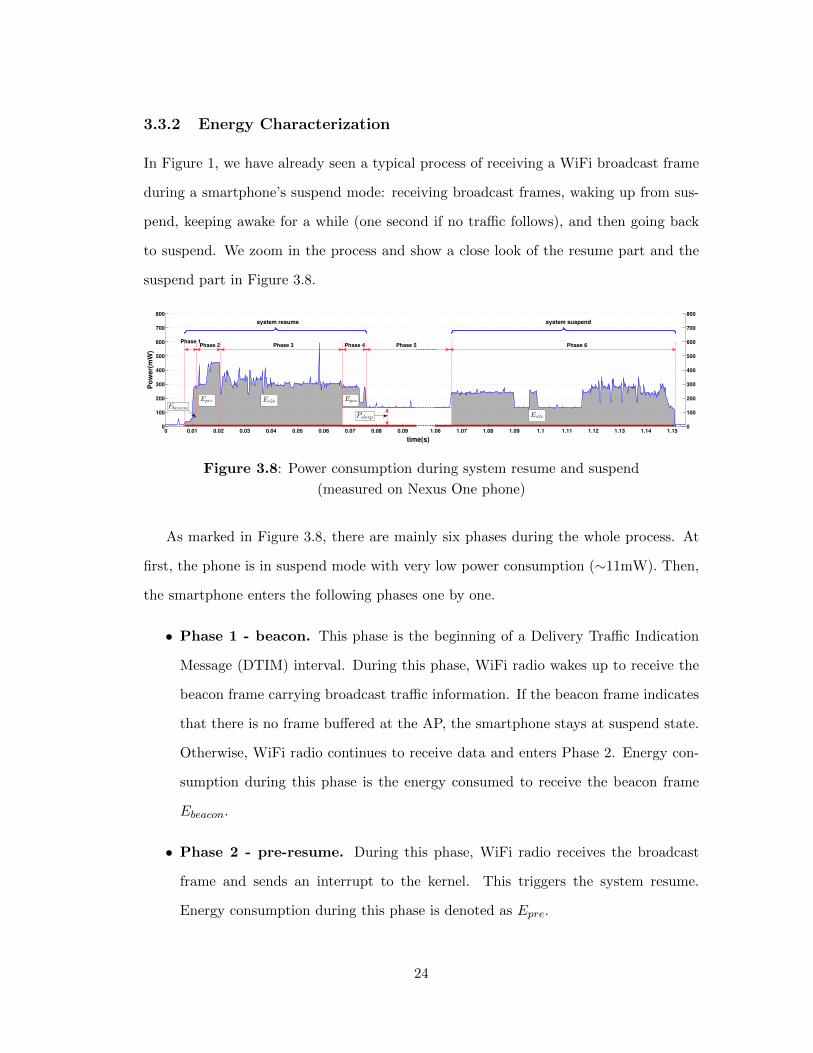
3.3.2 Energy Characterization
In Figure 1, we have already seen a typical process of receiving a WiFi broadcast frame
during a smartphone’s suspend mode: receiving broadcast frames, waking up from sus-
pend, keeping awake for a while (one second if no tra�c follows), and then going back
to suspend. We zoom in the process and show a close look of the resume part and the
suspend part in Figure 3.8.
Po
we
r(m
W)
0 0.01 0.02 0.03 0.04 0.05 0.06 0.07 0.08 0.090
100
200
300
400
500
600
700
800
1.06 1.07 1.08 1.09 1.1 1.11 1.12 1.13 1.14 1.150
100
200
300
400
500
600
700
800
Phase 1Phase 2 Phase 3 Phase 4 Phase 5
Psleep
Ebeacon
Epre Es2a Epos
Phase 6
Ea2s
............
............
............
system resume system suspend
time(s)
Figure 3.8: Power consumption during system resume and suspend
(measured on Nexus One phone)
As marked in Figure 3.8, there are mainly six phases during the whole process. At
first, the phone is in suspend mode with very low power consumption (⇠11mW). Then,
the smartphone enters the following phases one by one.
• Phase 1 - beacon. This phase is the beginning of a Delivery Tra�c Indication
Message (DTIM) interval. During this phase, WiFi radio wakes up to receive the
beacon frame carrying broadcast tra�c information. If the beacon frame indicates
that there is no frame bu↵ered at the AP, the smartphone stays at suspend state.
Otherwise, WiFi radio continues to receive data and enters Phase 2. Energy con-
sumption during this phase is the energy consumed to receive the beacon frame
Ebeacon
.
• Phase 2 - pre-resume. During this phase, WiFi radio receives the broadcast
frame and sends an interrupt to the kernel. This triggers the system resume.
Energy consumption during this phase is denoted as Epre
.
24
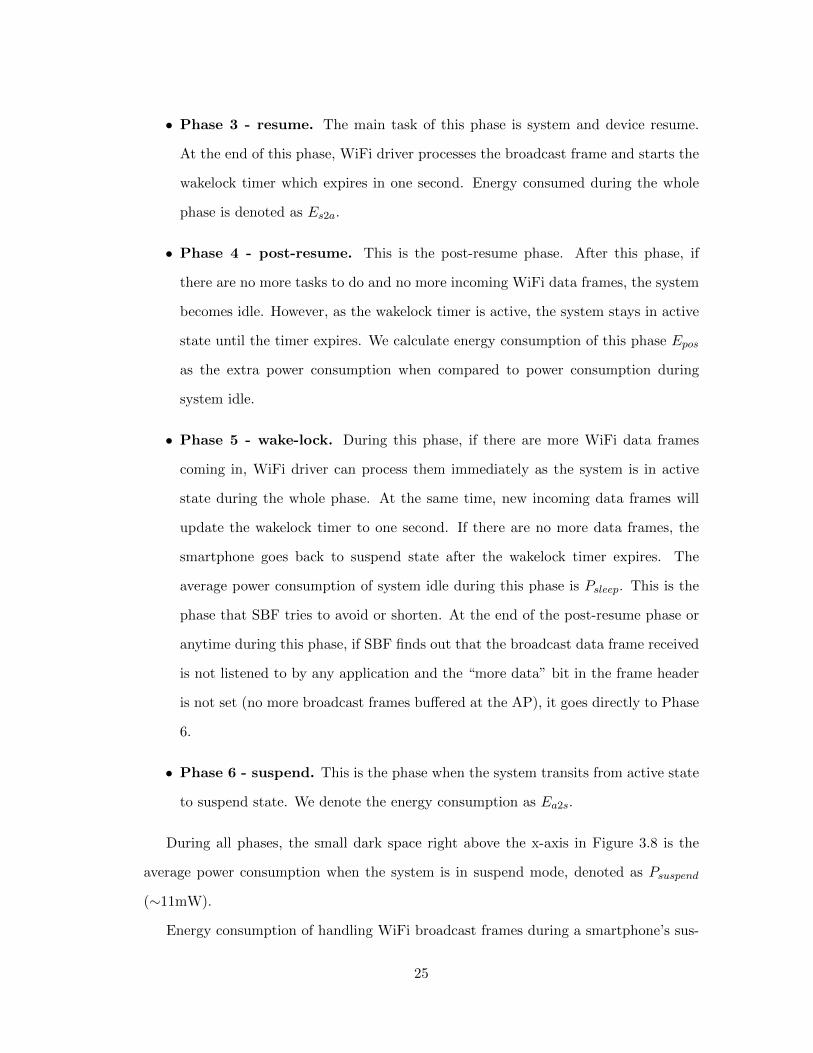
• Phase 3 - resume. The main task of this phase is system and device resume.
At the end of this phase, WiFi driver processes the broadcast frame and starts the
wakelock timer which expires in one second. Energy consumed during the whole
phase is denoted as Es2a.
• Phase 4 - post-resume. This is the post-resume phase. After this phase, if
there are no more tasks to do and no more incoming WiFi data frames, the system
becomes idle. However, as the wakelock timer is active, the system stays in active
state until the timer expires. We calculate energy consumption of this phase Epos
as the extra power consumption when compared to power consumption during
system idle.
• Phase 5 - wake-lock. During this phase, if there are more WiFi data frames
coming in, WiFi driver can process them immediately as the system is in active
state during the whole phase. At the same time, new incoming data frames will
update the wakelock timer to one second. If there are no more data frames, the
smartphone goes back to suspend state after the wakelock timer expires. The
average power consumption of system idle during this phase is Psleep
. This is the
phase that SBF tries to avoid or shorten. At the end of the post-resume phase or
anytime during this phase, if SBF finds out that the broadcast data frame received
is not listened to by any application and the “more data” bit in the frame header
is not set (no more broadcast frames bu↵ered at the AP), it goes directly to Phase
6.
• Phase 6 - suspend. This is the phase when the system transits from active state
to suspend state. We denote the energy consumption as Ea2s.
During all phases, the small dark space right above the x-axis in Figure 3.8 is the
average power consumption when the system is in suspend mode, denoted as Psuspend
(⇠11mW).
Energy consumption of handling WiFi broadcast frames during a smartphone’s sus-
25
pend mode can be divided into three aspects. (1) The first aspect E1 is energy consumed
by WiFi radio to receive WiFi frames, including idle listening, data transmission, and
frame processing. (2) The second aspect E2 is energy consumed by system state trans-
fers, including transitions from suspend to active and transitions from active to suspend.
(3) The third aspect E3 is energy consumed in system idle state due to WiFi wakelock.
SBF is a software method. It does not stop WiFi radio from receiving any broadcast
frame. So, SBF does not impact energy consumed by the first aspect. From Figure 3.1,
we see this part of energy is not dominant when broadcast tra�c is sparse. SBF increases
energy consumption of the second aspect because SBF puts smartphone into suspend
mode more aggressively than the “receive-all” solution. With SBF, the chance that a
broadcast data frame comes in when the system is in suspend mode becomes higher. As
a result, the frequency of system state transfer increases. This is the overhead of SBF.
However, SBF reduces energy consumed in the third aspect because SBF reduces the time
that the system spends at idle/active state after receiving a broadcast frame. During
a smartphone’s suspend mode, energy reduction of SBF in the third aspect is usually
larger than the energy increase in the second aspect, which is why SBF saves energy.
Later, in our evaluation results (Figure 3.9), we show how much energy is consumed in
these three aspects respectively.
3.3.3 Energy Saving Modeling
Suppose that a smartphone receives n UDP broadcast frames during m beacon intervals.
The ith
broadcast frame arrives at time ti
(ti
> ti�1 for all 1 i n) during beacon
interval bi
(1 bi
m). The frame length is Li
and WiFi data rate is ri
. Beacon
interval is ⌧b
and it is typically configured to be 102.4ms in real world WiFi networks.
DTIM interval is set to 1, which means Delivery Tra�c Indication Messages are sent
with every beacon. WiFi wakelock timer length is ⌧w
, which is one second on the phones
we used. In order to model energy saving of SBF, we need to calculate the following
parameters for each frame Fi
: system state when the broadcast frame arrives s(i) (1
26
means suspend and 0 means active), start time of wakelock timer tw(i), and wakelock
e↵ective time length Twl
(i). Without loss of generality, and to simplify the model, we
assume the first beacon interval starts at time 0 and the initial state of the smartphone
system is suspend, which is
sa(1) = sb(1) = 1
twa(1) = twb(1) = Tbeacon
+ Tpre
+ Ts2a
Tbeacon
, Tpre
, and Ts2a are time lengths of the beacon phase, pre-resume phase, and
resume phase, respectively. To di↵erentiate variables under di↵erent methods, we use
superscript ‘a’ for variables under the “receive-all” method and superscript ‘b’ for vari-
ables under SBF. Based on these two initial values, we can calculate the corresponding
parameters for all following n � 1 frames under the “receive-all” method and SBF, re-
spectively.
Energy Consumption of “receive-all”. If a frame i arrives after the suspend phase
of frame i � 1, then the system state upon frame arrival is suspend mode. Otherwise,
the system is in active mode.
sa(i) =
8><
>:
0 , if ti
twa(i� 1) + ⌧w
+ Ta2s
1 , otherwise(3.1)
If a frame arrives during the suspend phase of the previous frame, it interrupts the
suspend process. We assume that suspend energy cost is evenly distributed across the
suspend phase. Once a suspend process is interrupted, system transits back to active
mode immediately without extra transition energy consumption. If sa(i) = 1 for a frame
i, then the system needs to transit from suspend mode to active mode to process the
frame. So, sa(i) can also be used to indicate whether a broadcast frame triggers the
system resume or not.
27
Wakelock timer for the ith
(2 i n) broadcast frame starts at time
twa(i) =
8><
>:
ti
+ Li
/ri
+ Tbeacon
+ Tpre
+ Ts2a ,if sa(i) = 1
max{twa(i� 1), ti
+ Li
/ri
} ,if sa(i) = 0(3.2)
Wakelock e↵ective time length for the ith
(1 i n� 1) broadcast frame is
T a
wl
(i) = min{⌧w
,max{0, ti+1 � twa(i)}} (3.3)
With the above three variables, we calculate system state transfer energy consumption
of “receive-all” method as
Ea
2 = (Epre
+ Es2a + E
pos
+ Ea2s) ⇤
nX
i=1
sa(i) + Ea
is
(3.4)
where Ea
is
is the energy consumed by interrupted suspends.
Ea
is
=E
a2s
Ta2s⇤
nX
i=2
T a
is
(i) (3.5)
with
T a
is
(i) =
8><
>:
ti
� twa(i� 1)� T a
wl
(i� 1) , if 0 < ti
� twa(i� 1)� T a
wl
(i� 1) < Ta2s
0 , otherwise
(3.6)
Then, the total energy consumed by the “receive-all” method is calculated as
Ea = Ea
1 + Ea
2 + Ea
3 (3.7)
28
where Ea
2 is already shown in Equation (3.4) and
Ea
1 = Pidle
⇤ Tidle
+ Pr
⇤nX
i=1
Li
ri
+ Efp
⇤Nb
(3.8)
Ea
3 = Psleep
⇤nX
i=1
T a
wl
(i) (3.9)
In Equation (3.8), Pidle
is WiFi idle listening power consumption. Pr
is the power
consumption of WiFi when WiFi radio is receiving a frame. Since time to process a
frame is very short, we assume that WiFi groups the processing of all data frames
received during the same beacon interval. So, there is only a one-time frame processing
energy cost during a beacon interval, denoted as Efp
. Also, we assume Efp
is constant
across all beacon intervals. Nb
is the number of beacon intervals with data frame(s). It
is calculated as
Nb
=| � | where � = {i | 9bj
= i ^ 1 i m ^ 1 j n} (3.10)
Tidle
in Equation (3.8) is the total time that WiFi radio spends at idle listening between
data transmission. Considering a beacon interval bi
, WiFi radio stays in idle listening
between frame transmissions. If the “more data” bit is set in the last frame of a beacon
interval, WiFi radio also stays in idle listening after transmission of the last frame of this
beacon interval and before start of the next beacon interval.
Tidle
=X
i2�[txi + L
xi/rxi � (bi
� 1) ⇤ ⌧b
+ dmore
(xi
) ⇤ (bi
⇤ ⌧b
� txi � L
xi/rxi)]�nX
i=1
Li
/ri
(3.11)
with xi
= max{j | bj
= i ^ 1 j n}
where dmore
(i) stands for the “more data” bit in the MAC layer header of the ith
frame.
Energy Consumption of SBF. When SBF operates in a WiFi driver, the system state
upon frame arrival is
29
sb(i) =
8><
>:
0 , if ti
< twb(i� 1) + T b
wl
(i� 1) + Ta2s
1 , otherwise(3.12)
Also, we have wakelock start time
twb(i) =
8><
>:
ti
+ Li
/ri
+ Tbeacon
+ Tpre
+ Ts2a ,if sb(i) = 1
max{twb(i� 1), ti
+ Li
/ri
} ,if sb(i) = 0(3.13)
and wakelock e↵ective time length
T b
wl
(i) = max{0, dmore
(i) ⇤min(bi
⇤ ⌧b
, ti+1)� twb(i)} (3.14)
where dmore
(i) stands for the “more data” bit in the MAC layer header of the ith
frame.
If this bit is set, then SBF keeps the smartphone awake until the next broadcast frame
or the next beacon interval, whichever comes first. Otherwise, SBF puts the smartphone
into suspend state immediately.
Then, state transfer energy consumption by SBF is
Eb
2 = (Epre
+ Es2a + E
pos
+ Ea2s) ⇤
nX
i=1
sb(i) + Eb
is
(3.15)
where Eb
is
is energy consumed by interrupted suspends for SBF.
Eb
is
=E
a2s
Ta2s⇤
nX
i=2
T b
is
(i) (3.16)
where
T b
is
(i) =
8><
>:
ti
� twb(i� 1)� T b
wl
(i� 1) , if 0 < ti
� twb(i� 1)� T b
wl
(i� 1) < Ta2s
0 , otherwise
(3.17)
30
Similarly, the total energy consumption of SBF is
Eb = Eb
1 + Eb
2 + Eb
3 (3.18)
where Eb
2 is already shown in Equation (3.15) and
Eb
1 = Ea
1 (3.19)
Eb
3 = Psleep
⇤nX
i=1
T b
wl
(i) (3.20)
Energy Saving of SBF. With the total energy consumption of both SBF and “receive-
all”, we calculate energy saving percentage of SBF as
p =Ea � Eb
Ea
(3.21)
3.4 SBF Performance Evaluation
We evaluate performance of SBF in terms of energy e�ciency and delay through trace
driven simulation. The traces we used are the five traces we introduced in Section 3.2.2.
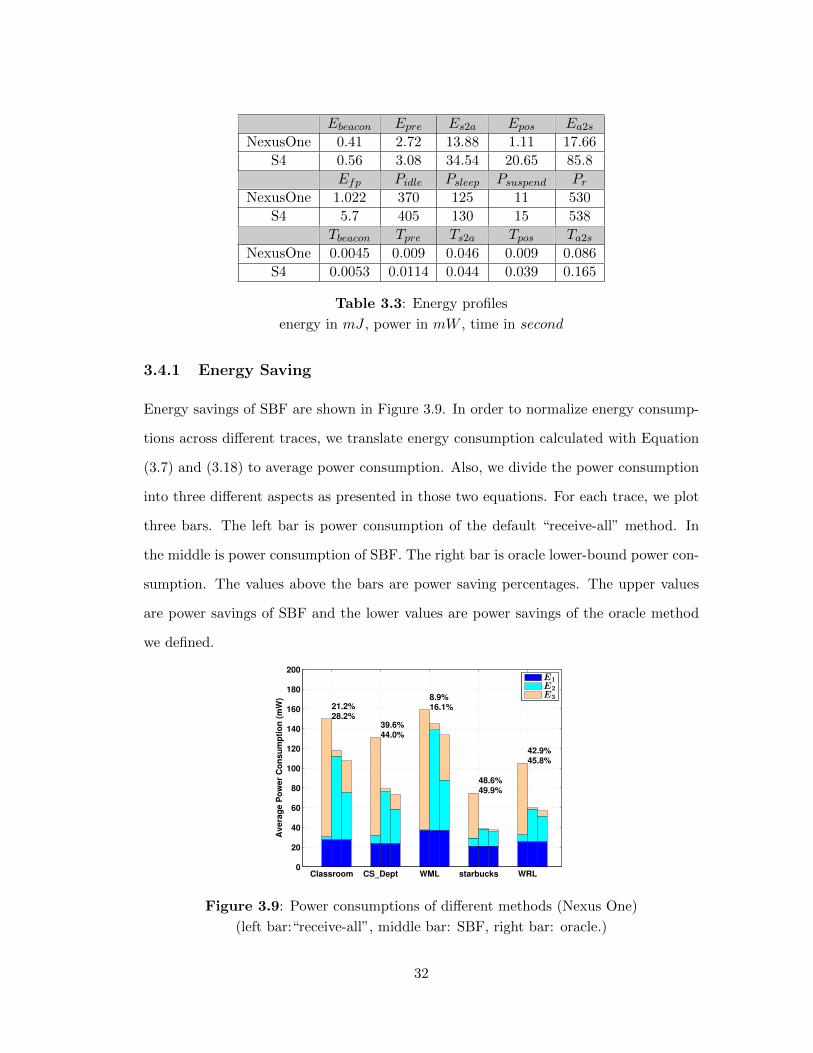
With a Monsoon power meter, we measure and profile the power/energy consumption
of two phones: Nexus One and Galaxy S4. The values are listed in Table 3.3. To
demonstrate the energy e�ciency of SBF, we compare energy consumption of SBF to
the “receive-all” method and an oracle lower bound. To calculate this lower bound, we
assume that SBF has the information of future frame arrival time. So, it can decide
to keep the system active until the next broadcast frame when the wakelock energy
consumption E3(i) is less than state transfer energy cost E2(i) for the current frame i
(benefit is less than overhead). This also gives the upper bound of energy savings.
31
Ebeacon
Epre
Es2a E
pos
Ea2s
NexusOne 0.41 2.72 13.88 1.11 17.66S4 0.56 3.08 34.54 20.65 85.8
Efp
Pidle
Psleep
Psuspend
Pr
NexusOne 1.022 370 125 11 530S4 5.7 405 130 15 538
Tbeacon
Tpre
Ts2a T
pos
Ta2s
NexusOne 0.0045 0.009 0.046 0.009 0.086S4 0.0053 0.0114 0.044 0.039 0.165
Table 3.3: Energy profiles
energy in mJ , power in mW , time in second
3.4.1 Energy Saving
Energy savings of SBF are shown in Figure 3.9. In order to normalize energy consump-
tions across di↵erent traces, we translate energy consumption calculated with Equation
(3.7) and (3.18) to average power consumption. Also, we divide the power consumption
into three di↵erent aspects as presented in those two equations. For each trace, we plot
three bars. The left bar is power consumption of the default “receive-all” method. In
the middle is power consumption of SBF. The right bar is oracle lower-bound power con-
sumption. The values above the bars are power saving percentages. The upper values
are power savings of SBF and the lower values are power savings of the oracle method
we defined.
Classroom CS_Dept WML starbucks WRL0
20
40
60
80
100
120
140
160
180
200
Avera
ge P
ow
er
Co
nsu
mp
tio
n (
mW
)
21.2%28.2%
39.6%44.0%
8.9%16.1%
48.6%49.9%
42.9%45.8%
E1
E2
E3
Figure 3.9: Power consumptions of di↵erent methods (Nexus One)
(left bar:“receive-all”, middle bar: SBF, right bar: oracle.)
32
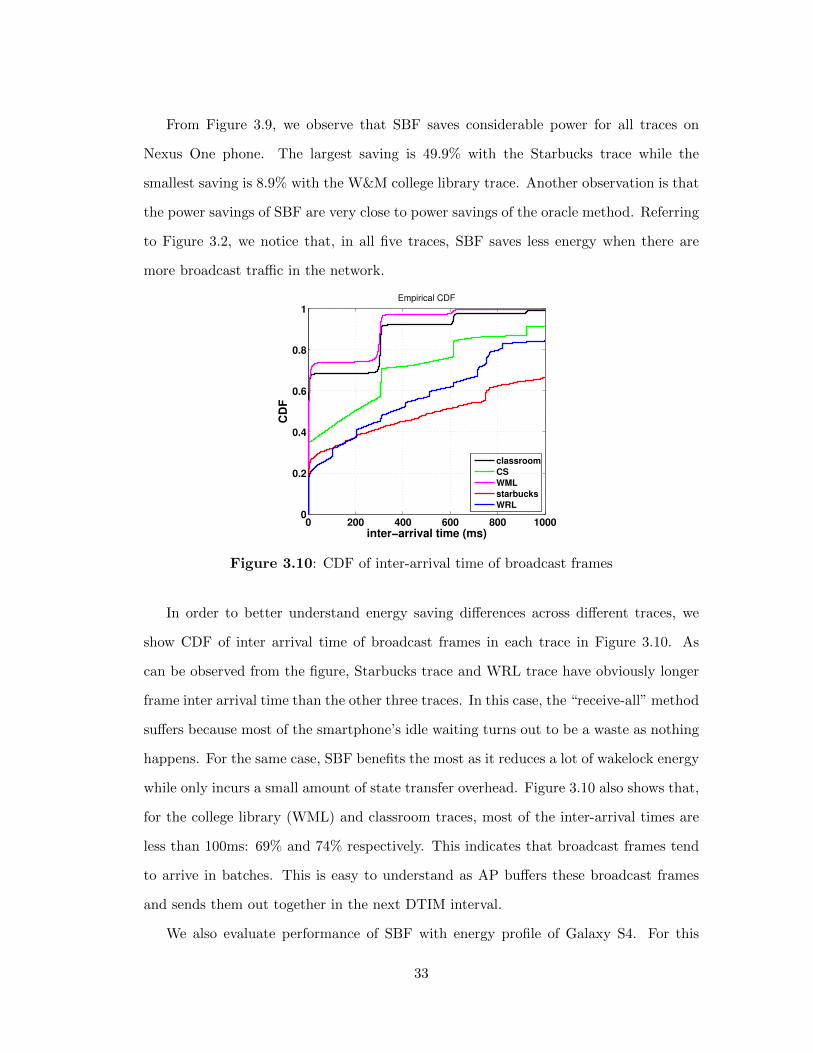
From Figure 3.9, we observe that SBF saves considerable power for all traces on
Nexus One phone. The largest saving is 49.9% with the Starbucks trace while the
smallest saving is 8.9% with the W&M college library trace. Another observation is that
the power savings of SBF are very close to power savings of the oracle method. Referring
to Figure 3.2, we notice that, in all five traces, SBF saves less energy when there are
more broadcast tra�c in the network.
0 200 400 600 800 10000
0.2
0.4
0.6
0.8
1
inter−arrival time (ms)
CD
FEmpirical CDF
classroomCSWMLstarbucksWRL
Figure 3.10: CDF of inter-arrival time of broadcast frames
In order to better understand energy saving di↵erences across di↵erent traces, we
show CDF of inter arrival time of broadcast frames in each trace in Figure 3.10. As
can be observed from the figure, Starbucks trace and WRL trace have obviously longer
frame inter arrival time than the other three traces. In this case, the “receive-all” method
su↵ers because most of the smartphone’s idle waiting turns out to be a waste as nothing
happens. For the same case, SBF benefits the most as it reduces a lot of wakelock energy
while only incurs a small amount of state transfer overhead. Figure 3.10 also shows that,
for the college library (WML) and classroom traces, most of the inter-arrival times are
less than 100ms: 69% and 74% respectively. This indicates that broadcast frames tend
to arrive in batches. This is easy to understand as AP bu↵ers these broadcast frames
and sends them out together in the next DTIM interval.
We also evaluate performance of SBF with energy profile of Galaxy S4. For this
33
phone, SBF only saves energy (⇠ 12.3%) under the Starbucks trace. This is because
state transfer energy cost is quite high on S4 phone, as can be seen from Table 3.3. The
overhead is too heavy to be counteracted by wakelock energy reduction of SBF when the
broadcast tra�c is not sparse. Even with the oracle solution, power saving is only 1.1%
and 5.8% under the W&M college library trace and classroom trace respectively.
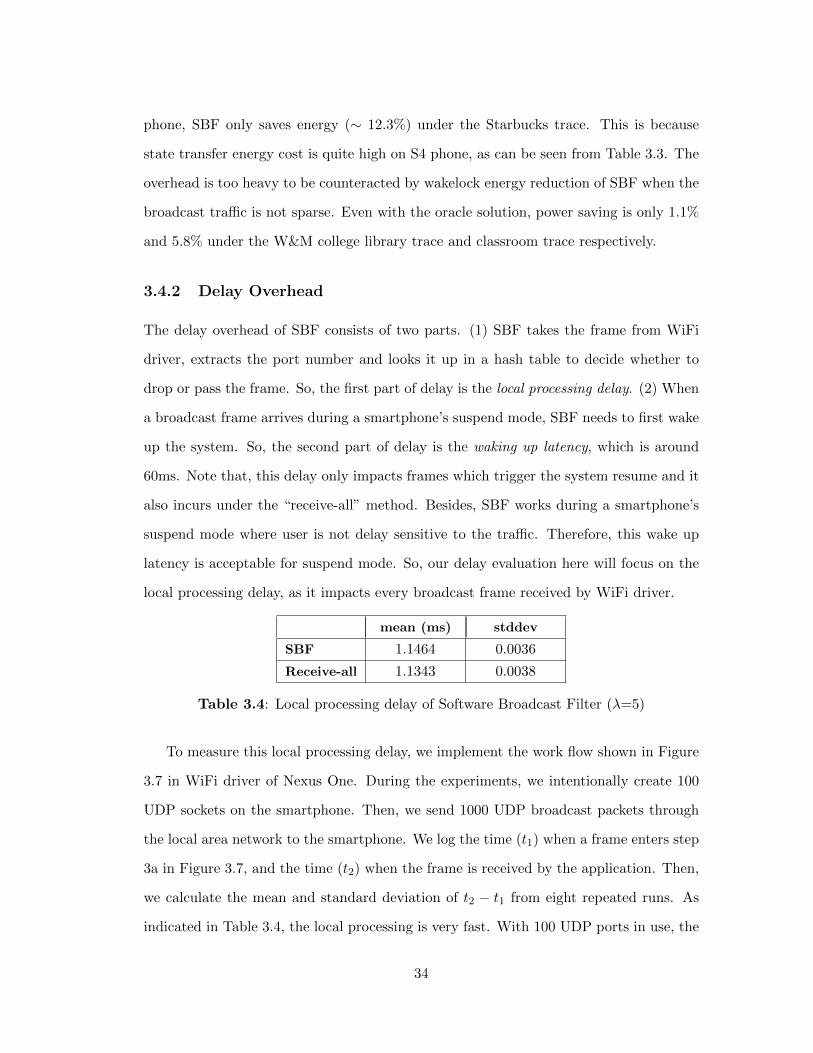
3.4.2 Delay Overhead
The delay overhead of SBF consists of two parts. (1) SBF takes the frame from WiFi
driver, extracts the port number and looks it up in a hash table to decide whether to
drop or pass the frame. So, the first part of delay is the local processing delay. (2) When
a broadcast frame arrives during a smartphone’s suspend mode, SBF needs to first wake
up the system. So, the second part of delay is the waking up latency, which is around
60ms. Note that, this delay only impacts frames which trigger the system resume and it
also incurs under the “receive-all” method. Besides, SBF works during a smartphone’s
suspend mode where user is not delay sensitive to the tra�c. Therefore, this wake up
latency is acceptable for suspend mode. So, our delay evaluation here will focus on the
local processing delay, as it impacts every broadcast frame received by WiFi driver.
mean (ms) stddev
SBF 1.1464 0.0036
Receive-all 1.1343 0.0038
Table 3.4: Local processing delay of Software Broadcast Filter (�=5)
To measure this local processing delay, we implement the work flow shown in Figure
3.7 in WiFi driver of Nexus One. During the experiments, we intentionally create 100
UDP sockets on the smartphone. Then, we send 1000 UDP broadcast packets through
the local area network to the smartphone. We log the time (t1) when a frame enters step
3a in Figure 3.7, and the time (t2) when the frame is received by the application. Then,
we calculate the mean and standard deviation of t2 � t1 from eight repeated runs. As
indicated in Table 3.4, the local processing is very fast. With 100 UDP ports in use, the
34
local processing delay only increases by 1.07%.
3.5 Conclusion and Future Work
This work studies di↵erent ways to handle WiFi broadcast tra�c on modern smartphones
during suspend mode. By examining WiFi drivers on four Android smartphones, we find
that modern smartphones face the dilemma of handling broadcast frames during suspend
mode: either receive all UDP broadcast frames su↵ering high power consumption or
receive none UDP broadcast frame sacrificing functionalities. We analyze wireless traces
under five di↵erent scenarios and show that the “receive-none” solution blocks both
useless and useful broadcast frames. For the “receive-all” solution, we measure the
impact of WiFi broadcast tra�c on power consumption of smartphones in suspend mode.
Results show that ARP broadcast tra�c only slightly increases the power consumption
due to ARP o✏oad. However, power consumption increases dramatically as UDP tra�c
volume increases.
Based on these findings, we propose Software Broadcast Filter (SBF) for fine-grained
UDP broadcast frame processing. Compared to “receive-none” approach, SBF does
not impair functionalities of smartphone applications as it only blocks useless broadcast
frames. Compared to “receive-all” approach, SBF saves up to 49.9% energy consumption.
Meanwhile, SBF only increases the local processing delay by 1.07%.
Software broadcast filter is not perfect but opens the door for fine-grained WiFi
broadcast filter research in smartphones. As future work, we plan to improve SBF in
the following ways. First, we plan to adapt SBF to reduce state transfer overhead. For
example, SBF can decide how long to keep awake according to the current broadcast
tra�c volume. Second, we will combine software broadcast filter and firmware broadcast
filter, switching between them according to the current context. Finally, SBF works after
a WiFi radio receives a frame and the system already switches to active mode. In future,
we plan to leverage a low power radio, such as Bluetooth, to wake up the smartphone
only when necessary.
35
Chapter 4
HIDE: AP-assisted Broadcast
Tra�c Management to Save
Smartphone Energy
4.1 Introduction
WiFi is among the top biggest culprits for battery drain on smartphones, mainly due to
two factors. First, WiFi consumes considerable amount of power on smartphones. For
example, when WiFi is turned o↵, power consumption of Galaxy S4 is ⇠130mW with
system idle and screen o↵. When WiFi is receiving data, the power consumption adds up
to ⇠538mW . Second, the amount of data tra�c over WiFi is significant on smartphones.
Global mobile data tra�c grew 69 percent in 2014 and is expected to grow even faster
[89]. Meanwhile, WiFi has been the major interface for data communication. A report
shows that WiFi accounts for 73% of total tra�c on Android smartphones [90]. With
mobile data o✏oading [91, 89], more and more smartphone tra�c will flow over WiFi.
Reducing WiFi energy consumption can e↵ectively boost smartphone battery life.
Generally, energy consumed by WiFi is spent for data downloading/uploading desired
by users. In some cases, unwanted (or useless) tra�c may become rampant and dominate
WiFi energy consumption, such as malicious tra�c from attackers (e.g., denial-of-service
36
or energy attackers) [11, 28] and background broadcast data tra�c that is useless to
a smartphone [92] (e.g., WiFi broadcast frames for printer service discovery). Thus,
to reduce WiFi energy consumption, we seek to cut down energy waste incurred by
unwanted WiFi tra�c.
Existing literature mainly focuses on how to receive desired tra�c in a more energy
e�cient way, e.g., tra�c scheduling or tra�c shaping [93, 20, 94, 32]. With these meth-
ods, a client has no choice of what should be sent to it. In the previous chapter, we
propose Software Broadcast Filter (SBF) to filter out useless broadcast frames in the
WiFi driver after they are received by smartphones. In this way, useless broadcast data
frames are still received by smartphones. Unnecessary energy has already been consumed
to receive and process these useless data frames. What is worse, if a smartphone is in
suspend mode (i.e., the system-on-chip (SoC) of the device including CPU, ROM, and
the micro-controller circuits for various components are suspended [10]) when a useless
frame arrives, the device still needs to switch to active mode in order to wake up the
CPU and other resources to do the processing.
In this work, we improve smartphone energy e�ciency by reducing energy wasted
on useless WiFi broadcast tra�c1. Specifically, we propose to filter out useless UDP-
padded broadcast frames (MAC layer WiFi broadcast data frames with UDP payload)
at APs before they are received by smartphones. Thus, no energy will be wasted on
smartphones to receive or process these useless broadcast frames. We focus on broadcast
tra�c because broadcast tra�c is normal tra�c that naturally exists in almost every
network. In contrast, malicious unicast tra�c is abnormal tra�c which only exists in
the targeted network. It is trivial to extend our system to incorporate useless unicast
tra�c. Although it is also interesting to work on other types of WiFi broadcast frames,
in this work, we focus on UDP-padded broadcast frames as they are the majority of
WiFi broadcast data frames [92]. In the rest of this chapter, unless specifically stated,
broadcast frame/tra�c means UDP-padded broadcast frame/tra�c. Also, we target at
1In this chapter, we use unwanted tra�c and useless tra�c interchangeably.
37
smartphones in suspend mode because power consumption is very low in this state. If a
data frame arrives during a smartphone’s suspend mode, the smartphone needs to switch
to high power active mode and stays in that mode for a while. The energy impact of
useless tra�c on smartphones in suspend mode is much more serious than the impact
on smartphones in active mode.
However, in order to filter out useless broadcast tra�c at APs, two research questions
need to be answered. The first question is how to di↵erentiate between useful and useless
broadcast tra�c. APs have no idea about what broadcast frames are needed by clients.
Moreover, the definition of “useful” and “useless” is di↵erent across clients. A broadcast
frame which is useless to a client may be useful to another client. The second question
is how to manage useless broadcast tra�c in an energy e�cient way. An AP cannot
simply drop a useless broadcast frame for one client as it may be useful to other clients.
Currently, the 802.11 network protocol assumes that broadcast frames are to be received
by all clients. So, an AP uses only one bit in beacon frames to indicate any bu↵ered
broadcast frames to all clients. This cannot deliver client-specific notifications. Besides,
communication between a client and AP has cost. It incurs energy overhead as well as
brings extra tra�c to the network which may decrease network throughput.
In this work, we answer the above two research questions. Our main idea is to enable
cooperation between an AP and smartphone clients. Clients tell the AP what are needed.
With the information from clients, the AP identifies useless broadcast frames for each
client. Then, tra�c notifications sent out within beacon frames are extended to o↵er one
bit for each client. So, the AP can indicate to each client only useful broadcast frames.
With our solution, no energy is wasted to receive useless broadcast frames. Moreover, if
there are no useful frames, a client does not even need to wake up from suspend mode.
Thus, our solution remarkably reduces the energy wasted on unwanted tra�c. Our main
contributions are:
• We design a framework, namely HIDE, working between an AP and smartphone
clients to reduce smartphone energy wasted on useless broadcast tra�c. In our
38
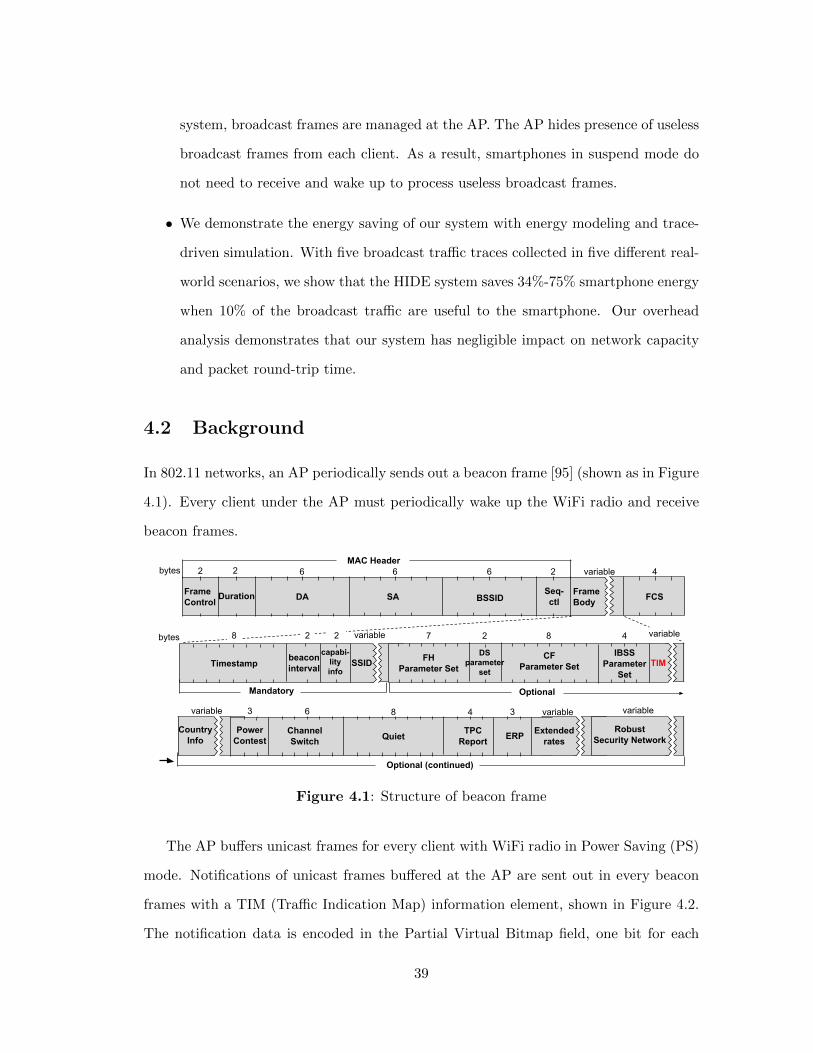
system, broadcast frames are managed at the AP. The AP hides presence of useless
broadcast frames from each client. As a result, smartphones in suspend mode do
not need to receive and wake up to process useless broadcast frames.
• We demonstrate the energy saving of our system with energy modeling and trace-
driven simulation. With five broadcast tra�c traces collected in five di↵erent real-
world scenarios, we show that the HIDE system saves 34%-75% smartphone energy
when 10% of the broadcast tra�c are useful to the smartphone. Our overhead
analysis demonstrates that our system has negligible impact on network capacity
and packet round-trip time.
4.2 Background
In 802.11 networks, an AP periodically sends out a beacon frame [95] (shown as in Figure
4.1). Every client under the AP must periodically wake up the WiFi radio and receive
beacon frames.
FCS
4
DA SA BSSIDFrameControl Duration Frame
Body
MAC Header2 2 6 6 6
Seq-ctl
2bytes
TIMDS
parameterset
CFParameter Set
FHParameter Set
IBSSParameter
SetSSID
capabi-lityinfo
beaconinterval
bytes
variable
variable 7 2 8 4 variable228
Mandatory Optional
TIM TIM
Timestamp
PowerContest
ChannelSwitch Quiet TPC
Report ERP Extendedrates
RobustSecurity Network
CountryInfo
variable variable variable3 6 8 4 3
Optional (continued)
Figure 4.1: Structure of beacon frame
The AP bu↵ers unicast frames for every client with WiFi radio in Power Saving (PS)
mode. Notifications of unicast frames bu↵ered at the AP are sent out in every beacon
frames with a TIM (Tra�c Indication Map) information element, shown in Figure 4.2.
The notification data is encoded in the Partial Virtual Bitmap field, one bit for each
39
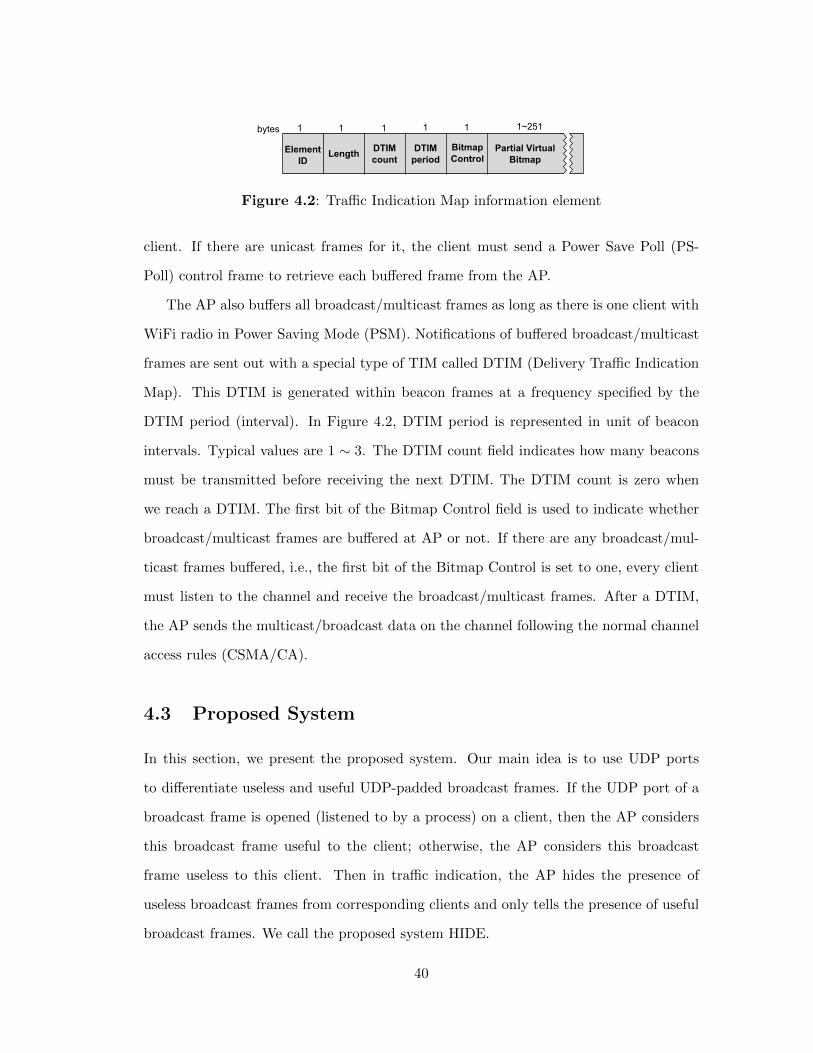
111
DTIMcount
DTIM period
Partial Virtual Bitmap
ElementID
Length
bytes 1~25111
BitmapControl
Figure 4.2: Tra�c Indication Map information element
client. If there are unicast frames for it, the client must send a Power Save Poll (PS-
Poll) control frame to retrieve each bu↵ered frame from the AP.
The AP also bu↵ers all broadcast/multicast frames as long as there is one client with
WiFi radio in Power Saving Mode (PSM). Notifications of bu↵ered broadcast/multicast
frames are sent out with a special type of TIM called DTIM (Delivery Tra�c Indication
Map). This DTIM is generated within beacon frames at a frequency specified by the
DTIM period (interval). In Figure 4.2, DTIM period is represented in unit of beacon
intervals. Typical values are 1 ⇠ 3. The DTIM count field indicates how many beacons
must be transmitted before receiving the next DTIM. The DTIM count is zero when
we reach a DTIM. The first bit of the Bitmap Control field is used to indicate whether
broadcast/multicast frames are bu↵ered at AP or not. If there are any broadcast/mul-
ticast frames bu↵ered, i.e., the first bit of the Bitmap Control is set to one, every client
must listen to the channel and receive the broadcast/multicast frames. After a DTIM,
the AP sends the multicast/broadcast data on the channel following the normal channel
access rules (CSMA/CA).
4.3 Proposed System
In this section, we present the proposed system. Our main idea is to use UDP ports
to di↵erentiate useless and useful UDP-padded broadcast frames. If the UDP port of a
broadcast frame is opened (listened to by a process) on a client, then the AP considers
this broadcast frame useful to the client; otherwise, the AP considers this broadcast
frame useless to this client. Then in tra�c indication, the AP hides the presence of
useless broadcast frames from corresponding clients and only tells the presence of useful
broadcast frames. We call the proposed system HIDE.
40
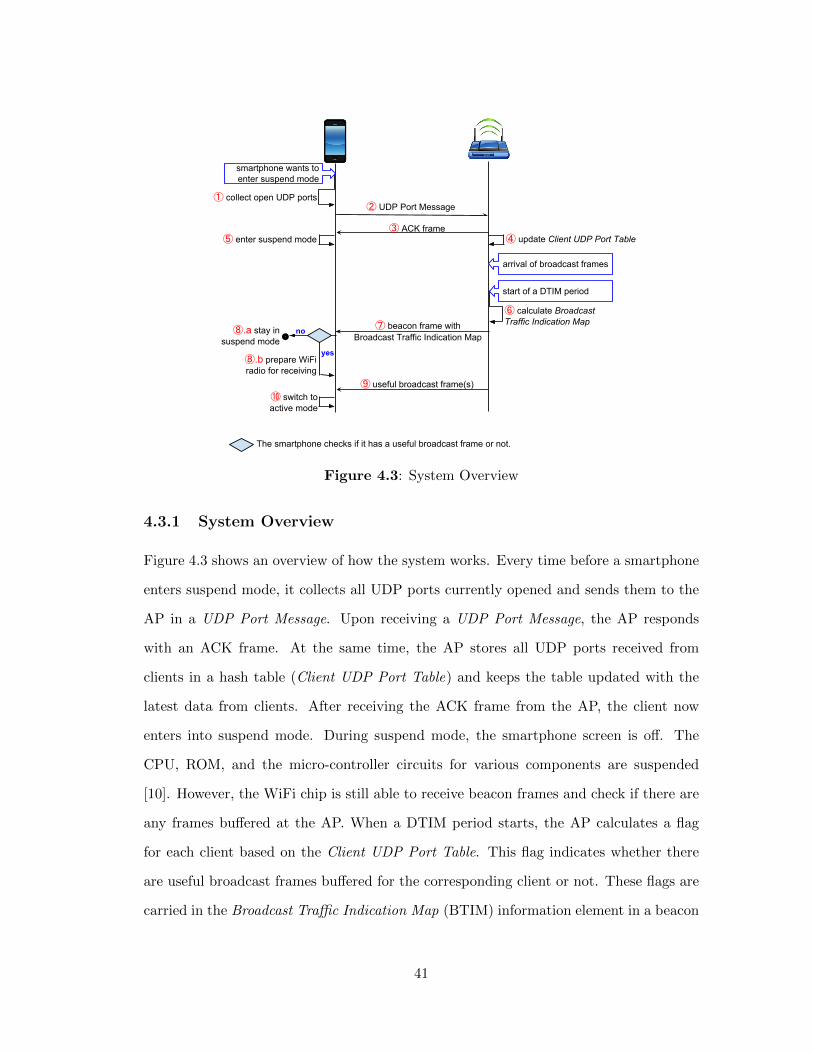
① collect open UDP ports② UDP Port Message
④ update Client UDP Port Table③ ACK frame
arrival of broadcast frames
⑥ calculate Broadcast Traffic Indication Map
start of a DTIM period
smartphone wants to enter suspend mode
⑦ beacon frame with Broadcast Traffic Indication Map
⑨ useful broadcast frame(s)
⑧.b prepare WiFi radio for receiving
⑩ switch to active mode
⑤ enter suspend mode
⑧.a stay in suspend mode ⌾
no
yes
The smartphone checks if it has a useful broadcast frame or not.
Figure 4.3: System Overview
4.3.1 System Overview
Figure 4.3 shows an overview of how the system works. Every time before a smartphone
enters suspend mode, it collects all UDP ports currently opened and sends them to the
AP in a UDP Port Message. Upon receiving a UDP Port Message, the AP responds
with an ACK frame. At the same time, the AP stores all UDP ports received from
clients in a hash table (Client UDP Port Table) and keeps the table updated with the
latest data from clients. After receiving the ACK frame from the AP, the client now
enters into suspend mode. During suspend mode, the smartphone screen is o↵. The
CPU, ROM, and the micro-controller circuits for various components are suspended
[10]. However, the WiFi chip is still able to receive beacon frames and check if there are
any frames bu↵ered at the AP. When a DTIM period starts, the AP calculates a flag
for each client based on the Client UDP Port Table. This flag indicates whether there
are useful broadcast frames bu↵ered for the corresponding client or not. These flags are
carried in the Broadcast Tra�c Indication Map (BTIM) information element in a beacon
41
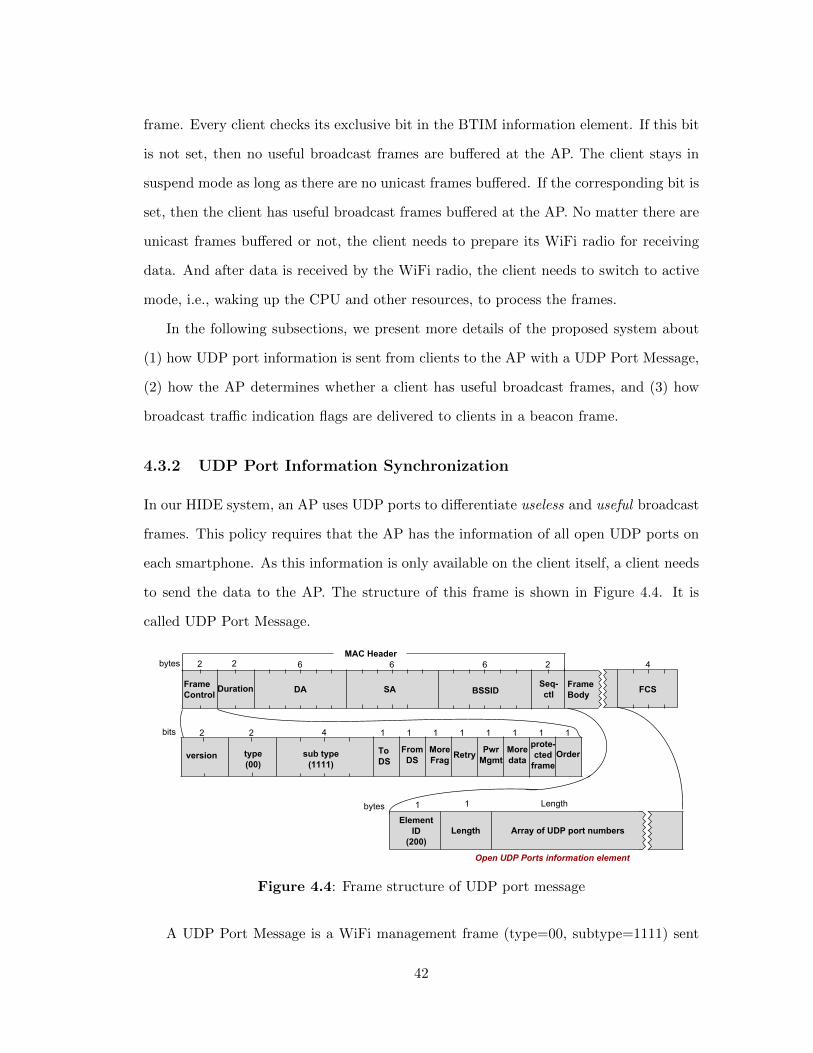
frame. Every client checks its exclusive bit in the BTIM information element. If this bit
is not set, then no useful broadcast frames are bu↵ered at the AP. The client stays in
suspend mode as long as there are no unicast frames bu↵ered. If the corresponding bit is
set, then the client has useful broadcast frames bu↵ered at the AP. No matter there are
unicast frames bu↵ered or not, the client needs to prepare its WiFi radio for receiving
data. And after data is received by the WiFi radio, the client needs to switch to active
mode, i.e., waking up the CPU and other resources, to process the frames.
In the following subsections, we present more details of the proposed system about
(1) how UDP port information is sent from clients to the AP with a UDP Port Message,
(2) how the AP determines whether a client has useful broadcast frames, and (3) how
broadcast tra�c indication flags are delivered to clients in a beacon frame.
4.3.2 UDP Port Information Synchronization
In our HIDE system, an AP uses UDP ports to di↵erentiate useless and useful broadcast
frames. This policy requires that the AP has the information of all open UDP ports on
each smartphone. As this information is only available on the client itself, a client needs
to send the data to the AP. The structure of this frame is shown in Figure 4.4. It is
called UDP Port Message.
4 1
Open UDP Ports information element
Length Array of UDP port numbers
FCS
4
DA SA BSSIDFrameControl Duration Frame
Body
MAC Header2 2 6 6 6
Seq-ctl
2
1 1 Length
version type(00)
sub type(1111)
ToDS
FromDS
MoreFrag Retry Pwr
MgmtMoredata
prote-cted
frameOrder
bits
bytes
2 2 1 1 1 1 1 1 1
bytes
ElementID
(200)
Figure 4.4: Frame structure of UDP port message
A UDP Port Message is a WiFi management frame (type=00, subtype=1111) sent
42
from a client to an AP, reporting a set of UDP ports opened on the client. To reduce the
size of the message, a client only reports UDP ports associated with the source address
INADDR ANY. To carry the UDP port information, we add a new information element,
named Open UDP Ports information element (as in Figure 4.4) to the standard 802.11
protocol. We use 200, which is reserved and unused by 802.11 protocols, as the element
ID for Open UDP Ports information element. This information element contains an
array of UDP port numbers. Each UDP port number takes 2 bytes. Upon receiving
a UDP Port Message, the AP responds with an ACK frame, so that the client knows
the message is successfully delivered. If an ACK frame is not received by the client, the
normal retransmission operation applies to the UDP Port Message.
Each time before a client enters suspend mode, it sends a UDP port message to the
AP. If there is a change made to the set of open UDP ports on a client, such as adding a
new open UDP port or deleting an existing open UDP port, the system should definitely
have already resumed to active mode to process such an event. Next time when the
system is about to enter suspend mode, a new UDP port message will be sent to the AP
with the latest UDP port information. In this way, an AP can always get the updated
open UDP ports from a client.
4.3.3 Tra�c Di↵erentiation at AP
A broadcast frame may be useful to one client while being useless to another client. So,
in the HIDE system, the AP maintains a broadcast flag (one bit) for every associated
client. If there is any useful broadcast frame bu↵ered for a client, the corresponding
broadcast flag is set to 1; otherwise, the broadcast flag is set to 0.
Open UDP ports of all clients are stored in a hash table (Client UDP Port Table).
With this hash table, the AP then calculates the broadcast flag for each client. The
procedure is described in Algorithm 1. Right before transmission of a beacon frame
representing the start of a DTIM period, the AP resets all broadcast flags to 0. Then,
for every broadcast frames currently bu↵ered, the AP extracts the destination UDP port
43
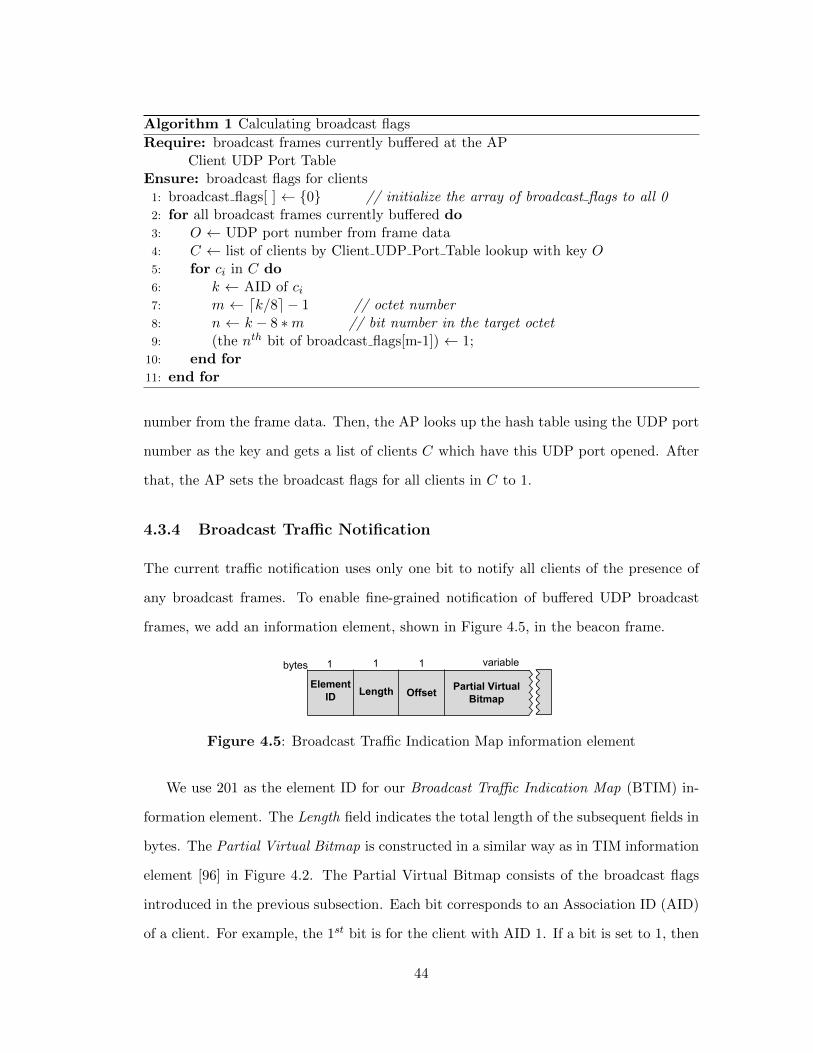
Algorithm 1 Calculating broadcast flagsRequire: broadcast frames currently bu↵ered at the AP
Client UDP Port TableEnsure: broadcast flags for clients1: broadcast flags[ ] {0} // initialize the array of broadcast flags to all 02: for all broadcast frames currently bu↵ered do3: O UDP port number from frame data4: C list of clients by Client UDP Port Table lookup with key O5: for c
i
in C do6: k AID of c
i
7: m dk/8e � 1 // octet number8: n k � 8 ⇤m // bit number in the target octet9: (the nth bit of broadcast flags[m-1]) 1;
10: end for11: end for
number from the frame data. Then, the AP looks up the hash table using the UDP port
number as the key and gets a list of clients C which have this UDP port opened. After
that, the AP sets the broadcast flags for all clients in C to 1.
4.3.4 Broadcast Tra�c Notification
The current tra�c notification uses only one bit to notify all clients of the presence of
any broadcast frames. To enable fine-grained notification of bu↵ered UDP broadcast
frames, we add an information element, shown in Figure 4.5, in the beacon frame.
111
Offset Partial Virtual Bitmap
ElementID Length
bytes variable
Figure 4.5: Broadcast Tra�c Indication Map information element
We use 201 as the element ID for our Broadcast Tra�c Indication Map (BTIM) in-
formation element. The Length field indicates the total length of the subsequent fields in
bytes. The Partial Virtual Bitmap is constructed in a similar way as in TIM information
element [96] in Figure 4.2. The Partial Virtual Bitmap consists of the broadcast flags
introduced in the previous subsection. Each bit corresponds to an Association ID (AID)
of a client. For example, the 1st bit is for the client with AID 1. If a bit is set to 1, then
44
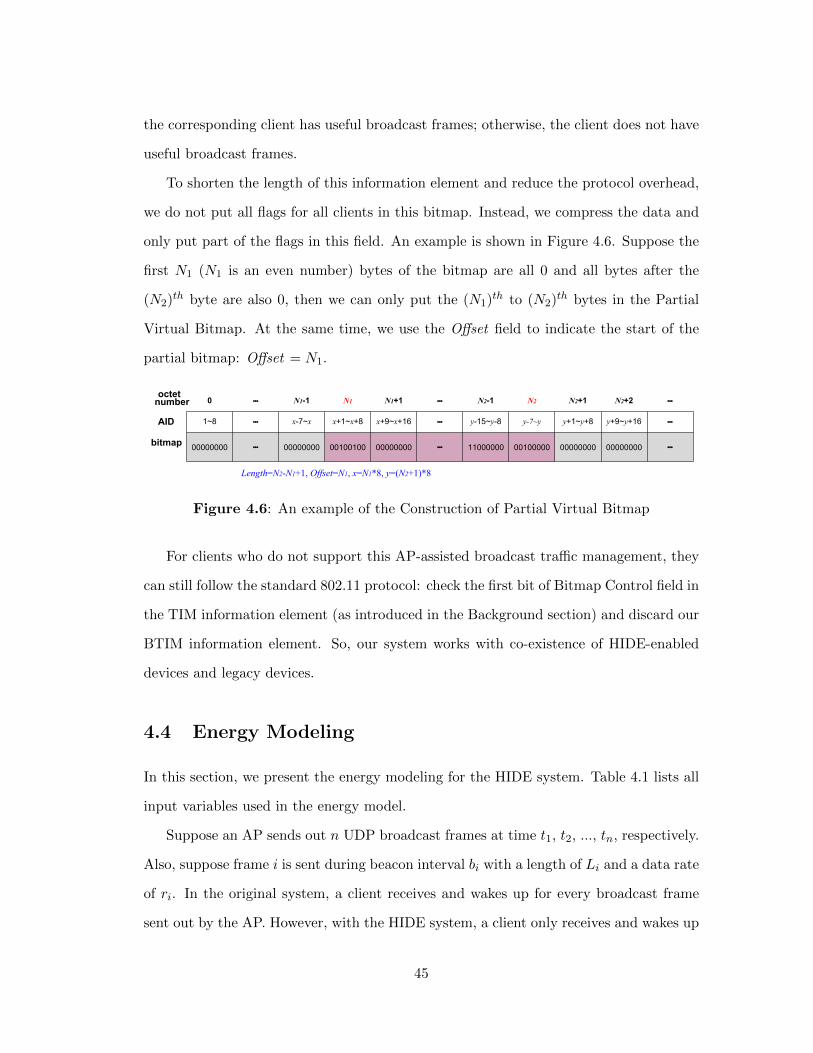
the corresponding client has useful broadcast frames; otherwise, the client does not have
useful broadcast frames.
To shorten the length of this information element and reduce the protocol overhead,
we do not put all flags for all clients in this bitmap. Instead, we compress the data and
only put part of the flags in this field. An example is shown in Figure 4.6. Suppose the
first N1 (N1 is an even number) bytes of the bitmap are all 0 and all bytes after the
(N2)th byte are also 0, then we can only put the (N1)th to (N2)th bytes in the Partial
Virtual Bitmap. At the same time, we use the O↵set field to indicate the start of the
partial bitmap: O↵set = N1.
0 ⋯ N1-1 N1 N1+1 ⋯ N2-1 N2 N2+1 N2+2 ⋯
1~8 ⋯ x-7~x x+1~x+8 x+9~x+16 ⋯ y-15~y-8 y-7~y y+1~y+8 y+9~y+16 ⋯
00000000 ⋯ 00000000 00100100 00000000 ⋯ 11000000 00100000 00000000 00000000 ⋯
AID
bitmap
octet number
Length=N2-N1+1, Offset=N1, x=N1*8, y=(N2+1)*8
Figure 4.6: An example of the Construction of Partial Virtual Bitmap
For clients who do not support this AP-assisted broadcast tra�c management, they
can still follow the standard 802.11 protocol: check the first bit of Bitmap Control field in
the TIM information element (as introduced in the Background section) and discard our
BTIM information element. So, our system works with co-existence of HIDE-enabled
devices and legacy devices.
4.4 Energy Modeling
In this section, we present the energy modeling for the HIDE system. Table 4.1 lists all
input variables used in the energy model.
Suppose an AP sends out n UDP broadcast frames at time t1, t2, ..., tn, respectively.
Also, suppose frame i is sent during beacon interval bi
with a length of Li
and a data rate
of ri
. In the original system, a client receives and wakes up for every broadcast frame
sent out by the AP. However, with the HIDE system, a client only receives and wakes up
45
for broadcast frames that are useful to it. Let ui
denote whether a UDP broadcast frame
i is useful to a client or not. If ui
= 1, then the ith UDP broadcast frame is useful to the
client; otherwise, the ith UDP broadcast frame is useless to the client. Based on this,
the UDP broadcast tra�c from the AP, in the perspective of a HIDE-enabled client, is
n0 =P
n
i=1 ui
ti
0 =⇢
ti
, if ui
= 1null , if u
i
= 0(4.1)
With the filtered UDP broadcast tra�c, the total energy consumed by the whole system
for all the n UDP broadcast frames can be calculated as
E = Eb
+ Ef
+ Ewl
+ Est
+ Eo
(4.2)
where Eb
is the energy consumed to receive all beacon frames, Ef
is the energy consumed
to receive all broadcast data frames, Est
is the energy consumed by system state transfer,
Ewl
is the energy consumption during system idle periods due to WiFi wakelocks, and
Eo
is the energy overhead of the HIDE system.
1) System state. Energy consumed for a UDP broadcast frame depends on the system
state when the frame arrives. Thus we derive the system state first. For each UDP
broadcast frame received, a wakelock of duration ⌧ is acquired in the WiFi driver. This
wakelock keeps the whole device awake and allows time for applications to process and
respond to this frame. Also, due to the wakelock, subsequent frames can be received
immediately.
If a UDP broadcast frame arrives during the wakelock of the previous frame, it renews
the wakelock time and resets the time-to-expire to ⌧ . If a UDP broadcast frame arrives
when the system is in suspend mode, the WiFi driver needs to first wake up the operating
system. If a UDP broadcast frame arrives during system resume operation, activation
of the WiFi wakelock will be delayed until the resume operation is finished.
Let s(i) stands for the operating system state when frame i arrives. s(i) = 0 means
46
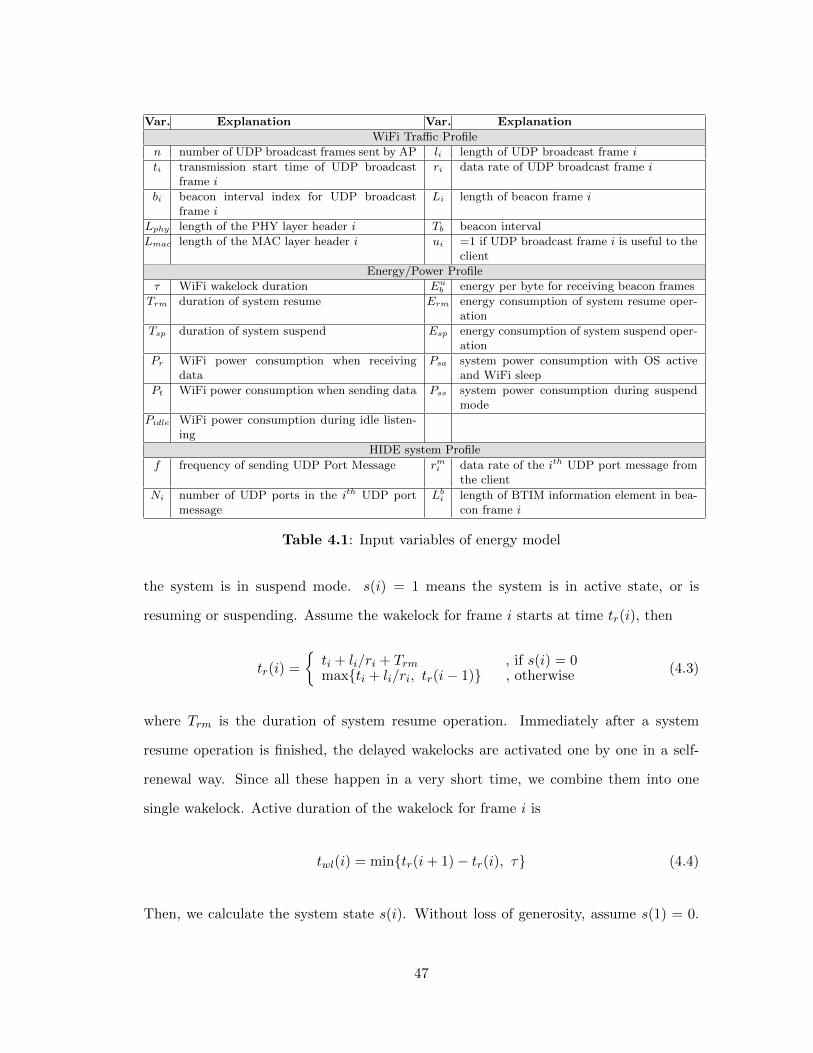
Var. Explanation Var. Explanation
WiFi Tra�c Profilen number of UDP broadcast frames sent by AP li length of UDP broadcast frame iti transmission start time of UDP broadcast
frame iri data rate of UDP broadcast frame i
bi beacon interval index for UDP broadcastframe i
Li length of beacon frame i
Lphy length of the PHY layer header i Tb beacon intervalLmac length of the MAC layer header i ui =1 if UDP broadcast frame i is useful to the
clientEnergy/Power Profile
⌧ WiFi wakelock duration Eub energy per byte for receiving beacon frames
Trm duration of system resume Erm energy consumption of system resume oper-ation
Tsp duration of system suspend Esp energy consumption of system suspend oper-ation
Pr WiFi power consumption when receivingdata
Psa system power consumption with OS activeand WiFi sleep
Pt WiFi power consumption when sending data Pss system power consumption during suspendmode
Pidle WiFi power consumption during idle listen-ing
HIDE system Profilef frequency of sending UDP Port Message rmi data rate of the ith UDP port message from
the clientNi number of UDP ports in the ith UDP port
messageLb
i length of BTIM information element in bea-con frame i
Table 4.1: Input variables of energy model
the system is in suspend mode. s(i) = 1 means the system is in active state, or is
resuming or suspending. Assume the wakelock for frame i starts at time tr
(i), then
tr
(i) =
⇢ti
+ li
/ri
+ Trm
, if s(i) = 0max{t
i
+ li
/ri
, tr
(i� 1)} , otherwise (4.3)
where Trm
is the duration of system resume operation. Immediately after a system
resume operation is finished, the delayed wakelocks are activated one by one in a self-
renewal way. Since all these happen in a very short time, we combine them into one
single wakelock. Active duration of the wakelock for frame i is
twl
(i) = min{tr
(i+ 1)� tr
(i), ⌧} (4.4)
Then, we calculate the system state s(i). Without loss of generosity, assume s(1) = 0.
47
For 2 i n
s(i) =
⇢0 , if t
i
+ li
/ri
� tr
(i� 1) + ⌧ + Tsp
1 , otherwise (4.5)
where Tsp
is the duration of system suspend operation.
2) Energy consumption of receiving beacon frames. The first item Eb
in Eq.
(4.2) is calculated as
Eb
= Eu
b
⇤X
b1ibn
Li
(4.6)
where Eu
b
is the energy consumption per byte of WiFi radio when receiving beacon frames
and Li
is the length of the ith beacon frame.
3) Energy consumption of receiving broadcast data frames. This second item
in the right end of Eq. (4.2) Ef
is calculated as
Ef
= Pr
⇤nX
i=1
tt(i) + Pidle
⇤ (nX
i=1
td(i) +X
b1ibn
tf(i)) (4.7)
where Pr
and Pidle
are the power consumption of WiFi radio when receiving data and
idle listening, respectively. tt(i) is the transmission time of the ith UDP broadcast frame,
td(i) is the length of time that the WiFi driver spends in idle listening state right after
receiving the ith UDP broadcast frame, and tf(i) is the idle listening time between the
ith beacon frame and the first UDP broadcast frame in the ith beacon interval. So,
tt(i) =li
ri
(4.8)
tf(i) = minj2{k|bk=i}
tj
� tb(i) (4.9)
td(i) = {min{ti+1, tb(bi + 1)}� t
i
� li
/ri
} ⇤ dmore
(i) (4.10)
where dmore
(i) is the ‘more data’ bit in the ith UDP broadcast frame. If this bit is set,
WiFi radio listens to the channel for future broadcast frames. tb(i) is the start time
of the ith beacon interval and Tb
is the beacon interval. Without loss of generosity, we
48
assume tb(1) = 0. Then,
tb(i) = (i� 1) ⇤ Tb
(4.11)
4) Energy consumption of system idle due to WiFi wakelocks. Ewl
in Eq. (4.2)
is calculated as
Ewl
= Psa
⇤nX
i=1
twl
(i) (4.12)
where Psa
is the power consumption when the system is active and idle. twl
is the
duration of wakelock for frame i being active which is presented in Eq. (4.4).
5) Energy consumption of state transfers. Est
in Eq. (4.2) is calculated as this.
Est
= (Erm
+ Esp
) ⇤nX
i=1
[1� s(i)] + Esp
⇤nX
i=2
y(i) (4.13)
where Erm
and Esp
are the energy consumption of system resume and suspend opera-
tions, respectively. It may happen that a WiFi driver tries to acquire a wakelock when
the system suspend operation is in execution. In this case, the system aborts the suspend
operation. Let y(i) denote the time portion of system in suspend operation upon arrival
of frame i (2 i n), then
y(i) =max{0, t
r
(i)� tr
(i� 1)� twl
(i� 1)} ⇤ s(i)Tsp
(4.14)
6) Energy overhead. Energy overhead of our HIDE system contains two parts: energy
consumed by transmission of UDP port messages E1o
and energy consumed by receiving
extra bits in beacon frames E2o
.
Eo
= E1o
+ E2o
(4.15)
In the HIDE system, we add a Broadcast Tra�c Indication Map information element
in the beacon frame. So, the extra energy consumed to receive beacon frames in a HIDE
system is
E1o
= Eu
b
⇤X
b1ibn
Lb
i
(4.16)
49
where Lb
i
is the total length of BTIM information element in beacon frame i.
In the HIDE system, a client sends out UDP Port Messages to synchronize open
UDP ports with AP. This part of energy overhead, denoted as E2o
, is calculated as
E2o
= M ⇤ Pt
⇤X
i
Lm
i
rmi
(4.17)
where M is the number of UDP Port Messages sent out by the client.
M = f ⇤ Tb
⇤ (bn
� bi
+ 1) (4.18)
In Eq. (4.17), Pt
is the power consumption of WiFi radio when sending data. rmi
is the
data rate of the ith UDP port message from a client and Lm
i
is its length. From Figure
4.4, we see that it includes the PHY and MAC layer headers, 2 bytes of fixed fields plus
a series of UDP port. Each UDP port takes 2 bytes. With Ni
UDP ports in the message,
we have
Lm
i
= Lphy
+ Lmac
+ 2 + 2 ⇤Ni
(4.19)
4.5 Network Capacity and Delay Analysis
The proposed system impacts network throughput and delay in two ways. First, in our
system, AP is in charge of managing broadcast tra�c. Frame processing at AP is slowed
down. Consequently, packet delay is increased. Second, extra management frames (UDP
Port Message) are introduced in the system. Protocol overhead is increased. Conse-
quently, the network capacity, which is the maximum network throughput, is decreased.
In this section, we quantify the impact of our system on network capacity and delay.
4.5.1 Network Capacity
Bianchi et al. [97] model the maximum network throughput that can be achieved in an
802.11 network with di↵erent numbers of nodes. We borrow their model to calculate the
50
network capacity, denoted as S. Let � be the network throughput defined in [97], which
is defined as the fraction of time the channel is used to successfully transmit payload
bits. And let r be the average WiFi data rate (in bits/s) during transmission of payload
bits. Then, the network capacity (in bits/s) of the original 802.11 network is
S1 = � ⇤ r (4.20)
Assume that there are N clients in the network and the percent of clients with HIDE
enabled is p. With our system, the total number of UDP Port Messages sent out per
unit time by all clients is
nu
= N ⇤ p ⇤ f (4.21)
where f is the frequency of sending UDP Port Messages from a client, the same as defined
in Table 4.1. Meanwhile, in the original network, the number of data frames transmitted
per unit time is
n = S1/L (4.22)
where L is the average length of payload bits in a data frame. Let Lm denote the average
length of UDP Port Messages. Then, the network capacity with our HIDE system is
S2 = (n� nu
⇤ dLm
Le) ⇤ L (4.23)
Therefore, the percentage of decrease in network capacity is
c = 1� S2/S1 (4.24)
4.5.2 Network Delay
Delay overhead of the HIDE system is mainly due to maintenance of the Client UDP
Port Table and table lookup for identifying useful broadcast frames. Here, we calculate
the extra network delay incurred by the HIDE system through approximate estimation.
For each UDP port message received, an AP needs to refresh the table by deleting
51
the old ports from the hash table and inserting the new ports to the table. Assume the
original round-trip time of a packet is D. Let no
be the average number of open UDP
ports in a client. With N as the total number of clients in the network, p as the percent
of clients with HIDE enabled, and f as the sending rate of UDP Port Messages from a
HIDE-enabled client, frame processing time at the AP will be increased by
t1 = f ⇤D ⇤N ⇤ p ⇤ no
⇤ (⌧del
+ ⌧ins
) (4.25)
where ⌧del
and ⌧ins
are the durations of a delete operation and an insert operation,
respectively.
At the start of each DTIM period, for each UDP broadcast frame currently bu↵ered,
an AP needs to look up the UDP port from the hash table. Frame processing time at
the AP will be further increased by
t2 = nf
⇤ ⌧lp
(4.26)
where ⌧lp
is the duration of a table lookup operation and nf
is the average number of
broadcast frames bu↵ered at AP during each DTIM period.
Then, the percentage of increase in network delay is
d = (t1 + t2)/D (4.27)
Here, the delay overhead calculated is actually the upper bound, because the processing
time of UDP Port Messages at the AP may overlap with part of the packet round-
trip time, such as the channel access time and packet forwarding time in the backbone
network. Also, a packet exchange may start and end in the middle of one DTIM period.
In this case, our system does not incur the delay overhead of t2.
52
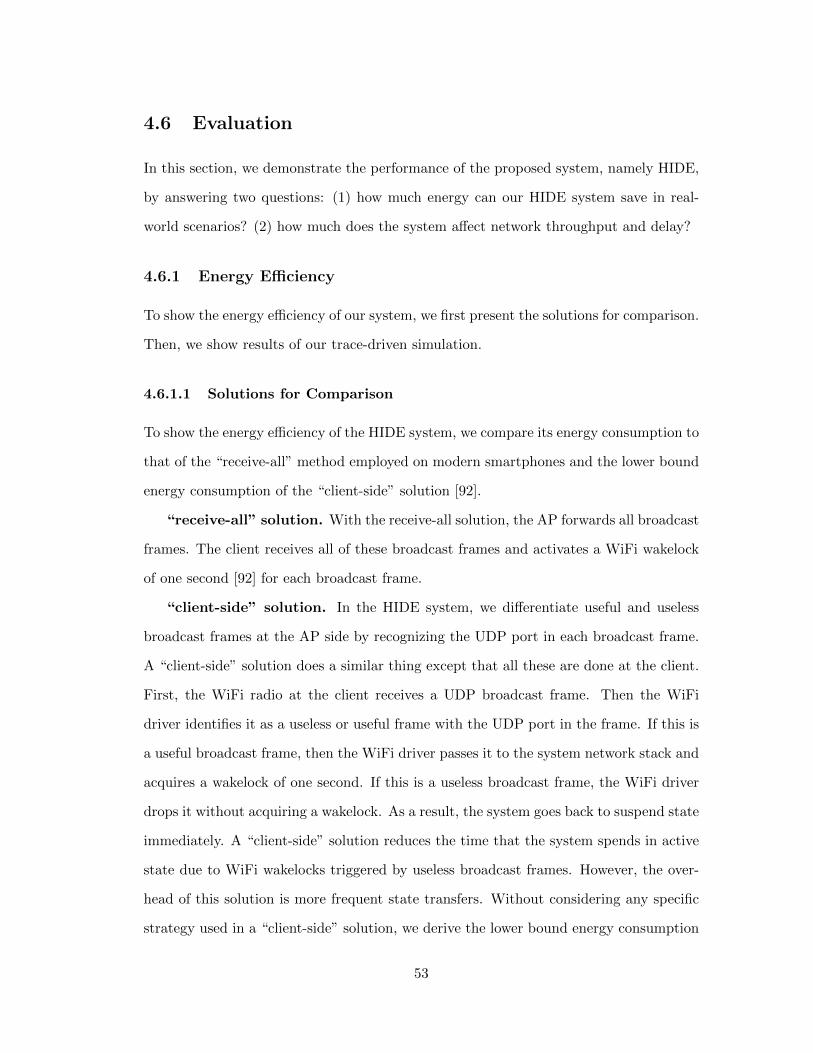
4.6 Evaluation
In this section, we demonstrate the performance of the proposed system, namely HIDE,
by answering two questions: (1) how much energy can our HIDE system save in real-
world scenarios? (2) how much does the system a↵ect network throughput and delay?
4.6.1 Energy E�ciency
To show the energy e�ciency of our system, we first present the solutions for comparison.
Then, we show results of our trace-driven simulation.
4.6.1.1 Solutions for Comparison
To show the energy e�ciency of the HIDE system, we compare its energy consumption to
that of the “receive-all” method employed on modern smartphones and the lower bound
energy consumption of the “client-side” solution [92].
“receive-all” solution. With the receive-all solution, the AP forwards all broadcast
frames. The client receives all of these broadcast frames and activates a WiFi wakelock
of one second [92] for each broadcast frame.
“client-side” solution. In the HIDE system, we di↵erentiate useful and useless
broadcast frames at the AP side by recognizing the UDP port in each broadcast frame.
A “client-side” solution does a similar thing except that all these are done at the client.
First, the WiFi radio at the client receives a UDP broadcast frame. Then the WiFi
driver identifies it as a useless or useful frame with the UDP port in the frame. If this is
a useful broadcast frame, then the WiFi driver passes it to the system network stack and
acquires a wakelock of one second. If this is a useless broadcast frame, the WiFi driver
drops it without acquiring a wakelock. As a result, the system goes back to suspend state
immediately. A “client-side” solution reduces the time that the system spends in active
state due to WiFi wakelocks triggered by useless broadcast frames. However, the over-
head of this solution is more frequent state transfers. Without considering any specific
strategy used in a “client-side” solution, we derive the lower bound energy consumption
53
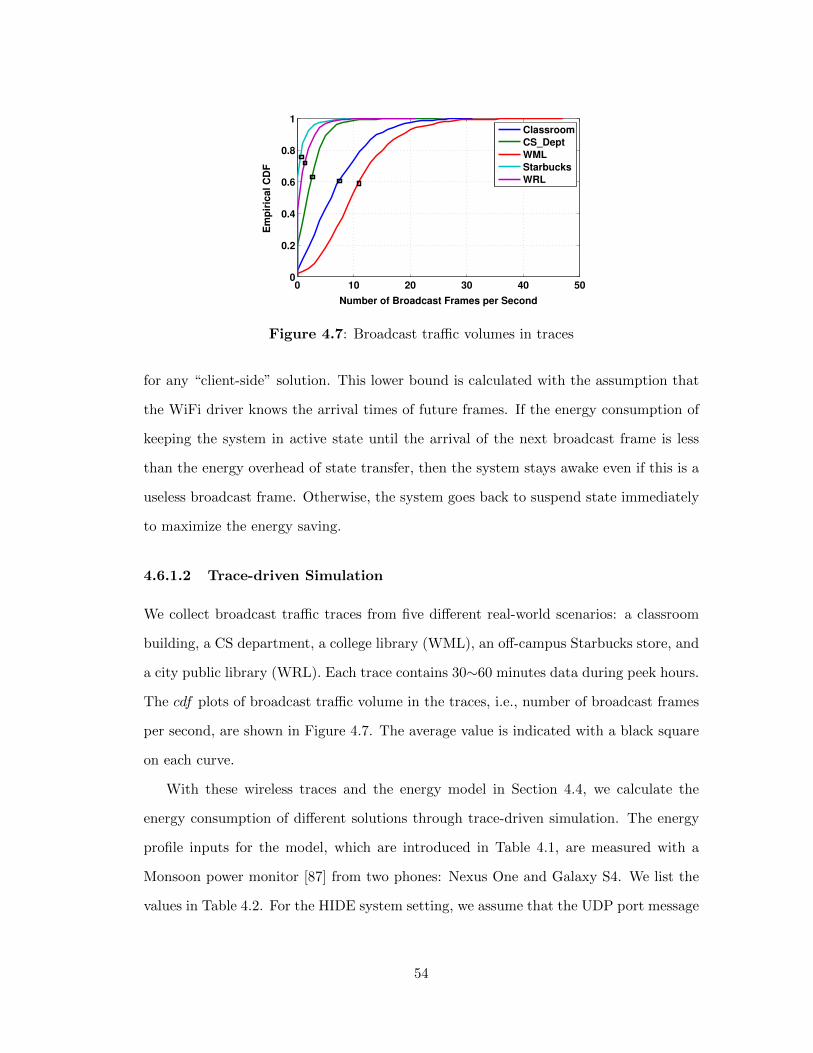
0 10 20 30 40 500
0.2
0.4
0.6
0.8
1
Number of Broadcast Frames per Second
Em
pir
ical C
DF
ClassroomCS_DeptWMLStarbucksWRL
Figure 4.7: Broadcast tra�c volumes in traces
for any “client-side” solution. This lower bound is calculated with the assumption that
the WiFi driver knows the arrival times of future frames. If the energy consumption of
keeping the system in active state until the arrival of the next broadcast frame is less
than the energy overhead of state transfer, then the system stays awake even if this is a
useless broadcast frame. Otherwise, the system goes back to suspend state immediately
to maximize the energy saving.
4.6.1.2 Trace-driven Simulation
We collect broadcast tra�c traces from five di↵erent real-world scenarios: a classroom
building, a CS department, a college library (WML), an o↵-campus Starbucks store, and
a city public library (WRL). Each trace contains 30⇠60 minutes data during peek hours.
The cdf plots of broadcast tra�c volume in the traces, i.e., number of broadcast frames
per second, are shown in Figure 4.7. The average value is indicated with a black square
on each curve.
With these wireless traces and the energy model in Section 4.4, we calculate the
energy consumption of di↵erent solutions through trace-driven simulation. The energy
profile inputs for the model, which are introduced in Table 4.1, are measured with a
Monsoon power monitor [87] from two phones: Nexus One and Galaxy S4. We list the
values in Table 4.2. For the HIDE system setting, we assume that the UDP port message
54
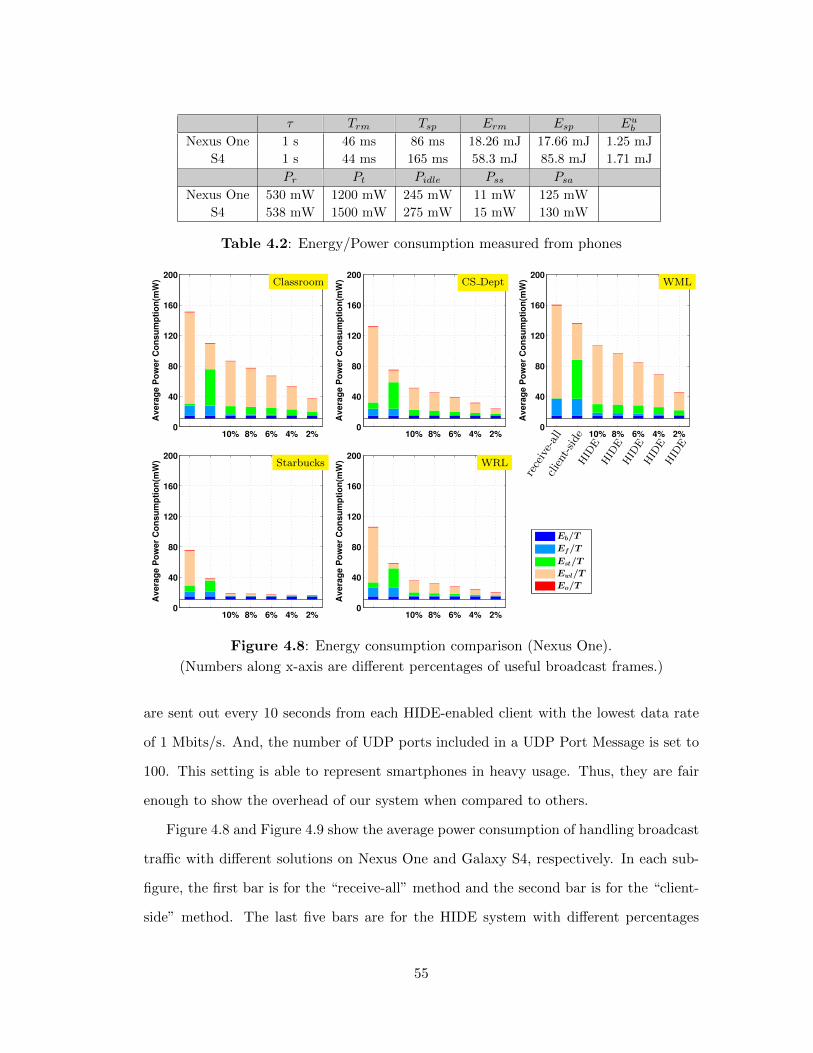
⌧ Trm Tsp Erm Esp Eub
Nexus One 1 s 46 ms 86 ms 18.26 mJ 17.66 mJ 1.25 mJS4 1 s 44 ms 165 ms 58.3 mJ 85.8 mJ 1.71 mJ
Pr Pt Pidle Pss Psa
Nexus One 530 mW 1200 mW 245 mW 11 mW 125 mWS4 538 mW 1500 mW 275 mW 15 mW 130 mW
Table 4.2: Energy/Power consumption measured from phones
10% 8% 6% 4% 2%0
40
80
120
160
200
Avera
ge P
ow
er
Co
nsu
mp
tio
n(m
W) Classroom
10% 8% 6% 4% 2%0
40
80
120
160
200
Avera
ge P
ow
er
Co
nsu
mp
tio
n(m
W) CS Dept
10% 8% 6% 4% 2%0
40
80
120
160
200
Avera
ge P
ow
er
Co
nsu
mp
tio
n(m
W) WML
client-side
HIDE
HIDE
HIDE
HIDE
HIDE
receive-all
10% 8% 6% 4% 2%0
40
80
120
160
200
Avera
ge P
ow
er
Co
nsu
mp
tio
n(m
W) Starbucks
10% 8% 6% 4% 2%0
40
80
120
160
200
Avera
ge P
ow
er
Co
nsu
mp
tio
n(m
W) WRL
Eb/T
Ef/T
Est/T
Ewl/T
Eo/T
Figure 4.8: Energy consumption comparison (Nexus One).
(Numbers along x-axis are di↵erent percentages of useful broadcast frames.)
are sent out every 10 seconds from each HIDE-enabled client with the lowest data rate
of 1 Mbits/s. And, the number of UDP ports included in a UDP Port Message is set to
100. This setting is able to represent smartphones in heavy usage. Thus, they are fair
enough to show the overhead of our system when compared to others.
Figure 4.8 and Figure 4.9 show the average power consumption of handling broadcast
tra�c with di↵erent solutions on Nexus One and Galaxy S4, respectively. In each sub-
figure, the first bar is for the “receive-all” method and the second bar is for the “client-
side” method. The last five bars are for the HIDE system with di↵erent percentages
55
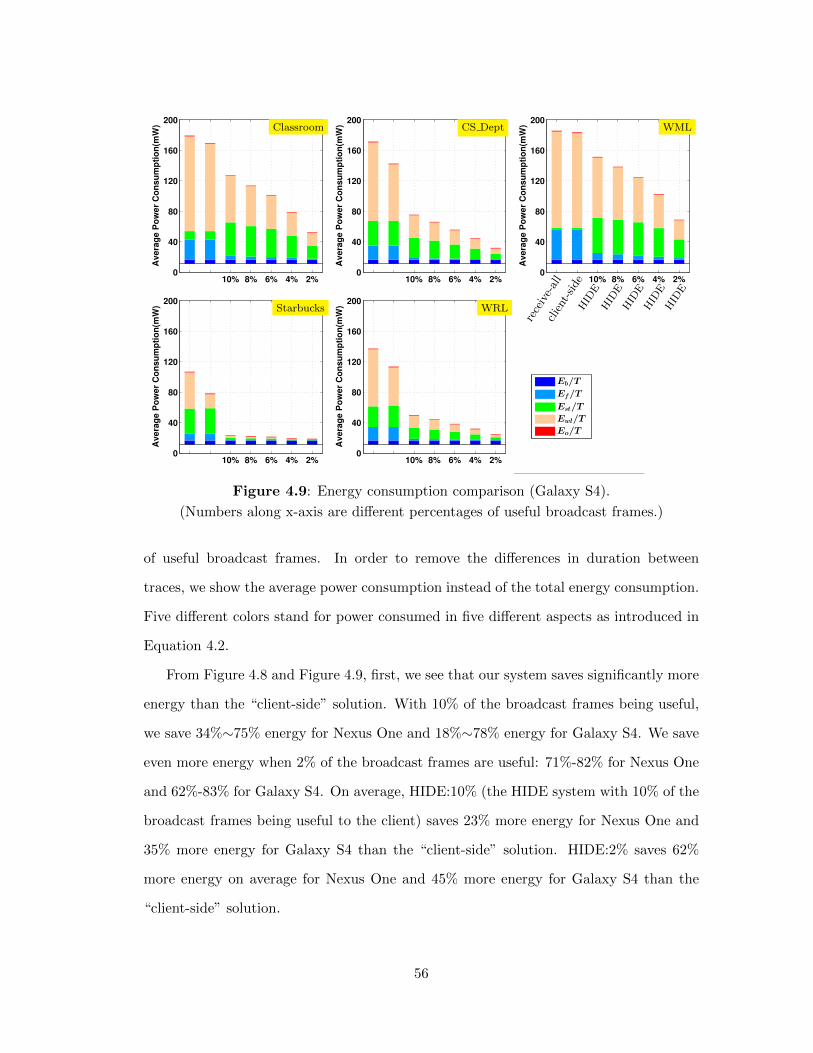
10% 8% 6% 4% 2%0
40
80
120
160
200
Avera
ge P
ow
er
Co
nsu
mp
tio
n(m
W) Classroom
10% 8% 6% 4% 2%0
40
80
120
160
200
Avera
ge P
ow
er
Co
nsu
mp
tio
n(m
W) CS Dept
10% 8% 6% 4% 2%0
40
80
120
160
200
Avera
ge P
ow
er
Co
nsu
mp
tio
n(m
W) WML
client-side
HIDE
HIDE
HIDE
HIDE
HIDE
receive-all
10% 8% 6% 4% 2%0
40
80
120
160
200
Avera
ge P
ow
er
Co
nsu
mp
tio
n(m
W) Starbucks
10% 8% 6% 4% 2%0
40
80
120
160
200
Avera
ge P
ow
er
Co
nsu
mp
tio
n(m
W) WRL
Eb/T
Ef/T
Est/T
Ewl/T
Eo/T
Figure 4.9: Energy consumption comparison (Galaxy S4).
(Numbers along x-axis are di↵erent percentages of useful broadcast frames.)
of useful broadcast frames. In order to remove the di↵erences in duration between
traces, we show the average power consumption instead of the total energy consumption.
Five di↵erent colors stand for power consumed in five di↵erent aspects as introduced in
Equation 4.2.
From Figure 4.8 and Figure 4.9, first, we see that our system saves significantly more
energy than the “client-side” solution. With 10% of the broadcast frames being useful,
we save 34%⇠75% energy for Nexus One and 18%⇠78% energy for Galaxy S4. We save
even more energy when 2% of the broadcast frames are useful: 71%-82% for Nexus One
and 62%-83% for Galaxy S4. On average, HIDE:10% (the HIDE system with 10% of the
broadcast frames being useful to the client) saves 23% more energy for Nexus One and
35% more energy for Galaxy S4 than the “client-side” solution. HIDE:2% saves 62%
more energy on average for Nexus One and 45% more energy for Galaxy S4 than the
“client-side” solution.
56
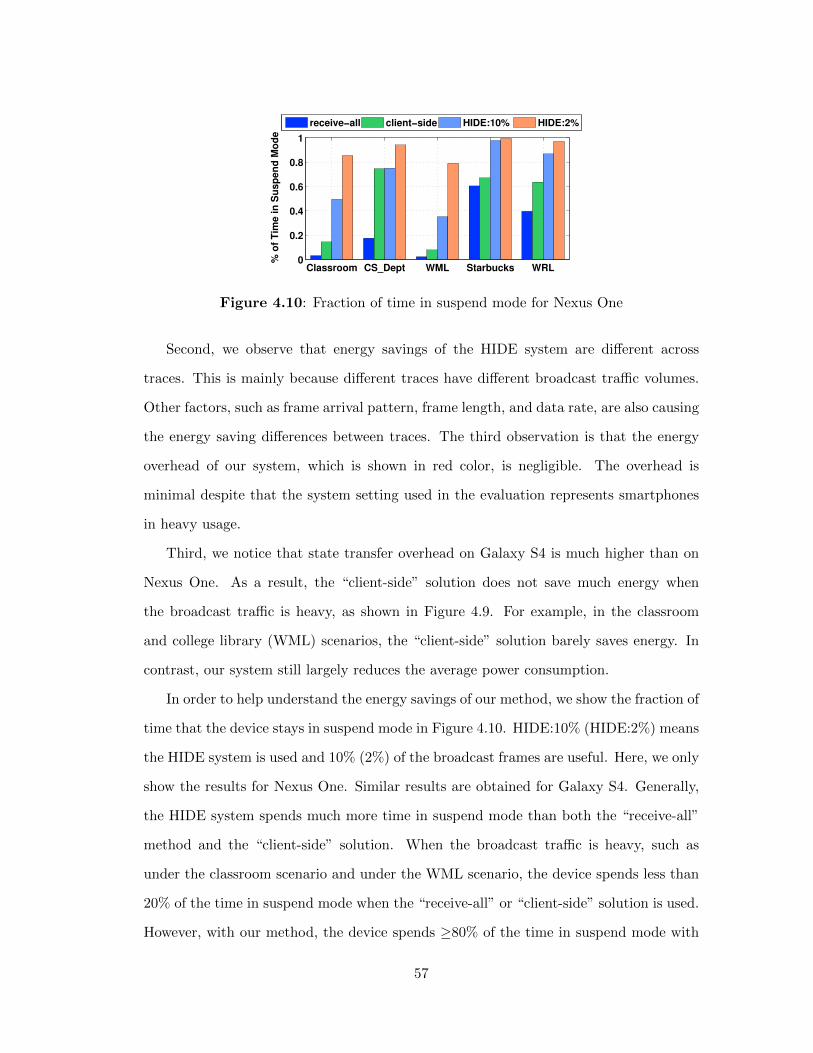
Classroom CS_Dept WML Starbucks WRL0
0.2
0.4
0.6
0.8
1
% o
f T
ime in
Su
sp
en
d M
od
e
receive−all client−side HIDE:10% HIDE:2%
Figure 4.10: Fraction of time in suspend mode for Nexus One
Second, we observe that energy savings of the HIDE system are di↵erent across
traces. This is mainly because di↵erent traces have di↵erent broadcast tra�c volumes.
Other factors, such as frame arrival pattern, frame length, and data rate, are also causing
the energy saving di↵erences between traces. The third observation is that the energy
overhead of our system, which is shown in red color, is negligible. The overhead is
minimal despite that the system setting used in the evaluation represents smartphones
in heavy usage.
Third, we notice that state transfer overhead on Galaxy S4 is much higher than on
Nexus One. As a result, the “client-side” solution does not save much energy when
the broadcast tra�c is heavy, as shown in Figure 4.9. For example, in the classroom
and college library (WML) scenarios, the “client-side” solution barely saves energy. In
contrast, our system still largely reduces the average power consumption.
In order to help understand the energy savings of our method, we show the fraction of
time that the device stays in suspend mode in Figure 4.10. HIDE:10% (HIDE:2%) means
the HIDE system is used and 10% (2%) of the broadcast frames are useful. Here, we only
show the results for Nexus One. Similar results are obtained for Galaxy S4. Generally,
the HIDE system spends much more time in suspend mode than both the “receive-all”
method and the “client-side” solution. When the broadcast tra�c is heavy, such as
under the classroom scenario and under the WML scenario, the device spends less than
20% of the time in suspend mode when the “receive-all” or “client-side” solution is used.
However, with our method, the device spends �80% of the time in suspend mode with
57
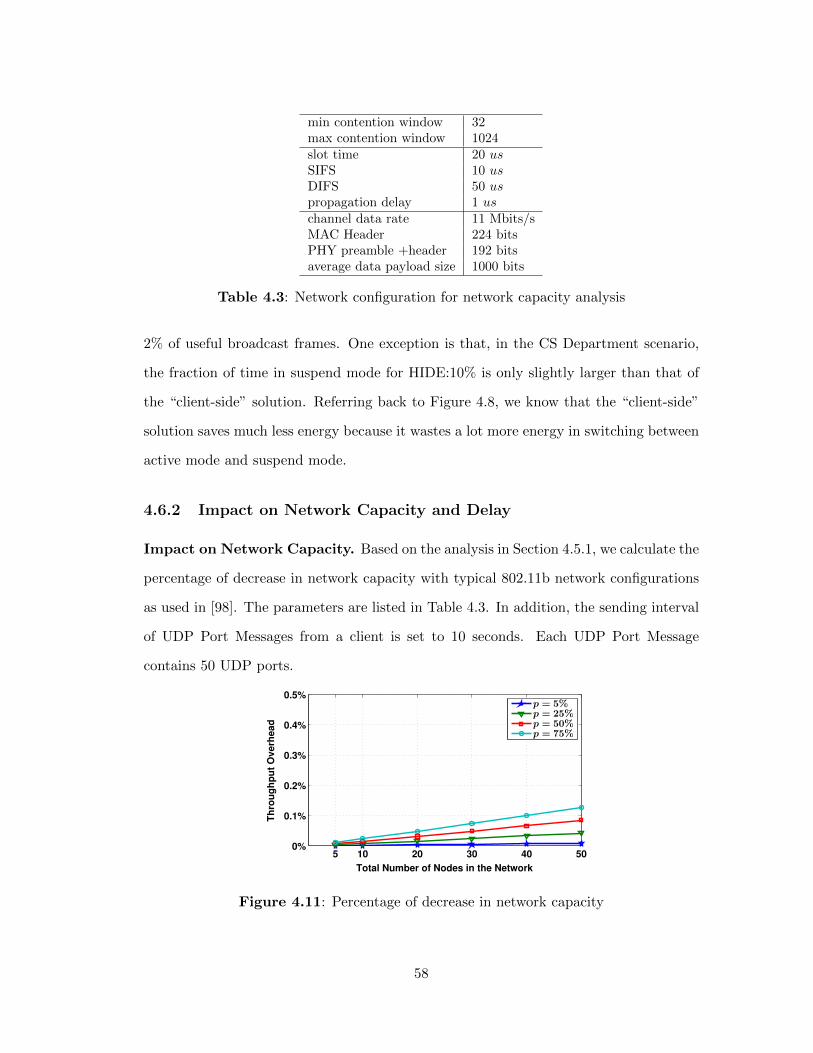
min contention window 32max contention window 1024slot time 20 usSIFS 10 usDIFS 50 uspropagation delay 1 uschannel data rate 11 Mbits/sMAC Header 224 bitsPHY preamble +header 192 bitsaverage data payload size 1000 bits
Table 4.3: Network configuration for network capacity analysis
2% of useful broadcast frames. One exception is that, in the CS Department scenario,
the fraction of time in suspend mode for HIDE:10% is only slightly larger than that of
the “client-side” solution. Referring back to Figure 4.8, we know that the “client-side”
solution saves much less energy because it wastes a lot more energy in switching between
active mode and suspend mode.
4.6.2 Impact on Network Capacity and Delay
Impact on Network Capacity. Based on the analysis in Section 4.5.1, we calculate the
percentage of decrease in network capacity with typical 802.11b network configurations
as used in [98]. The parameters are listed in Table 4.3. In addition, the sending interval
of UDP Port Messages from a client is set to 10 seconds. Each UDP Port Message
contains 50 UDP ports.
5 10 20 30 40 50 0%
0.1%
0.2%
0.3%
0.4%
0.5%
Total Number of Nodes in the Network
Th
rou
gh
pu
t O
ve
rhe
ad
p = 5%
p = 25%
p = 50%
p = 75%
Figure 4.11: Percentage of decrease in network capacity
58
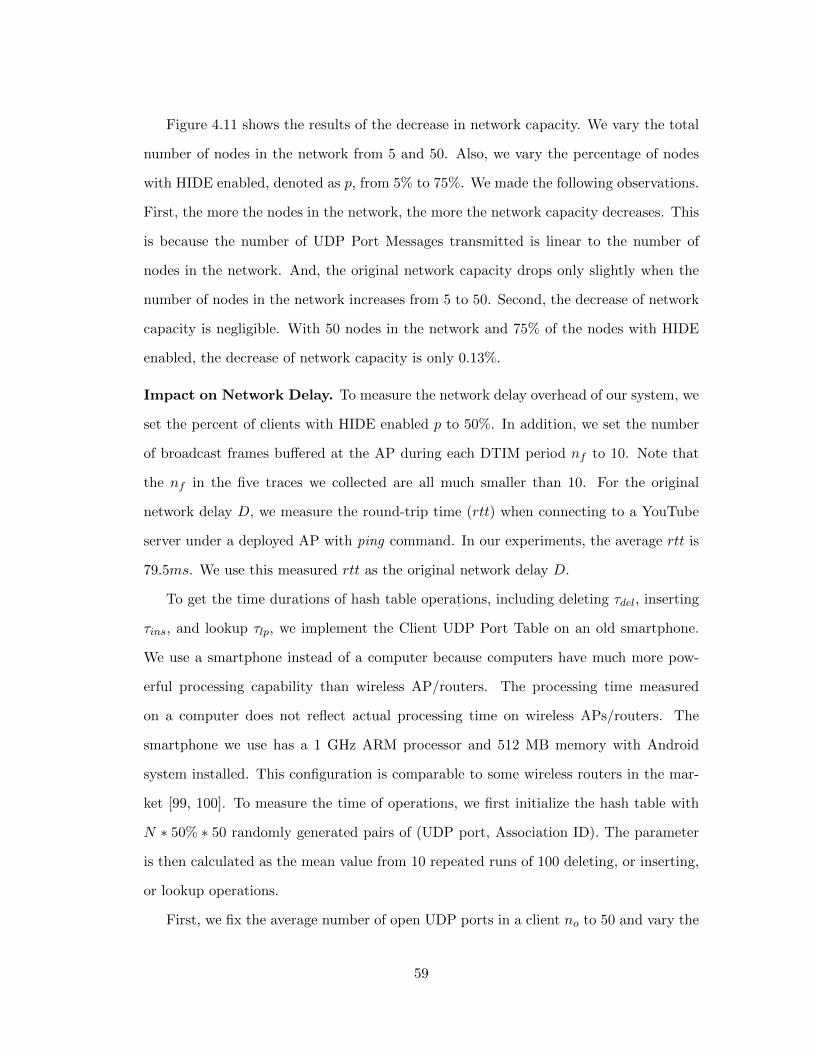
Figure 4.11 shows the results of the decrease in network capacity. We vary the total
number of nodes in the network from 5 and 50. Also, we vary the percentage of nodes
with HIDE enabled, denoted as p, from 5% to 75%. We made the following observations.
First, the more the nodes in the network, the more the network capacity decreases. This
is because the number of UDP Port Messages transmitted is linear to the number of
nodes in the network. And, the original network capacity drops only slightly when the
number of nodes in the network increases from 5 to 50. Second, the decrease of network
capacity is negligible. With 50 nodes in the network and 75% of the nodes with HIDE
enabled, the decrease of network capacity is only 0.13%.
Impact on Network Delay. To measure the network delay overhead of our system, we
set the percent of clients with HIDE enabled p to 50%. In addition, we set the number
of broadcast frames bu↵ered at the AP during each DTIM period nf
to 10. Note that
the nf
in the five traces we collected are all much smaller than 10. For the original
network delay D, we measure the round-trip time (rtt) when connecting to a YouTube
server under a deployed AP with ping command. In our experiments, the average rtt is
79.5ms. We use this measured rtt as the original network delay D.
To get the time durations of hash table operations, including deleting ⌧del
, inserting
⌧ins
, and lookup ⌧lp
, we implement the Client UDP Port Table on an old smartphone.
We use a smartphone instead of a computer because computers have much more pow-
erful processing capability than wireless AP/routers. The processing time measured
on a computer does not reflect actual processing time on wireless APs/routers. The
smartphone we use has a 1 GHz ARM processor and 512 MB memory with Android
system installed. This configuration is comparable to some wireless routers in the mar-
ket [99, 100]. To measure the time of operations, we first initialize the hash table with
N ⇤ 50% ⇤ 50 randomly generated pairs of (UDP port, Association ID). The parameter
is then calculated as the mean value from 10 repeated runs of 100 deleting, or inserting,
or lookup operations.
First, we fix the average number of open UDP ports in a client no
to 50 and vary the
59
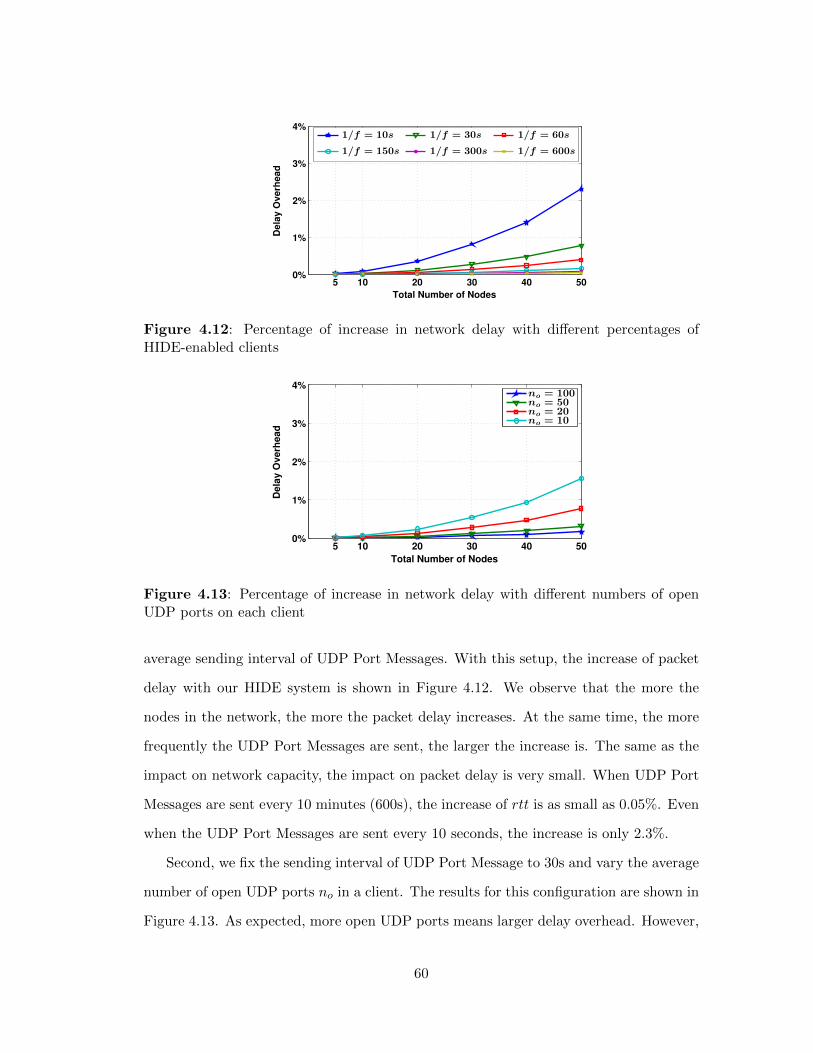
5 10 20 30 40 500%
1%
2%
3%
4%
Total Number of Nodes
De
lay
Ov
erh
ea
d
1/f = 10s 1/f = 30s 1/f = 60s
1/f = 150s 1/f = 300s 1/f = 600s
Figure 4.12: Percentage of increase in network delay with di↵erent percentages ofHIDE-enabled clients
5 10 20 30 40 500%
1%
2%
3%
4%
Total Number of Nodes
De
lay
Ov
erh
ea
d
no = 100no = 50no = 20no = 10
Figure 4.13: Percentage of increase in network delay with di↵erent numbers of openUDP ports on each client
average sending interval of UDP Port Messages. With this setup, the increase of packet
delay with our HIDE system is shown in Figure 4.12. We observe that the more the
nodes in the network, the more the packet delay increases. At the same time, the more
frequently the UDP Port Messages are sent, the larger the increase is. The same as the
impact on network capacity, the impact on packet delay is very small. When UDP Port
Messages are sent every 10 minutes (600s), the increase of rtt is as small as 0.05%. Even
when the UDP Port Messages are sent every 10 seconds, the increase is only 2.3%.
Second, we fix the sending interval of UDP Port Message to 30s and vary the average
number of open UDP ports no
in a client. The results for this configuration are shown in
Figure 4.13. As expected, more open UDP ports means larger delay overhead. However,
60
the overhead is less than 1.6% with 100 UDP ports in use on each HIDE-enabled client.
During our overhead analysis, we find that t1 � t2 in Equation (4.27). Meanwhile,
according to Equation (4.25), t1 is linear to the original network delay D. Our analysis
results above actually have little dependence on the actual value of the original network
delay, although we use a measured value of 79.5 ms.
4.7 Conclusion and Future Work
Energy is wasted on smartphones to receive broadcast frames that are useless to the
smartphone and to switch from low power suspend mode to high power active mode to
process these useless WiFi broadcast frames. In this work, we propose a framework,
namely HIDE, to reduce energy wasted on smartphones due to useless broadcast frames,
with assistance from the WiFi Access Point (AP). In the HIDE system, a client coordi-
nates with the AP to identify useful broadcast frames. Then, tra�c notifications sent
out from AP only indicate useful broadcast frames that are currently bu↵ered at the
AP. The presence of useless broadcast frames is hidden by the AP from the client. As a
result, a client in suspend mode does not need to receive the useless broadcast frames.
Neither does it need to switch to active mode and process the useless frames.
With WiFi broadcast traces collected from five di↵erent real-world scenarios, we
conduct trace-driven simulation with the energy model derived in this work. The results
show that our system saves 34%-75% energy for the Nexus One phone and 18%-78% for
the Galaxy S4 phone when 10% of the broadcast frames are useful to the smartphone.
When 2% of the broadcast frames are useful to the smartphone, our system saves 71%-
82% energy for Nexus One and 62%-83% for Galaxy S4. We also analyze the performance
overhead of the proposed system. The impact of the HIDE system on network capacity
is less than 0.2% and the impact on packet round-trip time is no more than 2.3%.
In future, we plan to evaluate the system with more broadcast tra�c traces and for
more smartphones. Combining the HIDE system with the “client-side” solution is also
one direction to be explored.
61
Chapter 5
Continuous Authentication with
Touch Behavioral Biometrics and
Voice on Wearable Glasses
5.1 Introduction
Wearable glasses have attracted considerable attention over the years. More and more
large companies are investing money on wearable glasses. Now, more than 20 wearable
glasses are under production or development [101], including Google Glass, Microsoft
HoloLens, Facebook Oculus Rift, Epson Moverio, Sony SmartEyeglass, Intel Radar Pace,
and Osterhout Design Group (ODG) R-7. The hand-free nature and augmented reality
capability of wearable glasses open up new opportunities for human-machine interactions.
Wearable glasses are going to become an important part of our daily lives. A recent study
by Juniper Research shows that more than 12 million consumer smart glasses will be
shipped in 2020, increasing from less than one million in 2016 [102].
When using these wearable glasses, some personal information is stored on the devices
for easy revisit, such as contacts information, location data, messages, emails, personal
photos and videos, account information, and much more. When the owner takes o↵
his/her smart glasses and puts them aside, for example, when the device is charging or
62
when the owner needs to go to the restroom, an impostor will certainly have the chance
to grab the device and access the owner’s private information. In addition to privacy
leakage of the owner, an imposter can also send e-mails/messages to any contact stored
on the glasses in the guise of the owner, bringing privacy threats to the owner’s friends,
family, and colleagues.
To protect user privacy on wearable glasses, a continuous authentication system is
more suitable than a one-time authentication system. A one-time user authentication
system only authenticates a user when he/she tries to unlock the device, typically by
asking the user to input a password or PIN, a graphical pattern, or a sequence of touch
gestures (a user is authorized as long as the right gesture types are performed in the
correct order). However, the owner may forget to lock the device right after using the
device. There are mechanisms which automatically lock the device upon an event, such
as screen timeout. Google Glass has on-head detection, which automatically locks the
device when a user takes o↵ the glass. However, on-head detection on Google Glass is
not reliable. It does not work when the glass is not worn in the perfect position. It also
does not work with Google Glass frames which are customized for users in need of vision
correction. More importantly, even if the device is locked, a one-time authentication
system can easily be broken into by peeking [103, 104, 105] or smudge attacks [106, 107].
Alternatively, wearable glasses can automatically pair with another trusted device, such
as the owner’s smartphone, to perform authentication. However, successful pairing only
indicates that the owner is nearby. It does not necessarily mean that the current user
is the owner. A one-time authentication solution does not work well. Therefore, a
continuous authentication system which continuously authenticates the user during the
whole time of user operation is needed to better protect user privacy.
Touch behavioral biometrics have been demonstrated to be e↵ective in continuous
user authentication on smartphones [45, 47, 53]. The hypothesis is that di↵erent users
have di↵erent characteristics when interacting with smartphones and these behavioral
biometrics are di�cult to fake. We believe the same is also true on wearable glasses.
63
However, due to user interaction di↵erences between wearable glasses and smartphones,
systems proposed on smartphones cannot be applied directly on wearable glasses. First,
users hold their smartphones with hand(s) but wear smart glasses on their head. Motion
sensors, such as accelerometers and gyroscopes, respond to user touch events in a di↵erent
pattern on wearable glasses. As a result, features working on smartphones may not work
well on wearable glasses. Second, wearable glasses only have a touchpad with no virtual
keyboard support. Keystroke biometric information [108] is not available on wearable
glasses. Third, wearable glasses touchpad is much smaller than smartphone touch screen.
Thus, the resolution of biometric information on wearable glasses, such as coordinates,
is much lower than that on smartphones. Feature discriminability needs to be examined
on wearable glasses. Finally, di↵erent touch gestures are used on wearable glasses. For
example, there are no pinch gestures on Google Glass. To zoom in or out, a two-finger
swipe forward or backward gesture is used. Thus, new features that are specific to
wearable glasses need to be explored.
In this work, we study the performance of using touch gestures and voice commands
for continuous user authentication on wearable glasses with the example of Google Glass.
We consider both touch gestures and voice commands as they are two major channels
for user interaction on wearable glasses. An authentication system based only on touch
biometrics can be easily circumvented by using voice commands. Similarly, a system
purely based on voice authentication does not always work, as voice commands are not
available all the time. A user may be in a situation when speaking is not appropriate, e.g.,
at a meeting with quiet surroundings. Although touch behavioral based authentication
[45, 47, 53] and voice based authentication [109, 40, 110] are two well-studied fields, our
contributions lie in that we study them in a new platform and we integrate these two
dimensions to accommodate various scenarios.
In our system, we use both touch behavioral features extracted from touchpad data as
well as corresponding sensor data during touch gestures and voice features extracted from
user-issued voice commands. These features can be easily extracted in the background
64
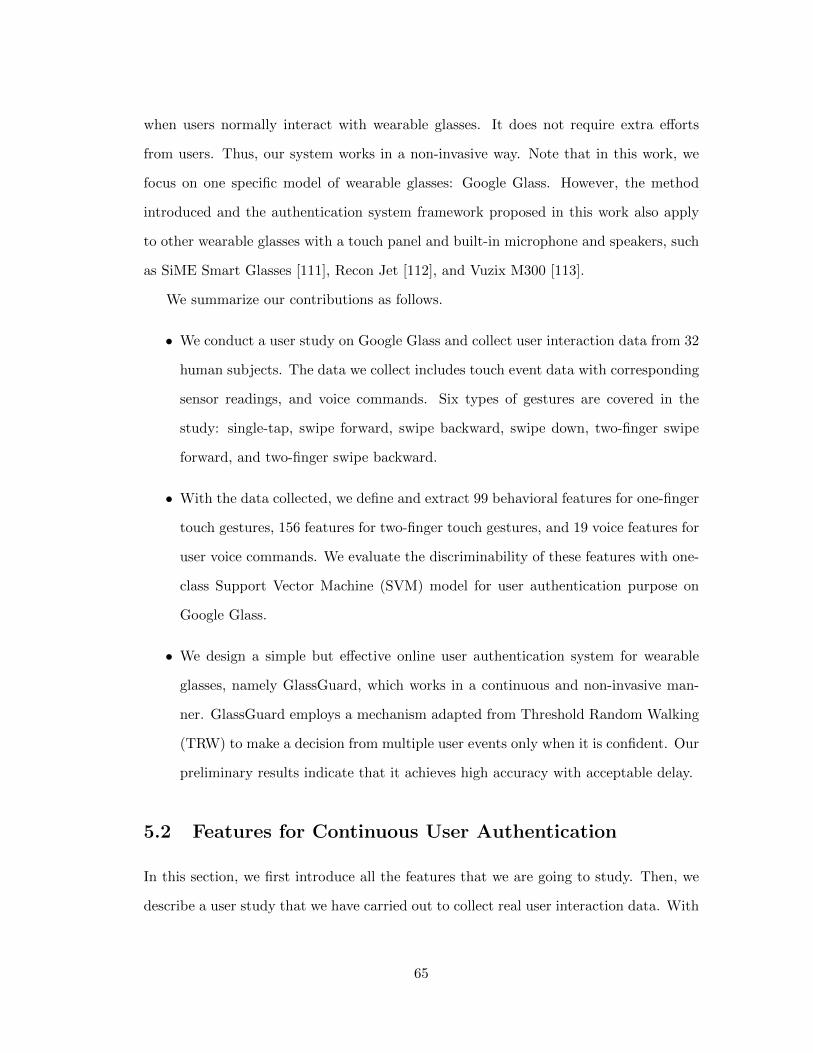
when users normally interact with wearable glasses. It does not require extra e↵orts
from users. Thus, our system works in a non-invasive way. Note that in this work, we
focus on one specific model of wearable glasses: Google Glass. However, the method
introduced and the authentication system framework proposed in this work also apply
to other wearable glasses with a touch panel and built-in microphone and speakers, such
as SiME Smart Glasses [111], Recon Jet [112], and Vuzix M300 [113].
We summarize our contributions as follows.
• We conduct a user study on Google Glass and collect user interaction data from 32
human subjects. The data we collect includes touch event data with corresponding
sensor readings, and voice commands. Six types of gestures are covered in the
study: single-tap, swipe forward, swipe backward, swipe down, two-finger swipe
forward, and two-finger swipe backward.
• With the data collected, we define and extract 99 behavioral features for one-finger
touch gestures, 156 features for two-finger touch gestures, and 19 voice features for
user voice commands. We evaluate the discriminability of these features with one-
class Support Vector Machine (SVM) model for user authentication purpose on
Google Glass.
• We design a simple but e↵ective online user authentication system for wearable
glasses, namely GlassGuard, which works in a continuous and non-invasive man-
ner. GlassGuard employs a mechanism adapted from Threshold Random Walking
(TRW) to make a decision from multiple user events only when it is confident. Our
preliminary results indicate that it achieves high accuracy with acceptable delay.
5.2 Features for Continuous User Authentication
In this section, we first introduce all the features that we are going to study. Then, we
describe a user study that we have carried out to collect real user interaction data. With
65
the data collected, we evaluate the performance of these features and conduct feature
selection.
5.2.1 Key User Events
Common touch gestures on Google Glass are as follows: single-tap to select an item,
swipe backward (forward) to move left (right) through items, swipe down to go back,
and two-finger swipe forward (backward) to zoom in (out).
With a built-in microphone and speaker, Google Glass accepts voice commands as
user inputs, such as “OK, Glass! Take a picture!” This o↵ers a hand-free interaction
which can be extremely useful for people with disabilities and for wearers with both
hands busy.
When designing features, we focus on the above six types of touch gestures and all
voice commands.
5.2.2 Proposed Features
We propose di↵erent feature sets for one-finger touch gestures, two-finger touch gestures,
and voice commands. Our features for one-finger touch gestures are proposed based on
several existing works on smartphones[45, 54, 50], as here we only want to obtain a list
of potential features. Later, we conduct feature selection to find the best features that
work on Google Glass.
Features for One-finger Touch Gestures. We divided our features for touch
gestures into two categories: (1) touch-based features, which are features extracted from
touchpad data; and (2) sensor-based features, which are features extracted from sensor
readings during touch gestures.
Figure 5.1 gives an example of a one-finger touch gesture along the timeline. Table
5.1 lists all 18 touch-based features for a one-finger touch gesture. Note that each touch
gesture generates multiple records in the raw touch data, as the touchpad is continuously
sampling. The statistics below, such as minimum, maximum, and median, are calculated
66
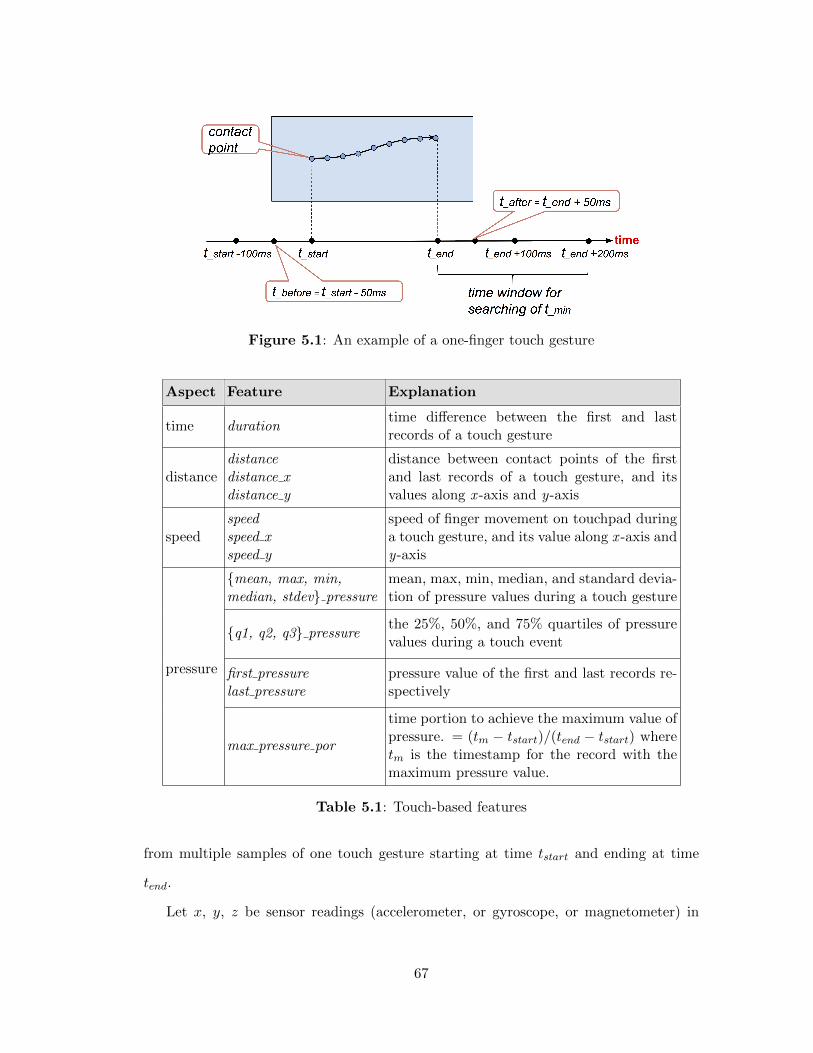
Figure 5.1: An example of a one-finger touch gesture
Aspect Feature Explanation
time durationtime di↵erence between the first and lastrecords of a touch gesture
distancedistancedistance xdistance y
distance between contact points of the firstand last records of a touch gesture, and itsvalues along x -axis and y-axis
speedspeedspeed xspeed y
speed of finger movement on touchpad duringa touch gesture, and its value along x -axis andy-axis
pressure
{mean, max, min,median, stdev} pressure
mean, max, min, median, and standard devia-tion of pressure values during a touch gesture
{q1, q2, q3} pressurethe 25%, 50%, and 75% quartiles of pressurevalues during a touch event
first pressurelast pressure
pressure value of the first and last records re-spectively
max pressure por
time portion to achieve the maximum value ofpressure. = (t
m
� tstart
)/(tend
� tstart
) wheretm
is the timestamp for the record with themaximum pressure value.
Table 5.1: Touch-based features
from multiple samples of one touch gesture starting at time tstart
and ending at time
tend
.
Let x, y, z be sensor readings (accelerometer, or gyroscope, or magnetometer) in
67
each axis and net =px2 + y2 + z2. Table 5.2 lists all sensor-based features during a
one-finger touch gesture.
Let �max
be the maximum accelerometer readings during a touch event and tmax
be
the corresponding timestamp. Considering a 100ms time window before a touch gesture,
let tbefore
be the center of the time window and �before
be the average net value of
accelerometer readings. Considering a 100ms time window after a touch gesture, let tafter
be the center of the time window and �after
be the average net value of accelerometer
readings. Then, in Table 5.2, we list the sensor-based features. The following features
in Table 5.2 are calculated as
acc after before net = �after
� �before
(5.1)
acc mean before net = acc mean net� �before
(5.2)
acc max before net = acc max net� �before
(5.3)
acc ndt before after =tafter
� tbefore
�after
� �before
(5.4)
acc ndt max after =tafter
� tmax
�after
� �max
(5.5)
acc time to restore = tmin
� tend
(5.6)
where tmin
is the time instance within a T2 = 200ms time window after a touch event
when the sensor reading restores to the average value before this touch event.
tmin
= argmintj2(tend,tend+T2]
��nettj � �
before
�� (5.7)
In order to save space, we only list the 27 features based on accelerometer data.
Features based on gyroscope and magnetometer are defined accordingly. In total, we
have 81 sensor-based features. We do not include frequency domain features here as
extracting frequency domain features is energy hungry and requires high computation
capability. Later in Section 5.4, we show that our system achieves high accuracy with
only these time domain features.
68
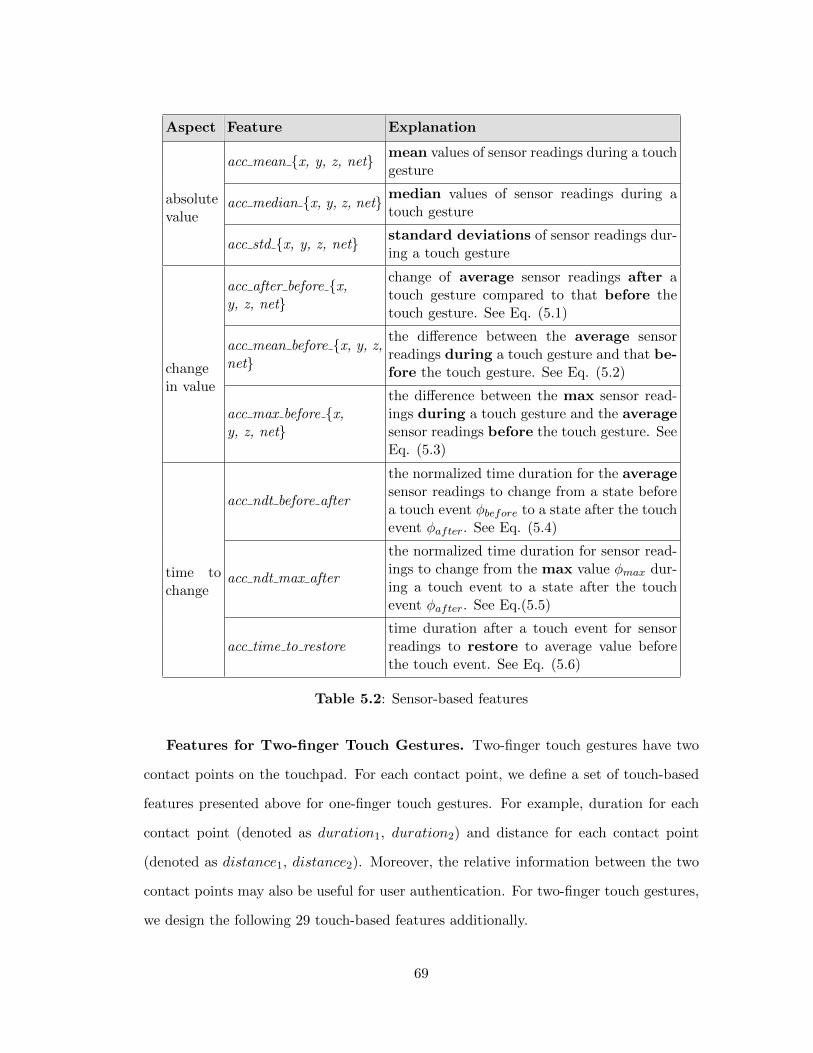
Aspect Feature Explanation
absolutevalue
acc mean {x, y, z, net} mean values of sensor readings during a touchgesture
acc median {x, y, z, net} median values of sensor readings during atouch gesture
acc std {x, y, z, net} standard deviations of sensor readings dur-ing a touch gesture
changein value
acc after before {x,y, z, net}
change of average sensor readings after atouch gesture compared to that before thetouch gesture. See Eq. (5.1)
acc mean before {x, y, z,net}
the di↵erence between the average sensorreadings during a touch gesture and that be-fore the touch gesture. See Eq. (5.2)
acc max before {x,y, z, net}
the di↵erence between the max sensor read-ings during a touch gesture and the averagesensor readings before the touch gesture. SeeEq. (5.3)
time tochange
acc ndt before after
the normalized time duration for the averagesensor readings to change from a state beforea touch event �
before
to a state after the touchevent �
after
. See Eq. (5.4)
acc ndt max after
the normalized time duration for sensor read-ings to change from the max value �
max
dur-ing a touch event to a state after the touchevent �
after
. See Eq.(5.5)
acc time to restoretime duration after a touch event for sensorreadings to restore to average value beforethe touch event. See Eq. (5.6)
Table 5.2: Sensor-based features
Features for Two-finger Touch Gestures. Two-finger touch gestures have two
contact points on the touchpad. For each contact point, we define a set of touch-based
features presented above for one-finger touch gestures. For example, duration for each
contact point (denoted as duration1, duration2) and distance for each contact point
(denoted as distance1, distance2). Moreover, the relative information between the two
contact points may also be useful for user authentication. For two-finger touch gestures,
we design the following 29 touch-based features additionally.
69
• duration: the duration of a touch gesture. It may be di↵erent from both duration1
and duration2 when the first and last records of a touch gesture belong to di↵erent
fingers.
• mean, max, min, median, and standard deviation of distances (or distances along
x axis, or distances along y axis) between two contact points.
• q1 di↵ dist, q2 di↵ dist, q3 di↵ dist : The 25%, 50%, and 75% quartiles of distances
between two contact points.
• first di↵ dist, last di↵ dist : the distance between the first (last) contact points of
two fingers.
• The di↵erence between the mean (or maximum, or minimum) pressure values for
two fingers during a touch gesture.
• The maximum di↵erence between pressure values of two fingers during a touch
gesture.
• The minimum di↵erence between pressure values of two fingers during a touch
gesture.
• The di↵erence between speeds (or speeds along the x axis, or speeds along the y
axis) of two fingers.
Sensor-based features for two-finger touch gestures are the same as those for one-finger
touch gestures. So, we have proposed 156 features in total for two-finger touch gestures,
81 from sensor data and 75 from touch data.
Features for Voice Commands. For voice features, we use Mel-Frequency Cep-
stral Coe�cients (MFCC). MFCC is one of the most e↵ective and widely used features
in speech processing [114]. An audio file is recorded from each voice command. The
audio file is then divided into frames with a sliding window of 25 ms and a step size
of 10 ms. For each frame, we extract 20 coe�cients. The first coe�cient indicates the
direct current of the voice signal. It does not convey any information about the spectral
shape. So, we discard the first coe�cient [110] and use the 2nd to the 20th coe�cients to
construct an MFCC vector. Before extracting MFCC vectors, we apply silence removal
70
[115] to the audio.
5.2.3 User Study
In order to evaluate the features listed above, we conduct a user study to collect real
user data1.
To obtain all the touch event data, we use the “getevent” tool [116]. With this
tool, we are able to collect raw touch data (including coordinates of contact points, and
pressure) at background without user perception.
To obtain sensor readings during a touch event, we write a Google Glass application
that samples sensor data with system API. The application runs as a background service.
It does not interrupt users’ normal operations. The application logs down data from all
three inertial sensors (accelerometer, magnetometer, and gyroscope) with a sampling
rate of 200 Hz, 200 Hz, and 100 Hz, respectively.
Google Glass automatically records user commands and saves them locally. To an-
alyze these voice commands, we pull these files out from Google Glass with adb [117]
tool.
Using the tools introduced above, we conducted a user study and collected interaction
data from 32 subjects. All of the participants are college students, comprising 13 females
and 19 males. The data of each user is collected from multiple sessions in a two-hour
time frame. In order to collect as many interested user events as possible, a user is
asked to perform a specific task in each session. There are 7 tasks in the user study and
each task is repeated multiple times: (1) swipe to view the application list one by one;
(2) swipe to view the options in the settings menu one by one; (3) take pictures with
touch gestures; (4) take pictures with voice commands; (5) Google search with voice
commands; (6) delete pictures one by one; (7) use a customized application which asks
the user to performance a series of randomly selected touch gestures. We carried out our
user study on a Google Glass with system version XE 18.11. All data is collected in the
1This user study was approved by the Protection of Human Subject Committee at the College ofWilliam & Mary.
71
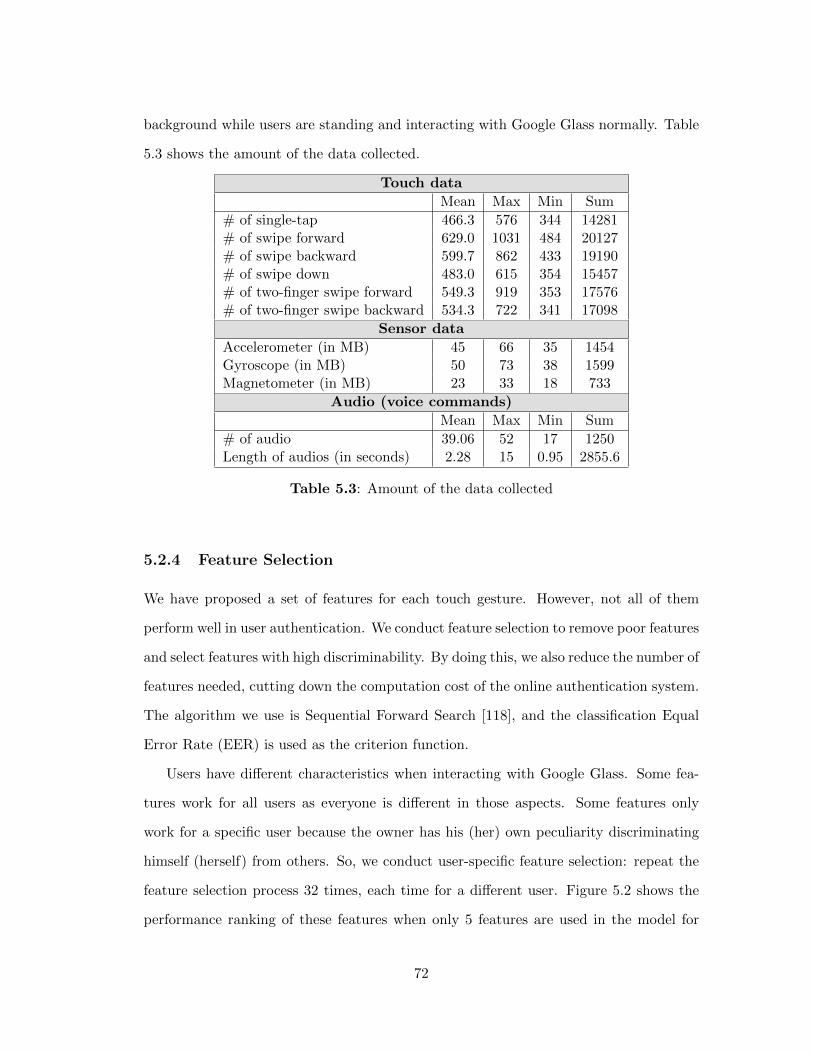
background while users are standing and interacting with Google Glass normally. Table
5.3 shows the amount of the data collected.
Touch dataMean Max Min Sum
# of single-tap 466.3 576 344 14281# of swipe forward 629.0 1031 484 20127# of swipe backward 599.7 862 433 19190# of swipe down 483.0 615 354 15457# of two-finger swipe forward 549.3 919 353 17576# of two-finger swipe backward 534.3 722 341 17098
Sensor dataAccelerometer (in MB) 45 66 35 1454Gyroscope (in MB) 50 73 38 1599Magnetometer (in MB) 23 33 18 733
Audio (voice commands)Mean Max Min Sum
# of audio 39.06 52 17 1250Length of audios (in seconds) 2.28 15 0.95 2855.6
Table 5.3: Amount of the data collected
5.2.4 Feature Selection
We have proposed a set of features for each touch gesture. However, not all of them
perform well in user authentication. We conduct feature selection to remove poor features
and select features with high discriminability. By doing this, we also reduce the number of
features needed, cutting down the computation cost of the online authentication system.
The algorithm we use is Sequential Forward Search [118], and the classification Equal
Error Rate (EER) is used as the criterion function.
Users have di↵erent characteristics when interacting with Google Glass. Some fea-
tures work for all users as everyone is di↵erent in those aspects. Some features only
work for a specific user because the owner has his (her) own peculiarity discriminating
himself (herself) from others. So, we conduct user-specific feature selection: repeat the
feature selection process 32 times, each time for a di↵erent user. Figure 5.2 shows the
performance ranking of these features when only 5 features are used in the model for
72
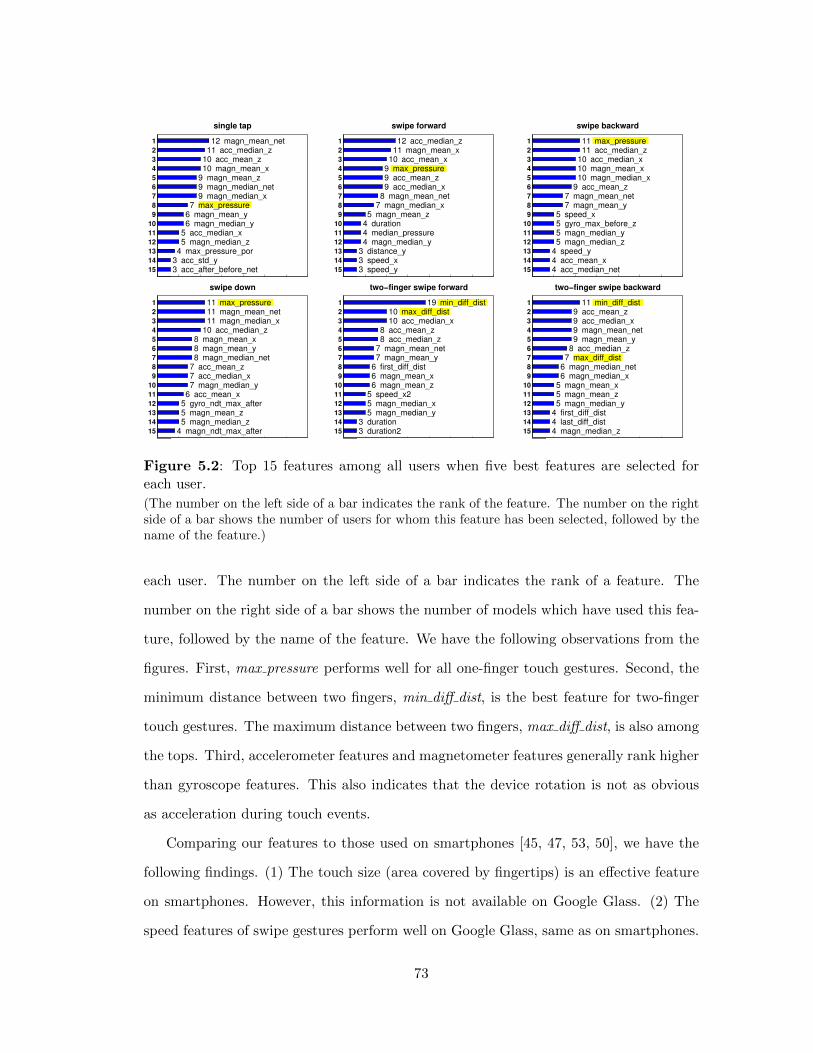
1
2
3
4
5
6
7
8
9
10
11
12
13
14
15
single tap
12 magn_mean_net11 acc_median_z
10 acc_mean_z10 magn_mean_x
9 magn_mean_z9 magn_median_net9 magn_median_x
7 max_pressure 6 magn_mean_y6 magn_median_y
5 acc_median_x5 magn_median_z
4 max_pressure_por3 acc_std_y3 acc_after_before_net
1
2
3
4
5
6
7
8
9
10
11
12
13
14
15
swipe forward
12 acc_median_z11 magn_mean_x
10 acc_mean_x9 max_pressure 9 acc_mean_z9 acc_median_x
8 magn_mean_net7 magn_median_x
5 magn_mean_z4 duration4 median_pressure4 magn_median_y
3 distance_y3 speed_x3 speed_y
1
2
3
4
5
6
7
8
9
10
11
12
13
14
15
swipe backward
11 max_pressure 11 acc_median_z
10 acc_median_x10 magn_mean_x10 magn_median_x
9 acc_mean_z7 magn_mean_net7 magn_mean_y
5 speed_x5 gyro_max_before_z5 magn_median_y5 magn_median_z
4 speed_y4 acc_mean_x4 acc_median_net
1
2
3
4
5
6
7
8
9
10
11
12
13
14
15
swipe down
11 max_pressure 11 magn_mean_net11 magn_median_x
10 acc_median_z8 magn_mean_x8 magn_mean_y8 magn_median_net
7 acc_mean_z7 acc_median_x7 magn_median_y
6 acc_mean_x5 gyro_ndt_max_after5 magn_mean_z5 magn_median_z
4 magn_ndt_max_after
1
2
3
4
5
6
7
8
9
10
11
12
13
14
15
two−finger swipe forward
19 min_diff_dist10 max_diff_dist10 acc_median_x
8 acc_mean_z8 acc_median_z
7 magn_mean_net7 magn_mean_y
6 first_diff_dist6 magn_mean_x6 magn_mean_z
5 speed_x25 magn_median_x5 magn_median_y
3 duration3 duration2
1
2
3
4
5
6
7
8
9
10
11
12
13
14
15
two−finger swipe backward
11 min_diff_dist9 acc_mean_z9 acc_median_x9 magn_mean_net9 magn_mean_y
8 acc_median_z7 max_diff_dist
6 magn_median_net6 magn_median_x
5 magn_mean_x5 magn_mean_z5 magn_median_y
4 first_diff_dist4 last_diff_dist4 magn_median_z
Figure 5.2: Top 15 features among all users when five best features are selected foreach user.(The number on the left side of a bar indicates the rank of the feature. The number on the rightside of a bar shows the number of users for whom this feature has been selected, followed by thename of the feature.)
each user. The number on the left side of a bar indicates the rank of a feature. The
number on the right side of a bar shows the number of models which have used this fea-
ture, followed by the name of the feature. We have the following observations from the
figures. First, max pressure performs well for all one-finger touch gestures. Second, the
minimum distance between two fingers, min di↵ dist, is the best feature for two-finger
touch gestures. The maximum distance between two fingers, max di↵ dist, is also among
the tops. Third, accelerometer features and magnetometer features generally rank higher
than gyroscope features. This also indicates that the device rotation is not as obvious
as acceleration during touch events.
Comparing our features to those used on smartphones [45, 47, 53, 50], we have the
following findings. (1) The touch size (area covered by fingertips) is an e↵ective feature
on smartphones. However, this information is not available on Google Glass. (2) The
speed features of swipe gestures perform well on Google Glass, same as on smartphones.
73
An exception on Google Glass is the swipe down gesture. This is because the vertical
length of the touchpad here is much smaller than that on smartphones. (3) Two-finger
swipe gestures are new gestures on Google Glass. Although there are also two-finger
gestures (e.g. pinch) on smartphones, they have totally di↵erent definitions. Thus,
di↵erent features are used. For example, the distance between two fingers are not useful
for pinch gestures on smartphones. However, they perform pretty well for two-finger
swipe gestures on Google Glass.
5.3 The GlassGuard System
In this section, we present the framework of our online authentication system, which
we call GlassGuard. Figure 5.4 shows the architecture of the GlassGuard authentication
system. There are five modules in the system. The Feature Extraction module calculates
a set of features determined by o✏ine training. In the following part of this section, we
introduce each of the other four modules.
5.3.1 Event Monitor
The Event Monitor continuously monitors all user events when the screen is on, including
touch events and voice commands. If it is a touch event, the Event Monitor forwards
the touch data and the corresponding sensor data for feature extraction. If it is a voice
command, the Event Monitor forwards the audio file for feature extraction.
The Event Monitor also communicates with the Power Control module. On one hand,
it reports occurrences of user events to the Power Control module. On the other hand, it
gets instructions from the Power Control module about whether it should forward data
for feature extraction or not. The details are explained in the Power Control subsection.
5.3.2 Classifiers
After features are extracted, they are passed to one of the classifiers. To achieve high
accuracy, we train one classifier for each gesture type and for voice command, respec-
74
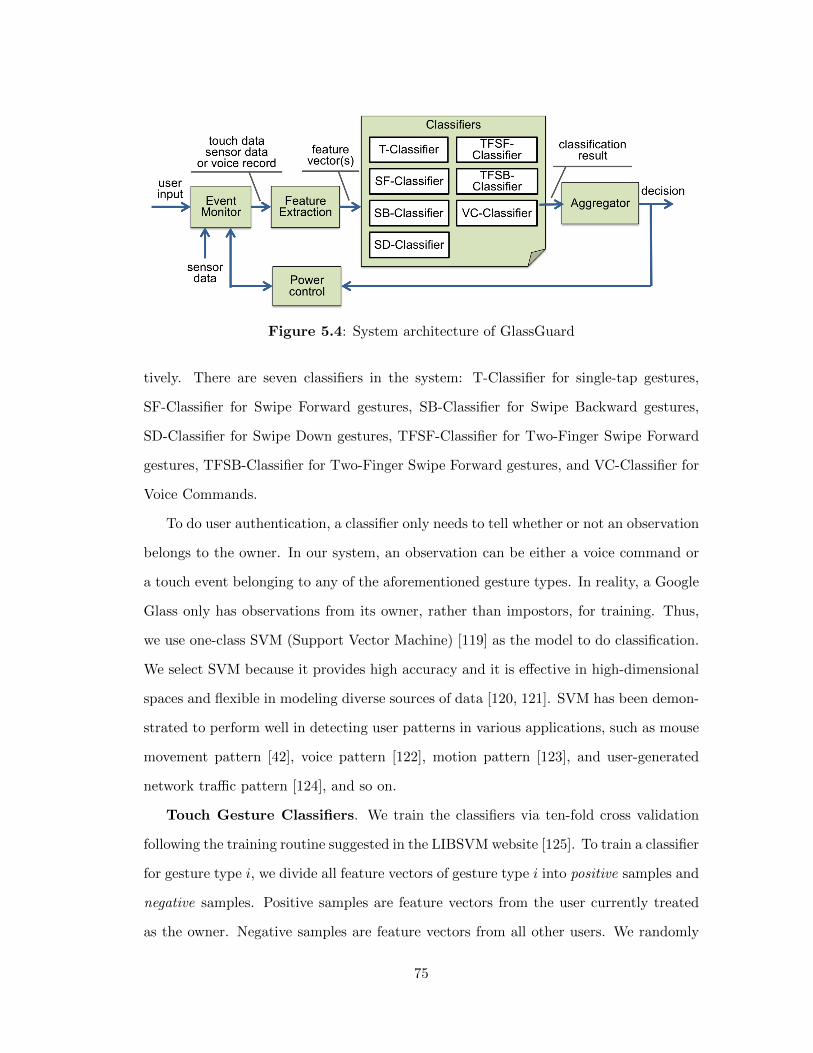
Figure 5.4: System architecture of GlassGuard
tively. There are seven classifiers in the system: T-Classifier for single-tap gestures,
SF-Classifier for Swipe Forward gestures, SB-Classifier for Swipe Backward gestures,
SD-Classifier for Swipe Down gestures, TFSF-Classifier for Two-Finger Swipe Forward
gestures, TFSB-Classifier for Two-Finger Swipe Forward gestures, and VC-Classifier for
Voice Commands.
To do user authentication, a classifier only needs to tell whether or not an observation
belongs to the owner. In our system, an observation can be either a voice command or
a touch event belonging to any of the aforementioned gesture types. In reality, a Google
Glass only has observations from its owner, rather than impostors, for training. Thus,
we use one-class SVM (Support Vector Machine) [119] as the model to do classification.
We select SVM because it provides high accuracy and it is e↵ective in high-dimensional
spaces and flexible in modeling diverse sources of data [120, 121]. SVM has been demon-
strated to perform well in detecting user patterns in various applications, such as mouse
movement pattern [42], voice pattern [122], motion pattern [123], and user-generated
network tra�c pattern [124], and so on.
Touch Gesture Classifiers. We train the classifiers via ten-fold cross validation
following the training routine suggested in the LIBSVM website [125]. To train a classifier
for gesture type i, we divide all feature vectors of gesture type i into positive samples and
negative samples. Positive samples are feature vectors from the user currently treated
as the owner. Negative samples are feature vectors from all other users. We randomly
75
divide all positive samples into k (k=10) equal size subsets, and do the same for negative
samples. Then, we train a one-class SVM model with k� 1 positive subsets, leaving one
subset of positive samples for testing. Then, we test the same model with one subset of
negative samples. We repeat the training and testing steps until each subset of positive
samples and each subset of negative samples are used exactly once for testing. With
all the decision values calculated from the SVM models, we plot the Receiver Operating
Characteristic (ROC) curve, which is insensitive to class skew [126]. The mis-prediction
ratio of all positive samples is False Reject Rate (FRR) and the mis-prediction ratio of
all negative samples is False Accept Rate (FAR).
VC-Classifier. Classification of voice features (MFCC vectors) is done in the same
way as classification for touch gestures. However, the FAR and FRR are calculated in
a di↵erent way. To get the EER for the voice command classifier, we treat all MFCC
vectors extracted from the same audio file as a whole. If the percentage of misclassified
MFCC vectors in an audio file is greater than a threshold p, then we think this audio file is
misclassified and treat this as one error. The FAR and FRR are calculated as percentage
of misclassified audio files in owner’s data and in other users’ data, respectively. We do
this because it is normal to treat one user voice command as one user event. A threshold
p is used because the classification results of MFCC vectors are noisy as the audio
contains background sound and notification sound of the glass system. The value of p
can be experimentally decided.
5.3.3 Aggregator
GlassGuard has seven classifiers. All classifiers make predictions independently. For each
user event, we obtain one classification result. Once a classification result is generated,
it is passed to the Aggregator module. To improve the accuracy of the authentication
system, the Aggregator combines multiple classification results, which may come from
di↵erent classifiers, and makes one final decision: whether or not the current wearer is
the owner. In order to do that, we need to solve two problems: (1) how to combine
76
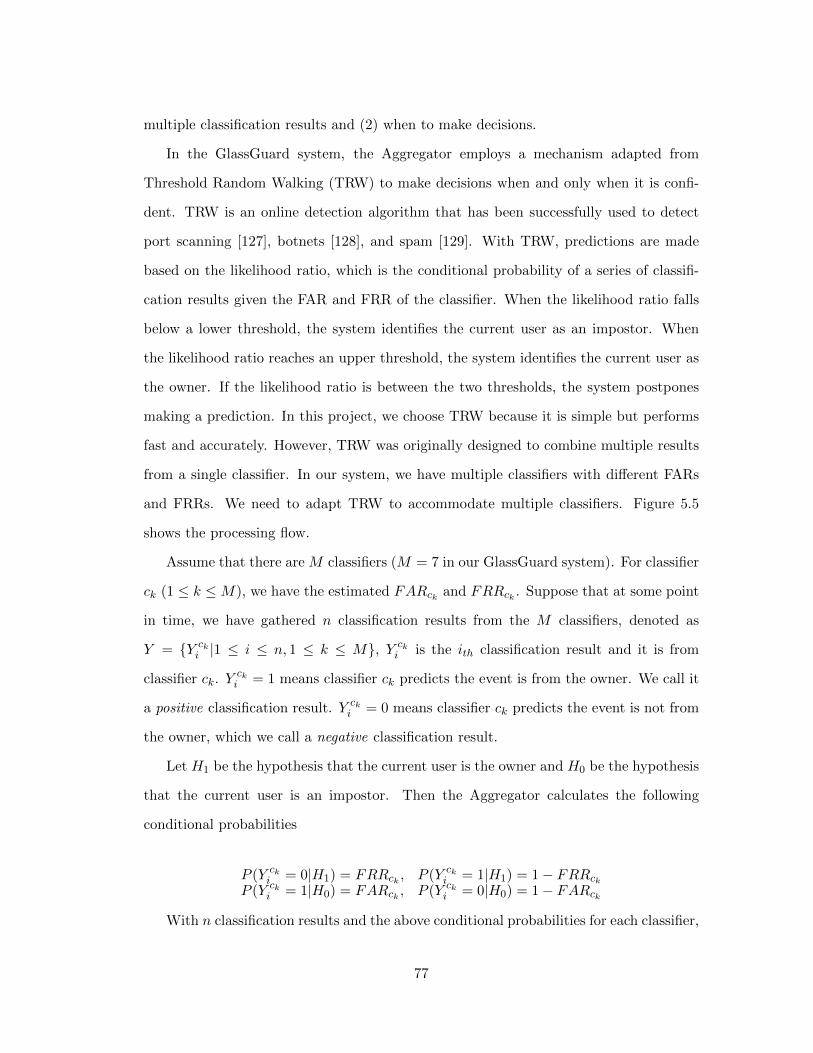
multiple classification results and (2) when to make decisions.
In the GlassGuard system, the Aggregator employs a mechanism adapted from
Threshold Random Walking (TRW) to make decisions when and only when it is confi-
dent. TRW is an online detection algorithm that has been successfully used to detect
port scanning [127], botnets [128], and spam [129]. With TRW, predictions are made
based on the likelihood ratio, which is the conditional probability of a series of classifi-
cation results given the FAR and FRR of the classifier. When the likelihood ratio falls
below a lower threshold, the system identifies the current user as an impostor. When
the likelihood ratio reaches an upper threshold, the system identifies the current user as
the owner. If the likelihood ratio is between the two thresholds, the system postpones
making a prediction. In this project, we choose TRW because it is simple but performs
fast and accurately. However, TRW was originally designed to combine multiple results
from a single classifier. In our system, we have multiple classifiers with di↵erent FARs
and FRRs. We need to adapt TRW to accommodate multiple classifiers. Figure 5.5
shows the processing flow.
Assume that there are M classifiers (M = 7 in our GlassGuard system). For classifier
ck
(1 k M), we have the estimated FARck and FRR
ck . Suppose that at some point
in time, we have gathered n classification results from the M classifiers, denoted as
Y = {Y cki
|1 i n, 1 k M}, Y cki
is the ith
classification result and it is from
classifier ck
. Y cki
= 1 means classifier ck
predicts the event is from the owner. We call it
a positive classification result. Y cki
= 0 means classifier ck
predicts the event is not from
the owner, which we call a negative classification result.
Let H1 be the hypothesis that the current user is the owner and H0 be the hypothesis
that the current user is an impostor. Then the Aggregator calculates the following
conditional probabilities
P (Y cki
= 0|H1) = FRRck , P (Y ck
i
= 1|H1) = 1� FRRck
P (Y cki
= 1|H0) = FARck , P (Y ck
i
= 0|H0) = 1� FARck
With n classification results and the above conditional probabilities for each classifier,
77
Figure 5.5: Processing flow of the Aggregator module
the Aggregator calculates the likelihood ratio
⇥(Y ) =nY
i=1
P (Y cki
|H0)
P (Y cki
|H1)(5.8)
In practice, both FAR and FRR are smaller than 50%. We have
P (Y cki
= 0|H0)
P (Y cki
= 0|H1)=
1� FARck
FRRck
> 1
Similarly,P (Y ck
i
= 1|H0)
P (Y cki
= 1|H1)=
FARck
1� FRRck
< 1
which means, a negative classification result increases the value of ⇥(Y ) while a positive
classification result decreases the value of ⇥(Y ).
When ⇥(Y ) � ⌘1, the system takes hypothesis H0 (is an impostor) to be true. When
⇥(Y ) ⌘2, the system takes hypothesis H1 (is the owner) to be true. A basic principle
78
of choosing values for ⌘1 and ⌘2 is [127]
⌘1 =�
↵⌘2 =
1� �
1� ↵(5.9)
where ↵ and � are two user-selected values. ↵ is the expected false alarm rate (H0
selected when H1 is true) and � is the expected detection rate (H0 selected when H0 is
true) of the whole system. The typical values are ↵ = 1% and � = 99%.
5.3.4 Power Control
As with smartphones, energy consumption is an important user concern on Google Glass.
In addition, if the power consumption of the system is too high, the temperature on the
surface of Google Glass can easily get very high [130]. This may make users uncomfort-
able as well as slow down the system. So, while we aim to achieve high accuracy for the
protection of the device owner’s privacy, we also want to reduce the power consumption.
In the GlassGuard system, the Power Control module is designed to improve the energy
e�ciency of the whole system. The basic idea is to pause feature extraction and classifi-
cation whenever the privacy risk becomes low and restart those processes whenever the
privacy risk reverts back to high.
When to pause? In the GlassGuard system, the Power Control module gets all
decisions made by the Aggregator module and communicates with the Event Monitor
module. If a negative decision (the current user is an impostor) is made by the Aggre-
gator, then the glass system needs to do something to restrict access to the device, for
example, lock the device and send an alert to the owner. The specific strategy to take
when an impostor is detected is beyond the scope of this work. Whenever a positive
decision (the current user is the owner) is made by the Aggregator, the Power Control
module instructs the Event Monitor module to temporarily pause forwarding data for
feature extraction. As a result, data will not be processed by the Feature Extraction
module or the Classifiers. To save more energy, when feature extraction is paused, the
Event Monitor module also stops sampling sensor data.
79
When to restart? After sending a pause instruction to the Event Monitor module,
the Power Control module starts a timer T for checking restarting conditions. T is set to
a short interval, for example, 15 seconds. The Event Monitor module monitors all user
events all the time and keeps updating the Power Control module with user activities.
If there is no report of user events from the Event Monitor before timer T expires, it
is possible that the user has been changed since the previous authentication decision.
The Power Control module restarts feature extraction by instructing the Event Monitor
module to continue forwarding data. As a result, feature extraction is enabled. The
system extracts features and does all the following processing beginning from the next
user event. If the Power Control module receives a report of user events from the Event
Monitor module before timer T expires, it considers that the current user has not been
changed since the previous positive decision from the Aggregator. The Power Control
module does not restart feature extraction. At the same time, the timer T is reset. The
basic assumption for this is that it is unlikely for the user to be changed in 15 seconds.
And even if this happens, the owner should be able to instantly notice this as the owner
was using the glass 15 seconds ago. In real world, there are cases when the owner wants
to share something on the glass screen with his/her friends. The owner takes o↵ the glass
and passes it to his/her friends. In this case, the user is changed within a short time,
perhaps less than 15 seconds. However, the owner knows this and the owner actually
wants it to happen. Hence it does not lie in the scope of our privacy protection.
5.4 Evaluation
In this section, we evaluate the performance of the GlassGuard authentication system
through o✏ine analysis by answering two questions. (1) How well do the classifiers
perform? We address this by showing the EER for each classifier in the system. (2)
How well does the whole system work? Here, we show the accuracy of all decisions made
by the system and the average delay to make a decision. To evaluate the accuracy, we
show the detection rate and false alarm rate when only one single type of user event
80
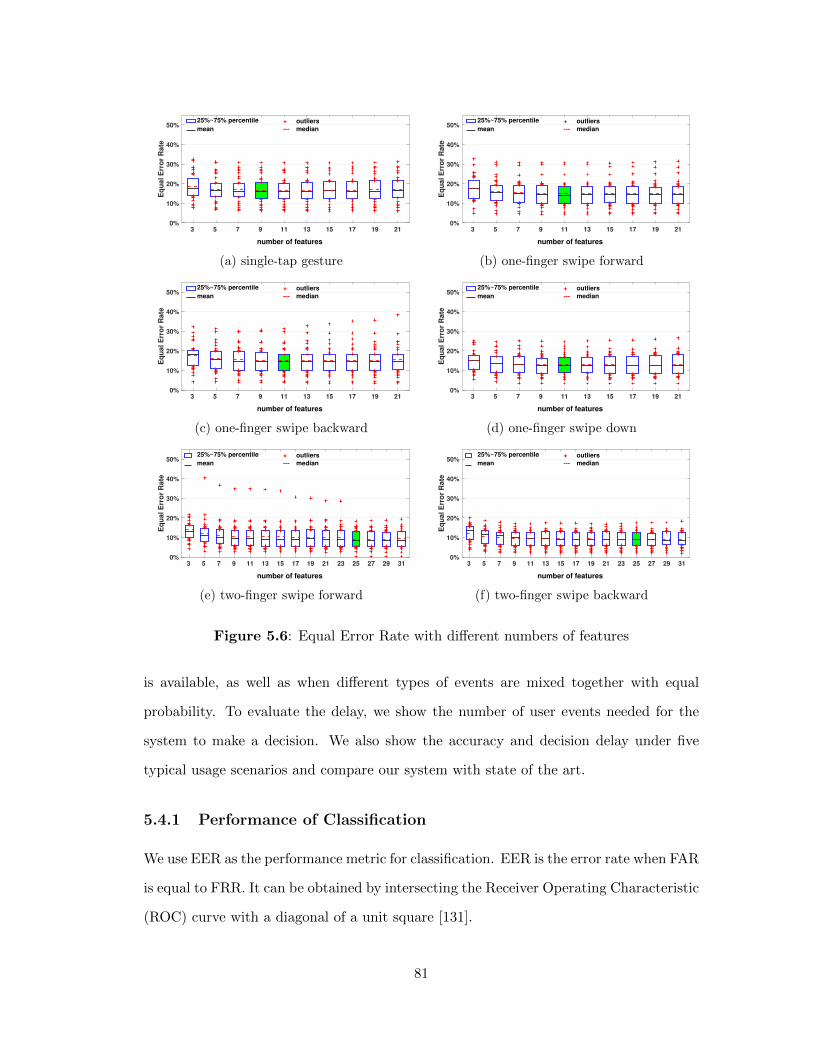
3 5 7 9 11 13 15 17 19 21 0%
10%
20%
30%
40%
50%
Eq
ual
Err
or
Ra
te
number of features
25%~75% percentile + outliersmean --- median
(a) single-tap gesture
3 5 7 9 11 13 15 17 19 21 0%
10%
20%
30%
40%
50%
Eq
ual
Err
or
Ra
te
number of features
25%~75% percentile + outliersmean --- median
(b) one-finger swipe forward
3 5 7 9 11 13 15 17 19 21 0%
10%
20%
30%
40%
50%
Eq
ual
Err
or
Ra
te
number of features
25%~75% percentile + outliersmean --- median
(c) one-finger swipe backward
3 5 7 9 11 13 15 17 19 21 0%
10%
20%
30%
40%
50%
Eq
ual
Err
or
Ra
te
number of features
25%~75% percentile + outliersmean --- median
(d) one-finger swipe down
3 5 7 9 11 13 15 17 19 21 23 25 27 29 31 0%
10%
20%
30%
40%
50%
Eq
ua
l E
rro
r R
ate
number of features
25%~75% percentile + outliersmean --- median
(e) two-finger swipe forward
3 5 7 9 11 13 15 17 19 21 23 25 27 29 31 0%
10%
20%
30%
40%
50%
Eq
ua
l E
rro
r R
ate
number of features
25%~75% percentile + outliersmean --- median
(f) two-finger swipe backward
Figure 5.6: Equal Error Rate with di↵erent numbers of features
is available, as well as when di↵erent types of events are mixed together with equal
probability. To evaluate the delay, we show the number of user events needed for the
system to make a decision. We also show the accuracy and decision delay under five
typical usage scenarios and compare our system with state of the art.
5.4.1 Performance of Classification
We use EER as the performance metric for classification. EER is the error rate when FAR
is equal to FRR. It can be obtained by intersecting the Receiver Operating Characteristic
(ROC) curve with a diagonal of a unit square [131].
81
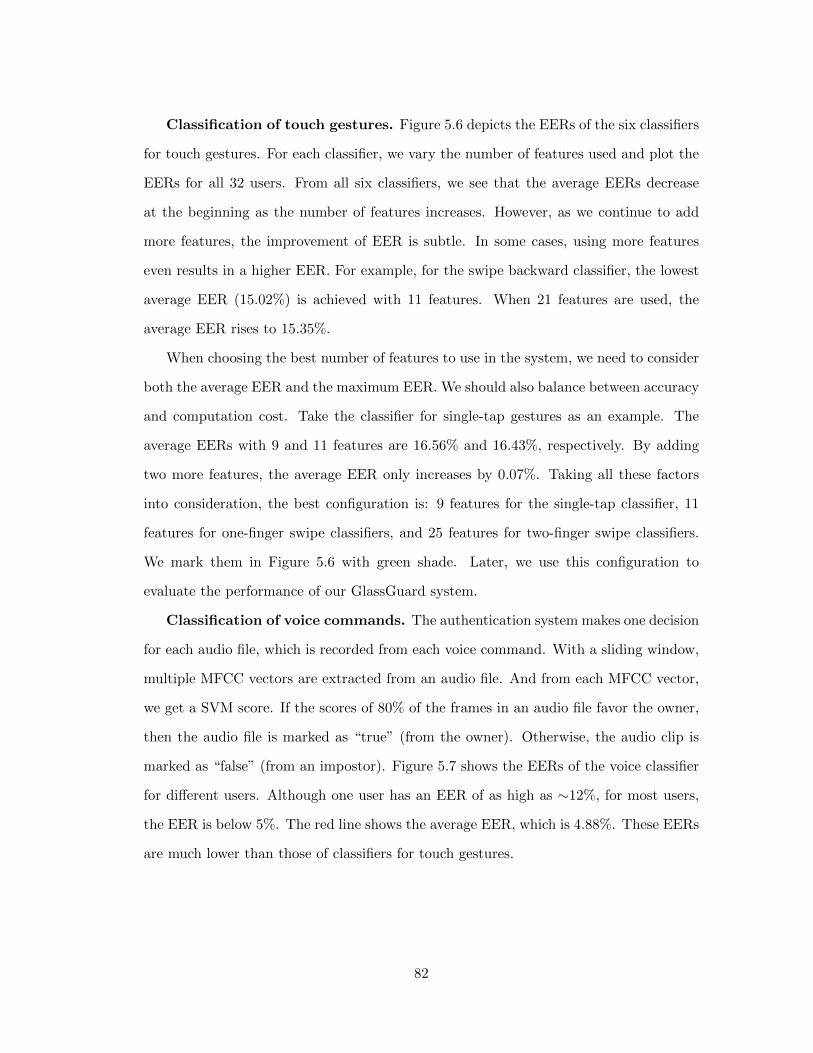
Classification of touch gestures. Figure 5.6 depicts the EERs of the six classifiers
for touch gestures. For each classifier, we vary the number of features used and plot the
EERs for all 32 users. From all six classifiers, we see that the average EERs decrease
at the beginning as the number of features increases. However, as we continue to add
more features, the improvement of EER is subtle. In some cases, using more features
even results in a higher EER. For example, for the swipe backward classifier, the lowest
average EER (15.02%) is achieved with 11 features. When 21 features are used, the
average EER rises to 15.35%.
When choosing the best number of features to use in the system, we need to consider
both the average EER and the maximum EER. We should also balance between accuracy
and computation cost. Take the classifier for single-tap gestures as an example. The
average EERs with 9 and 11 features are 16.56% and 16.43%, respectively. By adding
two more features, the average EER only increases by 0.07%. Taking all these factors
into consideration, the best configuration is: 9 features for the single-tap classifier, 11
features for one-finger swipe classifiers, and 25 features for two-finger swipe classifiers.
We mark them in Figure 5.6 with green shade. Later, we use this configuration to
evaluate the performance of our GlassGuard system.
Classification of voice commands. The authentication system makes one decision
for each audio file, which is recorded from each voice command. With a sliding window,
multiple MFCC vectors are extracted from an audio file. And from each MFCC vector,
we get a SVM score. If the scores of 80% of the frames in an audio file favor the owner,
then the audio file is marked as “true” (from the owner). Otherwise, the audio clip is
marked as “false” (from an impostor). Figure 5.7 shows the EERs of the voice classifier
for di↵erent users. Although one user has an EER of as high as ⇠12%, for most users,
the EER is below 5%. The red line shows the average EER, which is 4.88%. These EERs
are much lower than those of classifiers for touch gestures.
82
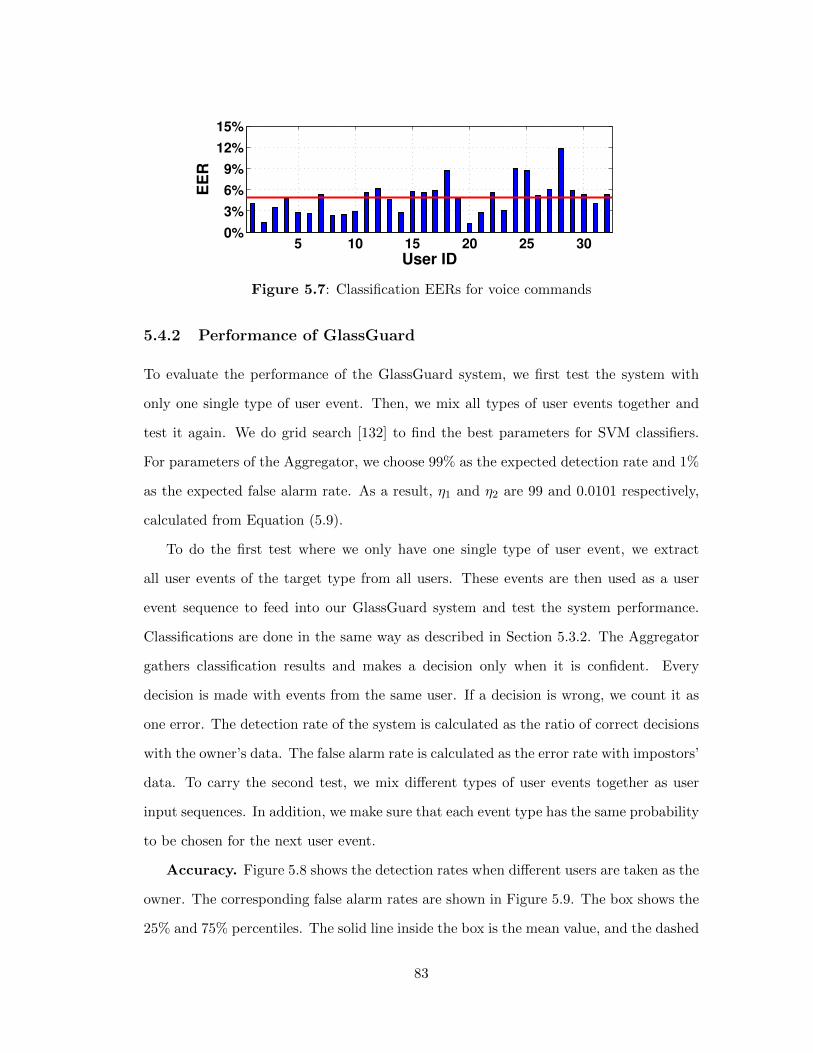
5 10 15 20 25 30 0%
3%
6%
9%
12%
15%
User ID
EE
R
Figure 5.7: Classification EERs for voice commands
5.4.2 Performance of GlassGuard
To evaluate the performance of the GlassGuard system, we first test the system with
only one single type of user event. Then, we mix all types of user events together and
test it again. We do grid search [132] to find the best parameters for SVM classifiers.
For parameters of the Aggregator, we choose 99% as the expected detection rate and 1%
as the expected false alarm rate. As a result, ⌘1 and ⌘2 are 99 and 0.0101 respectively,
calculated from Equation (5.9).
To do the first test where we only have one single type of user event, we extract
all user events of the target type from all users. These events are then used as a user
event sequence to feed into our GlassGuard system and test the system performance.
Classifications are done in the same way as described in Section 5.3.2. The Aggregator
gathers classification results and makes a decision only when it is confident. Every
decision is made with events from the same user. If a decision is wrong, we count it as
one error. The detection rate of the system is calculated as the ratio of correct decisions
with the owner’s data. The false alarm rate is calculated as the error rate with impostors’
data. To carry the second test, we mix di↵erent types of user events together as user
input sequences. In addition, we make sure that each event type has the same probability
to be chosen for the next user event.
Accuracy. Figure 5.8 shows the detection rates when di↵erent users are taken as the
owner. The corresponding false alarm rates are shown in Figure 5.9. The box shows the
25% and 75% percentiles. The solid line inside the box is the mean value, and the dashed
83
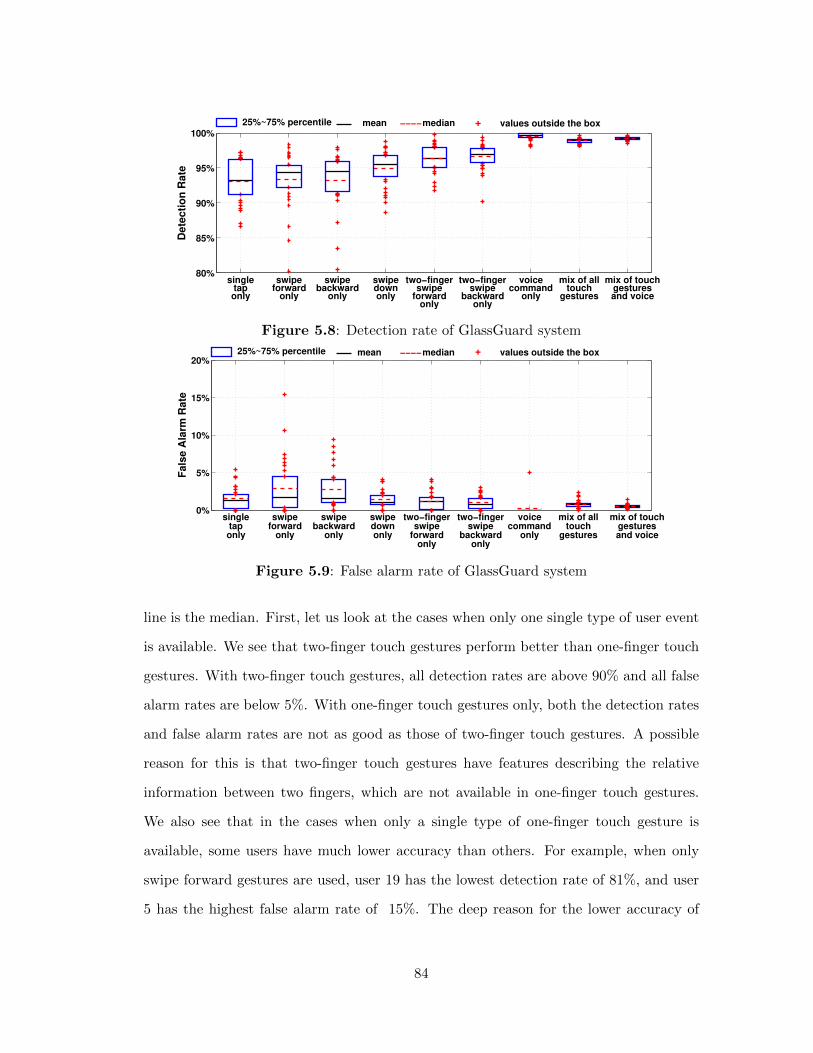
80%
85%
90%
95%
100%
Dete
cti
on
Rate
singletaponly
swipeforward
only
swipebackward
only
swipedownonly
two−fingerswipe
forwardonly
two−fingerswipe
backwardonly
voicecommand
only
mix of alltouch
gestures
mix of touchgesturesand voice
mean25%~75% percentile + values outside the box−−−−median
Figure 5.8: Detection rate of GlassGuard system
0%
5%
10%
15%
20%
Fals
e A
larm
Rate
singletaponly
swipeforward
only
swipebackward
only
swipedownonly
two−fingerswipe
forwardonly
two−fingerswipe
backwardonly
voicecommand
only
mix of alltouch
gestures
mix of touchgesturesand voice
mean25%~75% percentile + values outside the box−−−−median
Figure 5.9: False alarm rate of GlassGuard system
line is the median. First, let us look at the cases when only one single type of user event
is available. We see that two-finger touch gestures perform better than one-finger touch
gestures. With two-finger touch gestures, all detection rates are above 90% and all false
alarm rates are below 5%. With one-finger touch gestures only, both the detection rates
and false alarm rates are not as good as those of two-finger touch gestures. A possible
reason for this is that two-finger touch gestures have features describing the relative
information between two fingers, which are not available in one-finger touch gestures.
We also see that in the cases when only a single type of one-finger touch gesture is
available, some users have much lower accuracy than others. For example, when only
swipe forward gestures are used, user 19 has the lowest detection rate of 81%, and user
5 has the highest false alarm rate of 15%. The deep reason for the lower accuracy of
84
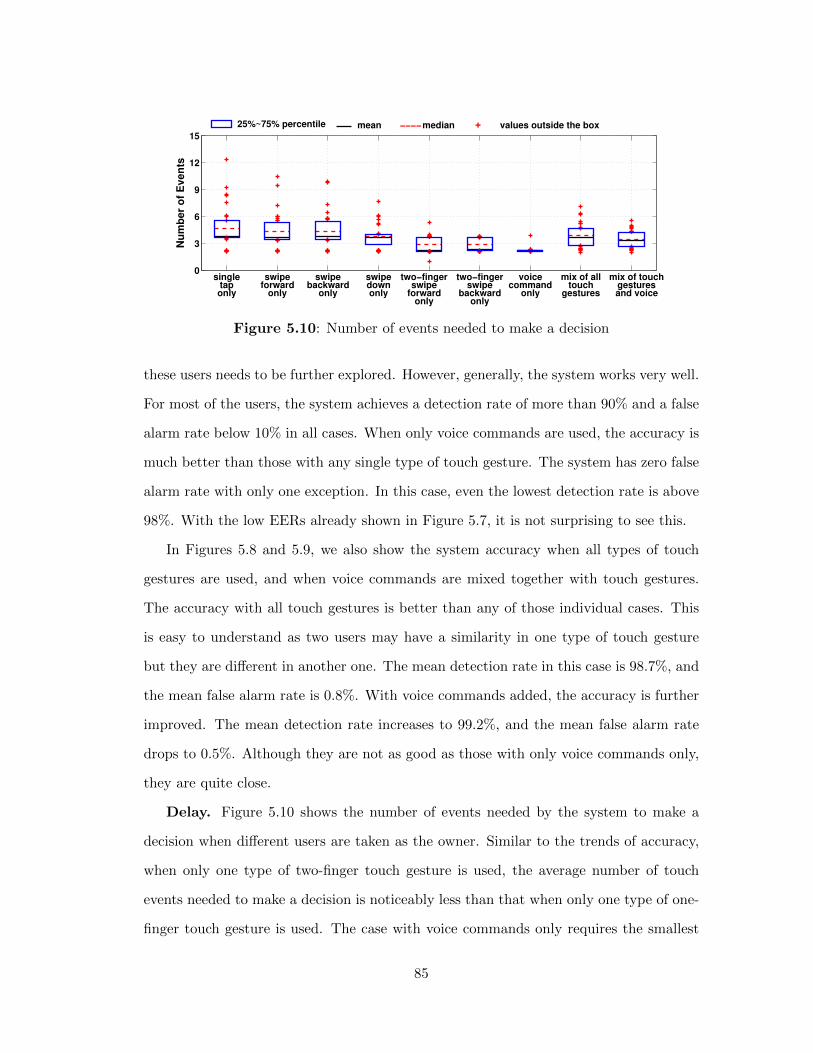
0
3
6
9
12
15
Nu
mb
er
of
Even
ts
singletaponly
swipeforward
only
swipebackward
only
swipedownonly
two−fingerswipe
forwardonly
two−fingerswipe
backwardonly
voicecommand
only
mix of alltouch
gestures
mix of touchgesturesand voice
mean25%~75% percentile + values outside the box−−−−median
Figure 5.10: Number of events needed to make a decision
these users needs to be further explored. However, generally, the system works very well.
For most of the users, the system achieves a detection rate of more than 90% and a false
alarm rate below 10% in all cases. When only voice commands are used, the accuracy is
much better than those with any single type of touch gesture. The system has zero false
alarm rate with only one exception. In this case, even the lowest detection rate is above
98%. With the low EERs already shown in Figure 5.7, it is not surprising to see this.
In Figures 5.8 and 5.9, we also show the system accuracy when all types of touch
gestures are used, and when voice commands are mixed together with touch gestures.
The accuracy with all touch gestures is better than any of those individual cases. This
is easy to understand as two users may have a similarity in one type of touch gesture
but they are di↵erent in another one. The mean detection rate in this case is 98.7%, and
the mean false alarm rate is 0.8%. With voice commands added, the accuracy is further
improved. The mean detection rate increases to 99.2%, and the mean false alarm rate
drops to 0.5%. Although they are not as good as those with only voice commands only,
they are quite close.
Delay. Figure 5.10 shows the number of events needed by the system to make a
decision when di↵erent users are taken as the owner. Similar to the trends of accuracy,
when only one type of two-finger touch gesture is used, the average number of touch
events needed to make a decision is noticeably less than that when only one type of one-
finger touch gesture is used. The case with voice commands only requires the smallest
85
number of events to make a decision, which is below 4 for all users with a mean of 2.24.
The number of events needed for the case with all touch gestures mixed is in between
that of the case with only one type of one-finger touch gesture and that of the case with
only one type of two-finger touch gesture. When touch gestures are mixed together with
voice commands, the system needs 3.5 user events on average to make a decision.
Accuracy and delay in typical usage scenarios. We have demonstrated the
performance of our system when only one type of user event is available. We also show
the performance when all types of user events are mixed together with equal probability.
However, in reality, the distribution of these event types largely depends on what a user
wants to do, how the data is organized on the Google Glass, and also a user’s own
preference (touch gesture or voice command).
Here we take five typical usage scenarios and show the accuracy and decision delay
under each of the scenarios. (1) Skim through the timeline. A user can access pictures,
videos, emails, and application notifications in timeline. Under this scenario, the user
swipes forward to see the items in the timeline one by one. The user event sequence
consists of only swipe forward gestures. (2) Delete a picture in the timeline. A user does
the followings: swipe forward to enter the timeline, continue swipe forward (assume
once) to find the group of pictures, single-tap to select the pictures, tap to show the
options, swipe forward twice to reach the “Delete” option, and then tap to delete. (3)
Take a picture and share it using voice commands. A user event sequence for this is
as follows: “OK Glass!”, “Take a picture”, “OK, glass!”, “Share it with...”, and swipe
down to go back. (4) Take a picture and share it using touch gestures: tap to go to
applications, swipe forward (assume twice) to find the picture application, tap to select
the application, tap to get the options, tap to select the “Share” option, tap to select
a contact, and swipe down to go back. (5) Google search. A user event sequence for
this is: tap to go to applications, swipe forward (assume once) to find the Google Search
application, tap to select the application, (speak the keyword), tap to show the options
when the content is ready, tap to view the website, two-finger swipe forward to zoom in,
86
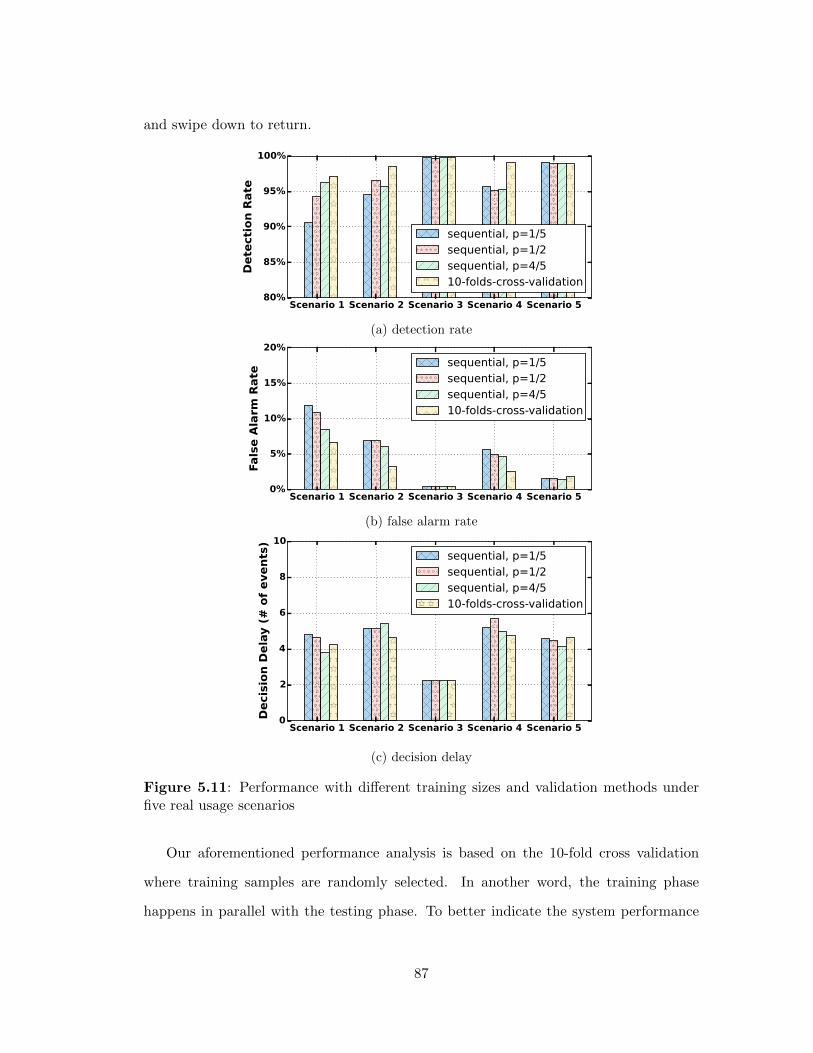
and swipe down to return.
(a) detection rate
(b) false alarm rate
(c) decision delay
Figure 5.11: Performance with di↵erent training sizes and validation methods underfive real usage scenarios
Our aforementioned performance analysis is based on the 10-fold cross validation
where training samples are randomly selected. In another word, the training phase
happens in parallel with the testing phase. To better indicate the system performance
87
during real deployment, we perform sequential validation where the training phase and
testing phase happen in sequence. All N samples are ordered in time sequence. We select
the first p ⇤N (p=1/5, 1/2, or 4/5) samples for training and the remaining (1� p) ⇤N
samples for testing (except for voice commands of which we have less than 40 samples
per user).
We present the average performance in Figure 5.11. Form the figure, we have three
main observations. First, Scenario 1 has the lowest detection rate as it only contains
swipe forward gestures. Scenario 3 mainly consists of voice commands, so it performs
the best. Second, in general, larger training size results in better performance. However,
the performance gap is small. When p = 1/5, we still have detection rate above 90%
and false alarm rate below 12%. Third, di↵erent validation methods have very similar
performance under Scenario 3 because the training for voice commands remain the same.
5.4.3 Performance Comparison
As far as we know, the work presented by Chauhan et al. [64] is the only study covering
touch behavior based user authentication on wearable glasses. In their work, the authors
also study the performance of touch behavioral biometrics for user authentication on
Google Glass. Specifically, they consider four types of touch events: single-tap (T), swipe
forward (F), swipe backward (B), and swipe down (D). And they consider seven gesture
combinations: T, F, B, D, T+F, T+F+B, T+F+B+D. Di↵erent classification models
are trained for di↵erent gesture combinations. All classification models make predictions
independently. To obtain n samples of a gesture combination, each gesture type should
appear at least n times. For example, under the Google search scenario (Scenario 5)
introduced in the previous subsection, the user event sequence is: TFTVTTFD (where
V denotes voice command and F denotes two-finger swipe forward gesture). Their system
can get one prediction from the T model with four samples, one prediction from the F
model with one sample, and one prediction from the T+F model with one sample. The
T+F+B model and the T+F+B+D model, which are able to provide higher accuracy,
88
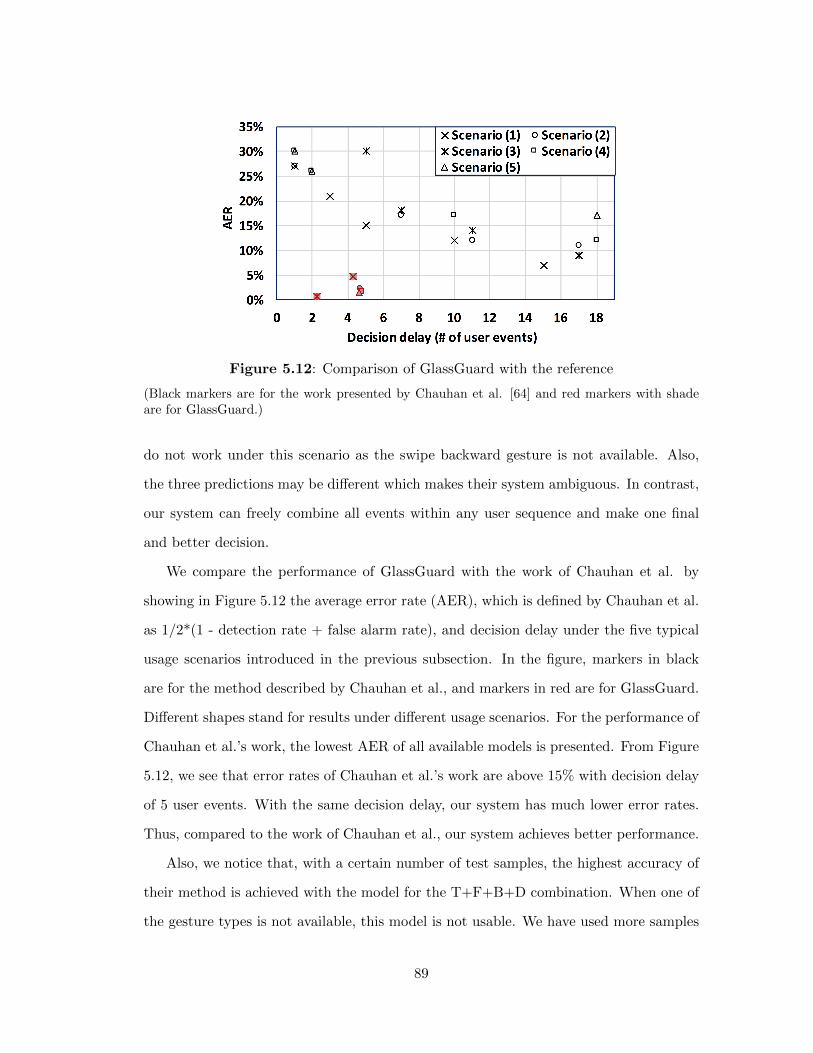
Figure 5.12: Comparison of GlassGuard with the reference
(Black markers are for the work presented by Chauhan et al. [64] and red markers with shadeare for GlassGuard.)
do not work under this scenario as the swipe backward gesture is not available. Also,
the three predictions may be di↵erent which makes their system ambiguous. In contrast,
our system can freely combine all events within any user sequence and make one final
and better decision.
We compare the performance of GlassGuard with the work of Chauhan et al. by
showing in Figure 5.12 the average error rate (AER), which is defined by Chauhan et al.
as 1/2*(1 - detection rate + false alarm rate), and decision delay under the five typical
usage scenarios introduced in the previous subsection. In the figure, markers in black
are for the method described by Chauhan et al., and markers in red are for GlassGuard.
Di↵erent shapes stand for results under di↵erent usage scenarios. For the performance of
Chauhan et al.’s work, the lowest AER of all available models is presented. From Figure
5.12, we see that error rates of Chauhan et al.’s work are above 15% with decision delay
of 5 user events. With the same decision delay, our system has much lower error rates.
Thus, compared to the work of Chauhan et al., our system achieves better performance.
Also, we notice that, with a certain number of test samples, the highest accuracy of
their method is achieved with the model for the T+F+B+D combination. When one of
the gesture types is not available, this model is not usable. We have used more samples
89
for training than Chauhan et al. but the di↵erence is not as large as it appears. In their
work, 75 samples for the combination of T+F+B+D add up to 300 user events. Besides,
even if their accuracy can be improved by increasing the training size, their decision
delay does not change because they still need to wait for a fixed number of test samples.
And our comparison shows that our system has much shorter decision delay.
5.5 Conclusion and Future Work
In this work, we study a set of touch behavioral features and voice features for user
authentication on wearable glasses. With data collected from a user study consisting
of 32 participants with Google Glass, the discriminability of these features are then
evaluated with SVM models and Sequential Forward Search. With 9 features for single-
tap gestures, 11 features for swipe forward/backward/down gestures, and 25 features
for two-finger swipe forward/backward gestures, we show that the average EERs of
classification based on single type of touch gesture are between 9% and 16.6%. With
MFCC vectors extracted from audios, the EER of classification on voice commands is
4.88% on average.
We propose a continuous and non-invasive user authentication system for wearable
glasses, named GlassGuard. GlassGuard continuously monitors user touch gestures and
voice commands. It employs a mechanism adapted from Threshold Random Walking
to make a decision from multiple user events only when it is confident. Our evaluation
results based on data collected with Google Glass show that, when decisions are made
purely on a single type of user event, the average detection rate is above 93% with a
false alarm rate below 3% after less than 5 user events. When all types of user events
are mixed with equal probability, our GlassGuard system achieves a detection rate of
99% and a false alarm rate of 0.5% after 3.46 user events. We also demonstrate the
performance of GlassGuard with 5 typical usage scenarios, under which the detection
rates are above 93.3% and the false alarm rates are below 2.84% after 4.66 events.
In the future, we plan to deploy the proposed system on Google Glass and measure
90
the power consumption. Once the system is deployed on real devices, we would like to
measure the performance under routine daily use by di↵erent people other than the five
typical usage scenarios evaluated in this work. Also, we plan to validate the applicability
of the authentication system over longer term.
91
Chapter 6
Conclusion
In this dissertation, we propose solutions to enhance energy e�ciency and privacy pro-
tection on smart devices.
First, to the best of our knowledge, we are the first to present measurements and
analysis of di↵erent ways to deal with WiFi broadcast tra�c during smartphone suspend
mode. Through power consumption and functionality analysis, we reveal the dilemma
of dealing with WiFi broadcast tra�c on modern smartphones during suspend mode:
receive all and su↵er high power consumption, or receive none and sacrifice functionali-
ties. We address the dilemma by proposing Software Broadcast Filter (SBF). SBF passes
useful broadcast frames for normal application functions. SBF blocks useless broadcast
frames without triggering unnecessary wakelock time. Compared to the “receive-none”
solution, SBF does not impair functionalities of smartphone applications. Compared to
the “receive-all” solution, SBF reduces the power consumption by up to 49.9% for the
Nexus One phone.
Second, we propose HIDE, an AP-assisted broadcast tra�c management scheme, to
further reduce smartphone energy wasted on useless broadcast frames. In the HIDE
system, a client coordinates with the AP to enable tra�c di↵erentiation between useful
and useless broadcast frames at the AP. Then, the AP hides the presence of useless
broadcast frames from smartphones. As a result, a smartphone in suspend mode does
not receive useless broadcast frames. Neither does it switch to active mode and pro-
92
cess useless broadcast frames. With WiFi broadcast traces collected from five di↵erent
real-world scenarios, we conduct trace-driven simulation with an energy model derived.
The results show that our system saves 34%-75% energy for the Nexus One phone and
18%-78% for the Galaxy S4 phone when 10% of the broadcast frames are useful to the
smartphone. When 2% of the broadcast frames are useful to the smartphone, our sys-
tem saves 71%-82% energy for Nexus One and 62%-83% for Galaxy S4. We also analyze
the performance overhead of the proposed system. The impact of the HIDE system on
network capacity is less than 0.2% and the impact on packet round-trip time is no more
than 2.3%.
Third, we propose GlassGuard for continuous and non-invasive user authentication
on wearable glasses with the example of Google Glass. GlassGuard system collects data
and extracts features from six types of touch gestures (single tap, swipe forward, swipe
backward, swipe down, two-finger swipe forward, and two-finger swipe backward) as well
as voice commands. A one-class SVM is trained for each user event type. By aggregating
multiple classification results, which may come from di↵erent classifiers, with adapted
Random Threshold Walking, GlassGuard makes a decision from multiple user events
only when it is confident. Our evaluation results show that, when decisions are made
purely on a single type of user events, the average detection rate is above 93% with
false alarm rate below 3% after less than 5 user events. When all types of user events
are mixed with equal probability, our GlassGuard system achieves a detection rate of
99% and a false alarm rate of 0.5% after 3.46 user events. We also demonstrate the
performance of GlassGuard with five typical usage scenarios, under which the detection
rates are all above 93.3% and the false alarm rates are below 2.84% after no more than
4.66 events.
As future work, we would like to study the energy e�ciency during user privacy
protection. We will explore how to make the current continuous authentication systems
more energy e�cient.
93
Bibliography
[1] Market Share: Final PCs, Ultramobiles and Mobile Phones, All Countries, 4Q16.
http://www.gartner.com/newsroom/id/3609817, February, 2017.
[2] Mobile Fact Sheet. http://www.pewinternet.org/fact-sheet/mobile/, Jan-
uary, 2017.
[3] Smart Glasses Market Report 2015. http://www.augmentedreality.org/#!
smartglassesreport/c88h, January, 2015.
[4] How Consumers Are Engaging With Mobile Video Around the World. http:
//advertising.aol.com/mobile-video-global, 2017.
[5] What do consumers want? Better batteries, not wearables. http://fortune.com/
2015/01/07/what-do-consumers-want-better-batteries-not-wearables/,
January, 2015.
[6] Few smartphone users interested in phones without headphone jacks.
https://today.yougov.com/news/2016/09/22/smartphone-longer-battery-
life-headphone-jack/, September, 2016.
[7] Lookout Projects Lost and Stolen Phones. http://www.businesswire.com/
news/home/20120322005325/en/Lookout-Projects-Lost-Stolen-Phones-
Cost-U.S., 2012.
94
[8] Symantec Smartphone Honey Stick Project. http://www.symantec.com/about/
news/resources/presskits/detail.jsp?pkid=symantec-smartphone-honey-
stick-project, 2012.
[9] Ildar Muslukhov, Yazan Boshmaf, Cynthia Kuo, Jonathan Lester, and Konstantin
Beznosov. Know your enemy: the risk of unauthorized access in smartphones by
insiders. In Proceedings of the 15th international conference on Human-computer
interaction with mobile devices and services, pages 271–280. ACM, 2013.
[10] Abhilash Jindal, Abhinav Pathak, Y Charlie Hu, and Samuel Midki↵. Hypnos:
understanding and treating sleep conflicts in smartphones. In ACM Eurosys, 2013.
[11] Radmilo Racic, Denys Ma, and Hao Chen. Exploiting mms vulnerabilities to
stealthily exhaust mobile phone’s battery. In Securecomm and Workshops, 2006,
pages 1–10. IEEE, 2006.
[12] Niranjan Balasubramanian, Aruna Balasubramanian, and Arun Venkataramani.
Energy consumption in mobile phones: a measurement study and implications for
network applications. In ACM IMC, 2009.
[13] Aaron Carroll and Gernot Heiser. An analysis of power consumption in a smart-
phone. In Proceedings of the 2010 USENIX conference on USENIX annual tech-
nical conference, pages 21–21, 2010.
[14] Gian Paolo Perrucci, Frank HP Fitzek, and Jorg Widmer. Survey on energy con-
sumption entities on the smartphone platform. In Vehicular Technology Conference
(VTC Spring), 2011 IEEE 73rd, pages 1–6, 2011.
[15] Eduardo Cuervo, Aruna Balasubramanian, Daeki Cho, Alec Wolman, Stefan
Saroiu, Ranveer Chandra, and Paramvir Bahl. MAUI: Making Smartphones Last
Longer with Code O✏oad. In ACM MobiSys, 2010.
[16] Fahad R Dogar, Peter Steenkiste, and Konstantina Papagiannaki. Catnap: ex-
95
ploiting high bandwidth wireless interfaces to save energy for mobile devices. In
ACM Mobisys, 2010.
[17] J. Liu and L. Zhong. Micro power management of active 802.11 interfaces. In
ACM Mobisys, 2008.
[18] Andrew J Pyles, Xin Qi, Gang Zhou, Matthew Keally, and Xue Liu. SAPSM:
Smart adaptive 802.11 psm for smartphones. In Proceedings of the 2012 ACM
Conference on Ubiquitous Computing, pages 11–20. ACM, 2012.
[19] Shuo Deng and Hari Balakrishnan. Tra�c-aware techniques to reduce 3G/LTE
wireless energy consumption. In ACM CoNEXT, 2012.
[20] E. Rozner, V. Navda, R. Ramjee, and S. Rayanchu. NAPman: network-assisted
power management for wifi devices. In ACM Mobisys, 2010.
[21] Arun Ramanatha Bharadwaj. Managing wifi energy in smartphones by throttling
network packets. PhD thesis, Applied Sciences: School of Computing Science,
Simon Fraser University, 2014.
[22] Abhinav Pathak, Abhilash Jindal, Y Charlie Hu, and Samuel P Midki↵. What is
keeping my phone awake?: characterizing and detecting no-sleep energy bugs in
smartphone apps. In ACM Mobisys, 2012.
[23] Yuvraj Agarwal, Steve Hodges, Ranveer Chandra, James Scott, Paramvir Bahl,
and Rajesh Gupta. Somniloquy: Augmenting Network Interfaces to Reduce PC
Energy Usage. In NSDI, 2009.
[24] Fabio Ricciato, Eduard Hasenleithner, Philipp Svoboda, and Wolfgang Fleischer.
On the impact of unwanted tra�c onto a 3g network. In Security, Privacy and Trust
in Pervasive and Ubiquitous Computing, 2006. SecPerU 2006. Second International
Workshop on, pages 8–pp. IEEE, 2006.
96
[25] Ismo Puustinen and Jukka K Nurminen. The e↵ect of unwanted internet tra�c on
cellular phone energy consumption. In New Technologies, Mobility and Security
(NTMS), 2011 4th IFIP International Conference on, pages 1–5. IEEE, 2011.
[26] Ramya Raghavendra, Elizabeth M Belding, Konstantina Papagiannaki, and
Kevin C Almeroth. Unwanted link layer tra�c in large IEEE 802.11 wireless
networks. Mobile Computing, IEEE Transactions on, 9(9):1212–1225, 2010.
[27] Yu Chen and Kai Hwang. Collaborative detection and filtering of shrew DDoS
attacks using spectral analysis. Journal of Parallel and Distributed Computing,
66(9):1137–1151, 2006.
[28] Thomas Martin, Michael Hsiao, Dong Ha, and Jayan Krishnaswami. Denial-of-
service attacks on battery-powered mobile computers. In Proceedings of the Sec-
ond IEEE International Conference on Pervasive Computing and Communications
(PerCom’04), PERCOM ’04, pages 309–. IEEE Computer Society, 2004.
[29] Rongxing Lu, Xiaodong Lin, Haojin Zhu, Xiaohui Liang, and Xuemin Shen. BE-
CAN: a bandwidth-e�cient cooperative authentication scheme for filtering injected
false data in wireless sensor networks. Parallel and Distributed Systems, IEEE
Transactions on, 23(1):32–43, 2012.
[30] Wenjun Gu, Zhimin Yang, Dong Xuan, Weijia Jia, and Can Que. Null data frame:
A double-edged sword in IEEE 802.11 WLANs. Parallel and Distributed Systems,
IEEE Transactions on, 21(7):897–910, 2010.
[31] Indrajeet Singh, Srikanth V Krishnamurthy, Harsha V Madhyastha, and Iulian
Neamtiu. Zapdroid: Managing infrequently used applications on smartphones.
IEEE Transactions on Mobile Computing, 2016.
[32] Xin Qi, Qing Yang, David T Nguyen, Gang Zhou, and Ge Peng. Lbvc: towards low-
bandwidth video chat on smartphones. In Proceedings of the 6th ACM Multimedia
Systems Conference, pages 1–12. ACM, 2015.
97
[33] Lorenzo Keller, Anh Le, Blerim Cici, Hulya Seferoglu, Christina Fragouli, and
Athina Markopoulou. MicroCast: cooperative video streaming on smartphones. In
Proceedings of the 10th international conference on Mobile systems, applications,
and services, pages 57–70. ACM, 2012.
[34] Mohammad Ashraful Hoque, Matti Siekkinen, and Jukka K Nurminen. Using
crowd-sourced viewing statistics to save energy in wireless video streaming. In
Proceedings of the 19th annual international conference on Mobile computing &
networking, pages 377–388. ACM, 2013.
[35] Min Woo Kim, Dong Geun Yun, Jong Min Lee, and Seong Gon Choi. Battery
life time extension method using selective data reception on smartphone. In Infor-
mation Networking (ICOIN), 2012 International Conference on, pages 468–471.
IEEE, 2012.
[36] Abdurhman Albasir, Kshirasagar Naik, Bernard Plourde, and Nishith Goel. Ex-
perimental study of energy and bandwidth costs of web advertisements on smart-
phones. In Mobile Computing, Applications and Services (MobiCASE), 2014 6th
International Conference on, pages 90–97. IEEE, 2014.
[37] Jiaping Gui, Stuart Mcilroy, Meiyappan Nagappan, and William G.J. Halfond.
Truth in Advertising: The Hidden Cost of Mobile Ads for Software Developers. In
Software Engineering (ICSE), 2015 IEEE/ACM 37th IEEE International Confer-
ence on, volume 1, pages 100–110, May 2015.
[38] Adblock Plus for Android. https://adblockplus.org/android-about. Accessed
February 2017.
[39] Feng Qian, Junxian Huang, Je↵rey Erman, Z Morley Mao, Subhabrata Sen, and
Oliver Spatscheck. How to reduce smartphone tra�c volume by 30%? In Passive
and Active Measurement, pages 42–52. Springer, 2013.
98
[40] Hong Lu, AJ Bernheim Brush, Bodhi Priyantha, Amy K Karlson, and Jie Liu.
Speakersense: energy e�cient unobtrusive speaker identification on mobile phones.
In Pervasive Computing, pages 188–205. Springer, 2011.
[41] Shaxun Chen, Amit Pande, and Prasant Mohapatra. Sensor-assisted facial recogni-
tion: an enhanced biometric authentication system for smartphones. In Proceedings
of the 12th annual international conference on Mobile systems, applications, and
services, pages 109–122. ACM, 2014.
[42] Nan Zheng, Aaron Paloski, and Haining Wang. An e�cient user verification system
via mouse movements. In Proceedings of the 18th ACM conference on Computer
and communications security, pages 139–150. ACM, 2011.
[43] Rick Joyce and Gopal Gupta. Identity authentication based on keystroke latencies.
Communications of the ACM, 33(2):168–176, 1990.
[44] Chao Shen, Zhongmin Cai, and Xiaohong Guan. Continuous authentication for
mouse dynamics: A pattern-growth approach. In Dependable Systems and Net-
works (DSN), 2012 42nd Annual IEEE/IFIP International Conference on, pages
1–12. IEEE, 2012.
[45] Michael Frank, Ralf Biedert, En-Di Ma, Ivan Martinovic, and Dong Song. Touch-
alytics: On the applicability of touchscreen input as a behavioral biometric for
continuous authentication. Information Forensics and Security, IEEE Transac-
tions on, 8(1):136–148, 2013.
[46] Napa Sae-Bae, Kowsar Ahmed, Katherine Isbister, and Nasir Memon. Biometric-
rich gestures: a novel approach to authentication on multi-touch devices. In Pro-
ceedings of the SIGCHI Conference on Human Factors in Computing Systems,
pages 977–986. ACM, 2012.
[47] Nan Zheng, Kun Bai, Hai Huang, and Haining Wang. You are how you touch: User
99
verification on smartphones via tapping behaviors. In Network Protocols (ICNP),
2014 IEEE 22nd International Conference on, pages 221–232. IEEE, 2014.
[48] Cristiano Giu↵rida, Kamil Majdanik, Mauro Conti, and Herbert Bos. I sensed it
was you: authenticating mobile users with sensor-enhanced keystroke dynamics. In
Detection of Intrusions and Malware, and Vulnerability Assessment, pages 92–111.
Springer, 2014.
[49] Benjamin Dra�n, Jiang Zhu, and Joy Zhang. Keysens: Passive user authenti-
cation through micro-behavior modeling of soft keyboard interaction. In Mobile
Computing, Applications, and Services, pages 184–201. Springer, 2013.
[50] Hui Xu, Yangfan Zhou, and Michael R Lyu. Towards continuous and passive
authentication via touch biometrics: An experimental study on smartphones. In
Symposium On Usable Privacy and Security, SOUPS, volume 14, pages 187–198,
2014.
[51] Tao Feng, Jun Yang, Zhixian Yan, Emmanuel Munguia Tapia, and Weidong Shi.
Tips: Context-aware implicit user identification using touch screen in uncontrolled
environments. In Proceedings of the 15th Workshop on Mobile Computing Systems
and Applications, page 9. ACM, 2014.
[52] Lingjun Li, Xinxin Zhao, and Guoliang Xue. Unobservable re-authentication for
smartphones. In NDSS, 2013.
[53] Cheng Bo, Lan Zhang, Xiang-Yang Li, Qiuyuan Huang, and Yu Wang. Silentsense:
silent user identification via touch and movement behavioral biometrics. In Pro-
ceedings of the 19th annual international conference on Mobile computing & net-
working, pages 187–190. ACM, 2013.
[54] Zdenka Sitova, Jaroslav Sedenka, Qing Yang, Ge Peng, Gang Zhou, Paolo Gasti,
and Kiran Balagani. HMOG: New Behavioral Biometric Features for Continuous
100
Authentication of Smartphone Users. IEEE Transactions on Information Forensics
and Security, 11(5):877–892, May 2016.
[55] Jiang Zhu, Pang Wu, Xiao Wang, and Joy Zhang. Sensec: Mobile security through
passive sensing. In Computing, Networking and Communications (ICNC), 2013
International Conference on, pages 1128–1133. IEEE, 2013.
[56] Jani Mantyjarvi, Mikko Lindholm, Elena Vildjiounaite, Satu-Marja Makela, and
HA Ailisto. Identifying users of portable devices from gait pattern with accelerome-
ters. In Acoustics, Speech, and Signal Processing, 2005. Proceedings.(ICASSP’05).
IEEE International Conference on, volume 2, pages ii–973. IEEE, 2005.
[57] Claudia Nickel, Tobias Wirtl, and Christoph Busch. Authentication of smartphone
users based on the way they walk using k-nn algorithm. In Intelligent Information
Hiding and Multimedia Signal Processing (IIH-MSP), 2012 Eighth International
Conference on, pages 16–20. IEEE, 2012.
[58] Mauro Conti, Irina Zachia-Zlatea, and Bruno Crispo. Mind how you answer me!:
transparently authenticating the user of a smartphone when answering or placing
a call. In Proceedings of the 6th ACM Symposium on Information, Computer and
Communications Security, pages 249–259. ACM, 2011.
[59] Lin Yang, Wei Wang, and Qian Zhang. VibID: User Identification through Bio-
Vibrometry. In 2016 15th ACM/IEEE International Conference on Information
Processing in Sensor Networks (IPSN), pages 1–12. IEEE, 2016.
[60] Cory Cornelius, Ronald Peterson, Joseph Skinner, Ryan Halter, and David Kotz.
A wearable system that knows who wears it. In Proceedings of the 12th annual
international conference on Mobile systems, applications, and services, pages 55–
67. ACM, 2014.
[61] Kasper B Rasmussen, Marc Roeschlin, Ivan Martinovic, and Gene Tsudik. Au-
101
thentication using pulse-response biometrics. In Proceedings of the Network and
Distributed Systems Security Symposium (NDSS), 2014.
[62] Pan Chan, Tzipora Halevi, and Nasir D. Memon. Glass OTP: Secure and Conve-
nient User Authentication on Google Glass. In Financial Cryptography Workshops,
volume 8976, pages 298–308. Springer, 2015.
[63] Sugang Li, Ashwin Ashok, Yanyong Zhang, Chenren Xu, Janne Lindqvist, and
Macro Gruteser. Whose move is it anyway? authenticating smart wearable devices
using unique head movement patterns. In PerCom, 2016.
[64] Jagmohan Chauhan, Hassan Jameel Asghar, Mohamed Ali Kaafar, and Anirban
Mahanti. Gesture-based continuous authentication for wearable devices: the google
glass case. arXiv preprint arXiv:1412.2855, 2014.
[65] Sauvik Das, Eiji Hayashi, and Jason I Hong. Exploring capturable everyday mem-
ory for autobiographical authentication. In Proceedings of the 2013 ACM inter-
national joint conference on Pervasive and ubiquitous computing, pages 211–220.
ACM, 2013.
[66] Paul Giura, Ilona Murynets, Roger Piqueras Jover, and Yevgeniy Vahlis. Is it really
you?: user identification via adaptive behavior fingerprinting. In Proceedings of the
4th ACM conference on Data and application security and privacy, pages 333–344.
ACM, 2014.
[67] Hossein Shafagh and Anwar Hithnawi. Poster: come closer: proximity-based au-
thentication for the internet of things. In Proceedings of the 20th annual inter-
national conference on Mobile computing and networking, pages 421–424. ACM,
2014.
[68] Stephan Richter, Christian Holz, and Patrick Baudisch. Bootstrapper: recognizing
tabletop users by their shoes. In Proceedings of the SIGCHI Conference on Human
Factors in Computing Systems, pages 1249–1252. ACM, 2012.
102
[69] He Wang, Xuan Bao, Romit Roy Choudhury, and Srihari Nelakuditi. Insight:
recognizing humans without face recognition. In Proceedings of the 14th Workshop
on Mobile Computing Systems and Applications, page 7. ACM, 2013.
[70] Android Power Management. http://elinux.org/Android_Power_Management,
November 2013.
[71] Android battery drain. http://forums.sonos.com/showthread.php?t=37497,
December 2013.
[72] How to find the root cause of your Android battery problems. http:
//www.reddit.com/r/Android/comments/19kq0a/how_to_find_the_root_
cause_of_your_android, March 2013.
[73] Dropbox on your home PC may be contributing to poor battery life on your
phone! http://forum.xda-developers.com/showthread.php?t=2094997, Jan-
uary 2013.
[74] Dropbox LAN sync. https://www.dropbox.com/help/137/en. Accessed Febru-
ary 2017.
[75] M. Goldmann and G. Kreitz. Measurements on the Spotify peer-assisted music-
on-demand streaming system. In Peer-to-Peer Computing (P2P), 2011 IEEE In-
ternational Conference on, pages 206–211, 2011.
[76] Jin Teng, Boying Zhang, Xinfeng Li, Xiaole Bai, and Dong Xuan. E-shadow:
Lubricating social interaction using mobile phones. In ICDCS, June 2011.
[77] Ngoc Do, ChengHsin Hsu, and Nalini Venkatasubramanian. CrowdMAC: A Crowd-
sourcing System for Mobile Access. In Proceedings of the 13th International Mid-
dleware Conference, Middleware, pages 1–20, 2012.
[78] Why are UDP packets dropped while sleeping? https://groups.google.com/
forum/#!topic/android-platform/DxlkphoLsd4, July 2012.
103
[79] Udp broadcast packets not received in sleep mode. http://stackoverflow.com/
questions/9363389/udp-broadcast-packets-not-received-in-sleep-mode,
February 2012.
[80] Reception of UDP packets in sleep mode. https://groups.google.com/forum/
#!topic/android-platform/OpbSdp9FTmA, June 2011.
[81] Wifi network connectivity issues and a possible fix. http://forum.xda-
developers.com/nexus-4/general/wifi-network-connectivity-issues-
fix-t2072930, December 2012.
[82] Ranveer Chandra, Sandeep Karanth, Thomas Moscibroda, Vishnu Navda, Jitendra
Padhye, Ramachandran Ramjee, and Lenin Ravindranath. Dircast: A practical
and e�cient Wi-Fi multicast system. In IEEE ICNP, 2009.
[83] Shuai Wang, Song Min Kim, Yunhuai Liu, Guang Tan, and Tian He. Corlayer: A
transparent link correlation layer for energy e�cient broadcast. In ACM MobiCom,
2013.
[84] Enhua Tan, Lei Guo, Songqing Chen, and Xiaodong Zhang. Psm-throttling: Min-
imizing energy consumption for bulk data communications in wlans. In Network
Protocols, 2007. ICNP 2007. IEEE International Conference on, pages 123–132.
IEEE, 2007.
[85] Ronny Krashinsky and Hari Balakrishnan. Minimizing Energy for Wireless Web
Access Using Bounded Slowdown. In ACM MOBICOM, 2002.
[86] ARP o✏oad. http://alliedtelesis.com/manuals/at2911GP/ah1072914.html.
Accessed July 2014.
[87] Monsoon solutions. http://www.msoon.com/LabEquipment/PowerMonitor/,
2014.
104
[88] Tra�c generation model. http://en.wikipedia.org/wiki/Traffic_
generation_model. Accessed February 2017.
[89] Cisco Visual Networking Index: Global Mobile Data Tra�c Forecast Update 2014-
2019 White Paper. http://www.cisco.com/c/en/us/solutions/collateral/
service-provider/visual-networking-index-vni/white_paper_c11-
520862.html, 2015. Accessed February 2015.
[90] Understanding today’s smartphone user. http://www.informatandm.com/wp-
content/uploads/2013/06/Mobidia-ITM-June-2013.pdf. Accessed July 2014.
[91] Mobile data o✏oading. https://en.wikipedia.org/wiki/Mobile_data_
offloading. Accessed July 2014.
[92] Ge Peng, Gang Zhou, David T Nguyen, and Xin Qi. All or None? The Dilemma
of Handling WiFi Broadcast Tra�c in Smartphone Suspend Mode. In IEEE IN-
FOCOM, 2015.
[93] Andrew J Pyles, Zhen Ren, Gang Zhou, and Xue Liu. Sifi: exploiting voip si-
lence for wifi energy savings insmart phones. In UbiComp, Proceedings of the 13th
international conference on Ubiquitous Computing, pages 325–334. ACM, 2011.
[94] J. Manweiler and R. Roy Choudhury. Avoiding the rush hours: Wifi energy man-
agement via tra�c isolation. In Proceedings of the 9th international conference on
Mobile systems, applications, and services, pages 253–266. ACM, 2011.
[95] Matthew Gast. 802.11 wireless networks: the definitive guide. O’Reilly Media,
Inc, 2005.
[96] Pejman Roshan and Jonathan Leary. 802.11 Wireless LAN fundamentals. Cisco
press, 2004.
[97] Giuseppe Bianchi. Performance analysis of the IEEE 802.11 distributed coordina-
105
tion function. Selected Areas in Communications, IEEE Journal on, 18(3):535–547,
2000.
[98] Haitao Wu, Yong Peng, Keping Long, Shiduan Cheng, and Jian Ma. Performance
of reliable transport protocol over IEEE 802.11 wireless LAN: analysis and en-
hancement. In INFOCOM 2002. Twenty-First Annual Joint Conference of the
IEEE Computer and Communications Societies. Proceedings. IEEE, volume 2,
pages 599–607. IEEE, 2002.
[99] Linksys WRT1200AC. https://wikidevi.com/wiki/Linksys_WRT1200AC. Ac-
cessed August 2015.
[100] Netgear R7000. https://wikidevi.com/wiki/Netgear_R7000. Accessed August
2015.
[101] Smartglasses. https://en.wikipedia.org/wiki/Smartglasses. Accessed Febru-
ary 2017.
[102] Consumer & Enterprise Smart Glasses: Opportunities & Forecasts 2015-
2020. http://www.juniperresearch.com/researchstore/devices-wearables/
smart-glasses/consumer-enterprise-smart-glasses. Accessed February
2016.
[103] Diksha Shukla, Rajesh Kumar, Abdul Serwadda, and Vir V Phoha. Beware, your
hands reveal your secrets! In Proceedings of the 2014 ACM SIGSAC Conference
on Computer and Communications Security, pages 904–917. ACM, 2014.
[104] Nur Haryani Zakaria, David Gri�ths, Sacha Brosto↵, and Je↵ Yan. Shoulder
surfing defence for recall-based graphical passwords. In Proceedings of the Seventh
Symposium on Usable Privacy and Security, page 6. ACM, 2011.
[105] Susan Wiedenbeck, Jim Waters, Leonardo Sobrado, and Jean-Camille Birget. De-
sign and evaluation of a shoulder-surfing resistant graphical password scheme. In
106
Proceedings of the working conference on Advanced visual interfaces, pages 177–
184. ACM, 2006.
[106] Adam J Aviv, Katherine Gibson, Evan Mossop, Matt Blaze, and Jonathan M
Smith. Smudge attacks on smartphone touch screens. WOOT, 10:1–7, 2010.
[107] Stefan Schneegass, Frank Steimle, Andreas Bulling, Florian Alt, and Albrecht
Schmidt. Smudgesafe: Geometric image transformations for smudge-resistant user
authentication. In Proceedings of the 2014 ACM International Joint Conference
on Pervasive and Ubiquitous Computing, pages 775–786. ACM, 2014.
[108] Benjamin Dra�n, Jiang Zhu, and Joy Zhang. Keysens: passive user authenti-
cation through micro-behavior modeling of soft keyboard interaction. In Mobile
Computing, Applications, and Services, pages 184–201. Springer, 2014.
[109] Douglas A Reynolds. Speaker identification and verification using gaussian mixture
speaker models. Speech communication, 17(1):91–108, 1995.
[110] Chenren Xu, Sugang Li, Gang Liu, Yanyong Zhang, Emiliano Miluzzo, Yih-Farn
Chen, Jun Li, and Bernhard Firner. Crowd++: unsupervised speaker count with
smartphones. In Proceedings of the 2013 ACM international joint conference on
Pervasive and ubiquitous computing, pages 43–52. ACM, 2013.
[111] SiME Smart Glasses. http://www.chipsip.com/archive/SiME%20Smart%
20Glasses_2015Jan(1).pdf. Accessed August 2016.
[112] Recon Jet. http://www.reconinstruments.com/products/jet/tech-specs/.
Accessed August 2016.
[113] Vuzix M300 Smart Glasses. https://www.vuzix.com/Products/m300-smart-
glasses. Accessed August 2016.
[114] Douglas A Reynolds. Experimental evaluation of features for robust speaker identi-
fication. Speech and Audio Processing, IEEE Transactions on, 2(4):639–643, 1994.
107
[115] Silence removal in speech signals. http://www.mathworks.com/matlabcentral/
fileexchange/28826-silence-removal-in-speech-signals. Accessed Febru-
ary 2017.
[116] Getevent. https://source.android.com/devices/input/getevent.html. Ac-
cessed February 2017.
[117] Android Debug Bridge. http://developer.android.com/tools/help/adb.
html. Accessed February 2017.
[118] Isabelle Guyon and Andre Elissee↵. An introduction to variable and feature selec-
tion. The Journal of Machine Learning Research, 3:1157–1182, 2003.
[119] Corinna Cortes and Vladimir Vapnik. Support-vector networks. Machine learning,
20(3):273–297, 1995.
[120] Asa Ben-Hur and Jason Weston. A user’s guide to support vector machines. Data
mining techniques for the life sciences, pages 223–239, 2010.
[121] Bernhard Scholkopf, Koji Tsuda, and Jean-Philippe Vert. Kernel methods in com-
putational biology. MIT Press, 2004.
[122] William M Campbell, Joseph P Campbell, Douglas A Reynolds, Elliot Singer, and
Pedro A Torres-Carrasquillo. Support vector machines for speaker and language
recognition. Computer Speech & Language, 20(2):210–229, 2006.
[123] Rezaul Begg and Joarder Kamruzzaman. A machine learning approach for auto-
mated recognition of movement patterns using basic, kinetic and kinematic gait
data. Journal of biomechanics, 38(3):401–408, 2005.
[124] Alice Este, Francesco Gringoli, and Luca Salgarelli. Support vector machines for
TCP tra�c classification. Computer Networks, 53(14):2476–2490, 2009.
[125] Chih-Chung Chang and Chih-Jen Lin. LIBSVM Tools. http://www.csie.ntu.
edu.tw/~cjlin/libsvmtools/. Accessed February 2017.
108
[126] Tom Fawcett. Roc graphs: Notes and practical considerations for researchers.
Machine learning, 31:1–38, 2004.
[127] Jaeyeon Jung, Vern Paxson, Arthur W Berger, and Hari Balakrishnan. Fast
portscan detection using sequential hypothesis testing. In Proceedings of IEEE
Symposium on Security and Privacy, pages 211–225. IEEE, 2004.
[128] G Gu, J Zhang, and W Lee. Botsni↵er: Detecting botnet command and con-
trol channels in network tra�c. In Proceedings of the 15th Annual Network and
Distributed System Security Symposium, NDSS, 2008.
[129] Mengjun Xie, Heng Yin, and Haining Wang. An e↵ective defense against email
spam laundering. In Proceedings of the 13th ACM conference on Computer and
communications security, pages 179–190. ACM, 2006.
[130] Robert LiKamWa, Zhen Wang, Aaron Carroll, Felix Xiaozhu Lin, and Lin Zhong.
Draining our glass: An energy and heat characterization of google glass. In Pro-
ceedings of 5th Asia-Pacific Workshop on Systems, APSys ’14, pages 10:1–10:7,
New York, NY, USA, 2014. ACM.
[131] Plotting AP and ROC curves. http://www.vlfeat.org/overview/plots-rank.
html. Accessed August 2016.
[132] Chih-Wei Hsu, Chih-Chung Chang, Chih-Jen Lin, et al. A practical guide to
support vector classification. Technical report, 2003.
109
Related Documents


